enhancing comprehension in open distance learning ... - CORE
415
ENHANCING COMPREHENSION IN OPEN DISTANCE LEARNING COMPUTER PROGRAMMING EDUCATION WITH VISUALIZATION by MARTHA ANNA SCHOEMAN submitted in accordance with the requirements for the degree of DOCTOR OF PHILOSOPHY In the subject COMPUTER SCIENCE at the University of South Africa Supervisor: Prof JH Gelderblom (October 2015)
-
Upload
khangminh22 -
Category
Documents
-
view
0 -
download
0
Transcript of enhancing comprehension in open distance learning ... - CORE

ENHANCING COMPREHENSION IN OPEN DISTANCE LEARNING COMPUTER PROGRAMMING EDUCATION WITH VISUALIZATION
by
MARTHA ANNA SCHOEMAN
submitted in accordance with the requirements for
the degree of
DOCTOR OF PHILOSOPHY
In the subject
COMPUTER SCIENCE
at the
University of South Africa
Supervisor: Prof JH Gelderblom
(October 2015)


5391849:
I declare that
ENHANCING COMPREHENSION IN OPEN DISTANCE LEARNING COMPUTER PROGRAMMING EDUCATION WITH VISUALIZATION
is my own work and that all the sources that I have used or quoted have been indicated and
acknowledged by means of complete references.
____ _______ ____15 October 2015____
SIGNATURE DATE
(Mrs)

i
Abstract This thesis describes a research project aimed at improving the tracing skills of first-year
programming students enrolled for an introductory C++ course at an open distance learning institution
by means of a tutorial in the form of a program visualization tool to teach the students to draw
variable diagrams. The research was based on the findings from the BRACElet project (Clear,
Whalley, Robbins, Philpott, Eckerdal, Laakso & Lister, 2011). A design-based research methodology
was followed.
To guide the process of developing the tutorial, a framework of 26 guidelines for developing and
using visualization tools to teach programming was synthesized from the literature on computing
education research CER, educational psychology and computer graphics. Guidelines were
supplemented with reasons or explanations for their recommendation and considerations to be taken
into account when using a guideline. The framework was enhanced by lessons learnt during the
development and testing of the tutorial.
The tutorial was tested and refined during two implementation cycles. Both cycles included
quantitative and qualitative investigations. All students registered for the introductory module
received the tool with their study material. For the quantitative investigations, students completed a
questionnaire after using the tutorial. Through the questionnaire biographical data was acquired, the
manner in which students used the tutorial and how they experienced using it. The responses to the
questionnaires were statistically analysed in combination with respondents’ final marks. The
statistical modelling indicated that the students’ biographical properties (a combination of level of
programming experience, marks obtained for Mathematics and English in matric and first-time
registration for COS1511 or not), had the biggest impact on their final marks by far.
During the qualitative investigations students were eye tracked in a Human-Computer Interaction
laboratory. The gaze replays in both cycles revealed that students’ reading skills impacted largely on
their success, connecting with the findings from the quantitative investigations.
Reflections on why the tutorial did not achieve its purpose; and why poor reading skills may have
such a strong effect on learning to program, contribute some theoretical understanding as to how
novices learn to program.
Keywords: Computer science education; teaching programming; novice programmers; introductory
programming courses; distance teaching/learning; open-distance learning; program visualization;
framework of guidelines for creating program visualizations; interactive tutorial; design-based
research; educational psychology; eye tracking; reading skills; BRACElet


iii
Acknowledgements
I wish to acknowledge all who assisted me during the completion of this thesis:
• The Lord, who is able to do so much more than we can ever ask for, or even think of, who
accompanied me on this journey.
• My supervisor, Professor Helene Gelderblom, for guidance, academic support and friendship.
• The statistician, Hennie Gerber, for his assistance and patience.
• My husband, Johan; sons, Chris, Jan-Hendrik and Berto; and soon-to-be daughter, Karin, for
love, support, patience and so often sharing our life with my studies.
• My family, friends and colleagues for prayers, support and encouragement, and in particular
two very special ladies, Benita Serfontein and Femia Vinciguerra.
• The Dean of CSET and SoC management for time-out to complete this thesis.

v
Table of Contents
Abstract ....................................................................................................................................... i
Acknowledgements .......................................................................................................................... iii
Table of Contents .............................................................................................................................. v
List of Figures ................................................................................................................................ xiii
List of Tables .................................................................................................................................. xv
Journal publications from this research ........................................................................................... xix
List of abbreviations and acronyms ................................................................................................. xxi
Note to the reader ......................................................................................................................... xxiii
Design-based research phase covered in Chapter 1............................................................................. 1
Map of Chapter 1 (Introduction) ........................................................................................................ 2
Chapter 1 Introduction ................................................................................................................... 3
1.1 Introduction ........................................................................................................................ 3
1.2 Background ........................................................................................................................ 3
1.2.1 Visualization to enhance comprehension ..................................................................... 5
1.2.2 Tracing........................................................................................................................ 6
1.2.3 Experiences while teaching introductory programming ................................................ 7
1.3 Research problem, aim and questions .................................................................................. 8
1.3.1 Research problem ....................................................................................................... 8
1.3.2 Aim ............................................................................................................................. 8
1.3.3 Thesis and research questions ...................................................................................... 9
1.4. Research design and methodology ...................................................................................... 9
1.4.1 Underlying assumptions ............................................................................................ 10
1.4.2 Delineation and limitations (Scope) ........................................................................... 10
1.5 Significance of outcomes, results and contributions of the research ................................... 11
1.6 Brief chapter overviews .................................................................................................... 12
1.7 Conclusion ....................................................................................................................... 14
Design-based research phase covered in Chapter 2........................................................................... 15
Map of Chapter 2 (Literature review) ............................................................................................... 16
Chapter 2 Literature review ......................................................................................................... 17
2.1 Introduction ...................................................................................................................... 17
2.2 ODL, e-learning and MOOCs ........................................................................................... 18
2.3 Teaching programming in distance education .................................................................... 20
2.4 Teaching introductory programming courses ..................................................................... 22

vi
2.4.1 The pedagogy of teaching introductory programming ................................................ 22
2.4.2 Mental models, threshold concepts and LEM in learning to program ......................... 25
2.4.2.1 Mental models ...................................................................................................... 26
2.4.2.2 Threshold concepts ............................................................................................... 28
2.4.2.3 Learning Edge Momentum (LEM) ........................................................................ 29
2.4.3 Problems novices experience ..................................................................................... 29
2.4.3.1 The differences between novices and experts ........................................................ 29
2.4.3.2 What do novices find difficult ............................................................................... 32
2.5 Tracing ............................................................................................................................. 38
2.5.1 Tracing defined ......................................................................................................... 38
2.5.2 The purpose of tracing ............................................................................................... 39
2.5.3 Difficulties novices have with tracing ........................................................................ 40
2.5.4 The advantages of teaching novices to trace............................................................... 41
2.6 Visualization .................................................................................................................... 42
2.6.1 Software visualization – an overview......................................................................... 43
2.6.2 SV in education ......................................................................................................... 44
2.6.3 How successful is visualization ................................................................................. 45
2.6.3.1 Learner engagement with visualization technology ............................................... 46
2.6.3.2 Research on the educational value of software visualization .................................. 48
2.7 Summary and conclusion .................................................................................................. 53
Design-based research phase covered in Chapter 3........................................................................... 55
Map of Chapter 3 (The BRACElet Project) ...................................................................................... 56
Chapter 3 The BRACElet Project ................................................................................................. 57
3.1 Introduction ...................................................................................................................... 57
3.2 Background ...................................................................................................................... 57
3.3 History of BRACElet ........................................................................................................ 59
3.4 BRACElet’s findings ........................................................................................................ 63
3.4.1 BRACElet’s guiding principles ................................................................................. 63
3.4.1.1 Bloom’s taxonomy for computer science assessment............................................. 64
3.4.1.2 The SOLO taxonomy ............................................................................................ 65
3.4.2 Findings from First Action Research Cycle................................................................ 67
3.4.3 Findings from Second Action Research Cycle ........................................................... 68
3.4.4 Findings from Third Action Research Cycle .............................................................. 70
3.4.5 Key contributions ...................................................................................................... 71
3.5 Theoretical basis for BRACElet’s work ............................................................................ 72
3.5.1 Research in mathematics education ........................................................................... 72
vii
3.5.2 A neo-Piagetian perspective on novice programmers’ development ........................... 74
3.5.2.1 The sensorimotor stage ......................................................................................... 74
3.5.2.2 The preoperational stage ....................................................................................... 75
3.5.2.3 The concrete operational stage .............................................................................. 75
3.5.2.4 The formal operational stage ................................................................................. 76
3.5.3 Applying the neo-Piagetian perspective ..................................................................... 76
3.5.4 Implications of the neo-Piagetian perspective ............................................................ 78
3.6 Continuation of BRACElet’s work .................................................................................... 79
3.6.1 Student annotations (‘doodles’) ................................................................................. 79
3.6.2 Novices’ understanding of the relationship between the concepts ‘object’ and ‘class’ 79
3.6.3 Misconceptions about assignment .............................................................................. 80
3.6.4 Examination question classification ........................................................................... 80
3.6.5 A longitudinal study into the development of novices – examination question generation and benchmarking .................................................................................... 80
3.6.6 BABELnot ................................................................................................................ 81
3.7 Summary and conclusion .................................................................................................. 82
Design-based research phase covered in Chapter 4........................................................................... 85
Map of Chapter 4 (Research design and methodology)..................................................................... 86
Chapter 4 Research design and methodology ............................................................................... 87
4.1 Introduction ...................................................................................................................... 87
4.2 The structure of a research design ..................................................................................... 87
4.2.1 Philosophical paradigms and approaches in information systems and computing research ..................................................................................................................... 87
4.2.2 Purpose of the research .............................................................................................. 91
4.2.3 Context ..................................................................................................................... 91
4.2.4 Methodology ............................................................................................................. 91
4.2.5 Ethical considerations................................................................................................ 92
4.3 Research design for this study ........................................................................................... 92
4.3.1 Design-based research ............................................................................................... 93
4.3.1.1 Challenges and advantages in design-based research ............................................. 97
4.3.1.2 Ensuring validity in design-based research ............................................................ 98
4.3.2 Research problem and purpose .................................................................................. 99
4.3.2.1 Research problem ................................................................................................. 99
4.3.2.2 Aim .................................................................................................................... 100
4.3.2.3 Thesis and research questions ............................................................................. 101
4.3.3 Philosophical approach chosen as paradigm............................................................. 101
viii
4.3.4 Context ................................................................................................................... 102
4.3.4.1 Local context ...................................................................................................... 102
4.3.4.2 Broader context .................................................................................................. 104
4.3.4.3 Researcher’s context ........................................................................................... 105
4.3.5 Methodology ........................................................................................................... 106
4.3.5.1 Phase 1: Analysis of practical problems by researchers and practitioners in collaboration ...................................................................................................... 106
4.3.5.2 Phase 2: Development of solutions informed by existing design principles and technological innovation ..................................................................................... 106
4.3.5.3 Phase 3: Iterative cycles of testing and refinement of solutions in practice ........... 106
4.3.5.4 Phase 4: Reflection to produce ‘design principles’ and enhance solution implementation .................................................................................................. 112
4.3.6 Validating the research effort................................................................................... 113
4.3.7 Ethical considerations.............................................................................................. 114
4.4 Conclusion and summary ................................................................................................ 115
Design-based research phase covered in Chapter 5......................................................................... 117
Map of Chapter 5 (Development of the tutorial to teach tracing) .................................................... 118
Chapter 5 Development of the tutorial to teach tracing ............................................................... 119
5.1 Introduction .................................................................................................................... 119
5.2 Guidelines from the literature for using and creating visualization tools effectively ......... 120
5.2.1 Guidelines from CER .............................................................................................. 120
5.2.2 Guidelines from educational psychology ................................................................. 126
5.2.3 Guidelines from computer graphics ......................................................................... 134
5.3 A Framework of guidelines for developing and creating visualization tools for teaching programming .................................................................................................................. 136
5.4 Design and development of a tutorial to teach tracing...................................................... 146
5.4.1 The Drawing Variable Diagrams Tutorial ................................................................ 146
5.4.1.1 Tutorial specifications......................................................................................... 146
5.4.1.2 Activities and implementation of activities .......................................................... 146
5.4.2 Motivation for design decisions ............................................................................... 154
5.4.2.1 Design decisions based on the context ................................................................ 154
5.4.2.2 Design decisions based on the framework of guidelines ..................................... 155
5.4.3 Development process and initial testing ................................................................... 160
5.4.4 Lessons learnt ......................................................................................................... 160
5.4.4.1 Lessons learnt during the development of the tutorial .......................................... 160
5.4.4.2 Lessons learnt during the testing of the tutorial ................................................... 163
5.4.5 Further guidelines ................................................................................................... 166
ix
5.5 Summary and conclusion ................................................................................................ 167
Note to the reader regarding Chapters 6 and 7 ................................................................................ 170
Design-based research phase covered in Chapter 6......................................................................... 171
Map of Chapter 6 (First implementation cycle of the Drawing Variable Diagrams Tutorial) ........... 172
Chapter 6 First implementation cycle of the Drawing Variable Diagrams Tutorial ...................... 173
6.1 Introduction .................................................................................................................... 173
6.1.1 Quantitative investigation ........................................................................................ 173
6.1.2 Qualitative investigation .......................................................................................... 174
6.2 The relationships between students’ marks and their ability to explain and trace code ..... 175
6.2.1 Examination paper and final mark ........................................................................... 176
6.2.2 The effect of the ability to explain the purpose of code (question 1) on a student’s final mark........................................................................................................................ 177
6.2.3 The effect of the ability to trace (question 2) on a student’s final mark ..................... 178
6.2.4 The combined effect of the ability to explain code and the ability to trace (questions 1 and 2) on a student’s final mark ............................................................................... 179
6.3 Factors that impact on students’ final marks .................................................................... 181
6.3.1 Background to the questionnaires used in the first implementation cycle .................. 182
6.3.2 Biographical detail and descriptive statistics ............................................................ 183
6.3.3 Factors that could influence the a student’s final mark (PM%) ................................. 185
6.3.3.1 English and Mathematics marks .......................................................................... 185
6.3.3.2 Profile score ....................................................................................................... 187
6.3.3.3 Positive user experience (questions 17 to 21) ...................................................... 188
6.3.3.4 Students’ prior experience of programming, use of tracing and time spent using the tutorial ............................................................................................................... 191
6.3.4 Modelling the relationships between the final mark and factors that could possibly affect it .................................................................................................................... 193
6.3.4.1 First semester 2012 model on all the data for relationships between the final mark (PM%) and the factors that could possibly influence it ........................................ 193
6.3.4.2 Second semester 2012 model on all the data for relationships between the final mark (PM%) and the factors that could possibly influence it ........................................ 195
6.3.4.3 Modelling with decision trees ............................................................................. 196
6.3.4.4 Relationship between time spent using tutorial and PM% .................................... 198
6.3.4.5 Relationship between programming experience (Q10) and PM% ........................ 199
6.4 Direct live observation and eye tracking in the HCI laboratory ........................................ 202
6.4.1 Procedure in HCI laboratory .................................................................................... 203
6.4.2 Participants ............................................................................................................. 204
6.4.3 Analysis of gaze replays .......................................................................................... 205
x
6.4.3.1 Learning from the tutorial ................................................................................... 205
6.4.3.2 Problems/Issues with the instructions on how to use the tutorial .......................... 208
6.4.3.3 Navigation through the tutorial ........................................................................... 209
6.4.3.4 Reading skills ..................................................................................................... 210
6.4.4 Analysis of the questionnaire completed after eye tracking ...................................... 212
6.4.5 Update of tutorial based in analysis of the eye tracking and accompanying questionnaire completed after eye tracking .............................................................. 213
6.5 Feedback from students in first implementation cycle ..................................................... 214
6.6 Findings ......................................................................................................................... 215
6.7 Summary and conclusion ................................................................................................ 218
Design-based research phase covered in Chapter 7......................................................................... 221
Map of Chapter 7 (Second implementation cycle of the Drawing Variable Diagrams Tutorial)....... 222
Chapter 7 Second implementation cycle of the Drawing Variable Diagrams Tutorial ................. 223
7.1 Introduction .................................................................................................................... 223
7.2 The impact of the low response rates for the questionnaires on the quantitative investigation 224
7.3 Factors that could impact on students’ final marks .......................................................... 226
7.3.1 Examination paper and final mark ........................................................................... 226
7.3.2 Background and adaptions to the questionnaires used in the second implementation cycle ....................................................................................................................... 228
7.3.3 Biographical detail and descriptive statistics ............................................................ 229
7.3.4 Factors that could influence students’ final marks (PM%) ........................................ 231
7.3.4.1 Mathematics and English marks .......................................................................... 231
7.3.4.2 Profile score ....................................................................................................... 232
7.3.4.3 The manner of tutorial use (questions 13 to 15, and 20 to 22) .............................. 235
7.3.4.4 Students’ prior experience of programming and use of tracing (questions 10, 12, 16 and 17) ............................................................................................................... 237
7.3.4.5 Learning from the tutorial (questions 18, 19, 23 to 36, 42 and 43) ....................... 238
7.3.4.6 Positive user experience (questions 37 to 41) ...................................................... 242
7.4 Direct live observation and eye tracking in the HCI laboratory ........................................ 246
7.4.1 Participants ............................................................................................................. 247
7.4.2 Analysis of gaze replays .......................................................................................... 248
7.4.2.1 Learning from the tutorial ................................................................................... 248
7.4.2.2 Problems/issues with the instructions on how to use the tutorial .......................... 249
7.4.2.3 Navigation through the tutorial ........................................................................... 250
7.4.2.4 Reading skills ..................................................................................................... 250
7.4.3 Analysis of the questionnaire completed after eye tracking ...................................... 251

xi
7.5 Feedback from students in second implementation cycle ................................................. 254
7.6 Findings ......................................................................................................................... 255
7.7 Enhancing the framework of guidelines for using and creating visualizations .................. 258
7.8 Summary and conclusion ................................................................................................ 260
Design-based research phase covered in Chapter 8......................................................................... 263
Map of Chapter 8 (Conclusion) ...................................................................................................... 264
Chapter 8 Conclusion ................................................................................................................ 265
8.1 Introduction .................................................................................................................... 265
8.2 Summary of research process and findings ...................................................................... 265
8.3 Delineation, limitations and discussion of problems ........................................................ 270
8.4 Conclusions .................................................................................................................... 272
8.5 Reflection on the conclusions.......................................................................................... 272
8.5.1 Why poor reading skills play such a big role in learning to program ........................ 273
8.5.2 Why the tutorial did not achieve its purpose ............................................................ 274
8.5.3 Reflection on the validity of the research process ..................................................... 277
8.6 Summary of contributions ............................................................................................... 278
8.6.1 Theoretical contribution .......................................................................................... 278
8.6.2 Practical contribution .............................................................................................. 279
8.6.3 Professional development of the researcher ............................................................. 279
8.7 Suggestions for further and future research ..................................................................... 280
8.8 Concluding remark ......................................................................................................... 281
REFERENCES.............................................................................................................................. 282
Appendix A Ethical clearance ........................................................................................................ 312
Appendix B Questionnaires used during implementation and testing of Drawing Variable Diagram Tutorial...................................................................................................................... 313
B.1 Questionnaires used in first implementation cycle ........................................................... 313
B.1.1 First semester 2012 ................................................................................................. 313
B.1.2 Second semester 2012 ............................................................................................. 316
B.2 Questionnaires used in second implementation cycle....................................................... 319
B.2.1 First semester 2013 ................................................................................................. 319
B.2.1.1 First questionnaire .............................................................................................. 319
B.2.1.2 Second questionnaire .......................................................................................... 322
B.2.2 Second semester 2013 (only questionnaire) ............................................................. 328
B.3 Comparison between questionnaires used in first and second implementation cycles ....... 335
Appendix C Documentation used for eye tracking and observation in HCI laboratory .................... 337
C.1 E-mail request to participate in research .......................................................................... 337
xii
C.2 Informed consent form .................................................................................................... 338
C.3 Task List for usability testing of Drawing Variable Diagrams tutorial ............................. 339
C.4 Interview questions for the Drawing Variable Diagrams Research Project ....................... 341
Appendix D Supporting statistical figures and tables ..................................................................... 343
D.1 First implementation cycle 2012 of the Drawing Variable Diagrams Tutorial .................. 343
D.1.1. Final marks for 2012 examinations (section 6.2.1) ................................................... 343
D.1.2 The effect of the ability to explain the purpose of code (question 1) on a student’s final mark (section 6.2.2) ................................................................................................. 343
D.1.3 The effect of the ability to trace (question 2) on a student’s final mark (section 6.2.3) 344
D.1.4 The combined effect of effect of the ability to explain code and the ability to trace (questions 1 and 2) on a student’s final mark (section 6.2.4) .................................... 344
D.1.5 Biographical detail and descriptive statistics (section 6.3.2) ..................................... 346
D.1.5 English and Mathematics marks (section 6.3.3.1) .................................................... 348
D.1.6 Positive user experience (questions 17 to 21) (section 6.3.3.3). ................................ 348
D.1.7 First semester 2012 model on all the data for relationships between the final mark (PM%) and the factors that could possibly influence it (section 6.3.4.1) ................... 349
D.1.8 Second semester 2012 model on all the data for relationships between the final mark (PM%) and the factors that could possibly influence it (section 6.3.4.1) ................... 350
D.1.9 Relationship between time spent using tutorial (Q16) and PM% (section 6.3.4.4) .... 351
D.1.10 Relationship between programming experience (Q10) and PM% (section 6.3.4.5) ... 352
D.2 Second implementation cycle 2012 of the Drawing Variable Diagrams Tutorial .............. 353
D.2.1. Final marks for 2013 examinations (section 7.2.1) ................................................... 353
D.2.2 Biographical detail and descriptive statistics (section 7.3.3) ..................................... 353
D.2.3 English and Mathematics marks (section 7.3.4.1) .................................................... 355
D.2.4 Learning experience (questions 18, 19, 23 to 36, 42 and 43) (section 7.3.4.5)........... 355
D.2.5 Positive user experience (questions 37 to 41) (section 7.3.4.6). ................................ 357
Appendix E Instructions for using the Drawing Variable Diagrams Tutorial .................................. 359
E.1 Landing page and instructions for first version of the Drawing Variable Diagrams Tutorial 359
E.2 Instructions for second version of the Tutorial to Draw Variable Diagrams ..................... 362
Appendix F A framework of guidelines for developing and creating visualizations for teaching programming ............................................................................................................. 374
xiii
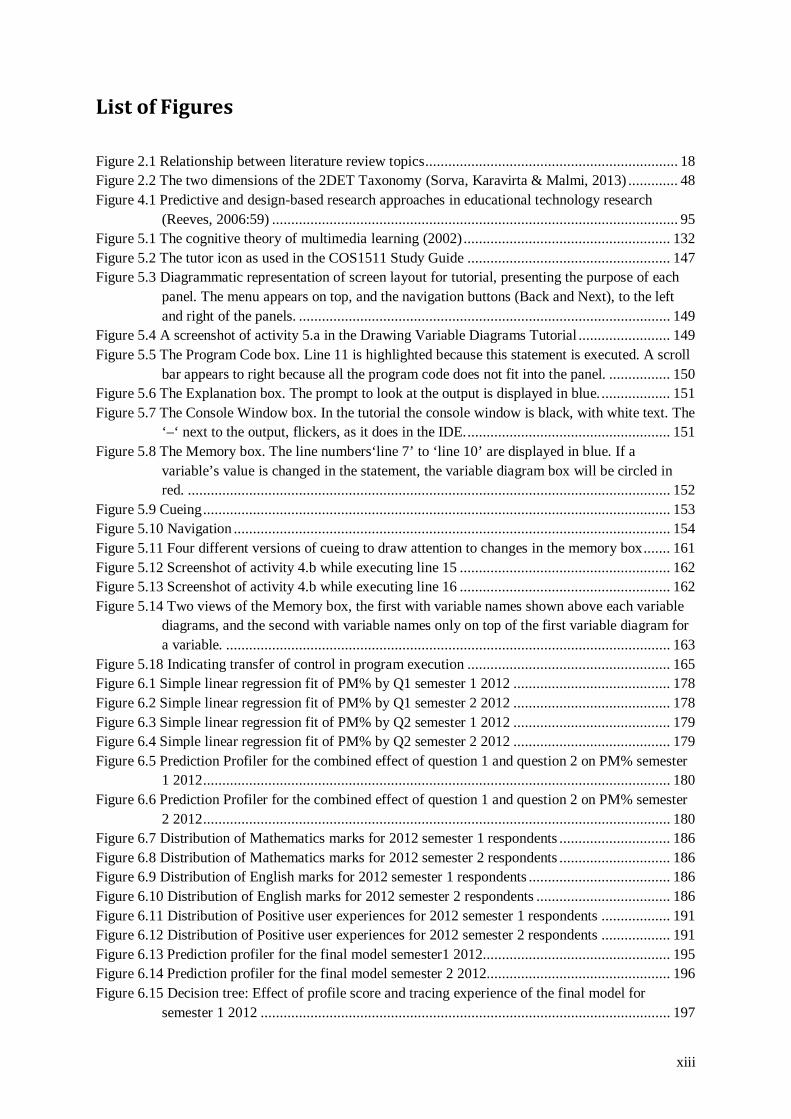
List of Figures
Figure 2.1 Relationship between literature review topics .................................................................. 18 Figure 2.2 The two dimensions of the 2DET Taxonomy (Sorva, Karavirta & Malmi, 2013) ............. 48 Figure 4.1 Predictive and design-based research approaches in educational technology research
(Reeves, 2006:59) .......................................................................................................... 95 Figure 5.1 The cognitive theory of multimedia learning (2002) ...................................................... 132 Figure 5.2 The tutor icon as used in the COS1511 Study Guide ..................................................... 147 Figure 5.3 Diagrammatic representation of screen layout for tutorial, presenting the purpose of each
panel. The menu appears on top, and the navigation buttons (Back and Next), to the left and right of the panels. ................................................................................................. 149
Figure 5.4 A screenshot of activity 5.a in the Drawing Variable Diagrams Tutorial ........................ 149 Figure 5.5 The Program Code box. Line 11 is highlighted because this statement is executed. A scroll
bar appears to right because all the program code does not fit into the panel. ................ 150 Figure 5.6 The Explanation box. The prompt to look at the output is displayed in blue. .................. 151 Figure 5.7 The Console Window box. In the tutorial the console window is black, with white text. The
‘–‘ next to the output, flickers, as it does in the IDE. ..................................................... 151 Figure 5.8 The Memory box. The line numbers‘line 7’ to ‘line 10’ are displayed in blue. If a
variable’s value is changed in the statement, the variable diagram box will be circled in red. .............................................................................................................................. 152
Figure 5.9 Cueing .......................................................................................................................... 153 Figure 5.10 Navigation .................................................................................................................. 154 Figure 5.11 Four different versions of cueing to draw attention to changes in the memory box ....... 161 Figure 5.12 Screenshot of activity 4.b while executing line 15 ....................................................... 162 Figure 5.13 Screenshot of activity 4.b while executing line 16 ....................................................... 162 Figure 5.14 Two views of the Memory box, the first with variable names shown above each variable
diagrams, and the second with variable names only on top of the first variable diagram for a variable. .................................................................................................................... 163
Figure 5.18 Indicating transfer of control in program execution ..................................................... 165 Figure 6.1 Simple linear regression fit of PM% by Q1 semester 1 2012 ......................................... 178 Figure 6.2 Simple linear regression fit of PM% by Q1 semester 2 2012 ......................................... 178 Figure 6.3 Simple linear regression fit of PM% by Q2 semester 1 2012 ......................................... 179 Figure 6.4 Simple linear regression fit of PM% by Q2 semester 2 2012 ......................................... 179 Figure 6.5 Prediction Profiler for the combined effect of question 1 and question 2 on PM% semester
1 2012 .......................................................................................................................... 180 Figure 6.6 Prediction Profiler for the combined effect of question 1 and question 2 on PM% semester
2 2012 .......................................................................................................................... 180 Figure 6.7 Distribution of Mathematics marks for 2012 semester 1 respondents ............................. 186 Figure 6.8 Distribution of Mathematics marks for 2012 semester 2 respondents ............................. 186 Figure 6.9 Distribution of English marks for 2012 semester 1 respondents ..................................... 186 Figure 6.10 Distribution of English marks for 2012 semester 2 respondents ................................... 186 Figure 6.11 Distribution of Positive user experiences for 2012 semester 1 respondents .................. 191 Figure 6.12 Distribution of Positive user experiences for 2012 semester 2 respondents .................. 191 Figure 6.13 Prediction profiler for the final model semester1 2012 ................................................. 195 Figure 6.14 Prediction profiler for the final model semester 2 2012 ................................................ 196 Figure 6.15 Decision tree: Effect of profile score and tracing experience of the final model for
semester 1 2012 ........................................................................................................... 197

xiv
Figure 6.16 Decision tree: Effect of the profile score and using the tutorial while working through the Study Guide of the final model for semester 2 2012 ...................................................... 197
Figure 6.17 Visual comparison of group means illustrating differences between time spent using the tutorial in relation to PM% semester 1 2012 ................................................................. 199
Figure 6.18 Visual comparison of group means illustrating differences between time spent using the tutorial in relation to PM% semester 2 2012 ................................................................. 199
Figure 6.19 Visual comparison of group means illustrating the differences in programming experience in relation to PM% semester 1 2012. ............................................................................ 201
Figure 6.20 Visual comparison of group means illustrating differences in programming experience in relation to PM% semester 2 2012 ................................................................................. 201
Figure 6.21 Eye tracker’s opening screen ....................................................................................... 208 Figure 6.22 Participant 8’s attempt at drawing variable diagrams ................................................... 208 Figure 6.23 Landing page of first version of the Drawing Variable Diagrams Tutorial ................... 209 Figure 7.1 Distribution of final marks for respondents in semester 1 2013 ...................................... 228 Figure 7.2 Distribution of final marks for respondents in semester 2 2013 ...................................... 228 Figure 7.3 Distribution of Mathematics marks obtained by 2013 semester 1 respondents................ 232 Figure 7.4 Distribution of Mathematics marks obtained by 2013 semester 2 respondents................ 232 Figure 7.5 Distribution of English marks for 2013 semester 1 respondents ..................................... 232 Figure 7.6 Distribution of English marks for 2013 semester 2 respondents ..................................... 232 Figure 7.7 Distribution of learning experience scores for 2013 semester 1 respondents .................. 242 Figure 7.8 Distribution of learning experience scores for 2013 semester 2 respondents .................. 242 Figure 7.9 Distribution of Positive user experience for 2013 semester 1 respondents ...................... 244 Figure 7.10 Distribution of Positive user experience for 2013 semester 2 respondents .................... 244 Figure D.1.1 Residual by predicted plot for the combined effect of question 1 and question 2 on PM%
semester 1 2012 ........................................................................................................... 345 Figure D.1.2 Actual by predicted plot for the combined effect of question1 and question 2 on PM%
semester 1 2012 ........................................................................................................... 345 Figure D.1.3 Residual by predicted plot for the combined effect of question 1 and question 2 on PM%
semester 2 2012 ........................................................................................................... 345 Figure D.1.4 Actual by predicted plot for the combined effect of question 1 and question 2 on PM%
semester 2 2012 ........................................................................................................... 345 Figure D.1.5 Residual by predicted plot for the final model for the relationship between PM% and the
factors that could influence it for semester 1 2012 ........................................................ 350 Figure D.1.6 Actual by predicted plot for the final model for the relationship between PM% and the
factors that could influence it for semester 1 2012 ........................................................ 350 Figure D.1.7 Residual by predicted plot for the final model for the relationship between PM% and that
the factors that could influence it semester 2 2012 ........................................................ 351 Figure D.1.8 Actual by predicted plot for the final model for the relationship between PM% and that
the factors that could influence it semester 2 2012 ........................................................ 351 Figure E.2 Landing page of tutorial ............................................................................................... 359 Figure E.3 First page of instructions .............................................................................................. 360 Figure E.4 Second page of instructions .......................................................................................... 360 Figure E.5 Third page of instructions ............................................................................................. 361

xv
List of Tables Table 1.1 Registration, pass rate, distinctions and dropout for COS1511 from 2011 to 2014, as
obtained from Unisa’s Directorate Information and Analysis (DIA) (Nyalungu, 20 March 2015; Van Zyl, 15 March 2015). ......................................................................................... 4
Table 2.1 Misconceptions about the relationship between language elements and underlying memory usage (Kaczmarczyk, Petrick, East and Herman 2010) ...................................................... 36
Table 2.2 The Engagement Taxonomy (Naps, Röβling et al. 2003) .................................................. 46 Table 2.3 The Extended Engagement Taxonomy (Myller et al., 2009) ............................................. 47 Table 2.4 The categories of the 2DET Taxonomy (Sorva, Karavirta & Malmi, 2013) ....................... 50 Table 3.1 The SOLO taxonomy for classifying responses on code-explaining questions (Clear,
Whalley, Lister, Carbone, Hu, Sheard, Simon & Thompson, 2008) ................................... 66 Table 3.2 SOLO categories for code writing solutions (Whalley et al., 2011) ................................... 66 Table 4.1 Fundamental beliefs of research paradigms and approaches (Creswell, 2014; Lincoln,
Lynham & Guba, 2011; Wahyuni, 2012)........................................................................... 90 Table 4.2 Prerequisites for degrees and diplomas that COS1511 is offered to ................................. 103 Table 4.3 Phases of design-based research mapped against elements that need to be addressed in the
research with the corresponding positions and methods in the thesis (adapted from Herrington et al., 2007:3) ................................................................................................ 107
Table 5.1 A Framework of guidelines for developing and creating visualizations for teaching programming .................................................................................................................. 138
Table 5.2 List of activities in the drawing variable diagrams tutorial .............................................. 148 Table 6.1 Structure: Part B of COS1511 examination papers in 2012 ............................................. 176 Table 6.2 Mean percentages and standard deviations of marks achieved by respondents for questions 1
to 8 in Part B of the two semester examinations in 2012. ................................................. 177 Table 6.3 Parameter estimates for the full model for the effect of question 1 and question 2 on PM%
semester 1 2012 .............................................................................................................. 179 Table 6.4 Parameter estimates for the full model for the effect of question 1 and question 2 on PM%
semester 2 2012 .............................................................................................................. 180 Table 6.5 Types of English and Mathematics accepted as Grade 12 (Matric) subjects at Unisa ....... 185 Table 6.6 Frequency distributions for questions used to calculate a profile score for respondents for
both semesters in 2012 .................................................................................................... 188 Table 6.7 User experience response ratings representing positive user experience of the Drawing
Variable Diagrams Tutorial usage for semester 1 2012 (all respondents) ......................... 189 Table 6.8 User experience response ratings representing positive user experience of the Drawing
Variable Diagrams Tutorial usage for semester 2 2012 (all respondents) ......................... 189 Table 6.9 Cronbach’s coefficient alphas for positive user experience for both semesters in 2012 .... 189 Table 6.10 Frequency distribution of questionnaire items for students’ prior experience of
programming and use of tracing for semesters in 2012 (all respondents) .......................... 192 Table 6.11 Effect tests for the full model semester 1 2012 .............................................................. 194 Table 6.12 Effect tests for the final model semester 1 2012 ............................................................ 194 Table 6.13 Effect tests for the full model semester 2 2012 .............................................................. 195 Table 6.14 Effect tests for the final model semester 2 2012 ............................................................ 196 Table 6.15 Connecting letters report: Relationship between time spent using tutorial and PM%
semester 1 2012 .............................................................................................................. 198 Table 6.16 Connecting letters report: Relationship between time spent using tutorial and PM%
semester 2 2012 .............................................................................................................. 198
xvi
Table 6.17 Connecting letters report: Relationship between programming experience and PM% semester 1 2012 .............................................................................................................. 200
Table 6.18 Connecting letters report: Relationship between programming experience and PM% semester 2 2012 .............................................................................................................. 200
Table 6.19 Description of activities worked through during observations in the HCI laboratory ..... 203 Table 6.20 Biographical information of participants observed in HCI laboratory ............................ 204 Table 7.1 Structure: Part B of COS1511 examination papers in 2013 ............................................. 227 Table 7.2 Mean percentages and standard deviations of marks achieved by respondents for questions 1
to 10 in Part B of the two semester examinations in 2013 ................................................ 227 Table 7.3 Frequency distributions of questions used to calculate profile scores of respondents for both
semesters in 2013 ........................................................................................................... 233 Table 7.4 Mean percentages: final mark (PM%) for profile scores for both semesters 2013 ............ 235 Table 7.5 Tutorial use by respondents in both semesters of 2013 .................................................... 236 Table 7.6 Frequency distribution of questionnaire items for students’ prior experience of
programming and use of tracing for both semesters in 2013 ............................................ 238 Table 7.7 Frequency distributions of respondents’ ‘learning experience of the Drawing Variable
Diagrams Tutorial’ semester 1 2013 ................................................................................ 239 Table 7.8 Frequency distributions of respondents’ ‘learning experience of the Drawing Variable
Diagrams Tutorial’ semester 2 2013 ................................................................................ 240 Table 7.9 Cronbach’s coefficient alphas for learning experience for both semesters in 2013 ........... 241 Table 7.10 User experience response ratings representing positive user experience of the Drawing
Variable Diagrams Tutorial usage for semester 1 2013 (all respondents) ......................... 243 Table 7.11 User experience response ratings representing positive user experience of the Drawing
Variable Diagrams Tutorial usage for semester 2 2013 (all respondents) ......................... 243 Table 7.12 Cronbach’s coefficient alphas for positive user experience for both semesters in 2013 .. 243 Table 7.13 Biographical information of participants observed in HCI laboratory ............................ 247 Table B.3.1 Comparison between questionnaires, showing adaptions and extensions used in the
second implementation cycle .......................................................................................... 335 Table D.1.1 Quantiles for final marks for respondents for both semesters 2012 .............................. 343 Table D.1.2 Summary statistics for final marks for respondents for both semesters 2012 ................ 343 Table D.1.3 Multivariate correlations for questions 1 to 8 in Part B of the first semester 2012
examination paper .......................................................................................................... 343 Table D.1.4 Multivariate correlations for questions 1 to 8 in Part B of the second semester 2012
examination paper .......................................................................................................... 343 Table D.1.5 Analysis of variance for linear regression question 1 on PM% semester 1 2012 .......... 344 Table D.1.6 Summary of fit for linear regression question 1 on PM% semester 1 2012 .................. 344 Table D.1.7 Analysis of variance for linear regression question 1 on PM% semester 2 2012 .......... 344 Table D.1.8 Summary of fit for linear regression question 1 on PM% semester 2 2012 .................. 344 Table D.1.9 Analysis of variance for linear regression question 2 on PM% semester 1 2012 .......... 344 Table D.1.10 Summary of fit for linear regression question 2 on PM% semester 1 2012................. 344 Table D.1.11 Analysis of variance for linear regression question 2 on PM% semester 2 2012 ........ 344 Table D.1.12 Summary of fit for linear regression question 2 on PM% semester 2 2012................. 344 Table D.1.13 Analysis of variance for combined effect of question 1 and question 2 on PM% semester
1 2012 ............................................................................................................................ 344 Table D.1.14 Measure of fit for combined effect of question 1 and question 2 on PM% semester 1
2012 ............................................................................................................................... 344 Table D.1.16 Measure of fit for combined effect of question 1 and question 2 on PM% semester 2
2012 ............................................................................................................................... 345
xvii
Table D.1.17 Biographical data of students in first semester of 2012 .............................................. 346 Table D.1.18 Biographical data of students in second semester of 2012 ......................................... 347 Table D.1.19 Quantiles for Mathematics marks for respondents for both semesters 2012 ............... 348 Table D.1.20 Summary statistics for Mathematics marks for respondents for both semesters 2012 . 348 Table D.1.21 Quantiles for English marks for respondents for both semesters 2012 ....................... 348 Table D.1.22 Summary statistics for English marks for respondents for both semesters 2012 ......... 348 Table D.1.23 Quantiles for positive user experience for both semesters 2012 all respondents ......... 348 Table D.1.24 Summary statistics for positive user experience for both semesters 2012 all respondents...................................................................................................................................................... 348 Table D.1.25 Cronbach’s coefficient alpha for positive user experience semester 1 2012 ............... 349 Table D.1.26 Cronbach’s coefficient alpha for positive user experience semester 2 2012 ............... 349 Table D.1.27 Analysis of variance for the full model for the relationship between PM% and the
factors that could influence it for semester 1 2012 ........................................................... 349 Table D.1.28 Measure of fit for the full model for the relationship between PM% and the factors that
could influence it for semester 1 2012 ............................................................................. 349 Table D.1.29 Analysis of variance for the final model for the relationship between PM% and the
factors that could influence it for semester 1 2012 ........................................................... 349 Table D.1.30 Measure of fit for the final model for the relationship between PM% and the factors that
could influence it for semester 1 2012 ............................................................................. 349 Table D.1.31 Analysis of variance for the full model for the relationship between PM% and the
factors that could influence it for semester 2 2012 ........................................................... 350 Table D.1.32 Measure of fit for the full model for the relationship between PM% and the factors that
could influence it for semester 2 2012 ............................................................................. 350 Table D.1.33 Analysis of variance for the final model for the relationship between PM% and the
factors that could influence it for semester 2 2012 ........................................................... 350 Table D.1.34 Measure of fit for the final model for the relationship between PM% and that the factors
that could influence it for semester 2 2012 ...................................................................... 350 Table D.1.35 Analysis of variance for PM% by time spent using the tutorial for semester 1 2012... 351 Table D.1.36 Measure of fit for PM% by time spent using the tutorial for semester 1 2012 ............ 351 Table D.1.37 Analysis of variance for PM% by time spent using the tutorial for semester 2 2012... 351 Table D.1.38 Measure of fit for PM% by time spent using the tutorial for semester 2 2012 ............ 351 Table D.1.39 Analysis of variance for PM% by programming experience for semester 1 2012 ....... 352 Table D.1.40 Measure of fit for PM% by programming experience for semester 1 2012 ................. 352 Table D.1.41 Analysis of variance for PM% by programming experience for semester 2 2012 ....... 352 Table D.1.42 Measure of fit for PM% PM% by programming experience for semester 2 2012 ....... 352 Table D.2.1 Quantiles for final marks for respondents for both semesters 2013 .............................. 353 Table D.2.2 Summary statistics for final marks for respondents for both semesters 2013 ................ 353 Table D.2.3 Biographical data of students in both semesters of 2013 .............................................. 353 Table D.2.4 Quantiles for Mathematics marks for respondents for both semesters 2013 ................. 355 Table D.2.5 Summary statistics for Mathematics marks for respondents for both semesters 2013 ... 355 Table D.2.6 Quantiles for English marks for respondents for both semesters 2013 ......................... 355 Table D.2.7 Summary statistics for English marks for respondents for both semesters 2013 ........... 355 Table D.2.8 Quantiles for learning experience for 2013 respondents for both semesters ................ 355 Table D.2.9 Summary statistics for learning experience for 2013 respondents for both semesters .. 355 Table D.2.10 Cronbach’s coefficient alpha for learning experience semester 1 2013 ..................... 356 Table D.2.11 Cronbach’s coefficient alpha for learning experience semester 2 2013 ..................... 357 Table D.2.12 Quantiles for Positive user experience for all respondents for both semesters 2013 ... 357

xviii
Table D.2.13 Summary statistics for Positive user experience for all respondents for both semesters 2013 ............................................................................................................................... 357
Table D.2.14 Cronbach’s coefficient alpha for positive user experience in semester 1 2013........... 358 Table D.2.15 Cronbach’s coefficient alpha for positive user experience in semester 2 2013........... 358 Table F.1 A framework of guidelines for developing and creating visualizations for teaching
programming, with references……………………………………………………………..358

xix
Journal publications from this research Schoeman, M., Gelderblom, H. & Smith, E. (2012) A tutorial to teach tracing to first-year
programming students. Progressio, 34(3), 59-80. Available at:
https://www.researchgate.net/publication/282610380_A_tutorial_to_teach_tracing_to_first-
year_programming_students#full-text.
Schoeman, M., Gelderblom, H. & Muller, H. (2013) Investigating the Effect of Program Visualization
on Introductory Programming in a Distance Learning Environment. African Journal of Research
in Mathematics, Science and Technology Education, 17(1-2), 139-151. Available at:
http://dx.doi.org/10.1080/10288457.2013.828408.


xxi
List of abbreviations and acronyms ACE Australasian Computing Education Conference
AUT Auckland University of Technology
AV algorithm visualization
BRACE Building Research in Australasian Computing Education
CER computing education research
COS1511 Introduction to Programming I
CS Ed Computer Science education
CUSP course and unit of study portal
DMA direct-manipulation animation
ET Engagement Taxonomy
HCI Human-Computer Interaction
ICER International Workshop on Computing Education Research
ICO Input, Calculate, and Output
IDE interface development environment
ILDF Integrative Learning Design Framework
IRT Initialise, Repeat for each entry (in list, table, or array), and Terminate
ITiCSE Conference on Innovation and Technology in Computer Science Education
LEM learning edge momentum
LMS Learning Management System
LOs learning objects
MCQs multiple choice questions
MOOCs massive open online courses
ODL open distance learning
NACCQ Annual National Advisory Committee on Computing Qualifications
NDEEN National Diploma in Electrical Engineering
NDINL National Diploma: Information Technology
NDIT National Diploma: Information Technology

xxii
PM% the final mark for each student in the statistical analysis
PV program visualization
SOLO Structure of the Observed Learning Outcome
SV software visualization
UML Unified Modeling Language
Unisa University of South-Africa

xxiii
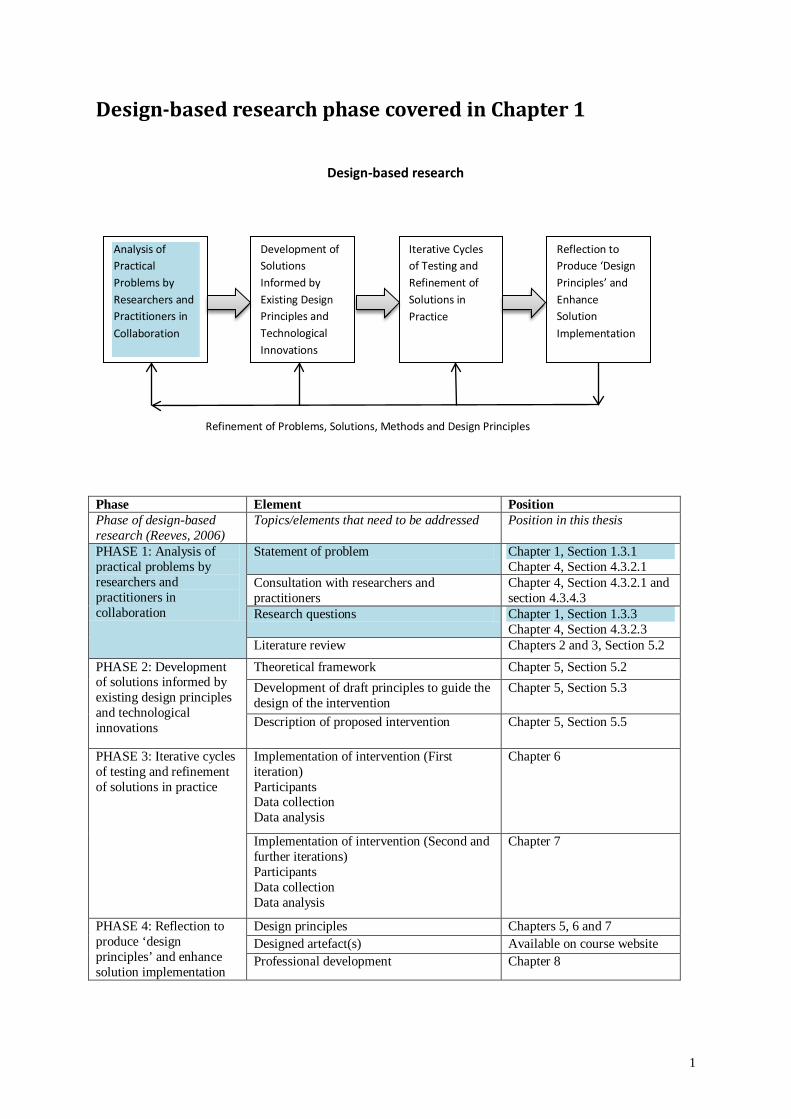
Note to the reader
This study was conducted using design-based research. To assist the reader in understanding the
process that was followed, the figure and table used on the next page, appears in front of each chapter.
The figure shows the phases used in design-based while the table provides more detail on each phase
and the section in the thesis where it is covered. The phase and sections covered in the chapter will be
highlighted in both the figure and the table to show how the research progresses.

1
Design-based research phase covered in Chapter 1
Design-based research
Phase Element Position Phase of design-based research (Reeves, 2006)
Topics/elements that need to be addressed Position in this thesis
PHASE 1: Analysis of practical problems by researchers and practitioners in collaboration
Statement of problem Chapter 1, Section 1.3.1 Chapter 4, Section 4.3.2.1
Consultation with researchers and practitioners
Chapter 4, Section 4.3.2.1 and section 4.3.4.3
Research questions Chapter 1, Section 1.3.3 Chapter 4, Section 4.3.2.3
Literature review Chapters 2 and 3, Section 5.2 PHASE 2: Development of solutions informed by existing design principles and technological innovations
Theoretical framework Chapter 5, Section 5.2 Development of draft principles to guide the design of the intervention
Chapter 5, Section 5.3
Description of proposed intervention Chapter 5, Section 5.5
PHASE 3: Iterative cycles of testing and refinement of solutions in practice
Implementation of intervention (First iteration) Participants Data collection Data analysis
Chapter 6
Implementation of intervention (Second and further iterations) Participants Data collection Data analysis
Chapter 7
PHASE 4: Reflection to produce ‘design principles’ and enhance solution implementation
Design principles Chapters 5, 6 and 7 Designed artefact(s) Available on course website Professional development Chapter 8
Analysis of Practical Problems by Researchers and Practitioners in Collaboration
Development of Solutions Informed by Existing Design Principles and Technological Innovations
Iterative Cycles of Testing and Refinement of Solutions in Practice
Reflection to Produce ‘Design Principles’ and Enhance Solution Implementation
Refinement of Problems, Solutions, Methods and Design Principles
2
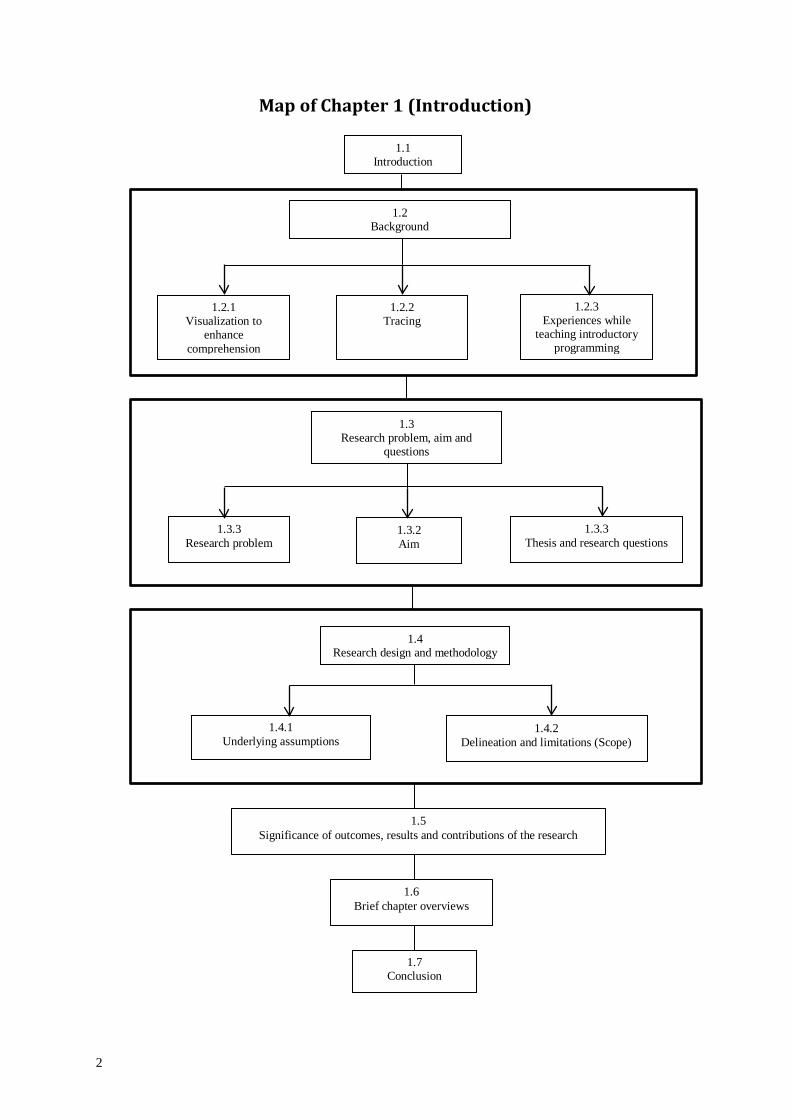
Map of Chapter 1 (Introduction)
1.1 Introduction
1.2 Background
1.3 Research problem, aim and
questions
1.7 Conclusion
1.2.1 Visualization to
enhance comprehension
1.2.2 Tracing
1.2.3 Experiences while
teaching introductory programming
1.3.3 Research problem
1.3.2 Aim
1.3.3 Thesis and research questions
1.5 Significance of outcomes, results and contributions of the research
1.6 Brief chapter overviews
1.4 Research design and methodology
1.4.1 Underlying assumptions
1.4.2 Delineation and limitations (Scope)

3
Chapter 1 Introduction
1.1 Introduction
This thesis describes a research project aimed at improving the tracing skills of first-year
programming students enrolled for an introductory C++ course at the University of South-Africa
(Unisa), to increase their comprehension and programming ability. This was done by means of a
tutorial in the form of a program visualization (PV) tool to teach the students to draw variable
diagrams. To develop the PV tool, the researcher first extracted a framework of guidelines/principles
from the literature to guide the process. The research therefore had a twofold purpose, namely to offer
a general framework of guidelines for designing and developing visualization tools to teach
programming; and to put it to the test by developing a tutorial based on these guidelines, to teach
introductory programing students how to draw variable diagrams to trace their programs.
In this introductory chapter, the background for the study is provided in section 1.2. Section 1.3
elaborates on the research problem, its aims and the research question. The research design and
methodology are described in section 1.4, while the significance of the study’s outcomes, results and
contributions are discussed in section 1.5. Section 1.6 provides an overview of the chapters
comprising the study, and the conclusion follows in section 1.7.
1.2 Background
It is generally accepted that it is difficult to learn how to program (Bellström & Thorén, 2009;
McCracken, Almstrum, Diaz, Guzdial, Hagan, Kolikant, Laxer, Thomas, Utting & Wilusz, 2001;
Pane, Ratanamahatana & Myers, 2001; Robins, Rountree & Rountree, 2003). As a result, the pass rate
for students taking first-year programming courses, in general, is low, with a high drop-out rate. At
the same time, there are also a high number of distinctions, thereby creating a bimodal results
distribution (Bornat, Dehnadi & Simon, 2008; Corney, 2009; McCracken et al., 2001; Robins, 2010).
Unisa is no exception in this regard, as the pass rate for the introductory programming module at
Unisa, COS1511 (Introduction to Programming I), from 2011 to 2014 varies from 28% to 32%, while
the number of distinctions at the same time varies from 8% to 14% (see Table 1.1). Being an open
distance learning (ODL) institution may even exacerbate this situation, given the fact that students
have to study independently, without face-to-face support.
In contrast with the above, two independent studies claim that the average pass rate for introductory
programming courses worldwide is 67% (Bennedsen & Caspersen, 2007; Watson & Li, 2014),
although pass rates may vary considerably – from 23.1% to 96% (Watson & Li, 2014). Nevertheless,
literature shows that the teaching of programming remains a continuous field of investigation

4
(Morgan, Sheard, Butler, Falkner, Simon & Weerasinghe, 2015). Researchers attempt both to
determine the reasons for the perceived bimodal phenomenon as well as to remedy it. This leads, to
Table 1.1 Registration, pass rate, distinctions and dropout for COS1511 from 2011 to 2014, as obtained from Unisa’s Directorate Information and Analysis (DIA) (Nyalungu, 20 March 2015; Van Zyl, 15 March 2015).
Exam Year
Sitting
Registration Module
Count***
Examination Sitting
Admitted Normal Wrote*
Normal Pass*
Normal* Pass Rate
Percentage (Passed
/written %)
Number of Distinctions (Percentage of written
in brackets)**
Dropout***
Dropout rate
(Dropout / Enrollment
%)
2011 Jun
2381 2183 1923 549 28.5% 198 (10%) 458 19.2%
2011 Nov
1457 1197 1191 346 29.1% 111 (9%) 266 18.3%
2012 Jun
2213 2061 1827 582 31.9% 197 (11%) 386 17.4%
2012 Nov
1528 1417 1267 352 27.8% 106 (8%) 261 17.1%
2013 Jun
1180 1083 988 337 34.1% 138 (14%) 192 16.2%
2013 Nov
1145 1020 920 276 30.0% 83 (9%) 225 19.7%
2014 Jun
976 889 809 258 31.9% 101 (13%) 167 17.1%
2014 Nov
1054 1017 894 263 29.4% 78 (9%) 160 15.1%
(Legend: * – The term ‘Normal’ refers to students who were registered for the specific semester. ** – The percentage of students who wrote the examination and obtained distinctions appears in brackets after the number of distinctions. *** – ‘Dropout’ refers to students who were registered at the end of the semester but did not write the examination. It does not include cancellations, which will raise the dropout rate considerably when taken into account.) Similarly, ‘Registration Module Count’ indicates the number of students still registered by the end of the semester and therefore excludes cancellations.
research being conducted inter alia on programming ability or aptitude; teaching and learning theories
and models; teaching, learning and assessment tools and techniques; the curriculum and typical
problems first-year programming students experience (Dale, 2006; Kinnunen, McCartney, Murphy &
Thomas, 2007; Lahtinen, Ala-Mutka & Järvinen, 2005; Lister, Adams, Fitzgerald, Fone, Hamer,
Lindholm, McCartney, Moström, Sanders, Seppälä, Simon & Thomas, 2004; Milne & Rowe, 2002;
Robins et al., 2003; Sheard, Simon, Hamilton & Lonnberg, 2009; Simon, Carbone, Raadt, Lister,
Hamilton & Sheard, 2008). Judging by the variety of factors investigated in this research and its
results, the cause of the bimodal results distribution is probably over-determined, that is, influenced
by several factors (Sheard, Simon et al. 2009).
5
In an attempt to explain this phenomenon, Robins (2010:58) suggests a new mechanism, referred to as
learning edge momentum (LEM). The learning edge is “the boundaries of existing knowledge which
form the context into which newly learned concepts (information, understanding and skills) must be
integrated”. Over time, the consequences of either successful or unsuccessful learning becomes self-
reinforcing, since any successful learning in a specific domain makes it easier to some extent, to
acquire further related concepts from that domain, while unsuccessful learning has the opposite effect.
Robins (2010) also investigated the well-known assumption that there are two different groups of
people, those who can program and those who cannot. He found no convincing evidence to support
this premise, and therefore proposes that both the high drop-out and bi-modal results distribution in
introductory computer science courses, are due to the nature of the subject material concerned. To
improve the pass rate and lower the drop-out rate, effective teaching and learning during the initial
stages of first-year programming courses, should take advantage of the LEM mechanism to achieve a
better through-put rate (Robins, 2010).
Two aspects employed to improve the success of novice programmers, both related to this study,
namely visualization and tracing, are discussed below as well as the researcher’s experiences while
teaching introductory programming.
1.2.1 Visualization to enhance comprehension
Visualization is one of the methods used by computer science educators to assist students in mastering
programming concepts. Software visualization (SV) in particular, aims to demonstrate different
elements of software graphically, so that users can comprehend and reason about it (Petre & Quincey,
2006). This may take on the form of either AV or PV. AV demonstrates the high-level operations of
an algorithm to assist understanding of its procedural behaviour (Hundhausen, Douglas & Stasko,
2002). PV shows the effect of each operation in implemented code (Röβling, Malmi, Clancy, Joy,
Kerren, Korhonen, Moreno, Naps, Oechsle, Radenski, Ross & Velazquez-Iturbide, 2008). PV also
facilitates program comprehension and debugging (Helminen & Malmi, 2010).
The success of SV is debatable. It is for instance, not always pedagogically successful (Foutsitzis &
Demetriadis, 2008; Hundhausen et al., 2002; Lahtinen, 2008; Naps, Röβling, Almstrum, Dann,
Fleischer, Hundhausen, Korhonen, Malmi, McNally, Rodger & Velázquez-Iturbide, 2003; Pears,
Seidman, Malmi, Mannila, Adams, Bennedsen, Devlin & Paterson, 2007; Shaffer, Cooper &
Edwards, 2007). Responses about the situations in which PVs are useful are also ambiguous –
students may use PVs while studying, but claim they are most beneficial when presented by a teacher
(Lahtinen, Jarvinen & Melakoski-Vistbacka, 2007). On the other hand, the literature indicates that
individual engagement is essential to benefit from visualization (Isohanni & Knobelsdorf, 2011;
Kaila, Rajala, Laakso & Salakoski, 2009). Depending on the level of engagement with visualization, it

6
can improve knowledge acquisition, attitude and programming skills (Urquiza-Fuentes & Velázquez-
Iturbide, 2009a).
A significant number of SVs have been developed, but they are rarely used by teachers or lecturers
other than the developers themselves. While instructors may agree that visualizations can help
students, they are frequently not sufficiently convinced of its value to use it. They cite reasons for not
using it, such as the difficulty and lack of time to adapt and maintain the visualization according to the
courseware used at the institution (Ben-Bassat Levy & Ben-Ari, 2007; Domingue, 2002; Hundhausen
& Brown, 2007; Naps, Röβling et al., 2003; Pears, East, McCartney, Ratcliffe, Stamouli, Berglund,
Kinnunen, Moström, Schulte & Eckerdal, 2007; Röβling et al., 2008). According to Shaffer, Cooper,
Alon, Akbar, Stewart, Ponce and Edwards (2010:9:18), “much of AV development seems to occur in
a social vacuum”, since despite larger developers communicating with each other, smaller developers
do not seem to be aware of the results of studies on the effectiveness of visualizations.
1.2.2 Tracing
Research has shown that students need to be able to read (that is trace) and explain code to be capable
to write code (Lister, Clear, Simon, Bouvier, Carter, Eckerdal, Jacková, Lopez, McCartney, Robbins,
Seppälä & Thompson, 2010; Lopez, Whalley, Robbins & Lister, 2008; Philpott, Robbins & Whalley,
2007; Rountree, Rountree, Robins & Hannah, 2005; Sheard, Carbone, Lister, Simon, Thompson &
Whalley, 2008; Venables, Tan & Lister, 2009). Soloway (1986:857) pointed out this requirement in
1986 already, by stating that “designers and maintainers who did not carry out simulations did not
develop an effective design or an effective enhancement”.
The BRACElet project’s1 research (Clear, Philpott & Robbins, 2009; Lister et al., 2004; Lister et al.,
2010; Whalley & Lister, 2009) suggests that novice programmers develop these skills in a hierarchical
order, as follows: They first learn to read, that is trace, code. Once this ability becomes dependable,
they develop the skill to explain code. When students are reasonably adept at both reading and
explaining, the capacity to systematically write code develops. The skills in this hierarchy are not
necessarily acquired in a strict order, but instead support each other and improve in parallel. However,
a certain minimal competency at tracing and explaining is required, before a minimal competence to
systematically write code is displayed (Lister et al., 2010; Lister, Fidge & Teague, 2009; Venables et
al., 2009; Whalley & Lister, 2009).
Cogan and Gurwitz (2009) indicated that teaching students memory tracing (tracking the changes in
values of all variables on paper during program execution) early in their introductory programming
courses, improved the pass rate rate. Hertz and Jump (2013) report similar results. This seems to
1 The BRACElet project was a multi-institutional multi-national study investigating novice acquisition of programming skills. In Chapter 3 the BRACElet project is discussed in detail.
7
confirm both BRACElet’s findings (Lister et al., 2009; Venables et al., 2009) and the LEM effect
(Robins, 2010).
Calls for teaching students manual memory tracing (Lister, 2007; Lister et al., 2004; Lister et al.,
2009; Soloway, 1986) are supported by the benefits of doing so. Manual memory tracing teaches
students to focus on understanding the detail of what their programs actually do (Cogan & Gurwitz,
2009; Lister et al., 2004; Lister et al., 2009; McCracken et al., 2001; Perkins, Hancock, Hobbs, Martin
& Simmons, 1989). This allows them to create a mental model of the program and to predict its
behaviour (Robins et al., 2003), which in turn assists in avoiding errors and finding them more
quickly (Cogan & Gurwitz, 2009). It also serves a motivational role by breaking down the initial
technical and emotional barriers to the complicated process of creating correct code, while better
preparing them to understand more difficult algorithms (Cogan & Gurwitz, 2009). This encourages
them to continue doing so (Thomas, Ratcliffe & Thomasson, 2004).
In the light of the above, it is clear that in an ODL environment such as Unisa, where students usually
have to study without physical contact with lecturers or fellow students, the ability to trace in order to
analyze and debug programs, therefore is all the more important. Furthermore, manual tracing is an
important debugging skill. Therefore this is important in writing code too, especially when
maintaining programs written by others.
1.2.3 Experiences while teaching introductory programming
In the introductory programming course at Unisa, COS1511, memory tracing is taught by means of
static variable diagrams. While explaining these static variable diagrams to students during individual
consultations, the researcher noticed that they seemed to understand a manual visual simulation of
tracing, that is what happens in computer memory while a program is being executed, much better. In
marking examination scripts for the follow-up first-year module, she also noticed that the kind of
errors students make can be linked to lack of knowledge and comprehension of the processes that
occur in CPU memory during program execution, particularly during parameter transfer. This
corresponds to the findings of Milne and Rowe (2002), who ascribe students’ problems with object-
oriented programming to lack of a clear mental model of how their programs’ storage work in
memory and how objects in memory relate to each other.
The findings by the BRACElet project (Clear et al., 2009; Lister et al., 2004; Lister et al., 2009;
Whalley & Lister, 2009) triggered the researcher’s interest in providing a way to assist introductory
programming students at Unisa in learning to trace, in the hope that this would assist them to master
the art of programming. Since PV has been used successfully in non-ODL settings, the researcher
wished to provide Unisa’s introductory programming students with a tool to compensate for their lack
of face-to-face instruction. The tool took the form of a customized tutorial to teach students to draw
8
variable diagrams to do memory tracing. The tutorial was not intended as a tool to be used during
program construction, but instead to teach the students how to do manual tracing. This is in line with
research showing that students need to engage with tracing themselves, in order to benefit from it
(Hundhausen et al., 2002; Lauer, 2008; Naps, Röβling et al., 2003; Thomas et al., 2004).
1.3 Research problem, aim and questions
Against this background, the research problem addressed in this study, its aim, thesis and the research
questions are described below.
1.3.1 Research problem
The research problem addressed in this study was formulated as follows:
As can be seen in Table 1.1, the pass rate for the introductory first-year programming course at Unisa
(COS1511) is consistently low, varying between 28% and 32% from 2011 to 2014. At the same time
the dropout rate varies between 15% and 20% with the number of distinctions from 8% to 14%.
The low pass rate and high drop-out in the first introductory programming course at Unisa
(COS1511), is exacerbated by the demands of the ODL environment, where students have to study on
their own, without face-to-face contact with lecturers. The diverse backgrounds of Unisa’s students
and the wide variety of degrees for which COS1511 students are enrolled, pose additional challenges,
such as varying levels of computer literacy, English being the second or third language for the
majority of students and classes consisting of large numbers of students (Schoeman, Gelderblom &
Muller, 2013). In particular, the problem seems to be the fact that students experience problems to
understand and learn from text-based study material how to draw variable diagrams to trace program
code.
1.3.2 Aim
Since PV has achieved a measure of success in non-ODL environments, as mentioned above, the
effect of a PV tool (a tutorial) to enhance comprehension of tracing in ODL computer programming
education with the aim of improving the pass rate of first-year programming students at Unisa, was
investigated. To this end, the researcher examined guidelines from literature for using visualization to
teach programming and developed a framework to guide the design of PV tools for teaching
programing. Based on these guidelines, a PV tool in the form of a customised tutorial to teach
students to draw variable diagrams to do memory tracing, was developed and put to the test. The aim
of the tutorial was to teach students to draw variable diagrams to track the run-time behaviour of
programs themselves.
This research therefore had a twofold aim:

9
• to create a framework of guidelines for designing, developing and using visualization tools to
teach programming; as well as
• to test the framework to determine whether a PV tool to teach tracing based on the framework
of guidelines enhances comprehension in such a manner that it assists students in an ODL
environment in mastering the art of programming to the extent that it impacts the pass rate for
the module.
1.3.3 Thesis and research questions
In the light of the research problem and the aim of this research, the thesis of this PhD is:
A framework of guidelines for using and creating visualization tools to teach programming,
synthesized from literature and tested and refined through practical application, can be employed to
develop a PV tool to teach introductory programming students in an ODL environment, to trace
programs in order to improve students’ programming skills.
To test this thesis the researcher investigated the following research questions:
1. What guidelines and principles for using and creating visualizations to teach programming,
can be derived from literature?
2. Will a tutorial to teach tracing to visualize program execution and parameter transfer, based
on the framework of guidelines, assist students in acquiring programming skills in an ODL
environment so that it is noticeable in average marks?
3. How do students’ biographical properties, their positive user experience, their use of tracing
and the extent and manner of tutorial use, affect their ability to acquire programming skills in
an ODL environment?
4. What lessons have been learnt through the practical testing and refinement of the visualization
tool?
1.4. Research design and methodology
The research design and methodology for this research is described in detail in Chapter 4. Therefore
only a brief overview of the design and methodology is given here.
The research design for this study was based on design-based research, the educational variation of
design research. This variation is frequently used in computing education research (CER) to do
research in naturalistic settings (Cooper, Grover, Guzdial & Simon, 2014). Design-based research
consists of an iterative analysis, design, development and implementation process that delivers both a
practical and theoretical contribution. The practical contribution is based on using existing technology
to develop an intervention to solve a real-world problem. During this process a theoretical
10
contribution is generated by enhancing existing design theories and principles. Accordingly, in
applying the research design for this research, the researcher followed a pragmatic approach that
aimed to solve a real-world problem, as discussed in section 1.3.1, and focused on usefulness. The
two contributions constituting the aims of the research are indicated in section 1.3.2.
No comprehensive research methodology for design-based research has yet been identified or
accepted (Mingfong, Yam San & Ek Ming, 2010; Morgan, 2013; Oh & Reeves, 2010; Plomp &
Nieveen, 2009). The methodology followed in this study is based on Reeves’ (2006) four phases of
design-based research consisting of the –
• analysis of practical problems in collaboration with practitioners;
• development of solutions informed by existing design principles and technological
innovations;
• iterative cycles of testing and refinement of solutions in practice; and
• reflection to produce design principles and enhance solution implementation.
As applied in this research, the first phase included the statement of the problem; a discussion of
consultation with researchers and practitioners; and the research questions as well as the literature
review. During phase 2 the theoretical framework, the development of draft principles to guide the
design of the intervention and a description of the proposed intervention was developed. In phase 3,
two iterative cycles of implementation of the intervention, including the participants, data collection
and analysis were described. Phase 4 presents the design principles, and the designed artifact as well
as a reflection on the professional development of the researcher. The chapter overviews in section 1.6
relate each of Reeves’ (2006) four phases of design-based research to specific chapters. This provides
more detail on the research process followed.
The underlying assumptions and scope of the research design and methodology are described below.
1.4.1 Underlying assumptions
The underlying assumption was made that the composition of the student cohort registered for
COS1511, would not change significantly during the time the study was conducted.
It was assumed that Robins’ (2010) LEM effect is valid, and no attempt to prove or disprove it, was
made.
1.4.2 Delineation and limitations (Scope)
This study built on the work done by the BRACElet team (Clear et al., 2009; Lister et al., 2004; Lister
et al., 2009; Whalley & Lister, 2009).
The study was conducted on only one first-year programming module, namely COS1511.
11
The Drawing Variable Diagrams Tutorial was not intended as a tool to be used during program
construction, but instead to teach the students how to do manual tracing of variables. It only
demonstrated selected examples from the COS1511 Study Guide to teach students how to draw
variable diagrams for the programming constructs covered in the COS1511 syllabus.
The investigation into the factors that influence marks of students who have access to the tutorial in
COS1511, was limited to their biographical properties, their positive user experience, their use of
tracing and the extent and manner of their tutorial use. Questionnaires to investigate these factors
were distributed to all the COS1511 students in the quantitative investigation. This resulted in self-
selection sampling, a nonprobability sampling method, which could have been biased towards
students willing to answer the questionnaires (Fowler Jr, 2009; Oates, 2006). The number of
responses on the questionnaires has been a limitation. Since the qualitative investigation also used
self-selection sampling, the same bias regarding willing participants could have applied.
1.5 Significance of outcomes, results and contributions of the research
The theoretical contribution of this PhD lies in the guidelines provided in the framework for
designing, developing and using visualization tools to teach programming that was developed. A
considerable number of the guidelines in the framework are supported by reasons or explanations,
and/or considerations that should be taken into account when applying the guideline, since some
guidelines contra-indicate others. Although various studies have presented guidelines for creating
visualizations, a comprehensive framework of this nature for designing, developing and using
visualization tools, could not be identified by this researcher. The results of this research therefore
make a unique contribution to the guidelines for creating visualizations to teach programming.
It is envisaged that these guidelines would be used to develop PV tools and may serve as a departure
point for the construction of a generic PV system for introductory programming that could possibly
allow integration with other course materials, as advocated by Sorva, Karavirta and Malmi (2013).
Introductory programming instructors could also use it to evaluate existing PV tools to determine
whether it would be suitable for the intended purpose, and how to use it. This addresses the need for
models for teaching and learning of programming, as expressed in the literature (Cooper et al., 2014;
Sheard et al., 2009). Its application could therefore improve the teaching of computer programming.
According to Sorva, Karavirta and Malmi (2013:15:54) “Evaluative studies on interventions in which
PV is strongly and longitudinally integrated into a CS1 courses are scarce”. Accordingly, they
recommend the undertaking of more empirical research to allow informed decisions about the use of
PV tools to be taken (Sorva, Karavirta & Malmi 2013). This research is such a study and the intention
with it is to contribute to the understanding of how novice programmers develop proficiency (Lister et
al., 2010). As can be seen from Table 1.1, this study was conducted on classes consisting of large

12
numbers of students, with regular enrollments of a minimum of 1000 students per semester. This
lends credibility to the results of the study.
Improving the teaching of computer programming, supports the South African Department of Higher
Education and Training‘s Strategic Plan 2010-2015 (Strategic Planning 2010-2015, 2010) that calls
for an improvement of teaching and learning practices and applying the lessons learnt in best practices
across the system. This corresponds to a worldwide trend for empirical research to evaluate and
disseminate new teaching initiatives (Morgan et al., 2015; Sheard, Morgan, Butler, Falkner,
Weerasinghe & Cook, 2014; Sorva, Karavirta & Malmi, 2013).
In practical real life, this study can assist students to master the skill of tracing and as a result, the art
of programming. Students who have laid a good foundation in the art of programming in the first
introductory module should –
• enjoy a solid base for further modules and enhanced comprehension in follow-up modules;
and
• complete their degrees in a shorter time, and at a lower cost.
In general, successfully enhancing students’ programming skills will –
• improve the pass rate, which is typically very low, for COS1511 first-year programming
students in Unisa’s ODL environment;
• relieve the pressure on lecturers from students who repeat the same module several times;
• increase the subsidy Unisa receives from government; and
• relieve the shortage of skilled IT workers in South-Africa.
In turn, these practical real life benefits will improve the graduation rate at Unisa and the rate at which
key skills necessary for economic growth and social development are delivered, in line with the
strategic priorities of the RSA’s Department of Higher Education and Training‘s Strategic Plan 2010-
2015 (Strategic Planning 2010-2015, 2010).
Teaching and assessing students on manual tracing, also supports the ACM’s appeal for an emphasis
on the teaching of basic programming, in order to answer industry’s need for quality in terms of
testing, debugging and bug tracking, as well as its need for code archeology (that is making sense of
large, poorly-documented code bases) (Cassel, Clements, Davies, Guzdial, McCauley, McGettrick,
Sloan, Snyder, Tymann & Weide, 2008).
1.6 Brief chapter overviews
The literature review runs over two chapters, Chapters 2 and 3. Both are part of phase 1 in the design–
based research methodology used in this study. Chapter 2 provides the context and theoretical base for
the research by discussing open-distance learning (ODL), e-learning, massive open online courses
13
(MOOCs), teaching programming in distance education, teaching introductory programming courses
and the role of tracing and visualization in teaching programming. Chapter 3 analyses the contribution
of the BRACElet project to teaching programming. The motivation for the BRACElet study, the study
itself, its findings, follow-up work and its implications are covered.
In Chapter 4 the research design and methodology for this study are discussed. This is also part of
phase 1 in the design-based methodology used in this research. Firstly, the structure of a research
design in general is described and then the research design for this study is explicated. This includes a
discussion of the nature of design-based research, its challenges and advantages and ensuring validity
during design-based research. The research problem for this PhD study is then discussed in detail and
the philosophical approach followed is justified. The context of the research is sketched and the four
phases in the methodology are described, as well as validating the research effort and the ethical
considerations.
Chapter 5 describes the development of the tutorial to draw variable diagrams. This covers the last
part of phase 1 as well as phase 2 of this design-based research effort. The first part of the chapter
consists of a literature study of guidelines from three areas for using and creating visualization tools,
namely CER, educational psychology and computer graphics. A framework of guidelines for using
and creating visualization tools is then developed, based on guidelines from the literature. In the
second part of the chapter, a description of the tutorial to draw variable diagrams; the motivation for
design decisions taken in its development; the development process itself; and the initial testing are
described. Lessons learnt during the development and initial testing, as well as further guidelines are
described. Chapter 5 therefore answers the first research question:
What guidelines and principles for using and creating visualizations to teach programming
can be derived from literature?
It also partially answers the fourth research question:
What lessons have been learnt through the practical testing and refinement of the visualization
tool?
Chapters 6 and 7 describe the findings of this study with regard to the practical implications of the
study, that is, the effect that using the tutorial has on students’ performance. It covers the first and
second cycles of implementation of the intervention, namely phase 3 in this design-based research.
Chapter 6 and 7 therefore answer the second and third research questions, as well as the fourth
research question namely:
2 Will a tutorial to teach tracing to visualize program execution and parameter transfer, based
on the framework of guidelines, assist students in acquiring programming skills in an ODL
environment so that it is noticeable in pass rates or average mark?
14
3 How do students’ biographical properties, their positive user experience, their use of tracing
and the extent and manner of tutorial use, affect their ability to acquire programming skills in
an ODL environment?
4. What lessons have been learnt through the practical testing and refinement of the visualization
tool?
Chapters 6 and 7 follow a similar structure. The participants and data collection and analysis are
described. The data collection and analysis comprised two parts, a quantitative and a qualitative
investigation. A summary of the findings and an evaluation thereof were used then to adapt the
tutorial. The findings were also used to adapt the questionnaire employed in the first cycle for the
second cycle. In both chapters the findings also offer some lessons learnt during the practical testing
and refinement of the tutorial.
Finally, Chapter 8 provides the summary and conclusion.
1.7 Conclusion
This thesis reports on a study to improve introductory programming students’ tracing skills in an ODL
environment. The researcher’s contribution is twofold, namely presenting a framework of guidelines
for designing and developing visualization tools to teach programming that can be used both to
develop new tools and to evaluate existing tools for possible use; as well as the results of an empirical
investigation in using the framework to develop and test a tool to teach introductory programming
students to trace.
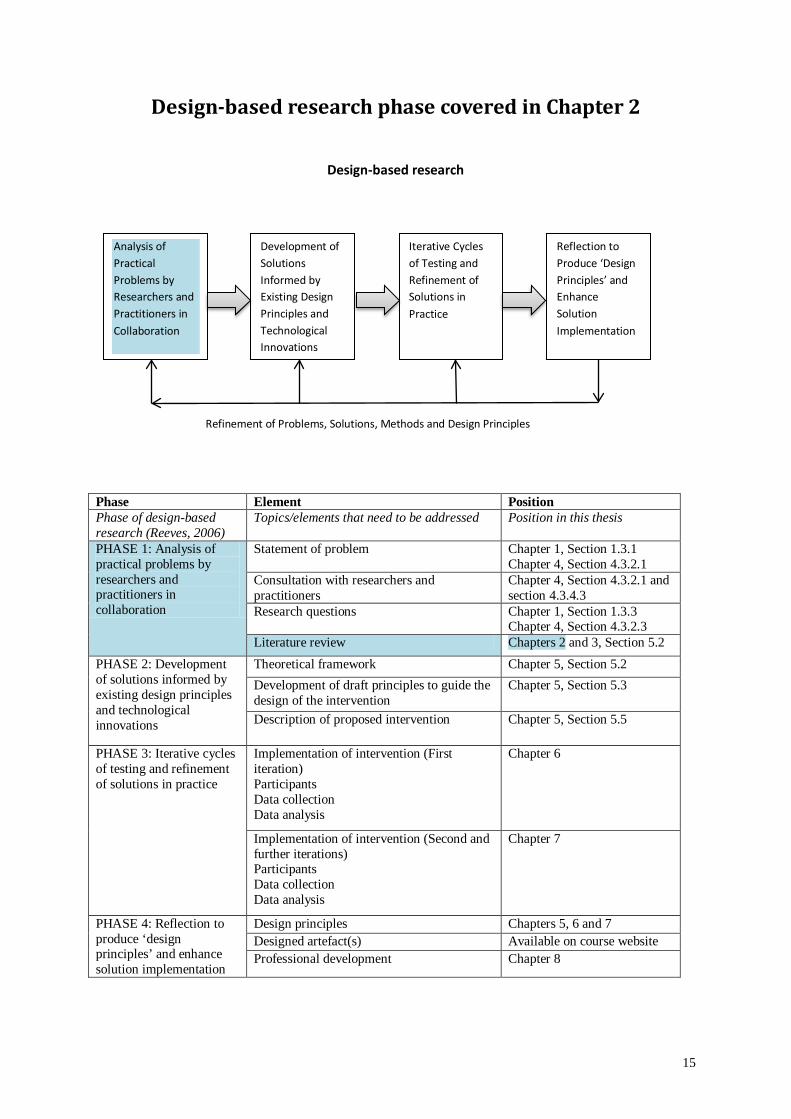
15
Design-based research phase covered in Chapter 2
Design-based research
Phase Element Position Phase of design-based research (Reeves, 2006)
Topics/elements that need to be addressed Position in this thesis
PHASE 1: Analysis of practical problems by researchers and practitioners in collaboration
Statement of problem Chapter 1, Section 1.3.1 Chapter 4, Section 4.3.2.1
Consultation with researchers and practitioners
Chapter 4, Section 4.3.2.1 and section 4.3.4.3
Research questions Chapter 1, Section 1.3.3 Chapter 4, Section 4.3.2.3
Literature review Chapters 2 and 3, Section 5.2 PHASE 2: Development of solutions informed by existing design principles and technological innovations
Theoretical framework Chapter 5, Section 5.2 Development of draft principles to guide the design of the intervention
Chapter 5, Section 5.3
Description of proposed intervention Chapter 5, Section 5.5
PHASE 3: Iterative cycles of testing and refinement of solutions in practice
Implementation of intervention (First iteration) Participants Data collection Data analysis
Chapter 6
Implementation of intervention (Second and further iterations) Participants Data collection Data analysis
Chapter 7
PHASE 4: Reflection to produce ‘design principles’ and enhance solution implementation
Design principles Chapters 5, 6 and 7 Designed artefact(s) Available on course website Professional development Chapter 8
Analysis of Practical Problems by Researchers and Practitioners in Collaboration
Development of Solutions Informed by Existing Design Principles and Technological Innovations
Iterative Cycles of Testing and Refinement of Solutions in Practice
Reflection to Produce ‘Design Principles’ and Enhance Solution Implementation
Refinement of Problems, Solutions, Methods and Design Principles

16
Map of Chapter 2 (Literature review)
2.1 Introduction
2.4 Teaching introductory programming courses
2.5 Tracing
2.7 Summary and conclusion
2.4.1 The pedagogy of
teaching introductory programming
2.4.2 Mental models, threshold
concepts and LEM in learning to program
2.4.3 Problems novices
experience
2.5.1 Tracing defined
2.5.3 Difficulties
novices have with tracing
2.5.4 The advantages of teaching novices to
trace
2.3 Teaching programing in distance education
2.6 Vizualisation
2.6.1 Software vizualisation
– an overview
2.6.3 How successful is
vizualisation?
2.2 ODL, e-learning and MOOCs
2.5.2 The purpose of
tracing
2.6.2 Software vizualisation
in education

17
Chapter 2 Literature review
2.1 Introduction
This research investigated the effect of introducing a tutorial to teach tracing, into the course material
of an introductory programming course at Unisa, a large open distance learning (ODL) institution.
The tutorial resembles a PV tool that shows the internal computer memory during a step by step
execution of a program, similar to tracing a program. This chapter provides the context and theoretical
base for the research. To this end, the following topics are addressed here: ODL, e-learning and
MOOCs; teaching programming in distance education; teaching introductory programming courses;
tracing; and visualization. This study is based on research by the BRACElet project (Clear, Whalley,
Robbins, Philpott, Eckerdal, Laakso & Lister, 2011) that contributed substantially to the body of work
on teaching introductory programming, between 2004 and 2010. In their work the role of tracing in
learning to program, is of particular importance for this research. The contribution of the BRACElet
project will be covered in Chapter 3.
Section 2.2 defines the ODL environment at Unisa, where this research was done. The teaching of
programming in distance education in general is discussed in section 2.3, while section 2.4 focuses on
teaching introductory programming courses. This section covers the pedagogy of teaching
introductory programming, and elaborates on mental models, threshold concepts and the learning
edge momentum (LEM) effect in learning to program. Also considered is the problems novices
experience, by referring to the differences between novices and experts and investigating the concepts
novices find difficult.
Tracing is one of the ways that can be used to address misconceptions novices have and to assist them
in developing mental models for programming (Robins et al., 2003). Section 2.5 focuses on research
findings regarding the use of tracing to teach programming, and addresses the role of tracing in
programming, difficulties novices have with tracing and the advantages of teaching novices to trace.
The tutorial that was developed for this study uses a form of software visualization, namely PV to
teach tracing. Section 2.6 presents the background on visualization. It provides an overview of SV in
general, and in particular of SV in education. The success of visualization in education is investigated.
Section 2.7 concludes the chapter.
Figure 2.1 shows the relationships between these topics and their contribution to the background for
the development of the tutorial. As depicted by Figure 2.1 the ODL environment in which the course
is offered; the teaching of programming in distance education, and in particular teaching introductory
programming by means of visualization, the findings of the BRACElet project (Clear et al., 2011) and
the importance of tracing were all factors that played a role in the development and implementation of
the tutorial.

18
Figure 2.1 Relationship between literature review topics
2.2 ODL, e-learning and MOOCs
The University of South Africa (Unisa) is the only comprehensive dedicated distance education
university in South-Africa and applies what is known as an ODL policy (UNISA Open Distance
Learning Policy, 2008). Distance education is characterised by the physical separation between the
learning institution and its students. However, the ‘distance’ also includes time, economic, social,
educational, epistemological and communication distances between not only the institution and its
students, but between students themselves too (Heydenrich & Prinsloo, 2010). In addition, for
students who have to study on their own, inadequate listening skills (Roberts & Gous, 2014) or
reading skills (Gous & Roberts, 2014) may add to the ‘distance’. Open learning refers to an approach
where the institution allows students to have flexibility and choice in what, when, where, at what pace
and how they learn (Jeffries, Lewis, Meed & Merritt, 1990; UNISA Open Distance Learning Policy,
2008).
Although most international literature uses the term ‘open and distance learning’, Unisa employs the
term ‘open distance learning’ as indicated above (Heydenrich & Prinsloo, 2010; UNISA Open
Distance Learning Policy, 2008). According to UNESCO, open and distance learning “stresses at the
same time openness concerning access, organization and methods, flexibility in delivery and
communication patterns, and the use of various technologies in support of learning” (Unesco Open
and Distance Learning: Prospects and Policy Considerations, 1997:10). Unisa combines the
characteristics of distance education and the approach of open learning into ODL. The University
ODL, e-learning & MOOCs
Teaching programming in distance education
Teaching introductory programming
Pedagogy
Mental models, threshold concepts & LEM
Tracing Visualization
Tutorial – visualization to teach tracing
BRACElet
19
therefore defines it as “a multi-dimensional concept aimed at bridging the time, geographical,
economic, social, educational and communication distance between student and institution, student
and academics, student and courseware and student and peers” (UNISA Open Distance Learning
Policy, 2008:2). It also focuses on “removing barriers to access learning, flexibility of learning
provision, student-centeredness, supporting students and constructing learning programmes with the
expectation that students can succeed” (UNISA Open Distance Learning Policy, 2008:2).
Unisa follows the fifth generation model in distance education (Moore & Kearsley, 2011; Taylor,
2001) with open, distance and e-learning (ODeL) tuition. ODeL aims to provide all teaching and
learning material to students in digital format. Once this has been phased in completely, all students
will have access to an eTutor or eMentor and core student assessment, except undergraduate
examinations and practical assignments, will be managed electronically and online. This places
significant emphasis on e-learning in the Unisa environment as a means to bridge the distance in
ODL.
Although e-learning typically refers to using the Internet for instruction and learning (Neal & Miller,
2005) some definitions include all electronic media such as Web-based learning, computer-assisted
instruction, multi-media CD-ROMs, online course and audio/video tape as well as the Internet and
intranets (De Villiers, Becker & Adebesin, 2012; Hung, 2012). According to Masie (2009), e-learning
has evolved from the electronic design, delivery and administration of learning to using search tools,
social learning activities, YouTube-like video segments and expanded blended learning. Currently
Masie’s definition (2009) as well as the broader definition of e-learning as used by De Villiers et al.
(2012) and Hung (2012) are applied to various degrees in different faculties in the Unisa environment.
Printed material, audio- and videoconferencing, discussion classes, face-to-face tutors or e-tutors are
also used.
A relatively new development in distance education is MOOCs offered by private online learning
companies and universities such as Stanford, MIT and Harvard. Well-known entities offering MOOCs
are Coursera (see http://www.coursera.org), the Khan Academy (see http://khanacademy.org),
Udacity (see https://www.udacity.com) and edX (see http:://www.edx.org). MOOCs typically have no
entry-level requirements; and offer enrolment, quizzes, assignments, statements of accomplishment
and so forth, but do not offer academic credit or charge tuition fees, although some may provide
certification at a cost (Cooper & Sahami, 2013; Daniel, 2012; Martin, 2012). A number of MOOCs
now offer proctored examinations which may be used to apply for certification for transfer credit
through the American Council on Education (Lewin, 2013). Some residential universities incorporate
MOOCs in traditional courses with students watching online course videos before discussing it during
class time (Lewin, 2013; Martin, 2012).
20
Technological developments and infrastructure allow conventional universities to integrate and adopt
open and distance learning with blended or hybrid forms of delivery, teaching, learning and support.
For example, learning management systems (LMSs) such as WebCT, Blackboard, Moodle and Sakai
are used to manage and support both distance education and residential education. This reduces the
distinction between residential and distance education (Heydenrich & Prinsloo, 2010; Unesco Open
and Distance Learning: Prospects and Policy Considerations, 1997).
Unisa’s vision is to become “the African university in service of humanity” (UNISA Open Distance
Learning Policy, 2008:1). In 2012 and 2013, during the implementation phase of this PhD study,
Unisa had more than 400 000 students from across South-Africa, Africa and other parts of the world
(Unisa at a Glance 2012, 2012; Unisa at a Glance 2013, 2013). Of these, in 2012, 69% were African,
and 4.8% came from outside South-Africa (Unisa at a Glance 2012, 2012). In 2013, 68% were
African and 9% came from beyond the borders of South-Africa (Unisa at a Glance 2013, 2013). The
language of tuition is English, which means Unisa has a large number of students who study in their
second or third language. Furthermore, students at Unisa come from both urban and rural areas where
the infrastructures are vastly different. The level of exposure to and availability of modern technology
also affects the level of technical support that can be given by the learner support system in these
areas (Sonnekus, Louw & Wilson, 2006). Mbatha and Naidoo (2010) found that even in an urban area
(Pretoria), students do not actively engage in e-learning. They use Unisa’s LMS, myUnisa, only for
basic educational needs and not to engage with other learners and stakeholders. In South-Africa, more
and more school leavers are entering distance education (Heydenrich & Prinsloo, 2010). In both 2012
and 2013, 26% of students enrolled at Unisa were 24 years or younger (Unisa at a Glance 2012, 2012;
Unisa at a Glance 2013, 2013). Many of these students are underprepared by the school system and
struggle to adapt to higher education (Heydenrich & Prinsloo, 2010; Scott, Yeld & Hendry, 2007). A
number of researchers have indicated that students at SA tertiary institutions, and in particular those
for whom English is their second language, suffer from poor reading skills (Gous and Roberts, 2014;
Matjila and Pretorius, 2004; Pretorius and Ribbens, 2005). Poor reading skills could increase the level
of distance in ODL as Unisa research shows that the average first-year student, from a background
where reading was neglected, could have the reading ability of twelve-year olds, not eighteen-year
olds (Kilfoil, 2008). Therefore, despite all the technological advances, the various ‘distances’ in ODL
remains a factor that influences the learning experience of students at Unisa, and may well have an
effect on their performance. This should be taken into account when designing study material.
2.3 Teaching programming in distance education
As mentioned before, LMSs allow conventional universities to offer both residential and distance
education. As a result, apart from the face-to-face contact, there is little difference between teaching
programming face to face and teaching it online. Frequently, a course is offered both face to face and

21
online with the same model followed for both courses (Bruce-Lockhart & Norvell, 2007b; Chinn,
Sheard, Carbone & Laakso, 2010; de Raadt, Watson & Toleman, 2009; MacDonald, Dorn &
MacDonald, 2004; Malan, 2009; Meisalo, Sutinen & Torvinen, 2003). Such courses typically provide
both printed and web-based materials, regular assignments with discussions on solutions, and tutors
(Meisalo et al., 2003; Meiselwitz, 2002), lecture slides and laboratory worksheets before lectures,
with audio recordings afterwards, both practical and tutorial exercises and solutions, and online
quizzes (Chinn et al., 2010; Corney, Teague & Thomas, 2010). Some universities use online tools that
provide formative and summative feedback to students about their concept comprehension (Chinn et
al., 2010; Kaila et al., 2009). Automated assessment tools are used (Ala-Mutka, 2005; Ihantola,
Ahoniemi, Karavirta & Seppälä, 2010), as well as other tools to enhance student learning, such as
program or AV tools (Ben-Ari, Bednarik, Ben-Bassat Levy, Ebel, Moreno, Myller & Sutinen, 2011;
Kaila, Rajala, Haavisto, Holvitie, Laakso & Salakoski, 2011).
To enhance online learning in MOOCs, Cooper and Sahami (2013) suggest using new tools such as
algorithm visualizations (for example, AlgoViz, http://algoviz.org), or probability visualizations (see
http://www.redblobgames.com), programming practice environments (such as Codingbat,
http://codingbat.com, or Problets, http://problets.org) and editable coding visualizers (for example
Online Python Tutor, http://www.pythontutor.com).
Additional approaches investigated for teaching programming online, include an electronic Adaptive
Book composed of learning objects (LOs) that can be customized by instructors to deliver just-in-time
interactive learning modules to students (Adamchik & Gunawardena, 2003; Adamchik &
Gunawardena, 2005). It also includes a virtual workplace that provides an online interface
development environment (IDE) and programming environment for students, and allows the
instructor direct access to the student’s workplace (Ng, Choy, Kwan & Chan, 2005); online
environments to provide synchronized interaction between students and instructors (Cavus,
Uzunboylu & Ibrahim, 2007; Domingue & Mulholland, 1997; El-Sheikh, 2009; Malan, 2009);
blended learning (Robbins, 2008); and collaborative learning efforts (Tsai, 2012; Tsai, Shen & Tsai,
2011).
Visualization is used in several forms to enhance comprehension in distance teaching. Some
institutions use videos to provide the classroom experience (Bruce-Lockhart & Norvell, 2007b;
Murphy, Phung & Kaiser, 2008). Others recreate the classroom experience with virtual lectures and
Web-conferencing (Bower, 2009; Koifman, Shimshoni & Tal, 2008; Malan, 2009). As in face-to-face
teaching, both algorithm and program visualizations are used at times. Koifman, Shimshoni and Tal
(2008) incorporate an AV system with virtual lectures and web conferencing, while Bruce-Lockhart
and Norvell (2007b) use PV with interactive course notes. The PV system Jeliot3 has also been used
in an online course (Čisar, Radosav, Pinter & Čisar, 2011).

22
Apart from the lack of direct contact that face-to-face teaching provides, most institutions in distance
education teach programming in much the same way as in face-to-face institutions. However, the
‘distance’ in distance education, may add to the difficulties students experience.
2.4 Teaching introductory programming courses
In this section the teaching of introductory programming courses is discussed in general, without
referring specifically to online courses.
2.4.1 The pedagogy of teaching introductory programming
Pedagogy deals with the manner in which teaching and learning are structured in order to enable
desired learning outcomes. For introductory programming courses, the primary emphasis in the
instructional setting usually falls on one of three main approaches: teaching programming as an
application of skills in problem solving; learning a particular programming language; and code/system
production (Pears, Seidman et al., 2007).
Teaching programming as problem-solving is based on Polya’s (1957) classic work in mathematics.
Courses with this approach frequently focus on analysis and design before coding, and/or
conceptualise programming tasks without using a specific programming language (Barnes, Fincher &
Thompson, 1997; Falkner & Palmer, 2009; Fincher, 1999; Kiesmüller, 2009). Courses may start with
teaching algorithms without writing code, and students using special didactically reduced, text-based,
or visual languages to write their first programs (Kiesmüller, 2009). Acton, Voll, Wolfman and Yu
(2009) describe the following two initiatives in problem-based teaching at the University of British
Columbia: problem-based Just-in-Time-Teaching and problem-based peer learning. Queensland
University of Technology also restructured their introductory programming course to focus on
problem-solving (Corney, 2009; Corney et al., 2010).
Palumbo (1990) conducted an extensive literature review on the connections between learning
programming languages and problem solving skills. He focused specifically on the transferability of
learning a programming language to problem solving skills. Programming as problem solving,
concerns two classes of problems, namely problems similar to ones that have been solved previously,
and new problems that may be in a different application domain. Palumbo (1990) distinguishes
between these two classes as well as between two types of skill transfer: near-distant and specific-
generalised transfer. Near transfer refers to the ability to transfer skills and expertise to a new
problem-solving domain with features similar to the domain in which proficiency and skill have
already been obtained and established. Distant transfer is defined as the transfer of skills and expertise
to a new problem-solving domain which is distinctly different from the problem-solving domain
where expertise has already been acquired (Palumbo, 1990). Specific transfer refers to the transfer of

23
one or more specific skills to a new-problem solving domain, while generalised transfer is defined as
the transfer of general problem-solving techniques from one problem-solving domain to another. Both
types of skill transfer are required in learning to program, but cannot be expected to happen in
introductory programming courses since the time is too limited. Expert programmers as described by
Winslow (1996) are characterised by both distant and generalised transfer skills. This takes time and
experience to develop. The author notes that it takes approximately ten years to turn a novice into an
expert (Winslow, 1996).
According to Robins, Rountree and Rountree (2003) typical introductory programming courses follow
the second approach mentioned above. That is, they are ‘knowledge driven’ and focus on presenting
knowledge about a particular programming language as well as the features supported by the
paradigm to which that programming language belongs. Programming languages attempt to develop
both declarative and procedural knowledge of students (Mandinach & Linn, 1986). The declarative
aspects of programming knowledge refer to being able to state for example how a for loop works.
Programming strategies refer to the way knowledge is used and applied, such as using the for loop
appropriately in a program (Davies, 1993). Students are taught the command structure (declarative
knowledge) of a programming language and are then presented with situations where they have to use
this knowledge in strategically different ways (procedural knowledge) (Palumbo, 1990). Apart from
studying the structure and syntax of the programming language, students also need to acquire certain
schemas or plans, and the concepts of the programming paradigm. Schemas or plans in this context,
refer to approaches to accomplish a task, for example how to determine the average of values (Robins
et al., 2003). Common programming paradigms for introductory computer science courses are
objects-first/object-oriented, functional or imperative/procedural (Davies, Polack-Wahl & Anewalt,
2011; Tew & Guzdial, 2010).
The required learning outcomes of programming courses are simple programs or software systems. If
this is emphasised, as in the third pedagogical approach (code/system production), learning is based in
the context of code and system development (Pears, Seidman et al., 2007). This corresponds to what
Fincher (1999) describes as the ‘literacy approach’ where students are immersed in code
development. For example, students do an ‘apprenticeship’ by reading, studying and extending
programs written by experienced programmers (Astrachan & Reed, 1995) and developing working
programs in laboratory settings under supervision (Vihavainen, Paksula & Luukkainen, 2011).
Another example is live programming with a computer and projector to demonstrate the programming
process in class and providing process recordings with added explanations (Bennedsen & Caspersen,
2005b). Situating programming assignments in the real-world domain also proves to be effective
(Malan, 2010).
24
The explicit teaching of programming strategies is advocated as an alternative approach (Pears,
Seidman et al., 2007; Robins et al., 2003; Soloway, 1986). An example where this was implemented
successfully is described in De Raadt et al. (2009). Hughes (2012) reports on three different
approaches to teach programming strategies, explicitly using the 3D, interactive programming
environment Alice; the Python programming language; and an interactive flowcharting tool, Visual
Logic. The author then concludes that Visual Logic produced the best results (Hughes, 2012).
Teaching roles of variables, which represent certain stereotypical variable usage patterns as
programming strategies, has also been successful (Sorva, Karavirta & Korhonen, 2007).
Based on an overview of research into programming, novice programmers, and learning and teaching
in introductory computer science courses, Robins et al. (2003) recommend the following for a
conventionally structured course with lectures, practical work and a conventional curriculum focused
on knowledge:
• An introductory computer science course should be realistic in its expectations and develop
systematically, by starting with simple facts, models and rules which are only expanded as
students gain experience.
• Instruction should not focus only on the teaching of new language features, but also on how to
combine and use those features, with special attention to basic program design.
• The fundamental mental models that underlie programming such as the notional machine,
models of control, data structures and data representation, program design and problem
domain should all be addressed, to prevent students from forming their own dubious models.
• Laboratory based, or practical programming tasks forming part of a typical introductory
programming course, play an essential role to provide experience and reinforce learning, but
should be based on and emphasise programming principles.
Robins et al. (2003) also recommend that the underlying issue of basic program design should be
addressed with explicit naming and teaching of schemas/plans. This would be highly applicable in
courses that base learning in the context of code and development. In courses teaching programming
as problem-solving, covering language features and how to use and combine them should also be
emphasised. In general, it may be beneficial to make control flow and data flow explicit in
development environments or programming tools for teaching novices. For programming as problem-
solving courses, Palumbo (1990) recommends that sufficient time should be allowed to develop
students’ programming language knowledge base and to use that knowledge in strategically different
ways.
The pedagogy followed in the COS1511 module at Unisa, is to teach the C++ programming language
as a basis for the follow-up courses in object-orientation. The students learn the structures and syntax
25
of C++ while learning to develop code to solve problems. During this process it is important to ensure
that students develop appropriate mental models for and of programming.
2.4.2 Mental models, threshold concepts and LEM in learning to program
It is not easy to learn how to program. In his section three concepts related to this issue are discussed,
namely mental models, threshold concepts and LEM .
To produce compilable, executable programs in an appropriate and correct form, computing students
are expected to learn how to successfully apply the following steps (McCracken et al., 2001):
• Abstracting the problem from its description.
• Generating the sub-problems, i.e. decomposing the problem according to the programming
paradigm taught.
• Transforming sub-problems into sub-solutions by implementing the sub-solutions while
following a specific programming paradigm.
• Re-composing the sub-solutions to generate a working program.
• Evaluating the resulting program and iterate the process accordingly.
Linn and Dalbey (1989) describe an ideal chain of cognitive accomplishments from programming
instruction. The first link in this chain consists of the features of the language being taught. The
second link is the design skills used to combine the language features to form a program. This
includes templates or schemas and plans which provide students with a set of techniques to solve
problems without inventing new code, as well the procedural skills of planning, testing and
reformulating code to solve new problems. The third link is problem-solving skills which allow the
student to abstract templates and procedural skills from the programming language taught and apply it
to new programming languages and situations.
Du Boulay (1989) describes five overlapping domains that must be mastered in learning to program,
namely –
• a general orientation to what programs are for and what can be done with them;
• the notational machine, a model of the computer with regard to executing programs;
• notation, that is the syntax and semantics of a particular programming language;
• structures, which are the schemas/ plans to execute specific tasks; and
• pragmatics, consisting of the skills of planning, developing, testing, debugging, and
implementing programs.
These areas are all interrelated and each presents a potential source of difficulty.
The core elements characterising computer programming are data types, data operators, variables and
constants, input/output control, sequential, iterative and conditional control structures. This list may

26
be extended with data structures and abstraction, by modularised programming that incorporates
parameter/message passing, as well as local/private and global/public variables. According to Farrell
in (Naidoo & Ranjeeth, 2007), all of these concepts have to be mastered, regardless of which
programming paradigm is adopted. Mastering structured programming is an essential step in learning
object-oriented programming (Lo & Lee, 2013; Zhang, 2010). Other researchers agree that students
would be unable to properly use and understand object-oriented techniques without appropriate
mental models of variables and assignment (Ben-Ari, 2001; Ma, Ferguson, Roper & Wood, 2011).
Furthermore, Naidoo and Ranjeeth (2007) assert that a deeper understanding of fundamental concepts
would enable novices to adapt easier to processing new problem domains.
Once these core elements of programming have been mastered, students still need to learn and
practise implementing them in designing and writing programs that can solve problems correctly.
During this process students need mental models to guide and assist them.
2.4.2.1 Mental models Kieras and Boviar (1984) define a mental model as some kind of understanding of how a device
works in terms of its internal structure and processes. According to Isbell, Stein, Cutler, Forbes,
Fraser, Impagliazzo, Proulx, Russ, Thomas and Xu (2010) a model is a representation of some
information, physical reality or virtual entity that hides details and aspects not critical to the
phenomenon being modelled. It can therefore be manipulated and simulated but still provides the
ability to provide predictions or cause change in the modelled world. A mental model consequently is
a person’s internal representation of an entity, how it behaves and what responses can be expected
from it.
Constructivist theory claims that students actively construct new knowledge by building recursively
on the foundation of prior knowledge. In this process each individual creates his/her own mental
model (Ben-Ari, 2001). Effective learning requires the development of viable mental models that
match the actual design model and correctly explain the reality (Lui, Kwan, Poon & Cheung, 2004).
Ben-Ari (2001) maintains that a novice programmer has no effective model of a computer. Therefore
a viable mental model of a computer should be explicitly taught and programming exercises
postponed until students have developed a viable model.
Robins et al. (2003) identify five mental models involved in writing a program, which overlap in
some degree with the five domains to be mastered in programming (Du Boulay, 1989), namely –
• a model/knowledge of the programming language;
• an understanding/mental model of the problem domain, i.e. task the program should perform;
• a model or abstraction of the computer, whose properties are denoted by the programming
language;

27
• a model of the intended program; and
• a model of the program as it actually is.
Wick (2007:509) describes the difficulty presented by the conceptual gap between the problem
domain and the program in the following statement: “What makes programming hard is that the
language of the problem does not match with the language of the solution.”
Winslow (1996) maintains that models are crucial to build understanding. These include models of
control, data structures, and data representation, in addition to an understanding of the real world
problem domain and program design. If the instructor does not provide them, students will develop
their own mental models of programming concepts and what happens when computers execute
programs (Sorva, 2008; Winslow, 1996). These mental models are frequently unstable and subject to
change according to circumstances (Sorva, 2013). Models of control, data structures, and data
representation refer to the knowledge or model of the programming language pointed out by Robins et
al. (2003).
Winslow (1996) describes the process of program problem solving as taking place in the following
steps:
• Understand the problem.
• Determine how to solve the problem, first in some way, and then in a computer compatible
way.
• Translate the solution into a computer program.
• Test and debug the program.
Understanding the problem corresponds to building a mental model of the problem domain, while
testing and debugging in turn, relate to reconciling the difference between the model of the intended
program and the model of the program as it actually is (see Robins et al., 2003).
Novices need models which they can use to decompose the solution (the third stage above) into steps
that they know how to translate into a computer program. A useful pattern as an example of a problem
solving model is the three basic steps required for many simple problems, namely Input, Calculate,
and Output (ICO). This can be extended as follows with a looping pattern: Initialise, Repeat for each
entry (in list, table, or array), and Terminate (IRT) (Winslow, 1996). Such a problem solving model
helps students to convert domain specific solutions into computer compatible solutions.
Mayer (1989) showed that providing a concrete model (the ‘notional machine’) of a computer to
novices, can have a positive effect on their ability to code and use new technical information. His
work supports Du Boulay’s idea of presenting novices with a notional machine as an idealised model
of the computer represented by the constructs of the programming language (Du Boulay, O'Shea &

28
Monk, 1989), and ties in with the model or abstraction of the computer indicated by Robins et al.
(2003).
In an extensive investigation on the mental models of assignment held by students in an introductory
Java course, it was found that those students with a viable mental model performed considerably
better in both programming tasks and exams than those with non-viable models (Ma, Ferguson,
Roper, Ross & Wood, 2008; Ma, Ferguson, Roper & Wood, 2007; Ma et al., 2011). Some students
required a period of time to change their faulty mental models. This confirms the importance of
appropriate mental models for key programming concepts. It may also suggest that the concept of
assignment might be a threshold concept.
2.4.2.2 Threshold concepts Threshold concepts are seen as ‘conceptual gateways’, that is, difficult core concepts in a discipline
which can block progress, but once understood, allows understanding of more advanced, previously
inaccessible concepts (Meyer & Land, 2005). They are characterised by being:
• transformative, because they improve understanding of a concept significantly so that learners
view the discipline differently;
• irreversible, since it is unlikely to forget or unlearn them;
• integrative, as it exposes previously hidden interrelatedness of concepts and allow learners to
make new connections;
• frequently troublesome, because of the conceptual difficulty, being counter-intuitive or using
language that is ‘alien’; and
• bounded, indicating the limits or boundaries of the conceptual area or discipline (Meyer &
Land, 2005).
In computer science, proposed threshold concepts cover state, program-memory interaction, levels of
abstraction, pointers, the distinction between classes, objects and instances, recursion and induction,
procedural abstraction and polymorphism (Rountree & Rountree, 2009). Khalife (2006:246) considers
“a simple yet concrete model of the computer internals and how it operates during program
execution,” as the first threshold facing introductory programming students. Sorva (2013) also
considers ‘program dynamics’ a major threshold for novice programmers. Research showing that an
adequate mental model of program working storage (namely program-memory interaction) is required
to transform introductory students from an end-user mind-set to a programmer mind-set, confirms this
view (Vagianou, 2006). Note that crossing a threshold, is a gradual process taking place in a so-called
‘liminal space’ (Meyer & Land, 2005), the transitional period between learning a new concept and
mastering it (Boustedt, Eckerdal, McCartney, Moström, Ratcliffe, Sanders & Zander, 2007; Eckerdal,
McCartney, Moström, Sanders, Thomas & Zander, 2007; McCartney, Boustedt, Eckerdal, Moström,
Sanders, Thomas & Zander, 2009; Meyer & Land, 2005). Students should be encouraged to actively
29
and deliberately engage with a threshold concept to internalise it, for example by using PV tools to
make students aware of the step-by-step process in program execution (Sorva, 2010). Mastering the
relevant threshold concepts could allow a new mental model to be formed or an existing one to be
adapted (Eckerdal, McCartney, Moström, Ratcliffe, Sanders & Zander, 2006).
2.4.2.3 Learning Edge Momentum (LEM) Threshold concepts also tie in with the concept of LEM proposed by Robins (2010). LEM is based on
the following two well-known and accepted factors: “firstly, that concepts in programming languages
are tightly integrated; and secondly that we learn at the edges of what we already know” (Robins,
2010:55). The core of the LEM hypothesis is that the effects of successful or unsuccessful learning are
self-reinforcing over time. When new concepts have to be learned, previous successful learning of
related concepts will make it easier to master the new concepts, while unsuccessful learning will make
it more difficult. This creates a momentum effect towards either success or failure. The tight
integration of concepts in a programming language, exaggerates the LEM effect (Robins, 2010).
All of the above provides evidence that it is crucial that novices should master the core fundamental
concepts and develop appropriate mental models in order to become proficient programmers.
2.4.3 Problems novices experience
Many of the difficulties novices experience can be related to lack of viable mental models for
programming. In this section the problems novices experience are examined by referring to the
differences between novices and experts, after which the concepts novices find difficult, are
elaborated on.
2.4.3.1 The differences between novices and experts
Novices and experts develop code in different ways (Palumbo, 1990; Pears, Seidman et al., 2007;
Robins et al., 2003). As mentioned previously, it takes about ten years to turn a novice into an expert.
Expertise begins with general problem-solving skills and basic knowledge about the field, which
grows with repeated practice (Winslow, 1996).
Various studies reviewed by Winslow (1996) concluded that novices –
• lack adequate mental models;
• are limited to superficial knowledge;
• have fragile knowledge (knows something but fails to use it when required);
• use general problem-solving strategies instead of strategies dependent on the specific
problem; and
• approach programming through control structures, and in a line-by-line, bottom-up approach.

30
Robins et al. (2003) confirm this and add that novices spend little time on both planning and testing
code. They attempt small ‘local’ fixes instead of reformulating code. They are often weak at tracking
or tracing code and may not understand that programs execute sequentially. Their knowledge is more
context-specific than general (Robins et al., 2003), as they tend to work with smaller, less-integrated
information units (Palumbo, 1990). As a result, their problem-solving strategies can also be fragile
(Robins et al., 2003), since they lack adequate organized, meaningful knowledge patterns in memory
(Wiedenbeck, 2005). Furthermore, novices often do not realise their own shortcomings (Ala-Mutka,
2004).
Spohrer and Soloway (1989) provide an overview of the underlying problems novices experience.
They identify three types of construct-based problems which hinder novices in learning the correct
semantics of programming language constructs, as well as nine types of plan composition problems
causing problems with planning and design, respectively entailing the following:
• Construct-based problems:
• Natural-language problem. Novices confuse the semantics of programming-language
constructs with the related natural-language words.
• Human interpreter problem. Novices assume that the computer will interpret a construct
in the way they intend it to be interpreted.
• Inconsistency problem. When novices understand how a construct works in a certain
situation, they may assume that it will do the same in a slightly different situation.
• Plan composition problems:
• Summarisation problem. Only the primary function of a plan is taken into account, while
the secondary functions may be overlooked.
• Optimisation problem. Inapplicable optimisation may be attempted.
• Previous-experience problem (Plan-pollution). Inappropriate aspects of previous plans
may be used in a related-plan.
• Specialisation problem. Abstract plans may be used inappropriately or instantiated
incorrectly.
• Natural-language problem. Mapping from natural language to a programming language
may be incorrect.
• Interpretation problem. Implicit problem specifications may be left out or only included
when novices can easily retrieve plans for it.
• Boundary problem. Novices find it difficult to specify correct boundary points when
adapting a plan to specialised situations.
• Unexpected cases problem. Uncommon, unlikely or boundary cases may be omitted.
• Cognitive load problem. Minor but important parts of plans may be omitted, or plan
interactions may be overlooked.
31
Soloway and Spohrer (1989) also report on general misconceptions held by novices. Novices
frequently assume that the computer will do what they mean, rather than what they say, and do not
realise the level of detail that needs to be specified (Du Boulay, 1989). Bonar and Soloway (1989)
show that novices’ pre-programming knowledge about standard tasks in step-by-step natural
language, plays an important role in relation to the bugs in their programs, especially if their
programming knowledge is fragile. Spohrer and Soloway (1989) found that a large percentage of
program bugs are caused by a few bug types; and that most bugs are the result of plan composition
problems (putting the pieces of a program together) and not of construct-based problems
(misconceptions about language constructs).
Experts, in contrast (Winslow, 1996) –
• have many mental models which they select and combine in resourceful ways;
• have a deep, hierarchical, many-layered knowledge of their subject with explicit maps
between the layers;
• apply all their knowledge;
• work forward from the givens when processing a task in familiar areas and develop sub-goals
hierarchically, but fall back on general problem-solving techniques when faced with
unfamiliar problems;
• recognise problems with a similar solutions more easily;
• tend to approach programs through data structures or objects;
• use abstract algorithms rather than language specific syntax;
• work faster and more accurate; and
• have better syntactical and semantic knowledge and better tactical and strategic skills.
Robins et al. (2003) add to the above that experts have efficiently organised and specialised
knowledge representations; organise their knowledge based on functional characteristics instead of
superficial details; use both general and specialised problem-solving strategies; use specialised plans
and a top-down, breadth-first approach to deconstruct and understand programs; and are flexible in
their approach to understand programs and willing to discard dubious hypotheses. Wiedenbeck (2005)
confirms that efficient programming knowledge organisation distinguishes experts from novices.
In contrast to novices, experts spend much of their time on planning. Experts are aware of the
advantages of testing their code and have well-developed strategies to design tests to expose all
possible problems. Novices frequently test only the obvious and may neglect to test all of their code.
Experts consider large-scale as well as minor changes when required to modify their programs, while
novices tend to attempt ‘local’ fixes (Linn & Dalbey, 1989).
32
Experts use sophisticated problem-solving skills such as decomposition, analogical reasoning and
systematically plan, code and debug their programs. Novices classify tasks and write programs
according to surface characteristics while experts use the general concepts and underlying structures
to solve programing problems (Kurland, Pea, Clement & Mawby, 1989).
In summary, while experts use sophisticated knowledge representations and problem-solving
strategies, novices experience difficulty in basic program planning, and their programming specific
knowledge is often fragile (Pears, Seidman et al., 2007; Robins et al., 2003). Even if they know the
syntax and semantics of individual statements, they do not know how to combine these into valid
programs (Winslow, 1996). To assist novices in becoming experts, educators should take note of the
recommendations in Robins et al. (2003), and pay special attention to assist novices in developing
appropriate mental models for programming.
2.4.3.2 What do novices find difficult Much of the research in computing education (CER) focuses on why students find learning to
program difficult, and what topics cause difficulties, as well as on factors predicting student success.
This can be seen from the following themes revealed by surveys of CER:
• Theories and models (pedagogy) of teaching/learning (Clancy, Stasko, Guzdial, Fincher &
Dale, 2001; Palumbo, 1990; Pears, Seidman, Eney, Kinnunen & Malmi, 2005; Pears,
Seidman et al., 2007; Robins et al., 2003; Sheard et al., 2009; Valentine, 2004).
• Ability/aptitude/understanding, including the difference between novices and experts (Clancy
et al., 2001; Palumbo, 1990; Robins et al., 2003; Sheard et al., 2009).
• Teaching/learning and assessment techniques (Clancy et al., 2001; Palumbo, 1990; Pears et
al., 2005; Pears, Seidman et al., 2007; Robins et al., 2003; Sheard et al., 2009; Valentine,
2004).
• Tools to assist with teaching/learning and assessment (Clancy et al., 2001; Palumbo, 1990;
Pears et al., 2005; Pears, Seidman et al., 2007; Robins et al., 2003; Sheard et al., 2009;
Valentine, 2004).
For the purpose of this study the topics that novices find difficult to understand is important, as the
purpose of the tutorial developed for this study is to address some of those topics. A brief summary of
the reasons why novices fail is presented, before the topics that novices find difficult are expanded on.
The list that follows does not claim to be comprehensive, but among the reasons why novices fail to
learn to program, the following are listed from the literature:
• fragile programming knowledge and in particular, fragile problem-solving strategies (Robins
et al., 2003);
• misconceptions about programming constructs (Soloway & Spohrer, 1989);
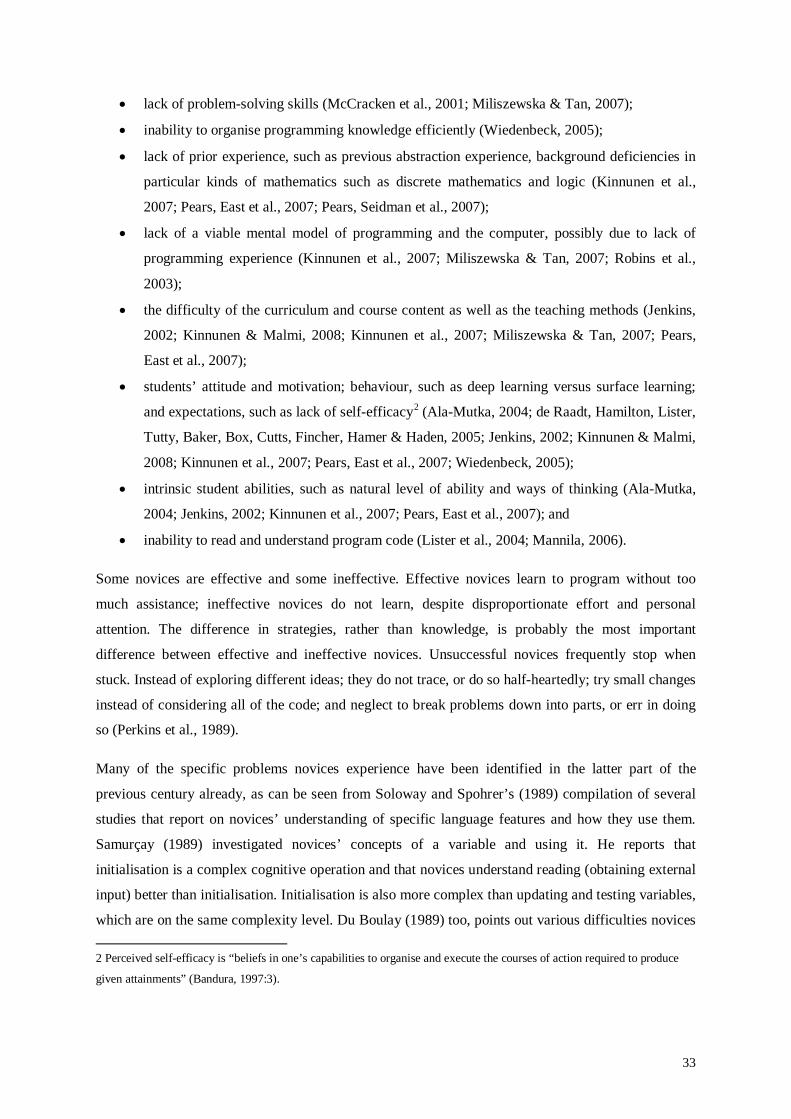
33
• lack of problem-solving skills (McCracken et al., 2001; Miliszewska & Tan, 2007);
• inability to organise programming knowledge efficiently (Wiedenbeck, 2005);
• lack of prior experience, such as previous abstraction experience, background deficiencies in
particular kinds of mathematics such as discrete mathematics and logic (Kinnunen et al.,
2007; Pears, East et al., 2007; Pears, Seidman et al., 2007);
• lack of a viable mental model of programming and the computer, possibly due to lack of
programming experience (Kinnunen et al., 2007; Miliszewska & Tan, 2007; Robins et al.,
2003);
• the difficulty of the curriculum and course content as well as the teaching methods (Jenkins,
2002; Kinnunen & Malmi, 2008; Kinnunen et al., 2007; Miliszewska & Tan, 2007; Pears,
East et al., 2007);
• students’ attitude and motivation; behaviour, such as deep learning versus surface learning;
and expectations, such as lack of self-efficacy2 (Ala-Mutka, 2004; de Raadt, Hamilton, Lister,
Tutty, Baker, Box, Cutts, Fincher, Hamer & Haden, 2005; Jenkins, 2002; Kinnunen & Malmi,
2008; Kinnunen et al., 2007; Pears, East et al., 2007; Wiedenbeck, 2005);
• intrinsic student abilities, such as natural level of ability and ways of thinking (Ala-Mutka,
2004; Jenkins, 2002; Kinnunen et al., 2007; Pears, East et al., 2007); and
• inability to read and understand program code (Lister et al., 2004; Mannila, 2006).
Some novices are effective and some ineffective. Effective novices learn to program without too
much assistance; ineffective novices do not learn, despite disproportionate effort and personal
attention. The difference in strategies, rather than knowledge, is probably the most important
difference between effective and ineffective novices. Unsuccessful novices frequently stop when
stuck. Instead of exploring different ideas; they do not trace, or do so half-heartedly; try small changes
instead of considering all of the code; and neglect to break problems down into parts, or err in doing
so (Perkins et al., 1989).
Many of the specific problems novices experience have been identified in the latter part of the
previous century already, as can be seen from Soloway and Spohrer’s (1989) compilation of several
studies that report on novices’ understanding of specific language features and how they use them.
Samurçay (1989) investigated novices’ concepts of a variable and using it. He reports that
initialisation is a complex cognitive operation and that novices understand reading (obtaining external
input) better than initialisation. Initialisation is also more complex than updating and testing variables,
which are on the same complexity level. Du Boulay (1989) too, points out various difficulties novices 2 Perceived self-efficacy is “beliefs in one’s capabilities to organise and execute the courses of action required to produce
given attainments” (Bandura, 1997:3).
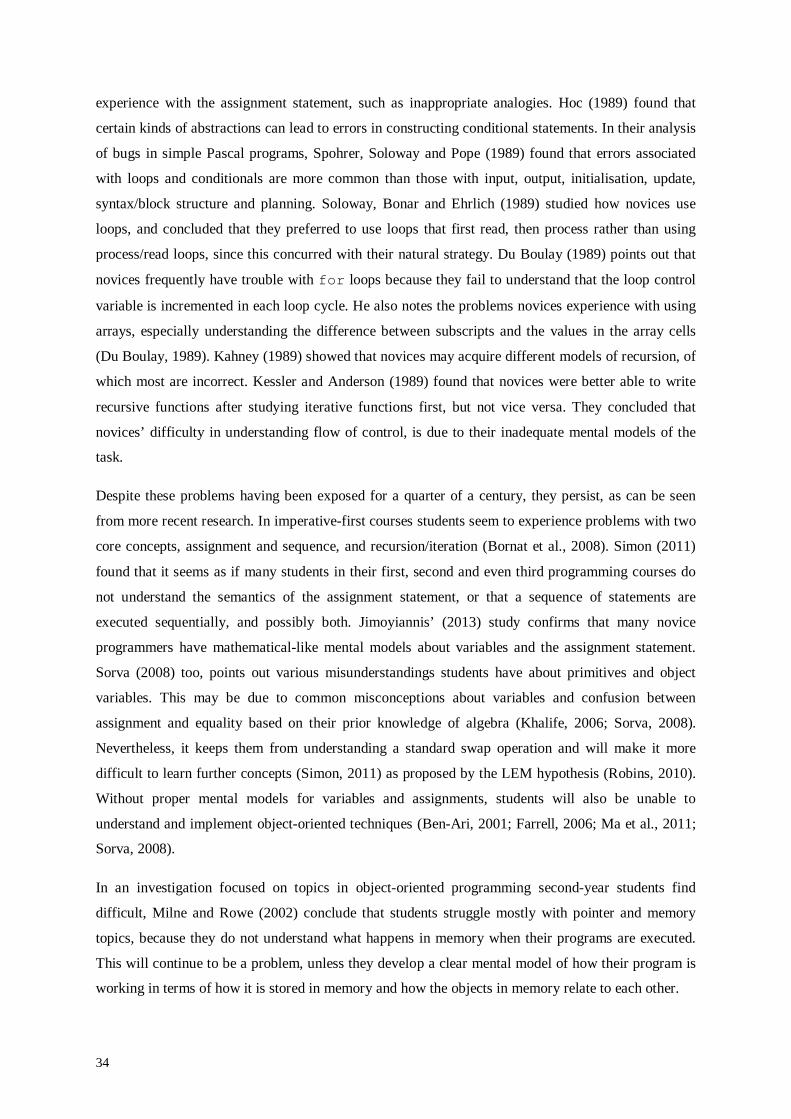
34
experience with the assignment statement, such as inappropriate analogies. Hoc (1989) found that
certain kinds of abstractions can lead to errors in constructing conditional statements. In their analysis
of bugs in simple Pascal programs, Spohrer, Soloway and Pope (1989) found that errors associated
with loops and conditionals are more common than those with input, output, initialisation, update,
syntax/block structure and planning. Soloway, Bonar and Ehrlich (1989) studied how novices use
loops, and concluded that they preferred to use loops that first read, then process rather than using
process/read loops, since this concurred with their natural strategy. Du Boulay (1989) points out that
novices frequently have trouble with for loops because they fail to understand that the loop control
variable is incremented in each loop cycle. He also notes the problems novices experience with using
arrays, especially understanding the difference between subscripts and the values in the array cells
(Du Boulay, 1989). Kahney (1989) showed that novices may acquire different models of recursion, of
which most are incorrect. Kessler and Anderson (1989) found that novices were better able to write
recursive functions after studying iterative functions first, but not vice versa. They concluded that
novices’ difficulty in understanding flow of control, is due to their inadequate mental models of the
task.
Despite these problems having been exposed for a quarter of a century, they persist, as can be seen
from more recent research. In imperative-first courses students seem to experience problems with two
core concepts, assignment and sequence, and recursion/iteration (Bornat et al., 2008). Simon (2011)
found that it seems as if many students in their first, second and even third programming courses do
not understand the semantics of the assignment statement, or that a sequence of statements are
executed sequentially, and possibly both. Jimoyiannis’ (2013) study confirms that many novice
programmers have mathematical-like mental models about variables and the assignment statement.
Sorva (2008) too, points out various misunderstandings students have about primitives and object
variables. This may be due to common misconceptions about variables and confusion between
assignment and equality based on their prior knowledge of algebra (Khalife, 2006; Sorva, 2008).
Nevertheless, it keeps them from understanding a standard swap operation and will make it more
difficult to learn further concepts (Simon, 2011) as proposed by the LEM hypothesis (Robins, 2010).
Without proper mental models for variables and assignments, students will also be unable to
understand and implement object-oriented techniques (Ben-Ari, 2001; Farrell, 2006; Ma et al., 2011;
Sorva, 2008).
In an investigation focused on topics in object-oriented programming second-year students find
difficult, Milne and Rowe (2002) conclude that students struggle mostly with pointer and memory
topics, because they do not understand what happens in memory when their programs are executed.
This will continue to be a problem, unless they develop a clear mental model of how their program is
working in terms of how it is stored in memory and how the objects in memory relate to each other.
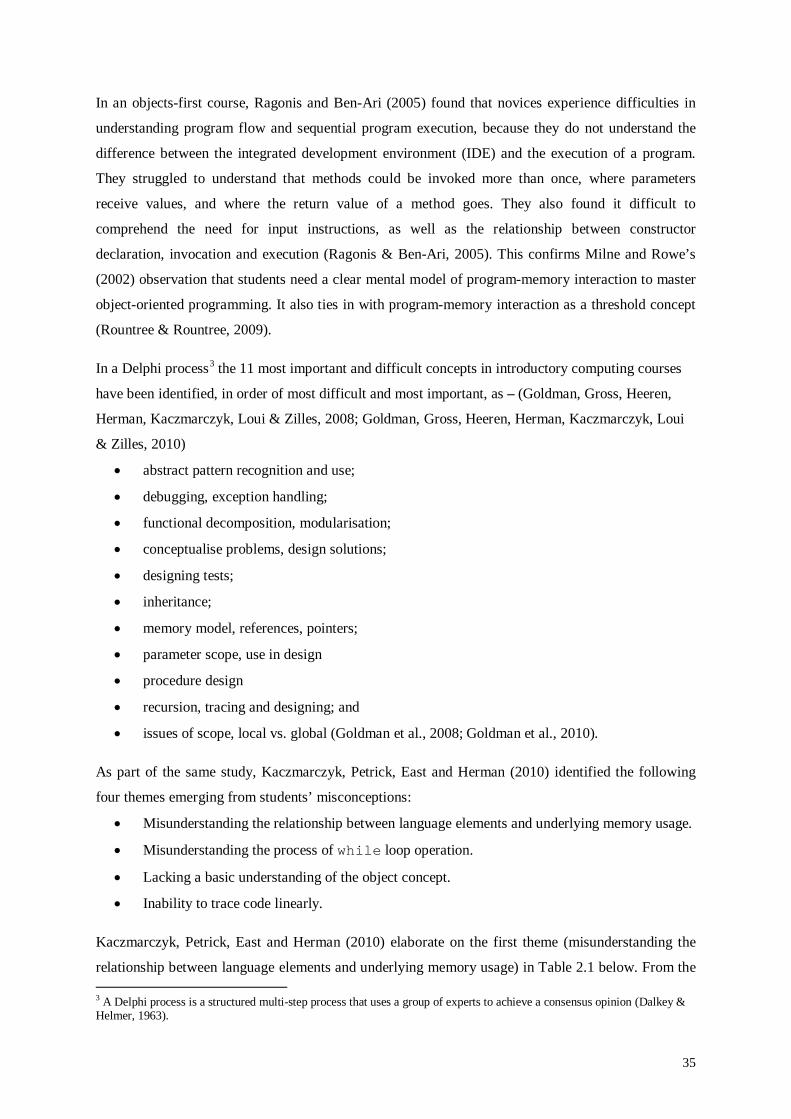
35
In an objects-first course, Ragonis and Ben-Ari (2005) found that novices experience difficulties in
understanding program flow and sequential program execution, because they do not understand the
difference between the integrated development environment (IDE) and the execution of a program.
They struggled to understand that methods could be invoked more than once, where parameters
receive values, and where the return value of a method goes. They also found it difficult to
comprehend the need for input instructions, as well as the relationship between constructor
declaration, invocation and execution (Ragonis & Ben-Ari, 2005). This confirms Milne and Rowe’s
(2002) observation that students need a clear mental model of program-memory interaction to master
object-oriented programming. It also ties in with program-memory interaction as a threshold concept
(Rountree & Rountree, 2009).
In a Delphi process3 the 11 most important and difficult concepts in introductory computing courses
have been identified, in order of most difficult and most important, as – (Goldman, Gross, Heeren,
Herman, Kaczmarczyk, Loui & Zilles, 2008; Goldman, Gross, Heeren, Herman, Kaczmarczyk, Loui
& Zilles, 2010)
• abstract pattern recognition and use;
• debugging, exception handling;
• functional decomposition, modularisation;
• conceptualise problems, design solutions;
• designing tests;
• inheritance;
• memory model, references, pointers;
• parameter scope, use in design
• procedure design
• recursion, tracing and designing; and
• issues of scope, local vs. global (Goldman et al., 2008; Goldman et al., 2010).
As part of the same study, Kaczmarczyk, Petrick, East and Herman (2010) identified the following
four themes emerging from students’ misconceptions:
• Misunderstanding the relationship between language elements and underlying memory usage.
• Misunderstanding the process of while loop operation.
• Lacking a basic understanding of the object concept.
• Inability to trace code linearly.
Kaczmarczyk, Petrick, East and Herman (2010) elaborate on the first theme (misunderstanding the
relationship between language elements and underlying memory usage) in Table 2.1 below. From the 3 A Delphi process is a structured multi-step process that uses a group of experts to achieve a consensus opinion (Dalkey & Helmer, 1963).
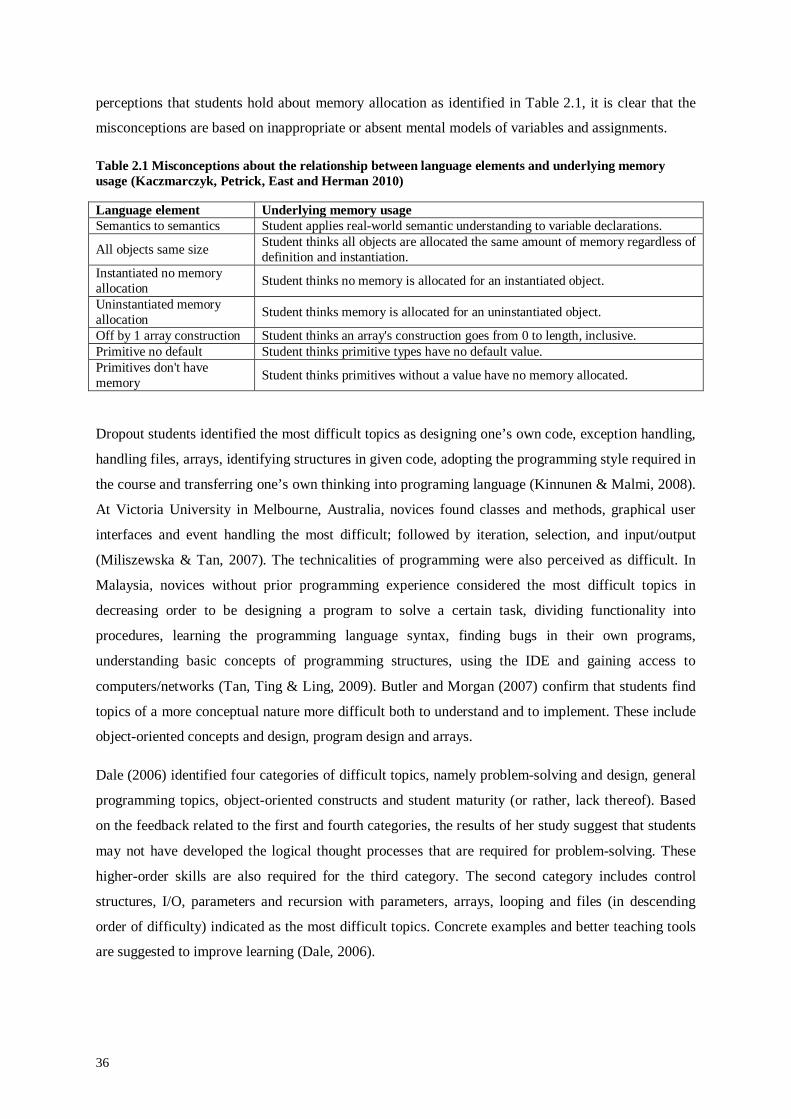
36
perceptions that students hold about memory allocation as identified in Table 2.1, it is clear that the
misconceptions are based on inappropriate or absent mental models of variables and assignments.
Table 2.1 Misconceptions about the relationship between language elements and underlying memory usage (Kaczmarczyk, Petrick, East and Herman 2010)
Language element Underlying memory usage Semantics to semantics Student applies real-world semantic understanding to variable declarations.
All objects same size Student thinks all objects are allocated the same amount of memory regardless of definition and instantiation.
Instantiated no memory allocation Student thinks no memory is allocated for an instantiated object.
Uninstantiated memory allocation Student thinks memory is allocated for an uninstantiated object.
Off by 1 array construction Student thinks an array's construction goes from 0 to length, inclusive. Primitive no default Student thinks primitive types have no default value. Primitives don't have memory Student thinks primitives without a value have no memory allocated.
Dropout students identified the most difficult topics as designing one’s own code, exception handling,
handling files, arrays, identifying structures in given code, adopting the programming style required in
the course and transferring one’s own thinking into programing language (Kinnunen & Malmi, 2008).
At Victoria University in Melbourne, Australia, novices found classes and methods, graphical user
interfaces and event handling the most difficult; followed by iteration, selection, and input/output
(Miliszewska & Tan, 2007). The technicalities of programming were also perceived as difficult. In
Malaysia, novices without prior programming experience considered the most difficult topics in
decreasing order to be designing a program to solve a certain task, dividing functionality into
procedures, learning the programming language syntax, finding bugs in their own programs,
understanding basic concepts of programming structures, using the IDE and gaining access to
computers/networks (Tan, Ting & Ling, 2009). Butler and Morgan (2007) confirm that students find
topics of a more conceptual nature more difficult both to understand and to implement. These include
object-oriented concepts and design, program design and arrays.
Dale (2006) identified four categories of difficult topics, namely problem-solving and design, general
programming topics, object-oriented constructs and student maturity (or rather, lack thereof). Based
on the feedback related to the first and fourth categories, the results of her study suggest that students
may not have developed the logical thought processes that are required for problem-solving. These
higher-order skills are also required for the third category. The second category includes control
structures, I/O, parameters and recursion with parameters, arrays, looping and files (in descending
order of difficulty) indicated as the most difficult topics. Concrete examples and better teaching tools
are suggested to improve learning (Dale, 2006).
37
In an international survey, Lahtinen, Ala-Mutka and Järvinen (2005) identified the most difficult
issues in programming as understanding how to design a program to solve a certain task; dividing
functionality into procedures, functions and/or classes; and finding bugs in own programs. All of
these require understanding larger entities of a program instead of only some details. Recursion,
pointers and references, abstract data types, error handling, and using language libraries were singled
out as the most difficult programming concepts. Learning to apply rather than understanding basic
concepts appears to present the biggest problem. This work confirms the findings by Soloway and
Spohrer (1989), Milne and Rowe (2002) and Dale (2006).
Based on the work by Milne and Rowe (2002), Lahtinen et al. (2005) and Tan, Ting and Ling (2009),
Piteira and Costa (2012) summarised topics in introductory programming courses from the highest
level of student comprehension to the lowest, as being – selection structures; variables
(lifetime/scope); loop structures; operators and precedence; structured data types; abstract data types;
recursion; pointers and references. This concurs to a large extent with the work by Ben-Ari (2001),
Bornat et al. (2008), Butler and Morgan (2007), Dale (2006), Farrell (2006), Goldman et al. (2008),
Goldman et al. (2010), Hertz and Ford (2013), Jimoyiannis (2013), Kaczmarczyk et al. (2010),
Khalife (2006), Kinnunen and Malmi (2006), Lahtinen et al. (2005), Ma et al. (2011), Miliszewska
and Tan (2007), Milne and Rowe (2002), Ragonis and Ben-Ari (2005), Simon (2011), Soloway and
Spohrer (1989) and Sorva (2008) investigating the topics that novices find difficult
discussed/described above.
Schulte and Bennedsen (2006) investigated what teachers teach in introductory programming and
came to the conclusion that the majority of the ‘classic’ topics (such as iteration and syntax) are taught
at the same level, with the same difficulty and the same relevance regardless of which paradigm
(imperative or OO) is followed. An interesting finding was that most teachers consider a mental
model of the notional machine less important, but despite that, believed a hierarchy of object-
interaction presented as the basis for a notional machine in OO, was important (Schulte & Bennedsen,
2006). Related to this is, Herz and Ford’s (2013) investigation in the importance an instructor ascribes
to a topic and the time spent teaching a topic as underlying factors that influence introductory student
leaning. Little correlation has been found between time spent on teaching a topic and students’
abilities related to that topic. In contrast, novices’ abilities on a topic correlate to a large extent
positively with how important the instructor deems the topic to be, with the exception of control
structures, subroutines/functions and types. This suggests that these are difficult topics to master, once
again confirming previous research.
Considering the problems highlighted by the research presented above, it seems as if students
experience the same problems after the introduction of OO, as they did before. Many of these
problems originate in a lack of an appropriate mental model of a running program, which Khalife

38
(2006) considers the first threshold facing introductory programming students. An inadequate
comprehension of program-memory interaction is reflected in the problems students experience with
memory topics such as variables, assignment, data structures, parameters, objects, pointers and
references. Lack of understanding the flow of control in a running program is reflected in problems
with the execution sequence, control structures, procedures and recursion. Students also struggle with
program design and debugging. The complexities of OO may even introduce more problems since
more material have to be covered in introductory courses, with less time allocated to basic concepts
such as control structures. Event-handling and class methods also add an additional layer of
complexity (McCauley, Fitzgerald, Lewandowski, Murphy, Simon, Thomas & Zander, 2008).
2.5 Tracing
One of the mechanisms to assist with clearing up misconceptions held by novices (see section 2.4.3.2
What do novices find difficult) and developing mental models (as discussed under the Section 2.4.2.1
Mental models), is to teach them tracing. In the following sections tracing itself is defined, the reasons
why tracing is important are explained, difficulties novices experience with tracing as well as the
advantages of teaching novices to trace are pointed out.
2.5.1 Tracing defined
Tracing is the “mental simulation of a program execution” (Vainio & Sajaniemi, 2007:78), that is, to
imitate at some level of detail and/or accuracy, the process of a computer executing code (Fitzgerald,
Simon & Thomas, 2005). Tracing can be done in various ways, such as mentally, by comparing
output with code, by tracking the values of variables on paper, using temporary statements to print
variables’ values, and using a debugger (Murphy, Lewandowski, McCauley, Simon, Thomas &
Zander, 2008). Tracing can also be done at two levels, namely ‘concrete simulation’ where code is
traced with the actual values of variables; and ‘symbolic simulation’, that is on a higher level, where
the different steps in which the program is executed are simulated (Détienne & Soloway, 1990).
Concrete simulation corresponds to what Cogan and Gurwitz (2009) call memory tracing. This is the
activity where a programmer ‘executes’ a program (or segment) on paper, by tracing the statements
one by one, in the process tracking the values of all variables, and how they change during program
execution. The purpose of this action is typically to debug a program, or to understand what the
program does (Cogan & Gurwitz, 2009), and especially to test boundary or error conditions
(Fitzgerald et al., 2005). Memory tracing differs from hand-checking a program. With hand-checking,
the calculations to solve a problem are done independently of the program and these results are then
compared to the program’s final output (Cogan & Gurwitz, 2009). Memory tracing is also called
‘close tracking’ (Perkins et al., 1989), or a ‘walkthrough’ – hand executing code in meticulous detail
(Lister et al., 2004).

39
Mentally comparing output with code, using statements to print variables’ values, and using a
debugger, resemble symbolic simulation. Symbolic tracing frequently involves plan or pattern
recognition (Détienne & Soloway, 1990; Fitzgerald et al., 2005), one of the abilities that distinguishes
experts from novices.
2.5.2 The purpose of tracing
Tracing plays an important role in program comprehension. When a programmer reads a program,
he/she constructs two mental models. The first model is a low-level program model based on the
structure of the program code as indicated by control flow relationships such as loops and
conditionals. The second model is a higher-level domain model based on the data flow which reflects
the main purpose of the program or the application (Mannila, 2006; Vainio & Sajaniemi, 2007). These
two mental models of a program correspond with the comprehension that the two levels of tracing
(concrete simulation and symbolic simulation) can produce. Novices typically find it difficult to
abstract from the code to construct a domain model, because they tend to have concrete mental
representations of the program code and understand concepts in isolation (Mannila, 2006). They find
it difficult to “see the forest, not just the trees” (Lister, Simon, Thompson, Whalley & Prasad,
2006:122) due to their lack of experience and the complexity of symbolic tracing (Vainio &
Sajaniemi, 2007).
Tracing is also an important strategy in debugging (Murphy, Lewandowski et al., 2008). Ducassé and
Emde (1988) identified the following seven types of knowledge required for successful debugging:
knowledge of the intended program, knowledge of the actual program, understanding of the
programming language, general programming expertise, knowledge of the application domain,
knowledge of bugs, and knowledge of debugging methods. Knowledge of the actual program and the
intended program refers to input/output, program behaviour and implementation. The majority of
competent debuggers are competent programmers, but not all good programmers are good debuggers
(Ahmadzadeh, Elliman & Higgins, 2005; Fitzgerald, Lewandowski, McCauley, Murphy, Simon,
Thomas & Zander, 2008). The key factor that distinguishes good debuggers from good programmers
is knowledge of the actual program implementation. This indicates that the ability to read and
understand other people’s programs is an essential skill to acquire in the journey from novice to
expert (Ahmadzadeh et al., 2005).
In line with the findings by Ahmadazeh et al. (2005) and Fitzgerald et al. (2008), several studies
showed that students who cannot trace or read code, usually cannot explain code, and also that
students who perform reasonably well at code writing tasks, can typically both trace and explain code
(Lister et al., 2010; Lister et al., 2009; Lopez et al., 2008; Philpott et al., 2007; Rountree et al., 2005;
Sheard et al., 2008; Venables et al., 2009). Acton et al. (2009) also found that students who cannot
draw memory representations of data structures, achieve poor grades. This is not a recent conclusion.
40
Soloway (1986:857) found that “designers and maintainers who did not carry out simulations did not
develop an effective design or an effective enhancement.”
Studies by the BRACElet project (Clear et al., 2009; Lister et al., 2010; Whalley & Lister, 2009)
suggest the possibility that a novice programmer develops skills in a hierarchical order, as follows:
The novice first acquires the ability to read, namely to trace code. Once this competency becomes
reliable, the capacity to explain code develops. When students are reasonably capable of both reading
and explaining, the skill to systematically write code emerges. The skills in this hierarchy do not
necessarily develop in a strict order, but instead reinforce each other and develop in parallel.
Furthermore, students require a certain minimal competence at tracing and explaining before
exhibiting a minimal competence to systematically write code (Lister et al., 2010; Lister et al., 2009;
Venables et al., 2009; Whalley & Lister, 2009). See Chapter 3 for more on the BRACElet project.
Kumar (2013) found that solving code-tracing problems improved students’ code-writing skills. The
study used selection statements (if and if-else statements). The improvement affected mainly the
language syntax skills of students and those who spent more time on the code-tracing exercises
showed greater improvement.
Carbone, Hurst, Mitchell and Gunstone (2009) identified five technical skills influencing student
learning of programming. Three of these, close tracking (tracing), tinkering and debugging skills, are
interdependent. If students can trace their code, they can localise problems and understand the issues,
and then make informed changes.
From the above, it is clear that learning to trace programs is an important stepping stone in learning to
program as well as in learning to debug programs.
2.5.3 Difficulties novices have with tracing
Fitzgerald et al. (2005) investigated strategies that students follow to trace code and classified these
strategies according to Bloom’s taxonomy (Krathwohl, 2002) and the Approaches to Study Inventory
(see Tait & Entwistle, 1996). They found that successful tracing depended not only on which strategy
was followed, but rather on ‘how well’ the strategy was executed (Fitzgerald et al., 2005). Their
classifications imply that seeking higher levels of meaning from the code (symbolic tracing) falls into
the higher levels of Bloom’s taxonomy and that it requires deep learning strategies. This explains why
novices find symbolic tracing more difficult.
Novices often use tracing ineffectively, for example by using print statements to trace flow of control
without including other information such as the values of variables (Murphy, Lewandowski et al.,
2008). Perkins et al. (1989) maintain that accurate tracing (close tracking) is a mentally demanding
41
activity that requires understanding of the language primitives and the rules for flow of control. The
following factors influence the ability to track accurately (Perkins et al., 1989):
• Motivation, because students do not understand the importance of tracking and lack
confidence in doing it.
• A flawed understanding of the programming language constructs.
• Projecting intentions on the code that prevents correct mapping from the code to the output,
that is students expect the code to do what they intend it to do.
• Cognitive style differences – students who naturally work methodically and reflectively may
be better at tracing than those who have a trial-and-error approach.
Vaino and Sajaniemi (2007) found that novices have two types of difficulties with diagrams used to
trace programs, namely being unable to draw diagrams that describe the program state and being
unable to use diagrams in program tracing. They argue that students should have automated the
processing of syntactic details so that they understand the concepts depicted in diagrams, before they
will be able to draw and use such diagrams.
2.5.4 The advantages of teaching novices to trace
Several studies show that teaching novices to trace can be beneficial. Cogan and Gurwitz (2009)
claim that teaching students tracing skills early in their introductory programming courses improved
the through-put rate. Kollmansberger (2010) found an increase of 40% in course completion on
introducing a tool that emphasizes tracing the step-by-step execution of each statement interactively.
Hertz and Jump (2013) organised their first and second year programming courses around program
memory traces that depict all of a program’s accessible memory (stack, heap and static) on paper.
This improved students’ programming grades as well as retention and pass rates. These examples
seem to confirm Robins’ (2010) LEM effect, as well as the findings by the BRACElet studies (Lister
et al., 2009; Venables et al., 2009).
Tracing forces students to engage with their programs on a deeper level. First-year students without
prior programming experience often treat source code as simple text, instead of an executable
program meant to accomplish a task. They then simply aim to create a program that compiles without
syntax errors, without considering the actual purpose of the program. Teaching them to trace, focus
their attention on what the program actually does (McCracken et al., 2001). Manually performing a
memory trace forces the programmer to understand the role of every statement in the program, and
makes the process more concrete (Cogan & Gurwitz, 2009). Thomas, Ratcliffe and Thomasson (2004)
also conclude that students have to construct diagrams to trace code themselves in order to make
sense of the code. This confirms the recommendation by Perkins et al. (1989) to trace written code in
order to comprehend what it actually does, rather than what it may seem to do on first inspection.

42
Tracing a program allows the novice to create a mental model of the program and predict its
behaviour, an essential part of program comprehension (Robins et al., 2003).
Teaching students to trace can play a motivational role. Thomas et al. (2004) maintain that once
students discover the value of constructing tracing diagrams, it encourages them to continue doing so.
Manual tracing teaches them a rigorous attention to detail which assists both in avoiding errors and
finding errors more quickly. This helps them overcome initial technical and emotional barriers to the
challenging demands of generating correct code and better prepares them to master more complex
algorithms (Cogan & Gurwitz, 2009).
Perkins et al. (1989) recommend teaching a mental model of the computer, in the form of a notional
machine (Du Boulay et al., 1989) to assist with both close tracking and decomposing problems in
ways appropriate to the language’s capabilities. Vainio and Sajaniemi (2007) also recommend
teaching the notional machine to students, as well as how to form a mapping between diagrams and
program code. Correspondingly, tracing code may assist students in forming a mental model of the
computer so that they comprehend that program execution is sequential, that the order of statements
matter and that statements do not execute in parallel, that is the computer does exactly what it is told
(McCauley et al., 2008).
Lister (2007:138) maintains that students should be taught and thoroughly assessed on the “low-level
skill of tracing through code”, similar to Soloway’s (1986) plea that simulation should be explicitly
taught to students. Two multi-national studies (Lister et al., 2004; Lister et al., 2009) likewise propose
that manual memory tracing be emphasized and taught explicitly in introductory computer science
courses. Cogan and Gurwitz (2009) recommend that students should be trained to be proficient at
doing manual memory tracing before being introduced to automated debuggers, since memory tracing
enables students to form a better connection with the inner workings of their code, than when using
debuggers or print statements.
Teaching novices how to trace their programs can therefore play a valuable role in developing their
programming skills. Tracing is also an important debugging skill, and as such contribute to writing
good code as well as in maintaining code written by others.
2.6 Visualization
This section provides the background on visualization with an overview of SV in general, and in
particular of SV in education. The success of visualization in education is also examined.

43
2.6.1 Software visualization – an overview
One of the tools used to enhance the comprehension of programming concepts and facilitate tracing,
is SV. According to Petre and Quincey (2006:1), “software visualization uses visual representations to
make software more visible”. Visualization refers to the graphical display of information in order to
assist human comprehension of and reasoning about that information. SV specifically refer to
graphical techniques to illustrate different elements of software such as source code, software
structure, runtime behaviour, component interaction, or software evolution, with the aim to enhance
comprehension (Petre & Quincey, 2006). Price, Baecker and Small (1993:1) define SV as using
“typography, graphic design, animation and cinematography with modern human-computer
interaction (HCI) technology to facilitate both the human understanding and effective use of computer
software”.
A number of taxonomies to classify SV systems have been proposed (see Maletic, Marcus & Collard,
(2002); Myers, (1990); Price et al., (1993); Roman & Cox, (1993); Stasko & Patterson, (1992)). Each
of these researchers base their classification on different aspects such as the purpose of the
visualization (Myers, 1990); scaled dimensions (Stasko & Patterson, 1992); what is visualized (Price
et al., 1993); similarity between what is represented and how it is represented (Roman & Cox, 1993);
or tasks (Maletic et al., 2002). More recently some proposed taxonomies focused on classifying SV
systems for debugging purposes (Sensalire, Ogao & Telea, 2008), algorithm animation languages
(Karavirta, Korhonen, Malmi & Naps, 2010) or educational purposes (Mutua, Wabwoba, Ogao,
Anselmo & Abenga, 2012; Xu, Chen & Liu, 2009).
Aspects of software that can be visualized include the architecture, the design, the algorithm, the
source code, the data, execution/trace information, measurements and metrics, documentation, and
process information (Maletic et al., 2002; Petre, Blackwell & Green, 1998). Specific aspects of
software design and development represented with SV include object-oriented aspects, formalisms,
metrics, slicing, XML, software evolution, data mining in software systems, software security
analysis, and algorithm and software engineering education (Gračanin, Matković & Eltoweissy,
2005). Visualization can be done in terms of code, tables, diagrams, charts, visual metaphors (such as
icons, figures, images, and worlds) and can have various attributes (such as interactive, static,
dynamic, on-line or off-line views, multiple views, drill-down capabilities, multiple abstraction
levels). It can be rendered on paper or various types of monitors (Maletic et al., 2002). Gračanin et al.
(2005) discuss examples of two-dimensional and three-dimensional SV representations as well as
virtual environments.
Experts and novices use visualizations for different purposes. Experts use SV mainly for three
activities, namely code comprehension, debugging and design reasoning (Petre & Quincey, 2006). In
the field of code comprehension SV are mostly used for maintenance purposes (Gračanin et al., 2005;

44
Petre & Quincey, 2006). SVs for non-experts are typically intended to provide an idea of an expert’s
imagery or an expert’s reasoning process, how computers work or programs are executed, and to
provide additional views of complex relationships novices find difficult to comprehend (Petre et al.,
1998).
2.6.2 SV in education
A vast array of SV tools exists. SV tools used for novices in introductory programming courses
include visual programming environments, microworlds, AV systems, and PV systems (Helminen &
Malmi, 2010). Visual programming environments provide a simplified graphical interface to construct
programs with, instead of writing code. This eliminates the effort and complexity involved with the
syntax of a programing language and allows learners to concentrate on essential programming
concepts without being distracted by having to cope with syntax and error messages as well. JPie
(Goldman, 2004) and Karel Universe (Bergin, 2006) are examples of visual programming
environments. RAPTOR (Carlisle, 2009; Carlisle, Wilson, Humphries & Hadfield, 2005) is a visual
programming environment that uses flowcharts and UML (Unified Modeling Language) diagrams to
create programs. BlueJ (Kölling, Quig, Patterson & Rosenberg, 2003) is another IDE that defines
classes and their relationships with a graphical UML-like notation. BlueJ also has a built-in debugger
that allows single-step execution and an object inspector (Bennedsen & Schulte, 2010).
Microworlds also provide a simplified graphical interface with a specialised simplified teaching
language integrated with a world of objects that can be explored and manipulated with a limited set of
operations. Some examples of microworlds are Alice (Powers, Ecott & Hirshfield, 2007), Jeroo
(Sanders & Dorn, 2003) and Greenfoot (Henriksen & Kölling, 2004; Kölling, 2008a).
AV and PV systems are used to visualize algorithms, source code, data and execution/trace
information. Price et al. (1993) distinguishes between AV and PV. AV animates an algorithm in terms
of its high-level operations to enhance understanding of its procedural behaviour (Hundhausen et al.,
2002), while PV visualizes the actual implemented code, showing the effect of each operation
(Röβling et al., 2008). Taylor and Pountney (2009:204) define animation as “the rapid display of a
sequence of images in order to create an illusion of movement”, due to the phenomenon of persistence
of vision. Algorithm animation tools thus capture the dynamic behaviour of code by simulating the
algorithm. They typically use conceptual visualizations of the data structures involved, to highlight
relationships instead of reflecting the actual contents of computer memory and are intended for
lecturing purposes (Helminen & Malmi, 2010). Examples of AV systems include Animal (Röβling &
Freisleben, 2002), JHAVÉ (Naps, 2005), ALVIE (Crescenzi & Nocentini, 2007), jGRASP (Cross II &
Hendrix, 2007) and TRAKLA (Nikander, Korhonen, Seppälä, Karavirta, Silvasti & Malmi, 2004). PV
tools focus on the visualization of static structures such as the content of variables or the stack frame;
or display the dynamic aspects of program execution statement by statement (Pears, Seidman et al.,
45
2007). PV tools assist program comprehension and debugging (Helminen & Malmi, 2010). In PV
systems animation is used to show the sequential aspects of the software in execution. Examples of
PV tools include Jeliot 3 (Ben-Ari et al., 2011; Moreno & Joy, 2007), VIP (Virtanen, Lahtinen &
Järvinen, 2005), Teaching Machine (Norvell & Bruce-Lockhart, 2004), Jype (Helminen & Malmi,
2010) and ViLLE (Rajala, Laakso, Kaila & Salakoski, 2007). PVs are typically used to teach
programming structures in introductory courses using a specific programming language, while AVs
are used in courses on algorithms and data structures (Lahtinen, 2008). Therefore, in introductory
programming courses PV is used more often than AV (Lahtinen, Jarvinen & Melakoski-Vistbacka
2007).
Although a considerable number of SVs have been developed, few of them are used by teachers or
lecturers other than the developers themselves. Although instructors may agree that visualizations can
help learners learn computer science, they are not always sufficiently convinced of the educational
effectiveness of visualizations to use them (Hundhausen et al., 2002; Knobelsdorf, Isohanni &
Tenenberg, 2012; Naps, Cooper, Koldehofe, Leska, Rossling, Dann, Korhonen, Malmi, Rantakokko,
Ross, Anderson, Fleischer, Kuittinen & McNally, 2003; Shaffer, Akbar, Alon, Stewart & Edwards,
2011). Various reasons for not using SV are cited, such as the difficulty and lack of time to find,
download, install, learn, adapt, integrate into the course, and teach the students to use and maintain it
according to the study material used at the institution (Ben-Bassat Levy & Ben-Ari, 2007; Domingue,
2002; Hundhausen et al., 2002; Naps et al., 2003a; Pears, East et al., 2007; Röβling et al., 2008;
Shaffer et al., 2011). Platform dependence and the level of difficulty to integrate and adapt the
visualization to the course format and content, are also major reasons why the use of SV are not more
widespread (Naps et al., 2003a; Shaffer et al., 2011). Reiss (2005) proposes that the reason why SV is
not more successful is because it is out of touch with the realities of understanding, software and
developers. The reality of understanding refers to the fact that SV systems present generic
visualizations instead of visualizations for specific problems. The reality of software refers to SV
addressing past problems and solutions instead of today’s heterogeneous systems. The reality of
developers refers to the cost of learning and implementing a SV tool in terms of time and effort. This
echoes some of the reasons lecturers cite for not using SV tools in their teaching.
2.6.3 How successful is visualization
Feedback on the success of visualization is mixed. Despite lecturers’ general perception, research
shows that visualization is not always pedagogically effective or used effectively (Foutsitzis &
Demetriadis, 2008; Hundhausen et al., 2002; Laakso, Rajala, Kaila & Salakoski, 2008a; Naps,
Röβling et al., 2003; Pears, East et al., 2007; Shaffer et al., 2011; Shaffer et al., 2007). Shaffer et al.
(2007:152) claim that the majority of visualizations appear to “have no pedagogical value” in the
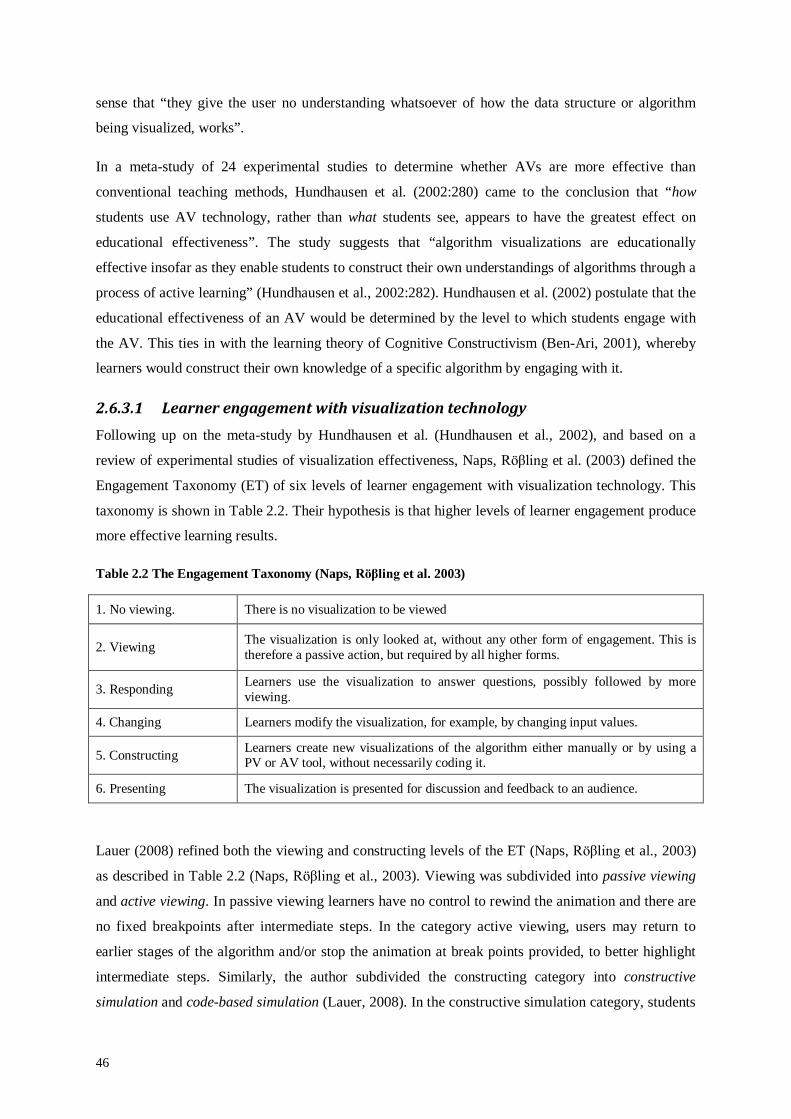
46
sense that “they give the user no understanding whatsoever of how the data structure or algorithm
being visualized, works”.
In a meta-study of 24 experimental studies to determine whether AVs are more effective than
conventional teaching methods, Hundhausen et al. (2002:280) came to the conclusion that “how
students use AV technology, rather than what students see, appears to have the greatest effect on
educational effectiveness”. The study suggests that “algorithm visualizations are educationally
effective insofar as they enable students to construct their own understandings of algorithms through a
process of active learning” (Hundhausen et al., 2002:282). Hundhausen et al. (2002) postulate that the
educational effectiveness of an AV would be determined by the level to which students engage with
the AV. This ties in with the learning theory of Cognitive Constructivism (Ben-Ari, 2001), whereby
learners would construct their own knowledge of a specific algorithm by engaging with it.
2.6.3.1 Learner engagement with visualization technology Following up on the meta-study by Hundhausen et al. (Hundhausen et al., 2002), and based on a
review of experimental studies of visualization effectiveness, Naps, Röβling et al. (2003) defined the
Engagement Taxonomy (ET) of six levels of learner engagement with visualization technology. This
taxonomy is shown in Table 2.2. Their hypothesis is that higher levels of learner engagement produce
more effective learning results.
Table 2.2 The Engagement Taxonomy (Naps, Röβling et al. 2003)
1. No viewing. There is no visualization to be viewed
2. Viewing The visualization is only looked at, without any other form of engagement. This is therefore a passive action, but required by all higher forms.
3. Responding Learners use the visualization to answer questions, possibly followed by more viewing.
4. Changing Learners modify the visualization, for example, by changing input values.
5. Constructing Learners create new visualizations of the algorithm either manually or by using a PV or AV tool, without necessarily coding it.
6. Presenting The visualization is presented for discussion and feedback to an audience.
Lauer (2008) refined both the viewing and constructing levels of the ET (Naps, Röβling et al., 2003)
as described in Table 2.2 (Naps, Röβling et al., 2003). Viewing was subdivided into passive viewing
and active viewing. In passive viewing learners have no control to rewind the animation and there are
no fixed breakpoints after intermediate steps. In the category active viewing, users may return to
earlier stages of the algorithm and/or stop the animation at break points provided, to better highlight
intermediate steps. Similarly, the author subdivided the constructing category into constructive
simulation and code-based simulation (Lauer, 2008). In the constructive simulation category, students

47
construct an animation by simulating an algorithm on a re-defined visualization, while in the code-
based simulation category they code the algorithms using a visual tool. Based on the results of several
other studies that investigated the relationship between learning result and levels of engagement,
Lauer (2008) concludes that active viewing is on a higher level than passive viewing, and that
changing and constructive simulation fits into the same level (level 4 in the ET (Naps, Röβling et al.,
2003)), while code-based construction is on a higher level.
Both the ET (Naps, Röβling et al., 2003) and Lauer’s (2008) refinement thereof are based on work in
AV research and the types of engagement found in AV tools. This research report’s focus is on PV.
Since PV tools support other types of engagement, Myller, Bednarik, Sutinen and Ben-Ari (2009)
extended the ET for PV. In particular, PV tools may provide opportunities to offer interactive input
and modify the source code used for the visualization. The extended ET is shown in Table 2.3 below.
Levels marked with an asterisk (*) are from the original ET, although some definitions were adapted
slightly. Changing has been divided into two categories, changing and modifying. Three new
categories have been added, namely controlled viewing, entering input, and reviewing. Some of these
correspond to some extent with Lauer’s (2008) refinement in that controlled viewing is similar to
active viewing, constructing to constructive modification, and modifying to constructive simulation.
Table 2.3 The Extended Engagement Taxonomy (Myller et al., 2009)
No viewing (*) There is no visualization to be viewed, but only material in textual format. For example, the students are reviewing the source code without modifying it or they are looking at the learning materials.
Viewing (*) The visualization is viewed with no interaction. For example, the students are looking at the visualization or the program output.
Controlled viewing The visualization is viewed and the students control the visualization, for example by selecting objects to inspect or by changing the speed of the animation.
Entering input The student enters input to a program or parameters to a method before or during their execution.
Responding (*) The visualization is accompanied by questions which are related to its content.
Changing (*) Changing of the visualization is allowed during the visualization, for instance, by direct manipulation.
Modifying Modification of the visualization is carried out before it is viewed, for example, by changing source code or an input set.
Constructing (*) The visualization is created interactively by the student by construction from components such as text and geometric shapes.
Presenting (*) Visualizations are presented and explained to others for feedback and discussion.
Reviewing Visualizations are viewed for the purpose of providing comments, suggestions and feedback on the visualization itself or on the program or algorithm.
Sorva, Karavirta & Malmi (2013) produced a comprehensive survey of PV systems for teaching
novices about the run-time behaviour of programs. To assist with this process they extended the
taxonomies proposed by Naps, Röβling et al. (2003) and Myller et al. (2009), in two dimensions to
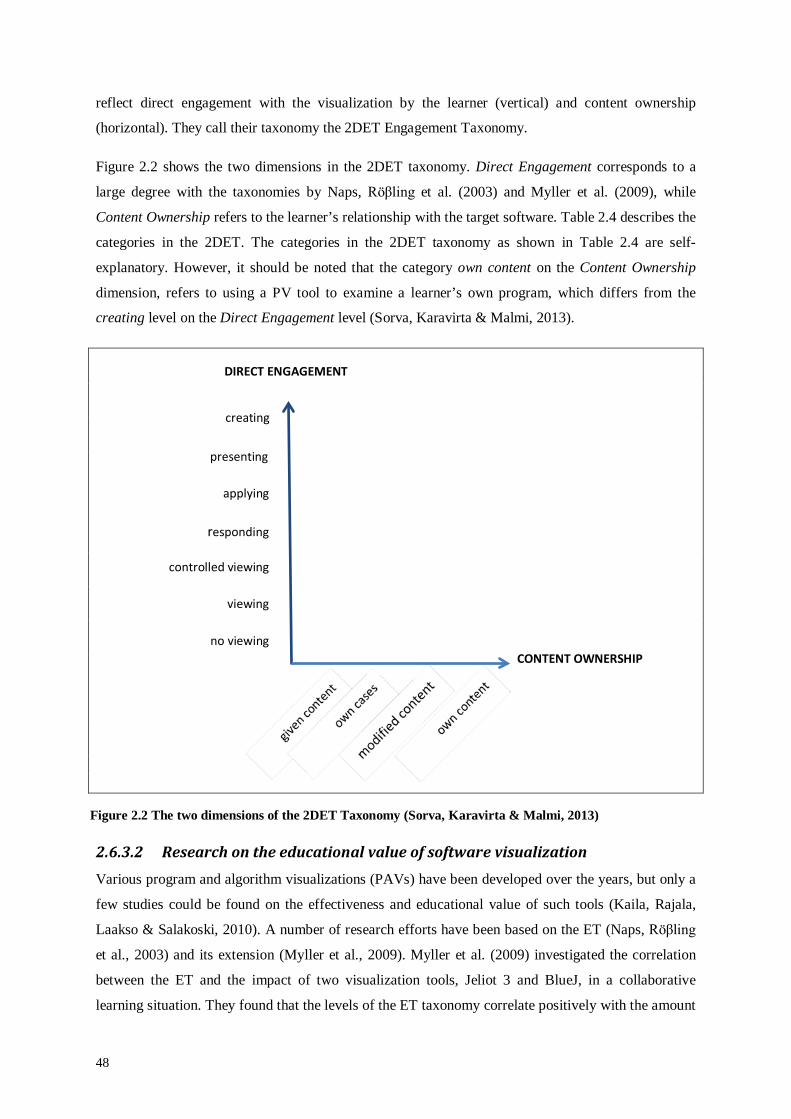
48
reflect direct engagement with the visualization by the learner (vertical) and content ownership
(horizontal). They call their taxonomy the 2DET Engagement Taxonomy.
Figure 2.2 shows the two dimensions in the 2DET taxonomy. Direct Engagement corresponds to a
large degree with the taxonomies by Naps, Röβling et al. (2003) and Myller et al. (2009), while
Content Ownership refers to the learner’s relationship with the target software. Table 2.4 describes the
categories in the 2DET. The categories in the 2DET taxonomy as shown in Table 2.4 are self-
explanatory. However, it should be noted that the category own content on the Content Ownership
dimension, refers to using a PV tool to examine a learner’s own program, which differs from the
creating level on the Direct Engagement level (Sorva, Karavirta & Malmi, 2013).
2.6.3.2 Research on the educational value of software visualization Various program and algorithm visualizations (PAVs) have been developed over the years, but only a
few studies could be found on the effectiveness and educational value of such tools (Kaila, Rajala,
Laakso & Salakoski, 2010). A number of research efforts have been based on the ET (Naps, Röβling
et al., 2003) and its extension (Myller et al., 2009). Myller et al. (2009) investigated the correlation
between the ET and the impact of two visualization tools, Jeliot 3 and BlueJ, in a collaborative
learning situation. They found that the levels of the ET taxonomy correlate positively with the amount
no viewing
viewing
presenting
applying
responding
controlled viewing
creating
DIRECT ENGAGEMENT
CONTENT OWNERSHIP
Figure 2.2 The two dimensions of the 2DET Taxonomy (Sorva, Karavirta & Malmi, 2013)

49
of interaction, and that interaction is an important part of successful collaboration. Laakso, Myller and
Korhonen (2009) also used the extended ET to investigate the difference between the controlled
viewing and changing engagement levels in collaborative pair learning with the AV TRAKLA2 and
confirmed that students on the changing engagement level learned more than those who engaged on
the controlled viewing level.
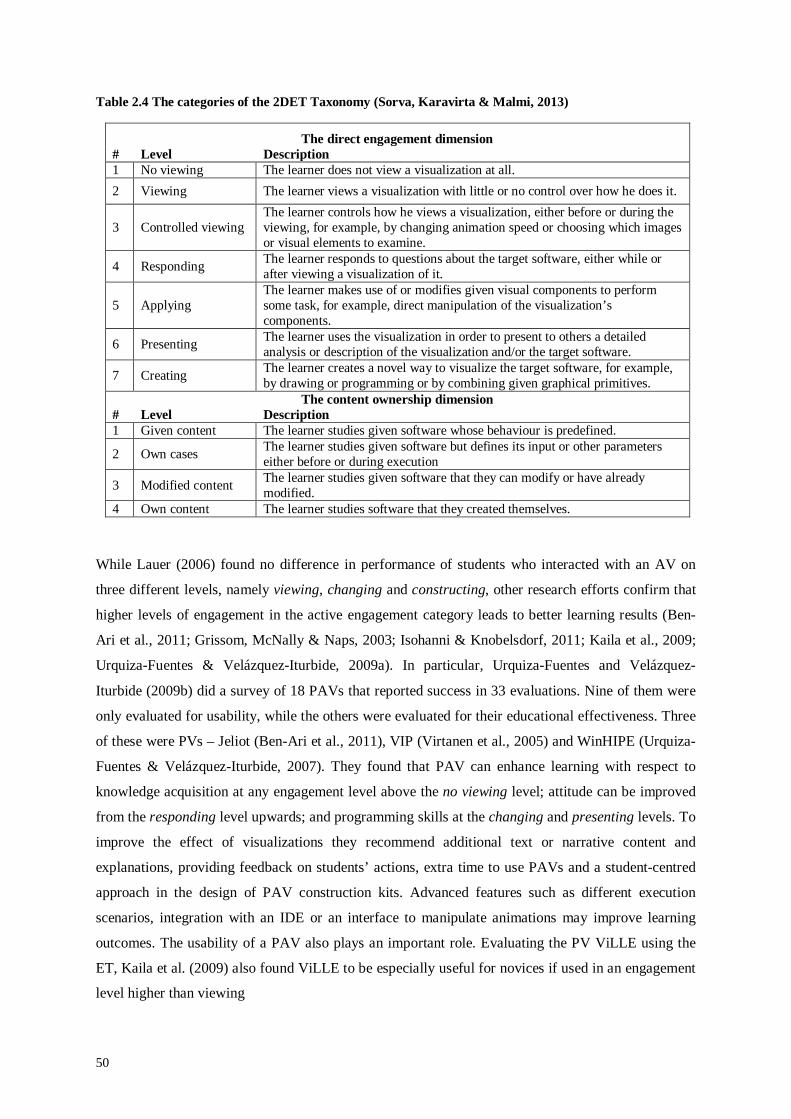
50
Table 2.4 The categories of the 2DET Taxonomy (Sorva, Karavirta & Malmi, 2013)
The direct engagement dimension # Level Description 1 No viewing The learner does not view a visualization at all. 2 Viewing The learner views a visualization with little or no control over how he does it.
3 Controlled viewing The learner controls how he views a visualization, either before or during the viewing, for example, by changing animation speed or choosing which images or visual elements to examine.
4 Responding The learner responds to questions about the target software, either while or after viewing a visualization of it.
5 Applying The learner makes use of or modifies given visual components to perform some task, for example, direct manipulation of the visualization’s components.
6 Presenting The learner uses the visualization in order to present to others a detailed analysis or description of the visualization and/or the target software.
7 Creating The learner creates a novel way to visualize the target software, for example, by drawing or programming or by combining given graphical primitives.
The content ownership dimension # Level Description 1 Given content The learner studies given software whose behaviour is predefined.
2 Own cases The learner studies given software but defines its input or other parameters either before or during execution
3 Modified content The learner studies given software that they can modify or have already modified.
4 Own content The learner studies software that they created themselves.
While Lauer (2006) found no difference in performance of students who interacted with an AV on
three different levels, namely viewing, changing and constructing, other research efforts confirm that
higher levels of engagement in the active engagement category leads to better learning results (Ben-
Ari et al., 2011; Grissom, McNally & Naps, 2003; Isohanni & Knobelsdorf, 2011; Kaila et al., 2009;
Urquiza-Fuentes & Velázquez-Iturbide, 2009a). In particular, Urquiza-Fuentes and Velázquez-
Iturbide (2009b) did a survey of 18 PAVs that reported success in 33 evaluations. Nine of them were
only evaluated for usability, while the others were evaluated for their educational effectiveness. Three
of these were PVs – Jeliot (Ben-Ari et al., 2011), VIP (Virtanen et al., 2005) and WinHIPE (Urquiza-
Fuentes & Velázquez-Iturbide, 2007). They found that PAV can enhance learning with respect to
knowledge acquisition at any engagement level above the no viewing level; attitude can be improved
from the responding level upwards; and programming skills at the changing and presenting levels. To
improve the effect of visualizations they recommend additional text or narrative content and
explanations, providing feedback on students’ actions, extra time to use PAVs and a student-centred
approach in the design of PAV construction kits. Advanced features such as different execution
scenarios, integration with an IDE or an interface to manipulate animations may improve learning
outcomes. The usability of a PAV also plays an important role. Evaluating the PV ViLLE using the
ET, Kaila et al. (2009) also found ViLLE to be especially useful for novices if used in an engagement
level higher than viewing
51
Urquiza-Fuentes and Velázquez-Iturbide reported in three papers (Urquiza-Fuentes & Velázquez-
Iturbide, 2012a; Urquiza-Fuentes & Velázquez-Iturbide, 2012b; Urquiza-Fuentes & Velázquez-
Iturbide, 2013) on a follow-up study on the effectiveness of the level of engagement using an existing
IDE with visualization features, WinHIPE. They found that engagement on both the viewing and
constructing level improved the grades and lowered the drop-out rates of students, in comparison with
the control group that did not use animation. Moreover, they found that for simple topics the
traditional approach (without animation) is sufficient, but that the traditional approach and viewing
outperformed constructing in highly complex topics. The determining factor in highly complex topics
appears to be the instructor’s explanations, either verbally in class or textually integrated in the
animation.
Research on educational effectiveness of PVs without using the ET (Naps, Röβling et al., 2003) on
UUhistle and BlueJ confirms the importance of engagement. When the educational effectiveness of
ViLLE was evaluated without the ET, the results also indicated that it might have a positive effect
(Rajala, Laakso, Kaila & Salakoski, 2008). Sorva, Lönnberg and Malmi (2013) did a qualitative
empirical evaluation of the visual program simulation (VPS) system UUhistle without using the ET.
VPS is described as an interactive form of educational program visualization, in which learners use
graphical controls to direct a program’s execution instead of watching an animation of it. Once again
the results indicate that the way in which the students use VPS, determines how much they benefit
from it. However, Sorva, Karavirta and Malmi (2013) conclude in their survey of PV tools used in the
teaching of introductory programming that although the results reported from evaluations are mostly
positive, it is difficult to indicate the effectiveness of levels of engagement above controlled viewing.
When Lahtinen, Ahoniemi and Salo (2007) integrated the PV system VIP into their introductory
course work and allowed students to choose voluntarily whether they use VIP or not in the weekly
exercises, three groups were discerned: students who never used VIP, a quarter of the class who
always used VIP, and a group who used it intermittently. Though the drop-out rate for the group who
never used the PV was considerably higher than the group who consistently used PV, they could not
conclude that the PV itself motivated the students to continue using it. However, students indicated
that the more difficult a topic is, the more useful they find the visualization. Student feedback on
ViLLE also confirmed that they found it useful (Kaila et al., 2009) and a course-long evaluation of
ViLLE showed that it seems to be beneficial in tracing code as well as in developing program writing
skills (Kaila et al., 2010). Prior experience of ViLLE also improved students’ performance, indicating
that familiarising students with the PV reduces the cognitive load of learning to use it (Laakso, Rajala,
Kaila & Salakoski, 2008b).
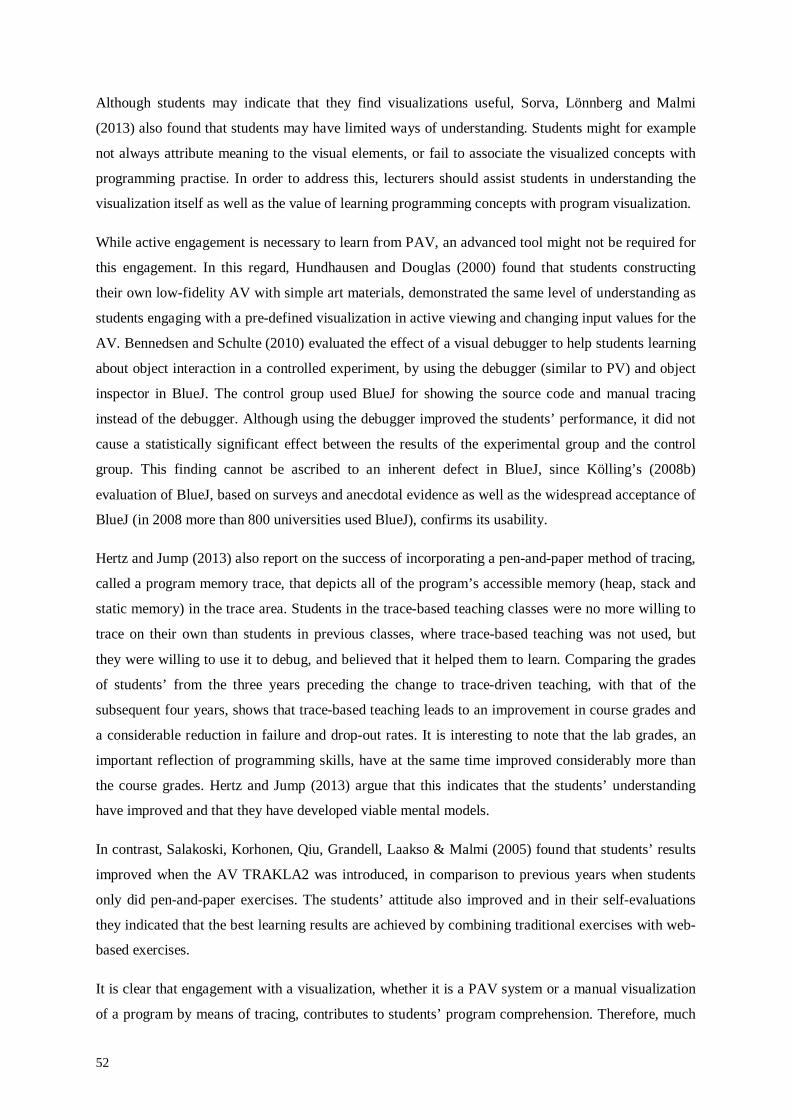
52
Although students may indicate that they find visualizations useful, Sorva, Lönnberg and Malmi
(2013) also found that students may have limited ways of understanding. Students might for example
not always attribute meaning to the visual elements, or fail to associate the visualized concepts with
programming practise. In order to address this, lecturers should assist students in understanding the
visualization itself as well as the value of learning programming concepts with program visualization.
While active engagement is necessary to learn from PAV, an advanced tool might not be required for
this engagement. In this regard, Hundhausen and Douglas (2000) found that students constructing
their own low-fidelity AV with simple art materials, demonstrated the same level of understanding as
students engaging with a pre-defined visualization in active viewing and changing input values for the
AV. Bennedsen and Schulte (2010) evaluated the effect of a visual debugger to help students learning
about object interaction in a controlled experiment, by using the debugger (similar to PV) and object
inspector in BlueJ. The control group used BlueJ for showing the source code and manual tracing
instead of the debugger. Although using the debugger improved the students’ performance, it did not
cause a statistically significant effect between the results of the experimental group and the control
group. This finding cannot be ascribed to an inherent defect in BlueJ, since Kölling’s (2008b)
evaluation of BlueJ, based on surveys and anecdotal evidence as well as the widespread acceptance of
BlueJ (in 2008 more than 800 universities used BlueJ), confirms its usability.
Hertz and Jump (2013) also report on the success of incorporating a pen-and-paper method of tracing,
called a program memory trace, that depicts all of the program’s accessible memory (heap, stack and
static memory) in the trace area. Students in the trace-based teaching classes were no more willing to
trace on their own than students in previous classes, where trace-based teaching was not used, but
they were willing to use it to debug, and believed that it helped them to learn. Comparing the grades
of students’ from the three years preceding the change to trace-driven teaching, with that of the
subsequent four years, shows that trace-based teaching leads to an improvement in course grades and
a considerable reduction in failure and drop-out rates. It is interesting to note that the lab grades, an
important reflection of programming skills, have at the same time improved considerably more than
the course grades. Hertz and Jump (2013) argue that this indicates that the students’ understanding
have improved and that they have developed viable mental models.
In contrast, Salakoski, Korhonen, Qiu, Grandell, Laakso & Malmi (2005) found that students’ results
improved when the AV TRAKLA2 was introduced, in comparison to previous years when students
only did pen-and-paper exercises. The students’ attitude also improved and in their self-evaluations
they indicated that the best learning results are achieved by combining traditional exercises with web-
based exercises.
It is clear that engagement with a visualization, whether it is a PAV system or a manual visualization
of a program by means of tracing, contributes to students’ program comprehension. Therefore, much

53
of the benefit a student derives from using a visualization will depend on their active engagement with
it.
2.7 Summary and conclusion
This chapter provided the background for this study on the role of visualization to enhance
comprehension in ODL programming education at Unisa. The visualization takes the form of tracing,
and the study investigates its effect in the introductory programming module COS1511. To this end,
ODL, teaching programming in distance education, teaching introductory programming courses,
tracing itself and visualization were considered in this chapter.
The nature of the ODL environment and specifically at Unisa has been described in section 2.2. Of
note here is the ‘distance’ in ODL and factors at Unisa that influence the ‘distance’, which may have
an effect on student performance. This includes the large number of students studying in their second
language, the effect that the difference in infrastructure in rural and urban areas has on the level of
exposure to and availability of modern technology with the resulting effect on student support, and the
poor preparation for higher education among Unisa students, which may include inadequate listening
and reading skills.
Section 2.3 provided an overview of teaching approaches and using visualizations in distance
education in general. In many instances this does not differ significantly from face-to-face teaching.
Section 2.4 focused on teaching introductory programming courses. The pedagogy of the three main
approaches namely teaching programming as an application of skills in problem solving; learning a
particular programming language; and code/system production, were described. Teaching
programming strategies as an alternative approach has also been discussed. Some recommendations
for a conventionally structured course where the focus is on learning a particular programming
language were offered. Unisa’s approach for the COS1511 modules, used in this study, is an
imperative-first approach teaching C++ as a basis for follow-up object-oriented courses.
Section 2.4 also covered the role of mental models; threshold concepts and the LEM effect in learning
to program. Students need to develop mental models of several aspects when learning to program.
This includes mental models of the programming language; the computer as a ‘notional machine’; the
problem domain or task the program should accomplish; the intended program and the program as it
actually is. Threshold concepts are difficult core concepts that could hinder students learning, while
the LEM effect postulates that the effect of successful or unsuccessful learning has momentum, which
would either make it easier or more difficult to learn new concepts.
Lastly, section 2.4 addressed the problems novices experience by investigating the difference between
novices and experts and considering specific aspects of programming and programming concepts
54
novices find difficult. Experts have well-developed and organised mental models which they know
how to combine as well as sophisticated problem-solving skills that they apply in planning and
debugging their programs. Novices in contrast, frequently have fragile programming specific
knowledge, experience difficulty in planning programs, and lack efficient debugging skills. In
addition, they have a variety of misconceptions, many of which relate to lack of a viable mental model
of the ‘notional machine’, from misconceptions on assignment and the execution sequence of a
program, to misconception on objects, pointers and memory topics. The added complexity of OO may
increase these problems.
Section 2.5 considered tracing, one of the methods that can assist with clearing up misconceptions and
developing mental models. Tracing is defined as tracking code with the actual values of variables –
‘concrete simulation’ and on a higher level, ‘symbolic tracing’ that simulates the steps in program
execution. Tracing plays an important role in program comprehension since it helps to construct a
model of the program’s purpose. It is also an important debugging strategy. Furthermore, research has
shown that novices first have to master tracing, that is reading code, before they develop the ability to
explain and write code. Novices find tracing difficult because it is a mentally demanding activity that
requires understanding of programming language constructs and control flow. They also have
difficulty in drawing and using diagrams that track program state. However, research has shown that
teaching tracing skills as an integral part of a programming course can produce positive results.
In section 2.6, visualization was covered with an overview of SV and the various tools available to
introductory programming courses. This study focuses on PV systems that visualize the execution of a
program step by step, similar to tracing a program. AV is related to PV and visualizes the execution of
an algorithm, but on a higher level than PV. Reports on the success of SV are mixed. The level of
learner engagement plays a key role in the success of SV in education. Engagement on the higher
levels of Naps’ (2003) ET where learners have more active engagement with visualization, leads to
better learning results. However, it may not be necessary to use a sophisticated tool to engage learners
with visualization. Some research has shown that pen-and-paper activities to engage learners in
tracing programs are also effective.
As mentioned before the BRACElet project (Clear et al., 2009; Lister et al., 2004; Lister et al., 2010;
Whalley & Lister, 2009) provides the basis for this study. The next chapter discusses the contribution
of the BRACElet project in understanding how novices learn to program and the role tracing in
particular plays in that process.

55
Design-based research phase covered in Chapter 3
Design-based research
Phase Element Position Phase of design-based research (Reeves, 2006)
Topics/elements that need to be addressed Position in this thesis
PHASE 1: Analysis of practical problems by researchers and practitioners in collaboration
Statement of problem Chapter 1, Section 1.3.1 Chapter 4, Section 4.3.2.1
Consultation with researchers and practitioners
Chapter 4, Section 4.3.2.1 and section 4.3.4.3
Research questions Chapter 1, Section 1.3.3 Chapter 4, Section 4.3.2.3
Literature review Chapters 2 and 3, Section 5.2 PHASE 2: Development of solutions informed by existing design principles and technological innovations
Theoretical framework Chapter 5, Section 5.2 Development of draft principles to guide the design of the intervention
Chapter 5, Section 5.3
Description of proposed intervention Chapter 5, Section 5.5
PHASE 3: Iterative cycles of testing and refinement of solutions in practice
Implementation of intervention (First iteration) Participants Data collection Data analysis
Chapter 6
Implementation of intervention (Second and further iterations) Participants Data collection Data analysis
Chapter 7
PHASE 4: Reflection to produce ‘design principles’ and enhance solution implementation
Design principles Chapters 5, 6 and 7 Designed artefact(s) Available on course website Professional development Chapter 8
Analysis of Practical Problems by Researchers and Practitioners in Collaboration
Development of Solutions Informed by Existing Design Principles and Technological Innovations
Iterative Cycles of Testing and Refinement of Solutions in Practice
Reflection to Produce ‘Design Principles’ and Enhance Solution Implementation
Refinement of Problems, Solutions, Methods and Design Principles

56
Map of Chapter 3 (The BRACElet Project)
3.1 Introduction
3.4 BRACElet’s findings
3.5 Theoretical basis for BRACElet’s work
3.7 Summary and conclusion
3.4.1 BRACElet’s
guiding principles
3.4.2 Findings from First Action
Research Cycle
3.4.5 Key
contributions
3.5.1 Research in mathematics
education
3.5.3 Applying the neo-
Piagetian perspective
3.5.4 Implications of the
neo-Piagetian perspective
3.3 History of BRACElet
3.6 Continuation of BRACElet’s work
3.6.1 Student
annotations (‘doodles’)
3.6.6 BABELnot
3.2 Background
3.5.2 A neo-Piagetian perspective
on novice programmers’ development
3.6.3 Misconceptions
about assignment
3.4.3 Findings from Second Action Research Cycle
3.4.4 Findings from Third Action
Research Cycle
3.6.2 Novices
understanding of the
relationship between the
concepts ‘object’ and
class’
3.6.4 Examination
question classification
3.6.5 A longitudinal study into the
development of novices -
Examination question
generation and benchmarking
57
Chapter 3 The BRACElet Project
3.1 Introduction
In this chapter the researcher continues to provide a context for the research by providing an overview
of the BRACElet project (Clear et al., 2009; Lister et al., 2004; Lister et al., 2010; Whalley & Lister,
2009) that served as the basis for this study, as indicated in Chapter 2. The focus is on the contribution
made by the BRACElet project in understanding how novices learn to program, the theoretical
foundation underlying the process of learning to program and the role of tracing in that process. This
provided the motivation for developing the tutorial to teach students how to trace.
Section 3.2 provides the background of the studies that motivated the BRACElet project, while in
section 3.3 the history of BRACElet is reviewed. In section 3.4, BRACElet’s guiding principles are
described before BRACElet’s findings are presented. In section 3.5 two possible interpretations are
discussed as a theoretical foundation for BRACElet’s work, namely research in mathematical
education and a neo-Piagetian perspective. The neo-Piagetian perspective is then applied to some of
the results of the BRACElet project and the implications of this perspective on teaching and learning
of programming considered. Section 3.6 consists of some of the extensions of BRACElet’s work, with
the summary and the conclusion in section 3.7.
3.2 Background
An important body of work on the research on how students learn to program was contributed by the
BRACElet project. The BRACElet project originated in New Zealand in December 2004, with the
final BRACElet workshop held in September 2010. It was a multi-institutional, multi-national
computer education study investigating novice programmers’ acquisition of programming skills. In
particular, it considered a possible hierarchy in which novices learn to read, explain and write
programs; and its exact order and its implications for the teaching and learning of programming (Clear
et al., 2009; Lister et al., 2010; Whalley & Lister, 2009).
This project used mainly naturally occurring data in the form of examination responses from
introductory computing courses (Lister et al., 2010). By July 2009, BRACElet had delivered more
than thirty publications (co)written by more than twenty authors, mostly from New Zealand,
Australia, and the USA (Lister et al., 2010). During the period September 2007 to February 2010,
sixteen papers were published by 26 authors from seven different countries and 14 different
institutions (Lister & Edwards, 2010). A considerable number of papers that either continued or
diversified the work done in BRACElet, have also been published since the final workshop (see for
example (Corney, Lister, Hogan, Fidge, Roggenkamp & Cardell-Oliver, 2012; Eckerdal, Laakso,
Lopez & Sarkar, 2011; Lister, Corney, Curran, D'Souza, Fidge, Gluga, Hamilton, Harland, Hogan &
58
Kay, 2012; Murphy, Fitzgerald, Lister & McCauley, 2012; Sheard, Simon, Carbone, Chinn, Laakso,
Clear, Raadt, D'Souza, Harland, Lister, Philpott & Warburton, 2011; Simon, 2011; Simon, Chinn,
Raadt, Philpott, Sheard, Laakso, D'Souza, Skene, Carbone, Clear, Lister & Warburton, 2012).
BRACElet was inspired by the ‘Bootstrapping’ projects (Fincher, Lister, Clear, Robins, Tenenberg &
Petre, 2005), namely Bootstrapping (2002), Scaffolding (2003) and BRACE4 (2004). BRACElet built
on the work of two ITiCSE working groups, the McCracken group (McCracken et al., 2001) and the
Leeds group (Lister et al., 2004).
Bootstrapping (2002) was initiated by the US National Science Foundation with the aim of improving
the state of Computer Science education (CS Ed) research in order to eventually improve the state of
CS Ed itself. It took the form of an initial multi-institutional workshop introducing techniques and
methodologies in CS Ed research, and presenting a shared research project. Participants then gathered
data during the following year to share and analyse at a capstone workshop with the aim to report on
those results in professional journals and also discuss continued collaboration. Scaffolding (2003)
followed the same pattern, while BRACE (2004) was an Australasian CS Ed research project
modelled on the same guidelines as the two US projects. Bootstrapping (2002) studied the manner in
which novices construct programming concepts, while Scaffolding (2003) compared the way in which
novices, graduating seniors and instructors design solutions. BRACE (2004) investigated cognitive,
behavioural and attitudinal factors that might affect novice programmers’ success (Simon, Lister &
Fincher, 2006).
The McCracken group (McCracken et al., 2001), a 2001 ITiCSE working group, investigated the
programming ability of students at the end of their first one or two courses in computer science. As
mentioned in section 2.4.2, they presented the following framework of learning objectives to describe
the problem-solving skills first-year computing students should acquire:
• Abstract a problem from its description.
• Generate sub-problems.
• Transform sub-problems into sub-solutions.
• Re-compose the sub-problems into a working program.
• Evaluate and iterate.
The McCracken group used a short, lab-based assignment to assess a combined sample of 216
students from four universities on these learning objectives. The assessment involved a general
evaluation (on program execution, verification, validation and style) and a degree of closeness score
rating how close a student’s program is to a working solution. They also administered a student
questionnaire. Quantitative analysis of the results shows a bimodal distribution, as well as a much
worse student performance than expected, at all four universities. Qualitative analysis indicates that 4 Building Research in Australasian Computing Education

59
the problems students experience with programming skills appear to be independent of country and
educational system. Abstracting the problem from its description was identified as the most difficult
part of problem-solving. The McCracken group ascribed the students’ inability to program at the end
of their first course to their lack of problem-solving skills and recommended further research on the
assessment of programming skills among a broader base of computer science educators and
universities.
The Leeds group (Lister et al., 2004) studied an alternative explanation for the poor results, namely
that many students have a fragile grasp of basic programming principles as well as a lack of basic
skills, such as tracing (manually executing) code. They argue that some minimal grasp of
programming concepts and associated skills is necessary before a student can problem-solve in the
manner defined by the McCracken group. Students from seven countries were tested on their
comprehension of existing code. A set of twelve multiple choice questions (MCQs) was used.
Students had to predict the outcome of executing a short piece of code (‘fixed-code questions’), and
also, when provided with the required function of a near-complete piece of code, to select the correct
completion of the code from a small set of possibilities (‘skeleton code’). While 941 students partook,
only the data from 556 who completed all twelve questions were analysed. A total of 37 students were
also interviewed and 56 doodles (scratch paper on which students worked while doing the MQCs)
were examined. The data indicated that students find ‘skeleton code’ more difficult than ‘fixed-code
questions’. The Leeds group concluded that many students lack the knowledge and skills which are
precursors to the problem-solving skills identified by the McCracken group, in particular the ability to
read code.
In summary, of the studies that motivated the BRACElet project, the McCracken group (McCracken
et al., 2001) investigated whether novices can write code, while Bootstrapping (2002) focused on how
they understand programming constructs. Scaffolding (2003) examined how novices understand
design and BRACE (2004) studied factors impacting on their programming ability and performance.
The Leeds group (Lister et al., 2004) investigated novices’ ability to read and trace code (Simon et al.,
2006). BRACElet, in turn, studied novices’ acquisition of programming skills to determine whether a
hierarchy exists according to which novices learn to read, explain and write program code, as well as
its implications for teaching and learning of programming.
3.3 History of BRACElet
Though not initially planned, the BRACElet5 organisers soon began to understand the project’s
operation in terms of action research. Action research is frequently implemented as a cycle of plan,
act, observe and reflect (De Villiers, 2005; Zuber-Skerrit, 1992). The first action research cycle built
5 The name BRACElet reflects its continuation of the BRACE project (Lister et al., 2012)
60
theory about novices’ acquisition of programming skills in terms of the taxonomies of Bloom and the
Structure of the Observed Learning Outcome (SOLO) (Biggs & Kollis, 1982), while the second action
research cycle investigated the relationship between code reading and code writing (Clear, Edwards,
Lister, Simon, Thompson & Whalley, 2008). The third action research cycle continued investigating
statistical relationships between reading and writing code, as well as whether programming consists of
a hierarchy of knowledge and skills (Whalley & Lister, 2009).
The participants in the first BRACElet workshop, held in December 2004 in New Zealand, considered
the work of the Leeds Group to lack a base of learning theories or educational models. Consequently,
on reflection, they devised an instrument in the form of a set of multiple choice and short answer
questions (Whalley & Clear, 2007; Whalley & Lister, 2009), based on the revised Bloom’s taxonomy
(Anderson, Krathwohl, Airasian, Cruikshank, Mayer, Pintrich, Raths & Wittrock, 2001). These
questions were included in the exams for the following semester at some of the participating New-
Zealand institutions, and the data the data obtained were analysed at the second BRACElet workshop
(Clear, Edwards et al., 2008; Clear et al., 2009; Whalley & Clear, 2007; Whalley & Lister, 2009;
Whalley & Robbins, 2007).
During the second BRACElet workshop at the 18th NACCQ conference of New-Zealand in 2005, the
SOLO taxonomy (Biggs & Kollis, 1982) was introduced and consolidated as part of a toolkit for
research at the partaking institutions. This was an attempt to gain a better understanding of the
students’ responses to the levels of difficulty of the multiple choice and short-answer questions (Clear,
Edwards et al., 2008; Clear et al., 2009; Whalley & Lister, 2009; Whalley & Robbins, 2007). The
results were published in several papers (Lister et al., 2006; Philpott et al., 2007; Thompson, Luxton-
Reilly, Whalley, Hu & Robbins, 2008; Thompson, Whalley, Lister & Simon, 2006; Whalley, 2006;
Whalley, Lister, Thompson, Clear, Robbins, Kumar & Prasad, 2006). See the next section on
BRACElet’s findings for a discussion of the results.
At the third BRACElet workshop in March 2006, at Auckland University of Technology (AUT) in
Auckland, Australia, a common ‘prototype’ framework was developed to allow participants flexibility
in their research as well as to compare and contrast experiments. Three essential components were
included (Clear, Ewards et al., 2008; Clear et al., 2009; Whalley & Clear, 2007; Whalley & Robbins,
2007), namely –
• a reading and tracing component to measure students’ ability to read and understand code,
using Bloom’s taxonomy to judge the difficulty;
• a SOLO component to classify a student’s ability to abstract, typically with a question to
‘explain in plain English’; and
• a writing component where students write some code comparable in difficulty to one of the
reading questions.
61
During the fourth workshop at the 19th annual NACCQ conference in Welllington, New-Zealand, in
July 2006, the common framework developed at the third workshop was reviewed and extended to
further investigate the writing skills of novice programmers. The framework now included four
components (Clear et al., 2009; Whalley & Robbins, 2007) namely –
• Bloom’s taxonomy to categorise the cognitive process required to answer a question;
• the SOLO taxonomy to classify the reasoning level expressed in answers;
• a categorization of the question-types used in BRACElet; and
• analysis of student script annotations to provide insight into the processes students follow to
solve a problem.
Both the fifth and sixth workshops were used to reflect and plan for the second action research cycle.
During the fifth workshop at the 20th annual NACCQ conference in Nelson, New-Zealand, in July
2007, questions fitting the common BRACElet framework were set (Clear et al., 2009). A new type of
question, Parsons’ problems (Parsons & Haden, 2006), was included. Parsons’ problems consist of
jumbled code which should be placed in the correct order. The sixth workshop at AUT, Auckland,
Australia, in December 2007, was sponsored by the ACM and SIGCSE and attended by nine
institutions. Contributed data were analysed to develop new research instruments to allow the
evaluation of novices’ program-writing skills in order to investigate a correlation with their program-
reading skills (Clear, Edwards et al., 2008; Clear et al., 2009).
The seventh workshop in January 2008, at the ACE2008 conference in Wollongong, Australia,
initiated the action for the second BRACElet action research cycle. The goals for this action research
cycle were to consolidate ‘explain in plain English’ questions; generate new questions; relate answers
to SOLO levels; examine gender effects, as well as differences between international and local
students, and undergraduate and postgraduate students; and to develop an ideal examination paper
(Clear, Edwards et al., 2008; Clear et al., 2009).
At the eighth workshop in July 2008, at the NACCQ conference at AUT, Auckland, Australia,
analysis of the assessment data from novice programmers contributed by participating institutions,
resulted in further refinement of the reading and writing classifications in the SOLO taxonomy (Clear
et al., 2009).
The ninth BRACElet workshop at ICER in Sydney, in September 2008, was used to reflect on the
data analysis up to that point, and for preliminary discussions on the third action research cycle (Clear
et al., 2009; Whalley & Lister, 2009). BRACElet regarded code writing ability as the dependent
variable in their investigation into a hierarchy of knowledge and skills in programming, as code
writing is considered to be at the top of the hierarchy. The third action research cycle continued

62
searching for statistical relationships between code writing and the other skills considered to be pre-
cursors to code writing (Whalley & Lister, 2009).
At the tenth BRACElet workshop in Wellington, New-Zealand, during the ACE2009 conference in
January 2009, the BRACElet 2009.1 (Wellington) Specification was issued. This Specification
published the research plan for the third BRACElet action research cycle and invited new participants
to join (Clear et al., 2009; Whalley & Lister, 2009). The common core of the BRACElet 2009.1
(Wellington) Specification consists of three parts, Basic Knowledge and Skills;
Reading/Understanding; and Writing. The Basic Knowledge and Skills part should test all the
programming constructs used in the other two parts to establish whether students understand the
programming constructs and have mastered relatively concrete skills such as tracing. The
Reading/Understanding part should determine whether students can recognize the purpose of a piece
of code from reading the code (that is, are they able to abstract?). At least one of the following types
of questions should be used here: ‘Explain in plain English’; Parson’s problems or Code
Classification Questions (placing pieces of code into two groups so that the code pieces in a group are
similar in some way, and different from the code pieces in the other group). For the Writing part, at
least one code writing task should be of similar complexity to one of the tracing tasks, and likewise, at
least one code writing task should be of comparable complexity as a Reading/Understanding part
(Clear et al., 2009; Whalley & Lister, 2009).
The eleventh BRACElet workshop was held at ITiCSE in Paris in July 2009. The group that attended
this workshop, replicated earlier BRACElet studies at other institutions to include a far larger pool of
naturally occurring data; refined the SOLO-taxonomy for code-explaining questions; extended the
SOLO taxonomy to cover code-writing questions; expanded earlier studies on student annotations
(‘doodles’) while answering examination questions; and explored a theoretical base in mathematics
education for the graduated hierarchy of skills development in programming. This confirmed earlier
empirical evidence about the relationship between code explaining and code writing, although the
exact nature of the relationship remains unclear (Clear et al., 2011; Lister et al., 2010; Lister &
Edwards, 2010).
The twelfth BRACElet workshop was held in Brisbane during January 2010 at the ACE2010
conference. A number of BRACElet activities (or ‘threads’) for the following year were presented
(Clear et al., 2011; Lister & Edwards, 2010). Two of these are incorporated in the BABELnot project
(Lister et al., 2012) that continues BRACElet’s work, namely –
• a survey and analysis of the types of exam questions used in examination papers for novice
programmers, including interviews with academics on how it is done; and
• an analysis of longitudinal data for students from the introductory course to the final capstone
project.

63
The final BRACElet workshop was held in September 2010, at the AUT, with a two-fold purpose,
namely to extend the work on theory that began in Paris in 2009; and to launch an on-going research
programme into the development from novice to professional programmer (the ‘NExpertise’ project).
The workshop divided into three groups that focused on the following issues (Clear et al., 2011):
• Investigating a hierarchy in the development of novices’ understanding of the relationship
between the concepts ‘object’ and ‘class’.
• An investigation into novices’ misconceptions about assignment.
• A longitudinal study on individual students to determine whether exam results in introductory
programming courses can predict success.
As can be seen from the above and mentioned before (see section 3.2) BRACElet conducted an
extensive multi-institutional, multi-national study into novices’ acquisition of programming skills
over three action-research cycles. The first four BRACElet workshops constituted the first action
research cycle, while the fifth to the eighth workshops covered the second action research cycle
(Clear, Edwards et al., 2008), and the ninth to the thirteenth workshops the third cycle (Clear et al.,
2011). The most important BRACElet findings are discussed in the next section.
3.4 BRACElet’s findings
As described in sections 3.2 and 3.3, BRACElet investigated a possible hierarchy in which novices
learn to read, explain and write programs, and if so, the exact order thereof, with the resulting
implications for the teaching and learning of programming (Clear et al., 2009; Lister et al., 2010;
Whalley & Lister, 2009). Furthermore, BRACElet used a form of action research which mainly
analyses naturally occurring data in the form of examination responses from introductory computing
courses according to the Bloom and SOLO taxonomies (Lister et al., 2010). BRACElet’s guiding
principles, including their adaptation of Bloom’s taxonomy for computer science assessment, as well
as the SOLO taxonomy, are described first, before the findings from the three action research cycles
are discussed. Finally their key contributions are presented.
3.4.1 BRACElet’s guiding principles
BRACElet’s guiding principles included the following (Clear, Edwards et al., 2008; Whalley & Clear,
2007; Whalley & Lister, 2009; Whalley & Robbins, 2007):
• A strong belief in a teaching-research nexus in which the research informs and improves
teaching – typical of educational action research.
• That student assessment are always more important so that the research is not allowed to
compromise the course.
• A common core or framework comprising a minimal set of properties that must be used in all
examinations.

64
• Repetition at different institutions and in different formats to confirm research outcomes.
• A set of rules of engagement about the research process itself.
• A publication protocol,
• Requirements for joining BRACElet, such as obtaining ethical clearance from their
institution.
Both the revised Bloom’s taxonomy (Anderson et al., 2001) and the SOLO taxonomy (Biggs &
Kollis, 1982) were used in BRACElet’s research. In the following two sub-sections these taxonomies
are described.
3.4.1.1 Bloom’s taxonomy for computer science assessment In the common framework used in BRACElet’s research, the revised Bloom’s taxonomy (Anderson et
al., 2001) was used to categorise the cognitive processes required to answer a question. To this end,
Thompson et al. (2008) adapted Bloom’s taxonomy for computer science assessment in introductory
programming courses.
Bloom’s taxonomy is a hierarchy of six categories, that is remember, understand, apply, analyse,
evaluate and create (Anderson et al., 2001). Thompson et al. (2008) adapted these categories as
follows:
• Remember is defined as retrieving relevant knowledge from long-term memory, a process
that includes recognising and recalling (Anderson et al., 2001). In programming assessment
Thompson et al. (2008) interpret this as –
• identifying a construct in a program segment;
• recognising the implementation of a subject area concept;
• recognising an appropriate description for a subject area concept or term; and
• recalling material explicitly covered in the course.
• Understand means to determine the meaning of instructional messages, that include oral,
written and graphical communication (Anderson et al., 2001). Thompson et al. (2008)
interpret this to –
• translate an algorithm from one form of representation to another (for example to
translate an algorithm in pseudo code into a programming language);
• explain a concept, algorithm or design pattern; and
• present an example of a concept, algorithm or design pattern.
• Apply is defined as executing or using a procedure in a given situation (Anderson et al.,
2001). Thompson et al. (2008) interpret this to –
• apply a known process, algorithm or design pattern to a familiar problem that has not
been solved previously in the same context, with the same data or with the same tools;
and
65
• apply a known process and algorithm or design pattern to an unfamiliar problem.
• Analyse is defined as dividing material into the parts that it is comprised of and detecting
how the parts relate to one another and to an overall purpose or structure (Anderson et al.,
2001). Thompson et al. (2008) interpret this as –
• breaking up a programming task into its components such as classes or methods;
• organising component parts to achieve an objective;
• identifying critical elements of a development; and
• identifying unimportant requirements or elements.
• Evaluate is defined as judging based on criteria and standards (Anderson et al., 2001).
Thompson et al. (2008) interpret this as to –
• determine whether a piece of code comply with requirements by defining an appropriate
testing strategy; and
• critique a piece of code based on coding standards or performance criteria.
Create is defined as combining elements to form a coherent or functional unit; or
reorganising elements to form a new pattern or structure (Anderson et al., 2001). Thompson et
al. (2008) interpret this as –
• producing a new alternative algorithm or a new combination of algorithms to solve a
problem; and
• constructing a code segment or program by inventing a new algorithm or applying
known algorithms in a new (to the students) combination.
Note that to effectively analyse a question requires an in-depth knowledge of the course as a whole
(Thompson et al., 2008).
3.4.1.2 The SOLO taxonomy The BRACElet project used the SOLO taxonomy (Biggs & Kollis, 1982) to classify the reasoning
level expressed in students’ answers. The SOLO taxonomy describes the quality of a student’s
understanding of a topic through four levels, from the lowest and least sophisticated level, ‘pre-
structural’, to the highest level, ‘extended abstract’ (Lister & Edwards, 2010). Using the revised
Bloom’s taxonomy (Anderson et al., 2001) produced mixed results, while the SOLO taxonomy could
be applied more consistently (Clear, Whalley, Lister, Carbone, Hu, Sheard, Simon & Thompson,
2008; Sheard et al., 2008; Whalley et al., 2006).
BRACElet adapted the SOLO taxonomy to classify student responses on code-explaining questions as
expounded in Table 3.1 (Clear, Whalley et al., 2008). At the lowest level, prestructural, the response
is unrelated to the question or substantially lacks knowledge of programming constructs. On the next
level, unistructural, a description for one portion of code is provided. A multistructural response

66
provides a line by line description of code, while a relational response provides a summary of the
code’s purpose.
Table 3.1 The SOLO taxonomy for classifying responses on code-explaining questions (Clear, Whalley, Lister, Carbone, Hu, Sheard, Simon & Thompson, 2008)
SOLO category Description
Relational [R] Provides a summary of what the code does in terms of the code’s purpose.
Multistructural [M] A line by line description is provided of all the code.
Unistructural [U] Provides a description for one portion of the code.
Prestructural [P] Substantially lacks knowledge of programming constructs or is unrelated to the question
Based on the SOLO taxonomy, it was found that when students have to explain a code fragment, they
frequently are able to explain what each line of code does (a multi-structural response), but are unable
to describe the purpose of the code (a relational level response). Furthermore, students who cannot
express a relational response, are usually unable to write coherent programs (Lister & Edwards,
2010).
At the eleventh BRACElet workshop in 2009, the SOLO taxonomy was also adapted to classify
student responses to code-writing questions (Whalley, Clear, Robbins & Thompson, 2011). Biggs and
Collis (1982) divided the SOLO categories in to two learning phases, an initial ‘quantitative’ phase
and a subsequent ‘qualitative’ phase, which are also shown in the SOLO taxonomy as adapted by
Whalley et al. (2011) in Table 3.2. During the quantitative phase students operate on the prestructural,
unistructural and multistructural levels when writing code, while they operate on the relational and
Table 3.2 SOLO categories for code writing solutions (Whalley et al., 2011)
Phase SOLO category Description
Qua
litat
ive Extended Abstract – Extending [EA] Uses constructs and concepts beyond those required in the
exercise to provide an improved solution.
Relational – Encompassing [R] Provides a valid well-structured program that removes all redundancy and has a clear logical structure. The specifications have been integrated to form a logical whole.
Qua
ntita
tive Multistructural – Refinement [M] Represents a translation that is close to a direct translation.
The code may have been reordered to make a valid solution.
Unistructural – Direct Translation [U] Represents a direct translation of the specifications. The code will be in the sequence of the specifications.
Prestructural [P] Substantially lacks knowledge of programming constructs or is unrelated to the question.
extended abstract levels in the qualitative phase. The unistructural level represents a direct translation
of the specifications, while the multistructural level is on a slightly higher level with possible
67
reordering of the specifications. At the relational level the specifications have been integrated to form
a logical whole, while on the extended abstract level concepts and constructs beyond those required
by the problem statement are used to provide an improved solution.
3.4.2 Findings from First Action Research Cycle
As mentioned in section 3.3., BRACElet’s first action research cycle built theory about novices’
acquisition of programming skills in terms of the Bloom’s and SOLO (Biggs & Kollis, 1982)
taxonomies as described above. They found that assessing programming fairly and consistently is
complex and challenging. Educators may underestimate the cognitive difficulty of their assessment
instruments, as well as the stages and time students require to develop programming skills.
Furthermore, students who cannot read and summarise a short piece of code (classified as ‘relational
thinking’ on the SOLO taxonomy), have not acquired enough skill to write their own code (Lister et
al., 2006; Whalley et al., 2006). Weaker students do not naturally develop the ability to reason about
code at an abstract level to determine its purpose (Lister, 2007; Lister et al., 2006). Philpott et al.
(2007) identified a clear link between the ability to trace code and relational thinking on the SOLO
taxonomy, and conclude that complete mastery of code tracing seems to indicate that relational
thinking can be achieved. A less than 50% performance on tracing seems to indicate an inability to
achieve relational thinking.
Whalley (2006) found that the different programming languages used in introductory programming
courses had no effect on student performance. She used the revised Bloom’s taxonomy (Anderson et
al., 2001) in her investigation, and recommended that it be refined to accurately identify the difficulty
of programming ideas and processes. Thompson et al. (2008) subsequently provided an interpretation
of the revised Bloom’s taxonomy (Anderson et al., 2001) for computer science, with the aim to foster
a common understanding of the cognitive processes that programming requires and to enable
discussion around assessment and cognitive processes.
Thompson et al. (2006), by using the SOLO taxonomy, compared a code classification question with
an ‘explain in plain English’ question to determine students’ ability to read and comprehend code.
The classification question consisted of four short pieces of code which had to be classified into two
groups according to similarities between the code pieces which were grouped together. Despite the
fact that only 75% of the students attempted the classification question, they nevertheless concluded
that this type of question is also a reasonably reliable indication of a student’s ability to comprehend
code.
Whalley, Prasad and Kumar (2007) analysed student script annotations (‘doodles’) with the SOLO
classification in an attempt to gain insight into the processes students follow to solve a problem. There
seemed to be no relation between the level of reasoning and the use of annotations by novice student
68
programmers, but it confirmed three key findings from the Leeds group (Lister et al., 2004), namely
that doodles tend to help students to reach the correct answer, higher achievers are inclined to doodle
more and that students are more likely to trace fixed code questions than skeleton code questions.
In summary, BRACElet’s first action research cycle used the revised Bloom’s and SOLO taxonomies
to develop a cognitive framework that can be used to classify the levels of difficulty of tasks used in
their research (Thompson et al., 2008; Whalley & Clear, 2007; Whalley & Robbins, 2007). The main
findings from this cycle indicates that students find tasks from the higher levels of the framework
(such as writing code) more difficult than those tasks at lower levels; that the ability to read a piece of
code and explain it in relational terms, is a higher order skill (Lister et al., 2006); and that complete
mastery of code tracing seems to be a requirement for relational thinking (Philpott et al., 2007).
3.4.3 Findings from Second Action Research Cycle
BRACElet’s second action research cycle investigated the relationship between code reading and
code writing (Clear, Edwards et al., 2008). The first action research cycle confirmed that students
struggle to develop the ability to reason about code at an abstract level. This implies a need for
teaching techniques that help students to see the relationships between the parts of a program, as well
as for assessment techniques to test for that ability.
Clear, Whalley et al. (2008) analysed the reliability of the SOLO taxonomy to categorise student
responses to ‘explain in plain English’ questions, derived an augmented set of SOLO categories for
application to the programming domain (see section 3.4.1.2), and statistically confirmed its
consistency. Sheard et al. (2008) used the SOLO taxonomy to classify written student responses in
two exams on introductory programming courses, one for a class of undergraduates, the other for a
class of postgraduates. They found a positive correlation between student performance on SOLO
reading tasks and on code writing tasks, as well as a higher level of SOLO responses from the
postgraduate students. They believe that this is the result of the postgraduate group having developed
higher level thinking skills during their undergraduate degree.
In contrast, Simon, Lopez, Sutton and Clear (2009) analysed two data sets, one from a university and
the other from a polytechnic in an attempt to confirm that novices need to be able to read program
code before being able to write it, but failed to reach a definite conclusion.
Another tool used in the investigation into the relationship between code reading and code writing,
was Parson’s problems, also called Parson’s puzzles (Parsons & Haden, 2006). In a Parson’s problem
students have to write code by selecting from provided code fragments or statements. Denny, Luxton-
Reilly and Simon (2008) evaluated Parson’s problems as a new type of examination question. A low
correlation between code writing and tracing, as well as between Parson’s problems and tracing,
69
seems to indicate that code writing and Parson’s problems require similar skills, while code tracing
requires different skills. Parson’s problems are easier and less subjective to mark than code writing
questions, while allowing lecturers to isolate and identify misconceptions (for example about logic or
syntax) more accurately.
Lopez et al. (2008) used stepwise regression to analyse responses in a Java end-of-semester
examination to construct a possible hierarchy of programming-related skills. The points each student
earned on the examination’s code writing tasks were used as the dependent variable at the top of the
hierarchy. The examination questions were placed in the following eight categories:
• Basic knowledge, for example knowledge of programming constructs and syntax errors.
• Data, namely knowledge of data types and operations on data types.
• Sequence, such as Parson’s problems, where students have to order code to solve a task.
• Tracing 1, non-iterative tracing tasks.
• Tracing 2, iterative tracing tasks.
• Exceptions.
• Explaining code.
• Writing code for a given problem.
Lopez et al. (2008) used a polytomous Rasch model (Rasch, 1993) to pre-process their data to address
some of the non-linearities in grading. They found confirmation for an association between code
tracing and code writing skills, especially for tracing loops, as well as an association between code
reading and code writing skills. Other observations made with regard to a possible hierarchy, are that
knowledge of basic programming constructs (basic knowledge and data) appears at the bottom of the
hierarchy, consistent with what is expected. The authors did not find a statistically significant
relationship between Tracing 1 (non-iterative) and Tracing 2 (iterative), but speculate that the Tracing
1 tasks might have been too simple (Lopez et al., 2008). The variable for Sequence tasks appeared
lower in the path diagram than Tracing 2, which might have been caused by a too easy Parson’s
problem. Philpott et al.’s (2007) conjecture that mastery of code tracing is an essential requirement for
relational thinking (explaining) is confirmed. Parson’s problems, Tracing and Explain are
intermediate skills, also consistent with previous BRACElet findings. Lopez et al. (2008) conclude
that possibly programming-related skills do not form a strict hierarchy, but that skills from more than
one lower level may influence the execution of a skill at a higher level in the hierarchy.
The second action research cycle confirmed a relationship between code tracing and code writing, as
well as between code reading and code writing. A possible hierarchy for developing programming
skills is suggested, with basic knowledge at the bottom, code tracing and code reading part of the
intermediate level and code writing on the highest level.

70
3.4.4 Findings from Third Action Research Cycle
The third action research cycle continued to investigate statistical relationships between reading and
writing code, as well as whether programming consists of a hierarchy of knowledge and skills
(Whalley & Lister, 2009). This investigation focused on replicating and further investigating Lopez et
al.’s (2008) study on the relationships between tracing iterative code, explaining code and writing
code.
In Lister et al.’s (2009) replication of Lopez et al.’s (2008) study, they analysed data from an end-of-
semester examination on an introductory course on Python. They used a non-parametric statistical
analysis (the chi-square test), in contrast to the linear relationships that have previously been
investigated. Consistent with the findings of Lopez et al. (2008), Lister et al. (2009) found that while
skill in tracing is a requirement for code writing, a combination of tracing and explaining skills has a
stronger influence on code writing ability. Their data too do not support the idea of a strict hierarchy.
However, they argue that most students need a minimal competency in tracing to enable them to
acquire the ability to explain code, and that these skills reinforce each other. Furthermore, a minimal
competency in both tracing and explaining is required before being able to systematically write code.
Once a student has acquired a minimal competency in all these skills, the skills will reinforce each
other and develop in parallel (Lister et al., 2009).
The ITiCSE’09 BRACElet working group replicated the earlier analysis by Lister et al. (2009) on
three new datasets, as well as Lopez et al.’s (2008) work on two new datasets (Lister et al., 2010).
Both replications support the findings of the original study, namely that students who can explain
code, in general, can trace code, and students who can write code can usually both trace and explain
code. With regard to the ordering of tracing, writing and explaining, the working group concludes that
there is some evidence that tracing is a lower-level skill than explaining or writing code, but that no
results currently indicate a hierarchy between explaining and writing.
Venables et al. (2009) studied the performance reliability of end-of-first-semester novices on the
questions in their own Java examination in order to determine whether they would find the same
relationships as Lopez et al. (2008). They used non-parametric statistical tests to establish non-linear
relationships. Venables et al. (2009) found that while there is a statistically significant relationship
between the ability to explain code and to write code, the relationship is not linear. The same
relationship was found between tracing and explaining. Furthermore, they also found that while a
minimal competency at tracing is necessary for code writing, that minimal skill alone is not enough to
allow code writing. However, there is a strong relationship between the combination of tracing and
explaining with the skill of writing (Venables et al., 2009).
71
In addition, Simon and Snowdon (2011) investigated whether students who seem to be unable to
explain the purpose of a simple code fragment, cannot do it because they are unable to determine the
purpose of the code, or because they do not have the language ability to express the purpose. They
used code-explaining questions, where students had to ‘explain in plain English’, and repeated the
same questions in a multiple-choice question format with plausible options. They conclude that
students, who fail code-explaining questions, are really unable to explain the purpose of the code, or
to recognise it from a list of options (Simon & Snowdon, 2011).
In summary, these findings suggest the possibility that a novice programmer develops skills in a
hierarchical order, as follows: At the bottom of the hierarchy are knowledge and understanding of
basic programming constructs, such as basic definitions and data types, selections and iterations. The
novice then learns to read code (that is trace, first non-iterative code and then iterative code). Once
this skill becomes reliable, the ability to explain code develops. When students are reasonably capable
of both reading and explaining, the skill to systematically write code develops. Tracing iterative code
and explaining code therefore, form the intermediate levels of the hierarchy, with code-writing at the
highest level. These skills do not necessarily develop in a strict order, but instead reinforce each other
in a cyclical manner and develop in parallel. Furthermore, students should have a certain minimal
ability to trace and explain code before they are able to show a minimal proficiency to systematically
write code (Lister et al., 2010; Lister et al., 2009; Venables et al., 2009; Whalley & Lister, 2009).
3.4.5 Key contributions
The key contributions of the BRACElet project are based on the analysis of naturally occurring data
in the form of students’ examination responses in introductory programming courses (Lister et al.,
2010). Clear et al. (2011) identified the central findings of the BRACElet project related to novices
learning to program as follows:
• In contrast with academics who abstract to explain code on a relational level, novices are
inclined not to do so, since they ‘could not see the forest for the trees’ (Lister et al., 2006).
• A student’s degree of mastery of code tracing tasks is an indication of his/her ability to think
relationally about code. Complete mastery of code tracing indicates an ability to think
relationally (Philpott et al., 2007).
• Students’ SOLO responses on code-reading (‘explain in plain English’) questions correlate
positively with their performance on code-writing (Sheard et al., 2008).
• There is a correlation in performance between ‘explain in plain English’ tasks and code
writing tasks, as well as between code tracing and code writing tasks. A possibility of a
hierarchy of programming related tasks with knowledge of programming constructs at the
bottom, ‘explain in plain English’, Parson’s problems and tracing of iterative code on one or

72
more intermediate levels and code writing at the top, was identified (Lister et al., 2009; Lopez
et al., 2008).
• A minimal level of tracing skill is required for code writing, but this in itself is not enough to
enable code writing. Skill in code explanation combined with tracing skills, predicts
performance in code writing (Venables et al., 2009).
In addition, the BRACElet project has contributed guidelines and toolkits for longitudinal multi-
national projects (Whalley & Clear, 2007). Several guidelines for the analysis of assessments and
students code have also been published, including the following:
• Guidelines for using Bloom’s taxonomy as a guide in the design of programming assessments
or programming problems (Thompson et al., 2008).
• Guidelines for using SOLO to reliably classify student responses to questions where they
have to explain code (Clear, Whalley et al., 2008).
• Guidelines for applying SOLO to setting programming assessments and tasks (Thompson,
2010).
• Guidelines and a process for using SOLO to categorise student responses to code writing
questions (Whalley et al., 2011).
BRACElet has therefore made a substantial contribution to the teaching of introductory programing
that can be used as a basis for further research in this area.
3.5 Theoretical basis for BRACElet’s work
During the third action research cycle, the BRACElet group began to investigate a theoretical
foundation for their results. Initially, links with research in mathematics education were investigated
(Lister et al., 2010). This was followed by a neo-Piagetian perspective on novice programmers’
development (Lister, 2011).
3.5.1 Research in mathematics education
At the eleventh BRACElet workshop, participants began to link the SOLO taxonomy with research in
mathematics education as a theoretical basis for BRACElet’s work (Lister et al., 2010; Lister &
Edwards, 2010).
Research in mathematics education divides knowledge into two types namely conceptual and
procedural knowledge (McCormick, 1997). Sfard (1991) explains procedural knowledge as
operational or process understanding that considers how something can be computed. In procedural
knowledge a concept is seen as an algorithm for manipulating things (Sfard, 1991). This allows a
student to apply the concept to some data. Conceptual knowledge is described as structural or object
understanding, where a concept is described by its properties, and treated as an entity. This, in turn,

73
allows a student to reason about a concept, by using the concept itself as data. BRACElet participants
place operational understanding on the multi-structural level or lower in the SOLO taxonomy, and
structural understanding on the relational level of the SOLO taxonomy (Lister & Edwards, 2010).
According to Sfard (1991), concept formation occurs in three phases from process to object
understanding, namely –
• interiorisation, where the student becomes familiar with applying the process to data;
• condensation, when the student abstracts the process in more manageable parts, and
ultimately abstracts it into input-output behaviour while still viewing it as an algorithmic
process; and
• reification when the concept is seen as a unified entity, understood by its characteristics, and
can be used as a primitive object in other concepts.
Since these phases build upon one another, a student who has reached object understanding about a
concept still maintains the process understanding about that concept. Also, once a concept has been
reified, it can be used as a building block or primitive component in the formation of a higher-level
concept, in a hierarchical manner. When relating this to the SOLO taxonomy, a concept that is
understood at the highest SOLO level (extended abstract), can be understood at the lowest SOLO
level (unistructural) when it becomes a primitive component in a new concept (Lister et al., 2010).
BRACElet considers skills in computer programming as similar to procedures in mathematics
education research, since both represent a set of step-by-step instructions. BRACElet explores skills
acquisition in contrast to mathematics education research where concept acquisition is studied. This is
part of the fundamental difference between mathematics that focuses on acquiring concepts and
computer science, which has both practical and conceptual learning goals. BRACElet recognises
strong links between theories of learning in mathematics and the SOLO classification used in their
research, though the extent to which conceptual hierarchies apply to computer science is not clear
(Lister et al., 2010).
An application of mathematics educational research to BRACElet’s work was published by Philpott,
Clear and Whalley (2009). They assessed the program comprehension skills of intermediate level
students with a pathfinder algorithm simulation task. Students’ comprehension levels were
categorised by Philpott et al. (2009) according to the SOLO taxonomy and then linked to the process
of concept formation as described by Sfard (1991). Philpott et al. (2009) argue that the SOLO phases
of ‘quantitative’ and qualitative’ as indicated in Table 3.2 map to Sfard’s (1991) concept and object
understanding, and may be used to measure the level of abstraction in computer science education.
Philpott et al. (2009) also present a guided discovery learning model that links tasks to the three
different stages of concept development proposed by Sfard (1991).

74
3.5.2 A neo-Piagetian perspective on novice programmers’ development
Neo-Piagetian theory was the inspiration for the SOLO taxonomy (Lister, 2011). This prompted Lister
(2011) to investigate a neo-Piagetian perspective to explain observations about novice programmers
in BRACElet’s research. Neo-Piagetian theory is derived from classical Piagetian theory (Piaget &
Inhelder, 1969). Classical Piagetian theory focuses on a child’s cognitive development in terms of
abstract reasoning from infancy up to adulthood. Neo-Piagetian theory instead focuses on the
cognitive development of people of any age while they acquire knowledge in a specific problem
domain (Teague, Corney, Fidge, Roggenkamp, Ahadi & Lister, 2012).
Piaget (Piaget & Inhelder, 1969) identified the following four stages in the cognitive development of
children up to adulthood: sensorimotor, pre-operational, concrete operational, and formal operational.
During the first two stages, up to about age seven, motor activity, followed by language and early
symbol manipulation respectively develop. In the third stage, the concrete operational stage, from
about seven to 12 years, a grasp of conservation of matter, of causality and the ability for
classification of concrete objects develop. In the fourth stage, the formal operational stage, from
around 12 years to adulthood, individuals exhibit an ability to think abstractly, systematically, and
hypothetically, and to use symbols related to abstract concepts. At this stage individuals are capable of
thinking abstractly and scientifically. Piaget’s theory links the cognitive development to biological
maturity of the brain and assumes that children will display the same level of abstract reasoning in
different areas (Piaget & Inhelder, 1969).
Neo-Piagetian theory (Morra, Gobbo, Marini & Sheese, 2007) argues that people, irrespective of their
age, go through the same stages as they develop progressively more abstract reasoning when they gain
experience in a specific problem domain. It is therefore possible for a person to demonstrate less
abstract forms of reasoning in an area where the person is a novice, than in another area where the
person is an expert. The increase in abstraction is considered to be the result of increasing the
effective capacity of working memory through the development of ‘chunking’. ‘Chunking’ happens
when a set of associated data items is stored as a unit in long-term memory (Lister, 2011).
Each of the four stages in neo-Piagetian theory, as it applies to novice programmers’ skills
development, are discussed below.
3.5.2.1 The sensorimotor stage In the first stage of cognitive development, the sensorimotor stage, novices do not have the
abstractions to reason about a specific problem and cannot apply them (Teague, Corney, Fidge et al.,
2012). Lister (2011) considers students with an ability of less than 50% to trace, to be at this stage.
Since they can only trace code with great effort, they are inclined not to use it to develop programs

75
(Teague, Corney, Fidge et al., 2012). They also “do not experience an executing program as a
deterministic machine” (Corney, Teague, Ahadi & Lister, 2012:2).
3.5.2.2 The preoperational stage By the preoperational stage, the second stage in cognitive development, novices have acquired some
appropriate abstractions, but their abstractions do not create a coherent comprehension of the problem
domain, since they are still fragmented. A novice may therefore be able to apply a concept when
prompted, but would not use it spontaneously or use it inappropriately (Lister, 2011; Teague, Corney,
Fidge et al., 2012).
Novices at this stage can trace code, but usually do not abstract from the code to deduct a meaningful
computation as executed by the code, since they see the lines of code as only weakly related (Lister,
2011). They use inductive reasoning to determine the function of a program segment, by manually
tracing the code with a set of input values and then examining the output to determine the purpose
thereof (Gluga, Kay, Lister & Teague, 2012).
Their inability to abstract makes it difficult for novices to use diagrammatic abstractions of code, and
they cannot use ‘doodles’ to help them understand it. Their inability to ‘chunk’, overloads their
working memory, so that they find it difficult to ‘explain in plain English’ (Lister, 2011).
3.5.2.3 The concrete operational stage In the third stage, the concrete operational stage, novices can reason about abstractions of code, but it
is restricted to familiar, real (‘concrete’) situations, not hypothetical situations (Lister, 2011; Teague,
Corney, Fidge et al., 2012). A student at the concrete operational stage, can write small programs if
presented with well-defined specifications, but struggles to write large programs from partial
specifications (Teague, Corney, Fidge et al., 2012). These students tend to deal with abstraction by
using specific examples to reduce the level of abstraction (Gluga et al., 2012).
This stage is characterised by the ability to reason about reversible processes, quantities that are
conserved and transitive inference (Corney, Teague et al., 2012; Lister, 2011). Transitive inference
refers to the ability to realise that if a certain relationship exists between two objects X and Y, and the
same relationship exists between objects Y and Z, it will also exist between objects X and Z (Lister,
2011).
Students in the concrete-operational stage can relate code to diagrams, and see how lines of code work
together to perform a computation (Corney, Teague et al., 2012). They should not need a concrete
written trace to determine the purpose of a small section of code (Teague, Corney, Ahadi & Lister,
2013), but may derive its function just by reading it and using deductive reasoning (Gluga et al.,
2012).
76
3.5.2.4 The formal operational stage The formal operational stage is the last, most advanced and most abstract stage in cognitive
development. This is the level at which expert programmers operate. At this stage people can reason
logically, consistently and systematically. They also have a reflexive capacity, namely the ability to
reflect about their own thinking (Lister, 2011; Teague, Corney, Fidge et al., 2012).
They can reason about hypothetical situations that they have never experienced, and be aware of what
is known for certain, and what is known with some probability of being true. This allows them to use
hypothetico-deductive reasoning to make a tentative inference from incomplete data and then
systematically search for further data to confirm or deny the tentative inference (Lister, 2011). They
can reason about unfamiliar situations, move from the abstract to the concrete, and apply problem-
solving skills in unfamiliar situations (Corney, Teague et al., 2012). Students at this stage would have
reached the learning objectives computing students should have acquired by the end of their first year,
as identified by the McCracken group (McCracken et al., 2001) and mentioned in sections 2.4.2 and
3.2.
3.5.3 Applying the neo-Piagetian perspective
The neo-Piagetian perspective may be used to interpret some of the earlier results in BRACElet
studies, as can be seen below.
BRACElet found that when students have to explain a code fragment, they frequently are able to
explain what each line of code does (a multi-structural response in the SOLO taxonomy), but are
unable to describe the purpose of the code which would be a relational level response. Those students
who cannot express a relational response, are usually unable to write coherent programs (Lister &
Edwards, 2010). This would indicate that such students are at the preoperational stage.
Philpott et al. (2009) found that a less than 50% ability to trace, indicates an inability to achieve
relational thinking, which would allow a student to provide a summary of what code does in terms of
the code’s purpose, that is, to abstract. The Leeds working group (Lister et al., 2004) demonstrated
that there are students who cannot trace code with 50% reliability at the end of the first semester of
their introductory programming course. Lister (2011) considers these students to be at the
sensorimotor stage in their cognitive development in the programming domain.
Students at the preoperational stage, who are unable to abstract to see the overall purpose of code, also
find it difficult to use diagrammatic abstractions of code. This explains why Whalley et al. (2007)
found that students at the multi-structural and unistructural level in the SOLO taxonomy do not use
doodles to help obtain an answer. Thomas et al. (2004) found that beginner students were reluctant to
use diagrams to trace code, while students with some high-school computing background, were more

77
willing to do so. Presumably, the beginner students were still at the preoperational stage, while those
with some computing background were at the next stage. The ‘middle novice programmers’ identified
by Lister (2007), who could trace, but could not use diagrams in an end-of-semester examination,
probably also were at the preoperational stage.
Whalley et al. (2007) found that students at the relational level in the SOLO taxonomy used doodles
on the more difficult questions more than other students. Such students would be at the concrete
operational stage and able to do so. Thomas et al. (2004) found that higher-achieving students do use
diagrams, but that those who do not use diagrams, do even better than those who do. The better-
achieving students, who do use diagrams, would be at the concrete operational stage, while better-
achieving students who do not use diagrams would probably be at the formal operational stage
(Thomas et al., 2004). The neo-Piagetian perspective is also supported by empirical evidence from
studies aimed specifically at investigating this perspective (Corney, Teague et al., 2012; Teague,
Corney, Ahadi & Lister, 2012; Teague, Corney, Fidge et al., 2012), as discussed below.
Corney, Teague et al. (2012) used questions provided by Lister to test his neo-Piagetian perspective in
an end-of-semester exam to investigate novices’ ability to reason with quantities that are conserved;
processes that are reversible; and properties that hold under transitive inference. These questions are
intended to determine whether they have reached the concrete operational stage. They also explored
the relationship between code explanation and concrete reasoning and came to the conclusion that
some code explanation questions require a certain degree of concrete operational reasoning (Corney,
Teague et al., 2012). They found evidence for students operating at the preoperational and concrete
operational stage in reversing and conservation, but only weak support for transitive inference
(Corney, Teague et al., 2012). The investigation confirms that some students are still at the
preoperational stage of reasoning at the end of their first semester of introductory programming.
Teague, Corney, Fidge et al. (2012) describe how a series of small two-weekly tests and think-aloud
sessions are used over a semester in an investigation into novices’ reasoning from a neo-Piagetian
perspective. They found evidence that indicates that students operate at the first three neo-Piagetian
levels, sensorimotor, preoperational and concrete operational. In another paper on the same study,
Teague et al. (2013) interpret the think-aloud data within a neo-Piagetian framework, and demonstrate
that some novices operate at the sensorimotor and preoperational stages, instead of the concrete
operational stage targeted by instructors.
It seems as if the neo-Piagetian perspective provides a plausible explanation for the results of many of
the studies in the BRACElet project. It may well be applicable to results of other studies on novice
programmers, though this has not been investigated in the research covered by this study.

78
3.5.4 Implications of the neo-Piagetian perspective
Viewing novice programmers from a neo-Piagetian perspective holds some important implications for
teaching and learning programming. Neo-Piagetian theory argues that progressing through the four
stages while gaining experience in a new domain are natural behaviour (Corney, Teague et al., 2012;
Lister, 2011). The empirical evidence from studies aimed specifically at investigating this perspective,
clearly shows that there are students who are still at the lower levels at the end of their first
introductory programming course. Most novices at the preoperational and concrete operational stages
are unable to advance to the formal operational reasoning stage by themselves, and should be
explicitly taught how to think relationally (Corney, Lister & Teague, 2011; Lister, 2011). However,
instructors typically tend to teach at the formal operational level, or at least at the concrete operational
level, and frequently use diagrams to explain. Students at the sensorimotor or preoperational stage
would find this nearly impossible to follow (Teague, Corney, Fidge et al., 2012).
Students are also expected to write a considerable number of programs to learn to program, which
students at the lowest two levels are unable to do (Corney, Teague et al., 2012; Lister, 2011). In order
to assist students at the lower levels in reaching the concrete operational or formal operational level,
different teaching methods that do not require students to write large amounts of code, need to be
employed (Lister, 2011). In this regard Corney et al. (2011) suggest for example teaching roles of
variables (Kuittinen & Sajaniemi, 2004; Sorva et al., 2007), namely typical usage patterns of
variables, and using it in ‘explain in plain English’ questions.
Students at the sensorimotor and pre-operational stages should be identified and assisted in dealing
with misconceptions and learning how to trace, as well as in developing abstractions (Teague et al.,
2013; Teague, Corney, Fidge et al., 2012).
Constructivist theory claims that students actively construct new knowledge in a recursive process
that combines the new knowledge with existing knowledge, that is, new knowledge is built on the
foundation formed by prior knowledge (Ben-Ari, 2001). Consistent with constructivist theory, Teague
et al. (2013:95) “believe that the ability to trace code is the foundation on which abstract reasoning
about code is built. That is, while the ability to trace code requires little need to form abstractions, we
believe that a novice will not begin to construct correct abstractions in their mind in the absence of the
foundational skill of tracing code.”
Teague et al. (2013) argue that novices’ inability to trace code might explain the bimodal grade
distribution that Dehnadi and Bornat (2006) and Robins (2010) found in introductory programming
courses. Students who are unable to trace may lack the ability to create the abstraction required to
write code, while those who have mastered the ability to trace, can make the abstractions necessary to
write code. The former would constitute the lower hump of bimodal distribution, while the latter

79
would fall into the higher hump (Teague et al., 2013). This would also tie in with the LEM effect
proposed by Robins (2010) as discussed in Chapter 2 (see section 2.4.2.3), and BRACElet’s proposed
hierarchy, since students who cannot trace lack the prior skill required to learn to explain and write
code.
Incorporating a neo-Piagetian perspective in planning and offering introductory programming courses
will require developing new teaching methods and new learning experiences that include learning to
trace and explain code, to assist students in progressing through the four stages. Students should also
be assisted in learning to think relationally. This may result in retaining more students and a better
pass rate rate.
3.6 Continuation of BRACElet’s work
During the last two BRACElet workshops several directions for continuation of the past work were
identified. Some of these are briefly discussed below.
3.6.1 Student annotations (‘doodles’)
The eleventh BRACElet workshop analysed student script notations (‘doodles’) from multiple
institutions in an attempt to further Whalley, Prasad and Kumar’s work (Lister et al., 2010). The
eleventh BRACElet workshop followed the same approach as McCartney, Moström, Sanders and
Seppälä (2004) who compared student annotations on skeleton questions (incomplete code fragments
that have to be completed) and fixed-code questions (questions on the results of executing a code
fragment). A large variation in the type of annotations used for synchronised tracing (tracing the
values of a number of variables line-by-line through code) was noted, but no real trend could be
determined. It was suggested that students who can explain code at relational level do not need to
make annotations, as they may be more expert and can predict the output of a code segment without
annotations (Lister et al., 2010). In a neo-Piagetian perspective such students would be at the concrete
operational or formal operational stage.
3.6.2 Novices’ understanding of the relationship between the concepts ‘object’ and ‘class’
A follow-up study of an investigation into novices’ understanding of the concepts ‘class’ and ‘object’
(Eckerdal, 2009; Eckerdal & Thuné, 2005), examined a possible hierarchy of how students learn
aspects of concepts (Eckerdal et al., 2011). In particular, it focused on how novices understand the
concepts ‘class’ and ‘object’ as a piece of program text (the aspect TEXT), the active behaviour of the
program when it is executed (the aspect ACTION) and the modelling aspect (the aspect MODEL) of
these concepts. The findings do not support a hierarchy but suggest that both TEXT and ACTION
aspects may develop in parallel (Eckerdal et al., 2011).

80
3.6.3 Misconceptions about assignment
The studies that explored Lister’s neo-Piagetian perspective used screening questions to exclude
students at the sensorimotor stage (Corney, Teague et al., 2012; Teague, Corney, Ahadi & Lister,
2012; Teague, Corney, Fidge et al., 2012). The screening questions test whether students understand
variables, assignment and ability to trace simple code. Following up on the results of the screening
questions, Simon (2011) analysed students’ responses on questions by testing their knowledge on
assignment and sequence. As was mentioned in section 2.4.3.2, he found that it appeared as if many
students in their first, second and even third programming courses do not understand the semantics of
the assignment statement, or that a sequence of statements are executed sequentially, and possibly
both (Simon, 2011). In a neo-Piagetian perspective, these students would still be at the sensorimotor
stage.
3.6.4 Examination question classification
While the seventh BRACElet workshop had as an aim to develop an ideal examination paper (Clear,
Edwards et al., 2008; Clear et al., 2009), the twelfth workshop identified a survey and an analysis of
questions used in examination papers for novices (Clear et al., 2011; Lister & Edwards, 2010).
Whalley et al. (2011) developed a framework to classify student responses to code-writing
examination questions. A classification scheme to investigate the characteristics of examinations
questions themselves were also explored in a pilot project (Sheard et al., 2011; Simon et al., 2012).
3.6.5 A longitudinal study into the development of novices – examination question generation and benchmarking
The interest in a longitudinal study into the development of novices, resulted in a project to
investigate novice programmers during the first three semesters of their programming studies
(Corney, Lister et al., 2012). The aim was to use students’ performance on in-class tests and certain
examination questions to determine at what stage of their studies they are able to demonstrate
understanding of various concepts. The project intended to create an archive of in-class and
examination questions, as well as a repository of students’ in-class test papers and examination
scripts, together with their performance data for the tests and examinations with the purpose of
benchmarking students on those questions (Corney, Lister et al., 2012).
Corney, Lister and Teague (2011) investigated the development of novice programmers during their
first semester in a longitudinal study. They used code that swapped the values of two variables as the
simplest case of a SOLO relational response in two tests during the semester. They then compared the
results of students in those tests with their end-of-semester examination results in a similar swap
question. Their findings indicate that students, who could successfully explain the swapping code in
81
week 3 of the semester, were more likely to write correct swapping code in week 5 and also
performed better code writing at the end of the semester (Corney et al., 2011). This indicates that the
problems students experience in learning to program probably start very early in the semester. The
researchers do not claim that code writing is dependent on the ability to explain code, but consider the
ability to understand and reason about code as a possible third variable in the link between code
writing and explaining (Corney et al., 2011). Replications of their study at other institutions produced
similar results (Murphy, Fitzgerald et al., 2012; Murphy, McCauley & Fitzgerald, 2012; Teague,
Corney, Ahadi & Lister, 2012).
Murphy, Fitzgerald et al. (2012) investigated the relationship between novices’ ability to explain code
segments and their ability to write code in a two-part final examination where students explained code
in the written part and used computers to write code in the programming part. Their results showed
that writing code and explaining code are highly correlated, confirming results from earlier studies
(Lister et al., 2010; Lopez et al., 2008; Venables et al., 2009), and that “the reasoning abilities
common to both writing and explaining code are non-trivial” (Murphy, Fitzgerald et al., 2012:117).
Furthermore, Murphy, Fitzgerald et al.’s (2012) findings confirm that this relationship also holds for
computer-based code-writing questions and not only for paper-based code-writing as in the previous
studies. The data were collected over four semesters, where for the last two semesters, students were
exposed to ‘explain in plain English’ questions during the semester. Despite this, no statistical
difference could be found between code-explaining abilities of students from the first two semesters
and those from the second two semesters. Murphy, Fitzgerald et al. (2012) speculate that should code-
explaining be incorporated in teaching, a strategy needs to be developed to do so.
Studies aimed at investigating the neo-Piagetian perspective (Corney, Teague et al., 2012; Teague et
al., 2012; Teague, Corney, Fidge et al., 2012), discussed in the previous section, were also part of this
project.
3.6.6 BABELnot
The BABELnot6 project resulted from BRACElet’s work and its continuation in the form of the
examination question classification project (section 3.6.4 above), the project to investigate novice
programmers’ development during the first three semesters (section 3.6.5 above) and Lister’s work on
neo-Piagetian theory (section 3.5.2) together with the course and unit of study portal (CUSP) at the
University of Sydney. The CUSP project captures and maps curriculum goals to relevant degrees.
Each graduate competency is in turn mapped to each assessment and learning outcome within each 6 The name BABELnot is deliberately similar to that of the BRACElet project, which uses the capitalisation to reflect its continuation of the BRACE project. BABELnot evokes the biblical Tower of Babel which could not be completed because its builders lost the ability to communicate with each other. BABELnot intends to help overcome the challenge of communication between programming educators by developing a common understanding about standards and assessment. (Lister et al., 2012).

82
subject of a degree. BABELnot merges CUSP, the examination classification project and examination
question generation and benchmarking project (Lister et al., 2012).
The BABELnot project aims to develop a framework for describing the learning goals and assessment
for programming for the first three programming subjects. An archive of examination questions and
performance data from real students for a subsection of the archived examination questions will also
be collected (Lister et al., 2012).
3.7 Summary and conclusion
This chapter is a continuation of the literature review from Chapter 2, with the purpose of continuing
to provide a context and theoretical basis for the research presented in this document. In particular, it
focused on the BRACElet project’s contribution to understanding the development of novice
programmers and the role of tracing in that.
In Section 3.2 the studies that motivated the BRACElet project were introduced, and in section 3.3 a
brief history of the thirteen workshops and three action research cycles that constituted the BRACElet
project was presented.
Section 3.4 covered BRACElet’s guiding principles for conducting such a multi-institutional, multi-
national study, including their adaptations of Bloom’s taxonomy for computer science and the SOLO
taxonomy for classifying student responses on examination questions. This section also presented the
findings in each of the three action research cycles during the project as well as BRACElet’s key
contributions. Of particular interest here, is the possible hierarchy in which students learn to program
proposed by BRACElet, in which tracing and code explaining form part of the intermediate level with
code-writing at the top of the hierarchy.
Two possibilities considered as a theoretical foundation for BRACElet’s work, research in
mathematics education and a neo-Piagetian perspective, were discussed in section 3.5. According to
the neo-Piagetian perspective a novice programmer goes through four stages (sensorimotor,
preoperational, concrete operational and formal operational) while developing the skill to program.
Each of the four stages was described and some of the results of the BRACElet project were the
interpreted with a neo-Piagetian perspective. The implications of applying a neo-Piagetian perspective
to teaching and learning of programming were then considered. Viewing the four stages as natural
steps in learning to program implies that it has to be taken into account when teaching programming.
Introductory courses should be adapted accordingly. This will require developing new teaching
methods, with more emphasis on teaching novices to trace and explain code, before they have to write
large amounts of code, especially if tracing is seen as a foundational skill required to develop

83
abstractions (Teague et al., 2013) and reasoning abilities common to both writing and explaining code
are viewed as non-trivial (Murphy, Fitzgerald et al., 2012).
Section 3.6 presented a brief overview of some of the extensions of BRACElet’s work, some of which
confirms previous work, and others that confirm the neo-Piagetian perspective on novice
programmers.
The BRACElet project contributed significantly to understanding and explaining the development
process of novice programmers and the role of tracing therein. It also provides a rich foundation for
further studies and extensions of its work.
This chapter and chapter 2 provided the context for the research. Chapter 2 provided the background
to ODL, teaching programming in distance education, teaching introductory programming courses,
tracing itself and visualization. This chapter, and in particular the neo-Piagetian perspective,
contributed to understanding the development of novice programmers and the role of tracing therein.
This was the premise for this research, namely that improving students’ tracing skills would improve
their programming skills and therefore their average marks, and the pass rate for the module
COS1511.
The next chapter addresses the research design and methodology followed to investigate the research
questions.

84
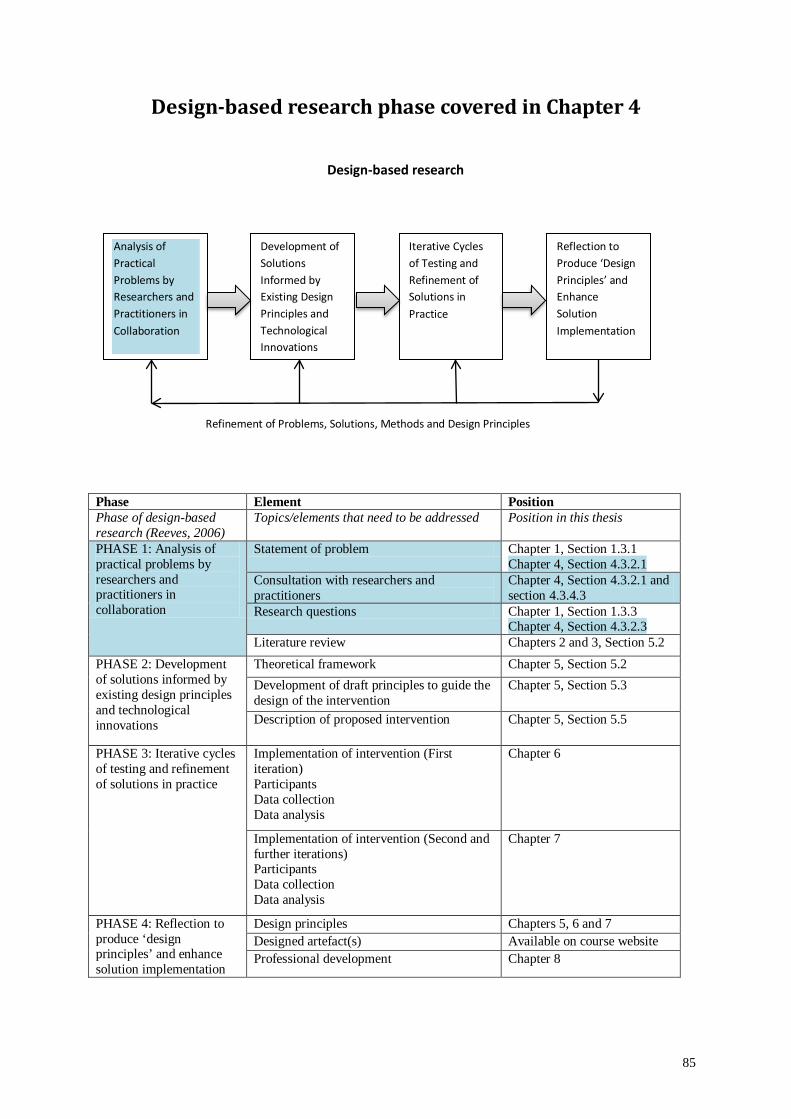
85
Design-based research phase covered in Chapter 4
Design-based research
Phase Element Position Phase of design-based research (Reeves, 2006)
Topics/elements that need to be addressed Position in this thesis
PHASE 1: Analysis of practical problems by researchers and practitioners in collaboration
Statement of problem Chapter 1, Section 1.3.1 Chapter 4, Section 4.3.2.1
Consultation with researchers and practitioners
Chapter 4, Section 4.3.2.1 and section 4.3.4.3
Research questions Chapter 1, Section 1.3.3 Chapter 4, Section 4.3.2.3
Literature review Chapters 2 and 3, Section 5.2 PHASE 2: Development of solutions informed by existing design principles and technological innovations
Theoretical framework Chapter 5, Section 5.2 Development of draft principles to guide the design of the intervention
Chapter 5, Section 5.3
Description of proposed intervention Chapter 5, Section 5.5
PHASE 3: Iterative cycles of testing and refinement of solutions in practice
Implementation of intervention (First iteration) Participants Data collection Data analysis
Chapter 6
Implementation of intervention (Second and further iterations) Participants Data collection Data analysis
Chapter 7
PHASE 4: Reflection to produce ‘design principles’ and enhance solution implementation
Design principles Chapters 5, 6 and 7 Designed artefact(s) Available on course website Professional development Chapter 8
Analysis of Practical Problems by Researchers and Practitioners in Collaboration
Development of Solutions Informed by Existing Design Principles and Technological Innovations
Iterative Cycles of Testing and Refinement of Solutions in Practice
Reflection to Produce ‘Design Principles’ and Enhance Solution Implementation
Refinement of Problems, Solutions, Methods and Design Principles

86
Map of Chapter 4 (Research design and methodology)
4.1 Introduction
4.2 The structure of a research design
4.3 Research design for this study
4.2.1 Philosophical paradigms and approaches in
Information Systems and Computing
research
4.2.2 Purpose of the
research
4.2.3 Context
4.2.4 Methodology
4.2.5 Ethical
considerations
4.3.1. Design-based
research
4.3.2 Research
problem and purpose
4.3.3 Philosophical
approach chosen as paradigm
4.3.4 Context
4.3.5 Methodology
4.3.6 Validating the research effort
4.3.7 Ethical
considerations
4.4 Conclusion
87
Chapter 4 Research design and methodology
4.1 Introduction
The previous two chapters provided the background for this study in the form of the literature review.
This chapter presents the research design and methodology applied in the research for this study.
Section 4.2 provides a general overview of the structure of a research design and the aspects that
should be addressed in a research design.
Section 4.3 describes the research design and methodology according to the aspects identified in
section 4.2. An overview of design-based research, the approach used to construct the research design,
is presented in section 4.3.1. In section 4.3.2 the reader is reminded of the research problem and
purpose of the research, while in section 4.3.3 the philosophical approach chosen as paradigm for this
research, is justified. Section 4.3.4 is a description of the context in which the research is conducted
and in section 4.3.5 the methodology applied in the research, is detailed, while section 4.3.6 consists
of a discussion validating the research. In section 4.3.7 the ethical considerations involved are
discussed and section 4.4 consists of the conclusion and summary of the chapter.
4.2 The structure of a research design
According to Mouton (2001:55) “a research design is a plan or blueprint of how you intend
conducting the research”. Durrheim (2006) sees a research design as a strategic framework acting as a
bridge between the research questions and the execution of the research. The research design should
therefore specify a “series of actions which will ensure that valid conclusions can be drawn from the
research” (Durrheim, 2006:36). This requires decisions about theoretical understandings and
assumptions about research held by the researcher (the philosophical paradigm), the aims and
objectives of the research, and the methods and techniques used to collect the data and analyse it
(methodology). During this whole process ethical considerations should be taken into account (Cheek,
2008). The context in which the research takes place also has an influence on the research design
(Durrheim, 2006).
The following sections elaborate on each of these aspects.
4.2.1 Philosophical paradigms and approaches in information systems and computing research
The concept of a paradigm has different interpretations (Freshwater & Cahill; Mertens, 2012; Morgan,
2007). The idea of using a paradigm to describe researchers’ belief about how they create knowledge
originated with Khun (1962/1996). According to Morgan (2007), Khun used this concept in more than
30 different ways in his book The Structure of Scientific Revolutions. The four basic ways in which

88
the concept of a paradigm is used, are paradigms as worldviews, as epistemological stances, as shared
beliefs among members of a speciality area, and as model examples of research (Morgan, 2007).
Morgan (2007:54) recommends that these four pproaches be considered as follows:
“Ultimately, it helps to think of these four increasingly specific versions of paradigms as nested
within each other. The model examples researchers use to demonstrate the key content of their
field reflect a set of shared beliefs about both the research questions they should ask and the
methods they should use to answer them. Shared beliefs about research topics and methods are,
in turn, based on epistemological stances that summarize researchers’ assumptions about what
can be known and how to go about such knowing. And at the broadest level, assumptions about
the nature of knowledge and reality are an important component of each researcher’s
worldview.”
In this research report a paradigm is regarded as a shared set of assumptions that determines the
perspective a research community holds on doing research. In line with Morgans’s (2007)
explanation, this includes the epistemological stance and worldview associated with a specific
paradigm.
Different paradigms have different ontological, epistemological and methodological assumptions that
guide the methods used, the interpretation and the assessment of research (Durrheim, 2006; Morgan,
2007; Oates, 2006). The axiological assumptions in a paradigm also influence the research perspective
(Vaishnavi & Keuchler, 2004). Ontology refers to the nature of the reality being studied, and what can
be known about it (Durrheim, 2006). Epistemology concerns the nature of knowledge and the
relationship between the researcher and knowledge (Creswell, 2003; Durrheim, 2006; Oates, 2006;
Vaishnavi & Keuchler, 2004). It is “a broad and high-level outline of the reasoning process by which
a school of thought performs its empirical and logical work” (Lee, 2004:6), that is how the researcher
reasons to acquire knowledge. Methodology refers to the practical processes and procedures used to
study the reality as perceived by the researcher (Creswell, 2003; Durrheim, 2006). Axiology refers to
the values an individual or group holds and the reasons why (Vaishnavi & Keuchler, 2004).
Most research in Information Systems and Computing, are based on one of three different
philosophical paradigms, namely positivism, interpretivism or critical research (Oates, 2006).
Positivism and interpretivism are the most dominant paradigms in Information Systems and Software
Engineering (Mora, Gelman, Steenkamp & Raisinghani, 2012). Pragmatism is also frequently used as
the philosophical foundation for design research (Cole, Purao, Rossi & Sein, 2005; De Villiers, 2005;
Hevner & Chatterjee, 2010; Kuechler, Vaishnavi & William L. Kuechler, n.d.), an emerging trend in
Information Systems and Information Technology (De Villiers & Harpur, 2013; Hevner & Chatterjee,
2010; Hevner, March, Park & Ram, 2004). It is noted that according to Biesta (2010:97), “pragmatism

89
should not be understood as a philosophical position among others, but rather as a set of philosophical
tools to address problems.”
The following paragraphs provide a brief overview of positivism, interpretivism, critical research and
pragmatism and a summary of the main beliefs in these four paradigms are presented in Table 4.1.
• Positivism holds that the world exists independently of humans and can be investigated
objectively, through empirical testing of theories and hypotheses. Knowledge is discovered or
generated through the scientific method, i.e. using experiments, observations and
measurements to determine universal laws. Therefore, quantitative data analysis is mainly
done by using mathematical modelling and proofs or statistical analysis. The researcher is
objective, and personal values and beliefs do not influence the research, so that findings are
consistent, value-free and replicable (De Villiers, 2012a; Oates, 2006).
• According to interpretivism, multiple subjective realities that are time and context dependent
exist. Reality is constructed through social interaction and people’s own perceptions.
Interpretivist research attempts to understand phenomena by studying the meanings and
values people ascribe to them. People are studied in their natural social environment through
dialogue and interaction, and qualitative data and analysis are used to provide rich
descriptions of findings. Both the researcher’s and participants’ values influence the findings,
and findings may be subjective (De Villiers, 2012a; Oates, 2006; Wahyuni, 2012). Therefore
researchers must be reflexive (Oates, 2006), and multiple data collections are frequently used
to triangulate findings (De Villiers, 2012a).
• Critical research is focused on transformation in order to empower people. While critical
researchers believe the world is created through social reality, like interpretivists, they also
argue that social reality and history influence people’s experiences and worldviews (Oates,
2006; Ponterotto, 2005). Research is reflexive (Oates, 2006) and influenced by the
researcher’s pro-active values (Ponterotto, 2005).
• Pragmatism accepts that there are “singular and multiple realities that are open to empirical
inquiry and orients itself toward solving practical problems in the ‘real world’” (Feilzer,
2010:8). Both the natural or physical world, and the social and psychological worlds are
recognised, and people construct and base knowledge on the reality of the world they
experience and live in (Creswell, 2014; Johnson & Onwuegbuzie, 2004). Pragmatists
believe that research occurs in social, historical, political and other contexts (Creswell,
2014). Research philosophy is viewed as a continuum so that positivist and interpretivist
perspectives are not exclusive (Feilzer, 2010; Wahyuni, 2012). The research question or
problem is considered to be the most important aspect, with the focus on choosing the
research approach that best addresses the problem, based on actions, situations and
consequences
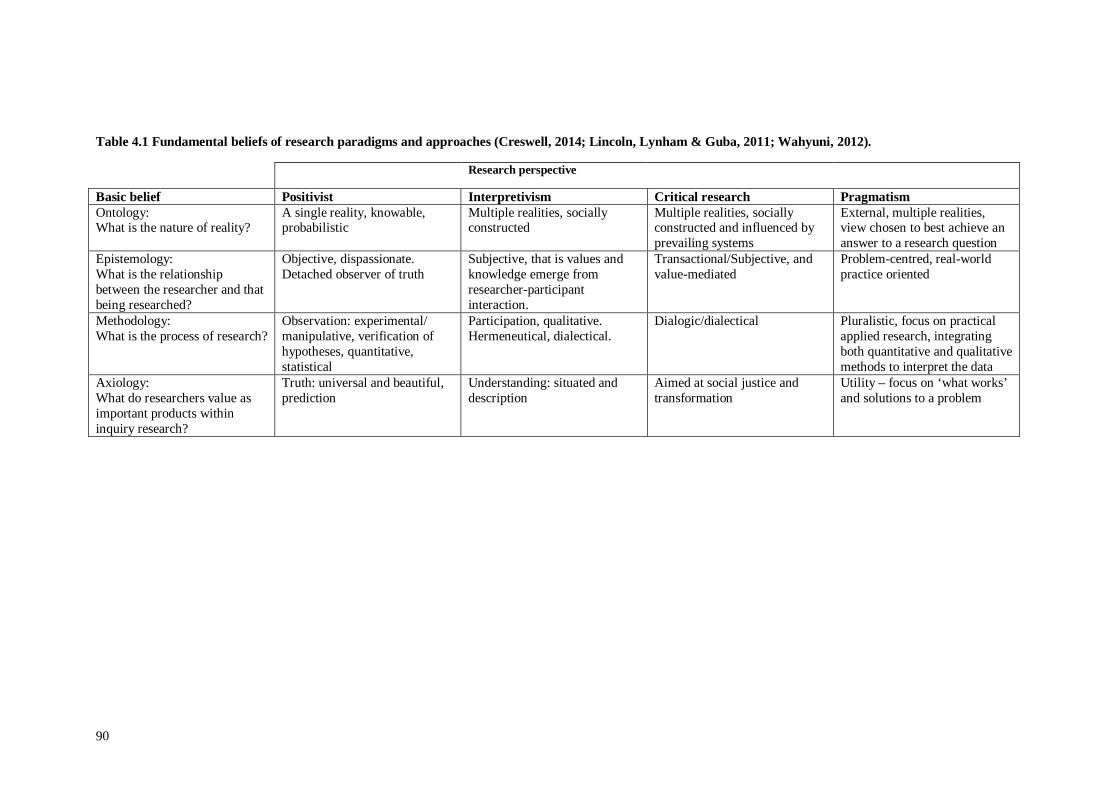
90
Table 4.1 Fundamental beliefs of research paradigms and approaches (Creswell, 2014; Lincoln, Lynham & Guba, 2011; Wahyuni, 2012).
Research perspective
Basic belief Positivist Interpretivism Critical research Pragmatism Ontology: What is the nature of reality?
A single reality, knowable, probabilistic
Multiple realities, socially constructed
Multiple realities, socially constructed and influenced by prevailing systems
External, multiple realities, view chosen to best achieve an answer to a research question
Epistemology: What is the relationship between the researcher and that being researched?
Objective, dispassionate. Detached observer of truth
Subjective, that is values and knowledge emerge from researcher-participant interaction.
Transactional/Subjective, and value-mediated
Problem-centred, real-world practice oriented
Methodology: What is the process of research?
Observation: experimental/ manipulative, verification of hypotheses, quantitative, statistical
Participation, qualitative. Hermeneutical, dialectical.
Dialogic/dialectical Pluralistic, focus on practical applied research, integrating both quantitative and qualitative methods to interpret the data
Axiology: What do researchers value as important products within inquiry research?
Truth: universal and beautiful, prediction
Understanding: situated and description
Aimed at social justice and transformation
Utility – focus on ‘what works’ and solutions to a problem

91
(Creswell, 2014; Johnson & Onwuegbuzie, 2004; Wahyuni, 2012). Accordingly, both
qualitative and quantitative methods are used to derive knowledge (Creswell, 2014; Feilzer,
2010; Johnson & Onwuegbuzie, 2004; Wahyuni, 2012). Research should be ‘useful’ (Feilzer,
2010) – ‘what works’ – and provide solutions to problems (Creswell, 2014). Therefore
pragmatism is value-oriented (Johnson & Onwuegbuzie, 2004).
The philosophical approach used in this research is justified in section 4.3.3.
4.2.2 Purpose of the research
The purpose statement of a study indicates why a specific study needs to be done and what the overall
intent or objectives are. It is based on a need, namely the research problem, and then refined into
research questions and objectives (Creswell, 2014; Oates, 2006).
The reader is reminded of the research problem that motivated this study in section 4.3.2. The purpose
of the research is also described in section 4.3.2.
4.2.3 Context
The context refers to the situation or ‘outside world’ in which the research is done (Oates, 2006). The
context is important, since the meaning of human creations, words, actions and experiences can only
be determined in relation to both the personal and social contexts in which they occur. Data should be
collected as far as possible in the natural context in which it occur, with minimal disturbance
(Durrheim, 2006).
The context in which this research was done is addressed in section 4.3.4.
4.2.4 Methodology
The research methodology refers to the general approach the researcher uses to do the research. It
guides the selection of methods and techniques that are used to sample, collect and analyse the data
(Leedy & Ormrod, 2005; Tashakkori & Teddlie, 2010).
Three research approaches can be used, namely the qualitative, quantitative or mixed methods.
• Research with a qualitative approach aims to explore and understand the meaning
individuals or groups ascribe to a social or human problem. This is typically done in a natural
setting where data are collected through observation and in interviews. Documents and audio-
visual material may also be used. The resulting text and visual data are then analysed and
interpreted.
• Research with a quantitative approach tests objective theories by examining the relationship
among variables. Scientific methods and procedures such as experiments and surveys are used

92
to measure these variables and the resulting numerical data are analysed with statistical
procedures.
• In a mixed methods approach both qualitative and quantitative data are collected and the
two forms of data are then integrated to provide a more complete understanding of the
research problem (Creswell, 2014).
The methodology used in this research is described in section 4.3.5.
4.2.5 Ethical considerations
Ethical research is guided by the following four philosophical principles (Durrheim, 2006):
• Autonomy and respect for the dignity of people refers to the requirements for voluntary
informed consent by research participants, as well as protection of individual and institutional
confidentiality.
• Nonmaleficence demands that the researcher ensures that the research causes no harm or
wrongs to the research participants.
• Beneficence requires the researcher to attempt to maximise the benefits of the research to
research participants.
• Justice in research requires that researchers treat participants fairly and with equity during the
whole research process.
In practice, these principles translate to certain rights that people directly involved with the research
are entitled to, as well as responsibilities that an ethical researcher has to comply with.
The ethical considerations applied in this study are discussed in section 4.3.6.
4.3 Research design for this study
The previous section provided an overview of the components in a research design. In this section
each of these components are described as they manifest in this research.
Both design-based research and action research have been considered as possible methodologies for
this study. The iterative cycles of design, enactment, analysis and redesign (Design-based Research
Collective, 2003) in design-based research, resembles action research, with the exception that the
participants in action research assist in constructing the knowledge (Wang & Hannafin, 2005). In the
ODL environment of Unisa, it would have been difficult to engage participants sufficiently to
accomplish this. Therefore design-based research was chosen as research methodology for this study.
Section 4.3.1 elaborates on design-based research.
In section 4.3.2 the research problem and the purpose of the study is reiterated, while justification for
the philosophical approach chosen as research paradigm is offered in section 4.3.3. The context in

93
which the research occurs is described in section 4.3.4, and in section 4.3.5 the methodology followed
is described in detail. In section 4.3.6 validating the research effort is discussed. Ethical
considerations are covered in section 4.3.7.
4.3.1 Design-based research
Design-based research, the educational variation of design research, is used to construct the research
design for this study. Design research stems from design science as conceptualised by Herbert Simon
in his classic book The Sciences of the Artificial (Simon, 1969/1981). Simon distinguishes between
natural sciences in which natural objects and phenomena are studied; and design sciences or ‘the
sciences of the artificial’, where man-made objects and artificial phenomena are studied. In
Information Systems and Information Technology, design research is called design science research,
while in educational technology and e-learning, it is termed design-based research (De Villiers,
2012b). It is noted that design-based research has been described with different terms in the literature,
including design experiments (Brown, 1992; Cobb, Confrey, diSessa, Lehrer & Schauble, 2003),
design research (Edelson, 2002; Oh & Reeves, 2010; Van den Akker, Gravemeijer, McKenney &
Nieveen, 2006), development research (Van den Akker, 1999), developmental research (Conceição,
Sherry & Gibson, 2004; Richey, Klein & Nelson, 2004) and formative research (Reigeluth & Frick,
1999). For the purpose of this research, design-based research is used.
Barab and Squire (2004) view design-based research as a series of approaches aiming to produce new
theories, artifacts and practices to explain and influence learning and teaching in natural settings.
Wang and Hannafin (2005:6) define design-based research as “a systematic but flexible methodology
aimed to improve educational practices through iterative analysis, design, development, and
implementation, based on collaboration among researchers and practitioners in real-world settings,
and leading to contextually-sensitive design principles and theories”. Design-based research delivers
both a practical and a theoretical contribution by –
• using technology / an intervention to solve a complex practical real-world problem; and
• contributing to design theories and principles (Barab & Squire, 2004; De Villiers, 2012b; De
Villiers & Harpur, 2013, Design-based Research Collective, 2003; Wang & Hannafin, 2005).
The features of design-based research have been extracted and synthesised from papers by Anderson
and Shattuck (2012), Barab and Squire (2004), Cobb, Confrey, diSessa, Lehrer and Schauble (2003),
De Villiers (2012b), De Villiers and Harpur (2013), the Design-Based Research Directive (2003)
Mingfong, Yam San and Ek Ming (2010), Oh and Reeves (2010), and Wang and Hannafin (2005).
According to these sources, design-based research is characterised by:
• Being situated in a real-world educational setting.
94
• Focusing on solving a complex problem by designing and testing an innovative intervention
or artifact.
• Basing the intervention on learning/instructional theory.
• Dual outcomes in the form of both a practical intervention and a related theoretical
contribution (design principles).
• Taking the context in which the research is done into account in both the design, evaluation
and interpretation of the research.
• Collaboration between researchers, designers, practitioners and participants.
• Iterative cycles of “design, enactment, implementation, analysis and evaluation, and redesign”
(Design-based Research Collective, 2003:5).
• Being reflective and flexible in revising and adapting the designed intervention.
• Being pragmatic – the design of the intervention should solve a real-world problem and lead
to the development of practical design principles, patterns and/or grounded theories impacting
on real educational settings – “the theory must do real work” (Cobb et al., 2003:10).
• Using mixed methods with a variety of research tools and techniques to suit the research
problem.
• Synergy between design and research that inform each other and develop concurrently.
• Rigorous accounts of the research process and findings.
• Communicating contextually-sensitive shareable theories to other practitioners and
educational designers.
• Extending existing methodologies such as action research and instructional systems design.
The design-based research community has not yet identified and accepted one comprehensive
research methodology (Mingfong et al., 2010; Morgan, 2013; Oh & Reeves, 2010; Plomp & Nieveen,
2009), though some general approaches have been proffered. Two of these approaches, respectively
by Reeves (2006) and Bannan-Ritland (2003), are described for the purpose of this research. Reeves’s
(2000; 2006) approach is described to illustrate the difference between design research methods and
traditional predictive research methods, while Bannan-Ritland (2003) offers a general model for
conducting design-based research that corresponds with the stages in design-based research identified
by Reeves.
Reeves (2000) distinguishes between design-based research methods and traditional predictive
research methods. A diagrammatic view of the stages in traditional predictive research in comparison
with the iterative stages in design-based research, is shown in Figure 4.1 (Reeves, 2006:59). In
traditional predictive research, theoretical findings are rarely applied in practice. This is due to a
number of reasons, but mainly because the theory lacks applicability in the real-world contexts of
practitioners. In contrast, one of the primary advantages of design-based research is that the

95
collaboration between practitioners and researchers allows for contextual solutions and
implementation thereof to real-world problems.
Figure 4.1 Predictive and design-based research approaches in educational technology research (Reeves, 2006:59)
Bannan-Ritland (2003) offers a general model for conducting design-based research with the
Integrative Learning Design Framework (ILDF). The ILDF contains the following four phases
(Bannan-Ritland, 2003; Oh & Reeves, 2010):
1. During the Informed Exploration phase the problem identification, literature survey, problem
definition, needs analysis and the audience characterisation are done to determine preliminary
design theories and principles.
2. During the Enactment phase the initial intervention is designed and refined into a more
substantial prototype in series of small micro-cycles, influenced by evaluations during the
local impact evaluation phase.
3. In the Evaluation: Local Impact phase the local impact of the intervention is evaluated. Data
are iteratively collected and analysed to simultaneously do formative evaluation of the
intervention and develop theory, developing into a more summative evaluation of the study’s
results and products. The data collected in formative evaluation serve to identify gaps, issues
Analysis of Practical Problems by Researchers and Practitioners in Collaboration
Development of Solutions Informed by Existing Design Principles and Technological Innovations
Iterative Cycles of Testing and Refinement of Solutions in Practice
Reflection to Produce ‘Design Principles’ and Enhance Solution Implementation
Refinement of Problems, Solutions, Methods and Design Principles
Hypotheses based upon Observations and/or Existing Theories
Experiments Designed to Test Hypotheses
Theory Refinement Based on Test Results
Application of Theory by Practitioners
Specification of New Hypotheses
Predictive Research
Design-based Research

96
and problems that have to be addressed to increase the effectiveness and utility of the
designed intervention.
4. In the Evaluation: Broader Impact phase outcomes are disseminated in the form of
publications as well as adoption and adaption of the designs and theories to a broader context.
The consequences of using the products of the research are also considered.
Reeves’ (2006) four stages of design-based research show correspondences with Bannan-Ritland’s
(2003) ILDF. Reeves’ first stage, the analysis of practical problems in collaboration with
practitioners, resembles the Informed Exploration phase in the ILDF, while his second stage, the
development of solutions informed by existing design principles and technological innovations, is
similar to the Enactment phase in the ILDF. Reeves’ third stage, iterative cycles of testing and
refinement of solutions in practice, is a combination of the Enactment and the local impact Evaluation
Phase in the ILDF. Reeves’ fourth stage, reflection to produce design principles and enhance solution
implementation, is included in the broader impact Evaluation Phase in the ILDF.
Compared to other methodologies where certain dominant methods are used to collect and analyse
data, in design-based research any appropriate approach may be followed, as justified by the design
researcher’s needs (Bannan-Ritland, 2003; Oh & Reeves, 2010). A combination of methods is used to
collect data from multiple sources to increase objectivity, reliability, validity and applicability
(McKenney, Nieveen & van den Akker, 2006; Wang & Hannafin, 2005). Furthermore, since design-
based research is conducted in real-world settings, data are collected from actual learners (Oh &
Reeves, 2010). Methods may differ and change according to new needs and issues that emerge during
the research process. The research focus may also change (Wang & Hannafin, 2005).
Context plays an important role in design-based research. Design-based research is conducted in
natural settings. Therefore the design of an intervention begins with an assessment of the local context
and its limitations (Anderson & Shattuck, 2012; Mingfong et al., 2010). Design researchers design
and study interventions and learning environments in collaboration with practitioners to gain insights
into how best to adapt and employ the intervention in new settings. In this way they become a part of
the research context (Oh & Reeves, 2010). Outcomes are seen as the result of interaction between the
designed intervention, human psychology, personal histories or experience and the local context
(Hoadley, 2004). “The intervention as enacted is a product of the context in which it is implemented”
and therefore it is also (an) outcome of the research (Design-based Research Collective, 2003:5).
In the following two sub-sections the challenges and advantages of design-based research as well as
ensuring validity in design-based research are discussed.

97
4.3.1.1 Challenges and advantages in design-based research The real-world setting in which design-based research occurs, offers both challenges and advantages.
The lack of control in the real-world situation in itself offers a challenge (Collins, Joseph &
Bielaczyc, 2004; De Villiers, 2012b). It is demanding to “characterise the complexity, fragility,
messiness and eventual solidity of the design and doing so in a way that will be valuable to others”
(Barab & Squire, 2004:4). A team effort may be necessary which makes it more difficult to control
the research process, but team members may provide additional insights and alternative interpretations
(Cobb et al., 2003, Design-based Research Collective, 2003; McKenney et al., 2006). While it is
difficult to generalise research findings from the local context, the knowledge generated is
immediately applicable (Hoadley, 2004; Wang & Hannafin, 2005).
Due to the nature of design-based research, researchers play the dual roles of designer and researcher.
Barab and Squire (2004:10) point out that “if a researcher is intimately involved in the
conceptualisation, design, development, implementation, and researching of a pedagogical approach,
then ensuring that researchers can make credible and trustworthy assertions is a challenge”. When
designers are involved in the evaluation, it may increase the chance for the evaluator effect
(McKenney et al., 2006). The evaluator effect occurs when the presence of the evaluator distort
findings because of participants’ reactions to the evaluator; changes in the evaluator self;
predispositions or biases of the evaluator; or evaluator incompetence (Patton, 1990). Designers may
be less open to criticism (McKenney et al., 2006). Reactivity, the phenomenon that people change
their behaviour because they know they are being tested or observed, may also occur (Leedy &
Ormrod, 2005; Oates, 2006; Terre Blanche, Durrheim & Painter, 2006). Reactivity includes the
Hawthorne effect and the experimenter effect (Oates, 2006; Terre Blanche et al., 2006). The
Hawthorne effect (Adair, 1984) occurs when participants change their behaviour during evaluation
because they know they are part of an experiment (Leedy & Ormrod, 2005; McKenney et al., 2006;
Wang & Hannafin, 2005). The experimenter effect occurs when the researcher gives subtle
unconscious clues about what he or she expects (Oates, 2006; Terre Blanche et al., 2006). This may
lead to hypothesis guessing when participants attempt to react in a way that they think the researcher
expects them to. Diffusion may also take place when knowledge of the treatment influences other
participants (McKenney et al., 2006). However, this intense involvement provides inside information
which allows for better insights into the strengths and weaknesses of the design (Anderson &
Shattuck, 2012; McKenney et al., 2006).
Design-based research entails meticulously documenting the research context, design process and its
implementation. The influence of changes in the intervention needs to be explored to determine how it
affects local and general findings. There needs to be a trade-off between refining the intervention to
maximise impact in the local context, while at the same time developing globally applicable

98
knowledge (Design-based Research Collective, 2003). This requires significant effort and also
generates large quantities of data that have to be collected and analysed, demanding considerable time
and resources (Cobb et al., 2003; Oh & Reeves, 2010; Wang & Hannafin, 2005). Linked to changes in
the intervention is the challenge to ensure rigour and validity while adapting research cycles to
findings from previous cycles (Cobb et al., 2003, Design-based Research Collective, 2003;
McKenney et al., 2006). The multiple iterations required in design-based research also make it
difficult to set a time limit to a project (Anderson & Shattuck, 2012).
The challenges of design-based research makes it all the more important to ensure the validity of the
research.
4.3.1.2 Ensuring validity in design-based research According to Hoadley (2004:204) in design-based research “the validity of a study is the likelihood
that our interpretation of the results accurately reflects the truth of the theory and the hypotheses
under examination”. This requires treatment validity, systemic validity and consequential validity.
Treatment validity requires the treatment or intervention to represent the theory it tests. Systemic
validity requires that the research and the implications drawn from it explain or answer the research
questions, i.e. provide a fair test of the theories involved. Consequential validity refers to how the
theories are applicable to decisions based on the research, that is, how interpreted results can be used
in practice for future prediction and implementation (Hoadley, 2004).
In design-based research, the consequences of an intervention are used as evidence to support the
validity of a claim (Barab & Squire, 2004). According to De Villiers and Harpur (2013:4) “The
designed object is validated by its use.” Therefore, processes of enactment in the cycle of design,
enactment, analysis and redesign, should be meticulously documented to explain why outcomes
occurred, since exact replication of a study is near impossible (Barab & Squire, 2004, Design-based
Research Collective, 2003; Edelson, 2002). Documenting the design and research process
continuously, thoroughly and systematically supports its validity, and allows for retrospective
analysis, publication and dissemination in a broader context (Edelson, 2002; Gravemeijer & Cobb,
2006; Oh & Reeves, 2010; Wang & Hannafin, 2005). Dissemination and publication of the emerging
design product and associated study, can also be used as tests of its efficacy (Kelly, 2006).
Triangulation from multiple data sources, iterative cycles of implementation and analysis, and using
standardised measures or instruments are used to ensure the reliability of both findings and measures
(Design-based Research Collective, 2003; Oh & Reeves, 2010; Wang & Hannafin, 2005).
Researchers should use methodological practices consistent with other qualitative and quantitative
research methods to confirm the trustworthiness and credibility of claims (Barab & Squire, 2004).
Iterative cycles of study in a real-world scenario provide a better understanding of the intervention
99
and in which context it has benefits, thereby producing more transferable and useful results (Amiel &
Reeves, 2008).
Design-based researchers acknowledge the difficulty of ensuring experimental control and
generalising research findings. They have to take into account “the intervention as enacted is a
product of the context in which it is implemented” (Design-based Research Collective, 2003:5), and
therefore may not have the expected result (Hoadley, 2004). Instead, the interventions could be
regarded as small improvements in educational technologies and classroom or ODL practice that may
have a long-term effect (Anderson & Shattuck, 2012).
The next section describes the real-world problem this research focuses on.
4.3.2 Research problem and purpose
Design-based research concentrates on solving a complex real-world educational problem by
designing and testing an innovative intervention or artifact, while contributing to design principles
and theories in this process. The real-world problem addressed in this study (discussed in more detail
in section 1.3.1), with the corresponding aims and research questions, is reiterated below.
4.3.2.1 Research problem The results of introductory programming courses at educational institutions typically have a bimodal
distribution, with a low pass rate and a high drop-out, as well as a high number of distinctions (Bornat
et al., 2008; Corney, 2009; Robins, 2010). Unisa is no exception in this regard. Table 1.1 in Chapter 1
shows the pass rates, number and percentage of distinctions and dropout rates for the introductory
programming module at Unisa, COS1511 from 2011 to 2014. The demands and nature of the ODL
environment at Unisa, as discussed in Chapter 2, may affect the situation.
Chapter 2 shows that many of the difficulties novices experience, can be related to lack of viable
mental models for programming, and that they need to master certain threshold concepts that will
allow easier learning of new concepts as proposed by the LEM effect hypotheses (Robins, 2010). The
importance of teaching novices program tracing to address misconceptions and to assist them in
developing mental models for programming, was also pointed out in Chapter 2. Furthermore, research
by the BRACElet project, discussed in Chapter 3, has shown that novices first have to master tracing,
that is, reading code, before they develop the ability to explain and write code.
Memory tracing and parameter transfer are taught in the introductory programming course at Unisa,
COS1511, by means of static variable diagrams in the COS1511 Study Guide (Halland, 2011). The
researcher noticed that students do not understand the static diagrams in the study guide, but that face
to face explanation of the static variable diagrams in consultations, help them to understand it. When
marking examination scripts for the follow-up first-year module, it is also clear from the kind of errors
100
students make, that they lack knowledge and comprehension of the processes that occur in CPU
memory during program execution. The knowledge gap is even more pronounced with regard to
parameter transfer. This is supported by literature (Bruce-Lockhart & Norvell, 2007a; Milne & Rowe,
2002), and confirms the need for a better understanding of what happens in computer memory when a
program executes.
This research is an attempt to address the lack of viable mental models in novice programmers and in
doing so, to improve the pass rate of first-year programming students in COS1511 at Unisa. This was
done by providing the COS1511 students with an interactive tutorial to teach them how to do memory
tracing. The tutorial resembles a PV tool. It takes the form of a customized tutorial to teach students
how to draw variable diagrams. The tutorial is based on the COS1511 Study Guide (Halland, 2011)
since correspondence between the artifact and the related study material is a key factor in its
acceptance as a learning tool (Naps, Röβling et al., 2003; Röβling, 2010). The tutorial was not
intended as a tool to be used during program construction, but rather to teach students how to do
manual tracing by themselves. This is in line with research that shows that students have to construct
diagrams to trace code themself in order to make sense of the code (Thomas et al., 2004) and that
engagement with visualization contributes to students’ program comprehension (Ben-Ari et al., 2011).
However, the key features and the pedagogical benefits of visualizations are not clear (Urquiza-
Fuentes & Velázquez-Iturbide, 2009b). Despite the general perception, research shows that
visualization is not always pedagogically effective or used effectively (Shaffer, Cooper & Edwards
2007; Foutsitzis & Demetriadis 2008). A framework of guidelines from literature for using
visualization to teach programming was compiled and used as a basis from which to develop the
tutorial to teach students how to draw variable diagrams. This was then enhanced with lessons learnt
during the development process and the evaluation of the tutorial itself and how students use it.
4.3.2.2 Aim Design-based research delivers dual outcomes with a practical intervention as well as a related
theoretical contribution in the form of design principles. Correspondingly, this research also had the
following two aims:
• A practical intervention with the tutorial to teach students to draw variable diagrams. The
purpose was to enhance comprehension in an open distance learning (ODL) environment in
such a manner that it assists students in mastering the art of programming to the extent that it
impacts the pass rate for the module.
• A theoretical contribution in the form of a framework of guidelines for designing, developing
and using visualization tools to teach programming.

101
4.3.2.3 Thesis and research questions In the light of the research problem and the aim of this research, the following thesis was formulated
for this research, as indicated in section 1.3.3:
A framework of guidelines for using and creating visualization tools to teach programming,
synthesized from literature and tested and refined through practical application, can be employed to
develop a PV tool to teach introductory programming students in an ODL environment, to trace
programs in order to improve students’ programming skills.
To test this thesis the researcher investigated the following research questions:
1. What guidelines and principles for using and creating visualizations to teach programming,
can be derived from literature?
2. Will a tutorial to teach tracing to visualize program execution and parameter transfer, based
on the framework of guidelines, assist students in acquiring programming skills in an ODL
environment so that it is noticeable in average marks?
3. How does students’ biographical properties, their positive user experience, their use of tracing
and the extent and manner of tutorial use, affect their ability to acquire programming skills in
an ODL environment?
4. What lessons have been learnt through the practical testing and refinement of the visualization
tool?
Data collected to answer research questions are interpreted according to a philosophical paradigm or
approach. The philosophical approach used in this research is motivated below.
4.3.3 Philosophical approach chosen as paradigm
According to Hevner and Chatterjee (2010:9), “design science as conceptualised by Simon
(1969/1981), supports a pragmatic research paradigm that calls for the creation of innovative artefacts
to solve real-world problems”. The prevailing world view of design research is therefore pragmatic
(Cole et al., 2005; De Villiers, 2005; Hevner & Chatterjee, 2010; Kuechler et al., n.d.). Design-based
research also has a pragmatic philosophical foundation (Barab & Squire, 2004; Wang & Hannafin,
2005). Accordingly, this research study follows a pragmatic approach.
Pragmatism is problem-centred and real-world practice oriented, similar to design-based research,
with a focus on usefulness. In this study the focus was on finding a solution to the low pass rate for
COS1511 that works. It was believed that finding a way to help students develop appropriate mental
models of what happens in computer memory when a program executes, by teaching them to trace,
would have a positive effect on students’ performance. In the researcher’s view, grounded on the
102
characteristics of design-based research as described in section 4.3.1, this was the research approach
best suited to this endeavour.
In agreement with pragmatism, the researcher acknowledged that each student has his/her own reality
which differs according to personal background and experience so that multiple external realities
exist. As a result, the tutorial might not have been useful to all COS1511 students. However, the
tutorial would be deemed to be effective if it benefited the majority of students.
Pragmatists believe that research occurs in social, historical, political and other contexts (Creswell,
2014). As mentioned before, context also plays an important role in design-based research. In this
research various contexts played a role. The next section elaborates on the contexts relevant to this
study.
4.3.4 Context
Various contexts, in the form of the ‘outside world’ (Oates, 2006), had an influence on this study.
This included the design setting, consisting of both the “classroom where design research is conducted
and larger systems influences (for example the environment and culture of the school, student
backgrounds)” (Wang & Hannafin, 2005:18). In this case, the ‘classroom’ was the ODL environment
in which COS1511 is offered. The ‘larger system influences’ referred to the social and historical
context which in turn shaped the students’ backgrounds, as well as their cultural background. The
researcher’s context may also have had an effect on the study, since in this case the researcher was
also a lecturer for COS1511. The researcher therefore played three roles, namely that of researcher,
designer and practitioner. Each of these contexts is discussed below.
4.3.4.1 Local context This research was conducted on students enrolled for COS1511, the first introductory course on
programming, at Unisa, a large ODL university in South-Africa. Since Unisa is a comprehensive
university, it offers both National Diplomas and degrees. COS1511 is offered to BSc students
specialising in Computing or Informatics, or doing a general BSc; to students doing the National
Diploma in Information Technology (NDINL/NDIT) and the National Diploma in Electrical
Engineering (NDEEN); as well as to BA Multimedia, BA Communication Science and BEd students.
It is also offered to students doing it for non-degree purposes and students following the access
programme7.
7 Unisa is an ODL university. It has a policy of open access to allow students who wish to study at Unisa to enrol through alternative admission routes, provided they comply with certain minimum statutory requirements. Students can be granted conditional exemption on grounds of mature age (older than 23 years, with standard 10/grade 12 and satisfying certain conditions, or older than 45 without any school qualifications). The access programme also allows students who do not have matriculation exemption to enrol provisionally at Unisa. Once

103
When this research started in 2011, COS1511 was part of the programme mix for both the National
Diploma: Information Technology (NDINL) and the BSc with Computer Science as major.
Subsequently, as from 2013, a new curriculum for NDINL has been implemented and the NDINL was
renamed the National Diploma in Information Technology (NDIT). In the new curriculum COS1511
has been replaced with another module. However, NDINL students who have to repeat COS1511 or
who had been registered for the NDINL before 2013 were still allowed to register for COS1511.
Since COS1511 is offered to both degree and diploma students, the pre-requisites are not the same for
all COS1511 students. In particular, NDIT, BA, BEd, non-degree purposes and access students do not
require Mathematics to enrol, while all the other students should have a rating of at least 4 (50% –
59%) for Mathematics. Students also have varying levels of computer literacy, since computer literacy
is not a prerequisite for all of these qualifications. Table 4.2 shows the prerequisites for the degrees
and diplomas that COS1511 is offered to. No aptitude test has to be passed before enrolling for any
degree or diploma (Unisa Calendar Part 7, 2010:6 & 43).
Table 4.2 Prerequisites for degrees and diplomas that COS1511 is offered to
Degree Prerequisites to enrol in COS1511
BSc degree:
Matric exemption with Mathematics and English with a rating of 4, or equivalent (50% – 59%). All students who take Computer Science or Informations Systems as a major should meet the computer literacy requirement. This means students should have passed Computer Application Technology or Information Technology with a rating of 4 (new National Senior Certificate (NSC)) or passed Computer Studies (NSC) or hold an Industry Standard qualification in Computer Literacy issued within the previous five years. If not, then EUP1501 (End-User Computing) is a co-requisite for registration for COS1511 for these students.
BA and BEd Senior Certificate with Matriculation Exemption or NSC with Degree admission or qualify for Conditional Exemption from the Matriculation Board
NDINL/NDIT NSC diploma or Senior certificate
NDEEN NSC diploma with Mathematics, English and Physical Sciences with a rating of 4
COS1511 is a semester module, offered twice a year via open distance education, with student
numbers varying from approximately 1 600 to 3 000 students per semester. All the study material are
made available on Unisa’s course website for COS1511 and consists of –
• a printed Study Guide (Halland, 2011), also available in electronic format;
• a CD containing the prescribed compiler and IDE;
• the tutorial developed for this study; and
they have passed a number of modules applicable to the degree they wish to register for, they are allowed to register formally for that degree.(Unisa Online FAQ)

104
• tutorial letters providing general information about the module, assignments, solutions to
assignments and previous examination papers (see for example
https://my.unisa.ac.za/portal/site/COS1511-12-S18).
In 2012, during the first cycle of testing the developed solution in practice, COS1511 was offered
with 4 lecturers, 14 face to face tutors, 1 e-tutor and 6 external markers. Attending tutor classes were
optional and an optional online forum for interaction with other students and the lecturers was
provided. In 2012 two video conferences were offered during each semester.
In 2013, during the second cycle of testing the developed solution in practice, in the first semester,
COS1511 was offered with 4 lecturers, 4 face to face tutors, 4 e-tutors plus an additional e-tutor for
Science Foundation students9 and 6 external markers. In the second semester of 2013 COS1511 was
offered with 3 lecturers, 5 face to face tutors, 4 e-tutors plus 4 additional e-tutors for Science
Foundation students and 6 external markers. Al students enrolled for COS1511 were allocated to e-
tutors. Each e-tutor tutored approximately 200 students online. No video conferences were offered in
2013. Ten to 30% of the Science Foundation students interacted with e-tutors.
The difference in pre-requisites for the degrees and diplomas for which COS1511 is offered, the
varying levels of computer literacy, the large student numbers and time constraints of the semester
system as well as the ‘distance’ from lecturers and fellow students in ODL as discussed in section 2.2
in Chapter 2, are some of the challenges experienced in the ODL ‘classroom’ at Unisa.
4.3.4.2 Broader context The broader context and theoretical basis for this study have been provided in Chapters 2 and 3. In
Chapter 2 ODL, e-learning and MOOCs; teaching programming in distance education; teaching
introductory programming courses; tracing and visualization are covered, while the focus of Chapter 3
is on the BRACElet project and their contribution to understanding how novices learn to program.
In section 2.2 of Chapter 2 the ODL environment at Unisa is discussed in particular. Factors in the
broader ODL environment that affect students are briefly recapped. The language of tuition at Unisa
is English. With a substantial number of African students (69% in 2012) as well as approximately 5%
foreign students, many of the students have to study in their second or third language. This may place
them at a disadvantage (Carter, Jernejcic & Lim, 2007; Gous & Roberts, 2014; Pillay & Jugoo, 2005).
A large number of students are younger than 25 years, underprepared for tertiary education and
struggle to adapt to it. Many students also come from a rural background, where infrastructure limits
exposure to and availability of modern technology. The high cost of bandwidth in South-Africa,
8 Access to the course website can be arranged on request. 9 The Science Foundation identifies students who may struggle to master the course work and provide additional tutoring free of charge to them.
105
inadequate Internet access, as well as the low technical proficiency level of first-year students as
indicated by Ragan in Ury (2005), also affect the level of support that can be given to these students.
In addition, it makes some of the approaches mentioned in section 2.3 in Chapter 2, where teaching
programming in distance education is addressed, difficult to implement successfully in the Unisa
environment.
As a result, multiple social realities exist. Depending on their background, each student has a different
social reality; for example a student that attended a previously disadvantaged school in a rural
environment has a different social reality than a student that attended a former Model C school and
took Computer Application Technology or Information Technology as a subject at school. Students
with English as first language have different social reality from those with English as a second or third
language. Students from overseas also have different social realities from SA students. Due to the
different social realities and cultural milieus of students, the tutorial used as intervention in this PhD
study, might have been effective for some students, while others might not have needed it.
As mentioned in Chapter 2, many of the problems the novices concerned experience, are due to their
inadequate mental models for programming. This also applies to COS1511 students, who may, in the
ODL environment where students have to study independently, struggle even more. In the light of the
role of tracing in learning to program, teaching novice programmers in the ODL environment to trace
in order to debug and to understand what a program does, may be all the more important.
The aspects identified in the broader context might all have impacted on this research.
4.3.4.3 Researcher’s context Design-based research is characterized by close collaboration between the researcher, designer,
practitioners and participants. In this situation the researcher was also the designer, and a practitioner,
since she was a lecturer for COS1511 during the study. These three roles require particular vigilance
to ensure credible and trustworthy assertions (Barab & Squire, 2004). In particular, the researcher had
to be aware of the possibility of the evaluator effect, the Hawthorne effect, the experimenter effect
and hypothesis guessing as discussed in section 4.3.1.1 in this chapter.
However, acting as researcher, designer and practitioner, also provided an opportunity for the
candidate to gain better insight into the strengths and weaknesses of the design because of the access
to inside information. Reeves (2006) views the close collaboration between practitioners and
researchers in identifying real problems; creating solutions based on existing design principles; and
testing and refining the design principles as one of the primary advantages of design-based research.
Being researcher and designer as well as practitioner gave the researcher in this study a distinct
advantage to deal with the matter at hand.
106
4.3.5 Methodology
The methodology followed in this study is based on Reeves’ (2006) four phases of design-based
research as discussed in section 4.3.1 of this chapter. For each of these four phases, Herrington,
McKenney, Reeves and Oliver (2007) identify certain elements that need to be described in a research
proposal. These elements also had to be addressed in the implementation of the research. Table 4.3 is
adapted from Herrington et al. (2007:4091) and shows where in this thesis each of the elements is
implemented as well as the methods used to do so.
4.3.5.1 Phase 1: Analysis of practical problems by researchers and practitioners in collaboration
As can be seen from Table 4.3, the first phase had already been addressed in Chapters 1, 2, 3 and
some of the preceding sections of this chapter. The remaining phases are addressed in the rest of the
research report. The methods and techniques followed in phases 2 to 4 are discussed below.
4.3.5.2 Phase 2: Development of solutions informed by existing design principles and technological innovation
Phase 2 is addressed in Chapter 5. The theoretical framework was provided by a literature study to
find guidelines for successful visualization. The literature study covered three fields, namely CER,
educational psychology and computer graphics. Principles to guide the design of the intervention, the
tutorial to teach students how to draw variable diagrams, were extracted from the guidelines for using
visualization in teaching provided by these three fields.
A detailed description of the tutorial and design decisions for its development is provided in Chapter
5. While the researcher designed the tutorial, it was implemented by external developers. Initial
testing was done by the researcher to determine whether the tutorial executes correctly. After testing,
the developers adapted the tutorial as specified by the researcher. Once this had been completed the
tutorial was deployed to the students.
Lessons learnt and guidelines discovered during the development process and the testing and
refinement of the tutorial, provided further guidelines for developing and using visualization in
teaching programming.
4.3.5.3 Phase 3: Iterative cycles of testing and refinement of solutions in practice Two cycles were used to test and refine the tutorial to teach students to draw variable diagrams. The
first cycle is described in Chapter 6, and the second cycle in Chapter 7. Mixed methods were used in
the data collection and analysis in these cycles. The qualitative method was used to explain, elaborate,
illustrate and clarify findings generated by the quantitative results (Greene, Caracelli & Graham,
1989). This provided contextual understanding for the quantitative findings, and assisted with a more
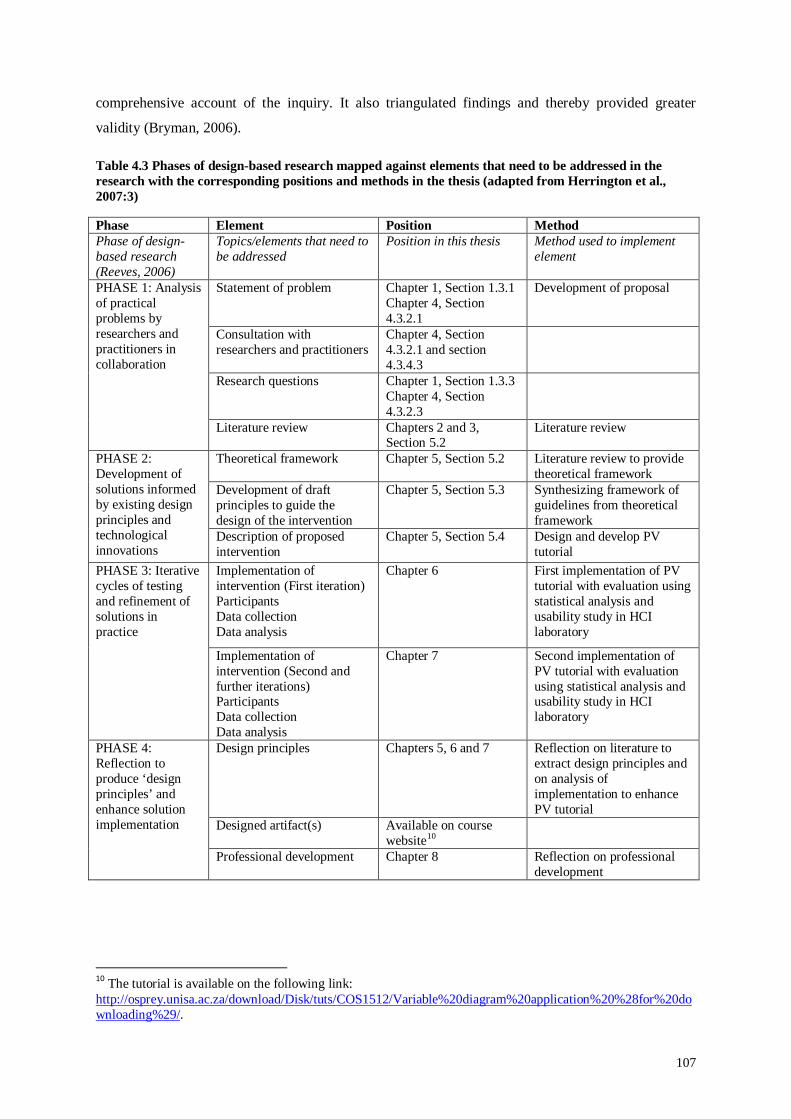
107
comprehensive account of the inquiry. It also triangulated findings and thereby provided greater
validity (Bryman, 2006).
Table 4.3 Phases of design-based research mapped against elements that need to be addressed in the research with the corresponding positions and methods in the thesis (adapted from Herrington et al., 2007:3)
Phase Element Position Method Phase of design-based research (Reeves, 2006)
Topics/elements that need to be addressed
Position in this thesis Method used to implement element
PHASE 1: Analysis of practical problems by researchers and practitioners in collaboration
Statement of problem Chapter 1, Section 1.3.1 Chapter 4, Section 4.3.2.1
Development of proposal
Consultation with researchers and practitioners
Chapter 4, Section 4.3.2.1 and section 4.3.4.3
Research questions Chapter 1, Section 1.3.3 Chapter 4, Section 4.3.2.3
Literature review Chapters 2 and 3, Section 5.2
Literature review
PHASE 2: Development of solutions informed by existing design principles and technological innovations
Theoretical framework Chapter 5, Section 5.2 Literature review to provide theoretical framework
Development of draft principles to guide the design of the intervention
Chapter 5, Section 5.3 Synthesizing framework of guidelines from theoretical framework
Description of proposed intervention
Chapter 5, Section 5.4 Design and develop PV tutorial
PHASE 3: Iterative cycles of testing and refinement of solutions in practice
Implementation of intervention (First iteration) Participants Data collection Data analysis
Chapter 6 First implementation of PV tutorial with evaluation using statistical analysis and usability study in HCI laboratory
Implementation of intervention (Second and further iterations) Participants Data collection Data analysis
Chapter 7 Second implementation of PV tutorial with evaluation using statistical analysis and usability study in HCI laboratory
PHASE 4: Reflection to produce ‘design principles’ and enhance solution implementation
Design principles Chapters 5, 6 and 7 Reflection on literature to extract design principles and on analysis of implementation to enhance PV tutorial
Designed artifact(s) Available on course website10
Professional development Chapter 8 Reflection on professional development
10 The tutorial is available on the following link: http://osprey.unisa.ac.za/download/Disk/tuts/COS1512/Variable%20diagram%20application%20%28for%20downloading%29/.

108
An important ethical consideration in this research was that the study should not impact negatively on
any student by preventing access to the tutorial, similar to the principles followed by the BRACElet
project as discussed in section 3.4.1. Therefore, it was not possible to use a control group as such, and
factor analysis was done instead to determine the effect of a number of factors, one of which was
students’ use of the tutorial, on their final marks.
The two cycles used to test and refine the tutorial are presented as follows in this research report:
• First cycle: The tutorial was first deployed in 2012 by incorporating it in the study material
for COS1511, for both the first and second semester of 2012. This constituted the first
iteration of testing and refinement. Chapter 6 reports in detail on this cycle.
• Second cycle: The second iteration of the implementation occurred in 2013 and is discussed
in Chapter 7. It followed a similar structure to the first cycle, after refinement of both the
tutorial and data collection instruments based on the findings of the first cycle.
The characteristics of the participants, data collection and data analysis were similar in both cycles,
and are briefly discussed below.
Participants
All students enrolled for COS1511 in 2012 and 2013 were participants of the research. Students
registered for 2012 acted as participants in the first cycle and students enrolled in 2013 were
participants in the second cycle. In the first semester of 2012, 2 877 students registered for COS1511
and in the second semester of 2012, 1 921 students. In the first semester of 2013, 1 623 students
enrolled for COS1511 and in the second semester of 2013, 1 593 students11. During each of the two
cycles, a number of these students were observed and eye tracked in the HCI usability laboratory at
Unisa while using the tutorial to evaluate the user interface and find usability problems in the design
(Nielsen, 1994). This was done to increase the effectiveness and utility of the designed intervention.
Self-selection sampling was used, since participants had to come to the usability laboratory at the
Muckleneuk campus of Unisa for the observation and eye tracking. Self-selection sampling occurs
when researchers advertise their need for respondents on a particular topic and collect data from
anyone who responds (Oates, 2006). It should be noted that these participants might not have been
representative of the wider COS1511 population, since they might have thought it would be to their
benefit to participate in the observation and eye tracking /usability testing of the tutorial (Oates,
2006).
11 These numbers differ from those in Table 1.1 in Chapter 1, since Table 1.1 reflects only students still registered for the module at the time of exam sitting, and does not include students who cancelled the module. It was not possible to determine whether students cancelled the module before or after they had completed the questionnaire or were tested in the Human Computer Interaction laboratory.

109
Data collection
The data collection of the research consisted of the following:
• An optional multiple choice questionnaire (see Appendices B.1.1 and B.1.2) on the tutorial, to
be completed with or after the first multiple choice assignment for COS1511 during the first
cycle. A number of questions that require the use of variable diagrams were asked in this
assignment, which should have encouraged students to use the tutorial to learn how to trace.
The questionnaire contained questions on biographical data and previous experience, how
students used the tutorial and their experience of using the tutorial. For the first semester in
the second cycle two questionnaires were administered, one similar to the questionnaire used
in the first cycle (Appendix B.2.1.1), to be completed with or after the first multiple choice
assignment for COS1511, and another to be completed at the end of the semester (Appendix
B.2.1.2). In the second semester of the second cycle only the second questionnaire from the
first semester in the second cycle were administered (Appendix B.2.2.). In the questionnaires
administered at the end of the semesters the questions from the first cycle were adapted or
expanded to shed more light on the findings of the first cycle.
• The examination marks for each student.
• Direct live observation with eye tracking of a small number of COS1511 students in the HCI
laboratory while using the tutorial. One participant at a time was observed. During
observation, participants interacted with the tutorial and conducted specified learning tasks,
including a retrospective comprehension test (see Appendix C.3 for a list of the learning
tasks). Participants were observed in real-time to note their actions, menu selections, reactions
and body language. Video recordings of the interaction were made for subsequent re-
observation and in-depth analysis. Time taken on tasks, reflection, exercises, errors, and so
on, was electronically recorded. The observations and eye-tracking (in particular, gaze
replays) were used to determine how students use the tutorial.
• A questionnaire with open-ended, semi-structured questions (Appendix C.4) that students
completed after the eye tracking and observation. The same questionnaire was used in both
the first and the second cycle.
The multiple choice survey on the tutorial as well as assignment and examination marks were
collected for both semesters in 2012 and 2013, while observation and eye tracking of students in the
usability laboratory were done once in 2012 and once in 2013.
In this study, questionnaires (Appendix B) were used to collect data about the students’ use and user
experience of the tutorial, since there were a large number of wide-spread participants; and
standardised data were required for the statistical analysis. The questionnaires were self-administered,
with closed questions and pre-defined answers to make it easy to complete and analyse. The
110
researcher used both her study leader and a professional statistician as sounding boards to assist with
ensuring the content and construct validity as well as the reliability of the questionnaire. Content
validity refers to making sure that the questionnaire generate data about the concepts being
investigated, while construct validity is concerned with whether the questions measure what they are
expected to measure. Reliability is concerned with whether the questionnaire would generate the same
results if repeatedly administered to the same students (Oates, 2006). Construct validity are
determined by Exploratory Factor analysis on the constructs in a questionnaire tested by a Likert scale
(Terre Blanche et al., 2006). In the first implementation cycle there was only one construct, namely
perception of positive experience, termed ‘positive user experience’. Therefore construct validity
could not be tested. In the second implementation cycle another construct was added to the
questionnaires, namely perception of learning from the tutorial, termed ‘learning experience’.
However, since there were not enough responses to allow for exploratory analysis, construct validity
could not be tested. Reliability of both of these constructs, that is, the internal consistency (Terre
Blanche et al., 2006), was however tested by item analysis. The disadvantages of using questionnaires
in this scenario included not being able to correct misunderstandings, offer explanations or help,
query disparities between answers or check the truthfulness of answers. The pre-defined answers
might have frustrated participants so that they refused to partake, and could also have biased
respondents to the researcher’s viewpoint (Oates, 2006).
While the questionnaires gave an indication of user experience, eye tracking in a usability laboratory
was used to observe how students used the tutorial, and so investigate usability. Eye tracking consists
of recording and measuring eye movements with a screen equipped with a built-in eye tracking
device. Most eye tracking studies analyse patterns of visual attention of individuals when performing
tasks such as reading, scanning or searching. Eye-tracking equipment allows for recording and
replaying the records of eye movement, while software identify and analyse patterns of visual
attention when performing a task (Djamasbi, 2014).
People only see when they focus overt attention on an object. A pause of eye movement on a specific
area is called a fixation. The rapid movements between fixations are called saccades. Since
information can only be perceived and interpreted information when the eyes fixate on it, there will be
more or longer fixations on more complicated, confusing or interesting features. The data created by
eye tracking consists of gaze plots and heatmap visualizations. A gaze plot shows the movement
sequence and position of fixations and saccades on an observed image. The size of a dot gives an
indication of the duration of a fixation, while the dots are numbered in the order in which fixations
occur. A heatmap highlights the areas of the image where participants fixated. Warm colours such as
red or orange will indicate longer fixations or many fixations on the same area (Djamasbi, 2014).
Since eye-tracking data only provides an indication of how long and where a participant fixated, it
does not give an indication of the success or comprehension of the participant. Additional
111
performance measures such as retrospective comprehension tests or think-aloud feedback from the
participant is required to correctly interpret the data (Hyönä, 2010). In addition, the following had to
be kept in mind to enhance validity in eye tracking (Poole & Ball, n.d.):
• Eye trackers can have difficulty tracking participants with glasses or contact lenses since that
interrupts the normal path of reflection. Large pupils and lazy eyes may also be problematic.
• Participants in eye-tracking should perform well-defined tasks to attribute eye movements to
actual cognitive processing.
• Visual distractions should be eliminated.
• Filtering and analysis should be performed automatically to process the huge amounts of data
generated by eye tracking, en eliminate introducing errors with manual data processing.
Pernice and Nielsen (2009) recommend using gaze replays with six participants for qualitative eye
tracking. Gaze replays enable the researcher to watch the test session video with the user’s eye motion
overlaid over a recording of the changing computer screen image. The user’s eye is represented by a
blue dot moving around the screen. Gaze replays are the most accurate method for analysing the
information since the replay can be slowed down to really see everything the user looked at in the
order in which they were doing it. However, they are very time consuming since the eye moves so
quickly that segments frequently have to be slowed down and replayed to get an accurate idea of what
happened (Pernice & Nielsen, 2009).
Heat maps and gaze plots can only be used when all participants follow the same path through an
application. Therefore only gaze replays were used to investigate how participants used the tutorial, as
each student followed his or her own path through the tutorial. After eye tracking, the participants
were asked to draw variable diagrams in a retrospective comprehension test to give an indication of
the comprehension or learning of the participant.
Data analysis
The main objective with the multiple-choice questionnaire included with the first assignment, was to
investigate the effect of the tutorial on examination marks. As far as the data analysis was concerned,
statistical analysis was used to investigate several factors that may affect students’ performance, such
as the biographical properties of students, their positive user experience and their use of tracing. The
extent and manner of their tutorial use were investigated in relation to their examination marks. A
trained statistician performed the analysis to ensure its validity. It should be noted that since the
survey was adapted and expanded, more factors were investigated in the second cycle.
Statistical analysis has also been used to compare the examination results of the participants with the
marks for questions on reading (tracing) program code, explaining program code and writing program
code to determine whether the students’ ability to read code (that is explain the purpose of code) and
112
trace code had any effect on students’ results. This was done to confirm that the findings from the
BRACElet project that was used as the departing point for this study, applied to the participants in this
study.
The live observations in the usability laboratory and the questionnaires completed after the
observations were used to provide further insight into the results of the statistical analysis. Tracking
the eye movements of participants using the tutorial provided knowledge of how students interact
with the tutorial. This identified usability problems with regard to the layout of the tutorial,
terminology used, students’ comprehension of the material presented and their navigation through the
tutorial. Analysing students’ actions, menu selections, reactions and body language on the video
recordings were combined with gaze replays, the retrospective comprehension test and the semi-
structured, open-ended questionnaire students complete after the eye tracking, to expose usability
problems with the tutorial. Improvements to the design could therefore be based on learner interaction
and feedback.
Together, these insights were used to refine and adapt the tutorial for further use. During the second
cycle, this was used as indications of whether refinement of the tutorial solved or improved usability
problems with the tutorial. These insights were once again used to refine and adapt the tutorial for
further use.
The findings from the data analysis during the first cycle are reported in Chapter 6 and the findings
from the data analysis during the second cycle are reported in Chapter 7. These two chapters also
report on how the data analysis was used to adapt and refine the tutorial for the next cycle in the study
or for further use.
4.3.5.4 Phase 4: Reflection to produce ‘design principles’ and enhance solution implementation
During this phase the output of the design-based research effort, that is, the knowledge and products
produced, are presented. The output consists of the following (Herrington et al., 2007):
• The theoretical contribution of the research in the form of design principles that can be used
for further development and implementation decisions.
• The practical output, namely the designed artifact itself.
• Societal outputs in the form of professional development of participants.
The theoretical contribution takes the form of the framework of guidelines for using visualization in
teaching programming. The framework of guidelines for using visualization in teaching programming
compiled from the literature review in Chapter 5 was used as the starting point for the design of the
tutorial. Lessons learnt and guidelines derived during the process of design and development of the
113
tutorial, as well as in the subsequent cycles of refinement and testing, were documented to enhance
the framework of guidelines and incorporated into the framework to refine it in Chapter 7.
In Chapter 8, the summary and conclusion, the success of the intervention is evaluated and the
findings discussed to show the significance of the study. The findings from each of the previous
phases were combined to answer the research questions and included reflections on the reasons for the
findings. The tutorial is available on the following link:
http://osprey.unisa.ac.za/download/Disk/tuts/COS1512/Variable%20diagram%20application%20%28
for%20downloading%29/. Click on Unisa.exe to download and execute it.
In Chapter 8 the researcher also reflects on the validity of the research and the societal outputs,
including her professional development during the research.
4.3.6 Validating the research effort
The validity of a research effort entails three aspects (Leedy & Ormrod, 2005), namely –
• internal validity – the extent to which the researcher can conclude and defend cause and effect
relationships among variables;
• external validity – the extent to the researcher can conclude that results can be generalised to
a broader context or larger population; and
• general credibility and trustworthiness – the extent to which others perceive the findings to be
convincing and of value.
Creswell and Plano Clark (2011) define validity in mixed methods research, as applying strategies
that address potential issues in data collection, data analysis and interpretations that might affect the
merging of the qualitative and quantitative components of the study and the conclusions drawn. The
following validity issues required particular attention when integrating the quantitative and qualitative
results in this study (Creswell & Plano Clark, 2011; Leedy & Ormrod, 2005):
• Samples for quantitative and qualitative aspects of the study had to be the same or sufficiently
similar to justify comparison between the quantitative and qualitative data.
• The quantitative and qualitative data should have addressed the same or related topics and
research question(s).
• Were the quantitative and qualitative data weighted equally in drawing conclusions? If not,
what was the rationale for giving priority to one type of data over the other?
• Specific statements or artifacts from the qualitative element of the study had to be used to
support or illustrate the quantitative results.
• Divergent findings between the quantitative and qualitative data had to be reasonably resolved
by gathering more data, reanalyzing current data and evaluating procedures.
• The iterative cycles had to be related to each other.

114
As discussed in section 4.3.1.2 of this chapter, meticulous documentation; triangulation through
multiple data sources and iterative cycles of implementation and analysis; as well as standardised
measures had be used to ensure reliability of findings and measures. In addition the validity of data
collection and analysis had to be ensured.
To ensure validity in the two cycles of data collection and analysis, the researcher had to adhere to
methodological practices consistent with using questionnaires and observation with eye tracking to
confirm the trustworthiness and credibility of claims (Barab & Squire, 2004). As mentioned before, a
trained statistician did the statistical analysis to ensure its validity.
Possible threats to the validity of the statistical analysis include the following (Oates, 2006):
• Differences between the year-groups used in the two implementation cycles (internal
validity).
• Events and changes in the Unisa ODL environment beyond the researcher’s control (internal
validity).
• Reactivity on the part of participants that wanted to help the researcher or to give a good
impression, and so tried to respond by giving what they think were the ‘correct’ responses
(internal validity).
• Too few participants that completed the questionnaires (external validity).
The researcher was the only person analysing the gaze replays for the eye-tracking participants. To
counteract possible threats to the validity in this process at least 6 participants performing the same
tasks, were used to provide triangulation of data, as recommended by Pernice and Nielsen (2009).
Verbatim quotes from participants’ feedback questionnaires were used to confirm findings. The
researcher also had to constantly reflect on her own assumptions and the effect her presence might
have had on the participants (Oates, 2006).
The next section addresses the ethical considerations applied in this study.
4.3.7 Ethical considerations
To comply with the Unisa research ethics policy, ethical clearance for this PhD study was obtained
from the School of Computing Ethics Sub-Committee in the College of Science, Engineering and
Technology at Unisa. The application for ethical clearance included screen shots of the tutorial; the
questionnaires students were to complete to determine their use and user experience of the tutorial;
and the informed consent form to be completed by students tested with eye tracking in the HCI
laboratory at Unisa, as well as the questionnaire that students were to complete after the eye tracking
tests. The letter confirming that ethical clearance was granted is included in Appendix A.
115
The work of the BRACElet project to understand the development of novice programmers and the
role of tracing in this process was a motivation for this study. One of the guiding and ethical
principles followed by the BRACElet project was that the study should not impact negatively on any
student (Clear, Edwards et al., 2008; Whalley & Clear, 2007; Whalley & Lister, 2009; Whalley &
Robbins, 2007). In this study, the researcher considered it important to follow the same principle. As a
result, a control group in which students would not have had access to the tutorial, while the rest of
the students did have access, could not be used. Instead factor analysis was done to determine the
effect of a number of factors (described in Chapters 6 and 7) on students’ final marks, including
students’ use of the tutorial. In preparation for this study, questions on tracing had been included in
assignments and the examination.
4.4 Conclusion and summary
This chapter presented the research design and methodology used in this study. In section 4.2 the
various aspects comprising a research design were discussed, and in section 4.3 the research design
and methodology were described according to these aspects.
Section 4.3.1 provided an overview of design-based research, the research design used. The research
problem and purpose of the research, including the research questions, were reiterated in section 4.3.2.
Section 4.3.3 provided the justification for choosing pragmatism as the philosophical paradigm or
approach for this research. The context, in which the research was conducted, is described in terms of
the local context, the broader context and the researcher’ own context, in section 4.3.4.
In section 4.3.5 Reeves’ (2006) four phases of design-based research were used to elaborate on the
methodology followed. The first of these four phases has already been addressed in Chapters 2 and 3
as well as in certain sections in this chapter. In section 4.3.6, validating the research effort was
discussed. Section 4.3.7 addressed ethical considerations. In the next chapter the second of Reeves’
(2006) four phases, namely the development of solutions informed by existing design principles and
technological innovations, is described.

116
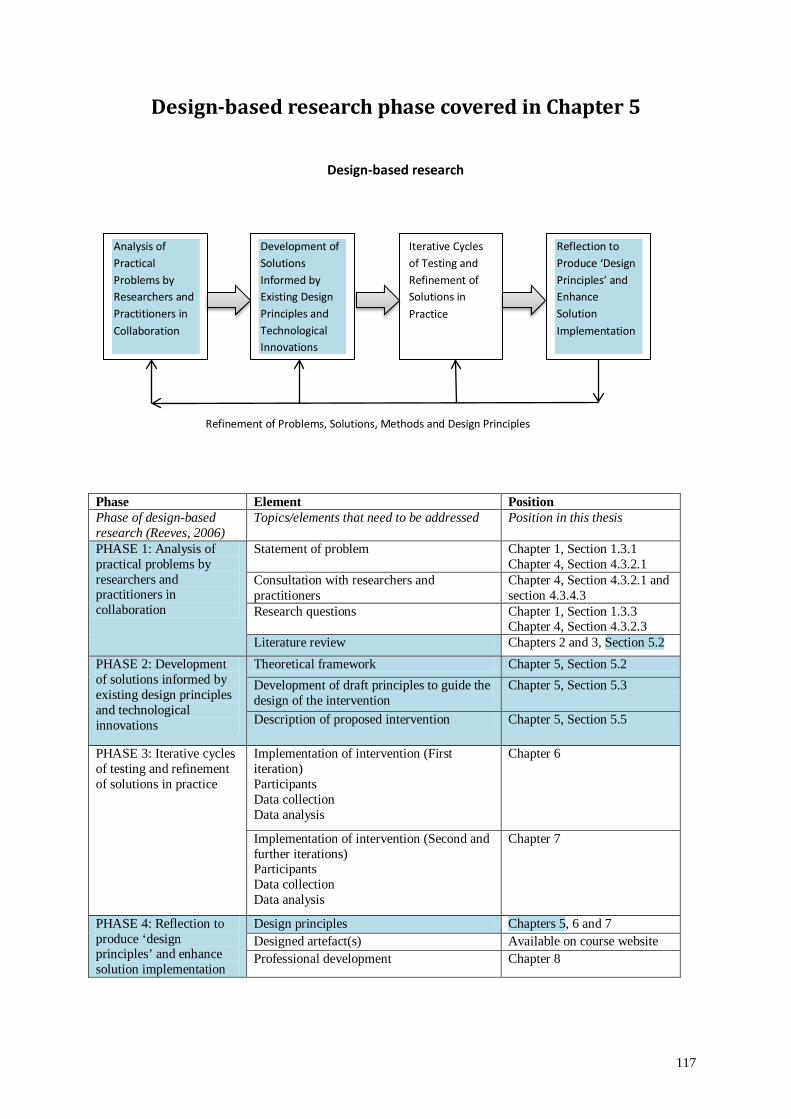
117
Design-based research phase covered in Chapter 5
Design-based research
Phase Element Position Phase of design-based research (Reeves, 2006)
Topics/elements that need to be addressed Position in this thesis
PHASE 1: Analysis of practical problems by researchers and practitioners in collaboration
Statement of problem Chapter 1, Section 1.3.1 Chapter 4, Section 4.3.2.1
Consultation with researchers and practitioners
Chapter 4, Section 4.3.2.1 and section 4.3.4.3
Research questions Chapter 1, Section 1.3.3 Chapter 4, Section 4.3.2.3
Literature review Chapters 2 and 3, Section 5.2 PHASE 2: Development of solutions informed by existing design principles and technological innovations
Theoretical framework Chapter 5, Section 5.2 Development of draft principles to guide the design of the intervention
Chapter 5, Section 5.3
Description of proposed intervention Chapter 5, Section 5.5
PHASE 3: Iterative cycles of testing and refinement of solutions in practice
Implementation of intervention (First iteration) Participants Data collection Data analysis
Chapter 6
Implementation of intervention (Second and further iterations) Participants Data collection Data analysis
Chapter 7
PHASE 4: Reflection to produce ‘design principles’ and enhance solution implementation
Design principles Chapters 5, 6 and 7 Designed artefact(s) Available on course website Professional development Chapter 8
Analysis of Practical Problems by Researchers and Practitioners in Collaboration
Development of Solutions Informed by Existing Design Principles and Technological Innovations
Iterative Cycles of Testing and Refinement of Solutions in Practice
Reflection to Produce ‘Design Principles’ and Enhance Solution Implementation
Refinement of Problems, Solutions, Methods and Design Principles
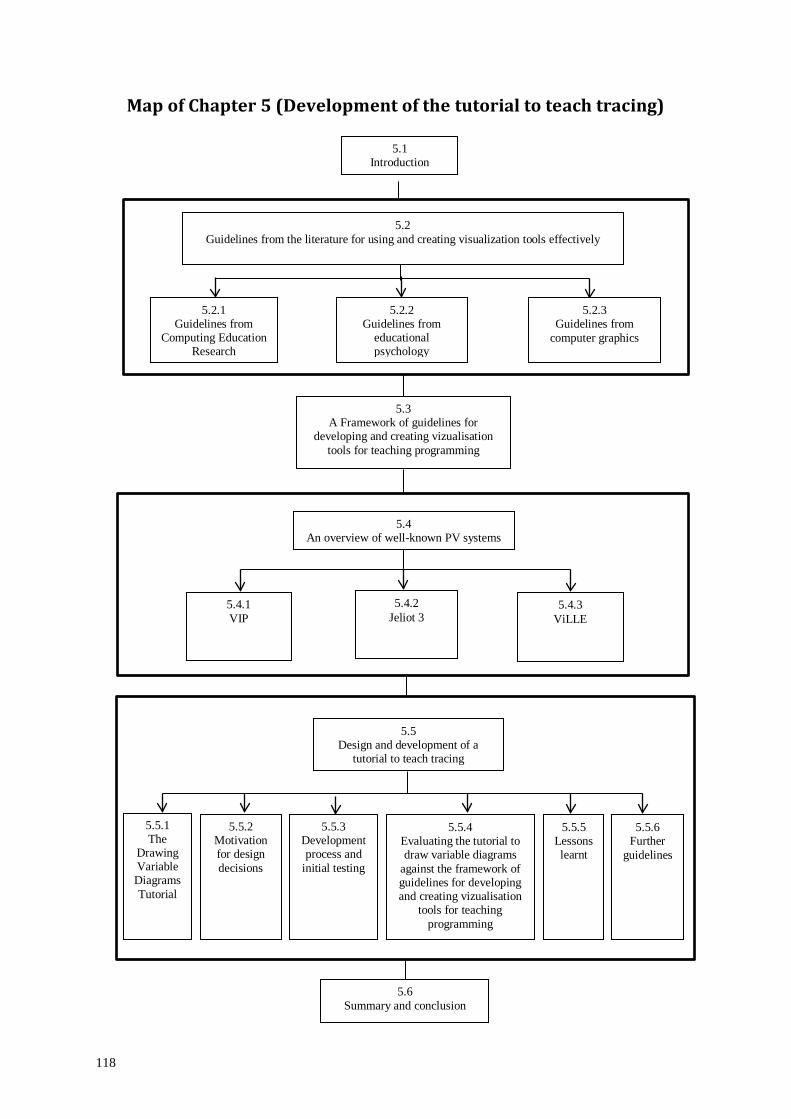
118
Map of Chapter 5 (Development of the tutorial to teach tracing)
5.1 Introduction
5.2 Guidelines from the literature for using and creating visualization tools effectively
5.4 An overview of well-known PV systems
5.6 Summary and conclusion
5.2.1 Guidelines from
Computing Education Research
5.2.2 Guidelines from
educational psychology
5.4.2 Jeliot 3
5.4.3 ViLLE
5.3 A Framework of guidelines for
developing and creating vizualisation tools for teaching programming
5.5 Design and development of a
tutorial to teach tracing
5.5.1 The
Drawing Variable Diagrams Tutorial
5.5.6 Further
guidelines
5.4.1 VIP
5.5.4 Evaluating the tutorial to draw variable diagrams
against the framework of guidelines for developing and creating vizualisation
tools for teaching programming
5.2.3 Guidelines from
computer graphics
5.5.2 Motivation for design decisions
5.5.5 Lessons learnt
5.5.3 Development process and
initial testing

119
Chapter 5 Development of the tutorial to teach tracing
5.1 Introduction
This study addresses the low pass rate situation in a first-year programming module (COS1511) at
Unisa, by providing the students with an interactive tutorial to teach them how to trace a computer
program. In particular, students experience problems to understand and learn from text-based study
material how to draw diagrams to trace program code. The literature review in Chapters 2 and 3 has
shown the importance of tracing in learning to program. This chapter describes the development of
the tutorial used to teach the students program tracing. It resembles a PV tool.
As discussed in the previous chapter, design-based research is used as research design for this study.
The aim of the research was therefore two-fold, devising a practical intervention in the form of the
tutorial as well as developing a framework of guidelines for using and creating visualizations or
visualization tools to teach programming. The tutorial developed in this study is specifically adapted
for use in an ODL environment.
The study is aligned to the four phases of design-based research according to Reeves (Reeves, 2006).
As has been shown in Table 4.3 in Chapter 4, most of the first phase (analysis of practical problems
by researchers and practitioners in collaboration), is addressed in various sections in Chapter 4. This
includes the problem statement, input from researchers and practitioners, and the research questions.
The final element in the first phase, the literature review, is covered almost completely in Chapters 2
and 3. This chapter presents the last component in the literature review in section 5.2, namely
guidelines from literature for using and creating visualization tools effectively, as well as the rest of
the second phase in design-based research (Reeves, 2006). This involved the development of a
solution informed by existing design principles and technological innovation.
The guidelines from the literature for using and creating visualization tools effectively as described in
section 5.2 were used to construct a framework of guidelines for using and creating visualizations and
visualization tools to teach programming. This framework is presented in section 5.3 and acted as the
theoretical framework to guide the design of the tutorial to teach tracing. The design and development
of the tutorial itself, as well as its evaluation against the framework of guidelines, is described in
section 5.4. This includes lessons learnt during the development and testing of the tutorial which led
to further guidelines for developing PV tools. The summary and conclusion is presented in section
5.5.
120
5.2 Guidelines from the literature for using and creating visualization tools effectively
AV (algorithm visualization) refers to illustrating an algorithm in terms of its high-level operations to
enhance understanding of its procedural behaviour (Hundhausen et al., 2002). PV (program
visualization) on the other hand, visualizes the actual implemented code or data, showing the effect of
each operation (Röβling et al., 2008). In 2007, Shaffer et al. (2007) claimed that despite a significant
number of papers reporting on AVs, not much has been published on how to create pedagogically
useful algorithm visualizations. Recently, however, the body of research on using AVs effectively is
growing (Shaffer et al., 2011). Since PVs require much more effort to implement, the bulk of
visualizations are AVs (Röβling et al., 2008), while most literature reviews also focus on AV.
However, although fewer papers provide guidelines for effective PVs, since AV is so close to PV,
many of the results in AV research can be applied to PV (Lahtinen, 2008).
This section presents guidelines from the literature for using and creating effective educational
visualization tools from three research areas, namely CER, educational psychology and computer
graphics. These general guidelines were used as a point of departure for developing the tutorial. Note
that in the ODL environment at Unisa where students have to study on their own, some of these
guidelines were not appropriate for use.
5.2.1 Guidelines from CER
Sorva, Karavirta and Malmi (2013:15:8) note that “Even a visualization that has been painstakingly
crafted to be as lucid as possible may fail to aid learning in practice”. In CER there seems to be
general consensus that visualizations are only educationally effective if they actively engage learners
in activities such as the following (Foutsitzis & Demetriadis, 2008; Hundhausen & Douglas, 2002;
Hundhausen et al., 2002; Naps, Röβling et al., 2003; Pears, Seidman et al., 2007):
• Constructing their own input data sets.
• Making predictions regarding future visualization states.
• Programming the target algorithm.
• Answering strategic questions about the visualization.
• Constructing their own visualizations.
Other ways in which program and algorithm visualization (PAV) can engage students, are to
encourage them to search for trends or structures; test a hypothesis through interaction; or by
specifying a result that students should achieve by tinkering with the parameters of an algorithm
(Foutsitzis & Demetriadis, 2008). Students can be asked to test their understanding through self-
assessment exercises (Hundhausen & Douglas, 2002). Periodic questions posed by the PAV may
serve the same purpose. Tickler questions (random pop-up questions in appropriate context without
121
feedback) focus students’ attention on specific issues and encourage self-explanation. Multiple-choice
questions and questions that prevent the user from continuing without the correct answer can also be
used (Foutsitzis & Demetriadis, 2008; Hansen, Narayanan & Hegarty, 2002; Naps, Röβling et al.,
2003; Röβling et al., 2008).
To ensure that students accept a PAV tool and really engage with it, it should be integrated as part of
the course material (Ben-Bassat Levy & Ben-Ari, 2007; Lahtinen, 2006; Lahtinen, Jarvinen &
Melakoski-Vistbacka, 2007; Röβling, 2010). Furthermore, they should be properly guided in how to
use it, as research has shown that this can lead to statistically significantly better learning results
(Grissom et al., 2003; Laakso et al., 2008b). PAV should be used with discretion. Since the use of
PAV tools can assist students with problems, but also have no value for students who already
understand programming well, Lahtinen (2006) and Lahtinen, Ahoniemi and Salo (2007) recommend
that students should be allowed to use PAV tools voluntarily.
Based on an empirical study and analysis, Stasko, Badre and Lewis (1993) report their insights on
conditions when animations may be beneficial. They believe that to be most effective, teachers should
provide comprehensive motivational instructions with animations. Animation displays should be
accompanied by textual explanations of the various steps in the animation, and animations should be
linked to specific instructional goals. Designers should perform user testing on each animation before
using it for instruction. A rewind-replay capability should be included to allow users to backtrack and
review operations. The authors also recommend that animation systems should support students to
build their own animations (Stasko et al., 1993). All of these recommendations have been echoed and
confirmed by follow-up research, as discussed below.
The Working Group on Visualization (Bergin, Brodie, Patiño-Martínez, McNally, Naps, Rodger,
Wilson, Goldweber, Khuri & Jiménez-Peris, 1996) provides the following principles to keep in mind
when designing a visualization tool:
• The primary goal when constructing a visualization should be to instruct and not to entertain.
‘Tricks’ to capture attention should be used to improve students’ comprehension.
• Provide the user with a standard GUI to manipulate the tool, for example a GUI similar to a
Windows environment with which the user is already familiar.
• Provide different views of the data, program or algorithm, for example. for a Quicksort
algorithm the actual data in an array structure, a ‘sticks’ view where the length of a bar
represents the magnitude of a value in the array, or the run-time stack and the recursive call
tree.
• Provide the user with simultaneous identical views of different algorithms manipulating the
same data, for instance when comparing algorithms, present the user with the same view of
the two algorithms using the same data set, in different windows.

122
• Draw the user’s attention to critical areas of the visualization, by using different colours for
example.
• Use a text window to explain the visualization to ensure that the user understands it. This
window should ideally be visible throughout the visualization.
• Provide a high degree of user interactive control to allow the user to pan, zoom, pause, speed-
up, slow-down and re-wind during the visualization.
• The best visualizations will require high-end display devices to allow different views of the
same algorithm, a simultaneous identical view of different algorithms as well as a text
window for explanations.
The Working Group on Improving the Educational Impact of Algorithm Visualization (Naps, Röβling
et al., 2003) describes the following set of best practices, based on experience, developed since the
‘80’s:
• Provide resources that help learners interpret the graphical representation that maps the
visualization to the underlying algorithm by explaining it with text or narration, or reinforce
the relationship with instructional time during the course.
• Adapt to the knowledge level of the user, for example use a less complicated system for
novices.
• Provide multiple views with windows for both pseudocode and program animation, or
program animation and algorithm animation for instance.
• Include performance information that shows the algorithm’s efficiency.
• Include the execution history so that learners can see previous steps.
• Support flexible execution control, for example by allowing the user to move both forward
and backwards and stop and pause.
• Support learner-built visualizations that allow users to build their own visualizations.
• Support custom input data sets so that users can explore the visualization with different data
sets.
• Support dynamic questions by periodically asking pop-up questions (ticklers) or questions
that prevent the user from continuing without correct answers.
• Support dynamic feedback on the learner’s activities in the system.
• Complement visualizations with explanations, for instance with a coordinated text window or
audio track, and integrating it into the course.
Several of the recommendations by these two working groups correspond, namely proving multiple
views, flexible execution control and providing explanations.
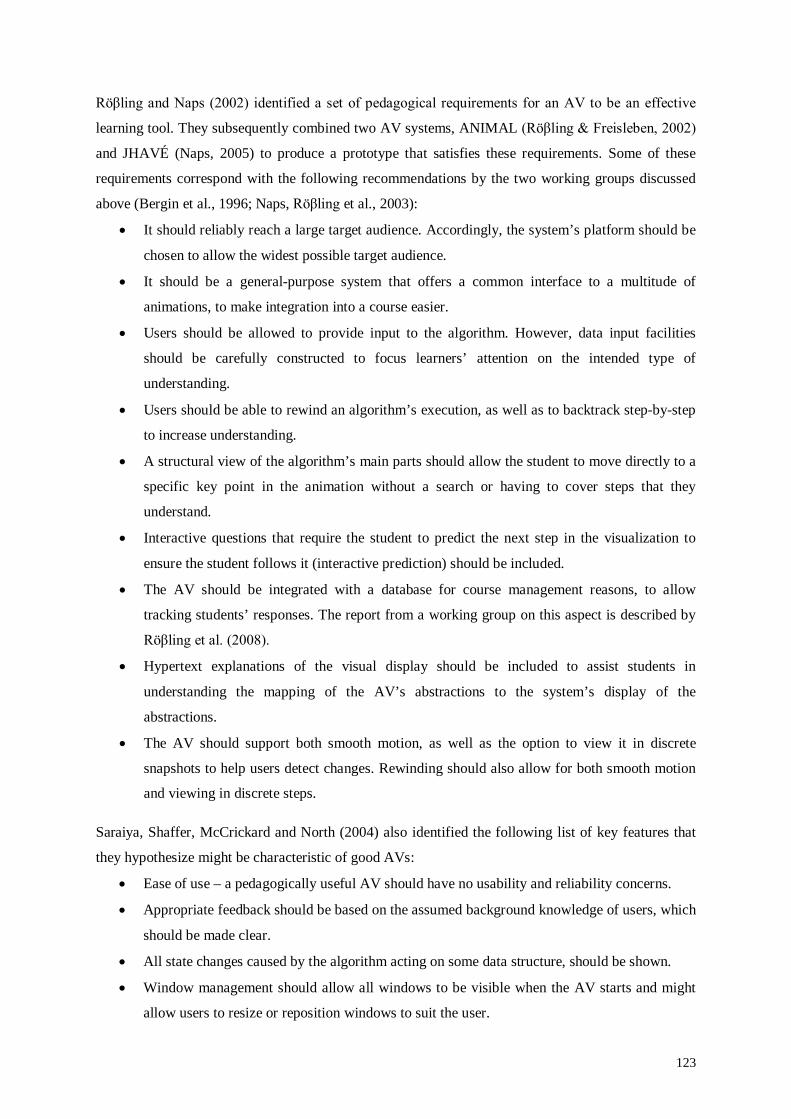
123
Röβling and Naps (2002) identified a set of pedagogical requirements for an AV to be an effective
learning tool. They subsequently combined two AV systems, ANIMAL (Röβling & Freisleben, 2002)
and JHAVÉ (Naps, 2005) to produce a prototype that satisfies these requirements. Some of these
requirements correspond with the following recommendations by the two working groups discussed
above (Bergin et al., 1996; Naps, Röβling et al., 2003):
• It should reliably reach a large target audience. Accordingly, the system’s platform should be
chosen to allow the widest possible target audience.
• It should be a general-purpose system that offers a common interface to a multitude of
animations, to make integration into a course easier.
• Users should be allowed to provide input to the algorithm. However, data input facilities
should be carefully constructed to focus learners’ attention on the intended type of
understanding.
• Users should be able to rewind an algorithm’s execution, as well as to backtrack step-by-step
to increase understanding.
• A structural view of the algorithm’s main parts should allow the student to move directly to a
specific key point in the animation without a search or having to cover steps that they
understand.
• Interactive questions that require the student to predict the next step in the visualization to
ensure the student follows it (interactive prediction) should be included.
• The AV should be integrated with a database for course management reasons, to allow
tracking students’ responses. The report from a working group on this aspect is described by
Röβling et al. (2008).
• Hypertext explanations of the visual display should be included to assist students in
understanding the mapping of the AV’s abstractions to the system’s display of the
abstractions.
• The AV should support both smooth motion, as well as the option to view it in discrete
snapshots to help users detect changes. Rewinding should also allow for both smooth motion
and viewing in discrete steps.
Saraiya, Shaffer, McCrickard and North (2004) also identified the following list of key features that
they hypothesize might be characteristic of good AVs:
• Ease of use – a pedagogically useful AV should have no usability and reliability concerns.
• Appropriate feedback should be based on the assumed background knowledge of users, which
should be made clear.
• All state changes caused by the algorithm acting on some data structure, should be shown.
• Window management should allow all windows to be visible when the AV starts and might
allow users to resize or reposition windows to suit the user.
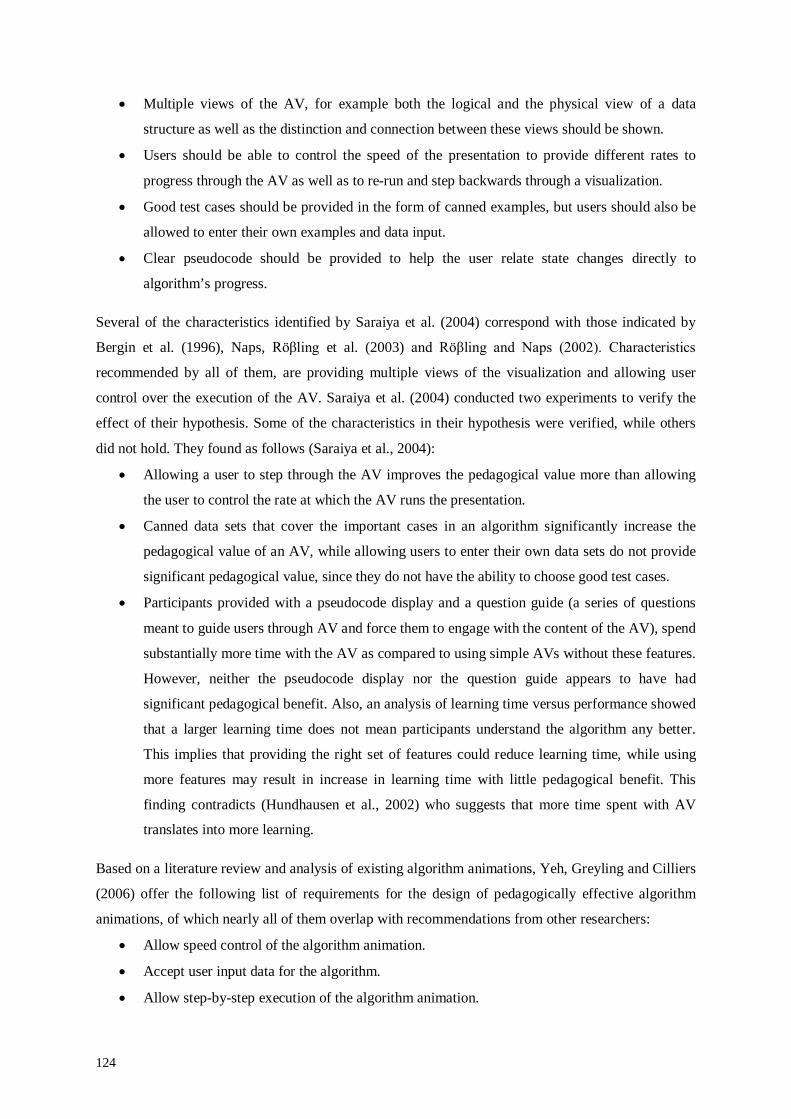
124
• Multiple views of the AV, for example both the logical and the physical view of a data
structure as well as the distinction and connection between these views should be shown.
• Users should be able to control the speed of the presentation to provide different rates to
progress through the AV as well as to re-run and step backwards through a visualization.
• Good test cases should be provided in the form of canned examples, but users should also be
allowed to enter their own examples and data input.
• Clear pseudocode should be provided to help the user relate state changes directly to
algorithm’s progress.
Several of the characteristics identified by Saraiya et al. (2004) correspond with those indicated by
Bergin et al. (1996), Naps, Röβling et al. (2003) and Röβling and Naps (2002). Characteristics
recommended by all of them, are providing multiple views of the visualization and allowing user
control over the execution of the AV. Saraiya et al. (2004) conducted two experiments to verify the
effect of their hypothesis. Some of the characteristics in their hypothesis were verified, while others
did not hold. They found as follows (Saraiya et al., 2004):
• Allowing a user to step through the AV improves the pedagogical value more than allowing
the user to control the rate at which the AV runs the presentation.
• Canned data sets that cover the important cases in an algorithm significantly increase the
pedagogical value of an AV, while allowing users to enter their own data sets do not provide
significant pedagogical value, since they do not have the ability to choose good test cases.
• Participants provided with a pseudocode display and a question guide (a series of questions
meant to guide users through AV and force them to engage with the content of the AV), spend
substantially more time with the AV as compared to using simple AVs without these features.
However, neither the pseudocode display nor the question guide appears to have had
significant pedagogical benefit. Also, an analysis of learning time versus performance showed
that a larger learning time does not mean participants understand the algorithm any better.
This implies that providing the right set of features could reduce learning time, while using
more features may result in increase in learning time with little pedagogical benefit. This
finding contradicts (Hundhausen et al., 2002) who suggests that more time spent with AV
translates into more learning.
Based on a literature review and analysis of existing algorithm animations, Yeh, Greyling and Cilliers
(2006) offer the following list of requirements for the design of pedagogically effective algorithm
animations, of which nearly all of them overlap with recommendations from other researchers:
• Allow speed control of the algorithm animation.
• Accept user input data for the algorithm.
• Allow step-by-step execution of the algorithm animation.
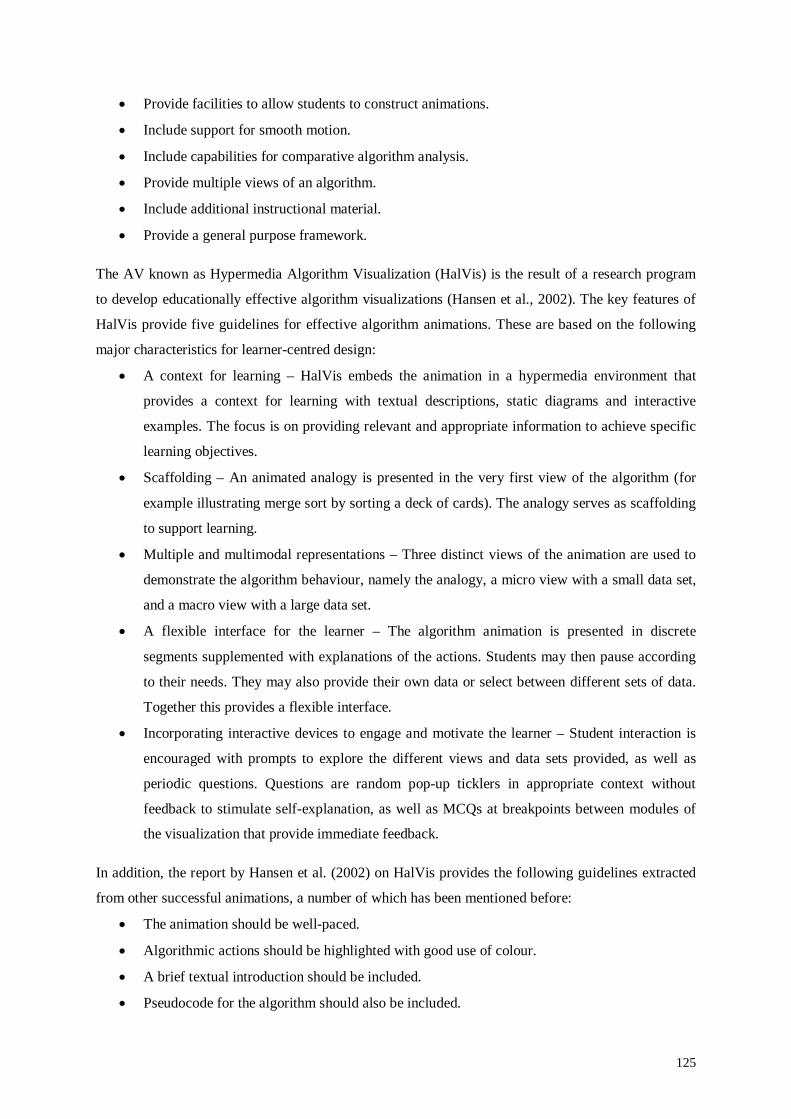
125
• Provide facilities to allow students to construct animations.
• Include support for smooth motion.
• Include capabilities for comparative algorithm analysis.
• Provide multiple views of an algorithm.
• Include additional instructional material.
• Provide a general purpose framework.
The AV known as Hypermedia Algorithm Visualization (HalVis) is the result of a research program
to develop educationally effective algorithm visualizations (Hansen et al., 2002). The key features of
HalVis provide five guidelines for effective algorithm animations. These are based on the following
major characteristics for learner-centred design:
• A context for learning – HalVis embeds the animation in a hypermedia environment that
provides a context for learning with textual descriptions, static diagrams and interactive
examples. The focus is on providing relevant and appropriate information to achieve specific
learning objectives.
• Scaffolding – An animated analogy is presented in the very first view of the algorithm (for
example illustrating merge sort by sorting a deck of cards). The analogy serves as scaffolding
to support learning.
• Multiple and multimodal representations – Three distinct views of the animation are used to
demonstrate the algorithm behaviour, namely the analogy, a micro view with a small data set,
and a macro view with a large data set.
• A flexible interface for the learner – The algorithm animation is presented in discrete
segments supplemented with explanations of the actions. Students may then pause according
to their needs. They may also provide their own data or select between different sets of data.
Together this provides a flexible interface.
• Incorporating interactive devices to engage and motivate the learner – Student interaction is
encouraged with prompts to explore the different views and data sets provided, as well as
periodic questions. Questions are random pop-up ticklers in appropriate context without
feedback to stimulate self-explanation, as well as MCQs at breakpoints between modules of
the visualization that provide immediate feedback.
In addition, the report by Hansen et al. (2002) on HalVis provides the following guidelines extracted
from other successful animations, a number of which has been mentioned before:
• The animation should be well-paced.
• Algorithmic actions should be highlighted with good use of colour.
• A brief textual introduction should be included.
• Pseudocode for the algorithm should also be included.

126
• Pseudocode lines should be highlighted synchronously as the animation executes.
McNally, Naps, Furcy, Grissom and Trefftz (2007) developed AVsupport, a suite of Java support
classes that enables creators of visualizations to rapidly construct pedagogically effective algorithm
visualizations. AVsupport is based on a subset of features that educational research has indicated is
required for real learning by users of animations. This subset includes the following:
• Accompanying text to explain the algorithmic context for the graphics being watched, to the
learner. AVsupport offers textual support in the form of standard HTML documents in which
the algorithm is described conceptually and pseudocode synchronised with the states of the
algorithm being graphically displayed.
• Variety should allow the learner to view repeated, but differing visualizations of the same
algorithm. This can be achieved by allowing the learner to provide different inputs to the
algorithm.
• Interactive questioning asks the learners questions that will force them to stop and think about
what they are viewing. If interactive feedback is provided, this will show them how well they
understand the algorithm.
• Ability to move backward and forward through the visualization: An animation should be
seen as a sequence of snapshots of the state of the algorithm at various points in its execution.
Therefore, if learners become confused somewhere along the sequence, they must be able to
selectively backtrack up to where they became lost.
Based on three qualitative studies among university and high school students about their use of the PV
tool ViLLE, Kaila et al. (2011) point out essential features for PV tools. As research has shown
repeatedly, the tool should activate and engage students, for example with questions (Ben-Ari et al.,
2011; Grissom et al., 2003; Isohanni & Knobelsdorf, 2011; Kaila et al., 2009; Laakso et al., 2009;
Urquiza-Fuentes & Velázquez-Iturbide, 2009a). Flexible controls, especially the ability to move
backwards in execution, are highly valued. This has also been suggested a number of times in
previous research results (McNally et al., 2007; Röβling & Naps, 2002; Saraiya et al., 2004). Variable
states should be shown clearly. Textual explanations in natural language, synchronised with program
state information, should be included.
5.2.2 Guidelines from educational psychology
Some PAV researchers provide recommendations derived from educational psychology. These
guidelines take the cognitive and perceptive demands of animation, as well as learning theories such
as dual coding and cognitive load into consideration.
Taylor and Pountney (2009) conducted experiments with UK undergraduate computing students to
compare the perceived usefulness of animated and static learning materials. In these experiments the
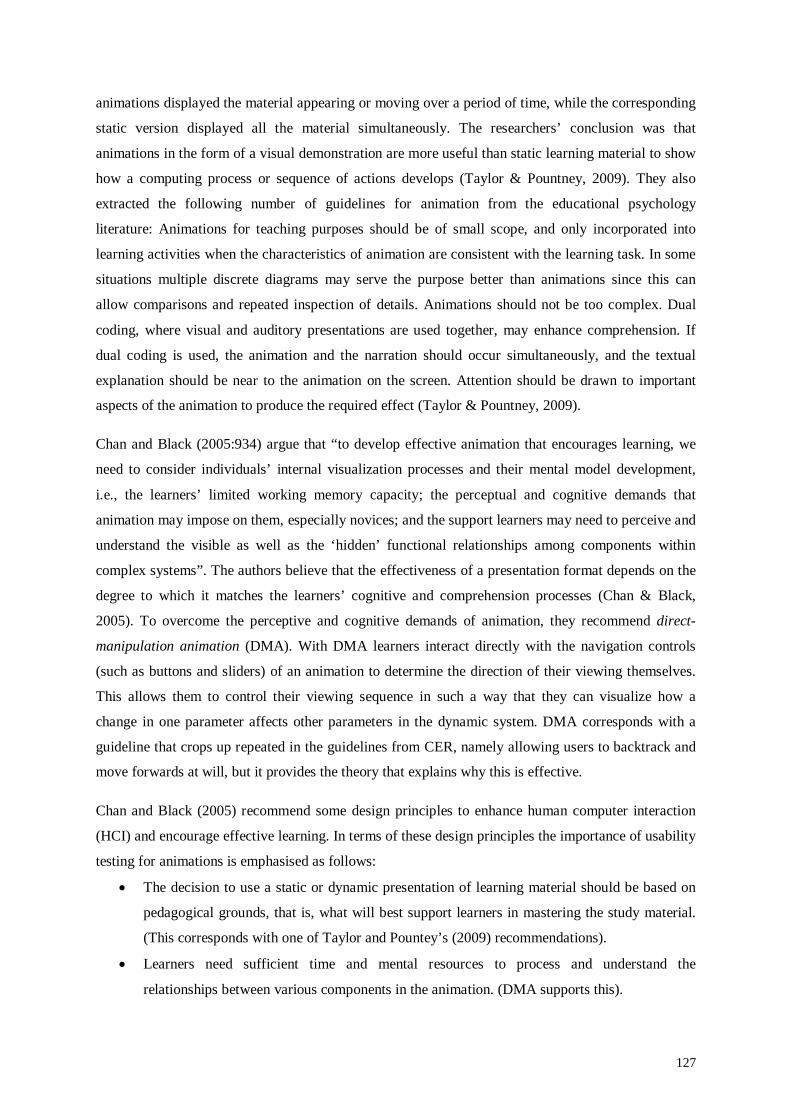
127
animations displayed the material appearing or moving over a period of time, while the corresponding
static version displayed all the material simultaneously. The researchers’ conclusion was that
animations in the form of a visual demonstration are more useful than static learning material to show
how a computing process or sequence of actions develops (Taylor & Pountney, 2009). They also
extracted the following number of guidelines for animation from the educational psychology
literature: Animations for teaching purposes should be of small scope, and only incorporated into
learning activities when the characteristics of animation are consistent with the learning task. In some
situations multiple discrete diagrams may serve the purpose better than animations since this can
allow comparisons and repeated inspection of details. Animations should not be too complex. Dual
coding, where visual and auditory presentations are used together, may enhance comprehension. If
dual coding is used, the animation and the narration should occur simultaneously, and the textual
explanation should be near to the animation on the screen. Attention should be drawn to important
aspects of the animation to produce the required effect (Taylor & Pountney, 2009).
Chan and Black (2005:934) argue that “to develop effective animation that encourages learning, we
need to consider individuals’ internal visualization processes and their mental model development,
i.e., the learners’ limited working memory capacity; the perceptual and cognitive demands that
animation may impose on them, especially novices; and the support learners may need to perceive and
understand the visible as well as the ‘hidden’ functional relationships among components within
complex systems”. The authors believe that the effectiveness of a presentation format depends on the
degree to which it matches the learners’ cognitive and comprehension processes (Chan & Black,
2005). To overcome the perceptive and cognitive demands of animation, they recommend direct-
manipulation animation (DMA). With DMA learners interact directly with the navigation controls
(such as buttons and sliders) of an animation to determine the direction of their viewing themselves.
This allows them to control their viewing sequence in such a way that they can visualize how a
change in one parameter affects other parameters in the dynamic system. DMA corresponds with a
guideline that crops up repeated in the guidelines from CER, namely allowing users to backtrack and
move forwards at will, but it provides the theory that explains why this is effective.
Chan and Black (2005) recommend some design principles to enhance human computer interaction
(HCI) and encourage effective learning. In terms of these design principles the importance of usability
testing for animations is emphasised as follows:
• The decision to use a static or dynamic presentation of learning material should be based on
pedagogical grounds, that is, what will best support learners in mastering the study material.
(This corresponds with one of Taylor and Pountey’s (2009) recommendations).
• Learners need sufficient time and mental resources to process and understand the
relationships between various components in the animation. (DMA supports this).

128
• A user-centred design is important. Consistent locations for buttons, sliders and switches will
minimise perceptual and cognitive demands on learners. Providing alternative interaction
methods such as sliders, or arrows on the screen to advance or backtrack, or keyboard arrows,
can accommodate different navigation styles or learning preferences.
Chan and Black’s (2005) recommendations tie in with two principles formulated by Tversky,
Morrison and Betrancourt (2002) that specify the conditions under which animation may be effective,
namely the congruence principle and the apprehension principle, as follows:
• The congruence principle states that “the structure and content of the external representation
should correspond to the desired structure and content of the internal representation” (Tversky
et al.:257). The animation should therefore present the process or procedure in the same way
and order that people visualize it.
• The apprehension principle states that “the structure and content of the external presentation
should be readily and accurately perceived and comprehended” (Tversky et al., 2002:258).
This means that the animation must be slow and clear enough to allow learners to perceive
changes and to understand the changes in the relations between the different parts and the
sequence of events.
Wouters, Paas and Merriënboer (2008) offer guidelines for designing effective animation from the
perspective of educational design, based on cognitive load theory. Cognitive load theory is “a theory
that emphasizes working memory constraints as determinants of instructional design effectiveness”
(Sweller, van Merriënboer & Paas, 1998:251). Learning requires information processing that involves
two structures in the human cognitive architecture, working memory and long-term memory. Working
memory has a limited processing capacity, while long-term memory has a virtually unlimited capacity
that can enhance working memory’s processing capacity with schemas.
Cognitive load theory posits that information can impose a cognitive load on working memory in the
following three respects (Sweller et al., 1998; Wouters et al., 2008):
• Intrinsic cognitive load depends on the interactivity of the subject matter, that is, the
complexity of the elements composing the information and the way they interact with each
other.
• Extraneous cognitive load depends on the way the information is presented. Poorly designed
educational material increases the extraneous cognitive load.
• Germane, or effective, cognitive load, is imposed when the information is presented in such a
way that learning is encouraged by facilitating the construction and/or automation of
cognitive schemas.
129
Subject matter with a large number of interactive elements is considered to be more difficult to master
than material with fewer elements and/or a low interactivity (De Jong, 2010). The tight integration of
concepts in a programming language is an indication of the high intrinsic cognitive load (Robins,
2010). The difficulty of the curriculum and course contents has also been listed as one of the reasons
why novices fail to learn to program (Jenkins, 2002; Kinnunen & Malmi, 2008; Kinnunen et al., 2007;
Miliszewska & Tan, 2007; Pears, East et al., 2007).
The three types of cognitive load are not isolated but combine into a load which cannot exceed the
available cognitive capacity, with the effect that a high load of one component comes at the cost of
another component. Therefore, to ensure effective learning, either the extraneous cognitive load or, in
the case of (very) complex material, both the extraneous cognitive load and the intrinsic cognitive
load should be reduced to increase the germane cognitive load (Wouters et al., 2008).
Wouters et al. (2008) offer the following guidelines to decrease intrinsic cognitive load by reducing or
managing the interactivity of the learning material:
• Scaffold learning with a sequence of simple-to-complex whole tasks. A whole task requires
the integration of different skills and knowledge. Start with relatively simple whole tasks to
allow learners to construct and automate schemas with low element interactivity and then
gradually increase the complexity.
• Use pre-training to first present isolated components before the interaction between these
components is instructed.
Guidelines to decrease the extraneous cognitive load, that is, to reduce activities that impede learning,
are the following (Wouters et al., 2008):
• Use pacing, which allows learners to control the tempo of presentation according to their own
cognitive needs. This concurs with Tversky et al.’s (2002) apprehension principle.
• Use segmentation by dividing animations into several segments in which each segment
presents an important part of a procedure or process.
• Apply the modality principle. Modality refers to the sensory mode in which verbal
information is presented: written or spoken. The modality principle suggests that textual
explanations in animations should be presented in spoken format, as this allows more
information to be processed visually. However, if the speaker has a foreign accent, this may
have a negative effect, since the additional effort to decipher the accent adds to the cognitive
load (Mayer, Sobko & Mautone, 2003). Also, when learners have control over the pacing of
the animation, written explanatory text is more effective than spoken explanatory text, since
this allows the student more time to study the information. It is also much easier to move
forwards and backwards through written text than through spoken texts, because the linearity
130
of the spoken text makes it more difficult to follow when scanning it through (Tabbers,
Martens & Merriënboer, 2004).
• Use the contiguity principle. The contiguity principle states that verbal explanations in
animations should be presented contiguously in time and textual explanation in the same
space as the illustrative material, so that the explanation and the pictorial information are
active simultaneously in working memory. This should exclude the split-attention effect. The
split-attention effect occurs when one source of information must be held in working memory
while searching for another, because the two sources of information have to been integrated
before it can be understood (Sweller et al., 1998).
• Use signalling, or cueing to present cues to assist the learner in selecting and organising the
instructional material. This could take various forms, such as underlining words, or using
arrows to focus attention on a specific part of the animation. Signalling assists meaningful
learning because it guides attention to relevant information and facilitates the efficiency of a
visual search for the necessary information (Ozcelik, Arslan-Ari & Cagiltay, 2010).
The following guidelines, suggested by Wouters et al. (2008) to increase germane cognitive load, are
intended to prompt learners in engaging in active processing of the learning material:
• Use expectancy-driven methods that require learners to predict the next step in a process in
the animation. This encourages self-explanation that will assist integrating newly acquired
knowledge with prior knowledge. Other researchers also recommend questions that ask
learners to predict the next step as a way to engage learners with animation (Foutsitzis &
Demetriadis, 2008; Hundhausen & Douglas, 2002; Hundhausen et al., 2002; Naps, Röβling et
al., 2003; Pears, East et al., 2007).
• Use sub-goaling to prompt learners to group coherent steps of a procedure into a meaningful
sub-goal in the animation.
• Ask learners to imagine procedures and concepts that are used in the animation, since studies
have shown that imagining skills before performing them leads to better performance
(Cooper, Tindall-Ford, Chandler & Sweller, 2001; Leahy & Sweller, 2004).
• Use variability by presenting problems that vary in relevant features so that leaners can
develop appropriate schemas by distinguishing between the relevant and irrelevant features.
The effectiveness of Wouters et al.’s (2008) guidelines depends on several mediating factors, notably
learners’ prior knowledge, spatial ability, motivation and the age of the learner. Animations intended
for novices may have no benefits for students with prior knowledge, as pointed out previously by
(Lahtinen, 2006; Lahtinen, Ahoniema & Salo, 2007). Learners with high spatial ability benefit more
from animations with verbal explanations than learners with low spatial ability. The pattern of
cognitive load may be affected by motivation and self-efficacy. Also, the efficiency of working

131
memory deteriorates with age. Design guidelines might also interact, for instance when pacing is
used, modality should be adapted since learner pacing seems to cancel the advantage of verbal over
written explanations. On the other hand, combinations of guidelines, such as signalling and modality,
might be particularly effective (Wouters et al., 2008).
Mayer and Moreno (2002) present seven design principles ensuing from a research program on
multimedia learning at University of California, Santa Barbara. Multimedia instruction exposes
learners to material in both verbal (on-screen text or narration) and visual (static photos or
illustrations, and video or animation) format. Mayer and Moreno’s design principles are grounded in
the cognitive theory of multimedia learning. The cognitive theory of multimedia learning is based on
the following (Sorva, Karavirta & Malmi, 2013) three assumptions:
• The dual-channel assumption believes that people have separate channels for processing
visual/pictorial representations and auditory/verbal representations.
• The limited capacity assumption presumes that each channel can only process a limited
amount of information at any one time. This corresponds to the limited capacity of working
memory in cognitive load theory.
Meaningful learning requires active processing, that only occurs when the learner engages in
cognitive processes such as extracting relevant material, organising it into a coherent representation
and integrating it with prior knowledge. Active processing brings to mind Naps’ (2000) Engagement
Taxonomy, as well as the research that emphasises the importance of engagement in order to learn
from AV or PV. Figure 5.1 provides a visual summary of the cognitive theory of multimedia learning.
Narration enters through the ears, the learner chooses some words for further processing in the verbal
channel that organises it in a cause-and-effect chain, and integrates it with the information from the
visual channel as well as prior knowledge. Animation enters through the eyes, the learner chooses
some images for further processing in the visual channel, organises it into a cause-and-effect chain,
and integrates it with the verbal information and prior knowledge. The theory postulates that
integration is most likely to occur when the corresponding pictorial and verbal representations are in
working memory at the same time. Accordingly, meaningful learning will be encouraged under
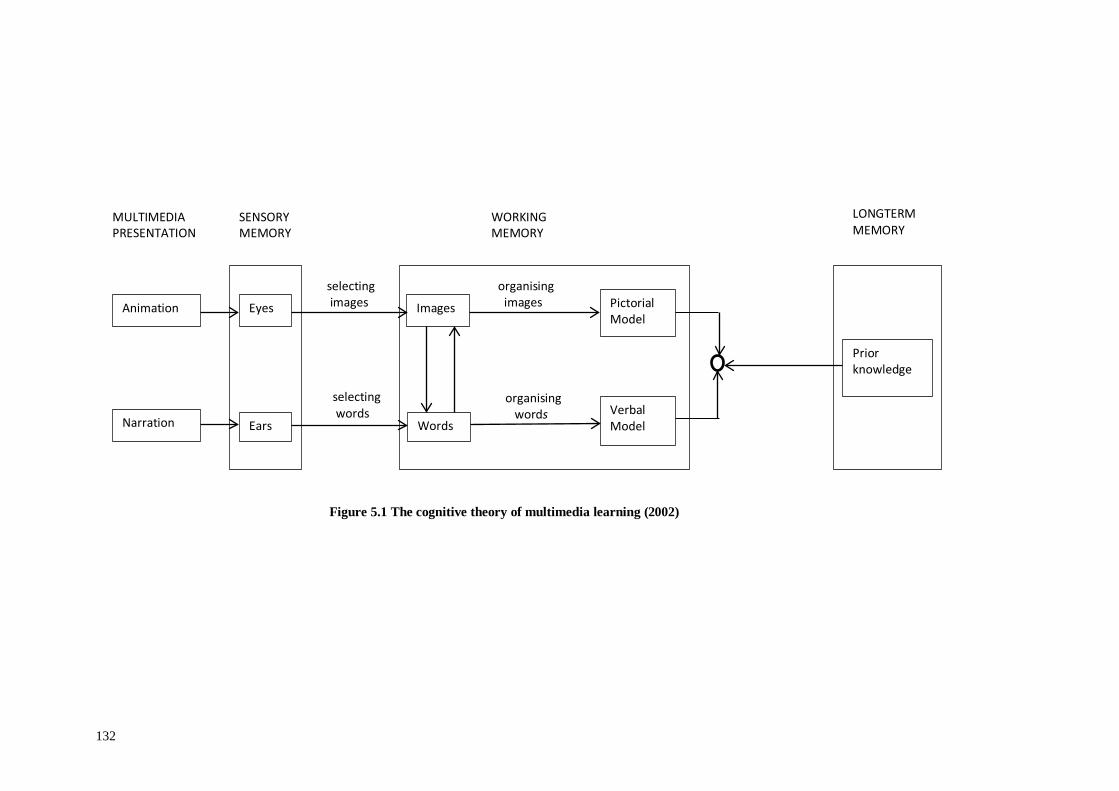
132
Figure 5.1 The cognitive theory of multimedia learning (2002)
MULTIMEDIA PRESENTATION
Animation
Narration
SENSORY MEMORY
WORKING MEMORY
LONGTERM MEMORY
Ears
Eyes
Images
Words
selecting images
selecting words
Pictorial Model
Verbal Model
organising images
organising words
Prior knowledge

133
instructional conditions that present pictorial and verbal information simultaneously (Mayer &
Moreno, 2002).
The seven design principles resulting from the cognitive theory of multimedia learning are the
following (Mayer & Moreno, 2002):
• The multimedia principle states that students learn better from both narration and animation
than from narration alone, when the learner has to create the mental picture himself.
• The spatial contiguity principle asserts that on-screen text should be presented near to the part
of the animation that it describes, to prevent wasting cognitive capacity on searching for the
corresponding animation section.
• According to the temporal contiguity principle, learners make better connections when
corresponding narration and animation are presented simultaneously.
• The coherence principle states that extraneous material (words, sounds, video, and pictures)
should be excluded to prevent wasting cognitive resources on irrelevant material.
• The modality principle maintains that learners learn better from animation and narration, than
from animation and on-screen text, since the visual channel is less likely to be overloaded.
That should provide more opportunity to build connections between corresponding words and
pictures.
• The redundancy principle asserts that learners learn better from animation and narration than
from animation, narration and on-screen text. It is based on the same rationale as the modality
principle.
• According to the personalisation principle, learners learn better from animation and narration
when the narration is in conversational tone (using ‘I’ and ‘you’) since they are more involved
and then work harder to understand the explanation.
Mayer and Moreno’s (2002) contiguity principles and the modality principle correspond with Wouters
et al.’s (2008) guidelines to decrease cognitive load. However, there is some evidence that the
modality and contiguity principles have to be applied with caution in the development of a tutorial to
teach novice programming students to trace.
With regard to the modality principle, the following research results have to be taken into account: If
self-paced animation is used, as has been repeatedly recommended, visual text is more effective than
spoken text, while it is also easier to move forwards and backwards through written text than through
spoken text (Tabbers et al., 2004).
Research regarding learners’ spatial ability should be taken into account when the contiguity principle
is applied, since the contiguity principle is affected by learners’ spatial ability. Mayer and Sims
(1994:392) define spatial visualization as “the ability to mentally rotate or fold objects in two or three
134
dimensions and to imagine the changing configuration of objects that would result from such
manipulations”. This ability is for example involved in building puzzles. The researchers examined
the way in which the spatial ability of learners inexperienced in a domain, may affect their learning
about a mechanical or biological system in that domain (Mayer & Sims, 1994:392). They found that
concurrent presentation of verbal and visual information benefits mainly learners with a high spatial
ability, since they have a better ability to build mental connections between the verbal and visual
representations. Wouters et al. (2008) confirm that learners with high spatial ability benefit more than
learners with low spatial ability from animations with verbal explanations. Cox, Fisher and O’Brien
(2005:93) describe program comprehension as “the process of generating a cognitive map from the
program source-code to a set of application domain concepts”. Program code, then represents an
abstract space that has to be navigated with the same cognitive strategies as used in natural
environments. Jones and Burnett (2007) in turn found a strong positive correlation between students’
spatial ability and their results in programming modules, with much lower correlations between their
spatial ability and non-programming modules. This seems to suggest that students with lower spatial
ability struggle more with programming subjects. They also found that students with a low spatial
ability use less effective navigational strategies when attempting to comprehend code (Jones &
Burnett, 2007). Therefore, it seems as if using verbal explanations in animation, even if the contiguity
principle is applied, might be to the disadvantage of weak programming students.
In the design and development of an animation to teach tracing, each of the above guidelines, and in
particular the modality and contiguity principles, should be considered carefully to determine whether
it would benefit the students for whom it is intended.
5.2.3 Guidelines from computer graphics
Khuri (2001) has extracted important practical guidelines from the field of computer graphics for AV
design and effective educational displays in algorithm animation. He stresses the importance of an
analysis of the users, their needs, their tasks, the scope of the package and the resources available to
developers. In this regard the following should be taken into account (Khuri, 2001):
• No AV can cater for all possible users. Novices need much more guidance in mapping the
visualization to the program, as well as help in how to use the AV system, than experienced
users. Short quizzes can help them understand the material. Experienced users, on the other
hand, may want to integrate their own programs into the system.
• The content of the AV should be selected according to its intended purpose, and an
assessment should be made to ensure that AV is the most effective way to present the
information.
135
• The situations where the visualization will be used also influence its design. Visualizations
intended for self-study need much more explanatory cues than one that will be used in a
classroom situation.
• Care should be taken in deciding which information should be presented and how it should be
done. An appropriate set of conventions in the form of the shape, size, colour, texture, sound
and arrangement of objects to represent different information, should be developed and
applied consistently.
• The designer should also set boundaries for the visualization, for example in the range and/or
format of input allowed.
Khuri (2001) also provides some guidelines and techniques for the visual representation of
information about programs. In particular, he discusses the display layout, using colour, sound,
selecting input data and providing interactivity as follows:
• To prevent the display area from being cluttered, it should be divided into functional areas
that are consistently used for the different types of information. Important information should
be placed near the top left, since eye-motion studies (in Western society) show that a human
being’s gaze goes to the upper-left of a rectangular display and then moves clockwise.
Multiple views of the same algorithm should be used judiciously to prevent information
overload.
• Although people do not learn more from colour displays than from black and white displays,
colour helps people to remember and is more enjoyable. A maximum of five colours, and
preferably four only for novices, should be used to allow more short-term memory for
information processing. Foveal (centre) and peripheral colours should be used appropriately,
for example, blue is suitable for large backgrounds, while red and green should be used in the
centre of the visual field. Strong contrasts of colours on the opposite of the colour wheel
should be avoided since this produces vibrations, illusions of shadows and afterimages.
Familiar colour coding such as red for stop or danger should be used. The same colour should
be used consistently for related elements to assist conceptual comprehension without verbal
clues. Bright colours should be used to draw attention. Colour can save screen space by for
example using a small area changing in colour to indicate progress, rather than a bar or line.
• Non-speech sound can be used to draw the user’s attention to an event. Since this can easily
be an irritating feature, a flexible easily accessible user-configuration component should be
included to allow users to specify the sound for each event and switching it on or off.
Documentation, online training and examples should be given to prepare users for using this
feature. The number of sounds should be restricted, since there is a threshold for the number
of sounds that can be learned and remembered.
136
• In selecting input data, it is better to start with smaller sets and allow for larger sets for users
who understand the visualization. Possible erroneous input situations should be taken into
account.
• The degree, methods and forms of interaction will be determined by the tasks users have to
accomplish when using the visualization. If the system is intended for exploratory purposes,
the interaction should encourage the user’s search for structures, trends or testing a
hypothesis. Students may test their understanding through self-assessment exercises such as
periodic tickler questions or questions that need to be answered before the animation
proceeds. The interaction mechanism should be simple and forgiving. The designer should
therefore take care to reduce the possibility of errors. An option is to allow reversal of actions,
such as providing an ‘undo’ or ‘redo’ facility.
In the next section a framework of guidelines for developing and creating visualizations for teaching
programming is offered.
5.3 A Framework of guidelines for developing and creating visualization tools for teaching programming
The framework of guidelines for developing and creating visualizations for teaching programming
represents the theoretical contribution of this study. It consists of a series of guidelines, where
possible, enhanced with one or more reasons or explanations for the guidelines as well as some
considerations that need to be taken into account when applying the guideline. The guidelines, reasons
and explanations, as well as the considerations were extracted from the literature covered in section
5.2. The field of educational psychology provided an especially rich source of reasons or explanations
and considerations to be taken into account.
Several of the guidelines appear in all three areas covered by the literature review. Corresponding
guidelines that appear in two or more areas have been synthesized into one guideline. Where possible,
one or more reasons or explanations for using the guideline as explicated in the literature are included.
Considerations to be taken into account when applying the guideline, again extracted from the
literature, are also offered. The framework itself is presented in Table 5.1, with the numbered
guidelines in the first column, reasons or explanations for using the guideline in the second column
and considerations to be taken into account when applying the guideline in the third column. To
improve readability, no references are shown in Table 5.1.
However, the framework with references included is also offered in Table F.1 in Appendix F. In Table
F.1 each guideline is followed by the reference(s) that support it in the second column. In the third
column reasons for using the guideline are offered, and in the fourth column considerations to be
taken into account when applying the guideline, are listed. Each reason or explanation and

137
consideration is also backed by the references concerned. Since these references are from three
different fields, namely computing education, education psychology and computer graphics, the
background of each reference in Table F.1 is shaded to indicate the field where it has been cited.
References from CER are shaded in blue, references from educational psychology in pink, and
references from computer graphics in purple.
Table F.1 also contains two additional guidelines namely guidelines 27 and 28, as well as expansions
to guidelines 6, 10, 11, 16, 17 and 23 which resulted from the research effort. The additional
guidelines and expanded guidelines are discussed in section 7.7 and shaded in green.
In the next section a description of the design and development of the tutorial to teach tracing is given.
This include design decisions and the motivations for it, based on the framework of guidelines, a
description of the tutorial itself, its development and testing and lessons learnt during this process.
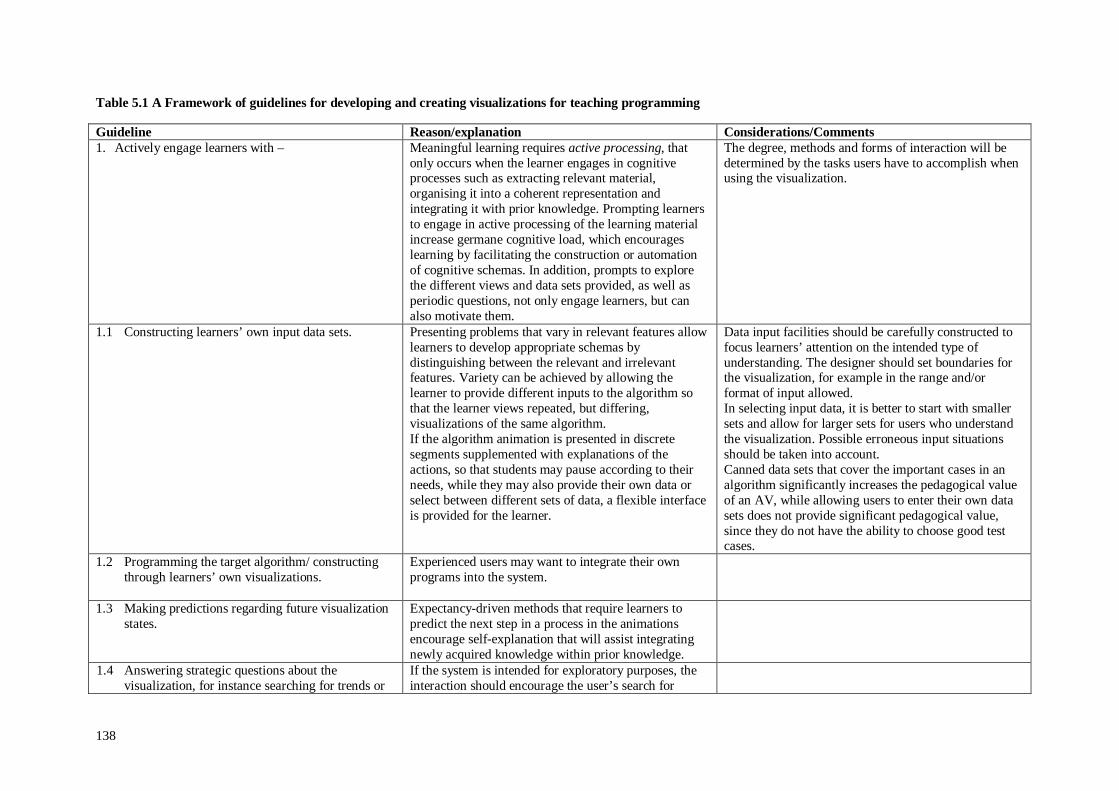
138
Table 5.1 A Framework of guidelines for developing and creating visualizations for teaching programming
Guideline Reason/explanation Considerations/Comments 1. Actively engage learners with – Meaningful learning requires active processing, that
only occurs when the learner engages in cognitive processes such as extracting relevant material, organising it into a coherent representation and integrating it with prior knowledge. Prompting learners to engage in active processing of the learning material increase germane cognitive load, which encourages learning by facilitating the construction or automation of cognitive schemas. In addition, prompts to explore the different views and data sets provided, as well as periodic questions, not only engage learners, but can also motivate them.
The degree, methods and forms of interaction will be determined by the tasks users have to accomplish when using the visualization.
1.1 Constructing learners’ own input data sets.
Presenting problems that vary in relevant features allow learners to develop appropriate schemas by distinguishing between the relevant and irrelevant features. Variety can be achieved by allowing the learner to provide different inputs to the algorithm so that the learner views repeated, but differing, visualizations of the same algorithm. If the algorithm animation is presented in discrete segments supplemented with explanations of the actions, so that students may pause according to their needs, while they may also provide their own data or select between different sets of data, a flexible interface is provided for the learner.
Data input facilities should be carefully constructed to focus learners’ attention on the intended type of understanding. The designer should set boundaries for the visualization, for example in the range and/or format of input allowed. In selecting input data, it is better to start with smaller sets and allow for larger sets for users who understand the visualization. Possible erroneous input situations should be taken into account. Canned data sets that cover the important cases in an algorithm significantly increases the pedagogical value of an AV, while allowing users to enter their own data sets does not provide significant pedagogical value, since they do not have the ability to choose good test cases.
1.2 Programming the target algorithm/ constructing through learners’ own visualizations.
Experienced users may want to integrate their own programs into the system.
1.3 Making predictions regarding future visualization states.
Expectancy-driven methods that require learners to predict the next step in a process in the animations encourage self-explanation that will assist integrating newly acquired knowledge within prior knowledge.
1.4 Answering strategic questions about the visualization, for instance searching for trends or
If the system is intended for exploratory purposes, the interaction should encourage the user’s search for
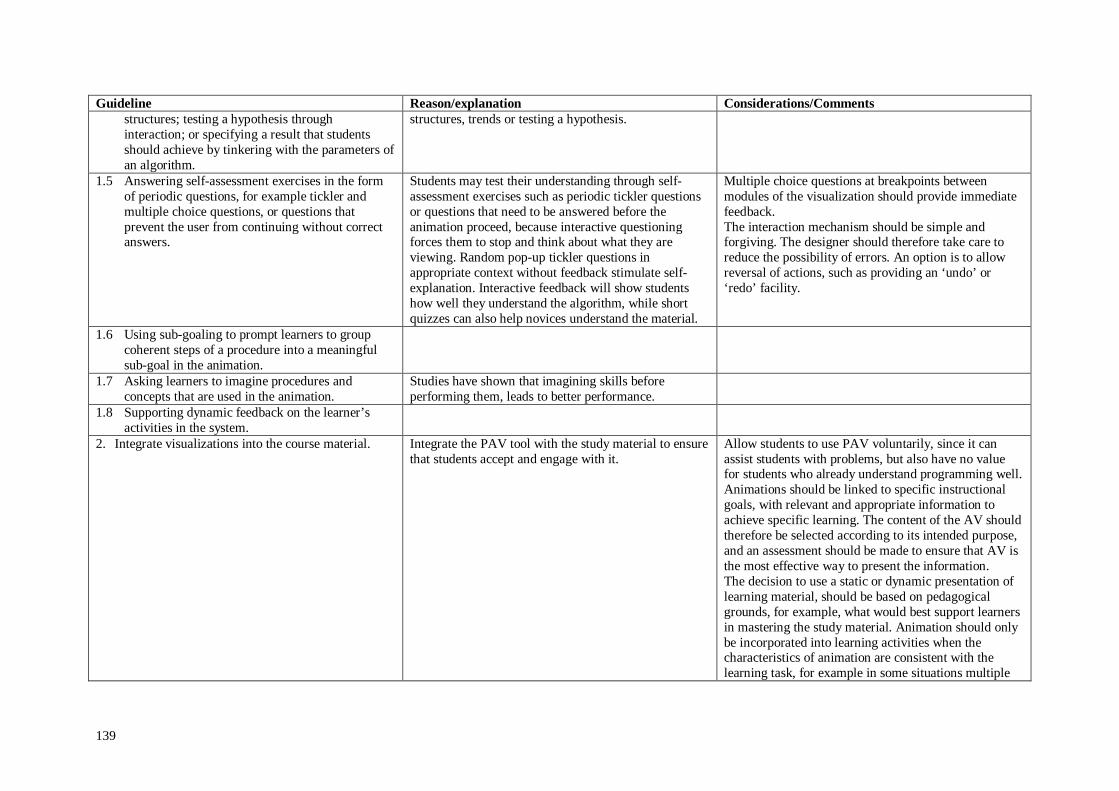
139
Guideline Reason/explanation Considerations/Comments structures; testing a hypothesis through interaction; or specifying a result that students should achieve by tinkering with the parameters of an algorithm.
structures, trends or testing a hypothesis.
1.5 Answering self-assessment exercises in the form of periodic questions, for example tickler and multiple choice questions, or questions that prevent the user from continuing without correct answers.
Students may test their understanding through self-assessment exercises such as periodic tickler questions or questions that need to be answered before the animation proceed, because interactive questioning forces them to stop and think about what they are viewing. Random pop-up tickler questions in appropriate context without feedback stimulate self-explanation. Interactive feedback will show students how well they understand the algorithm, while short quizzes can also help novices understand the material.
Multiple choice questions at breakpoints between modules of the visualization should provide immediate feedback. The interaction mechanism should be simple and forgiving. The designer should therefore take care to reduce the possibility of errors. An option is to allow reversal of actions, such as providing an ‘undo’ or ‘redo’ facility.
1.6 Using sub-goaling to prompt learners to group coherent steps of a procedure into a meaningful sub-goal in the animation.
1.7 Asking learners to imagine procedures and concepts that are used in the animation.
Studies have shown that imagining skills before performing them, leads to better performance.
1.8 Supporting dynamic feedback on the learner’s activities in the system.
2. Integrate visualizations into the course material. Integrate the PAV tool with the study material to ensure that students accept and engage with it.
Allow students to use PAV voluntarily, since it can assist students with problems, but also have no value for students who already understand programming well. Animations should be linked to specific instructional goals, with relevant and appropriate information to achieve specific learning. The content of the AV should therefore be selected according to its intended purpose, and an assessment should be made to ensure that AV is the most effective way to present the information. The decision to use a static or dynamic presentation of learning material, should be based on pedagogical grounds, for example, what would best support learners in mastering the study material. Animation should only be incorporated into learning activities when the characteristics of animation are consistent with the learning task, for example in some situations multiple
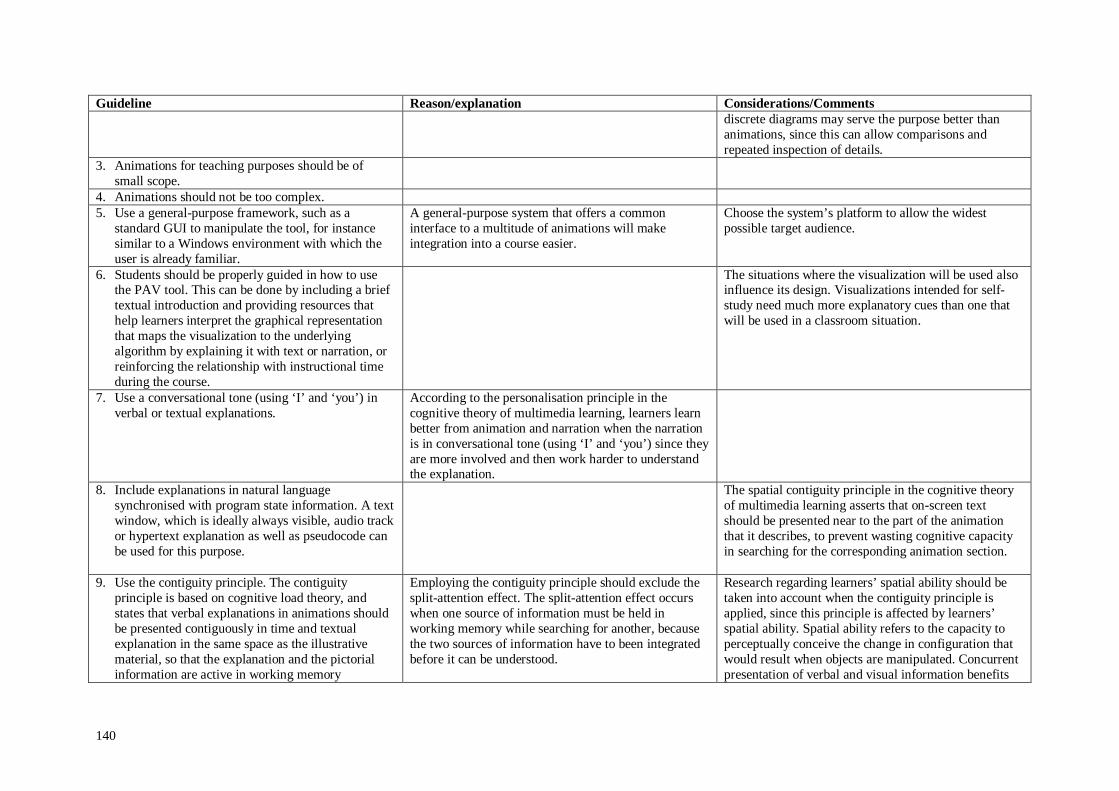
140
Guideline Reason/explanation Considerations/Comments discrete diagrams may serve the purpose better than animations, since this can allow comparisons and repeated inspection of details.
3. Animations for teaching purposes should be of small scope.
4. Animations should not be too complex. 5. Use a general-purpose framework, such as a
standard GUI to manipulate the tool, for instance similar to a Windows environment with which the user is already familiar.
A general-purpose system that offers a common interface to a multitude of animations will make integration into a course easier.
Choose the system’s platform to allow the widest possible target audience.
6. Students should be properly guided in how to use the PAV tool. This can be done by including a brief textual introduction and providing resources that help learners interpret the graphical representation that maps the visualization to the underlying algorithm by explaining it with text or narration, or reinforcing the relationship with instructional time during the course.
The situations where the visualization will be used also influence its design. Visualizations intended for self-study need much more explanatory cues than one that will be used in a classroom situation.
7. Use a conversational tone (using ‘I’ and ‘you’) in verbal or textual explanations.
According to the personalisation principle in the cognitive theory of multimedia learning, learners learn better from animation and narration when the narration is in conversational tone (using ‘I’ and ‘you’) since they are more involved and then work harder to understand the explanation.
8. Include explanations in natural language synchronised with program state information. A text window, which is ideally always visible, audio track or hypertext explanation as well as pseudocode can be used for this purpose.
The spatial contiguity principle in the cognitive theory of multimedia learning asserts that on-screen text should be presented near to the part of the animation that it describes, to prevent wasting cognitive capacity in searching for the corresponding animation section.
9. Use the contiguity principle. The contiguity principle is based on cognitive load theory, and states that verbal explanations in animations should be presented contiguously in time and textual explanation in the same space as the illustrative material, so that the explanation and the pictorial information are active in working memory
Employing the contiguity principle should exclude the split-attention effect. The split-attention effect occurs when one source of information must be held in working memory while searching for another, because the two sources of information have to been integrated before it can be understood.
Research regarding learners’ spatial ability should be taken into account when the contiguity principle is applied, since this principle is affected by learners’ spatial ability. Spatial ability refers to the capacity to perceptually conceive the change in configuration that would result when objects are manipulated. Concurrent presentation of verbal and visual information benefits
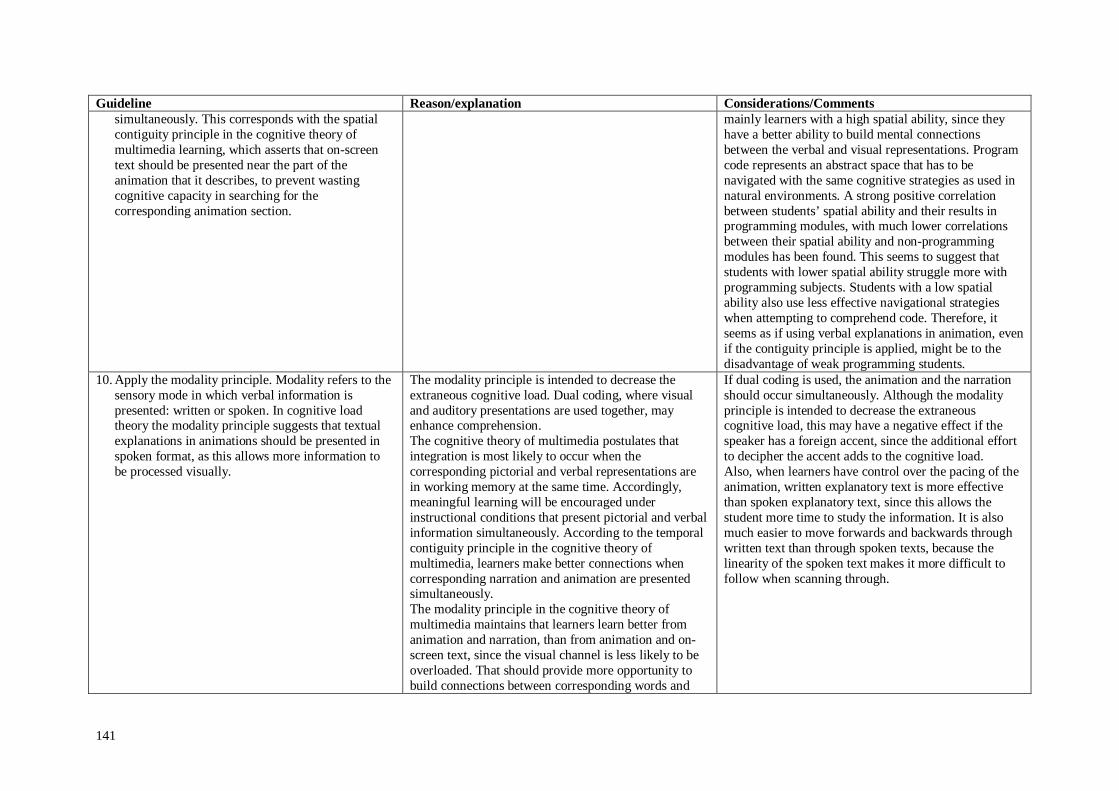
141
Guideline Reason/explanation Considerations/Comments simultaneously. This corresponds with the spatial contiguity principle in the cognitive theory of multimedia learning, which asserts that on-screen text should be presented near the part of the animation that it describes, to prevent wasting cognitive capacity in searching for the corresponding animation section.
mainly learners with a high spatial ability, since they have a better ability to build mental connections between the verbal and visual representations. Program code represents an abstract space that has to be navigated with the same cognitive strategies as used in natural environments. A strong positive correlation between students’ spatial ability and their results in programming modules, with much lower correlations between their spatial ability and non-programming modules has been found. This seems to suggest that students with lower spatial ability struggle more with programming subjects. Students with a low spatial ability also use less effective navigational strategies when attempting to comprehend code. Therefore, it seems as if using verbal explanations in animation, even if the contiguity principle is applied, might be to the disadvantage of weak programming students.
10. Apply the modality principle. Modality refers to the sensory mode in which verbal information is presented: written or spoken. In cognitive load theory the modality principle suggests that textual explanations in animations should be presented in spoken format, as this allows more information to be processed visually.
The modality principle is intended to decrease the extraneous cognitive load. Dual coding, where visual and auditory presentations are used together, may enhance comprehension. The cognitive theory of multimedia postulates that integration is most likely to occur when the corresponding pictorial and verbal representations are in working memory at the same time. Accordingly, meaningful learning will be encouraged under instructional conditions that present pictorial and verbal information simultaneously. According to the temporal contiguity principle in the cognitive theory of multimedia, learners make better connections when corresponding narration and animation are presented simultaneously. The modality principle in the cognitive theory of multimedia maintains that learners learn better from animation and narration, than from animation and on-screen text, since the visual channel is less likely to be overloaded. That should provide more opportunity to build connections between corresponding words and
If dual coding is used, the animation and the narration should occur simultaneously. Although the modality principle is intended to decrease the extraneous cognitive load, this may have a negative effect if the speaker has a foreign accent, since the additional effort to decipher the accent adds to the cognitive load. Also, when learners have control over the pacing of the animation, written explanatory text is more effective than spoken explanatory text, since this allows the student more time to study the information. It is also much easier to move forwards and backwards through written text than through spoken texts, because the linearity of the spoken text makes it more difficult to follow when scanning through.
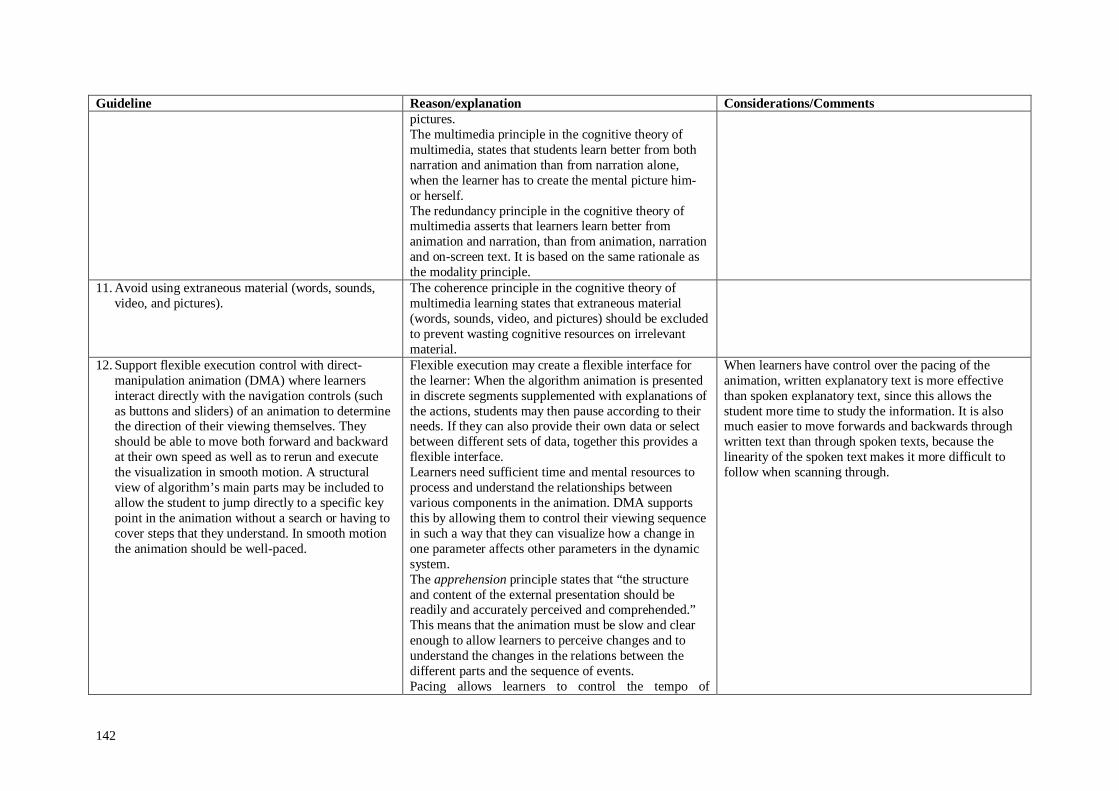
142
Guideline Reason/explanation Considerations/Comments pictures. The multimedia principle in the cognitive theory of multimedia, states that students learn better from both narration and animation than from narration alone, when the learner has to create the mental picture him- or herself. The redundancy principle in the cognitive theory of multimedia asserts that learners learn better from animation and narration, than from animation, narration and on-screen text. It is based on the same rationale as the modality principle.
11. Avoid using extraneous material (words, sounds, video, and pictures).
The coherence principle in the cognitive theory of multimedia learning states that extraneous material (words, sounds, video, and pictures) should be excluded to prevent wasting cognitive resources on irrelevant material.
12. Support flexible execution control with direct-manipulation animation (DMA) where learners interact directly with the navigation controls (such as buttons and sliders) of an animation to determine the direction of their viewing themselves. They should be able to move both forward and backward at their own speed as well as to rerun and execute the visualization in smooth motion. A structural view of algorithm’s main parts may be included to allow the student to jump directly to a specific key point in the animation without a search or having to cover steps that they understand. In smooth motion the animation should be well-paced.
Flexible execution may create a flexible interface for the learner: When the algorithm animation is presented in discrete segments supplemented with explanations of the actions, students may then pause according to their needs. If they can also provide their own data or select between different sets of data, together this provides a flexible interface. Learners need sufficient time and mental resources to process and understand the relationships between various components in the animation. DMA supports this by allowing them to control their viewing sequence in such a way that they can visualize how a change in one parameter affects other parameters in the dynamic system. The apprehension principle states that “the structure and content of the external presentation should be readily and accurately perceived and comprehended.” This means that the animation must be slow and clear enough to allow learners to perceive changes and to understand the changes in the relations between the different parts and the sequence of events. Pacing allows learners to control the tempo of
When learners have control over the pacing of the animation, written explanatory text is more effective than spoken explanatory text, since this allows the student more time to study the information. It is also much easier to move forwards and backwards through written text than through spoken texts, because the linearity of the spoken text makes it more difficult to follow when scanning through.
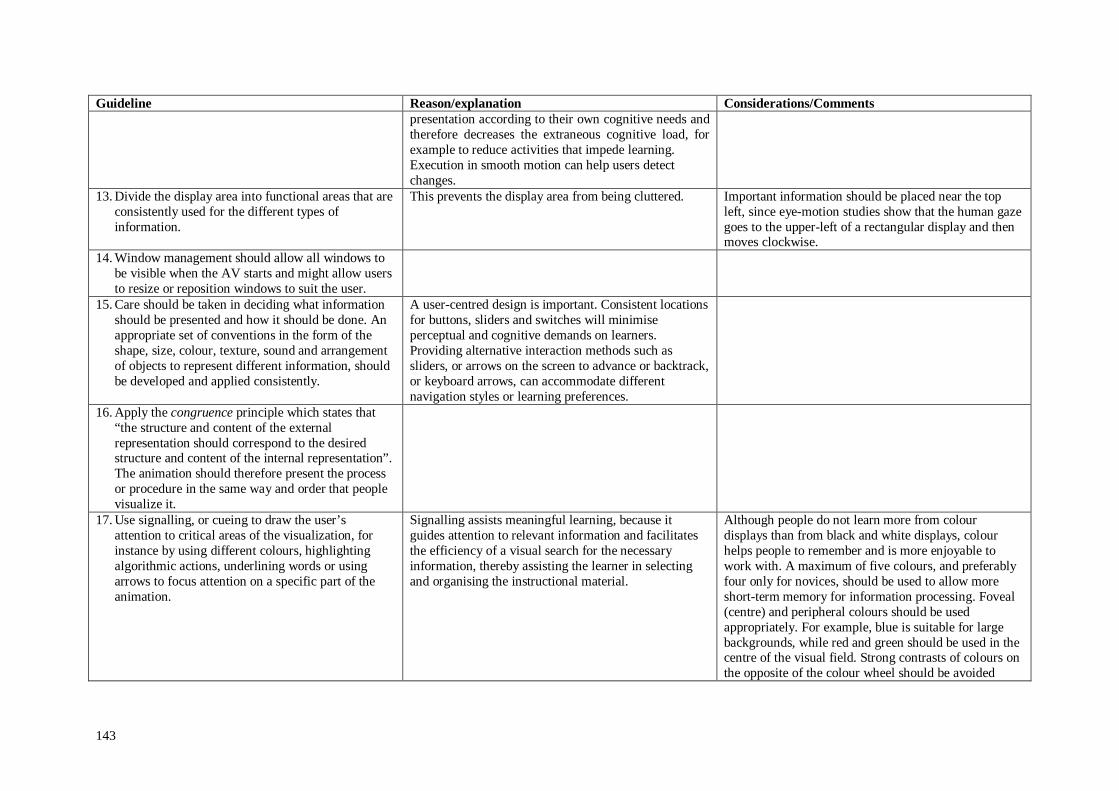
143
Guideline Reason/explanation Considerations/Comments presentation according to their own cognitive needs and therefore decreases the extraneous cognitive load, for example to reduce activities that impede learning. Execution in smooth motion can help users detect changes.
13. Divide the display area into functional areas that are consistently used for the different types of information.
This prevents the display area from being cluttered. Important information should be placed near the top left, since eye-motion studies show that the human gaze goes to the upper-left of a rectangular display and then moves clockwise.
14. Window management should allow all windows to be visible when the AV starts and might allow users to resize or reposition windows to suit the user.
15. Care should be taken in deciding what information should be presented and how it should be done. An appropriate set of conventions in the form of the shape, size, colour, texture, sound and arrangement of objects to represent different information, should be developed and applied consistently.
A user-centred design is important. Consistent locations for buttons, sliders and switches will minimise perceptual and cognitive demands on learners. Providing alternative interaction methods such as sliders, or arrows on the screen to advance or backtrack, or keyboard arrows, can accommodate different navigation styles or learning preferences.
16. Apply the congruence principle which states that “the structure and content of the external representation should correspond to the desired structure and content of the internal representation”. The animation should therefore present the process or procedure in the same way and order that people visualize it.
17. Use signalling, or cueing to draw the user’s attention to critical areas of the visualization, for instance by using different colours, highlighting algorithmic actions, underlining words or using arrows to focus attention on a specific part of the animation.
Signalling assists meaningful learning, because it guides attention to relevant information and facilitates the efficiency of a visual search for the necessary information, thereby assisting the learner in selecting and organising the instructional material.
Although people do not learn more from colour displays than from black and white displays, colour helps people to remember and is more enjoyable to work with. A maximum of five colours, and preferably four only for novices, should be used to allow more short-term memory for information processing. Foveal (centre) and peripheral colours should be used appropriately. For example, blue is suitable for large backgrounds, while red and green should be used in the centre of the visual field. Strong contrasts of colours on the opposite of the colour wheel should be avoided

144
Guideline Reason/explanation Considerations/Comments since this produces vibrations, illusions of shadows and afterimages. Use familiar colour coding such as red for stop or danger. The same colour should be used consistently for related elements to assist conceptual comprehension without verbal clues. Use bright colours to draw attention. Colour can save screen space by for example using a small area changing in colour to indicate progress, rather than a bar or line. Non-speech sound can be used to draw the user’s attention to an event. Since this may easily be an irritating feature, a flexible easily accessible user-configuration component should be included to allow users to specify the sound for each event and switching it on or off. Documentation, online training and examples should be given to prepare users for using this feature. The number of sounds should be restricted, as there is a threshold for the number of sounds that can be learned and remembered.
18. Include pseudocode for the algorithm. Clear pseudocode should be provided to help the user relate state changes directly to algorithm’s progress.
Providing the right set of features could reduce learning time, while using more features may result in increase in learning time with little pedagogical benefit. More time spent with AV does not necessarily translate into more learning.
19. Pseudocode lines should be highlighted synchronously as the animation executes.
This acts as a form of signalling or cueing, and may help the user relate state changes directly to algorithm’s progress.
20. Provide different views of the data, program or algorithm. This could include for example windows for both pseudocode and program animation, and both the logical and the physical view of a data structure as well as the distinction and connection between these views.
Prompts to explore different views and different data sets encourage student interaction and demonstrate algorithm behaviour in more detail. Multiple and multimodal representations, for example three distinct views of the animation may be used to demonstrate the algorithm behaviour – the analogy, a micro view with a small data set, and a macro view with a large data set.
Multiple views of the same algorithm should be used judiciously to prevent information overload.
21. Include capabilities for comparative algorithm analysis such as performance information that shows the algorithm’s efficiency, or simultaneous
Prompts to explore the different algorithms or data sets may encourage user interaction.
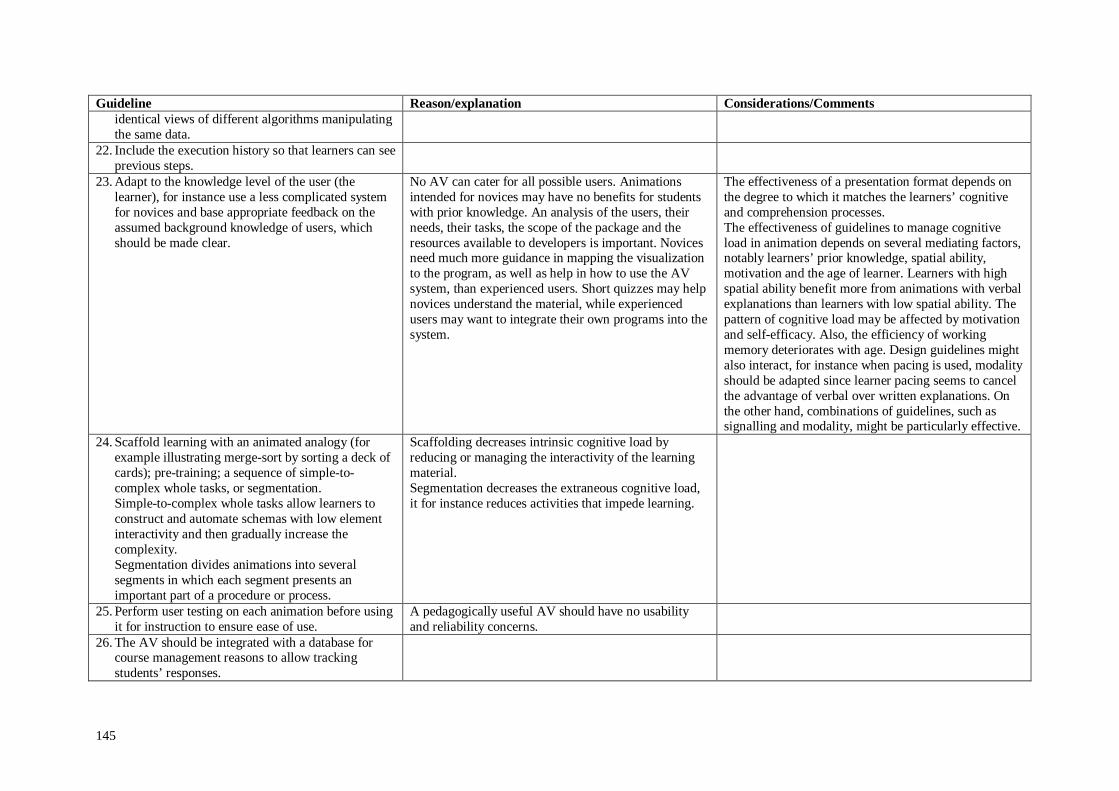
145
Guideline Reason/explanation Considerations/Comments identical views of different algorithms manipulating the same data.
22. Include the execution history so that learners can see previous steps.
23. Adapt to the knowledge level of the user (the learner), for instance use a less complicated system for novices and base appropriate feedback on the assumed background knowledge of users, which should be made clear.
No AV can cater for all possible users. Animations intended for novices may have no benefits for students with prior knowledge. An analysis of the users, their needs, their tasks, the scope of the package and the resources available to developers is important. Novices need much more guidance in mapping the visualization to the program, as well as help in how to use the AV system, than experienced users. Short quizzes may help novices understand the material, while experienced users may want to integrate their own programs into the system.
The effectiveness of a presentation format depends on the degree to which it matches the learners’ cognitive and comprehension processes. The effectiveness of guidelines to manage cognitive load in animation depends on several mediating factors, notably learners’ prior knowledge, spatial ability, motivation and the age of learner. Learners with high spatial ability benefit more from animations with verbal explanations than learners with low spatial ability. The pattern of cognitive load may be affected by motivation and self-efficacy. Also, the efficiency of working memory deteriorates with age. Design guidelines might also interact, for instance when pacing is used, modality should be adapted since learner pacing seems to cancel the advantage of verbal over written explanations. On the other hand, combinations of guidelines, such as signalling and modality, might be particularly effective.
24. Scaffold learning with an animated analogy (for example illustrating merge-sort by sorting a deck of cards); pre-training; a sequence of simple-to-complex whole tasks, or segmentation.
Simple-to-complex whole tasks allow learners to construct and automate schemas with low element interactivity and then gradually increase the complexity.
Segmentation divides animations into several segments in which each segment presents an important part of a procedure or process.
Scaffolding decreases intrinsic cognitive load by reducing or managing the interactivity of the learning material. Segmentation decreases the extraneous cognitive load, it for instance reduces activities that impede learning.
25. Perform user testing on each animation before using it for instruction to ensure ease of use.
A pedagogically useful AV should have no usability and reliability concerns.
26. The AV should be integrated with a database for course management reasons to allow tracking students’ responses.
146
5.4 Design and development of a tutorial to teach tracing
This section describes the design and development of the tutorial to teach tracing to novices in the
introductory programming module at Unisa, COS1511. The tutorial itself is described in section 5.4.1
and its design decisions are justified in section 5.4.2. The development process and the initial testing
are discussed in section 5.4.3. Lessons learnt during the initial testing of the tutorial and its
development are presented and related to the framework of guidelines for visualization in section
5.4.4.
5.4.1 The Drawing Variable Diagrams Tutorial12
The objective with developing the Drawing Variable Diagrams Tutorial was to enable the students to
improve their skill at tracing computer programs, with the aim of developing their programming
ability and ultimately increasing the pass rate for COS1511.
5.4.1.1 Tutorial specifications
The tutorial was developed in Adobe Flash Player 10 ActiveX. The screen dimensions fit a standard
screen of 1 024 by 768 pixels. The tutorial consists of 21 activities. Each activity demonstrates the
tracing of a program or program segment by drawing variable diagrams, statement by statement. Each
program or program segment presents a specific programming concept, for example reserving
memory space for variables, or a programming construct such as a for loop. Initially the activities
ranged in length from seven to 60 steps, although some of the larger activities have been shortened to
fewer steps in subsequent versions of the tutorial.
The introductory frame provides a menu that allows users to choose an activity, to view the
instruction manual or to exit from the tutorial. In the initial version, a series of screenshots was used
to demonstrate how to use the tutorial. This was replaced with a complete instruction manual in
PowerPoint format in subsequent versions (see Appendix E for both sets of instructions).
5.4.1.2 Activities and implementation of activities
As mentioned in section 5.4.1.1, the Drawing Variable Diagrams Tutorial consists of 21 activities
from the Study Guide for COS1511. The Study Guide contains 30 lessons, and each lesson contains a
number of activities students are supposed to do while working through the Study Guide. Not all
activities in the Study Guide are included in the tutorial, since not all of them require drawing variable
diagrams. Also, not all activities in the Study Guide that do require drawing variable diagrams are
included in the tutorial. As mentioned in the previous paragraph, each of the activities included, was
chosen either to introduce a specific concept such as reserving memory space with a declaration
12 A large part of this section was published in Schoeman, Gelderblom and Smith (2012).
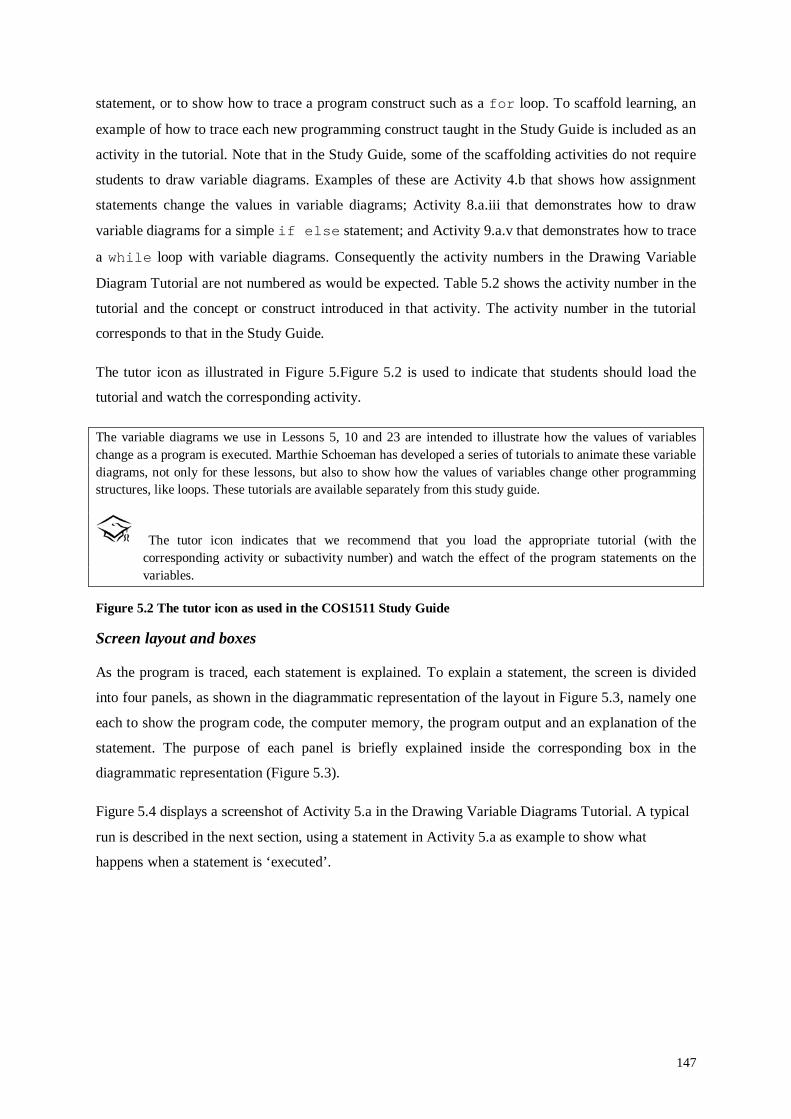
147
statement, or to show how to trace a program construct such as a for loop. To scaffold learning, an
example of how to trace each new programming construct taught in the Study Guide is included as an
activity in the tutorial. Note that in the Study Guide, some of the scaffolding activities do not require
students to draw variable diagrams. Examples of these are Activity 4.b that shows how assignment
statements change the values in variable diagrams; Activity 8.a.iii that demonstrates how to draw
variable diagrams for a simple if else statement; and Activity 9.a.v that demonstrates how to trace
a while loop with variable diagrams. Consequently the activity numbers in the Drawing Variable
Diagram Tutorial are not numbered as would be expected. Table 5.2 shows the activity number in the
tutorial and the concept or construct introduced in that activity. The activity number in the tutorial
corresponds to that in the Study Guide.
The tutor icon as illustrated in Figure 5.Figure 5.2 is used to indicate that students should load the
tutorial and watch the corresponding activity.
The variable diagrams we use in Lessons 5, 10 and 23 are intended to illustrate how the values of variables change as a program is executed. Marthie Schoeman has developed a series of tutorials to animate these variable diagrams, not only for these lessons, but also to show how the values of variables change other programming structures, like loops. These tutorials are available separately from this study guide.
The tutor icon indicates that we recommend that you load the appropriate tutorial (with the corresponding activity or subactivity number) and watch the effect of the program statements on the variables.
Figure 5.2 The tutor icon as used in the COS1511 Study Guide
Screen layout and boxes
As the program is traced, each statement is explained. To explain a statement, the screen is divided
into four panels, as shown in the diagrammatic representation of the layout in Figure 5.3, namely one
each to show the program code, the computer memory, the program output and an explanation of the
statement. The purpose of each panel is briefly explained inside the corresponding box in the
diagrammatic representation (Figure 5.3).
Figure 5.4 displays a screenshot of Activity 5.a in the Drawing Variable Diagrams Tutorial. A typical
run is described in the next section, using a statement in Activity 5.a as example to show what
happens when a statement is ‘executed’.

148
Table 5.2 List of activities in the drawing variable diagrams tutorial
Activity number in Drawing Variable Diagrams Tutorial
Concept or construct animated in Drawing Variable Diagrams Tutorial
3.a.i Shows how a declaration statement such as int a; reserves memory space.
4.a.ii Demonstrates tracing and using variable diagrams for the assignment statement.
4.b Demonstrates and trace a program line by line and use variable diagrams to show tracing of declaration statements and how the values of variables change with assignment statements.
5.a Demonstrates line by line tracing of a program to illustrate arithmetic operators.
8.a.iii Demonstrate tracing a simple if else statement.
9.a.v Demonstrates tracing a while loop that prints values from 10 to 20.
12.a.i Demonstrates tracing nested if statements.
12.b.i Demonstrates the effect of braces (i.e. ‘{‘ and ‘}’) on nested if statements.
13.a.i Demonstrates tracing switch statements.
14.d Demonstrates tracing a while loop for which the number of iterations cannot be determined beforehand.
14.h.ii Demonstrates tracing a while and a do…while loop that both determine the biggest of a number of positive integers, to illustrate the difference between while and do…while loops.
15.b.iii Demonstrates tracing a for loop.
16.a.ii Demonstrates tracing two nested for loops.
18.a.ii Demonstrates tracing a value-returning user-defined function with one value parameter.
21.a.vi Demonstrates tracing functions with value and reference parameters.
22.a.vi Demonstrates tracing a void function with a reference parameter.
23.a Use variable diagrams to illustrate the difference between value and reference parameters and integrate the concepts covered in activities 18.a.ii, 21.a.vi and 22.a.vi.
24.a.iii Demonstrates tracing a one-dimensional array.
26.a.iii Demonstrates tracing a two-dimensional array.
27.a Demonstrates tracing strings.
28.a.i & 28.a.ii combined Demonstrates tracing a struct.
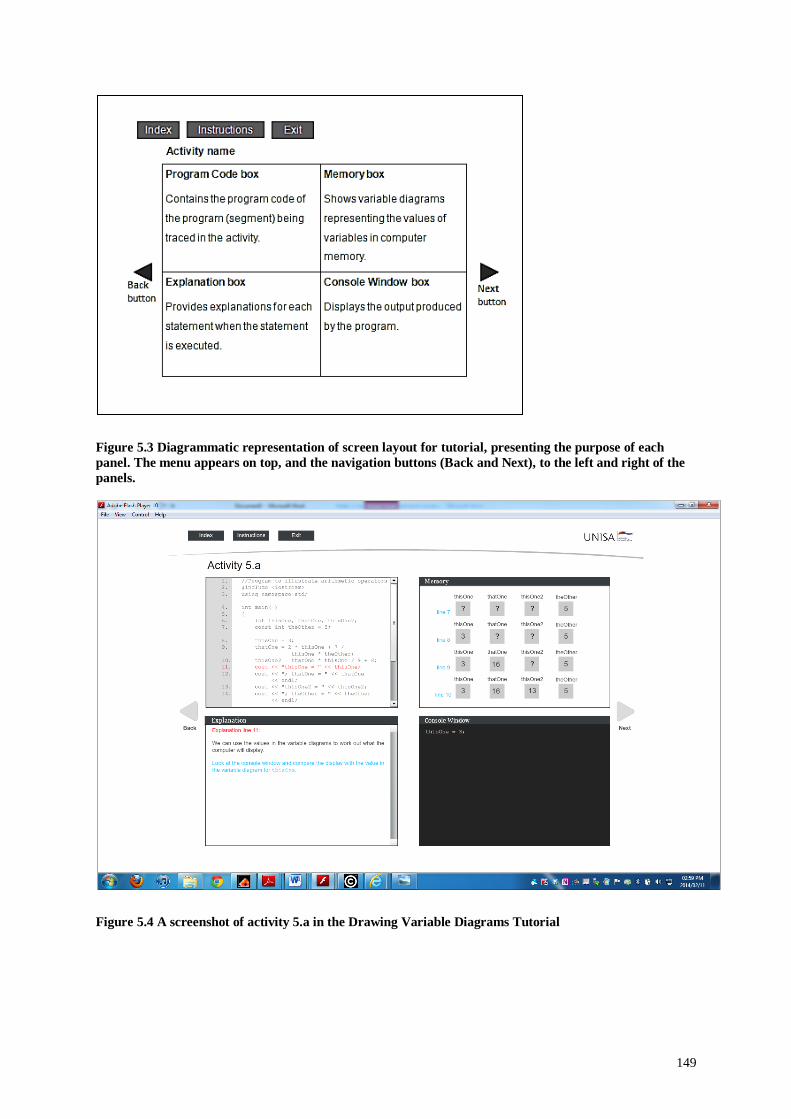
149
Figure 5.3 Diagrammatic representation of screen layout for tutorial, presenting the purpose of each panel. The menu appears on top, and the navigation buttons (Back and Next), to the left and right of the panels.
Figure 5.4 A screenshot of activity 5.a in the Drawing Variable Diagrams Tutorial

150
A typical run
In the Program Code box (see Figure 5.5) the program (segment) being traced, is displayed. The
statements are numbered to facilitate explanation and the drawing of variable diagrams. When a
statement is ‘executed’, it is highlighted in red in the Program Code box and explained in the
Explanation box while the variable diagrams depicting the state of the computer memory at that
specific time are reflected in the Memory box and the state of the Console window portrays the output
at that stage. Figures 5.8 to 5.11 respectively show a representation of the view in each of the four
panels for the same statement.
For example, when the statement in line 11 in the Program Code box in Figure 5.5 is ‘executed’, the
Explanation box in Figure 5.6 is also numbered ‘Explanation line 11’, and gives an explanation of
what happens when this statement is executed. Since the statement is an output statement, the
Explanation box prompts the user to look at the output produced by this statement in the Console
Window box in Figure 5.7. In the Memory box in Figure 5.8, the variable diagrams show the contents
of the computer memory at this stage. The Memory box displays variable diagrams for lines 7 to 10 to
show the values of the variables as they are modified in each statement. The question marks in the
variable diagrams indicate variables that have not yet been initialised. The user can now confirm that
the value the variable thisOne has in memory, is in fact displayed in the output.
Figure 5.5 The Program Code box. Line 11 is highlighted because this statement is executed. A scroll bar appears to right because all the program code does not fit into the panel.

151
Figure 5.6 The Explanation box. The prompt to look at the output is displayed in blue.
Figure 5.7 The Console Window box. In the tutorial the console window is black, with white text. The ‘–‘ next to the output, flickers, as it does in the IDE.
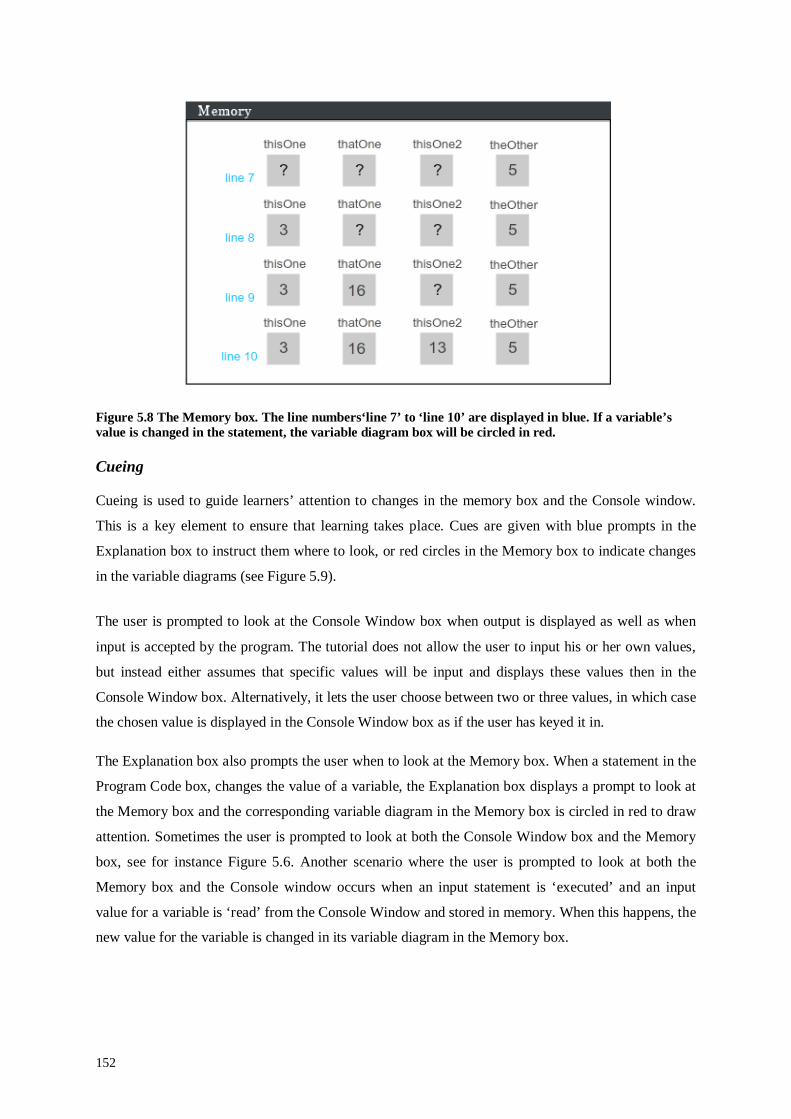
152
Figure 5.8 The Memory box. The line numbers‘line 7’ to ‘line 10’ are displayed in blue. If a variable’s value is changed in the statement, the variable diagram box will be circled in red. Cueing
Cueing is used to guide learners’ attention to changes in the memory box and the Console window.
This is a key element to ensure that learning takes place. Cues are given with blue prompts in the
Explanation box to instruct them where to look, or red circles in the Memory box to indicate changes
in the variable diagrams (see Figure 5.9).
The user is prompted to look at the Console Window box when output is displayed as well as when
input is accepted by the program. The tutorial does not allow the user to input his or her own values,
but instead either assumes that specific values will be input and displays these values then in the
Console Window box. Alternatively, it lets the user choose between two or three values, in which case
the chosen value is displayed in the Console Window box as if the user has keyed it in.
The Explanation box also prompts the user when to look at the Memory box. When a statement in the
Program Code box, changes the value of a variable, the Explanation box displays a prompt to look at
the Memory box and the corresponding variable diagram in the Memory box is circled in red to draw
attention. Sometimes the user is prompted to look at both the Console Window box and the Memory
box, see for instance Figure 5.6. Another scenario where the user is prompted to look at both the
Memory box and the Console window occurs when an input statement is ‘executed’ and an input
value for a variable is ‘read’ from the Console Window and stored in memory. When this happens, the
new value for the variable is changed in its variable diagram in the Memory box.
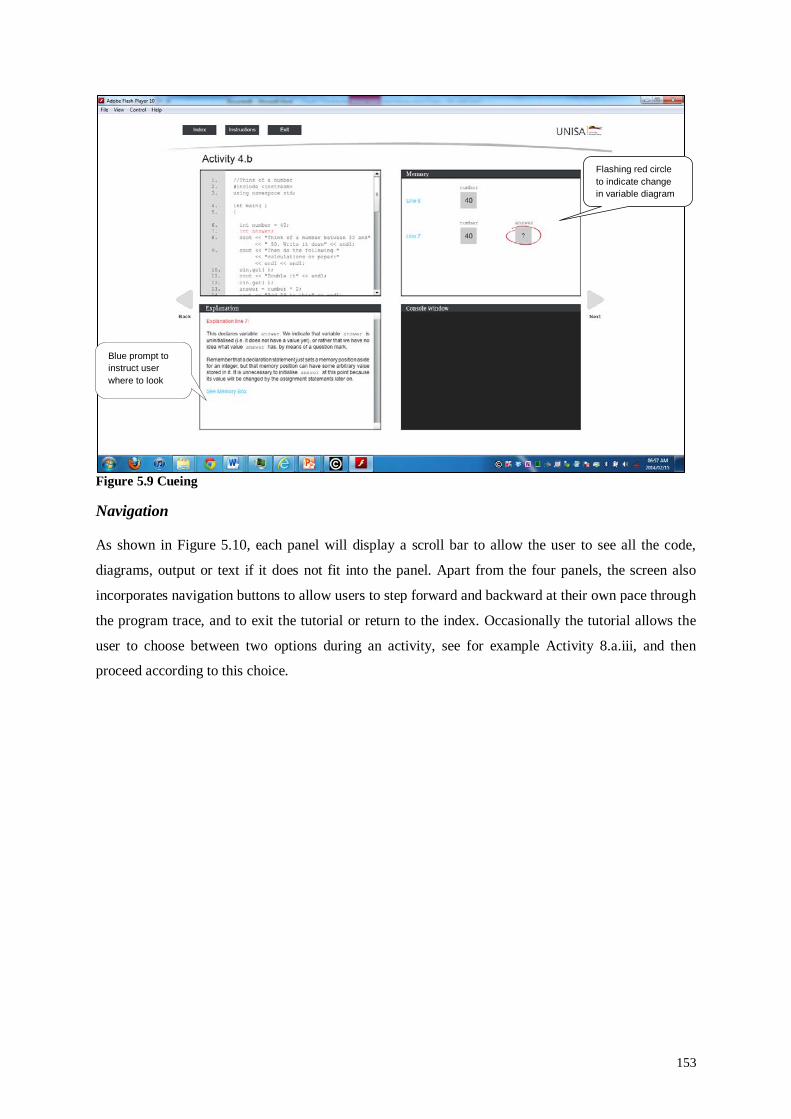
153
Figure 5.9 Cueing
Navigation
As shown in Figure 5.10, each panel will display a scroll bar to allow the user to see all the code,
diagrams, output or text if it does not fit into the panel. Apart from the four panels, the screen also
incorporates navigation buttons to allow users to step forward and backward at their own pace through
the program trace, and to exit the tutorial or return to the index. Occasionally the tutorial allows the
user to choose between two options during an activity, see for example Activity 8.a.iii, and then
proceed according to this choice.
Flashing red circle to indicate change in variable diagram
Blue prompt to instruct user where to look
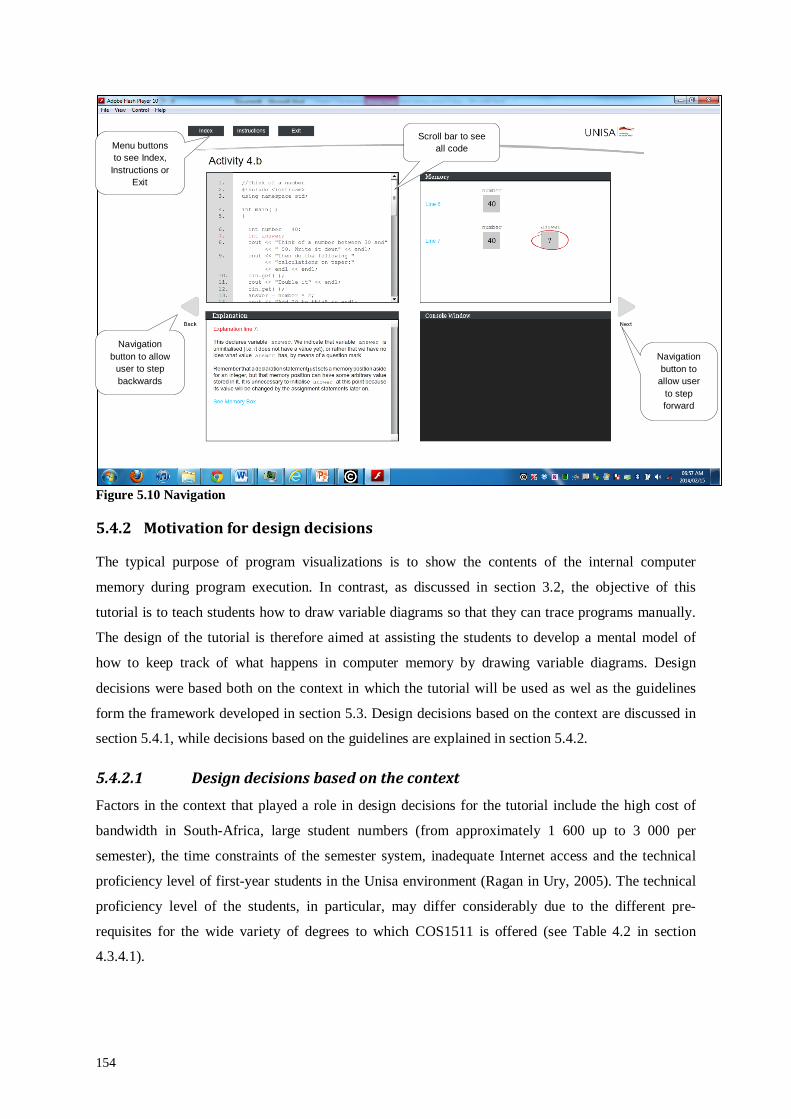
154
Figure 5.10 Navigation
5.4.2 Motivation for design decisions
The typical purpose of program visualizations is to show the contents of the internal computer
memory during program execution. In contrast, as discussed in section 3.2, the objective of this
tutorial is to teach students how to draw variable diagrams so that they can trace programs manually.
The design of the tutorial is therefore aimed at assisting the students to develop a mental model of
how to keep track of what happens in computer memory by drawing variable diagrams. Design
decisions were based both on the context in which the tutorial will be used as wel as the guidelines
form the framework developed in section 5.3. Design decisions based on the context are discussed in
section 5.4.1, while decisions based on the guidelines are explained in section 5.4.2.
5.4.2.1 Design decisions based on the context
Factors in the context that played a role in design decisions for the tutorial include the high cost of
bandwidth in South-Africa, large student numbers (from approximately 1 600 up to 3 000 per
semester), the time constraints of the semester system, inadequate Internet access and the technical
proficiency level of first-year students in the Unisa environment (Ragan in Ury, 2005). The technical
proficiency level of the students, in particular, may differ considerably due to the different pre-
requisites for the wide variety of degrees to which COS1511 is offered (see Table 4.2 in section
4.3.4.1).
Navigation button to
allow user to step forward
Scroll bar to see all code
Navigation button to allow
user to step backwards
Menu buttons to see Index,
Instructions or Exit

155
An important consideration was that including existing programming visualization tools in the course
material would require students to learn another environment in addition to the prescribed IDE and
compiler. In the semester system with limited time for lecturers to cover programming fundamentals
in detail, and for students to develop problem-solving and logic skills, high-level tools such as the
IDE and libraries may overwhelm the students more than it empower them (Leung, 2006). Therefore a
customised PV tutorial based on the Study Guide for COS1511 was developed, since correspondence
between the artifact and the related study material is such an important factor in its acceptance as a
learning tool (Naps, Röβling et al., 2003; Röβling, 2010). The tutorial resembles the static diagrams
provided in the Study Guide for COS1511 as closely as possible to enhance its comprehension. To
further align the tutorial with the study material, the Console Window box representing output from
the program, imitates that of the IDE used by the COS1511 students. The purpose of this is to assist
students in developing and reinforcing their own mental models of what happens when a program is
executed. The term ‘console window’ is also the term used in the IDE utilised by the students. To
demonstrate the use of the tutorial, it is incorporated in the students’ study material with compulsory
assignments.
Since Unisa students tend to have limited or intermittent internet access and unreliable postal systems,
the tutorial is supplied on CD as part of the study material in a format that allows users to install the
tutorial from the CD. To deal with unreliable postal systems, it may also be downloaded from the
course website.
5.4.2.2 Design decisions based on the framework of guidelines
Most of the guidelines from the framework presented in Table 5.1 have been used in the design and
development of the tutorial to teach tracing, as is discussed below. Reasons and explanations for those
that were not implemented and those where deviations from a guideline have been implemented, are
offered.
Since users’ level of engagement has been shown to play a major role in the success of a visualisation,
learners are presented with activities at certain points in the presentation to engage them. As
recommended in Guideline 1, they are actively engaged with self-assessment exercises in the form of
tickler questions, and questions that prevent the user from continuing without a correct answer.
Should a student answer a question that prevents the user from continuing incorrectly, an explanation
with the correct answer is provided. The other forms of engagement were considered beyond the
scope of the purpose of the tutorial.
To ensure acceptance the tutorial is integrated in the study material as discussed in section 5.4.1.2,
following Guideline 2. The animations are small (Guideline 3) and not too complex (Guideline 4).

156
Because learners would be using the tutorial on their own, the interface to the tutorial is kept very
simple with only three options, namely Index (to see the list of activities), Instructions (to learn how
to use the tutorial) and Exit (to exit from the tutorial). When the mouse is positioned over an option, a
drop-down explanation indicates the purpose of the option. Guideline 5 recommends using a general-
purpose framework similar to an environment with which the user is already familiar with. The simple
interface used for the tutorial therefore did not follow this guideline.
Since the learners would be using the tutorial at home, without assistance, for the first version of the
tutorial, a series of screen shots was used as instructions to show the users how to use the tutorial (see
Appendix E.1). However, during the qualitative investigation in first implementation cycle, it became
clear that this was not sufficient. Accordingly the instructions on how to use the tutorial was adapted
and changed to a to a Powerpoint presentation covering the following topics, including an example on
how to use the tutorial as the last topic(see Appendix E.2):
1. Introduction
2. What is a variable?
3. What is a variable diagram?
4. The purpose of variable diagrams
5. The purpose of the Drawing Variable Diagrams Tutorial
6. Activities in the Drawing Variable Diagrams Tutorial
7. How to use the Drawing Variable Diagrams Tutorial
8. The Landing Page
9. The Index page
10. Explanation of an activity screen
11. The Program code box
12. The Memory box
13. The Explanation box
14. The Console window box
15. The relationship between the four boxes on the screen for an activity
16. How to follow how variable diagrams are drawn
17. Notes
18. At the end of an activity
19. Using the Drawing Variable Diagrams Tutorial to see how variable diagrams are drawn for
activity 3.a.i
This corresponds to guideline 6 that recommends that students should be properly guided in how to
use the PAV tool, especially when used in self-study.

157
A conversational tone (Guideline 7) is used in the natural language explanations which are
synchronised with the program state information (Guideline 8) in the four panels displayed
simultaneously to explain a statement.
To allow students to form a mental model of what happens in computer memory; as well as how to
represent and keep track of it by drawing variable diagrams, the screen layout presents the program
simultaneously at four levels. The four panels used in the screen layout are shown in Figure 5.3 (one
each to show the program code, the computer memory, the program output and an explanation of the
step). In this way a student can keep track of what happens when a statement is executed, see how to
draw the variable diagrams indicating the change in memory (if any), read the explanation and also
see what output (if any) the statement produces. This follows guideline 9, the contiguity principle, but
only followed insofar as the textual explanations are presented in the same space as the illustrative
material.
To engage students, the tutorial is interactive and allows direct user control in the form of navigation
buttons to move forward or backward through an activity. This allows students to determine the pace
at which, and the direction in which the visualization unfolds, following Guideline 12 (supporting
flexible execution). As a result, guideline 10, the modality principle, that suggests textual explanations
should be spoken, was not adhered to, since guideline 12 is particularly suitable to the ODL
environment at Unisa. In the next paragraph the reasons for not following Guideline 10 are discussed
in more detail.
Many of Unisa’s students come from a disadvantaged educational background. Unisa research shows
that the average first-year student, from a background where reading was neglected, could have the
reading ability of twelve-year olds, not eighteen-year olds (Kilfoil, 2008). Other sources confirm that
South-African learners at both school and tertiary level, frequently perform below expectation in
terms of reading (Gous & Roberts, 2014; Hefer, 2013; Nel, Dreyer & Klopper, 2004). The 2014
National Benchmark tests in academic Literacy for South-Africa too indicate that only approximately
33% of applicants to higher education for 2015 had the ability to cope with academic literacy
demands of tertiary courses (Cliff, 2015). When text is combined with other visual material such as
images or film, the eye has to move between the text and the rest of the visuals on the screen which
places more demands on attention and adds to the cognitive load as information has to be combined
from two channels (Hefer, 2013). Guideline 12, supporting flexible execution control with DMA so
that learners can control the speed and direction of the animation to suit their learning style and
comprehension ability, is therefore particularly suitable for the ODL environment at Unisa, as this
will allow learners to process and understand the relationship between the various components in the
animation at their own pace. Flexible execution control is also highly recommended in both CER and
EP, as it provides a flexible interface that allow learners to pause and process material at their own
158
pace (Chan & Black, 2005; Hansen et al., 2002) which corresponds with the apprehension principle
(Tversky et al., 2002) and decreases the extraneous cognitive load (Wouters et al., 2008). With
flexible execution control, written explanatory text is more effective than spoken explanatory text and
easier to follow when moving forwards and backwards through the animation (Tabbers et al., 2004).
Regardless of the accent of the speaker used in the animation, it would be foreign to some students,
since many of them study in their second or third language, which would add to the cognitive load
(Mayer et al., 2003).
Guideline 11 (avoid using extraneous material) was followed with caution, because the user has to be
prompted judiciously, that is neither too much nor too little. For example, displaying variable names
only above each column instead of above each line in the Memory box (see Figure 5.14), would offer
too little information.
The four panels used to explain a statement follows Guideline 13, since they are used consistently for
the same information. Guideline 14 was followed partly since all windows are visible during the
entire animation, but users cannot resize them.
Complying with Guideline 15, a user-centred design with consistency in screen layout and navigation
buttons is followed. The cues used to guide users’ attention (Guideline 17) are always in the same
format. All prompts guiding the user to look at either the Console Window box or the Memory box
are displayed in blue, while the circles in the Memory box to draw attention to changes in the variable
diagrams are always red. In this way, it becomes ‘automatic’ knowledge, just enough to nudge the
user where to pay attention, without detracting from comprehension. A lean, elegant design with roll-
overs displaying the purpose of a button further minimises the cognitive load.
Changes in variable diagrams in the Memory box are only effected when a program statement that
causes a change in the internal memory is executed. Therefore, the Memory box will not display new
variable diagrams for each program line. This shows the student that memory does not change without
a program instruction, and it avoids distracting the student by an apparent change in the Memory box
which is in effect only a change in line number, thereby reducing extraneous cognitive load.
When demonstrating variable diagrams for activities with loops, both the Explanation box and the
Memory box indicate which iteration of the loop is executed. This helps the user to keep track of what
happens in memory, and so assists in developing the user’s mental model of what changes in memory
during each step in the loop’s execution.
The tutorial also follows Guideline 16, Tversky et al.’s (2002) congruence principle, to present the
process in the same way that people visualize it, again with the purpose of reinforcing learners’
mental model of program execution.
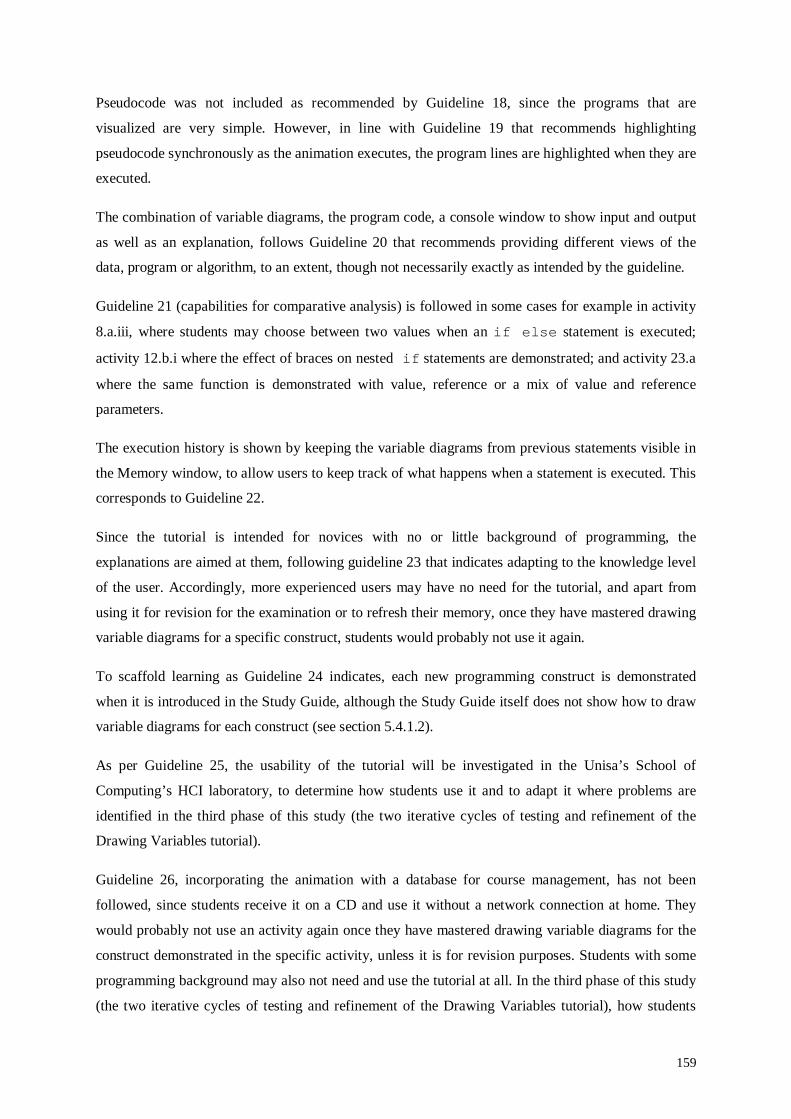
159
Pseudocode was not included as recommended by Guideline 18, since the programs that are
visualized are very simple. However, in line with Guideline 19 that recommends highlighting
pseudocode synchronously as the animation executes, the program lines are highlighted when they are
executed.
The combination of variable diagrams, the program code, a console window to show input and output
as well as an explanation, follows Guideline 20 that recommends providing different views of the
data, program or algorithm, to an extent, though not necessarily exactly as intended by the guideline.
Guideline 21 (capabilities for comparative analysis) is followed in some cases for example in activity
8.a.iii, where students may choose between two values when an if else statement is executed;
activity 12.b.i where the effect of braces on nested if statements are demonstrated; and activity 23.a
where the same function is demonstrated with value, reference or a mix of value and reference
parameters.
The execution history is shown by keeping the variable diagrams from previous statements visible in
the Memory window, to allow users to keep track of what happens when a statement is executed. This
corresponds to Guideline 22.
Since the tutorial is intended for novices with no or little background of programming, the
explanations are aimed at them, following guideline 23 that indicates adapting to the knowledge level
of the user. Accordingly, more experienced users may have no need for the tutorial, and apart from
using it for revision for the examination or to refresh their memory, once they have mastered drawing
variable diagrams for a specific construct, students would probably not use it again.
To scaffold learning as Guideline 24 indicates, each new programming construct is demonstrated
when it is introduced in the Study Guide, although the Study Guide itself does not show how to draw
variable diagrams for each construct (see section 5.4.1.2).
As per Guideline 25, the usability of the tutorial will be investigated in the Unisa’s School of
Computing’s HCI laboratory, to determine how students use it and to adapt it where problems are
identified in the third phase of this study (the two iterative cycles of testing and refinement of the
Drawing Variables tutorial).
Guideline 26, incorporating the animation with a database for course management, has not been
followed, since students receive it on a CD and use it without a network connection at home. They
would probably not use an activity again once they have mastered drawing variable diagrams for the
construct demonstrated in the specific activity, unless it is for revision purposes. Students with some
programming background may also not need and use the tutorial at all. In the third phase of this study
(the two iterative cycles of testing and refinement of the Drawing Variables tutorial), how students
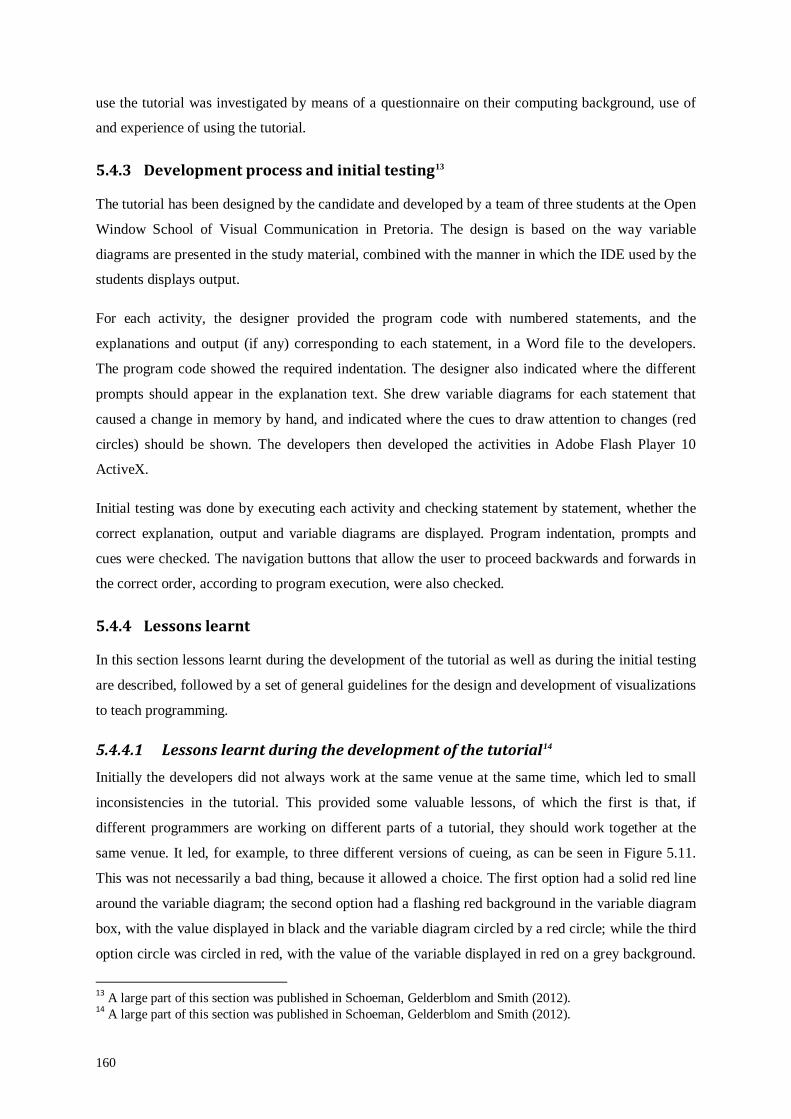
160
use the tutorial was investigated by means of a questionnaire on their computing background, use of
and experience of using the tutorial.
5.4.3 Development process and initial testing13
The tutorial has been designed by the candidate and developed by a team of three students at the Open
Window School of Visual Communication in Pretoria. The design is based on the way variable
diagrams are presented in the study material, combined with the manner in which the IDE used by the
students displays output.
For each activity, the designer provided the program code with numbered statements, and the
explanations and output (if any) corresponding to each statement, in a Word file to the developers.
The program code showed the required indentation. The designer also indicated where the different
prompts should appear in the explanation text. She drew variable diagrams for each statement that
caused a change in memory by hand, and indicated where the cues to draw attention to changes (red
circles) should be shown. The developers then developed the activities in Adobe Flash Player 10
ActiveX.
Initial testing was done by executing each activity and checking statement by statement, whether the
correct explanation, output and variable diagrams are displayed. Program indentation, prompts and
cues were checked. The navigation buttons that allow the user to proceed backwards and forwards in
the correct order, according to program execution, were also checked.
5.4.4 Lessons learnt
In this section lessons learnt during the development of the tutorial as well as during the initial testing
are described, followed by a set of general guidelines for the design and development of visualizations
to teach programming.
5.4.4.1 Lessons learnt during the development of the tutorial14
Initially the developers did not always work at the same venue at the same time, which led to small
inconsistencies in the tutorial. This provided some valuable lessons, of which the first is that, if
different programmers are working on different parts of a tutorial, they should work together at the
same venue. It led, for example, to three different versions of cueing, as can be seen in Figure 5.11.
This was not necessarily a bad thing, because it allowed a choice. The first option had a solid red line
around the variable diagram; the second option had a flashing red background in the variable diagram
box, with the value displayed in black and the variable diagram circled by a red circle; while the third
option circle was circled in red, with the value of the variable displayed in red on a grey background.
13 A large part of this section was published in Schoeman, Gelderblom and Smith (2012). 14 A large part of this section was published in Schoeman, Gelderblom and Smith (2012).
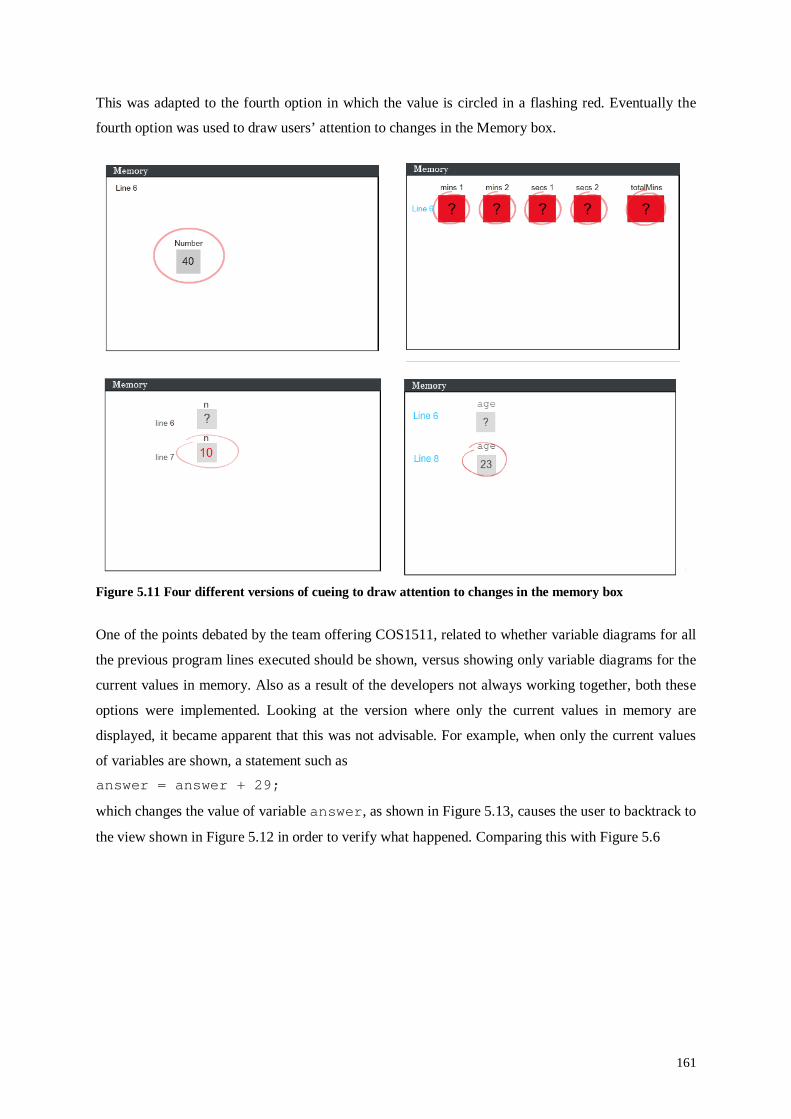
161
This was adapted to the fourth option in which the value is circled in a flashing red. Eventually the
fourth option was used to draw users’ attention to changes in the Memory box.
Figure 5.11 Four different versions of cueing to draw attention to changes in the memory box
One of the points debated by the team offering COS1511, related to whether variable diagrams for all
the previous program lines executed should be shown, versus showing only variable diagrams for the
current values in memory. Also as a result of the developers not always working together, both these
options were implemented. Looking at the version where only the current values in memory are
displayed, it became apparent that this was not advisable. For example, when only the current values
of variables are shown, a statement such as answer = answer + 29;
which changes the value of variable answer, as shown in Figure 5.13, causes the user to backtrack to
the view shown in Figure 5.12 in order to verify what happened. Comparing this with Figure 5.6
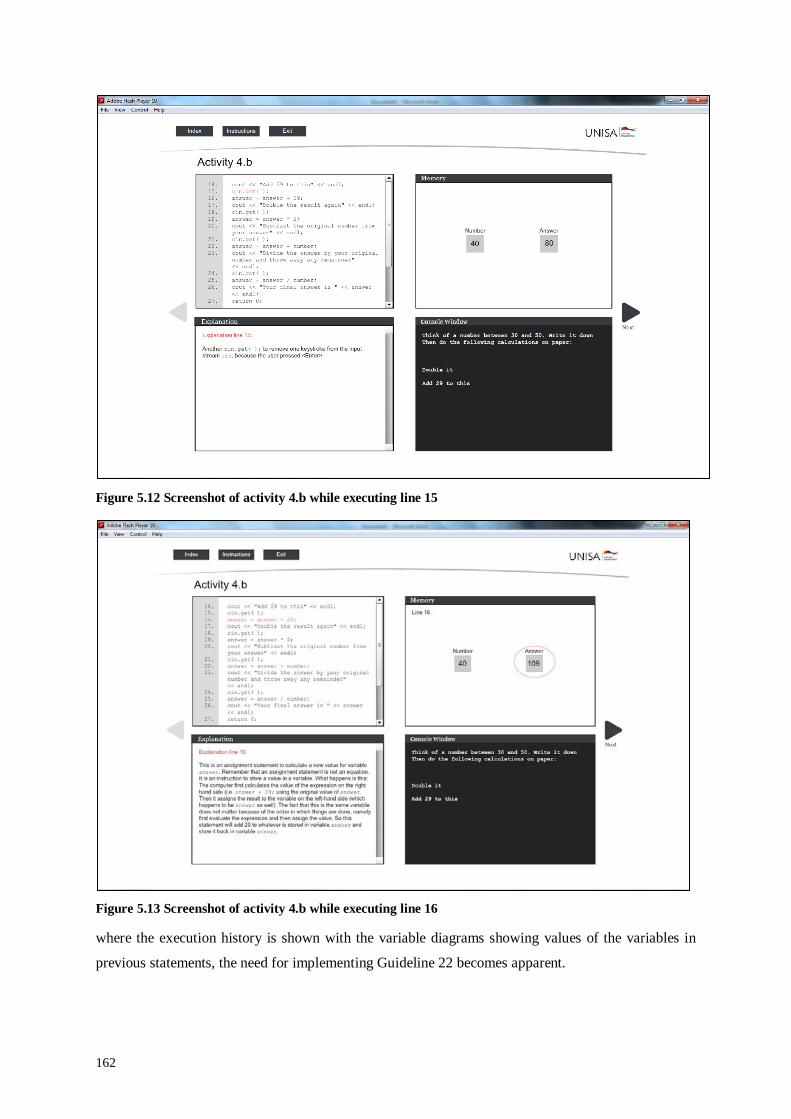
162
Figure 5.12 Screenshot of activity 4.b while executing line 15
Figure 5.13 Screenshot of activity 4.b while executing line 16
where the execution history is shown with the variable diagrams showing values of the variables in
previous statements, the need for implementing Guideline 22 becomes apparent.
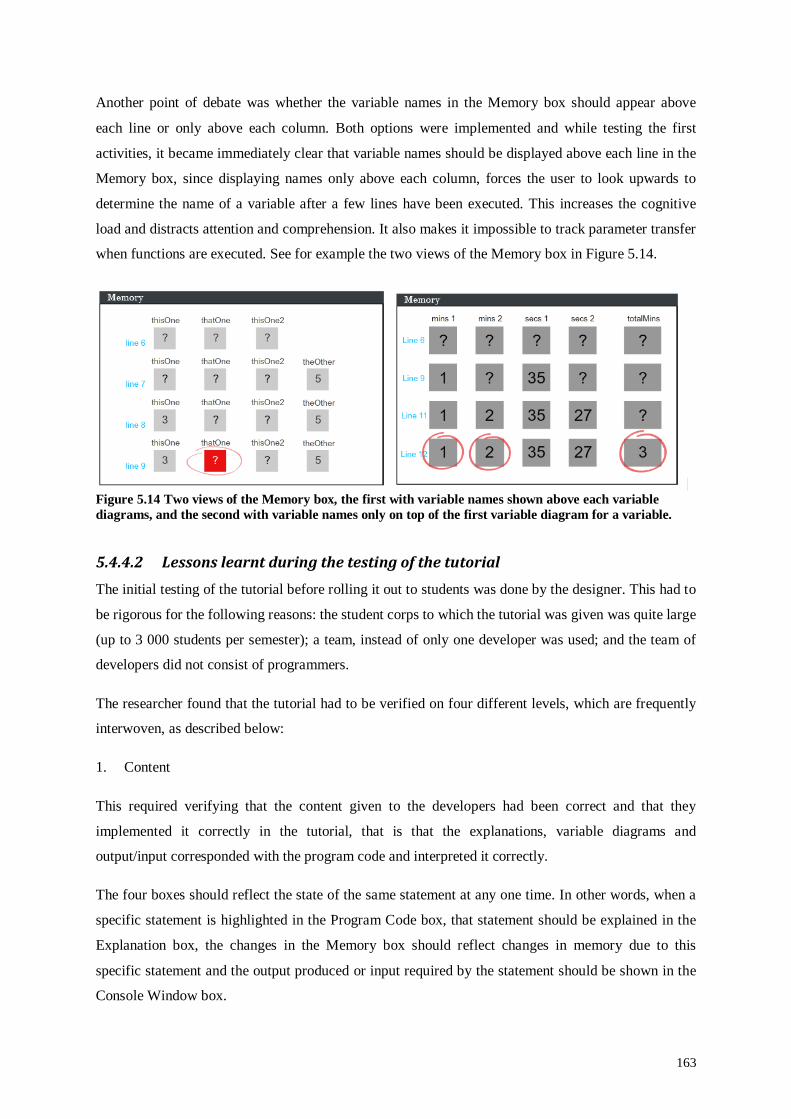
163
Another point of debate was whether the variable names in the Memory box should appear above
each line or only above each column. Both options were implemented and while testing the first
activities, it became immediately clear that variable names should be displayed above each line in the
Memory box, since displaying names only above each column, forces the user to look upwards to
determine the name of a variable after a few lines have been executed. This increases the cognitive
load and distracts attention and comprehension. It also makes it impossible to track parameter transfer
when functions are executed. See for example the two views of the Memory box in Figure 5.14.
Figure 5.14 Two views of the Memory box, the first with variable names shown above each variable diagrams, and the second with variable names only on top of the first variable diagram for a variable.
5.4.4.2 Lessons learnt during the testing of the tutorial The initial testing of the tutorial before rolling it out to students was done by the designer. This had to
be rigorous for the following reasons: the student corps to which the tutorial was given was quite large
(up to 3 000 students per semester); a team, instead of only one developer was used; and the team of
developers did not consist of programmers.
The researcher found that the tutorial had to be verified on four different levels, which are frequently
interwoven, as described below:
1. Content
This required verifying that the content given to the developers had been correct and that they
implemented it correctly in the tutorial, that is that the explanations, variable diagrams and
output/input corresponded with the program code and interpreted it correctly.
The four boxes should reflect the state of the same statement at any one time. In other words, when a
specific statement is highlighted in the Program Code box, that statement should be explained in the
Explanation box, the changes in the Memory box should reflect changes in memory due to this
specific statement and the output produced or input required by the statement should be shown in the
Console Window box.

164
Variable diagrams should only change for the statements in the program code that cause a change in
computer memory. Only the variable diagrams for those variables whose values are affected, should
change, while the values for the other variables available in memory at that stage, stay the same. In
addition, the change in value has to correspond to the program statement being imitated or ‘executed’.
2. Sequence: execution order
The execution order had to be checked to ensure that the activity is executed in the same order as the
program statements, including function calls and returns. This meant that program logic should be
reflected correctly when the Next button is used to step through the program, as well as checking that
the Back button still produces the correct sequence when steps are traced backward.
In addition, when the user has to choose between two options, the correct explanation should be
displayed, and execution should continue at the correct follow-up statement. Furthermore, this
sequence should still hold when the Back button has been used.
3. Format
Checking the format required checking the appearance of all four boxes.
In the Program Code box the indentation had to be correct and program statements had to follow the
correct syntax. The statement being ‘executed’ or simulated should be highlighted in red. Where
statements span more than one line, all the relevant lines should be highlighted. For function calls,
both the statement where the function call occurs as well the function signature should be highlighted,
and both should be visible. Similarly, for function returns, both the return statement and the original
calling statement should be highlighted and visible. If both cannot be shown simultaneously in the
Program Code box, a button with a message to allow the user to move between the two relevant
statements should be available in the Explanation box.
In the Explanation box font Arial was used for explanations and, as is convention, Courier New for
program code statements. Prompts in the Explanation box direct the user’s attention to changes in the
Memory box and the Console Window. All prompts should be in blue and in a consistent format.
Therefore both the format of the text had to be verified, as well as that of the prompts.
In the Memory box the name of the variable should appear above its variable diagram, and the line
number should appear to the left of all the variables in memory available to the program (visible) at
that stage. When a function call or return is executed, the transfer of control in program execution
should be indicated in the line numbers in the Memory box, such as for instance ‘Line 15 6’ when
a function is executed or ‘Line 9 15’ when control returns to the main function (see Figure 5.15).
Value and reference parameters, as well as inaccessible variables during function execution have to be

165
denoted correctly. Prompts to changes in the Memory box should all be in the form of red circles
around the relevant variable diagrams.
In the Console Window box the output had to correspond to the program statements in both content
and format. Similarly, input (if presented) had to be indicated in the Console Window box, and be in
the correct format. The cursor should also appear (as a blinking dash) in the correct position in the
Console Window box.
A very important aspect that had to be checked was to ensure that changes in the Memory box and
Console Window box did not change the previous contents of these two boxes because this would
portray an inaccurate picture of the tracing process.
Figure 5.18 Indicating transfer of control in program execution
4. Didactics
On a didactic level the necessary prompts to direct students’ attention to changes in the variable
diagrams (in the Memory box) and Console Window box should be displayed in the correct position
and at the correct moment and statement. These prompts are given in the Explanation box as blue text,
and in the Memory box as red circles around relevant variable diagrams.
Prompts have to be in a consistent format to reduce cognitive load, and this had to be verified too.
Indicating transfer of control
Indicating transfer of control
Indicating transfer of control
166
Part of verifying the didactic requirements were ensuring that students can see both the statement
where a function call occurs as well as the signature of the function, and that, if that is not possible, a
button in the Explanation box provides the opportunity to move between the calling statement and the
function signature. The same applies for the function returns.
As can be seen from the above, the initial testing and verification of a PV tool before rolling it out for
use by the students is an essential and crucial part of the development.
5.4.5 Further guidelines
From the development process and initial testing of the tutorial as described here, the following four
general guidelines for the design and development of visualizations to enhance comprehension are
identified:
1. Deliberately build in elements to help students consolidate their mental model, such as
presenting all four panels for a statement simultaneously on the same screen (following the
contiguity principle, Guideline 9) to enable them to integrate the information provided by
these four views. Numbering the statements in the Program Code box, the Explanation box
and the Memory box also assists with this process, as do labeling the iterations in loops.
Showing changes in variable diagrams in the Memory box only when changes in the internal
memory occur, and imitating the Console Window of the compiler to show output, serve the
same purpose.
2. Reduce extraneous cognitive load as much as possible. A number of the guidelines in the
framework are specifically intended to reduce extraneous cognitive load, namely Guidelines
10 (the modality principle), 12 (flexible execution control) and 24 (scaffolding). Using cues
consistently (Guideline 15), and using signaling to draw attention to important changes
(Guideline 17) also contributes to this purpose. Other elements in the tutorial intended to
reduce the extraneous cognitive load include the numbering of statements in the Program
Code box, the Explanation box and the Memory box; and changing variable diagrams only
with changes in the internal memory.
3. Prompt the user judiciously, that is neither too much nor too little. For example, using option
2 in Figure 5.11 (a flashing red background in the variable diagram box, with the value
displayed in black and a red circle around the variable diagram) to cue users to look at
changes in the Memory box, would be an overkill, while displaying variable names only
above each column instead of above each line in the Memory box, would offer too little
information.
4. Stringent testing of the PV tool with particular attention paid to verifying aspects of the PV
tool on four different levels, namely content; sequence and execution order; format; and
didactics should be done before providing it to students, as can be seen from section 5.5.5.2.
167
This enhances Guideline 25 in the framework (performing user testing on each animation
before using it for instruction), and also follows the principles of human-computer interaction.
Concerning the development process itself, it is recommended that the developers of visualizations
work together in the same venue to facilitate uniformity in the implementation. They should also
consult with the main designer before making design decisions regarding the implementation of the
visualization.
5.5 Summary and conclusion
This chapter presents the last part of the literature review for this study, namely guidelines from
literature for using and creating visualization tools effectively, in section 5.2. Guidelines from three
research areas, CER, educational psychology and computer graphics, are discussed. These guidelines
were converted to a framework of 26 guidelines for developing and creating visualization tools for
teaching programming in section 5.3.
Several of the guidelines occur in two or all three of the research areas. In such cases the guideline
was synthesized into a single guideline. The guidelines are enhanced with reasons or explanations for
their recommendation, as well as considerations that should be taken into account when implementing
a guideline. Most of the reasons, explanation and considerations given come from the fields of
educational research and computer graphics. Some considerations may rule out applying certain
guidelines, which may allow lecturers to develop visualizations that engage learners more effectively.
The design and development of the tutorial to teach tracing is described in section 5.4 as part of the
second phase (Development of solutions informed by existing design principles and technological
innovations) in the design-based research approach followed. The framework presented in section 5.3
is used as the theoretical framework to guide the design of the tutorial. The tutorial itself is described
in section 5.4.1. The description includes the tutorial specifications as well as the activities in the
tutorial and their implementation. The screen layout is shown and a typical run demonstrated by
showing the screens as a specific statement is ‘executed’. The cueing to guide students’ attention and
navigation through the tutorial are also described.
In section 5.4.2 the design decisions taken in developing the tutorial are discussed and related to the
guidelines in the framework from section 5.3. The ODL environment at Unisa played a significant
role in several design decisions. The development process itself and the initial testing are described in
section 5.4.3. Section 5.4.5 relates lessons learned during the development and testing of the tutorial.
Four general guidelines for the development of PVs are also identified and presented in section 5.4.5.
Together with the framework presented in section 5.3, these guidelines form part of the theoretical
contribution of this PhD study.

168
The next chapter describes the first cycle in the third phase (iterative cycles of testing and refinement
of solutions in practice) of the design-based research approach followed in this study.

169

170
Note to the reader regarding Chapters 6 and 7
The statistical analyses discussed in these chapters comprise several models. Chapter 6 describes the
first implementation cycle of the Drawing Variable Diagrams tutorial in 2012, while Chapter 7 covers
the second implementation cycle in 2013. In addition, the analysis for the first semester was repeated
for the second semester. The following measures are implemented to improve readability:
1. The statistical analyses for the two semesters in each implementation cycle are usually
discussed together. Graphs and tables are labelled clearly to indicate the semester and year it
refers to.
2. In cases where this is not feasible, a clear heading with a descriptive name for the model and
the semester for which it has been fitted is used. Thereafter the name of the model, the year or
the semester for which it is fitted, are sometimes omitted for the sake of readability.
3. Some supporting graphs and tables have been placed in Appendix D. All tables and graphs in
Appendix D are clearly labelled with the semester to which it applies, and provided with a
heading corresponding to the heading in the chapter. The section number as used in the
chapter is also supplied in brackets after the heading.
4. On occasion a local smoother is included in the fit of a model to show that the fit is not linear.
In these cases a small legend, which will not be mentioned in the accompanying discussion, is
included in the display.
5. The statistical analyses were done by a trained statistician and all assumptions for statistical
techniques were tested and satisfied.
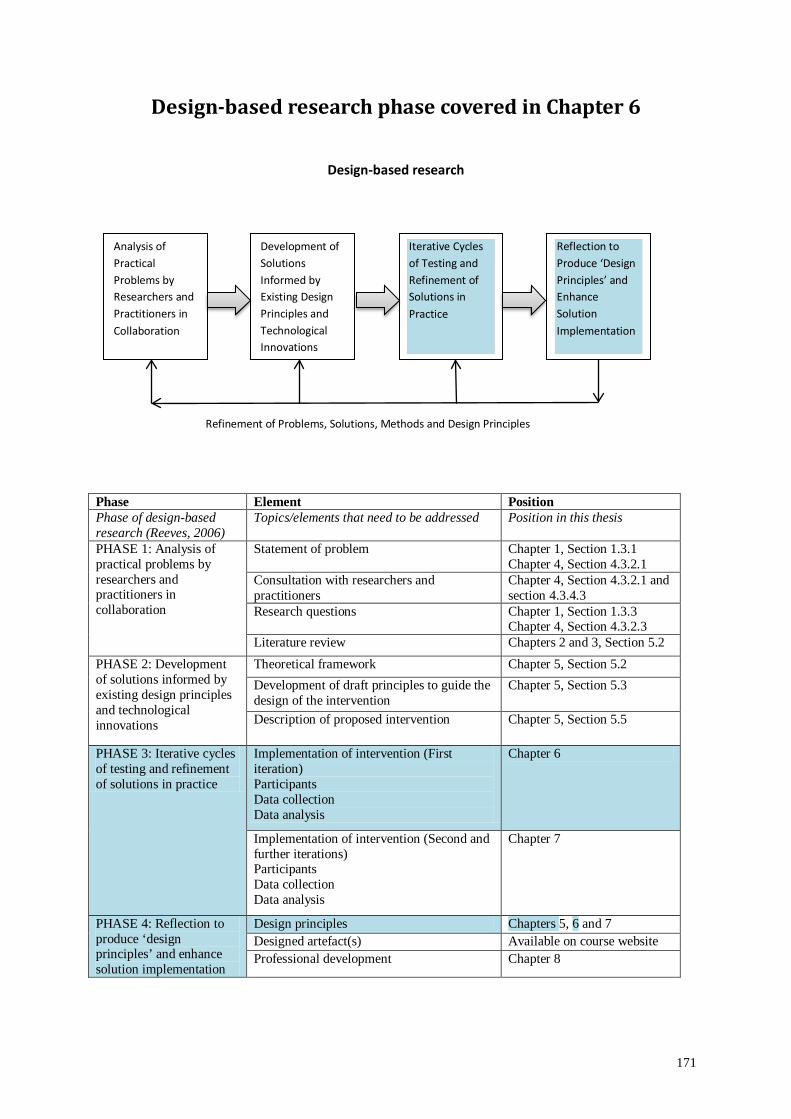
171
Design-based research phase covered in Chapter 6
Design-based research
Phase Element Position Phase of design-based research (Reeves, 2006)
Topics/elements that need to be addressed Position in this thesis
PHASE 1: Analysis of practical problems by researchers and practitioners in collaboration
Statement of problem Chapter 1, Section 1.3.1 Chapter 4, Section 4.3.2.1
Consultation with researchers and practitioners
Chapter 4, Section 4.3.2.1 and section 4.3.4.3
Research questions Chapter 1, Section 1.3.3 Chapter 4, Section 4.3.2.3
Literature review Chapters 2 and 3, Section 5.2 PHASE 2: Development of solutions informed by existing design principles and technological innovations
Theoretical framework Chapter 5, Section 5.2 Development of draft principles to guide the design of the intervention
Chapter 5, Section 5.3
Description of proposed intervention Chapter 5, Section 5.5
PHASE 3: Iterative cycles of testing and refinement of solutions in practice
Implementation of intervention (First iteration) Participants Data collection Data analysis
Chapter 6
Implementation of intervention (Second and further iterations) Participants Data collection Data analysis
Chapter 7
PHASE 4: Reflection to produce ‘design principles’ and enhance solution implementation
Design principles Chapters 5, 6 and 7 Designed artefact(s) Available on course website Professional development Chapter 8
Analysis of Practical Problems by Researchers and Practitioners in Collaboration
Development of Solutions Informed by Existing Design Principles and Technological Innovations
Iterative Cycles of Testing and Refinement of Solutions in Practice
Reflection to Produce ‘Design Principles’ and Enhance Solution Implementation
Refinement of Problems, Solutions, Methods and Design Principles
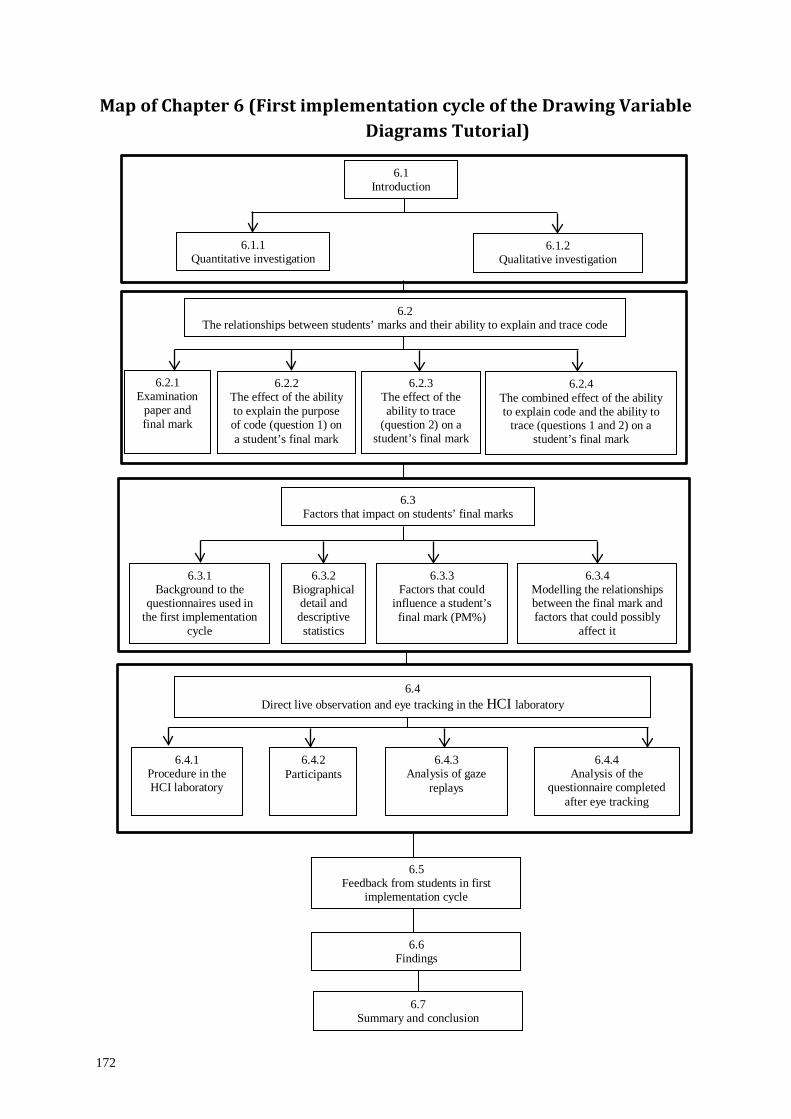
172
Map of Chapter 6 (First implementation cycle of the Drawing Variable Diagrams Tutorial)
6.5 Feedback from students in first
implementation cycle
6.2 The relationships between students’ marks and their ability to explain and trace code
6.3 Factors that impact on students’ final marks
6.7 Summary and conclusion
6.2.1 Examination
paper and final mark
6.2.2 The effect of the ability to explain the purpose of code (question 1) on a student’s final mark
6.3.3 Factors that could
influence a student’s final mark (PM%)
6.3.4 Modelling the relationships between the final mark and factors that could possibly
affect it
6.4 Direct live observation and eye tracking in the HCI laboratory
6.4.1 Procedure in the HCI laboratory
6.4.4 Analysis of the
questionnaire completed after eye tracking
6.3.1 Background to the
questionnaires used in the first implementation
cycle
6.4.3 Analysis of gaze
replays
6.2.4 The combined effect of the ability to explain code and the ability to
trace (questions 1 and 2) on a student’s final mark
6.4.2 Participants
6.2.3 The effect of the ability to trace
(question 2) on a student’s final mark
6.1 Introduction
6.1.1 Quantitative investigation
6.1.2 Qualitative investigation
6.3.2 Biographical
detail and descriptive statistics
6.6 Findings
173
Chapter 6 First implementation cycle of the Drawing Variable Diagrams Tutorial
6.1 Introduction
As shown in Table 4.3, the third phase of the design-based approach followed in this study consisted
of two iterative cycles of testing and refinement of the tutorial to teach students to draw variable
diagrams. The development of the tutorial itself has been discussed in Chapter 5.
This chapter, together with Chapter 7, addresses the second, third and fourth research questions,
namely:
1. Will a tutorial to teach tracing to visualize program execution and parameter transfer, based
on the framework of guidelines, assist students in acquiring programming skills in an ODL
environment so that it is noticeable in average marks?
2. How do students’ biographical properties, their positive user experience, their use of tracing
and the extent and manner of tutorial use, affect their ability to acquire programming skills in
an ODL environment?
3. What lessons have been learnt through the practical testing and refinement of the visualization
tool?
This chapter describes the first cycle in the testing and refinement of the tutorial to teach students to
draw variable diagrams which took place during 2012. This included both a quantitative and a
qualitative investigation. The quantitative investigation in particular, aims at answering the second
and third questions, while the reflection on the data analysis together with the qualitative investigation
answers question 4. In section 6.1.1 a background to the quantitative investigation is provided, and in
section 6.1.2, the same is done for the qualitative investigation. The quantitative investigation itself is
described in sections 6.2 and 6.3, while the qualitative investigation is covered in sections 6.4 and 6.5.
The findings from this implementation cycle are discussed in section 6.6, and in section 6.7 the
summary and conclusion of the chapter is presented.
6.1.1 Quantitative investigation
The data collection for the quantitative investigation comprised the following two aspects:
• Examination marks for each student.
• An optional multiple-choice questionnaire containing questions on biographical data and
previous experience, how students used the tutorial and their experience of using the tutorial.
The student number was used to link the information collected from each questionnaire to the same
student’s examination mark. More detail about the data collected for the quantitative investigation is
174
provided as background when its analysis is discussed. The SPSS statistical analysis software was
used to analyse the data.
The reader is reminded that due to ethical reasons (no student could be prevented access to the tutorial
– see section 4.3.5.3) a control group could not be used. Instead factor analysis was done to determine
the effect of a number of factors, one of which was students’ use of the tutorial, on their final marks.
The factor analysis was done on both students who have used the tutorial and those who did not.
Not all of the respondents were included in the statistical analysis for the following reasons:
• Respondents completed the questionnaire and the answers to Assignment 1, a multiple-choice
question assignment, on the same mark reading sheet. Respondents who completed the mark
reading sheet incorrectly by answering the multiple choice assignment questions, instead of
the questionnaire items, were excluded.
• Since it was expected that both students’ marks for Mathematics and English might have
influenced their final mark, only students for whom marks for Mathematics and English could
be obtained from the Unisa student system were included in the analysis.
• Respondents who did not submit both assignments and who did not write the examination at
the end of the semester, were excluded, since both these aspects influenced the final mark (the
dependent variable in the statistical analyses). The final mark was comprised from the year
mark and the examination mark. The year mark consisted of the marks obtained for
assignments submitted.
During the first semester 475 respondents satisfied the criteria to be included in the statistical analysis
and in the second semester 532 respondents satisfied these criteria.
The quantitative investigation aimed to answer the second and third research questions, as listed
above. To determine whether an improved ability to trace, would have an effect on a student’s final
mark, the relationships between students’ ability to explain the purpose of code and to trace, as well as
the combination of students’ ability to explain code and to trace, and their final marks, were
investigated. This is examined in section 6.2.
Students’ responses to the multiple-choice questionnaire were then used to investigate the factors that
impacted on their final marks in this study. This was done by categorising responses to the
questionnaire according to probable explanatory effects on students’ final marks, and modelling the
relationships between these factors and the final marks in section 6.3.
6.1.2 Qualitative investigation
The purpose of the qualitative investigation was to evaluate the user interface and find usability
problems in the design (Nielsen, 1994) to increase the effectiveness and utility of the designed
175
intervention. It was also intended to shed further light on the findings of the quantitative investigation.
The qualitative investigation comprised two parts, namely –
• direct live observation and eye tracking in a HCI laboratory; and
• written feedback from students on the COS1511 forum.
The direct live observation while using the tutorial combined with eye tracking, included a
retrospective comprehension test as well as a questionnaire with open-ended, semi-structured
questions that students completed after the eye tracking and observation. Data for written feedback
from COS1511 students, were obtained by initiating a topic on the COS1511 discussion forum that
requested feedback from students on reasons why they found the tutorial either helpful or frustrating.
The qualitative investigation aimed to contribute to the answer to research question 4. It also shed
more light on the results obtained in the quantitative investigation for research question 3. In section
6.4, the direct live observation and eye tracking conducted in the HCI laboratory are described, and in
section 6.5 feedback received from students on the online forum for COS1511, is reported.
6.2 The relationships between students’ marks and their ability to explain and trace code
The BRACElet project found a positive correlation in performance between ‘explain in plain English’
tasks and code writing tasks, as well as between code tracing and code writing tasks (Lister et al.,
2009; Lopez et al., 2008). They also found that a combination of skill in code explanation and tracing
skills, predicts performance in code writing (Venables et al., 2009).
Based on these findings, the premise for this research was that improving students’ tracing skills
would improve their programming skills and therefore their average marks. In order to confirm that
this also holds for the student cohort used in this research, the relationships between students’ abilities
to explain the purpose of code and to trace, and their final marks, were investigated. The purpose was
to determine whether their ability to explain code or trace affected their final marks. The combination
of students’ ability to explain code and to trace was also investigated to establish whether this affected
their final marks. The final mark for each student, comprised of the sum of the marks for the MCQs in
Part A and the questions in Part B of the examination paper, plus the year mark (represented by PM%
in the statistical analysis), was used as dependent variable in the analysis. The analysis included both
students who used the tutorial as well as students who did not use the tutorial.
Students could learn to trace by studying the relevant sections in the Study Guide for COS1511 or by
using the tutorial. As discussed in section 5.5.1.2, the activities in the tutorial show how to trace each
new programming construct or concept taught in the Study Guide.

176
The relationships between students’ marks and their ability to explain and trace code are presented
below in terms of students’ examination papers and final marks; the effect of the ability to explain the
purpose of code (question 1) on a student’s final mark; the effect of the ability to trace (question 2) on
a student’s final mark; and the combined effect of the ability to explain code and the ability to trace
(questions 1 and 2) on a student’s final mark.
6.2.1 Examination paper and final mark
Examination marks for each student were obtained from the Unisa student system after each
examination. The examination paper for both semesters in 2012 used the same structure: in Part A, ten
MCQs (20 marks) had to be answered on a mark reading sheet, and in Part B, eight questions had to
be answered on paper for a total of 70 marks. Part A was marked electronically and the researcher did
not have access to answers for individual questions in Part A. Unisa’s examination system combined
the results for Part A automatically with the results from Part B once the scripts for Part B had been
marked. Table 6.1 shows the topics and mark allocation for each of the 8 questions in Part B of the
examination paper. Part A of the examination paper contributed 20% to the final mark and Part B
contributed 70%. The year mark obtained from assignments submitted, contributed the additional
10% to a student’s final mark.
Table 6.1 Structure: Part B of COS1511 examination papers in 2012
Question number
Topic Marks allocated
1 Explain the purpose of two short code fragments. 4 2 Use variable diagrams to trace parts of two programs (a program using the switch
statement and a program call to a function with value and reference parameters), and indicate what the output will be.
11
3 Complete a program by writing nested if statements. 8 4 Complete a program by writing a while loop and if statement. 8 5 Answer questions on value and reference parameters; and write and call a small
function. 10
6 Write a complete program that uses a two dimensional array and functions to calculate totals and averages for each row in the array.
17
7 Define a struct, an array of structs and write statements to access components of a struct in the array.
6
8 Short questions in which students had to use string member functions. 6
Table 6.2 shows the mean percentages and standard deviations achieved by respondents for questions
1 to 8 in Part B of the two semester examinations in 2012. Semester 1 participants consistently did
better than semester 2 participants in all questions. In semester 1, question 3 (writing nested if
statements) had the highest mean percentage, while question 1 (explain code in plain English) had the
second-highest mean percentage, and question 4 (completing a program by writing a while loop and
if statement) the third-highest. In semester 2, question 1 (explain code in plain English) had the
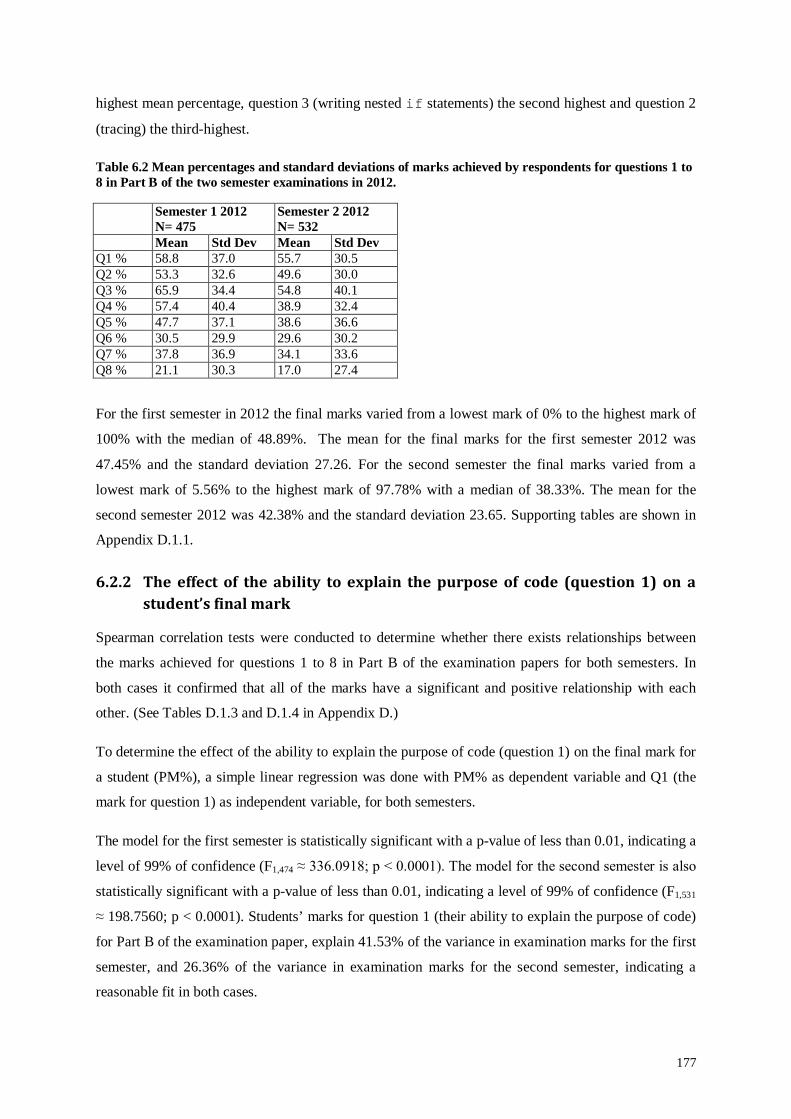
177
highest mean percentage, question 3 (writing nested if statements) the second highest and question 2
(tracing) the third-highest.
Table 6.2 Mean percentages and standard deviations of marks achieved by respondents for questions 1 to 8 in Part B of the two semester examinations in 2012.
Semester 1 2012 N= 475
Semester 2 2012 N= 532
Mean Std Dev Mean Std Dev Q1 % 58.8 37.0 55.7 30.5 Q2 % 53.3 32.6 49.6 30.0 Q3 % 65.9 34.4 54.8 40.1 Q4 % 57.4 40.4 38.9 32.4 Q5 % 47.7 37.1 38.6 36.6 Q6 % 30.5 29.9 29.6 30.2 Q7 % 37.8 36.9 34.1 33.6 Q8 % 21.1 30.3 17.0 27.4
For the first semester in 2012 the final marks varied from a lowest mark of 0% to the highest mark of
100% with the median of 48.89%. The mean for the final marks for the first semester 2012 was
47.45% and the standard deviation 27.26. For the second semester the final marks varied from a
lowest mark of 5.56% to the highest mark of 97.78% with a median of 38.33%. The mean for the
second semester 2012 was 42.38% and the standard deviation 23.65. Supporting tables are shown in
Appendix D.1.1.
6.2.2 The effect of the ability to explain the purpose of code (question 1) on a student’s final mark
Spearman correlation tests were conducted to determine whether there exists relationships between
the marks achieved for questions 1 to 8 in Part B of the examination papers for both semesters. In
both cases it confirmed that all of the marks have a significant and positive relationship with each
other. (See Tables D.1.3 and D.1.4 in Appendix D.)
To determine the effect of the ability to explain the purpose of code (question 1) on the final mark for
a student (PM%), a simple linear regression was done with PM% as dependent variable and Q1 (the
mark for question 1) as independent variable, for both semesters.
The model for the first semester is statistically significant with a p-value of less than 0.01, indicating a
level of 99% of confidence (F1,474 ≈ 336.0918; p < 0.0001). The model for the second semester is also
statistically significant with a p-value of less than 0.01, indicating a level of 99% of confidence (F1,531
≈ 198.7560; p < 0.0001). Students’ marks for question 1 (their ability to explain the purpose of code)
for Part B of the examination paper, explain 41.53% of the variance in examination marks for the first
semester, and 26.36% of the variance in examination marks for the second semester, indicating a
reasonable fit in both cases.
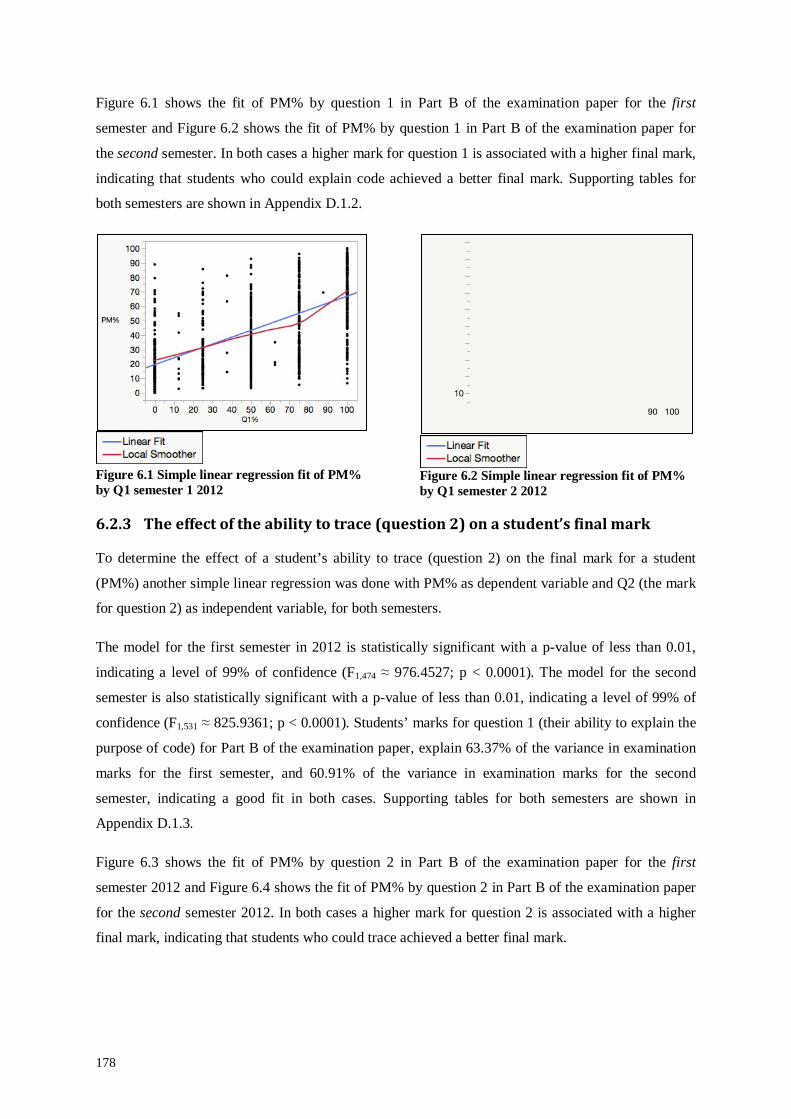
178
Figure 6.1 shows the fit of PM% by question 1 in Part B of the examination paper for the first
semester and Figure 6.2 shows the fit of PM% by question 1 in Part B of the examination paper for
the second semester. In both cases a higher mark for question 1 is associated with a higher final mark,
indicating that students who could explain code achieved a better final mark. Supporting tables for
both semesters are shown in Appendix D.1.2.
Figure 6.1 Simple linear regression fit of PM% by Q1 semester 1 2012
Figure 6.2 Simple linear regression fit of PM% by Q1 semester 2 2012
6.2.3 The effect of the ability to trace (question 2) on a student’s final mark
To determine the effect of a student’s ability to trace (question 2) on the final mark for a student
(PM%) another simple linear regression was done with PM% as dependent variable and Q2 (the mark
for question 2) as independent variable, for both semesters.
The model for the first semester in 2012 is statistically significant with a p-value of less than 0.01,
indicating a level of 99% of confidence (F1,474 ≈ 976.4527; p < 0.0001). The model for the second
semester is also statistically significant with a p-value of less than 0.01, indicating a level of 99% of
confidence (F1,531 ≈ 825.9361; p < 0.0001). Students’ marks for question 1 (their ability to explain the
purpose of code) for Part B of the examination paper, explain 63.37% of the variance in examination
marks for the first semester, and 60.91% of the variance in examination marks for the second
semester, indicating a good fit in both cases. Supporting tables for both semesters are shown in
Appendix D.1.3.
Figure 6.3 shows the fit of PM% by question 2 in Part B of the examination paper for the first
semester 2012 and Figure 6.4 shows the fit of PM% by question 2 in Part B of the examination paper
for the second semester 2012. In both cases a higher mark for question 2 is associated with a higher
final mark, indicating that students who could trace achieved a better final mark.
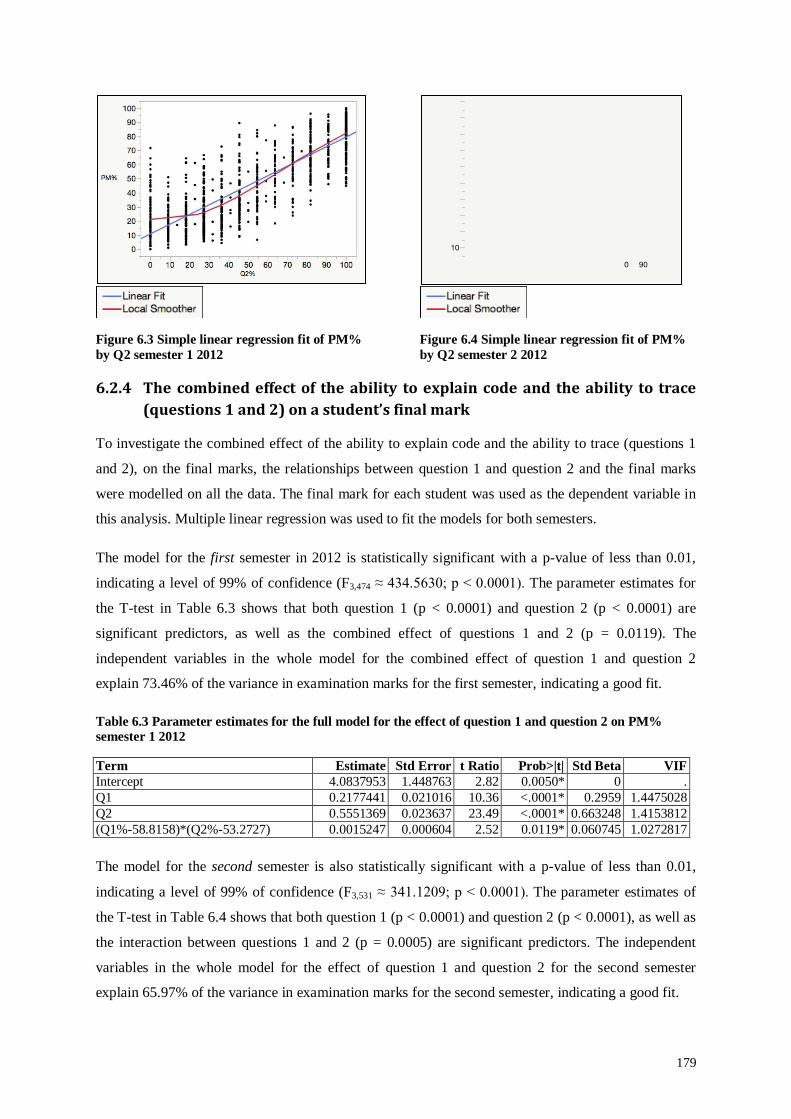
179
Figure 6.3 Simple linear regression fit of PM% by Q2 semester 1 2012
Figure 6.4 Simple linear regression fit of PM% by Q2 semester 2 2012
6.2.4 The combined effect of the ability to explain code and the ability to trace (questions 1 and 2) on a student’s final mark
To investigate the combined effect of the ability to explain code and the ability to trace (questions 1
and 2), on the final marks, the relationships between question 1 and question 2 and the final marks
were modelled on all the data. The final mark for each student was used as the dependent variable in
this analysis. Multiple linear regression was used to fit the models for both semesters.
The model for the first semester in 2012 is statistically significant with a p-value of less than 0.01,
indicating a level of 99% of confidence (F3,474 ≈ 434.5630; p < 0.0001). The parameter estimates for
the T-test in Table 6.3 shows that both question 1 (p < 0.0001) and question 2 (p < 0.0001) are
significant predictors, as well as the combined effect of questions 1 and 2 (p = 0.0119). The
independent variables in the whole model for the combined effect of question 1 and question 2
explain 73.46% of the variance in examination marks for the first semester, indicating a good fit.
Table 6.3 Parameter estimates for the full model for the effect of question 1 and question 2 on PM% semester 1 2012
Term Estimate Std Error t Ratio Prob>|t| Std Beta VIF Intercept 4.0837953 1.448763 2.82 0.0050* 0 . Q1 0.2177441 0.021016 10.36 <.0001* 0.2959 1.4475028 Q2 0.5551369 0.023637 23.49 <.0001* 0.663248 1.4153812 (Q1%-58.8158)*(Q2%-53.2727) 0.0015247 0.000604 2.52 0.0119* 0.060745 1.0272817
The model for the second semester is also statistically significant with a p-value of less than 0.01,
indicating a level of 99% of confidence (F3,531 ≈ 341.1209; p < 0.0001). The parameter estimates of
the T-test in Table 6.4 shows that both question 1 (p < 0.0001) and question 2 (p < 0.0001), as well as
the interaction between questions 1 and 2 (p = 0.0005) are significant predictors. The independent
variables in the whole model for the effect of question 1 and question 2 for the second semester
explain 65.97% of the variance in examination marks for the second semester, indicating a good fit.
180
Table 6.4 Parameter estimates for the full model for the effect of question 1 and question 2 on PM% semester 2 2012
Term Estimate Std Error t Ratio Prob>|t| Std Beta VIF Intercept 5.0288562 1.398051 3.60 0.0004* 0 . Q1 % 0.1809 0.021731 8.32 <.0001* 0.233035 1.2156986 Q2 % 0.5308628 0.022183 23.93 <.0001* 0.673644 1.2293121 (Q1 %-55.6861)*(Q2 %-49.5813) 0.0025155 0.000717 3.51 0.0005* 0.089798 1.01499
Supporting tables and graphs for both semesters are shown in Appendix D.1.4.
The prediction profilers for the full model for both semesters in Figure 6.5 and Figure 6.6 show
clearly that both question 1 (explaining code in plain English) and question 2 (tracing) had a positive
effect on a student’s final mark.
Figure 6.5 Prediction Profiler for the combined effect of question 1 and question 2 on PM% semester 1 2012
Figure 6.6 Prediction Profiler for the combined effect of question 1 and question 2 on PM% semester 2 2012
The ability to trace however, had a stronger association with the final mark than the ability to explain
code in plain English. The interaction between question 1 (explaining code in plain English) and
question 2 (tracing), also had an effect on the final mark of a student, although it was less than the
individual questions. Therefore, the ability to explain code and to trace as well as the combined effect
thereof had an effect on the final mark of students, although the combined effect was less than the
individual effects.
Following the above, the results of determining the relationships between students’ marks and their
ability to explain and trace code, both for students who used the tutorial as well as students who did
not use the tutorial, can be summarised as follows:
• The results of the statistical analysis for both semesters in 2012, were similar; and confirm the
findings of the BRACElet project that there exists a positive correlation between students’
ability to explain the purpose of code and to trace, and their final marks (Lister et al., 2009;
Lopez et al., 2008; Venables et al., 2009). The combination of students’ ability to explain
code and to trace, also affected their marks positively in both semesters.
• In both semesters the association between the ability to trace had a stronger association with
the final mark than the ability to explain code in plain English. The mean percentages for
question 1 (58.8% and 55.7% respectively) were higher than the mean percentages for
question 2 (53.3% and 49.6%). However, the mark allocation for question 2 carried a greater
181
weight (11/70) than question 1 (4/70) which explains the reason why question 2 (ability to
trace) had a higher effect than question 1 (ability to explain code in plain English) on the final
mark of a student. This may have skewed the statistical results, nevertheless the results of this
analysis confirms that an improved ability to trace should have a positive effect on a student’s
final mark.
In the next section, a number of factors that may have impacted on students’ final marks are
investigated.
6.3 Factors that impact on students’ final marks
A number of factors that may have a positive influence on introductory programming students’
performance were identified in the literature. These include –
• formal training or prior experience as a programmer (Byrne & Lyons, 2001; Wilson &
Shrock, 2001);
• existing problem-solving skills developed in subjects such as Mathematics and Science
(Bennedsen & Caspersen, 2005a; Chmura, 1998; Pillay & Jugoo, 2005; Wiedenbeck, 2005);
• past performance in Mathematics (Bergin & Reilly, 2006; Byrne & Lyons, 2001; White &
Sivitanides, 2003; Wilson & Shrock, 2001); and
• programming behaviour such as time spent debugging (Watson, Li & Godwin).
On the other hand, Ventura Jr (2005) found no relationship between Mathematics marks and prior
experience. Chmura (Chmura, 1998) noted that students with poor reading comprehension skills
struggle to learn to program. Carter, Jernejcic and Lim (2007) found that students learning to program
in their second or third language may experience a language barrier, since they have to continuously
translate during lectures as well as while studying text books in a language other than their first
language. Pillay and Jugoo (Pillay & Jugoo, 2005) observed that South-African students whose first
language differ from the teaching language, achieved lower marks; while Gous and Roberts (2014)
warn that students with a mother tongue other than English may be at a disadvantage. Concern about
South-African students’ reading ability also have been expressed by other researchers (Cliff, 2015;
Gous & Roberts, 2014; Hefer, 2013; Kilfoil, 2008; Nel et al., 2004).
Students’ responses to the multiple-choice questionnaire administered after they submitted their first
assignment, were categorised according to probable explanatory effects on their final marks. The
relationship between these factors and students’ final marks were then investigated, by fitting various
models on the data. The factors that may have impacted on students’ final marks are presented below
in terms of background information to the questionnaires used in the investigation, students’
biographical detail and descriptive data, factors that could have influenced their final marks and
models representing the relationship between these factors and students’ final marks.

182
6.3.1 Background to the questionnaires used in the first implementation cycle
The questionnaires for the first and second semesters of 2012 are shown in Appendix B.1. Both
questionnaires were included as the first part of the first assignment (a multiple choice assignment)
since this assignment contained questions that were intended to compel the students to engage with
the tutorial and drawing variable diagrams. The questionnaires included questions on biographical
data (questions 1 to 8); students’ computer literacy, their programming experience and registration for
COS1511 (questions 9 to 11); questions related to their use of the tutorial and drawing variable
diagrams (questions 12 to 16); and questions on their user experience (questions 17 to 21). Note that
the questions on biographical data differ slightly in the two questionnaires (questions 3 to 8), in an
attempt at greater clarity in the second semester.
Students were informed that completing the questionnaire was part of research on the usability and
effectiveness of the tutorial to teach drawing variable diagrams; and that completing the questionnaire
was optional. Nevertheless, a very good response rate was achieved. In the first semester 2 147 of the
2 877 students registered for COS1511 submitted assignment 1 and 1 231 students completed the
questionnaire, giving a response rate of 42.8%. In the second semester 1 727 of the 1 921 students
registered for COS1511, submitted assignment 1 and 1 000 students completed the questionnaire,
giving a response rate of 52.1%. As explained in section 6.1, not all of these respondents were
included in the statistical analysis. For the first semester of 2012, 475 (38.6%) and for the second
semester 532 (53.2%) of the respondents were included in the statistical analysis.
Since the questionnaires were distributed to all students registered for COS1511, random sampling
was not done. Instead it resulted in self-selection sampling (Oates, 2006). Being a nonprobability
sample, it could be biased towards students in the COS1511 population who were available and
willing to answer the questionnaire (Fowler Jr, 2009; Oates, 2006), so that normal assumptions for
calculating sampling errors cannot be applied (Fowler Jr, 2009). Nonresponse can be a problematic
cause for survey error, as “we lack good data about when nonresponse is and is not likely to be biased
with respect to the content of the survey” (Fowler Jr, 2009:66). However, high response rates can
reduce “the potential for error due to nonresponse to be important” (Fowler Jr, 2009:67).
The statistical analysis was done with the final mark for COS1511 (PM%) as the dependent variable,
which reduced the population size to the number of students who wrote the examination. Therefore,
the population size for the first semester in 2012 was 1 827 students and for the second semester in
2012 it was 1 267 (see Table 1.1 in section 1.1). Krejcie and Morgan (1970:608) provide a table to
determine the sample size to be representative of a given population when random sampling is done,
also used by Johnson and Christensen (2004:218). According to this table, for the first semester of
2012, when the population size was 1 827, 320 responses would have sufficed should random
sampling have been done (Johnson & Christensen, 2004; Krejcie & Morgan, 1970). In the second
183
semester of 2012 with a population size of 1 267, 297 responses would have sufficed (Johnson &
Christensen, 2004; Krejcie & Morgan, 1970). In actual fact, during the first semester 475 respondents
satisfied the criteria set to be included in the statistical analysis (see section 6.1.1) and in the second
semester 532 respondents satisfied these criteria. In both cases the number of respondents included in
the statistical analysis was well above the required numbers.
Bartlett, Kotrlik and Higgins (2001) recommend that to use multiple regression analysis in a study ,
the ratio of observations to independent variables should be between five and ten, with ten seen as the
optimal value. The same criteria apply when doing factor analysis, with the additional criterion that
factor analysis should not be done with less than 100 observations. Since seven independent variables
were investigated, the number of responses for both semesters was sufficient to allow multiple
regression analysis and factor analysis to be done.
Johnson and Christensen (2004) indicate several aspects to be taken into account with regard to
sample size applicable to this study, – including the following
• A smaller sample size may be used for a homogeneous population, which is not the case for
the COS1511 students.
• If the effect or relationship of an independent variable on a dependent variable is expected to
be weak, a larger sample is required. Before the analysis was done, the effect of the
independent variables on the dependent variable was unknown.
• More efficient random sampling methods need smaller samples. Self-selected sampling is not
the most efficient random sampling method available.
Taking these considerations into account, as well as the response rates of the questionnaires
administered in the first implementation cycle, the findings from the first implementation cycle will
not be generalised, but should hold, with caution, for those students in the 2012 COS1511 population
that met the criteria for inclusion in the statistical analysis.
The final marks (that is, the sum of the marks for the MCQs in Part A, the questions in Part B of the
examination paper and the year mark) were used as dependent variable in the statistical analysis to
determine how the biographical properties of the students, positive user experience, tracing and the
extent and manner of tutorial use affected their marks. The final mark is represented by PM% in the
statistical analysis.
6.3.2 Biographical detail and descriptive statistics
The biographical detail for the first semester 2012 respondents to the questionnaire is shown in Table
Table D.1.17. The majority of the students were male (74%). Approximately half of the students were
between 19 and 27 years of age (53%). Only 13% of respondents were full-time students who did not
184
work at all. Seventy-four per cent of the students worked full-time and 45% worked in a field related
to their degree. Note that this does not imply that their work involved programming, since COS1511
is offered to a number of different degrees and diplomas in various faculties. The remainder worked
part-time. Matric was the highest qualification of most students (52%), while 20% had a national
certificate and 21% a diploma. Six per cent had a degree and 2% a post-graduate degree.
Only 34% had English as their first language while 20% had Afrikaans as first language and the
remainder another language. Since South-Africa has 11 official languages and Unisa is an
international institution, all languages other than English and Afrikaans were grouped together. Forty-
six per cent indicated that they passed Mathematics with a C symbol on Higher or Standard grade,
while one per cent did not have Mathematics in matric. Fifty per cent indicated that they passed
English with a C symbol on higher or standard grade. Note that there is a possibility that students may
not have understood what a C symbol means, or the difference between higher and standard grade,
since their responses did not always correspond to the information obtained from Unisa’s student
system.
Thirty-nine per cent had Computer Applications Technology, Information Technology or Computer
Studies at school. Thirty-six per cent did some form of computer literacy course, 35% used a
computer daily at work, 12% ascribed their computer-literacy to taking Computer Applications
Technology, Information Technology or Computer Studies at school and the remainder were self-
taught.
The biographical detail for the second semester respondents to the questionnaire is shown in Table
D.1.18. Male students formed the largest portion of this cohort (70%). The students were fairly young,
with 67% of them between 19 and 27 years old. The majority were studying part-time (67%). Many of
them were unemployed (26%), and nearly as many worked in an IT-related environment (25%).
Sixteen per cent claimed to be full-time students. Most students had matric (64%), while 14% had a
national certificate and 16% had a diploma. Very few students had a degree (4.51%) or postgraduate
degree (1.69%). For 39% of the students English was their first language, while 17% had Afrikaans as
first language and the remainder had another language as their first language.
Forty-five per cent of the students indicated that they had studied Computer Applications Technology,
Information Technology or Computer Studies at school. Forty-three per cent of the respondents had
been enrolled for COS1511 previously. This is an indication that they might have had problems
mastering the module. Fifteen per cent had Computer Applications Technology, Information
Technology or Computer Studies at school. Forty-two per cent did some form of computer literacy
course, 22 % used a computer daily at work, 15% ascribed their computer-literacy to taking Computer
Applications Technology, Information Technology or Computer Studies at school and 20% were self-
taught.
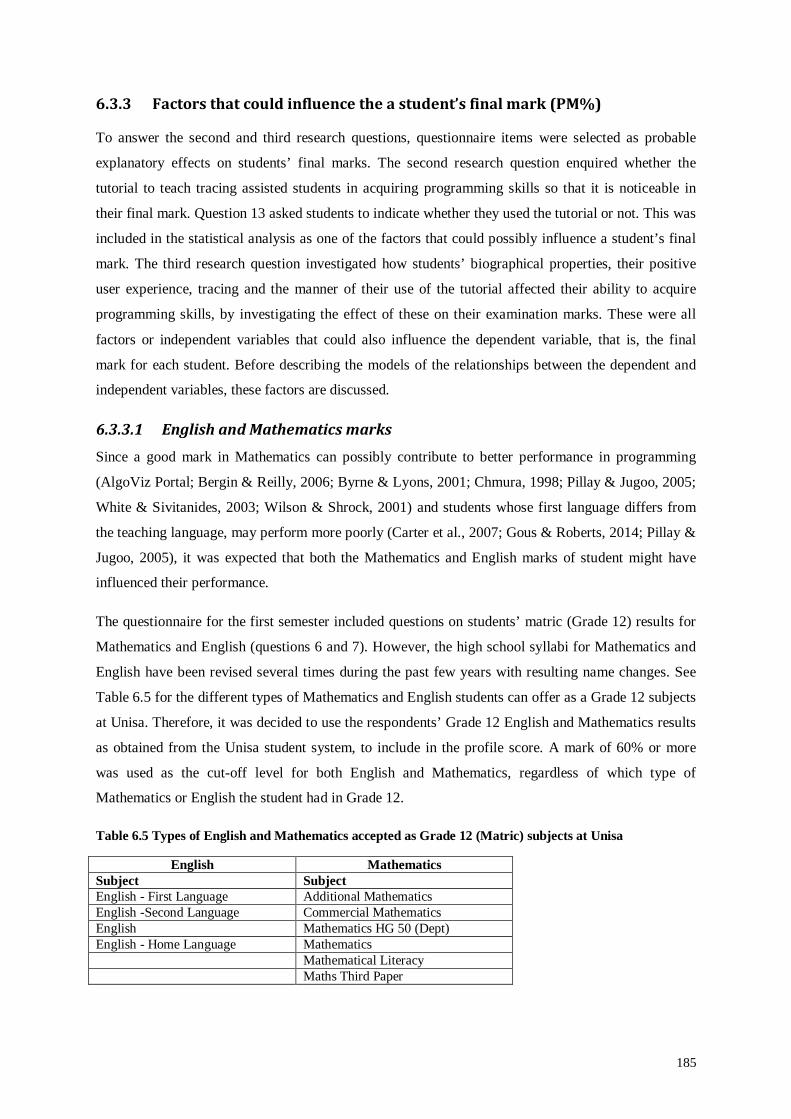
185
6.3.3 Factors that could influence the a student’s final mark (PM%)
To answer the second and third research questions, questionnaire items were selected as probable
explanatory effects on students’ final marks. The second research question enquired whether the
tutorial to teach tracing assisted students in acquiring programming skills so that it is noticeable in
their final mark. Question 13 asked students to indicate whether they used the tutorial or not. This was
included in the statistical analysis as one of the factors that could possibly influence a student’s final
mark. The third research question investigated how students’ biographical properties, their positive
user experience, tracing and the manner of their use of the tutorial affected their ability to acquire
programming skills, by investigating the effect of these on their examination marks. These were all
factors or independent variables that could also influence the dependent variable, that is, the final
mark for each student. Before describing the models of the relationships between the dependent and
independent variables, these factors are discussed.
6.3.3.1 English and Mathematics marks
Since a good mark in Mathematics can possibly contribute to better performance in programming
(AlgoViz Portal; Bergin & Reilly, 2006; Byrne & Lyons, 2001; Chmura, 1998; Pillay & Jugoo, 2005;
White & Sivitanides, 2003; Wilson & Shrock, 2001) and students whose first language differs from
the teaching language, may perform more poorly (Carter et al., 2007; Gous & Roberts, 2014; Pillay &
Jugoo, 2005), it was expected that both the Mathematics and English marks of student might have
influenced their performance.
The questionnaire for the first semester included questions on students’ matric (Grade 12) results for
Mathematics and English (questions 6 and 7). However, the high school syllabi for Mathematics and
English have been revised several times during the past few years with resulting name changes. See
Table 6.5 for the different types of Mathematics and English students can offer as a Grade 12 subjects
at Unisa. Therefore, it was decided to use the respondents’ Grade 12 English and Mathematics results
as obtained from the Unisa student system, to include in the profile score. A mark of 60% or more
was used as the cut-off level for both English and Mathematics, regardless of which type of
Mathematics or English the student had in Grade 12.
Table 6.5 Types of English and Mathematics accepted as Grade 12 (Matric) subjects at Unisa
English Mathematics Subject Subject English - First Language Additional Mathematics English -Second Language Commercial Mathematics English Mathematics HG 50 (Dept) English - Home Language Mathematics Mathematical Literacy Maths Third Paper
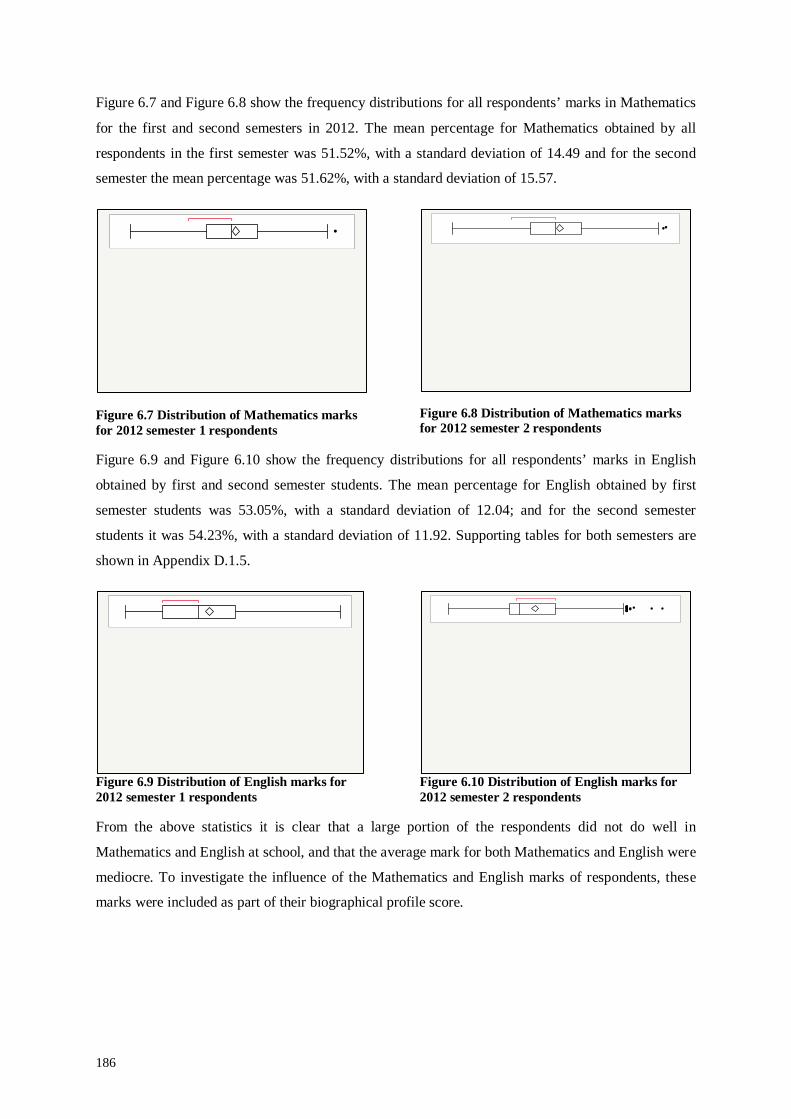
186
Figure 6.7 and Figure 6.8 show the frequency distributions for all respondents’ marks in Mathematics
for the first and second semesters in 2012. The mean percentage for Mathematics obtained by all
respondents in the first semester was 51.52%, with a standard deviation of 14.49 and for the second
semester the mean percentage was 51.62%, with a standard deviation of 15.57.
Figure 6.7 Distribution of Mathematics marks for 2012 semester 1 respondents
Figure 6.8 Distribution of Mathematics marks for 2012 semester 2 respondents
Figure 6.9 and Figure 6.10 show the frequency distributions for all respondents’ marks in English
obtained by first and second semester students. The mean percentage for English obtained by first
semester students was 53.05%, with a standard deviation of 12.04; and for the second semester
students it was 54.23%, with a standard deviation of 11.92. Supporting tables for both semesters are
shown in Appendix D.1.5.
Figure 6.9 Distribution of English marks for 2012 semester 1 respondents
Figure 6.10 Distribution of English marks for 2012 semester 2 respondents
From the above statistics it is clear that a large portion of the respondents did not do well in
Mathematics and English at school, and that the average mark for both Mathematics and English were
mediocre. To investigate the influence of the Mathematics and English marks of respondents, these
marks were included as part of their biographical profile score.
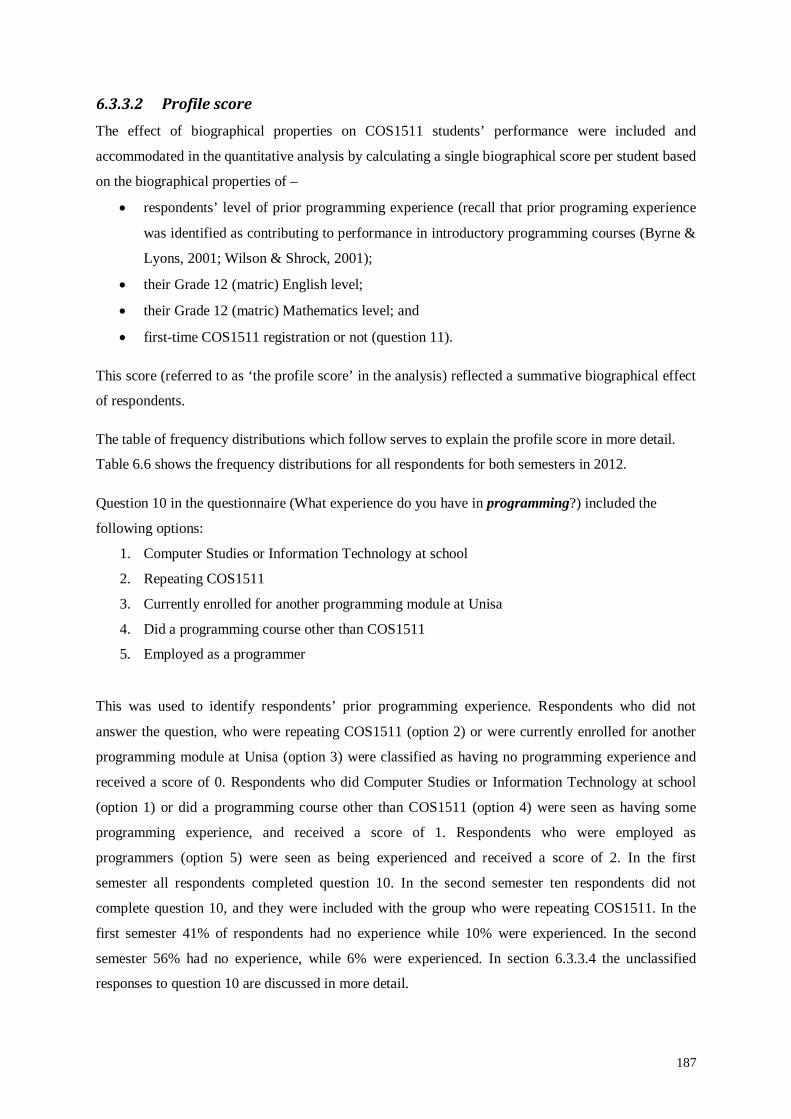
187
6.3.3.2 Profile score The effect of biographical properties on COS1511 students’ performance were included and
accommodated in the quantitative analysis by calculating a single biographical score per student based
on the biographical properties of –
• respondents’ level of prior programming experience (recall that prior programing experience
was identified as contributing to performance in introductory programming courses (Byrne &
Lyons, 2001; Wilson & Shrock, 2001);
• their Grade 12 (matric) English level;
• their Grade 12 (matric) Mathematics level; and
• first-time COS1511 registration or not (question 11).
This score (referred to as ‘the profile score’ in the analysis) reflected a summative biographical effect
of respondents.
The table of frequency distributions which follow serves to explain the profile score in more detail.
Table 6.6 shows the frequency distributions for all respondents for both semesters in 2012.
Question 10 in the questionnaire (What experience do you have in programming?) included the
following options:
1. Computer Studies or Information Technology at school
2. Repeating COS1511
3. Currently enrolled for another programming module at Unisa
4. Did a programming course other than COS1511
5. Employed as a programmer
This was used to identify respondents’ prior programming experience. Respondents who did not
answer the question, who were repeating COS1511 (option 2) or were currently enrolled for another
programming module at Unisa (option 3) were classified as having no programming experience and
received a score of 0. Respondents who did Computer Studies or Information Technology at school
(option 1) or did a programming course other than COS1511 (option 4) were seen as having some
programming experience, and received a score of 1. Respondents who were employed as
programmers (option 5) were seen as being experienced and received a score of 2. In the first
semester all respondents completed question 10. In the second semester ten respondents did not
complete question 10, and they were included with the group who were repeating COS1511. In the
first semester 41% of respondents had no experience while 10% were experienced. In the second
semester 56% had no experience, while 6% were experienced. In section 6.3.3.4 the unclassified
responses to question 10 are discussed in more detail.

188
Table 6.6 Frequency distributions for questions used to calculate a profile score for respondents for both semesters in 2012
Semester 1 Semester 2
Q10 Programming experience? N % of Total
N % of Total
No experience (0 - Repeating COS1511 or registered for another programming module simultaneously)
195 41.05% 293 56.13%
Moderate (1 - IT at school or completed other programming course)e
231 48.63% 196 37.55%
Experienced (2 - Employed as a programmer) 49 10.32% 33 6.32% All 475 100.00% 522 100.00% MATH >=60 No 296 62.32% 343 64.47% Yes 179 37.68% 189 35.53% All 475 100.00% 532 100.00% ENG >= 60 No 281 59.16% 328 61.65% Yes 194 40.84% 204 38.35% All 475 100.00% 532 100.00% Q11 FIRST time you have been registered for COS1511? No 133 28.00% 244 45.86% Yes 342 72.00% 288 54.14% All 475 100.00% 532 100.00% Profile score 0 62 13.05% 127 23.87% 1 87 18.32% 118 22.18% 2 116 24.42% 125 23.50% 3 122 25.68% 83 15.60% 4 81 17.05% 69 12.97% 5 7 1.47% 10 1.88% All 475 100.00% 532 100.00%
Mathematics and English marks for respondents as extracted from the Unisa student system were used
to distinguish between respondents who obtained less than 60% (0); or 60% or more. Only 38% of
first semester respondents and 36% of second semester respondents obtained 60% or more in matric
for Mathematics. Forty-one per cent of first semester respondents and 38% of second semester
respondents obtained 60% or more for English.
A large percentage of respondents were repeating the module (28% of the first semester respondents
and 46% of the second semester respondents). The majority of both first and second semester students
obtained a profile score of between zero and two (56% and 70% respectively).
6.3.3.3 Positive user experience (questions 17 to 21) Instead of investigating the effect of five sets of user experience response ratings on examination
marks, a single set of response ratings – which represents a combined measure of respondents’ user
experience – was investigated for its effect on examination marks.
The questionnaire items investigated in questions 17 to 21 as listed in Tables 6.7 and 6.8 (their
frequency distributions) were used to describe the joint construct of ‘positive user experience of the
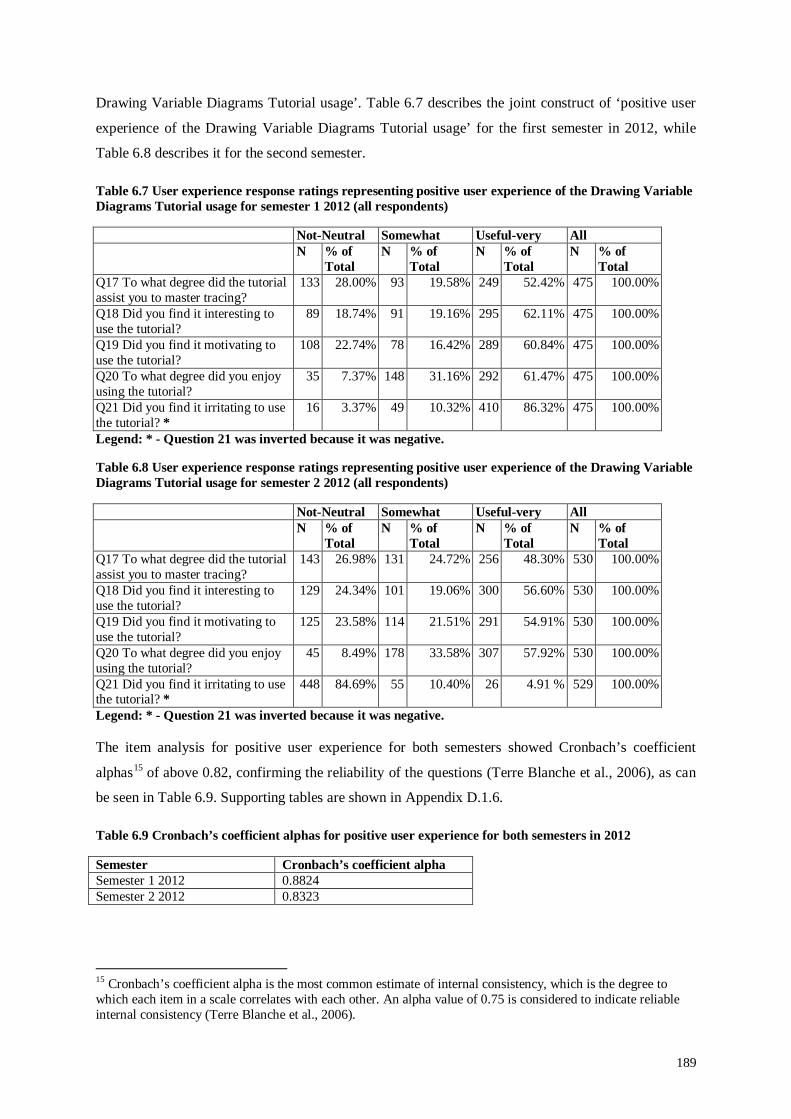
189
Drawing Variable Diagrams Tutorial usage’. Table 6.7 describes the joint construct of ‘positive user
experience of the Drawing Variable Diagrams Tutorial usage’ for the first semester in 2012, while
Table 6.8 describes it for the second semester.
Table 6.7 User experience response ratings representing positive user experience of the Drawing Variable Diagrams Tutorial usage for semester 1 2012 (all respondents)
Not-Neutral Somewhat Useful-very All N % of
Total N % of
Total N % of
Total N % of
Total Q17 To what degree did the tutorial assist you to master tracing?
133 28.00% 93 19.58% 249 52.42% 475 100.00%
Q18 Did you find it interesting to use the tutorial?
89 18.74% 91 19.16% 295 62.11% 475 100.00%
Q19 Did you find it motivating to use the tutorial?
108 22.74% 78 16.42% 289 60.84% 475 100.00%
Q20 To what degree did you enjoy using the tutorial?
35 7.37% 148 31.16% 292 61.47% 475 100.00%
Q21 Did you find it irritating to use the tutorial? *
16 3.37% 49 10.32% 410 86.32% 475 100.00%
Legend: * - Question 21 was inverted because it was negative.
Table 6.8 User experience response ratings representing positive user experience of the Drawing Variable Diagrams Tutorial usage for semester 2 2012 (all respondents)
Not-Neutral Somewhat Useful-very All N % of
Total N % of
Total N % of
Total N % of
Total Q17 To what degree did the tutorial assist you to master tracing?
143 26.98% 131 24.72% 256 48.30% 530 100.00%
Q18 Did you find it interesting to use the tutorial?
129 24.34% 101 19.06% 300 56.60% 530 100.00%
Q19 Did you find it motivating to use the tutorial?
125 23.58% 114 21.51% 291 54.91% 530 100.00%
Q20 To what degree did you enjoy using the tutorial?
45 8.49% 178 33.58% 307 57.92% 530 100.00%
Q21 Did you find it irritating to use the tutorial? *
448 84.69% 55 10.40% 26 4.91 % 529 100.00%
Legend: * - Question 21 was inverted because it was negative.
The item analysis for positive user experience for both semesters showed Cronbach’s coefficient
alphas15 of above 0.82, confirming the reliability of the questions (Terre Blanche et al., 2006), as can
be seen in Table 6.9. Supporting tables are shown in Appendix D.1.6.
Table 6.9 Cronbach’s coefficient alphas for positive user experience for both semesters in 2012
Semester Cronbach’s coefficient alpha Semester 1 2012 0.8824 Semester 2 2012 0.8323
15 Cronbach’s coefficient alpha is the most common estimate of internal consistency, which is the degree to which each item in a scale correlates with each other. An alpha value of 0.75 is considered to indicate reliable internal consistency (Terre Blanche et al., 2006).

190
Since internal consistency reliability was established a ‘positive user experience’ score could be
calculated to represent the five separate questionnaire items in evaluating whether user experience
affects examination marks (in conjunction with the other effects already mentioned). The frequency
distributions of the calculated ‘positive user experience’ scores are also presented in Tables 6.7 and
6.8. Note that the rating scale classes have been condensed in both tables to three rating categories.
Question 21 (Did you find it irritating to use the tutorial?) was negative and therefore inverted.
Most students claimed that the tutorial assisted them to master tracing. Fifty-two per cent of first
semester respondents found it useful or very useful and 20% found it somewhat useful. In semester 2,
48% found it useful or very useful and 25% found it somewhat useful. Most respondents found the
tutorial fairly or very interesting to use (62% of first semester respondents, and 57% of second
semester respondents). Likewise, most respondents found it motivating (61% in semester 1 and 55%
in semester 2). Most respondents also enjoyed using the tutorial (61% in semester 1 and 58% in
semester 2). Very few students found the tutorial irritating (3% in semester 1 and 5% in semester 2).
The positive user experience score for a student was calculated as the average of the ratings of all five
questions, which can range from 0 to 5. A score of 4 on the user experience for example, indicates
that a student answered four of the questions with a rating of ‘useful’ or ‘very useful’. This reflects a
very positive user experience. The mean positive user experience score for students in the first
semester, came to 3.75 when calculated, while for the second semester it came to 3.68. These mean
scores indicate that respondents had a positive user experience of the tutorial. The reason for the last
statement is that since the individual user experience scores were calculated for each individual as the
mean rating of each individual’s ratings of the five questions in question, the same rating scale values
apply to the user experience scores, namely ‘1’ indicating ‘not at all’; ‘2’ indicating a ‘neutral’
feeling; ‘3’ indicating ‘somewhat of value’; ‘4’ indicating ‘fairly useful’ and ‘5’ indicating ‘very
useful’. Supporting tables are shown in Appendix D.1.6.
Note that some students did not use the tutorial for a long time (less than 1 hour), or did not need the
tutorial, but might have perused it, and therefore may have indicated their impression, even if they had
not used it. The user experience was therefore calculated for all respondents.
Figure 6.11 and Figure 6.12 show the frequency distributions for the user experience of all
respondents for the first and second semesters in 2012 respectively.
In the next section students’ prior experience of programming, their use of tracing and the time they
spent using the tutorial are discussed.

191
Figure 6.11 Distribution of Positive user experiences for 2012 semester 1 respondents
Figure 6.12 Distribution of Positive user experiences for 2012 semester 2 respondents
6.3.3.4 Students’ prior experience of programming, use of tracing and time spent using the tutorial
Table 6.10 shows the frequency distribution of questionnaire items for the both semesters in 2012 for
all respondents on –
• programming experience (question 10);
• drawing variable diagrams before enrolling for COS1511 (question 12);
• using the tutorial while working through the study guide (question 13);
• drawing variable diagrams to understand programs in the Study Guide (question 14);
• drawing variable diagrams to understand to debug (question 15); and
• time spent using the tutorial (question 16).
Note that question 11 (prior registration for COS1511 or not) was included in the profile score.
As mentioned before, the responses to question 10 were collapsed into three for the purpose of the
profile score – no experience, moderate and experienced. Here the unclassified responses are reported.
Note that the number of responses to option 2 in question 10 (repeating COS1511), differ from the
number in question 11, where there were only two options (first time registered for COS1511 or not).
When respondents reported their own programming experience, 21% of first semester respondents
and 42% of second semester respondents indicated that their programming experience are limited to
repeating COS1511. In the first semester 20% of respondents were enrolled for another programming
module, while 14% of second semester respondents were enrolled for another programming module.
Twenty-four per cent of first semester respondents and 16% of second semester respondents had
completed another programming course. Approximately a quarter (25% of first semester respondents
and 22% of second semester respondents) had Computer Applications or Information Technology at
school, while 10% of first semester respondents and 6% of second semester respondents were
employed as programmers.

192
Table 6.10 Frequency distribution of questionnaire items for students’ prior experience of programming and use of tracing for semesters in 2012 (all respondents)
Semester 1 Semester 1 Q10 What experience do you have in programming? N % of Total N % of Total IT at school 119 25.05% 115 22.03% Repeating COS1511 100 21.05% 219 41.95% Currently enrolled for another programming module 95 20.00% 74 14.18% Completed programming course other than COS1511 112 23.58% 81 15.52% Employed as programmer 49 10.32% 33 6.32% All 475 100.00% 522 100.00% Q12 Have you drawn variable diagrams before enrolling for COS1511?
Yes 110 23.16% 132 24.81% No 365 76.84% 400 75.19% All 475 100.00% 532 100.00% Q13 Do you use the tutorial for this module while working through the study guide?
Yes 396 83.37% 438 82.33% No 79 16.63% 94 17.67% All 475 100.00% 532 100.00% Q14 Do you draw your own variable diagrams to help you to understand programs in the study guide?
Yes 309 65.05% 383 71.99% No 166 34.95% 149 28.01% All 475 100.00% 532 100.00% Q15 Do you draw your own variable diagrams to debug your programs?
Yes 235 49.47% 281 52.82% No 240 50.53% 251 47.18% All 475 100.00% 532 100.00% Q16 Up to now, how much time in total, have you spent using the tutorial?
Less than 1 hour 58 12.21% 91 17.13% 1-3 hours 130 27.37% 193 36.36% 4-6 hours 85 17.89% 91 17.13% 7 -8 hours 46 9.68% 46 8.66% More than 8 hours 156 32.84% 110 20.72% All 475 100.00% 531 100.00%
The majority of respondents had never drawn variable diagrams before (77% in the first semester and
75% in the second semester). Most of the respondents indicated that they used the tutorial while
working through the Study Guide16 (83% in the first semester and 82% in the second semester). The
majority of respondents claimed to draw variable diagrams to assist them in understanding programs
in the Study Guide (65% in the first semester and 72% in the second semester). Approximately half of
the respondents drew variable diagrams to help them debug their programs (49% in the first semester
and 53% in the second semester).
By the time respondents completed the questionnaire (when submitting assignment 1) they should
have studied lessons 1 to 14 in the Study Guide. These lessons included eleven activities in the
16 COS1511 students use a Study Guide instead of a prescribed text book.
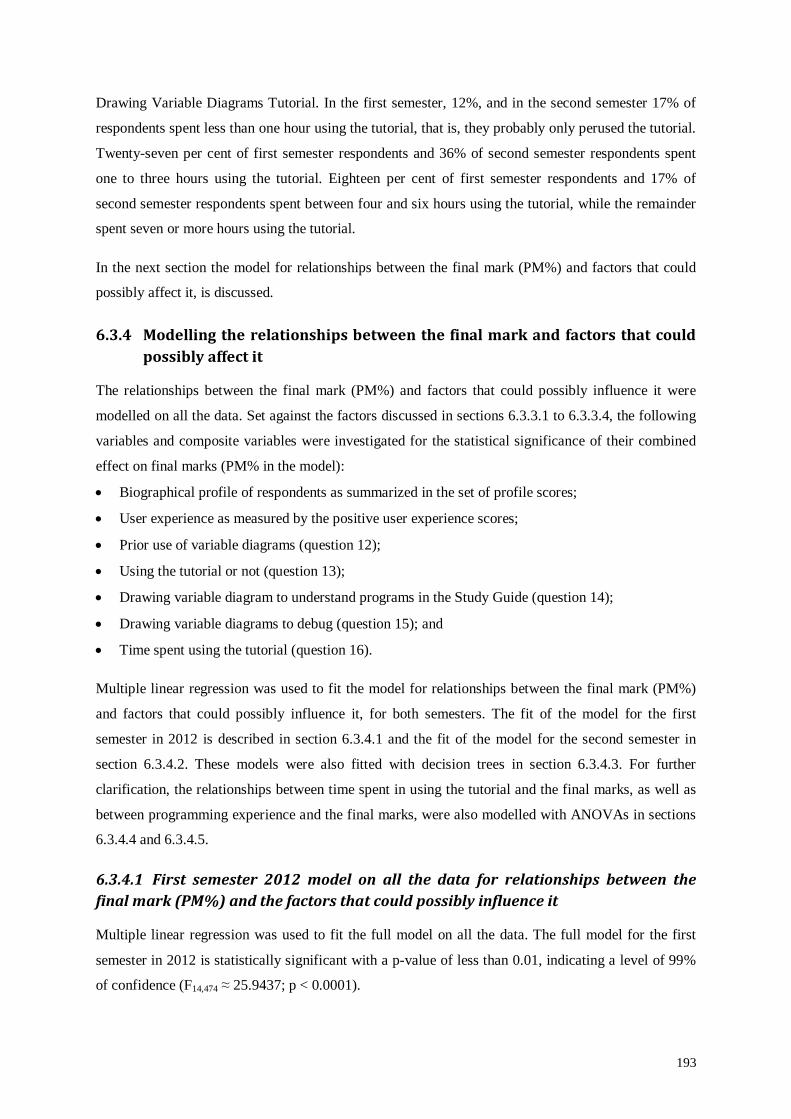
193
Drawing Variable Diagrams Tutorial. In the first semester, 12%, and in the second semester 17% of
respondents spent less than one hour using the tutorial, that is, they probably only perused the tutorial.
Twenty-seven per cent of first semester respondents and 36% of second semester respondents spent
one to three hours using the tutorial. Eighteen per cent of first semester respondents and 17% of
second semester respondents spent between four and six hours using the tutorial, while the remainder
spent seven or more hours using the tutorial.
In the next section the model for relationships between the final mark (PM%) and factors that could
possibly affect it, is discussed.
6.3.4 Modelling the relationships between the final mark and factors that could possibly affect it
The relationships between the final mark (PM%) and factors that could possibly influence it were
modelled on all the data. Set against the factors discussed in sections 6.3.3.1 to 6.3.3.4, the following
variables and composite variables were investigated for the statistical significance of their combined
effect on final marks (PM% in the model):
• Biographical profile of respondents as summarized in the set of profile scores;
• User experience as measured by the positive user experience scores;
• Prior use of variable diagrams (question 12);
• Using the tutorial or not (question 13);
• Drawing variable diagram to understand programs in the Study Guide (question 14);
• Drawing variable diagrams to debug (question 15); and
• Time spent using the tutorial (question 16).
Multiple linear regression was used to fit the model for relationships between the final mark (PM%)
and factors that could possibly influence it, for both semesters. The fit of the model for the first
semester in 2012 is described in section 6.3.4.1 and the fit of the model for the second semester in
section 6.3.4.2. These models were also fitted with decision trees in section 6.3.4.3. For further
clarification, the relationships between time spent in using the tutorial and the final marks, as well as
between programming experience and the final marks, were also modelled with ANOVAs in sections
6.3.4.4 and 6.3.4.5.
6.3.4.1 First semester 2012 model on all the data for relationships between the final mark (PM%) and the factors that could possibly influence it
Multiple linear regression was used to fit the full model on all the data. The full model for the first
semester in 2012 is statistically significant with a p-value of less than 0.01, indicating a level of 99%
of confidence (F14,474 ≈ 25.9437; p < 0.0001).
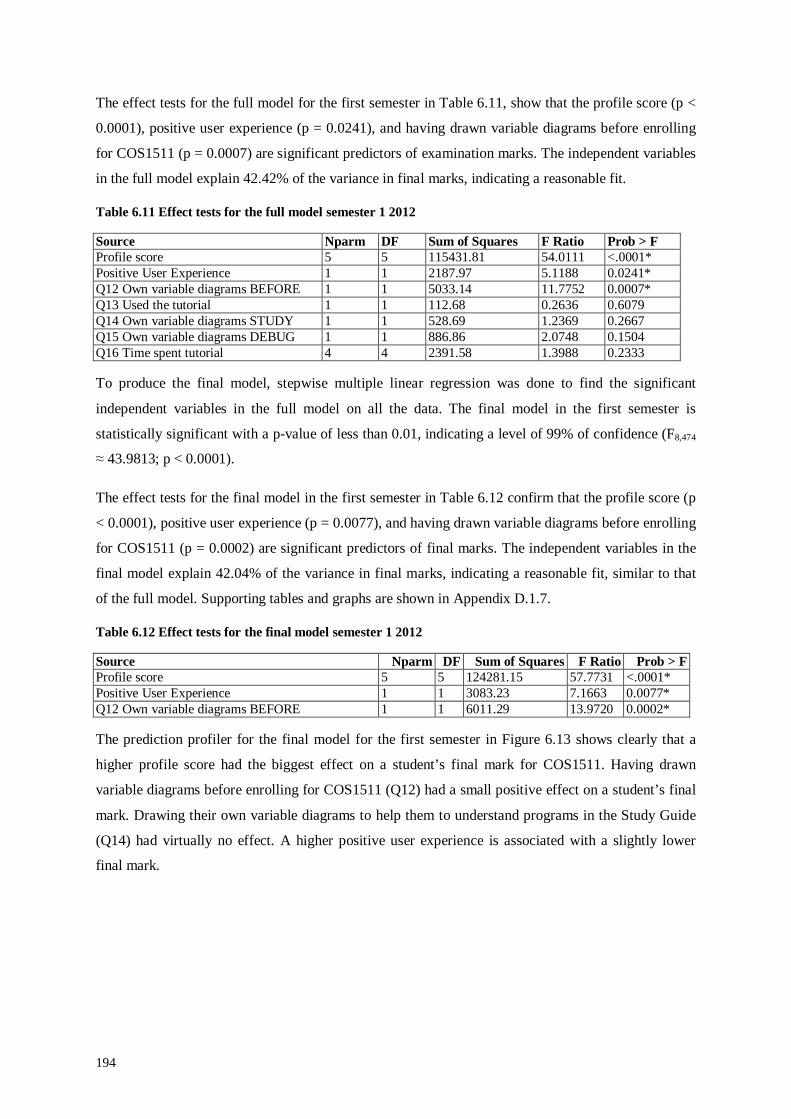
194
The effect tests for the full model for the first semester in Table 6.11, show that the profile score (p <
0.0001), positive user experience (p = 0.0241), and having drawn variable diagrams before enrolling
for COS1511 (p = 0.0007) are significant predictors of examination marks. The independent variables
in the full model explain 42.42% of the variance in final marks, indicating a reasonable fit.
Table 6.11 Effect tests for the full model semester 1 2012
Source Nparm DF Sum of Squares F Ratio Prob > F Profile score 5 5 115431.81 54.0111 <.0001* Positive User Experience 1 1 2187.97 5.1188 0.0241* Q12 Own variable diagrams BEFORE 1 1 5033.14 11.7752 0.0007* Q13 Used the tutorial 1 1 112.68 0.2636 0.6079 Q14 Own variable diagrams STUDY 1 1 528.69 1.2369 0.2667 Q15 Own variable diagrams DEBUG 1 1 886.86 2.0748 0.1504 Q16 Time spent tutorial 4 4 2391.58 1.3988 0.2333
To produce the final model, stepwise multiple linear regression was done to find the significant
independent variables in the full model on all the data. The final model in the first semester is
statistically significant with a p-value of less than 0.01, indicating a level of 99% of confidence (F8,474
≈ 43.9813; p < 0.0001).
The effect tests for the final model in the first semester in Table 6.12 confirm that the profile score (p
< 0.0001), positive user experience (p = 0.0077), and having drawn variable diagrams before enrolling
for COS1511 (p = 0.0002) are significant predictors of final marks. The independent variables in the
final model explain 42.04% of the variance in final marks, indicating a reasonable fit, similar to that
of the full model. Supporting tables and graphs are shown in Appendix D.1.7.
Table 6.12 Effect tests for the final model semester 1 2012
Source Nparm DF Sum of Squares F Ratio Prob > F Profile score 5 5 124281.15 57.7731 <.0001* Positive User Experience 1 1 3083.23 7.1663 0.0077* Q12 Own variable diagrams BEFORE 1 1 6011.29 13.9720 0.0002*
The prediction profiler for the final model for the first semester in Figure 6.13 shows clearly that a
higher profile score had the biggest effect on a student’s final mark for COS1511. Having drawn
variable diagrams before enrolling for COS1511 (Q12) had a small positive effect on a student’s final
mark. Drawing their own variable diagrams to help them to understand programs in the Study Guide
(Q14) had virtually no effect. A higher positive user experience is associated with a slightly lower
final mark.

195
Figure 6.13 Prediction profiler for the final model semester1 2012
6.3.4.2 Second semester 2012 model on all the data for relationships between the final mark (PM%) and the factors that could possibly influence it Multiple linear regression was also used to fit the full model for the second semester on all the data.
The full model for the second semester is statistically significant with a p-value of less than 0.01,
indicating a level of 99% of confidence (F12,529 ≈ 23.2767; p < 0.0001).
The effect tests for the full model in the second semester in Table 6.13 show that the profile score (p <
0.0001), having drawn variable diagrams before enrolling for COS1511 (p = 0.0397), using the
tutorial while working through the Study Guide (p = 0.0047), and drawing variable diagrams to debug
programs (p = 0.0371) are significant predictors of final marks. The independent variables in the full
model explain 33.56% of the variance in final marks, indicating a reasonable fit.
Table 6.13 Effect tests for the full model semester 2 2012
Source Nparm DF Sum of Squares F Ratio Prob > F Profile score 5 5 77498.388 41.9250 <.0001* Positive user experience 1 1 318.705 0.8621 0.3536 Q12 Own variable diagrams BEFORE 1 1 1571.241 4.2500 0.0397* Q13 Used the tutorial 1 1 2976.615 8.0514 0.0047* Q14 Own variable diagrams STUDY 1 1 215.864 0.5839 0.4451 Q15 Own diagrams DEBUG 1 1 1614.158 4.3661 0.0371* Q16 Time spent tutorial 2 2 525.564 0.7108 0.4917
To produce the final model, stepwise multiple linear regression was done to find the significant
independent variables in the full model on all the data. The final model in the second semester is
statistically significant with a p-value of less than 0.01, indicating a level of 99% of confidence (F7,531
≈ 39.36722; p < 0.0001).
The effect tests for the final model in the second semester in Table 6.14 confirm that the profile score
(p < 0.0001), having drawn variable diagrams before enrolling for COS1511 (p = 0.0206), and using
the tutorial while working through the study guide are significant predictors of final marks. The
independent variables in the final model for the second semester explain 33.63% of the variance in
final marks, indicating a reasonable fit, similar to that of the full model. Supporting tables and graphs
are shown in Appendix D.1.8.

196
Table 6.14 Effect tests for the final model semester 2 2012
Source Nparm DF Sum of Squares F Ratio Prob > F Profile score 5 5 83587.184 45.1314 <.0001* Q12 Own variable diagrams BEFORE 1 1 1996.715 5.3905 0.0206* Q13 Used the tutorial 1 1 3819.469 10.3113 0.0014*
The prediction profiler for the final model for the second semester shown in Figure 6.14 again shows
clearly that a higher profile score had the most effect on a student’s final mark for COS1511. As in
the first semester, having drawn their own variable diagrams before enrolling for COS1511 had a
small positive effect on a student’s final mark. Using the tutorial while working through the Study
Guide had a small negative effect on a student’s final mark.
Figure 6.14 Prediction profiler for the final model semester 2 2012
6.3.4.3 Modelling with decision trees Another fit with decision trees was also done for both semesters. The decision tree for the first
semester in 2012 depicted in Figure 6.15 shows the effect of the two dominant factors in the model,
that is, the profile score and having drawn variable diagrams before. It shows that 76% of students
with a lower profile score (0 or 1) fail the module, while 78% of students with a profile score of 2, 3
or 4, pass the module. Ninety-six per cent of students with a profile score of 4 or 5 pass the module.
Sixty-four per cent of the students with a profile score of 3 pass the module, and if they had drawn
their own variable diagrams before, 81% pass the module. Fifty-nine per cent of students who have a
profile score of 3, and have not drawn their own variable diagrams before, pass the module.
The decision tree for the second semester in Figure 6.16 shows the effect of the two dominant factors
in the model, that is, the profile score and using the tutorial while working through the Study Guide. It
shows that 81% of students with a lower profile score (0, 1 or 2) failed the module, while 67% of
students with a profile score of 3, 4 or 5 passed the module. Eighty-seven per cent of students with a
profile score of 3, 4 or 5, who did not use the tutorial, passed the module. Fifty-nine per cent of
students with a profile score of 3, 4 or 5, who used the tutorial, passed the module. Fifty-three per cent
of the students with a profile score of 3, who used the tutorial, failed. Seventy-three per cent of
students who had a profile score of 4 or 5, who used the tutorial, passed the module.

197
Figure 6.15 Decision tree: Effect of profile score and tracing experience of the final model for semester 1 2012
Figure 6.16 Decision tree: Effect of the profile score and using the tutorial while working through the Study Guide of the final model for semester 2 2012
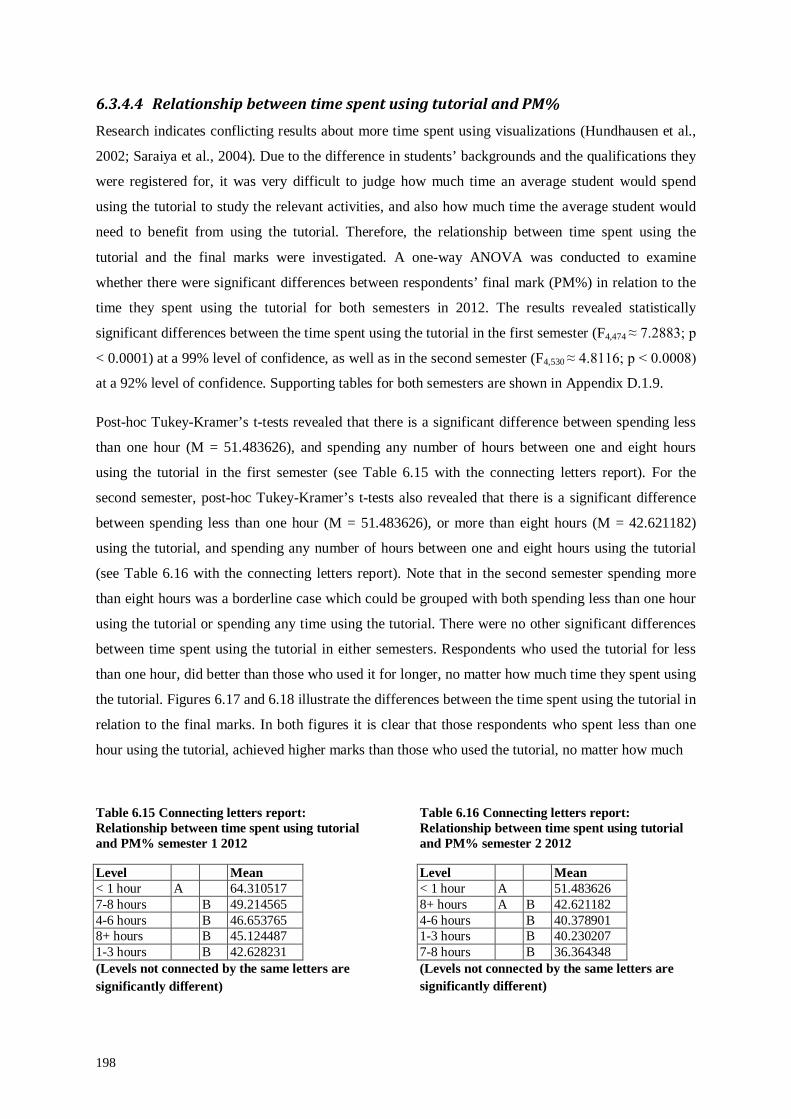
198
6.3.4.4 Relationship between time spent using tutorial and PM% Research indicates conflicting results about more time spent using visualizations (Hundhausen et al.,
2002; Saraiya et al., 2004). Due to the difference in students’ backgrounds and the qualifications they
were registered for, it was very difficult to judge how much time an average student would spend
using the tutorial to study the relevant activities, and also how much time the average student would
need to benefit from using the tutorial. Therefore, the relationship between time spent using the
tutorial and the final marks were investigated. A one-way ANOVA was conducted to examine
whether there were significant differences between respondents’ final mark (PM%) in relation to the
time they spent using the tutorial for both semesters in 2012. The results revealed statistically
significant differences between the time spent using the tutorial in the first semester (F4,474 ≈ 7.2883; p
< 0.0001) at a 99% level of confidence, as well as in the second semester (F4,530 ≈ 4.8116; p < 0.0008)
at a 92% level of confidence. Supporting tables for both semesters are shown in Appendix D.1.9.
Post-hoc Tukey-Kramer’s t-tests revealed that there is a significant difference between spending less
than one hour (M = 51.483626), and spending any number of hours between one and eight hours
using the tutorial in the first semester (see Table 6.15 with the connecting letters report). For the
second semester, post-hoc Tukey-Kramer’s t-tests also revealed that there is a significant difference
between spending less than one hour (M = 51.483626), or more than eight hours (M = 42.621182)
using the tutorial, and spending any number of hours between one and eight hours using the tutorial
(see Table 6.16 with the connecting letters report). Note that in the second semester spending more
than eight hours was a borderline case which could be grouped with both spending less than one hour
using the tutorial or spending any time using the tutorial. There were no other significant differences
between time spent using the tutorial in either semesters. Respondents who used the tutorial for less
than one hour, did better than those who used it for longer, no matter how much time they spent using
the tutorial. Figures 6.17 and 6.18 illustrate the differences between the time spent using the tutorial in
relation to the final marks. In both figures it is clear that those respondents who spent less than one
hour using the tutorial, achieved higher marks than those who used the tutorial, no matter how much
Table 6.15 Connecting letters report: Relationship between time spent using tutorial and PM% semester 1 2012
Level Mean < 1 hour A 64.310517 7-8 hours B 49.214565 4-6 hours B 46.653765 8+ hours B 45.124487 1-3 hours B 42.628231 (Levels not connected by the same letters are significantly different)
Table 6.16 Connecting letters report: Relationship between time spent using tutorial and PM% semester 2 2012
Level Mean < 1 hour A 51.483626 8+ hours A B 42.621182 4-6 hours B 40.378901 1-3 hours B 40.230207 7-8 hours B 36.364348 (Levels not connected by the same letters are significantly different)
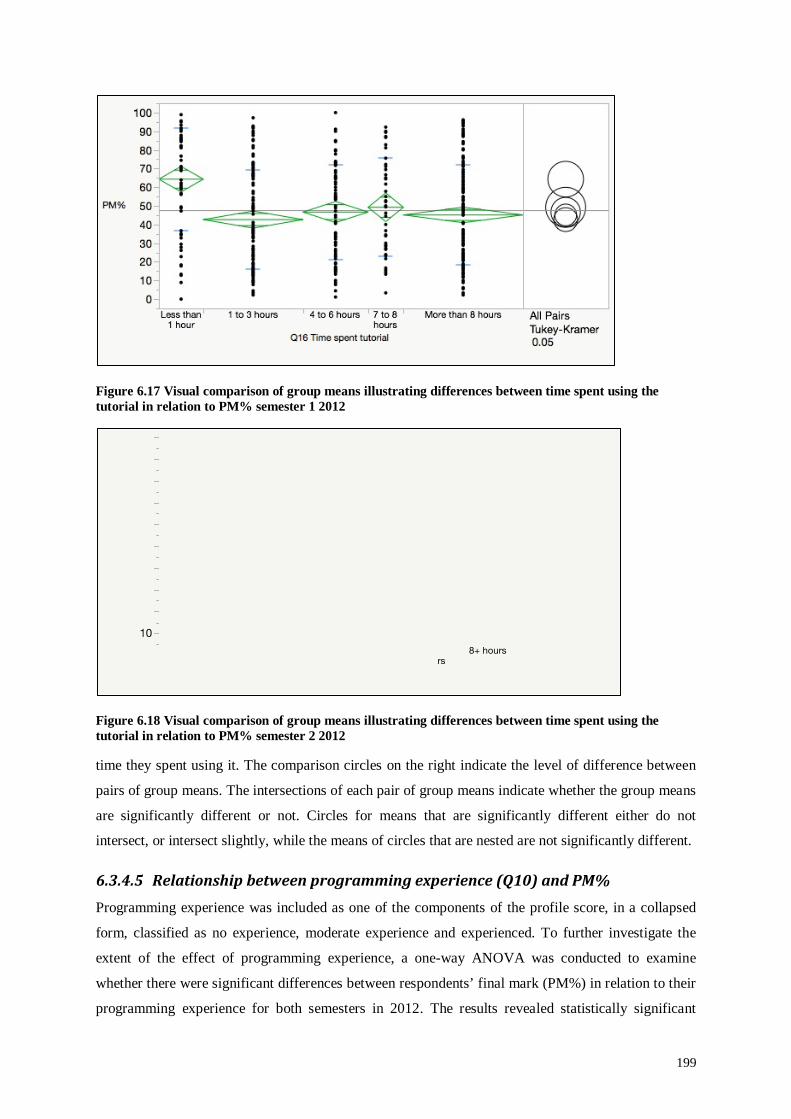
199
Figure 6.17 Visual comparison of group means illustrating differences between time spent using the tutorial in relation to PM% semester 1 2012
Figure 6.18 Visual comparison of group means illustrating differences between time spent using the tutorial in relation to PM% semester 2 2012
time they spent using it. The comparison circles on the right indicate the level of difference between
pairs of group means. The intersections of each pair of group means indicate whether the group means
are significantly different or not. Circles for means that are significantly different either do not
intersect, or intersect slightly, while the means of circles that are nested are not significantly different.
6.3.4.5 Relationship between programming experience (Q10) and PM% Programming experience was included as one of the components of the profile score, in a collapsed
form, classified as no experience, moderate experience and experienced. To further investigate the
extent of the effect of programming experience, a one-way ANOVA was conducted to examine
whether there were significant differences between respondents’ final mark (PM%) in relation to their
programming experience for both semesters in 2012. The results revealed statistically significant
200
differences between the programming experience in the first semester (F4,474 ≈ 33.4222; p < 0.0001) at
a 99% level of confidence, as well as in the second semester (F4,521 ≈ 33.9810; p < 0.0001), also at a
99% level of confidence. Post-hoc Tukey-Kramer’s t-tests revealed that in the first semester there is a
significant difference between being employed as a programmer (M = 69.886939) or having
completed a programming course other than COS1511 (M = 59.210625); having done Computer
Studies or Information Technology at school (M = 49.262185); and repeating COS1511 (M =
36.995000) or being currently enrolled for another programming module at Unisa (M = 30.766211)
(see Table 6.17 with the connecting letters report).
For the second semester, post-hoc Tukey-Kramer’s t-tests also revealed that there is a significant
difference between being employed as a programmer (M = 71.145152); having completed a
programming course other than COS1511 (M =50.548272) or having done Computer Studies or
Information technology at school (M = 48.806870); and repeating COS1511 (M = 35.329772) or
being currently enrolled for another programming module at Unisa (M = 29.752432) (see Table 6.18
with the connecting letters report). There were no other significant differences between programming
experiences in either semester. Supporting tables for both semesters are shown Appendix D.1.10.
Table 6.17 Connecting letters report: Relationship between programming experience and PM% semester 1 2012
Level Mean Employed as a programmer A 69.886939 Did a programming course other than COS1511
A 59.210625
Computer Studies or Information Technology at school
B 49.262185
Repeating COS1511 C 36.995000 Currently enrolled for another programming module at Unisa
C 30.766211
(Levels not connected by the same letters are significantly different)
Table 6.18 Connecting letters report: Relationship between programming experience and PM% semester 2 2012
Level Mean Employed as programmer A 71.145152 Did programming course other than COS1511
B 50.548272
Computer Studies or Information Technology at school
B 48.806870
Repeating COS1511 C 35.329772 Currently enrolled other module at UNISA
C 29.752432
(Levels not connected by the same letters are significantly different
Figures 6.19 and 6.20 illustrate the differences between programming experience in relation to the
final marks. Respondents who were employed as programmers obtained the best marks, while
respondents who were repeating COS1511 or were enrolled simultaneously for another programming
module achieved the lowest marks. Respondents who have completed another programming course
obtained higher marks than those who did Computer Studies or Information Technology at school.
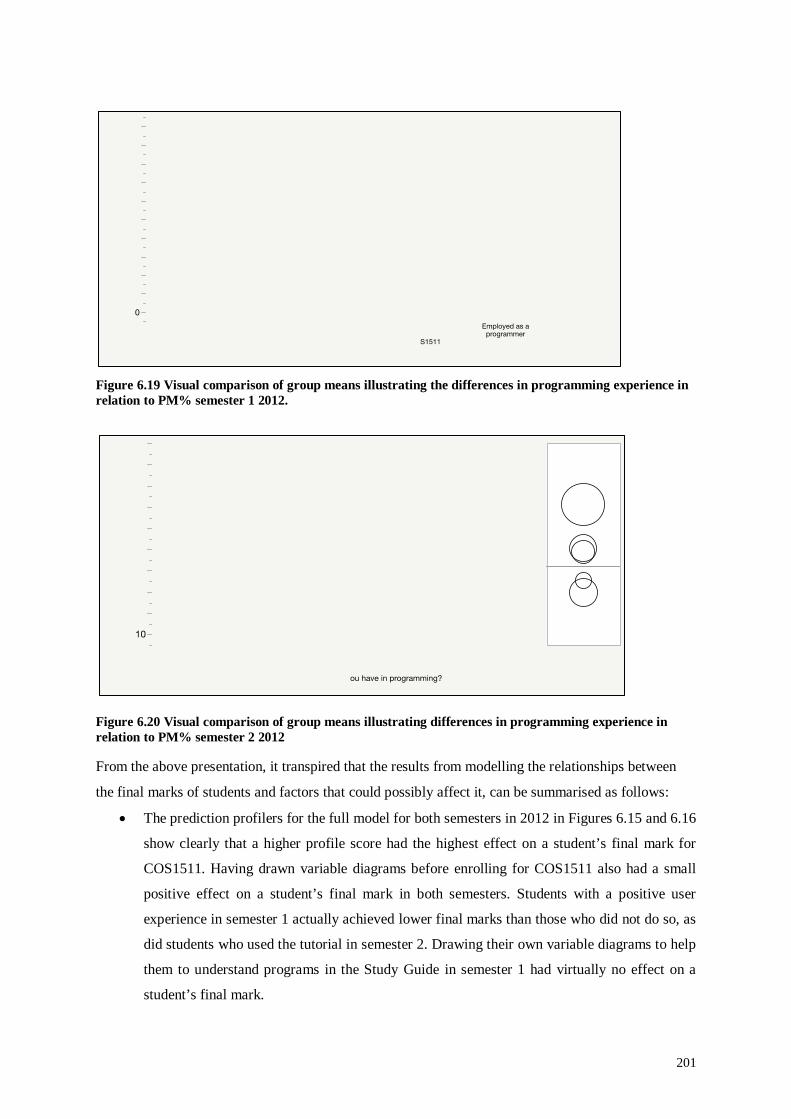
201
Figure 6.19 Visual comparison of group means illustrating the differences in programming experience in relation to PM% semester 1 2012.
Figure 6.20 Visual comparison of group means illustrating differences in programming experience in relation to PM% semester 2 2012
From the above presentation, it transpired that the results from modelling the relationships between
the final marks of students and factors that could possibly affect it, can be summarised as follows:
• The prediction profilers for the full model for both semesters in 2012 in Figures 6.15 and 6.16
show clearly that a higher profile score had the highest effect on a student’s final mark for
COS1511. Having drawn variable diagrams before enrolling for COS1511 also had a small
positive effect on a student’s final mark in both semesters. Students with a positive user
experience in semester 1 actually achieved lower final marks than those who did not do so, as
did students who used the tutorial in semester 2. Drawing their own variable diagrams to help
them to understand programs in the Study Guide in semester 1 had virtually no effect on a
student’s final mark.
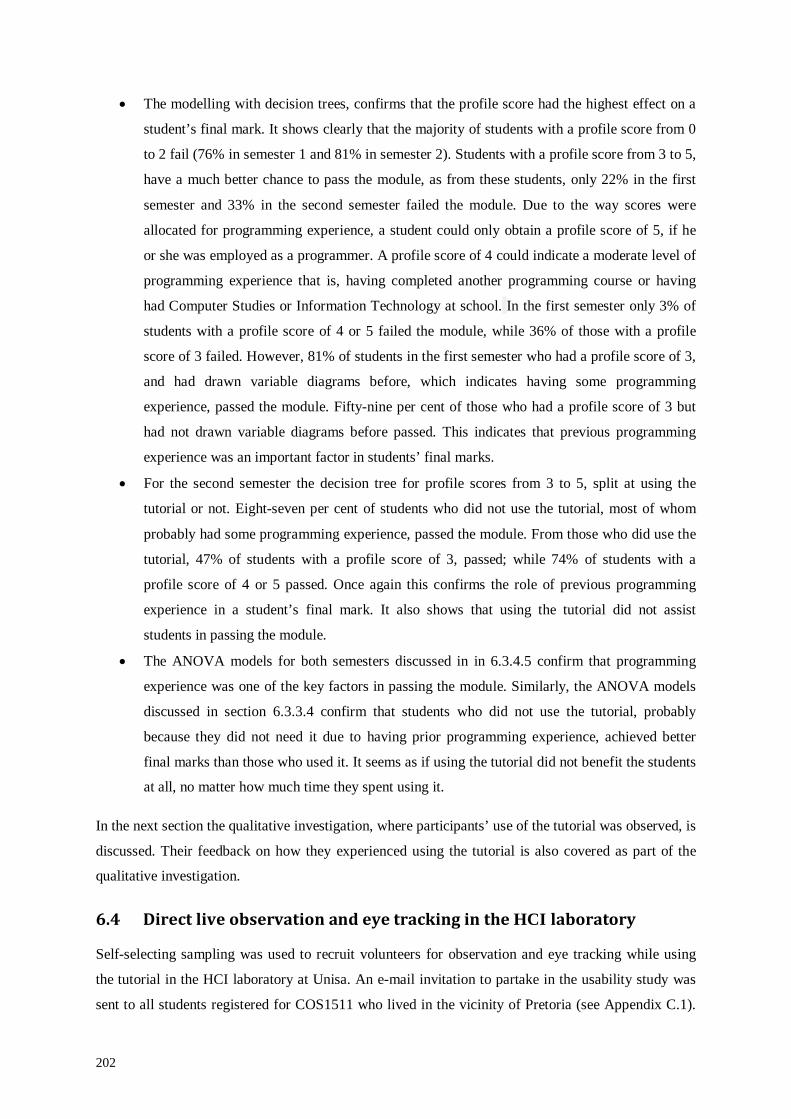
202
• The modelling with decision trees, confirms that the profile score had the highest effect on a
student’s final mark. It shows clearly that the majority of students with a profile score from 0
to 2 fail (76% in semester 1 and 81% in semester 2). Students with a profile score from 3 to 5,
have a much better chance to pass the module, as from these students, only 22% in the first
semester and 33% in the second semester failed the module. Due to the way scores were
allocated for programming experience, a student could only obtain a profile score of 5, if he
or she was employed as a programmer. A profile score of 4 could indicate a moderate level of
programming experience that is, having completed another programming course or having
had Computer Studies or Information Technology at school. In the first semester only 3% of
students with a profile score of 4 or 5 failed the module, while 36% of those with a profile
score of 3 failed. However, 81% of students in the first semester who had a profile score of 3,
and had drawn variable diagrams before, which indicates having some programming
experience, passed the module. Fifty-nine per cent of those who had a profile score of 3 but
had not drawn variable diagrams before passed. This indicates that previous programming
experience was an important factor in students’ final marks.
• For the second semester the decision tree for profile scores from 3 to 5, split at using the
tutorial or not. Eight-seven per cent of students who did not use the tutorial, most of whom
probably had some programming experience, passed the module. From those who did use the
tutorial, 47% of students with a profile score of 3, passed; while 74% of students with a
profile score of 4 or 5 passed. Once again this confirms the role of previous programming
experience in a student’s final mark. It also shows that using the tutorial did not assist
students in passing the module.
• The ANOVA models for both semesters discussed in in 6.3.4.5 confirm that programming
experience was one of the key factors in passing the module. Similarly, the ANOVA models
discussed in section 6.3.3.4 confirm that students who did not use the tutorial, probably
because they did not need it due to having prior programming experience, achieved better
final marks than those who used it. It seems as if using the tutorial did not benefit the students
at all, no matter how much time they spent using it.
In the next section the qualitative investigation, where participants’ use of the tutorial was observed, is
discussed. Their feedback on how they experienced using the tutorial is also covered as part of the
qualitative investigation.
6.4 Direct live observation and eye tracking in the HCI laboratory
Self-selecting sampling was used to recruit volunteers for observation and eye tracking while using
the tutorial in the HCI laboratory at Unisa. An e-mail invitation to partake in the usability study was
sent to all students registered for COS1511 who lived in the vicinity of Pretoria (see Appendix C.1).
203
They were told that the sessions would last approximately one to one-and-a-half hours. No incentive
for taking part was offered as Unisa does not allow this. The purpose of the eye tracking sessions was
to see how students would use the tutorial at home, and therefore participants were not told explicitly
that they should read the instructions.
In the first implementation cycle the observations in the HCI laboratory were done during the fourth
and fifth week of the second semester in 2012. Volunteers were requested to work through the first
eleven lessons in the Study Guide before their eye tracking sessions, following the study plan for the
module. This would have introduced them to their first C++ program, integers, variables, assignment
statements, declaring variables, input and output statements, mathematical operators, floating point
numbers, string and character variables, if statements, while loops, debugging and Boolean
values, as well as drawing variable diagrams for these statements.
This discussion of the direct live observation and eye tracking in the HCI laboratory during this
research, is continued by focusing on the procedure in the laboratory; the participants, analysis of gaze
replays; and analysis of the questionnaire completed after eye tracking.
6.4.1 Procedure in HCI laboratory
Students were observed one at time. Once a participant had signed the informed consent form (see
Appendix C.2), it was explained to him/her that the observation was intended to determine how
students would use the Drawing Variable Diagrams Tutorial on their own at home. The participant
was given the Task List in Appendix C and asked to draw variable diagrams for the first program in
the Task List on paper. Table 6.19 describes the six activities participants had to work through during
the observation.
Table 6.19 Description of activities worked through during observations in the HCI laboratory
Activity number in Drawing Variable Diagrams Tutorial
Concept or construct animated in Drawing Variable Diagrams tutorial
3.a.i Shows how a declaration statement such as int a; reserves memory space.
4.a.ii Demonstrates tracing and using variable diagrams for the assignment statement.
4.b Demonstrates and trace a program line by line and use variable diagrams to show tracing of declaration statements and how the values of variables change with assignment statements.
5.a Demonstrates line by line tracing of a program to illustrate arithmetic operators. 8.a.iii Demonstrate tracing a simple if else statement. 9.a.v Demonstrates tracing a while loop that prints values from 10 to 20.
After working through activities 3.a.i (reserving memory space for declarations), 4.a.ii (tracing
assignment statements) and 4.b (tracing a program with declarations and assignment statements line
by line) participants had to do the exercise at the end of activity 4.b. This required them to draw their

204
own variable diagrams on paper with a different initial value for the program in activity 4.b.
Thereafter participants had to work through activities 5.a (tracing a program with arithmetic
operators), 8.a.iii (tracing a simple if else statement) and 9.a.v (tracing a while loop). Then they
had to draw their own variable diagrams on paper for the second program on the Task List as a
retrospective comprehension test. The second program differed slightly from the first one, but used
the same programming constructs. Finally participants completed open-ended interview questions on
paper (available in Appendix C).
Note that the observations were intended to investigate how students would interact with the tutorial
when they encountered it for the first time, probably on their own and at home. This was an artificial
situation. Due to time constraints students could not internalise and learn from the tutorial as they
might have done in real life since the time constraints did not allow them to study the Study Guide in
combination with the tutorial as intensively as they would have done in their own time. Therefore it is
possible that they did not learn as much as they would have done under different circumstances.
6.4.2 Participants
Ten participants volunteered: two females and eight males. One of the ladies had vision impairment,
and could not be eye tracked. As a result she was not included in the analysis. Table 6.20 provides a
summary of the biographical information of the remaining participants. Feedback was obtained from
the open-ended post-test questionnaire participants completed and background was acquired from the
Unisa student system and/or conversations with the participants.
Table 6.20 Biographical information of participants observed in HCI laboratory
Participant Age Gender First language
Qualification registered for
No of times registered for Cos1511
Drawn variable diagrams before
Used tutorial before
Exam results
1 33 female Northern -Sotho
NDEEN* no no yes 50%
2 29 male Shona BSc Informatics
yes no yes 61%
3 19 male Afrikaans BSc Computing
no yes no 64%
4 20 male Swazi BSc Computing
yes yes no 39%
5 20 male Siswati/ English
NDINL** no yes yes 20%
6 29 male Venda NDEEN no no no n/a 7 25 male English NDEEN no yes no 64% 8 27 male English NDINL no no yes 10% 9 28 male XiTsonga BSc
Computing no no yes n/a
(Legend: *NDEEN – National Diploma in Electrical Engineering; **NDINL – National Diploma in Information Systems)

205
The ages of the participants varied from 19 to 33. The participants spoke eight different home
languages. Two had not been registered for COS1511 before, while the others had all been registered
before, but did not all progress to writing the examination. All claimed to be computer-literate.
Three participants were registered for the NDEEN, three for BSc Computing, two for the National
Diploma in Information Systems and one for BSc Informatics. Five participants had never drawn
variable diagrams before and four indicated that they had not used the Drawing Variable Diagrams
Tutorial before the observations. Four participants passed the examination at the end of the semester,
three failed and two did not write the examination.
6.4.3 Analysis of gaze replays
As indicated in section 4.3.5.3 gaze replays and observation were used to establish how participants
experienced the usability of the Drawing Variable Diagrams Tutorial. The analysis is discussed based
on issues identified during the observations and gaze replays. Four main issues were identified,
namely, learning from the tutorial, the instructions on how to use the tutorial, navigation through the
tutorial, and reading skills.
6.4.3.1 Learning from the tutorial In order to learn from the tutorial (see section 5.5.1.2 for a description of a typical run), it was
expected that students would firstly study the program code in the Program Box to form an idea of the
purpose of the program, then read the highlighted program statement again and study the explanation
in the Explanation Box to make sure they understand the statement. Thereafter they were expected to
inspect the Memory Box to see how the variable diagrams for the statement are drawn (if any) and to
look at the Console Window to inspect the output (if any) produced or to examine the input given to
the program. To continue to the next statement in the program students should have clicked on the
Next button, and to return to the previous statement, on the Back button.
Although this was a very artificial situation requiring participants to work through more than would
typically be done during one session in their own time, participants did not seem to learn from
working through the tutorial. This was evident in the fact that the variable diagrams drawn for the pre-
test and retrospective comprehension tests by the three participants who did so (participants 1, 2 and
3), did not differ. Recall that the pre-test and retrospective comprehension tests were deliberately very
similar, both using while loops with an if statement in the loop body; and that students were
requested to work through the study guide up to lesson 11 before the observations in order to cover
the study material presented in the activities they had to work through during the eye tracking and
observation.
206
Six participants did not read the program code and explanations. They simply scanned it or only read
part of it (participants 1, 3, 4, 6, 8, 9). Only three participants reconciled the four boxes in an activity
as was expected (participants 2, 5 and 7). Despite using the tutorial as was expected, the (incorrect)
variable diagrams drawn by participant 2 in the pre-test and retrospective comprehension tests did not
differ, participant 5 did not draw variable diagrams, and the variable diagrams for the pre-test and
retrospective comprehension test programs drawn by participant 7 were not correct, although he used
the tutorial to assist him in drawing his own variable diagrams for activity 4.b, which he did correctly.
The behaviour and variable diagrams drawn by the participants are briefly described below.
Participant 1 initially did not read the explanations or code before realising how to use the tutorial
after frequently referring back to the instructions. She drew the variable diagrams for both the pre-test
and the retrospective comprehension test before she worked through the tutorial, but rechecked them
afterwards and requested the researcher to check whether she did it correctly. She made only one
mistake – an incorrect line number.
Participant 2 never used the instructions, but nevertheless fairly quickly grasped how to use the
tutorial. The gaze replays showed that he used the tutorial to help him understand the relationship
between the program code and the resulting variable diagrams – he repeatedly compared the contents
of the Memory box with the program code, the Console window and the Explanation box. He did not
use line numbers when he drew variable diagrams, and did not realise that variables kept their values
when a loop is executed – for each execution of the loop and the corresponding input value he drew
the variable diagrams as if the variables had not been assigned any values yet. He did not draw
variable diagrams for activity 4.b, but did a calculation instead.
Participant 3 only referred to the Program Code box when instructed to do so in the Explanation box.
Presumably since he could already program, he did not follow the execution of the while loop in
activity 9.a.v, but simply clicked to reach the end of the loop, when he did inspect the boxes. He could
trace correctly, although he did not follow the conventions of the study guide.
Participant 4 looked puzzled at times, and though he tried to follow, sometimes fixating on code, or
reconciling the contents of the Memory box with the program code, it seemed as if he did not always
manage to do so. He might not have read or followed all the explanations, since at times his eye
movements in the Explanation box were very erratic. It is also possible that he became tired or lost
concentration. He did not draw the variable diagrams for the pre-test program, because he could not
remember how to do it. The variable diagrams he drew for activity 4.b were partly correct, but the
variable diagrams he drew in the retrospective comprehension test, were incorrect. It seemed as if he
could not follow the logic of using a control variable that receives a different input value during each
loop execution.
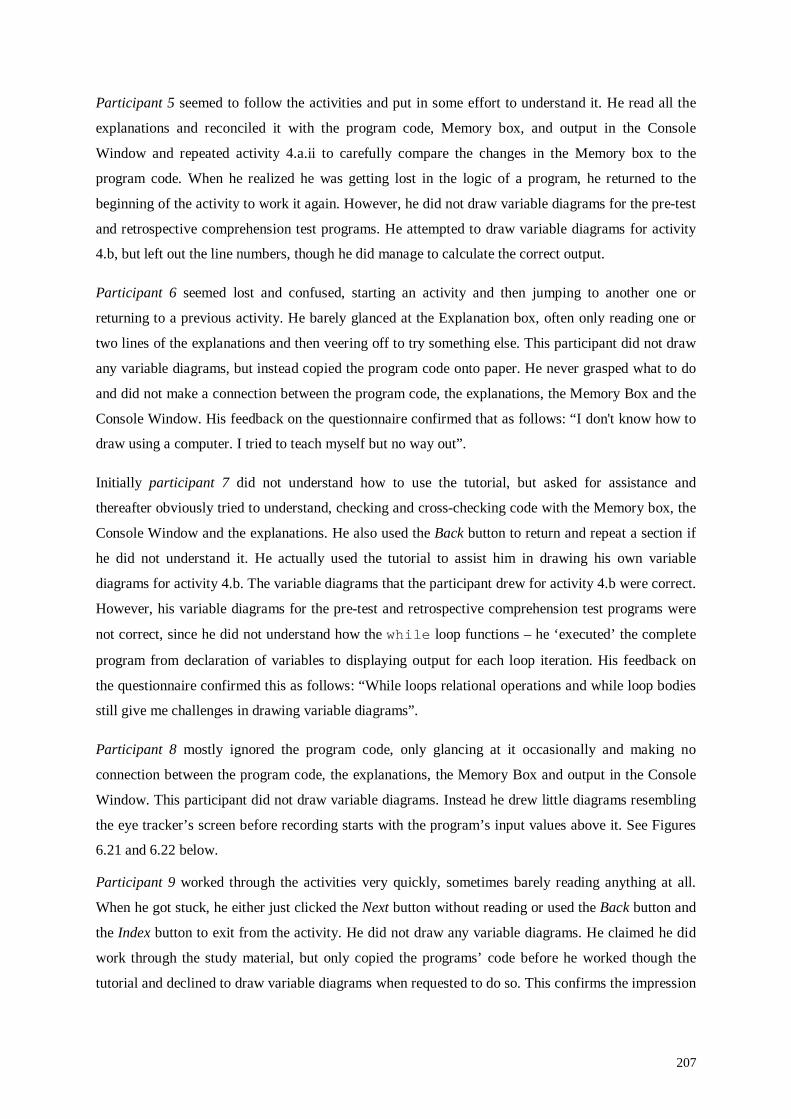
207
Participant 5 seemed to follow the activities and put in some effort to understand it. He read all the
explanations and reconciled it with the program code, Memory box, and output in the Console
Window and repeated activity 4.a.ii to carefully compare the changes in the Memory box to the
program code. When he realized he was getting lost in the logic of a program, he returned to the
beginning of the activity to work it again. However, he did not draw variable diagrams for the pre-test
and retrospective comprehension test programs. He attempted to draw variable diagrams for activity
4.b, but left out the line numbers, though he did manage to calculate the correct output.
Participant 6 seemed lost and confused, starting an activity and then jumping to another one or
returning to a previous activity. He barely glanced at the Explanation box, often only reading one or
two lines of the explanations and then veering off to try something else. This participant did not draw
any variable diagrams, but instead copied the program code onto paper. He never grasped what to do
and did not make a connection between the program code, the explanations, the Memory Box and the
Console Window. His feedback on the questionnaire confirmed that as follows: “I don't know how to
draw using a computer. I tried to teach myself but no way out”.
Initially participant 7 did not understand how to use the tutorial, but asked for assistance and
thereafter obviously tried to understand, checking and cross-checking code with the Memory box, the
Console Window and the explanations. He also used the Back button to return and repeat a section if
he did not understand it. He actually used the tutorial to assist him in drawing his own variable
diagrams for activity 4.b. The variable diagrams that the participant drew for activity 4.b were correct.
However, his variable diagrams for the pre-test and retrospective comprehension test programs were
not correct, since he did not understand how the while loop functions – he ‘executed’ the complete
program from declaration of variables to displaying output for each loop iteration. His feedback on
the questionnaire confirmed this as follows: “While loops relational operations and while loop bodies
still give me challenges in drawing variable diagrams”.
Participant 8 mostly ignored the program code, only glancing at it occasionally and making no
connection between the program code, the explanations, the Memory Box and output in the Console
Window. This participant did not draw variable diagrams. Instead he drew little diagrams resembling
the eye tracker’s screen before recording starts with the program’s input values above it. See Figures
6.21 and 6.22 below.
Participant 9 worked through the activities very quickly, sometimes barely reading anything at all.
When he got stuck, he either just clicked the Next button without reading or used the Back button and
the Index button to exit from the activity. He did not draw any variable diagrams. He claimed he did
work through the study material, but only copied the programs’ code before he worked though the
tutorial and declined to draw variable diagrams when requested to do so. This confirms the impression

208
Figure 6.21 Eye tracker’s opening screen
Figure 6.22 Participant 8’s attempt at drawing variable diagrams
that he did not master using the tutorial, as does his feedback as follows, on whether he finds it easier
to draw variable diagrams after working through the tutorial: “Yes, but it needs more understanding”.
Six participants never reconciled the contents of the four boxes on the screen. This, combined with the
descriptions of the participants’ behaviour and the variable diagrams drawn by them, confirmed the
impression that they did not learn from working through the tutorial. It could be due to the artificial
situation in which the observations were done, and the time frame in which it happened, but also
because participants did not read program code and/or explanations, or reconciled the four boxes on
the screen in an activity.
6.4.3.2 Problems/Issues with the instructions on how to use the tutorial The instructions in the version of the Drawing Variable Diagrams tutorial used in the first
implementation cycle, consisted of a series of screen shots of the introductory frame (called the
landing page), the Index page and an activity screen with instructions on what to do on each page (see
Appendix D). The landing page is shown in Figure 6.23. The instructions were very brief, simply
stating which button to click to choose an activity or exit, and how to navigate through the tutorial.
Only five of the participants read the introductory explanation of the purpose of the tutorial on the
landing page (see Figure 6.23). As a result they did not know how to interpret what they saw while
working through the tutorial and how it relates to the activities in the study guide.
Five participants read the instructions briefly and one scanned it. Five of the participants who
inspected the instructions still experienced problems in navigating the tutorial and seemed lost. Two
participants who read the instructions, referred back to it several times to decide how to proceed
during, before or at the end of activities. Two participants, who did not study the instructions, also
experienced problems using it, confirming the need for instructions. Clearly the instructions were
insufficient to explain to participants how to use the tutorial.
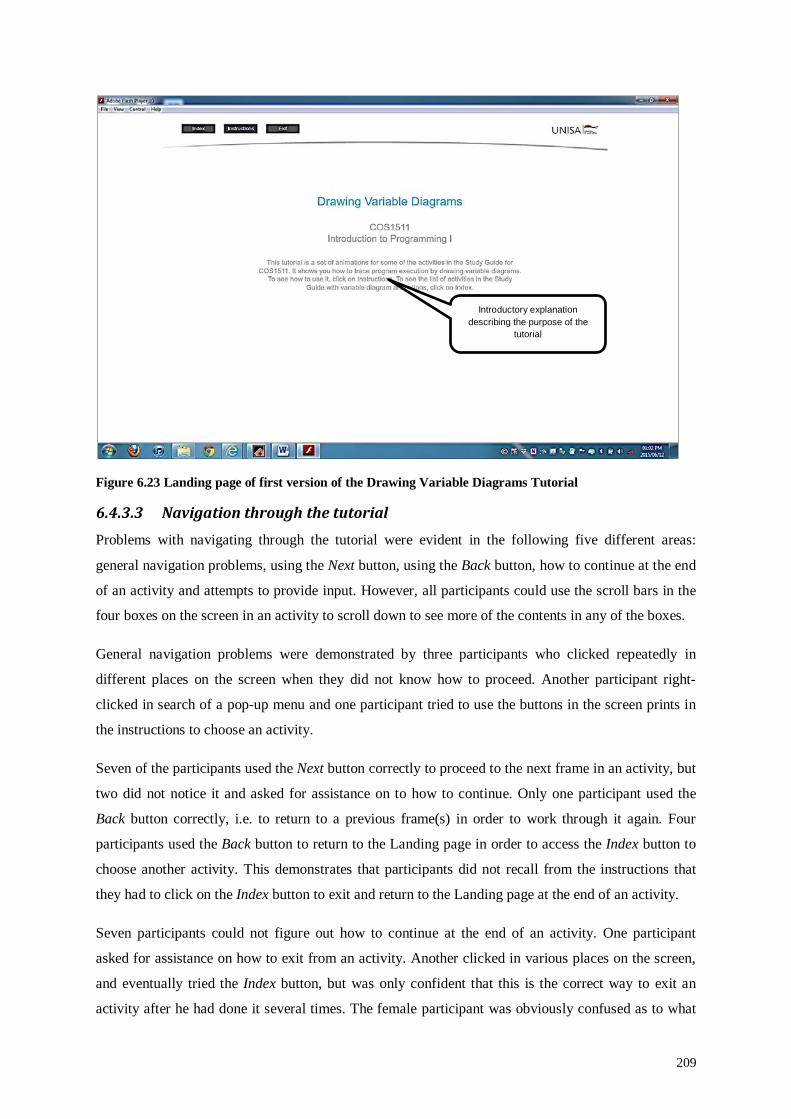
209
Figure 6.23 Landing page of first version of the Drawing Variable Diagrams Tutorial
6.4.3.3 Navigation through the tutorial Problems with navigating through the tutorial were evident in the following five different areas:
general navigation problems, using the Next button, using the Back button, how to continue at the end
of an activity and attempts to provide input. However, all participants could use the scroll bars in the
four boxes on the screen in an activity to scroll down to see more of the contents in any of the boxes.
General navigation problems were demonstrated by three participants who clicked repeatedly in
different places on the screen when they did not know how to proceed. Another participant right-
clicked in search of a pop-up menu and one participant tried to use the buttons in the screen prints in
the instructions to choose an activity.
Seven of the participants used the Next button correctly to proceed to the next frame in an activity, but
two did not notice it and asked for assistance on to how to continue. Only one participant used the
Back button correctly, i.e. to return to a previous frame(s) in order to work through it again. Four
participants used the Back button to return to the Landing page in order to access the Index button to
choose another activity. This demonstrates that participants did not recall from the instructions that
they had to click on the Index button to exit and return to the Landing page at the end of an activity.
Seven participants could not figure out how to continue at the end of an activity. One participant
asked for assistance on how to exit from an activity. Another clicked in various places on the screen,
and eventually tried the Index button, but was only confident that this is the correct way to exit an
activity after he had done it several times. The female participant was obviously confused as to what
Introductory explanation describing the purpose of the
tutorial
210
to do on reaching the end of an activity, and when she managed to return to the Landing page by
clicking on the Index button, used the instructions to confirm that this was the correct action.
Two participants tried to provide their own input values when the program code ‘executed’ an input
statement. This probably happened because they did not read the explanation explaining that the
tutorial will provide the input, and what the input will be.
In summary, participants could not navigate intuitively through the tutorial without instructions or
being instructed on how to do so.
6.4.3.4 Reading skills
Reading is a cognitive-linguistic activity comprising several component skills with decoding and
comprehension deemed to be the two main components (Pretorius, 2002). Decoding involves the
more technical skills to translate written symbols into language. Comprehension, in contrast, refers to
the overall understanding process of constructing meaning from the whole text (Pretorius, 2002;
Pretorius & Ribbens, 2005). Effective comprehension depends on good decoding skills. However,
good decoding skills alone are not sufficient for effective comprehension (Bertram, 2006). An
important part of comprehension is inferencing, that is, the ability to fill in gaps between text elements
and link information across textual units (Rickheit, Schnotz & Strohner, 1985). A good reader is in
fact a good comprehender (Bertram, 2006).
Eye movements are one of the best methods to study language comprehension processes. Eye
movements during reading consist of fixations (pausing eye movement on a specific area), saccades
(the movements between fixations) and regressions (saccades that move backwards in the text).
Regressions usually occur when the reader finds the text difficult or does not understand what was
read. In general the ease or difficulty associated with understanding a word during reading clearly
affects how long readers fixate on that word. Readers will fixate longer on less frequently used and/or
less predictable words, skip these words less and re-fixate on them more often (Rayner & Pollatsek,
2006).
There may be considerable variation in both fixation and saccade length since text difficulty; reading
skills and characteristics of the writing system all influence these values. More difficult text typically
causes longer fixations, shorter saccades and more regressions. Beginning, less skilled and dyslexic
readers also have longer fixations, shorter saccades and more regressions (Rayner, 2009). Non-
English speaking readers have longer fixations and shorter saccades resulting in a decreased reading
speed (Beymer, Russell & Orton, 2008). To dyslexic readers, letters may appear to move around so
that their vision is unstable (Stein & Walsh, 1997). Mindless reading shows longer and more off-text
fixations (Reichle, Reineberg & Schooler, 2010). When combined with other visual material such as
images or film, the eye has to move between the text and the rest of the visuals on the screen. This

211
places more demands on attention as information has to be combined from both channels (Hefer,
2013). Results from research by Frazier and Rayner (in Rayner & Pollatsek, 2006) suggest that
quickly appearing disruptions in eye-movement control could be used to identify syntactic processing
difficulties. The disruptions and regressive eye movements of some participants in the tests in the HCI
laboratory may therefore be an indicating of poor comprehension due to poor reading ability.
Judging by their eye movements, participants 1 and 2 read at a reasonable speed and displayed no
obvious reading difficulties. Participant 3 read well and faster than all the other participants.
Participant 7 read at a reasonable speed and had no problems in reading and comprehending what he
had read, since he followed instructions in the Explanation box to look at the Memory box or Console
Window without hesitation. All of them also passed the examination at the end of the semester.
Participant 4 looked puzzled at times, and though he tried to follow, sometimes fixating on code, or
reconciling the contents of the Memory box with the program code, it seemed as if he did not always
manage to do so. He might not have read or followed all the explanations, since at times his eye
movements in the Explanation box were very erratic resembling scanning, or displaying a zigzag
pattern with frequent regression. It is possible that he became tired or lost concentration, resulting in
mindless reading but it could also have occurred due to syntactic processing difficulties or dyslexion.
Participant 5 recommended adding “a zooming tab for those who have difficulties with reading small
or medium texts”. The participant had a reasonable reading speed, but sometimes jumped around and
reread sentences trying to understand, indicating that he found the text difficult to comprehend.
Participant 6 barely glanced at the Explanation box and may have a problem with reading since when
he looked at the Explanation box, he would read one or two lines of the explanations and then veer off
to try something else. He also used the mouse to guide his reading. This created the impression that he
did not understand or was not a skilled reader.
Participant 8 read slowly, rereading sentences and seemed to struggle to comprehend. His eye
movements showed short saccades and long fixations which indicate that either he found the text
difficult or was a beginning or dyslexic reader (Rayner, 2009).
Participant 9 went through the activities very quickly, sometimes barely reading anything at all.
When he did read, his eye movements often showed fairly short saccades and long fixations, and he
sometimes reread text. When he got stuck, he either just clicked the Next button without reading or
used the Back button and the Index button to exit from the activity. This could be an indication of
poor reading skills.
212
In summary, participants who could read reasonably well (participants 1, 2, 3 and 7) passed the
examination at the end of the semester, while those who displayed inadequate reading skills, did not
pass or did not write the examination.
6.4.4 Analysis of the questionnaire completed after eye tracking
The questionnaire that students completed after the eye tracking and observations in the HCI
laboratory is shown in Appendix C. Five participants indicated that they had used the Drawing
Variable Diagrams Tutorial before. Four of the participants indicated that they had drawn variable
diagrams before and stated that they found it easier to do after they had used the tutorial, since it
showed how to do so line by line, and was seen as a simple and quick way to refresh one’s memory.
Two of the four who had drawn variable diagrams before said that they drew variable diagrams
occasionally to help them understand programs in the Study Guide, while the other two said that they
had not done so in the past, but intended to do so in future. Of the five participants who indicated that
they had never drawn variable diagrams before, three nevertheless claimed to draw variable diagrams
to help them understand the programs in the Study Guide. This may be an indication of the
experimenter effect, when participants attempt to react in a way that they think the researcher expects
them to, due to subtle unconscious clues given by the researcher about what he or she expects (Oates,
2006; Terre Blanche et al., 2006), or simply that the participants did not understand the questions.
All the participants agreed that the questions in the activities helped them to concentrate or understand
the variable diagrams, even if it was “only a little bit”. Five participants wanted auditory explanations,
one would have liked to have it available occasionally and three preferred not to have it. Of the
participants who would have liked auditory explanations, two failed the end-of-semester examination;
two participants did not write the examination and one passed. This may be an indication that those
with poorer reading skills may wish to have auditory explanations to compensate for their reading
skills.
The participants made the following suggestions to improve the tutorial:
• Placing the Explanation box before the written program
• Indicating the end of an activity more explicit with instructions on how to continue
• Making the Next button more prominent
• Clarify what to do in the tutorial, e.g. to click the Next button to continue
• Auditory explanations for more difficult parts
• Adding a zooming tab for small text
Two students still found it difficult to understand while loops and one found incrementing a loop
variable confusing.
213
The results of the direct live observation and eye tracking in the HCI laboratory during this research
are summarised as follows:
• During the gaze replays, it became evident that the most obvious usability problems were how
to navigate the tutorial and how to learn from the tutorial by reconciling the four boxes
containing or representing the program code, the explanations, the CPU memory and the
console window.
• Factors that could have contributed to this situation include: not reading the introductory
explanation explaining the purpose of the tutorial; inadequate instructions; not reading the
explanations or ignoring the program code, Memory box or Console Window; and
participants who experienced problems with reading itself. The fact that five participants
wanted audio explanations, with two more requesting it as an option, confirms that reading
itself may be a factor to be taken into account.
• In general, the participants who used the tutorial as intended had better reading skills and
passed the examination at the end of the semester (participants 1, 2, 3 and 7), while those who
struggled either failed or did not write the examination (participants 4, 6, 8 and 9). Participant
5 seemed to make an effort to understand, but he did not draw variable diagrams. He also
failed the examination. He displayed a reasonable reading speed, but seemed to have
problems comprehending.
6.4.5 Update of tutorial based in analysis of the eye tracking and accompanying questionnaire completed after eye tracking
Based on the observations in the HCI laboratory and the participants’ recommendations, the
Drawing Variable Diagrams tutorial was updated as follows:
• The instructions were expanded into a presentation explaining what a variable and a variable
diagram is; the purpose of variable diagrams and the tutorial; the relationship between the
activities in the tutorial and the study guide; how to use the tutorial including a description of
the purpose of the various pages in the tutorial, an explanation of an activity screen, the four
boxes in an activity screen, the relationship between them and how to reconcile them; as well
as a walk-through of activity 3.a showing how to reconcile the boxes; and some notes on how
to proceed at the end of an activity. The instructions for the subsequent version of the
Drawing Variable Diagrams Tutorial are shown in Appendix E.
• A button ‘How to use this tutorial’ was placed immediately below the introductory
explanation on the introductory frame (landing page) leading to the instructions.
• The Next and Back buttons were made more prominent by giving them an outline and writing
‘Next’ and ‘Back’ below the buttons themselves.
214
• A Finished button replaced the Next button at the end of an activity and a prompt was placed
inside the Explanation box to tell users ‘Click Index button to go back to list of activities.’
• An explicit explanation that users need not provide any input was put in the explanations at
the beginning of activity 3.a as well as in the instructions.
• The number of iterations in all looping activities such as the for loop in activity 9.a.v, was
decreased to reduce the complexity.
• Minor changes to repair small errors picked up such as incomplete highlighting of lines in the
Program Code box.
The changes to the tutorial were all intended to improve its usability, with the main focus on
providing detailed instructions on how to use it.
6.5 Feedback from students in first implementation cycle
Towards the end of both the first and second semester in 2012, students were invited on the online
forum for COS1511to provide feedback on their experience of using the Drawing Variable Diagrams
tutorial. Unfortunately a very small number of students responded. Six students posted positive
responses, six responded negatively, five used the opportunity to complain about the Study Guide or
assignments, and one admonished other students for not putting in more effort into mastering the
module.
Under the positive feedback four respondents stated explicitly that they found the tutorial helpful. One
of them said that he had never seen program code before and commented – “I was able to write,
analyse, compile, run, and troubleshoot/debug without help from anyone.” Another appreciated being
able to – “see how things work ‘inside’”. The following feedback from three students confirmed that
drawing variable diagrams assists in creating a mental model of program execution:
• “Once you understand the drawing of the diagrams is the visualization of the logic in your
program the need for it and the understanding of it is much clearer. Using the CAI tutorials
also improved my understanding of them a whole lot better. It is definately (sic) very very
helpful.”
• “I found that once the conventions (as in the study guide) became second nature, it allowed
me to ‘compile’ the source code mentally, which is obviously an important skill to have. It is
a novel concept as far as I am concerned, the likes of which I never really considered.”
• “I must say I found that the variable diagram tutorial was really well written and easy to
follow. Also it helped me in following how variables change at each stage of the program. I
have managed to resolve some logic issues in my practice code by drawing up variable
diagrams. It seems to be one of the most important tutorials in the book.”

215
Under the negative feedback, two students complained that the tutorial was not easy to follow for
novices and another that he sometimes could not execute it (without any further elaboration as to why
he could not execute it). One student said it was easy to understand, but too basic. Two other students
also said it was too basic, since it did not cover the questions in the assignments. The following two
comments probably came from students who struggled:
• “Tutorial is helpful to someone who did computers at school and very difficult to understand
if one has never done computers. I managed assignment one with the help from someone who
did computers at school. Now that the person is gone I am finding it difficult to do it alone. I
cannot rectify errors on C++ since there are no examples of errors shown in the tutorials.”
• “I find out this tutorial is some how not helping me out to pass this module, because i have
been trying my best several time but i always get dissapointed.
1. The assignments are to far from what we have in our study guide.
2. The exam structure is always changing, which is difficult to understand comparing to the
basic tutorial that we must prepare for the exam.”
The general tone of the negative responses shows that some students did not understand the purpose
of the tutorial. They expected it to help them in doing their assignments, instead of showing them how
to draw variable diagrams for each new programming construct they learn. Tellingly, the responses
from students who found drawing variables and the tutorial beneficial implied that they spent time to
master it. This confirms that engagement with visualization is key to its success.
6.6 Findings
As discussed in section 6.3.1 the findings from the first implementation cycle will not be generalised,
but should hold, with caution, for those COS1511 students who wrote the examination in 2012.
The quantitative investigation discussed in sections 6.2 and 6.3 aimed to answer the second and third
research questions. In section 6.2, it was established that the findings by the BRACElet project
regarding the correlation in performance between ‘explain in plain English’ tasks and code writing
tasks as well as between code tracing and code writing tasks (Lister et al., 2009; Lopez et al., 2008)
are also applicable to the participants in this study. This confirmed that an improved ability to trace
should have had a positive effect on a student’s marks.
The following factors impacting on students’ final marks were explored in section 6.3:
• Mathematics and English marks;
• biographical properties as summarized in the set of profile scores;
• a positive user experience when using the tutorial;
• students’ prior experience of programming;
• their use of tracing; and
216
• the time they spent using the tutorial.
The mean percentages for Mathematics for students in both semesters were 51% and 52%
respectively, and for English 53% and 54% respectively. This indicated that students did not have a
strong Mathematical or English background, which was also evident in the poor reading skills some
participants demonstrated during the eye tracking and observation in the HCI laboratory.
Students’ biographical properties were expressed in a profile score comprised of their prior
programming experience, Grade 12 marks for Mathematics and English, and first-time registration for
COS1511 or not. The majority of both first and second semester students obtained a profile score of
between zero and two (56% and 70% respectively), indicating that most were not academically
strong.
Students expressed a positive user experience, 3.75 for the first semester and 3.68 for the second
semester.
The first semester students in general did better than second semester students, as the mean final
marks for the two semesters confirm (47% in the first semester and 42% in the second semester).
In both semesters, the majority of students had not drawn variable diagrams before enrolling for
COS1511, but claimed to use the tutorial and to draw their own variable diagrams to understand the
programs in the Study Guide. Approximately half of them drew their own variable diagrams to debug
their programs.
The relationship between students’ final mark and the following factors that could possibly affect it,
was modelled with multiple linear regression and refined with stepwise multiple linear regression for
both semesters:
• Biographical profile of respondents as summarized in the set of profile scores.
• User experience as measured by the positive user experience scores.
• Prior use of variable diagrams (q12).
• Using the tutorial or not (q13).
• Drawing variable diagram to understand programs in the Study Guide (q14).
• Drawing variable diagrams to debug (q15).
• Time spent using the tutorial (q16).
These models were also fitted with decision trees. The multiple linear regression and the decision tree
models for both semesters showed that students’ biographical properties (prior programming
experience, Mathematics and English marks, and first registration or not for COS1511) had by far the
biggest impact on their final marks. ANOVA models for both semesters confirmed that students who
were employed as programmers and were therefore classified as being experienced in programming,
217
achieved the highest marks. The ANOVA models for both semesters also confirmed that students who
spent less than one hour using the tutorial, achieved the highest marks.
The quantitative investigation therefore indicates that the tutorial did not assist students in acquiring
programming skills (research question 2). Students who used the tutorial achieved lower marks than
those who did not. The multiple linear regression analysis shows that use of the tutorial did not have
an effect in the first semester but did have an effect in the second semester. This might be due to the
composition of the data set, and may well vary for a larger data set in either of the semesters. The
factor that had the biggest positive impact on a student’s final mark (research question 3), was his or
her biographical properties as represented by the profile score while having drawn variable diagrams
before contributed to a lesser degree to a better final mark. A positive user experience did not
contribute to a higher final mark and students drawing their own variable diagrams, while working
through the Study Guide had almost no impact.
The qualitative investigation discussed in sections 6.4 and 6.5, aimed to enhance the answers to
research questions 3 and 4, by investigating students’ interaction with the tutorial as well as their user
experience of it. The direct live observation and eye tracking of participants discussed in section 6.4,
revealed the following problems:
• students did not really learn how to draw variable diagrams from using the tutorial;
• the instructions on how to use the tutorial were insufficient;
• students could not navigate intuitively through the tutorial; and
• lack of reading skills hampered understanding and learning from the tutorial.
A very small number of students provided feedback on the COS1511 discussion forum, as discussed
in section 6.5. Nevertheless, the positive feedback indicated that students, who spent enough time
engaging with it, believed they benefited from it. Negative feedback confirmed that novices did not
find it easy to use the tutorial, and that students misunderstood the purpose of the tutorial, since they
expected that it would assist them in doing their assignments.
The qualitative investigation confirmed the findings from the quantitative investigation in answer to
research question 2, namely that students did not learn from using the tutorial in its initial version.
The qualitative investigation also confirmed the findings of the quantitative investigation in answer to
research question 3, namely that students’ educational background as expressed in the biographical
profile score, contributed largely to their final marks for COS1511. Students in the qualitative
investigation who could read well, performed better in the examination, and found using the tutorial
easier. Lack of reading skills, tie in with the mediocre means in participants’ marks for English and
Mathematics in matric. Inadequate instructions for using the tutorial were partly to blame for students’

218
struggle to navigate through the tutorial and as a result, not learning from the tutorial, while lack of
reading skills contributed to this.
With regard to research question 4, the qualitative investigation revealed two important lessons,
namely that –
• students should be made aware of the purpose of a visualization; and
• they should receive detailed instructions on how to use it, especially if they are expected to do
so on their own, as in an ODL environment.
In preparation for the second cycle the deficiencies in the tutorial were addressed. In section 6.4.4 it
was described how this was done, while the second implementation cycle as such is discussed in
Chapter 7.
6.7 Summary and conclusion
This chapter described the quantitative and qualitative investigations of the first implementation cycle
of testing and refinement of the tutorial to teach students to draw variable diagrams. The aim was to
provide answers to research questions 2, 3 and 4 of this research investigation. The quantitative
investigation was discussed in sections 6.2 and 6.3, while the qualitative investigation was addressed
in sections 6.4 and 6.5.
The quantitate investigation included verifying that the findings from the BRACElet project (Lister et
al., 2009; Lopez et al., 2008) regarding the relationship between students’ abilities to explain code in
plain English and to trace code as well as the combination of these skills, and their final marks for
COS1511. The purpose of this was to confirm that an improved ability to trace should assist students
in acquiring programming skills. As discussed in section 6.2, the findings from this study confirmed
this.
In section 6.3, the relationships between factors that could influence a student’s final mark and his/her
final mark were investigated to determine how students’ interaction with the tutorial affected their
final marks. The results indicated that a student’s profile score (consisting of respondents’
programming experience, their Grade 12 (Matric) English and Mathematics levels and first-time
COS1511 registration) had the largest influence on their final mark. Being employed as a programmer
also had a significant effect on a student’s final mark. Having drawn variable diagrams before
enrolling for COS1511 had a small positive effect on a student’s examination mark. Time spent on
using the tutorial did not have a positive effect. Students who drew their own variable diagrams to
help them to understand programs in the Study Guide, actually achieved lower examination marks
than those who did not do so.
219
The qualitative investigation with direct observation and eye tracking in the HCI laboratory described
in section 6.4, confirmed the findings from the quantitative investigation, and added valuable insight
by revealing that lack of reading skills played a role in a student’s use of, and possible benefit from
the tutorial. It also exposed deficiencies in the tutorial linked to inadequate instructions on using the
tutorial. Poor reading skills are probably linked to lower marks for English.
The feedback from the COS1511 discussion forum as presented in section 6.5, confirmed that novices
found it difficult to learn from the tutorial and did not understand what the purpose of the tutorial is.
Students who engaged deeply enough with the tutorial, on the other hand, reported benefitting from it.
In section 6.6 the findings from this first implementation cycle were discussed. In summary, the
answer to research question 2 was that the tutorial did not assist students in acquiring programming
skills in Unisa’s ODL environment so that it is noticeable in average marks. The answer to research
question 3 revealed that students’ biographical background as expressed in their profile score played
by far the biggest role in their final mark. Two important lessons were learnt in answer to research
question 4, namely that students need be made aware of the purpose of the tutorial and should receive
detailed instructions on how to use it.
The next chapter describes the second implementation cycle of testing and refinement of the tutorial
to teach students to draw variable diagrams to assist in shedding more light on the findings from this
chapter.

220
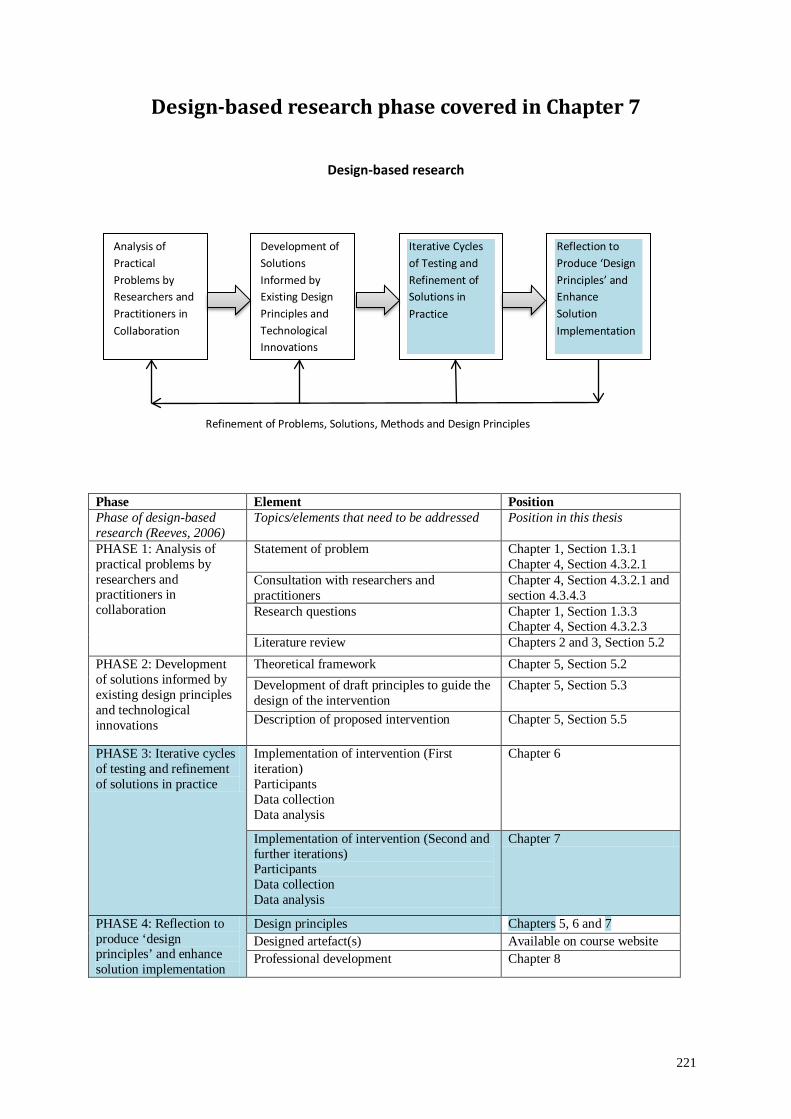
221
Design-based research phase covered in Chapter 7
Design-based research
Phase Element Position Phase of design-based research (Reeves, 2006)
Topics/elements that need to be addressed Position in this thesis
PHASE 1: Analysis of practical problems by researchers and practitioners in collaboration
Statement of problem Chapter 1, Section 1.3.1 Chapter 4, Section 4.3.2.1
Consultation with researchers and practitioners
Chapter 4, Section 4.3.2.1 and section 4.3.4.3
Research questions Chapter 1, Section 1.3.3 Chapter 4, Section 4.3.2.3
Literature review Chapters 2 and 3, Section 5.2 PHASE 2: Development of solutions informed by existing design principles and technological innovations
Theoretical framework Chapter 5, Section 5.2 Development of draft principles to guide the design of the intervention
Chapter 5, Section 5.3
Description of proposed intervention Chapter 5, Section 5.5
PHASE 3: Iterative cycles of testing and refinement of solutions in practice
Implementation of intervention (First iteration) Participants Data collection Data analysis
Chapter 6
Implementation of intervention (Second and further iterations) Participants Data collection Data analysis
Chapter 7
PHASE 4: Reflection to produce ‘design principles’ and enhance solution implementation
Design principles Chapters 5, 6 and 7 Designed artefact(s) Available on course website Professional development Chapter 8
Analysis of Practical Problems by Researchers and Practitioners in Collaboration
Development of Solutions Informed by Existing Design Principles and Technological Innovations
Iterative Cycles of Testing and Refinement of Solutions in Practice
Reflection to Produce ‘Design Principles’ and Enhance Solution Implementation
Refinement of Problems, Solutions, Methods and Design Principles

222
Map of Chapter 7 (Second implementation cycle of the Drawing Variable Diagrams Tutorial)
7.1 Introduction
7.3 Factors that could impact on students’ final marks
7.4 Direct live observation and eye tracking in the
HCI laboratory
7.7 Summary and conclusion
7.3.1 Examination
paper and final mark
7.3.2 Background and adaptions to the questionnaires used in the second implementation cycle
7.3.4 Factors that could influence students’ final marks (PM%)
7.4.1 Participants
7.4.3 Analysis of the
questionnaire completed after eye tracking
7.5 Feedback from students in second
implementation cycle
7.2 The impact of the low response rates for the
questionnaires on the quantitative investigation
7.4.2 Analysis of gaze replays
7.3.3 Biographical detail
and descriptive statistics
7.6 Findings
7.7 Enhancing the framework of guidelines for
using and creating visualizations
223
Chapter 7 Second implementation cycle of the Drawing Variable Diagrams Tutorial
7.1 Introduction
This chapter describes the second implementation cycle of testing and refinement of the tutorial to
teach students to draw variable diagrams in 2013, as shown in Table 4.3. The first implementation
cycle was covered in the previous chapter.
As did Chapter 6, this chapter has the purpose of addressing the second, third and fourth research
questions, namely:
2. Will a tutorial to teach tracing to visualize program execution and parameter transfer, based
on the framework of guidelines, assist students in acquiring programming skills in an ODL
environment so that it is noticeable in average marks?
3. How do students’ biographical properties, their positive user experience, their use of tracing
and the extent and manner of tutorial use, affect their ability to acquire programming skills in
an ODL environment?
4. What lessons have been learnt through the practical testing and refinement of the visualization
tool?
In Chapter 6 it was found that the tutorial did not assist students in acquiring programming skills.
Several deficiencies in the tutorial itself may have been the cause of this finding. The tutorial was
adapted according to the findings from the direct live observations and eye tracking done in an HCI
laboratory as described in section 6.4.4. See screen dumps of the second version of the tutorial in the
walk-through on how to use the tutorial in the updated instructions in Appendix E. The questionnaires
used were also adapted to request more feedback regarding students’ experience of using the tutorial
(see section 7.3.2).
During the second implementation cycle both the quantitative and qualitative investigations were
repeated to investigate whether the adaptions to the tutorial succeeded in improving the students’
learning experience while using the tutorial; what the effect thereof was on their final marks; and what
lessons could be learnt from this. As before, the quantitative investigation aims at answering the
second and third questions, while the reflection on the data analysis together with the qualitative
investigation answers question 4.
The data collection and analyses for both the quantitative and qualitative investigations followed the
same approaches as in the first implementation cycle. (See sections 6.1.1 and section 6.1.2 for a
review of these approaches). Note that due to a new regulation introduced by Unisa Management on
the manner in which questionnaires may be distributed to students, with effect from 2013,
224
questionnaires were no longer allowed to be included with assignments. Instead, students had to be
invited via e-mail to complete the questionnaires on the course website. As a result the response rate
was far less than in the first implementation cycle, so that the numbers of responses were too small to
repeat the modelling that was done in the statistical analysis for the first implementation cycle. The
impact this had on the quantitative investigation is described in section 7.2.
The quantitative investigation is described in section 7.3, while the qualitative investigation is
discussed in sections 7.4 and 7.5. The findings from this implementation cycle are discussed in
section 7.6, and in section 7.7 the framework of guidelines for using and creating visualizations is
refined by incorporating the lessons learnt during the research effort. In section 7.8 the summary and
conclusion is presented.
7.2 The impact of the low response rates for the questionnaires on the quantitative investigation
The intention was to repeat and expand the quantitative investigation done, during the second
implementation cycle. This would have entailed investigating –
• the relationships between students’ abilities to explain the purpose of code and to trace, and
their final marks, as well as the relationship between the combination of students’ ability to
explain code and to trace and their final marks to establish whether the findings of the
BRACElet project (Lister et al., 2009; Lopez et al., 2008) also applied to the 2013
participants; and
• modelling the relationships between the final mark and the same factors investigated in the
first implementation cycle that could possibly influence it, as well as two additional factors,
namely the manner in which students used the tutorial and their perception of learning from
the tutorial.
As mentioned in section 7.1, questionnaires could not be included with assignment questions and
students had to be invited via e-mail to complete the questionnaires on the COS1511 course website.
Despite repeated e-mails and announcements sent to the students requesting them to complete the
questionnaire, the response rates were far less than in the first implementation cycle.
In the first semester of 2013, 294 of the 1 623 students registered for COS1511, completed the first
questionnaire, giving a response rate of 18%. The second questionnaire was completed by 142
students, giving a response rate of 9%. Eighty-five students completed both the first and second
questionnaires. In the second semester 176 of the 1 593 students registered for COS1511, completed
the questionnaire, giving a response rate of 11%.

225
Using the final mark for COS1511 (PM%) as the dependent variable in the statistical analysis,
reduced the population size to the number of students who wrote the examination. Therefore the
population size for the first semester in 2013 was 988 and for the second semester in 2013 it was 920
(see Table 1.1 in section 1.1). For these population sizes a sample of 278 responses would have been
required in both cases to be representative of a given population when random sampling is done,
according to the table provided by Krejcie and Morgan (1970:608) and Johnson and Christensen
(2004:218).
Similar to the first implementation cycle, only respondents who submitted both assignments and
wrote the examination; and for whom matric marks for Mathematics and English could be obtained
from the Unisa student system, were included in the analysis. In the first semester of 2013, 66
respondents satisfied these conditions, allowing statistical analysis of 46% of the respondents. In the
second semester 76 respondents satisfied these conditions, allowing statistical analysis of 43% of the
second-semester respondents. However, these small numbers of responses were clearly not
representative of the populations. As a result only descriptive statistics could be calculated for the
quantitative investigation in the second implementation cycle. The relationships between students’
abilities to explain the purpose of code and to trace, and their final marks, as well as the relationship
between the combination of students’ ability to explain code and to trace and their final marks could
therefore not be investigated. The relationships between the final mark and the factors that could
possibly have influenced it could also not be investigated.
In order to examine the factors that could have affected a student’s final mark, albeit only with
descriptive statistics, only the second questionnaire in the first semester was considered. The second
questionnaire included all the questions that were used in the first questionnaire, which were also used
in the first implementation cycle in 2012. This covered all the factors that were investigated in the
first implementation cycle. The second questionnaire in the first semester as well as the only
questionnaire in the second semester included two more factors namely the manner in which students
used the tutorial throughout the semester, and their perception of how much they learnt from using the
tutorial. These two questionnaires were the same, except for the first question in the second
questionnaire for the first semester, that was used to determine whether students had answered the
first questionnaire in the first semester. Since the second questionnaire in the first semester and the
only questionnaire in the second semester were both administered at the end of the semester, the two
questionnaires could be processed in the same way. This provided more insight into the manner in
which students used the tutorial.
In the next section factors that could have influenced students’ final marks are discussed, including
the composition of the examination papers and final marks for 2013 and the questionnaires used in
2013.
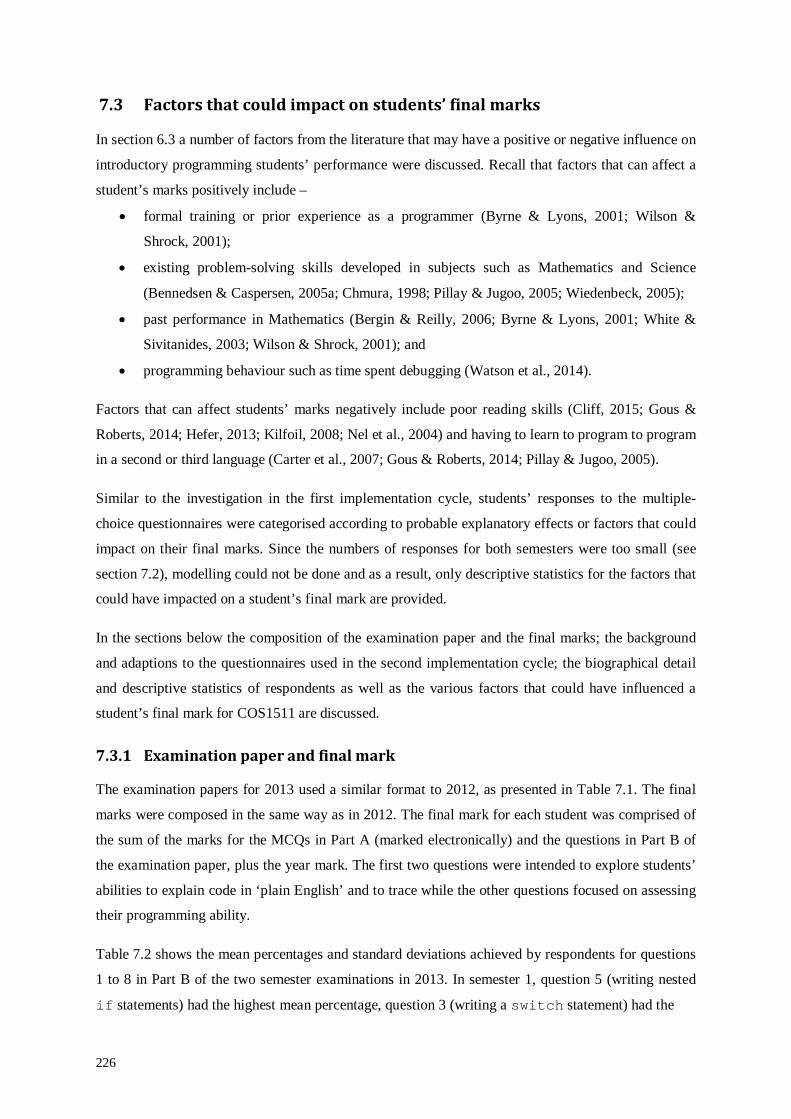
226
7.3 Factors that could impact on students’ final marks
In section 6.3 a number of factors from the literature that may have a positive or negative influence on
introductory programming students’ performance were discussed. Recall that factors that can affect a
student’s marks positively include –
• formal training or prior experience as a programmer (Byrne & Lyons, 2001; Wilson &
Shrock, 2001);
• existing problem-solving skills developed in subjects such as Mathematics and Science
(Bennedsen & Caspersen, 2005a; Chmura, 1998; Pillay & Jugoo, 2005; Wiedenbeck, 2005);
• past performance in Mathematics (Bergin & Reilly, 2006; Byrne & Lyons, 2001; White &
Sivitanides, 2003; Wilson & Shrock, 2001); and
• programming behaviour such as time spent debugging (Watson et al., 2014).
Factors that can affect students’ marks negatively include poor reading skills (Cliff, 2015; Gous &
Roberts, 2014; Hefer, 2013; Kilfoil, 2008; Nel et al., 2004) and having to learn to program to program
in a second or third language (Carter et al., 2007; Gous & Roberts, 2014; Pillay & Jugoo, 2005).
Similar to the investigation in the first implementation cycle, students’ responses to the multiple-
choice questionnaires were categorised according to probable explanatory effects or factors that could
impact on their final marks. Since the numbers of responses for both semesters were too small (see
section 7.2), modelling could not be done and as a result, only descriptive statistics for the factors that
could have impacted on a student’s final mark are provided.
In the sections below the composition of the examination paper and the final marks; the background
and adaptions to the questionnaires used in the second implementation cycle; the biographical detail
and descriptive statistics of respondents as well as the various factors that could have influenced a
student’s final mark for COS1511 are discussed.
7.3.1 Examination paper and final mark
The examination papers for 2013 used a similar format to 2012, as presented in Table 7.1. The final
marks were composed in the same way as in 2012. The final mark for each student was comprised of
the sum of the marks for the MCQs in Part A (marked electronically) and the questions in Part B of
the examination paper, plus the year mark. The first two questions were intended to explore students’
abilities to explain code in ‘plain English’ and to trace while the other questions focused on assessing
their programming ability.
Table 7.2 shows the mean percentages and standard deviations achieved by respondents for questions
1 to 8 in Part B of the two semester examinations in 2013. In semester 1, question 5 (writing nested
if statements) had the highest mean percentage, question 3 (writing a switch statement) had the

227
Table 7.1 Structure: Part B of COS1511 examination papers in 2013
Question number
Topic Marks allocated
1 Explain the purpose of two short code fragments. 4 2 Use variable diagrams to trace parts of two programs (a program using the switch
statement and a program call to a function with value and reference parameters), and indicate what the output will be.
11
3 Write a switch statement 5 4 Complete a program by writing a while loop and if statement. 7 5 Write a complete a program using nested if statements. 6 6 Write a function using a one-dimensional array. 6 7 Complete a program to declare a two dimensional array and determine the sum of
each row in the array. 8
8 Write function headers; convert a void function to a non-void function; write function calls; and write and call a small function.
12
9 Give the output for statements to print the values of the components of a struct and write a function to input values for the components of a struct.
6
10 Short questions in which students had to use string member functions. 5
second-highest mean percentage, and question 2 (tracing) the third-highest. In semester 2, question 5
(writing nested if statements) had the highest mean percentage, question 2 (tracing) had the second-
highest mean percentage, and question 3 (writing a switch statement) the third-highest.
Table 7.2 Mean percentages and standard deviations of marks achieved by respondents for questions 1 to 10 in Part B of the two semester examinations in 2013
Semester 1 2013 N= 66
Semester 2 2013 N = 76
Mean Std Dev Mean Std Dev Q1 % 39.7 30.9 48.8 35.9 Q2 % 50.2 23.8 63.1 23.6 Q3 % 60.0 39.1 62.9 41.5 Q4 % 53.8 34.8 42.6 26.4 Q5 % 62.6 39.9 95.3 42.8 Q6 % 33.0 36.8 56.5 36.0 Q7 % 31.5 32.5 44.4 38.3 Q8 % 34.9 36.2 46.3 35.6 Q9% 28.8 35.4 40.1 38.6 Q10% 11.0 22.3 31.1 45.4
For the first semester in 2013 the final marks varied from a lowest mark of 33% to the highest mark of
93% with the median of 60%. The mean for the final marks for the first semester 2013 was 61.15%
and the standard deviation 15.33. For the second semester the final marks varied from a lowest mark
of 9.14% to the highest mark of 94.09% with a median of 57.53%. The mean for the second semester
2013 was 54.72% and the standard deviation 24.72. Supporting tables are shown in Appendix D.2.1.
Although it appears as if second-semester respondents did consistently better than first-semester
respondents in all questions, both the mean and the median for the first semester were higher than the
mean and the median for the second semester. As can be seen from Figures 7.1 and 7.2, the final
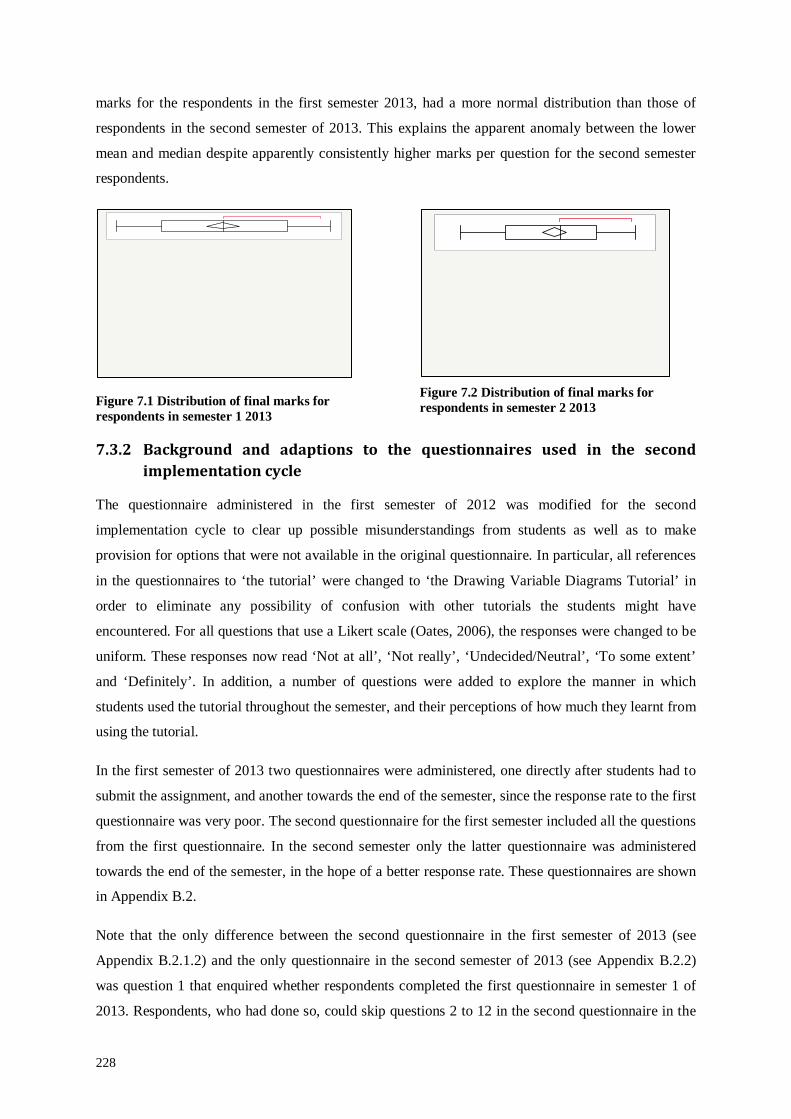
228
marks for the respondents in the first semester 2013, had a more normal distribution than those of
respondents in the second semester of 2013. This explains the apparent anomaly between the lower
mean and median despite apparently consistently higher marks per question for the second semester
respondents.
Figure 7.1 Distribution of final marks for respondents in semester 1 2013
Figure 7.2 Distribution of final marks for respondents in semester 2 2013
7.3.2 Background and adaptions to the questionnaires used in the second implementation cycle
The questionnaire administered in the first semester of 2012 was modified for the second
implementation cycle to clear up possible misunderstandings from students as well as to make
provision for options that were not available in the original questionnaire. In particular, all references
in the questionnaires to ‘the tutorial’ were changed to ‘the Drawing Variable Diagrams Tutorial’ in
order to eliminate any possibility of confusion with other tutorials the students might have
encountered. For all questions that use a Likert scale (Oates, 2006), the responses were changed to be
uniform. These responses now read ‘Not at all’, ‘Not really’, ‘Undecided/Neutral’, ‘To some extent’
and ‘Definitely’. In addition, a number of questions were added to explore the manner in which
students used the tutorial throughout the semester, and their perceptions of how much they learnt from
using the tutorial.
In the first semester of 2013 two questionnaires were administered, one directly after students had to
submit the assignment, and another towards the end of the semester, since the response rate to the first
questionnaire was very poor. The second questionnaire for the first semester included all the questions
from the first questionnaire. In the second semester only the latter questionnaire was administered
towards the end of the semester, in the hope of a better response rate. These questionnaires are shown
in Appendix B.2.
Note that the only difference between the second questionnaire in the first semester of 2013 (see
Appendix B.2.1.2) and the only questionnaire in the second semester of 2013 (see Appendix B.2.2)
was question 1 that enquired whether respondents completed the first questionnaire in semester 1 of
2013. Respondents, who had done so, could skip questions 2 to 12 in the second questionnaire in the
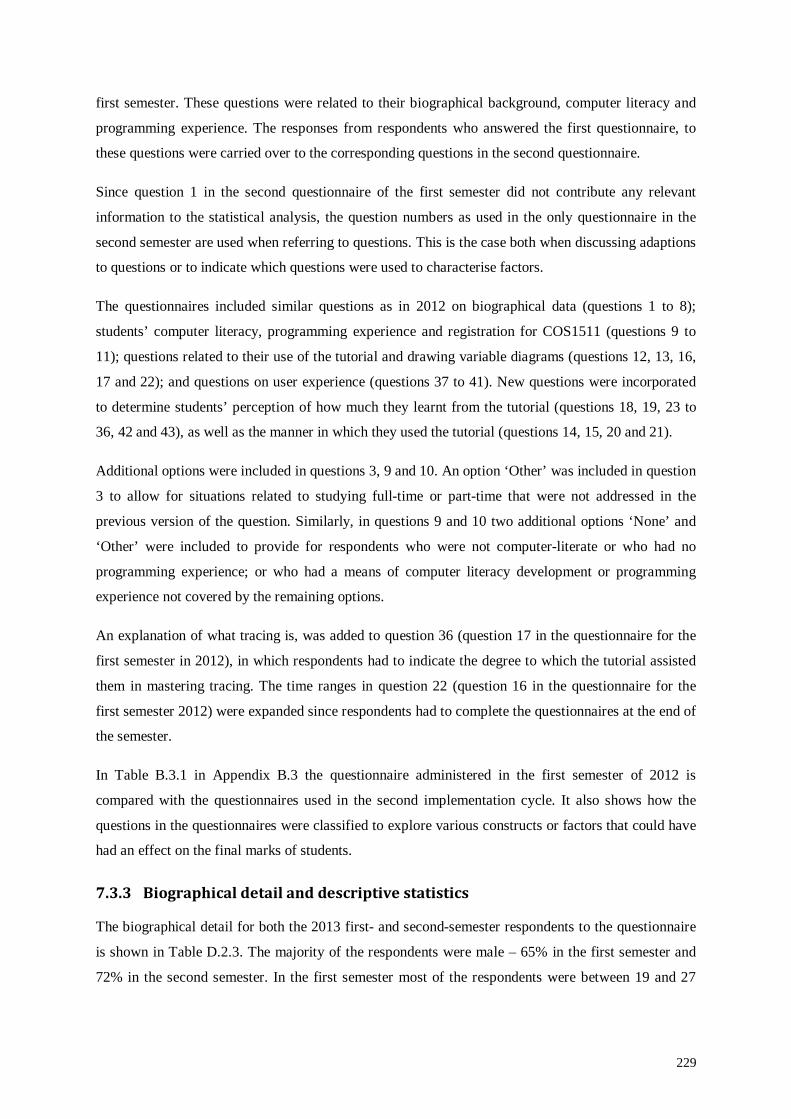
229
first semester. These questions were related to their biographical background, computer literacy and
programming experience. The responses from respondents who answered the first questionnaire, to
these questions were carried over to the corresponding questions in the second questionnaire.
Since question 1 in the second questionnaire of the first semester did not contribute any relevant
information to the statistical analysis, the question numbers as used in the only questionnaire in the
second semester are used when referring to questions. This is the case both when discussing adaptions
to questions or to indicate which questions were used to characterise factors.
The questionnaires included similar questions as in 2012 on biographical data (questions 1 to 8);
students’ computer literacy, programming experience and registration for COS1511 (questions 9 to
11); questions related to their use of the tutorial and drawing variable diagrams (questions 12, 13, 16,
17 and 22); and questions on user experience (questions 37 to 41). New questions were incorporated
to determine students’ perception of how much they learnt from the tutorial (questions 18, 19, 23 to
36, 42 and 43), as well as the manner in which they used the tutorial (questions 14, 15, 20 and 21).
Additional options were included in questions 3, 9 and 10. An option ‘Other’ was included in question
3 to allow for situations related to studying full-time or part-time that were not addressed in the
previous version of the question. Similarly, in questions 9 and 10 two additional options ‘None’ and
‘Other’ were included to provide for respondents who were not computer-literate or who had no
programming experience; or who had a means of computer literacy development or programming
experience not covered by the remaining options.
An explanation of what tracing is, was added to question 36 (question 17 in the questionnaire for the
first semester in 2012), in which respondents had to indicate the degree to which the tutorial assisted
them in mastering tracing. The time ranges in question 22 (question 16 in the questionnaire for the
first semester 2012) were expanded since respondents had to complete the questionnaires at the end of
the semester.
In Table B.3.1 in Appendix B.3 the questionnaire administered in the first semester of 2012 is
compared with the questionnaires used in the second implementation cycle. It also shows how the
questions in the questionnaires were classified to explore various constructs or factors that could have
had an effect on the final marks of students.
7.3.3 Biographical detail and descriptive statistics
The biographical detail for both the 2013 first- and second-semester respondents to the questionnaire
is shown in Table D.2.3. The majority of the respondents were male – 65% in the first semester and
72% in the second semester. In the first semester most of the respondents were between 19 and 27
230
years of age (68%), while in the second semester most respondents were slightly older, between 23
and 32 years old (57%).
In the first semester 24% of respondents were full-time students who did not work at all, while 13% of
second-semester respondents were full-time students who did not work at all. In the first semester
70% of the respondents worked full-time and 43% worked in a field related to their degree. For the
second semester similar ratios worked full-time (72%) and worked in a field related to their degree
(45%). Note that this does not imply that their work involved programming, since COS1511 is offered
to a number of different degrees and diplomas in various faculties. The remainder worked part-time.
Matric was the highest qualification for most respondents (58% in the first semester and 64% in the
second semester). The proportion of respondents who had national certificates, diplomas and degrees
in the two semesters were comparable. Thirteen per cent of first-semester respondents and 16% of
second-semester respondents had national certificates while 17% of first-semester respondents and
16% of second-semester respondents had a diploma. Four per cent of first-semester respondents and
3% of second-semester respondents had a degree. In the first semester 8% of respondents had a post-
graduate degree, and in the second semester 2%.
In both semesters English-speaking respondents comprised the largest group (46% in the first
semester and 43% in the second semester). In the first semester 32% of respondents had Afrikaans as
their first language and in the second semester 29% had Afrikaans as their first language. A bigger
proportion of the second-semester respondents had another language as their first language (28% in
comparison to 21%).
In the first semester 63% of respondents indicated that they passed Mathematics with a C symbol on
Higher or Standard grade, while 78% indicated the same in the second semester. In the first semester
all of the respondents had Mathematics in matric, while one person in the second semester (2%) did
not have Mathematics in matric. In the first semester 57% of respondents indicated that they passed
English with a C symbol on higher or standard grade, and 70% of second-semester respondents
indicated the same. In both semesters all respondents had English for matric. There is a possibility
that students may not have understood what a C symbol means, or the difference between higher and
standard grade, since only 41 of the 66 respondents in the first semester and 50 of the 76 respondents
in the second semester completed the questions on their matric results for Mathematics and English.
In the first semester 43% of the respondents had Computer Applications Technology, Information
Technology or Computer Studies at school and in the second semester 52%. Twenty-two per cent of
first-semester respondents and 34% of second-semester respondents did some form of computer
literacy course. Twenty-eight per cent of first-semester respondents and 29% of second-semester

231
respondents used a computer daily at work. In both semesters 15% of respondents ascribed their
computer-literacy to taking Computer Applications Technology, Information Technology or
Computer Studies at school. A relatively large part of respondents, 31% in the first semester and 20%
in the second semester, were self-taught. Four per cent of first-semester respondents and 6% of
second-semester respondents had other means of exposure to computer-literacy.
7.3.4 Factors that could influence students’ final marks (PM%)
The same factors or independent variables that were investigated for their influence on the dependent
variable, namely the final mark for each student, as in the first implementation cycle, were examined
in this implementation cycle. Two additional factors to represent students’ manner of tutorial use, and
their perception of how much they learnt from the tutorial, were also included. The factors
investigated and discussed below, were therefore the students’–
• Mathematics and English marks;
• profile scores;
• manner of their tutorial use;
• prior experience of programming and use of tracing;
• experience of learning from the tutorial; and
• positive user experience.
7.3.4.1 Mathematics and English marks
The statistical analysis in the first implementation cycle has shown that students’ Mathematics and
English marks as part of the profile score play an important part in contributing to their final marks.
As in the first implementation cycle, the respondents’ Grade 12 English and Mathematics results as
obtained from the Unisa student system were included in the profile score. A mark of 60% or more
was again used as the cut-off level for both English and Mathematics.
Figure 7.3 and Figure 7.4 respectively show the frequency distribution of respondents’ marks in
Mathematics for the first and second semesters in 2013. The mean percentage for Mathematics
obtained by first-semester respondents was 61.15%, with a standard deviation of 15.33; and for
second-semester respondents the mean percentage was 61.72%, with a standard deviation of 14.74.
Supporting tables for both semesters are shown in Appendix D.2.3.
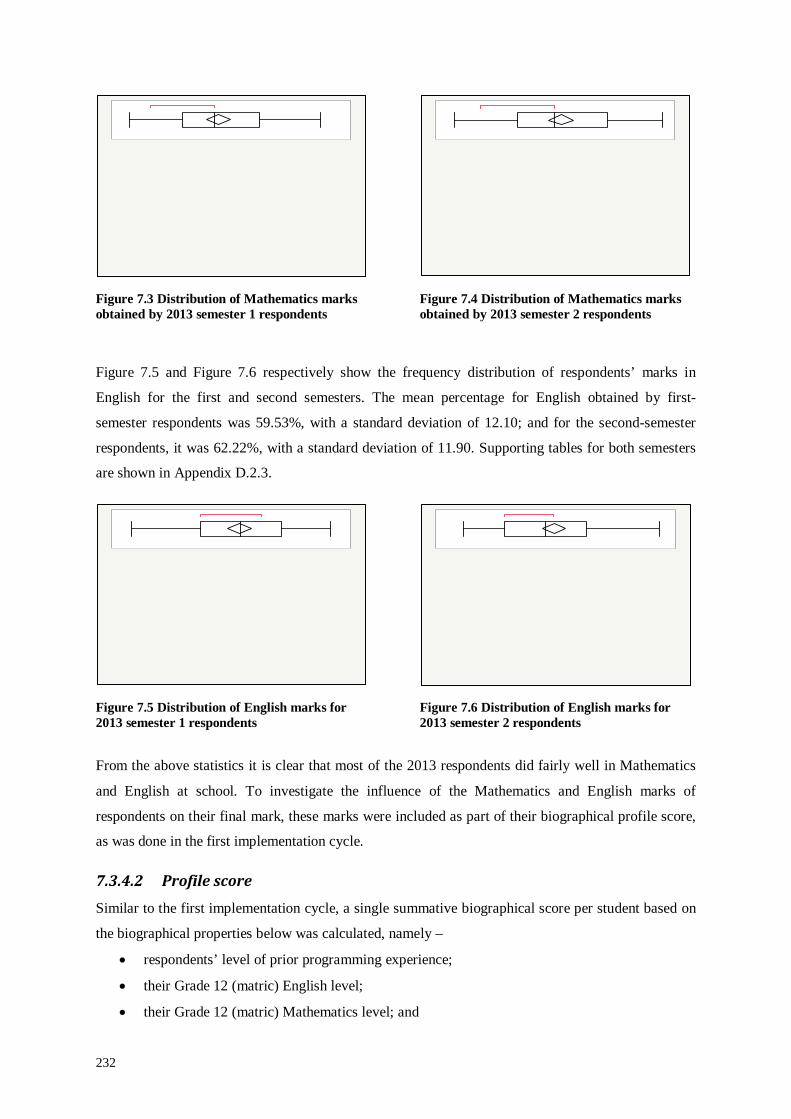
232
Figure 7.3 Distribution of Mathematics marks obtained by 2013 semester 1 respondents
Figure 7.4 Distribution of Mathematics marks obtained by 2013 semester 2 respondents
Figure 7.5 and Figure 7.6 respectively show the frequency distribution of respondents’ marks in
English for the first and second semesters. The mean percentage for English obtained by first-
semester respondents was 59.53%, with a standard deviation of 12.10; and for the second-semester
respondents, it was 62.22%, with a standard deviation of 11.90. Supporting tables for both semesters
are shown in Appendix D.2.3.
Figure 7.5 Distribution of English marks for 2013 semester 1 respondents
Figure 7.6 Distribution of English marks for 2013 semester 2 respondents
From the above statistics it is clear that most of the 2013 respondents did fairly well in Mathematics
and English at school. To investigate the influence of the Mathematics and English marks of
respondents on their final mark, these marks were included as part of their biographical profile score,
as was done in the first implementation cycle.
7.3.4.2 Profile score
Similar to the first implementation cycle, a single summative biographical score per student based on
the biographical properties below was calculated, namely –
• respondents’ level of prior programming experience;
• their Grade 12 (matric) English level;
• their Grade 12 (matric) Mathematics level; and

233
• whether it was a first-time COS1511 registration or not (question 11).
This score is referred to as ‘the profile score’.
The table of frequency distributions which follows serves to explain the profile score in more detail.
Table 7.3 shows the frequency distributions for the respondents for both semesters in 2013.
Table 7.3 Frequency distributions of questions used to calculate profile scores of respondents for both semesters in 2013
Semester 1 Semester 2 Q10 Programming experience? N % of Total N % of Total No experience (0 - None, Repeating COS1511 or registered for another programming module simultaneously)
23 42.59% 32 49.23%
Moderate (1 - IT at school, completed other programming course or have other programming experience)e
27 50.00% 25 38.46%
Experienced (2 - Employed as a programmer) 4 7.41% 8 12.31% All 54 100.00% 65 100.00% MATH >=60 No 27 40.91% 29 38.16% Yes 39 59.09% 47 61.84% All 66 100.00% 76 100.00% ENG >= 60 No 28 42.42% 26 34.21% Yes 38 57.58% 50 65.79% All 66 100.00% 76 100.00% Q11 FIRST time you have been registered for COS1511? No 6 10.91% 13 20.31% Yes 49 89.09% 51 79.69% All 55 100.00% 64 100.00% Profile score 0 0 0.00% 4 6.25% 1 10 18.52% 7 10.94% 2 14 25.93% 16 25.00% 3 10 18.52% 15 23.44% 4 18 33.33% 15 23.44% 5 2 3.70% 7 10.94% All 54 100.00% 64 100.00%
Question 10 in the questionnaire (What experience do you have in programming?) was used to
identify respondents’ prior programming experience, by providing the following options:
1. None
2. Computer Studies or Information Technology at school
3. Repeating COS1511
4. Currently enrolled for another programming module at Unisa
5. Did a programming course other than COS1511
6. Employed as a programmer
7. Other programming experience

234
Respondents who had no experience (option 1), who were repeating COS1511 (option 3) or were
currently enrolled for another programming module at Unisa (option 4) were classified as having had
no programming experience and received a score of 0. Respondents who did Computer Studies or
Information Technology at school (option 2), who did a programming course other than COS1511
(option 5) or had other programming experience (option 7) were seen as having had some
programming experience, and received a score of 1. Respondents who were employed as a
programmer (option 6) were seen as having been experienced and received a score of 2. In the first
semester, 43% of respondents had no experience while 7% were experienced. In the second semester,
49% had no experience, while 12% were experienced. In section 7.3.4.4 the unclassified responses to
question 10 are discussed in more detail.
Mathematics and English marks for respondents as extracted from the Unisa student system were used
to distinguish between respondents who obtained less than 60% (0); or 60% or more (1). Fifty-nine
per cent of first semester respondents and 62% of second semester respondents obtained 60% or more
in matric for Mathematics. Fifty-eight per cent of first semester respondents and 66% of second
semester respondents obtained 60% or more for English.
Most of the first-semester respondents were registered for the first time for the module (89% of the
first semester respondents and 80% of the second semester respondents). The majority of both first
and second semester students obtained a profile score of between two and four (78% and 72%
respectively).
Table 7.4 shows the profile scores with the corresponding average final marks (PM%) for both
semesters. In the first semester no respondent had a profile score of 0. Four respondents had a profile
score of 0 in the second semester and their mean final mark was 20%. In both semesters the mean
final mark for respondents with a profile score of 1, was between 30% and 40% (38% for first-
semester respondents and 32% for seven second-semester respondents). In both semesters the mean
final mark for respondents with a profile score of 2, was between 40% and 50% (41% for first-
semester respondents and 47% for seven second-semester respondents). First-semester respondents
with a profile score of 3 had a mean final mark of 56%, while the second-semester respondents with a
profile score of 3 had a mean final mark of 62%. In both semesters the mean final mark for
respondents with a profile score of 4, was just short of a distinction (74% for first-semester
respondents and 71% for seven second-semester respondents). In both semesters, the mean final mark
for respondents who had a profile score of 5 was well above 80% (87% in the first semester and 85%
in the second semester).
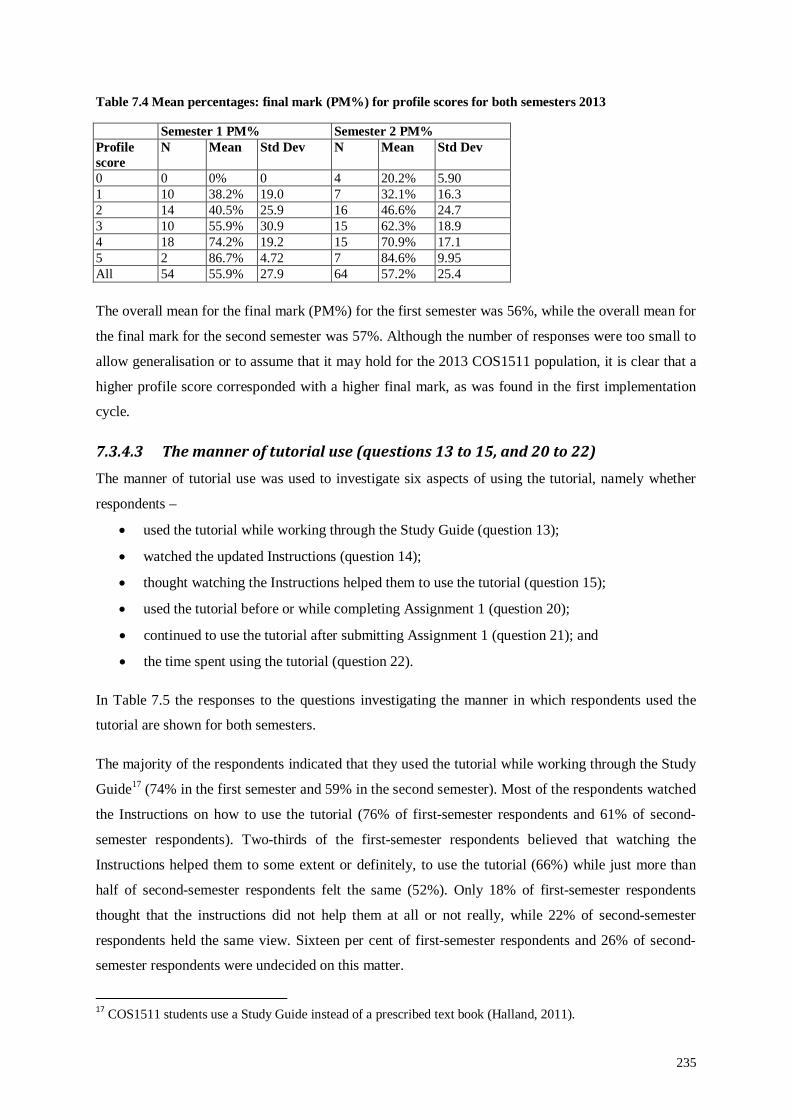
235
Table 7.4 Mean percentages: final mark (PM%) for profile scores for both semesters 2013
Semester 1 PM% Semester 2 PM% Profile score
N Mean Std Dev N Mean Std Dev
0 0 0% 0 4 20.2% 5.90 1 10 38.2% 19.0 7 32.1% 16.3 2 14 40.5% 25.9 16 46.6% 24.7 3 10 55.9% 30.9 15 62.3% 18.9 4 18 74.2% 19.2 15 70.9% 17.1 5 2 86.7% 4.72 7 84.6% 9.95 All 54 55.9% 27.9 64 57.2% 25.4
The overall mean for the final mark (PM%) for the first semester was 56%, while the overall mean for
the final mark for the second semester was 57%. Although the number of responses were too small to
allow generalisation or to assume that it may hold for the 2013 COS1511 population, it is clear that a
higher profile score corresponded with a higher final mark, as was found in the first implementation
cycle.
7.3.4.3 The manner of tutorial use (questions 13 to 15, and 20 to 22) The manner of tutorial use was used to investigate six aspects of using the tutorial, namely whether
respondents –
• used the tutorial while working through the Study Guide (question 13);
• watched the updated Instructions (question 14);
• thought watching the Instructions helped them to use the tutorial (question 15);
• used the tutorial before or while completing Assignment 1 (question 20);
• continued to use the tutorial after submitting Assignment 1 (question 21); and
• the time spent using the tutorial (question 22).
In Table 7.5 the responses to the questions investigating the manner in which respondents used the
tutorial are shown for both semesters.
The majority of the respondents indicated that they used the tutorial while working through the Study
Guide17 (74% in the first semester and 59% in the second semester). Most of the respondents watched
the Instructions on how to use the tutorial (76% of first-semester respondents and 61% of second-
semester respondents). Two-thirds of the first-semester respondents believed that watching the
Instructions helped them to some extent or definitely, to use the tutorial (66%) while just more than
half of second-semester respondents felt the same (52%). Only 18% of first-semester respondents
thought that the instructions did not help them at all or not really, while 22% of second-semester
respondents held the same view. Sixteen per cent of first-semester respondents and 26% of second-
semester respondents were undecided on this matter.
17 COS1511 students use a Study Guide instead of a prescribed text book (Halland, 2011).
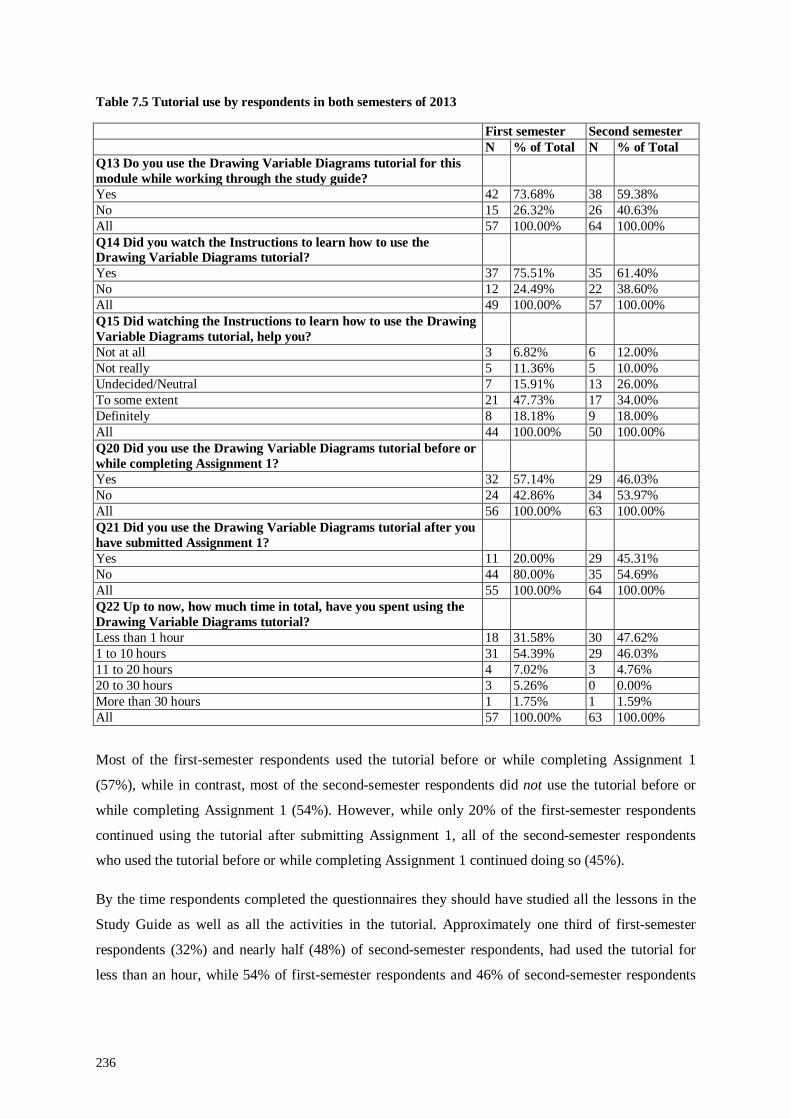
236
Table 7.5 Tutorial use by respondents in both semesters of 2013
First semester Second semester N % of Total N % of Total Q13 Do you use the Drawing Variable Diagrams tutorial for this module while working through the study guide?
Yes 42 73.68% 38 59.38% No 15 26.32% 26 40.63% All 57 100.00% 64 100.00% Q14 Did you watch the Instructions to learn how to use the Drawing Variable Diagrams tutorial?
Yes 37 75.51% 35 61.40% No 12 24.49% 22 38.60% All 49 100.00% 57 100.00% Q15 Did watching the Instructions to learn how to use the Drawing Variable Diagrams tutorial, help you?
Not at all 3 6.82% 6 12.00% Not really 5 11.36% 5 10.00% Undecided/Neutral 7 15.91% 13 26.00% To some extent 21 47.73% 17 34.00% Definitely 8 18.18% 9 18.00% All 44 100.00% 50 100.00% Q20 Did you use the Drawing Variable Diagrams tutorial before or while completing Assignment 1?
Yes 32 57.14% 29 46.03% No 24 42.86% 34 53.97% All 56 100.00% 63 100.00% Q21 Did you use the Drawing Variable Diagrams tutorial after you have submitted Assignment 1?
Yes 11 20.00% 29 45.31% No 44 80.00% 35 54.69% All 55 100.00% 64 100.00% Q22 Up to now, how much time in total, have you spent using the Drawing Variable Diagrams tutorial?
Less than 1 hour 18 31.58% 30 47.62% 1 to 10 hours 31 54.39% 29 46.03% 11 to 20 hours 4 7.02% 3 4.76% 20 to 30 hours 3 5.26% 0 0.00% More than 30 hours 1 1.75% 1 1.59% All 57 100.00% 63 100.00%
Most of the first-semester respondents used the tutorial before or while completing Assignment 1
(57%), while in contrast, most of the second-semester respondents did not use the tutorial before or
while completing Assignment 1 (54%). However, while only 20% of the first-semester respondents
continued using the tutorial after submitting Assignment 1, all of the second-semester respondents
who used the tutorial before or while completing Assignment 1 continued doing so (45%).
By the time respondents completed the questionnaires they should have studied all the lessons in the
Study Guide as well as all the activities in the tutorial. Approximately one third of first-semester
respondents (32%) and nearly half (48%) of second-semester respondents, had used the tutorial for
less than an hour, while 54% of first-semester respondents and 46% of second-semester respondents
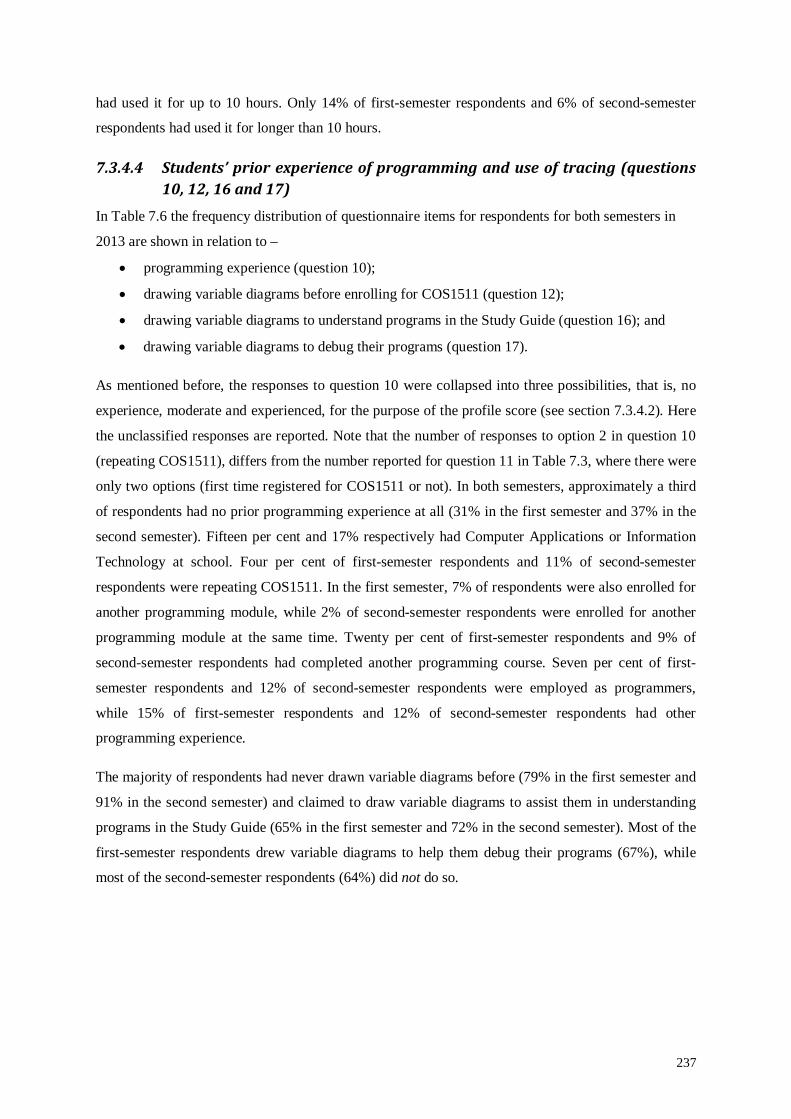
237
had used it for up to 10 hours. Only 14% of first-semester respondents and 6% of second-semester
respondents had used it for longer than 10 hours.
7.3.4.4 Students’ prior experience of programming and use of tracing (questions 10, 12, 16 and 17)
In Table 7.6 the frequency distribution of questionnaire items for respondents for both semesters in
2013 are shown in relation to –
• programming experience (question 10);
• drawing variable diagrams before enrolling for COS1511 (question 12);
• drawing variable diagrams to understand programs in the Study Guide (question 16); and
• drawing variable diagrams to debug their programs (question 17).
As mentioned before, the responses to question 10 were collapsed into three possibilities, that is, no
experience, moderate and experienced, for the purpose of the profile score (see section 7.3.4.2). Here
the unclassified responses are reported. Note that the number of responses to option 2 in question 10
(repeating COS1511), differs from the number reported for question 11 in Table 7.3, where there were
only two options (first time registered for COS1511 or not). In both semesters, approximately a third
of respondents had no prior programming experience at all (31% in the first semester and 37% in the
second semester). Fifteen per cent and 17% respectively had Computer Applications or Information
Technology at school. Four per cent of first-semester respondents and 11% of second-semester
respondents were repeating COS1511. In the first semester, 7% of respondents were also enrolled for
another programming module, while 2% of second-semester respondents were enrolled for another
programming module at the same time. Twenty per cent of first-semester respondents and 9% of
second-semester respondents had completed another programming course. Seven per cent of first-
semester respondents and 12% of second-semester respondents were employed as programmers,
while 15% of first-semester respondents and 12% of second-semester respondents had other
programming experience.
The majority of respondents had never drawn variable diagrams before (79% in the first semester and
91% in the second semester) and claimed to draw variable diagrams to assist them in understanding
programs in the Study Guide (65% in the first semester and 72% in the second semester). Most of the
first-semester respondents drew variable diagrams to help them debug their programs (67%), while
most of the second-semester respondents (64%) did not do so.

238
Table 7.6 Frequency distribution of questionnaire items for students’ prior experience of programming and use of tracing for both semesters in 2013
Semester 1 Semester 2 Q10 What experience do you have in programming? N % of Total N % of Total None 17 31.48% 24 36.92% Computer Studies or Information Technology at school 8 14.81% 11 16.92% Repeating COS1511 2 3.70% 7 10.77% Currently enrolled for another programming module at Unisa 4 7.41% 1 1.54% Did a programming course other than COS1511 11 20.37% 6 9.23% Employed as a programmer 4 7.41% 8 12.31% Other programming experience 8 14.81% 8 12.31% All 54 100.00% 65 100.00% Q12 Have you drawn variable diagrams before enrolling for COS1511?
Yes 12 21.05% 6 9.23% No 45 78.95% 59 90.77% All 57 100.00% 65 100.00% Q13 Do you use the Drawing Variable Diagrams tutorial for this module while working through the study guide?
Yes 42 73.68% 38 59.38% No 15 26.32% 26 40.63% All 57 100.00% 64 100.00% Q16 Do you draw your own variable diagrams to help you to understand programs in the study guide?
Yes 45 78.95% 36 55.38% No 12 21.05% 29 44.62% All 57 100.00% 65 100.00% Q17 Do you draw your own variable diagrams to debug your programs?
Yes 38 66.67% 23 35.38% No 19 33.33% 42 64.62% All 57 100.00% 65 100.00% Q22 Up to now, how much time in total, have you spent using the Drawing Variable Diagrams tutorial?
Less than 1 hour 18 31.58% 30 47.62% 1 to 10 hours 31 54.39% 29 46.03% 11 to 20 hours 4 7.02% 3 4.76% 20 to 30 hours 3 5.26% 0 0.00% More than 30 hours 1 1.75% 1 1.59% All 57 100.00% 63 100.00%
7.3.4.5 Learning from the tutorial (questions 18, 19, 23 to 36, 42 and 43)
A single set of response ratings was calculated to represent a combined measure of respondents’
perception of how much they learned from the tutorial.
The questionnaire items investigated in questions 18, 19, 23 to 36, 42 and 43 as listed in Tables 7.9
and 7.10 were used to describe the joint construct of respondents’ ‘learning experience of the Drawing
Variable Diagrams Tutorial’. The frequency distributions of the calculated ‘learning experience’
scores are also presented in Tables 7.7 and 7.8. In both tables the rating scale classes have been
condensed to three rating categories. Table 7.7 describes the joint construct of ‘learning experience of
the Drawing Variable Diagrams Tutorial’ for the first semester in 2013, while Table 7.8 describes it
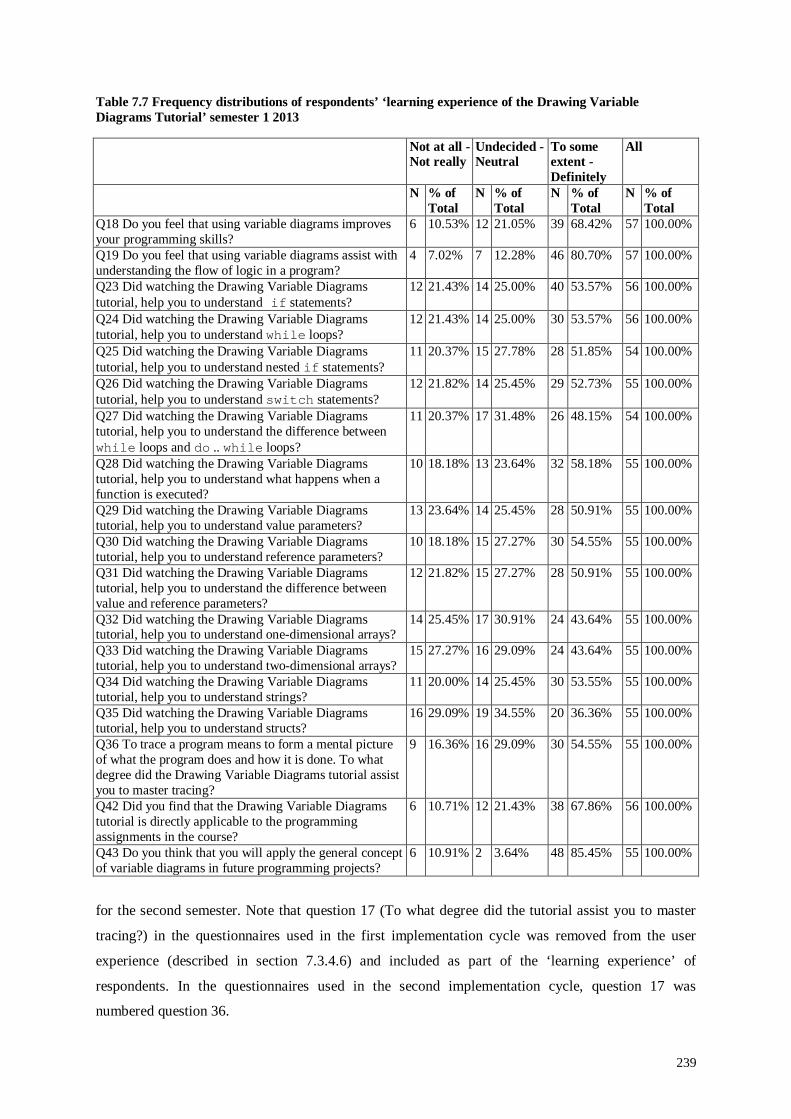
239
Table 7.7 Frequency distributions of respondents’ ‘learning experience of the Drawing Variable Diagrams Tutorial’ semester 1 2013
Not at all - Not really
Undecided - Neutral
To some extent - Definitely
All
N % of Total
N % of Total
N % of Total
N % of Total
Q18 Do you feel that using variable diagrams improves your programming skills?
6 10.53% 12 21.05% 39 68.42% 57 100.00%
Q19 Do you feel that using variable diagrams assist with understanding the flow of logic in a program?
4 7.02% 7 12.28% 46 80.70% 57 100.00%
Q23 Did watching the Drawing Variable Diagrams tutorial, help you to understand if statements?
12 21.43% 14 25.00% 40 53.57% 56 100.00%
Q24 Did watching the Drawing Variable Diagrams tutorial, help you to understand while loops?
12 21.43% 14 25.00% 30 53.57% 56 100.00%
Q25 Did watching the Drawing Variable Diagrams tutorial, help you to understand nested if statements?
11 20.37% 15 27.78% 28 51.85% 54 100.00%
Q26 Did watching the Drawing Variable Diagrams tutorial, help you to understand switch statements?
12 21.82% 14 25.45% 29 52.73% 55 100.00%
Q27 Did watching the Drawing Variable Diagrams tutorial, help you to understand the difference between while loops and do .. while loops?
11 20.37% 17 31.48% 26 48.15% 54 100.00%
Q28 Did watching the Drawing Variable Diagrams tutorial, help you to understand what happens when a function is executed?
10 18.18% 13 23.64% 32 58.18% 55 100.00%
Q29 Did watching the Drawing Variable Diagrams tutorial, help you to understand value parameters?
13 23.64% 14 25.45% 28 50.91% 55 100.00%
Q30 Did watching the Drawing Variable Diagrams tutorial, help you to understand reference parameters?
10 18.18% 15 27.27% 30 54.55% 55 100.00%
Q31 Did watching the Drawing Variable Diagrams tutorial, help you to understand the difference between value and reference parameters?
12 21.82% 15 27.27% 28 50.91% 55 100.00%
Q32 Did watching the Drawing Variable Diagrams tutorial, help you to understand one-dimensional arrays?
14 25.45% 17 30.91% 24 43.64% 55 100.00%
Q33 Did watching the Drawing Variable Diagrams tutorial, help you to understand two-dimensional arrays?
15 27.27% 16 29.09% 24 43.64% 55 100.00%
Q34 Did watching the Drawing Variable Diagrams tutorial, help you to understand strings?
11 20.00% 14 25.45% 30 53.55% 55 100.00%
Q35 Did watching the Drawing Variable Diagrams tutorial, help you to understand structs?
16 29.09% 19 34.55% 20 36.36% 55 100.00%
Q36 To trace a program means to form a mental picture of what the program does and how it is done. To what degree did the Drawing Variable Diagrams tutorial assist you to master tracing?
9 16.36% 16 29.09% 30 54.55% 55 100.00%
Q42 Did you find that the Drawing Variable Diagrams tutorial is directly applicable to the programming assignments in the course?
6 10.71% 12 21.43% 38 67.86% 56 100.00%
Q43 Do you think that you will apply the general concept of variable diagrams in future programming projects?
6 10.91% 2 3.64% 48 85.45% 55 100.00%
for the second semester. Note that question 17 (To what degree did the tutorial assist you to master
tracing?) in the questionnaires used in the first implementation cycle was removed from the user
experience (described in section 7.3.4.6) and included as part of the ‘learning experience’ of
respondents. In the questionnaires used in the second implementation cycle, question 17 was
numbered question 36.

240
Table 7.8 Frequency distributions of respondents’ ‘learning experience of the Drawing Variable Diagrams Tutorial’ semester 2 2013
Not at all - Not really
Undecided - Neutral
To some extend - Definitely
All
N % of Total
N % of Total
N % of Total
N % of Total
Q18 Do you feel that using variable diagrams improves your programming skills?
18 28.13% 10 15.63% 36 56.25% 64 100.00%
Q19 Do you feel that using variable diagrams assist with understanding the flow of logic in a program?
9 14.06% 16 25.00% 39 60.94% 64 100.00%
Q23 Did watching the Drawing Variable Diagrams tutorial helps you understand if statements
26 42.62% 5 8.20% 30 49.18% 61 100.00%
Q24 Did watching the Drawing Variable Diagrams tutorial, help you to understand while statements?
26 43.33% 6 10.00% 28 46.67% 60 100.00%
Q25 Did watching the Drawing Variable Diagrams tutorial, help you to understand nested if statements?
28 47.46% 7 11.86% 24 40.68% 59 100.00%
Q26 Did watching the Drawing Variable Diagrams tutorial, help you to understand switch statements?
27 46.56% 6 10.34% 25 43.10% 58 100.00%
Q27 Did watching the Drawing Variable Diagrams tutorial, help you to understand the difference between while loops and do .. while loops?
28 47.45% 7 11.86% 24 40.68% 59 100.00%
Q28 Did watching the Drawing Variable Diagrams tutorial, help you to understand what happens when a function is executed?
20 33.90% 14 23.73% 25 42.37% 59 100.00%
Q29 Did watching the Drawing Variable Diagrams tutorial, help you to understand value parameters?
21 37.50% 10 17.86% 25 44.64% 56 100.00%
Q30 Did watching the Drawing Variable Diagrams tutorial, help you to understand reference parameters?
28 48.28% 8 13.79% 26 44.83% 58 100.00%
Q31 Did watching the Drawing Variable Diagrams tutorial, help you to understand the difference between value and reference parameters?
25 43.10% 9 15.52% 24 41.38% 58 100.00%
Q32 Did watching the Drawing Variable Diagrams tutorial, help you to understand one-dimensional arrays?
29 50.87% 8 14.04% 20 35.09% 57 100.00%
Q33 Did watching the Drawing Variable Diagrams tutorial, help you to understand two-dimensional arrays?
32 54.23% 9 15.25% 18 30.51% 59 100.00%
Q34 Did watching the Drawing Variable Diagrams tutorial, help you to understand strings?
30 50.85% 9 15.25% 20 33.90% 59 100.00%
Q35 Did watching the Drawing Variable Diagrams tutorial, help you to understand structs?
30 52.63% 3 5.26% 24 42.11% 57 100.00%
Q36 To trace a program means to form a mental picture of what the program does and how it is done. To what degree did the Drawing Variable Diagrams tutorial assist you to master tracing?
21 35.59% 10 16.95% 28 47.46% 59 100.00%
Q42 Did you find that the Drawing Variable Diagrams tutorial is directly applicable to the programming assignments in the course?
13 22.54% 20 33.90% 26 44.07% 59 100.00%
Q43 Do you think that you will apply the general concept of variable diagrams in future programming projects?
18 30.51% 21 35.59% 20 33.90% 59 100.00%
The item analysis for learning experience for both semesters showed Cronbach’s coefficient alphas of
above 0.96, confirming the reliability of the questions (Terre Blanche et al., 2006), as can be seen in
Table 7.9. Supporting tables are shown in Appendix D.2.4.
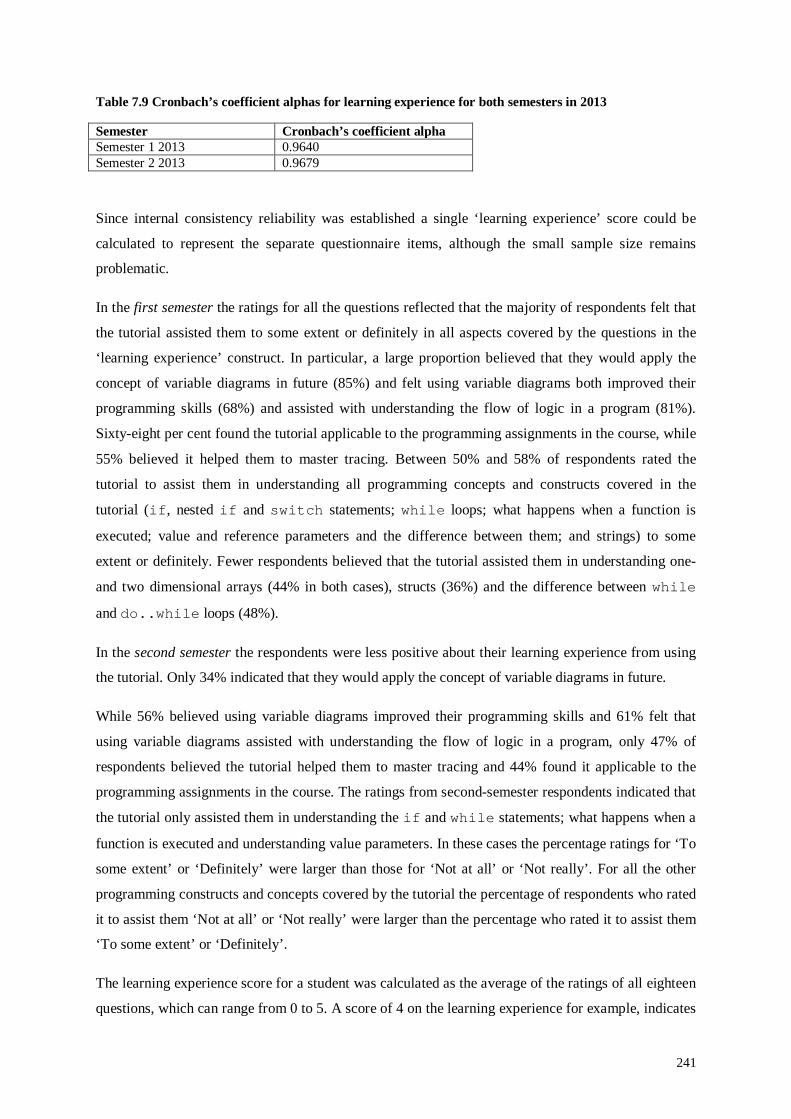
241
Table 7.9 Cronbach’s coefficient alphas for learning experience for both semesters in 2013
Semester Cronbach’s coefficient alpha Semester 1 2013 0.9640 Semester 2 2013 0.9679
Since internal consistency reliability was established a single ‘learning experience’ score could be
calculated to represent the separate questionnaire items, although the small sample size remains
problematic.
In the first semester the ratings for all the questions reflected that the majority of respondents felt that
the tutorial assisted them to some extent or definitely in all aspects covered by the questions in the
‘learning experience’ construct. In particular, a large proportion believed that they would apply the
concept of variable diagrams in future (85%) and felt using variable diagrams both improved their
programming skills (68%) and assisted with understanding the flow of logic in a program (81%).
Sixty-eight per cent found the tutorial applicable to the programming assignments in the course, while
55% believed it helped them to master tracing. Between 50% and 58% of respondents rated the
tutorial to assist them in understanding all programming concepts and constructs covered in the
tutorial (if, nested if and switch statements; while loops; what happens when a function is
executed; value and reference parameters and the difference between them; and strings) to some
extent or definitely. Fewer respondents believed that the tutorial assisted them in understanding one-
and two dimensional arrays (44% in both cases), structs (36%) and the difference between while
and do..while loops (48%).
In the second semester the respondents were less positive about their learning experience from using
the tutorial. Only 34% indicated that they would apply the concept of variable diagrams in future.
While 56% believed using variable diagrams improved their programming skills and 61% felt that
using variable diagrams assisted with understanding the flow of logic in a program, only 47% of
respondents believed the tutorial helped them to master tracing and 44% found it applicable to the
programming assignments in the course. The ratings from second-semester respondents indicated that
the tutorial only assisted them in understanding the if and while statements; what happens when a
function is executed and understanding value parameters. In these cases the percentage ratings for ‘To
some extent’ or ‘Definitely’ were larger than those for ‘Not at all’ or ‘Not really’. For all the other
programming constructs and concepts covered by the tutorial the percentage of respondents who rated
it to assist them ‘Not at all’ or ‘Not really’ were larger than the percentage who rated it to assist them
‘To some extent’ or ‘Definitely’.
The learning experience score for a student was calculated as the average of the ratings of all eighteen
questions, which can range from 0 to 5. A score of 4 on the learning experience for example, indicates

242
that the average rating a student gave to the questions was ‘To some extent’ and a score of 5 as
‘Definitely’, which reflects a very positive learning experience. The mean learning experience score
for the first-semester respondents came to 3.54 when it was calculated and for the second-semester
respondents it came to 3.22. These mean scores indicate that respondents in both semesters gave their
learning experience of the tutorial a rating of between ‘Neutral/Undecided’ and ‘To some extent’ and
that second-semester respondents rated it somewhat lower than first-semester respondents. Supporting
tables for both semesters are shown in Appendix D.2.4.
Figure 7.7 and Figure 7.8 show the frequency distributions of the learning experience scores of
respondents for the first and second semesters in 2013 respectively.
Figure 7.7 Distribution of learning experience scores for 2013 semester 1 respondents
Figure 7.8 Distribution of learning experience scores for 2013 semester 2 respondents
7.3.4.6 Positive user experience (questions 37 to 41)
As in the first implementation cycle, a single set of response ratings – representing a combined
measure of respondents’ user experience – was used to represent respondents’ user experience.
The questionnaire items investigated in questions 37 to 41 as listed in Tables 7.10 and 7.11 were used
to describe the joint construct of ‘positive user experience of the Drawing Variable Diagrams Tutorial
usage’. The frequency distribution of the calculated ‘positive user experience’ scores are also
presented in Tables 7.10 and 7.11. The rating scale classes have been condensed to three rating
categories in both tables. Table 7.10 describes the joint construct of ‘positive user experience of the
Drawing Variable Diagrams Tutorial usage’ for the first semester in 2013, while Table 7.11 describes
it for the second semester. Note that question 36 (To what degree did the tutorial assist you to master
tracing?) included in the joint construct of ‘positive user experience of the Drawing Variable
Diagrams Tutorial usage for the first implementation cycle, was replaced with Question 41 (Did you
find the tutorial easy to use?) for the second implementation cycle.
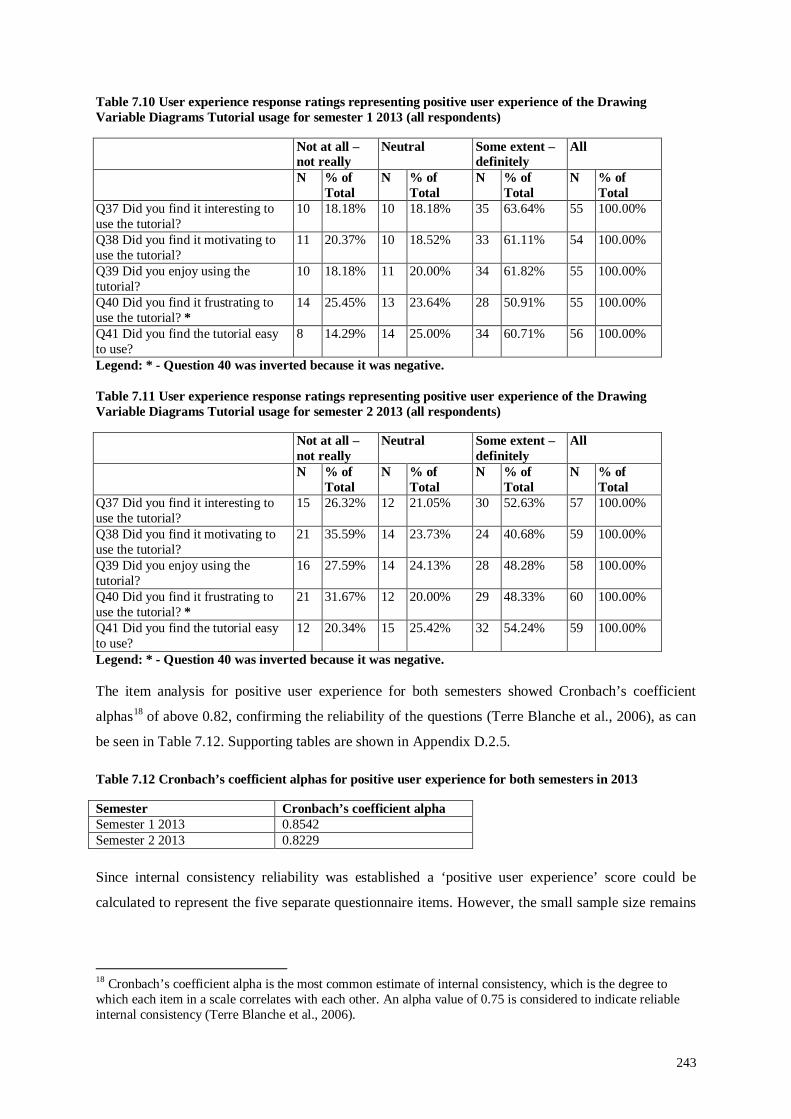
243
Table 7.10 User experience response ratings representing positive user experience of the Drawing Variable Diagrams Tutorial usage for semester 1 2013 (all respondents)
Not at all – not really
Neutral Some extent – definitely
All
N % of Total
N % of Total
N % of Total
N % of Total
Q37 Did you find it interesting to use the tutorial?
10 18.18% 10 18.18% 35 63.64% 55 100.00%
Q38 Did you find it motivating to use the tutorial?
11 20.37% 10 18.52% 33 61.11% 54 100.00%
Q39 Did you enjoy using the tutorial?
10 18.18% 11 20.00% 34 61.82% 55 100.00%
Q40 Did you find it frustrating to use the tutorial? *
14 25.45% 13 23.64% 28 50.91% 55 100.00%
Q41 Did you find the tutorial easy to use?
8 14.29% 14 25.00% 34 60.71% 56 100.00%
Legend: * - Question 40 was inverted because it was negative.
Table 7.11 User experience response ratings representing positive user experience of the Drawing Variable Diagrams Tutorial usage for semester 2 2013 (all respondents)
Not at all – not really
Neutral Some extent – definitely
All
N % of Total
N % of Total
N % of Total
N % of Total
Q37 Did you find it interesting to use the tutorial?
15 26.32% 12 21.05% 30 52.63% 57 100.00%
Q38 Did you find it motivating to use the tutorial?
21 35.59% 14 23.73% 24 40.68% 59 100.00%
Q39 Did you enjoy using the tutorial?
16 27.59% 14 24.13% 28 48.28% 58 100.00%
Q40 Did you find it frustrating to use the tutorial? *
21 31.67% 12 20.00% 29 48.33% 60 100.00%
Q41 Did you find the tutorial easy to use?
12 20.34% 15 25.42% 32 54.24% 59 100.00%
Legend: * - Question 40 was inverted because it was negative.
The item analysis for positive user experience for both semesters showed Cronbach’s coefficient
alphas18 of above 0.82, confirming the reliability of the questions (Terre Blanche et al., 2006), as can
be seen in Table 7.12. Supporting tables are shown in Appendix D.2.5.
Table 7.12 Cronbach’s coefficient alphas for positive user experience for both semesters in 2013
Semester Cronbach’s coefficient alpha Semester 1 2013 0.8542 Semester 2 2013 0.8229
Since internal consistency reliability was established a ‘positive user experience’ score could be
calculated to represent the five separate questionnaire items. However, the small sample size remains
18 Cronbach’s coefficient alpha is the most common estimate of internal consistency, which is the degree to which each item in a scale correlates with each other. An alpha value of 0.75 is considered to indicate reliable internal consistency (Terre Blanche et al., 2006).
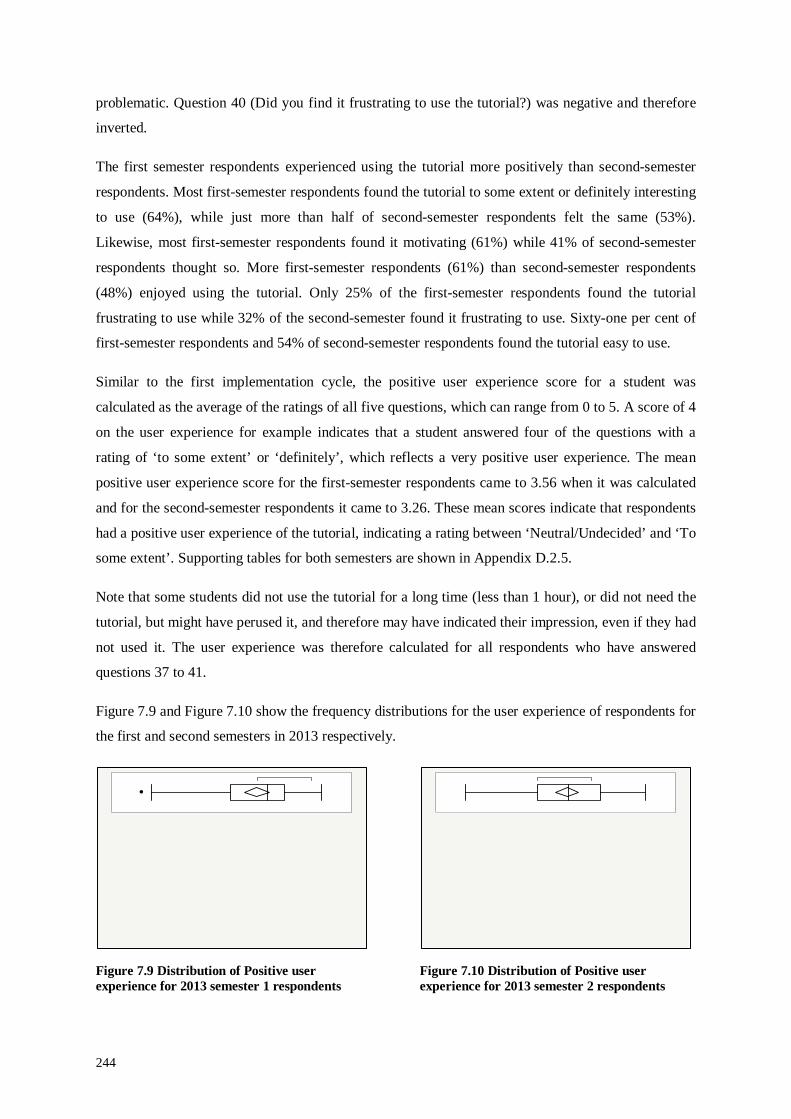
244
problematic. Question 40 (Did you find it frustrating to use the tutorial?) was negative and therefore
inverted.
The first semester respondents experienced using the tutorial more positively than second-semester
respondents. Most first-semester respondents found the tutorial to some extent or definitely interesting
to use (64%), while just more than half of second-semester respondents felt the same (53%).
Likewise, most first-semester respondents found it motivating (61%) while 41% of second-semester
respondents thought so. More first-semester respondents (61%) than second-semester respondents
(48%) enjoyed using the tutorial. Only 25% of the first-semester respondents found the tutorial
frustrating to use while 32% of the second-semester found it frustrating to use. Sixty-one per cent of
first-semester respondents and 54% of second-semester respondents found the tutorial easy to use.
Similar to the first implementation cycle, the positive user experience score for a student was
calculated as the average of the ratings of all five questions, which can range from 0 to 5. A score of 4
on the user experience for example indicates that a student answered four of the questions with a
rating of ‘to some extent’ or ‘definitely’, which reflects a very positive user experience. The mean
positive user experience score for the first-semester respondents came to 3.56 when it was calculated
and for the second-semester respondents it came to 3.26. These mean scores indicate that respondents
had a positive user experience of the tutorial, indicating a rating between ‘Neutral/Undecided’ and ‘To
some extent’. Supporting tables for both semesters are shown in Appendix D.2.5.
Note that some students did not use the tutorial for a long time (less than 1 hour), or did not need the
tutorial, but might have perused it, and therefore may have indicated their impression, even if they had
not used it. The user experience was therefore calculated for all respondents who have answered
questions 37 to 41.
Figure 7.9 and Figure 7.10 show the frequency distributions for the user experience of respondents for
the first and second semesters in 2013 respectively.
Figure 7.9 Distribution of Positive user experience for 2013 semester 1 respondents
Figure 7.10 Distribution of Positive user experience for 2013 semester 2 respondents
245
In the next section a summary of the factors that could possibly have affected a student’s final mark is
discussed.
Following the above exposition about factors affecting the final marks, the factors affecting the final
marks of the respondents can be summarised as follows:
• Note that due to the small number of responses, none of the descriptive statistics can be
generalised to the 2013 COS1511 population. Nevertheless, some of the descriptive statistics
confirm the modelling done in the first implementation cycle.
• Most of the respondents for both semesters did fairly well in Mathematics and English in
matric, with averages of 60% to 62% respectively. This in turn had a positive effect on their
profile scores, with the majority achieving a profile score of between 2 and 4. Although the
numbers of responses for the two semesters were too small to hold for the population, a
higher profile score were clearly associated with a higher final mark. Similar to the first
implementation cycle, only respondents who were employed as programmers could achieve a
profile score of 5. In both semesters the average final mark for respondents with a profile
score of 5 was a distinction. The average final mark for respondents with a profile score of 4,
indicating a moderate level of programming experience (having done Computer Studies or
Information Technology at school or a programming course other than COS1511, or having
other programming experience) was 74% and 71% respectively for the two semesters. This
confirms that previous programming experience was an important factor in students’ final
mark.
• The majority of respondents in both semesters watched the updated Instructions on how to
use the tutorial. Two-thirds of first-semester respondents believed it helped them while
approximately half of second-semester respondents agreed. Although more of the first-
semester respondents used the tutorial in completing Assignment 1, only 20% of them
continued using the tutorial afterwards. In contrast, while most of the second-semester
respondents did not use the tutorial in completing Assignment 1, those who did so continued
using the tutorial afterwards.
• The time spent on using the tutorial was lower than expected, with most respondents spending
only between 0 and 10 hours using it. The fact that the majority did not use the tutorial after
submitting Assignment 1, may explain this. While respondents with no programming
experience comprised the largest proportion of students in both semesters, a bigger proportion
of first-semester respondents than second-semester respondents had used variable diagrams
before. A larger proportion of first-semester respondents than second-semester respondents
also drew variable diagrams to understand programs in the Study Guide and to debug their
programs.

246
• The learning experience score for both semesters indicated a rating of between
‘Neutral/Undecided’ and ‘To some extent’, with a slightly higher score for first-semester
respondents. More first-semester respondents also believed that using variable diagrams
improved their programming skills and assisted in understanding the flow of logic in a
program. Correspondingly more of them indicated that they would apply variable diagrams in
future. This tie in with the fact that more of them drew variable diagrams to understand and
debug programs, confirming the value of tracing. The fact that most of the respondents did
not continue using the tutorial after they had submitted Assignment 1, may be one of the
reasons why they did not rate their learning experience from the tutorial higher. Assignment 1
covered only the first eleven of the 21 activities in the tutorial. Students who did not continue
using the tutorial after submitting Assignment 1, would not have studied the activities on for
loops; executing functions, value and reference parameters, one- and two dimensional arrays,
strings and structs.
• Similar to the learning experience scores, the positive user experience scores for both
semesters indicated a rating of between ‘Neutral/Undecided’ and ‘To some extent’, again with
a slightly higher score for first-semester respondents. This may also be related to the fact that
most of the respondents did not continue using the tutorial after they had submitted
Assignment 1.
In the next section the quantitative investigation for the second implementation cycle, where
participants’ use of the tutorial was observed, is discussed. The feedback on the COS1511 discussion
forum from students on how they experienced using the tutorial during the second implementation
cycle is also covered as part of the quantitative investigation.
7.4 Direct live observation and eye tracking in the HCI laboratory
During the second implementation cycle, the same procedure was followed as during the first
implementation cycle, to observe and track students’ eye movements while they used the Drawing
Variable Diagrams Tutorial as described in section 6.4.1, though at an earlier stage. In the first
implementation cycle the observations in the HCI laboratory were done during the fourth and fifth
week of the second semester in 2012, and in the second implementation cycle it was repeated in the
week preceding commencement of the second semester in 2013. The direct live observation and eye
tracking in the HCI laboratory during the second implementation cycle are presented below, in terms
of the participants concerned, an analysis of gaze replays and an analysis of the questionnaire
completed after eye tracking.
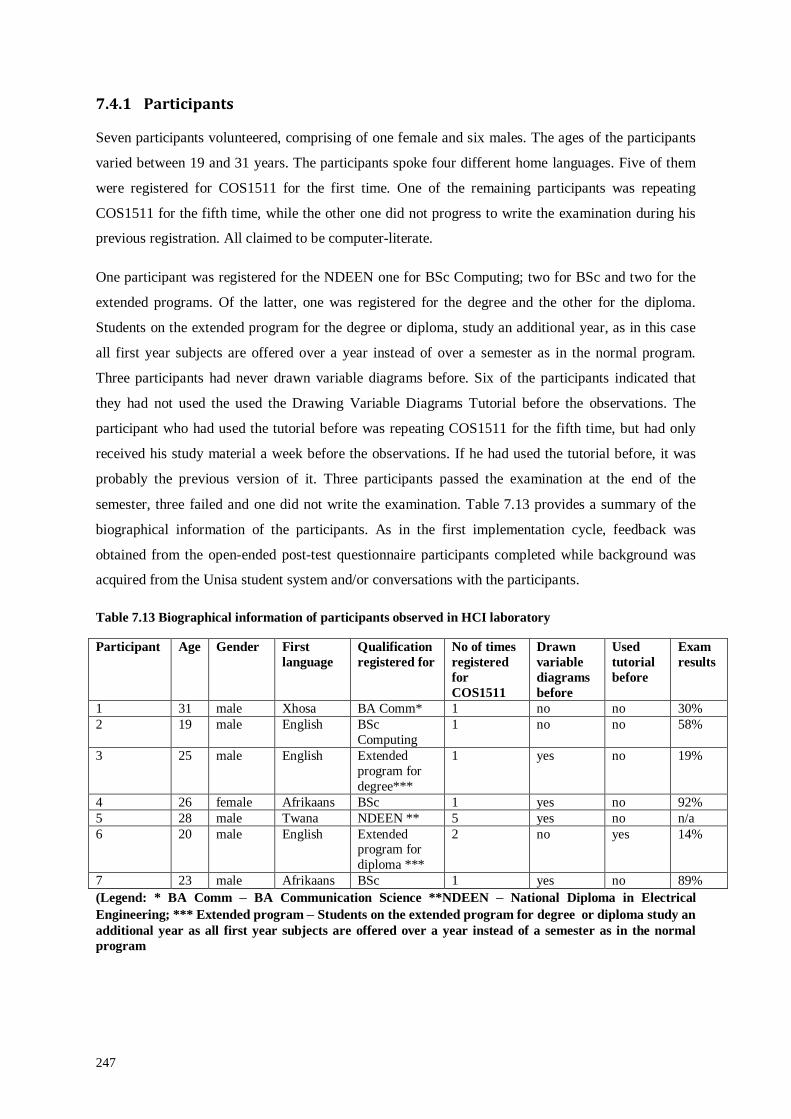
247
7.4.1 Participants
Seven participants volunteered, comprising of one female and six males. The ages of the participants
varied between 19 and 31 years. The participants spoke four different home languages. Five of them
were registered for COS1511 for the first time. One of the remaining participants was repeating
COS1511 for the fifth time, while the other one did not progress to write the examination during his
previous registration. All claimed to be computer-literate.
One participant was registered for the NDEEN one for BSc Computing; two for BSc and two for the
extended programs. Of the latter, one was registered for the degree and the other for the diploma.
Students on the extended program for the degree or diploma, study an additional year, as in this case
all first year subjects are offered over a year instead of over a semester as in the normal program.
Three participants had never drawn variable diagrams before. Six of the participants indicated that
they had not used the used the Drawing Variable Diagrams Tutorial before the observations. The
participant who had used the tutorial before was repeating COS1511 for the fifth time, but had only
received his study material a week before the observations. If he had used the tutorial before, it was
probably the previous version of it. Three participants passed the examination at the end of the
semester, three failed and one did not write the examination. Table 7.13 provides a summary of the
biographical information of the participants. As in the first implementation cycle, feedback was
obtained from the open-ended post-test questionnaire participants completed while background was
acquired from the Unisa student system and/or conversations with the participants.
Table 7.13 Biographical information of participants observed in HCI laboratory
Participant Age Gender First language
Qualification registered for
No of times registered for COS1511
Drawn variable diagrams before
Used tutorial before
Exam results
1 31 male Xhosa BA Comm* 1 no no 30% 2 19 male English BSc
Computing 1 no no 58%
3 25 male English Extended program for degree***
1 yes no 19%
4 26 female Afrikaans BSc 1 yes no 92% 5 28 male Twana NDEEN ** 5 yes no n/a 6 20 male English Extended
program for diploma ***
2 no yes 14%
7 23 male Afrikaans BSc 1 yes no 89% (Legend: * BA Comm – BA Communication Science **NDEEN – National Diploma in Electrical Engineering; *** Extended program – Students on the extended program for degree or diploma study an additional year as all first year subjects are offered over a year instead of a semester as in the normal program
248
7.4.2 Analysis of gaze replays
Similar to the first implementation cycle, gaze replays and observation were used to establish how
participants experienced the usability of the Drawing Variable Diagrams Tutorial after it had been
modified for the second implementation19. The analysis is discussed based on the same issues that
were identified during the observations and gaze replays in the first implementation cycle, namely
learning from the tutorial, the instructions on how to use the tutorial, navigation through the tutorial,
and reading skills.
7.4.2.1 Learning from the tutorial Recall from section 6.4.3.1, that in order to learn from the tutorial it was expected that students would
first study the program code in the Program Code box to form an idea of the purpose of the program,
then read the highlighted program statement again and study the explanation in the Explanation box to
make sure they understand the statement. Thereafter, they were expected to inspect the Memory box
to see how the variable diagrams for the statement are drawn (if any) and to look at the Console
Window to inspect the output (if any) produced or to examine the input given to the program. To
continue to the next statement in the program, students should have clicked on the Next button, and to
return to the previous statement, on the Back button.
Students’ ability to draw variable diagrams after working through the tutorial as well as the difference
in the variable diagrams they drew in the pre-test and retrospective comprehension tests in
combination with their behaviour while working through the tutorial, were used to judge whether they
learned from working through the tutorial or not. As in the first implementation cycle, this was a very
artificial situation requiring participants to work through more than would typically be done during
one session in their own time. In addition, the observations and eye tracking were done at an earlier
stage than in the first implementation cycle. A brief description of participants’ behaviour as related to
their learning experience follows below.
Participant 1 did not draw any variable diagrams, presumably because he did not work through the
lessons Study Guide before, as requested. He probably did not understand or know enough C++ to be
able to trace after only working through the tutorial. The variable diagrams drawn by participants 2, 4,
5 and 7 for both the pre-test and the retrospective comprehension tests, were all correct. This could be
because the self-sampling students who volunteered for this cycle were better prepared for the module
than those in the first cycle. Evidence of this may be the fact that participants 2, 4 and 5 all picked up
an error in activity 9.a.v, namely that the loop stops at 15 instead of 20 as indicated in the program (a
mistake that crept in while the tutorial was adapted for the second implementation cycle). However,
some evidence of learning was displayed by participants 3 and 6, as can be seen from the variable 19 The data collection has been described in section 4.3.5.3. This section explains how eye tracking is done and how it works, the form of data collection in eye tracking and how gaze replays are analysed.
249
diagrams they drew during the retrospective comprehension test. The variable diagrams participant 3
drew for activity 4.b were correct, but the pre-test and retrospective comprehension test variable
diagrams he drew were incorrect, since he did not realise that variables kept their values when a loop
is executed. For each execution of the loop and the corresponding input value, he drew the variable
diagrams as if the variables had not been assigned any values yet. He indicated that he struggled with
the looping and “find it easier to draw it on paper then to draw it on the actual program because it is
easier to identify variable and their values”, so he may have missed the purpose of the tutorial.
Participant 6 did not draw variable diagrams for the pre-test. While drawing the variable diagrams for
both activity 4.b and the retrospective comprehension test (program 2), he used the tutorial. His
variable diagrams were not quite correct, as he copied the program code and attempted to draw
variable diagrams next to the relevant lines of code. In activity 4.b, he made a subtraction error and in
program 2 he did not trace the loop. Participant 5 also used the tutorial while doing the exercise at the
end of activity 4.b. Participants 2 and 6 used the desktop calculator to do or check calculations.
In summary, this indicates a better learning experience than in the first implementation cycle, where
there was no difference between the pre-test and retrospective comprehension test results for any of
the three participants who drew variable diagrams. In this cycle some of the participants who could
not draw variable diagrams in their pre-test comprehension tests, used the tutorial to draw correct
variable diagrams for activity 4.b. This did not happen during the qualitative investigation in the first
cycle. Apparently the changes made to update the tutorial improved students’ learning experience
while using it.
7.4.2.2 Problems/issues with the instructions on how to use the tutorial
As described in section 6.4.5, the instructions for using the Drawing Variable Diagrams Tutorial were
updated extensively to explain what a variable and a variable diagrams is; the purpose of variable
diagrams and the tutorial; the relationship between the activities in the tutorial and the study guide;
how to use the tutorial including a walk-through of activity 3.a showing how to reconcile the boxes;
and some notes on how to proceed at the end of an activity (See the updated instructions in Appendix
C). The user’s attention was also drawn to the instructions by placing a button ‘How to use this
tutorial’ immediately below the introductory explanation on the introductory frame (landing page), in
addition to the Instructions button on top of the landing page.
The updated instructions seemed to suffice, since all participants were able to use the tutorial as
intended once they had read the instructions. All participants read the instructions, using an average
time of 12 minutes and 21 seconds to do so. The time spent reading the instructions varied from 4
minutes and 11 seconds to 25 minutes.

250
The following behaviour of participants confirms that the updated instructions suffice. All participants
made an effort to reconcile the four boxes in order to understand the activities, although not always
with the same level of success. Participant 1 made notes from the instructions on what a variable
diagram is, and the layout of the tutorial. Participants 3 and 5 did not study the instructions before
attempting the activities, but once they realised that they did not know how to proceed, returned to the
instructions and thereafter experienced no problems in using the tutorial. Participant 6 did not read all
the instructions before proceeding to the activities, but soon realised that he needed to do so and
thereafter returned to it several times.
7.4.2.3 Navigation through the tutorial In the eye tracking and observations in the first implementation cycle, five problems areas with
navigating through the tutorial were identified, namely general navigation problems, using the Next
button, using the Back button, how to continue at the end of an activity and attempts to provide input.
To address these problems, the Next and Back buttons were made more prominent by giving them an
outline and writing ‘Next’ and ‘Back’ inside the buttons themselves; a Finished button replaced the
Next button at the end of an activity with a prompt in the Explanation box to instruct users to use the
Index button to return to the list of activities; and an explicit explanation that users need not provide
any input was put in the explanations at the beginning of activity 3.a as well as in the instructions.
General navigation problems in the first implementation cycle included clicking repeatedly in
different places on the screen when a participant did not know how to proceed; right-clicking in
search of a pop-up menu and trying to use the buttons in the screen prints in the instructions to choose
an activity. Only two similar cases transpired in the eye tracking and observations in the second
implementation cycle, namely one participant who clicked repeatedly in the Memory box and another
who sometimes clicked inside some boxes. The latter also sometimes selected text, which might have
been his way of focusing, since he could read well and experienced no problems using the tutorial.
None of the other navigation problems (using the Next and Back buttons, continuing at the end of an
activity and providing own input) were evident during the eye tracking and observations in this
implementation cycle. This indicates that the modifications to rectify navigation problems were
successful.
7.4.2.4 Reading skills
As in the first implementation cycle, in general students who could read reasonably well (participants
2, 4 and 7), passed the examination at the end of the semester, while those who did not read well, with
the exception of one, failed. The remaining participant who failed could read well, but struggled with
mathematics. This corresponds with the results of the statistical analysis regarding the effect of
participants’ mathematics and English skills, as used in the profile score, on their final mark.
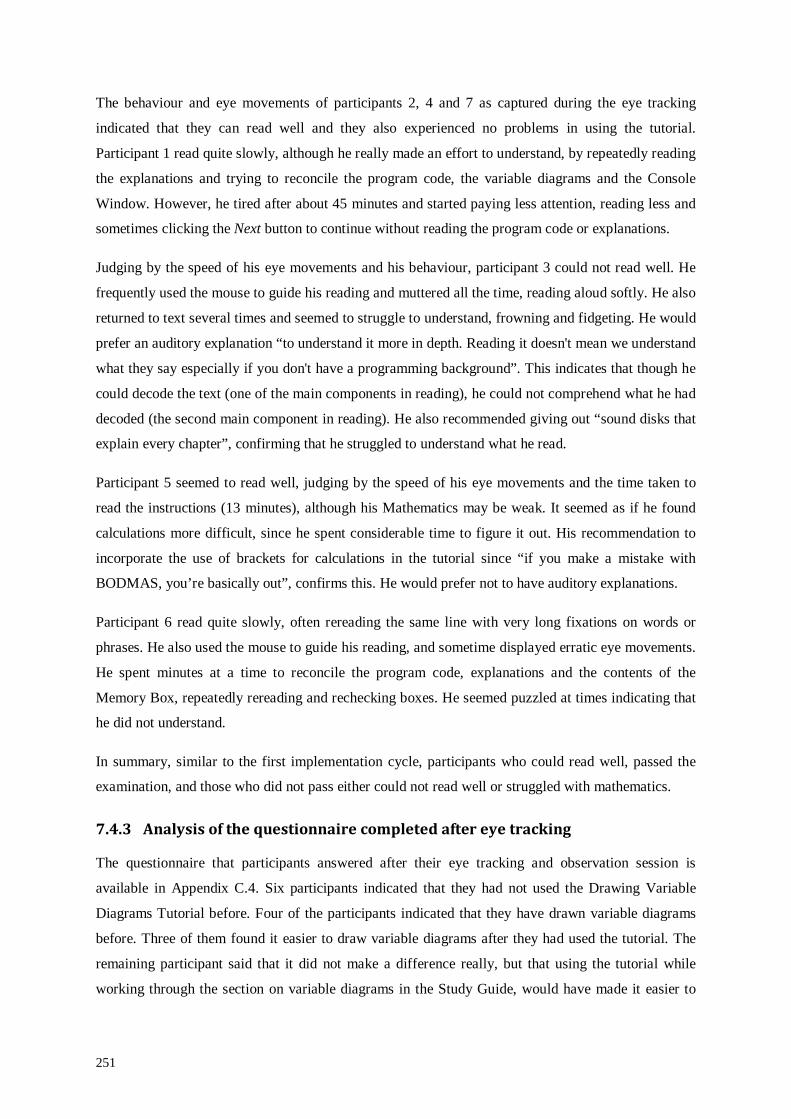
251
The behaviour and eye movements of participants 2, 4 and 7 as captured during the eye tracking
indicated that they can read well and they also experienced no problems in using the tutorial.
Participant 1 read quite slowly, although he really made an effort to understand, by repeatedly reading
the explanations and trying to reconcile the program code, the variable diagrams and the Console
Window. However, he tired after about 45 minutes and started paying less attention, reading less and
sometimes clicking the Next button to continue without reading the program code or explanations.
Judging by the speed of his eye movements and his behaviour, participant 3 could not read well. He
frequently used the mouse to guide his reading and muttered all the time, reading aloud softly. He also
returned to text several times and seemed to struggle to understand, frowning and fidgeting. He would
prefer an auditory explanation “to understand it more in depth. Reading it doesn't mean we understand
what they say especially if you don't have a programming background”. This indicates that though he
could decode the text (one of the main components in reading), he could not comprehend what he had
decoded (the second main component in reading). He also recommended giving out “sound disks that
explain every chapter”, confirming that he struggled to understand what he read.
Participant 5 seemed to read well, judging by the speed of his eye movements and the time taken to
read the instructions (13 minutes), although his Mathematics may be weak. It seemed as if he found
calculations more difficult, since he spent considerable time to figure it out. His recommendation to
incorporate the use of brackets for calculations in the tutorial since “if you make a mistake with
BODMAS, you’re basically out”, confirms this. He would prefer not to have auditory explanations.
Participant 6 read quite slowly, often rereading the same line with very long fixations on words or
phrases. He also used the mouse to guide his reading, and sometime displayed erratic eye movements.
He spent minutes at a time to reconcile the program code, explanations and the contents of the
Memory Box, repeatedly rereading and rechecking boxes. He seemed puzzled at times indicating that
he did not understand.
In summary, similar to the first implementation cycle, participants who could read well, passed the
examination, and those who did not pass either could not read well or struggled with mathematics.
7.4.3 Analysis of the questionnaire completed after eye tracking
The questionnaire that participants answered after their eye tracking and observation session is
available in Appendix C.4. Six participants indicated that they had not used the Drawing Variable
Diagrams Tutorial before. Four of the participants indicated that they have drawn variable diagrams
before. Three of them found it easier to draw variable diagrams after they had used the tutorial. The
remaining participant said that it did not make a difference really, but that using the tutorial while
working through the section on variable diagrams in the Study Guide, would have made it easier to

252
master the process. Three of the four who had drawn variable diagrams before, said that they drew
variable diagrams occasionally to help them understand programs in the Study Guide, one of them
only when she got stuck. The other participant said that he had not done so in the past, but intends to
do so in future. Of the three participants who indicated that they had never drawn variable diagrams
before, one nevertheless claimed to draw variable diagrams to help him understand the programs in
the Study Guide although he had not yet received his study material (he was repeating the module
though).
All the participants agreed that the questions in the activities helped them to concentrate or understand
the variable diagrams. Three participants wanted auditory explanations, three preferred not to have it
and one would like to have the option. Participants who could read well preferred the tutorial without
audio, although one of them recommended a toggle switch for sound to explain more difficult
sections. In contrast, three of the four participants who did not pass, would like to have auditory
explanations. These three participants also struggled with reading.
The participants made the following suggestions to improve the tutorial:
• Reducing the explanations about libraries used, namespace and the body of the code in later
activities.
• Issuing CDs with explanations for every chapter as well as summaries of certain chapters in
the Study Guide, in particular a summary of variables.
• Incorporating the use of brackets in calculations.
• Adding a toggle switch with sound for explanations or help.
One participant found the += operator and the while loop in the retrospective comprehension test
program confusing, and another indicated that “calculations are a bit tricky. One needs to make use of
BODMAS law throughout the calculations”. This indicates a possible problem with the mathematical
background of some students.
Five participants gave positive feedback on their experience of using the tutorial and the use of
variable diagrams. One participant termed it a “fun and engaging way to learn”, while another
reported that “it was amazing to witness the logic behind declaring and storing values in variables and
the practical view of it”. Participant 4 also believed that if she had used the tutorial while working
through the section on variable diagrams she would have mastered it in a shorter amount of time. One
participant found variable diagrams “a lil bit confusing when you draw them”. The last participant
declined to give any feedback on his experience.
From the above discussion, the adaptions made to the Drawing Variable Diagrams Tutorial and
following its application in the context of this research, as well as aspects concerning its future use,
are summarised as follows:
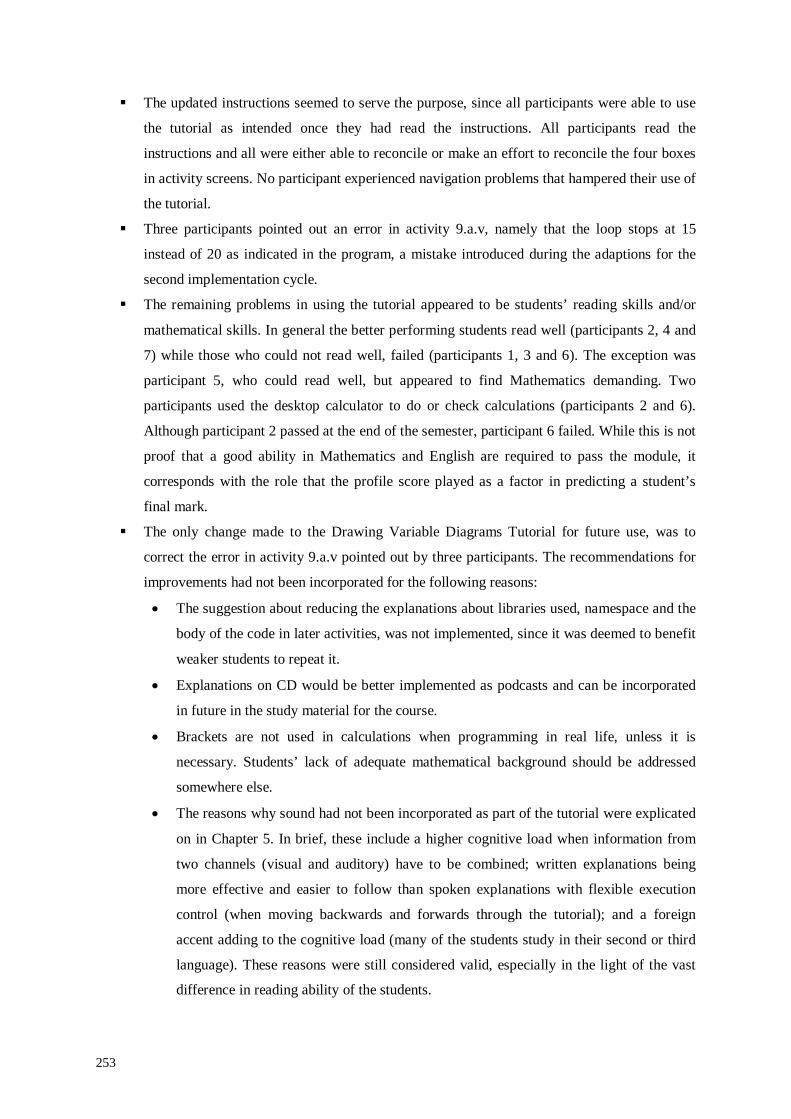
253
The updated instructions seemed to serve the purpose, since all participants were able to use
the tutorial as intended once they had read the instructions. All participants read the
instructions and all were either able to reconcile or make an effort to reconcile the four boxes
in activity screens. No participant experienced navigation problems that hampered their use of
the tutorial.
Three participants pointed out an error in activity 9.a.v, namely that the loop stops at 15
instead of 20 as indicated in the program, a mistake introduced during the adaptions for the
second implementation cycle.
The remaining problems in using the tutorial appeared to be students’ reading skills and/or
mathematical skills. In general the better performing students read well (participants 2, 4 and
7) while those who could not read well, failed (participants 1, 3 and 6). The exception was
participant 5, who could read well, but appeared to find Mathematics demanding. Two
participants used the desktop calculator to do or check calculations (participants 2 and 6).
Although participant 2 passed at the end of the semester, participant 6 failed. While this is not
proof that a good ability in Mathematics and English are required to pass the module, it
corresponds with the role that the profile score played as a factor in predicting a student’s
final mark.
The only change made to the Drawing Variable Diagrams Tutorial for future use, was to
correct the error in activity 9.a.v pointed out by three participants. The recommendations for
improvements had not been incorporated for the following reasons:
• The suggestion about reducing the explanations about libraries used, namespace and the
body of the code in later activities, was not implemented, since it was deemed to benefit
weaker students to repeat it.
• Explanations on CD would be better implemented as podcasts and can be incorporated
in future in the study material for the course.
• Brackets are not used in calculations when programming in real life, unless it is
necessary. Students’ lack of adequate mathematical background should be addressed
somewhere else.
• The reasons why sound had not been incorporated as part of the tutorial were explicated
on in Chapter 5. In brief, these include a higher cognitive load when information from
two channels (visual and auditory) have to be combined; written explanations being
more effective and easier to follow than spoken explanations with flexible execution
control (when moving backwards and forwards through the tutorial); and a foreign
accent adding to the cognitive load (many of the students study in their second or third
language). These reasons were still considered valid, especially in the light of the vast
difference in reading ability of the students.

254
In the next section the feedback from students on the COS1511 forum on using the Drawing Variable
Diagrams tutorial is discussed.
7.5 Feedback from students in second implementation cycle
During the second implementation cycle in 2013, students were once again invited to provide
feedback in both semesters on their experiences while using the Drawing Variable Diagrams Tutorial.
Eight students in total responded. Four of them provided feedback on the benefits and shortcomings
as well as a general view of the tutorial.
On the positive side, the visualization was considered to make learning and understanding easier. The
interactivity and the ability to navigate forward and backward were considered beneficial. The design
with the four boxes to display code, explanations, memory and the output was seen as well-
implemented and intuitive. The exercises that provide immediate feedback and solutions drew
positive comment. The tutorial was considered to be “very effective in communicating the necessary
skills to be acquired” while making learning “a bit more fun and interactive”. Three of the students
who responded were programmers and considered variable diagrams excellent tools for debugging
and for teaching novices “to start learning to read code”.
Four students who had not received the CD with their study material struggled to download it from
the Unisa student system. It was recommended that all the activities and the executable file be
bundled together in a zipped file for downloading purposes. One student found it frustrating that the
tutorial only ran in a Windows environment. Another complained that it went “full screen” and
prevented him from working on another application at the same time. He would also have liked better
graphics and colour use as well as “auditory stimulation” and links to additional exercises. Two
students found it difficult to understand value and reference parameters and one of them advised
others to work several times through the relevant activities.
In conclusion, general feedback from respondents commended the tutorial as follows:
• “Overall achieving the end goal of teaching the necessary skills (I would love to see this
applied to other subjects – especially maths).”
• “Overall, very practical and brings a sense of being in a classroom with a guided lesson
through practical examples and exercises.”
• “I think the package is good educational tool and further development thereof should be
encouraged as many future students can benefit from it.”
• “Overall though, I feel that the tutorial itself is an excellent idea and will continue to benefit
many aspiring programmers in the future!”
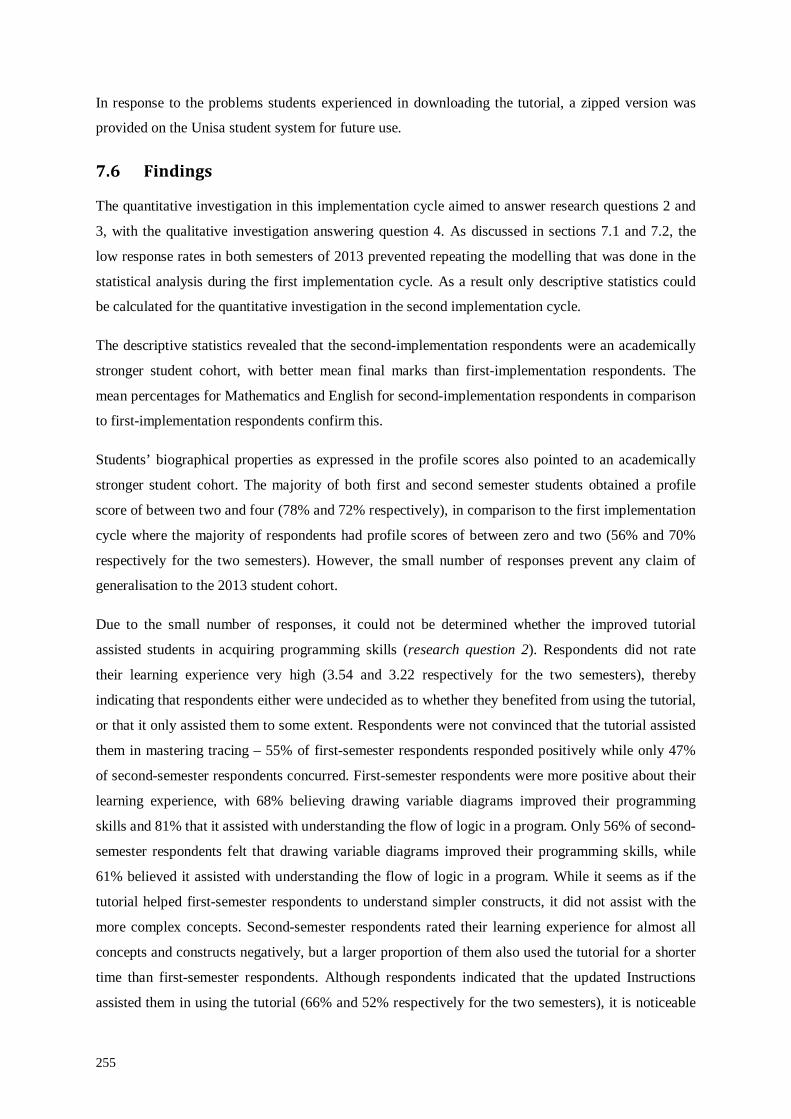
255
In response to the problems students experienced in downloading the tutorial, a zipped version was
provided on the Unisa student system for future use.
7.6 Findings
The quantitative investigation in this implementation cycle aimed to answer research questions 2 and
3, with the qualitative investigation answering question 4. As discussed in sections 7.1 and 7.2, the
low response rates in both semesters of 2013 prevented repeating the modelling that was done in the
statistical analysis during the first implementation cycle. As a result only descriptive statistics could
be calculated for the quantitative investigation in the second implementation cycle.
The descriptive statistics revealed that the second-implementation respondents were an academically
stronger student cohort, with better mean final marks than first-implementation respondents. The
mean percentages for Mathematics and English for second-implementation respondents in comparison
to first-implementation respondents confirm this.
Students’ biographical properties as expressed in the profile scores also pointed to an academically
stronger student cohort. The majority of both first and second semester students obtained a profile
score of between two and four (78% and 72% respectively), in comparison to the first implementation
cycle where the majority of respondents had profile scores of between zero and two (56% and 70%
respectively for the two semesters). However, the small number of responses prevent any claim of
generalisation to the 2013 student cohort.
Due to the small number of responses, it could not be determined whether the improved tutorial
assisted students in acquiring programming skills (research question 2). Respondents did not rate
their learning experience very high (3.54 and 3.22 respectively for the two semesters), thereby
indicating that respondents either were undecided as to whether they benefited from using the tutorial,
or that it only assisted them to some extent. Respondents were not convinced that the tutorial assisted
them in mastering tracing – 55% of first-semester respondents responded positively while only 47%
of second-semester respondents concurred. First-semester respondents were more positive about their
learning experience, with 68% believing drawing variable diagrams improved their programming
skills and 81% that it assisted with understanding the flow of logic in a program. Only 56% of second-
semester respondents felt that drawing variable diagrams improved their programming skills, while
61% believed it assisted with understanding the flow of logic in a program. While it seems as if the
tutorial helped first-semester respondents to understand simpler constructs, it did not assist with the
more complex concepts. Second-semester respondents rated their learning experience for almost all
concepts and constructs negatively, but a larger proportion of them also used the tutorial for a shorter
time than first-semester respondents. Although respondents indicated that the updated Instructions
assisted them in using the tutorial (66% and 52% respectively for the two semesters), it is noticeable
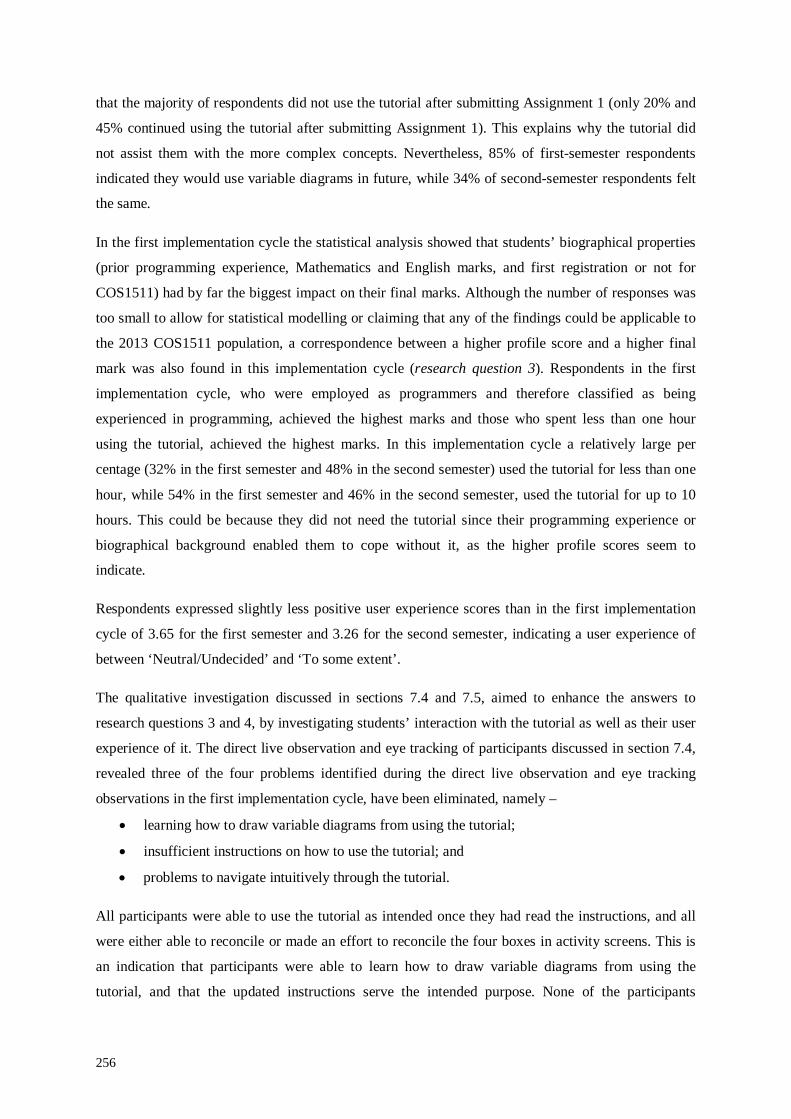
256
that the majority of respondents did not use the tutorial after submitting Assignment 1 (only 20% and
45% continued using the tutorial after submitting Assignment 1). This explains why the tutorial did
not assist them with the more complex concepts. Nevertheless, 85% of first-semester respondents
indicated they would use variable diagrams in future, while 34% of second-semester respondents felt
the same.
In the first implementation cycle the statistical analysis showed that students’ biographical properties
(prior programming experience, Mathematics and English marks, and first registration or not for
COS1511) had by far the biggest impact on their final marks. Although the number of responses was
too small to allow for statistical modelling or claiming that any of the findings could be applicable to
the 2013 COS1511 population, a correspondence between a higher profile score and a higher final
mark was also found in this implementation cycle (research question 3). Respondents in the first
implementation cycle, who were employed as programmers and therefore classified as being
experienced in programming, achieved the highest marks and those who spent less than one hour
using the tutorial, achieved the highest marks. In this implementation cycle a relatively large per
centage (32% in the first semester and 48% in the second semester) used the tutorial for less than one
hour, while 54% in the first semester and 46% in the second semester, used the tutorial for up to 10
hours. This could be because they did not need the tutorial since their programming experience or
biographical background enabled them to cope without it, as the higher profile scores seem to
indicate.
Respondents expressed slightly less positive user experience scores than in the first implementation
cycle of 3.65 for the first semester and 3.26 for the second semester, indicating a user experience of
between ‘Neutral/Undecided’ and ‘To some extent’.
The qualitative investigation discussed in sections 7.4 and 7.5, aimed to enhance the answers to
research questions 3 and 4, by investigating students’ interaction with the tutorial as well as their user
experience of it. The direct live observation and eye tracking of participants discussed in section 7.4,
revealed three of the four problems identified during the direct live observation and eye tracking
observations in the first implementation cycle, have been eliminated, namely –
• learning how to draw variable diagrams from using the tutorial;
• insufficient instructions on how to use the tutorial; and
• problems to navigate intuitively through the tutorial.
All participants were able to use the tutorial as intended once they had read the instructions, and all
were either able to reconcile or made an effort to reconcile the four boxes in activity screens. This is
an indication that participants were able to learn how to draw variable diagrams from using the
tutorial, and that the updated instructions serve the intended purpose. None of the participants
257
experienced navigation problems that hampered their use of the tutorial. However, the fourth problem
identified in the previous implementation cycle, namely lack of reading skills hampering
understanding and learning from the tutorial, still remained an issue. As before, students who
achieved higher marks could read well and those who did not perform well exhibited a poorer reading
ability, which may tie in with a lower profile score.
As in the first implementation cycle, a very small number of students provided feedback on the
COS1511 discussion forum, as discussed in section 7.5. Nevertheless, the positive feedback indicated
that students believed the tutorial to be effective in making both understanding and learning how to
draw variable diagrams easier. They also found the tutorial to be well-designed and intuitive.
Negative feedback revealed that some students who did not receive the CD with their study material
experienced problems downloading the tutorial from the COS1511 course website. This was
addressed for future use by bundling all the activities and the executable file together in a zipped file
for downloading purposes.
Despite the small sample sizes, responses to question 15 (Did watching the Instructions to learn how
to use the Drawing Variable Diagrams tutorial, help you?) in the quantitative investigation confirmed
that the updated Instructions assisted students in using the tutorial.
Both the correspondence between a higher profile score and a higher final mark in the quantitative
investigation as well as the findings from the qualitative investigation confirmed the answer to
research question 3 found in the first implementation cycle, namely that students’ educational
background as expressed in the biographical profile score, contributed largely to their final marks for
COS1511.
As in the first implementation cycle, students in the qualitative investigation who could read well
performed better in the examination, and found using the tutorial easier. The respondents in the
quantitative investigation in the second implementation cycle had higher means for mathematics and
English, with higher means for their final marks. This would tie in with better reading ability and
better performance, should it have been possible to generalise.
With regard to research question 4, the qualitative investigation confirmed the value of the two
lessons learnt in the previous implementation cycle, namely that –
• students should be made aware of the purpose of a visualization; and
• they should receive detailed instructions on how to use it, especially if they are expected to do
so on their own, as in an ODL environment.
In the next section the lessons learnt during this research effort are incorporated in the framework of
guidelines for using and creating visualizations.

258
7.7 Enhancing the framework of guidelines for using and creating visualizations
The final step in design-based research involves reflection on the research conducted, in order to
produce ‘design principles’ and enhance solutions implementation. At the completion of this study the
researcher reflected on the following –
• The framework of guidelines for using and creating visualizations as presented in Table 5.1 in
section 5.3.
• Lessons learnt during the development of the tutorial (section 5.4.4.1).
• Lessons learnt during the initial testing of the tutorial (section 5.4.4.2).
• The findings of the two implementation cycles, in particular those of the qualitative
investigations.
• The four general guidelines resulting from the development and initial testing process (section
5.4.5), namely:
• Build in elements to deliberately assist users in consolidating mental models.
• Reduce extraneous cognitive load as much as possible.
• Promp users judiciously
• Test the PAV tool stringently on four different levels: the correctness of content,
sequence of execution order, format and didactics.
The intention of the reflection was not to change to framework of guidelines, but to refine it by
incorporating the lessons learnt during the research effort. This was done by expanding guidelines 6,
10, 11, 16, 17 and 23; and adding two additional guidelines, namely guidelines 27 and 28.
According to guideline 6, students should be properly guided in how to use the PAV tool. This can be
done by including a brief textual introduction and providing resources that help learners interpret the
graphical representation that maps the visualization to the underlying algorithm by explaining it with
text or narration, or reinforcing the relationship with instructional time during the course. To expand
this, the researcher recommends that detailed instructions should be provided, in particular when a
PAV tool is used in an ODL environment. It is highly recommended that a way should be found to
compel users to work through the instructions for using the PAV tool before engaging with it for the
first time. The expansion is based on the findings of the qualitiative investigations.
Guideline 10 recommends applying the modality principle. Modality refers to the sensory mode in
which verbal information is presented: written or spoken. In cognitive load theory the modality
principle suggests that textual explanations in animations should be presented in spoken format, as
this allows more information to be processed visually. To expand this, it should be taken into account
that since the modality principle is not always applicable users should be allowed an option for
259
auditory explanations in conjunction with textual explanations. This expansion is based on feedback
from participants during the qualitative investigation.
According to guideline 11 using extraneous material (words, sounds, video, and pictures) should be
avoided. This guideline is expanded by the recommendation to reduce extraneous cognitive load as
much as possible, as discovered during the development and initial testing process, and confirmed by
the qualitative investigation’s analysis.
Guideline 16 advises applying Tversky et al.’s (2002:257) congruence principle which states that “the
structure and content of the external representation should correspond to the desired structure and
content of the internal representation”. The animation should therefore present the process or
procedure in the same way and order that people visualize it. The recommendation to use this as a
means of consolidating mental models deliberately expands this guideline. The expansion is based on
the four general guidelines resulting from the development and initial testing process.
Guideline 17 proposes using signalling, or cueing to draw the user’s attention to critical areas of the
visualization, for instance by using different colours, highlighting algorithmic actions, underlining
words or using arrows to focus attention on a specific part of the animation. The researcher expands it
by counselling that signalling or cueing should also be used judiciously to assist with navigation
through the PAV tool, by providing clear indications on how to navigate through the PAV tool,
without adding additional cognitive load. This expansion follows from analysis and findings of the
qualitative investigation.
Guideline 23 recommends adaping to the knowledge level of the user (the learner). For instance, use a
less complicated system for novices and base appropriate feedback on the assumed background
knowledge of users, which should be made clear. Expanding this guideline advises investigating
users’ demographic background and reading ability which should be taken into account before the
design and development of the PAV is done. This expansion to the guideline follows from the
findings of the qualitative investigation.
Two additional guidelines are added to the framework, namely guidelines 27 and 28. Guideline 27
recommends testing the PAV tool stringently regarding the correctness of content, sequence of
execution order, format and its didactical purpose. This is based on the researcher’s experiences
during the initial testing of the tutorial.
Guideline 28 in turn, advises educating users about the purpose of the PAV tool before they engage
with it for the first time, to avoid unrealistic expectations and to ensure that they use it appropriately.
This guideline results from the findings of the qualitative investigation.
260
The final framework of guidelines for using and creating visualizations is presented in Table F.1 in
Appendix F. The expansions and additional guidelines are shaded in green in Table F.1.
In the next section the summary and conclusion of the chapter follows.
7.8 Summary and conclusion
This chapter described the quantitative and qualitative investigations for the second implementation
cycle of testing and refinement of the tutorial to teach students to draw variable diagrams. The aim
was to continue to provide answers to research questions 2, 3 and 4. However, the low response rates
to the questionnaires for the quantitative investigation prevented both statistical modelling and
claiming that any of the findings in the quantitative investigation could hold for the 2013 COS1511
population since the small numbers of responses were clearly not representative. As a result only
descriptive statistics could be calculated as explained in section 7.2. The descriptive statistics for the
quantitative investigation was discussed in section 7.3, while the qualitative investigation was
addressed in sections 7.4 and 7.5.
In section 7.3, the descriptive statistics for factors that could influence a student’s final mark were
described, including two new constructs to represent students’ manner of tutorial use and their
perception of learning from the tutorial. Although the descriptive statistics cannot be claimed to hold
for the 2013 COS1511 population, both the means for English and Mathematics as well as the mean
final marks for the respondents were approximately 10% better than those of respondents in the first
implementation cycle. The average profile scores were also higher. Respondents rated their user
experience of the tutorial lower than in the first implementation cycle, but their manner of tutorial use
revealed that the majority only used it up to the time they had to submit the first assignment. This may
explain why they indicated that the tutorial did not assist them in mastering the more complex
concepts and constructs, since they did not use the tutorial to study it. A significant portion of them
indicated that they would continue using variable diagrams in future; and felt that drawing variable
diagrams assisted them in acquiring programming skills and understanding the flow of logic in
programs. This confirms the value of tracing.
The qualitative investigation with direct observation and eye tracking in the HCI laboratory described
in section 7.4 indicated that the updated instructions on using the tutorial succeeded in improving use
of the tutorial. It confirmed the findings from the first implementation cycle regarding the role that the
lack of reading skills played in a student’s use of and possible benefit from the tutorial. It also seemed
to confirm the effect that poor reading skills and a lower profile score can have on a student’s final
mark.
The feedback from the COS1511 discussion forum as presented in section 7.5 indicated that the
updated version of the tutorial allowed students to learn how to draw variable diagrams.

261
In section 7.6 the findings of the second implementation cycle were discussed. In summary, since the
quantitative investigation were restricted to calculating descriptive statistics, research question 2 could
not be answered explicitly, but it appeared as if the tutorial did not assist students in acquiring
programming skills in Unisa’s ODL environment so that it is noticeable in average marks. Similarly
the quantitative investigation did not allow for a clear-cut answer to research question 3, although it
seems to confirm that students’ biographical background as expressed in their profile score played an
important role in their final mark. Two important lessons learnt in answer to research question 4 in
the first implementation cycle were confirmed, namely that students need be made aware of the
purpose of the tutorial and that they should receive detailed instructions on how to use it. These
lessons as well as those learnt during the development and initial testing of the framework of
guidelines for using and creating visualizations were incorporated in the framework in section 7.7.
In the next chapter all the findings from this study are drawn together followed by a discussion of the
final conclusions and recommendations for future research.

262
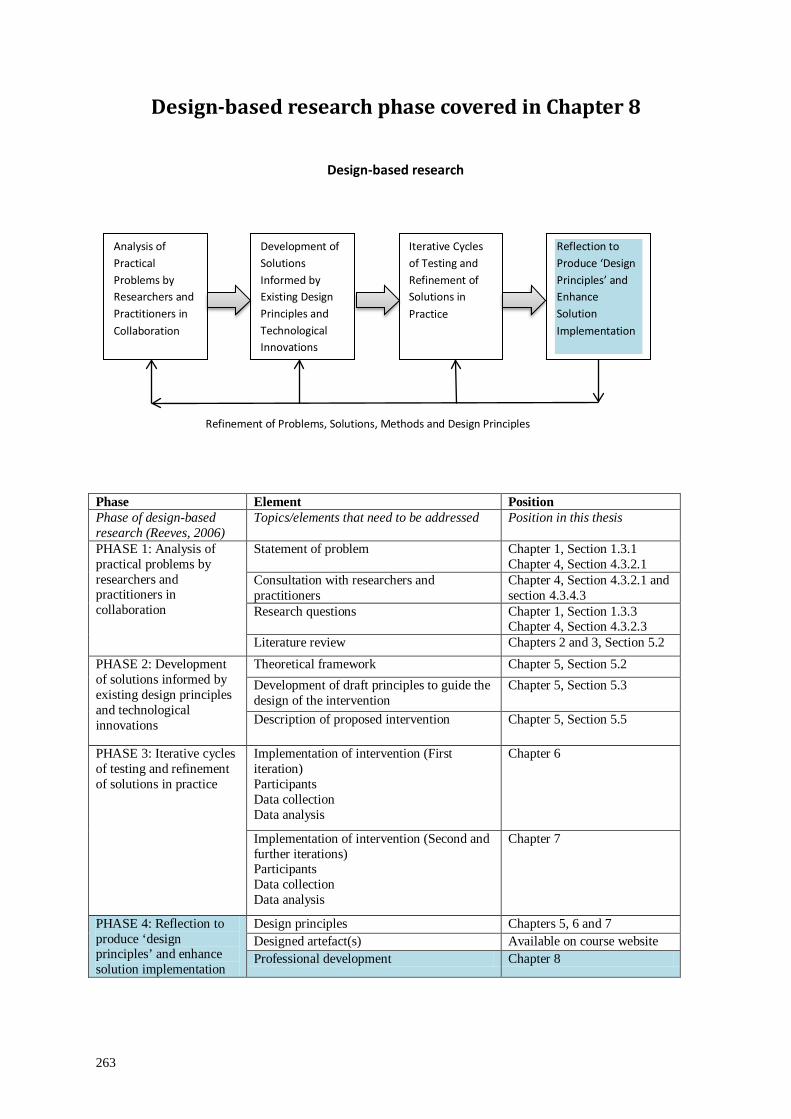
263
Design-based research phase covered in Chapter 8
Design-based research
Phase Element Position Phase of design-based research (Reeves, 2006)
Topics/elements that need to be addressed Position in this thesis
PHASE 1: Analysis of practical problems by researchers and practitioners in collaboration
Statement of problem Chapter 1, Section 1.3.1 Chapter 4, Section 4.3.2.1
Consultation with researchers and practitioners
Chapter 4, Section 4.3.2.1 and section 4.3.4.3
Research questions Chapter 1, Section 1.3.3 Chapter 4, Section 4.3.2.3
Literature review Chapters 2 and 3, Section 5.2 PHASE 2: Development of solutions informed by existing design principles and technological innovations
Theoretical framework Chapter 5, Section 5.2 Development of draft principles to guide the design of the intervention
Chapter 5, Section 5.3
Description of proposed intervention Chapter 5, Section 5.5
PHASE 3: Iterative cycles of testing and refinement of solutions in practice
Implementation of intervention (First iteration) Participants Data collection Data analysis
Chapter 6
Implementation of intervention (Second and further iterations) Participants Data collection Data analysis
Chapter 7
PHASE 4: Reflection to produce ‘design principles’ and enhance solution implementation
Design principles Chapters 5, 6 and 7 Designed artefact(s) Available on course website Professional development Chapter 8
Analysis of Practical Problems by Researchers and Practitioners in Collaboration
Development of Solutions Informed by Existing Design Principles and Technological Innovations
Iterative Cycles of Testing and Refinement of Solutions in Practice
Reflection to Produce ‘Design Principles’ and Enhance Solution Implementation
Refinement of Problems, Solutions, Methods and Design Principles
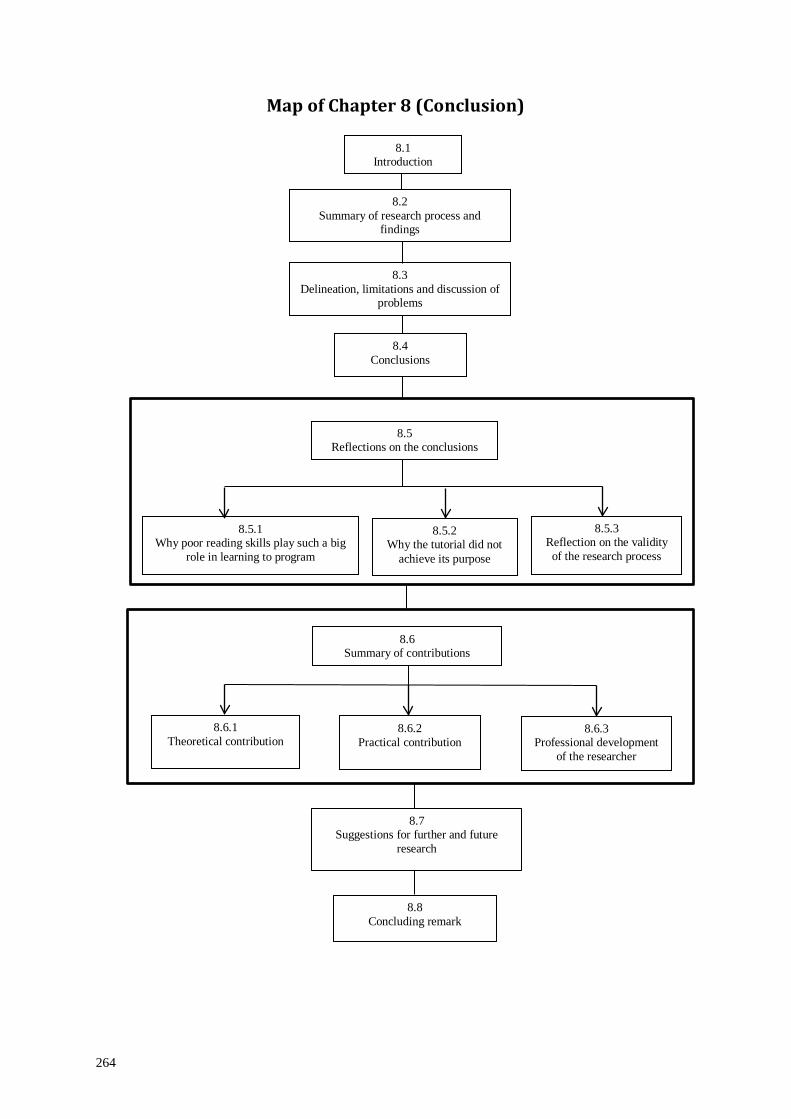
264
Map of Chapter 8 (Conclusion)
8.1 Introduction
8.2 Summary of research process and
findings
8.5 Reflections on the conclusions
8.3 Delineation, limitations and discussion of
problems
8.5.1 Why poor reading skills play such a big
role in learning to program
8.5.2 Why the tutorial did not
achieve its purpose
8.5.3 Reflection on the validity of the research process
8.7 Suggestions for further and future
research
8.8 Concluding remark
8.6 Summary of contributions
8.6.1 Theoretical contribution
8.6.3 Professional development
of the researcher
8.4 Conclusions
8.6.2 Practical contribution

265
Chapter 8 Conclusion
8.1 Introduction
This research was aimed at improving the tracing skills of introductory programming students at
Unisa by means of the COS1511 module Drawing Variable Diagrams Tutorial to teach them to trace.
A framework of guidelines for using visualization tools to teach programming was compiled from the
literature to guide the design of the tutorial. The investigation also intended to determine whether the
tutorial would assist students in the ODL environment at Unisa to the extent that it impacts on the
module pass rate.
In section 8.2 the research findings are described based on the research questions following from the
thesis for this study. In section 8.3 the delineation, limitations and problems experienced during the
study are discussed. The conclusions are presented in section 8.4, with the researcher’s reflections on
the conclusions in section 8.5, and a summary of the contributions in section 8.6. Suggestions for
future and further research follow in section 8.7 and a concluding remark in section 8.8.
8.2 Summary of research process and findings
The thesis for this study was as follows:
A framework of guidelines for using and creating visualization tools to teach programming,
synthesized from literature and tested and refined through practical application, can be employed to
develop a PV tool to teach introductory programming students in an ODL environment, to trace
programs in order to improve students’ programming skills.
To test the thesis four research questions were posed. Design-based research, which delivers both a
practical and theoretical contribution, was used to investigate the research questions. The design-
based research effort consisted of four phases (see Table 4.3). In the first phase (analysis of practical
problems by researchers and practitioners in collaboration) the problem statement (sections 1.2 and
4.3.2.1); the research questions (sections 1.3.3 and 4.3.2.3); consultation with researchers and
practitioners (section 5.2); and the literature review providing the background to the study (Chapters 2
and 3) were discussed. The three remaining phases were addressed in the investigations to find
answers for the research questions.
In the literature review the following topics were covered –
• the ODL learning environment (section 2.2);
• teaching programming in distance education (section 2.3);
• teaching introductory programming courses (section 2.4), including the pedagogy thereof;
mental models; threshold concepts and LEM; and the problems novices experience;

266
• tracing (section 2.5), by defining the concept of tracing; its purpose; difficulties novices
experience with tracing; and the advantages of teaching tracing;
• visualization (section 2.6) with an overview of SV; using SV in education; and the success of
SV; and
• the BRACElet project (Chapter 3) which served as motivation for this study. (The BRACElet
project’s findings were used as departing point for this study. In Chapter 3 the background
and history of the BRACElet project; its contribution to understanding how novices learn to
program; the theoretical foundations; and follow-up research were discussed).
The research questions and the processes followed to answer them are briefly described below with
indications of the sections where the findings were discussed in detail:
1. What guidelines and principles for using and creating visualizations to teach programming,
can be derived from literature?
To answer this question, guidelines for using and creating visualizations were extracted from a
literature survey in three areas, namely CER, educational psychology and computer graphics. This
process was part of the second phase in the design-research process, that is, development of solutions
informed by existing design principles and technological innovations. These guidelines were
combined in a framework of 26 guidelines for developing and using visualization tools to teach
programming, as presented in Table 5.1 in Chapter 5. Several of the guidelines that appear in more
than one of the three areas were synthesised into a single guideline. Guidelines were supplemented
with reasons or explanations for their recommendation as well as considerations to be taken into
account when using a guideline. References for each guideline, reason or explanation and
consideration are provided. Compiling the framework of guidelines was part of the fourth phase,
namely reflection to produce ‘design principles’ and enhance solution implementation.
2. Will a tutorial to teach tracing to visualize program execution and parameter transfer, based
on the framework of guidelines, assist students in acquiring programming skills in an ODL
environment so that it is noticeable in average marks?
This question was answered by developing the Drawing Variable Diagrams Tutorial and
implementing the tutorial in practice. The design and development of the tutorial was described in
section 5.4 in Chapter 5. This was the final part of the second phase in the design-research process.
The third phase in the design-based research process was the testing and refinement of the solutions in
iterative cycles in practice. The implementation of the tutorial with two similar iterative cycles of
testing and refinement in practice was described in Chapters 6 and 7. During each implementation
cycle the tutorial was distributed to the COS1511 students in both semesters. Feedback on their use of
the tutorial was gathered by means of questionnaires for quantitative analysis; as well as direct live

267
observation with eye tracking in the HCI laboratory, and requests for feedback on the online forum for
COS1511 for qualitative analysis. The questionnaires were analysed in combination with their final
marks for the COS1511 module to answer the second and third research questions. The findings from
the direct live observation with eye tracking as well as the feedback on the forum was used to refine
the tutorial for subsequent implementation cycles and to cast more light onto the findings from the
quantitative investigation.
The statistical analysis for the first implementation cycle in 2012 revealed that the findings by the
BRACElet project (Lister et al, 2009; Lopez et al., 2008) regarding the correspondence between both
students’ abilities to explain the purpose of code and to write code; and to trace code and to write
code; as well as the correspondence between the combination of these abilities and writing code, also
hold for the COS1511 students who wrote the examinations at the end of the two semesters. In theory
then, should using the tutorial have assisted them in improving their programming skills, it should
have been noticeable in increased pass rates or in the average final mark. However, the modelling
done in the statistical analysis for the first implementation cycle in 2012 showed that students, who
used the tutorial, achieved lower marks than those who did not use it (sections 6.3.4.2 to 6.3.4.4).
The low response rates in both semesters to the questionnaires administered in the second
implementation cycle in 2013 prevented repeating the statistical modelling done in the first
implementation cycle. Consequently only descriptive statistics was calculated for the quantitative
investigation, and those could not be generalised to the 2013 COS1511 population. Nevertheless, only
55% of the first-semester respondents and 47% of the second-semester respondents in the second-
implementation cycle indicated that they believed the tutorial assisted them in mastering tracing
(section 7.3.4.5). Second-implementation cycle respondents in both semesters also rated their
experience of learning from the tutorial between ‘Undecided/Neutral’ and ‘To some extent’ (section
7.3.4.5). Although the second implementation cycle therefore did not provide a conclusive answer to
this research question, it leans towards confirming the findings from the first implementation cycle.
In summary, the tutorial did not assist students in acquiring programming skills to the extent that it is
noticeable in the pass rate or average final mark.
3. How do students’ biographical properties, their positive user experience, their use of tracing
and the extent and manner of tutorial use, affect their ability to acquire programming skills in
an ODL environment?
Feedback provided in both the quantitative and qualitative investigations was used to answer this
question, which was also part of the third phase in the design-based research process. Due to the low
number of responses to the questionnaires in the second implementation cycle, only the quantitative

268
analysis for the two semesters in the first implementation cycle provided conclusive answers. The
qualitative investigations in both implementation cycles provided supporting evidence.
In the first implementation cycle, the modelling done in the statistical analysis of the responses to the
questionnaires in combination with respondents’ final marks indicated that the students’ biographical
properties as represented by their profile scores, had the biggest impact on their final marks for
COS1511 by far. A student’s profile score represented a combination of his/her level of programming
experience, marks obtained for Mathematics and English in matric and first-time registration for
COS1511 or not (sections 6.3.3.2, and 6.3.4.1 to 6.3.4.4).
A mean positive user experience score based on responses to the questionnaires was calculated for
both semesters in the first implementation cycle. This indicated that respondents in general found the
tutorial useful, with ratings of 3.75 and 3.68 out of maximum of 5 (section 6.3.3.3). However, a
positive user experience had a small negative relationship with the final mark (section 6.3.4.1).
Students, who had drawn variable diagrams before enrolling for COS1511, did slightly better than
those who had never done so (sections 6.3.4.1 to 6.3.4.3). Drawing their own variable diagrams while
working through the Study Guide had virtually no effect (section 6.3.4.1), and drawing their own
variable diagrams to debug their programs did not show up as a significant predictor in the final
model (sections 6.3.4.1 and 6.3.4.2).
Time spent on using the tutorial, did not show up as a significant predictor in the final model for
either of the two semesters in the first implementation cycle (sections 6.3.4.1 and 6.3.4.2).
Investigating the relationship between time spent on using the tutorial and the final mark, revealed
that students who used the tutorial for less than one hour achieved better marks than anyone else
(section 6.3.4.4).
The qualitative investigation in the first implementation cycle revealed four main areas of concern,
namely that participants did not seem to learn from using the tutorial how to draw variable diagrams;
the instructions on how to use the tutorial were insufficient; participants could not navigate
instinctively through the tutorial; and they lacked reading skills. In particular, participants with poor
reading skills did not pass the module (sections 6.4.3 and 6.4.4). Some of the feedback on the
COS1511 forum confirmed these issues, while other feedback indicated that the tutorial did assist
some students in creating a mental model of program execution (section 6.5).
To address deficiencies in the tutorial itself and the instructions on how to use it, the instructions on
using the tutorial were expanded substantially, while the tutorial was adapted to explicitly indicate
how to navigate through it (section 6.4.5) with the intention of re-investigating the issues in the
second implementation cycle.
269
The low number of responses to the questionnaires in the second implementation cycle in 2013
hampered the quantitative investigation so that only descriptive statistics could be calculated and no
claim can be made that this is representative of the population. Although this cannot be generalised,
the mean marks for both English and Mathematics for respondents in both semesters in 2013 were
approximately 10% higher than the mean marks for English and Mathematics in the first
implementation cycle. This resulted in higher profile scores. Higher profile scores corresponded with
higher final marks (section 7.3.4.2); confirming that a student’s profile score had an important impact
on his/her final mark for COS1511.
The scores calculated for positive user experience were slightly lower than in the first implementation
cycle, though still positive (section 7.3.4.6). Although the majority of second-implementation
respondents had not drawn variable diagrams before (section 7.3.4.4), most of them displayed a
positive attitude towards using variable diagrams indicating that they used it while working through
the Study Guide (74% and 59% respectively); believed it improved their programming skills (68%
and 56%) and assisted with understanding the flow of logic in programs (81% and 61%). While 85%
of first-semester respondents would use variable diagrams in future, only 34% of second-semester
respondents would do so (section 7.3.4.4).
The descriptive statistics revealed that most of the respondents only used the tutorial up to the time
when they had to submit the first assignment. Consequently, the majority spent between zero and ten
hours using the tutorial. The majority watched the updated instructions and felt that it helped them to
use the tutorial (section 7.3.4.3), indicating the updated instructions made it easier to use the tutorial.
Learning experience scores reflecting students’ experience of how much they learnt from the tutorial
were also calculated for both semesters, with values of 3.54 and 3.22 out of 5 respectively for the two
semesters (section 7.3.4.5).
The qualitative investigation in the second implementation cycle showed that both the adaptions to the
instructions on how to use the tutorial and the tutorial itself, served the intended purpose, since, once
participants had read the instructions, they were able to use and learn from the tutorial as expected;
and experienced no problems in navigating through the tutorial. Lack of reading skills, however, still
was problematic. This confirmed the finding in the first implementation cycle that participants who
read well, could use the tutorial easily and passed the module, while those who struggled to read,
experienced problems in using the tutorial and did not pass the module. Feedback on the COS1511
forum indicated that students felt that the tutorial succeeded in making understanding and learning to
draw variable diagrams easier and was well-designed and intuitive to use. Negative feedback related
to not receiving the CD with the tutorial or issues with downloading it.
In summary, students’ biographical properties in terms of their educational background represented by
first-registration for COS1511, their marks for Mathematics and English and their programming

270
experience had a far bigger effect on their final marks than their use of the tutorial, positive user
experience, their use of tracing or the extent and manner of tutorial use. Furthermore, their reading
ability, another indication of the level of their educational background, contributed to the impact of
their biographical properties on their final marks. Nevertheless there were indications that some
students found the tutorial to be effective.
4. What lessons have been learnt through the practical testing and refinement of the visualization
tool?
This question is part of the last phase of design-based research (phase 4), consisting of reflection to
produce ‘design principles’ and enhance solution implementation. In the second part of Chapter 5 the
development and initial testing of the tutorial based on the framework of guidelines, was described,
including lessons learnt during the development (section 5.4.4.1) and initial testing (section 5.4.4.2).
These lessons resulted in four general guidelines, namely to deliberately consolidate mental models,
reduce extraneous cognitive load, prompt users judiciously and test the PAV tool stringently
regarding the correctness of content, sequence of execution order, format and didactics (section 5.4.5).
The qualitative investigation in the first implementation cycle revealed two further lessons regarding
the implementation of visualization tools (section 6.6) which were confirmed by the qualitative
investigation in the second implementation cycle (section 7.6), namely to educate students about the
purpose of the PAV tool, and to provide detailed instructions on how to use it to best effect.
By reflecting on the framework and the lessons learnt during the two implementation cycles, the
original framework is refined (but not changed) by expanding guidelines 6, 10, 11, 16, 17 and 23; and
adding two additional guidelines, namely guidelines 27 and 28, as presented in Table 7.14.
In addition to the reflection that was done while investigating research questions 2 to 4, phase 4 of
design-based research requires reflection on the professional development of the researcher. This is
done in section 8.6 where the output from this research effort is discussed.
8.3 Delineation, limitations and discussion of problems
The delineation of this study entailed -
• conducting the study on only one first-year programming module, COS1511;
• demonstrating selected samples from the Study Guide in the tutorial to teach students how to
draw variable diagrams for programming constructs; and
• limiting the investigation into factors that could have affected their final marks to their
biographical properties, their positive user experience, their use of tracing and the extent and
manner of their tutorial use.

271
A limitation of the study was using self-selection sampling for both the quantitative and qualitative
investigations, which could have led to biased samples in both cases as only students who were
willing to partake responded. In the first implementation cycle this did not pose a problem for the
quantitative investigation, as enough responses were received to claim that the findings of the
statistical modelling would hold for the 2012 COS1512 population (see section 6.3.1). However, in
the second implementation cycle in 2013, the number of responses to the questionnaires was far too
small to do any statistical modelling so that only descriptive statistics could be calculated (see section
7.2). As a result, the quantitative findings of the first implementation cycle could not be confirmed by
the second implementation cycle and the effect of improvements to the tutorial could not be properly
investigated.
Although self-selection sampling was also used for the qualitative investigation, the nature of the
investigation itself (direct observation with eye tracking in the HCI laboratory) required at least six
participants (Pernice & Nielsen, 2009) (see section 4.3.5.3) for the usability evaluation. In the
qualitative investigations in both implementation cycles, the number of participants exceeded this
number (see sections 6.4.2 and 7.4.1), which lends credibility to the findings.
Changes to the manner in which the module had to be presented (see section 4.3.4.1), was beyond the
researcher’s control. This in part, is one of the reasons why the responses to the questionnaires in the
second implementation cycle were so poor, since questionnaires were no longer allowed to be
distributed in conjunction with assignments (see section 7.1). In 2013, the NDINL was renamed NDIT
as a new curriculum was implemented and COS1511 was replaced with another module for the NDIT,
which would have altered the composition of the COS1511 cohort. However, students who were
registered for NDINL before 2013 as well as those who had to repeat COS1511 were still allowed to
register for COS1511. Also in 2013, all students were allocated to e-tutors. Both of these changes
could have had an effect on the final marks of students in 2013, but since the statistical modelling
could not be repeated, nothing can be said about their possible effect.
The heterogeneous composition of the COS1511 student cohort with COS1511 being offered to a
variety of degrees and diplomas with deferent prerequisites (see section 4.3.4.1), makes it difficult to
generalise the quantitative findings. This is one of the reasons why the findings are interpreted with
caution. On the other hand, the large number of students enrolled for COS1511 per semester,
combined with the varied qualifications for which they are enrolled, as well as their diverse
backgrounds, adds weight to the significance of the statistical results since it allowed the study to
offer some of the same benefits as a multi-institutional, multi-national study. In multi-institutional,
multi-national studies in computer science education, the number of students per study typically
consists of between 100 and 300 students (Fincher, Lister, Clear, Robins, Tenenberg & Petre, 2005).
As can be seen from Table 1.1, this study involved far larger numbers of students.

272
In the next section the conclusions of this research effort are presented.
8.4 Conclusions
Following the discussion of the research findings and the problems experienced, the subsequent
conclusions are made:
1. The framework of 26 guidelines for developing and using visualization tools to teach
programming was successful in assisting the researcher to develop the Drawing Variable
Diagrams Tutorial.
2. The tutorial did not assist students in acquiring programming skills in an ODL environment to
the extent that it was noticeable in average marks.
3. Adaptions to the tutorial for the second implementation cycle were successful in making the
tutorial more effective in supporting the students, and some students believed they benefited
from using it.
4. The biographical properties of students who wrote the COS1511 examinations as
characterised by a combination of their level of programming experience, marks obtained for
Mathematics and English in matric and first-time registration for COS1511 or not, had an
overwhelming effect on their final marks, far more than the manner and extent of their use of
the tutorial had.
5. Students’ reading skills played a major role in their success or not in COS1511.
In the light of the above, the thesis for this study can only be partially accepted, as it is possible to
employ a framework of guidelines for using and creating visualization tools to teach programming,
synthesized from literature and tested and refined through practical application to develop a PV tool to
teach introductory programming students in an ODL environment to trace programs. It could however
not be shown that using the tutorial improved their programming skills to a noticeable extent. The
main reason for this was the extent to which the effect of students’ biographical properties on their
final mark overshadowed the result of their use of the tutorial.
In the next section the researcher reflects on questions prompted by these conclusions.
8.5 Reflection on the conclusions
The conclusions raised the following two questions with the researcher:
1. Why do poor reading skills play such a big role in learning to program?
2. Why did the tutorial not achieve its purpose?
Below, in sections 8.5.1 and 8.5.2, the researcher attempts to find answers to these two questions
based on the literature review done for this study. In addition, the researcher reflects on the validity of
the research process followed in section 8.5.3.
273
8.5.1 Why poor reading skills play such a big role in learning to program
According to Gous and Roberts (2014:2623) “The area where reading is computed and represented in
the brain originally was used to see objects and navigate terrain. For this reason reading is still related
to traversing a terrain, almost like visiting objects in context”. Program code also represents an
abstract space that has to be navigated with the same cognitive strategies as used in natural
environments, since program comprehension is described as “the process of generating a cognitive
map from the program source-code to a set of application domain concepts” (Cox, Fisher & O'Brien,
2005:93). Jones and Burnett (2007) found a strong correlation between students’ spatial ability, that is
their ability to navigate, and their results in programming modules, with much lower correlations
between their spatial ability and non-programming modules. Students with a low spatial ability also
use less effective navigational strategies when attempting to comprehend code (Jones & Burnett,
2007) (See section 5.2.2). This relationship between the area in the brain where reading is processed
and navigational ability, explains why students with lower spatial ability struggle more with
programming subjects and confirms Chmura’s (1998) finding that students with poor reading
comprehension skills struggle to learn to program.
Reading ability is a strong predictor of academic performance (Bertram, 2006; Pretorius, 2002), even
in a subject such as Mathematics, which is typically associated with logico-deductive skills (Pretorius,
2002). BRACElet argues that the development of programming skills follows a similar process as the
development of mathematical skills (Lister & Edwards, 2010; Philpott, Clear & Whalley, 2009) (See
section 3.5.1). Mathematicians consider ‘word problems’ one of the most difficult things to teach, but
programming is mostly comprised of solving word problems. The issue seems to be the ability to
convert the words on paper to something meaningful to the student (Winslow, 1996), which
corresponds with the comprehension and interferencing (that is, the ability to fill in gaps between text
elements and link information across textual units (Rickheit, Schnotz & Strohner, 1985)) (see section
6.4.3.4)) parts of reading. The ability to program requires the same type of logico-deductive skills as
Mathematics, and if students struggle to read, it will be all the more difficult to convert the words on
paper or the program code to something meaningful, that is, to abstract.
As the results of the BRACElet project (see section 3.4) indicate, novices acquire programming skills
in the following hierarchical order: firstly by learning to read or trace code; then to explain code; and
once reasonably capable of both reading and explaining, to systematically write code. To comprehend
program code, interferencing needs to be used to an even greater extent than when reading
conventional text. Students who struggle to read, will then also find it difficult to read or trace code,
as well as to explain it, because they need to use interferencing to understand the code before they can
explain it. Interferencing in reading program code also poses its own difficulties for novices, such as
incorrect mapping from natural language to a programming language (Spohrer & Soloway, 1989); and
274
confusing the semantics of programming-language constructs with the related natural-language words
and/or mathematical concepts such as assignment (Jimoyiannis, 2013; Khalife, 2006; Simon, 2011;
Sorva, 2008; Spohrer & Soloway, 1989) (see sections 2.4.3.1 and 2.4.3.2). This may explain why poor
readers find it difficult to learn to program, especially if they experience problems with inferencing.
According to cognitive load theory, learning requires information processing in both working memory
and long-term memory. Working memory has a limited processing capacity inhibited by intrinsic
cognitive load (the difficulty of the subject matter); extraneous cognitive load (the way information is
presented) and germane cognitive load (when information is presented in such a way that it facilitates
the construction of cognitive schemas) (Sweller, van Merriënboer & Paas, 1998; Wouters, Paas &
Merriënboer, 2008) (see section 5.2.2). The limited processing capacity of working memory
corresponds with the limited capacity assumption in the cognitive theory of multimedia learning
which assumes that the channels for processing visual and auditory representations (eyes and ears)
can only process a limited amount of material per occasion (Sorva, Karavirta & Malmi, 2013) (see
section 5.2.2). The tight integration of concepts in a programming language indicates a high intrinsic
cognitive load (Robins, 2010) (see section 5.2.2). Reading at the frustration level (where the reader
reads with less than 90% decoding accuracy and 60% level of comprehension) or the instructional
level (95% decoding accuracy and 75% level of comprehension) (McCormick, 1995) would impose a
high cognitive load on working memory (Sweller et al., 1998), making it very difficult to master the
subject matter. As a result students who struggle to read will find it difficult to learn to program.
In summary, three reasons why poor reading skills may impact more on learning to program than on
learning in other subjects, have been identified, namely –
• the relationship between the area in the brain where both reading is processed and
navigational ability is seated, and comprehending program code;
• the higher level of interferencing required to read and understand program code; and
• the high intrinsic cognitive load associated with programming languages which taxes the
processing capacity of working memory, which will make it more difficult for poor readers to
learn to program.
8.5.2 Why the tutorial did not achieve its purpose
Data from the National Benchmark Test in Academic Literacy show that most of the South-African
matriculates are not prepared for tertiary education (Cliff, 2015) (see section 6.3). Many of Unisa’s
students are in the same boat. Unisa research shows that the average first-year student, from a
background where reading was neglected, could have the reading ability of twelve-year olds, not
eighteen-year olds (Kilfoil, 2008) (see section 6.3). Children ‘learn to read’ through decoding, while
comprehension enables them to ‘read to learn’ (Matjila & Pretorius, 2004). By Grades 9 to 12 reading
275
comprehension for complex topics becomes better than listening for successful readers, while
listening comprehension is better than reading comprehension for poor readers. During the post-
school phase, for highly skilled readers, reading is more efficient than listening as a learning tool
(Matjila & Pretorius, 2004; Pretorius & Ribbens, 2005). A typical twelve-year old would be in Grade
7, so that an average first-year Unisa student from a reading-neglected background would not have the
skill to learn complex topics by reading. Five out of nine of the participants observed in the HCI
laboratory in the first implementation cycle and three out of seven of the participants observed in the
HCI laboratory in the second implementation cycle indicated that they would prefer to have auditory
explanations added to the tutorial. In both cycles there was also another participant who would have
liked the option to have it. This, as well as the fact that some of them displayed erratic eye movements
while reading the text in the tutorial, may be an indication of poor reading skills, and would explain
why they could not properly utilise the tutorial.
The literature review revealed that there is general consensus that visualizations are only
educationally effective if they actively engage learners in activities (Foutsitzis & Demetriadis, 2008;
Hundhausen & Douglas, 2002; Hundhausen, Douglas & Stasko, 2002; Naps, Röβling et al., 2003;
Pears, Seidman, et al., 2007). Despite integrating the tutorial as part of the study material to ensure
students engage with it, as recommended (Ben-Bassat Levy & Ben-Ari, 2007; Lahtinen, 2006;
Lahtinen, Jarvinen & Melakoski-Vistbacka, 2007; Röβling, 2010), this did not happen to the degree
that was expected, as the findings from the quantitative investigations showed. The average amount of
time spent using the tutorial and the fact that most of the students did not continue using the tutorial
after they had submitted Assignment 1, certainly did not reflect a “high commitment to visualization”
(Isohanni & Knobelsdorf, 2011:38) (see section 5.4.1), which would have been an indication of active
engagement and should have allowed students to benefit more from the tutorial.
Academically strong students probably did not need the tutorial (Lahtinen, 2006), as the negative
correspondence between the time they spent using the tutorial and their final marks indicated.
Average students may have benefited more than weak or strong students (Ben-Bassat Levy, Ben-Ari
& Uronen, 2003) (see section 5.4.2), but the bimodal results distribution (see Table 1.1) may have
hidden this effect. Some students certainly misunderstood the purpose of the tutorial, as their feedback
on the COS1511 forum showed, and maybe they misunderstood the activities too.
Prior experience of using a PV lowered the cognitive load and allowed students to learn more
effectively from it (Laakso, Rajala, Kaila & Salakoski, 2008) (see section 5.4.3). Since students did
not have the benefit of prior experience of using a PV, the cognitive load might have been too much
for some of them, especially if they had poor reading skills. The ‘distance’ in ODL in terms of time,
economic, social, educational, epistemological and communication distances between the institution
and its students, as well as between students themselves (Heydenrich & Prinsloo, 2010), exacerbated
276
by inadequate reading skills (Gous & Roberts, 2014) (see section 2.2) could well have contributed to
this.
According to Lister’s (2011) neo-Piagetian theory novices in the first stage of cognitive development,
the sensorimotor stage, cannot abstract to reason about a specific problem and can only trace with
great difficulty. At this stage they also do not understand that an executing program is a ‘deterministic
machine’ (Corney, Teague, Ahadi & Lister, 2012:2), which is what teaching them to trace is
attempting to accomplish. At the preoperational stage, the second stage, while novices have acquired
some appropriate abstractions, their abstractions are still fragmented so that they cannot apply a
concept spontaneously or use it inappropriately (Lister, 2011; Teague, Corney, Fidge et al., 2012).
Although they can trace, they typically cannot abstract from the code to deduce the purpose of the
computation (Gluga, Kay, Lister & Teague, 2012; Lister, 2011). In the third stage, the concrete
operational stage, novices tend to deal with abstraction by using specific examples to reduce the level
of abstraction (Gluga et al., 2012), can relate code to diagrams and comprehend how lines of code
comprise a computation (Corney et al., 2012). They may be able to derive the function of a small
program fragment just by reading it and using deductive reasoning to determine its purpose (Gluga et
al., 2012) without a concrete written trace (Teague et al., 2013). The last stage, the formal operational
stage, is the most advanced and the most abstract stage, the level at which expert programmers
operate (Lister, 2011; Teague et al., 2013). This is the stage that is expected of computing students at
the end of their first year (McCracken, Almstrum, Diaz, Guzdial, Hagan, Kolikant, Laxer, Thomas,
Utting & Wilusz, 2001) (See section 3.5.2). COS1511 is a semester module, and it would be
unrealistic to expect COS1511 students to have reached this stage after six months of distance
education. Rather, it is more realistic to expect successful COS1511 students to have reached the
concrete operational stage at the end of their first semester of introductory programming education.
However, if their reading ability does not allow them to inference, they will be unable to abstract, and
will still be at the sensorimotor stage of cognitive development where they find it very difficult to
trace; or at the preoperational stage where even though they can trace, they cannot abstract from the
code to determine its meaning. At these stages they will not be able to benefit from the tutorial.
Lastly, the design of the system itself might have been a factor in the level of its success. The
qualitative investigation during the first impemetation cycle pointed out that the instructions for using
it was insufficient and that students could not navigate intuitively through the tutorial. This indicated
that the instructions on how to use the tutorial and how to navigate through the tutorial should be
adapted. This was done for the second implementation cycle, but the low response rate prevented
repeating the statistical modelling that was done in the first implementation cycle. As a result the
quantitative investigation could not indicate whether or not the adaptions to the tutorial had the
desired effect (improving students’ programming skills). The qualitative investigation in the second
implementation cycle indicated that the the changes to the tutorial improved the user experience. This
277
eliminated all the problems identified during the qualitative investigation in the first implementation
cycle, except the restrictions imposed by the students’ poor reading ability.
In summary, possible reasons why the tutorial did not deliver the expected results, could be –
• poor reading skills that prevented students from utilising the tutorial as expected;
• lack of active engagement;
• a cognitive load that was too high for some of the students to cope with in combination with
the ‘distance’ in ODL education;
• deficiencies in the design of the tutorial itself; and
• students’ inability to abstract due to poor reading skills.
8.5.3 Reflection on the validity of the research process
Ensuring validity in design-based research requires treatment validity; systemic validity and
consequential validity (Hoadley, 2004) as discussed in section 4.3.2.1.
Treatment validity demands that the intervention represents the theory it tests, and in design-based
research the consequences of the intervention supports the validity of its claim (Barab & Squire,
2004). This requires comprehensive documentation of the research process to explain why outcomes
occurred. The process of developing the framework of guidelines for developing and using
visualization tools to teach programming; the development and implementation of the Drawing
Variable Diagrams Tutorial and the iterative cycles of implementation and investigation were
described meticulously in the preceding chapters of this study. This supports the treatment validity of
the findings. The two publications that resulted to date from this research effort (Schoeman et al.
2012, 2013) also supports treatment validity as does the statistical analysis that confirms the findings
of the BRACElet project (Lister et al, 2009; Lopez et al., 2008) (see sections 6.2.2 to 6.2.4).
Systemic validity requires that the research and resulting implications answer the research questions.
Using triangulation with both qualitative and quantitative investigations; iterative cycles of
implementation and analysis; and using established methodological practices in the research ensured
the reliability of the findings.
Consequential validity refers to how the interpreted results can be applied practically for future
prediction and implementation. The framework of guidelines for developing and using visualization
tools to teach programming provides a tool that can be used by other educators to implement and
evaluate SVs. Disclosing the reason(s) for the poor pass rates in Unisa’s ODL environment makes a
valuable contribution that can be used to implement measures to improve teaching practices at the
institution.
This research effort thereby satisfies treatment validity, systemic validity and consequential validity.
278
In the next section the contributions made by this study is discussed.
8.6 Summary of contributions
The last phase of design-based research (phase 4) consists of reflection to produce ‘design principles’
and enhance solution implementation. This includes the output from the research, namely design
principles, the designed artefact and reflection on the professional development of the researcher. The
theoretical contribution constitutes the design principles while the tutorial that was developed
represents the practical contribution. In the following sections the theoretical and practical
contributions as well as the professional development of the researcher are discussed.
8.6.1 Theoretical contribution
The framework of guidelines for developing and using visualization tools to teach programming as
presented in Table 5.1 and enhanced in Table 7.14 represents the theoretical contribution of the study.
No comprehensive framework of this nature has been found by the researcher, although several sets of
guidelines for creating visualizations have been presented in the three areas reviewed, as described in
section 5.2. Similar guidelines that occurred in more than one of the three areas reviewed were
synthesised into one guideline. The different areas covered in the literature survey allowed the
researcher to enhance the guidelines with reasons or explanations for their recommendation, as well as
with considerations that should be taken into account when implementing them, as some
considerations may exclude certain guidelines under specific circumstances. The lessons learnt
through the practical testing and refinement of the Drawing Variable Diagrams Tutorial, allowed the
researcher to add further value to the framework of guidelines by expanding six of the original
guidelines in the framework and incorporating two more guidelines. Both the framework and the
lessons learnt can be used by other researchers and educators to either develop new PAVs or evaluate
and adapt existing PAVs, although it cannot guarantee the success of the resulting PAVs. Particular
emphasis is placed on the importance of considering the demographical background and reading
abilities of the intended users. In addition, it should be taken into account that the levels of
engagement of the users determine to a large degree whether a PAV succeeds in achieving its purpose
or not.
This research effort provides two theoretical contributions to improving computer programming
education in the form of –
• the framework of guidelines for developing and using visualization tools to teach
programming; and
• some theoretical understanding as to how novices learn to program in the reflection on
possible reasons why

279
• poor reading skills may have such a strong effect on learning to program; and
• the tutorial did not achieve its purpose.
This is in line with the contribution design-based research can make in developing contextualized
theories of learning and teaching (Design-based Research Collective, 2003).
8.6.2 Practical contribution
The practical contributions made by this study consist of the development of the Drawing Variable
Diagrams Tutorial, tested and refined through two implementation cycles, and the results of the
investigations during the two implementation cycles.
Developing the tutorial demonstrated that the framework of guidelines can be utilised for its intended
purpose.
Although introducing the tutorial into the study material for COS1511 did not improve the pass rate or
class average to a noticeable extent, there was evidence that some students believed they benefited
from it, and that it could benefit other students too. The most important contribution however, was
revealing the role that students’ biographical background, and their reading skills in particular, played
in their success or not in studying introductory programming in Unisa’s ODL environment. This
provided some explanation for a long-standing problem with low pass rates in introductory
programming modules at Unisa. It also clarified the real-world demands made on the tutorial, one of
the advantages of design-based research (Design-based Research Collective, 2003).
In addition, the results of the quantitative investigation confirmed that the hierarchical development of
reading, explaining and writing code that BRACElet found, also holds in an ODL environment.
8.6.3 Professional development of the researcher
This research effort took the researcher on a journey of learning and discovery/understanding – of the
vast amount of literature on how novices learn to program and SV; research methods and paradigms;
statistical analysis and the challenges of doing empirical research. These challenges included
communicating with the implementers of the tutorial, questionnaire design, recruiting participants,
obtaining feedback from students, and working with two different statisticians due to unforeseen
circumstances.
The researcher learnt that as much as possible of what has to be done, should be put on paper, in such
a clear manner that there can be no leeway for misunderstanding. In future research efforts, the
questionnaire will be designed in conjunction with the statistician, and much more time spent on the
initial planning to decide what and how it will be analysed. Some commitment from the statistician to

280
complete the project will also be insisted on. Recruiting participants remain a very difficult aspect to
handle in the ODeL environment, which certainly requires further investigation.
On the level of personal development, the researcher discovered that she has a great deal of
perseverance and can work very hard. The researcher also noticed how much her writing skills and
capacity to edit her own work developed, which is very gratifying. In this process she gained
confidence in her ability to do research.
In addition, the study provided the researcher with more insight in the problems first-time students in
the ODL environment at Unisa and in particular, novice programmers face. It made her aware of
various possibilities to address these problems, and increased her empathy with novice programming
students and her desire to assist them.
8.7 Suggestions for further and future research
Both the theoretical and practical contributions of this research effort offer possibilities for further
research directly related to this thesis and future research in the wider context of this study. Future
research directly related to this study includes further research on:
• The framework of guidelines for developing and using visualization tools to teach
programming can be refined by incorporating more guidelines from educational psychology
and computer graphics, as well as the results of the on-going investigations in SVs. This can
provide a quick start for new developers or adaptors of PAVs to use as a checklist.
• Adapting the framework for mobile devices can be explored, since mobile learning and e-
learning have become important facets of ODeL.
• The researcher is still convinced of the value of teaching novices to trace. Other ways of
visualizing tracing can be investigated, for example using podcasts, which may appeal more
to students. A podcast demonstrating how to draw variable diagrams for each new concept
can be used with students rating how much they learned from it.
• The tutorial itself can be enhanced by including more activities to engage students to see how
that affects the user experience and learning experience of students.
Aspects in the wider context that warrant further research are:
• Since most of the students only used the tutorial to a limited extent; and sending e-mails and
sms’s failed to activate them into responding to the online questionnaires, future research into
how to ensure students effectively engage with their study material in Unisa’s online
environment, should be considered. The effectiveness of current practices such as e-tutors
should also be investigated together with possible modifications to make the system more
efficient. This could take the form of a survey under students, maybe by phoning them on
their cell phones.
281
• In the light of the important role reading plays in learning to program, an issue that warrants
research is how to identify programming students with poor reading skills and how to assist
them by improving their reading skills specifically with the aim of learning to program. An
educational psychologist should be able to assist with a program to improve reading skills.
• Investigating ways to improve learners’ spatial skills in an effort to improve their reading
skills and the effect of improve learners’ spatial skills on their programming skills, offer
another worthwhile research topic. This could be cross-disciplinary research where an
occupation therapist prescribes exercises to improve spatial skills, and an educational
psychologist assist with improving reading skills. An experiment could be done where both
learners’ spatial skills and reading skills are tested before and afterwards, while some do the
exercises to improve spatial skills and others the program to improve reading skills, for a
period. A control group that does not follow either the exercises to improve spatial skills or
the program to improve reading skills, should be used included in the research to determine
whether either improving spatial skills or reading skills developed their programming skills.
8.8 Concluding remark
Although introducing the tutorial into the study material for COS1511, did not have the desired effect,
the research provided valuable insight into the reason(s) for the low pass rate for the introductory
programming module in Unisa’s ODL environment. The framework of guidelines for developing and
using visualization tools to teach programming also contributed a synthesised reference for other
educators who wish to incorporate visualization tools in their teaching of introductory programming.
In turn, the reflection on the effect of poor reading skills in learning to program adds to the body of
knowledge about how novices learn to program.
282
REFERENCES Acton, D., Voll, K., Wolfman, S. & Yu, B. (2009) Pedagogical transformations in the UBC CS
science education initiative. Proceedings of the 14th Western Canadian Conference on Computing Education, 3-8.
Adair, J. G. (1984) The Hawthorne effect: A reconsideration of the methodological artifact. Journal of applied psychology, 69(2), 334.
Adamchik, V. & Gunawardena, A. (2003) A learning objects approach to teaching programming. Information Technology: Coding and Computing [Computers and Communications] ITCC 2003.
Adamchik, V. & Gunawardena, A. (2005) Adaptive book: teaching and learning environment for programming education. International Conference on Information Technology: Coding and Computing, 2005. ITCC 2005.
Ahmadzadeh, M., Elliman, D. & Higgins, C. (2005) An analysis of patterns of debugging among novice computer science students. Proceedings of the 10th annual SIGCSE conference on Innovation and technology in computer science education. Caparica, Portugal, ACM.
Ahoniemi, T. & Lahtinen, E. (2007) Visualizations in preparing for programming exercise sessions. Electronic Notes in Theoretical Computer Science, 178, 137-144.
Ala-Mutka, K. (2004) Problems in learning and teaching programming-a literature study for developing visualizations in the Codewitz-Minerva project. Codewitz Needs Analysis, 1-13.
Ala-Mutka, K. (2005) A survey of automated assessment approaches for programming assignments. Computer Science Education, 15(2), 83-102.
AlgoViz Portal. Available at: http://algoviz.org (accessed on 25 July 2013).
Amiel, T. & Reeves, T. C. (2008) Design-Based Research and Educational Technology: Rethinking Technology and the Research Agenda. Educational Technology & Society, 11(4), 29-40.
Anderson, L. W., Krathwohl, D. R., Airasian, P. W., Cruikshank, K. A., Mayer, R. E., Pintrich, P. R., Raths, J. & Wittrock, M. C. (2001) A Taxonomy for Learning, Teaching, and Assessing: A Revision of Bloom's Taxonomy of Educational Objectives, New York, Addison Wesley Longman, Inc.
Anderson, T. & Shattuck, J. (2012) Design-Based Research: A Decade of Progress in Education Research? Educational Researcher, 41(1), 16-25.
Astrachan, O. & Reed, D. (1995) AAA and CS 1: the applied apprenticeship approach to CS 1. SIGCSE Bull., 27(1), 1-5.
Bandura, A. (1997) Self-efficacy: The exercise of control, Worth Publishers.
Bannan-Ritland, B. (2003) The Role of Design in Research: The Integrative Learning Design Framework. Educational Researcher, 32(1), 21-24.
Barab, S. & Squire, K. (2004) Design-based research: Putting a stake in the ground. The Journal of the learning sciences, 13(1), 1-14.

283
Barnes, D. J., Fincher, S. & Thompson, S. (1997) Introductory problem solving in computer science. 5th Annual Conference on the Teaching of Computing.
Bartlett, J. E., Kotrlik, J. W. & Higgins, C. C. (2001) Organizational research: Determining appropriate sample size in survey research appropriate sample size in survey research. Information technology, learning, and performance journal, 19(1), 43.
Bednarik, R., Moreno, A. & Myller, N. (2006) Various Utilizations of an Open-Source Program Visualization Tool, Jeliot 3. Informatics in Education, 5(2), 195-206.
Bellström, P. & Thorén, C. (2009) Learning how to program through visualization: A pilot study on the Bubble Sort algorithm. Second International Conference on the Applications of Digital Information and Web Technologies, 2009. ICADIWT '09. London, IEEE.
Ben-Ari, M. (2001) Constructivism in computer science education. Journal of Computers in Mathematics and Science Teaching, 20(1), 45-73.
Ben-Ari, M. (2013) Vizualisation of Programming. Improving Computer Science Education, 52.
Ben-Ari, M., Bednarik, R., Ben-Bassat Levy, R., Ebel, G., Moreno, A. S., Myller, N. & Sutinen, E. (2011) A decade of research and development on program animation: The Jeliot experience. Journal of Visual Languages & Computing, 22(5), 375-384.
Ben-Ari, M., Myller, N., Sutinen, E. & Tarhio, J. (2002) Perspectives on program animation with Jeliot. Lecture notes in computer science, 31-45.
Ben-Bassat Levy, R. & Ben-Ari, M. (2007) We work so hard and they don't use it: acceptance of software tools by teachers. ACM SIGCSE Bulletin, 39(3), 246-250.
Ben-Bassat Levy, R., Ben-Ari, M. & Uronen, P. A. (2003) The Jeliot 2000 program animation system. Comput. Educ., 40(1), 1-15.
Bennedsen, J. & Caspersen, M. E. (2005a) An investigation of potential success factors for an introductory model-driven programming course. Proceedings of the first international workshop on Computing education research. Seattle, WA, USA, ACM.
Bennedsen, J. & Caspersen, M. E. (2005b) Revealing the programming process. SIGCSE Bull., 37(1), 186-190.
Bennedsen, J. & Caspersen, M. E. (2007) Failure rates in introductory programming. SIGCSE Bull., 39(2), 32-36.
Bennedsen, J. & Schulte, C. (2010) BlueJ Visual Debugger for Learning the Execution of Object-Oriented Programs? Trans. Comput. Educ., 10(2), 1-22.
Bergin, J. (2006) Karel universe drag & drop editor. SIGCSE Bull., 38(3), 307-307.
Bergin, J., Brodie, K., Patiño-Martínez, M., McNally, M., Naps, T., Rodger, S., Wilson, J., Goldweber, M., Khuri, S. & Jiménez-Peris, R. (1996) An overview of visualization: its use and design: Report of the Working Group in Visualization. ACM SIGCSE Bulletin. ACM.
Bergin, S. & Reilly, R. (2006) Predicting introductory programming performance: A multi-institutional multivariate study. Computer Science Education, 16(4), 303-323.

284
Bertram, C. (2006) Exploring teachers's reading competences: a South African case study. Open Learning: The Journal of Open, Distance and e-Learning, 21(1), 5.
Beymer, D., Russell, D. & Orton, P. (2008) An eye tracking study of how font size and type influence online reading. Proceedings of the 22nd British HCI Group Annual Conference on People and Computers: Culture, Creativity, Interaction-Volume 2, 15-18.
Biesta, G. (2010) Pragmatism and the philosophical foundations of mixed methods research. in Sage handbook of mixed methods in social and behavioral research. Second edition. (2010): edited by Tashakkori, A. & Teddlie, C., Thousand Oaks, CA; London, Sage:95-118.
Biggs, J. B. & Kollis, K. F. (1982) Evaluating the quality of learning: the SOLO taxonomy (Structure of the Observed Learning Outcome), New York, Academic Press.
Bonar, J. & Soloway, E. (1989) Preprogramming knowledge: A major source of misconceptions in novice programmers. In Studying the novice programmer edited by Soloway, E. & Sphorer, J. C., Lawrence Erlbaum Associates, Hillsdale, NJ:325-353.
Bootstrapping (2002) Bootstrapping Research in Computer Science Education. Available at: http://depts.washington.edu/bootstrp/ (accessed on 21 October 2010).
Bornat, R., Dehnadi, S. & Simon (2008) Mental models, consistency and programming aptitude. Tenth Australasian Computing Education Conference (ACE 2008).
Boustedt, J., Eckerdal, A., McCartney, R., Moström, J. E., Ratcliffe, M., Sanders, K. & Zander, C. (2007) Threshold concepts in computer science: do they exist and are they useful? SIGCSE Bull., 39(1), 504-508.
Bower, M. (2009) Discourse analysis of teaching computing online. Computer Science Education, 19(2), 69-92.
Brace (2004) Building Research in Australasian Computing Education. Available at: http://www.cs.otago.ac.nz/brace (accessed on 21 October 2010).
Brown, A. L. (1992) Design experiments: Theoretical and methodological challenges in creating complex interventions in classroom settings. The journal of the learning sciences, 2(2), 141-178.
Bruce-Lockhart, M. P. & Norvell, T. S. (2007a) Developing mental models of computer programming interactively via the web. Frontiers In Education Conference-Global Engineering: Knowledge Without Borders, Opportunities Without Passports, 2007. FIE'07. 37th Annual. IEEE.
Bruce-Lockhart, M. P. & Norvell, T. S. (2007b) Developing Mental Models of Computer Programming Interactively Via the Web. 37th ASEE/IEEE Frontiers in Education Conference. Milwaukee, WI.
Bryman, A. (2006) Integrating quantitative and qualitative research: how is it done? Qualitative Research, 6(1), 97-113.
285
Butler, M. & Morgan, M. (2007) Learning challenges faced by novice programming students studying high level and low feedback concepts. ICT: Providing Choices for Learners and Learning, ASCILITE Singapore, 99-107.
Byrne, P. & Lyons, G. (2001) The effect of student attributes on success in programming. ACM SIGCSE Bulletin. ACM.
Carbone, A., Hurst, J., Mitchell, I. & Gunstone, D. (2009) An exploration of internal factors influencing student learning of programming. Proceedings of the Eleventh Australasian Conference on Computing Education - Volume 95, 25-34.
Carlisle, M. C. (2009) Raptor: a visual programming environment for teaching object-oriented programming. J. Comput. Small Coll., 24(4), 275-281.
Carlisle, M. C., Wilson, T. A., Humphries, J. W. & Hadfield, S. M. (2005) RAPTOR: a visual programming environment for teaching algorithmic problem solving. SIGCSE Bull., 37(1), 176-180.
Carter, L., Jernejcic, L. & Lim, N. (2007) Success in CS: Is culture a factor? Frontiers In Education Conference-Global Engineering: Knowledge Without Borders, Opportunities Without Passports, 2007. FIE'07. 37th Annual. IEEE.
Cassel, L., Clements, A., Davies, G., Guzdial, M., McCauley, R., McGettrick, A., Sloan, B., Snyder, L., Tymann, P. & Weide, B. W. (2008) Computer Science Curriculum 2008: An Interim Revision of CS 2001. Association for Computing Machinery and IEEE Computer Society.
Cavus, N., Uzunboylu, H. & Ibrahim, D. (2007) Assessing the success rate of students using a learning management system together with a collaborative tool in web-based teaching of programming languages. Journal of Educational Computing Research, 36 (3), 301-321.
Chan, M. & Black, J. (2005) When can animation improve learning? Some implications on human computer interaction and learning. Conference Proceedings of the World Conference on Educational Multimedia, Hypermedia and Telecommunications 2005, 933-938.
Cheek, J. (2008) Research Design. In Qualitative Research Methods edited by Given, L. M., Sage:761-763.
Chinn, D., Sheard, J., Carbone, A. & Laakso, M.-J. (2010) Study habits of CS1 students: what do they do outside the classroom? Proceedings of the Twelfth Australasian Conference on Computing Education-Volume 103, 53-62.
Chmura, G. A. (1998) What abilities are necessary for success in computer science. ACM SIGCSE Bulletin, 30(4), 55-58.
Čisar, S. M., Radosav, D., Pinter, R. & Čisar, P. (2011) Effectiveness of program visualization in learning Java: a case study with Jeliot 3. International Journal of Computers Communications & Control, 6(4), 669-682.
Clancy, M., Stasko, J., Guzdial, M., Fincher, S. & Dale, N. (2001) Models and Areas for CS Education Research. Computer Science Education, 11(4), 323.

286
Clear, T., Edwards, J., Lister, R., Simon, B., Thompson, E. & Whalley, J. (2008) The teaching of novice computer programmers: bringing the scholarly-research approach to Australia. Proceedings of the tenth conference on Australasian computing education - Volume 78. Wollongong, NSW, Australia, Australian Computer Society, Inc.
Clear, T., Philpott, A. & Robbins, P. (2009) Report on the eighth BRACElet workshop: BRACElet Technical Report, 01/08 AUT University, Auckland. Journal of Applied Computing and Information Technology, 7(1).
Clear, T., Whalley, J., Robbins, P., Philpott, A., Eckerdal, A., Laakso, M. & Lister, R. (2011) Report on the final BRACElet workshop: Auckland University of Technology, September 2010. Journal of Applied Computing and Information Technology & People, 15(1).
Clear, T., Whalley, J. L., Lister, R., Carbone, A., Hu, M., Sheard, J., Simon, B. & Thompson, E. (2008) Reliably Classifying Novice Programmer Exam Responses using the SOLO Taxonomy. In Mann, S. & Lopez, M. (Eds.) 21st Annual Conference of the National Advisory Committee on Computing Qualifications (NACCQ 2008). Auckland, New Zealand.
Cliff, A. (2015) South African matrics not ready for university - how universities can help. Available at: http://www.timeslive.co.za/local/2015/07/20/South-African-matrics-not-ready-for-university---how-universities-can-help (accessed on 22 July 2015).
Cobb, P., Confrey, J., DiSessa, A. A., Lehrer, R. & Schauble, L. (2003) Design experiments in educational research. Educational researcher, 32(1), 9-13.
Cogan, E. & Gurwitz, C. (2009) Memory Tracing. Journal of Computer Science, 5(8), 608-613.
Cole, R., Purao, S., Rossi, M. & Sein, M. K. (2005) Being Proactive: Where Action Research meets Design Research. ICIS 2005 Proceedings. Paper 27. Available at: http://aisel.aisnet.org/icis2005/27 (accessed on 12 June 2013).
Collins, A., Joseph, D. & Bielaczyc, K. (2004) Design research: Theoretical and methodological issues. The Journal of the learning sciences, 13(1), 15-42.
Conceição, S., Sherry, L. & Gibson, D. (2004) Using developmental research to design, develop, and evaluate an urban education portal. Journal of Interactive Learning Research, 15(3), 271-286.
Cooper, G., Tindall-Ford, S., Chandler, P. & Sweller, J. (2001) Learning by imagining. Journal of Experimental Psychology: Applied, 7(1), 68-82.
Cooper, S., Grover, S., Guzdial, M. & Simon, B. (2014) A Future for Computing Education Research. COMMUNICATIONS OF THE ACM, 57(11), 34-36.
Cooper, S. & Sahami, M. (2013) Reflections on Stanford's MOOCs. Communications of the ACM, 56(2), 28-30.
Corney, M. (2009) Designing for engagement: Building IT systems. ALTC First Year Experience Curriculum Design Symposium 2009. Queensland, Australia: QUT Department of Teaching and Learning Support Services.
Corney, M., Lister, R., Hogan, J., Fidge, C., Roggenkamp, M. & Cardell-Oliver, R. (2012) Novice Programmers in the First Three Semesters: Gaining a Better Understanding of the Problem.
287
Available at: http://www.acdict.edu.au/documents/CorneyNoviceProgrammersintheFirstThreeSemesters.pdf (accessed on 12 June 2013).
Corney, M., Lister, R. & Teague, D. M. (2011) Early relational reasoning and the novice programmer: Swapping as the "Hello World" of relational reasoning. Conferences in Research and Practice in Information Technology (CRPIT). Australian Computer Society, Inc.
Corney, M., Teague, D. & Thomas, R. N. (2010) Engaging students in programming. Proceedings of the Twelfth Australasian Conference on Computing Education-Volume 103, 63-72.
Corney, M., Teague, D. M., Ahadi, A. & Lister, R. (2012) Some empirical results for neo-Piagetian reasoning in novice programmers and the relationship to code explanation questions. Proceedings of Conferences in Research and Practice in Information Technology (CRPIT) (Vol.123), 77-86.
Cox, A., Fisher, M. & O'Brien, P. (2005) Theoretical considerations on navigating codespace with spatial cognition. Proceedings of the 17th Workshop of the Psychology of Programming Interest Group, 92-105.
Crescenzi, P. & Nocentini, C. (2007) Fully integrating algorithm visualization into a cs2 course.: a two-year experience. SIGCSE Bull., 39(3), 296-300.
Creswell, J. W. (2003) Research Design: Qualitative, Quantitative, and Mixed Methods Approaches, Thousand Oaks, Calif., 2nd ed., SAGE.
Creswell, J. W. (2014) Research design: Qualitative, quantitative, and mixed methods approaches, Los Angeles, Calif., 4th ed., SAGE.
Creswell, J. W. & Plano Clark, V. L. (2011) Designing and Conducting Mixed Methods Research, Thousand Oaks, Calif., SAGE.
Cross II, J. H. & Hendrix, T. D. (2007) jGRASP: an integrated development environment with visualizations for teaching Java in CS1, CS2, and beyond. Journal of Computing Sciences in Colleges, 23(2), 170-172.
Dale, N. B. (2006) Most difficult topics in CS1: results of an online survey of educators. SIGCSE Bull., 38(2), 49-53.
Dalkey, N. & Helmer, O. (1963) An experimental application of the Delphi method to the use of experts. Management science, 9(3), 458-467.
Daniel, J. (2012) Making Sense of MOOCs: Musings in a Maze of Myth, Paradox and Possibility. Journal of Interactive Media in Education (JIME).
Davies, S., Polack-Wahl, J. A. & Anewalt, K. (2011) A snapshot of current practices in teaching the introductory programming sequence. Proceedings of the 42nd ACM technical symposium on Computer science education, 625-630.
Davies, S. P. (1993) Models and theories of programming strategy. International Journal of Man-Machine Studies, 39(2), 237.

288
De Jong, T. (2010) Cognitive load theory, educational research, and instructional design: some food for thought. Instructional Science, 38(2), 105-134.
De Raadt, M., Hamilton, M., Lister, R., Tutty, J., Baker, B., Box, I., Cutts, Q., Fincher, S., Hamer, J. & Haden, P. (2005) Approaches to learning in computer programming students and their effect on success. Proceedings of the 28th HERDSA Annual Conference: Higher Eduation in a Changing World (HERDSA 2005). Higher Education Research and Development Society of Australasia (HERDSA).
De Raadt, M., Watson, R. & Toleman, M. (2009) Teaching and assessing programming strategies explicitly. Proceedings of the Eleventh Australasian Conference on Computing Education-Volume 95, 45-54.
De Villiers, M. R. (2005) Interpretive research models for Informatics: action research, grounded theory, and the family of design- and development research. Alternation, 12(2), 10-52.
De Villiers, M. R. (2012a) Models for Interpretive Information Systems Research, Part 1: IS Research, Action Research, Grounded Theory - A Meta-Study and Examples. In Research Methodologies, Innovations and Philosophies in Software Systems Engineering and Information Systems edited by Mora, M., Gelman, O., Steenkamp, A. L. & Raisinghani, M., Hershey, Pau., IGI Global:222-237.
De Villiers, M. R. (2012b) Models for Interpretive Information Systems Research, Part 2: Design Research, Development Research, Design-Science Research, and Design-Based Research: A Meta-Study and Examples. In Research Methodologies, Innovations and Philosophies in Software Systems Engineering and Information Systems edited by Mora, M., Gelman, O., Steenkamp, A. L. & Raisinghani, M., Hershey, Pau., IGI Global:238-255.
De Villiers, M. R., Becker, D. & Adebesin, F. (2012) Learning with an e-learning tutorial: cognition and the value of errors. Progressio, 34 (3).
De Villiers, M. R. & Harpur, P. A. (2013) Design-based research - the educational variant of design research: illustrated by the design of an m-learning environment. SAICSIT'13. East London, South-Africa.
Dehnadi, S. & Bornat, R. (2006) The camel has two humps. Available at: http://www. cs. mdx. ac. uk/research/PhDArea/saeed/paper1.pdf (accessed on 6 June 2013).
Denny, P., Luxton-Reilly, A. & Simon, B. (2008) Evaluating a new exam question: Parsons problems. Proceeding of the Fourth International Workshop on Computing Education Research. Sydney, Australia, ACM.
Design-based Research Collective. (2003) Design-based Research: An emerging paradigm for educational inquiry. Educational Researcher, 32(1), 5-8.
Détienne, F. & Soloway, E. (1990) An empirically-derived control structure for the process of program understanding. International Journal of Man-Machine Studies, 33(3), 323-342.
Djamasbi, S. (2014) Eye Tracking and Web Experience. AIS Transactions on Human-Computer Interaction, 6(2), 37-54.

289
Domingue, J. (2002) Software Visualization and Education. In Software Visualization edited by S.Diehl, Berlin Heidelberg, Springer-Verlag:205-212.
Domingue, J. B. & Mulholland, P. (1997) Teaching Programming at a Distance: The Internet Software Visualization Laboratory. Journal of Interactive Media in Education (JIME), (1), 1-31.
Du Boulay, B. (1989) Some Difficulties of Learning to Program. In Studying the Novice Programmer edited by Soloway, E. & Sphorer, J. C., Lawrence Erlbaum:283-299.
Du Boulay, B., O'Shea, T. & Monk, J. (1989) The Black Box Inside the Glass Box: Presenting Computing Concepts to Novices. In Studying the novice programmer edited by Soloway, E. & Spohrer, J. C., Hillsdale, NJ: Lawrence Erlbaum Associates:431-446.
Ducassé, M. & Emde, A. M. (1988) A review of automated debugging systems: knowledge, strategies and techniques. Proceedings of the 10th international conference on Software engineering, 162-171.
Durrheim, K. (2006) Research Design. In Research in practice: Applied methods for the social sciences edited by Terre Blanche, M. J., Durrheim, K., & Painter, D., Cape Town, UCT Press.
Ebel, G. & Ben-Ari, M. (2006) Affective effects of program visualization. Proceedings of the second international workshop on Computing education research. Canterbury, United Kingdom, ACM.
Eckerdal, A. (2009) Ways of Thinking and Practising in Introductory Programming. Available at: https://www.it.uu.se/research/publications/reports/2009-002/2009-002-nc.pdf (accessed on 30 April 2013).
Eckerdal, A., Laakso, M.-J., Lopez, M. & Sarkar, A. (2011) Relationship between text and action conceptions of programming: a phenomenographic and quantitative perspective. Proceedings of the 16th annual joint conference on Innovation and technology in computer science education, 33-37.
Eckerdal, A., McCartney, R., Moström, J. E., Ratcliffe, M., Sanders, K. & Zander, C. (2006) Putting threshold concepts into context in computer science education. SIGCSE Bull., 38(3), 103-107.
Eckerdal, A., McCartney, R., Moström, J. E., Sanders, K., Thomas, L. & Zander, C. (2007) From Limen to Lumen: computing students in liminal spaces. Proceedings of the third international workshop on Computing education research. Atlanta, Georgia, USA, ACM.
Eckerdal, A. & Thuné, M. (2005) Novice Java programmers' conceptions of "object" and "class", and variation theory. SIGCSE Bull., 37(3), 89-93.
Edelson, D. C. (2002) Design Research: What We Learn When We Engage in Design. The Journal of the Learning Sciences, 11(1), 105-121.
El-Sheikh, E. M. (2009) Techniques for Engaging Students in an Online Computer Programming Course. Systemics, Cybernetics and Informatics, 7(1), 12.
Falkner, K. & Palmer, E. (2009) Developing authentic problem solving skills in introductory computing classes. SIGCSE Bull., 41(1), 4-8.

290
Farrell, J. (2006) An object-oriented approach to programming logic and design, London, Thomson.
Feilzer, M. Y. (2010) Doing mixed methods research pragmatically: Implications for the rediscovery of pragmatism as a research paradigm. Journal of mixed methods research, 4(1), 6-16.
Fincher, S. (1999) What are we doing when we teach programming? 29th Annual Frontiers in Education Conference, 1999. FIE'99. San Juan, Puerto Rico, IEEE.
Fincher, S., Lister, R., Clear, T., Robins, A., Tenenberg, J. & Petre, M. (2005) Multi-Institutional, Multi-National Studies in CSEd research: Some design considerations and trade-offs. ICER '05. Seattle, WA, USA, ACM.
Fitzgerald, S., Lewandowski, G., McCauley, R., Murphy, L., Simon, B., Thomas, L. & Zander, C. (2008) Debugging: finding, fixing and flailing, a multi-institutional study of novice debuggers. Computer Science Education, 18(2), 93-116.
Fitzgerald, S., Simon, B. & Thomas, L. (2005) Strategies that students use to trace code: an analysis based in grounded theory. Proceedings of the first International workshop on Computing Education Research (ICER'05). Seattle, WA, USA, ACM.
Foutsitzis, C. & Demetriadis, S. (2008) AlCoLab: Architecture of Algorithm Visualization System. Advanced Learning Technologies, 2008. ICALT '08. Eighth IEEE International Conference on. Santander, Cantabria.
Fowler Jr, F. J. (2009) Survey Research Methods (4th ed.). SAGE Publications, Inc, Thousand Oaks, CA, SAGE Publications, Inc.
Freshwater, D. & Cahill, J. (2013) Paradigms Lost and Paradigms Regained. Journal of Mixed Methods Research, 7(1), 3-5.
Gluga, R., Kay, J., Lister, R. & Teague, D. (2012) On the reliability of classifying programming tasks using a neo-piagetian theory of cognitive development. Proceedings of the ninth annual international conference on International computing education research. Auckland, New Zealand, ACM.
Goldman, K. (2004) An interactive environment for beginning Java programmers. Science of Computer Programming, 53(1), 3-24.
Goldman, K., Gross, P., Heeren, C., Herman, G., Kaczmarczyk, L., Loui, M. C. & Zilles, C. (2008) Identifying important and difficult concepts in introductory computing courses using a Delphi process. ACM SIGCSE Bulletin, 40(1), 256-260.
Goldman, K., Gross, P., Heeren, C., Herman, G. L., Kaczmarczyk, L., Loui, M. C. & Zilles, C. (2010) Setting the Scope of Concept Inventories for Introductory Computing Subjects. Trans. Comput. Educ., 10(2), 1-29.
Gous, I. G. P. & Roberts, J. (2014) Message in a Bottle: Reading from Paper Versus Reading on Screen in ODeL Settings. Mediterranean Journal of Social Sciences, 5(23), 2616-2626.
Gračanin, D., Matković, K. & Eltoweissy, M. (2005) Software visualization. Innovations in Systems and Software Engineering, 1(2), 221-230.

291
Gravemeijer, K. & Cobb, P. (2006) Design research from a learning design perspective. Educational design research, 17-51.
Greene, J. C., Caracelli, V. J. & Graham, W. F. (1989) Toward a conceptual framework for mixed-method evaluation designs. Educational evaluation and policy analysis, 11(3), 255-274.
Grissom, S., McNally, M. F. & Naps, T. (2003) Algorithm visualization in CS education: comparing levels of student engagement. Proceedings of the 2003 ACM symposium on Software visualization, 87-94.
Halland, K. (2011) Introduction to Programming I, Pretoria, Unisa.
Hansen, S., Narayanan, N. H. & Hegarty, M. (2002) Designing Educationally Effective Algorithm Visualizations. Journal of Visual Languages and Computing, 13(3), 291-317.
Hefer, E. (2013) Reading second language subtitles: A case study of Afrikaans viewers reading in Afrikaans and English. Perspectives, 21(1), 22.
Helminen, J. & Malmi, L. (2010) Jype – a program visualization and programming exercise tool for Python. Proceedings of the 5th international symposium on Software visualization, 153-162.
Henriksen, P. & Kölling, M. (2004) Greenfoot: Combining object visualisation with interaction. Companion to the 19th annual ACM SIGPLAN conference on Object-oriented programming systems, languages, and applications. ACM.
Herrington, J., McKenney, S., Reeves, T. & Oliver, R. (2007) Design-based research and doctoral students: Guidelines for preparing a dissertation proposal. Proceedings of World Conference on Educational Multimedia, Hypermedia and Telecommunications 2007, 4089-4097.
Hertz, M. & Ford, S. M. (2013) Investigating factors of student learning in introductory courses. Proceeding of the 44th ACM technical symposium on Computer science education, 195-200.
Hertz, M. & Jump, M. (2013) Trace-Based Teaching in Early Programming Courses. SIGCSE’13. Denver, Colorado, USA, ACM.
Hevner, A. & Chatterjee, S. (2010) Design Research in Information Systems Theory and Practice, New York Dordrecht Heidelberg London, Springer.
Hevner, A. R., March, S. T., Park, J. & Ram, S. (2004) Design science in information systems research. MIS quarterly, 28(1), 75-105.
Heydenrich, J. F. & Prinsloo, P. (2010) Revisiting the five generations of distance education: Quo vadis? Progressio: South-African Journal for Open and Distance Learning Practice, 32(1), 5-26.
Hoadley, C. M. (2004) Methodological Alignment in Design-Based Research. Educational Psychologist, 39(4), 203-212.
Hoc, J.-M. (1989) Do We Really Have Conditional Statements in Our Brains? In Studying the Novice Programmer edited by Soloway, E. & Sphorer, J. C., Lawrence Erlbaum:179-190.
Holvitie, J., Rajala, T., Haavisto, R., Kaila, E., Laakso, M.-J. & Salakoski, T. (2012) Breaking the Programming Language Barrier: Using Program Visualizations to Transfer Programming
292
Knowledge in One Programming Language to Another. 12th IEEE International Conference onAdvanced Learning Technologies (ICALT), 2012. IEEE.
Hughes, D. S. (2012) Introducing programming logic in a one-credit course. Proceedings of the 50th Annual Southeast Regional Conference, 48-52.
Hundhausen, C. D. & Brown, J. L. (2007) What You See Is What You Code: A "live" algorithm development and visualization environment for novice learners. J. Vis. Lang. Comput., 18(1), 22-47.
Hundhausen, C. D. & Douglas, S. (2000) Using visualizations to learn algorithms: should students construct their own, or view an expert's? Proceedings of 2000 IEEE International Symposium on Visual Languages, 21-28.
Hundhausen, C. D. & Douglas, S. A. (2002) Low-fidelity algorithm visualization. Journal of Visual Languages & Computing, 13(5), 449-470.
Hundhausen, C. D., Douglas, S. A. & Stasko, J. T. (2002) A meta-study of algorithm visualization effectiveness. Journal of Visual Languages & Computing, 13(3), 259-290.
Hung, J.-L. (2012) Trends of e-learning research from 2000 to 2008: Use of text mining and bibliometrics. British Journal of Educational Technology, 43(1), 5-16.
Hyönä, J. (2010) The use of eye movements in the study of multimedia learning. Learning and Instruction, 20(2), 172-176.
Ihantola, P., Ahoniemi, T., Karavirta, V. & Seppälä, O. (2010) Review of recent systems for automatic assessment of programming assignments. Proceedings of the 10th Koli Calling International Conference on Computing Education Research, 86-93.
Isbell, C. L., Stein, L. A., Cutler, R., Forbes, J., Fraser, L., Impagliazzo, J., Proulx, V., Russ, S., Thomas, R. & Xu, Y. (2010) (Re)defining computing curricula by (re)defining computing. SIGCSE Bull., 41(4), 195-207.
Isohanni, E. & Knobelsdorf, M. (2010) Behind the curtain: students' use of VIP after class. Proceedings of the Sixth International workshop on Computing Education research. Aarhus, Denmark, ACM.
Isohanni, E. & Knobelsdorf, M. (2011) Students' long-term engagement with the visualization tool VIP. Proceedings of the 11th Koli Calling International Conference on Computing Education Research. Koli, Finland, ACM.
Isohanni, E. & Knobelsdorf, M. (2013) Students’ Engagement with the Visualization Tool VIP in Light of Activity Theory. Tampere University of Technology. Department of Pervasive Computing, Tampere, Finland.
Jeffries, C., Lewis, R., Meed, J. & Merritt, R. (1990) A-Z of Open Learning, National Extension College.
Jenkins, T. (2002) On the difficulty of learning to program. Proceedings of the 3rd Annual Conference of the LTSN Centre for Information and Computer Sciences - Volume 4, 53-58.
293
Jimoyiannis, A. (2013) Using SOLO taxonomy to explore students' mental models of the programming variable and the assignment statement. Themes in Science and Technology Education, 4(2), pp. 53-74.
Johnson, R. B. & Christensen, L. (2004) Educational research: Quantitative, qualitative, and mixed approaches, Sage.
Johnson, R. B. & Onwuegbuzie, A. J. (2004) Mixed methods research: A research paradigm whose time has come. Educational researcher, 33(7), 14-26.
Jones, S. J. & Burnett, G. E. (2007) Spatial skills and navigation of source code. SIGCSE Bull., 39(3), 231-235.
Kaczmarczyk, L. C., Petrick, E. R., East, J. P. & Herman, G. L. (2010) Identifying student misconceptions of programming. Proceedings of the 41st ACM technical symposium on Computer science education, 107-111.
Kahney, H. (1989) What do Novice Programmers Know About Recursion? In Studying the Novice Programmer edited by Soloway, E. & Sphorer, J. C., Lawrence Erlbaum:209-228.
Kaila, E., Rajala, T., Haavisto, R., Holvitie, J., Laakso, M.-J. & Salakoski, T. (2011) Important features in program visualization. Proceedings of International Conference on Engineering Education, 21-26.
Kaila, E., Rajala, T., Laakso, M.-J. & Salakoski, T. (2009) Effects, Experiences and Feedback from Studies of a Program Visualization Tool. Informatics in Education, 8(1), 17-34.
Kaila, E., Rajala, T., Laakso, M.-J. & Salakoski, T. (2010) Effects of course-long use of a program visualization tool. Proceedings of the Twelfth Australasian Conference on Computing Education - Volume 103. Brisbane, Australia, Australian Computer Society, Inc.
Kannusmäki, O., Moreno, A., Myller, N. & Sutinen, E. (2004) What a Novice Wants: Students Using Program Visualization in Distance Programming Course. Conference Proceedings of the Third Program Visualization Workshop, 126-133.
Karavirta, V., Korhonen, A., Malmi, L. & Naps, T. (2010) A comprehensive taxonomy of algorithm animation languages. J. Vis. Lang. Comput., 21(1), 1-22.
Kelly, A. E. (2006) Quality criteria for design research. In Educational design research edited by Van Den Akker, J., Gravemeijer, K., McKenney, S. & Nieveen, N., London; New York, Routledge:107-118.
Kessler, C. M. & Anderson, J. R. (1989) Learning Flow of Control: Recursive and Iterative Procedures. In Studying the Novice Programmer edited by Soloway, E. & Sphorer, J. C., Lawrence Erlbaum:229-260.
Khalife, J. T. (2006) Threshold for the introduction of programming: Providing learners with a simple computer model. Proceedings of 28th International Conference on Information Technology Interfaces, 2006, 71-76.
Khuri, S. (2001) Designing effective algorithm visualizations. Proceedings of First International Program Visualization Workshop, 1-12.

294
Kieras, D. E. & Bovair, S. (1984) The role of a mental model in learning to operate a device. Cognitive science, 8(3), 255-273.
Kiesmüller, U. (2009) Diagnosing Learners’ Problem-Solving Strategies Using Learning Environments with Algorithmic Problems in Secondary Education. Trans. Comput. Educ., 9(3), 1-26.
Kilfoil, W. R. (2008) Determining Workload in relation to Credits and Notional Hours. Internal Report, Unisa.
Kinnunen, P. & Malmi, L. (2006) Why students drop out CS1 course? Proceedings of the second international workshop on Computing education research. ACM.
Kinnunen, P. & Malmi, L. (2008) CS minors in a CS1 course. Proceedings of the Fourth international Workshop on Computing Education Research, 79-90.
Kinnunen, P., McCartney, R., Murphy, L. & Thomas, L. (2007) Through the eyes of instructors: a phenomenographic investigation of student success. Proceedings of the third international workshop on Computing education research. Atlanta, Georgia, USA, ACM.
Knobelsdorf, M., Isohanni, E. & Tenenberg, J. (2012) The reasons might be different: why students and teachers do not use visualization tools. Proceedings of the 12th Koli Calling International Conference on Computing Education Research, 1-10.
Koifman, I., Shimshoni, I. & Tal, A. (2008) MAVIS: A multi-level algorithm visualization system within a collaborative distance learning environment. Journal of Visual Languages & Computing, 19(2), 182-202.
Kölling, M. (2008a) Greenfoot: a highly graphical ide for learning object-oriented programming. SIGCSE Bull., 40(3), 327-327.
Kölling, M. (2008b) Using BlueJ to Introduce Programming. In Reflections on the Teaching of Programming edited by, Springer Berlin / Heidelberg:98-115
Kölling, M., Quig, B., Patterson, A. & Rosenberg, J. (2003) The BlueJ system and its pedagogy. Computer Science Education, 13(4), 249-268.
Kollmansberger, S. (2010) Helping students build a mental model of computation. Proceedings of the fifteenth annual conference on Innovation and technology in computer science education, 128-131.
Krathwohl, D. R. (2002) A Revision of Bloom's Taxonomy: an Overview. THEORY INTO PRACTICE, 41(4), 54.
Krejcie, R. V. & Morgan, D. W. (1970) Determining sample size for research activities. Educational and Psychological Measurement (30), 607-610.
Kuechler, B., Vaishnavi, V. & William L. Kuechler, S. (n.d.) Design [Science] Research in IS: A Work in Progress. Available at: http://ais.site-ym.com/?page=DesignScienceResearc&hhSearchTerms=%22design+and+research%22 (accessed on 3 October 2013).
295
Kuhn, T. S. (1962/1996) The structure of scientific revolutions, Chicago, University of Chicago Press.
Kuittinen, M. & Sajaniemi, J. (2004) Teaching roles of variables in elementary programming courses. SIGCSE Bull., 36(3), 57-61.
Kumar, A. N. (2013) A Study of the Influence of Code-tracing Problems on Code-writing Skills. ITiCSE’13. Canterbury, England, UK., ACM.
Kurland, D. M., Pea, R. D., Clement, C. & Mawby, R. (1989) A Study of the Development of Programming Ability and Thinking Skills in High School Students. In Studying the Novice Programmer edited by Soloway, E. & Spohrer, J. C., Lawrence Erlbaum:83-112.
Laakso, M.-J., Myller, N. & Korhonen, A. (2009) Comparing Learning Performance of Students Using Algorithm Visualizations Collaboratively on Different Engagement Levels. Educational Technology & Society, 12(2), 267-282.
Laakso, M.-J., Rajala, T., Kaila, E. & Salakoski, T. (2008a) Effectiveness of Program Visualization: A Case Study with the ViLLE Tool. Journal of Information Technology Education, 7.
Laakso, M.-J., Rajala, T., Kaila, E. & Salakoski, T. (2008b) The impact of prior experience in using a visualization tool on learning to program. IADIS International Conference on Cognition and Exploratory Learning in Digital Age.
Lahtinen, E. (2006) Integrating the Use Of Visualizations to Teaching Programming. Methods, Materials and Tools for Programming Education.
Lahtinen, E. (2008) Students' individual differences in using visualizations: prospects of future research on program visualizations. Proceedings of the 8th International Conference on Computing Education Research. Koli, Finland, ACM.
Lahtinen, E., Ahoniemi, T. & Salo, A. (2007) Effectiveness of integrating program visualizations to a programming course. in Lister, R. & Simon (Eds.) Seventh Baltic Sea Conference on Computing Education Research (Koli Calling 2007). Koli National Park, Finland, Australian Computer Society, Inc.
Lahtinen, E., Ala-Mutka, K. & Järvinen, H.-M. (2005) A Study of the Difficulties of Novice Programmers. ITiCSE'05. Monte de Caparica, Portugal, ACM.
Lahtinen, E., Jarvinen, H.-M. & Melakoski-Vistbacka, S. (2007) Targeting program visualizations. SIGCSE Bull., 39(3), 256-260.
Lauer, T. (2006) Learner Interaction with Algorithm Visualizations: Viewing vs. Changing vs. Constructing. ITiCSE'06 11th Annual Conference on Innovation and Technology in Computer Science Education. Bologna, Italy, ACM.
Lauer, T. (2008) Reevaluating and refining the engagement taxonomy. SIGCSE Bull., 40(3), 355-355.
Leahy, W. & Sweller, J. (2004) Cognitive load and the imagination effect. Applied cognitive psychology, 18(7), 857-875.
Lee, A. S. (2004) Thinking about social theory and philosophy for information systems. Social theory and philosophy for Information Systems, 1-26.
296
Leedy, P. D. & Ormrod, J. E. (2005) Practical Research: Planning and Design, Upper Saddle River NJ, Prentice Hall.
Leung, S. T. (2006) Integrating visualization to make programming concepts concrete: dot net style. Proceedings of the 7th conference on Information technology education. Minneapolis, Minnesota, USA, ACM.
Lewin, T. (2013) Colleges Adapt Online Courses to Ease Burden. New York Times. 29 April 2013. Available at: http://www.nytimes.com/2013/04/30/education/colleges-adapt-online-courses-to-ease-burden.html?ref=technology&_r=1& (accessed on 1 May 2013).
Lincoln, Y. S., Lynham, S. A. & Guba, E. G. (2011) Paradigmatic controversies, contradictions, and emerging confluences, revisited. In The Sage handbook of qualitative research. Edited by Denzin, N. K. & Lincoln, Y. S., Thousand Oaks, Calif., Sage:97-128.
Linn, M. C. & Dalbey, J. (1989) Cognitive consequences of programming instruction. In Studying the novice programmer edited by Soloway, E. J. & Sphorer, J. C., Hillsdale, NJ, Lawrence Erlbaum:57-81.
Lister, R. (2007) The Neglected Middle Novice Programmer: Reading and Writing without Abstracting. 20th Annual Conference of the National Advisory Committee on Computing Qualifications. NACCQ, Port Nelson, New Zealand.
Lister, R. (2011) Concrete and other neo-piagetian forms of reasoning in the novice programmer. Proceedings of Australasian Computing Education Conference (ACE 2011) (Volume 114), 9-18.
Lister, R., Adams, E. S., Fitzgerald, S., Fone, W., Hamer, J., Lindholm, M., McCartney, R., Moström, J. E., Sanders, K., Seppälä, O., Simon, B. & Thomas, L. (2004) A multi-national study of reading and tracing skills in novice programmers. SIGCSE Bull., 36(4), 119-150.
Lister, R., Clear, T., Simon, Bouvier, D. J., Carter, P., Eckerdal, A., Jacková, J., Lopez, M., McCartney, R., Robbins, P., Seppälä, O. & Thompson, E. (2010) Naturally occurring data as research instrument: analyzing examination responses to study the novice programmer. SIGCSE Bull., 41(4), 156-173.
Lister, R., Corney, M. W., Curran, J., D'Souza, D., Fidge, C. J., Gluga, R., Hamilton, M., Harland, J., Hogan, J. & Kay, J. (2012) Toward a shared understanding of competency in programming: an invitation to the BABELnot Project. Proceedings of the 14th Australasian Computing Education Conference (ACE2012) (Vol. 123). Australian Computer Society.
Lister, R. & Edwards, J. (2010) Teaching Novice Computer Programmers: bringing the scholarly approach to Australia. A report on the BRACElet project. Available at: http://www.altc.edu.au/resource-teaching-novice-computer-programmersbringing-scholarly-approach-australia-report-bracelet- (accessed on 11 June 2013).
Lister, R., Fidge, C. & Teague, D. (2009) Further Evidence of a Relationship between Explaining, Tracing and Writing Skills in Introductory Programming. Proceedings of the 14th annual ACM SIGCSE Conference on Innovation and Technology in Computer Science Education. Paris, France, ACM.
297
Lister, R., Simon, B., Thompson, E., Whalley, J. & Prasad, C. (2006) Not seeing the forest for the trees: novice programmers and the SOLO taxonomy. SIGCSE Bull., 38(3), 118-122.
Lo, A. W. & Lee, V. (2013) Direct Negative Experience as a Means of Effective Learning: An Exploratory Study. Journal of Research in Innovative Teaching, 6(1), 18.
Lopez, M., Whalley, J., Robbins, P. & Lister, R. (2008) Relationships between reading, tracing and writing skills in introductory programming. Proceeding of the Fourth international Workshop on Computing Education Research. Sydney, Australia, ACM.
Lui, A. K., Kwan, R., Poon, M. & Cheung, Y. H. Y. (2004) Saving weak programming students: applying constructivism in a first programming course. SIGCSE Bull., 36(2), 72-76.
Ma, L., Ferguson, J., Roper, M., Ross, I. & Wood, M. (2008) Using cognitive conflict and visualisation to improve mental models held by novice programmers. ACM SIGCSE Bulletin, 40(1), 342-346.
Ma, L., Ferguson, J., Roper, M. & Wood, M. (2007) Investigating the viability of mental models held by novice programmers. ACM SIGCSE Bulletin, 39, 499-503.
Ma, L., Ferguson, J., Roper, M. & Wood, M. (2011) Investigating and improving the models of programming concepts held by novice programmers. Computer Science Education, 21(1), 57-80.
MacDonald, M., Dorn, B. & MacDonald, G. (2004) A Statistical Analysis of Student Performance in Online Computer Science Courses. SIGCSE'04. Norfolk, Virginia, USA, ACM.
Malan, D. J. (2009) Virtualizing Office Hours in CS 50. ITiCSE'09. Paris, France, ACM.
Malan, D. J. (2010) Reinventing CS50. Proceedings of the 41st ACM technical symposium on Computer science education, 152-156.
Maletic, J. I., Marcus, A. & Collard, M. L. (2002) A task oriented view of software visualization. Proceedings of First International Workshop on Visualizing Software for Understanding and Analysis, 32-40.
Mandinach, E. B. & Linn, M. C. (1986) The cognitive effects of computer learning environments. Journal of Educational Computing Research, 2(4), 411-427.
Manhartsberger, M. & Zellhofer, N. (2005) Eye tracking in usability research: What users really see. Usability Symposium, 198(2), 141-152.
Mannila, L. (2006) Progress reports and novices' understanding of program code. Proceedings of the 6th Baltic Sea conference on Computing education research: Koli Calling 2006, 27-31.
Martin, F. G. (2012) Will massive open online courses change how we teach? Commun. ACM, 55(8), 26-28.
Masie, E. (2009) Think piece: Defining 'e' in e-learning. The Knowledge Tree. Australian Flexible Learning Framework.
298
Matjila, D. S. & Pretorius, E. J. (2004) Bilingual and biliterate? An exploratory study of grade 8 reading skills in Setswana and English. Per Linguam: a Journal of Language Learning = Per Linguam: Tydskrif vir Taalaanleer, 20(1), 1-21.
Mayer, R. E. (1989) The Psychology of How Novices Learn to Program. In Studying the Novice Programmer edited by Soloway, E. & Sphorer, J. C., Hillsdale, NJ: Lawrence Erlbaum Associates:129-159.
Mayer, R. E. & Moreno, R. (2002) Animation as an Aid to Multimedia Learning. Educational Psychology Review, Vol. 14, No. 1, 14(1), 87-99.
Mayer, R. E. & Sims, V. K. (1994) For whom is a picture worth a thousand words? Extensions of a dual-coding theory of multimedia learning. Journal of educational psychology, 86(3), 389-401.
Mayer, R. E., Sobko, K. & Mautone, P. D. (2003) Social cues in multimedia learning: Role of speaker's voice. Journal of Educational Psychology, 95(2), 419.
Mbatha, B. T. & Naidoo, L. (2010) Problems hampering the collapse of distance in ODL. Progressio, 32(1), 170-184.
McCartney, R., Boustedt, J., Eckerdal, A., Moström, J. E., Sanders, K., Thomas, L. & Zander, C. (2009) Liminal spaces and learning computing. European Journal of Engineering Education, 34(4), 383-391.
McCartney, R., Moström, J., Sanders, K. & Seppälä, O. (2004) Questions, Annotations, and Institutions: observations from a study of novice programmers. 4th Finnish/Baltic Sea Conference on Computer Science Education. Koli, Finland.
McCauley, R., Fitzgerald, S., Lewandowski, G., Murphy, L., Simon, B., Thomas, L. & Zander, C. (2008) Debugging: a review of the literature from an educational perspective. Computer Science Education, 18(2), 67-92.
McCormick, R. (1997) Conceptual and procedural knowledge. International journal of technology and design education, 7(1-2), 141-159.
McCracken, M., Almstrum, V., Diaz, D., Guzdial, M., Hagan, D., Kolikant, Y. B.-D., Laxer, C., Thomas, L., Utting, I. & Wilusz, T. (2001) A multi-national, multi-institutional study of assessment of programming skills of first-year CS students. SIGCSE Bulletin, 33(4), 125-140.
McKenney, S., Nieveen, N. & Van Den Akker, J. (2006) Design research from a curriculum perspective. In Educational design research edited by Van Den Akker, J., Gravemeijer, K., Mckenney, S. & Nieveen, N., Routledge London:67-90.
McNally, M., Naps, T., Furcy, D., Grissom, S. & Trefftz, C. (2007) Supporting the rapid development of pedagogically effective algorithm visualizations. J. Comput. Sci. Coll., 23(1), 80-90.
Meisalo, V., Sutinen, E. & Torvinen, S. (2003) Choosing appropriate methods for evaluating and improving the learning process in distance programming courses. Proceedings of 33rd ASEE/IEEE Frontiers in Education Conference, T2B11-T2B16.

299
Meiselwitz, G. (2002) Using the Web to maintain the benefits of small class instrcution in large classes. Journal of Computing Sciences in Colleges, 2011.
Mertens, D. M. (2012) What comes first? The Paradigm or the Approach? Journal of Mixed Methods Research, 6(4), 255-257.
Meyer, J. H. & Land, R. A. Y. (2005) Threshold concepts and troublesome knowledge (2): Epistemological considerations and a conceptual framework for teaching and learning. Higher Education, 49, 373-388.
Miliszewska, I. & Tan, G. (2007) Befriending Computer Programming: A Proposed Approach to Teaching Introductory Programming. Issues in Informing Science and Information Technology, 4, 277-289.
Milne, I. & Rowe, G. (2002) Difficulties in Learning and Teaching Programming – Views of Students and Tutors. Education and Information Technologies, 7(1), 55-66.
Mingfong, J., Yam San, C. & Ek Ming, T. (2010) Unpacking the design process in design-based research. Proceedings of the 9th International Conference of the Learning Sciences - Volume 2. Chicago, Illinois, International Society of the Learning Sciences.
Moore, M. G. & Kearsley, G. (2011) Distance education: A systems view of online learning, Cengage Learning.
Mora, M., Gelman, O., Steenkamp, A. L. & Raisinghani, M. (2012) Research Methodologies, Innovations and Philosophies in Software Systems Engineering and Information Systems, Hershey Pau., IGI Global.
Moreno, A. (2008) Program animation activities in Moodle. ACM SIGCSE Bulletin, 40(1), 361-361.
Moreno, A. & Joy, M. S. (2007) Jeliot 3 in a Demanding Educational Setting. Electronic Notes in Theoretical Computer Science, 178(0), 51.
Morgan, A. (2013) 'Proof of concept': Beginning to use design-based research to improve science literacies for middle years learners. Australian Journal of Language and Literacy, The, 36(1), 3-16.
Morgan, D. L. (2007) Paradigms Lost and Pragmatism Regained: Methodological Implications of Combining Qualitative and Quantitative Methods. Journal of Mixed Methods Research, 1(1), 48-76.
Morgan, M., Sheard, J., Butler, M., Falkner, K., Simon & Weerasinghe, A. (2015) Teaching in First-Year ICT Education in Australia: Research and Practice. Conferences in Research and Practice in Information Technology (CRPIT) - Computing Education, Vol.160, 81-90.
Morra, S., Gobbo, C., Marini, Z. & Sheese, R. (2007) Cognitive development: neo-Piagetian perspectives, Psychology Press.
Mouton, J. (2001) How to succeed in your master's and doctoral studies: a South African guide and resource book, Pretoria, Van Schaik.
300
Murphy, C., Phung, D. & Kaiser, G. (2008) A Distance Learning Approach to Teaching eXtreme Programming. ITiCSE'08. Madrid, Spain, ACM.
Murphy, L., Fitzgerald, S., Lister, R. & McCauley, R. (2012) Ability to 'explain in plain english' linked to proficiency in computer-based programming. Proceedings of the ninth annual international conference on International computing education research, 111-118.
Murphy, L., Lewandowski, G., McCauley, R., Simon, B., Thomas, L. & Zander, C. (2008b) Debugging: the good, the bad, and the quirky -- a qualitative analysis of novices' strategies. SIGCSE Bull., 40(1), 163-167.
Murphy, L., McCauley, R. & Fitzgerald, S. (2012) 'Explain in plain English' questions: implications for teaching. Proceedings of the 43rd ACM technical symposium on Computer Science Education, 385-390.
Mutua, S., Wabwoba, F., Ogao, P., Anselmo, P. & Abenga, E. (2012) Classifying Program Visualization Tools to Facilitate Informed Choices: Teaching and Learning Computer Programming. International Journal of Computer Science and Telecommunications, 3(2), 42-48.
Myers, B. A. (1990) Taxonomies of visual programming and program visualization. Journal of Visual Languages & Computing, 1(1), 97-123.
Myller, N., Bednarik, R., Sutinen, E. & Ben-Ari, M. (2009) Extending the Engagement Taxonomy: Software Visualization and Collaborative Learning. Trans. Comput. Educ., 9(1), 1-27.
Naidoo, R. & Ranjeeth, S. (2007) Errors made by students in a computer programming course. Proceedings of the Computer Science and IT Education Conference.
Naps, T. (2005) JHAVE: supporting algorithm visualization. Computer Graphics and Applications, IEEE, 25(5), 49.
Naps, T., Cooper, S., Koldehofe, B., Leska, C., Rossling, G. R., Dann, W., Korhonen, A., Malmi, L., Rantakokko, J., Ross, R. J., Anderson, J., Fleischer, R., Kuittinen, M. & McNally, M. (2003a) Evaluating the educational impact of visualization. SIGCSE Bull., 35(4), 124-136.
Naps, T., Röβling, G., Almstrum, V., Dann, W., Fleischer, R., Hundhausen, C., Korhonen, A., Malmi, L., McNally, M., Rodger, S. & Velázquez-Iturbide, J. Á. (2003) Exploring the role of visualization and engagement in computer science education. ACM SIGCSE Bulletin, 35(2), 131-152.
Neal, L. & Miller, D. (2005) The basics of e-learning an excerpt from handbook of human factors in web design. eLearn Magazine. ACM.
Nel, C., Dreyer, C. & Klopper, M. (2004) An analysis of reading profiles of first-year students at Potchefstroom University: a cross-sectional study and a case study. South African Journal of Education, 24(1), 95-103.
Ng, S. C., Choy, S. O., Kwan, R. & Chan, S. F. (2005) A web-based environment to improve teaching and learning of computer programming in distance education. Lecture notes in computer science, 279-290.
301
Nielsen, J. (1994). Usability inspection methods. In Conference companion on Human factors in computing systems ACM, 413-414.
Nikander, J., Korhonen, A., Seppälä, O., Karavirta, V., Silvasti, P. & Malmi, L. (2004) Visual algorithm simulation exercise system with automatic assessment: TRAKLA2. Informatics in Education-An International Journal, (Vol 3_2), 267-288.
Norvell, T. S. & Bruce-Lockhart, M. P. (2004) Teaching computer programming with program animation. Canadian Conference on Computer and Software Engineering Education. Calgary, Alberta.
Nyalungu, I.V. ([email protected]) (20 March 2015) RE: Pass rate for COS1511 [DIA Task Ref No: MAR15Q34] Distinctions please [DIA Task Ref No: MAR15Q50], E-mail to Schoeman, M. A. ([email protected]).
Oates, B. J. (2006) Researching Information Systems and Computing, London, SAGE.
Oh, E. & Reeves, T. C. (2010) The implications of the differences between design research and instructional systems design for educational technology researchers and practitioners. Educational Media International, 47(4), 263-275.
Ozcelik, E., Arslan-Ari, I. & Cagiltay, K. (2010) Why does signaling enhance multimedia learning? Evidence from eye movements. Computers in Human Behavior, 26(1), 110.
Palumbo, D. B. (1990) Programming language/problem-solving research: A review of relevant issues. Review of Educational Research, 60(1), 65-89.
Pane, J. F., Ratanamahatana, C. A. & Myers, B. A. (2001) Studying the language and structure in non-programmers' solutions to programming problems. International Journal of Human-Computer Studies, 54(2), 237-264.
Parsons, D. & Haden, P. (2006) Parson's programming puzzles: a fun and effective learning tool for first programming courses. Proceedings of the 8th Australasian Conference on Computing Education - Volume 52, 157-163.
Patton, M. Q. (1990) Qualitative evaluation and research methods, London, SAGE.
Pears, A., East, P., McCartney, R., Ratcliffe, M. B., Stamouli, I., Berglund, A., Kinnunen, P., Moström, J.-E., Schulte, C. & Eckerdal, A. (2007) What's the problem? Teachers' experience of student learning successes and failures. Proceedings of the Seventh Baltic Sea Conference on Computing Education Research-Volume 88. Australian Computer Society, Inc.
Pears, A., Seidman, S., Eney, C., Kinnunen, P. & Malmi, L. (2005) Constructing a core literature for computing education research. ACM SIGCSE Bulletin, 37(4), 152-161.
Pears, A., Seidman, S., Malmi, L., Mannila, L., Adams, E., Bennedsen, J., Devlin, M. & Paterson, J. (2007) A survey of literature on the teaching of introductory programming. ACM SIGCSE Bulletin, 39(4), 204-223.
Perkins, D. N., Hancock, C., Hobbs, R., Martin, F. & Simmons, R. (1989) Conditions of Learning in Novice Programmers. In Studying the Novice Programmer edited by Soloway, E. & Sphorer, J. C., Hillsdale, New Jersey, Lawrence Erlbaum Associates, Inc.:261-279.
302
Pernice, K. & Nielsen, J. (2009) How to conduct eye-tracking studies. Available at: http://www.nngroup.com/reports/how-to-conduct-eyetracking-studies/ (accessed on 9 August 2013).
Petre, M., Blackwell, A. F. & Green, T. R. G. (1998) Cognitive Questions in Software Visualisation. In Software Visualization: Programming as a Multi-Media Experience edited by Stasko, J., J. Domingue, Price, B. & Brown, M., MIT Press:453-480.
Petre, M. & Quincey, E. D. (2006) A gentle overview of software visualisation. PPIG Newsletter – September 2006.
Philpott, A., Clear, T. & Whalley, J. (2009) Understanding student performance on an algorithm simulation task: implications for guided learning. SIGCSE Bull., 41(1), 408-412.
Philpott, A., Robbins, P. & Whalley, J. L. (2007) Assessing the Steps on the Road to Relational Thinking. IN Mann, S. & Bridgeman, N. (Eds.) The 20th Annual Conference of the National Advisory Committee on Computing Qualifications. Nelson NZ.
Piaget, J. & Inhelder, B. R. (1969) The psychology of the child, ,New York, Basic Books.
Pillay, N. & Jugoo, V. R. (2005) An investigation into student characteristics affecting novice programming performance. ACM SIGCSE Bulletin, 37(4), 107-110.
Piteira, M. & Costa, C. (2012) Computer programming and novice programmers. Proceedings of the Workshop on Information Systems and Design of Communication, 51-53.
Plomp, T. & Nieveen, N. (2009) Educational design research: An introduction., Enschede, the Netherlands, Netherlands institute for curriculum development.
Polya, G. (1957) How to solve it: A new aspect of mathematical method, Princeton University Press.
Ponterotto, J. G. (2005) Qualitative Research in Counseling Psychology: A Primer on Research Paradigms and Philosophy of Science. Journal of Counseling Psychology, 52(2), 126-136.
Poole, A. & Ball, L. J. (n.d.) Eye Tracking in Human-Computer Interaction and Usability Research: Current Status and Future Prospects. Available at: www.alexpoole.info/blog/wp-content/./PooleBall-EyeTracking.pdf (accessed on 8 May 2013).
Powers, K., Ecott, S. & Hirshfield, L. M. (2007) Through the looking glass: teaching CS0 with Alice. SIGCSE Bull., 39(1), 213-217.
Pretorius, E. J. (2002) Reading ability and academic performance in South Africa: Are we fiddling while Rome is burning? Language Matters, 33(1), 169-196.
Pretorius, E. J. & Ribbens, R. (2005) Reading in a disadvantaged high school: Issues of accomplishment, assessment and accountability. South African Journal of Education, 25(3), 139-147.
Price, B. A., Baecker, R. M. & Small, I. S. (1993) A principled taxonomy of software visualization. Journal of Visual Languages and Computing, 4(3), 211-266.
Ragonis, N. & Ben-Ari, M. (2005) On understanding the statics and dynamics of object-oriented programs. SIGCSE Bull., 37(1), 226-230.
303
Rajala, T., Kaila, E., Laakso, M.-J. & Salakoski, T. (2009) Effects of Collaboration in Program Visualization. Technology Enhanced Learning Conference 2009 (TELearn 2009).
Rajala, T., Laakso, M.-J., Kaila, E. & Salakoski, T. (2007) VILLE – A Language-Independent Program Visualization Tool. in Lister, R. & Simon (Eds.) Seventh Baltic Sea Conference on Computing Education Research (Koli Calling 2007). Koli National Park, Finland, Australian Computer Society, Inc.
Rajala, T., Laakso, M.-J., Kaila, E. & Salakoski, T. (2008) Effectiveness of Program Visualization: A Case Study with the ViLLE Tool. Journal of Information Technology Education: Innovations in Practice, 715-32.
Rasch, G. (1993) Probabilistic models for some intelligence and attainment tests, Chicago, ERIC.
Rayner, K. (2009) Eye movements and attention in reading, scene perception, and visual search. The quarterly journal of experimental psychology, 62(8), 1457-1506.
Rayner, K. & Pollatsek, A. (2006) Eye-movement Control in Reading. In Handbook of Psycholinguistics edited by Traxler, M. J. & Gernsbacher, M. A., 2 ed. San Diego, Elsevier:613-657.
Reeves, T. C. (2000) Socially Responsible Educational Technology Research. Educational Technology, 40(6), 19-28.
Reeves, T. C. (2006) Design research from a technology perspective. Educational design research, 1(3), 52-66.
Reichle, E. D., Reineberg, A. E. & Schooler, J. W. (2010) Eye movements during mindless reading. Psychological Science, 21(9), 1300-1310.
Reigeluth, C. M. & Frick, T. W. (1999) Formative research: A methodology for creating and improving design theories. Instructional-design theories and models, 2, 633-651.
Reiss, S. P. (2005) The Paradox of Software Visualization. Proceedings of the 3rd IEEE International Workshop on Visualizing Software for Understanding and Analysis, 59-63.
Richey, R. C., Klein, J. D. & Nelson, W. A. (2004) Developmental research: Studies of instructional design and development. Handbook of research for educational communications and technology, Bloomington, Association for Educational Communications & Technology, 1099-1130.
Rickheit, G., Schnotz, W. & Strohner, H. (1985) The Concept of Inference in Discourse Comprehension. Advances in Psychology, 293-49.
Robbins, S. (2008) A three pronged approach to teaching undergraduate operating systems. SIGOPS Oper. Syst. Rev., 42(6), 93-100.
Roberts, J. J. & Gous, I. G. P. (2014) ODEL Open and Distance Education and listening: The need for metacognitive listening strategies. Journal of Educational and Social Research, 4(3), 63-70.
Robins, A. (2010) Learning edge momentum: a new account of outcomes in CS1. Computer Science Education, 20(1), 37 - 71.
304
Robins, A., Rountree, J. & Rountree, N. (2003) Learning and Teaching Programming: A Review and Discussion. Computer Science Education, 13(2), 137 - 172.
Roman, G.-C. & Cox, K. C. (1993) A Taxonomy of Program Visualization Systems. Computer, 26(12), 11-24.
Rountree, J. & Rountree, N. (2009) Issues regarding threshold concepts in computer science. Proceedings of the Eleventh Australasian Conference on Computing Education - Volume 95, 139-146.
Rountree, J., Rountree, N., Robins, A. & Hannah, R. (2005) Observations of Student Competency in a CS1 Course. Australasian Computing Education Conference 2005. Newcastle, Australia, Australian Computer Society, Inc.
Röβling, G. (2010) A Family of Tools for Supporting the Learning of Programming. Algorithms 2010, (3), 168-182.
Röβling, G. & Freisleben, B. (2002) ANIMAL: A system for supporting multiple roles in algorithm animation. Journal of Visual Languages & Computing, 13(3), 341-354.
Röβling, G., Malmi, L., Clancy, M., Joy, M., Kerren, A., Korhonen, A., Moreno, A., Naps, T., Oechsle, R., Radenski, A., Ross, R. J. & Velazquez-Iturbide, J. Á. (2008) Enhancing learning management systems to better support computer science education. Inroads SIGCSE Bulletin, 40(4), 142-166.
Röβling, G. & Naps, T. L. (2002) A testbed for pedagogical requirements in algorithm visualizations. ACM SIGCSE Bulletin, 34(3), 96-100.
Salakoski, T., Korhonen, A., Qiu, X., Grandell, L., Laakso, M.-J. & Malmi, L. (2005) Multi-perspective study of novice learners adopting the visual algorithm simulation exercise system TRAKLA2. Informatics in Education-An International Journal, (Vol 4_1), 49-68.
Samurçay, R. (1989) The concept of variable in programming: Its meaning and use in problem-solving by novice programmers. In Studying the novice programmer edited by Soloway, E. & Sphorer, J. C., Lawrence Erlbaum:161-178.
Sanders, D. & Dorn, B. (2003) Jeroo: a tool for introducing object-oriented programming. SIGCSE Bull., 35(1), 201-204.
Saraiya, P., Shaffer, C. A., McCrickard, D. S. & North, C. (2004) Effective features of algorithm visualizations. SIGCSE Bull., 36(1), 382-386.
Scaffolding (2003) Scaffolding Research in Computer Scence Education. Available at: http://depts.washington.edu/srcse/ (accessed on 21 October 2010).
Schoeman, M., Gelderblom, H. & Muller, H. (2013) Investigating the Effect of Program Visualization on Introductory Programming in a Distance Learning Environment. African Journal of Research in Mathematics, Science and Technology Education, 17(1-2), 139-151.
Schoeman, M., Gelderblom, H. & Smith, E. (2012) A tutorial to teach tracing to first-year
programming students. Progressio, 34(3), 59-80.

305
Schulte, C. & Bennedsen, J. (2006) What do teachers teach in introductory programming? Proceedings of the second international workshop on Computing education research, 17-28.
Scott, I., Yeld, N. & Hendry, J. (2007) Higher Education Monitor: A Case for Improving Teaching and Learning in South African Higher Education. Pretoria, The Council on Higher Education.
Sensalire, M., Ogao, P. & Telea, A. (2008) Classifying desirable features of software visualization tools for corrective maintenance. Proceedings of the 4th ACM symposium on Software visualization. ACM.
Sfard, A. (1991) On the dual nature of mathematical conceptions: Reflections on processes and objects as different sides of the same coin. Educational studies in mathematics, 22(1), 1-36.
Shaffer, C. A., Akbar, M., Alon, A. J. D., Stewart, M. & Edwards, S. H. (2011) Getting algorithm visualizations into the classroom. Proceedings of the 42nd ACM technical symposium on Computer science education, 129-134.
Shaffer, C. A., Cooper, M. & Edwards, S. H. (2007) Algorithm visualization: a report on the state of the field. ACM SIGCSE Bulletin, 39(1), 150-154.
Shaffer, C. A., Cooper, M. L., Alon, A. J. D., Akbar, M., Stewart, M., Ponce, S. & Edwards, S. H. (2010) Algorithm visualization: The state of the field. ACM Transactions on Computing Education (TOCE), 10(3), 1-22.
Sheard, J., Carbone, A., Lister, R., Simon, B., Thompson, E. & Whalley, J. L. (2008) Going SOLO to Assess Novice Programmers. ITiCSE'08. Madrid, Spain, ACM.
Sheard, J., Morgan, M., Butler, M., Falkner, K., Weerasinghe, A. & Cook, B. (2014) Experiences of first-year students in ICT courses: good teaching practices. Monash University (Lead).
Sheard, J., Simon, Carbone, A., Chinn, D., Laakso, M.-J., Clear, T., Raadt, M. D., D'Souza, D., Harland, J., Lister, R., Philpott, A. & Warburton, G. (2011) Exploring programming assessment instruments: a classification scheme for examination questions. Proceedings of the seventh international workshop on Computing education research, 33-38.
Sheard, J., Simon, S., Hamilton, M. & Lonnberg, J. (2009) Analysis of research into the teaching and learning of programming. Proceedings of the fifth international workshop on Computing education research workshop. Berkeley, CA, USA, ACM.
Simon (2011) Assignment and sequence: why some students can't recognise a simple swap. Proceedings of the 11th Koli Calling International Conference on Computing Education Research, 10-15.
Simon, Chinn, D., Raadt, M. D., Philpott, A., Sheard, J., Laakso, M.-J., D'souza, D., Skene, J., Carbone, A., Clear, T., Lister, R. & Warburton, G. (2012) Introductory programming: examining the exams. Proceedings of the Fourteenth Australasian Computing Education Conference - Volume 123, 61-70.
Simon, Lopez, M., Sutton, K. & Clear, T. (2009) Surely we Must Learn to Read before We Learn to Write! IN Clear, M. H. A. T. (Ed.) Eleventh Australasian Computing Education Conference (ACE2009). Wellington, New Zealand, Australian Computer Society, Inc.
306
Simon & Snowdon, S. (2011) Explaining program code: giving students the answer helps - but only just. Proceedings of the seventh international workshop on Computing education research. Providence, Rhode Island, USA, ACM.
Simon, B., Lister, R. & Fincher, S. (2006) Multi-institutional computer science education research: A review of recent studies of novice understanding. Frontiers in Education Conference, 36th Annual. IEEE.
Simon, H. A. (1969/1981) The sciences of the artificial, Cambridge, MA, London, MIT Press.
Simon, S., Carbone, A., Raadt, M. D., Lister, R., Hamilton, M. & Sheard, J. (2008) Classifying computing education papers: process and results. Proceeding of the Fourth international Workshop on Computing Education Research. Sydney, Australia, ACM.
Soloway, E. (1986) Learning to program = learning to construct mechanisms and explanations. Communications of the ACM, 29(9), 850-858.
Soloway, E., Bonar, J. & Ehrlich, K. (1989) Cognitive Strategies and Looping Constructs: An Empirical Study. In Studying the Novice Programmer edited by Soloway, E. & Sphorer, J. C., Lawrence Erlbaum:191-198.
Soloway, E. & Spohrer, J. C. (1989) Studying the novice programmer, Lawrence Erlbaum Hillsdale, NJ.
Sonnekus, I. P., Louw, W. & Wilson, H. (2006) Emergent learner support at University of South Africa: An informal report. Progressio, 28(1&2), 44-53.
Sorva, J. (2008) The same but different students' understandings of primitive and object variables. Proceedings of the 8th International Conference on Computing Education Research, 5-15.
Sorva, J. (2010) Reflections on threshold concepts in computer programming and beyond. Proceedings of the 10th Koli Calling International Conference on Computing Education Research, 21-30.
Sorva, J. (2013) Notional machines and introductory programming education. ACM Transactions on Computing Education (TOCE), 13(2), 8.
Sorva, J., Karavirta, V. & Korhonen, A. (2007) Roles of variables in teaching. Journal of Information Technology Education, 6(2007), 407-423.
Sorva, J., Karavirta, V. & Malmi, L. (2013) A Review of Generic Program Visualization Systems for Introductory Programming Education. Trans. Comput. Educ., 13(4), 1-64.
Sorva, J., Lönnberg, J. & Malmi, L. (2013) Students' ways of experiencing visual program simulation. Computer Science Education, 23(3), 207-238.
Spohrer, J. C. & Soloway, E. (1989) Novice Mistakes: Are the Folk Wisdoms Correct? In Studying the Novice Programmer edited by Soloway, E. & Sphorer, J. C., Lawrence Erlbaum:401-416.
Spohrer, J. C., Soloway, E. & Pope, E. (1989) A goal/plan analysis of buggy Pascal programs. In Studying the Novice Programmer edited by Soloway, E. & Spohrer, J. C., Lawrence Erlbaum:355-399.

307
Stasko, J., Badre, A. & Lewis, C. (1993) Do algorithm animations assist learning? an empirical study and analysis. Proceedings of the INTERACT '93 and CHI '93 Conference on Human Factors in Computing Systems, 61-66.
Stasko, J. T. & Patterson, C. (1992) Understanding and characterizing software visualization systems. Proceedings of the 1992 IEEE Workshop on Visual Languages, 3-10.
Stein, J. & Walsh, V. (1997) To see but not to read; the magnocellular theory of dyslexia. Trends in neurosciences, 20(4), 147-152.
Strategic Planning 2010-2015. (2010) in Department of Higher Education and Training, R. S.-A. (Ed.).
Sweller, J., Van Merriënboer, J. J. G. & Paas, F. G. W. C. (1998) Cognitive Architecture and Instructional Design. Educational Psychology Review, 10(3), 251-296.
Tabbers, H. K., Martens, R. L. & Merriënboer, J. J. G. (2004) Multimedia instructions and cognitive load theory: Effects of modality and cueing. British Journal of Educational Psychology, 74(1), 71-81.
Tait, H. & Entwistle, N. (1996) Identifying students at risk through ineffective study strategies. Higher Education, 31(1), 97-116.
Tan, P.-H., Ting, C.-Y. & Ling, S.-W. (2009) Learning Difficulties in Programming Courses: Undergraduates' Perspective and Perception. Proceedings of the 2009 International Conference on Computer Technology and Development - Volume 01, 42-46.
Tashakkori, A. & Teddlie, C. (2010) Sage handbook of mixed methods in social & behavioral research, Sage.
Taylor, J. C. (2001) Fifth generation distance education. Instructional Science and Technology, 4(1), 1-14.
Taylor, M. & Pountney, D. (2009) Animation as an Aid for Higher Education Computing Teaching. In Transactions on Edutainment edited by Pan, Z. & Al., E., Berlin Heidelberg, Springer-Verlag:203–218.
Teague, D. M., Corney, M. W., Ahadi, A. & Lister, R. (2012) Swapping as the" Hello World" of relational reasoning: replications, reflections and extensions. Proceedings of Conferences in Research and Practice in Information Technology (CRPIT) (Vol. 123). Australian Computer Society, Inc.
Teague, D. M., Corney, M. W., Ahadi, A. & Lister, R. (2013) A qualitative think aloud study of the early Neo-Piagetian stages of reasoning in novice programmers. Proceedings of 15th Australasian Computing Education Conference, 87-95.
Teague, D. M., Corney, M. W., Fidge, C. J., Roggenkamp, M. G., Ahadi, A. & Lister, R. (2012) Using neo-Piagetian theory, formative in-Class tests and think alouds to better understand student thinking: a preliminary report on computer programming. Proceedings of 2012 Australasian Association for Engineering Education (AAEE) Annual Conference.

308
Terre Blanche, M. J., Durrheim, K. & Painter, D. (Eds.) (2006) Research in practice: Applied methods for the social sciences, Cape Town, UCT Press.
Tew, A. E. & Guzdial, M. (2010) Developing a validated assessment of fundamental CS1 concepts. Proceedings of the 41st ACM technical symposium on Computer science education, 97-101.
Thomas, L., Ratcliffe, M. & Thomasson, B. (2004) Scaffolding with Object Diagrams in First Year Programming Classes: Some Unexpected Results. SIGCSE Bull., 36(1), 250-254.
Thompson, E. (2010) Using the Principles of Variation to Create Code Writing Problem Sets. 11 th Annual Conference of the Subject Centre for Information and Computer Sciences, 11-16.
Thompson, E., Luxton-Reilly, A., Whalley, J. L., Hu, M. & Robbins, P. (2008) Bloom’s Taxonomy for CS Assessment. Tenth Australasian Computing Education Conference (ACE2008). Wollongong, Australia, Australian Computer Society, Inc.
Thompson, E., Whalley, J., Lister, R. & Simon, B. (2006) Code Classification as a Learning and Assessment Exercise for Novice Programmers. 19th Annual Conference of the National Advisory Committee on Computing Qualifications (NACCQ 2006). Wellington, New Zealand.
Tsai, C.-W. (2012) An effective online teaching method: the combination of collaborative learning with initiation and self-regulation learning with feedback. Behaviour & Information Technology, 1-12.
Tsai, C.-W., Shen, P.-D. & Tsai, M.-C. (2011) Developing an appropriate design of blended learning with web-enabled self-regulated learning to enhance students' learning and thoughts regarding online learning. Behaviour & Information Technology, 30(2), 261-271.
Tversky, B., Morrison, J. B. & Betrancourt, M. (2002) Animation: can it facilitate? International journal of human-computer studies, 57(4), 247-262.
Unesco Open and Distance Learning: Prospects and Policy Considerations. (1997), United Nations Educational, Scientific and Cultural Organisation (UNESCO).
Unisa at a Glance 2012. (2012) Available at: http://www.unisa.ac.za/Default.asp?Cmd=ViewContent&ContentID=95478 (accessed on 29 April 2013).
Unisa at a Glance 2013. (2013) Available at: http://www.unisa.ac.za/media/PDFflips/UnisaGlance2013/index.html (accessed on 19 March 2015).
Unisa Calendar Part 7, (2010) Pretoria, Unisa.
Unisa Online FAQ. Available at: http://www.unisa.ac.za/Default.asp?Cmd=ViewContent&ContentID=19366 (accessed on 8 November 2013).
UNISA Open Distance Learning Policy. (2008) Pretoria, South-Africa, Unisa.
309
Urquiza-Fuentes, J. & Velázquez-Iturbide, J. Á. (2007) An Evaluation of the Effortless Approach to Build Algorithm Animations with WinHIPE. Electronic Notes in Theoretical Computer Science, 178, 3-13.
Urquiza-Fuentes, J. & Velázquez-Iturbide, J. Á. (2009a) Pedagogical Effectiveness of Engagement Levels – A Survey of Successful Experiences. Electronic Notes in Theoretical Computer Science, 224(0), 169-178.
Urquiza-Fuentes, J. & Velázquez-Iturbide, J. Á. (2009b) A Survey of Successful Evaluations of Program Visualization and Algorithm Animation Systems. Trans. Comput. Educ., 9(2), 1-21.
Urquiza-Fuentes, J. & Velázquez-Iturbide, J. Á. (2012a) Comparing the effectiveness of different educational uses of program animations. Proceedings of the 17th ACM annual conference on Innovation and technology in computer science education, 174-179.
Urquiza-Fuentes, J. & Velázquez-Iturbide, J. Á. (2012b) A Long-Term Evaluation of Educational Animations of Functional Programs. Advanced Learning Technologies (ICALT), 2012 IEEE 12th International Conference on. IEEE.
Urquiza-Fuentes, J. & Velázquez-Iturbide, J. Á. (2013) Toward the effective use of educational program animations: The roles of student's engagement and topic complexity. Comput. Educ., 67, 178-192.
Ury, G. (2005) A Longitudinal Study Comparing Undergraduate Student Performance in traditional courses to the performance in online course delivery. The Information Systems Education Journal, 3(20), 3-9.
Vagianou, E. (2006) Program working storage: a beginner's model. Proceedings of the 6th Baltic Sea conference on Computing education research: Koli Calling 2006, 69-76.
Vainio, V. & Sajaniemi, J. (2007) Factors in novice programmers' poor tracing skills. SIGCSE Bull., 39(3), 236-240.
Vaishnavi, V. & Keuchler, W. (2004) Design research in information systems. Available at: http://desrist.org/design-research-in-information-systems/ (accessed on 23 April 2013).
Valentine, D. W. (2004) CS educational research: a meta-analysis of SIGCSE technical symposium proceedings. SIGCSE Bull., 36(1), 255-259.
Van Den Akker, J. (1999) Principles and methods of development research. In Design approaches and tools in education and training edited by Van Den Akker, J., Dordrecht, Kluwer Academic Publishers:1-14.
Van Den Akker, J., Gravemeijer, K., McKenney, S. & Nieveen, N. (2006) Educational design research, London, New York, Routledge.
Van Zyl, D. ([email protected]). (15 March 2015) RE: Pass rate for COS1511 [DIA Task Ref No: MAR15Q34], E-mail to Schoeman, M. A. ([email protected]).
Venables, A., Tan, G. & Lister, R. (2009) A closer look at tracing, explaining and code writing skills in the novice programmer. Proceedings of the fifth international workshop on Computing education research workshop. Berkeley, CA, USA, ACM.

310
Ventura Jr, P. R. (2005) Identifying predictors of success for an objects-first CS1. Computer Science Education, 223-243.
Vihavainen, A., Paksula, M. & Luukkainen, M. (2011) Extreme apprenticeship method in teaching programming for beginners. Proceedings of the 42nd ACM technical symposium on Computer science education, 93-98.
Virtanen, A. T., Lahtinen, E. & Järvinen, H.-M. (2005) VIP, a Visual Interpreter for Learning Introductory Programming with C++. IN Salakoski, T. (Ed.) Koli Calling 2005 Conference on Computer Science Education. Koli, Finland.
Wahyuni, D. (2012) The Research Design Maze: Understanding Paradigms, Cases, Methods and Methodologies. Journal of Applied Management Accounting Research, 10(1), 69-80.
Wang, F. & Hannafin, M. J. (2005) Design-based research and technology-enhanced learning environments. Educational Technology Research & Development, 53(4), 5-23.
Wang, P., Bednarik, R. & Moreno, A. (2012) During automatic program animation, explanations after animations have greater impact than before animations. Proceedings of the 12th Koli Calling International Conference on Computing Education Research, 100-109.
Watson, C. & Li, F. W. B. (2014) Failure rates in introductory programming revisited. Proceedings of the 2014 conference on Innovation & technology in computer science education. Uppsala, Sweden, ACM.
Watson, C., Li, F. W. B. & Godwin, J. L. (2014) No tests required: comparing traditional and dynamic predictors of programming success. Proceedings of the 45th ACM technical symposium on Computer science education. ACM.
Whalley, J. (2006) CSEd Research Instrument Design: the Localisation Problem. 19th Annual Conference of the National Advisory Committee on Computing Qualifications (NACCQ 2006). Wellington, New Zealand.
Whalley, J. & Clear, T. (2007) The Many Ways of the BRACElet Project. Bulletin of Applied Computing and Information Technology, 5(1), 17.
Whalley, J., Clear, T., Robbins, P. & Thompson, E. (2011) Salient elements in novice solutions to code writing problems. 13th Australasian Computing Education Conference (ACE 2011) (vol.114), 37 - 46.
Whalley, J. & Lister, R. (2009) The BRACElet 2009.1 (Wellington) Specification. IN Hamilton, M. & Clear, T. (Eds.) Eleventh Australasian Computing Education Conference (ACE2009). Wellington, New Zealand, Australian Computer Society, Inc.
Whalley, J., Lister, R., Thompson, E., Clear, T., Robbins, P., Kumar, P. K. A. & Prasad, C. (2006) An Australasian Study of Reading and Comprehension Skills in Novice Programmers, using the Bloom and SOLO Taxonomies. IN Tolhurst, D. & Mann, S. (Eds.) Eighth Australasian Computing Education Conference (ACE2006). Hobart, Tasmania, Australia, Australian Computer Society, Inc.

311
Whalley, J., Prasad, C. & Kumar, P. K. A. (2007) Decoding Doodles: Novice Programmers and Their Annotations. IN Mann, S. & Simon (Eds.) Ninth Australian Computing Education Conference (ACE2007). Ballata, Victoria, Australia, Australian Computer Society, Inc.
Whalley, J. & Robbins, P. (2007) Report on the Fourth BRACElet Workshop. Bulletin of Applied Computing and Information Technology, 2010(1), 7.
White, G. & Sivitanides, M. (2003) An empirical investigation of the relationship between success in mathematics and visual programming courses. Journal of Information Systems Education, 14(4), 409-416.
Wick, M. R. (2007) Bridging the conceptual gap: assessing the impact on student attitudes toward programming. SIGCSE Bull., 39(1), 509-513.
Wiedenbeck, S. (2005) Factors affecting the success of non-majors in learning to program. Proceedings of the first international workshop on Computing education research. Seattle, WA, USA, ACM.
Wilson, B. C. & Shrock, S. (2001) Contributing to success in an introductory computer science course: a study of twelve factors. ACM SIGCSE Bulletin. ACM.
Winslow, L. E. (1996) Programming pedagogy – A psychological overview. ACM SIGCSE Bulletin, 28(3), 17-22.
Wouters, P., Paas, F. & Merriënboer, J. J. G. V. (2008) How to Optimize Learning From Animated Models: A Review of Guidelines Based on Cognitive Load. Review of Educational Research, 78(3), 645-675.
Xu, S., Chen, X. & Liu, D. (2009) Classifying software visualization tools using the Bloom's taxonomy of cognitive domain. Conference Proceedings of Canadian Conference on Electrical and Computer Engineering, 2009. CCECE'09., 13-18.
Yeh, C. L., Greyling, J. H. & Cilliers, C. B. (2006) A framework proposal for algorithm animation systems. Proceedings of the 2006 annual research conference of the South African institute of computer scientists and information technologists on IT research in developing countries. Somerset West, South Africa, South African Institute for Computer Scientists and Information Technologists.
Zhang, X. (2010) Assessing students structured programming skills with Java: The blue, berry and blueberry assignment. Journal of Information Technology Education (9), 9.
Zuber-Skerrit, O. (1992) Action Research in Higher Education, London, Kogan Page.

312
Appendix A Ethical clearance
Ms. MA Schoeman School of Computing UNISA Pretoria
2012-02-16
Permission to conduct research project 022/MS/2012
The request for ethical approval for your PhD research project entitled “An interactive tutorial to teach tracing to first-year ODL students” refers. The College of Science, Engineering and Technology’s (CSET) Research and Ethics Committee (CREC) has considered the relevant parts of the studies relating to the abovementioned research project and research methodology and is pleased to inform you that ethical clearance is granted for your study as set out in your proposal and application for ethical clearance. Therefore, involved parties may also consider ethics approval as granted. However, the permission granted must not be misconstrued as constituting an instruction from the CSET Executive or the CSET CREC that sampled interviewees (if applicable) are compelled to take part in the research project. All interviewees retain their individual right to decide whether to participate or not. We trust that the research will be undertaken in a manner that is respectful of the rights and integrity of those who volunteer to participate, as stipulated in the UNISA Research Ethics policy. The policy can be found at the following URL: http://cm.unisa.ac.za/contents/departments/res_policies/docs/ResearchEthicsPolicy_apprvCounc_21Sept07.pdf Please note that if you subsequently do a follow-up study that requires the use of a different research instrument, you will have to submit an addendum to this application, explaining the purpose of the follow- up study and attach the new instrument along with a comprehensive information document and consent form. Yours sincerely
Chair: School of Computing Ethics Sub-Committee
University of South Africa College of Science, Engineering and Technology
Preller Street, Muckleneuk Ridge, City of Tshwane PO Box 392 UNISA 0003 South Africa
Telephone + 27 12 429 6122 Facsimile + 27 12 429 6848 www.unisa.ac.za/cset

313
Appendix B Questionnaires used during implementation and testing of Drawing Variable Diagram Tutorial
B.1 Questionnaires used in first implementation cycle
B.1.1 First semester 2012
Mrs MA Schoeman ([email protected]; tel 012 429 6857) and prof JH Gelderblom ([email protected]; tel 012 429 6631) are conducting research on the usability and effectiveness of the tutorial to teach tracing for this module, COS1511. We will appreciate your co-operation in completing this optional part of Assignment 1 (Questions 1 to 21). The research is conducted under the following conditions:
• Participants are not personally being tested, and their participation will not impact in any way on their assessment in COS1511 assignments or the exam.
• There will be no monetary payment to the participants. • Participants are free to withdraw from the research or not partake at all, and there will be no
disadvantage if they do so. • In reporting results of this study, no names will be disclosed. Research findings will be
communicated at presentations or be published in academic publications, but anonymity and confidentiality will be preserved.
• By completing the questions that follow below on the same mark reading sheet as the rest of Assignment 1, you declare that you are aware of the above information and willingly partake in this research.
Choose only 1 option in each of the following questions: Question 1 Gender?
1. Male 2. Female
Question 2 What is your age? 1. 19 - 22 2. 23 - 27 3. 28 - 32 4. 32 – 40 5. 41 +
Question 3 Which ONE of the following describes your situation best?
1. I am a full-time student who does not work at all. 2. I am a full-time student who works part-time for extra pocket money (not to pay for my
studies). 3. I am a full-time student who works part-time to pay for my studies. 4. I work full-time and study after hours, and the work that I do is not related to my degree at all.
5. I work full-time and study after hours, and the work that I do is related to my degree Question 4 My highest qualification is
1. Matric 2. National certificate 3. Diploma 4. Degree 5. Post-graduate degree

314
Question 5 My first language is 1. English 2. Afrikaans 3. Other
Question 6 In my matric results*
1. I passed Mathematics (higher grade) or equivalent with a C-symbol or higher. 2. I passed Mathematics (higher grade) or equivalent with a D-symbol or lower. 3. I passed Mathematics (standard grade) or equivalent with a C-symbol or higher. 4. I passed Mathematics (standard grade) or equivalent with a D-symbol or lower. 5. I did not take Mathematics for matric.
*Students who do not have a South African matric should choose the options they think are most relevant to them. Question 7 In my matric results*
1. I passed English (higher grade) or equivalent with a C-symbol or higher. 2. I passed English (higher grade) or equivalent with a D-symbol or lower. 3. I passed English (standard grade) or equivalent with a C-symbol or higher. 4. I passed English (standard grade) or equivalent with a D-symbol or lower. 5. I did not take English for matric.
*Students who do not have a South African matric should choose the options they think are most relevant to them. Question 8 Did you have Computer Applications Technology, Information Technology or Computer Studies at school?
1. Yes 2. No
Question 9 What level of computer literacy do you have? If you have done more than one, choose the option reflecting the most recent one you have done.
1. Self-taught 2. Did Computer Applications Technology, Information Technology or Computer Studies at
school 3. Passed or enrolled for ICDL or EUP at Unisa 4. Done any other computer literacy course 5. Use a computer daily at work
Question 10 What experience do you have in programming?
6. Computer Studies or Information Technology at school 7. Repeating COS1511 8. Currently enrolled for another programming module at Unisa 9. Did a programming course other than COS1511 10. Employed as a programmer
Question 11 Which ONE of the following is applicable to you?
1. This is my first registration for COS1511. 2. I have been registered for COS1511 or COS111U before but have never written the
examination. 3. I have written the examination for COS1511 or COS111U once before. 4. I have written the examination for COS1511 or COS111U twice before. 5. I have written the examination for COS1511 or COS111U three or more times before.

315
Question 12 Have you drawn variable diagrams before enrolling for COS1511? 1. Yes 2. No
Question 13 Do you use the tutorial for this module while working through the study guide?
1. Yes 2. No
Question 14 Do you draw your own variable diagrams to help you to understand programs in the study guide?
1. Yes 2. No
Question 15 Do you draw your own variable diagrams to debug your programs?
1. Yes 2. No
Question 16 Up to now, how much time in total, have you spent using the tutorial?
1. Less than 1 hour 2. 1 to 3 hours 3. 4 to 6 hours 4. 7 to 8 hours 5. More than 8 hours
Question 17 To what degree did the tutorial assist you to master tracing?
1. Not at all 2. Neutral 3. A little bit 4. Fairly useful 5. Very useful
Question 18 Did you find it interesting to use the tutorial?
1. Not at all 2. Neutral 3. A little bit 4. Fairly interesting 5. Very interesting
Question 19 Did you find it motivating to use the tutorial?
1. Not at all 2. Neutral 3. A little bit 4. Fairly motivating 5. Very motivating
Question 20 To what degree did you enjoy using the tutorial?
1. Not at all 2. Not really 3. Neutral 4. Moderately 5. Very much
Question 21 Did you find it irritating to use the tutorial?
1. Not at all 2. Neutral

316
3. A little bit 4. Fairly irritating 5. Very irritating
B.1.2 Second semester 2012
Mrs MA Schoeman ([email protected]; tel 012 429 6857) and prof JH Gelderblom ([email protected]; tel 012 429 6631) are conducting research on the usability and effectiveness of the tutorial to teach tracing for this module, COS1511. We will appreciate your co-operation in completing this optional part of Assignment 1 (Questions 1 to 21).
The research is conducted under the following conditions:
• Participants are not personally being tested, and their participation will not impact in any way on their assessment in COS1511 assignments or the exam.
• There will be no monetary payment to the participants. • Participants are free to withdraw from the research or not partake at all, and there will be no
disadvantage if they do so. • In reporting results of this study, no names will be disclosed. Research findings will be
communicated at presentations or be published in academic publications, but anonymity and confidentiality will be preserved.
• By completing the questions that follow below on the same mark reading sheet as the rest of Assignment 1, you declare that you are aware of the above information and willingly partake in this research.
Choose only 1 option in each of the following questions: Question 1 Gender?
1. Male 2. Female
Question 2 What is your age? 1. 19 - 22 2. 23 - 27 3. 28 - 32 4. 32 – 40 5. 41 +
Question 3 Are you studying full-time or part-time?
1. Full-time 2. Part-time
Question 4 What is your occupation?
1. Unemployed 2. Full-time student 3. IT-related 4. Other
Question 5 What is your highest qualification?
1. Matric 2. National certificate 3. Diploma

317
4. Degree 5. Post-graduate degree
Question 6 What is your first language?
1. English 2. Afrikaans 3. Other
Question 7 Did you have Computer Applications Technology, Information Technology or Computer Studies at school?
1. Yes 2. No
Question 8 Have you been registered for COS1511 before?
1. Yes 2. No
Question 9 What level of computer literacy do you have? If you have done more than one, choose the option reflecting the most recent one you have done.
1. Self-taught 2. Did Computer Applications Technology, Information Technology or Computer Studies at school 3. Passed or enrolled for ICDL or EUP at Unisa 4. Done any other computer literacy course 5. Use a computer daily at work
Question 10 What experience do you have in programming?
1. Computer Studies or Information Technology at school 2. Repeating COS1511 3. Currently enrolled for another programming module at Unisa 4. Did a programming course other than COS1511 5. Employed as a programmer
Question 11 Which ONE of the following is applicable to you?
1. This is my first registration for COS1511. 2. I have been registered for COS1511 or COS111U before but have never written the
examination. 3. I have written the examination for COS1511 or COS111U once before. 4. I have written the examination for COS1511 or COS111U twice before. 5. I have written the examination for COS1511 or COS111U three or more times before.
Question 12 Have you drawn variable diagrams before enrolling for COS1511?
1. Yes 2. No
Question 13 Do you use the tutorial for this module while working through the study guide?
1. Yes 2. No
Question 14 Do you draw your own variable diagrams to help you to understand programs in the study guide?
1. Yes 2. No

318
Question 15 Do you draw your own variable diagrams to debug your programs? 1. Yes 2. No
Question 16 Up to now, how much time in total, have you spent using the tutorial?
1. Less than 1 hour 2. 1 to 3 hours 3. 4 to 6 hours 4. 7 to 8 hours 5. More than 8 hours
Question 17 To what degree did the tutorial assist you to master tracing?
1. Not at all 2. Neutral 3. A little bit 4. Fairly useful 5. Very useful
Question 18 Did you find it interesting to use the tutorial?
1. Not at all 2. Neutral 3. A little bit 4. Fairly interesting 5. Very interesting
Question 19 Did you find it motivating to use the tutorial?
1. Not at all 2. Neutral 3. A little bit 4. Fairly motivating 5. Very motivating
Question 20 To what degree did you enjoy using the tutorial?
1. Not at all 2. Not really 3. Neutral 4. Moderately 5. Very much
Question 21 Did you find it irritating to use the tutorial?
1. Not at all 2. Neutral 3. A little bit 4. Fairly irritating
5. Very irritating

319
B.2 Questionnaires used in second implementation cycle
B.2.1 First semester 2013
B.2.1.1 First questionnaire "Assignment 91" for COS1511-13-S1
Assignment 91 is a questionnaire to assist us in determining the usability and effectivenes of the Drawing variable Diagrams tutorial. Please complete Assignment 91 after you have submitted Assignment 1.
This assessment is due Wednesday, 2013-Mar-27 11:25 AM.
Choose only 1 option in each of the following questions:
1. Please select your gender? a. Male b. Female 2. What is your age? a. 19 - 22 b. 23 - 27 c. 28 - 32 d. 32 – 40 e. 41 + 3. Which ONE of the following describes your situation best? a. I am a full-time student who does not work at all. b. I am a full-time student who works part-time for extra pocket money (not to pay for my
studies). c. I am a full-time student who works part-time to pay for my studies. d. I work full-time and study after hours, and the work that I do is not related to my degree at all. e. I work full-time and study after hours, and the work that I do is related to my degree f. Other 4. My highest qualification is a. Matric b. National certificate c. Diploma d. Degree e. Post-graduate degree 5. My first language is a. English b. Afrikaans c. Other 6. If you do not have a South African matric please choose the option you think are most
relevant to you. In my matric results a. I passed Mathematics (higher grade) or equivalent with a C-symbol or higher. b. I passed Mathematics (higher grade) or equivalent with a D-symbol or lower. c. I passed Mathematics (standard grade) or equivalent with a C-symbol or higher. d. I passed Mathematics (standard grade) or equivalent with a D-symbol or lower.

320
e. I did not take Mathematics for matric. 7. If you do not have a South African matric please choose the option you think are most relevant to you. In my matric results a. I passed English (higher grade) or equivalent with a C-symbol or higher. b. I passed English (higher grade) or equivalent with a D-symbol or lower. c. I passed English (standard grade) or equivalent with a C-symbol or higher. d. I passed English (standard grade) or equivalent with a D-symbol or lower. e. I did not take English for matric. 8. Did you have Computer Applications Technology, Information Technology or Computer Studies at school? a. Yes b. No 9. Please choose the option below that best describes your computer literacy level. If more than one option applies to you, choose the option that reflects your most recent computer literacy enrichment experience. a. None b. Self-taught c. Did Computer Applications Technology, Information Technology or Computer Studies at
school d. Passed or enrolled for ICDL or EUP at Unisa e. Done any other computer literacy course f. Use a computer daily at work g. Other means of exposure/experience towards computer literacy development 10. What experience do you have in programming? a. None b. Computer Studies or Information Technology at school c. Repeating COS1511 d. Currently enrolled for another programming module at Unisa e. Did a programming course other than COS1511 f. Employed as a programmer g. Other programming experience 11. Which ONE of the following is applicable to you? a. This is my first registration for COS1511. b. I have been registered for COS1511 or COS111U before but have never written the
examination. c. I have written the examination for COS1511 or COS111U once before. d. I have written the examination for COS1511 or COS111U twice before. e. I have written the examination for COS1511 or COS111U three or more times before. 12. Have you drawn variable diagrams before enrolling for COS1511? a. Yes b. No

321
13. Do you use the Drawing Variable Diagrams tutorial for this module while working through the study guide? a. Yes b. No 14. If you answered yes on the previous question, did you watch the Instructions to learn how to use the Drawing Variable Diagrams tutorial? a. Yes b. No 15. If you answered yes on the previous question, did watching the Instructions to learn how to use the Drawing Variable Diagrams tutorial, help you? a. Not at all b. Not really c. Undecided/Neutral d. To some extent e. Definitely 16. Do you draw your own variable diagrams to help you to understand programs in the study guide? a. Yes b. No 17. Do you draw your own variable diagrams to debug your programs? a. Yes b. No 18. Do you feel that using variable diagrams improves your programming skills? a. Not at all b. Not really c. Undecided/Neutral d. To some extent e. Definitely 19. Do you feel that using variable diagrams assist with understanding the flow of logic in a program? a. Not at all b. Not really c. Undecided/Neutral d. To some extent e. Definitely 20. Did you use the Drawing Variable Diagrams tutorial before or while completing Assignment 1? a. Yes b. No

322
21. Did you use the Drawing Variable Diagrams tutorial after you have submitted Assignment 1? a. Not at all b. Not really 22. Up to now, how much time in total, have you spent using the Drawing Variable Diagrams tutorial? a. Less than 1 hour b. 1 to 10 hours c. 11 to 20 hours d. 20 to 30 hours e. More than 30 hours
B.2.1.2 Second questionnaire "Assignment 92" for COS1511-13-S1 Assignment 92 is now available as a self-assessment assignment. Please complete Assignment 92 even if you have submitted Assignment 91. If you have submitted Assignment 91, you may skip questions 2 to 12. Assignment 92 is due on 26 May. Assignment 92 is an optional questionnaire for research conducted by Mrs MA Schoeman ([email protected]) and Prof JH Gelderblom on the usability and effectiveness of the Drawing Variable Diagrams tutorial. Both Assignment 91 and 92 are questionnaires to assist us in determining the usability and effectiveness of the Drawing Variable Diagrams tutorial. This research is conducted under the following conditions: • Participants are not personally being tested, and their participation will not impact in any way on their assessment in COS1511 assignments or the exam. • There will be no monetary payment to the participants. • Participants are free to withdraw from the research or not partake at all, and there will be no disadvantage if they do so. • In reporting results of this study, no names will be disclosed. Research findings will be communicated at presentations or be published in academic publications, but anonymity and confidentiality will be preserved. • By completing the questions in Assignment 92, you declare that you are aware of the above information and willingly partake in this research. We appreciate your co-operation in this research. Best wishes for your studies! Regards Mrs MA Schoeman This assessment is due Tuesday, 2013-May-07 03:11 PM. Please choose one option from each of the following questions. 1. Have you submitted Assignment 91? If you did, you may skip questions 2 to 12. Please complete all the rest of the questions. a. Yes b. No

323
2. Please select your gender? a. Male b. Female 3. What is your age? a. 19 - 22 b. 23 - 27 c. 28 - 32 d. 32 – 40 e. 41 + 4. Which ONE of the following describes your situation best? a. I am a full-time student who does not work at all. b. I am a full-time student who works part-time for extra pocket money (not to pay for my
studies). c. I am a full-time student who works part-time to pay for my studies. d. I work full-time and study after hours, and the work that I do is not related to my degree at all. e. I work full-time and study after hours, and the work that I do is related to my degree f. Other 5. My highest qualification is a. Matric b. National certificate c. Diploma d. Degree e. Post-graduate degree 6. My first language is a. English b. Afrikaans c. Other 7. If you do not have a South African matric please choose the option you think are most relevant to you. In my matric results a. I passed Mathematics (higher grade) or equivalent with a C-symbol or higher. b. I passed Mathematics (higher grade) or equivalent with a D-symbol or lower. c. I passed Mathematics (standard grade) or equivalent with a C-symbol or higher. d. I passed Mathematics (standard grade) or equivalent with a D-symbol or lower. e. I did not take Mathematics for matric. 8. If you do not have a South African matric please choose the option you think are most relevant to you. In my matric results a. I passed English (higher grade) or equivalent with a C-symbol or higher. b. I passed English (higher grade) or equivalent with a D-symbol or lower. c. I passed English (standard grade) or equivalent with a C-symbol or higher. d. I passed English (standard grade) or equivalent with a D-symbol or lower. e. I did not take English for matric. 9. Did you have Computer Applications Technology, Information Technology or Computer Studies at school? a. Yes b. No

324
10. Please choose the option below that best describes your computer literacy level. If more than one option applies to you, choose the option that reflects your most recent computer literacy enrichment experience. a. None b. Self-taught c. Did Computer Applications Technology, Information Technology or Computer Studies at
school d. Passed or enrolled for ICDL or EUP at Unisa e. Done any other computer literacy course f. Use a computer daily at work g. Other means of exposure/experience towards computer literacy development 11. What experience do you have in programming? a. None b. Computer Studies or Information Technology at school c. Repeating COS1511 d. Currently enrolled for another programming module at Unisa e. Did a programming course other than COS1511 f. Employed as a programmer g. Other programming experience 12. Which ONE of the following is applicable to you? a. This is my first registration for COS1511. b. I have been registered for COS1511 or COS111U before but have never written the
examination. c. I have written the examination for COS1511 or COS111U once before. d. I have written the examination for COS1511 or COS111U twice before. e. I have written the examination for COS1511 or COS111U three or more times before. 13. Have you drawn variable diagrams before enrolling for COS1511? a. Yes b. No 14. Do you use the Drawing Variable Diagrams tutorial for this module while working through the study guide? a. Yes b. No 15. If you answered yes on the previous question, did you watch the Instructions to learn how to use the Drawing Variable Diagrams tutorial? a. Yes b. No 16. If you answered yes on the previous question, did watching the Instructions to learn how to use the Drawing Variable Diagrams tutorial, help you? a. Not at all b. Not really c. Undecided/Neutral d. To some extent e. Definitely 17. Do you draw your own variable diagrams to help you to understand programs in the study guide? a. Yes

325
b. No 18. Do you draw your own variable diagrams to debug your programs? a. Yes b. No 19. Do you feel that using variable diagrams improves your programming skills? a. Not at all b. Not really c. Undecided/Neutral d. To some extent e. Definitely 20. Do you feel that using variable diagrams assist with understanding the flow of logic in a program? a. Not at all b. Not really c. Undecided/Neutral d. To some extent e. Definitely 21. Did you use the Drawing Variable Diagrams tutorial before or while completing Assignment 1? a. Yes b. No 22. Did you use the Drawing Variable Diagrams tutorial after you have submitted Assignment 1? a. Not at all b. Not really 23. Up to now, how much time in total, have you spent using the Drawing Variable Diagrams tutorial? a. Less than 1 hour b. 1 to 10 hours c. 11 to 20 hours d. 20 to 30 hours e. More than 30 hours 24. Did watching the Drawing Variable Diagrams tutorial, help you to understand if statements? a. Not at all b. Not really c. Undecided/Neutral d. To some extent e. Definitely 25. Did watching the Drawing Variable Diagrams tutorial, help you to understand while loops? a. Not at all b. Not really c. Undecided/Neutral d. To some extent e. Definitely

326
26. Did watching the Drawing Variable Diagrams tutorial, help you to understand nested if statements? a. Not at all b. Not really c. Undecided/Neutral d. To some extent e. Definitely 27. Did watching the Drawing Variable Diagrams tutorial, help you to understand switch statements? a. Not at all b. Not really c. Undecided/Neutral d. To some extent e. Definitely 28. Did watching the Drawing Variable Diagrams tutorial, help you to understand the difference between while loops and do … while loops? a. Not at all b. Not really c. Undecided/Neutral d. To some extent e. Definitely 29. Did watching the Drawing Variable Diagrams tutorial, help you to understand what happens when a function is executed? a. Not at all b. Not really c. Undecided/Neutral d. To some extent e. Definitely 30. Did watching the Drawing Variable Diagrams tutorial, help you to understand value parameters? a. Not at all b. Not really c. Undecided/Neutral d. To some extent e. Definitely 31. Did watching the Drawing Variable Diagrams tutorial, help you to understand reference parameters? a. Not at all b. Not really c. Undecided/Neutral d. To some extent e. Definitely 32. Did watching the Drawing Variable Diagrams tutorial, help you to understand the difference between value and reference parameters? a. Not at all b. Not really c. Undecided/Neutral d. To some extent e. Definitely

327
33. Did watching the Drawing Variable Diagrams tutorial, help you to understand one-dimensional arrays? a. Not at all b. Not really c. Undecided/Neutral d. To some extent e. Definitely 34. Did watching the Drawing Variable Diagrams tutorial, help you to understand two-dimensional arrays? a. Not at all b. Not really c. Undecided/Neutral d. To some extent e. Definitely 35. Did watching the Drawing Variable Diagrams tutorial, help you to understand strings? a. Not at all b. Not really c. Undecided/Neutral d. To some extent e. Definitely 36. Did watching the Drawing Variable Diagrams tutorial, help you to understand structs? a. Not at all b. Not really c. Undecided/Neutral d. To some extent e. Definitely 37. To trace a program means to form a mental picture of what the program does and how it is done. To what degree did the Drawing Variable Diagrams tutorial assist you to master tracing? a. Not at all b. Not really c. Undecided/Neutral d. To some extent e. Definitely 38. Did you find it interesting to use the Drawing Variable Diagrams tutorial? a. Not at all b. Not really c. Undecided/Neutral d. To some extent e. Definitely 39. Did you find it motivating to use the Drawing Variable Diagrams tutorial? a. Not at all b. Not really c. Undecided/Neutral d. To some extent e. Definitely 40. Did you enjoy using the Drawing Variable Diagrams tutorial? a. Not at all

328
b. Not really c. Undecided/Neutral d. To some extent e. Definitely 41. Did you find it frustrating to use the Drawing Variable Diagrams tutorial? a. Not at all b. Not really c. Undecided/Neutral d. To some extent e. Definitely 42. Did you find the Drawing Variable Diagrams tutorial easy to use? a. Not at all b. Not really c. Undecided/Neutral d. To some extent e. Definitely 43. Did you find that the Drawing Variable Diagrams tutorial is directly applicable to the programming assignments in the course? a. Not at all b. Not really c. Undecided/Neutral d. To some extent e. Definitely 44. Do you think that you will apply the general concept of variable diagrams in future programming projects? a. Not at all b. Not really c. Undecided/Neutral d. To some extent e. Definitely
B.2.2 Second semester 2013 (only questionnaire)
"Assignment 91" for COS1511-13-S2 Assignment 91 is an optional questionnaire for research conducted by Mrs MA Schoeman ([email protected]) and Prof JH Gelderblom on the usability and effectiveness of the Drawing Variable Diagrams tutorial. Assignment 91 is a questionnaire to assist us in determining the usability and effectiveness of the Drawing Variable Diagrams tutorial. This research is conducted under the following conditions: • Participants are not personally being tested, and their participation will not impact in any way
on their assessment in COS1511 assignments or the exam. • There will be no monetary payment to the participants. • Participants are free to withdraw from the research or not partake at all, and there will be no
disadvantage if they do so. • In reporting results of this study, no names will be disclosed. Research findings will be
communicated at presentations or be published in academic publications, but anonymity and confidentiality will be preserved.

329
• By completing the questions in Assignment 91, you declare that you are aware of the above information and willingly partake in this research.
We appreciate your co-operation in this research. Best wishes for your studies! Regards Mrs MA Schoeman This assessment is due Saturday, 2013-Oct-12 02:08 PM. Choose only 1 option in each of the following questions: 1. Please select your gender? a. Male b. Female 2. What is your age? a. 19 - 22 b. 23 - 27 c. 28 - 32 d. 32 – 40 e. 41 + 3. Which ONE of the following describes your situation best? a. I am a full-time student who does not work at all. b. I am a full-time student who works part-time for extra pocket money (not to pay for my
studies). c. I am a full-time student who works part-time to pay for my studies. d. I work full-time and study after hours, and the work that I do is not related to my degree at all. e. I work full-time and study after hours, and the work that I do is related to my degree f. Other 4. My highest qualification is a. Matric b. National certificate c. Diploma d. Degree e. Post-graduate degree 5. My first language is a. English b. Afrikaans c. Other 6. If you do not have a South African matric please choose the option you think are most relevant to you. In my matric results a. I passed Mathematics (higher grade) or equivalent with a C-symbol or higher. b. I passed Mathematics (higher grade) or equivalent with a D-symbol or lower. c. I passed Mathematics (standard grade) or equivalent with a C-symbol or higher. d. I passed Mathematics (standard grade) or equivalent with a D-symbol or lower. e. I did not take Mathematics for matric.

330
7. If you do not have a South African matric please choose the option you think are most relevant to you. In my matric results a. I passed English (higher grade) or equivalent with a C-symbol or higher. b. I passed English (higher grade) or equivalent with a D-symbol or lower. c. I passed English (standard grade) or equivalent with a C-symbol or higher. d. I passed English (standard grade) or equivalent with a D-symbol or lower. e. I did not take English for matric. 8. Did you have Computer Applications Technology, Information Technology or Computer Studies at school? a. Yes b. No 9. Please choose the option below that best describes your computer literacy level. If more than one option applies to you, choose the option that reflects your most recent computer literacy enrichment experience. a. None b. Self-taught c. Did Computer Applications Technology, Information Technology or Computer Studies at
school d. Passed or enrolled for ICDL or EUP at Unisa e. Done any other computer literacy course f. Use a computer daily at work g. Other means of exposure/experience towards computer literacy development 10. What experience do you have in programming? a. None b. Computer Studies or Information Technology at school c. Repeating COS1511 d. Currently enrolled for another programming module at Unisa e. Did a programming course other than COS1511 f. Employed as a programmer g. Other programming experience 11. Which ONE of the following is applicable to you? a. This is my first registration for COS1511. b. I have been registered for COS1511 or COS111U before but have never written the examination. c. I have written the examination for COS1511 or COS111U once before. d. I have written the examination for COS1511 or COS111U twice before. e. I have written the examination for COS1511 or COS111U three or more times before. 12. Have you drawn variable diagrams before enrolling for COS1511? a. Yes b. No 13. Do you use the Drawing Variable Diagrams tutorial for this module while working through the study guide? a. Yes b. No

331
14. If you answered yes on the previous question, did you watch the Instructions to learn how to use the Drawing Variable Diagrams tutorial? a. Yes b. No 15. If you answered yes on the previous question, did watching the Instructions to learn how to use the Drawing Variable Diagrams tutorial, help you? a. Not at all b. Not really c. Undecided/Neutral d. To some extent e. Definitely 16. Do you draw your own variable diagrams to help you to understand programs in the study guide? a. Yes b. No 17. Do you draw your own variable diagrams to debug your programs? a. Yes b. No 18. Do you feel that using variable diagrams improves your programming skills? a. Not at all b. Not really c. Undecided/Neutral d. To some extent e. Definitely 19. Do you feel that using variable diagrams assist with understanding the flow of logic in a program? a. Not at all b. Not really c. Undecided/Neutral d. To some extent e. Definitely 20. Did you use the Drawing Variable Diagrams tutorial before or while completing Assignment 1? a. Yes b. No 21. Did you use the Drawing Variable Diagrams tutorial after you have submitted Assignment 1? a. Not at all b. Not really 22. Up to now, how much time in total, have you spent using the Drawing Variable Diagrams tutorial? a. Less than 1 hour b. 1 to 10 hours c. 11 to 20 hours d. 20 to 30 hours e. More than 30 hours

332
23. Did watching the Drawing Variable Diagrams tutorial, help you to understand if statements? a. Not at all b. Not really c. Undecided/Neutral d. To some extent e. Definitely 24. Did watching the Drawing Variable Diagrams tutorial, help you to understand while loops? a. Not at all b. Not really c. Undecided/Neutral d. To some extent e. Definitely 25. Did watching the Drawing Variable Diagrams tutorial, help you to understand nested if statements? a. Not at all b. Not really c. Undecided/Neutral d. To some extent e. Definitely 26. Did watching the Drawing Variable Diagrams tutorial, help you to understand switch statements? a. Not at all b. Not really c. Undecided/Neutral d. To some extent e. Definitely 27. Did watching the Drawing Variable Diagrams tutorial, help you to understand the difference between while loops and do … while loops? a. Not at all b. Not really c. Undecided/Neutral d. To some extent e. Definitely 28. Did watching the Drawing Variable Diagrams tutorial, help you to understand what happens when a function is executed? a. Not at all b. Not really c. Undecided/Neutral d. To some extent e. Definitely 29. Did watching the Drawing Variable Diagrams tutorial, help you to understand value parameters? a. Not at all b. Not really c. Undecided/Neutral d. To some extent e. Definitely

333
30. Did watching the Drawing Variable Diagrams tutorial, help you to understand reference parameters? a. Not at all b. Not really c. Undecided/Neutral d. To some extent e. Definitely 31. Did watching the Drawing Variable Diagrams tutorial, help you to understand the difference between value and reference parameters? a. Not at all b. Not really c. Undecided/Neutral d. To some extent e. Definitely 32. Did watching the Drawing Variable Diagrams tutorial, help you to understand one-dimensional arrays? a. Not at all b. Not really c. Undecided/Neutral d. To some extent e. Definitely 33. Did watching the Drawing Variable Diagrams tutorial, help you to understand two-dimensional arrays? a. Not at all b. Not really c. Undecided/Neutral d. To some extent e. Definitely 34. Did watching the Drawing Variable Diagrams tutorial, help you to understand strings? a. Not at all b. Not really c. Undecided/Neutral d. To some extent e. Definitely 35. Did watching the Drawing Variable Diagrams tutorial, help you to understand structs? a. Not at all b. Not really c. Undecided/Neutral d. To some extent e. Definitely 36. To trace a program means to form a mental picture of what the program does and how it is done. To what degree did the Drawing Variable Diagrams tutorial assist you to master tracing? a. Not at all b. Not really c. Undecided/Neutral d. To some extent e. Definitely

334
37. Did you find it interesting to use the Drawing Variable Diagrams tutorial? a. Not at all b. Not really c. Undecided/Neutral d. To some extent e. Definitely 38. Did you find it motivating to use the Drawing Variable Diagrams tutorial? a. Not at all b. Not really c. Undecided/Neutral d. To some extent e. Definitely 39. Did you enjoy using the Drawing Variable Diagrams tutorial? a. Not at all b. Not really c. Undecided/Neutral d. To some extent e. Definitely 40. Did you find it frustrating to use the Drawing Variable Diagrams tutorial? a. Not at all b. Not really c. Undecided/Neutral d. To some extent e. Definitely 41. Did you find the Drawing Variable Diagrams tutorial easy to use? a. Not at all b. Not really c. Undecided/Neutral d. To some extent e. Definitely 42. Did you find that the Drawing Variable Diagrams tutorial is directly applicable to the programming assignments in the course? a. Not at all b. Not really c. Undecided/Neutral d. To some extent e. Definitely 43. Do you think that you will apply the general concept of variable diagrams in future programming projects? a. Not at all b. Not really c. Undecided/Neutral d. To some extent e. Definitely
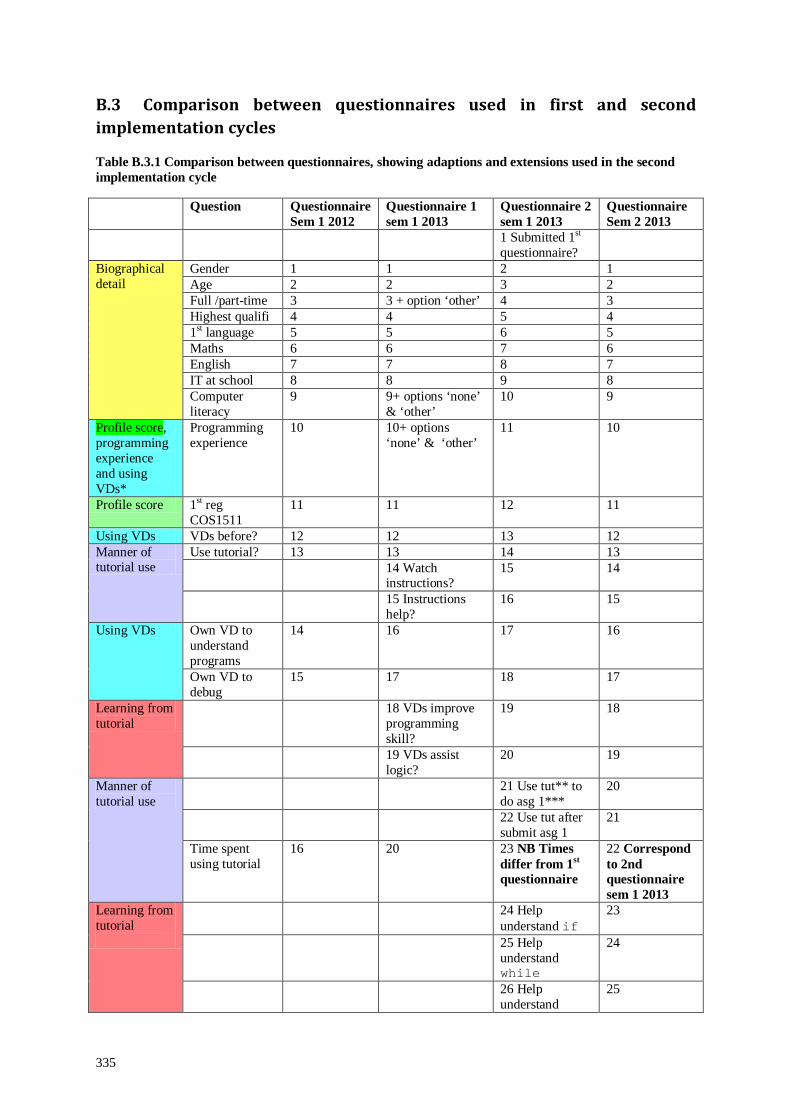
335
B.3 Comparison between questionnaires used in first and second implementation cycles
Table B.3.1 Comparison between questionnaires, showing adaptions and extensions used in the second implementation cycle
Question Questionnaire Sem 1 2012
Questionnaire 1 sem 1 2013
Questionnaire 2 sem 1 2013
Questionnaire Sem 2 2013
1 Submitted 1st questionnaire?
Biographical detail
Gender 1 1 2 1 Age 2 2 3 2 Full /part-time 3 3 + option ‘other’ 4 3 Highest qualifi 4 4 5 4 1st language 5 5 6 5 Maths 6 6 7 6 English 7 7 8 7 IT at school 8 8 9 8 Computer literacy
9 9+ options ‘none’ & ‘other’
10 9
Profile score, programming experience and using VDs*
Programming experience
10 10+ options ‘none’ & ‘other’
11 10
Profile score 1st reg COS1511
11 11 12 11
Using VDs VDs before? 12 12 13 12 Manner of tutorial use
Use tutorial? 13 13 14 13 14 Watch
instructions? 15 14
15 Instructions help?
16 15
Using VDs Own VD to understand programs
14 16 17 16
Own VD to debug
15 17 18 17
Learning from tutorial
18 VDs improve programming skill?
19 18
19 VDs assist logic?
20 19
Manner of tutorial use
21 Use tut** to do asg 1***
20
22 Use tut after submit asg 1
21
Time spent using tutorial
16 20 23 NB Times differ from 1st questionnaire
22 Correspond to 2nd questionnaire sem 1 2013
Learning from tutorial
24 Help understand if
23
25 Help understand while
24
26 Help understand
25

336
nested ifs 27Help
understand switch
26
Learning from tutorial
28 Help understand diff while & do while
27
29 Help understand function execution
28
30 Help understand value parameters
29
31 Help understand reference parameters
30
32 Help understand difference between value & ref parameters
31
33 Help understand 1 dim arrays
32
34 Help understand 2 dim arrays
33
35 Help understand strings
34
36 Help understand structs
35
Tut help master tracing?
17 21 +explain tracing
37 36
Positive user experience Positive user experience
Interesting to use tut?
18 22 38 37
Motivating to use tut?
19 23 39 38
Enjoy using tut?
20 24 40 39
Irritating to use tut?
21 25 ‘frustrating’ instead of ‘irritating’
41 40
26 Tut easy to use?
42 41
Learning from tutorial
27 Applicable to assignments?
43 42
28 Apply VDs in future?
44 43
Legend: *VD – variable diagram;**tut – tutorial; ***asg – assignment

337
Appendix C Documentation used for eye tracking and observation in HCI laboratory
C.1 E-mail request to participate in research
Request to participate in research
Dear Student
We are conducting research on the usability and effectiveness of the tutorial to teach tracing for COS1511. In particular, we want to determine how easy it is to use the tutorial and how to improve it. We need volunteers to observe while they use the tutorial in the Human Computer Interaction laboratory at the Muckleneuk Campus of Unisa in Pretoria.
Each session will take approximately 1 to 1½ hours, and you would only do one session. We would like you to work though lesson 1 to 11 of the Study Guide for COS1511 beforehand, though it is not necessary to do the activities for those lessons in the tutorial to teach tracing, beforehand.
The research is conducted under the following conditions:
• Participants are not personally being tested, and their participation will not impact in any way on their assessment in COS1511 assignments or the exam.
• There will be no monetary payment to the participants. • Participants are free to withdraw from the research or not partake at all, and there will be no
disadvantage if they do so. • In reporting results of this study, no names will be disclosed. Research findings will be
communicated at presentations or be published in academic publications, but anonymity and confidentiality will be preserved.
If you are willing to participate on 2, 3 or 8 August, please contact Mrs Schoeman at the following e-mail address [email protected]. Please include your student number and cell phone number in the e-mail so that we can arrange a suitable time.

338
C.2 Informed consent form
Thank you for volunteering as a participant in this research on the usability and effectiveness of the tutorial to teach tracing for the module, COS1511 Mrs MA Schoeman ([email protected]; tel 012 429 6857) and prof JH Gelderblom ([email protected]; tel 012 429 6631) are conducting research on the usability and effectiveness of the Tutorial to teach tracing software which is supplementary study material for the module COS1511. The research is conducted under the following conditions:
• Participants are not personally being tested, and their participation in this study will not impact in any way on their assessment in COS1511 assignments or the exam.
• There will be no monetary payment to participants. • Participants are free to withdraw from the research and there will be no disadvantage if they do so. • In reporting results of this study, no names will be disclosed. Research findings will be communicated at
presentations or be published in academic publications, but anonymity and confidentiality will be preserved. I (full name) ________________________________________________________________________________________ Contact details _____________________________________________________________________________________ declare that I am aware of all the information provided above and have willingly served as a participant in the research on the Tutorial to teach tracing. I am aware that the findings of this study might be published in academic sources, but that my name will not be disclosed. on ………………… at ……………………………………….. Date Place …………………………. Signature
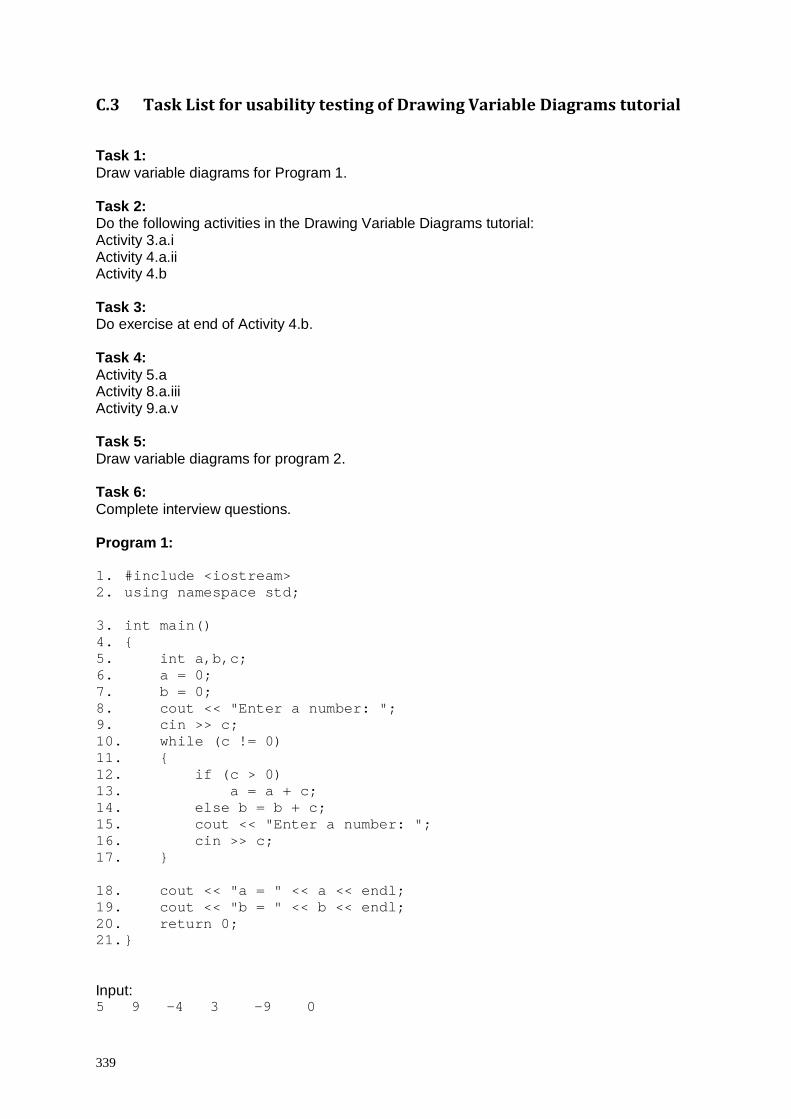
339
C.3 Task List for usability testing of Drawing Variable Diagrams tutorial
Task 1: Draw variable diagrams for Program 1. Task 2: Do the following activities in the Drawing Variable Diagrams tutorial: Activity 3.a.i Activity 4.a.ii Activity 4.b Task 3: Do exercise at end of Activity 4.b. Task 4: Activity 5.a Activity 8.a.iii Activity 9.a.v Task 5: Draw variable diagrams for program 2. Task 6: Complete interview questions. Program 1: 1. #include <iostream> 2. using namespace std; 3. int main() 4. { 5. int a,b,c; 6. a = 0; 7. b = 0; 8. cout << "Enter a number: "; 9. cin >> c; 10. while (c != 0) 11. { 12. if (c > 0) 13. a = a + c; 14. else b = b + c; 15. cout << "Enter a number: "; 16. cin >> c; 17. } 18. cout << "a = " << a << endl; 19. cout << "b = " << b << endl; 20. return 0; 21. } Input: 5 9 -4 3 -9 0
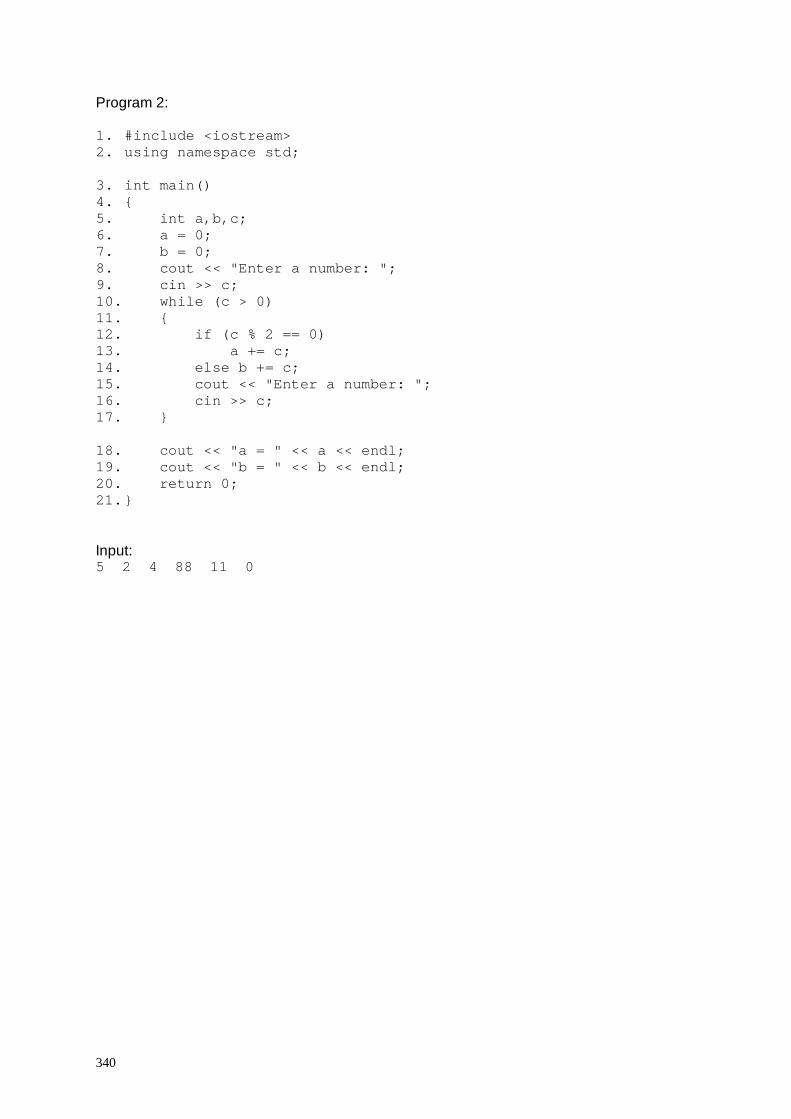
340
Program 2: 1. #include <iostream> 2. using namespace std; 3. int main() 4. { 5. int a,b,c; 6. a = 0; 7. b = 0; 8. cout << "Enter a number: "; 9. cin >> c; 10. while (c > 0) 11. { 12. if (c % 2 == 0) 13. a += c; 14. else b += c; 15. cout << "Enter a number: "; 16. cin >> c; 17. } 18. cout << "a = " << a << endl; 19. cout << "b = " << b << endl; 20. return 0; 21. } Input: 5 2 4 88 11 0

341
C.4 Interview questions for the Drawing Variable Diagrams Research Project
Participant Age Gender Date First language 1. Are you computer literate, i.e. did you do Computer Science at school, EUP1501, a course or taught yourself ? 2. Have you drawn variable diagrams before? If Yes, Where did you learn to do it? 3. Have you used the e-learning tutorial, Drawing Variable Diagrams before today? 4. If you have drawn variable diagrams before, did you find it easier to do now that you have used the tutorial? Why/ why not? 5. Do you draw your own variable diagrams to help you to understand programs in the study guide? 6. Did the questions in the activities help you to concentrate, think or understand drawing variable diagrams?

342
7. Would you like to have sound / someone explaining how to do it while using the tutorial? 8. What would you change? 9. Were there any weaknesses in Drawing Variable Diagrams or things in Drawing Variable Diagrams that confused you? Yes/No/not sure 10. If so, please tell us about them 11. What you think about your experience with the Drawing Variable Diagrams tutorial? 12. Were you put off by working in the usability lab, being observed? 13. Is there anything else you would like to tell us? Thank you for taking part. We really appreciate it!
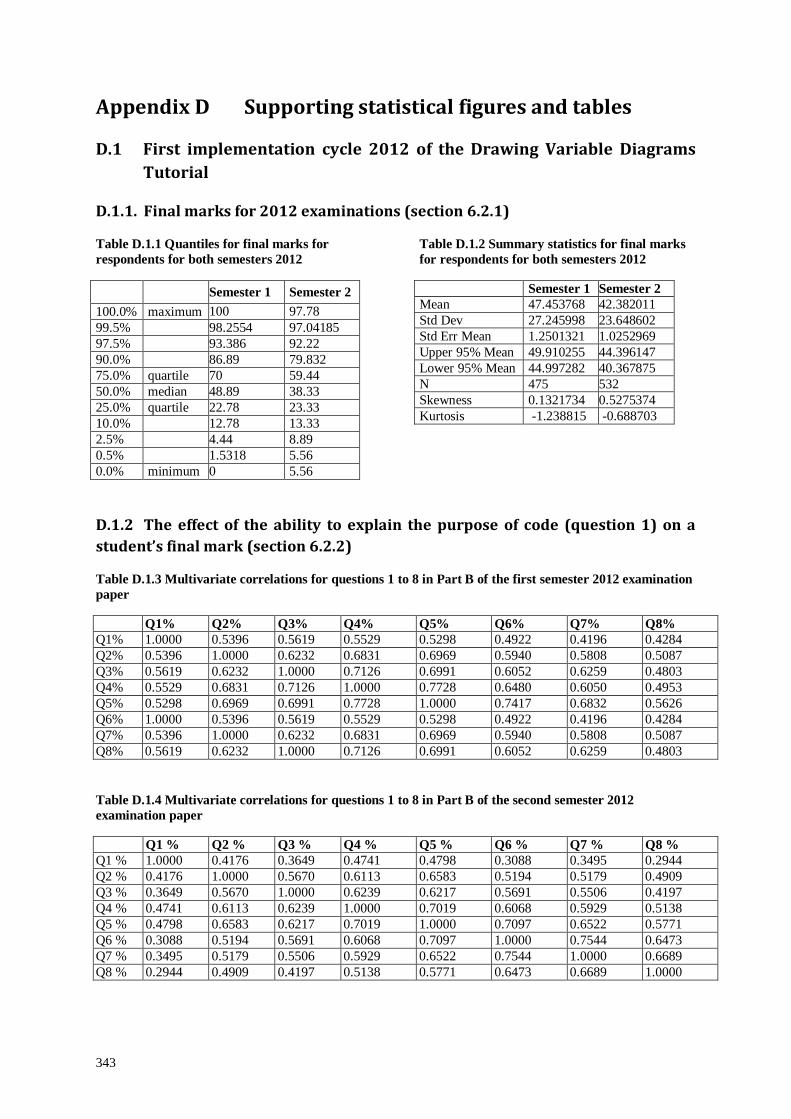
343
Appendix D Supporting statistical figures and tables
D.1 First implementation cycle 2012 of the Drawing Variable Diagrams Tutorial
D.1.1. Final marks for 2012 examinations (section 6.2.1)
Table D.1.1 Quantiles for final marks for respondents for both semesters 2012
Semester 1 Semester 2 100.0% maximum 100 97.78 99.5% 98.2554 97.04185 97.5% 93.386 92.22 90.0% 86.89 79.832 75.0% quartile 70 59.44 50.0% median 48.89 38.33 25.0% quartile 22.78 23.33 10.0% 12.78 13.33 2.5% 4.44 8.89 0.5% 1.5318 5.56 0.0% minimum 0 5.56
Table D.1.2 Summary statistics for final marks for respondents for both semesters 2012
Semester 1 Semester 2 Mean 47.453768 42.382011 Std Dev 27.245998 23.648602 Std Err Mean 1.2501321 1.0252969 Upper 95% Mean 49.910255 44.396147 Lower 95% Mean 44.997282 40.367875 N 475 532 Skewness 0.1321734 0.5275374 Kurtosis -1.238815 -0.688703
D.1.2 The effect of the ability to explain the purpose of code (question 1) on a student’s final mark (section 6.2.2)
Table D.1.3 Multivariate correlations for questions 1 to 8 in Part B of the first semester 2012 examination paper
Q1% Q2% Q3% Q4% Q5% Q6% Q7% Q8% Q1% 1.0000 0.5396 0.5619 0.5529 0.5298 0.4922 0.4196 0.4284 Q2% 0.5396 1.0000 0.6232 0.6831 0.6969 0.5940 0.5808 0.5087 Q3% 0.5619 0.6232 1.0000 0.7126 0.6991 0.6052 0.6259 0.4803 Q4% 0.5529 0.6831 0.7126 1.0000 0.7728 0.6480 0.6050 0.4953 Q5% 0.5298 0.6969 0.6991 0.7728 1.0000 0.7417 0.6832 0.5626 Q6% 1.0000 0.5396 0.5619 0.5529 0.5298 0.4922 0.4196 0.4284 Q7% 0.5396 1.0000 0.6232 0.6831 0.6969 0.5940 0.5808 0.5087 Q8% 0.5619 0.6232 1.0000 0.7126 0.6991 0.6052 0.6259 0.4803
Table D.1.4 Multivariate correlations for questions 1 to 8 in Part B of the second semester 2012 examination paper
Q1 % Q2 % Q3 % Q4 % Q5 % Q6 % Q7 % Q8 % Q1 % 1.0000 0.4176 0.3649 0.4741 0.4798 0.3088 0.3495 0.2944 Q2 % 0.4176 1.0000 0.5670 0.6113 0.6583 0.5194 0.5179 0.4909 Q3 % 0.3649 0.5670 1.0000 0.6239 0.6217 0.5691 0.5506 0.4197 Q4 % 0.4741 0.6113 0.6239 1.0000 0.7019 0.6068 0.5929 0.5138 Q5 % 0.4798 0.6583 0.6217 0.7019 1.0000 0.7097 0.6522 0.5771 Q6 % 0.3088 0.5194 0.5691 0.6068 0.7097 1.0000 0.7544 0.6473 Q7 % 0.3495 0.5179 0.5506 0.5929 0.6522 0.7544 1.0000 0.6689 Q8 % 0.2944 0.4909 0.4197 0.5138 0.5771 0.6473 0.6689 1.0000
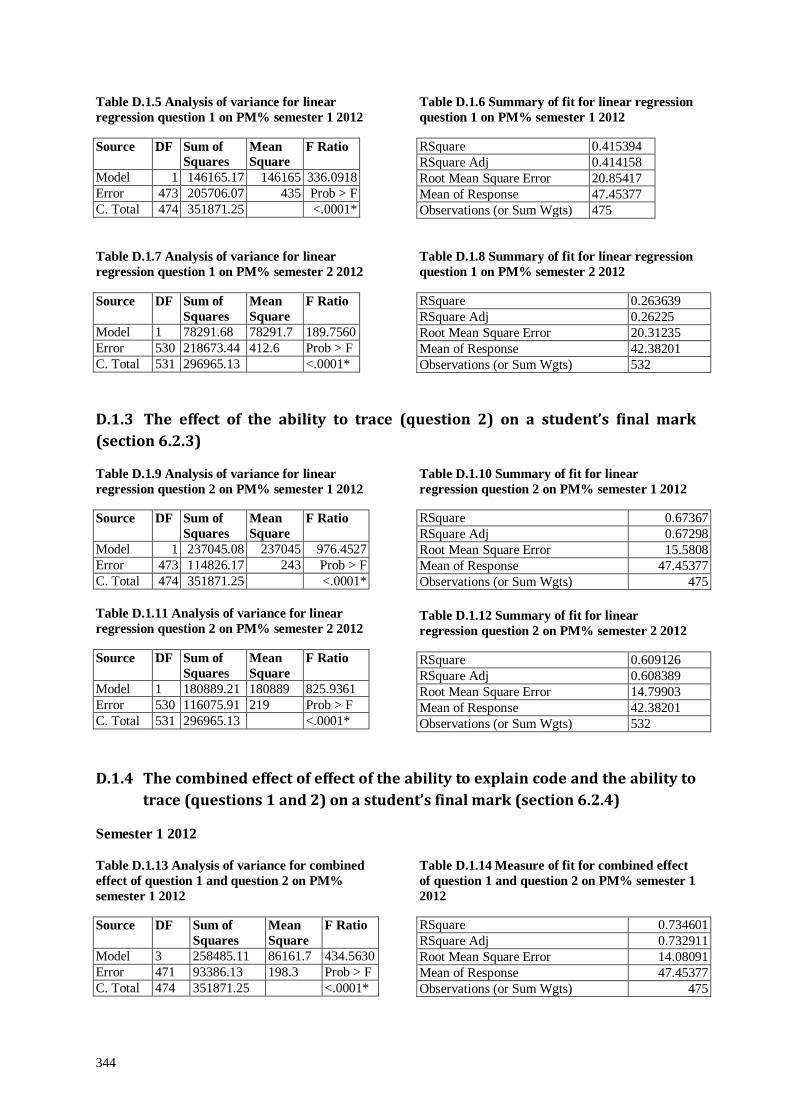
344
Table D.1.5 Analysis of variance for linear regression question 1 on PM% semester 1 2012
Source DF Sum of Squares
Mean Square
F Ratio
Model 1 146165.17 146165 336.0918 Error 473 205706.07 435 Prob > F C. Total 474 351871.25 <.0001*
Table D.1.6 Summary of fit for linear regression question 1 on PM% semester 1 2012
RSquare 0.415394 RSquare Adj 0.414158 Root Mean Square Error 20.85417 Mean of Response 47.45377 Observations (or Sum Wgts) 475
Table D.1.7 Analysis of variance for linear regression question 1 on PM% semester 2 2012
Source DF Sum of Squares
Mean Square
F Ratio
Model 1 78291.68 78291.7 189.7560 Error 530 218673.44 412.6 Prob > F C. Total 531 296965.13 <.0001*
Table D.1.8 Summary of fit for linear regression question 1 on PM% semester 2 2012
RSquare 0.263639 RSquare Adj 0.26225 Root Mean Square Error 20.31235 Mean of Response 42.38201 Observations (or Sum Wgts) 532
D.1.3 The effect of the ability to trace (question 2) on a student’s final mark (section 6.2.3)
Table D.1.9 Analysis of variance for linear regression question 2 on PM% semester 1 2012
Source DF Sum of Squares
Mean Square
F Ratio
Model 1 237045.08 237045 976.4527 Error 473 114826.17 243 Prob > F C. Total 474 351871.25 <.0001*
Table D.1.10 Summary of fit for linear regression question 2 on PM% semester 1 2012
RSquare 0.67367 RSquare Adj 0.67298 Root Mean Square Error 15.5808 Mean of Response 47.45377 Observations (or Sum Wgts) 475
Table D.1.11 Analysis of variance for linear regression question 2 on PM% semester 2 2012
Source DF Sum of Squares
Mean Square
F Ratio
Model 1 180889.21 180889 825.9361 Error 530 116075.91 219 Prob > F C. Total 531 296965.13 <.0001*
Table D.1.12 Summary of fit for linear regression question 2 on PM% semester 2 2012
RSquare 0.609126 RSquare Adj 0.608389 Root Mean Square Error 14.79903 Mean of Response 42.38201 Observations (or Sum Wgts) 532
D.1.4 The combined effect of effect of the ability to explain code and the ability to trace (questions 1 and 2) on a student’s final mark (section 6.2.4)
Semester 1 2012
Table D.1.13 Analysis of variance for combined effect of question 1 and question 2 on PM% semester 1 2012
Source DF Sum of Squares
Mean Square
F Ratio
Model 3 258485.11 86161.7 434.5630 Error 471 93386.13 198.3 Prob > F C. Total 474 351871.25 <.0001*
Table D.1.14 Measure of fit for combined effect of question 1 and question 2 on PM% semester 1 2012
RSquare 0.734601 RSquare Adj 0.732911 Root Mean Square Error 14.08091 Mean of Response 47.45377 Observations (or Sum Wgts) 475

345
Figure D.1.1 Residual by predicted plot for the combined effect of question 1 and question 2 on PM% semester 1 2012
Figure D.1.2 Actual by predicted plot for the combined effect of question1 and question 2 on PM% semester 1 2012
Semester 2 1012
Table D.1.15 Analysis of variance for the combined effect of question 1 and question 2 on PM% semester 2 2012
Source DF Sum of Squares
Mean Square
F Ratio
Model 3 195894.24 65298.1 341.1209 Error 528 101070.88 191.4 Prob > F C. Total 531 296965.13 <.0001*
Table D.1.16 Measure of fit for combined effect of question 1 and question 2 on PM% semester 2 2012
RSquare 0.659654 RSquare Adj 0.65772 Root Mean Square Error 13.83554 Mean of Response 42.38201 Observations (or Sum Wgts) 532
Figure D.1.3 Residual by predicted plot for the combined effect of question 1 and question 2 on PM% semester 2 2012
Figure D.1.4 Actual by predicted plot for the combined effect of question 1 and question 2 on PM% semester 2 2012

346
D.1.5 Biographical detail and descriptive statistics (section 6.3.2) Table D.1.17 Biographical data of students in first semester of 2012
Q1 Gender? N % of Total 1. Male 353 74.32% 2. Female 122 25.68% All 475 100.00% Q2 What is your age? 1. 19 - 22 27 5.68% 2. 23 - 27 224 47.16% 3. 28 - 32 129 27.16% 4. 32 – 40 80 16.84% 5. 41 + 15 3.16% All 475 100.00% Q3 Which ONE of the following describes your situation best? 1. I am a full-time student who does not work at all. 64 13.47% 2. I am a full-time student who works part-time for extra pocket money (not to pay for my studies).
30 6.32%
3. I am a full-time student who works part-time to pay for my studies. 30 6.32% 4. I work full-time and study after hours, and the work that I do is not related to my degree at all.
136 28.63%
5. I work full-time and study after hours, and the work that I do is related to my degree 215 45.26% All 475 100.00% Q4 My highest qualification is 1. Matric 247 52.00% 2. National certificate 95 20.00% 3. Diploma 98 20.63% 4. Degree 27 5.68% 5. Post-graduate degree 8 1.68% All 475 100.00% Q5 My first language is 1. English 161 33.89% 2. Afrikaans 96 20.21% 3. Other 218 45.89% All 475 100.00% Q6 In my Matric results 1. I passed Mathematics (higher grade) or equivalent with a C-symbol or higher. 95 20.00% 2. I passed Mathematics (higher grade) or equivalent with a D-symbol or lower. 74 15.58% 3. I passed Mathematics (standard grade) or equivalent with a C-symbol or higher. 125 26.32% 4. I passed Mathematics (standard grade) or equivalent with a D-symbol or lower. 176 37.05% 5. I did not take Mathematics for matric. 5 1.05% All 475 100.00% Q7 In my Matric results 1. I passed English (higher grade) or equivalent with a C-symbol or higher. 221 46.53% 2. I passed English (higher grade) or equivalent with a D-symbol or lower. 206 43.37% 3. I passed English (standard grade) or equivalent with a C-symbol or higher. 15 3.16% 4. I passed English (standard grade) or equivalent with a D-symbol or lower. 33 6.95% All 475 100.00% Q8 Did you have Computer Applications Technology, Information Technology or Computer Studies at school?
1 Yes 183 38.53% 2 No 292 61.47% All 475 100.00% Q9 What level of computer literacy do you have? If you have done more than one, choose the option reflecting the most recent one you have done.
Self-taught 79 16.63% Did Computer Applications Technology, Information Technology or Computer Studies at 58 12.21%
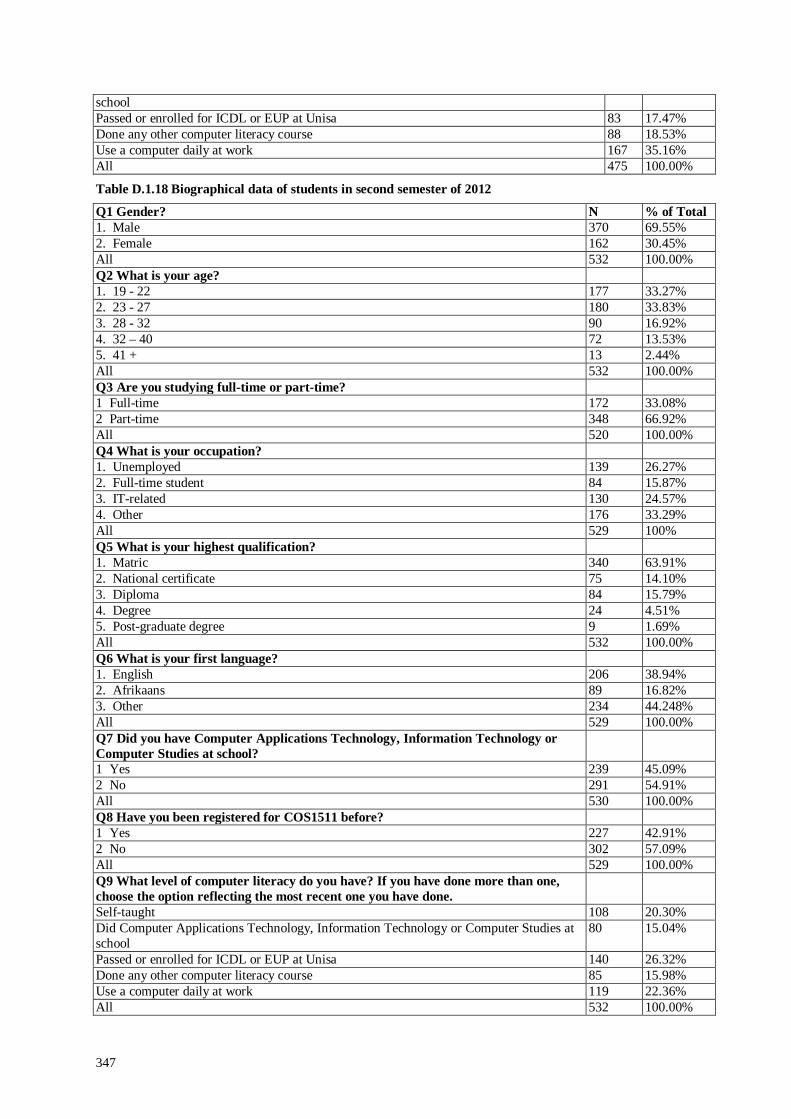
347
school Passed or enrolled for ICDL or EUP at Unisa 83 17.47% Done any other computer literacy course 88 18.53% Use a computer daily at work 167 35.16% All 475 100.00%
Table D.1.18 Biographical data of students in second semester of 2012
Q1 Gender? N % of Total 1. Male 370 69.55% 2. Female 162 30.45% All 532 100.00% Q2 What is your age? 1. 19 - 22 177 33.27% 2. 23 - 27 180 33.83% 3. 28 - 32 90 16.92% 4. 32 – 40 72 13.53% 5. 41 + 13 2.44% All 532 100.00% Q3 Are you studying full-time or part-time? 1 Full-time 172 33.08% 2 Part-time 348 66.92% All 520 100.00% Q4 What is your occupation? 1. Unemployed 139 26.27% 2. Full-time student 84 15.87% 3. IT-related 130 24.57% 4. Other 176 33.29% All 529 100% Q5 What is your highest qualification? 1. Matric 340 63.91% 2. National certificate 75 14.10% 3. Diploma 84 15.79% 4. Degree 24 4.51% 5. Post-graduate degree 9 1.69% All 532 100.00% Q6 What is your first language? 1. English 206 38.94% 2. Afrikaans 89 16.82% 3. Other 234 44.248% All 529 100.00% Q7 Did you have Computer Applications Technology, Information Technology or Computer Studies at school?
1 Yes 239 45.09% 2 No 291 54.91% All 530 100.00% Q8 Have you been registered for COS1511 before? 1 Yes 227 42.91% 2 No 302 57.09% All 529 100.00% Q9 What level of computer literacy do you have? If you have done more than one, choose the option reflecting the most recent one you have done.
Self-taught 108 20.30% Did Computer Applications Technology, Information Technology or Computer Studies at school
80 15.04%
Passed or enrolled for ICDL or EUP at Unisa 140 26.32% Done any other computer literacy course 85 15.98% Use a computer daily at work 119 22.36% All 532 100.00%

348
D.1.5 English and Mathematics marks (section 6.3.3.1)
Table D.1.19 Quantiles for Mathematics marks for respondents for both semesters 2012
Semester 1 Semester 2 100.0% maximum 91 93 99.5% 87.24 90.67 97.5% 80 80 90.0% 70 72.7 75.0% quartile 60 60 50.0% median 50 50 25.0% quartile 40 40 10.0% 33 33 2.5% 33 27.975 0.5% 28.14 13.665 0.0% minimum 10 10
Table D.1.20 Summary statistics for Mathematics marks for respondents for both semesters 2012
Semester 1 Semester 2 Mean 51.517895 51.62406 Std Dev 14.488071 15.572975 Std Err Mean 0.6647583 0.6751741 Upper 95% Mean 52.824132 52.9504 Lower 95% Mean 50.211657 50.29772 N 475 532 Skewness 0.4479225 0.3308532 Kurtosis -0.600023 -0.5953
Table D.1.21 Quantiles for English marks for respondents for both semesters 2012
Semester 1 Semester 2 100.0% maximum 89 90 99.5% 80 83.675 97.5% 80 80 90.0% 70 70 75.0% quartile 60 60 50.0% median 50 50 25.0% quartile 40 47 10.0% 40 40 2.5% 33 33 0.5% 31.14 31.995 0.0% minimum 30 30
Table D.1.22 Summary statistics for English marks for respondents for both semesters 2012
Semester 1 Semester 2 Mean 53.052632 54.231203 Std Dev 12.039815 11.923529 Std Err Mean 0.5524246 0.5169506 Upper 95% Mean 54.138136 55.246722 Lower 95% Mean 51.967128 53.215684 N 475 532 Skewness 0.3562772 0.3732152 Kurtosis -0.412812 -0.434236
D.1.6 Positive user experience (questions 17 to 21) (section 6.3.3.3).
Table D.1.23 Quantiles for positive user experience for both semesters 2012 all respondents
Semester 1 Semester 2 100.0% maximum 5 5 99.5% 5 5 97.5% 5 5 90.0% 5 4.8 75.0% quartile 4.4 4.4 50.0% median 3.8 3.8 25.0% quartile 3.2 3 10.0% 2.6 2.6 2.5% 1.78 1.8 0.5% 1 1.131 0.0% minimum 1 1
Table D.1.24 Summary statistics for positive user experience for both semesters 2012 all respondents
Semester 1 Semester 2 Mean 3.7511579 3.680283 Std Dev 0.8951662 0.8948144 Std Err Mean 0.041073 0.0388683 Upper 95% Mean 3.8318657 3.7566381 Lower 95% Mean 3.6704501 3.6039279 N 475 530 Skewness -0.569449 -0.397598 Kurtosis -0.133829 -0.490948
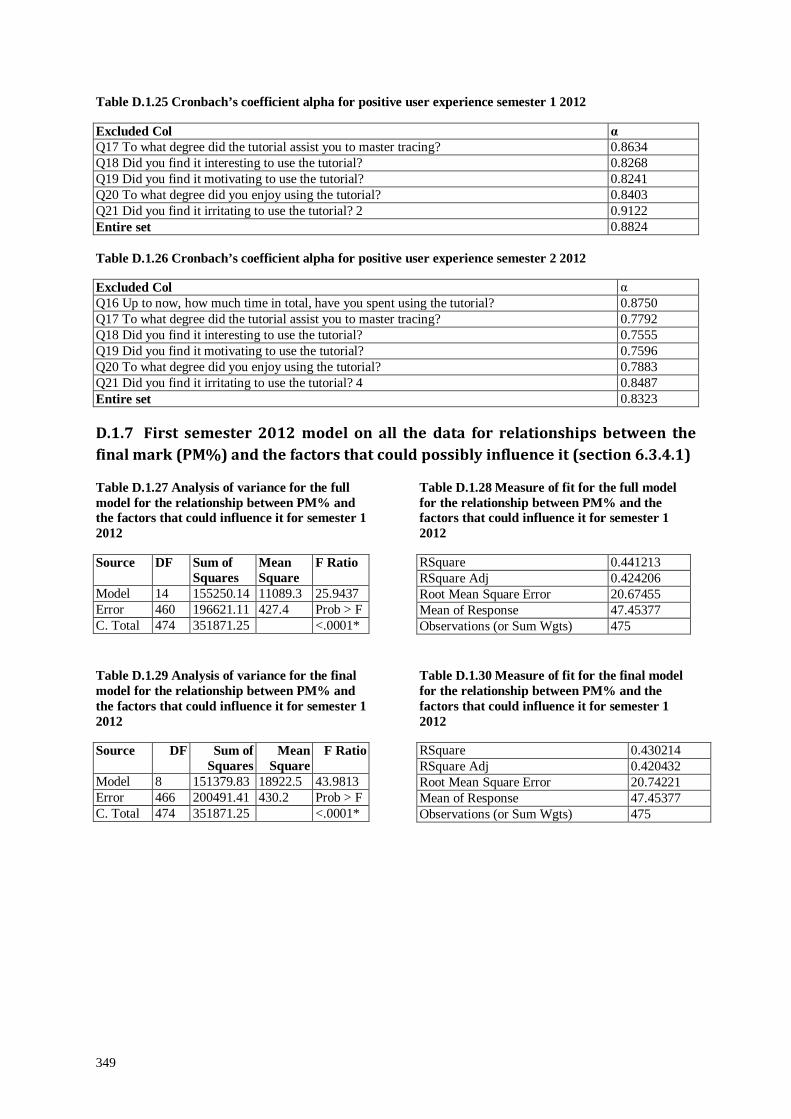
349
Table D.1.25 Cronbach’s coefficient alpha for positive user experience semester 1 2012
Excluded Col α Q17 To what degree did the tutorial assist you to master tracing? 0.8634 Q18 Did you find it interesting to use the tutorial? 0.8268 Q19 Did you find it motivating to use the tutorial? 0.8241 Q20 To what degree did you enjoy using the tutorial? 0.8403 Q21 Did you find it irritating to use the tutorial? 2 0.9122 Entire set 0.8824 Table D.1.26 Cronbach’s coefficient alpha for positive user experience semester 2 2012
Excluded Col α Q16 Up to now, how much time in total, have you spent using the tutorial? 0.8750 Q17 To what degree did the tutorial assist you to master tracing? 0.7792 Q18 Did you find it interesting to use the tutorial? 0.7555 Q19 Did you find it motivating to use the tutorial? 0.7596 Q20 To what degree did you enjoy using the tutorial? 0.7883 Q21 Did you find it irritating to use the tutorial? 4 0.8487 Entire set 0.8323
D.1.7 First semester 2012 model on all the data for relationships between the final mark (PM%) and the factors that could possibly influence it (section 6.3.4.1)
Table D.1.27 Analysis of variance for the full model for the relationship between PM% and the factors that could influence it for semester 1 2012
Source DF Sum of Squares
Mean Square
F Ratio
Model 14 155250.14 11089.3 25.9437 Error 460 196621.11 427.4 Prob > F C. Total 474 351871.25 <.0001*
Table D.1.28 Measure of fit for the full model for the relationship between PM% and the factors that could influence it for semester 1 2012
RSquare 0.441213 RSquare Adj 0.424206 Root Mean Square Error 20.67455 Mean of Response 47.45377 Observations (or Sum Wgts) 475
Table D.1.29 Analysis of variance for the final model for the relationship between PM% and the factors that could influence it for semester 1 2012
Source DF Sum of Squares
Mean Square
F Ratio
Model 8 151379.83 18922.5 43.9813 Error 466 200491.41 430.2 Prob > F C. Total 474 351871.25 <.0001*
Table D.1.30 Measure of fit for the final model for the relationship between PM% and the factors that could influence it for semester 1 2012
RSquare 0.430214 RSquare Adj 0.420432 Root Mean Square Error 20.74221 Mean of Response 47.45377 Observations (or Sum Wgts) 475
350
Figure D.1.5 Residual by predicted plot for the final model for the relationship between PM% and the factors that could influence it for semester 1 2012
Figure D.1.6 Actual by predicted plot for the final model for the relationship between PM% and the factors that could influence it for semester 1 2012
D.1.8 Second semester 2012 model on all the data for relationships between the final mark (PM%) and the factors that could possibly influence it (section 6.3.4.1)
Table D.1.31 Analysis of variance for the full model for the relationship between PM% and the factors that could influence it for semester 2 2012
Source DF Sum of Squares
Mean Square
F Ratio
Model 12 103265.11 8605.43 23.2767 Error 517 191135.17 369.70 Prob > F C. Total 529 294400.28 <.0001*
Table D.1.32 Measure of fit for the full model for the relationship between PM% and the factors that could influence it for semester 2 2012
RSquare 0.350764 RSquare Adj 0.335695 Root Mean Square Error 19.2276 Mean of Response 42.25683 Observations (or Sum Wgts) 530
Table D.1.33 Analysis of variance for the final model for the relationship between PM% and the factors that could influence it for semester 2 2012
Source DF Sum of Squares
Mean Square
F Ratio
Model 7 102866.79 14695.3 39.6722 Error 524 194098.33 370.4 Prob > F C. Total 531 296965.13 <.0001*
Table D.1.34 Measure of fit for the final model for the relationship between PM% and that the factors that could influence it for semester 2 2012
RSquare 0.346394 RSquare Adj 0.337662 Root Mean Square Error 19.24621 Mean of Response 42.38201 Observations (or Sum Wgts) 532
351
Figure D.1.7 Residual by predicted plot for the final model for the relationship between PM% and that the factors that could influence it semester 2 2012
Figure D.1.8 Actual by predicted plot for the final model for the relationship between PM% and that the factors that could influence it semester 2 2012
D.1.9 Relationship between time spent using tutorial (Q16) and PM% (section 6.3.4.4)
Semester 1 1012
Table D.1.35 Analysis of variance for PM% by time spent using the tutorial for semester 1 2012
Source DF Sum of Squares
Mean Square
F Ratio
Q16 Up to now, how much time in total, have you spent using the tutorial?
4 20551.26 5137.81 7.2883
Error 470 331319.99 704.94 C. Total 474 351871.25
Table D.1.36 Measure of fit for PM% by time spent using the tutorial for semester 1 2012
RSquare 0.058406 RSquare Adj 0.050392 Root Mean Square Error 26.55063 Mean of Response 47.45377 Observations (or Sum Wgts) 475
Semester 2 1012
Table D.1.37 Analysis of variance for PM% by time spent using the tutorial for semester 2 2012
Source DF Sum of Squares
Mean Square
F Ratio
Q16 Up to now, how much time in total, have you spent using the tutorial?
4 10468.47 2617.12 4.8116
Error 526 286102.36 543.92 C. Total 530 296570.84
Table D.1.38 Measure of fit for PM% by time spent using the tutorial for semester 2 2012
RSquare 0.035298 RSquare Adj 0.027962 Root Mean Square Error 23.32211 Mean of Response 42.34465 Observations (or Sum Wgts) 531
352
D.1.10 Relationship between programming experience (Q10) and PM% (section 6.3.4.5)
Semester 1 1012
Table D.1.39 Analysis of variance for PM% by programming experience for semester 1 2012
Source DF Sum of Squares
Mean Square
F Ratio
Q10 What experience do you have in programming?
4 77923.00 19480.8 33.4222
Error 470 273948.24 582.9 C. Total 474 351871.25
Table D.1.40 Measure of fit for PM% by programming experience for semester 1 2012
RSquare 0.221453 RSquare Adj 0.214827 Root Mean Square Error 24.14267 Mean of Response 47.45377 Observations (or Sum Wgts) 475
Semester 2 1012
Table D.1.41 Analysis of variance for PM% by programming experience for semester 2 2012
Source DF Sum of Squares
Mean Square
F Ratio
Q10 What experience do you have in programming?
4 60113.37 15028.3 33.9810
Error 517 228646.90 442.3 C. Total 521 288760.27
Table D.1.42 Measure of fit for PM% PM% by programming experience for semester 2 2012
RSquare 0.208177 RSquare Adj 0.202051 Root Mean Square Error 21.02991 Mean of Response 42.13389 Observations (or Sum Wgts) 522

353
D.2 Second implementation cycle 2012 of the Drawing Variable Diagrams Tutorial
D.2.1. Final marks for 2013 examinations (section 7.2.1)
Table D.2.1 Quantiles for final marks for respondents for both semesters 2013
Semester 1 Semester 2 100.0% maximum 93 94.09 99.5% 93 94.09 97.5% 90.975 92.2625 90.0% 80 89.034 75.0% quartile 74 75 50.0% median 60 57.53 25.0% quartile 50 30.915 10.0% 40 18.708 2.5% 33 12.795 0.5% 33 9.14 0.0% minimum 33 9.14
Table D.2.2 Summary statistics for final marks for respondents for both semesters 2013
Semester 1 Semester 2 Mean 61.151515 54.721233 Std Dev 15.328448 24.71571 Std Err Mean 1.8868015 2.8927551 Upper 95% Mean 64.919718 60.487835 Lower 95% Mean 57.383312 48.954631 N 66 73 Skewness -0.01156 -0.102583 Kurtosis -0.777914 -1.179244
D.2.2 Biographical detail and descriptive statistics (section 7.3.3)
Table D.2.3 Biographical data of students in both semesters of 2013
Semester 1 2013 Semester 2 2013 Q1 Gender? N % of Total 1. Male 35 64.81% 47 72.31% 2. Female 19 35.19% 18 27.69% All 54 100.00% 65 100.00% Q2 What is your age? 1. 19 - 22 20 37.04% 15 23.08% 2. 23 - 27 17 31.48% 21 32.31% 3. 28 - 32 9 16.67% 16 24.62% 4. 32 – 40 7 12.96% 10 15.38% 5. 41 + 1 1.85% 3 4.62% All 54 100.00% 65 100.00% Q3 Which ONE of the following describes your situation best? 1. I am a full-time student who does not work at all. 13 24.07% 8 12.50% 2. I am a full-time student who works part-time for extra pocket money (not to pay for my studies).
2 3.70% 3 4.69%
3. I am a full-time student who works part-time to pay for my studies. 1 1.85% 5 7.81% 4. I work full-time and study after hours, and the work that I do is not related to my degree at all.
15 27.78% 17 26.56%
5. I work full-time and study after hours, and the work that I do is related to my degree
23 42.59% 29 45.31%
6. Other 0 0.00% 2 3.13% All 54 100.00% 64 100.00% Q4 My highest qualification is 1. Matric 31 58.49% 41 64.06% 2. National certificate 7 13.21% 10 15.63% 3. Diploma 9 16.98% 10 15.63% 4. Degree 2 3.77% 2 3.13% 5. Post-graduate degree 4 7.55% 1 1.56% All 53 100.00% 64 100.00%
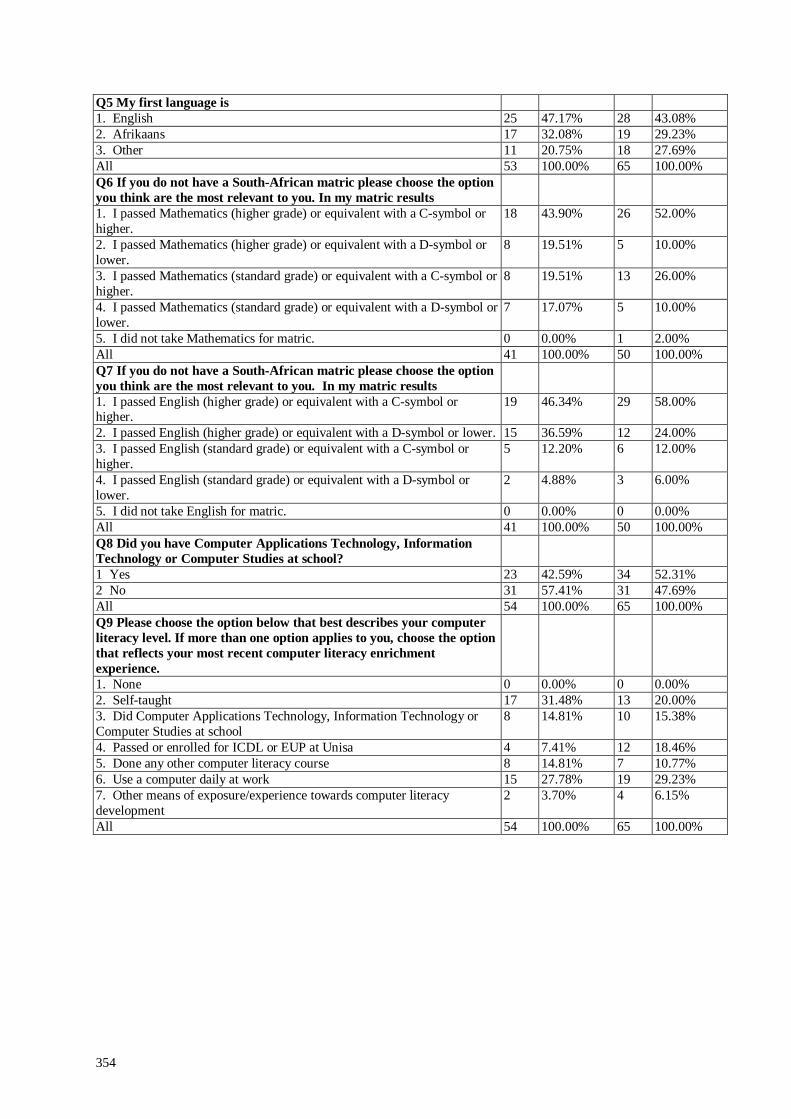
354
Q5 My first language is 1. English 25 47.17% 28 43.08% 2. Afrikaans 17 32.08% 19 29.23% 3. Other 11 20.75% 18 27.69% All 53 100.00% 65 100.00% Q6 If you do not have a South-African matric please choose the option you think are the most relevant to you. In my matric results
1. I passed Mathematics (higher grade) or equivalent with a C-symbol or higher.
18 43.90% 26 52.00%
2. I passed Mathematics (higher grade) or equivalent with a D-symbol or lower.
8 19.51% 5 10.00%
3. I passed Mathematics (standard grade) or equivalent with a C-symbol or higher.
8 19.51% 13 26.00%
4. I passed Mathematics (standard grade) or equivalent with a D-symbol or lower.
7 17.07% 5 10.00%
5. I did not take Mathematics for matric. 0 0.00% 1 2.00% All 41 100.00% 50 100.00% Q7 If you do not have a South-African matric please choose the option you think are the most relevant to you. In my matric results
1. I passed English (higher grade) or equivalent with a C-symbol or higher.
19 46.34% 29 58.00%
2. I passed English (higher grade) or equivalent with a D-symbol or lower. 15 36.59% 12 24.00% 3. I passed English (standard grade) or equivalent with a C-symbol or higher.
5 12.20% 6 12.00%
4. I passed English (standard grade) or equivalent with a D-symbol or lower.
2 4.88% 3 6.00%
5. I did not take English for matric. 0 0.00% 0 0.00% All 41 100.00% 50 100.00% Q8 Did you have Computer Applications Technology, Information Technology or Computer Studies at school?
1 Yes 23 42.59% 34 52.31% 2 No 31 57.41% 31 47.69% All 54 100.00% 65 100.00% Q9 Please choose the option below that best describes your computer literacy level. If more than one option applies to you, choose the option that reflects your most recent computer literacy enrichment experience.
1. None 0 0.00% 0 0.00% 2. Self-taught 17 31.48% 13 20.00% 3. Did Computer Applications Technology, Information Technology or Computer Studies at school
8 14.81% 10 15.38%
4. Passed or enrolled for ICDL or EUP at Unisa 4 7.41% 12 18.46% 5. Done any other computer literacy course 8 14.81% 7 10.77% 6. Use a computer daily at work 15 27.78% 19 29.23% 7. Other means of exposure/experience towards computer literacy development
2 3.70% 4 6.15%
All 54 100.00% 65 100.00%
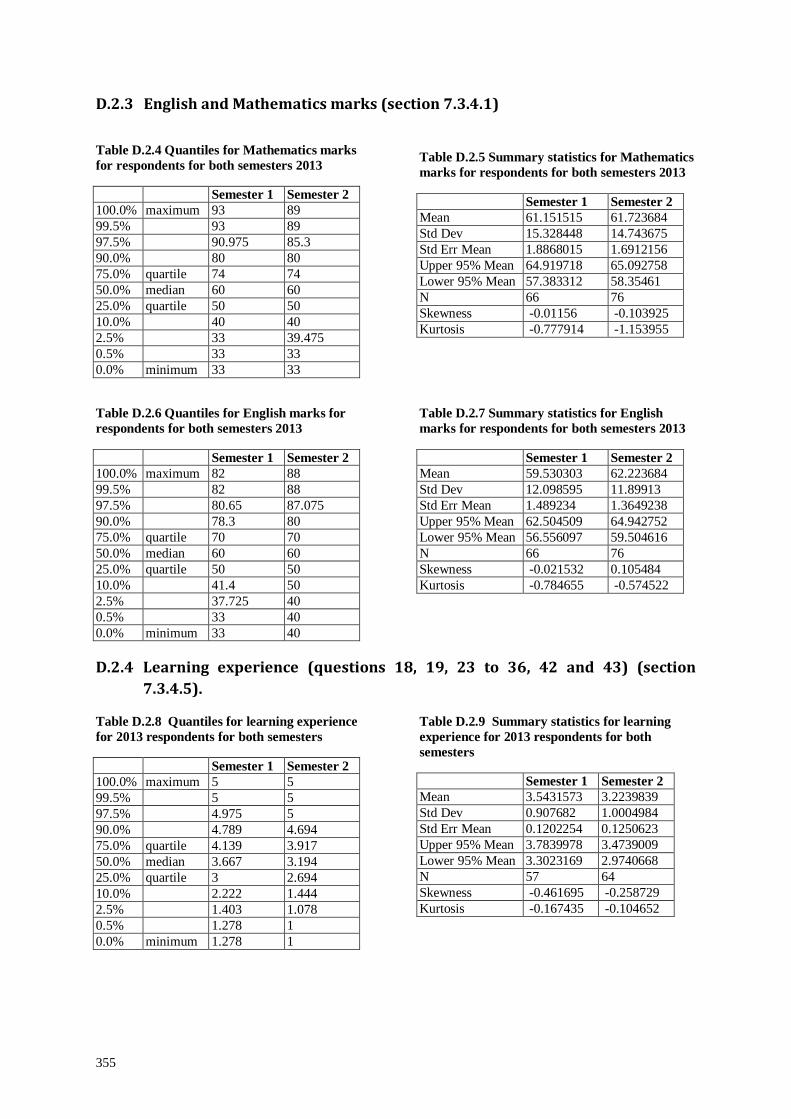
355
D.2.3 English and Mathematics marks (section 7.3.4.1)
Table D.2.4 Quantiles for Mathematics marks for respondents for both semesters 2013
Semester 1 Semester 2 100.0% maximum 93 89 99.5% 93 89 97.5% 90.975 85.3 90.0% 80 80 75.0% quartile 74 74 50.0% median 60 60 25.0% quartile 50 50 10.0% 40 40 2.5% 33 39.475 0.5% 33 33 0.0% minimum 33 33
Table D.2.5 Summary statistics for Mathematics marks for respondents for both semesters 2013
Semester 1 Semester 2 Mean 61.151515 61.723684 Std Dev 15.328448 14.743675 Std Err Mean 1.8868015 1.6912156 Upper 95% Mean 64.919718 65.092758 Lower 95% Mean 57.383312 58.35461 N 66 76 Skewness -0.01156 -0.103925 Kurtosis -0.777914 -1.153955
Table D.2.6 Quantiles for English marks for respondents for both semesters 2013
Semester 1 Semester 2 100.0% maximum 82 88 99.5% 82 88 97.5% 80.65 87.075 90.0% 78.3 80 75.0% quartile 70 70 50.0% median 60 60 25.0% quartile 50 50 10.0% 41.4 50 2.5% 37.725 40 0.5% 33 40 0.0% minimum 33 40
Table D.2.7 Summary statistics for English marks for respondents for both semesters 2013
Semester 1 Semester 2 Mean 59.530303 62.223684 Std Dev 12.098595 11.89913 Std Err Mean 1.489234 1.3649238 Upper 95% Mean 62.504509 64.942752 Lower 95% Mean 56.556097 59.504616 N 66 76 Skewness -0.021532 0.105484 Kurtosis -0.784655 -0.574522
D.2.4 Learning experience (questions 18, 19, 23 to 36, 42 and 43) (section 7.3.4.5).
Table D.2.8 Quantiles for learning experience for 2013 respondents for both semesters
Semester 1 Semester 2 100.0% maximum 5 5 99.5% 5 5 97.5% 4.975 5 90.0% 4.789 4.694 75.0% quartile 4.139 3.917 50.0% median 3.667 3.194 25.0% quartile 3 2.694 10.0% 2.222 1.444 2.5% 1.403 1.078 0.5% 1.278 1 0.0% minimum 1.278 1
Table D.2.9 Summary statistics for learning experience for 2013 respondents for both semesters
Semester 1 Semester 2 Mean 3.5431573 3.2239839 Std Dev 0.907682 1.0004984 Std Err Mean 0.1202254 0.1250623 Upper 95% Mean 3.7839978 3.4739009 Lower 95% Mean 3.3023169 2.9740668 N 57 64 Skewness -0.461695 -0.258729 Kurtosis -0.167435 -0.104652

356
Table D.2.10 Cronbach’s coefficient alpha for learning experience semester 1 2013
Excluded Col α Q18 Do you feel that using variable diagrams improves your programming skills? 0.9645 Q19 Do you feel that using variable diagrams assist with understanding the flow of logic in a program? 0.9653 Q23 Did watching the Drawing Variable Diagrams tutorial, help you to understand if statements? 0.9602 Q24 Did watching the Drawing Variable Diagrams tutorial, help you to understand while loops? 0.9600 Q25 Did watching the Drawing Variable Diagrams tutorial, help you to understand nested if statements? 0.9597 Q26 Did watching the Drawing Variable Diagrams tutorial, help you to understand switch statements? 0.9605 Q27 Did watching the Drawing Variable Diagrams tutorial, help you to understand the difference between while loops and do É while loops?
0.9606
Q28 Did watching the Drawing Variable Diagrams tutorial, help you to understand what happens when a function is executed?
0.9602
Q29 Did watching the Drawing Variable Diagrams tutorial, help you to understand value parameters? 0.9603 Q30 Did watching the Drawing Variable Diagrams tutorial, help you to understand reference parameters?
0.9606
Q31 Did watching the Drawing Variable Diagrams tutorial, help you to understand the difference between value and reference parameters?
0.9614
Q32 Did watching the Drawing Variable Diagrams tutorial, help you to understand one-dimensional arrays?
0.9610
Q33 Did watching the Drawing Variable Diagrams tutorial, help you to understand two-dimensional arrays?
0.9610
Q34 Did watching the Drawing Variable Diagrams tutorial, help you to understand strings? 0.9626 Q35 Did watching the Drawing Variable Diagrams tutorial, help you to understand structs? 0.9618 Q36 To trace a program means to form a mental picture of what the program does and how it is done. To what degree did the Drawing Variable Diagrams tutorial assist you to master tracing?
0.9632
Q42 Did you find that the Drawing Variable Diagrams tutorial is directly applicable to the programming assignments in the course?
0.9637
Q43 Do you think that you will apply the general concept of variable diagrams in future programming projects?
0.9674
Entire set 0.9640

357
Table D.2.11 Cronbach’s coefficient alpha for learning experience semester 2 2013
Excluded Col α Q18 Do you feel that using variable diagrams improves your programming skills? 0.9670 Q19 Do you feel that using variable diagrams assist with understanding the flow of logic in a program? 0.9682 Q23 Did watching drawing variable diagram tutorial helps you understand if statements 0.9659 Q24 Did watching the Drawing Variable Diagrams tutorial, help you to understand if statements? 0.9649 Q25 Did watching the Drawing Variable Diagrams tutorial, help you to understand nested if statements? 0.9646 Q26 Did watching the Drawing Variable Diagrams tutorial, help you to understand switch statements? 0.9649 Q27 Did watching the Drawing Variable Diagrams tutorial, help you to understand the difference between while loops and do É while loops?
0.9649
Q28 Did watching the Drawing Variable Diagrams tutorial, help you to understand what happens when a function is executed?
0.9653
Q29 Did watching the Drawing Variable Diagrams tutorial, help you to understand value parameters? 0.9655 Q30 Did watching the Drawing Variable Diagrams tutorial, help you to understand reference parameters?
0.9653
Q31 Did watching the Drawing Variable Diagrams tutorial, help you to understand the difference between value and reference parameters?
0.9650
Q32 Did watching the Drawing Variable Diagrams tutorial, help you to understand one-dimensional arrays?
0.9647
Q33 Did watching the Drawing Variable Diagrams tutorial, help you to understand two-dimensional arrays?
0.9652
Q34 Did watching the Drawing Variable Diagrams tutorial, help you to understand strings? 0.9665 Q35 Did watching the Drawing Variable Diagrams tutorial, help you to understand structs? 0.9660 Q36 To trace a program means to form a mental picture of what the program does and how it is done. To what degree did the Drawing Variable Diagrams tutorial assist you to master tracing?
0.9679
Q42 Did you find that the Drawing Variable Diagrams tutorial is directly applicable to the programming assignments in the course?
0.9687
Q43 Do you think that you will apply the general concept of variable diagrams in future programming projects?
0.9680
Entire set 0.9679
D.2.5 Positive user experience (questions 37 to 41) (section 7.3.4.6).
Table D.2.12 Quantiles for Positive user experience for all respondents for both semesters 2013
Semester 1 Semester 2 100.0% maximum 5 5 99.5% 5 5 97.5% 5 5 90.0% 4.8 4.58 75.0% quartile 4.2 4 50.0% median 3.8 3.3 25.0% quartile 3 2.6 10.0% 2.08 2 2.5% 1.085 1.21 0.5% 1 1 0.0% minimum 1 1
Table D.2.13 Summary statistics for Positive user experience for all respondents for both semesters 2013
Semester 1 Semester 2 Mean 3.5696429 3.2608333 Std Dev 1.0190762 0.9557184 Std Err Mean 0.1361798 0.1233827 Upper 95% Mean 3.8425532 3.5077216 Lower 95% Mean 3.2967325 3.0139451 N 56 60 Skewness -0.731662 -0.104789 Kurtosis 0.0616672 -0.593283
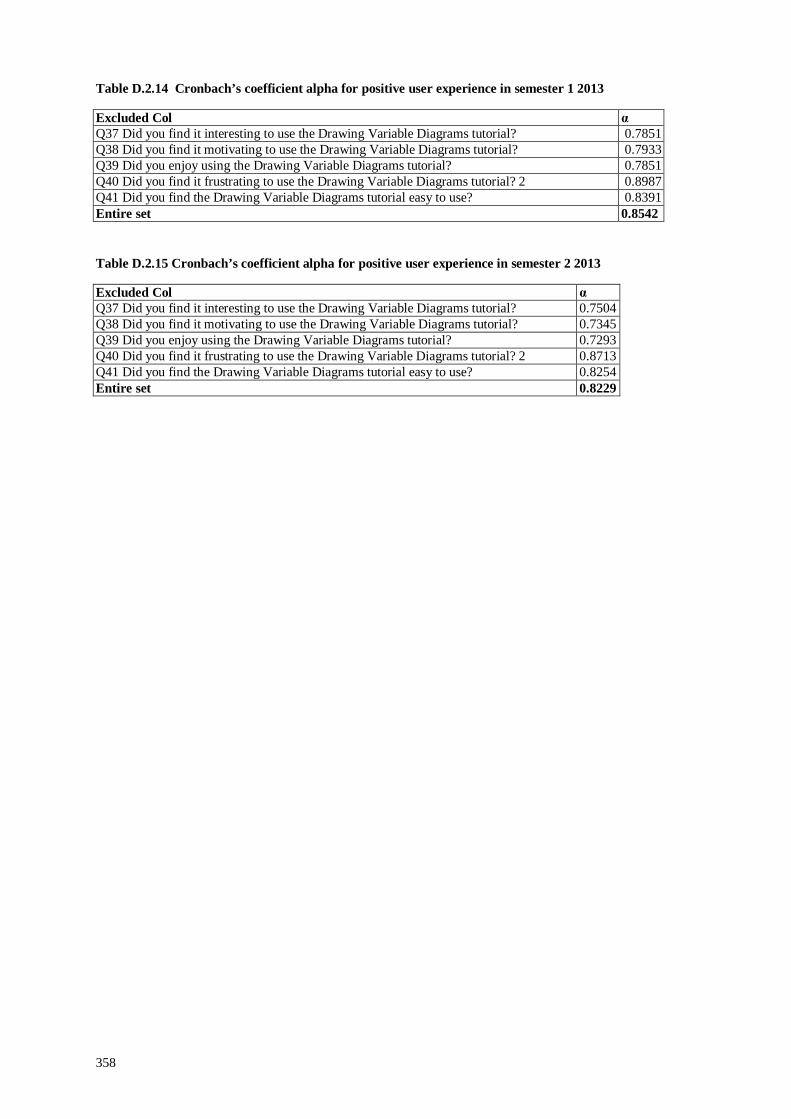
358
Table D.2.14 Cronbach’s coefficient alpha for positive user experience in semester 1 2013
Excluded Col α Q37 Did you find it interesting to use the Drawing Variable Diagrams tutorial? 0.7851 Q38 Did you find it motivating to use the Drawing Variable Diagrams tutorial? 0.7933 Q39 Did you enjoy using the Drawing Variable Diagrams tutorial? 0.7851 Q40 Did you find it frustrating to use the Drawing Variable Diagrams tutorial? 2 0.8987 Q41 Did you find the Drawing Variable Diagrams tutorial easy to use? 0.8391 Entire set 0.8542
Table D.2.15 Cronbach’s coefficient alpha for positive user experience in semester 2 2013
Excluded Col α Q37 Did you find it interesting to use the Drawing Variable Diagrams tutorial? 0.7504 Q38 Did you find it motivating to use the Drawing Variable Diagrams tutorial? 0.7345 Q39 Did you enjoy using the Drawing Variable Diagrams tutorial? 0.7293 Q40 Did you find it frustrating to use the Drawing Variable Diagrams tutorial? 2 0.8713 Q41 Did you find the Drawing Variable Diagrams tutorial easy to use? 0.8254 Entire set 0.8229
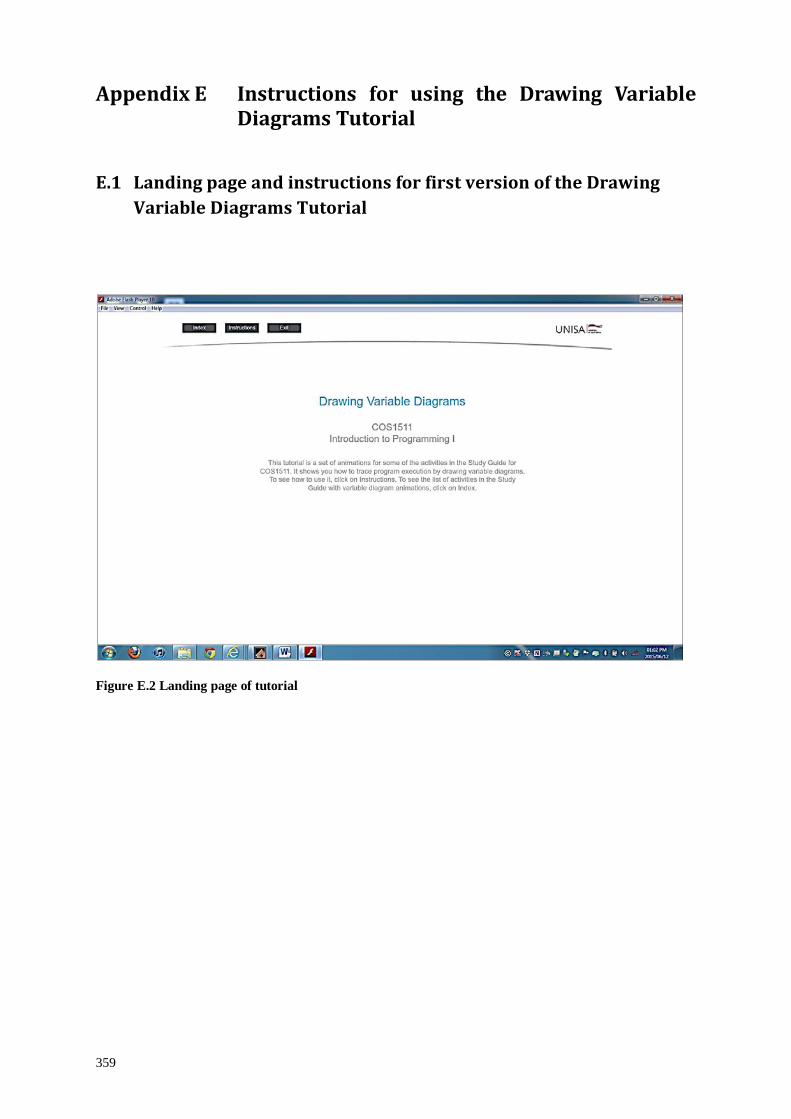
359
Appendix E Instructions for using the Drawing Variable Diagrams Tutorial
E.1 Landing page and instructions for first version of the Drawing Variable Diagrams Tutorial
Figure E.2 Landing page of tutorial
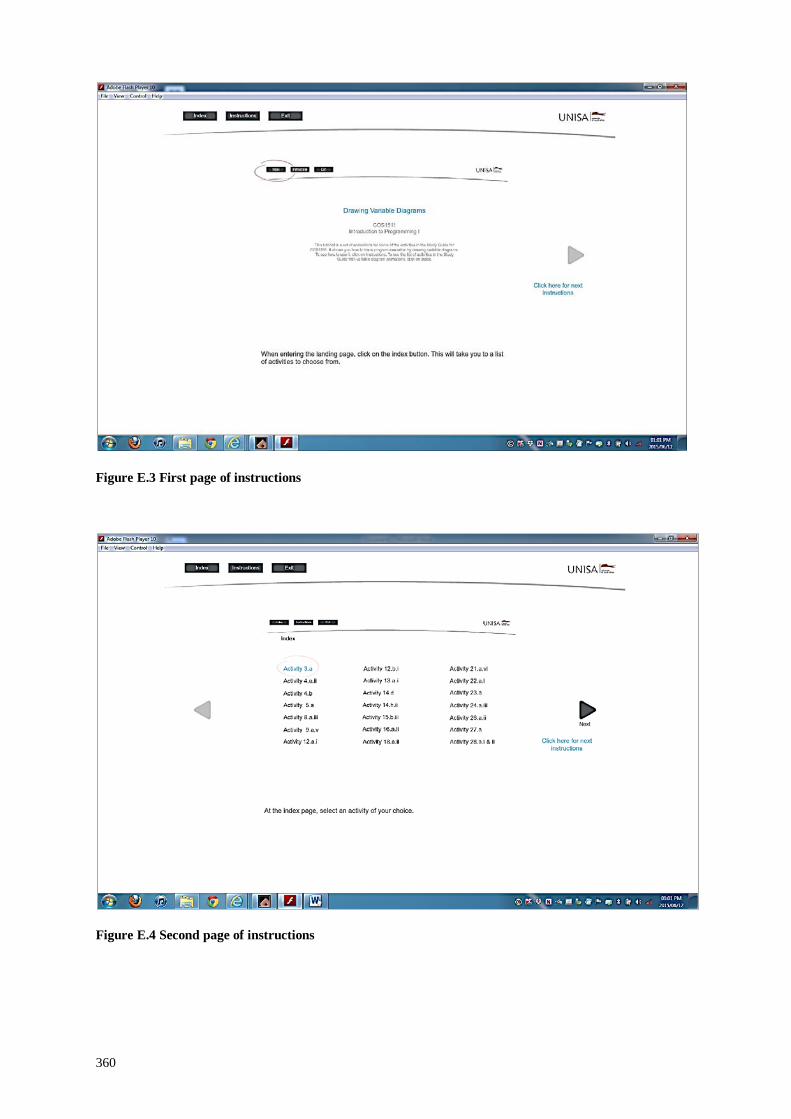
360
Figure E.3 First page of instructions
Figure E.4 Second page of instructions
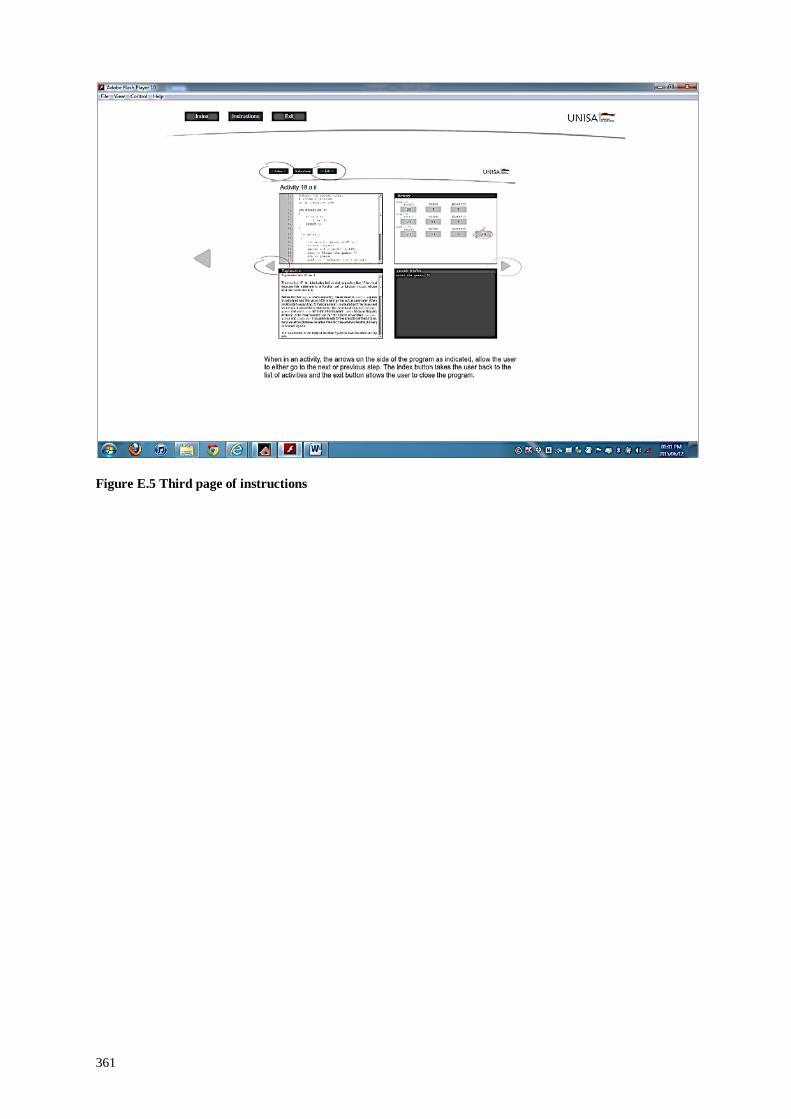
361
Figure E.5 Third page of instructions

362
E.2 Instructions for second version of the Tutorial to Draw Variable Diagrams
Instructions for using the Drawing Variable Diagrams tutorial
Welcome to the Drawing Variable Diagrams tutorial and its instructions.
This is a PowerPoint presentation.
To view each new page, you have to press Enter.
This set of instructions cover the following topics:
1. Introduction
2. What is a variable?
3. What is a variable diagram?
4. The purpose of variable diagrams
5. The purpose of the Drawing Variable Diagrams tutorial
6. Activities in the Drawing Variable Diagrams tutorial
7. How to use the Drawing Variable Diagrams tutorial
8. The Landing Page
9. The Index page
10. Explanation of an activity screen
11. The Program code box
12. The Memory box
13. The Explanation box
14. The Console window box
15. The relationship between the four boxes on the screen for an activity
16. How to follow how variable diagrams are drawn
17. Notes
18. At the end of an activity
19. Using the Drawing Variable Diagrams tutorial to see how variable diagrams are drawn for activity 3.a.i
1. Introduction
• The Drawing Variable Diagrams tutorial shows you how to draw variable diagrams for various programming constructs which you learn in COS1511.
• You should use it together with your COS1511 Study Guide.
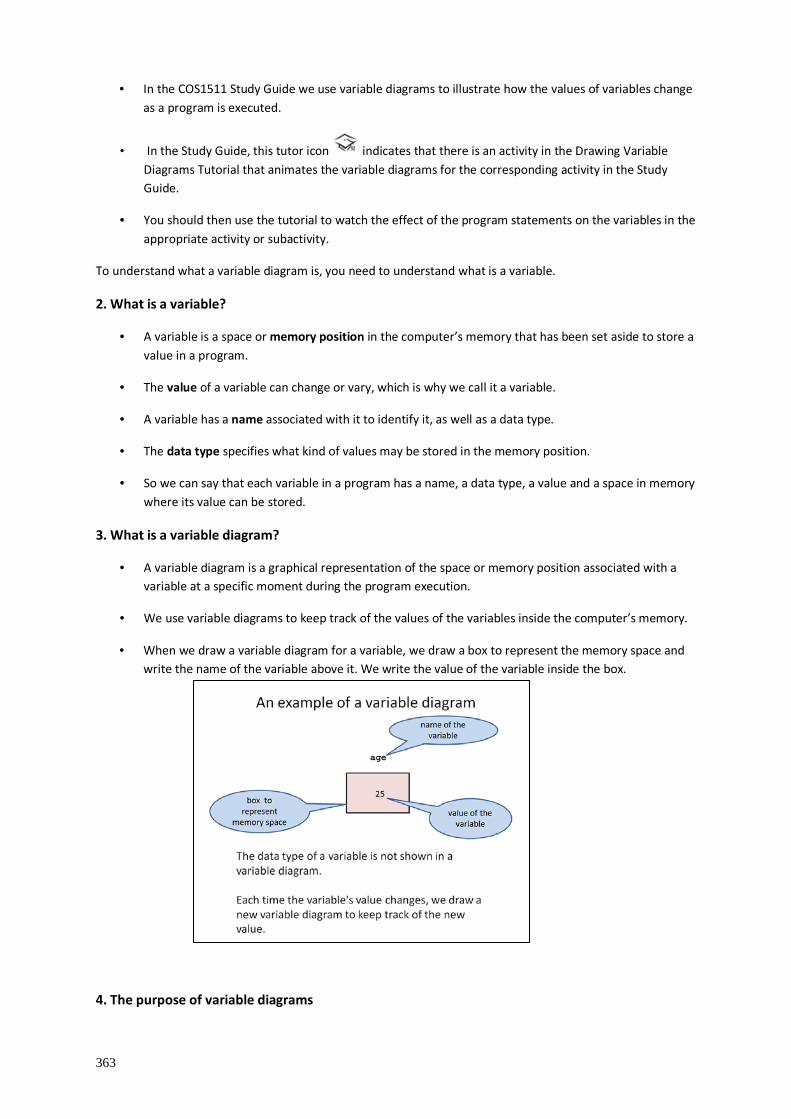
363
• In the COS1511 Study Guide we use variable diagrams to illustrate how the values of variables change as a program is executed.
• In the Study Guide, this tutor icon indicates that there is an activity in the Drawing Variable Diagrams Tutorial that animates the variable diagrams for the corresponding activity in the Study Guide.
• You should then use the tutorial to watch the effect of the program statements on the variables in the appropriate activity or subactivity.
To understand what a variable diagram is, you need to understand what is a variable.
2. What is a variable?
• A variable is a space or memory position in the computer’s memory that has been set aside to store a value in a program.
• The value of a variable can change or vary, which is why we call it a variable.
• A variable has a name associated with it to identify it, as well as a data type.
• The data type specifies what kind of values may be stored in the memory position.
• So we can say that each variable in a program has a name, a data type, a value and a space in memory where its value can be stored.
3. What is a variable diagram?
• A variable diagram is a graphical representation of the space or memory position associated with a variable at a specific moment during the program execution.
• We use variable diagrams to keep track of the values of the variables inside the computer’s memory.
• When we draw a variable diagram for a variable, we draw a box to represent the memory space and write the name of the variable above it. We write the value of the variable inside the box.
4. The purpose of variable diagrams

364
• We draw variable diagrams to trace a program, that is, to form a mental picture of what the program does and how it is done.
• This helps us to understand algorithms and also to debug programs.
• An algorithm is a set of instructions to perform a task, for example to sort a list of names in alphabetic order.
• To debug a program means to find an error in a program where the error causes the program to do something else than what we intend the program to do.
5. The purpose of the Drawing Variable Diagrams tutorial
• The Drawing Variable Diagrams Tutorial shows one example of how to draw variable diagrams for each new programming construct you learn in the COS1511 Study Guide.
• If you know how to draw variable diagrams, you can draw your own variable diagrams on paper for any program to understand what it does, or to debug it.
• So the purpose of the Drawing Variable Diagrams Tutorial is to show you how to draw variable diagrams so that you eventually can draw your own variable diagrams to figure out any program.
6. Activities in the Drawing Variable Diagrams tutorial
• Activity 3.a.i is the first activity in the Study Guide that the Drawing Variable Diagrams Tutorial demonstrates.
• We did not provide animated variable diagrams for all the activities in the Study Guide, but only for those activities where you learn about a new programming construct.
• This is to help you understand what the effect of the new programming construct you are learning, is, and how to draw variable diagrams for this construct.
7. How to use the Drawing Variable Diagrams tutorial
• This tutorial should be used together with your COS1511 Study Guide.
• Once you have studied a section in the COS1511 Study Guide that shows the tutor icon you can watch an animation for the corresponding activity in the Drawing Variable Diagrams tutorial to help you understand how the variable diagrams are drawn.
8. The Landing page
The first page you see when you enter the Drawing Variable Diagrams Tutorial, is called the landing page.
This page has three menu buttons on top: Index, Instructions and Exit.
Click on the Index button to go to the Index page to see the list of activities that the tutorial animates.
Click on the Instructions button to see this set of instructions.
Click on the Exit button to leave the Drawing Variable Diagrams Tutorial.
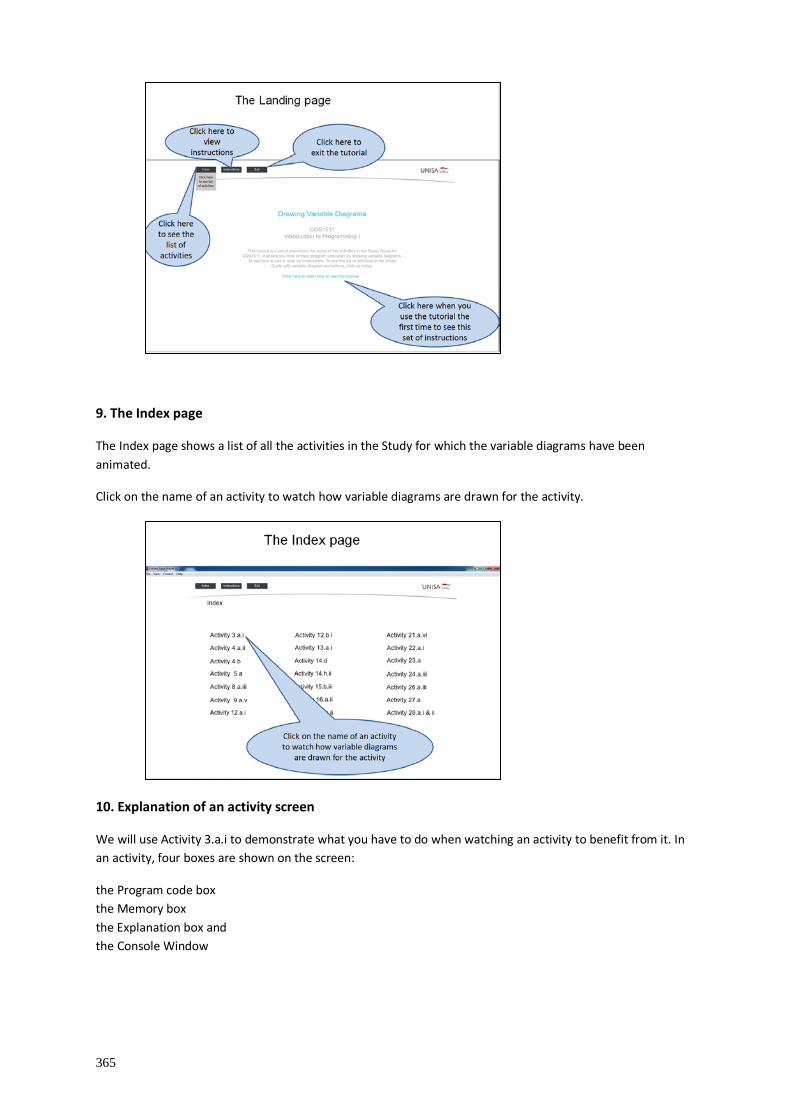
365
9. The Index page
The Index page shows a list of all the activities in the Study for which the variable diagrams have been animated.
Click on the name of an activity to watch how variable diagrams are drawn for the activity.
10. Explanation of an activity screen
We will use Activity 3.a.i to demonstrate what you have to do when watching an activity to benefit from it. In an activity, four boxes are shown on the screen:
the Program code box the Memory box the Explanation box and the Console Window
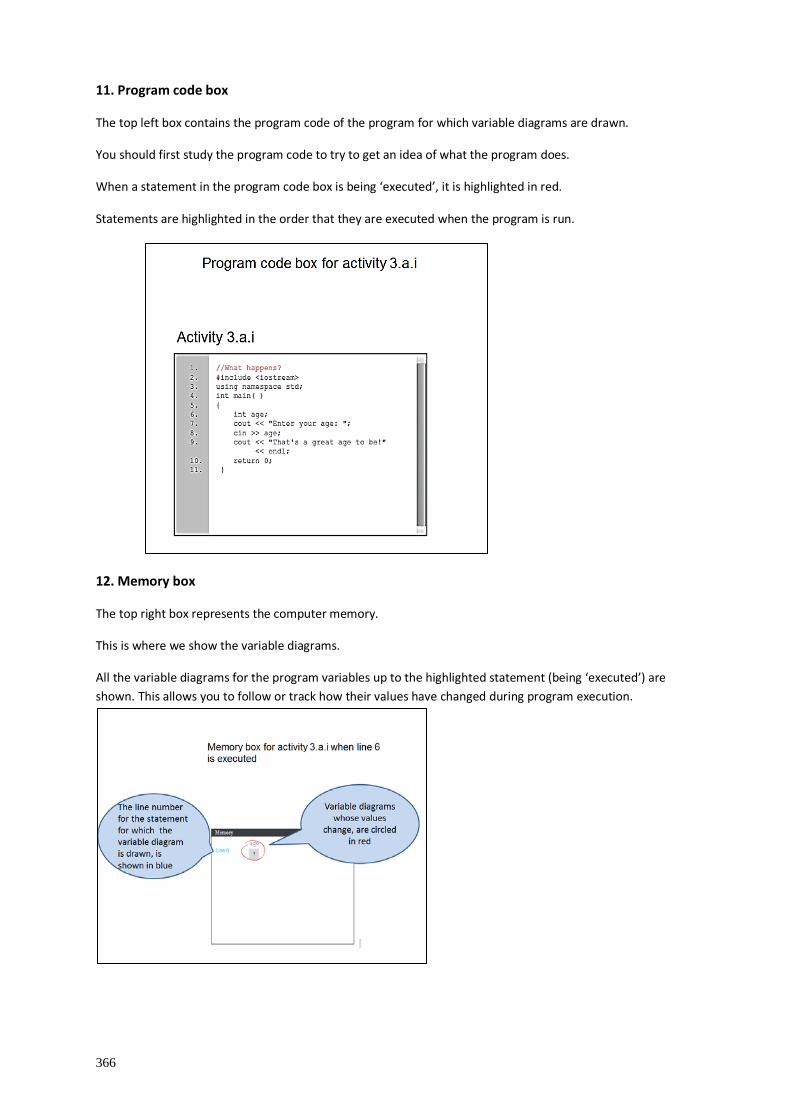
366
11. Program code box
The top left box contains the program code of the program for which variable diagrams are drawn.
You should first study the program code to try to get an idea of what the program does.
When a statement in the program code box is being ‘executed’, it is highlighted in red.
Statements are highlighted in the order that they are executed when the program is run.
12. Memory box
The top right box represents the computer memory.
This is where we show the variable diagrams.
All the variable diagrams for the program variables up to the highlighted statement (being ‘executed’) are shown. This allows you to follow or track how their values have changed during program execution.
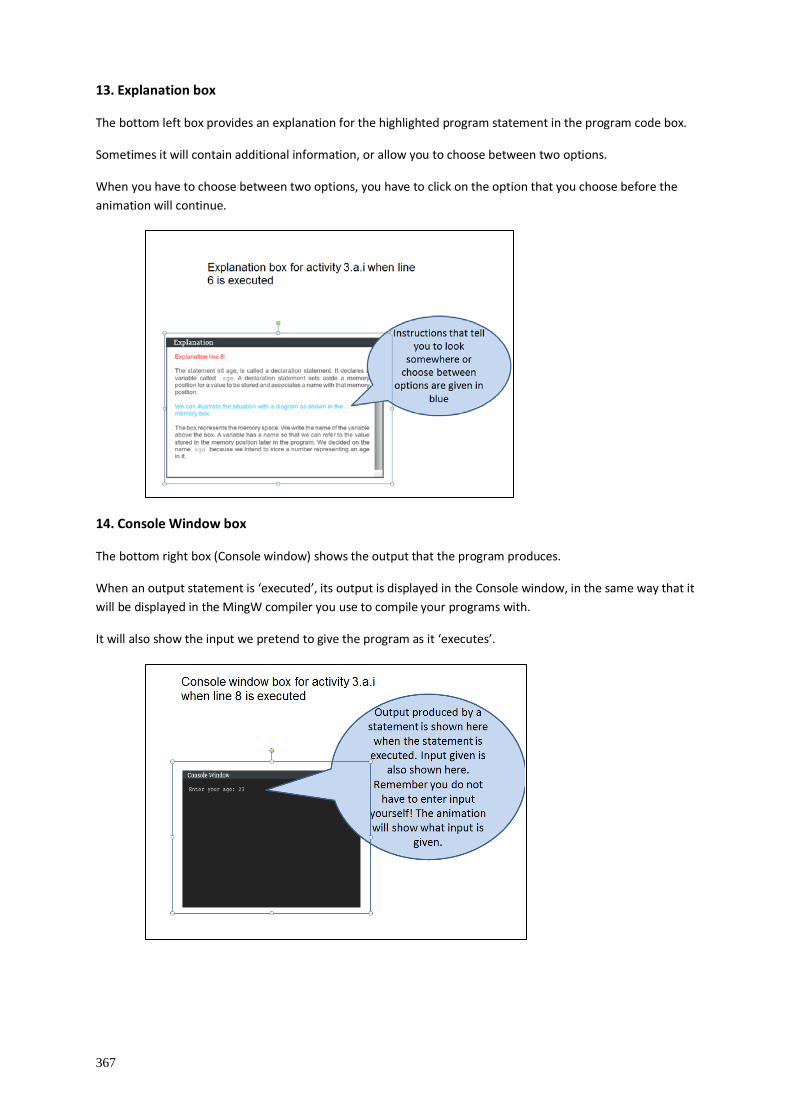
367
13. Explanation box
The bottom left box provides an explanation for the highlighted program statement in the program code box.
Sometimes it will contain additional information, or allow you to choose between two options.
When you have to choose between two options, you have to click on the option that you choose before the animation will continue.
14. Console Window box
The bottom right box (Console window) shows the output that the program produces.
When an output statement is ‘executed’, its output is displayed in the Console window, in the same way that it will be displayed in the MingW compiler you use to compile your programs with.
It will also show the input we pretend to give the program as it ‘executes’.

368
15. The relationship between the four boxes on the screen for an activity
The statements in the program code box are highlighted in the order that the program is executed.
When a statement is highlighted, an explanation for the highlighted statement is given in the Explanation box.
At the same time the Memory box shows how the variable diagram for the statement is drawn, if the statement requires it.
Simultaneously the Console window shows the output the statement produces (if any) and if input is given, what is entered.
16. How to follow how variable diagrams are drawn
First study the program code to try to get an idea of what the program does.
Then read the highlighted program statement.
Next, read the explanation for the statement to make sure you understand what the highlighted statement does.
Then check the Memory box to see how the variable diagram for this statement is drawn, and how the computer memory changed.
Also look at the Console window to see what (if any) output the statement produces, or what input is given for the statement.
Make sure you understand what a program statement does, and what its effect is on the variables involved, as well as what output it produces (if any).
Once you understand the effect of a statement and how a variable diagram for the statement is drawn, click on the Next button on the right-hand side of the screen to see what happens when the next statement is executed.
You can also use the Back button on the left-hand side of the screen to go back to the previous statement in the program.
17. Notes:
You need not provide any input when a statement requires input. The animation will show some input and what the effect thereof is.
Sometimes you may have to choose between two options to see different results for different inputs, or to answer a question to help you make sure you understand the program statement.
Blue instructions in the Explanation box tell you to look somewhere or to choose between two options.
We do not draw variable diagrams for all statements that is executed, but only when the statement changes the computer memory.
18. At the end of an activity
When the last statement in the program has been ‘executed’, you can click the Index button to go back to the Index page if you want to watch another activity, or the Exit button if you want to exit the tutorial.

369
19. Using the Drawing Variable Diagrams tutorial to see how variable diagrams are drawn for activity 3.a.i
We use numbered call-outs to show how someone would watch activity 3.a.i to see how variable diagrams are drawn for this activity.
In this process we will guide you where and what to look at to make sure you understand how to use the tutorial to learn how to draw variable diagrams for the programming constructs you learn in COS1511.
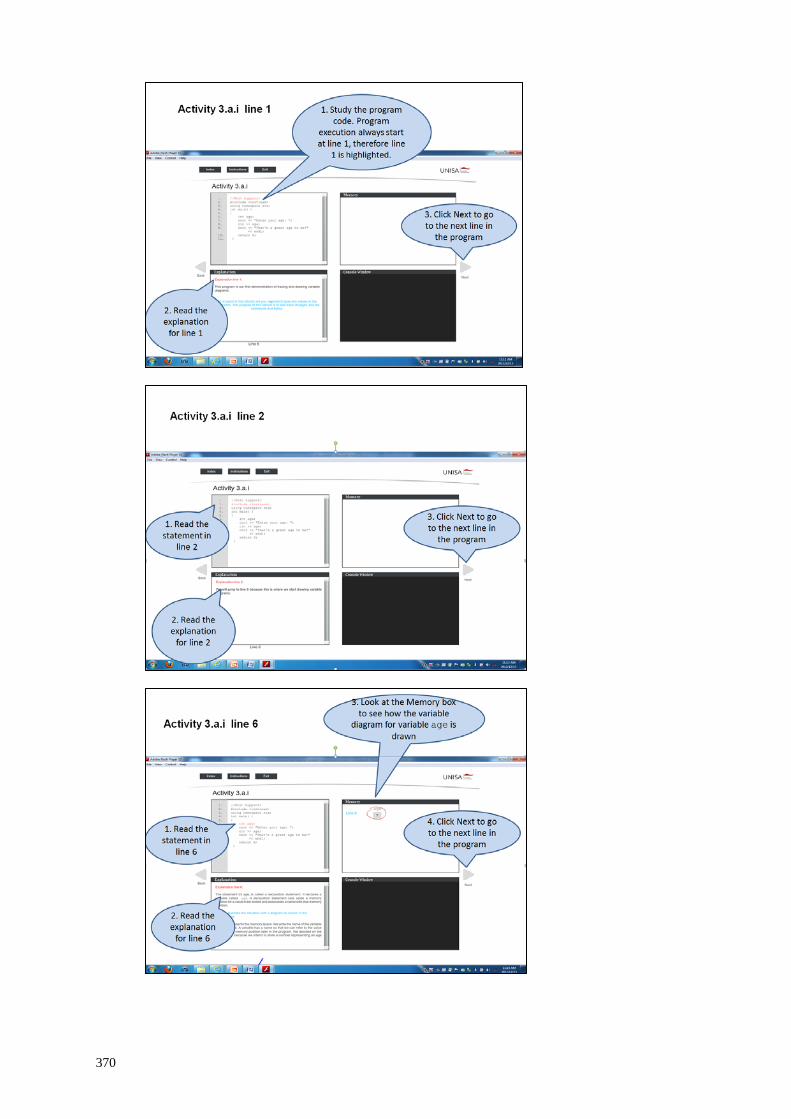
370
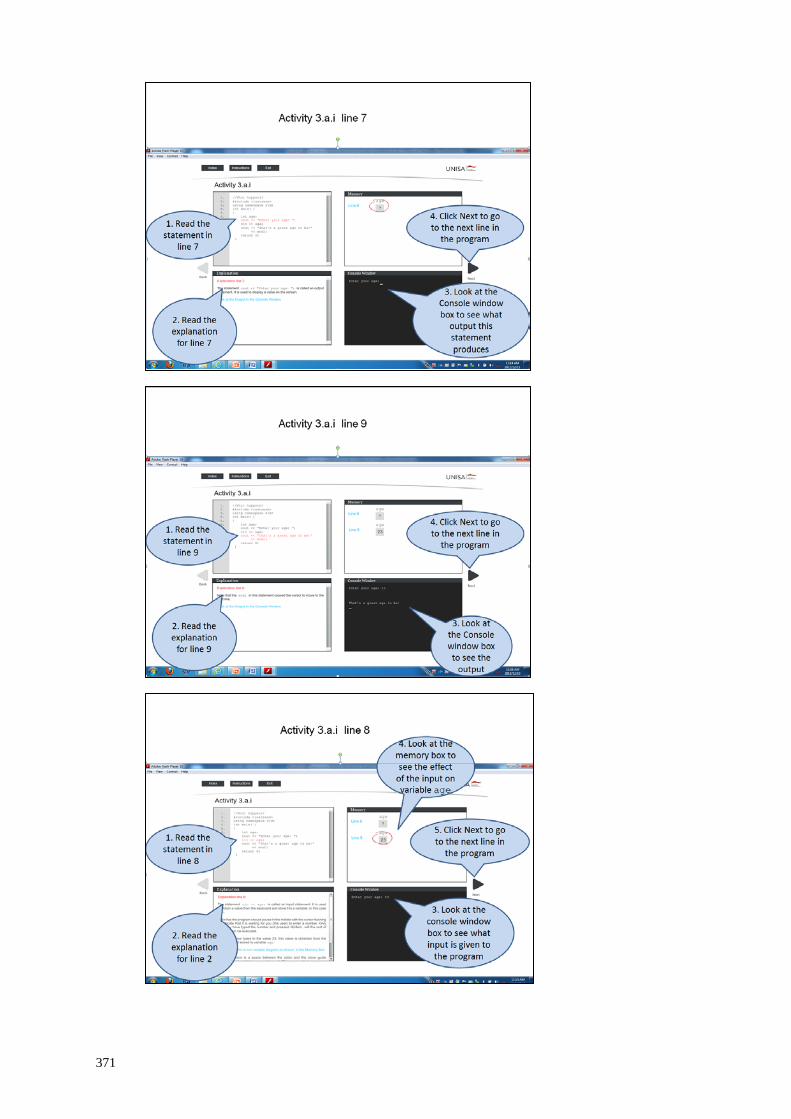
371
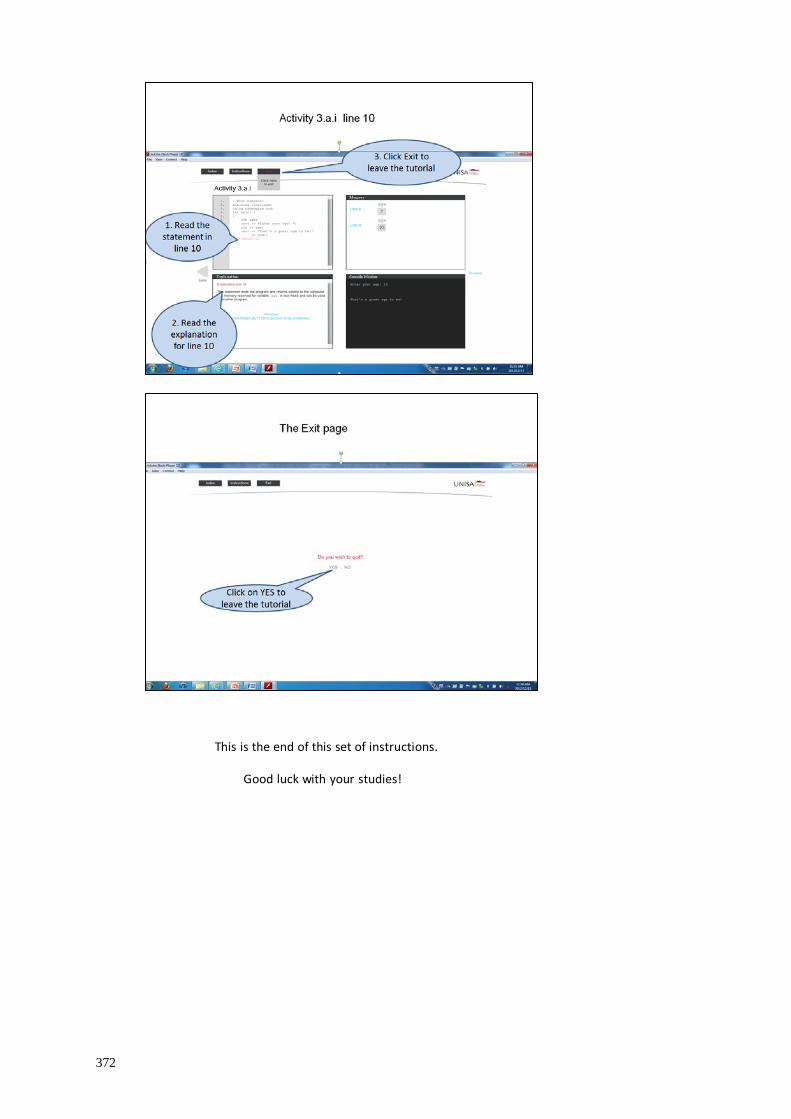
372
This is the end of this set of instructions.
Good luck with your studies!

373
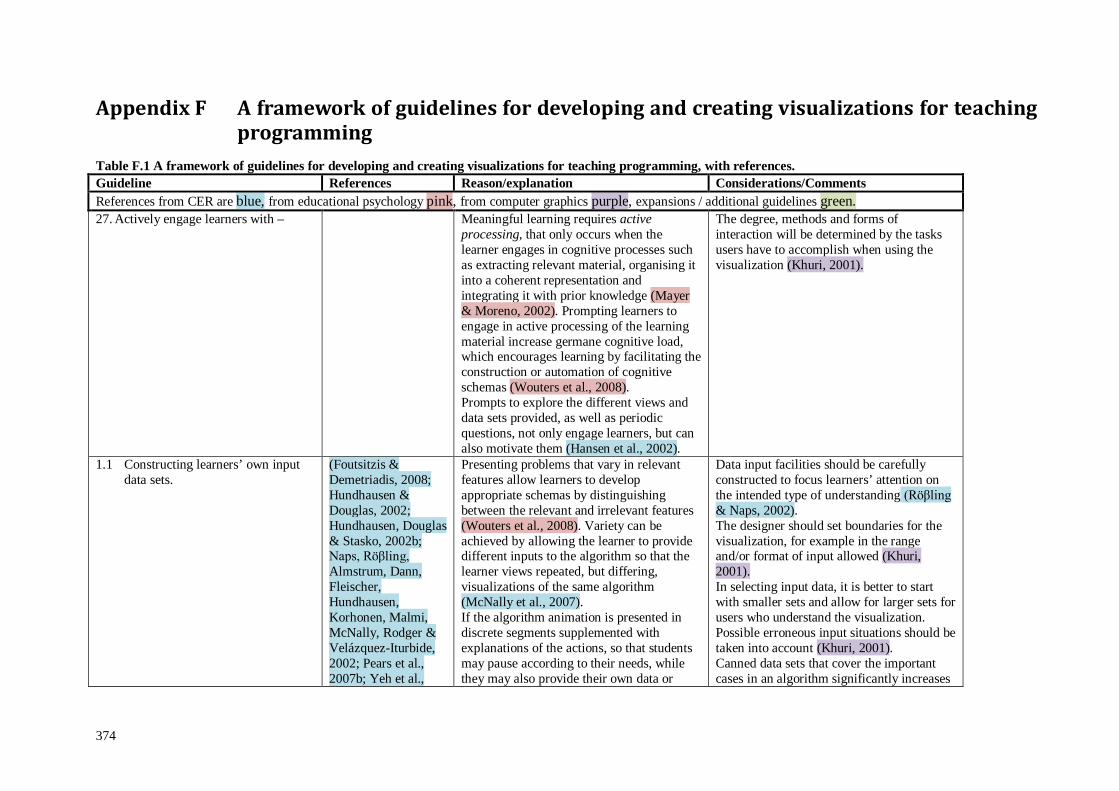
374
Appendix F A framework of guidelines for developing and creating visualizations for teaching programming
Table F.1 A framework of guidelines for developing and creating visualizations for teaching programming, with references. Guideline References Reason/explanation Considerations/Comments References from CER are blue, from educational psychology pink, from computer graphics purple, expansions / additional guidelines green. 27. Actively engage learners with – Meaningful learning requires active
processing, that only occurs when the learner engages in cognitive processes such as extracting relevant material, organising it into a coherent representation and integrating it with prior knowledge (Mayer & Moreno, 2002). Prompting learners to engage in active processing of the learning material increase germane cognitive load, which encourages learning by facilitating the construction or automation of cognitive schemas (Wouters et al., 2008). Prompts to explore the different views and data sets provided, as well as periodic questions, not only engage learners, but can also motivate them (Hansen et al., 2002).
The degree, methods and forms of interaction will be determined by the tasks users have to accomplish when using the visualization (Khuri, 2001).
1.1 Constructing learners’ own input data sets.
(Foutsitzis & Demetriadis, 2008; Hundhausen & Douglas, 2002; Hundhausen, Douglas & Stasko, 2002b; Naps, Röβling, Almstrum, Dann, Fleischer, Hundhausen, Korhonen, Malmi, McNally, Rodger & Velázquez-Iturbide, 2002; Pears et al., 2007b; Yeh et al.,
Presenting problems that vary in relevant features allow learners to develop appropriate schemas by distinguishing between the relevant and irrelevant features (Wouters et al., 2008). Variety can be achieved by allowing the learner to provide different inputs to the algorithm so that the learner views repeated, but differing, visualizations of the same algorithm (McNally et al., 2007). If the algorithm animation is presented in discrete segments supplemented with explanations of the actions, so that students may pause according to their needs, while they may also provide their own data or
Data input facilities should be carefully constructed to focus learners’ attention on the intended type of understanding (Röβling & Naps, 2002). The designer should set boundaries for the visualization, for example in the range and/or format of input allowed (Khuri, 2001). In selecting input data, it is better to start with smaller sets and allow for larger sets for users who understand the visualization. Possible erroneous input situations should be taken into account (Khuri, 2001). Canned data sets that cover the important cases in an algorithm significantly increases
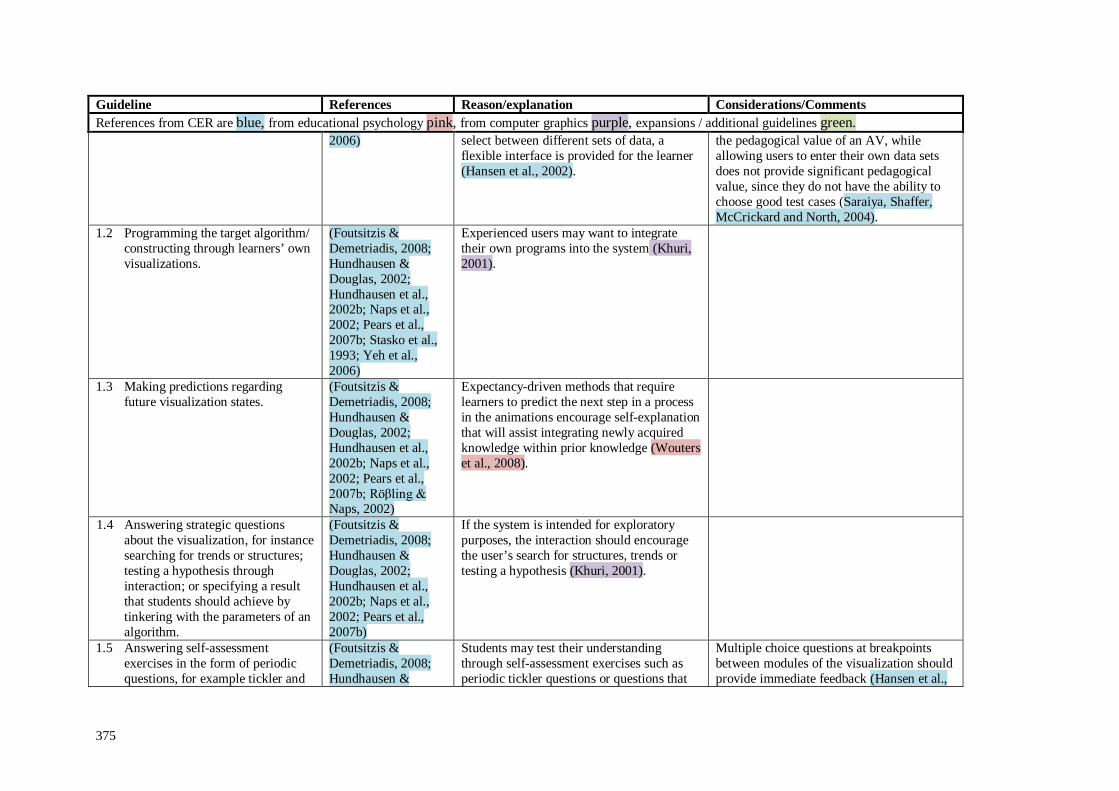
375
Guideline References Reason/explanation Considerations/Comments References from CER are blue, from educational psychology pink, from computer graphics purple, expansions / additional guidelines green.
2006)
select between different sets of data, a flexible interface is provided for the learner (Hansen et al., 2002).
the pedagogical value of an AV, while allowing users to enter their own data sets does not provide significant pedagogical value, since they do not have the ability to choose good test cases (Saraiya, Shaffer, McCrickard and North, 2004).
1.2 Programming the target algorithm/ constructing through learners’ own visualizations.
(Foutsitzis & Demetriadis, 2008; Hundhausen & Douglas, 2002; Hundhausen et al., 2002b; Naps et al., 2002; Pears et al., 2007b; Stasko et al., 1993; Yeh et al., 2006)
Experienced users may want to integrate their own programs into the system (Khuri, 2001).
1.3 Making predictions regarding future visualization states.
(Foutsitzis & Demetriadis, 2008; Hundhausen & Douglas, 2002; Hundhausen et al., 2002b; Naps et al., 2002; Pears et al., 2007b; Röβling & Naps, 2002)
Expectancy-driven methods that require learners to predict the next step in a process in the animations encourage self-explanation that will assist integrating newly acquired knowledge within prior knowledge (Wouters et al., 2008).
1.4 Answering strategic questions about the visualization, for instance searching for trends or structures; testing a hypothesis through interaction; or specifying a result that students should achieve by tinkering with the parameters of an algorithm.
(Foutsitzis & Demetriadis, 2008; Hundhausen & Douglas, 2002; Hundhausen et al., 2002b; Naps et al., 2002; Pears et al., 2007b)
If the system is intended for exploratory purposes, the interaction should encourage the user’s search for structures, trends or testing a hypothesis (Khuri, 2001).
1.5 Answering self-assessment exercises in the form of periodic questions, for example tickler and
(Foutsitzis & Demetriadis, 2008; Hundhausen &
Students may test their understanding through self-assessment exercises such as periodic tickler questions or questions that
Multiple choice questions at breakpoints between modules of the visualization should provide immediate feedback (Hansen et al.,

376
Guideline References Reason/explanation Considerations/Comments References from CER are blue, from educational psychology pink, from computer graphics purple, expansions / additional guidelines green.
multiple choice questions, or questions that prevent the user from continuing without correct answers.
Douglas, 2002; Hundhausen et al., 2002b; Khuri, 2001; Naps et al., 2002; Pears et al., 2007b)
need to be answered before the animation proceed (Khuri, 2001), because interactive questioning forces them to stop and think about what they are viewing (McNally et al., 2007). Hansen et al. (2002) agree that random pop-up tickler questions in appropriate context without feedback, stimulate self-explanation. Interactive feedback will show students how well they understand the algorithm (McNally et al., 2007), while short quizzes can also help novices understand the material (Khuri, 2001).
2002). The interaction mechanism should be simple and forgiving. The designer should take care to reduce the possibility of errors, by. allowing reversal of actions, e.g. providing an ‘undo’ or ‘redo’ facility (Khuri, 2001).
1.6 Using sub-goaling to prompt learners to group coherent steps of a procedure into a meaningful sub-goal in the animation.
(Wouters et al., 2008)
1.7 Asking learners to imagine procedures and concepts that are used in the animation.
(Wouters et al., 2008)
Studies have shown that imagining skills before performing them, leads to better performance (Wouters et al., 2008).
1.8 Supporting dynamic feedback on the learner’s activities in the system.
(Naps et al., 2002)
28. Integrate visualizations into the course material.
(Ben-Bassat Levy & Ben-Ari, 2007; Lahtinen, 2006; Lahtinen et al., 2007a; Naps et al., 2002; Röβling, 2010)
Integrate the PAV tool with the study material to ensure that students accept and engage with it (Ben-Bassat Levy & Ben-Ari, 2007; Lahtinen, 2006; Lahtinen et al., 2007a; Röβling, 2010).
Allow students to use PAV voluntarily (Lahtinen et al., 2007a), since it can assist students with problems, but also have no value for students who already understand programming well (Lahtinen, 2006). Animations should be linked to specific instructional goals (Stasko et al., 1993), with relevant and appropriate information to achieve specific learning objectives (Hansen et al., 2002). The content of the AV should therefore be selected according to its intended purpose, and an assessment should be made to ensure that AV is the most
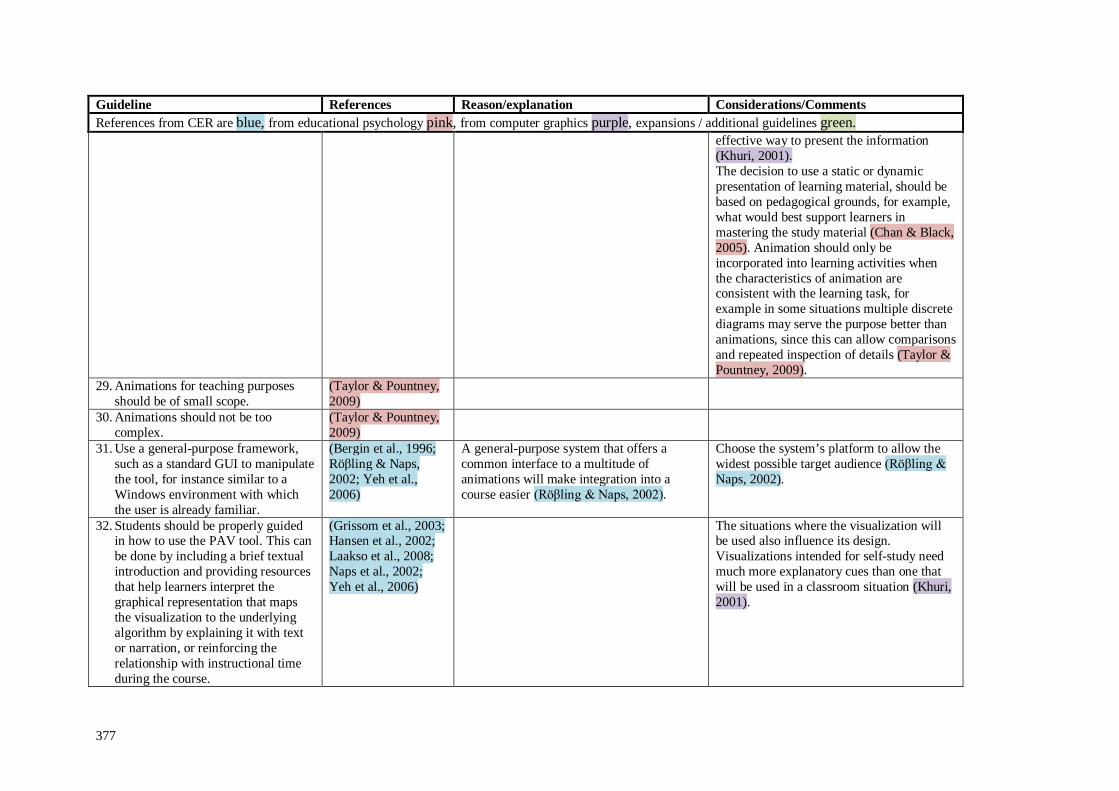
377
Guideline References Reason/explanation Considerations/Comments References from CER are blue, from educational psychology pink, from computer graphics purple, expansions / additional guidelines green.
effective way to present the information (Khuri, 2001). The decision to use a static or dynamic presentation of learning material, should be based on pedagogical grounds, for example, what would best support learners in mastering the study material (Chan & Black, 2005). Animation should only be incorporated into learning activities when the characteristics of animation are consistent with the learning task, for example in some situations multiple discrete diagrams may serve the purpose better than animations, since this can allow comparisons and repeated inspection of details (Taylor & Pountney, 2009).
29. Animations for teaching purposes should be of small scope.
(Taylor & Pountney, 2009)
30. Animations should not be too complex.
(Taylor & Pountney, 2009)
31. Use a general-purpose framework, such as a standard GUI to manipulate the tool, for instance similar to a Windows environment with which the user is already familiar.
(Bergin et al., 1996; Röβling & Naps, 2002; Yeh et al., 2006)
A general-purpose system that offers a common interface to a multitude of animations will make integration into a course easier (Röβling & Naps, 2002).
Choose the system’s platform to allow the widest possible target audience (Röβling & Naps, 2002).
32. Students should be properly guided in how to use the PAV tool. This can be done by including a brief textual introduction and providing resources that help learners interpret the graphical representation that maps the visualization to the underlying algorithm by explaining it with text or narration, or reinforcing the relationship with instructional time during the course.
(Grissom et al., 2003; Hansen et al., 2002; Laakso et al., 2008; Naps et al., 2002; Yeh et al., 2006)
The situations where the visualization will be used also influence its design. Visualizations intended for self-study need much more explanatory cues than one that will be used in a classroom situation (Khuri, 2001).
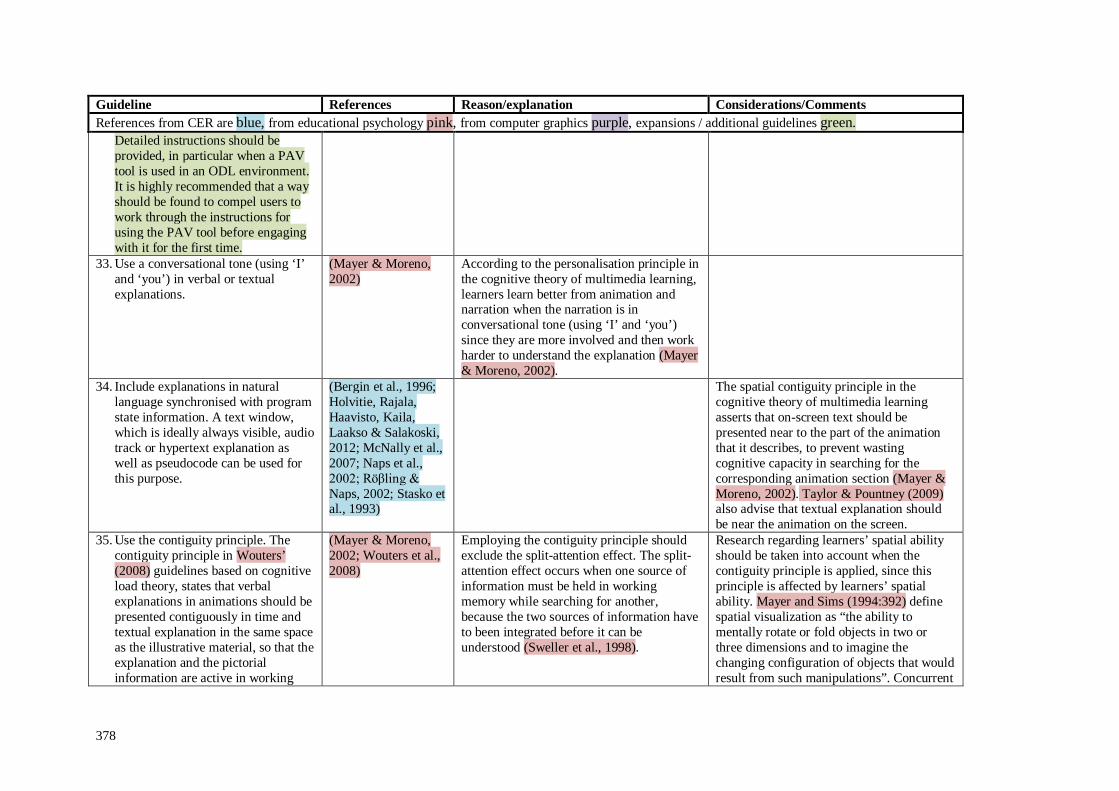
378
Guideline References Reason/explanation Considerations/Comments References from CER are blue, from educational psychology pink, from computer graphics purple, expansions / additional guidelines green. Detailed instructions should be
provided, in particular when a PAV tool is used in an ODL environment. It is highly recommended that a way should be found to compel users to work through the instructions for using the PAV tool before engaging with it for the first time.
33. Use a conversational tone (using ‘I’ and ‘you’) in verbal or textual explanations.
(Mayer & Moreno, 2002)
According to the personalisation principle in the cognitive theory of multimedia learning, learners learn better from animation and narration when the narration is in conversational tone (using ‘I’ and ‘you’) since they are more involved and then work harder to understand the explanation (Mayer & Moreno, 2002).
34. Include explanations in natural language synchronised with program state information. A text window, which is ideally always visible, audio track or hypertext explanation as well as pseudocode can be used for this purpose.
(Bergin et al., 1996; Holvitie, Rajala, Haavisto, Kaila, Laakso & Salakoski, 2012; McNally et al., 2007; Naps et al., 2002; Röβling & Naps, 2002; Stasko et al., 1993)
The spatial contiguity principle in the cognitive theory of multimedia learning asserts that on-screen text should be presented near to the part of the animation that it describes, to prevent wasting cognitive capacity in searching for the corresponding animation section (Mayer & Moreno, 2002). Taylor & Pountney (2009) also advise that textual explanation should be near the animation on the screen.
35. Use the contiguity principle. The contiguity principle in Wouters’ (2008) guidelines based on cognitive load theory, states that verbal explanations in animations should be presented contiguously in time and textual explanation in the same space as the illustrative material, so that the explanation and the pictorial information are active in working
(Mayer & Moreno, 2002; Wouters et al., 2008)
Employing the contiguity principle should exclude the split-attention effect. The split-attention effect occurs when one source of information must be held in working memory while searching for another, because the two sources of information have to been integrated before it can be understood (Sweller et al., 1998).
Research regarding learners’ spatial ability should be taken into account when the contiguity principle is applied, since this principle is affected by learners’ spatial ability. Mayer and Sims (1994:392) define spatial visualization as “the ability to mentally rotate or fold objects in two or three dimensions and to imagine the changing configuration of objects that would result from such manipulations”. Concurrent

379
Guideline References Reason/explanation Considerations/Comments References from CER are blue, from educational psychology pink, from computer graphics purple, expansions / additional guidelines green.
memory simultaneously. This corresponds with the spatial
contiguity principle in the cognitive theory of multimedia learning, which asserts that on-screen text should be presented near the part of the animation that it describes, to prevent wasting cognitive capacity in searching for the corresponding animation section (Mayer & Moreno, 2002).
presentation of verbal and visual information benefits mainly learners with a high spatial ability, since they have a better ability to build mental connections between the verbal and visual representations (Mayer & Sims, 1994). Program code represents an abstract space that has to be navigated with the same cognitive strategies as used in natural environments (Cox et al., 2005). A strong positive correlation between students’ spatial ability and their results in programming modules, with much lower correlations between their spatial ability and non-programming modules, has been found (Jones & Burnett, 2007). This seems to suggest that students with lower spatial ability struggle more with programming subjects. Students with a low spatial ability also use less effective navigational strategies when attempting to comprehend code (Jones & Burnett, 2007). Therefore, it seems as if using verbal explanations in animation, even if the contiguity principle is applied, might be to the disadvantage of weak programming students.
36. Apply the modality principle. Modality refers to the sensory mode in which verbal information is presented: written or spoken. In cognitive load theory the modality principle suggests that textual explanations in animations should be presented in spoken format, as this allows more information to be processed visually. Since the modality principle is not
(Wouters et al., 2008) The modality principle is intended to decrease the extraneous cognitive load (Wouters et al., 2008). Taylor and Pountney (2009) also maintain that dual coding, where visual and auditory presentations are used together, may enhance comprehension. The cognitive theory of multimedia postulates that integration is most likely to occur when the corresponding pictorial and verbal representations are in working memory at the same time. Accordingly,
If dual coding is used, the animation and the narration should occur simultaneously (Taylor & Pountney, 2009). Although the modality principle is intended to decrease the extraneous cognitive load (Wouters et al., 2008), this may have a negative effect if the speaker has a foreign accent, since the additional effort to decipher the accent adds to the cognitive load (Mayer et al., 2003). Also, when learners have control over the
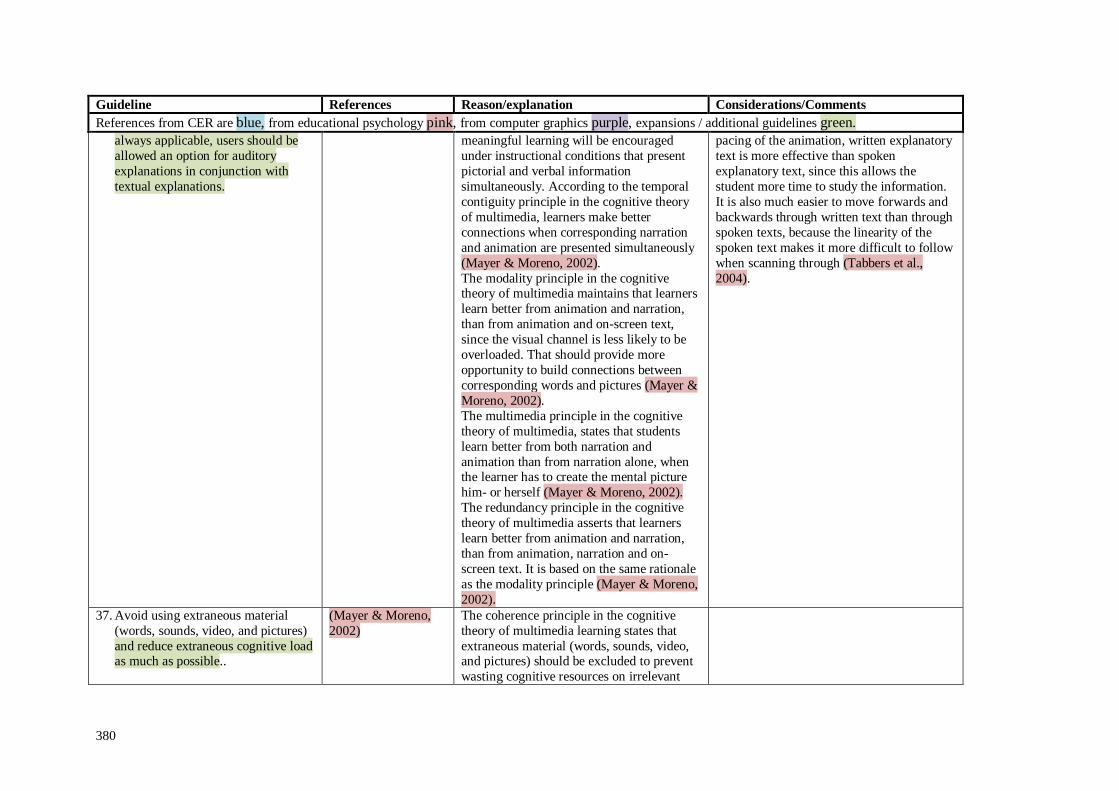
380
Guideline References Reason/explanation Considerations/Comments References from CER are blue, from educational psychology pink, from computer graphics purple, expansions / additional guidelines green.
always applicable, users should be allowed an option for auditory explanations in conjunction with textual explanations.
meaningful learning will be encouraged under instructional conditions that present pictorial and verbal information simultaneously. According to the temporal contiguity principle in the cognitive theory of multimedia, learners make better connections when corresponding narration and animation are presented simultaneously (Mayer & Moreno, 2002). The modality principle in the cognitive theory of multimedia maintains that learners learn better from animation and narration, than from animation and on-screen text, since the visual channel is less likely to be overloaded. That should provide more opportunity to build connections between corresponding words and pictures (Mayer & Moreno, 2002). The multimedia principle in the cognitive theory of multimedia, states that students learn better from both narration and animation than from narration alone, when the learner has to create the mental picture him- or herself (Mayer & Moreno, 2002). The redundancy principle in the cognitive theory of multimedia asserts that learners learn better from animation and narration, than from animation, narration and on-screen text. It is based on the same rationale as the modality principle (Mayer & Moreno, 2002).
pacing of the animation, written explanatory text is more effective than spoken explanatory text, since this allows the student more time to study the information. It is also much easier to move forwards and backwards through written text than through spoken texts, because the linearity of the spoken text makes it more difficult to follow when scanning through (Tabbers et al., 2004).
37. Avoid using extraneous material (words, sounds, video, and pictures) and reduce extraneous cognitive load as much as possible..
(Mayer & Moreno, 2002)
The coherence principle in the cognitive theory of multimedia learning states that extraneous material (words, sounds, video, and pictures) should be excluded to prevent wasting cognitive resources on irrelevant
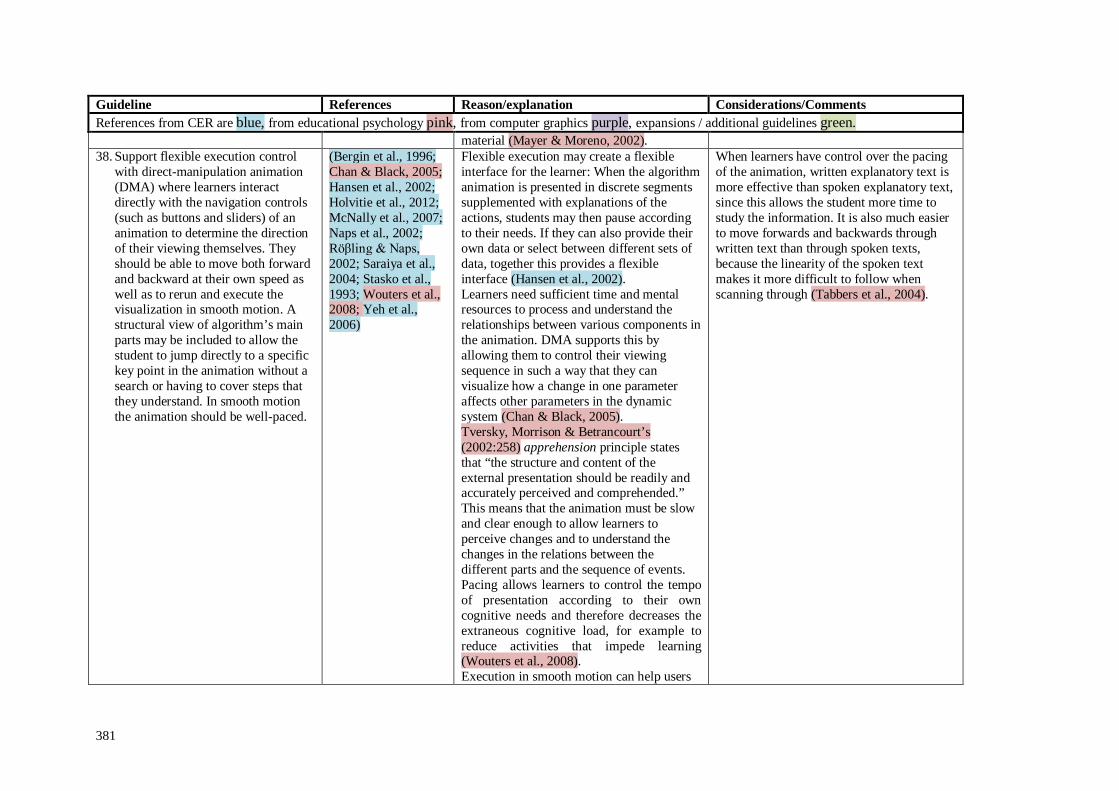
381
Guideline References Reason/explanation Considerations/Comments References from CER are blue, from educational psychology pink, from computer graphics purple, expansions / additional guidelines green.
material (Mayer & Moreno, 2002). 38. Support flexible execution control
with direct-manipulation animation (DMA) where learners interact directly with the navigation controls (such as buttons and sliders) of an animation to determine the direction of their viewing themselves. They should be able to move both forward and backward at their own speed as well as to rerun and execute the visualization in smooth motion. A structural view of algorithm’s main parts may be included to allow the student to jump directly to a specific key point in the animation without a search or having to cover steps that they understand. In smooth motion the animation should be well-paced.
(Bergin et al., 1996; Chan & Black, 2005; Hansen et al., 2002; Holvitie et al., 2012; McNally et al., 2007; Naps et al., 2002; Röβling & Naps, 2002; Saraiya et al., 2004; Stasko et al., 1993; Wouters et al., 2008; Yeh et al., 2006)
Flexible execution may create a flexible interface for the learner: When the algorithm animation is presented in discrete segments supplemented with explanations of the actions, students may then pause according to their needs. If they can also provide their own data or select between different sets of data, together this provides a flexible interface (Hansen et al., 2002). Learners need sufficient time and mental resources to process and understand the relationships between various components in the animation. DMA supports this by allowing them to control their viewing sequence in such a way that they can visualize how a change in one parameter affects other parameters in the dynamic system (Chan & Black, 2005). Tversky, Morrison & Betrancourt’s (2002:258) apprehension principle states that “the structure and content of the external presentation should be readily and accurately perceived and comprehended.” This means that the animation must be slow and clear enough to allow learners to perceive changes and to understand the changes in the relations between the different parts and the sequence of events. Pacing allows learners to control the tempo of presentation according to their own cognitive needs and therefore decreases the extraneous cognitive load, for example to reduce activities that impede learning (Wouters et al., 2008). Execution in smooth motion can help users
When learners have control over the pacing of the animation, written explanatory text is more effective than spoken explanatory text, since this allows the student more time to study the information. It is also much easier to move forwards and backwards through written text than through spoken texts, because the linearity of the spoken text makes it more difficult to follow when scanning through (Tabbers et al., 2004).

382
Guideline References Reason/explanation Considerations/Comments References from CER are blue, from educational psychology pink, from computer graphics purple, expansions / additional guidelines green.
detect changes (Röβling and Naps, 2002). 39. Divide the display area into
functional areas that are consistently used for the different types of information.
(Khuri, 2001) This prevents the display area from being cluttered (Khuri, 2001).
Important information should be placed near the top left, since eye-motion studies show that the human gaze goes to the upper-left of a rectangular display and then moves clockwise (Khuri, 2001).
40. Window management should allow all windows to be visible when the AV starts and might allow users to resize or reposition windows to suit the user.
(Saraiya et al., 2004)
41. Care should be taken in deciding what information should be presented and how it should be done. An appropriate set of conventions in the form of the shape, size, colour, texture, sound and arrangement of objects to represent different information, should be developed and applied consistently.
(Khuri, 2001)
A user-centred design is important. Consistent locations for buttons, sliders and switches will minimise perceptual and cognitive demands on learners. Providing alternative interaction methods such as sliders, or arrows on the screen to advance or backtrack, or keyboard arrows, can accommodate different navigation styles or learning preferences (Chan & Black, 2005).
42. Apply Tversky et al.’s (2002:257) congruence principle which states that “the structure and content of the external representation should correspond to the desired structure and content of the internal representation”. The animation should therefore present the process or procedure in the same way and order that people visualize it. Use this as a means of consolidating mental models deliberately.
(Tversky et al., 2002)
43. Use signalling, or cueing to draw the user’s attention to critical areas of the visualization, for instance by using different colours, highlighting
(Bergin et al., 1996; Hansen et al., 2002; Taylor & Pountney, 2009; Wouters et al.,
Signalling assists meaningful learning, because it guides attention to relevant information and facilitates the efficiency of a visual search for the necessary information
Although people do not learn more from colour displays than from black and white displays, colour helps people to remember and is more enjoyable. A maximum of five
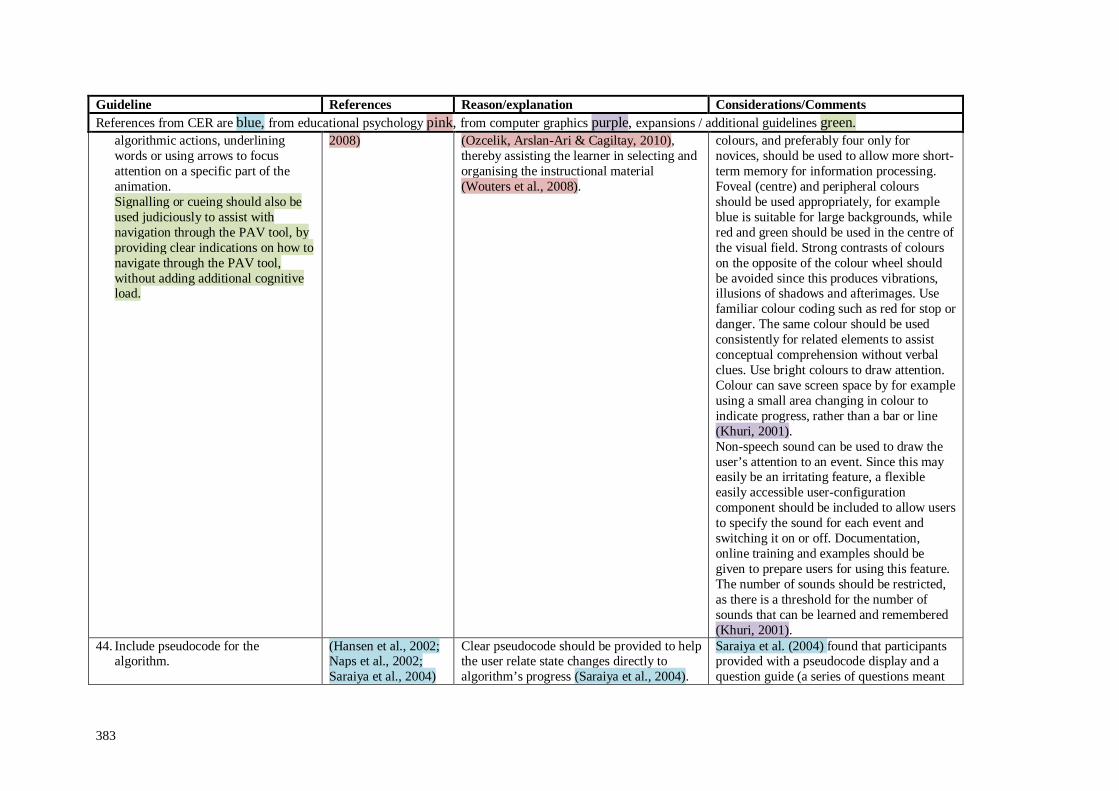
383
Guideline References Reason/explanation Considerations/Comments References from CER are blue, from educational psychology pink, from computer graphics purple, expansions / additional guidelines green.
algorithmic actions, underlining words or using arrows to focus attention on a specific part of the animation. Signalling or cueing should also be used judiciously to assist with navigation through the PAV tool, by providing clear indications on how to navigate through the PAV tool, without adding additional cognitive load.
2008)
(Ozcelik, Arslan-Ari & Cagiltay, 2010), thereby assisting the learner in selecting and organising the instructional material (Wouters et al., 2008).
colours, and preferably four only for novices, should be used to allow more short-term memory for information processing. Foveal (centre) and peripheral colours should be used appropriately, for example blue is suitable for large backgrounds, while red and green should be used in the centre of the visual field. Strong contrasts of colours on the opposite of the colour wheel should be avoided since this produces vibrations, illusions of shadows and afterimages. Use familiar colour coding such as red for stop or danger. The same colour should be used consistently for related elements to assist conceptual comprehension without verbal clues. Use bright colours to draw attention. Colour can save screen space by for example using a small area changing in colour to indicate progress, rather than a bar or line (Khuri, 2001). Non-speech sound can be used to draw the user’s attention to an event. Since this may easily be an irritating feature, a flexible easily accessible user-configuration component should be included to allow users to specify the sound for each event and switching it on or off. Documentation, online training and examples should be given to prepare users for using this feature. The number of sounds should be restricted, as there is a threshold for the number of sounds that can be learned and remembered (Khuri, 2001).
44. Include pseudocode for the algorithm.
(Hansen et al., 2002; Naps et al., 2002; Saraiya et al., 2004)
Clear pseudocode should be provided to help the user relate state changes directly to algorithm’s progress (Saraiya et al., 2004).
Saraiya et al. (2004) found that participants provided with a pseudocode display and a question guide (a series of questions meant
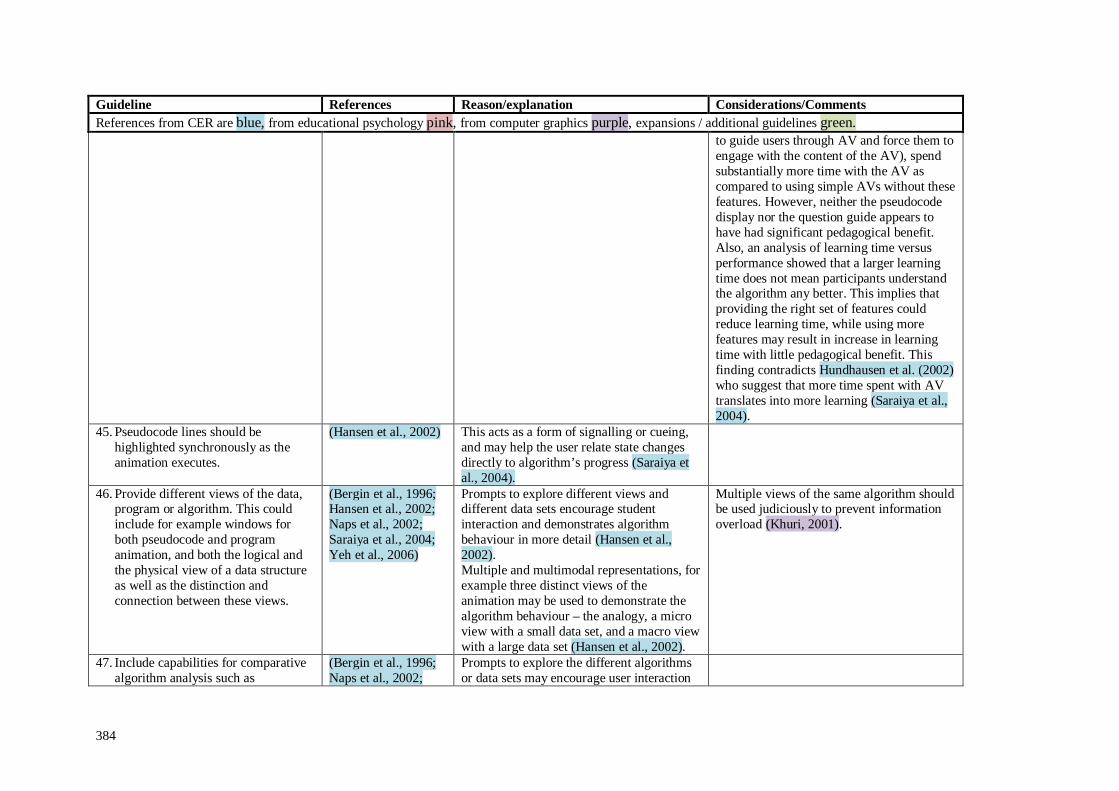
384
Guideline References Reason/explanation Considerations/Comments References from CER are blue, from educational psychology pink, from computer graphics purple, expansions / additional guidelines green.
to guide users through AV and force them to engage with the content of the AV), spend substantially more time with the AV as compared to using simple AVs without these features. However, neither the pseudocode display nor the question guide appears to have had significant pedagogical benefit. Also, an analysis of learning time versus performance showed that a larger learning time does not mean participants understand the algorithm any better. This implies that providing the right set of features could reduce learning time, while using more features may result in increase in learning time with little pedagogical benefit. This finding contradicts Hundhausen et al. (2002) who suggest that more time spent with AV translates into more learning (Saraiya et al., 2004).
45. Pseudocode lines should be highlighted synchronously as the animation executes.
(Hansen et al., 2002)
This acts as a form of signalling or cueing, and may help the user relate state changes directly to algorithm’s progress (Saraiya et al., 2004).
46. Provide different views of the data, program or algorithm. This could include for example windows for both pseudocode and program animation, and both the logical and the physical view of a data structure as well as the distinction and connection between these views.
(Bergin et al., 1996; Hansen et al., 2002; Naps et al., 2002; Saraiya et al., 2004; Yeh et al., 2006)
Prompts to explore different views and different data sets encourage student interaction and demonstrates algorithm behaviour in more detail (Hansen et al., 2002). Multiple and multimodal representations, for example three distinct views of the animation may be used to demonstrate the algorithm behaviour – the analogy, a micro view with a small data set, and a macro view with a large data set (Hansen et al., 2002).
Multiple views of the same algorithm should be used judiciously to prevent information overload (Khuri, 2001).
47. Include capabilities for comparative algorithm analysis such as
(Bergin et al., 1996; Naps et al., 2002;
Prompts to explore the different algorithms or data sets may encourage user interaction

385
Guideline References Reason/explanation Considerations/Comments References from CER are blue, from educational psychology pink, from computer graphics purple, expansions / additional guidelines green.
performance information that shows the algorithm’s efficiency, or simultaneous identical views of different algorithms manipulating the same data.
Yeh et al., 2006)
(Hansen et al., 2002).
48. Include the execution history so that learners can see previous steps.
(Naps et al., 2002)
49. Adapt to the knowledge level of the user (the learner). For instance use a less complicated system for novices and base appropriate feedback on the assumed background knowledge of users, which should be made clear. The users’ demographic background and reading ability should be investigated and taken into account before the design and development of the PAV is done.
(Naps et al., 2002; Saraiya et al., 2004)
No AV can cater for all possible users (Khuri, 2001). Animations intended for novices may have no benefits for students with prior knowledge (Lahtinen, 2006; Lahtinen et al., 2007a). Khuri (2001) stresses the importance of an analysis of the users, their needs, their tasks, the scope of the package and the resources available to developers. Novices need much more guidance in mapping the visualization to the program, as well as help in how to use the AV system, than experienced users. Short quizzes may help novices understand the material, while experienced users may want to integrate their own programs into the system (Khuri, 2001).
The effectiveness of a presentation format depends on the degree to which it matches the learners’ cognitive and comprehension processes (Chan & Black, 2005). The effectiveness of Wouters et al.’s (2008) guidelines to manage cognitive load in animation depends on several mediating factors, notably learners’ prior knowledge, spatial ability, motivation and the age of learner. Learners with high spatial ability benefit more from animations with verbal explanations than learners with low spatial ability. The pattern of cognitive load may be affected by motivation and self-efficacy. Also, the efficiency of working memory deteriorates with age. Design guidelines might also interact, for instance when pacing is used, modality should be adapted since learner pacing seems to cancel the advantage of verbal over written explanations. On the other hand, combinations of guidelines, such as signalling and modality, might be particularly effective (Wouters et al., 2008).
50. Scaffold learning with an animated analogy (for example illustrating merge-sort by sorting a deck of cards); pre-training; a sequence of simple-to-complex whole tasks, or segmentation.
(Hansen et al., 2002; Wouters et al., 2008)
Scaffolding decreases intrinsic cognitive load by reducing or managing the interactivity of the learning material (Wouters et al., 2008). Segmentation decreases the extraneous cognitive load, it for instance reduces

386
Guideline References Reason/explanation Considerations/Comments References from CER are blue, from educational psychology pink, from computer graphics purple, expansions / additional guidelines green. Simple-to-complex whole tasks
allow learners to construct and automate schemas with low element interactivity and then gradually increase the complexity.
Segmentation divides animations into several segments in which each segment presents an important part of a procedure or process.
activities that impede learning (Wouters et al., 2008)
51. Perform user testing on each animation before using it for instruction to ensure ease of use.
(Saraiya et al., 2004; Stasko et al., 1993).
A pedagogically useful AV should have no usability and reliability concerns (Saraiya et al., 2004).
52. The AV should be integrated with a database for course management reasons to allow tracking students’ responses.
(Röβling et al., 2008; Röβling & Naps, 2002)
27. Test the PAV tool stringently regarding the correctness of content, sequence of execution order, format and its didactical purpose.
28. Educate users about the purpose of the PAV tool before they engage with it for the first time, to avoid unrealistic expectations and to ensure that they use it appropriately.

387