Measuring Frailty using Self-report and Test-based Health Measures
Upload
khangminh22Category
view
0download
0
Engaging the Osteological Paradox:
A Study of Frailty and Survivorship in the 1918 Influenza Pandemic
by
Amanda Wissler
A Dissertation Presented in Partial Fulfillment
of the Requirements for the Degree
Doctor of Philosophy
Approved June 2021 by the
Graduate Supervisory Committee:
Jane E. Buikstra, Chair
Sharon N. DeWitte
Christopher Stojanowski
Svenn-Erik Mamelund
ARIZONA STATE UNIVERSITY
August 2021

i
ABSTRACT
Published in 1992, “The osteological paradox: problems of inferring prehistoric
health from skeletal samples” highlighted the limitations of interpreting population health
from archaeological skeletal samples. The authors drew the attention of the
bioarchaeological community to several unfounded assumptions in the field of
paleopathology. They cautioned that bioarchaeologists needed to expand their
methodological and theoretical toolkits and examine how variation in frailty influences
mortality outcomes. This dissertation undertakes this task by 1) establishing a new
approach for handling missing paleopathology data that facilitates the use of new
analytical methods for exploring frailty and resiliency in skeletal data, and 2)
investigating the role of prior frailty in shaping selective mortality in an underexplored
epidemic context. The first section takes the initial step of assessing current techniques
for handling missing data in bioarchaeology and testing protocols for imputation of
missing paleopathology variables. A review of major bioarchaeological journals
searching for terms describing the treatment of missing data are compiled. The articles
are sorted by subject topic and into categories based on the statistical and theoretical rigor
of how missing data are handled. A case study test of eight methods for handling missing
data is conducted to determine which methods best produce unbiased parameter
estimates. The second section explores how pre-existing frailty influenced mortality
during the 1918 influenza pandemic. Skeletal lesion data are collected from a sample of
424 individuals from the Hamann-Todd Documented Collection. Using Kaplan-Meier
and Cox proportional hazards, this chapter tests whether individuals who were healthy

ii
(i.e. non-frail) were equally likely to die during the flu as frail individuals. Results
indicate that imputation is underused in bioarchaeology, therefore procedures for
imputing ordinal and continuous paleopathology data are established. The findings of the
second section reveal that while a greater proportion of non-frail individuals died during
the 1918 pandemic compared to pre-flu times, frail individuals were more likely to die at
all times. The outcomes of this dissertation help expand the types of statistical analyses
that can be performed using paleopathology data. They contribute to the field’s
knowledge of selective mortality and differential frailty during a major historical
pandemic.

iii
ACKNOWLEDGMENTS
It’s been a very long journey to get here and I have so many people to thank for
their support, guidance, and friendship. First, much love and thanks to my mother, father,
and sister. Mom, you set the bar high and constantly encouraged me to work hard and
never give up. Dad, you taught me how to be creative, practical, and to always be
curious. Thanks also to Amy for the many walks.
Special thanks to my advisor, Jane Buikstra, who was patient with me through
some rough times and guided me though numerous dissertation ideas. I appreciate your
encouraging, candid feedback and support. I know you had my back many times
throughout the years and I would not have made it here without you taking me on.
Thanks also to Sharon DeWitte who was so positive and encouraging when I needed it.
I never would have survived graduate school without my friends and fellow
SHESC grad students. Thanks for all my fellow bioarchs for the support, laughter, and
allowing me to use you as a sounding board: Emily Sharp, Kelly Blevins, Kathleen Paul,
Tommy Budd, Kent Johnson, Emily Schach, Marcos Martinez, Sarah Hall, Tisa Loewen.
Thanks also to the many other grad students of SHESC, especially Amanda McGrosky,
Ellis Locke, and Nicolas Gauthier. Special shout out to my Core Team including Aliya
Hoff, Christopher Schwartz, and April Kamp-Whitaker. To Hailey Campbell and
Alizabeth Duncan, my gymnastics folk, you supported me, kept me grounded, and gave
me a whole new stress outlet.
Many thanks also to my forensic family including Dr. Laura Fulginiti, Dr. Andrew
Seidel, and Kari Guilbault. Andy in particular: you gave me so much sage advice and

iv
bizarre TV show recommendations.
Thank you to all those at the Cleveland Museum of Natural History, particularly
Dr. Yohannes Haile-Selassie, Dr. Gavin Svenson, Amanda McGee, Lyman Jellema, and
David Chapman who granted me access to the collection and helped me with all my
research needs.
I also want to thank all the podcasters who kept me sane during months of data
collection and data cleaning. I want to specially thank Matt Gourley, Mark McConville,
and Paul F. Tompkins whose voices kept me going through some troubling times.
Last but most of all, I can never give enough thanks to Sofía Pacheco-Forés and
Irene Smail. Two of my favorite people in the whole world. You are a huge part of this
dissertation, my grad school experience, and the person I have come to be.

v
TABLE OF CONTENTS
Page
LIST OF TABLES ................................................................................................................ viii
LIST OF FIGURES ................................................................................................................. ix
CHAPTER
1 INTRODUCTION ................................................................................................ 1
Reactions to the Osteological Paradox ............................................................ 5
Research Orientation ........................................................................................ 8
Structure of the Dissertation........................................................................... 11
2 MISSING DATA IN BIOARCHAEOLOGY I: A REVIEW OF THE
LITERATURE ..................................................................................................... 15
Materials and Methods ................................................................................... 19
Results ............................................................................................................. 26
Discussion ....................................................................................................... 30
Conclusion ...................................................................................................... 39
References ...................................................................................................... 40
3 MISSING DATA IN BIOARCHAEOLOGY II: A TEST OF MULTIPLE
IMPUTATION ..................................................................................................... 46
Part I: Background .......................................................................................... 47
Data Types ................................................................................................. 47
Classes of Missing Data ............................................................................ 49
Deletion and Imputation Methods ............................................................ 51

vi
CHAPTER Page
Imputation in Other Fields ........................................................................ 58
Part II: Missing Data in Bioarchaeology and Paleopathology ...................... 60
The Use of Imputation in Bioarchaeology ............................................... 61
Case Study: A Test of Imputation Methods in Paleopathology ............... 63
Imputation Methods .................................................................................. 65
Assessing Success ..................................................................................... 66
Case Study Results .................................................................................... 66
Case Study Discussion .............................................................................. 81
Conclusion ...................................................................................................... 86
References ...................................................................................................... 88
4 FRAILTY AND SURVIVORSHIP IN THE 1918 INFLUENZA PANDEMIC ...
............................................................................................................................... 96
Background ..................................................................................................... 97
Bioarchaeology and Frailty .......................................................................... 100
Materials and Method................................................................................... 102
Data Collection Methods .............................................................................. 103
Analytical Methods ...................................................................................... 104
Results ........................................................................................................... 106
Discussion ..................................................................................................... 115
Implications for Bioarchaeology .................................................................. 119
Conclusion .................................................................................................... 122

vii
CHAPTER Page
References .................................................................................................... 123
5 CONCLUSION ................................................................................................. 137
Summary of Results ..................................................................................... 137
Future Directions and Intellectual Merit ...................................................... 140
REFERENCES .................................................................................................................... 147
APPENDIX
A AUTHOR CONTRIBUTIONS ............................................................................ 181

viii
LIST OF TABLES
Table Page
1. Missing Data Methods .......................................................................................... 23
2. Bioarchaeological Subtopics ................................................................................. 25
3. Summary Results of Literature Review ................................................................ 27
4. Mean and Variance of Ordinal Missing Data ....................................................... 67
5. Tau and Kappa of Ordinal Missing Data .............................................................. 68
6. Imputation Rankings of Ordinal Missing Data ..................................................... 69
7. Mean and Variance of MCAR, MAR, MNAR Ordinal Data .............................. 71
8. Tau and Kappa of MCAR, MAR, MNAR Ordinal Data ..................................... 72
9. Imputation Rankings for MCAR, MAR, MNAR Ordinal Data .......................... 73
10. Mean and Variance of Continuous Missing Data .............................................. 75
11. Tau and Kappa of Continuous Missing Data ...................................................... 76
12. Imputation Rankings of Continuous Missing Data ............................................ 77
13. Mean and Variance of MCAR, MAR, MNAR Continuous Data ...................... 78
14. Tau and Kappa of MCAR, MAR, MNAR Continous Data ............................... 79
15. Imputation Rankings for MCAR, MAR, MNAR Continuous Data .................. 80
16. Results of Survival Analysis Using Frailty Index ............................................ 110
17. Results of Cox Proportional Hazards Analysis Using Frailty Index ............... 110
18. Results of Survival Analysis Using Periosteal Lesion Status .......................... 114
19. Results of Cox Proportional Hazards Analysis Using Periosteal Lesion Status 114

ix
LIST OF FIGURES
Figure Page
1. Literature Review Flow Chart ............................................................................... 21
2. Missing Data Method by Subtopic ....................................................................... 28
3. Missing Data Method by Year .............................................................................. 30
4. Classes of Data ...................................................................................................... 47
5. Rubin’s Categories of Missing Data ..................................................................... 49
6. Missing Data Methods Used ................................................................................. 52
7. Imputation by Bioarchaeological Subtopic .......................................................... 62
8. Kaplan-Meier Curves for Control Group Using Frailty Index .......................... 108
9. Kaplan-Meier Curves for Flu Group Using Frailty Index .................................. 109
10. Kaplan-Meier Curves for Control Group Using Periosteal Lesion Status ...... 112
11. Kaplan-Meier Curves for Flu Group Using Periosteal Lesion Status ............. 113

1
CHAPTER 1
INTRODUCTION
Paleopathology, or the study of past health, explores the origins of health
disparity, and the role of disease in the evolution of human biology and society (Buikstra
and Roberts 2012; Grauer 2012; Mcilvaine and Reitsema 2013; Temple and Goodman
2014). Studying health in ancient contexts elucidates the effects of major cultural and
environmental transitions on the human condition, and how social structures and human
ingenuity have influenced our biology over time.
Bioarchaeologists commonly examine past health through the lens of stress.
Stress is defined broadly as disruption to biological homeostasis caused by disease,
nutritional, environmental, and/or cultural perturbation (Brown 1981; Huss-Ashmore et
al. 1982; Bush and Zvelebil 1991; Goodman et al. 1984). Bodily tissues attempt to
compensate for this disruption through a process known as allostasis (McEwen 1998;
McEwen 2005; Klaus 2014) resulting in what are known as indicators of skeletal stress.
Bioarchaeologists have compiled a vast suite of physical changes to the human skeleton
to investigate the effects of stress in the past. Many are general reflections of long-term
poor health such as reduced stature, structural asymmetry, cortical structure, low sexual
dimorphism, altered subadult growth curves, malocclusion, musculoskeletal markers and
osteoporosis (Buikstra and Cook, 1980; Huss-Ashmore et al., 1982; Goodman et al.,
1984). Others such as Harris lines, periosteal reactions, porotic hyperostosis, cribra
orbitalia, dental defects, and skeletal indicators of infectious disease are considered
indicative of acute stress events (Brown, 1981; Goodman et al., 1988).

2
Bioarchaeologists differentiate between nonspecific indicators of skeletal stress,
and skeletal changes that are pathognomonic of certain disease processes (e.g.
tuberculosis, syphilis, diffuse idiopathic skeletal hyperostosis). The pattern and
appearance of the latter can be used to diagnose specific illnesses. Nonspecific indicators,
however, cannot be used to identify a specific disease or stressor. Bone tissue can
respond to injury or disease in a limited number of ways: by depositing bone, or by
removing bone. While a nonspecific indicator of skeletal stress may have a certain cause
(e.g. starvation), the lesion will not be distinguishable from a lesion caused by another
stressor and are thus nonspecific.
Inadequate health due to stress caused by cultural, nutritional, and environmental
factors can permanently shape the human body, causing skeletal lesions, stunted growth,
and structural abnormalities (Buikstra and Cook 1980; Goodman et al. 1984; Huss-
Ashmore et al. 1982). Bioarchaeologists use nonspecific indicators of skeletal stress to
examine health while drawing connections to broader cultural and sociological change
(Larsen 1997).
In 1992, Wood et al. published “The osteological paradox: problems of inferring
prehistoric health from skeletal samples” – an article that raised fundamental concerns
about the ability to make straightforward interpretations about past health from skeletal
assemblages. The authors coalesced their arguments around three main topics:
demographic nonstationarity, selective mortality and hidden heterogeneity.
Demographic nonstationarity refers to the non-static nature of real populations. A
stationary population is one in which fertility and mortality rates do not change over time

3
and are both equal to zero, there is no population movement or migration, and the size of
the population remains constant, and the number of individuals who die at each age
remains constant (Coale 1956; Hoppa and Vaupel 2002; Lotka 1977; Milner et al. 2008;
Sattenspiel and Harpending 1983). Virtually no real-life populations are perfectly
stationary, however one of the foundations of paleodemographic analyses is that the
living population from which the cemetery sample is derived was stationary. Milner et al.
(2008) surmised that this assumption occurred in the early days of paleodemography
when life tables – which are founded on demographic stationarity – were adopted as a
standard technique. The belief at the time that human population growth had been almost
zero for most of prehistoric history supported the approach (Alesan et al. 1999). The
assumption posed significant problems for demographic interpretations estimated from
skeletal samples. Age-at-death distributions more strongly reflect fertility rates rather
than mortality rates (Coale 1956; Johansson and Horowitz 1986; Milner et al. 2008;
Sattenspiel and Harpending 1983). As a result, fluctuating mortality profiles may be a
greater reflection of changing fertility rates rather than mortality in the past.
Selective mortality refers to the idea that “all individuals do not have an equal
chance of entering the skeletal sample at each age” (Milner et al., 2008; p. 586). The
individuals who comprise a skeletal sample are the non-survivors of a population. The
most frail of each age cohort are selectively eliminated from the living population
(Vaupel et al. 1979). Assuming lesions are reflective of frailty, selective mortality results
in the least healthy individuals of a skeletal series being more likely to exhibit skeletal
lesions. The prevalence of lesions in the skeletal sample will therefore overestimate the

4
prevalence of illness in the living population from which the assemblage is drawn,
causing it to appear as though the living population was less healthy than it was.
Hidden Heterogeneity in risks refers to the fact that while alive, the individuals
who will eventually compose a skeletal sample, differed in their “underlying frailty and
susceptibility to disease and death” (Wood et al., 1992, p. 345; Vaupel et al. 1979). The
causes for this underlying variation in frailty are innumerable and may include genetics
(Johnson et al. 1998; Lawrence et al. 2021; Sathyan and Verghese 2020; Taylor 2010;
Wailoo 2014), environmental conditions (Dent et al. 2020; Loucks et al. 2011; Martins et
al. 2020), mal- or undernutrition (Hayward et al. 2013; Larsen et al. 2001; Mummert et
al. 2011), early life stresses (Armelagos et al. 2009; Barker et al. 1993; Barker 1998;
Maniam et al. 2014), among others. Furthermore, it can be difficult, if not impossible, to
identify sources of differential frailty in the past using skeletal remains (Milner et al.
2008). Wood et al (1992) indicated that hidden variation in frailty hinders the ability of
bioarchaeologists to make sweeping statements about health in the past as aggregate data
on lesion frequencies cannot capture this variation. By failing to account for individual
and subgroup heterogeneity, our perception of the prevalence of disease in the living
population will be skewed.
One of the other important concepts highlighted by Wood et al. (1992) was that
skeletal lesions may reflect survival rather than increased frailty and mortality, as was the
standard interpretation by most paleopathologists. Skeletal lesions take weeks, months or
even years to manifest, therefore a population with a high frequency of stress lesions
could reflect a healthier, more robust group than one with no lesions at all, with

5
individuals of this latter group having perished before lesions could develop.
Wood et al. (1992) were not the first to recognize these issues. Cook and Buikstra
(1979) acknowledged that the juvenile skeletal record may be inherently biased if the
more sick individuals are entering the record at younger ages than others. Ortner (1991)
questioned the assumption that the presence of skeletal pathology is indicative of poor
health. Why did Wood et al. (1992) become so influential? The journal in which the
article was published appealed to broader audience and was more aggressive than
previous publications that addressed this issue. Furthermore, the format in which Wood et
al. (1992) appeared required comments to be published with the article, so generating
academic dialogue was a fundamental aspect of the paper (Buikstra, personal
communication). DeWitte and Stojanowski (2015) hypothesize that the timing of the
article may play a role. It was published around the time of the Columbian
quincentennial, a period during which the impact of colonialism on the health of
indigenous peoples was a popular research topic (Baker and Kealhofer 1996; Larsen
1994; Larsen 2001; Larsen et al. 2001). The field was ready for a critical discussion of
the methods and theory in bioarchaeology. Furthermore, while previous researchers had
discussed problems inherent in skeletal samples, these concerns were not the main
argument of their articles as they were for Wood et al. (1992).
Reactions to the Osteological Paradox
While most bioarchaeologists recognized the importance of the limitations
articulated by Wood et al., not all agreed, contending that the problems were insignificant
or easily overcome. Goodman and Martin (2002) maintained that heterogeneity in frailty

6
is not invisible in the skeletal record but is evident in “differing mortality profiles” (p. 13)
and is clearly elucidated when scholars use multiple indicators of stress in their analyses
(see also Goodman, 1993). Cohen et al. (1994) asserted that “heterogeneity, differential
frailty, and selective mortality, although real, do not play quantitatively as important a
selective role in the creation of cemetery samples” (p. 631) as maintained by Wood et al.
Despite the widespread acknowledgement of the osteological paradox having vital
consequences for paleopathology and paleodemography, few publications in the ensuing
decades sought to accept the challenge (Boldsen 1997; Garland 2020; Kyle et al. 2018;
Lukacs 1994; McCool et al. 2021; Novak et al. 2017; O'Donnell 2019; Wright and Chew
1998; Wright and Yoder 2003). DeWitte and Stojanowski (2015) showed that the
concerns raised by the osteological paradox were being handled in one of four ways: 1)
as an brief mention as an “important theoretical contribution,” 2) as a “potential study
limitation” but with no real engagement with the material, 3) as an ad hoc explanation
when results about the distribution of disease do not align with previous hypotheses, and
4) articles engaging with the osteological paradox by exploring frailty and mortality in
bioarchaeological contexts. Most articles fell into the first, second and third categories,
with only a handful in the fourth.
The past five years, however, have seen a notable increase in the number of
publications dedicated to serious engagements with the osteological paradox.
Considerable effort has been focused on identifying sources of heterogeneous frailty in
the past (Cheverko 2018; DeWitte 2009; DeWitte 2012; DeWitte et al. 2016; Jatautis et
al. 2018; Marklein 2020; Marklein et al. 2016; Newman and Gowland 2017; Temple

7
2019; Yaussy and DeWitte 2019; Yaussy et al. 2016). Using a set of dental casts with
known genealogical information, Lawrence et al. (2021) showed that linear enamel
hypoplasia may have a “heritable component” that was accounted for by genetic
relatedness as well as shared household environment of family members. The authors
suggested that one of the hidden forces influencing heterogeneity in the risk of
developing LEH may be due to genetic susceptibility. Yaussy (2019) used an
intersectional approach to examine how gender and class identities shaped health and
mortality in 18th and 19th century England. She found variable interactions between the
multiple identities and the manifestation of stress indicators, ultimately concluding that
having at least one marginalized identity (low socioeconomic status or female) was
associated with earlier mortality.
No longer content with assuming that skeletal lesions are direct indicators of
frailty, many scholars have adopted frameworks to interpret lesions to variably reflect
frailty and/or resilience (Berger and Wang 2017; Hoover and Hudson 2016; Marklein and
Crews 2017; Marklein et al. 2016; Godde et al. 2020; Godde and Hens 2021), as well as
how frailty and the risk of mortality may vary over the life course (Agarwal 2016;
Dewitte 2014b; McCool et al. 2021). McFadden and Oxenham (2020) tested how the risk
of mortality due to cribra orbitalia may vary between juveniles and adults. They re-
analyzed pathology data collected for the Global History of Health Project using Kaplan-
Meier and Cox regression analyses. A large portion of the samples that had a statistically
significant relationship between cribra orbitalia and survival when juveniles were
included had no relationship once juveniles were eliminated from the sample. These

8
results suggest that cribra orbitalia may be associated with increased mortality in
juveniles, but increased survival in adults.
New analytical methods that rely on fewer assumptions about the relationship
between skeletal lesions and frailty – such as survival and hazards analysis, odds ratios,
and multi-state models – are being used to explore the associations between skeletal
lesions, mortality, and other biological and cultural factors (Cheverko and Hubbe 2017;
DeWitte and Wood 2008; Kelmelis et al. 2017; Kyle et al. 2018; Redfern et al. 2019;
Redfern et al. 2015; Sołtysiak 2015; Usher 2000; Walter and DeWitte 2017). Using a
combination of survivorship, hazards models, and stable isotope analysis, McCool et al.
(2021) investigated temporal variation in lesion severity and frequency in a Peruvian
sample. Their results revealed that the force of selective mortality associated with cranial
lesions changed across the phases of the Late Intermediate Period.
Research Orientation
A key assertion of the osteological paradox is that scholars must be more critical
of how skeletal lesions are analyzed and how they are interpreted. This dissertation seeks
to advance knowledge about analysis and interpretation through two distinctive
objectives.
The first goal is to advance our methods for analyzing paleopathology data.
Paleopathology data frequently include a mix of data types, including continuous,
ordinal, binary, metric, and non-metric data, age-ranges, and descriptions. Compared to
other social science fields, the sample sizes are generally small. As a result, missing data
can have an enormous impact on the range of applicable statistical analyses, the power to

9
detect meaningful differences, and the potential biases introduced into the sample
composition (Allison 2001; Baraldi and Enders 2010; De Leeuw et al. 2003; Enders
2010; Finch 2010; Graham 2009; Howell 2007; Kang 2013; McKnight et al. 2007; Myers
2011; Osborne 2013; Peng et al. 2006; van Buuren 2018). The first section of this
dissertation aims to advance our knowledge of methods for handling missing data in
bioarchaeology and paleopathology. This will encourage bioarchaeologists and
paleopathologists to explore new analytical methods for investigating the osteological
paradox along with other important topics.
The second goal of this dissertation is to further interrogate the relationship
between skeletal frailty and mortality using a unique pandemic context. This section
builds on the results of the first section by incorporating new missing data methods into
paleopathology analyses. One of the barriers to exploring aspects of the osteological
paradox in the past, particularly heterogeneity in risks, has been a lack of temporal or
demographic control over the samples. The individuals in an assemblage often died over
a long period of time, and therefore they did not necessarily experience the same socio-
cultural environment or climate (DeWitte and Stojanowski 2015; Kyle et al. 2018;
Lawrence et al. 2021; Stojanowski 2013). This chronological bias prevents meaningful
inter- and intra-sample comparisons. To properly understand skeletal stress lesions and
their utility as indicators of frailty or resilience, as well as examine individual variation in
health, the ideal study sample is a group of individuals who died within a short time
frame and experienced a single substantial stress event (Wood et al. 1992; Temple 2019).

10
Epidemics are therefore an ideal context in which to examine variation in frailty and
resilience.
Many of the initial advances in paleoepidemiology and paleodemography have
been made within “catastrophic” burial contexts – contexts where usually large numbers
of individuals were interred within a short time as a result of famine, violence, or an
outbreak of epidemic disease (Gowland and Chamberlain 2005; Keckler 1997;
Margerison and Knusel 2002). For example, DeWitte and colleagues explored the impact
of pre-existing frailty during the Black Death (DeWitte 2009; DeWitte 2014a; DeWitte
and Wood 2008; Zarulli et al. 2018). DeWitte and Wood (2008) demonstrated that the
Black Death did not kill indiscriminately, but that prior frailty increased the risk of
mortality and sex may have been an additional risk factor (DeWitte 2009). This section of
the dissertation expands on this work by exploring selective mortality during the 1918
influenza pandemic and the role of prior frailty in contributing to increased risk of death.
The 1918 influenza pandemic is an excellent case study for investigating skeletal
lesions and differential frailty in the past. There is a remarkable amount of scholarship on
the pandemic, which was used to formulate hypotheses and interpret the results within
appropriate historical and biological contexts. Numerous books and articles have
described the historical trajectory of the pandemic (Aligne 2016; Barry 2004; Barry 2005;
Chowell et al. 2010; Erkoreka 2010; Jester et al. 2019; Oxford et al. 2002; Patterson and
Pyle 1991; Shanks and Brundage 2012; Taubenberger and Morens 2006), explored risk
factors for increased morbidity and mortality (Afkhami 2003; Ammon 2001; Bengtsson
et al. 2018; Dahal et al. 2018; Herring and Sattenspiel 2007; Johnson 2001; Mamelund

11
2003; Mamelund 2004; Mamelund 2011; Mamelund and Dimka 2019; McCracken and
Curson 2003; McSweeny et al. 2007; Murray et al. 2006; Noymer and Garenne 2000; Oei
and Nishiura 2012; Økland and Mamelund 2019; Paskoff and Sattenspiel 2019; Paynter
et al. 2011; Pinnelli and Mancini 1998; Rice 1988; Tripp and Sawchuk 2017; Tuckel et
al. 2006; Wilson and Baker 2008; Zürcher et al. 2016), and detailed the structure and
behavior of the 1918 virus itself (Basler et al. 2001; de Wit et al. 2018; Kobasa et al.
2007; Kobasa et al. 2004; Oxford and Gill 2018; Reid et al. 1999; Reid et al. 2004; Reid
et al. 2000; Stevens et al. 2004; Taubenberger et al. 1997; Tumpey et al. 2005).
Skeletal data for this dissertation were obtained from the Hamann-Todd
Documented Osteological Collections – a documented skeletal collection containing
individuals who died in Cleveland, Ohio, prior to and during the 1918 pandemic. Each
individual has associated records on age-at-death and cause of death, eliminating
uncertainty that may arise from traditional osteological age-at-death methods (Buckberry
2015; Hoppa and Vaupel 2002; Milner et al. 2008) and uncertainty about death due to
other causes. The assemblage also provides an appropriate comparative sample to assess
changes in selective mortality during the 1918 flu.
Structure of the Dissertation
In addition to the introduction and the concluding chapters, this dissertation is
organized into two sections, the first containing two chapters and the second containing
one chapter. The second chapter explores the handling of missing data within the field of
bioarchaeology. Missing data are a frequent and unavoidable challenge in bioarchaeo-
logical research, yet how missing data introduce bias or invalidate statistical analyses are

12
infrequently made explicit. There is no consensus on best practices for the treatment or
reporting of missing data. As an initial step in taking stock and exploring approaches to
missing data in bioarchaeology, this study reviews bioarchaeological publications to
ascertain what methods are currently used to handle them. Over 1000 bioarchaeology
articles (2011-2020) from four major anthropology journals were surveyed, searching for
the terms “missing,” “absent,” “unobserv,” “replace,” and “imputat” when used to refer
to missing data. The articles so identified were then categorized by one of eight
bioarchaeological subtopics and scored according to a set of six broad approaches for
handling missing data. The results reveal broad themes in how missing data are treated in
bioarchaeology, laying the groundwork for new missing data methods in the field.
Chapter 3 builds on the results of chapter 2 by exploring the use of imputation to
handle missing paleopathology data. An overview of missing data management in the
social sciences and in bioarchaeology is provided, followed by a test of imputation and
deletion methods for handling missing data. In the test, missing data were simulated on
complete datasets of ordinal (n=287) and continuous (n=369) bioarchaeological data.
Missing values were imputed using six imputation methods (predictive mean matching,
mean, random, random forest, expectation maximization, stochastic regression) and the
success of each at obtaining the parameters of the original dataset compared with listwise
and pairwise deletion.
Chapter 4 applies all the techniques and contextual information learned in the
previous chapters to test the impact of prior frailty on mortality and survival in the 1918
influenza pandemic. A large amount of contemporary anecdotal evidence reports that

13
“healthy young adults” were among the greatest risk group during the pandemic (Glezen
1996; Hoffman 2011; Luk et al. 2001; Short et al. 2018; Taubenberger and Morens
2006). Despite little scientific evidence, these accounts have been incorporated into
modern-day academic scholarship, perpetuating the idea that the 1918 virus killed healthy
individuals. Much research on the 1918 flu utilizes data from demographic records –
most of which do not contain individual-level information on chronic health conditions,
nutritional or environmental stresses, or other illnesses that render a person “unhealthy.”
By using a novel bioarchaeological approach, we can combine individual-level
information on health and stress gleaned from the skeletal remains of individuals who
died in 1918 to ask the question: were healthy individuals dying during the 1918
pandemic? Or did a currently unidentified underlying frailty contribute to increased
mortality?
Skeletal lesion data on porotic hyperostosis, cribra orbitalia, linear enamel
hypoplasia, periodontal disease, and tibial periosteal lesions were obtained from a sample
of 424 individuals from the Hamann-Todd documented osteological collection. The
sample was separated into a control group (those who died prior to the 1918 pandemic)
and a flu group (those who died during the pandemic). Skeletal data were analyzed
alongside age-at-death information using Kaplan-Meier survival and Cox proportional
hazards analysis. The results inform our understanding of frailty and selective mortality
in the 1918 flu and in broader bioarchaeological contexts.
The final chapter summarizes the results of the dissertation. It reviews the goals
and findings of each chapter, assessing how they engage with the osteological paradox

14
and contribute to bioarchaeological knowledge and our understanding of the 1918
influenza pandemic. Future research that builds on the results found in the previous
chapters is proposed, including investigating sources of heterogeneity in frailty during the
1918 flu, and additional testing of imputation in bioarchaeology. The dissertation
concludes with an overview of the intellectual merits of this project and how the results
expand our knowledge of the 1918 flu, advance methods and theory in bioarchaeology,
and elucidate the interactions between people and pathogens in an epidemic context.

15
CHAPTER 2
MISSING DATA IN BIOARCHAEOLOGY I: A REVIEW OF THE LITERATURE
Amanda Wissler, Kelly Blevins.
Target Journal: American Journal of Physical Anthropology
Missing data commonly occur in nearly all types of quantitative research,
including medicine, ecology, psychology, education, communication, and biology
(Altman and Bland 2007; Dong and Peng 2013; Enders 2010; McKnight et al. 2007; Van
Buuren 2018b). However, most introductory statistics texts do not discuss missing data,
what causes them, how to treat them, or how they influence the validity of statistical
analyses (Allison 2001; Altman and Bland 2007). The lack of attention paid to missing
data means that most researchers simply delete cases, individuals, or variables that are
missing values with little understanding of potential bias introduced (Acock 2005; Enders
2010; Harel et al. 2008; King et al. 1998). Many scholars may be unaware that alternative
options for handling missing data exist (McKnight et al. 2007).
Missing data are a particularly inevitable challenge in bioarchaeological research.
Preservation and recovery factors beginning at the death of the individual and lasting
through curation affect skeletal element preservation and attendant data quality and
quantity. Specialized mortuary treatment, secondary burial practices, taphonomy, burial
environment, excavation, cleaning, transport, and curation all shape skeletal assemblages
(Gordon and Buikstra 1981; Nawrocki 1995; Stodder 2008; Walker et al. 1988).
Archaeological and historical assemblages are incomplete, fragmentary, and regularly
have taphonomic changes obscuring bone surfaces. Skeletons from identified collections

16
are generally more complete, but still suffer from missing elements taken for destructive
sampling and the loss of small bones such as those of the hands and feet, sesamoids, and
coccygeal elements. In addition to these postmortem biases in skeletal completeness,
antemortem events such as tooth loss and wear can exclude elements and individuals
from downstream analyses.
Despite these pervasive problems, there are no standardized methods for handling
or reporting missing data. Often, missing data are not considered from the outset of a
project, accounted for in project design, or explicitly documented in publications. This
can lead to inconsistent and non-replicable results, systemically biased datasets and
conclusions, and inhibit the use of results as comparative data or in meta-analyses (De
Leeuw et al. 2003; Finch 2010; McKnight et al. 2007; Quintero and LeBoulluec 2018;
Von Elm et al. 2007). Lack of engagement with missing data is also a barrier to
implementing more advanced statistics and hypothesis testing. Most statistical tests
require that no cells have missing data (Graham 2012) and deletion approaches generally
reduce the sample size significantly, resulting in a loss of statistical power and an
inability to explore interactions among many variables.
Scholars in other areas of the social sciences such as psychology and
epidemiology have noted a similar lack of protocols for handling and reporting missing
data and have thus developed guidelines for moving forward (Burton and Altman 2004;
Jeličić et al. 2009; Von Elm et al. 2007; Wilkinson 1999). As an initial step toward
increasing the theoretical and statistical rigor of missing data treatments in
bioarchaeology, this paper surveys the state of missing data in the field – examining what

17
methods are used to handle missingness, and how missingness is reported in publications.
To accomplish these objectives, this paper begins with a brief overview of missing data
theory followed by a bioarchaeology literature review in which we assess how
researchers approach missing data and how missing data are reported. Guided by the
literature review results, we address why accounting for missing data is a critical aspect
of scientific rigor and provide recommendations for bioarchaeologists to improve their
handling and reporting of missing data.
Rubin (1976) defined three categories of missing data based on different causes of
missingness. The first of these, missing completely at random (MCAR), occurs when a
value is missing due to a cause that is unrelated to that variable or any other variables in
the dataset (Enders 2010; McKnight et al. 2007; Quintero and LeBoulluec 2018). MCAR
data are likely rare among bioarchaeological datasets but could occur when skeletons are
only partially recovered due to an incomplete excavation grid or when taphonomic
processes vary stochastically across mortuary deposits, resulting in some poorly
preserved skeletal elements or cortical surfaces. The second category is missing at
random (MAR). A value is MAR when the cause of the missingness is related to some
variable in the dataset but not the variable of interest (Enders 2010; Myers 2011; Schafer
and Graham 2002). Dental morphology data are generally MAR. While dental wear in
older individuals results in trait missingness, an individual’s age does not impact their
dental morphology. The third category is missing not at random (MNAR or NMAR).
MNAR occurs when the cause of a missing value is dependent on that variable or when
the cause of missingness is unknown (Little and Rubin 2002; Van Buuren 2018b). A
18
common example of MNAR data is dental enamel defects (DEDs). DEDs are pervasive
in the bioarchaeological record and are a frequently recorded pathology. DEDs are often
unobservable in older individuals, as the labial or buccal tooth surfaces can be obscured
by dental wear. In much bioarchaeological research, however, there is an assumed
relationship between DEDs and survivorship (age-at-death) (see Bhaskaran and Smeeth,
2014 for examples of MAR, MCAR, and MNAR variables). Data that are MCAR or
MAR are less problematic than MNAR and are often referred to as “ignorable” (Allison
2001; Enders 2010; Graham 2012; Osborne 2013). Deleting data that are MCAR or
MAR, however, will result in a decline in statistical power due to a decreased sample
size, but because MCAR and MAR data are missing in ways that are “random,” their
absence should not introduce bias into the dataset (Graham 2009; Howell 2007; Myers
2011). MNAR, however, are problematic and are also referred to as “nonignorable”
(Allison 2001; Graham 2009; Graham 2012). The probability of missingness is dependent
on the missing data; it is almost impossible to know the true extent of that relationship,
therefore it is not possible to control for or compensate for the missingness (Graham
2012; Howell 2007; McKnight et al. 2007). Data missing not at random can result in a
substantially biased dataset, as it means that information vital to answering the research
question is absent (De Leeuw et al. 2003; Finch 2010; Graham 2009; Osborne 2013).
There are many methodological and theoretical approaches for eliminating or
handling missing data. Deletion methods are by far the most common, especially in the
social sciences (Altman and Bland 2007; Harel et al. 2008; King et al. 1998). Case-wise
or list-wise deletion involves removing entire cases or individuals from a dataset for all
19
analyses if any values are missing. Pairwise deletion involves removing individuals with
missing data on a test-by-test basis, creating slightly different samples for each analysis
in order to maximize the available data (Allison 2001; Howell 2007; Little and Rubin
2002; Quintero and LeBoulluec 2018). Imputation involves inserting plausible values in
place of missing variables (Allison 2001; McKnight et al. 2007; Schafer and Graham
2002). A wide variety of imputation methods exist, the simplest being mean imputation,
in which the variable mean is substituted for a missing value. Other, more complex
methods include maximum likelihood, stochastic regression, and multiple imputation.
Numerous books and articles exist describing specific imputation techniques, their
statistical assumptions, advantages, and disadvantages (De Waal et al. 2011; Finch 2010;
Graham 2012; McKnight et al. 2007; Musil et al. 2002; Quintero and LeBoulluec 2018;
Schafer and Graham 2002; Van Buuren 2018a).
Materials and Methods
The objective of this literature review is to determine if there are commonly used
methods for handling missing data in bioarchaeology, whether these methods vary by
bioarchaeological subtopic, and if there is any variation in methods and treatment over
time.
Articles reporting human skeletal elements, mummified remains, or materials
derived from human remains (i.e. dental casts) were compiled from the last 10 years of
four major anthropology journals: American Journal of Physical Anthropology (2011-
2020), Bioarchaeology International (2017-2020), International Journal of
Paleopathology (2011-2020), and International Journal of Osteoarchaeology (2011-

20
2020). Bioarchaeology International began in 2017, therefore only the most recent four
years are included through volume 4 number 1, which was the most recent issue available
at the time of the current study. Research articles and reports were included;
commentaries, literature reviews, book reviews or annual meeting programs were
excluded. Case studies, osteobiographies, and differential diagnoses were omitted, as this
investigation focuses on population-level studies. Articles with very small samples sizes
tended to present individual osteobiographies, while those with larger samples more often
analyzed the individuals using a population approach. Therefore, publications reporting a
sample size of fewer than 10 individuals were eliminated. In choosing to focus upon
bioarchaeology, we excluded paleoanthropology and forensic anthropology by including
articles studying materials dating to the Holocene (~10kya) through approximately 50
years ago. The aim was to stay strictly within the purview of bioarchaeology, therefore
papers comparing anatomically modern humans to primates or other hominins were also
excluded. This resulted in approximately 1000 articles (see Figure 1 for literature review
flowchart).
Each article was searched for the following terms: “missing,” “absent,” “imputat,”
“replace,” and “unobserv.” Articles that employed any of these words in the context of
missing data were compiled for further analysis by the first author. Note that these five
terms did not necessarily capture every instance of missing data.
An original goal of this review was to catalog the frequency of specific
procedures used during data collection (e.g. antimere substitution) and pre-analysis data
treatments (e.g. case deletion, imputation). However, there was a lack of consistency in

21
the language authors used to describe their methods, how they conceptualized their
missing data, where in the article missing data were addressed, and whether this
Figure 1.
Literature Review Flow Chart.

22
information was included in the publication. Literature reviews of missing data in other
disciplines have experienced similar difficulties (Klebanoff and Cole 2008; Lang and
Little 2018; Peugh and Enders 2004; Powney et al. 2014). As a result, the research aim
shifted to explore broader patterns in how bioarchaeological researchers engage with
missing data, ranging from data collection procedures, theoretical considerations, and
discussions of the impact of missing data. How missing data were discussed was
therefore categorized according to the following six general missing data methods (Table
1).
A: The authors acknowledged there were values missing from their data. They
stated, for example, that “unfused epiphyses are commonly missing,” or present summary
data and indicate where certain data were unobservable or absent.
B: The researchers implemented procedures during data collection or pre-analysis
data treatment to control for or minimize missing data. Examples included antimere
substitution, excluding individuals who did not meet a minimum threshold of
completeness, omitting individuals/elements with damage or pathology, or creating an
index in which variable categories are collapsed to optimize available data.
C: The article discussed missing data generally as a concern – usually in the
introduction or in the conclusion – but not directly related to the study sample. For
example, “Traditionally, anthropologists have relied on morphological or metric criteria
for sex determination, but none of these approaches are 100% accurate, especially when
skeletons are incomplete and more sexually dimorphic bones, like the innominate, are
absent or are very fragmented” (Garcia 2012, p. 361).

23
D: The article mentioned the presence of missing data as a reason for choosing a
specific statistical method or as an important aspect of the method chosen. For example,
numerous studies justified their use of mean measure of divergence as it can handle large
amounts of missing data (e.g. Ragsdale and Edgar 2015).
Table 1.
Six Missing Data Methods
Category Explanation
A • Acknowledges missing data in the sample
• e.g. “unfused epiphyses were commonly missing”
B
• Uses a collection procedure or pre-analysis data treatment to
control for or minimize missing data
• e.g. substituting right for left
• e.g. excluding individuals who may be missing certain skeletal
elements
C
• Mentions missingness in intro/conclusion generally as a
concern or limitation
• e.g. “Traditionally, anthropologists have relied on
morphological or metric criteria for sex determination, but
none of these approaches are 100% accurate, especially when
skeletons are incomplete and more sexually dimorphic bones,
like the innominate, are absent or are very fragmented”
(Garcia p. 361 2012; IJOA)
D • Mentions missing data as a reason for choosing a specific
statistical method or as an important aspect of the method
chosen
E
• Mentions missing data as a potential limitation for their results
• e.g. renders the sample not entirely representative or limits
statistical power
F • Performs imputation or substitution for missing data
• e.g. linear regression, mean replacement

24
E: The article cited missing data as a potential limitation for the results and
conclusions. For example, the authors discussed how missing data may have reduced the
statistical power to detect meaningful differences or how patterns of missingness biased
the skeletal sample causing it to be unrepresentative of the original population.
F: The study used imputation to replace missing data with statistically generated
values. A single article could be assigned to more than one missing data method category.
For instance, it was common for articles that performed some type of statistical
imputation (F) to first use a method such as antimere substitution (B) to minimize
missing data and also state that their statistical method allowed missing data (D).
Each article was further categorized into one of eight subject subtopics according
to the paper’s main research question (Table 2). Topics within bioarchaeology have
preferred analytical methods, unique types of data, and draw from different non-
anthropological fields to inform their methods and theory. Examining how these topics
variously handle missing data provides insight into broader patterns within the field.
Pathology articles included those studying health and disease, paleoepidemiology,
musculoskeletal markers, dental wear, and cranial and dental modification. Articles
categorized under morphology included studies of tooth shape, stature, limb and cranial
shape (when not used for biodistance studies). Methods articles had the goal of creating
or testing a method such as age estimation or statistics; they have employed morphology
or musculoskeletal markers but the focus of the paper was on the method. For example
Stojanowski and Hubbard (2017) evaluated “what variables and methods best identify
known relatives within [a] sample (p. 814)” in biological distance analyses. Since the

25
Table 2.
Eight Bioarchaeological Subtopics
goal of this paper was to inform and refine biodistance methodology, this paper was
placed in “methods” rather than “biodistance.” Biodistance articles used metric or
nonmetric traits to examine biological affinity and migration. Similarly, papers on
ancient DNA explored biological affinity or migration but using ancient DNA. Isotopes
articles use isotopes from skeletal elements or preserved tissues to examine diet,
migration, and past lifeways. Trauma studies explored skeletal trauma and past violence.
Category Explanation
Pathology
Health and disease, paleoepidemiology,
musculoskeletal markers, cranial and dental
modification, dental wear
Morphology
Stature (when not in framework of poor health), limb
and cranial shape (when not used for biological
distance), tooth shape
Methods
Creating or testing a method (e.g. aging, sexing,
statistics)
May use morphology or musculoskeletal markers but
the focus of the paper is on the method
Biodistance Using metric or nonmetric data to examine biological
affinity
aDNA Ancient DNA to examine migration, biological
affinity
Isotopes Using isotopes from skeletal elements to examine diet,
migration, lifeways
Trauma Skeletal trauma, warfare
Archaeology
Using bioarchaeological methods to explore an overall
cultural context, or lifeway. Doing basic osteological
methods to establish a context

26
Finally, archaeology articles used bioarchaeological methods to explore an overall
cultural context. Several articles in this category involved establishing the age and sex
profiles of a new skeletal assemblage, emphasizing the importance of a new
archaeological context.
Results
Of the approximately 1000 bioarchaeology articles compiled, 277 mention
missing data using one of the five search terms. A total of 142 were from the American
Journal of Physical Anthropology, 93 from the International Journal of
Osteoarchaeology, 32 from International Journal of Paleopathology, and 10 from
Bioarchaeology International. The number of articles per year remained relatively
consistent, ranging between 23-33 articles per year and averaging 27.7 per year. Nine
articles could not be meaningfully categorized into a single subject and were thus placed
into two categories and double counted. For example, Redfern et al. (2017) examined the
association between multiple skeletal trauma and health status; it was therefore placed in
both the trauma and pathology categories. The other 723 articles excluded from further
analysis had study designs that discussed missingness in terms other than the five
selected, did not have missing data, or did not disclose the presence of missing data. It
would not be appropriate to generate summary statistics using the full 1000, therefore the
following results will focus on 277 scorable articles.
Overall, the most common missing data method found was B. A total of 137 articles
(49.5%) employed a technique during data collection or data cleaning to limit missing
data (Table 3). Note that due to double counting eight articles and because a single article

27
may have been tallied in multiple missingness categories the column sums in table 3 will
not add up to 277. The most frequently used technique was antimere substitution (i.e.
substituting the right element if the left was damaged or absent) or excluding individuals
that failed to meet a minimum number of necessary observable elements. The second
most common missing data method was A (n=116, 41.9%), which indicated the presence
of missing data in the study. Only 22 articles employed missing data method D. Notably,
few articles used missing data methods C (n=14) and E (n=25). A total of 44 articles used
missing data method F (imputation). Table 3 also summarizes the number of articles per
bioarchaeological subject topic. The majority are in pathology (n=126), followed by
morphology (n=68) and methods (n=58) while the fewest are from isotopes (n=15) and
ancient DNA (n=9).
Table 3.
Summary Literature Review Results
A B C D E F total
aDNA 4 2 0 0 2 1 9
Archaeology 14 3 1 0 1 0 19
Biodistance 1 20 0 6 6 15 48
Isotopes 11 2 0 1 0 1 15
Methods 15 22 8 6 4 3 58
morphology 16 31 0 2 2 17 68
Pathology 48 52 4 7 8 7 126
Trauma 7 5 1 0 2 0 15
total 116 137 14 22 25 44

28
Figure 2 shows the percentage of each missing data method by subject topic. Given that
the International Journal of Paleopathology and Bioarchaeology International focus
heavily on skeletal pathology it is unsurprising there are so many articles in this area. The
vast majority (80%) of pathology articles utilized missing data methods A or B – the least
rigorous. Despite the large number of articles missing data in relation to their collection
procedures or indicating that there are missing data in their samples, only 5.6%
mentioned missing data as a potential problem or limitation for their results. Morphology
contains the second greatest number of articles using a missing data method (n=68). Not
quite half employed missing data method B. Morphology also has the second largest
Figure 2.
Barplot Showing Percentage of Missing Data Method by Subtopic
29
percentage (25%) of articles doing imputation. On the other hand, comparatively few
articles of this topic discussed missing data as a potential concern or a limitation for their
results (E). A total of 58 articles were categorized into the methods subfield. Most
employed missing data methods A and B. Methods papers also had the greatest
percentage (11%) of articles that considered the ability to handle missing data as an
important aspect of their statistical methods selection (D) and papers falling in missing
data method A (14%) – discussing missingness generally as a concern or limitation. A
total of 48 biodistance articles used a missing data method, about half of which used
collection procedure to minimize missing data (B). Compared to the other subjects, a
greater proportion of the biodistance articles fell into missingness category D (missing
data as a reason for choosing a specific statistical method) or F (imputation). Trauma was
among the smallest subject group (n=15) and displayed the lowest diversity in the
techniques for handling missing data, with over 40% used method A. Only 15 articles
that employed a missing data method could be categorized as “isotopes,” 11 of which
acknowledged missing data (A). A single isotopes article used imputation (Allen et al.
2020); however, this article falls into two subject categories, the other being biodistance.
Finally, only 9 articles categorized into the aDNA topic, most of which detail the
presence of missing data (A) or mention missing data as a limitation for their results (E).
Figure 3 shows how patterns in missing data methods have varied over time. The number
of articles in each missingness category remains relatively constant over the past 10 years
– indicating very little temporal change. There is a slight increase in the number of
articles that discussed how missing data in the samples was a limitation for their results

30
Figure 3.
Trends in the Usage Of Missing Data Methods Over Time
and interpretations (E). Finally, only four articles (Falys and Prangle 2015; Luna 2019;
Niinimäki 2012; Niinimäki and Baiges Sotos 2013) stated that there were no missing data
in their sample or that missing data treatments were unnecessary. It is possible that many
of the 723 articles also had no missing data but did not mention it in the text.
Discussion
This literature review explores how bioarchaeologists handle missing data by
reviewing published articles from the last ten years from four major journals. In general,

31
we find that the most prevalent missing data methods were those deemed the least
statistically or theoretically rigorous (A and B). The most frequent method employed a
collection procedure to limit missingness such as antimere substitution or excluding
individuals who fail to meet a minimum threshold of completeness (B). The ubiquity this
method reveals that these are the base procedures for handling missing data in
bioarchaeology. Indeed, substituting the right element when the left is unavailable is
established in Standards for Data Collection from Human Skeletal Remains (Buikstra and
Ubelaker 1994) for cranial, postcranial, and dental measurements. Furthermore, these
results suggest that missing data is anticipated and planned for in bioarchaeological
studies despite a lack of discussion of missing data in the field. Few authors explicitly
considered missing data as an important aspect of a statistical analyses (D), indicating
that analytical approaches are infrequently dictated by missing data. Examination of the
impact of missing data was rare as were wider discussions of the statistical and
interpretive limitations imposed by missing data – particularly given the number of
articles explicitly pointing out missing values in their skeletal data.
Each bioarchaeological topic has its own preferred techniques for conceptualizing
and handling missing data. For example, pathology and trauma articles engage with
missing data in the least rigorous ways. Both areas tend to focus on highly contextualized
patterns of pathology and trauma and their data are more likely to be counts of particular
lesions or injuries. General descriptive statistics and univariate analyses may be seen as
appropriate in these cases and more sophisticated techniques to handle missing data
viewed as unnecessary.

32
Biodistance and morphology – areas which tend to be the most statistically
advanced in bioarchaeology – used the most rigorous approaches for missing data. These
articles more often explicitly used statistical methods that allow missing data and were
more cognizant of analytical methods that can be biased by missingness. This may be
because multivariate statistics, such as would be used in biodistance or morphological
analyses, do not permit missing data – causing scholars in these areas to deal with their
missing data on a statistically more sophisticated level.
Despite its frequent use in other fields, imputation of missing data is uncommon
in bioarchaeology. It was expected that the number of articles using imputation would
increase over time as the computational power of standard laptops has grown and
statistical software packages for imputation have become widely available. However, the
number of articles imputing missing data remained constant over the past 10 years.
Two articles had the explicit goal of examining or developing missing data
methods in bioarchaeology and were thus excluded from analysis. Auerbach (2011)
developed mathematical formulae for estimating vertebral heights, femoral and tibial
lengths, and talocalcaneal height when skeletal elements were absent, as previous
methods did not facilitate handling missing data. Auerbach’s article represents one of the
few instances of a protocol devised specifically to minimize obstacles due to missing
skeletal data that does not involve deletion. Additional work in this vein would permit
researchers not only to maximize the use of all available information, but also allow
greater exploitation of the information contained in highly fragmentary and/or
commingled assemblages. For example, formulae could be developed that estimate

33
bucco-lingual or mesio-distal dental measurements for missing or damaged teeth given
measurements of the available teeth. Such techniques could be broadened beyond
continuous data with the development of models that predict the probable sex estimation
score of missing elements (e.g. glabella) given the recorded scores of available elements
within a population context. Auerbach (2011) also draws the reader’s attention to the
importance of handling missing data properly rather than ignoring them, explaining how
patterns of missingness in skeletal samples are usually assumed to be missing at random,
when in fact biases in preservation may cause data to be missing not at random,
generating a sample that is unrepresentative of the original population.
Stojanowski and Johnson (2015) examined how dental wear influences the
scoring of dental non-metric traits – in particular how higher levels of wear may result in
trait downgrading. They found notable inconsistencies in when observers scored a dental
non-metric trait versus when they coded it as missing or unobservable due to dental
attrition, a bias that had the potential to support inaccurate interpretations about global
dental patterns and population movement. Their conclusions show how profoundly
missing data can affect inferences about the past when not handled adequately.
The paucity of articles with the stated goal of exploring missing data suggests that
bioarchaeology is not critically engaging with missing data methods or theory – a
concern given the ubiquity of missing data in the field. The lack of engagement with
missing data indicates that researchers are not considering how missing data may bias
statistical analyses and ensuing results and conclusions. This study shows that the most
common method for dealing with missing data is category B (antimere substitution or

34
deletion). Though pairwise and case-wise deletion are among the most simple methods
for dealing with missing data, their use relies on the most conservative assumptions: less
than 5% total missingness and that missingness is completely random (Graham 2009;
Little and Rubin 2002). When the patterns of missing data do not meet these criteria and
pairwise or case-wise deletion are employed, the results can be skewed, presenting an
incomplete and biased outcome (McKnight et al. 2007). Bioarchaeological data are likely
to be MNAR and therefore fail the requirements for pairwise and case-wise deletion,
though this has not been explored in detail. More porous pathological skeletal elements
are less likely to preserve over time or survive excavation; they may be separated from
the rest of the individual and placed in an entirely different collection specializing in
pathology. Smaller, lighter, and more fragile bones such as those belonging to children or
females may be less likely to be recovered during excavation (Bello et al. 2006; Gordon
and Buikstra 1981; Holt and Benfer 2000; Mays 1992; Stojanowski et al. 2002; Walker et
al. 1988). Such biases are an inherent and yet unknowable part of bioarchaeological data.
Based on the findings from this literature review, it is not standard practice in
bioarchaeology to critically examine patterns of missingness in the data during the study
design phase or in publication. The management of missing data in bioarchaeology has
important implications for the scientific rigor of the research and the future of the field.
Missing data can substantially decrease sample sizes, limiting the power of the study to
detect meaningful differences between groups (Graham 2009; Kang 2013; McKnight et
al. 2007; Peng et al. 2006). Most bioarchaeological studies do not perform power
analyses so it is unclear whether those with small sample sizes are capable of producing

35
meaningful results. Failure to disclose missing data can also create uncertainty in a
research article; the number of individuals listed in one section may not match the
number presented in another, if pairwise deletion were performed but not described in the
methods.
Furthermore, missing data have a significant impact on what statistical analyses
are possible (Peng et al. 2006). Multivariate methods incorporate multiple variables in a
single test, allowing the researcher not only to control for but also investigate the
interactions between many variables simultaneously. These methods facilitate a more
realistic understanding of how study outcomes are influenced by the interaction of
biological, social, and material variables. Most multivariate statistics methods, however,
such as principle components analysis, discriminant analysis, or generalized linear
models, do not permit missing data – potentially causing researchers to gravitate to more
simple analytical methods and neglect more complex statistics that could reveal more
nuanced patterns in bioarchaeological data.
More advanced statistical methods can be excellent tools for bioarchaeologists to
address some of the concerns raised by Wood et al. (1992) in the osteological paradox.
The use of simple statistics such as lesion counts and frequencies to infer past population
health will overestimate the prevalence of skeletal lesions in a population, providing a
biased and false understanding of past health. Elementary statistical tests also rely on
straightforward – and potentially erroneous – assumptions about the relationship between
lesions and individual health and mortality. Advanced analytical methods allow
researchers to investigate ancient health without requiring such assumptions. Survival

36
and hazards models, for instance, have been used successfully to investigate sources of
increased morbidity and mortality in the past, without presupposing that skeletal lesions
are indicative of poor health (DeWitte 2014; DeWitte 2015; DeWitte et al. 2013; Godde
et al. 2020; Redfern and DeWitte 2011).
Despite an abundance of approaches for handling missing data, they are rarely
discussed in most fields and often go unreported (Harel et al. 2008; Lang and Little 2018;
Powney et al. 2014; Sylvestre 2011; Wood et al. 2004). In many ways, there is an
unrecognized taboo against discussing missing data – the assumption being that a study
with missing data was badly designed and poorly executed (Van Buuren 2018b). To
avoid such censure, authors often gloss-over areas of their sample with missing data,
sometimes eliminating entire variables and sub-groups behind-the-scenes. Missing data
have been described by researchers as a “dirty little secret” (Peugh and Enders 2004; p.
540), and may be widely regarded as “a nuisance that is best hidden” (Burton and Altman
2004 p. 6). In reality, “contrary to the old adage that the best solution to missing data is
not to have them, there are times when building missing data into the overall
measurement design is the best use of limited resources” (Graham 2009, p. 551).
Focusing only on complete datasets privileges certain contexts such as those with better
preservation (Auerbach 2011; Holt and Benfer 2000). Incorporating, exploring, and
working with missing data provides a more holistic and less biased understanding of all
the data and maximizes a researcher’s time, energy, and finances.
Missing data are critical component of the data planning, collection, and analysis
processes and should be reported and discussed. Upon publication, however, missing data

37
are often concealed or undisclosed. Small details such as pre-analysis data treatments and
excluded samples are often removed due to word limits. Including this information
facilitates study repeatability and transparency, particularly for students and early career
researchers who may be unfamiliar with the standard protocols. Including information on
the cause and patterns of missing data in the sample informs the reader of important
biases in recovery, preservation, and curation, an understanding of which is essential for a
baseline assumption in much bioarchaeological research: the study sample is
representative of the population. Clarity in the study design and execution helps the
authors, readers, and reviewers evaluate the research and assess the interpretations.
Furthermore, a clear understanding of the research design and sample composition is
essential if the study is to be included in meta-analyses (Von Elm et al. 2007).
Numerous authors from other fields have recognized systemic inconsistencies in
missing data reporting and created guidelines to improve the rigor of research design and
publishing in their respective areas (Akl et al. 2015; Burton and Altman 2004; Jeličić et
al. 2009; Wilkinson 1999). Following their example, we propose several
recommendations to increase bioarchaeological engagement with missing data and
transparency in study design. (1) Bioarchaeologists should publish detailed descriptions
of data collection procedures, detailing how individuals were selected for inclusion. (2)
Researchers should document specific causes of missing data (e.g. is the tooth missing,
broken, worn, unerupted, etc.) rather than only recording “NA.” (3) Publications should
include any pre-analysis data treatments or data cleaning, as well as justifications for
these decisions. (4) Authors should disclose when missing data are present – or if there

38
are no missing data – and provide exact numbers of individuals and variables excluded
for each analysis. (5) Discussion sections should describe how missing data impacts
sample representativeness and research findings. (6) When appropriate, implementation
of Little’s MCAR test (Little 1988) can reveal patterns in missing data and indicate when
missing data may be problematic. Numerous statistical tutorials and packages for this test
exist for R, SPSS, and Stata. According to the results of this research, imputation of
missing data is underused in bioarchaeology but has great potential for future use. We
recommend exploring imputation of various kinds of bioarchaeological data and
ascertaining which methods are appropriate. Greater collaboration with statisticians will
be beneficial in this regard.
This study has several limitations. Four of the most well-known journals in
bioarchaeology were chosen for analysis, yet it is possible that papers engaging in more
critical discussions of missing data theory and procedures to handle missing data may be
published in more methods-oriented journals. As mentioned above, articles included in
our analysis were identified using one of the five keywords. Those that discussed missing
data without using one of the keywords were not included; our results may therefore
underestimate certain types of missing data methods. We provide an overview of missing
data in bioarchaeology only and do not provide comparative data from other areas.
Further research of missing data in other fields in anthropology such as archaeology or
evolutionary anthropology would provide a greater understanding of how anthropologists
as a whole handle missing data and provide guidance for future bioarchaeologists.

39
Conclusion
Overall, the results of this study suggest bioarchaeology lacks a strong foundation
in missing data methods and theory. Theoretically and statistically rigorous approaches
for handling missing data are infrequently used while the least sophisticated methods for
treating missing data are by far the most prevalent. We find that certain bioarchaeological
subfields employ favored techniques for missing data, and that patterns in missing data
methods have remained relatively constant over the past ten years. Researchers need to
improve their awareness of missing data in their samples and appropriate methods for
managing missing data. Small steps such as clearly reporting pre-analysis data treatments
and patterns of missingness in publications, discussing the biases and limitations missing
data presents, and exploring alternative methods such as imputation can address
fundamental concerns in the field and improve the statistical rigor of our analyses.

40
REFERENCES
Acock AC. 2005. Working with missing values. Journal of Marriage and family
67(4):1012-1028.
Akl EA, Shawwa K, Kahale LA, Agoritsas T, Brignardello-Petersen R, Busse JW,
Carrasco–Labra A, Ebrahim S, Johnston BC, and Neumann I. 2015. Reporting
missing participant data in randomised trials: systematic survey of the
methodological literature and a proposed guide. BMJ open 5(12):e008431.
Allen KG, Mills RD, Knudson KJ, and von Cramon‐Taubadel N. 2020. Biological
diversity in an Islamic archaeological population: A radiogenic strontium isotope
and craniometric analysis of affinity in Ottoman Romania. American Journal of
Physical Anthropology 171(4):569-583.
Allison PD. 2001. Missing data: Sage publications.
Altman DG, and Bland JM. 2007. Missing data. British Medical Journal 334(7590):424-
424.
Auerbach BM. 2011. Methods for estimating missing human skeletal element osteometric
dimensions employed in the revised fully technique for estimating stature.
American Journal of Physical Anthropology 145(1):67-80.
Bello SM, Thomann A, Signoli M, Dutour O, and Andrews P. 2006. Age and sex bias in
the reconstruction of past population structures. American journal of physical
anthropology 129(1):24-38.
Bhaskaran K, and Smeeth L. 2014. What is the difference between missing completely at
random and missing at random? International Journal of Epidemiology
43(4):1336-1339.
Buikstra JE, and Ubelaker DH. 1994. Standards for data collection from human skeletal
remains. Research Series 1. Fayetteville AL: Arkansas Archaeological Survey.
Burton A, and Altman D. 2004. Missing covariate data within cancer prognostic studies:
a review of current reporting and proposed guidelines. British journal of cancer
91(1):4-8.
De Leeuw ED, Hox JJ, and Huisman M. 2003. Prevention and treatment of item
nonresponse. Journal of Official Statistics 19:153-176.
De Waal T, Pannekoek J, and Scholtus S. 2011. Handbook of statistical data editing and
imputation: John Wiley & Sons.

41
DeWitte SN. 2014. Health in post‐Black Death London (1350–1538): Age patterns of
periosteal new bone formation in a post‐epidemic population. American Journal
of Physical Anthropology 155(2):260-267.
DeWitte SN. 2015. Setting the stage for medieval plague: Pre‐black death trends in
survival and mortality. American Journal of Physical Anthropology 158(3):441-
451.
DeWitte SN, Boulware JC, and Redfern RC. 2013. Medieval monastic mortality: Hazard
analysis of mortality differences between monastic and nonmonastic cemeteries in
England. American Journal of Physical Anthropology 152(3):322-332.
Dong Y, and Peng C-YJ. 2013. Principled missing data methods for researchers.
SpringerPlus 2(1):1-17.
Enders CK. 2010. Applied missing data analysis: Guilford press.
Falys CG, and Prangle D. 2015. Estimating age of mature adults from the degeneration of
the sternal end of the clavicle. American Journal of Physical Anthropology
156(2):203-214.
Finch WH. 2010. Imputation methods for missing categorical questionnaire data: A
comparison of approaches. Journal of Data Science 8(3):361-378.
Garcia S. 2012. Is the circumference at the nutrient foramen of the tibia of value to sex
determination on human osteological collections? Testing a new method.
International Journal of Osteoarchaeology 22(3):361-365.
Godde K, Pasillas V, and Sanchez A. 2020. Survival analysis of the Black Death: Social
inequality of women and the perils of life and death in Medieval London.
American Journal of Physical Anthropology 173(1):168-178.
Gordon CC, and Buikstra JE. 1981. Soil pH, bone preservation, and sampling bias at
mortuary sites. American Antiquity: 566-571.
Graham JW. 2009. Missing data analysis: Making it work in the real world. Annual
Review of Psychology 60:549-576.
Graham JW. 2012. Missing data: Analysis and design: Springer Science & Business
Media.
Harel O, Zimmerman R, and Dekhtyar O. 2008. Approaches to the handling of missing
data in communication research. The SAGE sourcebook of advanced data
analysis methods for communication research:349-371.

42
Holt B, and Benfer RA. 2000. Estimating missing data: an iterative approach. Journal of
Human Evolution 39:289-296.
Howell DC. 2007. The treatment of missing data. The Sage handbook of social science
methodology:208-224.
Jeličić H, Phelps E, and Lerner RM. 2009. Use of missing data methods in longitudinal
studies: the persistence of bad practices in developmental psychology.
Developmental Psychology 45(4):1195.
Kang H. 2013. The prevention and handling of the missing data. Korean journal of
anesthesiology 64(5):402.
King G, Honaker J, Joseph A, and Scheve K. 1998. List-wise deletion is evil: what to do
about missing data in political science. Annual Meeting of the American Political
Science Association, Boston.
Klebanoff MA, and Cole SR. 2008. Use of multiple imputation in the epidemiologic
literature. American Journal of Epidemiology 168(4):355-357.
Lang KM, and Little TD. 2018. Principled missing data treatments. Prevention Science
19(3):284-294.
Little RJ. 1988. A test of missing completely at random for multivariate data with
missing values. Journal of the American statistical Association 83(404):1198-
1202.
Little RJ, and Rubin DB. 2002. Statistical analysis with missing data: John Wiley &
Sons.
Luna LH. 2019. Canine sex estimation and sexual dimorphism in the collection of
identified skeletons of the University of Coimbra, with an application in a Roman
cemetery from Faro, Portugal. International Journal of Osteoarchaeology
29(2):260-272.
Mays S. 1992. Taphonomic factors in a human skeletal assemblage. Circaea 9(20):54-58.
McKnight PE, McKnight KM, Sidani S, and Figueredo AJ. 2007. Missing data: A gentle
introduction: Guilford Press.
Musil CM, Warner CB, Yobas PK, and Jones SL. 2002. A comparison of imputation
techniques for handling missing data. Western Journal of Nursing Research
24(7):815-829.

43
Myers TA. 2011. Goodbye, listwise deletion: Presenting hot deck imputation as an easy
and effective tool for handling missing data. Communication methods and
measures 5(4):297-310.
Nawrocki SP. 1995. Taphonomic processes in historic cemeteries. Bodies of evidence:
reconstructing history through skeletal analysis:49-66.
Niinimäki S. 2012. The relationship between musculoskeletal stress markers and
biomechanical properties of the humeral diaphysis. American Journal of Physical
Anthropology 147(4):618-628.
Niinimäki S, and Baiges Sotos L. 2013. The relationship between intensity of physical
activity and entheseal changes on the lower limb. International Journal of
Osteoarchaeology 23(2):221-228.
Osborne JW. 2013. Six: Dealing with missing or incomplete data: Debunking the myth of
emptiness. Best practices in data cleaning: A complete guide to everything you
need to do before and after collecting your data:105-138.
Peng C-YJ, Harwell M, Liou S-M, and Ehman LH. 2006. Advances in missing data
methods and implications for educational research. In: Sawilowsky SS, editor.
Real data analysis.
Peugh JL, and Enders CK. 2004. Missing data in educational research: A review of
reporting practices and suggestions for improvement. Review of educational
research 74(4):525-556.
Powney M, Williamson P, Kirkham J, and Kolamunnage-Dona R. 2014. A review of the
handling of missing longitudinal outcome data in clinical trials. Trials 15(1):1-11.
Quintero M, and LeBoulluec A. 2018. Missing Data Imputation for Ordinal Data.
International Journal of Computer Applications 181(5):10-16.
Ragsdale CS, and Edgar HJ. 2015. Cultural interaction and biological distance in
postclassic period Mexico. American Journal of Physical Anthropology
157(1):121-133.
Redfern RC, and DeWitte SN. 2011. Status and health in Roman Dorset: The effect of
status on risk of mortality in post‐conquest populations. American journal of
physical anthropology 146(2):197-208.
Redfern RC, Judd MA, and DeWitte SN. 2017. Multiple injury and health in past
societies: an analysis of concepts and approaches, and insights from a multi‐
period study. International journal of osteoarchaeology 27(3):418-429.

44
Rubin DB. 1976. Inference and missing data. Biometrika 63(3):581-592.
Schafer JL, and Graham JW. 2002. Missing data: our view of the state of the art.
Psychological methods 7(2):147.
Stodder AL. 2008. Taphonomy and the nature of archaeological assemblages. Biological
anthropology of the human skeleton 2:73-115.
Stojanowski C, and Hubbard A. 2017. Sensitivity of dental phenotypic data for the
identification of biological relatives. International Journal of Osteoarchaeology
27(5):813-827.
Stojanowski CM, and Johnson KM. 2015. Observer error, dental wear, and the inference
of new world sundadonty. American Journal of Physical Anthropology
156(3):349-362.
Stojanowski CM, Seidemann RM, and Doran GH. 2002. Differential skeletal
preservation at Windover Pond: causes and consequences. American Journal of
Physical Anthropology: 119(1):15-26.
Sylvestre Y. 2011. CONSORT: missing missing data guidelines, the effects on
HTA monograph reporting. Trials 12(1):1-1.
Van Buuren S. 2018. Flexible Imputation of Missing Data. Boca Raton: CRC Press.
Von Elm E, Altman DG, Egger M, Pocock SJ, Gøtzsche PC, and Vandenbroucke JP.
2007. The Strengthening the Reporting of Observational Studies in Epidemiology
(STROBE) statement: guidelines for reporting observational studies. Annals of
internal medicine 147(8):573-577.
Walker PL, Johnson JR, and Lambert PM. 1988. Age and sex biases in the preservation
of human skeletal remains. American Journal of Physical Anthropology
76(2):183-188.
Wilkinson L. 1999. Statistical methods in psychology journals: Guidelines and
explanations. American psychologist 54(8):594.
Wood AM, White IR, and Thompson SG. 2004. Are missing outcome data adequately
handled? A review of published randomized controlled trials in major medical
journals. Clinical trials 1(4):368-376.

45
Wood JW, Milner GR, Harpending HC, Weiss KM, Cohen MN, Eisenberg LE,
Hutchinson DL, Jankauskas R, Cesnys G, and Česnys G. 1992. The osteological
paradox: problems of inferring prehistoric health from skeletal samples [and
comments and reply]. Current Anthropology:343-370.

46
CHAPTER 3
MISSING DATA IN BIOARCHAEOLOGY II: A TEST OF MULTIPLE
IMPUTATION
Missing data are ubiquitous in the social sciences. Bioarchaeological data may be
lost due to myriad factors including differential preservation, selective excavation, post-
mortem damage, pathology, transcription errors or computer crashes. When not handled
properly, missing values can introduce substantial bias into a dataset, leading to
erroneous study results and flawed interpretations. Furthermore, most statistical tests
require datasets with no missing data. Despite the importance of missing data, their
treatment is often unreported in the social sciences, including bioarchaeology. If they are
addressed, the least statistically and theoretically rigorous methods are generally used
(see previous chapter). The goal of this paper is to explore techniques for handling
missing data, focusing on the use of imputation to manage missing bioarchaeology and
paleopathology data. Our target audience includes anthropologists who have basic
statistical and programming knowledge, but they need not be statistical experts; methods
are explained conceptually rather than mathematically. This paper has two sections. Part
1 details background information on data types, categories of missing data, deletion and
imputation methods, and the use of imputation in the social sciences. Part 2 focuses on
bioarchaeology and paleopathology, discussing special challenges with handling these
data and concludes with a case study test of eight methods for handling missing ordinal
and continuous paleopathology data.

47
Part I: Background
Data Types
Researchers must be aware of the data classes involved in their analyses to ensure
consistent data recording and the application of appropriate statistical analysis. Data types
determine appropriate techniques for managing missing data. Data can be partitioned into
two broad categories: quantitative and qualitative (figure 4). Quantitative data are
numerical and can only be expressed using numbers (Quintero and LeBoulluec 2018;
Ranganathan and Gogtay 2019). Qualitative data are categorical, generally describing
Figure 4.
Flow Chart Showing Classes of Data.

48
some aspect or characteristic of the data, and cannot be expressed by numbers in a way
that is mathematically meaningful (Ranganathan and Gogtay 2019; Verma 2016). There
are two subtypes of quantitative data: continuous and discrete. Continuous data may be
any number – including decimals and fractions – and can be continuously subdivided into
smaller units (Quintero and LeBoulluec 2018). Femoral length is an example of
continuous data; a meter can be divided into centimeters, millimeters, and so on and can
be expressed as a fraction or with decimals. Note that simply because a caliper only
displays 1 decimal place does not mean the data are not continuous; it means the
measurement tool is not capable of capturing the full data. Discrete data can only be
expressed in whole integers that are mathematically meaningful (King and Eckersley
2019; Ranganathan and Gogtay 2019) and cannot be subdivided into smaller parts. For
example, the number of patients will be in whole integers only (i.e., 2.5 patients is not a
valid response). There are three subtypes of qualitative data: ordinal, nominal, and binary.
Ordinal data are categorical data with an inherent hierarchy; the data can be ranked but
neither the value of that rank, nor the differences between the ranks can be measured or
mathematically expressed (King and Eckersley 2019; Shreffler and Huecker 2020; Verma
2016). For example, the estimated age of a person could be “young adult,” “middle
adult,” or “old adult.” There is a meaningful order to these categories, but the differences
between them cannot be conveyed with numbers. Nominal data are categorical data that
have no inherent order such as sex, country, or species (King and Eckersley 2019;
Quintero and LeBoulluec 2018; Shreffler and Huecker 2020). Binary data are categorical

49
data that have only two possible answers (e.g., Yes/No, Present/Absent) and can be
ordinal or nominal.
Classes of Missing Data
The best way to manage missing data will be determined by how and why the
data are missing. Rubin (1976) described three main categories of missing data: missing
completely at random, missing at random, and missing not at random (Figure 5). Data are
described as missing completely at random (MCAR) when the reason the data are
missing is unrelated to the pattern of missingness or any other variables of interest in the
data set (Graham et al. 1997; Pepinsky 2018; Quintero and LeBoulluec 2018). If we have
Figure 5.
Rubin’s Three Categories of Missing Data

50
collected two variables (X and Y), data are MCAR “if the probability of missing data on
Y is unrelated to the value of Y itself or to the values of any other variables in the data
set” (Allison, 2001; p. 3). For example, in a dataset containing information on age (X)
and femoral length (Y), data on femoral length would be MCAR if their missingness
depends on something other than age or femoral length.
The second category is missing at random (MAR). Data are missing at random if
the pattern of missingness depends on some variable in the dataset that is not the variable
of interest (Graham et al. 2007; Pepinsky 2018; Quintero and LeBoulluec 2018). Data are
MAR if the probability of missing data on Y depends on the variable X but not on Y
(Allison 2001). Using the above example, femoral length (Y) data would be missing at
random if the missingness depended on age (X) but not on femoral length (Y).
The third category of missing data is missing not at random (MNAR), also called
not missing at random (NMAR). Data are described as MNAR if the probability of
missingness depends on the missing data; i.e. if the probability of missing data on Y
depends on Y (Pepinsky 2018; Quintero and LeBoulluec 2018). For example, data
missing under the variable femoral length (Y) would be MNAR if the data are missing
because of femoral length (Y). In practice, this may be because the researcher opted to
exclude individuals with unusually short or long femurs, or because only “normal”
femurs were accessioned to the museum collection. MNAR is most concerning to
researchers as it will likely introduce bias into the dataset. MNAR has also been referred
to as inaccessible missingness as both the cause and the probability of missingness is
unknown (Graham 2012; van Buuren 2018). In bioarchaeology (and paleopathology in

51
particular), missing data likely fall into a combination of all three categories and it may
be impossible to discern which variables belong in which category (Morris et al. 2014;
Myers 2011).
Deletion and Imputation Methods
Most statistical analyses do not permit missing data. Therefore, there is an
abundance of techniques for handling missing data, including removing individuals or
variables with missing values, or inserting plausible values in place of missing values.
Selected, common methods are described below (see figure 6).
Listwise deletion (aka case-wise deletion) involves the removal of an individual
and all its data – an entire row in a spreadsheet – if any data for that individual are
missing (Allison 2001; Graham 2012; van Buuren 2018). This is the default method
employed by statistical software programs SAS, SPSS, and Stata (van Buuren 2018).
Listwise deletion has the advantage of being easy to understand, simple to execute, and
does not require advanced statistical knowledge or software (Allison 2001; Meeyai
2016). It creates a complete dataset that allows one to proceed with statistical analysis
(Baraldi and Enders 2010). If, however, the amount of missing data is even moderate,
listwise deletion can result in an enormous decrease in sample size and subsequent loss of
statistical power (Baraldi and Enders 2010; Graham 2012). The amount of missing data
may be so great that an entire variable will be deleted. If the data are not MCAR, listwise
deletion can introduce substantial bias into final p-values and confidence intervals
(Allison 2001; Baraldi and Enders 2010). Many statisticians consider listwise deletion to

52
Figure 6.
Missing Data Methods Discussed in Chapter
be the worst of all possible techniques for handling missing data (Allison 2001; King et
al. 1998; van Buuren 2018; Wilkinson 1999).
Pairwise Deletion (aka available case analysis) involves dropping cases or
individuals based on variables present for each analysis (Allison 2001; Graham 2012; van
Buuren 2018). For example, an individual missing a periodontal disease score will be
deleted from any analyses requiring periodontal disease as a variable but included in
other tests. This approach is easy to perform and has the benefit of making use of all
available data, greatly maximizing the sample size. On the other hand, each analysis uses
a slightly different sample, generating results that may not be comparable or can even
53
disagree (Myers 2011; Newman 2014; van Ginkel et al. 2020). Published tables may list
different sample sizes, which can be confusing and misleading if not appropriately
explained. Repeatedly running similar analyses on overlapping samples raises concerns
of alpha inflation. If the data are not MCAR, pairwise deletion can create bias in the
parameter estimates (Allison 2001; Baraldi and Enders 2010). Furthermore, as each
analysis is based on a slightly different sample, there is no straightforward procedure for
calculating the standard error for the entire sample (Graham 2012).
Imputation, defined as inserting a plausible value in place of a missing value, is an
alternative to deletion methods for handling missing data (Allison 2001; Schafer 1999;
Schafer and Graham 2002). Imputation is a broad term that encompasses numerous
frameworks and mathematical models for producing and selecting the imputed values.
Maximum Likelihood is an imputation approach that estimates the most likely
parameters (mean and standard deviation) based on the observed data. The algorithm
selects values that “maximize the probability of observing what has, in fact, been
observed” (Allison, 2001; p. 13).
Expectation maximization (EM) is a form of maximum likelihood imputation.
This method uses a two-step iterative process. In the E-step, a missing value is imputed
based on what would be expected given other values in the dataset (Dempster et al. 1977;
Graham 2012; Newman 2003). In the M-step, the algorithm checks whether the new
value has the highest probability of being a good fit with the rest of data. If not, the
process begins again, imputing a more likely value until all missing data have been
replaced with the most likely values (Musil et al. 2002). Expectation maximization
54
procedures generally perform better than mean imputation or deletion methods
(Nelwamondo et al. 2007). One potential drawback to expectation maximization is that it
produces standard errors that may be narrower than those of the true data (Musil et al.
2002).
Single imputation replaces a missing value with a single substitute value, whereas
multiple imputation replaces a single missing value with multiple possible values drawn
from a distribution. Instead of selecting a single value to impute and hoping that it is the
best, multiple values reflecting the uncertainty and variation in imputing unknown values
(Allison 2000; Finch 2010; Little and Rubin 2002; van Buuren 2018).
The process of multiple imputation involves three main steps (Graham 2012).
First, the data are imputed, creating many imputed datasets where the number of imputed
datasets is expressed by the variable m. The exact mathematical approach for generating
values to be substituted for the missing values can be performed in a variety of ways
(e.g., regression, random forest). The m imputed datasets will differ slightly as the
imputed values will all be different, “reflecting our uncertainty about what to impute”
(van Buuren, 2018; p. 20). Second, each of the m datasets are analyzed separately using
the desired statistical analysis. If the original research design required a logistic
regression, the regression would be performed on each of the m datasets, producing m
coefficients, standard errors, and p-values. Third, the m coefficients, standard errors, and
p-values are combined into a single coefficient, a single standard error, and a single p-
value using Rubin’s Rules (Rubin 1987). Rubin’s rules are a set of equations for properly
pooling parameter estimates. While the researcher may be tempted to switch steps two

55
and three, thus pooling the imputed datasets and analyzing the single pooled dataset, this
violates Rubin’s Rules. Pooling the estimates too early eliminates the variation multiple
imputation introduces into the datasets.
Mean Replacement is a form of single imputation that computes the mean of each
variable and substitutes the mean for each missing data point (Little and Rubin 2002). It
has the benefit of being easy to understand and implement but will decrease the variance
of the sample, causing large amounts of missing data to have an increasingly negative
impact (Osborne 2013). Mean imputation is also known to artificially increase the
strength of the relationships between variables (Graham 2012; Musil et al. 2002).
Regression imputation uses the data to build a model that will predict the best
values to substitute for missing data. As with standard regression procedure, a model is
fitted with the variable containing the missing data set as the dependent variable. The
model coefficients predict appropriate values to impute. Regression imputation is
relatively easy to understand and utilizes more of the information in the dataset (Graham
2012; Musil et al. 2002). On the other hand, as the imputed values will generally lie on
the regression line, the data variance will be lowered and the correlations between
variables artificially inflated (Graham 2012; van Buuren 2018; Zhang 2016).
Stochastic regression imputation corrects for the over correlation between
variables by adding random “noise” to the model (Newman 2003; van Buuren 2018). One
way to add this noise is by randomly selecting residuals and adding that value to the
prediction (Enders 2010; Little and Rubin 2002; van Buuren 2018). Stochastic regression
has the advantage of being able to produce unbiased parameters when the data are MCAR

56
or MAR but will produce narrow standard errors (Allison 2001; Enders 2010).
Random Forest imputation uses a decision tree approach to predict the best values
to impute. A bootstrapped random subset of samples is created to build multiple
regression trees for each variable (Shah et al. 2014). The behavior of the data as it is run
through the trees predicts the best values for the missing data. Random forest imputation
is a commonly used method in epidemiology (Henriksson et al. 2016; Shah et al. 2014;
Weng et al. 2019), and is capable of handling mixed data types and variable interactions
(Stekhoven and Bühlmann 2012; Tang and Ishwaran 2017; Waljee et al. 2013). Random
forest imputation can also be perceived as a black box technique, with little
understanding of how the decision trees are being grown (Breiman 2001).
Hot deck imputation is a broad “record matching technique” in which missing
values from an individual (the recipient) are replaced by observed values from a similar
case (the donor) (Kaiser, 1983, p. 1). There are a variety of methods that can be used for
determining what “similar” means and selecting an appropriate donor (Little and Rubin
2002). Depending on the approach used, hot deck imputation can be relatively easy to
understand and execute and some forms (e.g. random, sequential, last observation carried
forward) work well with categorical data (De Waal et al. 2011; Hardt et al. 2013). Since
substitute values are drawn from variables already in the dataset, this approach will
impute realistic values that reflect the actual data (Andridge and Little 2010; Siddique
and Belin 2008). Hot deck methods are used frequently by the US Census Bureau and
other governmental agencies (Andridge and Little 2010). There is, however, less
evaluative information on hot deck methods (Little and Rubin 2002).

57
Random hot deck imputation forms a donor pool of complete cases that have other
variables with values similar to those of the case with missing data. A donor is selected at
random from the pool and the donor’s variable is used to fill in the missing value for the
recipient (Bechtel et al. 2011; De Waal et al. 2011).
Predictive mean matching is another form of hot deck imputation. In this method,
a missing value is imputed by selecting an observed outcome from a case with a similar
predicted mean (Bailey et al. 2020; Little 1988; Vink et al. 2014). Because predictive
mean matching selects values from other donor cases within the dataset, imputed values
will always fit with the observed range of values (Kleinke 2018; Vink et al. 2014). A
potential disadvantage to predictive mean matching is that it may not be acceptable for
use with small sample sizes as the pool of available observed outcomes with a similar
case mean will be small (Kleinke 2018).
Of the imputation methods surveyed here, the authors believe that there are many
advantages to multiple imputation. Under the right set of circumstances, it can produce
unbiased estimates even if the data are not MCAR (Allison 2001). Once the m imputed
datasets are created, they can be used repeatedly for any number of different analyses
(Schafer and Graham 2002). Most statistical software programs, including SPSS, SAS,
Stata, and R are able to perform multiple imputation. On the other hand, multiple
imputation can be unwieldy, intimidating, and easy to do incorrectly. However, it is
generally believed to be one of the best methods for handling missing data (Allison 2001;
Graham 2012; van Buuren 2018).

58
How many imputations (m) are necessary to best estimate the parameters of
interest? Technically, since the more imputations one does the more precise the estimates,
it is generally better to do more. However, the higher the m the longer the computer will
take to run the analysis and the more computational storage required. Due to these
drawbacks, initial recommendations suggested that as few as 3-5 imputations were more
than adequate (Schafer and Olsen 1998). As computing power and statistical software has
advanced, performing large numbers of imputations is no longer a challenge. Von Hippel
(2009) recommends “the number of imputations should be similar to the percentage of
cases that are incomplete” (p. 278); i.e. If 30% of the data are missing, one should
perform m=30 imputations. Graham et al. (2007) finds that low numbers of imputations
can have a significant decrease in statistical power and introduce bias. They recommend
that for low levels of missingness (<15%), one should perform 10-20 imputations and for
higher levels of missingness (20-40%) one should perform at least 40 imputations to
preserve a high level of statistical power.
Imputation in other fields
While missing data are a problem in nearly all fields of research, some disciplines
have adopted advanced methods for handling missing data more quickly than others. A
coarse examination of the literature suggests that the social and behavioral sciences have
been slow to accept more computationally and statistically intensive methods such as
multiple imputation or regression, whereas the natural and ecological sciences use such
methods more commonly.

59
Many scholars in psychology, political science, sociology, and economics use
imputation methods. The data missing in these studies frequently stem from surveys in
which responses are missing because the respondent did not understand the question,
declined to answer, or was unable to complete the survey (Krause et al. 2018). Turney
(2015) examined how paternal incarceration may be a cause of food insecurity for
children, using multiple imputation to impute missing survey answers on how often a
child has been hungry or how often they skipped meals. Evans and Smokowski (2015)
test how social capital – as measured by proxies such as social support and mental health
– predicted the likelihood of intervening in school bullying. They imputed missing survey
data on demographic factors such as ethnicity and religion, and responses on parental
support, school satisfaction, and optimism about the future. Within the social sciences,
imputation of missing variables appears to be more common in social network analyses
than other fields (Huisman 2009; Krause et al. 2018), possibly because the analysis of
social networks is sensitive to missing data (Huisman 2009).
Researchers in the natural and ecological sciences have adopted imputation
techniques as standard for dealing with missing data. Mean imputation, multiple
imputation, and random forest imputation have been used to impute a diverse suite of
plant and animal traits such as leaf area, seed mass, plant height, animal body mass, litter
size, diet diversity, sociality, and generation length (Bird et al. 2020; Cooke et al. 2019;
Cooke et al. 2020; Grilo et al. 2020; Ordonez and Svenning 2017; Pacifici et al. 2013;
Taugourdeau et al. 2014). Divíšek et al. (2018) for example, searched for patterns of traits
that could be indicators of invasive plant species and imputed missing data on leaf area,

60
plant height, and seed weight. While investigating how certain traits relate to ecological
strategies, Cooke et al. (2020) used multiple imputation to impute body mass, habitat
breadth, generation length, diet, and litter/clutch size.
Imputation of missing demographic or health data is commonplace within
epidemiological and clinical medical studies (Barnard and Meng 1999; Bodnar et al.
2006; Costello et al. 2014; Ferrie et al. 2005; Petersen et al. 2014; Zeka et al. 2006).
Lassale et al. (2018) imputed missing body measurements, testing the association
between obesity and coronary heart disease. Dam et al. (2016) used multiple imputation
to impute missing values for age, education, smoking, and health status to examine
whether increased alcohol use in postmenopausal women increased their risk of breast
cancer while decreasing their risk of coronary heart disease.
Part II: Missing Data in Bioarchaeology and Paleopathology
Raw bioarchaeological data come in a wide variety of types including lesion
counts, age ranges, continuous measurements, sex estimations, descriptions, and
nonmetric trait scores. Paleopathology data have their own suite of unique characteristics
that make them more challenging to analyze than data from other fields. The data are
often a mix of continuous, categorical, and binary variables. Many statistical tests do not
work well with categorical data or do not accept mixed data types. Unlike continuous
data, categorical and binary data have a low range of possible values. For example,
according to Standards for Data Collection from Human Skeletal Remains (Buikstra and
Ubelaker 1994), porotic hyperostosis should be recorded as 0, 1, 2, 3, or 4 – with 0 as no
expression, and 4 as the highest expression. Some of the more statistically complicated

61
methods for imputing missing data do not work well with such a narrow range of values.
On the other hand, because of this low range, less computationally intensive methods
may be successful. A randomly imputed number selected from 0-4 will be more likely to
be correct than one selected from 0-100.
Another challenge with bioarchaeological data is that we regularly collect data
that are MNAR, yet we fail to account for those biases in our analyses or interpretations.
For example, most scoring procedures for periodontal disease code missing teeth as NA
or not scorable (e.g. Kerr, 1988) . However, in cases of extreme periodontal disease, tooth
loss will occur (Lindhe et al. 1983; Morelli et al. 2018; Ong 1998; Ramseier et al. 2017).
Antemortem tooth loss may therefore be the highest expression of periodontal disease.
Scoring teeth missing antemortem as NA introduces MNAR values, creating a biased
dataset.
The Use of Imputation in Bioarchaeology
The previous chapter on missing data in bioarchaeology assessed how
bioarchaeologists handle and report missing data. We surveyed bioarchaeology articles
from 4 major anthropology journals published between 2010-2020, searching for the
following terms: “absent,” “imputat,” “missing,” “unobserv,” and “replace” used in the
context of missing data. The articles were categorized according to the level of statistical
and theoretical rigor used to handle missing data. According to our results, only 41
articles out of 277 identified using some form of imputation to handle their missing data
– most of which were biodistance or morphology studies.

62
Within these articles, a variety of imputation methods were employed (Figure 7).
Regression imputation was the most common (n=11) including linear, multiple and PCA
regression to estimate missing values. Six articles used expectation maximization – all of
which were biodistance papers. Mean imputation (n=5) was also frequently used to
handle missing data. Five articles used specific regression-based equations published by
Auerbach (2011) and Auerbach et al. (2005) to estimate measurements of missing
Figure 7.
Barplot Showing Imputation Approaches Used by Each Bioarchaeology Subtopic.
Note. Mean = mean; Regression = regression; EM = expectation maximization; NN =
nearest neighbor; TPS = thin plate spline; Auerbach = Auerbach; Other/Unclear =
other/unclear
63
skeletal elements. Several geometric morphometric articles (n=4) employed thin plate
spline to reconstruct missing areas. Two articles used nearest neighbor techniques for
imputation of missing data. Finally, nine articles used other, less common approaches or
were not specific about their statistical method. Willman et al. (2012), for example,
“visually reconstruct[ed] a worn cusp tip” (p. 41). Ibáñez‐Gimeno et al. (2013) imputed
the median in place of missing values. Reyes‐Centeno et al. (2017) imputed missing
landmarks by “reflected relabeling of the bilateral homologue” (p. 272). Two others used
multiple imputation, specifically the mice R package, but did not identify a specific
statistical technique. Overall, these results show that there is a wide variety of imputation
methods used in bioarchaeology, even within subject topics.
Case study: a test of imputation methods in paleopathology
Given the complexities of bioarchaeological data, the second aim of this paper is
to discover which imputation technique (if any) is appropriate for imputing missing
ordinal and continuous paleopathology data. To accomplish this goal, we simulated
missing data on two complete bioarchaeological datasets (i.e. no missing data) and tested
multiple methods for imputing ordinal paleopathology data and continuous skeletal
measurements alongside pairwise and listwise deletion to discover which approach best
obtained the parameters of the original dataset.
Ordinal missing data were simulated on a complete dataset of 287 individuals
from the Hamann-Todd Documented Skeletal Collection. The individuals included a mix
of males, females, Black individuals and white individuals ranging in age from 18 to 80
years. Demographic data were not included in the imputation analyses. Recorded

64
paleopathology data included porotic hyperostosis, cribra orbitalia, periodontal disease,
linear enamel hypoplasia, and periosteal lesions of the tibia. The range of ordinal values
for each were porotic hyperostosis: 0-2; cribra orbitalia: 0-3; periodontal disease: 0-4;
linear enamel hypoplasia: 0-3; periostosis: 0-3.
Continuous missing data were simulated on a complete dataset of 369 individuals
from the same collection. Variables included left and right femoral lengths – measured in
centimeters – and the antero-posterior (AP) and transverse (TR) vertebral neural canal
diameters of T1, T5, T10, L1 and L3 – measured in millimeters.
Five different datasets with 5%, 10%, 20%, 30%, and 40% of the data missing
were created using the R package imputeR (v2.2; Feng et al., 2020) resulting in 50
simulated missing datasets for ordinal and continuous data combined. To accurately
reflect patterns of missingness found in a genuine bioarchaeology dataset, five additional
datasets with percentages of missingness that were equal to the percent missing for each
variable from the entire pooled sample. Missing data were simulated as MCAR, MAR
and MNAR using the R package missMethods (v0.2.0; Rockel, 2020). For the ordinal
data, percentages of missingness were set at porotic hyperostosis = 12.5%, cribra orbitalia
= 20%, periodontal disease = 25%, linear enamel hypoplasia = 30%, and periostosis =
10%. For continuous data, the following percentages of missingness were selected:
femoral length right = 10%, femoral length left = 10%, T1AP = 15%, T1TR = 10%,
T5AP = 12.5%, T5TR = 10%, T10AP = 15%, T10TR = 15%, L1AP = 20%, L1TR =
15%, L3AP = 20%, L3TR = 15%.

65
Imputation Methods
Six imputation methods were selected: predictive mean matching, random
replacement, mean replacement, expectation maximization, random forest, and stochastic
linear regression (continuous data only). These methods were chosen as they are among
the more commonly used in the social sciences. Excellent statistical packages have been
created for each, making these methods easy to implement and more accessible to non-
experts. The methods represent a wide range of statistical approaches and range from
mathematically simple (e.g., mean imputation), to complex (e.g. expectation
maximization or stochastic linear regression). This list also includes the most common
imputation methods used by bioarchaeologists.
Several methods make use of the mice package (v3.11.0; van Buuren and
Groothuis-Oudshoorn, 2011): random replacement, mean replacement, predictive mean
matching, and stochastic linear regression. For each, m=10 imputations were performed
with 50 iterations. In a few instances, a single R package did not work well for both
ordinal and continuous data and two different packages had to be used. Random forest
imputation of ordinal data was executed with the missForest package (v1.4; Stekhoven,
2013), while for continuous data mice was used. Similarly, imputation via expectation
maximization for ordinal data was performed using TestDataImputation (v1.1; Dai et al.,
2019) while for continuous data missMethods (v0.2.0; Rockel, 2020) was used. All
analyses were performed in RStudio version 1.1.456 (Rstudio Team, 2016).

66
Assessing success
The success of each imputation method was assessed by comparing the mean and
variance of the imputed datasets with those of the original using percent error; a lower
percentage indicates a better fit. Success was also assessed using Kendall’s rank
correlation coefficient and Cohen’s kappa where 1 indicates perfect agreement and 0 no
agreement; a value approaching 1 indicates a better fit. For pairwise and listwise deletion
only the mean and variance could be assessed since these methods create no
corresponding dataset. Cohen’s kappa and Kendall’s tau have been used in other similar
imputation test cases; however, they may not be the most effective for assessing
imputation success. The goal of imputation is to not to recover the exact values missing
from the dataset, but to “preserve important characteristics of the data set as a whole”
(Graham, 2009, p. 559). Cohen’s kappa and Kendall’s tau assess pairwise agreement
between the original and imputed values, which is not the point of imputation, and may
be less important than other broad parameters.
Case Study Results
Ordinal Data The results are presented in Tables 4-9; Tables 4, 5, and 6 present
outcomes for 5%, 10%, 20%, 30%, and 40% missing data while Tables 7, 8 and 9 present
findings for the MCAR, MAR, and MNAR datasets. Tables 4, 5, 7, and 8 show the
percent error for the mean and variance and the Kendall’s tau and Cohen’s kappa
coefficients. Tables 6 and 9 present the performance rankings of each imputation method
on the dataset. Imputation methods will increase the sample variance, therefore the
percent error for the variance is generally the highest.
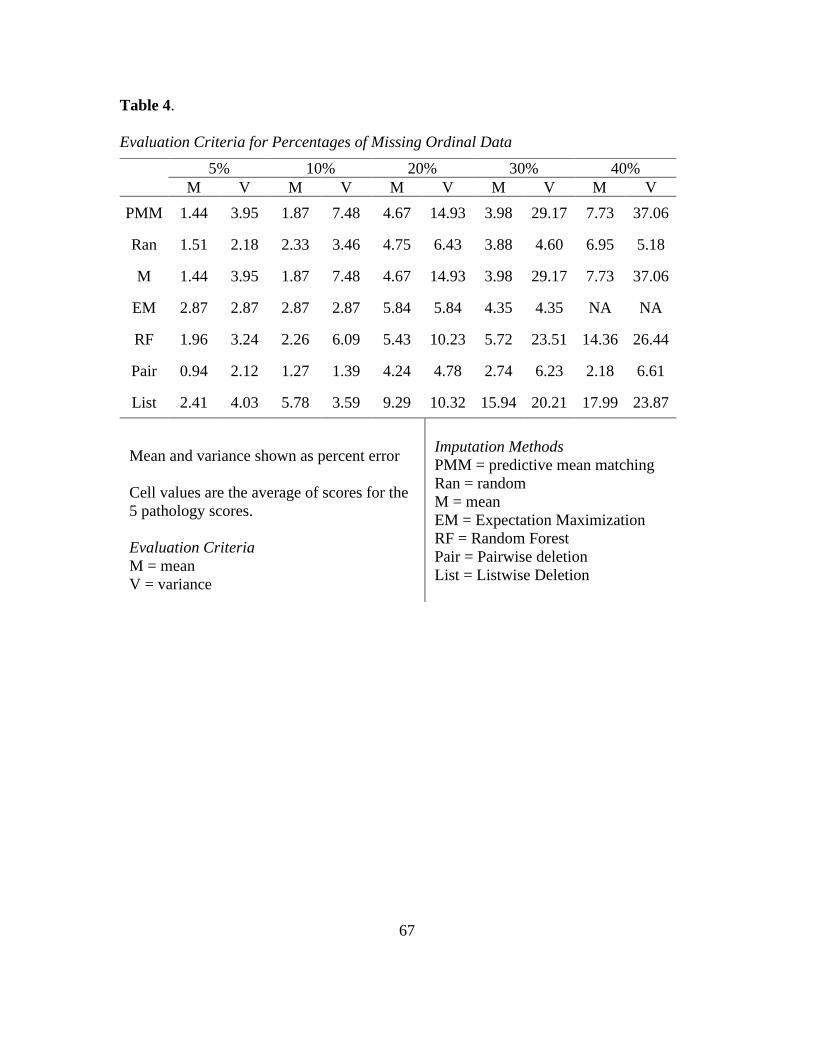
67
Table 4.
Evaluation Criteria for Percentages of Missing Ordinal Data
5% 10% 20% 30% 40%
M V M V M V M V M V
PMM 1.44 3.95 1.87 7.48 4.67 14.93 3.98 29.17 7.73 37.06
Ran 1.51 2.18 2.33 3.46 4.75 6.43 3.88 4.60 6.95 5.18
M 1.44 3.95 1.87 7.48 4.67 14.93 3.98 29.17 7.73 37.06
EM 2.87 2.87 2.87 2.87 5.84 5.84 4.35 4.35 NA NA
RF 1.96 3.24 2.26 6.09 5.43 10.23 5.72 23.51 14.36 26.44
Pair 0.94 2.12 1.27 1.39 4.24 4.78 2.74 6.23 2.18 6.61
List 2.41 4.03 5.78 3.59 9.29 10.32 15.94 20.21 17.99 23.87
Mean and variance shown as percent error
Cell values are the average of scores for the
5 pathology scores.
Evaluation Criteria
M = mean
V = variance
Imputation Methods
PMM = predictive mean matching
Ran = random
M = mean
EM = Expectation Maximization
RF = Random Forest
Pair = Pairwise deletion
List = Listwise Deletion

68
Table 5.
Evaluation Criteria for Percentages of Ordinal Missing Data
5% 10% 20% 30% 40%
T K T K T K T K T K
PMM 0.95 0.93 0.90 0.85 0.81 0.71 0.71 0.58 0.639 0.47
Ran 0.95 0.92 0.91 0.85 0.82 0.71 0.71 0.57 0.61 0.47
M 0.92 0.95 0.84 0.91 0.73 0.85 0.57 0.74 0.47 0.68
EM 0.95 0.95 0.90 0.90 0.82 0.81 0.70 0.72 0.60 0.61
RF 0.95 0.92 0.90 0.84 0.81 0.70 0.70 0.57 0.60 0.47
Kendall’s Tau and Cohen’s Kappa are the
test statistics
Cell values are the average of scores for the
5 pathology scores.
Evaluation Criteria
T = Kendall’s Tau
K = Cohen’s Kappa
Imputation Methods
PMM = predictive mean matching
Ran = random
M = mean
EM = Expectation Maximization
RF = Random Forest
Pair = Pairwise deletion
List = Listwise Deletion

69
69
Table 6.
Imputation Rankings for Arbitrary Percentages of Ordinal Missing Data.
5% 10% 20% 30% 40% Final
M V T K M V T K M V T K M V T K M V T K
PMM 2 5 1 3 2 6 4 4 2 6 3 3 3 6 2 3 3 5 1 3 4
Ran 3 2 4 4 4 3 1 3 3 3 1 4 2 2 1 4 2 1 2 4 2
M 2 5 5 2 2 6 5 1 2 6 5 1 3 6 5 1 3 5 5 1 5
EM 1 3 3 1 5 2 3 2 5 2 2 2 4 1 4 2 NA NA 4 2 2
RF 4 4 2 5 3 5 2 5 4 4 4 5 5 5 3 5 4 4 3 5 6
Pair 1 1 NA NA 1 1 NA NA 1 1 NA NA 1 3 NA NA 1 2 NA NA 1
List 5 7 NA NA 6 4 NA NA 6 5 NA NA 6 4 NA NA 5 3 NA NA 7
Cell values are the average of the 5
pathology rankings.
Evaluation Criteria
M = mean
V = variance
T = Kendall’s Tau
K = Cohen’s Kappa
Imputation Methods
PMM = predictive mean matching
Ran = random
M = mean
EM = Expectation Maximization
RF = Random Forest
Pair = Pairwise deletion
List = Listwise Deletion
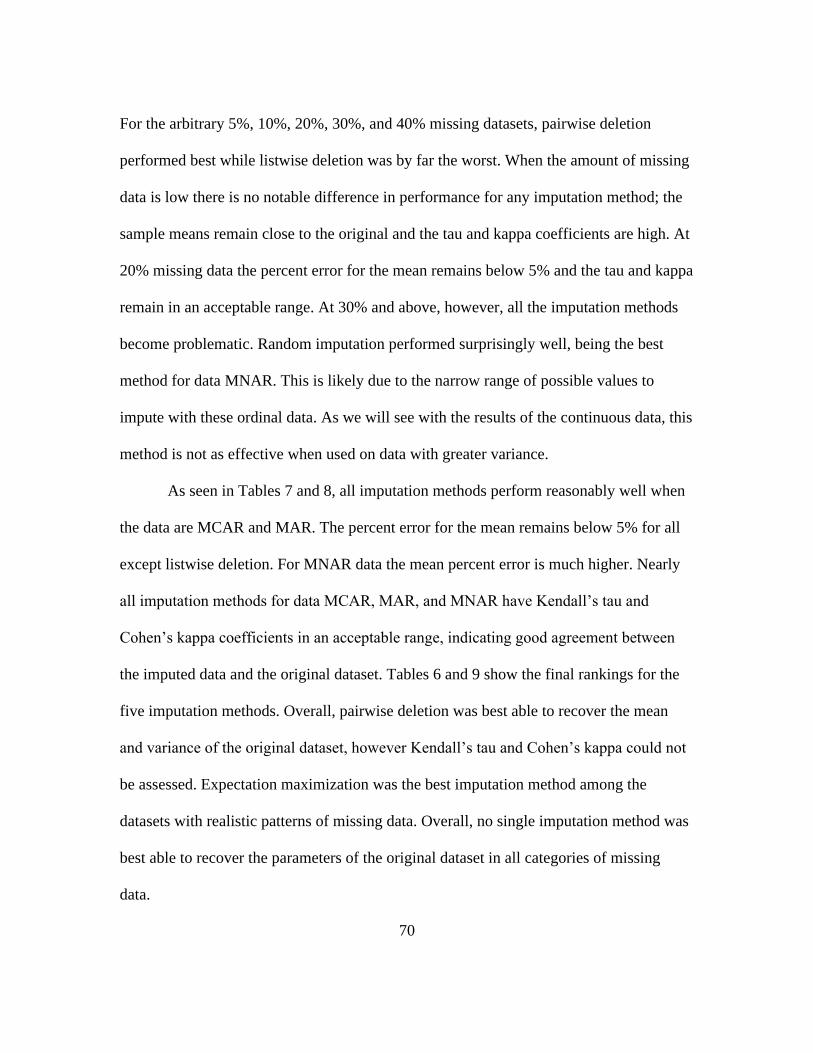
70
For the arbitrary 5%, 10%, 20%, 30%, and 40% missing datasets, pairwise deletion
performed best while listwise deletion was by far the worst. When the amount of missing
data is low there is no notable difference in performance for any imputation method; the
sample means remain close to the original and the tau and kappa coefficients are high. At
20% missing data the percent error for the mean remains below 5% and the tau and kappa
remain in an acceptable range. At 30% and above, however, all the imputation methods
become problematic. Random imputation performed surprisingly well, being the best
method for data MNAR. This is likely due to the narrow range of possible values to
impute with these ordinal data. As we will see with the results of the continuous data, this
method is not as effective when used on data with greater variance.
As seen in Tables 7 and 8, all imputation methods perform reasonably well when
the data are MCAR and MAR. The percent error for the mean remains below 5% for all
except listwise deletion. For MNAR data the mean percent error is much higher. Nearly
all imputation methods for data MCAR, MAR, and MNAR have Kendall’s tau and
Cohen’s kappa coefficients in an acceptable range, indicating good agreement between
the imputed data and the original dataset. Tables 6 and 9 show the final rankings for the
five imputation methods. Overall, pairwise deletion was best able to recover the mean
and variance of the original dataset, however Kendall’s tau and Cohen’s kappa could not
be assessed. Expectation maximization was the best imputation method among the
datasets with realistic patterns of missing data. Overall, no single imputation method was
best able to recover the parameters of the original dataset in all categories of missing
data.

71
Table 7.
Evaluation Criteria for Ordinal MCAR, MAR, and MNAR Datasets
MCAR MAR MNAR
M V M V M V
PMM 2.78 16.41 3.04 17.03 11.74 24.52
Ran 2.26 16.55 2.50 17.52 2.50 17.52
M 1.92 18.72 2.35 19.32 12.08 26.53
EM 2.76 14.77 2.30 15.64 9.70 23.11
RF 2.21 15.15 4.52 15.47 11.02 22.51
Pair 1.92 3.01 2.35 3.97 12.08 8.70
List 4.19 5.38 6.70 11.03 12.99 9.14
Mean and variance presented
as percent error
Cell values are the average of
the 5 pathology scores.
Evaluation Criteria
M = mean
V = variance
Imputation Methods
PMM = predictive mean
matching
Ran = random
M = mean
EM = Expectation Maximization
RF = Random Forest
Pair = Pairwise deletion
List = Listwise Deletion
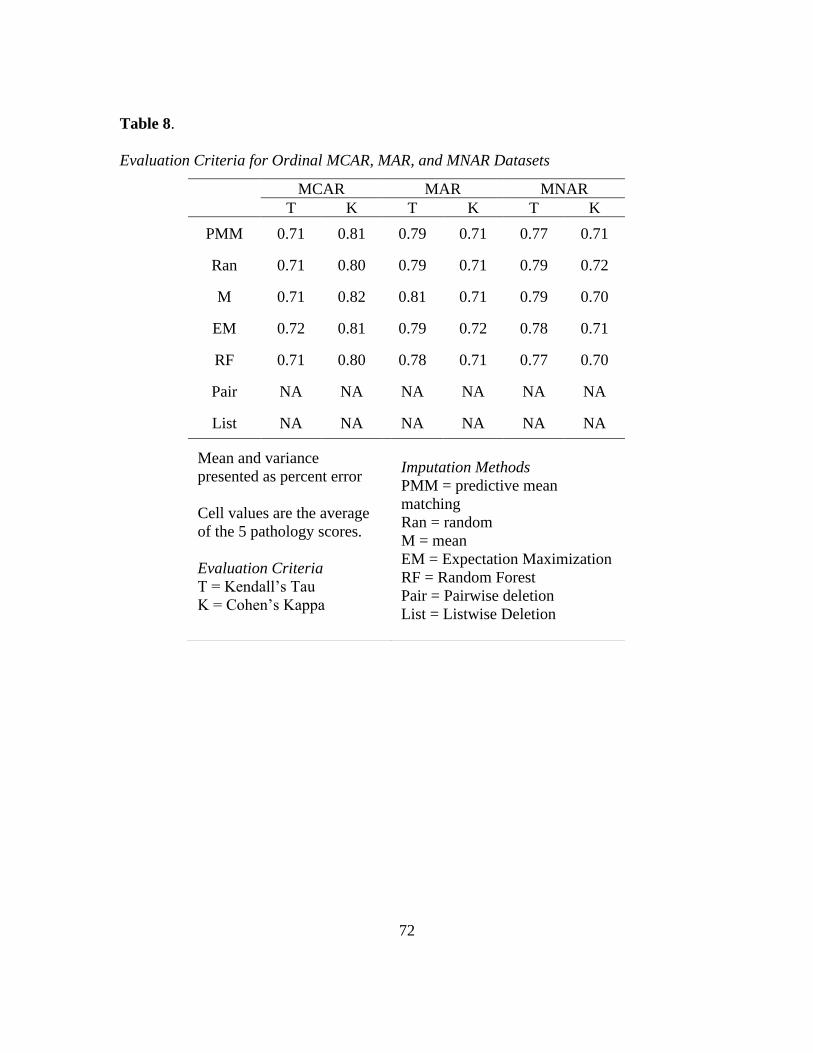
72
Table 8.
Evaluation Criteria for Ordinal MCAR, MAR, and MNAR Datasets
MCAR MAR MNAR
T K T K T K
PMM 0.71 0.81 0.79 0.71 0.77 0.71
Ran 0.71 0.80 0.79 0.71 0.79 0.72
M 0.71 0.82 0.81 0.71 0.79 0.70
EM 0.72 0.81 0.79 0.72 0.78 0.71
RF 0.71 0.80 0.78 0.71 0.77 0.70
Pair NA NA NA NA NA NA
List NA NA NA NA NA NA
Mean and variance
presented as percent error
Cell values are the average
of the 5 pathology scores.
Evaluation Criteria
T = Kendall’s Tau
K = Cohen’s Kappa
Imputation Methods
PMM = predictive mean
matching
Ran = random
M = mean
EM = Expectation Maximization
RF = Random Forest
Pair = Pairwise deletion
List = Listwise Deletion

73
Table 9.
Imputation Rankings for Ordinal MCAR, MAR, and MNAR Datasets
MCAR MAR MNAR Final
M V T K M V T K M V T K
PMM 6 5 2 2 3 5 4 3 4 6 5 3 5
Ran 4 6 3 4 5 6 2 2 1 3 1 1 3
M 1 7 4 1 1 7 1 4 5 7 2 4 3
EM 5 3 1 3 4 4 3 1 2 5 3 2 2
RF 3 4 4 5 6 3 5 4 3 4 4 4 6
Pair 1 1 NA NA 1 1 NA NA 5 1 NA NA 1
List 7 2 NA NA 7 2 NA NA 7 2 NA NA 7
Cell values are the average of the 5
pathology rankings.
Evaluation Criteria
M = mean
V = variance
T = Kendall’s Tau
K = Cohen’s Kappa
Imputation Methods
PMM = predictive mean matching
Ran = random
M = mean
EM = Expectation Maximization
RF = Random Forest
Pair = Pairwise deletion
List = Listwise Deletion

74
Continuous Data The results for continuous data are presented in Tables 10-15;
Tables 10, 11, and 12 present outcomes for the 5%, 10%, 20%, 30%, and 40% missing
data while Tables 13, 14, and 15 show findings for the MCAR, MAR, and MNAR
datasets. The percent error for both the means and the variances are lower for continuous
data, indicating that obtaining the parameters of the original dataset was far more
successful with continuous compared to ordinal data. The highest percent error for the
mean across all imputed continuous datasets was only 1.56% (MNAR random
imputation), well below the majority of the percent errors for ordinal data. For the 5%,
10%, 20%, 30% and 40% missing datasets, predictive mean matching performed best
across nearly all percentages of missingness, with stochastic regression a close second.
For the 5%, 10%, 20%, 30% and 40% datasets, the more advanced imputation methods
(predictive mean matching, expectation maximization, random forest, and stochastic
regression) had high levels of success obtaining the original mean up through 40%
missing data. Pairwise deletion performed comparably to random number and mean
imputation, likely because pairwise deletion maintains the sample variance better than
imputation methods – increasing its appearance of success in the rankings. Listwise
deletion performed poorly compared to all the other methods. Estimates of success were
not obtainable for listwise deletion of 40% missingness because the sample size had
decreased so significantly.
According to the results for the MCAR, MAR, and MNAR datasets, all
imputation and deletion methods were relatively successful at recovering the means of
the MCAR and MAR datasets, particularly compared to the results of the ordinal data.

75
Table 10.
Evaluation Criteria for Arbitrary Percentages of Missing Continuous Data
5% 10% 20% 30% 40%
M V M V M V M V M V
PMM 0.05 1.6 0.05 2.87 6.48 6.48 0.18 11.18 0.22 15.78
Ran 0.09 5.57 0.13 8.46 18.62 18.62 0.24 28.62 0.37 36.88
M 0.09 6.19 0.12 9.58 20.79 20.79 0.22 31.61 0.36 41.02
EM 0.05 1.50 0.06 2.34 5.35 5.35 0.21 8.45 0.20 11.60
RF 0.06 3.01 0.06 4.24 10.40 10.40 0.19 18.13 0.27 25.39
Reg 0.05 1.62 0.06 2.39 6.24 6.24 0.17 10.25 0.28 14.09
Pair 0.09 1.33 0.12 1.43 2.54 2.54 0.22 3.27 0.36 4.51
List 0.95 4.39 0.78 11.28 30.85 30.85 1.72 43.26 NA NA
Mean and variance shown as percent error
Cell values are the average of scores for the
5 pathology scores.
Evaluation Criteria
M = mean
V = variance
Imputation Methods
PMM = predictive mean matching
Ran = random
M = mean
EM = Expectation Maximization
RF = Random Forest
Reg = Stochastic Regression
Pair = Pairwise deletion
List = Listwise Deletion

76
Table 11.
Evaluation Criteria for Arbitrary Percentages of Missing Continuous Data
5% 10% 20% 30% 40%
T K T K T K T K T K
PMM 0.97 0.94 0.95 0.90 0.90 0.80 0.84 0.70 0.76 0.59
Ran 0.94 0.94 0.89 0.90 0.790 0.80 0.68 0.70 0.58 0.59
M 0.94 0.94 0.90 0.90 0.81 0.80 0.73 0.70 0.65 0.59
EM 0.96 0.94 0.94 0.90 0.88 0.80 0.83 0.70 0.75 0.59
RF 0.97 0.94 0.94 0.90 0.88 0.80 0.82 0.70 0.75 0.59
Reg 0.97 0.94 0.95 0.90 0.89 0.80 0.83 0.70 0.77 0.59
Pair NA NA NA NA NA NA NA NA NA NA
List NA NA NA NA NA NA NA NA NA NA
Kendall’s Tau and Cohen’s Kappa are the
test statistics
Cell values are the average of scores for the
5 pathology scores.
Evaluation Criteria
T = Kendall’s Tau
K = Cohen’s Kappa
Imputation Methods
PMM = predictive mean matching
Ran = random
M = mean
EM = Expectation Maximization
RF = Random Forest
Reg = Stochastic Regression
Pair = Pairwise deletion
List = Listwise Deletion

77
77
Table 12.
Imputation Rankings for Arbitrary Percentages of Continuous Missing Data.
5% 10% 20% 30% 40% Final
M V T K M V T K M V T K M V T K M V T K
PMM 2 3 1 2 1 4 1 3 1 4 1 3 2 4 2 1 2 4 2 1 1
Ran 5 7 6 3 6 6 6 3 6 6 6 3 6 5 6 1 5 6 6 3 7
M 6 8 5 2 5 7 5 2 5 7 5 2 5 6 5 2 6 7 5 4 6
EM 1 2 4 2 4 2 4 2 4 2 4 2 4 2 3 2 1 2 3 4 3
RF 4 5 3 1 3 5 3 1 2 5 3 1 3 5 4 1 3 5 4 2 4
Reg 3 4 2 2 2 3 2 2 3 3 2 2 1 3 1 2 4 3 1 4 2
Pair 6 1 NA NA 5 1 NA NA 5 1 NA NA 5 1 NA NA 6 1 NA NA 5
List 8 6 NA NA 7 8 NA NA 7 8 NA NA 7 8 NA NA NA NA NA NA 8
Cell values are the average of the 5
pathology rankings.
Evaluation Criteria
M = mean
V = variance
T = Kendall’s Tau
K = Cohen’s Kappa
Imputation Methods
PMM = predictive mean matching
Ran = random
M = mean
EM = Expectation Maximization
RF = Random Forest
Reg = Stochastic Regression
Pair = Pairwise deletion
List = Listwise Deletion

78
Table 13.
Evaluation Criteria for Continuous MCAR, MAR, and MNAR Datasets
MCAR MAR MNAR
M V M V M V
PMM 0.07 4.05 0.13 6.13 0.28 6.61
Ran 0.15 11.70 0.30 14.02 0.78 14.11
M 0.15 13.12 0.30 15.32 0.77 15.51
EM 0.08 3.77 0.14 4.67 0.28 5.48
RF 0.10 6.58 0.16 8.51 0.42 8.92
Reg 0.07 3.64 0.13 5.66 0.28 6.20
Pair 0.15 2.16 0.30 2.47 0.77 2.69
List 0.68 7.07 1.22 12.35 3.70 13.50
Mean and variance presented
as percent error
Cell values are the average
of the 5 pathology scores.
Evaluation Criteria
M = mean
V = variance
Imputation Methods
PMM = predictive mean
matching
Ran = random
M = mean
EM = Expectation
Maximization
RF = Random Forest
Reg = Stochastic Regression
Pair = Pairwise deletion
List = Listwise Deletion
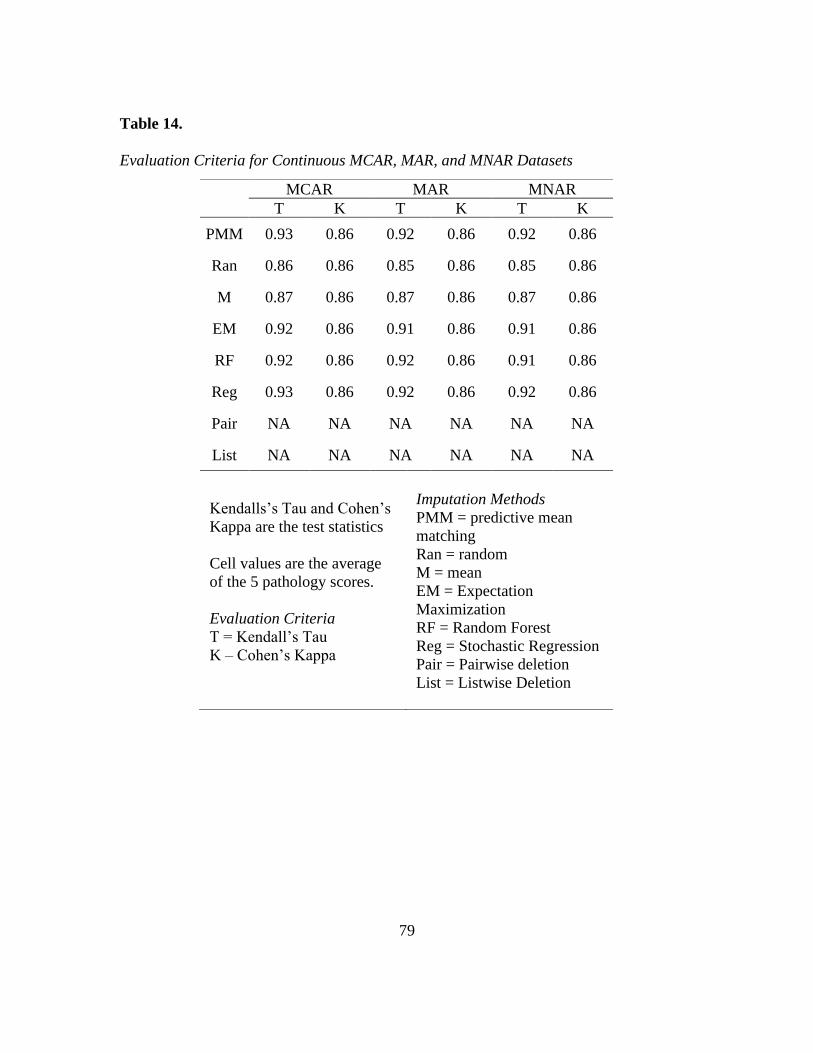
79
Table 14.
Evaluation Criteria for Continuous MCAR, MAR, and MNAR Datasets
MCAR MAR MNAR
T K T K T K
PMM 0.93 0.86 0.92 0.86 0.92 0.86
Ran 0.86 0.86 0.85 0.86 0.85 0.86
M 0.87 0.86 0.87 0.86 0.87 0.86
EM 0.92 0.86 0.91 0.86 0.91 0.86
RF 0.92 0.86 0.92 0.86 0.91 0.86
Reg 0.93 0.86 0.92 0.86 0.92 0.86
Pair NA NA NA NA NA NA
List NA NA NA NA NA NA
Kendalls’s Tau and Cohen’s
Kappa are the test statistics
Cell values are the average
of the 5 pathology scores.
Evaluation Criteria
T = Kendall’s Tau
K – Cohen’s Kappa
Imputation Methods
PMM = predictive mean
matching
Ran = random
M = mean
EM = Expectation
Maximization
RF = Random Forest
Reg = Stochastic Regression
Pair = Pairwise deletion
List = Listwise Deletion

80
80
Table 15.
Evaluation Criteria for Continuous MCAR, MAR, and MNAR Datasets
MCAR MAR MNAR Final
M V T K M V T K M V T K
PMM 1 4 3 2 1 4 1 1 3 4 4 1 2
Ran 5 7 4 6 5 7 4 6 6 7 4 6 7
M 6 8 2 5 6 8 2 5 5 8 1 5 6
EM 3 3 2 4 3 2 2 4 1 2 1 4 3
RF 4 5 1 3 4 5 3 3 4 5 4 3 5
Reg 2 2 2 1 2 3 2 2 2 3 1 2 1
Pair 6 1 NA NA 6 1 NA NA 6 1 NA NA 4
List 8 6 NA NA 8 6 NA NA 8 6 NA NA 8
Cell values are the average of the 5
pathology rankings.
Evaluation Criteria
M = mean
V = variance
T = Kendall’s Tau
K = Cohen’s Kappa
Imputation Methods
PMM = predictive mean matching
Ran = random
M = mean
EM = Expectation Maximization
RF = Random Forest
Reg = Stochastic Regression
Pair = Pairwise deletion
List = Listwise Deletion
81
Mean and random imputation performed poorly compared to imputation and in some
cases did worse than pairwise deletion or listwise deletion. Expectation maximization and
stochastic regression worked well for data that are MNAR. A pattern is evident in the
Cohen’s kappa and Kendall’s tau coefficients in which variables tend to have similar, if
not identical, results across all imputation methods. The percent error for
T5AP, L1AP and L3AP, which had the highest percentages of missingness, are highest
regardless of the imputation or deletion method employed. This indicates that the
percentage of missingness may play a greater role in the ability to recover original dataset
parameters than the imputation method used. For MCAR, MAR, and MNAR data,
stochastic regression and predictive mean matching performed best, expectation
maximization and random forest imputation ranked toward the middle, and other methods
ranked at the bottom.
Case Study Discussion
For ordinal data, no imputation or deletion method performed significantly better
than any others across all datasets. This uniformity likely reflects problems inherent in
paleopathology data: the low range of possible values, high inter-variable correlation, and
variable percentages of missingness. Imputation of ordinal MNAR data was unsuccessful
for every missing data method, although random imputation performed well across the
MCAR, MAR, and MNAR datasets. We suspect this was the result of random chance in
which the algorithm was able to impute the exact original value. For continuous data,
both predictive mean matching and stochastic regression performed well across all types
of data, including those missing not at random (MNAR).

82
Despite expert caution against pairwise deletion (Allison 2001; Graham 2012;
Kang 2013; van Buuren 2018), this method performed well for ordinal data. Because
pairwise deletion performs better in obtaining the original variance than imputation, its
standing in the rankings is elevated. For continuous data, pairwise deletion did not
perform as well as stochastic regression, predictive mean matching, or expectation
maximization for any dataset. Deletion methods cause a high rate of data loss that can be
especially problematic if the data are MNAR. Paleopathologists generally have such
small sample sizes any method that reduces the data further is suboptimal and may result
in a biased dataset and decreased analytical power.
Given its ability to work with multiple data types, we expected random forest
imputation to work better for ordinal data, yet it performed poorly in nearly all instances.
Finding an R package that could smoothly perform random forest imputation for this type
of ordinal data was also difficult. It is probably the narrow range of possible values
resulted in a reduced ability to form discrete decision trees. Random forest might not be
advisable for similar ordinal paleopathology data.
Critics of imputation claim these approaches “make up data,” invoking various
justifications for continuing to use deletion methods (Osborne 2013; Schafer 1999; van
Ginkel et al. 2020). Studies have shown, however, that imputed data are often better able
to recover the original parameter estimates and be more easily replicable by other
researchers than deletion methods (King et al. 1998; Osborne 2013). Using an
epidemiological dataset which examined the association between blood transfusions and
BMI after hip surgery, Pedersen et al. (2017) compared the results of multiple imputation

83
with listwise deletion alongside the full dataset. Multiple imputation generated results
that more closely matched those of the full dataset and correctly identified additional
variables of importance. The results using listwise deletion had larger standard errors and
failed to identify gender as a confounding variable. Fichman and Cummings (2003)
reanalyzed data from a study by Kraut et al. (1998) who examined the impact of internet
usage on depression while largely using deletion to handle missing data. Fichman and
Cummings (2003) used multiple imputation to eliminate missing data in Kraut et al.’s
(1998) sample – increasing the sample size from 169 to 363 – and reanalyzed the data.
The original results of Kraut et al.’s (1998) study showed that increased internet usage
was associated with increased depression. Using the entire sample, however, Fichman
and Cummings (2003) found no significant relationship between the amount of time
spent on the internet and higher depression scores. The findings of this study support the
conclusions of this prior research. Listwise deletion was the worst at recovering the
parameters of the original skeletal sample. If the data are MNAR, listwise deletion is the
least appropriate method to employ for ordinal or continuous paleopathology data.
Numerous scholars have drawn attention to the dearth of advanced statistical
analyses in bioarchaeology (Agarwal 2016; Konigsberg and Frankenberg 2013). Recent
years have seen a surge in more advanced methods such as hazards models, survival
analysis, and linear regression. However, much research – particularly paleopathology
and trauma analysis – still depends on relatively simple statistical analyses such as chi-
squared or ANOVAs. Reliance on more simple statistics represents a major stumbling
block to the advancement of paleopathology. Analyses such as the ANOVA, t-test, or
84
chi-squared have strict statistical assumptions about the data such as normal distribution
or equal variances; inappropriate use of such tests can result in flawed results. As
paleopathology data rarely adhere to these assumptions, data often must be aggregated or
binned in ways that obscure vitally important patterns. More sophisticated analyses allow
data to be explored on a spectrum rather than by arbitrary bins.
Another serious drawback of the simpler methods is their failure to account for
the concerns raised by Wood et al. (1992) in the Osteological Paradox. Because of
selective mortality, straightforward percentages or counts of pathology lesions from a
skeletal sample will overestimate our understanding of disease prevalence in the living
population. The authors explain how aggregating data for more simple analyses prevents
us from accounting for variation in individual frailty, obscuring not only important
variation in disease experience but also the potential presence of subpopulations.
How much missing data is too much? There is little clear guidance on the
maximum amount of missing data allowed before missing data methods or statistical
analyses become too biased (Dong and Peng 2013; Hardt et al. 2013; Meeyai 2016;
Saunders et al. 2006). The definition of a “small” amount of missingness varies from
<5% to <20% missingness (Little and Rubin 2002; Tabachnick et al. 2007). Some
statisticians caution that bias may occur in samples with more than 10% of the data
missing and that samples with over 40% missing should be used for “hypothesis
generating” only (Madley-Dowd et al., 2019, p. 64). Others recommend a maximum of
30% missingness when imputing missing data and no more than 20% with samples sizes
of 50 or lower (Hardt et al. 2013). On the other hand, under tightly controlled

85
circumstances, authors have managed to successfully impute and analyze datasets with
much higher percentages of missing data. Madley-Dowd et al. (2019) imputed up to 80%
missing MCAR and MAR data employing multiple imputation with auxiliary variables.
Meeyai (2016) was able to recover unbiased parameters for MCAR data with 60% of the
values missing for samples greater than n=1000. Graham et al. (2007) obtained unbiased
regression coefficients with a 90% fraction of missing information but found that
statistical power dropped considerably after 50% missingness even with m=20
imputations.
The percent of missing information may not be the most important consideration
when faced with missing data. Sample size is an important factor; 20% missingness may
have a greater impact with a sample size of 50 than with a sample size of 500 (Meeyai
2016; Saunders et al. 2006). The class of missingness – MCAR, MAR, or MNAR – will
also affect how much missing data is acceptable. Even a small amount of MNAR values
may result in a biased dataset no matter what imputation method is used (Dong and Peng
2013; Tabachnick et al. 2007). Whether the missing values are among the independent
and/or dependent variables will also impact the success of missing data methods and
ultimate statistical analyses (Saunders et al. 2006).
This study has several limitations. First, according to Rubin’s Rules (Rubin 1987),
statistical analyses are to be performed on each of the m datasets, and the final parameters
of interest (e.g. p-values, confidence intervals, etc.) pooled at the very end using the
equations designed by Rubin. The approach used in this paper, however, pools the
multiply imputed datasets and assesses success at the end. Testing the success of

86
imputation on every type of statistical analysis bioarchaeologists use is beyond the scope
of a single paper and the approach employed here is intended as a first step. Additional
study is needed to test the success of imputation using different statistical analyses.
Second, the success of imputation and deletion methods will depend not only on the
percent of missing data, but also on the sample size. The samples used here (ordinal
n=287; continuous n=369) are rather large compared to most paleopathology datasets.
Additional research is needed to compare the results found here with those from smaller
samples. Third, this study tests the success of missing data methods on ordinal and
continuous data separately, however many bioarchaeologists collect mixed data types.
Further research should identify which methods are successful at imputing mixed data
including continuous, ordinal, and binary values.
Conclusion
The primary aim of this paper is to provide background on missing data methods
and theory, highlighting how imputation can be used to manage missing bioarchaeology
and paleopathology data. There are a great number of approaches for handling missing
data, including deleting absent data or imputing missing values. While each technique has
advantages and disadvantages, imputation methods are generally recommended over
deletion. Other fields in the natural and social sciences commonly make use of
imputation. Bioarchaeological research, however, seldom uses imputation to handle
missing data. This paper tests the ability of eight methods to yield unbiased parameter
estimates when handling missing ordinal and continuous bioarchaeological data. Results
demonstrated that no single method performed best in all circumstances, suggesting there

87
is no “one-size-fits-all” solution to the missing data problem. Listwise deletion performed
the worst for both ordinal and continuous data, introducing the most error into the dataset,
while pairwise deletion performed well for ordinal variables but ranked toward the
bottom for continuous data. Ultimately, the best method for handling missing continuous
data was stochastic regression or predictive mean matching. Stochastic regression is
particularly useful when the data may be missing not at random (MNAR). We intend for
these findings to encourage the use of more advanced methods to handle missing data in
bioarchaeology. With greater control over the data, bioarchaeologists can explore sources
of bias and implement statistically rigorous analyses.

88
REFERENCES
Agarwal SC. 2016. Bone morphologies and histories: Life course approaches in
bioarchaeology. American Journal of Physical Anthropology 159:130-149.
Allison PD. 2000. Multiple imputation for missing data: A cautionary tale. Sociological
methods & research 28(3):301-309.
Allison PD. 2001. Missing data: Sage publications.
Andridge RR, and Little RJ. 2010. A review of hot deck imputation for survey non‐
response. International statistical review 78(1):40-64.
Auerbach BM. 2011. Methods for estimating missing human skeletal element osteometric
dimensions employed in the revised fully technique for estimating stature.
American Journal of Physical Anthropology 145(1):67-80.
Auerbach BM, Raxter MH, and Ruff C. 2005. If I only had a...: missing element
estimation accuracy using the fully technique for estimating statures. American
Journal Of Physical Anthropology p 67-67.
Bailey BE, Andridge R, and Shoben AB. 2020. Multiple imputation by predictive mean
matching in cluster-randomized trials. BMC medical research methodology 20:1-
16.
Baraldi AN, and Enders CK. 2010. An introduction to modern missing data analyses.
Journal of school psychology 48(1):5-37.
Barnard J, and Meng X-L. 1999. Applications of multiple imputation in medical studies:
from AIDS to NHANES. Statistical methods in medical research 8(1):17-36.
Bechtel L, Gonzalez Y, Nelson M, and Gibson R. 2011. Assessing several hot deck
imputation methods using simulated data from several economic programs.
Proceedings of the Section on Survey Research Methods, American Statistical
Association. p 5022-5036.
Bird JP, Martin R, Akçakaya HR, Gilroy J, Burfield IJ, Garnett ST, Symes A, Taylor J,
Şekercioğlu ÇH, and Butchart SH. 2020. Generation lengths of the world's birds
and their implications for extinction risk. Conservation Biology.
Bodnar LM, Tang G, Ness RB, Harger G, and Roberts JM. 2006. Periconceptional
multivitamin use reduces the risk of preeclampsia. American journal of
epidemiology 164(5):470-477.

89
Breiman L. 2001. Random forests. Machine learning 45(1):5-32.
Buikstra JE, and Ubelaker DH. 1994. Standards for data collection from human skeletal
remains.
Cooke RS, Eigenbrod F, and Bates AE. 2019. Projected losses of global mammal and
bird ecological strategies. Nature communications 10(1):1-8.
Cooke RS, Eigenbrod F, and Bates AE. 2020. Ecological distinctiveness of birds and
mammals at the global scale. Global Ecology and Conservation 22:e00970.
Costello S, Brown DM, Noth EM, Cantley L, Slade MD, Tessier-Sherman B, Hammond
SK, Eisen EA, and Cullen MR. 2014. Incident ischemic heart disease and recent
occupational exposure to particulate matter in an aluminum cohort. Journal of
exposure science & environmental epidemiology 24(1):82-88.
Dam MK, Hvidtfeldt UA, Tjønneland A, Overvad K, Grønbæk M, and Tolstrup JS. 2016.
Five year change in alcohol intake and risk of breast cancer and coronary heart
disease among postmenopausal women: prospective cohort study. bmj 353.
De Waal T, Pannekoek J, and Scholtus S. 2011. Handbook of statistical data editing and
imputation: John Wiley & Sons.
Dempster A, Laird N, and Rubin D. 1977. Maximum likelihood from incomplete data via
the EM algorithm. Journal of the Royal statistical Society 39(1):1-38.
Divíšek J, Chytrý M, Beckage B, Gotelli NJ, Lososová Z, Pyšek P, Richardson DM, and
Molofsky J. 2018. Similarity of introduced plant species to native ones facilitates
naturalization, but differences enhance invasion success. Nature communications
9(1):1-10.
Dong Y, and Peng C-YJ. 2013. Principled missing data methods for researchers.
SpringerPlus 2(1):1-17.
Enders CK. 2010. Applied missing data analysis: Guilford press.
Evans CB, and Smokowski PR. 2015. Prosocial bystander behavior in bullying dynamics:
Assessing the impact of social capital. Journal of youth and adolescence
44(12):2289-2307.
Ferrie JE, Martikainen P, Shipley MJ, and Marmot MG. 2005. Self-reported economic
difficulties and coronary events in men: evidence from the Whitehall II study.
International Journal of Epidemiology 34(3):640-648.

90
Fichman M, and Cummings JN. 2003. Multiple imputation for missing data: Making the
most of what you know. Organizational Research Methods 6(3):282-308.
Finch WH. 2010. Imputation methods for missing categorical questionnaire data: A
comparison of approaches. Journal of Data Science 8(3):361-378.
Graham JW. 2009. Missing data analysis: Making it work in the real world. Annual
review of psychology 60:549-576.
Graham JW. 2012. Missing data: Analysis and design: Springer Science & Business
Media.
Graham JW, Hofer SM, Donaldson SI, MacKinnon DP, and Schafer JL. 1997. Analysis
with missing data in prevention research.
Graham JW, Olchowski AE, and Gilreath TD. 2007. How many imputations are really
needed? Some practical clarifications of multiple imputation theory. Prevention
science 8(3):206-213.
Grilo C, Koroleva E, Andrášik R, Bíl M, and González‐Suárez M. 2020. Roadkill risk
and population vulnerability in European birds and mammals. Frontiers in
Ecology and the Environment 18(6):323-328.
Hardt J, Max H, Tamara B, and Wilfried L. 2013. Multiple imputation of missing data: a
simulation study on a binary response. Open Journal of Statistics 2013.
Henriksson A, Zhao J, Dalianis H, and Boström H. 2016. Ensembles of randomized trees
using diverse distributed representations of clinical events. BMC medical
informatics and decision making 16(2):85-95.
Huisman M. 2009. Imputation of missing network data: Some simple procedures. Journal
of Social Structure 10(1):1-29.
Ibáñez‐Gimeno P, De Esteban‐Trivigno S, Jordana X, Manyosa J, Malgosa A, and Galtés
I. 2013. Functional plasticity of the human humerus: shape, rigidity, and muscular
entheses. American journal of physical anthropology 150(4):609-617.
Kaiser J. 1983. The Effectiveness of Hot-deck Procedures in Small Samples.
Kang H. 2013. The prevention and handling of the missing data. Korean journal of
anesthesiology 64(5):402.

91
Kerr NW. 1988. A method of assessing periodontal status in archaeologically derived
skeletal material. Journal of paleopathology 2(2):67-78.
King A, and Eckersley R. 2019. Statistics for biomedical engineers and scientists: How to
visualize and analyze data: Academic Press.
King G, Honaker J, Joseph A, and Scheve K. 1998. List-wise deletion is evil: what to do
about missing data in political science. Annual Meeting of the American Political
Science Association, Boston.
Kleinke K. 2018. Multiple imputation by predictive mean matching when sample size is
small. Methodology.
Konigsberg LW, and Frankenberg SR. 2013. Bayes in biological anthropology. American
journal of physical anthropology 152:153-184.
Krause RW, Huisman M, Steglich C, and Sniiders TA. 2018. Missing network data a
comparison of different imputation methods. 2018 IEEE/ACM International
Conference on Advances in Social Networks Analysis and Mining (ASONAM):
IEEE. p 159-163.
Kraut R, Patterson M, Lundmark V, Kiesler S, Mukophadhyay T, and Scherlis W. 1998.
Internet paradox: A social technology that reduces social involvement and
psychological well-being? American psychologist 53(9):1017.
Lassale C, Tzoulaki I, Moons KG, Sweeting M, Boer J, Johnson L, Huerta JM, Agnoli C,
Freisling H, and Weiderpass E. 2018. Separate and combined associations of
obesity and metabolic health with coronary heart disease: a pan-European case-
cohort analysis. European heart journal 39(5):397-406.
Lindhe J, Haffaiee A, and Socransky S. 1983. Progression of periodontal disease in adult
subjects in the absence of periodontal therapy. Journal of clinical periodontology
10(4):433-442.
Little RJ. 1988. Missing-data adjustments in large surveys. Journal of Business &
Economic Statistics 6(3):287-296.
Little RJ, and Rubin DB. 2002. Statistical analysis with missing data: John Wiley &
Sons.

92
Madley-Dowd P, Hughes R, Tilling K, and Heron J. 2019. The proportion of missing
data should not be used to guide decisions on multiple imputation. Journal of
clinical epidemiology 110:63-73.
Meeyai S. 2016. Logistic Regression with Missing Data: A Comparisson of Handling
Methods, and Effects of Percent Missing Values. Journal of Traffic and Logistics
Engineering 4(2).
Morelli T, Moss KL, Preisser JS, Beck JD, Divaris K, Wu D, and Offenbacher S. 2018.
Periodontal profile classes predict periodontal disease progression and tooth loss.
Journal of periodontology 89(2):148-156.
Morris TP, White IR, and Royston P. 2014. Tuning multiple imputation by predictive
mean matching and local residual draws. BMC medical research methodology
14(75).
Musil CM, Warner CB, Yobas PK, and Jones SL. 2002. A comparison of imputation
techniques for handling missing data. Western Journal of Nursing Research
24(7):815-829.
Myers TA. 2011. Goodbye, listwise deletion: Presenting hot deck imputation as an easy
and effective tool for handling missing data. Communication methods and
measures 5(4):297-310.
Nelwamondo FV, Mohamed S, and Marwala T. 2007. Missing data: A comparison of
neural network and expectation maximization techniques. Current Science:1514-
1521.
Newman DA. 2003. Longitudinal modeling with randomly and systematically missing
data: A simulation of ad hoc, maximum likelihood, and multiple imputation
techniques. Organizational research methods 6(3):328-362.
Newman DA. 2014. Missing data: Five practical guidelines. Organizational Research
Methods 17(4):372-411.
Ong G. 1998. Periodontal disease and tooth loss. International dental journal 48(S3):233-
238.
Ordonez A, and Svenning J-C. 2017. Consistent role of Quaternary climate change in
shaping current plant functional diversity patterns across European plant orders.
Scientific Reports 7:42988.

93
Osborne JW. 2013. Six: Dealing with missing or incomplete data: Debunking the myth of
emptiness. Best practices in data cleaning: A complete guide to everything you
need to do before and after collecting your data:105-138.
Pacifici M, Santini L, Di Marco M, Baisero D, Francucci L, Marasini GG, Visconti P,
and Rondinini C. 2013. Generation length for mammals. Nature Conservation
5:89.
Pedersen AB, Mikkelsen EM, Cronin-Fenton D, Kristensen NR, Pham TM, Pedersen L,
and Petersen I. 2017. Missing data and multiple imputation in clinical
epidemiological research. Clinical epidemiology 9:157-166.
Pepinsky TB. 2018. A note on listwise deletion versus multiple imputation. Political
Analysis 26(4):480-488.
Petersen CB, Bauman A, Grønbæk M, Helge JW, Thygesen LC, and Tolstrup JS. 2014.
Total sitting time and risk of myocardial infarction, coronary heart disease and
all-cause mortality in a prospective cohort of Danish adults. International Journal
of Behavioral Nutrition and Physical Activity 11(1):13.
Quintero M, and LeBoulluec A. 2018. Missing Data Imputation for Ordinal Data.
International Journal of Computer Applications 181(5):10-16.
Ramseier CA, Anerud A, Dulac M, Lulic M, Cullinan MP, Seymour GJ, Faddy MJ,
Bürgin W, Schätzle M, and Lang NP. 2017. Natural history of periodontitis:
Disease progression and tooth loss over 40 years. Journal of clinical
periodontology 44(12):1182-1191.
Ranganathan P, and Gogtay NJ. 2019. An Introduction to Statistics–Data Types,
Distributions and Summarizing Data. Indian journal of critical care medicine:
peer-reviewed, official publication of Indian Society of Critical Care Medicine
23(Suppl 2):S169.
Reyes‐Centeno H, Ghirotto S, and Harvati K. 2017. Genomic validation of the
differential preservation of population history in modern human cranial anatomy.
American journal of physical anthropology 162(1):170-179.
Rubin DB. 1976. Inference and missing data. Biometrika 63(3):581-592.
Rubin DB. 1987. Multiple imputation for nonresponse in surveys. New York: John Wiley
& Sons.

94
Saunders JA, Morrow-Howell N, Spitznagel E, Doré P, Proctor EK, and Pescarino R.
2006. Imputing missing data: A comparison of methods for social work
researchers. Social work research 30(1):19-31.
Schafer JL. 1999. Multiple imputation: a primer. Statistical methods in medical research
8(1):3-15.
Schafer JL, and Graham JW. 2002. Missing data: our view of the state of the art.
Psychological methods 7(2):147.
Schafer JL, and Olsen MK. 1998. Multiple imputation for multivariate missing-data
problems: A data analyst's perspective. Multivariate behavioral research
33(4):545-571.
Shah AD, Bartlett JW, Carpenter J, Nicholas O, and Hemingway H. 2014. Comparison of
random forest and parametric imputation models for imputing missing data using
MICE: a CALIBER study. American journal of epidemiology 179(6):764-774.
Shreffler J, and Huecker MR. 2020. Types of Variables and Commonly Used Statistical
Designs. StatPearls StatPearls [Internet]. Treasure Island (FL): StatPearls
Publishing; 2021 Jan-. Available from:
https://www.ncbi.nlm.nih.gov/books/NBK557882/.
Siddique J, and Belin TR. 2008. Multiple imputation using an iterative hot‐deck with
distance‐based donor selection. Statistics in medicine 27(1):83-102.
Stekhoven DJ, and Bühlmann P. 2012. MissForest—non-parametric missing value
imputation for mixed-type data. Bioinformatics 28(1):112-118.
Tabachnick BG, Fidell LS, and Ullman JB. 2007. Using multivariate statistics: Pearson
Boston, MA.
Tang F, and Ishwaran H. 2017. Random forest missing data algorithms. Statistical
Analysis and Data Mining: The ASA Data Science Journal 10(6):363-377.
Taugourdeau S, Villerd J, Plantureux S, Huguenin‐Elie O, and Amiaud B. 2014. Filling
the gap in functional trait databases: use of ecological hypotheses to replace
missing data. Ecology and Evolution 4(7):944-958.
Turney K. 2015. Paternal incarceration and children’s food insecurity: A consideration of
variation and mechanisms. Social Service Review 89(2):335-367.
van Buuren S. 2018. Flexible imputation of missing data. Boca Raton: CRC press
Taylor & Francis Group.

95
van Ginkel JR, Linting M, Rippe RC, and van der Voort A. 2020. Rebutting existing
misconceptions about multiple imputation as a method for handling missing data.
Journal of personality assessment 102(3):297-308.
Verma JP. 2016. Sports Research with Analytical Solution Using SPSS. Hoboken: John
Wiley & Sons, Inc.
Vink G, Frank LE, Pannekoek J, and Van Buuren S. 2014. Predictive mean matching
imputation of semicontinuous variables. Statistica Neerlandica 68(1):61-90.
Von Hippel PT. 2009. 8. How to impute interactions, squares, and other transformed
variables. Sociological methodology 39(1):265-291.
Waljee AK, Mukherjee A, Singal AG, Zhang Y, Warren J, Balis U, Marrero J, Zhu J, and
Higgins PD. 2013. Comparison of imputation methods for missing laboratory data
in medicine. BMJ open 3(8).
Weng SF, Vaz L, Qureshi N, and Kai J. 2019. Prediction of premature all-cause
mortality: A prospective general population cohort study comparing machine-
learning and standard epidemiological approaches. PloS one 14(3):e0214365.
Wilkinson L. 1999. Statistical methods in psychology journals: Guidelines and
explanations. American psychologist 54(8):594.
Willman JC, Maki J, Bayle P, Trinkaus E, and Zilhão J. 2012. Middle Paleolithic human
remains from the Gruta da Oliveira (Torres Novas), Portugal. American journal of
physical anthropology 149(1):39-51.
Wood JW, Milner GR, Harpending HC, Weiss KM, Cohen MN, Eisenberg LE,
Hutchinson DL, Jankauskas R, Cesnys G, and Česnys G. 1992. The osteological
paradox: problems of inferring prehistoric health from skeletal samples [and
comments and reply]. Current Anthropology:343-370.
Zeka A, Zanobetti A, and Schwartz J. 2006. Individual-level modifiers of the effects of
particulate matter on daily mortality. American journal of epidemiology
163(9):849-859.
Zhang Z. 2016. Missing data imputation: focusing on single imputation. Annals of
translational medicine 4(1).

96
CHAPTER 4
FRAILTY AND SURVIVORSHIP IN THE 1918 INFLUENZA PANDEMIC
Though largely forgotten by the public (Crosby 2003; Hume 2000; Stanwell-
Smith 2019), the 1918 influenza is one of the most well-studied historical pandemics. An
intriguing aspect of the 1918 flu was the unusual age-at-death distribution. Seasonal
outbreaks and epidemics of influenza are generally fatal to young children and the
elderly, yet the 1918 virus was unusually deadly to adults between the ages of 20-40
years old – commonly assumed to be the most resilient segment of a population (Barry
2004; Barry 2005; Crosby 2003; Gagnon et al. 2013; Luk et al. 2001; Shanks and
Brundage 2012; Simonsen et al. 1998; Taubenberger and Morens 2006). Another
remarkable feature of the pandemic was that the illness struck adults who otherwise had
appeared perfectly healthy. It has become widely accepted that the 1918 virus killed
“healthy young adults,” however this has not been explicitly tested. Were these adults
truly healthy? Or was there some underlying frailty yet to be identified? Much of the
research on the 1918 flu relies on data obtained from historical records such as medical
records, vital statistics, census data, and life insurance records. These data often do not
include individual-level information on co-morbidities, health conditions, or general
environmental, nutritional, and chronic stressors and may therefore be inadequate for
testing whether the people who died were healthy.
In this paper, we use a bioarchaeological approach to explicitly interrogate the
hypothesis that healthy individuals were as likely to die as non-healthy individuals during
the pandemic. Poor health due to environmental, social, nutritional, or disease stresses
97
can leave permanent impressions on the skeleton such as reduced stature, structural
asymmetry, abnormal subadult growth, poor teeth, or skeletal lesions (e.g. Buikstra and
Cook 1980; Goodman et al. 1984; Larsen 1997). These stresses and their associated
skeletal markers have been correlated with increased morbidity and mortality. Here, we
assess patterns of these nonspecific indicators of skeletal stress to examine changes in
individual- and population-level health during the 1918 pandemic.
Background
The 1918 influenza pandemic was one of the deadliest global outbreaks of disease
since the Black Death. An estimated one-third of the world’s population became infected
with the virus (Crosby 2003; Taubenberger and Morens 2006) and approximately 50
million people died (Jordan 1927; Olson et al. 2005; Patterson and Pyle 1991; Johnson
and Mueller 2002; Taubenberger and Morens 2006). Most of the deaths were caused by
secondary bacterial pneumonia infection rather than the influenza virus itself (Shanks and
Brundage 2012). Despite the enormous amount of scholarship dedicated to the 1918
pandemic, many questions about the event remain unresolved.
The high death rate among young adults remains one of the most studied and yet
most mysterious features of the pandemic (Barry 2004; Barry 2005; Crosby 2003; Luk et
al. 2001; Simonsen et al. 1998; Taubenberger and Morens 2006). Normal mortality
curves form a U-shaped distribution, with most deaths occurring among the very young
and the very old. The mortality curve for the 1918 flu pandemic, however, produced a W-
shaped age-at-death distribution with deaths occurring among young children and the
elderly, but with a spike in the death rate among young adults (Ahmed et al. 2007;
98
Noymer and Garenne 2000; Shanks and Brundage 2012; Taubenberger and Morens
2006). In a survey of data collected from the United States and Canada, Gagnon et al.
(2013) found that the greatest mortality was in adults who were 28 years old. Between
1918-1919, the mortality rate of individuals between 15-34 due to pneumonia and
influenza was more than twenty times higher than previous years (Taubenberger and
Morens 2006). Though several theories have been advanced, scholars remain unsure why
young adults died at a rate that was so much greater than expected.
One prominent explanation for the unusually high young adult mortality is the
“cytokine storm” hypothesis. Cytokines are a class of proteins that are released as part of
the immune system response (Chousterman et al. 2017; Tisoncik et al. 2012).
Researchers speculate that the 1918 virus provoked an excessive release of cytokines –
the cytokine storm – that lead to lung inflammation, respiratory distress, and systemic
organ failure (de Wit et al. 2018; Ferrara et al. 1993; Kash et al. 2006; Kobasa et al. 2004;
Osterholm 2005; Tisoncik et al. 2012). Those with strong immune systems – generally
young adults – would have been at greatest risk for cytokine storms (Ma et al. 2011).
Co-infection with tuberculosis and influenza is another possible explanation for
the high mortality rate among young adults. Numerous studies have found a relationship
between tuberculosis infection and increased morbidity and mortality in 1918 (Espersen
1954; Noymer and Garenne 2000; Oei and Nishiura 2012; Zürcher et al. 2016; Mamelund
and Dimka 2019). Tuberculosis is more prevalent in young adults compared to children
or older adults (Dye 2006; Rothman 1994; Schaaf et al. 2010; Shryock and Association
1904). Tuberculosis commonly causes necrosis in lung tissues, creating cavities that

99
become opportune sites for secondary bacterial infection (Gadkowski and Stout 2008;
Noymer and Garenne 2000).
An additional reason for high young adult mortality in 1918 is prior exposure to
another influenza virus that impaired the immune system’s ability to respond to the 1918
virus (Gagnon et al. 2015; Hallman and Gagnon 2014; Shanks and Brundage 2012). The
“original antigenic sin” hypothesis proposes that the immune system adapts to the first
viral strain encountered. It becomes effective at combating that particular strain, but less
able to withstand other strains (Davenport et al. 1953; Francis Jr 1955; Kim et al. 2009).
Individuals born around 1889-1890 may have imprinted on the “Russian Flu” virus, and
their immune systems were then unable to effectively fight the 1918 virus (Gagnon et al.
2013; Hallman and Gagnon 2014).
The age-at-death distribution of the 1918 pandemic was notable not only due to
the over-representation of young adults, but the underrepresentation of older adults
(Mamelund 2011), which Worobey et al. (2014) contend could not have been caused by
exposure to a single previous pandemic. Numerous influenza viruses had circulated prior
to 1918 including an H1N1 between 1830-1847, H1N8 in 1847-1889, H3N8 in 1889-
1890, and H1N8 in 1900-1918. Worobey et al. (2014) hypothesize that exposure to
hemagglutinin 1 (H1) and neuraminidase 1 (N1) subtypes provided immunity in the 1918
pandemic. The immune systems of those born between 1889-1890 who were exposed
only to the H3 and N8 subtypes, were unable to fight the H1 or N1 subtypes. Individuals
born in the 1830s were exposed to the N1 and N1 subtypes and had greater survival in
1918 despite being in their 80’s in 1918. Meanwhile those born between 1847-1889 were
100
exposed only to the H1 subtype, conferring some immunity in 1918 and contributing to
the low than anticipated morality rate among older adults.
Contemporary reports of the 1918 pandemic noted that the victims of the virus
were not only young adults, but “healthy young adults” (Glezen 1996; Hoffman 2011;
Luk et al. 2001; Short et al. 2018; Taubenberger and Morens 2006). The illness “seemed
to be as fatal to strong adults as to young children and to the old and debilitated”
(Phipson, 1923, p. 516). Daland (1919), a medical doctor at the US Naval Hospital in
Philadelphia, reported that “most of the patients were between the ages of twenty to
twenty-six years and were in unusually good physical condition” (p. 63). France (1919), a
medical doctor from Virginia, noted that while many of patients he saw who died from
pneumonia had previously been treated for other ailments such as tuberculosis, pellagra
or heart problems, “a large percentage were young men apparently healthy and vigorous”
(p. 39). According to present-day influenza researcher W. Paul Glezen “[it] was not just
the weak and infirm who were taken away but the flower and strength of the land” (1996
p. 66). Despite numerous accounts echoing these sentiments, there are few concrete,
scientific data to support these claims.
Bioarchaeology and Frailty
Bioarchaeology is the study of human skeletal remains within past contexts
(Buikstra 1977; Larsen 1997). While previous studies on selective mortality during the 1918
flu have relied on primary archival documents or on viral DNA extracted from only a few
individuals, bioarchaeological data allow us to target the individual disease experience from a
biological perspective. Life events such as trauma, environmental stress, and disease shape

101
overall growth and morphology, leaving permanent markers on the skeleton and dentition.
These data can be aggregated to provide a population-level understanding of selective
mortality during the 1918 flu.
Stress is defined broadly as disruption to biological homeostasis caused by
disease, nutritional, environmental, and/or cultural perturbation (Brown 1981; Buikstra
and Cook 1980; Bush and Zvelebil 1991; Edinborough and Rando 2020; Goodman et al.
1988; Huss-Ashmore et al. 1982; Klaus 2014; Selye 1976). Bodily tissues attempt to
compensate for this disruption through a process known as allostasis (McEwen 1998;
McEwen 2005), resulting in what are known as nonspecific indicators of skeletal stress
(Klaus 2014). Many of these indicators, such as reduced stature or structural asymmetry,
reflect very long-term adverse health conditions (Buikstra and Cook 1980; Goodman et
al. 1984; Huss-Ashmore et al. 1982) while others such as periosteal reactions, porotic
hyperostosis, cribra orbitalia, and dental defects can be indicative of acute stress events
(Brown 1981; Goodman et al. 1988).
Accumulation of nonspecific indicators of skeletal stress have been correlated
with increased frailty (DeWitte and Wood 2008; Wood et al. 1992). Frailty – defined as
the increased susceptibility to death (Vaupel et al. 1979; Wood et al. 1992) – has become
a useful framework for examining social, environmental, and biological processes that
cause certain people to be at higher risk for increased mortality (Marklein et al. 2016;
Redfern and DeWitte 2011; Usher 2000). DeWitte and colleagues, for example, have
explored the impact of pre-existing frailty during the Black Death (DeWitte 2009;
DeWitte 2014; DeWitte and Wood 2008; Zarulli et al. 2018). DeWitte and Wood (2008)
102
demonstrated that the Black Death did not kill indiscriminately, but that prior frailty
increased the risk of mortality. More refined research has shown, however, the presence
or absence of nonspecific indicators of skeletal stress is inadequate for determining
whether a person was frail (DeWitte 2014; Grauer 1993; Mays et al. 2002; Novak and
Šlaus 2010; Wood et al. 1992). Skeletal tissues take weeks or months to react to a
stressor. As lesions take time to develop, the most frail person will die before lesions
manifest. The presence of lesions may reflect a person who was resilient – at least
resilient enough to withstand the initial onslaught of stress or disease. DeWitte (2014)
made advances in this area by parsing skeletal lesions more finely – demonstrating that
active skeletal stress lesions were associated with significantly increased mortality while
healed lesions were associated with greater survival. This study builds upon previous
research on stress and pandemics to explore assumptions about the 1918 influenza
pandemic. It uses a bioarchaeological approach to examine the question: were healthy
individuals dying during the 1918 pandemic? Based on prior assumptions, we
hypothesize that non-frail (i.e. healthy) individuals were equally likely to die as frail
individuals in 1918.
Materials and Methods
Data were collected from the Hamann-Todd Documented Osteological Collection
housed at the Cleveland Museum of Natural History. The Hamann-Todd is comprised of
over 3,000 individuals who were born between 1825-1910 (De La Cova 2010) and died
between 1910-1938 in Cleveland, Ohio and surrounding areas (Mensforth and Latimer
1989). The majority of the individuals were of low socioeconomic status and died in

103
almshouses or public hospitals (De La Cova 2010; Hunt and Albanese 2005). Their
unclaimed bodies were dissected in anatomy classes and then the bones were cleaned,
labeled, and added to the collection. Nearly every individual is accompanied by archival
documentation on their name, age-at-death, date of death, sex, race, and cause of death
(Jones-Kern and Latimer 1996). The exact dates of death are recorded by month,
however dates of birth are less certain. Many of the individuals’ ages end in a 0 or 5 – a
phenomenon known as age heaping (Stockwell and Wicks 1974; Szołtysek et al. 2018) –
suggesting that the precise age for many was estimated rather than truly known. The
sample used here included 424 individuals: 371 males and 53 females. Only individuals
who died of natural causes (e.g. pneumonia, tuberculosis, myocarditis, influenza, cancer,
etc.) were included; deaths of unknown causes, or as a result of accident, homicide or
suicide were excluded from analyses. All individuals in the flu group did not necessarily
have a cause of death that was listed as influenza or pneumonia. However, it is likely that
influenza played a contributing factor in at least some of these other deaths.
Data Collection Methods
Data were collected on five nonspecific indicators of skeletal stress that manifest
at various ages from the skeleton and dentition. Porotic hyperostosis and cribra orbitalia
refer to abnormal porosity to the external surface of the cranium or on the inner surface of
the eye orbits and may be caused by systemic illnesses such as iron deficiency anemia,
high parasite load or scurvy (McFadden and Oxenham 2020; Stuart-Macadam 1991;
Walker et al. 2009; Wapler et al. 2004). The presence or absence of porotic hyperostosis
and cribra orbitalia was recorded using macroscopic observation following Buikstra and

104
Ubelaker (1994). Periostosis refers to inflammation of the periosteum caused by physical
trauma, local or systemic infection (Roberts and Manchester 2007; Roberts 2019; Weston
2012). In the skeleton, it manifests as new bone formation. Periostosis of the tibia was
recorded through macroscopic observation collected on the anterior shaft of the tibia
(Buikstra and Ubelaker 1994; DeWitte 2014; Weston 2012). Whether the lesion was
active, healed, or mixed (in the process of healing, or reactivating) was also recorded
(Lallo 1973; Weston 2008). Periodontal disease is caused by a bacterial infection in the
oral cavity that destroys the gums, periodontal ligament, cementum and alveolar bone
(DeWitte and Bekvalac 2010; Pihlstrom et al. 2005). The severity of periodontal disease
was scored following standards set by Kerr (1988) and the maximum score in each
quadrant of the oral cavity recorded. Linear enamel hypoplasia (LEH) are linear defects
in tooth enamel produced by disruption in the process of enamel formation caused by
systemic stress, malnutrition or disease in childhood (Goodman and Rose 1990; Keita
and Boyce 2001). The presence of LEH was recorded on the anterior teeth following
Starling and Stock (2007). Missing skeletal lesion data were imputed using the “pmm”
function of the mice R package (van Buuren and Groothuis-Oudshoorn 2011).
Analytical Methods
The individuals of the Hamann-Todd were separated into two groups based on
whether they 1) never experienced the pandemic (control group), or 2) died during the
pandemic (flu group). The pandemic struck Cleveland between September 1918-March
1919. The flu group (n=83) includes individuals who died during this seven-month
period. The control group (n= 341) includes those who died prior to the pandemic (1910-

105
August 1918). Frailty status was determined using skeletal lesion data in two ways. First,
skeletal lesion data were combined to create a frailty index (FI). An individual with at
least two frailty indicators was given FI=1 and those with zero or one frailty lesion FI=0.
This decision was based on testing the survivorship of the pooled samples and selecting
the number of lesions that had the greatest discriminatory power. Second, the effect of
activity status (active, mixed, or healed) of periosteal lesions of the tibia was assessed.
An active lesion is characterized by woven or unremodeled new bone formation
resulting from osteoblastic activity and indicates local or systemic injury or disease
processes that were ongoing at the time of death (DeWitte 2014). A mixed lesion
contains both active and healing tissues at the time of death; it may be in the process of
healing or was healing and is in the process of becoming active again. A healed lesion is
characterized by smooth, remodeled bone, indicating a lesion that was not active at the
time of death. Active lesions have been correlated with lower survivorship – i.e. greater
frailty – than mixed or healed lesions (DeWitte 2014).
The data were analyzed using Kaplan-Meier survival and Cox proportional
hazards analysis. Survival analysis models the effect of certain variables on the time
elapsed until an event occurs. In this case, the effect of time period (control=0, flu=1) on
survival was assessed and statistical significance evaluated using the log rank test
(=0.05). If non-frail (healthy) people were equally likely to die as frail people during the
1918 pandemic, we expect to find no difference in survivorship or median survival time
between frail and non-frail individuals during the flu. A hazard ratio expresses the
differences in the risk of death between two or more groups. The change in the risk of

106
death in flu vs. control group was assessed using Cox proportional hazards analysis
(Miller Jr 1981) modeling period of death (control or flu) as the covariate. The Cox
model is semiparametric and does not specify the baseline hazard, meaning it does not
assume that the survival times will follow a specific type of distribution. This makes it
optimal for paleopathology analyses when the underlying hazard models are unknown
and sample sizes are often insufficient for estimating model parameters. If non-frail
people were as likely to die as frail people during the 1918 pandemic, we expect to find
no difference in the hazard ratio/risk of mortality between the non-frail and the frail
individuals during the flu. All analyses were performed in RStudio Version 1.1.456
(Rstudio Team, 2016).
Results
Figures 8 and 9 show the results of the Kaplan-Meier survival curves for the
control and flu groups using the frailty index. The control group shows a difference in
survivorship between frail and non-frail individuals. Frail individuals had lower
survivorship than those who were non-frail though the difference is not statistically
significant (p=0.16). The median survival time for frail individuals was 44 years and for
the non-frail was slightly longer at 45 years (Table 16). The results of the Cox
proportional hazards analysis for the control group show a similar picture. The results are
interpreted using the hazard ratios. Values that are greater than 1 indicate a risk of death
that is greater than the reference group (here the reference is FI=0). Values equal to 1
indicate no difference in the risk of death between groups. Values less than 1 indicate a

107
risk of death that is less than that of the reference group. In the control group (Table 17),
frail individuals were 1.1974 times more likely to die than those who were non-frail.
During the flu, we see that the difference in survivorship between the frail and the
non-frail remains is similar to the frail vs non-frail difference in the control group (Figure
9). The median survival times for the frail and the non-frail in both the control and flu
groups decrease by six years. Focusing on the flu sample, according to the results of the
Cox proportional hazards analysis, the frail were 1.1275 times more likely to die than the
non-frail, reflecting an increased risk of death for those with skeletal lesions, albeit a
small and non-statistically significant one.
Figures 10 and 11 present the Kaplan-Meier curves using periosteal lesion activity
as a reflection of frailty. In the control group, we can see that those with active lesions
(i.e. the most frail) had the lowest survivorship, and those with mixed lesions had the
greatest survivorship. Separate log-rank tests indicated no significant difference between
survival of individuals with active vs healed (p = 0.52) and active vs mixed (p=0.29)
periosteal lesions. There is a 6 and 7 year difference in the median survival time between
individuals with active lesions and those with healed or mixed lesions (table 18).
According to the results of the Cox proportional hazards analysis, having active or
healed lesions was associated with an increase in the risk of death in the control group
(table 19). Note that the reference group is mixed lesions because that group had the
greatest survival according to the Kaplan-Meier analysis and the sample sizes change

108
Figure 8.
Kaplan-Meier Survival Curves of Control Group Using Frailty Index
Note. Survivorship curves show the non-frail (red line) compared to the frail (green line)
in the control group using the frailty index. P-value (0.16) is the result of the log-rank
test.

109
Figure 9.
Kaplan-Meier Survival Curves of Flu Group Using Frailty Index
Note. Survivorship curves show the non-frail (red line) compared to the frail (green line)
in those who died during the 1918 influenza pandemic using the frailty index. P-value
(0.62) is the result of the log-rank test.

110
Table 16.
Results of Survival Analysis Using Frailty Index.
Lesion Status N
Median
survival time
(years)
Lower 0.95 Upper
0.95
Control FI=0 – non-frail 79 45 42 50
FI=1 – frail 262 44 40 45
Flu FI=0 – non-frail 25 39 34 50
FI=1 – frail 58 38 35 42
Table 17.
Cox Proportional Hazards Results for Frailty Index.
Hazard Ratio p-value Lower 0.95 Upper 0.95
Control - Frail 1.20 0.16 0.93 1.54
Flu - Frail 1.11 0.62 0.70 1.18
Note. Hazard ratios are in relation to non-frail individuals.

111
individuals with no periosteal lesions are not included. In the control group having active
or healed lesions was associated with a greater risk of death compared to mixed lesions.
Those with active lesions were 1.3 times more likely to die and those with healed about
1.1 times more likely to die.
Within the flu group (figure 11), individuals with active lesions showed the
lowest survival values, but the survivorship of those with healed lesions decreased by a
much greater magnitude. The median survival time for those with active lesions
decreases only from 39 to 36 years while the median survival time for those with healed
lesions decreases from 45 years to 38.5 years. During the flu, those with mixed lesions
had greater survivorship than those with active lesions though the difference was not
significant (p=0.091). According to the results of the Cox proportional hazards analysis
(table 19), having active or healed lesions is still associated with an increase in the risk of
mortality compared to mixed lesions. In the flu group active lesions were associated with
a 2.9 times greater likelihood of death and healed lesions a 1.59 times greater likelihood.
According to these results there is a greater risk of death associated with active lesions in
the flu compared to the control.

112
Figure. 10
Kaplan-Meier Survival Curves of Control Group Using Periosteal Lesions
Note. Survivorship curves show survivorship of those with active (red), mixed (blue) and
healed (green) periosteal lesions of the tibia in the control group. P-value (0.62) is the
result of the log-rank test.

113
Figure 11.
Kaplan-Meier Survival Curves of Flu Group Using Periosteal Lesions
Note. Survivorship curves show survivorship of those with active (red), mixed (blue) and
healed (green) periosteal lesions of the tibia in those who died in the 1918 flu pandemic.
P-value (0.15) is the result of the log-rank test.

114
Table 18.
Kaplan-Meier Survival Results for Periosteal Lesion Activity Status
Lesion Status N
Median survival
time (yrs) Lower 0.95 Upper 0.95
Control
Active 14 39 35 65
Mixed 60 46 42 40
Healed 126 45 40 40
Flu
Active 5 36 32 NA
Mixed 11 45 40 NA
Healed 32 38.5 35 50
Table 19.
Cox Proportional Hazards Results for Periosteal Lesion Activity Status.
Lesion status Hazard Ratio Lower 0.95 Upper 0.95
Control Active 1.31 0.73 2.35
Healed 1.10 0.81 1.50
Flu Active 2.90 0.94 8.70
Healed 1.59 0.78 3.25
Note. Hazard ratios are in relation to mixed tibial lesions.

115
Discussion
The results reveal a complicated picture of frailty and survival during the 1918
pandemic. In both pandemic and non-pandemic periods, frail individuals were more
likely to die. During the flu, however, non-frail individuals died at a slightly greater rate
than they did prior to the pandemic. Given that the global crude mortality rate of the 1918
flu was around 2.5% (Johnson and Mueller 2002; Patterson and Pyle 1991; Taubenberger
2005; Taubenberger and Morens 2006), or even as low as ~1% in the United States
(Viboud et al. 2013), this small difference is expected. Based on the results reported here,
the force of selective mortality decreased during the 1918 influenza pandemic, albeit very
slightly. This means that healthy, non-frail individuals were more likely to die during the
pandemic compared to non-pandemic times. However, non-frail individuals were not
equally likely to die as frail individuals; those with frailty indicators were still more likely
to die during the pandemic.
Considering the unusual mortality of young adults, a greater decrease in selective
mortality was expected for those between 20-40 years old. In Figure 9, a greater
separation between the survival curves for the frail and non-frail between the ages of 20-
40 is visible. Though the difference is slight, this suggests that frailty had a greater
impact on mortality for young adults compared to older adults.
Given that we do find modest support for increased frailty for young adults, do
these offer support for any of the hypotheses discussed previously for the cause of high
young adult mortality in 1918? We discuss implications for the cytokine storm
hypothesis, and the tuberculosis co-morbidity model.

116
A central assumption of the cytokine storm hypothesis is that the young adults
who died were the most healthy individuals. The results found here partially support this
hypothesis: due to the decrease in selective mortality more non-frail people were dying
who would have been at risk for the cytokine storm. However, frail individuals were still
more likely to die, suggesting that the cytokine storm could not have been the sole
explanation for the unusual mortality in the 1918 pandemic.
Based on these findings, we suggest that a broader interaction between
periodontal disease and influenza may have increased the risk of cytokine storms. As
mentioned above, a cytokine storm occurs when the immune system releases excessive
cytokines – a class of pro-inflammatory proteins. Periodontal disease is caused by
dysregulation of inflammatory processes, which includes cytokine activity (Andrukhov et
al. 2011; Hegde and Awan 2019; Okada and Murakami 1998; Ramadan et al. 2020;
Seymour and Gemmell 2001). Periodontal disease has also been linked with other
chronic inflammatory conditions such as rheumatoid arthritis (Berthelot and Le Goff
2010; Bingham III and Moni 2013; Detert et al. 2010; Potempa et al. 2017) and
inflammatory bowel disease (Piras et al. 2017; Poyato-Borrego et al. 2020; She et al.
2020; Vavricka et al. 2013), as well as pneumonia and chronic obstructive pulmonary
disorder (Azarpazhooh and Leake 2006; Raghavendran et al. 2007; Scannapieco et al.
2003). Periodontal disease has been associated with low levels of systemic inflammation
(Acharya et al. 2017; Hajishengallis and Chavakis 2021; Loos 2005; Marouf et al. 2021;
Molayem and Pontes 2020).

117
There is little scholarship exploring how coinfection with periodontal disease and
the influenza virus influences morbidity and mortality. However, recent research suggests
that Covid-19-periodontitis coinfection may place patients at greater risk for cytokine
storms and poor health outcomes (Botros et al. 2020; Fabri 2020; Gupta and Sahni 2020;
Hajizadeh et al. 2021; Kara et al. 2020; Marouf et al. 2021; Molayem and Pontes 2020;
Sahni and Gupta 2020; Siddharthan et al. 2020; Sukumar and Tadepalli 2021). As of yet,
this hypothesis has not been able to be extensively tested. Marouf et al. (2021) found that
Covid-19 patients with pre-existing periodontal disease had greater likelihood of
requiring ventilators, admission to the ICU, and death. Larvin et al. (2020) found that
while individuals with self-reported periodontal disease had no greater risk of Covid-19
infection, those with painful/bleeding gums were almost two times as likely to die of
Covid-19 compared to the control group. While there are important differences between
SARS-CoV-2 and the 1918 H1N1 influenza, it is likely that a co-occurrence of
periodontal disease and influenza increased the risk of an out-of-control inflammatory
response and elevated the risk of death. Furthermore, a person with periodontal disease
would have been perceived as “healthy” by those around them even though they had an
underlying source of frailty.
The results of this study may also shed light on the tuberculosis hypothesis.
Previous studies have found a relationship between tuberculosis and influenza mortality
in 1918 (Espersen 1954; Herring and Sattenspiel 2007; Mamelund and Dimka 2019;
Noymer and Garenne 2000; Oei and Nishiura 2012; Tripp et al. 2018; Zürcher et al.
2016). Noymer (2009), however, argues that tuberculosis may not have been a direct risk

118
factor for increased influenza mortality, but that the association may be due to
coincidental overlapping groups of at-risk individuals. The results found here support the
hypothesis that tuberculosis was a direct risk factor for influenza mortality – namely that
frail individuals were more likely to die. However, if tuberculosis were a significant risk
factor for mortality in 1918, how do we explain the report of “healthy” individuals?
While the effects of latent tuberculosis infection are understudied, latent TB has
been associated with increased chronic inflammation (Cowan et al. 2012; Huaman et al.
2016; Jensen et al. 2013; LaVergne et al. 2020; Naik et al. 2020) as well as greater risk of
other adverse health outcomes (Huaman et al. 2018; Naik et al. 2020). Studies have
reported a correlation between prior tuberculosis infection and worse outcomes from
influenza (Abadom et al. 2016; Archer et al. 2009; Puvanalingam et al. 2011; Walaza et
al. 2020). Crespo et al. (2017) found that cells previously exposed to M. tuberculosis
showed an inflammatory response when subsequently exposed to P. gingivalis, one of the
types of bacterial responsible for periodontal disease (PD). The authors conclude that
“chronic infections like TB … may cause a systemic inflammatory shift that can affect
other inflammatory processes such as the one present in PD” (p. 143). Crespo et al.
(2017) further proposes a framework for examining latent tuberculosis in the
bioarchaeological record. Individuals with latent TB would express a hyperinflammatory
phenotype, which would result in osteological evidence of periodontal disease, but no
skeletal evidence of tuberculosis. These expectations align well with the results found
here. Individuals with latent tuberculosis, have no discernible symptoms (Barry et al.
2009; CDC.gov 2020; Pai and Rodrigues 2015), and in a time before testing was widely

119
available could have easily been viewed as “healthy.” It seems possible, then, that latent
tuberculosis could be responsible for the high mortality rate among young adults in 1918,
the perception of these individuals as “healthy,” as well as the increased risk of death due
to frailty markers found here.
Implications for Bioarchaeology
The results of this study have implications for our understanding of stress, skeletal
lesions, and frailty in the bioarchaeological record. Collecting descriptive statistics on
lesion activity status has been common for decades (Andrushko 2007; Bartelink 2006;
Berger and Wang 2017; Buikstra and Ubelaker 1994; Rose 1989; Shuler 2011; Šlaus
2000). While the understanding of healed skeletal lesions as a reflection of recovery and
resilience is not new (e.g. Mensforth et al. 1978), Wood et al. (1992) were among the first
to amplify this idea within bioarchaeology and emphasize the role lesion status may play
in revealing variation in frailty. Summarizing data from an Oneota sample, Wood et al.
(1992) showed that active cranial lesions are more common in individuals who died in
childhood while healed/healing lesions are more common among those who survived to
adulthood. Bauder (2009) and Marx (2011) used the proportion of active to
healed/healing lesions as a “survivorship index,” assuming that healed lesions are
indicative of greater survival. DeWitte (2014), however, was the first to explicitly test the
impact of lesion status on survivorship. Using Kaplan-Meier survival analyses, she
demonstrated that individuals with active tibial periosteal lesions had the lowest
survivorship, and individuals with mixed and healed lesions had middling and greatest
survivorship, respectively. Budd and Wissler (2016) replicated DeWitte’s (2014) study

120
using a Nubian sample and found similar results. This study, however, finds that
individuals with mixed periosteal lesions had greater survival than those with healed
lesions, as do the aggregate results of Schwalenberg (2020). Using a sample of
individuals from Colonial Period Peru, Phillips (2019) found that the presence of
periosteal lesions of the tibia was associated with increased survival rather than mortality.
These varying results suggest that lesion activity status is more complicated than
previously thought and may be context and sample-dependent. More studies that explore
the connection between lesion status and mortality are needed to understand this variation
and develop a more holistic picture of the relationship between skeletal lesions and
frailty.
The results found here also expand our knowledge of the impact of lesion status
across the life course. DeWitte’s (2014) study included individuals of all ages, but all
with active lesions and approximately half of those with mixed lesions are below the age
of 20. The sample used by Phillips (2019) is mostly adult individuals over the age of 15.
Given that anyone who has made it to adulthood is a survivor, it is possible that the
impact of lesion activity (or even lesions in general) may vary over the life span and
decrease in adulthood. Figure 1 from DeWitte (2014) showed that the strength of
selective mortality associated with lesions tapers off after age 40. Similarly, our Figure 3
shows that after age 50, lesion activity status plays almost no role in shaping variation in
mortality. The results found by McFadden and Oxenham (2020) support the hypothesis
that the risk of mortality associated with nonspecific indicators of skeletal stress can vary
over time. They reanalyzed data on cribra orbitalia from the Global History of Health

121
Project, separating juveniles from the samples. They found that approximately half of the
samples demonstrating a significant relationship between cribra orbitalia and survival in
combined samples, showed no relationship after juveniles were removed.
This study contributes to our understanding of selective mortality in diverse burial
contexts. DeWitte and Wood (2008) used bioarchaeological data to test the assumption
that the Black Death was not selective regarding frailty. Like the results found here, frail
individuals were more likely to die than the non-frail during this epidemic event. We
hypothesize that all deaths due to natural causes, i.e. excluding accident/homicide/sui-
cide, are subject to selective mortality. While epidemic events show a decrease in the
strength of selective mortality, resulting in more non-frail individuals dying, the most
frail will always be at the greatest risk (Kyle et al. 2018). This has implications for our
understanding of burial contexts and selective mortality. Singleton or mass burials – if
they result from natural causes such famine or disease – will never be entirely
catastrophic and will contain the frailest individuals of a population. The only wholly
catastrophic assemblage – meaning that all members of the population, regardless of
frailty status, are equally likely to be included – may be one caused by a mass casualty
event such as war, accident, or massacre. To fully investigate selective mortality in
bioarchaeological assemblages, researchers need to recognize the limitations of their
samples and may need to be creative when searching for unique burial contexts.
This paper has several limitations. Firstly, the small sample size, particularly of
the flu group, means that some of the statistical analyses were underpowered. While
trends in the data can be seen, statistical significance could not be properly assessed.

122
Secondly, while the ages at death listed for the individuals of the Hamann-Todd are
generally accurate, the evidence of “age-heaping” suggests that some non-random
variation may have been introduced into the analyses.
Conclusion
This paper used a bioarchaeological approach to test the assumption that healthy
individuals were as likely to die as frail individuals during the 1918 influenza pandemic.
Using Kaplan-Meier survival and Cox proportional hazards analysis, we show that while
more non-frail individuals died during the pandemic compared to the pre-flu period, frail
individuals were more likely to die overall. These results enhance our understanding of
the unusual age-at-death distribution during the 1918 flu. Demonstrating that frail
individuals were more likely to die in 1918 allows new critical investigation into previous
explanations. We also propose a novel hypothesis that systemic inflammation due to
periodontal disease may have increased the risk of cytokine storms during the influenza
pandemic and contributed to greater mortality among young adults. This research
demonstrates how bioarchaeology can inform our perspectives on historical pandemics
and contribute valuable new insight to public health research. Additional study in this
area can increase our knowledge of differential frailty in past and present contexts,
enhancing our ability to mitigate the effects of pandemics.

123
REFERENCES
Abadom TR, Smith AD, Tempia S, Madhi SA, Cohen C, and Cohen AL. 2016. Risk
factors associated with hospitalisation for influenza-associated severe acute
respiratory illness in South Africa: A case-population study. Vaccine
34(46):5649-5655.
Acharya AB, Thakur S, Muddapur M, and Kulkarni RD. 2017. Cytokine ratios in chronic
periodontitis and type 2 diabetes mellitus. Diabetes & Metabolic Syndrome:
Clinical Research & Reviews 11(4):277-278.
Ahmed R, Oldstone MB, and Palese P. 2007. Protective immunity and susceptibility to
infectious diseases: lessons from the 1918 influenza pandemic. Nature
immunology 8(11):1188-1193.
Andrukhov O, Ulm C, Reischl H, Nguyen PQ, Matejka M, and Rausch‐Fan X. 2011.
Serum cytokine levels in periodontitis patients in relation to the bacterial load.
Journal of periodontology 82(6):885-892.
Andrushko VA. 2007. The bioarchaeology of Inca imperialism in the heartland: an
analysis of prehistoric burials from the Cuzco region of Peru: ProQuest.
Archer BN, Cohen C, Naidoo D, Thomas J, Makunga C, Blumberg L, Venter M,
Timothy G, Puren A, and McAnerney JM. 2009. Interim report on pandemic
H1N1 influenza virus infections in South Africa, April to October 2009:
epidemiology and factors associated with fatal cases. Eurosurveillance
14(42):19369.
Azarpazhooh A, and Leake JL. 2006. Systematic review of the association between
respiratory diseases and oral health. Journal of periodontology 77(9):1465-1482.
Barry CE, Boshoff HI, Dartois V, Dick T, Ehrt S, Flynn J, Schnappinger D,
Wilkinson RJ, and Young D. 2009. The spectrum of latent tuberculosis: rethinking the
biology and intervention strategies. Nature Reviews Microbiology 7(12):845-855.
Barry JM. 2004. The site of origin of the 1918 influenza pandemic and its public health
implications. Journal of Translational Medicine 2(1):3.
Barry JM. 2005. The great influenza: The story of the deadliest pandemic in history:
Penguin.
124
Bartelink EJ. 2006. Resource intensification in pre-contact central California: A
bioarchaeological perspective on diet and health patterns among hunter-gatherers
from the lower Sacramento Valley and San Francisco Bay: Texas A&M
University.
Bauder JM. 2009. Porotic hyperostosis: Differential diagnosis and implications for
subadult survivorship in prehistoric west-central Illinois: State University of New
York at Binghamton, Department of Anthropology.
Berger E, and Wang H. 2017. Bioarchaeology of adaptation to a marginal environment in
bronze age Western China. American Journal of Human Biology 29(4):e22956.
Berthelot J-M, and Le Goff B. 2010. Rheumatoid arthritis and periodontal disease. Joint
Bone Spine 77(6):537-541.
Bingham III CO, and Moni M. 2013. Periodontal disease and rheumatoid arthritis: the
evidence accumulates for complex pathobiologic interactions. Current opinion in
rheumatology 25(3):345.
Botros N, Iyer P, and Ojcius DM. 2020. Is there an association between oral health and
severity of COVID-19 complications? Biomedical Journal 43(4):325.
Brown DE. 1981. General stress in anthropological fieldwork. American Anthropologist
83(1):74-92.
Budd T, and Wissler A. 2016. Testing Differential Frailty in a Sudanese Sample. Society
for American Archaeology. Orlando, FL.
Buikstra JE. 1977. Biocultural dimensions of archeological study: a regional perspective.
Southern Anthropological Society Proceedings.
Buikstra JE, and Cook DC. 1980. Palaeopathology: an American account. Annual
Review of Anthropology 9:433-470.
Buikstra JE, and Ubelaker DH. 1994. Standards for data collection from human skeletal
remains.
Bush H, and Zvelebil M. 1991. Health in past societies: biocultural interpretations of
human skeletal remains in archaeological contexts: Tempus Reparatum Oxford.
CDC.gov. 2020. Latent TB Infection and TB Disease. In: Elimination DoT, editr. Centers
for Disease Control and Prevention. https://www.cdc.gov/tb/topic/basics/
tbinfectiondisease.htm.

125
Chousterman BG, Swirski FK, and Weber GF. 2017. Cytokine storm and sepsis disease
pathogenesis. Seminars in immunopathology: Springer. p 517-528.
Cowan J, Pandey S, Filion L, Angel J, Kumar A, and Cameron D. 2012. Comparison of
interferon‐γ‐, interleukin (IL)‐17‐and IL‐22‐expressing CD4 T cells, IL‐22‐
expressing granulocytes and proinflammatory cytokines during latent and active
tuberculosis infection. Clinical & Experimental Immunology 167(2):317-329.
Crespo FA, Klaes CK, Switala AE, and DeWitte SN. 2017. Do leprosy and tuberculosis
generate a systemic inflammatory shift? Setting the ground for a new dialogue
between experimental immunology and bioarchaeology. American journal of
physical anthropology 162(1):143-156.
Crosby AW. 2003. America's forgotten pandemic: the influenza of 1918. New York:
Cambridge University Press.
Daland J. 1919. Observations on the Epidemic of Influenza Occurring in the US Naval
Hospitals in Philadelphia in 1918. Transactions of the American Climatological
and Clinical Association 35:63.
Davenport FM, Hennessy AV, Francis Jr T, and Fabisch WtTAoP. 1953. Epidemiologic
and immunologic significance of age distribution of antibody to antigenic variants
of influenza virus. The Journal of experimental medicine 98(6):641-656.
De La Cova C. 2010. Cultural Patterns of Trauma among 19th‐Century‐Born Males in
Cadaver Collections. American Anthropologist 112(4):589-606.
de Wit E, Siegers JY, Cronin JM, Weatherman S, van den Brand JM, Leijten LM, van
Run P, Begeman L, van den Ham H-J, and Andeweg AC. 2018. 1918 H1N1
influenza virus replicates and induces proinflammatory cytokine responses in
extrarespiratory tissues of ferrets. The Journal of Infectious Diseases 217(8):1237-
1246.
Detert J, Pischon N, Burmester GR, and Buttgereit F. 2010. The association between
rheumatoid arthritis and periodontal disease. Arthritis research & therapy 12(5):1-
7.
DeWitte SN. 2009. The effect of sex on risk of mortality during the Black Death in
London, AD 1349–1350. American journal of physical anthropology 139(2):222-
234.
DeWitte SN. 2014. Differential survival among individuals with active and healed
periosteal new bone formation. International Journal of Paleopathology 7:38-44.

126
DeWitte SN, and Bekvalac J. 2010. Oral health and frailty in the medieval English
cemetery of St Mary Graces. American journal of physical anthropology
142(3):341-354.
DeWitte SN, and Wood JW. 2008. Selectivity of Black Death mortality with respect to
preexisting health. P Natl Acad Sci 105(5):1436-1441.
Dye C. 2006. Global epidemiology of tuberculosis. The Lancet 367(9514):938-940.
Edinborough M, and Rando C. 2020. Stressed Out: Reconsidering stress in the study of
archaeological human remains. Elsevier.
Espersen E. 1954. Epidemic of Influenza B among Green-landic Patients in a Danish
Tuberculosis Sanatorium. Influenza and Pulmonary Tuberculosis. Acta
tuberculosea Scandinavica 29(2):125-139.
Fabri GMC. 2020. Potential Link between COVID-19 and Periodontitis: Cytokine Storm,
Immunosuppression, and Dysbiosis. Oral Health and Dental Management
20(1):1-5.
Ferrara J, Abhyankar S, and Gilliland D. 1993. Cytokine storm of graft-versus-host
disease: a critical effector role for interleukin-1. Transplantation proceedings. p
1216.
France JJ. 1919. Clinical Notes on the Influenza Epidemic. Journal of the National
Medical Association 11(2):38.
Francis Jr T. 1955. The current status of the control of influenza. Annals of internal
medicine 43(3):534-538.
Gadkowski LB, and Stout JE. 2008. Cavitary pulmonary disease. Clinical microbiology
reviews 21(2):305-333.
Gagnon A, Miller MS, Hallman SA, Bourbeau R, Herring DA, Earn DJ, and Madrenas J.
2013. Age-specific mortality during the 1918 influenza pandemic: Unravelling the
mystery of high young adult mortality. PLoS One 8(8):e69586.
Gagnon A, Acosta JE, Madrenas J, and Miller MS. 2015. Is antigenic sin always
“original?” Re-examining the evidence regarding circulation of a human H1
influenza virus immediately prior to the 1918 Spanish flu. PLoS Pathog
11(3):e1004615.

127
Glezen WP. 1996. Emerging infections: pandemic influenza. Epidemiologic reviews
18(1):64-76.
Goodman AH, Brooke Thomas R, Swedlund AC, and Armelagos GJ. 1988. Biocultural
perspectives on stress in prehistoric, historical, and contemporary population
research. American Journal of Physical Anthropology 31(S9):169-202.
Goodman AH, Martin D, Armelagos GJ, and Clark G. 1984. Indicators of stress from
bones and teeth. In: MN C, and Armelagos GJ, editors. Paleopathology at the
origins of agriculture. New York: Academic Press. p 13-49.
Goodman AH, and Rose JC. 1990. Assessment of systemic physiological perturbations
from dental enamel hypoplasias and associated histological structures. American
Journal of Physical Anthropology 33(S11):59-110.
Grauer AL. 1993. Patterns of anemia and infection from medieval York, England.
American Journal of Physical Anthropology 91(2):203-213.
Gupta S, and Sahni V. 2020. The intriguing commonality of NETosis between COVID-
19 & Periodontal disease. Medical Hypotheses 144:109968.
Hallman S, and Gagnon A. 2014. Does exposure to influenza very early in life affect
mortality risk during a subsequent outbreak? The 1890 and 1918 pandemics in
Canada. Modern environments and human health:123-138.
Hajishengallis G, and Chavakis T. 2021. Local and systemic mechanisms linking
periodontal disease and inflammatory comorbidities. Nature Reviews
Immunology:1-15.
Hajizadeh F, Houshmand B, Ekhlasmandkermani M, Khazaei S, and Kheiri A. 2021.
Cytokine Profiles in Periodontitis and COVID-19. Dental Hypotheses 12(1):36.
Hegde R, and Awan K. 2019. Effects of periodontal disease on systemic health. Disease-
a-Month 65(6):185-192.
Herring A, and Sattenspiel L. 2007. Social contexts, syndemics, and infectious disease in
northern Aboriginal populations. American Journal of Human Biology: 19(2):
190-202.
Hoffman BL. 2011. Influenza activity in Saint Joseph, Missouri 1910-1923: Evidence for
an early wave of the 1918 pandemic. PLoS currents 2.

128
Huaman MA, Deepe Jr GS, and Fichtenbaum CJ. 2016. Elevated circulating
concentrations of interferon-gamma in latent tuberculosis infection. Pathogens &
immunity 1(2):291.
Huaman MA, Ticona E, Miranda G, Kryscio RJ, Mugruza R, Aranda E, Rondan PL,
Henson D, Ticona C, and Sterling TR. 2018. The relationship between latent
tuberculosis infection and acute myocardial infarction. Clinical Infectious
Diseases 66(6):886-892.
Hume J. 2000. The “forgotten” 1918 influenza epidemic and press portrayal of public
anxiety. Journalism & Mass Communication Quarterly 77(4):898-915.
Hunt DR, and Albanese J. 2005. History and demographic composition of the Robert J.
Terry anatomical collection. American Journal of Physical Anthropology
127(4):406-417.
Huss-Ashmore R, Goodman AH, and Armelagos GJ. 1982. Nutritional inference from
paleopathology. In: Schiffer M, editor. Advances in archaeological method and
theory. New York: Academic Press. p 395-474.
Jensen AV, Jensen L, Faurholt-Jepsen D, Aabye MG, Praygod G, Kidola J, Faurholt-
Jepsen M, Changalucha J, Range N, and Krarup H. 2013. The Prevalence of
Latent Mycobacterium tuberculosis Infection Based on an Interferon-c Release
Assay: A Cross-Sectional Survey among Urban Adults in Mwanza, Tanzania.
Johnson NP, and Mueller J. 2002. Updating the accounts: global mortality of the 1918-
1920" Spanish" influenza pandemic. Bulletin of the History of Medicine
76(1):105-115.
Jones-Kern K, and Latimer B. 1996. History of the Hamann-Todd Osteological
Collection: Skeletons Out of the Closet. Explorer. The Cleveland Museum of
Natural History.
Jordan EO. 1927. Epidemic Influenza. American Medical Association First Edition.
Kara C, Çelen K, Dede FÖ, Gökmenoğlu C, and Kara NB. 2020. Is periodontal
disease a risk factor for developing severe Covid-19 infection? The potential role
of Galectin-3. Experimental Biology and Medicine 245(16):1425-1427.
Kash JC, Tumpey TM, Proll SC, Carter V, Perwitasari O, Thomas MJ, Basler CF, Palese
P, Taubenberger JK, and García-Sastre A. 2006. Genomic analysis of increased
host immune and cell death responses induced by 1918 influenza virus. Nature
443(7111):578-581.

129
Keita S, and Boyce A. 2001. Diachronic patterns of dental hypoplasias and vault
porosities during the predynastic in the Naqada region, Upper Egypt. American
Journal of Human Biology 13(6):733-743.
Kerr NW. 1988. A method of assessing periodontal status in archaeologically derived
skeletal material. Journal of paleopathology 2(2):67-78.
Kim JH, Skountzou I, Compans R, and Jacob J. 2009. Original antigenic sin responses to
influenza viruses. The Journal of Immunology 183(5):3294-3301.
Klaus HD. 2014. Frontiers in the bioarchaeology of stress and disease: Cross‐disciplinary
perspectives from pathophysiology, human biology, and epidemiology. American
journal of physical anthropology 155(2):294-308.
Kobasa D, Takada A, Shinya K, Hatta M, Halfmann P, Theriault S, Suzuki H, Nishimura
H, Mitamura K, and Sugaya N. 2004. Enhanced virulence of influenza A viruses
with the haemagglutinin of the 1918 pandemic virus. Nature 431(7009):703-707.
Kyle B, Reitsema LJ, Tyler J, Fabbri PF, and Vassallo S. 2018. Examining the
osteological paradox: Skeletal stress in mass graves versus civilians at the Greek
colony of Himera (Sicily). American journal of physical anthropology
167(1):161-172.
Lallo JW. 1973. The skeletal biology of three prehistoric American Indian societies from
Dickson Mounds. Amherst: University of Massachusetts.
Larsen CS. 1997. Bioarchaeology: interpreting behavior from the human skeleton:
Cambridge University Press.
Larvin H, Wilmott S, Wu J, and Kang J. 2020. The impact of periodontal disease on
hospital admission and mortality during COVID-19 pandemic. Frontiers in
medicine 7.
LaVergne S, Umlauf A, McCutchan A, Heaton R, Benson C, Kumarasamy N, and Bharti
AR. 2020. Impact of Latent Tuberculosis Infection on Neurocognitive
Functioning and Inflammation in HIV-Infected and Uninfected South Indians.
JAIDS Journal of Acquired Immune Deficiency Syndromes 84(4):430-436.
Loos BG. 2005. Systemic markers of inflammation in periodontitis. Journal of
periodontology 76:2106-2115.
Luk J, Gross P, and Thompson WW. 2001. Observations on mortality during the 1918
influenza pandemic. Clinical Infectious Diseases 33(8):1375-1378.

130
Ma J, Dushoff J, and Earn DJ. 2011. Age-specific mortality risk from pandemic
influenza. Journal of theoretical biology 288:29-34.
Mamelund S-E. 2011. Geography may explain adult mortality from the 1918–20
influenza pandemic. Epidemics 3(1):46-60.
Mamelund S-E, and Dimka J. 2019. Tuberculosis as a Risk Factor for 1918 Influenza
Pandemic Outcomes. Tropical Medicine and Infectious Disease 4(2):74.
Marklein KE, Leahy RE, and Crews DE. 2016. In sickness and in death:
Assessing frailty in human skeletal remains. American journal of physical
anthropology 161(2):208-225.
Marouf N, Cai W, Said KN, Daas H, Diab H, Chinta VR, Hssain AA, Nicolau B, Sanz
M, and Tamimi F. 2021. Association between periodontitis and severity of
COVID‐19 infection: A case–control study. Journal of clinical periodontology.
Marx AM. 2011. Periostitis and survivorship at Cerro Mangote, Panama: State University
of New York at Binghamton.
Mays S, Fysh E, and Taylor GM. 2002. Investigation of the link between visceral surface
rib lesions and tuberculosis in a medieval skeletal series from England using
ancient DNA. American Journal of Physical Anthropology: The Official
Publication of the American Association of Physical Anthropologists 119(1):27-
36.
McEwen BS. 1998. Stress, adaptation, and disease: Allostasis and allostatic load. Annals
of the New York academy of sciences 840(1):33-44.
McEwen BS. 2005. Stressed or stressed out: what is the difference? Journal of Psychiatry
and Neuroscience 30(5):315.
McFadden C, and Oxenham MF. 2020. A paleoepidemiological approach to the
osteological paradox: Investigating stress, frailty and resilience through cribra
orbitalia. American Journal of Physical Anthropology 173(2):205-217.
Mensforth R, Lovejoy C, Lallo J, and Armelagos G. 1978. The role of constitutional
factors, diet, and infectious disease in the etiology ofporotic hyperostosis and
periosteal reactions in prehistoric infants and children. Medical Anthropolo gy 2.
Mensforth RP, and Latimer BM. 1989. Hamann‐Todd collection aging studies:
Osteoporosis fracture syndrome. American Journal of Physical Anthropology
80(4):461-479.

131
Miller Jr R. 1981. Survival Analysis. New York: Wiley.
Molayem S, and Pontes CC. 2020. The Mouth-COVID Connection: H-6 Levels in
Periodontal Disease—Potential Role in COVID-19-Related Respiratory
Complications. Medicina stomatologică 57(4):68-80.
Naik S, Alexander M, Kumar P, Kulkarni V, Deshpande P, Yadana S, Leu C-S, Araújo-
Pereira M, Andrade BB, and Bhosale R. 2020. Systemic Inflammation in
Pregnant Women With Latent Tuberculosis Infection. Frontiers in immunology
11.
Novak M, and Šlaus M. 2010. Health and disease in a Roman walled city: an example of
Colonia Iulia Iader. J Anthropol Sci 88:189-206.
Noymer A. 2009. Testing the influenza–tuberculosis selective mortality hypothesis with
Union Army data. Social Science & Medicine 68(9):1599-1608.
Noymer A, and Garenne M. 2000. The 1918 influenza epidemic's effects on sex
differentials in mortality in the United States. Population and Development
Review 26(3):565-581.
Oei W, and Nishiura H. 2012. The relationship between tuberculosis and influenza death
during the influenza (H1N1) pandemic from 1918-19. Computational and
Mathematical Methods in Medicine 2012.
Okada H, and Murakami S. 1998. Cytokine expression in periodontal health and disease.
Critical Reviews in Oral Biology & Medicine 9(3):248-266.
Olson DR, Simonsen L, Edelson PJ, and Morse SS. 2005. Epidemiological evidence of
an early wave of the 1918 influenza pandemic in New York City. Proceedings of
the National Academy of Sciences of the United States of America
102(31):11059-11063.
Osterholm MT. 2005. Preparing for the next pandemic. New England Journal of
Medicine 2005(352):1839-1842.
Pai M, and Rodrigues C. 2015. Management of latent tuberculosis infection: An
evidence-based approach. Lung India: official organ of Indian Chest Society
32(3):205.
Patterson KD, and Pyle GF. 1991. The geography and mortality of the 1918 influenza
pandemic. Bulletin of the History of Medicine 65(1):4.

132
Phillips M. 2019. Biological Stress and Age-at-Death: Differential Survivorship in
Colonial Period North Coast Peru.
Phipson ES. 1923. The pandemic of influenza in India in the year 1918. The Indian
medical gazette 58(11):509.
Pihlstrom BL, Michalowicz BS, and Johnson NW. 2005. Periodontal diseases. The
Lancet 366(9499):1809-1820.
Piras V, Usai P, Mezzena S, Susnik M, Ideo F, Schirru E, and Cotti E. 2017. Prevalence
of apical periodontitis in patients with inflammatory bowel diseases: a
retrospective clinical study. Journal of endodontics 43(3):389-394.
Potempa J, Mydel P, and Koziel J. 2017. The case for periodontitis in the pathogenesis of
rheumatoid arthritis. Nature Reviews Rheumatology 13(10):606.
Poyato-Borrego M, Segura-Sampedro JJ, Martín-González J, Torres-Domínguez Y,
Velasco-Ortega E, and Segura-Egea JJ. 2020. High Prevalence of apical
periodontitis in patients with inflammatory bowel disease: an age-and gender-
matched case-control study. Inflammatory bowel diseases 26(2):273-279.
Puvanalingam A, Rajendiran C, Sivasubramanian K, Ragunanthanan S, Suresh S, and
Gopalakrishnan S. 2011. Case series study of the clinical profile of H1N1 swine
flu influenza. The Journal of the Association of Physicians of India 59:14-16, 18.
Raghavendran K, Mylotte JM, and Scannapieco FA. 2007. Nursing home-associated
pneumonia, hospital-acquired pneumonia and ventilator-associated pneumonia:
the contribution of dental biofilms and periodontal inflammation. Periodontology
2000 44:164.
Ramadan DE, Hariyani N, Indrawati R, Ridwan RD, and Diyatri I. 2020. Cytokines and
chemokines in periodontitis. European Journal of Dentistry 14(3):483.
Redfern RC, and DeWitte SN. 2011. Status and health in Roman Dorset: The effect of
status on risk of mortality in post‐conquest populations. American Journal of
Physical Anthropology 146(2):197-208.
Roberts C, and Manchester K. 2007. The archaeology of disease: Cornell University
Press.
Roberts CA. 2019. Infectious Disease: Introduction, Periostosis, Periostitis,
Osteomyelitis, and Septic Arthritis. Ortner's Identification of Pathological
Conditions in Human Skeletal Remains: Elsevier. p 285-319.
133
Rose JC. 1989. Biological consequences of segregation and economic deprivation: A
post-slavery population from southwest Arkansas. Journal of Economic
History:351-360.
Rothman SM. 1994. Living in the shadow of death: tuberculosis and the social
experience of illness in American history. Johns Hopkins University Press.
Baltimore.
Sahni V, and Gupta S. 2020. COVID-19 & Periodontitis: The cytokine connection.
Medical Hypotheses 144:109908.
Scannapieco FA, Bush RB, and Paju S. 2003. Associations between periodontal disease
and risk for nosocomial bacterial pneumonia and chronic obstructive pulmonary
disease. A systematic review. Annals of periodontology 8(1):54-69.
Schaaf HS, Collins A, Bekker A, and Davies PD. 2010. Tuberculosis at extremes of age.
Respirology 15(5):747-763.
Schwalenberg MB. 2020. Frailty in the Lower Illinois River Valley: An Analysis of
Periosteal New Bone Formation during the Transition to Agriculture. Raleigh,
North Carolina: North Carolina State University.
Selye H. 1976. The Stress of Life (Revised. Edition.). New York: McGrawHill.
Seymour GJ, and Gemmell E. 2001. Cytokines in periodontal disease: where to from
here? Acta Odontologica Scandinavica 59(3):167-173.
Shanks GD, and Brundage JF. 2012. Pathogenic responses among young adults during
the 1918 influenza pandemic. Emerging infectious diseases 18(2):201.
She Y-y, Kong X-b, Ge Y-p, Liu Z-y, Chen J-y, Jiang J-w, Jiang H-b, and Fang S-l.
2020. Periodontitis and inflammatory bowel disease: a meta-analysis. BMC oral
health 20(1):1-11.
Short KR, Kedzierska K, and van de Sandt CE. 2018. Back to the future: lessons learned
from the 1918 influenza pandemic. Frontiers in cellular and infection
microbiology 8:343.
Shryock RH, and Association NT. 1904. A Study of the Voluntary Health Movement in
the United States. Nova Iorque: Arno Press.

134
Shuler KA. 2011. Life and death on a Barbadian sugar plantation: historic and
bioarchaeological views of infection and mortality at Newton Plantation.
International Journal of Osteoarchaeology 21(1):66-81.
Siddharthan S, Naing NN, and Wan-Arfah N. 2020. Periodontal Disease and COVID 19.
Journal of Pharmaceutical Research International:88-91.
Simonsen L, Clarke MJ, Schonberger LB, Arden NH, Cox NJ, and Fukuda K. 1998.
Pandemic versus epidemic influenza mortality: a pattern of changing age
distribution. Journal of Infectious Diseases 178(1):53-60.
Šlaus M. 2000. Biocultural analysis of sex differences in mortality profiles and stress
levels in the late medieval population from Nova Rača, Croatia. American Journal
of Physical Anthropology 111(2):193.
Stanwell-Smith R. 2019. Influenza pandemics - feared but also easily forgotten?
Perspectives in Public Health 139(5):210.
Starling AP, and Stock JT. 2007. Dental indicators of health and stress in early Egyptian
and Nubian agriculturalists: a difficult transition and gradual recovery. American
Journal of Physical Anthropology 134(4):520-528.
Stockwell EG, and Wicks JW. 1974. Age heaping in recent national censuses. Social
Biology 21(2):163-167.
Stuart-Macadam P. 1991. Porotic Hyperostosis: changing Interpretations. In: Ortner DJ,
and Aufderheide AC, editors. Human Paleopathology, Current Syntheses and
Future Options. Washington: Smithsonian Institution Press. p 36-39.
Sukumar K, and Tadepalli A. 2021. Nexus between COVID-19 and periodontal disease.
Journal of International Medical Research 49(3):1-11.
Szołtysek M, Poniat R, and Gruber S. 2018. Age heaping patterns in Mosaic data.
Historical Methods: A Journal of Quantitative and Interdisciplinary History
51(1):13-38.
Taubenberger J. 2005. The virulence of the 1918 pandemic influenza virus: unraveling
the enigma. Infectious Diseases from Nature: Mechanisms of Viral Emergence
and Persistence: Springer. 101-115.
Taubenberger JK, and Morens DM. 2006. 1918 Influenza: the mother of all pandemics.
Rev Biomed 17:69-79.
135
Tisoncik JR, Korth MJ, Simmons CP, Farrar J, Martin TR, and Katze MG. 2012. Into the
eye of the cytokine storm. Microbiology and Molecular Biology Reviews
76(1):16-32.
Tripp L, Sawchuk LA, and Saliba M. 2018. Deconstructing the 1918–1919 Influenza
Pandemic in the Maltese Islands: A Biosocial Perspective. Current Anthropology
59(2):229-239.
Usher BM. 2000. A multistate model of health and mortality for paleodemography: Tirup
cemetery.
van Buuren S, and Groothuis-Oudshoorn K. 2011. mice: Multivariate Imputation by
Chained Equations in R. Journal of Statistical Software 45(3):1-67.
Vaupel JW, Manton KG, and Stallard E. 1979. The impact of heterogeneity in individual
frailty on the dynamics of mortality. Demography 16(3):439-454.
Vavricka SR, Manser CN, Hediger S, Vögelin M, Scharl M, Biedermann L, Rogler S,
Seibold F, Sanderink R, and Attin T. 2013. Periodontitis and gingivitis in
inflammatory bowel disease: a case–control study. Inflammatory bowel diseases
19(13):2768-2777.
Viboud C, Eisenstein J, Reid AH, Janczewski TA, Morens DM, and Taubenberger JK.
2013. Age-and sex-specific mortality associated with the 1918–1919 influenza
pandemic in Kentucky. The Journal of infectious diseases 207(5):721-729.
Walaza S, Cohen C, Tempia S, Moyes J, Nguweneza A, Madhi SA, McMorrow M, and
Cohen AL. 2020. Influenza and tuberculosis co‐infection: A systematic review.
Influenza and other respiratory viruses 14(1):77-91.
Walker PL, Bathurst RR, Richman R, Gjerdrum T, and Andrushko VA. 2009. The causes
of porotic hyperostosis and cribra orbitalia: A reappraisal of the iron‐deficiency‐
anemia hypothesis. American Journal of Physical Anthropology 139(2):109-125.
Wapler U, Crubezy E, and Schultz M. 2004. Is cribra orbitalia synonymous with anemia?
Analysis and interpretation of cranial pathology in Sudan. American Journal of
Physical Anthropology 123(4):333-339.
Weston DA. 2008. Investigating the specificity of periosteal reactions in pathology
museum specimens. American Journal of Physical Anthropology 137(1):48-59.

136
Weston DA. 2012. Nonspecific infection in paleopathology: interpreting periosteal
reactions. In: Grauer AL, editor. A companion to paleopathology. Malden: Wiley-
Blackwell. 492-512.
Wood JW, Milner GR, Harpending HC, Weiss KM, Cohen MN, Eisenberg LE,
Hutchinson DL, Jankauskas R, Cesnys G, and Česnys G. 1992. The osteological
paradox: problems of inferring prehistoric health from skeletal samples [and
comments and reply]. Current Anthropology:343-370.
Zarulli V, Jones JAB, Oksuzyan A, Lindahl-Jacobsen R, Christensen K, and Vaupel JW.
2018. Women live longer than men even during severe famines and epidemics.
Proceedings of the National Academy of Sciences: 115(4): E832-E840.
Zürcher K, Zwahlen M, Ballif M, Rieder HL, Egger M, and Fenner L. 2016. Influenza
pandemics and tuberculosis mortality in 1889 and 1918: analysis of historical data
from Switzerland. PLoS One 11(10).
137
CHAPTER 5
CONCLUSION
This dissertation engages the osteological paradox by improving the
methodological handling of bioarchaeological data and contributing to our understanding
of skeletal lesions as indicators of frailty and resilience. It builds on previous scholarship
to show that ideas expressed by Wood et al. (1992) should be viewed as a framework for
elevating our understanding of the interactions between skeletal lesions, frailty and
survival as well as how they are shaped by biological, demographic, and cultural factors,
rather than as a challenge that needs to be “solved.” Chapter 2 presents background
information on the handling of missing data in bioarchaeology while Chapter 3
demonstrates how imputation of missing paleopathology data can enhance
bioarchaeologists’ ability to analyze skeletal lesions. Chapter 4 incorporates methods
proposed in Chapters 2 and 3 to analyze skeletal data from the Hamann-Todd Collection
to answer the question: were healthy individuals as likely to die as frail individuals during
the 1918 influenza pandemic? Together, these chapters contribute to a more nuanced
understanding of the relationship between frailty, selective mortality, and skeletal lesions.
Summary of Results
This dissertation had two primary goals: 1) to establish a new approach for the
handling of missing paleopathology data that will facilitate the use of new analytical
methods for exploring frailty and resiliency in skeletal data, and 2) to investigate the role
of prior frailty in shaping selective mortality in the 1918 influenza pandemic using a

138
novel bioarchaeological approach. How these goals were achieved in the preceding
chapters is discussed below.
Chapter 2 broadly explored how missing data are handled in bioarchaeology by
conducting a review of the literature. All bioarchaeology articles published between
2011-2020 from four anthropology journals (American Journal of Physical
Anthropology, International Journal of Paleopathology, International Journal of
Osteoarchaeology, Bioarchaeology International) were reviewed. Each article was
searched for the following terms when used in the context of missing data: “absent,”
“imputat,” “replace,” “missing,” and “unobserv.” We identified 276 articles that met the
search term criteria that were further categorized by subject topic and by the level of
theoretical and statistical rigor in which missing data were managed.
The results revealed considerable variety in how bioarchaeologists handle missing
data, yet overall they rely on the least rigorous approaches. Methods such as antimere
substitution and deletion are used widely across subject topics. Archaeology, pathology,
and trauma articles used more basic missing data methods, while those such as
biodistance and morphology more often employed advanced statistics. Despite the
ubiquity of missing data, theoretical considerations of how they introduce bias are
uncommon and standards for reporting are inconsistent. In Chapter 2 I propose a series of
recommendations to improve techniques for handling and reporting missing data. These
consist of (1) detailed descriptions of procedures for data collection, (2) explanations of
any pre-analysis data treatments, (3) disclosing the presence of missing data in the
sample, or when there are no missing data, (4) considerations of how missing data may

139
impact sample representativeness, and (5) testing for problematic patterns of missing
data. Greater attention to these issues will increase the statistical rigor of the field,
address fundamental areas of concern, and lead to new areas of anthropological inquiry.
Chapter 3 built upon Chapter 2 in developing and testing a new methodology for
handling missing bioarchaeology data. Imputation is widely considered the best method
for managing missing values, yet the results of Chapter 2 suggest it is underused in
bioarchaeology. To determine the best technique for bioarchaeological data, a test of six
imputation methods (predictive mean matching, mean, random, random forest,
expectation maximization, stochastic regression) was conducted on a sample of ordinal
and continuous variables. The success of each method at obtaining unbiased estimates of
the sample mean, variance, Kendall’s tau, and Cohen’s Kappa were compared with
listwise and pairwise deletion.
In all instances, listwise deletion was least successful at obtaining the original
parameters. Pairwise deletion performed well for ordinal data but ranked toward the
bottom for continuous data. Imputation of continuous data was successful for 40%
missingness, with stochastic regression and predictive mean matching ranked highest.
Imputation of ordinal pathology data was more difficult, but several imputation methods
were able to recover original parameter estimates with up to 30% missingness. These
findings support the use of imputation methods over deletion for handling missing
bioarchaeological and paleopathology data, especially when the data are continuous.
Whereas deletion methods reduce sample size, imputation maintains sample size,
improving statistical power and preventing bias from being introduced into the dataset.

140
Chapter 4 expanded our knowledge of the relationship between frailty and
mortality by testing the widely held assumption that adults who died during the 1918
influenza pandemic were “healthy.” Skeletal pathology and age-at-death data were
collected from 424 individuals from the Hamann-Todd Documented Collection.
Presence/absence data and activity status were collected on five nonspecific indicators of
skeletal stress known to be correlated with increased frailty in this sample (porotic
hyperostosis, cribra orbitalia, linear enamel hypoplasia, periodontal disease, and
periosteal lesions of the tibia). Missing data were imputed following the
recommendations established in Chapter 3. Individuals were deemed frail if they had at
least two skeletal stress indicators or active periosteal lesions. The sample was separated
into a flu group (n=83) and a control group (n=341).
Using Kaplan-Meier survival and Cox proportional hazards analyses, I tested if
individuals who were non-frail were equally as likely to die as those who were frail
during the 1918 flu. The results demonstrated that while more non-frail individuals did
die during the pandemic compared to non-pandemic times, frail individuals were more
likely to die during both time periods. These findings suggest that at least some of the
individuals perceived as “healthy” in 1918 had some underlying frailty that was captured
in the bioarchaeological data. Furthermore, the conclusions of this chapter increase our
understanding of selective mortality during epidemic events.
Future directions and Intellectual Merit
The results of this dissertation lay the groundwork for future research on missing
data methods in paleopathology as well as investigating selective mortality and frailty

141
within the context of the 1918 influenza pandemic. As mentioned in Chapter 3, the
sample sizes for testing the imputation of missing continuous and ordinal values were
quite large compared to most paleopathology studies. The techniques that worked best
with a larger sample may be less appropriate with a smaller one. Additional imputation
case tests are required to clarify which missing data method works best given different
sample sizes.
Chapter 4 hypothesized that systemic inflammation caused by periodontal disease
may have increased the risk of cytokine storms during the 1918 flu. This interaction may
have contributed directly to the unusually high mortality among young adults as well as
the perception that people who were dying were “healthy.” Increasing the sample size by
incorporating more individuals and collecting more detailed information on the severity
and activity of periodontal disease would help further tease out this potential relationship.
This research established that differential frailty played a role in contributing to
selective mortality in the 1918 influenza pandemic. The next step is to identify additional
specific risk factors that may shape variation in frailty and resilience. Previous
scholarship has suggested that a variety of factors influenced the risk of morbidity and
mortality during the 1918 flu. These include socioeconomic status (Bengtsson et al. 2018;
Grantz et al. 2016; Mamelund 2006; Mamelund 2018; McCracken and Curson 2003;
Murray et al. 2006; Tuckel et al. 2006), race and racism (Britten 1932; Dahal et al. 2018;
Gamble 2010; Herring and Sattenspiel 2007; Mamelund 2001; Mamelund 2011; Økland
and Mamelund 2019; Pool 1973; Schmitt and Nordyke 1999; Shanks et al. 2012;
Tomkins 1992; Wilson and Baker 2008), and sex/gender roles (Ammon 2001;

142
Brennaman 2019; Paskoff and Sattenspiel 2019; Rice 2018; Tuckel et al. 2006; Wilson et
al. 2014; Winslow and Rogers 1920). The findings of these studies, however, have
generated mixed results about how and why these factors contributed to increased
morbidity and mortality. For example, some authors have reported that African
Americans experienced lower rates of morbidity and mortality during the fall wave of the
pandemic compared to white Americans (Britten 1932; Frankel and Dublin 1919; Frost
1920; Garrett 2008; Opie et al. 1919). Økland and Mamelund (2019), on the other hand,
found that white Americans experienced greater morbidity in fall of 1918, but African
Americans had greater case fatality. Combined with data obtained from documentation
and historical records, bioarchaeological analyses can help untangle these uncertainties
by examining how intersecting identities affected frailty and survival in 1918.
Another research agenda that will stem from this dissertation is investigating how
selective mortality during the 1918 influenza shaped the lives of the survivors. As
mentioned previously, prior research on the Black Death demonstrated that pre-existing
frailty influenced the risk of death from the Black Death (DeWitte 2009; DeWitte 2014a;
DeWitte and Hughes-Morey 2012). Due to the removal of large numbers of frail
individuals from the population, post-epidemic populations experienced increased
survivorship for almost two centuries compared to those who lived before the epidemic
(DeWitte 2014b). Interestingly, males experienced greater increase in post-epidemic
survivorship greater than did females (DeWitte 2018). Very few studies have considered
the long-term impacts of the 1918 flu on population health and demography. This
143
research program will have strong implications for our ability to elucidate the long-term
transformative power of disease to shape human biology and society.
The results of this dissertation first and foremost expand our knowledge of the
1918 influenza pandemic. Scholars are still unsure why age-at-death distribution was so
unusual, why certain populations suffered catastrophic mortality rates, and why there was
substantial variation in mortality. This dissertation demonstrated that underlying frailty
influenced mortality in 1918. These results will contribute to the dialogue on why young
adults were disproportionately at risk. They can be used to bolster certain theories such as
the cytokine storm and tuberculosis hypotheses.
This study is the first to utilize bioarchaeological data to examine the 1918
influenza and demonstrates the potential for additional study in this area as well as for
other historical pandemics. Seasonal and epidemic influenza represents an enormous
drain on social and economic resources caused by lost work-days, hospitalizations,
medical visits and deaths (Molinari et al. 2007; Reed et al. 2015). Many of the viral
strains of influenza that continue to plague the world population are descendants of the
1918 H1N1 virus (Taubenberger and Morens 2006). By continuing to risk factors for
increased influenza mortality and characterizing how the disease may spread differently
in various populations, these avenues of research can aid with predicting how a future
influenza outbreak could affect modern populations.
Bioanthropological study of epidemics is a relatively new area of inquiry yet it
has permitted valuable new insight into heterogeneous frailty and selective mortality. The
new discipline has stimulating the growth of a variety of subfields including
144
paleodemography, paleoepidemiology, and paleopathology. However, because of the
relative novelty of this research, our understanding of changing patterns of mortality and
survivorship in epidemic contexts is largely founded on work conducted on the Black
Death in Europe. This dissertation provides an invaluable comparative datapoint for
assessing how frailty and selective mortality may vary during an entirely different
epidemic event.
This dissertation enriches the knowledge base and theory of anthropology and
related fields, as it combines methods and theory from multiple disciplines including
bioarchaeology, epidemiology, demography, and statistics to examine the origins and
evolution of human health and selective mortality. By identifying the foundations of
differential survival, this project will augment our understanding of how the forces of
natural selection shape biological vulnerability within our species.
By drawing attention to the widespread use of deletion methods for handling
missing data in bioarchaeology, this dissertation also provides a framework for the use of
imputation to manage missing values in paleopathology datasets. Statistically and
theoretically rigorous approaches to missing data will improve the size and composition
of bioarchaeological datasets and permit the use of more advanced statistical analyses –
opening new realms of inquiry for bioarchaeologists and paleodemographers.
Pandemics on the scale of the 1918 influenza and the current Covid-19 have a
remarkable ability to shape human society, genetics, and immunity. At the same time,
human behavior can force change in pathogen behavior and biology. Elucidating this
complex human-pathogen relationship helps us understand variation in pathogen

145
virulence and infectious disease etiology. This dissertation adds temporal depth to our
understandings of the long-term interactions between humans and their disease
environment, improving our scientific knowledge of human-pathogen coevolution.
As we saw in 2020, the threat of devastating global pandemics is high. In this
increasingly interconnected world, it is likely that Covid-19 will not be the last one many
of us face in our lifetimes. As such, we must already begin thinking about risk factors for
infection, cultural and biological sources of resilience, how to distribute health warnings,
combating fake information, and ensuring equitable access to medical care. This
dissertation shows how anthropologists and social scientists can contribute vital
information and unique perspectives to this area of discourse (DeWitte 2016; van Doren
2021). We are trained to understand how human biology is shaped by social, cultural, and
historical contexts in ways that medical professionals often are not. We know that
structural inequalities shape morbidity and mortality and that historical context is key to
understanding them. This dissertation adds temporal depth to our understandings of the
long-term interactions between humans and their disease environment and the
development of health disparity. Despite being able to contribute nuanced perspectives on
how social factors shape one’s health, recent history has shown that epidemiologists and
medical doctors are unlikely invite social scientists and anthropologists to be part of their
conversation. This dissertation integrates commonly used types of demographic
information, that may seem more familiar and reliable, with novel skeletal data. We hope
that research such as this will help break down the barrier separating the social scientists
from the hard scientists leading to greater collaboration between disciplines. Multiple

146
perspectives will expand our knowledge of pandemic risk factors and combating future
outbreaks.

147
REFERENCES
Abadom TR, Smith AD, Tempia S, Madhi SA, Cohen C, and Cohen AL. 2016. Risk
factors associated with hospitalisation for influenza-associated severe acute
respiratory illness in South Africa: A case-population study. Vaccine
34(46):5649-5655.
Acharya AB, Thakur S, Muddapur M, and Kulkarni RD. 2017. Cytokine ratios in chronic
periodontitis and type 2 diabetes mellitus. Diabetes & Metabolic Syndrome:
Clinical Research & Reviews 11(4):277-278.
Acock AC. 2005. Working with missing values. Journal of Marriage and family
67(4):1012-1028.
Afkhami A. 2003. Compromised constitutions: the Iranian experience with the 1918
influenza pandemic. Bulletin of the History of Medicine:367-392.
Agarwal SC. 2016. Bone morphologies and histories: Life course approaches in
bioarchaeology. American Journal of Physical Anthropology 159:130-149.
Ahmed R, Oldstone MB, and Palese P. 2007. Protective immunity and susceptibility to
infectious diseases: lessons from the 1918 influenza pandemic. Nature
immunology 8(11):1188-1193.
Akl EA, Shawwa K, Kahale LA, Agoritsas T, Brignardello-Petersen R, Busse JW,
Carrasco–Labra A, Ebrahim S, Johnston BC, and Neumann I. 2015. Reporting
missing participant data in randomised trials: systematic survey of the
methodological literature and a proposed guide. BMJ open 5(12):e008431.
Alesan A, Malgosa A, and Simó C. 1999. Looking into the demography of an Iron Age
population in the Western Mediterranean. I. Mortality. American Journal of
Physical Anthropology: The Official Publication of the American Association of
Physical Anthropologists 110(3):285-301.
Aligne C. 2016. Overcrowding and mortality during the influenza pandemic of 1918:
Evidence from US Army Camp AA Humphreys, Virginia. American Journal of
Public Health 106(4):642-644.
Allen KG, Mills RD, Knudson KJ, and von Cramon‐Taubadel N. 2020. Biological
diversity in an Islamic archaeological population: A radiogenic strontium isotope
and craniometric analysis of affinity in Ottoman Romania. American journal of
physical anthropology 171(4):569-583.
Allison PD. 2000. Multiple imputation for missing data: A cautionary tale. Sociological
methods & research 28(3):301-309.

148
Allison PD. 2001. Missing data: Sage publications.
Altman DG, and Bland JM. 2007. Missing data. BMJ 334(7590):424-424.
Ammon CE. 2001. The 1918 Spanish flu epidemic in Geneva, Switzerland. International
Congress Series: Elsevier. p 163-168.
Andridge RR, and Little RJ. 2010. A review of hot deck imputation for survey non‐
response. International statistical review 78(1):40-64.
Andrukhov O, Ulm C, Reischl H, Nguyen PQ, Matejka M, and Rausch‐Fan X. 2011.
Serum cytokine levels in periodontitis patients in relation to the bacterial load.
Journal of periodontology 82(6):885-892.
Andrushko VA. 2007. The bioarchaeology of Inca imperialism in the heartland: an
analysis of prehistoric burials from the Cuzco region of Peru: ProQuest.
Archer BN, Cohen C, Naidoo D, Thomas J, Makunga C, Blumberg L, Venter M,
Timothy G, Puren A, and McAnerney JM. 2009. Interim report on pandemic
H1N1 influenza virus infections in South Africa, April to October 2009:
epidemiology and factors associated with fatal cases. Eurosurveillance
14(42):19369.
Armelagos GJ, Goodman AH, Harper KN, and Blakey ML. 2009. Enamel hypoplasia and
early mortality: Bioarcheological support for the Barker hypothesis. Evolutionary
Anthropology: Issues, News, and Reviews: Issues, News, and Reviews 18(6):261-
271.
Auerbach BM. 2011. Methods for estimating missing human skeletal element osteometric
dimensions employed in the revised fully technique for estimating stature.
American Journal of Physical Anthropology 145(1):67-80.
Auerbach BM, Raxter MH, and Ruff C. 2005. If I only had a...: missing element
estimation accuracy using the fully technique for estimating statures. American
Journal of Physical Anthropology 126(S40): 67.
Azarpazhooh A, and Leake JL. 2006. Systematic review of the association between
respiratory diseases and oral health. Journal of periodontology 77(9):1465-1482.
Bailey BE, Andridge R, and Shoben AB. 2020. Multiple imputation by predictive mean
matching in cluster-randomized trials. BMC medical research methodology 20:1-
16.
Baker BJ, and Kealhofer L. 1996. Bioarchaeology of Native American adaptation in the
Spanish borderlands: Univ Press of Florida.

149
Baraldi AN, and Enders CK. 2010. An introduction to modern missing data analyses.
Journal of school psychology 48(1):5-37.
Barker DJ, Godfrey KM, Gluckman PD, Harding JE, Owens JA, and Robinson JS. 1993.
Fetal nutrition and cardiovascular disease in adult life. The Lancet
341(8850):938-941.
Barker DJP. 1998. Mothers, babies, and health in later life: Elsevier Health Sciences.
Barnard J, and Meng X-L. 1999. Applications of multiple imputation in medical studies:
from AIDS to NHANES. Statistical methods in medical research 8(1):17-36.
Barry CE, Boshoff HI, Dartois V, Dick T, Ehrt S, Flynn J, Schnappinger D, Wilkinson
RJ, and Young D. 2009. The spectrum of latent tuberculosis: rethinking the
biology and intervention strategies. Nature Reviews Microbiology 7(12):845-855.
Barry JM. 2004. The site of origin of the 1918 influenza pandemic and its public health
implications. Journal of Translational Medicine 2(1):3.
Barry JM. 2005. The great influenza: The story of the deadliest pandemic in history:
Penguin.
Bartelink EJ. 2006. Resource intensification in pre-contact central California: A
bioarchaeological perspective on diet and health patterns among hunter-gatherers
from the lower Sacramento Valley and San Francisco Bay: Texas A&M
University.
Basler CF, Reid AH, Dybing JK, Janczewski TA, Fanning TG, Zheng H, Salvatore M,
Perdue ML, Swayne DE, and Garcia-Sastre A. 2001. Sequence of the 1918
pandemic influenza virus nonstructural gene (NS) segment and characterization of
recombinant viruses bearing the 1918 NS genes. Proceedings of the National
Academy of Sciences 98(5):2746-2751.
Bauder JM. 2009. Porotic hyperostosis: Differential diagnosis and implications for
subadult survivorship in prehistoric west-central Illinois: State University of New
York at Binghamton, Department of Anthropology.
Bechtel L, Gonzalez Y, Nelson M, and Gibson R. 2011. Assessing several hot deck
imputation methods using simulated data from several economic programs.
Proceedings of the Section on Survey Research Methods, American Statistical
Association. p 5022-5036.
Bello SM, Thomann A, Signoli M, Dutour O, and Andrews P. 2006. Age and sex bias in
the reconstruction of past population structures. American journal of physical
anthropology 129(1):24-38.

150
Bengtsson T, Dribe M, and Eriksson B. 2018. Social class and excess mortality in
Sweden during the 1918 influenza pandemic. American Journal of Epidemiology
187(12):2568-2576.
Berger E, and Wang H. 2017. Bioarchaeology of adaptation to a marginal environment in
bronze age Western China. American Journal of Human Biology 29(4):e22956.
Berthelot J-M, and Le Goff B. 2010. Rheumatoid arthritis and periodontal disease. Joint
Bone Spine 77(6):537-541.
Bhaskaran K, and Smeeth L. 2014. What is the difference between missing completely at
random and missing at random? International journal of epidemiology
43(4):1336-1339.
Bingham III CO, and Moni M. 2013. Periodontal disease and rheumatoid arthritis: the
evidence accumulates for complex pathobiologic interactions. Current opinion in
rheumatology 25(3):345.
Bird JP, Martin R, Akçakaya HR, Gilroy J, Burfield IJ, Garnett ST, Symes A, Taylor J,
Şekercioğlu ÇH, and Butchart SH. 2020. Generation lengths of the world's birds
and their implications for extinction risk. Conservation Biology 34(5): 1252-1261.
Bodnar LM, Tang G, Ness RB, Harger G, and Roberts JM. 2006. Periconceptional
multivitamin use reduces the risk of preeclampsia. American journal of
epidemiology 164(5):470-477.
Boldsen JL. 1997. Estimating patterns of disease and mortality in a medieval Danish
village. Integrating archaeological demography: Multidisciplinary approaches to
prehistoric population (24):229-241.
Botros N, Iyer P, and Ojcius DM. 2020. Is there an association between oral health and
severity of COVID-19 complications? Biomedical Journal 43(4):325.
Breiman L. 2001. Random forests. Machine learning 45(1):5-32.
Brennaman AL. 2019. Doomed to Die?: An Examination of Demographics and
Comorbidity During the 1918 Influenza Pan-demic in Milwaukee. A Journal of
Collegiate Anthropology 10(1):75.
Britten RH. 1932. The incidence of epidemic influenza, 1918-19. Public Health Reports
47(6):304-339.
Brown DE. 1981. General stress in anthropological fieldwork. American Anthropologist
83(1):74-92.

151
Buckberry J. 2015. The (mis) use of adult age estimates in osteology. Annals of human
biology 42(4):323-331.
Budd T, and Wissler A. 2016. Testing Differential Frailty in a Sudanese Sample. Society
for American Archaeology. Orlando, FL.
Buikstra JE. 1977. Biocultural dimensions of archeological study: a regional perspective.
Southern Anthropological Society Proceedings.
Buikstra JE, and Cook DC. 1980. Palaeopathology: an American account. Annual
Review of Anthropology 9:433-470.
Buikstra JE, and Ubelaker DH. 1994. Standards for data collection from human skeletal
remains.
Burton A, and Altman D. 2004. Missing covariate data within cancer prognostic studies:
a review of current reporting and proposed guidelines. British journal of cancer
91(1):4-8.
Bush H, and Zvelebil M. 1991. Health in past societies: biocultural interpretations of
human skeletal remains in archaeological contexts: Tempus Reparatum Oxford.
CDC.gov. 2020. Latent TB Infection and TB Disease. In: Elimination DoT, editor.
Centers for Disease Control and Prevention: https://www.cdc.gov/tb/topic/basics/
tbinfectiondisease.htm.
Cheverko CM. 2018. The biological impact of developmental stress in the past:
correlations between growth disruptions and mortality risk in bioarchaeology: The
Ohio State University.
Cheverko CM, and Hubbe M. 2017. Comparisons of statistical techniques to assess age‐
related skeletal markers in bioarchaeology. American journal of physical
anthropology 163(2):407-416.
Chousterman BG, Swirski FK, and Weber GF. 2017. Cytokine storm and sepsis disease
pathogenesis. Seminars in immunopathology: Springer. 517-528.
Chowell G, Viboud C, Simonsen L, Miller MA, and Acuna-Soto R. 2010. Mortality
patterns associated with the 1918 influenza pandemic in Mexico: evidence for a
spring herald wave and lack of preexisting immunity in older populations. The
Journal of infectious diseases 202(4):567-575.
Coale AJ. 1956. The effects of changes in mortality and fertility on age composition. The
Milbank Memorial Fund Quarterly 34(1):79-114.
152
Cohen MN, Wood JW, and Milner GR. 1994. The osteological paradox reconsidered.
Current Anthropology 35(5): 629-637.
Cook DC, and Buikstra JE. 1979. Health and differential survival in prehistoric
populations: prenatal dental defects. American Journal of Physical Anthropology
51(4):649-664.
Cooke RS, Eigenbrod F, and Bates AE. 2019. Projected losses of global mammal and
bird ecological strategies. Nature communications 10(1):1-8.
Cooke RS, Eigenbrod F, and Bates AE. 2020. Ecological distinctiveness of birds and
mammals at the global scale. Global Ecology and Conservation 22:e00970.
Costello S, Brown DM, Noth EM, Cantley L, Slade MD, Tessier-Sherman B, Hammond
SK, Eisen EA, and Cullen MR. 2014. Incident ischemic heart disease and recent
occupational exposure to particulate matter in an aluminum cohort. Journal of
exposure science & environmental epidemiology 24(1):82-88.
Cowan J, Pandey S, Filion L, Angel J, Kumar A, and Cameron D. 2012. Comparison of
interferon‐γ‐, interleukin (IL)‐17‐and IL‐22‐expressing CD4 T cells, IL‐22‐
expressing granulocytes and proinflammatory cytokines during latent and active
tuberculosis infection. Clinical & Experimental Immunology 167(2):317-329.
Crespo FA, Klaes CK, Switala AE, and DeWitte SN. 2017. Do leprosy and tuberculosis
generate a systemic inflammatory shift? Setting the ground for a new dialogue
between experimental immunology and bioarchaeology. American journal of
physical anthropology 162(1):143-156.
Crosby AW. 2003. America's forgotten pandemic: the influenza of 1918. New York:
Cambridge University Press.
Dahal S, Jenner M, Dinh L, Mizumoto K, Viboud C, and Chowell G. 2018. Excess
mortality patterns during 1918–1921 influenza pandemic in the state of Arizona,
USA. Annals of epidemiology 28(5):273-280.
Daland J. 1919. Observations on the Epidemic of Influenza Occurring in the US Naval
Hospitals in Philadelphia in 1918. Transactions of the American Climatological
and Clinical Association 35:63.
Dam MK, Hvidtfeldt UA, Tjønneland A, Overvad K, Grønbæk M, and Tolstrup JS. 2016.
Five year change in alcohol intake and risk of breast cancer and coronary heart
disease among postmenopausal women: prospective cohort study. British Medical
Journal 353.

153
De La Cova C. 2010. Cultural Patterns of Trauma among 19th‐Century‐Born Males in
Cadaver Collections. American anthropologist 112(4):589-606.
De Leeuw ED, Hox JJ, and Huisman M. 2003. Prevention and treatment of item
nonresponse. Journal of Official Statistics 19:153-176.
De Waal T, Pannekoek J, and Scholtus S. 2011. Handbook of statistical data editing and
imputation: John Wiley & Sons.
de Wit E, Siegers J, Cronin JM, Weatherman S, van den Brand J, Leijten LM, van Run P,
Begeman L, van den Ham H-J, and Andeweg AC. 2018. 1918 H1N1 influenza
virus replicates and induces pro-inflammatory cytokine responses in extra-
respiratory tissues of ferrets. The Journal of infectious diseases 217(8): 1237-
1246.
de Wit E, Siegers JY, Cronin JM, Weatherman S, van den Brand JM, Leijten LM, van
Run P, Begeman L, van den Ham H-J, and Andeweg AC. 2018. 1918 H1N1
influenza virus replicates and induces proinflammatory cytokine responses in
extrarespiratory tissues of ferrets. The Journal of Infectious Diseases 217(8):1237-
1246.
Dempster A, Laird N, and Rubin D. 1977. Maximum likelihood from incomplete data via
the EMalgorithm. Journal of the Royal statistical Society 39(1):1-38.
Dent E, Ambagtsheer R, Beilby J, and Stewart S. 2020. Frailty and seasonality. The
journal of nutrition, health & aging 24:574-549.
Detert J, Pischon N, Burmester GR, and Buttgereit F. 2010. The association between
rheumatoid arthritis and periodontal disease. Arthritis research & therapy 12(5):1-
7.
DeWitte SN. 2009. The effect of sex on risk of mortality during the Black Death in
London, AD 1349–1350. American Journal of Physical Anthropology
139(2):222-234.
DeWitte SN. 2012. Sex differences in periodontal disease in catastrophic and attritional
assemblages from medieval London. American Journal of Physical Anthropology
149(3):405-416.
DeWitte SN. 2014. Differential survival among individuals with active and healed
periosteal new bone formation. International Journal of Paleopathology 7:38-44.
DeWitte SN. 2014. Health in post‐Black Death London (1350–1538): Age patterns of
periosteal new bone formation in a post‐epidemic population. American Journal
of Physical Anthropology 155(2):260-267.

154
Dewitte SN. 2014. Modeling the second epidemiologic transition in London: Patterns of
mortality and frailty during industrialization. Modern environments and human
health: Revisiting the second epidemiologic transition:35-53.
DeWitte SN. 2014. Mortality risk and survival in the aftermath of the Medieval Black
Death. PloS one 9(5):e96513.
DeWitte SN. 2015. Setting the stage for medieval plague: Pre‐black death trends in
survival and mortality. American Journal of Physical Anthropology 158(3):441-
451.
DeWitte SN. 2016. Archaeological Evidence of Epidemics Can Inform Future
Epidemics. Annual Review of Anthropology 45:63-77.
DeWitte SN. 2018. Stress, sex, and plague: Patterns of developmental stress and survival
in pre‐and post‐Black Death London. American Journal of Human Biology
30(1):e23073.
DeWitte SN, and Bekvalac J. 2010. Oral health and frailty in the medieval English
cemetery of St Mary Graces. American Journal of Physical Anthropology
142(3):341-354.
DeWitte SN, Boulware JC, and Redfern RC. 2013. Medieval monastic mortality: Hazard
analysis of mortality differences between monastic and nonmonastic cemeteries in
England. American Journal of Physical Anthropology 152(3):322-332.
DeWitte SN, and Hughes-Morey G. 2012. Stature and frailty during the Black Death: the
effect of stature on risks of epidemic mortality in London, AD 1348–1350.
Journal of Archaeological Science 39(5):1412-1419.
DeWitte SN, Hughes-Morey G, Bekvalac J, and Karsten J. 2016. Wealth, health and
frailty in industrial-era London. Annals of human biology 43(3):241-254.
DeWitte SN, and Stojanowski CM. 2015. The Osteological Paradox 20 Years Later: Past
Perspectives, Future Directions. Journal of Archaeological Research 23(4):397-
450.
DeWitte SN, and Wood JW. 2008. Selectivity of Black Death mortality with respect to
preexisting health. Proceedings of the National Academy of Sciences
105(5):1436-1441.
Divíšek J, Chytrý M, Beckage B, Gotelli NJ, Lososová Z, Pyšek P, Richardson DM, and
Molofsky J. 2018. Similarity of introduced plant species to native ones facilitates
naturalization, but differences enhance invasion success. Nature communications
9(1):1-10.

155
Dong Y, and Peng C-YJ. 2013. Principled missing data methods for researchers.
SpringerPlus 2(1):1-17.
Dye C. 2006. Global epidemiology of tuberculosis. The Lancet 367(9514):938-940.
Edinborough M, and Rando C. 2020. Stressed Out: Reconsidering stress in the study of
archaeological human remains. Journal of Archaeological Science 121:105197
Enders CK. 2010. Applied missing data analysis: Guilford press.
Erkoreka A. 2010. The Spanish influenza pandemic in occidental Europe (1918–1920)
and victim age. Influenza and other respiratory viruses 4(2):81-89.
Espersen E. 1954. Epidemic of Influenza B among Green-landic Patients in a Danish
Tuberculosis Sanatorium. Influenza and Pulmonary Tuberculosis. Acta
tuberculosea Scandinavica 29(2):125-139.
Evans CB, and Smokowski PR. 2015. Prosocial bystander behavior in bullying dynamics:
Assessing the impact of social capital. Journal of youth and adolescence
44(12):2289-2307.
Fabri GMC. 2020. Potential Link between COVID-19 and Periodontitis: Cytokine Storm,
Immunosuppression, and Dysbiosis. Oral Health and Dental Management
20(1):1-5.
Falys CG, and Prangle D. 2015. Estimating age of mature adults from the degeneration of
the sternal end of the clavicle. American Journal of Physical Anthropology
156(2):203-214.
Ferrara J, Abhyankar S, and Gilliland D. 1993. Cytokine storm of graft-versus-host
disease: a critical effector role for interleukin-1. Transplantation proceedings. p
1216.
Ferrie JE, Martikainen P, Shipley MJ, and Marmot MG. 2005. Self-reported economic
difficulties and coronary events in men: evidence from the Whitehall II study.
International Journal of Epidemiology 34(3):640-648.
Fichman M, and Cummings JN. 2003. Multiple imputation for missing data: Making the
most of what you know. Organizational Research Methods 6(3):282-308.
Finch WH. 2010. Imputation methods for missing categorical questionnaire data: A
comparison of approaches. Journal of Data Science 8(3):361-378.
France JJ. 1919. Clinical Notes on the Influenza Epidemic. Journal of the National
Medical Association 11(2):38.

156
Frankel LK, and Dublin LI. 1919. Influenza mortality among wage earners and their
families: a preliminary statement of results. American Journal of Public Health
9(10):731-742.
Frost WH. 1920. Statistics of influenza morbidity: with special reference to certain
factors in case incidence and case fatality. Public Health Reports (1896-
1970):584-597.
Gadkowski LB, and Stout JE. 2008. Cavitary pulmonary disease. Clinical microbiology
reviews 21(2):305-333.
Gagnon A, Miller MS, Hallman SA, Bourbeau R, Herring DA, Earn DJ, and Madrenas J.
2013. Age-specific mortality during the 1918 influenza pandemic: Unravelling the
mystery of high young adult mortality. PLoS One 8(8):e69586.
Gamble VN. 2010. “There Wasn't a Lot of Comforts in Those Days:” African Americans,
Public Health, and the 1918 Influenza Epidemic. Public Health Reports
125(3_suppl):113-122.
Garcia S. 2012. Is the circumference at the nutrient foramen of the tibia of value to sex
determination on human osteological collections? Testing a new method.
International Journal of Osteoarchaeology 22(3):361-365.
Garland CJ. 2020. Implications of accumulative stress burdens during critical periods of
early postnatal life for mortality risk among Guale interred in a colonial era
cemetery in Spanish Florida (ca. AD 1605–1680). American Journal of Physical
Anthropology 172(4):621-637.
Garrett TA. 2008. Pandemic economics: The 1918 influenza and its modern-day
implications. Federal Reserve Bank of St Louis Review 90(March/April 2008).
Glezen WP. 1996. Emerging infections: pandemic influenza. Epidemiologic reviews
18(1):64-76.
Godde K, Pasillas V, and Sanchez A. 2020. Survival analysis of the Black Death: Social
inequality of women and the perils of life and death in Medieval London.
American Journal of Physical Anthropology 173(1):168-178.
Godde K, and Hens SM. 2021. An epidemiological approach to the analysis of cribra
orbitalia as an indicator of health status and mortality in medieval and post‐
medieval London under a model of parasitic infection. American journal of
physical anthropology 174(4):631-645.

157
Goodman AH. 1993. On the interpretation of health from skeletal remains. Current
Anthropology 34(3):281-288.
Goodman AH, Brooke Thomas R, Swedlund AC, and Armelagos GJ. 1988. Biocultural
perspectives on stress in prehistoric, historical, and contemporary population
research. American Journal of Physical Anthropology 31(S9):169-202.
Goodman AH, Martin D, Armelagos GJ, and Clark G. 1984. Indicators of stress from
bones and teeth. In: MN C, and Armelagos GJ, editors. Paleopathology at the
origins of agriculture. New York: Academic Press. p 13-49.
Goodman AH, and Martin DL. 2002. Reconstructing health profiles from skeletal
remains. In: Steckel RH, and Rose JC, editors. The Backbone of History
Cambridge University Press, Cambridge, UK. Cambridge: Cambridge University
Press. p 11-60.
Goodman AH, and Rose JC. 1990. Assessment of systemic physiological perturbations
from dental enamel hypoplasias and associated histological structures. American
Journal of Physical Anthropology 33(S11):59-110.
Gordon CC, and Buikstra JE. 1981. Soil pH, bone preservation, and sampling bias at
mortuary sites. American Antiquity:566-571.
Gowland R, and Chamberlain A. 2005. Detecting plague: palaeodemographic
characterisation of a catastrophic death assemblage. Antiquity 79:146-157.
Graham JW. 2009. Missing data analysis: Making it work in the real world. Annual
review of psychology 60:549-576.
Graham JW. 2012. Missing data: Analysis and design: Springer Science & Business
Media.
Graham JW, Hofer SM, Donaldson SI, MacKinnon DP, and Schafer JL. 1997. Analysis
with missing data in prevention research.
Graham JW, Olchowski AE, and Gilreath TD. 2007. How many imputations are really
needed? Some practical clarifications of multiple imputation theory. Prevention
science 8(3):206-213.
Grantz KH, Rane MS, Salje H, Glass GE, Schachterle SE, and Cummings DA. 2016.
Disparities in influenza mortality and transmission related to sociodemographic
factors within Chicago in the pandemic of 1918. Proceedings of the National
Academy of Sciences 113(48):13839-13844.
158
Grauer AL. 1993. Patterns of anemia and infection from medieval York, England.
American Journal of Physical Anthropology 91(2):203-213.
Grilo C, Koroleva E, Andrášik R, Bíl M, and González‐Suárez M. 2020. Roadkill risk
and population vulnerability in European birds and mammals. Frontiers in
Ecology and the Environment 18(6):323-328.
Gupta S, and Sahni V. 2020. The intriguing commonality of NETosis between COVID-
19 & Periodontal disease. Medical Hypotheses 144:109968.
Hajishengallis G, and Chavakis T. 2021. Local and systemic mechanisms linking
periodontal disease and inflammatory comorbidities. Nature Reviews
Immunology:1-15.
Hajizadeh F, Houshmand B, Ekhlasmandkermani M, Khazaei S, and Kheiri A. 2021.
Cytokine Profiles in Periodontitis and COVID-19. Dental Hypotheses 12(1):36.
Hardt J, Max H, Tamara B, and Wilfried L. 2013. Multiple imputation of missing data: a
simulation study on a binary response. Open Journal of Statistics 3(5):370-378.
Harel O, Zimmerman R, and Dekhtyar O. 2008. Approaches to the handling of missing
data in communication research. The SAGE sourcebook of advanced data
analysis methods for communication research:349-371.
Hayward AD, Rickard IJ, and Lummaa V. 2013. Influence of early-life nutrition on
mortality and reproductive success during a subsequent famine in a preindustrial
population. Proceedings of the National Academy of Sciences 110(34):13886-
13891.
Hegde R, and Awan K. 2019. Effects of periodontal disease on systemic health. Disease-
a-Month 65(6):185-192.
Henriksson A, Zhao J, Dalianis H, and Boström H. 2016. Ensembles of randomized trees
using diverse distributed representations of clinical events. BMC medical
informatics and decision making 16(2):85-95.
Herring A, and Sattenspiel L. 2007. Social contexts, syndemics, and infectious disease in
northern Aboriginal populations. American Journal of Human Biology: The
Official Journal of the Human Biology Association 19(2):190-202.
Hoffman BL. 2011. Influenza activity in Saint Joseph, Missouri 1910-1923: Evidence for
an early wave of the 1918 pandemic. PLoS currents 2.
Holt B, and Benfer RA. 2000. Estimating missing data: an iterative approach. Journal of
Human Evolution 39:289-296.

159
Hoover KC, and Hudson MJ. 2016. Resilience in prehistoric persistent hunter–gatherers
in northwest Kyushu, Japan as assessed by population health and archaeological
evidence. Quaternary International 405:22-33.
Hoppa RD, and Vaupel JW. 2002. Paleodemography: age distributions from skeletal
samples: Cambridge University Press.
Howell DC. 2007. The treatment of missing data. The Sage handbook of social science
methodology:208-224.
Huaman MA, Deepe Jr GS, and Fichtenbaum CJ. 2016. Elevated circulating
concentrations of interferon-gamma in latent tuberculosis infection. Pathogens &
immunity 1(2):291.
Huaman MA, Ticona E, Miranda G, Kryscio RJ, Mugruza R, Aranda E, Rondan PL,
Henson D, Ticona C, and Sterling TR. 2018. The relationship between latent
tuberculosis infection and acute myocardial infarction. Clinical Infectious
Diseases 66(6):886-892.
Huisman M. 2009. Imputation of missing network data: Some simple procedures. Journal
of Social Structure 10(1):1-29.
Hume J. 2000. The “forgotten” 1918 influenza epidemic and press portrayal of public
anxiety. Journalism & Mass Communication Quarterly 77(4):898-915.
Hunt DR, and Albanese J. 2005. History and demographic composition of the Robert J.
Terry anatomical collection. American Journal of Physical Anthropology
127(4):406-417.
Huss-Ashmore R. 1981. Bone growth and remodeling as a measure of nutritional stress.
Biocultural Adaptation: Comprehensive Approaches to Skeletal Analysis, Martin
DL, Bumsted MP (eds) Research Reports(20):84-95.
Huss-Ashmore R, Goodman AH, and Armelagos GJ. 1982. Nutritional inference from
paleopathology. In: Schiffer M, editor. Advances in archaeological method and
theory. New York: Academic Press. p 395-474.
Ibáñez‐Gimeno P, De Esteban‐Trivigno S, Jordana X, Manyosa J, Malgosa A, and Galtés
I. 2013. Functional plasticity of the human humerus: shape, rigidity, and muscular
entheses. American journal of physical anthropology 150(4):609-617.
Jatautis Š, Suchomlinov A, and Jankauskas R. 2018. An association between adult
lifespan and stature in preindustrial Lithuanian populations: Analysis of skeletons.
HOMO 69(4):167-175.

160
Jeličić H, Phelps E, and Lerner RM. 2009. Use of missing data methods in longitudinal
studies: the persistence of bad practices in developmental psychology.
Developmental psychology 45(4):1195.
Jensen AV, Jensen L, Faurholt-Jepsen D, Aabye MG, Praygod G, Kidola J, Faurholt-
Jepsen M, Changalucha J, Range N, and Krarup H. 2013. The Prevalence of
Latent Mycobacterium tuberculosis Infection Based on an Interferon-c Release
Assay: A Cross-Sectional Survey among Urban Adults in Mwanza, Tanzania.
Jester B, Uyeki TM, Jernigan DB, and Tumpey TM. 2019. Historical and clinical aspects
of the 1918 H1N1 pandemic in the United States. Virology 527:32-37.
Johansson SR, and Horowitz S. 1986. Estimating mortality in skeletal populations:
influence of the growth rate on the interpretation of levels and trends during the
transition to agriculture. American Journal of Physical Anthropology 71(2):233-
250.
Johnson L, Barnard J, Rodriquez L, Smith EC, Swerdloff R, Wang X, and Wang C. 1998.
Ethnic differences in testicular structure and spermatogenic potential may
predispose testes of Asian men to a heightened sensitivity to steroidal
contraceptives. Journal of andrology 19(3):348-357.
Johnson N. 2001. Aspects of the historical geography of the 1918-19 influenza pandemic
in Britain: University of Cambridge.
Johnson NP, and Mueller J. 2002. Updating the accounts: global mortality of the 1918-
1920" Spanish" influenza pandemic. Bulletin of the History of Medicine
76(1):105-115.
Jones-Kern K, and Latimer B. 1996. History of the Hamann-Todd Osteological
Collection: Skeletons Out of the Closet. Explorer. The Cleveland Museum of
Natural History.
Jordan EO. 1927. Epidemic Influenza. American Medical Association First Edition.
Kaiser J. 1983. The Effectiveness of Hot-deck Procedures in Small Samples.
Kang H. 2013. The prevention and handling of the missing data. Korean journal of
anesthesiology 64(5):402.
Kara C, Çelen K, Dede FÖ, Gökmenoğlu C, and Kara NB. 2020. Is periodontal disease a
risk factor for developing severe Covid-19 infection? The potential role of
Galectin-3. Experimental Biology and Medicine 245(16):1425-1427.

161
Kash JC, Tumpey TM, Proll SC, Carter V, Perwitasari O, Thomas MJ, Basler CF, Palese
P, Taubenberger JK, and García-Sastre A. 2006. Genomic analysis of increased
host immune and cell death responses induced by 1918 influenza virus. Nature
443(7111):578-581.
Keckler CN. 1997. Catastrophic mortality in simulations of forager age-at-death: where
did all the humans go. Integrating Archaeological Demography: Multidisciplinary
Approaches to Prehistoric Populations Center for Archaeological Investigations,
Occasional Papers (24):205-228.
Keita S, and Boyce A. 2001. Diachronic patterns of dental hypoplasias and vault
porosities during the predynastic in the Naqada region, Upper Egypt. American
Journal of Human Biology 13(6):733-743.
Kelmelis KS, Price MH, and Wood J. 2017. The effect of leprotic infection on the risk of
death in medieval rural Denmark. American Journal of Physical Anthropology
164(4):763-775.
Kerr NW. 1988. A method of assessing periodontal status in archaeologically derived
skeletal material. Journal of Paleopathology 2(2):67-78.
King A, and Eckersley R. 2019. Statistics for biomedical engineers and scientists: How to
visualize and analyze data: Academic Press.
King G, Honaker J, Joseph A, and Scheve K. 1998. List-wise deletion is evil: what to do
about missing data in political science. Annual Meeting of the American Political
Science Association, Boston.
Klaus HD. 2014. Frontiers in the bioarchaeology of stress and disease: Cross‐disciplinary
perspectives from pathophysiology, human biology, and epidemiology. American
Journal of Physical Anthropology 155(2):294-308.
Klebanoff MA, and Cole SR. 2008. Use of multiple imputation in the epidemiologic
literature. American Journal of Epidemiology 168(4):355-357.
Kleinke K. 2018. Multiple imputation by predictive mean matching when sample size is
small. Methodology 14(1):3-15.
Kobasa D, Jones SM, Shinya K, Kash JC, Copps J, Ebihara H, Hatta Y, Kim JH,
Halfmann P, and Hatta M. 2007. Aberrant innate immune response in lethal
infection of macaques with the 1918 influenza virus. Nature 445(7125):319-323.
Kobasa D, Takada A, Shinya K, Hatta M, Halfmann P, Theriault S, Suzuki H, Nishimura
H, Mitamura K, and Sugaya N. 2004. Enhanced virulence of influenza A viruses
with the haemagglutinin of the 1918 pandemic virus. Nature 431(7009):703-707.

162
Konigsberg LW, and Frankenberg SR. 2013. Bayes in biological anthropology. American
journal of physical anthropology 152:153-184.
Krause RW, Huisman M, Steglich C, and Sniiders TA. 2018. Missing network data a
comparison of different imputation methods. 2018 IEEE/ACM International
Conference on Advances in Social Networks Analysis and Mining (ASONAM):
IEEE. p 159-163.
Kraut R, Patterson M, Lundmark V, Kiesler S, Mukophadhyay T, and Scherlis W. 1998.
Internet paradox: A social technology that reduces social involvement and
psychological well-being? American psychologist 53(9):1017.
Kyle B, Reitsema LJ, Tyler J, Fabbri PF, and Vassallo S. 2018. Examining the
osteological paradox: Skeletal stress in mass graves versus civilians at the Greek
colony of Himera (Sicily). American Journal of Physical Anthropology
167(1):161-172.
Lallo JW. 1973. The skeletal biology of three prehistoric American Indian societies from
Dickson Mounds. Amherst: University of Massachusetts.
Lang KM, and Little TD. 2018. Principled missing data treatments. Prevention Science
19(3):284-294.
Larsen CS. 1994. In the wake of Columbus: Native population biology in the postcontact
Americas. American Journal of Physical Anthropology 37(S19):109-154.
Larsen CS. 1997. Bioarchaeology: interpreting behavior from the human skeleton:
Cambridge University Press.
Larsen CS. 2001. Bioarchaeology of Spanish Florida: The impact of colonialism:
University Press of Florida.
Larsen CS, Griffin MC, Hutchinson DL, Noble VE, Norr L, Pastor RF, Ruff CB, Russell
KF, Schoeninger MJ, and Schultz M. 2001. Frontiers of contact: bioarchaeology
of Spanish Florida. Journal of World Prehistory 15(1):69-123.
Larvin H, Wilmott S, Wu J, and Kang J. 2020. The impact of periodontal disease on
hospital admission and mortality during COVID-19 pandemic. Frontiers in
medicine 7.
Lassale C, Tzoulaki I, Moons KG, Sweeting M, Boer J, Johnson L, Huerta JM, Agnoli C,
Freisling H, and Weiderpass E. 2018. Separate and combined associations of
obesity and metabolic health with coronary heart disease: a pan-European case-
cohort analysis. European Heart Journal 39(5):397-406.

163
LaVergne S, Umlauf A, McCutchan A, Heaton R, Benson C, Kumarasamy N, and Bharti
AR. 2020. Impact of Latent Tuberculosis Infection on Neurocognitive
Functioning and Inflammation in HIV-Infected and Uninfected South Indians.
JAIDS Journal of Acquired Immune Deficiency Syndromes 84(4):430-436.
Lawrence J, Stojanowski CM, Paul KS, Seidel AC, and Guatelli‐Steinberg D. 2021.
Heterogeneous frailty and the expression of linear enamel hypoplasia in a
genealogical population. American Journal of Physical Anthropology.
Lindhe J, Haffaiee A, and Socransky S. 1983. Progression of periodontal disease in adult
subjects in the absence of periodontal therapy. Journal of Clinical Periodontology
10(4):433-442.
Little RJ. 1988. Missing-data adjustments in large surveys. Journal of Business &
Economic Statistics 6(3):287-296.
Little RJ. 1988. A test of missing completely at random for multivariate data with
missing values. Journal of the American Statistical Association 83(404):1198-
1202.
Little RJ, and Rubin DB. 2002. Statistical analysis with missing data: John Wiley &
Sons.
Loos BG. 2005. Systemic markers of inflammation in periodontitis. Journal of
periodontology 76:2106-2115.
Lotka AJ. 1977. The stability of the normal age distribution. Mathematical Demography:
Springer. p 101-107.
Loucks EB, Almeida ND, Taylor SE, and Matthews KA. 2011. Childhood family
psychosocial environment and coronary heart disease risk. Psychosomatic
medicine 73(7):563.
Luk J, Gross P, and Thompson WW. 2001. Observations on mortality during the 1918
influenza pandemic. Clinical Infectious Diseases 33(8):1375-1378.
Lukacs J. 1994. The osteological paradoz and the Indus civilization: Problems of
inferring health from human skeletons at Harappa. In: Kenoyer J, editor. From
Sumer to Meluhha: Contributions to the Archaeology of South and West Asia in
Memory of George F Dales Jr. Madison: University of Wisconsin, Madison. p
143-155.

164
Luna LH. 2019. Canine sex estimation and sexual dimorphism in the collection of
identified skeletons of the University of Coimbra, with an application in a Roman
cemetery from Faro, Portugal. International Journal of Osteoarchaeology
29(2):260-272.
Ma J, Dushoff J, and Earn DJ. 2011. Age-specific mortality risk from pandemic
influenza. Journal of Theoretical Biology 288:29-34.
Madley-Dowd P, Hughes R, Tilling K, and Heron J. 2019. The proportion of missing
data should not be used to guide decisions on multiple imputation. Journal of
Clinical Epidemiology 110:63-73.
Mamelund S-E. 2006. Social factors, mortality and the Spanish influenza in Kristiania
1918–19. Interdisciplinary Communications:106.
Mamelund S-E. 2001. The Spanish influenza among Norwegian ethnic minorities 1918-
1919. Memorandum.
Mamelund S-E. 2003. Spanish influenza mortality of ethnic minorities in Norway 1918–
1919. European Journal of Population/Revue européenne de Démographie
19(1):83-102.
Mamelund S-E. 2004. An egalitarian disease? Socioeconomic status and individual
survival of the Spanish Influenza pandemic of 1918-19 in the Norwegian capital
of Kristiania. Memorandum.
Mamelund S-E. 2011. Geography may explain adult mortality from the 1918–20
influenza pandemic. Epidemics 3(1):46-60.
Mamelund S-E. 2018. 1918 pandemic morbidity: The first wave hits the poor, the second
wave hits the rich. Influenza and other respiratory viruses 12(3):307-313.
Mamelund S-E, and Dimka J. 2019. Tuberculosis as a Risk Factor for 1918 Influenza
Pandemic Outcomes. Tropical Medicine and Infectious Disease 4(2):74.
Maniam J, Antoniadis C, and Morris MJ. 2014. Early-life stress, HPA axis adaptation,
and mechanisms contributing to later health outcomes. Frontiers in endocrinology
5:73.
Margerison BJ, and Knusel C. 2002. Paleodemographic Comparison of a Catastrophic
and an Attritional Death Assemblage. American Journal of Physical
Anthropology 119:134-143.

165
Marklein KE. 2020. East of Rome: Exploring potential impacts of Roman imperialism on
Northeastern Mediterranean populations through a bioarchaeological perspective.
Journal of Archaeological Science: Reports 34:102590.
Marklein KE, and Crews DE. 2017. Frail or hale: Skeletal frailty indices in Medieval
London skeletons. PloS one 12(5):e0176025.
Marklein KE, Leahy RE, and Crews DE. 2016. In sickness and in death: Assessing frailty
in human skeletal remains. American journal of physical anthropology
161(2):208-225.
Marouf N, Cai W, Said KN, Daas H, Diab H, Chinta VR, Hssain AA, Nicolau B, Sanz
M, and Tamimi F. 2021. Association between periodontitis and severity of
COVID‐19 infection: A case–control study. Journal of clinical periodontology.
Martins BA, Visvanathan R, Barrie HR, Huang CH, Matsushita E, Okada K, Satake S,
Edwards S, Uno C, and Kuzuya M. 2020. Built Environment and Frailty:
Neighborhood Perceptions and Associations With Frailty, Experience From the
Nagoya Longitudinal Study. Journal of Applied Gerontology:0733464820912663.
Marx AM. 2011. Periostitis and survivorship at Cerro Mangote, Panama: State University
of New York at Binghamton.
Mays S. 1992. Taphonomic factors in a human skeletal assemblage. Circaea 9(20):54-58.
Mays S, Fysh E, and Taylor GM. 2002. Investigation of the link between visceral surface
rib lesions and tuberculosis in a medieval skeletal series from England using
ancient DNA. American Journal of Physical Anthropology: The Official
Publication of the American Association of Physical Anthropologists 119(1):27-
36.
McCool WC, Anderson AS, and Kennett DJ. 2021. Using a multimethod life history
approach to navigate the osteological paradox: A case study from Prehispanic
Nasca, Peru. American Journal of Physical Anthropology.
McCracken K, and Curson P. 2003. Flu downunder: a demographic and geographic
analysis of the 1919 epidemic in Sydney, Australia. The Spanish influenza
pandemic of 1918-1919: New perspectives: Routledge, Taylor and Francis Group.
p 110-131.
McEwen BS. 1998. Stress, adaptation, and disease: Allostasis and allostatic load. Annals
of the New York academy of sciences 840(1):33-44.
McEwen BS. 2005. Stressed or stressed out: what is the difference? Journal of Psychiatry
and Neuroscience 30(5):315.

166
McFadden C, and Oxenham MF. 2020. A paleoepidemiological approach to the
osteological paradox: Investigating stress, frailty and resilience through cribra
orbitalia. American Journal of Physical Anthropology 173(2):205-217.
McKnight PE, McKnight KM, Sidani S, and Figueredo AJ. 2007. Missing data: A gentle
introduction: Guilford Press.
McSweeny K, Colman A, Fancourt N, Parnell M, Stantiall S, Rice G, Baker M, and
Wilson N. 2007. Was rurality protective in the 1918 influenza pandemic in New
Zealand? The New Zealand Medical Journal (Online) 120(1256).
Meeyai S. 2016. Logistic Regression with Missing Data: A Comparisson of Handling
Methods, and Effects of Percent Missing Values. Journal of Traffic and Logistics
Engineering 4(2).
Mensforth R, Lovejoy C, Lallo J, and Armelagos G. 1978. The role of constitutional
factors, diet, and infectious disease in the etiology of porotic hyperostosis and
periosteal reactions in prehistoric infants and children. Medical Anthropology 2.
Mensforth RP, and Latimer BM. 1989. Hamann‐Todd collection aging studies:
Osteoporosis fracture syndrome. American Journal of Physical Anthropology
80(4):461-479.
Miller Jr R. 1981. Survival Analysis. New York: Wiley.
Milner GR, Wood JW, and Boldsen JL. 2008. Advances in Paleodemography. In:
Katzenberg MA, and Saunders SR, editors. Biological Anthropology of the
Human Skeleton, second edition: John Wiley and Sons. p 561-599.
Molayem S, and Pontes CC. 2020. The Mouth-COVID Connection: H-6 Levels in
Periodontal Disease—Potential Role in COVID-19-Related Respiratory
Complications. Medicina stomatologică 57(4):68-80.
Molinari N-AM, Ortega-Sanchez IR, Messonnier ML, Thompson WW, Wortley PM,
Weintraub E, and Bridges CB. 2007. The annual impact of seasonal influenza in
the US: measuring disease burden and costs. Vaccine 25(27):5086-5096.
Morelli T, Moss KL, Preisser JS, Beck JD, Divaris K, Wu D, and Offenbacher S. 2018.
Periodontal profile classes predict periodontal disease progression and tooth loss.
Journal of periodontology 89(2):148-156.
Morris TP, White IR, and Royston P. 2014. Tuning multiple imputation by predictive
mean matching and local residual draws. BMC medical research methodology
14(75).
167
Mummert A, Esche E, Robinson J, and Armelagos GJ. 2011. Stature and robusticity
during the agricultural transition: evidence from the bioarchaeological record.
Economics & Human Biology 9(3):284-301.
Murray CJ, Lopez AD, Chin B, Feehan D, and Hill KH. 2006. Estimation of potential
global pandemic influenza mortality on the basis of vital registry data from the
1918–20 pandemic: a quantitative analysis. The Lancet 368(9554):2211-2218.
Musil CM, Warner CB, Yobas PK, and Jones SL. 2002. A comparison of imputation
techniques for handling missing data. Western Journal of Nursing Research
24(7):815-829.
Myers TA. 2011. Goodbye, listwise deletion: Presenting hot deck imputation as an easy
and effective tool for handling missing data. Communication methods and
measures 5(4):297-310.
Naik S, Alexander M, Kumar P, Kulkarni V, Deshpande P, Yadana S, Leu C-S, Araújo-
Pereira M, Andrade BB, and Bhosale R. 2020. Systemic Inflammation in
Pregnant Women With Latent Tuberculosis Infection. Frontiers in immunology
11.
Nawrocki SP. 1995. Taphonomic processes in historic cemeteries. Bodies of evidence:
reconstructing history through skeletal analysis:49-66.
Nelwamondo FV, Mohamed S, and Marwala T. 2007. Missing data: A comparison of
neural network and expectation maximization techniques. Current Science:1514-
1521.
Newman DA. 2003. Longitudinal modeling with randomly and systematically missing
data: A simulation of ad hoc, maximum likelihood, and multiple imputation
techniques. Organizational research methods 6(3):328-362.
Newman DA. 2014. Missing data: Five practical guidelines. Organizational Research
Methods 17(4):372-411.
Newman SL, and Gowland RL. 2017. Dedicated followers of fashion? Bioarchaeological
perspectives on socio‐economic status, inequality, and health in urban children
from the industrial revolution (18th–19th C), England. International Journal of
Osteoarchaeology 27(2):217-229.
Niinimäki S. 2012. The relationship between musculoskeletal stress markers and
biomechanical properties of the humeral diaphysis. American Journal of Physical
Anthropology 147(4):618-628.

168
Niinimäki S, and Baiges Sotos L. 2013. The relationship between intensity of physical
activity and entheseal changes on the lower limb. International Journal of
Osteoarchaeology 23(2):221-228.
Novak M, Howcroft R, and Pinhasi R. 2017. Child health in five early medieval Irish
sites: a multidisciplinary approach. International Journal of Osteoarchaeology
27(3):398-408.
Novak M, and Šlaus M. 2010. Health and disease in a Roman walled city: an example of
Colonia Iulia Iader. Journal of Anthropological Science 88:189-206.
Noymer A. 2009. Testing the influenza–tuberculosis selective mortality hypothesis with
Union Army data. Social Science & Medicine 68(9):1599-1608.
Noymer A, and Garenne M. 2000. The 1918 influenza epidemic's effects on sex
differentials in mortality in the United States. Population and Development
Review 26(3):565-581.
O'Donnell L. 2019. Indicators of stress and their association with frailty in the precontact
southwestern United States. American Journal of Physical Anthropology
170(3):404-417.
Oei W, and Nishiura H. 2012. The relationship between tuberculosis and influenza death
during the influenza (H1N1) pandemic from 1918-19. Computational and
Mathematical Methods in Medicine 2012.
Okada H, and Murakami S. 1998. Cytokine expression in periodontal health and disease.
Critical Reviews in Oral Biology & Medicine 9(3):248-266.
Økland H, and Mamelund S-E. 2019. Race and 1918 influenza pandemic in the United
States: A review of the literature. International journal of environmental research
and public health 16(14):2487.
Olson DR, Simonsen L, Edelson PJ, and Morse SS. 2005. Epidemiological evidence of
an early wave of the 1918 influenza pandemic in New York City. Proceedings of
the National Academy of Sciences of the United States of America
102(31):11059-11063.
Ong G. 1998. Periodontal disease and tooth loss. International dental journal 48(S3):233-
238.
Opie EL, Freeman AW, Blake FG, Small JC, and Rivers TM. 1919. Pneumonia
following influenza (at Camp Pike, Ark.). Journal of the American Medical
Association 72(8):556-565.

169
Ordonez A, and Svenning J-C. 2017. Consistent role of Quaternary climate change in
shaping current plant functional diversity patterns across European plant orders.
Scientific Reports 7:42988.
Ortner DJ. 1991. Theoretical and methodological issues in paleopathology. Human
paleopathology: current syntheses and future options Washington, DC:
Smithsonian Institution Press p:5-11.
Osborne JW. 2013. Six: Dealing with missing or incomplete data: Debunking the myth of
emptiness. Best practices in data cleaning: A complete guide to everything you
need to do before and after collecting your data:105-138.
Osterholm MT. 2005. Preparing for the next pandemic. New England Journal of
Medicine 2005(352):1839-1842.
Oxford J, Sefton A, Jackson R, Innes W, Daniels R, and Johnson N. 2002. World War I
may have allowed the emergence of “Spanish” influenza. The Lancet infectious
diseases 2(2):111-114.
Oxford JS, and Gill D. 2018. Unanswered questions about the 1918 influenza pandemic:
origin, pathology, and the virus itself. The Lancet Infectious Diseases
18(11):e348-e354.
Pacifici M, Santini L, Di Marco M, Baisero D, Francucci L, Marasini GG, Visconti P,
and Rondinini C. 2013. Generation length for mammals. Nature Conservation
5:89.
Pai M, and Rodrigues C. 2015. Management of latent tuberculosis infection: An
evidence-based approach. Lung India: official organ of Indian Chest Society
32(3):205.
Paskoff T, and Sattenspiel L. 2019. Sex‐and age‐based differences in mortality during the
1918 influenza pandemic on the island of Newfoundland. American Journal of
Human Biology 31(1):e23198.
Patterson KD, and Pyle GF. 1991. The geography and mortality of the 1918 influenza
pandemic. Bulletin of the History of Medicine 65(1):4.
Paynter S, Ware R, and Shanks G. 2011. Host and environmental factors reducing
mortality during the 1918–1919 influenza pandemic. Epidemiology & Infection
139(9):1425-1430.
Pedersen AB, Mikkelsen EM, Cronin-Fenton D, Kristensen NR, Pham TM, Pedersen L,
and Petersen I. 2017. Missing data and multiple imputation in clinical
epidemiological research. Clinical epidemiology 9:157-166.

170
Peng C-YJ, Harwell M, Liou S-M, and Ehman LH. 2006. Advances in missing data
methods and implications for educational research. In: Sawilowsky SS, editor.
Real data analysis.
Pepinsky TB. 2018. A note on listwise deletion versus multiple imputation. Political
Analysis 26(4):480-488.
Petersen CB, Bauman A, Grønbæk M, Helge JW, Thygesen LC, and Tolstrup JS. 2014.
Total sitting time and risk of myocardial infarction, coronary heart disease and
all-cause mortality in a prospective cohort of Danish adults. International Journal
of Behavioral Nutrition and Physical Activity 11(1):13.
Peugh JL, and Enders CK. 2004. Missing data in educational research: A review of
reporting practices and suggestions for improvement. Review of educational
research 74(4):525-556.
Phillips M. 2019. Biological Stress and Age-at-Death: Differential Survivorship in
Colonial Period North Coast Peru.
Phipson ES. 1923. The pandemic of influenza in India in the year 1918. The Indian
medical gazette 58(11):509.
Pihlstrom BL, Michalowicz BS, and Johnson NW. 2005. Periodontal diseases. The
Lancet 366(9499):1809-1820.
Pinnelli A, and Mancini P. 1998. Mortality peaks in Italy in the late 19th and early 20th
centuries: trends by age and sex. European Journal of Population/Revue
européenne de Démographie 14(4):333-365.
Piras V, Usai P, Mezzena S, Susnik M, Ideo F, Schirru E, and Cotti E. 2017. Prevalence
of apical periodontitis in patients with inflammatory bowel diseases: a
retrospective clinical study. Journal of endodontics 43(3):389-394.
Pool D. 1973. The effects of the 1918 pandemic of influenza on the Maori population of
New Zealand. Bulletin of the History of Medicine 47(3):273-281.
Potempa J, Mydel P, and Koziel J. 2017. The case for periodontitis in the pathogenesis of
rheumatoid arthritis. Nature Reviews Rheumatology 13(10):606.
Powney M, Williamson P, Kirkham J, and Kolamunnage-Dona R. 2014. A review of the
handling of missing longitudinal outcome data in clinical trials. Trials 15(1):1-11.
171
Poyato-Borrego M, Segura-Sampedro JJ, Martín-González J, Torres-Domínguez Y,
Velasco-Ortega E, and Segura-Egea JJ. 2020. High Prevalence of apical
periodontitis in patients with inflammatory bowel disease: an age-and gender-
matched case-control study. Inflammatory bowel diseases 26(2):273-279.
Puvanalingam A, Rajendiran C, Sivasubramanian K, Ragunanthanan S, Suresh S, and
Gopalakrishnan S. 2011. Case series study of the clinical profile of H1N1 swine
flu influenza. The Journal of the Association of Physicians of India 59:14-16, 18.
Quintero M, and LeBoulluec A. 2018. Missing Data Imputation for Ordinal Data.
International Journal of Computer Applications 181(5):10-16.
Raghavendran K, Mylotte JM, and Scannapieco FA. 2007. Nursing home-associated
pneumonia, hospital-acquired pneumonia and ventilator-associated pneumonia:
the contribution of dental biofilms and periodontal inflammation. Periodontology
2000 44:164.
Ragsdale CS, and Edgar HJ. 2015. Cultural interaction and biological distance in
postclassic period Mexico. American Journal of Physical Anthropology
157(1):121-133.
Ramadan DE, Hariyani N, Indrawati R, Ridwan RD, and Diyatri I. 2020. Cytokines and
chemokines in periodontitis. European Journal of Dentistry 14(3):483.
Ramseier CA, Anerud A, Dulac M, Lulic M, Cullinan MP, Seymour GJ, Faddy MJ,
Bürgin W, Schätzle M, and Lang NP. 2017. Natural history of periodontitis:
Disease progression and tooth loss over 40 years. Journal of clinical
periodontology 44(12):1182-1191.
Ranganathan P, and Gogtay NJ. 2019. An Introduction to Statistics–Data Types,
Distributions and Summarizing Data. Indian journal of critical care medicine:
peer-reviewed, official publication of Indian Society of Critical Care Medicine
23(Suppl 2):S169.
Redfern R, DeWitte S, Beaumont J, Millard A, and Hamlin C. 2019. A new method for
investigating the relationship between diet and mortality: Hazard analysis using
dietary isotopes. Annals of Human Biology 46(5):378-387.
Redfern RC, and DeWitte SN. 2011. Status and health in Roman Dorset: The effect of
status on risk of mortality in post‐conquest populations. American Journal of
Physical Anthropology 146(2):197-208.
Redfern RC, DeWitte SN, Pearce J, Hamlin C, and Dinwiddy KE. 2015. Urban–rural
differences in Roman Dorset, England: A bioarchaeological perspective on
Roman settlements. American journal of physical anthropology 157(1):107-120.

172
Redfern RC, Judd MA, and DeWitte SN. 2017. Multiple injury and health in past
societies: an analysis of concepts and approaches, and insights from a multi‐
period study. International Journal of Osteoarchaeology 27(3):418-429.
Reed C, Chaves SS, Kirley PD, Emerson R, Aragon D, Hancock EB, Butler L,
Baumbach J, Hollick G, and Bennett NM. 2015. Estimating influenza disease
burden from population-based surveillance data in the United States. PloS one
10(3):e0118369.
Reid AH, Fanning TG, Hultin JV, and Taubenberger JK. 1999. Origin and evolution of
the 1918 “Spanish” influenza virus hemagglutinin gene. Proceedings of the
National Academy of Sciences 96(4):1651-1656.
Reid AH, Fanning TG, Janczewski TA, Lourens RM, and Taubenberger JK. 2004. Novel
origin of the 1918 pandemic influenza virus nucleoprotein gene. Journal of
Virology 78(22):12462-12470.
Reid AH, Fanning TG, Janczewski TA, and Taubenberger JK. 2000. Characterization of
the 1918 “Spanish” influenza virus neuraminidase gene. Proceedings of the
National Academy of Sciences 97(12):6785-6790.
Reyes‐Centeno H, Ghirotto S, and Harvati K. 2017. Genomic validation of the
differential preservation of population history in modern human cranial anatomy.
American Journal of Physical Anthropology 162(1):170-179.
Rice G. 1988. Black November: The 1918 Influenza Epidemic in New Zealand.
Wellington: Allen & Unwin.
Rice GW. 2018. 'That Terrible Time': Reflections on the 1918 Influenza Pandemic in
New Zealand. The New Zealand Medical Journal (Online) 131(1481):6-8.
Roberts C, and Manchester K. 2007. The archaeology of disease: Cornell University
Press.
Roberts CA. 2019. Infectious Disease: Introduction, Periostosis, Periostitis,
Osteomyelitis, and Septic Arthritis. Ortner's Identification of Pathological
Conditions in Human Skeletal Remains: Elsevier. p 285-319.
Rose JC. 1989. Biological consequences of segregation and economic deprivation: A
post-slavery population from southwest Arkansas. Journal of Economic
History:351-360.
Rothman SM. 1994. Living in the shadow of death: tuberculosis and the social
experience of illness in American history.

173
Rubin DB. 1976. Inference and missing data. Biometrika 63(3):581-592.
Rubin DB. 1987. Multiple imputation for nonresponse in surveys. New York: John Wiley
& Sons.
Sahni V, and Gupta S. 2020. COVID-19 & Periodontitis: The cytokine connection.
Medical Hypotheses 144:109908.
Sathyan S, and Verghese J. 2020. Genetics of frailty: a longevity perspective.
Translational Research 221:83-96.
Sattenspiel L, and Harpending H. 1983. Stable populations and skeletal age. American
Antiquity:489-498.
Saunders JA, Morrow-Howell N, Spitznagel E, Doré P, Proctor EK, and Pescarino R.
2006. Imputing missing data: A comparison of methods for social work
researchers. Social work research 30(1):19-31.
Scannapieco FA, Bush RB, and Paju S. 2003. Associations between periodontal disease
and risk for nosocomial bacterial pneumonia and chronic obstructive pulmonary
disease. A systematic review. Annals of periodontology 8(1):54-69.
Schaaf HS, Collins A, Bekker A, and Davies PD. 2010. Tuberculosis at extremes of age.
Respirology 15(5):747-763.
Schafer JL. 1999. Multiple imputation: a primer. Statistical methods in medical research
8(1):3-15.
Schafer JL, and Graham JW. 2002. Missing data: our view of the state of the art.
Psychological methods 7(2):147.
Schafer JL, and Olsen MK. 1998. Multiple imputation for multivariate missing-data
problems: A data analyst's perspective. Multivariate behavioral research
33(4):545-571.
Schmitt RC, and Nordyke EC. 1999. Influenza deaths in Hawai'i, 1918-1920.
Schwalenberg MB. 2020. Frailty in the Lower Illinois River Valley: An Analysis of
Periosteal New Bone Formation during the Transition to Agriculture. Raleigh,
North Carolina: North Carolina State University.
Selye H. 1976. The Stress of Life (rev. edn.). New York: McGrawHill.
Seymour GJ, and Gemmell E. 2001. Cytokines in periodontal disease: where to from
here? Acta Odontologica Scandinavica 59(3):167-173.

174
Shah AD, Bartlett JW, Carpenter J, Nicholas O, and Hemingway H. 2014. Comparison of
random forest and parametric imputation models for imputing missing data using
MICE: a CALIBER study. American Journal of Epidemiology 179(6):764-774.
Shanks GD, and Brundage JF. 2012. Pathogenic responses among young adults during
the 1918 influenza pandemic. Emerging infectious diseases 18(2):201.
Shanks GD, Hussell T, and Brundage JF. 2012. Epidemiological isolation causing
variable mortality in island populations during the 1918–1920 influenza
pandemic. Influenza and other respiratory viruses 6(6):417-423.
She Y-y, Kong X-b, Ge Y-p, Liu Z-y, Chen J-y, Jiang J-w, Jiang H-b, and Fang S-l.
2020. Periodontitis and inflammatory bowel disease: a meta-analysis. BMC oral
health 20(1):1-11.
Short KR, Kedzierska K, and van de Sandt CE. 2018. Back to the future: lessons learned
from the 1918 influenza pandemic. Frontiers in cellular and infection
microbiology 8:343.
Shreffler J, and Huecker MR. 2020. Types of Variables and Commonly Used Statistical
Designs. StatPearls StatPearls Treasure Island (FL): StatPearls Publishing; 2021
Jan-. Available from: https://www.ncbi.nlm.nih.gov/books/NBK557882/.
Shryock RH, and Association NT. 1904. A Study of the Voluntary Health Movement in
the United States. Nova Iorque: Arno Press.
Shuler KA. 2011. Life and death on a Barbadian sugar plantation: historic and
bioarchaeological views of infection and mortality at Newton Plantation.
International Journal of Osteoarchaeology 21(1):66-81.
Siddharthan S, Naing NN, and Wan-Arfah N. 2020. Periodontal Disease and COVID 19.
Journal of Pharmaceutical Research International:88-91.
Siddique J, and Belin TR. 2008. Multiple imputation using an iterative hot‐deck with
distance‐based donor selection. Statistics in medicine 27(1):83-102.
Simonsen L, Clarke MJ, Schonberger LB, Arden NH, Cox NJ, and Fukuda K. 1998.
Pandemic versus epidemic influenza mortality: a pattern of changing age
distribution. Journal of infectious diseases 178(1):53-60.
Šlaus M. 2000. Biocultural analysis of sex differences in mortality profiles and stress
levels in the late medieval population from Nova Rača, Croatia. American Journal
of Physical Anthropology 111(2):193.

175
Sołtysiak A. 2015. Early urbanization and mobility at Tell Brak, NE Syria: the evidence
from femoral and tibial external shaft shape. HOMO-Journal of Comparative
Human Biology 66(2):101-117.
Stanwell-Smith R. 2019. Influenza pandemics - feared but also easily forgotten?
Perspectives in Public Health 139(5):210.
Starling AP, and Stock JT. 2007. Dental indicators of health and stress in early Egyptian
and Nubian agriculturalists: a difficult transition and gradual recovery. American
Journal of Physical Anthropology 134(4):520-528.
Stekhoven DJ, and Bühlmann P. 2012. MissForest—non-parametric missing value
imputation for mixed-type data. Bioinformatics 28(1):112-118.
Stevens J, Corper AL, Basler CF, Taubenberger JK, Palese P, and Wilson IA. 2004.
Structure of the uncleaved human H1 hemagglutinin from the extinct 1918
influenza virus. Science 303(5665):1866-1870.
Stockwell EG, and Wicks JW. 1974. Age heaping in recent national censuses. Social
Biology 21(2):163-167.
Stodder AL. 2008. Taphonomy and the nature of archaeological assemblages. Biological
anthropology of the human skeleton 2:73-115.
Stojanowski C, and Hubbard A. 2017. Sensitivity of dental phenotypic data for the
identification of biological relatives. International Journal of Osteoarchaeology
27(5):813-827.
Stojanowski CM. 2013. Mission cemeteries, mission peoples: historical and evolutionary
dimensions of intracemetery bioarchaeology in Spanish Florida: University Press
of Florida.
Stojanowski CM, and Johnson KM. 2015. Observer error, dental wear, and the inference
of new world sundadonty. American Journal of Physical Anthropology
156(3):349-362.
Stojanowski CM, Seidemann RM, and Doran GH. 2002. Differential skeletal
preservation at Windover Pond: causes and consequences. American Journal of
Physical Anthropology 119(1):15-26.
Stuart-Macadam P. 1991. Porotic Hyperostosis: changing Interpretations. In: Ortner DJ,
and Aufderheide AC, editors. Human Paleopathology, Current Syntheses and
Future Options. Washington: Smithsonian Institution Press. p 36-39.

176
Sukumar K, and Tadepalli A. 2021. Nexus between COVID-19 and periodontal disease.
Journal of International Medical Research 49(3):03000605211002695.
Sylvestre Y. 2011. CONSORT: missing data guidelines, the effects on HTA monograph
reporting. Trials 12(1):1-1.
Szołtysek M, Poniat R, and Gruber S. 2018. Age heaping patterns in Mosaic data.
Historical Methods: A Journal of Quantitative and Interdisciplinary History
51(1):13-38.
Tabachnick BG, Fidell LS, and Ullman JB. 2007. Using multivariate statistics: Pearson
Boston, MA.
Tang F, and Ishwaran H. 2017. Random forest missing data algorithms. Statistical
Analysis and Data Mining: The ASA Data Science Journal 10(6):363-377.
Taubenberger J. 2005. The virulence of the 1918 pandemic influenza virus: unraveling
the enigma. Infectious Diseases from Nature: Mechanisms of Viral Emergence
and Persistence: Springer. p 101-115.
Taubenberger JK, and Morens DM. 2006. 1918 Influenza: the mother of all pandemics.
Rev Biomed 17:69-79.
Taubenberger JK, Reid AH, Krafft AE, Bijwaard KE, and Fanning TG. 1997. Initial
genetic characterization of the 1918 “Spanish” influenza virus. Science
275(5307):1793-1796.
Taugourdeau S, Villerd J, Plantureux S, Huguenin‐Elie O, and Amiaud B. 2014. Filling
the gap in functional trait databases: use of ecological hypotheses to replace
missing data. Ecology and Evolution 4(7):944-958.
Taylor SE. 2010. Mechanisms linking early life stress to adult health outcomes.
Proceedings of the National Academy of Sciences 107(19):8507-8512.
Temple DH. 2019. Bioarchaeological evidence for adaptive plasticity and constraint:
Exploring life‐history trade‐offs in the human past. Evolutionary Anthropology:
Issues, News, and Reviews 28(1):34-46.
Tisoncik JR, Korth MJ, Simmons CP, Farrar J, Martin TR, and Katze MG. 2012. Into the
eye of the cytokine storm. Microbiology and Molecular Biology Reviews
76(1):16-32.
Tomkins SM. 1992. The influenza epidemic of 1918–19 in Western Samoa. The Journal
of Pacific History 27(2):181-197.

177
Tripp L, and Sawchuk LA. 2017. Insights into secular trends of respiratory tuberculosis:
The 20th century Maltese experience. PloS one 12(8):e0183296.
Tripp L, Sawchuk LA, and Saliba M. 2018. Deconstructing the 1918–1919 Influenza
Pandemic in the Maltese Islands: A Biosocial Perspective. Current Anthropology
59(2):229-239.
Tuckel P, Sassler S, Maisel R, and Leykam A. 2006. The diffusion of the influenza
pandemic of 1918 in Hartford, Connecticut. Social Science History:167-196.
Tumpey TM, Basler CF, Aguilar PV, Zeng H, Solórzano A, Swayne DE, Cox NJ, Katz
JM, Taubenberger JK, and Palese P. 2005. Characterization of the reconstructed
1918 Spanish influenza pandemic virus. science 310(5745):77-80.
Turney K. 2015. Paternal incarceration and children’s food insecurity: A consideration of
variation and mechanisms. Social Service Review 89(2):335-367.
Usher BM. 2000. A multistate model of health and mortality for paleodemography: Tirup
cemetery.
van Buuren S. 2018. Flexible imputation of missing data. Boca Raton: CRC press. Taylor
& Francis Group.
van Buuren S, and Groothuis-Oudshoorn K. 2011. mice: Multivariate Imputation by
Chained Equations in R. Journal of Statistical Software 45(3):1-67.
van Doren TP. 2021. The 1918 Influenza Pandemic Has Lessons for COVID-19: An
Anthropology Student Perspective. American Journal of Public Health 111(1):79-
80.
van Ginkel JR, Linting M, Rippe RC, and van der Voort A. 2020. Rebutting existing
misconceptions about multiple imputation as a method for handling missing data.
Journal of personality assessment 102(3):297-308.
Vaupel JW, Manton KG, and Stallard E. 1979. The impact of heterogeneity in individual
frailty on the dynamics of mortality. Demography 16(3):439-454.
Vavricka SR, Manser CN, Hediger S, Vögelin M, Scharl M, Biedermann L, Rogler S,
Seibold F, Sanderink R, and Attin T. 2013. Periodontitis and gingivitis in
inflammatory bowel disease: a case–control study. Inflammatory bowel diseases
19(13):2768-2777.
Verma JP. 2016. Sports Research with Analytical Solution Using SPSS. Hoboken: John
Wiley & Sons, Inc.

178
Viboud C, Eisenstein J, Reid AH, Janczewski TA, Morens DM, and Taubenberger JK.
2013. Age-and sex-specific mortality associated with the 1918–1919 influenza
pandemic in Kentucky. The Journal of infectious diseases 207(5):721-729.
Vink G, Frank LE, Pannekoek J, and Van Buuren S. 2014. Predictive mean matching
imputation of semicontinuous variables. Statistica Neerlandica 68(1):61-90.
Von Elm E, Altman DG, Egger M, Pocock SJ, Gøtzsche PC, and Vandenbroucke JP.
2007. The Strengthening the Reporting of Observational Studies in Epidemiology
(STROBE) statement: guidelines for reporting observational studies. Annals of
internal medicine 147(8):573-577.
Von Hippel PT. 2009. 8. How to impute interactions, squares, and other transformed
variables. Sociological methodology 39(1):265-291.
Wailoo K. 2014. Dying in the city of the blues: sickle cell anemia and the politics of race
and health: UNC Press Books.
Walaza S, Cohen C, Tempia S, Moyes J, Nguweneza A, Madhi SA, McMorrow M, and
Cohen AL. 2020. Influenza and tuberculosis co‐infection: A systematic review.
Influenza and other respiratory viruses 14(1):77-91.
Waljee AK, Mukherjee A, Singal AG, Zhang Y, Warren J, Balis U, Marrero J, Zhu J, and
Higgins PD. 2013. Comparison of imputation methods for missing laboratory data
in medicine. BMJ open 3(8).
Walker PL, Bathurst RR, Richman R, Gjerdrum T, and Andrushko VA. 2009. The causes
of porotic hyperostosis and cribra orbitalia: A reappraisal of the iron‐deficiency‐
anemia hypothesis. American Journal of Physical Anthropology 139(2):109-125.
Walker PL, Johnson JR, and Lambert PM. 1988. Age and sex biases in the preservation
of human skeletal remains. American Journal of Physical Anthropology
76(2):183-188.
Walter BS, and DeWitte SN. 2017. Urban and rural mortality and survival in Medieval
England. Annals of Human Biology 44(4):338-348.
Wapler U, Crubezy E, and Schultz M. 2004. Is cribra orbitalia synonymous with anemia?
Analysis and interpretation of cranial pathology in Sudan. American Journal of
Physical Anthropology 123(4):333-339.
Weng SF, Vaz L, Qureshi N, and Kai J. 2019. Prediction of premature all-cause
mortality: A prospective general population cohort study comparing machine-
learning and standard epidemiological approaches. PloS one 14(3):e0214365.

179
Weston DA. 2008. Investigating the specificity of periosteal reactions in pathology
museum specimens. American Journal of Physical Anthropology 137(1):48-59.
Weston DA. 2012. Nonspecific infection in paleopathology: interpreting periosteal
reactions. In: Grauer AL, editor. A companion to paleopathology. Malden: Wiley-
Blackwell. p 492-512.
Wilkinson L. 1999. Statistical methods in psychology journals: Guidelines and
explanations. American Psychologist 54(8):594.
Willman JC, Maki J, Bayle P, Trinkaus E, and Zilhão J. 2012. Middle Paleolithic human
remains from the Gruta da Oliveira (Torres Novas), Portugal. American Journal
of Physical Anthropology 149(1):39-51.
Wilson N, and Baker M. 2008. Ninety years on: What we still need to learn from "Black
November" 1918 about pandemic influenza. The New Zealand Medical Journal
121(1285):136-138.
Wilson N, Oliver J, Rice G, Summers JA, Baker MG, Waller M, and Shanks GD. 2014.
Age-specific mortality during the 1918–19 influenza pandemic and possible
relationship to the 1889–92 influenza pandemic. The Journal of Infectious
Diseases 210(6):993-995.
Winslow C-E, and Rogers JF. 1920. Statistics of the 1918 Epidemic of Influenza in
Connecticut: with a consideration of the factors which influenced the prevalence
of this disease in various communities. The Journal of Infectious Diseases:185-
216.
Wood AM, White IR, and Thompson SG. 2004. Are missing outcome data adequately
handled? A review of published randomized controlled trials in major medical
journals. Clinical trials 1(4):368-376.
Wood JW, Milner GR, Harpending HC, Weiss KM, Cohen MN, Eisenberg LE,
Hutchinson DL, Jankauskas R, Cesnys G, and Česnys G. 1992. The osteological
paradox: problems of inferring prehistoric health from skeletal samples [and
comments and reply]. Current Anthropology:343-370.
Wright LE, and Chew F. 1998. Porotic Hyperostosis and paleoepidemiology: A forensic
perspective on anemia among the ancient Maya. American Anthropologist
100:924-939.
Wright LE, and Yoder CJ. 2003. Recent progress in bioarchaeology: approaches to the
osteological paradox. Journal of Archaeological Research 11(1):43-70.

180
Yaussy SL. 2019. The Intersections of Health and Wealth: Socioeconomic Status, Frailty,
and Mortality in Industrial England.
Yaussy SL, and DeWitte SN. 2019. Calculus and survivorship in medieval London: The
association between dental disease and a demographic measure of general health.
American Journal of Physical Anthropology 168(3):552-565.
Yaussy SL, DeWitte SN, and Redfern RC. 2016. Frailty and famine: Patterns of mortality
and physiological stress among victims of famine in medieval London. American
Journal of Physical Anthropology 160(2):272-283.
Zarulli V, Jones JAB, Oksuzyan A, Lindahl-Jacobsen R, Christensen K, and Vaupel JW.
2018. Women live longer than men even during severe famines and epidemics.
Proceedings of the National Academy of Sciences:201701535.
Zeka A, Zanobetti A, and Schwartz J. 2006. Individual-level modifiers of the effects of
particulate matter on daily mortality. American Journal of Epidemiology
163(9):849-859.
Zhang Z. 2016. Missing data imputation: focusing on single imputation. Annals of
translational medicine 4(1).
Zürcher K, Zwahlen M, Ballif M, Rieder HL, Egger M, and Fenner L. 2016. Influenza
pandemics and tuberculosis mortality in 1889 and 1918: analysis of historical data
from Switzerland. PLoS One 11(10):e0162575.

181
APPENDIX A
AUTHOR CONTRIBUTIONS

182
Chapter 2 of this dissertation was coauthored. Kelly Blevins has granted her
permission for a modified version of this publication to be included in this dissertation.
Copyright © 2022 FDOKUMEN