
Energy Use and Environmental Impact of New Residential ...
139
Energy Use and Environmental Impact of New Residential Buildings Adalberth, Karin 2000 Link to publication Citation for published version (APA): Adalberth, K. (2000). Energy Use and Environmental Impact of New Residential Buildings. Byggnadsfysik LTH, Lunds Tekniska Högskola. Total number of authors: 1 General rights Unless other specific re-use rights are stated the following general rights apply: Copyright and moral rights for the publications made accessible in the public portal are retained by the authors and/or other copyright owners and it is a condition of accessing publications that users recognise and abide by the legal requirements associated with these rights. • Users may download and print one copy of any publication from the public portal for the purpose of private study or research. • You may not further distribute the material or use it for any profit-making activity or commercial gain • You may freely distribute the URL identifying the publication in the public portal Read more about Creative commons licenses: https://creativecommons.org/licenses/ Take down policy If you believe that this document breaches copyright please contact us providing details, and we will remove access to the work immediately and investigate your claim.
-
Upload
khangminh22 -
Category
Documents
-
view
3 -
download
0
Transcript of Energy Use and Environmental Impact of New Residential ...

LUND UNIVERSITY
PO Box 117221 00 Lund+46 46-222 00 00
Energy Use and Environmental Impact of New Residential Buildings
Adalberth, Karin
2000
Link to publication
Citation for published version (APA):Adalberth, K. (2000). Energy Use and Environmental Impact of New Residential Buildings. Byggnadsfysik LTH,Lunds Tekniska Högskola.
Total number of authors:1
General rightsUnless other specific re-use rights are stated the following general rights apply:Copyright and moral rights for the publications made accessible in the public portal are retained by the authorsand/or other copyright owners and it is a condition of accessing publications that users recognise and abide by thelegal requirements associated with these rights. • Users may download and print one copy of any publication from the public portal for the purpose of private studyor research. • You may not further distribute the material or use it for any profit-making activity or commercial gain • You may freely distribute the URL identifying the publication in the public portal
Read more about Creative commons licenses: https://creativecommons.org/licenses/Take down policyIf you believe that this document breaches copyright please contact us providing details, and we will removeaccess to the work immediately and investigate your claim.

Energy Use and Environmental lmpact of New Residential Buildings
Karin Adalberth
Report TVBH-1012 Lund 2000 Department of Building Physics, LTH
LUND INSTITUTE OF TECHNOLOGY Lund Univers i ty

Errata
Page
s. 11 Figure 1
s. 22 Table 1
s. 47 References
Revision (underlined text is revised or added)
Reference missing (Abel E et al, 1995)
Usable floor area for the single-unit dwelling no 3 in Örebro should be 138 m2
Reference rnissing Abel E, Adamson B, Elmroth A, Johansson T B, 1995: Energiboken - kunskapsläge och forskningsfront. Report T21 :1995. The Swedish Council for Building Research. Stockholm. Sweden.

Energy Use and Environmental lmpact of New Residential Buildings
Karin Adalberth
ISRN LUTVDG/TVBH--00/1012--SE(l 32) ISBN 91-88722-20-1

Department of Building Physics, LTH Lund University P.O. Box 118 SE-221 00 LUND Sweden
Telephone: +46 46 222 73 85 Telefax: +46 46 222 45 35
© Karin Adalberth Illustrators: Lilian Johansson and Bosse Markenholm Editor: Nina Eriksson

Abstract The objective ofthis thesis is to investigate the energy use and environmental impact ofresidential buildings. Seven authentic buildings built in the 1990s in Sweden are investigated. They are analysed according to energy use and environmental impact <luring their life cycle: manufacture ofbuilding materials, transport ofbuilding materials and components to the building site, erection to a building, occupancy, maintenance and renovation, and finally demolition and removal of debris. Results show that approx. 85 % ofthe total estimated energy use <luring the life cycle is used <luring the occupation phase. The energy used to manufacture building and installation materials constitutes approx. 15 % of the total energy use. 70-90 % of the total environmental impact arises <luring the occupation phase, while the manufacture of construction and installation materials constitutes 10-20 %. In conclusion, the energy use and environmental impact <luring the occupation phase makeup a majority ofthe total. At the end of the thesis, a tool is presented which helps designers and clients predict the energy use <luring the occupation phase fora future multi-family building before any constructional or installation drawings are made. In this way, different thermal properties may be elaborated in order to receive an energy-efficient and environmentally adapted dwelling.
KEYWORDS: building, residential building, single-unit dwelling, multi-family building, energy use, energy demand, environmental impact, life cycle

2

Preface
The following PhD thesis was initiated in the summer of 1992. A Swedish housing exhibition was held in Örebro, which raised many questions regarding the environmental impact of dwellings. This thesis offers answers to many of these questions.
The study has a number of defined target groups: decision-making politicians with the power to control practices within the building sector; public authorities responsible for the formulation and implementation ofrules; and the Ecocyclic Council ofthe Swedish Construction Industry. In addition, clients, project managers and architects are addressed, since they have a !arge influence on the actual construction and/or reconstruction of dwellings. It is my wish that researchers in other countries within the field ofbuildings and their environmental impact will find this research useful.
During the past years many peopie have offered advice on the progress ofthis work. I would particularly like to thank to my supervisor Professor Arne Elmroth at Lund University in Sweden, who has thoroughly followed and supported all my work. I also thank my colleaguc Anders Almgrenat Lund University in Sweden, whose analytical capacity is irreplaceable. I also thank the Swedish Council for Building Research and the Swedish Foundation for Strategic Environmental Research MISTRA for the financial support.
This PhD thesis contains oftwo parts. The first part isa summary offive papers. The second part contains five papers published intemationally or submitted for publishing, which present the work performed <luring the past years. I hope you enjoy reading it!
Lund in January 2000 Karin Adalberth
3

4

Summary
Since 1973, when Sweden suffered an energy crisis, research has mainly focused on the energy use in buildings <luring their period of use. There have been few studies on the total energy use <luring the life cycle of a building. It is a subject that must be addressed, considering the urgent need to save energy in order to reduce the environmental impact.
Objectives
The overall objective ofthis thesis is to investigate the energy use and the environmental impact <luring the life cycle of new residential buildings, and to provide recommendations on how energy-efficient houses with a small environmental impact can be constructed. Seven authentic buildings are investigated: three single-unit dwellings and four multi-family buildings built in the l 990s in Sweden.
Approach
The energy use and the environmental impact are estimated <luring the life cycle of the seven buildings. According to the definition used, the life cycle includes the following temporal phases: manufacture ofbuilding materials, transport ofbuilding materials and components to the building site, erection to a building, occupancy, maintenance and renovation, and finally demolition and removal of debris. The environmental impact refers to the following indicators: global warming potential, acidification, eutrophication, photochemical ozone creation potentials and human toxicity.
The occupation phase is assumed to be 50 years, since the economic life span of a Swedish building is about 40--50 years. It is also assumed that no extensions, re-constructions, or significant changes are made <luring the occupation phase. Only sequential maintenance, e.g. repainting and white goods exchange, is made. The life span of different maintenance is taken from (SABO, 1998).
Description of the buildings
The three single-unit dwellings are constructed as prefabricated floor and wall elements in a factory. The frames ofthe houses are made ofwood and the facades are covered with a wooden panelling. In two ofthe dwellings, the foundation is slab on ground, and in the third an indoor air-ventilated crawl space. The degree ofthermal insulation in externa! walls is 245-290 mm. In the roofs the thermal insulation thickness is 415-550 mm. The dwellings are equipped with a mechanical supply and exhaust air ventilation. The heat in the exhaust air is also exchanged into the supply air.
The four multi-family buildings are not as homogenous as the three single-unit dwellings. The frameworks are either light-weight concrete combined with concrete, concrete, wood or concrete combined with steel columns. The foundations in three ofthe buildings consist ofslab on ground. The fourth building hasa cellar. The thickness ofthe thermal insulation in the externa! walls is 150--235 mm. The roofs have a thermal insulation thickness of220--400 mm. The buildings are equipped with a mechanical ventilation system: either a mechanical supply and exhaust air or only exhaust air. Only one ofthe buildings' mechanical ventilation systems uses the heat from the exhaust air by providing it to the supply air.
5

Method
In order to calculate the energy use throughout the life cycle, data is collected from various research reports. Data conceming the energy required to manufacture construction materials are collected from a report from the Danish Building Research Institute (Andersen S et al, 1993) and (Dinesen Jet al, 1997). The report also supplies data regarding the energy required for various processes during the erection and demolition ofthe building. Data regarding the energy needed for different transports is collected from Chalmers University ofTechnology in Sweden (Tillman A-M et al, 1991). The energy use during the occupation phase for space heating and ventilation is calculated with the aid ofthe Swedish software Enorm (Munther K, 1996). The energy demand for hot water production and household electricity is estimated with empirical equations based on (Boverket, l 994b ).
The environmental impact throughout the life cycle is determined by combining the estimated energy use during the life cycle with an assumed energy supply system. This procedure is carried out for the whole life cycle, except for the manufacturing phase, in which emissions related to processes are included. This impact is calculated using a life cycle assessment tool developed at the Danish Building Research Institute (Petersen E H, 1997). The supplied energy for the seven buildings is assumed to be the average Swedish district heating mix and the average electricity mix from the European OECD countries. One energy supply system is used for the heat mix and one for the electricity mix, and not the local net for each ofthe buildings, in order to compare the environmental impact of the buildings and not the impact ofthe energy supply systems.
Results and conclusions
The energy use for the seven authentic residential buildings is, on an annual basis, between 123 and 176 kWh/(m2 usable floor area· year) during their total life cycle. The annual energy use for space heating, hot water, and household electricity amounts between 100 and 150 kWh/(m2 usable floor area· year). Approx. 85 % ofthe total energy use is used during the occupation phase. The energy used to manufacture all construction materials including the renovation phase is estimated to approx. 15 % of the total energy use.
The share ofthe energy used to manufacture building materials is still approx. 15 %, even if the seven buildings have different buildings sizes, types ofbuilding constructions, frameworks, thermal properties and installation techniques. Instead, the building constructions and installation techniques have a !arge influence on the energy use during the occupation phase. When e.g. the thermal thickness in the extemal wall is increased, the energy demand during the manufacturing phase will of course increase, hut the energy use during the occupation phase decreases more. This means that the total energy use during the life cycle is reduced.
The calculated and the charged energy use during the occupation phase are also determined. Results show that there is a deviation between the calculated and the charged energy demand for all the seven studied residential buildings - between O % and 50 %. Since the charged use is higher than the calculated use, the dominant occupation phase is even more dominant than initially believed. In addition, the size of the deviation added up during the 50 years of occupation may be just as high as or higher than the manufacturing phase. Deviations may be caused by a higher indoor air temperature than assumed, a higher air change rate than assumed, and/or deviations from the project documents compared to the actual performance of the building constructions.
6

The environmental impact during the life cycle is also estimated for the four multi-family buildings. The impact is determined by investigating global warming potential, acidification, eutrophication, photochemical ozone creation potentials, and human toxicity. Among the different phases, the occupation phase has the highest environmental impact. This phase stands for 70-90 % of the total environmental impact <luring the buildings' life cycle.
The environmental impact that arises when all construction materials are manufactured is 10-20 % ofthe total impact. This figure is independent ofthe multi-family building's size, type of foundation, framework, building construction, thermal properties and installation technique.
The results show conformity between energy use and environmental impact <luring the life cycle. In both aspects, the occupation phase constitutes a majority ofthe life cycle. Since the distribution of energy use and the environmental impact over the life cycle have a similar pattem, the energy use of a building can be used as one indicator of a building' s environmental status.
Based on the fäets listed above, i.e. the dominance of the occupation phase, the final study deals with energy use <luring the occupation phase. A simple and user-friendly tool is developed to predict the energy use fora future multi-family building in the early design phase before any constructional or installation drawings are made. The tool is an equation with 10 parameters related to buildings, e.g. length, width, height, indoor air temperature, thermal transmittances etc. This tool can help designers and clients to predict the energy use by elaborating different thermal properties in order to receive an energy-efficient house. At the end of the design phase, when constructional and installation drawing are at hand, a more thorough estimate ofthe energy use should be performed, since the tool only provides a rough estimate.
Recommendations
Since conformity between the estimated energy use and the environmental impact <luring the life cycle is established, and since the occupation phase is very dominant, the following three recommendations are articulated:
1. A house should be designed with low energy use <luring the occupation phase, even if the energy demand <luring the manufacturing phase will increase. This is e.g. achieved by:
Making careful designs of the intersections between elements in order to keep values for thermal bridges as low as possible
Designing ventilation systems with heat recovery ofthe exhaust air
Choosing energy-efficient windows for the building.
2. The energy use for space heating, ventilation, domestic hot water and household electricity should be estimated <luring the design phase with realistic input data to ensure that the predicted energy use matches reality.
3. High quality <luring constructions (the actual erection ofthe building) should be enforced to maintain a minimal deviation between the designed and performed building.
7

8

Contents
Abstract ................................................................................................................................ 1
Preface ................................................................................................................................. 3 Summary .............................................................................................................................. 5
1 Background .................................................................................................................... 11 1.1 National goals for the environrnent in Sweden .............................................................. 12 1.2 Sustainable development ................................................................................................ 13
1.2.1 Methods for environrnental assessment.. .............................................................. 13
? Obje,..,tives ...................................................................................................................... 1 '-
2.1 Approach ........................................................................................................................ 16
2.1.l The building .......................................................................................................... 16 2.1.2 Definition of the life cycle .................................................................................... 17 2.1.3 Environrnental impact ofbuildings ...................................................................... 18
2.1.4 Energy supply systems ......................................................................................... 18 2.1.5 Bottom-up approach ............................................................................................. 20
3 Description of the studied buildings ............................................................................ 21
4 Methods to determine energy use and environmental impact ............................................ 23 4.1 Manufacture ofbuilding materials ................................................................................. 23 4.2 Transportation and removal ofbuilding materials ......................................................... 24 4.3 Erection and demolition ofthe buildings ....................................................................... 24
4.4 Occupation ofthe buildings ........................................................................................... 24 4.5 Renovation ofthe buildings ........................................................................................... 26
5 Results and conclusions ............................................................................................... 27 5 .1 Energy use <luring the buildings' life cycle .................................................................... 2 7
5 .2 Influence of different thermal properties ....................................................................... 31 5.3 Calculated and charged energy use <luring the occupation phase ...................................... 34 5 .4 Environrnental impact <luring the buildings' life cycle .................................................. 3 7
5 .5 Environrnental impact and energy use of buildings ....................................................... 40 5 .6 Predicting the occupational energy demand in an early design phase ...................................... 41
6 Recommendations ......................................................................................................... 45
Appendix Paper I: Energy use <luring the Life Cycle of uildings: a Method
Paper 2: Energy use <luring the Life Cycle ofSingle-Unit Dwellings: Examples
Paper 3: Energy Use in Four Multi-Family Buildings During their Life Cycle Paper 4: Life Cycle Assessment of four Multi-Family Buildings
Paper 5: Predicting Energy Use for Multi-Family Buildings in an early Design Phase
9

10

1 Background Since 1973, when Sweden suffered an energy crisis, the energy use in Swedish buildings for space heating and ventilation has decreased. This is e.g. due to increased thermal insulation thickness in foundations, externa! walls and roofs, improved air tightness of the building envelope, recovered heat in the exhaust air, and improved efficiency ofheat exchangers. Figure l shows how the energy use in Swedish has decreased from the 1970s to the l 990s.
kWh/m'
4001 ; . ; ; I ----~',, i 1 i i ~-.: ..
300 ....... ·>,tJ····---~------------L Single-unitdwellings ____ _
·~--r--·-·----:-~ 200 • i f >c:±~~r~c c .
: : : : 100 ··············c·············,··············c·············,··············
1970 1975 1980 1985 1990 1995
Figure 1 The development of energy use in Swedish buildings.
So far, research has mainly focused on the energy use in buildings for space heating and ventilation <luring theit period of use. There have been few studies on the total energy use <luring the life cycle of a building - from the manufacture ofbuilding material until the building is demolished.
In terms of sustainable buildings, it is also important to reduce the environmental impact derived from using energy. This is e.g. achieved by being energy-efficient and by producing energy with low emissions. A large proportion ofthe energy produced in Sweden, used in the residential buildings and premises, has its origin in fossil fuels. More than 40 % ofthe production comes from oil, and 5 % from coal, see Figure 2. When energy is obtained from these energy sources, different kinds of pollution are released, such as carbon dioxide, sulphur dioxide, nitric oxide, dust etc. This pollution contributes to the destruction ofthe environment, and may alter or disturb the ecological system. Hence, we must become more effective and economical in our use of energy.
11

Approx. 40 % of the energy is used in residential buildings and premises for space heating, ventilation, domestic hot water production, household electricity, and different processes. Nearly 40 % is used in the industry, and approx. 20 % for transportation, see Figure 2. Since the building sector not only uses buildings but also manufacture and transport materials and components, it really constitutes much more than 40 %. With this in mind, it is interesting to study buildings from a life cycle perspective.
hydra power
15%
heat pumps
in district heating
plants 2%
nuclear
power
15%
coal and
coke 5%
480TWh
crude oil
andoil
products
42%
2%
industry
38%
transports
22%
393 TWh
premises
40%
heat pumps,
combined heat
and power
hydra
power
22%
other
4% oil products
and coal
27%
bio fuels, peat
etc
waste heat, 16%
nuclear power industrial
21 % surplus heat
4%
156TWh
Figure 2 The Jeft graph shows the total energy supply in Sweden. The centre graph shows the use of produced energy within Sweden. The right graph shows the energy supply to residential buildings and premises. (Nutek, 1998)
1.1 National goals for the environment in Sweden
In April 1999 the Swedish Parliament adopted 15 national goals dealing with environmental targets (Swedish Parliament, 1999). The targets were e.g. set for air, water and soil pollution on a local, national and global leve!, economical management ofwater and forests, and increased knowledge of chemical substances. In order to realise these goals, the govemment assigned the Swedish Board ofHousing, Building and Planning to make sector-specific subtargets.
At the end of 1999, the Swedish Board of Housing, Building and Planning presented its results (Boverket, 1999). One sub-target focuses on the energy use in buildings. It is emphasised that the total annual energy demand in new buildings should not exceed 60 kWh/m2 usable floor area in the year 2020, which is approx. 50 % of current figures. This demand will e.g. be enforced through a rigorous building code.
Today, the existing Swedish Building Code (Boverket, l 994a) contains three regulations limiting the energy use when building new buildings. The first regulation deals with the average thermal transmittance of the building envelope; the second regulation with the air tightness -the air leakage should not exceed 0.8 litre/(m2·s) with a differential pressure of 50 Pascal - ; and the third regulation cancerns restrictions regarding the heat needed for ventilation air. In addition, there are some general directions about considering thermal bridges in the building's envelope and about using energy-efficient installations.
12

Similar codes do not exist for existing buildings, but the Swedish Board ofHousing, Building and Planning has addressed a sub-target for these buildings. The future building code may include requirements about the equipment in existing buildings in order to make their electricity use more efficient. In addition, a compulsory energy declaration of such buildings may be constituted.
1.2 Sustainable development
In order to attain a sustainable development several subjects must be addressed, e.g. building materials and their environmental impact. A forum ofthe Swedish Building Sector (Ecocyclic Society of the Building Sector, 1995) has formulated guidelines about the responsibility involved in the manufacture ofbuilding materials. In addition, it has suggested that manufacturers should use environmental information labels for building products. Furthermore, several research projects address the environmental impact ofbuilding materials. These LCA 1 studies include e.g. (Sundberg K, 1994), an LC}:t.. on gypsum vvall board; (Jönsson J:1., 1995) and (Paulsen J, 1999), two analysis of different flooring materials; (Erlandsson M, 1996), an analysis of glulam wood and other wooden products; and finally, (Borg M, 1997), an analysis of steel sheet.
It is not obvious how an LCA should be carried out. Boundary settings and allocations influence the results, especially when an LCA is applied to highly recyclable building materials. This matter is discussed and analysed in (Trinius W, 1999).
Waste is another discussion topic in the building sector. The Ecocyclic Society ofthe Building Sector is working on identifying hazardous waste generated at building sites. It has also promised to decrease the amount ofwaste by 50 % within five years, from 1995 to 2000. The waste problem is addressed by research projects e.g. like (Sigfrid L, 1993) (Lindhe N, 1996) and (Thormark C, 1997). The last project discusses how a house can be designed for recycling and the recycling capacity ofbuilding constructions.
1.2.1 Methods for environmental assessment
During the past years, methods for the environmental assessment ofbuildings have been developed. An official method has been developed at the Royal Institute ofTechnology in Sweden (Glaumann M, 1998). It is based on five topics: energy use, use of materials, indoor environment, outdoor environment, and life cycle cost. The first two topics centre on an estimate and evaluation of the flows of energy and material use during the buildings' life cycle. The indoor environment evaluates risks (new buildings) or existing problems (existing buildings) with allergies, sick building syndromes, thermal comfort, indoor air quality, noise and lighting status etc. The outdoor environment evaluates the influence on the ecosystem, resource depietion, and human health. The life cycle cost ofthe building deals with the economy ofthe building <luring its whole life cycle.
Another method for assessing the environmental status ofbuildings has been developed by a building consultant company (J&W, 1997). This method is based on four topics: energy use, use ofnatural resources, indoor environment, and outdoor environment. Together, these topics form a questionnaire with 80-90 questions, depending on the use of the building. The an-
I A method for analysing and assessing the environmental impact of a material, product or service throughout its entire life cycle
13

swers to the questionnaire are ranked with credits and predefined levels: level 1 means failed environmental adjustment, level 3 acceptable adjustment, and level 5 excellent adjustment.
A third method, freely translated as 'inventory and assessment ofthe indoor environment in existing buildings'2, has been developed and financed by the Organisation for Municipal Housing Companies, the Swedish Federation for Rental Property Owners and (SABO, 1998). The method concems the indoor environment, summarised as a questionnaire and ranked with certain credits.
There are several other methods available from other countries. The two most famous are the British Research Establishment Environmental Assessmeni Method, BREEAM, and the Building Environmental Performance Assessment Criteria, BEP AC.
BREEAM became available on the market in the early 1990s and was later revised. It includes environmental issues categorised as global, local or indoor (Prior Jet al, 1995). These issues include: carbon dioxide emission due to energy use, ozone depletion potential in connection with insulation materials, low water usage ofWCs, and available space and storage for recycling household waste. Within each issue, credits may be acquired when the building attains or exceeds a certain benchmark performance. In total, 30 credits are available.
BEPAC has been developed in Canada (Cole R, 1994). It is based on five topics: ozone layer protection, impact of energy use, indoor environment, resource conservation ( e.g. by preserving and renovating existing buildings, reusing building materials and making_the use of water more efficient in the future building) and location (e.g. in relations to public communications). Each area is given a credit, from O to 10 points. Each criterion is then weighted by a certain factor.
These environmental assessment methods all cover a wide area: from the indoor to the outdoor environment including issues such as energy use ofbuildings. The different issues are assigned similar importance in all methods, i.e. their impact is ranked similarly. The results from this thesis, i.e. energy issues and their related environmental impact, can be used to develop environmental assessment methods.
2 Miljöinventering och miljöbedömning av byggnader
14

2 Objectives
The overall objective is to study the energy use and the environmental impact <luring the life cycle of new residential buildings, and to provide recommendations for the construction of an energy-efficient building with a low environmental impact. The project has been divided into different steps.
The first step involves an analysis ofhow energy is used <luring the life cycle of single-unit and multi-family houses (Paper 1-3). The energy use <luring the life cycle is estimated on a theoretical basis. Questions to be answered are:
• Which phase ofthe building's life cycle has the highest energy use? • How do different building constructions, frameworks and installation techniques affect
the total energy use <luring the life cycle? • Do the estimated energy values equal reality? In other word, is there a difference be
tween the calculated and the charged energy use <luring the occupation phase? How will a deviation influence the energy use <luring the life cycle?
The second step is to analyse the environmental impact during the life cycle (Paper 4). The environmental impact is determined by combining the estimated energy use during the life cycle with an assumed energy supply system. This procedure is carried out for the whole life cycle, except for the manufacturing phase. For this phase emissions related to processes are included, e.g. the emission of carbon dioxide involved to manufacture cement. The manufacturing phase is treated differently since fäets about emissions arising from this phase are more established than those from other phases. Questions to be answered are:
• Which phase of the buildings' life cycle has the highest environmental impact? • Are there differences in environmental impact due to different building constructions,
frameworks and installation techniques? • Are there any similarities between environmental impact and energy use <luring the life
cycle?
Based on knowledge gained in the first two steps, the last step was to do determine how the energy use <luring the occupation phase could be lowered, i.e. the space heating, ventilation, domestic hot water, and household electricity. In Sweden, an estimate of future building's need for space heating and ventilation is usually made. This is often done <luring the design phase when constructional and installation drawings are at hand.
However, the design work could be made more rational. If it were possible to predict the energy use before any constructional or installation drawings are made, designers and clients could elaborate with different thermal properties and decide where further development is required to produce an energy-efficient house.
The third and final step is therefore to provide a simple and user-friendly tool for predicting energy use in a multi-family building in an early design phase before any constructional or installation drawings are made (Paper 5). Questions to be answered are:
• How can the energy use be predicted in an early design phase? • Which are the main thermal properties of a house contribute to a low energy use?
15

2.1 Approach
In this study, new residential buildings are analysed. Three single-unit dwellings and four multi-family buildings are selected for an investigation of energy use and environmental impact <luring their life cycle. It is important to examine both single-unit dwellings and multifamily buildings in order to find possible deviations between these kinds ofbuildings.
The PhD-thesis is summarised and presented in chapters 2-6, but is included in full Paper 1-5.
2.1.1 The building
This study focuses on new residences built in the l 990s. During the past 5-10 years, less residential buildings have been built in Sweden, see Figure 3. Compared to what was built <luring the l 960s and early 1970s, the current contribution to the building stock is low. The existing building stock is studied by another research project at Lund University in Sweden. It focuses on the environmental impact of dwellings built in the 1960s - a building category that is currently facing or about to face its first !arge renovation or reconstruction.
Number of dwellings
80000 .--~~~~~~~~~~~~~~~~~~~~~~~~~
Multi-family buildings
60000 --
' ' '
,' · _. :\ Singfo-unit dw~llings 40000 ----- - ~.,...__ "'' - - -
20000 ' / - - - -_-___::,..-- -
1955 1960 1965 1970 1975 1980 1985 1990 1995 2000
Figure 3 Growth for new residential buildings in Sweden (SCB, 1999a).
16

Seven authentic buildings are studied <luring their life cycle. The building is defined as all materials, constructions and installations included in a house - from the excavation to make room for the foundation and up to the roof, see Figure 4.
0
Figure 4 A building is defined as all materials, constructions and installations - from the excavation to make room for the foundation and up to the roof.
2.1.2 Definition of the life cycle
According to the definition used, the life cycle includes the following temporal phases: manufacture ofbuilding materials, transport ofbuilding materials and components to the building site, erection to a building, occupancy, maintenance and renovation, and finally demolition, and removal of debris. The content ofthe different temporal phases is further described in chapter 4.
The buildings are assumed to have an occupation phase of 50 years, since the economic life span normally is set to 40-50 years. It is assumed that no extensions, re-constructions or significant changes are made <luring the occupation phase ofthese 50 years. Only sequential maintenance is made, see also paragraph 4.5. The intervals for different kinds ofmaintenance are taken from statistical data over maintenance intervals (SABO, 1998).
17

2.1.3 Environmental impact of buildings
There are many factors included in the establishment of a building's environmental impact <luring its life cycle. Issues related to the externa! environment are e.g. use of soil, use of water, generation ofwaste including hazardous waste etc. Issues related to the interna! environment impact are e.g. emissions from building materials <luring the occupation phase, thennal comfort, indoor air quality, acoustic quality etc.
In order to limit the scope of this thesis, the environmental impact throughout the life cycle is detennined by combining the estimated energy use <luring the life cycle with an assumed energy supply system. This procedure is carried out for the whole life cycle, except for the manufacturing phase. For this phase, emissions related to processes are included, e.g. the emission of carbon dioxide involved to manufacture cement. The manufacturing phase is treated differently since fäets about emissions arising from this phase are more established and well-known than those from other phases.
The environmental impact throughout the life cycle is detennined by investigating global wanning potential, acidification, eutrophication, photochemical ozone creation potentials, and human toxicity.
2.1.4 Energy supply systems
The environmental impact from the multi-family buildings is detennined by combining the estimated energy use <luring the life cycle with an assumed energy supply system. This requires information about the energy supply system and the related emissions from the energy production. During a 50-year life cycle, the energy source or the energy supply system will supposedly change several times. In the study, however, it is assumed that the energy supply system will be constant <luring the entire life cycle.
The idea is primarily to compare the environmental impact ofthe buildings and not the impact of different energy supply systems. Hence, the average Swedish district heating mix (and not the local net for each ofthe buildings) and the average electricity mix in the European OECD countries is used for all the buildings to get the same 'emission set' from the heating and electricity source respectively.
The average Swedish district heating mix was chosen to get a representative mix and not an extreme mix - e.g. in the district heating net in Växjö, 95 % the production is based on biomass.
The European OECD countries' average electricity mix3 was chosen since the electricity system in Europe is slowly tuming into one large network. To some extent, Sweden is already a part ofthis system and will be so even more in the future. The European Union's electricity mix could not be used, since Sweden imports Norwegian electricity and Norway is not in the Union.
3 The following countries are included in the OECD: Austria, Belgium, the Czech Republic, Denmark, Finland, France, Germany, Greece, Hungary, Iceland, lreland, ltaly, Luxembourg, the Netherlands, Norway, Portugal, Spain, Sweden, Switzerland, Turkey and the United Kingdom.
18

Figure 5 shows the mix in the Swedish district heating net. This heat mix is only used <luring the occupation phase. During the manufacturing phase the building material's heat mix is already predefined, see paragraph 4.1. During the other time phases, e.g. the transportation and the erection, no explicit heat is used. Even ifheat is used <luring the erection phase for space heating, this heat is assumed to be produced by electricity, i.e. the European OECD electricity mix. See also chapter 4. Figure 6 shows the electricity mix ofthe European OECD countries. This mix is used <luring all the phases ofthe life cycle.
When the energy sources have been selected, the emissions set connected with the energy production, e.g. the amount ofreleased carbon dioxide per kWh heat produced from oii, has to be determined. These data are collected from (Frees N et al, 1996).
biomass fuel 28%
refuse oil
10% 8%
surplus others
heat 7%
11%
electr. heat
3% pumps
15%
Figure 5 The mix in the Swedish district heating net, 41.2 TWh <luring 1997 (Swedish District Heating Association, 1999). The mix is used to determine the environmental impact due to heat usage in four multi-family houses.
nuclear power 400/o
brown coal -8% coal
30"/o
wind
natural - gas
8%
oil 10%
Figure 6 The electricity mix ofthe OECD countries within Europe, 2 678 TWh <luring 1995 (IEA, 1998). The mix is used to determine the environmental impact due to electricity usage in four multi-family houses.
19

2.1.5 Bottom-up approach
This study is performed using a bottom-up approach. Buildings are analysed in detail, i.e. the building materials that constitute its constructions and then up to a complete building. No estimates are made by multiplying one square meter of an element with the total amount of the element that constitutes one house. Consequently the increased uncertainty involved in any multiplication of one square meter of an element with a large amount of square meters is avoided. Also, the focus is on the entire building and therefore all connections between elements are included.
The opposite ofthe term bottom-up is top-down. In this approach, the total building stock is analysed and followed by tracing the figures down to a single building. This method is not used in this thesis, but the results from this thesis may be useful in a comparison ofhow these two approaches converge.
20

3 Description of the studied buildings Seven buildings are investigated based on energy use and environmental impact <luring their life cycle. Three single-unit dwellings and four multi-family buildings built in the l 990s in Sweden are examined. They are located in Örebro, Malmö, Helsingborg, Växjö and Stockholm in Sweden. Their characteristics are presented in Table 1.
The buildings are chosen on different bases. The single-unit family houses were included in a research program involving Lund University in Sweden. It studied 26 single-unit dwellings to be exhibited at the Swedish Housing Exhibition in 1992. The exhibition was going to show how Swedish wooden dwellings are built today and in the future. From the 26 dwellings, three houses were chosen, characteristic for their time. In part, they also have different kinds ofbuilding constructions.
The building technique in the three houses is not extreme. They are constructed with prefabricated elements, a technique used for 70-80 % of all single-unit dwellings built in the early 1990s (National Association ofSwedish Wooden House Manufacturers, 1999). Two ofthc single-unit dwellings are also standard dwellings - houses that were presented in the catalogue from Boro AB. The third dwelling has a more unique design, but is still constructed from prefabricated elements.
The single-unit dwellings all have wooden frameworks and extemal cladding. In two ofthe dwellings, the foundation is slab on ground. The third is an indoor air-ventilated crawl space. The thickness ofthermal insulation in the extemal walls is 245-290 mm, common in many Swedish single-unit dwellings. The roofs have a thermal insulation thickness of 415-550 mm. For further information, see Paper 2.
The multi-family buildings were chosen in order to include different kinds ofbuilding constructions and simultaneously have buildings that are characteristic oftheir time. Different building contractors were contacted in the mid- l 990s, and asked to submit information of multi-family houses for research purposes. This resulted in four buildings indifferent parts of Sweden. A house in Stockholm was chosen since its contractor won a contest. The purpose of the contest was to create a healthy and energy-efficient house at an affordable cost ofliving. The Stockholm house in this study is to some extent a modification ofthis house proposal.
The Växjö house was chosen since it has a wooden framework, which is quite an unusual solution fora four-storey multi-family house in Sweden. The Helsingborg house was chosen since the client received two awards for being an 'environmentally adapted' company. Finally, the Malmö house was chosen since it is built with a conventional and traditional type of building technique. The four buildings have different architectural appearances - something which has characterised buildings in the 1990s compared to multi-family buildings built e.g. in the l 960s.
The four multi-family buildings are all constructed differently. The frameworks are either light-weight concrete combined with concrete, concrete, wood or concrete combined with steel columns. Three ofthe foundations are slab on ground and the fourth building hasa cellar. The thickness ofthe thermal insulation in the different extemal walls in the buildings is 150-235 mm. The roofs have a thermal insulation thickness of220-400 mm. For further information, please see Paper 3.
21

Table 1 The characteristics ofthe seven studied residential buildings. The buildings are analysed based on energy use and environmental impact <luring their life cycle.
Single-unit Single-unit Single-unit Multi-family Multi-family Multi-family Multi-family dwelling no dwelling no dwellingno building in buildingin building in buildingin I in Örebro 2 in Örebro 3 in Örebro Malmö Helsingborg Växjö Stockholm
Usable floor 130 129 136 700 I 160 1190 1 520 area, m2
Numberof IYi 2 3Yi 4 4 floors
Type of Detached Detached Detached A larger Pointblock Slab block Slab block building house house house detached house
Numberof 6 8 16 15 apartments
Type of Wood Wood Wood Light-weight Concrete Wood Steel columns framework concrete and and concrete
concrete
Estimated over- 0.18 0.18 0.21 0.26 0.44 0.32 0.30 all U value, W/(m2.oq
Air change rate, 0.7 0.8 0.6 0.5 * 0.5 * 0.5 * 0.5 * h-1
Ventilation Mech. Mech. Mech. Mech. Mech. Mech. Mech. system supply and supply and supply and supplyand exhaust air exhaust air exhaust air
exhaust air exhaust air exhaust air exhaust air
Heat recovery Yes Yes Yes Yes No No No
Heat source District District District District District District District heating heating heating heating heating heating heating
Space heating Warmair Warmair Warmair Under-floor Radiators Radiators Radiators system distribution distribution distribution heating
integrated integrated integrated with the vent. with the vent. with the vent.
* Designed value
22

4 Methods to determine energy use and environmental impact The energy use and the environmental impact <luring the life cycle of seven residential buildings have been estimated. The various methods applied are presented in different publications. The method used to determine the energy use <luring the life cycle is described in Paper 1 and in Paper 3, where it is slightly revised. The major difference between the papers is that the heat recovery from debris is included in Paper 3. The method used to estimate the environmental impact is presented in Paper 4. In the paragraphs below, the methods are briefly described.
4.1 Manufacture of building materials
In order to estimate the energy use and the environmental impact in the manufacturing phase, the amount ofbuilding and installation materials has to be k_nown. This amount is obtained from drawings and interviews with designers and contractors. V ertical and horizontal framework sections (including all kinds offixing devices), not load-bearing partitions, surface finishes, electrical installations, and installation materials for building services are all estimated. In addition, the amount is enumerated with a waste factor, since waste arises <luring the erection phase depending on the skills ofthe craftsmen involved and the geometry and complexity ofthe building. The amount is calculated using typical waste factors from a study by (Larsson B, 1983 ).
In order to estimate the energy used to manufacture a certain amount ofbuilding material, energy data for different building and installation materials has to be known. Data from the Danish Building Research Institute (Andersen Set al, 1993) and (Dinesen Jet al, 1997) are used. The advantage ofusing these data is that one research team has collected them with the same methodology, which means that they can be considered comparable. Corresponding Swedish data, with the stated qualities, do not exist.
The data comprises energy demands for extracting raw materials, production and transport of semi-manufactures, heating of manufacturing and administration premises, and the production of final construction materials. Some data are manufacture-specific information and some are not. When no manufacturer-specific information is available, typical generic data or data for equivalent products is used instead.
The energy required to manufacture the building and installation materials has been estimated by multiplying the amount ofmaterial with the specific energy data.
The environmental impact <luring the manufacturing phase has been estimated by multiplying the amount ofmaterials with the emissions to air, liquid effluents and solid waste for each material. The emissions are related both to heating and electricity, as well as to processes, e.g. the emission of carbon dioxide to manufacture cement. This procedure has been done with the LCA tool developed at the Danish Building Research Institute (Petersen E H, 1997). In the tool, i.e. a database, quantifiable input such as raw materials and energy sources for several building materials is defined. Information of other materials can be included.
23

4.2 Transportation and removal of building materials
The energy use and the environmental impact due to the transport of materials have been estimated. The calculations are based on the estimated transport distance from the manufacturers ofthe building materials to the building sites. There are also transports from the building site toa waste-disposal site (waste from the erection, renovation and demolition). This study assumes that there is a waste-disposal plant in the municipality where the buildings are located. The transport distance is assumed to be 20 kilometres.
The energy use and environmental impact related to different transports have been derived. The kind oftransport carrier, e.g. smaller lorry, larger lorry, boat or ship, for transporting different materials and/or components is thoroughly analysed. Data on energy demands and produced emissions from transport carriers using fossil fuels are taken from (Tillman A-M et al, 1991).
The energy demands and environmental impact arising from different transport jobs is assumed to be unchanged when the buildings are renovated and demolished some 30, 40 or 50 years later, even ifthis is not likely.
4.3 Erection and demolition of the buildings
The energy use and the environmental impact in the erection and demolition phases have also been included in the study, e.g. processes such as dehydration ofbuilding material, heating of construction object, concreting, excavation and removal of soil.
The energy use is then calculated using data collected by the Danish Building Research Institute (Andersen Set al, 1993). The environmental impact is established based on the energy use and its associated heat and electricity supply system. Other impacts, e.g. air-bom emissions <luring welding and painting, are omitted due toa lack ofinformation. Most ofthe processes are assumed to use electricity, e.g. dehydration ofbuilding material, heating of construction objects, and concreting. The excavation and removal of soil are assumed to be performed by a vehicle using fossil fuel.
4.4 Occupation of the buildings
The energy use for space heating and ventilation <luring the occupation phase, including electricity use for pumps and fans, are calculated using the Swedish software Enorm (Munther K, 1996). This software enables an approximation of the energy use during the occupation phase. Since one ofthe objectives ofthis study was to determine differences between the time phases, this software suffices. In addition, it is commonly used by consultants, contractors and authorities in Sweden. Approx. 400 licenses ofthe software (version 1000) had been sold in December 1999 (Swedish Building Centre, 1999).
The Enorm software computes the energy and average power demand <luring a period of twelve months based on outdoor temperatures and average solar radiation on a 24-hour basis.
Factors taken into account in the program are e.g. the thermal transmittances and the area of the building envelope, i.e. foundation, extemal walls, windows, doors and roof. The thermal transmittances are calculated according to the Swedish building code (Boverket, 1994a). When an under-floor heating system is present, the thermal transmittance for the floor has
24

been determined using a method presented in (Adalberth K, 1995). The method considers the extra heat flow through the foundation due to a higher temperature in the floor.
Furthermore, the orientation ofthe windows indifferent directions is considered in the software.
The thermal bridges of the buildings are estimated using two-dimensional software, (Blomberg T, 1996) and (Hagentoft C-E, 1991). The following thermal bridges are determined: the connections between the foundation and the external wall, the external wall and the intennediate floor, the extemal v.,rall and the balconies, and finally, between the external wall and the roof.
The air leakage ofthe buildings is assumed to be 0.8 litre/(m2·s) at a differential pressure of 50 Pascal, which is a maximum air leakage permitted in residential buildings according to the building code.
The indoor air temperature is assumed to be 20° C, since this level is often used in energy simulations. In reality, the indoor air temperature is often higher. An investigation performed in 800 single-unit dwellings and in 400 multi-family buildings showed that the indoor air temperature was on average 20.9° C in single-unit dwelling and 22.2° C in multi-family buildings (Andersson K et al, 1993).
Another factor to be taken into account is the heating system and its degree of efficiency within the building. All seven studied buildings rely on the district heating net for their heating supply. In this case, a 100 % degree of efficiency is assumed within the building. Pumps for the heating distribution system within the building are also considered.
In addition, the ventilation system including the airflow rate and heat exchanger is considered. The airflow rate and the kind ofheat exchanger are determined using the building services' installation drawings. Ifthe manufacturer ofthe heat exchanger is not known, a heat exchanger has been assumed based on the kind subscribed and combined with airflow rates. The electricity use for fans is estimated by using a general figure of 0.5 Watt per m2 usable floor area and fan.
The heat capacity ofthe buildings is not considered in this investigation. In (Isakson P et al, 1984) it is established that a high heat capacity in residential buildings does not reduce the energy demand, since the interna! load in such buildings is low. The load has to be higher than 25 W/m2 usable floor area in order to take advantage ofthe heat capacity. In residential buildings the interna! load is seldom above this limit.
The energy demand for domestic hot water production, Em1w (kWliJyear), and household electricity, EHE (kWh/year), <luring the occupation phase is estimated as follows:
Ew,w = (5·number ofapartments + 0.05·usable floor area)·365 EHE = (4.8·number of apartments + 0.048·usable floor area)-365
(Equation I) (Equation 2)
The equations are empirical and acquired by experience (Boverket, l 994b ). Household electricity includes electricity demands for stove, refrigerator, freezer, washing-machine, television, lighting etc.
25

4.5 Renovation of the buildings
The buildings are renovated <luring the 50-year of occupation. During these years it is assumed that no extensions, re-constructions or significant changes are made. Only sequential maintenance is made. The interval for different kinds of maintenance measures is taken from statistical data over maintenance intervals (SABO, 1998).
Sequential maintenance includes e.g. repainting and paper-hanging ofintemal surfaces every 8 years, exchange ofwhite goods every 12 years, exchange ofplastic flooring every 20 years, exchange of windows and doors every 30 years as well as wardrobes, cupboards and roofing tiles.
During the renovation, energy is needed and an environmental impact arises when residual and new building materials are transported and new building materials manufactured. These are estimated in a similar way as description in paragraphs 4.1 and 4.2.
26

5 Results and conclusions This chapter presents the results from Papers 2-5.
The first tl1ree paragraphs discuss the energy use ofthe seven buildings. The first paragraph explains how energy is used <luring the life cycle. The second paragraph describes how energy is affected by different thermal properties, e.g. thermal thickness in externa! walls. The third paragraph presents a comparison between the estimated and the charged energy use <luring the occupation phase.
The fourth paragraph presents the environmental impact ofthe four multi-family buildings: How the impact is distributed throughout the life cycle and if it is influenced by different building constructions and installation techniques.
The fifth paragraph presents the energy use and the environmentai impact <luring the life cycle in order to investigate whether there is conformity between the two issues.
The sixth paragraph discusses how the energy use <luring the occupation phase could be predicted in an early design phase, before any constructional or installation drawings were made.
5.1 Energy use during the buildings' life cycle
Table 2 and Table 3 present the estimated energy need for the three single-unit dwellings and the four multi-family buildings (Papers 2 and 3). According to estimates, the single-unit dwellings use 170, 176 and 171 kWh/(m2 usable floor area · year). The annual energy use for space heating, hot water, and household electricity is 141, 148 and 128 kWh/(m2 usable floor area· year). Approx. 85 % ofthe total energy use is used <luring the occupation phase.
The multi-family buildings use 123, 144, 171 and 143 kWh/(m2 usable floor area· year) <luring their life cycle. The annual energy use for space heating, hot water, and household electricity is 100, 121, 150 and i21 kWh/(m2 usable floor area· year). Approx. 85 % ofthe total energy use is used <luring the occupation phase. This means that the occupation phase's share ofthe total energy use is about the same for the single-unit dwellings and the multi-family buildings.
The total energy use is generally lower for multi-family buildings than for single-unit dwellings. This is due to a lower energy demand <luring the occupation phase. The envelope of the multi-family building is smaller per apartment than the building envelope ofthe single-unit dwellings. Consequently, the heat flow through the building envelope per apartment will be small er.
27

Table 2 Estimated energy use <luring the life cycle of three single-unit dwellings, The m2 in the units refer to the usable floor area in the house concemed, The figures in the table are rounded off
Single-unit dwellings the Örebro house no I the Örebro house no 2 the Örebro house no 3
Phases kWh/m' % kWh/m' % kWh/m' %
Manufacturing 900 11 870 10 730 10
Transport 40 0 40 0 30 0
Erection 80 70 50
Occupancy, 50 years 14 J,50=7 100 83 148°50=7 400 85 128°50=6 400 85
Renovation (manufacturing 390 5 370 4 330 4 and transport)
Demolition 10 0 <10 0 <10 0
Removal 30 0 20 0 20 0
Total kWh/(m2 ,50 years) 8 500 100 8 800 100 7 600 100
Total kWh/(m2,year) 170 176 151
Table 3 Estimated energy use <luring the life cycle of four multi-family buildings, The m' in the units refer to the usable floor area in the house concemed, The figures in the table are rounded off
Multi-family buildings the Malmö the Helsingborg the Växjö the Stockholm building building building building
Phases kWh/m' % kWh/m' % kWh/m' % kWh/m' %
l'v:ianufacturing 770 13 820 11 1 180 14 830 12
Transport 60 30 0 30 0 40 I
Erection 70 120 2 50 80
Occupancy, 50 years 100°50=5 000 81 12 J,50=6 050 84 150,50=7 500 88 121'50=6 050 84
Renovation (manufactur-340 6 310 4 410 4 270 4 ing, transport and recovery)
Demolition <10 0 <10 0 <10 0 <10 0
Removal 20 0 20 0 10 0 20 0
Recovery -110 -2 -70 -1 -620 -7 -120 -2
Total kWh/(m2,50 years) 6 200 100 7 200 100 8 500 100 7 100 100
Total kWh/(m2 ,year) 123 144 171 143
According to estimates, the energy used to manufacture all construction materials including the renovation phase of the individual dwelling is approx, 15 % of the total energy use. Translated into different terms, this corresponds to 7-8 years of occupation (space heating, ventilation, domestic hot water and household electricity). In other words, independent of building size, type of foundation, framework, building construction, thermal properties and installation technique, the percentage of energy used to manufacture building materials is approx. 15 %,
28

However, this should not demean the importance of choosing building materials with a small environmental impact <luring the manufacturing phase. If two building materials have the same environmental impact <luring the occupation phase, the one with the lowest environmental impact <luring the manufacturing phase should be chosen - many a little makes a mickle. Furthermore, it is important to develop products and materials in order to get a more sustainable manufacturing process.
According to estimates, the energy used to manufacture thermal insulating materials for the dwellings (mineral wool and polystyrene) corresponds to less than 2 years' energy use <luring actual occupation (for space heating, ventilation, domestic hot water, and household electricity), (Paper 2). Such energy demand to manufacture thermal insulating material are noteworthy, since this material contributes to a low energy use <luring the occupation phase.
The estimated energy demand for transports and processes <luring the erection and demolition ofthe houses constitutes approx. 1 % ofthe total energy use. Compared to the entire life cycle, very little energy is hence used for such purposes.
Table 2 and Table 3 also indicate that a high energy use <luring the manufacturing phase does not imply a low energy use <luring the occupation phase. In addition, a low energy use <luring the manufacturing phase does not imply a high energy use <luring the occupation phase. The important thing is to attain a building with a low energy demand <luring the occupation phase, since this results in a low energy demand <luring the entire life cycle.
5.1.1 Discussion
The results presented in Table 2 and Table 3 are somewhat uncertain. The estimated energy demand to manufacture the building materials is uncertain, since some ofthe information is not manufacturer-specific. In these cases, typical generic data or data for equivalent products is used. Ifthe energy demand ofthe manufacturing phase is increased or decreased by 50 %, the 85-15 ratio becomes 80-20 or 90-10 (depending on whether 50 % are added or subtracted).
Furthermore, the occupation phase in this study is assumed to be 50 years, but will hopefully last longer. If so, the environmental impact from this phase will become even more dominant <luring the life cycle.
The presented results are true for residential buildings in Sweden with a total occupational energy use ofmore than 100 kWh/(m2 usable floor area· year). Ifa house uses zero kWh <luring the occupation phase, the manufacturing energy will be very important. The question is when the energy for manufacture is equal or higher than the amount for occupational energy use. lf the occupation phase is 50 years and the manufacturing energy use is l 000 kWh/m2, which is approx. what the seven residential buildings used, the occupation phase should be lower than 20 kWh/(m2 usable floor area· year) in order to attain at least a 50-50 ratio.
29

5.1.2 Conclusion
The occupation phase constitutes approx. 85 % ofthe total estimated energy demand <luring the buildings' 50-year life cycle.
85%
Figure 7 Approx. 85 % ofthe total estirnated energy dernand <luring a building's 50-year life cycle is used <luring the occupation phase. l 5 % is used <luring the rnanufacturing and renovation phases.
30

5.2 lnfluence of different thermal properties
Different thermal properties in one ofthe multi-familybuildings (the Växjö building) is altered, e.g. framework, thickness ofthermal insulation in externa! walls, thermal character of windows, and degree ofheat recovery in the exhaust air (Paper 3). This is done in order to analyse how the alteration influences the total energy use <luring the life cycle.
The constructions are varied in such a way that the building's performance will be the same. When e.g. the thermal thickness in the externa! wall increase, additional materials are included in order to get moisture, thermal and structural 'correct' construction. In addition, when the thickness ofthe thermal insulation is increased, the wall 'grows' outward in order to receive the same usable floor area.
Results show that there are many ways to decrease the energy use in buildings by using wellknown technology, see Table 4. One energy-efficient solution is to increase the thermal insulation thickness in the externa! walls from approx. 240 mm to 370 mm. The thermal transmittance is then decreased from 0.20 to 0.13 W/(m2 •0 C), which increases the energy used for manufacture from I 180 to 1 200 kWh/m2 • Nevertheless, the energy use <luring the occupation phase is decreased from 7 500 to 7 310 kWh/(m2·50 years). This means that the total energy is decreased by approx. 200 kWh/m2 •
The windows are also varied. They are exchanged from a single pane with a sealed unit and a thermal transmittance of 1.90 W/(m2 •0 C), toa single pane with a sealed argon-filled unit with two surfaces and low-emission coatings anda thermal transmittance of 1.15 W/(m2 •0 C). The energy for manufacture increases from 1 180 to 1 200 kWh/m2 • Nevertheless, the energy use <luring the occupation phase is decreased from 7 500 to 6 960 kWh/(m2·50 years). This results in a decreased total estimated energy use by approx. 500 kWh/m2 •
Table 4 The influence on total energy use for the Växjö building with different thennal properties.
The Växjö building The original Extemal walls with U Windows with U value Mech. vent. with building* value 0.13 W/(m2 •0 C) 1.15 W/(m2 •0 C) heat exchanger
Phases kWh/m2 kWh/m2 kWh/m2 kWh/m2
Manufacturing 1 180 I 200 I 200 1190
Transport 30 30 30 30
Erection 50 50 50 50
Occupancy, 50 years 150·50=7 500 146·50=7 310 139·50=6 960 127·50=6 360
Renovation (manufacturing, 410 410 410 410
transport and recovery)
Demolition <10 <10 <10 <10
Removal 10 10 10 10
Recovery -620 -620 -620 -620
Total kWh/(m2·50 years) 8 500 8 300 8 000 7 400
Total kWh/(m2·year) 171 167 161 148
* The original building has no heat recovery in the exhaust air, the thermal transmittance of the externa! walls is 0.20 W/(m2 •0 C) and the thennal transmittance ofthe windows is 1.90 W/(m2·°C).
31

Another energy-efficient solution would be to use a heat recovery system to gain heat from the exhaust air, Table 4. Ifthe temperature efficiency is increased from O % (i.e. no heat recovery) to 70 % in the Växjö building and the same air change rate is maintained, the estimated energy use <luring the life cycle is decreased by approx. l 100 kWh/m2 •
In (Adalberth K, 1995) the thermal properties of a single-unit dwelling (the Örebro house no 1) are also altered. When the thermal insulation thickness in the externa! walls is increased from 290 mm to 490 mm, the energy use for manufacture increases from 900 to 940 kWh/m2
and the energy use <luring the occupation phase decreases from approx. 7 100 to 7 000 kWh/(m2·50 years). This means that the total energy is decreased by approx. 100 kWh/m2 •
The same pattem is obtained by increasing the number of window-panes in the Örebro house no 1. The original windows have a single pane plus a sealed unit with a low-emission coating, which gives a thermal transmittance of 1.63 W/(m2 · 0 C). These are exchanged for two separate sealed units (quadruple-glazed windows) with two surfaces with low-emission coatings, which gives a thermal transmittance of 0.85 W /(m2 •0 C). The manufacturing energy use is increased from 900 to 910 kWh/m2, but the energy use <luring the occupation phase is decreased from 7 100 to 6 400 kWh/(m2·50 years), resulting in a total reduction ofthe energy use by 600 kWh/m2 • Thus, the same pattem is generally obtained for single-unit dwellings and multifamily buildings when the thermal properties are altered.
5.2. 1 lnfluence of different frameworks
The framework in the Växjö building is also altered. The original building has a wooden framework, which is exchanged for a concrete framework. It is necessary to achieve an identical use of energy <luring the phase of occupancy, i.e. the space heating, for both altematives in order to compare the frameworks only. Result show that the house uses 171 and 172 kWh/(m2·year) for the wooden and concrete framework respectively, Table 5. The difference is small or insignificant. (Paper 3)
Table 5 The influence on total energy use for the Växjö building with different frameworks.
Multi-family building in Växjö W ooden framework Concrete framework
Phases kWh/m' kWh/m'
Manufacturing I 180 960
Transport 30 30
Erection 50 100
Occupancy, 50 years 150·50=7 500 149·50=7 450
Renovation (manufactuting, transport and recovery) 410 410
Demolition <10 <10
Removal 10 20
Recovery -620 -340
Total kWh/(m2 ·50 years) 8 500 8 600
Total kWh/(m2 ·year) 171 172
32

5.2.2 lnter-related results
There are other thermal properties, which influence the energy use <luring the life cycle, e.g. thermal bridges. (Adalberth K, 1995) studies thermal bridges in the foundation of a singleunit dwelling. The floor over a crawl space has longitudinal and pervading beams in order to support the floor. The beams constitute large thermal bridges and cause increased space heat by approx. 15 %. The need for space heating without the thermal bridges is approx. 85 kWh/(m2·year). From a life cycle perspective, the energy use <luring the occupation phase would be greatly increased, resulting in an even more dominant phase.
Another feature, which may influence the energy use <luring the life cycle, is under-floor heating. In a single-unit dwelling, the energy use is estimated with under-floor heating and radiators respectiyely (Adalberth K, 1995). Results show that the estimated need for space heating increases by approx. 15 % with under-floor heating, which results in a substantial increase of the energy need <luring the occupation phase and consequently of the total energy need.
5.2.3 Conclusion
Different thennal properties influence the total energy use ofthe life cycle indifferent ways. However, little energy is used to manufacture building materials and installations. Instead, the different thermal properties of the buildings have a large influence on the energy need <luring the occupation phase. When e.g. the thermal thickness in the externa! wall is increased, so is the energy demand <luring the manufacturing phase, but the energy demand <luring the occupation phase decreases more. This means that the total energy use <luring the life cycle is reduced.
Figure 8 It is wise to design residential buildings by focusing on the occupation phase, i.e. providing energyefficient solutions to the building in order to attain a low energy demand <luring occupancy.
33

5.3 Calculated and charged energy use during the occupation phase
The calculated energy use <luring the occupation phase ofthe buildings is compared to the actual energy use (Paper 3).
The charged energy use for the multi-family buildings is determined by contacting the property manager to receive the use ofheating and electricity outside the apartments, e.g. for laundry facilities, and energy use for fans and pumps. In addition, the energy supplier has been contacted in order to get the electricity inside apartments, i.e. household electricity included lighting. The charged heat is determined for only one year: November 1997 to October 1998 i.e. the second year of occupation.
The energy use for space heating and ventilation is calculated to be between 53 and 94 kWh/(m2·year), but the charged energy use is between 97 and 129 kWh/(m2·year) for the multi-family buildings. This is an increase of30-90 %. The opposite is found for electricity use. The calculated electricity use is higher than the charged use, between 10 and 20 kWh/(m2·year).
The difference between the calculated and the charged energy use <luring the occupation phase could be just as high as the energy demand in the manufacturing phase. Ifthe deviation is 20 kWh/(m2·year), or 1000 kWh/m2 <luring a 50-year life cycle, it equals the size ofthe manufacturing phase. In sum, the charged energy use is between O % and 50 % higher than the calculated use. Since the charged use is higher than the calculated use, the dominant occupation phase is even more dominant than initially believed. This deviation will have an influence, albeit of a different magnitude, on the total energy use <luring the life cycle.
One reason for the deviation could be that the actual indoor temperature is higher than the assumed 20° C. Furthermore, the air change rate may be higher than the assumed 0.50 acr. In addition, there may be deviations from the project documents compared to the actual performance ofthe building constructions and building services.
5.3.1 lnter-related results
Deviations between the project documents and the actual performance were observed <luring a comparison of a design phase and the following contracting work (Adalberth K, 1995). The total energy use of24 single-unit dwellings4 (i.e. space heating, ventilation, domestic hot water and household electricity) were calculated <luring the design phase based on the project documents. On average, the energy use was 129 kWh/(m2·year). Later, the energy use was calculated based on knowledge ofhow the dwellings were actually built. The following deviations from the project documents were observed: failures in the air tightening, inappropriate selection ofwindows compared to what was prescribed in the design phase, deviation in the adjustment ofventilation flow rates and poor thermal insulation in some crawl spaces. These deviations resulted in an increase in the average energy use from 129 to 135 kWh/(m2·year). Two years later, it was possible to receive the charged energy use for the 24 dwellings. The charged energy use <luring the second year of occupation was on average 145 kWh/(m2·year), Figure 9.
4 Three ofthe 24 dwellings are among those investigated in Paper 2, namely the Örebro house no I, 2 and 3.
34

Number of single-unit dwellings
12
1: I 6
4
2
0
~ . .
' . .
.
80 100 120
Number of single-unit dwellings
12
10
8
6
4
2
0 80 100 120
Number of single-unit dwellings
I
140 160 180 200 220 kWh/(m'·year)
140 160 180 200 220
kWh/(m'·year)
kWh/(m'·year)
Figure 9 The top diagram shows the estimated energy use <luring occupation based on the project documents for 24 single-unit dwellings. The centre diagram shows the estimated energy use based on information of how the dwellings were built. The bortom diagram shows the charged energy use.
35

A study by (Sandberg E, 1998) describes the calculated and the charged energy use in 16 multi-family buildings. The calculated heat demand for space heating, heating for ventilation and domestic hot water is on average 97 kWh/(m2·year). The charged energy use is on average 155 kWh/(m2·year). This means that the charged heat is more than 50 % higher than the calculated heat. The difference can e.g. be explained by a higher indoor air temperature, a frequent use of window airing, a higher ventilation rate, a higher degree of solar shading due to surrounding buildings and trees, and finally, a higher degree ofthermal bridges.
5.3.2 Conclusion
There is often a deviation between the calculated and the charged energy use for buildings. The size ofthe deviation summed up over 50 years of occupation may be just as high or higher than the manufacturing phase.
Figure 10 There is often a deviation between the calculated and the charged energy use for buildings. The deviation for the studied residential buildings is between O % and 50 %.
36

5.4 Environmental impact during the buildings' life cycle
The environmental impact ofthe four multi-family buildings has been estimated (Paper 4). The impact is determined by investigating global warming potential, acidification, eutrophi""tirin, phntnch,,mic« 1 nzone t'rte,atinn pnttentials, ,mn hum«n t,wir.ity
Results show that the occupation phase has the highest environmental impact among the temporal phases that the buildings pass, see Figure 11. The occupation phase is assumed to be 50 years and consequently important. 70-90 % ofthe estimated environmental impact <luring a dwelling's life cycle arises <luring the occupation phase.
The second dominant phase is the manufacturing ofbuilding and installation materials. This phase constitutes l 0-20 % of the life cycle. The environmental impact from the other phases - transport, erection and demolition - has a marginal influence on the impact.
According to estimates, the environmental impact that arises when all construction materials of the different multi-family buildings are manufactured is 10-20 % of the total impact. The figure is independent ofthe building's size, type offoundation, framework, building construction, thermal properties and installation technique.
5.4.1 Discussion
The choice of energy source <luring the life cycle has a !arge effect on the environmental impact. A sensitivity analysis has been performed, in which the electricity mix is altered from the OECD European mix toa Swedish mix. Results show that the influence ofthe occupation phase decreases from 80-90 % to 60-80 % for all the effect categories, except human toxicity which decreases from 70 % to 40 % when a Swedish mix is used ( 45 % nuclear and 45 % hydroelectric power).
This decrease may be explained by the fäet that the Swedish electricity mix is 'cleaner' from an LCA perspective. In LCA methodology, the environmental impact from electricity produced in nuclear power plants is minor. Often, the environmental impact is estimated based only on the construction and operation ofthe power plant. The effects from the manufacture ofuranium and the final waste disposal are seldom handled, since this impact can not be presented in global warming potential or acidification. Consequently, the environmental impact arising from nuclear power plant activities is underestimated.
The lowest environmental impact from a building is of course received when l 00 % renewable energy sources are used, e.g. biomass for heat and wind power for electricity use. In this way, the emissions, i.e. indirectly the impact on the environment, wil! be low.
One ofthe studied multi-family houses is located in Växjö, where the district heating system has much renewable energy, namely 90 % biomass. Ifthe electricity used in the building also were made up by renewable energy e.g. wind power, the total environmental impact <luring the life cycle would be extremely low.
The environmental effects from exploiting biomass are not well-known or documented. Hence, the supplied energy to the Växjö building must be used efficiently in order to share the biomass with other buildings in Växjö or its surroundings, having a more polluted energy mix.
37

Malmö
Växjö
Stockholm
Malmö
Växjö
Stockholm
Malmö
Växjö
Stockholm
a) Global Wanning Potentials
0 0.5 1.5
ton C02 equivalent/(m2·50yrs)
c) Eutrophication
0 0.001 0.002 0.003 0.004 0.005 0.006
0
ton N03 equivalentl(m'·50yrs)
IOO 200 300 400 500 600 700
Equivalent/(m'·50yrs)
Malmö
Växjö
Stockholm
b) Acidification
0.002 0.004 0.006 0.008 0.01
ton S02 equivalent/(m'·SOyrs)
d) Photochemical ozone creation potentials
0.0001 0.0002 0.0003 0.0004 0.0005
ton C2H4 equivalent/(m'·50yrs)
O 2000 4000 6000 8000 10000 12000
kWh/(m'·SOyrs)
~ Manufacturing ~ Transport I Erection ~ Occupation O Renovation ~ Demolition I Removal of debris
Figure 11 The environmental impact ( expressed as global warming potential, acidification, eutrophication, photochemical ozone creation potentials and human toxicity) and energy use <luring the life cycle of the four multi-family buildings.
38

5.4.2 Conclusion
The occupation phase constitutes 70-90 % ofthe total environmental impact <luring the buildings' life cycle.
The environmental impact from the manufacturing phase constitutes I 0-20 % ofthe total, and therefore has little influence on the total impact. The figure is independent ofthe multi-family building's size, type offoundation, framework, building construction, thermal properties and installation technique.
Instead, the building's constructions and installation techniques have a !arge influence on the environmental impact from the occupation phase and consequently on the total environmental impact.
70-90 %
[I ' 0 I] 0 0
Figure 12 70-90 % ofthe total environmental impact during the multi-family building's life cycle arises during the occupation phase. I 0-20 % arises during the manufacturing and renovation phases.
39
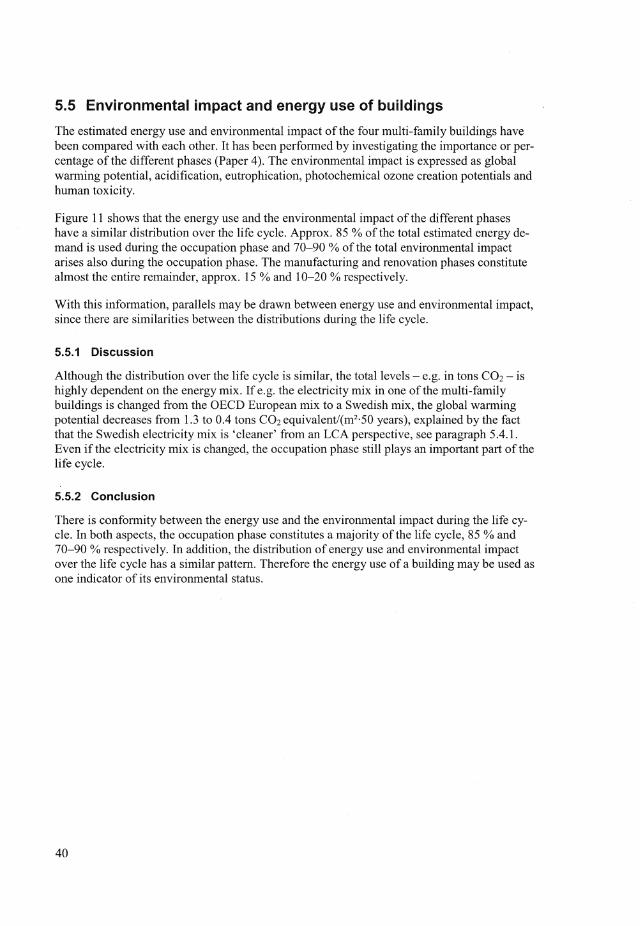
5.5 Environmental impact and energy use of buildings
The estimated energy use and environmental impact ofthe four multi-family buildings have been compared with each other. It has been performed by investigating the importance or percentage ofthe different phases (Paper 4). The environmental impact is expressed as global warming potential, acidification, eutrophication, photochemical ozone creation potentials and human toxicity.
Figure 11 shows that the energy use and the environmental impact ofthe different phases have a similar distribution over the life cycle. Approx. 85 % ofthe total estimated energy demand is used <luring the occupation phase and 70-90 % ofthe total environmental impact arises also <luring the occupation phase. The manufacturing and renovation phases constitute almost the entire remainder, approx. 15 % and 10-20 % respectively.
With this information, parallels may be drawn between energy use and environmental impact, since there are similarities between the distributions <luring the life cycle.
5.5.1 Discussion
Although the distribution over the life cycle is similar, the total levels - e.g. in tons C02 - is highly dependent on the energy mix. If e.g. the electricity mix in one ofthe multi-family buildings is changed from the OECD European mix to a Swedish mix, the global warming potential decreases from 1.3 to 0.4 tons C02 equivalent/(m2·50 years), explained by the fäet that the Swedish electricity mix is 'cleaner' from an LCA perspective, see paragraph 5.4.1. Even if the electricity mix is changed, the occupation phase still plays an important part of the life cycle.
5.5.2 Conclusion
There is conformity between the energy use and the environmental impact <luring the life cycle. In both aspects, the occupation phase constitutes a majority ofthe life cycle, 85 % and 70-90 % respectively. In addition, the distribution of energy use and environmental impact over the life cycle has a similar pattem. Therefore the energy use of a building may be used as one indicator of its environmental status.
40

5.6 Predicting the occupational energy demand in an early design phase
Due to the compiled information in paragraph 5.1-5.5, this paragraph deals with the energy use <luring the occupation phase. In Sweden, an estimate ofthe future building's need for cp"C'" hP<>ting "nr! "entj]c,tion is ns:nc,lly mc,rlP. This is "ften rl"nP rl11ring thP rlPsign ph""P
when constructional and installation drawings are at hand. However, this process could be made more rational. If it was possible to predict the energy use before any constructional or installation drawings were made, designers and clients could elaborate with different thermal properties and hence decide how to attain an energy-efficient house.
Thus, this paragraph summarises a simplified and user-friendly tool for predicting the energy use in a multi-family building in an early design phase before any constructional or installation drawings are made (Paper 5).
The tool has been developed to calculate the energy use for muiti-family buildings of different size and with various thermal properties. In total, 17 parameters are varied. The alterations of the buildings are planned with a reduced experimental design in order to get the maximum amount of information with as few runs as possible. The design is performed with the software Modde (Umetri, 1997). The results from the energy simulations are evaluated with the statistical method multiple linear regression (Draper N R et al, 1998).
The output is a mathematical mode! showing the relation between the parameters and the energy use <luring the occupation phase for space heating and ventilation included electricity for pumps and fans, EsHv [kWh/year], see Equation 3 and 4.
The total energy use for space heating, ventilation, domestic hot water and household electricity is often of interest to designers and clients. In order to receive the total energy use, the habits of the residents have to be known. If the residents are assumed to use 1 500 kWh/person for domestic hot water EoHw, (Briheim B, 1991) and (Haugen T, 1984), and 3 000 kWh/apartment for household electricity EHE, (Lyberg M, 1989) and (Pettersen T D, 1997), the total energy use <luring the occupation phase, Erm AL may be estimated as follows:
ErorAL = EsHv + EoHw + EHE
Eror AL = ! OA + ! 500·number of residents + 3 OOO·number of apartments
where
A 3.175 + 0.013-L 0.962·U1,,, + 0.151·U. 0.103·V + 0.006-T;-T,,
+ 0.023· W + 0.102·H + 0.286·qlh ~ 0.182· T,,
+ 0.004-T; + + 0.435·acr +
(Equation 3)
(Equation 4)
(Equation 5)
Abbreviations in Equation 5 are listed in Table 6. The table also presents the intervals for which the parameters are valid. Note that equation 4 is only valid within these intervals. The intervals are chosen from different references, see Paper 5. The paper also includes an example ofhow the equation may be used.
The factors in front of the parameters in Equation 5 are scaled and centred in order to compare their interna! influence on the energy use, see Table 6. Note that their influence is only true when the parameters are varied within the presented intervals.
41

Table 6 The factors in front ofthe parameters in Equation 5 are scaled and centred in order to compare the parameters' influence on the energy use. The orthogonally scaled and centred coefficients are only true for the Iisted parameters when they are varied within the presented intervals.
Thermal bridges, q1b
The average outdoor temperature, T.,
Ventilation system, V
-1 = balanced ventilation with heat exchanger, temperature efficiency 80 %
-0.5 = balanced ventilation with heat exchanger, temperature efficiency 65 %
0 = balanced ventilation with heat exchanger, temperature efficiency 50 %
I = exhaust air with no heat exchange
Intervals
0.05 < qtb < 1.20 W/(m· 0 C) *
1.8 <Tu< 8.0°C
-l<V<I
Number of levels, H 2 < H < 4
Indoor air temperature, T, 19 < T1 < 25° C
U values ofwindows, U,. 1.00 < Uw< 2.00 W/(m2 •0 C)
U values of floor, walls and roof u1"' 0.15 < Ufw,. < 0.30 W/(m2 •0 C)
The length ofthe building, L 25 < L < 35 m
Air change rate ofthe mechanical ventilation, acr 0.3 < acr < 0.6 h- 1
The width of the building, W I O < W < 15 m
Average size of apartments, apt 65 < apt < 85 m2/apartment
Area ofwindows, Aw 10 < Aw < 20% ofusable floor area
Orientation ofwindows, W,,,.;ent 10 < W0 ,.1ent < 40 % facing south and north, respectively
Orthogonally scaled and centred coefficients
0.33
0.30
0.21
0.20
0.20
0.15
0.14
0.13
0.13
0.11
<0.10
<0.10
<0.10
* A high value represents a design in which no efforts are made to reduce the amount ofthermal bridges. A low value represents a careful design in which the intersections between different building constructions are thoroughly considered.
As shown in Table 6, the thermal bridges and the average outdoor air temperature have the largest influence on the energy use for space heating and ventilation. It must be stressed that the magnitude ofthe orthogonally scaled and centred coefficient ofthe thermal bridges depends on its large interval.
The second most important factors is the kind ofventilation system, the height ofthe building and the indoor air temperature.
The thermal transmittance ofthe windows and the floor/walls/roofhave about the same influence on the energy use as the air change rate and the house's length and width. The average size of the apartments, the window area and the orientation of the windows have a small influence only.
42

The scaled and centred coefficients in Table 6 may also be interpreted as follows:
Approx. the same energy reduction is attained by decreasing the amount ofthermal bridges from 1.2 to 0.65 W /(m· 0 C) as by using windows with a thermal transmittance of 1.00 instead of 2.00 W /(m2 • 0 C)
Approx. the same energy reduction is attained by decreasing the amount of thermal bridges from 1.2 to 0.05 W/(m· 0 C) as by choosing windows with a thermal transmittance of 1.00 instead of 2.00 W/(m2 • 0 C) and choosing floor, walls and roofwith a thermal transmittance of 0.15 instead of 0.30 W /(m2 •0 C).
5.6.1 Conclusion
The developed tool is an example ofhow the energy use may be predicted in an early design phase. Nevertheless, it is important to remember that this simple tool should only be used <luring an early design phase. A thorough estimate ofthe energy use for the future building should be performed when the constructional and installation drawings are at hand.
The tool contains certain parameters, which influence the energy use more or less. It would be unfair to list them in a conclusion, since their ranking depends on the !imitations set for the parameters. Instead, see Table 6 where the parameters are ranked. Note that the ranking is only true for the parameters when they are varied within the presented intervals.
Figure 13 A simple and user-friendly tool has been developed in order to predict the occupational energy use for a future dwelling in an early design phase before any constructional and installation drawings are at hand. The tool may help designers and clients to predict the energy use by elaborating different thermal properties in order to receive an energy-efficient house.
43

44

6 Recommendations Based on the results and conclusions certain recommendations can be made within the area of energy use and environmental impact in new residential buildings.
Since conformity between the estimated energy use and the environmental impact <luring the life cycle is established, and since the occupation phase is very dominant, the following three recominendations are articulated:
1. A house should be designed with low energy use <luring the occupation phase, even if the energy demand <luring the manufacturing phase will increase. This is e.g. achieved by:
Making careful designs ofthe intersections between elements in order to keep values for thermal bridges as low as possible
Designing ventilation systems with heat recovery of the exhaust air
Choosing energy-efficient windows for the building.
2. The energy use for space heating, ventilation, domestic hot water and household electricity should be estimated <luring the design phase with realistic input to ensure that the predicted energy use matches reality.
3. High quality <luring constructions (the actual erection ofthe building) should be enforced to maintain a minimal deviation between the designed and performed building.
45

46

References
Adalberth K, 1995: Bygga Bruka Riva - Energianvändning i småhus ur ett kretsloppsperspektiv. Licentiate Thesis. Report no TVBH 3034. ISBN 91-88722-04-X. Department of Building Physics. Lund University. Lund. Sweden. (in Swedish)
Adalberth K, 1999: Energy Use in Multi-Family Dwellings during their Life Cycle. Report no 3034. ISBN 91-88722-17-1. Department of Building Physics. Lund University. Lund. Sweden.
Andersen S, Dinesen J, Hjort Knudsen Hand Willendrup A, 1993: Livscyklusbaseret bygningsprojektering (Eng. Life-cycle-based building design. Energy and environment model, calculating tool and database). Report no 224. Danish Building Research Institute. Horsholm. Denmark. (in Danish)
Andersson K and Norlen U, 1993: Bostadsbeståndets inneklimat. ELIB report no 7. TN:30. Centre for Built Environment. Royal Institute ofTechnology. Gävle. Sweden. (in Swedish)
Blomberg T, 1996: Heat Conduction in Two and Three Dimensions. PhD-thesis. Report no TVBH-1008. Department of Building Physics. Lund University. Lund. Sweden.
Borg M, 1997: Livscykelinventering av kallvalsad varmförzinkad stålplåt. SBI report no 187:9. Swedish Institute ofSteel Construction. Stockholm. Sweden. (in Swedish)
Boverket, 1994a: Boverkets Byggregler BBR94. ISBN 91-38-12851-9. The Swedish Board ofHousing, Building and Planning. Karlskrona. Sweden. (in Swedish)
Boverket, 1994b: Byggnaders värmeenergibehov. Utgångspunkter för omfördelningsberäkning. ISBN 91-7147-157-X. ISSN 1400-1012. The Swedish Board ofHousing, Building and Planning. Karlskrona. Sweden. (in Swedish)
Boverket, 1999: Byggsektoms miljömål. ISBN 91-7147-572-9. The Swedish Board of Housing, Building and Planning. Karlskrona. Sweden. (in Swedish)
Briheim B, 1991: Solvarmt tappvarmvatten i flerbostadshus. Report no 169. Norwegian Building Research Institute. Norway. (in Norwegian)
Dinesen J, Krogh Hand Traberg-Borup S, 1997: Livscyklusbaseret bygningsprojekteringOpgarelse afbygningers energiforbrug of energirelaterede milj0påvirkninger (Eng. Lifecycle-based Building Design. Calculation ofbuildings' energy consumption and energyrelated environmental impacts). Report no 279. Danish Building Research Institute. H0rsholm. Denmark. (in Danish)
Draper NR and Smith H, 1998: Applied Regression Analysis. ISBN 0-4711-7082-8. Third Edition. John Wiley & Sons. New York. USA.
Ecocyclic Society of the Building Sector, 1995: Miljöansvar för byggvaror inom ett kretsloppstänkande - ett utvidgat producentansvar. Stockholm. Sweden. (in Swedish)
Erlandsson M, 1996: Miljövarudeklaration Limträ. Hållfasthetsklass L40. Moelven Töreboda Limträ AB. Trätek. Stockholm. Sweden. (in Swedish)
47

Frees N and Pedersen M A, 1996: Enhedsproces database - UMIP Enhedsproces database. ISBN 87-7810-547-1. The Institute for Product Development. Technical University of Denmark. The Ministry ofEnvironment and Energy. The Danish Environmental Protection Agency. Danish Industry. Denmark. (in Danish)
Glaumann M, 1998: Miljövärdering av byggnader. Centre for Built Environment. Royal Institute ofTechnology. Sweden. (in Swedish)
Hagentoft C-E, 1991: Heat Conduction Program. PC-program HConP. Hagentoft Konsultfirma. Göteborg. Sweden.
Haugen T, 1984: Energifördelning i bygninger. STF report no A84017. SINTEF. Norway. (in Norwegian)
IEA, 1998: World Energy Outlook. 1998 Edition. ISBN 92-64-16185---6. The Intemational Energy Agency. Paris. France.
Isakson P and Kellner J, 1984: En jämförelse mellan en lätt byggnad med aktiv värmelagring och en tung byggnad. Report no R105:1984. The Swedish Council for Building Research. Stockholm. Sweden. (in Swedish)
J&W, 1997: Miljöstatusbedömning av byggnader. Stockholm. Sweden. (in Swedish)
Jönsson Å, 1995: Life Cycle Assessment of Flooring Materials - A case study and methodological considerations. Licentiate thesis. Report no 1995:3. Technical Environmental Planning. Chalmers University ofTechnology. Gothenburg. Sweden.
Larsson B, 1983: Materialförbrukning på byggarbetsplatsen. Building Economics and Construction Management. Chalmers University of Technology. Gothenburg. Sweden. (in Swedish)
Lindhe N, 1996: Effektivare materialanvändning på byggarbetsplatsen. En studie av materialspill. Report no 9603. Byggmästareföreningen Väst. Gothenburg. Sweden. (in Swedish)
Lyberg M and Honarbakhsh A, 1989: Förutsägelse av årliga energiförbrukningar från korttidsmätningar. Report no R106:1989. The Swedish Council for Building Research. Stockholm. Sweden. (in Swedish)
Pettersen T D, 1997: Uncertainty analysis of energy consumption in dwellings. PhD thesis. Report no 1997:122. ISBN 82-417-0160-2. ISSN 0802-3271. The Norwegian University of Science and Technology. Trondheim. Norway.
Munther K, 1996: Enorm version 1000. AB Swedish Building Centre. Stockholm. Sweden. (in Swedish)
National Association ofSwedish Wooden House Manufacturers, 1999: http://www.husfabrikema.com/index.htm. Sweden. (in Swedish)
Nutek, 1998: Energy in Sweden- fäets and figures 1998. Information no 169-94. Stockholm. Sweden.
48

Paulsen J, 1999: Life Cycle Assessment for Building Products - With Special Focus on Maintenance and Impacts from the Usage Phase. Licentiate Thesis. ISSN 0349-5752. ISBN 91-7170--476-0. Division of Building Materials. Royal Institute of Technology. Stockholm. Sweden.
Petersen E H, 1997: Database og opg0re!sev,erkt0j for bygningsdeles ofbygningers milj0parametre (Eng. Database and inventory tool for building components and buildings' environmental parameters). SBI Report 275. Danish Building Research Institute. H0rsholm. Denmark. (in Danish)
Prior J and Bartlett P, 1995: Environmental Standard- Homes fora greener world. Report no BR 278. Building Research Establishment. Garston. Watford. England.
SABO, 1998: Underhållsnorm. Organisation for Municipal Housing Companies. Stockholm. Sweden. (in Swedish)
SCB, 1999a: Statistiska centralbyrån. www.scb.se/ekonomi/bostäder/bostadsbyggande /nybyggnad/nybyggdia.asp. Sweden. (in Swedish)
SCB, 1999b: Statistiska centralbyrån. http://www.scb.se/databaser/makro/SaveShow.asp. Sweden. (in Swedish)
Sandberg E, 1998: Energimål - kort sikt. Hammarby Sjöstad. Preliminary report. ATON Teknik Konsult AB. Stockholm. Sweden. (in Swedish)
Sigfrid L, 1993: Miljöstörande material i rivningsavfall - en fallstudie av kadmium, kvicksilver, bly, PCB och CFC i byggnader. Stiftelsen REFORSK. Report no 0284-9968 81. Lund. Sweden. (in Swedish)
Sundberg K, 1994: Miljökonsekvenser av byggnadsmaterial: Gipsskivan - en livscykelanalys. TRITA-BYMA Report no 1994:1. ISSN 0349-5752. Division ofBuilding Materials. Royal Institute ofTechnology. Stockholm. Sweden. (in Swedish)
Swedish Building Centre, 1999: Personnel communication with the Swedish Building Centre in Stockholm. Sweden.
Swedish District Heating Association, 1999: www.fvf.se/fjarrvarme/FvoKv _i_sammdrag.htm. (in Swedish)
SABO, 1998: Miljöinventering i befintlig bebyggelse MIBB. Swedish Federation for Rental Property Owners, Organisation for Municipal Housing Companies and Swedish Union of Tenants. Stockholm. Swedcn. (in Swcdish)
Swedish Parliament, 1999: Svenska miljömål -- miljöpolitik för ett hållbart Sverige. Proposition no 1997/98:145. Swedish Parliament. Stockholm. Sweden. (in Swedish)
Thormark C, 1997: Potential Savings Provided by Design for Recycling in Building Construction. Licentiate Thesis. Report no T ABH--97 /3050. Department of Building Science. Lund University. Lund. Sweden.
49

Tillman A-M, Baumann H, Eriksson Hand Rydberg T, 1991: Packaging and the Environment - Life-cycle analyses of selected packaging materials - Quantification of environment loadings. SOU 1991 :77. Chalmers industriteknik. Chalmers Teknikpark. Gothenburg. Sweden.
Trinius W, 1999: Environmental Assessment in Building and Construction - Goal and Scope Definition as Key to Methodology choices. PhD Thesis. ISSN 0349-5752. ISBN 91-7170-479-5. Division ofBuilding Materials. Royal Institute ofTechnology. Stockholm. Sweden.
Umetri, 1997: Modde for Windows. Users's Guide. Umetri AB. Umeå. Sweden.
50

Energy use during the Ufe Cycle of Buildings: a Method
Published in Building and Environment, Vol. 32, No. 4
Paper1
Appendix


e Pergamon Buildingand Em.Jironment, Vol. 32, No. 4, pp. 317-320, 1997
© l 997 Elsevier Science Ltd. All rights reserved Printed in Great Britain
0360-1323/97 $17.00+0.00
Pil: 80360-1323(96)00068-6
Energy use <luring the Life Cycle of Buildings: a Method
K. ADALBERTH* (Received 14 May 1996; revised 28 August 1996; accepted 7 November 1996)
So far, research has mainly been concentrated on the energy use for buildings during their period ofuse, that is to say, the energy neededfor space heating, hot water and electricity. But what about the energy use fora building during ils life cycle? This paper presents a method on how to calculate the energy use during the life cycle oja building. In the companion paper "Energy use during the life cycle oj single-unit dwellings: examples" [Building and Environrnent, 1997, 32, 321-329] the rnethod is applied on three single-unit dwellings built in Sweden in 1991 and 1992. © 1997 E/sevier Science Ltd.
BACKGROUND
Studies on the total energy use during the life cycle of a building are desirable, considering the urgent necessity to save energy. To date, research has mainly focused on the energy use for buildings during their period of use: space heating, hot water and the need for electricity. The purpose of this study is· to present a developed methodology on how to estimate the energy use during the life cycle of a building.
In the present context, the expression "the life cycle of a building" refers to all temporal phases or stages, from the point where the construction materials are produced until the building is to be demolished. Energy is required during every one of these stages. The temporal phases involved are presented in Fig. I.
Pertinent conditions, definitions and restrictions In order to be able to calculate the energy use during
the life cycle of a building, some definitions and restrictions have to be made. When calculating the amounts of construction materials, all the quantities have to be included: from the excavation for the foundation (including the drainage and capillary-severing layer) up to the chimney on the roof.
The period of use for buildings, the so-called "management" phase, has to be assumed. In this study the management phase is assumed to be 50 years, as the economic life-span of a building in Sweden is about 40-50 years. The energy use during the management period is based on the assumption that no extensions or considerable changes are made <luring the relevant 50-year period. Only "normal" maintenance has been taken into account.
*Department ofBuilding Physics, Lund University, P.O. Box 118, S-221 00 Lund, Sweden.
317
METHOD
Manufacturing energy use during production and renovation
Energy is required whenever construction materials are going to be manufactured. Table 1 presents a compilation of the manufacturing energy requirements (primary energy) regarding construction materials [I]. The energy uses stated are general in character. It would be desirable for the manufacturers of these materials to be able to supply information regarding the energy use associated with their particular product. Such a statement would ensure that more specific energy requirement data for each type of construction material would become available. At the same time, this energy use would be monitored and adjusted as product development continued.
In Table I, the waste of each material produced during the erection of the building is also presented. The waste is expressed as a waste factor w, (% ).
The energy requireinent for producing all the building materials, Qm,nur (kWh), is estimated as follows:
n
Qm,nur= L m,·(l+w;/lOO)·M, ;~ 1
where n = number of materials, i= the material of concern, m, = amount of the building material i (ton), w, = the factor for waste of the material i produced <luring erection of the building (%), and M, = energy required for manufacturing the building material i (kWh/ton).
In order to be able to calculate the energy use during the renovation phase, some assumptions regarding the life-span ofthe various construction materials have to be made (see Table 2). These life-spans are collected from the maintenance norm ofthe Organisation for Municipal Housing Companies [3]. The assumed life-spans contained in the maintenance norm are based on experience. The relevant materials are exchanged (number of times)

318 K. Adalberth
Production Management Destruction
Manufacturing Transportation Erection Occupation Renovation Occupation Demolition Removal
Fig. I. The shifting temporal phases of a building <luring its life cycle.
Table I. Energy use for manufacturing construction materials, M; (kWh), collected from Andersen et al. [!]. Manufacturing energy (primary energy) comprises energy required for the extraction ofthe raw material and the production and transport ofsemi-manufactures; the heating ofmanufacturing and administration premises; and the production of the final construction material. The combustion value of the construction materials is also included in the manufacturing energy, i.e. no deduction for such a value has been made. The factor for waste W; (%) produced <luring erection or renovation of the building is based
upon a study by Larsson [2]
M; W;
Materials (kWh/ton) (%)
Concrete, reinforced Concrete, plain Gypsum wallboard Tiles and clinkers Timber: rough saw (0.5 ton/m3)
Timber: planed (0.5 ton/m3)
Timber: shingles and shavings (0.6 ton/m3)
Glass Mineral wool Polyvinyl chloride (PVC) Polythene Polystyrene Coatings: paints and lacquers Steel Copper Ventilating channels, sheet meta! Electric wires, copper White goods, 1110 kWh/item
according to the following formula:
life-span of a building life-span of material - 1
560 210
2400 2000 1440 2240 3150 7230 5330
24650 16400 29650
7000 8890
19 500 9000
19780
20 10 10 10 10 10 7 0
10 5 5
lO 5 5 5
10 5 0
An example of this is as follows. A plastic carpet is assumed to have a life-span of 17 years, according to Table 2. Our calculations thus inform us that it will be exchanged (50/17)-1 = 1.9 times.
The exact meaning of the concept "life-span" in relation to a product varies. Sometimes a product will be
Table 2. The life-spans of some construction materials
Life-span of building
Life-span of building Frame (extemal walls, interior walls, joists,
fundament, insulation) Parquet flooring Water pipes and electric wires Ventilating channels F acing: wooden panelling Windows and doors Wardrobes and cupboards Roofing tiles and drainpipes Plastic carpeting Water heater White goods Painting and wallpapering
Life-span (years)
50
50 50 50 50 30 30 30 30 17 16 12 lO
exchanged because it has expired or has become worn out. In such a case, the life-span may be the "technical life-span", for instance the life-span of white goods. In another case, a product might be replaced due to altered fashions, or because the user has become tired of the appearance of a certain product. In such a context, the
.!ife-span may be considered as the "aesthetic life-span", e.g. wallpaper or indoor paint.
The energy use for producing the building materials during the renovation, Qm,nur.renov (kWh), is estimated as follows:
n
Qm,nuf.renov= Im,·(l+w;/IOO)·M, i-I
. (life-span of a building _ ) life-span ofmaterial i 1 '
where n = number of materials; i = the material concerned; m, = amount of the building material i (ton); w, = factor for waste of the material i produced during erection of the building (% ); and M, = energy required for manufacturing the building material i (kWh/ton).
Energy use for transportation during the production, renovation and destruction
Energy is required whenever construction materials are to be moved from one place to another. Transport takes place from the manufacturer to the building site, both while the building is being erected and when it is renovated. It should be pointed out that the transportation of raw and semi-manufactured materials is included in the manufacturing energy category. This transport energy accounts for approximately 5-10% of the manufacturing energy for each construction material.
There will also be transportation from the building to waste disposal sites in connection with renovation and demolition. This study assumes that there is a waste disposal plant in the municipality where the building is located. The relevant transportation distance is assumed to be 20km.
Table 3 presents various energy uses associated with different kinds oftransportation. In the context oftransportation, the relevant source of energy is made up of fossil fuels.
One reason for the difference in energy use between lorries for long-distance and short-distance transportation is that lorries which have long distances to go
Table 3. Energy use (primary energy) for various types of transportation according to Tillman et al. [4]
Transport energy, T, Means of conveyance (kWh/ton km)
Road, long-distance (distances>50km) 0.28 Road, short-distance (distances:s;50km) 0.75 Coastal vessel 0.13 Deep-sea transport 0.06

Energy use during the Life Cycle oj Buildings: a Method 319
Table 4. Energy use (primary energy) for various processes during the erection and demolition of buildings [I]
Types of processes P,
Drying of standard concrete on building site Drying of concrete element
44kWh/ton 25kWh/ton 32kWh/m3
3kWh/ton 2kWh/m2
Excavation and removal of soil Smoothing of soil Crane lifting Lighting of construction object Heating of construction object Heating of sheds
will carry larger loads (see Table 3). Another relevant factor is that short-distance transportation tends to take place on streets and roads in cities, whereas long-distance transport primarily occurs on country roads and hence requires less fuel.
The energy use, Q"'"'• (kWh), for transporting the building materials to and from the building site when erecting, renovating and demolishing the building is estimated as follows:
Q,ran,p,,rect = L m,· (1 +w,/100) · d,· T, i= I
n
Q,ran,p,cenov= L m,·(l+w,/100) i= I
n
. (life-span ofbuilding ) . (d .. -ll'fi f . 1-1 ,+20) 1, \ 1 e-span o matena
Q,ran,p,,~ov = L m, ·(I+ w,/100) · 20 · T, i= I
where n = number of materials; i = the material concerned; m, = amount of the building material i (ton); w, = factor for waste of the material i produced <luring erection of the building (% ); d1 = distance from the manufacturer of material i to the building site (km); 20 = the assumed distance from the building site to the waste disposal site (km); and T, = energy required for the conveyance concerned (kWh/ton km).
Energy use during the erection and demolition When erecting a building, energy will be needed for a
variety of processes, for instance drying and drainage, the heating of sheds and of the building itself, electricity for lighting purposes and for machinery, and so on. Conversely, processes associated with the demolition phase involve similar requirements. The energy data pertaining to the various processes, P1, were collected from Andersen et al. [I] (see Table 4).
During the renovation, some energy will also be needed for different processes in order to exchange the renovation materials. However, most of this energy is made up of manual work and therefore this energy demand is not considered in this study.
The energy use for different processes when erecting and demolishing the building, Q,=• and Qd,mot (kWh), is estimated as follows:
m
Qerect = L Pi' pj j=I
26 kWh/m2 usable floor area 26 k/Whm2 usable floor area 14kWh/m2 usable floor area
m
Qd,mol = L P1' pj J= I
where m = number of processes; j = the type of process; p1 = the amount of the process j (ton, m3 . or m2 usable floar area); and P1 = energy required for the process j (kWh/ton, kWh/m3 or kWh/m2 usable floar area).
Energy use during the occupation Finally, the energy use <luring occupation (space heat
ing, hot water and electricity) was calculated with the aid of the Swedish computer program Enorm [5]. This program computes the energy and average power requirement <luring a period of 12 months, based on average outdoor temperatures on a 24-hour basis and average solar radiation. Factors taken into account by the program include: the U values of the building concerned; air leakage; thermal bridges; window orientation indifferent directions; heating system; and ventilation including the heat exchanger (heat from the exhaust air being transferred to the supply air). Computations do not include the accumulation of heat in the frame and furnishings of the building, as this would call for climate data for every hour at least.
The energy needed <luring the occupation phase, Q0 ~••
(kWh), is obtained by multiplying the energy use per year, Q=•• (kWh/year), by the life-span of the building concerned, in this case 50 years:
Qoccup = Qoccup,ycar · 50
Energy use during the life cycle The different energy demands <luring the whole life
cycle are now presented. In order to obtain the total energy demand <luring the life cycle, Q"'"Y''' (kWh), the different energy demands <luring the different phases have to be summarised:
Qlifecycle = Qmanur+ Qtransp.prod + Qerect + Qoccup
+ {Qmanuf,renov + Qtransp,renov) + Qdemol + Qtransp,remov
It should be pointed out that the energy requirement, or energy gain, that arises in the context of reuse, recycling or combustion (energy extraction) is not taken into consideration here. The reason for this is that the energy use or gain engendered <luring the handling of "leftover products" depends on the quality of the worn-out material and on the extent to which it is processed. The data available at the present time are still incomplete and too vague to be included.

320 K. Adalberth
CLOSING REMARKS
In this paper a method to calculate the total energy use <luring the life cycle is presented. In the companion paper "Energy use <luring the life cycle of single-unit dwellings: examples" [7] the method is applied. The paper gives
examples of the total energy use for three single-unit dwellings built in Sweden in 1991 and 1992. The purpose is to gain an insight into the total energy use fora dwelling <luring its life cycle. This and the companion paper are also presented in [6].
REFERENCES
I. Andersen, S., Dinesen, J., Hjort Knudsen, H. and Willendrup, A., Livscyklus-baseret bygningsprojektering. Repor! no 224, Danish Building Research Institute, H0rsholm, Denmark, 1993.
2. Larsson, B., Materialförbrukning På Byggarbetsplatsen. Building Economics And Construction Management, Chalmers University OfTechnology, Gothenburg, Sweden, 1983.
3. SABO, Maintenance norm. Organisation For Municipal Housing Companies, Stockholm, Sweden, 1992.
4. Tillman, A.-M., Baumann, H., Eriksson, H. and Rydberg, T., Packaging and the environment-lifecycle analyses of selected packaging materials-quantification of environment loadings. SOU 1991 :77, Chalmers Industriteknik, Chalmers Teknikpark, Gothenburg, Sweden, 1991.
5. Munther, K., Enorm Version 800. Energiforskning Ab, Stockholm, Sweden, 1992. 6. Adalberth, K., Bygga Bruka Riva-Energianvändning i småhus ur ett kretsloppsperspektiv (Eng.
production management destruction-energy use for three single-unit dwellings). Tvbh 3027, Department of Building Physics, Lund University, Lund, Sweden, 1995.
7. Adalberth, K., Energy use <luring the lifetime ofsingle-unit dwellings: examples. Building and Environment, 1997, 32, 321-329.

Energy use during the Life Cycle of S=n-•- • •n=• n·we11 : ............... Exam""'1e .... I 1'!:jn:::·u 111. LI 11111'!:j.:,· I • ...,, • .:,
Published in Building and Environment, Vol. 32, No. 4
Paper2
Appendix


f!) Pergamon Building and Environment, Vol. 32, No. 4, pp. 321-329, 1997
© 1997 Elsevier Science Ltd. All rights reserved Printed in Great Britain
0360-1323/97 $17.00+0.00
Pil: 80360-1323(96)00069-8
Energy use <luring the Lif e Cycle of SingleU nit Dwellings: Examples
K. ADALBERTH* (Received 14 May 1996; revised28 August 1996; accepted7 November 1996)
The energy use during the life cycle ofthree single-unit dwellings built in Sweden in 1991 and 1992 is presented. These houses were prefabricated and their frameworks are made ofwood. The purpose of this study is to gain an insight inta the energy use fora dwelling during its //fe cyc/e. The method used is described in the companion paper "Energy use during the /ife cyc/e of buildings: a method" [Building and Environment, 1997, 32, 317-320]. © 1997 Elsevier Science Ltd.
BACKGROUND
Three single-unit dwellings were studied with regard to the energy use throughout the life cycle. The dwellings were built in Sweden in 1991-1992. Figures 1-4 present the exterior and construction of the dwellings. They are ordinary single-family dt.:i1ellings, prefabricated in a factory. The factory manufactures externa! wall andjoist elements which then are transported to the building site. The facades of the houses·are covered with wooden panelling, and the frames are made of wood. The insulating material in the walls and roofs consists of glass wool. The roofs are covered with concrete roofing tiles.
Table I presents some ofthe dwellings' characteristics. The airtightness varies between 2.1 and 3.8 m3/(m2 h) at a differential pressure of 50 Pa across the building envelope, which may be considered "normal". According to the Swedish Building Code, airtightness in dwellings must not exceed 3.0m3/(m2 h). The airtightness is stated in the unit m3/(m2 h) when there is a differential pressure of 50 Pa between the inside and the outside. During occu-
The south facade of House no I
The north facade of House no 2
pancy, the differential pressure between the inside and the outside is assumed to be 2.5 Pa.
The dwellings are equipped with mechanical supply and exhaust air ventilation. The heat in the exhaust air is heat-exchanged into the supply air before the exhaust air is released into the open air outside. The efficiency of the heat exchanger is assumed te be 50'%. The dwellings are heated with hot air. To safeguard maximum economy in the use of installations and components, heating systems are integrated with the ventilation of the dwellings. The supply air is heated toa maximum of 40°C (depending on the heating requirement); consequently, it conveys both air and heat at the same time.
The rate of air change in the dwellings (see Table I) is higher than the average value for a single-unit dwelling in Sweden. That average is 0.291/(s m2 usable floor area), which corresponds to roughly 0.4 air-change rate/hour [I].
Externa! walls, floors and roofs/ceilings are well insulated, but not unusually so for Swedish conditions. Variations in the outdoor temperature and solar radiation in
The south facade of House no 3 Fig. I. The exterior of the dwellings.
*Department of Building Physics, Lund University, P.O. Box 118, S-221 00 Lund, Sweden.
321

322 K. Adalberth
Table I. Essential data concerning the three houses in the study
Unit Unit
Usable floor area m' Volume m' Inhabitants Number af floors Airtightness at a differential pressure af 50 Pa m3/(m2 h) Indoor temperature "C Air-change rate h-' U values
Roof W/(m'K) Externa! walls W/(m2 K) Foundation W/(m'K) Door W/(m'K) Windows W/(m2 K)
Area of the windows North m' East m' South m' West m'
House 1
130 347
5 1 3.8
20 0.7
0.09 0.15 0.26 0.69 1.63
4.6 3.4
15.6 1.1
rooflng Ules llllng balten fibre building board roof lruss
House 2 House 3
129 138 310 315
5 5 1 2 2.4 2.1
20 20 0.8 0.6
0.09 0.09 0.17 0.17 0.27 0.29 0.69 0.69 1.36 1.36
6.8 6.0 5.5
8.4 10.0 1.4 2.8
-------- ! - - - - - - - -1 --------1
wood panel ballen - - - - - - - -wlnd prolecUon
45 mineral woo! bet.ween verllcal st.uds
245 mineral wool bet.ween verUcal lighl sluds
polyelhylene folle
550 loose fill mineral wool polyethylene folie
28x70 secondary spaced boarding 28x70 secondary spaced boardlng
13 gypsum board 13 gypsum board o, Fig. 2. Different constructions: foundation, externa} walls and roof in house 1. All measurements in the
figure are in mm.
the area within which the dwellings have been built are shown in Fig. 5.
RESULTS
Manufacturing energy use during production and renovation
In order to estimate the energy required in manufacturing the construction materials, the quantities of building materials must be calculated. In this case, however, the amount of macadam, joint glue and putty, as well as ventilation equipment and supply and exhaust air devices, have not been included. The reason for this is that no data on the manufacturing energy pertaining to these materials and appurtenances were available.
Figures 6 and 7 present the quantities of materials in the dwellings and the energy requirements associated
with manufacturing the building materials. The m2 unit refers to m2 of usable floar area (the gross floor area minus the externa! wall area) in the dwelling concemed.
Concrete comprised the major share of the construction materials used in the three single-unit dwellings. Concrete accounts for 65-75% ofthe total weight quantity. Next in line is wood, at 12-21 % by weight, and then gypsum with 6-7%. The reason for the !arge proportion ofwood is that the three dwellings have wooden panelling and wooden frames.
It is interesting to observe the proportion of plastics, expressed as a quantity, in Fig. 6 and to relate it to the manufacturing energy requirement shown in Fig. 7. The weight of plastics is between 1 and 2%, whereas the manufacturing energy related to plastic materials amounts to no less than 18-23% of the entire amount required for the three dwellingsl

Energy use during the Life Cycle of Single-Unit Dwellings: Examples
rooflng llles l111ng bollen flbre bulldlng boord
wood panel balten wlnd prolecllon
2~5 mineral wool belween lighl studs
13 ~;~:~t~;~d folie
roof lruss
I --------i - - - - - - - -j -------1
- - - - - - - -550 loose flll mineral wool
polyelhylene folie 28x70 secondery spaced boerdlng 28x70 secondery speced boerding
13 gypsum boord
Fig. 3. Different constructions: foundation, externa! walls and roof in house 2. All measurements in the figure are in mm.
wood panel botten wind proiection
rooflng llles 25x38 Ullng ballen
flbre bu!ldlng board 85 ,enllloled loyer 25 mtnerel wool
2x195 mineral wool poiyeihylene foiJe J
28x70 secondary spoced boardlng
13 gypsum boord
550 loose ftll mineral wool polyelhylene folie
323
- !
2415 mineral wool belween light studs
13 ~;~:~t~~~d folie 28x70 secondory spaced boordlng
13 gypsum boord
Fig. 4. Different constructions: foundation, external walls and roof in house 3. All measurements in the figure are in mm.
20-,---------,,--~------,,-,--------~2so
015 ·······-----··-·-····---/- 200 f i / \ ~ t 10 ·---------··----- ;'/ ·-------·----------\ __ -- --------------- 150 i E ---------------,/ ·····--------········---··\ •.... ---------· ~ ; s ,, \ 100 I "tJ / \ "iil 'g o +----,..,-,_ ____________ ,". _ _,~--+so i
-s~--------------------'-O MAM JJASOND
months
- outdoortemperature---- global solar radiatlon
Fig. 5. Outdoor temperature (city of Västerås) and global solar radiation (suburb of Bromma near Stockholm) in relation to the horizontal surface <luring the year [2]. The two locations are geographically
close to the three dwellings studied. The average annual temperature is 5.9°C.

324 K. Adalberth
minwool 3%
gypsum 7% meta I
1%
wood 21%
glass, fridge etc
1%
min wool 3%
gypsum 6% meta I
1%
plastic 1%
minwool 3%
gypsum 7% meta I
1%
glass, fridge etc
1%
House no 1 House no 2 House no 3 Weight: 69 tons = 0.53 tonlm' Weight: 80 tons = 0.62 ton/m1 Weight: 65 tons "" 0.47 tonfm1
Fig. 6. Quantities of materials in the three dwellings. The dwellings weigh 65-80 tons, corresponding to 0.47-0.62 ton/m2 usable floar area.
white whl12 white goods
glass etc goods glass etc goods glass etc
7',(, 3%
7% 2% 7% 0%
concrete 28%
meta I plastic meta I 4% 23% 4%
4% mlnwool mlnwool gypsum minwool
House no1 10% Houseno2 10% 10% Houseno3 9%
Energy for manufacturing: 900 kWh/m2 Energy for manufacturing: 870 kWhlm" Energy for manufacturlng: 730 kWhlm2
Fig. 7. Energy required in manufacturing construction materials. The materials require between 730 and 900 kWh/m2 usable floor area.
The proportion of concrete in Fig. 6 and the relevant manufacturing energy requirement in Fig. 7 may also be compared. While the weight of the concrete used in the three dwellings amounts to 65-75% of the whole, the energy used for manufacturing concrete only accounted for 19-28% of the entire manufacturing energy requirement of the dwellings. In other words, the pattern of distribution with respect to energy requirement is very different from the percentages by weight.
The amounts of energy used in manufacturing the construction materials in houses I, 2 and 3 are 900, 870 and 730 kWh/m2 usable floar area, respectively. The reason for the lower energy use/m2 usable floor area of dwelling number 3 is because it is a two-storey dwelling.
Based on assumptions regarding the life-spans of various materials (presented in Table 2 in the companion paper "Energy use <luring the life cycle of buildings: a method" [3]), the quantity of renovation materials may be calculated. The relevant quantities are presented in Fig. 8. Figure 9 shows the energy used when manufacturing renovation materials.
A [arge proportion of the renovation materials is made up of concrete (see Fig. 8). The reason for the preponderance of concrete is that the roofing tiles of the houses are made of this material. Even so, a !arge share of the energy required for manufacturing "renovation materials" is associated with white goods and plastic products (see Fig, 9). This is because the life-span of
white goods is no more than 12 years and that of plastic is only 17 years.
Energy use for transportation during the production, renovation and destruction
Materials are transported from their manufacturers to the building site both <luring the erection phase and <luring renovation. In the case of renovation and demolition, "worn out" materials will also be removed. Figure I O presents the movement of transport <luring the production of the three single-unit dwellings.
When construction materials are removed, in the case of renovation or demolition, the transportation routes look different. This study assumes that there is a waste disposal plant in the municipality where the three dwellings are located. The relevant transportation distance is assumed to be 20 km.
Figure 11 isa bar chart illustra ting the transport energy used in connection with production, renovation and destruction. The discrepancies in the transport energy associated with production are due to different quantities of materials, as well as to the relative locations of the factories where the elements are prefabricated, the manufacturer of the materials and the building site. Transport energy <luring renovation is much the same for the three dwellings. The differences in transport energy <luring destruction are solely due to dissimilar quantities of materials.

Energy use during the Life Cycle oj Single-Unit Dwellings: Examples 325
2% House no 1
glass, fridge etc
4%
concrete 51%
House no 2
wood 11%
glass, fridge etc
4%
plastic 16%
House no 3
glass, fridge etc
5%
Amount of materials: 11 tons "" 0.09 tonlm' Amount of materials: 10 tons= 0.08 ton/m2
Fig. 8. The quantities of renovation materials. Amount of materials: 11 tons= 0.08 ton/m::i
concrete, glass etc
7%
white goods 49%
plastic 37%
concrete, glass etc
5%
white goods
53%
concrete, glass etc
9%
White goods 47%
House no 1 House no 2 House no 3 Energy for manufacturing: 390 kWh/m2 Energy for manufacturlng: 370 kWh/m2 Energy for manufacturing: 330 kWh/m3
Fig. 9. Energy used when manufacturing construction materials employed in the renovation.
Energy use during the erection and demolition During the erection and the demolition of buildings,
energy is required for a variety of processes. Figure 12 shows the calculated energy use <luring the erection and demolition of the three dwellings.
A iarge share of the process energy used <luring the construction ofthe dwellings is required for space heating at the building site and for the excavation and thc rcmoval of soil.
The main reason for the difference in the process energy used <luring the construction of the dwellings is due to the quantity of soil that is to be excavated and removed (see Fig. 12). House I needs more energy for the excavation and removal of soil than the others, as it has a foundation with crawl-space, whereas the others are slabon-ground buildings. A crawl-space fundament is placed deeper in the soil than a slab on the ground, which is why more soil had to be removed.
It can also be seen from Fig. 12 that the energy used for desiccating the frame varies. This is due to the fäet that more energy is used to dry the slabs in houses 2 and 3 than is used for the crawl-space ofhouse I, which has a wooden floor structure.
Energy use during the occupation During the years when the dwelling is actually
inhabited, energy is required for space heating, hot water
and electricity. The energy use <luring this period was calculated with the aid of the Swedish computer program Enorm [4] (see also the companion paper "Energy use <luring the life cycle of buildings: a method" [3]).
The people who live in the dwellings are able to influence the utiiisation of energy, e.g. indoor ten1perature, hot water use and electricity. However, the indoor tem-pcrature has been assumed to be 20°C throughout. Standard values have been employed in the calculations of the energy requirements regarding hot water and domestic electricity. They were estimated according to the following procedure:
• hot water: 5 x number of apartments + 0.05 x usable floor area (k Wh/24 ho urs);
• domestic electricity: 4.5 x number of apartment-s+0.045 x usable floor area (kWh/24hours).
The standard equations were based on an investigation of 8000 households in Stockholm in the years 1972-1984 [5].
Table 2 presents the energy used <luring the occupation. The various assumptions and characteristics pertaining to the dwellings studied were described above. No account is taken of any energy required for the cooling of the dwelling in the case of excessive indoor temperature. This could occur <luring the summer months.
The energy required for heating, domestic hot water
326 K. Adalberth
500km
400
300
200
100
Fig. 10. The movement of transport with regard to construction materials for houses 1, 2 and 3. The map of Sweden on the left applies to house I and that on the right applies to houses 2 and 3. House l was prefabricated at Mockfjärd, and houses 2 and 3 were prefabricated at Landsbro. The building site of the three single-family dwellings is located 150km west ofStockholm, in the city ofÖrebro. The thicker the lines in the figure, the greater is the share of the total energy required for transportation purposes. Only
transportation requiring more than 50 kWh has been included.
kWh/m2 usable floor area 80
70 .............................................. ················· ...................................... .
60
50
production dystruction renovat10n
House no 1
production dystruction renovat10n
Houseno2
production dystruction renovat10n
House no 3 Fig. 11. Transport energy used in connection with production, renovation and destruction of the dwellings
concerned.

Energy use during the Life Cycle of Sing/e-Unit Dwellings: Examp/es
kWh/ml Wltble Door area 80~~~~~~~~~~~~~~~~~,
60
" 40
10
11,,urnl
.lighting,13111letifting
o=" [I ~lmng'-J:sm
11=:cfsoil D""""-
Fig. 12. Calculated energy use for various processes in connection with the erection and demolition of the three dwellings.
4500
4000
3500
3000
2500
2000
1,00
1000
,oo
kWhfm~uublcfloorma
. ...,. ...... o domc:sliohotwata"
D ""'""~
Fig. 13. Calculated energy requirements throughout the 50 years of occupation.
Table 2. Calculated energy use during occupation for space heating, hot water and electricity
House I House 2 House 3 (kWh/m2 yr) (kWh/m2 yr) (kWh/m2 yr)
Space heating, ventilation inc!uded 76 83 64 Domestic hot water 32 32 32 Electricity 32 33 32 Total 141 148 128
Table 3. Energy use during the life cyc!e of the three dwellings studied
House l % House 2 % House 3 Phases (kWh/m2 · 50yr) (kWh/m2 • 50yr) (kWh/m2 • 50yr)
Production Manufacturing 900 11 870 100 730 Transportation 40 0 40 0 30 Erection 80 I 70 l 50
Management Occupation 7100 83 7400 85 6400 Renovation: manufacturing 390 5 370 4 330 Renovation: transportation <10 0 <10 0 <10
Destruction Demolition 10 0 <10 0 <10 Removal: transportation 30 0 20 0 20
Total energy (kWh/m' · 50 yr) 8500 100 8800 100 7600
327
%
10 0 I
85 4 0
0 0
100

328 K. Adalberth
and electricity amounts to 141, 148 and 128 kWh/(m2 ;,-,
"' usable floor area· year) for houses 1, 2 and 3, respectively. ~ ~ bJ}
~ ~ b -§ '2 l House 3 needs less energy for heating than the others; " 0
"' 0 <.." 0
this is because it is a two-storey dwelling with smaller "" ~]? oo..c::--..
'O " ~~~ ~ transmission losses (the other two are bungalows) anda " :;'i ",,a,: O'\ Q0 ~N
"' "' """" <n 8 lower air-change rate than houses 1 and 2. '"@ :g r.Llro~ 2? s 8
Figure 13 presents the energy use of the dwellings dur-.E å .c:i:s: ;;; 00 i:s:""
ing their occupation, calculated on the basis of a 50- 8 M ""~ bJ} c o-
year life-span. In fäet, these energy usages ha ve been "" 0
" '.Ct? M <n '.O ·.:i :l " 0 M '.O 00
calculated twice. The first calculation was based on plan- i " "' - o.....:-0 "~
ning documents. The second (shown in Table 2) was 5 ::r:: Cl
performed against the background of certain knowledge ,s of how the dwellings were actually built, as there were bJ} ~ " deviations from the planning documents (the erection of '§ :;; bJ}
1J ~ ~-§i the dwellings did not entirely comply with the drawings t, 0
"" 0 ~:5=:?,_
and designs). The heating requirement ofthe three build- " "" ~]? " " N-~ ~
ings increased by, on average, 10%. "' :;'i gg~ 0\ - ~N
8 "' --"' 8 :g f.Ll "'~ M~ 0
A further comparison has been made with the energy ~ c::,? '8 Ei "' requirements measured in the dwellings [6]. Results from "
Ns .c:i:s: :g °' i:s:""
this comparison show that the energy requirements that '.:::! ""00 >, o:!:
were in fäet registered are, by and ]arge, even higher than e:i "' c 0
1:! " ·..:::: '2
<n °' "" ~ .8 '.000
those that were calculated on a theoretical basis. "~ :g ONM " >, 0 "~ ...s·G ::r:: Cl <l'.l·c: ~u "'" SUMMARY AND CONCLUSIONS å! " 0 " ~ M u"' ~ b .§ '2 1J Table 3 presents the total energy use ofthe three single- Zt 0
0 <.." 0 oo~
unit dwellings, "from the cradle to the grave". The results ~ ~ "" »- - [;;~~~ " ~~?
1! - :;'i ";cii:,: 0-,-,..::.:::N
are presented as kWh/(m 2 usable floar area· 50 years). - 0 "' """" --"' Ei ·-" :g r.Llro~ 8? 0
This table clearly shows that houses I, 2 and 3 require " . 8 <-: O M s .,,a,: 8500, 8800 and 7600 kWh/(m2 usable floar area· 50 years) ~-~ ;;; i:,:-"' during their respective life cycle. Calculated on an annual 'O " .-'<-
"'"" c o:!:
basis, this works out at 170, 176 and 151 kWh/(m2 usable .$ 8 ..,:' 0
-~ ]' "'°' ,.._ . "' :l '.000 00 °' floar area· year), respectively. The annual energy use for bJ}oo " ONM c:~ 0 "~
space heating, hot water and electricity amounts to 141, ~ i::: ::r:: Cl
i·E ;;; 148 and 128 kWh/(m2 usable floar area· year), respec- 'O 11 "' tively, for the three dwellings. This means that same "" 'O -5 8 " 85% of the total energy usage is required during the o,iO "' C: M
1 management phase - a significant finding. The eon-·.;::; i::: ..:::!'C:
clusion at this point is as follows: in order to save energy "" .S ~ it is essential to produce dwellings that require small .5 ~
Ei
" amounts of energy during their management phases. al 0 ,-....·..;::::: :g >, u
It should be pointed out that the three dwellings may, -~::, -~ tl
at present, be regarded as low-energy buildings. Thus, for '"@ ~~§ ·5 instance, the energy use for space heating and ventilation ;;; Sö ~ only amounts to 76, 83 and 64 kWh/(m2 usable floar 8 "'O " i:: i:: 6 i:: ·c: area· year), respectively. ,s 2-2-~;~
bJ} ..c:: ..c:: -- ...... (I:;!
Table 3 also shows that the energy used in manu- " ~~~;g facturing all the construction materials employed in eon-
"§ oo 00 +-' ro t, V)~ .5 _g S
nection with the erection and renovation ofthe individual "" ~ lf) t.z bO ~
" N \I O C::~ dwelling amounts to same 15% of the total energy use. " " ~ @B-~U This corresponds to same 7 years of ,occupation (space 6
~ ~~]6~ heating, hot water and electricity). '8 g Il.) ;:::3 i:: I:)!)
Another interesting observation is that the energy i:l o ~ ä .9 b gf·c: 6 ~ ~
required for manufacturing heat-insulating materials for ~ "§~]g'_g the dwellings (mineral wool and polystyrene) corresponds ·a u~~g;§ to less than 2 years' energy use during actual occupation
er ~g~gf~-~ ~ ;; E] .§ ~ g.
(for space heating, hot water and electricity) (see Table ;,-,
~ 6 __:--::, "C) ..0 (.)
4). Such a low energy requirement for insulating material " O g @"O .9< g
is noteworthy in view of the fact that these single-unit f.Ll §~g~~<.S ,,,:
~b~ ~-~] dwellings are, after all, low-energy houses. " :;'i i .5 0 g 'i.i ::i Furthermore, Table 3 shows that the transportation " f-< 0..2'f-<W~
and process energy used during the erection and demo-

Energy use during the Life Cycle oj Single-Unit Dwellings: Examples 329
lition of the dwellings comprises approximately 1 % of the total energy requirement. Thus, against the background of the entire life cycle of the single-unit dwelling, very little energy is used for such purposes.
As described above, the dwellings were prefabricated in factories for further transportation to the building site. This entails an "extra" transportation requirement compared to the situation where a dwelling is erected on the site "from scratch". Even so, these extra transportation requirements do not result in any significantly increased use of energy compared to the .. total energy requirement. In comparison to construction which lakes place entirely on site, the advantages inherent in prefabrication outweigh the disadvantages. Thus, for instance, construction materials are protected from wind and weather; measunnents are more exact; less material is wasted because prefabrication factories are in the ha bit of sa ving materials in order to save money; construction workers in charge of different stages in the building pro-
cess have greater experience of their particular jobs, which means that construction elements will be better executed and combined; and so on.
RECOMMENDA TIONS
By way of conclusion, three important recommendations may be articulated on the basis of this study.
i. Make sure the dwelling requires little energy <luring the occnpation stage.
2. Monitor and follow up the building stage (the actnal erection of the building) in order to ensure quality in the construction work.
3. Select construction materials whose manufacture requires little energy.
If these three points, in the order sta ted, are adhered to, the outcome will be an energy-efficient single-unit dwelling throughout its life cycle.
REFERENCES
1. Andersson, K. and Norlen, U., Bostadsbeståndets inneklimat. ELIB-report number 7, TN30, Centre for Built Environment, Royal !nstitute ofTechnology, Gävle, Sweden, 1993.
2. Harderup, E., Klimatdata för fuktberäningar. Department of Building Physics, Lund University, Lund, Sweden, 1995.
3. Adalberth, A., Energy use <luring the life cycle of buildings: a method. Building and Environment, 1997, 32, 317-320.
4. Munther, K., Enorm version 800. Energiforskning AB, Stockholm, Sweden, 1992. 5. Anderlind, G., Bankvall, C. and Munther, K., Energibehov i nya byggnader. RI40:1984, Swedish
Council For Building Research, Stockholm, Sweden, 1984. 6. Hedbrant, J., Energianvändning Villastaden, Bo92. Division of Energy Systems, Linköping Univer,
sity, Linköping, Sweden, 1996.


Energy Use in Four Multi-Family Buildings During their Ufe Cyc!e
Published in lnternational Journal of low Energy and Sustainable Buildings, Vol. 2000
Paper3
Appendix


Energy Use in Four Multi-Family Houses Du ring their Lif e Cycle
SUBMITTED: July 1999 REVISED: Nov 1999 PUBLISHED: Jan 2000
Karin Adalberth, PhD student Department of Building Physics, Lund University, Sweden karin. adalberth@byggtek. lth.se
KEYWORDS: multi-family houses, multi~family buildings, energy use, energy demand, life cycle
SUMMARY: The aim oj this study is to analyse the energy use in buildings during their life cycle and evaluate which phase has the largest energy demand. The objective is also to analyse the influence of different building characteristics and whether the difference between the charged and the estimated energy use during the occupation phase influences the total energy use. Four authentic Swedish multi-family houses built in 1996 were investigated. Results show that the houses are estimated to use 6200- 8500 kWhlm 2 during their 50-year life cvcle. A majority ofthis is used during the occupation phase, approx. 85 %. Almost the rest is made up by the manujacture and renovation phases, approx. 15 %. Results also show that by altering the windows (adding another pane) the energy demand during the manujacture phase will be increased, but not by as much as the energy requirement is decreased during the occupation phase, It was also discovered that the charged energy use during the occupation phase is higher than the estimated - the 85 % increases to 88 %. This could be due to the jact that the indoor temperature and the air exchange rate are higher than the assumed. Deviations may also occur between the project documents and the actual perjormance oj the building constructions. In conclusion: In order to obtain an energyefficient house during its whole life cycle, it is important to design with low energy demands during the occupation phase, This may eK be achieved hy adding another pane to windows, even if this increases the manujacture energy demand. Finally, it is important to make energy estimates during the design phase with "realistic" input and follorv up the erection phase, in order to eliminate deviations between estimated and charged energy use during the occupation phase.
International Journal af low Energy and Sustainable Buildings, VoL2000, Adalberth I

1. Background
Since 1973, when Sweden suffered an energy crisis, we have made the use of energy more efficient in buildings in our country. W e have e.g. improved the thermal envelope through thermal insulation and air tightness, started to recover heat from the exhaust air, and made white goods more efficient.
So far, research has mainly focused on the energy use in buildings <luring their phase ofuse: space heating, heat for ventilation, domestic hot water, household electricity, lighting, pumps, and fans. There have been few studies on the total energy use <luring a building's life cycle. It is a subject that must be addressed, considering the urgent need to save energy.
1.1 Objectives
The aim ofthis study is to analyse the total use of energy in multi-family houses <luring their life cycle. Questions to be answered are:
Which phase ofthe building's life cycle has the highest energy use?
How do different building features influence the total energy use <luring the life cycle?
Do the estimated energy values represent "reality"? In other words, is there a difference between the charged and the estimated energy use <luring the occupation phase? Will a deviation influence the energy use <luring the life cycle?
Four multi-family houses were investigated based on the energy used <luring their life cycle, see Fig. l. The houses were built in 1996, and are located in Malmö, Helsingborg, Växjö and Stockholm in Sweden.
The target groups ofthis study are: Decision-making politicians who have the power to control practices within the building sector; public authorities responsible for the formulation and implementation of rules; and the Ecocycle Council of the Swedish Construction Industry (in Swedish Byggsektoms Kretsloppråd). In addition, building project commissioners and property managers are addressed, since they execute the actual construction and/or reconstruction of dwellings.
2 International Journal oj Low Energy and Sustainable Buildings, Vol.2000. Adalberth

FIG. 1 - The figure shows the outline of the multi-family houses: the Malmö house (upper lejt), the Helsingborg house (lower left), the Stockholm house (upper right) and the Växjö hm1,·1? flnwPr r;aht) ··-··-- ,·- "-· "-c:,··-/·
1.2 Other studies
There area couple of studies on the total energy use during a building's life cycle. One study by (Nemeth B.W., 1998) presents the energy use offive single-unit dwellings in Norway. Another study by ( Cole R.J. et al, 1996) examines the energy use during the life cycle of an office.
Another related work is the IEA annex 31 "Energy-Related Environmental Impact of Buildings". It aims at providing building sector researchers with information to improve methods and data for measming the energy-related effect ofbuildings on their interior, local and global environments. The goal is to be of considerable assistance in the reduction of these effects. (IEA, 1999)
This study offers a contribution to this endeavour. It deals withfour authentic Swedish multifamily buildings. The houses also have a rather good thermal behaviour, seen from an intemational perspective.
International Journal of low Energy and Sustainable Buildings, Vo/.2000. Adalberth 3

2. Description of the dwellings
The four studied buildings are all constructed differently. For example, they have different frameworks and foundations, a different thermal degree of the envelope, different ventilation systems etc. Table 1 presents the different characteristics ofthe buildings.
TABLE. 1 - The table presents the different characteristics of Jour multi-family houses. The houses have been analysed by means of the energy use during their life cycle.
unit theMalmö the Helsingborg the Växjö the Stockholm house house house house
Usable floor area m2 700 1,160 1,190 1,520
Number of floors 2 3.5 4 4
Number of apartments 6 8 16 15
Number ofresidents*1 19 21 26 50
Type of framework Light-weight Concrete Wood Steel columns concrete and and concrete
concrete
Overall U value*2 W/(m2.o C) 0.26 0.44 0.32 0.30
Air tightness*2 litre/(m2·s) 0.8 0.8 0.8 0.8 @50Pa
Supply air flow rate*2 m3/h 870 1,430 1,540 1,670
Air exchange rate*2 h-1 0.5 0.5 0.5 0.5
Ventilation system Mechanical Mechanical Mechanical Mechanical supplyand exhaust air exhaust air exhaust air exhaust air
Heat recovery Yes No No No
Source ofheat District District District District heating heating heating heating
Space heating system Under-floor Radiators Radiators Radiators heatin
*1 The number of residents has been estimated according to (SCB, 1990). Approx. 1.0 persons live in an apartment with one room anda kitchen; 1.3 persons live in an apartment with two rooms anda kitchen; 1.9 persons live in an apartment with three rooms anda kitchen; 2.6 persons live in an apartment withfour rooms anda kitchen; and.fina/ly 3.0 persons live in an apartment with five rooms anda kitchen.
*2 Indicates the average of the estimated values for foundation, externa! walls, windows, doors and roof
4 International Journal oj low Energy and Sustainable Buildings, Vol.2000, Adalberth

3. Method
The expression "a building's life cycle" refers to all temporal phases: the manufacture of building materials, transport, the erectionJconstruction of a building, occupancy, renovation, and finally demolition, removal, and recovery ofheat from debris.
In order to calculate the energy requirement throughout the life cycle, data were collected from various research reports. Reports from the Danish Building Research Institute (Andersen S. et al, 1993) and (Dinesen J. et al, 1997) contain different data conceming the energy required to manufacture construction materials. They also supply data regarding the energy required for various processes during the erection of a building.
The amount ofbuilding and installation materials has been obtained from drawings and inter1iews with designers and contractors. Vertical and horizontal parts ofthe framework (including all kinds offixing devices), non-load hearing partitions, surface finishes, electrical installations, and building services installation materials are all estimated.
A report from Chalmers University of Technology in Sweden (Tillman A.-M. et al, 1991) provides data relating to the energy required for different kinds of transport, for instance using lorries and ships.
The energy requirement <luring the occupation phase for space heating and ventilation was calculated using the Swedish software called Enorm (Munther K., 1996). This software is mainly used by Swedish consultants, contractors and authorities to estimate energy use in residential buildings at the design stage.
The software computes the energy and average power requirements during a period oftwelve months hased on average solar radiation and outdoor temperatures on a 24-hour basis. The following factors are taken into account: The U values ofbuilding constructions, the area of the buildings constructions, thermal bridges, air leakage, window orientation in different directions, heating system, and ventilation including heat exchange. Computations do not include the accumulation ofheat in the framework and fumishings ofthe building, as this would ca!! for hourly climate data.
In addition, the energy demand for hot water production Qctom hot water (kWh/yr) and household electricity, lighting Q1iouse,elec (kWh/yr), during the occupation phase was estimated according to Equ. 1 and Equ. 2:
Qctorn hot water = (5·number of apartments + 0.05·usable floor area)-365 (EQU. l)
Qhouse,elec = (4.5·number ofapartments + 0.045·usable floor area)·365 (EQU. 2)
The equations are empirical, based on an investigation of 8,000 families in Stockholm, Sweden (Anderlind G. et al, 1984).
lnternational Journal oj low Energy and Sustainable Buildings, Vo/.2000, Adalberth 5

The occupation phase is assumed to be 50 years, since the economic life span of a Swedish building is normally assumed to be 40-50 years (The Nordic Accounting Network, 1999). It is also assumed that no extensions, re-constructions, or significant changes are made <luring the occupation phase. Only sequential maintenance, e.g. repainting and an exchange ofwhite goods, is done. The life span of different maintenance is taken from (SABO, 1998), which isa Swedish organisation for municipal housing companies that e.g. provides statistical data over maintenance intervals.
Finally, data from the demolition ofthe building and the energy gained when heat is recovered from debris were also taken from the Danish Building Research Institute (Andersen S. et al, 1993) and (Dinesen J. et al, 1997).
In conclusion, the different energy needs in various phases ( estimated using the references presented above) are summarised, Equ. 3, in order to obtain the total energy need <luring a life cycle Qlife cycle:
Qure cycle = Qproduction + Qmanagement + Qctestruction =
= [Qmanuf + Qiransp,prod + Qerect] +
+ [Qoccup·50 years + (Qmanuf,renov + Qiransp, renov- Qrecov, renov)] +
+ [Qctemol + Qiransp, remov - Qrecov,destr] (EQU. 3)
For further information about the method, please see (Adalberth K., 1999).
6 International Journal of Low Energy and Sustainable Buildings, Vol.2000, Adalberth

4. Results
4.1 Energy use during the life cycle
Table 2 presents a general picture ofthe energy used <luring the life cycle ofthe four multifamily houses.
TABLE. 2 - Estimated energy use during the life cycle of the Jour multi-family houses. The results are presented as kWh/(m 2·50 years). The m2 unit refers to square meters of usable jloor area in the house concerned.
the Malmö the Helsingborg The Växjö the Stockholm house house house house
Phases kWh/m2 % kWh/m2 % kWh/m2 % kWh/m2 %
Manufacture 770 13 820 11 1,180 14 830 12
Transport 60 30 0 30 0 40
Erection 70 120 2 50 80
Occupancy, 50 years * 5,020 81 6,030 84 7,500 88 6,040 84
Renovation (manufacture, 340 6 310 4 410 4 270 4 tr:msport and recovery)
Demolition <10 0 <10 0 <10 0 <10 0
Rem oval 20 0 20 0 10 0 20 0
Recovery -110 -2 -70 -1 -620 -7 -120 -2
Total kWh/(m2·50 years) 6,200 100 7,200 100 8,500 100 7,100 100
Total kWh/(m2·year) 123 144 171 143
* The energy required during the occupation phase is presented as delivered energy. The energy demand in other phases is presented as primary energy. It would be preferable to present all energy demands as delivered energy, since the scope of this study is to compare the different houses and not the energy systems. Unfortunately, a conversion oj primary energy to delivered energy has not been possible, since the heat and electricity use in several data was not explicitly described.
As shown in Table 2, the houses use between 6,200 and 8,500 kWh/m2 <luring their life cycle. A majority ofthe energy, between 5,000 and 7,500 kWh/m2, is used during the phase of occupancy. This energy demand constitutes approx. 85 % ofthe total energy use in all houses, even ifthe houses have a good thermal behaviour seen from an intemational perspective. The second and third dominant phases are the manufacture and renovation phases. They constitute approx. 15 per cent of the total energy use <luring the life cycle, see Table 2.
lnternational Journal oj Low Energy and Sustainable Buildings, Vol.2000, Adalberth 7

Table 2 also shows that the transport and process energy used to erect and demolish the houses constitutes approx. I per cent of the total energy requirement. Hence, if the entire life cycle ofthe multi-family houses is considered, very little energy is used for such purposes.
In (Adalberth K., 1995) the energy use <luring the life cycle is studied for three single-unit dwellings. This study establishes that 85 % was used <luring the occupation phase and approx. 15 % <luring the manufacture and renovation phases. These results correspond to the results for multi-family houses, i.e. an 85-15 ratio.
The energy needed <luring the occupation phase and to manufacture the building and installation materials is, as presented, a majority ofthe total energy. These times phases will therefore be further described in the following text, see also (Adalberth K., 1999).
4.1.1 Energy use during the occupation phase
The energy use <luring the occupation phase has been estimated. The energy used for space heating, ventilation, domestic hot water, pumps, fans, and household electricity is presented in Table 3.
TABLE. 3 - The table presents the estimated energy use during the occupation phase for Jour multi-family houses. The houses have been analysed by means of their energy demand during the life cycle.
the the the the Malmö Helsingborg Växjö Stockholm house house house house
kWh/(m2·yr) kWh/(m2·yr) kWh/(m2·yr) kWh/(m2·yr)
Thermal heat: space heating 26 55 54 42 and ventilation
Thermal heat: domestic hot 27 25 40 31 water
Electricity use: household 41 37 52 44 and lighting
Electricity: pumps and fans 6 4 4 4
Total: 100 121 150 121
As shown in Table 3, the Malmö house uses the least energy, 100 kWh/(m2·yr). This is due to its excellent energy characterisation - e.g. the house recover heat from its exhaust air-, see Table 1.
The Helsingborg house uses a lot of energy for space heating and ventilation. Actually, this energy need is above the limits established in regulations in the Swedish Building Code (Boverket., 1994). In order to fulfil the building code, the energy use for space heating and ventilation has to be lowered by 25 kWh/(m2·yr).
8 International Journal oj Low Energy and Sustainable Buildings, Vo/.2000, Adalberth

By replacing all windows in the Helsingborg house with more energy-efficient windows with a U value of 1.15 W/(m2 • 0 C) (originally, the windows had a U value of 1.90 and 2.75 W/(m2 · 0 C)), the house would reduce the space heating by 15 kWh/m2 •
By installing a heat recovery system for the ventilation, e.g. a plate heat exchanger with a temperature efficiency of0.68 anda fan effect of 2.5 W/(m3/s), the energy use would be decreased by 19 kWh/m2, 5 kWh/m2 ofwhich is electricity.
Even ifthe Växjö and the Stockholm houses use 150 and 121 kWh/(m2·yr) respectively, they do fulfil the energy goals set in the Swedish Building Code ( c.f. the house in Helsingborg, which uses 121 kWh/m2). They are allowed to use this much energy thanks to their energy supply system, which consists ofbiomass, heat pumps, and energy from a refuse combustion plant. In other words, the building code perrnit buildings to use more energy ifthey are supplied with these energy sources. If the heat in the district heating net were produced by electricity or mainly by fossil fuel, the energy use would have to be lowered by 16 and 12 kWh/(m2 ·yr) in the Växjö and Stockholm house respectively.
4.1.2 Energy use to manufacture building and installation materials
The energy use <luring the manufacturing phase has been estimated. Fig. 2 shows the energy needed to manufacture building and installation materials in the dwellings.
A !arge proportion of the energy for the Malmö house is used to manufacture concrete and wood: 22 per cent for each material. The foundation and intermediate floors are made of concrete, and roof trusses and wood panels in the roof are made of wood. Metal requires 14 per cent (reinforcement bars, steel studs, ventilation channels, and aluminium windows), plastics 12 per cent (carpets, thermal insulation, paint, anda vapour barrier), and mineral \Vool 10 per cent (thermal insulation below the foundation in the externa! walls, and in the roof).
A !arge proportion ofthe energy for the Helsingborg house is used to manufacture concrete -36 per cent. The framework is made of concrete, and the facade material is lightweight concrete blocks. Consequently, the energy needed to manufacture steel (reinforcement bars) is also high: 26 per cent.
In the house in Växjö, a !arge part of the energy is used to manufacture wood - 59 per cent. The framework consists of wooden studs in the externa! and interna! walls, veneer timber beams in the intermediate floor, roof trusses, and wooden floor finish. In addition, some energy is used to manufacture gypsum plasterboard - 12 per cent. This material is used as a surface finish on externa! walls (both inside and outside ), interna! walls, floor, and ceiling.
A !arge proportion ofthe energy for the Stockholm house is used to manufacture wood- 28 per cent - and 20 per cent for metal, 18 per cent for concrete, and 12 per cent for mineral wool respectively. Wood is used in externa! curtain walls, interna! walls, rooftrusses and as floor finish. Meta! is used in the framework as steel columns, and as reinforcement bars in foundation, interna! walls between apartments, and in the intermediate floor. Concrete is used in foundation (slab on ground), interna! walls between apartments, and the intermediate floor. Mineral wool (thermal insulation) is used in externa! curtain walls and the roof.
lnternational Journal ofLow Energy and Sustainable Bui/dings, Vol.2000, Adalberth 9

plastics 12%
other w hite goods 1 %
7%
wool 10% glass 2%
wood 22%
The Malmö house: 770 kWh/m2
gypsum concrete 12%
3% other 1%
white goods 5%
meta! 5%
plastics 6%
mineral wool 7%
glass 2%
gypsum 4%
cheramic tiles 6%
wood 59%
The Växjö house: 1, 180 kWh/m2
plastics 5%
mineral
w h1te goocts 4% other
0%
concrete 36%
wool3% glass 4% wood
16%
ceramic tiles 3%
The Helsingborg house: 820 kWh/m2
other- concrete
18% h. d 1% w 1te goo s
5%
meta]
20%
7% mineral wool glass
12% 3%
gypsum
ceramic tiles
1%
wood 28%
The Stockholm house: 830 kWh/m2
FIG. 2 - The materials require between 800 and 1,200 kWh/m 2 floar area. The combustion value of the construction materials, e.g. wood, is included in the numbers. In other words, no deduction for such a value has been made.
In conclusion, the energy used to manufacture building and installation materials <luring the production phase is approx. 800-1,200 kWh/m2 usable floor area, or approx. l 0-15 per cent of the total energy use <luring the life cycle. The energy used to produce thermal insulation is less than 100 kWh/m2 for each house - a rather small share of the energy use, since this material contributes to a decreased energy use <luring the occupation phase.
The house in Malmö uses the least energy to manufacture materials and the house in Växjö the most energy. Nevertheless, the house in Växjö could have been made slightly more energy-efficient by exchanging the veneer timber beams in the intermediate floor for a product with less glue.
JO lnternational Journal of low Energy and Sustainable Buildings, Vo/.2000. Adalberth

4.2 The influence of different construction characteristics in the building
In order to determine how different building features affect the energy use <luring the whole life cycle ofthe houses, an alteration ofthe building constructions has been performed. The following altematives were selected:
framework
thickness of thermal insulation in externa! walls
thermal performance in windows
degree ofheat recovery from the exhaust air.
The Växjö house has been selected to vary the building constructions. All building and installation materials in the Växjö house, from the excavation to make room for the foundation to the chimney on the roof, have been considered when the building technology was changed.
4.2.1 Different frameworks
The first feature to be altered is the framework. The original Växjö house has a wooden framework - quite an unusual solution fora four-storey multi-family house in Sweden. The wooden framework is exchanged for a concrete framework. The only restriction was to attain an identicai use of energy <luring the phase of occupancy, i.e. the space heating, for both altematives in order to compare the frameworks only.
In the concrete framework, concrete takes the place of mineral wool, gypsum plasterboard and wood in the intermediate fioor. In addition, the ioad-bearing waii, originally made of gypsum plasterboard and wooden studs, is exchanged for a concrete wall.
The energy demand for manufacturing some building materials are as follows, (Andersen S. et al, 1993) and (Dinesen J. et al, 1997):
plain concrete 160 kWh/ton
rough saw timber with a density of 0.5 ton/m3 3060 kWh/ton
gypsum plasterboard 1440 kWh/ton
rock wool 3890 kWh/ton
The energy used in manufacture comprises energy required for the extraction of raw materials, production and transport of semi-manufactures, heating of manufacture and administration premises, and production of the final construction materials. The combustion value of the construction materials is included in the energy used for manufacture - that is, no deduction for such a value has been made.
Table 4 summarises the energy use <luring the life cycle ofthe house in Växjö with a wooden anda concrete framework. Results show that the house uses 171 and 172 kWh/(m2·year) usable floor area for the wooden and concrete frameworks respectively. The difference is small or insignificant.
lnternational Journal oj Low Energy and Sustainab/e Buildings, Vo/.2000, Adalberth ll

TABLE. 4 - Energy use during the life cycle oj the house in Växjö with a wooden or concrete framework.
wooden framework concrete framework
Phases kWh/m2 % kWh/m2 %
Manufacture 1,180 14 960 11
Transport 30 0 30 0
Erection 50 100
Occupation, 50 years 7,500 88 7,450 87
Renovation: manufacture 460 5 460 5
Renovation: transport <10 0 <10 0
Renovation: recovery -80 -1 -80 -1
Demolition <10 0 <10 0
Rem oval <10 0 20 0
Recovery -620 -7 -340 -4
Total kWh/(m2 ·1ife span): 8,500 100 8,600 100
Total kWh/(m2 ·year): 171 172
A study by (Björklund T. and Jönsson Å., 1997) has investigated the environmental impact of concrete and wooden frameworks in dwellings and warehouses. The impact was determined over the life cycle. Results showed that there was no !arge difference between the frame altematives over the complete life cycle from an environmental point ofview. When the manufacture phases were compared, the wooden frames were generally rated a little lower than the concrete frames for dwellings. The Växjö house shows results in the same direction over the whole life cycle. The wooden framework uses less energy than the concrete framework, but the difference is very small.
Fig. 3 shows the energy needed to manufacture all building and installations materials ofthe Växjö house with different frameworks. As shown, the energy used to produce the building and installation materials for the house in Växjö with a wooden framework is 1,180 kWh/m2 •
The corresponding number fora concrete framework is 960 kWh/m2 •
12 !nternational Journal oj Low Energy and Sustainable Buildings, Vol.2000, Adalberth

concrete 3% other 1%
white goods
gypsum 12%
h . d otheL w 1te goo s !%
6% concrete
21%
5%
meta! 5% plastics
8%
gypsum
4% plastics
6%
woo] 7'% glass 2%
wood 59%
mineral wool
5%
2% wood
39%
Wooden framework 1,180 kWliJm2 Concrete framework 960 kWh/m2
HG. 3 - The energy required to manujäcture building and installation materials for the house in Växjö.
In the woodenframework, most energy is used to manufacture wood (59 %, see Fig. 3). The framework consists of wooden studs in externa! and interna! walls, veneer timber beams in the intermediate floor, rooftrusses, and wooden floor finish. In addition, some energy is used to manufacture gypsum plasterboard (12 %). This material is used as a surface finish on the externa! walls ( on the inside as well as the outside ), interna! walls, floors, and ceilings. Sometimes, the gypsum plasterboard is double to increase the fire resistance, for instance in the intermediate floor, the ceiling, and the interna! walls between apartments.
In the concreteframework, most energy is used to manufacture wood (39 %), concrete (21 %) and metal (14 %). Wood is used in secondary externa! walls, secondary interna! walls, and in the roof. Concrete is used in foundation, intermediate floor, and externa! and internal loadbearing walls. Most ofthe meta! is used as reinforcement bars in the concrete.
With a concrete framework, less energy is required to produce wood, gypsum plasterboard and mineral wool. On the other hand, more energ-y is used to produce concrete and meta! (reinforcement bars). In conclusion, the concrete framework requires less energy (960 kWh/m2 ) to manufacture the building and installation materials than the wooden framework (1, 180 kWh/m2).
At the building site, energy is needed to build the house, e.g. for drying and drainage, heating the sheds and the actual building. In addition, electricity for lighting and machinery is needed. The Växjö house uses approx. 50 kWh/m2 usable floor area with a wooden framework, and approx. 100 k\X/h/m2 usable floor area \Vith a concrete frame\vork, see Table 4. The concrete framework uses much energy to dehydrate the concrete. Furthermore, the shuttering, formwork, and concreting use more energy.
In conclusion, there is a small or insignificant difference in energy use during the life cycle for wooden and concrete frameworks.
fnternational Journal of Low Energy and Sustainable Buildings, Vol.2000, Adalberth 13

4.2.2 Thermal insulation thickness
The second feature to be altered is the thermal insulation thickness in the externa! walls. The following assumptions are roade:
the usable floor area is the same in all cases, i.e. the wall "grows outwards"
the alterations are carried out to produce a "fully functional construction", i.e. all materials, nails etc. are included in order to get e.g. a weatherproof construction.
The original externa! walls ofthe house in Växjö are insulated with 45/50+120+70 mm rock wool. In alternative I, the 70-mm thermal insulation is removed. This increases the U value from 0.20 to 0.26 W/(m2·° C).
In alternative 2, the thermal insulation is increased from 45/50 to 180 mm. This gives a thermal insulation thickness of 180+ 120+ 70 mm. As a consequence, the U value is reduced from 0.20 to 0.13 W /(m2 ·° C). Table 5 shows the energy use during the life cycle for the original house as well as for the two alternatives.
The energy used in the manufacture phase increases slightly with the thermal insulation thickness, see Table 5. On the other hand, the energy use during the phase of occupancy decreases more. In conclusion, the energy use during the life cycle is reduced when the thermal insulation thickness in the externa! walls is increased.
TABLE. 5 - The energy use during the life cyclefor the house in Växjö, when the thermal insulation thickness in the externa/ walls is altered.
120+70 mm thermal original solution: 180+120+70 mm insulation in the 45/50+120+70 mm thermal insulation in
externa! walls, U = thermal insulation in the externa! walls, U = 0.26 W/(m2• 0 C) the externa! walls, U = 0.13 W/(m2·° C)
0.20 W/(m2 •0 C)
Phases kWh/m2 % kWh/m2 % kWh/m2 %
Manufacture 1,140 13 1,180 14 1,200 14
Transport 30 0 30 0 30 0
Erection 50 50 50
Occupation, 50 years 7,670 88 7,500 88 7,310 88
Renovation: manufacture 460 5 460 5 460 6
Renovation: transport <10 0 <10 0 <10 0
Renovation: recovery -80 -1 -80 -1 -90 -1
Demolition <10 0 <10 0 <10 0
Removal <10 0 <10 0 <10 0
Recovery -600 -7 -620 -7 -620 -7
Total kWh/(m2·50 years): 8,700 100 8,500 100 8,300 100
Total kWh/(m2·year): 174 171 167
14 lnternationa/ Journal of low Energy and Sustainab/e Buildings, Vol.2000, Adalberth

4.2.3 Thermal performance of windows
In the house in Växjö, the thermal performance of the windows has also been altered. The original windows are single-paned with a sealed unit that hasa U value of 1.90 W/(m2 ·° C).
In alternative 1, the windows are exchanged fora single pane anda sealed argon-filled unit with low-emission coatings. This reduces the U value to 1.15 W/(m2 • 0 C). The solar factor, i.e. the amount of solar radiation fälling on the window for further transmittance into the room, is about 92 % relative a standard window with triple glazing and no low-emission coating. The window resembles a Swedish window called "Övernm window".
In alternative 2, the original windows are exchanged for two sealed argon-fiiled units with low-emission coatings, four panes in total (Hidemark B. et al, 1993). This reduces the U value to 1.00 W /(m2 • 0 C). The solar factor is approx. 84 %. This window was produced fora Swedish housing exhibition in 1992. Table 6 shows the energy use during the life cycle for the original house and the two alternatives.
As shown in Table 6, the energy use during the life cycle decreases with the U value ofthe windows. Ifall windows in the house in Växjö were exchanged for energy-efficient windows with a U value of 1.00 W/(m2 ·° C), the energy use would decrease from 171 to 159 kWh/(m2 ·year), or 6 per cent. During a life span of 50 years, the house in Växjö would save 600 kWh/m2 or 720,000 kWh energy. This energy would heat 40 single-unit houses using 17,000 kWh each, during one year.
TABLE. 6 - The energy use during the ltfe cycle for the house in Växjö with different kinds of windows.
original solution: l +2 1 +2 window panes 2+2 window panes window panes, with low-emission with low-emission
U = 1.90 W/(m2 •0 C) coatings and gas, U = coatings and gas, U = 1.15 W/(m2 ·° C) I W/(m2 •0 C)
phases kWh/m2 % kWh/m2 % kWh/m2 %
Manufacture 1,180 14 1,200* 15 i,200* 15
Transport 30 0 30 0 30 0
Erection 50 50 50
Occupation, 50 years 7,500 88 6,960 87 6,890 87
Renovation: manufacture 460 5 480 6 460 6
Renovation: transport <10 0 <10 0 <10 0
Renovation: recovery -80 -1 -80 -1 -80 -1
Demolition <10 0 <10 0 <10 0
Removal <10 0 <10 0 <10 0
Recovery -620 -7 -620 -8 -620 -8
Total kWh/(m2 ·50 years): 8,500 100 8,000 100 7,900 100
Total kWh/(m2·year): 171 161 159
* The windows with a single pane and a sealed, argon-filled unit with low-emission coatings, anda U value of 1.15 W/(m 2• ° C), use more energy during production than the ather windows with two sealed, argan-filled units with low-emission coatings, U value of 1. 00. This is due ta aluminium profiles on the outside of the window with a single pane anda sealed unit. The window with twa sealed units has no aluminium profiles an the outside.
lnternational Journal of Low Energy and Sustainable Buildings, Vo/.2000, Adalberth 15

4.2.4 Heat recovery in the exhaust air
The fourth feature to be altered is the degree ofheat recovery in the exhaust air. The original house uses a mechanical ventilation system, "exhaust air without heat recovery". This solution is exchanged fora mechanical ventilation system, "supply and exhaust air with heat recovery''. It is assumed that the plate heat exchanger in the alternative solution has a temperature efficiency degree of0.68 anda fan effect of2.5 W/(m3/s).
Table 7 presents the energy use <luring the life cycle, when the degree ofheat recovery in the exhaust air is varied (the increased use of electricity is considered). As shown, the energy use <luring the life cycle decreases when the mechanical exhaust air system with no heat recovery is replaced by a mechanical ventilation system with a plate heat exchanger. The energy use decreases from 171 to 148 kWh/(m2·year), or 13 per cent- a significant difference.
During its 50-year life span, the house in Växjö would save 1,140 kWh/m2 or 1,360,000 kWh energy ifheat recovery in the exhaust air were installed. This energy would provide 80 singleunit houses with heating, 17 ,000 kWh each, <luring one year.
TABLE. 7 - The energy use for the house in Växjö with different degrees of heat recovery in the exhaust air.
original solution: mechanical mechanical supply and exhaust exhaust system without heat system with plate heat exchanger
exchanger
Phases kWh/m2 % kWh/m2 %
Manufacture 1,180 14 1,190 16
Transport 30 0 30 0
Erection 50 50
Occupation, 50 years 7,500 88 6,360 86
Renovation: manufacture 460 5 470 6
Renovation: transport <10 0 <10 0
Renovation: recovery -80 -1 -80 -1
Demolition <10 0 <10 0
Rem oval <10 0 <10 0
Recovery -620 -7 -620 -9
Total kWh/(m2·50 years): 8,500 100 7,400 100
Total kWh/(m2·year): 171 148
16 Jnternational Journal oj low Energy and Sustainable Buildings, Vol.2000, Adalberth

4.2.5 Changes in energy use with different constructions
Table 8 summarises how the total energy use ofthe Växjö house is influenced when different constmction alternatives are used.
The table shows that there are various ways of decreasing the energy use. Ifthe house had a single pane anda sealed, argon-filled unit with low-emission coatings, U = 1.15 W/(m2 ·° C), the energy use would decrease by 6 per cent <luring the life cycle or approx. 10 kWh/(m2·year).
Table 8 also shows that one major parameter, which would decrease the ertergy use in the Växjö house, is the degree ofheat recovery ofthe exhaust air. Ifthe degree ofheat recovery was increased from O % to 68 % (i.e. the temperature efficiency degree ), the energy use <luring the life cycle would decrease from 171 to 148 kWh/(m2·year), or by 13 per cent. This kind of installation technology or change is not unique in any way. The solution has been available on the Sweden market for approx. 25 years.
Finally, a combination ofheat recovery ofthe exhaust air anda single pane anda sealed argon-filled unit with low-emission coatings would decrease the energy use <luring the life cycle from 171 to 140 kWh/(m2·year), or by 18 per cent. The energy use would be reduced by 31 kWh/(m2·year) or 1,920,000 kWh - enough to supply 110 single-unit houses, which use 17 ,000 kWh each, with energy for one year.
TABLE. 8 - The energy use during the life cyclefor the Växjö house. The building technology of the house has been altered in order to determine how it influences the energy use during the life cycle. .
Parameters
Mechanical supply and exhaust system with plate heat exchanger 1 +2 window panes with low-emission coatings and gas, U = 1.15 W/(m2 •0 C)
Mechanical supply and exhaust system with plate heat exchanger
2+2 window panes with low-emission coatings and gas, U = 1.00 W/(m2 •0 C)
1 +2 window panes with low-emission coatings and gas, U = 1.15 W/(m2 •0 C)
and
370 mm thermal insulation in the externa} walls, U = 0.13 W/(m2 •0 C)
Original solution: 235-240 mm thermal insulation in externa! walls, U = 0.20 W/(m2 •0 C) 1+2 window panes, U = 1.90 W/(m2 •0 C) Ventilation system including mechanical exhaust system and a wooden framework
Concrete framework
165-170 mm thermal insulation in externa! walls, U = 0.26 W /(m2 •0 C)
Energyuse <luring the life
cycle kWh/(m2 ·year)
140
148
159
161
167
171
172
174
lnternational Journal oj low Energy and Sustainable Buildings, Vol.2000. Adalberth
Difference compared to original solution
-18 %
-13 %
-7%
-6%
-2%
+1 %
+2%
17

4.3 Will a deviation between the estimated and the charged energy use during the occupation phase affect the results?
In the following paragraphs, the estimated energy use and the energy use actually charged <luring the occupation phase are presented. It is sometimes observed that there is a deviation between the estimated and the actual energy use (Sandberg E., 1998) and (Adalberth K., 1995). The idea is to evaluate how a change in the occupation phase influences the total energy use <luring the life cycle.
The charged energy use has been determined by contacting the property manager and establishing the use ofheating and electricity outside the apartments, e.g. in common laundry facilities. Furthermore, the energy supplier has been contacted in order to obtain information about the electricity inside apartments.
Fig. 4 presents the estimated energy use and the actual energy use for the four multi-family houses <luring their occupation phase.
Malmö: estimated
Malmö: charged !l,'!;!fi"''"'' .,
.•. . ,, Helsingborg: estimated lilheat
Helsingborg: charged /·. ;·c: ,: c.,C•·., ';' • electricity
Växjö: estimated .::,:·,C,:.-, .. <'' !· /'-
Växjö: charged ·.'ci:<,, : ·i c''r·• ... . ':·:': . .;:.,,.,;,,:: ',. '
Stockholm: estimated .>•-t' ;,,. · .. :
Stockholm: charged :. ,,, . . :c .. . ,, ..
0 50 !00 150 200 kWh/(m'·year)
FIG. 4 - Estimated and charged energy use, both electricity and heat, for the Jour multi-family houses.
Fig. 4 shows that the charged energy use is higher than the estimated use for the four houses. The Malmö house is estimated to use 100 kWh/m2, but is charged 131 kWh/m2 ; the Helsingborg house is estimated to use 121 kWh/m2, but is charged 181 kWh/m2; the Växjö house is estimated to use 150 kWh/m2, but is charged 160 kWh/m2; and finally the Stockholm house is estimated to use 121 kWh/m2, but is charged 148 kWh/m2 • In conclusion, the charged energy use is between O and 50 per cent higher than the estimated use.
Fig. 4 also shows that the charged use of heating consistently lies above the estimated use. The actual use ofheating is about 30-50 kWh higher/m2 usable floor area (i.e. 30-90 per cent) than the estimated use. Note that no "normalisation" ofthe charged heat, based on a "reference year" and using the outdoor temperature, has been done. Nevertheless, the outdoor temperature has been above the reference year by more than 1 ° C <luring the heating season. This means that the charged energy use would increase if data were standardised.
18 lnternational Journal of Low Energy and Sustainable Buildings, Vol.2000, Adalberth

One reason why the actual heating figures are higher than estimates could be that the actual indoor temperature is higher than the estimated 20° C. An increase of the indoor temperature from 20° C to 22° C would increase the estimated heating by 4 kWh/(m2 ·year) for the Malmö house, 7 kWh/(m2·year) for the Helsingborg and Stockholm house respectively, and 10 kWh/(m2 ·year) for the Växjö house. In addition, the air exchange rate may also be higher than the estimated 0.50. Furthermore, there may be deviations from the project documents compared to the actual performance ofthe building constructions, due toa lack of quality assessment at the building site. This kind of deviation has been observed <luring contract work dealing with 26 single-unit dwellings built in 1992 (Adalberth K., 1995). The deviation consisted of: Poor air tightening, inappropriate selection ofwindows compared to what was prescribed in the design documents, poor adjustment ofventilation flow rates and poor thermal insulation in some crawl spaces.
When it comes to the use of electricity, the estimated electricity use is higher than the charged use - between l O and 20 kWh/m2 , see Fig. 4. This may be explained by the use of energyefficient white goods. When the household electricity was predicted, a "standard estimate" was used, see paragraph 3.
In a study made by (Sandberg E., 1998), the estimated and the charged energy use in 16 multifamily houses were studied. Results showed that the estimated heat requirements for space heating, heating for ventilation and domestic hot water was on average 97 kWh/m2 usable floor area. The charged energy use was on average 155 kWh/m2 • This means that the charged energy use was 50 per cent higher than the estimated use. The difference was e.g. explained by:
a higher indoor air temperature
a trequent use ofwindow airmg
higher ventilation flows
a higher degree of solar shading due to surrounding buildings and trees, and,
a higher degree of thermal bridges.
The study suggests a way to deal with the difference between estimated and charged energy use. Building regulations shouldfocus on the charged energy use instead ofthe estimated value (as it is now, authorities give permission to commissioners ofbuilding projects to start building based on the estimated energy use). In this way, a more "realistic" approach would be used to estimate the energy use.
To conclude the discussion about the difference beh,veen estimated and charged energy use: The dominant occupation phase, which constitutes 85 per cent, is even more dominant than initially believed since the actual use is higher than the estimated use. Furthermore, it would make sense to design dwellings more energy-efficient <luring the planning phase, since the charged energy may be higher than what was estimated for the building.
5. Conclusions
The paper deals with four authentic multi-family houses built in Sweden in 1996. They were evaluated based on total energy use <luring their life cyc!e. The life cycle is divided into the following time phases: manufacture ofbuilding materials, transport, erection toa building, occupancy, renovation, and finally demolition, removal, and recovery ofheat from debris. Questions to be answered in this study were as follow in paragraphs 5.1-5.3.
Jnternational Journal of low Energy and Sustainable Buildings, Vol.2000, Adalberth 19

5.1 Which phase of the buildings' life cycle has the highest use of energy?
During the life cycle, the Malmö, Helsingborg, Växjö and Stockholm houses use approx. 123, 144, 171, 143 kWh/(m2 ·year) respectively. A majority of this energy is used <luring the phase of occupancy for space heating, ventilation, domestic hot water, pumps, fans and household electricity. This energy demand is between 100 and 150 kWh/(m2·year), which constitutes approx. 85 % ofthe total energy use for the four houses.
The second and third dominant phases are the manufacture and renovation phases. These constitute approx. 15 % of the total energy use during the life cycle. The impact of manufacturing materials is therefore low and its importance in a life cycle modest.
The energy demand for transports and processes during the erection and demolition of the houses constitutes approx. 1 per cent of the total energy requirements. Compared to the entire life cycle, very little energy is hence used for such purposes.
In short: Design a house to attain a low energy demand during the occupation phase.
5.2 How do different features of the building affect the total energy use during the life cyde?
Four different features ofthe Växjö house have been altered, namely framework, thickness of thermal insulation in externa! walls, thermal character ofwindows, and finally, degree ofheat recovery in the exhaust air.
By increasing the thermal insulation thickness in the extemal walls from approx. 240 to 370 mm (U value decreases from 0.20 to 0.13 W/(m2 •0 C)), the energy use <luring the life cycle is decreased from 171 to 167 kWh/(m2·year).
By exchanging the windows from a single pane and a sealed unit, U = 1.90 W /(m2 ·° C), to windows with a single pane anda sealed argon-filled unit with low-emission coatings, U = 1.15 W/(m2 •0 C), the energy use is decreased from 171 to 161 kWh/(m2·year).
By improving the degree ofheat recovery ofthe exhaust air, from O % toa temperature efficiency degree of 68 %, the energy use <luring the life cycle is decreased from 171 to 148 kWh/(m2 ·year).
In conclusion: Designa house with good performance in the thermal envelope and install a heat exchanger with high temperature efficiency in order to recover heat from the exhaust air. When the thermal thickness is increased, so is the energy demand <luring the manufacture phase. However, the energy requirement <luring the occupation phase will decrease more. This means that the total energy use during the life cycle is reduced.
5.3 wm a deviation between the estimated and the charged energy use during the occupation phase affect the energy use during the life cycle?
The estimated energy use during the occupation phase of the four multi-family houses has been compared to the actually charged energy use. This has been done since a deviation between estimated and actual energy use is sometimes observed.
20 lnternational Journal of Low Energy and Sustainable Buildings, Vol.2000, Adalberth
The charged energy use was higher than the estimated use - on average between O and 50 per cent. This means that the energy use <luring the whole life cycle increased from approx. 123, 144, 171, 143 to 154, 204, 180 and 169 kWh/(m2·year) for the Malmö, Helsingborg, Växjö and Stockholm house respectively.
One reason why the use of energy was higher than the estimate could be that the actual indoor temperature is higher than the estimated 20° C. Also, the air exchange rate may be higher than the estimated 0.50 acr. In addition, there may be deviations from the project documents compared to the actual performance of the building constructions due to a lack of quality assessment at the building site.
In short, the dominant occupation phase is even more dominant than initially believed, since the actual use is higher than the estimated use. When the actual energy use is considered, the occupation phase increases from 85 to 88 % of the total use of energy <luring the life cycle.
5.4 Recommendations
In order to get an energy-efficient house <luring the entire life cycle,
designa house with low energy demands <luring the occupation phase
design a house with good performance of the thermal envelope, by e.g. adding another pane to windows, even if the energy demand <luring the manufacture phase will increase, and finally
estimate the energy use <luring the design phase with "realistic" input and enforce high quality <luring constructions, so that the deviation between estimated and charged energy use will be low.
6. Acknowledgement
My thanks to the Swedish Council for Building Research and Foundation for Strategic Environmental Research, Mistra, for having financed the work. I also wish to thank my supervisor Professor Arne Elmroth, who has offered advice on the progress of this study.
7. References
Adalberth K. (1999). Energy Use in Multi-Family Dwellings <luring their Life Cycle, TVBH-3034, ISBN 91-88722-17-1, Department ofBuilding Physics, Lund University, Lund, Sweden.
Adalberth K. ( 1995). Bygga Bruka Riva - Energianvändning i småhus ur ett kretsloppsperspektiv (Eng. Energy Use in Single-Unit Dwellings in a Life-Cycle Perspective), ISBN 91-88722-04-X, Department ofBui!ding Physics, Lund University, Lund, Sweden.
Andersen S., Dinesen J., Hjort Knudsen H. and Willendrup A. (1993). Livscyklus-baseret bygningsprojektering (Eng. Life-cycle-based building design, Energy and environment mode!, calculating tool and database ), Report no 224, Danish Building Research Institute, H0rsholm, Denmark.
Anderlind G., Bankvall C. and Munther K. (1984). Energibehov i nya byggnader (Eng. Energy demand in new buildings ), Rl 40: 1984, Swedish Council oj Building Research, Stockholm, Sweden.
lnternational Journal ofLow Energy and Sustainable Buildings, Vol.2000, Adalberth 21

Björklund T. and Jönsson A. (1997). LCA ofBuilding Frame Structures, Environmental Impact over the Life Cycle ofWooden and Concrete Frames, Report no 1997:2, Technical Environmental Planning, Chalmers University ofTechnology, Gothenburg, Sweden.
Boverket (1994). Boverkets Byggregler BBR94 (Eng. The Swedish Building Code), the Swedish Board of Housing, Building and Planning, ISBN 91-38-12851-9, Karlskrona, Sweden.
Cole R.J. and Keman P.C. (1996). Life-Cycle Energy Use in Office Buildings, Building and Environment, 1996, Pergamon Press, Volume 31, No 4, pp 307-317, Great Britain.
Dinesen J., Krogh H. and Traberg-Borup S. (1997). Livscyklusbaseret bygningsprojekteringOpg0relse af bygningers energiforbrug of energirelaterede milj0påvirkninger (Eng. Life-cyclebased Building Design, Calculation ofbuildings' energy consumption and energy-related environmental impacts), Report no 279, Danish Building Research Jnstitute, H0rsholm, Denmark.
Hidemark B., Samuelson I. and Sjöholm B. (1993). Bo92 fönstret 2+2 - Beskrivning och mätresultat (Eng. The four paned window at the Swedish exhibition Bo92- A description and results from the measurements ), SP AR report no 1993 :64, Energy Technology/Building Physics, Swedish National Testing and Research Jnstitute, Borås, Sweden.
IEA (1999). www.tce.rmit.edu.au/iea/index.htm, The International Energy Agency, Homepage of IEA annex 31.
Munther K. (1996). Enorm version 1000, AB Swedish Building Centre, Stockholm, Sweden.
The Nordic Accounting Network (1999). http://www.nan.shh.fi/NAN-Local/Standards/3 l 0593-sw.html, Swedish School of Economics and Business Administration in Helsinki, Helsinki, Finland.
Nemeth B.W. (1998). En analyse av totalenergiforbruket i fem versjoner av en norsk bolig (Eng. An Analyse ofthe Total Energy Demand ofFive Different Norwegian Dwellings), IBTrapport no 1998:l, ISBN 82--471-0200-5, PhD-thesis, Department ofBuilding Technology, Norwegian University of Science and Technology, Trondheim, Norway.
Petersen E.H. (1997). Livscyklusvurdering afbygningsdele (Eng. Life cycle assessement of building components), PhD-thesis, SBI Report 272, Danish Building Research Jnstitute, H0rsholm, Denmark.
SABO (1998). Maintenance Norm, Organisation for Municipal Housing Companies, Stockholm, Sweden.
SCB (1990). Folk och Bostadsräkningen (Eng. Population and Housing Census in Sweden), Statistics Sweden. Örebro, Sweden.
Sandberg E. ( 1998). Energimål - kort sikt, Hammarby Sjöstad (Eng. Energy Targets Short Term, The town-district Hammarby Sjöstad, ATON Teknik Konsult AB, Stockholm, Sweden. (preliminary report)
Tillman A-M., Baumann H., Eriksson H. and Rydberg T. (1991). Packaging and the Environment - Life-cycle analyses of selected packaging materials - Quantification of environment loadings, SOU 1991 :77, Chalmers industriteknik, Chalmers Teknikpark, Gothenburg, Sweden.
© Jnternational Journal af Low Energy and Sustainable Buildings, 2000 Available al http://www.ce.kth.se/bim/leas
22 !nternational Journal af low Energy and Sustainable Buildings, Vol.2000, Adalberth

Life Cycle Assessment of four 111111l+LS::~mih, R11ilrlinnct 1iiu11.1-1 u11111y ....,. ...... '-'•• •::J"
Submitted for publication in lnternational Journal of low Energy and Sustainable Buildings
Paper4
Appendix


Lif e Cycle Assessment of four Multi-Family Buildings
SUBMITTED: November 1999 REVISED: ---PUBLISHED: ---
Karin Adalberth, PhD student Department of Building Physics, Lund University, Sweden [email protected]
Anders Almgren, PhD student Department of Building Physics, Lund University, Sweden [email protected]
Ebbe Holleris Petersen, PhD Energy and lndoor Climate Division, Danish Building Research Institute, Denmark [email protected]
KEYWORDS: LCA, Life Cycle Assessment, life cycle, multi-family building, residential building. environmental load. environmental impact. energy use, energy demand
SUMMARY: This study covers an LCA dealing with the environmental impact af Jour multifamily dwellings in Sweden built in 1996. The buildings are authentic and have e.g. different frameworks and foundations, different numbers af apartments, a different thermal degree af the envelope, different ventilation systems etc. The aim is ta establish which phase in the life cycle that has the highest environmental impact; whether there are parallels between environmental impact and energy use; and whether differences in environmental impact subsist due ta a choice af building construction. The environmental impact refers ta the effects: global warming potential, acidification, eutrophication, photochemical ozone creation potentials, and human taxicity. The occupation phase is assumed ta be 50 years. Results show that the occupation phase has the highest environmental impact during the life cycle, approx. 70-90 % af the environmental impact during the dwelling's life cycle. Parallels can be drawn ta the energy use during the life cycle, for which the occupation phase constitutes 85 % af the total. Since the manufacture phase has such a small impact an the total impact during the life cycle, approx. 10-20 % af the total, the selection offramework has little effect. It is better ta choose constructions and installations, which cause a small environmental impact during the occupation phase. Finally, since the occupation phase is very dominant and since there is conformity between energy use and environmental impact during the life cycle, it is wise ta both design buildings that are energy-efficient during their occupation phase, and ta produce energy with low emissions in order ta obtain an environmentally adapted dwelling.
International Journal oj low Energy and Sustainable Buildings, Vol. 2000, Adalberth, Almgren and Petersen

1. Background Throughout its existence a building has a certain environmental impact on the surrounding ecosystem. The effects can be noticed on a local, regional and global leve!. All different processes and phases included in the construction and use of a building add to the total environmental impact. A common method for determining this impact is LCA, the Life Cycle Assessment method. LCA is a method for analysing and assessing the environmental impact of a material, product or service throughout an entire life cycle.
This study covers an LCA dealing with the environmental impact of four multi-family dwellings in Sweden, all with different frameworks and foundations. A report ofthe total energy use during the life cycle ofthe same buildings has already been published (Adalberth K, 1999).
1.1 Objectives
The aim ofthe study is to investigate the enviromnental impact offour multi-family buildings erected in 1996. Questions to be answered are:
• Which phase ofthe buildings' life cycle has the highest environmental impact?
• Are there similarities between environmental impact and energy use <luring the life cycle?
• Are there differences in environmental impact due to the choice ofbuilding construction and framework?
1.2 Other studies
There are a few other studies dealing with energy use and environmental impact during the life cycle of a complete building.
Two different essays, (Cole R et al, 1996) and (Nemeth B W, 1998), describe the energy use in an office and five single-unit dwellings respectively. Another study made by (Adilstam T, 1997) examines the environmental impact oftwo multi-family buildings with a lightweight steel framework.
The contribution ofthis study is to compare the energy use during the life cycle with the corresponding environmental impact. In addition, this study deals with four authentic Swedish multi-family buildings with e.g. different frameworks and foundations, different numbers of floors and apartments, different themial degree ofthe envelope, different ventilation systems etc.
2 Jnternational Journal of low Energy and Sustainable Buildings. Val. 2000. Adalberth. Almgren and Petersen

2. Method In this study, environmental impact refers to the following effect categories: global warming potential, acidification, eutrophication, photochemical ozone creation potentials and human toxicity. The global warming potential includes the following emissions: carbon dioxide, carbon monoxide, nitrous oxide and methane. Acidification includes: ammonia, hydrogen fluorine, nitrogen monoxides and sulphur dioxide. Eutrophication includes: ammonia, nitrous oxide and nitrogen oxides. Photochemical ozone creation potential includes: formaldehyde, carbon monoxide, methane, and volatile organic compounds. The effect category human toxicity includes emissions such as arsenic, lead, cadmium, carbon monoxide, mercury, nitrous oxide, nickel, nitrogen monoxide and sulphur dioxide.
The total global warming potentials have been estimated by translating the different emissions presented above into C02 equivalents - the emissions were multiplied with different weightingfactors and then added up. The size ofthe weighting factors depends on the emission's contribution to radiative forcing, taking into consideration the atmospheric lifetimes and absorption properties ofthe gases (IPCC, 1994).
In the same way, other emissions affecting acidification, eutrophication, photochemical ozone creation and human toxicity are connected to certain weighting factors. The factors are collected from (Lindfors L-G et al, 1995).
The reason for choosing these effect categories is that they are considered especially important in literature and from an environmental and political point ofview. For example, in April 1999 the Swedish Parliament adopted 15 national goals dealing with environmental targets. Global warming potential, acidification, eutrophication, photochemical ozone creation potentials and human toxicity were five ofthem (Swedish Parliament, 1999).
The environmentaf impact ofthe four multi-family buildings has been investigated <luring their life cycle. The expression 'life cycle' refers to the following phases: manufacture of building materials, transport, erection ofthe building, occupancy, renovation, and finally demolition and removal, see Figure 1.
Residual products have been handled in different ways. Gypsum wallboards and white goods are assumed to go to a landfill. This environmental impact is included in the life cycle. The disposal of other materials is not included in the life cycle, since this profit or loss will supposedly be included in the life cycle of the next product using these materials. Wooden and plastic products are assumed to be combusted in order to recover heat. All other materials, e.g. concrete, minera] v.rool and metals, are assumed to be recycled into new products.
Production Management Destruction
Manufacture Transport Erection Occupation Renovation Occupation Demolition Removal
FJG. 1: A building's various temporal phases during its life cycle.
lnternational Journal of Low Energy and Sustainable Buildings, Vol. 2000, Adalberth, Almgren and Petersen 3

2.1 Functional unit
In order to evaluate and present the environmental impact ofthe four buildings, a functional unit has to be chosen. There are several functional units to choose from e.g. resident, apartment, and m2 usable floor area.
The functional unit 'resident' would reflect the effectiveness ofthe layout; i.e. the number of rooms and consequently the number ofresidents, anda comparison between the buildings would be complex. On the other hand, the unit would indeed show the environmental impact of a building, since it is more environmentally adopted to live four people in an apartment with four rooms anda kitchen thanjust two.
The functional unit 'apartment' would favour as many apartments as possible in a building, i.e. the environmental impact would decrease ifall inhabitants had an apartment of their own, and this would not be correct.
The third alternative, m2 usable floor area, would make a comparison between the buildings easier. 'Layout' efficiency and number of apartments would not influence this functional unit, see paragraphs above. This unit is also widely used in other studies.
Unfortunately, it has not been possible to carry out a complete analysis ofthis topic within this study. Nevertheless, the functional unit 'm2 usable floor area' is chosen. The usable floor area is defined as the floor area in the apartments, staircases, cellar and attic.
2.2 The LCA tool
The environmental impact ofthe four multi-family buildings has been evaluated with an LCA tool developed at the Danish Building Research Institute (Petersen E H, l 997b ). The tool is designed with the relation-database program Microsoft Access, and consists of a database and an inventory tool. In the database, all quantifiable input (raw material, energy sources and products) and output (emissions to air, liquid effluents and solid waste) can be stored for every process, i.e. means oftransport, energy source, building material and building element used during a building's lifetime. Since it is both difficult and time-consuming to obtain data for these processes, a number of processes commonly used for Danish buildings and the Danish building industry have been predefined in the database. The database therefore contains data for:
• Means oftransport, e.g. truck, coaster, train.
• Energy sources, e.g. electricity, natura! gas, oil and coal. The typical emissions, which occur when these fuels are used in !arge stationary industrial installations, can be automatically included.
• Building materials, e.g. cement, concrete, light concrete, gypsum boards, bricks, wood, metals, glass, plastic, insulation materials.
• Building elements, e.g. exterior walls, interior walls, foundations, roof constructions, windows.
4 International Journal oj low Energy and Sustainab/e Buildings, Vol. 2000, Adalberth, Almgren and Petersen

By using these predefined processes, an LCA for a building can be performed in a fraction of the time that would otherwise be required. The database and inventory tool can also be used to perform LCAs for building elements or building materials. It is hence possible to analyse individual parts of a building in more detail. If e.g. an LCA fora building establishes the exterior walls as a significant contributor to environmental effects, they can be further analysed in order to identify the specific wall or material in the wall which is responsible for the environmental impact.
When an LCA is performed, the inventory tool calculates the total input/output, i.e. the consumption ofraw materials (including fuels) and energy, which occur over the entire lifetime of the building. It also calculates the total airbome emissions, liquid effluents and solid waste, which will be deposited. Afterwards, the input/output can be displayed on a screen or printed in the form of input/output tables. The printout includes tables containing:
• Primary raw materials and fuels used, i.e. raw materials extracted from nature (e.g. sand, stone, clay, coal, oil and natura! gas)
• Secondary raw materials and fuels used, i.e. industrial waste products (e.g. fly ash, micro silica, wood and saw dust)
• Energy use and how it is divided into individual energy sources
• Airbome emissions
• Liquid effluents
• Solid waste for deposition.
Pr.r h11il.lina PlPmPnk '>n.l hnildina~ tl,p '>tn,mnk rli~nb"Pd in tl,p t"h]P~ <lrP ~1,r,urn "~ hntl, tr.fal ..L ...,_._ .................................. b _._.__._.__.__.__._.__._.,._, ~ ........... ............................ b...,, ....... _. ................................. ..., ........ t' ........ .J '""'""" .................... ..., ............ _.__....,. ............. .., .................... .,...,,., ..................................... ..
input/output <luring the entire lifetime and input/output per year. For products (with no expected lifetime, since it depends on what they will be used for), only total input/output is displayed. The inventory tool can also calculate the potential environmental impacts from the input/output and present them on a screen or printed in the form of tables or graphically as normalised and weighted environmental profiles.
2.3 Pertinent conditions and restrictions
2.3.1 Manufacture of materials during production and renovation
In order to estimate the environn1ental impact ofthe four buildings, certain simplifications have to be made. In cases when manufacturer-specific information was not available, typical generic data or data for equivalent products has been used instead. Table 1 shows the references, from which data was collected.
International Journal af Low Energy and Sustainable Buildings, Val. 2000, Adalberth, Almgren and Petersen 5

TABLE. 1: In order to estimate the environmental impact ofbuildings, background information on materials is required. The table shows the references, from which data has been collected.
Building product Concrete, mortar, brick, gypsum etc
Aerated concrete Concrete Lightweight-aggregate concrete blocks Macadam Mortar Brick, red and yellow Gypsum wallboard
Thermal insulation Glass wool Rockwool
Metal products Aluminium Copper Steel from scrap Zinc
Plastic products Expanded polystyrene Polyethylene and polypropylene Polyvinyl chloride
W ooden products Chip board Glulam wood Planed timber Plywood Veneered laminboard beam, product KERTO
Others Linoleum as floor covering Underlay felt, product Y AP 2500, White goods: refrigerator, freezer, stove, washing machine, drying cupboard Windows, product ELIT window EFH12*12 M
Reference
(Yxhult, 1998) (Björklund T et al, 1997) (Leca, 1997) (DTI, 1995a)* (Björklund T et al, 1996) (DTI, 1995b)* (Gyproc, 1996)*
(Ceutrick D, 1993)* (Ceutrick D, 1993)*
(European Aluminium Associate, 1996)* (Suner M, 1996) (The Danish Steel Works Ltd, 1996)* (Kiinniger Tand Richter K, 1995)*
(Neste Ltd, 1995)* (Boustead I, 1993) (Boustead I, 1998)
(Novopan Tneindustri, 1995)* (Erlandsson M, 1996) (BPS, 1997)* (Vänerply, 1999) (Plyfa, 1999)
(Jönsson A, 1995) (Mataki Ltd, 1999) (Electrolux, 1998)
(Erlandsson M, 1997)
* Already dejined in the LCA tool developed by the Danish Building Research Institute (Petersen E H, 1997b).
6 international journal oj Low Energy and Sustainable Buildings, Vol. 2000, Adalberth, Almgren and Petersen

The investigated dwellings can hence be described as models based on existing buildings. This is nota great !imitation since the scope ofthis study is to compare building systems and ways to estimate environmental impact, not producer-specific products.
The amount ofbuilding and installation materials has been obtained from drawings and interviews with designers and contractors. Vertical and horizontal framework sections (including all kinds of fixing devices ), not load-bearing partitions, surface finishes, electrical · installations, and installation materials for building services are all estimated.
When materials are handled <luring construction, waste is produced. The amount depends on the skills ofthe craftsmen involved and the geometry and complexity ofthe building. The amount has been calculated using typical waste factors from a study by (Lindhe N, 1996).
2.3.2 Transports during production, renovation and destruction
The cnvironmental impact due to transports has been considered. The calculations are based on the estimated transport distance between manufacturers and building sites <luring construction and renovation. There are also transports from the building site to a wastedisposal site <luring renovation and demolition. This study assumes that there is a wastedisposal plant in the municipality where the buildings are located. The transport distance is assumed to be 20 kilometres.
Furthermore, the environmental load relating to different transports has been derived from (Tillman A-M et al, 1991), which provides data on energy demands and produced emissions.
2.3.3 The erection and demolition of the building
The environmental impact ofthe erection and dcmolition phases has also been included in the study. Due to the lack of information on emissions from these processes they have only been evaluated by mearis oftheir energy use. Other emissions, e.g. air-bom emissions when performing the welding and painting, are omitted due to a lack of information. The environmental impact has then been calculated using data collected by the Danish Building Research Institute (Andersen Set al, 1993).
2.3.4 Occupation
In this study, the occupation phase is assumed to be 50 years, since the economic life span of a building in Sweden is about 40-50 years. The estimated environmental impact <luring the occupation phase is based on the assumption that no extensions, re-constructions, or significant changes are made <luring the relevant 50-year phase. Only sequential maintenance, e.g. repainting and white goods exchange, has been taken into account (SABO, 1998).
The environmental impact of this phase has been evaluated by means of its energy use. The energy requirements <luring the occupation phase were calculated using the Swedish software Enorm (Munther K, 1996). It calculates energy and average power requirements for space heating and ventilation <luring a period oftwelve months, based on average outdoor temperatures and solar radiation on a 24-hour basis. Factors taken into account are: U values ofthe building constructions, thermal bridges, air leakage, window orientation, heating system, and ventilation including heat exchange. Computations do not include the accumulation ofheat in the framework and fumishings ofthe building, since this would call for hourly climate data.
International Journal af Low Energy and Sustainable Buildings, Val. 2000, Adalberth, Almgren and Petersen 7

The energy requirements for domestic hot water and household electricity in Enorm is calculated using empirical equations and acquired by experience (Boverket, 1994).
2.3.5 Energy sources
In order to estimate the environmental impact, the emissions from energy production must be known. During a 50-year life cycle, the energy source or the energy supply system will supposedly change several times. In the calculations, however, it is assumed that the energy supply system will be constant during the entire life cycle.
The average Swedish district heating and the European OECD countries' average electricity mix have been used to determine the environmental impact due to energy use. The purpose of using the Swedish district heating and the European OECD countries' electricity mix, e.g. <luring the occupation phase (and not the local net for each ofthe buildings) is primarily to compare the environmental impact ofthe buildings and not the irnpact ofthe energy supply systems. Hence, the average Swedish district heating has been used for all the buildings in order to get same 'emission set' from the heat source. Figure 2 shows the mix in the Swedish district heating net.
28%
coal 8%
oil 8%
3%
natura! gas 5%
FIG. 2: The mix in the Swedish district heating net, 41.2 TWh during 1997 (Swedish District Heating Association, 1999). This mix has been used to determine the environmental impact due to heat usage in the Jour studied multi-family houses.
By choosing the electricity rnix ofthe European OECD countries, it was possible to cornpare the buildings. In addition, the electricity systern is tuming into one large network for all countries. Sweden is already apart ofthis system to some extent, and will be so even more in the near future. Furthermore, 80-85 % of the total energy use during the life cycle is used <luring the phase of occupancy (Adalberth K, 1999), a period which is rnainly in the future. This is yet another reason to choose the OECD European rnix. Figure 3 shows this electricity rnix. The following countries are included in the OECD: Austria, Belgium, the Czech Republic, Denmark, Finland, France, Germany, Greece, Hungary, Iceland, Ireland, Italy, Luxernbourg, the Netherlands, Norway, Portugal, Spain, Sweden, Switzerland, Turkey and the United Kingdom.
8 International Journal af low Energy and Sustainable Buildings, Val. 2000, Adalberth, Almgren and Petersen

The electricity mix ofthe European Union has not been considered as an alternative mix, since Sweden imports Norwegian electricity and Norway is not in the Union.
biomass fuel 1%
oil 10%
coal 30%
8%
nuclear power 40%
FIG. 3: The electricity mix ofthe OECD countries within Europe (IEA, 1998). This mix has been used to determine the environmental impact due to electricity usage in the Jour studied multi-family houses.
3. Description of the buildings The four buildings, which were analysed based on environmental impact, are located in different parts of Sweden: in Malmö, Helsingborg, Växjö and Stockholm. They were built in 1996 and selected for their different types of foundation and framework, different locations in Sweden, and different nun1bei of floors and apai--1:ments. Table 2 sums up their major characteristics.
fnternational Journal of Low Energy and Sustainable Buildings, Val. 2000, Adalberth, Almgren and Petersen 9

T ABLE. 2: Sorne characteristics of the Jour rnulti-farnily buildings. The buildings have been analysed based on environrnental irnpact.
Unit Malmö Helsingborg Växjö Stockholm
Numberof 6 8 16 15 apartments
Number of floors 3*1 3.5 4 5*1
Usable floor m2 700 1 160 1 190 1 520 area
Roomheight m 2.4 2.6 2.55 2.4
Surface of m2 920 1 380 1610 1 600 heated volume
Mean U value*2 W/(m2·K) 0.26 0.44 0.32 0.30
Kindof Lightweight Concrete Wood Steel columns framework concrete and concrete
and concrete
Energyuse kWh/m2 100 121 150 121 <luring occupation*2
Amountof ton/m2 1.0 1.5 0.8 1.3 building materials*2
- dominant %ofthe 74 % concrete 85 % concrete 33 % concrete 71 % concrete building weight 14 %macadam 10%macadam 35%macadam 20%macadam material
Amountof m3/m2 0.8 1.0 1.2 1.2 building materials*2
- dominant % ofthe 43 % concrete 64 % concrete 51 % min. wool 45 % min.wool building volume 29 % min. wool 20 % min.wool 16%wood 33 % concrete material
Supply air flow m3/h 870 1 430 1 540 1 670
Air change rate h-1 0.5 0.5 0.5 0.5
Ventilation Mechanical Mechanical Mechanical Mechanical system supply and exhaust air exhaust air exhaust air
exhaust air
Heat recovery of Yes No No No the exhaust air
Heat source District heating District heating District heating District heating
Space heating Underfloor Radiators Radiators Radiators system heating
*1 The top leve! is an attic *2 Indicates estirnated values
10 lnternational Journal of low Energy and Sustainable Buildings, Vol. 2000, Adalberth, Almgren and Petersen

3.1 Constructions in the Malmö building
The foundation of the building is a concrete slab on ground with 70-mm mineral wool below the slab.
The extemal walls consist of two different types. One has a facade made of masonry veneer, 150-mm mineral wool and a finish on the inside made of 200-mm lightweightaggregate concrete. The other wall hasa facade made of masonry veneer, gypsum plasterboard, 170-mm mineral wool between wooden studs, polyethylene foil, and a gypsum plasterboard on the inside of the wall.
FIG. 4: An outline of the Malmö building. The framework is made of lightweight concrete and concrete.
The roof structure is made of fibre-cement tiles, asphalt-impregnated polyester felt, grooved timber, 265-mm mineral wool between wooden timber rooftrusses, 70-mm mineral wool between a polyethylene foil and a gypsum plasterboard on the insidc.
The windows are single-paned anda sealed argon-filled unit.
3.2 Constructions in the Helsingborg building
The foundation of the building is a celiar made of concrete, with 65-mm polystyrene on the outside of the extemal foundation walls. No thermal insulation has been used below the basement floor.
The extemal walls are of two different types. One has a framework made of concrete and 150-mm mineral wool and rendered lightweight concrete blocks as facade material. The other type has a wooden framework with 165-mm mineral wool between the studs, polyethylene foil, and gypsum plasterboard on the inside. The facade material consists of rendered lightweight concrete blocks.
FIG. 5: An outline of the Helsingborg building. The framework is made of concrete.
There are two different types of roof structure. One contains concrete roofing tiles, asphaltimpregnated polyester felt, fibre building board, 220-mm mineral wool between timber roof trusses, polyethylene foil, and gypsum plasterboard. The other has concrete roofing tiles, asphalt-impregnated polyester felt, a fibre building board, 400-mm mineral wool, anda concrete attic floor structure.
The windows are single-paned and a sealed unit.
lnternational Journal oj Low Energy and Sustainable Buildings, Val. 2000, Adalberth, Almgren and Petersen 11

3.3 Constructions in the Växjö building
The building foundation is a concrete slab on ground with 70-mm expanded polystyrene below the slab.
The extemal walls have 240-mm (some 235-mm) mineral wool between wooden studs, polyethylene foil, and a gypsum plasterboard on the inside of the wall. The facade is made of wooden panel or rendering over 50-mm mineral wool.
The roof structure consists of two layers of asphalt-impregnated felt, wood panels, 400-mm loose-fill mineral wool between wooden rooftrusses, polyethylene foil, and two layers of gypsum plasterboard on the inside. The windows are single-paned and a sealed unit.
FIG. 6: An outline of the Växjö building. The framework is made of wood - quite an unusual solution fora four-storey multifamily building in Sweden.
3.4 Constructions in the Stockholm building
The building foundation is a concrete slab on ground. Below the slab is 100-mm expanded polystyrene along the outer zone (Ö-1 metre) ofthe building, and 50-mm expanded polystyrene in the building's inner zone (1--6 metres).
The extemal walls contain steel pillars with a wooden framework and with 210-mm (or 170-mm) mineral wool in between. The inside ofthe walls is made of polyethylene foil and gypsum plasterboard. The facade consists of rendering on top of 50-mm mineral wool.
FIG. 7: An outline of the Stockholm building. The framework is made of steel columns and concrete.
The roof structure is made of concrete roofing tiles, asphalt-impregnated polyester felt, wood panels, 265-mm ( or 170-mm) mineral wool between wooden roof trusses. The inside of the roof consists of polyethylene foil and grooved timber.
There are different types ofwindows in the building. About 1/3 ofthe windows are singlepaned and one sealed gas unit with two low-emission coatings. The other windows are triplepaned with sealed gas units.
12 lnternational Journal of Low Energy and Sustainable Buildings, Vol. 2000, Adalberth, Almgren and Petersen

4. Results An LCA ofthe four multi-family buildings during their 50-year life cycle has been made. Figure 8 presents the environmental impact based on the five effect categories: global warming potentials, acidification, eutrophication, photochemical ozone creation potentials and human toxicity. In addition, the energy use <luring the life cycle is presented.
The graphs in Figure 8 show that the time phase with the highest environmental impact is the occupation phase, approx. 70-90 % ofthe life cycle's total. The impact from the buildings is almost the same within each category. The total global warming potential is approx. 1.5 ton C02 equivalent/(m2·50 years) for all the buildings. The total acidification is approx. 8-10 kg S02 equivalent/(m2·50 years).
In a study by (Adilstam T, 1997), the environmental impact oftwo multi-family buildings with a lightweight steel framework was analysed. Results showed that approx. 80-85 % ofthe total S02 emissions were produced <luring the building's occupation phase. This supports the results presented in Figure 8. Adilstam also showed that the amount of C02, without translation of other emissions into C02 equivalents, was about 0.14 ton/(m2·50 years). These low C02 emissions were explained by the fäet that the heat production during the occupation phase used biomass, and therefore no C02 emission was obtained <luring ihis phase. Also no consideration was made for electricity use <luring the occupation phase.
Ifthe four multi-family houses in this study were compared to Adilstam's findings, i.e. 100 % biomass as input in the district heating net and no electricity use <luring occupation, the total C02 emission would be between 0.20 and 0.30 ton/(m2·50 years), which is almost the same as Adilstam's results.
Figure 8c also shows that the eutrophication is approx. 4-5 kg N03 equivalent/(m2·50 years) for each building. The photochemical ozone creation is approx. 0.3 kg C2H 4
equivalent/(m2·50 years), see Figure 8d. The difference between the buildings may be explained by differences in energy use, primary the use ofheat <luring the occupation phase. The energy use in the Växjö building is the highest of the four multi-family buildings, followed by the Helsingborg and Stockholm, and finally Malmö, see Figure 8f. The occupation phase constitutes approx. 75-80 % ofthe total photochemical ozone creation, of which 70 % arises from heat usage.
One reason why the Växjö building has a !arge energy demand <luring the occupation phasc is because ofthe lack ofheat recovery from the exhaust air. In addition, the dwelling uses much more househo!d electricity than the other buildings. This is due to a !arge proportion of small apartments. Eight out of sixteen apartments are fairly small ( I Vi rooms with a kitchen and 42 m2 usable floor area). This means that the building e.g. has more white goods than the other buildings. The building is actually exempted from the Swedish building code and permitted to use this much energy, since approx. 95 % ofthe energy source for the local district heating net is biomass.
The graph in Figure 8e shows the environmental impact expressed in human toxicity. Compared to other effect categories, this result has !arge uncertainties conceming the input data in the different phases and how emissions are handled. Nevertheless, the time phase with the highest impact is the occupation phase, approx. 65-70% of the life cycle total.
The graph in Figure Sf shows that approx. 85 % of the energy demand is used <luring the occupation phase. Parallels can obviously be drawn between energy use and environmental impact - the occupation phase is very dominant!
International Journal oj low Energy and Sustainable Buildings. Vol. 2000, Adalberth. Almgren and Petersen 13

Helsingborg
Växjö
Stockholm
Malmö
Helsingborg
Stockholm
Helsingborg
Stockholm
a) Global Warming Potentials
0 0.5 1.5 2
ton C02 equivalent/(m2·50yrs)
0 0.001 0.002 0.003 0.004 0.005 0.006
ton N03 equivalent/(m2·50yrs)
e) Human toxicity
0 100 200 300 400 500 600 700
Malmö
Helsingborg
Stockholm
0
b) Acidification
0.002 0.004 0.006 0.008 0.01
ton S02 equivalent/(m2·50yrs)
0 0.0001 0.0002 0.0003 0.0004 0.0005
ton C2H4 equivalent/(m2·50yrs)
f) Energy use
Malmö
Helsingborg
Stockholm
0 2000 4000 6000 8000 1000012000
Eqvivalent/(m2·50yrs) kWh/(m2·50yrs)
ll:l:'lManufacture ISTransport IErection '2!occupation I Renovation lfäDemolitionE::IRemoval of debris
FIG. 8: Environmental impact in the effect categories, i.e. global warming potential, acidification, eutrophication, photochemical ozone creation potentials and human toxicity, as well as energy use in Jour multi-family buildings during their life cycle.
14 lntemational Journal oj Low Energy and Sustainable Buildings. Vol. 2000, Adalberth, Almgren and Petersen
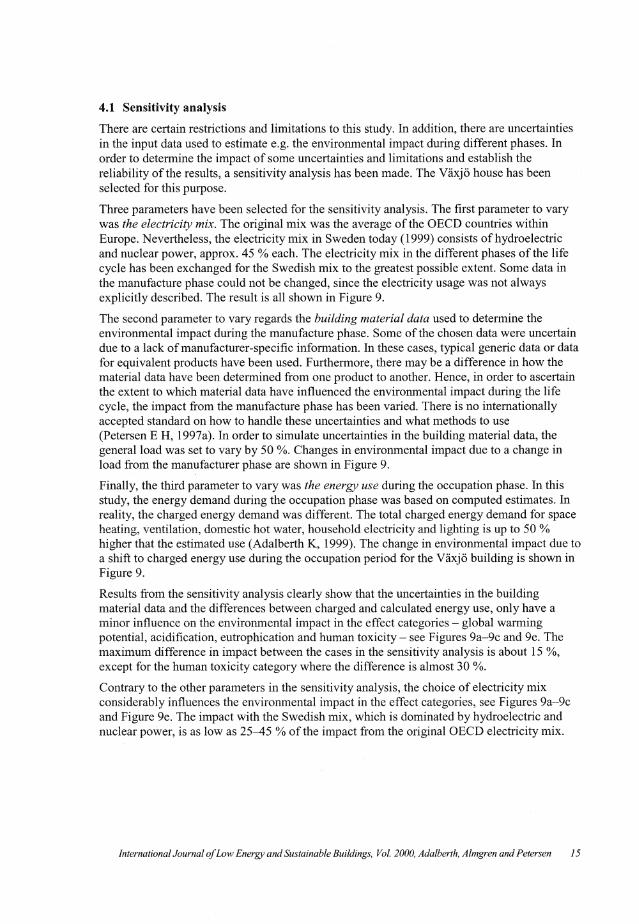
4.1 Sensitivity analysis
There are certain restrictions and !imitations to this study. In addition, there are uncertainties in the input data used to estimate e.g. the environmental impact <luring different phases. In order to determine the impact of some uncertainties and !imitations and establish the reliability ofthe results, a sensitivity analysis has been made. The Växjö house has been selected for this purpose.
Three parameters have been selected for the sensitivity analysis. The first parameter to vary was the electricity mix. The original mix was the average ofthe OECD countries within Europe. Nevertheless, the electricity mix in Sweden today (1999) consists ofhydroelectric and nuclear power, approx. 45 % each. The electricity mix in the different phases ofthe life cycle has been exchanged for the Swedish mix to the greatest possible extent. Some data in the manufacture phase could not be changed, since the electricity usage was not always explicitly described. The result is all shown in Figure 9.
The second parameter to vary regards the building material data used to determine the environmental impact <luring the manufacture phase. Some ofthe chosen data were uncertain due to a lack of manufacturer-specific information. In these cases, typical generic data or data for equivalent products have been used. Furthermore, there may be a difference in how the material data have been determined from one product to another. Hence, in order to ascertain the extent to which material data have influenced the environmental impact <luring the life cycle, the impact from the manufacture phase has been varied. There is no intemationally accepted standard on how to handle these uncertainties and what methods to use (Petersen E H, 1997a). In order to simulate uncertainties in the building material data, the general load was set to vary by 50 %. Changes in environmental impact due to a change in load from the manufacturer phase are shown in Figure 9.
Finally, the third parameter to vary was the energy use <luring the occupation phase. In this study, the energy demand <luring the occupation phase was based on computed estimates. In reality, the charged energy demand was different. The total charged energy demand for space heating, ventilation, domestic hot water, household electricity and lighting is up to 50 % higher that the estimated use (Adalberth K, 1999). The change in environmental impact due to a shift to charged energy use <luring the occupation period for the Växjö building is shown in Figure 9.
Results from the sensitivity analysis clearly show that the uncertainties in the building material data and the differences between charged and calculated energy use, only have a minor influence on the environmental impact in the effect categories - global warming potential, acidification, eutrophication and human toxicity - see Figures 9a-9c and 9e. The maximum difference in impact between the cases in the sensitivity analysis is about 15 %, except for the human toxicity category where the difference is almost 30 %.
Contrary to the other parameters in the sensitivity analysis, the choice of electricity mix considerably influences the environmental impact in the effect categories, see Figures 9a-9c and Figure 9e. The impact with the Swedish mix, which is dominated by hydroelectric and nuclear power, is as low as 25-45 % ofthe impact from the original OECD electricity mix.
Jnternational Journal oj Low Energy and Sustainable Buildings, Vol. 2000, Adalberth. Almgren and Petersen 15

SE electricity mix
Charged energy ~2222222222S288&.I
0 0.5 I 1.5 2 ton C02 equivalent/(m2·50yrs)
c) Eutrophication
Original Växjö
SE electricity mix ~~~22:a
b) Acidification
SE electricity mix
Building mtr +50% ~~2$8888QS8888S8888$8888i
Charged energy ~18~8888S38888~2S22):&I
Original Växjö
SE electricity mix
Building mtr -50%
0 0.002 0.004 0.006 0.008 0.01
ton S02 equivalent/(m2·50yrs)
d) Photochemical ozone creation potentials
Building mtr +50% ~~;t222Q222Q2222Q222i1 Building mtr +50%
Charged energy ~[1;1$388$88848888$'.ANll!881!
0 0.001 0.002 0.003 0.004 0.005 0.006
ton N03 equivalent/(m2·50yrs)
e) Human toxicity ~-1
Original Växjö~~~~~~~~~~~-
SE electricity mix
Building mtr -50% ~ls;~~~~~?S~~-
Building mtr +50%~~~15S288S888228882&9111 I
Charged energy ~~tR~?.822:?.8~~~sllt
Charged energy
0 0.0001 0.0002 0.0003 0.0004 0.0005
ton C2H4 equivalent/(m2·50yrs)
f) Energy use I
Original Växjö ~~~22~22~22122~1
SE electricity mix
Building mtr -50%
Building mtr +50% ~~1$282ES822882:ZSS32il
Charged energy ~~~22~Q2~Q2Q2~Qlt
0 100 200 300 400 500 600 700 0 2000 4000 6000 8000 1000012000
Equivalent/(m2·50yrs) kWh/(m2·50yrs)
!§§Manufacture i::3Transport IErection f2!occupation l!illRenovation fi!loemolition ~Removal of debris
FJG. 9: In order to determine the impacts of !imitations and uncertainties in input data, a sensitivity analys is has been carried out. The figure shows how same parameters irifluence the environmental impact and the energy use during the life cycle of one of the multi-family buildings; the Växjö building.
16 lnternational Journal oj Low Energy and Sustainable Buildings, Val. 2000, Adalberth, Almgren and Petersen

Figure 9d shows that the uncertainties in the building material data and electricity mix have no major impact on the photochemical ozone creation potential. This category is primarily effected by the shift to charged energy in the occupation phase. In the Växjö case, it can be explained by a higher heat usage fhan calculated ( emissions from the district heating during the occupation phase hasa major effect on this effect category). This building was estimated to use 94 kWh heat/m2 and 56 kWh electricity/m2, which is a total of 150 kWh/m2 • Instead, the building was using 123 kWh heat/m2 and 37 kWh electricity/m2, 160 kWh/m2 altogether.
Another important result is that although the studied parameters in the sensitivity analysis were significantly varied, the impact ofthe occupation phase is still dominant in the building's life cycle. The graphs in Figures 9a-9e show that the time phase with the highest environmental impact is the occupation phase, approx. 70-90 % ofthe life cycle, except for the eutrophication regarding the change in electricity mix. In this case, the occupation phase only forms 60 %.
5. Conclusions The aim ofthis study was to investigate the environmental impact offour multi-family buildings. The following questions were put:
5.1 Which phase of the life cycle has the highest environmental impact?
Results show that the occupation phase has the highest environmental impact. This phase is assumed to last for 50 years and consequently this phase is important. Approx. 70-90 % of the environmental impact during the dwelling's life cycle, expressed as global warming potential, acidification, eutrophication, photochemical ozone creation potentials and human toxicity arises during the occupation phase.
The second dominant time phase is the manufacturing ofbuilding and installation materials. This phase constitutes approx. 10-20 % ofthe life cycle.
The environmental impact from the phases transport, erection and demolition has a marginal effect on the impact.
It is important to remember that the choice of energy source during the life cycle has a large effect on the environmental impact. The sensitivity analysis shows that the influence ofthe occupation phase decreases from 80-90 % to 60-70 % for all effect categories ( except human toxicity) ifthe electricity mix is changed from OECD European mix toa Swedish mix. The Swedish electricity mix is 'cleaner' from an LCA perspective ( 45 % nuclear and 45 % hydroelectric power), and hence produces a lower environmental impact.
The sensitivity analysis also shows that the district heating source during the occupation phase hasa major impact on the photochemical ozone creation potentials. Ifthe district heating source was based on biomass, the environmental impact would be low. On the other hand, if the energy source was based on fossil fuels, the environmental impact would be very high.
Finally, the sensitivity analysis shows that the impact from the occupation phase is still very dominant, despite uncertainties in input data for energy mix, energy use and manufacture.
International Journal of low Energy and Sustainable Buildings, Vol. 2000, Adalberth, Almgren and Petersen 17

5.2 Are there similarities between environmental impact and energy use during the life cycle?
In previous studies, (Adalberth K, 1995) and (Adalberth K, 1999), the energy use during the life cycle ofthree single-unit dwellings and four multi-family buildings has been studied. These results show that approx. 85 % and 15 % of the energy use during the life cycle occurs during the occupation and manufacture phases respectively.
This study shows that the energy use and the environmental impact in the five studied effect categories (global warming potential, acidification, eutrophication, photochemical ozone creation potentials and human toxicity) have a similar distribution over the life cycle.
Although the distribution over the life cycle is similar, the total level - e.g. the ton C02 -
greatly depends on the energy mix. If e.g. the electricity mix in Växjö is changed from the OECD European mix toa Swedish mix, the global warming potential decreases from 1.3 to 0.4 tons C02 equivalent/(m2·50 years).
5.3 Are there differences in environmental impact due to the choke of building construction and framework?
The environmental impact from the five studied effect categories is almost the same for all dwellings. The study also shows that the impact from different frameworks is very similar and hence has little influence on the total environmental impact <luring the life cycle. On the other hand, it is important to choose constructions and installations which produce low environmental impact <luring the occupation phase, e.g. a well insulated thermal envelope, windows with high energy performance, and energy-efficient white goods and building services installations.
In this study, different buildings with different weight (the amount ofbuilding materials) have been analysed, see Table 1. There is no strict correlation between the mass, energy use and environmental impact <luring the manufacture of the buildings. The results confirm an other study concerning different constructions (Cole Rand Rousseau D, 1992). Four externa! walls were examined. It was established that there is no correlation between the mass ofthe construction and its energy use and the emissions generated when the constructions are manufactured.
5.4 Recommendation
Since the occupation phase is very dominant and since there is conformity between the energy use and the environmental impact <luring the life cycle, it is wise to both design buildings that are energy-efficient <luring their occupation phase, and to produce energy with low emissions. This will lead to an environmentally adapted dwelling.
6. Acknowledgements Our thanks to Professor Arne Elmroth at Lund University in Sweden, who has offered advice on the progress of our study. We would also like to thank our financial supporters; the Swedish Foundation for Strategic Environmental Research MISTRA.
18 International Journal oflow Energy and Sustainable Buildings, Vol. 2000, Adalberth, Almgren and Petersen

7. References Adalberth K. (1999). Energy Use in Multi-Family Dwellings during their Life Cycle, ISBN 91-88722-17-1, Department ofBuilding Physics, Lund University, Lund, Sweden.
Adalberth K. (1995). Bygga Bruka Riva - Energianvändning i småhus ur ett kretsloppsperspektiv, ISBN 91-88722-04-X, Department ofBuilding Physics, Lund University, Lund, Sweden. (in Swedish)
Adilstam T. (1997). Livscykelanalys av bostadshus i Lättbyggnad, Report TRlT A-BYMA 1997:lOE, Department ofBuilding Sciences, Royal Institute ofTechnology, Stockholm, Sweden. (in Swedish)
Boverket. (1994). Byggnaders värmeenergibehov, Utgångspunkter för omfördelningsberäkning, ISBN 91-7147-157-X, ISSN 1400-1012, The Swedish Board ofHousing, Building and Planning, Karlskrona, Sweden. (in Swedish)
Andersen S, Dinesen J, Hjort Knudsen Hand Willendrup A. (1993). Livscyklus-baseret bygningsprojektering (Eng, Life-cycle-based building design, Energy and environment model, calculating tool and database ), Report no 224, Danish Building Research Institute, H0rsholm, Denmark.
Björklund T, Jönsson Å and Tillman A-M. (1996). LCA ofBuilding Frame StructuresEnvironmental lmpact ofthe Life Cycle ofConcrete and Steel Frames, Report no 1996:8, ISSN 1400-9560, Technical Environmental Planning, Chalmers University ofTechnology, Gothenburg, Sweden.
Björklund Tand Tillrnan A-tvt (1997). LCA ofBuilding Fra.i-ne Stn1ctures - Environn1ental lmpact ofthe Life Cycle ofWooden and Concrete Frames, Report no 1997:2, ISSN 1400-9560, Technical Environmental Planning, Chalmers University of Technology, Gothenburg, Sweden.
Boustead I. (1993). Eco-profiles ofthe European plastics industry, Report:3, Polyethylene and polypropylene, Association of Plastics Manufacturers in Europe and Plastic Waste Management Institute, Brussels, Belgium.
Boustead I, 1998: Eco-profiles ofthe European plastics industry, Report:6, Polyvinyl chloride, Second edition, Association of Plastics Manufacturers in Europe and European Council ofVinyl Manufacturers, Brussels, Belgium.
BPS. (1997). Handbog i Miljorigtig Projektering, Publication no 121, Building Planning System, The Ministry of Environment and Energy, Denmark, (in Danish).
Ceutrick D. (1993). Life cycle inventory for wall insulation products, F/emish Institute for Technological Research, VITO, Belgium.
Cole Rand Rousseau D. (1992). Environmental Auditing for Building Construction: Energy and Air Pollution Indices for Building Materials, Building and Environment, Volume 27, No 1, pp 23-30, Pergamon Press, Great Britain.
Cole R J and Keman PC. (1996). Life-Cycle Energy Use in Office Buildings, Building and Environment, 1996, Volume 31, No 4, pp 307-317, Pergamon Press, Great Britain.
DTI. (1995a); Brancheanalyse Beton, Renere teknologi ved, Status report ofphase 3, ISBN 87-7810-412-2, Building Technology, Danish Technological Institute, Denmark, (in Danish).
lnternational Journal oj Low Energy and Sustainable Buildings, Vol. 2000, Adalberth, Almgren and Petersen l 9

DTI. (1995b). Data collected by Murvrerkscentret, Building Technology, Danish Technological Jnstitute, Hasselager, Denmark, (in Danish).
Electrolux. (1998). Byggvarudeklarationer för vitvaror (Eng, Building product environmental declarations ofwhite goods), http://wtest.electrolux.se/elux/produkt.htm, Sweden. (in Swedish)
Erlandsson M. (1996). Miljövarudeklaration Limträ, Hållfasthetsklass L40, Moelven Töreboda Limträ AB, Trätek, Stockholm, Sweden. (in Swedish)
Erlandsson M. (1997). Miljövarudeklaration Fönster, EFH 12xl2 M, Elitfönster AB, Trätek, Stockholm, Sweden. (in Swedish)
European Aluminium Associate. ( 1996). Ecological Profile Report for the European Aluminium Industry, European Aluminium Associate, Brussels, Belgium.
Gyproc. (1996). Data collected by Gyproc Ltd, Kalundborg, Denmark.
IEA. (1998). World Energy Outlook, 1998 Edition, ISBN 92-64-16185-6, The !nternational Energy Agency, Paris, France.
IPCC. (1994). Radiative Forcing ofClimate Change -The 1994 Report ofthe Scientific Assessment Group ofIPCC, Intergovernmental Panel on Climatic Change, John Houghton, Meteorological Ojjice, London, U.K.
Jönsson Å. (1995). Life Cycle Assessment of Flooring Materials - A case study and methodological considerations, Licentiate thesis, Report no 1995 :3, Technical Environmental Planning, Chalmers University oj Technology, Gothenburg, Sweden.
Kunniger T and Richter K. (1995). Okologischer Vergleich von Freileitungsmasten (Eng, Overhead Hanging Electric Line and its Environmental Impact), Swiss Federal Laboratories for Materials, EMPA, Switzerland, (in German).
Leca. (1997). LECA byggblock Byggvarudeklaration, SvenskLeca, Linköping, Sweden. (in Swedish)
Lindfors L-G, Christiansen K, Hoffman L, Virtanen Y, Juntilla V, Hanssen 0-J, Rönning A, Ekvall Tand Finnveden G. (1995). Nordic Guidelines on Life-Cycle Assessment, Nord 1995:20, ISBN 92-9120-692-X, Nordic Council oj Minister, Copenhagen, Denmark.
Lindhe N. (1996). Effektivare materialanvändning på byggarbetsplatsen, En studie av materialspill, Report no 9603, Byggmästarf!;[Öreningen Väst, Gothenburg, Sweden. (in Swedish)
Mataki. (1999). Byggvarudeklaration för Y AP 2500, underlagspapp, www.trelleborg.com/mataki, Sweden. (in Swedish)
Munther K. (1996). Enorm version l 000, AB Swedish Building Centre, Stockholm, Sweden. (in Swedish)
Neste Ltd. (1995). Data collected by Neste Thermisol Ltd, Hedensted, Denmark.
Nemeth B W. (1998). En analyse av totalenergiforbruket i fem versjoner av en norsk bolig, IBT-rapport no 1998:1, ISBN 82-471-0200-5, PhD-thesis, Department ofBuilding Technology, NTNU, Trondheim, Norway, (in Norwegian).
20 Jnternational Journal of Low Energy and Sustainable Buildings, Val. 2000, Adalberth, Almgren and Petersen

Novopan Traeindustri. (1995). data collected by Novopan Traeindustri A-S, Ryomgård, Denmark, (in Danish).
Petersen E H. (1997a). Livscyklusvurdering afbygningsdele (Eng, Life cycle assessement of building components), PhD thesis, SBI Report 272, Danish Building Research Institute, H0rsholm, Denmark.
Petersen E H. ( 1997b ). Database og opg0relsev~rkt0j for bygningsdeles of bygningers milj0parametre (Eng, Database and inventory tool for building components and buildings' environmental parameters), SBI Report 275, Danish Building Research Institute, H0rsholm, Denmark.
Plyfa. (1999). KERTO Miljövarudeklaration, Plyfa Handel AB, Malmö, Sweden. (in Swedish)
SABO. (1998). Underhållsnorm, Organisation for Municipal Housing Companies, Stockholm, Sweden. (in Swedish)
Suner M. (1996). Life Cycle Assessment of Aluminium, Copper and Steel, ISSN 1400-9560, Technical Environmental Planning, Chalmers University ofTechnology, Gothenburg, Sweden.
Swedish District Heating Association. (1999). www jv.f.se/fjarrvarme/FvoKv _i sammdrag.htrnl, Sweden. (in Swedish)
Swedish Parliament. ( 1999). Svenska miljömål - miljöpolitik för ett hållbart Sverige, Proposition no 1997/98:145, Swedish Parliament, Stockholm, Sweden. (in Swedish)
The Danish Steel Works Ltd. (1996). Data collected by the Danish Steel Works Ltd, Frederiksvaerk, Denmark.
Tillman A-M Baumann H Eriksson Hand Rydberg T. (1991). Packaging and the Environment - Life-cycle analyses of selected packaging materials - Quantification of environment loadings, SOU 1991:77, Chalmers industriteknik, Chalmers Teknikpark, Gothenburg, Sweden.
Vänerply. (1999). Miljövarudeklaration - Plywoodskiva, Vänerply AB, Otterbäcken, Sweden. (in Swedish)
Yxhult. (1998). Byggvarudeklaration Ytong - Autoklaverad lättbetong, Yxhult AB, Kumla, Sweden. (in Swedish)
© lnternational Journal of Low Energy and Sustainable Buildings, 2000 Available at http://www.ce.kth.se/bimlleas
lnternational Journal of Low Energy and Sustainable Buildings, Vol. 2000, Adalberth, Almgren and Petersen 21


Predicting Energy Use for Multi-Family Buildings in an ear!y Design Phase
Submitted for publication in lnternational Journal of Low Energy and Sustainable Buildings
Paper 5
Appendix


Predicting Energy Use for Multi-Family Buildings in an early Design Phase
SUBMITTED: January 2000 REVISED: --PUBLISHED: ---
Karin Adalberth, PhD student Department of Building Physics, Lund University, Sweden [email protected]
Anders Almgren, PhD student Department of Building Physics, Lund University, Sweden [email protected]
KEYWORDS: energy, energy use, energy demand, multi-family building, residential building, design tool, energy prediction
SUMMARY: The objective of this paper is to provide a simple and user-friendly toolfor predicting the energy use for a multi-family building in an early design phase before any constructional or installation drawings are made. The tool is developed by calculating the energy use for buildings with dif!erent size, building technologies and installation techniques. The results from the energy simulations are analysed with a statistical evaluation method. The simplified tool includes ten parameters injluencing the energy demand: number of thermal bridges, average outdoor temperature during the year, ventilation system, indoor air temperature, length, width, and number of levets in the building, thermal transmittance of windows, average thermal transmittance of jloor, externa! walls and roof, and finally air change rate. The developed tool constitutes an example of how the energy use may be predicted. Nevertheless, it is important to remember that this simple tool should only be used during an early design phase. A more thorough estimate of the energy use for the future building should be performed when the constructional and installation drawings are at hand.
International Journal of low Energy and Sustainable Buildings, Vol. 2000, Adalberth and Almgren

1. Background Before a building is built, the energy use ofthe future building is usually estimated. This is often done at the end ofthe design phase when constructional and installation drawings are af hand, in order to predict the energy use for space heating, ventilation, domestic hot water, and household electricity.
The design work could be made more rational. If there is a way to predict the energy use before any constructional or installation drawings are made, the designer and the client could elaborate with different building constructions and installation techniques. In this way, they could decide the best way to construct an energy-efficient house. By doing so both the cost and the and the effort put into the project would be used more effective. In other words, since the building is better planned in the ear!y design phase, the number of changes in constructional and installation drawings will decrease.
1.1 Objectives
The objective ofthis paper is to provide a simple and user-friendly tool for predicting the energy use fora multi-family building in an early design phase before any constructional or installation drawing are made. The tool should be available to clients and designers when they are planning a new multi-family building.
1.2 Limitations
Even ifthe energy use may be predicted with the tool, a thorough estimate ofthe energy use for the future building should be performed when the constructional and installation drawings are at hand. The tool can only make a rough estimate of the energy use, nota precise calculation.
Furthermore, the tool is only developed for new slab and balcony access blocks. The presumptions for other buildings, e.g. tower blocks, single-unit dwellings and offices, are different. This restriction is necessary to create a tool, which can provide a good estimate. The slab and balcony access blocks represent approx. 50 % ofthe total multi-family houses built between 1990 and 1996 (SCB, 1997).
2. Method The method used in this paper is divided into four steps. These are described in the text below.
2.1 Selected parameters
The first step was to search through different building constructions and installation techniques that may influence the energy use for space heating and ventilation. Twenty-two parameters were chosen and then merged into seventeen in order to achieve an acceptable workload. The thermal transmittance ofthe floor, externa! walls and roofare combined into one parameter, as well as the thermal bridges of different intersections. These seventeen parameters are presented in Table. 1.
2 lnternational Journal of Low Energy and Sustainable Buildings, Vol. 2000, Adalberth and Almgren

TABLE. I: The table shows different building constructions and installation techniques, which may injluence the energy use for space heating and ventilation. This study investigates how the building constructions and installation techniques influence the energy use within the intervals stated below.
No Altered parameters influencing on the space heating Unit Intervals and ventilation
The length ofthe building, L m 25 <L < 35
2 The width of the building, W m 10<W<l5
3 Number of lev els, H # 2<H<4
4 A verage size of apartments, apt m2/apartment 65 < apt< 85
5 Indoor air temperature, Ti oc 19 < Ti< 25
6 Area of windows, Aw % ofusable 10 <Aw< 20 floor area
7 Thermal transmittances of floor, walls and roof, Urwr W/(m2.oq 0.15 < Ufivr < 0.30
8 Thermal transmittance ofwindows, Uwind W/(m2.oq 1.00 < Uwind < 2.00
9 Orientation ofwindows, Warient % facing south l O < Warient < 40 and north, respecti vel y
10 Share of solar transmittance through windows, S % 90 < S< 105
11 C:,....-ra.o-n~'Y'lrr for-fAr c-F % 'iO < ,f < I 00 U\ol.l.\,,.1....,.1..1..I..I..I.C, .1.U.'1,..'iL,>JJ..' ..:JJ - - -J - - -
12 Air leakage, [ · litre/(m2·s) at 50 0.4 < [< 1.6 Pa differential pressure
13 Thermal bridges: floor/extemal walls, intermediate W/(m· 0 C) 0.05 < qtb < 1.20 floor/extemal walls, roof/extemal walls, balco-nies/extemal walls, qtb
14 Average outdoor air temperature <luring the year, Tu oc 1.8 < Tu <8.0
1 <: Air change rate ofthe mechanical ventilation, acr h-1 0.3 < acr < 0.6 lJ
16 Ventilation system, V -1 <V< 1
-1 = balanced ventilation with heat exchanger, temperature efficiency 80 %
-0.5 = balanced ventilation with heat exchanger, temperature efficiency 65 %
O= balanced ventilation with heat exchanger, temperature efficiency 50 %
1 = exhaust air with no heat exchange
17 Specific fan power, Ptan kW/(m3/s) 0.5 < Ptan< 2
International Journal of Low Energy and Sustainable Buildings, Vol. 2000, Adalberth and Almgren 3

2.1.1 The intervals ofthe building features
The intervals presented in Table. 1 are supposed to represent the span of"normal" Swedish buildings built <luring the l 990s.
The width of the building is chosen after personal communication with (Eden M, 1999). Slab blocks or balcony access blocks are either narrow or deep. The narrow blocks have a depth of approx. 10 m, and the deep blocks have a width of approx. 12-15 m. Hence, the interval of the width is chosen to be I 0-15 m.
The length depends on the area available for the building. It is assumed to vary between 25 m and35 m.
The height of a multi-family building depends on the detailed development plan ofthe community. Approx. 40 % ofmulti-family houses built between 1990 and 1995 have 1 or 2 levels and approx. 15 % and 20 % ofthe buildings have 3 or 4 levels respectively (SCB, 1997). The interval in this study is set to vary between 2 and 4 levels.
The size oj apartments is set according to statistics (SCB, 1999). The average size of an apartment in multi-family houses is approx. 75 m2 • The interval is set to 65-85 m2/apartment.
The interval of the indoor air temperature is based on a study by (Norlen U et al, 1993) carried out on 1100 Swedish houses. It shows that the indoor air temperature varies between 18° C and 26° C, with an average of 22.2° C. The interval in this study is set to 19-25° C.
During the 1980s, the Swedish building code (SBN, 1980) stated that the window area should be less than 15 % of the floor area. This rule was set in order to restrict the energy use in buildings. During the l 990s this rule has been abolished, causing an increase of the window area. The interval for the window area is estimated to varybetween 10 % and 20 % ofthe floor area.
The interval for the thermal transmittance of floors, externa! walls and roof is based on studies by (Tolstoy N et al, 1993). The thermal transmittance for externa! walls in multi-family buildings built in 1976-1988 are approx. 0.27 W/(m2 •0 C). The thermal transmittance of roofs in multi-family buildings built in 1976-1988 is in average 0.17 W/(m2·°C). The mean thermal transmittance value for floors, externa! walls and roof is set to vary between 0.15 and 0.30 W/(m2·°C).
The target for windows is to use triple-glazed windows with or without coatings. The most energy-efficient triple-glazed window with low-emission coating has a thermal transmittance ofapprox. 1.00 W/(m2 · 0 C) (Överums Fönsterfabrik, 1995). The highest thermal transmittance value for triple-glazed windows with wooden frames is approx. 1.80 W/(m2 •0 C). The thermal transmittance ofwindows in multi-family buildings built in 1976--1988 is approx. 2.00 W/(m2 · 0 C), (Tolstoy N et al, 1993). The interval in this study is set to 1.00-2.00 W/(m2 •0 C).
The orientation oj the windows depends on the layout ofthe building and ofthe building site. Nevertheless, the share ofwindows orientated to the south is set to vary between 10 % and 40 %. The percentage of windows orientated to the north is the same as to the south, while the remaining window area is equally distributed between the east and west facade.
The solar transmittance through a triple-glazed window is 100 %, ifthe definition in (Munther K, 1996) is used. According to the same definition, the transmittance through a tripleglazed window with one low emission coating is 92 %. The interval for solar transmittance is set to 90-105 % in this study.
4 /nternational Journal oj Low Energy and Sustainable Buildings, Val. 2000, Adalberth and Almgren

The screeningfactor considers the amount of solar radiation coming in through a window. In some cases, there are e.g. trees and window reveals preventing the solar radiation from reaching the window. In (Munther K, 1996) the screening factor is recommended to be 75 %. In this study, the interval for this factor is set to 50-100 %.
It is sometimes difficult to set an interval for air leakage, which causes unintentional ventilation. A study by (Tomevall M et al, 1992) presents the air leakage of 26 single-unit dwellings built during 1991 and 1992. The air leakage is between 0.4 and l .9 litre/(m2·s) at 50 Pa pressure difference. The average for the houses is 1.0 litre/(m2·s), which is actually above the limit, 0.8 litres/(m2·s), set in the Swedish building code. In multi-family houses the air leakage may be different, since the air leakage area per apartment is smaller than in single-unit dwellings due toa lower ratio ofthe building envelope. Ifthe building envelope consists of concrete or interna! brickwork, the air leakage is probably lower than the limit set in the building code. If the building envelope of a multi-family building consists of curtain walls, the air leakage is probably higher, and in some cases higher than the limit set in the code. In this study, the interval for air leakage is set to 0.4-l.6 litre/(m2·s) at 50 Pa differential pressure.
The thermal bridges affect the energy use for space heating. (Levin P et al, 1993) contains an estimate ofthe thermal bridges in three multi-family houses. The thermal bridges related to the intersection of floor/external wall, intermediatc floor/cxtemal wall, externa! wall/roof with and without balcony cantilever are analysed. Results show that the total energy use (space heating, ventilation, domestic hot water and household electricity) is increased by 2-21 % with thermal bridges. In this study, the intervals for thermai bridges is set to be approx. the same as in (Levin P et al, 1993), namely 0.05-1.2 W /(m· 0 C). A high value represents a design in which no efforts have been made to reduce the amount of thermal bridges. A low value represents a careful design, in ;vhich the intersections bet\veen different building constru.ctions are thoroughly considered. The unit meter in the parameter refers to the circumference ofthe intersections between the floor/extemal wall, intermediate floor/extemal wall, externa! wall/roof and the length of balconies. In this study, the balconies are assumed to be 3 meters long per apartment.
Different outdoor climates are investigated: Luleå, Gävle and Malmö. The average annual outdoor air temperature in Luleå is 1.8° C, in Gävle 5.2° C and in Malmö 8.0° C. Hence, the interval for the outdoor temperatureisset to vary between 1.8° C and 8.0° C.
The air change rate, i.e. mechanical ventilation, in Swedish dwellings should be at least 0.35 litie/(m2 ·s) according to the Svvedish building code. This value corresponds to approx. 0.5 acr/h, when the height ofthe room is 2.4 m. In apartments equipped with demand-controlled ventilation systems, the air change rate may be decreased to 0.3 acr/h (Blomsterberg Å, 1998). The interval for the air change rate is limited to vary between 0.3 and 0.6 acr/h.
There are basically two ventilation 5ystems to choose from: balanced ventilation and exhaust ventilation. The ventilation systems may be combined with a heat exchanger, which gains heat from the exhaust air. In this study, the following combinations ofventilation systems and heat exchanger are investigated: exhaust air with no heat exchange; balanced ventilation including heat exchanger with a temperature efficiency of 50 %, 65 % and 80 % respectively.
lnternational Journal of low Energy and Sustainable Buildings, Val. 2000, Adalberth and Almgren 5

The intervals of the specific fan power are based on (Boverket, 1995). The exhaust air ventilation system is recommended to have a specific fan power of approx. 0.7 kW/(m3/s), a balanced ventilation ofapprox. 2.0 kW/(m3/s), anda balanced ventilation with a heat exchange ofapprox. 2.5 kW/(m3/s). The interval in this study is set to 0.5-2 kW/(m3/s).
In (Isakson P et al, 1984), it is established that a high heat capacity in residential buildings does not reduce the energy demand, since the interna! load in such buildings is low. The load must be higher than 25 W /m2 usable floor area in order to make use of the heat capacity. In residential buildings the interna! load is seldom above this limit. A temperature control system, which allows decreased temperatures, should also be installed in such a building. In this study, the heat capacity is not considered.
2.2 Experimental design
The second step is to design an experimental plan on how the parameters can be varied. With an experimental design, the number ofvariations or combinations ofthe parameters can be decreased in order to attain a !arge amount of information with a small number of runs.
If no experimental design is made, the number of energy simulations would be very high in order to cover all combinations: 217 + 1. In this study, the number of simulations is decreased to 217- 12 + 1 = 33. Theoretically, a mode! can be designed with only 17+1 runs, but by adding more simulations the mode! is confirmed and its error estimated.
The experimental design is designed with a linear mode! in mind, i.e. the parameters are presumed independent. Some interactions between parameters can still be added later in the study.
The experimental design is performed with a software called MODDE (Umetri, 1997). MODDE stands for model!ing and design and is used to generate and evaluate statistical experimental designs.
2.3 The energy simulation program
The third step is to make energy simulations, i.e. calculations ofthe energy use for space heating and ventilation. This is performed with the Swedish computer program Enorm (Munther K, 1996). It computes the energy and average power demand <luring a period of twelve months. The following factors are considered: area ofthe building envelope, window · orientation, thermal transmittance ofbuilding constructions, thermal bridges, indoor air temperature, outdoor air temperature, air leakage, air change rate by the mechanical ventilation, and ventilation including the temperature efficiency ofthe heat exchanger.
The software has some !imitations. It does e.g. not include the accumulation ofheat in the framework and furnishings of the building. If the window area is !arge and the sun is shining, this could cause an overestimate ofthe energy demand for space heating, since the software does not consider the heat storage effect. This is not a great !imitation, since the heat capacity hasa small effect on the energy use in residential buildings (Isakson P et al, 1984), see also paragraph 3.1.1.
The software was chosen since it is commonly used by consultants, contractors and authorities in Sweden. Approx. 400 licenses ofthe software (version 1000) had been sold by December 1999 (Swedish Building Centre, 1999).
6 lnternational Journal of Low Energy and Sustainable Buildings, Vol. 2000, Adalberth and Almgren

The experimental design is a kind of evaluation of the software, since the outcome of the statistical evaluation (i.e. factors showing the importance of different building constructions and installation techniques) actually represents the magnitude ofthe factors in the software's computer code. Nevertheless, the number of equation systems is !arge and the structure is complex. Therefore, the statistical evaluation method leads to a simplification of the equation systems.
2.4 Statistical evaluation method
The fourth and final step is the evaluation ofthe 33 energy simulations. This is performed using a statistical evaluation method. In this study, a rnultiple linear regression method is used. The method is described in (Draper N R et al, 1998). The output is a mathematical mode! described as:
EsHv =b0 +b1 ·x1 +b2 ·x2 + .... +residual
where ESHv = the energy use for space heating and ventilation [kWh/year] bk = is an unknown coefficient whose value is determined by the analysis xk = is the k:th parameters
(EQU 1)
The statistical evaluation was performed using the software MODDE (Umetri, 1997).
3. Results
3.1 Model for predicting the energy use in a future multi-family building
The 33 runs in the experimental planare carried out and evaluated with the statistical evaluation method. Results show that the computed energy use is close to the predicted energy use, using the model R2>90 %, as well as random computations compared to the predicted energy use, Q2>0.85 %. However, there are certain cases when the predicted energy use does not comply with the computed energy use.
There may be several reasons for this deviation. Some extreme values for certain parameters may cause a poor adjustment to the mode!. There may also be too many parameters in the mode! (17).
Therefore, the next step is to make a ne\v experimental plan excluding some parameters that have marginai influence on the energy use (space heating and ventilation). The following four parameters are excluded: screening factor, percentage of solar transmittance through windows, air leakage, and fan effect. A more accurate model is achieved by excluding these parameters.
Hence, the second experimental plan includes 13 parameters. The four excluded parameters are fix ed: the screening factor is set to 95 %, the share of solar transmittance through windows is set to 75 %, the air leakage is set to 0.8 litre/(m2·s) at 50 Pa differential pressure, and finally the fan effect is set to l kW/(m3/s).
In the second experimental plan, 33 new runs are made and evaluated. The results show a high accuracy ofthe predictions using the mode! Q2>0.90. Fig. l presents the relation between the calculated and the predicted energy need.
lnternational Journal of low Energy and Sustainable Buildings, Vol. 2000, Adalberth and Almgren 7

In one ofthe 33 runs there isa major difference between the calculated and the predicted energy use. This is run number 1. Two additional experiments are computed around this run to receive a better mode!, but no improvement is noted. Hence, the mode!' s use must be restricted: It should only be used to predict energy needs above 10 000 kWh/year for space heating and ventilation.
10Log (predicted energy use)
5.5 -
5.0 -
4.5 -
//;;,.,~ ///
4.0 -
I I I I
4.0 4.5 5.0 5.5
10Log ( calculated energy use)
FJG. 1: The relation between calculated and predicted energy need. The energy needs are logarithmic.
In this second experimental plan, the evaluation ofthe 33 runs show a relation between the parameters and the energy use for space heating and ventilation, EsHv [kWh/year]. The general mathematical mode! ofEqu. 1 can then be expressed as:
10 log EsHv = 3.175+0.013· l+0.023· W +0.102 · H +0.004· T; +0.962 ·U1w,.
+0.151 · U w +0.286· q,b +0.182· T11 +0.435·acr+00.103 · V +0.006· T; · T,, (EQU. 2)
By making the equation logarithmic, a better mode! is achieved and the possibility of a negative energy use is avoided. The mode! is also tested by making the individual parameters logarithmic, but this does not improve the mode!.
A reason for having the logarithmic mode!, may also be that the intervals of the chosen parameters are spread over a !arge interval and therefore have a different impact on the energy use for space heating and ventilation. By using a logarithmic expression for EsHv the parameters become normally distributed and better adapted to a linear mode!.
The use of interaction between the parameters indoor air temperature T; and average outdoor air temperature T11 improves the accuracy ofthe mode!. This improvement indicates that there may be an interaction between these parameters, which can not be explained by the single parameters T; and Tu. It may also be explained by too few runs, i.e. the errors in the mode! are compensated by making an interaction of the two parameters.
8 lnternational Journal oj low Energy and Sustainable Buildings, Vol. 2000, Adalberth and Almgren

Equ. 2 may be used as a simple tool to predict the energy use in a future multi-family house and before any constructional or installation drawings are made. It is important to remember that the equation is only valid within the intervals of the parameters shown in Table. I.
In order to attain the total energy use <luring the occupation phase, the energy use for domestic hot water and household electricity has to be added. These two demands greatly depend on the habits of the inhabitants and therefore have been excluded in the experimental design and statistical evaluation method above.
Information about the household electricity demand has been collected from two references. The first reference claims that household electricity (stove, refrigerator, freezer, washing machine, dishwasher, tumble-dryer, television, microwave oven and "small appliances") in 14 single-unit dwellings is 2 800-6 600 kWh/(year·apartment), with an average of 4 700 kWh/(year-apartment) (Pettersen T D, 1997).
The second reference states the household electricity in 44 town houses and two multi-family buildings is on average approx. 4 400 and 2 600 kWh/(year·apartment) respectively (Lyberg M, 1989). The number of appliances in residential buildings has probably increased since then, and thus also the household electricity demand. On the other hand, current household appliances are more energy efficient, which results in decreased electricity use.
The first reference notes a higher household electricity use in single-unit dwellings than the other reference. On the other hand, the second reference gives a lower household electricity use in multi-family buildings than in single-unit dwellings. Hence, the household electricity, EHE, for multi-family dwellings is estimated at 3 000 kWh/(yearapartment) in this study.
Information about the domestic hot water usage has been collected from (Briheim B, 1991) and (Haugen T, 1984). The domestic hot water is 1 600-2 700 and 500-1 500 kWh/resident respectively. In this study, the energy used to produce domestic hot water, EDHW, is set to 1 500 kWh/resident.
In order to attain the total energy use <luring the occupation phase ErorAL [kWh/year], the following equation is made:
EmrAL = EsHv + E HE + E DHW
This gives:
where
EmrAL = IDA +3000· numberof apartments+ 1500· numberof inhabitants
A = 3.175 + 0.013 · L + 0.023 · W +0.102 · H + 0.004 T; + 0.962 · U fivr + 0.151 · Uw
+ 0.286 · q,b +0.182 · r;, + 0.435 · acr + 00.103 ·V+ 0.006 · r; · T,,
(EQU. 3)
(EQU. 4)
(EQU. 5)
Since Equ. 4 isa continuous function and evaluated within the intervals ofthe parameters, any values within the intervals may be chosen, e.g. the length may be 26.5 m. Table. 2 shows an example ofhow Equ. 4 may be used.
Jnternational Journal of Low Energy and Sustainable Buildings, Vol. 2000, Adalberth and Almgren 9

TABLE. 2: A comparison between the energy use estimated with tte simple tool and the energy use estimated with the software Enorm.
Parameters Predicted total energy Estimated total energy use with Equ. 4 use with Enorm**
Basic case I kWhlyear kWhl(m2·year) kWhlyear kWhl(m2·year)
Length 30m Width 15m Height 4 levels Indoor air temperature 22° C U value offloor, walls and roof0.25 W/(m2 •0 C) U value ofwindows 1.7 W/(m2 •0 C) Thermal bridges 1.2 W/(°C·m) Climate for Stockholm, Tu 6.6° C 269 000 149 261 700 145
Air change rate 0.5 h- 1
Balanced vent. with heat exch., temp. eff. 50 % Average size ofapartments 75 m2/apt Number ofinhabitants 40
Changes from the basic case above
Indoor air temperature 20° C 244 000 136 242 100 135
U value offloor, walls and roof0.20 W/(m2 •0 C) 254 700 141 253 600 141
U value ofwindows 1.15 W/(m2 • 0 C) 245 200 136 245 400 136
Thermal bridges 0.8 W/(°C·m) 237 300 132 239 700 133
Thermal bridges 0.3 W/(°Cm) 207 800 115 213 200 118
Climate Mora, Tu 3.4° C 330 100* 183* 305 500* 170*
Air change rate 0.4 h- 1 256 000 142 252 800 140
Air change rate 0.3 h. 1 244 200 136 243 900 136
Balanced vent. with heat exch., temp. eff. 80 % 240 100 133 239 100 133
Balanced vent. with heat exch., temp. eff. 65 % 253 700 141 250 300 139
Mechanical exhaust air with no heat exchanger 305 700 170 298 100 166
Average size ofapartments 85 m2/apt 260 000 144 256 500 142
Number ofinhabitants 30 254 000 141 252 900 141
Thermal bridges 0.8 W/(°C-m) Air change rate 0.4 h-1
213 300 118 222 300 124 Balanced vent. with heat exch., temE. eff. 65 %
Indoor air temperature 20° C U value offloor, walls and roof0.20 W/(m2 •0 C) U value ofwindows 1.15 W/(m2 •0 C) 168 100 93 164 900 92 Thermal bridges 0.3 W/(m·0 C) Balanced vent. with heat exch., teme. eff. 80 %
* The amplitude oj the average outdoor air temperature during the year has not been considered in the mode!. Thus, the mode! will diverge slightly compared to Enorm calculations when other cilies are chosen than those tested, i.e. Luleå, Gävle and Malmö.
* * The energy use for space heating and ventilation is estimated according to Enorm. The domestic hot water and household electricity is set to 1 500 kWh/resident and 3 000 kWh/apartment respectively according to Equ. 4.
JO International Journal oflow Energy and Sustainable Buildings, Vol. 2000, Adalberth and Almgren

3.2 The importance of each parameter The coefficients in front ofthe parameters in Equ. 2 do not really represent the importance of the parameters. In order to show their intemal relations, the coefficients are orthogonally scaled and centred, see Table. 3. In this way it is possible to rank the parameters according to importance. Note that the presented coefficients in Table. 3 are only true for the parameters when they are varied within the presented interval.
TABLE. 3: The importance af the parameters is orthogonally scaled and centred in order ta evaluate their interna! relation. In the table, they are sorted according to influence an the energy use (space heating and ventilation). The orthogonally scaled and centred coejjicients, i. e. the degree af influence, are only true for the list ed parameters when they are varied within the presented interval.
Intervals Orthogonal scaled and
centred coefficients
Parameters with influence, included in the 2nct experimental plan and from Equ. 2
Thermal bridges, q1b 0.05 < q1b < 1.20 W /(m· 0 C) 0.33
A verage outdoor air temperature, Tu
Ventilation system, V
-1 = balanced ventilation with heat exchanger, temperature efficiency 80 %
-0.5 balanced ventilation with heat exchanger, temperature efficiency 65 %
0 = baianced ventiiation with heat exchanger, temperature efficiency 50 %
1 = exhaust air with no heat exchange
Number oflevels, H
Indoor air temperature, T;
U value ofwindows, Uw
U value of floor, walls and roof Utwr
Air change rate, acr
The length of the building, L
1.8 <Tu< 8.0°C
-1 <V< 1
2<H<4
19 < T; < 25°C
1.00 < Uw < 2.00 W/(m2 •0 C)
0.15 < Utwr < 0.30 W/(m2 •0 C)
0.3 < acr < 0.6 h- 1
25 <L < 35 m
0.30
0.21
0.20
0.20
0.15
0.14
0.13
0.13
The width of the building, W l O < W < 15 m 0.11
Parameters with low influence, included in the 2"ct experimental plan but excluded from Equ. 2
Average size of apartments, apt 65 < apt < 85 m2/apartment <0.10
Area ofwindows, Aw
Orientation of windows, Worient
10 < Aw< 20% of usable floor area
1 0 < Worient < 40 % facing south and north, respectively
<0.10
<0.10
fnternational Journal oj Low Energy and Sustainable Buildings, Vol. 2000, Adalberth and Almgren 11

As shown in Table. 3, the thermal bridges and the average outdoor air temperature have the largest influence on the energy use for space heating and ventilation. It must be stressed that the magnitude ofthe orthogonally scaled and centred coefficient ofthe thermal bridges depends on its large interval.
Three parameters have the second largest influence, namely the ventilation system, the indoor air temperature and the height of the building.
The thermal transmittance ofthe floor/walls/roofand the windows have about the same influence on the energy use, as well as the length, air change rate and width. The average size of the apartments, the window area and the orientation ofthe windows have only little influence.
The scaled and centred coefficients in Table. 3 may also be interpreted as follows:
• Approx. the same energy reduction is received ifthe amount ofthermal bridges is decreased from 1.2 to 0.65 W/(m· 0 C) as by choosing windows with a thermal transmittance of 1.00 instead of 2.00 W/(m2 •0 C).
• Approx. the same energy reduction is received ifthe amount ofthermal bridges is decreased from 1.20 to 0.05 W /(m·°C) as by choosing windows with a thermal transmittance of 1.00 instead of2.00 W/(m2 •0 C) and floor, walls and roofwith an thermal transmittance of0.15 instead of0.30 W/(m2 •0 C).
4. Conclusions It is useful for designers and clients to be able to roughly predict the energy use for a future building before any constructional or installation drawings are made, in order to decide the best way to construct an energy efficient house.
The simple tool developed and presented in this paper constitutes an example on how the energy use may be predicted (the tool is presented in Equ. 4).
Nevertheless, it is important to remember that the simple tool should only be used during an early design phase. A thorough estimate ofthe energy use for the future building must be performed when the constructional and installation drawing are at hand. The tool can only roughly predict the energy use, not make a precise calculation.
5. Further work The method used in this study could also be adopted to make a simple tool for predicting energy use in single-unit dwellings. In the near future, the residential buildings built in the l 960s and 1970s will be renovated or reconstructed. It would be useful with a simplified tool for predicting the energy use in an early phase for these houses.
I 2 International Journal oj Low Energy and Sustainable Buildings, Vol. 2000, Adalberth and Almgren

6. Ref erences Blomsterberg Å. ( 1998). Aktuella luftflöden vid behovsanpassad ventilation i bostäder, Article published within a competition dealing with demand-controlled ventilation systems, J&W BAS, Malmö, Sweden, (in Swedish).
Boverket. (1995). Eleffektivitet i byggnader, ISBN 91-7147-163-4, ISSN 1400-1012, The Swedish Board af Housing, Building and Planning, Karlskrona, Sweden, (in Swedish).
Briheim B (1991). Solvarmt tappvarmvatten i flerbostadshus (Eng. Sunheated water in family houses), Report no 169, Norwegian Building Research Institute, Norway, (in Norwegian).
Haugen T. (1984). Energifördelning i bygninger, STF A84017, SINTEF. Norway. (in Norwegian)
Draper NR and Smith H, 1998: Applied Regression Analysis. ISBN 0-471-17082-8, Third Edition, John Wiley & Sons, New York, USA.
Eden M. (1999). personal communication, Department af Architectural Design, Chalmers, Gothenburg, Sweden.
Isakson P and Kellner J. (1984). En jämförelse mellan en lätt byggnad med aktiv värmelagring och en tung byggnad, Report no Rl 05: 1984, The Swedish Council for Building Research, Stockholm, Sweden, (in Swedish).
Levin P and Mao G. (1993). The importance ofthermal bridges in new Swedish multi family buildings, Proceedings af the 3rd Symposium Building Physics in Nordic Countries 1993, Pp 99-107, Copenhagen. Denmark.
Munther K. (1996). Enorm version 1000, AB Swedish Building Centre, Stockholm, Sweden. (in Swedish)
Norlen U and Andersson K. (1993). Bostadsbeståndets inneklimat, ELIB report no 7, TN: 30, Centre for Built Environment, Royal Institute of Technology, Gävle, Sweden, (in Swedish).
Lyberg M and Honarbakhsh A. (1989). Förutsägelse av årliga energiförbrukningar från korttidsmätningar, Report no Rl06:1989, The Swedish Councilfor Building Research, Stockholm, Sweden, (in Swedish).
Pettersen T D. (1997) Uncertainty analysis of energy consumption in dwellings, PhD thesis. Report no 1997:122, ISBN 82-417-0160-2, ISSN 0802-3271, The Norwegian University af Science and Technology, Trondheim, 1'"1orvVay.
SBN. (1980). Svensk Byggnorm (The Swedish Building Code), ISBN 91-38-07565-2, ISSN 0348-1441, Statens planverk, Stockholm, Sweden. (in Swedish)
SCB. (1997). Bostads- och byggnadsstatistisk årsbok 1997 (Eng. Yearbook of Housing an Building Statistics 1997), ISBN 91-618-0882-2, ISSN 0349-4713, Statistiska centralbyrån, Stockholm, Sweden, (in Swedish).
SCB (1999). Statistiska centralbyrån, http://www.scb.se/databaser/. Sweden. (in Swedish)
Swedish Building Centre. (1999). personnel communication with Björn Cuno, Swedish Building Centre, Stockholm, Sweden.
lnternational Journal oj low Energy and Sustainable Buildings, Vol. 2000, Adalberth and Almgren 13

Tolstoy N, Borgström M, Högberg Hand Nilsson J. (1993). Bostadsbeståndets tekniska egenskaper, ELIB report no 6. TN:29, Centrefor Built Environment, Royal Institute ofTechnology, Gävle, Sweden, (in Swedish).
Tomevall M and Carlsson T. (1992). Kontroll av bostäder i Bo92 Örebro, Report no 91E7 0477 and 91E7 0477, Swedish National Testing and Research Institute, Borås, Sweden, (in Swedish).
Umetri. (1997). MODDE for Windows. User's Guide, Umetri AB, Umeå, Sweden.
Överums Fönsterfabrik. (1995). Brochure from the Överums window factory, AB ÖVerums Fönsterfabrik, Överum, Sweden. (in Swedish)
© lnternational Journal of Low Energy and Sustainable Buildings, 2000 Available at http:/lwww.ce.kth.se/biml/eas
I 4 lnternational Journal of Low Energy and Sustainable Buildings, Vol. 2000, Adalberth and Almgren

Dissertations from the Department of Building Physics, Lund University, Sweden
Bankvall C G Natural Convective Heat Transfer in Insulated Structures. Report 38. 1972 Heat Transfer in Insulation and Insulated Structure. Report 39.
Sandberg P-I Moisture Balance in Building Elements Exposed to Natura! Climatic Conditions. Report 43. (in Swedish)
Bomberg M Moisture Flow through Porous Building Materials. Report 52.
Samuelsson I Moisture Transfer in Steel Deck. Report 67. (in Swedish)
Andersson A-C Interna! Additional Insulation. Thermal Bridges, Moisture problems Movements and Durability. TVBH-1001. (in Swedish)
Kronvall J Air Flows in Building Components. TVBH-1002.
Johannesson G Active Heat Capacity. Models and Parameters for the Thermal Performance of Buildings. TVBH-1003.
Hagentofi C-E Heat Loss to the Ground fron1 a Building. Slab on the Ground and Cellar. TVBH-1004.
Harderup L-E Concrete Slab on the Ground and Moisture Control. Verification of some Methods to Improve the Moisture Conditions in the Foundation. TVBH-1005.
1973
1974
1976
1979
1980
1981
1000 1700
1991
Bornehag C-G Mönsteranalys av inomhusluft- Undersökning av luftkvalitet i 1994 sjuka hus med flytspackelproblem. BFR Report no R23: 1994. Swedish Council ofBuilding Research. Stockholm. (in Swedish)
Blomberg T Heat Conduction in Two and Three Dimensions. Computer 1996 Modelling of Building Physics Applications. TVBH-1008.
Roots P Heat Transfer through a W ell Insulated Externa! W ooden 1997 Frame Wall. TVBH-1009.
Arfvidsson J Moisture Transport in Porous Media. Modelling Based on 1998 Kirchhoff Potentials. TVBH-1010.
Harderup E Methods to select corrections for moisture calculations at variable 1998 externa! climatic data. TVBH-1011 (in Swedish)
Adalberth K Energy Use and Environmental Impact ofNew 2000 Residential Buildings. TVBH-1012.