
ENERGY TRENDS JUNE 2017 - GOV.UK
86
ENERGY TRENDS JUNE 2017 June 2017
-
Upload
khangminh22 -
Category
Documents
-
view
0 -
download
0
Transcript of ENERGY TRENDS JUNE 2017 - GOV.UK

ENERGY TRENDS JUNE 2017
June 2017

This document is available in large print, audio and braille
on request. Please email [email protected] with the version
you require.
This is a National Statistics publication
The United Kingdom Statistics Authority has designated these statistics as National
Statistics, in accordance with the Statistics and Registration Service Act 2007 and
signifying compliance with the UK Statistics Authority: Code of Practice for Official
Statistics.
Designation can be broadly interpreted to mean that the statistics:
meet identified user needs are well explained and readily accessible are produced according to sound methods, and are managed impartially and objectively in the public interest
Once statistics have been designated as National Statistics it is a statutory requirement
that the Code of Practice shall continue to be observed
© Crown copyright 2017
You may re-use this information (not including logos) free of charge in any format or
medium, under the terms of the Open Government Licence.
To view this licence, visit www.nationalarchives.gov.uk/doc/open-government-
licence/version/3/ or write to the Information Policy Team, The National Archives, Kew,
London TW9 4DU, or email: [email protected].
Any enquiries regarding this publication should be sent to us at
This publication is available for download at www.gov.uk/government/statistics/energy-
trends-june-2017.

1
Contents Page
Introduction 2
The main points for the first quarter of 2017 3
Section 1 - Total Energy 4
Tables 1.1: Indigenous production of primary fuels 12 1.2: Inland energy consumption: primary fuel input basis 13
1.3: Supply and use of fuels, and Seasonally adjusted and temperature corrected final energy consumption
14
Section 2 - Solid Fuels and Derived Gases 17
Tables 2.1: Supply and consumption of coal 22 2.2: Supply and consumption of coke oven coke, coke breeze and other manufactured solid fuels
23
2.3: Supply and consumption of coke oven gas, blast furnace gas, benzole and tars
24
Section 3 - Oil and Oil Products 25
Tables 3.1: Supply and use of crude oil, natural gas liquids and feedstocks 32 3.2: Supply and use of petroleum products 33
3.4: Supply and use of petroleum products - latest quarter 34
3.5: Biofuels sales and sales through supermarkets 35
3.6: Stocks of petroleum at end of period 36
Section 4 - Gas 37
Table 4.1: Natural gas supply and consumption 45
Section 5 - Electricity 46
Tables 5.1: Fuel used in electricity generation and electricity supplied 53
5.2: Supply and consumption of electricity 54
Section 6 - Renewables 55
Tables 6.1: Renewable electricity capacity and generation 62
6.2: Liquid biofuels for transport consumption 63
Special feature articles
Renewable energy in 2016 64 Enhancements to Energy Trends gas tables 72 Changes to Eurostat tables methodology 78 Recent and forthcoming publications of interest to users of energy statistics 81

2
Introduction
Energy Trends and Energy Prices are produced by the Department for Business, Energy and Industrial Strategy (BEIS) on a quarterly basis. Both periodicals are published concurrently in June, September, December and March. The June editions cover the first quarter of the current year.
Energy Trends includes information on energy as a whole and by individual fuels. The text and charts provide an analysis of the data in the tables. The tables are mainly in commodity balance format, as used in the annual Digest of UK Energy Statistics. The 2016 edition of the Digest was published on 28 July 2016 and is available on the BEIS section of the GOV.UK website at: www.gov.uk/government/collections/digest-of-uk-energy-statistics-dukes
The balance format shows the flow of a commodity from its sources of supply, through to its final use. The articles provide in-depth information on current issues within the energy sector.
The text and tables included in this publication represent a snapshot of the information available at the time of publication. However, the data collection systems operated by BEIS, which produce this information, are in constant operation. New data are continually received and revisions to historic data made. To ensure that those who use the statistics have access to the most up-to-date information, revised data will be made available as soon as possible, via the electronic versions of these tables. The electronic versions are available free of charge from the BEIS section of the GOV.UK website. In addition to quarterly tables, the main monthly tables that were published in the period up to May 2001 when Energy Trends was produced monthly, continue to be updated and are also available on the BEIS section of the GOV.UK website. Both sets of tables can be accessed at: www.gov.uk/government/organisations/department-for-business-energy-and-industrial-strategy/about/statistics
Annual data for 2016 included within this edition is on a provisional basis. New data are continually received and revisions to previous data made. Finalised figures for 2016 will be published on the 27 July 2017 in the annual Digest of UK Energy Statistics.
Energy Trends does not contain information on Foreign Trade, Weather (temperature, wind speed, sun hours and rainfall) and Prices. Foreign Trade and Weather tables are available on the BEIS section of the GOV.UK website at: www.gov.uk/government/organisations/department-for-business-energy-and-industrial-strategy/about/statistics. Information on Prices can be found in the Energy Prices publication and on the BEIS section of the GOV.UK website at: www.gov.uk/government/collections/quarterly-energy-prices
Please note that the hyperlinks to tables within this document will open the most recently published version of a table. If you require a previously published version of any table please contact Kevin Harris (see details below).
If you have any comments on Energy Trends or Energy Prices publications please send them to:
Kevin Harris BEIS Energy Statistics Team 1st Floor Abbey 2 1 Victoria Street London SW1H 0ET E-mail: [email protected] Tel: 0300 068 5041

3
The main points for the first quarter of 2017:
Total energy production was 0.1 per cent lower than in the first quarter of 2016.
Oil production fell by 4.6 per cent when compared with the first quarter of 2016, driven largely by a decrease in production at fields feeding into the Sullom Voe terminal.
Natural gas production was 4.7 per cent higher than in the first quarter of 2016, following the start-up of the Cygnus gas field in December 2016.
Coal production in the first quarter of 2017 was 11.7 per cent lower than the first quarter of 2016, due to falling demand. Coal imports were 9.1 per cent lower as generators’ demand for coal fell by 32 per cent.
Total primary energy consumption for energy fell by 2.8 per cent. However, when adjusted to take account of weather differences between the first quarter of 2016 and the first quarter of 2017, total primary energy consumption fell by 0.7 per cent.
Temperatures in the quarter were on average 0.7 degrees warmer than a year earlier, with average temperatures in both February and March being warmer than a year earlier.
Final energy consumption (excluding non-energy use) was 2.2 per cent lower than in the first quarter of 2016. Domestic consumption fell by 5.1 per cent due to warmer weather. On a seasonally and temperature adjusted basis final energy consumption fell by 0.1. per cent, within which domestic consumption fell 0.5 per cent.
Gas demand was 0.7 per cent lower than the first quarter of 2016, whilst electricity consumption was 2.3 per cent lower, both driven by the warmer weather in the first quarter of 2017.
Electricity generated in the first quarter of 2017 increased 1.0 per cent compared to 2016 Q1, by 0.9 TWh to 93.2 TWh, however net imports fell 3.1 TWh over the same period, leading to a 2.2 per cent fall in electricity supplied.
Coal’s share of generation decreased from 15.9 per cent to 11.3 per cent, whilst gas’s share rose from 37.0 per cent to 39.9 per cent. Nuclear’s share of generation increased slightly from 18.8 per cent in the first quarter of 2016 to 18.9 per cent in the first quarter of 2017.
Low carbon electricity’s share of generation increased from 44.4 per cent in the first quarter of 2016 to 45.6 per cent in the first quarter of 2017.
Renewables’ share of electricity generation increased to 26.6 per cent, compared to the 25.6 per cent share in the first quarter of 2016, mostly due to increased wind and solar capacity.
Renewable electricity generation was a record 24.8 TWh in the first quarter of 2017, an increase of 5.1 per cent on the same period a year earlier.

Total Energy
4
Section 1 - Total Energy
Relevant tables 1.1: Indigenous production of primary fuels Page 12 1.2: Inland energy consumption: primary fuel input basis Page 13 1.3: Supply and use of fuels, and Seasonally adjusted and temperature corrected final energy consumption Page 14-16
Contacts for further information:
Iain MacLeay Kevin Harris Total energy statistics Total energy statistics Tel: 0300 068 5048 Tel: 0300 068 5041 E-mail: [email protected] E-mail: [email protected]
Key results show:
Total energy production was 0.1 per cent lower than in the first quarter of 2016 with increased gas output offsetting a fall in oil production. (Charts 1.1 & 1.2)
Total primary energy consumption for energy uses fell by 2.8 per cent. However, when adjusted to take account of weather differences between the first quarter of 2016 and the first quarter of 2017, primary energy consumption fell by 0.7 per cent. (Chart 1.3)
Final consumption fell by 2.1 per cent compared to the first quarter of 2016. Domestic consumption fell by 5.1 per cent reflecting the warmer weather in the quarter, other final users’ consumption fell by 2.3 per cent, industrial consumption fell by 0.5 per cent, whilst transport consumption rose by 0.5 per cent. (Chart 1.4)
Net import dependency was 37.4 per cent, up 3.3 percentage points from the first quarter of 2016. (Chart 1.6)
Fossil fuel dependency was 82.1 per cent in the first quarter of 2017. (Chart 1.7)

Total Energy
5
Chart 1.1 Production of indigenous primary fuels (Table 1.1)
0
2
4
6
8
10
12
14
16
Coal Oil Natural Gas Nuclear Wind, solarand hydro
Bioenergy &Waste
Mil
lio
n t
on
nes
of
oil
eq
uiv
ale
nt
2016 Q1
2017 Q1
Total production in the first quarter of 2017 stood at 33.2 million tonnes of oil equivalent, 0.1 per cent lower than in the first quarter of 2016. Production of oil fell by 4.5 per cent compared to the first quarter of 2016, due to a decrease in production at fields feeding into the Sullom Voe terminal, while production of natural gas rose by 4.7 per cent, following the start-up of the Cygnus gas field in December 2016. Primary electricity output in the first quarter of 2017 was 3.1 per cent higher than in the first quarter of 2016, within which nuclear electricity output was 1.8 per cent higher and output from wind, solar and natural flow hydro was 7.1 per cent higher, boosted by increased wind and solar capacity. Production of bioenergy and waste was 1.1 per cent higher compared to the first quarter in 2016. Coal production fell by 11.7 per cent compared to the first quarter in 2016 due to falling demand, particularly for electricity generation.

Total Energy
6
Chart 1.2 UK production (annual growth rate) (Table 1.1)
-6%
-4%
-2%
0%
2%
4%
6%
8%
10%
12%
14%
Q12014
Q2 Q3 Q4 Q12015
Q2 Q3 Q4 Q12016
Q2 Q3 Q4 Q12017
An
nu
al
gro
wth
ra
te
In the first quarter of 2017, the annual growth rate of UK production was -0.1 per cent, down 4.8 percentage points compared to the first quarter of 2016, but up 2.4 percentage points on the fourth quarter of 2016, with increases in gas, bioenergy and primary electricity output offset by decreases in oil and coal output.

Total Energy
7
Chart 1.3 Total inland consumption (primary fuel input basis) (1) (Table 1.2)
180
185
190
195
200
205
210
Q1 Q2 Q3 Q4
Mil
lio
n t
on
nes
of
oil
eq
uiv
ale
nt
2014
2015
2016
2017
0
Total inland consumption on a primary fuel input basis (temperature corrected, seasonally adjusted annualised rate), was 195.5 million tonnes of oil equivalent in the first quarter of 2017, 0.7 per cent lower than in the first quarter of 2016. On an unadjusted basis inland consumption was 2.8 per cent lower, with the average temperature in the first quarter of 2017 being 6.4 degrees Celcius, 0.7 degrees Celsius higher than the same period a year earlier. Between the first quarter of 2016 and the first quarter of 2017 (on a seasonally adjusted and temperature corrected basis) coal and other solid fuel consumption fell by 23 per cent as demand fell from electricity generators. Also on a seasonally adjusted and temperature corrected basis, between the first quarter of 2016 and the first quarter of 2017, oil consumption fell by 0.5 per cent, whilst natural gas consumption rose by 3.5 per cent with increased demand from electricity generators. On the same basis, bioenergy consumption rose by 1.4 per cent between the first quarter of 2016 and the first quarter of 2017, whilst primary electricity consumption fell by 1.8 per cent. The fall in primary electricity was due to a reduction in electricity imports from France which were down by 68 per cent due to damage to the interconnector.

Total Energy
8
Chart 1.4 Final energy consumption by user (Table 1.3a)
0
5
10
15
20
25
30
35
40
45
50
Q12014
Q2 Q3 Q4 Q12015
Q2 Q3 Q4 Q12016
Q2 Q3 Q4 Q12017
Mil
lio
n t
on
nes
of
oil
eq
uiv
ale
nt
Domestic
Services
Industry
Transport
Total final consumption fell by 2.1 per cent between the first quarter of 2016 and the first quarter of 2017. Domestic sector energy consumption fell by 5.1 per cent, reflecting the warmer weather compared to a year earlier. Service sector energy consumption fell by 2.3 per cent. Industrial sector energy consumption fell by 0.5 per cent. Transport sector energy consumption rose by 0.5 per cent.

Total Energy
9
Chart 1.5 Seasonally adjusted and temperature corrected final energy consumption (Table 1.3c)
20
25
30
35
40
45
50
Q12014
Q2 Q3 Q4 Q12015
Q2 Q3 Q4 Q12016
Q2 Q3 Q4 Q12017
Mil
lio
n t
on
nes
of
oil
eq
uiv
ale
nt
Unadjusted consumption
Temperature adjusted consumption
Seasonally & temperature adjusted consumption
0
Total unadjusted final energy consumption (excluding non-energy use) fell by 2.2 per cent between the first quarter of 2016 and the first quarter of 2017. On a seasonally and temperature adjusted basis final energy consumption (excluding non-energy use) fell by 0.1 per cent between the first quarter of 2016 and the first quarter of 2017. Unadjusted domestic consumption fell by 5.1 per cent over the same period, and was down 0.5 per cent on a temperature and seasonally adjusted basis. Consumption data by fuel and sector is available in table ET 1.3c is now included within this publication as well as on the BEIS section of the GOV.UK website at: www.gov.uk/government/statistics/total-energy-section-1-energy-trends

Total Energy
10
Chart 1.6 Net import dependency (Table 1.3a)
20%
25%
30%
35%
40%
45%
50%
55%
Q12014
Q2 Q3 Q4 Q12015
Q2 Q3 Q4 Q12016
Q2 Q3 Q4 Q12017
0%
In the first quarter of 2017, imports rose by 1.1 per cent, whilst exports fell by 4.8 per cent. As a result, net import dependency rose 3.3 percentage points from the first quarter of 2016 to 37.4 per cent. However, between the fourth quarter of 2016 and the first quarter of 2017 net import dependency fell 4.9 percentage points as net import volumes decreased.

Total Energy
11
Chart 1.7 Fossil fuel dependency (Table 1.3a)
76%
78%
80%
82%
84%
86%
88%
Q12014
Q2 Q3 Q4 Q12015
Q2 Q3 Q4 Q12016
Q2 Q3 Q4 Q12017
0%
In the first quarter of 2017 fossil fuel dependency was 82.1 per cent, down 0.4 percentage points from the first quarter of 2016.

1 TOTAL ENERGYTABLE 1.1. Indigenous production of primary fuels
Million tonnes of oil equivalent
Total Coal1 Petroleum2 Natural gas3 Bioenergy & waste4,5 Nuclear Wind, solar and hydro6
2012 121.3r 10.6 48.8 37.4r 7.0r 15.2 2.28 2013 113.9r 8.0 44.5 35.3r 7.7r 15.4 3.02 2014 112.5r 7.3 43.7 35.8r 8.3r 13.9 3.60 2015 123.7r 5.4 49.5 38.8r 9.8r 15.5 4.66
2016 p 125.1r 2.6r 52.0r 39.8r 10.8r 15.4r 4.57r
Per cent change +1.2 -51.1 +4.9 +2.4 +10.4 -0.4 -1.8 2016 Quarter 1 33.2r 0.6r 13.8 10.2r 3.5r 3.7r 1.30r Quarter 2 30.4r 0.6r 13.3 9.6r 2.4r 3.6r 1.04r Quarter 3 29.5r 0.6r 12.3 9.5r 1.8r 4.1r 1.13r
Quarter 4 32.0r 0.7r 12.6r 10.5r 3.1r 4.1r 1.11r
2017 Quarter 1 p 33.2r 0.6r 13.2r 10.7r 3.6r 3.8r 1.39r
Per cent change 7 -0.1 -11.7 -4.5 +4.7 +1.1 +1.8 +7.1 1. Includes an estimate of slurry.2. Crude oil, offshore and land, plus condensates and petroleum gases derived at onshore treatment plants.3. Includes colliery methane, excludes gas flared or re-injected. 4. Includes solid renewable sources (wood, straw and waste), a small amount of renewable primary heat sources (solar, geothermal etc), liquid biofuels and sewage gas and landfill gas.5. Bioenergy & waste introduced as a separate category from March 2014 - see special feature article in the March 2014 edition of Energy Trends at:www.gov.uk/government/collections/energy-trends-articles6. Includes solar PV and natural flow hydro.7. Percentage change between the most recent quarter and the same quarter a year earlier.
Primary electricity
12

1 TOTAL ENERGYTABLE 1.2 Inland energy consumption: primary fuel input basis Million tonnes of oil equivalent
Primary electricity Primary electricityNatural Bioenergy Wind, solar Net Natural Bioenergy Wind, solar Net
Total Coal1 Petroleum2 gas3 & waste4, 5 Nuclear and hydro6 imports Total Coal Petroleum gas & waste Nuclear and hydro imports Unadjusted 7 Seasonally adjusted and temperature corrected 8,9 (annualised rates)
2012 208.1r 40.9 67.0 73.3r 8.4r 15.2 2.28 1.02 208.2r 41.0r 67.0 73.3 8.4r 15.2 2.28 1.02 2013 206.8r 39.0r 65.8 72.6r 9.6r 15.4 3.02 1.24 204.0r 38.3r 65.8 70.5r 9.6r 15.4 3.02 1.24 2014 194.0r 31.5r 66.0r 66.1r 11.2r 13.9 3.60 1.76 199.3r 33.1r 66.0r 69.9r 11.2r 13.9 3.60 1.76 2015 195.5r 25.1r 67.3r 68.1r 13.1r 15.5 4.66 1.80 198.3r 25.6r 67.3r 70.5r 13.1r 15.5 4.66 1.80 2016 p 192.8r 12.4 68.0r 76.7r 14.2r 15.4r 4.57 1.51 193.7r 12.6r 68.0r 77.4r 14.2r 15.4r 4.57 1.51 Per cent change -1.4 -50.5 +1.1 +12.6 +8.2 -0.4 -1.8 -16.2 -2.3 -50.7 +1.1 +9.9 +8.2 -0.4 -1.8 -16.2
2016 Quarter 1 56.4r 4.9 16.5r 25.1r 4.3r 3.7r 1.30r 0.52 196.8r 15.9r 66.1r 76.6r 17.2r 14.6r 4.40r 2.06 Quarter 2 43.8r 2.3r 16.9r 16.1r 3.3r 3.6r 1.04r 0.46 190.8r 12.2r 67.7r 76.6r 13.3r 14.6r 4.56r 1.84 Quarter 3 39.5r 1.9 17.2r 12.1r 2.7r 4.1r 1.13r 0.40 188.5r 10.7r 68.9r 74.8r 10.7r 16.3r 5.43r 1.61 Quarter 4 53.2r 3.3r 17.3r 23.4r 3.9r 4.1r 1.11r 0.13 198.7r 11.7r 69.4r 81.6r 15.5r 16.1r 3.90r 0.52
2017 Quarter 1 p 54.8r 3.7r 16.4r 24.9r 4.4r 3.8r 1.39r 0.25 195.5r 12.2r 65.7r 79.4r 17.4r 14.9r 4.78r 1.00 Per cent change 10 -2.8 -25.0 -0.5 -0.8 +1.4 +1.8 +7.1 -51.6 -0.7 -22.9 -0.5 +3.5 +1.4 +2.1 +8.6 -51.6 1. Includes net foreign trade and stock changes in other solid fuels.2. Inland deliveries for energy use, plus refinery fuel and losses, minus the differences between deliveries and actual consumption at power stations.3. Includes gas used during production and colliery methane. Excludes gas flared or re-injected and non-energy use of gas. 4. Includes solid renewable sources (wood, straw and waste), a small amount of renewable primary heat sources (solar, geothermal, etc.), liquid biofuels, landfill gas and sewage gas. 5. Bioenergy & waste introduced as a separate category from March 2014 - see special feature article in the March 2014 edition of Energy Trends at:www.gov.uk/government/collections/energy-trends-articles6. Includes natural flow hydro, but excludes generation from pumped storage stations.7. Not seasonally adjusted or temperature corrected.8. Coal and natural gas are temperature corrected; petroleum, bioenergy and waste, and primary electricity are not temperature corrected.9. For details of temperature correction see the June and September 2011 editions of Energy Trends; Seasonal and temperature adjustment factors were reassessed in June 2013www.gov.uk/government/collections/energy-trends10. Percentage change between the most recent quarter and the same quarter a year earlier.
13

1 TOTAL ENERGYTable 1.3a Supply and use of fuels
Thousand tonnes of oil equivalent2015 2015 2015 2015 2016 2016 2016 2016 2017
2015 2016 pper cent change
1st quarter
2nd quarter
3rd quarter
4th quarter
1st quarter
2nd quarter
3rd quarter
4th quarter
1st quarter p
per cent change 1
SUPPLY Indigenous production 123,673r 125,135r +1.2 31,712r 31,858r 27,244r 32,859r 33,204r 30,435r 29,456r 32,039r 33,181 -0.1 Imports 155,134r 149,687r -3.5 43,153r 35,472r 36,326r 40,183r 39,606r 35,487r 33,359r 41,236r 40,024 +1.1 Exports -76,644r -75,763r -1.1 -16,975r -19,520r -20,225r -19,924r -19,510r -18,174r -20,473r -17,606r -18,580 -4.8 Marine bunkers -2,684r -2,840r +5.8 -592r -747r -734r -611r -574r -777r -816r -674r -544 -5.2 Stock change2 +3,907r +4,907r +25.6 +3,311r -757r +534r +819r +5,649r -1,028r +37r +250r +2,712 Primary supply 203,387r 201,125r -1.1 60,610r 46,305r 43,146r 53,327r 58,375r 45,943r 41,563r 55,244r 56,794 -2.7 Statistical difference3 113r 32r 93r 43r -66r 43r 128r -28r -47r -21r -8 Primary demand 203,274r 201,093r -1.1 60,516r 46,262r 43,212r 53,283r 58,248r 45,971r 41,611r 55,265r 56,802 -2.5 Transfers4 32 -14r -1 2r 35 -4 -5r -1r -2r -7r 7 TRANSFORMATION -41,329r -37,404 -9.5 -12,115r -9,604r -9,117r -10,492r -10,531r -8,497r -8,242r -10,134r -10,161 -3.5 Electricity generation -37,543r -34,214 -8.9 -10,961r -8,609r -8,326r -9,648r -9,687r -7,736r -7,483r -9,309r -9,266 -4.3 Heat generation -1,088r -1,152 +5.9 -351r -240r -209r -287r -357r -256r -215r -324r -359 +0.8 Petroleum refineries -152r -155 +2.2 -69r -33r -29r -20r -27r -39r -70r -20r -69 (+) Coke manufacture -156 -81r -48.0 -48 -46 -38 -24 -20r -20 -21 -20 -23 +12.9 Blast furnaces -2,277 -1,692r -25.7 -665 -647 -485 -480 -407r -425 -432 -428 -418 +2.8 Patent fuel manufacture -68r -64r -6.8 -11r -19r -18r -21 -21r -11r -10r -22r -15 -28.6 Other5 -44 -46r +3.5 -10 -9 -12 -12 -12r -11r -11r -11r -11 -10.6 Energy industry use 12,485r 11,881r -4.8 3,180r 3,096r 3,030r 3,179r 3,131r 2,947r 2,853r 2,950r 3,033 -3.1 Losses 3,133r 2,823r -9.9 978r 647r 656r 852r 870r 666r 595r 692r 834 -4.1 FINAL CONSUMPTION 146,360r 148,971r +1.8 44,246r 32,917r 30,441r 38,755r 43,714r 33,861r 29,914r 41,482r 42,783 -2.1 Iron & steel 1,262r 946r -25.0 363r 344r 294r 261r 246r 238r 229r 234r 251 +2.0 Other industries 23,099r 22,784r -1.4 7,046r 5,038r 4,907r 6,107r 6,952r 4,984r 4,754r 6,094r 6,908 -0.6 Transport 54,749r 55,767r +1.9 12,819r 13,875r 14,321r 13,734r 12,998r 14,210r 14,558r 14,002r 13,068 +0.5 Domestic 40,046r 41,295r +3.1 16,259r 7,470r 4,996r 11,321r 15,765r 7,804r 4,483r 13,242r 14,962 -5.1 Other Final Users 19,344r 19,875r +2.7 5,877r 4,310r 3,950r 5,207r 5,729r 4,493r 3,789r 5,864r 5,595 -2.3 Non energy use 7,859r 8,303r +5.7 1,882r 1,880r 1,973r 2,125r 2,024r 2,132r 2,102r 2,045r 1,999 -1.2
DEPENDENCY6
Net import dependency 38.1%r 36.2% 42.8%r 33.9%r 36.7%r 37.6%r 34.1%r 37.1%r 30.4%r 42.3%r 37.4% Fossil fuel dependency 82.1% 81.5% 84.0%r 81.4%r 80.9%r 81.4%r 82.5%r 80.8%r 79.1%r 82.8%r 82.1% Low carbon share 16.5%r 17.0%r 14.8%r 16.9%r 17.3%r 17.3%r 16.0%r 17.4%r 19.1%r 16.4%r 16.8%
1. Percentage change between the most recent quarter and the same quarter a year earlier; (+) represents a positive percentage change greater than 100%.2. Stock change + = stock draw, - = stock build.3. Primary supply minus primary demand.4. Annual transfers should ideally be zero. For manufactured fuels differences occur in the rescreening of coke to breeze. For oil and petroleum products differences arise due to small variations in the calorific values used.5. Back-flows from the petrochemical industry - see article in the June 2016 edition of Energy Trends.6. See article in the December 2010 edition of Energy Trends.
14

1 TOTAL ENERGYTable 1.3b Supply and use of fuels Thousand tonnes of oil equivalent
Coa
l
Man
ufac
ture
d fu
els4
Prim
ary
oil
Petr
oleu
m
Prod
ucts
Nat
ural
gas
5
Bio
ener
gy &
w
aste
6
Prim
ary
elec
tric
ity
Elec
tric
ity
Hea
t sol
d
Coa
l
Man
ufac
ture
d fu
els4
Prim
ary
oil
Petr
oleu
m
Prod
ucts
Nat
ural
gas
5
Bio
ener
gy &
w
aste
6
Prim
ary
elec
tric
ity
Elec
tric
ity
Hea
t sol
d
SUPPLY Indigenous production 631 - 13,791 - 10,211 3,547 5,025 - - 557 - 13,164 - 10,690 3,587 5,183 - - Imports 1,772 204 12,589 9,664 14,012 820 - 545 - 1,612 133 13,625 8,972 14,515 835 - 332 - Exports -77 -4 -11,047 -6,546 -1,734 -74 - -28 - -89 -5 -10,766 -6,242 -1,326 -71 - -83 - Marine bunkers - - - -574 - - - - - - - - -544 - - - - - Stock change1 +2,380 -1 +386 +159 +2,725 - - - - +1,427 +46 +447 -341 +1,134 - - - -Primary supply 4,706 199 15,719 2,704 25,214 4,293 5,025 516 - 3,507 174 16,470 1,845 25,013 4,351 5,183 250 -Statistical difference2 +47 -1 +1 +34 +54 +0 - -7 - -8 +0 -18 -55 +69 - - +5 -Primary demand 4,659 199 15,718 2,670 25,160 4,293 5,025 524 - 3,515 174 16,489 1,900 24,944 4,351 5,183 245 -Transfers3 - 10 -309 +305 +20 -31 -1,299 +1,299 - - +4 -608 +604 61 -53 -1,391 +1,391 -TRANSFORMATION -4,239 43 -15,409 15,174 -6,877 -2,503 -3,726 6,569 436 -3,144 85 -15,880 15,635 -7,511 -2,547 -3,792 6,555 436 Electricity generation -3,576 -131 - -161 -6,188 -2,475 -3,726 6,569 - -2,423 -135 - -132 -6,821 -2,518 -3,792 6,555 - Heat generation -47 -13 - -15 -689 -28 - - 436 -50 -13 - -15 -689 -28 - - 436 Petroleum refineries - - -15,536 15,509 - - - - - - - -16,007 15,939 - - - - - Coke manufacture -337 317 - - - - - - - -367 344 - - - - - - - Blast furnaces -240 -167 - - - - - - - -266 -152 - - - - - - - Patent fuel manufacture -39 36 - -19 - - - - - -38 41 - -18 - - - - - Other7 - - 127 -140 - - - - - - - 127 -138 - - - - -Energy industry use - 106 - 1,045 1,377 - - 534 68 - 103 - 1,044 1,287 - - 531 68 Losses - 21 - - 99 - - 749 - - 23 - - 93 - - 718 -FINAL CONSUMPTION 421 126 - 17,104 16,827 1,759 - 7,108 370 371 137 - 17,095 16,115 1,752 - 6,943 370 Iron & steel 7 75 - 3 100 - - 61 - 6 77 - 3 103 - - 61 - Other industries 286 - - 1,182 2,927 480 - 1,925 153 243 - - 1,172 2,942 483 - 1,915 153 Transport 3 - - 12,673 - 221 - 100 - 3 - - 12,730 - 235 - 100 - Domestic 117 39 - 887 11,096 862 - 2,743 22 114 49 - 865 10,445 811 - 2,656 22 Other final users 8 - - 455 2,596 196 - 2,279 196 4 - - 447 2,515 223 - 2,210 196 Non energy use - 11 - 1,903 110 - - - - - 12 - 1,878 110 - - - -1. Stock fall +, stock rise -.2. Primary supply minus primary demand.3. Annual transfers should ideally be zero. For manufactured fuels differences occur in the rescreening of coke to breeze. For oil and petroleum products differences arise due to small variations in the calorific values used.4. Includes all manufactured solid fuels, benzole, tars, coke oven gas and blast furnace gas.5. Inludes colliery methane.6. Includes geothermal, solar heat and biofuels for transport; wind and wave electricity included in primary electricity figures. 7. Back-flows from the petrochemical industry - see article in the June 2016 edition of Energy Trends.
2017 Quarter 1 p2016 Quarter 1
15

1 Total EnergyTable 1.3c Seasonally adjusted and temperature corrected final energy consumption data1
Thousand tonnes of oil equivalent2015 2015 2015 2015 2016 2016 2016 2016 2017
2015 2016 pper cent change
1st quarter
2nd quarter
3rd quarter
4th quarter
1st quarter
2nd quarter
3rd quarter
4th quarter
1st quarter p
per cent change2
By consuming sector
Final Consumption (unadjusted)Industry 24,362r 23,730r -2.6 7,410r 5,382r 5,202r 6,368r 7,198r 5,221r 4,982r 6,329r 7,159 -0.5Transport 54,749r 55,767r +1.9 12,819r 13,875r 14,321r 13,734r 12,998r 14,210r 14,558r 14,002r 13,068 +0.5Domestic 40,046r 41,295r +3.1 16,259r 7,470r 4,996r 11,321r 15,765r 7,804r 4,483r 13,242r 14,962 -5.1Other final users 19,344r 19,875r +2.7 5,877r 4,310r 3,950r 5,207r 5,729r 4,493r 3,789r 5,864r 5,595 -2.3Total 138,501r 140,668r +1.6 42,365r 31,037r 28,468r 36,630r 41,690r 31,729r 27,812r 39,437r 40,783 -2.2
Final Consumption (Seasonally and temperature adjusted)Industry 24,361r 23,730r -2.6 6,279r 6,054r 6,054r 5,973r 6,069r 5,905r 5,801r 5,956r 5,997 -1.2Transport 54,748r 55,766r +1.9 13,634r 13,673r 13,750r 13,692r 13,863r 13,969r 13,955r 13,980r 13,969 +0.8Domestic 42,143r 42,747r +1.4 10,756r 10,122r 10,556r 10,709r 10,738r 10,853r 10,458r 10,698r 10,682 -0.5Other final users 19,963r 20,302r +1.7 5,070r 4,793r 5,056r 5,044r 5,019r 5,075r 5,076r 5,132r 4,988 -0.6Total 141,215r 142,545r +0.9 35,740r 34,641r 35,416r 35,418r 35,689r 35,800r 35,290r 35,766r 35,637 -0.1
By fuel
Final Consumption (unadjusted)Gas 42,023r 43,379r +3.2 17,359r 7,719r 5,131r 11,813r 16,717r 8,137r 4,464r 14,061r 16,006 -4.3Electricity 26,092r 26,122r +0.1 7,174r 6,161r 6,052r 6,705r 7,108r 6,095r 5,966r 6,952r 6,943 -2.3Other 70,385r 71,167r +1.1 17,831r 17,157r 17,285r 18,112r 17,864r 17,497r 17,383r 18,423r 17,836 -0.2Total 138,501r 140,668r +1.6 42,365r 31,037r 28,468r 36,630r 41,690r 31,729r 27,812r 39,437r 40,784 -2.2
Final Consumption (Seasonally and temperature adjusted)Gas 44,236r 44,838r +1.4 11,415r 10,499r 11,199r 11,123r 11,224r 11,368r 10,914r 11,332r 11,183 -0.4Electricity 26,219r 26,211r -0.0 6,606r 6,600r 6,601r 6,413r 6,564r 6,541r 6,550r 6,556r 6,453 -1.7Other 70,760r 71,496r +1.0 17,719r 17,543r 17,616r 17,882r 17,901r 17,891r 17,826r 17,878r 18,001 +0.6Total 141,215r 142,545r +0.9 35,740r 34,641r 35,416r 35,418r 35,689r 35,800r 35,290r 35,766r 35,637 -0.1
1. For methodology see articles in Energy Trends (June 2011 and September 2011 editions)2. Percentage change between the most recent quarter and the same quarter a year earlier.
16

Solid Fuels and Derived Gases
17
Section 2 – Solid Fuels and Derived Gases
Relevant tables 2.1: Supply and consumption of coal Page 22 2.2: Supply and consumption of coke oven coke, coke breeze and other manufactured solid fuels Page 23 2.3: Supply and consumption of coke oven gas, blast furnace gas, benzole and tars Page 24
Contact for further information:
Chris Michaels Coal statistics Tel: 0300 068 5050 E-mail: [email protected]
Key results show:
Overall coal production in the first quarter of 2017 fell to a new record low, down 12 per cent (0.1 million tonnes) compared with the first quarter of 2016 with further contraction in surface mine output, including a new record low in January 2017 when some coal mines had a seasonal shut down. (Chart 2.1)
Coal imports fell 9.1 per cent (0.2 million tonnes) on levels shown in the first quarter of 2016, as demand fell, especially for use by electricity generators.(Charts 2.1 and 2.2)
The demand for coal by electricity generators in the first quarter of 2017 was 32 per cent
(1.8 million tonnes) lower than demand in the first quarter of 2016 due to a fall in coal generation capacity, with the closures of Ferrybridge C and Longannet in March 2016. There was a seasonal demand increase in the first quarter of 2017, along with a small increase in generation from Eggborough and Fiddlers Ferry coming back online as part of the Supplemental Balancing Reserve. The SBR went off line at the end of February 2017. (Chart 2.3)
Total stock levels were down 41 per cent to 6.1 million tonnes compared to a year earlier. This was due to closure of coal fired power plants and generators using held stock for electricity
generation while purchasing less coal from the UK and overseas. (Chart 2.4)

Solid Fuels and Derived Gases
18
Chart 2.1 Coal supply (Table 2.1)
0
2
4
6
8
10
12
14
16
18
Q12014
Q2 Q3 Q4 Q12015
Q2 Q3 Q4 Q12016
Q2 Q3 Q4 Q12017
Mil
lio
n T
on
nes
Deep-mined Surface mining Imports
Coal production in the first quarter of 2017 reached a record low of 0.9 million tonnes, 12 per cent down compared to the first quarter of 2016. The bulk of this decrease came from the contraction in surface mine output as deep mine production is now under 1 per cent of production with only seven small deep mines remaining. The falls were due to decreased demand, particularly for electricity generation, and seasonal shut downs in January 2017 which led to record low production for that month.
Table 2A Coal imports by origin
Thousand Tonnes
2015 2016p 2016 Q1 2017 Q1p
European Union 614 439
106 42
Russia 8,380 2,292
937 1,347
Colombia 6,553 2,667
1,068 181
USA 5,018 1,420
318 739
Australia 910 778
43 56
Other Countries 1,042 898
204 67
Total Imports 22,518 8,494 2,675 2,431
Imports of coal in the first quarter of 2017 were 9.1 per cent lower than in the first quarter of 2016 at 2.4 million tonnes. The decrease reflects reduced consumption by electricity generators with the closures of Ferrybridge C and Longannet in March 2016. There was a seasonal demand increase from coal-fired power stations in the first quarter of 2017, along with a small increase in generation from Eggborough and Fiddlers Ferry coming back online as part of the Supplemental Balancing Reserve (SBR). The SBR went off line at the end of February 2017.

Solid Fuels and Derived Gases
19
Chart 2.2 Steam coal imports by origin (Table 2.4)
0
200
400
600
800
1000
1200
EU Colombia Russia USA Other Countries
Th
ou
sa
nd
To
nn
es
Q1 2016 Q1 2017
In the first quarter of 2017, steam coal comprised 77 per cent of coal imports and coking coal comprised 22 per cent. Imports of both fell compared to the first quarter of 2016, with steam coal imports down 10 per cent to 1.9 million tonnes and coking coal imports down 7.5 per cent to 0.5 million tonnes.
Russia overtook Colombia as the biggest supplier of steam coal providing 56 per cent of steam coal imports in the first quarter of 2017. The USA became the second largest supplier, providing 30 per cent (561 thousand tonnes). The USA had not exported any steam coal in the first quarter of 2016 and had only exported 373 thousand tonnes of steam coal to the UK for the whole of 2016. Steam coal imports from Colombia fell by 83 per cent.

Solid Fuels and Derived Gases
20
Chart 2.3 Coal consumption (Table 2.1)
0
2
4
6
8
10
12
14
Q12014
Q2 Q3 Q4 Q12015
Q2 Q3 Q4 Q12016
Q2 Q3 Q4 Q12017
Mil
lio
n T
on
nes
Electricity Generators
Generators Trend (= average of 4 quarters ending)
Colleries, coke ovens and other conversion industries
Final Consumers
Total demand for coal in the first quarter of 2017, at 5.4 million tonnes, was 25 per cent lower than in the first quarter of 2016. Consumption by electricity generators was down by a third to 3.9 million tonnes. Electricity generators accounted for 72 per cent of total coal use in the first quarter of 2017 compared with 79 per cent a year earlier.
In the first quarter of 2017, sales to industrial users fell by 15 per cent to 0.4 million tonnes whilst sales to other final consumers (including domestic) decreased by 5.0 per cent to 0.2 million tonnes. Coal used in blast furnaces was up 11 per cent compared to the first quarter of 2016, to 0.4 million tonnes.

Solid Fuels and Derived Gases
21
Chart 2.4 Coal stocks (Table 2.1)
0
2
4
6
8
10
12
14
16
18
20
22
Q12014
Q2 Q3 Q4 Q12015
Q2 Q3 Q4 Q12016
Q2 Q3 Q4 Q12017
Mil
lio
n T
on
nes
Electricity Generators
Other Distributed
Undistributed
Coal stocks fell seasonally by 2.2 million tonnes during the first quarter of 2017 and at the end of March stood at 6.1 million tonnes (a new record low). This was 4.2 million tonnes lower than at the end of March 2016.
The level of coal stocks at power stations at the end of the first quarter of 2017 was 4.8 million tonnes, 4.1 million tonnes lower than at the end of March 2016. This reflected the closure of two coal-fired power stations and generators using held stock for electricity generation, reducing
purchases from the UK and overseas.
Stocks held by coke ovens were 0.4 million tonnes at the end of the first quarter of 2017, this was 12 thousand tonnes lower than stock levels at the end of March 2016.
Stocks held by producers (undistributed stocks) at the end of the first quarter of 2017 were 0.5 million tonnes, 0.1 million tonnes higher than at the end of March 2016.

2 SOLID FUEL AND DERIVED GASESTable 2.1 Supply and consumption of coal
Thousand tonnes2015 2015 2015 2015 2016 2016 2016 2016 2017
2015 2016 p1st
quarter2nd
quarter3rd
quarter4th
quarter1st
quarter2nd
quarter3rd
quarter4th
quarter1st
quarter pSUPPLYIndigenous production 8,598 4,178 -51.4 3,122 2,441 1,424 1,612 1,001 962 1,027 1,188 883 -11.7 Deep mined 2,784 22 -99.2 980 880 420 504 7 6 5 5 5 -22.4 Surface mining2 5,814 4,156 -28.5 2,142 1,561 1,004 1,108 994 957 1,022 1,183 878 -11.6 Imports4 22,518 8,494 -62.3 9,817r 4,707r 3,891 4,103 2,675 1,356 1,694 2,768 2,431 -9.1 Exports5 385 443 +15.1 111 75 104 96 103 76 137 128 118 +15.0 Stock change6 +6,862r +5,655r -17.6 +815r +1,378r +1,749r +2,920r +3,651r +971r +9r +1,023r +2,177 -40.4 Total supply 37,593r 17,883r -52.4 13,643r 8,451r 6,960r 8,539r 7,225 3,213r 2,594r 4,851r 5,373 -25.6 Statistical difference -18r -6r -19r +11r +6r -16r +2 +4r -1r -11 -10 Total demand 37,612r 17,889r -52.4 13,662r 8,440r 6,954r 8,555r 7,223 3,209r 2,595r 4,863r 5,383 -25.5 TRANSFORMATION 34,988r 15,678 -55.2 12,983r 7,791r 6,349r 7,865r 6,611r 2,685 2,081r 4,301r 4,845 -26.7 Electricity generation 29,330r 12,058r -58.9 11,283r 6,154r 5,041r 6,851r 5,722 1,808 1,187r 3,341r 3,878 -32.2 Heat generation7 213 213 - 80 42r 32 58 76r 43 29r 65r 80 +5.8 Coke manufacture 3,673 1,821 -50.4 1,165 1,083 880 545 443 438 464 475 482 +8.8 Blast furnaces 1,544 1,364 -11.7 423 447 330 344 316 345 346 357 350 +11.1 Patent fuel manufacture 228r 223 -2.5 32r 64r 65r 66 55 51 55 62 54 -1.7 Energy industry use - - - - - - - - - - - FINAL CONSUMPTION 2,624r 2,211r -15.7 679r 649r 605r 691 612r 524r 514r 562r 538 -12.0 Iron & steel 44r 35r -21.7 11r 12 11r 10 10 10 7r 7r 9 -13.0 Other industries 1,999r 1,580r -20.9 501r 504r 474r 519 431 381r 393r 376 367 -14.8 Domestic 552r 550r -0.4 158r 127 113r 154 156 123r 101 171r 152 -2.4 Other final users 29r 47r +60.5 8r 6r 7r 8 15r 11 12r 9r 10 -32.5 Stocks at end of periodDistributed stocks 13,471r 7,766r -42.4 19,224r 17,718r 16,176r 13,471r 9,817r 8,863r 8,805r 7,766r 5,552 -43.5 Of which: Major power producers8 12,595r 6,962r -44.7 17,218r 15,885r 14,733r 12,595r 8,933r 8,163r 8,125r 6,962r 4,794 -46.3 Coke ovens 547 605r +10.6 836 955 742 547r 457r 488r 322r 605r 445 -2.7 Undistributed stocks 441r 492r +11.4 736r 863r 656r 441r 444 427 476 492r 529 +19.2 Total stocks9 13,913r 8,258r -40.6 19,960r 18,581 16,832r 13,913r 10,261r 9,291r 9,281r 8,258r 6,081 -40.7 1. Percentage change between the most recent quarter and the same quarter a year earlier.2. The term 'surface mining' has now replaced opencast production. Opencast production is a surface mining technique.3. Not produced since 2013 as the only mine producing slurry has ceased trading4. For a detailed breakdown of UK Imports by country and grade of coal refer to Table 2.4 Coal imports (internet table only).5. Trade is counted as an export under three conditions, when it is recorded as an import and is subsequently exported; it enters the UK port with the intention of being imported but due to a change of ownership at the port it is exported without having cleared the port; and when items leave the warehouse and are exported. Trade is not classified as exports when it is resting at a UK port and the UK is not the intended final destination.6. Stock change + = stock draw, - = stock build.7. Heat generation is based on an annual figure and is then split over a quarterly period. The 2016 heat generation figure will not be published until the end of July 2017. Therefore, the 2015 figure is used as an estimate for 2017.8. This includes stocks held at ports.9. For some quarters, closing stocks may not be consistent with stock changes, due to additional stock adjustments
per cent change
per cent change 1
22

2 SOLID FUEL AND DERIVED GASESTable 2.2 Supply and consumption of coke oven coke, coke breeze and other manufactured solid fuels
Thousand tonnes2015 2015 2015 2015 2016 2016 2016 2016 2017
2015 2016 p1st
quarter2nd
quarter3rd
quarter4th
quarter1st
quarter2nd
quarter3rd
quarter4th
quarter1st
quarter pSUPPLYIndigenous production 2,965 1,593 -46.3 895 868 727 474 376 385 409 424 408 +8.6
Coke Oven Coke 2,716 1,332 -51.0 854 800 658 404 320 319 344 348 346 +8.1 Coke Breeze 18 16 -10.6 5 5 4 5 4 4 4 4 4 +10.2 Other MSF 231 245 +6.2 36 64 65 66 51 61 61 71 57 +11.4
Imports 1,132 1,251r +10.5 302 290 215 325 287 284 284 397r 187 -34.8 Exports 111 22 -79.9 23 74 7 8 6 4 6 6 7 +23.7 Stock change1 64 -126 (-) +73 +37 -50 +4 -2 +21 -15 -130 +65 Transfers -3 -4 -2 -1 - - -1 -1 -0 -2 -1 Total supply 4,047 2,691 -33.5 1,246 1,121 885 796 654 685 671 682 652 -0.3
Statistical difference 0 0 -0 - 0 -0 -0 - 0 -0 -0 Total demand 4,047 2,691 -33.5 1,246 1,121 885 796 654 685 671 682 652 -0.3
TRANSFORMATION 3,257 2,140 -34.3 1,009 908 705 635 525 548 533 535 508 -3.1 Coke manufacture - - - - - - - - - - - Blast furnaces 3,257 2,140 -34.3 1,009 908 705 635 525 548 533 535 508 -3.1
Energy industry use - - - - - - - - - - - FINAL CONSUMPTION 790 551 -30.2 237 213 179 161 130 137 138 146 144 +10.9 Iron & steel 539 316 -41.4 165 151 125 98 75 79 84 78 76 +0.9 Other industries 17 - -100.0 10 6 - - - - - - - Domestic 235 236 +0.4 62 56 54 63 55 58 55 68 68 +24.6 Stocks at end of period2 1,124 1,249r +11.2 1,115 1,028 1,038 1,124 1,126 1,108 1,142 1,249r 1,187 +5.5 1. Stock change + = stock draw, - = stock build.2. For some quarters, closing stocks may not be consistent with stock changes, due to additional stock adjustments3. Percentage change between the most recent quarter and the same quarter a year earlier; (+) represents a positive percentage change greater than 100%.
per cent change
per cent change 3
23

2 SOLID FUEL AND DERIVED GASESTable 2.3 Supply and consumption of coke oven gas, blast furnace gas, benzole and tars
GWh2015 2015 2015 2015 2016 2016 2016 2016 2017
2015 2016 p1st
quarter2nd
quarter3rd
quarter4th
quarter1st
quarter2nd
quarter3rd
quarter4th
quarter1st
quarter p
SUPPLYIndigenous production 22,156 14,089 -36.4 6,995 6,315 4,972 3,874 3,406 3,603 3,424 3,656 3,541 +4.0
Coke oven gas 6,890 3,468 -49.7 2,264 2,030 1,595 1,000 870 836 855 907 960 +10.3 Blast furnace gas 14,131 10,090 -28.6 4,359 3,941 3,117 2,713 2,403 2,645 2,439 2,603 2,444 +1.7 Benzole & tars 1,136 531 -53.2 371 344 260 161 134 123 129 145 138 +3.0
Transfers 420 344 -18.2 92 96 99 132 127 106 64 47 56 -55.8 Total supply 22,576 14,433 -36.1 7,088 6,411 5,071 4,006 3,534 3,709 3,487 3,703 3,597 +1.8 Statistical difference +41r +9r +33 -14 +5 +17 -6r +10 +10r -5r +5 Total demand 22,535 14,424r -36.0 7,054 6,425 5,066 3,989 3,540r 3,699 3,477r 3,708r 3,592 +1.5 TRANSFORMATION 9,704 6,875r -29.2 3,192 2,580 2,053 1,880 1,669r 1,682r 1,653r 1,871r 1,716 +2.8 Electricity generation 9,107 6,278r -31.1 3,042 2,430 1,904 1,731 1,520r 1,533r 1,504r 1,721r 1,566 +3.1 Heat generation2 598 598 - 149 149 149 149 149 149 149 149 149 - Energy industry use 8,330 4,846 -41.8 2,581 2,358 1,894 1,497 1,236 1,235 1,150 1,226 1,200 -2.9 Losses 2,646 1,116 -57.8 674 912 737 323 248 337 318 213 272 +9.6 FINAL CONSUMPTION 1,855 1,587r -14.5 608 576 383 289 387r 445r 356r 399r 404 +4.4 Iron & steel 719 1,056r +46.8 237 231 123 128 254r 322r 227r 254r 267 +5.2 Other industries3 - - - - - - - - - - - Non-Energy Use4 1,136 531 -53.2 371 344 260 161 134 123 129 145 138 +3.0 1. Percentage change between the most recent quarter and the same quarter a year earlier; (+) represents a positive percentage change greater than 100%.2. Heat generation is based on an annual figure and is then split over a quarterly period. The 2016 heat generation figure will not be published until the end of July 2017. Therefore, the 2015 figure is used as an estimate for 2017.3. The main industrial consumer of derived gases Monckton coke-works (also a producer of them) closed in December 2014.4. From 2009, unclassified final consumption for benzole and tars has been recorded under non energy use
per cent change
per cent change 1
24

Oil and Oil Products
25
Section 3 – Oil and Oil Products
Relevant tables 3.1: Supply and use of crude oil, natural gas liquids and feedstocks Page 32 3.2: Supply and use of petroleum products Page 33 3.4: Supply and use of petroleum products: latest quarter Page 34 3.5: Biofuels sales and sales through supermarkets Page 35 3.6: Stocks of petroleum at end of period Page 36
Contacts for further information:
Matthew Curds Natalie Cartwright Upstream Oil (primary oils) Downstream Oil (petroleum products) Oil and Gas Statistics Team Oil and Gas Statistics Team Tel. 0300 068 8414 Tel. 0300 068 5260 E-mail: [email protected] E-mail: [email protected]
Key results show: Total indigenous UK production of crude oil and NGLs (Natural Gas Liquids) in Q1 2017 was 4.6 per cent lower than a year ago, driven largely by a decrease in production at fields feeding into the Sullom Voe terminal. (Chart 3.1)
Indigenous production of petroleum products was 3.0 per cent higher in the first quarter of 2017 compared with the same quarter in 2016, partly because Q1 2016 production was affected by maintenance that had been delayed from 2015. The long term trend is one of ongoing decline in UK refinery production (Chart 3.2)
The pattern of trade showed substantial variation compared to last year. Imports of petroleum products decreased by 7.3 per cent and exports decreased by 4.7 per cent. The UK was a net importer of petroleum products in Q1 2017 by 2.5 million tonnes. (Chart 3.2)
Net imports of primary oils (crude oil, NGLs and feedstocks) in Q1 2017 nearly doubled to 2.6 million tonnes due to lower indigenous production and increased refinery demand. The UK’s refineries relied more on imported oil, with net imports meeting around 10 per cent of the UK's refinery demand, up from 2.7 per cent in Q1 2016. (Chart 3.3)
Demand in Q1 2017 was down 0.3 per cent compared to the first quarter of 2016. Demand for key transport fuels increased by 0.5 per cent compared with Q1 2016. Motor spirit deliveries were down by 2.4 per cent, whilst deliveries of DERV (road diesel) and aviation fuels were up by 0.5 per cent and 5.3 per cent respectively. (Chart 3.5)
Overall stocks of crude oil and petroleum products were up by 4.1 per cent at end of the Q1 2017 compared to a year earlier. (Chart 3.6)

Oil and Oil Products
26
Chart 3.1 Production and trade of crude oil and NGLs (Table 3.1)
Indigenous production of primary oils was down 4.6 per cent with a crude oil contraction of 6.0 per cent, contrasting with an increase in NGL production of 16 per cent. The opening of new fields such as Golden Eagle has seen a boost to production since early 2015, with production in Q1 2016 particularly high and a recent decline in output from fields feeding into Sullom Voe. NGL production has been boosted because oil extracted from new fields contains a higher proportion of NGLs. Imports of crude oil and NGLs were 12 per cent higher compared with Q1 2016, reflecting lower production and increased refinery demand for feedstocks. Exports of crude oil and NGLs stayed broadly the same whereas exports of feedstocks decreased by 44 per cent, again due to increased refinery demand this quarter. Overall, net imports of primary oils (crude, NGLs and feedstocks) were 2.6 million tonnes in Q1 2017, compared with 1.4 million tonnes in the same quarter of 2016.

Oil and Oil Products
27
Chart 3.2 Production and trade of petroleum products (Table 3.2)
Indigenous production of petroleum products in Q1 2017 was 3.0 per cent higher compared with the same quarter in 2016. This is partly due to maintenance postponed from 2015 to Q1 2016, which affected production figures last year. Compared to Q1 2016 imports of petroleum products in Q1 2017 decreased by 7.3 per cent and exports decreased by 4.7 per cent. The majority of petroleum products saw a decrease in imports, particularly for motor spirit (down 16 per cent). Demand for motor spirit has been down this quarter, alongside higher production compared to this period last year. Exports of motor spirit were stable, but all other products except petroleum gases saw a decrease in exports. In overall terms, the UK was a net importer (2.5 million tonnes) of petroleum products in Q1 2017.
0

Oil and Oil Products
28
Chart 3.3 Overall trade in primary oils and petroleum products (Table 3.1)
Net imports of primary oils (crude, NGLs and feedstocks) increased from 1.4 million tonnes in Q1 2016 to 2.6 million tonnes in Q1 2017, an increase of 87 per cent. Decreased indigenous production of crude oil has meant higher imports in Q1 2017, with refineries using more imported and process oils. The UK’s overall net import dependence for primary oils (crude, NGLs and feedstocks) was 10 per cent in Q1 2017, up from 2.7 per cent in Q1 2016. In Q1 2017 the UK was a net importer of petroleum products, by 2.5 million tonnes, down from 2.8 million tonnes in the first quarter of 2016.

Oil and Oil Products
29
Chart 3.4 Final consumption of oil (Table 3.4)
In quarter 1 2017, final consumption of petroleum products was down 0.1 per cent, the first quarter to show a reduction following 10 consecutive quarters of increases in demand. Increases in consumption have largely been driven by key transport fuels, and in Q1 2017 demand for diesel increased just 0.5 per cent and motor spirit was down 2.4 per cent, following a period of robust demand likely driven by the comparatively low cost of road fuel in recent quarters. There was an increase in demand for aviation turbine fuel of 5.3 per cent. Fuel use in the domestic sector was down by 2.5 per cent because this has been a warmer period compared to this time last year. Non-energy use was stable compared to Q1 2016 (down 1.2 per cent) following the recent period of growth in this sector.
Oil and Oil Products
30
Chart 3.5 Demand for key transport fuels (Table 3.4 and Table 3.5)
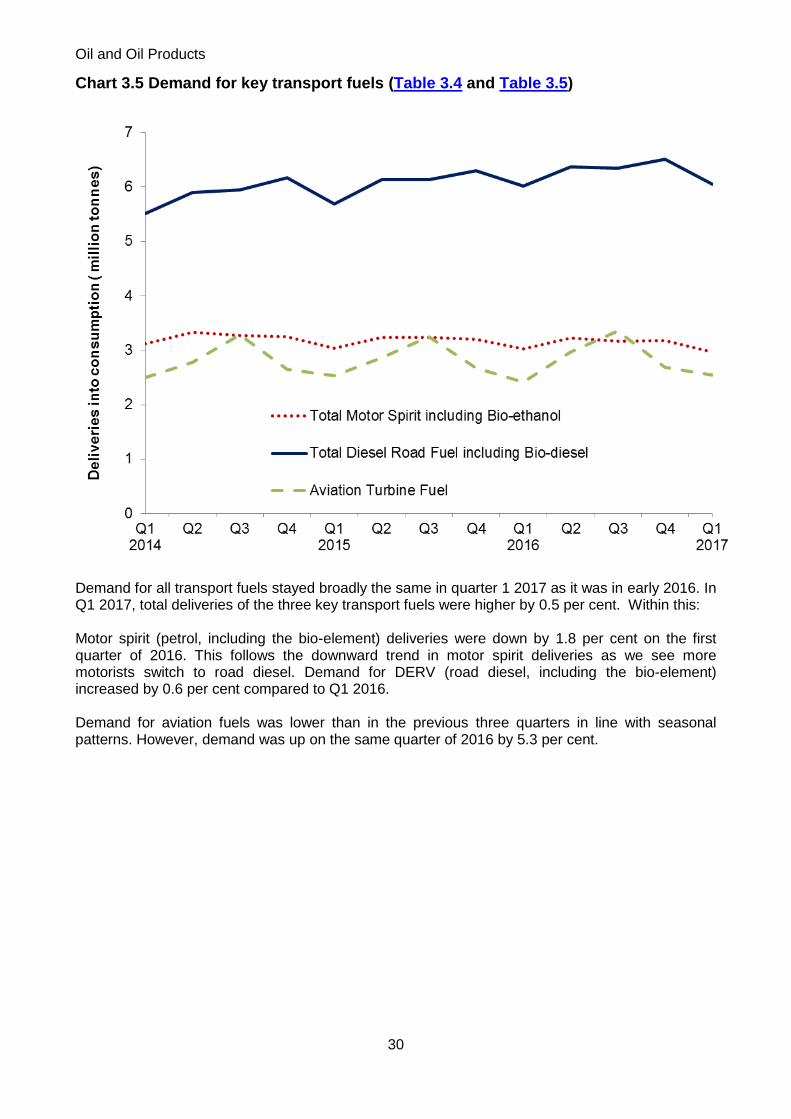
Demand for all transport fuels stayed broadly the same in quarter 1 2017 as it was in early 2016. In Q1 2017, total deliveries of the three key transport fuels were higher by 0.5 per cent. Within this: Motor spirit (petrol, including the bio-element) deliveries were down by 1.8 per cent on the first quarter of 2016. This follows the downward trend in motor spirit deliveries as we see more motorists switch to road diesel. Demand for DERV (road diesel, including the bio-element) increased by 0.6 per cent compared to Q1 2016. Demand for aviation fuels was lower than in the previous three quarters in line with seasonal patterns. However, demand was up on the same quarter of 2016 by 5.3 per cent.

Oil and Oil Products
31
Chart 3.6 UK oil stocks (Table 3.6)
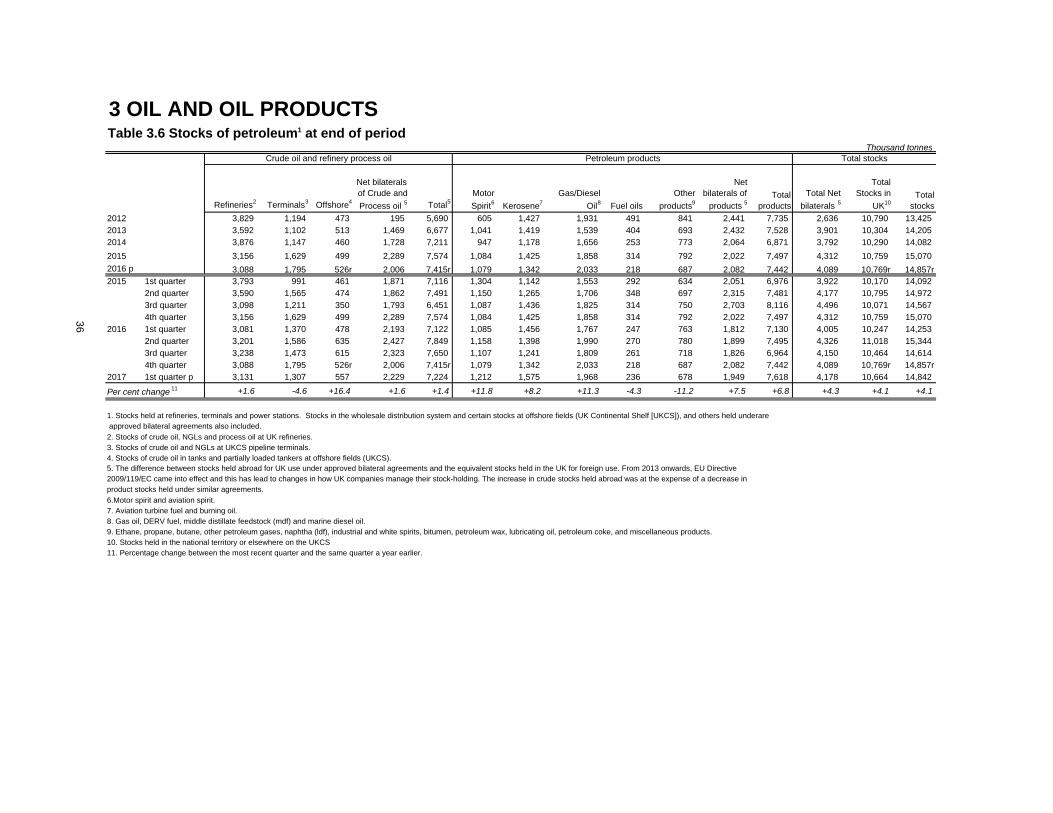
At the end of Q1 2017 total stocks of crude and products were up by 4.1 per cent compared to Q1 2016, and both physical stocks and net bilaterals had increased. Stocks of crude and feedstocks increased by 1.4 per cent and stocks of products increased by 6.8 per cent. An increase in stocks of crude and process oils being held offshore offset volumes no longer being held at terminals, while volumes held at refineries increased by 1.6 per cent. The most notable increases in stocks of products were in motor spirit and gas/diesel oil, at 11.8 per cent and 11.3 per cent respectively. Product stocks held abroad for the UK under bilateral agreements were up by 7.5 per cent as companies seek to maximise efficiency. Chart 3.6 shows crude and product stocks held for the UK. At the end of Q1 2017, UK companies held stocks equal to around 61 days of consumption. Further information on how the UK meets its oil stocking obligations are set out at: www.gov.uk/government/publications/uk-emergency-oil-stocking-international-obligations

3 OIL AND OIL PRODUCTSTable 3.1 Supply and use of crude oil, natural gas liquids and feedstocks1 Thousand tonnes
2015 2015 2015 2015 2016 2016 2016 2016 2017
2015 2016 pper cent change
1st quarter
2nd quarter
3rd quarter
4th quarter
1st quarter
2nd quarter
3rd quarter
4th quarter
1st quarter p
per cent change 8
SUPPLY Indigenous production2 45,698 47,872r +4.8r 10,836 12,141 10,515 12,206 12,716 12,210 11,377 11,570r 12,130 -4.6 Crude oil 42,826 44,306r +3.5r 10,163 11,364 9,895 11,404 11,816 11,347 10,560 10,583r 11,103 -6.0 NGLs3 2,462 3,139r +27.5r 577 689 508 688 784 757 717 881r 911 +16.2 Feedstocks 410 428 +4.2 96 88 112 114 116 105 100 106 116 -0.3 Imports4 50,604r 48,708r -3.7r 12,037r 12,035r 12,979r 13,553r 11,480r 11,785r 12,305 13,138r 12,432 +8.3 Crude oil & NGLs 45,286r 42,415r -6.3r 10,952r 10,931 11,396 12,006r 9,842 10,171 10,681 11,721r 10,989 +11.7 Feedstocks 5,318r 6,293r +18.3r 1,085r 1,104r 1,583r 1,547 1,638r 1,614r 1,624 1,417 1,443 -11.9 Exports4 33,709r 34,856r +3.4r 8,096r 9,309r 7,908 8,396r 10,090r 7,976r 8,225 8,565r 9,834 -2.5 Crude Oil & NGLs 31,820r 33,247r +4.5r 7,612r 8,846 7,279 8,083r 9,460 7,544 7,931 8,312r 9,481 +0.2 Feedstocks 1,890r 1,609r -14.8r 484r 463r 630 313 630r 433r 294 253r 353 -43.9 Stock change5 -98r -125r +27.2 -59 -384 970 -626r 355 -492 95 -83r 408 +14.9 Transfers6 -1,152 -1,282r +11.3r -100 -382 -225 -445 -225 -368 -209 -481r -493 (+) Total supply 61,343r 60,317r -1.7 14,618r 14,101r 16,331r 16,292 14,236r 15,159r 15,343 15,579r 14,643 +2.9 Statistical difference7 -48r -45r -15r -2r -16r -16 +14r -81r +4.3r +17.1r -11 Total demand 61,391r 60,362r -1.7 14,633r 14,103 16,347r 16,308 14,221r 15,240r 15,339r 15,562 14,653 +3.0 TRANSFORMATION 61,391r 60,362r -1.7 14,633r 14,103 16,347r 16,308 14,221r 15,240r 15,339r 15,562 14,653 +3.0 Petroleum refineries 61,391r 60,362r -1.7 14,633r 14,103 16,347r 16,308 14,221r 15,240r 15,339r 15,562 14,653 +3.0 1. As there is no use made of primary oils and feedstocks by industries other than the oil and gas extraction and petroleum refining industries, other industry headings have not been included in this table. As such, this table is a summary of the activity of what is known as the Upstream oil industry.2. Includes offshore and onshore production.3. Natural Gas Liquids (NGLs) are condensate and petroleum gases derived at onshore treatment plants.4. Foreign trade as recorded by the Petroleum Industry which may differ from the figures published by HM Revenue and Customs in the Overseas Trade Statistics. Data are subject to further revision as revised information on imports and exports becomes available.5. Stock fall (+), stock rise (-). Stocks include stocks held at refineries, at oil terminals and also those held in tanks and partially loaded vessels at offshore facilities.6. Mostly direct disposals to petrochemical plants. 7. Total supply minus total demand.8. Percentage change between the most recent quarter and the same quarter a year earlier.
32

3 OIL AND OIL PRODUCTSTable 3.2 Supply and use of petroleum products
Thousand tonnes2015 2015 2015 2015 2016 2016 2016 2016 2017
2015 2016 p1st
quarter2nd
quarter3rd
quarter4th
quarter1st
quarter2nd
quarter3rd
quarter4th
quarter1st
quarter pSUPPLY Indigenous production2 63,282r 62,455r -1.3r 15,106r 14,628r 16,713r 16,835r 14,819r 15,790r 15,689r 16,156r 15,263 +3.0 Imports3 32,133r 34,854r +8.5r 7,712r 8,457r 8,024r 7,940r 8,814r 9,098r 8,539r 8,403r 8,170 -7.3 Exports3 22,926r 24,312r +6.0r 5,038r 5,212r 6,260r 6,416r 5,964r 6,245r 6,179r 5,923r 5,687 -4.7 Marine bunkers 2,509r 2,659r +6.0r 551r 698r 687r 573r 538 727 763 632r 510 -5.3 Stock change4 -743 +89r -142 -266 -267 -68 148r -278 460 -241 -301 Transfers5 -1,190 -1,268r -530 -249 -227 -184 -474 -300 -281 -212r -256 Total supply 68,046r 69,158r +1.6r 16,556r 16,660r 17,296r 17,534r 16,805r 17,337r 17,465r 17,552r 16,679 -0.7 Statistical difference6 -51r +30r 66r -25r -62r -30r 32r -2r -7r 8r -49 Total demand 68,097r 69,128r +1.5r 16,490r 16,685r 17,358r 17,564r 16,773r 17,339r 17,472r 17,544r 16,728 -0.3 TRANSFORMATION 1,125r 1,094r -2.7r 262r 256r 293r 314r 302r 254r 250r 288r 272 -9.9 Electricity generation 560r 501r -10.5r 132r 128r 142r 158r 146r 110r 115r 130r 118 -19.1 Heat generation 59 58r -0.7r 15 15 15 15 15r 14r 14r 15 15 - Other Transformation 506 535r +5.7r 115 113 136 142 142 130 121r 143r 139 -1.9 Energy industry use 4,043r 3,946r -2.4r 983r 924r 1,089r 1,047r 988r 1,019r 949r 990r 991 +0.2 Petroleum Refineries 3,344r 3,284r -1.8r 808r 750r 915r 872r 823r 854r 783 824r 825 +0.3 Blast Furnaces - - - Others 699 662r -5.3r 175 175 175 175 166r 166r 166r 166r 166 - FINAL CONSUMPTION 62,929r 64,088r +1.8r 15,245r 15,505r 15,976r 16,203r 15,482r 16,066r 16,273r 16,266r 15,466 -0.1 Iron & steel 6 4r -29.9r 1 1r 2r 2r 3r 1r 0 0 3 +7.3 Other industries 3,939r 3,722r -5.5r 1,051r 821r 858r 1,208r 1,095r 821r 842r 964r 1,073 -1.9 Transport 48,374r 49,292r +1.9r 11,356r 12,265r 12,638r 12,115r 11,495r 12,531r 12,867r 12,400r 11,549 +0.5 Domestic 2,273r 2,275r +0.1r 845r 414r 363 652r 799r 447r 313r 716r 779 -2.5 Other final users 1,813r 1,840r +1.5r 443r 449r 467r 454r 410r 473r 485r 473r 401 -2.2 Non energy use 6,525r 6,954r +6.6r 1,548r 1,556r 1,648r 1,773r 1,681r 1,794r 1,766r 1,714r 1,661 -1.2 1. Percentage change between the most recent quarter and the same quarter a year earlier; (+) represents a positive percentage change greater than 100%.2. Includes refinery production and petroleum gases extracted as products during the production of oil and gas.3. Foreign trade as recorded by the Petroleum Industry which may differ from the figures published by HM Revenue and Customs in the Overseas Trade Statistics. Data are subject for further revision as revised information on imports and exports becomes available.4. Stock fall (+), stock rise (-).5. Mainly transfers from product to feedstock.6. Total supply minus total demand.
per cent change
per cent change 1
33

3 OIL AND OIL PRODUCTSTable 3.4 Supply and use of petroleum products - latest quarter
Thousand tonnes
Tota
l Pe
trol
eum
Pr
oduc
ts
Mot
or s
pirit
DER
V 9
Gas
oil1
Avi
atio
n tu
rbin
e fu
el
Fuel
oils
Petr
oleu
m
gase
s2
Bur
ning
oil
Oth
er
prod
ucts
3
Tota
l Pe
trol
eum
Pr
oduc
ts
Mot
or s
pirit
DER
V 9
Gas
oil1
Avi
atio
n tu
rbin
e fu
el
Fuel
oils
Petr
oleu
m
gase
s2
Bur
ning
oil
Oth
er
prod
ucts
3
SUPPLY Indigenous Production4
14,819r 4,111 2,932 1,720 915 1,114 1,703r 671 1,653 15,263 4,378 3,160 1,668 1,016 1,027 1,738 671 1,606 Imports5 8,814 979 3,560 507 2,084 283 195 359 846 8,170 827 3,321 183 2,293 296 221 246 782 Exports5 5,964 2,707 559 621 307 907 182 73 609 5,687 2,708 476 533 268 795 231 31 644 Marine bunkers 538 - - 345 - 193 0 - - 510 - - 328 - 182 - - - Stock change6 +148 -0 +56 +43 -57 +51 -12 +26 +41 -301 -133 +87 -21 -240 -10 -21 +8 +30 Transfers7 -474 +515 -72 -200 -218 -139 - +210 -570 -256 +462 -152 +92 -239 -148 -22 +230 -479Total supply 16,805r 2,898 5,918 1,104 2,418 209 1,704r 1,194 1,361 16,679 2,825 5,940 1,062 2,562 187 1,685 1,124 1,294Statistical difference8 +32 +21 - +9 +2 -2 -34 +13 +23 -49 +17 - -4 +18 -8 -48 -15 -9 Total demand 16,773r 2,877 5,889 1,095 2,416 211 1,738r 1,181 1,366 16,728 2,808 5,921 1,066 2,543 195 1,734 1,139 1,323TRANSFORMATION 302 - - 25 - 70 181 - 26 272 - - 25 - 42 176 - 28 Electricity generation 146 - - 24 - 59 63 - - 118 - - 24 - 31 63 - - Heat generation 15 - - 1 - 11 2 - - 15 - - 1 - 11 2 - - Petroleum refineries - - - - - - - - - - - - - - - - - - Coke manufacture - - - - - - - - - - - - - - - - - - Blast furnaces - - - - - - - - - - - - - - - - - - Patent fuel manufacture 22 - - - - - 0 - 22 21 - - - - - 0 - 21 Other transformation 9 120 - - - - - 116 - 4 118 - - - - - 111 - 7Energy industry use 988 - - 150 - 80 470 - 289 991 - - 150 - 59 472 - 310FINAL CONSUMPTION 15,482 2,877 5,889 920 2,416 61 1,087 1,181 1,051 15,466 2,808 5,921 891 2,543 94 1,086 1,139 984 Iron & steel 3 - - - - 3 0 - - 3 - - - - 3 - - - Other industries 1,095r - - 326 - 37 106r 489 137 1,073 - - 334 - 81 101 459 98 Transport 11,495 2,877 5,889 292 2,416 0 19 - 2 11,549 2,808 5,921 270 2,543 1 4 - 2 Domestic 799 - - 29 - - 78 692 - 779 - - 25 - - 74 680 - Other final users 410r - - 270 - 21 119r - - 401 - - 258 - 9 133 - - Non energy use 1,681 - - 4 - - 766 - 912 1,661 - - 3 - - 774 - 884
1. Includes middle distillate feedstock destined for use in the petrochemical industry and marine diesel2. Includes ethane, propane, butane and other petroleum gases3. Includes naphtha, industrial and white spirits, lubricants, bitumen, petroleum waxes, petroleum coke and other oil products4. Includes refinery production and petroleum gases extracted as products during the production of oil and gas5. Foreign trade as recorded by the Petroleum Industry which may differ from the figures published by HM Revenue and Customs in the Overseas Trade Statistics Data are subject to further revision as revised information on imports and exports becomes available6. Stock fall (+), stock rise (-).7. Mainly transfers from product to feedstock.8. Total supply minus total demand.9. Backflows from petrochemical companies have been placed on a separate row for the first time June 2016. Please see article in Energy Trend June 2016 for more information
2017 1st quarter p2016 1st quarter
34

3 OIL AND OIL PRODUCTS
Table 3.5 Biofuel sales and sales through supermarkets1
Thousand tonnes
2015 2015 2015 2015 2016 2016 2016 2016 2017
2015 2016 p1st
quarter 2nd
quarter3rd
quarter 4th
quarter 1st
quarter 2nd
quarter 3rd
quarter4th
quarter1st
quarter p
MOTOR SPIRIT of which, Hydrocarbon 3 12,082 11,951r -1.1% 2,893 3,076 3,072 3,040 2,877 3,072 3,014 2,988r 2,808 -2.4% of which, Bio-ethanol 4 631 603r -4.5% 150 161 163 157 146 154 150 152r 160 9.8%Total Motor Spirit including Bio-ethanol 12,713 12,554r -1.3% 3,043 3,237 3,235 3,197 3,023 3,226 3,164 3,140r 2,968 -1.8% of which, sold through Supermarkets 5 5,794 5,885 1.6% 1,418 1,467 1,435 1,473 1,480 1,479 1,453 1,473 1,388 -6.2%DIESEL ROAD FUEL of which, Hydrocarbon 3 23,656 24,648r 4.2% 5,575 5,998 5,976 6,106 5,889 6,173 6,167 6,419r 5,921 0.5% of which, Bio-diesel 4 595 630r 5.8% 111 135 158 191 127 195 174 133r 131 2.8%Total Diesel Road Fuel including Bio-diesel 24,251 25,279r 4.2% 5,687 6,133 6,134 6,298 6,016 6,368 6,342 6,552r 6,052 0.6% of which, sold through Supermarkets 5 6,644 7,267 9.4% 1,605 1,648 1,706 1,685 1,793 1,802 1,814 1,858 1,761 -1.8%
1. Monthly data for inland deliveries of oil products are available - See BEIS website: https://www.gov.uk/government/collections/oil-statistics2. Percentage change between the most recent quarter and the same quarter a year earlier.3. Demand excluding bioethanol. Based on HMRC data.4. Bioethanol based on HMRC data and excludes other renewables5. Data for sales by supermarkets collected by a monthly reporting system. Includes Asda, Morrisons, Sainsburys and Tesco only.
35
per cent change
per cent change 2
3 OIL AND OIL PRODUCTSTable 3.6 Stocks of petroleum1 at end of period
Thousand tonnesCrude oil and refinery process oil Petroleum products Total stocks
Refineries2 Terminals3 Offshore4 Total5
2012 3,829 1,194 473 195 5,690 605 1,427 1,931 491 841 2,441 7,735 2,636 10,790 13,425 2013 3,592 1,102 513 1,469 6,677 1,041 1,419 1,539 404 693 2,432 7,528 3,901 10,304 14,205 2014 3,876 1,147 460 1,728 7,211 947 1,178 1,656 253 773 2,064 6,871 3,792 10,290 14,082 2015 3,156 1,629 499 2,289 7,574 1,084 1,425 1,858 314 792 2,022 7,497 4,312 10,759 15,070 2016 p 3,088 1,795 526r 2,006 7,415r 1,079 1,342 2,033 218 687 2,082 7,442 4,089 10,769r 14,857r2015 1st quarter 3,793 991 461 1,871 7,116 1,304 1,142 1,553 292 634 2,051 6,976 3,922 10,170 14,092
2nd quarter 3,590 1,565 474 1,862 7,491 1,150 1,265 1,706 348 697 2,315 7,481 4,177 10,795 14,972 3rd quarter 3,098 1,211 350 1,793 6,451 1,087 1,436 1,825 314 750 2,703 8,116 4,496 10,071 14,567 4th quarter 3,156 1,629 499 2,289 7,574 1,084 1,425 1,858 314 792 2,022 7,497 4,312 10,759 15,070
2016 1st quarter 3,081 1,370 478 2,193 7,122 1,085 1,456 1,767 247 763 1,812 7,130 4,005 10,247 14,253 2nd quarter 3,201 1,586 635 2,427 7,849 1,158 1,398 1,990 270 780 1,899 7,495 4,326 11,018 15,344 3rd quarter 3,238 1,473 615 2,323 7,650 1,107 1,241 1,809 261 718 1,826 6,964 4,150 10,464 14,614 4th quarter 3,088 1,795 526r 2,006 7,415r 1,079 1,342 2,033 218 687 2,082 7,442 4,089 10,769r 14,857r
2017 1st quarter p 3,131 1,307 557 2,229 7,224 1,212 1,575 1,968 236 678 1,949 7,618 4,178 10,664 14,842
Per cent change 11 +1.6 -4.6 +16.4 +1.6 +1.4 +11.8 +8.2 +11.3 -4.3 -11.2 +7.5 +6.8 +4.3 +4.1 +4.1
2. Stocks of crude oil, NGLs and process oil at UK refineries.3. Stocks of crude oil and NGLs at UKCS pipeline terminals.4. Stocks of crude oil in tanks and partially loaded tankers at offshore fields (UKCS).
6.Motor spirit and aviation spirit.7. Aviation turbine fuel and burning oil.8. Gas oil, DERV fuel, middle distillate feedstock (mdf) and marine diesel oil.9. Ethane, propane, butane, other petroleum gases, naphtha (ldf), industrial and white spirits, bitumen, petroleum wax, lubricating oil, petroleum coke, and miscellaneous products.10. Stocks held in the national territory or elsewhere on the UKCS11. Percentage change between the most recent quarter and the same quarter a year earlier.
5. The difference between stocks held abroad for UK use under approved bilateral agreements and the equivalent stocks held in the UK for foreign use. From 2013 onwards, EU Directive
Total products
Net bilaterals of
products 5Total Net
bilaterals 5
Total Stocks in
UK10 Total
stocks
1. Stocks held at refineries, terminals and power stations. Stocks in the wholesale distribution system and certain stocks at offshore fields (UK Continental Shelf [UKCS]), and others held underare
36
product stocks held under similar agreements.
Net bilaterals of Crude and Process oil 5
Motor Spirit6 Kerosene7
Gas/Diesel Oil8
approved bilateral agreements also included.
2009/119/EC came into effect and this has lead to changes in how UK companies manage their stock-holding. The increase in crude stocks held abroad was at the expense of a decrease in
Fuel oilsOther
products9

Gas
37
Section 4 - Gas
Relevant table 4.1: Natural gas supply and consumption Page 45
Contacts for further information:
Matthew Curds James Halliwell Upstream gas Downstream gas Oil and Gas Statistics Team Oil and Gas Statistics Team Tel. 0300 068 8414 Tel. 0300 068 8121 E-mail: [email protected] E-mail: [email protected]
Key results show: The most notable development this quarter related to trade. Whilst imports were up 3.6 per cent, exports fell by nearly a quarter to 15 TWh - the lowest quarterly figure since 2004 (Chart 4.4).The quarter also saw a sharp contraction in Liquefied Natural Gas (LNG) imports which was balanced by increased gas from Norway (Chart 4.5). UK production of natural gas in Q1 2017 was 4.7 per cent higher in comparison to the same quarter of 2016, following the start-up of the Cygnus gas field in December 2016. Within this, production of associated gas was 8.9 per cent higher whilst dry gas production was 2.6 per cent lower (Chart 4.2) Demand for natural gas in Q1 2017 fell by 0.7 per cent compared to last year to 291 TWh, the first decrease since Q4 2015. (Chart 4.6) Growth in demand for electricity generation has continued because of the ongoing reduction of coal generation capacity, although it slowed this quarter. Compared to growth rates of 40 per cent seen in 2016, it was 10.3 per cent in Q1 2017. (Chart 4.6) In contrast final consumption was down 4.2 per cent, with domestic use and other final users down 5.9 and 3.1 per cent respectively, driven by warmer weather in Q1 2017 compared to Q1 2016. (Chart 4.6) Gross gas production and imports have been revised from 2008 onwards following new data submitted by industry. As a result, some gas previously categorised as arising from indigenous production on the UKCS has been reallocated to Norwegian imports. The revisions affect data back to 2008 and reduces UK production by 2 to 3 per cent. For further information please see the article Enhancements to Energy Trends gas tables at: www.gov.uk/government/collections/gas-statistics#energy-trends-articles Gas consumption has been revised from 2008 onwards following review. Revisions made have been based upon the correction on some misreporting, and use of data sources such as the Purchasers Inquiry and ONS Index of Services and Production data to help evaluate changes over time. These revisions affect data back to 2008 and reduce other final users’ figures, whilst increasing other industries. All other revisions this month are relatively small and due to providers restating figures or new data replacing estimates.

Gas
38
Chart 4.1 Production and imports and exports of natural gas (Table 4.1)
0
20
40
60
80
100
120
140
160
180
Q12014
Q2 Q3 Q4 Q12015
Q2 Q3 Q4 Q12016
Q2 Q3 Q4 Q12017
TW
h
Indigenous Production Imports Exports
Gross production of natural gas was up by 4.7 per cent in Q1 2017, in line with recent upward trends but still at around a third of peak production levels seen in Q1 2000. The increase this quarter is due in part to the start-up of the Cygnus gas field in December 2016, alongside continued strong production across much of the UK's Continental Shelf. The UK imports natural gas primarily from Norway (predominantly via the Langeled, Tampen Link and Gjoa/Vega pipelines). Smaller volumes are imported from Belgium (via the UK-Belgium Interconnector) and the Netherlands (via the Balgzand to Bacton line). See Map 4.1 for an illustration of trade flows. Imports in Q1 2017 were up 3.6 per cent on the same quarter in 2016, and were driven by a 23 per cent increase in imports from Norway. The UK exports natural gas primarily to Belgium (60 per cent of total exports in 2016) and Ireland (20 per cent of total exports in 2016). Exports decreased in Q1 2017 by nearly a quarter to reach the lowest level seen since 2004. The decrease was driven by 40 per cent drops in gas sent to Ireland and Belgium compared to this time last year. In part this was due to higher production levels at the Corrib field now supplying Ireland, but also because injections of gas into the Rough Storage Facility have been suspended in recent months meaning less is available to be drawn from stock.

Gas
39
Chart 4.2 Production of dry gas and associated gas (not shown in published tables)
0
10
20
30
40
50
60
70
80
90
Q12014
Q2 Q3 Q4 Q12015
Q2 Q3 Q4 Q12016
Q2 Q3 Q4 Q12017
TW
h
Associated gas
Dry gas
Production of associated gas (natural gas produced from oil fields) in Q1 2017 was up 8.9 per cent compared to the same quarter last year, from 75 to 81 TWh. This increase partly reflects the steady production of a number of relatively new condensate fields in the North Sea. In comparison dry gas production (natural gas composed mainly of methane) fell by 2.6 per cent in Q1 2017 on last year.

Gas
40
Chart 4.3 Gas availability (Table 4.2)
0
50
100
150
200
250
300
350
Q12014
Q2 Q3 Q4 Q12015
Q2 Q3 Q4 Q12016
Q2 Q3 Q4 Q12017
TW
h
Gas available Average 4 rolling quarters
Gas available at terminals is roughly equal to gross gas production minus producers own use, plus net imports. Gas availability is seasonal, mirroring gas demand, and peaks during Q1 and Q4 each year. Gas availability in Q1 2017 increased by 7.1 per cent compared to Q1 2016 to 265 TWh, and was driven by increases in net imports and UK production. The long-term picture shows that the average availability over four rolling quarters had remained fairly constant since the start of 2012 before increasing slightly since the start of 2015.

Gas
41
Chart 4.4 Import and exports (Table 4.3 and Table 4.4)
-75
-50
-25
0
25
50
75
100
125
150
175
200
Q12014
Q2 Q3 Q4 Q12015
Q2 Q3 Q4 Q12016
Q2 Q3 Q4 Q12017
TW
h
LNG - imports Pipeline - imports Exports
Net Imports during Q1 2017 were up by 7.4 per cent in comparison to the same quarter in 2016. This increase has been driven by the lower export figure, a result of a significantly lower stock draw linked to the continued suspension of gas injections into the Rough Storage Facility. As noted in Chart 4.1, the UK imports natural gas primarily from Norway (predominantly via the Langeled, Tampen Link and Gjoa/Vega pipelines). Smaller volumes are imported from Belgium (via the UK-Belgium Interconnector) and the Netherlands (via the Balgzand to Bacton line). Pipeline imports were up by nearly one-fifth, with imports from Norway up 23 per cent and imports from Belgium increasing to 13 TWh from 1 TWh, driving an overall 3.6 per cent increase in imports. In contrast imports of LNG have decreased by 44 per cent, meaning LNG only accounted for 12 per cent of total imports compared to twice that figure in the same quarter last year. Exports decreased by a quarter over the same timeframe driven by a 41 per cent decrease in exports to the Republic of Ireland, which is largely due to the production from the Corrib gas field now supplying Ireland and a 38 per cent decrease in exports to Belgium.
Liquefied Natural Gas 'reloads' started in late 2014 and have continued since with the UK exporting to countries including Brazil, Pakistan and the United Arab Emirates.

Gas
42
Chart 4.5 Imports by origin (Table 4.4)
0
20
40
60
80
100
120
140
160
180
Q12014
Q2 Q3 Q4 Q12015
Q2 Q3 Q4 Q12016
Q2 Q3 Q4 Q12017
TW
h
Norway Netherlands Belgium LNG - Qatar LNG - Other
In Q1 2017 the main development is the contraction in the amount of LNG imported into the UK, with LNG’s share of total imports decreasing from 23 per cent in Q1 2016 to 13 per cent in Q1 2017. The majority of LNG imports are sourced from Qatar (around 83 per cent of total LNG imports in Q1 2017), and these volumes fell by nearly half in comparison to the same period last year to 20 TWh. The decrease was driven by high demand in Northeast Asia for Qatar gas following the temporary shutdown of a number of nuclear facilities across the region coinciding with the start of the peak winter demand. This has increased LNG prices in the Asia market and consequently diverted supply from the European market In contrast pipeline imports have increased, up nearly one-fifth on Q1 2016. Norway remains the principal source of UK gas imports (at three-quarters of total imports in Q1 2017 compared to half in 2010) and has seen a 23 per cent increase in comparison to Q1 2016, with imports from Belgium also increasing from around 1 TWh to 13 TWh. During the same timeframe imports from the Netherlands dropped by more than half to 9 TWh, the lowest levels of imports from the Netherlands in Q1 since 2006.
A complete country breakdown for physical pipeline and LNG imports is provided in Energy Trends Table 4.4 - Supplementary information on the origin of UK gas imports.

Gas
43
Map 4.1: UK imports and exports of gas Q1 2017*
3.9 TWh
Vesterled
Pipeline
NTS
Imports
Exports
UK-Belgium
Interconnector
UK-Ireland
4.2
TWh
4.4 TWh
NTS - National Transmission
System for gas, including link
to N. Ireland
LNG
3.6 TWh
Nominated BBL export,
Chiswick, Grove,
Markham, Minke
Windermere & Windgate.
13.0 TWh
23.2 TWh
BBL
9.3 TWh
Langeled Pipeline
70.3 TWh
Tampen
Link &
Gjoa/Vega
27.8 TWh
4.6 TWh
LNG
16.8 TWh
Cats
Pipeline
0.1 TWh
LNG Out
2.5 TWh
Sage Pipeline
0.4 TWh
Interconnector
*Please note that imports and exports in this map uses nominated flows through the UK-Belgium Interconnector and BBL pipeline as in Table 4.1. The figures here will differ from those in ET Table 4.3 which uses actual physical flows through the Interconnector.

Gas
44
Chart 4.6 UK demand for natural gas (Table 4.1)
0
20
40
60
80
100
120
140
160
Q12014
Q2 Q3 Q4 Q12015
Q2 Q3 Q4 Q12016
Q2 Q3 Q4 Q12017
TW
h
Domestic Industries
Others Electricity generation
UK demand for natural gas in Q1 2017 is down 0.7 per cent in comparison Q1 2016 to 291 TWh, the first fall since Q4 2015. Growth in demand for electricity generation has continued because of the ongoing reduction of coal generation capacity, although it slowed this quarter. Compared to growth rates of 40 per cent seen in 2016, growth was just 10.3 per cent in Q1 2017. In contrast final consumption was down 4.2 per cent, with domestic use and other final users down 5.9 and 3.1 per cent in order respectively, driven by the warmer weather in early 2017 compared to 2016.

4 GASTable 4.1. Natural gas supply and consumption GWh
2015 2015 2015 2015 2016 2016 2016 2016 2017
2015 2016 pper cent change
1st quarter
2nd quarter
3rd quarter
4th quarter
1st quarter
2nd quarter
3rd quarter
4th quarter
1st quarter p
per cent change 1
SUPPLYIndigenous production 451,437r 462,307r +2.4 112,572 118,539 99,296 121,031 118,637 111,542 110,387r 121,740r 124,213 +4.7 Imports 501,563r 534,740r +6.6 158,922 95,206 104,648 142,788 162,960 114,908 89,950 166,923 168,807 +3.6 of which LNG 152,406r 122,310r -19.7 35,618 36,581 39,207 41,001 36,505 35,591 36,351 13,863 20,424 -44.1 Exports 159,517r 116,862r -26.7 27,518 39,356 52,184 40,459 20,163 27,979 51,985 16,735 15,416 -23.5
Stock change2 +3,515r +16,242r 34,500 -11,042 -15,919 -4,024 31,688 -9,551 -6,797 901 13,185Transfers 559r 1,575r 52 135 182 190 238 345 457 535 710Total supply 797,558r 898,002r +12.6 278,528 163,481 136,023 219,526 293,361 189,265r 142,013r 273,363r 291,500 -0.6
Statistical difference 779r 1,476r 1 471 -135 443 626 859r 24r -34r 801Total demand 796,779r 896,527r +12.5 278,527 163,010 136,158 219,083 292,735 188,406r 141,988r 273,397r 290,699 -0.7 TRANSFORMATION 237,682r 323,763r +36.2 59,195 55,292 60,220 62,975 79,870 77,013r 73,250r 93,629r 87,241 +9.2
Electricity generation 212,289r 297,643r +40.2 51,068 49,655 55,277 56,289 71,854 71,180r 68,295r 86,314r 79,224 +10.3 Heat generation3 25,393r 26,120r +2.9 8,127 5,637 4,942 6,687 8,016 5,833 4,955 7,315 8,016 -
Energy industry use 58,645r 57,773r -1.5 14,692 15,512 13,115 15,326 16,014 14,096r 13,913r 13,749r 14,966 -6.5 Losses 6,469r 5,396r -16.6 1,438 1,115 1,833 2,082 1,154 1,393r 1,636r 1,212r 1,081 -6.4 FINAL CONSUMPTION 493,983r 509,596r +3.2 203,203 91,090 60,990 138,699 195,697 95,903r 53,189r 164,806r 187,412 -4.2
Iron & steel 5,374 4,155r -22.7 1,528 1,476 1,253 1,118 1,161 990 973 1,032 1,201 +3.5 Other industries 93,825r 93,842r - 34,213 17,680 16,140 25,793 34,033 18,017r 15,166r 26,625r 34,217 +0.5 Domestic 297,582r 311,375r +4.6 133,809 51,606 27,617 84,549 129,040 55,039r 23,098r 104,197r 121,472 -5.9 Other final users 91,935r 95,115r +3.5 32,336 19,012 14,664 25,923 30,186 20,580r 12,674r 31,676r 29,244 -3.1 Non energy use3 5,267 5,109r -3.0 1,317 1,317 1,317 1,317 1,277r 1,277r 1,277r 1,277r 1,277 -
1. Percentage change between the most recent quarter and the same quarter a year earlier.2. Stock change + = stock draw, - = stock build.3. For heat generation and non energy use, the 2017 figures currently shown are the 2016 figures carried forward - these will be updated in June 2018.
45

Electricity
46
Section 5 - Electricity
Relevant tables 5.1: Fuel used in electricity generation and electricity supplied Page 53 5.2: Supply and consumption of electricity Page 54
Contacts for further information:
Stephen Ashcroft Nick Jesson Ravina Singh Electricity Statistics Electricity Statistics Electricity Statistics Tel: 0300 068 2928 Tel: 0300 068 5346 Tel: 0300 068 5046
E-mail: [email protected]
Key results show:
Electricity generation increased only marginally in 2017 Q1 (+1.0 per cent) from 92.3 TWh a year earlier to 93.2 TWh (Chart 5.1); however, due to a 3.1 TWh fall in net imports over the same period, total electricity supplied fell 2.2 per cent to 96.1 TWh. There were substantial shifts in fuel mix over the period. Coal’s share of generation decreased from 15.9 per cent to 11.3 per cent, whilst gas’ share rose from 37.0 per cent in the first quarter of 2016 to 39.9 per cent in the first quarter of 2017. (Chart 5.2). Renewables’ share of electricity generation increased from 25.6 per cent in the first quarter of 2016 to 26.6 per cent in the first quarter of 2017. (Chart 5.2). Low carbon electricity (renewables plus nuclear) generation share increased from 44.4 per cent in the first quarter of 2016 to 45.6 per cent in the first quarter of 2017. (Chart 5.3). The UK remains a net importer with 3.0 per cent of electricity supplied from net imports in the first quarter of 2017. However, net imports were down 52 per cent from the first quarter of 2016 due to damage to the France-UK interconnector. (Chart 5.4). Final consumption of electricity during the first quarter of 2017, at 80.7 TWh, was 2.3 per cent lower than in the same period last year. Domestic sales fell by 3.2 per cent. (Chart 5.5).
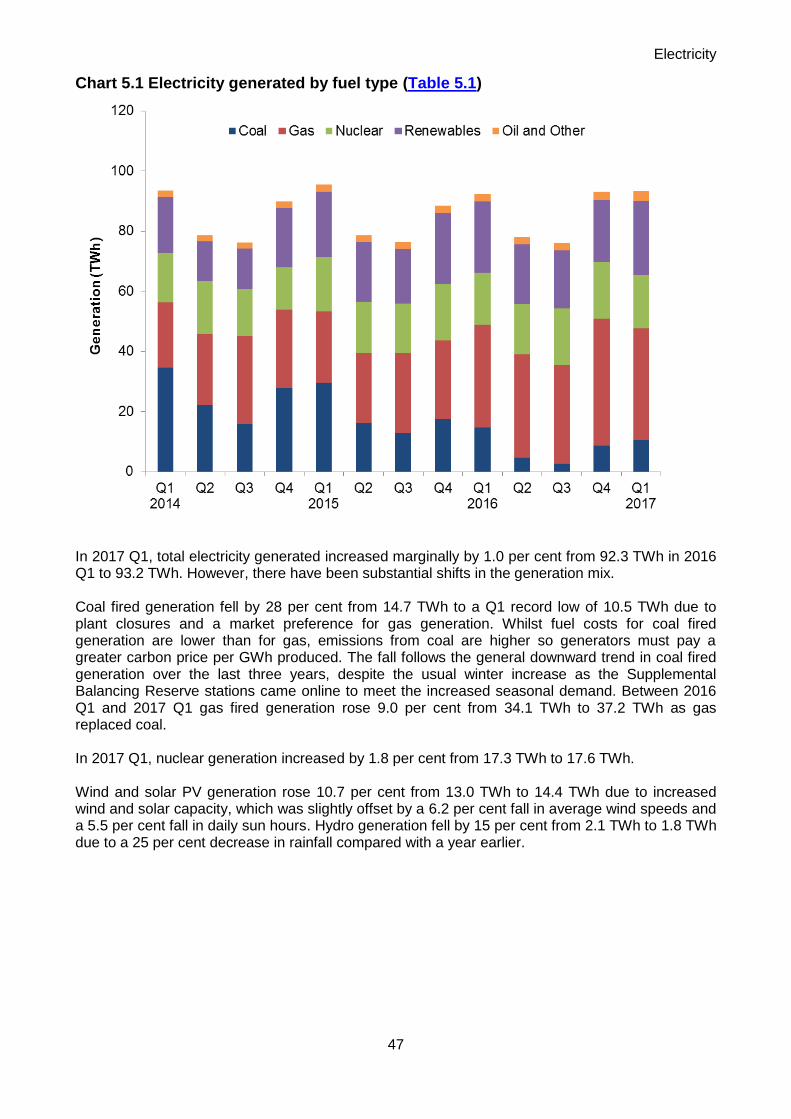
Electricity
47
Chart 5.1 Electricity generated by fuel type (Table 5.1)
In 2017 Q1, total electricity generated increased marginally by 1.0 per cent from 92.3 TWh in 2016 Q1 to 93.2 TWh. However, there have been substantial shifts in the generation mix. Coal fired generation fell by 28 per cent from 14.7 TWh to a Q1 record low of 10.5 TWh due to plant closures and a market preference for gas generation. Whilst fuel costs for coal fired generation are lower than for gas, emissions from coal are higher so generators must pay a greater carbon price per GWh produced. The fall follows the general downward trend in coal fired generation over the last three years, despite the usual winter increase as the Supplemental Balancing Reserve stations came online to meet the increased seasonal demand. Between 2016 Q1 and 2017 Q1 gas fired generation rose 9.0 per cent from 34.1 TWh to 37.2 TWh as gas replaced coal. In 2017 Q1, nuclear generation increased by 1.8 per cent from 17.3 TWh to 17.6 TWh. Wind and solar PV generation rose 10.7 per cent from 13.0 TWh to 14.4 TWh due to increased wind and solar capacity, which was slightly offset by a 6.2 per cent fall in average wind speeds and a 5.5 per cent fall in daily sun hours. Hydro generation fell by 15 per cent from 2.1 TWh to 1.8 TWh due to a 25 per cent decrease in rainfall compared with a year earlier.
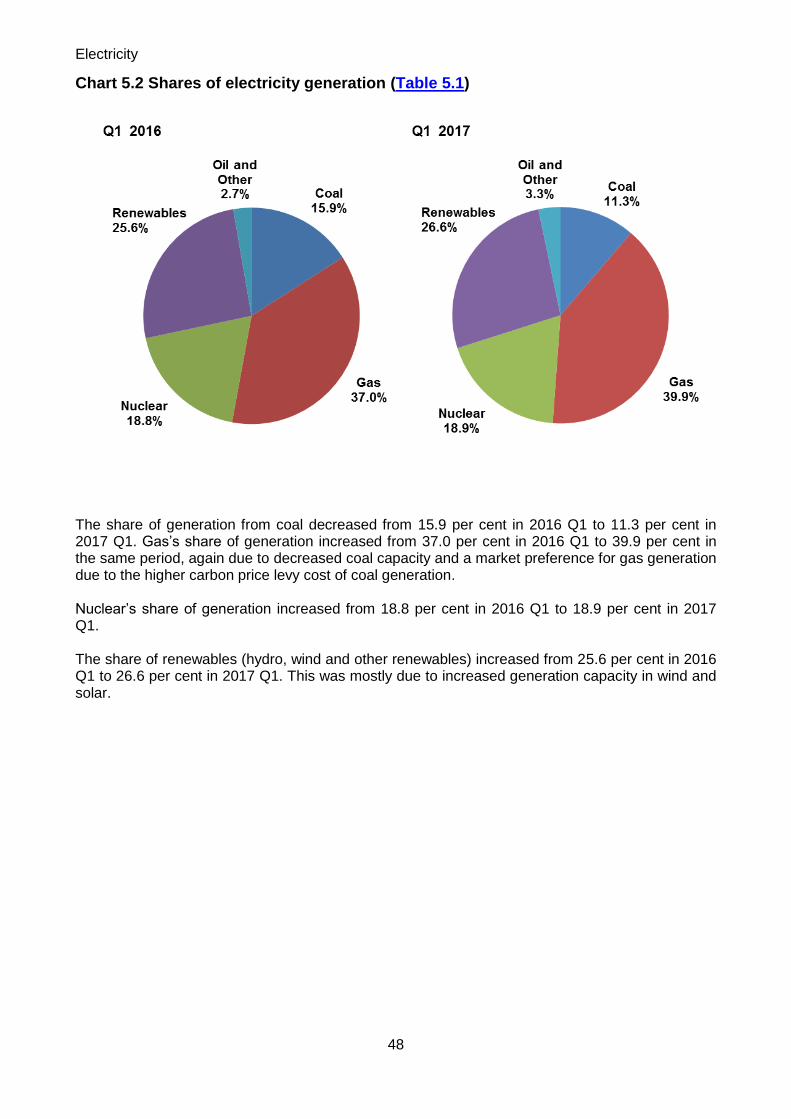
Electricity
48
Chart 5.2 Shares of electricity generation (Table 5.1)
The share of generation from coal decreased from 15.9 per cent in 2016 Q1 to 11.3 per cent in 2017 Q1. Gas’s share of generation increased from 37.0 per cent in 2016 Q1 to 39.9 per cent in the same period, again due to decreased coal capacity and a market preference for gas generation due to the higher carbon price levy cost of coal generation. Nuclear’s share of generation increased from 18.8 per cent in 2016 Q1 to 18.9 per cent in 2017 Q1. The share of renewables (hydro, wind and other renewables) increased from 25.6 per cent in 2016 Q1 to 26.6 per cent in 2017 Q1. This was mostly due to increased generation capacity in wind and solar.

Electricity
49
Chart 5.3 Low carbon electricity’s share of generation (Table 5.1)
Low carbon electricity generation includes nuclear, wind, solar, hydro and thermal renewable generation. Since renewable generation is affected by weather conditions including wind speeds, daily sun hours and volume of rainfall, this means that increased renewables capacity does not necessarily lead to increased low carbon generation share. Low carbon electricity’s share of generation increased from 44.4 per cent in 2016 Q1 to 45.6 per cent in 2017 Q1, largely due to higher renewables generation. This was mostly due to a 16.7 per cent increase in wind capacity and a 12.9 per cent increase in solar capacity.

Electricity
50
Chart 5.4 UK trade in electricity (Table 5.6)
The UK has four interconnectors allowing trade with continental Europe: England-France (2 GW capacity), England-Netherlands (1 GW), Northern Ireland-Ireland (0.6 GW) and Wales-Ireland (0.5 GW). In 2017 Q1, compared with the same period in 2016, imports of electricity fell by 39 per cent (-2.5 TWh) to 3.9 TWh, whilst exports increased by around 3 times (+0.6 TWh). The unusually low volume of imports in Q4 2016 and Q1 2017 was due to damage to the UK-France interconnector caused by a ships anchor in November 2016. The increase in exports was mostly due to increased demand from France following a number of nuclear outages.
The UK has been a net importer of electricity since 2010 Q1. In 2017 Q1, net imports of electricity were 2.9 TWh, 52 per cent lower than 6.0 TWh in 2016 Q1. Net imports represented 3.0 per cent of electricity supplied in 2017 Q1, with net imports of 0.6 TWh from France and 1.8 TWh from the Netherlands.

Electricity
51
Chart 5.5 Electricity final consumption (Table 5.2)
15
20
25
30
35
Q12014
Q2 Q3 Q4 Q12015
Q2 Q3 Q4 Q12016
Q2 Q3 Q4 Q12017
TW
h
Industrial Commercial and Other Domestic
0
Final consumption of electricity fell by 2.3 per cent in 2017 Q1, from 82.7 TWh in 2016 Q1, to 80.7 TWh.
Domestic consumption fell by 3.2 per cent, from 31.9 TWh in 2016 Q1 to 30.9 TWh in 2017 Q1. Temperatures were on average 0.7 degrees higher than in 2016 Q1 – see Energy Trends table 7.1 at: www.gov.uk/government/statistics/energy-trends-section-7-weather. In 2017 Q1 industrial use of electricity was 23.0 TWh, 0.5 per cent lower than the same period in 2016. Consumption by commercial and other users was 26.9 TWh, 2.9 per cent lower.

Electricity
52
Chart 5.6 Fuel used for electricity generation (Table 5.1)
Fuel used by generators in 2017 Q1 fell 3.2 per cent, from 18.5 mtoe in 2016 Q1 to 17.9 mtoe in 2017 Q1 (note that for wind (and other primary renewable sources), the fuel used is assumed the same as the electricity generated, unlike thermal generation where conversion losses are incurred). In 2017 Q1, coal use was 32 per cent lower than in 2016 Q1, while gas use was 10.2 per cent higher than a year earlier as generation switched from coal to gas. Coal accounted for 13.5 per cent of all fuel use in 2017 Q1, a record Q1 low. Nuclear sources were 1.8 per cent higher. Renewables (hydro, wind, solar and thermal renewables) accounted for 23.4 per cent of all fuel used.

5 ELECTRICITYTable 5.1. Fuel used in electricity generation and electricity supplied
2015 2015 2015 2015 2016 2016 2016 2016 2017
2015 2016 p 1st quarter
2nd quarter
3rd quarter
4th quarter
1st quarter
2nd quarter
3rd quarter
4th quarter
1st quarter p
FUEL USED IN GENERATIONAll generating companies Million tonnes of oil equivalentCoal 18.34 7.54 -58.9 7.06 3.85 3.15 4.28 3.58 1.13 0.74 2.09 2.43 -32.2 Oil 0.61 0.58 -3.6 0.14 0.13 0.17 0.17 0.11 0.15 0.16r 0.16r 0.18 +67.1 Gas 18.28 25.63 +40.2 4.40 4.28 4.76 4.85 6.19 6.13 5.88r 7.43r 6.82 +10.2 Nuclear 15.48 15.41 -0.4 4.00 3.72 3.64 4.11 3.73 3.58 4.05 4.06 3.79 +1.8 Hydro 0.54 0.46 -14.4 0.17 0.12 0.09 0.16 0.18 0.08 0.10r 0.10r 0.15 -15.0 Wind and Solar 2 4.12 4.11 -0.2 1.10 0.98 0.85 1.18 1.12 0.96 1.03r 1.00r 1.24 +10.7 Bioenergy 3 8.32 9.99 +20.0 1.97 1.99 2.05 2.31 2.66 2.54 2.25r 2.55r 2.80 +5.5 Other fuels 1.71 1.90 +10.7 0.49 0.43 0.51 0.28 0.46 0.45 0.45 0.54 0.27 -41.3 Net imports 1.80 1.78 -1.1 0.42 0.48 0.51 0.40 0.52 0.46 0.40 0.40 0.25 -51.6 Total all generating companies 69.20 67.41 -2.6 19.74 15.98 15.75 17.73 18.53 15.48 15.07r 18.33r 17.93 -3.2
ELECTRICITY GENERATEDAll generating companies TWhCoal 75.88 30.71 -59.5 29.55 16.01 12.83 17.48 14.69 4.58 2.72 8.72r 10.52 -28.4 Oil 2.04 1.84 -9.7 0.52 0.42 0.54 0.55 0.34 0.56 0.44r 0.50r 0.83 (+) Gas 99.88 143.36 +43.5 23.63 23.48 26.56 26.20 34.11 34.49 32.67r 42.10r 37.16 +9.0 Nuclear 70.34 71.73 +2.0 18.17 16.92 16.56 18.69 17.34 16.66 18.86 18.87 17.64 +1.8 Hydro (natural flow) 6.30 5.39 -14.4 2.01 1.43 1.03 1.83 2.09 0.94 1.15r 1.21r 1.77 -15.0 Wind and Solar 2 47.86 47.79 -0.2 12.79 11.45 9.93 13.69 13.02 11.13 11.96r 11.67r 14.41 +10.7 - of which, Offshore6 17.42 16.41 -5.8 4.68 3.58 3.41 5.76 5.15 3.25 3.58r 4.42r 5.01 -2.7 Bioenergy 3 29.24 30.04 +2.7 6.95 7.01 7.06 8.22 8.52 7.70 6.22r 7.60r 8.65 +1.4 Pumped Storage 2.74 2.96 +8.0 0.72 0.65 0.65 0.71 0.76 0.69 0.69r 0.82r 0.79 +3.8 Other fuels 4.64 5.57 +20.2 1.20 1.16 1.17 1.11 1.40r 1.30r 1.34r 1.53r 1.43 +2.4 Total all generating companies 338.92 339.40 +0.1 95.56 78.53 76.34 88.49 92.27 78.04 76.06r 93.03r 93.21 +1.0
ELECTRICITY SUPPLIED 4
All generating companies TWhCoal 71.99 29.14 -59.5 28.04 15.19 12.17 16.58 13.94 4.34 2.58 8.28r 9.98 -28.4 Oil 1.85 1.67 -9.7 0.47 0.38 0.49 0.50 0.30 0.51 0.40r 0.46r 0.77 (+) Gas 98.00 140.84 +43.7 23.19 23.02 26.06 25.73 33.56 33.87 32.07r 41.34r 36.49 +8.7 Nuclear 63.89 65.15 +2.0 16.51 15.37 15.04 16.98 15.75 15.13 17.13 17.14 16.03 +1.8 Hydro 6.25 5.35 -14.4 2.00 1.41 1.02 1.82 2.07 0.93 1.14r 1.20r 1.76 -15.1 Wind and Solar 2 47.87 47.79 -0.2 12.79 11.45 9.93 13.69 13.02 11.13 11.96r 11.67r 14.41 +10.7 - of which, Offshore6 17.42 16.41 -5.8 4.68 3.58 3.41 5.76 5.15 3.25 3.58r 4.42r 5.01 -2.7 Bioenergy 3 25.38 26.02 +2.5 6.03 6.08 6.12 7.15 7.41 6.69 5.34r 6.58r 7.52 +1.4 Pumped Storage (net supply) 5 -0.98 -1.07 +8.6 -0.25 -0.23 -0.25 -0.25 -0.27 -0.26 -0.23r -0.30r -0.29 +5.6 Other fuels 4.30 5.16 +20.1 1.11 1.07 1.09 1.03 1.30 1.20 1.25r 1.42r 1.33 +2.4 Net imports 20.94 17.55 -16.2 4.91 5.54 5.89 4.60 6.00 5.35 4.68 1.51 2.90 -51.6 Total all generating companies 339.49 337.59 -0.6 94.80 79.29 77.57 87.83 93.08 78.88 76.33r 89.30r 90.89 -2.4 1. Percentage change between the most recent quarter and the same quarter a year earlier.
2. Includes wave and tidal3. Up to 2006 Q4, this includes non-biodegradable wastes. From 2007 Q1, this is included in 'Other fuels' (as it is not considered a renewable source).4. Electricity supplied net of electricity used in generation5. Net supply from pumped storage is usually negative, as electricity used in pumping is deducted.
6. This now includes a small amount of offshore wind generation from other generators
per cent change
per cent change 1
53

5 ELECTRICITYTable 5.2 Supply and consumption of electricity
GWh
2015 2015 2015 2015 2016 2016 2016 2016 2017
2015 2016 pPer cent change
1st quarter
2nd quarter
3rd quarter
4th quarter
1st quarter
2nd quarter
3rd quarter
4th quarter
1st quarter p
Per cent change 1
SUPPLYIndigenous production 338,917r 339,398 +0.1 95,559 78,533r 76,337 88,489r 92,267 78,039r 76,062r 93,029r 93,209 +1.0
Major power producers2 3 293,251 289,985 -1.1 84,265 66,645 64,903 77,438 80,565 65,450r 63,025r 80,945r 80,539 - Auto producers 42,926 46,453 +8.2 10,571 11,238r 10,780 10,337r 10,940r 11,900r 12,345r 11,268r 11,879 +8.6 Other sources 4 2,739 2,959 +8.0 723 650 653 714 762 689 693 815 791 +3.8
Imports 22,716 19,699 -13.3 5,462 6,023 6,152 5,080 6,334 5,622 4,951 2,792 3,863 -39.0 Exports 1,778 2,153 +21.1 555 484 259 480 331 275 268 1,279 960 (+) Transfers - - - - - - - - - - - Total supply 359,855 356,943 -0.8 100,466 84,072r 82,230 93,088r 98,271 83,386r 80,745r 94,543r 96,112 -2.2 Statistical difference 1,192 194 238 307r 193 455r 85- 186r 120r -26r 53Total demand 358,663 356,749 -0.5 100,228 83,765 82,037 92,633 98,356 83,200r 80,625r 94,568r 96,059 -2.3 TRANSFORMATION - - - - - - - - - - - Energy industry use 5 27,896 26,631 -4.5 7,535 6,615 6,592 7,154 6,974 6,297r 6,273r 7,087r 6,969 -0.1 Losses 27,319 26,323 -3.6 9,256 5,499 5,065 7,499 8,713 6,016r 4,969r 6,624r 8,348 -4.2 FINAL CONSUMPTION 303,448 303,795 +0.1 83,437 71,651 70,380 77,979 82,669 70,886r 69,383r 80,857r 80,742 -2.3 Iron & steel 3,688 2,847 -22.8 990 935 887 875 708 703 707 730r 714 +1.0 Other industries 89,219 88,961 -0.3 23,969 22,156 22,267 20,827 22,387 21,728r 22,000r 22,845r 22,268 -0.5 Transport 4,516 4,669 +3.4 1,129 1,129 1,129 1,129 1,167 1,167 1,167 1,167 1,167 - Domestic 107,764 107,971 +0.2 31,546 24,148 22,124 29,947 31,904 24,014 21,831r 30,222r 30,894 -3.2 Other final users 98,262 99,347 +1.1 25,804 23,282 23,974 25,202 26,502 23,274 23,679 25,892r 25,698 -3.0 Non energy use - - - - - - - - - - -
2. Companies that produce electricity from nuclear sources plus all companies whose prime purpose is the generation of electricity are included under the heading "Major Power Producers". At the end of December 2015 they were:
3. This table includes the change of definition of Major power producers (MPPs) to include major wind farm companies. Details of this change of definition were given in an article on pages 43 to 48 of the September 2008 edition of Energy Trends.
54
AES Electric Ltd., Anesco Ltd., Baglan Generation Ltd., British Energy plc., British Solar Renewables Ltd., Centrica Energy, Centrica Renewable Energy Ltd., CEP Wind 2, Coolkeeragh ESB Ltd., Corby Power Ltd., Coryton Energy Company Ltd., Cubico Sustainable Investments Ltd., Deeside Power Development Company Ltd., DONG Energy Burbo UK Ltd., Drax Power Ltd., EDF Energy plc., EDF Energy Renewables Ltd., Eggborough Power Ltd., E.On UK plc., Eneco Wind UK Ltd., Energy Power Resources, Falck Renewables Ltd., Fellside Heat and Power Ltd., First Hydro Company., Greencoat UK Wind plc., Immingham CHP, Infinis plc., International Power Mitsui, Lark Energy Ltd., Lightsource Renewable Energy Ltd., London Waste Ltd., Lynemouth Power Ltd., Magnox North Ltd., Marchwood Power Ltd., Peel Energy Ltd., Premier Power Ltd., Riverside Resource Recovery Ltd., Rocksavage Power Company Ltd., RWE Innogy Markinch Ltd., RWE Npower plc., Saltend Cogeneration Company Ltd., Scira Offshore Energy Ltd., Scotia Wind (Craigengelt) Ltd., Scottish Power plc., Scottish and Southern Energy plc., Seabank Power Ltd., SELCHP Ltd., Sembcorp Utilities (UK) Ltd., Severn Power Ltd., Slough Heat and Power Ltd., Spalding Energy Company Ltd., Statkraft Energy Ltd., Statkraft Wind UK Ltd.,Third Energy Trading Ltd.
1. Percentage change between the most recent quarter and the same quarter a year earlier.
4. Gross supply from pumped storage hydro.5. Includes electricity used in generation and for pumping, along with energy used by other fuel industries (including coal and coke, blast furnaces, extraction of oil and gas, petroleum refiniries, nuclear fuel production and gas and electricity supply) .

Renewables
55
Section 6 - Renewables
Relevant tables 6.1: Renewable electricity capacity and generation Page 62 Page 54 6.2: Liquid biofuels for transport consumption Page 63
Contacts for further information:
James Hemingway Liz Waters Renewables Statistics Renewables Statistics Tel: 0300 068 5042 Tel: 0300 068 5735
E-mail: [email protected]
Key results show: Renewables’ share of electricity generation was 26.6 per cent in 2017 Q1, up 1.0 percentage points on the share in 2016 Q1, reflecting increased capacity. Wind speeds and rainfall were lower than last year. (Chart 6.1) Renewable electricity generation was a record 24.8 TWh in 2017 Q1, an increase of 5.1 per cent on the 23.6 TWh in 2016 Q1. (Chart 6.2) Onshore wind increased by 1.3 TWh (20 per cent) to 7.7 TWh in 2017 Q1, the highest increase across the technologies. Total wind generation increased by 10 per cent to 12.7 TWh; the increase in capacity was partially offset by lower wind speeds. Solar increased by 16 per cent, from 1.5 TWh in 2016 Q1 to 1.7 TWh in 2017 Q1 due to increased capacity. (Chart 6.2) Renewable electricity capacity was 36.9 GW at the end of 2017 Q1, a 12 per cent increase (4.0 GW) on a year earlier, and a 3.3 per cent increase (1.2 GW) on the previous quarter. Of both increases in 2017 Q1, over half was due to new onshore wind capacity. (Chart 6.3) In 2017 Q1, just 54 MW of capacity eligible for the Feed in Tariff scheme was installed, increasing the total to 6.1 GW, across 897,135 installations. (Chart 6.5) Liquid biofuels consumption provisionally rose by 6.7 per cent, from 327 million litres in 2016 Q1 to 349 million litres in 2017 Q1. This represented 3.1 per cent of petrol and diesel consumed in road transport. (Chart 6.6)

Renewables
56
Chart 6.1 Renewables’ share of electricity generation (Table 6.1)
0%
2%
4%
6%
8%
10%
12%
14%
Wind Bioenergy Solar PV Hydro
Sh
are
of
gen
era
tio
n
Offshore5.4%
Onshore8.3%
Renewables’ share of electricity generation increased from 25.6 per cent in 2016 Q1 to 26.6 per cent in 2017 Q1, but remained 0.2 percentage points lower than 2015 Q4’s record 26.8 per cent. The increase on a year earlier reflects increased capacity, particularly in onshore wind and solar PV. Average wind speeds and rainfall were both lower than last year.
Total electricity generated from renewables in 2017 Q1 was up by 5.1 per cent on 2016 Q1, from 23.6 TWh to a new record of 24.8 TWh. Overall electricity generation was 93.2 TWh in 2017 Q1, up 1.0 per cent on a year earlier (92.3 TWh). This increase in overall generation partly offset the increase in renewables’ share of electricity generation by 0.3 percentage points. Total electricity generation figures (all generating companies) can be found in table ET 5.1, at: www.gov.uk/government/statistics/electricity-section-5-energy-trends

Renewables
57
Chart 6.2 Renewable electricity generation (Table 6.1)
0
5
10
15
20
25
30
Q12014
Q2 Q3 Q4 Q12015
Q2 Q3 Q4 Q12016
Q2 Q3 Q4 Q12017
Ge
ne
rati
on
(T
Wh
)
Shoreline wave / tidalSolar PVOffshore WindOnshore WindHydroBioenergy
In 2017 Q1, electricity generated from onshore wind increased by 20 per cent, from 6.4 TWh in 2016 Q1 to 7.7 TWh, though generation from offshore wind fell by 2.7 per cent to 5.0 TWh. The far higher increase in capacity for onshore wind, compared to offshore wind, offset the lower wind speeds during the quarter. Wind speeds in 2017 Q1, at 9.2 knots, were down 0.6 knots on both the long term mean and 2016 Q1 - see Energy Trends table 7.2 at: www.gov.uk/government/statistics/energy-trends-section-7-weather.
Generation from solar photovoltaics increased by 16 per cent (0.2 TWh) to 1.7 TWh compared to 2016 Q1, due to increased capacity.
Hydro generation fell by 15 per cent on a year earlier to 1.8 TWh; average rainfall (in the main hydro catchment areas) fell by 24 per cent during the quarter, which included the driest January since 2010 - see Energy Trends table 7.4 at: www.gov.uk/government/statistics/energy-trends-section-7-weather. In 2017 Q1, generation from bioenergy1 increased by 1.4 per cent on a year earlier, from 8.5 TWh to 8.6 TWh, with small increases in generation from plant biomass and biodegradable waste partly offset by reduced generation from landfill gas.
Bioenergy had the largest share of generation (36 per cent) with, 27 per cent from onshore wind, 22 per cent from offshore wind, 8.8 per cent from hydro and 6.2 per cent from solar PV.
1 Bioenergy consists of: landfill gas, sewage gas, energy from waste, plant biomass, animal biomass, anaerobic
digestion and co-firing (generation only)

Renewables
58
Chart 6.3 Renewable electricity capacity (as at end of quarter) (Table 6.1)
0
5
10
15
20
25
30
35
40
Q12014
Q2 Q3 Q4 Q12015
Q2 Q3 Q4 Q12016
Q2 Q3 Q4 Q12017
Insta
lle
d C
ap
acit
y (
GW
)
Shoreline wave / tidal
Solar PV
Offshore Wind
Onshore Wind
Hydro
Bioenergy
At the end of 2017 Q1, the UK’s renewable electricity capacity totalled 36.9 GW, an increase of 12 per cent (4.0 GW) on that installed at the end of 2016 Q1, and 3.3 per cent (1.2 GW) higher than the previous quarter. At the end of 2017 Q1, solar PV, at 12.2 GW, represented one-third of all renewable capacity, the highest share of renewable technologies. This was followed by onshore wind (32 per cent), bioenergy (16 per cent) and offshore wind (15 per cent).2 Compared with a year ago, onshore wind capacity increased by 2.2 GW (23 per cent), and offshore wind by 0.4 GW (7.1 per cent). Solar PV increased by 1.2 GW, with 0.3 GW of this deployed in the latest quarter, with the closure of the Renewables Obligation (RO) to the remaining new (grace period) solar schemes on 31 March 2017. During the quarter, a second solar PV scheme registered for support under Contracts for Differences (CfDs), the 10 MW, Triangle, began generating. During 2017 Q1, onshore wind capacity increased by 742 MW, with the opening of many new wind farms, including the 69 MW Corriegarth, 54 MW Ray and 45 MW Corriemollie sites – all in Scotland - and a further 39 MW of the Pen y Cymoedd wind farm in Wales (raising capacity to 195 MW). Offshore wind capacity increased by 160 MW, with the completion of Burbo Bank Extension (increasing from 200 MW to 258 MW) and generation beginning at the first 102 MW (across two phases) of Dudgeon (402 MW when complete).
2 To note that renewable generation and capacity figures include installations accredited on all support schemes
(Renewables Obligation, Feed in Tariffs, Contracts for Difference), as well as those not eligible for support or are commissioned but awaiting support accreditation. This should particularly be noted for solar PV (and onshore wind), where figures consist of many installations across several or all of these categories.

Renewables
59
Chart 6.4 Renewable electricity load factors (Table 6.1)
0%
10%
20%
30%
40%
50%
60%
70%
80%
Q12014
Q2 Q3 Q4 Q12015
Q2 Q3 Q4 Q12016
Q2 Q3 Q4 Q12017
Lo
ad
Fac
tor
(%)
Bioenergy Hydro Onshore Wind
Offshore Wind Solar PV
In 2017 Q1, onshore wind’s load factor fell by 0.5 percentage points, from 31.4 per cent in 2016 Q1 to 30.9 per cent, due to lower onshore wind speeds. Meanwhile, offshore wind’s load factor fell by 4.0 percentage points, from 46.3 per cent in 2016 Q1 to 42.3 per cent in 2017 Q1.3 Compared with 2016 Q4 – the calmest Q4 in the last 16 years - onshore and offshore wind’s load factors were up by 5.7 and 3.7 percentage points, respectively, with wind speeds up 1.6 knots. Hydro’s load factor in 2017 Q1 fell by ten percentage points, from 53.7 per cent in 2016 Q1 to 43.8 per cent, with average rainfall down by 24 per cent. Compared with 2016 Q4 – the driest Q4 in the last 16 years - hydro’s load factor in 2017 Q1 was up by 14 percentage points, from 30.1 per cent, with average rainfall up by 23 per cent.
For bioenergy, the load factor in 2017 Q1 was 68.0 per cent, down 3.1 percentage points on the record 71.1 per cent in 2016 Q1, but up 7.8 percentage points on 2016 Q4, reflecting the full return to operation of the biomass units at Drax power station, following maintenance outages in the second half of 2016.
3 Load Factors are calculated using an average of capacity at the start and end of the quarter. Therefore, they can be
influenced by the time in the quarter when any new capacity came online. This may particularly be the case for large wind farms, such as London Array offshore, that come online incrementally throughout the quarter.

Renewables
60
Chart 6.5 Feed in Tariffs: eligible installed capacity (as at end of quarter)
0
1,000
2,000
3,000
4,000
5,000
6,000
7,000
Q12014
Q2 Q3 Q4 Q12015
Q2 Q3 Q4 Q12016
Q2 Q3 Q4 Q12017
Insta
lle
d C
ap
acit
y (
MW
)
AD and micro CHP Wind Hydro Solar PV
At the end of 2017 Q1, 6.1 GW of capacity was installed and eligible for the GB Feed in Tariff (FiT) scheme4, a 9.1 per cent increase on that at the end of 2016 Q1. Much (0.2 GW) of this 0.5 GW increase occurred in 2016 Q2, with around 50 MW being installed in each of the last two quarters, reflecting the new CAPs mechanism. In terms of number of installations, at the end of 2017 Q1, there were 897,135 eligible for the FiT scheme, a 1.1 per cent increase on the 887,493 confirmed at the end of the previous quarter, and 4.6 per cent higher than the 857,439 schemes confirmed at the end of 2016 Q1. Solar photovoltaics (PVs) represent the majority of both installations and installed capacity confirmed on FiTs, with, respectively, 99 per cent and 81 per cent of the total. The majority of PV installations are sub-4 kW retrofitted schemes, which increased by 35,181 (82 MW) from 2016 Q1 to bring the total to 836,014 (2,421 MW) at the end of 2017 Q1. Renewable installations confirmed on FiTs (all except MicroCHP) represented 16 per cent of all renewable installed capacity. Statistics on Feed in Tariffs can be found at: www.gov.uk/government/collections/feed-in-tariff-statistics
4 Data are for schemes accredited under the Microgeneration Certification Scheme (MCS) and ROOFIT, which are pre-
requisites for registering for the FIT scheme; not all of these installations will eventually be confirmed onto the FIT scheme.

Renewables
61
Chart 6.6 Liquid biofuels for transport consumption (Table 6.2)
0
100
200
300
400
500
600
Q12014
Q2 Q3 Q4 Q12015
Q2 Q3 Q4 Q12016
Q2 Q3 Q4 Q12017
Vo
lum
e (m
illio
n lit
res
)
Bioethanol Biodiesel
In 2017 Q1, 349 million litres of liquid biofuels were consumed in transport, a rise of 6.7 per cent on the total in 2016 Q1 (327 million litres). Bioethanol consumption increased by 9.8 per cent, from 184 million litres in 2016 Q1 to 202 million litres in 2017 Q1, while biodiesel consumption rose by 2.8 per cent, from 143 million litres in 2016 Q1 to 147 million litres in 2017 Q1. In 2017 Q1, the largest share of consumption was from bioethanol (58 per cent), with the remaining 42 per cent coming from biodiesel, compared with 2016 Q1’s shares of 56 per cent and 44 per cent respectively. In 2017 Q1, biodiesel accounted for 2.0 per cent of total diesel consumed in transport, and bioethanol a record 5.0 per cent of motor spirit. The combined contribution of the two fuels was 3.1 per cent, 0.2 percentage points higher than 2016 Q1’s share.

6 RENEWABLESTable 6.1. Renewable electricity capacity and generation
2015 2015 2015 2015 2016 2016 2016 2016 2017
2015 2016 p 1st quarter 2nd quarter 3rd quarter 4th quarter 1st quarter 2nd quarter 3rd quarter 4th quarter 1st quarter p
Cumulative Installed Capacity 1 MWOnshore Wind 9,222 10,924 +18.5 8,707 8,810 9,022 9,222 9,479r 9,633r 10,295r 10,924 11,655 +23.0 Offshore Wind 5,094 5,294 +3.9 4,739 5,014 5,094 5,094 5,094 5,094 5,094 5,294 5,453 +7.1 Shoreline wave / tidal 9 13 +50.9 9 9 9 9 8 8 8 13 13 +73.2 Solar photovoltaics 9,535 11,899 +24.8 7,900 8,206 8,581 9,535 11,008r 11,469r 11,742r 11,899 12,178 +10.6 Small scale Hydro 299 358 +19.6 260 266 271 299 307r 311r 343r 358 360 +17.3 Large scale Hydro 1,477 1,477 - 1,477 1,477 1,477 1,477 1,477 1,477 1,477 1,477 1,477 - Landfill gas 1,061 1,062 +0.1 1,061 1,061 1,061 1,061 1,062r 1,062r 1,062r 1,062 1,062 - Sewage sludge digestion 231 257 +11.3 231 231 231 231 257 257 257 257 257 +0.2 Energy from waste 925 1,017 +9.9 826 834 902 925 934r 934r 983r 1,017 1,032 +10.6 Animal Biomass (non-AD) 2 111 129 +17.0 111 111 111 111 129 129 129 129 129 - Anaerobic Digestion 323 420 +29.9 263 266 299 323 370r 377r 405r 420 426 +15.1 Plant Biomass 3 2,607 2,850 +9.3 2,297 2,298 2,963 2,607 2,787r 2,787r 2,796r 2,850 2,850 +2.3 Total 30,893 35,700 +15.6 27,880 28,582 30,021 30,893 32,909r 33,537r 34,591r 35,700 36,894 +12.1 Co-firing 4 21 13 -35.9 21 21 21 21 13r 13r 13r 13 2 -83.1
Generation 5 GWhOnshore Wind 6 22,894 20,962 -8.4 7,176 4,767 3,817 7,135 6,406r 4,010r 4,631r 5,915 7,703 +20.2 Offshore Wind 6, 7 17,423 16,406 -5.8 4,676 3,578 3,412 5,757 5,150r 3,253r 3,584r 4,419 5,014 -2.7 Shoreline wave / tidal 6 2 0 -99.6 1 0 0 0 - - - 0 0 Solar photovoltaics 6 7,546 10,420 +38.1 938 3,109 2,701 798 1,464r 3,872r 3,750r 1,335 1,691 +15.6 Hydro 6 6,299 5,395 -14.4 2,011 1,425 1,028 1,834 2,089r 938r 1,154r 1,214 1,774 -15.1 Landfill gas 6 4,872 4,703 -3.5 1,240 1,212 1,201 1,220 1,218r 1,171r 1,158r 1,156 1,071 -12.1 Sewage sludge digestion 6 894 950 +6.3 225 233 217 220 236r 251r 229r 234 235 -0.4 Energy from waste 8 2,585 2,741 +6.0 607 603 687 688 728r 626r 677r 710 858 +17.8 Co-firing with fossil fuels 183 117 -35.9 36 36 57 55 51 15 5r 47 20 -61.3 Animal Biomass (non-AD) 2, 6 648 650 +0.4 170 171 142 165 171 165 140r 173 198 +15.6 Anaerobic Digestion 1,471 2,052 +39.5 325 349 371 426 482r 492r 524r 554 507 +5.1 Plant Biomass 3, 6 18,587 18,829 +1.3 4,351 4,409 4,383 5,443 5,637r 4,981r 3,481r 4,730 5,757 +2.1 Total 83,403 83,225 -0.2 21,755 19,893 18,015 23,741 23,633r 19,773r 19,333r 20,485 24,827 +5.1 Non-biodegradable wastes 9 2,586 2,742 +6.0 607 604 687 688 728r 626r 678r 710 858 +17.8
Load Factors 10
Onshore Wind 29.4% 23.7% 38.5% 24.9% 19.4% 35.4% 31.4%r 19.2%r 21.0% 25.2% 31.6%Offshore Wind 41.5% 36.0% 46.9% 33.6% 30.6% 51.2% 46.3%r 29.2%r 31.9% 38.5% 43.2%Solar photovoltaics 11.5% 11.1% 6.5% 17.7% 14.6% 4.0% 6.5%r 15.8%r 14.6% 5.1% 6.5%Hydro 41.0% 34.0% 53.7% 37.5% 26.7% 47.1% 53.7%r 24.1%r 29.0% 30.1% 44.7%Landfill gas 52.5% 50.4% 54.2% 52.3% 51.2% 52.1% 52.5%r 50.5%r 49.4% 49.3% 46.7%Sewage sludge digestion 45.7% 44.3% 46.6% 46.1% 42.4% 43.1% 44.3%r 44.7%r 40.3% 41.3% 42.3%Energy from waste 36.8% 32.1% 37.3% 33.3% 35.8% 34.1% 35.9%r 30.7%r 32.0% 32.1% 38.8%Animal Biomass (non-AD) 66.9% 61.7% 71.1% 70.9% 58.1% 67.7% 65.4%r 58.5%r 49.2% 60.7% 70.9%Anaerobic Digestion 59.8% 62.8% 60.1% 60.6% 59.5% 61.9% 63.7%r 60.4%r 60.7% 60.8% 55.5%Plant Biomass 87.5% 78.6% 88.7% 87.9% 75.5% 88.5% 95.7%r 81.8%r 56.5% 75.9% 93.5%Total (excluding co-firing and non-biodegradable wastes) 34.1% 28.4% 38.2% 32.2% 27.8% 35.2% 33.8%r 27.2%r 25.7% 26.3% 31.6%
1. Cumulative capacity at the end of the quarter/year2. Includes the use of poultry litter and meat and bone. 3. Includes the use of straw and energy crops. Also includes high-range co-firing (>85% biomass). 4. This is the amount of fossil fuelled capacity used for co-firing of renewables based on the proportion of generation accountedfor by the renewable source over the course of the year.5. Generation figures for the latest quarter are highly provisional, particularly for the thermal renewable technologies (such as landfill gas) in the lower half of the table.6. Actual generation figures are given where available, but otherwise are estimated using a typical load factor or the designload factor, where known. Generation from FiT schemes is estimated this way.7. For 2009, shoreline wave and tidal are included in offshore wind.8. Biodegradable part only, which accounts for 50% from 2015.9. Non-biodegradable (50%, from 2015) part of Energy from Waste, plus a small quantity of generation from waste tyres, hosptal waste and general industrial waste.10. Load factors are calculated based on installed capacity at the beginning and the end of the quarter/year. These can be influenced by the time in the period when new capacity came online.Load factors on an unchanged configuration basis, which consider just those sites operational throughout the year, are available annually in table DUKES 6.5, at:www.gov.uk/government/publications/renewable-sources-of-energy-chapter-6-digest-of-united-kingdom-energy-statistics-dukes11. Percentage change between the most recent quarter and the same quarter a year earlier; (+) represents a positive percentage change greater than 100%.
62
per cent change
per cent change 12

6 RENEWABLESTable 6.2. Liquid biofuels for transport consumption
2015 2015 2015 2015 2016 2016 2016 2016 20172015 2016 1st quarter 2nd quarter 3rd Quarter 4th Quarter 1st quarter 2nd quarter 3rd Quarter 4th Quarter 1st Quarter p
Volume (million litres) Million litresBioethanol 795 759 -4.5 189 203 205 198 184 194 189 192 202 9.8%Biodiesel 669 708 +5.8 125 152 177 215 143 219 196 150 147 2.8%Total biofuels for transport 1,464 1,467 +0.2 314 355 382 413 327 413 385 342 349 6.7%
Energy (thousand toe)Bioethanol 448 428 -4.5 107 114 116 112 104 109 107 108 114 9.8%Biodiesel 550 582 +5.8 103 125 145 177 117 180 161 123 121 2.8%Total biofuels for transport 998 1,010 +1.2 209 239 261 288 221 289 268 231 235 6.1%
Shares of road fuels (volume basis)Bioethanol as per cent of Motor Spirit 4.6% 0.0% 4.6% 4.6% 4.7% 4.5% 4.5% 4.4% 4.4% 4.5% 5.0%Biodiesel as per cent of DERV 2.3% 0.0% 1.8% 2.1% 2.4% 2.9% 2.0% 2.9% 2.6% 1.9% 2.0%Total biofuels as per cent of road fuels 3.2% 0.0% 2.9% 3.0% 3.3% 3.5% 2.9% 3.4% 3.2% 2.8% 3.1%
1. Percentage change between the most recent quarter and the same quarter a year earlier.Source: HM Revenue and Customs Hydrocarbon Oils Bulletin, available at:www.uktradeinfo.com/Statistics/Pages/TaxAndDutybulletins.aspx
Shares of road fuels - % change on quarter in previous year % change on quarter in previous year (-ve value is decrease)Bioethanol as per cent of Motor Spirit 0.1% 0.1% -0.1% 0.0% -0.1% -0.2% -0.3% -0.1% 0.5%Biodiesel as per cent of DERV -1.1% -1.6% -1.4% -0.3% 0.2% 0.8% 0.2% -0.9% 0.0%Total biofuels as per cent of road fuels -0.7% -1.0% -0.9% -0.2% 0.0% 0.4% 0.0% -0.7% 0.2%
per cent change
63
per cent change 1

Special feature – Renewable energy in 2016
64
Renewable energy in 2016
Introduction This article includes a first estimate of the UK’s progress against the Renewable Energy Directive (RED) for 2016. It incorporates an update of the proportion of renewable electricity generation for 2016 previously published in the March 2017 issue of Energy Trends, and a first estimate of renewable heat generation. The first three sections describe trends in actual generation for electricity, heat, and renewable transport fuels in 2016. The subsequent sections relate to the methodology used to calculate progress against the Directive and UK progress for 2016. It also includes a brief comparison of member states’ progress for 2015, the latest year for which data have been published.
Key messages
Progress against the Renewable Energy Directive (2009);
In 2016, renewable energy provisionally accounted for 8.9 per cent of final energy consumption, as measured using the 2009 Renewable Energy Directive (RED) methodology, an increase of 0.7 percentage points on 2015.
The UK has now exceeded its third interim target; averaged over 2015 and 2016, at 8.5 per cent against its target of 7.5 per cent. Chart 1 shows current progress and all targets;
Chart 1: Progress against Renewable Energy Directive and UK targets
Renewable electricity accounted for 24.6 per cent of total generation (as measured using the RED methodology), an increase of 2.3 percentage points compared to 2015.
Renewable heat accounted for 6.2 per cent of total heat consumption, an increase of 0.7 percentage points on 2015.
Renewable energy for transport accounted for 4.5 per cent of total transport energy, 0.1 percentage points higher than in 2015.

Special feature – Renewable energy in 2016
65
Trends in Generation;
Total renewable energy increased by 706 ktoe (4.3 per cent), from 16,591 in 2015 to 17,296 ktoe in 2016.
Renewable electricity generation fell by 0.2 TWh (0.2 per cent) to 83.2 TWh in 2016
Electricity generation from solar photovoltaics increased by 2.9 TWh (38 per cent) to 10.4 TWh, a record.
Total wind generation fell by 7.3 per cent to 37.4 TWh in 2016 as a result of lower wind speeds.
15 per cent of renewable heat generation in 2016 was supported by the Renewable Heat Incentive (RHI).
Renewable electricity generation In 2016, renewable electricity generation represented 71 per cent of total renewable energy (on a
fuel input basis; see table 5 at the end of this article). Total renewable generation fell by 0.2
TWh (0.2 per cent) to 83.2 TWh in 2016. Total wind generation fell by 7.3 per cent to 37.4 TWh; an increase in capacity (mostly for onshore wind) was more than offset by lower wind speeds compared to 2015, though wind speeds for that year had been the highest for the preceding 15 years. Onshore wind fell by 8.4 per cent to 21.0 TWh and offshore wind fell by 5.8 per cent.
Generation from hydro also fell, by 14 per cent to 5.4 TWh in 2016, although 2015 had been a
record year due to high rainfall (in the main hydro catchment areas)1. Solar photovoltaic
generation showed the largest absolute increase of the renewable technologies (2.9 TWh or 38 per cent) due to additional capacity which increased by 25 per cent. For the second year, solar photovoltaics are the leading technology by capacity though is the fourth largest in generation
terms. The largest increase in generation in percentage terms was anaerobic digestion which showed growth of 40 per cent to 2.1 TWh in 2016, a record, the result of increased capacity supported by the Feed in Tariff. Table 1 below shows electricity generation over the last three years by technology;
Table 1
Generation (TWh) 2014 2015 2016
Percentage
share in
2016
Onshore Wind 18.6 22.9 21.0 25.2% Offshore Wind 13.4 17.4 16.4 19.7% Shoreline wave/Tidal 0.0 0.0 0.0 0.0% Solar photovoltaics 4.1 7.5 10.4 12.5% Hydro Small scale 0.8 1.0 1.0 1.2% Hydro Large scale 5.1 5.3 4.4 5.3% Landfill gas 5.0 4.9 4.7 5.7% Sewage sludge digestion 0.8 0.9 1.0 1.1% Municipal solid waste combustion 1.9 2.6 2.7 3.3% Co-firing with fossil fuels 0.1 0.2 0.1 0.1% Animal Biomass 0.6 0.6 0.7 0.8% Anaerobic Digestion 1.0 1.5 2.1 2.5%
Plant Biomass 13.1 18.6 18.8 22.6%
Total generation 64.5 83.4 83.2 100.0%
Onshore wind continued to be the leading individual technology for the generation of
electricity from renewable sources during 2016, although its share of renewables generation continued to fall, from 28 percent in 2015 to 25 per cent in 2016. Offshore wind’s share of
1 Weather data are available as part of this publication;
www.gov.uk/government/statistics/energy-trends-section-7-weather

Special feature – Renewable energy in 2016
66
renewables generation also fell slightly in 2016 to 20 per cent (from 21 per cent in 2015). The remaining technologies’ shares were similar to 2015.
Heat production Renewable heat generation accounted for 23 per cent of total renewable sources in 2015 (see table 5 at the end of this article), up slightly (one and a half percentage points) on 2015. The four categories of renewable heat production in the United Kingdom are the direct combustion of various forms of bioenergy, (94 per cent of the total), active solar heating, geothermal, and heat pumps. Table 2 below shows the source mix.
Table 2
Heat generation (ktoe) 2014 2015 2016
Percentage
share in
2016
Landfill gas 13.6 13.6 13.6 0.3% Sewage sludge digestion 67.7 73.1 72.1 1.8% Wood combustion - domestic 1,698.1 1,908.5 1,954.0 49.6% Wood combustion - industrial 319.1 318.7 319.1 8.1% Animal Biomass 34.5 30.7 23.0 0.6% Anaerobic digestion 42.9 95.5 179.4 4.5% Plant Biomass 561.2 837.7 1,102.2 28.0% Biodegradable energy from waste 22.4 45.6 45.7 1.2% Active solar heating 49.6 50.7 51.2 1.3% Deep geothermal 0.8 0.8 0.8 0.0%
Heat Pumps 106.7 155.8 182.2 4.6%
Total 2,916.6 3,530.6 3,943.3 100.0%
Renewables used to generate heat have grown in recent years, following a decline up to 2005 as a result of tighter emission controls which discouraged on-site burning of biomass, especially wood waste. Policies such as the Renewable Heat Incentive (RHI) and Renewable Heat Premium Payment (RHPP) schemes are designed to support renewable heat production. Around 15 per cent of renewable heat during 2016 was supported through the receipt of RHI payments (589 ktoe, or 6,852 GWh). Domestic use of wood is the main contributor to renewables used for heat – comprising around 50 per cent of the renewable heat total. Plant biomass represented 28 per cent of renewable heat and industrial wood 8.1 per cent. Heat pumps (mainly in the domestic sector) contributed 4.6 per cent of the renewable heat total.
Liquid biofuels for transport Liquid biofuels for transport comprised around 5.8 per cent of total renewable sources. Two road transport fuels, biodiesel and bioethanol, are sold blended with diesel and petrol. In 2016, 708 million litres (582 ktoe) of biodiesel and 759 million litres (428 ktoe) of bioethanol were consumed in 2016; by volume, biodiesel consumption was 5.8 per cent higher than in 2015, whilst bioethanol consumption was 4.5 per cent lower. During 2016, biodiesel accounted for 2.4 per cent of diesel, and bioethanol 4.4 per cent of motor spirit; the combined contribution of biodiesel and bioethanol was 3.1 per cent by volume, 0.1 percentage points lower than in 2015. The Renewable Energy Directive introduced various sustainability criteria for transport biofuels; certain biofuels derived from waste products (for example, waste cooking oil) have extra weighting when monitoring progress against the transport component, but not the overall target, of the Directive.

Special feature – Renewable energy in 2016
67
Progress against the Renewable Energy Directive
Table 3 shows the increasing share of renewable energy from electricity, heat and transport;
Table 3: Progress against the 2009 Renewable Energy Directive
2004 2010 2014 2015 2016
Percentage of electricity from renew able
sources (normalised) 3.5% 7.4% 17.8% 22.3% 24.6%
Percentage of heating and cooling from
renew able sources 0.7% 2.8% 4.7% 5.5% 6.2%
Percentage of transport energy from
renew able sources 0.2% 3.3% 5.3% 4.4% 4.5%
Overall renew able consumption1,2 1.1% 3.8% 7.0% 8.2% 8.9%1
Measured as a percentage of capped gross final energy consumption using net calorific values
2Cannot be direc t ly calculated from the three separate measures
The proportion of renewable electricity is, calculated on a RED basis, 24.6 per cent for 2016, 2.3 percentage points higher than in 2015 and 0.3 percentage points higher than the initial estimate published in the March 2017 edition of Energy Trends. Although actual generation fell in 2016, the normalising effect of the RED methodology (see below) has resulted in an actual increase. Renewable heat also increased though to a lesser extent; from 5.5 per cent in 2015 to 6.2 per cent in 2016. The share of renewable energy in transport increased slightly, by 0.1 percentage point to 4.5 per cent. Chart 2 below shows
Chart 2: Progress against Renewable Energy Directive
Renewable Energy Directive Methodology Progress against the RED is measured using a defined methodology; full details are published by Eurostat and can be found in the “SHARES manual”; http://ec.europa.eu/eurostat/web/energy/data/shares

Special feature – Renewable energy in 2016
68
However, some of the key adjustments are outlined below; Electricity Generation; Generation uses a normalisation approach for wind and hydro generation to negate the effects of variable wind speeds and rainfall from one year to the next. Normalised wind generation is calculated using the average load factor for the most recent five years and applying to the average of the start and end of year capacity. For Hydro, the load factor is the average of the past 15 years, applied to capacity at the end of the current year. Heat Generation; Net calorific values are used in the heat energy calculation in contrast to The Digest of UK Energy Statistics (DUKES) which uses Gross Calorific Values. Additionally, heat energy generated by heat pumps includes only those heat pumps meeting the minimum Seasonal Performance Factor (SPF) of 2.5. Renewable Energy for Transport Some liquid biofuels, mostly those derived from waste products, are awarded double credits under the Renewable Transport Fuel Obligation scheme
2. This applies to the transport specific target of
10 per cent and not in the overall progress calculation. Overall calculation adjustment Final total energy consumption (i.e. the denominator) includes a cap on air transport fuel (6.18 per cent).
Renewable electricity’ share of generation (different measures) In addition to the RED methodology for calculating renewable electricity’s share of total generation, using normalisation; it is also calculated on an International Basis (actual generation as a percentage of total generation), and on a Renewables Obligation (RO) basis (generation supported by the Renewables Obligation as a percentage of electricity sales). In 2016, the lowest measure was on the International Basis at 24.5 per cent On the RED basis, generation was higher at 24.6 per cent reflecting the normalisation of wind and hydro generation. The highest measure was the RO measure at 26.2 per cent. Table 4 below shows a comparison of the three different measures;
Table 4
2004 2010 2014 2015 2016
International Basis1 3.6% 6.9% 19.1% 24.6% 24.5%
Renewable Obligation2 3.1% 7.2% 19.8% 26.1% 26.2%
2009 Renewable Energy Directive3 3.5% 7.4% 17.8% 22.3% 24.6%
1 All renewable electricity as a percentage of total UK electricity generation
2 Measured as a percentage of UK electricity sales
3 2009 Renewable Energy Directive measured as a percentage of gross electricity
consumption
Load factors in 2016 (see table ET 6.1) for wind and hydro generation were low compared to the previous year and to the long term mean due to low wind speeds, and low rainfall in the main catchment areas (see tables ET 7.2 and ET 7.4 respectively for weather data). This fall in generation due to these weather effects were damped by the normalisation process and in such years, the proportion calculated on a RED basis will tend to diverge from the alternate measures. Chart 3 shows this divergence;
2 www.gov.uk/guidance/renewable-transport-fuels-obligation
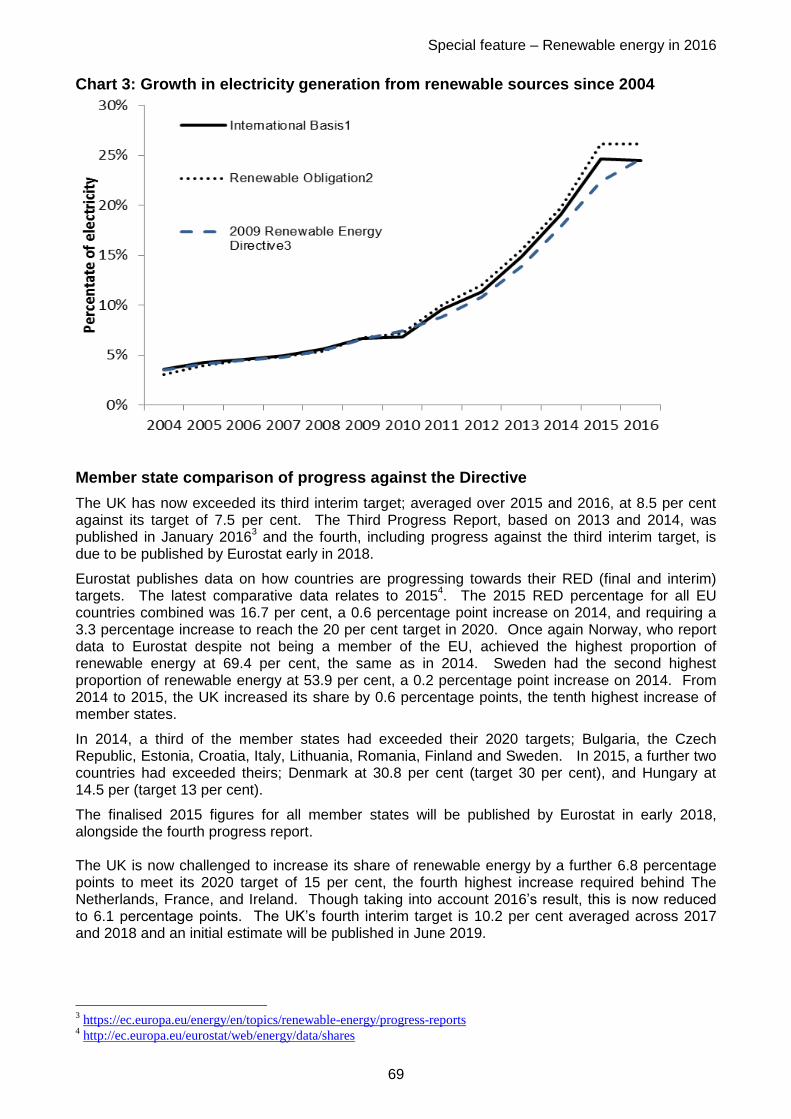
Special feature – Renewable energy in 2016
69
Chart 3: Growth in electricity generation from renewable sources since 2004
Member state comparison of progress against the Directive
The UK has now exceeded its third interim target; averaged over 2015 and 2016, at 8.5 per cent against its target of 7.5 per cent. The Third Progress Report, based on 2013 and 2014, was published in January 2016
3 and the fourth, including progress against the third interim target, is
due to be published by Eurostat early in 2018.
Eurostat publishes data on how countries are progressing towards their RED (final and interim) targets. The latest comparative data relates to 2015
4. The 2015 RED percentage for all EU
countries combined was 16.7 per cent, a 0.6 percentage point increase on 2014, and requiring a 3.3 percentage increase to reach the 20 per cent target in 2020. Once again Norway, who report data to Eurostat despite not being a member of the EU, achieved the highest proportion of renewable energy at 69.4 per cent, the same as in 2014. Sweden had the second highest proportion of renewable energy at 53.9 per cent, a 0.2 percentage point increase on 2014. From 2014 to 2015, the UK increased its share by 0.6 percentage points, the tenth highest increase of member states.
In 2014, a third of the member states had exceeded their 2020 targets; Bulgaria, the Czech Republic, Estonia, Croatia, Italy, Lithuania, Romania, Finland and Sweden. In 2015, a further two countries had exceeded theirs; Denmark at 30.8 per cent (target 30 per cent), and Hungary at 14.5 per (target 13 per cent).
The finalised 2015 figures for all member states will be published by Eurostat in early 2018, alongside the fourth progress report. The UK is now challenged to increase its share of renewable energy by a further 6.8 percentage points to meet its 2020 target of 15 per cent, the fourth highest increase required behind The Netherlands, France, and Ireland. Though taking into account 2016’s result, this is now reduced to 6.1 percentage points. The UK’s fourth interim target is 10.2 per cent averaged across 2017 and 2018 and an initial estimate will be published in June 2019.
3 https://ec.europa.eu/energy/en/topics/renewable-energy/progress-reports
4 http://ec.europa.eu/eurostat/web/energy/data/shares

Special feature – Renewable energy in 2016
70
For further information on renewable energy statistics please contact either of the following:
Liz Waters James Hemingway
Renewables Statistics Renewables Statistics Tel: 0300 068 5735 Tel: 0300 068 5042 E-mail: [email protected] E-mail: [email protected]

Special feature – Renewable energy in 2016
71
Table 5: Renewable sources used to generate electricity and heat, and for
transport fuels (1) (2)
Thousand tonnes of oil equivalent
2014 2015 2016
Used to generate electricity (3)
Wind:
Onshore 1,595.4 1,968.6 1,802.4
Offshore 1,152.6 1,498.1 1,410.6
Shoreline w ave / tidal (4) 0.2 0.2 0.0
Solar photovoltaics 348.6 648.8 896.0
Hydro: - - -
Small scale 71.8 84.6 87.4
Large scale (5) 434.5 456.9 376.5
Bioenergy: - - -
Landfill gas 1,650.8 1,598.0 1,542.4
Sew age sludge digestion 275.5 293.3 311.7
Biodegradable energy from w aste 682.1 905.2 1,117.4
Co-firing w ith fossil fuels 25.1 37.8 24.6
Animal Biomass (6) 224.8 235.3 230.1
Anaerobic digestion 335.4 482.4 673.1
Plant Biomass (7) 2,912.9 3,847.6 3,871.0
Total bioenergy 6,106.6 7,399.6 7,770.4
Total 9,709.7 12,056.9 12,343.3
Non-biodegradable energy from w aste (8) 688.4 911.5 1,123.7
Used to generate heat Active solar heating 49.6 50.7 51.2
Bioenergy:
Landfill gas 13.6 13.6 13.6
Sew age sludge digestion 67.7 73.1 72.1
Wood combustion - domestic 1,698.1 1,908.5 1,954.0
Wood combustion - industrial 319.1 318.7 319.1
Animal Biomass (9) 34.5 30.7 23.0
Anaerobic digestion 42.9 95.5 179.4
Plant Biomass (10) 561.2 837.7 1,102.2
Biodegradable energy from w aste (6) 22.4 45.6 45.7
Total bioenergy 2,759.6 3,323.3 3,709.1
Deep geothermal 0.8 0.8 0.8
Heat Pumps 106.7 155.8 182.2
Total 2,916.6 3,530.6 3,943.3
Non-biodegradable w astes (8) 158.4 158.5 167.6
Renewable sources used as transport fuels as Bioethanol 458.8 449.1 427.8
as Biodiesel 783.8 554.1 581.7
Total 1,242.7 1,003.1 1,009.5
Total use of renewable sources and wastes Solar heating and photovoltaics 398.1 699.5 947.2
Onshore w ind 1,595.4 1,968.6 1,802.4
Offshore w ind 1,152.6 1,498.1 1,410.6
Shoreline w ave / tidal 0.2 0.2 0.0
Hydro 506.3 541.6 463.9
Bioenergy 8,866.2 10,722.9 11,479.4
Deep geothermal 0.8 0.8 0.8
Heat Pumps 106.7 155.8 182.2
Transport biofuels 1,242.7 1,003.1 1,009.5
Total 13,869.0 16,590.6 17,296.1
Non-biodegradable energy from w aste (8) 846.8 1,070.0 1,291.3
All renewables and wastes 14,715.8 17,660.6 18,587.5
(1) Includes some waste of fossil fuel origin.
(2) See the Digest of UK Energy Statistics for technical notes and definitions of the categories used in this table.
(3) For wind, solar PV and hydro, the figures represent the energy content of the electricity supplied but for
bioenergy the figures represent the energy content of the fuel used.
(4) Includes the EMEC test facility.
(5) Excluding pumped storage stations.
(6) Includes electricity from poultry litter combustion and meat & bone combustion.
(7) Includes electricity from straw and energy crops.
(8) Non-biodegradable part of municipal solid waste plus waste tyres, hospital waste, and general industrial waste.
(9) Includes heat from farm waste digestion, and meat and bone combustion.
(10) Includes heat from straw, energy crops, paper and packaging.

Special feature – Enhancement to Energy Trends gas tables
72
Enhancements to Energy Trends gas tables Background This article outlines the i.) effects of new data from industry in regards to indigenous production and imports, ii.) methodological changes to the UK’s gas export volumes and iii.) the inclusion of biomethane injections into the grid from certified Renewable Heat Incentive (RHI) installations.
Changes to gross gas production and gas import volumes Gross gas production and imports have been revised from 2008 onwards following new data submitted by industry. As a result, some gas previously categorised as arising from indigenous production on the UKCS has been reallocated to imports. The supply of gas into the UK remains steady but the spilt between indigenous production and imports has altered.
Impact of revisions Over the last 9 years, around ~2.6 per cent of the gas that has been reported as domestic production from some terminals should have been reported as imported gas from Norway. There are some more significant annual spikes outlined in table 1 below. Table 1: Changes in UKCS gross production (GWh)
2008 2009 2010 2011 2012 2013 2014 2015 2016
Previous 809,649 693,965 664,353 526,030 452,094 424,153 427,784 460,268 476,744 Revised 807,821 679,344 642,515 511,532 434,941 410,460 415,515 451,437 462,307 Difference -0.2% -2.1% -3.3% -2.8% -3.8% -3.2% -2.9% -1.9% -3.0%
Consequently, this has had a similar impact to imports, where imports from Norway had previously been underestimated by around ~2.5 per cent as outlined in table 2 below. Table 2: Changes in imports (GWh) 2008 2009 2010 2011 2012 2013 2014 2015 2016
Previous 407,188 457,447 592,554 588,475 549,518 535,105 476,837 492,382 521,586 Revised 409,049 471,843 614,479 603,924 566,669 548,223 488,937 501,563 534,740 Difference +0.5% +3.1% +3.7% +2.6% +3.1% +2.5% +2.5% +1.9% +2.5%
The breakdown of imports can be found in table ET 4.3 and ET 4.4 and users will see revisions for imports from Norway for the reasons mentioned previously along with two new sources from Norway specifically outlined in table ET 4.4.
Changes to gas export volumes Changes have been made to the methodology used by BEIS to calculate exports to the Republic of Ireland and the Isle of Man. These changes include removing Virtual Reverse Flows (VRF) from the gas sent to Ireland, use of a new data source for gas to Northern Ireland and gas to the Isle of Man, which have now been separately identified in the latest Energy Trends table ET 4.3. Further details are provided below. Virtual Reverse Flows (VRF) at the Moffat Interconnector Under European Commission regulations1 it is required that gas transported between two regulated natural gas pipeline systems must be bi-directional. This could be gas travelling in both directions physically or there is the option for gas to physically travel in one direction and then a reverse flow service on a virtual basis offered in the opposite direction.
1 Regulation (EC) 1775/2005 of the European Parliament and of the Council of 28 September 2005 on conditions for
access to the natural gas transmission networks.

Special feature – Enhancement to Energy Trends gas tables
73
However, the Moffat Interconnector2 is uni-directional in a physical sense with physical gas flows leaving the UK and entering the Republic of Ireland (with take-off points at the Isle of Man and Northern Ireland). Consequently, from March 2016 a virtual reverse flow service was offered at the Moffat interconnector where Irish shippers are able to avail a surplus on the network and sell the gas back within the UK. As a result there are no physical flows from the Republic of Ireland to the UK and virtual gas flows are subtracted from exports to Ireland, which is referred to as netting. Since March 2016 these virtual reverse flows have been counted within the export figure to Ireland despite no physical flows occurring. We have since worked with National Grid and Gas Networks Ireland (GNI) to identify and remove these virtual flows to ensure only physical flows are reported in table ET 4.3. In future publications only physical exports will be included in line with the methodology mandated by the International Energy Agency (IEA) and the European Union (EU).
Exports to the Isle of Man Along with the above changes, gas sent to the Isle of Man via a take off point on the Moffat interconnector is separated identified using data provided by Manx Utilities. Annex A illustrates the basics of the gas flows from the UK through to the Republic of Ireland, Northern Ireland and the Isle of Man.
Impact of revisions Gas exports to the Republic of Ireland have decreased following the separation of gas to the Isle of Man from 2005 onwards. These increases are relatively small but are larger from March 2016 onwards following an amendment to the methodology to ensure that exports to the Republic of Ireland reported in table ET 4.3 are physical flows. An example of the structural change to table ET 4.3 can be found highlighted in Annex B.
Inclusion of biomethane injections into the grid from RHI installations Previously the gas Energy Trends tables did not include biomethane injected into the grid in the upstream supply side of table ET 4.2, only gas that was available at terminals. Biomethane has been injected into the National Grid since 2014, though the volumes were small (0.02 per cent of supply in 2014, 0.2 per cent in 2016). As volumes are growing, BEIS will include these going forward. The biomethane injections into the grid that will be reported are those certified under the Renewable Heat Incentive (RHI) into the gas supply for the UK. This data is obtained by the Renewable Heat team within BEIS, from Xoserve and then the team record match the data to a certified RHI installation. A single monthly number for biomethane injections is then provided to the oil and gas statistics team to include in the UK’s gas supply. Consequently, in the latest table ET 4.2 two new columns have been added to account for the additional gas supply, one for biomethane injections into the grid and another for total gas available3 in the UK. These structural changes are shown in Annex C. The biomethane injections were already included in the downstream side of Table ET 4.2 within gas input into the transmission system. Gas Distribution Networks within Great Britain provide monthly data to BEIS for gas they input into the transmission system and through investigations it has been discovered that this data already contains biomethane injections into the grid. Therefore, the inclusion of the biomethane injections data rebalances gas supply and demand in table ET 4.2. This change has also impacted table ET 4.1 where the biomethane injections into the grid are included as transfers in the supply side.
2 See page 103 of DUKES 2016 for a map of UK pipelines
www.gov.uk/government/uploads/system/uploads/attachment_data/file/540923/Chapter_4_web.pdf
3 Gas available at terminals plus biomethane injections into the grid.

Special feature – Enhancement to Energy Trends gas tables
74
Further developments
As ever, BEIS welcome comments on the methodology and suggestions for its improvement.
Acknowledgements BEIS would like to acknowledge the assistance of the Oil and Gas Authority (OGA), Xoserve, National Grid, Gas Networks Ireland (GNI), Isle of Man Government and Manx Utilities.
Matthew Curds Upstream oil and gas
Oil and Gas Statistics Team
Tel. 0300 068 8414
E-mail: [email protected]

Special feature – Enhancement to Energy Trends gas tables
75
Annex A: Gas flows from the UK to the Republic of Ireland with take-off points for
Northern Ireland and the Isle of Man
Gas is sent from Great Britain via the Moffat exit point in Scotland through the Moffat
interconnector to,
1. Northern Ireland via the Scottish Northern Ireland Pipeline (SNIP),
2. Then the Isle of Man via a take-off point on the Moffat interconnector,
3. And finally the Republic of Ireland via the Moffat interconnector.
1
2
3
UK Moffat exit point

Annex B: Energy Trends Table 4.3 under the new methodology
GASTABLE 4.3 Natural gas imports and exports GWh
Imports
From From the From Liquefied Total To To the To To the To the Liquefied Total Net
Belgium1 Netherlands2 Norway3 Natural Gas4Imports Belgium1 Netherlands5 Norway6
Republic of Isle of Man8 Natural Gas9Exports Imports10
Ireland7
2012 14,264 78,258 311,736 150,098 554,356 50,343 23,729 49 56,764 825 0 131,711 +422,645
2013 35,367 81,519 318,634 102,620 538,140 27,458 18,597 20 52,257 1,251 0 99,582 +438,558
2014 3,949 70,293 278,818 123,910 476,969 48,074 18,852 9 47,737 1,267 0 115,938 +361,030
2015 2,116 35,933 307,943 152,406 498,398 84,465 20,789 3 46,898 1,192 3,005 156,353 +342,045
2016 p 15,414 47,444 347,005 122,310 532,173 67,189 18,302 1 21,943 1,349 5,511 114,294 +417,879
Per cent change (+) +32.0 +12.7 -19.7 +6.8 -20.5 -12.0 -58.6 -53.2 +13.1 +83.4 -26.9 +22.2
2016 January - April 836 27,313 131,896 49,935 209,980 10,799 7,131 0 9,692 538 443 28,604 +181,376
2017 January - April p 12,576 9,352 154,991 32,373 209,292 15,946 5,715 0 6,564 495 2,486 31,205 +178,086
Per cent change (+) -65.8 +17.5 -35.2 -0.3 +47.7 -19.9 - -32.3 -8.0 (+) +9.1 -1.8
2016 February 228 6,729 31,328r 14,208r 52,492r 1,335 1,662 0 2,732r 134 - 5,863r +46,629r
March 359 8,487 36,794r 12,686r 58,326r 1,961 1,765 0 2,285r 136 443 6,591r +51,735r
April - 4,919 29,788r 13,430r 48,138r 5,300 1,928 - 2,205r 126 - 9,559r +38,578r
Total 587 20,135 97,910 40,324 158,955 8,596 5,356 0 7,222 396 443 22,013 +136,942
2017 February 5,355 3,590 40,662r 4,628r 54,235r 204 1,199 0 1,225r 130 1,014 3,772r +50,464r
March 26 517 38,563r 9,983r 49,089r 3,201 1,393 0 1,456r 127 - 6,177r +42,912r
April p - 14 28,970 11,949 40,933 12,541 1,469 - 2,132 95 - 16,238 +24,695
Total 5,381 4,121 108,195 26,560 144,257 15,946 4,061 0 4,813 352 1,014 26,186 +118,071
Per cent change 11 (+) -79.5 +10.5 -34.1 -9.2 +85.5 -24.2 - -33.4 -11.3 (+) +19.0 -13.8
1. Physical flows of gas through the Bacton-Zeebrugge Interconnector.
2. Physical flows via the BBL pipeline.
3. Via the Langeled pipeline, Vesterled pipelines, the Tampen Link (from Statfjord to FLAGS), SAGE pipeline (from the Norwegian Alveheim and Edvard Greig gas fields that are linked to SAGE) and the CATS pipeline (from the Norwegian Rev and Gaupe gas fields that are linked to CATS
4. From various sources to Milford Haven (South Hook and Dragon), Isle of Grain and Gasport Teesside
5. Direct exports from the Chiswick, Grove, Kew, Markham, Minke, Orca, Stamford, Windermere and Wingate offshore gas fields.
6. Injection into the Norwegian Ula field.
7. Gas to the Isle of Man is included in exports to the Republic of Ireland up until 2004 and then seperately identified from 2005 onwards.
8. Gas reported by the Isle of Man at the exit point of the Moffat Interconnector from 2005 onwards.
9. Exports of LNG in 2016 broken down by destination are as follows: Argentina (913 GWh), Egypt (1,018 GWh), Puerto Rico (443 GWh) South Korea (1,124 GWh) and United Arab Emirates (2,014 GWh)
10. A negative figure means the the UK was a net exporter of gas.
11. Percentage change between the most recent quarter and the same quarter a year earlier; (+) represents a positive percentage change greater than 100%.
Exports
76

Annex C: Energy Trends Table 4.2 under the new methodology
GASTABLE 4.2 Natural gas production and supply GWh
Upstream gas industry Downstream gas industry
Gross gas Less Plus Gas available Plus Total gas Gas input Less Gas output
production1Producers' Exports3
Imports Net at terminals5Biomethane available7
into Operators' LNG Storage Stock Metering from
own use2 imports4 injected into the grid6transmission own use9
Terminals' Own Use11 changes12 differences13transmission
systems8 Own Use10 systems14
2012 434,941 48,461 144,023 566,669 +422,646 809,127 - 809,127 809,460 1,682 2,218 595 -326 6,099 799,191
2013 410,460 46,000 109,664 548,223 +438,559 803,019 - 803,019 803,478 2,017 1,517 644 -1,265 5,697 794,869
2014 415,515 45,313 127,907 488,937 +361,030 731,153 136 731,289 732,137 1,500 1,831 651 +1,731 5,302 721,121
2015 451,437 51,024 159,517 501,563 +342,046 742,459 980 743,439 741,539 1,725 2,252 458 -3,973 7,281 733,796
2016 p 462,307 50,079 116,862 534,740 +417,878 830,106 1,919 832,025 830,966 2,369 1,808 140 -16,382 4,065 838,966
Per cent change +2.4 -1.9 -26.7 +6.6 +22.2 +11.8 +95.9 +11.9 +12.1 +37.3 -19.7 -69.4 (+) -44.2 +14.3
2016 January - April 156,811 18,235 29,909 211,284 181,376 319,952 504 320,456 320,346 750 738 72 -35,330 1,053 353,062
2017 January - April p 164,842 16,920 31,767 209,854 178,086 326,008 838 326,846 326,550 1,246 478 16 -17,661 980 341,492
Per cent change +5.1 -7.2 +6.2 -0.7 -1.8 +1.9 +66.2 +2.0 +1.9 +66.2 -35.2 -78.3 -50.0 -7.0 -3.3
2016 February 37,154r 4,480 6,237r 52,866r +46,629r 79,302r 116 79,418 79,591r 171r 210r 15 -11,518 334 90,379r
March 39,195r 4,408 7,011r 58,746r +51,735r 86,523r 132 86,654 86,301r 218 187r 16 -5,323 420 90,784r
April 38,173r 4,261 9,746r 48,324r +38,578r 72,490r 139 72,629 72,649r 141 198 26 -3,596r 338r 75,541
Total 114,522 13,149 22,994 159,936 136,942 238,315 386 238,701 238,542 530 596 58 -20,438 1,091 256,704
2017 February 37,837r 4,071 3,875r 54,339r +50,464r 84,230r 192r 84,422r 84,291r 362 68r 5 -2,288r 131r 86,011r
March 41,298r 4,161r 6,351r 49,263r +42,912r 80,050r 220 80,270r 80,061r 271 148r 5 -1,441r 351 80,728r
April p 40,629 4,101 16,352 41,047 +24,695 61,223 219 61,442 61,316 187 177 4 -4,465 344 65,069
Total 119,764 12,333 26,577 144,648 118,071 225,502 631 226,133 225,668 820 393 14 -8,194 826 231,808
Per cent change 15 +4.6 -6.2 +15.6 -9.6 -13.8 -5.4 +63.5 -5.3 -5.4 +54.8 -34.1 -75.0 -59.9 -24.3 -9.7
1.
2.
3.
4. A negative figure means the UK was a net exporter of gas.
5.
6.
7.
8.
9.
10. Estimated at 1.5 per cent of gas from LNG terminals entering the National Transmission Systems.
11. Gas used in the Rough Storage Facility.
12
13.
14.
15. Percentage change between the most recent quarter and the same quarter a year earlier; (+) represents a positive percentage change greater than 100%.
Gas available at terminals for consumption in the UK as recorded by the terminal operators.
Gas received as reported by the pipeline operators. This differs from gas available at terminals due to different methods for calculating the volumes of gas involved being used by the terminal and pipeline operators. Pipeline operators include Transco, who run the national pipeline network, and other pipelines that take North Sea gas supplies
direct to consumers.
Gas consumed by pipeline operators in pumping operations etc.
Including public gas supply, direct supplies by North Sea producers, third party supplies and stock changes. These figures differ from those for total consumption in Table 1.2 which include producers and operators own use of gas excluded in this table.
Biomethane injections into the grid from installations certified under the Renewable Heat Incentive (RHI).
Gas available at terminals and from biomethane injected into the grid.
Includes waste and producers own use, but excludes gas flared.
Gas used for drilling, production and pumping operations.
Includes exports direct from UKCS as well as others carried out by the downstream gas industry from the national transmission system.
The National Transmission System (NTS) consists of 276 discrete metering points with a degree of measuring uncertainty associated with each individual meter. The complexity of the system makes it difficult to ensure that all meters are accurate so that errors or bias in the flow calculations may occur. These errors/biases may occur for a
number of reasons such as liquid contamination in the meter tube or on the plate itself, plate installation issues, dull plate edge, damage to plate edge, warped plate, grease on plate and incorrect parameters within the flow computer configuration.
Stocks of gas held in specific storage sites, either as liquefied natural gas, pumped into salt cavities or stored by pumping the gas back into fields. A positive number shows stock being placed into storage which reduces the gas output from the the transmission systems.
77

Special feature – Changes to Eurostat tables methodology
78
Changes to Eurostat tables methodology
Introduction This article explains the rationale behind revisions made to the UK figures within the Eurostat tables from the Quarterly Energy Prices (QEP) publication. Eurostat collect data on the price of gas and electricity across member states. The data is collected by each member state and then submitted to Eurostat for publication.
Eurostat have recently amended the previous directive to a regulation and clarified their preferred treatment of taxes and levies and have issued new guidelines. Harmonised guidance on the methodology1 for data collection are provided in an attempt to have comparable statistics across member states.
The UK has amended its data collection and is now collecting data on the value of any social and environmental policies affecting gas and electricity bills. This has been done to provide a more comparable base price to compare against other EU member states.
Summary of changes to survey Eurostat requests that energy price data submitted is disaggregated into three elements: the base price of the energy, the cost of any social and environmental policies, and the cost of VAT, which combined make up the total price of the energy.
For domestic prices, the UK has previously combined the base price and the costs of social and environmental policies where these policy costs were not separately identifiable on a consumer’s bill. This resulted in our prices showing a larger base price element and zero additional costs due to policies, whereas other member states were showing two distinct elements. For industrial prices, the same approach was taken. The cost of the Climate Change Levy is separately identified on bills so was included by BEIS as a tax and levy.
After reviewing the guidance and in discussion with Eurostat, we felt that the source of these charges is similar across the member states and therefore our statistics would be more comparable if the costs of these policies were disaggregated from the base price. As such, we have now started collecting data on the value of the energy sold that is a result of any social or environmental policy. Some policies affect only domestic or industrial whereas some affect the price of both. A full list of policies impacting bills can be found in Annex A.
Summary of revisions The charts below, based on prices in the period of July to December 2016, demonstrate how the new methodology acts to lower the base price and now shows the cost of the social and environmental policies. However, the total price remains unchanged. It can be seen that these policies largely affect electricity bills, and that the industrial gas price disaggregation is broadly unchanged as few policies outside of the Climate Change Levy apply to industrial gas prices.
The three elements of the prices are labelled as Level 1 – 3, whereby level 1 is the base price, level 2 is the base price plus levies and level 3 which is the base price plus levies and VAT. All three levels are submitted and are available on Eurostat’s website2. As part of QEP, for domestic prices, we publish level 1 and level 3 as level 2 can be derived easily by dividing level 3 by 1.05 to remove the VAT element.
1 Eurostat regulation: http://eur-lex.europa.eu/legal-content/EN/TXT/PDF/?uri=OJ:L:2016:311:FULL&from=EN
2 Eurostat data: http://ec.europa.eu/eurostat/web/energy/data/database

Special feature – Changes to Eurostat tables methodology
79
Figure 1: Domestic prices, old vs. new methodology (Medium size band)
For Industrial users, we publish level 1 and level 2 as most firms will reclaim VAT as a recoverable cost. Also prices including VAT can be derived by adding 20 per cent to the level 2 price.
Figure 2: Industrial prices, old vs. new methodology (Medium size band)
Level 1 Level 1
Level 1 Level 1
Level 3 Level 3
Level 3 Level 3
Level 3 Level 3
Level 3 Level 3
Level 2
Level 2
Level 2
Level 2

Special feature – Changes to Eurostat tables methodology
80
Conclusion The changes to the methodology have been made to provide more accurate comparisons to other member states in the EU. The proportion of the total value of domestic energy sold that is a result of Environmental and social policies is 14 per cent for electricity and 2 per cent for gas over semester 2 2016. Our data collection is still being developed to be as accurate as it can be, as some suppliers have had difficulty reporting against our requirements. In comparison to Ofgem’s annual report3, our data collection has requested a breakdown of some policies not covered by Ofgem’s requests. However, the figures are broadly in line, where expected, with those published by Ofgem which is based on suppliers’ consolidated segmental statements4.
User feedback Please send any comments or queries regarding this analysis to the contact details below:
Liz Vincent Reuben Pullan Energy Prices Statistics Energy Prices Statistics Tel: 0300 068 5162 Tel: 0300 068 5057 E-mail: [email protected] E-mail: [email protected]
Annex A
Policy Domestic Electricity
Industrial Electricity
Domestic Gas
Industrial Gas
Climate change levy X X Energy company obligation (ECO) measures X X
Renewable obligation support costs X X Feed in tariffs X X
Warm home discount (WHD) scheme X Smart meters and better billing X X
Assistance for areas with high electricity distribution costs
X
Renewable energy guarantees origin X X Contract for difference support costs X X
Carbon price floor X X EU ETS X X
Capacity market support costs X X Carbon reduction commitment X x
3 Ofgem bills, prices and profit: www.ofgem.gov.uk/publications-and-updates/infographic-bills-prices-and-profits
4 CSS reports: www.ofgem.gov.uk/publications-and-updates/energy-companies-consolidated-segmental-statements-css
Level 1 Level 1 Level 1 Level 1

Special feature – Recent and forthcoming publications
81
Recent and forthcoming publications of interest to users of energy statistics
Smart Meters quarterly statistics This quarterly publication provides estimates of the number of Smart Meters installed and operating in homes and businesses in Great Britain. The latest release, covering estimates of the number of Smart Meters deployed up to the end of March 2017, was published on 25 May 2017 at: www.gov.uk/government/collections/smart-meters-statistics Household Energy Efficiency statistics This series presents statistics on the Energy Company Obligation (ECO), Green Deal and homes insulated. The headline release presents monthly updates of ECO measures and quarterly updates of in-depth ECO statistics, carbon savings and the Green Deal schemes. The latest release was published on 22 June 2017 at: www.gov.uk/government/collections/household-energy-efficiency-national-statistics
Annual Fuel Poverty statistics report and sub-regional data This annual publication details the latest statistics on fuel poverty. The 2017 edition, detailing the 2015 statistics, was published on 29 June 2017, along with a series of detailed data tables, at: www.gov.uk/government/collections/fuel-poverty-statistics. Data for 2015 at sub-regional level is available at: www.gov.uk/government/collections/fuel-poverty-sub-regional-statistics
Local authority carbon dioxide emissions This annual publication provides estimates of local authority carbon dioxide emissions in the United Kingdom. Data for 2015 was published on 29 June 2017 at: www.gov.uk/government/collections/uk-local-authority-and-regional-carbon-dioxide-emissions-national-statistics
Sub-national road transport consumption This annual publication provides estimates of sub-national road transport fuel consumption in the United Kingdom, by vehicle and fuel type. Data for 2015 was published on 29 June 2017 at: www.gov.uk/government/collections/road-transport-consumption-at-regional-and-local-level
Digest of United Kingdom Energy Statistics This annual publication provides essential information for everyone involved in energy, from economists to environmentalists, and from energy suppliers to energy users. The 2017 edition will be published on 27 July 2017. With extensive tables, charts and commentary covering all the major aspects of energy, it provides a detailed and comprehensive picture of energy production and use over the last 5 years. It will be available (along with additional annexes and key series back to 1970) at: www.gov.uk/government/collections/digest-of-uk-energy-statistics-dukes
UK Energy in Brief This annual publication summarises the latest statistics on energy production, consumption, prices and climate change in the United Kingdom. The figures are primarily taken from the Digest of United Kingdom Energy Statistics (see above). The 2017 edition will be published on 27 July 2017 at: www.gov.uk/government/collections/uk-energy-in-brief
Energy Flow Chart This annual publication illustrates the flow of primary fuels from home production and imports to their eventual final uses. The flows are shown in their original state and after being converted into different kinds of energy by the secondary fuel producers, and are measured in million tonnes of oil equivalent, with the widths of the bands approximately proportional to the size of the flows they represent. The 2017 edition of the chart, showing the flows for 2016, will be published on 27 July 2017 at: www.gov.uk/government/collections/energy-flow-charts

Special feature – Recent and forthcoming publications
82
Energy Consumption in the United Kingdom This annual publication brings together statistics from a variety of sources to produce a comprehensive review of energy consumption and changes in efficiency, intensity and output since the 1970s, with a particular focus on trends since 1990. The information is presented in five sections covering overall energy consumption and energy consumption in the transport, domestic, industrial and service sectors. The 2017 edition will be published on 27 July 2017 at: www.gov.uk/government/collections/energy-consumption-in-the-uk
National Energy Efficiency Data-framework 2017
This publication presents analysis from the National Energy Efficiency Data-Framework (NEED). It provides updated domestic energy consumption results to include 2015 gas and electricity consumption data. It also includes updated estimates of the impact of installing energy efficiency measures on a household’s gas consumption for measures installed in 2014. The latest edition will be published on 27 July 2017 at: www.gov.uk/government/collections/national-energy-efficiency-data-need-framework.
Sub-national consumption of other fuels, 2015 This publication presents the findings of the residual fuels sub–national energy consumption analysis in the UK for the period covering 1 January to 31 December 2015. Other fuels are defined as non-gas, non-electricity and non-road transport fuels, and cover consumption of coal, petroleum, manufactured solid fuels and bioenergy and waste not used for electricity generation or road transport. The release will be published on 28 September 2017 at: www.gov.uk/government/collections/sub-national-consumption-of-other-fuels
Sub-national total final energy consumption, 2015 This factsheet presents the findings of the sub–national energy consumption analysis in the UK for all fuels, for the period covering 1 January to 31 December 2015. The release will be published on 28 September 2017 at: www.gov.uk/government/collections/total-final-energy-consumption-at-sub-national-level

Explanatory notes
General Symbols used in the tables More detailed notes on the methodology used to compile the figures and data sources are available on the BEIS section of the GOV.UK website.
.. - p r e
not available nil or not separately available provisional revised; where a column or row shows ‘r’ at the beginning, most, but not necessarily all, of the data have been revised. estimated; totals of which the figures form a constituent part are therefore partly estimated
Notes to tables Conversion factors Figures for the latest periods
and the corresponding averages (or totals) are provisional and are liable to subsequent revision.
1 tonne of crude oil = 1 tonne = 1 gallon (UK) = 1 kilowatt (kW) = 1 megawatt (MW) = 1 gigawatt (GW) = 1 terawatt (TW) =
7.55 barrels 1,000 kilograms 4.54609 litres 1,000 watts 1,000 kilowatts 1,000 megawatts 1,000 gigawatts
All conversion of fuels from original units to units of energy is carried out on the basis of the gross calorific value of the fuel. More detailed information on conversion factors and calorific values is given in Annex A of the Digest of United Kingdom Energy Statistics.
The figures have not been adjusted for temperature or seasonal factors except where noted.
Due to rounding the sum of the constituent items may not equal the totals.
Conversion matrices
Percentage changes relate to the corresponding period a year ago. They are calculated from unrounded figures but are shown only as (+) or (-) when the percentage change is very large.
To convert from the units on the left hand side to the units across the top multiply by the values in the table. To: From Thousand toe Terajoules (TJ) Gigawatt hours (GWh) Million therms To: From Tonnes of oil equivalent Gigajoules (GJ) Kilowatt hours (kWh) Therms
Thousand toe Multiply by 1 0.023885 0.085985 2.5200 Tonnes of oil equivalent Multiply by 1 0.023885 0.000085985 0.0025200
Terajoules 41.868 1 3.6000 105.51 Gigajoules 41.868 1 0.003600 0.105510
GWh 11.630 0.27778 1 29.307 kWh 11,630 277.78 1 29.307
Million therms 0.39683 0.0094778 0.034121 1 Therms 396.83 9.4778 0.034121 1
Quarterly figures relate to calendar quarters.
All figures relate to the United Kingdom unless otherwise indicated.
Further information on Oil and Gas is available from The Oil & Gas Authority at: www.ogauthority.co.uk/
Note that all factors are quoted to 5 significant figures
Abbreviations Sectoral breakdowns ATF Aviation turbine
fuel The categories for final consumption by user are defined by the Standard Industrial Classification 2007, as follows:
CCGT Combined cycle gas turbine
Fuel producers Final consumers Iron and steel Other industry Transport Other final users Agriculture Commercial Public administration Other services Domestic
05-07, 09, 19, 24.46, 35 24 (excluding 24.4, 24.53 and 24.54) 08, 10-18, 20-23, 24.4 (excluding 24.46), 24.53, 24.54, 25-33, 36-39, 41-43 49-51 01-03 45-47, 52-53, 55-56, 58-66, 68-75, 77-82 84-88 90-99 Not covered by SIC 2007
DERV Diesel engined road vehicle
LNG Liquefied natural gas MSF Manufactured
solid fuels NGLs Natural gas liquids UKCS United Kingdom
continental shelf

© Crown copyright 2017 Department for Business, Energy & Industrial Strategy 1 Victoria Street, London SW1H 0ET www.gov.uk/beis