
Indonesia's Most Preferred Department Store 2012 - Media ...
Upload
khangminh22Category
view
4download
0
Faculty of Behavioural, Management and Social Sciences
Master of Environmental and Energy Management
MASTER THESIS
Energy future for the new Indonesia’s capital city:
An energy modelling approach
Rivano William Toontje (2291002)
Supervisor:
Maarten Arentsen
Joy Clancy
2020

ii
ABSTRACT
The plan of capital city relocation of Indonesia to East Borneo has been enacted to
encounter many problems carried by the current capital, Jakarta. A good energy
planning, especially in the power sector, is entailed to make sure any policy or measure
taken still complies with the national target of energy share without neglecting any
trade-off or threat. This research aims to analyse the energy model scenario for the
power sector of the East Borneo where the new Indonesia’s capital city is located until
2050 in accordance with the Paris Agreement and National Energy General Plan in
order to give its implication to the government as the future plan for the new capital city
development. LEAP energy modelling tool will be used as the analytical tool with
quantitative methods and design-based approach. Two model scenarios, Business-as-
Usual and Capital City Relocation scenarios is designed to make comparison and
analysis for the impact of capital city relocation in the power sector.
Keywords: capital city relocation, energy planning, power sector, LEAP.

ACKNOWLEDGMENT
This thesis research is made to answer the question that came to my head “What would
be the future of the energy sector in Indonesia?” As I experienced how EU countries
keep their strong commitment in promoting cleaner energy to tackle the issue of climate
change, I look back at what my country has done towards this issue. As a “life-
changing” step, the plan to relocate the capital city could give such an enormous impact
to the country, especially in the energy sector. From this reason, I initiated to do my
research on the planned new capital city related to its implication in the power sector
and its correlation with climate change mitigation.
This thesis is dedicated to my mother, the strongest person I ever had. She gave me
the reason to be strong and keep my chin up even in a tough situation. For this reason,
I have the willingness to finish my thesis and eventually end my master program in
MEEM. My greatest honour to present my work to you.
I would like to give my deepest appreciation and gratitude to my first supervisor, Dr.
Maarten Arentsen, who supported me the most from the beginning until the finalization
of this thesis. My great appreciation also for my second supervisor, Professor Joy
Clancy, for her thoughtful understanding and invaluable insight during the making of
this thesis. Likewise, I would also like to thank all of the MEEM members: teachers,
staff, and not to mention, my supportive cohorts MEEM 20/21 who made all of this
process more meaningful.
I would also like to thank all of people who supported me during the process of the
thesis making: Mrs. Kamia Handayani who introduced me to LEAP, Mr. Nanang
Kristanto and Mr. Azhari Sauqi from DEN who gave me thoughtful insight about the
energy outlook in Indonesia.
Finally, I also want to thank my father, brother, and all of my family and friends who
supported me since I made the decision to go abroad to pursue my study.
In the end, I hope this thesis would be helpful for those who read and could give a
small meaningful contribution to my country, Indonesia.
ii
TABLE OF CONTENTS ABSTRACT ................................................................................................................ ii ACKNOWLEDGMENT ................................................................................................ i LIST OF FIGURES .................................................................................................... iii LIST OF TABLES ...................................................................................................... iv LIST OF ACRONYMS/ABBREVIATIONS ................................................................... v 1. CHAPTER 1 INTRODUCTION ......................................................................... 1
1.1 Background ........................................................................................ 1 1.2 Problem statement .............................................................................. 2 1.3 Research objectives ........................................................................... 3
1.4 Research question .............................................................................. 4 1.5 Methodology ....................................................................................... 4
1.6 Ethical statement ................................................................................ 4 1.7 Defining concept ................................................................................. 5 1.8 Overview of the thesis report .............................................................. 6
2. CHAPTER 2 PLANNING FOR THE CAPITAL CITY RELOCATION ................ 1 2.1 Introduction: learning from the past .................................................... 1 2.2 East Borneo in a nutshell .................................................................... 3 2.3 Planning concept ................................................................................ 6
2.4 Location .............................................................................................. 7 2.5 Function .............................................................................................. 8 2.6 Population ......................................................................................... 10
2.7 Evaluation ......................................................................................... 10 2.8 Conclusion ........................................................................................ 13
3. CHAPTER 3 MODELLING APPROACH ........................................................ 15 3.1 Introduction: energy planning and energy modelling ........................ 15 3.2 LEAP data analysis ........................................................................... 17
3.2.1 Research framework ............................................................................. 17 3.2.2 Validation of data analysis .................................................................... 19 3.2.3 Conclusion ............................................................................................ 22
4. CHAPTER 4 ELECTRICITY MODEL ANALYSIS RESULTS .......................... 23 4.1 The Business as Usual scenario....................................................... 23 4.1.1 Demand side analysis ........................................................................... 23 4.1.2 Electricity mix analysis .......................................................................... 25 4.1.3 GHG emissions analysis ....................................................................... 26
4.1.4 Cost benefit analysis ............................................................................. 29 4.2 The capital city relocation scenario ................................................... 31
4.2.1 Demand side analysis ........................................................................... 31 4.2.2 Electricity mix analysis .......................................................................... 33 4.2.3 GHG emissions analysis ....................................................................... 34 4.2.4 Cost benefit analysis ............................................................................. 37 4.3 Finding and discussion ..................................................................... 39
5. CHAPTER 5 CONCLUSIONS ........................................................................ 41 5.1 Conclusions ...................................................................................... 41 5.2 Recommendations ............................................................................ 43
6. REFERENCE ................................................................................................ 45 APPENDIX A Capital city relocations ..................................................................... 53 APPENDIX B The algorithm of LEAP ..................................................................... 54 APPENDIX C Data for validation of the LEAP model ............................................. 56 APPENDIX D Data for LEAP model – BAU and CCR scenarios ............................ 58
iii
LIST OF FIGURES
Figure 1.1 Location of the current and new capital cities of Indonesia ................................... 2
Figure 2.1 East Borneo district map....................................................................................... 4
Figure 2.2 Energy mix of East Borneo (2015) ........................................................................ 5
Figure 2.3 Area mapping of the new capital city .................................................................... 8
Figure 3.1 Research framework ...........................................................................................17
Figure 4.1 Electricity demand 2019 - 2050 (BAU scenario) ..................................................24
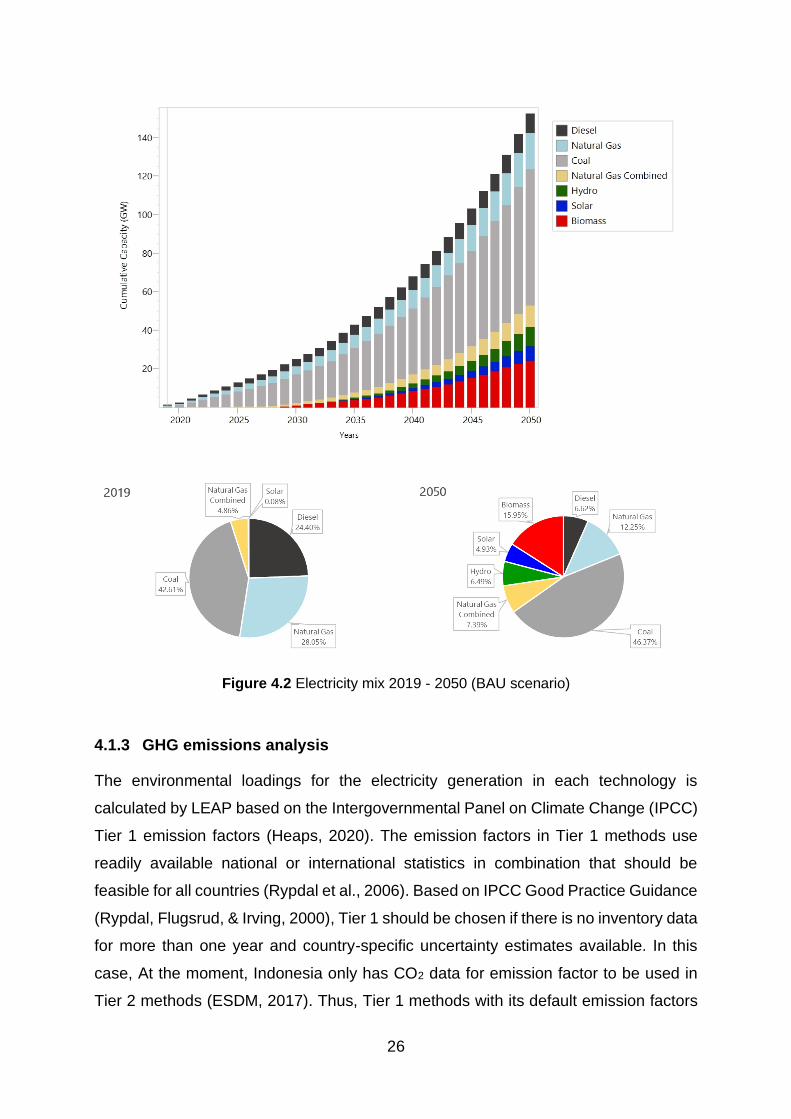
Figure 4.2 Electricity mix 2019 - 2050 (BAU scenario) ..........................................................26
Figure 4.3 GHG emissions 2019 – 2050 (BAU scenario) ......................................................27
Figure 4.4 CO2 emissions 2019 - 2050 (BAU scenario) ........................................................28
Figure 4.5 CH4 emissions 2019 - 2050 (BAU scenario) ........................................................29
Figure 4.6 N2O emissions 2019 - 2050 (BAU scenario) ........................................................29
Figure 4.7 Cumulated discounted cost 2019 - 2050 (BAU scenario) .....................................30
Figure 4.8 Cumulated discounted cost per technology 2019 - 2050 (BAU scenario) .............31
Figure 4.9 Population of East Borneo 2019 - 2050 ...............................................................32
Figure 4.10 Electricity demand 2019 - 2050 (CCR scenario) ................................................32
Figure 4.11 Electricity demand composition 2019 - 2050 (CCR scenario) ............................33
Figure 4.12 Electricity mix 2019 - 2050 (CCR scenario) .......................................................34
Figure 4.13 GHG emissions 2019 - 2050 (CCR scenario) ....................................................35
Figure 4.14 CO2 emissions 2019 - 2050 (CCR scenario) ......................................................36
Figure 4.15 CH4 emissions 2019 - 2050 (CCR scenario) ......................................................36
Figure 4.16 N2O emissions 2019 - 2050 (CCR scenario) ......................................................37
Figure 4.17 Cumulated discounted cost 2019 - 2050 (CCR scenario) ..................................38
Figure 4.18 Cumulated discounted cost per technology 2019 - 2050 (CCR scenario) ..........38
Figure 4.19 Cumulated disc. additional cost per technology 2019 - 2050 (CCR scenario) ....39
Figure C.1 Energy load shape ..............................................................................................56
Figure D.1 Energy load shape ..............................................................................................58
iv
LIST OF TABLES
Table 2.1 Potential energy capacity of East Borneo (2015) ................................................... 4
Table 2.2 Functioning planning for the new capital city .......................................................... 9
Table 2.3 Evaluation results for the relocation plan ..............................................................13
Table 3.1 Parameters for LEAP validation ............................................................................20
Table 3.2 LEAP validation result ...........................................................................................21
Table 4.1 Equation for electricity demand 2019-2050 ...........................................................23
Table 4.2 LEAP analysis results summary............................................................................40
Table A.1 Capital city relocations list ....................................................................................53
Table C.1 Parameter list for LEAP validation ........................................................................56
Table C.2 Characteristic of power generation technology for LEAP validation ......................57
Table D.1 Parameter list for LEAP analysis ..........................................................................58
Table D.2 Characteristic of power generation technology for LEAP validation ......................59
v
LIST OF ACRONYMS/ABBREVIATIONS
ACRONYM DEFINITION
BAU Business as Usual
BPS Badan Pusat Statistik (Central Statistic Body)
CCR Capital City Relocation
DEN Dewan Energi Nasional (National Energy Council)
ESDM Energi dan Sumber Daya Mineral (Ministry of Energy and Mineral
Resources)
GHG Greenhouse Gas
GWP Global Warming Potential
IKN Ibu Kota Negara (planned new capital city of Indonesia)
NDC Nationally Determined Contributions on Climate Change
IPCC Intergovernmental Panel on Climate Change
LEAP Low Emissions Analysis Platform
MMSCF Million Standard Cubic Feet
NGCC Natural Gas Combined Cycle
OSeMOSYS Open Source Energy Modeling System
PLN Perusahaan Listrik Negara (National Electricity Company)
PPN Perencanaan Pembangunan Nasional (Ministry of National
Development Planning)
PUPR Pekerjaan Umum dan Perumahan Rakyat (Ministry of General
Works and Public Housing)
RUED Rancangan Umum Energi Daerah (District General Plan of
Energy)
RUEN Rancangan Umum Energi Nasional (National Energy General
Plan)
RUKN Rencana Umum Ketenagalistrikan Nasional (National Electricity
General Plan)
RUPTL Rencana Usaha Penyediaan Tenaga Listrik (Business Plan of
Electricity Supply)
1
1. CHAPTER 1 INTRODUCTION
In Chapter 1, the background and problem statement related to the relocation planning
of the capital city of Indonesia are introduced. Furthermore, the research objective and
(sub) research question(s) are presented based on this background. Additionally, a
brief explanation of methodology, ethical statement, concept definition, and overview
of this thesis are explained in this chapter.
1.1 BACKGROUND
The urgency of capital city relocation of Indonesia has arisen since the current capital,
Jakarta, faces many problems. With a population of more than 10 million people,
Jakarta should deal with traffic congestion which is estimated to give economic loss up
to 2.6 billion USD per year (Julita, 2019). Massive grey infrastructure along with the
increasing population does not go along with the green measures. From the 30% target
of green area based on National Constitution No. 26/2007 about Spatial Planning
(Indonesia, 2007), only 9% of total area of Jakarta are covered in green infrastructure.
One prominent issue that must be faced by the city is climate change. As it is located
in the coastal zone in the northwest of Java Island, Jakarta is facing the issue of sea
level rise along with the land subsidence which are projected to inundate almost all
Jakarta’s coastal zone in 2100 (Indonesia Climate Change Sectoral Roadmap
(ICCSR), 2010). ICCSR (2010) has predicted the area will be flooded with an elevation
between 0 to 3 m or 3 to 4 m in intensified extreme weather. Abidin (2010) analysed
the land subsidence in the coastal area of the city will occur in between 1 to 15 cm per
year. The situation is exacerbated with the seawater infiltration and the weakening river
flow due to the altitudinal difference between the river and the sea level. As a result,
groundwater and surface water quality will be decreased significantly.
The relocation is amplified with an inevitable condition of the geographic characteristic
of the city. Jakarta is located in a volcanic archipelago which is flanked between the
Indo-Australian oceanic plates and Eurasian plate. This tectonically active region has
a high potential risk of earthquake as the subduction of these two plates is placed only
200 km northward from Jakarta (Isburhan et al., 2019).
In response to the extensive issues of sociological, economic, topographical, and
climate change risks, Joko Widodo as the President for the Republic of Indonesia has

2
announced plans to relocate its capital city from Jakarta to Borneo, potentially in the
District of Penajam Paser Utara and Kutai Kartanegara, East Borneo (see Figure 1).
Nur Azhar, Putri Fatima, and Tamas (2020) offer several reasons why this location is
chosen, in which it is located near two major international airports, has access of
Balikpapan-Samarinda toll road and Port of Semayang, abundant access to energy
(both fossil and renewable) and clean water resources, and also it crosses the
Indonesia Archipelagic Sea Lanes. One of the prominent reasons is it has relatively
low seismic activity and is far from a subduction zone which means it is safer than
Jakarta in terms of natural hazard risks.
Figure 1.1 Location of the current and new capital cities of Indonesia
1.2 PROBLEM STATEMENT
The concept of a forest city (or “Nagara Rimba Nusa”) has been revealed as the new
capital city is located in the largest forested area in Indonesia and considered to be
one of the cores for the global biodiversity (Post, 2019). Consequently, the
development of the infrastructure is rather focused more on the green measures and
clean energy. The latter should be considered with a conscientious planning in
supporting the national target to reduce greenhouse gas emissions to 29% compared
to Business As Usual (BAU) in 2030 (DEN, 2017).
It is apparently seen that the government of Indonesia has tried to be more adaptable
in response to the considerable climate change risks, environmental issues, pollution
and traffic problems, and sociological influences. Nevertheless, the relocation plan
could be questionable in regards of the sustainability of the new capital and its
repercussions to the surrounding area. Van de Vuurst and Escobar (2020) warned
3
about a major biodiversity catastrophe that could be happened as the effect of the
relocation without multidisciplinary and sustainable transition. Borneo island itself has
already lost around 30% of its forest within 50 years with primary forest being the most
heavily affected (Margono, Potapov, Turubanova, Stolle, & Hansen, 2014; Van de
Vuurst & Escobar, 2020). Moreover, Borneo also has a few numbers of endemic
species which have been categorized as critically endangered fauna such as Bornean
Orangutan (Pogo pygmaeus) (Ancrenaz et al., 2008; IUCN, 2020). For these reasons,
studying the relocation plan compounded with the climate-change and sustainability
causes should be carefully put in the first place in order to bring a nurturing effect to
the affected area rather than to be even more damaging.
The concept of sustainability is closely linked to the access of sustainable energy.
Energy services have a profound effect on any elements of a city, such as productivity,
health, education, food and water security, and communication services (Vezzoli et al.,
2018). On the other hand, there are implications connected to energy, especially
related to developing countries. Access to energy, availability of renewable resources,
social, politics and economics issues become the hindrance in the development of
sustainable energy. Thus, a sustainable energy development and energy planning is
important to realise the concept of sustainable city for the new capital without
overlooking all of these hindrances. Hitherto, there is no study or analysis that concerns
the energy planning for the new capital city. Nur Azhar, Putri Fatima, and Tamas (2020)
examined the environmental aspects of the relocation in accordance to disaster
mitigation using a mental model approach. Van de Vuurst & Escobar (2020) gave their
perspective of mass migration expected to occur linked to the biodiversity impacts.
Nonetheless, no study specifically put the energy planning of the relocation at the first
place. Thus, there is a need to account this aspect in order to comply with the national
target of energy share without neglecting any trade-off or threat.
1.3 RESEARCH OBJECTIVES
This research aims (i) to analyse the energy model scenario for the power sector of
the new Indonesia’s capital city until 2050 in accordance with the Paris Agreement and
National Energy General Plan; (ii) to provide recommendations to the Indonesian
government on the preferred power system of the planned new capital.
4
1.4 RESEARCH QUESTION
Main research question
How will the power system of East Borneo develop until 2050 with the relocation of the
capital of Indonesia to the region if the system will be designed in accordance with the
Paris Agreement on Climate Change? (RQ)
Sub research questions
1. How will the newly planned capital of Indonesia look like in terms of location,
size, functions and activities? (sRQ1)
2. How would the energy system for the power sector of the new capital of
Indonesia look like? (sRQ2)
3. What are the estimated CO2 equivalent emissions impacts for East Borneo of
the relocation of the capital of Indonesia? (sRQ3)
4. What are the implications of the relocation of the capital to East Borneo for the
costs of power production in East Borneo? (sRQ4)
1.5 METHODOLOGY
Two scenarios of the East Borneo region will be built and compared with the help of
the LEAP model in order to answer the research question and sub research questions.
The two scenarios are 1) the power system of East Borneo without the newly planned
capital (the Business-As-Usual (BAU) scenario) and 2) the power system of East
Borneo with the newly planned capital (the Capital City Relocation (CCR) scenario).
The perspective is analytical in its comparison of both scenarios to find out the impact
of the newly planned capital on the power system in the East Borneo region. An in-
depth explanation about the data analysis using LEAP is written in Chapter 3.
1.6 ETHICAL STATEMENT
This research is subject to ethical considerations concerning the purpose and methods
to be deployed as it may contain some data privacy (i.e. from National Energy Council)
and this research also may affect related stakeholders or institutions. This research
upholds the principle of research integrity based on Netherlands Code of Conduct for

5
Research Integrity: honesty, scrupulousness, transparency, independence, and
responsibility (KNAW et al., 2018). Therefore, confidentiality and transparency of data
is upheld during accessing all of the research material.
1.7 DEFINING CONCEPT
The following key concepts are defined for the purpose of this research. These
definitions are mentioned in consideration with the context of Indonesian government
stipulation in purpose to be closely applied to Indonesia’s situation:
Energy planning: the process of approaching national or regional targets through
policies and strategies which derived from the analysis of energy sector scenarios.
Energy modelling: the process of formulating or simulating a model that focuses on
energy as an economic resource and associated directly or indirectly with the decision-
making process.
Energy mix: the group of different primary energy sources from which secondary
energy for direct use is produced (% of ton oil equivalent).
Electricity generation mix: the group of primary energy sources contributes in the
total electrical energy production (% of Megawatt hour).
New energy resources: energy resources that could be produced from a new
technology, both from renewable or non-renewable energy resources, such as nuclear,
hydrogen, coal bed methane, liquified coal, and gasified coal (Indonesian Government,
2014).
Renewable energy resources: energy resources that could be produced from
sustainable energy resources that is not depleted when used, such as geothermal,
wind, bioenergy, solar, hydro, and ocean thermal (Indonesian Government, 2014).
Capital city relocation: the movement of the national capital city, fully or certain part
of it, to another geographical area within the country.
6
1.8 OVERVIEW OF THE THESIS REPORT
The thesis report is divided into five chapters. This chapter gives the information about
the background, research objectives, and research questions of the research. The next
chapter answers the first sub research question about the planning for the capital city
relocation and also introduces the energy modelling tool. Chapter 3 explains the
concept and method for the research design. Moreover, chapter 4 develops the energy
modelling for the planned new capital city, answering the second, third, and last sub
research questions. Lastly, chapter 5 summarize the content of the research based on
the modelling result in chapter 4.
1
2. CHAPTER 2 PLANNING FOR THE CAPITAL CITY RELOCATION
This chapter is introduced with some past experiences of capital city relocations in
other countries. Moreover, it elaborates the concept of the planned new capital city in
East Borneo from the current condition to its planning concept in regards of the function
and population. In the end, this chapter answers the first sub research question of this
thesis (SRQ1).
2.1 INTRODUCTION: LEARNING FROM THE PAST
Displacement of a capital city is a remarkable case that happened in some countries
during civilization throughout centuries. More than 30 countries have run the risk of
relocating their capital cities. Rossman (2017) argued that capital city relocations are
rather a typical theme in political development and were taken as the part of history of
most nations rather than something extraordinary. He indicated four big groups of
factors of placing a capital city: geographical, military, cultural, and political.
Nevertheless, capital city movement turned into a more exceptional condition in the
modern states as more contemporary and properly urban decisions were taken into
account. Table A.1 in Appendix A shows the list of capital city relocations after World
War II (Quistorff, 2015). It is shown from the table that some capitals were purposely
built and some others only moved several functions partially to the new capital, namely
Brazil, Pakistan, Belize, Nigeria, Malaysia, Myanmar, Palau, and South Korea. Brazil
has moved its capital city from Rio de Janeiro to Brasilia in 1960. The city was
specifically planned and built in four years to be the capital of Brazil in order to serve
the needs of the whole population of this giant nation as it is sparsely populated and
located more in the central compared to the overcrowded coastal city of Rio. The
capital city relocation to the centre in order to be more neutral was also taking place in
Nigeria, where the country had devised the new area in the centre of the country as
the new capital, replacing Lagos in the coast which was already overpopulated. In other
cases, Canberra as the new Australia’s capital was rather built in a political situation
where the federation was commenced in 1901 and Melbourne was still the temporary
capital at that time. To compromise a long dispute over whether Sydney or Melbourne
should be the permanent capital, Canberra which is geographically located between
them was chosen.
2
The latest capital city relocation and presumably most similar with Indonesia’s planning
is in Malaysia. Putrajaya was a planned city designed as the new federal administrative
centre of Malaysia following the government’s decision to relocate its federal capital in
June 1993. The reason behind the relocation from Kuala Lumpur is to alleviate traffic
congestion and overcrowded population in the former city (Chin, 2006). The area was
chosen as it has a good accessibility to major transportation networks, pristine natural
vegetation and land form, and also minimal negative impact to local communities. The
construction of Putrajaya commenced in October 1996 and the seat of government
started to shift to the new area in 1999. Entitling “City in a Garden – Intelligent City”,
Putrajaya tried to adopt the concept of sustainable urban city by integrating
metropolitan parks with wetland, botanical garden, vegetation, and water bodies while
also combining integrated neighbourhood and community by providing public
transportation such as buses and monorail and also bicycle trails, efficient accessibility,
intelligent telecommunication and information technology, and dynamic, lively and
economic vitality. At that time, the city was planned to accommodate 335,000
inhabitants on 4,400 hectares of land.
Looking at the past experiences, the realisation of capital city relocations is varied
among other countries. The duration from the conception to the realisation usually
takes years or even decades. The conception of Brasilia started in 1827 and just
realised by construction in 1956 until the capital was inaugurated in 1960 (Quistorff,
2015). During this period, the relocation plan was hindered and changed many times
by political interests and unstable condition of the government (Quistorff, 2015). In
other hand, the conception of Putrajaya only took around three years until it was
realised in 1996 (Moser, 2010), while Nigeria need fifteen years to build its new capital
in Abuja (Reva, 2016) and ten years for South Korea (Hur, Cho, Lee, & Bickerton,
2019). By this point, no study or evidence shows the energy policy or planning taken
as concern in the relocation of capital city. The concept of green city with the
consideration of energy transition to renewable and clean energy is undiscovered as
the concept of sustainability and climate change adaptation are rather new and
countries still put the economic development as the top priority at that time. Giving
example to Putrajaya. Even though this new capital claimed itself as a sustainable
urban city, Putrajaya is still using natural gas as the fuel source for its district cooling
system. Furthermore, this city is also failed to actualise the concept of green city as it
3
could not overcome the main shortcoming of its climatic condition (Moser, 2010). Lack
of innovative and resourceful microclimatic features, ecological footprint minimisation,
and correct green measures (shade trees or green roofs instead of decorative shrubs
and trimmed hedges) in the design has resulted in weak resistance to intense heat
during daytime. As the result, extensive usage of air conditioning which leads to GHG
emissions cannot be avoided. In terms of mobility, there is little evidence of green and
sustainability reflected in the public transportation as it still uses natural gas as the
main fuel. Bicycles are also encouraged more as a recreation rather than as a mode
of transportation.
Reflecting to a few preceding capital city relocations, it is going to be a big challenge
for the government of Indonesia to realise its new capital city with the ideal conception
which will be explained in the following sections. Thus, a proper and careful planning
and urban design along with the support from the government and related stakeholders
is needed with the concern of time and financial management.
2.2 EAST BORNEO IN A NUTSHELL: ENERGY CURRENT CONDITION AND
GENERAL PLAN
East Borneo is a province in Borneo Island consisting of seven districts and three big
cities (see Figure 2.1). As the fourth lowest population density in Indonesia with 439
trillion Rupiah of GDP (2015) and 3.7 million inhabitants (2019) in 127,347.92 km2 of
total area, East Borneo has some issues that are generally faced by low-populated
provinces outside the Java-Bali region (DEN, 2019a). Most of the resources for
electricity comes from conventional non-renewable resources which derived of 372
million litres of petroleum and 2,791 mmscf of natural gas (DEN, 2019a). Almost all
areas within this province have been electrified, while some small villages in remote
areas still use self-subsistent oil-fuelled generators to generate the electricity.
Normally, the generator is operated from 6 to 10 PM every day. In this case, the fuel
transportation becomes a concern as it takes a lot of effort to transport the fuel with
inadequate road system. Solar energy is utilized in limited households and villages,
especially in remote area where electrification from PLN is not reached. Until the end
of 2017, there are 5,998 units of solar generators installed across 72 villages with total
capacity of 479,840 W (DEN, 2019a). Another renewable resource utilized are micro-
hydro and biogas. in 2015 to 92.43% in 2017 (DEN, 2019a). To summarize, energy
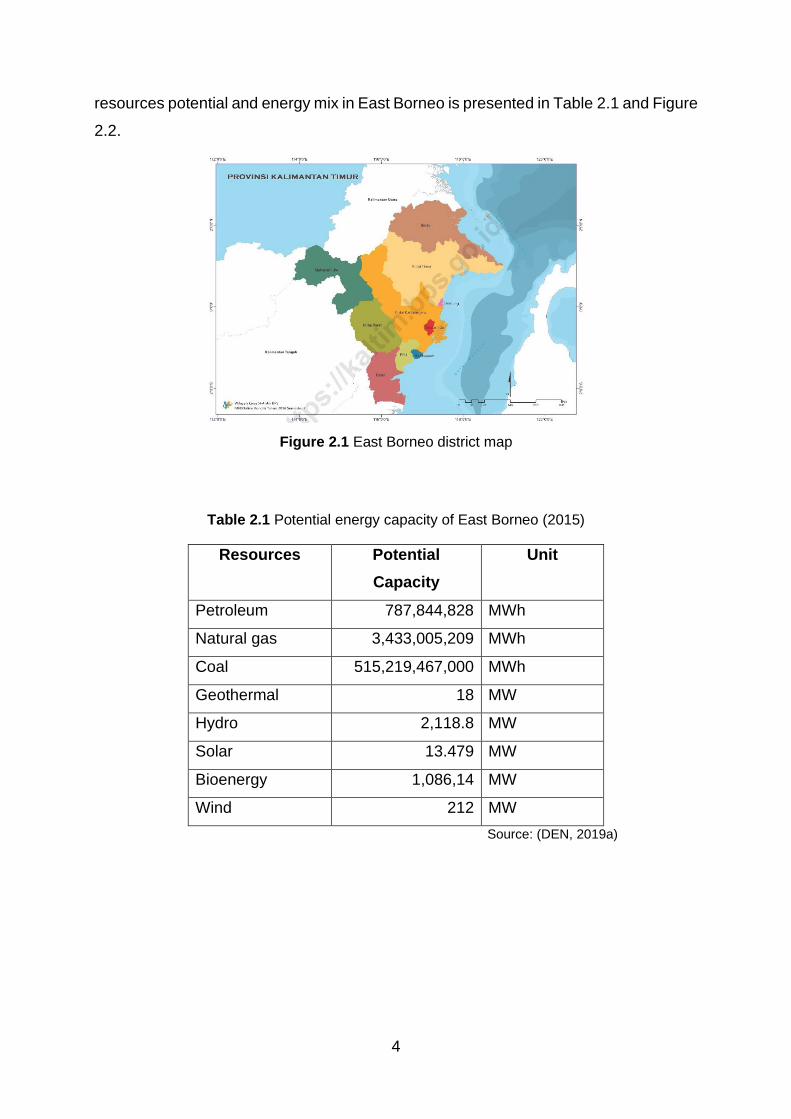
4
resources potential and energy mix in East Borneo is presented in Table 2.1 and Figure
2.2.
Figure 2.1 East Borneo district map
Table 2.1 Potential energy capacity of East Borneo (2015)
Resources Potential
Capacity
Unit
Petroleum 787,844,828 MWh
Natural gas 3,433,005,209 MWh
Coal 515,219,467,000 MWh
Geothermal 18 MW
Hydro 2,118.8 MW
Solar 13.479 MW
Bioenergy 1,086,14 MW
Wind 212 MW
Source: (DEN, 2019a)
5
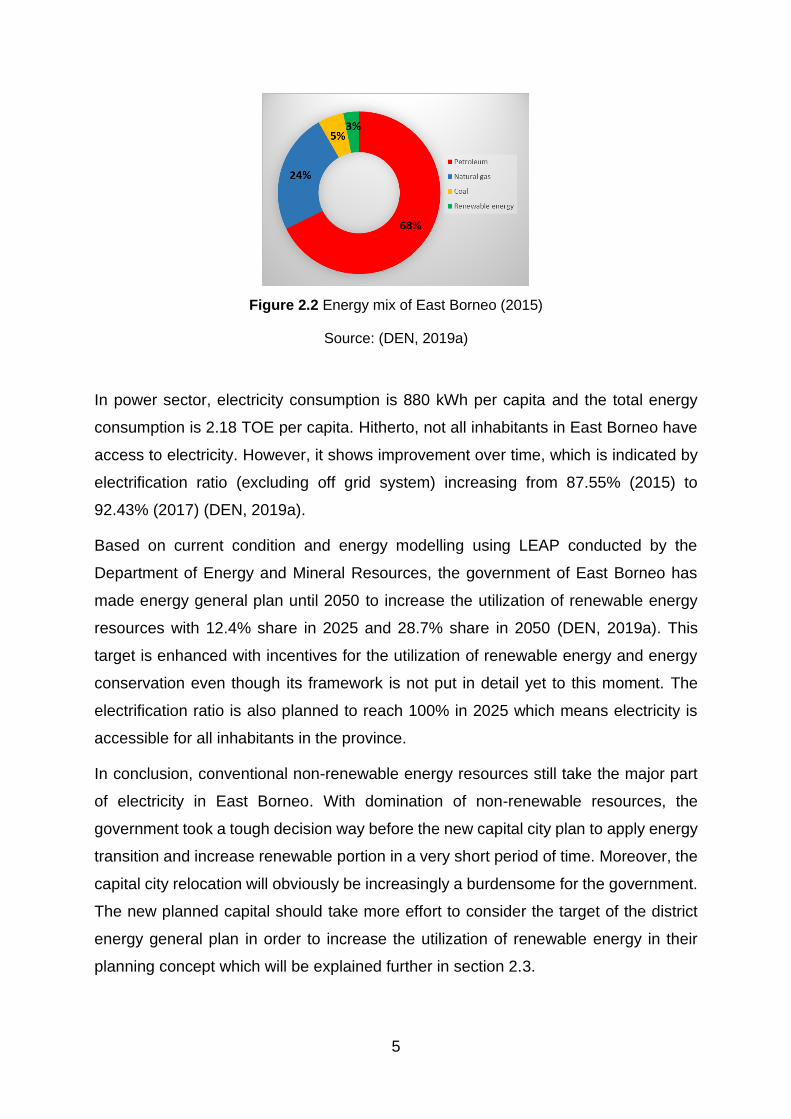
Figure 2.2 Energy mix of East Borneo (2015)
Source: (DEN, 2019a)
In power sector, electricity consumption is 880 kWh per capita and the total energy
consumption is 2.18 TOE per capita. Hitherto, not all inhabitants in East Borneo have
access to electricity. However, it shows improvement over time, which is indicated by
electrification ratio (excluding off grid system) increasing from 87.55% (2015) to
92.43% (2017) (DEN, 2019a).
Based on current condition and energy modelling using LEAP conducted by the
Department of Energy and Mineral Resources, the government of East Borneo has
made energy general plan until 2050 to increase the utilization of renewable energy
resources with 12.4% share in 2025 and 28.7% share in 2050 (DEN, 2019a). This
target is enhanced with incentives for the utilization of renewable energy and energy
conservation even though its framework is not put in detail yet to this moment. The
electrification ratio is also planned to reach 100% in 2025 which means electricity is
accessible for all inhabitants in the province.
In conclusion, conventional non-renewable energy resources still take the major part
of electricity in East Borneo. With domination of non-renewable resources, the
government took a tough decision way before the new capital city plan to apply energy
transition and increase renewable portion in a very short period of time. Moreover, the
capital city relocation will obviously be increasingly a burdensome for the government.
The new planned capital should take more effort to consider the target of the district
energy general plan in order to increase the utilization of renewable energy in their
planning concept which will be explained further in section 2.3.

6
2.3 PLANNING CONCEPT
The planning concept for new capital city of Indonesia (IKN) was prepared based on
New Capital City Relocation Plan by the Ministry of National Development Plan
(PPN/BAPPENAS). The plan is limited in basic information on land use planning and
zonation, regulation, function, and economical analysis, as the masterplan is still on
progress and the law provision has not been enacted yet by the government.
The new capital city is designed with the ideal concept of “the best city on earth”
(BAPPENAS, 2019). One of the main principles of the concept is to uphold the values
of smart, green, beautiful, and sustainable. The concept of forest city is applied in these
values as Kalimantan is the centre of biodiversity in Indonesia with 262 of 386 species
of dipterocarp trees found in this island (FAO, 2011). With more than 1285 endemic
tree species and some endangered faunas such as orangutans, Sumatran rhinoceros,
pygmy elephant, and dugong, Borneo has lost a significant portion of its forest due to
deforestation with only half of its forest remains today (Kieft & Liu, 2019). Therefore,
the development of the forest city is expected to increase the quality of the forest in
Kalimantan by enhancing the restoration of endangered species in the rainforest due
to deforestation (BAPPENAS, 2019).
As part of the concept, the development of renewable energy is enhanced in the initial
concept design of the new planned capital city. The government, through the National
Energy Council (DEN), has enacted the National General Plan of Energy (RUEN),
which adapted by each province with their District General Plan of Energy (RUED). In
these documents, the government clearly stated the acceleration of renewable energy
development as the strategy of climate change mitigation in order to meet Paris
Agreement target, which is to control the increasing of the earth temperature not more
than 2oC (DEN, 2017). Through the Constitutional Law no. 30 of 2009 on Electricity,
the government of Indonesia has set the share of new and renewable energy in the
national energy mix up to 23% in 2025 and 31% in 2050 (Handayani, 2019). Besides
that, the Constitutional Law no. 16 of 2016 about Paris Agreement Ratification states
the commitment of the government to reduce greenhouse gas emissions up to 29% in
2030, with sector energy itself has the contribution to reduce GHG emissions up to
11% in 2030 (ESDM, 2015).
7
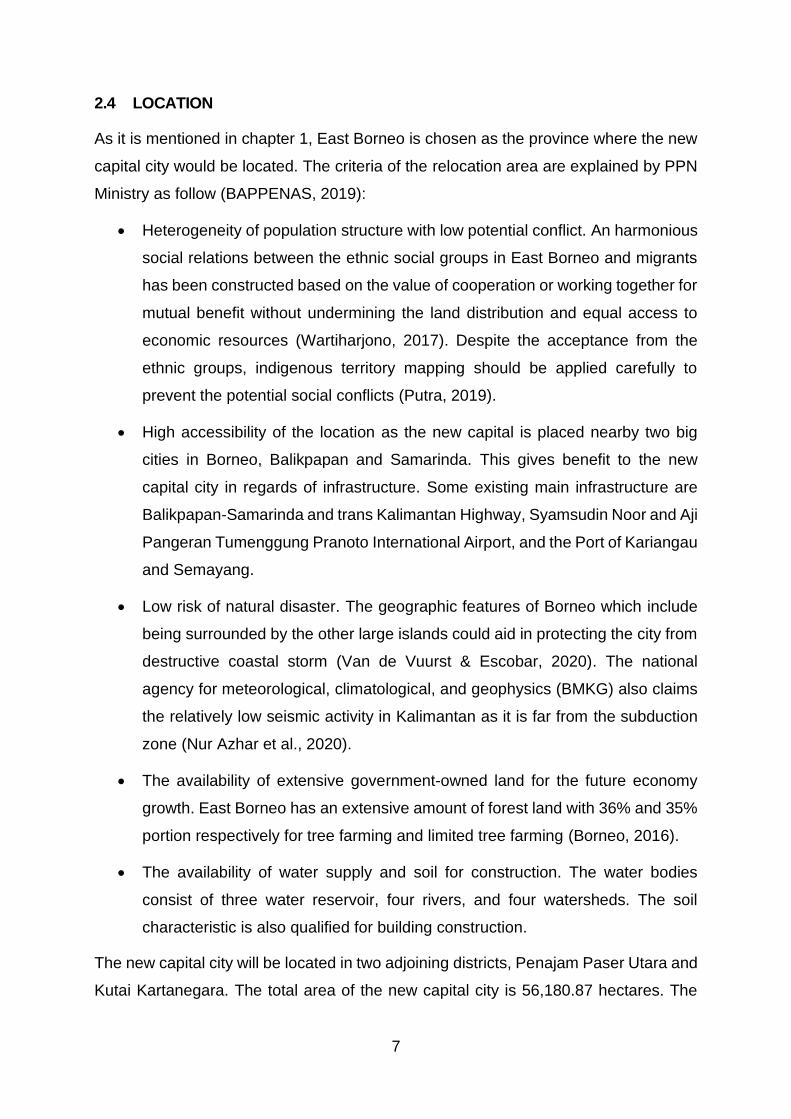
2.4 LOCATION
As it is mentioned in chapter 1, East Borneo is chosen as the province where the new
capital city would be located. The criteria of the relocation area are explained by PPN
Ministry as follow (BAPPENAS, 2019):
• Heterogeneity of population structure with low potential conflict. An harmonious
social relations between the ethnic social groups in East Borneo and migrants
has been constructed based on the value of cooperation or working together for
mutual benefit without undermining the land distribution and equal access to
economic resources (Wartiharjono, 2017). Despite the acceptance from the
ethnic groups, indigenous territory mapping should be applied carefully to
prevent the potential social conflicts (Putra, 2019).
• High accessibility of the location as the new capital is placed nearby two big
cities in Borneo, Balikpapan and Samarinda. This gives benefit to the new
capital city in regards of infrastructure. Some existing main infrastructure are
Balikpapan-Samarinda and trans Kalimantan Highway, Syamsudin Noor and Aji
Pangeran Tumenggung Pranoto International Airport, and the Port of Kariangau
and Semayang.
• Low risk of natural disaster. The geographic features of Borneo which include
being surrounded by the other large islands could aid in protecting the city from
destructive coastal storm (Van de Vuurst & Escobar, 2020). The national
agency for meteorological, climatological, and geophysics (BMKG) also claims
the relatively low seismic activity in Kalimantan as it is far from the subduction
zone (Nur Azhar et al., 2020).
• The availability of extensive government-owned land for the future economy
growth. East Borneo has an extensive amount of forest land with 36% and 35%
portion respectively for tree farming and limited tree farming (Borneo, 2016).
• The availability of water supply and soil for construction. The water bodies
consist of three water reservoir, four rivers, and four watersheds. The soil
characteristic is also qualified for building construction.
The new capital city will be located in two adjoining districts, Penajam Paser Utara and
Kutai Kartanegara. The total area of the new capital city is 56,180.87 hectares. The

8
planned centre area for the government itself is 5,644 hectares. The capital has a total
authority area of 256,142.74 hectares, in which the expansion plan will be carried out
in the future. This total authority area will include part of the tree farms in Penajam
Pasir Utara and conservation area (Bukit Soeharto) in Kutai Kartanegara. The map for
this new capital city is shown in Figure 2.3.
Figure 2.3 Area mapping of the new capital city
Source: (BAPPENAS, 2019)
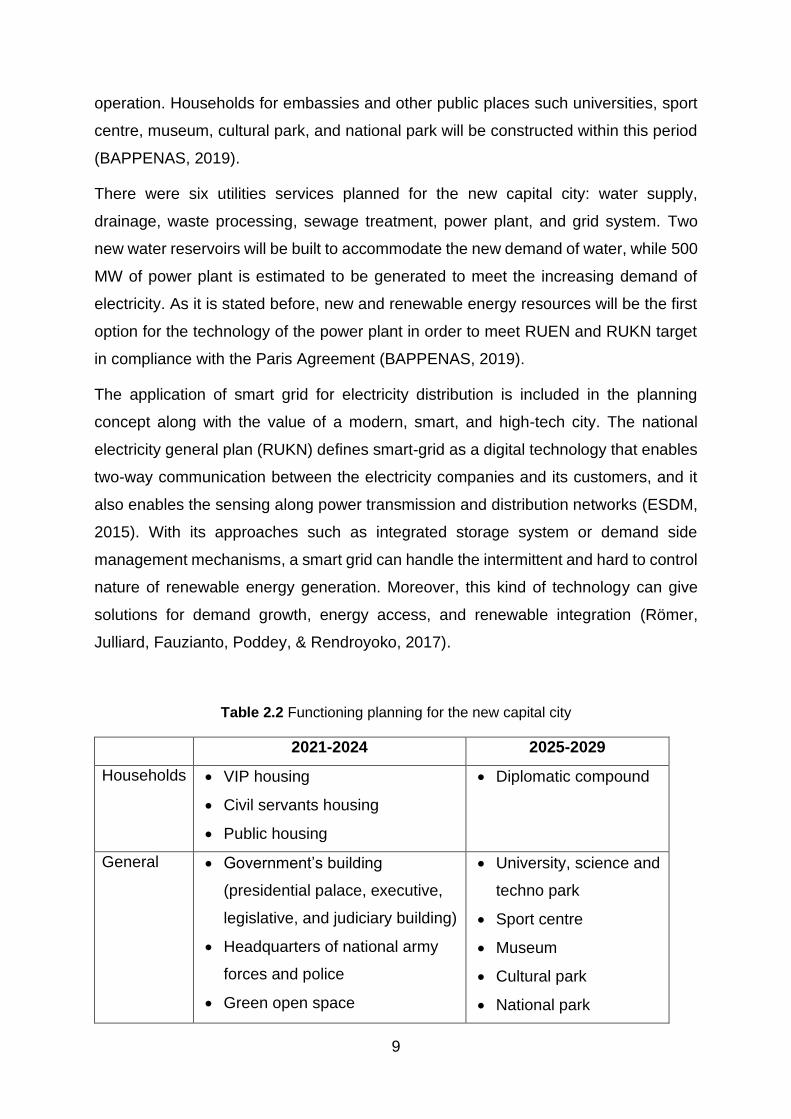
2.5 FUNCTION
As it is shown in Table 2.2, the plan for the city functioning is divided into two
consecutive period with four main categories: households, business, industry, and
general. The first period (2021-2024) mainly focuses on the construction of the main
function of the government. Thus, the building for the presidential palace, executive,
legislative, and juridical committees are prioritized along with the headquarters for
defence institutions (national army and police). Subsequently, the housing for
government officials and civil servants are built. Moreover, the infrastructure for
business centre and public facilities are developed within this stage. In the second
period (2025-2029), the business and industries sectors will be started to build. There
is no detail yet about what kind of industries will be developed but it is stated that the
industries should combine the aspects of high technology and clean energy in their
government
capital city
total authority
9
operation. Households for embassies and other public places such universities, sport
centre, museum, cultural park, and national park will be constructed within this period
(BAPPENAS, 2019).
There were six utilities services planned for the new capital city: water supply,
drainage, waste processing, sewage treatment, power plant, and grid system. Two
new water reservoirs will be built to accommodate the new demand of water, while 500
MW of power plant is estimated to be generated to meet the increasing demand of
electricity. As it is stated before, new and renewable energy resources will be the first
option for the technology of the power plant in order to meet RUEN and RUKN target
in compliance with the Paris Agreement (BAPPENAS, 2019).
The application of smart grid for electricity distribution is included in the planning
concept along with the value of a modern, smart, and high-tech city. The national
electricity general plan (RUKN) defines smart-grid as a digital technology that enables
two-way communication between the electricity companies and its customers, and it
also enables the sensing along power transmission and distribution networks (ESDM,
2015). With its approaches such as integrated storage system or demand side
management mechanisms, a smart grid can handle the intermittent and hard to control
nature of renewable energy generation. Moreover, this kind of technology can give
solutions for demand growth, energy access, and renewable integration (Römer,
Julliard, Fauzianto, Poddey, & Rendroyoko, 2017).
Table 2.2 Functioning planning for the new capital city
2021-2024 2025-2029
Households • VIP housing
• Civil servants housing
• Public housing
• Diplomatic compound
General • Government’s building
(presidential palace, executive,
legislative, and judiciary building)
• Headquarters of national army
forces and police
• Green open space
• University, science and
techno park
• Sport centre
• Museum
• Cultural park
• National park

10
• Airport and port refurbishment
• Military base
• Utilities:
o Water supply
o Drainage system
o Waste processing
o Sewage treatment
o Power plant and grid
systems
Business - • Shopping mall
• Business centre
• Convention hall
Industry - • High tech and clean
industries
Source: (BAPPENAS, 2019)
2.6 POPULATION
As the initialization, the new capital city is designated as the new administration seat
of the government of Indonesia. There will be around 182,462 of civil servants will be
relocated from Jakarta to East Borneo, with 79 % comes from the ministries and 21%
from other government bodies/institutions. The ministries/bodies/institutions to be
relocated will be defined in the national constitutional law. Besides that, around 53,483
national army forces and polices is likewise moved to the new capital. Along with
families and other related personnel, 1.5 million of people will be migrated to be the
inhabitants of the new capital city within the first period of the relocation (BAPPENAS,
2019).
2.7 EVALUATION
An ex-ante evaluation of the new capital city is conducted by using the Plan-Process-
Results (PPR) methodology focuses on the plan proposed by Oliveira and Pinho
(2015). This method provides a strong morphological dimension evaluation with a
sound and substantiated judgment to a built environment which now linked to the
11
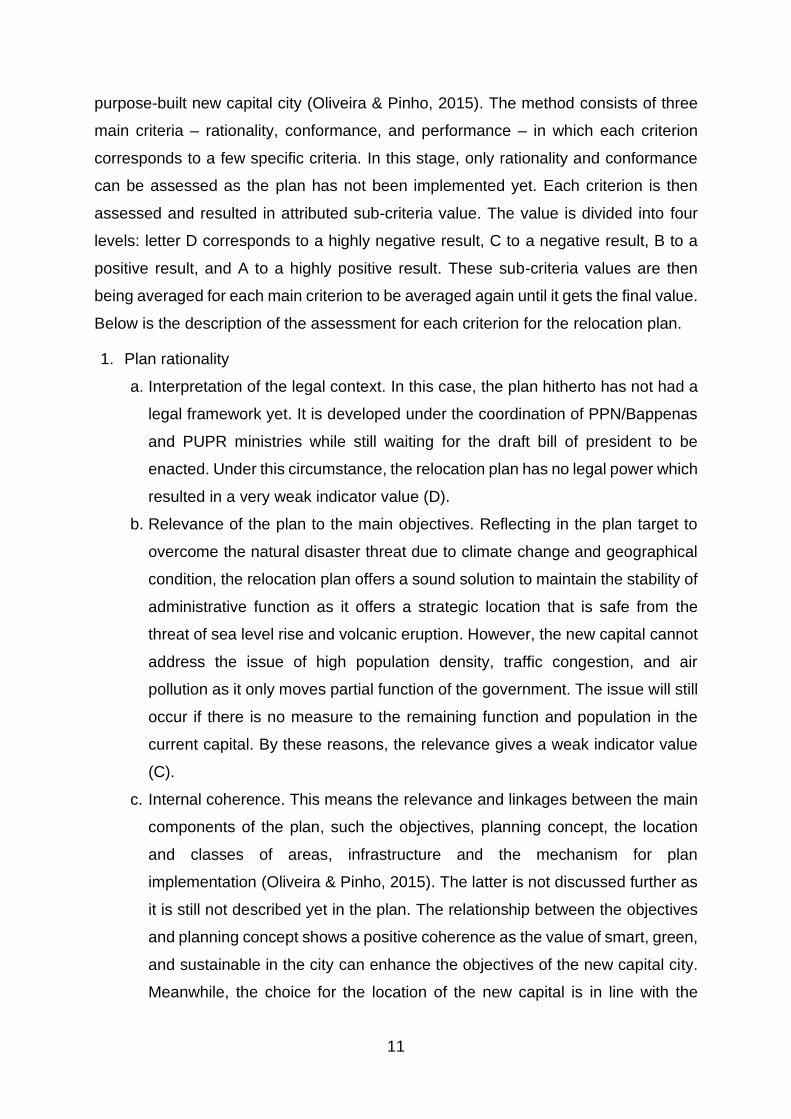
purpose-built new capital city (Oliveira & Pinho, 2015). The method consists of three
main criteria – rationality, conformance, and performance – in which each criterion
corresponds to a few specific criteria. In this stage, only rationality and conformance
can be assessed as the plan has not been implemented yet. Each criterion is then
assessed and resulted in attributed sub-criteria value. The value is divided into four
levels: letter D corresponds to a highly negative result, C to a negative result, B to a
positive result, and A to a highly positive result. These sub-criteria values are then
being averaged for each main criterion to be averaged again until it gets the final value.
Below is the description of the assessment for each criterion for the relocation plan.
1. Plan rationality
a. Interpretation of the legal context. In this case, the plan hitherto has not had a
legal framework yet. It is developed under the coordination of PPN/Bappenas
and PUPR ministries while still waiting for the draft bill of president to be
enacted. Under this circumstance, the relocation plan has no legal power which
resulted in a very weak indicator value (D).
b. Relevance of the plan to the main objectives. Reflecting in the plan target to
overcome the natural disaster threat due to climate change and geographical
condition, the relocation plan offers a sound solution to maintain the stability of
administrative function as it offers a strategic location that is safe from the
threat of sea level rise and volcanic eruption. However, the new capital cannot
address the issue of high population density, traffic congestion, and air
pollution as it only moves partial function of the government. The issue will still
occur if there is no measure to the remaining function and population in the
current capital. By these reasons, the relevance gives a weak indicator value
(C).
c. Internal coherence. This means the relevance and linkages between the main
components of the plan, such the objectives, planning concept, the location
and classes of areas, infrastructure and the mechanism for plan
implementation (Oliveira & Pinho, 2015). The latter is not discussed further as
it is still not described yet in the plan. The relationship between the objectives
and planning concept shows a positive coherence as the value of smart, green,
and sustainable in the city can enhance the objectives of the new capital city.
Meanwhile, the choice for the location of the new capital is in line with the
12
objective. Nevertheless, the correlation between the location and the planning
concept is still questionable as it could be a threat for the conservation area
without an environment protective measure and mechanism. By these reasons,
the internal coherence gives a weak indicator value (C).
d. External coherence. The external plan discussed here is referred to the district
general plan of energy (RUED). The conception of sustainable city for the new
capital is placed on the coherence between the RUED plan and the relocation
plan as it goes along with the plan to enhance renewable energy. Hence, the
external coherence gives a good indicator value (B).
e. Participation in plan making. Hitherto, the local government has been actively
involved in the plan making with the assistance by Bappenas/PPN and PUPR
ministries. Public participation has been initiated by PUPR through an open
urban design contest for the new capital city. There is also an open discussion
and socialization through social media for people to get informed and engaged
with the issue of the new capital. Nevertheless, directly affected people, which
in this case are the citizen of Penajam Paser Utara and Kutai Kartanegara, has
not yet been involved in the city plan (Hamdani, 2020). In his journal, Hamdani
(2020) also found that there is no platform for indigenous people to give
opinions and suggestions. Lack of participation of public in the affected area
gives a weak indicator value for this criterion (C).
2. Plan conformance
a. Effectiveness. The effectiveness of this plan is shown in how the development
of the plan can be realised as expected. The concept of sustainable city seems
hard to realise reflecting from the past experiences of capital city relocation
from other countries which showed no evidence of success story to implement
this concept. This is further compounded with the fact that conventional fuels,
especially coal, are still relied upon the primary fuels. Even though DEN and
ESDM have created strategic plan through RUED for increasing the renewable
resources portion in the electricity mix, the development of non-renewable
power plant is still included in this plan. Hence, the effectiveness criterion gives
a weak indicator value (C).
b. Commitment of resources. The resources here are referred on the planning
staff and the financial resources available (Oliveira & Pinho, 2015). By this
point, Bappenas/PPN as the main planner has actively contributed to the plan
13
making and coordination with the local government and related functions. In
regards of the financial resources, the new capital city is budgeted with 34
billion USD or equal to 3.27% of annual GDP (Shimamura & Mizunoya, 2020).
This is a sound budget if compared to 20 billion USD of projected cost in Sejong
City (Hur et al., 2019) and 3% of GDP for Brasilia (Quistorff, 2015). However,
the government heftily put more than half of the budget in public-private
partnerships scheme and private sector, while only around 20% budget is
subsidized by the government (Shimamura & Mizunoya, 2020). This brings
more uncertainty to this point as there is hitherto no fixed partnership strategy
that can guarantee the funding for the new capital. This reason gives a weak
indicator value for the criterion (C).
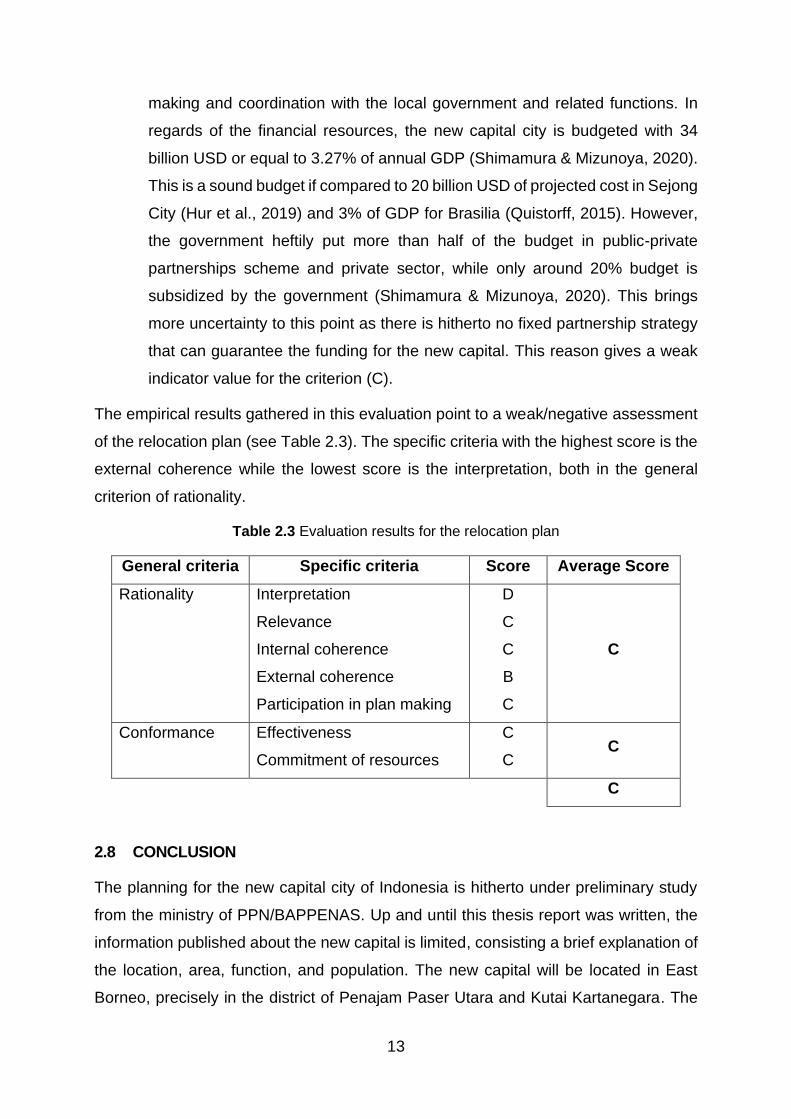
The empirical results gathered in this evaluation point to a weak/negative assessment
of the relocation plan (see Table 2.3). The specific criteria with the highest score is the
external coherence while the lowest score is the interpretation, both in the general
criterion of rationality.
Table 2.3 Evaluation results for the relocation plan
General criteria Specific criteria Score Average Score
Rationality Interpretation
Relevance
Internal coherence
External coherence
Participation in plan making
D
C
C
B
C
C
Conformance Effectiveness
Commitment of resources
C
C C
C
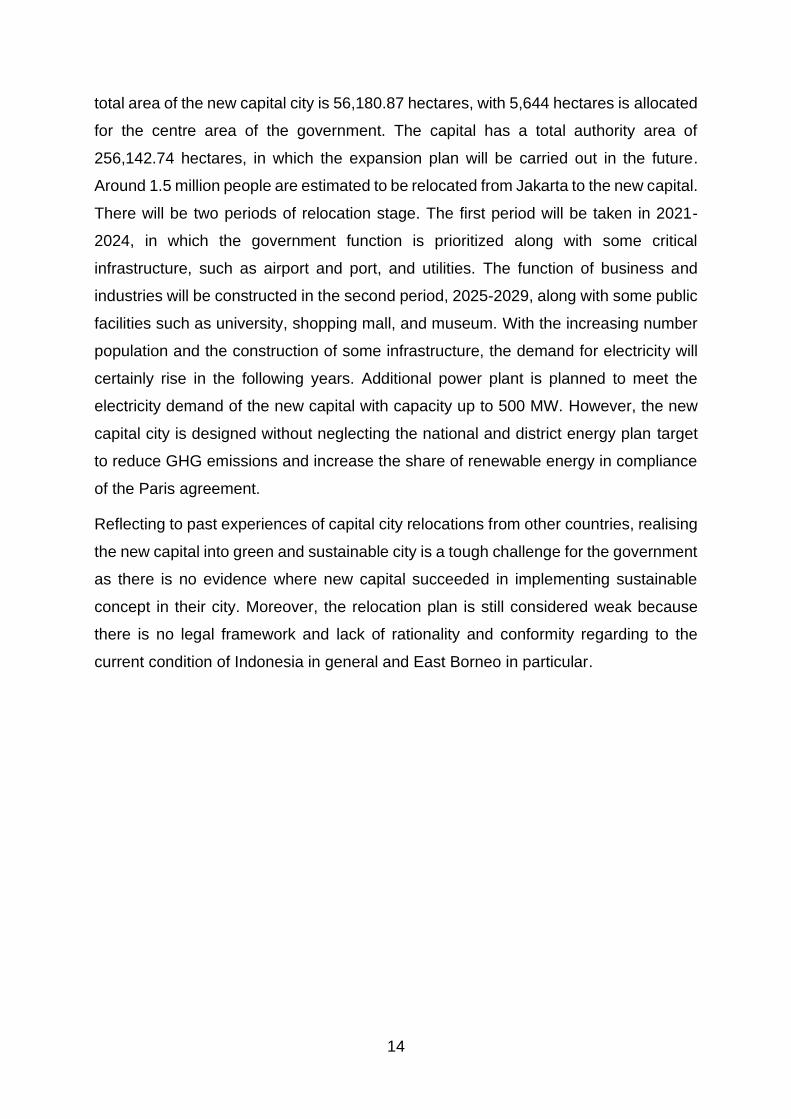
2.8 CONCLUSION
The planning for the new capital city of Indonesia is hitherto under preliminary study
from the ministry of PPN/BAPPENAS. Up and until this thesis report was written, the
information published about the new capital is limited, consisting a brief explanation of
the location, area, function, and population. The new capital will be located in East
Borneo, precisely in the district of Penajam Paser Utara and Kutai Kartanegara. The
14
total area of the new capital city is 56,180.87 hectares, with 5,644 hectares is allocated
for the centre area of the government. The capital has a total authority area of
256,142.74 hectares, in which the expansion plan will be carried out in the future.
Around 1.5 million people are estimated to be relocated from Jakarta to the new capital.
There will be two periods of relocation stage. The first period will be taken in 2021-
2024, in which the government function is prioritized along with some critical
infrastructure, such as airport and port, and utilities. The function of business and
industries will be constructed in the second period, 2025-2029, along with some public
facilities such as university, shopping mall, and museum. With the increasing number
population and the construction of some infrastructure, the demand for electricity will
certainly rise in the following years. Additional power plant is planned to meet the
electricity demand of the new capital with capacity up to 500 MW. However, the new
capital city is designed without neglecting the national and district energy plan target
to reduce GHG emissions and increase the share of renewable energy in compliance
of the Paris agreement.
Reflecting to past experiences of capital city relocations from other countries, realising
the new capital into green and sustainable city is a tough challenge for the government
as there is no evidence where new capital succeeded in implementing sustainable
concept in their city. Moreover, the relocation plan is still considered weak because
there is no legal framework and lack of rationality and conformity regarding to the
current condition of Indonesia in general and East Borneo in particular.
15
3. CHAPTER 3 MODELLING APPROACH
3.1 INTRODUCTION: ENERGY PLANNING AND ENERGY MODELLING
There are a few definitions of energy modelling. It was defined a long time ago as the
process of formulating a model that focuses on energy as an economic resource and
associated directly or indirectly with the decision making process (Samouilidis, 1980).
Rebelatto & Frandoloso (2020) described energy modelling as a way to boost the
performance and control of an energy system. Energy modelling can be used to
explore the energy setting in regional or global scale (Urban, Benders, & Moll, 2007)
with time scale in the near future or to a reasonable long term (Pokharel et al., 2012).
Kydes, Shaw, & McDonald (1995) defined the long term in a time period between 25
to 50 years ahead.
Energy models can be categorized into several categories based on different
approaches. Van Beeck (2003) characterized energy model based on analytical
approach (top-down and bottom-up), future perspective (forecasting, scenario
analysis, back casting), special purposes (energy demand, energy supply, impact
assessment, appraisal), underlying methodology (econometrics, macroeconomics,
economic equilibrium, optimization, simulation, spreadsheet, and multi-criteria
methods), mathematical approach (linear programming, mixed integer programming,
and dynamic programming), data requirements (qualitative and quantitative,
desegregate and aggregate), time horizon (short, medium, and long term), and
geographical coverage (local, national regional, and global).
In regards of long-term energy forecasting, Ouedraogo (2017) divided the modelling
tools into several categories: simulation (e.g. RAMSES, BALMOREL, LEAP, WASP,
etc.), scenario (e.g. MARKAL/TIMES, MESSAGE, LEAP, etc.), equilibrium (e.g.
MARKAL, PRIMES, etc.), top-down (ENPEP-BALANCE, LEAP, etc.), bottom-up
(HOMER, RAMSES, MARKAL/TIMES, MESSAGE, LEAP, etc.), operation
optimization (BALMOREL, MESSAGE, RAMSES, etc.), and investment optimization
tools (MESSAGE, MARKAL/TIMES, RETScreen, etc.). As these models provide
insights of how the energy system would evolve in the future, they become more
developed to comply with what the user needs.
16
Modelling energy system in developing countries is quite challenging and complex as
there are some distinctive factors possessed within developing countries. High reliance
on conventional non-renewable energy resources, the existence of large informal
sectors, inefficient energy sectors, poor performance of power sector, supply
shortages, energy poverty, inequity in energy access, rapid increase in electricity
demand are many characteristics of energy sectors in developing countries
(Ouedraogo, 2017). Many scholars have reviewed these characteristics in regards to
the relevance of the energy model to the targeted countries. The fundamental
differences between developed countries and developing countries may preclude the
adoption of many existing energy models in developing countries as most of them are
replications of energy system in developed countries (Irsyad, Halog, Nepal, &
Koesrindartoto, 2017). Urban et al. (2007) suggest a simulation model in which a
bottom-up approach is preferred as it does not assume the perfect market and optimal
behaviour compared to the optimization approach do and it overcomes the
contradictory economic assumptions that the top-down model offers. On the other
hand, Pandey (2002) and van Ruijven et al. (2008) suggest to still use the top-down
approach by modifying the model’s assumption in accordance with developing
country’s characteristics. Therefore, an analysis with a more country-specific or
regional focus is preferred with some indicators relevant to most developing economies
such as resource management, assessment of energy alternatives, economic and
technical challenge in accordance with the transformation of the energy infrastructure
from centralized to decentralized, and financial vulnerabilities in households (Debnath
& Mourshed, 2018). Nevertheless, integrating both top-down and bottom-up
approaches in conventional energy modelling will improve the robustness of the result
in conducting energy model analysis (Irsyad et al., 2017).
The Low Emissions Analysis Platform (LEAP) is an energy model tool developed by
the Stockholm Environment Institute (SEI) which combines both bottom-up and top-
down approaches with simulation-based methods and has been used in 190 countries.
Bottom-up models describe current and prospective technologies in detail and top-
down models more determine the energy system in terms of the broader economy and
aggregate relationships which derived empirically from historical data. Combination of
both approaches in LEAP gives more advantage than other models as it creates an
integrated energy-economy model by connecting the technological details in bottom-

17
up models with the reliance on real market data in top-down model (Böhringer &
Rutherford, 2011; Rivers & Jaccard, 2005). Moreover, LEAP has been analysed to
address a large number of developing countries’ characteristics (Urban et al., 2007),
making it becoming the de facto standard for energy modelling tools in the developing
world (Heaps, 2020). Indonesia became one of the 32 countries which use LEAP as
their energy planning tools in the basis for their Nationally Determined Contributions
on Climate Change (NDC) in order to comply with the Paris Agreement. Another benefit
that LEAP offers is its low initial data requirements and free-subscription for developing
countries users, making it easier to use in the case of Indonesia.
3.2 LEAP DATA ANALYSIS
Combination of quantitative and qualitative methods is applied in analysing the data.
Quantitative methods take a significant role as all of the data are inputted and analysed
in the LEAP energy modelling which is used as the primary tool in this research. The
detail of the LEAP structure and how it is used this research is explained in research
framework.
3.2.1 Research Framework
The scheme of research framework of this research is elaborated in Figure 3.1.
Figure 3.1 Research framework
The LEAP structure is shown in the dashed box in Figure 3.1. It is consisting of three
components of analysis: resources, transformation, and demand. The model input
consists of demographic and macroeconomics data along with electricity data of the
technology used in the analysis. The input of this data is then calculated by LEAP with
Energy planning and modelling
Preliminary research: East
Borneo
Capital city relocation
Dem
ogr
aph
ic a
nd
mac
roec
on
om
ics
dat
a
Resources analysis
Transformation analysis
Demand analysis
GHG emissions
Cost benefit
Electricity mix
Conclusion and recommendation
(a) (b) (c) (d)
Comparative analysis
BAUScenario
CCRScenario
sRQ2
sRQ3
sRQ4
RQ
(e)
sRQ1
LEAP STRUCTURE
18
the algorithm explained in Appendix B. The model output of the analysis is then divided
into three components: the technology added capacity which is interpreted as
electricity mix, GHG emissions, and cost benefit.
In general, the research framework of this research is conducted in the following
sequences:
(a) First step is conducting the literature review and preliminary research of the
current condition of the research target in regards to energy and electricity
planning. In this step, the basis for the CCR scenario is made using scientific
and logical assumptions to answer the first sub research question (sRQ1).
Review on energy models is also carried out to determine the best model for
the analysis and research material needed. This step is already covered in
chapter 2.
(b) Analysis of electricity mix is taken into two scenarios, Business-as-Usual (BAU)
scenario and Capital City Relocation (CCR) scenario. Both scenarios are
analysed using LEAP in which all related data consisting of demographic and
macroeconomic data are inputted into several steps within the model.
Resources analysis will be focused on the supply side for the primary energy
used, such as petroleum, coal, natural gas, or solar and wind. Output of the
resources is carried out in transformation analysis where electricity generation
and distribution are taken place. Moreover, outputs of both resources and
transformation are the input for demand side analysis which includes all sectors
related to electricity usage. Validation of LEAP is conducted prior the scenario
analysis using historical data from the past.
(c) Result of the LEAP model for both scenarios is separated into three aspects:
electricity mix, GHG emissions, and cost analysis. All of these aspects answer
the remaining three sub research questions.
(d) Comparative analysis is conducted between both scenarios.
(e) Implication of the capital city relocation is concluded based on the result of the
comparative analysis. Recommendation is then carried out in this final step.
19
3.2.2 Validation of Data Analysis
The LEAP model for East Borneo’s power system is validated using the data from 2010
as the base year and then the expansion of power generation capacity is simulated
within the period time between 2011 and 2018. The validation is conducted by using
the optimization function in LEAP. This function is intended to get the capacity of the
power generation addition with the least-cost technology at the end of the period based
on the electricity demand in the base year. The output from the simulation is then
compared with the actual data of electricity generation. The input and output
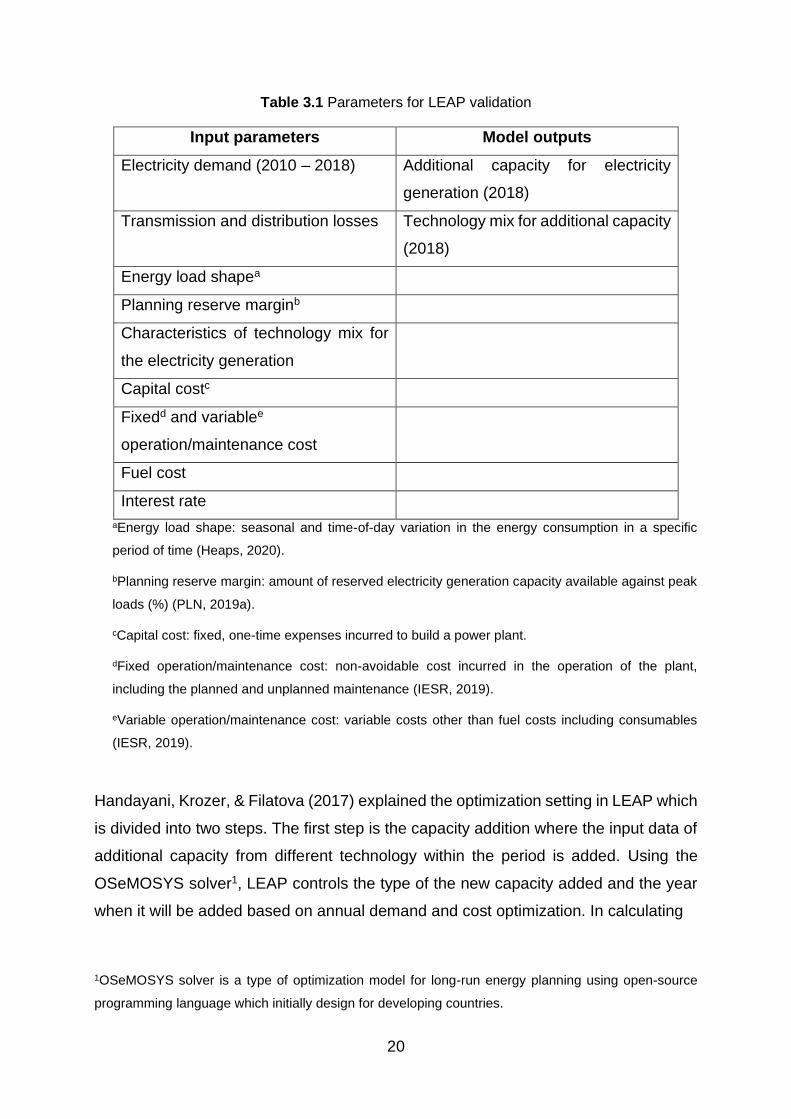
parameters for this validation step are summarized in Table 3.1. The input for the
electricity demand is the actual data of counted electricity consumption from 2010 to
2018 which is derived into four sectors: households, business, industrial, and
general/public. Other parameters such as transmission and distribution losses, and
economical costs are also based on actual data. Meanwhile, planning reserve margin,
interest rate, and characteristics of the technology mix are assumed based on the
literature (see Appendix C). Energy load shape data is gathered using the data from
Java-Bali model from Kamia Handayani’s thesis (2019) with that assumption that the
load shape of East Borneo and Java-Bali is similar. All of these inputs will then be
calculated by LEAP to get two outputs, the additional capacity of the electricity
generation and the composition of technology mix for the additional capacity. The detail
of this calculation is explained in Appendix B.
The technology mix during this period still mainly came from conventional fuels. Based
on PLN statistical report (PLN, 2011), coal (steam turbine), natural gas (gas turbine),
natural gas combined cycle (NGCC), and diesel are the technology used for power
generation in East Borneo in 2010. Diesel power plants have the largest capacity,
generating 65% of the total electricity mix. This is because during this period,
exploration of oil was still enhanced with some productive wells along with the high
demand of oil consumption as the effect of fuel subsidy from the government (Akhmad
& Amir, 2018).
20
Table 3.1 Parameters for LEAP validation
Input parameters Model outputs
Electricity demand (2010 – 2018) Additional capacity for electricity
generation (2018)
Transmission and distribution losses Technology mix for additional capacity
(2018)
Energy load shapea
Planning reserve marginb
Characteristics of technology mix for
the electricity generation
Capital costc
Fixedd and variablee
operation/maintenance cost
Fuel cost
Interest rate
aEnergy load shape: seasonal and time-of-day variation in the energy consumption in a specific
period of time (Heaps, 2020).
bPlanning reserve margin: amount of reserved electricity generation capacity available against peak
loads (%) (PLN, 2019a).
cCapital cost: fixed, one-time expenses incurred to build a power plant.
dFixed operation/maintenance cost: non-avoidable cost incurred in the operation of the plant,
including the planned and unplanned maintenance (IESR, 2019).
eVariable operation/maintenance cost: variable costs other than fuel costs including consumables
(IESR, 2019).
Handayani, Krozer, & Filatova (2017) explained the optimization setting in LEAP which
is divided into two steps. The first step is the capacity addition where the input data of
additional capacity from different technology within the period is added. Using the
OSeMOSYS solver1, LEAP controls the type of the new capacity added and the year
when it will be added based on annual demand and cost optimization. In calculating
1OSeMOSYS solver is a type of optimization model for long-run energy planning using open-source
programming language which initially design for developing countries.

21
an optimal system, LEAP takes into account all of the relevant running costs and
benefits incurred in the system such as capital costs, decommissioning costs, fixed
and variable operating and maintenance costs, fuel costs, and environmental
externality values (Heaps, 2020). The decommissioning costs and environmental
externality values such as pollution damage or abatement costs are neglected in this
research as there is no reference available. The second step is the electricity dispatch
from each type of power supply. In this step, LEAP controls the dispatch of electricity
from each technology based on the output of the solver for the running cost. Finally,
the combination of the technology with the least cost available will be shown as the
result.
The optimization setting for the electricity generation capacity in East Borneo from
2010 to 2018 shows an accurate result. As it is shown in Table 3.2, LEAP gives the
added capacity for the electricity generation from 2010 to 2018 slightly below the actual
capacity with only 2.07% difference. Meanwhile, the technology mix resulting from the
LEAP shows 100% coal as the technology added, compared to the actual mix where
coal only gives 79% portion of the electricity mix. This is due to the fact that the
operating and maintenance cost of coal power plants inputted on LEAP is much lower
than the other technology. Borneo island is the biggest coal producer in Indonesia.
Thus, the distribution cost of coal within this island is cheaper. This is also the reason
why coal power plants are still used in RUED as the primary fuel for electricity
generation in East Borneo. Nevertheless, the LEAP calculations are still reliable and
can be accepted to be used in this research in regards of some limitations in data input
and assumptions.
Table 3.2 LEAP validation result
Actual data LEAP optimization
settings
Difference
Cumulative electricity
generation capacity
added 2010 - 2018
662.3 MW 648.6 MW 2.07%
Technology mix of
the added capacities
Coal: 79%
Natural gas: 21%
Coal: 100%
22
3.2.3 Conclusion
LEAP is chosen as the energy modelling tool used in this research as it combines
bottom-up and top-down approaches which gives more integrated technical-economy
model. LEAP also well-known to be used in developing countries and it is commonly
used for energy modelling in Indonesia as it is available with free-subscription for
developing countries. LEAP is structured in this research as the primary tool to analyse
the resources, demand, and transformation of electricity. Later on, LEAP will calculate
the input of demographical, economic, and technology data and generate the output
into three categories: electricity mix, GHG emissions, and cost benefit. These outputs
furthermore will answer the last three sub research question. Moreover, A series of
historical data of East Borneo electricity is used to validate the data analysis using
LEAP. The results of the validation show an acceptable deviation between the LEAP
simulation output and actual data which implies that the tool can be used reliably for
this research.
23
CHAPTER 4 ELECTRICITY MODEL ANALYSIS RESULTS
4.1 THE BUSINESS AS USUAL SCENARIO
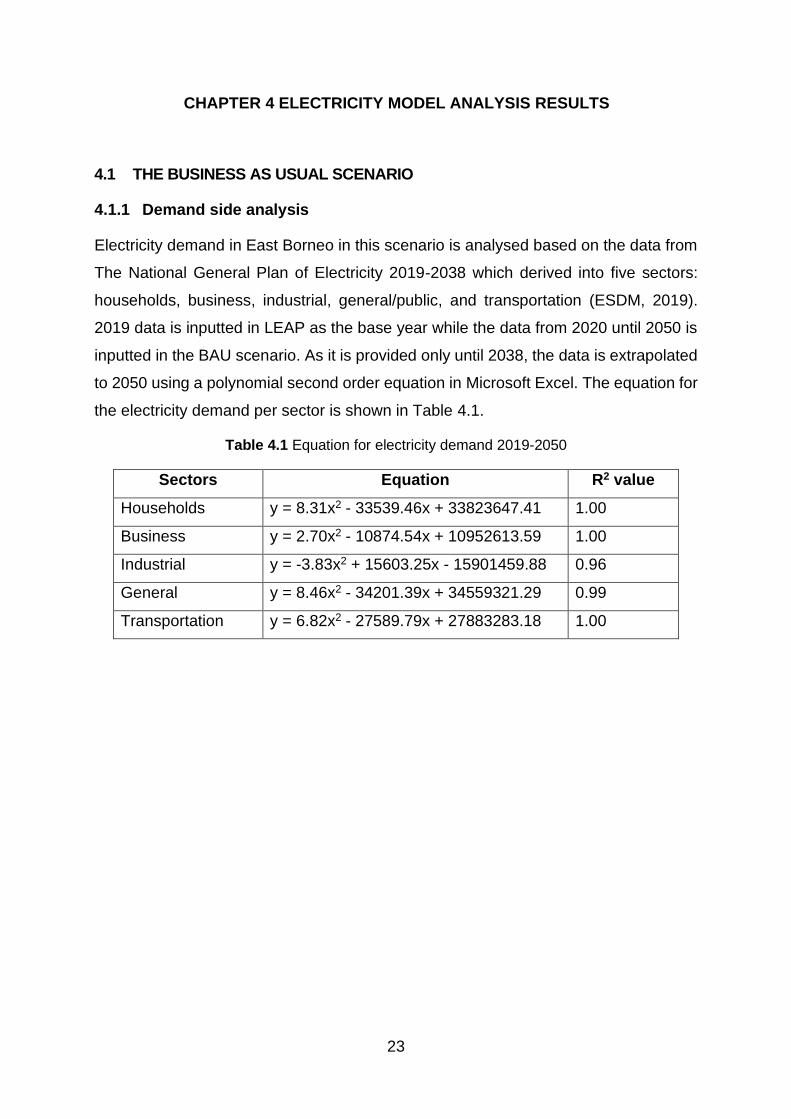
4.1.1 Demand side analysis
Electricity demand in East Borneo in this scenario is analysed based on the data from
The National General Plan of Electricity 2019-2038 which derived into five sectors:
households, business, industrial, general/public, and transportation (ESDM, 2019).
2019 data is inputted in LEAP as the base year while the data from 2020 until 2050 is
inputted in the BAU scenario. As it is provided only until 2038, the data is extrapolated
to 2050 using a polynomial second order equation in Microsoft Excel. The equation for
the electricity demand per sector is shown in Table 4.1.
Table 4.1 Equation for electricity demand 2019-2050
Sectors Equation R2 value
Households y = 8.31x2 - 33539.46x + 33823647.41 1.00
Business y = 2.70x2 - 10874.54x + 10952613.59 1.00
Industrial y = -3.83x2 + 15603.25x - 15901459.88 0.96
General y = 8.46x2 - 34201.39x + 34559321.29 0.99
Transportation y = 6.82x2 - 27589.79x + 27883283.18 1.00
24
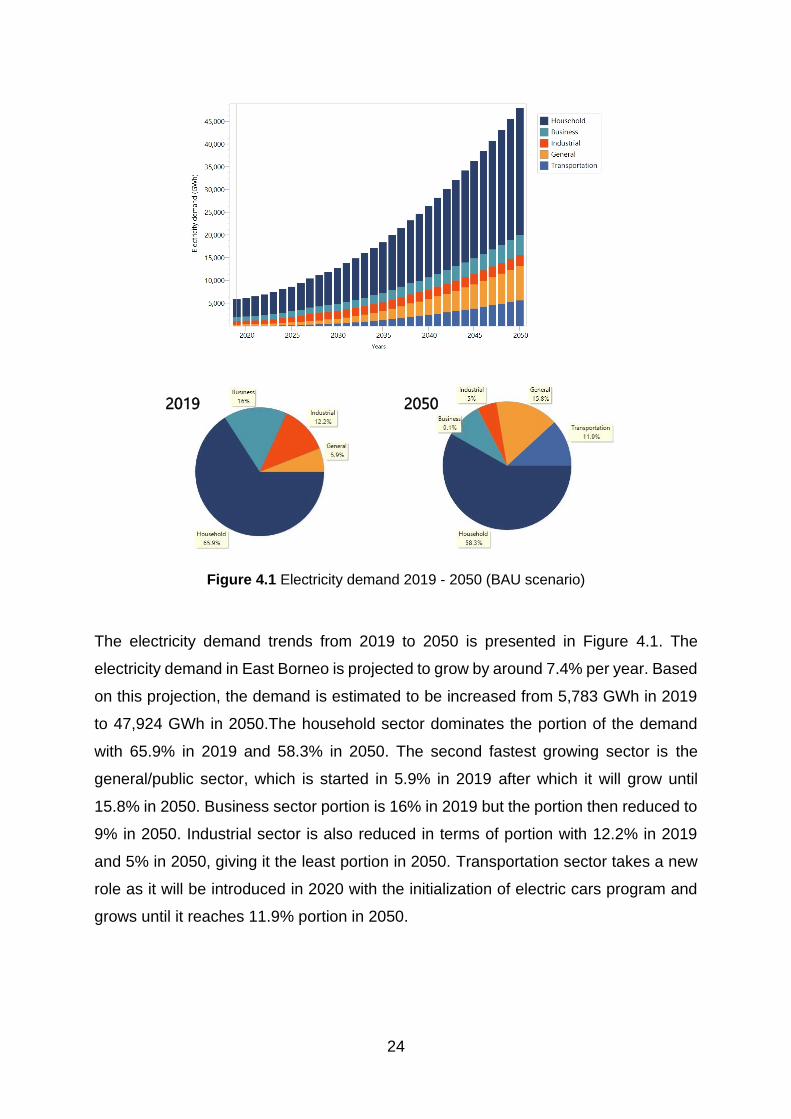
Figure 4.1 Electricity demand 2019 - 2050 (BAU scenario)
The electricity demand trends from 2019 to 2050 is presented in Figure 4.1. The
electricity demand in East Borneo is projected to grow by around 7.4% per year. Based
on this projection, the demand is estimated to be increased from 5,783 GWh in 2019
to 47,924 GWh in 2050.The household sector dominates the portion of the demand
with 65.9% in 2019 and 58.3% in 2050. The second fastest growing sector is the
general/public sector, which is started in 5.9% in 2019 after which it will grow until
15.8% in 2050. Business sector portion is 16% in 2019 but the portion then reduced to
9% in 2050. Industrial sector is also reduced in terms of portion with 12.2% in 2019
and 5% in 2050, giving it the least portion in 2050. Transportation sector takes a new
role as it will be introduced in 2020 with the initialization of electric cars program and
grows until it reaches 11.9% portion in 2050.
2019 2050
25
4.1.2 Electricity mix analysis
The electricity mix is defined with the data of electricity demand from section 4.1.1. and
some assumptions shown in Appendix D. Some data parameters such as planned
reserve margin, interest rate, load shape, capital cost, and characteristic of technology
mix is assumed to be the same with the data from LEAP validation. However, other
parameters such as transmission and distribution losses, operation and maintenance
cost, and fuel cost is updated based on the newest data in 2018. The added capacity
of power generation is inputted based on the scenario of District General Plan of
Energy in East Borneo 2019 where renewable energy resources such as hydropower,
solar PV, and biomass are started to be introduced in the electricity mix along with
other non-renewable resources (DEN, 2019b). The added capacity is calculated
internally by LEAP which is then called the endogenous capacity. The calculation of
the endogenous capacity is processed in order to maintain a minimum planning
reserve margin (Heaps, 2020). LEAP adds the endogenous capacity along with the
current capacity (called exogenous capacity) in a specific year within the time period
based on how quickly the electricity demand increases and the initial reserve margin.
The result of the calculation of electricity mix is shown in Figure 4.2. The capacity of
electricity generation is increased from 1.2 GW in 2019 to 152.6 GW in 2050. Coal still
gets the biggest portion of the electricity mix with 46.37% in 2050. As East Borneo is
the province with the largest coal reserves in the country, it can be seen that the
government will continue to try to harness the potential of coal in the future. However,
the development of renewable energy power plants also takes part in this scenario.
With 15.95% of biomass, 6.49% of hydropower, and 4.93% of solar, the electricity
generation from renewable energy resources takes 27.3% of the total electricity mix in
2050. This result seems to imply that the national target of renewable energy mix of
31% in 2050 is not achieved. Nevertheless, the government has proportional targets
for each province considering the economic and social aspects in developing
renewable energy. Thus, this target already is set in compliance with the national target
of electricity mix and furthermore, Paris Agreement target. The analysis about this
target is discussed later in section 4.3.
26
Figure 4.2 Electricity mix 2019 - 2050 (BAU scenario)
4.1.3 GHG emissions analysis
The environmental loadings for the electricity generation in each technology is
calculated by LEAP based on the Intergovernmental Panel on Climate Change (IPCC)
Tier 1 emission factors (Heaps, 2020). The emission factors in Tier 1 methods use
readily available national or international statistics in combination that should be
feasible for all countries (Rypdal et al., 2006). Based on IPCC Good Practice Guidance
(Rypdal, Flugsrud, & Irving, 2000), Tier 1 should be chosen if there is no inventory data
for more than one year and country-specific uncertainty estimates available. In this
case, At the moment, Indonesia only has CO2 data for emission factor to be used in
Tier 2 methods (ESDM, 2017). Thus, Tier 1 methods with its default emission factors

27
from IPCC are chosen in this analysis to comprise all other elements of greenhouse
gas emissions alongside with the availability of the data in LEAP database.
The GHG emissions captured in the analysis are divided into three components:
carbon dioxide (CO2), methane (CH4), and nitrous oxide (N2O). The emissions are
shown by measuring the Global Warming Potential (GWP) in CO2 equivalent basis
(Forster et al., 2007). The GWP was developed to allow comparisons of global warming
impacts of different gases within the time horizon (US EPA, 2017). Direct GHG
emissions are identified at the point where emissions are produced in 100 years of
time horizon (Heaps, 2020).
The total GHG emissions in this scenario based on its technology is shown in Figure
4.3. It is shown that the emissions are increased drastically from 0.6 million metric
Tonnes of CO2 equivalent in 2019 to 4.9 million metric Tonnes of CO2 equivalent in
2020 and then will reach 28.7 million metric Tonnes of CO2 equivalent in 2050. The
biggest contributor of total GHG emissions will be the coal power plant with 95.1% of
total emissions in 2050, followed by NGCC (3.3%), biomass (0.8%), natural gas
(0.5%), and diesel (0.3%). Most of the GHG emissions will come from CO2 with 98.8%,
followed by N2O (0.8%) and CH4 (0.4%).
Figure 4.3 GHG emissions 2019 – 2050 (BAU scenario)
The trending of GHG per type can be seen in Figure 4.4, 4.5, and 4.6. Figure 4.4
displays the CO2 emissions in 2019 – 2050. The emissions were dominantly produced
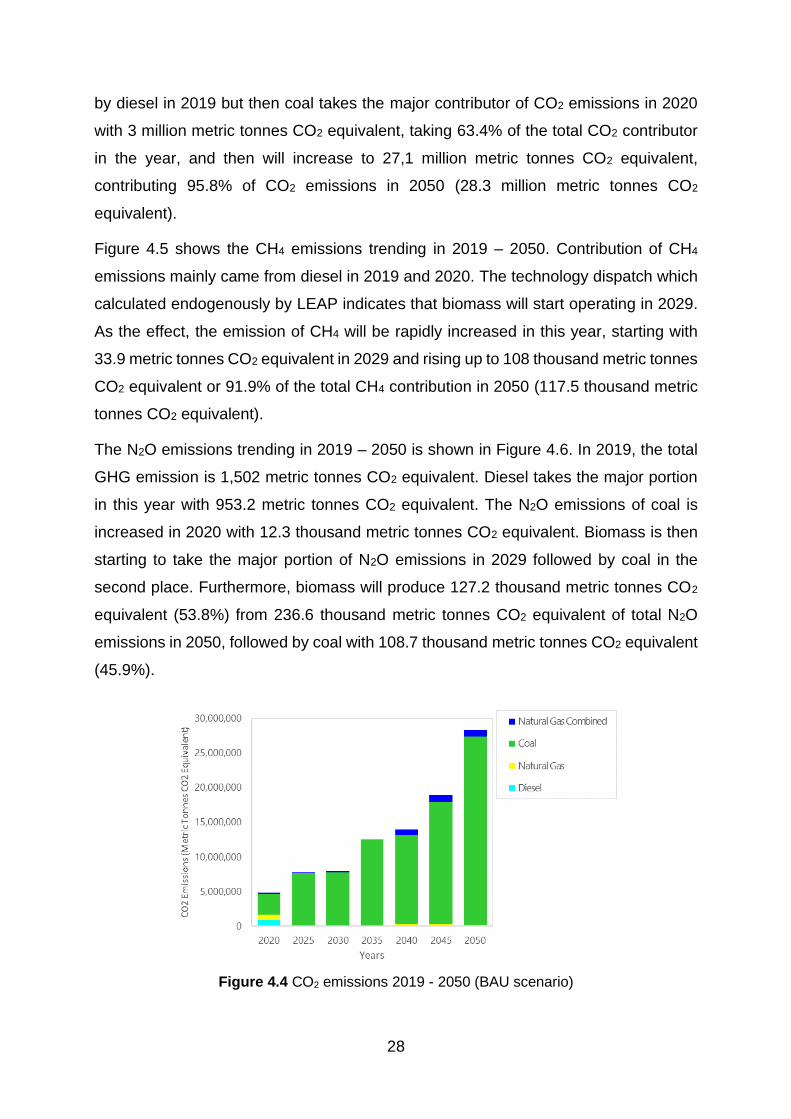
28
by diesel in 2019 but then coal takes the major contributor of CO2 emissions in 2020
with 3 million metric tonnes CO2 equivalent, taking 63.4% of the total CO2 contributor
in the year, and then will increase to 27,1 million metric tonnes CO2 equivalent,
contributing 95.8% of CO2 emissions in 2050 (28.3 million metric tonnes CO2
equivalent).
Figure 4.5 shows the CH4 emissions trending in 2019 – 2050. Contribution of CH4
emissions mainly came from diesel in 2019 and 2020. The technology dispatch which
calculated endogenously by LEAP indicates that biomass will start operating in 2029.
As the effect, the emission of CH4 will be rapidly increased in this year, starting with
33.9 metric tonnes CO2 equivalent in 2029 and rising up to 108 thousand metric tonnes
CO2 equivalent or 91.9% of the total CH4 contribution in 2050 (117.5 thousand metric
tonnes CO2 equivalent).
The N2O emissions trending in 2019 – 2050 is shown in Figure 4.6. In 2019, the total
GHG emission is 1,502 metric tonnes CO2 equivalent. Diesel takes the major portion
in this year with 953.2 metric tonnes CO2 equivalent. The N2O emissions of coal is
increased in 2020 with 12.3 thousand metric tonnes CO2 equivalent. Biomass is then
starting to take the major portion of N2O emissions in 2029 followed by coal in the
second place. Furthermore, biomass will produce 127.2 thousand metric tonnes CO2
equivalent (53.8%) from 236.6 thousand metric tonnes CO2 equivalent of total N2O
emissions in 2050, followed by coal with 108.7 thousand metric tonnes CO2 equivalent
(45.9%).
Figure 4.4 CO2 emissions 2019 - 2050 (BAU scenario)

29
Figure 4.5 CH4 emissions 2019 - 2050 (BAU scenario)
Figure 4.6 N2O emissions 2019 - 2050 (BAU scenario)
4.1.4 Cost benefit analysis
The cost analysis in this report is conducted only for electricity generation, excluding
cost from demand side (for example cost for fuel in transportation) and resources side
(import and export cost). The environmental costs are also neglected as there are no
externalities such as polluter pays or environmental taxes applied in Indonesia at the
moment. The total cost for electricity generation is calculated based on the data of
capital cost, fixed operation maintenance cost, and variable operation maintenance
cost per technology shown in Table D.1 and Table D.2 (Appendix D).
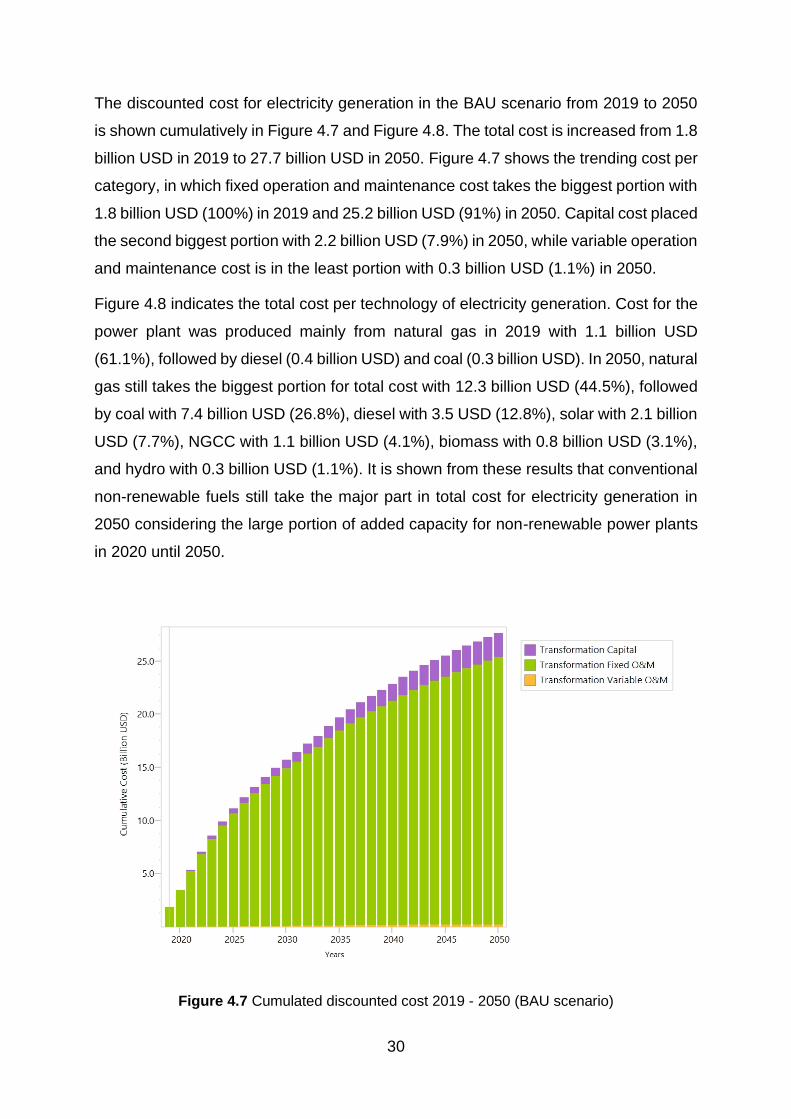
30
The discounted cost for electricity generation in the BAU scenario from 2019 to 2050
is shown cumulatively in Figure 4.7 and Figure 4.8. The total cost is increased from 1.8
billion USD in 2019 to 27.7 billion USD in 2050. Figure 4.7 shows the trending cost per
category, in which fixed operation and maintenance cost takes the biggest portion with
1.8 billion USD (100%) in 2019 and 25.2 billion USD (91%) in 2050. Capital cost placed
the second biggest portion with 2.2 billion USD (7.9%) in 2050, while variable operation
and maintenance cost is in the least portion with 0.3 billion USD (1.1%) in 2050.
Figure 4.8 indicates the total cost per technology of electricity generation. Cost for the
power plant was produced mainly from natural gas in 2019 with 1.1 billion USD
(61.1%), followed by diesel (0.4 billion USD) and coal (0.3 billion USD). In 2050, natural
gas still takes the biggest portion for total cost with 12.3 billion USD (44.5%), followed
by coal with 7.4 billion USD (26.8%), diesel with 3.5 USD (12.8%), solar with 2.1 billion
USD (7.7%), NGCC with 1.1 billion USD (4.1%), biomass with 0.8 billion USD (3.1%),
and hydro with 0.3 billion USD (1.1%). It is shown from these results that conventional
non-renewable fuels still take the major part in total cost for electricity generation in
2050 considering the large portion of added capacity for non-renewable power plants
in 2020 until 2050.
Figure 4.7 Cumulated discounted cost 2019 - 2050 (BAU scenario)

31
Figure 4.8 Cumulated discounted cost per technology 2019 - 2050 (BAU scenario)
4.2 THE CAPITAL CITY RELOCATION SCENARIO
4.2.1 Demand side analysis
The change in electricity demand in this scenario is mostly due to the increase in the
population which comes from the civil servants in Jakarta. As it is stated before in
section 2.6., around 1.5 million of people are predicted to move to the new capital after
the first period of the relocation is completed in 2024 (BAPPENAS, 2019). With an
assumption that the average growth rate per year is 1.54% (DEN, 2019a), the trending
of population before and after the relocation can be seen in Figure 4.9.
Figure 4.10 shows the electricity demand in this scenario. The additional population
directly affects the increasing demand in household and transportation sectors. In other
hand, business, industrial, and general sectors are assumed to remain the same with
BAU scenario as there is no information yet about how much capacity added for these
sectors even though the development of these sectors is stated in the preliminary plan.
There will be 60,820 GWh of total electricity demand in 2050, or 12,896 GWh of
additional demand compared to the BAU scenario. Household sector will remain
having the largest demand with 38,652 GWh in 2050, or 10,717 GWh of additional
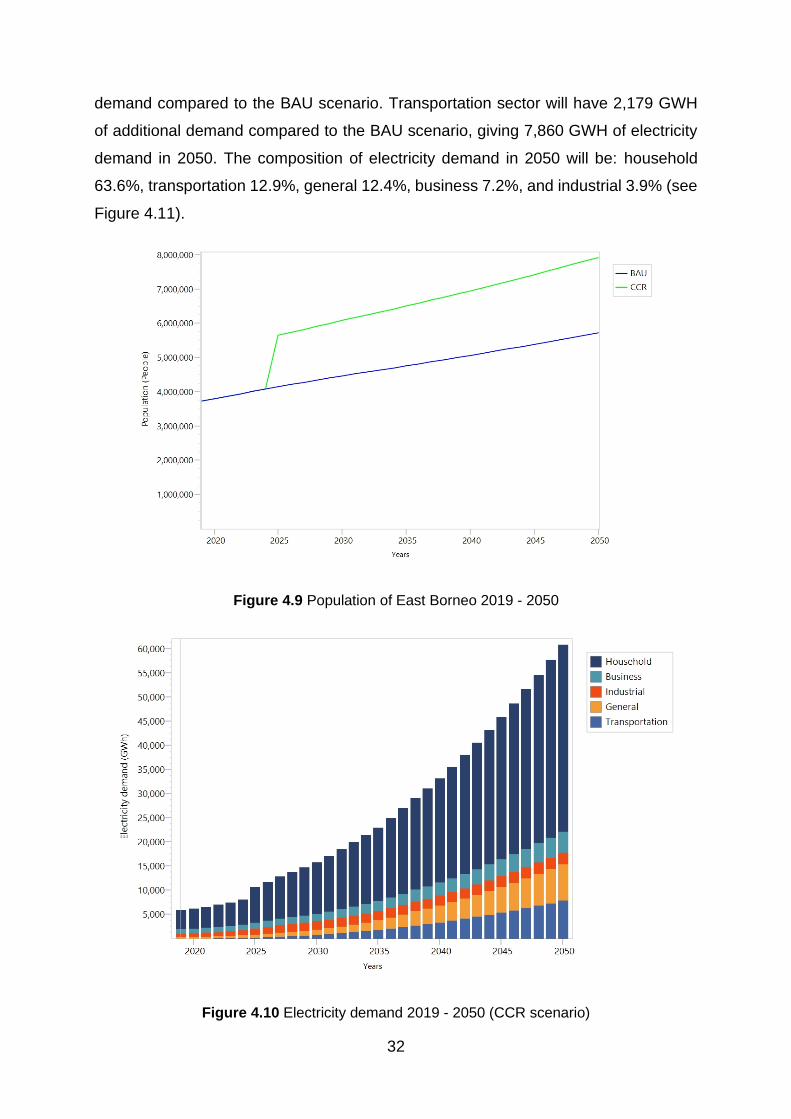
32
demand compared to the BAU scenario. Transportation sector will have 2,179 GWH
of additional demand compared to the BAU scenario, giving 7,860 GWH of electricity
demand in 2050. The composition of electricity demand in 2050 will be: household
63.6%, transportation 12.9%, general 12.4%, business 7.2%, and industrial 3.9% (see
Figure 4.11).
Figure 4.9 Population of East Borneo 2019 - 2050
Figure 4.10 Electricity demand 2019 - 2050 (CCR scenario)
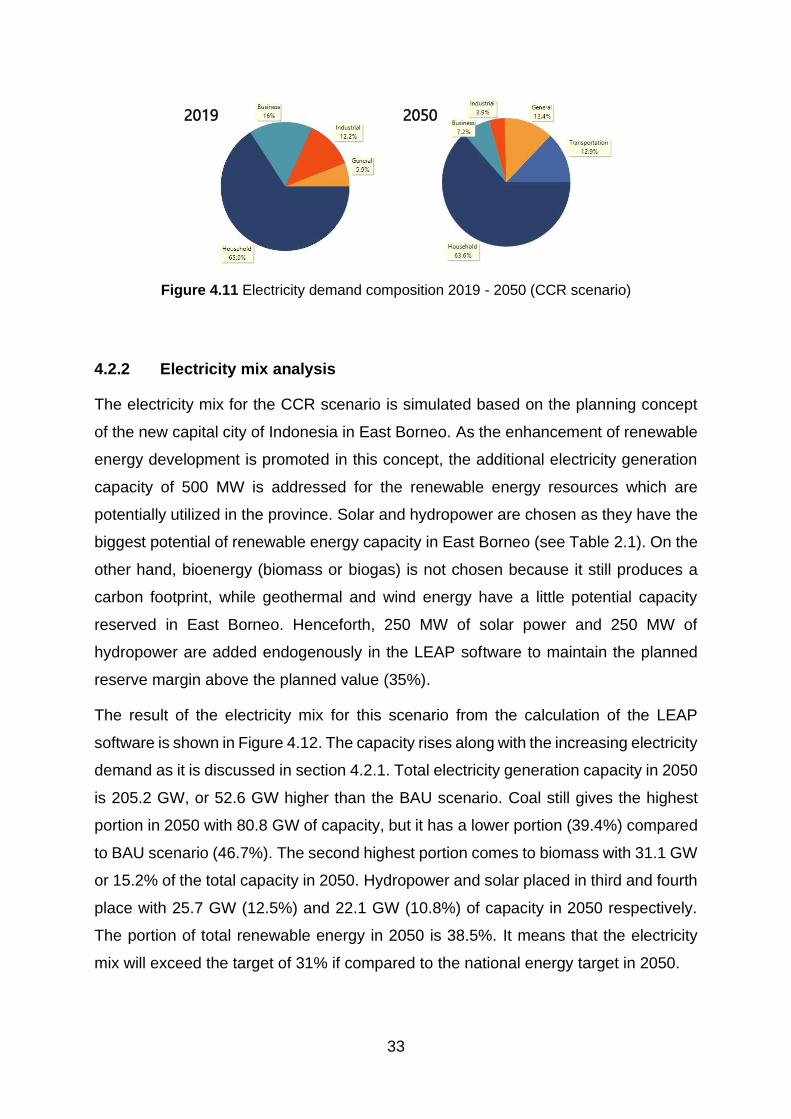
33
Figure 4.11 Electricity demand composition 2019 - 2050 (CCR scenario)
4.2.2 Electricity mix analysis
The electricity mix for the CCR scenario is simulated based on the planning concept
of the new capital city of Indonesia in East Borneo. As the enhancement of renewable
energy development is promoted in this concept, the additional electricity generation
capacity of 500 MW is addressed for the renewable energy resources which are
potentially utilized in the province. Solar and hydropower are chosen as they have the
biggest potential of renewable energy capacity in East Borneo (see Table 2.1). On the
other hand, bioenergy (biomass or biogas) is not chosen because it still produces a
carbon footprint, while geothermal and wind energy have a little potential capacity
reserved in East Borneo. Henceforth, 250 MW of solar power and 250 MW of
hydropower are added endogenously in the LEAP software to maintain the planned
reserve margin above the planned value (35%).
The result of the electricity mix for this scenario from the calculation of the LEAP
software is shown in Figure 4.12. The capacity rises along with the increasing electricity
demand as it is discussed in section 4.2.1. Total electricity generation capacity in 2050
is 205.2 GW, or 52.6 GW higher than the BAU scenario. Coal still gives the highest
portion in 2050 with 80.8 GW of capacity, but it has a lower portion (39.4%) compared
to BAU scenario (46.7%). The second highest portion comes to biomass with 31.1 GW
or 15.2% of the total capacity in 2050. Hydropower and solar placed in third and fourth
place with 25.7 GW (12.5%) and 22.1 GW (10.8%) of capacity in 2050 respectively.
The portion of total renewable energy in 2050 is 38.5%. It means that the electricity
mix will exceed the target of 31% if compared to the national energy target in 2050.
2019 2050
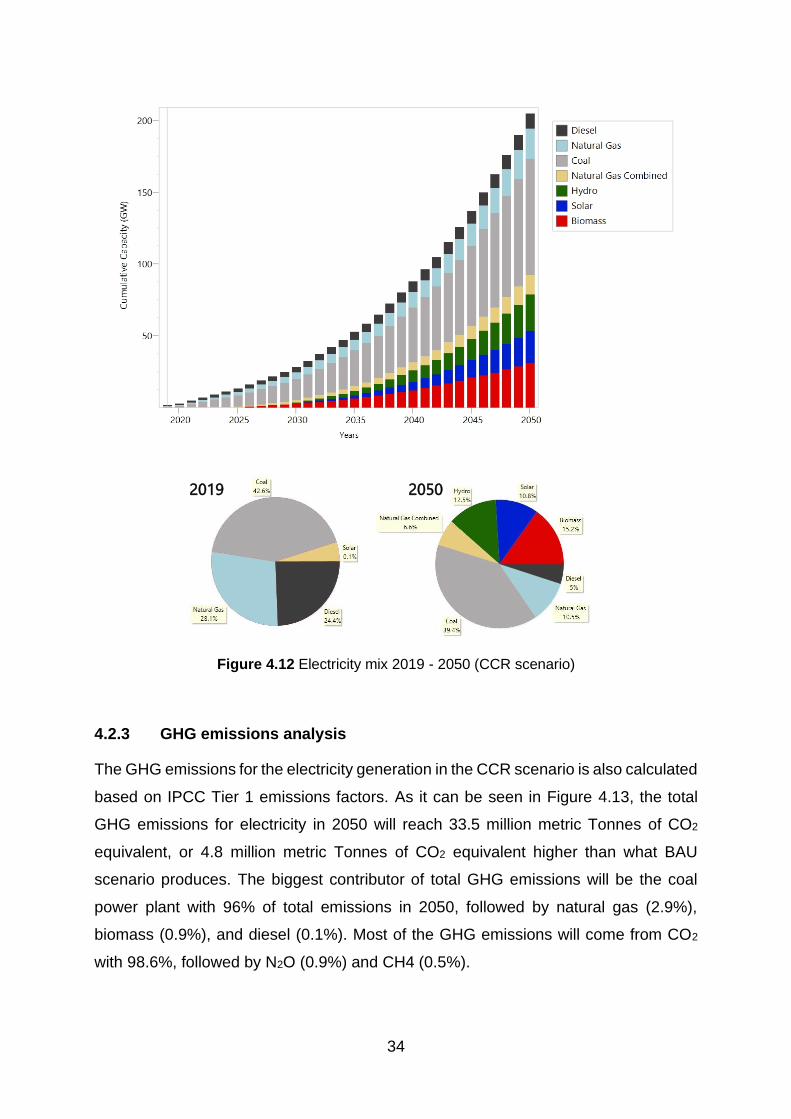
34
Figure 4.12 Electricity mix 2019 - 2050 (CCR scenario)
4.2.3 GHG emissions analysis
The GHG emissions for the electricity generation in the CCR scenario is also calculated
based on IPCC Tier 1 emissions factors. As it can be seen in Figure 4.13, the total
GHG emissions for electricity in 2050 will reach 33.5 million metric Tonnes of CO2
equivalent, or 4.8 million metric Tonnes of CO2 equivalent higher than what BAU
scenario produces. The biggest contributor of total GHG emissions will be the coal
power plant with 96% of total emissions in 2050, followed by natural gas (2.9%),
biomass (0.9%), and diesel (0.1%). Most of the GHG emissions will come from CO2
with 98.6%, followed by N2O (0.9%) and CH4 (0.5%).
2019 2050
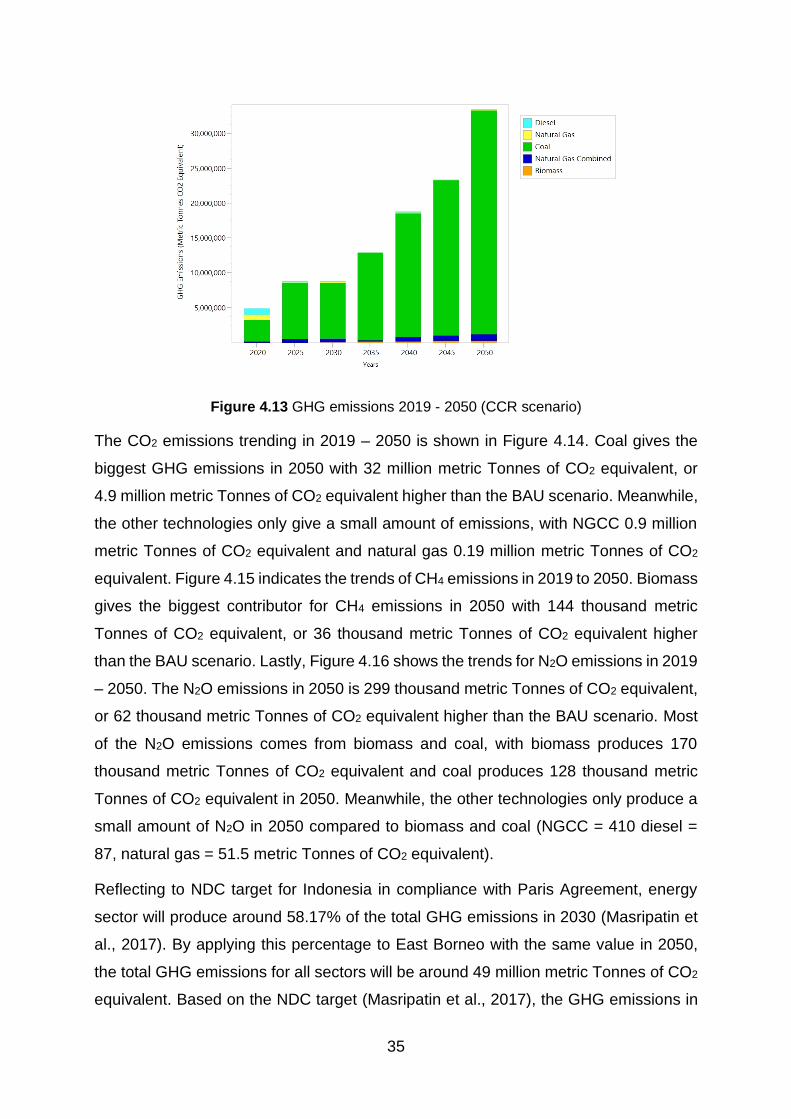
35
Figure 4.13 GHG emissions 2019 - 2050 (CCR scenario)
The CO2 emissions trending in 2019 – 2050 is shown in Figure 4.14. Coal gives the
biggest GHG emissions in 2050 with 32 million metric Tonnes of CO2 equivalent, or
4.9 million metric Tonnes of CO2 equivalent higher than the BAU scenario. Meanwhile,
the other technologies only give a small amount of emissions, with NGCC 0.9 million
metric Tonnes of CO2 equivalent and natural gas 0.19 million metric Tonnes of CO2
equivalent. Figure 4.15 indicates the trends of CH4 emissions in 2019 to 2050. Biomass
gives the biggest contributor for CH4 emissions in 2050 with 144 thousand metric
Tonnes of CO2 equivalent, or 36 thousand metric Tonnes of CO2 equivalent higher
than the BAU scenario. Lastly, Figure 4.16 shows the trends for N2O emissions in 2019
– 2050. The N2O emissions in 2050 is 299 thousand metric Tonnes of CO2 equivalent,
or 62 thousand metric Tonnes of CO2 equivalent higher than the BAU scenario. Most
of the N2O emissions comes from biomass and coal, with biomass produces 170
thousand metric Tonnes of CO2 equivalent and coal produces 128 thousand metric
Tonnes of CO2 equivalent in 2050. Meanwhile, the other technologies only produce a
small amount of N2O in 2050 compared to biomass and coal (NGCC = 410 diesel =
87, natural gas = 51.5 metric Tonnes of CO2 equivalent).
Reflecting to NDC target for Indonesia in compliance with Paris Agreement, energy
sector will produce around 58.17% of the total GHG emissions in 2030 (Masripatin et
al., 2017). By applying this percentage to East Borneo with the same value in 2050,
the total GHG emissions for all sectors will be around 49 million metric Tonnes of CO2
equivalent. Based on the NDC target (Masripatin et al., 2017), the GHG emissions in
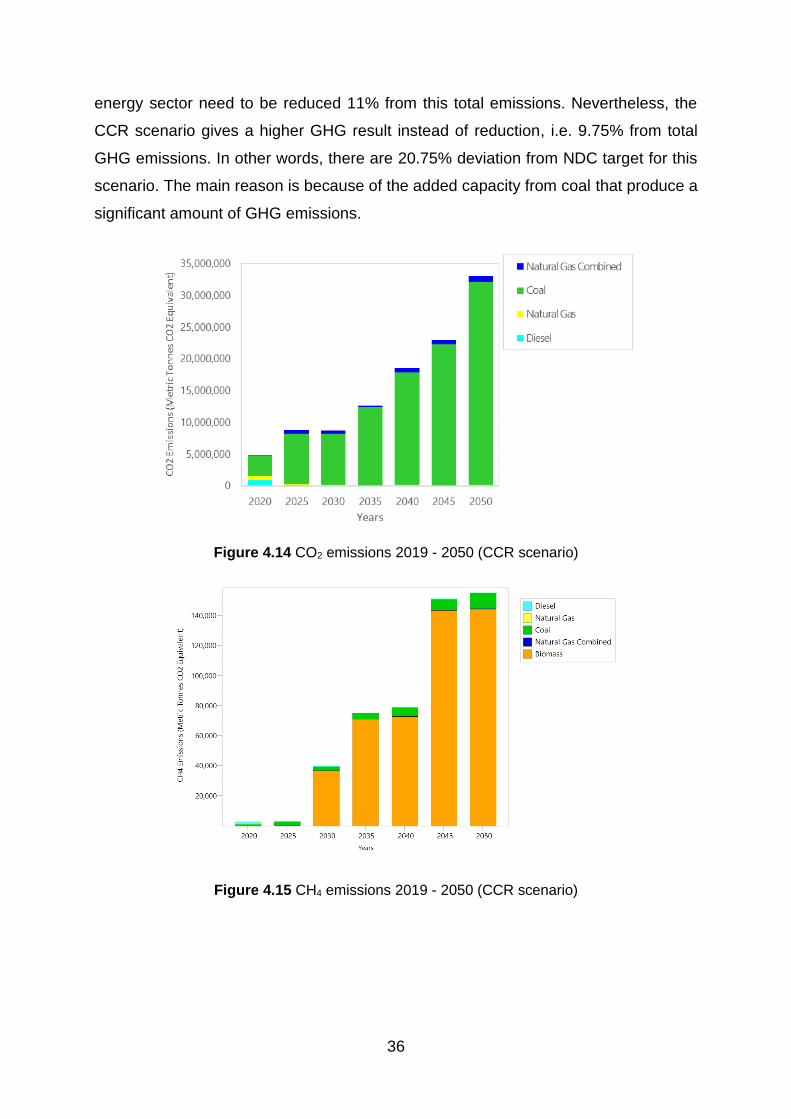
36
energy sector need to be reduced 11% from this total emissions. Nevertheless, the
CCR scenario gives a higher GHG result instead of reduction, i.e. 9.75% from total
GHG emissions. In other words, there are 20.75% deviation from NDC target for this
scenario. The main reason is because of the added capacity from coal that produce a
significant amount of GHG emissions.
Figure 4.14 CO2 emissions 2019 - 2050 (CCR scenario)
Figure 4.15 CH4 emissions 2019 - 2050 (CCR scenario)
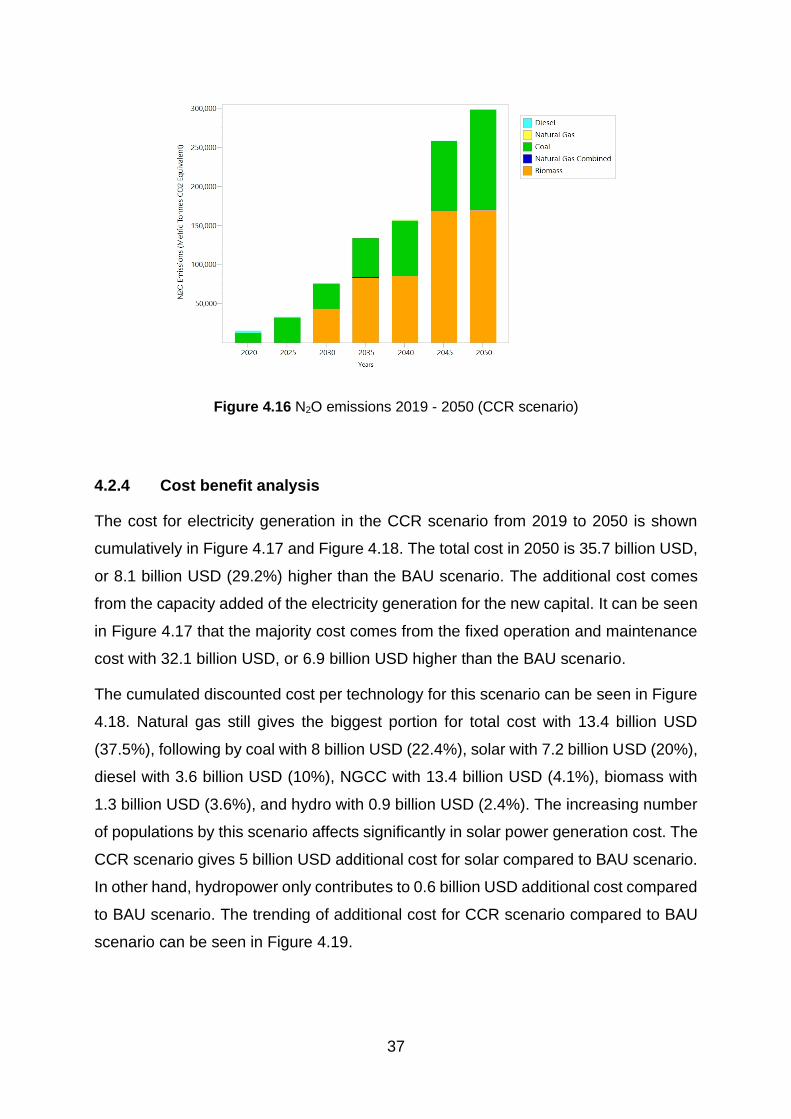
37
Figure 4.16 N2O emissions 2019 - 2050 (CCR scenario)
4.2.4 Cost benefit analysis
The cost for electricity generation in the CCR scenario from 2019 to 2050 is shown
cumulatively in Figure 4.17 and Figure 4.18. The total cost in 2050 is 35.7 billion USD,
or 8.1 billion USD (29.2%) higher than the BAU scenario. The additional cost comes
from the capacity added of the electricity generation for the new capital. It can be seen
in Figure 4.17 that the majority cost comes from the fixed operation and maintenance
cost with 32.1 billion USD, or 6.9 billion USD higher than the BAU scenario.
The cumulated discounted cost per technology for this scenario can be seen in Figure
4.18. Natural gas still gives the biggest portion for total cost with 13.4 billion USD
(37.5%), following by coal with 8 billion USD (22.4%), solar with 7.2 billion USD (20%),
diesel with 3.6 billion USD (10%), NGCC with 13.4 billion USD (4.1%), biomass with
1.3 billion USD (3.6%), and hydro with 0.9 billion USD (2.4%). The increasing number
of populations by this scenario affects significantly in solar power generation cost. The
CCR scenario gives 5 billion USD additional cost for solar compared to BAU scenario.
In other hand, hydropower only contributes to 0.6 billion USD additional cost compared
to BAU scenario. The trending of additional cost for CCR scenario compared to BAU
scenario can be seen in Figure 4.19.
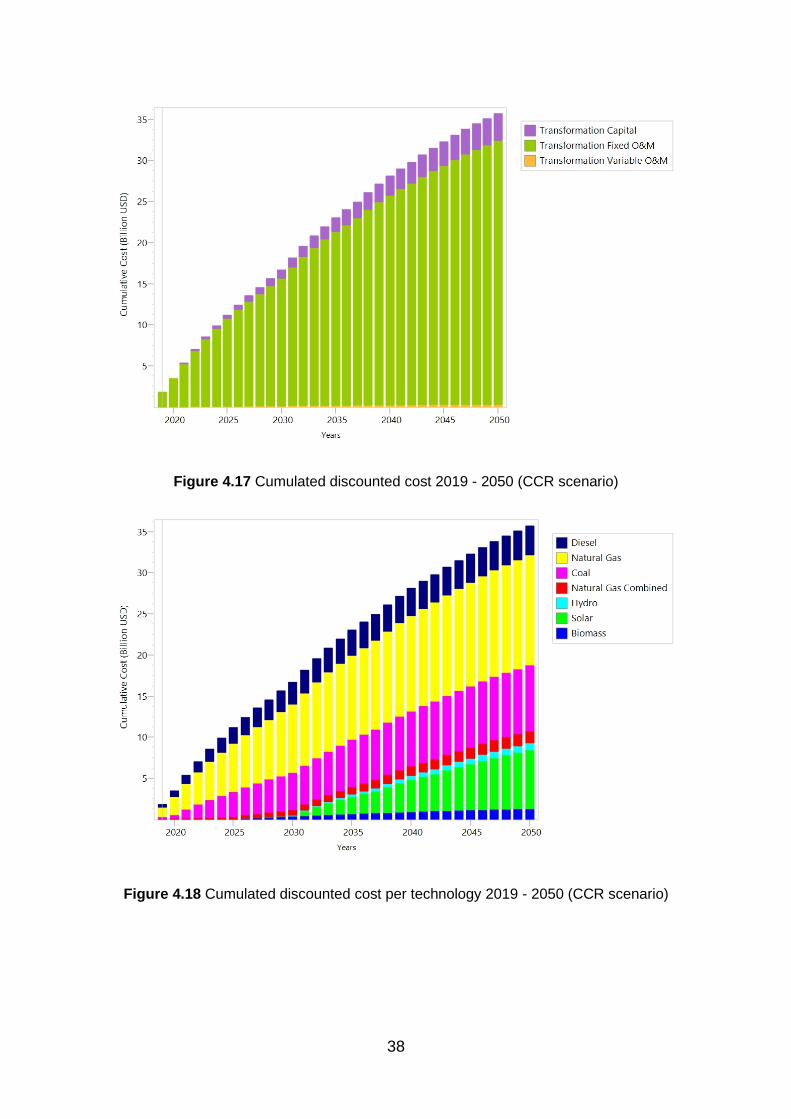
38
Figure 4.17 Cumulated discounted cost 2019 - 2050 (CCR scenario)
Figure 4.18 Cumulated discounted cost per technology 2019 - 2050 (CCR scenario)
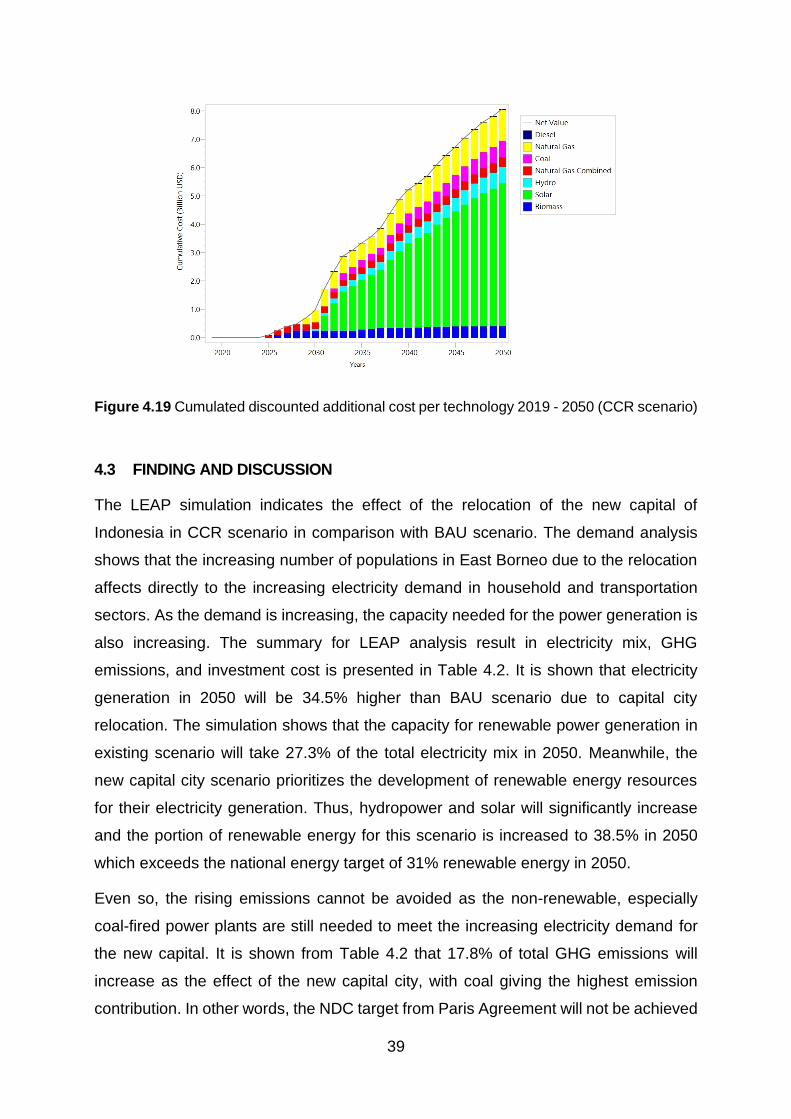
39
Figure 4.19 Cumulated discounted additional cost per technology 2019 - 2050 (CCR scenario)
4.3 FINDING AND DISCUSSION
The LEAP simulation indicates the effect of the relocation of the new capital of
Indonesia in CCR scenario in comparison with BAU scenario. The demand analysis
shows that the increasing number of populations in East Borneo due to the relocation
affects directly to the increasing electricity demand in household and transportation
sectors. As the demand is increasing, the capacity needed for the power generation is
also increasing. The summary for LEAP analysis result in electricity mix, GHG
emissions, and investment cost is presented in Table 4.2. It is shown that electricity
generation in 2050 will be 34.5% higher than BAU scenario due to capital city
relocation. The simulation shows that the capacity for renewable power generation in
existing scenario will take 27.3% of the total electricity mix in 2050. Meanwhile, the
new capital city scenario prioritizes the development of renewable energy resources
for their electricity generation. Thus, hydropower and solar will significantly increase
and the portion of renewable energy for this scenario is increased to 38.5% in 2050
which exceeds the national energy target of 31% renewable energy in 2050.
Even so, the rising emissions cannot be avoided as the non-renewable, especially
coal-fired power plants are still needed to meet the increasing electricity demand for
the new capital. It is shown from Table 4.2 that 17.8% of total GHG emissions will
increase as the effect of the new capital city, with coal giving the highest emission
contribution. In other words, the NDC target from Paris Agreement will not be achieved
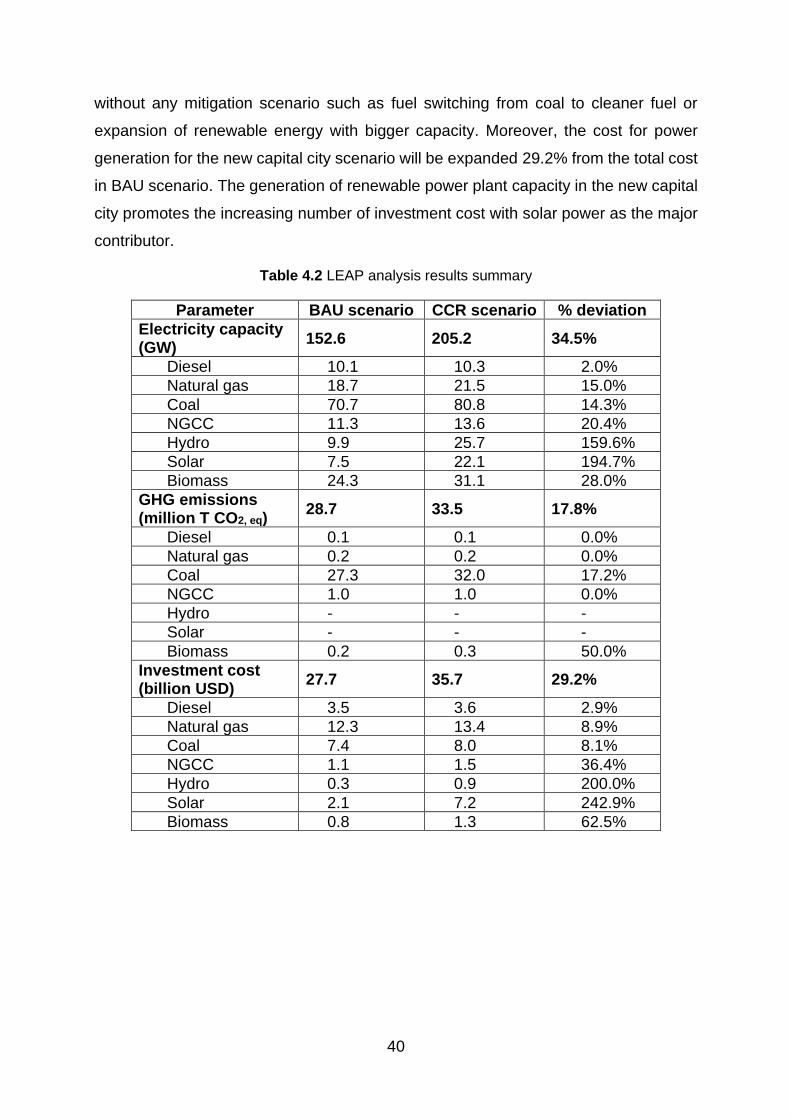
40
without any mitigation scenario such as fuel switching from coal to cleaner fuel or
expansion of renewable energy with bigger capacity. Moreover, the cost for power
generation for the new capital city scenario will be expanded 29.2% from the total cost
in BAU scenario. The generation of renewable power plant capacity in the new capital
city promotes the increasing number of investment cost with solar power as the major
contributor.
Table 4.2 LEAP analysis results summary
Parameter BAU scenario CCR scenario % deviation
Electricity capacity (GW)
152.6 205.2 34.5%
Diesel 10.1 10.3 2.0%
Natural gas 18.7 21.5 15.0%
Coal 70.7 80.8 14.3%
NGCC 11.3 13.6 20.4%
Hydro 9.9 25.7 159.6%
Solar 7.5 22.1 194.7%
Biomass 24.3 31.1 28.0%
GHG emissions (million T CO2, eq)
28.7 33.5 17.8%
Diesel 0.1 0.1 0.0%
Natural gas 0.2 0.2 0.0%
Coal 27.3 32.0 17.2%
NGCC 1.0 1.0 0.0%
Hydro - - -
Solar - - -
Biomass 0.2 0.3 50.0%
Investment cost (billion USD)
27.7 35.7 29.2%
Diesel 3.5 3.6 2.9%
Natural gas 12.3 13.4 8.9%
Coal 7.4 8.0 8.1%
NGCC 1.1 1.5 36.4%
Hydro 0.3 0.9 200.0%
Solar 2.1 7.2 242.9%
Biomass 0.8 1.3 62.5%
41
5. CHAPTER 5 CONCLUSIONS
This chapter structurally concludes the thesis by answering the main question and sub
research questions. Moreover, the restrictions and recommendations for further
research are explained.
5.1 CONCLUSIONS
The objective of this research is to analyse the energy model for the planned new
capital city of Indonesia located in East Borneo until 2050. Relying on the target for the
National Energy General Plan and Paris Agreement, this research tries to examine the
scenario of capital city relocation in comparison with the existing electricity scenario.
Below is the explanation of the answers for the sub research questions.
1. How will the newly planned capital of Indonesia look like in terms of location, size,
functions and activities?
The new capital city of Indonesia is planned to be located in the district of Penajam
Paser Utara and Kutai Kartanegara, East Borneo. The total area of the new capital city
is 56,180.87 hectares, with 5,644 hectares allocated for the centre area of the
government. Around 1.5 million people consisting of civil servants and their relatives
are expected to move from Jakarta to the new capital. The relocation planning will be
divided into two stages, the first stage (2021-2024) which prioritizes the construction
for the government function and core infrastructures, and the second stage (2025-
2029) which points out the construction of support functions such as business,
industries, and public facilities. As the new capital city will uphold the concept of smart,
green, and sustainable city, the development of renewable energy such as hydropower
and solar is planned to meet the increasing demand of electricity. An evaluation has
been made and it is concluded that the plan is still considered weak because legal
framework has not been enacted yet and there is lack of rationality and conformity
regarding to the current condition of Indonesia in general and East Borneo in particular.
2. How would the energy system for the power sector of the new capital of Indonesia
look like?

42
The implication of electricity generation of the new capital city is analysed by
developing the scenarios of Business as Usual (BAU) and Capital City Relocation
(CCR) in LEAP energy modelling tool. The result of the model shows that the new
capital requires higher electricity capacity as the population is increasing which leads
to additional electricity demand. Total electricity generation capacity in 2050 will be
205.2 GW, or 52.6 GW higher than the BAU scenario. Coal still gives the highest
portion in 2050 with 80.8 GW of capacity, but it has a lower portion (39.4%) compared
to BAU scenario (46.7%) as larger portion of renewable fuel such as biomass, solar,
and hydropower is expected in the development of the new capital city. Furthermore,
the electricity mix in 2050 is expected to achieve national energy general plan target
for renewable energy with estimated renewable energy portion 38.5%.
3. What are the estimated CO2 equivalent emissions impacts for East Borneo of the
relocation of the capital of Indonesia?
Using the same LEAP model in electricity mix analysis, the GHG emissions show an
increasing figure in the new capital as a result of an increase in electricity capacity.
The total GHG emissions for electricity in 2050 will reach 33.5 million metric Tonnes of
CO2 equivalent, or 4.8 million metric Tonnes of CO2 equivalent higher than what BAU
scenario produces. As the consequence of high coal capacity added to the new capital
city, the province cannot achieve NDC target of Paris Agreement for GHG emissions
reduction.
4. What are the implications of the relocation of the capital to East Borneo for the costs
of power production in East Borneo?
Further LEAP analysis in cost-benefit of the electricity generation after the capital
relocation shows that the relocation also affects to the increasing cost of electricity
generation. Total cost for power production in 2050 will be 35.7 billion USD, or 29.2%
higher than the BAU scenario. High investment will be needed for the cost of fixed
operation and maintenance transformation, especially in solar power generation.
These lead to answering the main question below:
How will the power system of East Borneo develop until 2050 with the relocation of the
capital of Indonesia to the region if the system will be designed in accordance with the
Paris Agreement on Climate Change?
43
The relocation of Indonesia’s new capital city will actually increase the power
generation capacity in the province as a result of the increasing demand of electricity.
This will affect to a growing number of GHG emissions and investment cost. Even
though it already embraces the concept of a green and sustainable city in its
development plan, the new capital is predicted to fail to meet the NDC target of Paris
Agreement in 2050 because non-renewable energy technology, especially coal, is still
largely included in the energy plan.
5.2 RECOMMENDATIONS
Such mitigation scenarios need to be promoted in order to reduce GHG emissions and
subsequently achieve the NDC target. A drastic transition would be difficult for the
province since coal has already contributed to one third of the economy in East Borneo
(Agus Praditya Tampubolon, Arinaldo, & Adiatma, 2018). Thus, partially fuel switching
from coal to cleaner technologies can be an alternative solution for this scenario. For
example, the development of biomass or natural gas co-firing into coal-fired power
plants can reduce GHG emissions significantly (Basu, Butler, & Leon, 2011; Cheng et
al., 2016; Choi et al., 2020; Roni et al., 2017; Thanapal, Annamalai, Ansley, & Ranjan,
2016; Truong, Patrizio, Leduc, Kraxner, & Ha-Duong, 2019). The extensive number of
additional costs is the effect of high fixed cost of solar. Nevertheless, as the price of
solar and other renewable energy resources will be much lower in the future
(BloombergNEF, 2019; IRENA, 2016), renewable energy will further develop electricity
generation. In the end, the electricity target for East Borneo could be achieved without
neglecting the Paris Agreement by combining the development of renewable energy
and cleaner technology for non-renewable energy. Moreover, coal transition to cleaner
renewable energy provides more benefits for Indonesia to overcome the environmental
burden of coal. This measure also anticipates economic risks of coal export in the
future as major coal export destination countries are also adapting more clean energy
policies (Deon Arinaldo; Julius Christian Adiatma, 2019).
The energy model of the new planned capital has been correlated with the Paris
Agreement’s target. However, this research is limited in regards of finding the detail
information of the planning for the capital city relocation. With no legal framework and
detail planning in business and industrial sectors, the energy model is restricted to only
a few sectors. This model would benefit greatly once the provision of law for the new

44
capital has been enacted and more detail information such as the demand planning for
business and industrial sector could be gathered. More factual scenarios related to
climate change adaptation could be carried out then in future work. As a result, this
analysis is expected to be more in-depth and comprehensive so that it can provide
more accurate and impactful results for decision makers. Ultimately, this study
contributes to providing an initial analysis of the environmental impact of the planned
new capital city development. Despite the limited availability of data, this study has
shown major consequences of planned relocation to the environment. Ignoring the
results of this study will only pose bigger problems for sustainability in the future. Thus,
this research is expected to provide an initial signal for the government to continue to
promote renewable energy development in the plan for the new capital to prevent these
problems and maintain the sustainability of the city.
45
6. REFERENCE
Abidin, H., Andreas, H., Gamal, M., Gumilar, I., Napitupulu, M., Fukuda, Y., … Riawan,
E. (2010). Land subsidence characteristics of the Jakarta basin (Indonesia) and
its relation with groundwater extraction and sea level rise. (January 2018), 113–
130. https://doi.org/10.1201/b10530-11
Agus Praditya Tampubolon, Arinaldo, D., & Adiatma, J. C. (2018). The Future of Coal
in Indonesia study: Coal Dynamics and Energy Transition in Indonesia.
Akhmad, & Amir. (2018). Study of fuel oil supply and consumption in indonesia.
International Journal of Energy Economics and Policy, 8(4).
Ancrenaz, M., Marshall, A., Goossens, B., van Schaik, C., Sugardjito, J., Gumal, M., &
Wich, S. (2008). Pongo pygmaeus ssp. morio. IUCN Red List of Threatened
Species. Version 2010.1, 8235.
BAPPENAS. (2019). Buku Saku Pemindahan Ibukota Negara. Jakarta: Kementerian
Perencanaan Pembangunan Nasional/Badan Perencanaan Pembangunan
Nasional Republik Indonesia.
Basu, P., Butler, J., & Leon, M. A. (2011). Biomass co-firing options on the emission
reduction and electricity generation costs in coal-fired power plants. Renewable
Energy, 36(1), 282–288. https://doi.org/10.1016/j.renene.2010.06.039
BloombergNEF. (2019). New Energy Outlook 2019. New York, USA.
Böhringer, C., & Rutherford, T. F. (2011). Combining Top-Down and Bottom-Up in
Energy Policy Analysis: A Decomposition Approach. SSRN Electronic Journal,
(06). https://doi.org/10.2139/ssrn.878433
Borneo, T. G. of E. (2016). Potensi Kehutanan Kalimantan Timur. Retrieved June 8,
2020, from https://kaltimprov.go.id/halaman/potensi-kehutanan
Cheng, L., Ye, X. P., English, B. C., Boylan, D., Johnson, T., & Zemo, B. (2016). Co-
firing switchgrass in a 60-megawatt pulverized coal-fired boiler: Effects on
combustion behavior and pollutant emissions. Energy Sources, Part A: Recovery,
Utilization and Environmental Effects, 38(3), 322–329.
https://doi.org/10.1080/15567036.2012.756563
Chin, H. S. (2006). Putrajaya – Administrative Centre of Malaysia -Planning Concept
46
and Implementation-. Sus. Urban Devt & Governance Conference, Seoul, (May),
1–20.
Choi, M., Kim, K., Li, X., Deng, K., Park, Y., Seo, M., … Choi, G. (2020). Strategic
combustion technology with exhaust tube vortex flame: Combined effect of
biomass co-firing and air-staged combustion on combustion characteristics and
ash deposition. Energy, 203(x), 117839.
https://doi.org/10.1016/j.energy.2020.117839
Debnath, K. B., & Mourshed, M. (2018). Challenges and gaps for energy planning
models in the developing-world context. Nature Energy, 3(3), 172–184.
https://doi.org/10.1038/s41560-018-0095-2
DEN. (2017). Peraturan Presiden Republik Indonesia Nomor 22 Tahun 2017 Tentang
Rencana Umum Energi Nasional. Retrieved from
https://www.esdm.go.id/assets/media/content/content-rencana-umum-energi-
nasional-ruen.pdf
DEN. (2019a). Lampiran I Perda Provinsi Kalimantan Timur Nomor 8 Tahun 2019
tentang Rencana Umum Energi Daerah.
DEN. (2019b). Lampiran II Perda Provinsi Kalimantan Timur Nomor 8 Tahun 2019
tentang Rencana Umum Energi Daerah.
Deon Arinaldo; Julius Christian Adiatma. (2019). Indonesia’s Coal Dynamics: Toward
A Just Energy Transition. Retrieved from http://iesr.or.id/wp-
content/uploads/2019/08/Indonesias-Coal-Dynamics_Toward-a-Just-Energy-
Transition.pdf
ESDM. (2015). Rencana Umum Ketenagalistrikan Nasional 2015 - 2034.
ESDM. (2017). Kajian Penggunaan Faktor Emisi Lokal ( Tier 2 ) dalam Kajian
Inventarisasi GRK Sektor Energi.
ESDM. (2019). Rencana Umum Ketenagalistrikan Nasional 2019 - 2038. Retrieved
from http://repositorio.unan.edu.ni/2986/1/5624.pdf
FAO. (2011). Indonesia: Country report for the state of the world’s forest genetic
resources.
Forster, P., Ramaswamy, V., Artaxo, P., Berntsen, T., Betts, R., Fahey, D. W., …

47
Dorland, R. van. (2007). Changes in Atmospheric Constituents and in Radiative
Forcing. In Climate Change 2007: The Physical Science Basis. Contribution of
Working Group I to the Fourth Assessment Report of the Intergovernmental Panel
on Climate Change. https://doi.org/10.20892/j.issn.2095-3941.2017.0150
Hamdani, R. S. (2020). Proyek Lintas Batas Administrasi : Analisis Partisipasi Publik
dalam Proses Perencanaan Ibu Kota Negara Republik Indonesia. Journal of
Regional and Rural Development Planning, 4(1), 43–62.
Handayani, K. (2019). Electricity & climate change: seeking for the triple nexus of
electrification, climate change mitigation, and climate change adaptation.
University of Twente, Enschede.
Handayani, K., Filatova, T., Krozer, Y., & Anugrah, P. (2020). Seeking for a climate
change mitigation and adaptation nexus: Analysis of a long-term power system
expansion. Applied Energy, 262(December 2019), 114485.
https://doi.org/10.1016/j.apenergy.2019.114485
Handayani, K., Krozer, Y., & Filatova, T. (2017). Trade-offs between electrification and
climate change mitigation: An analysis of the Java-Bali power system in Indonesia.
Applied Energy, 208(August), 1020–1037.
https://doi.org/10.1016/j.apenergy.2017.09.048
Handayani, K., Krozer, Y., & Filatova, T. (2019). From fossil fuels to renewables: An
analysis of long-term scenarios considering technological learning. Energy Policy,
127(December 2018), 134–146. https://doi.org/10.1016/j.enpol.2018.11.045
Heaps, C. G. (2020). LEAP: The Low Emissions Analysis Platform. Retrieved from
https://leap.sei.org
Hur, J. Y., Cho, W., Lee, G., & Bickerton, S. H. (2019). The “Smart Work” Myth: How
Bureaucratic Inertia and Workplace Culture Stymied Digital Transformation in the
Relocation of South Korea’s Capital. Asian Studies Review, 43(4), 691–709.
https://doi.org/10.1080/10357823.2019.1663786
IESR. (2019). A Roadmap for Indonesia’s Power Sector: How Renewable Energy Can
Power Java-Bali and Sumatera. Jakarta.
Indonesia Climate Change Sectoral Roadmap (ICCSR). (2010). Scientific basis:
analysis and projection of sea level rise and extreme weather event. Retrieved
48
from https://www.bappenas.go.id/files/2013/5229/9917/analysis-and-projection-
of-sea-level-rise-and-extreme-weathe__20110217130224__1.pdf
Indonesia, R. (2007). UU Republik Indonesia nomor 26 tahun 2007 tentang penataan
ruang.
Indonesian Government. (2014). Indonesian Government Law No 79 In 2014 About
National Energy Policy (p. 8). p. 8.
IRENA. (2016). The Power to Change: Solar and Wind Cost Reduction Potential to
2025. In Inernational Renewable Energy Agency.
Irsyad, M. I. Al, Halog, A. B., Nepal, R., & Koesrindartoto, D. P. (2017). Selecting tools
for renewable energy analysis in developing countries: An expanded review.
Frontiers in Energy Research, 5(DEC). https://doi.org/10.3389/fenrg.2017.00034
Isburhan, R. W. P., Nuraeni, G., Verdhora Ry, R., Yudistira, T., Cipta, A., & Cummins,
P. (2019). Horizontal-to-Vertical Spectral Ratio (HVSR) Method for Earthquake
Risk Determination of Jakarta City with Microtremor Data. IOP Conference Series:
Earth and Environmental Science, 318(1). https://doi.org/10.1088/1755-
1315/318/1/012033
IUCN. (2020). IUCN Red List of Threatened Species. Retrieved July 22, 2020, from
https://www.iucnredlist.org/
Julita, L. (2019). Bank Dunia: Macet Bikin Rugi Indonesia Rp 56 T Per Tahun.
Retrieved March 18, 2020, from CNBC Indonesia website:
https://www.cnbcindonesia.com/news/20191003141047-4-104180/bank-dunia-
macet-bikin-rugi-indonesia-rp-56-t-per-tahun
Kieft, J., & Liu, L. (2019). Deforestation in Borneo is slowing, but regulation remains
key. Retrieved June 6, 2020, from UN environment programme website:
https://www.unenvironment.org/news-and-stories/story/deforestation-borneo-
slowing-regulation-remains-key
KNAW, Centres, N. F. of U. M., Research, N. O. for S., Federatie, T., Sciences, N. A.
of U. of A., & Vsnu. (2018). Netherlands Code of Conduct for Research Integrity.
World Development. https://doi.org/https://doi.org/10.17026/dans-2cj-nvwu
Kydes, A. S., Shaw, S. H., & McDonald, D. F. (1995). Beyond the horizon: Recent
directions in long-term energy modeling. Energy, 20(2), 131–149.
49
https://doi.org/10.1016/0360-5442(94)00060-G
Margono, B. A., Potapov, P. V., Turubanova, S., Stolle, F., & Hansen, M. C. (2014).
Primary forest cover loss in indonesia over 2000-2012. Nature Climate Change,
4(8), 730–735. https://doi.org/10.1038/nclimate2277
Masripatin, N., Rachmawaty, E., Suryanti, Y., Styawan, H., Farid, M., & Iskandar, N.
(2017). Strategi implementasi NDC (Nationally Determined Contribution). Jakarta.
Moser, S. (2010). Putrajaya: Malaysia’s new federal administrative capital. Cities,
27(4), 285–297. https://doi.org/10.1016/j.cities.2009.11.002
Nur Azhar, H., Putri Fatima, H. H., & Tamas, I. N. (2020). Preliminary study of
Indonesia capital city relocation based on disaster mitigation principle with mental
model approach. E3S Web of Conferences, 148, 1–7.
https://doi.org/10.1051/e3sconf/202014806002
Oliveira, V., & Pinho, P. (2015). Evaluation in urban planning : from theory to practice.
Journal of Planning Literature, 24(October), 31–49.
https://doi.org/10.1177/0885412210364589
Ouedraogo, N. S. (2017). Africa energy future: Alternative scenarios and their
implications for sustainable development strategies. Energy Policy, 106, 457–471.
https://doi.org/10.1016/j.enpol.2017.03.021
Pandey, R. (2002). Energy policy modelling: Agenda for developing countries. Energy
Policy, 30(2), 97–106. https://doi.org/10.1016/S0301-4215(01)00062-3
PLN. (2011). PLN Statistics 2010. Retrieved from
http://www.pln.co.id/dataweb/STAT/STAT2012ENG.pdf
PLN. (2019a). RUPTL Rencana usaha penyediaan tenaga listrik PT PLN (Persero)
2019 - 2028.
PLN. (2019b). Statistik PLN 2018. https://doi.org/10.1017/CBO9781107415324.004
Pokharel, S., Ahmade, A. A., Al-Ansari, F. A., Allaf, H. Al, Daneshvar, M. S., &
AbdelQadir, A. M. (2012). Energy modeling for policy analysis. Proceedings of the
3rd Gas Processing Symposium, 199–208. https://doi.org/10.1016/b978-0-444-
59496-9.50029-1
Post, T. J. (2019). ‘Nagara Rimba Nusa’ announced as winner of new capital city

50
design contest. Retrieved April 17, 2020, from
https://www.thejakartapost.com/news/2019/12/23/nagara-rimba-nusa-
announced-as-winner-of-new-capital-city-design-contest.html
Putra, R. A. (2019). Pengamat: Waspada Potensi Konflik Sosial Akibat Pemindahan
Ibu Kota Negara. Retrieved June 8, 2020, from dw.com website:
https://www.dw.com/id/pengamat-waspada-potensi-konflik-sosial-akibat-
pemindahan-ibu-kota-negara/a-49840002
Quistorff, B. (2015). Capitalitis? Effects of the 1960 Brazilian Capital Relocation. SSRN
Electronic Journal, 1–30. https://doi.org/10.2139/ssrn.2588620
Rebelatto, B. G., & Frandoloso, M. A. L. (2020). Energy Modelling: Methods and
Applications. (January), 0–12. https://doi.org/10.1007/978-3-319-71057-0
Reva, D. (2016). Capital city relocation and national security: the cases of Nigeria and
Kazakhstan (University of Pretoria Faculty of Humanitites).
https://doi.org/10.2307/20630710
Rivers, N., & Jaccard, M. (2005). Combining top-down and bottom-up approaches to
energy-economy modeling using discrete choice methods. Energy Journal, 26(1),
83–106. https://doi.org/10.5547/ISSN0195-6574-EJ-Vol26-No1-4
Römer, B., Julliard, Y., Fauzianto, R., Poddey, M. J., & Rendroyoko, I. (2017).
Pioneering smart grids for Indonesia - the case of a smart grid roadmap
development. CIRED - Open Access Proceedings Journal, 2017(1), 2484–2487.
https://doi.org/10.1049/oap-cired.2017.0318
Roni, M. S., Chowdhury, S., Mamun, S., Marufuzzaman, M., Lein, W., & Johnson, S.
(2017). Biomass co-firing technology with policies, challenges, and opportunities:
A global review. Renewable and Sustainable Energy Reviews, 78(May 2016),
1089–1101. https://doi.org/10.1016/j.rser.2017.05.023
Rossman, V. (2017). Capital cities: Varieties and patterns of development and
relocation. In Routledge. https://doi.org/10.1080/07352166.2018.1522906
Rypdal, K., Flugsrud, K., & Irving, W. (2000). IPCC good practice guidance and
uncertainty management in national greenhouse gas inventories, Chapter 7:
Methodological choice and recalculation.
https://doi.org/10.4324/9781315691688-2
51
Rypdal, K., Paciornik, N., Eggleston, S., Goodwin, J., Irving, W., Penman, J., &
Woodfield, M. (2006). IPCC guidelines for national greenhouse gas inventories,
Chapter 1: Introduction.
Samouilidis, J. (1980). Energy modelling: A new challenge for management science.
Omega, 8(6), 609–621. https://doi.org/10.1016/0305-0483(80)90002-X
Shimamura, T., & Mizunoya, T. (2020). Sustainability prediction model for capital city
relocation in Indonesia based on inclusive wealth and system dynamics.
Sustainability (Switzerland), 12(10). https://doi.org/10.3390/su12104336
Thanapal, S. S., Annamalai, K., Ansley, R. J., & Ranjan, D. (2016). Co-firing carbon
dioxide-torrefied woody biomass with coal on emission characteristics. Biomass
Conversion and Biorefinery, 6(1), 91–104. https://doi.org/10.1007/s13399-015-
0166-6
Truong, A. H., Patrizio, P., Leduc, S., Kraxner, F., & Ha-Duong, M. (2019). Reducing
emissions of the fast growing Vietnamese coal sector: The chances offered by
biomass co-firing. Journal of Cleaner Production, 215, 1301–1311.
https://doi.org/10.1016/j.jclepro.2019.01.065
Urban, F., Benders, R. M. J., & Moll, H. C. (2007). Modelling energy systems for
developing countries. Energy Policy, 35(6), 3473–3482.
https://doi.org/10.1016/j.enpol.2006.12.025
US EPA. (2017). Understanding Global Warming Potentials | Greenhouse Gas (GHG)
Emissions | US EPA. Retrieved June 20, 2020, from
https://www.epa.gov/ghgemissions/understanding-global-warming-potentials
van Beeck, N. (2003). A New Decision Support Method for Local Energy Planning.
Tilburg University.
Van de Vuurst, P., & Escobar, L. E. (2020). Perspective: Climate Change and the
Relocation of Indonesia’s Capital to Borneo. Frontiers in Earth Science,
8(January), 1–6. https://doi.org/10.3389/feart.2020.00005
van Ruijven, B., Urban, F., Benders, R. M. J., Moll, H. C., van der Sluijs, J. P., de Vries,
B., & van Vuuren, D. P. (2008). Modeling Energy and Development: An Evaluation
of Models and Concepts. World Development, 36(12), 2801–2821.
https://doi.org/10.1016/j.worlddev.2008.01.011

52
Vezzoli, C., Ceschin, F., Osanjo, L., M’Rithaa, M. K., Moalosi, R., Nakazibwe, V., &
Diehl, J. C. (2018). Designing Sustainable Energy for All.
https://doi.org/10.1007/978-3-319-70223-0
Wartiharjono, S. (2017). Potensi konflik dan pembentukan modal sosial : belajar dari
sebuah desa transmigran di Kalimantan Timur. Conflict potential and social capital
construction : a case study of a transmigrant village in East Kalimantan.
Masyarakat, Kebudayaan Dan Politik, 30, 84–93.

53
1. APPENDIX A CAPITAL CITY RELOCATIONS
2.
Table A.1 Capital city relocations list
No Year Old New Country Notes
1 1950 Tel Aviv-Jaffo Jerusalem Israel
2 1959 Karachi Rawalpindi Pakistan
3 1960 (none) Nouakchott Mauritania
4 1961 Rio de Janeiro Brasilia Brazil Purpose-built
5 1962 Butare Kigali Rwanda
6 1962 Ta’izz Sana’a North Yemen
7 1965 Mafeking Gaborone Botswana
8 1969 Rawalpindi Islamabad Pakistan Purpose-built
9 1970 Belize City Belmopan Belize Purpose-built, partial
10 1970 Salalah Muscat Oman Partial
11 1974 Zomba Lilongwe Malawi Partial (parliament moved
in 1994)
12 1974 Madina do Boe Bissau Guinea Bissau
13 1975 Luang Prabang Vientiane Laos
14 1976 Quezon City Manila Philippines
15 1976 Saigon Hanoi Vietnam
16 1982 Colombo Kotte Sri Lanka
17 1983 Abidjan Yamoussoukro Cote d’Ivore Partial (many admin
functions and embassies stayed in Abidjan)
18 1989 Kolonia Palikir F.S. of Micronesia
19 1990 Santiago Valparafso Chile Partial (legislative only)
20 1990 Aden Sana’a (South) Yemen
21 1991 Lagos Abuja Nigeria Purpose-built
22 1996 Dar es Salaam Dodoma Tanzania Partial (legislative only)
23 1997 Almaty Astana Kazakhstan
24 1999 Bonn Berlin Germany Partial (certain functions
transferred in 1990)
25 1999 Kuala Lumpur Putrajaya Malaysia Purpose-built, partial
(executive only)
26 2005 Yangon Naypyidaw Myanmar Purpose-built
27 2006 Koror Ngerulmud Palau Purpose-built
28* 2012 Seoul Sejong South Korea Purpose-built, partial
(several ministries only) Source: Quistorff (2015)
*updated, not from the source
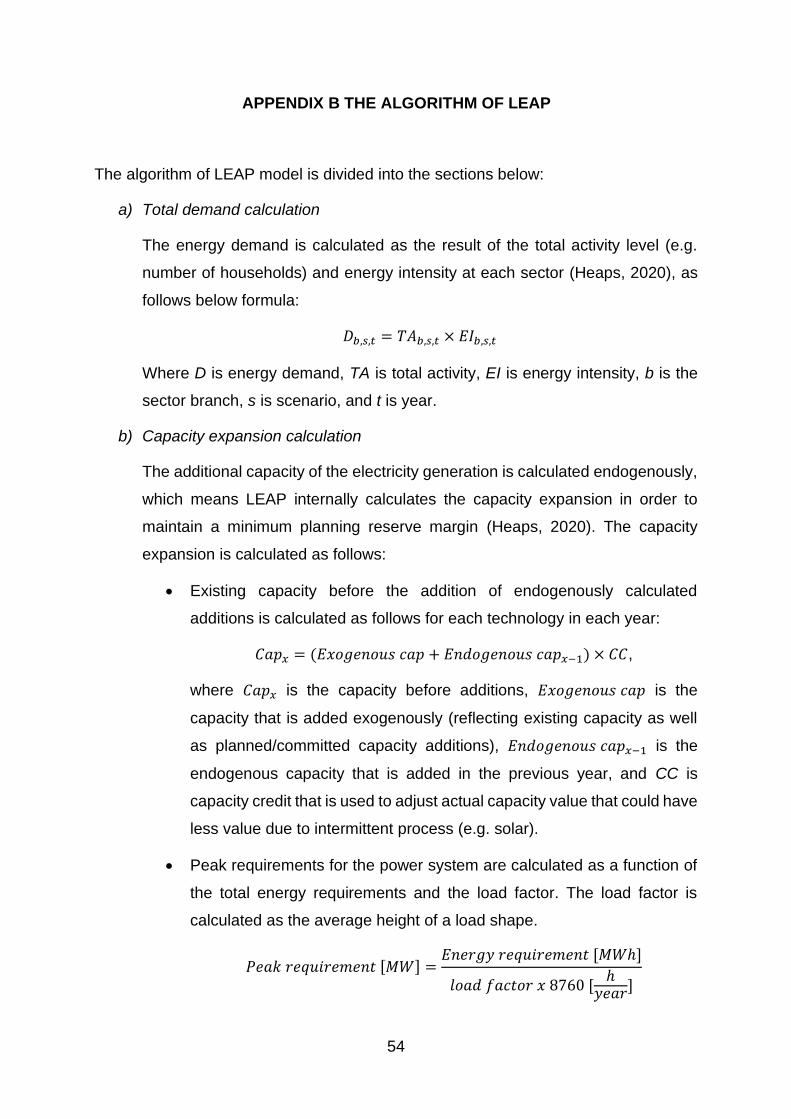
54
3. APPENDIX B THE ALGORITHM OF LEAP
4.
The algorithm of LEAP model is divided into the sections below:
a) Total demand calculation
The energy demand is calculated as the result of the total activity level (e.g.
number of households) and energy intensity at each sector (Heaps, 2020), as
follows below formula:
𝐷𝑏,𝑠,𝑡 = 𝑇𝐴𝑏,𝑠,𝑡 × 𝐸𝐼𝑏,𝑠,𝑡
Where D is energy demand, TA is total activity, EI is energy intensity, b is the
sector branch, s is scenario, and t is year.
b) Capacity expansion calculation
The additional capacity of the electricity generation is calculated endogenously,
which means LEAP internally calculates the capacity expansion in order to
maintain a minimum planning reserve margin (Heaps, 2020). The capacity
expansion is calculated as follows:
• Existing capacity before the addition of endogenously calculated
additions is calculated as follows for each technology in each year:
𝐶𝑎𝑝𝑥 = (𝐸𝑥𝑜𝑔𝑒𝑛𝑜𝑢𝑠 𝑐𝑎𝑝 + 𝐸𝑛𝑑𝑜𝑔𝑒𝑛𝑜𝑢𝑠 𝑐𝑎𝑝𝑥−1) × 𝐶𝐶,
where 𝐶𝑎𝑝𝑥 is the capacity before additions, 𝐸𝑥𝑜𝑔𝑒𝑛𝑜𝑢𝑠 𝑐𝑎𝑝 is the
capacity that is added exogenously (reflecting existing capacity as well
as planned/committed capacity additions), 𝐸𝑛𝑑𝑜𝑔𝑒𝑛𝑜𝑢𝑠 𝑐𝑎𝑝𝑥−1 is the
endogenous capacity that is added in the previous year, and CC is
capacity credit that is used to adjust actual capacity value that could have
less value due to intermittent process (e.g. solar).
• Peak requirements for the power system are calculated as a function of
the total energy requirements and the load factor. The load factor is
calculated as the average height of a load shape.
𝑃𝑒𝑎𝑘 𝑟𝑒𝑞𝑢𝑖𝑟𝑒𝑚𝑒𝑛𝑡 [𝑀𝑊] =𝐸𝑛𝑒𝑟𝑔𝑦 𝑟𝑒𝑞𝑢𝑖𝑟𝑒𝑚𝑒𝑛𝑡 [𝑀𝑊ℎ]
𝑙𝑜𝑎𝑑 𝑓𝑎𝑐𝑡𝑜𝑟 𝑥 8760 [ℎ
𝑦𝑒𝑎𝑟]
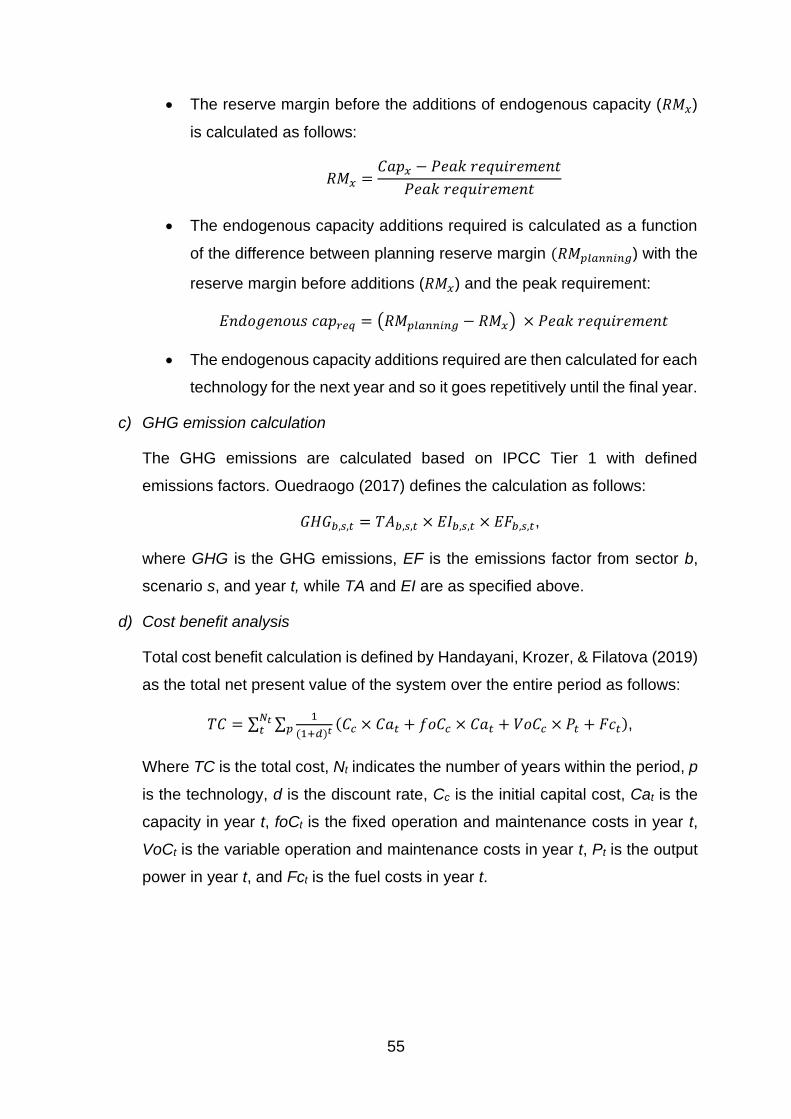
55
• The reserve margin before the additions of endogenous capacity (𝑅𝑀𝑥)
is calculated as follows:
𝑅𝑀𝑥 =𝐶𝑎𝑝𝑥 − 𝑃𝑒𝑎𝑘 𝑟𝑒𝑞𝑢𝑖𝑟𝑒𝑚𝑒𝑛𝑡
𝑃𝑒𝑎𝑘 𝑟𝑒𝑞𝑢𝑖𝑟𝑒𝑚𝑒𝑛𝑡
• The endogenous capacity additions required is calculated as a function
of the difference between planning reserve margin (𝑅𝑀𝑝𝑙𝑎𝑛𝑛𝑖𝑛𝑔) with the
reserve margin before additions (𝑅𝑀𝑥) and the peak requirement:
𝐸𝑛𝑑𝑜𝑔𝑒𝑛𝑜𝑢𝑠 𝑐𝑎𝑝𝑟𝑒𝑞 = (𝑅𝑀𝑝𝑙𝑎𝑛𝑛𝑖𝑛𝑔 − 𝑅𝑀𝑥) × 𝑃𝑒𝑎𝑘 𝑟𝑒𝑞𝑢𝑖𝑟𝑒𝑚𝑒𝑛𝑡
• The endogenous capacity additions required are then calculated for each
technology for the next year and so it goes repetitively until the final year.
c) GHG emission calculation
The GHG emissions are calculated based on IPCC Tier 1 with defined
emissions factors. Ouedraogo (2017) defines the calculation as follows:
𝐺𝐻𝐺𝑏,𝑠,𝑡 = 𝑇𝐴𝑏,𝑠,𝑡 × 𝐸𝐼𝑏,𝑠,𝑡 × 𝐸𝐹𝑏,𝑠,𝑡,
where GHG is the GHG emissions, EF is the emissions factor from sector b,
scenario s, and year t, while TA and EI are as specified above.
d) Cost benefit analysis
Total cost benefit calculation is defined by Handayani, Krozer, & Filatova (2019)
as the total net present value of the system over the entire period as follows:
𝑇𝐶 = ∑ ∑1
(1+𝑑)𝑡(𝐶𝑐 × 𝐶𝑎𝑡 + 𝑓𝑜𝐶𝑐 × 𝐶𝑎𝑡 + 𝑉𝑜𝐶𝑐 × 𝑃𝑡 + 𝐹𝑐𝑡)𝑝
𝑁𝑡𝑡 ,
Where TC is the total cost, Nt indicates the number of years within the period, p
is the technology, d is the discount rate, Cc is the initial capital cost, Cat is the
capacity in year t, foCt is the fixed operation and maintenance costs in year t,
VoCt is the variable operation and maintenance costs in year t, Pt is the output
power in year t, and Fct is the fuel costs in year t.
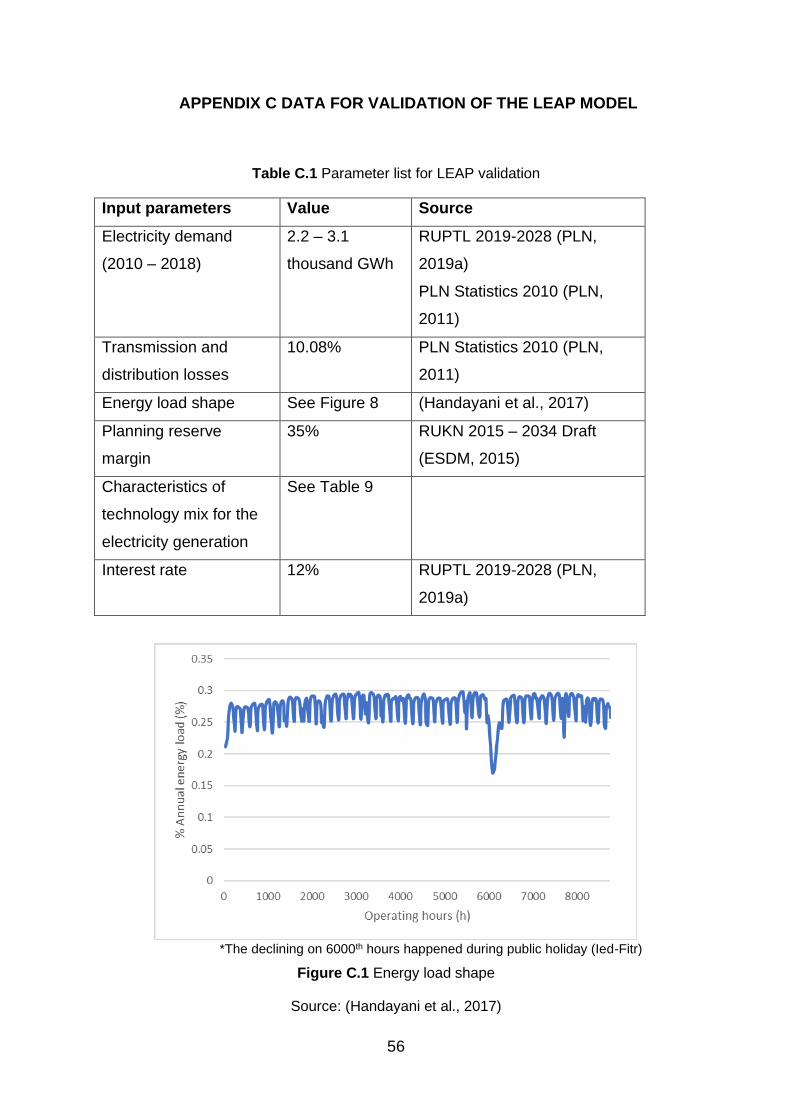
56
5. APPENDIX C DATA FOR VALIDATION OF THE LEAP MODEL
Table C.1 Parameter list for LEAP validation
Input parameters Value Source
Electricity demand
(2010 – 2018)
2.2 – 3.1
thousand GWh
RUPTL 2019-2028 (PLN,
2019a)
PLN Statistics 2010 (PLN,
2011)
Transmission and
distribution losses
10.08% PLN Statistics 2010 (PLN,
2011)
Energy load shape See Figure 8 (Handayani et al., 2017)
Planning reserve
margin
35% RUKN 2015 – 2034 Draft
(ESDM, 2015)
Characteristics of
technology mix for the
electricity generation
See Table 9
Interest rate 12% RUPTL 2019-2028 (PLN,
2019a)
*The declining on 6000th hours happened during public holiday (Ied-Fitr)
Figure C.1 Energy load shape
Source: (Handayani et al., 2017)
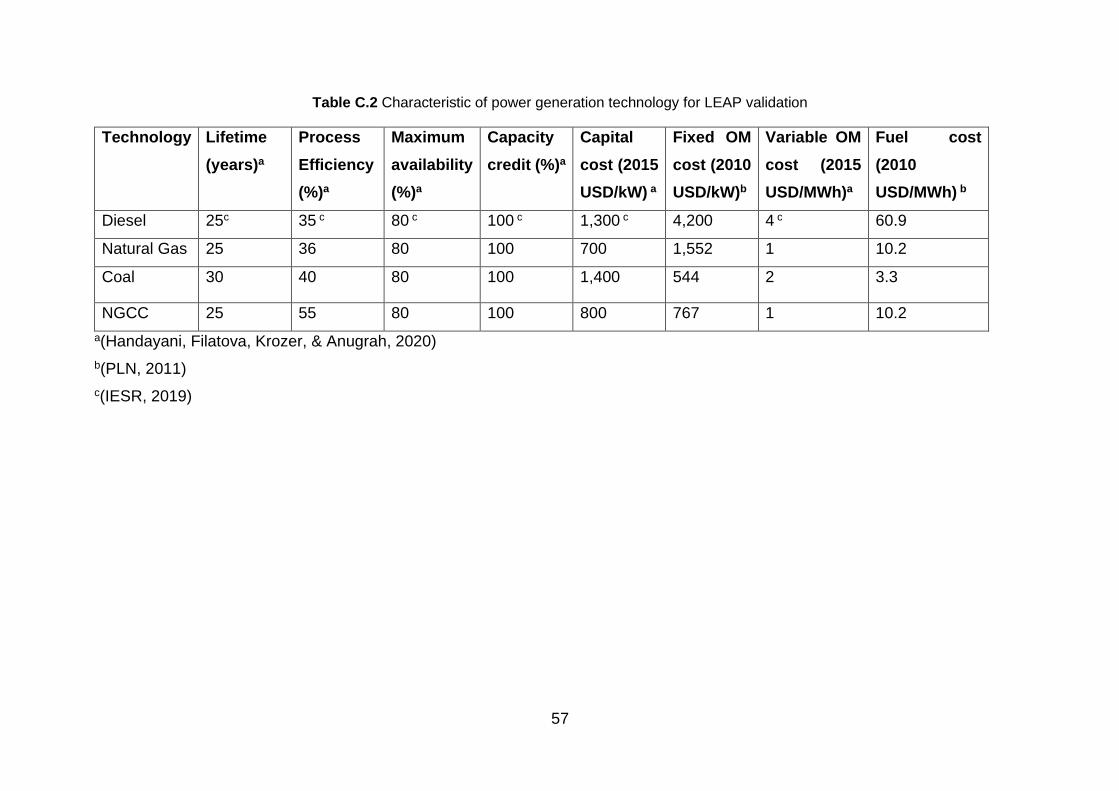
57
Table C.2 Characteristic of power generation technology for LEAP validation
Technology Lifetime
(years)a
Process
Efficiency
(%)a
Maximum
availability
(%)a
Capacity
credit (%)a
Capital
cost (2015
USD/kW) a
Fixed OM
cost (2010
USD/kW)b
Variable OM
cost (2015
USD/MWh)a
Fuel cost
(2010
USD/MWh) b
Diesel 25c 35 c 80 c 100 c 1,300 c 4,200 4 c 60.9
Natural Gas 25 36 80 100 700 1,552 1 10.2
Coal 30 40 80 100 1,400 544 2 3.3
NGCC 25 55 80 100 800 767 1 10.2
a(Handayani, Filatova, Krozer, & Anugrah, 2020)
b(PLN, 2011)
c(IESR, 2019)
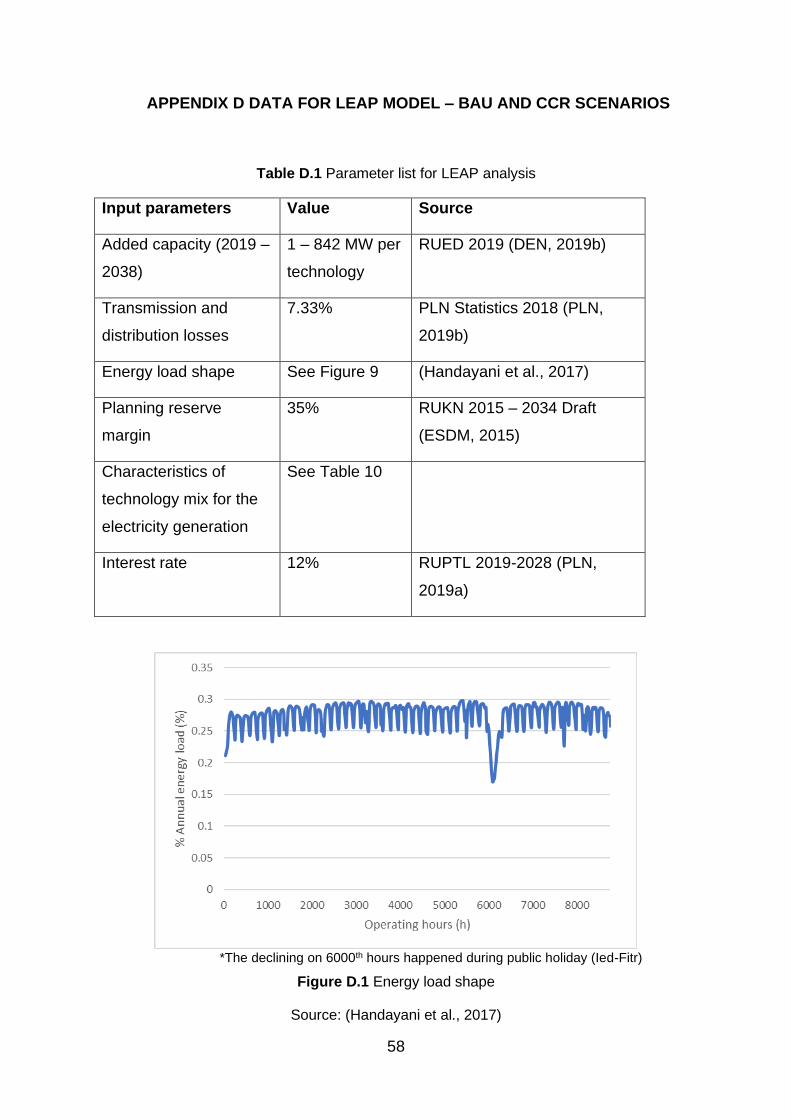
58
6. APPENDIX D DATA FOR LEAP MODEL – BAU AND CCR SCENARIOS
Table D.1 Parameter list for LEAP analysis
Input parameters Value Source
Added capacity (2019 –
2038)
1 – 842 MW per
technology
RUED 2019 (DEN, 2019b)
Transmission and
distribution losses
7.33% PLN Statistics 2018 (PLN,
2019b)
Energy load shape See Figure 9 (Handayani et al., 2017)
Planning reserve
margin
35% RUKN 2015 – 2034 Draft
(ESDM, 2015)
Characteristics of
technology mix for the
electricity generation
See Table 10
Interest rate 12% RUPTL 2019-2028 (PLN,
2019a)
*The declining on 6000th hours happened during public holiday (Ied-Fitr)
Figure D.1 Energy load shape
Source: (Handayani et al., 2017)

59
Table D.2 Characteristic of power generation technology for LEAP validation
Technology Lifetime
(years)a
Process
Efficiency
(%)a
Maximum
availability
(%)a
Capacity
credit (%)a
Capital
cost (2015
USD/kW) a
Fixed OM
cost (2018
USD/kW)b
Variable OM
cost (2015
USD/MWh)a
Fuel cost
(2018
USD/MWh) b
Diesel 25c 35 c 80 c 100 c 1,300 c 1,346 4 c 60.9
Natural Gas 25 36 80 100 700 3,493 1 10.2
Coal 30 40 80 100 1,400 502 2 3.3
NGCC 25 55 80 100 800 785 1 10.2
Hydro 50 100 41 51 2,000 213 1 -
Solar 20 100 17 22 2,069 4,226 0.4 -
Biomass 20 35 80 100 2,228 78a 6.5 2.7a
a(Handayani et al., 2020)
b(PLN, 2019b)
c(IESR, 2019)
Copyright © 2022 FDOKUMEN