
Energy Efficiency and Cost Saving Opportunities for Distilleries
171
Document Number 430-R-21043 Office of Air and Radiation Energy Efficiency and Cost Saving Opportunities for Distilleries An ENERGY STAR® Guide for Energy and Plant Managers February 2022
-
Upload
khangminh22 -
Category
Documents
-
view
2 -
download
0
Transcript of Energy Efficiency and Cost Saving Opportunities for Distilleries
Document Number 430-R-21043 Office of Air and Radiation
Energy Efficiency and Cost Saving Opportunities for Distilleries
An ENERGY STAR® Guide for Energy and Plant Managers
February 2022
The ENERGY STAR Distilleries Guide i
Energy Efficiency and Cost Saving Opportunities for Distilleries
An ENERGY STAR® Guide for Energy and Plant Managers Claudia Stuckrath, Utrecht University
Ernst Worrell, Utrecht University
February 2022
Disclaimer
This guide was prepared for the United States Government and is believed to contain correct information. Neither the United States Government nor any agency thereof, nor any persons or organizations involved in its development, makes any warranty, express or implied, or assumes any legal responsibility for the accuracy, completeness, or usefulness of any information, apparatus, product, or process disclosed, or represents that its use would not infringe on privately owned rights. Reference herein to any specific commercial product, process, or service by its trade name, trademark, manufacturer, or otherwise, does not necessarily constitute or imply its endorsement, recommendation, or favoring by the United States Government or any agency thereof, or any persons or organizations involved in its development. The views and opinions of authors expressed herein do not necessarily state or reflect those of the United States Government or any agency thereof.
Development of this guide was funded by the U.S. Environmental Protection Agency. The research embodied in this report was supported through U.S. Environmental Protection Agency Contract No. 68HE0H18A0003.
The cover photo is of copper pot stills, courtesy of Bardstown Bourbon Co.
The ENERGY STAR Distilleries Guide ii
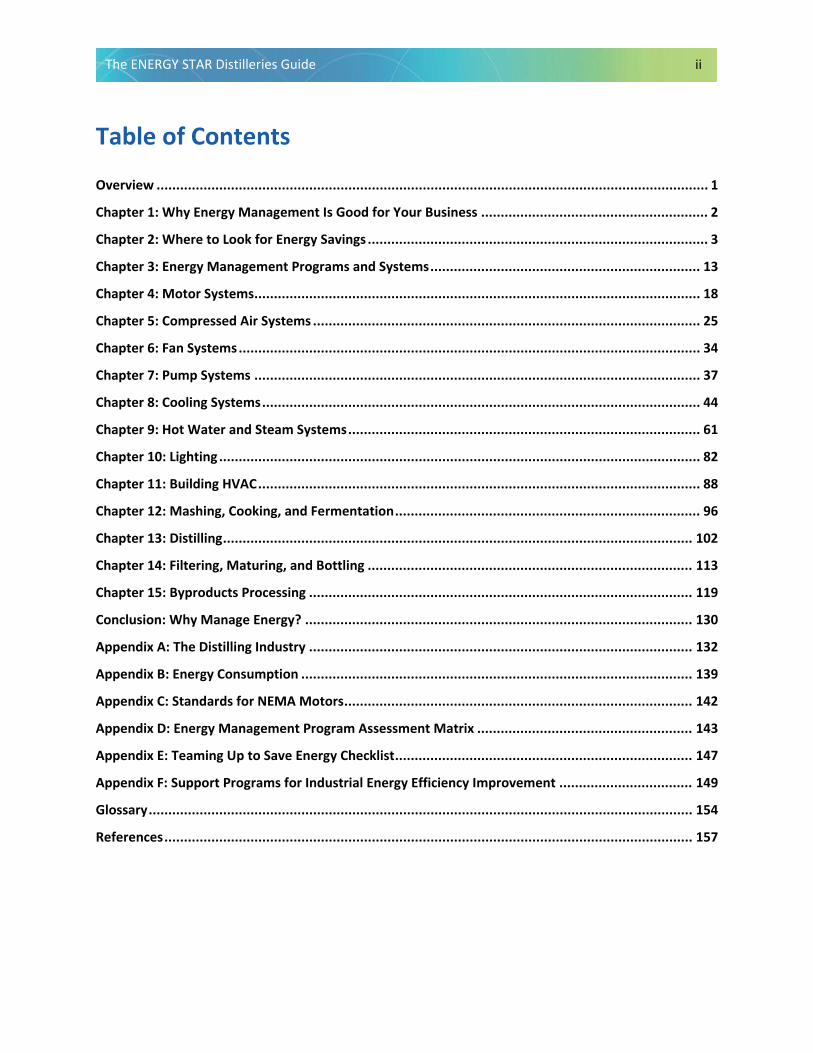
Table of Contents
Overview ............................................................................................................................................. 1
Chapter 1: Why Energy Management Is Good for Your Business .......................................................... 2
Chapter 2: Where to Look for Energy Savings ....................................................................................... 3
Chapter 3: Energy Management Programs and Systems ..................................................................... 13
Chapter 4: Motor Systems .................................................................................................................. 18
Chapter 5: Compressed Air Systems ................................................................................................... 25
Chapter 6: Fan Systems ...................................................................................................................... 34
Chapter 7: Pump Systems .................................................................................................................. 37
Chapter 8: Cooling Systems ................................................................................................................ 44
Chapter 9: Hot Water and Steam Systems .......................................................................................... 61
Chapter 10: Lighting ........................................................................................................................... 82
Chapter 11: Building HVAC ................................................................................................................. 88
Chapter 12: Mashing, Cooking, and Fermentation .............................................................................. 96
Chapter 13: Distilling ........................................................................................................................ 102
Chapter 14: Filtering, Maturing, and Bottling ................................................................................... 113
Chapter 15: Byproducts Processing .................................................................................................. 119
Conclusion: Why Manage Energy? ................................................................................................... 130
Appendix A: The Distilling Industry .................................................................................................. 132
Appendix B: Energy Consumption .................................................................................................... 139
Appendix C: Standards for NEMA Motors ......................................................................................... 142
Appendix D: Energy Management Program Assessment Matrix ....................................................... 143
Appendix E: Teaming Up to Save Energy Checklist ............................................................................ 147
Appendix F: Support Programs for Industrial Energy Efficiency Improvement .................................. 149
Glossary ........................................................................................................................................... 154
References ....................................................................................................................................... 157
The ENERGY STAR Distilleries Guide 1
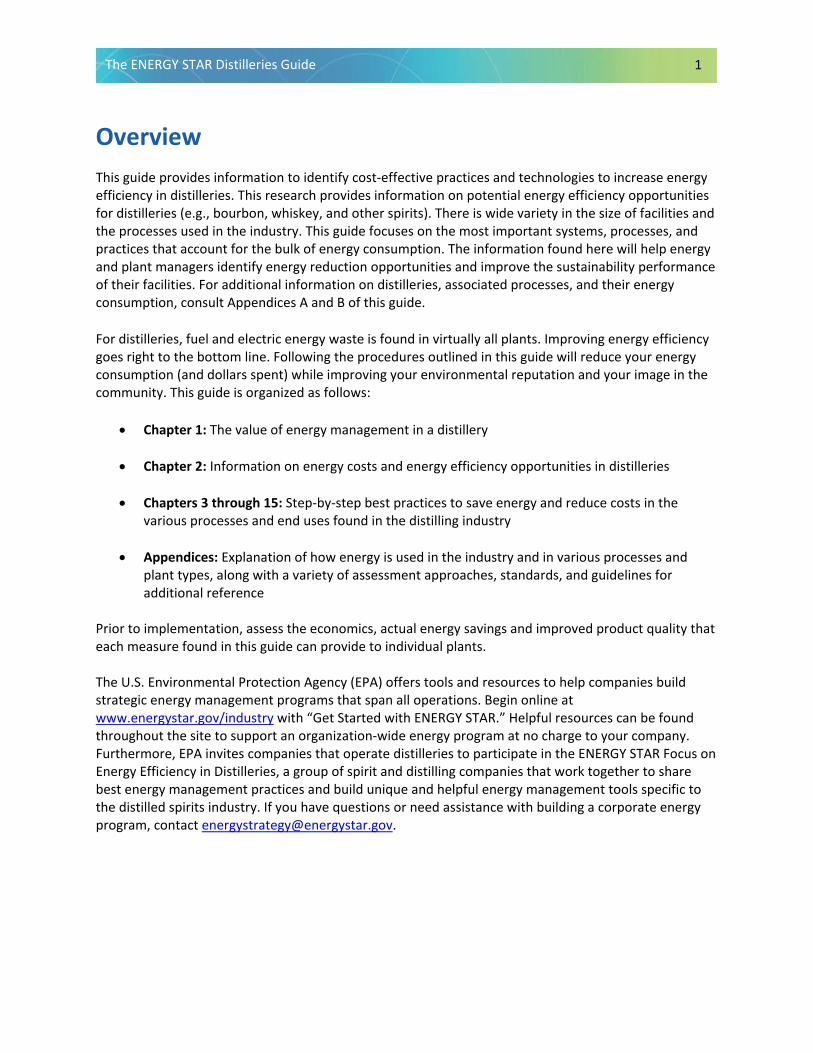
Overview This guide provides information to identify cost-effective practices and technologies to increase energy efficiency in distilleries. This research provides information on potential energy efficiency opportunities for distilleries (e.g., bourbon, whiskey, and other spirits). There is wide variety in the size of facilities and the processes used in the industry. This guide focuses on the most important systems, processes, and practices that account for the bulk of energy consumption. The information found here will help energy and plant managers identify energy reduction opportunities and improve the sustainability performance of their facilities. For additional information on distilleries, associated processes, and their energy consumption, consult Appendices A and B of this guide.
For distilleries, fuel and electric energy waste is found in virtually all plants. Improving energy efficiency goes right to the bottom line. Following the procedures outlined in this guide will reduce your energy consumption (and dollars spent) while improving your environmental reputation and your image in the community. This guide is organized as follows:
• Chapter 1: The value of energy management in a distillery • Chapter 2: Information on energy costs and energy efficiency opportunities in distilleries • Chapters 3 through 15: Step-by-step best practices to save energy and reduce costs in the
various processes and end uses found in the distilling industry • Appendices: Explanation of how energy is used in the industry and in various processes and
plant types, along with a variety of assessment approaches, standards, and guidelines for additional reference
Prior to implementation, assess the economics, actual energy savings and improved product quality that each measure found in this guide can provide to individual plants. The U.S. Environmental Protection Agency (EPA) offers tools and resources to help companies build strategic energy management programs that span all operations. Begin online at www.energystar.gov/industry with “Get Started with ENERGY STAR.” Helpful resources can be found throughout the site to support an organization-wide energy program at no charge to your company. Furthermore, EPA invites companies that operate distilleries to participate in the ENERGY STAR Focus on Energy Efficiency in Distilleries, a group of spirit and distilling companies that work together to share best energy management practices and build unique and helpful energy management tools specific to the distilled spirits industry. If you have questions or need assistance with building a corporate energy program, contact [email protected].

The ENERGY STAR Distilleries Guide 2
Chapter 1: Why Energy Management Is Good for Your Business Energy management programs control long-term energy risks and build stability into the business by reducing energy costs by 3% to 10% annually. Energy management also reduces waste and emissions that can be costly to control.
Well-run energy programs attract new talent to your company, improve its reputation within communities, and create value for the corporate brand.
To withstand future price fluctuations and remain competitive, new plants should use energy-efficient, state-of-the-art technologies, while older and more inefficient plants should assess retrofitting opportunities. Energy efficiency improvements will reduce the energy cost per unit of product, which is a practical method for growing market share.
To see financial returns from energy management, regularly assess energy performance and implement steps to increase energy efficiency in areas where you will get the most efficiency for dollars spent. Turn your company into a high-performance organization that improves your bottom line and environmental reputation by achieving the following:
• Actively managing energy.
• Adopting a structured approach.
• Establishing policies and procedures that will achieve long-term results.
• Enlisting senior management’s support.
• Allocating staff and resources to energy management.
• Establishing goals.
• Developing management structures that empower staff to address energy efficiencyissues directly.
• Identifying and implementing energy savings.
• Building a culture of continuous improvement.
DID YOU KNOW?
Energy savings from improving energy efficiency go directly to a company’s bottom line! Many
companies can save 3% to 10% annually.

The ENERGY STAR Distilleries Guide 3
• Some process variations exist with DID YOU KNOW?distilleries; however, the two processeswith the highest energy use are If you do not manage energy, your businesstypically cooking and distillation. is giving money away to the utility.Furthermore, in distilleries that dryspent grains for sale, the “dry house” can also constitute a significant percentage of a facility’senergy use.
• More than 90% of the fuel is used to produce hot water and steam for mashing or cooking thegrains, distillation, and powering the dry house (Jacques et al., 2003). A significant amount ofelectric energy is used in cooling the product after cooking and distillation.
• Annually, about 370 GWh of electricity is consumed by distilleries in the United States (U.S.Economic Census, 2018). Electricity is used throughout the entire plant, although dry houses andgrain processing represent the largest shares of electricity use. The primary electricity users aremotor systems, especially pumps and compressors/chillers.
Chapter 2: Where to Look for Energy Savings By looking strategically at how energy is used throughout the processes employed in a distillery, energy managers can better assess where energy efficiency efforts will be most effective. Reviewing energy use patterns and trends can save time by focusing management efforts on areas and processes where the greatest efficiency impacts can be achieved and where improvements can save on operational costs. This chapter looks at where energy is consumed, as well as trends in energy consumption.
The spirits industry in the United States has grown considerably over the past decade. While DID YOU KNOW? energy expenditures have grown, they have not increased as rapidly as sector output. Still, If the energy required per unit of product is distilleries spent almost $60 million annually on reduced, you can grow your market share! energy in 2018 (U.S. Economic Census, 2018). Over the past decade, the price of fuel (especially natural gas) has declined sharply, which has reduced the share of fuel contributions to energy costs from 60% to 50%. Despite the price of electricity increasing slightly over the years, the contribution of electricity to total energy use within the industry has increased as well.
How is this money spent?
The ENERGY STAR Distilleries Guide 4
Energy Consumption Within the Distilling Industry
In practice, the amount of energy and the proportion of energy used in each process will vary among distilleries, depending on the scale, products, processes used, and the efficiency of operations. The steps to produce a distilled spirit vary by the type of beverage being manufactured. All distilled spirits undergo most, if not all, of the key processes outlined below (see also Appendix A).
• Milling or Crushing: When grains are used as the base of the spirit, the grains are milled toincrease their surface area.
• Cooking and Mashing: The grains are cooked and mashed using hot water. The enzymes in thegrain convert starch into fermentable sugars.
• Fermentation: Yeast and water may be added to the mash or wort to start the fermentation toproduce alcohol.
• Distillation: The fermented liquid is heated to separate and concentrate the alcohol.The targeted concentration varies, depending on the type of spirits and the process design.
• Maturation: Some types of spirits are then matured in oak barrels for several years.
• Blending and Bottling: Finally, the spirits may be blended and then bottled.
Steam from boilers is used for distillation and drying spent grains (if done on site), while electricity is typically used for milling and conveying the grains, as well as cooling the products and byproducts from fermentation and distillation. Some direct-fired grain dryers exist; however, using steam is more common.
There is some variation in the energy used to make different kinds of spirits. In some spirits, such as whiskey, energy is needed to convert the starches to sugar (e.g., malting and mashing), whereas for other spirits, such as rum, the sugars are already present in the molasses feedstock. Similarly, some energy is needed to support the aging of certain spirits, such as whiskey and brandy, whereas other spirits, like vodka and gin, do not have this requirement.
Not all distilleries start at the same point in the production chain. An integrated distillery may perform all key processes—milling, mashing/cooking, distilling, aging, and bottling—to produce a retail-ready spirit onsite. Yet it is not uncommon to find distilleries following some permutation of these processes. For example, companies with several distilleries may use a central bottling facility, whereas others bottle onsite. Another common practice some distilleries employ is to refine a spirit from a separate facility with an additional distillation. In cases of infused spirits, such as gin, a neutral spirit from a separate facility may be redistilled with botanicals. In those cases, their expected energy footprints would be less than distilleries that distill directly from a mash.
Facilities that distill spirits directly from mash also may use different designs with their stills. While there are many variations in still designs, the key distinguishing factor is whether a distillery uses a column still, pot still, or a combination of both. The type of still and its shape and dimensions can affect the
The ENERGY STAR Distilleries Guide 5
characteristics of the final product; however, pot stills (operated in batch mode) typically have a higher energy intensity than column stills (operated continuously).
Often overlooked support processes also can vary among distilleries and affect energy use. A key driver of thermal and electricity use is whether the distillery will dry the spent grains prior to removal from the site. Partially or fully dried grains can be used for animal fodder. Removing moisture from byproducts can reduce the cost of transporting to the end user. Depending on the plant layout, drying and evaporation can represent up to 30% of fuel consumption (Jacques et al., 2003). Similarly, wastewater discharge permits may require some onsite treatment of processed water prior to discharge. Whether a facility is required to pretreat wastewater will affect its overall energy footprint.
Economies of scale can vary between small and large facilities. Large distilleries are expected to be more efficient than smaller ones, as observed by Galitsky in breweries (Galitsky et al., 2003). Similarly, large-scale industrial ethanol producers are less energy intensive than smaller distilleries that produce spirits for human consumption.
In the United States, typical thermal energy use for a distillery is estimated to be 70 to 75 kBtu/gallon (200 proof) [28 to 30 kBtu/gallon (80 proof)] and electricity is about 0.7 to 1.0 kWh/gallon (200 proof) [0.96 to 1.36 kBtu/gallon (80 proof)] (based on Jacques et al., 2003). An international benchmark of distilleries by the Beverage Industry Environmental Roundtable (BIER) found significant variation in the energy intensity of distilleries and bottling plants (BIER, 2012). The total energy use of distilleries using column still distillation ranges from 10 to 29 kBtu/gallon (80 proof), while for pot still distillation this could vary between 29 and 110 kBtu/gallon (80 proof), while the average was 34.4 kBtu/gallon. Energy use in bottling facilities varied between 0.7 and 5.4 kBtu/gallon, with an average of 2.1 kBtu/gallon. While the variation in energy use may be affected by the factors discussed above, it does suggest that there is potential for energy efficiency to improve energy savings.
So where are the best opportunities to save energy and reduce costs given the trends in overall energy consumption?
• Plant energy managers must efficiently control the cross-cutting equipment that powers theproduction process of a plant, including motor systems, pumps, and compressors/chillers.These systems require regular maintenance, active oversight, and replacement with moreenergy-efficient models when necessary.
• A second and equally important area is having efficient operating processes (especiallydistillation and the dry house) and steam systems. Process optimization and the most efficienttechnology are key to realizing energy savings in a plant’s operations.
• Finally, throughout a plant, there are various batch processes that run simultaneously, offeringopportunities for heat recovery and process integration.
While there may be opportunities to make a process more efficient, it may not be feasible if that will affect the characteristics of the final product. That said, energy use will almost always be associated with pumping, heating, and cooling liquids and byproducts. The question then becomes not how to make distilling more energy efficient, but how to pump, heat, and cool more efficiently.
The ENERGY STAR Distilleries Guide 6
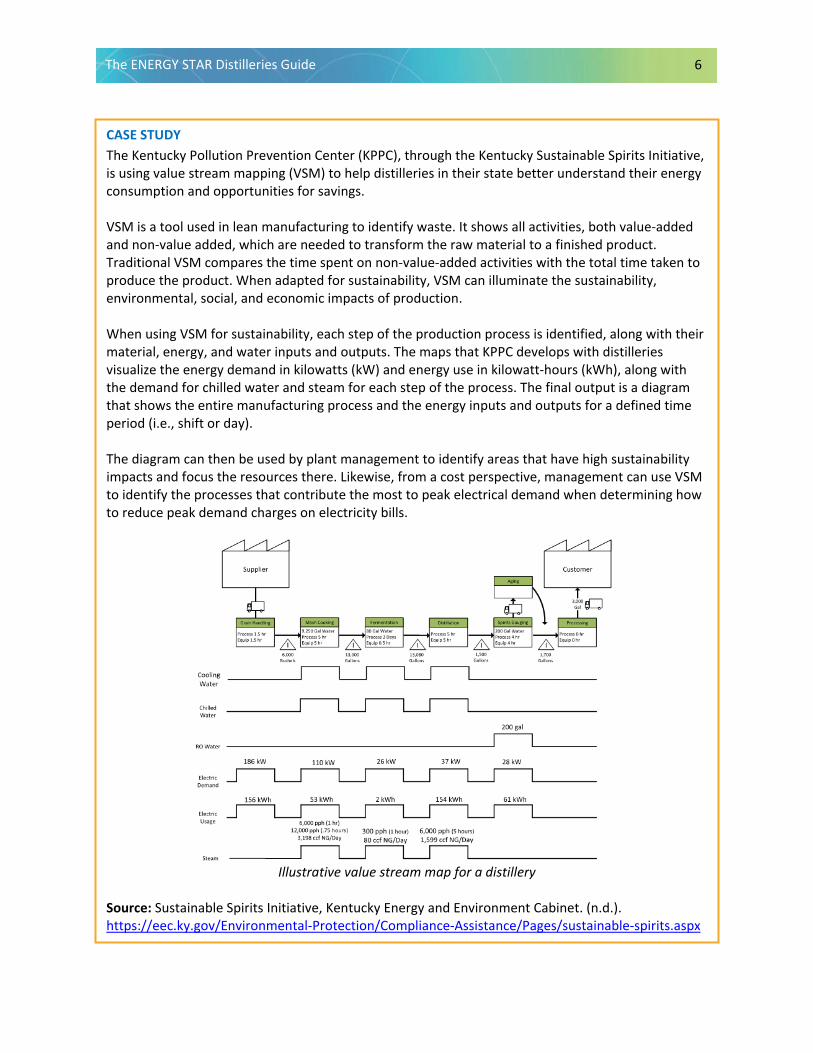
CASE STUDY The Kentucky Pollution Prevention Center (KPPC), through the Kentucky Sustainable Spirits Initiative, is using value stream mapping (VSM) to help distilleries in their state better understand their energy consumption and opportunities for savings.
VSM is a tool used in lean manufacturing to identify waste. It shows all activities, both value-added and non-value added, which are needed to transform the raw material to a finished product. Traditional VSM compares the time spent on non-value-added activities with the total time taken to produce the product. When adapted for sustainability, VSM can illuminate the sustainability, environmental, social, and economic impacts of production.
When using VSM for sustainability, each step of the production process is identified, along with their material, energy, and water inputs and outputs. The maps that KPPC develops with distilleries visualize the energy demand in kilowatts (kW) and energy use in kilowatt-hours (kWh), along with the demand for chilled water and steam for each step of the process. The final output is a diagram that shows the entire manufacturing process and the energy inputs and outputs for a defined time period (i.e., shift or day).
The diagram can then be used by plant management to identify areas that have high sustainability impacts and focus the resources there. Likewise, from a cost perspective, management can use VSM to identify the processes that contribute the most to peak electrical demand when determining how to reduce peak demand charges on electricity bills.
Illustrative value stream map for a distillery
Source: Sustainable Spirits Initiative, Kentucky Energy and Environment Cabinet. (n.d.). https://eec.ky.gov/Environmental-Protection/Compliance-Assistance/Pages/sustainable-spirits.aspx
The ENERGY STAR Distilleries Guide 7
Energy Efficiency Opportunities
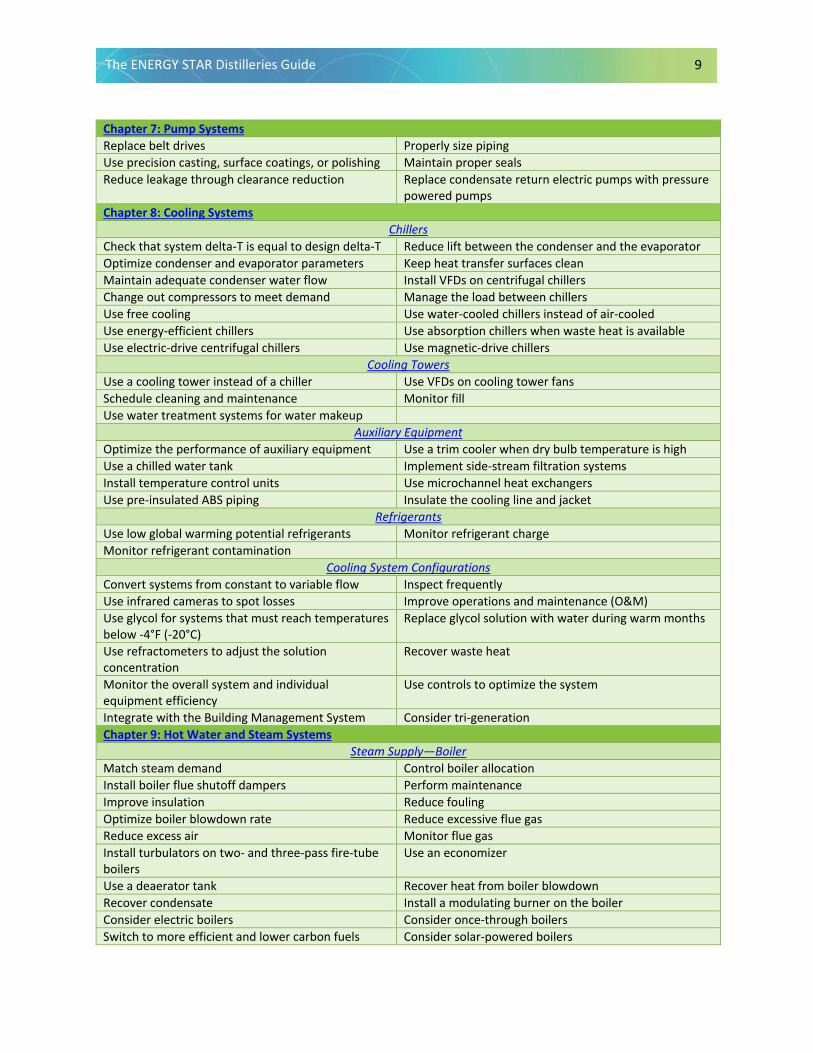
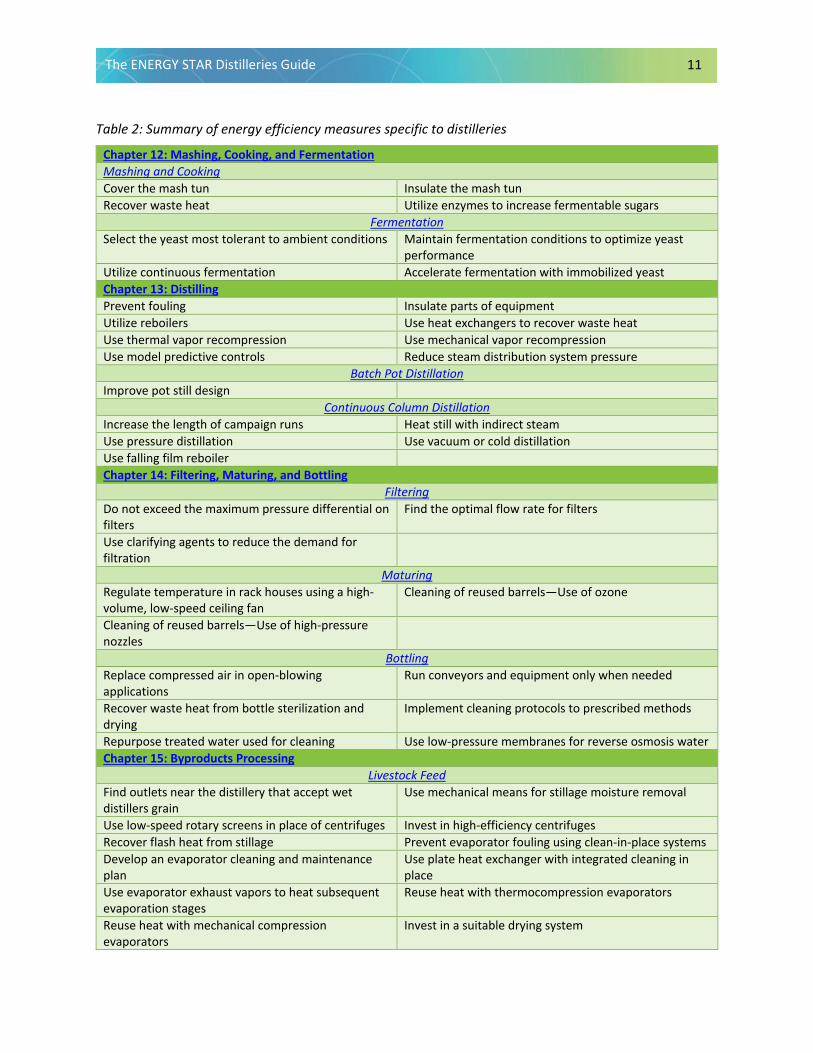
Chapters 3 through 11 explain energy efficiency measures found in common plant systems regardless of the industry and are summarized in Table 1. Chapters 12 through 15 explain energy efficiency opportunities that are unique to the processes found in distilleries and are summarized in Table 2. Generally, each chapter begins with a description of the topic, a checklist for quick reference, and a description of best practices, starting with measures that are easier to implement.
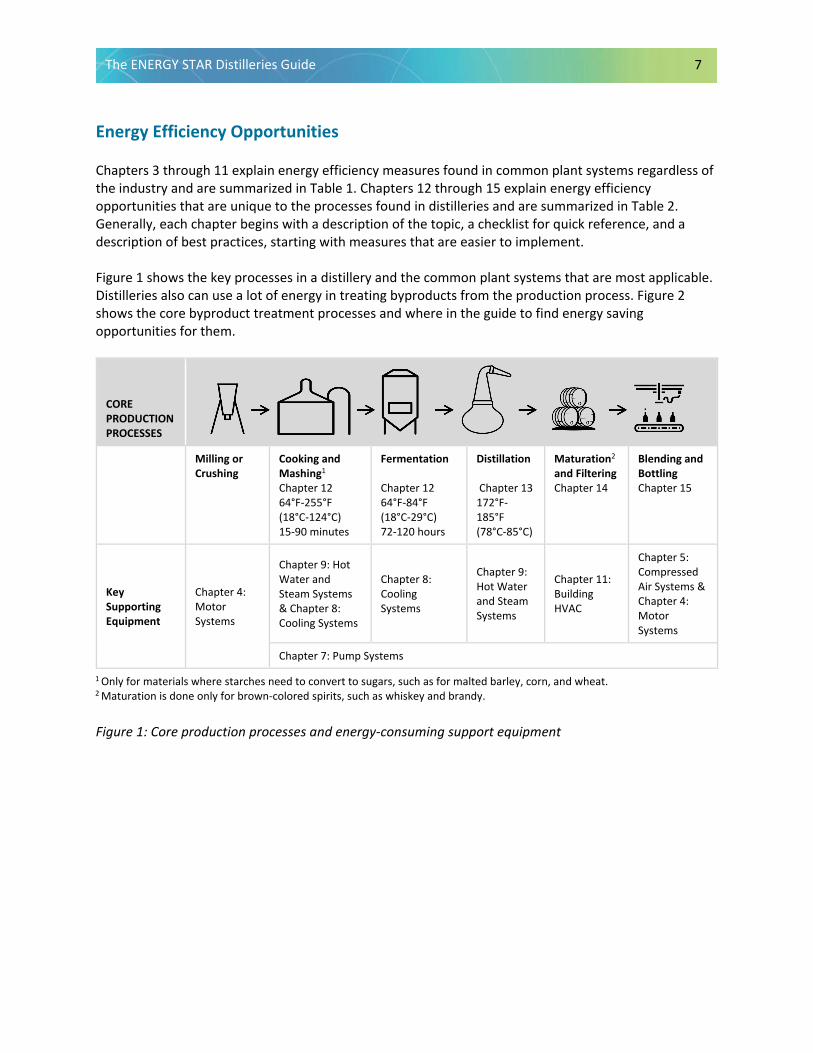
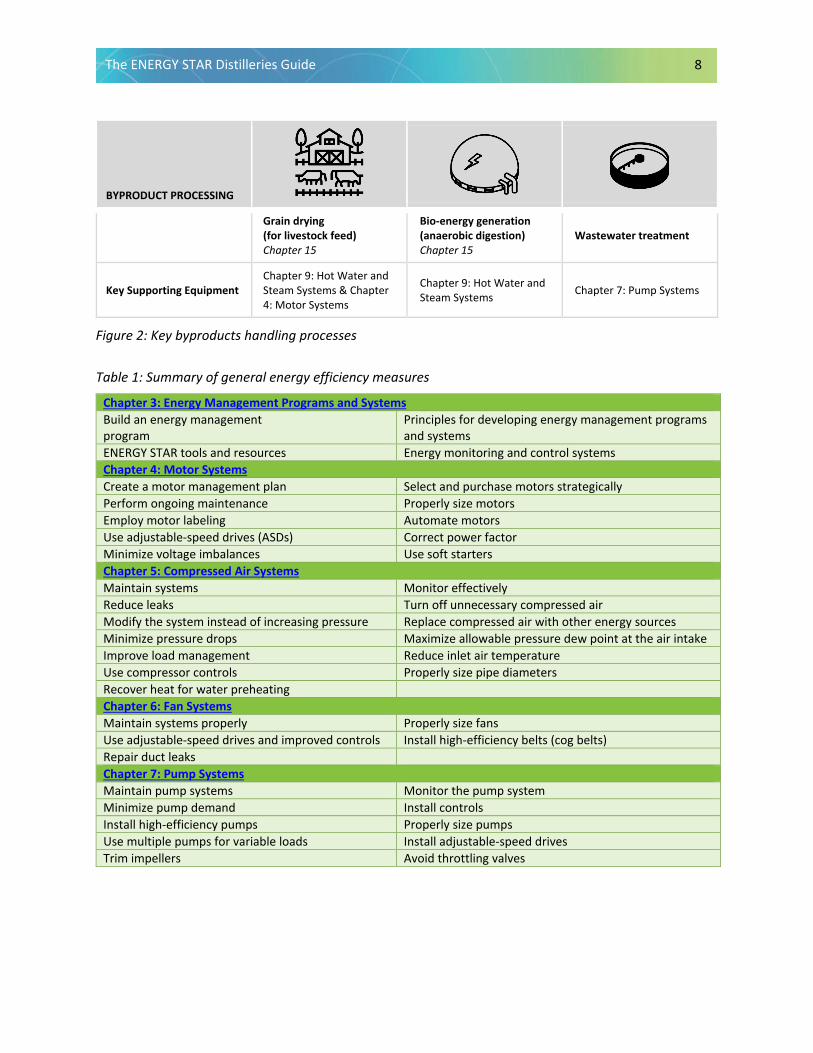
Figure 1 shows the key processes in a distillery and the common plant systems that are most applicable. Distilleries also can use a lot of energy in treating byproducts from the production process. Figure 2 shows the core byproduct treatment processes and where in the guide to find energy saving opportunities for them.
CORE PRODUCTION PROCESSES
Milling or Crushing
Cooking and Mashing1
Chapter 12 64°F-255°F (18°C-124°C) 15-90 minutes
Fermentation
Chapter 12 64°F-84°F (18°C-29°C) 72-120 hours
Distillation
Chapter 13 172°F-185°F (78°C-85°C)
Maturation2 and Filtering
Chapter 14
Blending and Bottling Chapter 15
Key Supporting Equipment
Chapter 4: Motor Systems
Chapter 9: Hot Water and Steam Systems & Chapter 8: Cooling Systems
Chapter 8: Cooling Systems
Chapter 9: Hot Water and Steam Systems
Chapter 11: Building HVAC
Chapter 5: Compressed Air Systems & Chapter 4: Motor Systems
Chapter 7: Pump Systems
1 Only for materials where starches need to convert to sugars, such as for malted barley, corn, and wheat. 2 Maturation is done only for brown-colored spirits, such as whiskey and brandy.
Figure 1: Core production processes and energy-consuming support equipment
The ENERGY STAR Distilleries Guide 8
BYPRODUCT PROCESSING
Grain drying (for livestock feed) Chapter 15
Bio-energy generation (anaerobic digestion) Chapter 15
Wastewater treatment
Key Supporting Equipment Chapter 9: Hot Water and Steam Systems & Chapter 4: Motor Systems
Chapter 9: Hot Water and Steam Systems Chapter 7: Pump Systems
Figure 2: Key byproducts handling processes
Table 1: Summary of general energy efficiency measures
Chapter 3: Energy Management Programs and Systems Build an energy management program
Principles for developing energy management programs and systems
ENERGY STAR tools and resources Energy monitoring and control systems Chapter 4: Motor Systems Create a motor management plan Select and purchase motors strategically Perform ongoing maintenance Properly size motors Employ motor labeling Automate motors Use adjustable-speed drives (ASDs) Correct power factor Minimize voltage imbalances Use soft starters Chapter 5: Compressed Air Systems Maintain systems Monitor effectively Reduce leaks Turn off unnecessary compressed air Modify the system instead of increasing pressure Replace compressed air with other energy sources Minimize pressure drops Maximize allowable pressure dew point at the air intake Improve load management Reduce inlet air temperature Use compressor controls Properly size pipe diameters Recover heat for water preheating Chapter 6: Fan Systems Maintain systems properly Properly size fans Use adjustable-speed drives and improved controls Install high-efficiency belts (cog belts) Repair duct leaks Chapter 7: Pump Systems Maintain pump systems Monitor the pump system Minimize pump demand Install controls Install high-efficiency pumps Properly size pumps Use multiple pumps for variable loads Install adjustable-speed drives Trim impellers Avoid throttling valves
The ENERGY STAR Distilleries Guide 9
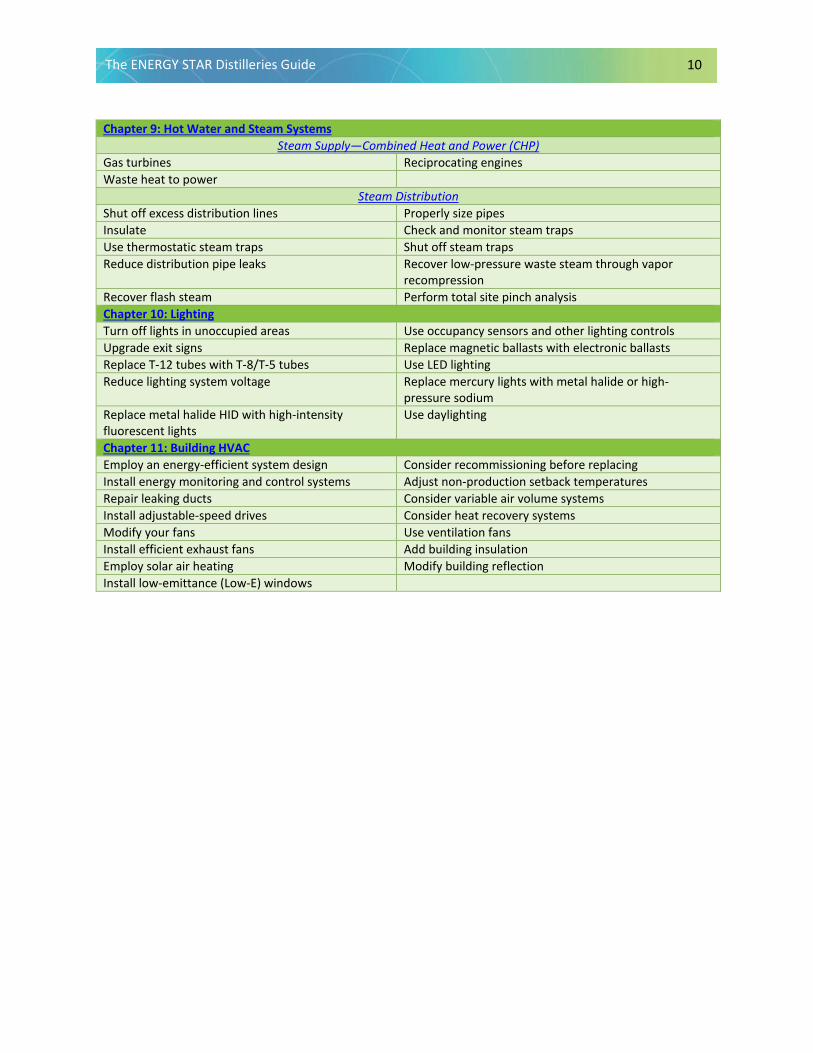
Chapter 7: Pump Systems Replace belt drives Properly size piping Use precision casting, surface coatings, or polishing Maintain proper seals Reduce leakage through clearance reduction Replace condensate return electric pumps with pressure
powered pumps Chapter 8: Cooling Systems
Chillers Check that system delta-T is equal to design delta-T Reduce lift between the condenser and the evaporator Optimize condenser and evaporator parameters Keep heat transfer surfaces clean Maintain adequate condenser water flow Install VFDs on centrifugal chillers Change out compressors to meet demand Manage the load between chillers Use free cooling Use water-cooled chillers instead of air-cooled Use energy-efficient chillers Use absorption chillers when waste heat is available Use electric-drive centrifugal chillers Use magnetic-drive chillers
Cooling Towers Use a cooling tower instead of a chiller Use VFDs on cooling tower fans Schedule cleaning and maintenance Monitor fill Use water treatment systems for water makeup
Auxiliary Equipment Optimize the performance of auxiliary equipment Use a trim cooler when dry bulb temperature is high Use a chilled water tank Implement side-stream filtration systems Install temperature control units Use microchannel heat exchangers Use pre-insulated ABS piping Insulate the cooling line and jacket
Refrigerants Use low global warming potential refrigerants Monitor refrigerant charge Monitor refrigerant contamination
Cooling System Configurations Convert systems from constant to variable flow Inspect frequently Use infrared cameras to spot losses Improve operations and maintenance (O&M) Use glycol for systems that must reach temperatures below -4°F (-20°C)
Replace glycol solution with water during warm months
Use refractometers to adjust the solution concentration
Recover waste heat
Monitor the overall system and individual equipment efficiency
Use controls to optimize the system
Integrate with the Building Management System Consider tri-generation Chapter 9: Hot Water and Steam Systems
Steam Supply—Boiler Match steam demand Control boiler allocation Install boiler flue shutoff dampers Perform maintenance Improve insulation Reduce fouling Optimize boiler blowdown rate Reduce excessive flue gas Reduce excess air Monitor flue gas Install turbulators on two- and three-pass fire-tube boilers
Use an economizer
Use a deaerator tank Recover heat from boiler blowdown Recover condensate Install a modulating burner on the boiler Consider electric boilers Consider once-through boilers Switch to more efficient and lower carbon fuels Consider solar-powered boilers
The ENERGY STAR Distilleries Guide 10
Chapter 9: Hot Water and Steam Systems Steam Supply—Combined Heat and Power (CHP)
Gas turbines Reciprocating engines Waste heat to power
Steam Distribution Shut off excess distribution lines Properly size pipes Insulate Check and monitor steam traps Use thermostatic steam traps Shut off steam traps Reduce distribution pipe leaks Recover low-pressure waste steam through vapor
recompression Recover flash steam Perform total site pinch analysis Chapter 10: Lighting Turn off lights in unoccupied areas Use occupancy sensors and other lighting controls Upgrade exit signs Replace magnetic ballasts with electronic ballasts Replace T-12 tubes with T-8/T-5 tubes Use LED lighting Reduce lighting system voltage Replace mercury lights with metal halide or high-
pressure sodium Replace metal halide HID with high-intensity fluorescent lights
Use daylighting
Chapter 11: Building HVAC Employ an energy-efficient system design Consider recommissioning before replacing Install energy monitoring and control systems Adjust non-production setback temperatures Repair leaking ducts Consider variable air volume systems Install adjustable-speed drives Consider heat recovery systems Modify your fans Use ventilation fans Install efficient exhaust fans Add building insulation Employ solar air heating Modify building reflection Install low-emittance (Low-E) windows
The ENERGY STAR Distilleries Guide 11
Table 2: Summary of energy efficiency measures specific to distilleries
Chapter 12: Mashing, Cooking, and Fermentation Mashing and Cooking Cover the mash tun Insulate the mash tun Recover waste heat Utilize enzymes to increase fermentable sugars
Fermentation Select the yeast most tolerant to ambient conditions Maintain fermentation conditions to optimize yeast
performance Utilize continuous fermentation Accelerate fermentation with immobilized yeast Chapter 13: Distilling Prevent fouling Insulate parts of equipment Utilize reboilers Use heat exchangers to recover waste heat Use thermal vapor recompression Use mechanical vapor recompression Use model predictive controls Reduce steam distribution system pressure
Batch Pot Distillation Improve pot still design
Continuous Column Distillation Increase the length of campaign runs Heat still with indirect steam Use pressure distillation Use vacuum or cold distillation Use falling film reboiler Chapter 14: Filtering, Maturing, and Bottling
Filtering Do not exceed the maximum pressure differential on filters
Find the optimal flow rate for filters
Use clarifying agents to reduce the demand for filtration
Maturing Regulate temperature in rack houses using a high-volume, low-speed ceiling fan
Cleaning of reused barrels—Use of ozone
Cleaning of reused barrels—Use of high-pressure nozzles
Bottling Replace compressed air in open-blowing applications
Run conveyors and equipment only when needed
Recover waste heat from bottle sterilization and drying
Implement cleaning protocols to prescribed methods
Repurpose treated water used for cleaning Use low-pressure membranes for reverse osmosis water Chapter 15: Byproducts Processing
Livestock Feed Find outlets near the distillery that accept wet distillers grain
Use mechanical means for stillage moisture removal
Use low-speed rotary screens in place of centrifuges Invest in high-efficiency centrifuges Recover flash heat from stillage Prevent evaporator fouling using clean-in-place systems Develop an evaporator cleaning and maintenance plan
Use plate heat exchanger with integrated cleaning in place
Use evaporator exhaust vapors to heat subsequent evaporation stages
Reuse heat with thermocompression evaporators
Reuse heat with mechanical compression evaporators
Invest in a suitable drying system

The ENERGY STAR Distilleries Guide 12
Chapter 15: Byproducts Processing Livestock Feed
Maintain proper seals on dryers Insulate the dryer drum Use low-temperature dryers Dry using solar heating Dry using superheated steam
Bio-Energy Generation Generate biogas with anaerobic digestion
The ENERGY STAR Distilleries Guide 13
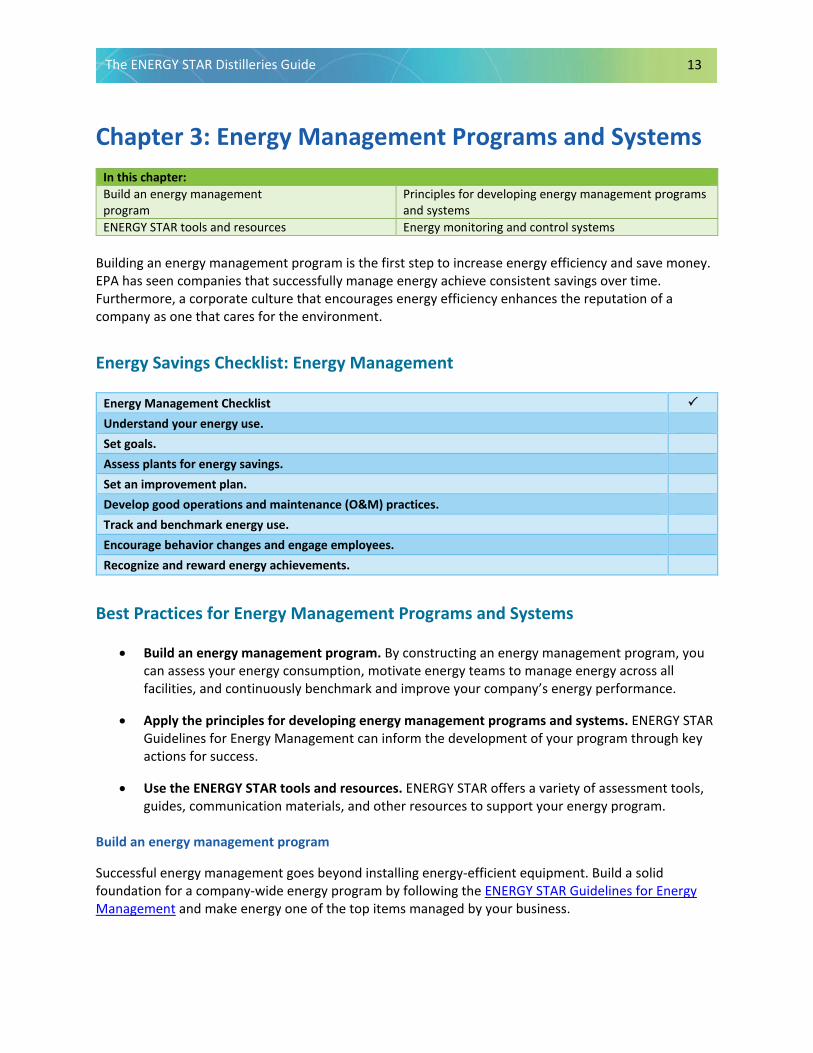
Chapter 3: Energy Management Programs and Systems In this chapter: Build an energy management program
Principles for developing energy management programs and systems
ENERGY STAR tools and resources Energy monitoring and control systems
Building an energy management program is the first step to increase energy efficiency and save money. EPA has seen companies that successfully manage energy achieve consistent savings over time. Furthermore, a corporate culture that encourages energy efficiency enhances the reputation of a company as one that cares for the environment.
Energy Savings Checklist: Energy Management
Energy Management Checklist
Understand your energy use. Set goals. Assess plants for energy savings. Set an improvement plan. Develop good operations and maintenance (O&M) practices. Track and benchmark energy use. Encourage behavior changes and engage employees. Recognize and reward energy achievements.
Best Practices for Energy Management Programs and Systems
• Build an energy management program. By constructing an energy management program, youcan assess your energy consumption, motivate energy teams to manage energy across allfacilities, and continuously benchmark and improve your company’s energy performance.
• Apply the principles for developing energy management programs and systems. ENERGY STARGuidelines for Energy Management can inform the development of your program through keyactions for success.
• Use the ENERGY STAR tools and resources. ENERGY STAR offers a variety of assessment tools,guides, communication materials, and other resources to support your energy program.
Build an energy management program
Successful energy management goes beyond installing energy-efficient equipment. Build a solid foundation for a company-wide energy program by following the ENERGY STAR Guidelines for Energy Management and make energy one of the top items managed by your business.

The ENERGY STAR Distilleries Guide 14
Next, institute sound energy management practices into your program, including: (1) energy assessments, (2) energy teams and (3) energy tracking, measurement, and benchmarking.
commitment to energy management because a team can accomplish much more than a single person can accomplish alone. The energy team is responsible for planning, implementing, benchmarking, monitoring, and evaluating the organizational energy management program. The team’s duties also include delivering training, communicating results, and providing recognition. The ENERGY STAR Teaming Up to Save Energy guide is designed to help organizations develop effective energy teams. The guide provides advice, checklists and examples for starting an energy program, organizing an energy team, building capacity, sustaining the team, and maintaining momentum (see also Appendix K).
1. Assess the energy efficiency of your plant(s).Assessing the energy used in plants helps determine how, how much and where energy is consumed. This information enables the identification of steps to improve the facility’s energy efficiency and save money. Assessments may be focused on the whole site or specific systems and processes.Assessments may be conducted by company staff, the local electric utility, contractors, or government programs:
• Staff teams. If company employees perform the plant assessment, include staff from various departments across the facility. This brings together a spectrum of experience and knowledge on the plant and its processes. Facilities of any size can successfully use this method. ENERGY STAR provides guidance for a type of assessment that uses employee teams, the Energy Treasure Hunt (see www.energystar.gov/treasurehunt for more information).
• Electric utility program. Local utility companies work with their industrial clients to achieve energy savings in existing facilities and in the design of new facilities. Check with your local electric utility to see what assistance it provides. Utilities sometimes offer specific programs for improving plant systems such as lighting or motors.
• Federal government programs.The U.S. Department of Energy (U.S. DOE) supports plant assessments through the Industrial Assessment Center (IAC) program. IACs are designed to help small- and medium-sized enterprises. Universities that participate in the program offer free assessments performed by students.
2. Build an energy team. DID YOU KNOW?Establishing an energy team is animportant part of making a
The cost of paying one employee to lead an energy management program should be more than
recovered by potential energy savings!
The ENERGY STAR Distilleries Guide 15
3. Monitor your energy systems.
Every company should compile, track, and benchmark energy data. Reliable energy data helpsyou manage energy and interpret energy efficiency trends over time so you can take correctiveaction when necessary.
Here are a few reasons it is important to monitor energy:
• Identifies increased use and costs that could be caused by operational inefficiencies.
• Supports participation in emergency demand response programs where utility companiesprovide financial incentives to customers who reduce their energy loads during peakdemand times.
• Provides data useful for corporate greenhouse gas (GHG) accounting initiatives.
Data on energy use can be found in utility bills, fuel purchase receipts, and from self-installed meters. Using an energy monitoring system is ideal. It requires little or no up-front capital and can result in immediate savings.
Energy monitoring systems include submeters at key areas in a plant to strategically track and manage energy. Submetering production departments can provide improved metrics and enables quick pinpointing of areas where energy problems may exist. The meters’ data should be managed with a data management tool; a simple spreadsheet may be sufficient, or tailored software is also available.
In its simplest form, an energy monitoring system should be based on the following:
• Monthly utility billing and energy-use data for the past 12 to 24 months
• Monthly production figures
A simple spreadsheet may be used to plot graphs for visually understanding the relationship between energy use and production as well as to identify any trends. Graphs can be made for fuel and electricity separately, as well as for total energy use (showing both in the same units, such as megajoules or British thermal units) and costs. For example:
• Graphs of energy use and production over time
• Graphs of energy costs and production over time
• Graphs of energy use on the vertical axis against production on the horizontal axis
• Graphs of energy use divided by production (showing specific energy consumption)
Often the analysis will show periods of good performance and poor performance. This information helps with setting targets for energy consumption based on expected production volumes. Tracking energy use by entering new data and re-evaluating it regularly will help identify problems and improve energy savings.
The ENERGY STAR Distilleries Guide 16
The ENERGY STAR Energy Tracking Tool is available at no cost to companies and sites for use in tracking energy.
Principles for developing energy management programs and systems
An organization-wide energy management program is the best way to save energy and money. It does not matter whether your company is big or small—any company can do it! Simply apply the following basic principles:
1. Make energy a priority.
Everyone in the company, especially senior management, must recognize that reducing energyuse is an important business objective that must be a part of decision making.
2. Commit to save energy.
Every level of the organization must support the commitment to improve energy efficiency.
3. Assign responsibility.
Someone must be assigned responsibility for managing energy across the company. The annualpay for a corporate energy manager is more than covered by the costs of the energy you willsave. An energy team with roles assigned to each member is a practical way to share the loadacross all facilities.
4. Look beyond your initial costs.
You get what you pay for. Energy-efficient equipment and products may cost more initially butthe long-term savings will surpass the initial costs.
5. Make energy management a continuous process.
ENERGY STAR tools and resources
EPA offers tools and resources to help companies build a strategic energy management program that spans all operations. Begin online at www.energystar.gov/industry with “Get Started with ENERGY STAR.” Helpful resources can be found throughout the site, which is designed to walk you through the main steps of building an organization-wide energy program at no charge to your company.
To assess how well your company manages energy currently, use the ENERGY STAR Energy Program Assessment Matrix, located within the ENERGY STAR Guidelines for Energy Management and Appendix J of this guide. EPA works with thousands of companies to identify the basics of an effective energy management program by using the ENERGY STAR Guidelines for Energy Management. If your company has questions or needs assistance with building a corporate energy program, contact [email protected].

The ENERGY STAR Distilleries Guide 17
Energy monitoring and control systems
The use of energy monitoring and process control systems can play an important role in energy management and in reducing energy use. These may include sub-metering, monitoring, and control systems. They can reduce the time required to perform complex tasks, often improve product and data quality and consistency, optimize process operations, and improve production budgeting. Although energy management systems are already widely disseminated in various industrial sectors, the performance of the systems can still be improved as automated controls and sensors become available. This reduces costs and increases energy savings further. Modern control systems are often not solely designed for energy efficiency but rather for improving productivity, product quality, and the efficiency of a production line. The systems can reduce the time required to perform complex tasks, often improve product and data quality and consistency, and optimize process operations. Monitoring and control systems can typically achieve energy savings of about 5%, while larger savings have been found in some cases. The savings and payback can vary greatly from plant to plant.
The ENERGY STAR Distilleries Guide 18
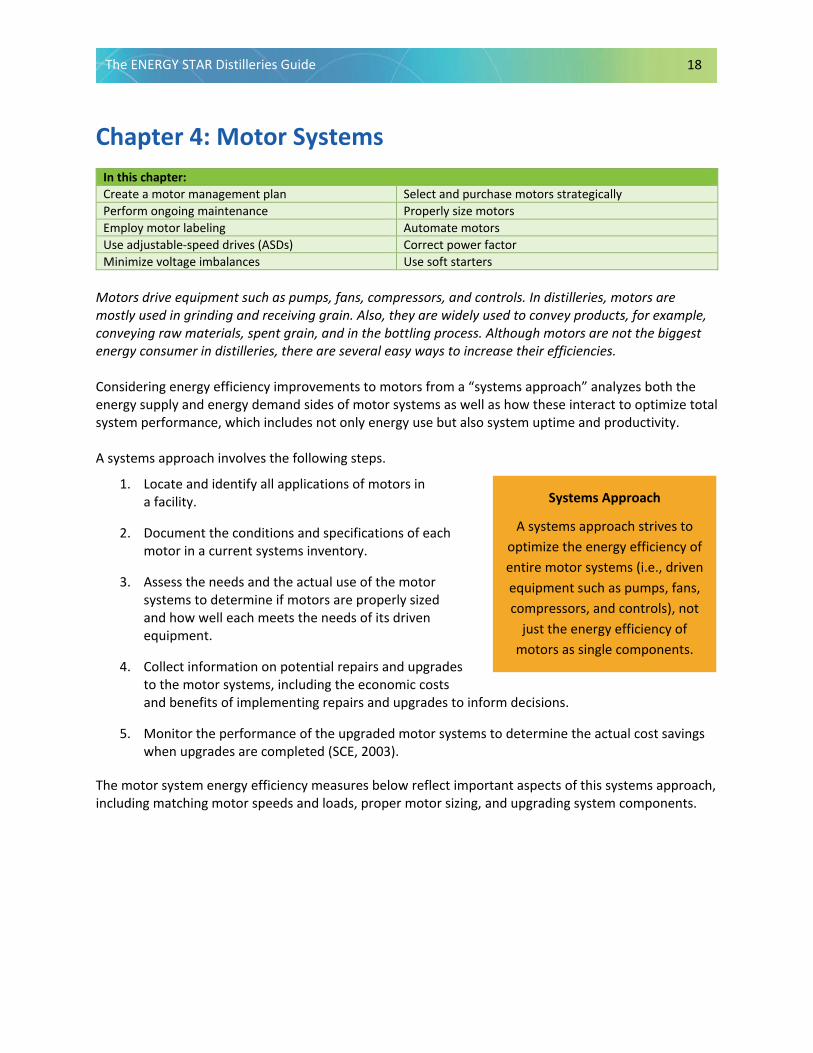
Chapter 4: Motor Systems In this chapter: Create a motor management plan Select and purchase motors strategically Perform ongoing maintenance Properly size motors Employ motor labeling Automate motors Use adjustable-speed drives (ASDs) Correct power factor Minimize voltage imbalances Use soft starters
Motors drive equipment such as pumps, fans, compressors, and controls. In distilleries, motors are mostly used in grinding and receiving grain. Also, they are widely used to convey products, for example, conveying raw materials, spent grain, and in the bottling process. Although motors are not the biggest energy consumer in distilleries, there are several easy ways to increase their efficiencies.
Considering energy efficiency improvements to motors from a “systems approach” analyzes both the energy supply and energy demand sides of motor systems as well as how these interact to optimize total system performance, which includes not only energy use but also system uptime and productivity.
A systems approach involves the following steps.
1. Locate and identify all applications of motors ina facility.
2. Document the conditions and specifications of eachmotor in a current systems inventory.
3. Assess the needs and the actual use of the motorsystems to determine if motors are properly sizedand how well each meets the needs of its drivenequipment.
4. Collect information on potential repairs and upgradesto the motor systems, including the economic costsand benefits of implementing repairs and upgrades to inform decisions.
5. Monitor the performance of the upgraded motor systems to determine the actual cost savingswhen upgrades are completed (SCE, 2003).
The motor system energy efficiency measures below reflect important aspects of this systems approach, including matching motor speeds and loads, proper motor sizing, and upgrading system components.
Systems Approach
A systems approach strives to optimize the energy efficiency of entire motor systems (i.e., driven equipment such as pumps, fans, compressors, and controls), not
just the energy efficiency of motors as single components.
The ENERGY STAR Distilleries Guide 19
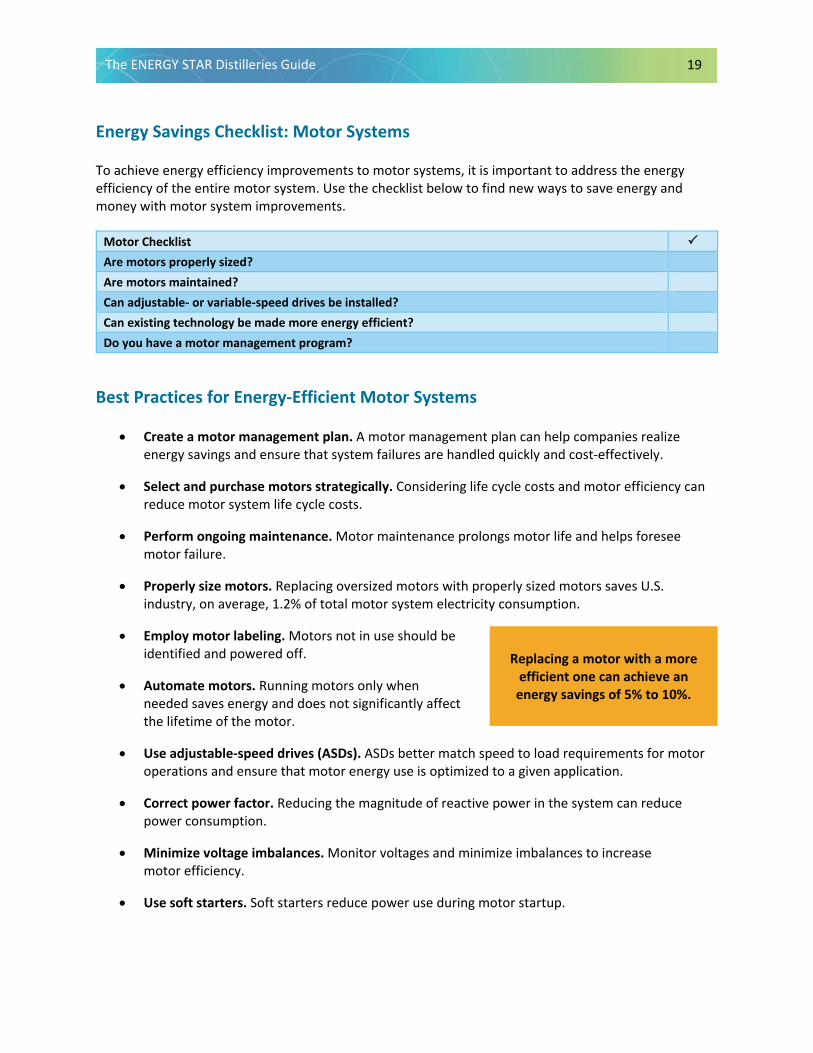
Energy Savings Checklist: Motor Systems
To achieve energy efficiency improvements to motor systems, it is important to address the energy efficiency of the entire motor system. Use the checklist below to find new ways to save energy and money with motor system improvements.
Motor Checklist
Are motors properly sized? Are motors maintained? Can adjustable- or variable-speed drives be installed? Can existing technology be made more energy efficient? Do you have a motor management program?
Best Practices for Energy-Efficient Motor Systems
• Create a motor management plan. A motor management plan can help companies realizeenergy savings and ensure that system failures are handled quickly and cost-effectively.
• Select and purchase motors strategically. Considering life cycle costs and motor efficiency canreduce motor system life cycle costs.
• Perform ongoing maintenance. Motor maintenance prolongs motor life and helps foreseemotor failure.
• Properly size motors. Replacing oversized motors with properly sized motors saves U.S.industry, on average, 1.2% of total motor system electricity consumption.
• Employ motor labeling. Motors not in use should beidentified and powered off.
• Automate motors. Running motors only whenneeded saves energy and does not significantly affectthe lifetime of the motor.
• Use adjustable-speed drives (ASDs). ASDs better match speed to load requirements for motoroperations and ensure that motor energy use is optimized to a given application.
• Correct power factor. Reducing the magnitude of reactive power in the system can reducepower consumption.
• Minimize voltage imbalances. Monitor voltages and minimize imbalances to increasemotor efficiency.
• Use soft starters. Soft starters reduce power use during motor startup.
Replacing a motor with a more efficient one can achieve an energy savings of 5% to 10%.
The ENERGY STAR Distilleries Guide 20
Create a motor management plan
A motor management plan is an essential part of a plant’s energy management strategy. A motor management plan helps companies realize long-term motor system energy savings and ensures that motor failures are handled quickly and cost-effectively. The Motor Decisions MatterSM Campaign suggests the following key activities for a sound motor management plan (MDM, 2012):
1. Create a motor survey and tracking program.
2. Develop guidelines for proactive repair/replace decisions.
3. Prepare for motor failure by creating a spare motor inventory.
4. Develop a purchasing specification.
5. Develop a repair specification.
6. Develop and implement a predictive and preventive maintenance program.
It is important to develop a motor purchasing policy and to stock a selection of preferred premium efficiency motors to replace existing motors at failure. Otherwise, it is likely and common that the motors will be replaced by less efficient alternatives.
The Motor Decisions MatterSM Campaign’s Motor Planning Kit contains further details on each of these elements (MDM, 2012).
Select and purchase motors strategically
Several factors are important when selecting a motor, including motor speed, horsepower, enclosure type, temperature rating, efficiency level, and quality of power supply. When selecting and purchasing a motor, it is also critical to consider the life cycle costs of that motor rather than just the price of its initial purchase and installation. Life cycle costing (LCC) is an accounting framework that enables calculation of the total costs of ownership for different investment options, leading to a sound evaluation of competing options in motor purchasing and repair or replacement decisions. A specific LCC guide has been developed for pump systems (Fenning et al., 2001), which also provides an introduction to LCC for motor systems.
The selection of energy-efficient motors is an important strategy for reducing motor system life cycle costs. Energy-efficient motors reduce energy losses through improved design, better materials, tighter tolerances, and improved manufacturing techniques. With proper installation, energy-efficient motors can also run cooler (which may help reduce facility heating loads) and have higher service factors, longer bearing life, longer insulation life, and less vibration.
Motor Selection
Up to 95% of a motor’s costs can be attributed to the energy it consumes
over its lifetime, while only around 5% of a motor’s costs are typically
attributed to its purchase, installation, and maintenance (MDM, 2012).
The ENERGY STAR Distilleries Guide 21
To be considered energy efficient in the United States, a motor must meet performance criteria published by the National Electrical Manufacturers Association (NEMA). See Appendix C for more information. The choice of installing a premium efficiency motor depends on motor operating conditions and the life cycle costs associated with the investment. In general, premium efficiency motors are most economically attractive when replacing motors with annual operations exceeding 2,000 hours/year. However, software tools such as MotorMaster+ (see Appendix F) can help identify attractive applications of premium efficiency motors based on the specific conditions at a given plant. Sometimes, even replacing an operating motor with a premium efficiency model may have a short payback period. According to data from the Copper Development Association, the upgrade to high-efficiency motors, as compared to motors that achieve the minimum efficiency as specified by the Energy Policy Act of 1992, can have paybacks of less than 15 months for 50 horsepower (hp) motors (CDA, 2001). Given the quick payback time, it usually makes sense to buy the most efficient motor available (U.S. DOE and CAC, 2003). NEMA and other organizations have created the Motor Decisions MatterSM campaign to help industrial and commercial customers evaluate their motor repair and replacement options, promote cost-effective applications of NEMA Premium™ motors and “best practice” repair, and support the development of motor management plans before motors fail. In some cases, it may be cost-effective to rewind an existing energy-efficient motor, instead of purchasing a new motor. As a rule of thumb, when rewinding costs exceed 60% of the costs of a new motor, purchasing the new motor may be a better choice (MDM, 2012). When rewinding a motor, it is important to choose a motor service center that follows best practice motor rewinding standards in order to minimize potential efficiency losses. An American National Standards Institute-approved recommended best practice standard has been offered by the Electric Apparatus Service Association (EASA) for the repair and rewinding of motors (EASA, 2006). When best rewinding practices are implemented, efficiency losses are typically less than 0.5% to 1% (EASA, 2003). However, poor quality rewinds may result in larger efficiency losses. It is therefore important to inquire whether the motor service center follows EASA best-practice standards (EASA, 2006). Perform ongoing maintenance
Motor maintenance prolongs motor life and helps anticipate motor failure. Motor maintenance measures can be categorized as either preventative or predictive. Preventative measures, which prevent unexpected downtime of motors, include electrical consideration, voltage imbalance minimization, load consideration, and motor ventilation, alignment, and lubrication. The purpose of predictive motor maintenance is to observe ongoing motor temperature, vibration, and other operating data to identify when it becomes necessary to overhaul or replace a motor before failure occurs (Barnish et al., 1997). The savings associated with an ongoing motor maintenance program are significant and could range from 2% to 30% of total motor system energy use (Efficiency Partnership, 2004).

The ENERGY STAR Distilleries Guide 22
Properly size motors
Inappropriately sized motors cause unnecessary energy losses. Where peak loads on driven equipment can be reduced, motor size can also be reduced. Replacing oversized motors with properly sized motors saves, on average for U.S. industry, 1.2% of total motor system electricity consumption (Xenergy, 1998). Higher savings can often be realized for smaller motors and individual motor systems.
Properly sizing a motor depends on the following: load on the motor, operating efficiency of the motor at that load point, the full-load speed of the motor to be replaced, and the full-load speed of the replacement motor. U.S. DOE provides a range of technical assistance, tip sheets and software tools for decision making on motor systems.
Employ motor labeling
Motors not in use should be powered off. This can be done through automated systems (see below) or motors can be labeled to show the typical use (e.g., continuous operations [365/24/7]), production days, during production, or when an operator is present. Toyota and Bodine Casting have successfully introduced (colored) labeling for motor systems in a number of plants.
Automate motors
Motors should only run when needed. Though some people are concerned that frequent motor startups will negatively affect a motor’s lifetime, as long as the frequency of motor startups is not excessive, the lifetime will not be significantly affected (U.S. DOE, 2008a). NEMA (2001) gives the maximum number of allowable motor startups per hour and the duration of rest time between startups, for various horsepower motors and synchronous speed ratings.
Use adjustable-speed drives (ASDs)1
Adjustable-speed drives better match speed to load requirements for motor operations, and therefore ensure that motor energy use is optimized to a given application. ASD systems are offered by many suppliers and are available worldwide. Worrell et al. (1997) provide an overview of savings achieved with ASDs in a wide array of applications; typical energy savings are shown to vary between 7% and 60%.
1 Several terms are used in practice to describe a motor system that permits a mechanical load to be driven at variable speeds, including adjustable-speed drives (ASDs), variable-speed drives, adjustable-frequency drives, and variable-frequency drives. The term ASD is used throughout this guide for consistency.
Motor Automation
A 10% reduction in motor operating time can save more energy than replacing a conventional motor with a NEMA Premium™ efficiency motor (U.S. DOE, 2008a). Therefore, automatic shutdown of motors that would otherwise be left idling can reduce energy costs without requiring high investment.
The ENERGY STAR Distilleries Guide 23
Correct power factor
Inductive loads like transformers, electric motors, and high-intensity discharge (HID) lighting may cause a low power factor, which may result in increased power consumption and increased electricity costs. The power factor can be corrected by minimizing idling of electric motors (a motor that is turned off consumes no energy), replacing motors with premium efficiency motors (see above), and installing capacitors in the AC circuit to reduce the magnitude of reactive power in the system. Minimize voltage imbalances
A voltage unbalance degrades the performance and shortens the life of three-phase motors. A voltage unbalance causes a current unbalance, which will result in torque pulsations, increased vibration and mechanical stress, increased losses, and motor overheating, which can reduce the life of a motor’s winding insulation. Voltage unbalances may be caused by a faulty operation of power factor correction equipment, an unbalanced transformer bank, or an open circuit. A rule of thumb is that the voltage unbalance at the motor terminals should not exceed 1%. Even a 1% unbalance will reduce motor efficiency at part load operation while a 2.5% unbalance will reduce motor efficiency at full load operation. See www.energy.gov/eere/amo/downloads/eliminate-voltage-unbalance. For a 100 hp motor operating 8,000 hours per year, a correction of the voltage unbalance from 2.5% to 1% will result in electricity savings of 9,500 kWh or almost $500 at an electricity rate of $0.05/kWh (U.S. DOE, 2005a). By regularly monitoring the voltages at the motor terminal and through regular thermographic inspections of motors, voltage unbalances may be identified. It is also recommended to verify that
CASE STUDY Formed in 2000, the Distell Group is a multinational beverage manufacturer based in South Africa that produces spirits, wines, ciders, and ready-to-drink beverages. As part of its Energy Management System program, managers identified that cooling accounts for a large share of its plants’ electricity use during production and bottling. The energy team undertook several activities to optimize the cooling plant at these sites, including the following:
• Installing a variable-speed drive on a compressor.
• Better utilizing a glycol plant, which allowed the company to decommission a Freon™ plant.
• Better sizing cold water pumps to meet demand.
• Installing a computerized control system to better manage cooling demand.
These projects resulted in energy savings per annum of 825,760 kWh, an annual CO2 emissions reduction of 726,133 kg, and a payback period of 1.4 years. Source: UNIDO (2020). Distell, Adam Tas site: Stellenbosch, Western Cape, South Africa. Efficiency Solutions for Industrial Cooling. www.industrialenergyaccelerator.org/wp-content/uploads/FINAL-13-Jan-case-study.pdf

The ENERGY STAR Distilleries Guide 24
single-phase loads are uniformly distributed and to install ground fault indicators as required. Another indicator that a voltage unbalance may be a problem is 120 Hz vibration, which should prompt an immediate check of voltage balance (U.S. DOE, 2005a). The typical payback period for voltage controller installation on lightly loaded motors in the United States is about 2 years (IAC, 2015).
Use soft starters
Soft starters are special devices, which allow the gradual speed acceleration of the motor, and limit the electrical stresses associated with motor startup (U.S. DOE, 2003b). With the use of soft starters, power use during motor startup can be reduced.
The ENERGY STAR Distilleries Guide 25
Chapter 5: Compressed Air Systems In this chapter: Maintain systems Monitor effectively Reduce leaks Turn off unnecessary compressed air Modify the system instead of increasing pressure Replace compressed air with other energy sources Minimize pressure drops Maximize allowable pressure dew point at the air intake Improve load management Reduce inlet air temperature Use compressor controls Properly size pipe diameters Recover heat for water preheating
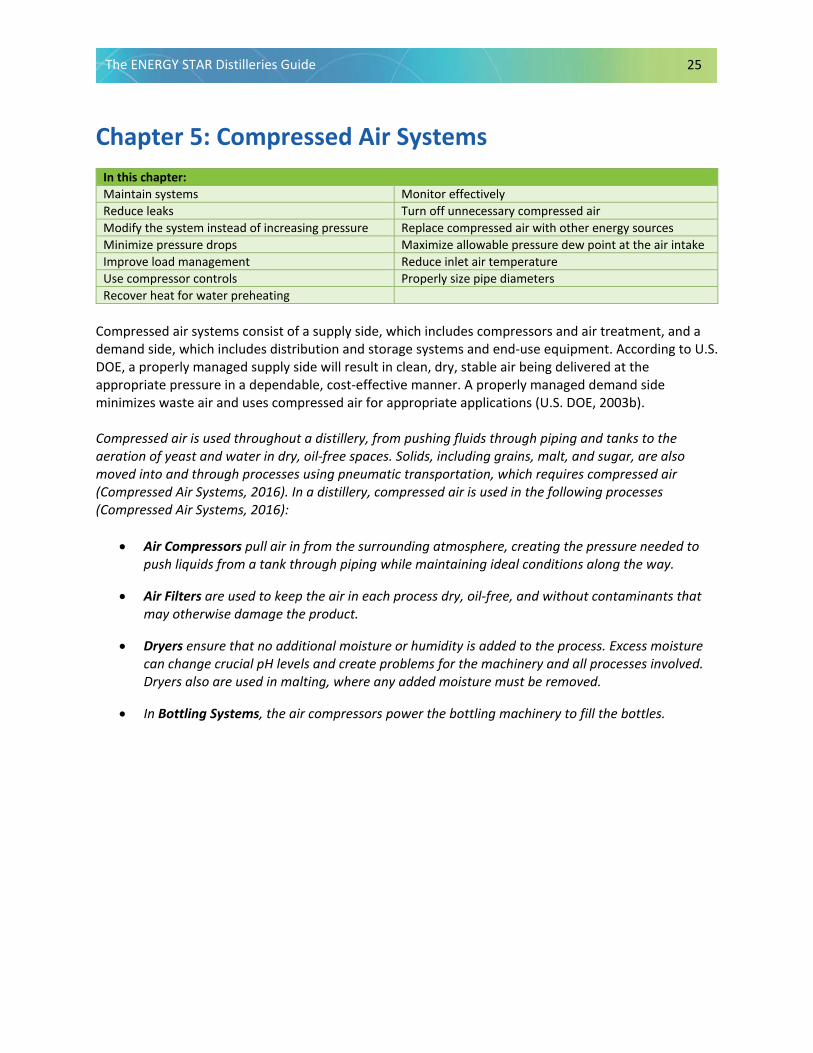
Compressed air systems consist of a supply side, which includes compressors and air treatment, and a demand side, which includes distribution and storage systems and end-use equipment. According to U.S. DOE, a properly managed supply side will result in clean, dry, stable air being delivered at the appropriate pressure in a dependable, cost-effective manner. A properly managed demand side minimizes waste air and uses compressed air for appropriate applications (U.S. DOE, 2003b).
Compressed air is used throughout a distillery, from pushing fluids through piping and tanks to the aeration of yeast and water in dry, oil-free spaces. Solids, including grains, malt, and sugar, are also moved into and through processes using pneumatic transportation, which requires compressed air (Compressed Air Systems, 2016). In a distillery, compressed air is used in the following processes (Compressed Air Systems, 2016):
• Air Compressors pull air in from the surrounding atmosphere, creating the pressure needed topush liquids from a tank through piping while maintaining ideal conditions along the way.
• Air Filters are used to keep the air in each process dry, oil-free, and without contaminants thatmay otherwise damage the product.
• Dryers ensure that no additional moisture or humidity is added to the process. Excess moisturecan change crucial pH levels and create problems for the machinery and all processes involved.Dryers also are used in malting, where any added moisture must be removed.
• In Bottling Systems, the air compressors power the bottling machinery to fill the bottles.
The ENERGY STAR Distilleries Guide 26
Energy Savings Checklist: Compressed Air
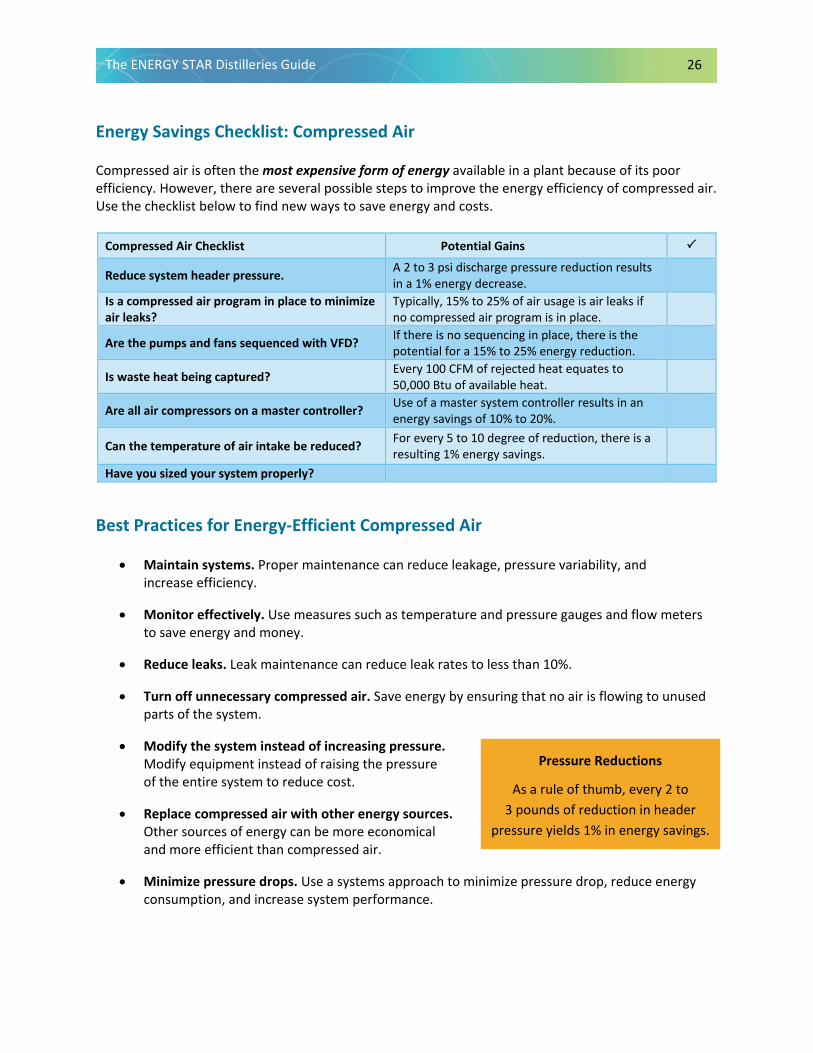
Compressed air is often the most expensive form of energy available in a plant because of its poor efficiency. However, there are several possible steps to improve the energy efficiency of compressed air. Use the checklist below to find new ways to save energy and costs.
Compressed Air Checklist Potential Gains
Reduce system header pressure. A 2 to 3 psi discharge pressure reduction results in a 1% energy decrease.
Is a compressed air program in place to minimize air leaks?
Typically, 15% to 25% of air usage is air leaks if no compressed air program is in place.
Are the pumps and fans sequenced with VFD? If there is no sequencing in place, there is the potential for a 15% to 25% energy reduction.
Is waste heat being captured? Every 100 CFM of rejected heat equates to 50,000 Btu of available heat.
Are all air compressors on a master controller? Use of a master system controller results in an energy savings of 10% to 20%.
Can the temperature of air intake be reduced? For every 5 to 10 degree of reduction, there is a resulting 1% energy savings.
Have you sized your system properly?
Best Practices for Energy-Efficient Compressed Air
• Maintain systems. Proper maintenance can reduce leakage, pressure variability, andincrease efficiency.
• Monitor effectively. Use measures such as temperature and pressure gauges and flow metersto save energy and money.
• Reduce leaks. Leak maintenance can reduce leak rates to less than 10%.
• Turn off unnecessary compressed air. Save energy by ensuring that no air is flowing to unusedparts of the system.
• Modify the system instead of increasing pressure.Modify equipment instead of raising the pressureof the entire system to reduce cost.
• Replace compressed air with other energy sources.Other sources of energy can be more economicaland more efficient than compressed air.
• Minimize pressure drops. Use a systems approach to minimize pressure drop, reduce energyconsumption, and increase system performance.
Pressure Reductions
As a rule of thumb, every 2 to 3 pounds of reduction in header
pressure yields 1% in energy savings.
The ENERGY STAR Distilleries Guide 27
• Maximize allowable pressure dew point at the air intake. Use a dryer with a floating dew pointto maximize efficiency.
• Improve load management. Use two-stage compressors or multiple smaller compressors tosave energy. Large compressors consume more electricity when they are unloaded than domultiple smaller compressors with similar overall capacity.
• Reduce inlet air temperature. Reduce air temperature to reduce the energy used by thecompressor and increase compressor capacity.
• Use compressor controls. The compressor controls shut off unneeded compressors and cansave up to 12% in energy costs annually.
• Properly size pipe diameters. Increasing pipe diameters can minimize pressure losses and leaks,reduce system operating pressures, and reduce energy consumption by 3%.
• Recover heat for water preheating. A heat recovery unit can recover thermal energy and saveup to 20% of the energy used in compressed air systems annually for space heating.
Maintain systems
Poor maintenance lowers compression efficiency and increases air leakage or pressure variability, leading to increased operating temperatures, poor moisture control, and excessive contamination. Improved maintenance reduces these problems and saves energy. Proper maintenance includes the following (U.S. DOE and CAC, 2003; Scales and McCulloch, 2007):
• Keep the compressor and intercooling surfaces clean and foul-free. Blocked filters increasepressure drop. Inspect and periodically clean filters to reduce pressure drop. Use filters with justa 1 psig pressure drop over 10 years. The payback period for filter cleaning is usually under 2years (Ingersoll Rand, 2001). Fixing improperly operating filters also will prevent contaminantsfrom entering tools and causing them to wear out prematurely. Generally, when a pressure dropexceeds 2 to 3 psig, replace the particulate and lubricant removal elements. Inspect all systemsat least annually. Consider adding filters in parallel that decrease air velocity and, therefore,decrease air pressure drop. A 2% reduction of annual energy consumption in compressed airsystems is projected when filters are replaced frequently (Radgen and Blaustein, 2001).
• Keep motors properly lubricated and cleaned. Poor motor cooling can increase motortemperature and winding resistance, shorten motor life, and increase energy consumption.Compressor lubricant should be changed every 2 to 18 months and checked to make sure it is atthe proper level. In addition to energy savings, this can help avoid corrosion and degradation ofthe system.
The ENERGY STAR Distilleries Guide 28
• Inspect drain traps periodically to ensure they are not stuck in the open or closed positions andare clean. Some users leave automatic condensate traps partially open at all times to allow forconstant draining. This practice wastes substantial energy and has no role in a properlymaintained system. Instead, install simple pressure-driven valves. Malfunctioning traps shouldbe cleaned and repaired, and not left open. Some auto drains, such as float switch or electronicdrains, do not waste air. Inspecting and maintaining drains typically has a payback of fewer than2 years (U.S. DOE, 2004a).
• Maintain the coolers on the compressor so that the dryer gets the lowest possible inlettemperature (U.S. DOE and CAC, 2003).
• Check belts for wear and adjust them. A good practice is to adjust after every 400 hoursof operation.
• Replace air lubricant separators according to specifications or sooner. Rotary screw compressorsgenerally start with their air lubricant separators having a 2 to 3 psid pressure drop at full load.When this increases to 10 psid, change the separator (U.S. DOE and CAC, 2003).
• Check water cooling systems for water quality (pH and total dissolved solids), flow, andtemperature. Clean and replace filters and heat exchangers per manufacturer’s specifications.
• Check for excess pressure, duration, and volume in applications that require compressed air.Applications not requiring maximum system pressure should be regulated, either by productionline sectioning or by pressure regulators on the equipment itself. Using more pressure thanrequired wastes energy and can shorten equipment life and add maintenance costs.
Monitor effectively
Effective monitoring systems save energy and money and typically include the following (CADDET, 1997):
• Pressure gauges on each receiver or main branch line and differential gauges across dryers,filters, etc.
• Temperature gauges across the compressor and its cooling system to detect foulingand blockages.
• Flow meters to measure the quantity of air used.
• Dew point temperature gauges to monitor the effectiveness of air dryers.
• Kilowatt-hour meters and hours run meters on the compressor drive.
• Checking of compressed air distribution systems after equipment has been reconfigured to besure that no air is flowing to unused equipment or obsolete parts of the compressed airdistribution system.
The ENERGY STAR Distilleries Guide 29
• Checking for flow restrictions of any type in a system, such as an obstruction or roughness,which can unnecessarily raise system operating pressures. As a rule of thumb, every 2 psi inpressure rise resulting from resistance to flow can increase compressor energy use by 1% (U.S.DOE and CAC, 2003). The largest pressure drops are usually found at the points of use, includingundersized or leaking hoses, tubes, disconnects, filters, regulators, valves, nozzles andlubricators (demand side), as well as air/lubricant separators, after-coolers, moisture separators,dryers and filters.
• Checking for compressed air use outside production hours.
Reduce leaks
A typical plant that has not been well maintained will likely have a leak rate equal to 20% to 50% of total compressed air production capacity (U.S. DOE and CAC, 2003). Leak maintenance can reduce this number to less than 10%. Overall, a 20% reduction of annual energy consumption in compressed air systems is projected for fixing leaks (Radgen and Blaustein, 2001).
Estimations of leaks vary with the size of the hole in the pipes or equipment. A compressor operating for 2,500 hours per year at 87 psi, with a leak diameter of 0.02 inch (½ mm), is estimated to lose 250 kWh per year; 0.04 inch (1 mm) loses an estimated 1,100 kWh per year; 0.08 inch (2 mm) loses an estimated 4,500 kWh per year; and 0.16 inch (4 mm) loses an estimated 11,250 kWh per year (CADDET, 1997).
In addition to increased energy consumption, leaks can make air tools less efficient and adversely affect production, shorten the life of the equipment, lead to additional maintenance requirements and increase unscheduled downtime. In the worst case, leaks can add unnecessary compressor capacity.
The most common areas for leaks are couplings, hoses, tubes, fittings, pressure regulators, open condensate traps and shutoff valves, pipe joints, disconnects, and thread sealants. A simple way to detect leaks is to apply soapy water to suspect areas. Another simple way is a bleed down test (Bayne, 2011). In a bleed down test, the plant air system is brought to full pressure and then shut down. By recording the system pressure while compressed air is not used anywhere in the plant, any pressure losses can be attributed to existing leaks. The best way to detect leaks is to use an ultrasonic acoustic detector, which can recognize the high-frequency hissing sounds associated with air leaks. After identification, leaks should be tracked, repaired, and verified. Leak detection and correction programs should be ongoing efforts.
Leak Reductions
The payback period for leak reduction efforts is generally
shorter than 4 months.
Continue the Program
Leak detection and correction programs should be ongoing efforts.
The ENERGY STAR Distilleries Guide 30
Turn off unnecessary compressed air
Equipment that is no longer using compressed air should have the air turned off completely using a simple solenoid valve. Compressed air distribution systems should be checked when equipment has been reconfigured to ensure that no air is flowing to unused equipment or obsolete parts of the compressed air distribution system. Modify the system instead of increasing pressure
For individual applications that require higher pressure, instead of raising the operating pressure of the whole system, special equipment modifications should be considered, such as employing a booster, increasing a cylinder bore, changing gear ratios, or changing operations to off-peak hours. Replace compressed air with other energy sources
Many operations can be accomplished more economically and efficiently using energy sources other than compressed air (U.S. DOE 2004b, U.S. DOE, 2004c). Various options exist to replace compressed air use, including:
• Cool electrical cabinets with air conditioning fans instead of compressed air vortex tubes.
• Create a vacuum with a vacuum pump instead of compressed air venturi methods.
• Cool, aspirate, agitate, mix, or inflate packaging with blowers.
• Clean parts or remove debris with brushes, blowers, or vacuum pump systems.
• Move parts with blowers, electric actuators, or hydraulics.
• Special case tools or actuators: electric motors should be considered because they are more efficient than using compressed air (Howe and Scales, 1995). However, it has been reported that motors can have less precision, shorter lives, and lack safety compared to compressed air. In these cases, using compressed air may be a better choice.
Based on numerous industrial case studies, the average payback period for replacing compressed air with other applications is about 1 year (IAC, 2015). Minimize pressure drops
Excessive pressure drop results in poor system performance and excessive energy consumption. Flow restrictions of any type in a system, such as an obstruction or roughness, resulting in higher operating pressures than needed. Resistance to flow increases the drive energy on positive displacement compressors by 1% of connected power for each 2 psi of differential (U.S. DOE and CAC, 2003). The largest pressure drops are usually found at the points of use, including undersized or leaking hoses, tubes, disconnects, filters, regulators, valves, nozzles, and lubricators (demand side), as well as air/lubricant separators on lubricated rotary compressors and after-coolers, moisture separators, dryers, and filters (supply side).
The ENERGY STAR Distilleries Guide 31
Minimizing the pressure drop requires a systems approach in design and maintenance. Air treatment components should be selected with the lowest possible pressure drop at specified maximum operating conditions and best performance. Manufacturers’ recommendations for maintenance should be followed, particularly in air filtering and drying equipment, which can have damaging moisture effects like pipe corrosion. Finally, minimize the distance the air travels through the distribution.
Maximize allowable pressure dew point at the air intake
Choose the dryer that has the maximum allowable pressure dew point and best efficiency. A rule of thumb is desiccant dryers consume 7% to 14% of the total energy of the compressor, whereas refrigerated dryers consume 1% to 2% as much energy as the compressor (Ingersoll Rand, 2001). Consider using a dryer with a floating dew point.
Improve load management
Because of the large amount of energy consumed by compressors, whether in full operation or not, partial load operation should be avoided. For example, unloaded rotary screw compressors still consume 15% to 35% of full-load power while delivering no useful work (U.S. DOE and CAC, 2003).
Air receivers can be employed near high demand areas to provide a supply buffer to meet short-term demand spikes that can exceed the normal compressor capacity. In this way, the number of required online compressors may be reduced. Multi-stage compressors theoretically operate more efficiently than single-stage compressors. Multi-stage compressors save energy by cooling the air between stages, reducing the volume and work required to compress the air. Replacing single-stage compressors with two-stage compressors typically provides a payback period of two years or less (Ingersoll Rand, 2001). Using multiple smaller compressors instead of one large compressor can save energy as well. Large compressors consume more electricity when they are unloaded than do multiple smaller compressors with similar overall capacity. An analysis of U.S. case studies shows an average payback period for optimally sizing compressors of about 1.5 years (IAC, 2015).
Reduce inlet air temperature
Reducing the inlet air temperature reduces the energy used by the compressor. In many plants, it is possible to reduce inlet air temperature to the compressor by drawing fresh air from outside the building. Importing fresh air can have paybacks of 2 to 5 years (CADDET, 1997). As a rule of thumb, each 5°F (3°C) will save 1% compressor energy use (CADDET, 1997; Parekh, 2000). In addition to energy savings, compressor capacity is increased when cold air from outside is used. Industrial case studies have found an average payback period for importing outside air of less than 1 year (IAC, 2015), but costs can vary significantly depending on facility layout.
Use compressor controls
The primary objectives of compressor control strategies are to shut off unneeded compressors and to delay bringing on additional compressors until needed. Energy savings for sophisticated compressor controls have been reported at around 12% annually (Radgen and Blaustein, 2001). An excellent review of compressor controls can be found in Compressed Air Challenge® Best Practices for Compressed Air Systems (Second Edition) (Scales and McCulloch, 2007). Common control strategies for compressed air systems include:
The ENERGY STAR Distilleries Guide 32
• Start/stop (on/off) controls, in which the compressor motor is turned on or off in response tothe discharge pressure of the machine. Start/stop controls can be used for applications withvery low duty cycles and are applicable to reciprocating or rotary screw compressors. The typicalpayback for start/stop controls is 1 to 2 years (CADDET, 1997).
• Load/unload controls, or constant speed controls, which allow the motor to run continuouslybut unloads the compressor when the discharge pressure is adequate. In most cases, unloadedrotary screw compressors still consume 15% to 35% of full-load power while delivering no usefulwork (U.S. DOE and CAC, 2003). Hence, load/unload controls can be inefficient.
• Modulating or throttling controls, which allow the output of a compressor to be varied to meetflow requirements by closing down the inlet valve and restricting inlet air to the compressor.Throttling controls are applied to centrifugal and rotary screw compressors.
• Single master sequencing system controls, which take individual compressor capacities onlineand offline in response to monitored system pressure demand and shut down any compressorsrunning unnecessarily. System controls for multiple compressors typically offer higher efficiencythan individual compressor controls.
• Multi-master controls, which are the latest technology in compressed air system control.Multi-master controls are capable of handling four or more compressors and provide bothindividual compressor control and system regulation by means of a network of individualcontrollers (Martin et al., 2000). The controllers share information, allowing the system torespond more quickly and accurately to demand changes. One controller acts as the lead,regulating the whole operation. This strategy allows each compressor to function at a level thatproduces the most efficient overall operation. The result is a highly controlled system pressurethat can be reduced close to the minimum level required (U.S. DOE and CAC, 2003). Accordingto Nadel et al. (2002), such advanced compressor controls are expected to deliver energysavings of about 3.5% where applied.
In addition to energy savings, the application of controls can sometimes eliminate the need for some existing compressors, allowing extra compressors to be sold or kept for backup. Alternatively, capacity can be expanded without the purchase of additional compressors. Reduced operating pressures will also help reduce system maintenance requirements (U.S. DOE and CAC, 2003).
Properly size pipe diameters
Increasing pipe diameters to the greatest size that is feasible and economical for a compressed air system can help to minimize pressure losses and leaks, which reduces system operating pressures and leads to energy savings. Increasing pipe diameters typically reduces compressed air system energy consumption by 3% (Radgen and Blaustein, 2001). Further savings can be realized by ensuring other system components (e.g., filters, fittings, hoses) are properly sized.
Recover heat for water preheating
As much as 80% to 93% of the electrical energy used by an industrial air compressor is converted into heat. In many cases, a heat recovery unit can recover 50% to 90% of this available thermal energy for space heating, industrial process heating, water heating, makeup air heating, boiler makeup water
The ENERGY STAR Distilleries Guide 33
preheating, industrial drying, industrial cleaning processes, heat pumps, laundries or preheating aspirated air for oil burners (Parekh, 2000). It has been estimated that approximately 50,000 Btu/hour of energy is available for each 100 CFM of capacity (at full load) (U.S. DOE and CAC, 2003). Paybacks are typically less than 1 year (Galitsky et al., 2005a). Heat recovery for space heating is not as common with water-cooled compressors because an extra stage of heat exchange is required and the temperature of the available heat is lower. However, with large water-cooled compressors, recovery efficiencies of 50% to 60% are typical (U.S. DOE and CAC, 2003). Implementing this measure saves up to 20% of the energy used in compressed air systems annually for space heating (Radgen and Blaustein, 2001).
CASE STUDY A U.S.-based distillery was able to reduce its energy consumption by implementing energy savings practices in the compressed air system. The previous compressed air system consisted of three water-cooled, oil-free air compressors of various ages, running in load/unload mode. The sizes of the air compressors were 110 kW, 90 kW, and 160 kW. Only the 110 kW unit was used to supply the baseload and the 90 kW air compressor provided additional supply during peak demand. The 160 kW unit, being very old, was used for backup. The distillery first determined that the system baseline was 21.7 kW/100 CFM. It then assessed the system and identified the following problems:
• Issues with the air dryer cooling purge flow.
• Higher than needed discharge pressure.
• 49 leaks, estimated at 87 CFM.
• Possible inappropriate uses of compressed air were causing higher than desired operating costs and occasional pressure issues.
The distillery addressed these issued by:
• Installing a new, 132 kW, oil-free variable-speed drive air compressor.
• Making adjustments to the dryer cooling purge.
• Making adjustments and repairing dust collectors.
• Repairing leaks, where economical. It was estimated that 75% of repairs were completed.
These measures, based on air compressor histogram readings, were estimated to save 257,000 kWh and reduce electricity costs by $16,600, which represents a 30% energy savings. Source: Marshall, R. (2019). Distillery Addresses Inappropriate Compressed Air Uses Saving $16,600 in Energy Costs. Compressed Air Best Practices. https://www.airbestpractices.com/system-assessments/end-uses/distillery-addresses-inappropriate-compressed-air-uses-saving-16600-ener
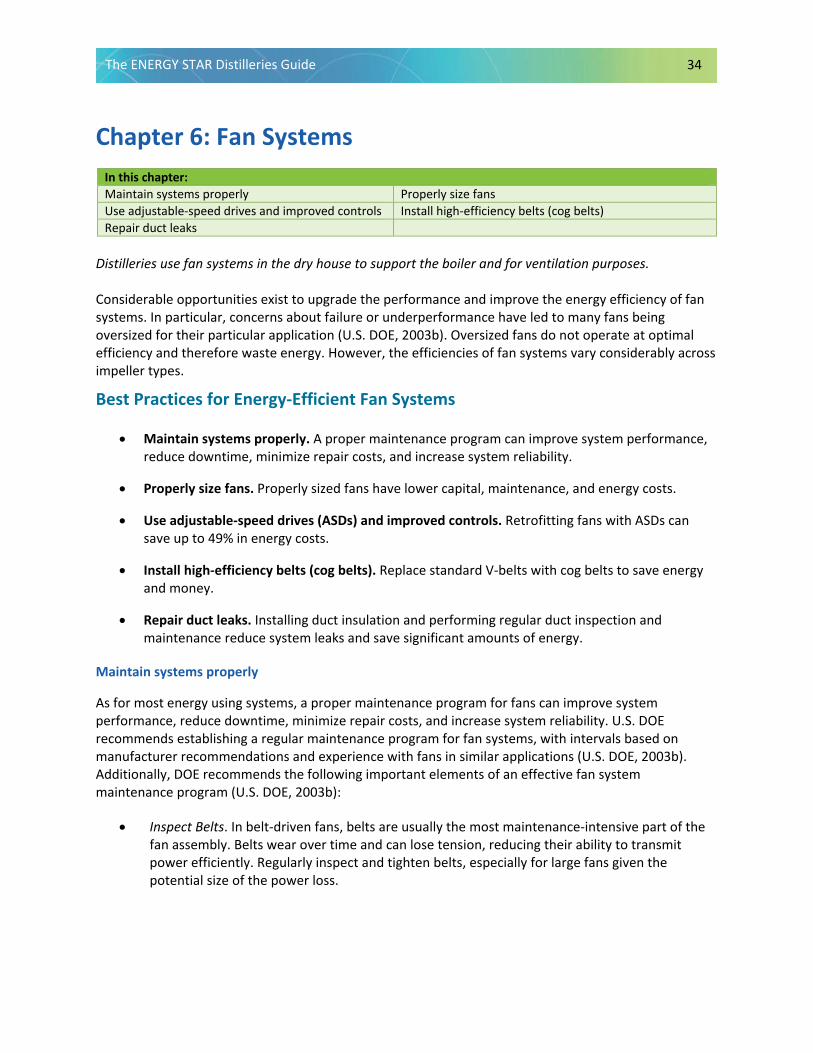
The ENERGY STAR Distilleries Guide 34
Chapter 6: Fan Systems In this chapter: Maintain systems properly Properly size fans Use adjustable-speed drives and improved controls Install high-efficiency belts (cog belts) Repair duct leaks
Distilleries use fan systems in the dry house to support the boiler and for ventilation purposes.
Considerable opportunities exist to upgrade the performance and improve the energy efficiency of fan systems. In particular, concerns about failure or underperformance have led to many fans being oversized for their particular application (U.S. DOE, 2003b). Oversized fans do not operate at optimal efficiency and therefore waste energy. However, the efficiencies of fan systems vary considerably across impeller types.
Best Practices for Energy-Efficient Fan Systems
• Maintain systems properly. A proper maintenance program can improve system performance,reduce downtime, minimize repair costs, and increase system reliability.
• Properly size fans. Properly sized fans have lower capital, maintenance, and energy costs.
• Use adjustable-speed drives (ASDs) and improved controls. Retrofitting fans with ASDs cansave up to 49% in energy costs.
• Install high-efficiency belts (cog belts). Replace standard V-belts with cog belts to save energyand money.
• Repair duct leaks. Installing duct insulation and performing regular duct inspection andmaintenance reduce system leaks and save significant amounts of energy.
Maintain systems properly
As for most energy using systems, a proper maintenance program for fans can improve system performance, reduce downtime, minimize repair costs, and increase system reliability. U.S. DOE recommends establishing a regular maintenance program for fan systems, with intervals based on manufacturer recommendations and experience with fans in similar applications (U.S. DOE, 2003b). Additionally, DOE recommends the following important elements of an effective fan system maintenance program (U.S. DOE, 2003b):
• Inspect Belts. In belt-driven fans, belts are usually the most maintenance-intensive part of thefan assembly. Belts wear over time and can lose tension, reducing their ability to transmitpower efficiently. Regularly inspect and tighten belts, especially for large fans given thepotential size of the power loss.
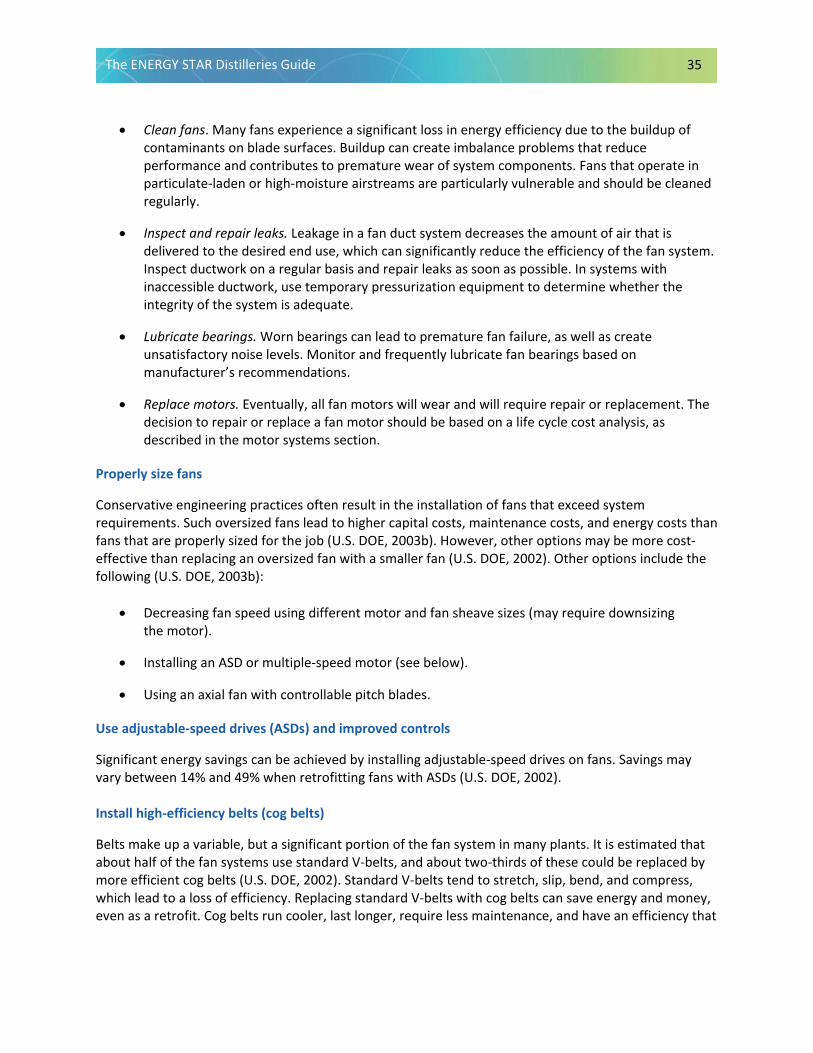
The ENERGY STAR Distilleries Guide 35
• Clean fans. Many fans experience a significant loss in energy efficiency due to the buildup ofcontaminants on blade surfaces. Buildup can create imbalance problems that reduceperformance and contributes to premature wear of system components. Fans that operate inparticulate-laden or high-moisture airstreams are particularly vulnerable and should be cleanedregularly.
• Inspect and repair leaks. Leakage in a fan duct system decreases the amount of air that isdelivered to the desired end use, which can significantly reduce the efficiency of the fan system.Inspect ductwork on a regular basis and repair leaks as soon as possible. In systems withinaccessible ductwork, use temporary pressurization equipment to determine whether theintegrity of the system is adequate.
• Lubricate bearings. Worn bearings can lead to premature fan failure, as well as createunsatisfactory noise levels. Monitor and frequently lubricate fan bearings based onmanufacturer’s recommendations.
• Replace motors. Eventually, all fan motors will wear and will require repair or replacement. Thedecision to repair or replace a fan motor should be based on a life cycle cost analysis, asdescribed in the motor systems section.
Properly size fans
Conservative engineering practices often result in the installation of fans that exceed system requirements. Such oversized fans lead to higher capital costs, maintenance costs, and energy costs than fans that are properly sized for the job (U.S. DOE, 2003b). However, other options may be more cost-effective than replacing an oversized fan with a smaller fan (U.S. DOE, 2002). Other options include the following (U.S. DOE, 2003b):
• Decreasing fan speed using different motor and fan sheave sizes (may require downsizingthe motor).
• Installing an ASD or multiple-speed motor (see below).
• Using an axial fan with controllable pitch blades.
Use adjustable-speed drives (ASDs) and improved controls
Significant energy savings can be achieved by installing adjustable-speed drives on fans. Savings may vary between 14% and 49% when retrofitting fans with ASDs (U.S. DOE, 2002).
Install high-efficiency belts (cog belts)
Belts make up a variable, but a significant portion of the fan system in many plants. It is estimated that about half of the fan systems use standard V-belts, and about two-thirds of these could be replaced by more efficient cog belts (U.S. DOE, 2002). Standard V-belts tend to stretch, slip, bend, and compress, which lead to a loss of efficiency. Replacing standard V-belts with cog belts can save energy and money, even as a retrofit. Cog belts run cooler, last longer, require less maintenance, and have an efficiency that

The ENERGY STAR Distilleries Guide 36
is about 2% higher than standard V-belts. Typical payback periods will vary from less than 1 year to 3 years.
Repair duct leaks
Duct leakage can waste significant amounts of energy in fan and ventilation systems. Measures for reducing duct leakage include installing duct insulation and performing regular duct inspection and maintenance, including ongoing leak detection and repair. For example, per studies by Lawrence Berkeley National Laboratory, repairing duct leaks in industrial and commercial spaces could reduce heating, ventilation, and air conditioning (HVAC) energy consumption by up to 30% (Galitsky et al., 2005a). Because system leakage can have a significant impact on fan system operating costs, U.S. DOE recommends considering the type of duct, the tightness and quality of the fittings, joint assembly techniques, and the sealing requirements for duct installation as part of the fan system design process as proactive leak prevention measures (U.S. DOE, 2003b).
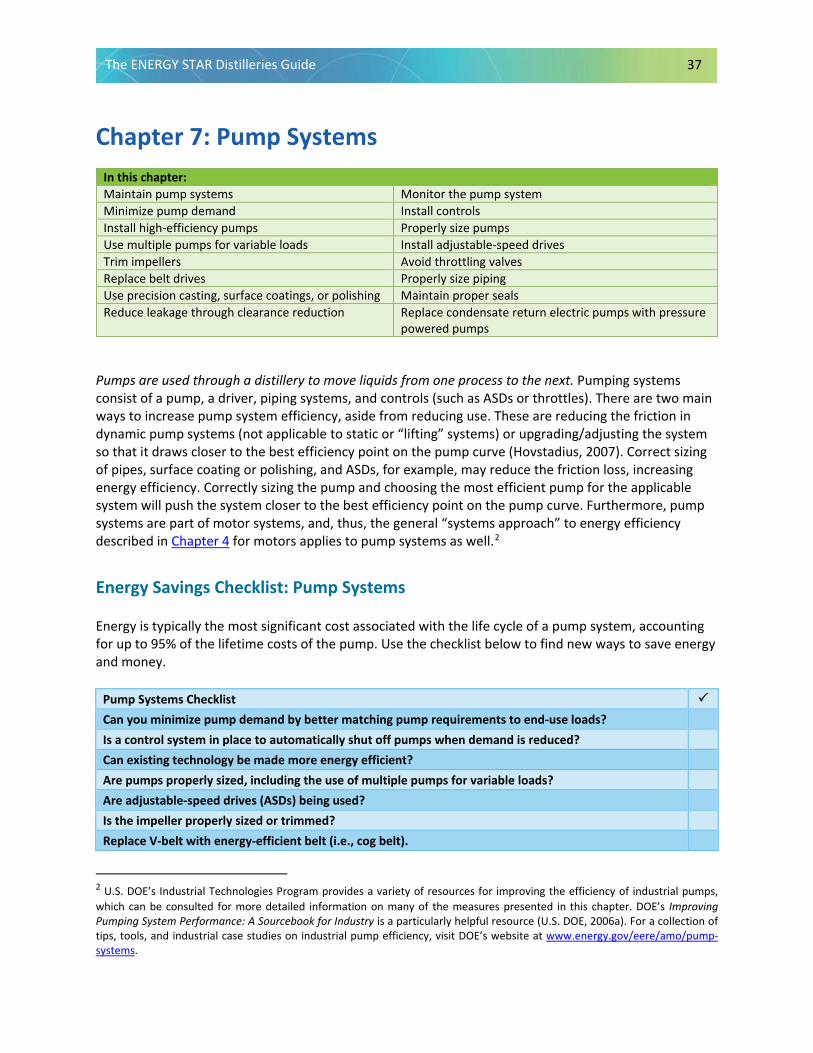
The ENERGY STAR Distilleries Guide 37
Chapter 7: Pump Systems In this chapter: Maintain pump systems Monitor the pump system Minimize pump demand Install controls Install high-efficiency pumps Properly size pumps Use multiple pumps for variable loads Install adjustable-speed drives Trim impellers Avoid throttling valves Replace belt drives Properly size piping Use precision casting, surface coatings, or polishing Maintain proper seals Reduce leakage through clearance reduction Replace condensate return electric pumps with pressure
powered pumps
Pumps are used through a distillery to move liquids from one process to the next. Pumping systems consist of a pump, a driver, piping systems, and controls (such as ASDs or throttles). There are two main ways to increase pump system efficiency, aside from reducing use. These are reducing the friction in dynamic pump systems (not applicable to static or “lifting” systems) or upgrading/adjusting the system so that it draws closer to the best efficiency point on the pump curve (Hovstadius, 2007). Correct sizing of pipes, surface coating or polishing, and ASDs, for example, may reduce the friction loss, increasing energy efficiency. Correctly sizing the pump and choosing the most efficient pump for the applicable system will push the system closer to the best efficiency point on the pump curve. Furthermore, pump systems are part of motor systems, and, thus, the general “systems approach” to energy efficiency described in Chapter 4 for motors applies to pump systems as well.2
Energy Savings Checklist: Pump Systems
Energy is typically the most significant cost associated with the life cycle of a pump system, accounting for up to 95% of the lifetime costs of the pump. Use the checklist below to find new ways to save energy and money.
Pump Systems Checklist
Can you minimize pump demand by better matching pump requirements to end-use loads? Is a control system in place to automatically shut off pumps when demand is reduced? Can existing technology be made more energy efficient? Are pumps properly sized, including the use of multiple pumps for variable loads? Are adjustable-speed drives (ASDs) being used? Is the impeller properly sized or trimmed? Replace V-belt with energy-efficient belt (i.e., cog belt).
2 U.S. DOE’s Industrial Technologies Program provides a variety of resources for improving the efficiency of industrial pumps, which can be consulted for more detailed information on many of the measures presented in this chapter. DOE’s Improving Pumping System Performance: A Sourcebook for Industry is a particularly helpful resource (U.S. DOE, 2006a). For a collection of tips, tools, and industrial case studies on industrial pump efficiency, visit DOE’s website at www.energy.gov/eere/amo/pump-systems.

The ENERGY STAR Distilleries Guide 38
Opportunities for Energy Efficiency
Initial costs are only a fraction of the lifetime cost of a pump system. Energy expenditures, and sometimes operations and maintenance (O&M) expenditures, are much more important. In general, for a pump system with a lifetime of 20 years, the initial capital expense of the pump and motor make up merely 2.5% of the total costs of ownership (Best Practice Programme, 1998). Depending on the pump application, energy outlays may comprise about 95% of the lifetime expenses of the pump. Hence, the initial choice of a pump system should be highly dependent on energy cost considerations rather than on initial costs such as the price of the pump and related parts.
Optimization of the design of a new pumping system should focus on optimizing the life cycle expenditures. Hodgson and Walters (2002) discuss software developed for this purpose and several case studies in which they show large reductions in energy use and lifetime costs of a complete pumping system. Typically, such an approach will lead to energy savings of 10% to 17%.
Best Practices for Energy-Efficient Pump Systems
• Maintain pump systems. A maintenance program keeps pumps running optimally and can saveup to 7% in energy.
• Monitor the pump system. Monitoring and maintenance can detect problems and determinesolutions to increase the efficiency of the system.
• Minimize pump demand. Reducing demand through holding tanks and elimination of bypassloops can save up to 20% in energy.
• Install controls. Control systems increase the efficiency of pump systems and significantlyreduce costs.
• Install high-efficiency pumps. New high-efficiency pumps can result in up to 10% in energysavings.
• Properly size pumps. Replacing oversized pumps with properly sized ones can reduce electricityby up to 25%.
• Use multiple pumps for variable loads. Using multiple pumps in parallel is a cost-effective andenergy-efficient method for pump systems with variable loads.
• Install adjustable-speed drives (ASDs). Including modulation features like ASDs can save anestimated 20% to 50% of pump energy consumption.
• Trim impellers. Reducing an impeller’s diameter reduces the energy added to the pump system.
• Avoid throttling valves. Pump demand reduction, controls, impeller trimming, and multiplepump strategies (all previously discussed in this section) are more energy-efficient flowmanagement strategies than throttling valves.
The ENERGY STAR Distilleries Guide 39
• Replace belt drives. Replacing belt drives with cog belts saves energy and money.
• Properly size piping. Increasing the pipe diameters, as part of a system retrofit, reducespumping energy.
• Use precision casting, surface coatings, or polishing. Using castings, coatings, or polishingreduces pump surface roughness and increases energy efficiency.
• Maintain proper seals. Use gas barrier seals, balanced seals, and no-contact labyrinth seals todecrease seal losses.
• Reduce leakage through clearance reduction. Use hard construction materials such aschromium steel to reduce the wear rate of the clearance between the impeller suction andpressure sides.
• Replace condensate return electric pumps with pressure powered pumps. It uses saturatedsteam or compressed air for energy savings and a longer life cycle.
Maintain pump systems
Inadequate maintenance can lower pump system efficiency, cause pumps to wear out more quickly, and increase pumping energy costs. A pump system maintenance program will help to avoid these problems by keeping pumps running optimally. Furthermore, improved pump system maintenance can lead to energy savings from 2% to 7% (U.S. DOE, 2002). A solid pump system maintenance program will generally include the following tasks (U.S. DOE, 2006a; U.S. DOE, 2002):
• Replacement of worn impellers, especially in caustic or semi-solid applications.
• Inspection and repair of bearings.
• Replacement of bearing lubrication on an annual or semiannual basis.
• Inspection and replacement of packing seals. Allowable leakage from packing seals is usuallybetween 2 and 60 drops per minute.
• Inspection and replacement of mechanical seals. Allowable leakage is typically 1 to 4 dropsper minute.
• Replacement of wear ring and impeller. Pump efficiency degrades by 1% to 6% for impellers lessthan the maximum diameter and with increased wear ring clearances.
• Check pump/motor alignment.
• Inspection of motor condition, including the motor winding insulation.
The ENERGY STAR Distilleries Guide 40
Monitor the pump system
Monitoring in conjunction with O&M can be used to detect problems and determine solutions to create a more efficient system. Monitoring can determine clearances that need adjustment, indicate a blockage, impeller damage, inadequate suction, operation outside of preferences, clogged or gas-filled pumps or pipes, or worn-out pumps. Monitoring should include the following:
• Specific energy consumption (i.e., electricity use/flow rate) (Hovstadius, 2007)
• Wear monitoring
• Vibration analyses
• Pressure and flow monitoring
• Current or power monitoring
• Differential head and temperature rise across the pump (also known as thermodynamic monitoring)
• Distribution system inspection for scaling or contaminant buildup
Minimize pump demand
An important component of the systems approach is to minimize pump demand by better matching pump requirements to end-use loads. Two effective strategies for reducing pump demand are the use of holding tanks and the elimination of bypass loops. Holding tanks can be used to equalize pump flows over a production cycle, which can allow for a more efficient operation of pumps at reduced speeds and lead to energy savings of 10% to 20% (U.S. DOE, 2002). Holding tanks and can also reduce the need to add pump capacity. The elimination of bypass loops and other unnecessary flows can result in energy savings of 10% to 20% (U.S. DOE, 2002). Other effective strategies for reducing pump demand include lowering process static pressures, minimizing elevation rises in the piping system, and lowering spray nozzle velocities. Install controls
Control systems can increase the energy efficiency of a pump system by shutting off pumps automatically when demand is reduced, or, alternatively, by putting pumps on standby at reduced loads until demand increases. Install high-efficiency pumps
It has been estimated that up to 16% of pumps in use in U.S. industry are more than 20 years old (U.S. DOE, 2002). Considering that a pump’s efficiency may degrade by 10% to 25% over the course of its life, replacement of aging pumps can lead to significant energy savings. The installation of newer, higher efficiency pumps typically results in energy savings of 2% to 10% (Elliott, 1994).
The ENERGY STAR Distilleries Guide 41
Several high-efficiency pumps are available for specific pressure head and flow rate capacity requirements. Choosing the right pump often saves both operating and capital costs. For a given duty, selecting a pump that runs at the highest speed suitable for the application will generally result in a more efficient selection, as well as the lowest initial cost (U.S. DOE, 2001a).
Properly size pumps
Pumps that are oversized for an application consume more energy than is necessary (see also “Avoid throttling valves” below). Replacing oversized pumps with pumps that are properly sized can often reduce the electricity use of a pumping system by 15% to 25% (U.S. DOE, 2002). Where peak loads can be reduced through improvements to pump system design or operation (e.g., via the use of holding tanks), pump size can also be reduced. If a pump is dramatically oversized, often its speed can be reduced with gear or belt drives or a slower speed motor. The typical payback period for the above strategies can be less than 1 year (Galitsky et al., 2005a).
Use multiple pumps for variable loads
The use of multiple pumps installed in parallel can be a cost-effective and energy-efficient solution for pump systems with variable loads. Parallel pumps offer redundancy and increased reliability, and can often reduce pump system electricity use by 10% to 30% for highly variable loads (U.S. DOE, 2002). Parallel pump arrangements often consist of a large pump, which operates during periods of peak demand, and a small pump (or “pony” pump), which operates under normal, more steady-state conditions. Because the pony pump is sized for normal system operation, this configuration operates more efficiently than a system that relies on a large pump to handle loads far below its optimum capacity.
Install adjustable-speed drives (ASDs)
ASDs better match speed to load requirements for pumps whereas, for motors, energy use is approximately proportional to the cube of the flow rate.3 Hence, small reductions in flow rates that are proportional to pump speed may yield large energy savings for friction dominated pump systems. However, in static head-dominated systems, the energy use might increase when using ASDs if the speed is turned down too much. New installations may result in short payback periods. In addition, the installation of ASDs improves overall productivity, control and product quality, and reduces wear on equipment, thereby lowering future maintenance costs. According to inventory data collected by Xenergy (1998), 82% of pumps in the U.S. industry have no load modulation feature (or ASD). Similar to being able to adjust the load in motor systems, including modulation features with pumps is estimated to save between 20% and 50% of pump energy consumption at relatively short payback periods, depending on the application, pump size, load and load variation (Xenergy, 1998; Best Practice Programme, 1996). The savings depend strongly on the system curve. As a rough rule of thumb, unless the pump curves are exceptionally flat, a 10% regulation in the
3 This equation applies to dynamic systems only. Systems that solely consist of lifting (static head systems) will accrue no benefits from ASDs (but often will become more inefficient) because pump efficiency usually drops when speed is reduced in such systems. A careful choice of operating points can, to some extent, overcome this problem. Similarly, systems with more static head will accrue fewer benefits than systems that are largely dynamic (friction) systems. More careful calculations must be performed to determine actual benefits, if any, for these systems.
The ENERGY STAR Distilleries Guide 42
flow should produce pump savings of 20%, and 20% regulation should produce savings of 40% (Best Practice Programme, 1996). Trim impellers
Impeller trimming refers to the process of reducing an impeller’s diameter via machining, which will reduce the energy added by the pump to the system fluid. Per U.S. DOE (2006b), one should consider trimming an impeller when any of the following conditions occur:
• Many system bypass valves are open, indicating that excess flow is available to system equipment.
• Excessive throttling is needed to control flow through the system or process.
• High levels of noise or vibration indicate excessive flow.
• A pump is operating far from its design point.
Trimming an impeller is slightly less effective than buying a smaller impeller from the pump manufacturer, but can be useful when an impeller at the next smaller available size would be too small for the given pump load. The energy savings associated with impeller trimming depend on pump power, system flow, and system head, and are roughly proportional to the cube of the diameter reduction (U.S. DOE, 2006a). An additional benefit of impeller trimming is a decrease in pump operating and maintenance costs. Care must be taken when an impeller is trimmed or the speed is changed so that the new operating point does not end up in an area where the pump efficiency is low. Avoid throttling valves
Throttling valves and bypass loops are indications of oversized pumps as well as the inability of the pump system design to accommodate load variations efficiently, and should always be avoided (Tutterow et al., 2000). Pump demand reduction, controls, impeller trimming, and multiple pump strategies (all previously discussed in this section) should always be more energy-efficient flow management strategies than throttling valves. Several industrial case studies from the IAC database suggest that the replacement of throttling systems with ASDs results in payback periods of only 1.6 to 2.3 years (IAC, 2015). Replace belt drives
Most pumps are directly driven. However, inventory data suggests 4% of pumps have V-belt drives (Xenergy, 1998). Standard V-belts tend to stretch, slip, bend, and compress, which leads to a loss of efficiency. Replacing standard V-belts with cog belts can save energy and money, even as a retrofit. It is better to replace the pump with a directly driven system, resulting in increased savings of up to 8% and payback periods as short as 6 months (Studebaker, 2007).
Properly size piping
Pipes that are too small for the required flow velocity can significantly increase the amount of energy required for pumping, in much the same way that drinking a beverage through a small straw requires a
The ENERGY STAR Distilleries Guide 43
greater amount of suction. Where possible, pipe diameters can be increased to reduce pumping energy requirements, but the energy savings due to increased pipe diameters must be balanced with increased costs for piping system components. That said, sizing a pipe too large can result in pressure reduction which forces a pump to work even harder. To properly size a pipe, consider the amount of volume that needs to move per minute and distance being travelled. In cases where a single pipe or a hose feeds into a larger pipe, efficiency can be lost. A life cycle costing approach is recommended to ensure positive economic benefits when energy savings, increased material costs, and installation costs are considered. Increasing pipe diameters will likely only be cost-effective during greater pump system retrofit projects. U.S. DOE estimates typical industrial energy savings in the 5% to 20% range (U.S. DOE, 2002).
Use precision castings, surface coatings, or polishing
The use of castings, coatings, or polishing reduces pump surface roughness, which, in turn, increases energy efficiency. It may also help maintain efficiency over time. This is more effective on smaller pumps. One case study in the steel industry analyzed the investment in a surface coating on the mill supply pumps (350 kW pumps). It was determined that the additional cost of coating, $1,200, would be paid back in 5 months by energy savings of $2,700 (or 36 MWh, 2%) per year (Hydraulic Institute and Europump, 2001). Energy savings for coating pump surfaces are estimated to be 2% to 3% over uncoated pumps (Best Practice Programme, 1998).
Maintain proper seals
Seal failure accounts for up to 70% of pump failures in many applications (Hydraulic Institute and Europump, 2001). The sealing arrangements on pumps will contribute to the power absorbed. Often the use of gas barrier seals, balanced seals, and non-contacting labyrinth seals decrease seal losses.
Reduce leakage through clearance reduction
Internal leakage losses are a result of differential pressure across the clearance between the impeller suction and pressure sides. The larger the clearance, the greater is the internal leakage causing inefficiencies. The normal clearance in new pumps ranges from 0.014 to 0.04 inch (0.35 to 1.0 mm) (Hydraulic Institute and Europump, 2001). With wider clearances, the leakage increases almost linearly with the clearance. For example, clearance of 0.2 inch (5 mm) decreases the efficiency by 7% to 15% in closed impellers and by 10% to 22% in semi-open impellers. Abrasive liquids and slurries, even rainwater, can affect the pump efficiency. Using very hard construction materials (such as high chromium steel) can reduce the wear rate.
Replace condensate return electric pumps with pressure powered pumps
The pressure powered pumps is a non-electric pump that transfers high temperature condensate, or other liquids, from a low point, low pressure, or vacuum space to an area of higher pressure or elevation. It uses steam, compressed air or any other suitable pressurized gas as the pumping force for energy savings and longer life cycle (Spirax Sarco, n.d.).
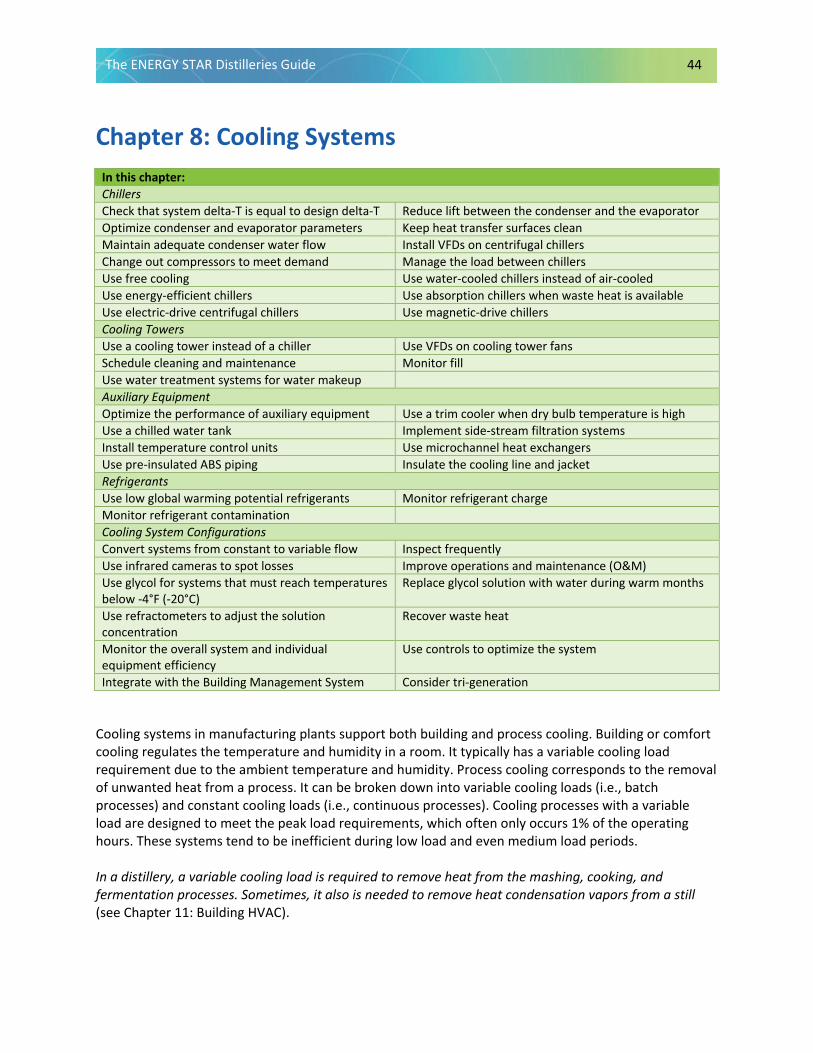
The ENERGY STAR Distilleries Guide 44
Chapter 8: Cooling Systems
In this chapter: Chillers Check that system delta-T is equal to design delta-T Reduce lift between the condenser and the evaporator Optimize condenser and evaporator parameters Keep heat transfer surfaces clean Maintain adequate condenser water flow Install VFDs on centrifugal chillers Change out compressors to meet demand Manage the load between chillers Use free cooling Use water-cooled chillers instead of air-cooled Use energy-efficient chillers Use absorption chillers when waste heat is available Use electric-drive centrifugal chillers Use magnetic-drive chillers Cooling Towers Use a cooling tower instead of a chiller Use VFDs on cooling tower fans Schedule cleaning and maintenance Monitor fill Use water treatment systems for water makeup Auxiliary Equipment Optimize the performance of auxiliary equipment Use a trim cooler when dry bulb temperature is high Use a chilled water tank Implement side-stream filtration systems Install temperature control units Use microchannel heat exchangers Use pre-insulated ABS piping Insulate the cooling line and jacket Refrigerants Use low global warming potential refrigerants Monitor refrigerant charge Monitor refrigerant contamination Cooling System Configurations Convert systems from constant to variable flow Inspect frequently Use infrared cameras to spot losses Improve operations and maintenance (O&M) Use glycol for systems that must reach temperatures below -4°F (-20°C)
Replace glycol solution with water during warm months
Use refractometers to adjust the solution concentration
Recover waste heat
Monitor the overall system and individual equipment efficiency
Use controls to optimize the system
Integrate with the Building Management System Consider tri-generation
Cooling systems in manufacturing plants support both building and process cooling. Building or comfort cooling regulates the temperature and humidity in a room. It typically has a variable cooling load requirement due to the ambient temperature and humidity. Process cooling corresponds to the removal of unwanted heat from a process. It can be broken down into variable cooling loads (i.e., batch processes) and constant cooling loads (i.e., continuous processes). Cooling processes with a variable load are designed to meet the peak load requirements, which often only occurs 1% of the operating hours. These systems tend to be inefficient during low load and even medium load periods. In a distillery, a variable cooling load is required to remove heat from the mashing, cooking, and fermentation processes. Sometimes, it also is needed to remove heat condensation vapors from a still (see Chapter 11: Building HVAC).
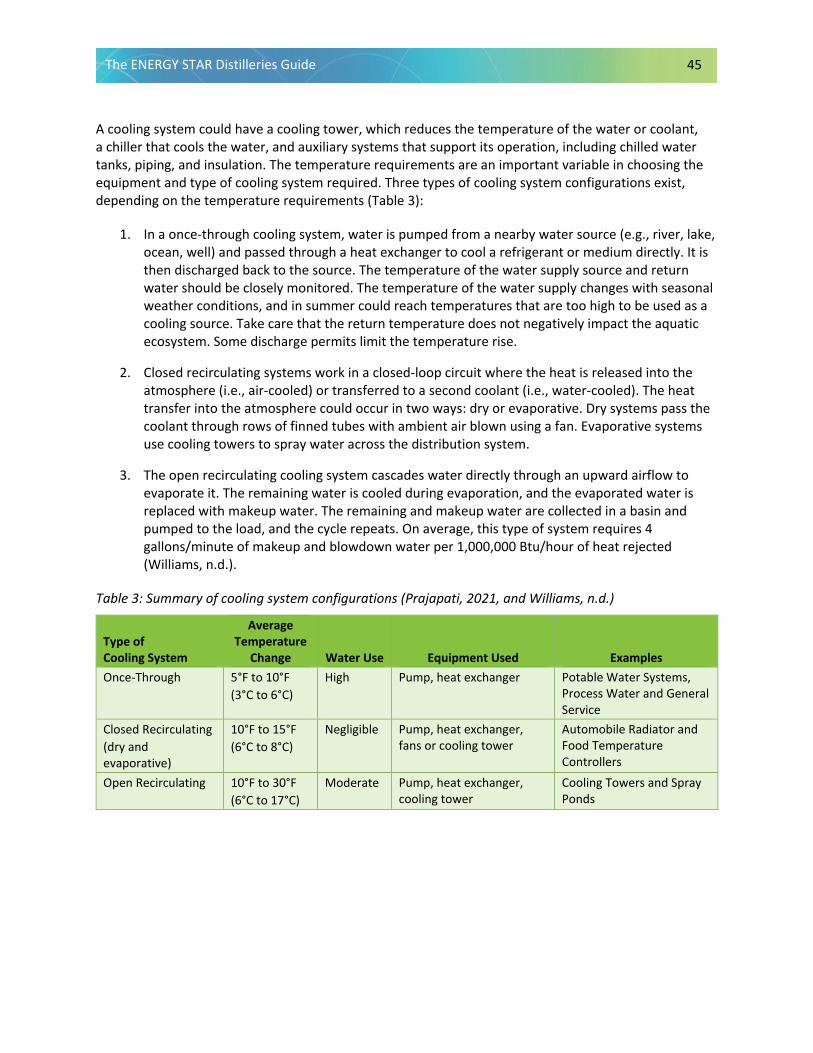
The ENERGY STAR Distilleries Guide 45
A cooling system could have a cooling tower, which reduces the temperature of the water or coolant, a chiller that cools the water, and auxiliary systems that support its operation, including chilled water tanks, piping, and insulation. The temperature requirements are an important variable in choosing the equipment and type of cooling system required. Three types of cooling system configurations exist, depending on the temperature requirements (Table 3):
1. In a once-through cooling system, water is pumped from a nearby water source (e.g., river, lake,ocean, well) and passed through a heat exchanger to cool a refrigerant or medium directly. It isthen discharged back to the source. The temperature of the water supply source and returnwater should be closely monitored. The temperature of the water supply changes with seasonalweather conditions, and in summer could reach temperatures that are too high to be used as acooling source. Take care that the return temperature does not negatively impact the aquaticecosystem. Some discharge permits limit the temperature rise.
2. Closed recirculating systems work in a closed-loop circuit where the heat is released into theatmosphere (i.e., air-cooled) or transferred to a second coolant (i.e., water-cooled). The heattransfer into the atmosphere could occur in two ways: dry or evaporative. Dry systems pass thecoolant through rows of finned tubes with ambient air blown using a fan. Evaporative systemsuse cooling towers to spray water across the distribution system.
3. The open recirculating cooling system cascades water directly through an upward airflow toevaporate it. The remaining water is cooled during evaporation, and the evaporated water isreplaced with makeup water. The remaining and makeup water are collected in a basin andpumped to the load, and the cycle repeats. On average, this type of system requires 4gallons/minute of makeup and blowdown water per 1,000,000 Btu/hour of heat rejected(Williams, n.d.).
Table 3: Summary of cooling system configurations (Prajapati, 2021, and Williams, n.d.)
Type of Cooling System
Average Temperature
Change Water Use Equipment Used Examples Once-Through 5°F to 10°F
(3°C to 6°C) High Pump, heat exchanger Potable Water Systems,
Process Water and General Service
Closed Recirculating (dry and evaporative)
10°F to 15°F (6°C to 8°C)
Negligible Pump, heat exchanger, fans or cooling tower
Automobile Radiator and Food Temperature Controllers
Open Recirculating 10°F to 30°F (6°C to 17°C)
Moderate Pump, heat exchanger, cooling tower
Cooling Towers and Spray Ponds
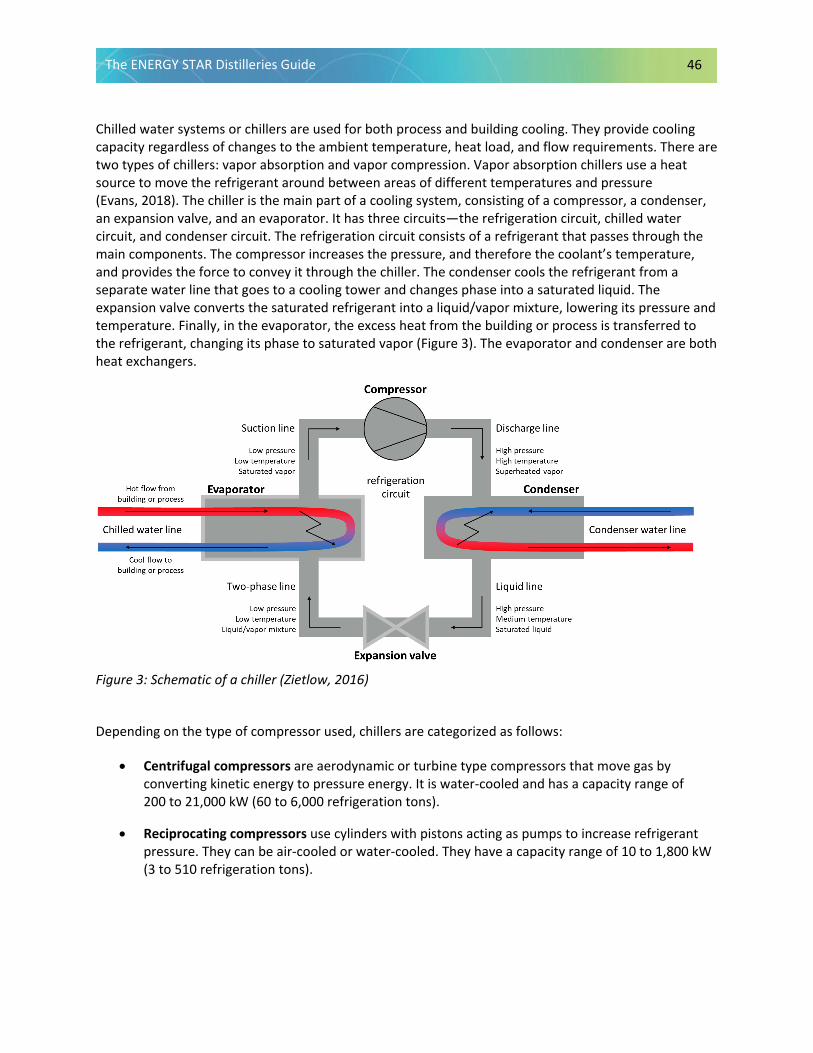
The ENERGY STAR Distilleries Guide 46
Chilled water systems or chillers are used for both process and building cooling. They provide cooling capacity regardless of changes to the ambient temperature, heat load, and flow requirements. There are two types of chillers: vapor absorption and vapor compression. Vapor absorption chillers use a heat source to move the refrigerant around between areas of different temperatures and pressure (Evans, 2018). The chiller is the main part of a cooling system, consisting of a compressor, a condenser, an expansion valve, and an evaporator. It has three circuits—the refrigeration circuit, chilled water circuit, and condenser circuit. The refrigeration circuit consists of a refrigerant that passes through the main components. The compressor increases the pressure, and therefore the coolant’s temperature, and provides the force to convey it through the chiller. The condenser cools the refrigerant from a separate water line that goes to a cooling tower and changes phase into a saturated liquid. The expansion valve converts the saturated refrigerant into a liquid/vapor mixture, lowering its pressure and temperature. Finally, in the evaporator, the excess heat from the building or process is transferred to the refrigerant, changing its phase to saturated vapor (Figure 3). The evaporator and condenser are both heat exchangers.
Figure 3: Schematic of a chiller (Zietlow, 2016)
Depending on the type of compressor used, chillers are categorized as follows:
• Centrifugal compressors are aerodynamic or turbine type compressors that move gas by converting kinetic energy to pressure energy. It is water-cooled and has a capacity range of 200 to 21,000 kW (60 to 6,000 refrigeration tons).
• Reciprocating compressors use cylinders with pistons acting as pumps to increase refrigerant pressure. They can be air-cooled or water-cooled. They have a capacity range of 10 to 1,800 kW (3 to 510 refrigeration tons).
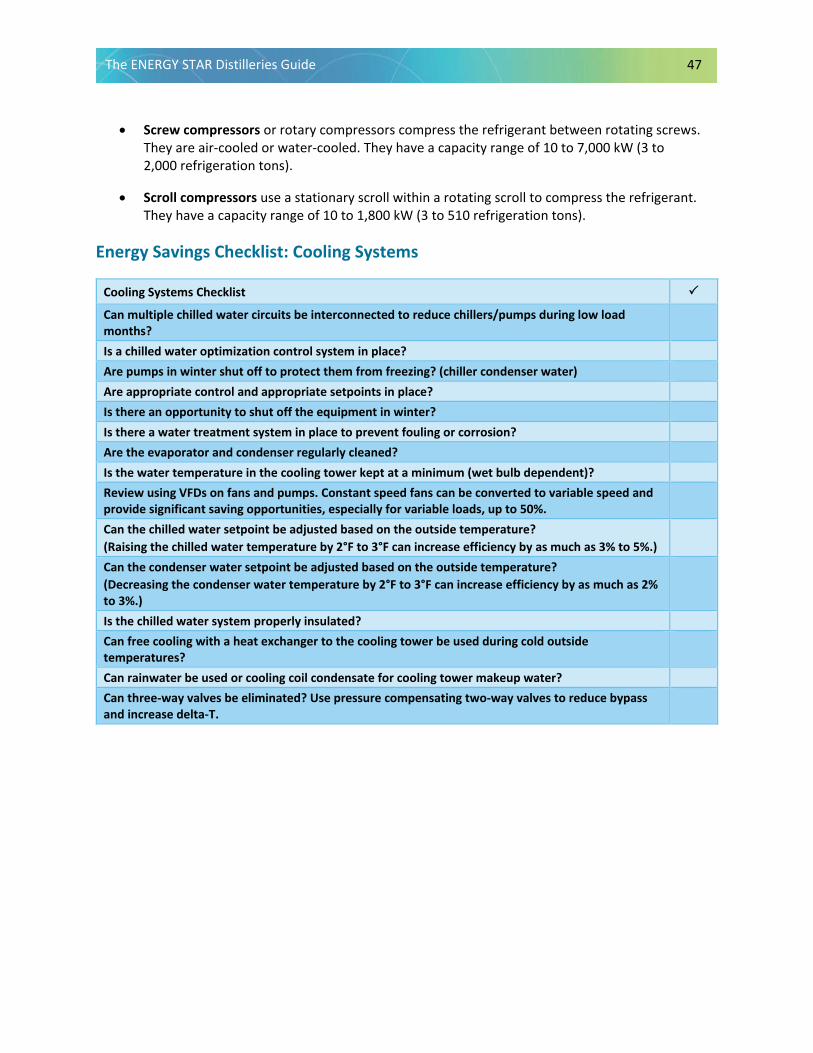
The ENERGY STAR Distilleries Guide 47
• Screw compressors or rotary compressors compress the refrigerant between rotating screws.They are air-cooled or water-cooled. They have a capacity range of 10 to 7,000 kW (3 to2,000 refrigeration tons).
• Scroll compressors use a stationary scroll within a rotating scroll to compress the refrigerant.They have a capacity range of 10 to 1,800 kW (3 to 510 refrigeration tons).
Energy Savings Checklist: Cooling Systems
Cooling Systems Checklist
Can multiple chilled water circuits be interconnected to reduce chillers/pumps during low load months? Is a chilled water optimization control system in place? Are pumps in winter shut off to protect them from freezing? (chiller condenser water) Are appropriate control and appropriate setpoints in place? Is there an opportunity to shut off the equipment in winter? Is there a water treatment system in place to prevent fouling or corrosion? Are the evaporator and condenser regularly cleaned? Is the water temperature in the cooling tower kept at a minimum (wet bulb dependent)? Review using VFDs on fans and pumps. Constant speed fans can be converted to variable speed and provide significant saving opportunities, especially for variable loads, up to 50%. Can the chilled water setpoint be adjusted based on the outside temperature? (Raising the chilled water temperature by 2°F to 3°F can increase efficiency by as much as 3% to 5%.) Can the condenser water setpoint be adjusted based on the outside temperature? (Decreasing the condenser water temperature by 2°F to 3°F can increase efficiency by as much as 2% to 3%.) Is the chilled water system properly insulated? Can free cooling with a heat exchanger to the cooling tower be used during cold outside temperatures? Can rainwater be used or cooling coil condensate for cooling tower makeup water? Can three-way valves be eliminated? Use pressure compensating two-way valves to reduce bypass and increase delta-T.
The ENERGY STAR Distilleries Guide 48
Best Practices for Energy-Efficient Cooling Systems
Chillers
• Check that system delta-T is equal to design delta-T. A low delta-T increases the energyconsumption of chilled water pumps.
• Reduce lift between the condenser and the evaporator. Raise the chilled water temperature orreduce the condenser water temperature to reduce the lift.
• Optimize condenser and evaporator parameters. Minimize the differences between thecondenser and the evaporator to reduce power input while increasing refrigeration output.
• Keep heat transfer surfaces clean. Scale and fouling buildup insulate the tubes in the heatexchanger, thus causing inefficiencies.
• Remove trapped air from the condenser. Air limits the amount of cold surface exposed tothe refrigerant.
• Maintain adequate condenser water flow. Blockage of the filter in the condenser water linereduces water flow.
• Install variable-frequency drives (VFDs) on centrifugal chillers. VFDs control the speed ofthe chiller.
• Change out compressors to meet demand. A compressor and motor drive that closely matchthe observed load can reduce energy use.
• Manage the load between chillers. Manage the load of two or more chillers to obtain acombined peak efficiency.
• Use free cooling. If the outside air temperature is low enough, the chiller should be shut off andoutside air used.
• Use water-cooled chillers instead of air-cooled. Water-cooled chillers are more efficient andslightly less expensive than an equivalent air-cooled chiller.
• Use energy-efficient chillers. These chillers typically have larger heat exchange areas andcompressors.
• Use absorption chillers when waste heat is available. They are energy efficient when wasteheat from a process can be captured and used to generate chilled water.
• Use electric-drive centrifugal chillers. 0.2 Btu of electric energy is required in modern electric-drive centrifugal chillers to remove 1 Btu of energy from the thermal water.
• Use magnetic-drive chillers. They operate more efficiently than reciprocating and screwcompressors. Power savings averaged 49% for three case studies in the United States.
The ENERGY STAR Distilleries Guide 49
Cooling Towers
• Use a cooling tower instead of a chiller. Cooling towers require a lower investment and are characterized by lower operational costs when compared with chillers.
• Use VFDs on cooling tower fans. It is more efficient to operate two or more cell fans at reduced speed than one at full speed during lower load conditions.
• Schedule cleaning and maintenance. Scale and foul are left behind when water is evaporated, which affects efficiency in the heat transfer.
• Monitor fill. Service or replace the fill in cooling towers to avoid fouling.
• Use water treatment systems for water makeup. Water treatment reduces tower blowdown frequency and limits tower fouling, keeping them more efficient.
Auxiliary Equipment
• Optimize the performance of auxiliary equipment. Opportunities to improve compressors, pumps, motors, and fans are found in previous sections of this guide.
• Use a trim cooler when dry bulb temperature is high. Trim coolers add a supplemental fluid cooler to a closed-loop system.
• Use a chilled water tank/ice storage. This expands the total system volume and increases thermal inertia.
• Implement side-stream filtration systems. These systems can reduce fouling, which has poor heat transfer.
• Install temperature control units (TCUs). These help to control process temperatures by circulating water or an oil-based fluid through the process application.
• Use microchannel heat exchangers. These heat exchangers are optimized to use low-density and low global warming potential (GWP) refrigerants.
• Use pre-insulated acrylonitrile butadiene styrene (ABS) piping. These systems are vapor tight, showing no thermal bridges, which minimizes energy loss along the lines.
• Insulate the cooling line and jacket. Insulation is a cost-effective way to reduce energy waste along cooling lines, expansion valves, and evaporators.
The ENERGY STAR Distilleries Guide 50
Refrigerants
• Use low GWP refrigerants. Often, energy efficiency measures are implemented to lower GHGs.If that is the aim, also consider using lower GWP refrigerants.
• Monitor refrigerant charge. Significant amounts of energy can be wasted in a refrigerationsystem with an inappropriate level of charge.
• Monitor refrigerant contamination. Energy savings due to the implementation of this measureare estimated at 2%.
Cooling System Configurations
• Inspect frequently. Reduce inefficiencies due to improperly working equipment.
• Use infrared cameras to spot losses. A temperature change would show that there is a leak oran uninsulated spot.
• Improve operations and maintenance (O&M). A low-cost energy savings practice is to increaseO&M.
• Convert systems from constant to variable flow. VFDs on pumps are used to match the coolingwater supply to the cooling water demand to save energy.
• Use glycol for systems that must reach temperatures below -4°F (-20°C). It is commonly used asthe heat transfer fluid in chillers.
• Replace the glycol solution with water during warm months. Glycol solution has a slightlylower heat transfer coefficient than water and requires more energy to cool.
• Use refractometers to adjust refrigerant concentration. These provide a simple way of checkingthe concentration.
• Recover waste heat. Extract heat from the chilled liquid that can be used along with the energyof compression to warm the circuit water for reheating and cooling.
• Monitor the overall system and individual equipment efficiency. Track energy consumption,diagnose poor performance, optimize system performance, and identify problem areas beforemajor repairs are needed.
• Use controls to optimize the system. Control and optimization help to regulate and efficientlyequilibrate energy consumption.
• Integrate with the Building Management System. Improperly configured BMS systems arebelieved to account for 20% of building energy usage.
• Consider tri-generation. Combined Heat and Power (CHP) offers the option to provide coolingby using absorption in combination with generation of heat and power.
The ENERGY STAR Distilleries Guide 51
Chillers
Check that system delta-T is equal to design delta-T
Delta-T is the difference between the temperature of supply and return chilled water. Low delta-T syndrome is a common problem in many chilled water systems that increases the energy consumption of chilled water pumps, decreasing the system’s overall operating efficiency and undermining occupant comfort (Dai et al., 2021). Several causes of low delta-T syndrome exist, some of the most common are the following:
• Limited heat exchange capacity of terminals due to coil fouling, clogged filters, undersized coils, improper valves, and poor valve authority
• Poor system design and construction with unbalanced water loops and oversized pumps
• Inappropriate adjustment of control parameters leading to local control failure
Reduce lift between the condenser and the evaporator
Lift is the difference in pressure or temperature of the refrigerant in the condenser and the evaporator. Energy use increases as the pressure or temperature difference between the evaporator and the condenser increases because the compressor has to work harder to achieve the lift. It is possible to raise the chilled water setpoint or reduce the condenser water setpoint to reduce lift. Optimize condenser and evaporator parameters
An optimized refrigeration system works with minimal differences between condenser and evaporator conditions (i.e., temperature and pressure). For the condenser, the goal is to obtain the lowest possible condensing temperature and pressure of the refrigerant. When using a cooling tower, allow the condenser temperature to get as cold as the cooling tower supply water will permit; check with your chiller manufacturer to determine the minimum condenser temperature lower setpoint. It reduces power input while increasing refrigeration output. For the evaporator, an increase in temperature and pressure increases the power input of the compressor and can dramatically increase the refrigeration output of the system. Increasing evaporator temperature by 1 degree can reduce the electricity consumption of the compressor by roughly 3% (Hackensellner, 2001; Lom and Associates, 1998). Keep heat transfer surfaces clean
The heat transfer surfaces in chillers tend to collect mineral and sludge deposits from the circulating water. Scale and fouling buildup insulate the tubes in the heat exchanger, causing inefficiencies in the exchange of heat. To compensate for this effect, a larger temperature difference is required between the water and the refrigerant. By keeping heat transfer surfaces clean, the chiller can more efficiently transfer heat. Remove trapped air from the condenser
Air trapped in the condenser causes increased pressure at the compressor discharge, resulting in increased compressor horsepower. It also limits the cold surface exposed to the refrigerant, generating a similar effect of dirt buildup.

The ENERGY STAR Distilleries Guide 52
Maintain adequate condenser water flow
Blockage of the filter in the condenser water line will increase condenser refrigerant temperature due to a reduced water flow. Install VFDs on centrifugal chillers
A variable-frequency drive (also known as an adjustable-frequency drive) or a variable-voltage/variable-frequency drive (also known as a variable-speed drive) is used to control motor speed and torque by varying motor input frequency and voltage. A VFD adjusts the compressor speed to match the cooling water supply with the cooling water demand. Change out compressors to meet demand
Generally, existing chillers are oversized, forcing the chiller to operate at reduced loads even during peak demand, causing surging and poor efficiency. Replacing the compressor and motor drive to match the observed load more closely can reduce energy use. Manage the load between chillers
The load required of two chillers can be managed in a way to obtain a combined peak efficiency. At the biotechnology manufacturing plant of Genentech in Vacaville, Calif., the load between chillers was managed by installing two 1,400-ton chillers and one 600-ton chiller instead of equally sized chillers. The design was made to operate the chillers at as close to full load as possible, where they are most efficient. Given the requirements of the plant, the two larger chillers are designed to run at full load and the smaller chiller is run to supply additional cooling only on an as-needed basis. This configuration reduces energy needs with a cost savings estimated at $113,250 per year (CIEE, 2000). Use free cooling
In some cases, cooling is also required when outside temperatures drop below the minimum condenser water temperature. If the outside air temperature is low enough, the chiller should be shut off and outside air used. If cooling cannot be done with outside air, a chiller bypass can be used to produce chilled water without using a chiller. Use water-cooled chillers instead of air-cooled
Water-cooled chillers are more efficient and slightly less expensive than an equivalent air-cooled chiller. The life cycle cost for a water-cooled chilled water system is lower than for an air-cooled system (even considering the initial cost and O&M costs for a cooling tower). Use energy-efficient chillers
Energy-efficient chillers use larger heat exchange areas and more efficient compressors to achieve more efficient overall operation. For example, for 500- to 1,000-ton machines, energy-efficient chillers achieve coefficients of performance (COPs) of 6.4 compared with standard models (particularly those 10 years old) with COPs of 4.1 (Castellow et al., 1997). Rated efficiency, however, is machine specific. Case studies indicate an average payback period for this measure of 2.8 years (IAC, 2001).
The ENERGY STAR Distilleries Guide 53
Use absorption chillers when waste heat is available
Typical absorption chillers require approximately 1.6 Btu of thermal energy delivered to the chiller to remove 1 Btu of energy from the chilled water. Vapor absorption chillers use heat to transfer the refrigerant around between areas of different temperatures and pressure (Evans, 2018). They are energy efficient when waste heat from the process or a CHP engine can be captured and used to generate chilled water. CHP engines are often coupled with an absorption chiller that uses waste heat from combustion. Absorption chillers could replace mechanical chillers to limit the facility’s electricity use and provide a hedge against peak electric demand charges. It uses a refrigerant water mixed with ammonia or lithium bromide. It has two chambers, the top chamber comprises the condenser and the generator, and the bottom one comprises the evaporator and absorber. A heat exchanger improves the efficiency of the system. However, absorption chillers are not easy to operate and maintain and require a skilled maintenance practice that many facilities do not have.
Use electric-drive centrifugal chillers
Modern electric-drive centrifugal chillers require 0.2 Btu of electrical energy to remove 1 Btu of energy from the chilled water (0.7 kW/ton) (Sullivan et al., 2010). Also, they are relatively easy to maintain.
Use magnetic-drive chillers
Magnetic-bearing chiller compressors operate more efficiently than reciprocating and screw compressors. The magnetic bearings operate without oil for lubrication, reducing energy losses due to friction. It also increases the heat transfer efficiency because no oil enters the evaporator or the condenser. Oil maintenance also is eliminated, resulting in O&M savings. The U.S. Navy’s Techval program had three different projects where magnetic-bearing chiller compressors were installed between 2005 and 2007. The energy savings achieved were between 40% and 65%, and the payback period calculated was between 3.8 and 8.4 years (Federal Energy Management Program, n.d.).
Cooling Towers
Use a cooling tower instead of a chiller
Cooling towers require a lower investment and are characterized by lower operational costs when compared with chillers (Lee, 1989). Temperature specifications of 85°F (29°C) or 90°F (32°C) can usually be met by installing a cooling tower or by using natural water. Based on a single audit, the payback period for replacing a refrigeration system with a cooling tower is estimated at approximately 1 year (IAC, 2010).
Use VFDs on cooling tower fans
VFDs adjust the fan speed to maintain the same flow required when external conditions change. It reduces energy consumption by slowing the motor. A fan’s power varies proportionally with the cube of its speed, meaning that a slight speed reduction causes a significant power reduction. For example, a reduction of 80% in speed causes a 50% reduction in energy consumption (Koepke, 2009). Therefore, it is more energy-efficient to run all existing fans at a slower speed than turn off some of the fans and run the others at full capacity.
The ENERGY STAR Distilleries Guide 54
Schedule cleaning and maintenance
Cooling towers use heat transfer and evaporation to cool water. One percent of water is lost for every 10°F of cooling. Scale and foul are left behind when water evaporates, which affects efficiency in the heat transfer. If maintenance and cleaning are not performed, the temperature of the water exiting the cooling tower will rise. For every 2°F increase, the equipment’s energy costs will increase by up to 6%. Performing scheduled maintenance and cleaning techniques can save facilities up to 15% on their electricity costs (tekWorx, n.d.). Monitor fill
The fill, wet deck, or surface maximizes the contact between air and water, encouraging evaporation. It is covered in a textured pattern, usually ridges or wrinkles that leave open spaces for water and air to travel. It should be serviced or replaced in cooling towers to avoid fouling (tekWorx, n.d.). Use water treatment systems for water makeup
Using water treatment systems for cooling tower makeup reduces tower blowdown frequency and limits tower fouling, keeping them more efficient. Auxiliary Equipment
Optimize the performance of auxiliary equipment
Opportunities to improve the efficiency of the auxiliary equipment used in the chiller systems, such as compressors, pumps, motors, and fans, can be found in the previous sections of this guide. Use a trim cooler when dry bulb temperature is high
A trim cooler adds a supplemental fluid cooler to a closed-loop system. It is typically used in a location with a high dry bulb temperature to provide the proper coolant temperature to the load. With an added liquid-to-liquid trim cooler, it is possible to use a water source to trim the temperature to the desired setpoint. It also is used to reduce reliance on city water as a coolant (Williams, n.d.). Use a chilled water tank/ice storage
A water tank/ice storage serves to expand the total system volume and increase thermal inertia. It can improve performance by ensuring better temperature control, increasing chiller longevity, reducing condenser cycling, and improving system startup times. It is commonly used when large instantaneous cooling loads with defined periods of operation are needed. A water tank is used to spread the instantaneous loads over longer periods, allowing a smaller chiller (Timms, 2019). Implement side-stream filtration systems
A heavily fouled cooling tower has poor heat transfer. Dirt and fouling also can damage analytical instrumentation, creating inaccuracies and premature failure. Manual cleaning can take days to be completed, contributing to downtime, instrumentation failure, decreased efficiencies, and increased water and chemical usage. There are solutions for side-stream filtration systems (Horner, 2021):
The ENERGY STAR Distilleries Guide 55
• Bag or Cartridge Filtration Technologies. These technologies are the lowest cost offerings incooling tower filtration. Different types of filters are available, also in several materials andsizes.
• Sand Filtration. The initial capital cost is higher than for bag or cartridge filters; however,operational costs are low. The size of sand filters depends on the flow rate. Typically, they areused to remove 20- to 30-micron particles, with a capacity to remove down to 5 microns.
• Centrifugal Separators. These separators have high capital costs but are simple to operate andhave minimal waste. They are not sized for very fine, low-density particle removal due to thetime required to remove the particles.
• Self-Cleaning Strainers. Strainers have high capital but minimal operating costs. They are highlyeffective at removing large particulate and treat higher flow rates at a reduced cost.
The filter can only remove particulate suspended within the water column. Agitation is needed to prevent debris and particulate from settling and accumulating on the basin floor. A sweeper package is recommended to agitate the basin.
Install temperature control units (TCUs)
TCUs help regulate process temperatures by circulating water or an oil-based fluid through the process application. The fluid temperature is controlled with a heater and a cooling valve. During operation, a temperature is set into the controller. The pump continually circulates the fluid from the TCU to the process and then back to the TCU. The temperature is controlled in the return line. If the temperature is higher than the set one, cooling is needed. Conversely, if the temperature is lower, heat is needed. The TCU does not generate the cooling itself. It utilizes a cooling source (e.g., chiller system, cooling tower system, city water). Selecting the right pump for each application is crucial as it is the heart of the system and essential for efficient and effective performance (see Chapter 7: Pump Systems). The pump chosen is directly related to the flow rates. High turbulence flows transfer more energy than low laminar flows; thus, the first is more effective (Stone, 2021).
Use microchannel heat exchangers
Microchannel heat exchangers are used, especially in large (approximately 400 tons), air-cooled chillers using screw and centrifugal compression. They are optimized to use low-density, low GWP refrigerants such as R-1234ze and R-515B. The system performance is sensitive to pressure drops because of the low density of these refrigerants. The microchannel tube geometry provides a balance between maximum heat rejection and internal refrigerant pressure drop. Microchannel heat exchangers reduce 30% of the refrigerant charge and increase efficiency by 10% compared with fin and tube heat exchangers (Process Cooling, 2021).
Use pre-insulated acrylonitrile butadiene styrene (ABS) piping
Pre-insulated ABS piping is an energy-efficient solution for industrial applications in a temperature range from -58°F to 104°F (-50°C to 40°C) due to its low thermal conductivity. It is insulated with high-density, closed-cell polyurethane foam and protected with a watertight, ultraviolet-resistant black polyethene

The ENERGY STAR Distilleries Guide 56
jacket. The system is vapor tight, showing no thermal bridges, which minimizes energy loss along the lines. Because of its properties, the piping is suited for beverage production (Sampaio, 2018).
Insulate the cooling line and jacket
It is often cost-effective to insulate cooling lines, expansion valves, and evaporators if the lines are uninsulated and if there is a significant average temperature difference between the cooling lines and their surroundings (e.g., more than 15°F [-9°C]). If lines are already insulated, upgrading may not be cost-effective. Use an insulation material that does not absorb moisture as condensation may form outside of the piping and that resists being crushed (i.e., mineral fiber insulation). Also consider easily removable insulation (i.e., thermal blanket insulation) on access points and some valves. Refrigerants
Use low global warming potential refrigerants
In addition to energy efficiency, using lower GWP refrigerants can help manufacturing plants reduce GHG emissions. Refrigerants should be carefully chosen depending on their thermochemical parameters, safety (i.e., flammability and toxicity), and environmental impact (i.e., GWP, ozone depletion). Current refrigerants have a high GWP. For example, hydrofluorocarbon (HFC) blend R-404A generates 3,922 times more warming than carbon dioxide (CO2). Current regulations aim to eliminate high GWP refrigerants and substitute them with refrigerants with a lower GWP. Regulations change over time and from state to state. For updated information, visit www.epa.gov/climate-hfcs-reduction. There is no simple substitute for refrigerants because lower GWP options may be more expensive and increase flammability (Figure 4). Refrigerants are named by the letter R (as in “refrigerants”) followed by a two- or three-digit number, and, in some cases, one or two letters, such as RXYZ (SWEP, n.d.).
CASE STUDY The Lakewood Brewing Co. in Garland, Texas, brews more than 10,000 barrels of beer per year. They installed a new pre-insulated ABS piping system for controlling the fermentation tank temperature and other parts of the process. Their main concern was to use a system that did not produce condensate. The piping system conveys food-grade glycol at 26°F (-3°C). It is used on the fermenting vessels and the bright tanks where the beer is produced and at the cold water tank. Lakewood has 25 tanks, 10 of which are 180-barrel tanks. Most of the remaining are 90-barrel tanks. Maintenance and visual inspection are performed monthly. Source: Sampaio, A. (2018). Piping System Cuts Condensation Concerns for Brewing. Process Cooling. www.process-cooling.com/articles/89268-piping-system-cuts-condensation-concerns-for-brewing
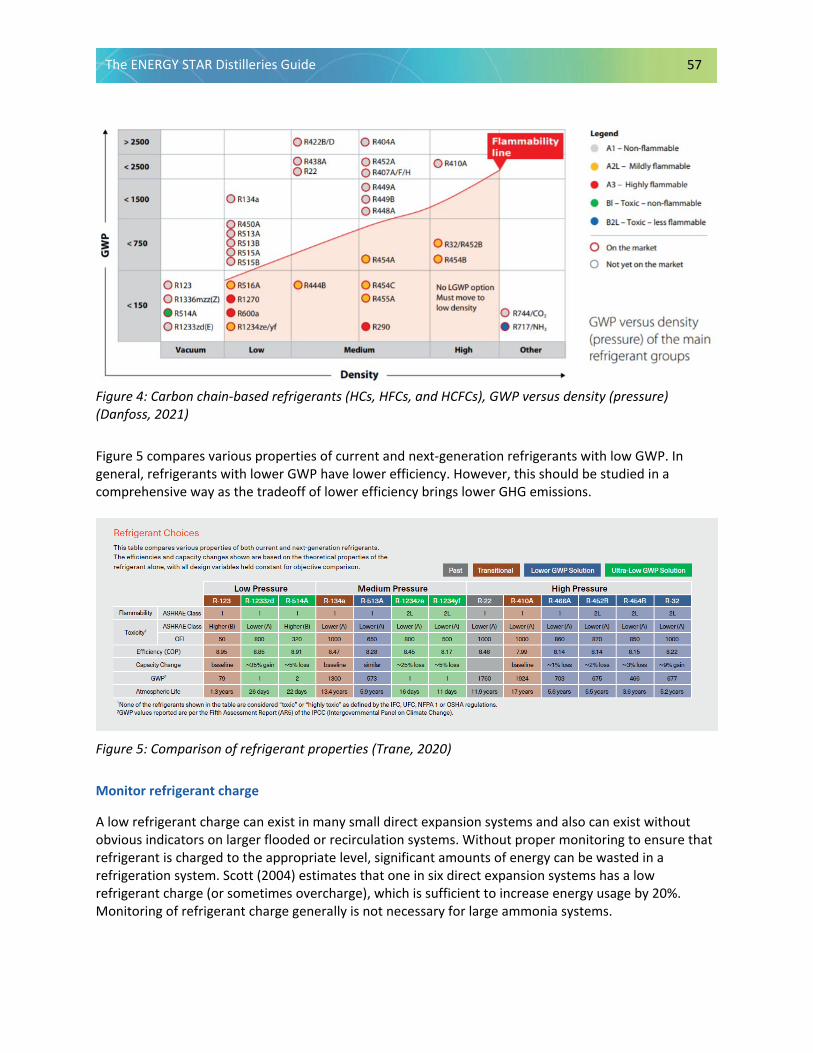
The ENERGY STAR Distilleries Guide 57
Figure 4: Carbon chain-based refrigerants (HCs, HFCs, and HCFCs), GWP versus density (pressure) (Danfoss, 2021)
Figure 5 compares various properties of current and next-generation refrigerants with low GWP. In general, refrigerants with lower GWP have lower efficiency. However, this should be studied in a comprehensive way as the tradeoff of lower efficiency brings lower GHG emissions.
Figure 5: Comparison of refrigerant properties (Trane, 2020)
Monitor refrigerant charge
A low refrigerant charge can exist in many small direct expansion systems and also can exist without obvious indicators on larger flooded or recirculation systems. Without proper monitoring to ensure that refrigerant is charged to the appropriate level, significant amounts of energy can be wasted in a refrigeration system. Scott (2004) estimates that one in six direct expansion systems has a low refrigerant charge (or sometimes overcharge), which is sufficient to increase energy usage by 20%. Monitoring of refrigerant charge generally is not necessary for large ammonia systems.
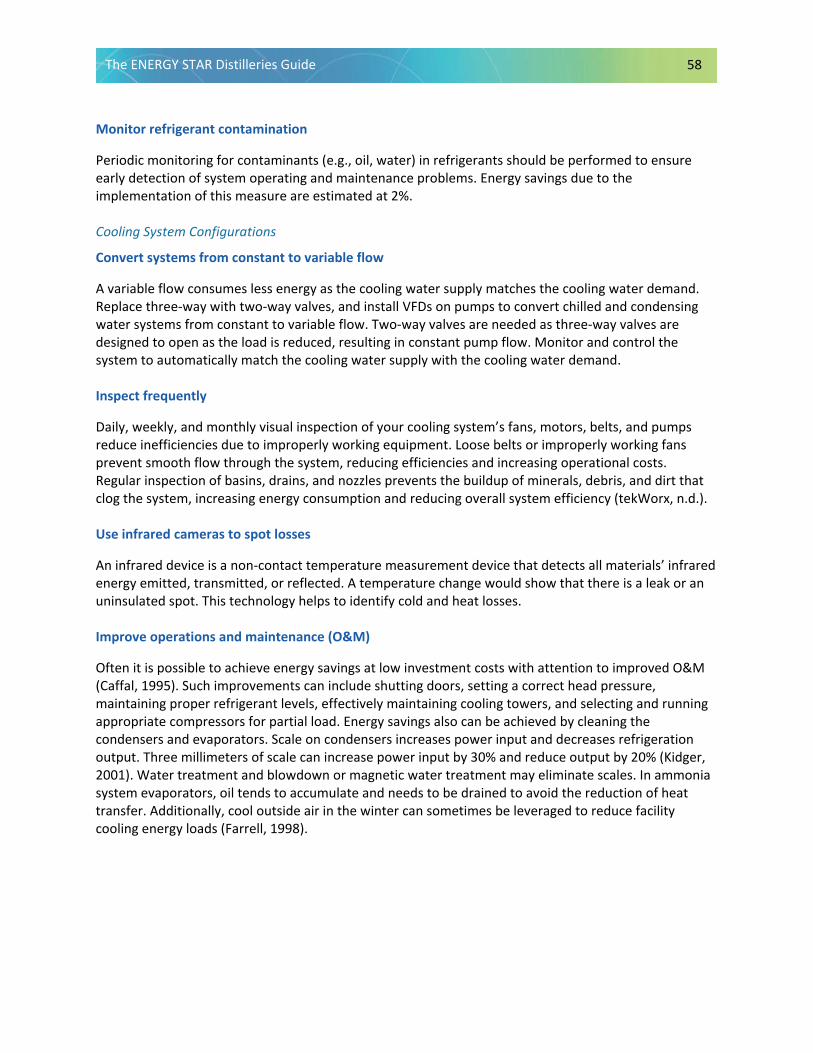
The ENERGY STAR Distilleries Guide 58
Monitor refrigerant contamination
Periodic monitoring for contaminants (e.g., oil, water) in refrigerants should be performed to ensure early detection of system operating and maintenance problems. Energy savings due to the implementation of this measure are estimated at 2%. Cooling System Configurations
Convert systems from constant to variable flow
A variable flow consumes less energy as the cooling water supply matches the cooling water demand. Replace three-way with two-way valves, and install VFDs on pumps to convert chilled and condensing water systems from constant to variable flow. Two-way valves are needed as three-way valves are designed to open as the load is reduced, resulting in constant pump flow. Monitor and control the system to automatically match the cooling water supply with the cooling water demand. Inspect frequently
Daily, weekly, and monthly visual inspection of your cooling system’s fans, motors, belts, and pumps reduce inefficiencies due to improperly working equipment. Loose belts or improperly working fans prevent smooth flow through the system, reducing efficiencies and increasing operational costs. Regular inspection of basins, drains, and nozzles prevents the buildup of minerals, debris, and dirt that clog the system, increasing energy consumption and reducing overall system efficiency (tekWorx, n.d.). Use infrared cameras to spot losses
An infrared device is a non-contact temperature measurement device that detects all materials’ infrared energy emitted, transmitted, or reflected. A temperature change would show that there is a leak or an uninsulated spot. This technology helps to identify cold and heat losses. Improve operations and maintenance (O&M)
Often it is possible to achieve energy savings at low investment costs with attention to improved O&M (Caffal, 1995). Such improvements can include shutting doors, setting a correct head pressure, maintaining proper refrigerant levels, effectively maintaining cooling towers, and selecting and running appropriate compressors for partial load. Energy savings also can be achieved by cleaning the condensers and evaporators. Scale on condensers increases power input and decreases refrigeration output. Three millimeters of scale can increase power input by 30% and reduce output by 20% (Kidger, 2001). Water treatment and blowdown or magnetic water treatment may eliminate scales. In ammonia system evaporators, oil tends to accumulate and needs to be drained to avoid the reduction of heat transfer. Additionally, cool outside air in the winter can sometimes be leveraged to reduce facility cooling energy loads (Farrell, 1998).
The ENERGY STAR Distilleries Guide 59
Use glycol refrigerant for systems that must reach temperatures below -4°F (-20°C)
A solution with ethylene glycol or propylene glycol is commonly used as the heat transfer fluid in chillers. Ethylene glycol is not food grade and should not be used in food or beverage applications; only propylene glycol can be used in food or beverage applications. It is diluted with water and enables your chiller system to maintain a range temperature of 25°F to 27°F (-4°C to -3°C). It is recommended to use glycol solutions up to ~50% to operate chilling systems down to -4°F (-20°C) and to move away from glycols to other fluids for operating temperatures below this. The reason is mainly due to the high viscosities from increasing glycol mixture percentages and reduced temperatures. Pumping viscous fluids inside heat exchangers is difficult, causing operational difficulties that outweigh the benefits.
Frequently double-wall heat exchangers are utilized, preventing contamination. In select warmer temperature applications, a glycol-to-water heat exchanger is used with pressure higher on the waterside to mitigate the potential for contamination (Personal Communication, Bimbo Bakeries USA, 2021). Primary glycol cooling could be used in mixer jackets, cream yeast systems, chilled ingredient water, process tanks, coolers, heat exchangers, and, depending on the application of the thermal process, environmental control.
Replace glycol solution with water during warm months
If a glycol solution in water is used as the cooling media to prevent freezing during cold months, consider draining the system and using water during warmer months. Glycol solution systems have a slightly lower heat transfer coefficient than water and require more energy to cool. Install a glycol storage tank to hold the drained glycol solution and refill the cooling system during the cold months.
Use refractometers to adjust the solution concentration
A refractometer is used to measure concentrations of liquids using the refractive index. It is possible to correlate the refractive index with the concentration of a solution. For example, a 35% propylene glycol mixture should correlate to readings of 24.75°Brix or a 2°F freezing point. To check the concentration, a sample of the chiller reservoir or process piping should be taken. To ensure a well-mixed solution, ensure that the solution has time to circulate before taking the sample (Terrien, 2020).
Recover waste heat
Heat recovery systems can extract heat from the chilled liquid that can be used along with the energy of compression to warm the circuit water for reheat and cooling. The energy that normally would be expelled to the atmosphere can be captured and used for other processes. There exist two possibilities. One possibility is using a heat exchanger that recovers heat from the condenser water. The other possibility is to use an additional condenser placed directly in the refrigeration circuit (Jia, 2006).
The ENERGY STAR Distilleries Guide 60
Monitor the overall system and individual equipment efficiency
The introduction of automatic monitoring on refrigeration systems can help energy managers and facilities engineers track energy consumption, diagnose poor performance, optimize system performance, and identify problem areas before major repairs are needed. Automated monitoring of energy performance is not yet common but can be very beneficial in exposing poor part-load efficiency and in identifying system deterioration, such as the effects of low refrigerant charge. The cost of automated monitoring is proportional to the size of the system and might be minor on new systems, where much data often can be obtained from control systems. The monitoring system should have the ability to provide system- and component-level information to operating staff, as well as high-level performance summaries for management. It is estimated that 3% of refrigeration energy can be saved by applying this measure. Use controls to optimize the system
Control and optimization help to regulate and efficiently equilibrate energy consumption. Different types of controls for cooling systems exist. For example, an early warning system can be implemented that sends a message to staff when equipment is operating outside expected parameters. Different algorithms continuously adjust cooling equipment operations and key setpoints based on different parameters, such as occupancy level and outdoor temperature, maximizing system efficiency in real time. Algorithms optimize the condenser water temperature by balancing auxiliary equipment power with chiller power to operate the chillers based on ambient conditions and load efficiency. Also, it is possible to optimize cooling tower isolation valves (cells) by sequencing them to flow water over the maximum amount of cooling towers without falling below the minimum flow rate of these tower cells (tekWorx, n.d.). Green Proving Ground recommends considering chiller plant optimization for all plants with loads greater than 3 million ton-hours. It is possible to obtain 35% cooling savings with an average plant efficiency of 0.64 kW/ton. The payback is less than 5 years (GPA, n.d.). Integrate with the Building Management System
Building Management Systems (BMS) are a critical component to managing energy demand. They are often implemented in projects with large mechanical, HVAC, and electrical systems. The systems included in a BMS represent 40% of a building's energy usage; it could go up to 70% if the lighting is included. Improperly configured BMS systems are believed to account for a 20% loss of building energy usage, or approximately 8% of total energy usage in the United States (Brambley et al., 2005).
Consider tri-generation
Many new CHP systems offer the option of tri-generation, which provides cooling in addition to electricity and heat. Cooling can be provided using either absorption or adsorption technologies, which both operate using recovered heat from the co-generation process.

The ENERGY STAR Distilleries Guide 61
Chapter 9: Hot Water and Steam Systems In this chapter: Steam Supply—Boiler Match steam demand Control boiler allocation Install boiler flue shutoff dampers Perform maintenance Improve insulation Reduce fouling Optimize boiler blowdown rate Reduce excessive flue gas Reduce excess air Monitor flue gas Install turbulators on two- and three-pass fire-tube boilers
Use an economizer
Use a deaerator tank Recover heat from boiler blowdown Recover condensate Install a modulating burner on the boiler Consider electric boilers Consider once-through boilers Switch to more efficient and lower carbon fuels Consider solar-powered boilers Steam Supply—Combined Heat and Power (CHP) Gas turbines Reciprocating engines Waste heat to power Steam Distribution Shut off excess distribution lines Properly size pipes Insulate Check and monitor steam traps Use thermostatic steam traps Shut off steam traps Reduce distribution pipe leaks Recover low-pressure waste steam through vapor
recompression Recover flash steam Perform total site pinch analysis
Hot water and steam are used throughout a distillery plant to support its core processes, which represents a distillery’s greatest energy expense. This section discusses general energy saving opportunities in boiler and steam systems. Discussion of distillery hot water and steam saving opportunities, such as recovering heat from streams specific to distilleries, can be found in subsequent distilling process chapters.
While the exact size and use of a modern steam system vary greatly, there is an overall pattern that steam systems follow (see Figure 6). Treated cold feedwater is fed to the boiler, where it is heated to form steam. Chemical treatment of the feedwater is required to remove impurities because impurities would otherwise collect on the boiler tube walls. Even though the feedwater has been treated, some impurities remain and can build up in the boiler water. Thus, water is periodically drained from the bottom of the boiler in a process known as blowdown. The generated steam travels along the pipes of the distribution system to get to the process where the heat will be used. Sometimes the steam is passed through a pressure reduction valve if the process requires lower pressure steam. In steam transport, the steam loses heat by radiation through the pipe wall and condenses without temperature changes, and some of it is condensed. The condensate is removed by a steam trap that allows condensate to pass through, but it blocks the passage of steam. Traditionally, boilers fed by fossil fuels have been used; however, with the need to reduce CO2 emissions, the use of electric boilers has been increasing.
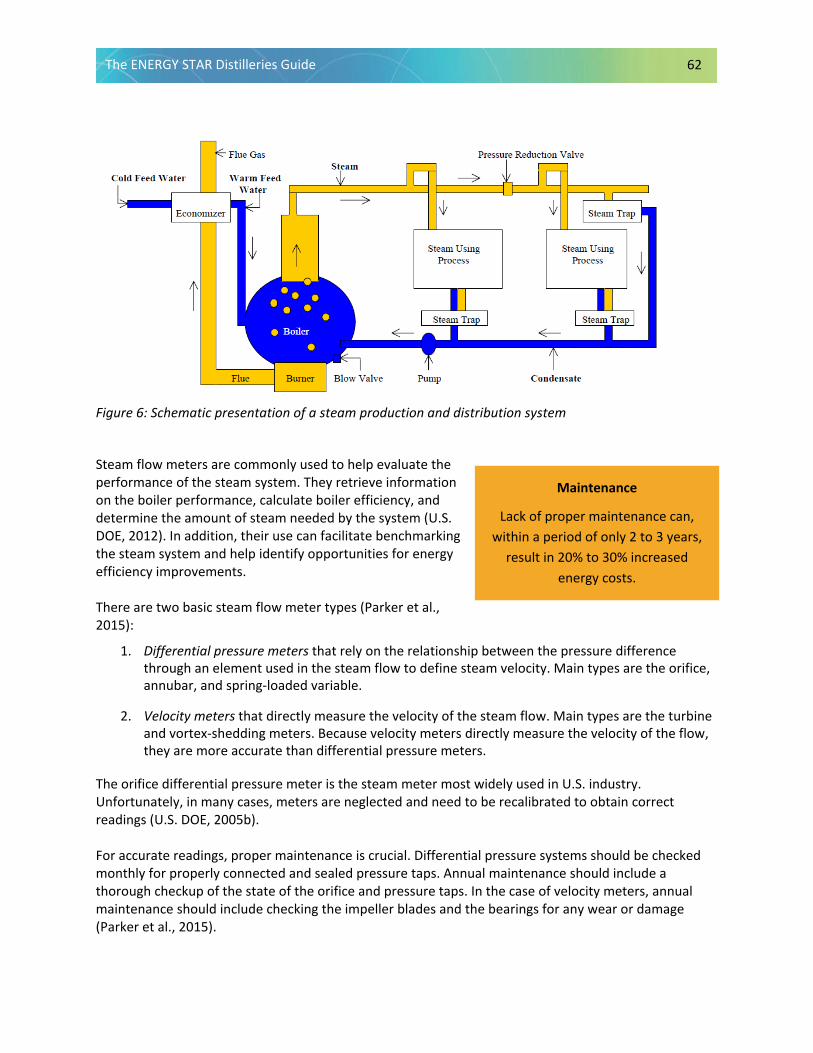
The ENERGY STAR Distilleries Guide 62
Figure 6: Schematic presentation of a steam production and distribution system
Steam flow meters are commonly used to help evaluate the performance of the steam system. They retrieve information on the boiler performance, calculate boiler efficiency, and determine the amount of steam needed by the system (U.S. DOE, 2012). In addition, their use can facilitate benchmarking the steam system and help identify opportunities for energy efficiency improvements. There are two basic steam flow meter types (Parker et al., 2015):
1. Differential pressure meters that rely on the relationship between the pressure difference through an element used in the steam flow to define steam velocity. Main types are the orifice, annubar, and spring-loaded variable.
2. Velocity meters that directly measure the velocity of the steam flow. Main types are the turbine and vortex-shedding meters. Because velocity meters directly measure the velocity of the flow, they are more accurate than differential pressure meters.
The orifice differential pressure meter is the steam meter most widely used in U.S. industry. Unfortunately, in many cases, meters are neglected and need to be recalibrated to obtain correct readings (U.S. DOE, 2005b). For accurate readings, proper maintenance is crucial. Differential pressure systems should be checked monthly for properly connected and sealed pressure taps. Annual maintenance should include a thorough checkup of the state of the orifice and pressure taps. In the case of velocity meters, annual maintenance should include checking the impeller blades and the bearings for any wear or damage (Parker et al., 2015).
Maintenance
Lack of proper maintenance can, within a period of only 2 to 3 years,
result in 20% to 30% increased energy costs.

The ENERGY STAR Distilleries Guide 63
Energy Savings Checklist: Steam Systems
Steam Systems Checklist
Are steam flow meters properly maintained? Is the whole system properly maintained? Does the burner use the proper air-to-fuel ratio? Is the system (e.g., boiler size, distribution lines) properly sized? Is waste heat recovered and reused? Are heat losses minimized? Do the steam turbines operate under optimum condition? Is the energy embodied in the pressure drop utilized?
Best Practices for Energy-Efficient Steam Systems
Steam Supply—Boiler
• Match steam demand. Use the right size boilers in the high-fire setting to improveenergy efficiency.
• Control boiler allocation. Employ automatic controllers for all boilers in systems that usemultiple boilers to shift the loads and maximize efficiency. Install automatic flow valves to shutoff unused boilers.
• Install boiler flue shutoff dampers. Reduce hot air losses by fitting fully closing stack dampers.
• Perform maintenance. Properly maintain the burner and condensate return systems to reduceenergy consumption by 10%.
• Improve insulation. Improve insulation and heater circuit controls and reduce energy use by 6%to 26%.
• Reduce fouling. Remove scale deposits built on the waterside of the boiler to improve heattransfer and reduce fuel use by up to 5%.
• Optimize boiler blowdown rate. Optimize the blowdown rate to reduce energy losses, makeupwater, and chemical treatment costs.
• Reduce excessive flue gas quantities. Repair leaks in the boiler and the flue that can lead toexcessive flue gases.
• Reduce excess air. Check the burner air-to-fuel ratio on a regular basis to reduce the amount ofwasted heat. Controlling the combustion process digitally can improve energy efficiency by3% to 5%.
• Monitor flue gas. Adopt flue gas monitoring to optimize the air-to-fuel ratio and detect scaledeposition to improve efficiency.
The ENERGY STAR Distilleries Guide 64
• Install turbulators on two- and three-pass fire-tube boilers. Place turbulators into the boilertubes to improve heat transfer and improve boiler efficiency.
• Use an economizer. Preheat boiler feedwater from flue gases in an economizer and reduce fueluse by 5% to 10%.
• Use a deaerator tank. The water thermal treatment to remove dissolved oxygen in the makeupwater will reduce the use of chemicals and the boiler blowdown rate.
• Recover heat from boiler blowdown. Use the heatfrom boiler blowdown for space heating orfeedwater preheating to improve energy efficiency.
• Recover condensate. Install a condensingeconomizer and improve overall heat recovery andsystem efficiency by up to 10%.
• Install a modulating burner on the boiler. It adjusts the flame based on steam demand.
• Consider electric boilers. If operated on renewable electricity, these reduce CO2 emissions.
• Consider once-through boilers. More efficient than standard boilers in specific circumstances, aonce-through boiler can lead to reduced fuel losses at startup, especially for boilers that arecycled often.
• Switch to more efficient and lower carbon fuels. Up to 30% reduction of CO2 emission byshifting from coal and oil to gas. Changing to (self-generated) biogas may further reduceemissions and energy costs (see also Chapter 15).
• Consider solar-powered boilers. Solar-powered boilers use the energy of the sun to directlytransfer energy to a heating medium.
Steam Supply—Combined Heat and Power (CHP)
• Gas turbines. Install a gas turbine to meet your power needs and recover the gas turbineexhaust to generate high-pressure steam or use it in heating or drying applications.
• Reciprocating engines. Use modern reciprocating engines to generate electricity and recoverthe heat from the engine exhaust, cooling water, and lubricating oil to generate steam or toheat water.
• Waste heat to power. Capture discarded process heat to generate electricity.
Steam Distribution
• Shut off excess distribution lines. Reduce steam distribution losses in a cost-effective mannerby shutting off excess lines.
• Properly size pipes. When designing new steam distribution systems, account for the velocityand pressure drop and avoid high heat losses, pressure drops, and erosion.
Reduction of excess air
As a rule of thumb, boiler efficiency can increase by 1% for each 15% reduction in excess air.
The ENERGY STAR Distilleries Guide 65
• Insulate. Reduce energy use by properly insulating the distribution system and by regularly inspecting and repairing worn insulation.
• Check and monitor steam traps. Adopt a scheme of regular steam trap checkups and followup maintenance to save up to 10% of energy. Also avoid the risk of water hammer and process low efficiency.
• Use thermostatic steam traps. Install thermostatic element steam traps and reduce energy use while improving reliability.
• Shut off steam traps. Shut off steam traps on superheated lines when not in use and save energy. Traps should be ready to work when the steam returns to distribution.
• Reduce distribution pipe leaks. Create a program of leak detection and maintenance on distribution pipes to decrease losses.
• Recover low-pressure waste steam through vapor recompression. Compress low-pressure waste steam to higher pressures so that it can be reused. Recompression will only need 5% to 10% of the energy required to raise an equivalent amount of steam in a boiler.
• Recover flash steam. Use a heat exchanger to recover the heat in flash steam to use it for space heating, feedwater preheating, or in a lower pressure steam process.
• Perform total site pinch analysis. Identify optimum site-wide utility levels by integrating the demands for heating and cooling and reduce the energy consumption by 20% to 30%.
Steam Supply—Boiler
Match steam demand
A boiler is more efficient in the high-fire setting. Since heating demands may change over time, situations can occur in which a boiler is operating beneath its optimum efficiency. Also, boilers may have been oversized because of anticipated additions or expansions that never occurred, or later, equipment may have been replaced or discarded from the boiler. Energy conservation or heat recovery measures also may have reduced heat demand. Thus, a facility may have multiple boilers, each rated at several times the maximum expected load (U.S. DOE, 2006b). Another common problem with oversized boilers is boiler “short cycling,” which occurs when an oversized boiler quickly satisfies process or space heating demands and then shuts down until the heat is again required. Fuel savings can be achieved by adding a smaller boiler to a system, sized to meet average loads at a facility, or by re-engineering the power plant to consist of multiple small boilers. Multiple small boilers offer reliability and flexibility to operators to follow load swings without over-firing and short cycling. Facilities with large seasonal variations in steam demand should operate small boilers when demand drops rather than operating large boilers year-round. Electric boilers may be ideal for this situation since these are more energy efficient than fuel-fired boilers, help to reduce onsite emissions, and fit in long-term climate goals. See “Consider electric boilers” below for more information.
The ENERGY STAR Distilleries Guide 66
Measures to run boilers on the high-fire setting have an average payback time of slightly less than 1 year. Installation of smaller boilers to increase the high-fire duty cycle has an average payback time of fewer than 2 years (IAC, 2015).
Steam accumulators can be used to supply steam load to the batch process and peak demands to allow stable operation of the steam boiler.
Control boiler allocation
Systems containing multiple boilers offer energy saving opportunities by using proper boiler allocation strategies. This is especially true if multiple boilers are operated simultaneously at low-fire conditions.
Automatic controllers determine the incremental costs (change in steam cost/change in load) for each boiler in the facility and then shift loads accordingly. This maximizes efficiency and reduces energy costs. If possible, loads should be scheduled to optimize boiler system performance.
The efficiency of hot water boilers can improve with automatic flow valves. These valves shut off boilers that are not being used, preventing hot water from the fired boiler from cooling as it passes through unused boilers in the system. Where valves are left open, the average flow temperature is lower than designed for and more fuel is used (CADDET, 2001b).
CASE STUDY Heaven Hill Distillery’s Bernheim Facility in Louisville, Kentucky, produces more than 1,500 barrels of American whiskey per day. The Bernheim Facility operates two natural gas boilers to provide steam to its distillery operations. In 2021, the Bernheim Facility installed a Data Transfer Interface (DTI) controller for the boilers. The DTI monitors boiler load usage and allows the boilers to operate on a lead-lag system. Lead-lag systems reduce the total amount of fuel consumed and increase boiler efficiency by sequencing the boilers to maintain the load at any given time, automatically taking unneeded boilers offline or to standby warming, depending on demand.
Additionally, the Bernheim Facility upgraded the Exhaust Gas Modules (EGAs) for both boilers. The EGAs sample the combustion gases in the stack and make small corrections in the air damper by adding or removing air. These corrections control the combustion of the burner and keep the volume of O2, CO2, and carbon monoxide at the commissioned values. This improves combustion, increases efficiency, reduces fuel consumption, and improves safety.
Installing the DTI and upgrading the EGAs are expected to return an estimated fuel savings of 2.78% per year.
Source: R. Nally, Manager, Environment and Sustainability, Heaven Hill Distillery, personal communication, June 23, 2021.
The ENERGY STAR Distilleries Guide 67
Install boiler flue shutoff dampers
Where boilers are regularly shut down due to load changes, heat loss to the chimney can be significant. A solution for stopping hot air loss is to fit fully closing stack dampers, which only operate when the boiler is not required. Another alternative is to fit similar gas-tight dampers to the fan intake (CADDET, 2001b). Perform maintenance
In the absence of a good maintenance system, the burners and condensate return systems can wear or go out of adjustment. These factors can end up costing a steam system up to 20% to 30% of initial efficiency over 2 to 3 years (U.S. DOE, 2001b). A simple maintenance program ensures that all components of the boiler are operating at peak performance and can result in substantial savings and reduce air pollutant emissions. On average, energy savings are estimated at 10% (U.S. DOE, 2001b). Establishing a maintenance schedule for boilers has an average payback time of 0.2 years (IAC, 2015). Improve insulation
The shell losses of a well-maintained boiler should be less than 1%. New insulation materials insulate better and have a lower heat capacity. As a result, the output temperature is more vulnerable to temperature fluctuations in the heating elements. Improved control is required to maintain the output temperature range of the old firebrick system. Savings of 6% to 26% can be achieved by combining improved insulation with improved heater circuit controls (Caffal, 1995). Reduce fouling
Fouling of the fireside of the boiler tubes and scaling waterside of the boiler should be controlled. Tests show that a soot layer of 0.03 inch (0.8 mm) reduces heat transfer by 9.5%, while a 0.18-inch (4.5-mm) layer reduces heat transfer by 69% (CIPEC, 2001). Scale deposits occur when calcium, magnesium, and silica, commonly found in most water supplies, react to form a continuous layer of material on the waterside of the boiler heat exchange tubes. Tests show that for water-tube boilers, 0.04 inch (1 mm) of buildup can increase fuel consumption by 2% (CIPEC, 2001). In fire-tube boilers, scaling can lead to fuel waste of up to 5% (U.S. DOE, 2006b). Moreover, scaling may result in tube failures. Scale removal can be achieved by mechanical means or acid cleaning. The presence of scale can be indicated by the flue gas temperature (see Chapter 9: Monitor flue gas) or be determined by visual inspection of the boiler tubes when the unit is shut down for maintenance. Fouling and scaling are more of a problem with coal-fed boilers than natural gas or oil-fed units. Boilers that burn solid fuels like coal should be checked more often as they have a higher fouling tendency than liquid fuel boilers (U.S. DOE, 2006b). Optimize the boiler blowdown rate
Insufficient blowdown may lead to carryover of boiler water into the steam or the formation of deposits. Excessive blowdown wastes energy, water, and chemicals. The optimum blowdown rate is determined by various factors, including the boiler type, operating pressure, water treatment, and quality of the makeup water.
The ENERGY STAR Distilleries Guide 68
Blowdown rates typically range from 4% to 8%, depending on the boiler feedwater flow rate; however, it can be as high as 10% when makeup water has a high solids content (U.S. DOE, 2006b). Minimizing the blowdown rate can substantially reduce energy losses, makeup water, and chemical treatment costs. The reduction of the blowdown rate has an average payback time of less than 1 year (IAC, 2015). Optimum blowdown rates can be achieved with an automatic blowdown control system. In many cases, the savings due to such a system can provide a simple payback of 1 to 3 years (U.S. DOE, 2006b). Reduce excessive flue gas quantities
Often, excessive flue gas results from leaks in the boiler and the flue, reducing the heat transferred to the steam and increasing pumping requirements. These leaks are often easily repaired. This measure consists of a periodic repair based on visual inspection or on flue gas monitoring, which is discussed below. Reduce excess air
The more air used to burn the fuel, the more heat that is wasted unnecessarily heating the excess air. However, too little air may cause higher combustion temperatures, leading to NOx emissions. The most efficient air-to-fuel ratio would depend on the type of fuel and air density. Poorly maintained boilers can have up to 140% excess air, leading to excessive amounts of waste gas. An efficient natural gas burner requires 2% to 3% excess oxygen, or 10% to 15% excess air in the flue gas to burn fuel without forming carbon monoxide. A rule of thumb is that boiler efficiency can be increased by 1% for each 15% reduction in excess air (U.S. DOE, 2006b). The air-to-fuel ratios of the burners should be checked regularly. On average, the analysis and adjustment of a proper air-to-fuel ratio had a payback time of 0.6 year. An efficient burner provides the proper air-to-fuel ratio throughout the full range of firing rates, without constant adjustment. Traditionally, this mixture was controlled using linkages or cables to position the air and fuel valves. These are subject to wear, repeatability difficulties, and a limited amount of adjustment. Modern burners are an alternative to complex linkage designs and are increasingly using servomotors with parallel positioning to independently control the quantities of fuel and air delivered to the burner head. These controls provide consistent performance and repeatability as the burner adjusts to different firing rates (U.S. DOE, 2006b). Implementing a digital system results in greater control of the combustion process and leads to an improvement in energy efficiency of 3% to 5% (CADDET, 2001b). Replacement of inefficient obsolete burners averages a payback period of about 2 years (IAC, 2015). Using a combination of carbon monoxide and oxygen readings, it is possible to optimize the air-to-fuel ratio for a high flame temperature (and thus the best energy efficiency) and low emissions (see Chapter 9: Monitor flue gas). See the case study above on Heaven Hill Distillery’s Bernheim Facility where the Exhaust Gas Modules were upgraded.
The ENERGY STAR Distilleries Guide 69
Monitor flue gas
The oxygen content of exhaust gas is a combination of excess air (which is deliberately introduced to improve safety or reduce emissions) and air infiltration (air leaking into the boiler). By combining an oxygen monitor with an intake airflow monitor, it is possible to detect small leaks. Using a combination of carbon monoxide and oxygen readings, it is possible to optimize the air-to-fuel mixture for a high flame temperature, best energy efficiency, and low emissions. The payback of installing flue gas analyzers to determine proper air-to-fuel ratios, on average, is about 0.6 year (IAC, 2015).
Monitoring flue gas temperature also can help to indicate scaling since the flue gas temperature is an indirect indicator of scale or deposit formation. If the flue gas temperature rises (with boiler load and excess air held constant), the effect is likely due to the presence of scale.
The percentage of oxygen in the flue gas can be measured by inexpensive gas-absorbing test kits. More expensive handheld, computer-based analyzers (ranging in cost from $500 to $1,000) display the percentage of oxygen, stack gas temperature, and boiler efficiency. They are a recommended investment for any boiler system with annual fuel costs exceeding $50,000 (U.S. DOE, 2006b).
Install turbulators on two- and three-pass fire-tube boilers
The packaged fire-tube boiler is the most common boiler design used to provide heating or process steam in industrial and heavy commercial applications. In a fire-tube boiler, hot combustion gases pass through long, small-diameter tubes where heat is transferred to the water through the tube walls. These gases enter the tubes in a turbulent flow regime. Within a few feet, laminar flow begins and a boundary layer of cooler gas forms along the tube walls. This layer serves as a barrier, retarding heat transfer. Turbulators, which consist of small baffles, angular metal strips, spiral blades, or coiled wire, may be inserted into the boiler tubes to break up the laminar boundary layer (U.S. DOE, 2006b). This increases the turbulence of the hot combustion gases and convective heat transfer to the tube surface. The result is improved boiler efficiency. Turbulator installers also can balance gas flow through the tubes by placing longer turbulators in the uppermost tubes. This practice increases the effectiveness of the available heat-transfer surface by eliminating thermal stratification and balancing the gas flow through the fire tubes.
The cost of installing turbulators is about $10 to $15 per boiler tube and the average payback time is 1 year (IAC, 2015). A manufacturing facility installed 150 turbulators into its fire-tube boiler. Tests conducted both before and after turbulator installation indicated a reduction in the stack gas temperature of 130°F (55°C). More combustion heat was being transferred into the boiler water. Each 40°F (22°C) reduction in the boiler flue gas temperature results in a 1% boiler efficiency improvement, so overall boiler efficiency was improved by about 3.3%, while fuel costs decreased by approximately 4%.
The ENERGY STAR Distilleries Guide 70
Use an economizer
The heat from flue gases can be used to preheat boiler feedwater in an economizer. By preheating the water supply, the temperature of the water at the inlet to the boiler is increased, reducing the amount of heat necessary to generate steam and save fuel. While this measure is fairly common in large boilers, there often is the potential to increase heat recovery. The limiting factor for flue gas heat recovery is the economizer wall temperature that should not drop below the dew point of acids in the flue gas. Traditionally, this is done by keeping the flue gases at a temperature significantly above the acid dew point. However, the economizer wall temperature is more dependent on the feedwater temperature than on the flue gas temperature because of the high heat transfer coefficient of water. Thus, it makes more sense to preheat the feedwater to close to the acid dew point before it enters the economizer. This allows the economizer to be designed so that the flue gas exiting the economizer is just above the acid dew point. Generally, boiler efficiency can be increased by 1% for every 40°F (22°C) reduction in flue gas temperature. By recovering waste heat, an economizer often can reduce fuel requirements by 5% to 10% and pay for itself in less than 2 years (U.S. DOE, 2006b).
Use a deaerator tank
A feed tank is the meeting place for cold makeup water and condensate return. The makeup water, as it is cold, absorbs free oxygen and other gases that are liberated when heated. It is essential to remove the dissolved oxygen before it is released in the boiler to prevent corrosion. Oxygen in feedwater can be “driven off” by heating and “absorbed” by chemical treatment. By heating the feedwater, typically to 185°F (85°C), to remove the bulk of the oxygen, the amount of scavenging chemicals required can be reduced by up to 75%. This also can improve boiler efficiency by reducing the blowdown requirements. Also, it is possible to use a deaerator head that mixes the cold makeup water with its high oxygen content with the flash steam from the condensate and blowdown heat recovery. Oxygen and other gases are liberated from the cold water and can be removed from the system through a vent before
CASE STUDY Harpoon Brewery in Windsor, Vermont, hosted an Energy Treasure Hunt to highlight actions that could save money and energy. Boilers and steam systems presented several opportunities. Harpoon installed a heat stack recovery system on top of the exhaust pipe to transfer waste heat to boiler makeup water. This system allowed the brewery to increase the inflow water temperature by 20°F to 30°F (-6.6°C to -1.1°C), which meant that less fuel was needed to prepare the boiler water. One decision that Harpoon made before installing the system was to ensure that the stack temperature would not become too low, which could result in condensation in the stack and subsequent corrosion problems. Source: Scott Shirley, formerly Harpoon Brewery, and Al Marzi, Harpoon Brewery, personal communication, July 2021.
The ENERGY STAR Distilleries Guide 71
entering the tank. The benefits are that dissolved oxygen entering the boiler is kept as low as possible, chemical dosing costs are kept to a minimum, there is high and steady feedwater temperature to the boiler, and maximum use of heat in the condensate return and from blowdown heat recovery (Spirax Sarco, 2001). Recover heat from boiler blowdown
When the water is blown from the high-pressure boiler tank, the pressure reduction often produces substantial amounts of steam. Up to 80% of the heat in the discharge is recoverable by using flash vessels and heat exchangers (CADDET, 2001b). The recovered heat can subsequently be used for space heating and feedwater preheating, increasing the efficiency of the system. Any boiler with continuous blowdown exceeding 5% of the steam rate is a good candidate for the introduction of blowdown waste heat recovery. If there is a non-continuous blowdown system, then consider the option of converting it to a continuous blowdown system coupled with heat recovery (U.S. DOE, 2006b). Larger energy savings occur with high-pressure boilers. The use of heat from boiler blowdown, on average, has a payback period of about 1.5 years (IAC, 2015). Recover condensate
By installing a condensing economizer, companies can improve overall heat recovery and steam system efficiency by up to 10% (U.S. DOE, 2007a). Many boiler applications can benefit from additional heat recovery. Condensing economizers require site-specific engineering and design, and a thorough understanding of the effect they will have on the existing steam system and water chemistry. Hot condensate can be returned to the boiler to save energy and reduce the need for treated boiler feedwater since condensate, being condensed steam, is extremely pure and has high heat content. Increasing the amount of returned condensate has an average payback period of about 1 year (IAC, 2015). Condensate also has been used to provide for hot water supply. This measure had an average payback period of 0.7 year (IAC, 2015). Care should be taken to prevent the forming of corrosion. Corrosion in condensate systems can limit the quality or quantity of returned condensate, may contain iron and copper corrosion products, and can deposit the corrosion products on boiler heat transfer surfaces, reducing heat transfer efficiency. In addition, corrosion may cause steam leaks, increasing maintenance and equipment costs. Condensate return will reduce water, chemicals, and fuel consumption by recovering water and heat and reducing chemical treatment needs and blowdown rate.
Install a modulating burner on the boiler
Boilers do not always run at full capacity. A typical steam boiler fires up when the pressure drops below the setpoint, meaning that more steam is needed, and it fires down once the setpoint threshold has been reached. The burner is either fully on or fully off. But every time the burner is ignited or extinguished, there is a loss of efficiency. A modulating burner adjusts the flame based on steam demand rather than being either fully on or off; the burner monitors the rate at which the pressure changes and adjusts the amount of fuel accordingly. As pressure equalizes, it provides just enough fuel to maintain a constant pressure. Modulating burners will not fix an undersized boiler, but they allow

The ENERGY STAR Distilleries Guide 72
boilers to be more efficient during periods of low demand. The burner itself also does not require more room nor a complete retrofit of the boiler.
Consider electric boilers
Electric boilers are highly efficient, often reaching 95% efficiency. The two main types of electric boilers use either resistance heating or electrode heating, where the current is passed through the water. Induction and infrared also can be used but are available for small-scale applications only. Typical capacities of electric boilers are up to 5 MWe, while electrode boilers can have capacities up to 70 MWe, producing hot water or (superheated) steam (up to 660°F [350°C]). In combination with heat storage, electric boilers can take advantage of low off-peak power rates. Electric boilers are very reliable, need limited maintenance, emit no air pollutants, and have lifetimes of at least 15 years. Many suppliers sell electric boilers for varying capacities and steam qualities.
Consider once-through boilers
In once-through boilers, water passes from the liquid to the vapor stage without the use of a steam drum. The removal of the steam drum enables the boiler to operate at supercritical pressures and much higher steam temperatures than with drum-type boilers, resulting in significantly improved unit efficiency (Lindsley et al., 2018). More efficient than flue boilers, it reduces the loss when boilers startup and are low loading.
CASE STUDY Diageo has a commitment of net zero emissions across its operations by 2030. Its 72,000-square-foot whiskey distillery in Lebanon, Kentucky, uses electric boilers and is the first large carbon-neutral U.S. distillery. The site is powered by 100% renewable electricity (by 2030), with a capacity to produce up to 10 million proof gallons per year, avoiding more than 117,000 metric tons of annual carbon emissions.
Creating heat through a boiler to support mashing, distilling, and grain drying is the new plant’s largest source of onsite energy and GHG emissions. Instead of a traditional fuel-fired boiler, the facility uses 22-foot-tall high-voltage jet electrode boilers. Aside from not using fossil fuels, electric boilers require less maintenance, can be turned off completely, and can be powered up very quickly. This helps make electric boilers more efficient.
Source: Klein, J. (2020). Electric boilers fuel Diageo’s carbon-neutral whiskey distillery dream. Greenbiz. www.greenbiz.com/article/electric-boilers-fuel-diageos-carbon-neutral-whiskey-distillery-dream
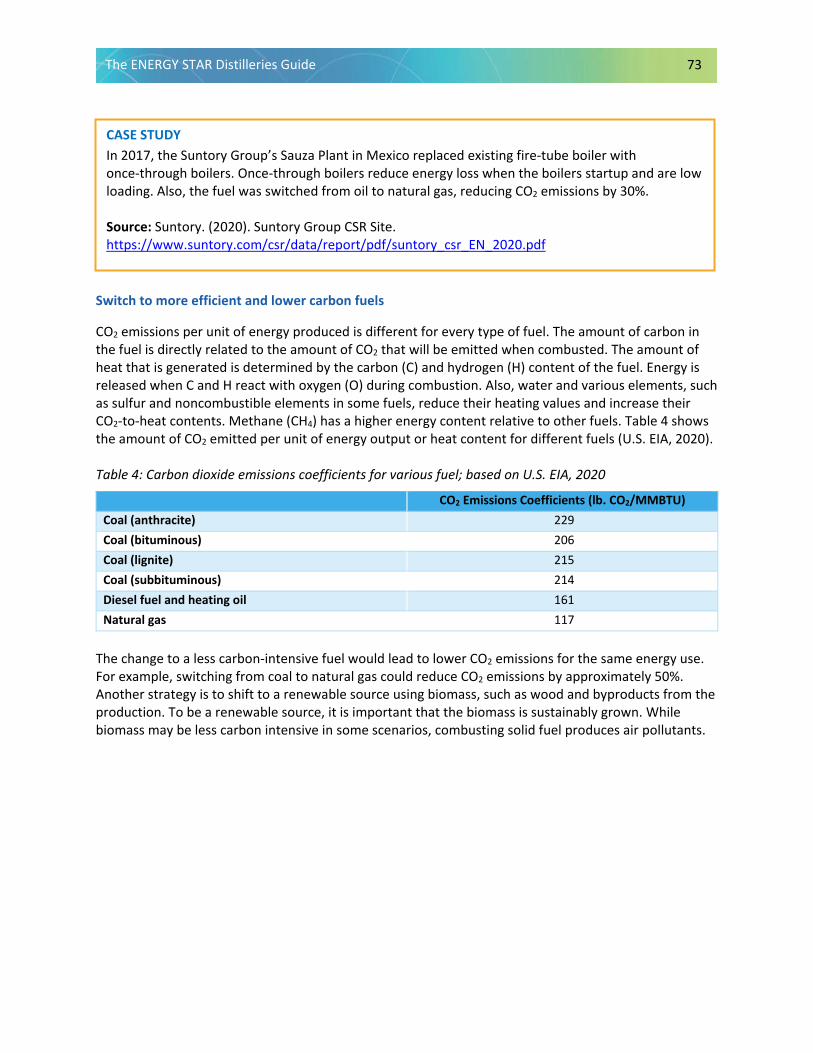
The ENERGY STAR Distilleries Guide 73
Switch to more efficient and lower carbon fuels
CO2 emissions per unit of energy produced is different for every type of fuel. The amount of carbon in the fuel is directly related to the amount of CO2 that will be emitted when combusted. The amount of heat that is generated is determined by the carbon (C) and hydrogen (H) content of the fuel. Energy is released when C and H react with oxygen (O) during combustion. Also, water and various elements, such as sulfur and noncombustible elements in some fuels, reduce their heating values and increase their CO2-to-heat contents. Methane (CH4) has a higher energy content relative to other fuels. Table 4 shows the amount of CO2 emitted per unit of energy output or heat content for different fuels (U.S. EIA, 2020). Table 4: Carbon dioxide emissions coefficients for various fuel; based on U.S. EIA, 2020
CO2 Emissions Coefficients (lb. CO2/MMBTU) Coal (anthracite) 229 Coal (bituminous) 206 Coal (lignite) 215 Coal (subbituminous) 214 Diesel fuel and heating oil 161 Natural gas 117
The change to a less carbon-intensive fuel would lead to lower CO2 emissions for the same energy use. For example, switching from coal to natural gas could reduce CO2 emissions by approximately 50%. Another strategy is to shift to a renewable source using biomass, such as wood and byproducts from the production. To be a renewable source, it is important that the biomass is sustainably grown. While biomass may be less carbon intensive in some scenarios, combusting solid fuel produces air pollutants.
CASE STUDY In 2017, the Suntory Group’s Sauza Plant in Mexico replaced existing fire-tube boiler with once-through boilers. Once-through boilers reduce energy loss when the boilers startup and are low loading. Also, the fuel was switched from oil to natural gas, reducing CO2 emissions by 30%. Source: Suntory. (2020). Suntory Group CSR Site. https://www.suntory.com/csr/data/report/pdf/suntory_csr_EN_2020.pdf

The ENERGY STAR Distilleries Guide 74
Another opportunity that supports fuel switching is onsite anaerobic digestion. Spent grain and stillage from distilleries, rather than being processed as animal feed or sent wet to nearby farms, can be digested to produce a fuel that could be used in the distillery. This topic is further discussed in Chapter 15.
Consider solar-powered boilers
Solar-powered boilers use concentrated solar power (CSP) to generate steam. CSP uses mirrors or lenses to concentrate a large area of sunlight onto a receiver and generate heat. The payback is between 3 and 8.5 years, depending on the fuel that solar is replacing. The applicability of this technology depends on the direct irradiation of solar light. Hence, this technology would be more applicable in areas with high direct irradiation (e.g., in the U.S. Southwest).
CASE STUDY Bacardi installed biomass boilers at their Tequila Cazadores® facility in Mexico and Aberfeldy® and Royal Brackla® Scotch whisky distilleries, which use wood pellets, chips, or leftover agave fibers instead of oil to produce reliable, cleaner energy.
The Cazadores facility was able to meet 60% of its thermal demand just from biomass waste generated at their site. Dewar’s Aberfeldy Distillery was able to cut its carbon emissions by 90% with their biomass boiler.
While biomass boilers have helped reduce emissions during the heating process, the company also has focused on renewable electricity from wind turbines and heat recovery systems at operations sites.
Source: Federman, A., and J. Gallagher. (2016). Tequila Cazadores® Biomass Boiler Cuts Distillery’s Carbon Footprint. Bacardi Limited. www.bacardilimited.com/media/news-archive/tequila-cazadores-biomass-boiler-cuts-distillerys-carbon-footprint/ John Dewars and Sons. (2015). Scotch Distillery reduces carbon footprint with biomass boiler. Biomass Limited. http://biomassmagazine.com/articles/12206/
CASE STUDY Four Fathers Distillery, Jacksonville, Florida, founded in 2015, uses solar energy to generate steam instead of gas or electric power. They use external compound parabolic concentrator thermal collectors to produce heat up to 400°F (204°C). They have a backup system of two gas-powered boilers for when the sun is not shining.
Source: Rivers, B. (2019). Sun-Powered Booze: Local Distillery Installs Solar Tech Made In Jacksonville. WJCT News. news.wjct.org/post/sun-powered-booze-local-distillery-installs-solar-tech-made-jacksonville
The ENERGY STAR Distilleries Guide 75
Steam Supply—Combined Heat and Power (CHP)
CHP is an efficient and clean approach to generating electric power and useful thermal energy from a single fuel source. CHP is used either to replace or supplement conventional separate heat and power. Instead of purchasing electricity from the local utility and burning fuel in an onsite furnace or boiler to produce thermal energy, facilities can use CHP onsite to provide both energy services in one energy-efficient process. In this way, and by avoiding distribution losses, CHP can achieve total efficiencies of more than 80%, compared with 50% for conventional technologies (i.e., grid-supplied electricity and an onsite boiler). Applications with a steady demand for electricity and thermal energy are potentially good economic targets for CHP deployment. Industrial applications, particularly in industries with continuous processing and high steam requirements, tend to be the most economical and represent most existing CHP capacity (U.S. EPA, 2015). Properly sized and configured CHP systems can effectively insulate facilities from a grid failure, providing continuity of critical operations. The design elements necessary so that a CHP system can be isolated from the grid (i.e., operate in “island” mode) are system specific and include additional controls and switchgear equipment (ORNL, 2013). The cost benefits of power exported to the grid will depend on regulations where the industry is located but can provide a major economic incentive. Not all states allow wheeling of power (i.e., sales of power directly to another customer using the grid for transport), and for the states that do allow wheeling, regulations also may differ with respect to the tariff structure for power sales to the grid operator. Most CHP systems consist of several individual components—prime mover (heat engine), generator, heat recovery, and electrical interconnection—configured into an integrated system. The type of equipment that drives the overall system (i.e., the prime mover) typically identifies the CHP system (U.S. EPA, 2015). Five technologies are represented by 95% of the CHP projects in place today and 99% of the total installed CHP electric capacity. These technologies are reciprocating engines, gas turbines (including gas turbine/steam turbine combined cycles), boiler/steam turbine, microturbine, and fuel cells (U.S. EPA, 2015). CHP systems are classified either as topping cycle or bottoming cycle CHP. In topping cycle CHP systems, fuel is used to generate electricity. Waste heat from the prime mover is then recovered and used for steam, hot water, process heating, and/or cooling applications. In bottoming cycle CHP systems, high-temperature thermal energy is first used for industrial applications, such as metal smelting furnaces, and the waste heat is then recovered and used to drive a turbine to produce electric power. The technology choice (see info.ornl.gov/sites/publications/files/Pub13655.pdf) for a CHP facility depends on available fuel and the amount of generating capacity needed (EIA, 2012). To be concise, this section provides only a quick overview of CHP applications and technologies used in distilled spirits production. For more information on CHP systems, the reader is referred to Oland (2004).
The ENERGY STAR Distilleries Guide 76
Gas turbines
Gas turbines are used to meet many different power needs, including propulsion, direct-drive, and stationary electricity generation. Gas turbines are well suited for industrial CHP applications because the high-temperature gas turbine exhaust can be used to generate high-pressure steam, or it can be used directly for heating or drying applications. Some industrial CHP systems use gas turbine exhaust to heat the input of a furnace or to preheat combustion air. This option may require replacing existing furnaces since the radiative heat transfer from gas turbine exhaust gases is much smaller than from combustion gases due to their lower temperature (Worrell et al., 1997). Gas turbines can range from 1 MW to hundreds of megawatts, and they can be utilized as simple cycle turbines or as part of a combined cycle where recovered steam is used to power a secondary steam turbine. Some recent designs use a Cheng cycle that injects steam directly into the gas turbine to boost power output. Electric efficiencies for simple cycle gas turbines can approach 40% high heating value (HHV); however, efficiency degrades quickly as the load is decreased, so gas turbines are best suited for applications where the system operates at near-constant full load. Given the size of most distilleries, only CHP systems based on (micro-) gas turbines would be a good fit. Reciprocating engines
There are two primary reciprocating engine designs relevant to stationary power generation applications—the spark ignition Otto cycle engine and the compression ignition diesel cycle engine. For baseload power and CHP applications, spark ignition natural gas-fueled engines tend to be used, with capacities ranging from 10 kW to 10 MW. Reciprocating engines represent more than 50% of all installed CHP systems, with engines fueled by natural gas and other gaseous fuels accounting for most of the installed capacity. Modern reciprocating engines are some of the most efficient CHP technologies, reaching more than 40% electric efficiency and 80% total CHP efficiency (HHV). Thermal energy can be recovered from three sources: (1) engine exhaust, (2) cooling water, and (3) lubricating oil. Steam can be produced from the exhaust of some larger engines; however, thermal energy from cooling water and lubricating oil can only be used to produce hot water (or chilled water with an absorption chiller).
CASE STUDY Beam Suntory’s Segovia distillery in Spain uses natural gas to fuel a CHP plant. The heat and electricity produced are used in the distillation process, while excess electrical power is sold to the local power company. The cogeneration plant has been shown to be 30% more efficient than when heat and electricity are produced separately. Source: Suntory. (2020). Suntory Group CSR Site. https://www.suntory.com/csr/data/report/pdf/suntory_csr_EN_2020.pdf
The ENERGY STAR Distilleries Guide 77
Waste heat to power
Waste heat to power (WHP) is the process of capturing heat discarded by an existing industrial process and using that heat to generate power (U.S. EPA, 2012). Waste heat streams can be used to generate power in what is called bottoming cycle CHP. In this configuration, fuel is first used to provide thermal energy in an industrial process, such as a furnace, and the waste heat from that process is then used to generate power. The key advantage of this type of WHP system is that waste heat utilization, which would otherwise be wasted, is used to produce electricity or mechanical power instead of purchasing power. Most WHP systems use the Rankine cycle, either with steam or with an organic fluid when the waste heat source has a lower boiling point. The latter is called the Organic Rankine Cycle (ORC). A Rankine cycle normally operates with water and therefore a steam temperature in the range of 265°F to 355°F (130°C to 180°C), but can be used at temperatures as low as 140°F to 160°F (60°C to 70°C) (SWEP, 2019). Payback will depend on local power prices and alternative uses of the waste heat. An ORC turbine was used in a rum distillery as a steam load management device to benefit from the steam that would have been vented when distillation is not taking place (FDT, 2020).
Steam Distribution
Shut off excess distribution lines
Installations and steam demands change over time, which may lead to under-utilization of steam distribution capacity and extra heat losses. It may be too expensive to optimize the system for changed steam demands. Still, checking for excess distribution lines and shutting off those lines is a cost-effective way to reduce steam distribution losses.
Properly size pipes
When designing new steam distribution systems, it is very important to account for the velocity and pressure drop. This reduces the risk of oversizing a steam pipe, which is not only a cost issue but would also lead to higher heat losses. A pipe that is too small may lead to erosion and increased pressure drop (Van de Ruit, 2000).
Insulate
Insulation can typically reduce energy losses by 90% and help ensure the proper steam pressure for plant equipment (U.S. DOE, 2006b). The application of insulation can lead to significant energy cost savings with relatively short payback periods. For example, the average payback period of insulation on steam and hot water lines, condensate lines, and feedwater tanks is about 1 year (IAC, 2015). The improvement of existing insulation can often lead to further savings. This measure consists of applying more or better insulating material. Crucial factors in choosing insulating material include low thermal conductivity, dimensional stability under temperature change, resistance to water absorption, and resistance to combustion. Other characteristics of insulating material may also be important, depending on the application (e.g., tolerance of large temperature variations and system vibration, compressive strength where insulation is load-bearing) (Baen and Barth, 1994).
Some types of insulation can become brittle or rot. As a result, energy can be saved by a regular inspection and maintenance program (CIBO, 1998). The repair of faulty insulation has an average payback time of 0.4 year (IAC, 2015).
The ENERGY STAR Distilleries Guide 78
During maintenance, insulation that covers pipes, valves, and fittings are often damaged or removed and not replaced. This can be avoided by using removable and reusable insulating pads, which are available to cover almost any surface (U.S. DOE, 2006b). Check and monitor steam traps
Steam traps capture condensate while keeping the steam in the piping. Sometimes the valves in the trap will get stuck or fail, resulting in steam and the money used to create the steam running down the drain. Steam trap performance can be assessed by observing the temperatures at different parts of the trap. If both the steam and condensate sides of the trap are the same temperature there is a problem: The trap is either stuck open and blowing steam or is not in operation. A simple laser thermometer or an infrared camera can be used to observe any temperature differentials across the trap. A program of checking steam traps to ensure proper operation can save significant amounts of energy. If the steam traps are not maintained for 3 to 5 years, 15% to 30% of the traps can be malfunctioning, thus allowing live steam to escape into the condensate return system. In systems with a regularly scheduled maintenance program, leaking traps should account for less than 5% of the trap population (U.S. DOE, 2006b). The repair and replacement of steam traps have an average payback time of about 0.4 year (IAC, 2015). Energy savings for a regular system of steam trap checks and followup maintenance is estimated to be up to 10% (Jones, 1997; Bloss et al., 1997). Attaching automated monitors to steam traps in conjunction with a maintenance program can save even more energy without significant added costs. Such a system is an improvement over steam trap maintenance alone because it gives quicker notice of steam trap malfunctioning or failure. Using automatic monitoring is estimated to save an additional 5% over regular steam trap maintenance, with a payback of about 1 year.
CASE STUDY Harpoon Brewery in Windsor, Vermont, hosted an Energy Treasure Hunt to help illuminate activities they could do to help save money on energy. Boilers and steam systems presented several opportunities. As steam travels from the boiler to the mash tun and kettle, some steam will condense. In 2016, Harpoon had around 20 steam traps throughout their Middlebury brewery. They used a Fluke infrared camera to identify the temperatures of different parts of the trap. They found several malfunctioning traps that they were able to fix relatively quickly. The utility provided the brewery with a report and steps they could follow to check steam traps on their own. Harpoon incorporated these steps into the maintenance protocols they conduct regularly. Source: Scott Shirley, formerly Harpoon Brewery, and Al Marzi, Harpoon Brewery, personal communication, July 2021.
The ENERGY STAR Distilleries Guide 79
Use thermostatic steam traps
Using modern thermostatic element steam traps can reduce energy use while improving reliability. The main advantages offered by these traps are that they open when the temperature is close to that of the saturated steam (within 0.6°F [2°C]), purge non-condensable gases after each opening, and are open on startup to allow a fast steam system warm-up. These traps also are very reliable and useful for a large range of steam pressures (Alesson, 1995). Energy savings will vary depending on the steam traps installed and the state of maintenance.
Examples of thermostatic traps are pinch traps. In these traps, a modulator automatically closes off flow as a chemically resistant elastomer around the modulator expands with the passage of hot condensate. As the condensate builds up and cools, the elastomer around the modulator contracts, allowing the orifice to open and create flow. It automatically responds to condensate temperature, has no live steam losses, and uses energy in the steam line at maximum efficiency (Kane et al., 1998).
Shut off steam traps
Energy savings can come from shutting off steam traps on superheated steam lines when they are not in use. This measure has an immediate payback (IAC, 2015).
Reduce distribution pipe leaks
As with steam traps, the distribution pipes themselves often have leaks that go unnoticed without a program of regular inspection and maintenance. On average, leak repair has a payback period of 0.3 year (IAC, 2015).
Recover low-pressure waste steam through vapor recompression
Low-pressure steam exhaust from industrial operations is usually vented to the atmosphere or condensed in a cooling tower. Simultaneously, other plant operations may require intermediate-pressure steam at 20 to 50 psi. Instead of letting down high-pressure steam across a throttling valve to meet these needs, low-pressure waste steam can be mechanically compressed or boosted to a higher pressure so that it can be reused. Recovery of the latent heat content of low-pressure steam reduces the boiler load, resulting in energy and fuel cost savings. Low-pressure steam potential uses include driving evaporation and distillation processes, producing hot water, space heating, producing a vacuum, or chilling water.
Vapor recompression relies on a mechanical compressor or steam jet ejector to increase the temperature of the latent heat in steam to render it usable for process duties. It is noted that the steam jet ejector is known for its simple construction, insensitivity to fouling, easy installation, low capital and installation costs, easy maintenance with no moving parts, and long useful operating lives.
Recompression typically requires only 5% to 10% of the energy required to raise an equivalent amount of steam in a boiler. Vapor recompression can be used in steam distribution systems to boost system pressures that have dropped to unacceptably low levels (U.S. DOE, 2006b).
The ENERGY STAR Distilleries Guide 80
Recover flash steam
When a steam trap purges condensate from a pressurized steam distribution system to ambient pressure, flash steam is produced. Depending on the pressures involved, the flash steam contains approximately 10% to 40% of the energy content of the original condensate. This energy can be recovered by a heat exchanger and used for space heating or feedwater preheating (Johnston, 1995; U.S. DOE, 2006b). The potential for this measure is site-dependent, as it is unlikely that a plant will build an entirely new system of pipes to transport this low-grade steam unless it can be used close to the steam traps. Sites using multi-pressure steam systems can route the flash steam formed from high-pressure condensate to reduced pressure systems. The flashing of high-pressure condensate can regenerate low-pressure steam. Low-pressure process steam requirements are usually met by throttling high-pressure steam; however, a portion of the process requirements can be achieved at a low cost by flashing high-pressure condensate. Flashing is particularly attractive when it is not economically feasible to return the high-pressure condensate to the boiler. The economics of heat recovery projects are most favorable when the waste steam heat content is high and the flow continuous. Seasonal space heating is not the most desirable end use. Flashing of high-pressure condensate to regenerate low-pressure steam has an average payback period of 0.7 year (IAC, 2015).
Perform total site pinch analysis
Process integration, or pinch analysis, refers to the exploitation of potential synergies that are inherent in any system that consists of multiple components working together. In plants that have multiple heating and cooling demands, the use of process integration techniques can significantly improve efficiencies. Developed in the early 1970s, process integration is now an established methodology for continuous processes (Linnhoff et al., 1992). The methodology involves the linking of hot and cold streams in a process in the thermodynamic optimal manner (i.e., not over the so-called “pinch”). Process integration is the art of ensuring that the components are well suited and matched in terms of size, function, and capability. Pinch analysis takes a systematic approach to identifying and correcting the performance-
CASE STUDY A major Scottish distillery that produces around 10.6 million liters of alcohol per year has cut the energy consumption per unit of alcohol production by around 3.5%. A flash steam recovery system was installed that uses a separator vessel to divide the flash steam and the condensate. Then, two plate heat exchangers capture the heat in the flash steam and the condensate. The energy recovered is used to preheat the boiler feedwater, raising the temperature in the boiler feed tank by between 68°F to 86°F (20°C to 30°C) and reducing by a corresponding amount the heat that the boiler has to achieve. The estimated savings are around £50,000 per year, considering the increase in the price of gas. It was estimated that the entire system will deliver a payback of around 18 months. Source: Spirax Sarco. (2020). Flash steam recovery savings top £50,000 per year at Scottish distillery. www.spiraxsarco.com/global/en-GB/case-studies/scottish-distillery

The ENERGY STAR Distilleries Guide 81
limiting constraint (or pinch) in any manufacturing process (Kumana, 2000a). Since its development, the pinch approach has been extended to resource conservation in general, whether the resource is capital, time, labor, electrical power, water, or a specific chemical compound or element, such as hydrogen (in refineries). The critical innovation in applying pinch analysis was the development of “composite curves” for heating and cooling, which represent the overall thermal energy demand and availability profiles for the process as a whole. When these two curves are drawn on a temperature enthalpy graph, they reveal the location of the process pinch (the point of closest temperature approach) and the minimum thermodynamic heating and cooling requirements. These are called the energy targets. The methodology involves first identifying the targets, and then following a systematic procedure for designing heat exchanger networks to achieve these targets. The optimum approach temperature at the pinch is determined by balancing the capital versus energy tradeoffs to achieve the desired payback. The procedure applies equally well to new designs, as well as to the retrofit of existing plants. The analytical approach to this analysis has been well documented in the literature (Kumana, 2000b; Smith, 1995; Shenoy, 1994). Energy savings potential using pinch analysis far exceeds that from well-known conventional techniques such as heat recovery from boiler flue gas, insulation, and steam trap management. Kumana (2000b) has reviewed pinch analyses in almost 60 U.S. plants and found cost savings potentials varying between 3% and 50%, and payback periods ranging from 0.6 to 4.7 years. A process energy analysis of the Valaisanne brewery (Switzerland) using pinch analysis techniques identified primary energy savings of 25% (Helbing, 2000). Ontario Hydro (Canada) noted that the use of pinch technology to reduce the refrigeration load in a brewery was able to cut peak load by 35%, saving nearly $600,000 annually (Singleton, 2000).

The ENERGY STAR Distilleries Guide 82
Chapter 10: Lighting In this chapter: Turn off lights in unoccupied areas Use occupancy sensors and other lighting controls Upgrade exit signs Replace magnetic ballasts with electronic ballasts Replace T-12 tubes with T-8/T-5 tubes Use LED lighting Reduce lighting system voltage Replace mercury lights with metal halide or high-pressure sodium Replace metal halide HID with high-intensity fluorescent lights
Use daylighting
Lighting is used either to provide overall ambient lighting throughout the manufacturing, storage, and office spaces or to provide low bay and task lighting to specific areas. High-intensity discharge (HID) sources are used for the former, including metal halide, high-pressure sodium, and mercury vapor lamps. Fluorescent, compact fluorescent (CFL), and incandescent lights are typically used for task lighting in offices.
Energy Savings Checklist: Lighting
Lighting corresponds to significant energy use and cost for many manufacturers and is an area with numerous opportunities for savings. Use the checklist below to find new ways to save energy and costs with lighting changes.
Lighting Checklist
Are unoccupied areas lit? Are lights left on during non-work hours? Are parts of the facility overlit? Can existing technology be made more energy efficient? Are exit lights using old technology? Can daylighting be used? Are the lighting controls in use? Is there a periodic review of lighting technology to ensure that the most efficient technology is in use?
Opportunities for Energy Efficiency
There are many options and choices for providing appropriate lighting for specific settings. When the opportunity to install new or replace and upgrade existing lighting presents itself, understanding the various energy requirements, lifetime, uses, and so forth for the numerous types of lighting sources can be an important part of energy management and savings in a manufacturing facility. Table 5 compares the lighting sources.
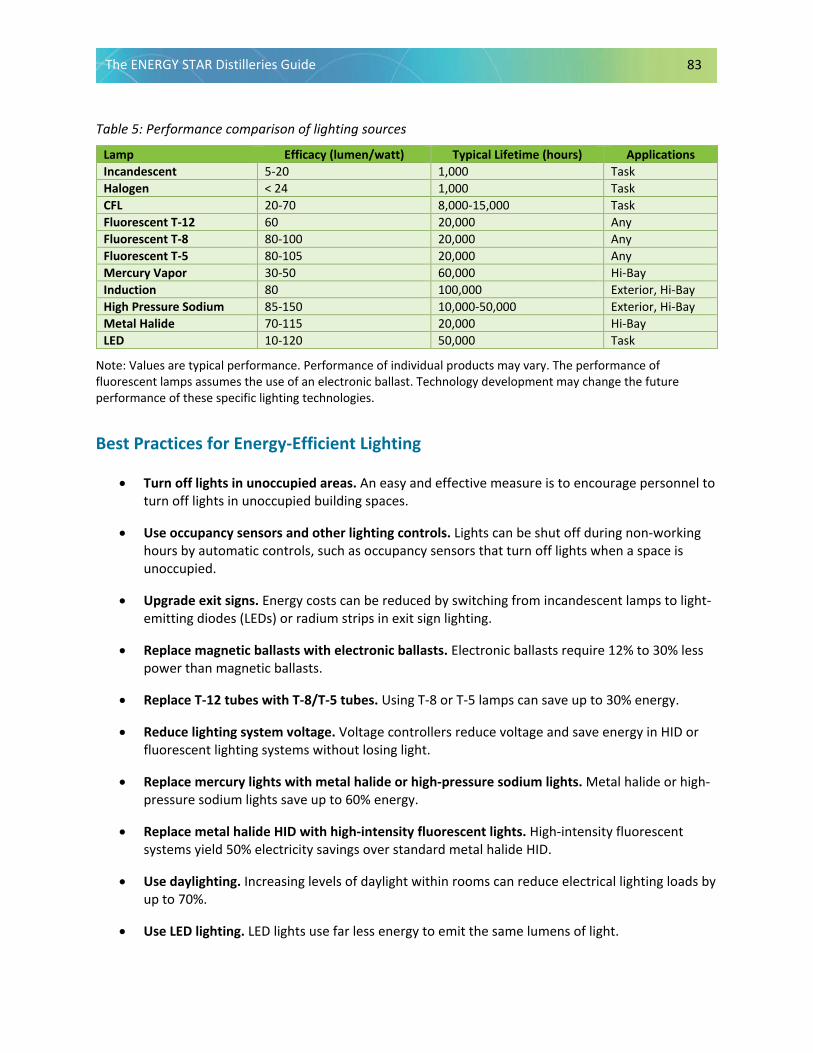
The ENERGY STAR Distilleries Guide 83
Table 5: Performance comparison of lighting sources
Lamp Efficacy (lumen/watt) Typical Lifetime (hours) Applications Incandescent 5-20 1,000 Task Halogen < 24 1,000 Task CFL 20-70 8,000-15,000 Task Fluorescent T-12 60 20,000 Any Fluorescent T-8 80-100 20,000 Any Fluorescent T-5 80-105 20,000 Any Mercury Vapor 30-50 60,000 Hi-Bay Induction 80 100,000 Exterior, Hi-Bay High Pressure Sodium 85-150 10,000-50,000 Exterior, Hi-Bay Metal Halide 70-115 20,000 Hi-Bay LED 10-120 50,000 Task
Note: Values are typical performance. Performance of individual products may vary. The performance of fluorescent lamps assumes the use of an electronic ballast. Technology development may change the future performance of these specific lighting technologies.
Best Practices for Energy-Efficient Lighting
• Turn off lights in unoccupied areas. An easy and effective measure is to encourage personnel toturn off lights in unoccupied building spaces.
• Use occupancy sensors and other lighting controls. Lights can be shut off during non-workinghours by automatic controls, such as occupancy sensors that turn off lights when a space isunoccupied.
• Upgrade exit signs. Energy costs can be reduced by switching from incandescent lamps to light-emitting diodes (LEDs) or radium strips in exit sign lighting.
• Replace magnetic ballasts with electronic ballasts. Electronic ballasts require 12% to 30% lesspower than magnetic ballasts.
• Replace T-12 tubes with T-8/T-5 tubes. Using T-8 or T-5 lamps can save up to 30% energy.
• Reduce lighting system voltage. Voltage controllers reduce voltage and save energy in HID orfluorescent lighting systems without losing light.
• Replace mercury lights with metal halide or high-pressure sodium lights. Metal halide or high-pressure sodium lights save up to 60% energy.
• Replace metal halide HID with high-intensity fluorescent lights. High-intensity fluorescentsystems yield 50% electricity savings over standard metal halide HID.
• Use daylighting. Increasing levels of daylight within rooms can reduce electrical lighting loads byup to 70%.
• Use LED lighting. LED lights use far less energy to emit the same lumens of light.

The ENERGY STAR Distilleries Guide 84
Turn off lights in unoccupied areas
An easy and effective measure is to encourage personnel to turn off lights in unoccupied building spaces. An energy management program that aims to improve the awareness of personnel with regard to energy use can help staff get in the habit of switching off lights and other equipment when not in use.
Use occupancy sensors and other lighting controls
Lights can be shut off during non-working hours by automatic controls, such as occupancy sensors, which turn off lights when a space is unoccupied. Manual controls also can be used in addition to automatic controls to save additional energy in smaller areas. Numerous case studies throughout the United States suggest that the average payback period for occupancy sensors is approximately 1 year (IAC, 2015).
Manual controls can be used in conjunction with automatic controls to save additional energy in smaller areas. One of the easiest measures is to install switches that allow occupants to control lights. Other lighting controls include daylight controls for indoor and outdoor lights, which adjust the intensity of electrical lighting based on the availability of daylight.
Figure 7: Lighting placement and controls
Upgrade exit signs
Energy costs can be reduced by switching from incandescent lamps to LEDs or radium strips in exit sign lighting. An incandescent exit sign uses about 40 W, while LED signs may use only about 4 to 8 W, reducing electricity use by 80 to 90%. A 1998 Lighting Research Center survey found that about 80% of exit signs being sold use LEDs (LRC, 2001). The lifetime of an LED exit sign is about 10 years, compared with 1 year for incandescent signs, which can reduce exit sign maintenance costs considerably. In addition to exit signs, LEDs are increasingly being used for path marking and emergency wayfinding systems. Their long life and cool operation allow them to be embedded in plastic materials, which makes them well suited for such applications (LRC, 2001).
New LED exit signs are inexpensive, with prices typically starting at around $20. The U.S. EPA’s ENERGY STAR program website (www.energystar.gov) provides a list of suppliers of LED exit signs.
Win
dow
Floor
Ceiling B A B C D

The ENERGY STAR Distilleries Guide 85
Tritium exit signs are an alternative to LED exit signs. Tritium signs are self-luminous and thus do not require an external power supply. The advertised lifetime of these signs is around 10 years and prices typically start at around $150 per sign.
Replace magnetic ballasts with electronic ballasts
A ballast is a mechanism that regulates the amount of electricity required to start a lighting fixture and maintain a steady output of light. Electronic ballasts can require 12% to 30% less power than their magnetic predecessors (Cook, 1998; Galitsky et al., 2005a). New electronic ballasts have smooth and silent dimming capabilities in addition to longer lives (up to 50% longer), faster run-up times, and cooler operation than magnetic ballasts (Eley et al., 1993; Cook, 1998). New electronic ballasts also have automatic switch-off capabilities for faulty or end-of-life lamps.
Replace T-12 tubes with T-8/T-5 tubes
In industry, typically T-12 tubes have been used. T-12 refers to the diameter in 1/8-inch increments (T-12 means 12/8-inch- or 3.8-cm-diameter tubes). The initial output for these lights is high, but the energy consumption is also high. They also have extremely poor efficacy, lamp life, lumen depreciation, and color rendering index. Because of this, maintenance and energy costs are high. Replacing T-12 lamps with T-8 lamps (smaller diameter) approximately doubles the efficacy of the former. Typical energy savings from the replacement of a T-12 lamp by a T-8 lamp are around 30% (Galitsky et al., 2005a). The switch to T-5 tubes or LED lighting (see below) could lead to even higher energy savings (see Table 5).
Use LED lighting
LED uses far less energy to emit the same lumens of light than the typical florescent lighting, which uses electrical arcs to excite mercury and phosphorous compounds to emit light. Several LED light products that are compatible with current light fixtures (such as T-8s) are available on the market, and prices for LED lighting have come down rapidly. Commercial LED systems are marketed for many lighting applications. The long lifetime of LEDs is, next to energy efficiency, a key advantage as it strongly reduces maintenance costs and energy costs. Including these cost savings in the investment decision generally will make a sound business case for LED lighting (see Table 5).
CASE STUDIES Beam Suntory in its Frankfort, Kentucky, facility installed LED lighting throughout the bottling and processing areas to improve light quality while also reducing energy use and cost. The company has also replaced metal halide lights with T-8 lights and motion sensors. LED lighting now lines the driveway. Any extra lights will be removed or switches will be placed on them.
In its Benelux Economic Union operations in Europe, Suntory reduced its electricity bill by 13.5%, mainly by the replacement of the neon lights in the building part with LEDs and the installation of motion/presence sensors in various rooms (e.g., bathrooms).
Source: Suntory. (2020). Suntory Group CSR Site. https://www.suntory.com/csr/data/report/pdf/suntory_csr_EN_2020.pdf

The ENERGY STAR Distilleries Guide 86
Reduce lighting system voltage
Reducing lighting system voltage can also save energy. A Toyota production facility installed reduced-voltage HID lights and realized a 30% reduction in lighting energy consumption (Galitsky et al., 2005a). Commercial products are available that attach to a central panel switch (controllable by computer) and constrict the flow of electricity to lighting fixtures, thereby reducing voltage and saving energy, with an imperceptible loss of light. Voltage controllers work with both HID and fluorescent lighting systems and are available from multiple vendors.
Replace mercury lights with metal halide or high-pressure sodium lights
Where color rendition is critical, metal halide lamps can replace mercury or fluorescent lamps with an energy savings of 50%. Where color rendition is not critical, high-pressure sodium lamps offer an energy savings of 50% to 60% compared with mercury lamps (Price and Ross, 1989). A plant-wide energy assessment at the Ford Cleveland Casting Plant in Cleveland, Ohio, identified the potential for 282,000 kWh savings in electricity consumption by replacing the 400 W mercury lights with 360 W metal halide lights. The payback period was estimated to be 3.7 years (U.S. DOE, 2003a).
Replace metal halide HID with high-intensity fluorescent lights
Traditional HID lighting can be replaced with high-intensity fluorescent lighting. These systems incorporate high-efficiency fluorescent lamps, electronic ballasts, and high-efficacy fixtures that maximize output to the work plane. The advantages of the systems are many. They have lower energy consumption, lower lumen depreciation over the lifetime of the lamp, better dimming options, faster startup and restrike capability, better color rendition, higher pupil lumen ratings and less glare (Martin et al., 2000). High-intensity fluorescent systems yield 50% electricity savings over standard metal halide HID. Dimming controls that are impractical in the metal halide HIDs also can save significant energy. In addition to energy savings and better lighting qualities, high-intensity fluorescents can help improve productivity and have reduced maintenance costs.
CASE STUDY Heaven Hill Distillery in Bardstown, Kentucky, has replaced 662 metal halide, mercury vapor, and fluorescent tube lights with four-lamp, F54T5HO High Bay fluorescent fixtures. These measures saved between 55% and 60% of the load for lighting in the warehouse, which translates to an approximate annual savings of $70,000. Also, occupancy sensors were installed, and all T-12 fluorescent fixtures were replaced with efficient LED lighting, reducing the facility’s energy demand by 1,816 MWh.
Source: Sustainable Spirits Initiative. (2015). A Look Into Sustainable Practices of Kentucky’s Distilleries and Breweries. https://eec.ky.gov/Environmental-Protection/Compliance-Assistance/DCA Resource Document Library/SustainableSpiritsBestPractices.pdf

The ENERGY STAR Distilleries Guide 87
Use daylighting
Daylighting involves the efficient use of natural light to minimize the need for artificial lighting in buildings. Increasing levels of daylight within rooms can reduce electrical lighting loads by up to 70% (CADDET, 2001a; IEA, 2000). Unlike conventional skylights, an efficient daylighting system may provide evenly dispersed light without creating heat gains, which can reduce the need for cooling compared with skylights. Daylighting differs from other energy efficiency measures because its features are integral to the architecture of a building; therefore, it is applied primarily to new buildings and incorporated at the design stage. However, existing buildings can sometimes be cost-effectively refitted with daylighting systems.
Daylighting can be combined with lighting controls to maximize its benefits. Because of its variability, daylighting is almost always combined with artificial lighting to provide the necessary illumination on cloudy days or after dark. Daylighting technologies include properly placed and shaded windows, atria, clerestories, light shelves, and light ducts. Clerestories, light shelves, and light ducts can accommodate various angles of the sun and redirect daylight using walls or reflectors.
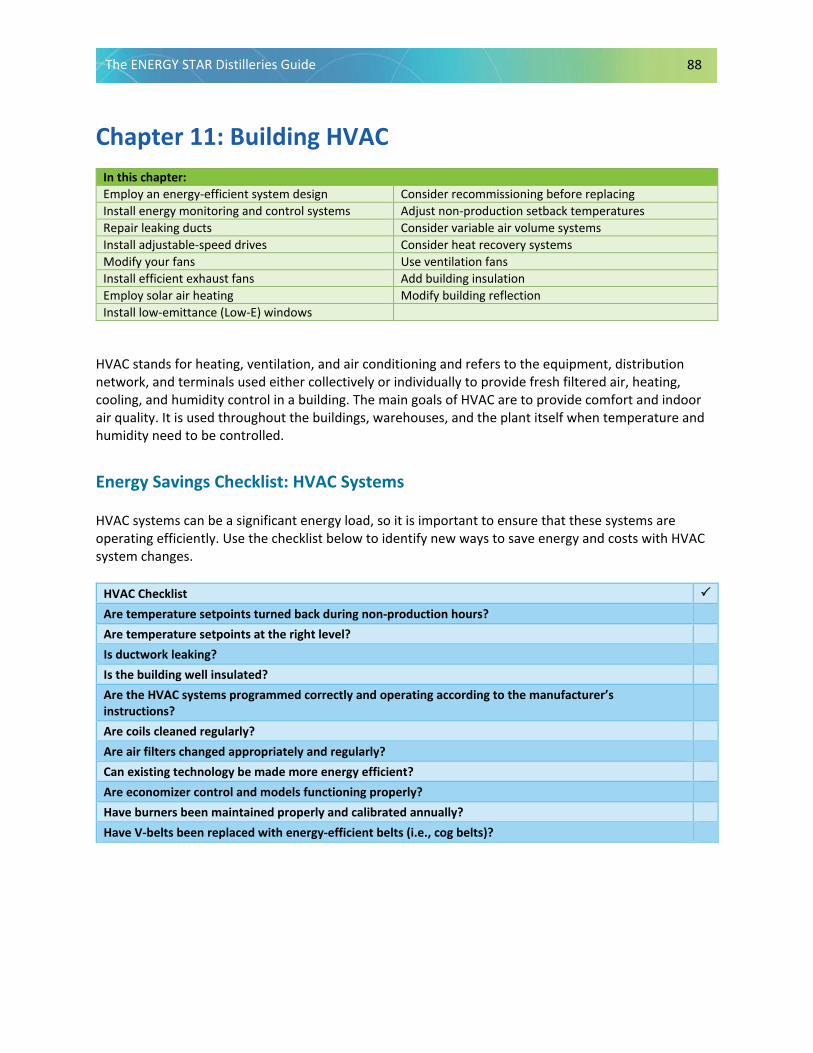
The ENERGY STAR Distilleries Guide 88
Chapter 11: Building HVAC In this chapter: Employ an energy-efficient system design Consider recommissioning before replacing Install energy monitoring and control systems Adjust non-production setback temperatures Repair leaking ducts Consider variable air volume systems Install adjustable-speed drives Consider heat recovery systems Modify your fans Use ventilation fans Install efficient exhaust fans Add building insulation Employ solar air heating Modify building reflection Install low-emittance (Low-E) windows
HVAC stands for heating, ventilation, and air conditioning and refers to the equipment, distribution network, and terminals used either collectively or individually to provide fresh filtered air, heating, cooling, and humidity control in a building. The main goals of HVAC are to provide comfort and indoor air quality. It is used throughout the buildings, warehouses, and the plant itself when temperature and humidity need to be controlled.
Energy Savings Checklist: HVAC Systems
HVAC systems can be a significant energy load, so it is important to ensure that these systems are operating efficiently. Use the checklist below to identify new ways to save energy and costs with HVAC system changes.
HVAC Checklist
Are temperature setpoints turned back during non-production hours? Are temperature setpoints at the right level? Is ductwork leaking? Is the building well insulated? Are the HVAC systems programmed correctly and operating according to the manufacturer’s instructions? Are coils cleaned regularly? Are air filters changed appropriately and regularly? Can existing technology be made more energy efficient? Are economizer control and models functioning properly? Have burners been maintained properly and calibrated annually? Have V-belts been replaced with energy-efficient belts (i.e., cog belts)?
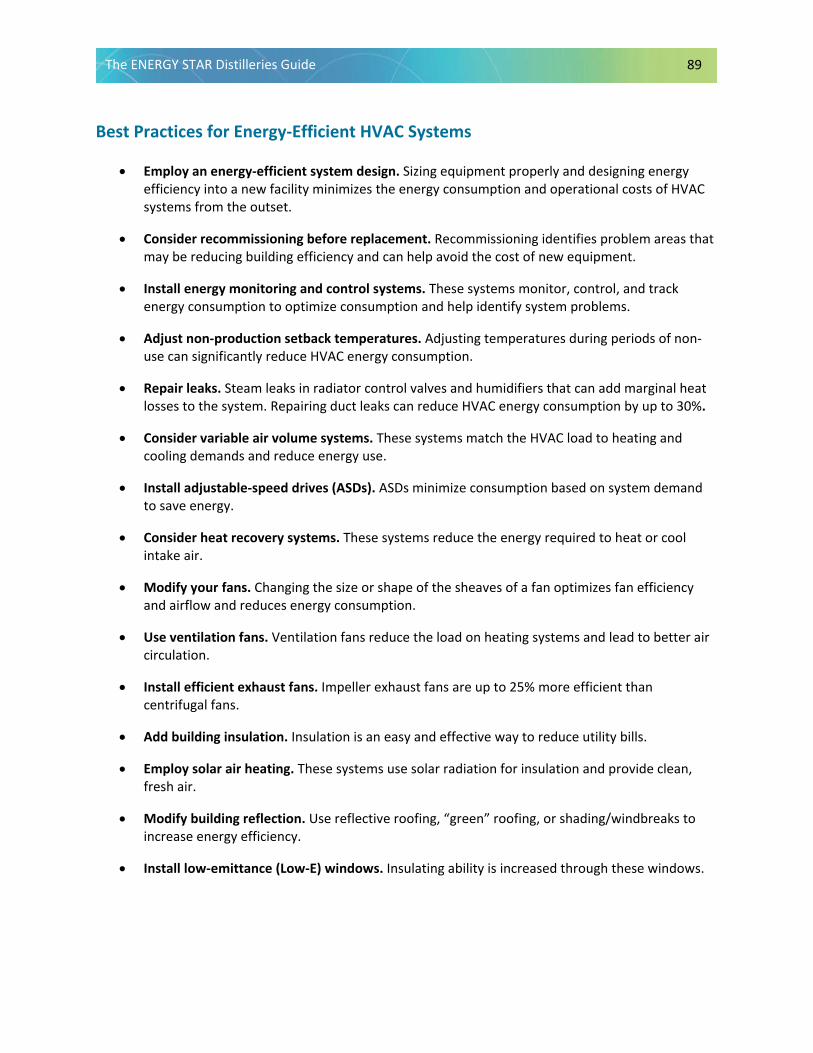
The ENERGY STAR Distilleries Guide 89
Best Practices for Energy-Efficient HVAC Systems
• Employ an energy-efficient system design. Sizing equipment properly and designing energyefficiency into a new facility minimizes the energy consumption and operational costs of HVACsystems from the outset.
• Consider recommissioning before replacement. Recommissioning identifies problem areas thatmay be reducing building efficiency and can help avoid the cost of new equipment.
• Install energy monitoring and control systems. These systems monitor, control, and trackenergy consumption to optimize consumption and help identify system problems.
• Adjust non-production setback temperatures. Adjusting temperatures during periods of non-use can significantly reduce HVAC energy consumption.
• Repair leaks. Steam leaks in radiator control valves and humidifiers that can add marginal heatlosses to the system. Repairing duct leaks can reduce HVAC energy consumption by up to 30%.
• Consider variable air volume systems. These systems match the HVAC load to heating andcooling demands and reduce energy use.
• Install adjustable-speed drives (ASDs). ASDs minimize consumption based on system demandto save energy.
• Consider heat recovery systems. These systems reduce the energy required to heat or coolintake air.
• Modify your fans. Changing the size or shape of the sheaves of a fan optimizes fan efficiencyand airflow and reduces energy consumption.
• Use ventilation fans. Ventilation fans reduce the load on heating systems and lead to better aircirculation.
• Install efficient exhaust fans. Impeller exhaust fans are up to 25% more efficient thancentrifugal fans.
• Add building insulation. Insulation is an easy and effective way to reduce utility bills.
• Employ solar air heating. These systems use solar radiation for insulation and provide clean,fresh air.
• Modify building reflection. Use reflective roofing, “green” roofing, or shading/windbreaks toincrease energy efficiency.
• Install low-emittance (Low-E) windows. Insulating ability is increased through these windows.
The ENERGY STAR Distilleries Guide 90
Employ an energy-efficient system design
For HVAC systems in new industrial facilities, the greatest opportunities for energy efficiency arise at the design stage. Sizing equipment properly and designing energy efficiency into a new facility generally minimizes the energy consumption and operational costs of HVAC systems from the outset. This practice often saves money in the long run, as it is generally less expensive to install energy-efficient HVAC equipment during construction than it is to upgrade an existing building with an energy-efficient system later on, especially if those upgrades lead to downtime.
Consider recommissioning before replacing
Before replacing HVAC system components to improve energy efficiency, explore the possibility of HVAC system recommissioning. Recommissioning is essentially the same process as commissioning, but it is applied to a building’s existing HVAC, controls and electrical systems (U.S. EPA, 2008). Commissioning is the process of verifying that a new building functions as intended and communicating the intended performance to the building management team. This usually occurs when a new building is turned over for occupancy. In practice, commissioning costs are not included in design fees and often compete with other activities, so commissioning is seldom pursued properly. To ensure that energy performance and operational goals are met, however, the building must be commissioned. To achieve this, ENERGY STAR recommends the following:
• Communicate your energy performance goals during commissioning to ensure that the design target is met. Encourage energy use tracking so that performance comparisons are made over time.
• Specify detailed commissioning activities in project contracts. Seek separate funding for commissioning work to ensure that it will get done and be done well.
• Hire building commissioning experts. Include the commissioning firm as part of the design team early in the project.
CASE STUDY The Edrington Group bottling plant in Glasgow, Scotland, can fill 600 bottles of whisky per minute. The finished product is stored in a separate warehouse prior to shipping. Massive heaters were initially used to heat the warehouse to provide comfort heating for the operators working in that space. A lot of energy was required to create heat, when in fact only a little heating was needed. Instead of heating the whole space, Edrington replaced the heaters with much smaller individual heaters installed in each forklift truck, increasing efficiency. Source: Dillion, G. (2015). A Rare Look Inside the UK’s Fastest Whisky Bottling Plant. Distillery Trail. www.distillerytrail.com/blog/a-rare-look-inside-the-uks-fastest-whisky-bottling-plant/
The ENERGY STAR Distilleries Guide 91
• Finalize and transfer a set of technical documents, including manufacturers’ literature forsystems and components. Supplement technical literature with summaries on how to operateand manage the systems. Provide an additional explanation for innovative design features.
Recommissioning involves a detailed assessment of existing equipment performance and maintenance procedures. This is compared with the intended or design performance and maintenance procedures to identify and fix problem areas that might be hampering building energy efficiency. Recommissioning can be a cost-effective retrofit, sometimes generating more savings than the cost of the retrofit measure. For example, recommissioning may help avoid the need to install new or additional equipment, leading to savings in capital investments.
U.S. EPA’s ENERGY STAR Building Upgrade Manual (U.S. EPA, 2008) recommends a stepwise approach to recommissioning, in which a series of strategically ordered building “tune-up” strategies are pursued. First, lighting and supplemental loads should be assessed, then the building envelope, followed by controls, testing, adjusting and balancing, heat exchange equipment, and finally heating and cooling systems. Most of these steps relate to HVAC system components or factors that will directly affect HVAC system energy consumption (such as building envelope and lighting). For more information, consult the manual.
Install energy monitoring and control systems
An energy monitoring and control system supports the efficient operation of HVAC systems by monitoring, controlling, and tracking system energy consumption. Such systems continuously manage and optimize HVAC system energy consumption while also providing building engineers and energy managers with a valuable diagnostic tool for tracking energy consumption and identifying potential HVAC problems. Several projects indicate that the average payback period for HVAC control systems is about 1.3 years.
Adjust non-production setback temperatures
Setting back building temperatures (i.e., adjusting building temperatures down in the winter or up in the summer) during periods of non-use, such as weekends or non-production times, can significantly reduce HVAC energy consumption.
Repair leaks
Leaking air ducts can waste significant amounts of energy. Install duct insulation and perform regular duct inspection and maintenance, including ongoing leak detection and repair. According to a study by Lawrence Berkeley National Laboratory, repairing duct leaks in industrial and commercial spaces can reduce HVAC energy consumption by up to 30%. The study also showed that duct tape should not be used for leak repair; aerosol sealants are preferred.
Consider variable air volume systems
Variable air volume systems adjust the rate of airflow into a room or space based on the current airflow requirements of that room or space. Variable air volume systems, therefore, work to more closely match HVAC load to heating and cooling demands, which reduces energy use.

The ENERGY STAR Distilleries Guide 92
Install adjustable-speed drives (ASDs)
ASDs can be installed on variable-volume air handlers and recirculation fans to match precisely the flow and pressure requirements of air handling systems. Energy consumed by fans can be lowered considerably since they do not constantly run at full speed. ASDs can also be used on chiller pumps and water system pumps to minimize power consumption based on system demand.
Consider heat recovery systems
Heat recovery systems reduce the energy required to heat or cool facility intake air by recovering the thermal energy of the exhaust air. Common heat recovery systems include heat recovery wheels, heat pipes, and run-around loops. Heat pipes recover about 45% to 65% of the exhaust heat, while the efficiency of run-around loops can be in the 55% to 65% range.
Modify your fans
Changing the size or shape of the sheaves of a fan can help optimize fan efficiency and airflow, reducing energy consumption. Toyota optimized the sheaves of its fans instead of installing ASDs on fans, finding better savings and payback periods than expected.
Use ventilation fans
Ventilation fans installed in the ceilings of work areas can help destratify workspace air, leading to better circulation of cool air in summer and warm air in winter, as well as more even temperature distributions from floor to ceiling. Such fans can help reduce the load on building heating systems by helping to “push down” warm air that rises during heating months.
Install efficient exhaust fans
Exhaust fans are standard components in any HVAC system. Mixed-flow impeller exhaust fans offer an efficient alternative to traditional centrifugal exhaust fans. They are typically 25% more efficient than centrifugal fans and can be cheaper to install and maintain. The expected payback period is about 2 years (Tetley, 2001).
Add building insulation
Adding insulation will reduce utility bills. Older buildings are likely to use more energy than newer ones, leading to very high heating and air conditioning bills. However, even in new buildings, adding insulation may reduce utility bills enough to pay for itself within a few years.
Various states have regulations and guidelines for building insulation (e.g., California’s Energy Efficiency Standards for Residential and Nonresidential Buildings, Title 24). Going beyond regulated insulation levels may be economically beneficial and should be considered as part of a new building’s design, as well as for reconstruction of existing buildings. For refrigerated warehouses, much higher levels of insulation are preferred.

The ENERGY STAR Distilleries Guide 93
Employ solar air heating
Solar air heating systems, such as Solarwall® (www.solarwall.com), use conventional steel siding painted black to absorb solar radiation for insulation. Fresh air enters the bottom of the panels where it is heated as it passes over the warm absorber. Fans distribute the air. This technology could produce up to 600 W/m2 of thermal energy (1.5 to 3.5 GJ/m2 per year), depending on the weather and geographical conditions. On a sunny day, this air will be heated to temperatures of 59°F to 104°F (15°C to 40°C) above ambient. Using this technology, Ford Motor Company’s Chicago Stamping Plant turned the south wall of its plant into a huge solar collector (CREST, 2001). Energy savings were estimated to be more than $300,000 per year compared with conventional gas air systems. Capital costs were $863,000 ($14.90 per square foot, including installation), resulting in a payback period of fewer than 3 years. In addition to energy savings, the system was said to provide clean fresh air for employees, even out hot and cold spots in the plant, and reduce emissions. However, this measure is only of interest for buildings in cold climates, and the potential benefits should be analyzed based on the local conditions of each site. This technology also could be used for cooling, where systems, such as NightSolar®, remove energy from the air to cool buildings without the use of compressors or refrigeration systems. This solar cooling technology is based on the scientific principle of nocturnal radiation cooling, which can cool a roof by as much as 18°F (10°C) below ambient temperature on a clear night. As warm night air touches the cooler surface of the panel, heat is transferred to the surface, which cools the air by radiating the heat to the cold night sky. The chilled air is then drawn in through perforations in the collector and enters the HVAC unit via an economizer cycle. This cooling can reduce or even displace conventional air conditioning from sunset to sunrise. The end result to the building owner could be up to 50% in energy savings that occurs from reducing onsite cooling and heating. This would depend on the availability of solar radiation and the gradient of temperatures. Modify building reflection
Reflective roofing. Use of a reflective coating on the roof of buildings in sunny, hot climates can save on air conditioning costs inside. Using reflective roofs, two medical offices in Northern California reduced air conditioning demand—one by 8% and the other by 12%. For colder climates, the heat lost due to cool roofs (in winter, for example) needs to be considered, as it could negate savings. In addition to location and weather, other primary factors (such as roof insulation, air conditioning efficiency, and building age) also influence energy savings. Reflective roof materials are available in different forms and colors. “Green” roofs. Roof gardens on a flat roof improve the insulation of buildings against both hot and cold by providing heat in winter and air conditioning in summer. In winter, “green” roofs can freeze, so they carry a slight heating penalty but still often yield net energy savings. In addition, a roof garden can increase the lifetime of the roof, reduce runoff to local storm drains, and lower air pollution and dust. Shading and windbreaks. Shade trees reduce the need for cooling in hot climates. Shade trees should be deciduous (providing shade in the summer and none in the winter) and planted on the west and southwest sides of the building (based on the path of the summer sun). Trees planted on the north side of the building in cold climates can reduce heating in winter by shielding the building from the wind. Vines can provide both shade and wind shielding.

The ENERGY STAR Distilleries Guide 94
Install low-emittance (Low-E) windows
Low-emittance windows are another effective strategy for improving building insulation. Low-E windows can lower the heat transmitted into a building to increase its insulating ability. There are two types of Low-E glass: high solar transmitting (for regions with higher winter utility bills) and low solar transmitting (for regions with higher summer utility bills). U.S. DOE supports the development of new window and glazing technology. The ENERGY STAR website includes a selection of rated Low-E windows. New window and glazing technologies are being developed worldwide (see, for example, www.efficientwindows.org).
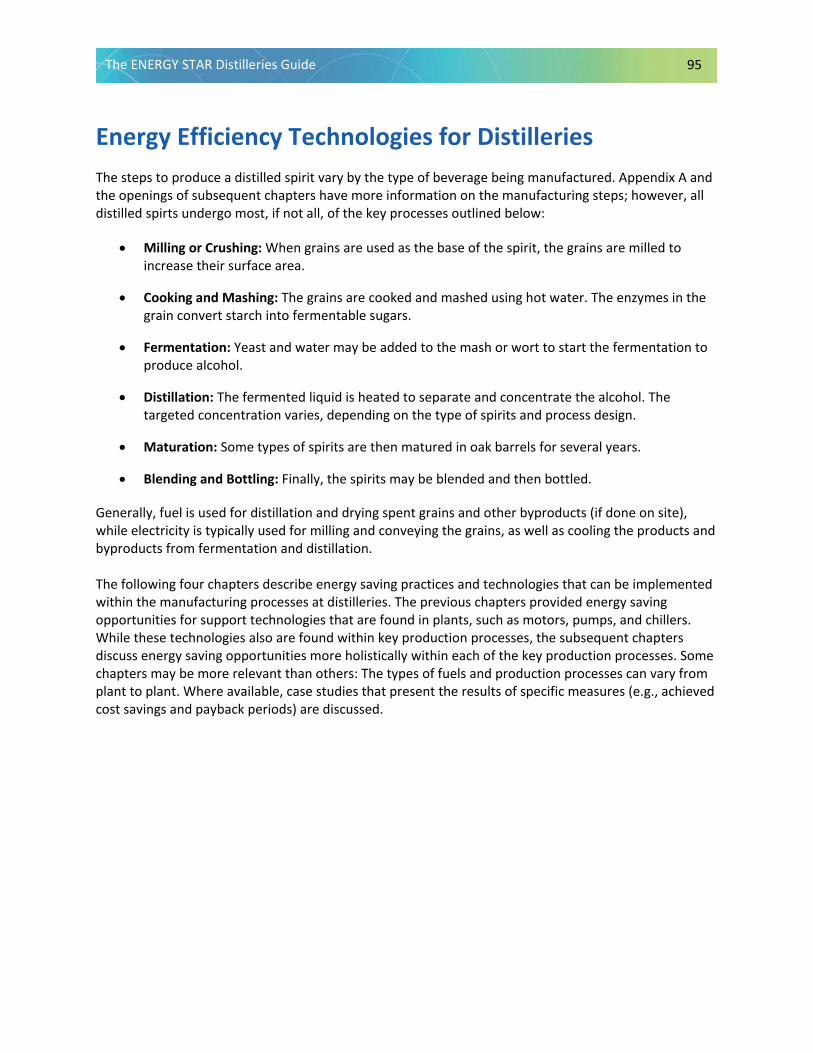
The ENERGY STAR Distilleries Guide 95
Energy Efficiency Technologies for Distilleries The steps to produce a distilled spirit vary by the type of beverage being manufactured. Appendix A and the openings of subsequent chapters have more information on the manufacturing steps; however, all distilled spirts undergo most, if not all, of the key processes outlined below:
• Milling or Crushing: When grains are used as the base of the spirit, the grains are milled to increase their surface area.
• Cooking and Mashing: The grains are cooked and mashed using hot water. The enzymes in the grain convert starch into fermentable sugars.
• Fermentation: Yeast and water may be added to the mash or wort to start the fermentation to produce alcohol.
• Distillation: The fermented liquid is heated to separate and concentrate the alcohol. The targeted concentration varies, depending on the type of spirits and process design.
• Maturation: Some types of spirits are then matured in oak barrels for several years.
• Blending and Bottling: Finally, the spirits may be blended and then bottled.
Generally, fuel is used for distillation and drying spent grains and other byproducts (if done on site), while electricity is typically used for milling and conveying the grains, as well as cooling the products and byproducts from fermentation and distillation. The following four chapters describe energy saving practices and technologies that can be implemented within the manufacturing processes at distilleries. The previous chapters provided energy saving opportunities for support technologies that are found in plants, such as motors, pumps, and chillers. While these technologies also are found within key production processes, the subsequent chapters discuss energy saving opportunities more holistically within each of the key production processes. Some chapters may be more relevant than others: The types of fuels and production processes can vary from plant to plant. Where available, case studies that present the results of specific measures (e.g., achieved cost savings and payback periods) are discussed.
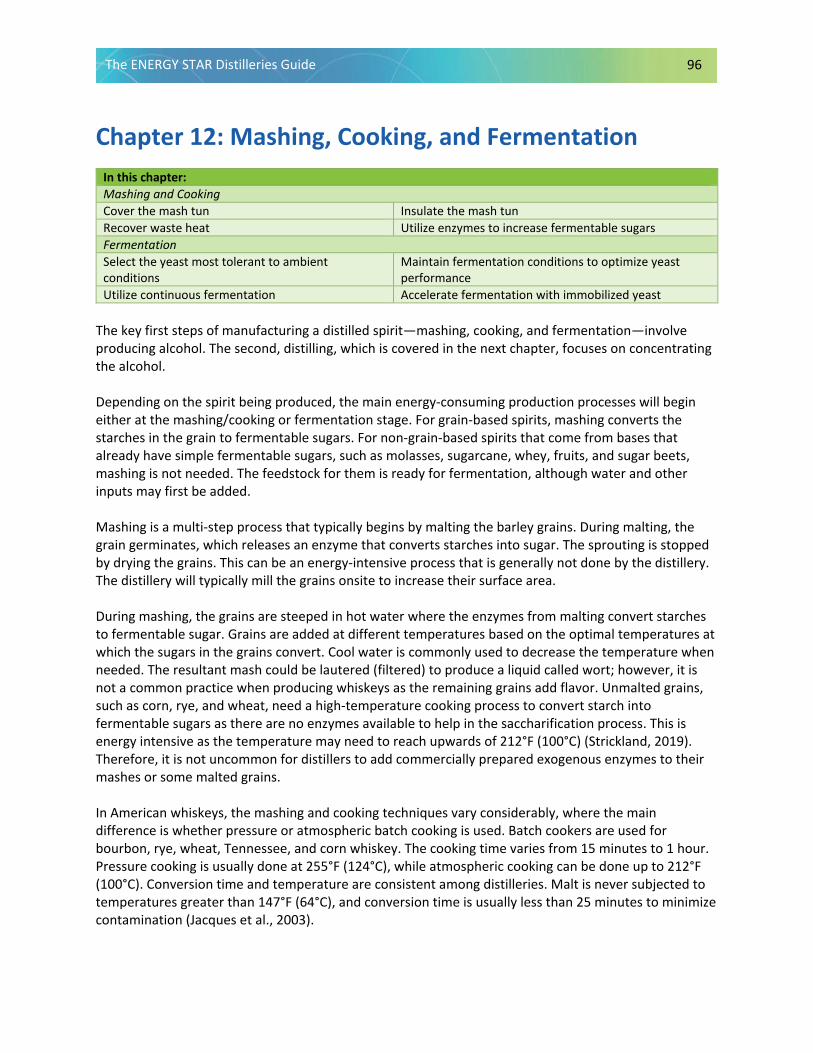
The ENERGY STAR Distilleries Guide 96
Chapter 12: Mashing, Cooking, and Fermentation In this chapter: Mashing and Cooking Cover the mash tun Insulate the mash tun Recover waste heat Utilize enzymes to increase fermentable sugars Fermentation Select the yeast most tolerant to ambient conditions
Maintain fermentation conditions to optimize yeast performance
Utilize continuous fermentation Accelerate fermentation with immobilized yeast
The key first steps of manufacturing a distilled spirit—mashing, cooking, and fermentation—involve producing alcohol. The second, distilling, which is covered in the next chapter, focuses on concentrating the alcohol.
Depending on the spirit being produced, the main energy-consuming production processes will begin either at the mashing/cooking or fermentation stage. For grain-based spirits, mashing converts the starches in the grain to fermentable sugars. For non-grain-based spirits that come from bases that already have simple fermentable sugars, such as molasses, sugarcane, whey, fruits, and sugar beets, mashing is not needed. The feedstock for them is ready for fermentation, although water and other inputs may first be added.
Mashing is a multi-step process that typically begins by malting the barley grains. During malting, the grain germinates, which releases an enzyme that converts starches into sugar. The sprouting is stopped by drying the grains. This can be an energy-intensive process that is generally not done by the distillery. The distillery will typically mill the grains onsite to increase their surface area.
During mashing, the grains are steeped in hot water where the enzymes from malting convert starches to fermentable sugar. Grains are added at different temperatures based on the optimal temperatures at which the sugars in the grains convert. Cool water is commonly used to decrease the temperature when needed. The resultant mash could be lautered (filtered) to produce a liquid called wort; however, it is not a common practice when producing whiskeys as the remaining grains add flavor. Unmalted grains, such as corn, rye, and wheat, need a high-temperature cooking process to convert starch into fermentable sugars as there are no enzymes available to help in the saccharification process. This is energy intensive as the temperature may need to reach upwards of 212°F (100°C) (Strickland, 2019). Therefore, it is not uncommon for distillers to add commercially prepared exogenous enzymes to their mashes or some malted grains.
In American whiskeys, the mashing and cooking techniques vary considerably, where the main difference is whether pressure or atmospheric batch cooking is used. Batch cookers are used for bourbon, rye, wheat, Tennessee, and corn whiskey. The cooking time varies from 15 minutes to 1 hour. Pressure cooking is usually done at 255°F (124°C), while atmospheric cooking can be done up to 212°F (100°C). Conversion time and temperature are consistent among distilleries. Malt is never subjected to temperatures greater than 147°F (64°C), and conversion time is usually less than 25 minutes to minimize contamination (Jacques et al., 2003).

The ENERGY STAR Distilleries Guide 97
Batch cooking is typically more energy efficient than a continuous system. Batch cooking uses 18% less heat than a continuous columnar cooker and 37% less heat than a continuous U-tube cooker (Jacques, 2003). Batch systems also generally use less enzyme than the other systems, possibly due to the difficulty of accurate dosing and good mixing in continuous systems. However, the batch system requires more than double the time for the continuous one during the cooking process. Continuous cookers are used only for whiskey producers that produce blended or light whiskey.
After the grains are mashed, they must be cooled to the desired fermentation temperature. Distilleries cool the mash or wort using vacuum technology (barometric condensers) or cooling coils. The mash or wort is then pumped to fermentation vessels (batch process) or to a fermenter (continuous process); inoculated yeast is added and backset to the desired final mash gallonage.
Fermentation, in addition to producing alcohol, also produces heat. To maintain optimal temperatures, modern distilleries will have closed-top fermenters and use cooling coils or external heat exchangers to control the fermentation temperature. They usually set fermenters at 81°F to 84°F (27°C to 29°C) and control at 86°F to 88°F (30°C to 31°C). Traditional distilleries may have metal or wood open-top fermenters without any device to control the fermentation temperature. They usually set their fermenters as cool as they can at 64°F to 70°F (18°C to 21°C) (Jacques et al., 2003).
Energy Savings Checklist: Mashing, Cooking, and Fermentation
Mashing and cooking processes require different temperatures, depending on the raw materials used and could require significant energy loads. It is important to ensure that these processes are operating efficiently. Fermentation requires temperature control with efficient equipment in order to achieve stable, consistent results. The checklist below can be used to prompt conversations around finding new ways to save energy and costs in mashing, cooking, and fermentation operations.
Mashing, Cooking, and Fermentation Checklist
Can existing technology be made more energy efficient? Is the temperature setting monitored and controlled? Is the cooker properly maintained? Is the still cooker insulated to prevent heat losses? Is waste heat from the cooling of the wort or mash recovered and reused? Are conditions in fermentation optimum for yeast? Is the fermentor properly maintained? Is the fermentor properly cleaned? Is the fermentation system operated close to design capacity? Are heat losses minimized?
Mashing and fermentation processes in distilleries are not unlike those in breweries, although differences exist.
Various technologies are applied in the beer brewing industry to increase the thermal efficiency of the process. Below we describe some opportunities briefly. More details can be found in Galitsky et al. (2003) or in the ENERGY STAR guide, Energy Efficiency Improvement and Cost Saving Opportunities for Breweries.

The ENERGY STAR Distilleries Guide 98
Best Practices for Energy-Efficient Mashing and Cooking
Cover the mash tun
A closed mash tun system condenses the vapors to approximately 86°F (30°C) and returns the condensate to the mash tun. Approximately 5.4 MJ/hl fuel could be saved in comparison with an open tun (Sorrell et al., 2011).
Insulate the mash tun
Insulating the mash tun is a simple practice that retains the heat, thus less energy is dissipated and lost. This practice is often overlooked, but usually gives an excellent return on investment. Different materials are applicable as insulators; thermal insulating coatings are a convenient solution as they are easy to apply to existing infrastructure.
Recover waste heat
During the entire process of distillation, there are two processes where heat is needed (mashing/cooking and distillation), and there also are two opportunities where cooling is needed (before fermentation and condensing alcohol in distilling) (see Figure 1). The specific temperatures depend on the type of spirit, raw materials, and equipment used.
In cooking and mashing, preheated water, typically from a hot water tank, is pumped into the mash tun at various stages and is mixed with the grains. The feedwater can be preheated using steam, electricity, or fuel. Alternatively, it can be heated in whole or in part through heat exchangers from hot mash, vapors, or stillage leaving the still that must be cooled. See Chapter 13 for more information on opportunities to recover waste heat.
Utilize enzymes to increase fermentable sugars
A key objective of mashing is to convert as much starch to fermentable sugars as possible. The use of enzymes, either industrial or native in the malted barley, can improve the starch to sugar conversion while using the same amount of energy.
In many mash bills, malted barley is used because it contains the necessary enzymes to convert the starches found in the grains to sugars. Outside of malted barley, both natural and synthetic enzymes also exist to aid in the mashing process. They could be used in lieu of, or in conjunction with, malted barley to achieve higher starch-to-sugar ratios, which could result in a lower amount of energy needed per unit of alcohol produced. This is a common practice in the production of fuel ethanol. However, it has not been widely used in the distillation of alcoholic beverages because it could impact the characteristics of the spirits. Therefore, this option may not be suitable for every distillery.
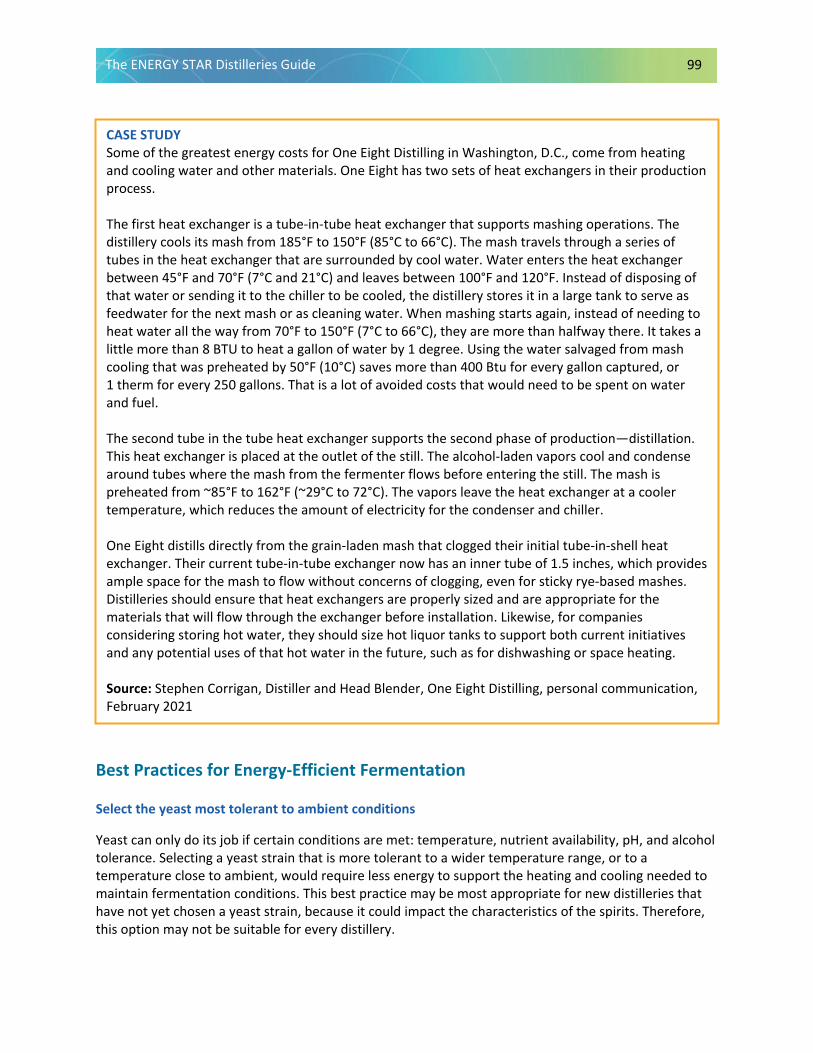
The ENERGY STAR Distilleries Guide 99
Best Practices for Energy-Efficient Fermentation
Select the yeast most tolerant to ambient conditions
Yeast can only do its job if certain conditions are met: temperature, nutrient availability, pH, and alcohol tolerance. Selecting a yeast strain that is more tolerant to a wider temperature range, or to a temperature close to ambient, would require less energy to support the heating and cooling needed to maintain fermentation conditions. This best practice may be most appropriate for new distilleries that have not yet chosen a yeast strain, because it could impact the characteristics of the spirits. Therefore, this option may not be suitable for every distillery.
CASE STUDY Some of the greatest energy costs for One Eight Distilling in Washington, D.C., come from heating and cooling water and other materials. One Eight has two sets of heat exchangers in their production process. The first heat exchanger is a tube-in-tube heat exchanger that supports mashing operations. The distillery cools its mash from 185°F to 150°F (85°C to 66°C). The mash travels through a series of tubes in the heat exchanger that are surrounded by cool water. Water enters the heat exchanger between 45°F and 70°F (7°C and 21°C) and leaves between 100°F and 120°F. Instead of disposing of that water or sending it to the chiller to be cooled, the distillery stores it in a large tank to serve as feedwater for the next mash or as cleaning water. When mashing starts again, instead of needing to heat water all the way from 70°F to 150°F (7°C to 66°C), they are more than halfway there. It takes a little more than 8 BTU to heat a gallon of water by 1 degree. Using the water salvaged from mash cooling that was preheated by 50°F (10°C) saves more than 400 Btu for every gallon captured, or 1 therm for every 250 gallons. That is a lot of avoided costs that would need to be spent on water and fuel. The second tube in the tube heat exchanger supports the second phase of production—distillation. This heat exchanger is placed at the outlet of the still. The alcohol-laden vapors cool and condense around tubes where the mash from the fermenter flows before entering the still. The mash is preheated from ~85°F to 162°F (~29°C to 72°C). The vapors leave the heat exchanger at a cooler temperature, which reduces the amount of electricity for the condenser and chiller. One Eight distills directly from the grain-laden mash that clogged their initial tube-in-shell heat exchanger. Their current tube-in-tube exchanger now has an inner tube of 1.5 inches, which provides ample space for the mash to flow without concerns of clogging, even for sticky rye-based mashes. Distilleries should ensure that heat exchangers are properly sized and are appropriate for the materials that will flow through the exchanger before installation. Likewise, for companies considering storing hot water, they should size hot liquor tanks to support both current initiatives and any potential uses of that hot water in the future, such as for dishwashing or space heating. Source: Stephen Corrigan, Distiller and Head Blender, One Eight Distilling, personal communication, February 2021
The ENERGY STAR Distilleries Guide 100
Maintain fermentation conditions to optimize yeast performance
If required conditions are not maintained, the yeast may convert sugars to alcohols or other components, such as hydrogen sulfide or glycerol, that are less desirable in the final product, resulting in less product per unit of energy used. As a best practice, the technical data sheets provided with the yeast will specify the optimal operating conditions. While distilleries are likely aware of this from a product quality/cost perspective, it is important to note that following these guidelines also can have a favorable impact on energy efficiency.
Accelerate fermentation with immobilized yeast
Immobilized yeast is a technique that suspends yeast in a gel so that a continuous stream of the material (glucose) being fermented passes through the gel. This method speeds the fermentation process, lowers energy requirements, and increases ethanol yields (Hohmann and Rendleman, 1993). The use of immobilized yeast is currently being used in the beer brewing industry in a few industrial-scale applications. It also is being used in ethanol production in Brazil with increased fermentation rates 1.2 to 2.5 times that of free yeasts (Wendhausen et al., 2001).
Utilize continuous fermentation
Continuous fermentation refers to an uninterrupted fermentation, which is the opposite of the common batch fermentation that is done at one time with a starting and ending point. Usually, continuous fermentation is used for the production of more than 15,000 gallons/day of alcohol. Switching from a batch to a continuous fermentation system in beer production facilities has shown up to 30% to 35% savings in energy and water consumption (European Commission, n.d.) due to the ability to improve heat integration, reducing heat losses, compared with batch processes.
There are two basic continuous fermentation schemes: one uses a single stirred tank and the other uses multiple series-connected stirred tanks (cascade system) (Guidoboni, 1984). The single stirred tank reactor or fermentor consists essentially of a single tank, with a means of mixing, which operates in a steady-state condition with a continuous feed of substrate and continuous extraction of product. In practice, the fermentor is operated with a constant volumetric liquid throughput at such a rate that the specific growth rate of the yeast is not exceeded by the liquid volumetric throughput (the dilution rate). If the growth rate is exceeded, the yeast is purged from the system and wash-out occurs. Fermentor productivity (the rate of alcohol production) is directly related to the number of living cells in the fermentor and the volumetric throughput (the dilution rate). Therefore, the fermentor is limited and proportional to the total volumetric liquid feed rate when it is operated at less than the wash-out dilution rate. This has been overcome in continuous fermentation processes by the inclusion of equipment or techniques to retain the yeast within the system (e.g., yeast recycling). The fermentor is usually operated at the maximum tolerable alcohol concentration and minimum substrate concentration. Traditional batch fermentation experience suggests that both high alcohol and low sugar concentrations depress fermentation performance. As a result of development work, it has been demonstrated that the effects of ethanol inhibition are offset by the increased yeast concentration made possible by yeast recycling.

The ENERGY STAR Distilleries Guide 101
In the cascade system, a number of tanks are connected in series with continuous flow of liquor and yeast from one tank to the next. The yeast could be recovered at the final fermentor of the series or at each fermentor, with only clarified liquor flowing from tank to tank. These series-connected fermentors offer improved productivities over single stirred tank fermentors because all the stages, except the final one, operate at reduced alcohol concentrations.
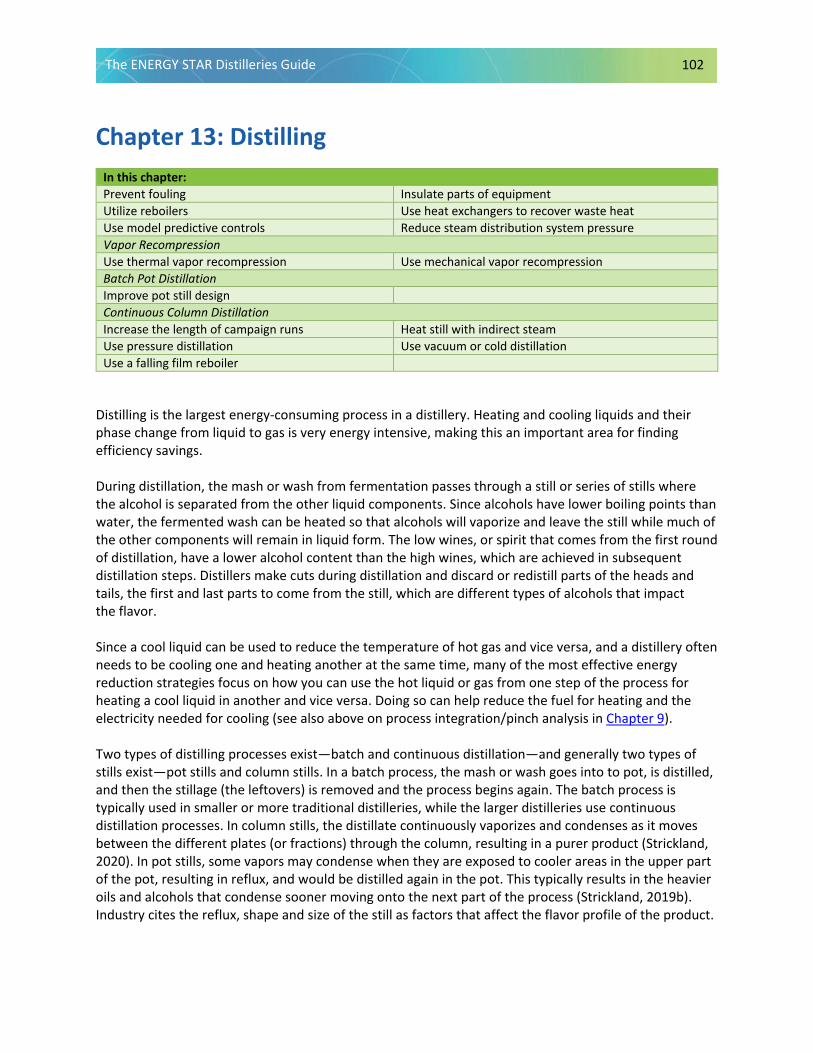
The ENERGY STAR Distilleries Guide 102
Chapter 13: Distilling In this chapter: Prevent fouling Insulate parts of equipment Utilize reboilers Use heat exchangers to recover waste heat Use model predictive controls Reduce steam distribution system pressure Vapor Recompression Use thermal vapor recompression Use mechanical vapor recompression Batch Pot Distillation Improve pot still design Continuous Column Distillation Increase the length of campaign runs Heat still with indirect steam Use pressure distillation Use vacuum or cold distillation Use a falling film reboiler
Distilling is the largest energy-consuming process in a distillery. Heating and cooling liquids and their phase change from liquid to gas is very energy intensive, making this an important area for finding efficiency savings.
During distillation, the mash or wash from fermentation passes through a still or series of stills where the alcohol is separated from the other liquid components. Since alcohols have lower boiling points than water, the fermented wash can be heated so that alcohols will vaporize and leave the still while much of the other components will remain in liquid form. The low wines, or spirit that comes from the first round of distillation, have a lower alcohol content than the high wines, which are achieved in subsequent distillation steps. Distillers make cuts during distillation and discard or redistill parts of the heads and tails, the first and last parts to come from the still, which are different types of alcohols that impact the flavor.
Since a cool liquid can be used to reduce the temperature of hot gas and vice versa, and a distillery often needs to be cooling one and heating another at the same time, many of the most effective energy reduction strategies focus on how you can use the hot liquid or gas from one step of the process for heating a cool liquid in another and vice versa. Doing so can help reduce the fuel for heating and the electricity needed for cooling (see also above on process integration/pinch analysis in Chapter 9).
Two types of distilling processes exist—batch and continuous distillation—and generally two types of stills exist—pot stills and column stills. In a batch process, the mash or wash goes into to pot, is distilled, and then the stillage (the leftovers) is removed and the process begins again. The batch process is typically used in smaller or more traditional distilleries, while the larger distilleries use continuous distillation processes. In column stills, the distillate continuously vaporizes and condenses as it moves between the different plates (or fractions) through the column, resulting in a purer product (Strickland, 2020). In pot stills, some vapors may condense when they are exposed to cooler areas in the upper part of the pot, resulting in reflux, and would be distilled again in the pot. This typically results in the heavier oils and alcohols that condense sooner moving onto the next part of the process (Strickland, 2019b). Industry cites the reflux, shape and size of the still as factors that affect the flavor profile of the product.
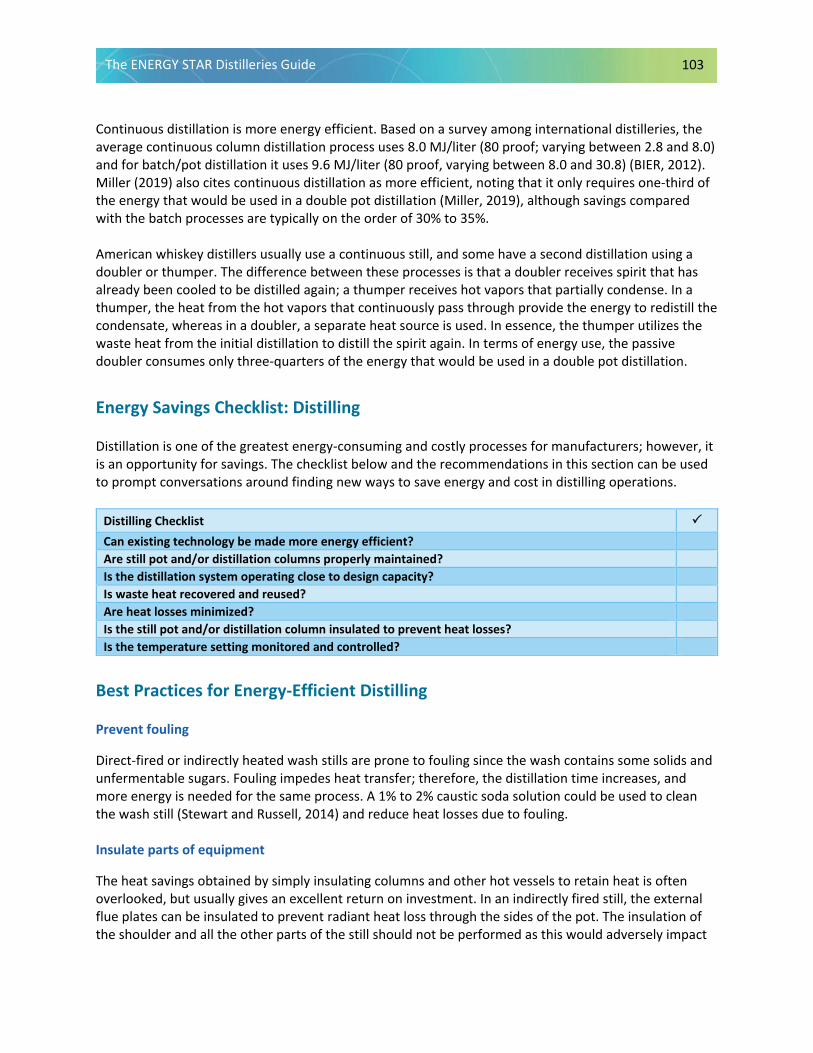
The ENERGY STAR Distilleries Guide 103
Continuous distillation is more energy efficient. Based on a survey among international distilleries, the average continuous column distillation process uses 8.0 MJ/liter (80 proof; varying between 2.8 and 8.0) and for batch/pot distillation it uses 9.6 MJ/liter (80 proof, varying between 8.0 and 30.8) (BIER, 2012). Miller (2019) also cites continuous distillation as more efficient, noting that it only requires one-third of the energy that would be used in a double pot distillation (Miller, 2019), although savings compared with the batch processes are typically on the order of 30% to 35%. American whiskey distillers usually use a continuous still, and some have a second distillation using a doubler or thumper. The difference between these processes is that a doubler receives spirit that has already been cooled to be distilled again; a thumper receives hot vapors that partially condense. In a thumper, the heat from the hot vapors that continuously pass through provide the energy to redistill the condensate, whereas in a doubler, a separate heat source is used. In essence, the thumper utilizes the waste heat from the initial distillation to distill the spirit again. In terms of energy use, the passive doubler consumes only three-quarters of the energy that would be used in a double pot distillation.
Energy Savings Checklist: Distilling
Distillation is one of the greatest energy-consuming and costly processes for manufacturers; however, it is an opportunity for savings. The checklist below and the recommendations in this section can be used to prompt conversations around finding new ways to save energy and cost in distilling operations.
Distilling Checklist Can existing technology be made more energy efficient? Are still pot and/or distillation columns properly maintained? Is the distillation system operating close to design capacity? Is waste heat recovered and reused? Are heat losses minimized? Is the still pot and/or distillation column insulated to prevent heat losses? Is the temperature setting monitored and controlled?
Best Practices for Energy-Efficient Distilling
Prevent fouling
Direct-fired or indirectly heated wash stills are prone to fouling since the wash contains some solids and unfermentable sugars. Fouling impedes heat transfer; therefore, the distillation time increases, and more energy is needed for the same process. A 1% to 2% caustic soda solution could be used to clean the wash still (Stewart and Russell, 2014) and reduce heat losses due to fouling. Insulate parts of equipment
The heat savings obtained by simply insulating columns and other hot vessels to retain heat is often overlooked, but usually gives an excellent return on investment. In an indirectly fired still, the external flue plates can be insulated to prevent radiant heat loss through the sides of the pot. The insulation of the shoulder and all the other parts of the still should not be performed as this would adversely impact

The ENERGY STAR Distilleries Guide 104
the reflux, which is essential for spirit character (Stewart and Russell, 2014). Different materials are suitable as insulators, while thermal insulating coatings are a convenient solution as they are easy to apply to existing infrastructure.
Utilize reboilers
Reboilers are simply heat exchangers that take a hot stream and use it to generate steam for another part of the process. In distillation, the liquid at the bottom of the distillation column can flow to a reboiler to be heated to a higher temperature using indirect steam pumped into the reboiler or through direct fire. The advantage of this is that the condensate can be returned to the boiler instead of creating extra liquid that must be disposed of in the stillage (Jacques et al., 2003) (see also Chapter 9).
Use heat exchangers to recover waste heat
Distilleries have several material flows that need to be either heated or cooled. Distilleries can use incoming water for cooling applications, such as in condensers, and then direct that heated water to other processes, such as mashing, where preheated water can be used to reduce the energy needed for heating, or as makeup water for steam boilers. Capturing and utilizing these flows can be an important source of thermal energy savings, thus increasing energy efficiency. Heat exchangers are one way to capture the waste heat from one process and redirect that energy to processes that need to be cooled.
CASE STUDY Headlands Distilling Co. (Australia) created a continuous distillation column in house that saves up to 80% of energy on the power used in the distillation process.
In Headlands’ system, the wash from fermentation, which contains ~7% alcohol, is pumped through the outer shell of the column still’s condenser. Since the wash is cooler than the vapors in the condenser, the wash increases in temperature while the vapors cool and condense. The wash is then pumped to the distillation column where it is further heated and distilled. The benefit is twofold: First, the liquid from fermentation is heated from 68°F to 149°F (20°C to 65°C), reducing the amount of energy needed to bring it to an even higher temperature in the still. Second, the wash is able to cool the vapors sufficiently so that condensation can take place without the addition of any cooling water.
Headlands was able to make this process even more efficient. Not all fermented liquid that goes into the still exits as vapor. The remaining 93%, which is mostly water, is still hot and a lot of energy (and money) was used to heat that water in the first place. Headlands installed a heat exchanger where the remaining water exits at the base of the still. The already preheated water goes through this second heat exchanger to heat the wash to an even higher temperature, thus further reducing the amount of fuel needed to heat the still. Any waste heat that is not recovered in this step is used to rinse the grains.
Source: Headlands Distilling. (n.d.). Sustainability. Retrieved January 26, 2021, from https://headlands.com.au/sustainability/
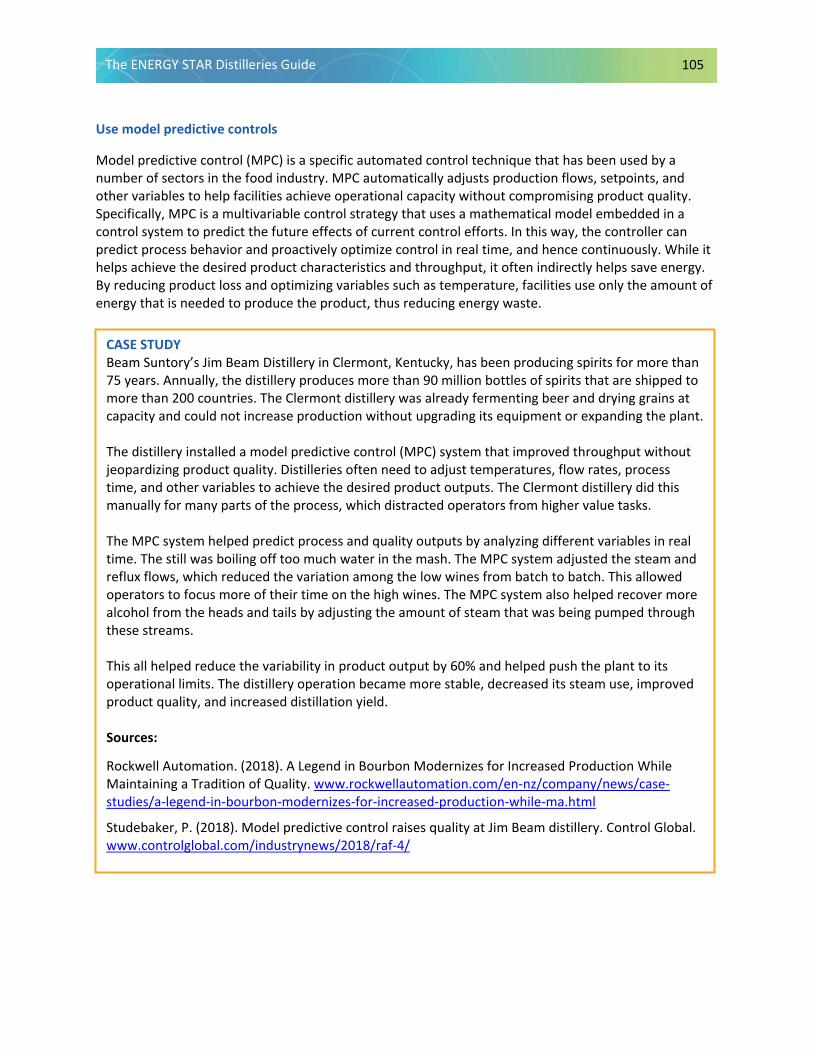
The ENERGY STAR Distilleries Guide 105
Use model predictive controls
Model predictive control (MPC) is a specific automated control technique that has been used by a number of sectors in the food industry. MPC automatically adjusts production flows, setpoints, and other variables to help facilities achieve operational capacity without compromising product quality. Specifically, MPC is a multivariable control strategy that uses a mathematical model embedded in a control system to predict the future effects of current control efforts. In this way, the controller can predict process behavior and proactively optimize control in real time, and hence continuously. While it helps achieve the desired product characteristics and throughput, it often indirectly helps save energy. By reducing product loss and optimizing variables such as temperature, facilities use only the amount of energy that is needed to produce the product, thus reducing energy waste.
CASE STUDY Beam Suntory’s Jim Beam Distillery in Clermont, Kentucky, has been producing spirits for more than 75 years. Annually, the distillery produces more than 90 million bottles of spirits that are shipped to more than 200 countries. The Clermont distillery was already fermenting beer and drying grains at capacity and could not increase production without upgrading its equipment or expanding the plant. The distillery installed a model predictive control (MPC) system that improved throughput without jeopardizing product quality. Distilleries often need to adjust temperatures, flow rates, process time, and other variables to achieve the desired product outputs. The Clermont distillery did this manually for many parts of the process, which distracted operators from higher value tasks. The MPC system helped predict process and quality outputs by analyzing different variables in real time. The still was boiling off too much water in the mash. The MPC system adjusted the steam and reflux flows, which reduced the variation among the low wines from batch to batch. This allowed operators to focus more of their time on the high wines. The MPC system also helped recover more alcohol from the heads and tails by adjusting the amount of steam that was being pumped through these streams. This all helped reduce the variability in product output by 60% and helped push the plant to its operational limits. The distillery operation became more stable, decreased its steam use, improved product quality, and increased distillation yield. Sources:
Rockwell Automation. (2018). A Legend in Bourbon Modernizes for Increased Production While Maintaining a Tradition of Quality. www.rockwellautomation.com/en-nz/company/news/case-studies/a-legend-in-bourbon-modernizes-for-increased-production-while-ma.html
Studebaker, P. (2018). Model predictive control raises quality at Jim Beam distillery. Control Global. www.controlglobal.com/industrynews/2018/raf-4/
The ENERGY STAR Distilleries Guide 106
Reduce steam distribution system pressure
Maintaining steam systems at pressures higher than are needed can result in wasted energy. Under high pressures, there will be more steam and embodied energy losses. By reducing steam distribution pressure to as low as feasible, flash losses can be minimized. In fact, a reduction of 0.5 bar for a 1 million liter of alcohol distillery would result in an approximate savings of €3,500 per year and lower radiant losses (Hamill et al., 2020).
Vapor recompression
Vapor recompression systems are similar to heat exchangers but operate more efficiently. Vapor recompression compresses the vapors exiting an evaporator or distillation column so that the vapor pressure and temperature rise. This hotter vapor can then be used as a heating medium. Recompression is an efficient waste heat recovery technology, producing upgraded heat that can be reused in the production processes. While energy is needed to recompress a vapor, the net energy savings from the additional heat that is generated makes these technologies efficient. There are two types of vapor recompression systems: thermal vapor recompression (TVR) systems and mechanical vapor recompression (MVR) systems.
Use thermal vapor recompression
TVR systems, also referred to as thermo-compressors, are simple, low-maintenance devices that can save a considerable amount of energy. In these systems, high-pressure steam is passed through a Venturi-type nozzle. This draws a vacuum in the vessel containing the hot liquid, causing it to boil. This steam combines with the now low-pressure steam for use. About 25% (depending on the design) of the steam out of the thermo-compressor is recovered heat from the liquid (Jacques et al., 2003). These systems work best when operating under constant running conditions for long periods (Sorrell, 2000). Unlike their MVR counterparts, TVR systems have no turning parts (GEA, n.d.).

The ENERGY STAR Distilleries Guide 107
Use mechanical vapor recompression
MVR systems, via a centrifugal fan, increase the pressure of the vapors exiting the still. As the pressure of the vapor increases, so does the steam’s (vapor’s) temperature, allowing the steam to more efficiently transfer its heat to lower temperature feedstocks. The compressed vapor can be reused for preheating water for a boiler (Hackensellner, 2000), preheating the mash or wash that goes into the still, or heating water used for cleaning.
While additional energy is required to compress the vapors, the useful heat in the compressed vapor contains more energy than the electricity required to compress the steam (Hackensellner, 2000; Kidger, 2001). MVR systems work best when operating constantly for long periods (Sorrell, 2000). Estimates for operating costs are around 2% to 7% of the investment costs (Hackensellner, 2000). MVR is a more efficient but costlier option than TVR to install and run so the savings must make it cost-effective (Jacques et al., 2003). Using MVR would allow offsetting onsite fuel use (and associated emissions) by electricity; consequently, it is an option to reduce CO2 emissions.
MVR can be integrated into the distillation still to efficiently recover heat from the distillation column. In a distillery, an MVR system would compress the vapors leaving the still, thus increasing the vapor temperature. When this occurs, the water used to cool the vapors leaves at a higher temperature, and that water can now be used to support other operations. With MVR, the still condensers can be
CASE STUDY Diageo’s Singleton of Glen Ord distillery in the Scottish Highlands doubled its plant capacity to meet the increased demand of its products. Briggs of Burton worked with Diageo’s engineering team to support the establishment of a mash house, tun room, and still house with eight pot stills. In the process, they also added thermal vapor recompression (TVR) and energy storage systems to both recent installations and existing still houses.
The TVR system consists of a split condenser design to recover both hot water and flash vapor generation, a copper-clad flash vessel, and externally heated stills with plate and frame heat exchangers. The TVR system is linked to thermal energy storage tanks that allow exporting of the extra energy to a nearby malt house. The expansion project also included the associated utilities and services, including the boiler house, control room, and supporting process tanks, which all required upgrading.
This distillery is recognized as the most energy-efficient malt distillery in the Diageo group and it achieved “Best in Group” on water and energy key performance indicators at the distillery.
Diageo has implemented similar TVR systems at other distilleries, including its Teaninich distillery.
Source: Briggs of Burton. (2018). Scottish Malt Distillery Expansion, Briggs TVR System. www.briggsplc.com/case-studies/distilling-scotch-malt-distillery-expansion/
Mitchell, Billy. (2016, December). Double Measures: Diageo’s Expanded Teaninich Distillery. Brewer and Distiller International. www.ibdlearningzone.org.uk/article/show/pdf/1676/
The ENERGY STAR Distilleries Guide 108
designed to produce hot water at temperatures up to 185°F (85˚C). For example, the recovered heat can be used to heat evaporators for pot ale or the distillation columns. Some distilleries already have heat exchangers that capture the heat from the vapors leaving the still to preheat other feedstocks. An MVR system would serve the same purpose but would first compress the vapors, which increases their temperature. When the vapors flow through the condenser, the heat exchange medium would now be heated to a higher temperature, which enables it to transfer even more heat to the feedstocks that need it. Early MVR applications (2002) in distilleries had been piloted in Japan at the Chita plant of Sungrain Ltd., producing concentrated alcohol for beverage applications (IEA HPC, 2014). The combination of MVR and TVR to produce steam resulted in primary energy savings exceeding 40%. Typically, energy savings will be in the range of 20% to 30%.
Batch Pot Distillation
Improve pot still design
Still design impacts the characteristics and flavor of the product. For example, the length and configuration of the swan neck of the still influences the amount of reflux, or condensate, that would be recirculated in the still and the profile of the esters that ultimately end up in the final product. For that reason, a distillery would typically not replace and redesign its stills for the sake of energy efficiency.
CASE STUDIES Mechanical vapor recompression (MVR) has been used by whisky producers, including Pernod Ricard’s Jameson Midleton distillery in Ireland and Chivas’s Strathclyde distillery in Scotland. The Jameson distillery integrated MVR into its distillation process when it expanded its distillery in 2014 to double production capacity to 64 million liters/year. The new process distills under vacuum and recovers heat using an MVR unit. The recovered heat is then reused in the distillation column. The installation resulted in annual fuel savings of €5.5 million/year and a reduction in CO2 emissions of 37,000 tons compared with the traditional process. The Strathclyde grain distillery in Glasgow produces Scotch whisky that is distilled with the help of an MVR system. MVR captures energy from recovered steam exiting the still. As a result of this and other improvements made between 2004 and 2006, there has been a drop of 10% in energy usage per liter of alcohol produced and the same decrease in CO2 emission levels. Source: Miller, G.H. (2019). Whisky Science: A Condensed Distillation. Springer.
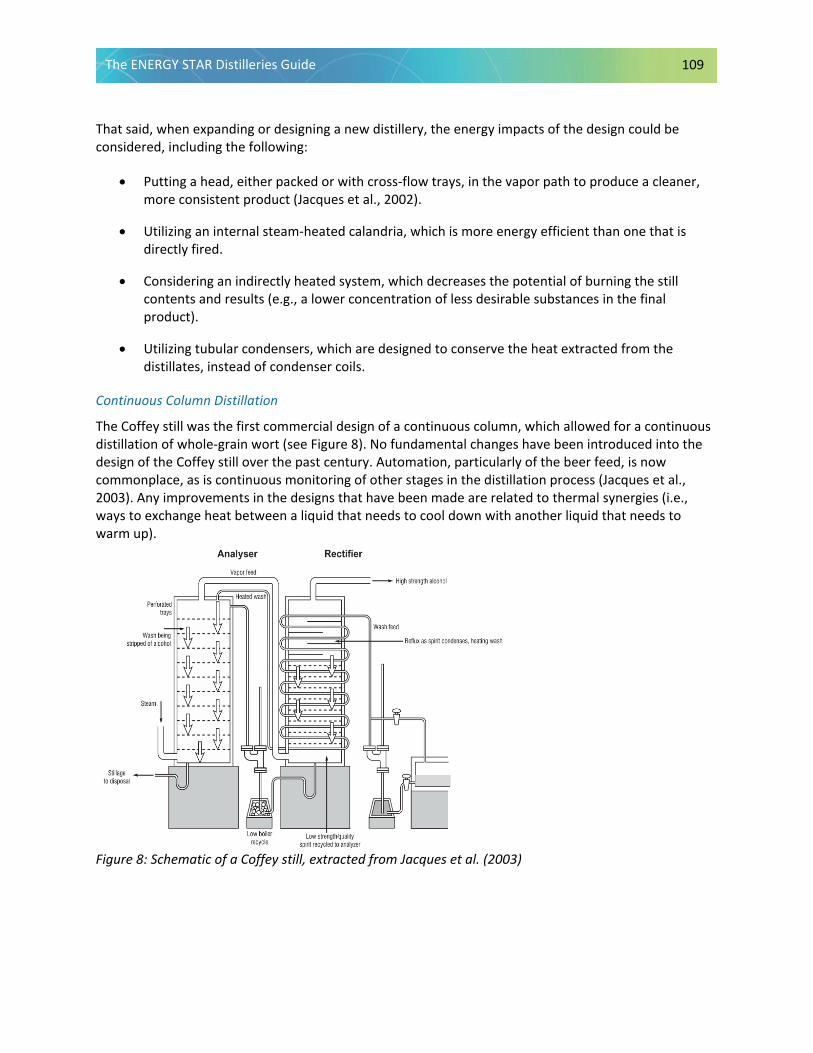
The ENERGY STAR Distilleries Guide 109
That said, when expanding or designing a new distillery, the energy impacts of the design could be considered, including the following:
• Putting a head, either packed or with cross-flow trays, in the vapor path to produce a cleaner,more consistent product (Jacques et al., 2002).
• Utilizing an internal steam-heated calandria, which is more energy efficient than one that isdirectly fired.
• Considering an indirectly heated system, which decreases the potential of burning the stillcontents and results (e.g., a lower concentration of less desirable substances in the finalproduct).
• Utilizing tubular condensers, which are designed to conserve the heat extracted from thedistillates, instead of condenser coils.
Continuous Column Distillation
The Coffey still was the first commercial design of a continuous column, which allowed for a continuous distillation of whole-grain wort (see Figure 8). No fundamental changes have been introduced into the design of the Coffey still over the past century. Automation, particularly of the beer feed, is now commonplace, as is continuous monitoring of other stages in the distillation process (Jacques et al., 2003). Any improvements in the designs that have been made are related to thermal synergies (i.e., ways to exchange heat between a liquid that needs to cool down with another liquid that needs to warm up).
Figure 8: Schematic of a Coffey still, extracted from Jacques et al. (2003)
The ENERGY STAR Distilleries Guide 110
Increase the length of campaign runs
A “campaign run” is the amount of time that the distillation column is being used. When a still stops or there is a lag between campaign runs, heat and energy in the still are lost. It also may need to be cleaned at that point. When it starts up again, more energy is needed to bring it up to temperature. Increasing the length of campaign runs and reducing the number of times it needs to startup reduces the amount of water and chemicals needed for cleaning and reduces the amount of heat that is needed (Hamill et al., 2020).
Heat still with indirect use of steam
The wash in the column still can be heated by injecting steam directly in the still where the wash and steam mix together. Or the wash can be heated indirectly from steam circulating through coils in the still. Indirect steam, rather than direct steam, provides an opportunity for the steam condensate to be recovered and recirculated as heat. If the steam is injected directly, much of it will condense in the still and would be discharged as spent wash or it would go the co-product route. By using steam indirectly, a distillery has an opportunity to reduce energy, save water, and reduce waste (Hamill et al., 2020).
Use pressure distillation
Under pressure distillation, one or more columns are run under pressure. Instead of the vapors from the heads, or the part of the distillation stream that is often discarded, being condensed by cooling water, they are passed through a reboiler that produces steam for another column (Jacques et al., 2003). In other words, the waste heat from the column under pressure is recovered to use it for the second (atmospheric) column, which reduces the total amount of steam that is required for distillation.
CASE STUDY Back in the early 2000s when MGP Ingredients, Inc.’s Atchison, Kansas, facility rebuilt their grain neutral spirit (GNS) distillation system, they used it as an opportunity to optimize their energy use. Utilizing a pressure distillation process design by KATZEN International, Inc., MGP built a distillation system that cascades the energy from higher pressure columns to atmospheric columns throughout the system. This is accomplished by using the overhead vapors from higher pressure distillation columns to power the reboilers of atmospheric distillation columns. Multiple heat exchangers are also utilized throughout the process to transfer heat from one stream that needs to be cooled to another that needs to be heated. By doing this, MGP is able to save a large amount of energy through the reduction of steam usage throughout the system. For every pound of steam that is put into the system, MGP is able to utilize it about 2.2 times throughout the system. These improvements have reduced energy use by approximately 46% of what a normal GNS distillation system of its caliber would use.
Source: Munim Hussain, Corporate Director of Environmental Engineering, MGP Ingredients, Inc., Personal Communication, August 3, 2021.
The ENERGY STAR Distilleries Guide 111
Use vacuum or cold distillation
Cold distillation comes originally from pharmaceutical laboratories. Instead of heating the botanicals and neutral grain spirit until they both reach a boiling point of around 172°F (78°C), a vacuum is used to bring down the boiling point to about 86°F (30°C) (Buchi, 2018). In this configuration, one column (usually the stripping column) is run under a vacuum, or lower pressure. In a vacuum, liquids boil at a lower temperature, which means that less energy is needed to evaporate the alcohols. In this setup, the waste heat from the heads of the atmospheric column can power the reboiler on the vacuum column. This practice is becoming common in distilleries using molasses as a feedstock. It also is being used by distilleries that want to maintain the more delicate flavors of the wash or other aromatics being distilled, which would otherwise be destroyed or altered at higher temperatures (Polonski, 2019, and McGee, 2009). Some of the compounds and flavors in the plants are heat sensitive. Therefore, in traditional distillation, these may be lost, changing the profile of the flavors. Also, it is possible to distill not only the ethanol but also the water and the water-soluble substances from the botanicals. This will affect the taste of the spirits. The lower temperatures in the stripping section have the added benefit of reduced calcium fouling of the trays (Jacques et al., 2003). There is a tradeoff between the energy needed to create the vacuum and the thermal energy used; therefore, for each case, it is necessary to calculate whether using this technology would result in an overall reduction in energy use.
CASE STUDY
When Pernod Ricard’s Jameson distiller in Midleton, Ireland, sought to modernize its operations, one new feature they integrated into the expanded site was operating the grain column still under vacuum conditions. In this setup, there was energy coupling by means of a pressure-vacuum cascade.
Changes like these do not occur overnight. Distilling under different temperatures and pressures, while reducing energy and GHGs, also has the potential to alter the key aromatic components of the spirits. The distillery needed to determine how to counteract these impacts. They partnered with an equipment provider over a period of more than 5 years to test this technology, first under laboratory conditions and then pilot scale conditions in the distillery. The result was a technological milestone that along with a mechanical vapor recompression system (heat pump) as explained in a previous case study and other upgrades, the vacuum distillation resulted in a reduction of 40% in CO2 emissions.
Source: Stewart, G., and I. Russell (Eds.). (2014). Whisky: Technology, Production and Marketing.
The ENERGY STAR Distilleries Guide 112
Use a falling film reboiler
The falling film evaporator as reboiler allows rapid startup and shutdown of the distillation column due to a smaller liquid capacity. The control and operation of the smallest temperature differences are easily controlled, therefore it is used for temperature-sensitive products and is suited for energy savings in a multiple-effect distillation process (GEA, 2013).
CASE STUDY Durham Distillery is a craft distillery in North Carolina that uses a combination of traditional and modern methods, including vacuum distillation.
First, the high-quality ethanol is distilled through the more traditional way at atmospheric pressure, using a fully electric copper still. The botanicals, such as juniper and caraway, are placed on a wide tray and the vapors are forced through the botanicals during the 3-hour process that produces a 200-liter batch of a base gin.
However, some fresh flavors, components such as cucumber, honeysuckle, and fig, cannot handle the heat. That is where vacuum distillation comes in. Durham Distillery uses the Rotavapor®, a vacuum still that was first used in the pharmaceutical industry. The ingredients are mixed with the alcohol in the still and then the pressure is reduced to zero. The ethanol and aromatics from the botanicals distill at room temperature. Therefore, these flavors are incorporated using the Rotavapor, which allows distilling at lower temperatures, thus avoiding the unpleasant flavors associated with cooked botanicals.
Source: Wojciechowska, I. (2015). Vacuum Distillation: When Gin Goes High-Tech. Tales of the Cocktail Foundation. https://talesofthecocktail.org/in-depth/vacuum-distillation-when-gin-goes-high-tech/
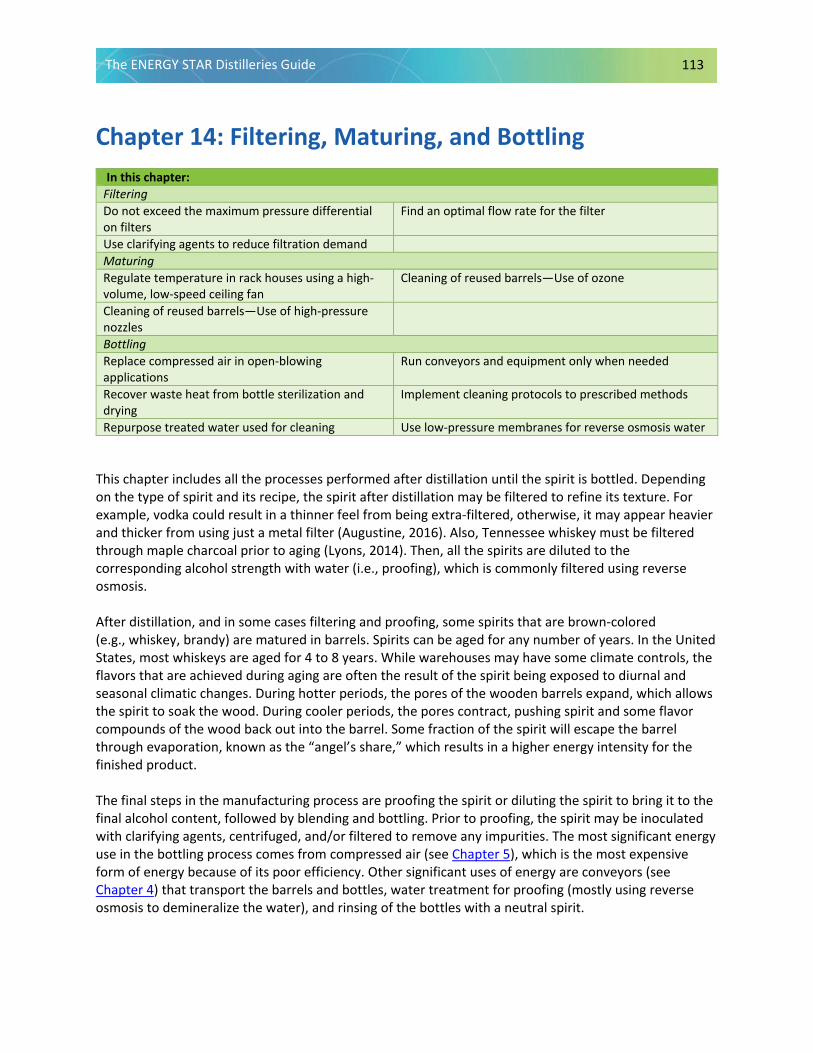
The ENERGY STAR Distilleries Guide 113
Chapter 14: Filtering, Maturing, and Bottling In this chapter: Filtering Do not exceed the maximum pressure differential on filters
Find an optimal flow rate for the filter
Use clarifying agents to reduce filtration demand Maturing Regulate temperature in rack houses using a high-volume, low-speed ceiling fan
Cleaning of reused barrels—Use of ozone
Cleaning of reused barrels—Use of high-pressure nozzles
Bottling Replace compressed air in open-blowing applications
Run conveyors and equipment only when needed
Recover waste heat from bottle sterilization and drying
Implement cleaning protocols to prescribed methods
Repurpose treated water used for cleaning Use low-pressure membranes for reverse osmosis water
This chapter includes all the processes performed after distillation until the spirit is bottled. Depending on the type of spirit and its recipe, the spirit after distillation may be filtered to refine its texture. For example, vodka could result in a thinner feel from being extra-filtered, otherwise, it may appear heavier and thicker from using just a metal filter (Augustine, 2016). Also, Tennessee whiskey must be filtered through maple charcoal prior to aging (Lyons, 2014). Then, all the spirits are diluted to the corresponding alcohol strength with water (i.e., proofing), which is commonly filtered using reverse osmosis. After distillation, and in some cases filtering and proofing, some spirits that are brown-colored (e.g., whiskey, brandy) are matured in barrels. Spirits can be aged for any number of years. In the United States, most whiskeys are aged for 4 to 8 years. While warehouses may have some climate controls, the flavors that are achieved during aging are often the result of the spirit being exposed to diurnal and seasonal climatic changes. During hotter periods, the pores of the wooden barrels expand, which allows the spirit to soak the wood. During cooler periods, the pores contract, pushing spirit and some flavor compounds of the wood back out into the barrel. Some fraction of the spirit will escape the barrel through evaporation, known as the “angel’s share,” which results in a higher energy intensity for the finished product. The final steps in the manufacturing process are proofing the spirit or diluting the spirit to bring it to the final alcohol content, followed by blending and bottling. Prior to proofing, the spirit may be inoculated with clarifying agents, centrifuged, and/or filtered to remove any impurities. The most significant energy use in the bottling process comes from compressed air (see Chapter 5), which is the most expensive form of energy because of its poor efficiency. Other significant uses of energy are conveyors (see Chapter 4) that transport the barrels and bottles, water treatment for proofing (mostly using reverse osmosis to demineralize the water), and rinsing of the bottles with a neutral spirit.
The ENERGY STAR Distilleries Guide 114
Energy Savings Checklist: Filtering, Maturing, and Bottling
The checklist below and the recommendations in this section and the sections referenced above can be used to prompt conversations around finding new ways to save energy and costs in the final stages of production.
Filtering, Maturing, and Bottling Checklist
Can existing technology be made more energy efficient? Are air compressors properly maintained? Is the bottling line operated close to design capacity? Is waste heat recovered and reused? Are heat losses minimized? Is the process monitored and controlled? Are bottle losses minimized?
Best Practices for Energy-Efficient Filtering
Do not exceed the maximum pressure differential on filters
Pressure gauges installed in the inlet and outlets of a filtration system could help detect instances where the system is using more energy than needed to operate. The gauges measure the pressure at which the spirit is pushed through the filter. A high-pressure differential between the two gauges can indicate that the filter media is spent and may need to be replaced. In those cases, the pump would be working and consuming more energy than needed to convey the spirit through the media. Most filter media will indicate the maximum differential pressure.
Find the optimal flow rate for filters
Flow meters installed on the filter can be used in conjunction with pressure gauges to find the optimal flow rate for balancing the energy and filter media costs. Ideally, the operator would want to find the flow rate that permits the most amount of liquid to flow through the filter before needing to replace the media. A flow rate that is too fast not only would prematurely clog the filter and lead to a high-pressure differential but it also would require a larger energy load to operate.
Operators can develop curves reflecting the total amount of liquid filtered at different flow rates before the maximum pressure differential is reached. For each flow rate, a graph can show time on one axis and pressure differential on another. The flow rate that allows for the most liquid to be filtered before the maximum pressure differential is reached, in many cases, would be the more energy efficient. However, this may affect the speed of the bottling line.
The ENERGY STAR Distilleries Guide 115
Use clarifying agents to reduce filtration demand
Clarifying agents can reduce haze and precipitate (clumped together) from small particles in a spirit. The type of media used will depend on the desired output on the product, such as removing haze, color, or microparticles. Common agents include bentonite, which binds proteins; pectinase, which can remove haze from a fruit-based spirit; silica gels; polyvinyl polypropylene; and charcoal. While racking and filtration are typically still needed to remove the particles that are entrapped by the clarifying agents, using these processes reduces the number of times a spirit needs to be filtered, thus reducing energy use. In other words, a distillery that utilizes a three-stage filtration approach may be able to reduce that to a one-stage approach. Similarly, clarifying agents, in some cases, could be used as an alternative to cold chill filtering, where a spirit may be chilled and held at temperatures below the freezing point of water for a period of time. While the clarifying agent would need to be removed, its use could avoid the energy needed to bring the spirit down to temperature.
Best Practices for Energy-Efficient Maturing
Regulate the temperature in rack houses using a high-volume, low-speed ceiling fan
Distilleries try to maintain consistent climatic conditions throughout a warehouse to prevent barrels from aging at different speeds. A high-volume, low-speed ceiling fan can help prevent air temperature stratification and humidity differentials within warehouses or other parts of a distillery. This ensures that every barrel ages equally, thus eliminating the need to rotate barrels from hot to cold spaces and vice versa, or other energy-intensive ways to maintain optimal conditions. Allagash Brewery installed two high-volume, low-speed fans that redistribute the pockets of warm air, ensuring that the product was kept at precisely 72°F (22°C) for the duration of the fermentation. After the installation, the rearranging of beer was no longer necessary (Process Cooling, 2017). Also, high concentration and a buildup of alcohol vapors have an intoxicating effect and are flammable. Thus, removing it using fans is a cost-efficient practice.
CASE STUDY Flying Leap Vineyards is a winery based in the high desert of southeastern Arizona, which also opened a distillery that produces whiskey and brandy. The dry climate is detrimental to aging spirits as a high amount of vapor escapes the barrels, leading to a drastic reduction in the amount of spirit at the end of the aging process. A humidification system, in concert with a high-volume, low-speed fan, was installed to prevent this problem. A humidifier, on its own, would have created different levels of relative humidity from top to bottom, leading to greater evaporation in certain areas. The fan mixes the indoor air, creating stable temperature and humidity for all barrels. High-volume, low-speed fans are a less energy-intensive practice than an HVAC system. Source: Process Cooling. (2017). 5 Ways to Use Fans in Breweries and Distilleries. www.process-cooling.com/articles/88763-ways-to-use-fans-in-breweries-and-distilleries
The ENERGY STAR Distilleries Guide 116
Cleaning of reused barrels—Use of ozone
Barrels that are used for aging the spirit may be cleaned before and after the maturation period. Barrels are typically cleaned with warm water. In wine making, barrels are typically cleaned with approximately 1.6 gallons of warm water per barrel. Moving to an ozone cleaning system can reduce hot water demand for barrel cleaning by up to 50% (Galitsky et al., 2005b). Ozone can be made onsite and on demand by a generator. Various suppliers provide (mobile) ozone generators. This eliminates the risks of storage. Ozone is a toxic gas, so personnel using the ozone cleaning process must be properly trained.
Cleaning of reused barrels—Use of high-pressure nozzles
High-pressure nozzles can be used to clean barrels in a shorter amount of time using less water in the process. This could result in water savings up to 40% of all water used in barrel cleaning (Galitsky et al., 2005b).
For any warehouses that have HVAC controls, consult Chapter 11. Similarly, warehouses that have conveyors or barrel elevators can benefit from the recommendations found in Chapter 4.
Best Practices for Energy-Efficient Bottling
The most significant energy use in bottling comes from compressed air (see Chapter 5) and motors used in conveyors (see Chapter 4). Energy efficiency measures to improve these systems can be found in their respective chapters.
Replace compressed air in open-blowing applications
During bottling, there are many applications that required 2 to 3 psi open-blowing air that could be provided by fans or blowers instead of compressed air, which has a pressure that could be 50 times higher and is known for being an energy-intensive process. Examples of these open-blowing applications are bottle drying for sleeve, paper, or pressure-sensitive labeling; crown and safety seal drying; warmer and pasteurizer discharge blow-off; combiner gap prevention; ionized air rinsing; drying prior to inkjet coding; and shrink or cardboard packing.
Opportunities in distilleries include the following:
• Using blowers instead for compressed air for air-powered conveyor systems to help conserveenergy and electricity costs.
• Some bottlers use ionized compressed air to clean the bottles prior to filling, blasting the insideof bottles using high-velocity blowers instead of compressed air prior to filling to remove dust.
• After bottling and capping, bottles may be rinsed or cooled with water where compressed airwould be used to remove water from the bottles. In such cases, compressed air knives could bereplaced with low-pressure fan blowers. If this is not possible, set the air pressure to the lowestlevel possible to maintain operations (Brewers Association, n.d.).

The ENERGY STAR Distilleries Guide 117
A soft drink bottler detected that they were using 100 psi compressed air in applications where only 2 to 3 psi were needed. They estimated that they could save 53,430 kWh, costing $4,530 a year. Therefore, they installed a high-speed motor, centrifugal blower, VFD, and four custom adjustable-mount nozzles. The centrifugal blowers direct drive technology-enabled adjustable operation speeds of up to 20,000 revolutions per minute, creating adjustable flow rates of up to 750 CFM at a pressure of 2.3 psi (Fenwick and Harris, 2012).
Run conveyors and equipment only when needed
When bottling beverages, the bottles travel along conveyors where they are rinsed or sanitized, filled, dried, labeled, and packaged. Other equipment, such as rinsers or air blowers, also may be operating along the conveyor belts. During periods where conveyors or equipment in one part of the bottling process are not being used due to slowdown, shutdown, or cleaning between product change-out, they can be turned to idle mode or shut off to save energy (Matthews, 2016; Marshall, n.d.). Sensors can be utilized to automate this process.
PepsiCo’s Indianapolis Gatorade plant developed a protocol to help ensure that conveyors are not left on during scheduled downtime. It implemented a “Master Stop” control project where the operator who receives the last case coming off the line has the responsibility for shutting off all the conveyors upstream with the help of a single button. A machine operator working in a second location would confirm that everything upstream is down. The plant also has sensors on equipment that prevents equipment from running when no product is on the line (Amandeep Sidhu, Engineering Manager, PepsiCo, Personal Communication, August 2021).
Recover waste heat from bottle sterilization and drying
Some distilleries (especially low-proof) may sterilize the bottles with steam and dry them using hot air before being filled. Food-grade steam that meets all applicable U.S. Food and Drug Administration and U.S. Department of Agriculture requirements for human consumption must be used. Often a culinary filter is used for steam supplied by a central boiler. Alternatively, smaller stainless steel electric steam generators can be installed closer to the bottling line. The sterilization and drying of bottles is a heat-intensive process and heat can be recovered from these processes (Exodraft, n.d.).
CASE STUDY The Edrington Group in Scotland set up an energy task force that strategizes energy reductions at its Glasgow headquarters and bottling plant. Over the past 4 years, as a result of these energy saving initiatives, the company has achieved a net gain savings of energy of more than 1.17 GWh, which equates to 225 tons of CO2 emissions.
Source: Broom, D. (2020). Energy efficient. Whisky Magazine. https://whiskymag.com/story?energy-efficient

The ENERGY STAR Distilleries Guide 118
Implement cleaning protocols to prescribed methods
Operators may be required to clean and flush the equipment to prevent contamination when switching between products in bottling operations and other parts of the distillery. The cleaning media may consume energy when being prepared, such as heating or purifying water. In some cases, operators may go beyond the prescribed protocol to varying degrees as a precautionary measure. Plants should have prescribed standard operating procedures for cleaning and work with operators to feel confident in the methods prescribed. Repurpose treated water used for cleaning
Some clean/sterilization in place (CIP/SIP) and other procedures used for cleaning equipment in bottling and other parts of the plant may include reverse osmosis or treated water for the final rinse. The final rinse water used may be tested with inline sensors to confirm that there are no contaminants or cleaning agents left in the system and that the equipment has been cleaned. The rinse water could be of high quality and repurposed for other processes in the plant, including cooling tower makeup water. While this activity can lower the costs for water and sewage, it also could result in energy savings by reducing the energy costs needed for treating the makeup water. Use low-pressure membranes for reverse osmosis water
Reverse osmosis water is characterized as having low conductivity and may be used in cleaning and other operations. While high-pressure membranes may result in lower conductivity of the output water, lower pressure membranes could result in a higher output, albeit higher conductivity. In cases when the required conductivity can be provided by lower pressure membranes, these media could help reduce the energy required in plants.
The ENERGY STAR Distilleries Guide 119
Chapter 15: Byproducts Processing In this chapter: Livestock Feed Find outlets near the distillery that accept wet distillers grain
Use mechanical means for stillage moisture removal
Use low-speed rotary screens in place of centrifuges Invest in high-efficiency centrifuges Recover flash heat from stillage Prevent evaporator fouling using clean-in-place systems Develop an evaporator cleaning and maintenance plan
Use a plate heat exchanger with integrated cleaning in place
Use evaporator exhaust vapors to heat subsequent evaporation stages
Reuse heat with thermocompression evaporators
Reuse heat with mechanical compression evaporators
Invest in a suitable drying system
Maintain proper seals on dryers Insulate the dryer drum Use low-temperature dryers Dry using solar heating Dry using superheated steam Bio-Energy Generation Generate biogas with anaerobic digestion
Byproducts are the products that are secondary to the main product of a process. There are multiple byproducts that are produced in a distillery at different stages of the manufacturing process.
If these outputs can provide economic value, they could be considered as co-products. In general, there are two predominant uses for the byproducts: livestock feed and bio-energy production.
Drying the stillage—the leftover water and grains following distillation—can be one of the greatest energy consumption activities for a distillery for those that operate a dry house. Whether byproducts are disposed of or upgraded to become a co-product, they often need to be treated before leaving the distillery using processes that can consume a lot of energy. Distilleries usually dry the stillage partially or fully to reduce the amount of weight (and fuel) needed to transport it to cattle or hog farms. Likewise, some distilleries also may dry the grain to reduce the cost of disposal. Distilleries can examine ways to reduce energy in these processes in order to reduce the overall energy intensity of the distillery.
As GHG emission reduction becomes more important, the stillage also can be processed onsite to generate energy. Typically, biogas is produced using anaerobic digestion; however, there also are a small number of CHP plants using dried stillage as a feedstock in the combustion process. These are strategies where the value of the livestock feed and energy recovered need to be weighted based on the individual situation of the distillery and local circumstances.
Lastly, upgrading byproducts to co-products, if not improving the energy efficiency and lowering a distillery’s onsite emissions, will generally lower the distillery’s embodied carbon footprint and scope 3 (indirect) emissions.
The ENERGY STAR Distilleries Guide 120
Energy Savings Checklist: Byproducts Processing
Byproducts processing may use significant amounts of energy if processed onsite; however, opportunities for savings exist. The checklist below and the recommendations in this section can be used to prompt conversations around new ways to save energy and costs in treating byproducts.
Byproducts Processing Checklist
Are all the byproducts processed? Is there any waste produced avoided? Can existing technology be made more energy efficient? Is the whole system properly maintained? Is waste heat recovered and reused? Are heat losses minimized? Is the energy embodied in the steam utilized?
Best Practices for Energy-Efficient Byproduct Processing for Livestock Feed
The dry house is where moisture is removed from the stillage or other byproducts to convert it into animal feed. Different products can be produced depending on the drying process and final moisture content of the byproduct. Common outputs are wet distillers grains, distillers dried grains, distillers dried grains with solubles, and thin stillage (backset) and/or syrup (concentrated thin stillage) (Figure 9).
Moisture removal from byproducts involves one or more of the following processes: mechanically removing moisture from stillage to produce wet cake and thin stillage, evaporating the thin stillage to produce a syrup, and drying the wet cake. Most improvements in dry house operations and energy efficiency have been the result of incorporating inter-process unit operations, energy-integration strategies, and technology breakthroughs in front-end processes. Jacques et al. (2003) report that it could take four times more energy to remove the same amount of water from the dryer than it would in an evaporator. Foremost is the reduction in stillage volumes due to increasing beer ethanol content, resulting in a significant reduction of dry house operations (Monceaux and Kuehner, 2009).
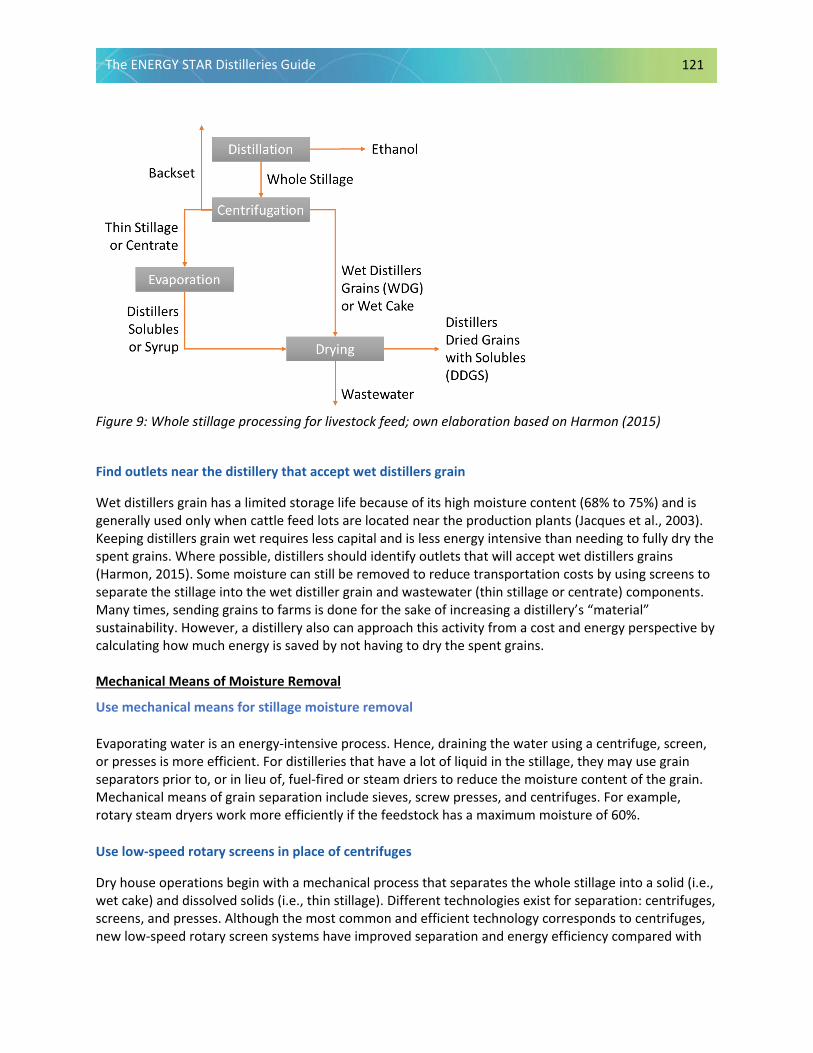
The ENERGY STAR Distilleries Guide 121
Figure 9: Whole stillage processing for livestock feed; own elaboration based on Harmon (2015)
Find outlets near the distillery that accept wet distillers grain
Wet distillers grain has a limited storage life because of its high moisture content (68% to 75%) and is generally used only when cattle feed lots are located near the production plants (Jacques et al., 2003). Keeping distillers grain wet requires less capital and is less energy intensive than needing to fully dry the spent grains. Where possible, distillers should identify outlets that will accept wet distillers grains (Harmon, 2015). Some moisture can still be removed to reduce transportation costs by using screens to separate the stillage into the wet distiller grain and wastewater (thin stillage or centrate) components. Many times, sending grains to farms is done for the sake of increasing a distillery’s “material” sustainability. However, a distillery also can approach this activity from a cost and energy perspective by calculating how much energy is saved by not having to dry the spent grains. Mechanical Means of Moisture Removal
Use mechanical means for stillage moisture removal
Evaporating water is an energy-intensive process. Hence, draining the water using a centrifuge, screen, or presses is more efficient. For distilleries that have a lot of liquid in the stillage, they may use grain separators prior to, or in lieu of, fuel-fired or steam driers to reduce the moisture content of the grain. Mechanical means of grain separation include sieves, screw presses, and centrifuges. For example, rotary steam dryers work more efficiently if the feedstock has a maximum moisture of 60%.
Use low-speed rotary screens in place of centrifuges
Dry house operations begin with a mechanical process that separates the whole stillage into a solid (i.e., wet cake) and dissolved solids (i.e., thin stillage). Different technologies exist for separation: centrifuges, screens, and presses. Although the most common and efficient technology corresponds to centrifuges, new low-speed rotary screen systems have improved separation and energy efficiency compared with
The ENERGY STAR Distilleries Guide 122
centrifuges. Applying organic polymers improves solids separation; however, this process is generally not cost-effective (Monceaux and Kuehner, 2009).
Invest in high-efficiency centrifuges
Although it involves more processing, distillers dried grain with solubles (DDGS) has traditionally been more appealing to the agricultural community as it has a longer storage life. Before being dried, the stillage is first centrifuged. The resultant liquid part (thin stillage or centrate) is transferred to an evaporator to produce distillers solubles. The solid part (wet distillers grains) is further dried to approximately 5% moisture and then coated with the distillers solubles for a final product (DDGS) for a final moisture content of 7% to 8% moisture (see Figure 9). Since most energy is typically consumed during the final step of drying the grains, distilleries can reduce energy use by investing in high-efficiency centrifuges and removing as much water in this step as possible as centrifuging uses less energy compared with other methods of water removal.
Recover flash heat from stillage
Except in vacuum distillation systems, once the spirit has been distilled, the leftover stillage is a superheated liquid that leaves the still at approximately 220°F (104°C). If the first process following distillation is screening or centrifuging, then flash heat (220°F to 212°F [104°C to 100°C]) is often lost. In these cases, heat exchangers can be installed between the still and stillage moisture removal systems to capture the flash heat. The waste heat can be used as a heat source for processes, such as preheating the incoming beer, the beer that enters the stripper column or mashing cooking, or cleaning water. It should be noted, however, that cooling of the whole stillage below the atmospheric boiling point causes the need for additional thermal energy later in the drying process (Jacques et al., 2003).
Evaporators
Evaporators are used to concentrate dissolved solids found in thin stillage—the liquid and dissolved solids that pass through a screen or centrifuge—or other liquid byproducts from the distillation process. The thin stillage has the bulk of the proteins and other nutrients, which is why it is typically evaporated and added to the dried distillers grains. The thin stillage is evaporated to increase its total solids from 5% to 10% to 30% to 50% (Monceaux and Kuehner, 2009). An evaporator is composed of a heat exchanger or calandria and transfers heat from the source stream to the thin stillage, raising its temperature to the boiling point. A vapor separator splits the water vapor from the thin stillage. The condenser removes energy from the evaporator via heat transfer with another fluid, and a vacuum source removes non-condensable components in the vapor.
Prevent evaporator fouling using clean-in-place systems
Fouling reduces heat transfer, and the cleaning usually involves downtime in the production process. Clean-in-place systems chemically clean heat exchangers, separators, and associated product-side piping without opening the equipment.
Develop an evaporator cleaning and maintenance plan
A regular maintenance and cleaning plan for evaporators can help reduce the amount of energy needed during the operation of evaporators (Brush, 2011). Regular maintenance can include inspecting for air
The ENERGY STAR Distilleries Guide 123
leaks into and out of the evaporators, cleaning heat transfer surfaces, inspecting insulation and replacing it when necessary, cleaning vapor separation chambers, and maintaining optimal pressure.
Use plate heat exchanger with integrated cleaning in place
The plate heat exchanger has a larger surface area than other types of heat exchangers, facilitating the transfer of heat. Plate heat exchangers can be integrated into evaporator systems by using the condensate from the distillation or evaporation processes to heat the incoming feedstock. Combined clean-in-place and heat exchanger technology also reduces downtime as it is easy to open and clean, preventing fouling and scaling to form.
Use evaporator exhaust vapors to heat subsequent evaporation stages
The efficiency of a simple evaporator system results in about one unit of steam removing one unit of water with a near-equal quantity of energy transferred to the cooling water (Monceaux and Kuehner, 2009). However, the energy efficiency of the evaporation process can be increased by using multiple, rather than single effect, evaporators. In multiple-effect evaporators, the vapor that boils off from one evaporator, which contains a lot of heat energy, is used as a heating medium in a subsequent evaporator (or “effect”). The liquid moves from one evaporator to the next, becoming more concentrated each time (Brush, 2011). The single unit of steam used to heat the liquid initially is essentially recycled in multiple stages, increasing the concentration of the final product per unit of energy input.
Reuse heat with thermocompression evaporators
Evaporator efficiency can be improved without necessarily needing to install additional evaporators during the evaporation process. Thermocompression evaporators compress the vapors, leaving the evaporator in a steam ejector with the addition of high-pressure steam. This results in a vapor that is at a higher pressure and temperature, which can be used to further heat and concentrate the liquid in the evaporator. A disadvantage of this kind of system is that the steam from the evaporator often contains
CASE STUDY In 2008, Glenfarclas Distillery in Speyside, Scotland, replaced a shell and tube evaporation system with an evaporation system with energy recovery from the distillation process and utilized plate heat exchangers with integrated cleaning in place instead.
The previous shell and tube evaporation system was not operating energy efficiently due to fouling and scaling. It also was difficult to clean and access. The distillery noted that the installed plate heat exchanger units have run without interruption, and the units are cleaned by flushing them once a week. The pot ale enters with 4% solids and water is evaporated to result in 45% solids.
Source: Alfa Laval. (2016). Plate heat exchangers boost efficiency at leading whisky distillery. Glenfarclas Distillery, Speyside, Scotland. www.alfalaval.com/globalassets/documents/media/stories/customer_story_glenfarclas_scotland_ppi00398en.pdf
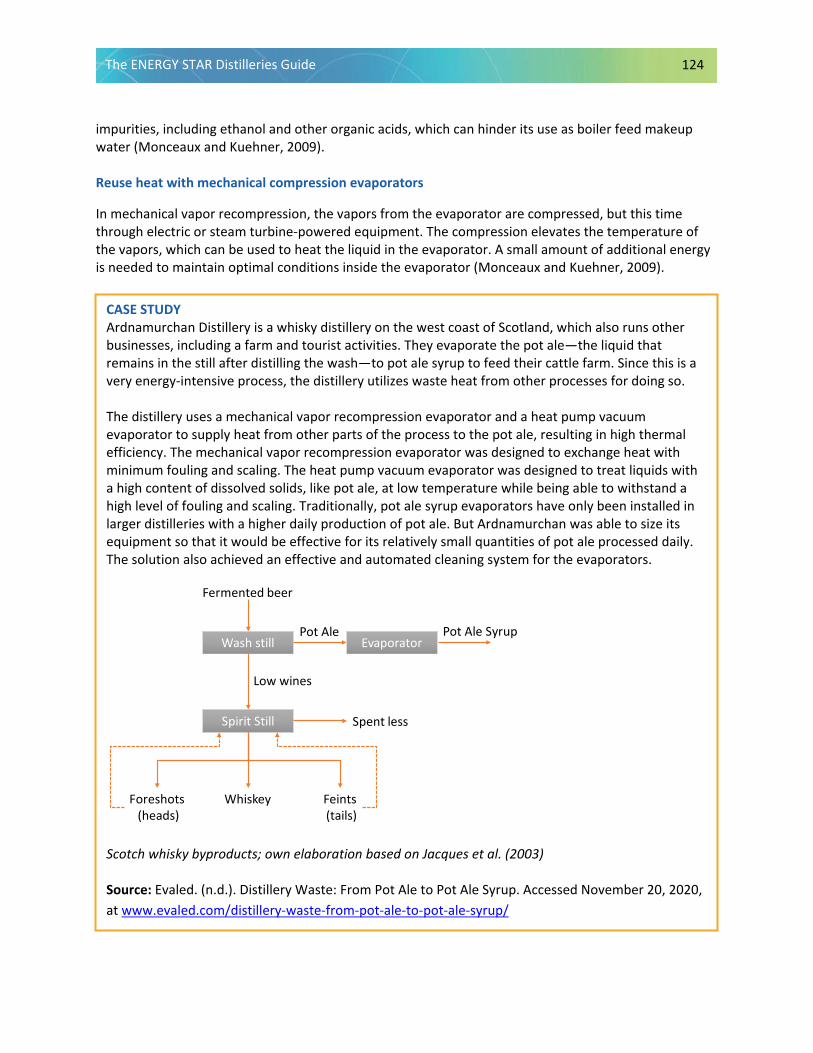
The ENERGY STAR Distilleries Guide 124
impurities, including ethanol and other organic acids, which can hinder its use as boiler feed makeup water (Monceaux and Kuehner, 2009). Reuse heat with mechanical compression evaporators
In mechanical vapor recompression, the vapors from the evaporator are compressed, but this time through electric or steam turbine-powered equipment. The compression elevates the temperature of the vapors, which can be used to heat the liquid in the evaporator. A small amount of additional energy is needed to maintain optimal conditions inside the evaporator (Monceaux and Kuehner, 2009).
CASE STUDY Ardnamurchan Distillery is a whisky distillery on the west coast of Scotland, which also runs other businesses, including a farm and tourist activities. They evaporate the pot ale—the liquid that remains in the still after distilling the wash—to pot ale syrup to feed their cattle farm. Since this is a very energy-intensive process, the distillery utilizes waste heat from other processes for doing so. The distillery uses a mechanical vapor recompression evaporator and a heat pump vacuum evaporator to supply heat from other parts of the process to the pot ale, resulting in high thermal efficiency. The mechanical vapor recompression evaporator was designed to exchange heat with minimum fouling and scaling. The heat pump vacuum evaporator was designed to treat liquids with a high content of dissolved solids, like pot ale, at low temperature while being able to withstand a high level of fouling and scaling. Traditionally, pot ale syrup evaporators have only been installed in larger distilleries with a higher daily production of pot ale. But Ardnamurchan was able to size its equipment so that it would be effective for its relatively small quantities of pot ale processed daily. The solution also achieved an effective and automated cleaning system for the evaporators.
Scotch whisky byproducts; own elaboration based on Jacques et al. (2003) Source: Evaled. (n.d.). Distillery Waste: From Pot Ale to Pot Ale Syrup. Accessed November 20, 2020, at www.evaled.com/distillery-waste-from-pot-ale-to-pot-ale-syrup/
Wash still
Spirit Still
Low wines
Spent less
Evaporator
Fermented beer
WhiskeyForeshots(heads)
Feints(tails)
Pot Ale Pot Ale Syrup
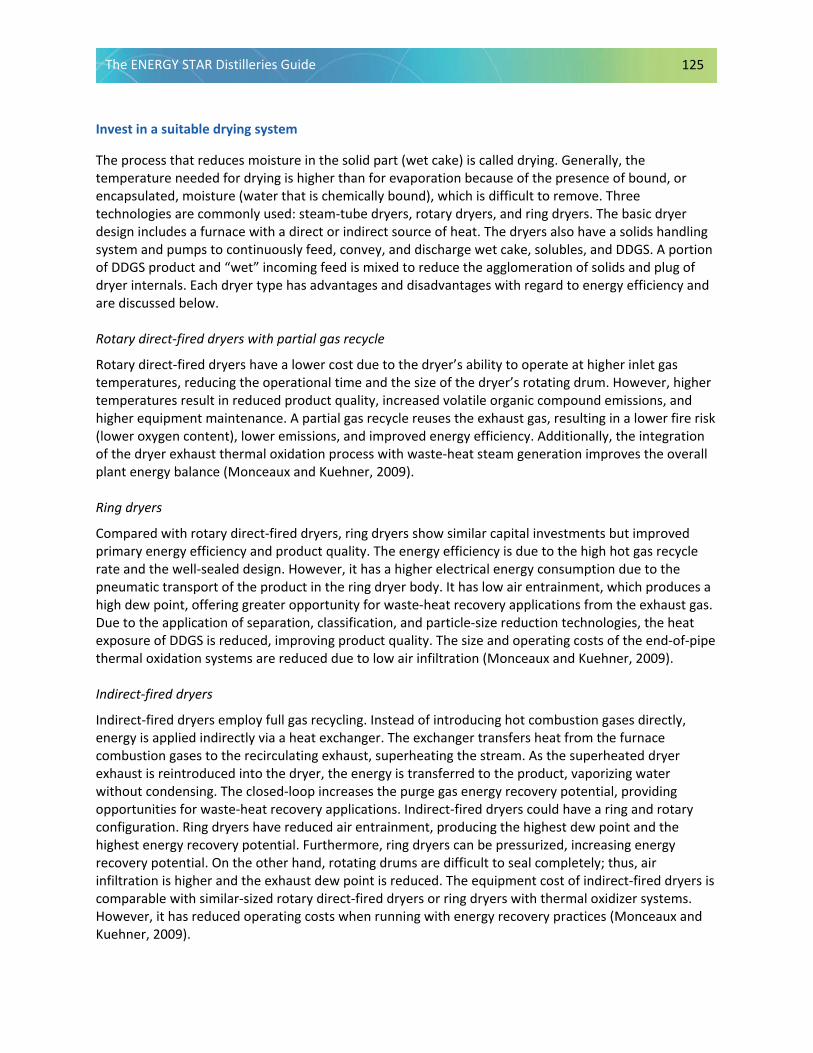
The ENERGY STAR Distilleries Guide 125
Invest in a suitable drying system
The process that reduces moisture in the solid part (wet cake) is called drying. Generally, the temperature needed for drying is higher than for evaporation because of the presence of bound, or encapsulated, moisture (water that is chemically bound), which is difficult to remove. Three technologies are commonly used: steam-tube dryers, rotary dryers, and ring dryers. The basic dryer design includes a furnace with a direct or indirect source of heat. The dryers also have a solids handling system and pumps to continuously feed, convey, and discharge wet cake, solubles, and DDGS. A portion of DDGS product and “wet” incoming feed is mixed to reduce the agglomeration of solids and plug of dryer internals. Each dryer type has advantages and disadvantages with regard to energy efficiency and are discussed below.
Rotary direct-fired dryers with partial gas recycle
Rotary direct-fired dryers have a lower cost due to the dryer’s ability to operate at higher inlet gas temperatures, reducing the operational time and the size of the dryer’s rotating drum. However, higher temperatures result in reduced product quality, increased volatile organic compound emissions, and higher equipment maintenance. A partial gas recycle reuses the exhaust gas, resulting in a lower fire risk (lower oxygen content), lower emissions, and improved energy efficiency. Additionally, the integration of the dryer exhaust thermal oxidation process with waste-heat steam generation improves the overall plant energy balance (Monceaux and Kuehner, 2009).
Ring dryers
Compared with rotary direct-fired dryers, ring dryers show similar capital investments but improved primary energy efficiency and product quality. The energy efficiency is due to the high hot gas recycle rate and the well-sealed design. However, it has a higher electrical energy consumption due to the pneumatic transport of the product in the ring dryer body. It has low air entrainment, which produces a high dew point, offering greater opportunity for waste-heat recovery applications from the exhaust gas. Due to the application of separation, classification, and particle-size reduction technologies, the heat exposure of DDGS is reduced, improving product quality. The size and operating costs of the end-of-pipe thermal oxidation systems are reduced due to low air infiltration (Monceaux and Kuehner, 2009).
Indirect-fired dryers
Indirect-fired dryers employ full gas recycling. Instead of introducing hot combustion gases directly, energy is applied indirectly via a heat exchanger. The exchanger transfers heat from the furnace combustion gases to the recirculating exhaust, superheating the stream. As the superheated dryer exhaust is reintroduced into the dryer, the energy is transferred to the product, vaporizing water without condensing. The closed-loop increases the purge gas energy recovery potential, providing opportunities for waste-heat recovery applications. Indirect-fired dryers could have a ring and rotary configuration. Ring dryers have reduced air entrainment, producing the highest dew point and the highest energy recovery potential. Furthermore, ring dryers can be pressurized, increasing energy recovery potential. On the other hand, rotating drums are difficult to seal completely; thus, air infiltration is higher and the exhaust dew point is reduced. The equipment cost of indirect-fired dryers is comparable with similar-sized rotary direct-fired dryers or ring dryers with thermal oxidizer systems. However, it has reduced operating costs when running with energy recovery practices (Monceaux and Kuehner, 2009).
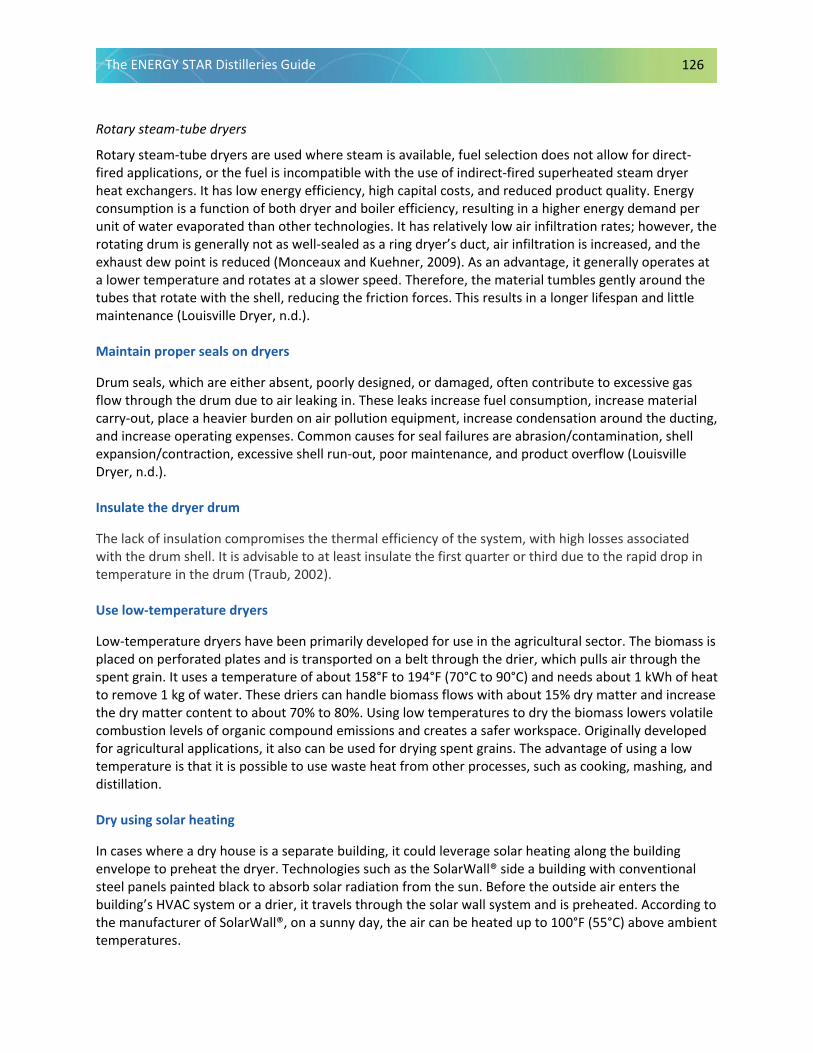
The ENERGY STAR Distilleries Guide 126
Rotary steam-tube dryers
Rotary steam-tube dryers are used where steam is available, fuel selection does not allow for direct-fired applications, or the fuel is incompatible with the use of indirect-fired superheated steam dryer heat exchangers. It has low energy efficiency, high capital costs, and reduced product quality. Energy consumption is a function of both dryer and boiler efficiency, resulting in a higher energy demand per unit of water evaporated than other technologies. It has relatively low air infiltration rates; however, the rotating drum is generally not as well-sealed as a ring dryer’s duct, air infiltration is increased, and the exhaust dew point is reduced (Monceaux and Kuehner, 2009). As an advantage, it generally operates at a lower temperature and rotates at a slower speed. Therefore, the material tumbles gently around the tubes that rotate with the shell, reducing the friction forces. This results in a longer lifespan and little maintenance (Louisville Dryer, n.d.).
Maintain proper seals on dryers
Drum seals, which are either absent, poorly designed, or damaged, often contribute to excessive gas flow through the drum due to air leaking in. These leaks increase fuel consumption, increase material carry-out, place a heavier burden on air pollution equipment, increase condensation around the ducting, and increase operating expenses. Common causes for seal failures are abrasion/contamination, shell expansion/contraction, excessive shell run-out, poor maintenance, and product overflow (Louisville Dryer, n.d.).
Insulate the dryer drum
The lack of insulation compromises the thermal efficiency of the system, with high losses associated with the drum shell. It is advisable to at least insulate the first quarter or third due to the rapid drop in temperature in the drum (Traub, 2002).
Use low-temperature dryers
Low-temperature dryers have been primarily developed for use in the agricultural sector. The biomass is placed on perforated plates and is transported on a belt through the drier, which pulls air through the spent grain. It uses a temperature of about 158°F to 194°F (70°C to 90°C) and needs about 1 kWh of heat to remove 1 kg of water. These driers can handle biomass flows with about 15% dry matter and increase the dry matter content to about 70% to 80%. Using low temperatures to dry the biomass lowers volatile combustion levels of organic compound emissions and creates a safer workspace. Originally developed for agricultural applications, it also can be used for drying spent grains. The advantage of using a low temperature is that it is possible to use waste heat from other processes, such as cooking, mashing, and distillation.
Dry using solar heating
In cases where a dry house is a separate building, it could leverage solar heating along the building envelope to preheat the dryer. Technologies such as the SolarWall® side a building with conventional steel panels painted black to absorb solar radiation from the sun. Before the outside air enters the building’s HVAC system or a drier, it travels through the solar wall system and is preheated. According to the manufacturer of SolarWall®, on a sunny day, the air can be heated up to 100°F (55°C) above ambient temperatures.

The ENERGY STAR Distilleries Guide 127
Dry using superheated steam
In a superheated steam dryer (SSD), superheated steam is used both as the heating and drying medium, similar to a convective dryer. In principle, it should be possible to convert any convective hot-air dryer into a superheated steam dryer, although, in practice, this is rather complicated as an SSD should be a closed system in order to avoid the leakage of steam out of the dryer and infiltration of the air into the dryer. One major advantage of an SSD is the ability to recover and reuse most of the energy supplied to the dryer, leading to substantial energy savings. An SSD also possesses other advantages, especially when applied to drying foods and biomaterials. One important benefit of an SSD is that no (or a very small amount of) oxygen is present in the drying chamber, resulting in negligible oxidation reactions (Tsotsas and Mujumdar, 2014), which may be less important in this particular application.
Best Practices for Energy-Efficient Bio-Energy Generation
Another alternative for managing distillery waste is to use it to generate energy. Currently, there are different technologies to produce energy from waste streams (see Figure 10). The best technology applicable depends on the characteristics of the feedstock used and the type of energy produced. The waste from distillation is homogeneous, low in carbohydrates, organic, and has high moisture content. Thermochemical technologies are not the most efficient because there is a high amount of energy that is needed to evaporate the water content. Esterification is not suitable as it needs an oil/fat-type feedstock. Bio-chemical technologies, specifically anaerobic digestion, are the most feasible way to generate energy from the stillage.
CASE STUDY In 2015, the Marble Distilling Co. and the Distillery Inn in Carbondale, co-designed and installed a Water Energy Thermal System (WETS™) that recaptures the energy from 100% of its process water. The system uses heat exchangers, improved controls, and two 5,000-gallon storage tanks to heat and cool the building, which includes a distillery, tasting room, five inn rooms, and an event space. This results in reducing the use of fresh water for cooling operations and eliminating hot water to the sewage system. WETS will allow the distillery to save 4 million gallons of water and 1.8 billion BTU in their first year of business. The payback of this investment is expected to take fewer than 10 years.
Source: Sutak, T. (2016). Colorado Distillery Pioneers Water & Energy Efficiency System. Elevation Outdoors Magazine. www.elevationoutdoors.com/blogs/colorado-distillery-pioneers-water-energy-efficiency-system/
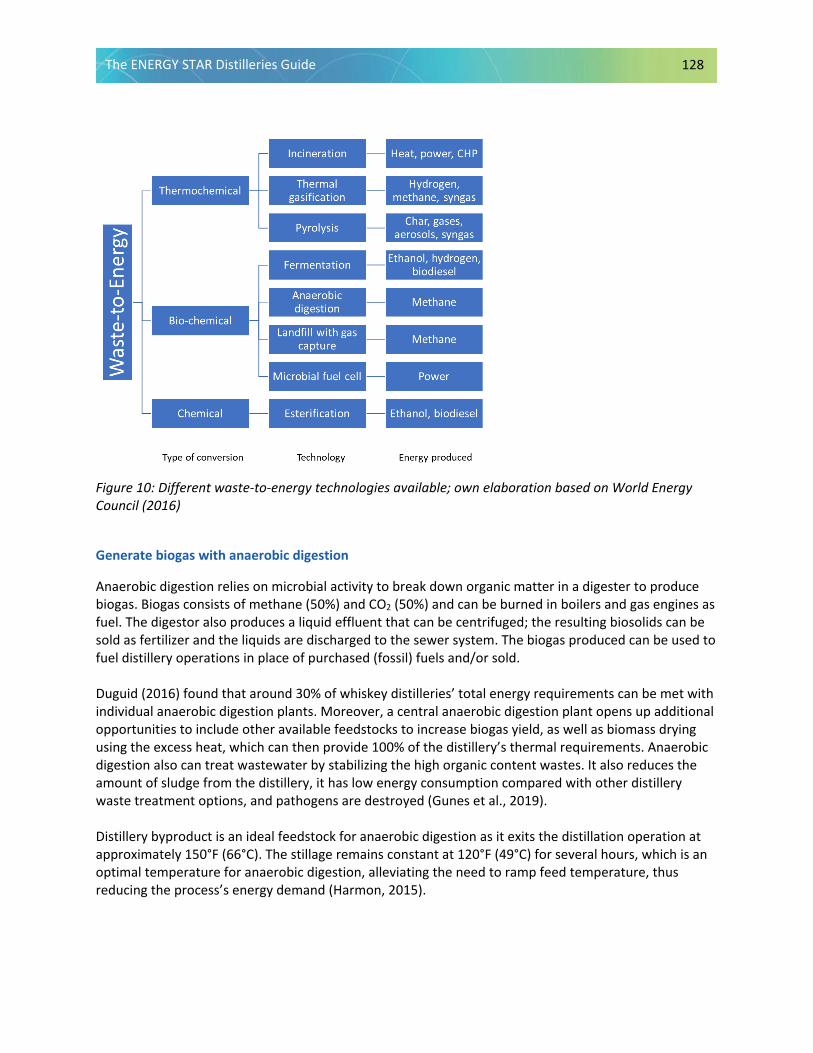
The ENERGY STAR Distilleries Guide 128
Figure 10: Different waste-to-energy technologies available; own elaboration based on World Energy Council (2016)
Generate biogas with anaerobic digestion
Anaerobic digestion relies on microbial activity to break down organic matter in a digester to produce biogas. Biogas consists of methane (50%) and CO2 (50%) and can be burned in boilers and gas engines as fuel. The digestor also produces a liquid effluent that can be centrifuged; the resulting biosolids can be sold as fertilizer and the liquids are discharged to the sewer system. The biogas produced can be used to fuel distillery operations in place of purchased (fossil) fuels and/or sold. Duguid (2016) found that around 30% of whiskey distilleries’ total energy requirements can be met with individual anaerobic digestion plants. Moreover, a central anaerobic digestion plant opens up additional opportunities to include other available feedstocks to increase biogas yield, as well as biomass drying using the excess heat, which can then provide 100% of the distillery’s thermal requirements. Anaerobic digestion also can treat wastewater by stabilizing the high organic content wastes. It also reduces the amount of sludge from the distillery, it has low energy consumption compared with other distillery waste treatment options, and pathogens are destroyed (Gunes et al., 2019). Distillery byproduct is an ideal feedstock for anaerobic digestion as it exits the distillation operation at approximately 150°F (66°C). The stillage remains constant at 120°F (49°C) for several hours, which is an optimal temperature for anaerobic digestion, alleviating the need to ramp feed temperature, thus reducing the process’s energy demand (Harmon, 2015).
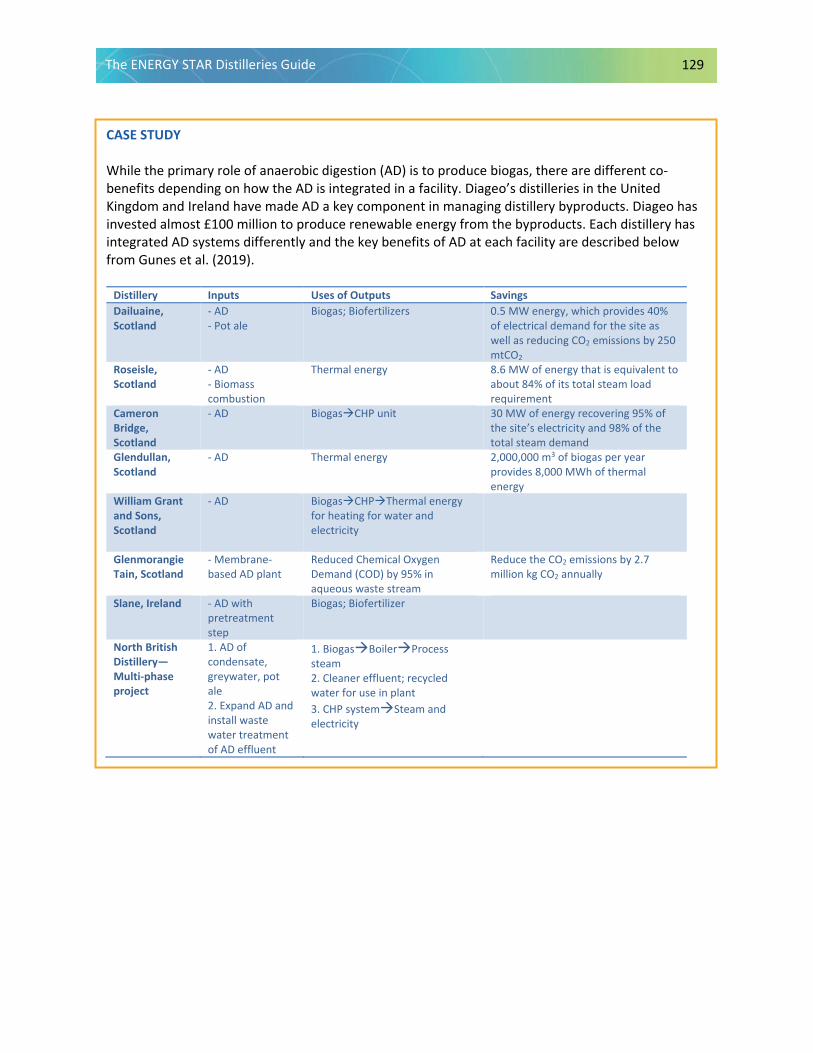
The ENERGY STAR Distilleries Guide 129
CASE STUDY
While the primary role of anaerobic digestion (AD) is to produce biogas, there are different co-benefits depending on how the AD is integrated in a facility. Diageo’s distilleries in the United Kingdom and Ireland have made AD a key component in managing distillery byproducts. Diageo has invested almost £100 million to produce renewable energy from the byproducts. Each distillery has integrated AD systems differently and the key benefits of AD at each facility are described below from Gunes et al. (2019).
Distillery Inputs Uses of Outputs Savings Dailuaine, Scotland
- AD- Pot ale
Biogas; Biofertilizers 0.5 MW energy, which provides 40% of electrical demand for the site as well as reducing CO2 emissions by 250 mtCO2
Roseisle, Scotland
- AD- Biomasscombustion
Thermal energy 8.6 MW of energy that is equivalent to about 84% of its total steam load requirement
Cameron Bridge, Scotland
- AD BiogasCHP unit 30 MW of energy recovering 95% of the site’s electricity and 98% of the total steam demand
Glendullan, Scotland
- AD Thermal energy 2,000,000 m3 of biogas per year provides 8,000 MWh of thermal energy
William Grant and Sons, Scotland
- AD BiogasCHPThermal energy for heating for water and electricity
Glenmorangie Tain, Scotland
- Membrane-based AD plant
Reduced Chemical Oxygen Demand (COD) by 95% in aqueous waste stream
Reduce the CO2 emissions by 2.7 million kg CO2 annually
Slane, Ireland - AD withpretreatmentstep
Biogas; Biofertilizer
North British Distillery—Multi-phase project
1. AD ofcondensate,greywater, potale2. Expand AD andinstall wastewater treatmentof AD effluent
1. BiogasBoilerProcesssteam 2. Cleaner effluent; recycledwater for use in plant3. CHP systemSteam andelectricity
The ENERGY STAR Distilleries Guide 130
Conclusion: Why Manage Energy? The U.S. distilling industry is energy intensive compared with other alcoholic beverages, with an annual energy expenditure of approximately $60 million (U.S. Economic Census, 2018). Improving energy efficiency is an important way to reduce energy costs and increase predictable earnings. Look strategically at how energy is currently used in plants, systems, and production processes. Focus on the areas where you can generate the greatest savings. This guide provides many examples of cost-effective best practices to increase energy efficiency, including the following:
• How to create a successful energy management program that assesses and tracks your energy and uses energy teams dedicated to finding and improving your energy savings.
• How to assess and fix energy waste in your plants, systems, and production processes, as well as at the organizational level.
• How to assess your company in relation to the current state of energy use in the distilling industry.
The most effective way to reduce energy costs is to cultivate a culture of energy efficiency within your organization. As you learned in Chapter 3, establishing an energy management program creates a culture of energy efficiency while assessing and tracking energy and improving savings. When the entire energy team, plant, and the company are engaged in energy management, additional cost-saving opportunities can be identified and create a process for continuous energy improvement within the organization. EPA ENERGY STAR offers tools and resources to help companies develop and continuously improve their energy management programs. These tools and resources include communication materials, assessment tools, and guides to help you benchmark your energy performance and energy management practices. ENERGY STAR also has opportunities for companies to become an ENERGY STAR partner. It offers the opportunity to participate in competitions to raise awareness about your energy management program. You may access these tools and resources at www.energystar.gov/industry. If your company has questions or needs assistance with building a corporate energy program, please contact [email protected]. Despite what efficiency measures you may have implemented in the past, there is always room for additional cost-effective energy efficiency improvements that will pay your company back tenfold and grow your bottom line!

The ENERGY STAR Distilleries Guide 131
Acknowledgments This work was supported by the Climate Protection Partnerships Division, Office of Air and Radiation, U.S. Environmental Protection Agency, under Contract No. 68HE0H18A0003 (Elizabeth Dutrow, U.S. EPA Contracting Officer’s Representative; Joshua S. Smith, ICF Task Order Manager).
We would like to thank (in alphabetical order) Andy Battjes (Brown-Forman), Bruce Bremer (Bremer Energy), Tye Buckley (Spirax Sarco), Alexandre da Silva Rosa (Spirax Sarco), Elizabeth Dutrow (U.S. EPA), Munim Hussain (MGP Ingredients), Andrew Jarrick (Diageo), Nathan Kreel (Univar Solutions), Daniel Macri (U.S. EPA), Al Marzi (Harpoon Brewery), Matt McGinness (Constellation Brands), Rachel Nally (Heaven Hill), Tom Pagliuco (TAPco Enterprises), Eric Reller (Distilled Spirits Council of the United States), Scott Shirley (formerly Harpoon Brewery), Amandeep Sidhu (PepsiCo), Joshua Smith (ICF), Matthew Strickland (Distillerie Côte des Saints), David Taylor (Chromalox), Mark Toda (Kentucky Pollution Prevention Center), and Walt Tunnessen (U.S. EPA) for their input, comments, and suggestions on the draft report and their useful comments. Despite all efforts, any remaining errors are the responsibility of the authors. The views expressed in this guide do not necessarily reflect those of the U.S. Environmental Protection Agency, or the U.S. Government.

The ENERGY STAR Distilleries Guide 132
Appendix A: The Distilling Industry The spirits market consists of the sale of vodka, whiskey, gin, brandy, rum, tequila and mezcal, liquors and cordials, and other specialty spirits. The global spirits market was valued at $677.4 billion in 2017 and has grown at a 4.0% compound annual growth rate (CAGR) between 2013 and 2017.4 Similarly, the market consumption volume increased by 2.4% annually (CAGR) between 2013 and 2017, to reach a total of 31,952.2 million liters in 2017 (MarketLine, 2018). The largest global companies (e.g., Diageo, United Spirits Limited, Pernod Ricard, Suntory/Beam, Bacardi) represent less than 7% of the global market (Bowman et al., 2015). In the United States, the spirits industry has grown over the past decade, with the number of distilled spirit manufacturers growing from a small number of large producers in the early 2000s, to now more than 2,000 distilleries across all 50 states (DISCUS, Personal communication, 2021). In 2017, the U.S. distilled spirits industry was responsible for 865,000 direct jobs in the United States (DISCUS, 2018). In 2019, the gross revenue of U.S. spirits suppliers was estimated to be $29 billion, an increase of 25% since 2014. The spirits industry has steadily increased its market share with beer and wine comprising 37.8% of alcoholic beverage sales in 2019 (DISCUS, 2020 a). In 2018, the U.S. distilled spirits industry had a value of shipments of $13.2 billion (U.S. Economic Census, 2018). Distilleries in the United States produce a variety of spirits, consisting mainly of whiskey/bourbon. In 2020, U.S. facilities, including both beverage and non-beverage facilities, produced 220 million proof gallons of whiskey; 14 million proof gallons of brandy; 12 million proof gallons of rum, gin, and vodka; and 19 billion proof gallons of other alcohol products (U.S. TTB, 2020). Those spirits may be redistilled or packaged into different types of products, including cordials, cocktails, and neutral spirits. Nearly half of all whiskey purchased in the United States comes from seven major brands. Figure 11 shows the largest brands by 2014 annual sales, where Jack Daniel’s, a Tennessee whiskey, represents the largest brand with a share of $204 million (Bowman et al., 2015).
Figure 11: Largest U.S. brands by 2014 annual sales, own elaboration based on Bowman et al. (2015)
4 The market is valued according to retail selling price and includes any applicable taxes.
Jack Daniel’s (Tennessee whiskey)
$204 million
Crown Royal (Canadian whisky)
$173 million
Jim Beam (bourbon)
$117 million
Fireball (specialty whiskey)
$86 million Seagram’s 7 (standard American whiskey)
$67 million
Jameson (Irish whiskey)
$66 million
Johnnie Walker (Scotch whisky)
$59 million
Others
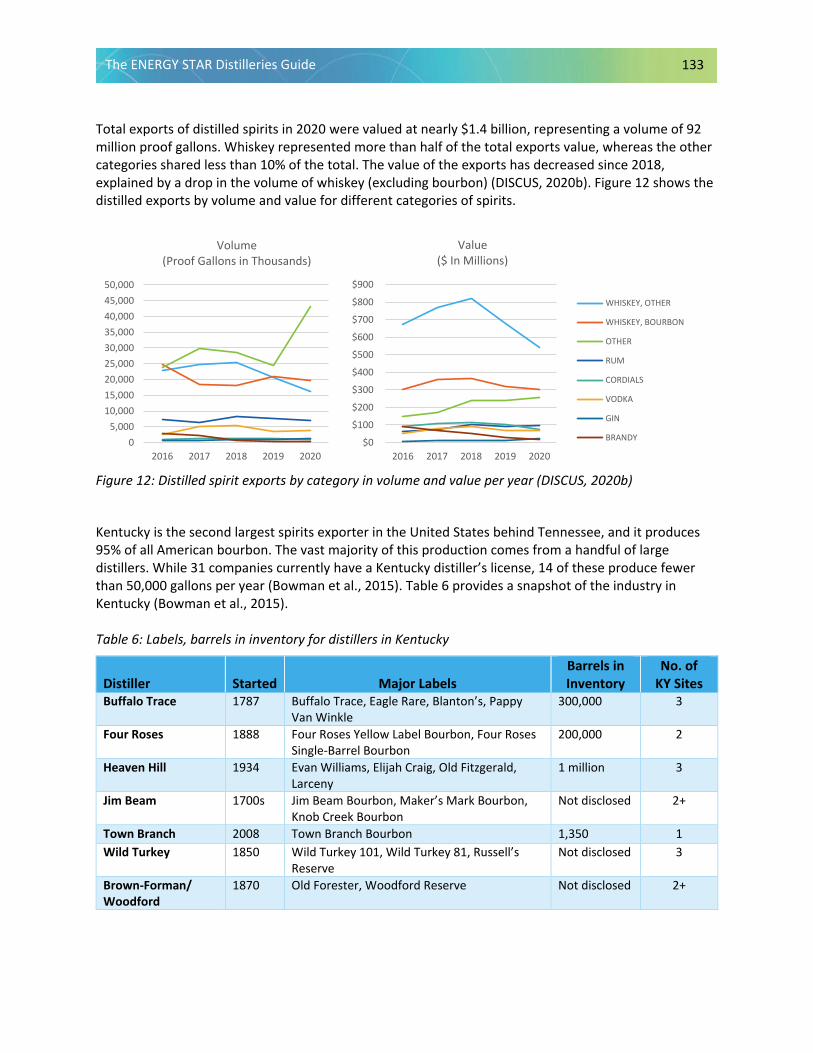
The ENERGY STAR Distilleries Guide 133
Total exports of distilled spirits in 2020 were valued at nearly $1.4 billion, representing a volume of 92 million proof gallons. Whiskey represented more than half of the total exports value, whereas the other categories shared less than 10% of the total. The value of the exports has decreased since 2018, explained by a drop in the volume of whiskey (excluding bourbon) (DISCUS, 2020b). Figure 12 shows the distilled exports by volume and value for different categories of spirits.
Figure 12: Distilled spirit exports by category in volume and value per year (DISCUS, 2020b)
Kentucky is the second largest spirits exporter in the United States behind Tennessee, and it produces 95% of all American bourbon. The vast majority of this production comes from a handful of large distillers. While 31 companies currently have a Kentucky distiller’s license, 14 of these produce fewer than 50,000 gallons per year (Bowman et al., 2015). Table 6 provides a snapshot of the industry in Kentucky (Bowman et al., 2015).
Table 6: Labels, barrels in inventory for distillers in Kentucky
Distiller Started Major Labels Barrels in Inventory
No. of KY Sites
Buffalo Trace 1787 Buffalo Trace, Eagle Rare, Blanton’s, Pappy Van Winkle
300,000 3
Four Roses 1888 Four Roses Yellow Label Bourbon, Four Roses Single-Barrel Bourbon
200,000 2
Heaven Hill 1934 Evan Williams, Elijah Craig, Old Fitzgerald, Larceny
1 million 3
Jim Beam 1700s Jim Beam Bourbon, Maker’s Mark Bourbon, Knob Creek Bourbon
Not disclosed 2+
Town Branch 2008 Town Branch Bourbon 1,350 1 Wild Turkey 1850 Wild Turkey 101, Wild Turkey 81, Russell’s
Reserve Not disclosed 3
Brown-Forman/ Woodford
1870 Old Forester, Woodford Reserve Not disclosed 2+
05,000
10,00015,00020,00025,00030,00035,00040,00045,00050,000
2016 2017 2018 2019 2020
Volume (Proof Gallons in Thousands)
$0
$100
$200
$300
$400
$500
$600
$700
$800
$900
2016 2017 2018 2019 2020
Value ($ In Millions)
WHISKEY, OTHER
WHISKEY, BOURBON
OTHER
RUM
CORDIALS
VODKA
GIN
BRANDY

The ENERGY STAR Distilleries Guide 134
Types of Spirits
All distilled spirits start with fermenting a sugary organic material and then distilling it to reach a certain proof. However, the base ingredients, distilling, aging, and blending processes (if any) determine the kind of spirit produced. For example, whiskey is made from grain, brandy from fruit, rum from sugar cane, Tequila from agave, and vodka and gin typically from grain. Whiskeys and brandies are aged, while vodkas and gins are not. While these broad categories are useful in understanding the market, significant variation exists among subcategories of each spirit (Bowman et al., 2015).
The U.S. Code of Federal Regulations (CFR) regulates the standards of identity for the several classes and types of distilled spirits from which some differences in the production processes can be gleaned. It defines 12 classes that are summarized in Table 7.
Table 7: Distilled spirits classifications summarized from U.S. 27 CFR 5.22
Class Type Description 1 Neutral spirits or alcohol
Produced from any material at or above 190 proof, and, if bottled, bottled at not less than 80 proof.
“Vodka” Not aged or stored in wood barrels at any time (except in paraffin-lined wood barrels).
“Grain spirits” Distilled from a fermented mash of grain and stored in oak containers.
2 Whiskey Alcoholic distillate from a fermented mash of grain produced at less than 190 proof in such manner that the distillate possesses the taste, aroma, and characteristics generally attributed to whiskey, stored in oak containers (except that corn whiskey need not be so stored), and bottled at not less than 80 proof, and also includes mixtures of such distillates for which no specific standards of identity are prescribed. “Bourbon whiskey,” “rye whiskey,” “wheat whiskey,” “malt whiskey,” or “rye malt whiskey”
Produced at not exceeding 160 proof from a fermented mash of not less than 51% corn, rye, wheat, malted barley, or malted rye grain, respectively. Stored at not more than 125 proof in charred new oak containers.
“Corn whiskey” Produced at not exceeding 160 proof from a fermented mash of not less than 80% corn grain. Could be stored in used or uncharred new oak containers.
“Straight” (e.g., “straight bourbon whiskey”)
The previous described whiskeys are called “straight” when stored for a period of 2 years or more.
“Whiskey distilled from bourbon (rye, wheat, malt, or rye malt) mash”
Produced in the United States from a fermented mash of not less than 51% corn, rye, wheat, malted barley, or malted rye grain, respectively, and stored in used oak containers.
Blended whiskey Mixture of straight whiskey or a blend of straight whiskeys
“Light whiskey” Produced in the United States at more than 160 proof and stored in used or uncharred new oak containers.
“Spirit whiskey” Mixture of neutral spirits and between 5% and 20% on a proof gallon basis of whiskey, and/or straight whiskey.
“Scotch whiskey” (whisky)
Manufactured in Scotland and stored in casks for at least 3 years.
“Irish whiskey” Manufactured in Ireland and stored in casks for at least 3 years.
“Canadian whiskey” (whisky)
Manufactured in Canada and stored in casks for at least 3 years.
3 Gin Obtained by original distillation from mash, or by redistillation of distilled spirits, or by mixing neutral spirits, with or over juniper berries and other aromatics, or with or over extracts derived from infusions, percolations, or maceration of such materials, and includes mixtures of gin and neutral spirits. It shall derive its main characteristic flavor from juniper berries and be bottled at not less than 80 proof.
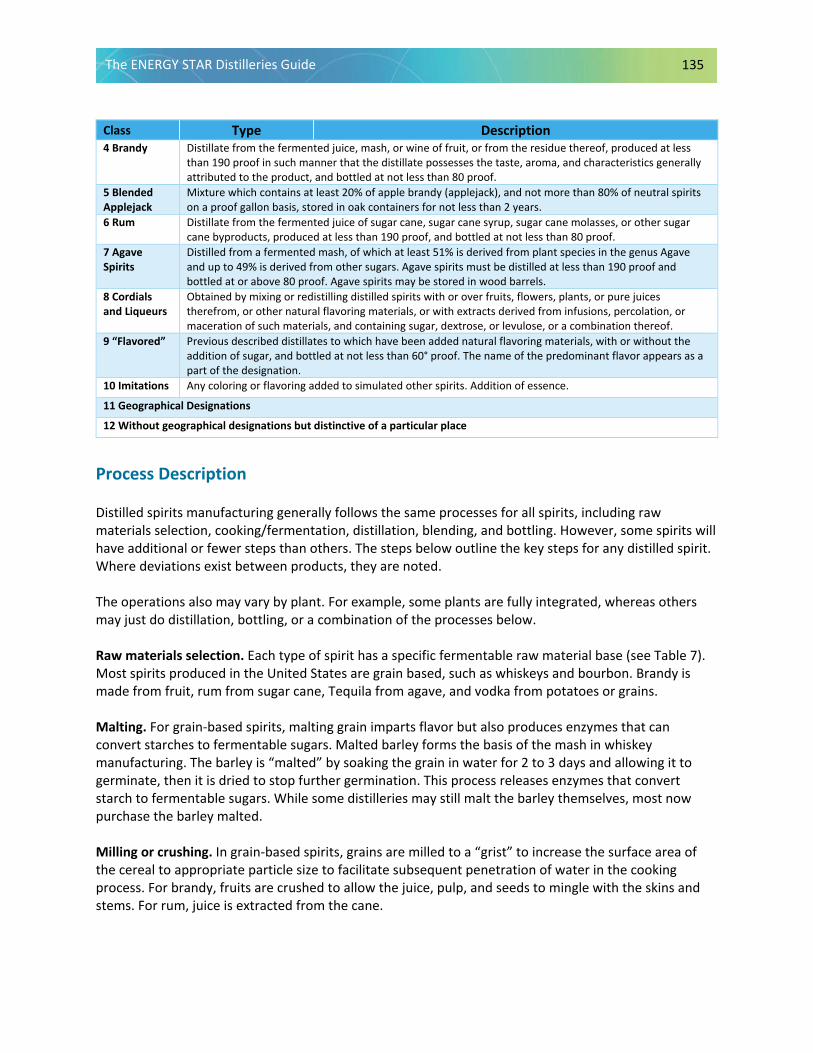
The ENERGY STAR Distilleries Guide 135
Class Type Description 4 Brandy Distillate from the fermented juice, mash, or wine of fruit, or from the residue thereof, produced at less
than 190 proof in such manner that the distillate possesses the taste, aroma, and characteristics generally attributed to the product, and bottled at not less than 80 proof.
5 Blended Applejack
Mixture which contains at least 20% of apple brandy (applejack), and not more than 80% of neutral spirits on a proof gallon basis, stored in oak containers for not less than 2 years.
6 Rum Distillate from the fermented juice of sugar cane, sugar cane syrup, sugar cane molasses, or other sugar cane byproducts, produced at less than 190 proof, and bottled at not less than 80 proof.
7 Agave Spirits
Distilled from a fermented mash, of which at least 51% is derived from plant species in the genus Agave and up to 49% is derived from other sugars. Agave spirits must be distilled at less than 190 proof and bottled at or above 80 proof. Agave spirits may be stored in wood barrels.
8 Cordials and Liqueurs
Obtained by mixing or redistilling distilled spirits with or over fruits, flowers, plants, or pure juices therefrom, or other natural flavoring materials, or with extracts derived from infusions, percolation, or maceration of such materials, and containing sugar, dextrose, or levulose, or a combination thereof.
9 “Flavored” Previous described distillates to which have been added natural flavoring materials, with or without the addition of sugar, and bottled at not less than 60° proof. The name of the predominant flavor appears as a part of the designation.
10 Imitations Any coloring or flavoring added to simulated other spirits. Addition of essence.
11 Geographical Designations
12 Without geographical designations but distinctive of a particular place
Process Description
Distilled spirits manufacturing generally follows the same processes for all spirits, including raw materials selection, cooking/fermentation, distillation, blending, and bottling. However, some spirits will have additional or fewer steps than others. The steps below outline the key steps for any distilled spirit. Where deviations exist between products, they are noted.
The operations also may vary by plant. For example, some plants are fully integrated, whereas others may just do distillation, bottling, or a combination of the processes below.
Raw materials selection. Each type of spirit has a specific fermentable raw material base (see Table 7). Most spirits produced in the United States are grain based, such as whiskeys and bourbon. Brandy is made from fruit, rum from sugar cane, Tequila from agave, and vodka from potatoes or grains.
Malting. For grain-based spirits, malting grain imparts flavor but also produces enzymes that can convert starches to fermentable sugars. Malted barley forms the basis of the mash in whiskey manufacturing. The barley is “malted” by soaking the grain in water for 2 to 3 days and allowing it to germinate, then it is dried to stop further germination. This process releases enzymes that convert starch to fermentable sugars. While some distilleries may still malt the barley themselves, most now purchase the barley malted.
Milling or crushing. In grain-based spirits, grains are milled to a “grist” to increase the surface area of the cereal to appropriate particle size to facilitate subsequent penetration of water in the cooking process. For brandy, fruits are crushed to allow the juice, pulp, and seeds to mingle with the skins and stems. For rum, juice is extracted from the cane.
The ENERGY STAR Distilleries Guide 136
Cooking and mashing. For spirits that are made from bases that have fermentable sugars, such as fruit or sugarcane, these feedstocks may undergo heating. When molasses is used as the feedstock for rum, water is added. For grain-based spirits, fermentable sugars are not readily available. The grains must be mixed with hot water to convert the starch into fermentable sugars. This water needs to be pretreated before it can be used in the process. While the terms “cooking” and “mashing” are used interchangeably, cooking typically refers to the initial phase, when unmalted grains are mixed with hot water and then the temperature is decreased depending on the gelatinization temperatures of the grains used. During mashing, starches convert to sugars. Cooking and mashing techniques can vary between plants for historic and product-specific reasons. It can take place in batches where grain and water are mixed together, heated and then cooled, or where grain and water are fed continuously to the cooker. Water also can be introduced at different points and at different temperatures to extract different types of starches. The duration and temperature of the mashing and cooking will vary depending on the “mash bill.” Cooking and mashing can occur under pressure in pressure cookers that can reduce cooking times and temperature, or they may be heated in mash tuns, which are not pressurized. Pressurized cookers are more commonly used for corn-based mixtures to reduce the cooking time and temperature as a higher temperature is needed for this grain. Pressure cooking is done at around 220°F to 260°F (114°C to 124°C), while atmospheric cooking can be done at temperatures up to 212°F (100°C). The time varies from 15 minutes to 1 hour. Conversion time and temperature are relatively consistent among distilleries. The resulting mash is subsequently cooled to about 77°F to 86°F (25°C to 30°C). Fermentation. At the beginning of the fermentation process, the cooled mash or wort (mash where the grains have been removed) is pumped to fermentation tanks and is inoculated with yeast. Over a period of days, the yeast will convert the sugar in the wort to ethanol and CO2. Fermentation usually takes 3 days. Sometimes it can be extended to 4 to 5 days to produce a “beer” (or distiller’s beer or wash) with an alcohol content of approximately 8% to 9% or even longer, which can result in a higher alcohol content of 10% to 11%. The fermentation reaction produces waste heat, which needs to be removed to maintain optimal fermentation and inhibit yeast loss. Fermenters are typically maintained at temperatures below 82°F to 88°F (28°C to 31°C). In modern distilleries, which use closed-top fermenters, water pumped through or on the surface of the fermentation tank cools the liquid to the desired temperature. The water may be room temperature from the utility, from a chiller, or even water that comes from first cooling the mash. Traditional distillers will have metal or wood open-top fermenters without any device to control the fermentation temperature. Distillation. Next, the mash or wash (fermented mash where the grains have been removed) is fed to the still or a series of stills, either a pot still or a column still, where alcohols and other compounds are separated; since alcohol has a lower boiling point (172°F to 185°F [78°C to 85°C]) than water, it will evaporate first. There exist different configurations, where up to five columns are placed in series to distill the wash to stronger proofs and to extract different portions of the feedstock. In bourbon
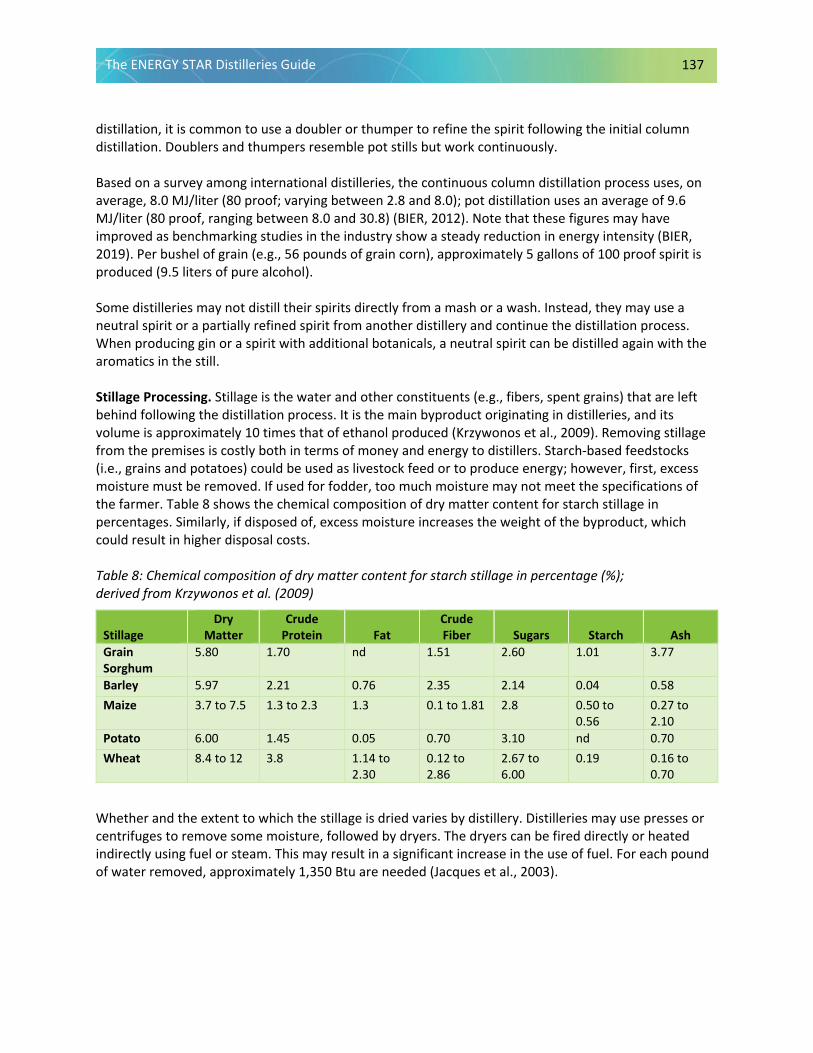
The ENERGY STAR Distilleries Guide 137
distillation, it is common to use a doubler or thumper to refine the spirit following the initial column distillation. Doublers and thumpers resemble pot stills but work continuously.
Based on a survey among international distilleries, the continuous column distillation process uses, on average, 8.0 MJ/liter (80 proof; varying between 2.8 and 8.0); pot distillation uses an average of 9.6 MJ/liter (80 proof, ranging between 8.0 and 30.8) (BIER, 2012). Note that these figures may have improved as benchmarking studies in the industry show a steady reduction in energy intensity (BIER, 2019). Per bushel of grain (e.g., 56 pounds of grain corn), approximately 5 gallons of 100 proof spirit is produced (9.5 liters of pure alcohol).
Some distilleries may not distill their spirits directly from a mash or a wash. Instead, they may use a neutral spirit or a partially refined spirit from another distillery and continue the distillation process. When producing gin or a spirit with additional botanicals, a neutral spirit can be distilled again with the aromatics in the still.
Stillage Processing. Stillage is the water and other constituents (e.g., fibers, spent grains) that are left behind following the distillation process. It is the main byproduct originating in distilleries, and its volume is approximately 10 times that of ethanol produced (Krzywonos et al., 2009). Removing stillage from the premises is costly both in terms of money and energy to distillers. Starch-based feedstocks (i.e., grains and potatoes) could be used as livestock feed or to produce energy; however, first, excess moisture must be removed. If used for fodder, too much moisture may not meet the specifications of the farmer. Table 8 shows the chemical composition of dry matter content for starch stillage in percentages. Similarly, if disposed of, excess moisture increases the weight of the byproduct, which could result in higher disposal costs.
Table 8: Chemical composition of dry matter content for starch stillage in percentage (%); derived from Krzywonos et al. (2009)
Stillage Dry
Matter Crude
Protein Fat Crude Fiber Sugars Starch Ash
Grain Sorghum
5.80 1.70 nd 1.51 2.60 1.01 3.77
Barley 5.97 2.21 0.76 2.35 2.14 0.04 0.58 Maize 3.7 to 7.5 1.3 to 2.3 1.3 0.1 to 1.81 2.8 0.50 to
0.56 0.27 to 2.10
Potato 6.00 1.45 0.05 0.70 3.10 nd 0.70 Wheat 8.4 to 12 3.8 1.14 to
2.30 0.12 to 2.86
2.67 to 6.00
0.19 0.16 to 0.70
Whether and the extent to which the stillage is dried varies by distillery. Distilleries may use presses or centrifuges to remove some moisture, followed by dryers. The dryers can be fired directly or heated indirectly using fuel or steam. This may result in a significant increase in the use of fuel. For each pound of water removed, approximately 1,350 Btu are needed (Jacques et al., 2003).

The ENERGY STAR Distilleries Guide 138
Some distilleries, most commonly small craft distillers, may dispose of the slop as waste without further processing. Others may process the stillage in an anaerobic digestor that recovers energy in the form of biogas from the stillage, which can help offset natural gas procured by the plant rather than expend energy in the case of needing to dry it (see Chapter 15). Maturation. Some spirits, such as whiskey and brandy, are aged to obtain the desired flavor profile, while other spirits, such as vodka and gin, are not. The minimum amount of time a spirit must be aged to be designated by a specific name is prescribed by law (see Table 7). Any aging beyond that can vary by distiller and the type of product. Aging generally occurs in oak barrels. Many whiskeys are aged for at least 2 years, while most are aged longer, typically 4 to 8 years, varying according to the producer and the product. For bourbon and some whiskeys, the barrels are “toasted” (charred) on the inside, which helps impart the desired flavor and other characteristics of the spirit. Barrels are usually purchased from a cooperage. Prior to maturation, the distilled spirit is usually partially diluted with water and then pumped into the barrel. The barrels are stored in warehouses where usually HVAC systems are not used and temperature and humidity are partially controlled with natural ventilation (i.e., open windows). Warm conditions (as found in Tennessee and Kentucky) may increase the alcohol percentage. After aging, the barrels are emptied, the whiskey filtered, and then diluted to the appropriate alcohol content (proof). During aging, particulate matter may develop and is removed through filtration (e.g., by membranes to ensure that no biological or bacterial activity takes place later in the bottle). Blending. Not all spirits are blended, such as vodkas and gin. For whiskeys, single malts may be bottled after maturation, whereas for other types, different barrels (of different age or practice/location in the warehouse) may be mixed to produce a blend with a consistent flavor. For liquors and cordials, the spirits are mixed and blended with other ingredients before bottling. Bottling. In the final step, the spirit is then diluted to the specified proof and pumped to a bottling line where bottles of different sizes and types are filled. While most bottling lines are automated, smaller craft distilleries may bottle by hand. The bottling line is generally contained in its own separate room and is kept dust free and under a slightly positive air pressure to reduce contamination. All bottles must be clean and dry. Bottles may be cleaned and dedusted by blowing air into the bottle, using a high-speed blower for air, or rinsed with neutral spirit Bottling equipment varies from simple siphon hoses, funnels, hand corking, and labeling machines to completely automate bottling lines. Energy use for bottling is estimated at 0.6 MJ/liter (80 proof), while varying between 0.2 and 1.5 MJ/liter (80 proof) (BIER, 2012).
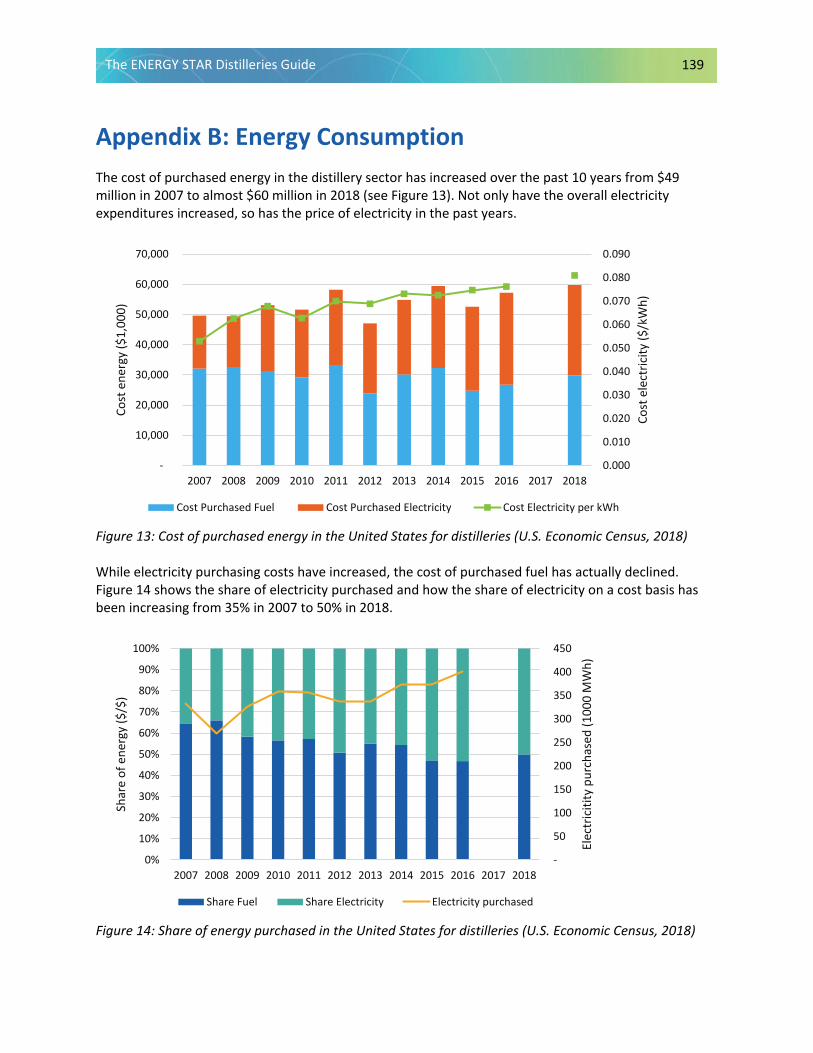
The ENERGY STAR Distilleries Guide 139
Appendix B: Energy Consumption The cost of purchased energy in the distillery sector has increased over the past 10 years from $49 million in 2007 to almost $60 million in 2018 (see Figure 13). Not only have the overall electricity expenditures increased, so has the price of electricity in the past years.
Figure 13: Cost of purchased energy in the United States for distilleries (U.S. Economic Census, 2018)
While electricity purchasing costs have increased, the cost of purchased fuel has actually declined. Figure 14 shows the share of electricity purchased and how the share of electricity on a cost basis has been increasing from 35% in 2007 to 50% in 2018.
Figure 14: Share of energy purchased in the United States for distilleries (U.S. Economic Census, 2018)
0.000
0.010
0.020
0.030
0.040
0.050
0.060
0.070
0.080
0.090
-
10,000
20,000
30,000
40,000
50,000
60,000
70,000
2007 2008 2009 2010 2011 2012 2013 2014 2015 2016 2017 2018
Cost
ele
ctric
ity ($
/kW
h)
Cost
ene
rgy
($1,
000)
Cost Purchased Fuel Cost Purchased Electricity Cost Electricity per kWh
-
50
100
150
200
250
300
350
400
450
0%
10%
20%
30%
40%
50%
60%
70%
80%
90%
100%
2007 2008 2009 2010 2011 2012 2013 2014 2015 2016 2017 2018
Elec
tric
itity
pur
chas
ed (1
000
MW
h)
Shar
e of
ene
rgy
($/$
)
Share Fuel Share Electricity Electricity purchased
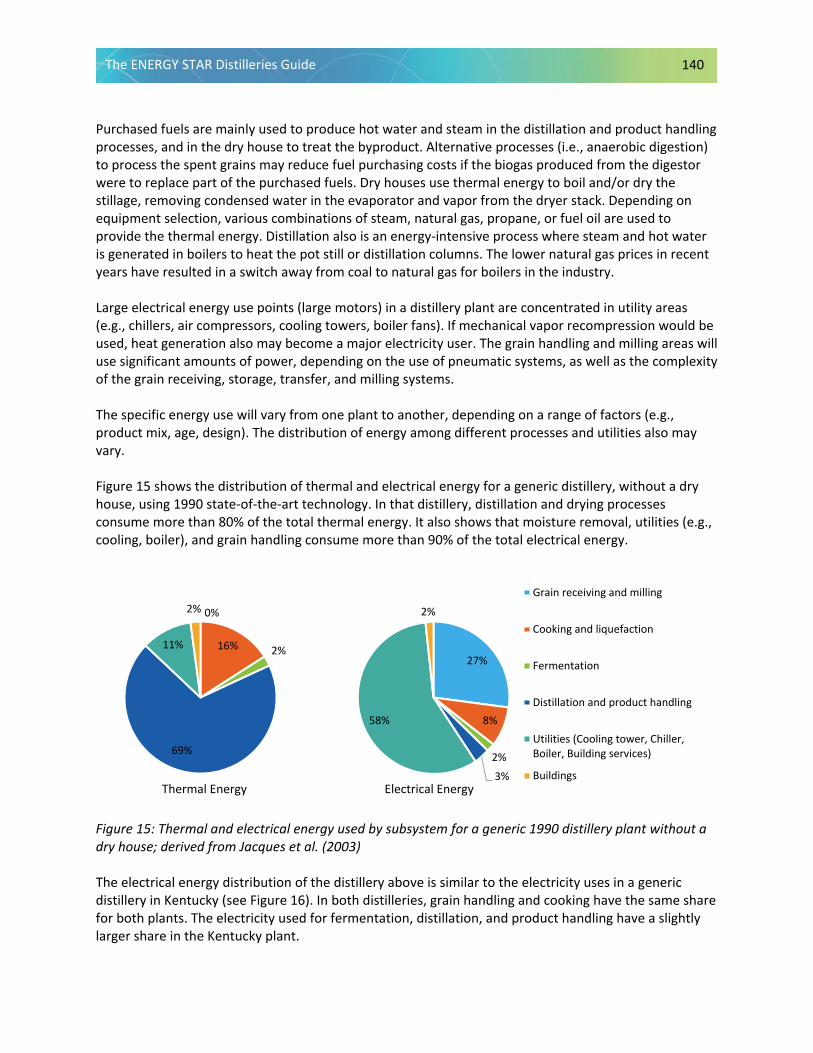
The ENERGY STAR Distilleries Guide 140
Purchased fuels are mainly used to produce hot water and steam in the distillation and product handling processes, and in the dry house to treat the byproduct. Alternative processes (i.e., anaerobic digestion) to process the spent grains may reduce fuel purchasing costs if the biogas produced from the digestor were to replace part of the purchased fuels. Dry houses use thermal energy to boil and/or dry the stillage, removing condensed water in the evaporator and vapor from the dryer stack. Depending on equipment selection, various combinations of steam, natural gas, propane, or fuel oil are used to provide the thermal energy. Distillation also is an energy-intensive process where steam and hot water is generated in boilers to heat the pot still or distillation columns. The lower natural gas prices in recent years have resulted in a switch away from coal to natural gas for boilers in the industry.
Large electrical energy use points (large motors) in a distillery plant are concentrated in utility areas (e.g., chillers, air compressors, cooling towers, boiler fans). If mechanical vapor recompression would be used, heat generation also may become a major electricity user. The grain handling and milling areas will use significant amounts of power, depending on the use of pneumatic systems, as well as the complexity of the grain receiving, storage, transfer, and milling systems.
The specific energy use will vary from one plant to another, depending on a range of factors (e.g., product mix, age, design). The distribution of energy among different processes and utilities also may vary.
Figure 15 shows the distribution of thermal and electrical energy for a generic distillery, without a dry house, using 1990 state-of-the-art technology. In that distillery, distillation and drying processes consume more than 80% of the total thermal energy. It also shows that moisture removal, utilities (e.g., cooling, boiler), and grain handling consume more than 90% of the total electrical energy.
Figure 15: Thermal and electrical energy used by subsystem for a generic 1990 distillery plant without a dry house; derived from Jacques et al. (2003)
The electrical energy distribution of the distillery above is similar to the electricity uses in a generic distillery in Kentucky (see Figure 16). In both distilleries, grain handling and cooking have the same share for both plants. The electricity used for fermentation, distillation, and product handling have a slightly larger share in the Kentucky plant.
0%
16% 2%
69%
11%
2%
Thermal Energy
27%
8%
2%
3%
58%
2%
Electrical Energy
Grain receiving and milling
Cooking and liquefaction
Fermentation
Distillation and product handling
Utilities (Cooling tower, Chiller,Boiler, Building services)
Buildings
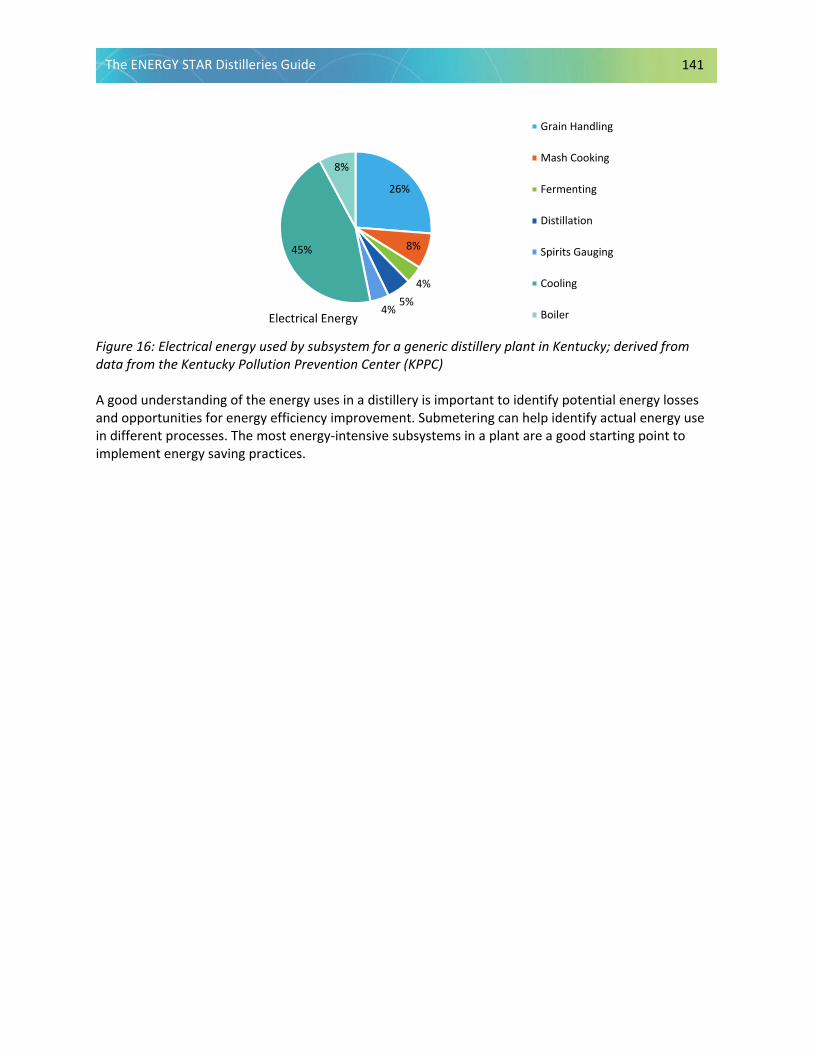
The ENERGY STAR Distilleries Guide 141
Figure 16: Electrical energy used by subsystem for a generic distillery plant in Kentucky; derived from data from the Kentucky Pollution Prevention Center (KPPC)
A good understanding of the energy uses in a distillery is important to identify potential energy losses and opportunities for energy efficiency improvement. Submetering can help identify actual energy use in different processes. The most energy-intensive subsystems in a plant are a good starting point to implement energy saving practices.
26%
8%
4%5%
4%
45%
8%
Electrical Energy
Grain Handling
Mash Cooking
Fermenting
Distillation
Spirits Gauging
Cooling
Boiler
The ENERGY STAR Distilleries Guide 142
Appendix C: Standards for NEMA Motors The Consortium for Energy Efficiency (CEE) has described the evolution of standards for energy-efficient motors in the United States, which is helpful for understanding “efficient” motor nomenclature (CEE, 2007):
• NEMA Energy Efficient (NEMA EE) was developed in the mid-1980s to define the term “energy efficient” in the marketplace for motors. NEMA Standards Publication No. MG-1 -2011, Table 12-11 defines efficiency levels for a range of different motors (NEMA, 2012).
• The Energy Policy Act of 1992 (EPACT) required that many commonly used motors comply with NEMA “energy efficient” ratings if offered for sale in the United States.
• In 1996, the CEE Premium Efficiency Criteria specification was designed to promote motors with higher efficiency levels than EPACT required, for the same classes of motors covered by EPACT. The CEE efficiency levels specified were generally two NEMA efficiency bands (Table 12-10, NEMA MG-1-2011) above those required by EPACT.
In 2001, the NEMA Premium™ Efficiency Electric Motor specification was developed to address confusion with respect to what constituted the most efficient motors available in the market. This specification was developed by NEMA, CEE, and other stakeholders, and was adapted from the CEE 1996 criteria. It currently serves as the benchmark for premium energy-efficient motors. NEMA Premium™ also denotes a brand name for motors that meet this specification. Specifically, this specification covers motors with the following attributes:
• Speed: 2, 4, and 6 pole
• Size: 1 to 500 horsepower
• Design: NEMA A and B
• Enclosure type: Open and closed
• Voltage: Low and medium voltage
• Class: General, definite, and special purpose
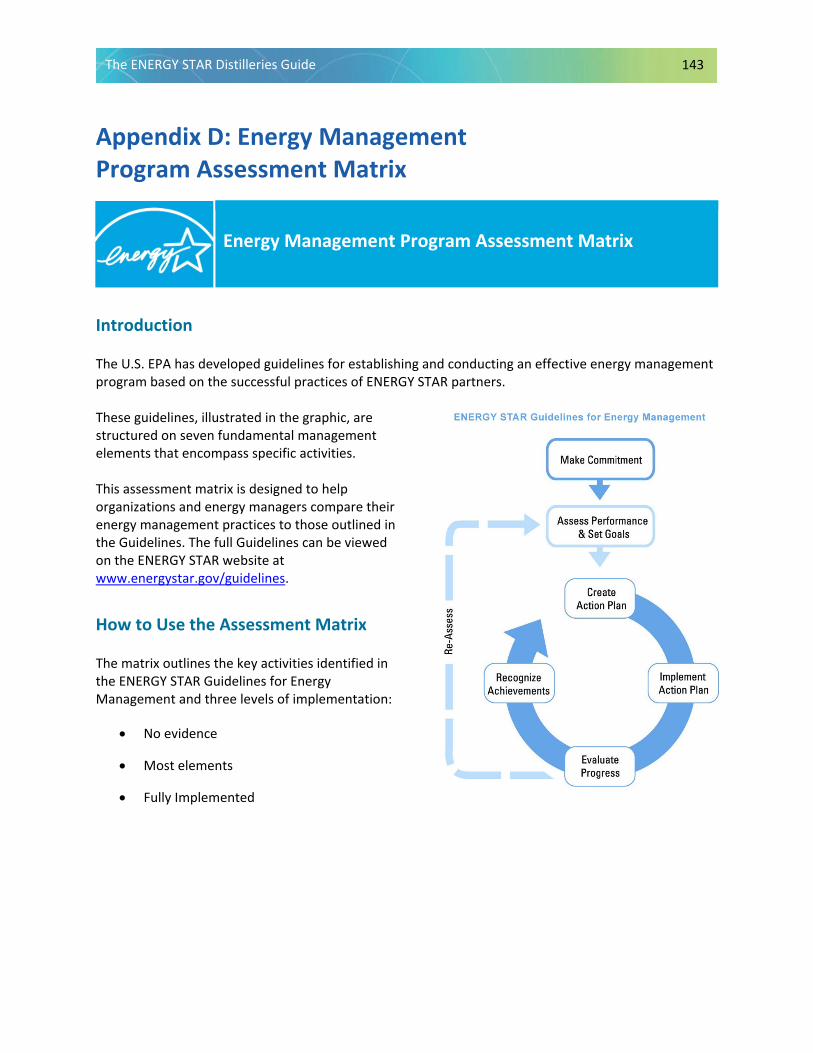
The ENERGY STAR Distilleries Guide 143
Appendix D: Energy Management Program Assessment Matrix
Energy Management Program Assessment Matrix
Introduction
The U.S. EPA has developed guidelines for establishing and conducting an effective energy management program based on the successful practices of ENERGY STAR partners.
These guidelines, illustrated in the graphic, are structured on seven fundamental management elements that encompass specific activities.
This assessment matrix is designed to help organizations and energy managers compare their energy management practices to those outlined in the Guidelines. The full Guidelines can be viewed on the ENERGY STAR website at www.energystar.gov/guidelines.
How to Use the Assessment Matrix
The matrix outlines the key activities identified in the ENERGY STAR Guidelines for Energy Management and three levels of implementation:
• No evidence
• Most elements
• Fully Implemented
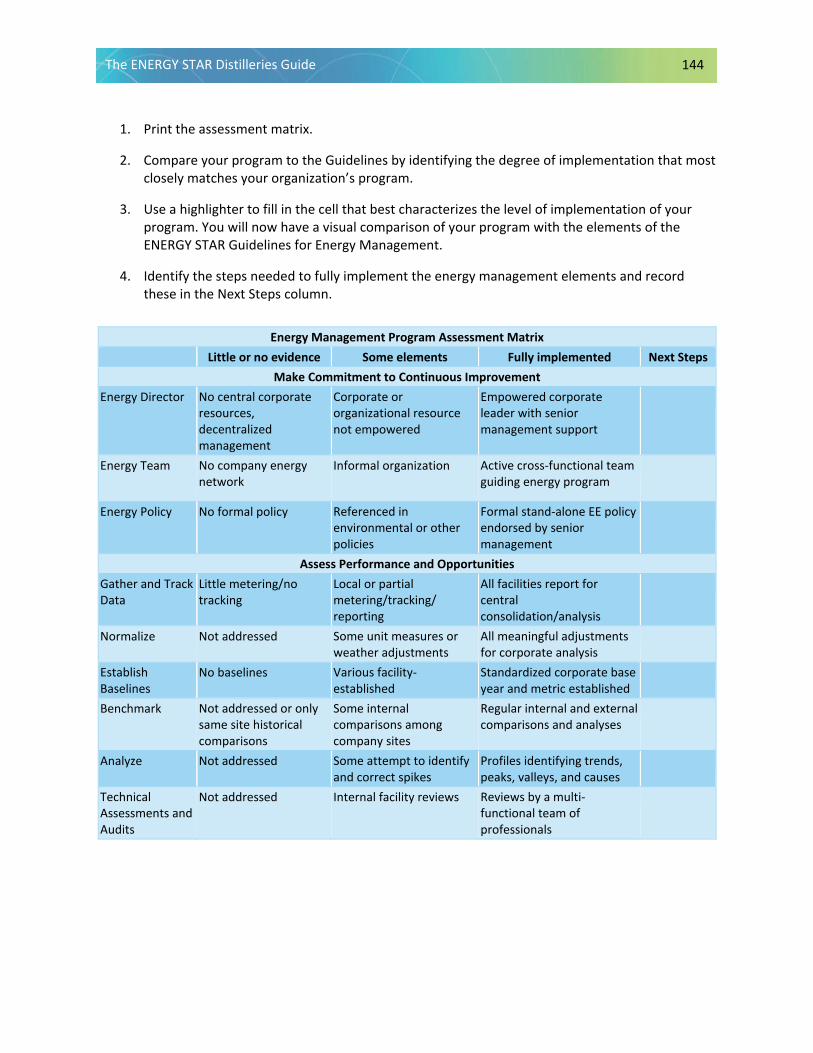
The ENERGY STAR Distilleries Guide 144
1. Print the assessment matrix.
2. Compare your program to the Guidelines by identifying the degree of implementation that most closely matches your organization’s program.
3. Use a highlighter to fill in the cell that best characterizes the level of implementation of your program. You will now have a visual comparison of your program with the elements of the ENERGY STAR Guidelines for Energy Management.
4. Identify the steps needed to fully implement the energy management elements and record these in the Next Steps column.
Energy Management Program Assessment Matrix Little or no evidence Some elements Fully implemented Next Steps
Make Commitment to Continuous Improvement Energy Director No central corporate
resources, decentralized management
Corporate or organizational resource not empowered
Empowered corporate leader with senior management support
Energy Team No company energy network
Informal organization Active cross-functional team guiding energy program
Energy Policy No formal policy Referenced in environmental or other policies
Formal stand-alone EE policy endorsed by senior management
Assess Performance and Opportunities Gather and Track Data
Little metering/no tracking
Local or partial metering/tracking/ reporting
All facilities report for central consolidation/analysis
Normalize Not addressed Some unit measures or weather adjustments
All meaningful adjustments for corporate analysis
Establish Baselines
No baselines Various facility-established
Standardized corporate base year and metric established
Benchmark Not addressed or only same site historical comparisons
Some internal comparisons among company sites
Regular internal and external comparisons and analyses
Analyze Not addressed Some attempt to identify and correct spikes
Profiles identifying trends, peaks, valleys, and causes
Technical Assessments and Audits
Not addressed Internal facility reviews Reviews by a multi-functional team of professionals
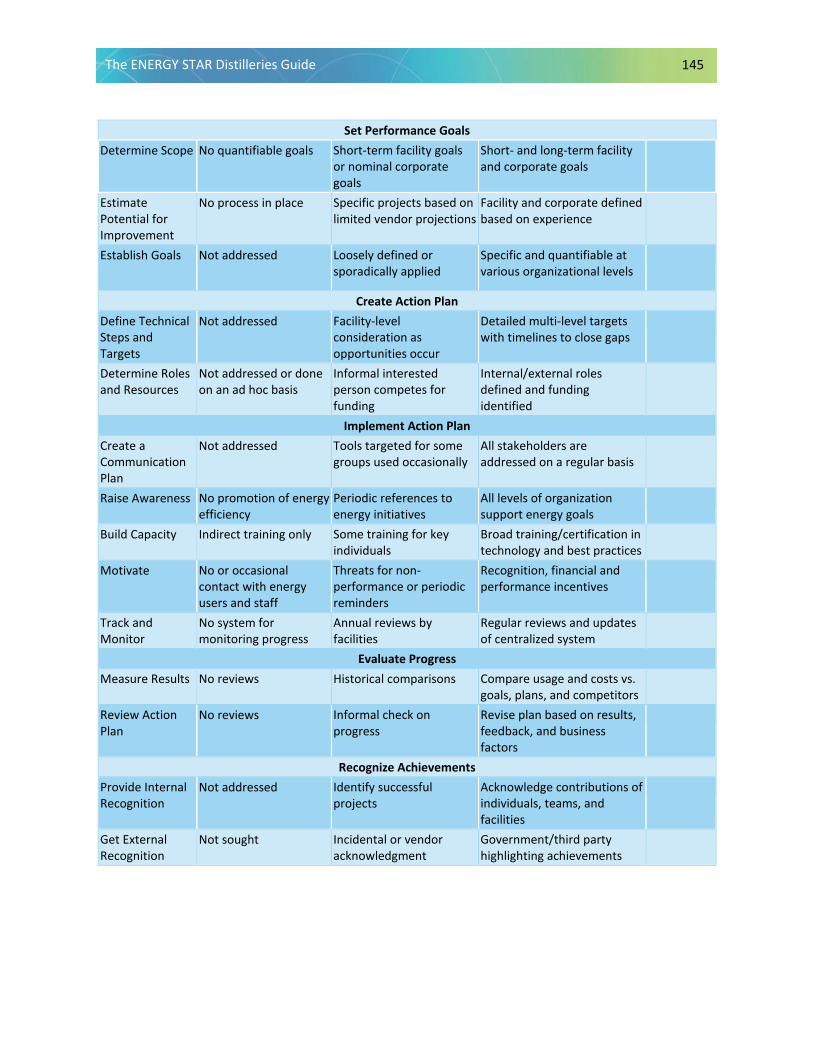
The ENERGY STAR Distilleries Guide 145
Set Performance Goals Determine Scope No quantifiable goals Short-term facility goals
or nominal corporate goals
Short- and long-term facility and corporate goals
Estimate Potential for Improvement
No process in place Specific projects based on limited vendor projections
Facility and corporate defined based on experience
Establish Goals Not addressed Loosely defined or sporadically applied
Specific and quantifiable at various organizational levels
Create Action Plan Define Technical Steps and Targets
Not addressed Facility-level consideration as opportunities occur
Detailed multi-level targets with timelines to close gaps
Determine Roles and Resources
Not addressed or done on an ad hoc basis
Informal interested person competes for funding
Internal/external roles defined and funding identified
Implement Action Plan Create a Communication Plan
Not addressed Tools targeted for some groups used occasionally
All stakeholders are addressed on a regular basis
Raise Awareness No promotion of energy efficiency
Periodic references to energy initiatives
All levels of organization support energy goals
Build Capacity Indirect training only Some training for key individuals
Broad training/certification in technology and best practices
Motivate No or occasional contact with energy users and staff
Threats for non-performance or periodic reminders
Recognition, financial and performance incentives
Track and Monitor
No system for monitoring progress
Annual reviews by facilities
Regular reviews and updates of centralized system
Evaluate Progress Measure Results No reviews Historical comparisons Compare usage and costs vs.
goals, plans, and competitors Review Action Plan
No reviews Informal check on progress
Revise plan based on results, feedback, and business factors
Recognize Achievements Provide Internal Recognition
Not addressed Identify successful projects
Acknowledge contributions of individuals, teams, and facilities
Get External Recognition
Not sought Incidental or vendor acknowledgment
Government/third party highlighting achievements
The ENERGY STAR Distilleries Guide 146
Interpreting Your Results
Comparing your program to the level of implementation identified in the Matrix should help you identify the strengths and weaknesses of your program. U.S. EPA has observed that organizations fully implementing the practices outlined in the Guidelines achieved the three greatest results. Organizations are encouraged to implement the Guidelines as fully as possible. By highlighting the cells of the matrix, you now can easily tell how well balanced your energy program is across the management elements of the Guidelines. Use this illustration of your energy management program for discussion with staff and management. Use the Next Steps column of the Matrix to develop a plan of action for improving your energy management practices.
Resources and Help
ENERGY STAR offers a variety of tools and resources to help organizations strengthen their energy management programs. Here are some next steps you can take with ENERGY STAR:
1. Read the Guidelines sections for the areas of your program that are not fully implemented.
2. Review ENERGY STAR Tools and Resources.
3. Find more sector-specific energy management information at www.energystar.gov/industry.
4. Become an ENERGY STAR Partner, if your company is not already, to take advantage of additional resources.
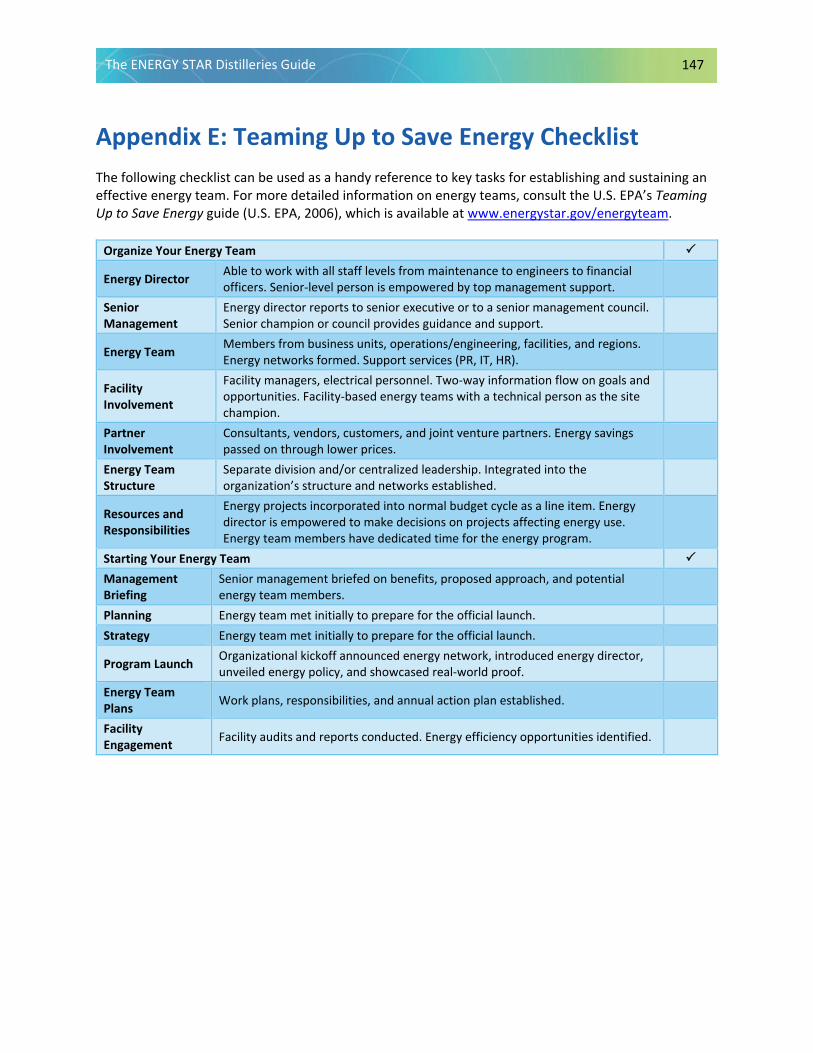
The ENERGY STAR Distilleries Guide 147
Appendix E: Teaming Up to Save Energy Checklist The following checklist can be used as a handy reference to key tasks for establishing and sustaining an effective energy team. For more detailed information on energy teams, consult the U.S. EPA’s Teaming Up to Save Energy guide (U.S. EPA, 2006), which is available at www.energystar.gov/energyteam.
Organize Your Energy Team
Energy Director Able to work with all staff levels from maintenance to engineers to financial officers. Senior-level person is empowered by top management support.
Senior Management
Energy director reports to senior executive or to a senior management council. Senior champion or council provides guidance and support.
Energy Team Members from business units, operations/engineering, facilities, and regions. Energy networks formed. Support services (PR, IT, HR).
Facility Involvement
Facility managers, electrical personnel. Two-way information flow on goals and opportunities. Facility-based energy teams with a technical person as the site champion.
Partner Involvement
Consultants, vendors, customers, and joint venture partners. Energy savings passed on through lower prices.
Energy Team Structure
Separate division and/or centralized leadership. Integrated into the organization’s structure and networks established.
Resources and Responsibilities
Energy projects incorporated into normal budget cycle as a line item. Energy director is empowered to make decisions on projects affecting energy use. Energy team members have dedicated time for the energy program.
Starting Your Energy Team Management Briefing
Senior management briefed on benefits, proposed approach, and potential energy team members.
Planning Energy team met initially to prepare for the official launch. Strategy Energy team met initially to prepare for the official launch.
Program Launch Organizational kickoff announced energy network, introduced energy director, unveiled energy policy, and showcased real-world proof.
Energy Team Plans Work plans, responsibilities, and annual action plan established.
Facility Engagement Facility audits and reports conducted. Energy efficiency opportunities identified.
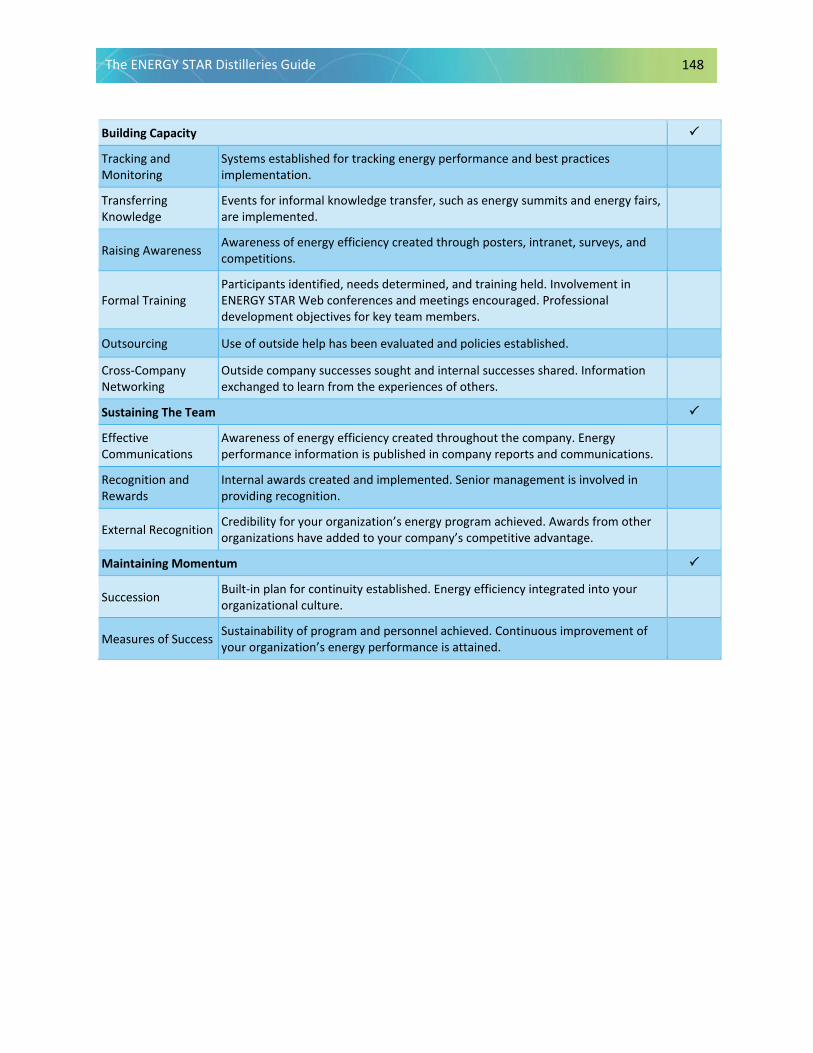
The ENERGY STAR Distilleries Guide 148
Building Capacity
Tracking and Monitoring
Systems established for tracking energy performance and best practices implementation.
Transferring Knowledge
Events for informal knowledge transfer, such as energy summits and energy fairs, are implemented.
Raising Awareness Awareness of energy efficiency created through posters, intranet, surveys, and competitions.
Formal Training Participants identified, needs determined, and training held. Involvement in ENERGY STAR Web conferences and meetings encouraged. Professional development objectives for key team members.
Outsourcing Use of outside help has been evaluated and policies established.
Cross-Company Networking
Outside company successes sought and internal successes shared. Information exchanged to learn from the experiences of others.
Sustaining The Team
Effective Communications
Awareness of energy efficiency created throughout the company. Energy performance information is published in company reports and communications.
Recognition and Rewards
Internal awards created and implemented. Senior management is involved in providing recognition.
External Recognition Credibility for your organization’s energy program achieved. Awards from other organizations have added to your company’s competitive advantage.
Maintaining Momentum
Succession Built-in plan for continuity established. Energy efficiency integrated into your organizational culture.
Measures of Success Sustainability of program and personnel achieved. Continuous improvement of your organization’s energy performance is attained.

The ENERGY STAR Distilleries Guide 149
Appendix F: Support Programs for Industrial Energy Efficiency Improvement This appendix provides a list of energy efficiency support available to industry. A brief description of the program or tool is given, as well as information on its target audience and the URL for the program. Included are federal and state programs. Use the URL to obtain more information from each of these sources. An attempt was made to provide as complete a list as possible; however, information in this listing may change with the passage of time.
Tools for Self-Assessment
Steam System Assessment Tool Description: Software package to evaluate energy efficiency improvement projects for steam systems. It includes an economic analysis capability. Target Group: Any industry operating a steam system Format: Downloadable software package (13.6 MB) Contact: U.S. Department of Energy URL: www.energy.gov/eere/amo/software-tools Steam System Scoping Tool Description: Spreadsheet tool for plant managers to identify energy efficiency opportunities in industrial steam systems. Target Group: Any industrial steam system operator Format: Downloadable software (Excel) Contact: U.S. Department of Energy URL: www.energy.gov/eere/amo/software-tools MotorMaster+ Description: Energy-efficient motor selection and management tool, including a catalog of more than 20,000 AC motors. It contains motor inventory management tools, maintenance log tracking, efficiency analysis, savings evaluation, energy accounting, and environmental reporting capabilities. Target Group: Any industry Format: Downloadable software (can also be ordered on CD) Contact: U.S. Department of Energy URL: www.energy.gov/eere/amo/motor-systems The 1*2*3 Approach to Motor Management Description: A step-by-step motor management guide and spreadsheet tool that can help motor service centers, vendors, utilities, energy efficiency organizations, and others convey the financial benefits of sound motor management. Target Group: Any industry Format: Downloadable Microsoft Excel spreadsheet Contact: Consortium for Energy Efficiency (CEE), (617) 589-3949 URL: https://library.cee1.org/content/123-approach-motor-management-users-guide/

The ENERGY STAR Distilleries Guide 150
AirMaster+: Compressed Air System Assessment and Analysis Software Description: Modeling tool that maximizes the efficiency and performance of compressed air systems through improved operations and maintenance practices. Target Group: Any industry operating a compressed air system Format: Downloadable software Contact: U.S. Department of Energy URL: www.energy.gov/eere/amo/software-tools
Fan System Assessment Tool (FSAT) Description: The tool helps to quantify the potential benefits of optimizing a fan system. FSAT calculates the amount of energy used by a fan system, determines system efficiency, and quantifies the savings potential of an upgraded system. Target Group: Any user of fans Format: Downloadable software Contact: U.S. Department of Energy URL: www.energy.gov/eere/amo/software-tools
Pumping System Assessment Tool (PSAT) Description: The tool helps industrial users assess the efficiency of pumping system operations. PSAT uses achievable pump performance data from Hydraulic Institute standards and motor performance data from the MotorMaster+ database to calculate potential energy and associated cost savings. Target Group: Any industrial pump user Format: Downloadable software Contact: U.S. Department of Energy URL: www.energy.gov/eere/amo/software-tools
Plant Energy Profiler/Integrated Tool Suite Description: The Plant Energy Profiler, or ePEP (formerly called Quick PEP), is an online software tool provided by the U.S. Department of Energy to help industrial plant managers in the United States identify how energy is being purchased and consumed at their plant and also identify potential energy and cost savings. ePEP is designed so that the user can complete a plant profile in about an hour. The ePEP online tutorial explains what plant information is needed to complete an ePEP case. Target Group: Any industrial plant Format: Online software tool Contact: U.S. Department of Energy URL: www.energy.gov/eere/amo/software-tools
ENERGY STAR Portfolio Manager Description: Online software tool helps to assess the energy performance of buildings by providing a 1 to 100 ranking of a building’s energy performance relative to the national building market. Measured energy consumption forms the basis of the ranking of performance. Target Group: Any building user or owner Format: Online software tool Contact: U.S. Environmental Protection Agency URL: www.energystar.gov/buildings/benchmark
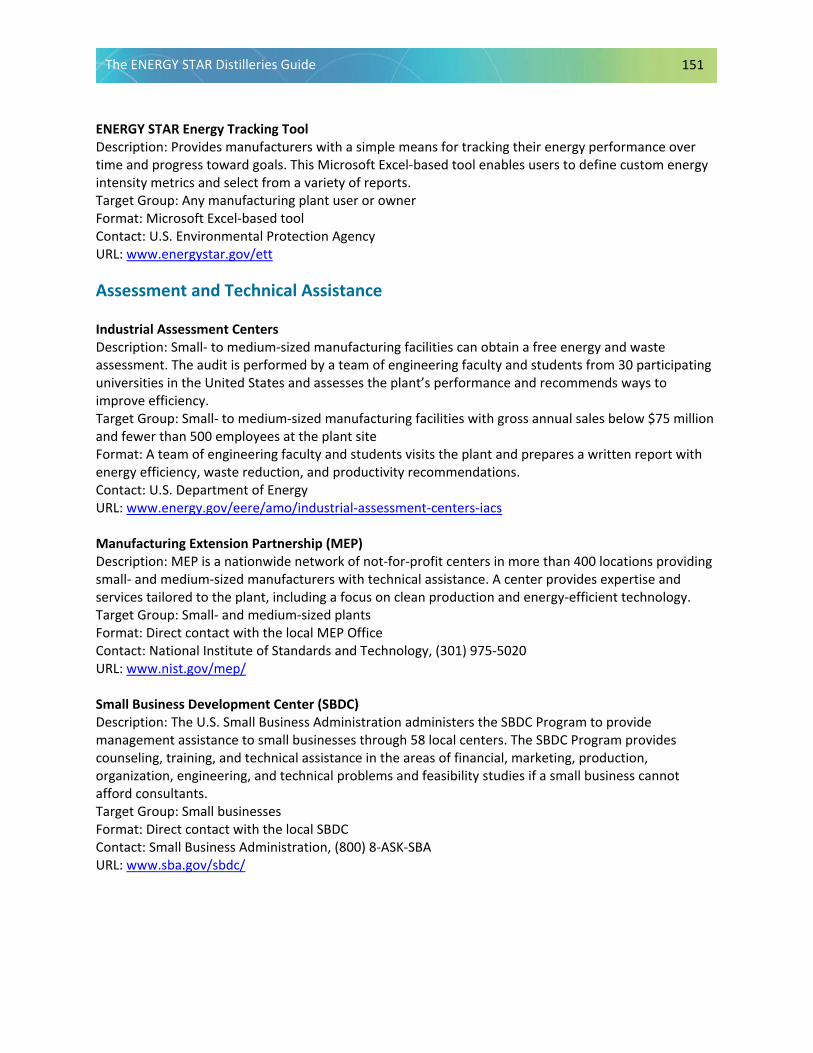
The ENERGY STAR Distilleries Guide 151
ENERGY STAR Energy Tracking Tool Description: Provides manufacturers with a simple means for tracking their energy performance over time and progress toward goals. This Microsoft Excel-based tool enables users to define custom energy intensity metrics and select from a variety of reports. Target Group: Any manufacturing plant user or owner Format: Microsoft Excel-based tool Contact: U.S. Environmental Protection Agency URL: www.energystar.gov/ett
Assessment and Technical Assistance
Industrial Assessment Centers Description: Small- to medium-sized manufacturing facilities can obtain a free energy and waste assessment. The audit is performed by a team of engineering faculty and students from 30 participating universities in the United States and assesses the plant’s performance and recommends ways to improve efficiency. Target Group: Small- to medium-sized manufacturing facilities with gross annual sales below $75 million and fewer than 500 employees at the plant site Format: A team of engineering faculty and students visits the plant and prepares a written report with energy efficiency, waste reduction, and productivity recommendations. Contact: U.S. Department of Energy URL: www.energy.gov/eere/amo/industrial-assessment-centers-iacs
Manufacturing Extension Partnership (MEP) Description: MEP is a nationwide network of not-for-profit centers in more than 400 locations providing small- and medium-sized manufacturers with technical assistance. A center provides expertise and services tailored to the plant, including a focus on clean production and energy-efficient technology. Target Group: Small- and medium-sized plants Format: Direct contact with the local MEP Office Contact: National Institute of Standards and Technology, (301) 975-5020 URL: www.nist.gov/mep/
Small Business Development Center (SBDC) Description: The U.S. Small Business Administration administers the SBDC Program to provide management assistance to small businesses through 58 local centers. The SBDC Program provides counseling, training, and technical assistance in the areas of financial, marketing, production, organization, engineering, and technical problems and feasibility studies if a small business cannot afford consultants. Target Group: Small businesses Format: Direct contact with the local SBDC Contact: Small Business Administration, (800) 8-ASK-SBA URL: www.sba.gov/sbdc/

The ENERGY STAR Distilleries Guide 152
ENERGY STAR—Selection and Procurement of Energy-Efficient Products for Business Description: ENERGY STAR identifies and labels energy-efficient office equipment. Look for products that have earned the ENERGY STAR. They meet the strict energy efficiency guidelines set by EPA. Office equipment included such items as computers, copiers, faxes, monitors, multifunction devices, printers, scanners, transformers, and water coolers. Target Group: Any user of labeled equipment Format: Website Contact: U.S. Environmental Protection Agency URL: www.energystar.gov/products?s=mega
Federal, State, Local, and Utility Incentives and Programs
Government and utilities sponsor incentives to assist businesses in assessing or financing energy-efficient process technology or buildings. Please contact your utility, state, and local government to determine what tax benefits, funding grants, or other assistance they may be able to provide your organization.
Database of State Incentives for Renewables and Efficiency (DSIRE) Description: DSIRE is a comprehensive source of information on state, local, utility, and federal incentives and policies that promote renewable energy and energy efficiency. Established in 1995, DSIRE is an ongoing project of the NC Solar Center and the Interstate Renewable Energy Council funded by the U.S. Department of Energy. Target Group: Any industry URL: www.dsireusa.org/
Beverage Industry Environmental Roundtable (BIER) Description: BIER is a technical coalition of leading global beverage companies working together to advance environmental sustainability within the beverage sector. BIER aims to effect sector change through work focused on water stewardship, energy efficiency and climate change, beverage container recycling, sustainable agriculture, and eco-system services. URL: www.bieroundtable.com
Kentucky Sustainable Spirits and Brewing Initiative (SSBI) Description: SSBI is focused on evaluating energy during the first year of training and then water, materials, and waste during the second year. URL: https://kppc.org/ksmi/ssb/
Tennessee Sustainable Spirits Description: Tennessee Sustainable Spirits (“Sustainable Spirits”) is a voluntary recognition and technical assistance program administered by Tennessee Department of Environment and Conservation's (TDEC) Office of Policy and Sustainable Practices, which seeks to reduce operational costs and environmental impacts for wineries and wine growers, breweries, and distilleries, as well as serve as a gateway to

The ENERGY STAR Distilleries Guide 153
sustainability education through popular brands. The new voluntary program will assist wineries and wine growers, breweries, and distilleries in improving operational sustainability by promoting best practices, providing technical assistance, and developing relationships. URL: www.tn.gov/environment/program-areas/opsp-policy-and-sustainable-practices/business-and-private-sector/tennessee-sustainable-spirits.html
The ENERGY STAR Distilleries Guide 154
Glossary ABS Acrylonitrile butadiene styrene
AD Anaerobic digestion
ASDs Adjustable-speed drives
Btu British thermal unit
CAC Compressed Air Challenge®
CEE Consortium of Energy Efficiency
CFL Compact fluorescent lamp
CFM Cubic feet per minute
CHP Combined Heat and Power
CIPEC Canadian Industry Program for Energy Conservation
cm Centimeter
CO2 Carbon dioxide
DDGS Distillers dried grains with solubles
DISCUS Distilled Spirits Council of the United States
EASA Electric Apparatus Service Association
EIA United States Energy Information Administration (U.S. Department of Energy)
EPACT Energy Policy Act
GHG Greenhouse gas
GJ Gigajoule
GWh Million kilowatt-hours (gigawatt-hours)
GWP Global warming potential
HFC Hydrofluorocarbon
HHV High Heating Value
The ENERGY STAR Distilleries Guide 155
HID High-intensity discharge
hl hectoliter
hp Horsepower
HVAC Heating, ventilation, and air conditioning
Hz Hertz
IAC Industrial Assessment Center
IEA International Energy Agency
kBtu Thousand British thermal units
kg Kilogram
KPPC Kentucky Pollution Prevention Center
kW Kilowatt
kWh Kilowatt-hour
LCC Life Cycle Costing
LED Light-emitting diode
Low-E Low-emittance
mm Millimeter
MVR Mechanical vapor recompression
MW Million watts (megawatt)
MWe Megawatt electric (One million watts of electric capacity)
MWh Million watt-hour (megawatt-hour)
NEMA National Electrical Manufacturers Association
NEMA EE National Electrical Manufacturers Association Energy Efficiency
NOx Nitrogen oxides
O&M Operations and maintenance
pH Potential of Hydrogen
The ENERGY STAR Distilleries Guide 156
psi Pounds per square inch
psid Pounds per square inch (differential)
psig Pounds per square inch (gauge)
TVR Thermal vapor recompression
U.S. DOE United States Department of Energy
U.S. EPA United States Environmental Protection Agency
VFD Variable-frequency drive
W Watt
WHP Waste heat to power
The ENERGY STAR Distilleries Guide 157
References AB InBev. (2020). Annual Report 2019. https://annualreport.ab-inbev.com/2019/assets/reports/2019-annual-report.pdf
Alesson, T. (1995). All steam traps are not equal. Hydrocarbon Processing, 74.
Alfa Laval. (2016). Plate heat exchangers boost efficiency at leading whisky distillery. Glenfarclas Distillery, Speyside, Scotland. www.alfalaval.com/globalassets/documents/media/stories/customer_story_glenfarclas_scotland_ppi00398en.pdf
Augustine, Cindy. (2016). Why Filtration Matters When Distilling Vodka. Liquor.com. www.liquor.com/articles/vodka-filtration
Baen, P.R., and R.E. Barth. (1994, September). Insulate heat tracing systems correctly. Chemical Engineering Progress, 41-46.
Barnish, T.J., M.R. Muller, and D.J. Kasten. (1997). Motor Maintenance: A Survey of Techniques and Results. Proceedings of the 1997 ACEEE Summer Study on Energy Efficiency in Industry. American Council for an Energy-Efficient Economy, Washington, D.C.
Bayne, C. (2011). Titan America. Personal Communication.
Beverage Industry Environmental Roundtable (BIER). (2012). Research on the Carbon Footprint of Spirits (Issue June). https://www.bieroundtable.com/wp-content/uploads/49d7a0_7643fd3fae5d4daf939cd5373389e4e0.pdf
BIER. (2019). Beverage Industry Continues to Drive Improvement in Water, Energy, and Emissions Efficiency: 2018 Benchmarking StudyTrends & Observations. http://www.bieroundtable.com/wp-content/uploads/2018-Water-and-Energy-Use-Benchmarking-Study.pdf
Bloss, D., R. Bockwinkel, and N. Rivers. (1997). Capturing Energy Savings with Steam Traps. Proceedings of the 1997 ACEEE Summer Study on Energy Efficiency in Industry. American Council for an Energy-Efficient Economy, Washington, D.C.
Bowman, J., J. McLaughlin, L. Sakaue, and C. Sommerfeld. (2015). Kentucky Bourbon Cluster: Cluster Competitiveness Project. Institute for Strategy and Competitiveness.
Brambley, M.R., P. Haves, S.C. McDonald, P. Torcellini, D. Hansen, D.R. Holmberg, and K.W. Roth. (2005). Advanced Sensors and Controls for Building Applications: Market Assessment and Potential R&D Pathways. U.S. Department of Energy, Office of Scientific and Technical Information. https://doi.org/10.2172/1217909
Brewers Association. Energy Usage, GHG Reduction, Efficiency and Load Management Manual. www.brewersassociation.org/attachments/0001/1530/Sustainability_Energy_Manual.pdf
The ENERGY STAR Distilleries Guide 158
Briggs of Burton. (2018). Scottish Malt Distillery Expansion, Briggs TVR System. www.briggsplc.com/case-studies/distilling-scotch-malt-distillery-expansion/
Broom, D. (2020). Energy efficient. Whisky Magazine. https://whiskymag.com/story?energy-efficient
Brush, A., E. Masanet, and E. Worrell. (2011). Energy Efficient Improvement and Cost Saving Opportunities for the Dairy Processing Industry. www.energystar.gov/buildings/tools-and-resources/energy-efficiency-improvement-and-cost-saving-opportunities-dairy-processing
BUCHI. (2018). Gin: Traditional Production Versus Modern Techniques. https://static1.buchi.com/sites/default/files/shortnotes/SN_331_2018_Gin_en.pdf
Caffal, C. (1995). Energy Management in Industry. CADDET Analyses Series 17. Sittard, The Netherlands.
California Institute of Energy Efficiency (CIEE). (2000). Cleanroom Case Study: Genentech, Vacaville: New Energy Efficient Site. Oakland, Calif.
Canadian Industry Program for Energy Conservation (CIPEC). (2001). Boilers and Heaters—Improving Energy Efficiency. Natural Resources Canada, Office of Energy Efficiency, Ottawa, Ontario, Canada.
Castellow, C., C.E. Bonnyman, H.G. Peach, J.C. Ghislain, P.A. Noel, M.A. Kurtz, J. Malinowski, and M. Kushler. (1997). Energy Efficiency in Automotive and Steel Plants. Proceedings of the 1997 ECEEE Summer Study, Stockholm, Sweden.
Centre for the Analysis and Dissemination of Demonstrated Energy Technologies (CADDET). (1997). Saving Energy With Efficient Compressed Air Systems. Maxi Brochure 6.
Centre for the Analysis and Dissemination of Demonstrated Energy Technologies (CADDET). (2001a). Saving Energy With Daylighting Systems. Maxi Brochure 14. Sittard, The Netherlands.
Centre for the Analysis and Dissemination of Demonstrated Energy Technologies (CADDET). (2001b). Saving Energy With Steam Production and Distribution. Maxi Brochure 13. Sittard, The Netherlands.
Compressed Air Systems. (2016). Compressed Air Systems for Breweries and Distilleries. www.compressedairsystems.com/blog/compressed-air-systems-breweries-distilleries/
Consortium for Energy Efficiency (CEE). (2007, May). Energy Efficiency Incentive Programs: Premium-Efficiency Motor and Adjustable Speed Drives in the U.S. and Canada. Boston, MA.
Cook, B. (1998, October). High-efficiency lighting in industry and commercial buildings. Power Engineering Journal, 197-206.
Copper Development Association (CDA). (2001). High-Efficiency Copper-Wound Motors Mean Energy and Dollar Savings. New York, N.Y.
Dai, M., X. Lu, and P. Xu. (2021). Causes of low delta-T syndrome for chilled water systems in buildings. Journal of Building Engineering, 33(May 2020), 101499. https://doi.org/10.1016/j.jobe.2020.101499

The ENERGY STAR Distilleries Guide 159
Danfoss. (2021). Refrigerant options now and in the future. https://assets.danfoss.com/documents/184711/AD224586434178en-000902.pdf
Dillion, G. (2015). A Rare Look Inside the UK’s Fastest Whisky Bottling Plant. Distillery Trail: Tails From the Trail. www.distillerytrail.com/blog/a-rare-look-inside-the-uks-fastest-whisky-bottling-plant/
Distilled Spirits Council of the United States (DISCUS). (2018). Economic Contribution of Alcohol Beverage Industry. www.distilledspirits.org/wp-content/uploads/2021/03/economic-contributions-2018-2.pdf
Distilled Spirits Council of the United States (DISCUS). (2020a). Distilled Spirits Economic Report and Supporting Tables. www.distilledspirits.org/news/distilled-spirits-council-economic-report-tariffs-cause-rough-seas-on-both-sides-of-the-atlantic-strong-u-s-spirits-market-in-jeopardy/ and www.distilledspirits.org/wp-content/uploads/2020/02/Economic-Briefing-Support-Tables-2019.pdf
Distilled Spirits Council of the United States (DISCUS). (2020b). Last Five Years of Annual Imports Exports 2020. www.distilledspirits.org/wp-content/uploads/2021/02/Last-Five-Year-Annual-Imports-Exports-2020.pdf
Duguid, L. (2016). Sustainable Energy Using Anaerobic Digestion of By-Products: Islay Whisky Industry Case Study (University of Strathclyde Engineering). www.esru.strath.ac.uk/Documents/MSc_2016/Duguid.pdf
Efficiency Partnership. (2004). Industrial Product Guide—Manufacturing and Processing Equipment: Compressed Air Equipment. Flex Your Power. San Francisco, Calif.
Electric Apparatus Service Association (EASA). (2003). The Effect of Repair/Rewinding on Motor Efficiency. St. Louis, Mo.
Electric Apparatus Service Association (EASA). (2006). ANSI/EASA Standard AR100-2006: Recommended Practice for the Repair of Rotating Electrical Apparatus. St. Louis, Mo.
Eley, C., T.M. Tolen, J.R. Benya, F. Rubinstein, and R. Verderber (1993). Advanced Lighting Guidelines: 1993. California Energy Commission, Sacramento, Calif.
Elliott, R.N., (1994). Electricity Consumption and the Potential for Electric Energy Savings in the Manufacturing Sector. American Council for an Energy-Efficient Economy, Washington, D.C. Report IE942.
European Commission. (n.d.). Moving from batch to continuous fermentation systems. Green Best Practice Community. Retrieved January 26, 2021, from https://greenbestpractice.jrc.ec.europa.eu/node/252
Evans, P. (2018). Chiller Types and Application Guide. The Engineering Mindset. http://theengineeringmindset.com/chiller-types-and-application-guide/
EWTech. (n.d.). Tecnología de Activación Electroquímica. Accessed February 1, 2021, at https://ewtech.co/como-funciona/tecnologia-de-activacion-electroquimica/
The ENERGY STAR Distilleries Guide 160
Exodraft. (n.d.). Breweries and Distilleries. Accessed February 1, 2021, at www.exodraft-heatrecovery.com/solutions/breweries-and-distilleries/
FDT Consulting Engineers & Project Managers, Ltd. (2020). Rum Distillery Utilities Study, Project Briefing. www.fdt.ie/case-study/rum-distillery-utilities-study
Federal Energy Management Program. (n.d.). Magnetic-Bearing Chiller Compressors. U.S. Department of Energy. Washington, D.C. www.energy.gov/eere/femp/magnetic-bearing-chiller-compressors
Fenning, L. et al. (Eds.). (2001). Pump Life Cycle Costs: A Guide to LCC Analysis for Pumping Systems. Hydraulic Institute/Europump/United States Department of Energy. ISBN: 1-880952-58-0.
Fenwick, C., and K. Harris. (2012). Bottler Best Practices: A Proven 3-Step Assessment Process. Compressed Air: Best Practices, 22-29. www.airbestpractices.com/sites/default/files/CABP_2012_01Jan-Feb_r1.pdf
Galitsky, C., N. Martin, E. Worrell, and B. Lehman. (2003). Energy Efficiency Improvement and Cost Saving Opportunities for Breweries—An ENERGY STAR® Guide for Energy and Plant Managers. Lawrence Berkeley National Laboratory, Berkeley, Calif. Report LBNL-50934.
Galitsky, C., S.C. Chang, E. Worrell, and E. Masanet. (2005a). Energy Efficiency Improvement and Cost Saving Opportunities for the Pharmaceutical Industry: An ENERGY STAR Guide for Energy and Plant Managers. Lawrence Berkeley National Laboratory, Berkeley, Calif. Report LBNL-57260.
Galitsky, C., E. Worrell, A. Radspeiler, P. Healy, and S. Zechiel. (2005b). BEST Winery Guidebook: Benchmarking and Energy and Water Savings Tool for the Wine Industry. Sacramento, Calif., Energy Commission. Report CEC-500-2005-167.
GEA. (2013). Applications in the Chemical, Pharmaceutical and Food Industry: Production of Beverage Alcohol and Bioethanol.
GEA. (n.d.). MVR/TVR Heated Distillation Plants. www.gea.com/en/products/distillation-fermentation/distillation/mvr-tvr-heated-distillation-plants%20.jsp
General Services Administration (GSA). (n.d.). www.gsa.gov/governmentwide-initiatives/climate-action-and-sustainability/emerging-building-technologies/about-green-proving-ground-gpg
Guidoboni, G.E. (1984). Continuous fermentation systems for alcohol production. Enzyme and Microbial Technology, 6, 194-200.
Gunes, B., J. Stokes, P. Davis, C. Connolly, and J. Lawler. (2019, July). Pre-treatments to enhance biogas yield and quality from anaerobic digestion of whiskey distillery and brewery wastes: A review. Renewable and Sustainable Energy Reviews, 113, 109281. https://doi.org/10.1016/j.rser.2019.109281
Hamill, A., J. Hanley, and V. Lane. (2020, July). Challenging the status quo: Energy efficient design in brewing and distilling. Brewer and Distiller International, 38-44.
Harmon, K.M. (2015). Bourbon Industry By-Product: A Sustainable Solution. MSc Thesis. Duke University.
The ENERGY STAR Distilleries Guide 161
Headlands Distilling. (n.d.). Sustainability. Retrieved January 26, 2021, from https://headlands.com.au/sustainability/
Hodgson, J., and T. Walters (2002). Optimizing Pumping Systems to Minimize First or Life-Cycle Costs. Proceedings of the 19th International Pump Users Symposium, Houston, Texas, February 25-28, 2002.
Hohmann, N., and C.M. Rendleman. (1993, January). Emerging Technologies in Ethanol Production. U.S. Department of Agriculture, Economic Research Service. Agricultural Information Bulletin No. 663.
Horner, A. (2021). The Importance of Keeping Your Cooling Towers Clean. Process Cooling. www.process-cooling.com/articles/90380-the-importance-of-keeping-your-cooling-towers-clean
Hovstadius, G. (2007). Key Performance Indicators for Pumping Systems. Proceedings Efficiency in Motor Driven Systems (EEMODS) ’07 Conference, Beijing, China, June 10-13, 2007.
Howe, B., and B. Scales (1995, November). Assessing Processes for Compressed Air Efficiency, E-Source Tech Update.
Hydraulic Institute and Europump. (2001). Pump Life Cycle Costs: A Guide to LCC Analysis for Pumping Systems. Parsippany, New Jersey.
IEA Heat Pump Centre. (2014). Application of Industrial Heat Pumps. Final Report—Part 2. IEA Industrial Energy-Related Systems and Technologies Annex 13/IEA Heat Pump Programme Annex. International Energy Agency, Paris, France.
Industrial Assessment Centers (IAC). (2015). Industrial Assessment Centers Database. Rutgers University, New Brunswick, New Jersey. Accessed March 2015 at https://iac.university/#database
Ingersoll Rand. (2001). Air Solutions Group: Compressed Air Systems Energy Reduction Basics. www.air.ingersoll-rand.com
International Energy Agency (IEA). (2000). Daylight in Buildings: A Sourcebook on Daylighting Systems and Components. Paris, France.
Jacques, K.A., T.P. Lyons, and D.R. Kelsall. (2003). The Alcohol Textbook: A Reference for the Beverage, Fuel and Industrial Alcohol Industries (Fourth edition). Nottingham University Press. https://doi.org/10.29312/remexca.v4i8.1130
Johnston, B. (1995, August). 5 Ways to Greener Steam. The Chemical Engineer, 594, 24-27.
Jones, T. (1997). Steam Partnership: Improving Steam Efficiency Through Marketplace Partnerships. Proceedings of the 1997 ACEEE Summer Study on Energy Efficiency in Industry. American Council for an Energy-Efficient Economy (ACEEE), Washington, D.C.
Kane, L., S. Romanow-Garcia, and D. Nakamura. (1998, January). Pinch steam trap has no moving parts. Hydrocarbon Processing, 77(1), 33.
Koepke, J. (2009). The Benefits of VFDs on Cooling Towers. HPAC Engineering.
The ENERGY STAR Distilleries Guide 162
Krzywonos, M., E. Cibis, T. Miśkiewicz, and A. Ryznar-Luty. (2009). Utilization and biodegradation of starch stillage (distillery wastewater). Electronic Journal of Biotechnology, 12(1). https://doi.org/10.2225/vol12-issue1-fulltext-5
Lighting Research Center (LRC). (2001). Lighting Futures: LEDs—From Indicators to Illuminators? Rensselaer Polytechnic Institute, Troy, N.Y.
Lindsley, D., J. Grist, and D. Parker. (2018). Thermal power plant control and instrumentation: The control of boilers and heat recovery steam generator.
Linnhoff, B., D.W. Townsend, D. Boland, G.F. Hewitt, B.E.A. Thomas, A.R. Guy, and R.H. Marsland. (1992). A User Guide on Process Integration for the Efficient Use of Energy (1992 edition). Institution of Chemical Engineers, Rugby, UK.
Louisville Dryer. (n.d.). https://louisvilledryer.com/
Lyons, T. Pearse. (2014). North American Whiskies: A Story of Evolution, Experience, and an Ongoing Entrepreneurial Spirit. Whisky, 39-48. https://doi.org/10.1016/b978-0-12-401735-1.00005-2
MarketLine. (2018). Spirits Global Industry Guide 2013-2022. https://store.marketline.com/report/mlig180079-06--spirits-global-industry-guide-2013-2022
Maroulis, Z.B., and G.D. Saravacos. (2003). Food Process Design. New York, N.Y.: Marcel Dekker.
Marriott, N.G., M.W. Schilling, and R.B. Gravani. (2018). Beverage Plant Sanitation. In Principles of Food Sanitation (pp. 367-387). Springer International Publishing AG. https://doi.org/10.1007/978-3-319-67166-6
Marshall, R. (n.d.). Milk Products Plant Finds 52 Percent Potential Savings. Compressed Air Best Practices. www.airbestpractices.com/system-assessments/pressure/milk-products-plant-finds-52-percent-potential-savings
Marshall, R. (2019). Distillery Addresses Inappropriate Compressed Air Uses Saving $16,600 in Energy Costs. Compressed Air Best Practices. www.airbestpractices.com/system-assessments/end-uses/distillery-addresses-inappropriate-compressed-air-uses-saving-16600-ener
Martin, N., M. Ruth, L. Price, R.N. Elliott, A.M. Shipley, and J. Thorne. (2000). Emerging Energy-Efficient Industrial Technologies. Berkeley: Lawrence Berkeley National Laboratory and Washington, D.C.: ACEEE.
Matthews, K. (2016). How to Increase Energy Efficiency at Your Brewery. www.craftbrewingbusiness.com/business-marketing/how-to-increase-energy-savings-at-your-brewery/
McGee, Harold. (2009). A Chill at the Still to Keep Flavors Fresh. New York Times. www.nytimes.com/2009/12/02/dining/02curious.html
Miller, G.H. (2019). Whisky Science: A Condensed Distillation. Springer.
The ENERGY STAR Distilleries Guide 163
Monceaux, D.A., and D. Kuehner. (2009). Dryhouse technologies and DDGS production. In The Alcohol Textbook.
Motor Decisions Matter (MDM). (2012). Motor Planning Kit. Boston, MA.
Nadel, S., M. Shepard, S. Greenberg, G. Katz, and A. de Almeida. (2002). Energy Efficient Motor Systems: A Handbook on Technology, Program and Policy Opportunities. American Council for an Energy-Efficient Economy (ACEEE), Washington, D.C.
National Electrical Manufacturers Association (NEMA). (2001). NEMA Standards Publication No. MG-10 2001, Energy Management Guide for Selection and Use of Fixed Frequency Medium AC Squirrel-Cage Polyphase Induction Motors. Rosslyn, Va.
National Electrical Manufacturers Association (NEMA). (2012). American National Standard—Motors and Generators. American National Standards Institute, Rosslyn, Va.
Oak Ridge National Laboratory (ORNL). (2013). Combined Heat and Power: Enabling Resilient Energy Infrastructure for Critical Facilities. Prepared by ICF International.
Oland, C.B. (2004). Guide to Combine Heat and Power Systems for Boiler Owners and Operators. Oak Ridge National Laboratory, Oak Ridge, Tennessee. Available at https://www.energy.gov/sites/prod/files/2014/05/f15/guide_chp_boiler.pdf
Parekh, P. (2000). Investment Grade Compressed Air System Audit, Analysis, and Upgrade. Proceedings of the 22nd National Industrial Energy Technology Conference. Houston, Texas, April 5-6, 2000, pp. 270-279.
Parker, S.A., W.D. Hunt, K.M. Fowler, W.F. Sandusky, G.P. Sullivan, B.K. Boyd, K.L.M. Stoughton, T.M. Koehler, and R. Pugh. (2015). Metering Best Practices: A Guide to Achieving Utility Resource Efficiency, Release 3.0. Prepared for the United States Department of Energy. Pacific Northwest National Laboratory, Richland, Washington.
Polonski, Adam. (2019). How Craft Beer Becomes Whiskey. Whiskey Advocate. www.whiskyadvocate.com/craft-beer-into-whiskey/
Prajapati, S. (2021). 3 Types of Cooling Systems and How They Work. Sensorex. https://sensorex.com/blog/2018/02/21/how-cooling-towers-work/
Price, A., and M.H. Ross. (1989, July). Reducing industrial electricity costs—An automotive case study. The Electricity Journal, 40-51.
Process Cooling. (2017). 5 Ways to Use Fans in Breweries and Distilleries. www.process-cooling.com/articles/88763-ways-to-use-fans-in-breweries-and-distilleries
Process Cooling. (2021). Microchannel Heat Exchangers Optimized for Use With Low GWP Refrigerants. www.process-cooling.com/articles/90340-microchannel-heat-exchangers-optimized-for-use-with-low-gwp-refrigerants
The ENERGY STAR Distilleries Guide 164
Radgen, P., and E. Blaustein (Eds.). (2001). Compressed Air Systems in the European Union, Energy, Emissions, Savings Potential and Policy Actions, Fraunhofer Institute for Systems Technology and Innovation, Karlsruhe, Germany.
Risen, C. (2021). Can a Fine Whiskey Age Overnight? The New York Times. www.nytimes.com/2021/02/11/dining/drinks/whiskey-bespoken-lost-spirits.html?referringSource= articleShare
Rivers, B. (2019). Sun-Powered Booze: Local Distillery Installs Solar Tech Made in Jacksonville. WJCT News. https://news.wjct.org/post/sun-powered-booze-local-distillery-installs-solar-tech-made-jacksonville
Rockwell Automation. (2018). A Legend in Bourbon Modernizes for Increased Production While Maintaining a Tradition of Quality. www.rockwellautomation.com/en-nz/company/news/case-studies/a-legend-in-bourbon-modernizes-for-increased-production-while-ma.html
Sampaio, A. (2018). Piping System Cuts Condensation Concerns for Brewing. Process Cooling. www.process-cooling.com/articles/89268-piping-system-cuts-condensation-concerns-for-brewing
Scales, W., and D.M. McCulloch. (2007). Best Practices for Compressed Air Systems (Second Edition). Compressed Air Challenge®, Washington, D.C. www.compressedairchallenge.org/
Shenoy, U. (1994). Heat Exchanger Network Synthesis. Houston, Texas: Gulf Publishing Company.
Smith, R. (1995). Chemical Process Design. New York, N.Y.: McGraw-Hill.
Sorrell, Steve, Alexandra Mallett, and Sheridan Nye. (2011). Barriers to Industrial Energy Efficiency: A Literature Review. Vienna, Austria: United Nations Industrial Development Organization.
Southern California Edison (SCE). (2003). Southern California Edison Educational Publication: Saving Money with Motors in Pharmaceutical Plants. Rosemead, Calif.
Spirax Sarco. (2001). Boiler feedtank systems. https://content.spiraxsarco.com/-/media/spiraxsarco/international/documents/ca/ti/pivotrol-ti-5-010-en.ashx?rev=d6a62e63ec9943369270581df01146c8
Spirax Sarco. (2020). Flash steam recovery savings top £50,000 per year at Scottish distillery. www.spiraxsarco.com/global/en-GB/case-studies/scottish-distillery
Spirax Sarco. (n.d.). The Pivotrol® Pump, PTC Pressure Powered Pump. https://content.spiraxsarco.com/-/media/spiraxsarco/international/documents/ca/ti/pivotrol-ti-5-010-en.ashx?rev=d6a62e63ec9943369270581df01146c8
Stewart, G., and I. Russell (Eds.). (2014). Whisky: Technology, Production and Marketing. Elsevier.
Stone, T. (2021). The In’s and Out’s of Temperature Control Units. Process Cooling. www.process-cooling.com/articles/90402-the-ins-and-outs-of-temperature-control-units

The ENERGY STAR Distilleries Guide 165
Strickland, M. (2019). Mash: Chemistry 101. Distiller Magazine. https://distilling.com/distillermagazine/mash-chemistry-101/
Strickland, Matthew. (2019b). Pot Distillation: How a Pot Still Works. Distiller Blog. https://blog.distiller.com/pot-still-distillation/
Strickland, Matthew. (2020). Column Distillation: How a Column Still Works. Distiller Blog. https://blog.distiller.com/column-still-distillation/
Strieder, N. (2014). Landmark 40% CO2 reduction from Midleton’s Distillery expansion. GEA. www.gea.com/en/stories/midleton-distillery-expansion.jsp
Studebaker, P. (2007, February). 2007 Best Practice Award Winners. Plant Services.
Studebaker, P. (2018). Model predictive control raises quality at Jim Beam distillery. Control Global. www.controlglobal.com/industrynews/2018/raf-4/
Suntory. (2020). Suntory Group CSR Site. https://www.suntory.com/csr/data/report/pdf/suntory_csr_EN_2020.pdf
Sustainable Spirits Initiative. (2015). Sustainable Spirits: A Look Into Sustainable Practices of Kentucky’s Distilleries and Breweries. https://eec.ky.gov/Environmental-Protection/Compliance-Assistance/DCA Resource Document Library/SustainableSpiritsBestPractices.pdf
Sustainable Spirits Initiative, Kentucky Energy and Environment Cabinet. (n.d.). Retrieved February 12, 2021, from https://eec.ky.gov/Environmental-Protection/Compliance-Assistance/Pages/sustainable-spirits.aspx
Sutak, T. (2016). Colorado Distillery Pioneers Water & Energy Efficiency System. Elevation Outdoors Magazine. www.elevationoutdoors.com/blogs/colorado-distillery-pioneers-water-energy-efficiency-system
SWEP. (2019). Clean Power When ORC System Recovers Waste Heat. www.swep.net/globalassets/applications/case-stories/clean-power-when-orc-system-recovers-waste-heat/orc_4_pages.pdf
SWEP. (n.d.). Refrigeration Handbook. www.swep.net/refrigerant-handbook/refrigerant-handbook
tekWorx. (n.d.). www.tekworx.us
Terrien, T. (2020). Refractometers—How They Are Used and Why They Are Important! G&D Chillers. https://gdchillers.com/basic-refrigeration/refractometers-how-they-are-used-and-why-they-are-important
Tetley, P.A. (2001). Cutting energy costs with laboratory workstation fume hood exhaust. Pharmaceutical Engineering 21(5): 90-97.
The ENERGY STAR Distilleries Guide 166
Timms, S. (2019). Understanding distillery chilling systems. G&D Chillers. https://gdchillers.com/basic-refrigeration/understanding-distillery-chilling-systems
Trane. (2020). HVAC Industry Update. www.trane.com/content/dam/Trane/Commercial/global/newsroom/blogs/REFR-PRB001F-EN_05052020.pdf
Traub, D.A. (2002). Rotary Dryers. Process Heating. www.process-heating.com/articles/85571-rotary-dryers-part-1
Tsotsas, E., and A.S. Mujumdar (Eds.). (2014). Modern drying technology, Volume 5: Process Intensification. ProQuest Ebook Central. https://ebookcentral.proquest.com
Tutterow, V., D. Casada, and A. McKane. (2000). Profiting from Your Pumping System. Proceedings of the 2000 Pump Users Expo, Louisville, Kentucky.
United Nations Industrial Development Organization (UNIDO). (2020). Distell, Adam Tas Site: Stellenbosch, Western Cape, South Africa. Efficiency Solutions for Industrial Cooling. www.industrialenergyaccelerator.org/wp-content/uploads/FINAL-13-Jan-case-study.pdf
United States Alcohol and Tobacco Tax and Trade Bureau (TTB). (2020). Statistical Report: Distilled Spirit. www.ttb.gov/images/pdfs/statistics/2020/2020_12ds.pdf
United States Department of Energy (DOE). (2001a). Pump Life Cycle Costs: A Guide to LCC Analysis for Pumping Systems. Office of Energy Efficiency and Renewable Energy, Industrial Technologies Program, Washington, D.C. DOE/GO-102001-1190.
United States Department of Energy (DOE). (2001b) Steam Cost Reduction Strategies: Reducing your steam system energy bill. U.S. Department of Energy, Washington, D.C.
United States Department of Energy (DOE). (2002). United States Industrial Electric Motor Systems Market Opportunities Assessment. Office of Industrial Technologies, Washington, D.C.
United States Department of Energy (DOE). (2003a, June). 3M: Hutchinson Plant Focuses on Heat Recovery and Cogeneration During Plant-Wide Energy Efficiency Assessment. Office of Industrial Technologies, U.S. Department of Energy, Washington, D.C..
United States Department of Energy (DOE). (2003b). Improving Fan System Performance: A Sourcebook for Industry. Office of Energy Efficiency and Renewable Energy, Industrial Technologies Program, Washington, D.C. DOE/GO-102003-1824.
United States Department of Energy (DOE). (2004a). Energy Tips—Compressed Air: Remove Condensate with Minimal Air Loss. Office of Energy Efficiency and Renewable Energy, Industrial Technologies Program, Washington, D.C. Compressed Air Tip Sheet #13.
United States Department of Energy (DOE). (2004b). Energy Tips—Compressed Air: Eliminate Inappropriate Uses of Compressed Air. Office of Energy Efficiency and Renewable Energy, Industrial Technologies Program, Washington, D.C. Compressed Air Tip Sheet #2.
The ENERGY STAR Distilleries Guide 167
United States Department of Energy (DOE). (2004c). Energy Tips—Compressed Air: Alternative Strategies for Low-Pressure End Uses. Office of Energy Efficiency and Renewable Energy, Industrial Technologies Program, Washington, D.C. Compressed Air Tip Sheet #11.
United States Department of Energy (DOE). (2005a). Energy Tips—Motor Systems. Eliminate Voltage Unbalance. Office of Energy Efficiency and Renewable Energy, Industrial Technologies Program, Washington, D.C. DOE/GO-102005-2061.
United States Department of Energy (DOE). (2005b). Steam Pressure Reduction: Opportunities and Issues. Office of Energy Efficiency and Renewable Energy, Industrial Technologies Program, Washington, D.C.
United States Department of Energy (DOE). (2006a). Improving Pumping System Performance: A Sourcebook for Industry. Office of Energy Efficiency and Renewable Energy, Industrial Technologies Program, Washington, D.C. DOE/GO-102006-2079.
United States Department of Energy (DOE). (2006b). Steam Tip Sheets. Industrial Technologies Program, Office of Industrial Technologies, Washington, D.C.
United States Department of Energy (U.S. DOE). (2007a) Steam Tip Sheets, August 2007. Industrial Technologies Program, Office of Industrial Technologies U.S. Department of Energy, Washington, D.C.
United States Department of Energy, Energy Efficiency and Renewable Energy (DOE). (2008a). Improving Motor and Systems Performance: A Sourcebook for Industry. Office of Energy Efficiency and Renewable Energy, Washington, D.C.
United States Department of Energy, Energy Efficiency and Renewable Energy (DOE). (2008b). Improving Process Heating System Performance: A Sourcebook for Industry. U.S. Department of Energy, Energy Efficiency and Renewable Energy. www.nrel.gov/docs/fy08osti/41589.pdf
United States Department of Energy, Energy Efficiency and Renewable Energy (DOE). (2012). Improving Steam System Performance: A Sourcebook for Industry. Second Edition. U.S. Department of Energy, Energy Efficiency and Renewable Energy. https://www.energy.gov/sites/prod/files/2014/05/f15/steamsourcebook.pdf
United States Department of Energy (DOE). (2016, December). CHP Installation Database. https://doe.icfwebservices.com/chpdb/
United States Department of Energy (DOE) and Compressed Air Challenge (CAC). (2003). Improving Compressed Air System Performance: A Sourcebook for Industry. Office of Industrial Technologies, Washington, D.C.
United States Economic Census. (2018). Manufacturing: Industry Series, Detailed Statistics by Industry for the U.S. https://data.census.gov/cedsci/table?q=31214%3A%20Distilleries&g=0100000US
United States Energy Information Administration (EIA). (2012, October). Combined heat and power technology fills an important energy niche. www.eia.gov/todayinenergy/detail.php?id=8250
The ENERGY STAR Distilleries Guide 168
United States Energy Information Administration (EIA). (2020). How much carbon dioxide is produced when different fuels are burned? www.eia.gov/tools/faqs/faq.php?id=73&t=11
United States Environmental Protection Agency (U.S. EPA). (2006). Teaming Up to Save Energy—Protect Our Environment Through Energy Efficiency. Prepared by ICF International. Washington, D.C.
United States Environmental Protection Agency (U.S. EPA). (2008). ENERGY STAR Building Upgrade Manual (2008 Edition). Office of Air and Radiation. Washington, D.C. Download from www.energystar.gov/index.cfm?c=business.bus_upgrade_manual
United States Environmental Protection Agency (U.S. EPA). (2012, May). Waste Heat to Power Systems. Washington, D.C.
United States Environmental Protection Agency (U.S. EPA). (2015, March). Catalog of CHP Technologies. Washington, D.C.
Wendhausen, R., A. Fregonesi, P.J.S. Morgan, I. Joekes, J. Augusto, R. Rodrigues, E. Tonella, and K. Althoff. (2001). Continuous fermentation of sugar cane syrup using immobilized yeast cells. Journal of Bioscience and Bioengineering, 91(1): 48-52.
Williams, B. (n.d.). The Six Basic Types of Liquid Cooling Systems. Compressed Air Best Practices. Retrieved May 12, 2021, from www.airbestpractices.com/technology/cooling-systems/six-basic-types-liquid-cooling-systems
Wisniewski, Ian. (n.d.). Pot Ale and Spent Lees. Whisky Magazine. https://whiskymag.com/story/pot-ale-and-spent-lee
Wojciechowska, I. (2015). Vacuum Distillation: When Gin Goes High-Tech. Tales of the Cocktail Foundation. https://talesofthecocktail.org/in-depth/vacuum-distillation-when-gin-goes-high-tech/
World Energy Council. (2016). World Energy Resources Waste to Energy.
Worrell, E., J.W. Bode, and J.G. de Beer. (1997). Energy Efficient Technologies in Industry—Analyzing Research and Technology Development Strategies, The “Atlas” Project. Department of Science, Technology, and Society, Utrecht University, Utrecht, The Netherlands.
Xenergy, Inc. (1998). United States Industrial Electric Motor Systems Market Opportunities Assessment. U.S. Department of Energy, Office of Industrial Technology and Oak Ridge National Laboratory. https://www1.eere.energy.gov/manufacturing/tech_assistance/pdfs/mtrmkt.pdf
Zietlow, D. (2016). Optimization of Cooling Systems. Momentum Press.