Energy Balance and Body Composition - PSPK
39
© 2008 Thomson - Wadsworth Energy Balance and Body Composition
-
Upload
khangminh22 -
Category
Documents
-
view
3 -
download
0
Transcript of Energy Balance and Body Composition - PSPK
© 2008 Thomson - Wadsworth
Energy Balance
and Body Composition
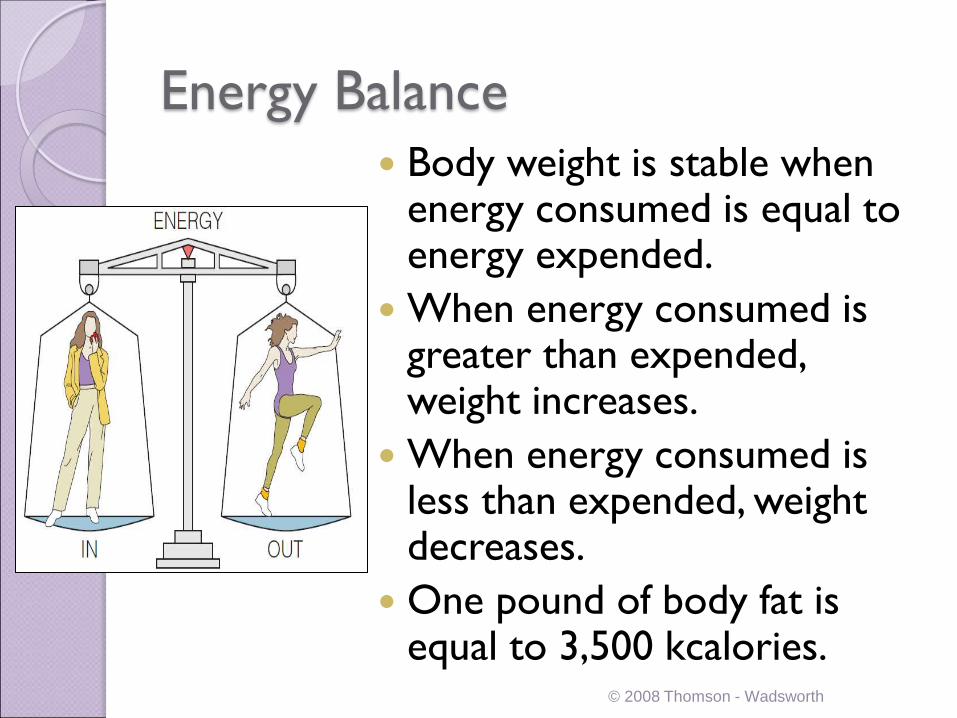
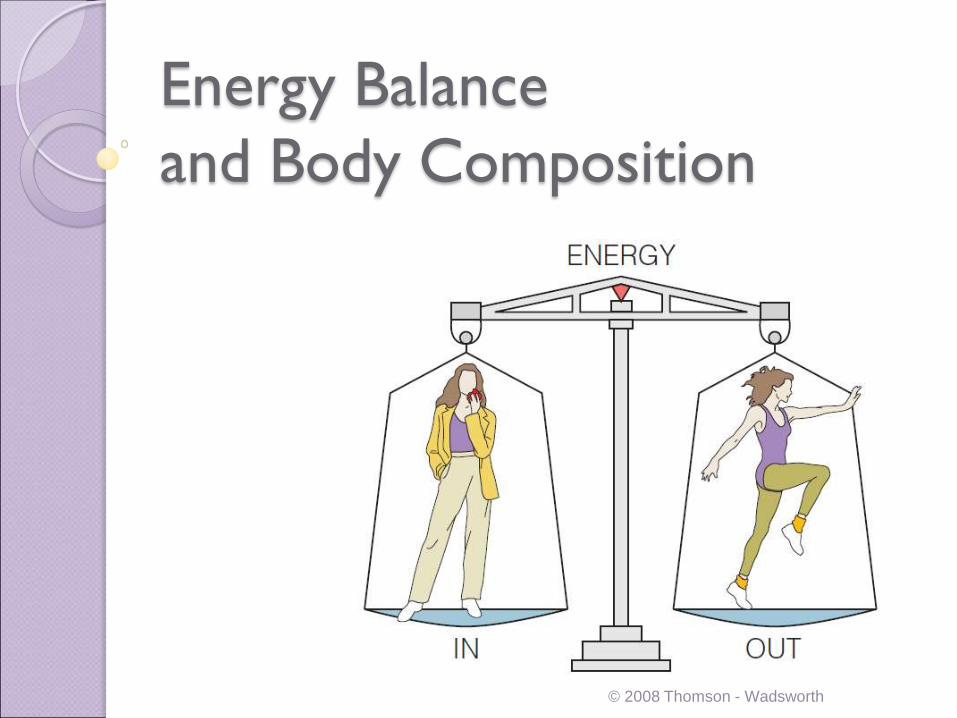
Energy Balance
Body weight is stable when energy consumed is equal to energy expended.
When energy consumed is greater than expended, weight increases.
When energy consumed is less than expended, weight decreases.
One pound of body fat is equal to 3,500 kcalories.
© 2008 Thomson - Wadsworth
Energy In: The kCalories Foods
Provide Eating behaviors respond to different
signals.
Hunger and appetite encourage eating, while satiation and satiety stop eating.
Messages are sent from the hormonal and nervous system.
Other aspects of human behavior affect eating habits.
© 2008 Thomson - Wadsworth
Energy In: The kCalories Foods
Provide Food Intake
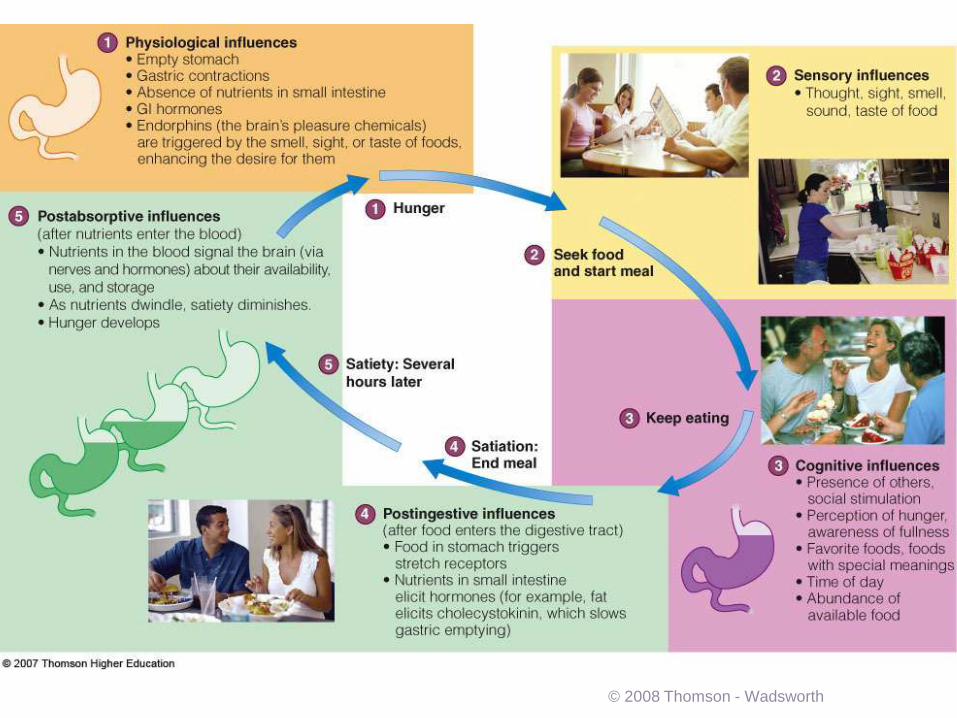
◦ Appetite initiates eating through the sight, smell,
thought or taste of food. Hunger is the feeling that
motivates us to eat and is controlled by the
hypothalamus.
◦ Satiation is the feeling of satisfaction and fullness that
causes us to stop eating.
◦ Satiety reminds us not to eat again until the body
needs food.
© 2008 Thomson - Wadsworth
© 2008 Thomson - Wadsworth
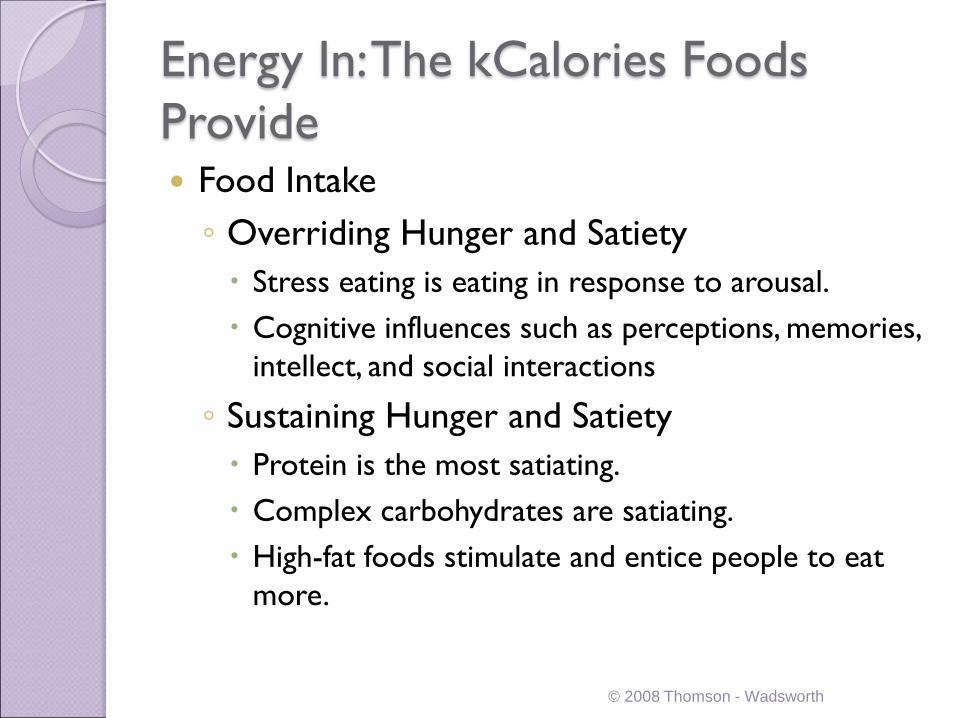
Energy In: The kCalories Foods
Provide Food Intake
◦ Overriding Hunger and Satiety
Stress eating is eating in response to arousal.
Cognitive influences such as perceptions, memories,
intellect, and social interactions
◦ Sustaining Hunger and Satiety
Protein is the most satiating.
Complex carbohydrates are satiating.
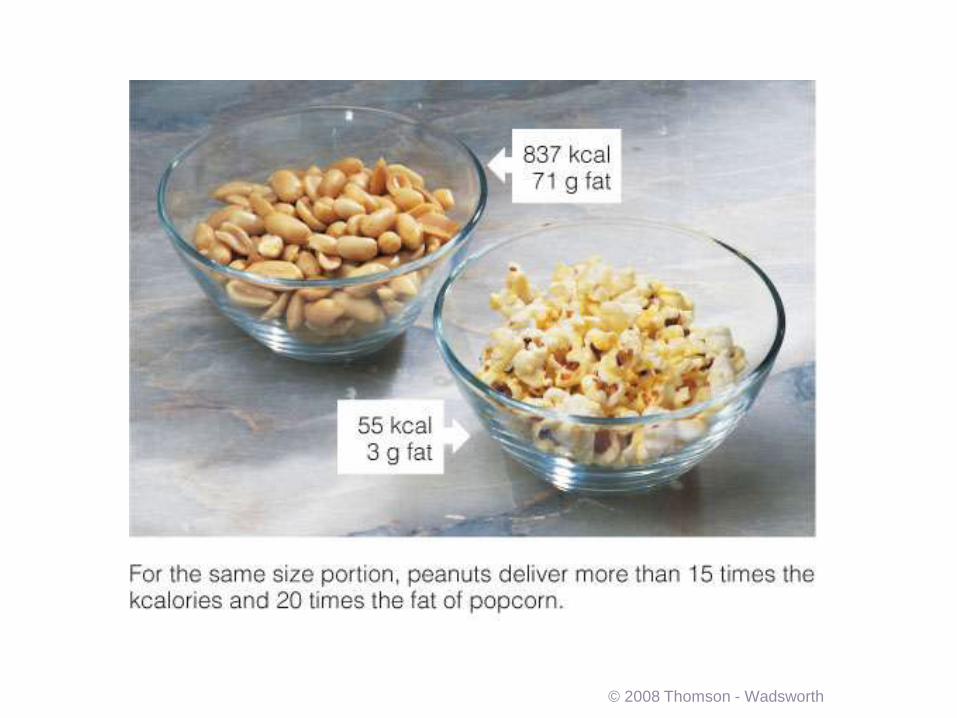
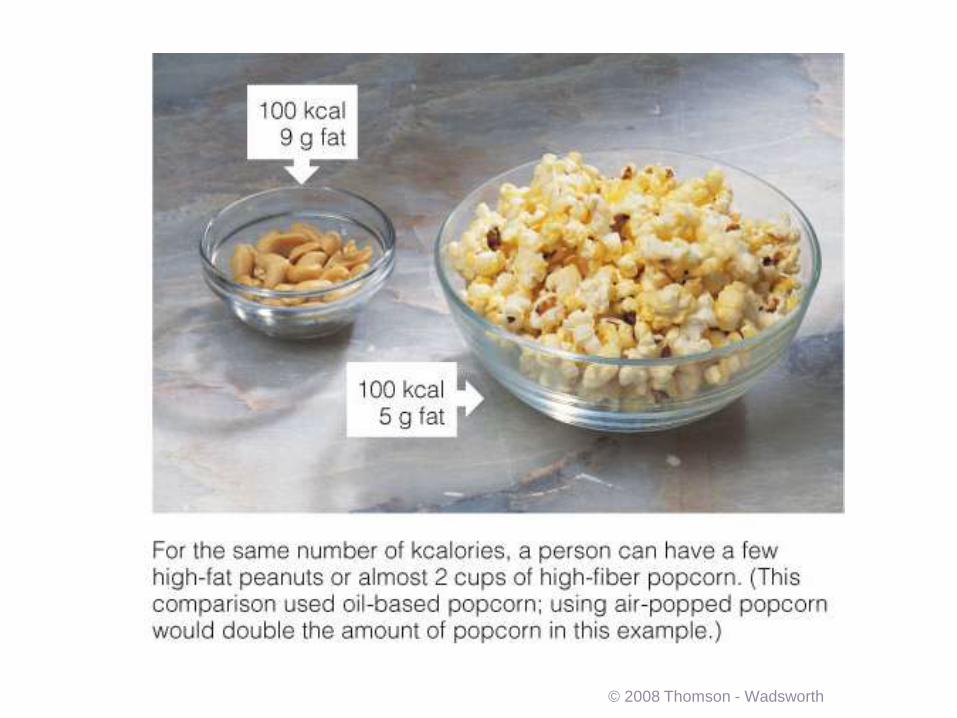
High-fat foods stimulate and entice people to eat
more.
© 2008 Thomson - Wadsworth
© 2008 Thomson - Wadsworth
© 2008 Thomson - Wadsworth
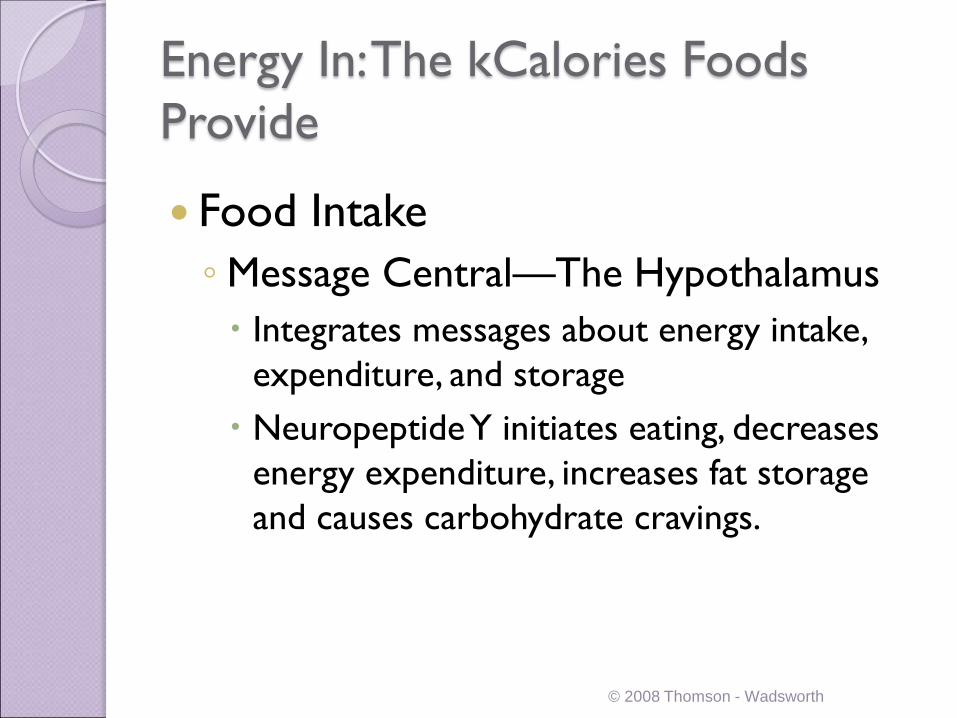
Energy In: The kCalories Foods
Provide
Food Intake
◦Message Central—The Hypothalamus
Integrates messages about energy intake,
expenditure, and storage
Neuropeptide Y initiates eating, decreases
energy expenditure, increases fat storage
and causes carbohydrate cravings.
© 2008 Thomson - Wadsworth
Energy Out: The kCalories the Body
Expends
Energy expenditure includes basal metabolic activities, physical activity, thermic effect of food and adaptive thermogenesis.
These energy requirements differ from person to person and are affected by age, gender, weight, and height.
The intensity and duration of physical activity also make a difference.
© 2008 Thomson - Wadsworth
© 2008 Thomson - Wadsworth
Energy Out: The kCalories the Body
Expends
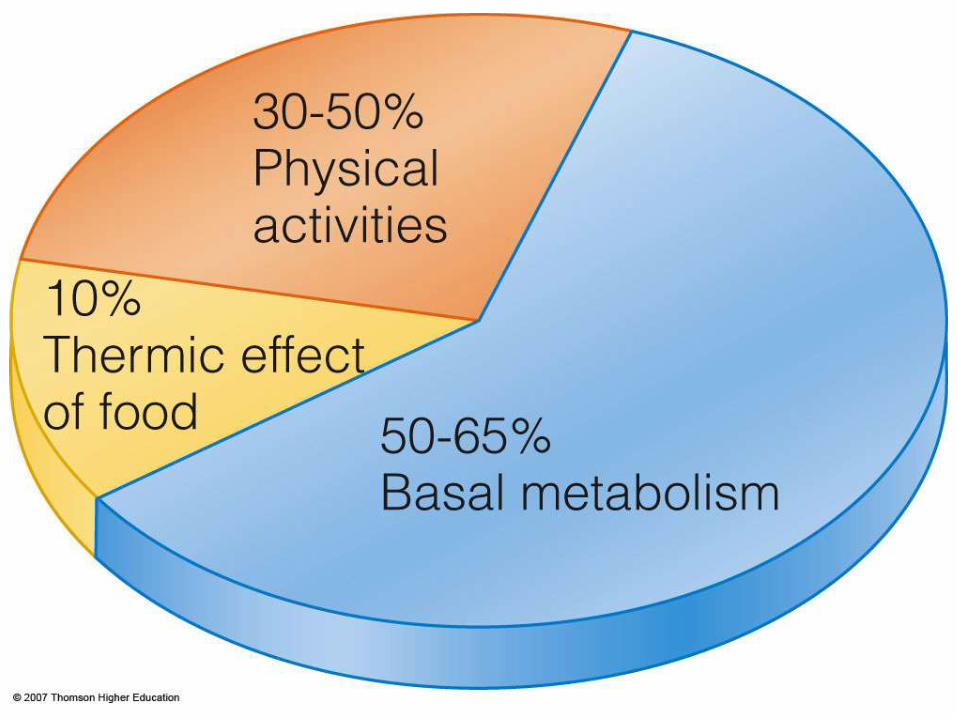
Components of Energy Expenditure
◦ [1] Basal Metabolism (basal metabolic rate,
BMR)
2/3 of energy expenditure
Supports the basic processes of life
Resting metabolic rate (RMR) is a measure of
energy slightly higher than BMR.
© 2008 Thomson - Wadsworth
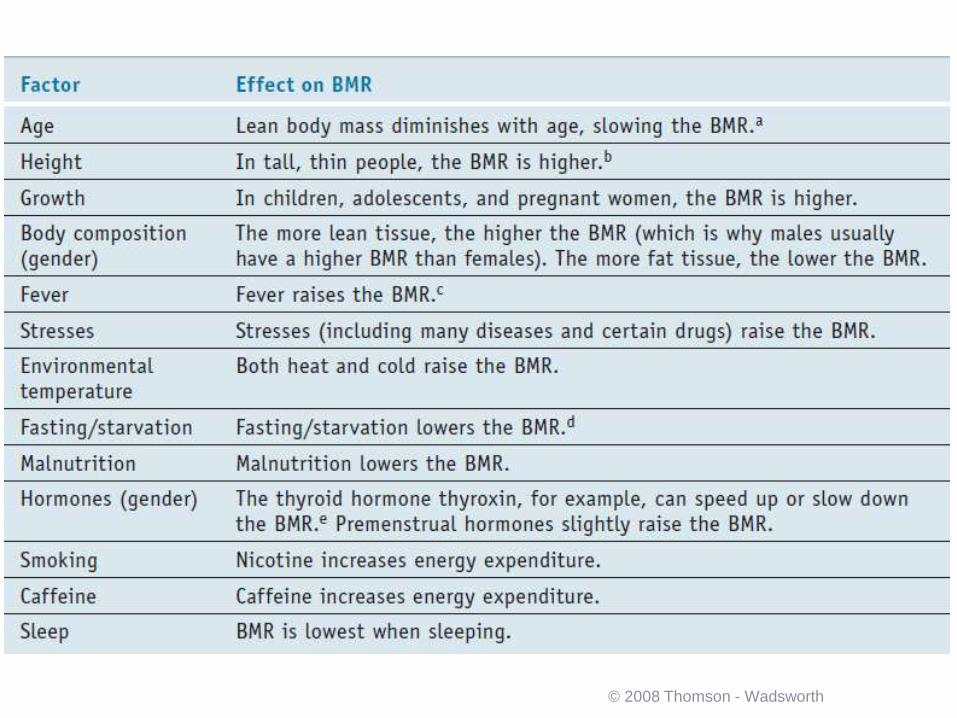
Energy Out: The kCalories the Body
Expends Components of Energy Expenditure
◦ [1] Basal Metabolism - Factors affecting BMR
Aging slows BMR
Height – the taller, the higher the BMR
Growth increases BMR
Body composition (lean body mass increases BMR)
Fever increases BMR.
Stress increases BMR.
Environmental temperature - both heat and cold
raise BMR
© 2008 Thomson - Wadsworth
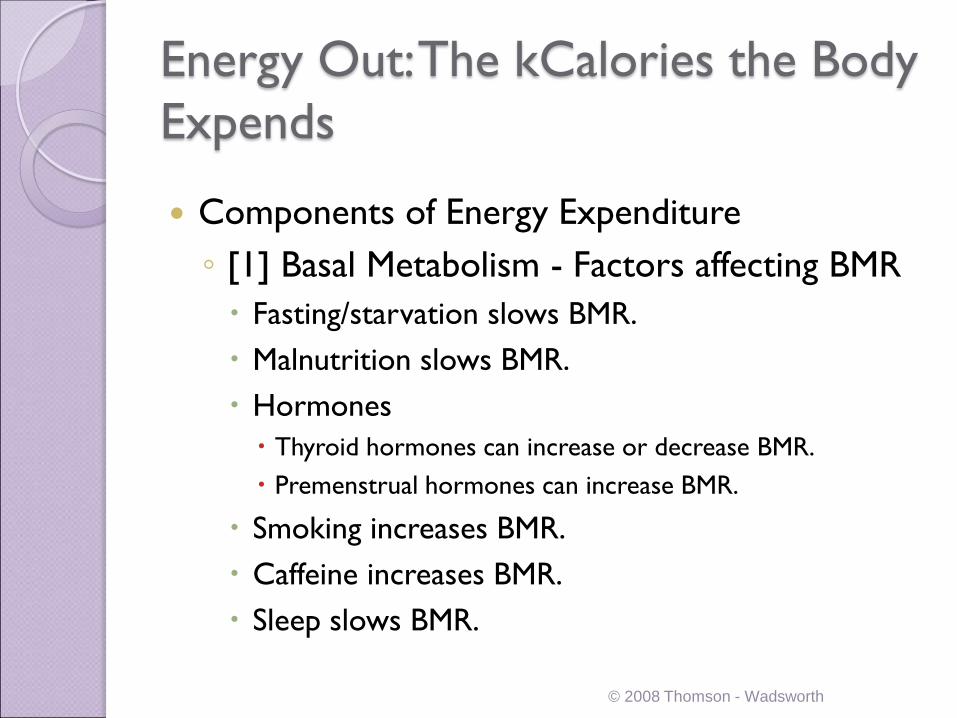
Energy Out: The kCalories the Body
Expends
Components of Energy Expenditure
◦ [1] Basal Metabolism - Factors affecting BMR
Fasting/starvation slows BMR.
Malnutrition slows BMR.
Hormones
Thyroid hormones can increase or decrease BMR.
Premenstrual hormones can increase BMR.
Smoking increases BMR.
Caffeine increases BMR.
Sleep slows BMR.
© 2008 Thomson - Wadsworth
© 2008 Thomson - Wadsworth
Energy Out: The kCalories the Body
Expends
Components of Energy Expenditure
◦ [2] Physical activity
Most variable and changeable
Voluntary
It can be significant in weight loss and weight
gain.
Duration, frequency and intensity influence
energy expenditure.
© 2008 Thomson - Wadsworth
Energy Out: The kCalories the Body
Expends
Components of Energy Expenditure
◦ [3] Thermic effect of food (TEF) is estimated at 10%
of total energy intake and involves digestion and
absorption.
Carbohydrate 5-10%
Fat 0-5%
Protein 20-30%
Alcohol 15-20%
◦ Adaptive thermogenesis is the adjustment in energy
expenditure related to environmental changes.
© 2008 Thomson - Wadsworth
Energy Out: The kCalories the Body
Expends Estimating energy requirements is affected by many
factors.
◦ Gender – men generally have a higher BMR
◦ Growth – BMR is high in people who are growing
◦ Age – BMR declines as lean body mass decreases
◦ Physical activity – Activities are clustered by intensity and vary considerably
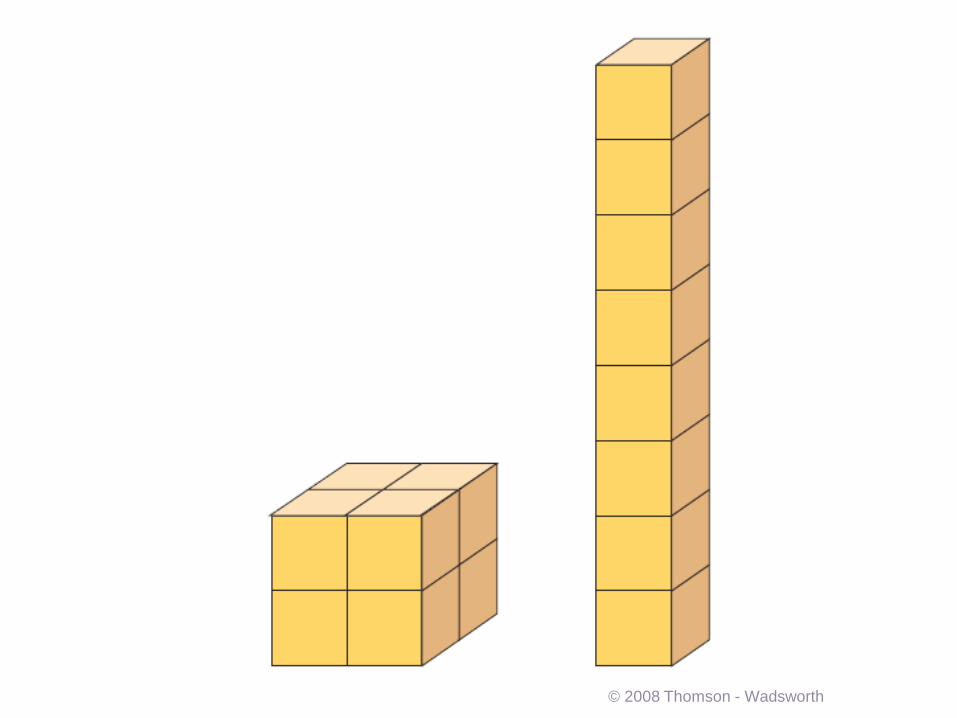
◦ Body composition and body size – taller people have more surface area and heavier people have higher BMRs
© 2008 Thomson - Wadsworth
© 2008 Thomson - Wadsworth
Body Weight, Body Composition,
and Health
Current weight standards use height and
weight data and do not take body
composition into consideration.
These may be misleading.
© 2008 Thomson - Wadsworth
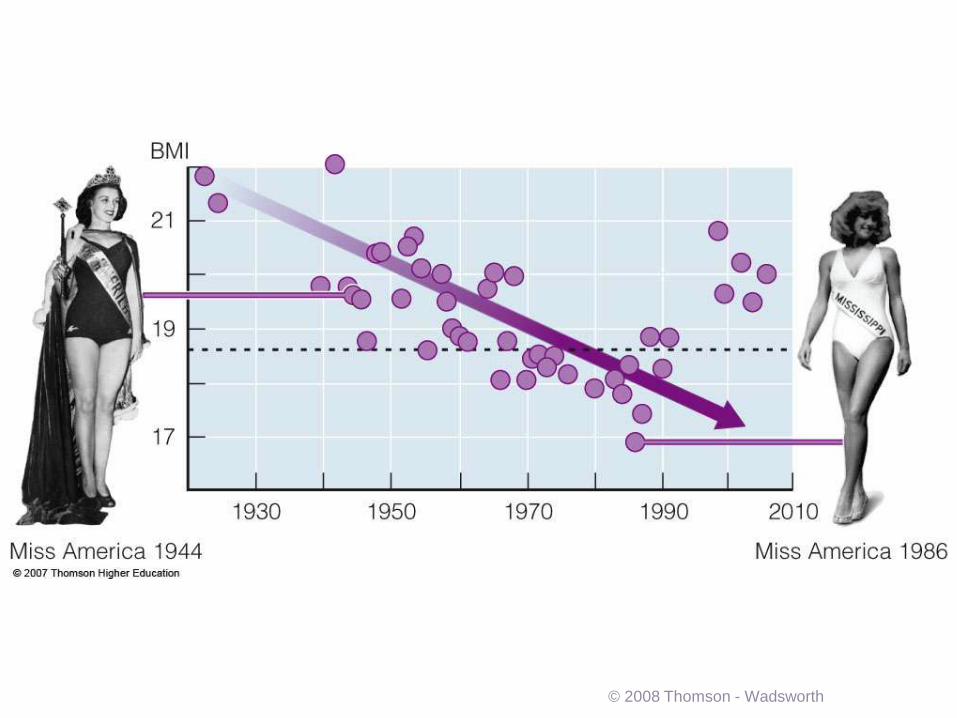
Body Weight, Body Composition,
and Health Defining Healthy Body Weight
◦ The Criterion of Fashion
Society values change over time.
Perceived body images
◦ The Criterion of Health
Good health supercedes appearance.
Longevity is a criterion.
© 2008 Thomson - Wadsworth
© 2008 Thomson - Wadsworth
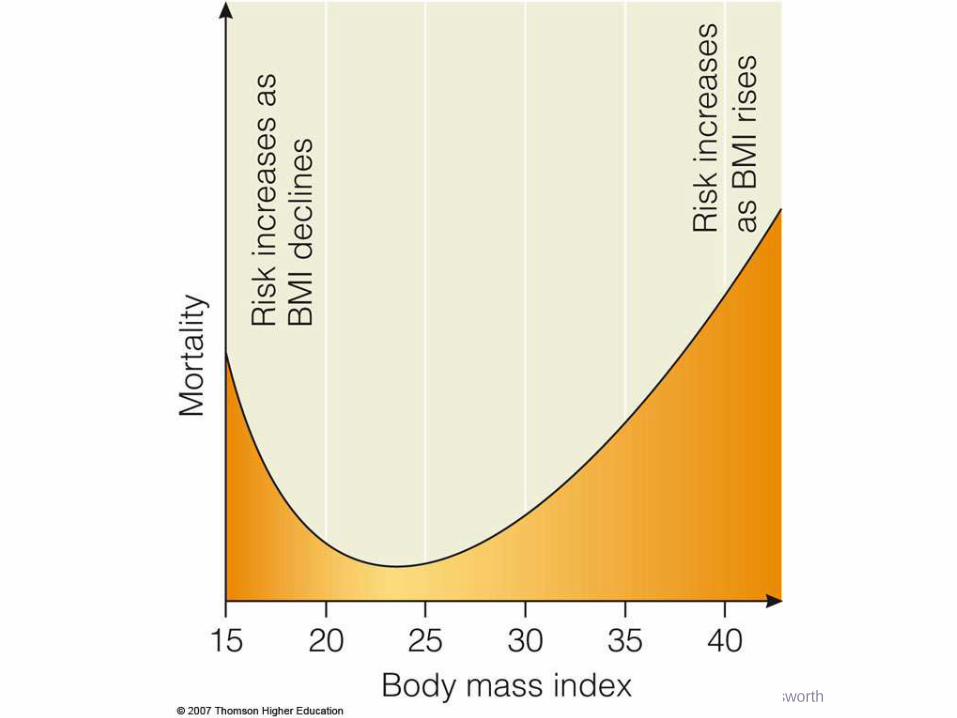
Body Weight, Body Composition,
and Health Defining Healthy Body Weight
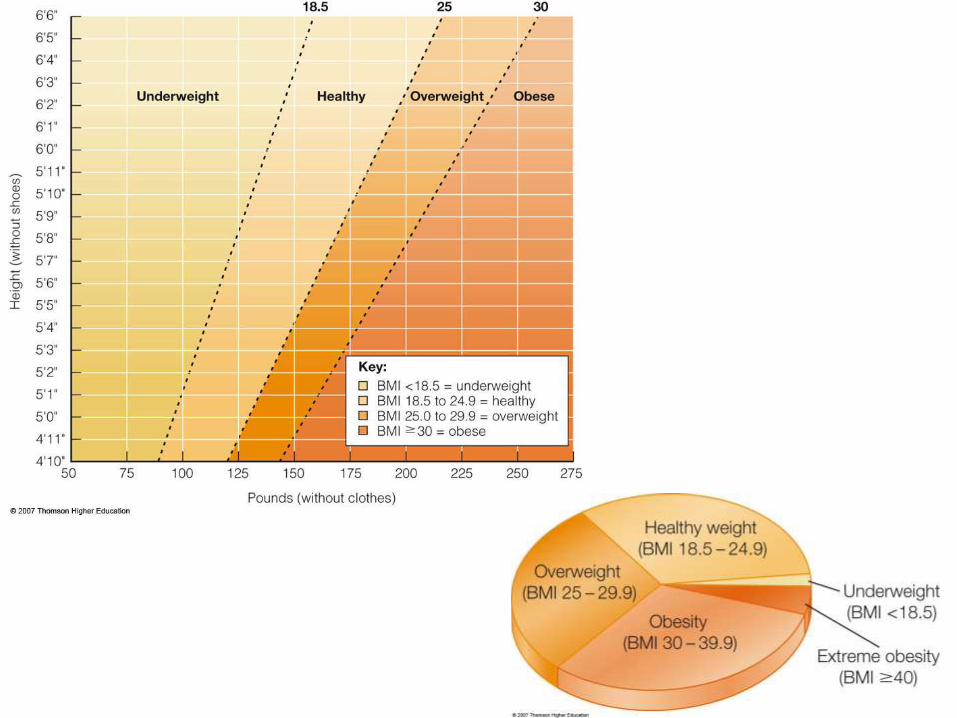
◦ Body mass index (BMI) measures relative
weight for height.
Underweight is a BMI below 18.5.
Overweight is a BMI above 25.
Obese is a BMI above 30.
© 2008 Thomson - Wadsworth
© 2008 Thomson - Wadsworth
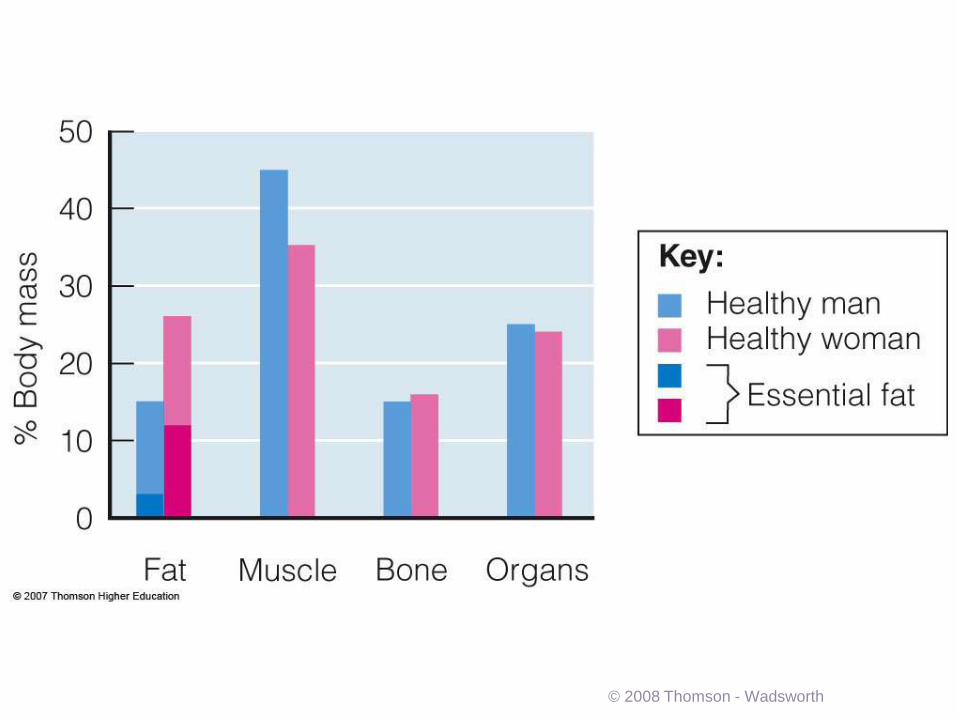
Body Weight, Body Composition,
and Health Body Fat and Its Distribution
◦ Some People Need Less Body Fat
Fat for fuel
Fat for insulation and protection
Fat to assist in nerve impulse transmissions
Fat to support normal hormone activity
◦ Some People Need More Body Fat
Thresholds differ among individuals
Thresholds differ for each function
© 2008 Thomson - Wadsworth
© 2008 Thomson - Wadsworth
Body Weight, Body Composition,
and Health Body Fat and Its Distribution
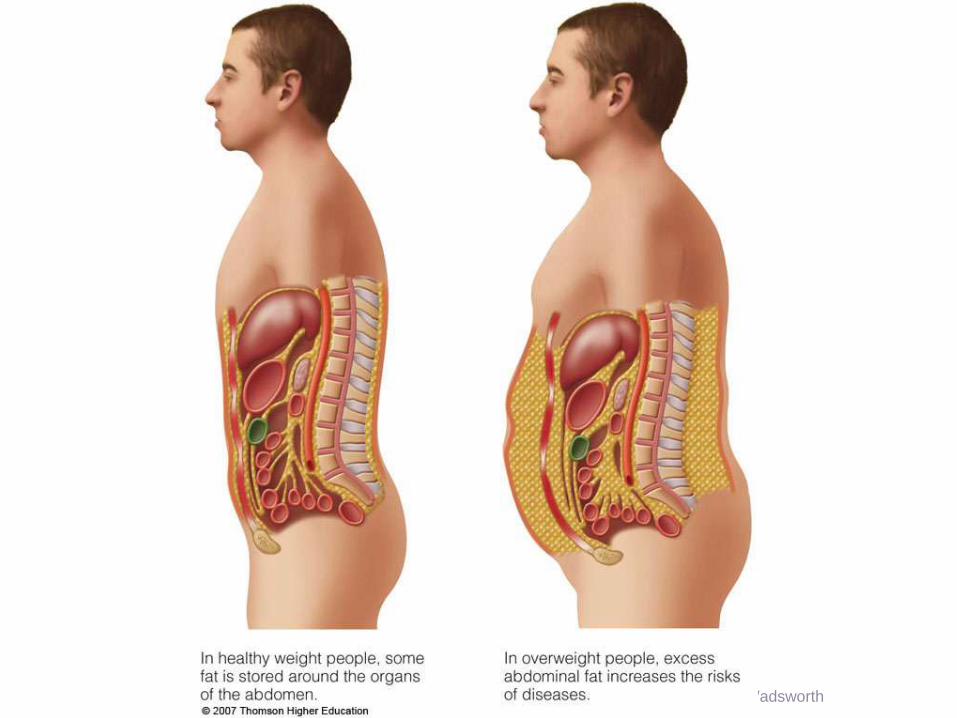
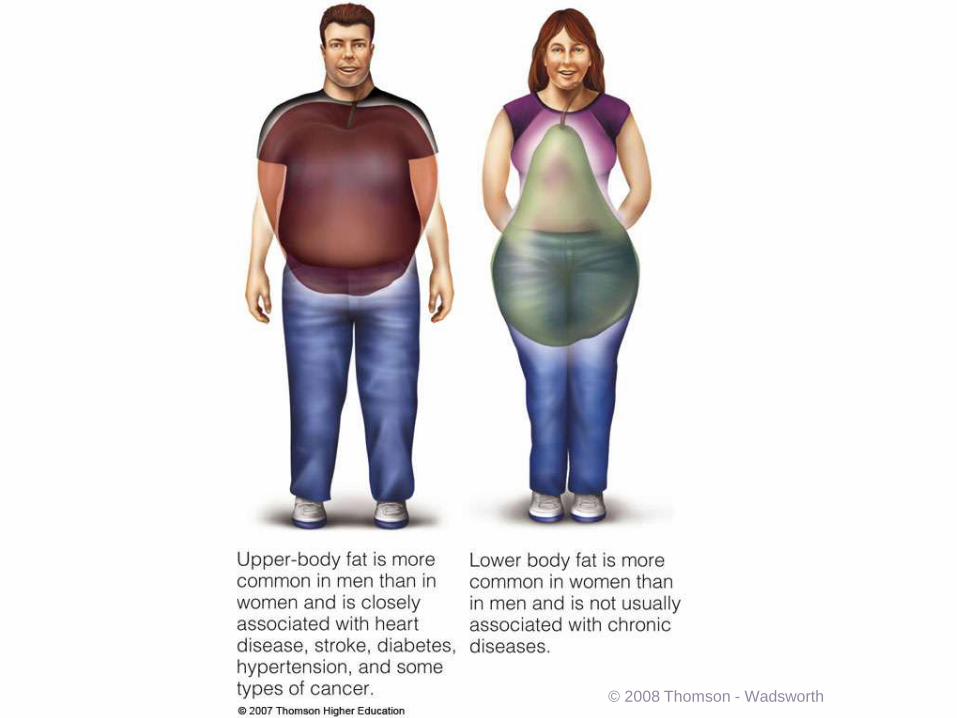
◦ Fat Distribution
Intra-abdominal fat around abdominal organs may
be critical.
Central obesity is excess fat around the trunk of
the body. It is also called abdominal fat or upper-
body fat.
Associated with increased risks
© 2008 Thomson - Wadsworth
© 2008 Thomson - Wadsworth
© 2008 Thomson - Wadsworth
Body Weight, Body Composition,
and Health Body Fat and Its Distribution
◦ Waist Circumference
Practical indicator of fat distribution and abdominal
fat
≥ 35’ is considered high risk for women.
≥ 40’ is considered high risk for men.
© 2008 Thomson - Wadsworth
Body Weight, Body Composition,
and Health Body Fat and Its Distribution
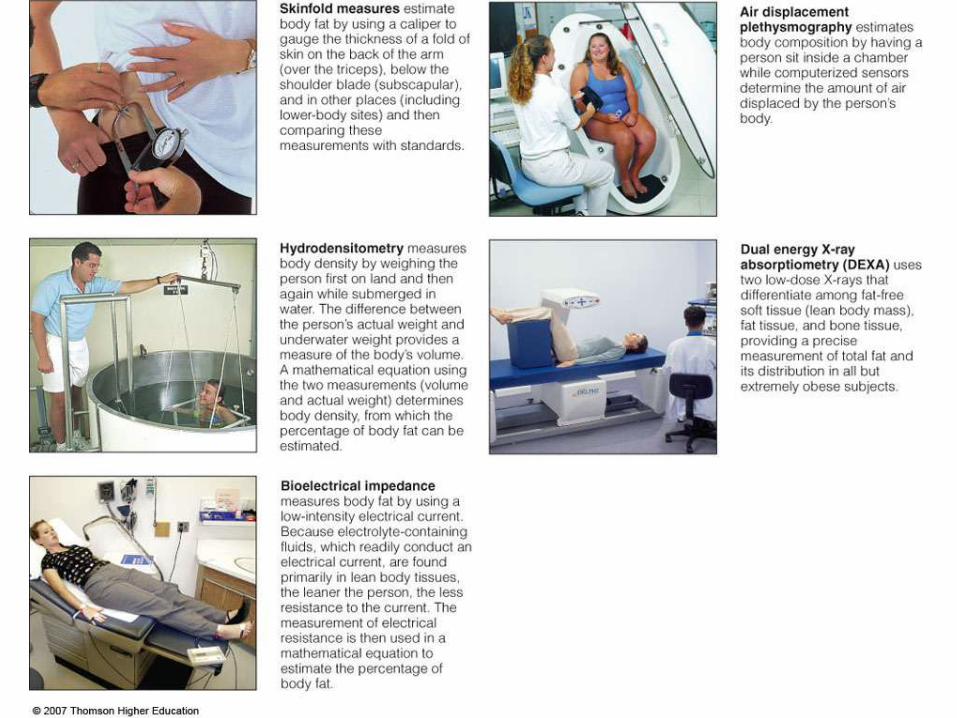
◦ Other Measures of Body Composition
Monitoring changes over time is important.
Fatfold measures
Hydrodensitometry
Bioelectrical impedance
Air displacement plethysmography
Dual energy X-ray absorptiometry (DEXA)
© 2008 Thomson - Wadsworth
© 2008 Thomson - Wadsworth
Body Weight, Body Composition,
and Health Health Risks Associated with Body Weight and
Body Fat
◦ An appropriate weight for an individual depends on
many factors which include body fat distribution,
health history and current state of health.
◦ Health Risks of Underweight
Cannot handle medical stresses
Menstrual irregularities and infertility
Pregnancy problems
Osteoporosis and bone fractures
© 2008 Thomson - Wadsworth
© 2008 Thomson - Wadsworth
Body Weight, Body Composition,
and Health
◦ Health Risks of Overweight
Diabetes
Hypertension
Cardiovascular disease
Sleep apnea
Osteoarthritis
Some cancers
Gallbladder disease
Kidney disease
Respiratory problems
Complications in
pregnancy and surgery
© 2008 Thomson - Wadsworth
Health Risks Associated with Body Weight and
Body Fat
Body Weight, Body Composition,
and Health Health Risks Associated with Body Weight
and Body Fat
◦ Cardiovascular disease and obesity have a
strong relationship.
◦ Diabetes and obesity have a strong
relationship.
Insulin resistance and obesity have a strong
relationship.
© 2008 Thomson - Wadsworth
Body Weight, Body Composition,
and Health Health Risks Associated with Body Weight
and Body Fat
◦ Inflammation and the Metabolic Syndrome
High blood pressure
High blood glucose
High blood triglycerides
Low HDL cholesterol
High waist circumference
© 2008 Thomson - Wadsworth
Body Weight, Body Composition,
and Health Health Risks Associated with Body Weight
and Body Fat
◦ Cancer risk increases with weight gain but the
relationship is unclear.
◦ Fit and Fat versus Sedentary and Slim
Healthy weight is important.
Cardiorespiratory fitness is important.
© 2008 Thomson - Wadsworth
Reference
Whitney E, Rolfes SR. 2011. Energy
balance & body composition, in
Understanding Nutrition 12th ed. Int’l
student ed. Thomson Learning Inc., USA,
pp. 240 – 260.
© 2008 Thomson - Wadsworth