Energy and entropy-based feature extraction for locating fault on transmission lines by using neural...
8
Energy and entropy-based feature extraction for locating fault on transmission lines by using neural network and wavelet packet decomposition Sami Ekici a, * , Selcuk Yildirim a , Mustafa Poyraz b a Department of Electrical Education, Firat University, 23119 Elazig, Turkey b Electrical and Electronics Engineering, Firat University, 23119 Elazig, Turkey Abstract The aim of this paper is to estimate the fault location on transmission lines quickly and accurately. The faulty current and voltage signals obtained from a simulation are decomposed by wavelet packet transform (WPT). The extracted features are applied to artificial neural network (ANN) for estimating fault location. As data sets increase in size, their analysis become more complicated and time con- suming. The energy and entropy criterion are applied to wavelet packet coefficients to decrease the size of feature vectors. The test results of ANN demonstrate that the applying of energy criterion to current signals after WPT is a very powerful and reliable method for reduc- ing data sets in size and hence estimating fault locations on transmission lines quickly and accurately. Ó 2007 Elsevier Ltd. All rights reserved. Keywords: Fault location; Wavelet packet; Neural network; Energy; Entropy 1. Introduction A fault occurs when two or more conductors come in contact with each other or ground Hawary (1995). In three phase systems, faults are classified as: • Single line-to-ground faults. • Line-to-line faults. • Double line-to-ground faults. • Three phase symmetrical faults. Ground faults have been considered as one of the main problems in power systems and account for more than 80% of all faults (Tungkanawanich, Kawasaki, Matsuura, & Kuno, 2000). These faults give rise to serious damage on power system equipments. A ground fault which occurs on transmission lines not only effects the equipments but also the power quality. So, it is necessary to determine the fault location on the line and clear the fault as soon as possible in order not to cause such damages. Flashover, lightning strikes, birds, wind, snow and ice-load lead to short circuits. Deformation of insulator materials also leads to short circuit faults. It is essential to detect the fault quickly and separate the faulty section of the transmission line. Locating ground faults quickly is very important for safety, economy and power quality. There are several methods such as using the variation of line impedance, measuring faulty current and voltage sig- nals and a lot of study has been continued with advances in computer technology. When fault location is estimated by using current and voltage wave information, methods based on traveling waves, faulty line impedance calcula- tions, neural network and wavelet transform (WT) are used widely (Hannienen & Lethonen, 2002). In traveling wave method, fault location is determined by using time differ- ence between incident and reflecting waves (A, 2004; Jian, Xiangxun, & Jianchao, 1998; Liang, Elangovan, & Dev- otta, 2000). This method has been restricted because of 0957-4174/$ - see front matter Ó 2007 Elsevier Ltd. All rights reserved. doi:10.1016/j.eswa.2007.05.011 * Corresponding author. Tel.: +90 424 2370000. E-mail address: sekici@firat.edu.tr (S. Ekici). www.elsevier.com/locate/eswa Available online at www.sciencedirect.com Expert Systems with Applications 34 (2008) 2937–2944 Expert Systems with Applications
Transcript of Energy and entropy-based feature extraction for locating fault on transmission lines by using neural...
Available online at www.sciencedirect.com
www.elsevier.com/locate/eswa
Expert Systems with Applications 34 (2008) 2937–2944
Expert Systemswith Applications
Energy and entropy-based feature extraction for locating faulton transmission lines by using neural network and wavelet
packet decomposition
Sami Ekici a,*, Selcuk Yildirim a, Mustafa Poyraz b
a Department of Electrical Education, Firat University, 23119 Elazig, Turkeyb Electrical and Electronics Engineering, Firat University, 23119 Elazig, Turkey
Abstract
The aim of this paper is to estimate the fault location on transmission lines quickly and accurately. The faulty current and voltagesignals obtained from a simulation are decomposed by wavelet packet transform (WPT). The extracted features are applied to artificialneural network (ANN) for estimating fault location. As data sets increase in size, their analysis become more complicated and time con-suming. The energy and entropy criterion are applied to wavelet packet coefficients to decrease the size of feature vectors. The test resultsof ANN demonstrate that the applying of energy criterion to current signals after WPT is a very powerful and reliable method for reduc-ing data sets in size and hence estimating fault locations on transmission lines quickly and accurately.� 2007 Elsevier Ltd. All rights reserved.
Keywords: Fault location; Wavelet packet; Neural network; Energy; Entropy
1. Introduction
A fault occurs when two or more conductors come incontact with each other or ground Hawary (1995). In threephase systems, faults are classified as:
• Single line-to-ground faults.• Line-to-line faults.• Double line-to-ground faults.• Three phase symmetrical faults.
Ground faults have been considered as one of the mainproblems in power systems and account for more than 80%of all faults (Tungkanawanich, Kawasaki, Matsuura, &Kuno, 2000). These faults give rise to serious damage onpower system equipments. A ground fault which occurson transmission lines not only effects the equipments but
0957-4174/$ - see front matter � 2007 Elsevier Ltd. All rights reserved.
doi:10.1016/j.eswa.2007.05.011
* Corresponding author. Tel.: +90 424 2370000.E-mail address: [email protected] (S. Ekici).
also the power quality. So, it is necessary to determinethe fault location on the line and clear the fault as soonas possible in order not to cause such damages. Flashover,lightning strikes, birds, wind, snow and ice-load lead toshort circuits. Deformation of insulator materials alsoleads to short circuit faults. It is essential to detect the faultquickly and separate the faulty section of the transmissionline. Locating ground faults quickly is very important forsafety, economy and power quality.
There are several methods such as using the variation ofline impedance, measuring faulty current and voltage sig-nals and a lot of study has been continued with advancesin computer technology. When fault location is estimatedby using current and voltage wave information, methodsbased on traveling waves, faulty line impedance calcula-tions, neural network and wavelet transform (WT) are usedwidely (Hannienen & Lethonen, 2002). In traveling wavemethod, fault location is determined by using time differ-ence between incident and reflecting waves (A, 2004; Jian,Xiangxun, & Jianchao, 1998; Liang, Elangovan, & Dev-otta, 2000). This method has been restricted because of
2938 S. Ekici et al. / Expert Systems with Applications 34 (2008) 2937–2944
the difficulty in analysis. Traveling waves require a veryhigh sampling rate as well. Calculating characteristic reac-tance is another method which is used for estimating faultdistance (Fikri & El-Sayed, 1988). This method calculatesreactance between relay point and fault represents an accu-rate estimation of fault distance when the fault resistance isvery small at line ends. One of the other techniquesemployed is Fourier transform which obtain line imped-ance in the frequency domain (Tawfik & Morcos, 1998).Recently the most used technique in estimation of fault dis-tance is artificial neural network (Lai et al., 2000; Yu &Song, 1998). Artificial neural network is trained with thesamples of faulty current and voltage signals. In spite ofFourier transform, recently WT has been used to obtainthe best information of current and voltage signals. Themain advantage of WT is that the band of analysis canbe finely adjusted and the results obtained from WT areshown on both the time and frequency domain.
In spite of the technological development and efforts inthe literatures for fault location studies, providing a morereliable and accurate fault location algorithm is still consid-ered a challenge. In this paper, a new extension of WTwhich is named wavelet packet transform (WPT) has beenused for feature extraction. WPT is capable of dividing thewhole time-frequency plane while the classical WT candetermine analysis only for low band frequency (Hong,Chiang, & Elangovan, 1999). The features obtained fromWPT will be used for training and testing of ANN. On
A3
A1
A2
D3
S
3
AA2
A1
DAA3 ADA3 DDA3
DA2
AAA
b
a
Fig. 1. Decomposition trees (a) wavelet tran
the other hand, training of ANN is very difficult as datasets increase in size. So, it is essential to reduce the sizeof data sets. For this purpose, wavelet energy and entropycriterion have been used. After the wavelet packet coeffi-cients are obtained for each faulty current and voltage sig-nals, the energy and entropy values have been calculatedfor each signal separately. In this way, the size of data setsdecreases in a remarkable ratio. In this paper, it is intendedto find out the best solution method which yields the bestresults for estimating transmission lines fault location byusing the above mentioned techniques.
2. Wavelet packet based feature extraction
2.1. Wavelet packet decomposition
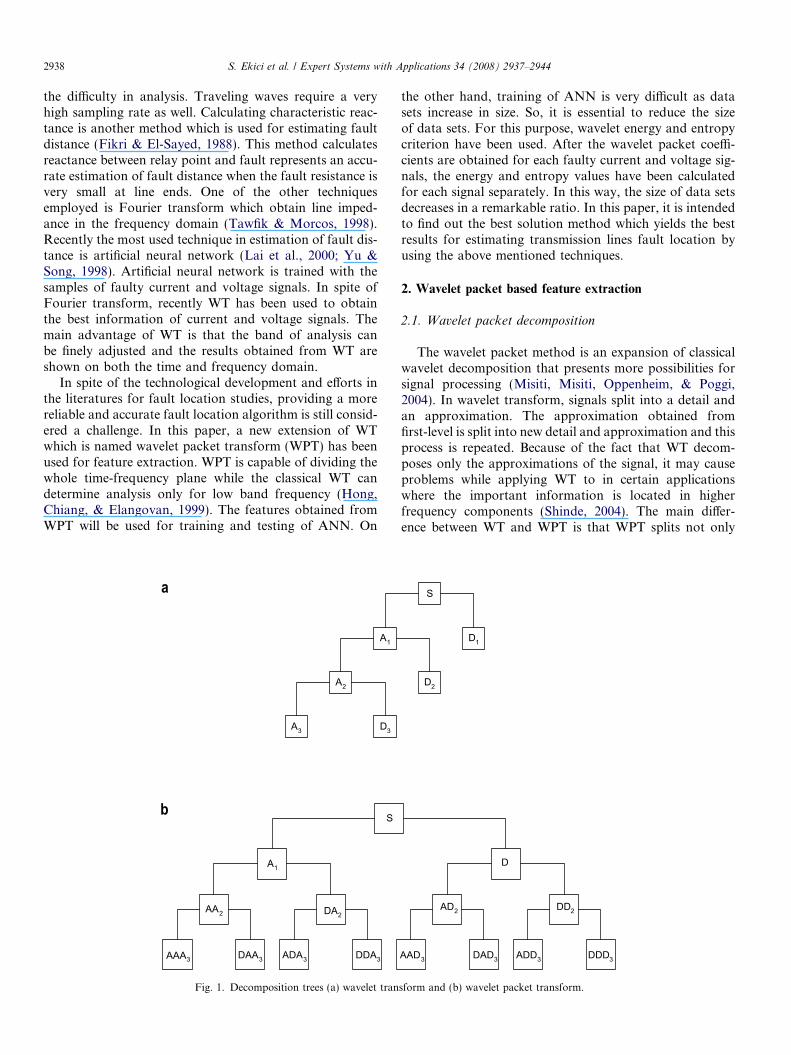
The wavelet packet method is an expansion of classicalwavelet decomposition that presents more possibilities forsignal processing (Misiti, Misiti, Oppenheim, & Poggi,2004). In wavelet transform, signals split into a detail andan approximation. The approximation obtained fromfirst-level is split into new detail and approximation and thisprocess is repeated. Because of the fact that WT decom-poses only the approximations of the signal, it may causeproblems while applying WT to in certain applicationswhere the important information is located in higherfrequency components (Shinde, 2004). The main differ-ence between WT and WPT is that WPT splits not only
D1
D2
S
AAD3 DAD3 ADD3 DDD3
AD2 DD2
D
sform and (b) wavelet packet transform.
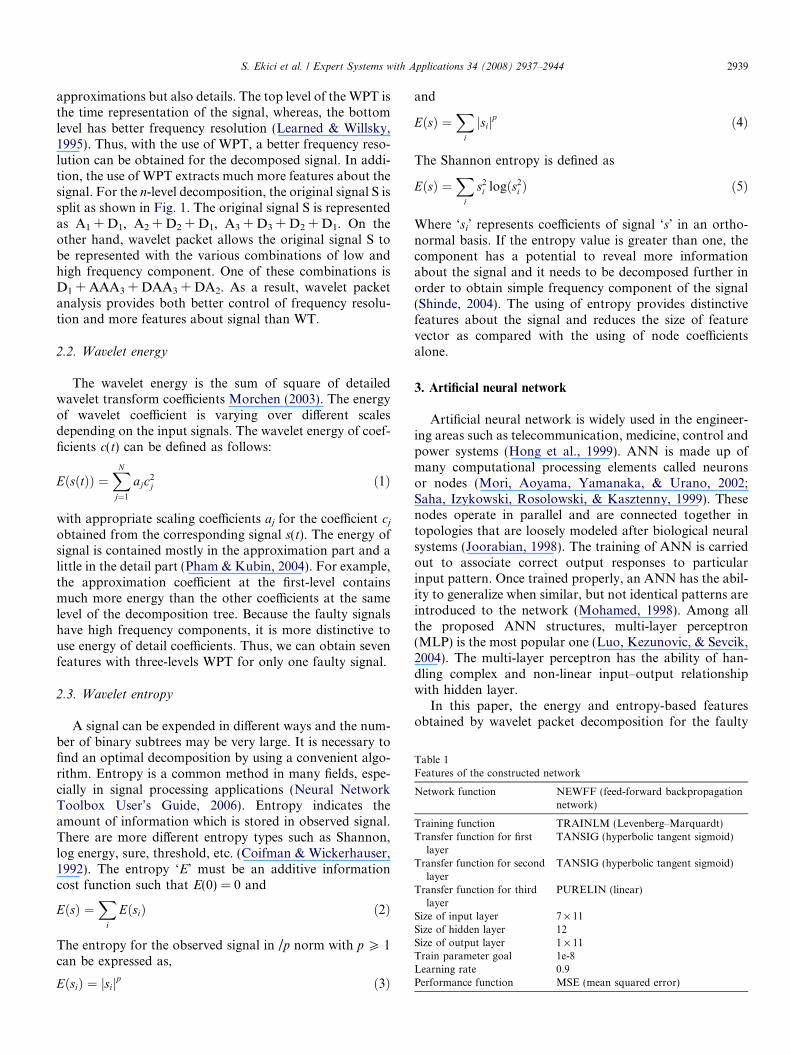
Table 1Features of the constructed network
Network function NEWFF (feed-forward backpropagationnetwork)
Training function TRAINLM (Levenberg–Marquardt)Transfer function for first
layerTANSIG (hyperbolic tangent sigmoid)
Transfer function for secondlayer
TANSIG (hyperbolic tangent sigmoid)
Transfer function for thirdlayer
PURELIN (linear)
Size of input layer 7 · 11Size of hidden layer 12Size of output layer 1 · 11Train parameter goal 1e-8Learning rate 0.9Performance function MSE (mean squared error)
S. Ekici et al. / Expert Systems with Applications 34 (2008) 2937–2944 2939
approximations but also details. The top level of the WPT isthe time representation of the signal, whereas, the bottomlevel has better frequency resolution (Learned & Willsky,1995). Thus, with the use of WPT, a better frequency reso-lution can be obtained for the decomposed signal. In addi-tion, the use of WPT extracts much more features about thesignal. For the n-level decomposition, the original signal S issplit as shown in Fig. 1. The original signal S is representedas A1 + D1, A2 + D2 + D1, A3 + D3 + D2 + D1. On theother hand, wavelet packet allows the original signal S tobe represented with the various combinations of low andhigh frequency component. One of these combinations isD1 + AAA3 + DAA3 + DA2. As a result, wavelet packetanalysis provides both better control of frequency resolu-tion and more features about signal than WT.
2.2. Wavelet energy
The wavelet energy is the sum of square of detailedwavelet transform coefficients Morchen (2003). The energyof wavelet coefficient is varying over different scalesdepending on the input signals. The wavelet energy of coef-ficients c(t) can be defined as follows:
EðsðtÞÞ ¼XN
j¼1
ajc2j ð1Þ
with appropriate scaling coefficients aj for the coefficient cj
obtained from the corresponding signal s(t). The energy ofsignal is contained mostly in the approximation part and alittle in the detail part (Pham & Kubin, 2004). For example,the approximation coefficient at the first-level containsmuch more energy than the other coefficients at the samelevel of the decomposition tree. Because the faulty signalshave high frequency components, it is more distinctive touse energy of detail coefficients. Thus, we can obtain sevenfeatures with three-levels WPT for only one faulty signal.
2.3. Wavelet entropy
A signal can be expended in different ways and the num-ber of binary subtrees may be very large. It is necessary tofind an optimal decomposition by using a convenient algo-rithm. Entropy is a common method in many fields, espe-cially in signal processing applications (Neural NetworkToolbox User’s Guide, 2006). Entropy indicates theamount of information which is stored in observed signal.There are more different entropy types such as Shannon,log energy, sure, threshold, etc. (Coifman & Wickerhauser,1992). The entropy ‘E’ must be an additive informationcost function such that E(0) = 0 and
EðsÞ ¼X
i
EðsiÞ ð2Þ
The entropy for the observed signal in /p norm with p P 1can be expressed as,
EðsiÞ ¼ jsijp ð3Þ
and
EðsÞ ¼X
i
jsijp ð4Þ
The Shannon entropy is defined as
EðsÞ ¼X
i
s2i logðs2
i Þ ð5Þ
Where ‘si’ represents coefficients of signal ‘s’ in an ortho-normal basis. If the entropy value is greater than one, thecomponent has a potential to reveal more informationabout the signal and it needs to be decomposed further inorder to obtain simple frequency component of the signal(Shinde, 2004). The using of entropy provides distinctivefeatures about the signal and reduces the size of featurevector as compared with the using of node coefficientsalone.
3. Artificial neural network
Artificial neural network is widely used in the engineer-ing areas such as telecommunication, medicine, control andpower systems (Hong et al., 1999). ANN is made up ofmany computational processing elements called neuronsor nodes (Mori, Aoyama, Yamanaka, & Urano, 2002;Saha, Izykowski, Rosolowski, & Kasztenny, 1999). Thesenodes operate in parallel and are connected together intopologies that are loosely modeled after biological neuralsystems (Joorabian, 1998). The training of ANN is carriedout to associate correct output responses to particularinput pattern. Once trained properly, an ANN has the abil-ity to generalize when similar, but not identical patterns areintroduced to the network (Mohamed, 1998). Among allthe proposed ANN structures, multi-layer perceptron(MLP) is the most popular one (Luo, Kezunovic, & Sevcik,2004). The multi-layer perceptron has the ability of han-dling complex and non-linear input–output relationshipwith hidden layer.
In this paper, the energy and entropy-based featuresobtained by wavelet packet decomposition for the faulty
InputPattern
OutputPattern
Produced
OutputPatternDesired
NeuralNetwork
LearningRule
Error
Modifying theweights connections
+-
Fig. 2. Training of neural network.
Estimation
Pre-processing
Simulation byATP
Energy&
Entropy
Wavelet PacketTransform
Artificial NeuralNetwork
Fig. 4. Block diagram of fault location technique.
x1
y y
2940 S. Ekici et al. / Expert Systems with Applications 34 (2008) 2937–2944
signals have been used as input for the neural network. Ifthe wavelet packet coefficients are used as inputs to theANN, it will result in rather large number of inputs posingdifficulty for training and testing of ANN in connec-tion with accuracy and speed. Therefore, the energy andentropy of wavelet packet coefficients have been used asinputs to the ANN instead, in order to overcome this prob-lem but retaining important features of the wavelet packetsignals.
MATLAB Neural Network Toolbox (Misiti et al., 2004)is used to build the network. Table 1 shows the features ofthe constructed network.
For designing WPT and ANN based fault locator, thefeatures which belong to faulty current and voltage signalswere used for training and testing of ANN after prepro-cessing. The number of neurons for the hidden layer is cho-sen to be 12 and hyperbolic tangent function was used asthe activation function of the hidden layer neurons. Satu-rated linear function was used for the output layer. Thetraining procedure of neural network has been shown inFig. 2.
4. The implementation of the fault location system
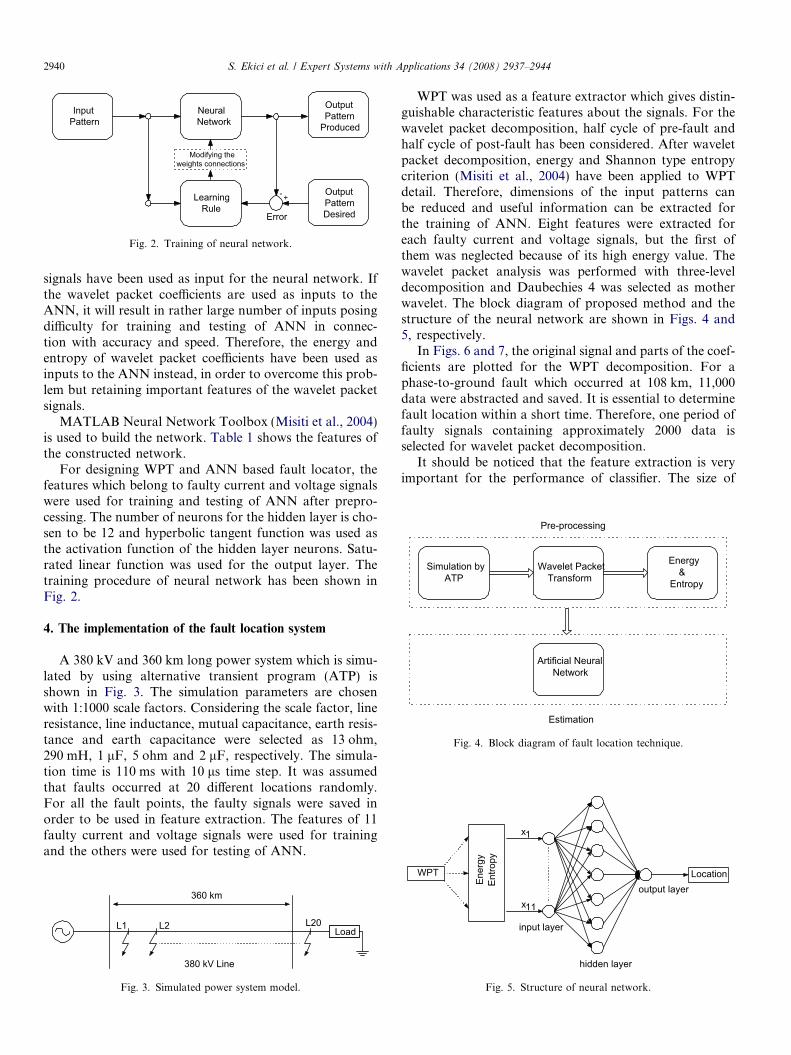
A 380 kV and 360 km long power system which is simu-lated by using alternative transient program (ATP) isshown in Fig. 3. The simulation parameters are chosenwith 1:1000 scale factors. Considering the scale factor, lineresistance, line inductance, mutual capacitance, earth resis-tance and earth capacitance were selected as 13 ohm,290 mH, 1 lF, 5 ohm and 2 lF, respectively. The simula-tion time is 110 ms with 10 ls time step. It was assumedthat faults occurred at 20 different locations randomly.For all the fault points, the faulty signals were saved inorder to be used in feature extraction. The features of 11faulty current and voltage signals were used for trainingand the others were used for testing of ANN.
L20Load
380 kV Line
360 km
L1 L2
Fig. 3. Simulated power system model.
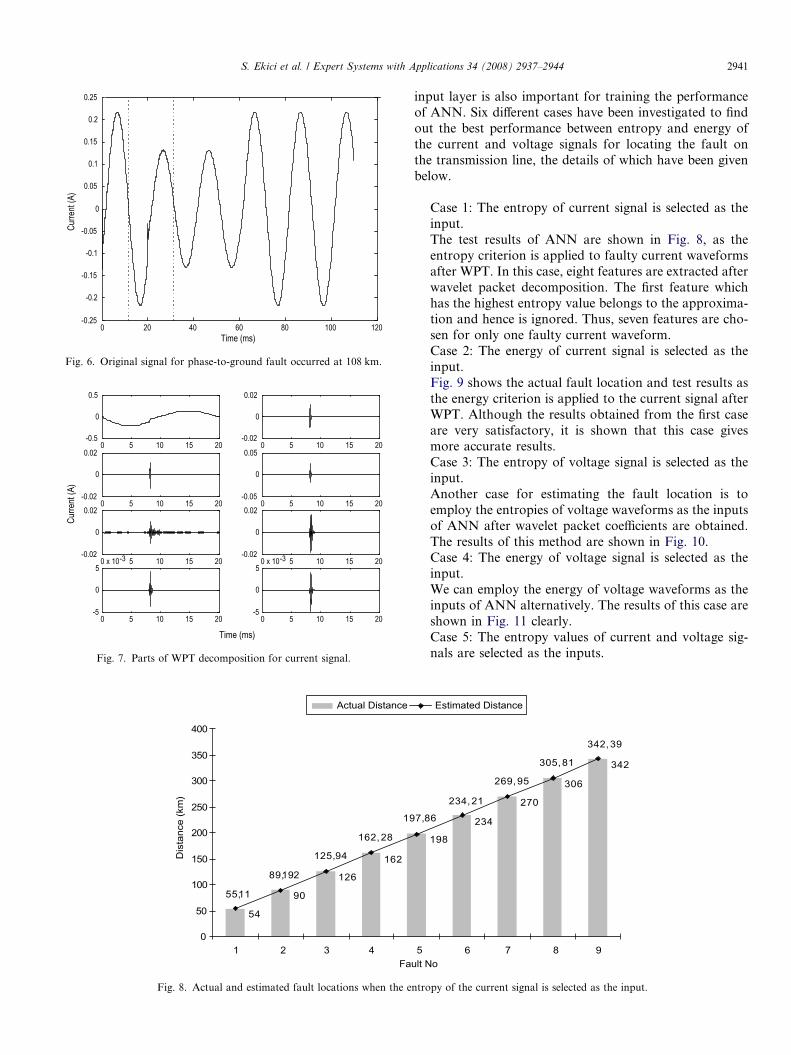
WPT was used as a feature extractor which gives distin-guishable characteristic features about the signals. For thewavelet packet decomposition, half cycle of pre-fault andhalf cycle of post-fault has been considered. After waveletpacket decomposition, energy and Shannon type entropycriterion (Misiti et al., 2004) have been applied to WPTdetail. Therefore, dimensions of the input patterns canbe reduced and useful information can be extracted forthe training of ANN. Eight features were extracted foreach faulty current and voltage signals, but the first ofthem was neglected because of its high energy value. Thewavelet packet analysis was performed with three-leveldecomposition and Daubechies 4 was selected as motherwavelet. The block diagram of proposed method and thestructure of the neural network are shown in Figs. 4 and5, respectively.
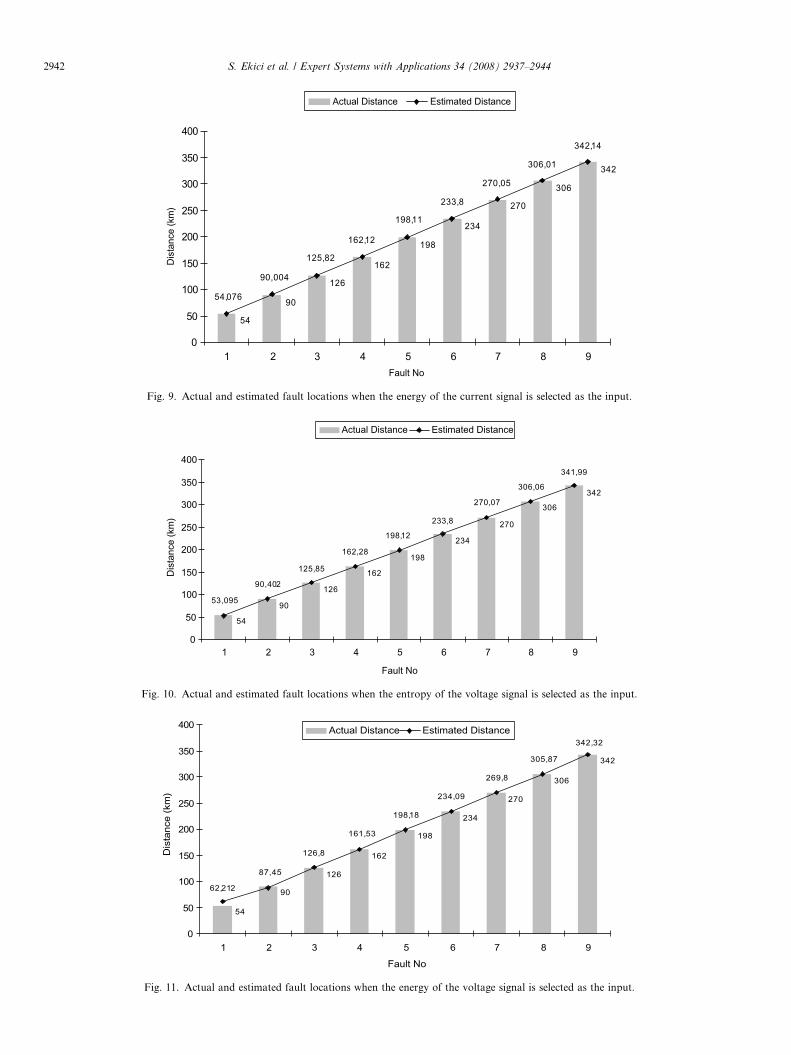
In Figs. 6 and 7, the original signal and parts of the coef-ficients are plotted for the WPT decomposition. For aphase-to-ground fault which occurred at 108 km, 11,000data were abstracted and saved. It is essential to determinefault location within a short time. Therefore, one period offaulty signals containing approximately 2000 data isselected for wavelet packet decomposition.
It should be noticed that the feature extraction is veryimportant for the performance of classifier. The size of
x11
Location
input layer
output layer
hidden layer
WPT
Ener
gEn
trop
Fig. 5. Structure of neural network.
0 20 40 60 80 100 120-0.25
-0.2
-0.15
-0.1
-0.05
0
0.05
0.1
0.15
0.2
0.25
Time (ms)
Curre
nt (A
)
Fig. 6. Original signal for phase-to-ground fault occurred at 108 km.
0 5 10 15 20-0.5
0
0.5
0 5 10 15 20-0.02
0
0.02
0 5 10 15 20-0.02
0
0.02
0 5 10 15 20-0.05
0
0.05
0 5 10 15 20-0.02
0
0.02
0 5 10 15 20-0.02
0
0.02
0 5 10 15 20-5
0
5x 10⁻³
0 5 10 15 20-5
0
5x 10⁻³
Curre
nt (A
)
Time (ms)
Fig. 7. Parts of WPT decomposition for current signal.
162
126
90
54
19
162,28
125,94
89,192
55,11
0
50
100
150
200
250
300
350
400
1 2 3 4Fa
Dis
tanc
e (k
m)
Actual Distance
Fig. 8. Actual and estimated fault locations when the e
S. Ekici et al. / Expert Systems with Applications 34 (2008) 2937–2944 2941
input layer is also important for training the performanceof ANN. Six different cases have been investigated to findout the best performance between entropy and energy ofthe current and voltage signals for locating the fault onthe transmission line, the details of which have been givenbelow.
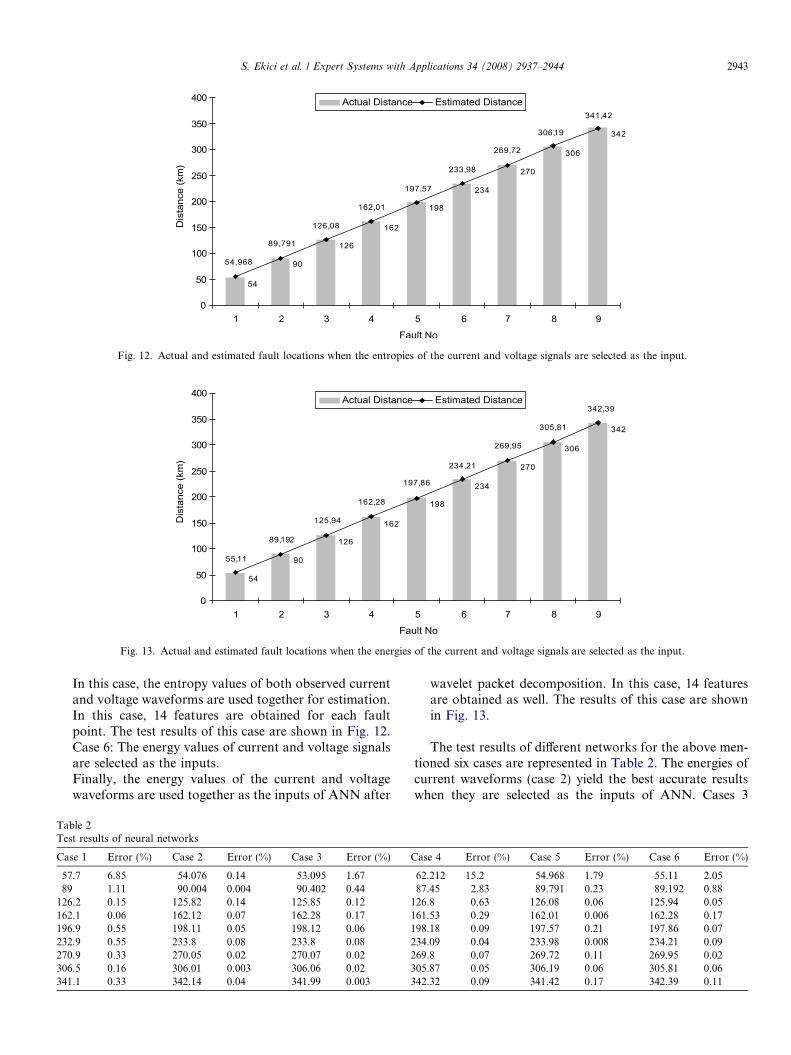
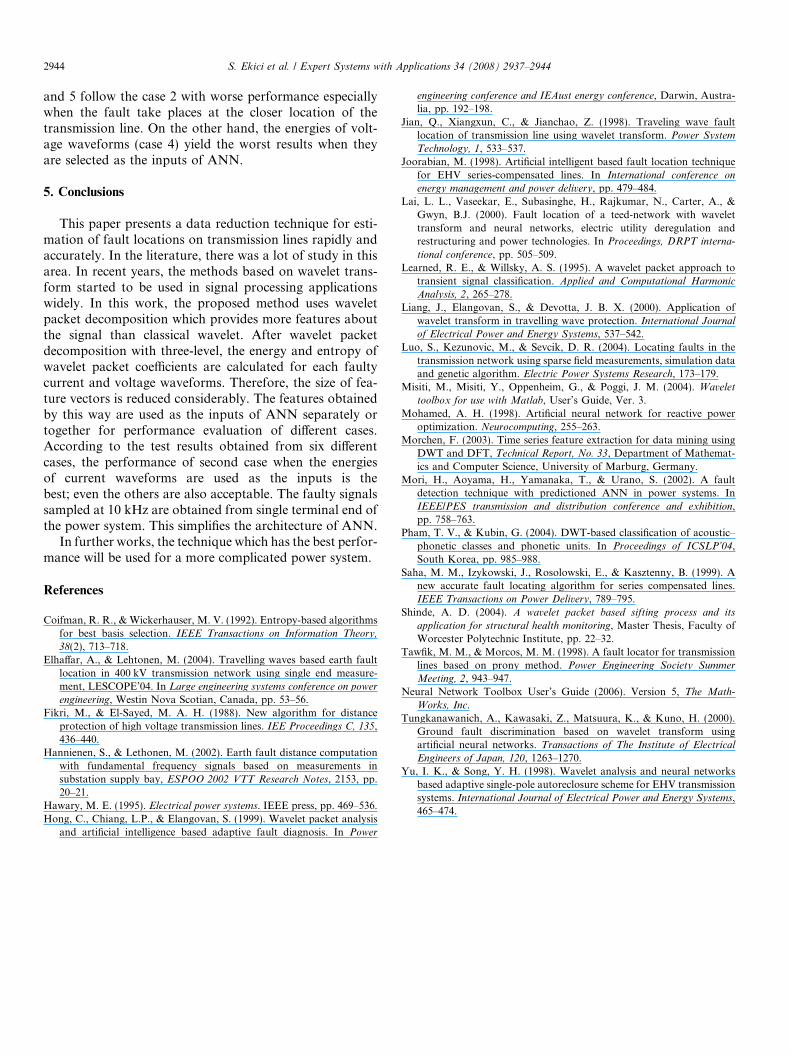
Case 1: The entropy of current signal is selected as theinput.The test results of ANN are shown in Fig. 8, as theentropy criterion is applied to faulty current waveformsafter WPT. In this case, eight features are extracted afterwavelet packet decomposition. The first feature whichhas the highest entropy value belongs to the approxima-tion and hence is ignored. Thus, seven features are cho-sen for only one faulty current waveform.Case 2: The energy of current signal is selected as theinput.Fig. 9 shows the actual fault location and test results asthe energy criterion is applied to the current signal afterWPT. Although the results obtained from the first caseare very satisfactory, it is shown that this case givesmore accurate results.Case 3: The entropy of voltage signal is selected as theinput.Another case for estimating the fault location is toemploy the entropies of voltage waveforms as the inputsof ANN after wavelet packet coefficients are obtained.The results of this method are shown in Fig. 10.Case 4: The energy of voltage signal is selected as theinput.We can employ the energy of voltage waveforms as theinputs of ANN alternatively. The results of this case areshown in Fig. 11 clearly.Case 5: The entropy values of current and voltage sig-nals are selected as the inputs.
342
306
270
234
198
342,39
305,81
269,95
234,21
7,86
5 6 7 8 9ult No
Estimated Distance
ntropy of the current signal is selected as the input.
342
306
270
234
198
162
126
90
54
54,076
90,004
125,82
162,12
198,11
233,8
270,05
306,01
342,14
0
50
100
150
200
250
300
350
400
1 2 3 4 5 6 7 8 9Fault No
Dis
tanc
e (k
m)
Actual Distance Estimated Distance
Fig. 9. Actual and estimated fault locations when the energy of the current signal is selected as the input.
342
306
270
234
198
162
126
90
54
125,85
270,07
341,99
233,8
198,12
162,28
90,402
53,095
306,06
0
50
100
150
200
250
300
350
400
1 2 3 4 5 6 7 8 9
Fault No
Dis
tanc
e (k
m)
Actual Distance Estimated Distance
Fig. 10. Actual and estimated fault locations when the entropy of the voltage signal is selected as the input.
342
306
270
234
198
162
126
90
54
342,32
62,212
87,45
126,8
161,53
198,18
234,09
269,8
305,87
0
50
100
150
200
250
300
350
400
1 2 3 4 5 6 7 8 9
Fault No
Dis
tanc
e (k
m)
Actual Distance Estimated Distance
Fig. 11. Actual and estimated fault locations when the energy of the voltage signal is selected as the input.
2942 S. Ekici et al. / Expert Systems with Applications 34 (2008) 2937–2944
342
306
270
234
198
162
126
90
54
341,42
306,19
269,72
233,98
197,57
162,01
126,08
54,968
89,791
0
50
100
150
200
250
300
350
400
1 2 3 4 5 6 7 8 9
Dis
tanc
e (k
m)
Actual Distance Estimated Distance
Fig. 12. Actual and estimated fault locations when the entropies of the current and voltage signals are selected as the input.
TabTes
Ca
5789
126162196232270306341
342
306
270
234
198
162
126
90
54
342,39
305,81
269,95
234,21
197,86
162,28
125,94
89,192
55,11
0
50
100
150
200
250
300
350
400
1 2 3 4 5 6 7 8 9
Dis
tanc
e (k
m)
Actual Distance Estimated Distance
Fig. 13. Actual and estimated fault locations when the energies of the current and voltage signals are selected as the input.
S. Ekici et al. / Expert Systems with Applications 34 (2008) 2937–2944 2943
In this case, the entropy values of both observed currentand voltage waveforms are used together for estimation.In this case, 14 features are obtained for each faultpoint. The test results of this case are shown in Fig. 12.Case 6: The energy values of current and voltage signalsare selected as the inputs.Finally, the energy values of the current and voltagewaveforms are used together as the inputs of ANN after
le 2t results of neural networks
se 1 Error (%) Case 2 Error (%) Case 3 Error (%) C
.7 6.85 54.076 0.14 53.095 1.671.11 90.004 0.004 90.402 0.44
.2 0.15 125.82 0.14 125.85 0.12 1
.1 0.06 162.12 0.07 162.28 0.17 1
.9 0.55 198.11 0.05 198.12 0.06 1
.9 0.55 233.8 0.08 233.8 0.08 2
.9 0.33 270.05 0.02 270.07 0.02 2
.5 0.16 306.01 0.003 306.06 0.02 3
.1 0.33 342.14 0.04 341.99 0.003 3
wavelet packet decomposition. In this case, 14 featuresare obtained as well. The results of this case are shownin Fig. 13.
The test results of different networks for the above men-tioned six cases are represented in Table 2. The energies ofcurrent waveforms (case 2) yield the best accurate resultswhen they are selected as the inputs of ANN. Cases 3
ase 4 Error (%) Case 5 Error (%) Case 6 Error (%)
62.212 15.2 54.968 1.79 55.11 2.0587.45 2.83 89.791 0.23 89.192 0.8826.8 0.63 126.08 0.06 125.94 0.0561.53 0.29 162.01 0.006 162.28 0.1798.18 0.09 197.57 0.21 197.86 0.0734.09 0.04 233.98 0.008 234.21 0.0969.8 0.07 269.72 0.11 269.95 0.0205.87 0.05 306.19 0.06 305.81 0.0642.32 0.09 341.42 0.17 342.39 0.11
2944 S. Ekici et al. / Expert Systems with Applications 34 (2008) 2937–2944
and 5 follow the case 2 with worse performance especiallywhen the fault take places at the closer location of thetransmission line. On the other hand, the energies of volt-age waveforms (case 4) yield the worst results when theyare selected as the inputs of ANN.
5. Conclusions
This paper presents a data reduction technique for esti-mation of fault locations on transmission lines rapidly andaccurately. In the literature, there was a lot of study in thisarea. In recent years, the methods based on wavelet trans-form started to be used in signal processing applicationswidely. In this work, the proposed method uses waveletpacket decomposition which provides more features aboutthe signal than classical wavelet. After wavelet packetdecomposition with three-level, the energy and entropy ofwavelet packet coefficients are calculated for each faultycurrent and voltage waveforms. Therefore, the size of fea-ture vectors is reduced considerably. The features obtainedby this way are used as the inputs of ANN separately ortogether for performance evaluation of different cases.According to the test results obtained from six differentcases, the performance of second case when the energiesof current waveforms are used as the inputs is thebest; even the others are also acceptable. The faulty signalssampled at 10 kHz are obtained from single terminal end ofthe power system. This simplifies the architecture of ANN.
In further works, the technique which has the best perfor-mance will be used for a more complicated power system.
References
Coifman, R. R., & Wickerhauser, M. V. (1992). Entropy-based algorithmsfor best basis selection. IEEE Transactions on Information Theory,
38(2), 713–718.Elhaffar, A., & Lehtonen, M. (2004). Travelling waves based earth fault
location in 400 kV transmission network using single end measure-ment, LESCOPE’04. In Large engineering systems conference on power
engineering, Westin Nova Scotian, Canada, pp. 53–56.Fikri, M., & El-Sayed, M. A. H. (1988). New algorithm for distance
protection of high voltage transmission lines. IEE Proceedings C, 135,436–440.
Hannienen, S., & Lethonen, M. (2002). Earth fault distance computationwith fundamental frequency signals based on measurements insubstation supply bay, ESPOO 2002 VTT Research Notes, 2153, pp.20–21.
Hawary, M. E. (1995). Electrical power systems. IEEE press, pp. 469–536.Hong, C., Chiang, L.P., & Elangovan, S. (1999). Wavelet packet analysis
and artificial intelligence based adaptive fault diagnosis. In Power
engineering conference and IEAust energy conference, Darwin, Austra-lia, pp. 192–198.
Jian, Q., Xiangxun, C., & Jianchao, Z. (1998). Traveling wave faultlocation of transmission line using wavelet transform. Power System
Technology, 1, 533–537.Joorabian, M. (1998). Artificial intelligent based fault location technique
for EHV series-compensated lines. In International conference on
energy management and power delivery, pp. 479–484.Lai, L. L., Vaseekar, E., Subasinghe, H., Rajkumar, N., Carter, A., &
Gwyn, B.J. (2000). Fault location of a teed-network with wavelettransform and neural networks, electric utility deregulation andrestructuring and power technologies. In Proceedings, DRPT interna-
tional conference, pp. 505–509.Learned, R. E., & Willsky, A. S. (1995). A wavelet packet approach to
transient signal classification. Applied and Computational Harmonic
Analysis, 2, 265–278.Liang, J., Elangovan, S., & Devotta, J. B. X. (2000). Application of
wavelet transform in travelling wave protection. International Journal
of Electrical Power and Energy Systems, 537–542.Luo, S., Kezunovic, M., & Sevcik, D. R. (2004). Locating faults in the
transmission network using sparse field measurements, simulation dataand genetic algorithm. Electric Power Systems Research, 173–179.
Misiti, M., Misiti, Y., Oppenheim, G., & Poggi, J. M. (2004). Wavelet
toolbox for use with Matlab, User’s Guide, Ver. 3.Mohamed, A. H. (1998). Artificial neural network for reactive power
optimization. Neurocomputing, 255–263.Morchen, F. (2003). Time series feature extraction for data mining using
DWT and DFT, Technical Report, No. 33, Department of Mathemat-ics and Computer Science, University of Marburg, Germany.
Mori, H., Aoyama, H., Yamanaka, T., & Urano, S. (2002). A faultdetection technique with predictioned ANN in power systems. InIEEE/PES transmission and distribution conference and exhibition,pp. 758–763.
Pham, T. V., & Kubin, G. (2004). DWT-based classification of acoustic–phonetic classes and phonetic units. In Proceedings of ICSLP’04,South Korea, pp. 985–988.
Saha, M. M., Izykowski, J., Rosolowski, E., & Kasztenny, B. (1999). Anew accurate fault locating algorithm for series compensated lines.IEEE Transactions on Power Delivery, 789–795.
Shinde, A. D. (2004). A wavelet packet based sifting process and its
application for structural health monitoring, Master Thesis, Faculty ofWorcester Polytechnic Institute, pp. 22–32.
Tawfik, M. M., & Morcos, M. M. (1998). A fault locator for transmissionlines based on prony method. Power Engineering Society Summer
Meeting, 2, 943–947.Neural Network Toolbox User’s Guide (2006). Version 5, The Math-
Works, Inc.Tungkanawanich, A., Kawasaki, Z., Matsuura, K., & Kuno, H. (2000).
Ground fault discrimination based on wavelet transform usingartificial neural networks. Transactions of The Institute of Electrical
Engineers of Japan, 120, 1263–1270.Yu, I. K., & Song, Y. H. (1998). Wavelet analysis and neural networks
based adaptive single-pole autoreclosure scheme for EHV transmissionsystems. International Journal of Electrical Power and Energy Systems,465–474.