Enclosure 2, Calculation No. ALION-CAL-SNC-7410-005 ...
128
Vogtle Electric Generating Plant, Units 1 & 2 Supporting Documents for Planned November 5, 2015 SNC NRC Public Meeting Regarding the Resolution of GS1-191 Enclosure 2 Head Loss Testing of a Prototypical Vogtle 1 and 2 Strainer Assembly
-
Upload
khangminh22 -
Category
Documents
-
view
0 -
download
0
Transcript of Enclosure 2, Calculation No. ALION-CAL-SNC-7410-005 ...
Vogtle Electric Generating Plant, Units 1 & 2Supporting Documents for Planned November 5, 2015 SNC NRC Public Meeting
Regarding the Resolution of GS1-191
Enclosure 2
Head Loss Testing of a Prototypical Vogtle 1 and 2 Strainer Assembly

A L I 0 N DESIGN CALCULATION AND ANALYSIS
Calculation N~o: ALI ON-CAL-SNC-7410-005 IRevisiOn: I Page I of 127
Calculation Title: Head Loss Testing of a Prototypical Vogtle I and 2 Strainer Assembly
Project No: 261-7410
Project Name: GSI- 191 Containment Sump Screen Test for Success Testing Phase II for Vogtle I and 2
Client: Southern Nuclear Operating Company
Document Purpose/Summary: '
The purpose of this document is to present and analyze the data collected during the execution of ALION-PLN-SNC-723 6-002, "Vogtle Chemical Effects Retest Plan" [Ref. I]. The test collected and recorded differential pressure,temperature, turbidity, and flow rate data while a specific quantity and mixture of debris was introduced into a testtank and allowed to build up on a strainer assembly prototypical of the strainers that are installed at Vogtle I and 2.Results of this testing will be used to support the performance assessment of the Vogtle I and 2 sump strainers.
The Vogtle Chemical Effects testing was designed and performed in accordance with WCAP- 16530-NP-A [Ref. 24]and March 2008 NRC Staff Review Guidance [Ref. 25]. This report was prepared 'Safety-related" in accordance withthe Alion Science and Technology Quality Assurance Program.
Total pages including Appendices and Attachments: 633
©20 15, Alion Science and Technology Corporation. All rights reserved. Any distribution or unauthorized use of thiscontent without the express written permission of Alion Science and Technology Corporation is strictly prohibited.
1. All software used in the preparation of this calculation meets the requirements in QAP 3.5, Use ofComputer Software and Error Reporting requirements. If applicable note Software Name/Version: LabVIEWsoftware. see page 15 of document: KaleidaGraph by Synergy Software see page 96 and Appendix 2 of
document.
2. If no software is used, the following statement "No software was used in the development of thiscalculation" appears in the Calculation: in Section:_________
'm o •-. •'[LI'" Jainisha ShahPreparer Signature: ~ J2015.08.1313:52:39 -06'00' Date: 0 8 /13 / 2.01.5
DESIGN VERIFICATION METHOD QA APPLICABILITY LEVEL
[] Design Review [] Safety Related
D] Alternative Calculation [] Non-Safety Related
[] Qualification Testing
Professional Engineer Approval (if required) NA
Signature!/Date
Prepared By: Jainisha R. Shah •J L ansaSa2015.08.13 13:53:35-06'00' 08/13/20d15
Printed/Typed Name Signature Date
Reviewed By: Janet Leavitt )-• L,-• :o 10o 08 13, 201
Printed/Typed Name Signature Date
Approved By: Andy Roudenko 2015.08.13131351 -07'00 081'/ 1Printed/Typed Name Signature Date
Form 3.4. IRevision 5Effective Date: I 1/14/14

A LIONSCIENlCE AND TECHNOLOGY
REVISION HISTORY LOG
Page 2 of 127
Document Number: ALION-CAL-SNC-74 10-005 Revision:I
Document Title: Head Loss Testing of a Prototypical Vogtle I and 2 Strainer Assembly
Instructions:Preparer to provide a brief description of each document revision, including rationale for the changeand, if applicable, identification of source documents used for the change.
REVISION DATE Description
0 12/31/09 Initial Issue
Incorporated correct manufacturer of Green Silicon Carbide inI08/04/15 Section 2.2.2.4, Non-Chemical. Test Debris and correct MSDS for
Silicon Carbide in Attachment F
___ t ____ ________________
Form 6.1.3Revision 3Effective Date: 9/12/14

~Head Loss Testing of a Prototypical Vogtle I and 2 Strainer Assembly
L iDocument No: ALION-CAL-SNC-7410-005 Revision: I Page: 3 of 127
TABLE OF CONTENTS
S Introduction ........................................................... i........................................ 92 Test Description ............................................................................................ I I
2.1I Test Facilities .................... ............................................................. 112.1.1 Test TankSetup ............................................................................ 112.1.2 Testing Equipment ......................................................................... 13
2.2 -Test Input Parameters....................................................................... 152.2.1 Strainer Array............................................................................... 152.2.2 Debris Types and Quantities.............................................................. 172.2.3 Test Flow Rates ............................................................................ 222.2.4 Test Water Source, Temperature and Turbidity........................................ 22
2.3 Test Matrix .................................................................................... 232.4 Test Procedures.............................................................................. 27
2.4.1 Debris Preparation Procedure............................................................ 272.4.2 Debris Introduction Procedure........................................................... 28
3 Test Results.................................... ............................................................... 303. I Overview of Head Loss Data ........................................................... ... 303.2 Data Reduction............................................................................... 303.3 Clean Strainer Head Loss.................................................................... 313.4 Test #tVOG- I -TB Results................................................................... 333.5 Test HVOG-2-FL-B Results................................................................. 493.6 Test #VOG-2-FL-B2 Results ............................................................... 633.7 Vortex Test Results ......................................................................... 774 Data Analysis................................................................................................. 784.1I Clean Screen Tests .......................................................................... 78
4.1I.1I Clean Screen Testing Discrepancies...................................................... 794.1I.2 Clean Screen Proceedings................................................................. 794.1 .3 Clean Screen Synopsis ..................................................................... 79
4.2 Test #kVOG-I -TB, Thin-Bed Test........................................................... 794.2.1 Test HVOG- I-TB Testing Discrepancies................................................ 804.2.2 Test #tVOG- I-TB Proceedings............................................................ 804.2.3 Test #VOG- I-TB Synopsis.............................................................. ... 82
4.3 Test #VOG-2-FL-B, Original Full Load Test.............................................. 844.3.1 Test #4VOG-2-FL-B Engineering Change Requests ..................................... 844.3.2 Test #VOG-2-FL-B Testing Discrepancies........................................ :...... 854.3.3 Test#HVOG-2-FL-B Proceedings.......................................................... 854.3.4 Test #VOG-2-FL-B Synopsis.............................................................. 88
4.4 Test #VOG-2-FL-B2, Full Load Retest .................................................... 894.4.1 Test HVOG-2-FL-B2 Engineering Change Requests.................................... 904.4.2 Test #VOG-2-FL-B2 Testing Discrepancies............................................. 904.4.3 Test #VOG-2-FL-B2 Proceedings ........................................................ 904.4.4 Test #VOG-2-FL-B2 Synopsis ............................................................ 93
4.5 Vortex Test ................................................................................... 94
Use or disclosure of the data contained herein is subject to the restricton on the Cover Page of this report.

~Head Loss Testing of a Prototypical Vogtle I and 2 Strainer Assembly
AL I 0 N~ Document No: ALION-CAL-SNC-7410-005 Revision: I Page: 4 of 127S~tENCE ADO0 TECNNQLOG
4.5. I Vortex Test Testing Discrepancies ...................................................... 954.5.2 Vortex Test Proceedings .................................................................. 954.5.3 Vortex Test Synopsis ...................................................................... 96
4.6 Test Termination Extrapolation............................................................. 964.6.1I Thin Bed Extrapolation..................................................................... 974.6.2 Full Load Extrapolation .................................................................... 984.6.3 Full Load Retest Extrapolation .......................................................... 100
4.7 Temperature and Velocity Correction.................. ................................. 1024.7.1 Flow Regime ............................ ................................................... 1]034.7.2 Temperature Correction................................................................. 1054.7.3 Head Loss Correction Summary........................................................ 120
4.8 Instrument Uncertainty .............................. ...................................... 1205 Conclusions ................................................................................................. I 122
5.1I Head Loss Testing .......................................................................... 1225.2 Vortex Testing...............................................................................1]23
5.3 Conservatisms .................. ...... .................................................... 1]256 References.................................................................................................... 126
APPENDIX I FLOW REGIME CALCULATIONS 2 PagesAPPENDIX 2 KALEIDAGRAPH VERSUS MICROSOFT EXCEL VERIFICATION 3 Pages
ATTACHMENT A TESTING PHOTOGRAPHS 97 PagesATTACHMENT B ALION-PLN-SNC-7236-002 43 PagesATTACH MENT C TESTING DISCREPANCI ES 8 PagesATTACHMENT D TEST LOGS 71 PagesATTACHMENT E INSTRUMENT SPECS AND CALIBRATION CERTS 59 Pages
ATTACHMENT F MSDS FOR NUKON, INTERAM, GROUND SILICA, ANDDIRT/DUST MIX 37 Pages
ATTACHMENT G CHEMICAL PREPARATION LOGS 181 PagesATTACHMENT H RAW DATA FILES I PageATTACHMENT I TECHNICAL DOCUMENT REVIEW CHECKLIST 4 Pages
LIST OF FIGURES
Figure I - I: Sample Test for Success Head Loss Curve ............................................................... 9Figure 2.I.1I- I: Isometric View of Strainer Test Module, Support Structure, and Simulated Plenum, Floor,Wall and Concrete Pad ....................................................................................................... 12Figure 2.I. 1-2: Photograph of Alion Test Tank with Vogtle Prototype Installed (Clean Screen)........... 12Figure 2. I. I-3: Vogtle Hydraulic Test Tank Diagram................................................................ 13Figure 2.2. I -I: Vogtle RHR Strainers (One strainer is omitted for detail)...................................... 16Figure 3.3- I: Clean Strainer Head Loss for Chemical Effects Prototype Testing.............................. 32Figure 3.4-I: Test #VOG- I-TB Differential Pressure and Velocity vs. Time - Day I ........................ 34Figure 3.4-2: Test #VOG- I-TB Differential Pressure and Velocity vs. Time - Day 2 ........................ 35Figure 3.4-3: Test #VOG- I-TB Differential Pressure and Velocity vs. Time - Day 3 ........................ 36Figure 3.4-4: Test #VOG- I-TB Differential Pressure and Velocity vs. Time - Day 4 ........................ 37
Use or disclosure of the data contained herein is subject to the restriction on the Cover Page of this report.
~Head Loss Testing of a Prototypical Vogtle I and 2 Strainer Assembly
I_ 0 N Document No: ALION-CAL-SNC-7410-005 Revision: I Page: 5 of 127
Figure 3.4-5: Test #VOG- I-TB Differential Pressure and Velocity vs. Time - Day 5S........................ 38Figure 3.4-6: Test #VOG- I -TB Differential Pressure and Temperature vs. Time - Day I.................. 39Figure 3.4-7: Test #VOG- I -TB Differential Pressure and Temperature vs. Time - Day 2 ................. 40Figure 3.4-8: Test #VOG- I -TB Differential Pressure and Temperature vs. Time - Day 3 ................. 41IFigure 3.4-9: Test #VOG- I -TB Differential Pressure and Temperature vs. Time - Day 4 ................. 42Figure 3.4-1I0: Test #VOG- I -TB Differential Pressure and Temperature vs. Time - Day 5 ............... 43Figure 3.4- I I: Test #VOG- I -TB Differential Pressure and Turbidity vs. Time - Day I ................. .... 44Figure 3.4-12: Test #VOG- I -TB Differential Pressure and Turbidity vs. Time - Day 2 ..................... 45Figure 3.4-13: Test #VOG- I -TB Differential Pressure and Turbidity vs. Time - Day 3 ..................... 46Figure 3.4-14: Test #VOG- I -TB Differential Pressure and Turbidity vs. Time - Day 4 ..................... 47Figure 3.4-15: Test #VOG- I -TB Differential Pressure and Turbidity vs. Time - Day 5 ..................... 48Figure 3.5- I: Test #VOG-2-FL-B Differential Pressure and Velocity vs. Time - Day I ...................... 5 IFigure 3.5-2: Test # VOG-2-FL-B Differential Pressure and Velocity vs. Time - Day 2 ..................... 52Figure 3.5-3: Test # VOG-2-FL-B Differential Pressure and Velocity vs. Time - Day 3 ..................... 53Figure 3.5-4: Test # VOG-2-FL-B Differential Pressure and Velocity vs. Time - Day 4 ..................... 54Figure 3.5-5: Test #VOG-2-FL-B Differential Pressure and Temperature vs. Time - Day I ............... 55Figure 3.5-6: Test # VOG-2-FL-B Differential Pressure and Temperature vs. Time - Day 2............... 56Figure 3.5-7: Test # VOG-2-FL-B Differential Pressure and Temperature vs. Time - Day 3............... 57Figure 3.5-8: Test # YOG-2-FL-B Differential Pressure and Temperature vs. Time - Day 4............... 58Figure 3.5-9: Test #VOG-2-FL-B Differential Pressure and Turbidity vs. Time - Day I..................... 59Figure 3.5-10: Test # VOG-2-FL-B Differential Pressure and Turbidity vs. Time - Day 2 .................. 60Figure 3.5- I I: Test # VOG-2-FL-B Differential Pressure and Turbidity vs. Time - Day 3 ............... ... 61IFigure 3.5-12: Test # VOG-2-FL-B Differential Pressure and Turbidity vs. Time - Day 4 .................. 62Figure 3.6-I: Test #VOG-2-FL-B2 Differential Pressure and Velocityvs. Time - Day I..................... 65Figure 3.6-2: Test #VOG-2-FL-B2 Differential Pressure and Velocity vs. Time - Day 2...... ............... 66Figure 3.6-3: Test #VOG-2-FL-B2 Differential Pressure and Velocity vs. Time - Day 3..................... 67Figure 3.6-4: Test #VOG-2-FL-B2 Differential Pressure and Velocity vs. Time - Day 4..................... 68Figure 3.6-5: Test #VOG-2-FL-B2 Differential Pressure and Temperature vs. Time - Day I .............. 69Figure 3.6-6: Test #VOG-2-FL-B2 Differential* Pressure and Temperature vs. Time - Day 2.............. 70Figure 3.6-7: Test #*VOG-2-FL-B2 Differential Pressure and Temperature vs. Time - Day 3............... 71Figure 3.6-8: Test #VOG-2-FL-B2 Differential Pressure and Temperature vs. Time - Day 4.............. 72Figure 3.6-9: Test #VOG-2-FL-B2 Differential Pressure and Turbidity vs. Time - Day I.... ............... 73Figure 3.6-1I0: Test #VOG-2-FL-B2 Differential Pressure and Turbidity vs. Time - Day 2 ................. 74Figure 3.6- I I: Test #VOG-2-FL-B2 Differential Pressure and Turbidity vs. Time - Day 3 ................. 75Figure 3.6-12: Test #VOG-2-FL-B2 Differential Pressure and Turbidity vs. Time - Day 4 ................. 76Figure 4.2-1: Test #VOG- I-TB Final Flow Sweep Values, With Debris......................................... 83Figure 4.3-I: Test #VOG-2-FL-B Final Flow Sweep Values, With Debris..................................... .. 89Figure 4.4- I: Test #VOG-2-FL-B2 Final Flow Sweep Values, With Debris ..................................... 94Figure 4.6- I: Test #VOG- I -TB Raw Data & Smooth Curve Fit (Step I) and Smoothed Data & FirstDerivative (Step 2) Plots................................................................................................... 97Figure 4.6-2: Test # VOG- I-TB Smoothed Data and Natural Log Curve Fit (Step 3) Plots................ 98Figure 4.6-3: VOG-2-FL-B Turbidity Extrapolation.................................................................. 98Figure 4.6-4: VOG-2-FL-B Head Loss Linear Extrapolation ....................................................... 99Figure 4.6-5: Test #VOG-2-FL-B Smoothed Data and Natural Log Curve Fit (Step 3) Plots............. 100Figure 4.6-6: Test #VOG-2-FL-B2 Raw Data & Smooth Curve Fit (Step I) and Smoothed Data & FirstDerivative (Step 2) Plots ............................................ .................................................... 100Figure 4.6-7: Test #VOG-2-FL-B2 Smoothed Data and Natural Log Curve Fit (Step 3) Plots............I01IFigure 4.7- I: Test #VOG- I -TB Chemical Full Debris Load Head Loss Vs Approach Velocity.............1I1I0
Use or disclosure of the data contained herein is subject to the restriction on the Cover Page of this report.

~Head Loss Testing of a Prototypical Vogtle I and 2 Strainer Assembly
AL I 0 N~ Document No: ALION-CAL-SNC-74l0-005 Revision: I Page: 6 of 127$CIENCE *t0 TtCHNOLOG
Figure 4.7-2: Test #VOG- I -TB Full Calcium Phosphate, Full Debris Load Head Loss vs ApproachVelocity ....................................................................................................................... 112Figure 4.7-3: Test #VOG- I -TB 30 Day Chemical Full Debris Load Head Loss vs Approach Velocity... 14Figure 4.7-4: Test #VOG-2-FL-B Chemical Full Debris Load Head Loss vs Approach Velocity .......... I 16Figure 4.7-5: Test #VOG-2-FL-B Full Calcium Phosphate Full Debris Load Head Loss vs ApproachVelocity ....................................................................................................................... I18Figure 4.7-6: Test #VOG-2-FL-B 30 Day Chemical Full Debris Load Head Loss vs Approach Velocity 120
LIST OF TABLES
Table 2.2.2- I: Plant Strainer Approach Velocities [Ref. 2].................... .................................... 17Table 2.2.2-2: Non-Chemical Debris Loads for Vogtle (before scaling) [Ref. 2]............................... 19Table 2.2.2-3: Chemical Debris Loads for Vogtle Testing (before scaling) ..................................... 20Table 2.2.2-4: NRC SER Dirt/Dust Grain Size Distribution [Ref. 26] ........................................... 21Table 2.2.2-5: Total Scaled non-Chemical Debris Loads for Vogtle Tests* .................................... 21Table 2.2.2-6: Total Scaled Chemical Debris Loads for Vogtle Tests............................................ 21Table 2.2.3-I: Test Flow Rates ........................................................................................... 22Table 2.3- I: Test Matrix for Test #VOG- I -TB................................................. •....................... 24Table 2.3-2: Test Matrix for Test #VOG-2-FL ....................................................................... 25Table 3.3-I: Clean Screen Data for Vogtle Tests .................................................................... 32Table 3.4-I: Test # VOG- I -TB Stabilized Head Loss Results........ ............................................. 49Table 3.5-I: Test #VOG-2-FL-B Stabilized Head Loss Results.................................................... 63Table 3.6-I: Test #VOG-2-FL-B2 Stabilized Head Loss Results .................................................. 77Table 4.2-I: Test # VOG- I-TB Final Flow Sweep Values .......................................................... 84Table 4.3k I: Test #VOG-2-FL-B Final Flow Sweep Values.......................................................... 89Table 4.4-I: Test #VOG-2-FL-B2 Final Flow Sweep Values ....................................................... 94Table 4.6- I: Test# VOG- I -TB, VQG-2-FL-B, & VOG-2-FL-B2 Extrapolated Head Loss Results (Step 4)
......................................................................................................................... 01JTable 4.7- I: Test #VOG- I-TB, VOG-2-FL-B, VOG-2-FL-B2 Maximum Stabilized Head Loss Results.. 104Table 4.7-2: Density and Viscosity Data at Analyzed Temperatures........... ................................ 106Table 4.7-3: Test #VOG- I-TB and VOG-2-FL-B Flow Sweep Adjusted Head Loss Values............... 108Table 4.7-4: Test #VOG- I-TB Chemical Head Loss Data @ 100 °F .......................................... 108Table 4.7-5: Test # VOG- I-TB Chemical Head Loss Data @ 140 0F .......................................... 108Table 4.7-6: Test # VOG- I -TB Chemical Head Loss Data @ 180 °F ......................................... 109Table 4.7-7: Test # VOG- I-TB Chemical Head Loss Data @ 212 °F ......................................... 109Table 4.7-8: *Test #VOG- I-TB Full Calcium Phosphate Head Loss Data @ 100 0F ........................ 110Table 4.7-9: Test # VOG- I-TB Full Calcium Phosphate Head Loss Data @ 140 0F........................I IITable 4.7-1I0: Test # VOG- I-TB Full Calcium Phosphate Head Loss Data @ 180 0F......................I IITable 4.7-IlI: Test # VOG- I-TB Full Calcium Phosphate Head Loss Data @ 212 0F......................I IITable 4.7-12: Test #VOG-lI-TB 30 Day Chemical Head Loss Data @ 100 °F...............................112Table 4.7-13: Test #VOG-lI-TB 30 Day Chemical Head Loss Data @ 140 °F ............................ 1....3Table 4.7-14: Test #VOG-lI-TB 30 Day Chemical Head Loss Data @ 180 °F...............................113Table 4.7-I5: Test #VOG-lI-TB 30 Day Chemical Head Loss Data @ 212 0F...............................I 3Table 4.7-16: Test #VOG-2-FL-B Chemical Head Loss Data @ 100 0F.......................................114Table 4.7-17: Test #VOG-2-FL-B Chemical Head Loss Data @ 140 °F.......................................115Table 4.7-18: Test #VOG-2-FL-B Chemical Head Loss Data @ 180 °F......... .............................. 115Table 4.7-19: Test #VOG-2-FL-B Chemical Head Loss Data @ 212 0F.......................................115
Use or disclosure of the data contained herein is subject to the restriction on the Cover Page of this report.
~Head Loss Testing of a Prototypical Vogtle I and 2 Strainer Assembly
LI 0 N~ Document No: ALION-CAL-SNC-7410-005 Revision: I Page: 7.of 127Sl• ANO TeCIInOLOG
Table 4.7-20: Test #VOG-2-FL-B Full Calcium Phosphate Head Loss Data @ 100 0F.....................116Table 4.7-21: Test #VOG-2-FL-B Full Calcium Phosphate Head Loss Data @ 140 0F.....................I 17Table 4.7-22: Test #VOG-2-FL-B Full Calcium Phosphate Head Loss Data @ 180 0F.....................117Table 4.7-23: Test #VOG-2-FL-B Full Calcium Phosphate Head Loss Data @ 212 0F.....................117Table 4.7-24: Test #VOG-2-FL-B 30 Day Chemical Head Loss Data @ 100 0F ............................ 118Table 4.7-25: Test #VOG-2-FL-B 30 Day Chemical Head Loss Data @ 140 0F.............................119Table 4.7-26: Test #VOG-2-FL-B 30 Day Chemical Head Loss Data @ 180 0F.............................119Table 4.7-27: Test #VOG-2-FL-B 30 Day Chemical Head Loss Data @ 212 0F ............................ 119Table 5.I- I: Bounding Head Loss Values during Testing........................................................... 123Table 5.2- I: Vortex Test Summary.................................................................................... 124
Use or disclosure of the data contained herein is subject to the restriction on the Cover Page af this report.

~Head Loss Testing of a Prototypical Vogtle I and 2 Strainer Assembly
LIO N Document No: ALION-CAL-SNC-74 10-005 Revision: I Page: 8 of 127
EXECUTIVE SUMMARY
A series of tests was performed in the Alion Test Tank to investigate the debris and chemical debris
load dependence of head loss effects associated with the predicted worst-case LOCA at the Vogtle I &
2 nuclear plants. The purpose of these tests was to measure the head loss response of the worst case
thin bed debris load and the worst case full load, both cases with chemical precipitates added after the
formation of the non-chemical debris bed.
A vortex test, one thin bed test, and two full load tests were conducted. The vortex test resulted in no
vortex formation although pump cavitation was noticeable at very low submergence levels. The thin
bed test resulted in a stabilized fiber- and particulate-only head loss of 0.625 ft-water, a stabilized
calcium phosphate head loss of 1.65 ft-water, and an all chemicals head loss of 2.60 ft-water at test
conditions. The bounding full load test resulted in a stabilized fiber- and particulate-only head loss of
5.46 ft-water, a stabilized calcium phosphate head loss of 6.57 ft-water, and an all chemicals head loss of
I11.81 ft-water at test conditions.
All head loss tests conducted flow sweeps upon final head loss stabilization; this data was used to
correct the head losses to various temperatures and velocities. Additionally, 30-day extrapolations
were conducted on the thin bed test results and the bounding full load test results. The thin bed test
resulted in a 30-day extrapolated head loss of 3. 15 ft-water at test conditions. The bounding full load
test resulted in a 30-day extrapolated head loss of 15.70 ft-water at test conditions.
The results of the testing can be applied to each test case (thin bed or full load) regarding the following
conditions: at sump temperatures above 140 0F, the calcium phosphate debris head loss can be applied;
at sump temperatures at and below 140 °F, the 30-day extrapolation results can be applied.
Use or disclosure of the data contained herein is subject to the restriction on the Cover Page of this report.
I INTRODUCTION
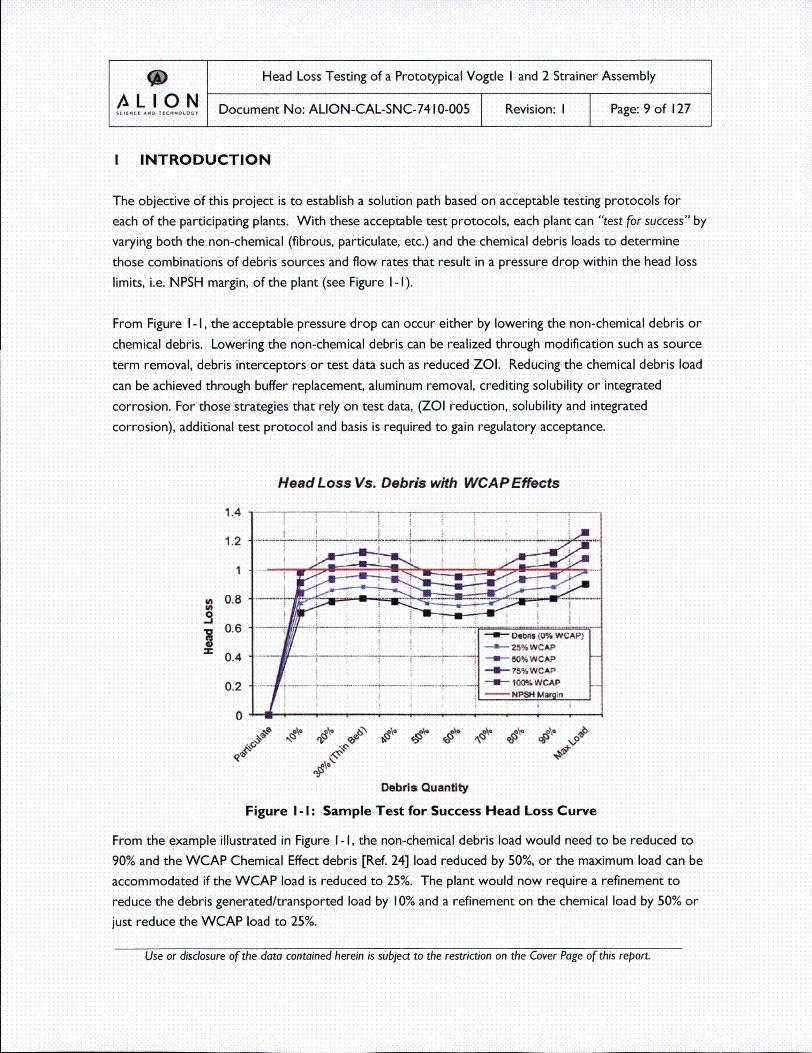
The objective of this project is to establish a solution path based on acceptable testing protocols foreach of the participating plants. With these acceptable test protocols, each plant can "'test for success" by
varying both the non-chemical (fibrous, particulate, etc.) and the chemical debris loads to determine
those combinations of debris sources and flow rates that result in a pressure drop within the head loss
limits, i.e. NPSH margin, of the plant (see Figure I -I).
From Figure I - I, the acceptable pressure drop can occur either by lowering the non-chemical debris or
chemical debris. Lowering the non-chemical debris can be realized through modification such as source
term removal, debris interceptors or test data such as reduced ZOI. Reducing the chemical debris load
can be achieved through buffer replacement, aluminum removal, crediting solubility or integrated
corrosion. For those strategies that rely on test data, (ZOI reduction, solubility and integrated
corrosion), additional test protocol and basis is required to gain regulatory acceptance.
Head Loss Vs. Debris with WCAP Effects
1.4
0.2 •I
0
= 0.8 _ -4_
"• 0Debris Quantit
FiueI- Sml Tes fo Success Head LosCurv
Frmteexml0llsrtd. nFgreI4I thnnchmia deri loadwoudnecoberdcdt
jutiedceteuCA rla to 25%. l Ts o ucesHa Ls uv
Use or disclosure of the data contained herein is subject to the restriction on the Cover Page of this report.

9 Head Loss Testing of a Prototypical Vogtle I and 2 Strainer Assembly
LION Document No: ALION-CAL-SNC-74 10-005 Revision: I Page: 10 of 127
Non-chemical debris will be added incrementally from thin-bed to maximum loading; WCAP chemical
precipitate surrogates will also be added to each test incrementally after the completion of non-chemical
debris addition. If the maximum head loss for the full range of non-chemical and chemical debris loads is
less than the available NPSH margin, or equivalent, then testing is complete and no refinements are
necessary.
Ultimately the selection of reduction strategies is based on achieving the desired outcome and
regulatory acceptance.
The NUREG/CR-6224 correlation [Ref. 5] is the primary analytical tool that is used to predict head loss
across a debris bed with known constituents. It is formulated in terms of physical debris properties
(density, surface-to-volume ratio, porosity, and compressibility) and physical fluid properties (density andl
viscosity). Since it is formulated in this manner, the NUREG/CR-6224 correlation can be verified
experimentally.
The purpose of the Vogtle testing was to collect and record differential pressure (DP), temperature, and
flow rate data while building a bed of a specific quantity and mixture of debris across a strainer assembly
representative of a portion of the larger assemblies that are installed at Vogtle. The specific debris
mixture used includes fibrous insulation debris, particulate debris, and chemical precipitates.
The objective of the tests was to determine the head loss associated with the addition of chemical
precipitates to a plant specific debris bed. This head loss will be validated over the range of application
for the bounding scenario (e.g., approach velocity and debris load).
The testing was designed and performed in accordance with WCAP-1I6530-NP-A [Ref. 24] and March
2008 NRC Staff Review Guidance [Ref. 25].
General Electric (GE) has designed a series of strainer modules for Vogtle. The layout and size of the
replacement screens is described in Reference 20. As a part of the qualification process, Alion will
validate the hydraulic performance of the replacement screens by performing chemical effects debris
head loss testing on a section (prototype) of the entire assembly.
The prototype strainer assembly consisted of seven stacked disks that are duplicates of the disks in the
plant strainers, which allows debris and flow to be scaled based on the ratio of numbers of disks. The
top surface of the top disk and the bottom surface of the bottom disk are solid steel, so that the
prototype contains six gaps total. The test facilities and the prototype test strainers will be discussed in
detail in Section 2.
Use or disclosure of the data contained herein is subject to the restricton on the Cover Page of this report.
9 Head Loss Testing of a Prototypical Vogtle I and 2 Strainer Assembly
L.o ,c.ooON Document No: ALION-CAL-SNC-7410-005 Revision: I Page: I I ofl127
2 TEST DESCRIPTION
A total of four tests were performed for the Vogtle strainer assembly testing in accordance with the
Vogtle test plan [Ref. I]. The test plan is also included in Attachment B. These tests were conducted
starting on March 30, 2009 and ending on April 20, 2009.
2.1I Test Facilities
The Vogtle chemical effects testing was performed at the Alion test lab in Warrenville, IL. The
prototype array was placed in a large test tank approximately 6 ft tall, 6 ft wide, and 10 ft long. The
array was located in one of the corners of the tank. Flow was routed from the tank sparger inlet,through the strainer/plenum assembly, and out through the side flow outlet channel (side suction).
2.I.1I Test Tank Setup
A computer aided drafting (CAD) representation of the Alion hydraulic test tank is shown in Figure
2.I.1 I- I (note that this figure is not to scale). Figure 2.I. 1-2 depicts a photograph of the Alion test tank
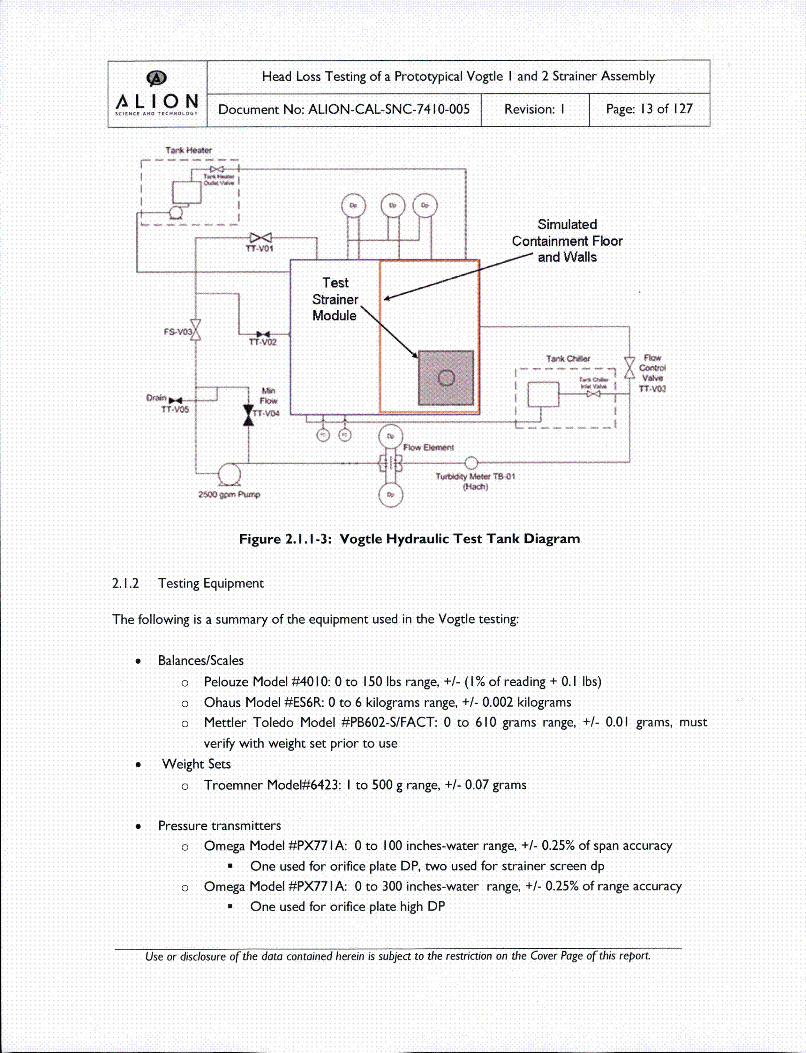
with the Vogtle prototype assembly installed. Figure 2.I. I-3 provides a general arrangement drawing of
the test tank and the associated equipment used in the tests. The flow rate through the strainer array
was controlled by throttling of the control valve on the return line to the tank (valve TT-V03 in Figure
2.I. 1-3) or through the adjustment of a variable frequency drive (VFD) on the pump motor.
All of the tests were performed with a plywood support structure, simulated plenum, plywood floor,
and plywood back wall, as shown in Figure 2.I. 1-2. This setup was utilized to simulate the actual Vogtle
strainers installed in containment. See Section 2.2. I.
Use or disclosure of the data contained herein is subject to the restriction on the Cover Page of this report.

9j Head Loss Testing of a Prototypical Vogtle I and 2 Strainer Assembly
k I 0 N Document No: ALION-CAL-SNC-7410-005 Revision: I Page: 12 ofl127
Figure 2.I.1I - I : Isometric View of Strainer Test Module, Support Structure, and SimulatedPlenum, Floor, Wall and Concrete Pad
Figure 2.I.I-2: Photograph of Alion Test Tank with Vogtle Prototype Installed (Clean Screen)
Use or disclosure of the data contained herein is subject to the restricton on the Cover Page of this report.
9 Head Loss Testing of a Prototypical Vogtle I and 2 Strainer Assembly
k O N Document No: ALION-CAL-SNC-74 10-005 Revision: I Page: 13 of 127
Flow
avo'tT-•
Figure 2.1 I.I-3: Vogtle Hydraulic Test Tank Diagram
2.1.2 Testing Equipment
The following is a summary of the equipment used in the Vogtle testing:
* Balances/Scales
o Pelouze Model #4010: 0 to 150 lbs range, +1- (I % of reading + 0.1I Ibs)
o Ohaus Model #ES6R: 0 to 6 kilograms range, +/- 0.002 kilograms
o Mettler Toledo Model #PB602-S/FACT: 0 to 610 grams range, +/- 0.01 grams, must
verify with weight set prior to use
* Weight Sets
o Troemner Model#6423: I to 500 g range, +/- 0.07 grams
* Pressure transmitters
o Omega Model #PX77 I A: 0 to 100 inches-water range, +/- 0.25% of span accuracy* One used for orifice plate DP, two used for strainer screen dp
o Omega Model #PX77 IA: 0 to 300 inches-water range, +/- 0.25% of range accuracy
* One used for orifice plate high DP
Use or disclosure of the data contained herein is subject to the restriction on the Cover Page of this report.

* Head Loss Testing of a Prototypical Vogtle I and 2 Strainer Assembly
A0,0,%LIQl€o oON Document No: ALION-CAL-SNC-74 10-005 Revision: I Page: 14 of 127
o Omega Model #PX771IA: 0 to 25 psi range, +1- 0.25% of range accuracy
•One used for strainer screen high DP
* Orifice Plate Flow meter
o Used with Pressure transmitters listed above: 70 gpm to 700 gpm, +1- 2.5% of
measured flow
o Vortex test only: 400 to 1200 gpm, +/- 2.5% of measured flow
* Thermocouples
o Omega Quick-disconnect 32 to 1652 0F range, + I% accuracy of reading
* Temperature Probe
o Digital -40 °C to 1350 °C range, +/- (0.1I% reading ± I°F)
* Turbidity Meter (for informational purposes only)
o Hach in-line turbidity meter: 0 to 4000 NTU range
* pH meter and probe
o Omega Model # PHH222 (meter) and Omega Model # PHE-141 I (probe): range 0 to
14, +/- 0.02 pH units, verify prior to use with traceable standards
*NI LabVIEWVTM data acquisition system, (v. 8.2.1I)o Real-time analog data acquisition system, allowing continuous display of test parameter
values and trends. Data is sampled every two seconds, and averaged over the previous
10 data points. Test data is recorded for each instrument in a simple spreadsheet for
later analysis.
Each of the scales/balances described above are top-loading with digital read-out displays. Three
different scales/balances were used due to the varying debris loads that were required for testing. For
the Mettler Toledo model, the calibration is verified through the use of a calibrated weight set prior to
use. The calibration information for the weight sets are shown in Attachment E.
The model #PX771A pressure transmitter is a low-power industrial differential pressure transducer
used for head loss measurements of water. The same model is used for pressure measurement across
the orifice plate to determine test flow rate, as well as across the plenum and strainers to determine
debris bed pressure drop, but each system is completely separated. For debris bed pressure drop, two
Use or disclosure of the data contained herein is subject to the restriction on the Cover Page of this report.

* Head Loss Testing of a Prototypical Vogtle I and 2 Strainer Assembly
AL I 0 hiJ Document No: ALION-CAL-SNC-7410-O05 Revision: I Page: 15 of 127
ranges for each system overlap to ensure the differential pressure signal is uninterrupted during testing
of low and high DP.
The thermocouples are ANSI type E quick disconnect temperature transducers. The thermometer is a
hand-held digital display temperature probe.
The turbidity meter is installed in-line on the return side of the pump, thus monitoring the water that
has already flowed through the strainers (downstream of the sump). Monitoring the downstream
turbidity aids in observing the filtering affects of the debris bed. The turbidity measurements are verified
prior to use in accordance with ALION-SPP-LAB-2352-20 [Ref. 27]. Turbidity measurements were
recorded for informational purposes only. Note that the turbidity meter was not available for a portion
of the testing (See testing discrepancies in Attachment C.)
Note that two each of the strainer differential pressure transmitters and thermocouples were used
during the testing to obtain redundant measurements. Refer to Attachment E for a more detailed
description of the test equipment.
The pH meter and probe were used to measure the pH of the chemical precipitates during preparation.
Prior to use, the calibration of the pH probe is verified through the use of certified buffer solutions of
pH 4, 7, and I 0. The certificate of conformance for the pH meter is shown in Attachment E.
The data collected by the electronic transducers was recorded by an automatic data acquisition system
controlled by the LabVIEW software. The LabVIEVV software is not a I 0CFR50 Appendix B verified and
validated computer code; however, verification steps are performed per procedure, ALION-SPP-LAB-
2352-13 - Test Equipment and Verification Procedure [Ref. 7], to ensure that the output from LabVIEWis valid for each test. The data was collected and recorded every other second and was uploaded
continuously onto a notepad application. Time-history plots of differential pressure, flow rate (and
approach velocity based on the strainer effective screen area), temperature, and turbidity are presented
on the LabVIEW front panel during testing, which is visible on the monitor of the computer that
supports the LabVIEW software.
2.2 Test Input Parameters
Controlled and uncontrolled test input parameters for the Vogtle chemical effects tests governed the
testing.
2.2.1I Strainer Array
There are two Residual Heat Removal (RHR) sumps and two Containment Spray (CS) sumps in the
Vogtle containment. The four sumps are distributed outside the outer bioshield wall in Vogtle
Use or disclosure of the data contained herein is subject to the restriction on the Cover Page of this report.
9j Head Loss Testing of a Prototypical Vogtle I and 2 Strainer Assembly
LION Document No: ALION-CAL-SNC-74 10-005 Revision: I Page: 16 of 127
containment. One pump takes suction from each sump; single failure analysis was considered for the
test plan and one RHR and one CS pump are assumed to be operational.
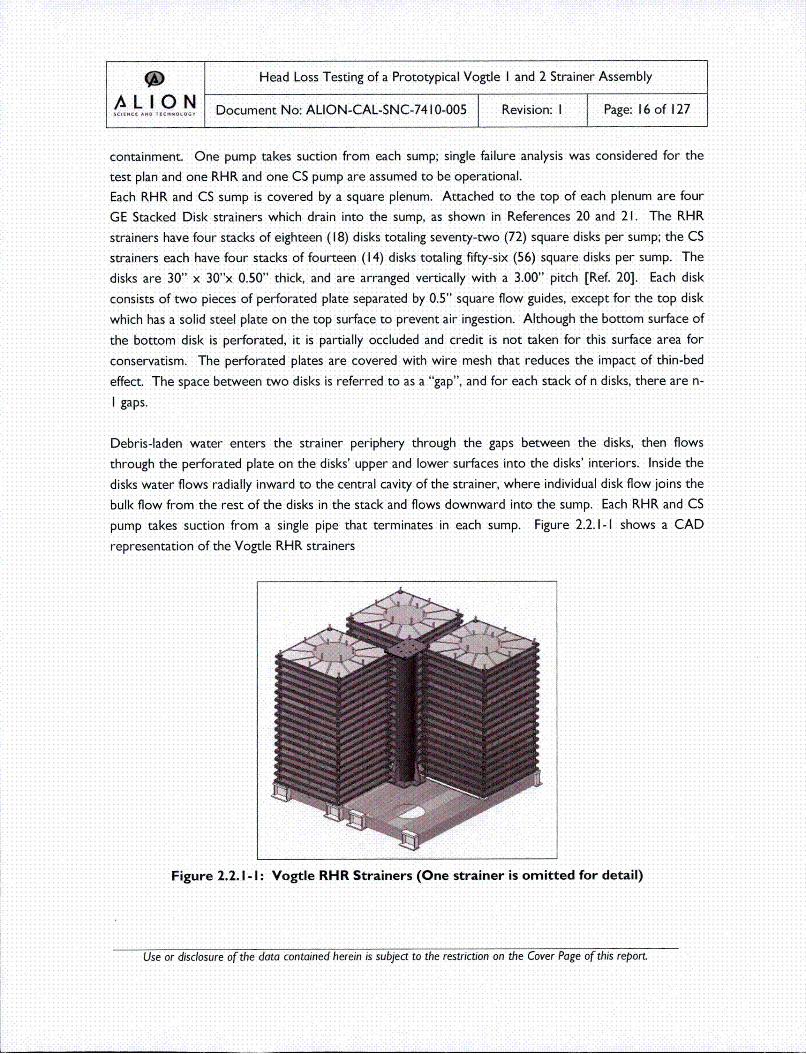
Each RHR and CS sump is covered by a square plenum. Attached to the top of each plenum are four
GE Stacked Disk strainers which drain into the sump, as shown in References 20 and 21. The RHR
strainers have four stacks of eighteen (I18) disks totaling seventy-two (72) square disks per sump; the CS
strainers each have four stacks of fourteen (14) disks totaling fifty-six (56) square disks per sump. The
disks are 30" x 30"x 0.50" thick, and are arranged vertically with a 3.00" pitch (Ref. 20]. Each disk
consists of two pieces of perforated plate separated by 0.5" square flow guides, except for the top disk
which has a solid steel plate on the top surface to prevent air ingestion. Although the bottom surface of
the bottom disk is perforated, it is partially occluded and credit is not taken for this surface area for
conservatism. The perforated plates are covered with wire mesh that reduces the impact of thin-bed
effect. The space between two disks is referred to as a "gap", and for each stack of n disks, there are n-
I gaps.
Debris-laden water enters the strainer periphery through the gaps between the disks, then flows
through the perforated plate on the disks' upper and lower surfaces into the disks' interiors. Inside the
disks water flows radially inward to the central cavity of the strainer, where individual disk flow joins the
bulk flow from the rest of the disks in the stack and flows downward into the sump. Each RHR and CS
pump takes suction from a single pipe that terminates in each sump. Figure 2.2.1-I shows a CAD
representation of the Vogtle RHR strainers
Figure 2.2.-I-: Vogtle RHR Strainers (One strainer is omitted for detail)
Use or disclosure of the data contained herein is subject to the restriction on the Cover Page of this report.

9 Head Loss Testing of a Prototypical Vogtle I and 2 Strainer Assembly
AL I 0 N Document No: ALION-CAL-SNC-74 10-005 Revision: I Page: 17 of 127
The prototype strainer net and gross surface area are 59.54 ft2 and 69.26 ft2. respectively [Ref. I ] and is
comprised of 7 disks that are duplicates of the disks in the plant strainers, which allows debris and flow
to be scaled based on the ratio of numbers of disks. The top surface of the top disk and the bottom
surface of the bottom disk are solid steel, so that the test article contains six gaps total.
2.2.2 Debris Types and Quantities
The types of conventional, non-chemical debris present in the Vogtle containment building include
NukonTM, Interam, various coatings (epoxy, IO7, Alkyd, and cold galvanizing), miscellaneous debris,
dirt/dust, and latent fiber [Ref. 2]. This debris was scaled based on plant strainer and prototype strainer
comparisons, and surrogate materials were used when applicable.
To simulate a post-LOCA chemical environment, two chemical precipitants were generated in
accordance with the guidance provided in Reference 24. These precipitants are sodium aluminum
silicate and aluminum oxyhydroxide.
2.2.2. I Debris Scaling
The Vogtle test strainer module replicates all hydraulic dimensions of the Vogtle plant strainer except
for number of strainer gaps [Ref. 20, 21]. Therefore, debris and flow rate scaling can be performed
without adjustments due to net flow area or strainer geometry since these are accounted for in the test
article - scaling can be performed based only on the numbers of strainer gaps.
The RHR strainer will be tested and the results used to bound the CS strainer, because the approach
velocity for the RHR strainer is higher than that of the CS strainer, as shown in Table 2.2.2- I. A higher
approach velocity through a given strainer array tends to increase the friction losses and thereby the
head losses through the array. For this reason, using a higher approach velocity is conservative.
Table 2.2.2- I: Plant Strainer Approach Velocities [Ref. 2]
Use or disclosure of the data contained herein is subject to the restriction on the Cover Page of this report.
9 Head Loss Testing of a Prototypical Vogtle I and 2 Strainer Assembly
AL I 0 N~ Document No: ALION-CAL-SNC-74 10-005 Revision: I Page: 18 of 127
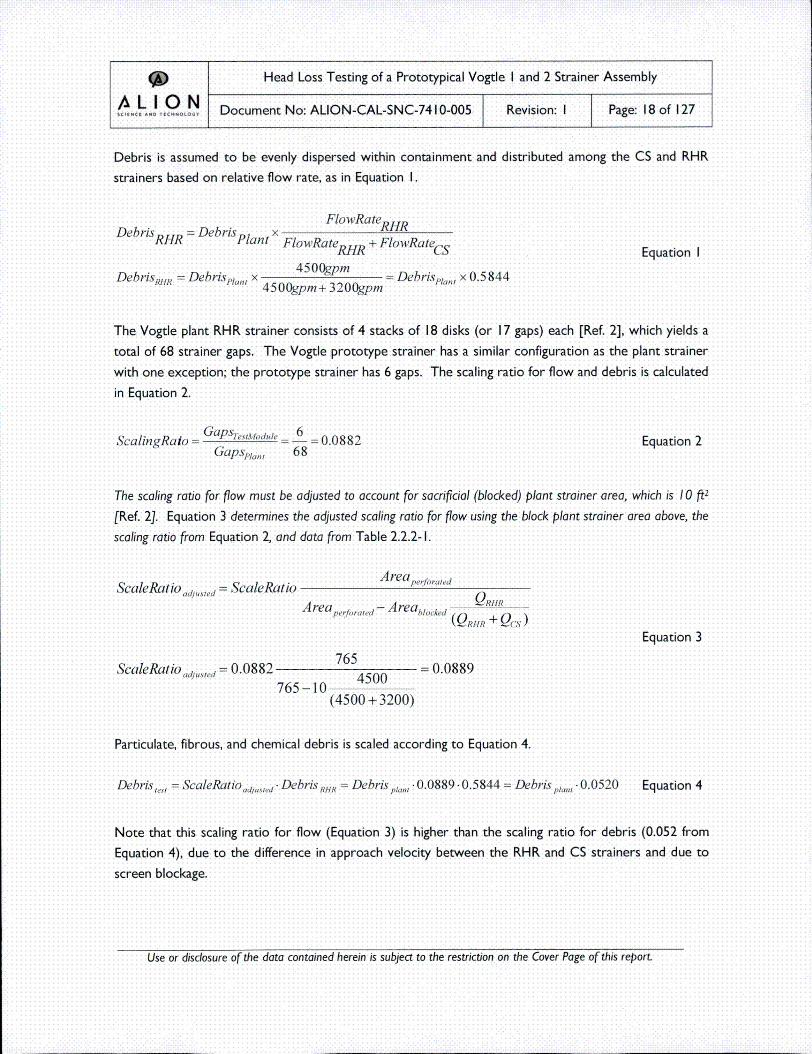
Debris is assumed to be evenly dispersed within containment and distributed among the CS and RHR
strainers based on relative flow rate, as in Equation I.
FlowR ateRHDebrisRHR = DebriS plant x FlowR ateRH + FwRHR c quto
Debris •R = Debris J'lanl x 45~m = Debrisi,,lan, x 0.5 8444500gpm + 3200gpm
The Vogtle plant RHR strainer consists of 4 stacks of 18 disks (or 17 gaps) each [Ref. 2], which yields a
total of 68 strainer gaps. The Vogtle prototype strainer has a similar configuration as the plant strainer
with one exception; the prototype strainer has 6 gaps. The scaling ratio for flow and debris is calculated
in Equation 2.
Scln~t-Gp~"Maa- 6 -0.0 882 Equation 2Sclig~to-Gapspl,,,, 68
The scaling ratio for flow must be adjusted to account for sacrificial (blocked) plant strainer area, which is 10 ft2
(Ref. 2). Equation 3 determines the adjusted scaling ratio for flow using the block plant strainer area above, the
scaling ratio from Equation 2, and data from Table 2.2.2-I.
A rearerforated
ScaleRatio ad,.uea = ScaleRatioArea ,p/rat,,,da -Area blocked QRH•R
(QRHR + Q(. ~)Equation 3
ScaleRatio adj.,.,ea = 0.0882 7650 = 0.08 89
765 -10 40(4500 + 3200)
Particulate, fibrous, and chemical debris is scaled according to Equation 4.
Debris,. = ScaleRatiod ia,,,ed . Debris •R=Debris p•,, .0.0889-0.5844 = Debris'p,, .0.0520 Equation 4
Note that this scaling ratio for flow (Equation 3) is higher than the scaling ratio for debris (0.052 from
Equation 4), due to the difference in approach velocity between the RHR and CS strainers and due to
screen blockage.
Use or disclosure of the data contained herein is subject to the restriction on the Cover Page of this report.
9 Head Loss Testing of a Prototypical Vogtle I and 2 Strainer Assembly
LIO N Document No: ALION-CAL-SNC-74 10-005 Revision: I Page: 19 ofl127
The important quantities for determining head loss are the average approach velocity through the
strainer surface/debris and the quantity of debris per unit strainer surface area (nominally the average
debris thickness). See Section 2.2.3 for the scaling of test flow rates.
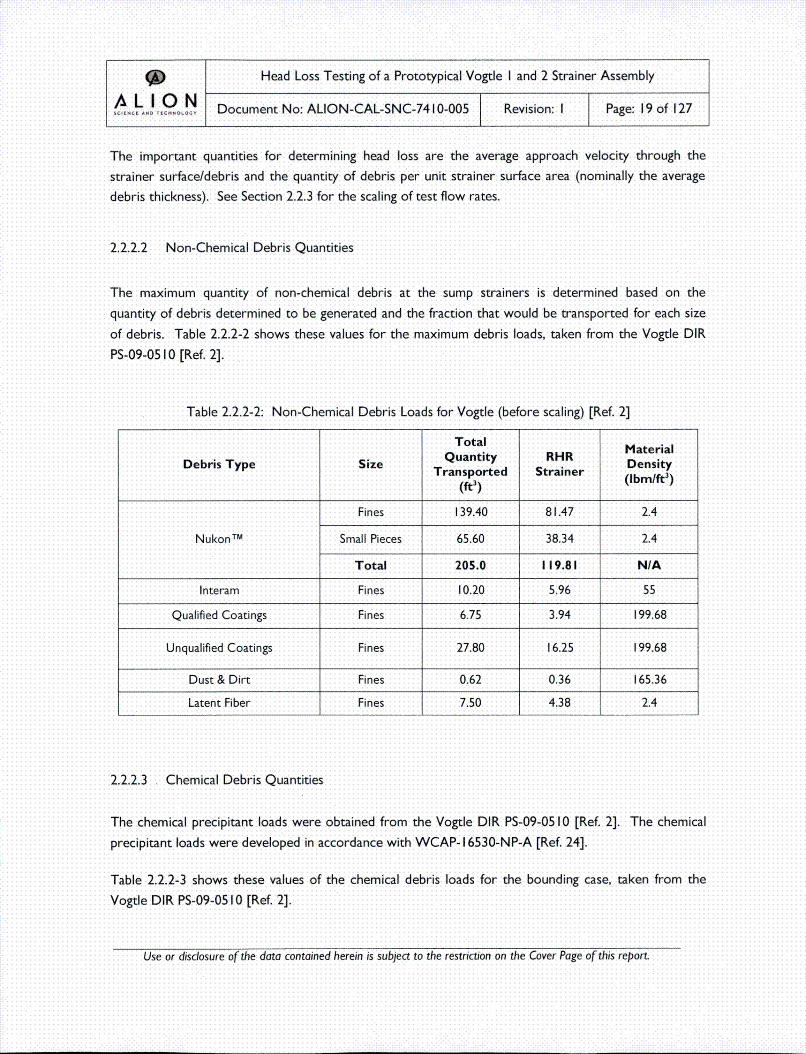
2.2.2.2 Non-Chemical Debris Quantities
The maximum quantity of non-chemical debris at the sump strainers is determined based on the
quantity of debris determined to be generated and the fraction that would be transported for each size
of debris. Table 2.2.2-2 shows these values for the maximum debris loads, taken from the Vogtle DIR
PS-09-0510 [Ref. 2].
Table 2.2.2-2: Non-Chemical Debris Loads for Vogtle (before scaling) [Ref. 2]
TotalDbiTyeSize Quantity RHR Mtra
DbiTyeTransported Strainer Densifty(ft3)(Imt)
Fines 139.40 81.47 2.4
NukonTM Small Pieces 65.60 38.34 2.4
Total 205.0 I119.81 N/A
Interam Fines 10.20 5.96 55
Qualified Coatings Fines 6.75 3.94 199.68
Unqualified Coatings Fines 27.80 16.25 199.68
Dust & Dirt Fines 0.62 0.36 165.36
Latent Fiber Fines 7.50 4.38 2.4
2.2.2.3 Chemical Debris Quantities
The chemical precipitant loads were obtained from the Vogtle DIR PS-09-05 10 [Ref. 2]. The chemical
precipitant loads were developed in accordance with WCAP- I16530-NP-A [Ref. 24].
Table 2.2.2-3 shows these values of the chemical debris loads for the bounding case, taken from the
Vogtle DIR PS-09-05 10 [Ref. 2].
Use or disclosure of the data contained herein is subject to the restriction on the Cover Page of this report.

* Head Loss Testing of a Prototypical Vogtle I and 2 Strainer Assembly
kI 0 N Document No: ALION-CAL-SNC-74 10-005 Revision: I Page: 20 of 127
Table 2.2.2-3: Chemical Debris Loads for Vogtle Testing (before scaling)Total Transported
Chemical Precipitate Transported Qty to RHR_________________________ (Ibs) Strainer (Ibs)
Sodium Aluminum Silicate 172.05 100.55Calcium Phosphate 102.0 59.61I
Aluminum Oxyhydroxide 0.0 0.0
2.2.2.4 Non-Chemical Test Debris
The following materials were used for the Vogtle chemical effects tests:
NukonTM was used as the surrogate for latent fiber, as recommended in NEI 04-07 [Ref. 6]. NukonTM is
supplied by Performance Contracting Inc. (PCI). The NukonTM was shredded into small pieces, boiled,
and then rinsed to simulate the destruction associated with a high-energy line break (HELB). Refer to
the test plan [Ref. I] and Section 2.4. I for a detailed description of the procedure that was used to
prepare the insulation debris for testing. NukonTM has an as-fabricated density of 2.4 Ibm/ft3 and a fiberdiameter of 7 microns [Ref. 5].
Interam E-54A insulation was used to simulate plant Interam fire barrier debris. The Interam is
manufactured by 3M. The Interam was double-shredded to simulate the destruction associated with a
HELB. Refer to the test plan [Ref. I] and Section 2.4.1 for a detailed description of the procedure that
was used to prepare the insulation debris for testing. Both the surrogate and plant Interam materials
have a microscopic density of 55 Ib/ft3.
Green Silicon Carbide powder manufactured by UK Abrasives Inc. and Electro Abrasives were used as a
surrogate for both the qualified and unqualified coatings. The density of the coatings at Vogtle is 199.68
Ib/ft3 [Ref. 2]. The surrogate to be used, silicon carbide, material specific gravity is 3.2, which
corresponds to a microscopic density of 199.25 Ib/ft3 (see Attachment F Product Data Sheet). The
critical parameter for selecting the surrogate material is the volume of the material in the debris mix
[Ref. 6]. The particulate material occupies a certain volume in the fibrous debris space that results in
increasing resistance to flow and higher head loss. The surrogate material volume was adjusted to
match the volume of the coatings particulate. The particle size for coatings is 10 microns spherical
particle diameter [Ref. 2]. The silicon carbide is a spherical particulate ranging in size from just under I
ipm to approximately 100 Ipm (see the Attachment F Product Data Sheet for the particle size
distribution and amount of material used for each test log).
Use or disclosure of the data contained herein is subject to the restriction on the Cover Page of this report.

9J Head Loss Testing of a Prototypical Vogtle I and 2 Strainer Assembly
AL I ON Document No: ALION-CAL-SNC-74 10-005 Revision: I Page: 21 of 127
Silica Sand prepared by Performance Contracting, Inc. was used as a surrogate material for latent dirt
and dust debris. The size distribution of the silica sand was prepared to be consistent with the latent
dirt/dust size distribution provided in the SER [Ref. 6]. Table 2.2.2-4 represents this size distribution.
Table 2.2.2-4: NRC SER Dirt/Dust Grain Size Distribution [Ref. 26]
- r - -- ---------- -- IPWR Mix 2 Sand Type Ohetrbutions aased on Product Data Sheets Size Cielslcalen I Consl•o
Coarse Sanda
Medium Sand Fine Sand AllocationBasis fibs) 2 NRCCalc TamerSand Redpe Mix Oblsi
< 75 microns 96.50% 37.4 37.4% 37% ie
< 500 microns 63.71% 34.4> 500 microns _____ _ 36.23% _____ _ 19.6
< 00microns 3.371% 0.3 27.3% 28% Cas
Note: Each type of sand has particles in two size rangesThe above recipe will achieve the NRC Tsrqe.le Sand Class Key
1000 1100.0% 1100.0%
The test plan [Ref. I] provides the detailed calculations for the non-chemical debris quantities used fortesting. Table 2.2.2-5 shows the scaled non-chemical debris quantities that were used during each test.
Table 2.2.2-5: Total Scaled non-Chemical Debris Loads for Vogtle Tests*
NukonTMNunM Itea SiliconTet#Small Pieces Carbide DrlDs
Tet# Fines (Ibm) (Ibm) (Ibm) (Ibm) (Ibm)
VOG- I -TB 7.45 0.0 29.15 358.42 5.3
VOG-2-FL 18.32 8.18 29.15 358.42 5.3*Non-.chemical debris quantities obtained from Attachment D
2.2.2.5 Chemical Test Debris
The types and quantities of chemical precipitates were obtained from Ref. 2. The chemical precipitates
were prepared in accordance with WCAP- 16530-NP-A [Ref. 24] and prepared by Alion in accordance
with ALION-SPP-LAB-2352-37 [Ref 23].
The test plan [Ref. I] provides the detailed calculations for the chemical debris quantities used for
testing. Table 2.2.2-6 shows the scaled chemical debris quantities that were used during each test.
Table 2.2.2-6: Total Scaled Chemical Debris Loads for Vogtle Tests•Volume (liters)
SodiumCalciumAluminum Phsat
Test Silicate Phosphate___
VOG- I-TB 368.58 480.73VOG-2-FL 368.58 480.73
Use or disclosure of the data contained herein is subject to the restriction on the Cover Page of this report.
~Head Loss Testing of a Prototypical Vogtle I and 2 Strainer Assembly
LI O h Document No: ALION-CAL-SNC-7410-005 Revision: I Page: 22 of 127
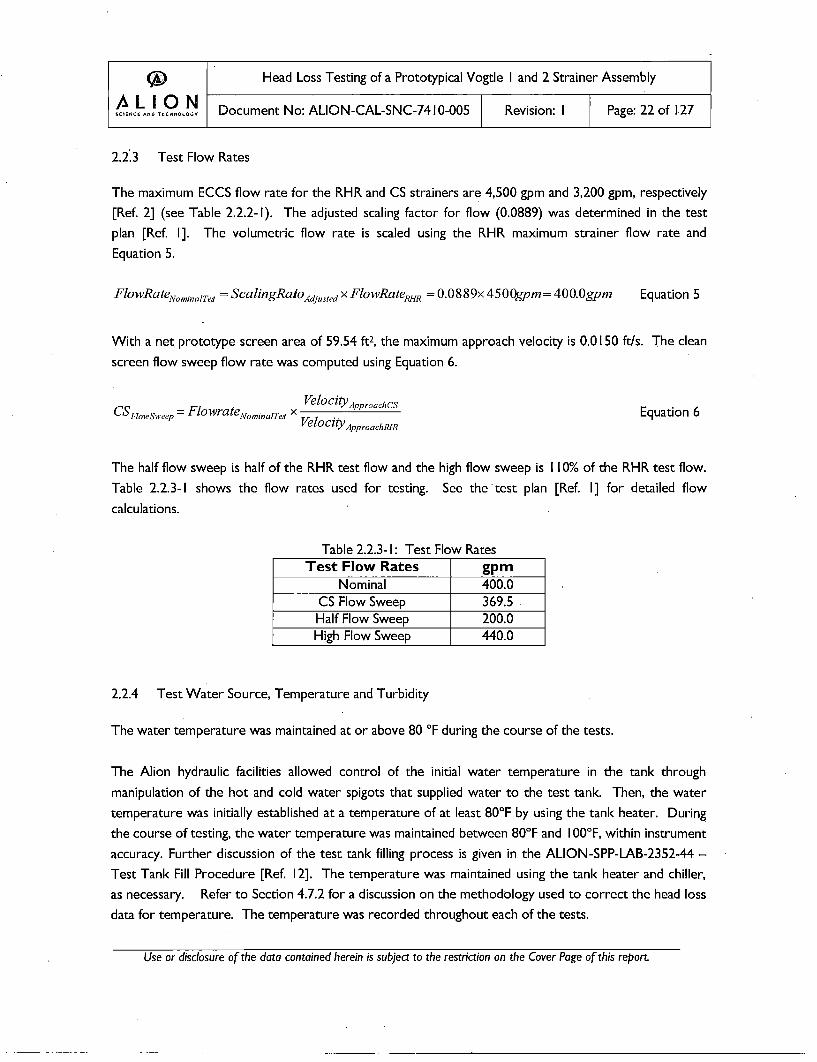
2.2.3 Test Flow Rates
The maximum ECCS flow rate for the RHR and CS strainers are 4,500 gpm and 3,200 gpm, respectively
[Ref. 2] (see Table 2.2.2-I). The adjusted scaling factor for flow (0.0889) was determined in the test
plan [Ref. I]. The volumetric flow rate is scaled using the RHR maximum strainer flow rate and
Equation 5.
FlowRateNombn alThe = cln~t~jse x FlowRatez4R =0O.0889× 4500gpm= 400.Ogpm Equation 5
With a net prototype screen area of 59.54 ft2, the maximum approach velocity is 0.0 1 50 ft/s. The clean
screen flow sweep flow rate was computed using Equation 6.
CS FiowSwieep = FlowrateNo,n,n,Te asx Velocity App r°ach CS Equation 6Velocity ApproachRFR
The half flow sweep is half of the RHR test flow and the high flow sweep is I 1 0% of the RHR test flow.
Table 2.2.3-I shows the flow rates used for testing. See the test plan [Ref. I] for detailed flow
calculations.
Table 2.2.3-I: Test Flow RatesTest Flow Rates gpm,
Nominal 400.0CS Flow Sweep 369.5Half Flow Sweep 200.0High Flow Sweep 440.0
2.2.4 Test Water Source, Temperature and Turbidity
The water temperature was maintained at or above 80 0F during the course of the tests.
The Alion hydraulic facilities allowed control of the initial water temperature in the tank through
manipulation of the hot and cold water spigots that supplied water to the test tank. Then, the water
temperature was initially established at a temperature of at least 80°F by using the tank heater. During
the course of testing, the water temperature was maintained between 80°F and I100 0F, within instrument
accuracy. Further discussion of the test tank filling process is given in the ALION-SPP-LAB-2352-44 -
Test Tank Fill Procedure [Ref. 12]. The temperature was maintained using the tank heater and chiller,
as necessary. Refer to Section 4.7.2 for a discussion on the methodology used to correct the head loss
data for temperature. The temperature was recorded throughout each of the tests.
Use or disclosure of the data contained herein is subject to the restriction an the Cover Page of this report.
~Head Loss Testing of a Prototypical Vogtle I and 2 Strainer Assembly
L I O h Document No: ALION-CAL-SNC-7410-005 Revision: I Page: 23 of 127M~tbN•A TECNWOLO•
The turbidity of the water was monitored during testing, but was not substantial to any decision making.
Typically, the turbidity of the water will spike during debris additions, and slowly decrease as the water
is filtered through the debris bed.
As described in the WCAP [Ref. 24], the precipitates were prepared using Reverse Osmosis (RO)
water. Due to limitations on the amount of treated water available for testing and the large volume of
water required for prototype testing, the test tank was filled with normal tap water.
2.3 Test Matrix
Table 2.3-I and Table 2.3-2 illustrate the matrices of the testing performed in accordance with the
associated test plan [Ref. I]. Refer to Section 2.4 for a description of the test procedures associated
with the following test matrices.
Use or disclosure of the data contained herein is subject to the restriction an the Cover Page of this report

(• Head Loss Testing of a Prototypical Vogtle I and 2 Strainer Assembly
AL I 0 NM Document No: ALION-CAL-SNC-7410-005 Revision: I. Page: 24 of 127SCI[CMCEANO TECKN OLOGY
Table 2.3- I: Test Matrix for Test #•VOG- I-TBEquivalent Slcn Dr/Ccim Sodium
NukonTM Bed Interam Slcn Drl Ccim AluminumThickness Carbide Dust Phosphate Silicate
Fines SmallsTest # (Ibm) (Ibm) (inches) (Ibm) (Ibm) (Ibm) (L) (L)
VGIIT- 0 0 0 0 0 0 0 0IFS
VOG-l1.2•TB-P 0 0 0 29.15 358.42 5.3 0 0
VGl3T- 1.49 0 0.125 0 0 0 0 0Fl
VGI4T- 1.49 0 0.250 0 0 0 0 0F2_______
VGI-T- 1.49 0 0.375 0 0 0 0 0F3
V -I6T- 1.49 0 0.500 0 0 0 0 0F4
VGl-T- 1.49 0 0.625 0 0 0 0 0F5
VOG- I.lI0-TB- 0 0 065 00 0 102
VGIlIT- 0 0 0.625 0 0 0 160.24 0CPI2
VO-.2T- 0 0 0.625 0 0 0 160.24 0CP3
VO -. 3T- 0 0 0.625 0 0 0 10.2 02.8
V NA- I.-BVO -. 4T- 0 0 0.625 .0 0 0 0 122.86NAS2I
VO-.5T- 0 0 0.625 0 0 0 0 122.86
NAS3
VO-.6T- 0 0 0.625 00 0 0 0FFS_______ ______ _
*The test plan [Ref. I ] called for up to two additional fiber additions to ensure that complete screencoverage was achieved (VOG- I1.8-TB-F6 & VOG- I1.9-TB-F7). It was determined during testing that
complete screen coverage was achieved with an equivalent bed thickness of 0.625 in. Thus, the
remaining fiber batches were not added (see Attachment D for a full description of the thin-bed test
proceedings).
Use or disclosure of the dato contained herein is subject to the restriction on the Cover Page of this report.

~Head Loss Testing of a Prototypical Vogtle I and 2 Strainer Assembly
AL IO 0 N~ Document No: ALION-CAL-SNC-7410-005 Revision: I Page: 25 of 127
Table 2.3-2: Test Matrix for Test #VOG-2-FL
Equivalent Slcn Dr/ Ccim SodiumNukonTM Bed Interam Slcn Dr! Ccim Aluminum
Thickness Carbide Dust Phosphate Silicate
Fines Smalls (nhs im Im Im 1 LTest # (Ibm) (Ibm) (nhs Im Im Im L L
VOG-2.lI-FL-IF5 0 0 0 0 0 0 0 0
VOG-2.2-FL-F I 4.58 2.04 0.478 7.29 89.61 1.32 0 0
VOG-2.3-FL-F2 4.58 2.04 0.956 7.29 89.61 1.32 0 0
VOG-2.4-FL-F3 4.58 2.04 1.435 7.29 89.61 1.32 .0 0
VOG-2.5-FL-F4 4.58 2.04 1.913 7..29 89.61 1.32 0 0
VG26F- 0 0 1.913 0 0 0 160.24 0CP I
VG27F- 0 0 1.913 0 0 0 160.24 0CP2
VOG-2.8-FL -C30 0 1.913 0 0 0 160.24 0
VG29F- 0 0 1.913 0. 0 0 0 122.86NAS I
VO-.0F- 0 0 1.913 0 0 0 0 122.86NAS2
VG2lIF- 0 0 1.913 0 0 0 0 122.86NAS3
VO-.2F- 0 0 1.913 00 0 0 0
*This test matrix applies to the original full load test, VOG-2-FL-B, and the full load retest,
VOG-2-FL-B2
The equivalent bed thickness provided in Table 2.3-I and Table 2.3-2 was determined (in the test plan)
by dividing the volume of fiber by the prototype strainer area. The equivalent bed thickness provided in
Table 2.3-I and Table 2.3-2 is based on the as-manufactured density of 2.4 Ib/ft3 for small pieces and
fines.
The NukonTM listed in Table 2.3-I and Table 2.3-2 represents the surrogate for latent fiber and is usedto model the NukonTM installed at the plant. For the thin-bed test, the tested NukonTM was comprised
of 100% fines. For the full-load test, the tested NukonTM was comprised of 70% fines and 30% smallpieces [Ref. I]. According to the Vogtle DIR, the plant NukonTM is comprised of 69% fines and 31I%
small pieces [Ref. 2]. Thus, assuming these size distributions for NukonTM debris ensures that there will
Use or disclosure of the data contained herein is subject to the restriction on the Cover Page of this report

~Head Loss Testing of a Prototypical Vogtle I and 2 Strainer Assembly
;•LION Document No: ALION-CAL-SNC-74 10-005 Revision: I Page: 26 of 127
be more total fine debris represented in testing than what is expected at Vogtle. See Section 2.4. I for
descriptions of the debris preparation methods.
The stabilization criteria for intermediate loads (i.e. at the end of each subtest) varied. After the
particulate debris load was added, a minimum of 5 pool turnovers was required. After each fibrous
debris load batch was added (not including the final batch), a minimum of 10 pool turnovers was
required. After the final fibrous debris load batch and after each chemical precipitate batch was added,
the subtest head loss value was achieved when a stable differential pressure was achieved. The head loss
was considered stable when the differential pressure across the debris bed changed by less than or equal
to I% over a I-hour period. in addition, the rate of head loss increase was required to be significantly
decreasing, or the head loss was required to be consistently steady at the completion of the subtest. In
some cases, especially after addition of chemical precipitant debris, an "unstable" debris bed formed
which lead to head loss that oscillates up and down as the bed shifts. When this situation occurred, the
head loss was declared stable if the peak head loss was not increasing over a period of 3 hours, or after '
8 hours had passed.
The test termination criteria were prescribed in the test plan [Ref. I]. The head loss measurements foreach test were recorded continuously throughout the test. The final head loss value was achieved when
a stable differential pressure was achieved. The head loss was considered stable when the differential
pressure across the debris bed changed by less than or equal to 1% over a I-hour period. In addition,
the rate of head loss increase was required to be significantly decreasing, or the head loss was required
to be consistently steady at termination of the test.
A 30 day test was considered. However, given the practical limitations of multiple 30 day tests, it was
decided that running the test for 30 days was not necessary based on the following:
I. The fibrous debris was prepared as 70% fines and 30% small pieces and the particulate debris
conservatively represented the smallest particle size for each debris type [Ref. I]. Therefore,
the debris had already been processed to its most basic form and, therefore, had little to no
opportunity for further degradation.
2. The debris was introduced in accordance with the March 2008 NRC Staff Review Guidance,
which conservatively forms a dense, highly stratified bed. This type of bed is highly compressed
and is not likely to degrade in a manner that would result in higher head loss. If anything, bed
degradation would likely result in decreasing head loss.
The above assertions were borne out by the testing. Note that the flow sweeps showed remarkable
correlation between the upsw'eep and downsweep, indicating that the debris bed was extremely stable.
Use or disclosure of the data contained herein is subject to the restriction on the Cover Page of this report.
~Head Loss Testing of a Prototypical Vogtle I and 2 Strainer Assembly
s0 o/LI9oQ-o o% h Document No: ALION-CAL-SNC-74 10-005 Revision: I Page: 27 of 127
Since the testing was not conducted for the entire mission time of 30 days, an extrapolation of the test
results to the mission time was performed to ensure that the head loss at 30 days is conservatively
predicted. The extrapolation methodology and results are presented in Section 4.6.
2.4 Test Procedures
The Vogtle test plan documents each of the generic procedures and the specific procedures used in the
testing. The Alion Testing Program has developed generic test procedures for lab safety, debris
preparation, and head loss testing. The following generic test procedures were used to perform the
testing specified in the Vogtle test plan:
* ALION-SPP-LAB-2352- 13 - Test Equipment Verification Procedure [Ref. 7]
* ALION-SPP-LAB-2352- 14 -Testing Discrepancies [Ref. 8]
* ALION-SPP-LAB-2352-21I - Test Lab Safety Procedure [Ref. 9]
* ALION-SPP-LAB-2352-22 - Debris Preparation Procedure [Ref. 10]* ALION-SPP-LAB-2352-23 - Hydraulic Testing of Debris Test Plan Guideline [Ref. I I]
* ALION-SPP-LAB-2352-37 - Generation of Chemical Precipitates for Chemical Test Loop Debris
Head Loss Procedure [Ref. 23]
* ALION-SPP-LAB-2352-44 - Test Tank Fill Procedure [Ref. 12]* ALION-SPP-LAB-2352-45 - Test Tank Draining and Cleaning Procedure [Ref. 13]
* ALION-SPP-LAB-2352-46 - Test Tank Debris Head Loss Procedure [Ref. 14]
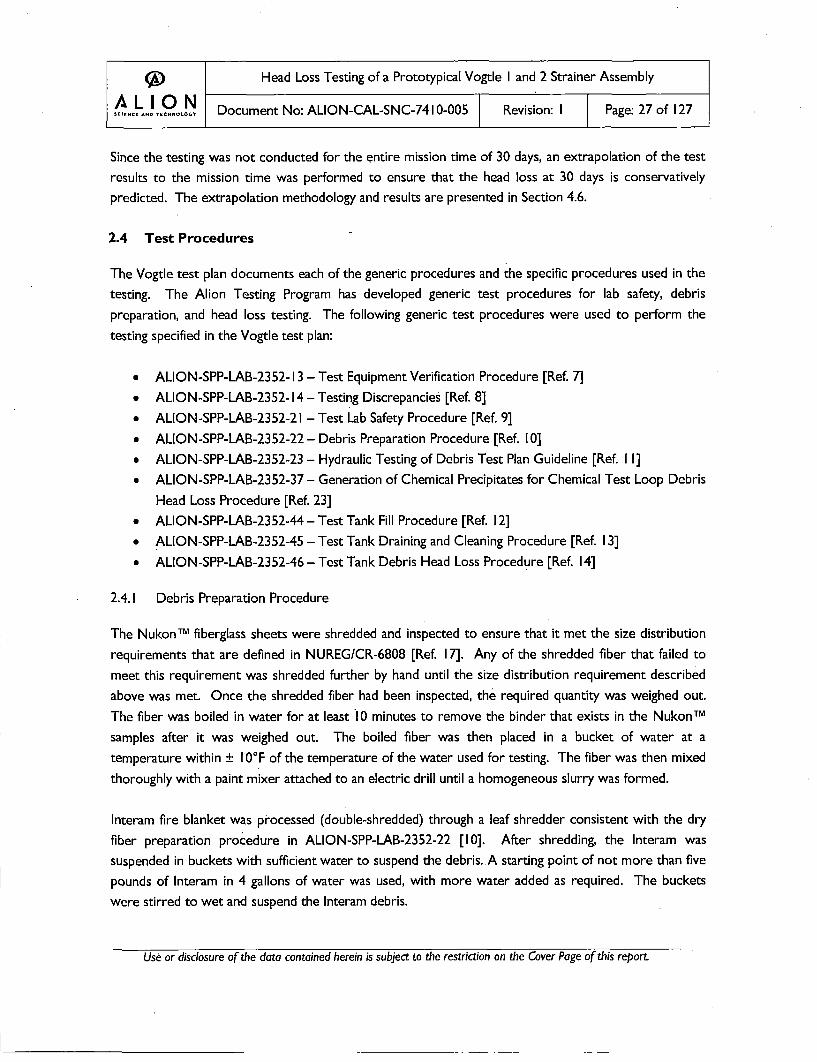
2.4.1 Debris Preparation Procedure
The NukonTM fiberglass sheets were shredded and inspected to ensure that it met the size distributionrequirements that are defined in NUREG/CR-6808 [Ref. 17]. Any of the shredded fiber that failed to
meet this requirement was shredded further by hand until the size distribution requirement described
above was met. Once the shredded fiber had been inspected, the required quantity was weighed out.
The fiber was boiled in water for at least 10 minutes to remove the binder that exists in the NukonTM
samples after it was weighed out. The boiled fiber was then placed in a bucket of water at a
temperature within + 10°F of the temperature of the water used for testing. The fiber was then mixed
thoroughly with a paint mixer attached to an electric drill until a homogeneous slurry was formed.
Interam fire blanket was processed (double-shredded) through a leaf shredder consistent with the dry
fiber preparation procedure in ALION-SPP-LAB-2352-22 [10]. After shredding, the Interam was
suspended in buckets with sufficient water to suspend the debris. A starting point of not more than five
pounds of Interam in 4 gallons of water was used, with more water added as required. The buckets
were stirred to wet and suspend the Interam debris.
Use or disclosure of the data contained herein is subject to the restriction on the Cover Page of this report.

~Head Loss Testing of a Prototypical Vogtle I and 2 Strainer Assembly
A• L I O Document No: ALION-CAL-SNC-7410-005 I Revision: I Page: 28 of 127.
The particulate debris (silicon carbide and dirt/dust) was received in a powdered form. The required
amount of particulate was weighed out and placed in a bucket of water at a temperature within + I 0°F
of the temperature of the water used for testing. The particulates were then placed in a bucket with
sufficient water to create a thin slurry. Particulate with water was mixed using a paint stirrer until no
agglomeration or clumping is observed. Before addition into the test, all particulate batches were mixed
once again with an electric paint stirrer to breakup clumps and create a thin slurry consisting of
approximately 10 lbs of particulate per 3 gallons of water.
The chemical precipitates were prepared in accordance with WCAP- 16530-NP-A [Ref. 24].
Additionally, the chemical precipitates were prepared as prescribed by ALION-SPP-LAB-2352-37 [Ref.
23]. The I-hour settling volume for each batch of chemical precipitates was determined at the time that
the batch was produced and was required to be 6 ml or greater. The chemical precipitate settling was
also required to be measured within 24 hours of the time the surrogate was to be used and the I -hour
settled volume was required to be 6 ml (sodium aluminum silicate and aluminum oxyhydroxide) or
greater and within 1.5 ml of the freshly prepared surrogate [Ref. 24]. Chemical precipitates that failed.
the 6 ml or greater (initial test or re-test) and within 1.5 ml of the freshly prepared surrogate criteria
were not used in testing.
2.4.2 Debris Introduction Procedure
For the thin-bed test, the full particulate load (Interam, coatings surrogate fines, dirtldust surrogate) was
added to begin testing. After an initial I/8" layer of fiber was added, batches of fiber were be added in
I/8" equivalent bed thicknesses. Thin-bed formation was observed visually, via head loss and turbidity
measurement. During shake-down testing, the criterion for thin-bed formation was determined to be
an equivalent bed thickness of at least 5/8 inches. After the final fiber addition met the steady head loss
criteria, chemical precipitates were added incrementally according to the test matrix provided in Table
2.3-I. The head loss stabilization criteria described in Section 2.4.1I were met after each addition of
chemical precipitates prior to the subsequent chemical precipitate addition.
For the full load tests, separate fiber and particulate mixes were added incrementally to the tank. The
fiber to particulate mass ratio in the tank was maintained constant to provide homogenous debris bed
accumulation. Chemical precipitants were added after the head loss of the last addition of non-chemical
debris has met the head loss stabilization criteria. Chemical precipitates, were added incrementally
according to the test matrix provided in Table 2.3-2. The head loss stabilization criterion was met after
each addition of chemical precipitates prior to the subsequent chemical precipitate addition.
The debris introduction method, i.e. all particulate debris (Interarn, coatings surrogate fines, dirt/dust
surrogate) added first, followed by batches of fine fibrous debris (latent fiber & NukonTM), followed by
Use or disclosure of the data contained herein is subject to the restriction on the Cover Page of this report.
(• Head Loss Testing of a Prototypical Vogtle I and 2 Strainer Assembly
LI 0 hiJ Document No: ALION-CAL-SNC-7410-005 Revision: I Page: 29 of 127
batches of small pieces of fibrous debris (NukonT M), was performed in accordance the March 2008 NRC
Staff Review Guidance [Ref. 25].
For all tests, chemical precipitate were added in batches as shown in the test matrices (Table 2.3-I and
Table 2.3-2) to provide chemical loads corresponding to the precipitant generation cases listed in Table
2.2.2-3.
A sparger system was installed on the return line and resided against the back wall of the tank to aid in
the suspension of the debris within the water. Two mechanical mixers were also installed inside the
tank the corners opposite the strainer module (see Figure 2.1. 1-3). All debris loads were added over
the mixers. For all tests, all debris was added at the side of the tank adjacent to the pump suction, away
from the simulated containment floor and walls. This allowed for even and representative debris bed
accumulation on the test strainer module. The debris was added in a controlled manner as to notdisturb the debris bed through unnecessary turbulence. These methods of debris agitation were
sufficient in keeping the debris suspended in the water; therefore, manual stirring was not conducted.
The debris introduction locations were noted in the test logs.
Near field settling was not credited during testing for all fibrous and particulate debris.
Use or disclosure of the data contained herein is subject to the restriction on the Cover Page of this report.
•) Head Loss Testing of a Prototypical Vogtle I and 2 Strainer Assembly
AL I ON Document No: ALION-CAL-SNC-74 10-005 Revision: I Page: 30 of 127
3 TEST RESULTS
This section contains a summary of the results of the Vogtle chemical effects testing.
3.1I Overview of Head Loss Data
The Vogtle I and 2 test program consisted of four separate series of tests (one thin bed test, two full
load tests, and one vortex test) which included subtests to cover multiple test objectives.
Test #VOG- I-TB was the thin-bed test that used a fibrous debris quantity sufficient to form a debris
bed with an equivalent thickness of 5/8-in., particulate quantities (coatings, dirt/dust, and Interam) that
bounded the particulate quantities described in Vogtle DIR PS-09-05 10 [Ref. 2], and WCAP predicted
chemical precipitants.
Tests #VOG-2-FL-B and #VOG-2-FL-B2 were the scaled load maximum fiber and particulate test that
bounded the debris quantities described in Vogtle DIR PS-09-0510 [Ref. 2] plus WCAP predicted
chemical precipitants corresponding to the case tested. Test #VOG-2-FL-B was the original full load
test and test #VOG-2-FL-B2 was the subsequent retest of the full load test.
A vortex test was also run on a debris-less, clean screen strainer to investigate the formation of vortices
under varying test conditions. Flow rate and water level were controlled in such a way that encouraged
vortex formation, and visual observation of vortex formation was noted.
The results of these tests are presented in Sections 3 and 4.
The turbidity traces below were used for observational purposes only; the measurement of the amount
of debris suspended in the water indicates whether or not filtering through the strainers and/or tank
settling is taking place. Turbidity measurement is only a test observation that aids in the control of
testing.
3.2 Data Reduction
In order to smooth out some of the inherent noise associated with test measurement, the'raw data
curves were processed to produce the results shown in the following sections. The data in the figures
of Sections 3.4-3.6 was processed using a one-minute rolling average data smoothing technique.
Starting with the 31st point (note that data is recorded every-other second), each data value wasreplaced with the average of the previous one-minute's worth of data values. This is the OMRAT
method described in "Methodology for Raw Electronic Data Reduction" [Ref. 18], slightly modified for
the test data that was taken every 2 seconds. All traces in the following graphs used this method to
Use or disclosure of the data contained herein is subject to the restriction on the Cover Page of this report.

~Head Loss Testing of a Prototypical Vogtle I and 2 Strainer Assembly
AL I 0 N~1 Document No: ALION-CAL-SNC-74 10-005 Revision: I Page: 31 of 127SCIENCE AWE TECHEOCOLY
reduce the noise in the data. Note that no data was removed via a true "data reduction"; all data that
was recorded was used in graphing the test results. This method was used for the graphing purposes,
only. The head loss data provided in the clean screen figure and final flow sweep figures in Section 3.3
and Sections 4.2-4.4, respectively, which is used for developing regression equations and flow and
temperature correction correlations, use an alternate methodology, as described in those sections.
3.3 Clean Strainer Head Loss
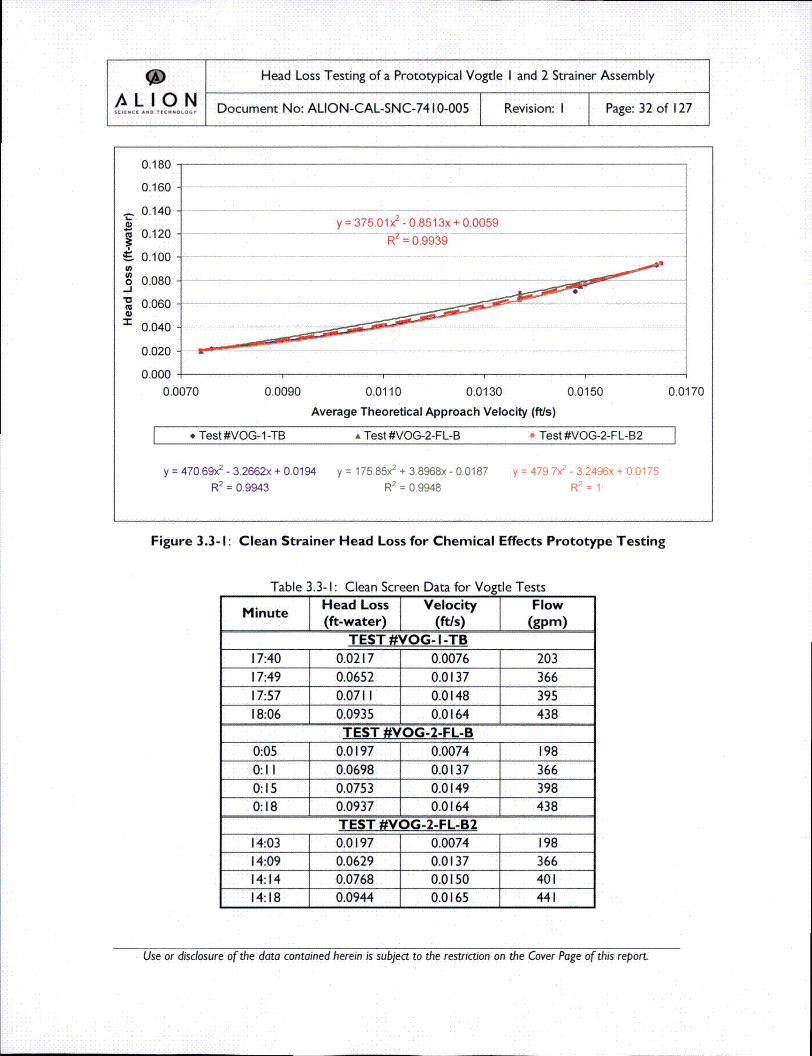
Figure 3.3- i depicts the clean strainer head loss for each test by plotting the differential pressures across
the clean strainer array versus fluid theoretical average approach velocities'. The clean strainer headloss data were fit with quadratic curves to determine an analytical relationship between clean strainer
head loss and velocity. The respective regression equations (calculated using Excel) are given on Figure
3.3- I. Only the downsweep portion of the clean screen flow sweep is plotted on Figure 3.3- I.
Table 3.3-I displays the values of the data points of Figure 3.3-I. The approach velocity and head loss
values shown are the one-minute averages of the minute before the action was logged in the test log.
For instance, if the stabilization was declared at 8:24 PM, then the data point below is the average of the
one-minute's worth of data points starting at 8:23:00 PM to 8:24:00 PM. This relieves the need to use
the data points taken in the logs, which are subject to fluctuation.
SNOTE: the "Velocity" values of all of the following figures and tables are the calculated averageapproach velocities based on flow rate and screen area. The correct description of these values is "TestTheoretical Average Approach Velocity," which would not account for non-uniform flow over thestrainer screen area.
Use or disclosure of the data contained herein is subject to the restriction on the Cover Page of this report.
* Head Loss Testing of a Prototypical Vogtle I and 2 Strainer Assembly
- LI-O N Document No: ALION-CAL-SNC-74 10-005 Revision: I Page: 32 ofl127
0.180
0.160
0.120 ~y = 375.0lx2R- 0.8513x=093 + 0.0059
o0.080.. I
S0.060S0.040
0.020
0.000 ...0.0070 0.0090 0.0110 0.0130 0.0150 0.0170
Average Theoretical Approach Velocity (ft/s)
[ •Test #VOG-1 -TB A Test #VOG-2-FL-B • Test #VOG-2-FL-B2
y = 470.69x2 - 3.2662x + 0.0194 y = 175 85x2
+ 3 8968x - 0.0187 y = 479 7x2• - 3 2496x + 00175
R2= 0.9943 R2= 0.9948 R2= 1
Figure 3.3- I: Clean Strainer Head Loss for Chemical Effects Prototype Testing
Table 3.3- I: Clean Screen Data for Vogtle Tests
________ TEST #VOG- I -TB ____
17:40 0.0217 f 0.0076 20317:49 0.0652 0.0137 366
17:57 0.071 I 0.0148 39518:06 0.0935 0.0164 438________ TEST #V.OG-2-FL-B ____
0:05 0.0197 0.0074 1980:1I1 0.0698 0.0137 366
0:15 0.0753 j 0.0149 3980:18 0.0937 J 0.0164 438
________ TEST #VOG-2-FL-B214:03 0.0197 0.0074 19814:09 0.0629 0.0137 36614:14 0.0768 0.0150 401I14:18 0.0944 0.0165 441
Use or disclosure of the data contained herein is subject to the restriction on the Cover Page of this report.
* Head Loss Testing of a Prototypical Vogtle I and 2 Strainer Assembly
L i Document No: ALION-CAL-SNC-74 10-005 Revision: I Page: 33 of 127
3.4 Test #VOG- I-TB Results
Figure 3.4-I through Figure 3.4-5 depict the results of Test #VOG- I-TB by plotting the differential
pressure across the debris bed and fluid average theoretical approach velocity versus time, with subtest
debris additions and flow adjustments indicated by vertical lines. Other test control operations and
observations are marked arrows at the time of execution/occurrence.
Figure 3.4-6 through Figure 3.4-10 plot the differential pressure across the debris bed and test water
temperature versus time of Test # VOG- I-TB. The temperature of the test constantly increased due to
pump heating and friction.
Figure 3.4- I I through Figure 3.4-15 plot the differential pressure across the debris bed and test turbidity
versus time of Test # VOG- I-TB. Each debris addition spiked the turbidity of the water and then
decreased as particulate matter was slowly filtered out of the water by the thin debris bed.
Bed reformations were observed during Test #VOG- I-TB after the second addition of sodium
aluminum silicate (VOG-I.1 14-TB-NAS2).
Use or disclosure of the data contained herein is subject to the restriction on the Cover Page of this report.

9D Head Loss Testing of a Prototypical Vogtle I and 2 Strainer Assembly
A,./ L I0 ,..~0 N Document No: ALION-CAL-SNC-7410-005 Revision: I Page: 34 of 127
Day 1 - Head Loss & Approach Velocity Profile
0.35 -
0.30
0.25
•, 0.20
O
-I0.15
0.0
0.100
5:20:00
I
*L .
• L , Inital t'• I•J'.m l• .......
* lwwe -i•ll~lq•l-T
1 . - B I S'.... ......... ........ ..... ...... .........
-0.018
0.016
0.014 _o
0.012
0 00
0.016 ".0
eU-
4-
0.002
-0
:12 AM)PMI
!
6:17:36PM 7:15:12 PM 8:12:48 PM 9:10:24PM 10:08:00 PM 11:05:36 PM
Time (H:MM:SS AMIPM)
-Head Loss •- - . Flow Adjustment '- Drain DOwn -Velocity
12:03
Figure 3.4- I: Test #VOG- I-TB Differential Pressure and Velocity vs. Time - Day I
Use or disclosure of the data contained herein is subject to the restriction on the Cover Page of this report.

9 Head Loss Testing of a Prototypical Vogtle I and 2 Strainer Assembly
,,,.,• ~o ,,.ooON Document No: ALION-CAL-SNC-74 10-005 Revision: I Page: 35 of 127
Day 2 - Head Loss & Approach Velocity Profile
0.60 0.016
0.014
i i , '0.012 ,°
•, 0.4 : 0.
= 0.30 ,o0.008 ,0•03 , • .-.J .. I €a"0 ,' <u-e
.<"0"" 0.06<"t- 0.200'004
S:; :o .=
0.10 I 0.0 I--
I.
0.00 0.00011:50:00 PM 4:38:00 AM 9:26:00 AM 2:14:00 PM 7:02:00 PM 11:50:00 PM
Time (H:MM:SS AM/PM)
-Head Loss - Drain Down -Velocity
Figure 3.4-2: Test #VOG- I-TB Differential Pressure and Velocity vs. Time - Day 2
Use or disclosure of the data contained herein is subject to the restriction on the Cover Page of this report.

9l Head Loss Testing of a Prototypical Vogtle I and 2 Strainer Assembly
/%kION Document No: ALION-CAL-SNC-74 10-005 Revision: I Page: 36 of 127
Day 3 - Head Loss & Approach Velocity Profile
I-a)
4-Cu
InIn0-J
(Ua)
1.60
1.40
1.20
1.00
0.80
0.60
0.40
0.20
0.0011:50:00 PM
'C,
'0..
I
, .
,'I-
,0
0.016
2 0.014
!J0.012
* 0.010
0.008
*0.006
I0.004
*0.002
-J 0.000
11:50:00 PM
C.)0
C.)
.2
a.0.
(-
l-
4:38:00 AM 9:26:00 AM 2:14:00 PM 7:02:00 PM
Time (H:MM:SS AMIPM)
-Head Loss .... Flow Adjustment - -- Drain Down -VelocitY
Figure 3.4-3: Test #VOG- I-TB Differential Pressure and Velocity vs. Time - Day 3
Use or disclosure of the data contained herein is subject to the restriction on the Cover Page of this report.
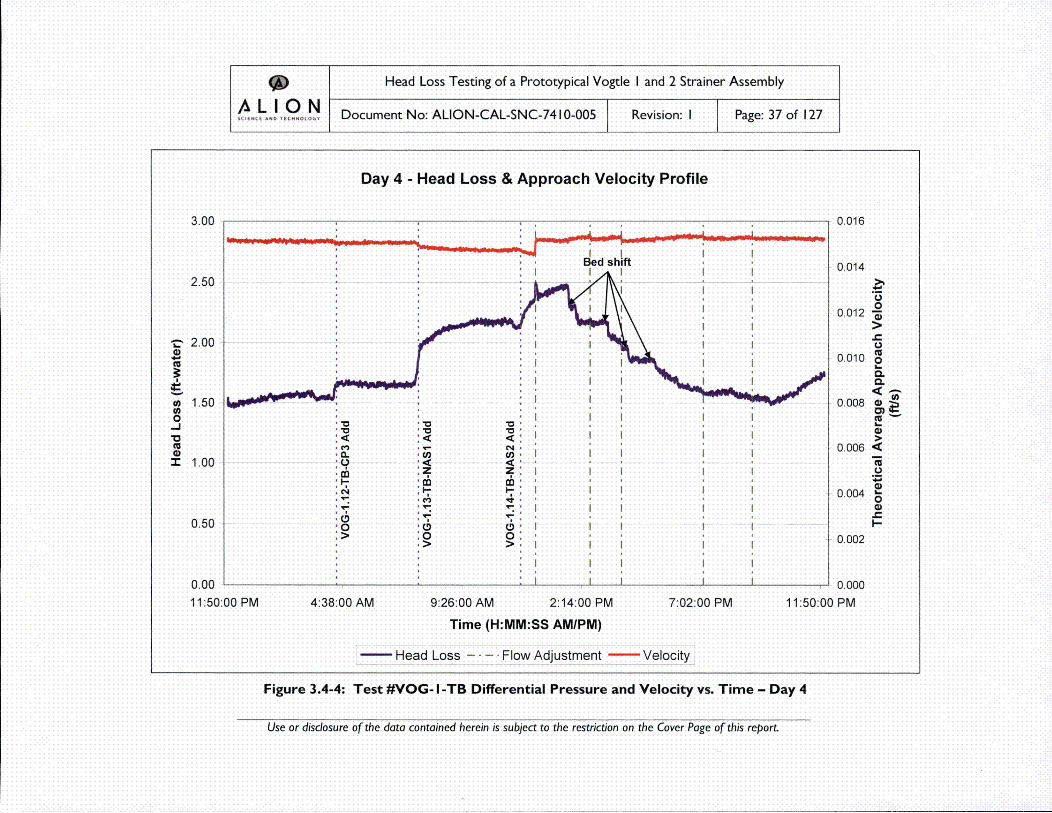
9 Head Loss Testing of a Prototypical Vogtle I and 2 Strainer Assembly
L.o ,0.oo.ON Document No: ALION-CAL-SNC-74 10-005 Revision: I Page: 37 of 127
Day 4 - Head Loss & Approach Velocity Profile
3.00
2.50
v2.00
1.5
0I 1.500
:I I'I ,I I
''0.
''0
'II
,uc O I I
"', "C,
'• g'I I
'> I
II
\ . .
__ _0.016
0.014
U0.012 •
U
0.010 0
F0.006 <1
0 00
0.0062
0.0040
11:50:00 PM
0.50
0.0011:50:00 PM 4:38:00 AM 9:26:00 AM 2:14:00 PM 7:02:00 PM
Time (H:MM:SS AMIPM)
- Head Loss -.... Flow Adjustment - Velocity
Figure 3.4-4: Test #VOG- I -TB Differential Pressure and Velocity vs. Time - Day 4
Use or disclosure of the data contained herein is subject to the restriction on the Cover Page of this report.

9 Head Loss Testing of a Prototypical Vogtle I and 2 Strainer Assembly
AL,./ LI O N Document No: ALION-CAL-SNC-74 10-005 Revision: I Page: 38 of 127
Day 5 - Head Loss & Approach Velocity Profile
4.00
3.50
3.00
,2.50
Oa, 2.00
"o
Cu1.50
1.00
0.50
0.0011:50:00 PM 2:14:00 AM
,'o
.4,'I-* 10.
0.018i I
0.016
0.014 •)
I11
0,.1 0.0100.-
, 0,
I EI-, . 0.006~
L~ ": ! 0.004 =* . 0' • 0.0
I I *.b ' -<1)
I I 0.002
2:14:00 PM 4:38:00 PM
Final .- €
Flowsweep ••1.1 6-TB-FFS
4:38:00 AM 7:02:00 AM 9:26:00 AM 11:50:00 AM
Time (H:MM:SS AMIPM)
-Head Loss-...voG1i.1 15-TB-NAS3 Add ....- Flow Adjustment -Velocity
Figure 3.4-5: Test #VOG- I -TB Differential Pressure and Velocity vs. Time - Day 5
Use or disclosure of the dota contained herein is subject to the restriction on the Cover Page of this report.
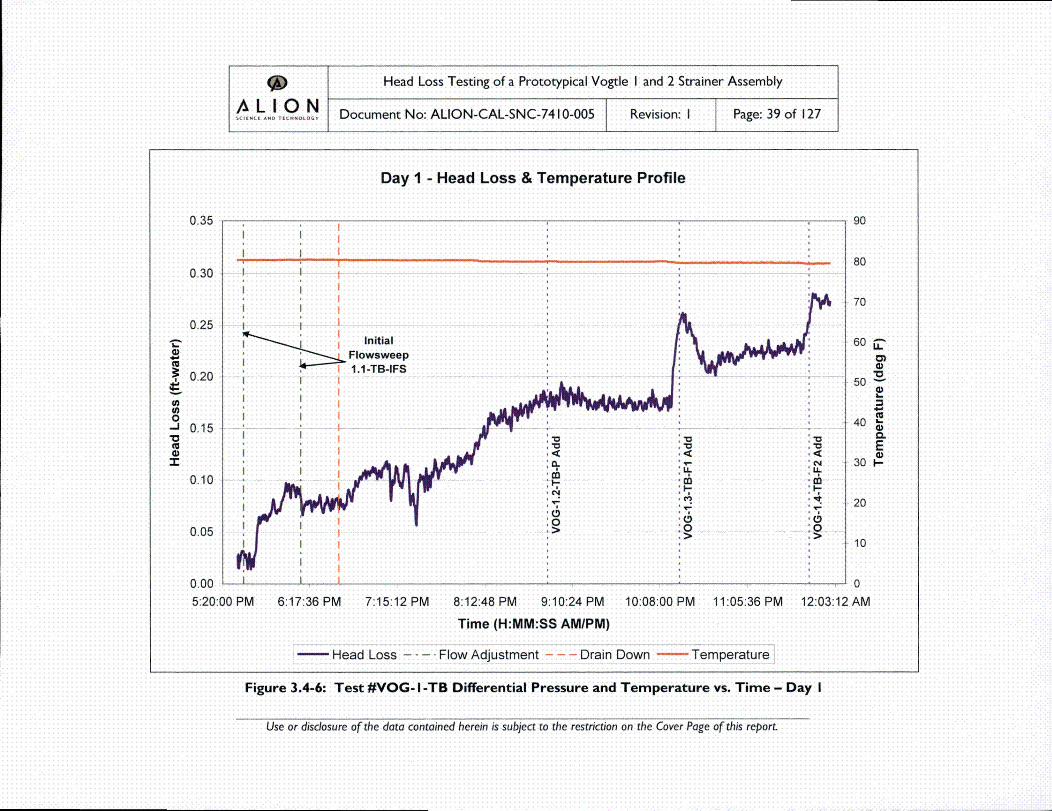
9 Head Loss Testing of a Prototypical Vogtle I and 2 Strainer Assembly
,,,.,/ .. ,_~o.ON Document No: ALION-CAL-SNC-74 10-005 Revision: I Page: 39 of 127
Day I - Head Loss & Temperature Profile
0.35
0.30
0.25
0.1
4--
I I
I I
* II I
I Initial'*• Flowsweep* I 1.1-TB-IFS
I
II
I I ID:'
I I ,•,
:,,'7'I
I I1
90
80
70
60 •
50"
20
100.10
0.05
n3 no( -^!
|
!
5:20:00 PM 6:17:36 PM 7:15:12 PM 8:12:48 PM 9:10:24 PM 10:08:00 PM 11:05:36 P
Time (H:MM:SS AMIPM)
-Head Loss ....- Flow Adjustment - - - Drain Down -Temperature
M 12:03:12 AM
Figure 3.4-6: Test #VOG- I-TB Differential Pressure and Temperature vs. Time - Day I
Use or disclosure of the data contained herein is subject to the restriction on the Cover Page of this report.

Day 2 - Head Loss & Temperature Profile
0.60 . i90
.... L, "80
0.50 7
J ,c
:5 500 0.30 0 .0.J'
A< u. u.- E= 0.20 .. -• :0 E 301-
I- ., 0
,, ,C ,
- .=,20.:, *° .>0
0130
* . E 10* * I,
0.00 '011:50:00 PM 4:38:00 AM 9:26:00 AM 2:14:00 PM 7:02:00 PM 11:50:00 PM
Time (H:MM:SS AMIPM)
-Head Loss - - - Drain Down - Temperature
Figure 3.4-7: Test #VOG- I-TB Differential Pressure and Temperature vs. Time - Day 2
Use or disclosure of the data contained herein is subject to the restriction on the Cover Page of this report.

* Head Loss Testing of a Prototypical Vogtle I and 2 Strainer Assembly
A• L I 0 N Document No: ALION-CAL-SNC-74 10-005 Revision: I Page: 41 of 127
Day 3 - Head Loss & Temperature Profile
4ID
1.60
1.40
1.20
1.00
0.80
0.60
0.40
0.20
0.0011:50:00 PM
'i90
ii70
,I 60 j
' 50•
E
mt 20
I 10
L 0
11:50:00 PM4:38:00 AM 9:26:00 AM 2:14:00 PM 7:02:00 PM
Time (H:MM:SS AMIPM)
- Head Loss ....- Flow Adjustment - -- Drain Down - Temperature
Figure 3.4-8: Test #VOG- I-TB Differential Pressure and Temperature vs. Time - Day 3
Use or disclosure of the data contained herein is subject to the restriction on the Cover Page of this report.

9• Head Loss Testing of a Prototypical Vogtle I and 2 Strainer Assembly
•,..• .I ,°.~oON Document No: ALION-CAL-SNC-74 10-005 Revision: I Page: 42 of 127
Day 4 - Head Loss & Temperature Profile
3.00
2.50
-~2.00
0 1.50 •,M•0-J
.. Z 1.00
0.50
0.0011 50:00 PM
80
70
60 •
50
4'
40
20
10
20
11:50:00 PM4:38:00 AM 9:26:00 AM 2:14:00 PM 7:02:00 PM
Time (H:MM:SS AMIPM)
Head Loss ....- Flow Adjustment - Temperature
Figure 3.4-9: Test #VOG- I-TB Differential Pressure and Temperature vs. Time - Day 4
Use or disclosure of the data contained herein is subject to the restriction on the Cover Page of this report.
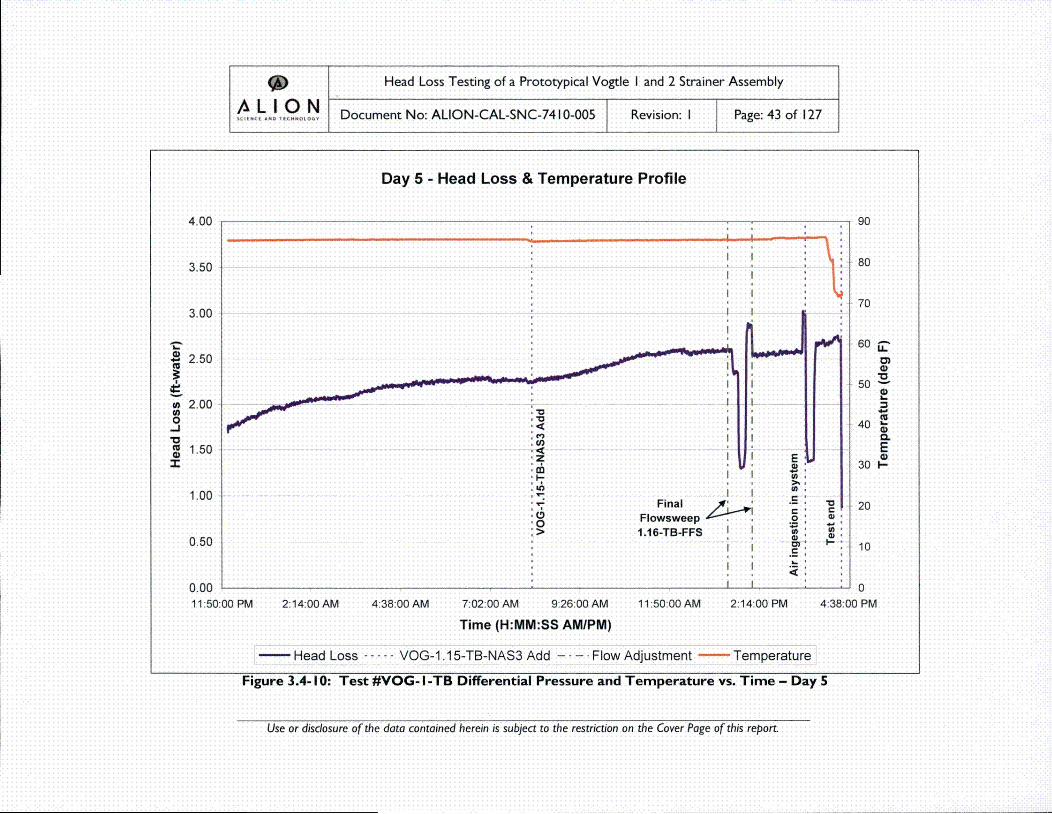
9 Head Loss Testing of a Prototypical Vogtle I and 2 Strainer Assembly
LION Document No: ALION-CAL-SNC-74 10-005 Revision: I Page: 43 of 127
Day 5 - Head Loss & Temperature Profile
4.00
3.50
3.00
2.50
o2.00
(U1.50
90
80
70
60
50
40
30
:1,
* 01.00
0.50
Final 'Flowsweep1.16-TB-FFS I0
I I
I I
I-
20
10
on L3(11:50:00 PM
' ' U
2:14:00 AM 4:38:00 AM 7:02:00 AM 9:26:00 AM 11:50:00 AM 2:14:00 PM
Time (H:MM:SS AM/PM)
-Head Loss ... VOG-1 .1 5-TB-NAS3 Add .... Flow Adjustment - Temperature
4:38:00 PM
Figure 3.4-1I0: Test #VOG- I -TB Differential Pressure and Temperature vs. Time - Day 5
Use or disclosure of the data contained herein is subject to the restriction on the Cover Page of this report.

*~ Head Loss Testing of a Prototypical Vogtle I and 2 Strainer Assembly
L.o T.oooON Document No: ALION-CAL-SNC-74 10-005 Revision: I Page: 44 of 127
Day I - Head Loss & Turbidity Profile
0.35
0.30
0.25
0.20
0.15
U-r
1200
"• 1100
1000p900800
700 I-z
* 600
-o 500 "
1- -4. 00
o 200
12:03:12 AM
0.10 , •
Ii I
AnnnI
5:20:00PM 6:17:,36 PM 7:15:12 PM 8:12:48 PM 9:10:24 PM 10:08:00 PM 11:05:3(
Time (H:MM:SS AMIPM)
-Head Loss ... -. Flow Adjustment - Drain Down -Turbidity
SPM
Figure 3.4-I I: Test #VOG- I-TB Differential Pressure and Turbidity vs. Time - Day I
Use or disclosure of the data contained herein is subject to the restriction on the Cover Page of this report.
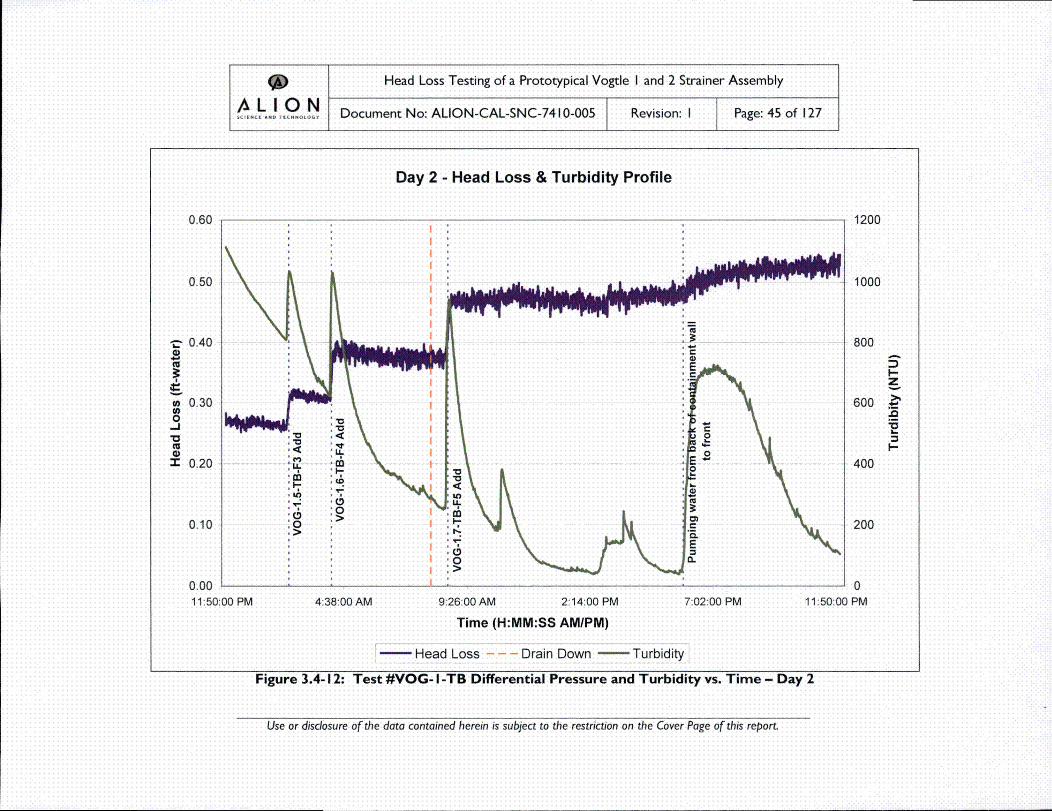
9 Head Loss Testing of a Prototypical Vogtle I and 2 Strainer Assembly
A,..•LI0 .. ~O N Document No: ALION-CAL-SNC-74 10-005 Revision: I Page: 45 of 127
Day 2 - Head Loss & Turbidity Profile
0.60
0.50 Nv~0.40
04.J
(U
0
-Z 0.20
0.10
I
1200
1000
800
600 _•'
400
200
'I01
0.00 ___
1 1:50:00 PM 4:38:00 AM 9:26:00 AM 2:14:00 PM 7:02:00 PM
Time (H:MM:SS AM/PM)
-Head Loss - - - Drain Down -- Turbidity
J011:50:00 PM
Figure 3.4-12: Test #VOG- I-TB Differential Pressure and Turbidity vs. Time - Day 2
Use or disclosure of the data contained herein is subject to the restriction on the Cover Page of this report.

9 Head Loss Testing of a Prototypical Vogtle I and 2 Strainer Assembly
A•,o/ Ll I,, 0o, N Document No: ALION-CAL-SNC-74 10-005 Revision: I Page: 46 of 127
Day 3 - Head Loss & Turbidity Profile
.- I
1.60
1.40
1.20
1,00
0,80
0.60
0,40 (I'
0,20 N
0.00
11:50:00 PM
1000
900
i800
i700
;600 •I
S400
I300
S200
i100
11:50:00 PM4:38:00 AM 9:26:00 AM 2:14:00 PM 7:02:00 PM
Time (H:MM:SS AM/PM)
'- Flow Adjustment -- _ Drain Down - Turbidity-Head Loss
Figure 3.4-13: Test #VOG- I-TB Differential Pressure and Turbidity vs. Time - Day 3
Use or disclosure of the data contained herein is subject to the restriction on the Cover Page of this report.

* Head Loss Testing of a Prototypical Vogtle I and 2 Strainer Assembly
AL I0 ,.o0 N Document No: ALION-CAL-SNC-74 10-005 Revision: I Page: 47 of 127
Day 4 - Head Loss & Turbidity Profile
3.00
2.50
"D 2.00
0 1.500,.J
.Z 1.00
0.50
'"0
I ed sI ift
z
0 0'o 0'
I
I
I
1;I
I
I
800
700
600
500-
400 .'
300 I--
200
100
0
11:50:00 PM0.0011:50:00 PM 4:38:00 , AM9:26:00 AM 2:14:00 PM 7:0;
Time (H:MM:SS AM/PM)
Head Loss ....- Flow Adjustment - Turbidity
2:00 PM
Figure 3.4-14: Test #VOG- I -TB Differential Pressure and Turbidity vs. Time - Day 4
Use or disclosure of the data contained herein is subject to the restriction on the Cover Page of this report.
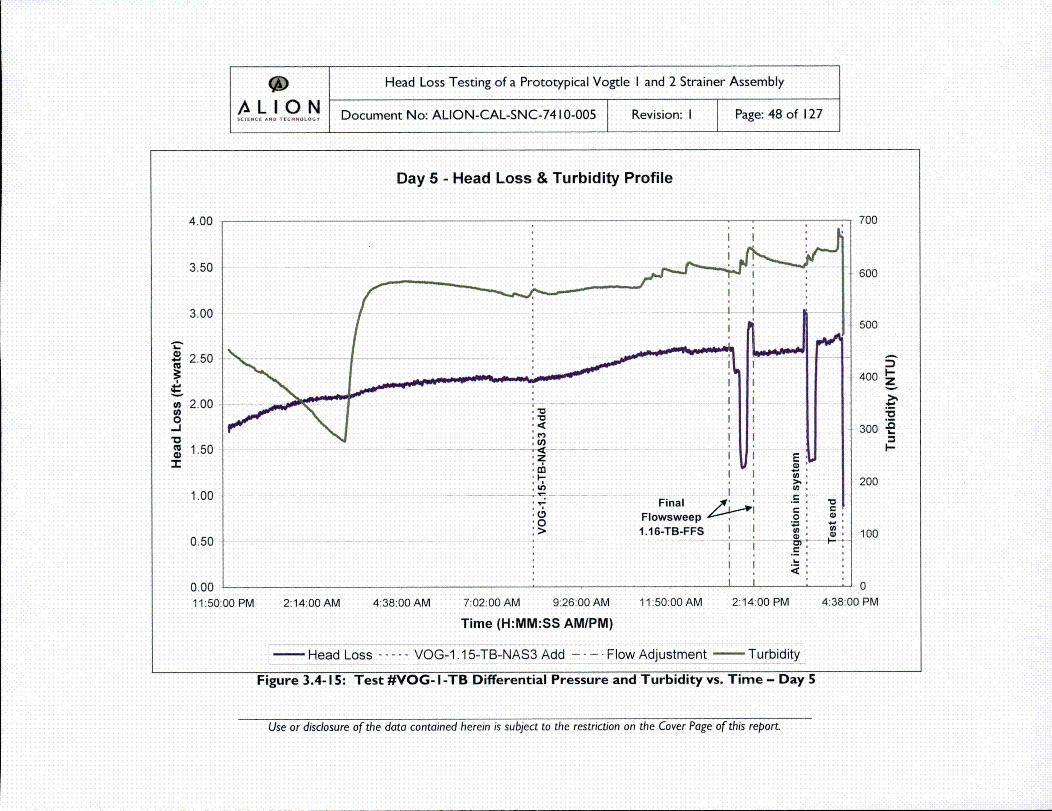
9t Head Loss Testing of a Prototypical Vogtle I and 2 Strainer Assembly
AL,.,/ L.I ..O N Document No: ALION-CAL-SNC-74 10-005 Revision: I Page: 48 of 127
Day 5 - Head Loss & Turbidity Profile
I..J"S
4.00
3.50
3.00
2.50
2.00
1.50
1.00
0.50
0.0011:50:00 PM
I I
Hr700
600
5OO
400
300
1-
200
100
0)
,I-* z
,*0I I IFinal ,__j ,Flowsweep i
1.16-TB-FFS I I
I ;
I I
U.E
0~
0,
0~
00~
I-.-
|
|
J O2:14:00 AM 4:38:00 AM 7:02:00 AM 9:26:00 AM 11:50:00 AM 2:14:00 PM
Time (H:MM:SS AMIPM)
-- Head Loss-...VOG-1 .1 5-TB-NAS3 Add -.... Flow Adjustment -- Turbidity
4:38:00 PM
Figure 3.4-I5: Test #VOG- I -TB Differential Pressure and Turbidity vs. Time - Day 5
Use or disclosure of the data contained herein is subject to the restriction on the Cover Page of this report.
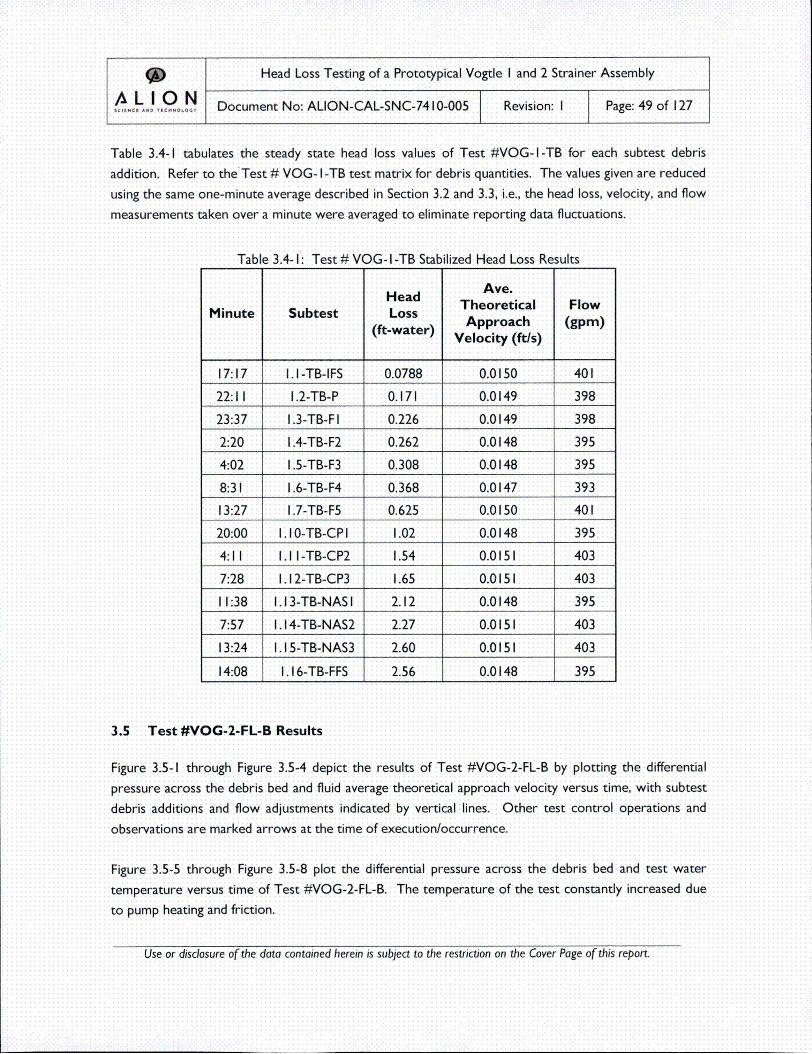
Table 3.4-I tabulates the steady state head loss values of Test #VOG- I-TB for each subtest debrisaddition. Refer to the Test # VOG- I-TB test matrix for debris quantities. The values given are reduced
using the same one-minute average described in Section 3.2 and 3.3, i.e., the head loss, velocity, and flow
measurements taken over a minute were averaged to eliminate reporting data fluctuations.
Table 3.4- I: Test # VOG- I-TB Stabilized Head Loss Results
Head Ave.Theoretical Flow
Minute Subtest Loss Apoc gm(ft-water) Velocity (ft/s)
17:17 1.1I-TB-IFS 0.0788 0.0150 401I
22:11I 1.2-TB-P 0.171 0.0149 398
23:37 1.3-TB-FlI 0.226 0.0149 398
2:20 I1.4-TB-F2 0.262 0.0148 395
4:02 1 .5-TB-F3 0.308 0.0148 395
8:31 1 .6-TB-F4 0.368 0.0147 393
13:27 I1.7-TB-F5 0.625 0.0150 401I
20:00 I.lI0-TB-CP I 1.02 0.0148 395
4:1 I 1 . II-TB-CP2 1.54 0.0151 403
7:28 I. 12-TB-CP3 1.65 0.0151 403
I11:38 l. 13-TB-NAS I 2.12 0.0148 395
7:57 I. 14-TB-NAS2 2.27 0.0151 403
13:24 I.l15-TB-NAS3 2.60 0.0151 403
14:08 I. I16-TB-FFS 2.56 0.0148 395
3.5 Test #VOG-2-FL-B Results
Figure 3.5-I through Figure 3.5-4 depict the results of Test #VOG-2-FL-B by plotting the differential
pressure across the debris bed and fluid average theoretical approach velocity versus time, with subtest
debris additions and flow adjustments indicated by vertical lines. Other test control operations and
observations are marked arrows at the time of execution/occurrence.
Figure 3.5-5 through Figure 3.5-8 plot the differential pressure across the debris bed and test water
temperature versus time of Test #VOG-2-FL-B. The temperature of the test constantly increased due
to pump heating and friction.
Use or disclosure of the data contained herein is subject to the restriction on the Cover Page of this report.

9 Head Loss Testing of a Prototypical Vogtle I and 2 Strainer Assembly
LION Document No: ALION-CAL-SNC-74 10-005 Revision: I Page: 50 of 127
Figure 3.5-9 through Figure 3.5-12 plot the differential pressure across the debris bed and test turbidity
versus time of Test #VOG-2-FL-B. Each debris addition spiked the turbidity of the water and then
decreased as particulate matter was slowly filtered out of the water by the thin debris bed.
A few bed reformations were observed during the main portion of Test #VOG-2-FL-B just after the first
addition of calcium phosphate (VOG-2.6-FL-CP I).
Use or disclosure of the data contained herein is subject to the restriction on the Cover Page of this report

9 Head Loss Testing of a Prototypical Vogtle I and 2 Strainer Assembly
,,,,,• .0 ,..ooON Document No: ALION-CAL-SNC-74 10-005 Revision: I Page: 51 of 127
Day I - Head Loss & Approach Velocity Profile
0
-!-
5.0 +•II
4.5 I
4.0 I
.1
1t2.5 hl
I1
2.0 JlI
III
ii'
0.5 Hil
onn
0.018
0.016
0.014
0.012
0.010
0.008
0.006
0.004
0.002
1____ 0 000'
a,
0
_0
(U0
0,(U
I-0
(Uu
*10o.0)
l-
11:40:00 PM I 4:28:00 AM 9:16:00 AM 2:04:00 PM 6:52:00 PM 11:40:0
Time (H:MM:SS AM/PM)
-- Head Loss -.... Flow Adjustment - - - Drain Down .... Tank Fill -- Velocity
)0 PM
Figure 3.5- I: Test #VOG-2-FL-B Differential Pressure and Velocity vs. Time - Day I
Use or disclosure of the data contained herein is subject to the restriction an the Cover Page of this report.
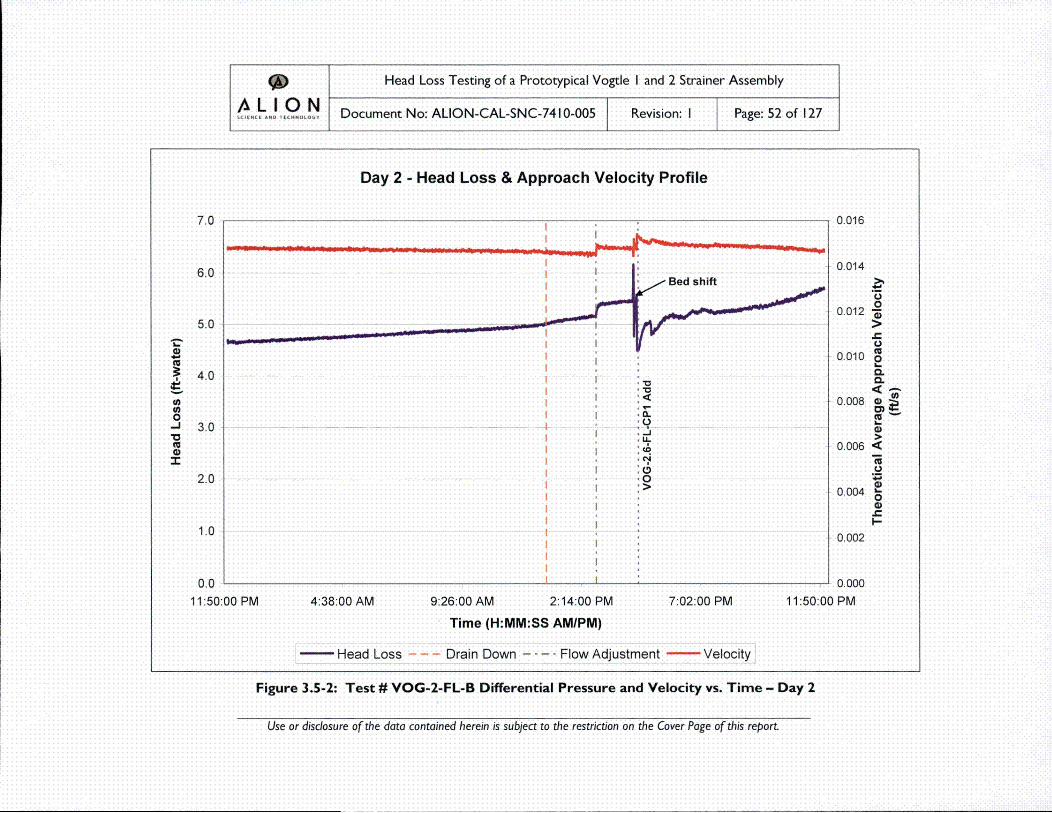
9 Head Loss Testing of a Prototypical Vogtle I and 2 Strainer Assembly
AL,.,/ LI0,,.~O N Document No: ALION-CAL-SNC-74 10-005 Revision: I Page: 52 of 127
Day 2 - Head Loss & Approach Velocity Profile
0_10o
-J
7,0
6.0
5.0
4.0
3.0
2.0
1.0
0.011:50:00 PM
I1Bed shift
. .............. _ .... __ ._ i
I IOI C.)
* A.-
I I.
I:o.
4:38:00 AM 9:26:00 AM 2:14:00 PM 7:02:00 PM
Time (H:MM:SS AMIPM)
Head Loss - - - Drain Down '- --. Flow Adjustment - Velocity
__ _0.016
00io~14
0.012 _o
0.0100a-0.
0.0068'
a)0.0064~
4--
0.004
0.002
11:50:00 PM
Figure 3.5-2: Test # VOG-2-FL-B Differential Pressure and Velocity vs. Time - Day 2
Use or disclosure of the data contained herein is subject to the restriction on the Cover Page of this report.
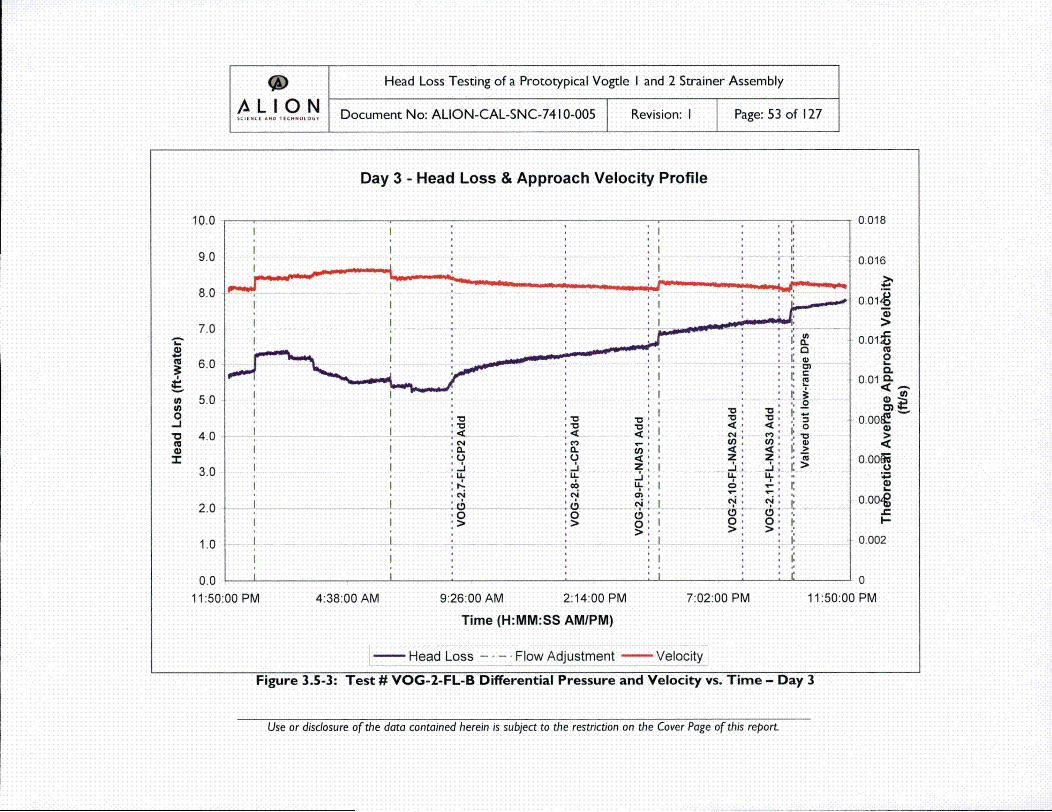
*J Head Loss Testing of a Prototypical Vogtle I and 2 Strainer Assembly
,,,.,/ L.1 --~o.O N Document No: ALION-CAL-SNC-74 10-005 Revision: I Page: 53 of 127
Day 3 - Head Loss & Approach Velocity Profile
U.0o.(U
"00
10.0
9.0
8.0
7.0
6.0
5.0
4.0
3.0
2.0
1.0
0.011:50:(3
I :. I. : , ,: .:
C . ' ... ..... . . ... Z_:- Z-- - - - - ,
I II O .
I " • :
:<*<C< I:
:I. , . ','1 :
' I , . I
0.018
0.016
0 .01,8
0.01•
0.0.01 0.
0
0.00,w
I-"
0.002
)0 PM00 PMi I I I
4:38:00 AFM 9:26:00 AM 2:14:00 PM 7:0,•
Time (H:MM:SS AMIPM)
-Head Loss .... Flow Adjustment - Velocity
2:00 PM 11: 50:0
Figure 3.5-3: Test # VOG-2-FL-B Differential Pressure and Velocity vs. Time - Day 3
Use or disclosure of the data contained herein is subject to the restriction on the Cover Page of this report.

9 Head Loss Testing of a Prototypical Vogtle I and 2 Strainer Assembly
A0,./ L 01 .oo0 N Document No: ALION-CAL-SNC-74 10-005 Revision: I Page: 54 of 127
Day 4 - Head Loss & Approach Velocity Profile
16.0
14.0
12.0
.a 10.0
(A8.0(,
0 6.0
* i. j I i
I *I"
Flowsweep I. ! "t2.1 2-FL-FFS I"••
0.018
0.016
0.014 (.
0.012 o
0.000 ,00 0
0.008
0.006 o
I.-
0.0042
0.000
)O PM
4.0
2.0
0.0
11:50:000 PM 3:26:00 AM 7:02:00 AM 10:38:00 AM 2:14:00 PM 5:50:00 PM
Time (H:MM:SS AMIPM)
Head Loss .... Flow Adjustment - Velocity
9:26:C
Figure 3.5-4: Test # VOG-2-FL-B Differential Pressure and Velocity vs. Time - Day 4
Use or disclosure of the data contained herein is subject to the restriction on the Cover Page of this report.

9 Head Loss Testing of a Prototypical Vogtle I and 2 Strainer Assembly
Ac,./ L.I.01 ,.oo N Document No: ALION-CAL-SNC-7410-005 Revision: I Page: 55 of 127
Day I - Head Loss & Temperature Profile
I..0(U
000
-J*0CU0I
5.0
4.5
4.0
3.5
3.0
2.5
2.0
1.5
1.0
0.5
90
80
70
60"-
50"-"
4-
0.E
30 I--
20
10
0
PM0.0 L- n--
11:40:00 PM 4:28:00 AM 9:16:00 AM 2 04 00 PM 6:52:00 PM 11:40:00
Time (H:MM:SS AMIPM)
- Head Loss - - - - Flow Adjustment --- Drain Down -. - - Tank Fill - Temperature
Figure 3.5-5: Test #VOG-2-FL-B Differential Pressure and Temperature vs. Time - Day I
Use or disclosure of the data contained herein is subject to the restricton on the Cover Page of this report.

9D Head Loss Testing of a Prototypical Vogtle I and 2 Strainer Assembly
AL..o0 N Document No: ALION-CAL-SNC-74 10-005 Revision: I Page: 56 of 127
Day 2 - Head Loss & Temperature Profile
4--
7.0
6.0
5.0
4.0
3.0
2.0
1.0
90
80
70
60 •
50)
20
50
0.0 J-__11:50:00 PM 4:38:00 AM 9:26:00 AM 2:14:00 PM 7:02:00 PM
Time (H:MM:SS AM/PM)
-- Head Loss - -- Drain Down -.... Flow Adjustment - Temperature
Jo11:50:00 PM
Figure 3.5-6: Test # VOG-2-FL-B Differential Pressure and Temperature vs. Time - Day 2
Use or disclosure of the data contained herein is subject to the restriction on the Cover Page of this report.
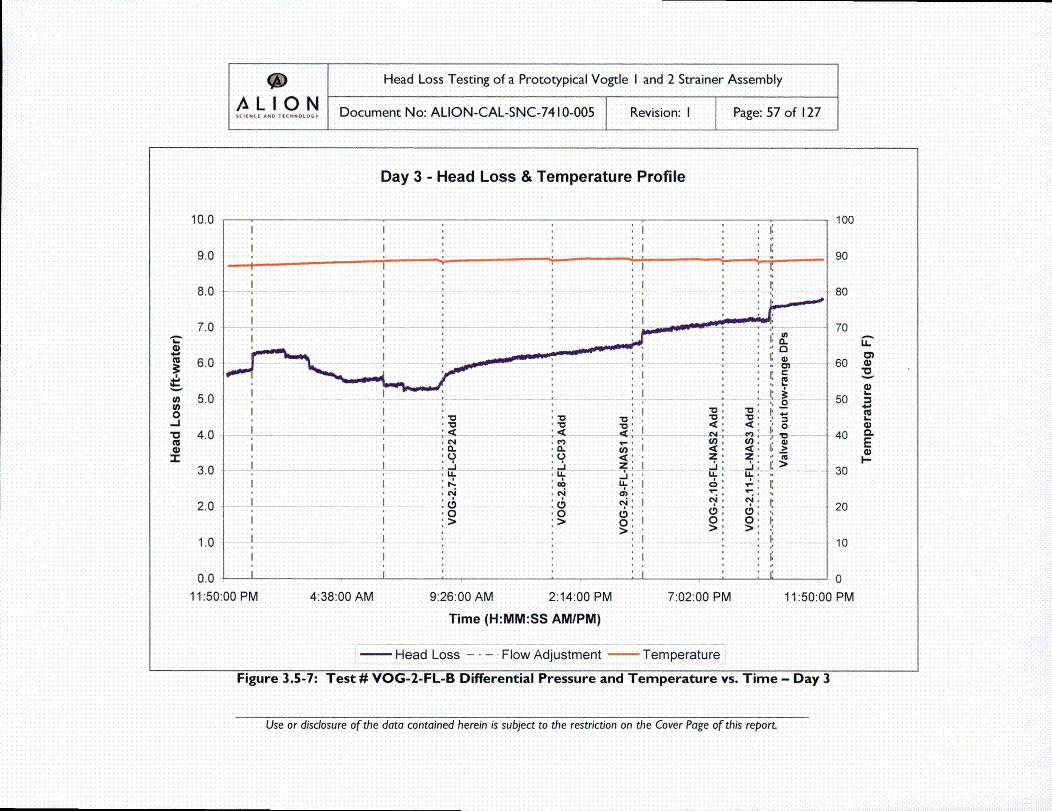
Day 3 - Head Loss & Temperature Profile
I.J"o.4.
10.0
9.0
8.0
7.0
6.0
5.0
4.0
3.0
2.0
1.0
0.0
11:50:1
II * 1 '. I
II * 1, ' I:
, : .~ ,... 4 ., .--- 0
, o: - •
' 2,: o>
.0"0 " O I:
, < < ,! >,'
II,' z 'I ' .
100
90
80
60 "
50 "•
40 E-E)
I,-30
20
10
0
)0 PMO0 PM 4:38:00 AM 9:26:00 AM 2:14:00 PM 7:02:00 PM
Time (H:MM:SS AM/PM)
Head Loss ....- Flow Adjustment - Temperature
11:50:0
Figure 3.5-7: Test # VOG-2-FL-B Differential Pressure and Temperature vs. Time - Day 3
Use or disclosure of the data contained herein is subject to the restriction on the Cover Page of this report.

Day 4 - Head Loss & Temperature Profile
16.0
14.0
12.0
4~10.0
e 8.00
6,
I 1-
, , . I
* I I
.0I
,lowsee . * =a::* *• 71-l iF . I I ::.* * .. .. .. .. ..I .I
I I
-100
90
80
70
60
.• 50
30
30
20
10
6:00 PM
0)
L.
0
EI-
4.0
2.0
0.011:50:00 PM 3:26:00 AM 7:02:00 AM 10:38:00 AM 2:14:00 PM 5:50:00 PM
Time (H:MM:SS AM/PM)
Head Loss ....- Flow Adjustment - Temperature
9:2(
Figure 3.5-8: Test # VOG-2-FL-B Differential Pressure and Temperature vs. Time - Day 4
Use or disclosure of the data contained herein is subject to the restriction on the Cover Page of this report.
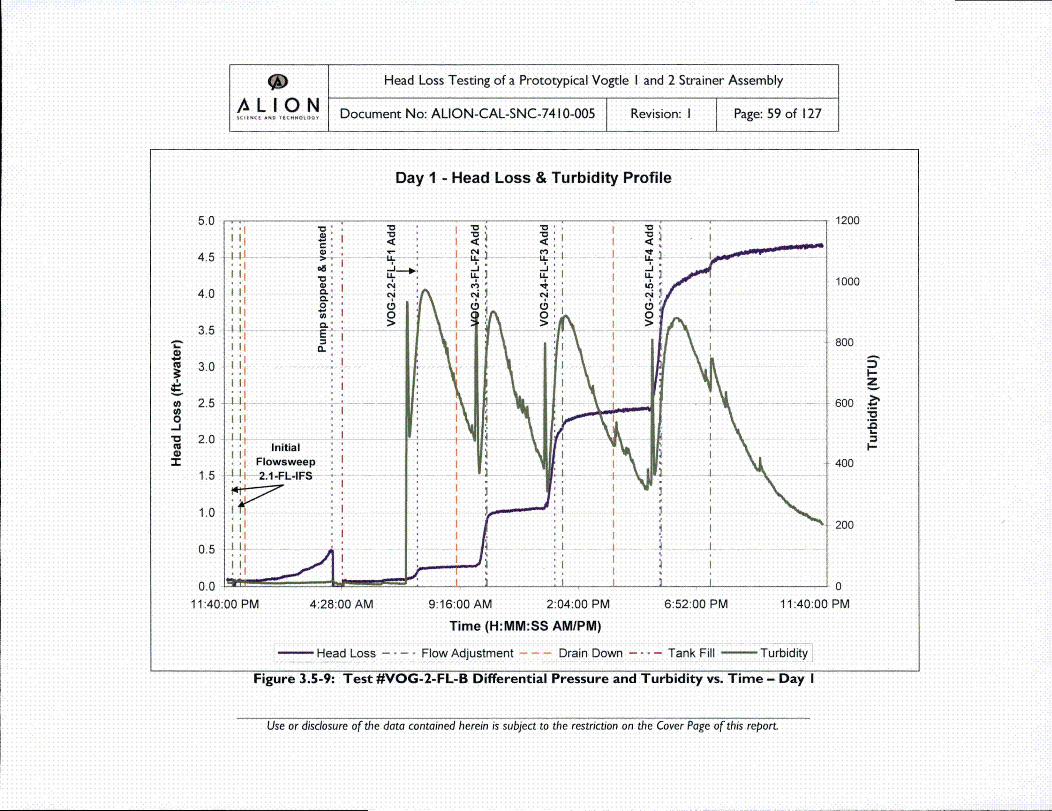
9D Head Loss Testing of a Prototypical Vogtle I and 2 Strainer Assembly
,•,.,• ..1,,.ooON Document No: ALION-CAL-SNC-74 10-005 Revision: I Page: 59 of 127
Day I - Head Loss & Turbidity Profile
a-0(U
a,00-J
(U0z
5.0 • -
4.5 H11
4.0 H1I
Iii
Iiil
III
'II
2.0 Ji'
1.5 ill 2
1.0
iil
0.0
11:40:00 PM
,: 1200
800
4600
I 200
6:52:00 PM 11:40:00 PM
"Tank Fill -- Turbidity
4:28:00 AM
Head Loss
9:16:00 AM 2:04:00 PM
Time (H:MM:SS AM/PM)
Flow Adjustment - - - Drain Down
Figure 3.5-9: Test #VOG-2-FL-B Differential Pressure and Turbidity vs. Time - Day I
Use or disclosure of the data contained herein is subject to the restriction on the Cover Page of this report.

9D Head Loss Testing of a Prototypical Vogtle I and 2 Strainer Assembly
A•..•L~o I°.~O N Document No: ALION-CAL-SNC-74 10-005 Revision: I Page: 60 of 127
Day 2 - Head Loss & Turbidity Profile
7.0 900
8006.0
700
5.0
I "I 600
~500
o I400"1 3.0 -J-
20 .o
300
1.0 10
0.0 II 0
11:50:00 PM 4:38:00 AM 9:26:00 AM 2:14:00 PM 7:02:00 PM 11:50:00 PM
Time (H:MM:SS AMIPM)
-Head Loss - -- Drain Down ....- Flow Adjustment - Turbidity
Figure 3.5-1I0: Test # VOG-2-FL-B Differential Pressure and Turbidity vs. Time - Day 2
Use or disclosure of the data contained herein is subject to the restriction on the Cover Page of this report.
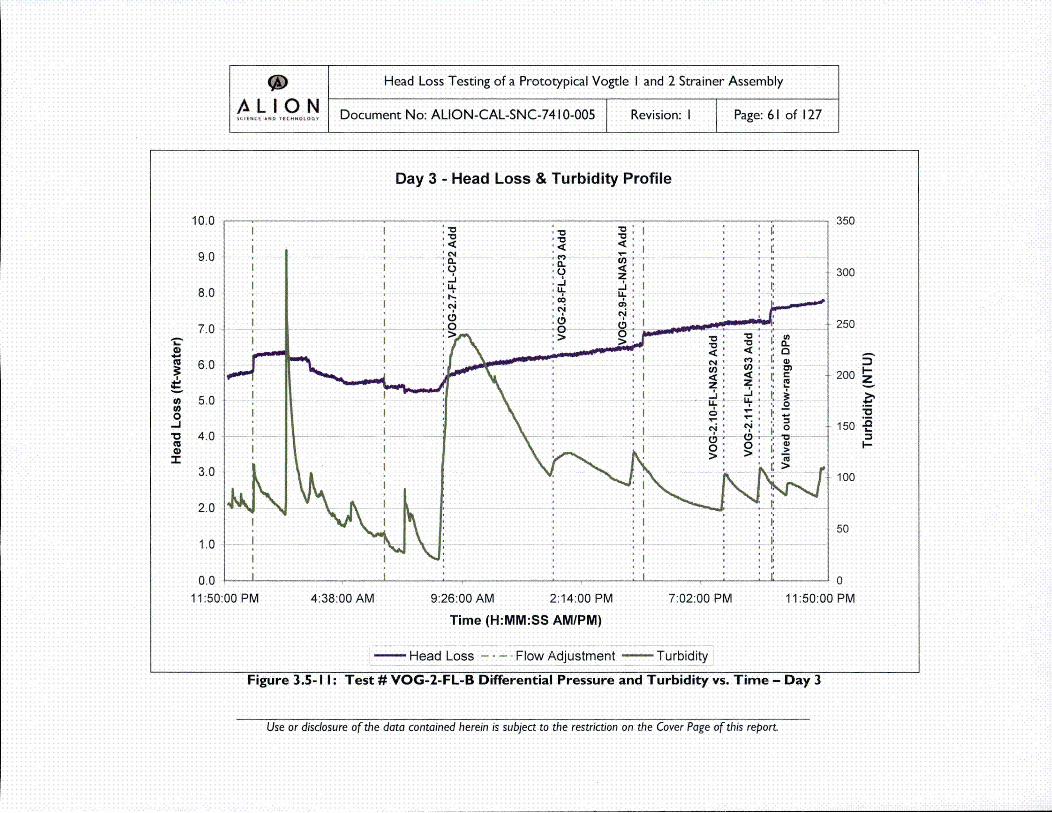
Day 3 - Head Loss & Turbidity Profile
4.J
"-J
10.0-
9.0 ,
8.0 i
7.0
6.04•
5.0
4.0
2.0
1.0
0.0 L
11:50:00 PM
*0...0 *7r
.9 *"C,0
N * N,..
4N(04z-JU-0
N
00
4C')U)4zU-
N
00
* C
, ÷
• N' I:, *t' r.
350
300
"• 250
200
5.
11 15000 P
:i' I'
I E I I I N
4:38:00 AM 9:26:00 AM 2:14:00 PM
Time (H:MM:SS AM/PM)
-Head Loss -: -- FloW Adjustment
7:02:00 PM
-- Turbidity
Figure 3.5- I I: Test # VOG-2-FL-B Differential Pressure and Turbidity vs. Time - Day 3
Use or disclosure of the data contained herein is subject to the restriction on the Cover Page of this report.

* Head Loss Testing of a Prototypical Vogtle I and 2 Strainer Assembly
A•,°/ L.1 I,. 0 o, N Document No: ALION-CAL-SNC-74 10-005 Revision: I Page: 62 of 127
Day 4 - Head Loss & Turbidity Profile
16.0
14.0
12.0
'4. 10.0
a, 8.0
-J
•U 6.0
I 'i
I
1Flowsweep • , a. ..
I ,,
500
400
300
200 -
100
000 PM
4.0
2.0
An111:50:00 PM 3:26:00 AM 7:02:00 AM 10:38:00 AM 2:14:00 PM 5:
Time (H:MM:SS AM/PM)
-Head Loss ....- Flow Adjustment - Turbidity
50:00 PM 9:26:(
Figure 3.5-12: Test # VOG-2-FL-B Differential Pressure and Turbidity vs. Time - Day 4
Use or disclosure of the data contained herein is subject to the restriction on the Cover Page of this report.
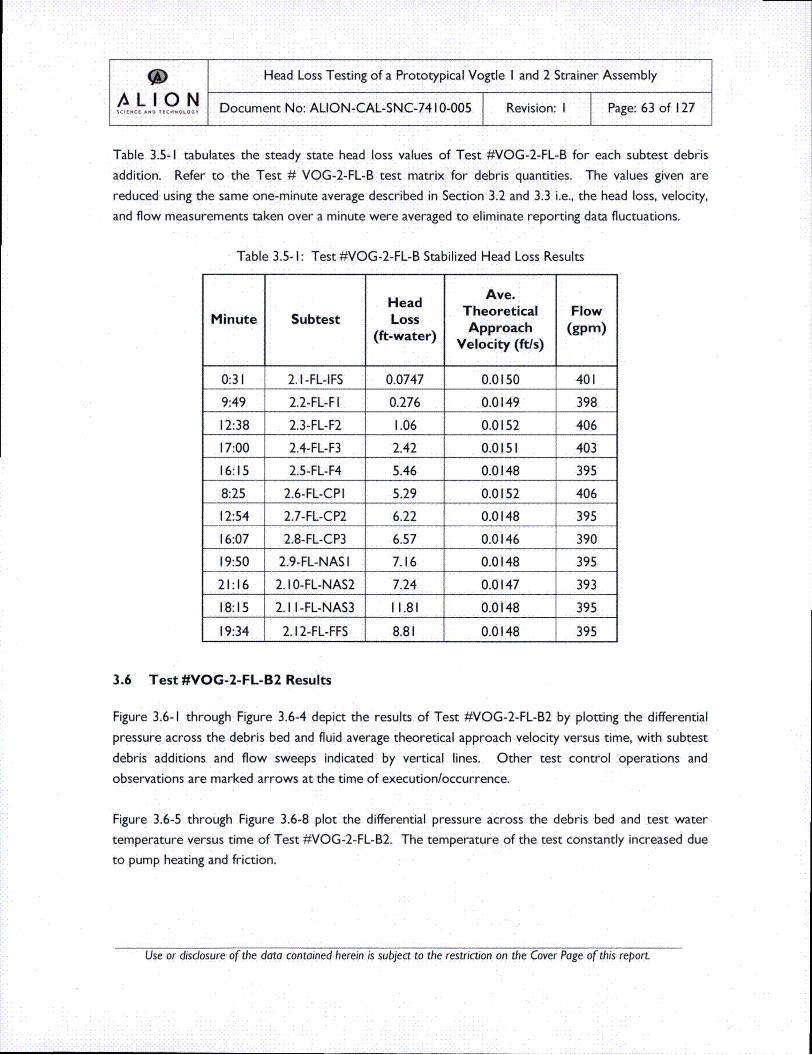
O Head Loss Testing of a Prototypical Vogtle I and 2 Strainer Assembly
LI 0 N Document No: ALION-CAL-SNC-74 10-005 Revision: I Page: 63 of 127
Table 3.5-I tabulates the steady state head loss values of Test #VOG-2-FL-B for each subtest debris
addition. Refer to the Test # VOG-2-FL-B test matrix for debris quantities. The values given are
reduced using the same one-minute average described in Section 3.2 and 3.3 i.e., the head loss, velocity,
and flow measurements taken over a minute were averaged to eliminate reporting data fluctuations.
Table 3.5-I: Test #VOG-2-FL-B Stabilized Head Loss Results
Head Ave.Theoretical Flow
Minute Subtest Loss Apoc gm(ft-water) Velocity (ft/s)
0:31 2.1I-FL-IFS 0.0747 0.0150 401I
9:49 2.2-FL-FlI 0.276 0.0149 398
12:38 2.3-FL-F2 1.06 0.0152 406
17:00 2.4-FL-F3 2.42 0.0151 403
16:15 2.5-FL-F4 5.46 0.0148 395
8:25 2.6-FL-CP I 5.29 0.0152 406
12:54 2.7-FL-CP2 6.22 0.0148 395
16:07 2.8-FL-CP3 6.57 0.0146 390
19:50 2.9-FL-NAS I 7.16 0.0148 395
21 :16 2. I0-FL-NAS2 7.24 0.0147 393
18:15 2.lI I-FL-NAS3 I11.81 0.0148 395
19:34 2.12-FL-FFS 8.81 0.0148 395
3.6 Test #VOG-2-FL-B2 Results
Figure 3.6-I through Figure 3.6-4 depict the results of Test #VOG-2-FL-B2 by plotting the differential
pressure across the debris bed and fluid average theoretical approach velocity versus time, with subtest
debris additions and flow sweeps indicated by vertical lines. Other test control operations and
observations are marked arrows at the time of execution/occurrence.
Figure 3.6-5 through Figure 3.6-8 plot the differential pressure across the debris bed and test water
temperature versus time of Test #VOG-2-FL-B2. The temperature of the test constantly increased due
to pump heating and friction.
Use or disclosure of the data contained herein is subject to the restriction on the Cover Page of this report.

* Head Loss Testing of a Prototypical Vogtle I and 2 Strainer Assembly
L i Document No: ALION-CAL-SNC-74 10-005 Revision: I Page: 64 of 127
Figure 3.6-9 through Figure 3.6-12 plot the differential pressure across the debris bed and test turbidity
versus time of Test #VOG-2-FL-B2. Each debris addition spiked the turbidity of the water and then
decreased as particulate matter was slowly filtered out of the water by the thin debris bed.
A few bed reformations were observed during the main portion of Test #VOG-2-FL-B2 between the
last fibrous debris addition (VOG-2.5-FL-F4) and the first calcium phosphate addition (VOG-2.7-FL-
CP I). Also, a major bed reformation was observed after the last sodium aluminum silicate addition
(VOG-2. I I -FL-NAS3) during a flow adjustment.
Use or disclosure of the data contained herein is subject to the restricton on the Cover Page of this report.

*• Head Loss Testing of a Prototypical Vogtle I and 2 Strainer Assembly
A,.,•L.l ,.oo, N Document No: ALION-CAL-SNC-74 10-005 Revision: I Page: 65 of 127
Day 1 - Head Loss & Approach Velocity Profile
3.50
3.00 I =_
I
2.50 t
2.00 I
'U I
oI I3
"o I I
a) III1.00 Inta "
I Intai Flowsweep
2 -FL-IFS
0.50 , ,
0.00
1:50:00PM 3:1624 PM
*0.018
•• "• 0.016i'0.014
0.012
.... .. / • i!0.010* 1
.• :,0.008
.,1
Ci 0.006
i;0.004
't
,10.002
1(0.000
10:28:24 PM 11:54:48 PM
0_o
(U
h..
0.
I--
4:42:48 PM 6:09:12 PM 7:35:36 PM 9:02:00 PM
Time (H:MM:SS AM/PM)
ad Loss .... Flow Adjustment - -- Drain Down - - Velocity-He
Figure 3.6-I: Test #VOG-2-FL-B2 Differential Pressure and Velocity vs. Time - Day I
Use or disclosure of the data contained herein is subject to the restriction on the Cover Page of this report.

9• Head Loss Testing of a Prototypical Vogtle I and 2 Strainer Assembly
LION Document No: ALION-CAL-SNC-74 10-005 Revision: I Page: 66 of 127
Day 2 - Head Loss & Approach Velocity Profile
7.00
6.00
5.00
S4.00
I00
"I 3.00"U
2.00
1.00
0.0011:50:00 PM
0.018
0.016. 0.014
S ,0.012
o .010
0.008
S0.006
0.0
I 0.002
L...L 0.000
11:50:00 PM
0013
U(U0a-0.0.4-
c0
(U -I.-0
4(UU4..0I-00
I-
4:38:00 AM 9:26:00 AM 2:14:00 PM 7:02:00 PM
Time (H:MM:SS AM/PM)
-Head Loss ....- Flow Adjustment -Velocity
Figure 3.6-2: Test #VOG-2-FL-B2 Differential Pressure and Velocity vs. Time - Day 2
Use or disclosure of the data contained herein is subject to the restriction on the Cover Page of this report.
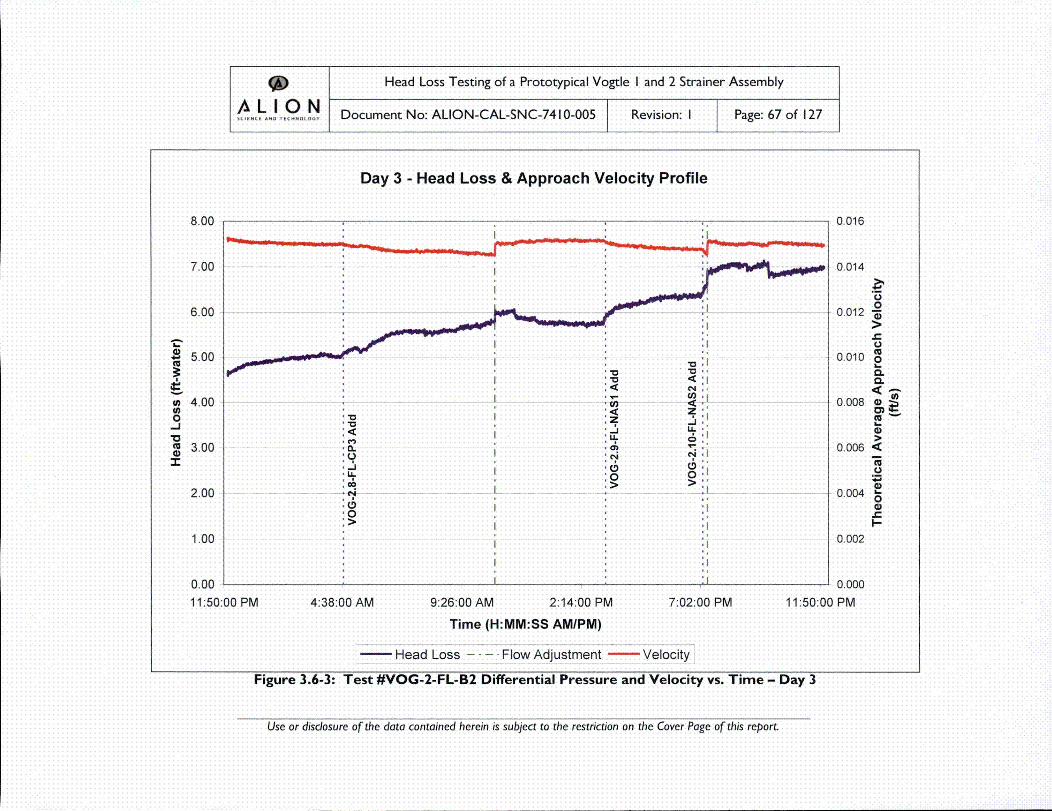
9 Head Loss Testing of a Prototypical Vogtle I and 2 Strainer Assembly
,•,./ L.1 .. o0,ON Document No: ALION-CAL-SNC-74 10-005 Revision: I Page: 67 of 127
Day 3 - Head Loss & Approach Velocity Profile
=,,U
-J-
8.00
7.00
6.00
5.00
4.00
3.00
2.00
1.00
0.00
11:50:1
4 . . .. .,c,
"* -J-J0
• N ,I
0.016
S0.014
0.012
0.010
0.008
0.006
0.004
0.002
0.000
0 PM
U0
C.)
a-
a-
O0 PM 4:38:00, AM9:26:00 AM 2:14:00 PM 7:02
Time (H:MM:SS AMIPM)
-Head Loss -• ' - Flow Adjustment -Velocity
.:00 PM 11:50:0,
Figure 3.6-3: Test #VOG-2-FL-B2 Differential Pressure and Velocity vs. Time - Day 3
Use or disclosure of the data contained herein is subject to the restriction on the Cover Page of this report.
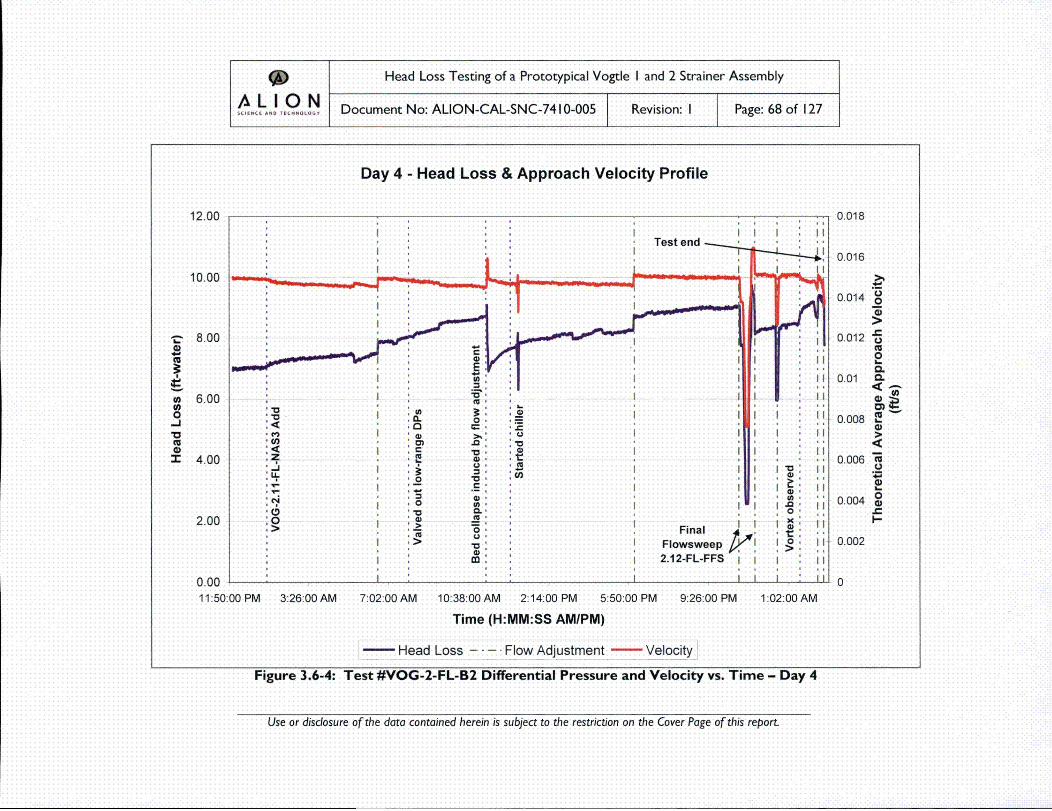
*~ Head Loss Testing of a Prototypical Vogtle I and 2 Strainer Assembly
,•...• ..I.,.0oON Document No: ALION-CAL-SNC-74 10-005 Revision: I Page: 68 of 127
Day 4 - Head Loss & Approach Velocity Profile
12.00
10.00
a-
4.J"u
.-J
8.00
6.00
4.00
* CU
:4 :•. • :®
<1: ,O = ,:I I I
I ,~ 0
:0 0: Final , :: ,;: Flowsweep :i ! II
2.12-FL-FFS III
*I , .I I I ' I I
0.018
0.016
0.014
0.012
0.01 0,.
0.008 a-•
0.006 CU
U)
0.004O
0.0022.00
0.0011 50:00 PM
I I I I I I I
3:26:00 AM 7:02:00 AM 10:38:00 AM 2:14:00 PM 5:50:00 PM 9:26:00 PM 1:02:00 AM
Time (H:MM:SS AMIPM)
Head Loss ....- Flow Adjustment - Velocity
Figure 3.6-4: Test #VOG-2-FL-B2 Differential Pressure and Velocity vs. Time - Day 4
Use or disclosure of the data contained herein is subject to the restriction on the Cover Page of this report.
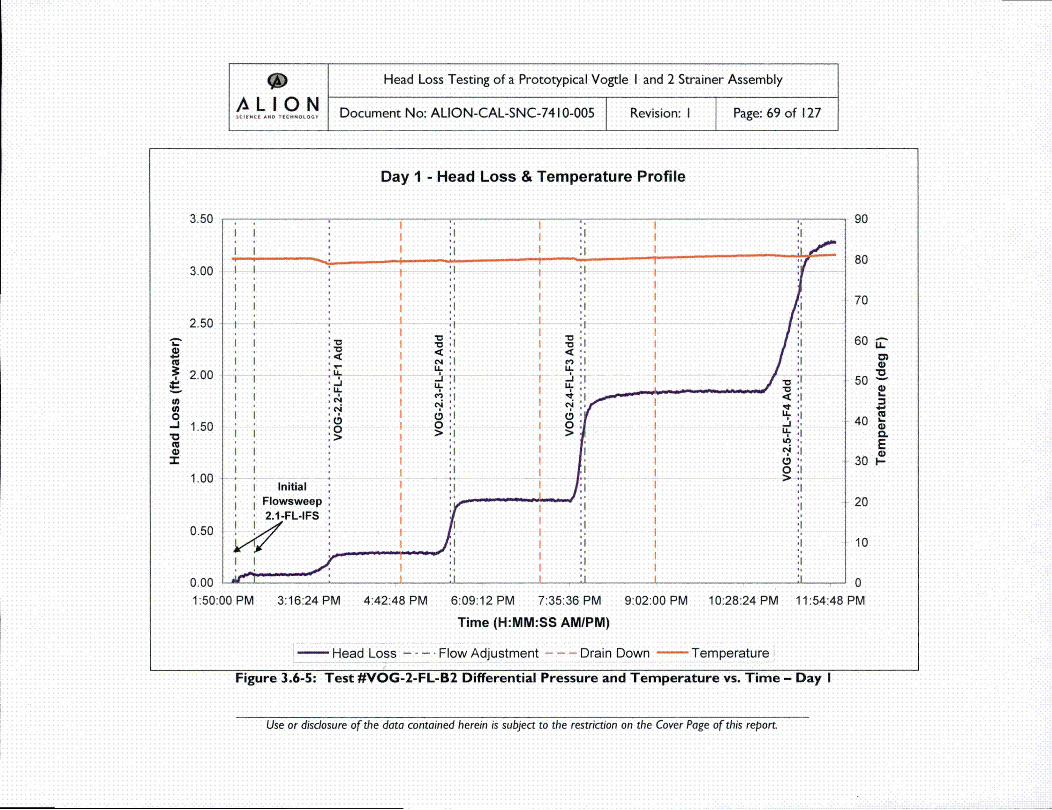
9D Head Loss Testing of a Prototypical Vogtle I and 2 Strainer Assembly
A•,0.•L~ ,,IO N Document No: ALION-CAL-SNC-74 10-005 Revision: I Page: 69 of 127
Day I - Head Loss & Temperature Profile
4.'
.-J
3.50
3.00
2.50
2.00
1.50
1.00
* . I' t iI :1I
I I I .II :
I I *' I .1 I ,
II I 'I
* * I .I.... jI *ojl',
I II '
:I Im I0*
' o
I i Initial I :1 1
Flowsweep I , :'-I- :* 2.1-FL-IFS i I• t :1
.I *, 1
'V I '1 I '1
IS
J,;I €
90
f_80
70
60 •"
50
40 "
L.
E30 I-
20
0.50 I100
8PMUAJU
1:50:00 PM 3:16:24 PM 4:42:48 PM 6:09:12 PM 7:35:36 PM 90200 PM 10:28:24 PM 11:54:4k
Time (H:MM:SS AMIPM)
- Head Loss - - - . Flow Adjustment --- Drain Down - Temperature
Figure 3.6-5: Test #VOG-2-FL-B2 Differential Pressure and Temperature vs. Time - Day I
Use or disclosure of the data contained herein is subject to the restriction on the Cover Page of this report.
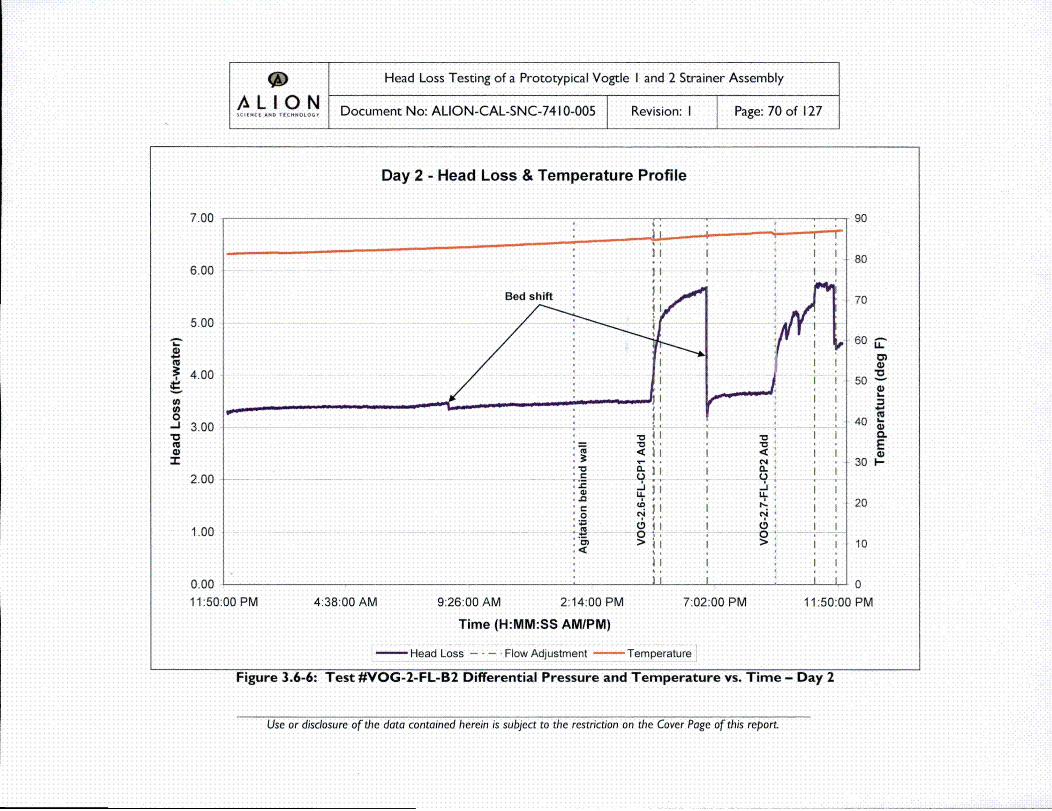
* Head Loss Testing of a Prototypical Vogtle I and 2 Strainer Assembly
,<,.,/ Lo ,<.~o,0N Document No: ALION-CAL-SNC-74 10-005 Revision: I Page: 70 of 127
Day 2 - Head Loss & Temperature Profile
7.00
6.00
5.00
I4.00
• 4 .00
U,-200
100
0.011:0:
21I1I
- -I I- I L = - I
'I
• I "
' '- J 1I •I I
.~ 0
... 41'o
90
80
70
60 •
50
40
0.E
30 I-
20
10
0
0 PM00 PM
II II
11:50:04:38:00 AIV 9:26:00 AM 2:14:00 PM 7:q
Time (H:MM:SS AMIPM)
-Head Loss .... Flow Adjustment - Temperature
02:00 PM
Figure 3.6-6: Test #VOG-2-FL-B2 Differential Pressure and Temperature vs. Time - Day 2
Use or disclosure of the data contained herein is subject to the restriction on the Cover Page of this report.
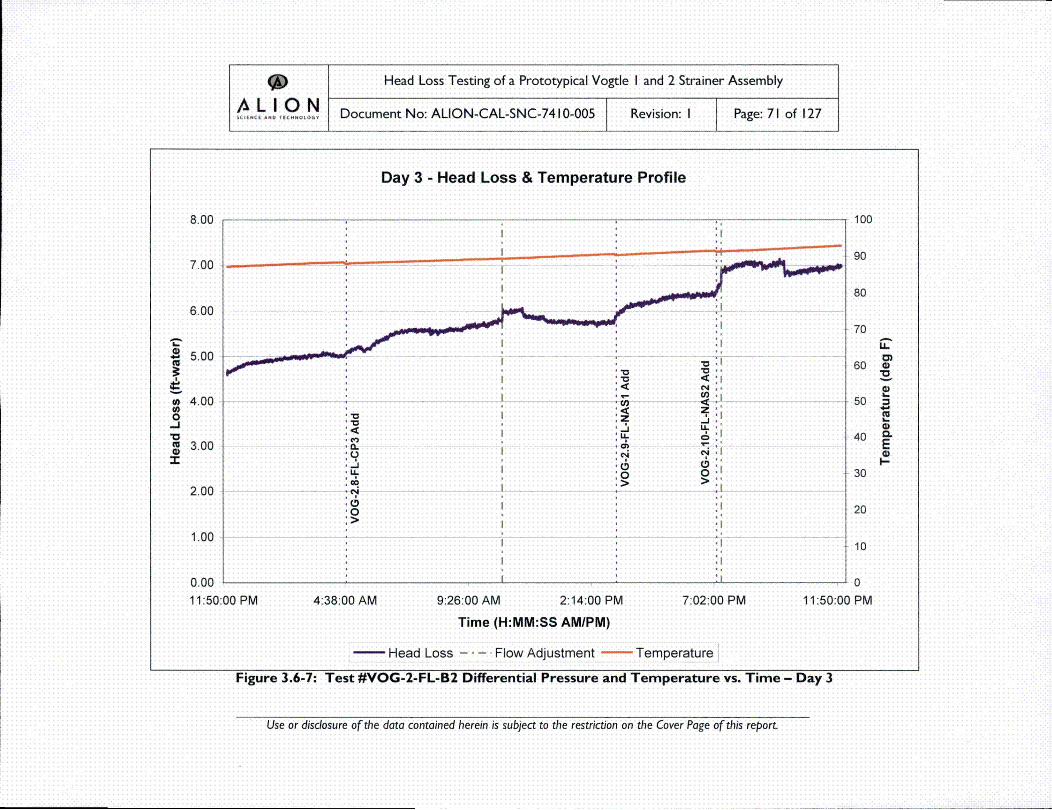
9 Head Loss Testing of a Prototypical Vogtle I and 2 Strainer Assembly
,•,,,•L.0 .o~°ON Document No: ALION-CAL-SNC-74 10-005 Revision: I Page: 71 of 127
Day 3 - Head Loss & Temperature Profile
I..I
0
8.00
7.00
6.00
5.00
4.00
3.00
2.00
1.00
0.0011:50:
"- -Ci :-.* I, .
*=1
.1I
100
S80
60
50
40
30
20
10
0
0 PM
0
E
00 PM 4:38:0C0 AM 9:26:00 AM 2:14:00 PM 7:02:0
Time (H:MM:SS AM/PM)
-Head Loss ....- Flow Adjustment -Temperature
0OPM 11:50:01
Figure 3.6-7: Test #VOG-2-FL-B2 Differential Pressure and Temperature vs. Time - Day 3
Use or disclosure of the data contained herein is subject to the restriction on the Cover Page of this report.

9 Head Loss Testing of a Prototypical Vogtle I and 2 Strainer Assembly
/•kIO N Document No: ALION-CAL-SNC-74 10-005 Revision: I Page: 72 of 127
Day 4 - Head Loss & Temperature Profile
12.00
10.00
. :I I I
I I I I
4-r
8.00
6.00
4.00
* I
*, I o
< V"V
:4
!o I
-di
-1w.
Cu
0.
0*
' U"V
Test end --
0..
4i.'
-- I
•, Final':Fowsweep
:2.12-FL-FFSII
I 1
II
I
I;iI;JIiI
I
'V
.0'
II
II
II
1I
1I
I1
110
100
90
80
70
60 0
50 -240
0.
30
10
0
2.00
U.UUf11:50:00 PM 3:26:00 AM 7:02:00 AM 10:38:00 AM 2:14:00 PM 5:50:00 PM 9:26:00 PM 1:02:00 AM
Time (H:MM:SS AM/PM)
Head Loss .... Flow Adjustment - Temperature
Figure 3.6-8: Test #VOG-2-FL-B2 Differential Pressure and Temperature vs. Time - Day 4
Use or disclosure of the data contained herein is subject to the restriction on the Cover Page of this report.
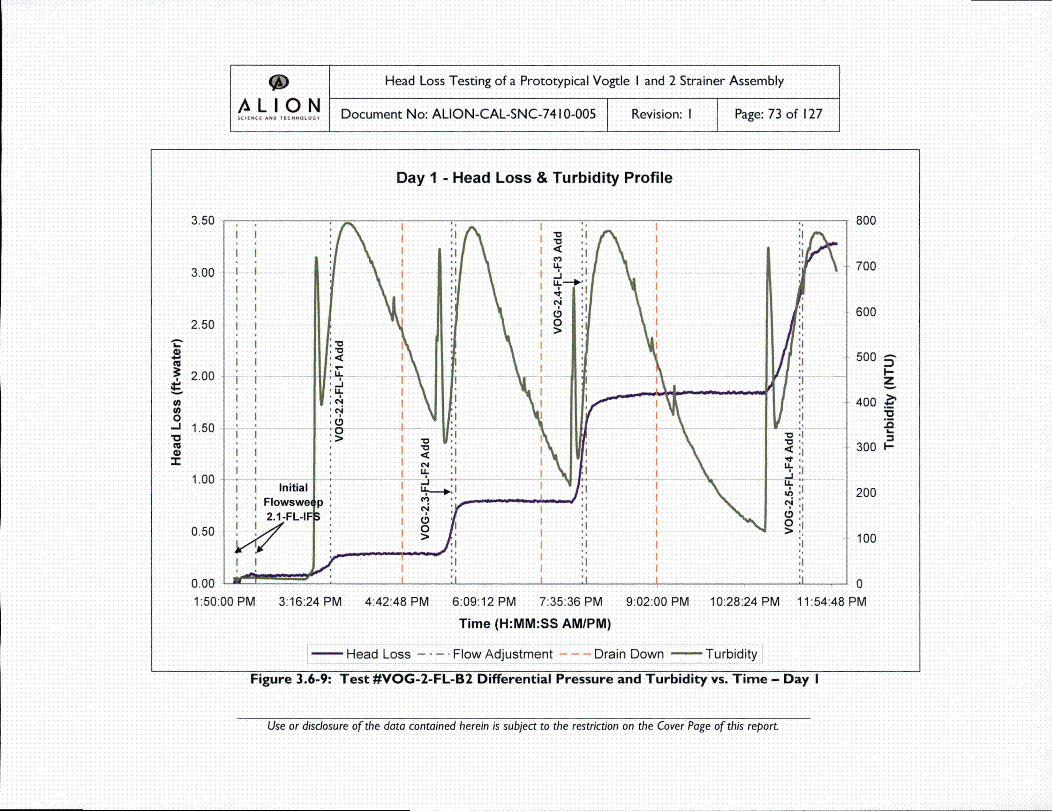
Day I - Head Loss & Turbidity Profile
3.50 I
I I 'i
3.00 I I. Ii
I I
2.50
, 2.00 I
0_. =-. ,
II,,'' I" 1.50 IN
1.0 Initial I
Flowswep I.2.1-FL-IFI
0.00 i
1:50:00 PM 3:16:24 PM 4:42:48 PM
,, 800
: 700
600
:j 500
*1 400
< :l 300
:t 200
> : 100
.1
10:28:24 PM 11:54:48 PM
I--z
I--
6:09:12 PM 7:35:36 PM 9:02:00 PM
Time (H:MM:SS AMIPM)
-Head Loss - - -. Flow Adjustment - -- Drain Down - Turbidity
Figure 3.6-9: Test #VOG-2-FL-B2 Differential Pressure and Turbidity vs. Time - Day I
Use or disclosure of the data contained herein is subject to the restriction on the Cover Page of this report.

* Head Loss Testing of a Prototypical Vogtle I and 2 Strainer Assembly
A•,,,%LI0 ,.~O N Document No: ALION-CAL-SNC-74 10-005 Revision: I Page: 74 of 127
Day 2 - Head Loss & Turbidity Profile
7.00
6.00
5.00
•, 4.00
0
-I3.00
Cu
2.00
1.00
0.0011:50:00 PM
800
I700
700
500
* 400
I I' 300I
* 200
I
I I 0
11:50:00 PM
I--z
1_
4:38:00 AM 9:26:00 AM 2:14:00 PM 7:02:00 PM
Time (H:MM:SS AMIPM)
-Head Loss .... Flow Adjustment -Turbidity
Figure 3.6-1I0: Test #VOG-2-FL-B2 Differential Pressure and Turbidity vs. Time - Day 2
Use or disclosure of the data contained herein is subject to the restriction on the Cover Page of this report.

* Head Loss Testing of a Prototypical Vogtle I and 2 Strainer Assembly
L.I,,oooON Document No: ALION-CAL-SNC-74 10-005 Revision: I Page: 75 of 127
Day 3 - Head Loss & Turbidity Profile
8.00
7.00
6.00
- 5.00
U)4.00
300"-J
2.00
1.00
0.0011:50:00 PM
.1
'1
____600
500
400
I-z
300,_"
200
100
0
11:50:00 PM
(.40I
4:38:00/ AM9:26:00 AM 2:14:00 PM 7:02
Time (H:MM:SS AMIPM)
Head Loss - -'-Flow Adjustment -Turbidity
2:00 PM
Figure 3.6-IlI: Test #VOG-2-FL-B2 Differential Pressure and Turbidity vs. Time - Day 3
Use or disclosure of the data contained herein is subject to the restriction on the Cover Page of this report.
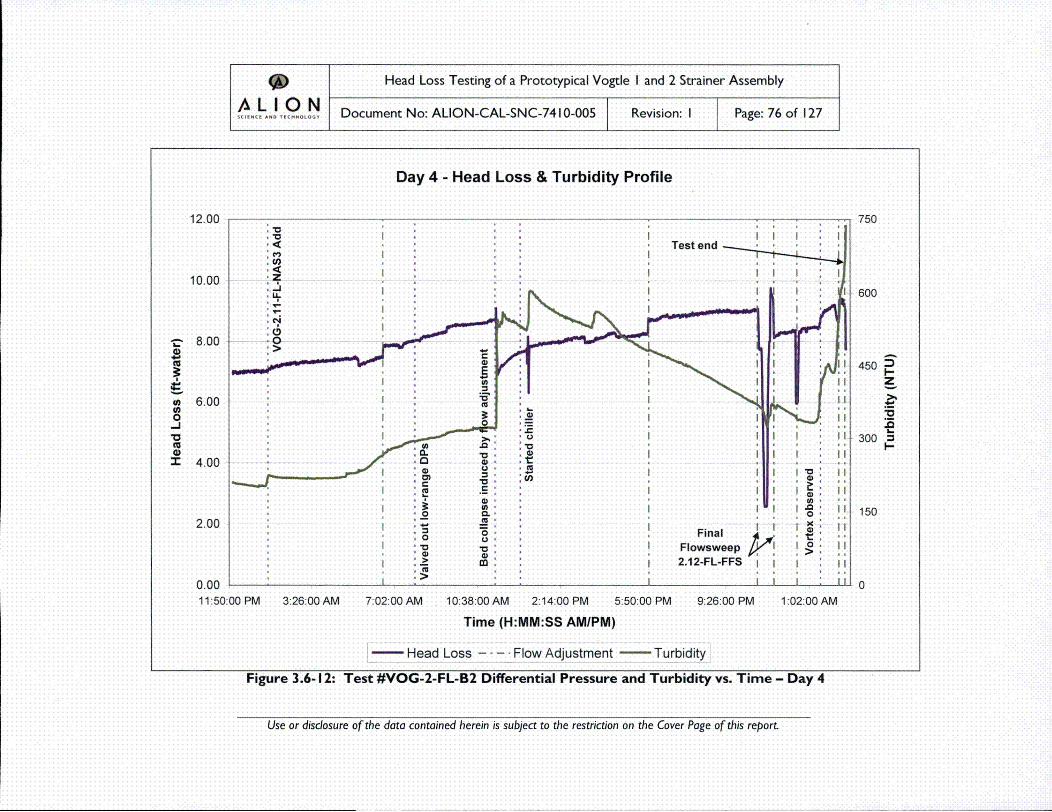
* Head Loss Testing of a Prototypical Vogtle I and 2 Strainer Assembly
/•LION Document No: ALION-CAL-SNC-74 10-005 Revision: I Page: 76 of 127
Day 4 - Head Loss & Turbidity Profile
12.00
10.00
r/)
.--
"0
U)-i-
8.00
6.00
4.00
750
600
450 •"
300 iL
150
0
2.00
0.00~ 1 : II I " I11:50:00 PM 3:26:00 AM 7:02:00 AM 10:38:00 AM 2:14:00 PM 5:50:00 PM 9:26:00 PM 1:02:00 AM
Time (H:MM:SS AM/PM)
-Head Loss .... Flow Adjustment - Turbidity
Figure 3.6-12: Test #VOG-2-FL-B2 Differential Pressure and Turbidity vs. Time - Day 4
Use or disclosure of the data contained herein is subject to the restriction on the Cover Page of this report.
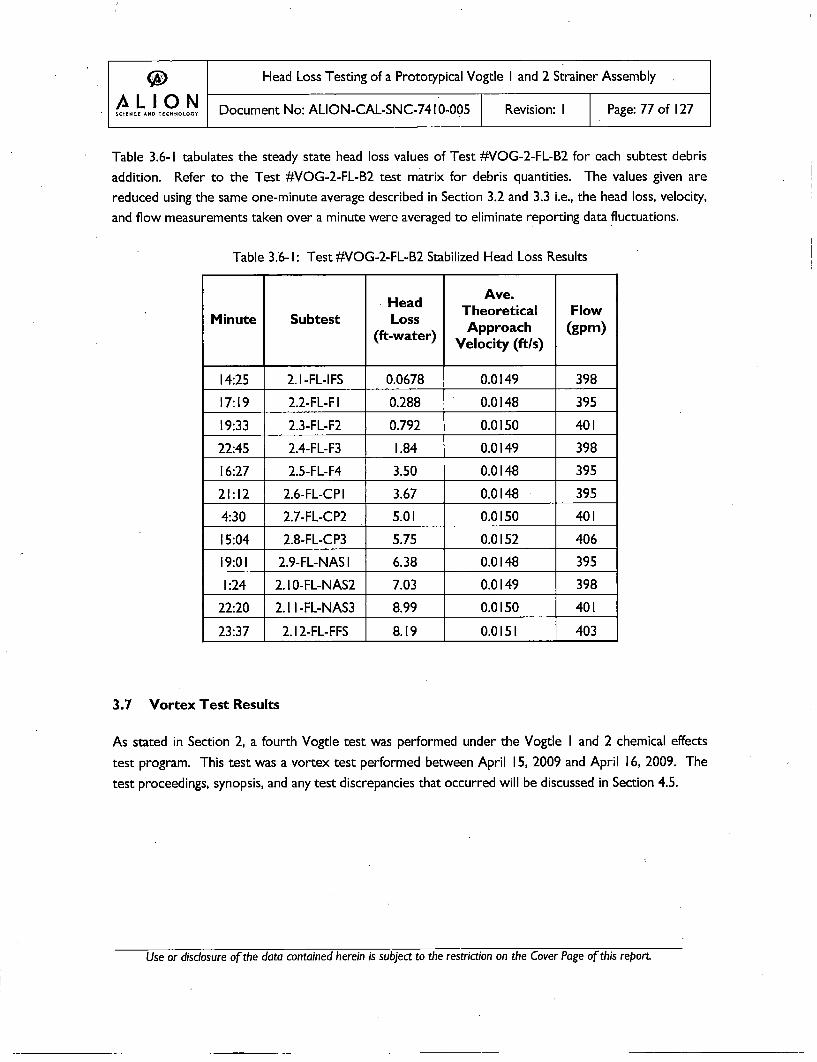
~Head Loss Testing of a Prototypical Vogtle I and 2 Strainer Assembly
---0- I Document No: ALION-CAL-SNC-7410-005 Revision: I Page: 77 of 127
Table 3.6- I tabulates the steady state head loss values of Test #VOG-2-FL-B2 for each subtest debris
addition. Refer to the Test #VOG-2-FL-B2 test matrix for debris quantities. The values given are
reduced using the same one-minute average described in Section 3.2 and 3.3 i.e., the head loss, velocity,
and flow measurements taken over a minute were averaged to eliminate reporting data fluctuations.
Table 3.6- I: Test #VOG-2-FL-B2 Stabilized Head Loss Results
Head AeTheoretical Flow
Minute Subtest Loss Apoc gm(ft-water) Velocity (ft/s)
14:25 2.1I-FL-IFS 0.0678 0.0149 398
17:19 2.2-FL-Fl 0.288 0.0148 395
19:33 2.3-FL-F2 0.792 0.0150 401
22:45 2.4-FL-F3 1.84 0.0149 398
16:27 2.5-FL-F4 3.50 0.0 148 395
21:12 2.6-FL-CPI 3.67 0.0148 395
4:30 2.7-FL-CP2 5.01 0.0 150 401I
15:04 2.8-FL-CP3 5.75 0.0152 406
19:01 2.9-FL-NAS I 6.38 0.0148 395
1:24 2.lI0-FL-NAS2 7.03 0.0149 398
22:20 2.11 -FL-NAS3 8.99 0.0150 401I
23:37 2.12-FL-FFS 8.19 0.0151 403
3.7 Vortex Test Results
As stated in Section 2, a fourth Vogtle test was performed under the Vogtle I and 2 chemical effects
test program. This test was a vortex test performed between April I5, 2009 and April 16, 2009. The
test proceedings, synopsis, and any test discrepancies that occurred will be discussed in Section 4.5.
Use or disclosure of the data contained herein is subject to the restriction on the Cover Page of this report.

4 DATA ANALYSIS
This section describes the data analysis methods that were used, provides a brief interpretation of thedata from each test, and discusses the impact of the instrument uncertainty.
As part of the testing program, a variety of raw data is collected and recorded, including differential
pressure across the strainer and debris bed, flow rate, temperature, and turbidity. Since these
measurements are collected continuously over the entire time of the test by an automatic data
acquisition system, they are inherently prone to measurement fluctuation. Data analysis involves
smooth-averaging techniques and will enhance the clarity of the data trends and improve the overall
quality of the results presentation. The data reduction methodology that was followed is explained in
Sections 3.2 and 3.3.
In the analysis of the flow sweeps that were conducted during testing, the terms "upsweep" and
•"downsweep" were used to describe the order of the flow rates of each sweep. An upsweep was a
flow rate increase through several points starting at a given flow rate and ending at a higher flow rate. A
downsweep is the opposite, i.e. the highest flow rate in the sweep is the initial flow rate. All clean
screen flow sweeps were upsweeps, which began at a lower velocity and ended at the highest.
The flow sweeps that were conducted with a debris bed, were downsweeps and then upsweeps. Taking
head loss measurements on the downsweep of a debris-laden screen decreases the chances of the bed
reforming because of the changing velocity.
As described in the note above Figure 3.3-I, the velocity values given in the following analyses are
calculated values based on flow rate and screen area. As such, the correct description of these values is
"Test Theoretical Average Approach Velocity" because these values assume uniform flow through the
screen area. This note applies to all figures and tables of Section 4.
4.1I Clean Screen Tests
Tests VOG-I.I-TB-IFS, VOG-2.I-FL-IFS, and VOG-2.I-FLB2-1FS were clean screen tests in which head
loss data was gathered as strainer approach velocity was varied. As can be seen on Figure 3.3-I the
impact of increasing the approach velocity through the clean strainers was a slight increase in head
loss--on the order of tenths of inches of water. No vortices were witnessed at any of the flow rates
during this testing.
Use or disclosure of the data contained herein is subject to the restriction on the Cover Page of this report.
*Head Loss Testing of a Prototypical Vogtle I and 2 Strainer Assembly
LA ol I0. oIoJO Document No: ALION-CAL-SNC-7410-005 Revision: I Page: 79 of 127
4.1I. I Clean Screen Testing Discrepancies
Clean screen subtest VOG-2. I-FL-IFS resulted in a testing discrepancy (see Attachment C). During theinitial flow sweep it was later determined that a sump pump which was in the tank, while not actively
functioning, had been passively draining the tank by providing a siphon. This occurred throughout the
initial flow sweep, gradually reducing the water level from 3.375 inches above the strainer at thebeginning of the flow sweep, to less than I inch, over the course of the 33 minute duration of the flow
sweep. However, no vortexing was observed throughout the flow sweep.
4.1.2 Clean Screen Proceedings
For each test, the flow rate was controlled via the throttle butterfly valve or the pump's variable
frequency drive (VFD). Each target flow rate was held for several minutes to allow for a stable head
lOSS.
4.1.3 Clean Screen Synopsis
The thin-bed clean screen head losses ranged from 0.0217 to 0.0935 ft-water at 0.0076 to 0.0164 ftls,
respectively. The original full load clean screen head losses ranged from 0.0197 to 0.0937 ft-water at
0.0074 to 0.0164 ftls, respectively. The full load retest clean screen head losses ranged from 0.0197 to0.0944 ft-water at 0.0074 to 0.0165 ftls, respectively. At the testing velocity of 0.015 ftls, the average
clean screen head loss was:
(0.071 I 'H 20±+0.0788'H2 O0+0.0753'H 20 +0.0747'H 2 0±+0.0768'H 20 +0.0678'H 2 0) - 0.074 I'H2 0
6
4.2 Test #VOG-I-TB, Thin-Bed Test
The purpose of this test was to determine if the strainer modules were susceptible to high head losses
created by a fiber and particulate debris load of a large break LOCA which generates minimal fibrous
debris, maximum particulate debris, and WCAP-predicted chemical precipitate loads. Such a situation
could result in a very thin, non-porous debris bed. A theoretical treatment of head loss would suggest
that the head loss for such a bed could be very high due to its high solidity, assuming a uniform debrisloading and adequate fibrous debris to cover the entire strainer surface. Test #•VOG- I-TB was intended
to determine the head loss created by a bed consisting of a minimum amount of fibrous debris to cover
the strainer, and a maximum amount of particulate debris, combined with WCAP-predicted chemical
loads.
Use or disclosure of the data contained herein is subject to the restriction on the Cover Page of this report.

~Head Loss Testing of a Prototypical Vogtle I and 2 Strainer Assembly
CL I 9OL! Document No: ALION-CAL-SNC-74 10-005 Revision: I Page: 80 of 127
The design of this particular test series allows for the observation of increasingly high head losses, after
each subsequent debris addition. The bed was built by initially adding all of the particulate debris
(Interam, silicon carbide, and dirt/dust mix), then adding fibrous fines in steps. Each fiber step was
equivalent to an approximate bed thickness of 0. 125 inches. The bed thickness ultimately reached atheoretical average thickness of 0.625 inches. After this debris bed stabilized, six chemical precipitate
batches were added according to WCAP predicted quantities, with both the calcium phosphate and
sodium aluminum silicate precipitates being broken down into three equivalent additions. The water
was too turbid to allow for visual observation of bed growth during the majority of the test.
4.2.1I Test #VOG- I -TB Testing Discrepancies
Test #VOG- I-TB resulted in three testing discrepancies. The first describes that sub-steps 37(d) and
42(d) in the test-specific procedure, ALION-SPP-SNC-74 10-002 [Ref. 3] were not performed. These
steps call for the acquisition and withholding of debris samples after the final debris preparation, but
prior to introduction into the tank. These steps were not performed due to concerns of non-
conservatively altering the total debris quantities in the tank.
The second discrepancy describes that at approximately 22:00 on March 30, 2009 during testing, the
tank temperature dipped below 80°F. Section 4.11.2 of the test plan [Ref. I] requires that the tank
heater be employed to maintain the test tank temperature between 80°F and 100°F. Due to the high
turbidity of the tank the heater was not activated, but rather the ambient temPerature of the lab was
raised. The tank temperature was above 80°F again by 03:30 on March 3 I, 2009, and never fell below
79°F.
The third discrepancy describes that the draining of water out of the tank after the stabilization of thefinal fibrous and particulate debris addition (step 66 of the test-specific procedure, ALION-SPP-SNC-
74 10-002 [Ref. 3]), occurred while the .tank turbidity was at 105 NTU. Sub-step 66(a) of the test-
specific procedure requires that the turbidity be less than 20 NTU before water is drained from the
tank. This discrepancy was committed to avoid unnecessarily lengthening the test. The water drained
from the tank was filtered with a screen and it was determined that no fibrous debris was present in the
water removed. The water was then sampled and it was determined that the entire volume removed
contained less 1.5 lbs of particulate debris.
4.2.2 Test #VOG- I -TB Proceedings
Two mechanical stirrers were required to suspend the debris due to the strainer configuration and flow
rate, one in the pit below the strainer, and another within the area underneath the strainer, bounded by
the simulated containment walls and floor. A sparger system was installed on the return line to aid in
the suspension of the debris within the water. Hand-stirring and manual adjustment of the mechanical
Use or disclosure of the data contained herein is subject to the restriction on the Cover Page of this report.

~Head Loss Testing of a Prototypical Vogtle I and 2 Strainer Assembly
LION Document No: ALION-CAL-SNC-74 10-005 Revision: I Page: 81 of 127
stirrers was performed as necessary during the additions of the fibrous and particulate debris,
performed with maximum care and consideration to avoid disturbing the bed or otherwise artificially
influencing the bed formation. Post-test photographs show that while nearly all of the NUKON® and
reached the strainers, approximately 10%- 15% of the (larger/heavier) dirt/dust surrogate and nearly all
of the Interam debris settled on the floor in front of the strainer array. Additionally, a minor amount(approximately 10-20 lb.) of silicon carbide settled underneath the simulated containment floor, and less
than 1.5 lbs of particulate debris was removed along with the water drained from the tank to ensure
sufficient volume in the tank for chemical additions.
After the clean screen flow sweep (subtest VOG-1.1I-TB-IFS), the Interam debris was added to the tank
into the pit area below the strainer, as part of subtest VOG- I.2-TB-P. The Interam was observed to
strongly resist suspension, even when directly agitated by the mechanical mixer (see Attachment A for
photographic evidence). After multiple attempts to suspend the Interam using the mechanical mixer to
induce turbulent flow patterns, a long-handled shovel was used to manually relocate the Interam debris
from the pit onto the simulated containment floor directly in front of the prototype strainer. The
majority of the Interam did not enter suspension even from this elevated position. The remainder of
the particulate debris (silicon carbide and dirt/dust mix) that constituted subtest VOG- I.2-TB-P was
then added. The particulate was allowed to circulate for five pool turnovers. Next, the NukonTM finesassociated with the fibrous insulation subtest VOG- 1.3-TB-FlIwere added, increasing the head loss to
0.23 ft-water. The NukonTM fines associated with the fibrous insulation subtest VOG- I.4-TB-F2 werethen added, increasing the head loss to 0.2_6 ft-water. The NukonTM fines associated with the fibrousinsulation subtests VOG-1.5-TB-F3, VOG-l.6-TB-F4, and VOG-l.7-TB-F5, were each similarly added to
the tank, resulting in increasing head loss measurements of 0.3! ft-water, 0.37 ft-water, and 0.643 ft-
water, respectively. Following the fibrous addition of subtest VOG- I.7-TB-F5, increasing head loss,
declining turbidity, and visual observation were collectively considered and it was determined that a
sufficient amount of fiber had been added to the tank to ensure complete screen coverage. The total
amount of fibrous debris added to the tank was equivalent to a theoretical thickness of 0.625 inches bed
on all strainer surfaces.
Over the next 28 houirs multiple adjustments to the mechanical mixers were affected, as well as the
introduction of a sump pump and attendant tubing which provided flow from beneath the simulated
containment floor into the pit beneath the strainer module, to ensure that particulate debris did not
accumulate beneath the simulated containment floor. These actions were undertaken to ensure that the
maximum amount of debris remained in suspension prior to attaching to the strainer debris bed. When
subsequent stirs both by hand and by manual adjustment of the mechanical mixers had only a minimal
effect on head loss and turbidity, water was drained out of the tank to ensure that there was sufficient
volume for the chemical additions. The stirs, both by hand and by adjustment of the mechanical mixers,
were performed with maximum care and consideration to avoid disturbing the bed or otherwise
Use or disclosure of the data contained herein is subject to the restriction on the Cover Page of this report.

~Head Loss. Testing of a Prototypical Vogtle I and 2 Strainer Assembly
LIO N Document No: ALION-CAL-SNC-74 10-005 Revision: I Page: 82 of 127
artificially influencing the bed formation. The head loss prior to the first calcium phosphate subtest was
approximately 0.63 ft-water.
The first calcium phosphate addition (subtest VOG-1.1 10-TB-CP I) was then added to the tank. After the
addition it was noted that a redundant thermocouple had been exposed by the lowering of the water
level prior to the addition. The thermocouple was promptly lowered into the test tank. The first
calcium phosphate addition increased the head loss to approximately 1.02 ft-water. Next, the second
calcium phosphate addition (subtest VOG- I. I I-TB-CP2) was added to the tank. After the addition it
was noted that the battery operating the mechanical mixer below the simulated containment floor had
been exhausted. The battery was recharged, reset, and the mechanical mixer restarted. One flow
adjustment was needed during this stabilization, and the second chemical precipitate addition increased
the head loss to approximately 1.54 ft-water. The third calcium phosphate addition (subtest VOG-. 1.2-
TB-CP3) increased the head loss to approximately 1.65 ft-water.
The first sodium aluminum silicate addition (subtest VOG-l.13-TB-NASI) was then added to the tank,
and raised the head loss to 2.12 ft-water. The second sodium aluminum silicate addition (subtest VOG-
1.14-TB-NAS2) was then added to the tank. During the stabilization period of the subtest VOG- I. 14-
TB-NAS2, multiple flow adjustments and bed shifts were made and observed, respectively. These bed
shifts were spontaneous and did not occur as the result of any test action, and appeared to occur
randomly as head loss increased. Several hours after the final bed shift and flow adjustment, it was
noted that the battery operating the mechanical mixer below the simulated containment floor had been
exhausted. The battery was recharged, reset, and the mechanical mixer restarted. The head loss then
stabilized at approximately 2.27 ft-water. The third and final sodium aluminum silicate addition (subtest
VOG-1I.1I5-TB-NAS3) was then added to the test tank. The subtest stabilized without incident at
approximately 2.60 ft-water. Upon stabilization of subtest VOG-I1. 15-TB-NAS3, the final flow sweep
was initiated, as planned.
The flow rate wasdecreased incrementally down to 200 gpm and subsequently up to 440 gpm without
incident. The flow rate was then returned to 400 gpm, and the water level was then lowered at a rate
of I inch every 5 minutes until air ingestion occurred. At a tank water level of 0.25 inches below the
top of the strainer module, air ingestion was observed, and the pump was secured off. After this flow
sweep and water drain down, the test was complete.
4.2.3 Test #VOG- I -TB Synopsis
For Test #VOG- I-TB, the theoretical equivalent bed thickness of the fibrous debris that was
determined to completely cover the strainer module was 0.675 inches (based on the density and
quantity of NukonTM debris). This debris bed, combined with the particulate and chemical precipitates,
produced a total final head loss of 2.60 ft-water.
Use or disclosure of the data contained herein is subject to the restriction on the Cover Page of this report.

9 Head Loss Testing of a Prototypical Vogtle I and 2 Strainer Assembly
LION Document No: ALION-CAL-SNC-74 10-005 Revision: I Page: 83 of 127
All debris and chemical precipitates except the Interam gathered in the area of the strainer without
major incident. The Interam resisted all reasonable attempts to suspend it, and so remained on thesimulated floor in front of the strainer module. A minor amount (approximately 10-20 lb.) of silicon
carbide settled underneath the simulated containment floor, and less than 1.5 lbs of particulate debris
was removed along with the water drained from the tank to ensure sufficient volume in the tank for
chemical additions. Each debris batch was added over the pit formed by the simulated containment
walls and floor, near the mechanical mixer. Water samples were taken at the completion of each
subtest. No vortexing occurred during testing, prior to the final water draw down.
The flow sweep provides data that can potentially be used in the analysis of velocity and temperature
correction. Figure 4.2-I presents the flow sweep data of the stable head loss values for the debris bed
test at the end of testing. The data can be used for the velocity and temperature corrections.
The data reduction technique used for this graph is the one-minute average of the data file's values of
the minute before the data was noted in the test log. This figure also provides the polynomial equation
of the trending curve of the data, as given by Microsoft Excel. Table 4.2- I is the data used to generate
the figure, taken from the data acquisition of Test #VOG- I -TB.
Test #VOG-1I-TB
3.50
_. 3.00
' 2.00
Co 9o1.50
0.000.0060 0.0080 0.0100 0.0120 0.0140 0.0160 0.0180
Average Theoretical Approach Velocity (ftls)
I * Upsweep -u- Downsweep -- Poly. (Downsweep) I
Figure 4.2- I: Test #VOG- I -TB Final Flow Sweep Values, With Debris
Use or disclosure of the data contained herein is subject to the restriction on the Cover Page of this report.

9 Head Loss Testing of a Prototypical Vogtle I and 2 Strainer Assembly
,•LION Document No: ALION-CAL-SNC-74 10-005 Revision: I Page: 84 ofl127
Table 4.2- I: Test # VOG- I -TB Final Flow Sweep Values
Minute Head Approach FlowAvrgd Loss Velocity (gpm)
Averged (ft-water) (ft/s)
13:24 2.60 0.0151 403
13:38 2.37 0.0139 371I
13:48 1.31 0.0075 200
14:01 2.87 0.0163 436
14:08 2.56 0.0148 395
4.3 Test #VOG-2-FL-B, Original Full Load Test
The purpose of this test was to determine the head loss developed in the largest, bounding case of
debris formation for fibrous, particulate, and chemical debris generated by a large break LOCA. Test
#VOG-2-FL-B was intended to determine the head loss created by a bed consisting of a maximum
amount of fibrous debris and a maximum amount of particulate debris, combined with WCAP-predicted
chemical loads. A secondary objective of this test was to determine the level of submersion that was
required by the strainer module in order to inhibit air ingestion, under both clean screen and debris
loaded conditions.
The design of this particular test series allows for the observation of increasingly high head losses after
each subsequent debris addition. The bed was built by adding the total fibrous and particulate debris
loads in four equal steps. Each step consisted of 25% of each of the fibrous and debris types (NukonTM
fines, NukonTM smalls, Interam, silicon carbide, and dirtldust surrogate). After this debris bed stabilized,
six chemical precipitate batches were added according to WCAP predicted quantities, with both the
calcium phosphate and sodium aluminum silicate precipitates being broken down into three equivalent
additions. The water was too turbid to allow for visual observation of bed growth during the majority
of the test. At both the start and end of the test after the flow sweep portion of the test, the water
level in the tank was reduced at a rate less than I inch every 5 minutes until air ingestion into the
strainer module was observed.
4.3.1I Test #VOG-2-FL-B Engineering Change Requests
Test #VOG-2-FL-B incorporated one engineering change request. At the client's request, the Interam
was introduced to the floor area immediately adjacent to the prototype strainer to aid in the transport
of the Interam to the prototype strainer. These actions were taken because it was observed upon
Use or disclosure of the data contained herein is subject to the restriction on the Cover Page of this report.

9 Head Loss Testing of a Prototypical Vogtle I and 2 Strainer Assembly
A0E~E L. ol 0 .Oo N Document No: ALION-CAL-SNC-74 10-005 Revision: I Page: 85 of 127
introduction of the Interam during Test #VOG- I -TB that the processed material did not readily
transport to the prototype strainer module. Execution of this engineering change request minimized the
potential to relocate the Interam after it was added to the tank.
4.3.2 Test #VOG-2-FL-B Testing Discrepancies
As stated in Section 4. I. I, Test #VOG-2-FL-B resulted in one testing discrepancy. During the initial flow
sweep it was later determined that a sump pump which was in the tank, while not actively functioning,
had been passively draining the tank by providing a siphon. This occurred throughout the initial flow
sweep, gradually reducing the water level from 3.375 inches above the strainer at the beginning of the
flow sweep, to less than I inch, over the course of the 33 minute duration of the flow sweep. However,
no vortexing was observed throughout the flow sweep.
4.3.3 Test #VOG-2-FL-B Proceedings
Two mechanical stirrers were required to suspend the debris due to the strainer configuration and flow
rate, one in the pit below the strainer, and another within the area underneath the strainer, bounded by
the simulated containment walls and floor. A sparger system was installed on the return line to aid in
the suspension of the debris within the water as well as a sump pump and attendant tubing which
provided flow from beneath the simulated containment floor into the pit beneath the strainer module,
to ensure that particulate debris did not accumulate beneath the simulated containment floor. Hand-
stirring and manual adjustment of the mechanical stirrers was performed as necessary during the
additions of the fibrous and particulate debris, with maximum care and consideration given to avoid
disturbing the bed or otherwise artificially influencing the bed formation. Post-test photographs show
that while nearly all of the NukonTM had reached the strainers, approximately 10%-I15% of the(larger/heavier) dirt/dust surrogate and nearly all of the Interam debris settled on the floor in front of
the strainer array (see Attachment A). Additionally, a minor amount (approximately 10-20 lb.) of silicon
carbide settled underneath the simulated containment floor, and less than 1.5 lbs of particulate debris
was removed along with the water drained from the tank to ensure sufficient volume in the tank for
chemical additions. Finally, a small amount of calcium phosphate (less than 0.25L of the 480.72 L_ total)
was spilled outside the tank such that it was unrecoverable.
After the clean screen flow sweep (subtest VOG-2. I-FL-IFS), the water level was gradually reduced from
a level initially less than one inch above the top of the strainer array to 12.375 inches below the top of
the strainer array, over the course of approximately 3.5 hours. At this point, only two gaps in the
strainer module remained submerged. Significant cavitations were then observed within the test pump,
indicative of air ingestion through the strainer module. The tank pump was then secured off, and the
testing apparatus was vented of air before the tank was returned to a water level to 3.375 inches above
the strainer module in preparation for debris addition.
Use or disclosure of the data contained herein is subject to the restriction on the Cover Page of this report.
9 Head Loss Testing of a Prototypical Vogtle I and 2 Strainer Assembly
AL~oT0~ O N Document No: ALION-CAL-SNC-74 10-005 Revision: I Page: 86 of 127
The Interam debris was added to the tank first, onto the simulated containment floor directly in front of
the prototype strainer. The majority of the Interam did not enter suspension even from this elevated
position. The remainder of the particulate and fibrous debris that constituted subtest VOG-2.2-FL-F I
was then added into the pit below the simulated containment floor, directly over the mechanical mixer.
The debris was allowed to circulate for ten pool turnovers, before water was removed from the tank to
be used in preparing the next debris addition. This water was then reintroduced into the tank along
with the debris of subtest VOG-2.3-FL-F2. After the head loss increase had stabilized to less than 0.02
ft-water over an hour, the debris of subtest VOG-2.3-FL-F2 was added to the tank in the same fashion.
The debris for subtests VOG-2.4-FL-F3 and VOG-2.5-FL-F4 were then similarly added to the tank, save
that the stabilization criteria to begin subtest VOG-2.5-FL-F4 was a head loss increase of less than I% of
the current head loss (2.42 ft-water), as per the test plan [Ref. I] for head losses in excess of 2.0 ft-
water. Flow adjustments were conducted during subtests VOG-2.3-FL-F2 and VOG-2.4-FL-F3 to
maintain the flow rate within the target 400 gpm +1- 10 gpm range. These subtests resulted in
increasing head loss values of approximately 0.28 ft-water, 1.06 ft-water, and 2.42 ft-water for the
subtests VOG-2.2-FL-F I, VOG-2.3-FL-F2, and VOG-2.4-FL-F3, respectively.
After the final fibrous and particulate subtest (VOG-2.5-FL-F4) a flow adjustment was necessary to
maintain target flow. Adjustments to the mechanical mixers were then affected to ensure that debris
was not settling within the tank. This action was undertaken to ensure that the maximum amount of
debris remained in suspension until attaching to the strainer debris bed, and was performed with due
consideration to avoid artificially impacting the debris bed. However, the adjustment was noted to have
had only a minimal effect on head loss and turbidity, and minimal debris was visually observed to be
newly circulating in the tank. Another flow adjustment was then necessitated, after which the strainer
was allowed a period of approximately 12 hours (-95 pool turnovers) to stabilize head loss and allow
the bed to capture as much of the circulating debris as possible. Near the end of this period, one final
stir/cleaning of debris was affected to return settled debris into circulation; however this action again
had only minimal effect on head loss and turbidity and was performed without impacting the debris bed.
Water was then removed from the tank to ensure sufficient volume for the chemical precipitate
additions. The turbidity at this point was approximately 70 NTU. The water was screened and it was
determined that the water removed contained negligible fibrous debris. The water removed, having a
turbidity of approximately 35 NTU less than that removed during the previous test, was assumed to
have a lower concentration of suspended particulate debris. At the concentration of suspended debris
found in the previous test, the entire volume of water removed from the tank would have contained less
I1.5 lbs of particulate debris. It was thus assumed that the water removed from the tank contained less
than I1.5 lbs of particulate debris. The debris in the tank was then allowed to circulate for another 5
hours (-40 pool turnovers). The head loss before the first calcium phosphate chemical precipitate
subtest was 5.46 ft-water.
Use or disclosure of the data contained herein is subject to the restriction on the Cover Page of this report.
The first calcium phosphate addition (subtest VOG-2.6-FL-CPI) was then added to the tank. During theaddition process a small amount (less than 0.25L of the I160.24L total) was spilled outside the tank such
that it was unrecoverable. Also during the addition process, a spontaneous bed shift was observed.
Two more spontaneous bed shifts, as well as two more flow adjustments occurred during the
stabilization period of precipitate addition VOG-2.6-FL-CP I. When the head loss stabilized following
the bed shifts, the final head loss was approximately 5.29 ft-water. Next, the second calcium phosphate
addition (subtest VOG-2.7-FL-CP2) was added to the tank. This second chemical precipitate addition
increased the head loss without incident to approximately 6.22 ft-water. The third calcium phosphate
addition (subtest VOG-2.8-FL-CP3) was then added, and increased the head loss uneventfully to
approximately 6.57 ft-water.
The first sodium aluminum silicate addition (subtest VOG-2.9-FL-NAS I) was then added to the test
tank. During the addition process, a small piece (approximately I cm 2) of nitrile rubber glove fell into the
tank. In the stabilization period of the addition step, one flow adjustment was needed before the head
loss stabilized at approximately 7.16 ft-water. The second sodium aluminum silicate addition (subtest
VOG-2.1I0-FL-NAS2) was then added to the tank. The chemical precipitate addition stabilized without
incident at approximately 7.24 ft-water. The third and final sodium aluminum silicate addition (subtest
VOG- I. II -FL-NAS3) was then added to the test tank. During the stabilization period, three flow
adjustments were needed, as well as the isolation of the low range (0- 100 in.-water) differential pressure
sensing cells due to increasing head loss. For the remainder of the test, the head loss was measured by
the high range (0-250 in.-water) differential pressure sensing cells. During the stabilization period of this
final chemical precipitate addition, the sump pump below the simulated containment floor, and its
attached discharge hose were moved repeatedly, as well as exchanged with a replacement sump pump in
an effort to ensure minimal debris settling. Manual stirring by hand was also employed to minimize
debris settling, as before this was performed with maximum care and consideration given to avoid
disturbing the bed or otherwise artificially influencing the bed formation. The subtest stabilized at
approximately I1I.81 ft-water. Upon stabilization of subtest VOG- I. I I -FL-NAS3, the final flow sweep
was initiated, as planned.
The flow rate was decreased incrementally down to 200 gpm and subsequently up to 440 gpm without
incident. The flow rate was then returned to 400 gpm, and the water level was then lowered at a rate
of I inch every 5 minutes until air ingestion occurred. At a tank water level of approximately 57 inches
(-3 inches above the strainer), type 6 vortices with attendant air ingestion were first observed, these
vortices became persistent at a water level of 56.125 inches (-2.25 inches above the strainer) and the
pump was secured off. After this flow sweep and water drain down, the test was complete.
Use or disclosure of the data contained herein is subject to the restriction on the Cover Page of this report

9 Head Loss Testing of a Prototypical Vogtle I and 2 Strainer Assembly
AL I ON Document No: ALION-CAL-SNC-74 10-005 Revision: I Page: 88 of 127
4.3.4 Test #VOG-2-FL-B Synopsis
For Test #VOG-2-FL-B, the fibrous and particulate debris bed, combined with chemical precipitates,
produced a total final head loss of 1 1.81I ft-water, at the test flow rate of 400 gpm. This head loss was
found to be bounding over the 2.60 ft-water head loss developed in Test #VOG- I -TB.
All debris and chemical precipitates except the Interam gathered in the area of the strainer without
major incident The Interam resisted all reasonable attempts to suspend it, and so remained on the
simulated floor in front of the strainer module. As the debris bed circumscribed the entire strainer
module, additional debris formed around the strainer along the simulated containment floor in a ramp
shape leading up to the strainer. This ramp formation of debris ranged in depth from approximately 0.5
to 6 inches and extended over a distance approximately equal to the width of the strainer. The Interam
debris was a part of this ramp formation. A minor amount (approximately 10-20 lb.) of silicon carbide
settled underneath the simulated containment floor. Each debris batch was added over the pit formed
by the simulated containment walls and floor, near the mechanical mixer. Water samples were taken at
the completion of each subtest. No vortexing occurred during testing, prior to the final water draw
down.
The flow sweep provides data that can potentially be used in the analysis of velocity and temperature
correction. Figure 4.3- I presents the flow sweep data of the stable head loss values for the debris bed
test at the end of testing. The data can be used for the velocity and temperature corrections.
The data reduction technique used for this graph is the one-minute average of the data file's values of
the minute before the data was noted in the test log. This figure also provides the polynomial equation
of the trending curve of the data, as given by Microsoft Excel. The data point taken from the 440 gpm
nominal flow point was removed from the trending curve as an outlier. The most probable explanation
for the unusual behavior of the data at this point is that the bed was irrevocably altered in the process
of lowering the flow rate to 50% and subsequently increasing it to I 10% of the original flow. Table 4.3- I
is the data used to generate the figure, taken from the data acquisition of Test #VOG-2-FL-B.
Use or disclosure of the data contained herein is subject to the restriction on the Cover Page of this report.
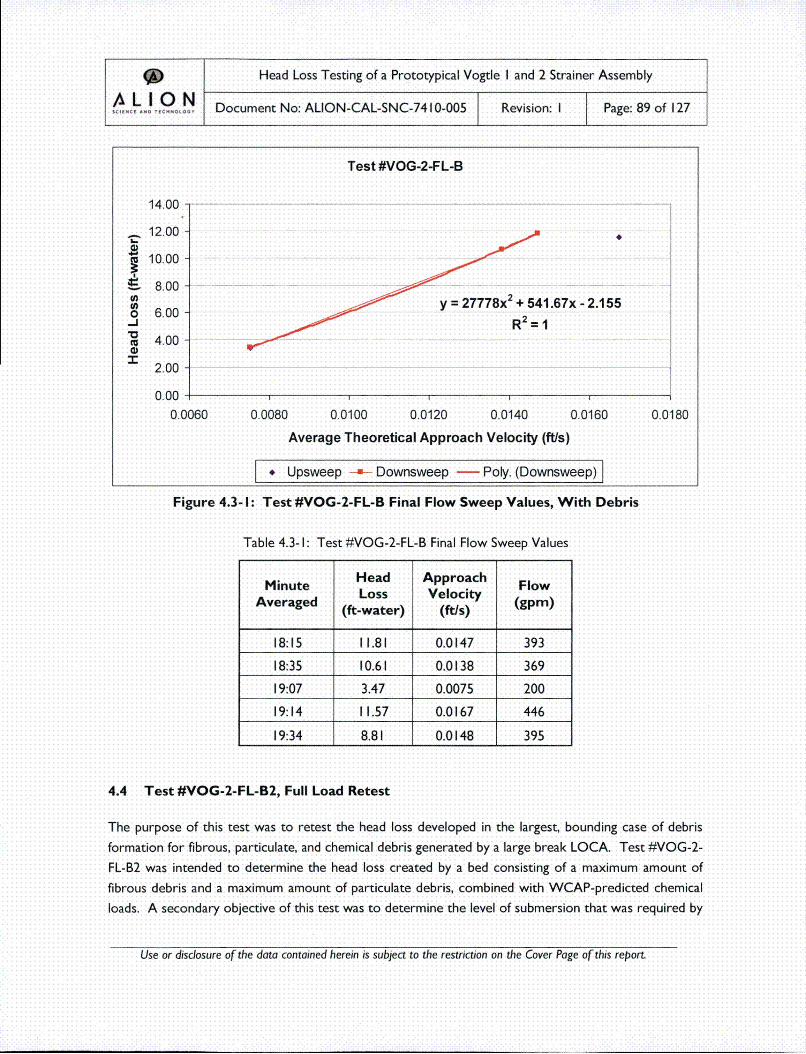
9 Head Loss Testing of a Prototypical Vogtle I and 2 Strainer Assembly
AL I ON Document No: ALION-CAL-SNC-74 10-005 Revision: I Page: 89 of 127
Test #VOG-2-FL-B
14.00 _ _ _ _ _ _ _ _ _ _ _ _ _ _ _ _ _ _ _ _ _ _ _ _ _ _ _ _ _ _
. 12.00
10.00
S.8.00 ..
6.00 277x 51.67x -2.155
2.00
0.00- .....
0.0060 0.0050 0.0100 0.0120 0.0140 0.0160 0.0180
Average Theoretical Approach Velocity (ft/s)
S* Upsweep -u- Downsweep - Poly. (Downsweep)
Figure 4.3- I: Test #VOG-2-FL-B Final Flow Sweep Values, With Debris
Table 4.3- I: Test #VOG-2-FL-B Final Flow Sweep Values
Minute Head Approach FlowAverged Loss Velocity (gmAveraged (ft-water) (ft/s) (gm
18:15 I11.81 0.0147 393
18:35 10.61 0.0138 369
19:07 3.47 0.0075 200
19:14 I11.57 0.0167 446
19:34 8.81 0.0148 395
4.4 Test #VOG-2-FL-B2, Full Load Retest
The purpose of this test was to retest the head loss developed in the largest, bounding case of debris
formation for fibrous, particulate, and chemical debris generated by a large break LOCA. Test #VOG-2-
FL-B2 was intended to determine the head loss created by a bed consisting of a maximum amount of
fibrous debris and a maximum amount of particulate debris, combined with WCAP-predicted chemical
loads. A secondary objective of this test was to determine the level of submersion that was required by
Use or disclosure of the data contained herein is subject to the restriction on the Cover Page of this report.
* Head Loss Testing of a Prototypical Vogtle I and 2 Strainer Assembly
LI O h Document No: ALION-CAL-SNC-7410-005 Revision: I Page: 90 of 127
the strainer module in order to inhibit air ingestion, under both clean screen and debris loaded
conditions.
The design of this particular test series allows for the observation of increasingly high head losses after
each subsequent debris addition. The bed was built by adding the total fibrous and particulate debris
loads in four equal steps. Each step consisted of 25% of each of the fibrous and debris types (Nukon TM
fines, NukonTM smalls, Interam, silicon carbide, and dirtldust surrogate). After this debris bed stabilized,six chemical precipitate batches were added according to WCAP predicted quantities, with both the
calcium phosphate and sodium aluminum silicate precipitate loads divided into three equivalent
additions. The water was too turbid to allow for visual observation of bed growth during the majority
of the test. At the end of the test after the flow sweep portion, the water level in the tank was reduced
at a rate less than I inch every 5 minutes until air ingestion into the strainer module was observed. The
water level reduction procedure was preformed before the initial flow sweep with an additional 3
strainer discs installed on the strainer module and at a flow rate of 900 gpm.
4.4. I Test #VOG-2-FL-B2 Engineering Change Requests
Test #VOG-2-FL-B2 incorporated one engineering change request. At the client's request, the initial
submersion test was completed with an additional 3 strainer discs added to the prototype strainer
module, and at the maximum flow rate achievable by the test apparatus (900 gpm). These actions were
taken to reduce the amount of scaling necessary between the test prototype and the plant strainer.
4.4.2 Test #VOG-2-FL-B2 Testing Discrepancies
Test #VOG-2-FL-B2 resulted in one testing discrepancy. The discrepancy states that at approximately
15:37 on April 16, 2009 during subtest VOG-2.2-FL-F I of testing, the tank temperature dipped below
80°F. Section 4.1I1.2 of the test plan [Ref. I] requires that the tank heater be employed to maintain the
test tank temperature between 80°F and 1 00°F. Due to the high turbidity of the tank the heater was
not activated, but rather the decision was made to allow the pump friction heat to raise the tank
temperature. The tank temperature was above 80°F again by 19:33 on April 16, 2009, and never fell
below 79°F.
4.4.3 Test #VOG-2-FL-B2 Proceedings
Two mechanical stirrers were required to suspend the debris due to the strainer configuration and flow
rate, one in the pit below the strainer, and another within the area underneath the strainer, bounded by
the simulated containment walls and floor. A sparger system was installed on the return line to aid in
the suspension of the debris within the water as well as a sump pump and attendant tubing which
provided flow from beneath the simulated containment floor into the pit beneath the strainer module,
Use or disclosure of the data contained herein is subject to the restriction on the Cover Page of this report.

9 Head Loss Testing of a Prototypical Vogtle I and 2 Strainer Assembly
AL I 0 N Document No: ALION-CAL-SNC-74 10-005 Revision: I Page: 91 of 127
to ensure that particulate debris did not accumulate beneath the simulated containment floor. Also, a
sump pump attached to a miniature sparger was installed beneath the simulated containment floor to
minimize settling of debris in that area. Hand-stirring and manual adjustment of the mechanical stirrers
was performed as necessary during the additions of the fibrous and particulate debris, with maximum
care and consideration given to avoid disturbing the bed or otherwise artificially influencing the bed
formation. Post-test photographs show that while nearly all of the NukonTM and reached the strainers,approximately 10%- 15% of the (larger/heavier) dirt/dust surrogate and nearly all of the Interam debris
settled on the floor in front of the strainer array (see Attachment A). Additionally, a minor amount
(approximately 10-20 lb.) of silicon carbide settled underneath the simulated containment floor.
To begin the test the submersion test was performed with 3 additional strainer discs, and a nominal flow
rate of 900 gpm. The water level was gradually reduced from an approximate level initially 4 inches
above the top of the strainer array to approximately 16 inches below the top of the strainer module,
over the course of approximately 2.5 hours. At this point, only three strainer discs in the strainer
module remained submerged. Significant cavitations were then observed within the test pump,
indicative of air ingestion through the strainer module. The tank pump was then secured off. The
additional 3 strainer discs were then removed from the strainer module, and the testing apparatus was
vented of air before the tank was returned to a water level to 3.375 inches above the strainer module in
preparation for the initial flow sweep.
After the initial flow sweep, the Interam debris was added to the tank first, onto the simulated
containment floor directly in front of the prototype strainer. The majority of the Interam did not enter
suspension even from this elevated position. The remainder of the particulate and fibrous debris that
constituted subtest VOG-2.2-FL-F I was then added into the pit below the simulated containment floor,
directly over the mechanical mixer. The debris was allowed to circulate for ten pool turnovers, before
water was removed from the tank to be used in preparing the next debris addition. This water was
then reintroduced into the tank along with the debris of subtest VOG-2.3-FL-F2. After the head loss
increase had stabilized to less than 0.02 ft-water over an hour, the debris for subtest VOG-2.3-FL-F2
was added to the tank in the same fashion. Debris for subtests VOG-2.4-FL-F3 and VOG-2.5-FL-F4
were then similarly added to the tank. Flow adjustments were conducted during subtests VOG-2.3-FL-
F2 and VOG-2.4-FL-F3 to maintain the flow rate within the target 400 gpm +/- 10 gpm range. The
subtests resulted in increasing head loss values of approximately 0.29 ft-water, 0.79 ft-water, and 1.84 ft-
water for the debris steps VOG-2.2-FL-F I, VOG-2.3-FL-F2, and VOG-2.4-FL-F3, respectively.
Approximately 7 hours after the final addition of fibrous and particulate debris (subtest VOG-2.5-FL-F4),
it was noted that the battery operating the mechanical mixer below the simulated containment floor had
been exhausted. The battery was recharged, reset, and the mechanical mixer restarted. A small,
spontaneous bed shift (less than 0.15 ft-water drop in head loss) occurred approximately two hours
Use or disclosure of the data contained herein is subject to the restriction on the Cover Page of this report.

9• Head Loss Testing of a Prototypical Vogtle I and 2 Strainer Assembly
L ON Document No: ALION-CAL-SNC-74 10-005 Revision: I Page: 92 of 127
later. Adjustments to the mechanical mixers were then affected to ensure that debris was not settling
within the tank• This action was undertaken to ensure that the maximum amount of debris remained in
suspension until attaching to the strainer debris bed, and was made with care to avoid artificially
impacting the debris bed. This was followed by another small, spontaneous bed shift, after which the
head loss stabilized at a level of 3.50 ft-water. The total circulation time after the final fibrous and
particulate debris addition (subtest VOG-2.5-FL-F4) was approximately 17.5 hours (- 170 pool
turnovers)
The first calcium phosphate addition (subtest VOG-2.6-FL-CPI) was then added to the tank. During the
stabilization period of this subtest, three separate flow adjustments were necessary. During the third
and final adjustment, there was a large (greater than 2.0 ft-water drop in head loss) bed shift. The
subtest stabilized at a final head loss value of 3.67 ft-water. Next, the second calcium phosphate
addition (subtest VOG-2.7-FL-CP2) was added to the tank. Two flow adjustments were needed, after
which there was a spontaneous bed shift, which resulted in an increase in flow which required a third
flow adjustment. After the third and final flow adjustment the subtest stabilized at a final value of 5.01
ft-water. The third calcium phosphate addition (subtest VOG-2.8-FL-CP3) was then added, and was
followed by a series of three separate, spontaneous bed shifts which were followed by a flow adjustment
upon their conclusion. This addition increased the head loss to approximately 5.75 ft-water.
The first sodium aluminum silicate addition (subtest VOG-2.9-FL-NAS I) was then added to the test
tank, and increased the head loss uneventfully to approximately 6.38 ft-water. The second sodium
aluminum silicate addition (subtest VOG-2.10-FL-NAS2) was then added to the tank. Shortly after the
addition a flow adjustment was made to maintain the flow rate within the proscribed values. The
chemical precipitate addition stabilized without further incident at approximately 7.03 ft-water. The
third and final sodium aluminum silicate addition (subtest VOG- I. I I -FL-NAS3) was then added to the
test tank. During the 21 hour stabilization period, of this subtest two spontaneous bed shifts occurred,
and four flow adjustments were necessitated, as well as the isolation of the low range (0-100 in.-water)
differential pressure sensing cells due to increasing head loss. For the remainder of the test, the head
loss was measured by the high range (0-250 in.-water) differential pressure sensing cells. Additionally,
during this stabilization period the chiller was employed to limit the temperature increase of the tank,
however the chiller did not produce enough temperature reduction to limit the increasing temperature
of the test tank. Therefore the tube attached to the sump pump which provided the return line from
underneath the simulated containment floor to the pit below the strainer was placed in a drum filled
with ice water to provide a heat exchanger. This helped to limit the temperature increase, and
maintained the tank temperature within the upper limit of 1 00°F for the remainder of the test. Also
during this period, a secondary thermocouple fell out of the tank temporarily, and was promptly
returned. The subtest stabilized at approximately 8.99 ft-water. Upon stabilization of subtest VOG-
I. I I -FL-NAS3, the final flow sweep was initiated, as planned.
Use or disclosure of the data contained herein is subject to the restriction on the Cover Page of this report.
9 Head Loss Testing of a Prototypical Vogtle I and 2 Strainer Assembly
LION Document No: ALION-CAL-SNC-74 10-005 Revision: I Page: 93 of 127
The flow rate was decreased incrementally down to 200 gpm and subsequently up to 440 gpm without
incident. The flow rate was then returned to 400 gpm, and the water level was then lowered at a rate
of I inch every 5 minutes until air ingestion occurred. At a tank water level of approximately 57.25
inches (--3 inches above the strainer), type 6 vortices with attendant air ingestion were first observed,
these vortices becoming persistent at 52.5 inches (-1.5 inches below the strainer). The water level was
reduced further until the pump was secured off at 51.5 inches. After this flow sweep and water drain
down, the test was complete.
4.4.4 Test #VOG-2-FL-B2 Synopsis
For Test #VOG-2-FL-B2, the fibrous and particulate debris bed, combined with chemical precipitates,
produced a total final head loss of 8.99 ft-water, at the test flow rate of 400 gpm. This head loss was
found to be bound by the I11.81 ft-water head loss developed in Test #VOG-2-FL-B.
All debris and chemical precipitates except the Interam gathered in the area of the strainer without
major incident. The Interam resisted all reasonable attempts to suspend it, and so remained on the
simulated floor in front of the strainer module. As the debris bed circumscribed the entire strainer
module, additional debris formed around the strainer along the simulated containment floor in a ramp
shape leading up to the strainer. This ramp formation of debris ranged in depth from approximately 0.5
to 6 inches and extended over a distance approximately equal to the width of the strainer. The Interam
debris was part of this ramp formation. A minor amount (approximately 10-20 lb.) of silicon carbide
settled underneath the simulated containment floor. Each debris batch was added over the pit formed
by the simulated containment walls and floor, near the mechanical mixer. Water samples were taken at
the completion of each subtest. No vortexing occurred during testing, prior to the final water draw
down.
The flow sweep provides data that can potentially be used in the analysis of velocity and temperature
correction. Figure 4.4- I presents the flow sweep data of the stable head loss values for the debris bed
test at the end of testing. The data can be used for the velocity and temperature corrections.
The data reduction technique used for this graph is the one-minute average of the data file's values of
the minute before the data was noted in the test log. This figure also provides the polynomial equation
of the trending curve of the data, as given by Microsoft Excel. Table 4.4- I is the data used to generate
the figure, taken from the data acquisition of Test #VOG-2-FL-B2.
Use or disclosure of the data contained herein is subject to the restriction on the Cover Page of this report.
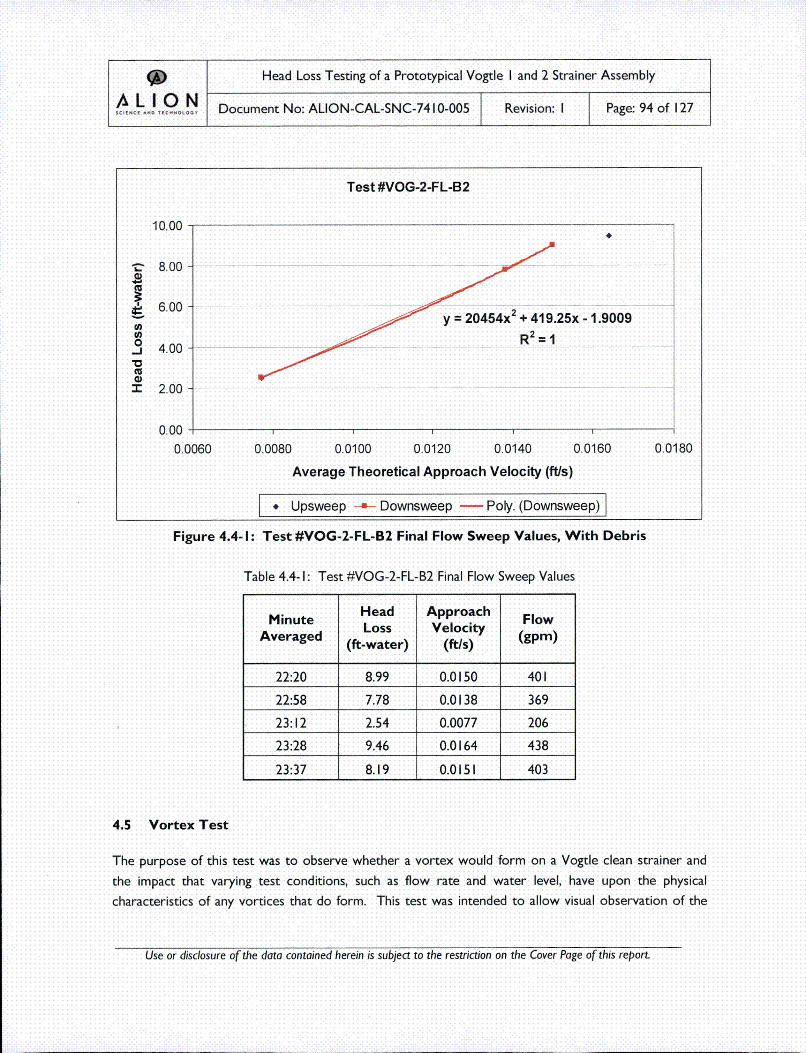
* Head Loss Testing of a Prototypical Vogtle I and 2 Strainer Assembly
-- •LI -- Document No: ALION-CAL-SNC-74 10-005 Revision: I Page: 94 of 127
Test #VOG-2-FL-B2
10.00
'- 8.00
) 6.00Y = 20454x2 +41 9.25x - 1.9009
o, 4.00. . .... .
I 2.00
0.00 ..... t
0.0060 0.0080 0.0100 0.0120 0.0140 0.0160 0.0180
Average Theoretical Approach Velocity (if/s)
[ Upsweep -a- Downsweep - Poly. (Downsweep)I
Figure 4.4- I: Test #VOG-2-FL-B2 Final Flow Sweep Values, With Debris
Table 4.4- I: Test #VOG-2-FL-B2 Final Flow Sweep Values
Minute Head Approach FlowAvrgd Loss Velocity (gpm)
Avraed (ft-water) (ft/s)
22:20 8.99 0.0150 401I
22:58 7.78 0.0138 369
23:12 2.54 0.0077 206
23:28 9.46 0.0164 438
23:37 8.19 0.0151 403
4.5 Vortex Test
The purpose of this test was to observe whether a vortex would form on a Vogtle clean strainer and
the impact that varying test conditions, such as flow rate and water level, have upon the physical
characteristics of any vortices that do form. This test was intended to allow visual observation of the
Use or disclosure of the data contained herein is subject to the restriction on the Cover Page of this report.

* Head Loss Testing of a Prototypical Vogtle I and 2 Strainer Assembly
LJON Document No: ALION-CAL-SNC-74 10-005 Revision: I Page: 95 of 127
size, shape, and location of formation of any vortices that may develop as the flow rate through the
strainer module and water level above the strainer module was varied.
The design of this particular test allows for the observation of any vortices that form after different test
parameters are changed. The water clarity throughout the test was sufficient to visually observe the
strainer module and the water surface during testing. The flow rate ranged from 758 gpm to 1046 gpm
at the beginning of the test and the flow rate was maintained at approximately 900 gpm for the
remainder of the test. At the beginning of the test, the water level was 3.625 inches above the top of
the strainer module. At the end of the test, the water level was 17.325 inches below the top of the
strainer module, which represented the lowest water level achieved during testing. The maximum
water level achieved during testing was 4.175 inches above the top of the strainer module.
4.5. I Vortex Test Testing Discrepancies
There were no test discrepancies associated with the vortex test.
4.5.2 Vortex Test Proceedings
The test was begun with a water level of 3.625 inches above the strainer assembly and a flow rate of 758
gpm. As the flow was increased to 1045 gpm, cavitation in the pump was audibly observed and no
vortices had formed. The water level was then drained down to 1.825 inches below the top of the
strainer assembly. During the drain down, the flow rate was reduced from 1046 gpm to 884 gpm and
heavy cavitation in the pump was observed. The head loss at this point was stabilized at 0.27 ft-water.
This ended the first phase of the test.
The second phase of the test began with the flow rate at approximately 900 gpm and a water level of
4.175 inches above the strainer module. This flow rate was maintained throughout the remainder of the
test. The clean screen head loss was measured and recorded as 0.26 ft-water. Following the clean
screen measurement, the water level was reduced using a sump pump. The point at which the top of
the strainer assembly just peaked above the water level, some pump noise was audibly observed and a
small surface swirl was visually observed in the front right corner of the tank. No vortices were
observed at this point. The head loss was stabilized at 0.26 ft-water
At a water level of approximately 8.0 inches below the top of the strainer assembly, three plates of the
module were uncovered and no vortices were observed. As the water was drained down to a level of
15.325 inches below the top of the strainer assembly, noise was audibly observed in the strainer
assembly. However, no vortices were observed at this time. Two flow rate adjustments were made at
this point in the test. Once the water level decreased another 0.5 inches from the previous point,
several air bubbles were visually observed and significant strainer suction was audibly observed. At the
minimum water level (I 7.325 inches below the top of the strainer module), the flow in the tank could
Use or disclosure of the data contained herein is subject to the restriction on the Cover Page of this report.
* Head Loss Testing of a Prototypical Vogtle I and 2 Strainer Assembly
/•LI 0 N Document No: ALION-CAL-SNC-74 10-005 Revision: I Page: 96 of 127
not be maintained due to the significant amount of air that was being pulled into the pump. Thus, the
test was terminated at the discretion of the test engineer and test coordinator. Four strainer plates
were still submerged and no appreciable vortices were observed at this point. During this portion of
the test, the head loss increased from 0.26 ft-water to 1.31I ft-water at the end of the test.
4.5.3 Vortex Test Synopsis
The head loss ranged from a clean screen value of 0.26 ft-water to a final maximum value of 1.31 ft-
water at a flow rate of 900 gpm. The water level was decreased from a maximum value of 4.175 inches
above the strainer assembly to 17.325 inches below the top of the strainer module.
During the course of testing, no appreciable vortices were visually observed. In the initial phase of
testing, it was observed that an increase in flow rate caused little noticeable change in the visual and
audible behavior of the test tank water and the strainer module. However, a decrease in the water level
caused significant cavitation in the pump to occur. In the second phase of testing, only the water level
was varied. As the water level decreased, the noise in the strainer increased from a slight suction sound
to a significant suction noise. However, the noise in the pump was not observed to change
considerably. Also, the degree of air ingestion in the test tank increased appreciably and was borne out
in the visual observation of air bubbles in the tank. The degree of air ingestion was sufficient to prevent
maintenance of the tank flow rate and caused termination of the test. The only observable eddy
formation during testing was small surface swirls that occurred intermittently during testing.
4.6 Test Termination Extrapolation
Three tests were conducted: Tests #VOG- I -TB, VOG-2-FL-B, and VOG-2-FL-B2. The raw test data for
these tests was analyzed in order to determine a bounding head loss value expected at the end of the 30
day mission time, using the following methodology. For each test, the raw data, starting from the last
chemical addition point and ending when the final head loss value was declared stable, is imported into
KaleidaGraph2 . The imported data is curve fit using a weighted (10%) smoothing algorithm, which uses
the locally weighted least-squared error method with an applied smoothing factor of 10%, controlling
the fraction of the data population considered during smoothing. In comparison to other smoothing
methods, this technique is less sensitive to outliers. This provides a "continuous" representation of the
data to allow further numerical analysis to be performed (Step I). A first order derivative is calculated
using the data from the smooth curve fit. The first derivative results are reviewed to ensure that the
slope of the smoothed data is trending towards zero, suggesting that the head loss profile is stabilizing
(Step 2). For the Thin Bed, the smoothed head loss data beginning at the last chemical debris addition
point (which is treated as time t = 0) is then curve fit to a simple logarithmic expression. The full load
2 KaleidaGraph is a spreadsheet software specializing in scientific graphing. curve fitting, and data analysis for largequantities of experimental data.
Use or disclosure of the data contained herein is subject to the restriction on the Cover Page of this report.
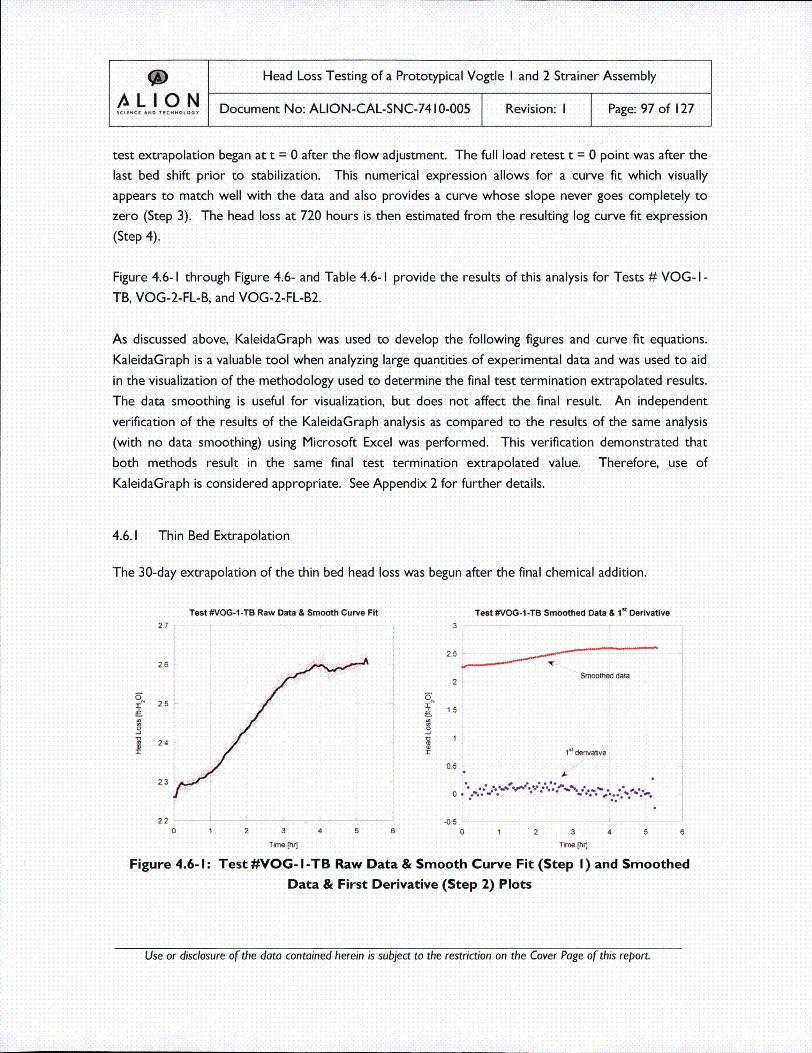
* Head Loss Testing of a Prototypical Vogtle I and 2 Strainer Assembly
L.0 ,0.oo N Document No: ALION-CAL-SNC-7410-005 Revision: I Page: 97 of 127
test extrapolation began at t = 0 after the flow adjustment. The full load retest t = 0 point was after thelast bed shift prior to stabilization. This numerical expression allows for a curve fit which visually
appears to match well with the data and also provides a curve whose slope never goes completely to
zero (Step 3). The head loss at 720 hours is then estimated from the resulting log curve fit expression
(Step 4).
Figure 4.6- I through Figure 4.6- and Table 4.6- I provide the results of this analysis for Tests # VOG- I -
TB, VOG-2-FL-B, and VOG-2-FL-B2.
As discussed above, KaleidaGraph was used to develop the following figures and curve fit equations.
KaleidaGraph is a valuable tool when analyzing large quantities of experimental data and was used to aid
in the visualization of the methodology used to determine the final test termination extrapolated results.
The data smoothing is useful for visualization, but does not affect the final result. An independent
verification of the results of the KaleidaGraph analysis as compared to the results of the same analysis
(with no data smoothing) using Microsoft Excel was performed. This verification demonstrated that
both methods result in the same final test termination extrapolated value. Therefore, use of
KaleidaGraph is considered appropriate. See Appendix 2 for further details.
4.6.1I Thin Bed Extrapolation
The 30-day extrapolation of the thin bed head loss was begun after the final chemical addition.
Test #VOG-1-TB Raw Data & Smooth Curve Fit Test #VOG-1 -TB Smoothed Data & 1't Derivative
I
2.7
2.6
2.5
2.4
2.3
2.2
Smoothed data
2.5
0.5l~ derivabva
0 *.*...- .. '•... '.% .\ •. : -
-0.5
0 1 2 3 4 5 6 0 1 2 3 4 5 6
Time [hr] Tim~e [hr]
Figure 4.6-I:• Test #VOG- I-TB Raw Data & Smooth Curve Fit (Step I) and Smoothed
Data & First Derivative (Step 2) Plots
Use or disclosure of the data contained herein is subject to the restriction on the Cover Page of this report.
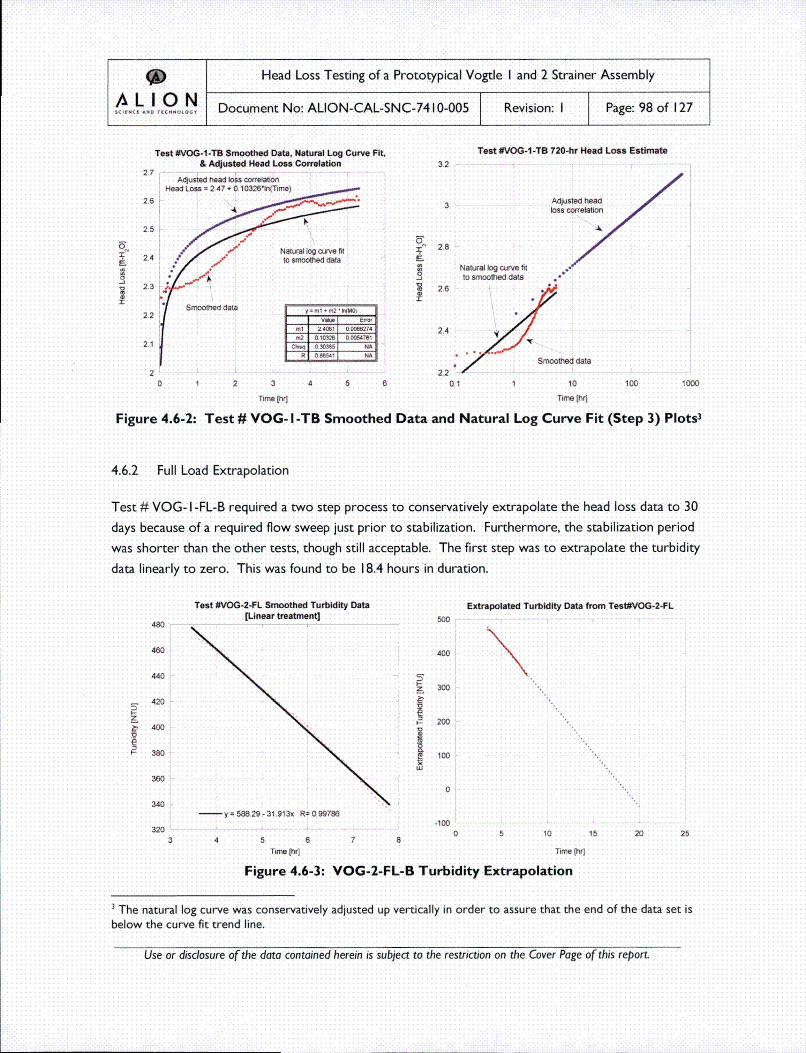
9J Head Loss Testing of a Prototypical Vogtle I and 2 Strainer Assembly
k ON Document No: ALION-CAL-SNC-74 10-005 Revision: I Page: 98 of 127
Test UVOG-1 -TB Smoothed Data, Natural Log Curve Fit.& Adjusted Head Loss Correlation
Adjusted head tos corelaioHead Loss = 247 + 0.10326In(Trime) ____
2.6 .
Test #VOG-1 .TB 720-hr Head Loss Estimate
3.2
Adjusted headtoss correation
0,
-r
25
2.4
2.3
2.2
21
Natural log curve fittto smoothed data
4•
0=
Smoothed data rizy~l m2"•O) i
2.8
26
24
2.2
Natural tog curve fitto smoothed data
Smoothed data
20 1 2 3 4 5 6 01 1 10 100 1000
Time [hr1 Time Lhrj
Figure 4.6-2: Test # VOG- I-TB Smoothed Data and Natural Log Curve Fit (Step 3) Plots3
4.6.2 Full Load Extrapolation
Test # VOG- I-FL-B required a two step process to conservatively extrapolate the head loss data to 30
dlays because of a required flow sweep just prior to stabilization. Furthermore, the stabilization period
was shorter than the other tests, though still acceptable. The first step was to extrapolate the turbidity
data linearly to zero. This was found to be 18.4 hours in duration.
Test #VOG-2-FL Smoothed Turbidity Data(Linear treatment] Extrapolated Turbidity Data from TeatWVOG-2-FL
I-I
480
460
440
420
400
380
360
340
320
Ip
500
400
300
200
100
0
-y 58629 -3 3913x R=0.99786
4
-1000 5 10 15 20 25
5 6 7 8Time (h~rj Time lhr]
Figure 4.6-3: VOG-2-FL-B Turbidity Extrapolation
SThe natural log curve was conservatively adjusted up vertically in order to assure that the end of the data set isbelow the curve fit trend line.
Use or disclosure of the data contained herein is subject to the restriction on the Cover Page of this report.

* Head Loss Testing of a Prototypical Vogtle I and 2 Strainer Assembly
AL I ON Document No: ALION-CAL-SNC-74 10-005 Revision: I Page: 99 of 127
Conservatively, this 8-hour period was used as a linear extrapolation duration applied to the head loss
at the end of the test. The linear regression used as the extrapolation equation is provided in Figure
4.6-4, below.
Linear treatment of Test #VOG-2-FL data
11.5
5.
0
6,_"I
11
10.5
•y = 10.274 + 0.20868x R= 0.99395
100 1 2 3 4 5 6 7 8
Time [hrJ]
Figure 4.6-4: VOG-2-FL-B Head Loss Linear Extrapolation
This differs from the other tests' extrapolations because the other tests' extrapolations were
logarithmic from the point of stability. The extra step added approximately 2.3 ft-water to the curve
prior to the aforementioned logarithmic curve fit. This is evident on the figures below in the large jump
between the log curve fit and the adjusted curve fit.
Use or disclosure of the data contained herein is subject to the restriction on the Cover Page of this report.

* Head Loss Testing of a Prototypical Vogtle I and 2 Strainer Assembly
,•LIO N Document No: ALION-CAL-SNC-74 10-005 Revision: I Page: 100 ofl127
Test#VO-2-F Smothe Daa & = DrivaiveTest #VOG-2-FL Smoothed Data. Natural Log Curve Fit,Test#VO-2-F Smothd Daa &I Delvaive& Adjusted Head Loss Correlation
12 14 ..
10 135 o•• ~
Smoothed data8• 13
S12.5 * Head Loss = 12.9 ÷ 0.42591*In<Time)
o == 124, -, Natural log curve fitt,,...
I •Dsvaie11.5 * to smoothed data
•2 11
0 1 2 3 4 5 6 7 80 1 2 3 4 5 8 7 8
Time [tit Time [hir]
Figure 4.6-5: Test #VOG-2-FL-B Smoothed Data and Natural Log Curve Fit (Step 3) Plots5
4.6.3 Full Load Retest Extrapolation
The Test # VOG-2-FL-B2 extrapolation to 30 days began after the final bed shift.
Test #VOG-FL-B2 Raw data & Smooth Curve Fit Test #VOG-FL-B2 Smoothed Data & 1 Derivativa
9.5 10
85
5"8. •6 Smoothed data
7.5 0o 4
Daa&Fis ervtv (Step 2)aPlot
Use or disclosure of the data contained herein is subject to the restriction on the Cover Page of this report.
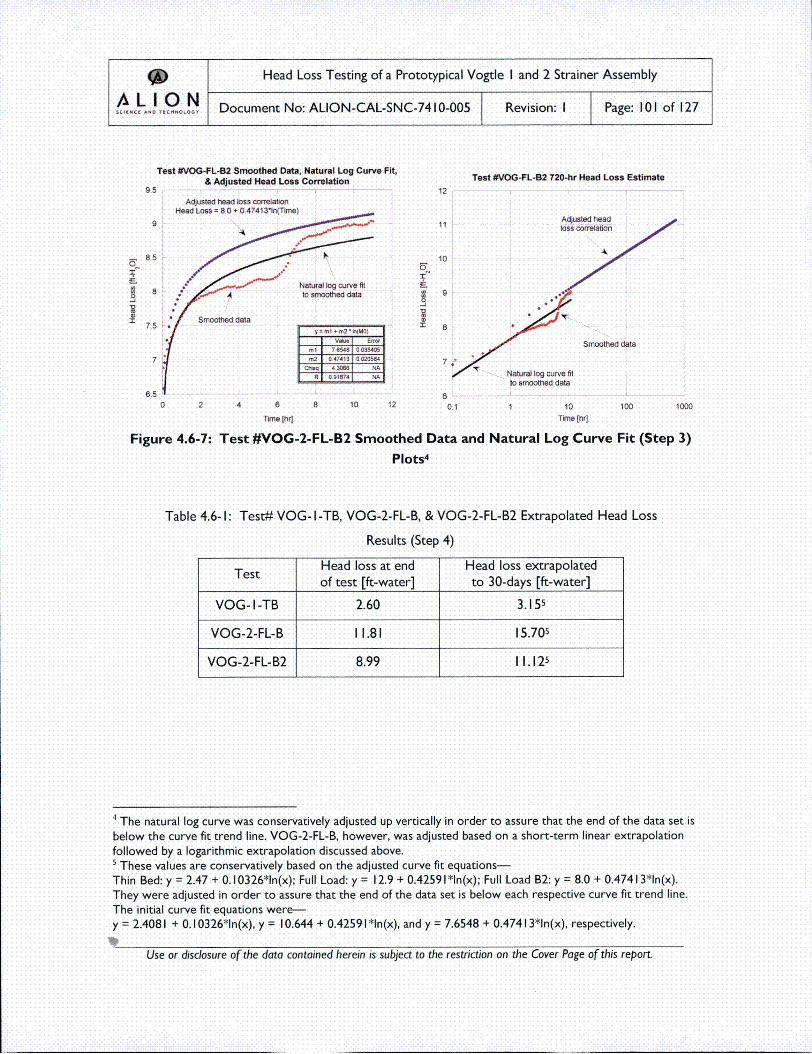
9 Head Loss Testing of a Prototypical Vogtle I and 2 Strainer Assembly
k L O Document No: ALION-CAL-SNC-7410-005 Revision: I Page: 101 of 127
*1
9.5
9
85
I
I
7.
6.5
rest #VOG-FL-B2 Smoothed Data. Natural Log Curve Fit,& Adjusted Head Lose Correlation Test #'JOG-FL-B2 720-hr Head Loss Estimate
Adjusted head loss coreteatiosHead Loss = 80. O .47413'In(Time)
12
11
10
Adjusted headloss correlation
Smoothed data
, -~i-Natural log curve fit
to smoothed data • 9
0*
7
Smoothed data
Natural log curve fitto smoothed data
0 2 4 8
Tan (hi8 10 121 10
Tlo'e [hrj100 1000
Figure 4.6-7: Test #VOG-2-FL-B2 Smoothed Data and Natural Log Curve Fit (Step 3)Plots4
Table 4.6- I: Test# VOG- I-TB, VOG-2-FL-B, & VOG-2-FL-B2 Extrapolated Head Loss
Results (Step 4)
Head loss at end Head loss extrapolatedTetof test [ft-water] to 30-days [ft-water]
VOG- I-TB 2.60 3.15s
VOG-2-FL-B I11.81 15.70s
VOG-2-FL-B2 8.99 I I. 1 2s
4The natural log curve was conservatively adjusted up vertically in order to assure that the end of the data set isbelow the curve fit trend line. VOG-2-FL-B, however, was adjusted based on a short-term linear extrapolationfollowed by a logarithmic extrapolation discussed above.sThese values are conservatively based on the adjusted curve fit equations-
Thin Bed: y = 2.47 + 0.10326*In(x); Full Load: y = 12.9 + 0.42591*In(x); Full Load B2: y = 8.0 + 0.47413*In(x).They were adjusted in order to assure that the end of the data set is below each respective curve fit trend line.The initial curve fit equations were-y = 2.4081 + 0.10326*In(x), y = 10.644 + 0.42591*In(x), and y = 7.6548 + 0.47413*In(x), respectively.
Use or disclosure of the data contained herein is subject to the restriction on the Cover Page of this report.

~Head Loss Testing of a Prototypical Vogtle I and 2 Strainer Assembly
LAo T-oooO N Document No: ALION-CAL-SNC-74 10-005 Revision: I Page: 102 of 127
4.7 Temperature and Velocity Correction
In order to compare the measured head loss at various points in the tests and between tests, it is
necessary to correct for both flow rate and temperature. The NUREG/CR-6224 correlation [Ref. 5],
used to estimate the head loss through debris beds composed of fibrous and particulate debris is given
by the following equation:
AH = AF3"5Sv, am (i1+57a• )1 +0".66Sv am-• pU 2 lALm Euto
Lamninar Term TurbulentTenn
where:
AH = head loss (ft-water)
Sv= surface-to-volume ratio of the debris (ft21ft3)
S= dynamic viscosity of water (lbm/ftlsec)
U = fluid approach velocity (ftlsec)
p = density of water (Ibm/fr3)
a~m = mixed debris bed solidity (one minus the porosity)
ALto = actual mixed debris bed thickness (in.)
A = 4.1 528x I 0-5 (ft-water/in.)/(Ibm/ft2/sec 2); conversion factor for English units.
The HLOSS code uses this equation and other inputs and iterations to estimate the head loss across
perforated plates of flat screen and stacked-disks assemblies. Complex geometry screens, like the
Vogtle strainer assemblies, cannot be directly modeled, because the debris bed thickness and fluid
approach velocity vary for different parts of the strainer. Nonetheless, the correlation provides insights
into how flow and temperature changes impact head loss even for these strainer designs.
The first part of this equation (proportional to viscosity and approach velocity) is the laminar head loss
term, and the second part (proportional to density and approach velocity squared) is the turbulent head
loss term. Knowing the relative proportion of the laminar and turbulent terms is important when
making corrections for flow and temperature. The turbulent and laminar proportion can be determined
in experimental measurements of head loss using flow sweep data, which involves measuring the head
loss as a function of velocity.
Use or disclosure of the data contained herein is subject to the restriction on the Cover Page of this report.
~Head Loss Testing of a Prototypical Vogtle I and 2 Strainer Assembly
I 0 O JJ Document No: ALION-CAL-SNC-7410-005 Revision: I Page: 103 of 127
4.7.1I Flow Regime
As discussed previously, flow sweeps were performed at the end of each of the test series after a stable,
debris-induced head loss had been achieved. The resulting equations for head loss as a function of
velocitY are presented in Figure 4.2-I through Figure 4.4-I. As noted above, the downsweep curve fits
will be used for determination of flow regime.
In Figure 4.2-I through Figure 4.4-I, the quadratic term represents the turbulent contribution to the
head loss while the linear term represents the laminar contribution. The contribution of each to the
overall flow regime is determined through substitution of a representative approach velocitY into theequation. (If a negative coefficient appears in the quadratic regression, this term will be treated as
"zero," meaning the flow regime for that particular curve is either 100% laminar or 100% turbulent. See
Appendix I.) Once each term is computed, their relative magnitude is compared in order to quantify
the laminar/turbulent split.
The clean screen head loss curves of Figure 3.3- I are normally considered to be 100% turbulent, which
is conservative relative to extrapolating the results to higher temperatures.
Appendix I shows the turbulent and laminar ratios for all three tests, using the downsweep of each final
flow sweep for the derivation. The results show that the flow through the debris bed for all three tests
varied. The flow regime for Test #VOG- I-TB is '-22% to 38% turbulent, the flow regime for Test
#VOG-2-FL-B is --28% to 46% turbulent, and the flow regime for Test #VOG-2-FL-B2 is -27% to 44%
turbulent.
Based on the laminar/turbulent split results, the data appears to be indicating that the debris bed
promotes laminar flow when the pressure drop is low. When the head loss across the bed gets high
and there is non-uniform loading, the water is traveling at high velocity through the thin spots, which
promotes turbulence. This is also demonstrated by comparing the laminar/turbulent split results of the
thin-bed test and the full load tests. These tests had the same particulate debris loads and the full load
tests had a greater fibrous debris load. As expected, as the fibrous debris load decreased, the measured
head loss progressively decreased. Additionally, the laminar contribution progressively increased.
Turbulent contribution appears highest for beds with relatively low porosity and beds that exhibit non-
uniformity.
Tests #VOG- I-TB represented the thin-bed condition for Vogtle with a maximum equivalent bed
thickness of 0.625 inches. Tests #VOG-2-FL-B and VOG-2-FL-B2 represent the full load configuration
that is expected at Vogtle in the event of a LOCA. The table below summarizes the Full Calcium
Phosphate head loss and maximum Chemical debris head loss for all three tests.
Use or disclosure of the data contained herein is subject to the restriction on the Cover Page of this report.
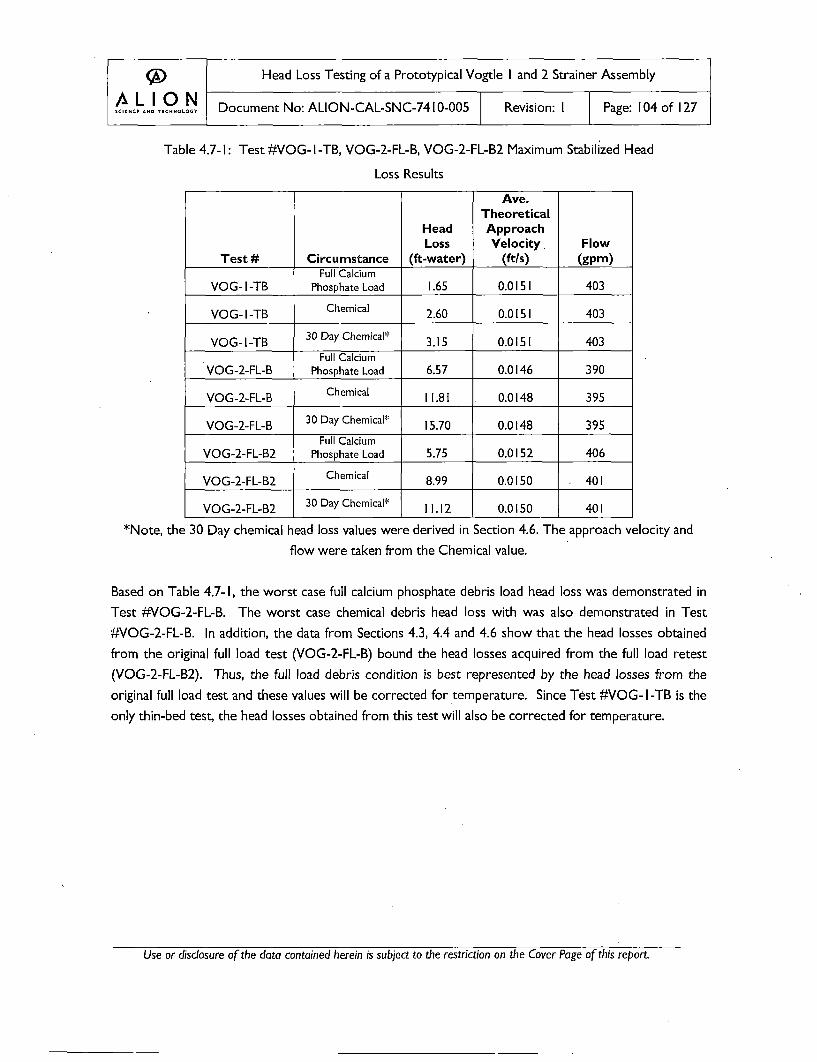
(•) Head Loss Testing of a Prototypical Vogtle I and 2 Strainer Assembly
/kLIO N Document No: ALION-CAL-SNC-7410-005 Revision: I Page: 104 of 127
Table 4.7- I: Test #VOG- I -TB, VOG-2-FL-B, VOG-2-FL-B2 Maximum Stabilized Head
Loss Results
Ave.Theoretical
Head ApproachLoss Velocity. Flow
Test # Circumstance (ft-water) (ftls) (gpm)Full Calcium
VOG- I -TB Phosphate Load 1.65 0.0151I 403
VOG-lI-TB Chemical 2.60 0.0151 403
VOG- I-TB 30 Day Chemical* 3.15 0.0151 403
Full CalciumVOG-2-FL-B Phosphate Load 6.57 0.0 146 390
VOG-2-FL-B Chemical I11.81 . 0.0 148 395
VOG-2-FL-B 30 Day Chemical* 15.70 0.0148 395
Full CalciumVOG-2-FL-B2 Phosphate Load 5.75 0.0152 406
VOG-2-FL-B2 Chemical 8.99 0.0150 401I
VOG-2-FL-B2 30 Day Chemical* 11. 12 0.0150 401I
*Note, the 30 Day chemical head loss values were derived in Section 4.6. The approach velocity and
flow were taken from the Chemical value.
Based on Table 4.7- I, the worst case full calcium phosphate debris load head loss was demonstrated in
Test #VOG-2-FL-B. The worst case chemical debris head loss with was also demonstrated in Test
#VOG-2-FL-B. In addition, the data from Sections 4.3, 4.4 and 4.6 show that the head losses obtained
from the original full load test (VOG-2-FL-B) bound the head losses acquired from the full load retest
(VOG-2-FL-B2). Thus, the full load debris condition is best represented by the head losses from the
original full load test and these values will be corrected for temperature. Since Test #VOG- I-TB is the
only thin-bed test, the head losses obtained from this test will also be corrected for temperature.
Use or disclosure of the data contained herein is subject to the restriction on the Cover Page of this report.
4.7.2 Temperature Correction
The equation below will be used to correct the measured head loss for changes in temperature.Because the test temperature is not representative of the temperature that would be expected in
containment, it is necessary to correct the test data for temperature.
AH AH'IRLL •i,+ RT P2 j (Correction for changes in tmeaue
RL = ratio of laminar flow
Ip= dynamic viscosity at temperature (Ibm/ft/sec) Euto
RT= ratio of turbulent flow
p =density at temperature (Ibm/ft3)
The final flow sweep performed in each of the tests provides data relative to the flow regime through
the debris bed, which is an important factor in correcting for temperature similarly to corrections in
velocity.
To calculate the corrected head loss at the desired temperatures, the viscosity and density of water at
the desired temperature, and test temperature of the particular test must be used. Furthermore, the
head losses at temperatures higher than prescribed in the test plan may be adjusted .to represent what
the head losses would have been at the target temperatures. All adjustments can be used for
comparison to NPSH requirements at those containment pool temperatures.
The measured head loss can be corrected for changes in temperature using the laminar and turbulent
ratios provided in Appendix I. Test #VOG- I-TB (full calcium phosphate, full chemical, 30 day chemical)
and Test #VOG-2-FL-B (full calcium phosphate, full chemical, 30 day chemical) head loss data will be
adjusted from the maximum average test tank temperature at the end of the flow sweep to 1 00°F,
1 40°F, 180 0F, and 21 2°F for comparison to NPSH requirements at those containment pool
temperatures. The viscosity and density (taken from standard engineering steam tables) of water at the
above temperatures, are given in Table 4.7-2.
Use or disclosure of the data contained herein is subject to the restriction on the Cover Page of this report.

~Head Loss Testing of a Prototypical Vogtle I and 2 Strainer Assembly
AL I O Document No: ALION-CAL-SNC-7410-005 Revision: I Page: 106 of 127
Table 4.7-2: Density and Viscosity Data at Analyzed TemperaturesTemperature Density Viscosity
(°F) (Ibm/cu.ft) (Ibm/ft/sec)
85 62.19 5.46 E-04
91 62.13 5.08E-04
100 62.02 4.59E-04
140 61.39 3.19E-04
180 60.58 2.35E-04
212 59.85 1.90E-04
The measured head loss values for Test #VOG- I-TB thin-bed debris load flow sweep plotted in Figure4.2-I will be temperature corrected using Equation 8 and the laminar and turbulent ratios provided in
Appendix I, to determine head loss values at I100°F, I140°F, 180 0F, and 21 2°F. The resulting temperature
corrected head loss values are calculated in Table 4.7-4 through Table 4.7-7 and plotted in Figure 4.7- I.
Additiotnally, for Test #VOG-l-TB, the measured head loss values plotted in Figure 4.2-I will be
reduced, based on the ratio of the maximum full calcium phosphate head loss (subtest )(X-CP3) as
compared to the flow sweep chemical head loss, in order to perform the same temperature corrections
for the full calcium phosphate head loss values. The resulting temperature corrected head loss values
are calculated in Table 4.7-8 through Table 4.7-I11 and plotted in Figure 4.7-2. It is considered
appropriate to use the flow sweep chemical head loss flow split data for the full calcium phosphate
debris bed due to the low fiber composition of the debris bed. Both the full calcium phosphate debris
bed and the chemical debris bed are dense debris beds with relatively low porosity and would be
anticipated to show similar flow split data.
Additionally, for Test #VOG-I-TB, the measured head loss values plotted in Figure 4.2-I will be
increased, based on the ratio of the 30 day chemical heard loss as compared to the flow sweep chemical
head loss, in order to perform the same temperature corrections for the 30 day chemical head loss
values. The resulting temperature corrected head loss values are calculated in Table 4.7-12 through
Table 4.7- 15 and plotted in Figure 4.7-3. It is considered appropriate to use the flow sweep chemical
head loss flow split data for the 30 day chemical debris bed due to the low fiber composition of the
debris bed. Both the 30 day chemical debris bed and the chemical debris bed are dense debris beds
with relatively low porosity and would be anticipated to show similar flow split data.
The measured head loss values for Test #VOG-2-FL-B full debris load flow sweep plotted in Figure 4.3- I
will be temperature corrected using Equation 8 and the laminar and turbulent ratios provided in
Use or disclosure of the data contained herein is subject to the restriction on the Cover Page of this report.

~Head Loss Testing of a Prototypical Vogtle I and 2 Strainer Assembly
A L .I 0 y hi1 Document No: ALION-CAL-SNC-7410-005 Revision: I Page: 107 of 127
Appendix I, to d~etermine head loss values at 100°F, 140°1F, 180 0F, and 212°F. The resulting temperature
corrected head loss values are calculated in Table 4.7-16 through Table 4.7-19 and plotted Figure 4.7-4.
Additionally, for Test #VOG-2-FL-B, the measured head loss values plotted in Figure 4.3-I will be
reduced, based on the ratio of the maximum full calcium phosphate head loss as compared to the flow
sweep chemical head loss, in order to perform the same temperature corrections for the full calcium
phosphate head loss values. The resulting temperature corrected head loss values are calculated in
Table 4.7-20 through Table 4.7-23 and plotted in Figure 4.7-5. It is considered appropriate to use the
flow sweep chemical head loss flow split data for the full calcium phosphate debris bed due to the lowfiber composition of the debris bed. Both the full calcium phosphate debris bed and the chemical debris
bed are dense debris beds with relatively low porosity and would be anticipated to show similar flow
split data.
Additionally, for Test #VOG-2-FL-B, the measured head loss values plotted in Figure 4.3-1 will be
increased, based on the ratio of the 30 day chemical head loss as compared to the flow sweep chemical
head loss, in order to perform the same temperature corrections for the 30 day chemical head loss
values. The resulting temperature corrected head loss values are calculated in Table 4.7-24 through
Table 4.7-27 and plotted in Figure 4.7-6. It is considered appropriate to use the flow sweep chemicalhead loss flow split data for the 30 day chemical debris bed due to the low fiber composition of the
debris bed. Both the 30 day chemical debris bed and the chemical debris bed are dense debris beds
with relatively low porosity and would be anticipated to show similar flow split data.
Near the end of the final flow sweep for Test #VOG-2-FL-B, significant bed damage was incurred and isevidenced by the fact that the head loss at 0.0165 ft/s is lower than the head loss at 0.0150 ft/s (see
Figure 3.5-4 and Figure 4.3-I). Thus, the bed damage was sufficient that the head loss was not able to
recover from its original value at 0.0150 ft/s. Consequently, the corrected head losses at 0.0165 ft/s are
excluded from Table 4.7-16 through Table 4.7-27 and Figure 4.7-4 through Figure 4.7-6.
Table 4.7-3 provides the flow sweep adjusted head loss values that will be used for temperature
correction of Test #VOG- I -TB and Test #VOG I-2-FL-B data.
Use or disclosure of the data contained herein is subject to the restriction on the Cover Page of this report.

(• Head Loss Testing of a Prototypical Vogtle I and 2 Strainer Assembly
AL I ON Document No: ALION-CAL-SNC-74 10-005 Revision: I Page: 108 of 127
Table 4.7-3: Test #VOG- I-TB and VOG-2-FL-B Flow Sweep Adjusted Head Loss
Values
TEST #VOG- I -TB TEST #VOG- I -TB
Full Fl acuApprach alFullFlwCalcium DayFlow Sweep 30 Day
elt Phosphate Chemical Adjusted Velroacit AdjusphtedVeocity Ajse Head Loss Head LossVeoiy Ajsd Chmcl dutdAdjusted eadsLoss HeadLLos(ft/s) Head Loss (ft-water) (ft-water) (ft/s) Head Loss (ft-water) (ft-water)
(ft-water) (ft-water)
0.0150 1.65 2.60 3.15 0.0150 6.57 I11.81 15.70
0.0138 1.504 2.37 2.87 0.0138 5.70 10.61 13.63
0.0075 0.838 1.31 1.60 0.0075 1.87 3.47 4.46
0.0 165 1.842 2.87 3.52 0.0165 7.71 I11.57 18.43
Corrections to head loss due to changes in approach velocity can be made using the equation generated
from the test data. Curves were fitted to the data points, using Microsoft Excel, for each temperature
to allow for easy calculation of the head loss at a specific approach velocity. The equations of the curves
are shown in Figure 4.7- I through Figure 4.7-6.
Table 4.7-4: Test #VOG- I-TB Chemical Head Loss Data @ 100 0F
Vi A• p• tJ• Pz Iz RaiosTemp. CorrectedV1 A1 P I~iP2 2 RaiosHead Loss, AH2
_(ft/sec.) (ft-water) (Ibm/fr3) (lb/fins) (Ibm/fr3) (lb/frns)" Lam. Turb. (ft-water)
0.0150 2.60 62.19 5.46E-04 62.02 4.59E-04 0.641 0.359 2.33
0.0138 2.37 62.19 5.46E-04 62.02 4.59E-04 0.660 0.340 2.12
0.0075 1.31I 62.19 5.46E-04 62.02 4.59E-04 0.782 0.218 1. 15
0.0165 2.87 62.19 5.46E-04 62.02 4.59E-04 0.623 0.377 2.58
Table 4.7-5: Test # VOG- I-TB Chemical Head Loss Data @ 140 °F
V• AH• p• pu P2 P2 Ratios Temp. CorrectedHead Loss, AH2
(ft/sec.) (fr-water) (Ibm/fr3) (lb/fins) (Ibm/fr3) (lb/fins) Lamn. Turb. (fr-water)
0.0150 2.60 62.19 5.46E-04 61.39 3.19E-04 0.641 0.359 1.90
0.0138 2.37 62.19 5.46E-04 61.39 3.l9E-04 0.660 0.340 1.71
0.0075 1.31 62.19 5.46E-04 61.39 3.19E-04 0.782 0.218 0.880
0.0165 2.87 62.19 5.46E-04 61.39 3.19E-04 0.623 0.377 2.11
Use or disclosure of the data contained herein is subject to the restriction on the Cover Page of this report.

~Head Loss Testing of a Prototypical Vogtle I and 2 Strainer Assembly
LION Document No: ALION-CAL-SNC-74 10-005 Revision: I Page: 109 ofl.27
Table 4.7-6: Test # VOG- I-TB Chemical Head Loss Data @ 180 0F
V p 1 P2P2 RtiosTemp. CorrectedV• A E P P • P2 12 RaiosHead Loss, AH 2
(fr/sec.) (ft-water) (Ibm/fr 3) (lb/fi/s) (ibm/ft3) (lb/fins) Lamn. Turb. (fr-water)
0.0150 2.60 62.19 5.46E-04 60.58 2.35 E-04 0.641 0.359 1.63
0.0138 2.37 62.19 5.46E-04 60.58 2.35E-04 0.660 0.340 1.46
0.0075 1.31 62.19 5.46E-04 60.58 2.35 E-04 0.782 0.218 0.719
0.0 165 2.87 62.19 5.46E-04 60.58 2.35E-04 0.623 0.377 1.82
Table 4.7-7: Test # VOG- I-TB Chemical Head Loss Data @ 212 0F
V• AH• p1 I, . P2 Pa2 Ratios Temp. CorrectedHead Loss, AH 2
(fr/sec.) (fr-water) (Ibm/ft3) (Ib/fr/s) (Ibm/ft 3) (lb/fins) Lamn. Turb. (ft-water)
0.0150 2.60 62.19 5.46E-04 59.85 1.90E-04 0.641 0.359 1.48
0.0138 2.37 62.19 5.46E-04 59.85 I1.90E-04 0.660 0.340 1.32
0.0075 1.31 62.19 5.46E-04 59.85 l.90E-04 0.782 0.218 0.631I
0.01 65 2.87 62.19 5.46E-04 59.85 I1.90E-04 0.623 0.377 1.66
Use or disclosure of the data contained herein is subject to the restriction on the Cover Page of this report.
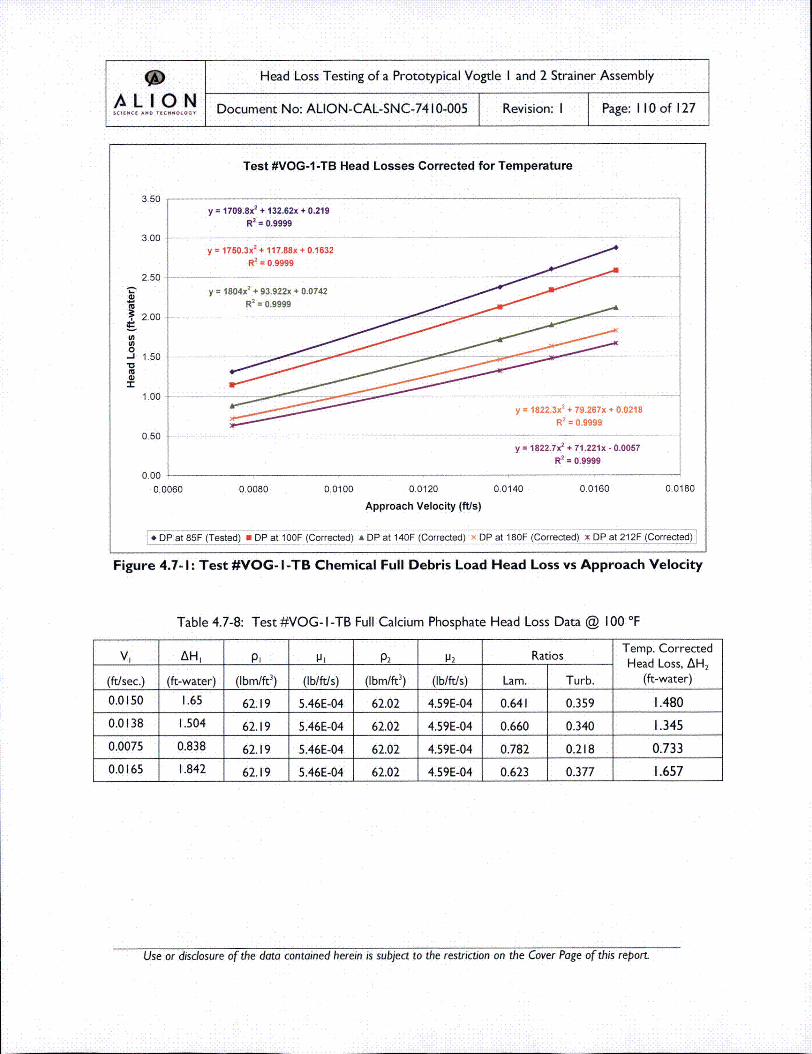
* Head Loss Testing of a Prototypical Vogtle I and 2 Strainer Assembly
k CLLO N Document No: ALION-CAL-SNC-74 10-005 Revision: I Page: 110 of 127
Test #VOG-1 -TB Head Losses Corrected for Temperature
3.50y = 1709.8x
2 + 132.62x + 0.219
R2
: 0.9999
3.00y = 1750.3x
2 + 117.88x + 0.1632
R2
= 0.9999
2.50~y = 1804x2 + 93.922x,* 0.0742 •
Rz = 0.99992.00
-J 1.50
1.00 ,...y : 1822.3x2 + 79.267x + 0.0218
0.50 -
y = 1822.7X2
+ 71.221X -.0.0057
R2 = 0.9999
0.00
0.0060 0.0080 0.0100 0.0120 0.0140 0.0160 0.0180
Approach Velocity (ft/s)
*DP at 85F (Tested) i DP at l00F (Corrected) A DP at 140F (corrected) X DP at 180F (Corrected) x DP at 212F (Corrected)
Figure 4.7- I: Test #VOG- I -TB Chemical Full Debris Load Head Loss vs Approach Velocity
Table 4.7-8: Test #VQG- I-TB Full Calcium Phosphate Head Loss Data @ 100 °F
V• AH• P1 lp P2 P2 Ratios Temp. CorrectedHead Loss, AH 2
(ft/sec.) (ft-water) (Ibm/ft3) (lIbft/s) (Ibm/ft3) (Ib/ft/s) Lam. Turb. (ft-water)
0.0150 1.65 62.19 5.46E-04 62.02 4.59E-04 0.641 0.359 1.480
0.0138 1.504 62.19 5.46E-04 62.02 4.59E-04 0.660 0.340 1.345
0.0075 0.838 62.19 5.46E-04 62.02 4.59E-04 0.782 0.218 0.733
0.0165 1.842 62.19 5.46E-04 62.02 4.59E-04 0.623 0.377 1.657
Use or disclosure of the data contained herein is subject to the restriction on the Cover Page of this report.

* Head Loss Testing of a Prototypical Vogtle I and 2 Strainer Assembly
LION Document No: ALION-CAL-SNC-74 10-005 Revision: I Page: I I I of 127
Table 4.7-9: Test # VOG- I-TB Full Calcium Phosphate Head Loss Data @ 140 °F
V1 AH1 pg Ip1 p2 l 2 Ratios Temp. CorrectedHead Loss, AH2
(ft/sec.) (ft-water) (Ibm/ft3) (Ib/ftls) (Ibm/ft3) (Iblft/s) Lam. Turb. (ft-water)
0.0150 1.65 62.19 5.46E-04 61.39 3.19E-04 0.641 0.359 1.203
0.0138 1.504 62.19 5.46E-04 61.39 3.19E-04 0.660 0.340 1.085
0.0075 0.838 62.19 5.46E-04 61.39 3.19E-04 0.782 0.218 0.563
0.0165 1.842 62.19 5.46E-04 61.39 3.19E-04 0.623 0.377 1.356
Table 4.7-1I0: Test # VOG- I -TB Full Calcium Phosphate Head Loss Data @ 180 °F
V1 AH1 p, Pg p2 iP2 Ratios Temp. CorrectedHead Loss, AH 2
(ft/sec.) (ft-water) (Ibm/ft3) (bIbft/s) (Ibm/ft 3) (lIbft/s) Lam. Turb. (ft-water)
0.0150 1.65 62.19 5.46E-04 60.58 2.35 E-04 0.641 0.359 1.032
0.0138 1.504 62.19 5.46E-04 60.58 2.35E-04 0.660 0.340 0.926
0.0075 0.838 62.19 5.46E-04 60.58 2.35 E-04 0.782 0.218 0.460
0.0 165 1.842 62.19 5.46E-04 60.58 2.35E-04 0.623 0.377 I. 170
Table 4.7-IlI: Test # VOG- I -TB Full Calcium Phosphate Head Loss Data @ 212 °F
V1 AH1 p• Ip P2 l2 Ratios Temp. CorrectedHead Loss, AH 2
(ft/sec.) (ft-water) (Ibm/ft3) (bIbft/s) (Ibm/ft 3) (lIbftds) Lam. Turb. (ft-water)
0.0150 1.65 62.19 5.46E-04 59.85 1.90E-04 0.641 0.359 0.938
0.0138 1.504 62.19 5.46E-04 59.85 1 .90E-04 0.660 0.340 0.838
0.0075 0.838 62.19 5.46E-04 59.85 1 .90E-04 0.782 0.218 0.404
0.0165 1.842 62.19 5.46E-04 59.85 1 .90E-04 0.623 0.377 1.068
Use or disclosure of the data contained herein is subject to the restriction on the Cover Page of this report.
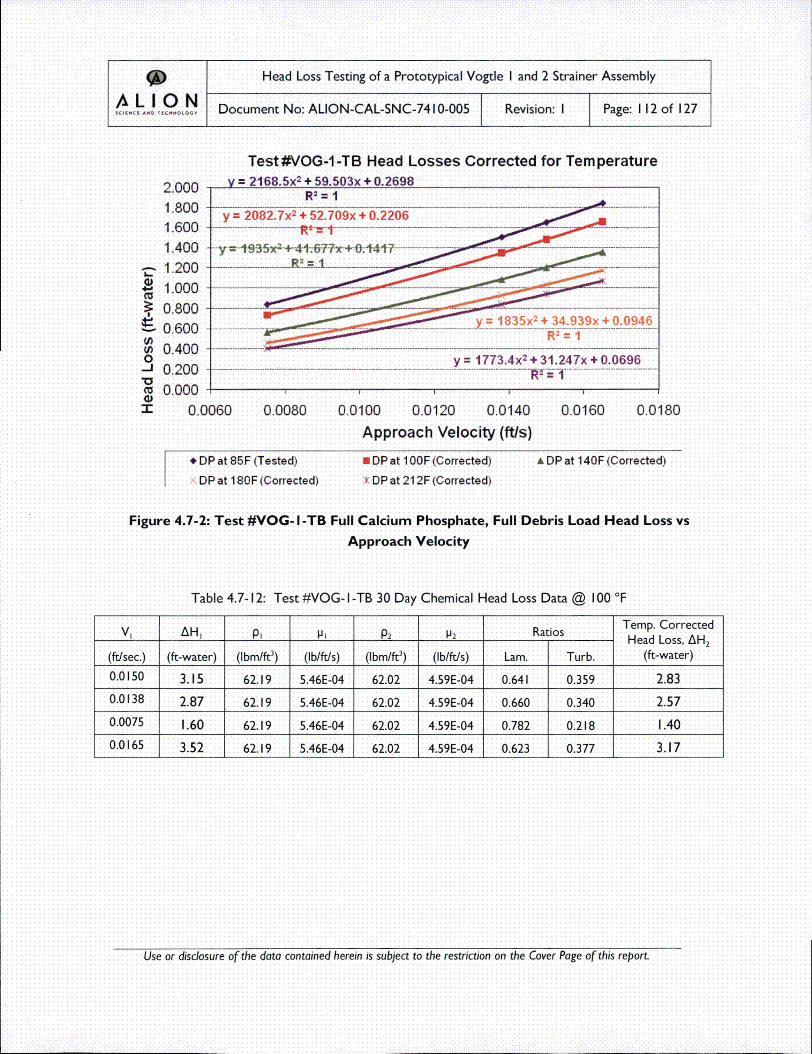
* Head Loss Testing of a Prototypical Vogtle I and 2 Strainer Assembly
A• L I 02 N Document No: ALION-CAL-SNC-74 10-005 Revision: I Page: 112 of 127
YTest %VOG-1 -TB Head Losses Corrected for Tem perature
r= 2168.5x2 + 59.503x + 0.2698
(A0.
-O
4..":
2.0001.800
1.600
1.400
1.200
1.000
0.800
0.600
0.400
0.200
0.000
0.c
y = 2082.7x 2 + 52.709x +0 02206
.y9-g35x•-+-4l1-6-77x*-44:1-,7---.....- - ...........--- - ........
.......... ... ......... ..... .... ....... ... ...35x2 + 34.939x ..... . .....+ 0.0946
y = 1773.4x2 ÷ 31.247x ÷ 0.0696.. . . ... . .. . .. . .. . .. .. . .. . .. . .. . .. . . . .. . .. . .. . .. . .. .. . .. . .. . . . . .. . . . .. .-i - _ - i . . .. .. . . . . .. . .. . .. .
)060 0.0080 0.0100 0.0120 0.0140Approach Velocity (ft/s)
0.0160 0.0180
* DP at 85F (Tested)'DP at 180F (Corrected)
* DP at 1 00F (Corrected):• DP at 21 2F (Corrected)
A DP at 140F (Corrected)
Figure 4.7-2: Test #VOG- I-TB Full Calcium Phosphate, Full Debris Load Head Loss vsApproach Velocity
Table 4.7-12: Test #VOG- I-TB 30 Day Chemical Head Loss Data @ 100 °F
V1 AH1 p P Pi P2 P2 Ratios Temp. CorrectedHead Loss, AH2
(ft/sec.) (ft-water) (Ibm/ft 3) (lb/ft/s) (lbm/ft3) (Ib/ftls) Lam. Turb. (ft-water)
0.0150 3.15 62.19 5.46E-04 62.02 4.59E-04 0.641 0.359 2.83
0.0138 2.87 62.19 5.46E-04 62.02 4.59E-04 0.660 0.340 2.57
0.0075 1.60 62.19 5.46E-04 62.02 4.59E-04 0.782 0.218 1.40
0.0165 3.52 62.19 5.46E-04 62.02 4.59E-04 0.623 0.377 3.17
Use or disclosure of the data contained herein is subject to the restricton on the Cover Page of this report.
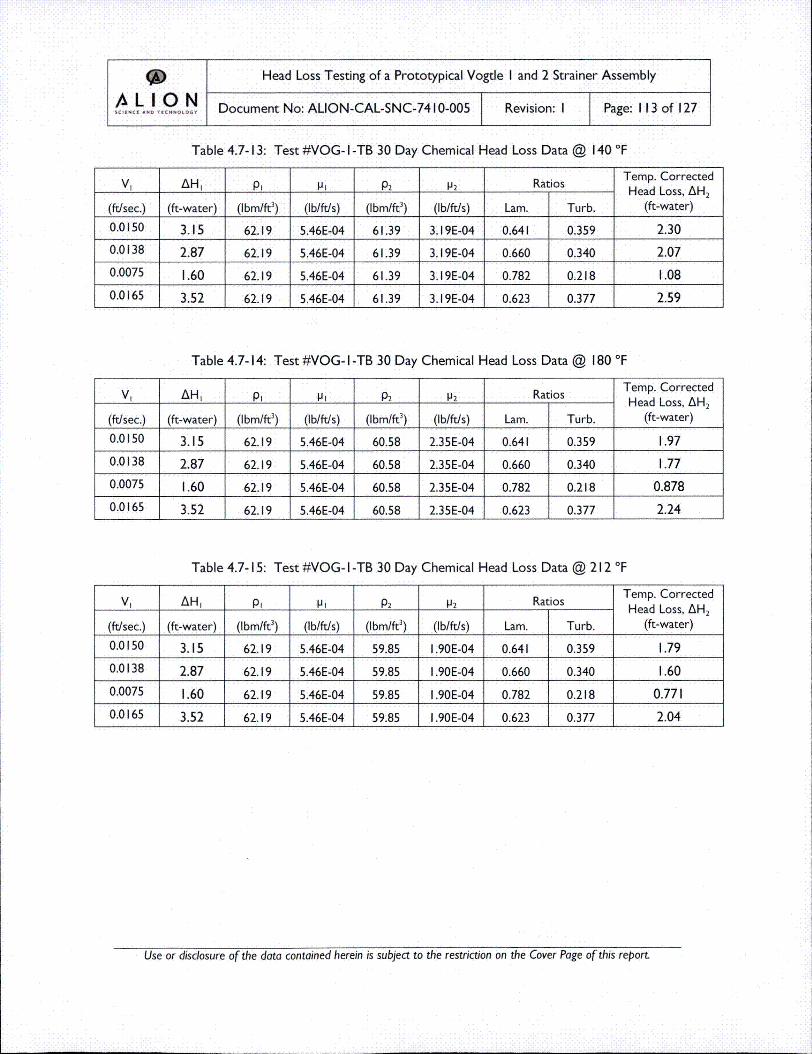
* Head Loss Testing of a Prototypical Vogtle I and 2 Strainer Assembly
LI 0 N Document No: ALION-CAL-SNC-74 10-005 Revision: I Page: I 13 of 127
Table 4.7-13: Test #VOG- I-TB 30 Day Chemical Head Loss Data @ 140 °F
V1 AH, p1 Ip1 p2 Ip2 Ratios Temp. CorrectedHead Loss, AH 2
(ft/sec.) (ft-water) (Ibm/ft3) (lb/ft/s) (Ibm/ft 3) (lb/ft/s) Lamn. Turb. (ft-water)
0.0150 3.15 62.19 5.46E-04 61.39 3.19E-04 0.641 0.359 2.30
0.0138 2.87 62.19 5.46E-04 61.39 3.19E-04 0.660 0.340 2.07
0.0075 1.60 62.19 5.46E-04 61.39 3.19E-04 0.782 0.218 1.08
0.0165 3.52 62.19 5.46E-04 61.39 3.19E-04 0.623 0.377 2.59
Table 4.7-14: Test #VOG- I-TB 30 Day Chemical Head Loss Data @ 180 0F
V1 AH1 p01 Ip1 p2 IP2 Ratios Temp. CorrectedHead Loss, AH2
(ft/sec.) (ft-water) (Ibm/fr3) (lb/fins) (Ibm/fr3) (lb/ftns) Lam. Turb. (ft-water)
0.0150 3.15 62.19 5.46E-04 60.58 2.35E-04 0.641 0.359 1.97
0.0138 2.87 62.19 5.46E-04 60.58 2.35E-04 0.660 0.340 1.77
0.0075 1.60 62.19 5.46E-04 60.58 2.35E-04 0.782 0.218 0.878
0.0 165 3.52 62.19 5.46E-04 60.58 2.35E-04 0.623 0.377 2.24
Table 4.7-I5: Test #VOG- I -TB 30 Day Chemical Head Loss Data @ 212 0F
V1 AH, Pl Pa p2 l2 Ratios Temp. CorrectedHead Loss, AH 2
(ft/sec.) (fr-water) (Ibm/fr 3) (Ib/ft/s) (Ibm/fr3) (lb/fins) Lam. Turb. (ft-water)
0.0150 3. 15 62.19 5.46E-04 59.85 I1.90E-04 0.64 1 0.359 1.79
0.0138 2.87 62.19 5.46E-04 59.85 I1.90E-04 0.660 0.340 1.60
0.0075 1.60 62.19 5.46E-04 59.85 I1.90E-04 0.782 0.218 0.771I
0.0 165 3.52 62.19 5.46E-04 59.85 1.90E-04 0.623 0.377 2.04
Use or disclosure of the data contained herein is subject to the restriction on the Cover Page of this report.
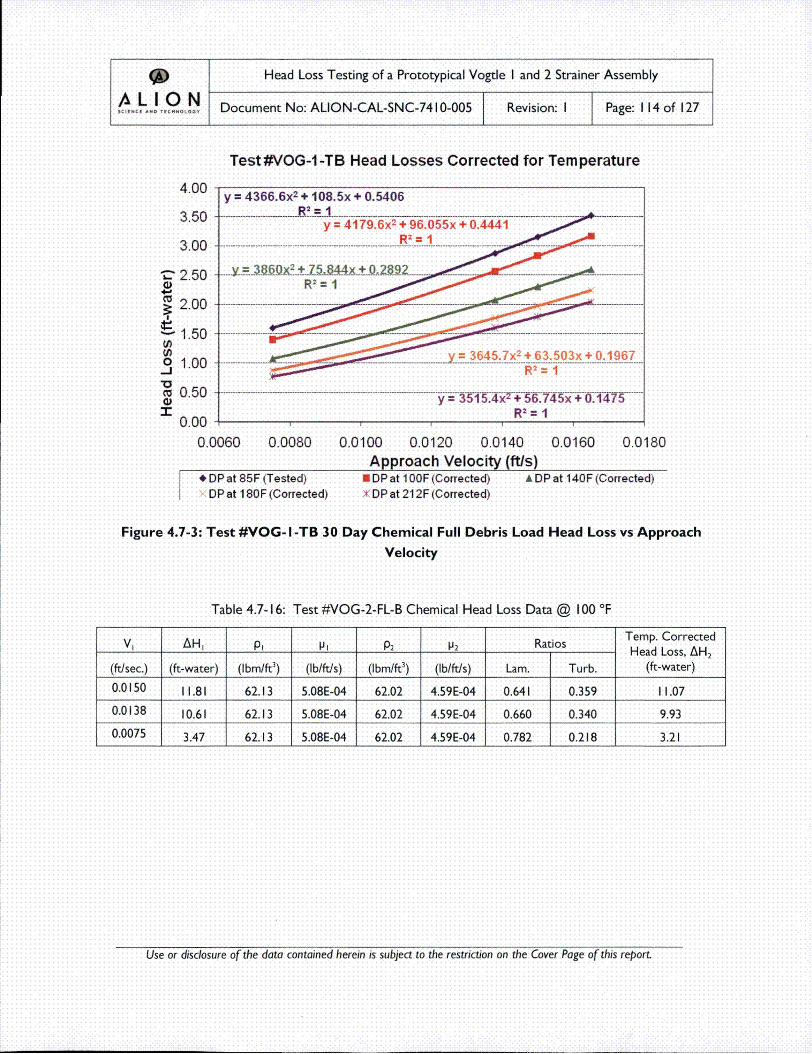
*~ Head Loss Testing of a Prototypical Vogtle I and 2 Strainer Assembly
AL I 0 N Document No: ALION-CAL-SNC-74 10-005 Revision: I Page: 114 of 127
Test #VOG-1 -TB Head Losses Corrected for Tem perature
4.00
3.50y = 4366.6x2 + 108.5x + 0.5406
y = 4179. 6x2 + 96.055x + 0.4441R2 = 1
4 flfl I3 ,U U ............. .. . ...
Z2.50•,2.00
-1.50
o 1.00.J
c~0.50'1"
_ ..y.=_ .38_60_x 2 .+_ 75.84.4.x +0.28.,s92R 2=1 -
...... - 64s.7 x2 _+_63._SO3x+ O.196.7R= 1
..... .. . .. ........ ..... .... •,• -,5-,- 7 4- ,-i:S .7 i -- OT4 !5 ...R2 = 1
0.00 ~0.0060 0.0080 0.0100 0.0120 0.0140
Approach Velocity (ft/s)0.0160 0.0180
* DP at 85F (Tested)- DP at 180F (Corrected)
* DP at 100F (Correctedf)D P at 21 2F (Corrected)
A DP at 1 40F (Corrected)
Figure 4.7-3: Test #VOG- I-TB 30 Day Chemical Full Debris Load Head Loss vs ApproachVelocity
Table 4.7-16: Test #VOG-2-FL-B Chemical Head Loss Data @ 100 °F
V1 AH1 P1 l P2 P2 Ratios Temp. CorrectedHead Loss, AH 2
(ft/sec.) (ft-water) (Ibbm/ft 3) (Ib/ft/s) (Ibm/ft3) (Ib/ft/s) Lam. Turb. (ft-water)
0.0150 1 1.81 62.13 5.08E-04 62.02 4.59E-04 0.641 0.359 I11.07
0.0138 10.61 62.13 5.08E-04 62.02 4.59E-04 0.660 0.340 9.93
0.0075 3.47 62.13 5.08E-04 62.02 4.59 E-04 0.782 0.218 3.21
Use or disclosure of the data contained herein is subject to the restriction on the Cover Page of this report.

9J Head Loss Testing of a Prototypical Vogtle I and 2 Strainer Assembly
LIO N Document No: ALION-CAL-SNC-74 10-005 Revision: I Page: 115 of 127
Table 4.7-I7: Test #VOG-2-FL-B Chemical Head Loss Data @ 140 °F
V1 ______ p1 Ip1 p2 I 2 Ratios Temp. CorrectedHead Loss, AH 2
(ft/sec.) (ft-water) (Ibm/ft 3) (Ib/ft/s) (Ibm/ft3) (Ib/ft/s) L~am. Turb. (ft-water)
0.0150 I11.81 62.13 5.08E-04 61.39 3.19E-04 0.641 0.359 8.94
0.0138 10.61 62.13 5.08E-04 61.39 3.19E-04 0.660 0.340 7.96
0.0075 3.47 62.13 5.08E-04 61.39 3.19E-04 0.782 0.218 2.45
Table 4.7-18: Test #VOG-2-FL-B Chemical Head Loss Data @ 180 °F
V1 AH1 P P P2 1P2 Ratios Temp. Corrected-- Head Loss, AH2
(ftlsec.) (ft-water) (Ibm/ft2 ) (lb/ft/s) (lbm/ft3) (Ib/ftls) Lam. Turb. (ft-water)
0.0150 I11.81 62.13 5.08E-04 60.58 2.35 E-04 0.641 0.359 7.64
0.0138 10.61 62.13 5.08E-04 60.58 2.35E-04 0.660 0.340 6.76
0.0075 3.47 62.13 5.08E-04 60.58 2.35 E-04 0.782 0.218 1.99
Table 4.7-19: Test #VOG-2-FL-B Chemical Head Loss Data @ 212 °F
V1 AH1 P Ii P2 P 2 Ratios Temp. CorrectedHead Loss, AH,
(fr/sec.) (ft-water) (Ibm/ft 3) (Ib/ft/s) (Ibm/ft 3) (lb/ft/s) Lam. Turb. (ft-water)
0.0150 I11.81 62.13 5.08E-04 59.85 1.90E-04 0.641 0.359 6.92
0.0138 10.61 62.13 5.08E-04 59.85 1.90E-04 0.660 0.340 6.1I0
0.0075 3.47 62.13 5.08E-04 59.85 1 .90E-04 0.782 0.218 1.74
Use or disclosure of the data contained herein is subject to the restriction on the Cover Page of this report.
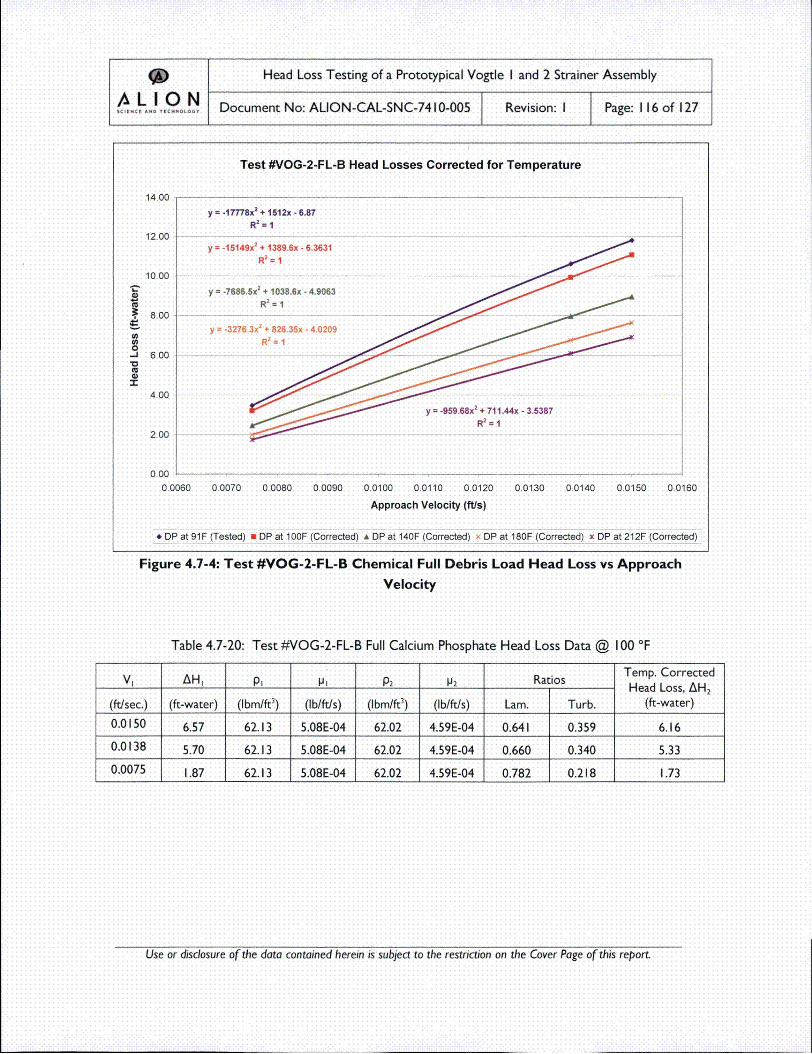
*J Head Loss Testing of a Prototypical Vogtle I and 2 Strainer Assembly
SO N Document No: ALION-CAL-SNC-7410-005 Revision: I Page: 116 of 127
Test #VOG-2-FL-B Head Losses Corrected for Temperature
14.00-- ___- -___ __________
y = -17778x2 + 1512x - 6.87
R2 = I
12.00y=-15149X2
+ 1389.6x - 6.3631 •
10.00*" y = -7686.5x2 * 1038,6x - 4.9063
S 8.00 ... ... . .y=-3276.3x2 + 826.35x - 4.0209
4I .00
2.00 • '•R
0.00
0.0060 0.0070 0.0080 0.0090 0.0100 0.0110 0.0120 0.0130 0.0140 0.0150 0.0160
Approach Velocity (fts)
* DP at 91F (Tested) *IDP at 100F (Corrected) & DP at 140F (Corrected) x Dp at i80F (Corrected) r DP at 2i2F (Corrected)
Figure 4.7-4: Test #VOG-2-FL-B Chemical Full Debris Load Head Loss vs ApproachVelocity
Table 4.7-20: Test #VOG-2-FL-B Full Calcium Phosphate Head Loss Data @ 100 °F
V1 A p• p•P P2 Ratios Temp. CorrectedHead Loss, AH 2
(fr/sec.) (fr-water) (Ibm/ft3) (lb/frns) (Ibm/ft 3) (lb/ft/s) Lam. Turb. (ft-water)
0.0150 6.57 62.13 5.08E-04 62.02 4.59E-04 0.641 0.359 6.16
0.0138 5.70 62.13 5.08E-04 62.02 4.59E-04 0.660 0.340 5.33
0.0075 1.87 62.13 5.08E-04 62.02 4.59E-04 0.782 0.218 1.73
Use or disclosure of the data contained herein is subject to the restriction on the Cover Page of this report.
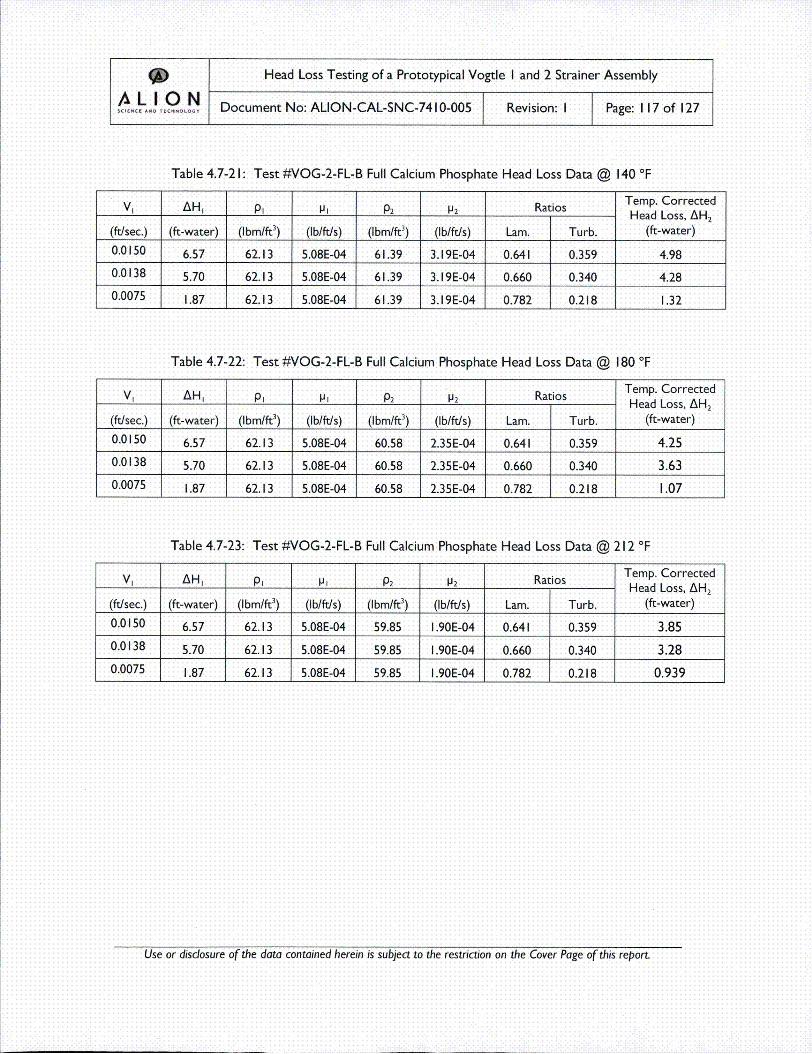
* Head Loss Testing of a Prototypical Vogtle I and 2 Strainer Assembly
/•LI 0 N~ Document No: ALION-CAL-SNC-7410-005 Revision: I Page: 117 of 127
Table 4.7-21: Test #VOG-2-FL-B Full Calcium Phosphate Head Loss Data @ 140 °F
V• AHI p0 I JP l2 Ratios Temp. CorrectedHead Loss, AH2
(ft/sec.) (ft-water) (Ibm/ft3) (lb/ft/s) (Ibm/fr3) (Ib/ft/s) Lam. Turb. (ft-water)
0.0150 6.57 62.13 5.08E-04 61.39 3.19E-04 0.641 0.359 4.98
0.0138 5.70 62.13 5.08E-04 61.39 3.19E-04 0.660 0.340 4.28
0.0075 1.87 62.13 5.08E-04 61.39 3.19E-04 0.782 0.218 1.32
Table 4.7-22: Test #VOG-2-FL-B Full Calcium Phosphate Head Loss Data @ 180 0F
V1 AH1 p• p•P 2 l 2 Ratios Temp. CorrectedHead Loss, AH 2
(ft/sec.) (ft-water) (Ibm/ft3) (lb/ft/s) (Ibm/ft 3) (lb/ft/s) Lam. Turb. (ft-water)
0.0150 6.57 62.13 5.08E-04 60.58 2.35E-04 0.641 0.359 4.25
0.0138 5.70 62.13 5.08E-04 60.58 2.35E-04 0.660 0.340 3.63
0.0075 1.87 62.13 5.08E-04 60.58 2.35E-04 0.782 0.218 1.07
Table 4.7-23: Test #VOG-2-FL-B Full Calcium Phosphate Head Loss Data @ 212 0F
V1 AH1 Pt Ii p2 IP2 Ratios Temp. CorrectedHead Loss, AH2
(ft/sec.) (ft-water) (Ibm/fr 3) (Ib/ftls) (Ibm/fr3) (lb/ft/s) Lam. Turb. (ft-water)
0.0150 6.57 62.13 5.08E-04 59.85 1.90E-04 0.641 0.359 3.85
0.0138 5.70 62.13 5.08E-04 59.85 1 .90E-04 0.660 0.340 3.28
0.0075 1.87 62.13 5.08E-04 59.85 I1.90E-04 0.782 0.218 0.939
Use or disclosure of the data contained herein is subject to the restriction on the Cover Page of this report.

* Head Loss Testing of a Prototypical Vogtle I and 2 Strainer Assembly
I•.0/ L.o ,.ooy Document No: ALION-CAL-SNC-7410-005 Revision: I Page: 118 of 127
Test #VOG-2-FL-B Head Losses Corrected for Tem peratu re
7.00
6.00
5.00
.•4.00
•' 3.00
o 2.00
"• 1.00
0.00
O.OC
y = 15608x2 + 275.48x - 1.074R= 1
R2 = 1
y = 15448X2 + 243.29x - 0.9654-.. . . .. . . . . . . . . . . I2_ _ .. . . .. . . .. . . .. . . .. . . .. . . .. . .
y = 1450 1x2 + 97.052x - 0.4698.. .. .. .. .. .. .. .. .. =_ -.1 .. . .... ....
060
y =14210x2 +68.094x - 03706
0.0080 0.0100 0.0120Approach Velocity (ft/s)
0.0140 0.0160
* DP at 91 F (Tested)x• DP at 180F (Corrected)
* DP at 1 00F (Corrected)D P at 21 2F (Corrected)
A DP at 140F (Corrected)
Figure 4.7-5: Test #VOG-2-FL-B Full Calcium Phosphate Full Debris Load Head Loss vsApproach Velocity
Table 4.7-24: Test #VOG-2-FL-B 30 Day Chemical Head Loss Data @ 100 °F
V1 AH1 Pl P P2 P2 Ratios Temp. CorrectedHead Loss, AH2
(ft/sec.) (ft-water) (Ibm/ft 3) (Ib/fins) (Ibm/ft 3) (Ib/ft/s) Lam. Turb. (ft-water)
0.0150 15.70 62.13 5.08E-04 62.02 4.59E-04 0.641 0.359 14.72
0.0138 13.63 62.13 5.08E-04 62.02 4.59E-04 0.660 0.340 12.75
0.0075 4.46 62.13 5.08E-04 62.02 4.59E-04 0.782 0.218 4.12
Use or disclosure of the data contained herein is subject to the restriction on the Cover Page of this report.
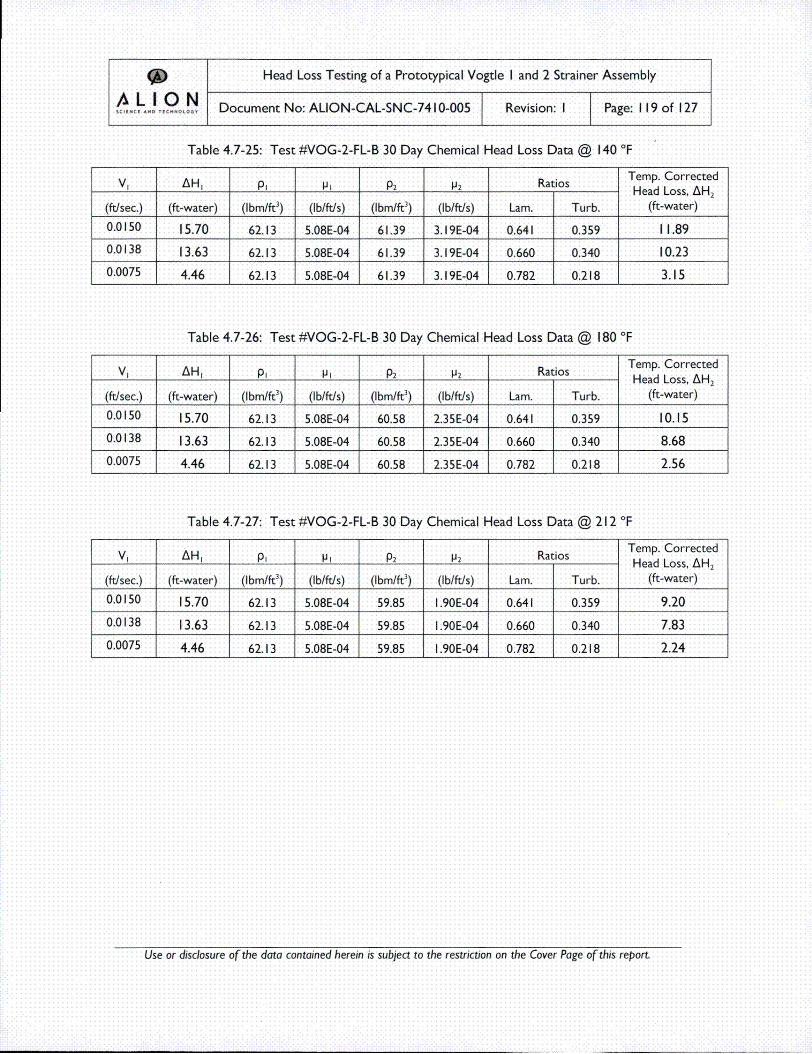
9• Head Loss Testing of a Prototypical Vogtle I and 2 Strainer Assembly
AL I 0 N~ Document No: ALION-CAL-SNC-7410-005 Revision: I Page: I 19 of 127
Table 4.7-25: Test #VOG-2-FL-B 30 Day Chemical Head Loss Data @ 140 °F
V1 AH1 p10 pJj12 P 2 Ratios Temp. CorrectedHead Loss, AH2
(ft/sec.) (ft-water) (Ibm/fr3) (lb/ft/s) (Ibm/ft3) (Iblftls) Lam. Turb. (ft-water)
0.0150 15.70 62.13 5.08E-04 61.39 3.19E-04 0.641 0.359 11.89
0.0138 13.63 62.13 5.08E-04 61.39 3.19E-04 0.660 0.340 10.23
0.0075 4.46 62.13 5.08E-04 61.39 3.19E-04 0.782 0.218 3.15
Table 4.7-26: Test #VOG-2-FL-B 30 Day Chemical Head Loss Data @ 180 0F
Vi AH1 p1 tpj P2 P2 Ratios Temp. Corrected________ Head Loss, AH2
(ft/sec.) (ft-water) (Ibm/ft3) (Ib/ft/s) (Ibm/ft3) (Ib/ft/s) Lam. Turb. (ft-water)
0.0150 15.70 62.13 5.08E-04 60.58 2.35E-04 0.641 0.359 I10.15
0.0138 13.63 62.13 5.08E-04 60.58 2.35E-04 0.660 0.340 8.68
0.0075 4.46 62.13 5.08E-04 60.58 2.35E-04 0.782 0.218 2.56
Table 4.7-27: Test #VOG-2-FL-B 30 Day Chemical Head Loss Data @ 212 0F
V1 AH• Pi PIl p2 IP2 Ratios Temp. Corrected
Head Loss, AH2
(ft/sec.) (ft-water) (Ibm/ft3) (lb/ftns) (Ibm/fr3) (lb/fins) Lam. Turb. (ft-water)
0.0150 15.70 62.13 5.08E-04 59.85 1.90E-04 0.641 0.359 9.20
0.0138 13.63 62.13 5.08E-04 59.85 1.90E-04 0.660 0.340 7.83
0.0075 4.46 62.13 5.08E-04 59.85 1 .90E-04 0.782 0.218 2.24
Use or disclosure of the data contained herein is subject to the restriction on the Cover Page of this report.

* Head Loss Testing of a Prototypical Vogtle I and 2 Strainer Assembly
k I 0 N Document No: ALION-CAL-SNC-74 10-005 Revision: I Page: 120 of 127
Test #VOG-2-FL-B Head Losses Corrected for Temnperatu re18.00
16.0O0 .... . .= 35_926 x2 + 690..0 _ 3. _-.2,.73.8.3....................... .......................
,-, 12.00 .... ..- 3.4.626.x._+_.386.R: I17.x.-..1_.6_93_5_. . ............• .........
8.00 = 35633x 2 +611.3x -2.4674
U) 6.00 -- ~0o ........ 33_-_ x2_252x-.1.2297....-- 4.00 ............
S 2.00 -33-1-- 8.5x-091
:" 0.00 , R =1
0.0060 0.0080 0.0100 0.0120 0.0140 0.0160Approach Velocity (ft/s)
* DP at 91 F (Tested) U DP at I100F (Corrected) A DP at 140F (Corrected)DP at 1 80F (Corrected) • DP at 21 2F (Corrected)
Figure 4.7-6: Test #VOG-2-FL-B 30 Day Chemical Full Debris Load Head Loss vs Approach
Velocity
4.7.3 Head Loss Correction Summary
Temperature corrections were performed for Test #VOG- I-TB (full calcium phosphate and full
chemical loads) and Test #VOG-2-FL-B (full calcium phosphate and full chemical loads) at 1 00°F, 1 40°F,
I180°F, and 21 2°F. Test #VOG- I-TB represents the thin-bed debris load condition for Vogtle. Test
#VOG-2-FL-B bounds the head losses from Test #VOG-2-FL-B2 and represents the full load condition
expected at Vogtle after a LOCA.
4.8 Instrument Uncertainty
The differential pressure instrumentation used in this testing has an accuracy of ±+0.25% of span. The
low-range differential pressure instruments have a scale of 0 to I00" of water, which equates to an
accuracy of 0.021 ft-water. The mid-range differential pressure instruments have a scale of 0 to 300" of
water, which equates to an accuracy of 0.063 ft-water. The high-range differential pressure instruments
have a scale of 0 to 25 psid, which equates to an accuracy of 0. 144 ft-water.
Use or disclosure of the data contained herein is subject to the restriction on the Cover Page of this report.
(• Head Loss Testing of a Prototypical Vogtle I and 2 Strainer Assembly
I_0 I O Document No: ALION-CAL-SNC-7410-005 Revision: I Page: 121 of 127
The orifice plate flow meters have an uncertainty of +/- 0.25% of the measured flow rate. At 400 gpm
this equates to I gpm uncertainty. The orifice plate flow meters utilize differential pressure transmitters
to determine the flow rate. Using the orifice plate equation (Flow Rate = 240.3929*(Dp)0.4985) and
solving for the DP at a flow rate of 400 gpm, yields a DP of 2.777 ft of water. Adding the instrument
accuracy (0.063 ft) yields a DP of 2.840 ft of water. Again, using the orifice plate equation (Flow Rate =
240.3929*(Dp)0.4985), substituting in the DP including the instrument inaccuracy (2.840 ft), yields a flow
rate of 404 gpm. Therefore, at 400 gpm, the combined instrument inaccuracy associated with the
differential pressure transmitter and orifice plate used to measure flow is 5 gpm.
Use or disclosure of the data contained herein is subject to the restriction on the Cover Page of this report.
~Head Loss Testing of a Prototypical Vogtle I and 2 Strainer Assembly
A•L I ON Document No: ALION-CAL-SNC-74 10-005 Revision: I Page: 122 of 127
5 CONCLUSIONS
Testing was performed for the purpose of determining the head loss of the full debris load condition and
the thin-bed condition for Vogtle. For the testing, the debris loads were based on Revision I of the
Vogtde DIR PS-09-0510 [Ref. 2].
The testing was designed and performed in accordance with WCAP- 16530-NP-A [Ref. 24] and March
2008 NRC Staff Review Guidance [Ref. 25].
5.1I Head Loss Testing
Tests #VOG-2-FL-B and VOG-2-FL-B2 represent the full debris load configuration expected at Vogtle
after a postulated LOCA. Test #VOG- I-TB represents the thin-bed condition at Vogtle with a
maximum equivalent bed thickness of 0.625 inches (based on the quantity of NukonTM plus the latent
fiber only). Test #VOG-2-FL-B provided the bounding head loss values for the Vogtle chemical effects
testing, including those obtained from Test #VOG-2-FL-B2, which had a theoretical equivalent bed
thickness of the fibrous debris was 1.91 3 inches (based on the quantity of NukonTM plus the latent
fiber).
Photographs of the debris bed after all of the fibrous debris had been added were taken during testing.
Test #VOG- I-TB, resulted in a head loss value of 2.6 ft-water after the final chemical precipitate
addition. This head loss value indicates that an adequate thin bed Was formed, due to the additional
contribution of the particulates and chemical precipitates. Tests #VOG-2-FL-B and VOG-2•FL-B2
resulted in head loss values of 11.81 ft-water and 8.99 ft-water, respectively after the final chemical
precipitate addition. Thus, the head losses obtained from Test #VOG-2-FL-B were bounding for Vogtle
I and 2. The difference in head loss values between the full load test and the re-test are attributable to
the bed reformations that occurred during each respective test, the non-uniform debris loading on the
strainer module, and the varied amount of debris that settled on the tank floor during each respective
test.
Temperature corrections were performed for Test #VOG-2-FL-B (non-chemical and chemical) and Test
#VOG-l-TB (non-chemical and chemical) at 100 0F, 140 0F, 180 0F, and 212 0F. Corrected head loss
values are provided in Section 4.7.2.
The table below provides an overview of the head loss test results and how they can be applied to
Vogtle plant conditions. High-temperature vertical loop testing has shown that aluminum will not
precipitate out under Vogtle sump chemistry conditions under a temperature of 128 °F [Ref 281. For
conservatism, this can be increased to a temperature of 140 °F; therefore, only the calcium phosphate
Use or disclosure of the data contained herein is subject to the restriction on the Cover Page of this report.

~Head Loss Testing of a Prototypical Vogtle I and 2 Strainer Assembly
,o,,,/ L.I...~oON Document No: ALION-CAL-SNC-74 10-005 Revision: I Page: 123 of 127
head loss should be applied to sump temperatures above 140 0F. When temperatures reach this
boundary and below, the 30-day head loss extrapolation values should be applied.
Table 5.I- I: Bounding Head Loss Values during Testing
Head Loss(ft-water)
Approach
Veloity Temperature(°F)
Bounding Test ApplicableFiber and
Particulate only 0.625 Q.0 I50 83
Full Calcium Sump temperaturesThin Bed Test
Phsht .50.0151 83 above 140 0F.VOG- I -TB Popae16
All Chemicals 2.60 0.0151 86 ________
30-Day Sump temperatures
extrapolation 3.15 0.015 I 86 at and below 140 0E.
Fiber and
Particulate only 5.46 0.0 148 88
Full Calcium Sump temperaturesFull Load Test
VO--LB Phosphate 6.57 0.0146 89 above 140 °F.All Chemicals 11.81 0.0148 93
30-Day Sump temperatures
_______extrapolation 15.70 0.0148 93 Jat and below 140 0F.
5.2 Vortex Testing
Each head loss test conducted a flow sweep after the full debris and chemical loads were added onto thestrainer. No flow sweep of any head loss test resulted in visible or audible vortexing.
The table below summarizes the vortex test that was conducted without debris and under various flowrates and water levels. The top of the strainer was taken as 62-7/8", and the net screen area of 59.54 ft2was used to calculate approach velocity from flow rate.
Use or disclosure of the data contained herein is subject to the restriction on the Cover Page of this report.
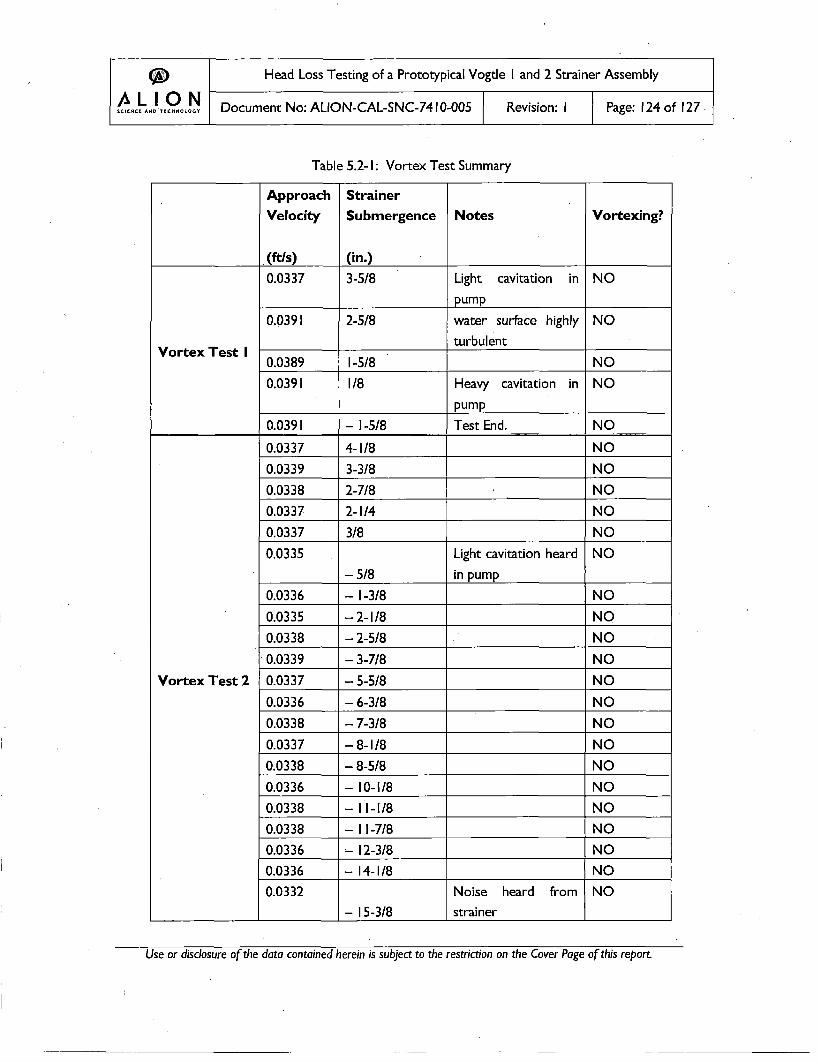
~Head Loss Testing of a Prototypical Vogtle I and 2 Strainer Assembly
AI ON.... ..... Document No: ALION-CAL-SNC-74 10-005 Revision: I Page: 124 of 127.
Table 5.2- I: Vortex Test Summary
Approach Strainer
Velocity Submergence Notes Vortexing?
•(ft/s) (in.)
0.0337 3-5/8 Light cavitation in NO
pump
0.0391 2-5/8 water surface highly NO
turbulentVortex Test I
0.03 89 1-5/8 NO
0.0391 1/8 Heavy cavitation in NO
________ ____________ pump ______
________0.0391I - 1-5/8 Test End. N O
0.0337 4-I/8 NO
0.0339 •3-3/8 NO
0.0338 2-7/8 NO
0.0337 2-1/4 NO
0.0337 3/8 NO
0.0335 Light cavitation heard NO
- 5/8 in pump______
0.0336 - I-3/8 NO
0.0335 - 2-I/8 NO
0.0338 - 2-5/8 NO
0.0339 - 3-7/8 NO
0.03 37 - 5-5/8 NO
0.0336 - 6-3/8 NO
0.0338 - 7-3/8 NO
0.0337 -8-1/8 NO
0.0338 - 8-5/8 NO
0.0336 - 10-1/8 NO0.0338 - 11-1/8 NO
0.0338 - 11-7/8 NO
0.0336 •-12-3/8 __________NO
0.0336 - 14-1/8 __________NO
Vortex Test 2
0.0332 Noise heardstrainer
from NO
- 15-3/8
Use or disclosure of the data contained herein is subject to the restriction on the Cover Page of this report.
~Head Loss Testing of a Prototypical Vogtle I and 2 Strainer Assembly
LI O Document No: ALION-CAL-SNC-7410-005 Revision: I Page: 125 of 127
0.03 37 - 15-7/8 Test End NO5.3 Conservatisrns
The following highlights some of the conservatisms that were used in conducting the Vogtle I and 2
testing:
* A transport fraction of 100% was assumed for all debris types. -
* As recommended by NRC staff review guidance [Ref. 25], all particulate debris (Interam,
coatings surrogates, dirt/dust) was added first. See Section .2.4.2 for further discussion of debris
introduction methods.
* The percentage of fiber fines versus fiber small pieces tested.(70% fines, 30% small pieces)
bounded what is expected at Vogtle per the Vogtle DIR PS-09-05 10. See Section 2.3 for further
discussion.
* Fiber small pieces are defined in the Vogtle DIR PS-09-05 10 as fiber pieces less than 6 inches (on
one side). Therefore, fiber small pieces range from multiple attached or interwoven strands of
fiber (Class 36) up to larger clumps of fiber (Class 6) and fragments of fiber that retain some
aspects of the original construction of the fiber matting (Class 7). Per the debris preparation
*procedure [Ref. 10], the fiber small pieces used in testing were required to be small fiber
clusters (Class 4) and smaller.
* All failed coatings were assumed to be in the form of fine particulate debris. Therefore, the
unqualified/qualified coatings load was added as silicon carbide powder.
* Approach velocities for testing were based on conservatively calculated maximum system flow
rates. Then for all tests, flow adjustments were made throughout the entire testing in order to
maintain a constant approach velocity equivalent to maximum system flow rate. It is anticipated
that during an accident, system flow rate would initially be less than test flow rate and the
decreasing suction head caused by debris bed accumulation would result in further reduction of
actual flow rate (thus head loss would be reduced).
6 Fibrous Debris Size Classifications are as defined in NUREG/CR-6808, "Knowledge Base for the Effect of Debrison Pressurized Water Reactor Emergency Core Cooling Sump Performance," February 2003 [Ref. 17].
Use or disclosure of the data contained herein is subject to the restriction on the Cover Page of this report.

~Head Loss Testing of a Prototypical Vogtle I and 2 Strainer Assembly
LAI ,~ooyON Document No: ALION-CAL-SNC-74 10-005 Revision: I Page: 126 of 127
6REFERENCES
I. ALION-PLN-SNC-7236-002, Vogtle Chemical Effects Retest Plan, Rev. 0.
2. Vogtle DIR PS-09-05 10, Rev. I, March 27, 2009.
3. ALION-SPP-LAB-SNC-74 10-002, Vogtle Thin Bed Test - Test A Test Procedure, Rev. 0.
4. ALION-SPP-LAB-SNC-74 10-003, Vogtle Full Load Test - Test B Test Procedure, Rev. 0.
5. NUREG/CR-6224, "Parametric Study of the Potential for BWR ECCS Strainer Blockage Due
to LOCA Generated Debris," G. Zigler, ET. Al, October 1995.
6. NEI 04-07, Volume 2, "Safety Evaluation by the Office of Nuclear Reactor Regulation Related
to NRC Generic Letter 2004-02," Rev. 0, December 2004.
7. ALION-SPP-LAB-2352- 13 - Test Equipment Verification Procedure, Rev. 3.
8. ALION-SPP-LAB-2352- 14 - Testing Discrepancies, Rev. 0.
9. ALION-SPP-LAB-2352-21I - Test Lab Safety Procedure, Rev. 4.
10. ALION-SPP-LAB-2352-22 - Debris Preparation Procedure, Rev. 3.
II. ALION-SPP-LAB-2352-23 - Hydraulic Testing of Debris Test Plan Guideline, Rev. 2.
12. •ALION-SPP-LAB-2352-44 - Test Tank Fill Procedure, Rev. I.
13. ALION-SPP-LAB-2352-45 - Test Tank Draining and Cleaning Procedure, Rev. I.
14. ALION-SPP-LAB-2352-46 - Test Tank Debris Head Loss Procedure, Rev. 4.
I5. ALION-PLN-LAB-2352-003 -Hydraulic Testing of Debris Program Description: Test Tank,
Rev. 5.
16. ALION-PLN-LAB-2352-240 -Protocol for Applying Chemical Effect Refinements to Hydraulic
Testing Results, Rev. 0.
17. NUREG/CR-6808, "Knowledge Base for the Effect of Debris on Pressurized Water Reactor
Emergency Core Cooling Sump Performance," February 2003.
18. ALION-REP-ALION-2806-05, Methodology for Raw Electronic Data Reduction, Rev. 0.
19. P. Mast, "HLOSS 1.1: A Code for the Prediction of ECCS Strainer Head Loss," ITS-REP-
QASW0200 1-01, Alion Science and Technology, Rev. 0.
20. GE Test Specification 26A7045R6.
21. GE Drawing 234C8466, Rev. 0.
22. ALION-CAL-SNC-7236-01I, Vogtle Chemical Product Generation Report, Rev. 0.
Use or disclosure of the data contained herein is subject ta the restriction on the Cover Page of this report.
~Head Loss Testing of a Prototypical Vogtle I and 2 Strainer Assembly
AL I 0 N~ Document No: ALION-CAL-SNC-74 10-005 Revision: I Page: 127 of 127
23. ALION-SPP-LAB-2352-37 - Generation of Precipitates for Chemical Test Loop Debris Head
Loss Procedure, Rev. 2.
24. Westinghouse report WCAP- 16530-NP-A, "Evaluation of Post-Accident Chemical Effects in
Containment Sump Fluids to Support GSI-191", Original Version February 2006, Approved
Version March 2008.
25. NRC Staff Review Guidance Regarding Generic Letter 2004-02 Closure in the Area of Plant-
Specific Chemical Evaluations, March 2008, Enclosure I.
26. Performance Contracting Inc. Nonconformance Report No. LX- 176, issued December 4,
2008.
27. ALION-SPP-LAB-2352-20 - Verification of pH, Conductivity and Turbidity Meters Using
Traceable Consumable Calibration Standards, Rev. 0.
28. ALION-CAL-SNC-7487-003 - Vogtle High Temperature Vertical Loop Test Report, Rev. 0.
Use or disclosure of the data contained herein is subject to the restriction on the Cover Page of this report.