Employment effects of army service and veterans' compensation: evidence from the Australian...
41
University of Wollongong Economics Working Paper Series 2010 http://www.uow.edu.au/commerce/econ/wpapers.html Employment Effects of Army Service and Veterans’ Compensation: Evidence from the Australian Vietnam-Era Conscription Lotteries Peter Siminski School of Economics University of Wollongong Wollongong, NSW 2522 WP 10-13 December 2010
-
Upload
independent -
Category
Documents
-
view
0 -
download
0
Transcript of Employment effects of army service and veterans' compensation: evidence from the Australian...
University of Wollongong Economics Working Paper Series 2010 http://www.uow.edu.au/commerce/econ/wpapers.html
Employment Effects of Army Service and Veterans’ Compensation: Evidence from the Australian Vietnam-Era
Conscription Lotteries
Peter Siminski
School of Economics University of Wollongong Wollongong, NSW 2522
WP 10-13
December 2010

Employment Effects of Army Service and Veterans’
Compensation: Evidence from the Australian Vietnam-Era
Conscription Lotteries1
Peter Siminski, University of Wollongong
December 2010
Abstract
Exploiting the Australian National Service lotteries of 1965-72, I estimate
the effect of Army service on employment outcomes. Population data
from military personnel records, tax returns, veterans’ compensation
records and the Census facilitate a rich and precise analysis, identified by
53,000 compliers. The employment effect is confined to men who served
1 I am grateful to Joshua Angrist, Rob Bray, Philip Clarke, Bob Gregory, Simon Ville and
seminar participants at the Australian National University, the University of Wollongong, the
Labour Econometrics Workshop and the Frontiers in Human Capital Research Workshop for
useful discussions and comments. I thank Alison Haynes and Louise Rawlings for excellent
research assistance; the Australian Bureau of Statistics, the Department of Veterans’ Affairs, the
Australian Tax Office and the Australian Institute of Health & Welfare for access and assistance
with de-identified data; the Department of Veterans’ Affairs and the Australian Research Council
for grant support (LP100100417). The views in this paper are the author’s alone, as are any
errors of fact or omission.
p1

in Vietnam and is very large, at -37 percentage points (95%CI: -32, -43) in
2006. The effect has emerged gradually since the 1990s, and is mirrored by
veterans’ Disability Pension effects. These results contrast with those for
the USA, possibly reflecting differences in employment incentives
associated with veterans’ compensation.
I. Introduction
In the context of the ongoing conflicts in Afghanistan and Iraq, there is continuing interest in
the human and financial costs of war (Bedard and Olivier 2006; Stiglitz and Bilmes 2008). One
aspect of this is the effect of military service on subsequent outcomes for veterans. In the case of
the Vietnam War, many studies have considered effects on health and longevity (see for instance
Angrist et al. 2010; Conley and Heewig 2009; Dobkin and Shabani 2009; Hearst et al. 1986).
Other studies have considered effects on human capital and earnings (Angrist 1990, 1993;
Angrist and Chen 2008).
As the majority of Vietnam veterans approach retirement age, attention has shifted recently to
the potential work disincentives associated with veterans’ compensation (Angrist et al. 2010;
Autor and Duggan 2007; Duggan et al. 2010). Unlike social security, US Veterans’ Compensation
(VC) is neither means tested nor dependent on employment status. Thus, VC has provided
opportunities for studying the behavioural responses associated with an almost pure income
effect, with implications for the design of both VC and social security. Whilst earlier work was
suggestive of a potentially large negative effect of VC on employment (Autor and Duggan 2007),
more recently a consensus seems to have emerged that this effect is in fact small or insignificant
(Angrist et al. 2010; Duggan et al. 2010), and perhaps manifest only for low-skill veterans
(Angrist et al. 2010).
p2

In this paper, I contribute to the debate by estimating employment effects for Australian
Vietnam veterans, for whom compensation rates are fundamentally tied to employability. The
Australian veterans’ compensation system is similar in some ways to the US VC. Compensation
includes cash payments and enhanced health insurance. These cash payments are notionally tied
to the level of incapacity (on a scale from zero to 100%). However, veterans who are ‘Totally and
Permanently Incapacitated’ receive the Disability Pension Special Rate (DP-SR), which is almost
three times larger than the highest rate of general compensation.2 In the USA, in contrast,
‘Individual Unemployability’ compensation is no greater than the highest rate of general
compensation.3 In both countries, veterans can combine such compensation payments with
income support. In Australia, the difference between the highest rate of general compensation
and DP-SR-plus-income-support is equal to 53% of average male full-time (before-tax) earnings.
By 2009, about half of Australian Vietnam veterans were receiving DP-SR, almost all of whom
began receiving DP-SR after 1990.
For identification of employment effects, I exploit Australia’s conscription lotteries held between
1965 and 1972. Sixteen lotteries were held, each pertaining to a six-month birth cohort of 20-
year-old men. Over 800,000 men registered for the ballots; 64,000 were enlisted in National
Service, including over 19,000 who served in Vietnam (see Langford 1997 for an account of the
scheme). For research purposes, these lotteries have several advantages over the corresponding
2 The DVA Disability Pension is the Australian equivalent of US Disability Compensation. The
DP-SR is received almost exclusively by veterans who are ‘Totally and Permanently
Incapacitated’ (TPI). TPI veterans cannot work more than eight hours per week, but in practice
most do not work at all. There is also an Intermediate Rate, which lies between the DP-SR rate
and the 100% General rate, but few veterans receive the Intermediate Rate.
3 See Angrist et al. (2010) and Autor and Duggan (2008) for details of the US VC system,
including ‘Individual Unemployability’.
p3

US lotteries. First, the effect of operational service in Vietnam can be differentiated from non-
operational service in Australia, due to large differences between cohorts in the probability of
Vietnam service. In particular, nobody from the last four cohorts served in Vietnam. Second,
randomization was by date of birth (DOB), achieved mechanically by using an actual lottery
barrel (on loan from a lottery agency). There is no evidence of randomization failure as in the
first US lottery (Fienberg 1971). Third, there was no GI Bill in Australia, and little or no effect of
ballot outcome on educational attainment. This is useful for attempts to estimate the
contribution of military experience to human capital. Fourth, the DOBs drawn were not
published until 1997, so there is no risk of discrimination by employers on the basis of ballot
eligibility. Fifth, there were no Random Sequence Numbers. DOBs were balloted in or balloted
out immediately, so the ballot outcome could not influence behaviour prior to determination of
eligibility. Finally, I show evidence of some external validity beyond the set of compliers who
identify the estimates. (For discussions of the limitations of the US lotteries, see: Angrist 1990;
Angrist et al. 1996; Angrist and Imbens 1997; Heckman 1997; Keane 2010; Rosenzweig and
Wolpin 2000).
Apart from our own work on mortality (Siminski and Ville 2011-forthcoming), no previous
studies have used the Australian conscription lotteries for identification. This is probably due to
a paucity of data. However, in 2006 DOB was collected in the Australian Census of Population
and Housing for the first time. The Australian Tax Office also has granted access to personal
income tax return data. I combine these with military personnel records, administrative veterans’
compensation records, and published contemporaneous population aggregates to construct unit-
record population data for both the first- and second-stage regressions. By using a Two-Sample
2SLS procedure (Atsushi and Solon 2010), I have no need to link the data sources.
I find that the employment effect is confined to men who served in Vietnam and is very large,
estimated at -37 percentage points in 2006 when most were in their late-50s. The effect is
p4

relatively recent, emerging gradually since the early 1990s. I also find a corresponding trend in
disability pension effects which largely mirror the employment effects, but are even larger. I
discuss several factors that may have contributed to these striking results, focusing on the
possible role of the Australian veterans’ compensation system.
The remainder of the paper is structured as follows. Section II outlines the estimation strategy.
Section III discusses the sources of data. The results are presented in Section IV, and Section V
concludes. In Appendix A, I discuss the validity of the exclusion restriction. Appendix B
provides a descriptive summary of trends in the DVA Disability Pension.
II. Estimation Strategy
The primary aim here is to estimate the effects of Vietnam-era Army service (r) and Army service
in Vietnam (v) on the probability that person i is employed in 2006 (y)4:
'i r i v i iy r v C iα β β γ= + + + + μ
(1)
C is a vector of 15 binary indicators representing six-month birth cohorts. r is likely to be
correlated with μ, because medical screening of potential Army entrants is highly selective, and
because men who seek out Army service may differ from those who do not. Selection for service
in Vietnam also was non-random, so v is likely to be correlated with μ. Thus OLS estimation of
(1) may not uncover the causal effects of service. To solve the problem of selection bias, I
construct instruments that exploit the random assignment of the conscription lotteries. A single
ballot outcome dummy (z) is a valid instrument. However, the effects of ballot outcome vary
4 National Service was in the Army. In our preliminary analysis, we confirmed that the ballot
outcome did not induce any men into other branches of the armed forces. The results are
virtually unchanged (but slightly less precise) if Army service is replaced with military service.
p5

between cohorts, so a more efficient strategy is to interact z with C. Let Z be a vector of 16
binary instruments, representing the ballot outcome in each cohort, respectively.5 The two first-
stage regressions are identified by the exclusion of Z from (1), along with considerable
differences between cohorts in the proportion of conscripts sent to Vietnam. The first-stage
regressions are:
0 1 2' 'r r ri ir Z C r
i iπ π π= + + +ε
vi i
(2)
0 1 2' 'v v vi iv Z Cπ π π= + + +ε
(3)
Using a Two-Sample 2SLS procedure (Atsushi and Solon 2010), I estimate the first stage-
regressions (2) and (3) by OLS with one dataset and the second-stage regression (1) with a
different dataset by OLS, after I replace r and v with the fitted values from (2) and (3). That is, I
use cross-sample fitted values of r and v. However, the first-stage coefficients come from
population data and therefore are treated as known. For simplicity, I do not introduce
heterogeneous treatment-effect notation, but I do note that the effect of Army service may vary
between individuals and subpopulations. This approach estimates the average effects for men
induced by the ballot outcome to enlist in the Army (balloted-in ‘compliers’).6 In general,
5 The term ‘ballot outcome’ refers to the outcome of the main conscription ballots. z = 1 for
men ‘balloted in’ and zero for men ‘balloted out’. A man is considered be ‘balloted in’ if his
DOB was drawn in the ballot held for his birth cohort. A separate set of ballots were conducted
for the presumably small number of men who were out of the country at the time of their main
ballot (Langford, 1997). This is not a complication, because each ballot was independent and
hence orthogonal, so the outcome of the main ballot was irrelevant for those who were
temporarily absent.
6 In the case of βv, the approach estimates the average effect for men induced by the ballot
outcome to serve in the Army in Vietnam.
p6

compliers cannot be individually identified (Angrist et al. 1996). However, in this case balloted-in
Army compliers are a majority subset (84%) of National Servicemen.7
I also show the results from specifications that include only one of the endogenous variables,
including the estimates for each individual cohort using a set of just-identified models.
The model is then extended by interacting v with p, which represents age eligibility for the
Service Pension (p = 0 if age < 60 years, 1 otherwise). Subject to a means test, veterans with
‘qualifying service’ (which essentially equates with service in Vietnam for the study population)
are eligible for the Service Pension from 60 years of age. Eligibility for the otherwise equivalent
social security Age Pension is from the age of 65. Service pension eligibility may encourage early
retirement, due to both the income and substitution effects associated with pension means tests
(Autor and Duggan 2007) and so βp is hypothesised to be negative.
'i r i v i p i i iy r v v p C iα β β β γ= + + + + + μ
(4)
Finally, I add a proxy for combat intensity in Vietnam (x), which varies between cohorts. Since
this is only relevant for those who served in Vietnam, it is interacted with v.8
7 Unlike in the US, there was no apparent incentive for balloted-in men to volunteer for service
in the Regular Army, so balloted-in compliers are a subset of National Servicemen. However, not
all National Servicemen are compliers. These include: men who were absent from Australia when
their age group was required to register and were subject to the separate, latter ballots; men who
failed to register for the ballots and were hence automatically considered for National Service
call-up; National Service volunteers; and men who would have volunteered subsequently had
they not been conscripted. Such men were not induced into the Army by the ballot outcome and
hence do not contribute to the identification of the model.
8 Since p and x vary only between cohorts, their main effects are already included in C.
p7

'i r i v i p i i x i i iy r v v p v x C iα β β β β γ= + + + + + + μ (5)
I hypothesize that men who served in Vietnam in periods of greater combat intensity will be
more likely to suffer from detrimental employment effects, and thus βx should be negative.
However, I have limited confidence in the reliability of the combat intensity proxy, as I discuss in
the sections that follow.
In addition to the 2SLS estimates, I report reduced-form estimates, which are more convenient
in some components of the analysis.
The exclusion of z from the employment equation is valid if its only effect on employment
outcomes is through inducement of Army service. In Appendix A, I consider several
hypothesized violations of this condition in relation to draft-avoidance behaviour, but conclude
that these are not a major concern.
III. Data
For the first- and second-stage regressions, a number of databases were constructed from
various sources, as described below.
A. First-Stage Database
For the first stage, the population consists of men born in 1945-52 who were Australian
residents when they turned twenty. Military personnel unit records were obtained from two
sources: the Nominal Roll of Vietnam Veterans (NRVV) from the Department of Veterans’
Affairs (DVA) and the Vietnam-Era database (VED) from the Australian Institute of Health &
Welfare (AIHW). Both contain DOB.
p8
The NRVV is believed to be of very high quality and contains records for all Vietnam veterans.
Over several decades, the DVA has made a concerted effort to complete and refine its contents.
However, personnel who did not serve in Vietnam are not included in the NRVV.
The VED contains records for all military personnel who served during the Vietnam War era. It
is used for data on men who served during the Vietnam era but not in Vietnam. The VED has
been used and refined by the AIHW & DVA for various health and mortality studies for nearly
three decades. The VED version used in this study was also used by Wilson et al. (2005). Whilst
successive modifications to the database are not well documented, the original source was a
database from the Central Army Records Office of ‘all Vietnam Veterans and non-veterans who
served during the Vietnam conflict era’ (AIHW 1992: 98). The estimated number of compliers,
and their distribution between cohorts (see first-stage results in Section IV) conforms to prior
expectations that are based on summaries of the National Service scheme (e.g. Department of
Labour and National Service various years; Langford 1997).
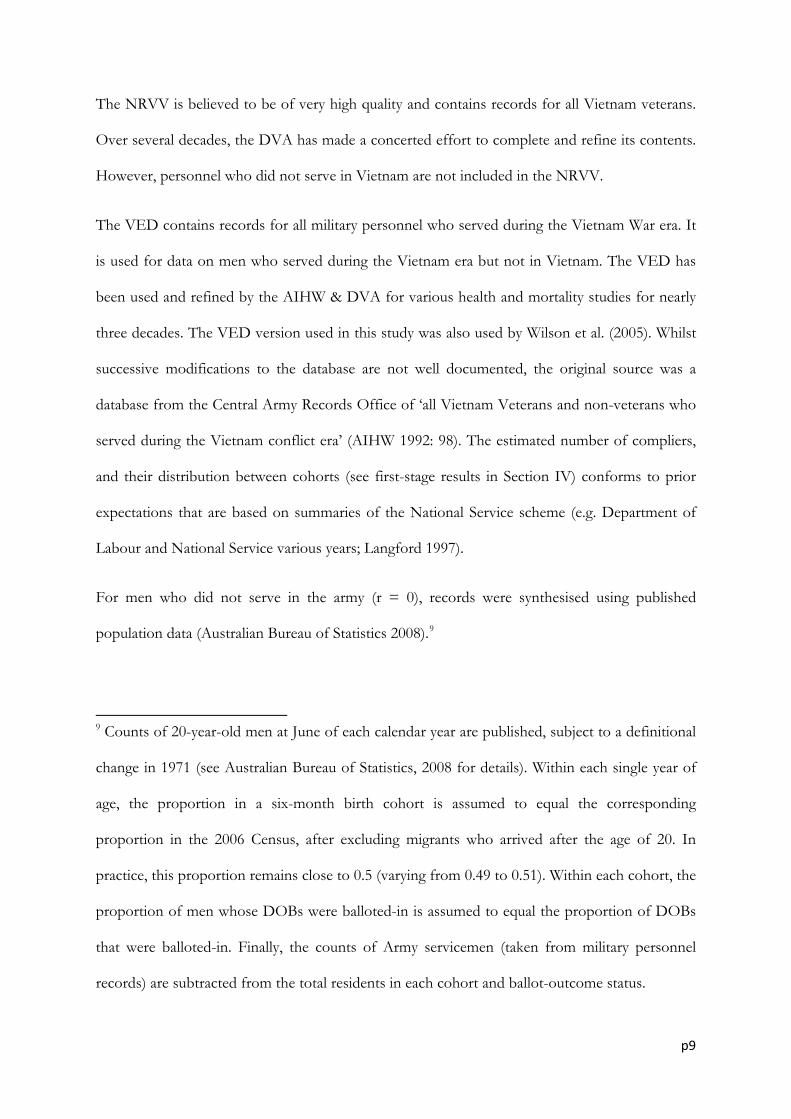
For men who did not serve in the army (r = 0), records were synthesised using published
population data (Australian Bureau of Statistics 2008).9
9 Counts of 20-year-old men at June of each calendar year are published, subject to a definitional
change in 1971 (see Australian Bureau of Statistics, 2008 for details). Within each single year of
age, the proportion in a six-month birth cohort is assumed to equal the corresponding
proportion in the 2006 Census, after excluding migrants who arrived after the age of 20. In
practice, this proportion remains close to 0.5 (varying from 0.49 to 0.51). Within each cohort, the
proportion of men whose DOBs were balloted-in is assumed to equal the proportion of DOBs
that were balloted-in. Finally, the counts of Army servicemen (taken from military personnel
records) are subtracted from the total residents in each cohort and ballot-outcome status.
p9

The upper panel of Table 1 describes the first-stage data. The population consists of 868,605
men; 9.4% of them served in the Army during the Vietnam era and 3.4% of them served in the
Army in Vietnam. Those who served in Vietnam spent an average of 261 days there. I do not
have data on total time spent in the Army, although the terms of National Service stipulated a
two-year commitment (which was reduced to 1.5 years in 1971). Of the Army servicemen who
served in Vietnam, 342 or 1.2% died in Vietnam. Balloted-in men were much more likely to
serve in the Army (27.1%) than those balloted out (3.2%). Similarly, they were much more like to
serve in Vietnam (8.8% compared to 1.5%).
B. Second-Stage (Outcomes) Data
As detailed below, several outcomes databases were constructed. None were linked to each
other, or to the first-stage data on a unit-record level.
1. Census 2006
In 2006 for the first time, the Census of Population and Housing collected DOB from all
respondents. The estimation population is the set of men born in 1945-52, excluding those who
arrived in Australia after the age of 20. Noting that each variable in the model is categorical, a
unit-record database was reconstructed from frequency tabulations of employment status by
cohort and ballot outcome. This covers every permutation of the variables in the second-stage
regression.
There are 675,832 such men in the Census data, 22% fewer than in the first-stage database.
Contributing to this attrition is mortality (9%), missing DOB in the Census (approximately 4%)
and Census undercount (approximately 2%). The remaining 7% is presumably attributable to
outbound migration. Such attrition is a threat to validity if it is correlated with ballot outcome.
However, the existing evidence suggests that this is not a major threat. In the Census data, men
with balloted-in DOBs make up 25.9% of the men in this age range, as compared to an expected
p10

25.8% if the DOB frequency distribution were independent of ballot outcome within each
cohort. Thus, balloted-in men are not disproportionately ‘missing’ from the Census data. Further
evidence suggests that any excess mortality amongst those balloted in is likely to be small. Some
198 National Servicemen (176 of whom had ‘balloted in’ DOBs) died in the Vietnam conflict.
This represents around 0.3% of National Servicemen, or 1% of National Servicemen who served
in Vietnam, or 0.02% of the study population. A mortality analysis comparing National Service
veterans to National Service non-veterans (Wilson et al. 2005) implies a similar number of
(additional) post-service excess deaths. My own research, exploiting the conscription lotteries,
finds no evidence of significantly elevated post-service mortality (in 1994-2007) associated with
Army service (Siminski and Ville 2011-forthcoming).
The middle panel of Table 1 includes a descriptive summary of Census data. The employment
rate for balloted-out men is considerably higher than for balloted-in men. Similarly, the disability
rate is higher amongst balloted-in men. There is little difference in educational attainment by
ballot outcome.
2. Personal Income Tax Data - 1993-2006
A supplementary second-stage database was constructed from the full set of personal income tax
return data for 1992-3, 1995-6, 1999-2000, 2002-3, 2005-6 and 2008-9. Not all residents submit
tax returns (Leigh 2005) but almost all employees do. Employees who had any tax withheld or
were liable to pay tax are required to submit a tax return, and the number of men in the database
with positive wage-and-salary income corresponds closely to data from other sources.10
10 For example, 642,253 men born in 1945-52 reported positive wages and salaries in 2001-2 on
their tax returns, compared to the 631,358 men who worked for wages or salaries as estimated
from HILDA data. For 2005-6, the counts are 576,477 (tax return data) and 531,237 (HILDA).
p11
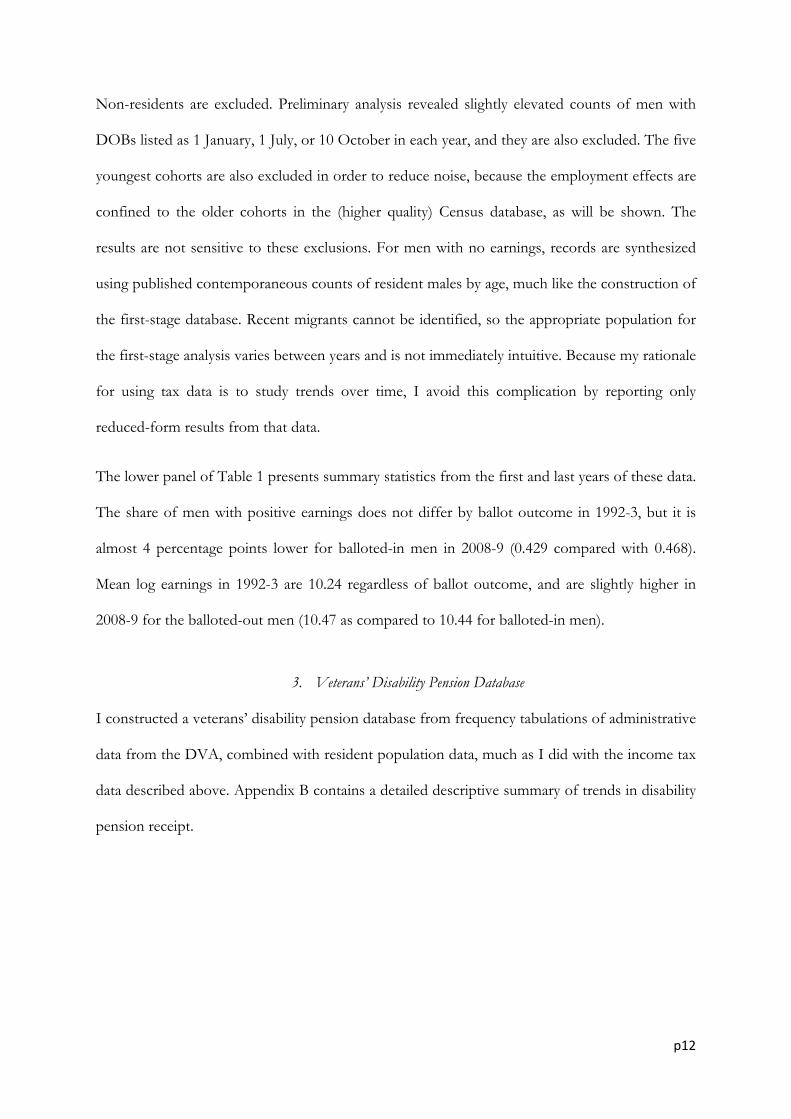
Non-residents are excluded. Preliminary analysis revealed slightly elevated counts of men with
DOBs listed as 1 January, 1 July, or 10 October in each year, and they are also excluded. The five
youngest cohorts are also excluded in order to reduce noise, because the employment effects are
confined to the older cohorts in the (higher quality) Census database, as will be shown. The
results are not sensitive to these exclusions. For men with no earnings, records are synthesized
using published contemporaneous counts of resident males by age, much like the construction of
the first-stage database. Recent migrants cannot be identified, so the appropriate population for
the first-stage analysis varies between years and is not immediately intuitive. Because my rationale
for using tax data is to study trends over time, I avoid this complication by reporting only
reduced-form results from that data.
The lower panel of Table 1 presents summary statistics from the first and last years of these data.
The share of men with positive earnings does not differ by ballot outcome in 1992-3, but it is
almost 4 percentage points lower for balloted-in men in 2008-9 (0.429 compared with 0.468).
Mean log earnings in 1992-3 are 10.24 regardless of ballot outcome, and are slightly higher in
2008-9 for the balloted-out men (10.47 as compared to 10.44 for balloted-in men).
3. Veterans’ Disability Pension Database
I constructed a veterans’ disability pension database from frequency tabulations of administrative
data from the DVA, combined with resident population data, much as I did with the income tax
data described above. Appendix B contains a detailed descriptive summary of trends in disability
pension receipt.
p12

IV. Results
A. First Stage Results
Table 2 shows results from the first stage regressions for r and v. The upper panel is from the
regressions with a single ballot outcome instrument. The ballot outcome is estimated to have
induced over 23% of balloted-in men into the Army, including over 7% into Army Service in
Vietnam. The IVs are strongly significant in both regressions, with t-stats of 245 and 117,
respectively. Similarly, the IVs are very strong in the overidentified models (lower panel of Table
2), with F-stats of 8,485 and 2,709, respectively. The coefficient of z16 is close to zero and is not
statistically significant in either first-stage regression. This is sensible, because conscription was
abolished in December 1972, shortly before men from the 16th cohort were due to be called up.
The IVs z13, z14, and z15 are strong predictors of r, but not of v. Similarly, z9, z10, and z11 are
much stronger predictors of r than v, relative to z1-z8. This is useful, because it allows me to
differentiate the effect of service in Australia from the effect of operational service in Vietnam.
The first-stage results imply that around 53,674 men were induced by the ballot outcome to
enlist in the Army. The number induced is 10,066 fewer than the total number of National
Servicemen (63,740) (Langford 1997). Compliers are a subset of National Servicemen, because
there was no apparent incentive for balloted-in men to join the Regular Army rather than await
call-up for National Service, unlike the US experience (this is also evidenced by the insignificant
coefficient of z16 in Table 2; see also footnote 7).
In Section III, it was argued that any correlation between mortality and ballot outcome is not
large enough to be a substantial threat to the validity of the approach. I now consider a related
but more subtle issue, drawing on the first-stage results. Veterans often have lower mortality
rates than the general population, because of pre-enlistment health screening. Between 1966 and
2001, the mortality rate for National Servicemen was 27% lower than community norms (Wilson
et al. 2005). This suggests that compliers (both balloted-in and balloted-out) account for a rising
p13

share of each cohort over time, thereby increasing the size of the ballot-outcome effects in the
first stage. Consider men who were 20-years old in 1965. Between 1965 and 2006, 11.6% of
them had died (author’s calculations from AIHW National Mortality Database). Extrapolating
from Wilson et al.’s estimates, the corresponding proportion of National Servicemen who died
after the Vietnam War is approximately 11.6% times 73% = 8.5%. Compliers account for 32.7%
of the first birth cohort (see coefficient of z1 in Table 2). By 2006, they probably account for
roughly 32.7% * (1 - 0.085) / (1 - 0.116) = 33.8% of the surviving population. Because death
rates are lower for younger cohorts, the magnitude of this issue is smaller for younger cohorts.
Given the small magnitude of bias and in the interest of transparency and simplicity, no
adjustments have been made.
B. 2SLS Employment Effects (Census 2006)
Figure 1 shows 2SLS employment effect estimates separately for each cohort. The youngest
cohort is omitted, z16 is irrelevant in the first stage. The top panel shows that Army service had
a major negative effect on the likelihood of employment, but only for some cohorts. In
particular, for cohorts in which no men were induced to serve in Vietnam (those born in 1951
and 1952), the effect of Army service is close to zero, is not statistically significant, and is
precisely estimated. This strongly suggests that the employment effect is confined to men who
served in Vietnam.
The lower panel of Figure 1 shows corresponding estimates under the assumption that Army
service only affected employment for those who went to Vietnam. The five youngest cohorts are
omitted because of the weakness of z12-z16 in the Vietnam service first-stage. In the lower
panel, there is much less variation between cohorts, although the effect is slightly larger for the
first three cohorts. In these cohorts, Vietnam veterans were age 60 or 61, and hence were eligible
for a Service Pension (Age), while other men (civilians of the same age, Army veterans who did
p14

not serve in Vietnam, and younger Vietnam veterans) were not. The estimates for the last two
cohorts shown are less precise, reflecting slightly weaker first stages.
Table 3 shows 2SLS estimates across cohorts. In the upper panel are the results of the just-
identified specifications, using a single ballot-outcome instrument. The lower panel has results
from the models that use the full set of 16 IVs. Column 1 presents the estimates from
specifications with Army service (r) as the sole endogenous regressor. The estimated coefficient
of r is -0.111 using one IV and -0.120 with all 16 IVs, with very small standard errors. In column
2, army service is excluded from the model, replaced with army service in Vietnam (v), which has
an estimated coefficient of -0.365 with one IV. With all 16 IVs, the point estimate remains
almost unchanged at -0.366, but is more precise.
The results in Column 3 are for the specification in equation (1), where the coefficients of r and
v are both identified. The estimated coefficient of v is -0.361, almost unchanged by the inclusion
of r. However, the coefficient of r is close to zero and is not statistically significant, despite a
small standard error. This suggests that the negative employment effect of Army service is only
manifest amongst men who served in Vietnam. This is consistent with the results in Figure 1,
which show no employment effect for the cohorts in which conscripts were not sent to Vietnam.
Further, r is not statistically significant in any of the other specifications that include v.
In column (4), I add the interaction of v and p (age eligibility for the Service Pension), which is
statistically significant at the 1% level. This is not surprising, because it represents the effect of
eligibility for an early retirement pension. What may be surprising is how small the effect is (-8.3
percentage points), suggesting that a clear majority of Vietnam veterans who were induced to
retire early (before the age pension eligibility age of 65) did so before reaching service pension
eligibility age (60 years).
p15
In column (5), I add a proxy for combat intensity (x), defined as the ratio of deaths in Vietnam
to men who served there for each cohort, rescaled to range from zero to one. This variable is
interacted with v, because only those who served in Vietnam saw combat in that period. Other
recent studies have used similar proxies for combat intensity (Costa and Kahn 2008; Rohlfs
2010). This variable is not statistically significant, but the estimate is imprecise. The reliability of
this proxy is questionable, since there were relatively few deaths in most cohorts. Further, the
probability of death in Vietnam is highest for the oldest cohorts, so it is difficult to know
whether the variable is picking up combat intensity or age effects.11 A better proxy would be
based on combat injuries, not deaths, but it is not available. A complete database of combat
injuries has been compiled (Fett et al. 1984), but it is unclear whether it still exists and its use by
external researchers is prohibited by a specific Act of Parliament: the Epidemiological Studies
(Confidentiality) Act 1981. A better measure of combat intensity may warrant further research.
However, it is clear that there is actually little variation in employment effects between cohorts if
Army service affected employment only for those who went to Vietnam (lower panel, Figure 1).
I return to this issue in the analysis of Disability Pension data later in this Section.
The overidentification test (Table 3, column 1) confirms that the Army service LATEs differ
between cohorts, which is consistent with the upper panel of Figure 1. For the other
specifications (columns 2 to 5), the overidentification tests show no evidence of heterogeneous
average effects between cohorts.
11 Variations of this proxy also were tried (not shown), including versions that vary by ballot
outcome and smoothed versions based on local averages with adjacent cohorts. None led to
precise enough estimates. Another proxy considered was share of National Servicemen serving
in infantry battalions, which had much higher casualty rates than other units. This was also futile,
because there is almost no variation between cohorts (stable around 41%).
p16

A broad literature suggests that employment effects should be larger for men with low potential
earnings (see for example Angrist et al. 2010; Autor and Duggan 2003, 2006; Cai and Gregory
2004). That cannot be tested here, because there are no proxies for potential earnings available to
interact with the instruments in the first-stage data. I do find that the share of the employment
effect accounted for by low-skill occupations (labourers, and machinery operators and drivers) is
considerably larger than the share of employment in those occupations (results available on
request). But it is possible that compliers were concentrated in those occupations to begin with.
This could be the result either of selection (high-skill balloted-in men more likely to avoid
enlistment), or a causal effect of service. I find no evidence that Army service reduced average
earnings (later in this Section). But, there are no data to test the selection argument. Men with
poor health and low intelligence were screened out in the medical and aptitude tests. However,
high skill may have been more resourceful in avoiding conscription, and they had a greater
incentive to do so, precisely because of their potential earnings. So, I cannot confidently
determine whether the employment effect is concentrated amongst low-skill men.
C. Employment and Disability Pension Effects Over Time
Table 4 shows the reduced-form estimates of employment and disability pension effects for
various years. The youngest five cohorts are excluded, as discussed previously.
The employment effect emerged gradually, beginning in the mid-1990s. The estimates are
negative and statistically significant for each year from 1998-9 to 2008-9. They increase (become
more negative) steadily throughout the period. The effect is largest for 2008-9 at -2.0 percentage
points.12 For 1992-3, the employment effect is actually positive (0.4 percentage points) and
12 When analysed comparably (by excluding the last five cohorts and including recent migrants),
the corresponding effect in the 2006 Census is larger (-3.1 percentage points). This is probably
due to differences in the definition of being employed, including the treatment of self-
p17
significant. Undoubtedly, some men were permanently unable to work immediately after being
injured in Vietnam. However, their numbers are apparently too small to drive the results for the
early 1990s. There is reason to be cautious in interpreting the positive effect for 1992-3, given
how small it is and a relative instability in effect sizes between cohorts as compared to the
Census results (results by cohort are available on request). Nevertheless, the tax data suggest that
the employment effect was either small or zero as recently as the mid-1990s.
DP-SR effects also increased strongly between 1990 and 2009, by a factor of over 26, from a
very small base (Table 4). The similarity of trends in DP-SR effects and employment effects
strongly suggests that the two are linked. The DP-SR effects are considerably larger than the
employment effects derived from tax data (Table 4) or from Census data (footnote 12). Thus,
the growth in DP-SR more than accounts for the employment effect. This is probably because
some compliers who receive DP-SR, and are hence not employed, would also not be employed
in the counterfactual (i.e. if they had been balloted out), but would be ineligible for DP-SR.
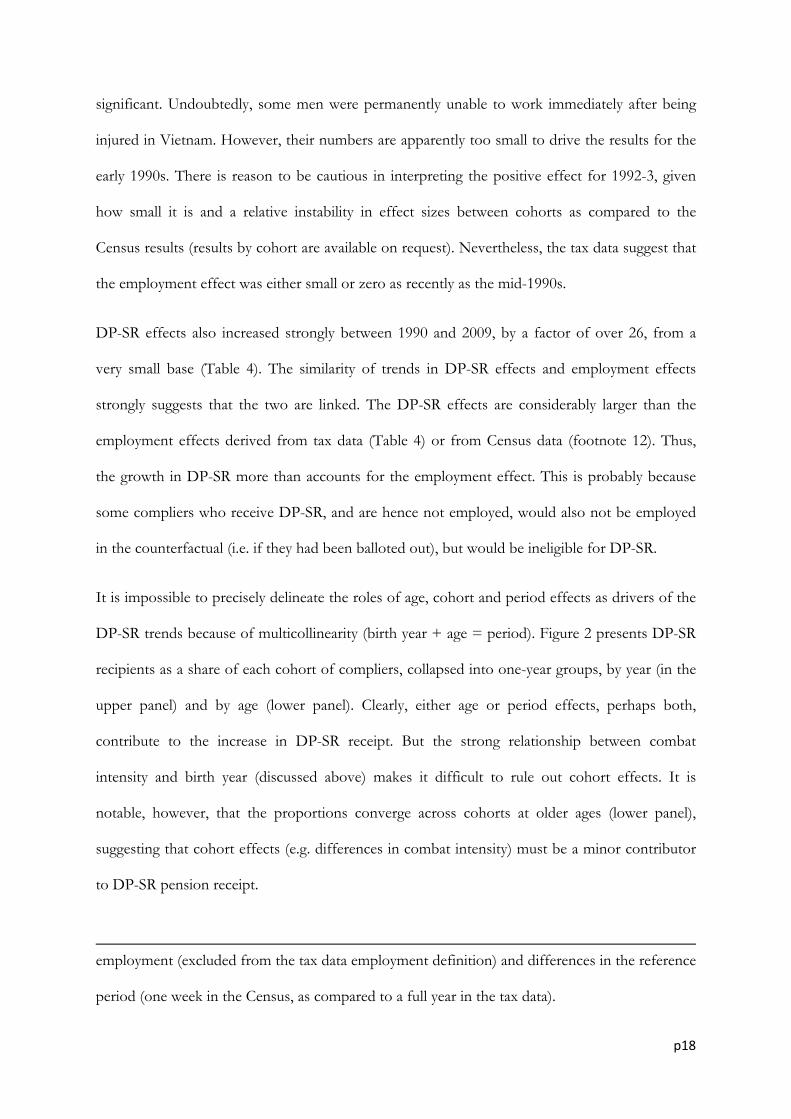
It is impossible to precisely delineate the roles of age, cohort and period effects as drivers of the
DP-SR trends because of multicollinearity (birth year + age = period). Figure 2 presents DP-SR
recipients as a share of each cohort of compliers, collapsed into one-year groups, by year (in the
upper panel) and by age (lower panel). Clearly, either age or period effects, perhaps both,
contribute to the increase in DP-SR receipt. But the strong relationship between combat
intensity and birth year (discussed above) makes it difficult to rule out cohort effects. It is
notable, however, that the proportions converge across cohorts at older ages (lower panel),
suggesting that cohort effects (e.g. differences in combat intensity) must be a minor contributor
to DP-SR pension receipt.
employment (excluded from the tax data employment definition) and differences in the reference
period (one week in the Census, as compared to a full year in the tax data).
p18
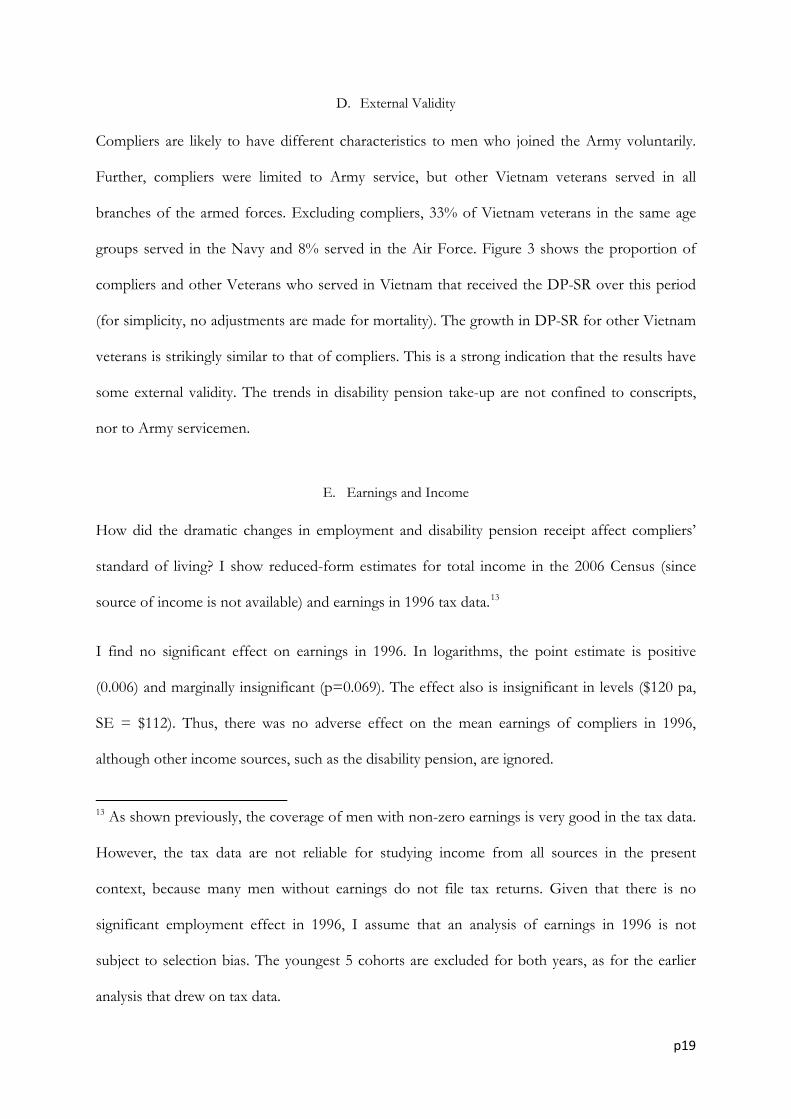
D. External Validity
Compliers are likely to have different characteristics to men who joined the Army voluntarily.
Further, compliers were limited to Army service, but other Vietnam veterans served in all
branches of the armed forces. Excluding compliers, 33% of Vietnam veterans in the same age
groups served in the Navy and 8% served in the Air Force. Figure 3 shows the proportion of
compliers and other Veterans who served in Vietnam that received the DP-SR over this period
(for simplicity, no adjustments are made for mortality). The growth in DP-SR for other Vietnam
veterans is strikingly similar to that of compliers. This is a strong indication that the results have
some external validity. The trends in disability pension take-up are not confined to conscripts,
nor to Army servicemen.
E. Earnings and Income
How did the dramatic changes in employment and disability pension receipt affect compliers’
standard of living? I show reduced-form estimates for total income in the 2006 Census (since
source of income is not available) and earnings in 1996 tax data.13
I find no significant effect on earnings in 1996. In logarithms, the point estimate is positive
(0.006) and marginally insignificant (p=0.069). The effect also is insignificant in levels ($120 pa,
SE = $112). Thus, there was no adverse effect on the mean earnings of compliers in 1996,
although other income sources, such as the disability pension, are ignored.
13 As shown previously, the coverage of men with non-zero earnings is very good in the tax data.
However, the tax data are not reliable for studying income from all sources in the present
context, because many men without earnings do not file tax returns. Given that there is no
significant employment effect in 1996, I assume that an analysis of earnings in 1996 is not
subject to selection bias. The youngest 5 cohorts are excluded for both years, as for the earlier
analysis that drew on tax data.
p19
Using equivalent specifications, I find no significant effect on mean personal income in 2006.14
Specified in logs, the point estimate is 0.001, (SE = 0.003) or -$193pa in levels (SE = $121).15
However, in the Census income is reported before tax, and the DVA Disability Pension is not
taxable. Although not conclusive, the results suggest that the effects on mean (after tax) income
likely were positive in both 1996 and 2006. But the data do not reveal whether the reduction in
earnings over this period was offset by the increase in transfers.
V. Conclusion
Using unit-record population data, I find huge negative effects of army service on employment
for Australia’s Vietnam veterans; effects that are confined to men who served in Vietnam. These
effects have only emerged in the last 15 years, coinciding with even larger veterans’ disability
pension effects. I have shown evidence suggesting that the effects are not confined to those
veterans who were induced to enlist by the conscription ballots.
These results are consistent with aging-related exacerbation of service-related health conditions.
However, similar employment effects have not been found for the U.S.: my estimate for 2006 is -
37 percentage points, while Angrist et al.’s (2010) estimate for the U.S. is just -0.5 percentage
14 Only categorical income data were collected in the Census, so income is set to the midpoint of
each category. The open-ended highest category is set to $2500 per week. The results are not
sensitive to the assumed value, because ballot outcome is found to be orthogonal to the
probability of having income in this category.
15 However, the distribution of income is heavily compressed amongst balloted-in men in 2006.
The probability of having income between $400 and $800 per week was much higher (reduced
form effect = 0.022, SE 0.002) for balloted-in men. The probability of having higher or lower
incomes was correspondingly reduced.
p20

points, and it is not statistically significant.16 Differences in Australian and U.S. involvement in
Vietnam are unlikely to explain this discrepancy: considerably higher proportions of American
soldiers serving in Vietnam were killed (1.7%) and wounded (8.9%), as compared to their
Australian counterparts (0.9% and 5.2%, respectively) (U.S. DVA 2008; Wilson et al. 2005).
Thus an explanation must be sought elsewhere. It has been suggested that Australia’s system of
veterans’ entitlements is amongst the most generous in the world (Clarke et al. 2003). Indeed, a
far greater proportion of Australia’s Vietnam veterans receive disability compensation than U.S.
veterans. The ‘reverse criminal’ standard-of-proof for disability claims made by Australia
veterans is very generous (see Appendix B). However, it seems likely that the results are
explained primarily by the central role of employability in the compensation system. There is a
very large difference in the Australian disability pension payment rate between veterans who can
and cannot work, which is not present in the U.S. system. A simple policy change that might be
worthy of further research is an increase in the highest general disability pension rate to equal the
DP-SR rate. This would not disadvantage any veteran, but would remove the work disincentive.
A rough, conservative estimate of the present value of lost earnings for Vietnam veterans is
$9.7bn (AU$2010, assuming a 5% discount rate), or almost $250,000 per soldier who served in
Vietnam.17 No detrimental effects of Army service on mean income are found, so this loss in
earnings appears to have been fully compensated.
16 They did, however, find a large and significant (though imprecisely estimated) effect of around
10 percentage points for low-skill workers. There are two qualifiers to this comparison. Angrist et
al.’s estimates are mean effects for Vietnam era veterans, not just for those who served in
Vietnam, and are estimated using earlier data (2000), and hence for younger veterans.
17 For this estimate, it is assumed that the employment effects estimated for compliers also apply
to other Vietnam veterans from the 1945-52 birth cohorts. The estimate is based on the
p21

The Australian conscription lotteries provide a natural experiment of the highest quality. Given
the similarities of Australian and U.S. culture and institutions, further comparative research is
likely to be informative. In future work, we aim to contribute to debates on the effects of army
service on human capital accumulation, and on other outcomes including crime and marital
stability.
Appendix A: Draft Avoidance Behaviour and the Exclusion Restriction
The ballot outcome was randomly assigned, but its validity as an instrumental variable depends
on the assumption that its only effect on employment was via inducement of army service. Here
I consider several forms of draft avoidance behaviour as potential violations of this assumption.
I conclude that there is little reason for concern.
A. University Education and Apprenticeships
Balloted-in students, apprentices, and trainees were granted temporary deferments of National
Service liability (Langford 1997). Prior to their ballot, men thus had an incentive to enrol in a
course of study or apprenticeship. Such actions occurred prior to the ballot and hence were
orthogonal to ballot outcome. However, after their ballot, the balloted-in men who had been
granted temporary deferments had an incentive to continue their studies rather than dropping
out, because temporary deferments were reassessed annually. If any such induced education
improved long-run employment prospects, then the validity of the IV is challenged. However,
analysis of Census data suggests this is not a significant issue. There is some evidence that
employment effects from Census data, the trends estimated using tax data, and male average
weekly earnings. Effects on older and younger Vietnam veterans, as well as possible effects prior
to 1996 and after 2009, are excluded.
p22

balloted-in men were slightly more likely to have post-high school educational attainment (the
reduced-form estimate is 0.004; p=0.013). However, this effect appears to be confined to
vocational qualifications (diplomas and certificates), whilst the effect on degree or higher
qualifications is not statistically significant. Further, there is a second potential explanation for
the slightly elevated attainment of vocational qualifications, which is not a threat to instrument
validity: the post-discharge National Service Vocational Training Scheme covered fees, travel
fares, textbooks, and equipment, as well as a living allowance for those studying full-time. This
may have raised the attainment of vocational qualifications. It is possible to include education in
the employment equation, but this has not been pursued, due to the weak education first-stage.
B. Marriage
Men who were ‘married at the time that call-up for their age group commenced’ were granted
indefinite deferment of National Service liability (Australian Government 1966). Again,
inducement of marriage prior to the ballot is orthogonal to ballot outcome. However, it appears
that there was a small window of opportunity (approximately two to three months) for men to
marry after the ballot, but before call-up. As an example, the first ballot was held on 10 March
1965. Most men were informed of the outcome ‘within a fortnight’, whilst call-up action
commenced on May 31, 1965 (Australian Government 1966). In later years, similar rules
prevailed (see for instance Department of Labour and National Service 1971). This appears to
have allowed men to avoid conscription through marriage after the ballot outcome was known.
However, to the authors’ knowledge there were no such concerns raised at the time. The fact
that the government policy on married men did not change substantively over this period
provides further support for a lack of concern.
p23

C. Health
Balloted-in men were not liable for call-up if they failed medical or psychological examinations.
The proportion of men who failed these examinations increased during the period. It has been
suggested that one explanation for this is the availability of ‘various tablets and medications’ that
helped men to fail the medical tests (Langford 1997). If such actions had long-run employment
consequences for these men, then the exclusion of ballot outcome from the employment
equation is invalid. To our knowledge there is no evidence in the historical records of such
concerns being raised.
D. Non-compliance and Prison
One way in which men dissented and did not comply with National Service obligation was to fail
to register for the ballot. If detected, such men were automatically liable for call-up and most of
them eventually conformed with the requirements. Only 14 men were imprisoned for failing to
comply with a call-up notice (Langford 1997). At least some of these men probably did not
register for the ballot, so not all of them would have had balloted-in birthdays. Thus, the ballot
outcome had a negligible effect on imprisonment amongst those who were not induced into the
Army.
E. Leaving the Country or Going ‘Underground’
Other ways to avoid the draft included hiding or fleeing the country. This represents a threat to
validity if substantial numbers of men did so as a result of being balloted-in and/or called up and
if this affected their long-run employment outcomes. In the US, the practice of avoiding the
draft by moving to other countries such as Canada reportedly was widespread. This practice has
not received substantial attention in the Australian literature, which suggests that it is less of an
issue, presumably for geographical reasons. A few examples of hiding and/or moving overseas
are given by Ham (2007: 271), sourced from Langley (1992). It is also unclear whether such
p24

actions were taken by men who failed to register or by those balloted-in. The official history of
Australia’s involvement states that prior to 1968 ‘some young men were covertly evading service
by devices such as travelling to New Zealand’ (Edwards 1997: 217) but no reference is given for
this claim. Amendments to the National Service Act were made in 1968, which prevented airlines
and shipping companies from issuing tickets to men of conscription age without a departmental
certificate (Edwards 1997: 217).
F. Citizen Forces
As an alternative to facing the National Service ballot, men could elect to serve in the Citizen
Forces (Army, Air Force or Navy Reserves) before their ballot (Department of Labour and
National Service 1966; Australian Government 1966). As in the cases discussed previously, this is
not a threat to validity because the choice to join the Citizen Forces was made prior to the ballot.
However, there was a brief period (up to December 8, 1965) when balloted-out men could
exploit a loophole. After finding out they were balloted-out, these men could resign from the
Citizen Forces. The ballot outcome thus not only had the effect of inducing some men into
National Service, but it also induced other men to stay in the Citizen Forces. This is only an issue
for the first two cohorts, and only to the extent that involvement in the Citizen Forces affected
long-run employment outcomes. Further, at December 31 1965, only 879 balloted-in men had
their liability deferred due to enlistment in the Citizen Forces (Australian Government 1966),
equal to 2.4% of men balloted-in in 1965. Thus, even for the 1945 birth-cohorts, this is a
negligible issue.
Appendix B: The DVA Disability Pension
This Appendix describes d trends in its receipt.
The DVA Disability Pension is roughly equivalent to VA Disability Compensation (DC) in the
US. The Disability Pension - Special Rate (DP-SR) is comparable to VA Individual
key elements of the DVA Disability Pension an
p25

Unemployability (IU) in the US. Almost all recipients of the DP-SR are ‘totally and permanently
incapacitated’ and can work no more than eight hours per week. Less than 1% of 50-59-year-old
DP-SR recipients report earnings to the DVA on their Service Pension assessment in a given
fortnight. Thus, almost all DP-SR recipients are not employed. In contrast, Non-SR DP receipt
does not involve any restrictions on employment. Receipt of DP can be combined with income
support, from DVA or from the social security system. Whilst linked data are unavailable, it is
likely that almost all Vietnam Veterans who are DP-SR recipients also receive the DVA Service
Pension-Invalidity, unless they fail the means test. DP income is not included in the Service
Pension income test.
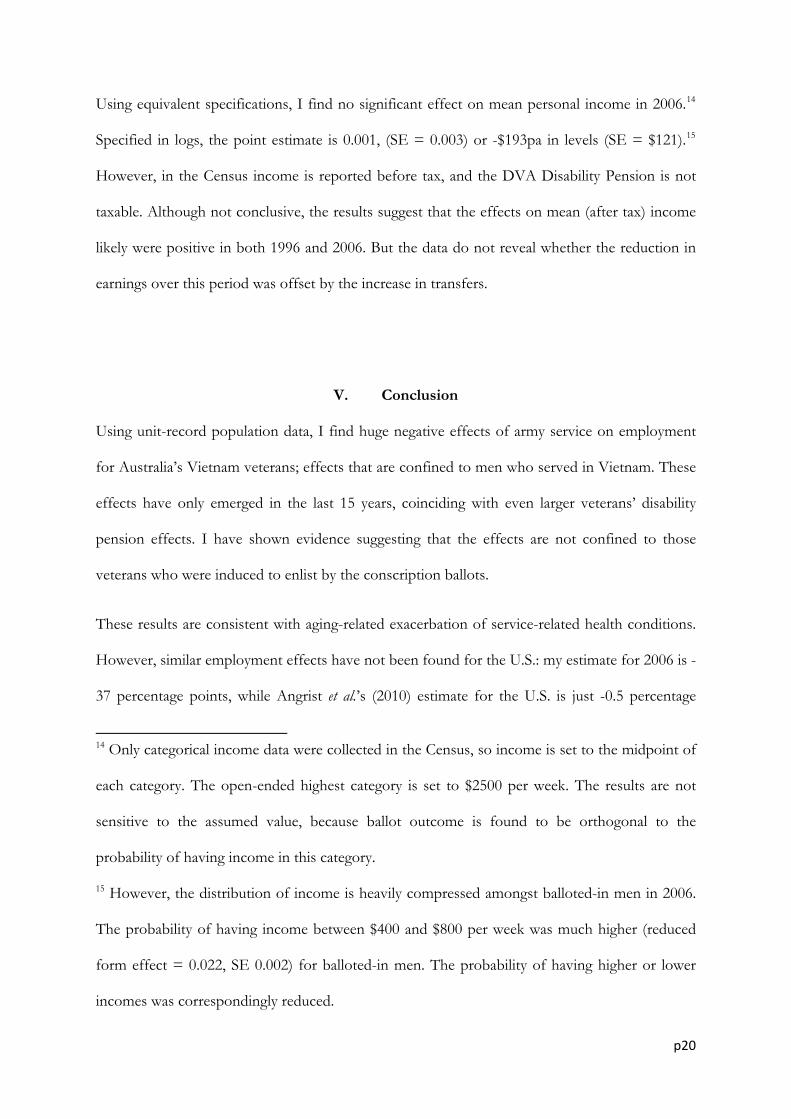
Figure B.1 shows the number of male DP recipients (who were born in 1945-52) between the
years 1990 and 2009, at June of each year.18 The number of DP recipients more than tripled,
ICD-10 conditions (most frequent accepted claims in 1990-2009), which account for half of all
from 10,691 at June 1990 to 32,550 at June 2009. The increase in DP-SR is far more striking. At
June 1990, only 798 received the DP-SR; by June 2009, there were 17,806 recipients, a more than
22-fold increase. As a share of all DP recipients, DP-SR recipients increased from 7% in 1990 to
55% in 2009.
Table B.1 shows the main health conditions associated with DP receipt. It includes the top 10
accepted claims. The upper panel shows the number of successful claims in five-year periods by
condition and overall. More than 80% of all accepted claims were lodged after 1989. The
number of accepted claims increased sharply over the 1990s and peaked in the early 2000s before
declining. The single most prevalent condition is Post Traumatic Stress Disorder (PTSD), for
which 17,399 successful claims were lodged. Of these, only 380 were lodged prior to 1990,
reflecting the emergence of PTSD as a recognized psychological condition. The next three
18 Men with a ‘zero rated’ DP are excluded. These men do not receive DP, but receive subsidised
medical care for a non-service related disability.
p26

conditions are hearing-related, together accounting for 32,289 accepted claims, and thus far
exceeding PTSD. Only 9% of such claims were lodged prior to 1990. These first four conditions
account for almost one third of accepted DP claims. The number of successful claims for all of
the other top-10 conditions also grew markedly during the 1990s. ‘Mental and Behavioural
disorders due to Alcohol Dependence’ was the third most prevalent condition amongst all
accepted claims during 1995-9.
The middle panel of Table B.1 shows the proportions of DP recipients who received
compensation for each of the top-ten conditions at various points in time. These do not sum to
recipients. It shows the proportions of DP-SR recipients who received compensation for each of
one, because many men receive compensation for more than one condition. The profile of DP
recipients changed considerably over this period. By the early 2000s, around half of all DP
recipients were receiving compensation for PTSD, about the same as for Sensorineural Hearing
Loss. By the late 2000s, more than one quarter were receiving compensation for Tinnitus.
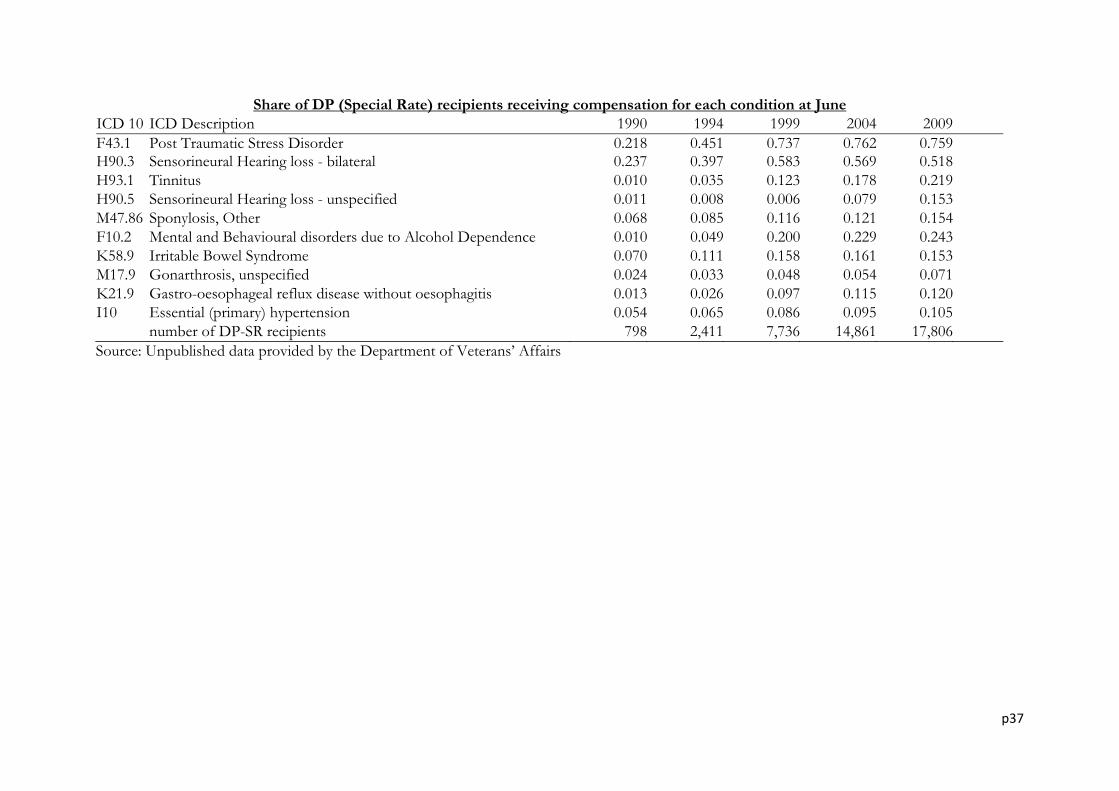
The lower panel of Table B.1 is similar to the middle panel, but is restricted to Special Rate DP
the top-ten conditions. The two standout conditions are PTSD and Sensorineural hearing loss.
In 1999 and later, almost three quarters of DP-SR recipients were receiving compensation for
PTSD. By the mid-2000s, around two-thirds were receiving compensation for Sensorineural
hearing loss.19 The third and fourth ranked conditions in 2009 were Mental and Behavioural
disorders due to Alcohol Dependence (24%) and Tinnitus (22%).
19 The data show that before 2002, there were almost no claims for Sensorineural Hearing loss –
unspecified. In contrast, from 2002 onwards, there were almost no claims for Sensorineural
Hearing loss – bilateral. This appears to be a change in coding or diagnostic practice, and thus it is
probably unlikely that men receive compensation for both of these conditions.
p27
Why has DP-SR receipt increased so much since 1990? There is no single outstanding reason for
this, but there are many factors that may have contributed. These include:
• Aging of the Vietnam veteran cohort. Aging exacerbates chronic conditions. Disability
pensions also may become more attractive for men as they approach retirement. Figure 2
suggests that aging is an important factor contributing to the growth in DP-SR.
• Standard of proof. Since 1977, DVA must grant DP claims for veterans with ‘operational
service’ (which equates to service in Vietnam in the present context) unless it proves
beyond reasonable doubt that an individual's condition is not service related. This is
effectively a ‘reverse criminal’ standard of proof. Whilst this change preceded the
observed increase in DP-SR by over a decade, it may be a factor in the magnitude of its
growth.
• Other changes to veterans’ benefits law. Changes to the interpretation of veterans’
compensation law are frequent and complex and a full investigation is beyond the scope
of this paper. The most recent review of the veterans’ benefits systems (Clarke et al.
2003)20 highlights the possible roles of two specific legal cases, both in 1981. The Bowman
(1981) case feasibly increased the scope of claims linking war-related impairment to
employability (Lloyd and Rees 1994: 391). The Law (1981) case ‘effectively conceded
smoking in war-time as a causative element in entitlement’ (Lloyd and Rees 1994: 358).
The introduction of ‘Statements of Principles’ in 1994 may have also been a factor.
These greatly clarified the circumstances in which DP claims would be accepted. It is
possible that this led to claims that otherwise would not have been lodged.
• PTSD. Post Traumatic Stress Disorder emerged as a recognised psychological illness in
the early 1980s. Between 1995 and 1999, it was the single largest illness category of
20 Another review is due to be completed in late 2010 or 2011.
p28

successful DP claims. Also since 1995, a majority of DP-SR recipients have been
receiving compensation for PTSD. However, even in the peak period of 1995-9, PTSD
accounts only for 19% of successful DP claims.
• Cultural change. The DVA (and the government more broadly) is known to exhibit a
culture of gratitude towards veterans. But this was not always the case with respect to
References
AIHW (1992), Dapsone exposure, Vietnam service and cancer incidence (Canberra: AIHW).
Angrist, Joshua D. (1990), 'Lifetime Earnings and the Vietnam Era Draft Lottery: Evidence from Social
Security Administrative Records', Americ 80 (3), 313-36.
d Labor Relations
Angrist, ckman, "Instrumental
32 (4), 823-27.
Angrist, 09), Mostly Harmless Econometrics (Princeton: Princeton
Angrist, Effects Using
Vietnam veterans. In Australia, as in the US, public attitudes towards Vietnam veterans
were not sympathetic in the latter stages of the war and for some time afterwards. This is
most clearly demonstrated by the fact that the symbolic Vietnam Veterans Welcome
Home Parade was not held until 1987. Similarly, relations between Vietnam veterans
associations and the DVA were not always cordial in the early years (Ham 2007). The
role of the Vietnam veterans association as a powerful and organized special interest
group also may have grown over this time.
an Economic Review,
--- (1993), 'The Effect Of Veterans Benefits On Education And Earnings', Industrial an
Review, 46 (4), 637-52.
Joshua D. and Imbens, Guido W (1997), 'Comment on James J He
Variables A Study of Implicit Behavioral Assumptions Used In Making Program Evaluations',
Journal of Human Resources,
Angrist, Joshua D. and Chen, Stacey H (2008), Long-Term Economic Consequences of Vietnam-Era Conscription:
Schooling, Experience and Earnings (Bonn: IZA DP No. Discussion Paper No. 3628).
Joshua D. and Pischke, Jorn-Steffen (20
University Press).
Joshua D., Imbens, Guido W, and Rubin, Donald (1996), 'Identification of Causal
Instrumental Variables', Journal ofthe American Statistical Association, 91 (434 (Jun., 1996)), 444-55.
p29

Angrist, Joshua D., Chen, Stacey H, and Frandsen, Brigham R (2010), 'Did Vietnam Veterans Get Sicker
in the 1990s? The Complicated Effects of Military Service on Self-Reported Health', Journal of
Atsushi,
557-61.
to the Stage of Call-Up', (Canberra: a background paper supplied at the
Autor, D
ics, 118 (1), 157-205.
s)), 119-24.
Veterans Disability Compensation Program',
Bedard,
and Korean War Veterans', American Economic Review, 96 (1), 176-94.
etnam-era Draft Lottery (NBER Working Paper No. 15105; Cambridge).
Dobkin, Shabani, Reza (2009), 'The Health Effects of Military Service: Evidence from the
quiry, 47 (1), 69-80.
Public Economics, 94, 824-37.
Inoue. and Solon, Gary (2010), 'Two-Sample Instrumental Variables Estimators', The Review of
Economics and Statistics, 92 (3),
Australian Bureau of Statistics (2008), Australian Historical Population Statistics, 2008 (Canberra: ABS Cat.
No. 3105.0.65.001).
Australian Government (1966), 'An Account of the Administrative Processes Involved in the National
Service Scheme up
request of Cabinet, Cabinet minute 27 April 1966, Cabinet decision 205, Cabinet Secretariat file
C162 Part 2, A4950/1, Australian Archives).
avid H and Duggan, Mark G (2003), 'The Rise in the Disability Rolls and the Decline in
Unemployment', The Quarterly Journal of Econom
--- (2006), 'The Growth in the Social Security Disability Rolls: A Fiscal Crisis Unfolding', The Journal of
Economic Perspectives, 20 (3), 71-96.
--- (2007), 'Distinguishing Income from Substitution Effects in Disability Insurance', American Economic
Review, 97 (2 (Papers & Proceeding
--- (2008), 'The Effect of Transfer Income on Labor Force Participation and Enrollment in Federal
Benefits Programs: Evidence from the
(Unpublished manuscript).
Kelly and Olivier, Deschenes (2006), 'The Long-Term Impact of Military Service on Health:
Evidence fron World War II
Cai, Lixin and Gregory, Robert G (2004), 'Labour Market Conditions, Applications and Grants of
Disability Support Pension (DSP) in Australia', Australian Journal of Labour Economics, 7 (3), 375-94.
Clarke, John, Riding, Doug, and Rosalky, David (2003), Report of the Review of Veterans' Entitlements
(Canberra: DVA).
Conley, Dalton and Heewig, Jennifer A (2009), The Long-Term Effects of Military Conscription on Mortality:
Estimates from the Vi
Costa, Dora and Kahn, Michael (2008), Health, Stress, And Social Networks: Evidence From Union Army
Veterans (NBER Working Paper 14053).
Department of Labour and National Service (1971), 'News Release, 14th January 1971', in DLNS (ed.),
(Canberra).
--- (various years), 'News Release'.
Carlos and
Vietnam Draft', Economic In
p30

Duggan, Mark, Rosenheck, Robert, and Singleton, Perry (2010), 'Policy and the Rise in Disability
Enrollment: Evidence for the Veterans Affairs’ Disability Compensation Program', The Journal of
Law and Economics, 53 (2), 379–98.
Edwards, Peter (1997), A Nation at War. Australian Politics, Society and Diplomacy during the Vietnam War,
1965-75 (Sydney: Allen & Unwin).
Fett, MJ, et al. (1984), The Mortality Report, 3 vols. (Australian Veterans Health Studies; Canberra: AGPS).
Fienberg, Stephen E. (1971), 'Randomization and Social Affairs: The 1970 Draft Lottery', Science, 171,
255-61.
Ham, P (2007), Vietnam. The Australian War (Sydney: Harper Collins).
Hearst, Norman, Newman, Thomas B, and Hulley, Stephen B (1986), 'Delayed Effects of the Military
Draft on Mortality', The New England Journal of Medicine, 314 (10), 620-24.
Heckman, James J (1997), 'Instrumental Variables: A Study of Implicit Behavioral Assumptions Used In
Making Program Evaluations', Journal of Human Resources, 32 (3), 441-62.
Keane, Michael P. (2010), 'Structural vs. Atheoretic Approaches to Econometrics', Journal of Econometrics,
156, 3-20.
Langford, Sue (1997), 'Appendix: The National Service Scheme 1964-1972', in Peter Edwards (ed.), A
Nation at War (Allen & Unwin).
Langley, G.A. (1992), A Decade of Dissent: Vietnam and the Conflict on the Australian Home Front (Sydney: Allen
& Unwin).
Leigh, Andrew (2005), 'Deriving Long-Run Inequality Series from Tax Data', Economic Record, 81 (255),
S58–S70.
Lloyd, C and Rees, J (1994), The Last Shilling: A History of Repatriation in Australia (Melbourne: Melbourne
University Press).
Rohlfs, Chris (2010), 'Does Combat Exposure Make You a More Violent or Criminal Person? Evidence
From the Vietnam Draft', The Journal of Human Resources, 45 (2), 271-300.
Rosenzweig, Mark R. and Wolpin, Kenneth I. (2000), 'Natural "Natural Experiments" in Economics',
Journal of Economic Literature, 38 (4), 827-74.
Siminski, Peter and Ville, Simon (2011-forthcoming), 'Long-Run Mortality Effects of Vietnam-Era Army
Service: Evidence from Australia’s Conscription Lotteries', American Economic Review, 101 (2
Papers and Proceedings).
Stiglitz, Joseph E and Bilmes, Linda J (2008), The Three Trillion Dollar War: The True Cost of the Iraq Conflict
(Allen Lane).
U.S. DVA (2009), 'Fact Sheet: America's Wars', <http://www1.va.gov/opa/fact/amwars.asp>, accessed
22/3/2009.
Wilson, EJ, Horsley, KW, and van der Hoek, R (2005), Australian National Service Vietnam Veterans Mortality
and Cancer Incidence Study 2005 (Canberra: Department of Veterans’ Affairs).
p31

p32
Table 1 Descriptive Statistics
Ballot outcome In Out All
A. First Stage DatabaseArmy service in Vietnam Era (mean) 0.271 0.032 0.094Army service in Vietnam (mean) 0.088 0.015 0.034Days in Vietnam (mean for Vietnam Army servicemen) 269 249 261Army Servicemen died in Vietnam (n) 218 124 342N 224,706 643,899 868,605
B. Census 2006Employed (mean) 0.690 0.729 0.719Disability (mean) 0.060 0.048 0.051Post-School qualifications (mean) 0.483 0.484 0.484Tertiary qualifications (mean) 0.151 0.152 0.152N 175,348 500,484 675,832
C. Personal Income Tax Return Database2008-09 Employee (mean) 0.429 0.468 0.458Log Earnings (mean) 10.44 10.47 10.47N 165,461 486,715 652,176 1992-93 Employee (mean) 0.679 0.678 0.678Log Earnings (mean) 10.24 10.24 10.24N 174,758 511,363 686,121
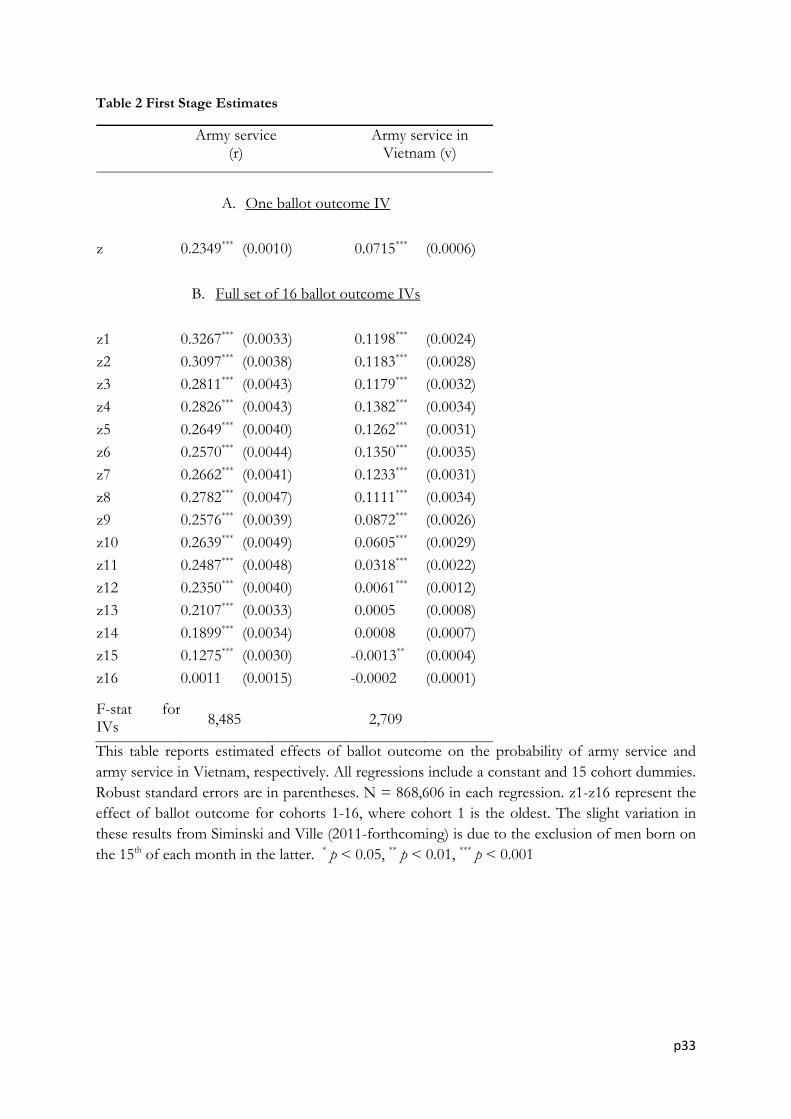
Table 2 First Stage Estimates
Army service
(r) Army service in
Vietnam (v)
A. One ballot outcome IV
z 0.2349*** (0.0010) 0.0715*** (0.0006)
B. Full set of 16 ballot outcome IVs
z1 0.3267*** (0.0033) 0.1198*** (0.0024)z2 0.3097*** (0.0038) 0.1183*** (0.0028)z3 0.2811*** (0.0043) 0.1179*** (0.0032)z4 0.2826*** (0.0043) 0.1382*** (0.0034)z5 0.2649*** (0.0040) 0.1262*** (0.0031)z6 0.2570*** (0.0044) 0.1350*** (0.0035)z7 0.2662*** (0.0041) 0.1233*** (0.0031)z8 0.2782*** (0.0047) 0.1111*** (0.0034)z9 0.2576*** (0.0039) 0.0872*** (0.0026)z10 0.2639*** (0.0049) 0.0605*** (0.0029)z11 0.2487*** (0.0048) 0.0318*** (0.0022)z12 0.2350*** (0.0040) 0.0061*** (0.0012)z13 0.2107*** (0.0033) 0.0005 (0.0008)z14 0.1899*** (0.0034) 0.0008 (0.0007)z15 0.1275*** (0.0030) -0.0013** (0.0004)z16 0.0011 (0.0015) -0.0002 (0.0001)
F-stat forIVs 8,485 2,709
This table reports estimated effects of ballot outcome on the probability of army service and army service in Vietnam, respectively. All regressions include a constant and 15 cohort dummies. Robust standard errors are in parentheses. N = 868,606 in each regression. z1-z16 represent the effect of ballot outcome for cohorts 1-16, where cohort 1 is the oldest. The slight variation in these results from Siminski and Ville (2011-forthcoming) is due to the exclusion of men born on the 15th of each month in the latter. * p < 0.05, ** p < 0.01, *** p < 0.001
p33

Table 3 2SLS Estimates of Employment Effects (Census 2006) (1) (2) (3) (4) (5)
A. One ballot outcome IV (z)
r -0.111*** (0.005) v -0.365*** (0.018)
B. Full set of 16 ballot outcome IVs (z1-16) r -0.120*** -0.002 0.001 -0.000 (0.005) (0.010) (0.010) (0.011) v -0.366*** -0.361*** -0.341*** -0.312*** (0.015) (0.029) (0.030) (0.060) vp -0.083** -0.078* (0.032) (0.034) vx -0.038 (0.071) Overidentification test statistic 32.18 3.36 3.35 1.78 1.72 p=0.006 p=0.999 p=0.998 p>0.999 p>0.999 Notes: This table shows estimates from linear regressions of employment on cross-sample fitted values of r and v from the 1st stage. A constant and 15 cohort dummies are also included in each regression. The overidentification test is the grouped data test (Angrist and Pischke 2009, pp143-144). The test statistic has a χ2 distribution with degrees of freedom equal to the number of IVs minus the number of endogenous regressors, in this case 15, 15, 14, 13 and 12 degrees of freedom, respectively. N = 675,832 in each regression. Robust standard errors are in parentheses. * p < 0.05, ** p < 0.01, *** p < 0.001
p34

p35
Table 4 Reduced Form Employment and Disability Pension Effects (1990-2009)
Year Employment Effect Disability Pension (SR) Effect
1990 0.002*** (0.0001)
1993 0.004** (0.0014) 0.004*** (0.0002)
1996 0.001 (0.0013) 0.009*** (0.0003)
1999 -0.004** (0.0014) 0.018*** (0.0004)
2002 -0.011*** (0.0014) 0.030*** (0.0005)
2006 -0.018*** (0.0015) 0.042*** (0.0006)
2009 -0.020*** (0.0015) 0.047*** (0.0006)
Notes: Employment effects are estimated using the personal income tax return database. The Last 5 cohorts are excluded from all years. 1993 represents the 1992-93 tax year, similarly for other years. Earlier data are not presently available. Men with positive earnings in a given tax year are counted as employed. Disability Pension (SR) receipt is at June of each year. Robust standard errors in parentheses. * p < 0.05, ** p < 0.01, *** p < 0.001

Table B.1 DVA Disability Pension Receipt – Top 10 conditions
Number of Accepted claims ICD 10 ICD Description pre-1990 1990-94 1995-99 2000-04 2005-09 TotalF43.1 Post Traumatic Stress Disorder 380 1945 7063 5595 2416 17399H90.3 Sensorineural Hearing loss - bilateral 2767 2428 6325 3246 28 14794H93.1 Tinnitus 115 305 1772 3431 3405 9028H90.5 Sensorineural Hearing loss - unspecified 65 37 16 4068 4281 8467M47.86 Sponylosis, Other 652 548 936 1372 2276 5784F10.2 Mental and Behavioural disorders due to Alcohol Dependence 34 254 2301 2004 1170 5763K58.9 Irritable Bowel Syndrome 315 379 1303 1153 343 3493M17.9 Gonarthrosis, unspecified 351 333 586 887 1599 3756K21.9 Gastro-oesophageal reflux disease without oesophagitis 46 122 1118 1274 524 3084I10 Essential (primary) hypertension 199 185 730 885 663 2662 Total Top 10 conditions 4924 6536 22150 23915 16705 74230 Other 22544 8455 15357 17704 13905 77965 Total 27468 14991 37507 41619 30610 152195
Share of DP recipients receiving compensation for each condition at JuneICD 10 ICD Description 1990 1994 1999 2004 2009F43.1 Post Traumatic Stress Disorder 0.051 0.159 0.417 0.494 0.504H90.3 Sensorineural Hearing loss - bilateral 0.279 0.347 0.505 0.480 0.421H93.1 Tinnitus 0.011 0.026 0.095 0.185 0.266H90.5 Sensorineural Hearing loss - unspecified 0.006 0.007 0.005 0.141 0.253M47.86 Sponylosis, Other 0.067 0.081 0.094 0.115 0.170F10.2 Mental and Behavioural disorders due to Alcohol Dependence 0.004 0.019 0.115 0.151 0.166K58.9 Irritable Bowel Syndrome 0.031 0.047 0.089 0.104 0.102M17.9 Gonarthrosis, unspecified 0.035 0.043 0.049 0.061 0.095K21.9 Gastro-oesophageal reflux disease without oesophagitis 0.005 0.011 0.057 0.085 0.090I10 Essential (primary) hypertension 0.019 0.026 0.049 0.065 0.077 number of DP recipients 10,691 14,481 22,112 29,402 32,550
p36
p37
Share of DP (Special Rate) recipients receiving compensation for each condition at JuneICD 10 ICD Description 1990 1994 1999 2004 2009F43.1 Post Traumatic Stress Disorder 0.218 0.451 0.737 0.762 0.759H90.3 Sensorineural Hearing loss - bilateral 0.237 0.397 0.583 0.569 0.518H93.1 Tinnitus 0.010 0.035 0.123 0.178 0.219H90.5 Sensorineural Hearing loss - unspecified 0.011 0.008 0.006 0.079 0.153M47.86 Sponylosis, Other 0.068 0.085 0.116 0.121 0.154F10.2 Mental and Behavioural disorders due to Alcohol Dependence 0.010 0.049 0.200 0.229 0.243K58.9 Irritable Bowel Syndrome 0.070 0.111 0.158 0.161 0.153M17.9 Gonarthrosis, unspecified 0.024 0.033 0.048 0.054 0.071K21.9 Gastro-oesophageal reflux disease without oesophagitis 0.013 0.026 0.097 0.115 0.120I10 Essential (primary) hypertension 0.054 0.065 0.086 0.095 0.105 number of DP-SR recipients 798 2,411 7,736 14,861 17,806Source: Unpublished data provided by the Department of Veterans’ Affairs

Figure 1 2SLS Employment Effects by birth cohort (Census 2006)
All Vietnam Era Army Service
‐30%
‐25%
‐20%
‐15%
‐10%
‐5%
0%
5%
10%
1945_1 1946_1 1947_1 1948_1 1949_1 1950_1 1951_1 1952_1 OVERALL
LATE (pe
rcen
tage points)
Birth cohort
Army Service in Vietnam
‐80%
‐70%
‐60%
‐50%
‐40%
‐30%
‐20%
‐10%
0%
10%
1945_1 1946_1 1947_1 1948_1 1949_1 1950_1 1951_1 1952_1 OVERALL
LATE (pe
rcen
tage points)
Birth cohort
p38

Figure 2 Share of Vietnam Veteran ‘Compliers’ receiving Disability Pension (Special Rate) by Cohort, Age and Year
0%
10%
20%
30%
40%
50%
60%
Year (at June)
1945 birth cohorts
1946 birth cohorts
1947 birth cohorts
1948 birth cohorts
1949 birth cohorts
1950 birth cohorts
0%
10%
20%
30%
40%
50%
60%
40 41 42 43 44 45 46 47 48 49 50 51 52 53 54 55 56 57 58 59 60 61 62 63 64
Age
1945 birth cohorts
1946 birth cohorts
1947 birth cohorts
1948 birth cohorts
1949 birth cohorts
1950 birth cohorts
Notes: Population restricted to men born between 1 Jan 1945 and 30 Jun 1950. Adjustments are not made for mortality, so all proportions are underestimates.
p39

Figure 3 Share of Vietnam Veterans Receiving DVA Disability Pension (Special Rate)
0%
10%
20%
30%
40%
50%
60%
1990 1993 1996 1999 2002 2006 2009
Vietnam veterans ‐ compliers
Other Vietnam Veterans
Notes: Population restricted to those born between 1 Jan 1945 and 30 Jun 1950. Adjustments are not made for mortality, so all proportions are underestimates. Figure B.1 Number of Male DVA Disability Pension recipients (born 1945-1952) at June, 1990-2009
‐
5,000
10,000
15,000
20,000
25,000
30,000
35,000
All DP
DP‐SR
Source: Unpublished data provided by the Department of Veterans’ Affairs
p40