EMODnet Lot 3 – Chemical data FINAL REPORT - European ...
92
EMODnet Lot 3 – Chemical data FINAL REPORT 4/6/2009 to 3/6/2011 Alessandra Giorgetti, Elena Partescano and Matteo Vinci (OGS) with the contribution of Dick Schaap (MARIS), Anders Windelin, Marc Bassompierre (NERI), Neil Holdsworth (ICES), Friedrich Nast, Anne Che-Bohnenstengel (BSH-DOD), Gilbert Maudire (IFREMER), Mark E. Charlesworth (NERC-BODC), Francisco Hernandez, Simon Claus and Klaas Deneudt (VLIZ), Serge Scory and Mia Devolder (RBINS-MUMM), Erik Marsman (RWS), Taco de Bruin (NIOZ), Lotta Fyrberg (SMHI), Alexey Khaliulin (MHI), Alexander Kuznetsov (RIHMI-WDC), Tamara Shiganova (SIO-RAS), Galinka Shtereva, Atanas Palazov (IO-BAS), Luminita Buga (NIMRD), Tornike Razmadze, Kakhaber Bilashvili (TSU-DNA), Sissy Iona (HCMR), Maria-Jesus Garcia and Victor León (IEO), George Zodiatis (OC-UCY), Reiner Schlitzer (AWI), Alexander Barth (UlG) Due date of deliverable: 4 th June 2011
-
Upload
khangminh22 -
Category
Documents
-
view
1 -
download
0
Transcript of EMODnet Lot 3 – Chemical data FINAL REPORT - European ...

EMODnet Lot 3 – Chemical data
FINAL REPORT
4/6/2009 to 3/6/2011 Alessandra Giorgetti, Elena Partescano and Matteo Vinci (OGS) with the contribution of Dick Schaap (MARIS), Anders Windelin, Marc Bassompierre (NERI), Neil Holdsworth (ICES), Friedrich Nast, Anne Che-Bohnenstengel (BSH-DOD), Gilbert Maudire (IFREMER), Mark E. Charlesworth (NERC-BODC), Francisco Hernandez, Simon Claus and Klaas Deneudt (VLIZ), Serge Scory and Mia Devolder (RBINS-MUMM), Erik Marsman (RWS), Taco de Bruin (NIOZ), Lotta Fyrberg (SMHI), Alexey Khaliulin (MHI), Alexander Kuznetsov (RIHMI-WDC), Tamara Shiganova (SIO-RAS), Galinka Shtereva, Atanas Palazov (IO-BAS), Luminita Buga (NIMRD), Tornike Razmadze, Kakhaber Bilashvili (TSU-DNA), Sissy Iona (HCMR), Maria-Jesus Garcia and Victor León (IEO), George Zodiatis (OC-UCY), Reiner Schlitzer (AWI), Alexander Barth (UlG) Due date of deliverable: 4th June 2011
EMODnet Lot 3 – Chemistry Final Report
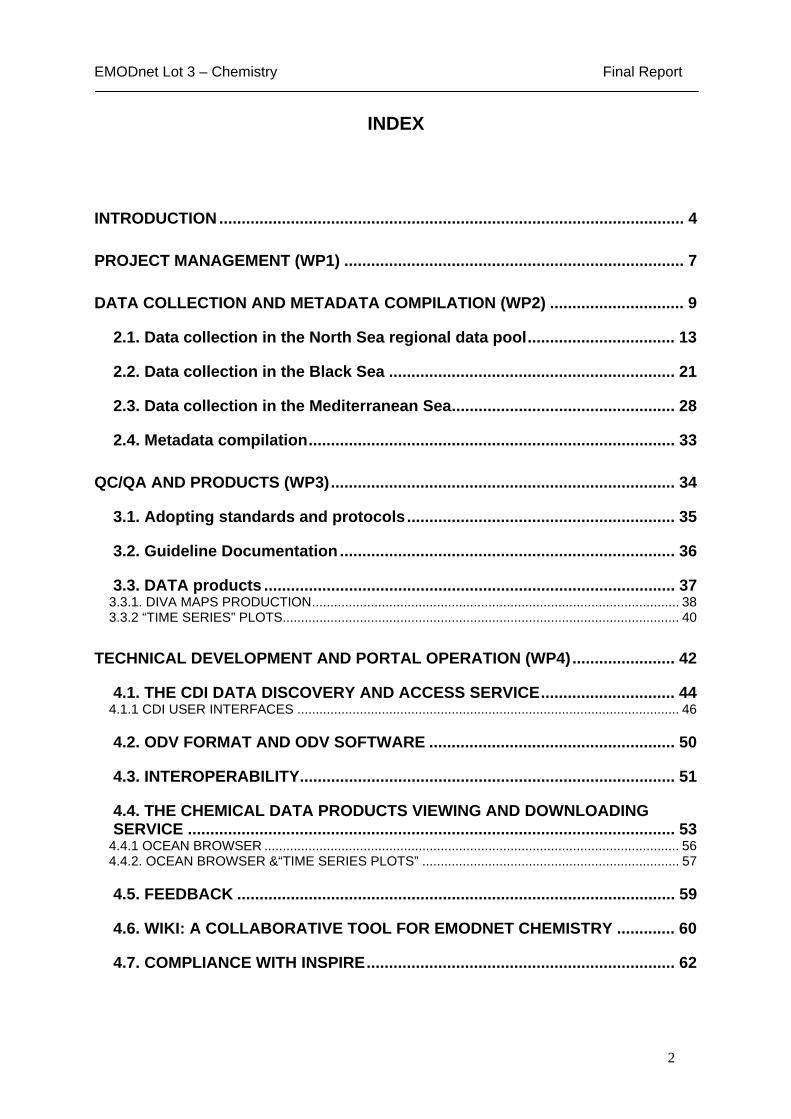
INDEX
INTRODUCTION ........................................................................................................ 4
PROJECT MANAGEMENT (WP1) ............................................................................ 7
DATA COLLECTION AND METADATA COMPILATION (WP2) .............................. 9
2.1. Data collection in the North Sea regional data pool................................. 13
2.2. Data collection in the Black Sea ................................................................ 21
2.3. Data collection in the Mediterranean Sea.................................................. 28
2.4. Metadata compilation.................................................................................. 33
QC/QA AND PRODUCTS (WP3)............................................................................. 34
3.1. Adopting standards and protocols............................................................ 35
3.2. Guideline Documentation ........................................................................... 36
3.3. DATA products ............................................................................................ 37 3.3.1. DIVA MAPS PRODUCTION.................................................................................................... 38 3.3.2 “TIME SERIES” PLOTS............................................................................................................ 40
TECHNICAL DEVELOPMENT AND PORTAL OPERATION (WP4)....................... 42
4.1. THE CDI DATA DISCOVERY AND ACCESS SERVICE.............................. 44 4.1.1 CDI USER INTERFACES ........................................................................................................ 46
4.2. ODV FORMAT AND ODV SOFTWARE ....................................................... 50
4.3. INTEROPERABILITY.................................................................................... 51
4.4. THE CHEMICAL DATA PRODUCTS VIEWING AND DOWNLOADING SERVICE ............................................................................................................. 53
4.4.1 OCEAN BROWSER ................................................................................................................. 56 4.4.2. OCEAN BROWSER &“TIME SERIES PLOTS” ...................................................................... 57
4.5. FEEDBACK .................................................................................................. 59
4.6. WIKI: A COLLABORATIVE TOOL FOR EMODNET CHEMISTRY ............. 60
4.7. COMPLIANCE WITH INSPIRE..................................................................... 62
2

EMODnet Lot 3 – Chemistry Final Report
ANALYSIS AND EVALUATION (WP5) ................................................................... 63
5.1. FEEDBACK FROM USERS.......................................................................... 64
5.2. EVALUATION OF THE EMODNET CHEMICAL LOT FOR USE IN ASSESSMENTS AND FUTURE DEVELOPMENTS ........................................... 68
5.3 Recommendations for the overall EMODnet.............................................. 74
5.4 SUMMARY..................................................................................................... 77
CONCLUSIONS....................................................................................................... 78
ANNEX I – LIST OF ACRONYMS ........................................................................... 80
ANNEX II – NEW SEADATANET P011 PARAMETER USAGE VOCABULARY TERMS ADDED FOR BIOTA IN EMODNET ........................................................... 82
ANNEX III – OVERVIEW OF CDI RECORDS INCLUDED IN EMODNET CDI USER INTERFACE............................................................................................................. 83
ANNEX IV – EXPLANATION OF CONCEPTS AND TERMINOLOGY.................... 91
3

EMODnet Lot 3 – Chemistry Final Report
INTRODUCTION
BACKGROUND
This Final Report describes the activities carried out during the first two years of EMODnet chemical pilot (4th of June 2009 – 3rd of June 2011), corresponding to the Development and build phase (M1-M12), to the test and monitor phase (M13-M18) and to the upgrade phase (M19-M24). The results obtained in this time period are described in the First Interim report (4th of June 2009 – 3rd of June 2010) and in the Second Interim report (4th of June 2010 – 3rd of December 2010). Here we recall what was achieved in the project, the deliverables produced by each work package, the challenges faced and any deviation from the project tender. An analysis of performance and lessons learned and an analysis of sustainability will be draft, as specified in the Technical Tender Form for Lot 3 – Chemical Data, leaving the final conclusions to the end of the project.
EMODnet Chemical pilot is undertaken by 25 partners representing the SeaDataNet network of Data Centres, selected on their geographical coverage and specific expertise. These Data Centres already manage a large volume of relevant data sets and can enlarge the available collections from data holders in their country. Moreover the SeaDataNet partnership includes ICES, which acts as data centre for monitoring data for OSPAR, HELCOM and EIONET ensuring consistency is maintained with existing data reporting routes.
The EMODnet Chemical tender asks for data sets from the Greater North Sea and the Black Sea region. However, we planned to expand the pilot regions with five spots from the Mediterranean (Balearic Sea, Gulf of Lion, North Adriatic Sea, Gulf of Athens and NE Levantine basin).
NORTH
B
M
LACK
EDITERRANEAN
4

EMODnet Lot 3 – Chemistry Final Report
EMODnet Chemical pilot is focused on the groups of chemicals required for monitoring the Marine Strategy Framework Directive:
1. synthetic compounds (i.e. pesticides, antifoulants, pharmaceuticals),
2. heavy metals,
3. radionuclides;
4. fertilisers and other nitrogen- and phosphorus-rich substances;
5. organic matter (e.g. from sewers or mariculture);
6. hydrocarbons including oil pollution.
Based on SeaDataNet (SDN) experience, the following strategy was proposed as approach for the EMODnet pilots:
• Develop a high-end dedicated portal, outfitted with a powerful spatial database, that is complemented with WMS, WFS and WCS services (OGC) to serve users and to provide layers for the wider community (e.g. the other EMODnet portals, the prototype European Atlas of the Seas, and the broad-scale European Marine Habitats map);
• Provide data sets for producing interpolated maps with specific resolution for each geographical region, that are loaded and integrated afterwards into the portals’ spatial database;
• Include a metadata discovery service in the portal, by adopting the SeaDataNet Common Data Index (CDI) metadata standard, that inter alia gives clear information about the background data, the access restrictions and distributors; this also maintains the relationship of the EMODnet portals with the SeaDataNet distributed infrastructure.
So far, EMODnet Chemical lot technical set-up is based on SeaDataNet V1 infrastructure, using the principle of ‘adopted and adapted’. In fact, EMODnet Chemical lot adopts and adapts:
• SDN Standards for background data, metadata and product. This in particular includes CDI (xml ISO 19115) metadata, ODV data format for background data exchange, SDN standard vocabularies (like P021 for CDI generation, P061 for units, P011 for ODV generation),
• CDI mechanism to access data with data policy management,
• SDN Security Services for user registrations,
• SDN Delivery Services for data access and downloading,
• SDN Products metadata catalogue (CAMIOON system),
• SDN Products viewing services for discovery, visualization and downloading of data products.
• SDN software tools (MIKADO metadata mapping and xml generator, NEMO formatting tool, DIVA software tool to produce gridded data products and error maps as NetCDF files, ODV software for “time series” products generation and QC check).
In particular, during the first year of project activities, the need was identified for specific methods to visualise parameters showing a non homogeneous spatio-temporal distribution which the EMODnet chemical lot considers. A specific workshop was organised to solve the issue and a new set of products were released, at first as a prototype. As a consequence, ODV/DIVA softwares were upgraded to produce maps, plots and related metadata
5

EMODnet Lot 3 – Chemistry Final Report
(DivadoXML) and the Ocean Browser Products Viewing Service functionalities upgraded to visualize station maps with links to time series plots.
This Final Report is organised into 5 sections, where the progress made in the 5 work packages according to the tender planning of activities is summarised. These are:
1 – Project management,
2 - Data collection and metadata compilation,
3 - QC/QA and products,
4 - Technical development and portal operation,
5 – Analysis and evaluation.
Some final remarks are given in the final section.
A list of acronyms is given in Annex 1 and further explanation of the standards and tools is provided in Annex 4.
6

EMODnet Lot 3 – Chemistry Final Report
PROJECT MANAGEMENT (WP1)
The project organization, as described in the Technical Tender Form for Lot 3 – Chemical Data includes the following elements: the project coordinator (OGS), the technical coordinator (MARIS), the Coordination group (OGS, MARIS, NERC-BODC, NERI-MAR, MHI, HCMR, ICES and IFREMER) and the Partners. During the project, the Coordination group has been extended with Gher and AWI.
The service contract was signed the 4th of June 2009, fixing the official starting date for the Lot 3 – Chemical Data
OGS prepared a Consortium Agreement, that was revised and signed by all partners, including the table with costs breakdown and the expected payments for each partner. In parallel, all partners sent to OGS the relevant invoice or debit note and were paid for the pre-financing portion.
During the first two years of EMODnet chemical pilot ( 4th of June 2009 – 3rd of June 2011 ) the following meeting were organised:
- Kick-off meeting (with the Coordination group), 2 - 3 July 2009, Trieste (Italy),
- Joint EMODNet - SeaDataNet meeting (with SDN Technical Task Team and EMODNet Coordination group), 3 – 4 September 2009, Antibes (France),
- 3rd Coordination group meeting, 21 January 2010, Paris (France),
- First Annual Partner group meeting, 2 April 2010, at the UNESCO Headquarters in Paris (France), soon after the SeaDataNet plenary meeting. A total of 34 participants of partners institutes from 19 countries contributed to the event,
- 4th Coordination group meeting, 5 - 6 July 2010, Trieste (Italy),
- Expert Group meeting, 20-21 September 2010, Venice (Italy),
- 5th Coordination group meeting, 21 September 2010, Venice (Italy),
- 6th Coordination group meeting, 15 November 2010 in videoconference,
- Second Annual Partner group meeting, 31 March - 1 April 2011, at the Hotel Europa in Ispra (Italy), after the last SeaDataNet plenary meeting. A total of 33 participants of partners institutes from 19 countries contributed to the event.
A report and/or action list is available in EMODnet Extranet for each event. Moreover, all meetings were described into the bi-monthly progress reports that were produced from August 2009 for the whole project duration, sent to EU and posted on the Extranet.
Following the Technical Tender Form, OGS and representatives from the Chemical lot participated in:
- EMODnet Preparatory Actions Seminar and Kick-off meeting, 4 June 2009, Brussels,
- Progress meeting for ur-EMODnet Preparatory Actions, 24 November 2009, Brussels,
- Second six-monthly progress meeting for ur-EMODnet preparatory actions, 25 May 2010, Copenhagen,
- Third meeting for ur-EMODNET thematic assembly group, 29 November 2010, Brussels,
- Fourth ur-EMODNET progress meeting, 7 June 2011, Brussels.
7

EMODnet Lot 3 – Chemistry Final Report
In addition, an expert meeting was organized in Venice (Italy) from the September 20th to September 21st, 2010, with 26 participants from the coordination group and nominated experts on data management, marine chemistry and contaminants. The general conclusions from the expert workshop were:
• To show data availability maps. The matrix “Variables VS Marine regions” now available on EMODnet Chemistry portal (under the section Metadata & Data) was developed in response to this point.
• Standard DIVA Interpolated maps will be produced for parameters with suitable data coverage, measured on basin scale.
• For parameters with a spatial coverage of individual stations repeated in time or datasets with fragmented coverage the agreed solution was to show station maps linked to plots of measured time series. The prototypes for “time series” products visualization was developed in response to this point.
To facilitate the communication for the management activities the following mailing lists were created:
Two leaflets describing the project objectives and results were produced and distributed to the dedicated Data Quality Control workshop organised by the FP 7 - UBSS - Upgrade Black Sea Scene project that was held in Rhodes Island, Greece between 11- 15 April 2011.
Finally, OGS with the contribution of all partners edited and revised the first and the second Interim Reports. Once accepted by DG MARE, the expected payments were distributed to each partner, after the relevant invoice or debit note was received.
All documents are available in EMODnet extranet website
8

EMODnet Lot 3 – Chemistry Final Report
DATA COLLECTION AND METADATA COMPILATION (WP2)
INTRODUCTION
The contribution to data collection and metadata compilation by each EMODnet partner was presented at the second year plenary meeting and extensively described in the meeting report (available on EMODnet Chemical portal under the meetings section).
An overview of the progress on data collection and metadata compilation in the three regions is also given here.
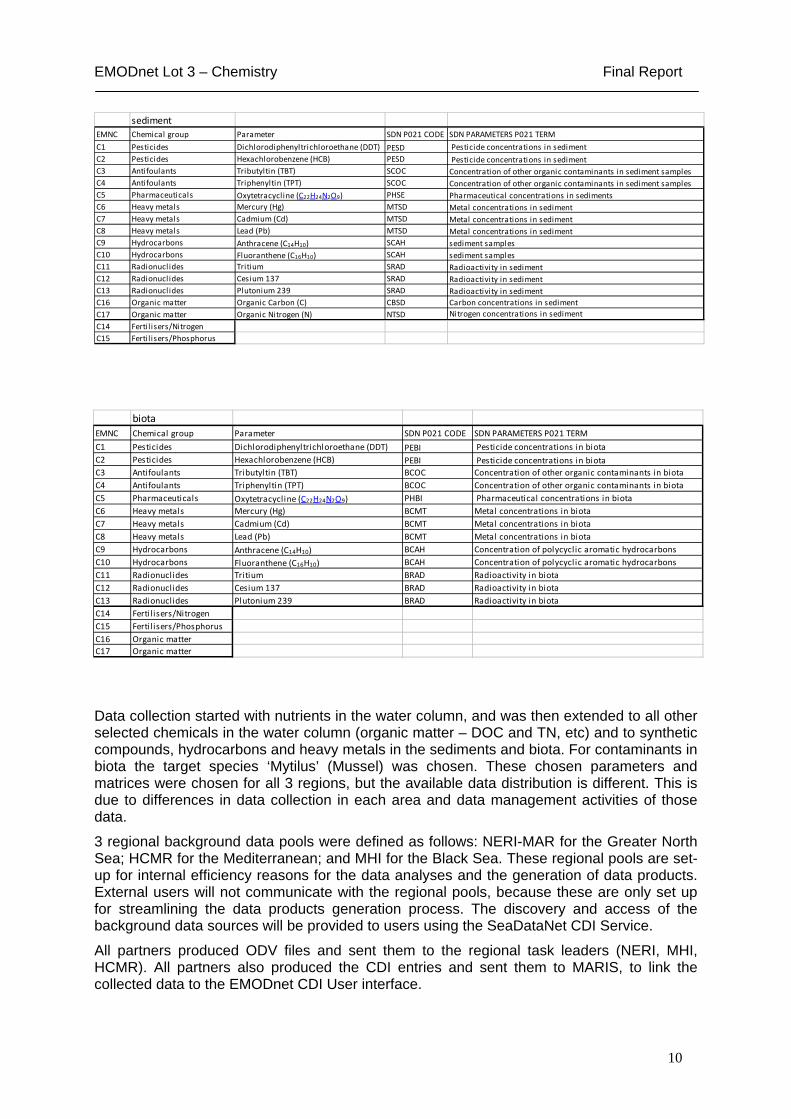
Based on MSFD requirements and on the availability of data in time and space (as time series geographically representative), a set of chemicals was selected from the 8 groups in the 3 matrices (water column, sediment, biota), to make a set of 17 selected parameters for product generation in the three regions. All these parameters were mapped to SeaDataNet vocabularies (mainly P021 - Parameter Discovery Vocabulary used for CDI generation, P061 - Data Storage Units used for units, and P011- Parameter Usage Vocabulary used for ODV files generation) as reported in the following tables.
water column
EMNC Chemical group Parameter SDN P021 CODE SDN PARAMETERS P021 TERM
C1 Pesticides Dichlorodiphenyltrichloroethane (DDT) PEWB Pesticide concentrations in water bodiesC2 Pesticides Hexachlorobenzene (HCB) PEWB Pesticide concentrations in water bodiesC3 Antifoulants Tributyltin (TBT) WCOC Concentration of other organic contaminants in the water columnC4 Antifoulants Triphenyltin (TPT) WCOC Concentration of other organic contaminants in the water columnC5 Pharmaceuticals Oxytetracycline (C22H24N2O9) PHWB Pharmaceutical concentrations in water bodiesC6 Heavy metals Mercury (Hg) MTWD Dissolved metal concentrations in the water columnC6 Heavy metals Mercury (Hg) MTWT Total metal concentrations in the water columnC6 Heavy metals Mercury (Hg) MTWP particulate metal concentrations in the water column C7 Heavy metals Cadmium (Cd) MTWD Dissolved metal concentrations in the water columnC7 Heavy metals Cadmium (Cd) MTWT Total metal concentrations in the water columnC7 Heavy metals Cadmium (Cd) MTWP particulate metal concentrations in the water column C8 Heavy metals Lead (Pb) MTWD Dissolved metal concentrations in the water columnC8 Heavy metals Lead (Pb) MTWT Total metal concentrations in the water columnC8 Heavy metals Lead (Pb) MTWP particulate metal concentrations in the water column C9 Hydrocarbons Anthracene (C14H10) PCHW columnC10 Hydrocarbons Fluoranthene (C16H10) PCHW columnC11 Radionuclides Tritium WRAD Radioactivity in the water columnC12 Radionuclides Cesium 137 WRAD Radioactivity in the water columnC13 Radionuclides Plutonium 239 WRAD Radioactivity in the water columnC14 Fertil isers/Nitrogen Nitrate (NO3) NTRA Nitrate concentration parameters in the water columnC15 Fertil isers/Phosphorus Phosphate (PO4) PHOS Phosphate concentration parameters in the water columnC16 Organic matter Organic Carbon (C) CORG Particulate total and organic carbon concentrations in the water columnC17 Organic matter Organic Nitrogen (N) NTOT Particulate total and organic nitrogen concentrations in the water column
9
EMODnet Lot 3 – Chemistry Final Report
sedimentEMNC Chemical group Parameter SDN P021 CODE SDN PARAMETERS P021 TERM
C1 Pesticides Dichlorodiphenyltrichloroethane (DDT) PESD Pesticide concentrations in sedimentC2 Pesticides Hexachlorobenzene (HCB) PESD Pesticide concentrations in sedimentC3 Antifoulants Tributyltin (TBT) SCOC Concentration of other organic contaminants in sediment samplesC4 Antifoulants Triphenyltin (TPT) SCOC Concentration of other organic contaminants in sediment samplesC5 Pharmaceuticals Oxytetracycline (C22H24N2O9) PHSE Pharmaceutical concentrations in sedimentsC6 Heavy metals Mercury (Hg) MTSD Metal concentrations in sediment C7 Heavy metals Cadmium (Cd) MTSD Metal concentrations in sediment C8 Heavy metals Lead (Pb) MTSD Metal concentrations in sediment C9 Hydrocarbons Anthracene (C14H10) SCAH sediment samplesC10 Hydrocarbons Fluoranthene (C16H10) SCAH sediment samplesC11 Radionuclides Tritium SRAD Radioactivity in sedimentC12 Radionuclides Cesium 137 SRAD Radioactivity in sedimentC13 Radionuclides Plutonium 239 SRAD Radioactivity in sedimentC16 Organic matter Organic Carbon (C) CBSD Carbon concentrations in sedimentC17 Organic matter Organic Nitrogen (N) NTSD Nitrogen concentrations in sediment
C14 Fertil isers/NitrogenC15 Fertilisers/Phosphorus
biotaEMNC Chemical group Parameter SDN P021 CODE SDN PARAMETERS P021 TERM
C1 Pesticides Dichlorodiphenyltrichloroethane (DDT) PEBI Pesticide concentrations in biotaC2 Pesticides Hexachlorobenzene (HCB) PEBI Pesticide concentrations in biotaC3 Antifoulants Tributyltin (TBT) BCOC Concentration of other organic contaminants in biotaC4 Antifoulants Triphenyltin (TPT) BCOC Concentration of other organic contaminants in biotaC5 Pharmaceuticals Oxytetracycline (C22H24N2O9) PHBI Pharmaceutical concentrations in biotaC6 Heavy metals Mercury (Hg) BCMT Metal concentrations in biota C7 Heavy metals Cadmium (Cd) BCMT Metal concentrations in biota C8 Heavy metals Lead (Pb) BCMT Metal concentrations in biota C9 Hydrocarbons Anthracene (C14H10) BCAH Concentration of polycyclic aromatic hydrocarbons C10 Hydrocarbons Fluoranthene (C16H10) BCAH Concentration of polycyclic aromatic hydrocarbons C11 Radionuclides Tritium BRAD Radioactivity in biotaC12 Radionuclides Cesium 137 BRAD Radioactivity in biotaC13 Radionuclides Plutonium 239 BRAD Radioactivity in biotaC14 Fertil isers/NitrogenC15 Fertil isers/PhosphorusC16 Organic matterC17 Organic matter
Data collection started with nutrients in the water column, and was then extended to all other selected chemicals in the water column (organic matter – DOC and TN, etc) and to synthetic compounds, hydrocarbons and heavy metals in the sediments and biota. For contaminants in biota the target species ‘Mytilus’ (Mussel) was chosen. These chosen parameters and matrices were chosen for all 3 regions, but the available data distribution is different. This is due to differences in data collection in each area and data management activities of those data.
3 regional background data pools were defined as follows: NERI-MAR for the Greater North Sea; HCMR for the Mediterranean; and MHI for the Black Sea. These regional pools are set-up for internal efficiency reasons for the data analyses and the generation of data products. External users will not communicate with the regional pools, because these are only set up for streamlining the data products generation process. The discovery and access of the background data sources will be provided to users using the SeaDataNet CDI Service.
All partners produced ODV files and sent them to the regional task leaders (NERI, MHI, HCMR). All partners also produced the CDI entries and sent them to MARIS, to link the collected data to the EMODnet CDI User interface.
10

EMODnet Lot 3 – Chemistry Final Report
The data made available in EMODNET Chemistry is obtained from two main data sources:
1. datasets already managed by the NODCs and made available for the project purposes (mainly nutrients in the water column);
2. new datasets obtained by the NODCs from 3rd parties (mainly parameters in biota and sediment matrix).
For the second source of data a preliminary step of analysis has to be done. This because the information are provided in different formats (xls, access, pdf, mysql databases, etc.). Before making the data available, the second time consuming step is to analyse the metadata, which commonly does not adequately describe the dataset. The description of how the data has been collected with all the metadata is essential to understand the data structure and to develop the tools (query or generic extraction) to handle the information and include them in the regional data pools, where common formats and codes are adopted. For this purpose, a necessary step is to check the existence of parameter’s codes and units in the dedicated SDN common vocabularies maintained by BODC and updated in collaboration with EMODNET Chemistry partners. The vocabularies considered in this step are:
P021: Parameter Discovery Vocabulary necessary to produce CDI for metadata
P011: Parameter Usage Vocabulary necessary to produce ODV4 format for data
P061: Data Storage Units necessary to produce ODV4 format for data
To produce the CDI XML metadata files it was recommended to use the MIKADO software tool and the SeaDataNet Common Vocabulary (in particular the P021 Parameter Discovery Vocabulary). For this purpose a small core group evaluated and extended the SDN P021 Vocabulary to cover all 17 chemical parameter selected for the three matrices (water column, sediment, biota). The complete mapping was included in a dedicated Excel file circulated to all partners (as reported in the above tables).
The data files have to be converted to SDN ODV4 format, by using the NEMO software tool and mapping to the SDN P011 vocabulary. The SeaDataNet Parameter Usage Vocabulary (SDN P011 vocabulary) contains over 20,000 entries of which only several hundred are of interest to the EMODNET pilot. To help all partners with the mapping, all the parameters in the current P011 that are of interest to EMODNET were extracted and included in a dedicated Excel file. The complete SeaDataNet Parameter Usage Vocabulary (SDN P011 vocabulary) can be found from SDN Web interface. A method to easily identify relevant parameter codes was recommended to all partners. As a result the P011 vocabulary was extended to cover all the new parameters for the EMODNET harvesting phase.
The collaboration with BODC is helping to fill the gaps in parameter descriptions and to extend the P011 coverage. IFREMER is keeping updated the link between Medar-Medatlas codes and P011 terms that at the moment is necessary to use the NEMO format conversion tool.
The analysis of parameters highlighted the complexity of EMODNET Chemical data. The related metadata are a key issue to define the new parameters, and to discriminate from existing ones. A number of variables have to be provided for new terms to be added to the parameter vocabulary to ensure that they are specific enough so users can identify any differences when combining data. For example, to add a new parameter term for a contaminant in biota, information is required for:
• parameter
• target species considered,
11

EMODnet Lot 3 – Chemistry Final Report
• measurement basis: dry/wet,
• tissue in which the measurement was made (matrix)
• method of analysis
A selection of new terms from SDN P011 vocabulary that have been added to handle EMODNET data is given in Annex II.
The MIKADO and NEMO software tools, developed within SeaDataNet project, are freely available from SeaDataNet portal under the section Standards & Software, http://www.seadatanet.org/standards_software/software.
12

EMODnet Lot 3 – Chemistry Final Report
2.1. DATA COLLECTION IN THE NORTH SEA REGIONAL DATA POOL
BACKGROUND Much of the data for the EMODnet chemical parameters are also available in the ICES database ‘DOME’ as result of contracting parties to OSPAR making annual submission of data to ICES. Therefore an extraction from DOME to the regional data pool (EMODnet Chemical Buffer Database) was carried out. This ICES DOME overview has been provided as a service for the national partners to make sure that they at least had those data sets covered themselves and described with CDIs next to adding more data sets. This has be done to achieve that all data sets are now managed by national nodes that give access through the CDI service. The handling of duplicates in a systematic and operational way is beyond the scope of the EMODNET Chemical pilot and it has been included in the context of the SeaDataNet II proposal, where it is intended to tackle the issue for all nodes in the distributed network.
The boundaries for the area covered are the following:
The status for the data collection in the Greater North Sea for the selected EMODNET parameters has been made available through the CDI is shown below. Data availability through EMODnet CDI User Interface is important for user access and necessary base for
13
EMODnet Lot 3 – Chemistry Final Report
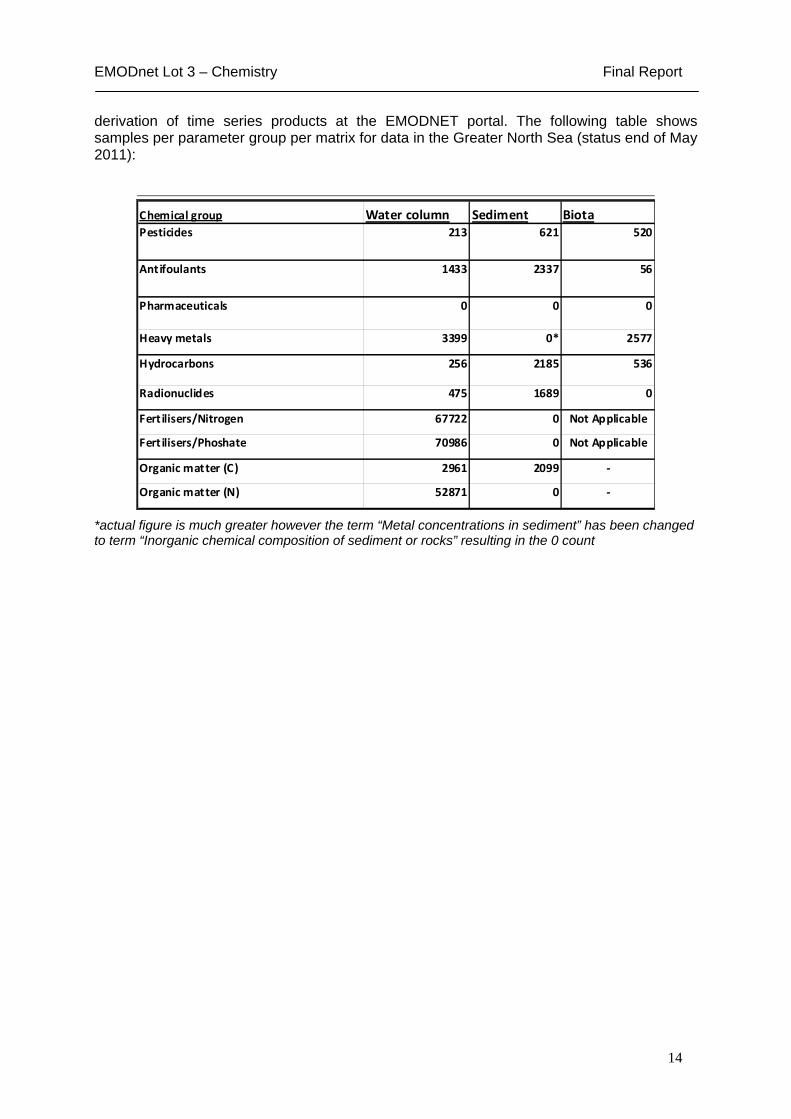
derivation of time series products at the EMODNET portal. The following table shows samples per parameter group per matrix for data in the Greater North Sea (status end of May 2011):
Chemical group Water column Sediment BiotaPesticides 213 621 520
Antifoulants 1433 2337 56
Pharmaceuticals 0 0 0
Heavy metals 3399 0* 2577
Hydrocarbons 256 2185 536
Radionuclides 475 1689 0
Fertilisers/Nitrogen 67722 0 Not Applicable
Fertilisers/Phoshate 70986 0 Not Applicable
Organic matter (C) 2961 2099 ‐
Organic matter (N) 52871 0 ‐
*actual figure is much greater however the term “Metal concentrations in sediment” has been changed to term “Inorganic chemical composition of sediment or rocks” resulting in the 0 count
14

EMODnet Lot 3 – Chemistry Final Report
The following figure shows all the data points for the selected EMODNET parameters for the Greater North Sea, which has been made available through the CDI.
DATA TYPE BIOTA
Overall data distribution: the spatial distribution map of samples on the left and the temporal distribution plot on the right are both good.
Limanda limanda liver measurements data distribution : the spatial distribution of samples on map on the left and the temporal distribution plot on the right are not enough homogenenous.
15
EMODnet Lot 3 – Chemistry Final Report
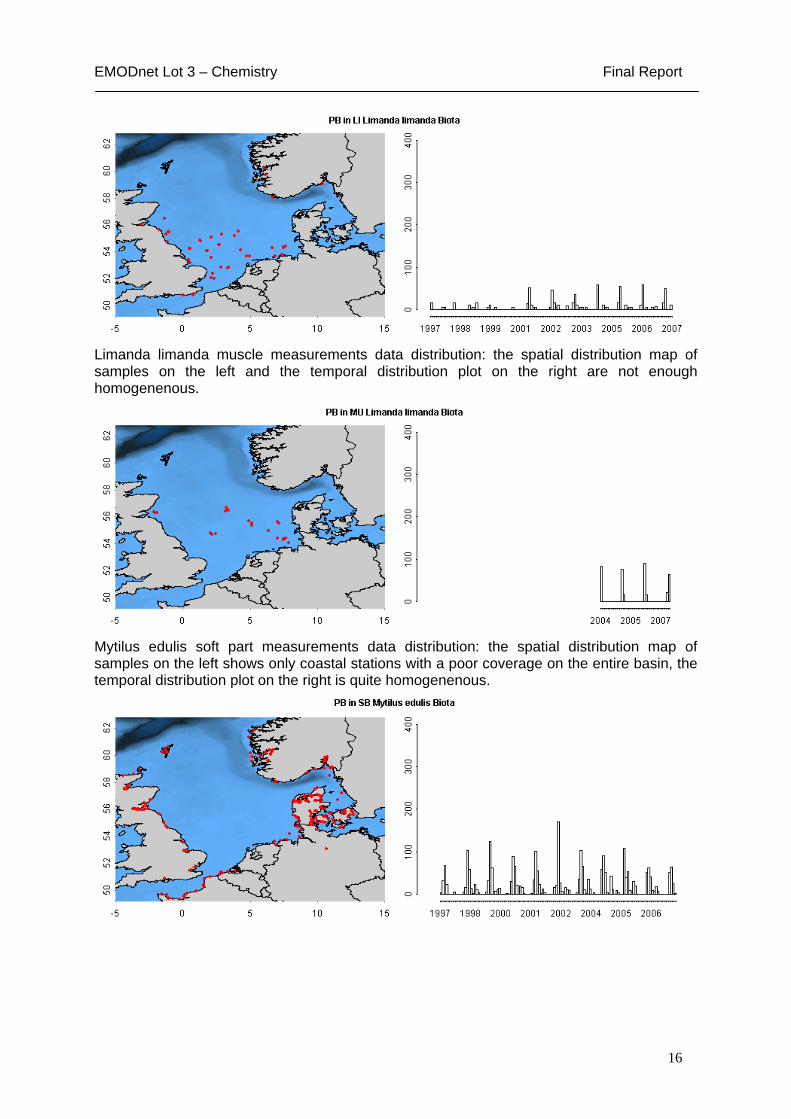
Limanda limanda muscle measurements data distribution: the spatial distribution map of samples on the left and the temporal distribution plot on the right are not enough homogenenous.
Mytilus edulis soft part measurements data distribution: the spatial distribution map of samples on the left shows only coastal stations with a poor coverage on the entire basin, the temporal distribution plot on the right is quite homogenenous.
16

EMODnet Lot 3 – Chemistry Final Report
DATA TYPE SEDIMENT
Overall data distribution: the spatial distribution map of samples on the left and the temporal distribution plot on the right are both enough homogenenous.
Sediment fraction 2000 (µm) data distribution: the spatial distribution map of samples on the left shows only coastal stations with a poor coverage on the entire basin, the temporal distribution plot on the right could more homogenenous.
17

EMODnet Lot 3 – Chemistry Final Report
DISCUSSION ON DATA AVAILABILITY
Based on the data collection in the region data pool an analysis of spatial and temporal distributions shows that:
• for the biota data type there are many different species and matrices measured (liver, muscles etc) and data is reported on a dry or wet weight basis
• In the sediment matrix there are different grain size categories used for analysis and data is reported on a dry or wet weight basis
• A lot of the measurements from biota and sediment matrix are from a limited number of coastal stations with repeated measurements over time.
This situation results predominantly in only small homogeneous datasets with poor spatial coverage which is not adequate to provide interpolated maps. Therefore only a limited set of the EMODNET parameters where geographic coverage was good were chosen to produce interpolated maps using the DIVA-software. The already produced interpolated DIVA maps are available at the EMODNET portal and the following figure shows an example for the nutrient parameter Nitrate in the matrix water column ([NO3-N, µmol/l], layer: 10 meters depth, month 1, data from 1970 to 2009 - Nitrate masked using relative error threshold 0.5)
18

EMODnet Lot 3 – Chemistry Final Report
For parameters where geographic coverage was poor some examples of time series was used to display the data as a product. An example of the recently developed time series products at the EMODnet portal is shown in following figure. This type of data product will be used for EMODnet parameters with a poor geographic distribution. So far only a few examples of time series products based on available data from EMODnet CDI User Interface has been made to demonstrate the data product time series method.
An example of the time series product at the EMODnet portal show concentration of mercury {Hg} per unit volume of the water body (time period: 2005-01-01 – 2010-01-01, depth 1 meter).
19

EMODnet Lot 3 – Chemistry Final Report
ACTIONS AND CONCLUSIONS The partners in the Greater North Sea still need to have focus on delivering CDI´s (to the central SeaDataNet directory (CDI)) for the selected EMODnet parameters to provide more data. In particular it can be seen that further pharmaceutical and radionuclide in biota data should be a priority for inclusion. The spatial coverage also shows that data availability tends to be better nearer the coast which is understandable given that monitoring and hence data availability is primarily near the sources of contamination, however if data is available for the central North Sea then this should be prioritised. This is also an important base for the further development of the time series products especially, there a focus on how to precisely make an automatic generation of the time series products also most be prioritized.
It is also still important to notice that especially in sediment and biota matrix the different grain size fractions and measurement methods and item measured (liver, muscles ...) often are a limiting factor for good, homogeneous and comparable data coverage. It is anticipated that difference in the basis of measuring (wet vs dry weight) and normalisation techniques could overcome some of these difficulties and improve comparability in the future.
20
EMODnet Lot 3 – Chemistry Final Report
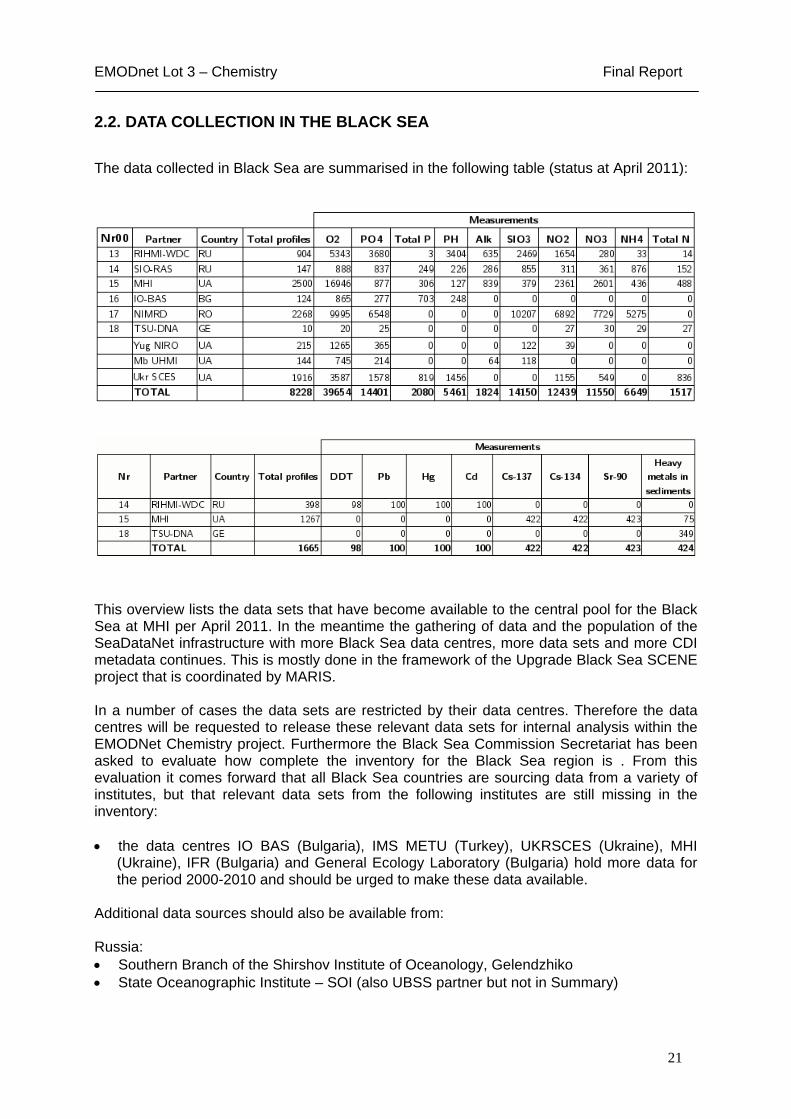
2.2. DATA COLLECTION IN THE BLACK SEA
The data collected in Black Sea are summarised in the following table (status at April 2011):
This overview lists the data sets that have become available to the central pool for the Black Sea at MHI per April 2011. In the meantime the gathering of data and the population of the SeaDataNet infrastructure with more Black Sea data centres, more data sets and more CDI metadata continues. This is mostly done in the framework of the Upgrade Black Sea SCENE project that is coordinated by MARIS. In a number of cases the data sets are restricted by their data centres. Therefore the data centres will be requested to release these relevant data sets for internal analysis within the EMODNet Chemistry project. Furthermore the Black Sea Commission Secretariat has been asked to evaluate how complete the inventory for the Black Sea region is . From this evaluation it comes forward that all Black Sea countries are sourcing data from a variety of institutes, but that relevant data sets from the following institutes are still missing in the inventory: • the data centres IO BAS (Bulgaria), IMS METU (Turkey), UKRSCES (Ukraine), MHI
(Ukraine), IFR (Bulgaria) and General Ecology Laboratory (Bulgaria) hold more data for the period 2000-2010 and should be urged to make these data available.
Additional data sources should also be available from: Russia: • Southern Branch of the Shirshov Institute of Oceanology, Gelendzhiko • State Oceanographic Institute – SOI (also UBSS partner but not in Summary)
21

EMODnet Lot 3 – Chemistry Final Report
Turkey: • Istanbul University (is implementing MoE monitoring program in the Black Sea during last
5 years) Ukraine: • Southern Scientific Research Institute of Marine Fisheries and Oceanography –
YugNIRO • Ukrainian Hydrometeorological Institute - Marine Branch (UHI – MB) Romania: • GeoEcomar • Delta Danube Institute Georgia: • Batumi Institute Fortunately all these mentioned data centres, except for the Batumi Institute, are partners in the Upgrade Black Sea SCENE project and are under way with connecting to the infrastructure and/or with further population of the CDI service. These institutes will be urged as part of the Upgrade Black Sea SCENE project to focus on the EMODNet Chemistry parameters, complete the Black Sea overview and make their relevant data sets available to MHI for inclusion in the EMODNet analyses and data products. Regarding the Black Sea data sources the situation is as follows: For Ukraine, Russia and Georgia we are informed that there is no differentiation between “research” and “environment” agencies. Indeed the data are mostly from “research” agencies because “environment” (non-governmental) agencies have no proper equipment to measure chemical elements and pollutants in seawater. Specifically about Ukraine only UkrSCES can be considered as environment agency and it is a component of the governmental ecological structure. A part of the Black Sea data are from them. At the moment, this data are passing the quality check procedure. Still in Ukraine there is an ecological station under Odessa National University located on Zmeiny island. It is not a research agency either. Black Sea data pool plan to receive data from it within 2011. Besides this they hope to get some additional data from the institutions participating in BlackSeaScene Upgrade Project in 2011.
22

EMODnet Lot 3 – Chemistry Final Report
Spatial and temporal distribution of the 5929 O2 profiles:
Spatial and temporal distribution of the 3450 PO4 profiles:
23

EMODnet Lot 3 – Chemistry Final Report
Spatial and temporal distribution of the 2744 SiO3 profiles:
Spatial and temporal distribution of the 3047 NO3 profiles:
24

EMODnet Lot 3 – Chemistry Final Report
Spatial and temporal distribution of the 3506 NO2 profiles:
Spatial and temporal distribution of the 1840 NH4 profiles:
25
EMODnet Lot 3 – Chemistry Final Report
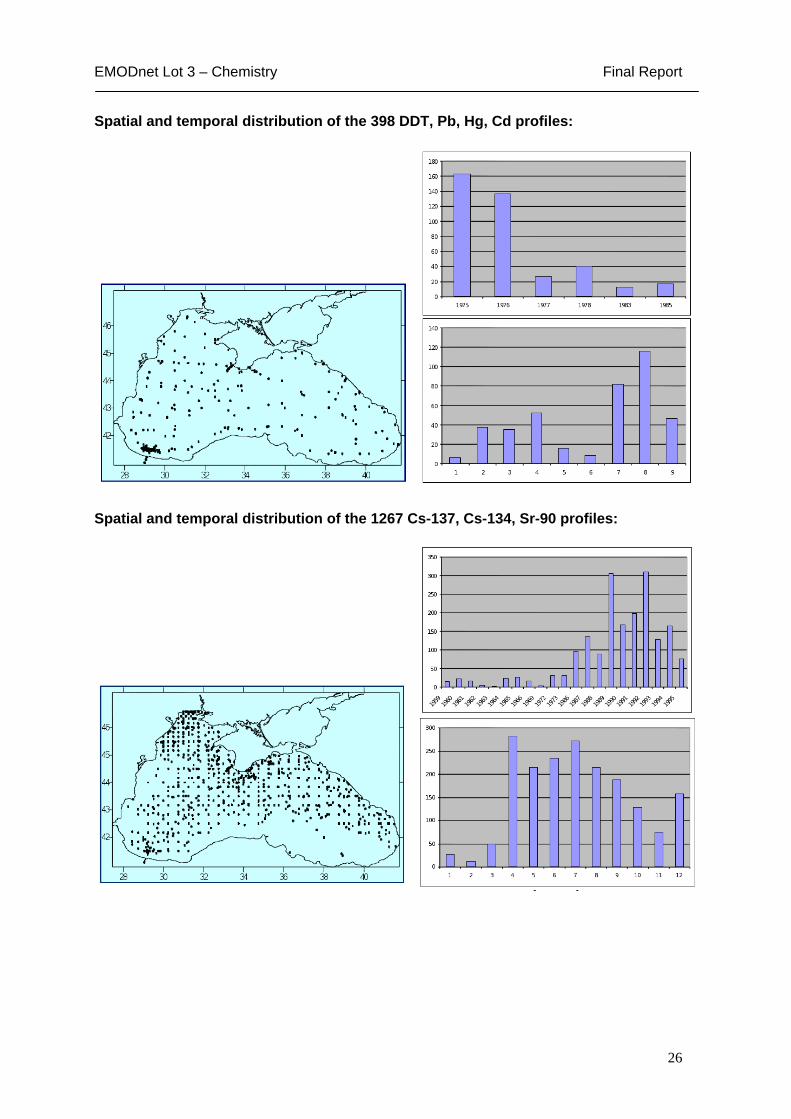
Spatial and temporal distribution of the 398 DDT, Pb, Hg, Cd profiles:
patial and temporal distribution of the 1267 Cs-137, Cs-134, Sr-90 profiles:
S
26

EMODnet Lot 3 – Chemistry Final Report
Spatial distribution of the 761 heavy metals in sediments Pb, Zn, Cu, Ni, Co, Cr, As, Sr, Ti%, Fe%, Mn%, samples: :
27
EMODnet Lot 3 – Chemistry Final Report
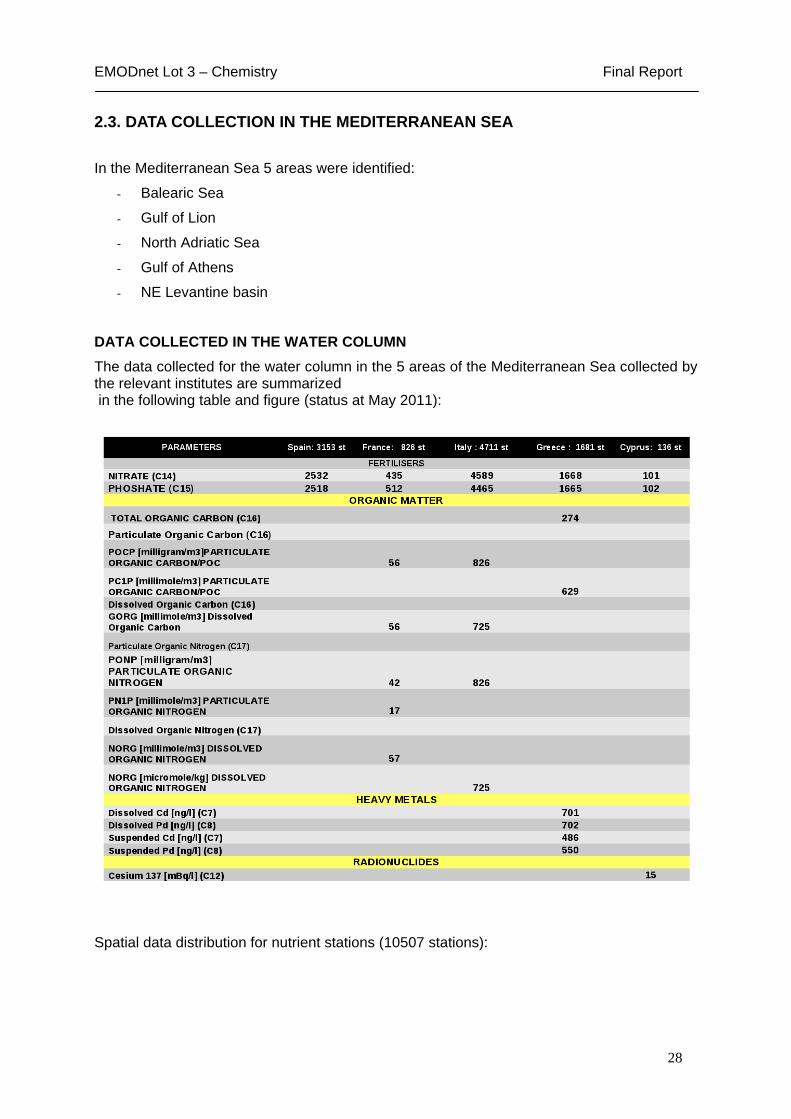
2.3. DATA COLLECTION IN THE MEDITERRANEAN SEA
In the Mediterranean Sea 5 areas were identified:
- Balearic Sea
- Gulf of Lion
- North Adriatic Sea
- Gulf of Athens
- NE Levantine basin
DATA COLLECTED IN THE WATER COLUMN
The data collected for the water column in the 5 areas of the Mediterranean Sea collected by the relevant institutes are summarized in the following table and figure (status at May 2011):
Spatial data distribution for nutrient stations (10507 stations):
28

EMODnet Lot 3 – Chemistry Final Report
Status of collected data compared to the initially foreseen (initial inventory):
Details about the collected data for the Water Column:
29

EMODnet Lot 3 – Chemistry Final Report
DATA COLLECTED IN BIOTA
The current status of Biota stations is shown below (Greece and Spain)
30

EMODnet Lot 3 – Chemistry Final Report
The Biota/Mussel per parameter:
31

EMODnet Lot 3 – Chemistry Final Report
DATA COLLECTED IN SEDIMENT
The current status of the Sediment stations distribution (Italy and Greece):
32

EMODnet Lot 3 – Chemistry Final Report
2.4. METADATA COMPILATION
The total CDI inventory for the EMODnet Chemical P021 terms and target areas gives an overview on the data availability through the EMODnet CDI User Interface (as each data profile is identified by a CDI entry).
Overview of CDI records for EMODNET chemistry - May 2011
The following table gives statistics on the data access restrictions. For a total of 468,233 records, 391,766 can be freely downloaded from EMODNET CDI User Interface.
Overview of CDI records for EMODNET chemistry including the Dataset Access Restriction code - May 2011
33

EMODnet Lot 3 – Chemistry Final Report
QC/QA AND PRODUCTS (WP3)
QUALITY ASSURANCE AND QUALITY CONTROL STANDARDS
Ultimately, the usefulness of the data that is collated and distributed through the EMODnet Chemical portal will be largely due to the uniform quality and reliability of these data. The work package is divided into a number of distinct activities, all of which contribute to the overall quality control and assurance of the data in the portal.
34
EMODnet Lot 3 – Chemistry Final Report
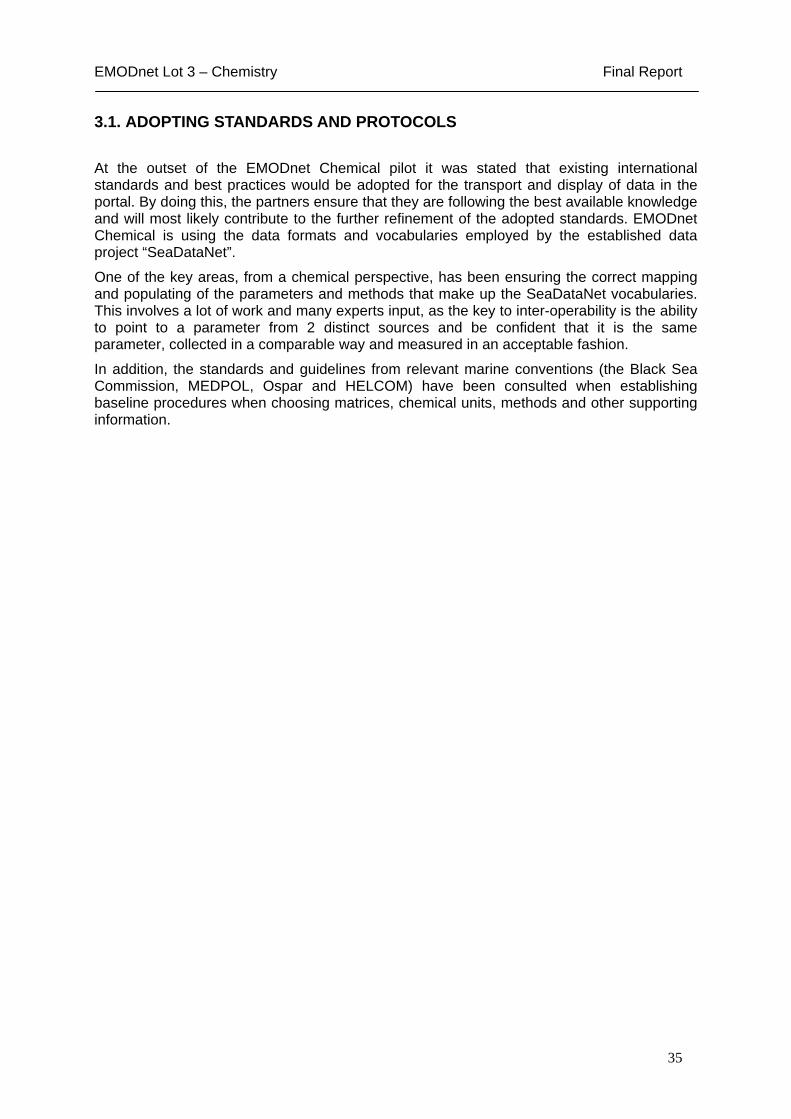
3.1. ADOPTING STANDARDS AND PROTOCOLS
At the outset of the EMODnet Chemical pilot it was stated that existing international standards and best practices would be adopted for the transport and display of data in the portal. By doing this, the partners ensure that they are following the best available knowledge and will most likely contribute to the further refinement of the adopted standards. EMODnet Chemical is using the data formats and vocabularies employed by the established data project “SeaDataNet”.
One of the key areas, from a chemical perspective, has been ensuring the correct mapping and populating of the parameters and methods that make up the SeaDataNet vocabularies. This involves a lot of work and many experts input, as the key to inter-operability is the ability to point to a parameter from 2 distinct sources and be confident that it is the same parameter, collected in a comparable way and measured in an acceptable fashion.
In addition, the standards and guidelines from relevant marine conventions (the Black Sea Commission, MEDPOL, Ospar and HELCOM) have been consulted when establishing baseline procedures when choosing matrices, chemical units, methods and other supporting information.
35
EMODnet Lot 3 – Chemistry Final Report
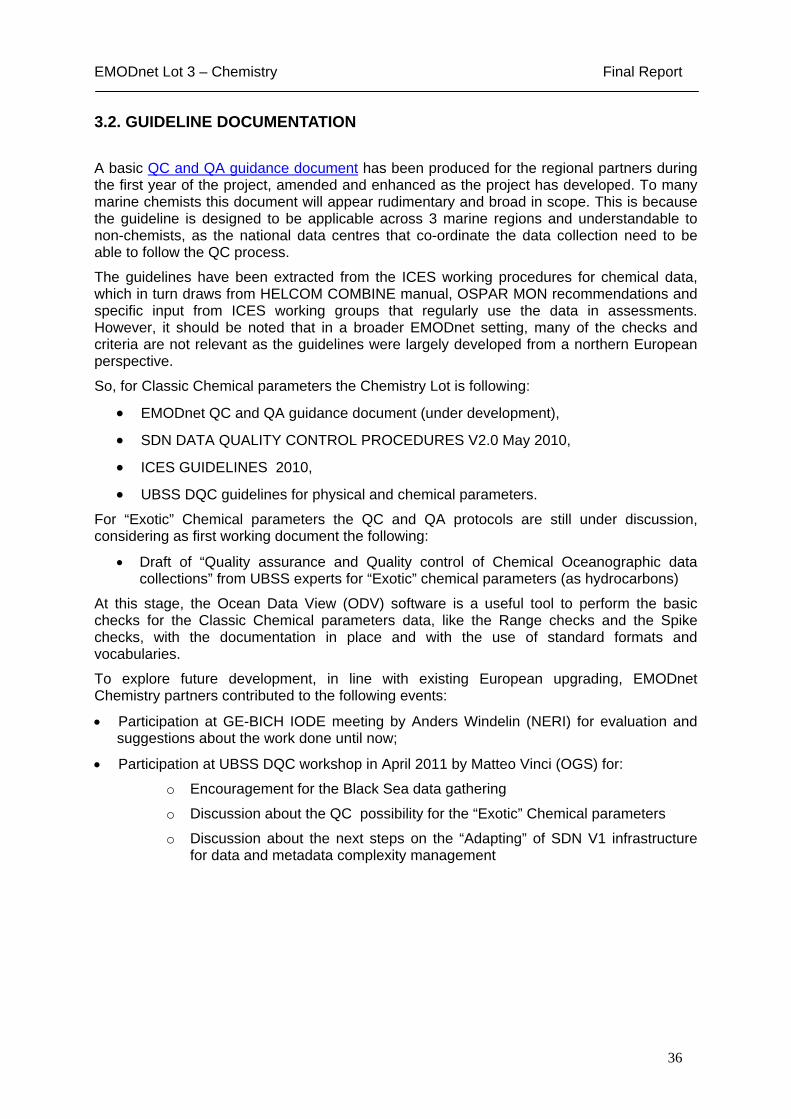
3.2. GUIDELINE DOCUMENTATION
A basic QC and QA guidance document has been produced for the regional partners during the first year of the project, amended and enhanced as the project has developed. To many marine chemists this document will appear rudimentary and broad in scope. This is because the guideline is designed to be applicable across 3 marine regions and understandable to non-chemists, as the national data centres that co-ordinate the data collection need to be able to follow the QC process.
The guidelines have been extracted from the ICES working procedures for chemical data, which in turn draws from HELCOM COMBINE manual, OSPAR MON recommendations and specific input from ICES working groups that regularly use the data in assessments. However, it should be noted that in a broader EMODnet setting, many of the checks and criteria are not relevant as the guidelines were largely developed from a northern European perspective.
So, for Classic Chemical parameters the Chemistry Lot is following:
• EMODnet QC and QA guidance document (under development),
• SDN DATA QUALITY CONTROL PROCEDURES V2.0 May 2010,
• ICES GUIDELINES 2010,
• UBSS DQC guidelines for physical and chemical parameters.
For “Exotic” Chemical parameters the QC and QA protocols are still under discussion, considering as first working document the following:
• Draft of “Quality assurance and Quality control of Chemical Oceanographic data collections” from UBSS experts for “Exotic” chemical parameters (as hydrocarbons)
At this stage, the Ocean Data View (ODV) software is a useful tool to perform the basic checks for the Classic Chemical parameters data, like the Range checks and the Spike checks, with the documentation in place and with the use of standard formats and vocabularies.
To explore future development, in line with existing European upgrading, EMODnet Chemistry partners contributed to the following events:
• Participation at GE-BICH IODE meeting by Anders Windelin (NERI) for evaluation and suggestions about the work done until now;
• Participation at UBSS DQC workshop in April 2011 by Matteo Vinci (OGS) for:
o Encouragement for the Black Sea data gathering
o Discussion about the QC possibility for the “Exotic” Chemical parameters
o Discussion about the next steps on the “Adapting” of SDN V1 infrastructure for data and metadata complexity management
36

EMODnet Lot 3 – Chemistry Final Report
3.3. DATA PRODUCTS
For the EMODnet Chemical lot, 2 main subsets of data products are highlighted depending upon the available data distribution:
• SDN Standard Interpolated Maps, produced only for parameters with homogeneous distribution and suitable data coverage in time and space (measured on basin scale),
• “Time series plots”, showing station maps with plots of measured time series (not trends) and link to metadata, produced for not homogeneous datasets as coastal points repeated in time and/or datasets with fragmented coverage.
Therefore, to discriminate a previous accurate data format Standardization and a Normalization analysis is performed by the Regional leaders.
37

EMODnet Lot 3 – Chemistry Final Report
3.3.1. DIVA MAPS PRODUCTION Data products are generated by the three regional task leaders, carried in NetCDF (CF) files, and made available on the web by means of a data products catalogue and a WMS viewing services. The latter shows interpolated chemical maps and error maps, also downloadable as GIS layers.
Map generation started with nutrients in the water column (for the 3 regions), then extended to other chemicals in the water column, and to synthetic compounds, hydrocarbons and heavy metals in the sediments and biota (considering the target species MYTILUS).
As agreed on the first annual meeting for EMODnet Chemical Lot a small working group have interacted with domain experts at their institutes to ask them which products could be useful and how to create them (data and map processing). The guidelines for products was shortly presented at the ur-EMODnet meeting in Copenhagen (25th may 2010) and is available at EMODnet chemical portal.
The aim for the guidelines for the DIVA maps production is to establish a common and documented basis for the maps production with focus on the pre-processing of data and the validation of the produced maps. The guidelines are divided into four steps:
1. Data extraction
2. Pre-processing of data
3. Maps production
4. Validation of the produced maps
The regional task leaders, which are responsible for the regional data pools are recommended to work through the listed processes. The following figure describes the overall concept for the DIVA maps production and is recommended as the working process for the maps production.
Public Store
Map production⇒ using DIVA (4D)2 main products available: - "classic" map (long/lat)- transect (distance / detph or distance /year)
Validationof the produced maps
Data extraction
Preprocessing of data- QA, QC- Detrending
data extraction
Guidelines:Preprocessing
Guidelines:Validation
data import
satisfied or not with the validation of the produced maps
(at the moment from the regional data pool)
38
EMODnet Lot 3 – Chemistry Final Report
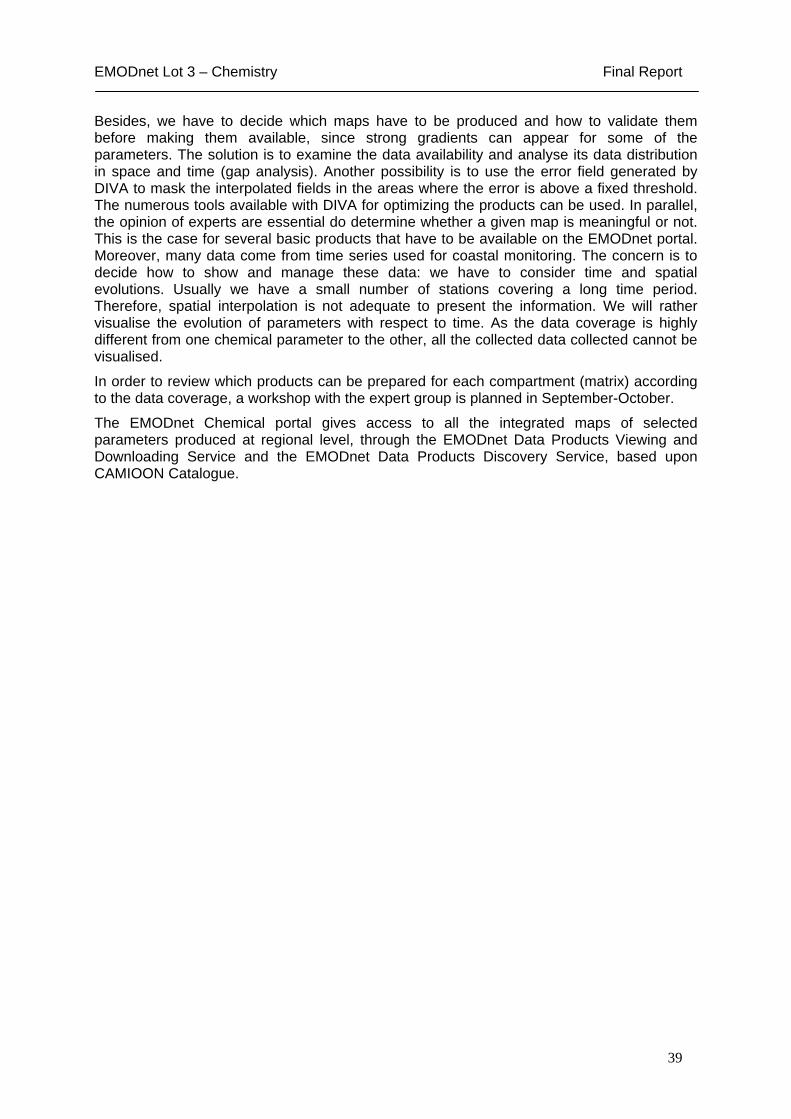
Besides, we have to decide which maps have to be produced and how to validate them before making them available, since strong gradients can appear for some of the parameters. The solution is to examine the data availability and analyse its data distribution in space and time (gap analysis). Another possibility is to use the error field generated by DIVA to mask the interpolated fields in the areas where the error is above a fixed threshold. The numerous tools available with DIVA for optimizing the products can be used. In parallel, the opinion of experts are essential do determine whether a given map is meaningful or not. This is the case for several basic products that have to be available on the EMODnet portal. Moreover, many data come from time series used for coastal monitoring. The concern is to decide how to show and manage these data: we have to consider time and spatial evolutions. Usually we have a small number of stations covering a long time period. Therefore, spatial interpolation is not adequate to present the information. We will rather visualise the evolution of parameters with respect to time. As the data coverage is highly different from one chemical parameter to the other, all the collected data collected cannot be visualised.
In order to review which products can be prepared for each compartment (matrix) according to the data coverage, a workshop with the expert group is planned in September-October.
The EMODnet Chemical portal gives access to all the integrated maps of selected parameters produced at regional level, through the EMODnet Data Products Viewing and Downloading Service and the EMODnet Data Products Discovery Service, based upon CAMIOON Catalogue.
39

EMODnet Lot 3 – Chemistry Final Report
3.3.2 “TIME SERIES” PLOTS The time-series data present a distribution that cannot be used to produce interpolated maps using DIVA software. For this reason, in conjunction with the partners, it was decided to use the ODV software as a tool to generate time-series products. Currently the Regional Leaders, have provided a sample of these products which are available on the web through the Ocean Browser viewing system. To facilitate the publication of the time series products the partners provided the time series plots and the meta-data index files that will be loaded in the WFS layer to the GHER group of Liege University. In this phase the time series images will be stored at a centralized place. Once production of time series images is extended to all partners then we will consider a place to store these images linked to OceanBrowser.
Technical development flow chart
To make it easier for partners to produce time series plots, the instructions to generate the plots using ODV software were distributed by the OGS and they can be consulted on the Emodnet Chemistry Web Portal, in the Extranet section under Internal Working Documents; while the suggestions to create the index file were distributed by the GHER on its MediaWiki. The time-series plots produced as following: 1 station, 1 parameter, 1 depth. The agreed index file is structured as follows:
<longitude> <latitude> <start_depth> <end_depth> <start_time> <end_time> <P011-code> <URL_of_image> <CDI_associated>
40

EMODnet Lot 3 – Chemistry Final Report
Test plots sent to the GHER (number of stations, parameters and plots)
41

EMODnet Lot 3 – Chemistry Final Report
TECHNICAL DEVELOPMENT AND PORTAL OPERATION (WP4)
In the two project years several technical activities have taken place for developing the EMODnet Chemical portal. The portal consists of a website giving information about the project and giving access to a number of core services. The website has been set-up and is operationally maintained by OGS. A draft structure and design of the portal was presented and discussed during one of the coordination-group meetings. The portal has been available since March 2010 at the following address: http://www.emodnet-chemistry.eu/portal/portal/.
The EMODnet Chemical portal gives a general overview about the European Marine Observation and Data Network and its on-going lots. There is also a section giving information about partners involved and another section highlighting the focus of the Chemical lot. Furthermore it has two separated sections with restricted access for the Extranet, that lets partners share project documents, and for the official progress reports submitted to the EU.
EMODNET Pilot portal for Chemistry available at http:// www.emodnet-chemistry.eu
To build the Emodnet's chemistry portal we have chosen the Jboss Portal framework. It is an open source and standards-based environment for hosting and serving a portal'web interface, publishing and managing its content. This framework is also flexible and scalable (it's simple to add standard compliant portlets and third parts software) and it simplify the customization of the web pages.
The Jboss Portal is based on:
· JAVA's technology is the engine of the framework
· HTML and CSS are used to simply customize the portal appearance
· a Postgresql database contains all data related to the web pages and the engine maintenance
A wiki has been included in the portal to manage the lessons learned. The wiki allows the creation and editing of any number of interlinked web pages via a web browser using a
42

EMODnet Lot 3 – Chemistry Final Report
simplified editor. It permits control over different functions (levels of access). For example editing rights may permit changing, adding or removing material.
The used technologies are:
· Wikimedia software (a wiki developed in PHP language)
· Postgres database for the contents
· In this case has been implemented a Central Authentication Service (CAS) authentication in place of MediaWiki's standard authentication (has been used SeaDataNet CAS): only SeaDataNet's registered users can insert or update arguments.
· The access to the Portal's wiki section is improved with an HTACCESS authentication.
The core services in the portal consist of the Chemical Data Discovery and Access service and the Chemical Data Products Viewing and Downloading service:
43

EMODnet Lot 3 – Chemistry Final Report
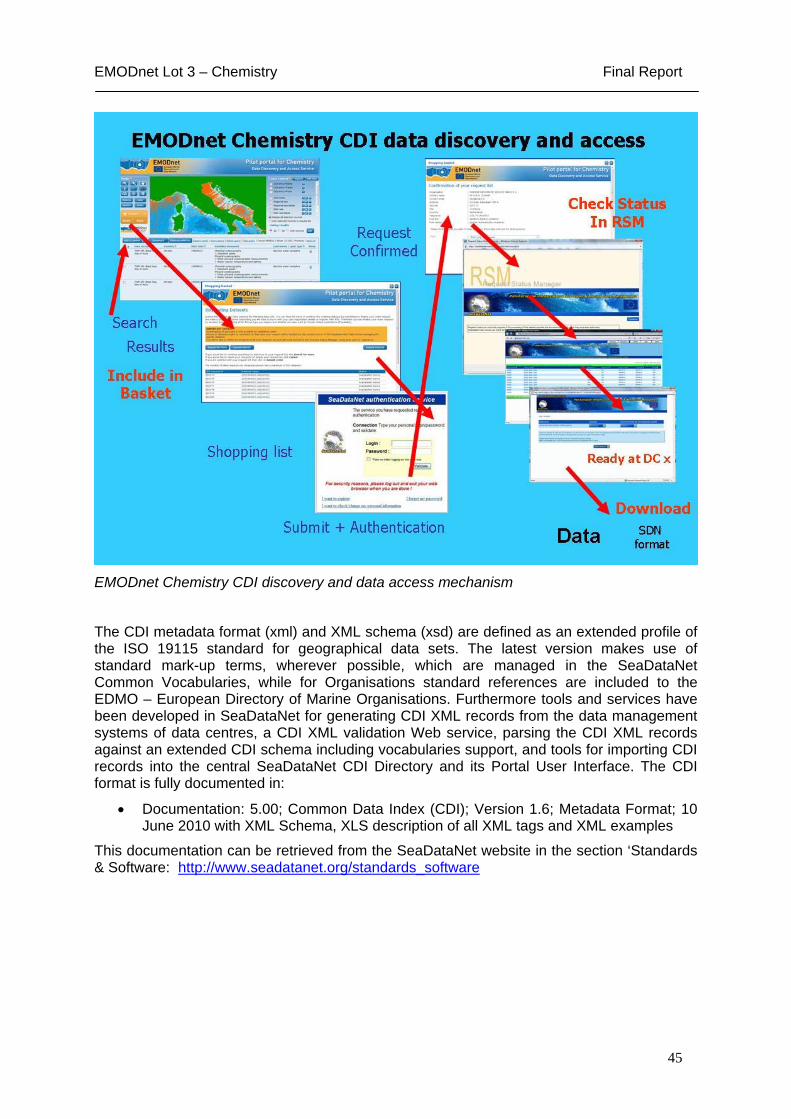
4.1. THE CDI DATA DISCOVERY AND ACCESS SERVICE The Data Discovery and Access service was launched in May 2010 and has been developed by MARIS as a dedicated version of the SeaDataNet Common Data Index (CDI) service. It provides the basis for giving overviews and access to identified chemical observation data sets that are managed at distributed data providers. The project aims to describe all identified chemistry data sets by means of the ISO 19115 based CDI format, supported by the SeaDataNet Common Vocabularies. This way users can identify all available data sets with their basic specifications and data originators and can request access to the data sets in a standard way. The CDI service gives users a detailed insight of the availability and geographical extent of marine data, archived at the connected data centres. It gives the description of individual data sets and measurements with key fields (what, where, when, how, who etc.). It is also the linking pin from the discovery services towards the delivery services, because it is directly related to the data sets, to which the users can request access. Users can freely search and browse in the CDI discovery services and identify relevant data sets. The CDI User Interface includes a shopping basket and transaction processing mechanism, by which users can request access to selected data sets. Access is given as downloading services, whereby the data sets can be downloaded by users from the data centres in the SeaDataNet standard data exchange formats. When a user wants access to the actual chemistry data sets via the shopping cart mechanism, then a user has to login with his/her SeaDataNet user id - password. This facilitates the further processing of a shopping request for multiple datasets to multiple data providers by one user action. Each dataset has a data access restriction determined by its data provider and chosen from a common vocabulary of options varying from unrestricted to restricted with a number of options in between. This restriction combined with the registered role of the SeaDataNet user determines whether the user gets immediate access to the requested dataset (within circa 10 - 15 minutes) or has to discuss terms with the data provider (within 1 - 3 days) or is denied access. Once granted access the user can download the agreed datasets using an online Transaction Register and its SeaDataNet user id - password. The user registration is thus required for facilitating the differentiated access policies of data providers, for enabling asynchronous processing of multiple requests to multiple data providers, and for providing data providers administrative information about their users which is used to improve services in contact with users and to justify their services to government and public.
44
EMODnet Lot 3 – Chemistry Final Report
EMODnet Chemistry CDI discovery and data access mechanism
The CDI metadata format (xml) and XML schema (xsd) are defined as an extended profile of the ISO 19115 standard for geographical data sets. The latest version makes use of standard mark-up terms, wherever possible, which are managed in the SeaDataNet Common Vocabularies, while for Organisations standard references are included to the EDMO – European Directory of Marine Organisations. Furthermore tools and services have been developed in SeaDataNet for generating CDI XML records from the data management systems of data centres, a CDI XML validation Web service, parsing the CDI XML records against an extended CDI schema including vocabularies support, and tools for importing CDI records into the central SeaDataNet CDI Directory and its Portal User Interface. The CDI format is fully documented in:
• Documentation: 5.00; Common Data Index (CDI); Version 1.6; Metadata Format; 10 June 2010 with XML Schema, XLS description of all XML tags and XML examples
This documentation can be retrieved from the SeaDataNet website in the section ‘Standards & Software: http://www.seadatanet.org/standards_software
45

EMODnet Lot 3 – Chemistry Final Report
4.1.1 CDI USER INTERFACES Users were originally provided with 2 user interfaces for querying the CDI metadatabase and requesting access to related distributed chemical data sets:
• the Quick Search giving a low threshold for first time users
• the Extended Search giving more options for experienced users
These interfaces were based upon the existing SeaDataNet CDI user interfaces. Later on in November 2010 an extra and new CDI user interface was developed and added by MARIS. This service was called “CDI matrix Variables VS Regions”. It shows in a clear way the data availability in the 3 regions of interest per each parameter considered. The matrix is linked directly to the CDI discovery service in order to help the users to search data in which are interested in. The image below gives an overview of “CDI matrix Variables VS Regions”. The matrix shows variables and whether there are measurement data available for specific marine regions. Colours indicates the number of measurements. Clicking on a coloured square activates a query for that specific combination of variable and marine region, whereby the results are presented in the Extended Search interface of the Common Data Index (CDI) data discovery and access service. Pointing the mouse on a coloured square shows the actual number of data sets for that combination.
Quick Search CDI user interface
46

EMODnet Lot 3 – Chemistry Final Report
Extended Search CDI user interface
47

EMODnet Lot 3 – Chemistry Final Report
New CDI discovery service ”matrix Variables VS Regions”.
48

EMODnet Lot 3 – Chemistry Final Report
New CDI discovery service ”matrix Variables VS Regions”.
49

EMODnet Lot 3 – Chemistry Final Report
4.2. ODV FORMAT AND ODV SOFTWARE All chemistry data sets are delivered in the SeaDataNet ODV ASCII format. The ODV4 format can be used directly in the popular Ocean Data View (ODV) analysis and presentation software package, which has been developed by AWI and upgraded as part of SeaDataNet. The ODV4 format documentation and the ODV software can be freely downloaded from the SeaDataNet portal in the standards and software section. For the Chemical Lot the tool is specifically used and suggested to visualize data and to generate time series plots for data which are less suitable for analysis with the DIVA software. The ODV software is a powerful software package for interactive exploration, analysis and visualization of oceanographic and other geo-referenced profile or sequence data. ODV runs on Windows (7, Vista, XP, 9x, Me, NT, 2000), Mac OS X, Linux, and UNIX (Solaris, Irix, AIX) systems. ODV data and configuration files are platform-independent and can be exchanged between different systems.
50
EMODnet Lot 3 – Chemistry Final Report
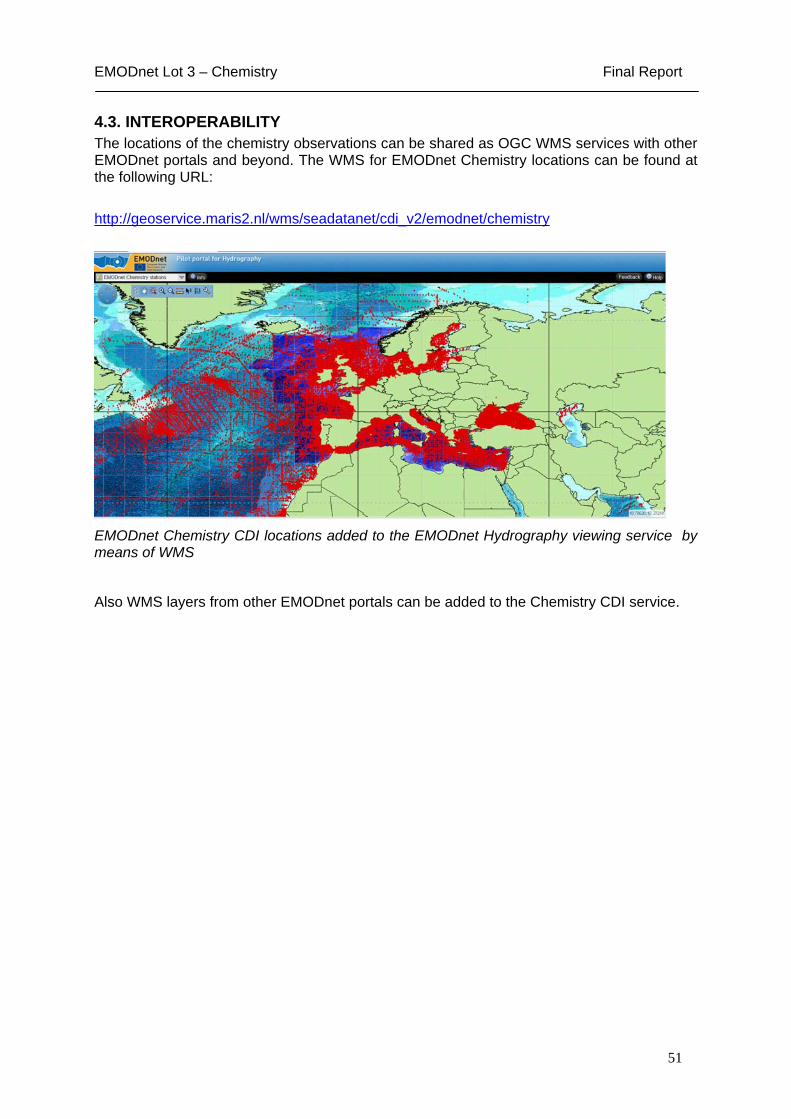
4.3. INTEROPERABILITY The locations of the chemistry observations can be shared as OGC WMS services with other EMODnet portals and beyond. The WMS for EMODnet Chemistry locations can be found at the following URL:
http://geoservice.maris2.nl/wms/seadatanet/cdi_v2/emodnet/chemistry
EMODnet Chemistry CDI locations added to the EMODnet Hydrography viewing service by means of WMS
Also WMS layers from other EMODnet portals can be added to the Chemistry CDI service.
51

EMODnet Lot 3 – Chemistry Final Report
Digital bathymetry of EMODnet Hydrography added to the EMODnet Chemistry CDI interface by means of WMS
52
EMODnet Lot 3 – Chemistry Final Report
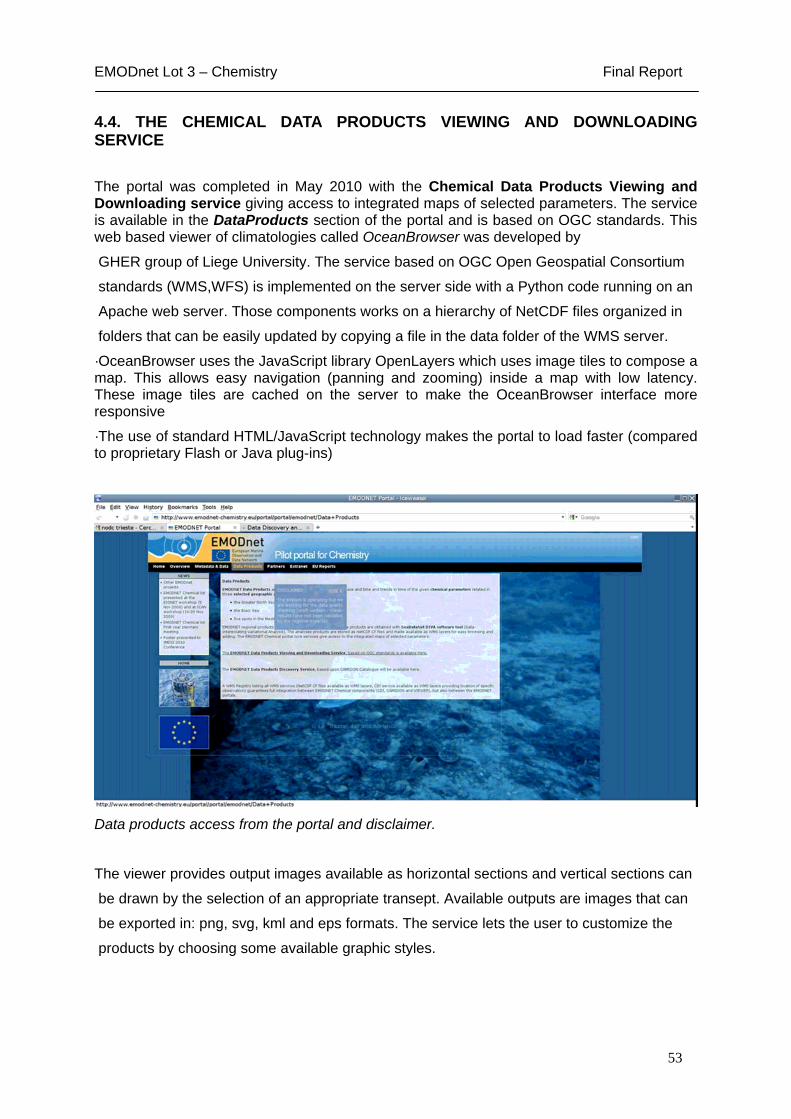
4.4. THE CHEMICAL DATA PRODUCTS VIEWING AND DOWNLOADING SERVICE
The portal was completed in May 2010 with the Chemical Data Products Viewing and Downloading service giving access to integrated maps of selected parameters. The service is available in the DataProducts section of the portal and is based on OGC standards. This web based viewer of climatologies called OceanBrowser was developed by
GHER group of Liege University. The service based on OGC Open Geospatial Consortium
standards (WMS,WFS) is implemented on the server side with a Python code running on an
Apache web server. Those components works on a hierarchy of NetCDF files organized in
folders that can be easily updated by copying a file in the data folder of the WMS server.
·OceanBrowser uses the JavaScript library OpenLayers which uses image tiles to compose a map. This allows easy navigation (panning and zooming) inside a map with low latency. These image tiles are cached on the server to make the OceanBrowser interface more responsive
·The use of standard HTML/JavaScript technology makes the portal to load faster (compared to proprietary Flash or Java plug-ins)
Data products access from the portal and disclaimer.
The viewer provides output images available as horizontal sections and vertical sections can
be drawn by the selection of an appropriate transept. Available outputs are images that can
be exported in: png, svg, kml and eps formats. The service lets the user to customize the
products by choosing some available graphic styles.
53
EMODnet Lot 3 – Chemistry Final Report
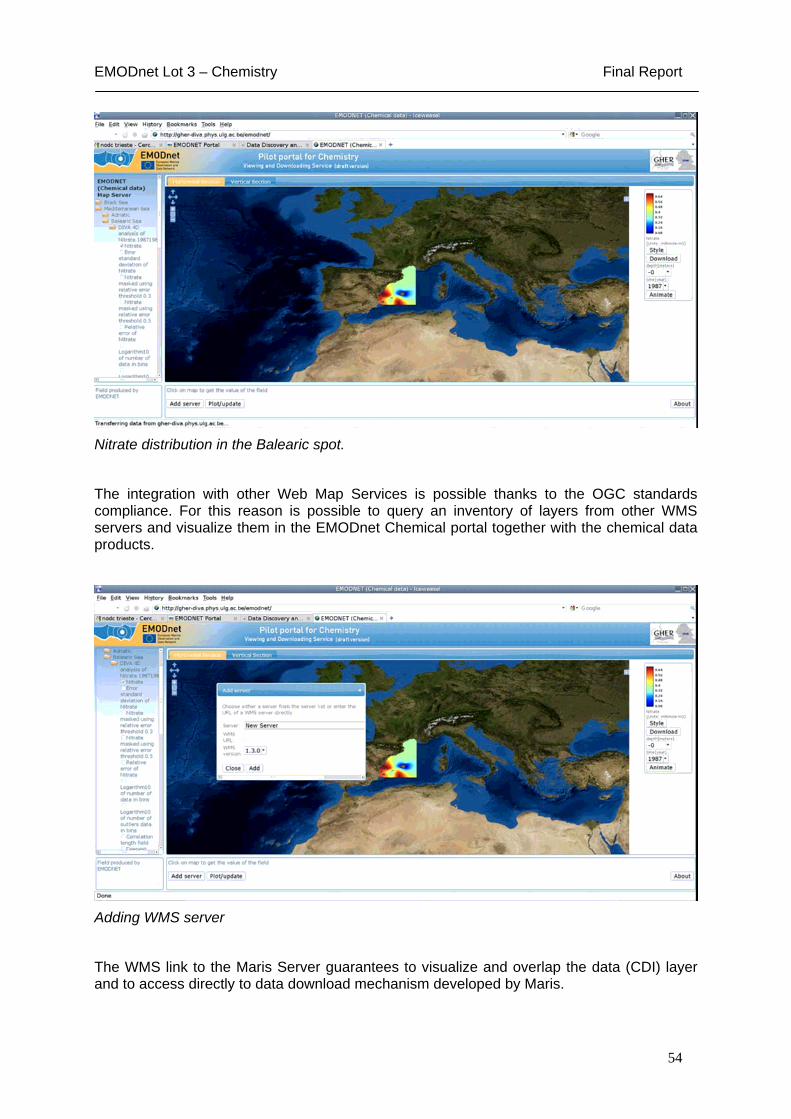
Nitrate distribution in the Balearic spot.
The integration with other Web Map Services is possible thanks to the OGC standards compliance. For this reason is possible to query an inventory of layers from other WMS servers and visualize them in the EMODnet Chemical portal together with the chemical data products.
Adding WMS server
The WMS link to the Maris Server guarantees to visualize and overlap the data (CDI) layer and to access directly to data download mechanism developed by Maris.
54

EMODnet Lot 3 – Chemistry Final Report
EMODnet Chemistry CDI layer overlapping the Nitrate distribution in the Balearic spot with a selection of data domain
55

EMODnet Lot 3 – Chemistry Final Report
4.4.1 OCEAN BROWSER For the Ocean Browser viewing service new features were added in the second year:
• changed directory structure: 1st level: masked field, 2nd level complete field and other fields
• better integration of CDI interface: the location of all available data can be overlaid to the gridded products and zoom level is maintained
• the interface has now two modes: panning and zooming by drawing an area.
Ocean Browser new feature:
1. changed structure;
2. zoom level maintained adding CDI layer;
3. panning and zooming mode.
56

EMODnet Lot 3 – Chemistry Final Report
4.4.2. OCEAN BROWSER &“TIME SERIES PLOTS” The time-series products are available on the web through the Ocean Browser viewing
system, click on 'Add server' and choose 'Plots of observations from EMODNet (chemical
data)'.
Add the Server (Plots of observation)
Actual stations distribution
Activate the "info mode" by clicking on the blue i, to identify the features of the stations.
57

EMODnet Lot 3 – Chemistry Final Report
Time series Plots and Common Data Index (CDI) linked to Ocean Browser viewing service
The stations used to produce the plots are synchronized with the SeaDataNet Common
Data Index (CDI), so the metadata are consulted by the portal.
Moreover, we are testing the possibility to download the data, used to generate the plots,
directly from the Ocean Browser viewing service.
Data Access
58

EMODnet Lot 3 – Chemistry Final Report
4.5. FEEDBACK In October 2010 a link to questionnaires devised to gather feedback was added to the portal.This link lets to users and
experts to fulfil two short on-line questionnaires on:
• data discovering and using (users can feedback on the CDI interface, the obtained
results, data format, criteria for searching data and using data)
• products (the suggestions are given about data product characteristics, accuracy of
contaminant's representation, how to improve the portal)
The results of these questionnaires are given on the next chapter “Analysis and
evaluation”.
EMODNET Pilot: Feedback page.
59

EMODnet Lot 3 – Chemistry Final Report
4.6. WIKI: A COLLABORATIVE TOOL FOR EMODNET CHEMISTRY To help gather information on the lessons learned in a
structured manner a number of options were considered that would beCollaborative
• Easy to manage (low cost of ownership)
• Easy to use (low cost of learning)
• Wide adopted (well supported)
• Flexible (to deal with unforeseen needs)
Depending on these requirements the adoption of a wiki server was proposed
(http://www.mediawiki.org) that offered:
• Access control
• Editing tools
• Revision history
• Patrolled edits
In addition the access control could be implemented using:
• SDN AAA services
• Ad hoc user repository
• Other identity management solutions (e.g. openID)
The advantages offered are that the number of required pages is small and it is possible to
have an initial predefined set of pages for each WP.
At the moment the wiki, visible on the WorkArea in the Emodnet Chemistry Web Portal, is in
production and is already used for the project's developments.
60

EMODnet Lot 3 – Chemistry Final Report
It is possible to access to the page for each WP.
61

EMODnet Lot 3 – Chemistry Final Report
4.7. COMPLIANCE WITH INSPIRE The EMODnet Chemistry services are fully compliant with INSPIRE as follows:
• applying Discovery – Viewing – Access services for retrieving survey data sets
• All viewers are based upon OGC WMS standards
• CDI Metadata profile is based upon ISO 19115 standards
Recently the INSPIRE draft Implementation Rules for data formats have been released. SeaDataNet is registered as a Spatial Data Interest Community (SDIC) for INSPIRE and will make a further analysis of these draft rules and give feedback to INSPIRE in the coming months till mid October 2011.
62
EMODnet Lot 3 – Chemistry Final Report
ANALYSIS AND EVALUATION (WP5)
The main 2 pieces of work within this work package have been; firstly to gather feedback from users and calculate statistics on use of the EMODnet chemistry portal and CDI interface; secondly, to use feedback from the consortium to identify how the EMODnet chemical lot could be used to provide data for scientific assessments, and improve the functionality of the portal in the future.
63

EMODnet Lot 3 – Chemistry Final Report
5.1. FEEDBACK FROM USERS A specific page on the EMODnet portal was developed to receive feedback. Users can either provide direct feedback to the consortium via e-mail or can complete a questionnaire. There are 2 questionnaires which are designed for getting feedback from firstly users who discover and use data and secondly users who access the products. The questions are limited to 10 to encourage users to provide feedback and have been designed to get information on how to improve the service and identify barriers to the provision or use of the data. Further information on spatial, temporal and parameter gaps in data will also allow prioritisation.
5.1.1. FEEDBACK FROM QUESTIONNAIRES ON DISCOVERING AND USING DATA An example screen shot of the questionnaire for discovering and using data is shown below.11 responses have so far been collected using this questionnaire. All responses have been positive with all 11 responses indicating that they had found data suitable for their need, received the data within a reasonable time scale and in the format they required and that the licence conditions were reasonable. Ease of use, speed of response and search criteria of CDI interface was deemed, very good, good or sufficient (poor and very poor were other categories). Responses to the question ‘If you received data from more than one source did you encounter any issues in using the data due to different measurement techniques, use of standards, nomenclature, quality assurance and data licence’ were mixed and tehse responses will be used to improve the system in the next phase.
5.1.2. FEEDBACK FROM QUESTIONNAIRES ON PRODUCTST
7 responses have been collected on the data products so far which has largely been positive In response to the following questions
How did you find the Data Product Portal characteristics ease of use, speed of response, help support? Responses were very good, good or sufficient (poor and very poor were other categories)
Do the products give an accurate representation of contaminant status in the chosen sea areas? 5 of 7 responses were ‘partially’ which demonstrates the issues identified with producing maps of contaminant distributions.
Was sufficient information available to show how the products had been developed? 4 of 7 responses were ‘yes’ with ‘some’ being the remaining responses suggesting that how the products have been developed should be more explicit on the portal.
64
EMODnet Lot 3 – Chemistry Final Report
5.1.3. FEEDBACK FROM MRAG ANALYSIS The analysis of the chemistry portal by MRAG was very positive with some useful comments which the consortium can use to improve the portal. Positive comments included:
‘The contractor felt that the hydrography and chemistry portals which are based on SeaDataNet technology were the easiest to use and had the most features’
The Chemistry portal site is easy to navigate and laid out in a logical way.’
“The project partners have also created an analysis of the matrix variables vs. marine regions. From this it is possible to get a general idea of where data is available or lacking.’
Some feedback from the review refers to specific links or design of the portal which will be taken into account in due course. Some other more specific comments will be addressed as follows:
‘Maps showing the horizontal distribution of chemicals should at least show the position of measurement stations for the user to estimate the degree of interpolation. Nitrogen/Phosphorus ratio (N/P), silicates/nitrogen ratio (Si/N) and silicates/phosphorus (Si/P) would be valuable products for the chemical lot (and easy to produce) as these ratios provide important characteristics of eutrophication’ This will have to be thought of more carefully and discussed with the users. Nutrient ratios can be used as an indication of eutrophication and care would have to be taken that it is not used in isolation as an indicator and it is used appropriately.
‘The initial registration for these is done on line but it can take up to a week for confirmation to arrive because a nominated data centre from the user's own country’ We feel that this was an isolated case however it is envisaged that SeaDataNet2 will address this issue further.
‘Maps showing the horizontal distribution of chemicals should at least show the position of measurement stations for the user to estimate the degree of interpolation.‘ The portal does allow the CDI layer showing the available station for the area to be added to the DIVA maps layer. It will be fairly easy in the future to also provide a map of the exact stations used to produce the maps as this is already an output option of DIVA.
Overall the review was positive and helpful in identifying areas for improvement which will be taken forward in the following phase.
5.1.4. WEB STATISTICS Web statistics is split between the webpages in the overall EMODnet portal and those specific to the CDI data search interface.
The below figures shows that since the launch of the data discovery service number of visitors have remained steadily grown to an average of 90 users per month since February and they are from a wide variety of countries throughout Europe and further afield. In the later stages of the project users who have registered to download data will be prompted to complete the questionnaires.
65

EMODnet Lot 3 – Chemistry Final Report
The figures below show the monthly report of visits of the EMODnet portal. The most visited page is the “Extranet” section: the number of visits has grown since the launch of the area where documents are accessible.
66

EMODnet Lot 3 – Chemistry Final Report
In the following diagram there is the countries list of the visitors. The used criteria are to check the extension of the incoming domain. Main users come from Italy. There are a considerable number of visitors under the label ”Unknown IP number”, which are identified only by the number of the internet provider (in this case the country is masked).
67

EMODnet Lot 3 – Chemistry Final Report
5.2. EVALUATION OF THE EMODNET CHEMICAL LOT FOR USE IN ASSESSMENTS AND FUTURE DEVELOPMENTS To identify how the EMODnet chemical lot could be used in the future to provide data which could be used for scientific assessments, feedback was obtained from the consortium. This evaluation may be used to improve the functionality of the portal in the future. 5.2.1. BARRIERS TO THE PROVISION OF DATA All partners were requested to provide information on the barriers for the provision of data in the following categories and to identify which was the most important barrier. The responses from 14 partners were subjectively categorized and each response given a score as follows:
1. Most important barrier - 4
2. Important - 3
3. Relevant - 2
4. Minor relevance - 1
5. No barrier - 0
The scores were averaged to provide a figure for the importance of each barrier across all partners. The figure below shows that the most important barrier to the provision of data for the EMODnet chemistry lot was the effort required to prepare the data. The willingness of institutions and legal factors were also significant barriers for the provision of data to the project.
The importance of different categories to act as barriers for the provision of data to the EMODnet project averaged across all partners. The higher the bar, the more important the barrier is.
68

EMODnet Lot 3 – Chemistry Final Report
Six of the 14 partners who replied stated that the effort required to prepare data was the most important barrier and the remaining respondents identified effort required as being important. Obtaining data and transferring the data from local databases into the CDI and ODV format and performing adequate QC takes up a significant amount of time despite the range of tools available to help partners do the transformation. The available tools are fit for purpose and the time taken to transfer data to the specified formats is largely unavoidable. In some cases the provision of data by the data holders to the EMODnet partners was in a variety of different formats which adds further time in transforming the data to the required CDI and ODV formats. However, in many cases once the transformation has been done, it can be rerun as new data becomes available and any learning and development overhead is reduced. The amount of resources required to prepare the data will in some cases be reduced by proposals under SeaDataNet 2 to allow direct production of the necessary formats. Experiences of how to reduce the effort required to prepare data should be shared amongst the consortium to maximize the availability of data in the future.
In some cases the legal barriers are associated with restricted data from the coastal zone, military areas and near borders. Many of these examples were specific to each country. For example in Italy, research and environmental institutions works under two different Ministries which complicates the situation. Often the generic letter from DG MARE and EEA provided at the start of the project had in some cases been used and was one of the useful tools to resolve these issues. In the future a formal letter to the member state policy departments directly from the EEA and EC may be more effective in removing legal or institutional barriers to the provision of data.
Some institutional barriers did exist among partners but in other cases a data sharing agreement had already been in existence within the country (e.g. GE, ES, UK, NL) which meant that any institutional barriers had already been removed. This was particularly the case for monitoring data that had already been collected as part of other legislative obligations such as OSPAR or the Water Framework Directive. Often where concern was expressed about making data available from the 3rd parties the SeaDataNet structure helped to overcome this institutional barrier by providing a clear explanation of CDI service features demonstrating that the data providers control the data sharing using the data policy. Data taken for research purposes was deemed harder to make available because of institutional barriers. To resolve this partners provided the following suggestions:
1. Setting mandatory reporting duties on data collection in EC projects. This should be updated and integrated in further EC projects funding schemas.
2. Promoting new ways of data publications and of citing data (and giving equal value to that as to journal publications and citations) which should be developed and promoted by the EU.
Some partners described that transcribing analogue data to digital was an issue, which if resourced would free up significant amounts of data. Other partners also identified that receiving data from research organizations within a reasonable time frame of it being collected was also reducing the amount of recent data available. These facts are borne out by the amount of available data in the portal for the relevant parameters which show that the amount of data peaked in 2005 and has since decreased (figure below). This decrease in data availability since 2005 may in part be caused by the delay in accessing data from scientists once it has been collected and the time required to process the data (ingest, QA and reformat).
69

EMODnet Lot 3 – Chemistry Final Report
Number of CDI records produced by year in the anthropogenic contamination and nutrient parameter groups.
5.2.2 THE CHALLENGES TO RENDERING DATA INTEROPERABLE From the beginning of the Chemical pilot one of the main challenges was the management of the heterogeneity and complexity of parameters addressed in this Lot.
To summarize the situation:
- 3 data types (water, sediment, biota) for 17 parameters with high heterogeneity of reporting basis (wet vs dry weight) matrices for biota (liver, mussel etc) measurement methods, instruments used etc
- different data distributions in time and space;
- different ministry leading environmental and research data in the different countries;
- heterogeneous data policy;
To deal with this situation the first step was to take the SeaDataNet infrastructure as technical set up with the principle of ”Adopting and Adapting”. More specifically this infrastructure was adopted as common standards. These are adopted for the metadata (using the CDI – Common Data Index and the common vocabularies) and for the data (ODV4 ACII format).
A core element of the SDN standards are the Common Vocabularies that guarantee the interoperability and homogeneity of used terms. The vocabularies consist of continuously updated lists of standardized terms that envelope an extended spectrum of fields of study connected to the oceanographic and wider community. The use of standardized terms helps to solve the problem of the heterogeneity of data collected during the Chemical Lot activities.
As well as adoption of the already existing SeaDataNet infrastructure the other key element for the management of the Chemical Lot has been adapting work to suit the specific project needs. This activity will also continue in the next phase in collaboration with SeaDataNet2 mainly focused to:
• Upgrade Common Vocabularies;
• Web Infrastructure upgrade for data and products flow management.
70

EMODnet Lot 3 – Chemistry Final Report
The nature of chemical data is that it has been produced by many methodologies and to different standards so agreeing a general QA approach is crucial to being able to compare data with confidence. The purpose of the QA guidelines was to ensure that as many attributes as possible were included in order to allow these cross-comparisons across measures and methods to take place. More specifically it can be noted that:
• contaminant data are reported on a dry or wet weight basis so persuading partners to also report the conversion factor (% Dry Weight) will allow more data to be directly compared
• Normalization techniques (methods for accounting for the context in which the chemical was extracted from a sample) will also become important for the comparability of data and assessment in the future
5.2.3. THE CHALLENGES TO PRODUCING CONTIGUOUS DATA OVER A MARITIME BASIN One of the main challenges of the Chemistry Lot is to produce contiguous data over a maritime basin from fragmented, inhomogeneous data.
As first step the objective was to produce interpolated maps by DIVA for all the basins of interest. After the analysis were highlighted the presence of 2 main subsets of available data:
• data with homogeneous distribution in time and space, suitable for DIVA analysis;
• data without homogeneous distribution in time and space;
Where the spatial distribution was too sparse or limited to coastal areas it was clearly not suitable to use DIVA analysis to make interpolated maps. To resolve this situation the partners aimed to obtain homogeneous datasets described as well as possible. For these datasets the technical solution commonly agreed was to show the single stations on maps linked to pre-produced plots that describes the time series of measurements for each parameter considered at specific depths.
5.2.4. THE FITNESS FOR PURPOSE OF THE DATA FOR MEASURING ECOSYSTEM HEALTH Ecosystem health is determined by a wide variety of topics and in different stages in the DPSIR framework (Drivers, Pressures, State, Impact, Response). The most effective way to describe how EMODnet Chemistry can be used to determine ecosystem health is to relate the findings to that required by the EC Marine Strategy Framework Directive which aims to assess, and if necessary, improve the status of maritime basins using 11 descriptors as a basis for assessment. Of these 11 descriptors the Chemistry Lot provides data that can be used for:
Descriptor 5: Human-induced eutrophication is minimised, especially adverse effects thereof, such as losses in biodiversity, ecosystem degradation, harmful algal blooms and oxygen deficiency in bottom water.
Descriptor 8: Concentrations of contaminants are at levels not giving rise to pollution effects.
Descriptor 9: Contaminants in fish and other seafood for human consumption do not exceed levels established by Community legislation or other relevant standards.
The EMODnet chemistry data does allows assessment within these particular descriptors, although by itself the data provided by EMODnet chemistry is not sufficient to make a holistic assessment of ecosystem health. Furthermore, the data that the EMODnet chemistry lot
71

EMODnet Lot 3 – Chemistry Final Report
provides is largely limited to providing pressure and state information whereas information on the impact of the pressures is also required for a holistic assessment. However, if the chemistry data is used in combination with EMODnet biology data and supporting information from the other lots, it can be used to assess ecosystem health. This is supported by the responses to the questionnaire of which 8 out of 11 respondents felt that the data from the EMODnet Chemical clot could be used ‘in part’ to measure ecosystem health. Once the proposed sea basin checks have been put in place in the next phase of EMODnet then a full assessment of ecosystem health using data from all lots will be possible. In the future the SeaDataNet architecture could be used to provide data under other descriptors such as noise and litter.
It can be concluded that a holistic assessment of EcoSystem health will draw on a number of sources of information and the EMODNET Chemistry portal is an important source of state and pressure information for the maritime basins. However, the chemistry portal in its current state of development is unable to provide information that is strictly comparable between different maritime basins and so the points raised in ‘challenges to rendering data interoperable’ would need to be thoroughly addressed before the portal is able to fully realize its potential to work across, as well as within, maritime basins
5.2.5. THE PRIORITIES AND EFFORT REQUIRED FOR IMPROVING THE ACCURACY, PRECISION AND COVERAGE OF THE DATA COLLATED In terms of coverage, the chemical portal has deliberately focused on a specific subset of all chemical parameters. Now that the EMODNET Chemistry infrastructure has been established it will be easier to incorporate a greater range of parameters and over a greater area (other sea basins for example). The portal can only make available what has been collected and therefore to greatly expand the number of existing parameters within already catalogued sea basins would entail increased monitoring activity within national and regional programmes.
Regarding accuracy and precision, it has been extensively noted in other sections of the report and the revision how for chemical data there are many attributes that should be recorded and available at the portal in order for the user to interpret the data correctly. Perhaps unlike the other EMODNET portals the chemistry portal has the difficult task of conveying to users that the chemical concentrations are very small in relation to the overall measuring capability and degree of precision of detection of a chemical in a sample. It will therefore continue to be important to ensure the supporting attributes are provided with the data and new ways of making this information digestible to end users be sought.
Establishing a quality assurance process for the entire chemical inventory for the EU basins would be a major undertaking, both in time and manpower. The approach in this portal was to take the core parts of established regional QA systems that already have been adopted at a national level. This is a far more cost effective method to ensure that a QA system is being adhered to without having to add another QA system on top. The advantage to this approach is that the national data centres are already working within the framework of national and regional QA and all that this entails and so investment is only needed where existing QA systems are not to the same level as established programmes. The disadvantage to this approach is that one is reliant on these QA systems being of a comparable quality, and that national data centres are part of these existing programmes.
In the next phase of development there are a number of key areas for improving the QA procedure:
• cross-comparison exercises between different sea basins (i.e. that belong to different QA programmes)
72

EMODnet Lot 3 – Chemistry Final Report
• workshops for national data centres that are not familiar with the QA programmes and the terminologies
• as noted elsewhere, the continued alignment of vocabularies to ensure comparability of methods etc. and some form of simplification of terms for end users.
• Ensure all requested supporting attributes (dry weight/wet weight calculations etc.) are provided for the majority of data through the portal
• More help for end users to use the data in a meaningful way (i.e. through examples and guidelines of interpretation, explanation of terms and vocabularies)
• Incorporate new data precision techniques, i.e. uncertainty reporting and the associated method have the possibility to greatly reduce the amount of material needed to be included in reporting while also making a more generic standard for all to follow.
73

EMODnet Lot 3 – Chemistry Final Report
5.3 RECOMMENDATIONS FOR THE OVERALL EMODNET
Sustainability
The EMODnet approach with thematic portals for specific disciplines and communities and with EMODNET concertation meetings together with MODEG experts is considered as very useful and effective. This way many potential players from a given discipline or theme can be engaged for their own specialism and interest, while the interoperability and cohesion between the thematic portals is achieved by using common standards from OGC for viewing services (WMS, WFS) and SeadataNet for data discovery and access services and semantic interoperability. In practice most of the portals (chemistry, hydrography, physics, geology (via link with Geo-Seas)) have adopted the SeaDataNet approach of using the CDI data discovery and access service including its flexible data access restrictions for giving overview and access to basic measurements datasets. Biology uses the EurOBIS standards, and as part of the recently funded SeaDataNet II project efforts will be undertaken to upgrade the SeaDataNet standards to make them also fit for handling biological data in an interoperability scheme with EurOBIS.
For the near future it should be considered also to establish an overall EMODnet portal. However that should guide users to the thematic portals for specific thematic functions and details and not try to take over everything at a common top level. The shared WMS services and shared CDI service could be common elements at the top domain, but more in depth queries such as browsing the digital bathymetry DTM or handling specific biology questions should be performed by the underlying thematic portals.
In terms of coverage, the chemical portal has deliberately focused on a specific subset of all chemical parameters. Now that the EMODNET Chemistry infrastructure has been established it will be easier to incorporate a greater range of parameters and over a greater area (other sea basins for example).
In the present phase of EMODnet more development projects are required to go ''wider'' and ''deeper''. This will encourage more data providers to come forward for data sharing and participating in the process of making complete overviews and homogeneous data products. Also this will give wider visibility at the policy and management levels both at EU and Member States that should seek integration of EMODnet output and services in management and policy processes and that will decide upon its future sustained funding. In parallel further RTD work will and must continue on standards and protocols that can be applied as basis for the EMODnet portals. For example SeaDataNet II will continue for another 4 year and this will look into establishing common marine standards for using sensorML, handling biological data, developing generic viewing services, achieving full INSPIRE compliance etc. It can be considered that RI projects such as SeaDataNet and its sibbling Geo-Seas are establishing marine domain standards that are adopted and implemented at national data centres. EMODnet stimulates a wider implementation and adoption of these standards, in practice resulting in an expansion of the SeaDataNet infrastructure of connected data centres.
The model for governance by actors in the system For the longer term a sustained EMODnet operation must be achieved in a cooperation between organisations acquiring and managing data, with structured funding from Member States and EU. In practice EU will fund the tip of the iceberg while most funding for the base
74

EMODnet Lot 3 – Chemistry Final Report
of the iceberg will be done by the Member States. This will cover both government organisations as well as research institutions. In this model there should also be roles and contributions from the private sector such as the offshore industry, the windfarm industry and others. It is too early to give ideas about the governance model. It should be flexible enough to cope with the different sectors and their interests. This should be subject of further analysis within the scope of the overall EMODnet development process. Also the relation with EU Directives should be further analyzed. For example it is envisaged that EMODnet will play an important role in the provision of marine environmental data from Member States to the WISE-MARINE system of EEA and DG Environment for assessing the Good Environmental Status (GES) of maritime basins. This can be a considered as EMODnet going to support a legal task for which it has to guarantee a specific performance and operational availability. On the other hand EMODnet will support other societal activities such as e.g. research for which less stringent tasks and guarantees might be posed.
Availability of standard procedures facilitating data flow
The EMODnet Chemistry approach is based upon the SeaDataNet philosophy and standards.
More specifically the Chemistry Lot objective is to “Adopt and Adapt” the SeaDataNet heritage. There are standards for metadata and data formats, use of common vocabularies and a data discovery and shopping mechanism which can handle differentiated data access conditions. This approach is successful in SeaDataNet and in many of the EMODnet portal developments. It is also flexible enough to handle new types of data by upgrading the common vocabularies and possibly adapting the format standards and their associated tools. The data products are made available via OGC based viewing services, which support interoperability and exchange of the mapping layers to other services. Data providers understand and accept the principles. Standard tools and procedures available from SeaDataNet, which have already been well validated and used, make easier all the activities.
Future activities for the Chemistry Lot Within the scope of the present project the following activities will be undertaken in the coming year:
- Gather and describe more data sets ;
- Continue with efforts for gathering more data from Environmental Agencies and Monitoring Programs;
- Produce upgraded products: DIVA interpolated maps;
- Extend the production of Time Series plots products to the other partners and their geographic coverage ;
- Upgrade the web portal:
- upgrade OceanBrowser viewing service giving more visibility to the Time Series products;
- upgrade Products Metadata and their browsing finalizing CAMIOON service;
- Products validation:
o DIVA interpolated maps internal validation meeting;
75

EMODnet Lot 3 – Chemistry Final Report
o cross-comparison exercises between different sea basins (i.e. that belong to different QA programmes);
- More help for end users to use the data in a meaningful way (i.e. through examples and guidelines of interpretation, explanation of terms and vocabularies);
- To push groups of selected potential users to fulfill online questionnaire.
For next project(s) the following ideas have come forward: - Expand the geographic coverage of areas of interest for the EMODnet Chemistry Lot ;
- Expand the parameters considered eg: silicates, stable isotopes...;
- Expand the number of data providers, data sets and metadata for existing regions and new regions;
- Second step of products validation highlighting a Pool of Experts selected from the Regions of interest that will give their contribution on: products validation, suggestion for the next steps about:
o DIVA interpolated maps internal validation ;
o Time Series products.
- workshops for national data centres that are not familiar with the QA programmes and the terminologies
- as noted elsewhere, the continued alignment of vocabularies to ensure comparability of methods etc. and some form of simplification of terms for end users.
76
EMODnet Lot 3 – Chemistry Final Report
5.4 SUMMARY Reviews of the chemistry portal have so far been positive and combined with the input from the expert workshop has allowed the portal to develop further to meet user needs. Some further development work will be considered in the next phase to improve functionality. The feedback from the consortium shows that due to the heterogeneity in the way in which contaminant data is collected and reported there are difficulties in providing continuous data across a maritime basin. However presenting time series at individual points is effective and meets user needs and there are also developments that could be completed to make data more comparable in the future. The data and products made available by the EMODnet Chemical lot can in part be used for measuring ecosystem health. Institutional and legal barriers for the provision of data are in some countries an issue however in the majority of cases the main barrier for the provision of data is the resources required to reformat data into the CDI and ODV formats. Some proposed work in SeaDataNet may reduce the amount of resources required and once the reformatting has been done for 1 data source then it can be repeated for additional data with low overheads. It is expected that use of the portal will increase with further dissemination in the final year.
77

EMODnet Lot 3 – Chemistry Final Report
CONCLUSIONS
The EMODnet Chemical pilot has represented a great challenge. In fact, the main difficulties were related to:
• The complexity of the measurements covering 8 groups of parameters (pesticides, antifoulants, pharmaceuticals, heavy metals , hydrocarbons, radionuclides, fertilisers, organic matter) collected on 3 matrices (sediment, water column and biota);
• The geographic heterogeneity of the measurements (coastal points time series Vs homogenous sampling) and of measurement methods (instrument, method, target species, target basis, grain sizes).
To address the first point, data collection was approached with a priority list to proceed over successive steps, starting with a first release ready at the end of the first year (as a proof of concepts).
To address the second point, great attention must be put on the collection and management of data. It has been crucial to provide the best metadata available describing for example: sediment fraction measured, dry/wet weights measurements, measurement methodology. This in order to help a correct comparison between different data sets. The continuous update and upgrade of SDN common vocabularies will help to manage this.
It is clear that the use of DIVA standard interpolation is suitable only for the more “classic” sets of parameters measured in the water column.
For the parameters measured in the other two matrices such as Biota and Sediment the spatial and temporal distribution of available data highlighted the need of a different commonly agreed analysis approach.
An Expert workshop was organised (Venice, September 2010) to deepen the discussion and define the most appropriate way to represent this heterogeneous data. The cooperation with EEA, with Marine Conventions (OSPAR, HELCOM and BSC) and MEDPOL was crucial for products definition and for the success of the workshop.
The conclusion of the Expert workshop were: • To show data availability using a matrix approach. The matrix “Variables VS Marine
regions” described in the technical development section was built to satisfy this need. • Standard DIVA Interpolated maps will be produced for parameters with suitable data
coverage, measured on basin scale. • For parameters with a spatial coverage such as
• coastal points repeated in time and • datasets with fragmented coverage the agreed solution is to show stations on maps linked to ODV pre-calculated plots that describe the time series of measurements for each parameter considered.
The EMODnet Chemical pilot is undertaken by a large partnership, that on one side needs coordination but on the other side brings long-term expertise in collecting, processing, management and giving access to datasets and products. The SeaDataNet experience and cooperation has always been a key element for the Chemical pilot.
The first year of activity was dedicated to set up the system components (the three internal regional data pools dedicated to the product generation, the SeaDataNet vocabularies used for chemical parameters mapping and their extension to cover all the EMODnet Chemical lot
78

EMODnet Lot 3 – Chemistry Final Report
parameters, the portal core services, discovery, viewing systems based on SeaDataNet CDI interface).
The second year was focused on:
• Continuing with data population and products generation,
• Increase portal functionalities (in the viewing and harmonisation),
• Finalise QC/QA and ask expert opinions (with ICES support).
The last phase of the project will be dedicated to:
• Continuing with data population and products generation, mainly for “time series” plots,
• Finalise products validation based on feedback from experts and potential users.
• To start the lessons learned collect the using the Wiki.
79

EMODnet Lot 3 – Chemistry Final Report
ANNEX I – LIST OF ACRONYMS
BSC Black Sea Commission
CAMIOON CAtalogue and Management of products of operatIOnal OceaNography
CDI Common Data Index (SeaDataNet metadata format)
DIVA Data Interpolating Variational Analysis
DOC Dissolved Organic Carbon
DOME Database on Oceanography and Marine Ecosystems
EEA European Environmental Agency
EU European Union
GHER GeoHydrodynamics and Environment Research, University of Liège
HCMR Hellenic Centre for Marine Research
HELCOM Helsinki Commission (for Baltic marine protection)
ICES International Council for the Exploitation of the Sea
IFREMER Institut Français de Recherche pour l'Exploitation de la Mer
IO-BAS Institute of Oceanology - Bulgarian Academy of Science
MARIS Mariene Informatie Service ‘MARIS’ BV
MEDPOL Mediterranean Pollution Monitoring and Research Programme
MHI Marine Hydrophysical Institute, Ukraine
MSFD Marine Strategy Framework Directive
NERC-BODC National Environmental Research Council – British Oceanographic Data Centre
NERI-MAR National Environmental Research Institute
NetCDF Network Common Data Format
NIMRD National Institute for Marine Research and Development “Grigore Antipa”
ODV Ocean Data View
OGC Open Geospatial Consortium
OGS Istituto Nazionale di Oceanografia e di Geofisica Sperimentale
OSPAR Oslo/Paris convention (for the Protection of the Marine Environment of the North-East Atlantic)
QA/ QC Quality Assurance/ Quality Control
RIHMI-WDC All Russian Research Institute of Hydro-meteorological Information – WDC B
SDN FP7 EU SeaDataNet project
SIO-RAS P.P. Shirshov Institute of Oceanology - Russian Academy of Science
TN Total Nitrogen
TSU-DNA Iv. Javakhishvili Tbilisi State University
WCS Web Coverage Service
80
EMODnet Lot 3 – Chemistry Final Report
WFS Web Feature Service
WMS Web Map Service
XML eXtensible Markup Language
81

EMODnet Lot 3 – Chemistry Final Report
ANNEX II – NEW SEADATANET P011 PARAMETER USAGE VOCABULARY TERMS ADDED FOR BIOTA IN EMODNET
The following list gives an example on new SeaDataNet P011 Parameters Usage Vocabulary terms (with Key Code and the related Code Description) added to include new collected data related to biota matrix into EMODNET infrastructure. In particular, these terms are needed to convert the new collected data into the common ODV4 data format, merge the information in the regional data pools and make them available through EMODNET CDI User Interface.
Key Code Description MMUSDDTP Concentration of 1-chloro-4-[2,2,2-trichloro-1-(4-
chlorophenyl)ethyl]benzene (pDDT CAS 50-29-3) per unit dry weight of biota {Mytilus galloprovincialis (ITIS: 79456: WoRMS 140481) [Subcomponent: flesh]}
MMUSPBXX Concentration of lead (Pb) per unit dry weight of biota {Mytilus galloprovincialis (ITIS: 79456: WoRMS 140481) [Subcomponent: flesh]}
MMUSANTH Concentration of anthracene (CAS 120-12-7) per unit dry weight of biota {Mytilus galloprovincialis (ITIS: 79456: WoRMS 140481) [Subcomponent: flesh]}
MMUSTTBT Concentration of tributyltin (TBT) per unit wet weight of biota {Mytilus galloprovincialis (ITIS: 79456: WoRMS 140481) [Subcomponent: flesh]}
MMUSHCBX Concentration of hexachlorobenzene (HCB CAS 118-74-1) per unit dry weight of biota {Mytilus galloprovincialis (ITIS: 79456: WoRMS 140481) [Subcomponent: flesh]}
MMUSCDXX Concentration of cadmium (Cd) per unit dry weight of biota {Mytilus galloprovincialis (ITIS: 79456: WoRMS 140481) [Subcomponent: flesh]}
MMUSHGXX Concentration of mercury (Hg) per unit dry weight of biota {Mytilus galloprovincialis (ITIS: 79456: WoRMS 140481) [Subcomponent: flesh]}
MMUSDDTO Concentration of 1-chloro-4-[2,2,2-trichloro-1-(2-chlorophenyl)ethyl]benzene (oDDT CAS 789-02-6) per unit dry weight of biota {Mytilus galloprovincialis (ITIS: 79456: WoRMS 140481) [Subcomponent: flesh]}
MMUSDTBT Concentration of tributyltin (TBT) per unit dry weight of biota {Mytilus galloprovincialis (ITIS: 79456: WoRMS 140481) [Subcomponent: flesh]}
82

EMODnet Lot 3 – Chemistry Final Report
ANNEX III – OVERVIEW OF CDI RECORDS INCLUDED IN EMODNET CDI USER INTERFACE
The following table gives an overview of CDI records for EMODNET Chemistry per Data Centre giving the source of data (Originator), the principal activity of the organization and the related legal status. The following codes are used:
Activity Type
Legal Status
83
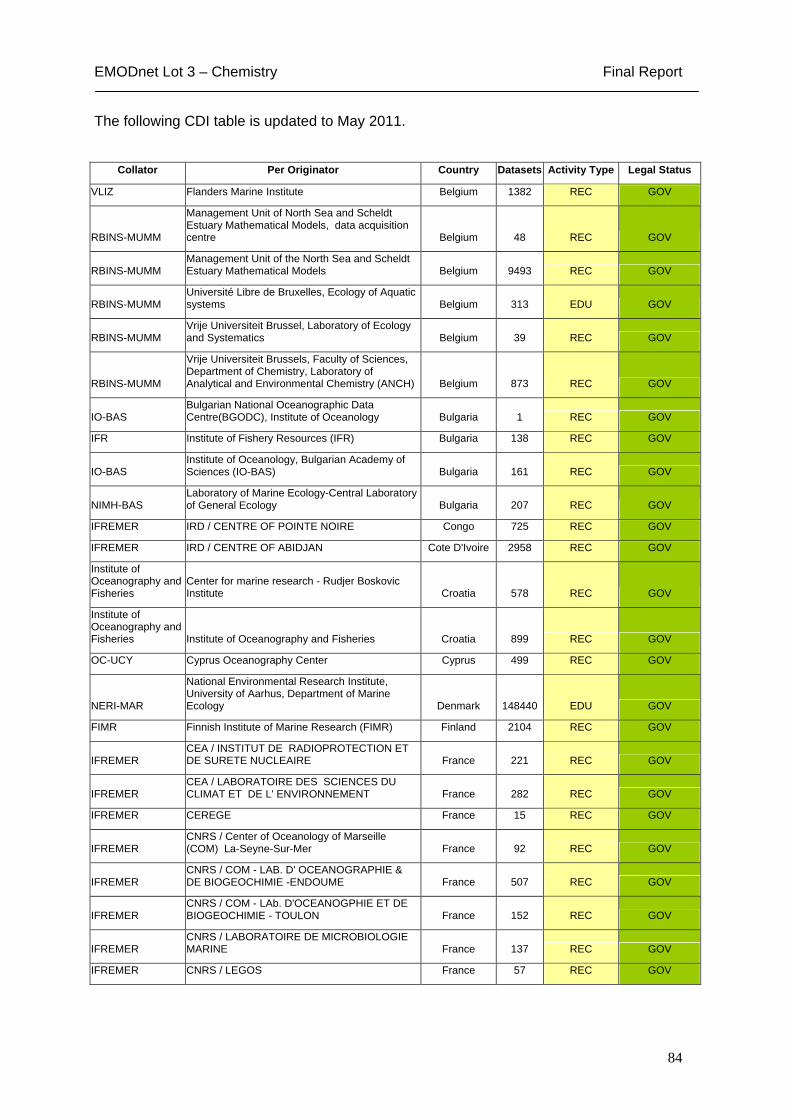
EMODnet Lot 3 – Chemistry Final Report
The following CDI table is updated to May 2011.
Collator Per Originator Country Datasets Activity Type Legal Status
VLIZ Flanders Marine Institute Belgium 1382 REC GOV
RBINS-MUMM
Management Unit of North Sea and Scheldt Estuary Mathematical Models, data acquisition centre Belgium 48 REC GOV
RBINS-MUMM Management Unit of the North Sea and Scheldt Estuary Mathematical Models Belgium 9493 REC GOV
RBINS-MUMM Université Libre de Bruxelles, Ecology of Aquatic systems Belgium 313 EDU GOV
RBINS-MUMM Vrije Universiteit Brussel, Laboratory of Ecology and Systematics Belgium 39 REC GOV
RBINS-MUMM
Vrije Universiteit Brussels, Faculty of Sciences, Department of Chemistry, Laboratory of Analytical and Environmental Chemistry (ANCH) Belgium 873 REC GOV
IO-BAS Bulgarian National Oceanographic Data Centre(BGODC), Institute of Oceanology Bulgaria 1 REC GOV
IFR Institute of Fishery Resources (IFR) Bulgaria 138 REC GOV
IO-BAS Institute of Oceanology, Bulgarian Academy of Sciences (IO-BAS) Bulgaria 161 REC GOV
NIMH-BAS Laboratory of Marine Ecology-Central Laboratory of General Ecology Bulgaria 207 REC GOV
IFREMER IRD / CENTRE OF POINTE NOIRE Congo 725 REC GOV
IFREMER IRD / CENTRE OF ABIDJAN Cote D'Ivoire 2958 REC GOV
Institute of Oceanography and Fisheries
Center for marine research - Rudjer Boskovic Institute Croatia 578 REC GOV
Institute of Oceanography and Fisheries Institute of Oceanography and Fisheries Croatia 899 REC GOV
OC-UCY Cyprus Oceanography Center Cyprus 499 REC GOV
NERI-MAR
National Environmental Research Institute, University of Aarhus, Department of Marine Ecology Denmark 148440 EDU GOV
FIMR Finnish Institute of Marine Research (FIMR) Finland 2104 REC GOV
IFREMER CEA / INSTITUT DE RADIOPROTECTION ET DE SURETE NUCLEAIRE France 221 REC GOV
IFREMER CEA / LABORATOIRE DES SCIENCES DU CLIMAT ET DE L' ENVIRONNEMENT France 282 REC GOV
IFREMER CEREGE France 15 REC GOV
IFREMER CNRS / Center of Oceanology of Marseille (COM) La-Seyne-Sur-Mer France 92 REC GOV
IFREMER CNRS / COM - LAB. D' OCEANOGRAPHIE & DE BIOGEOCHIMIE -ENDOUME France 507 REC GOV
IFREMER CNRS / COM - LAb. D'OCEANOGPHIE ET DE BIOGEOCHIMIE - TOULON France 152 REC GOV
IFREMER CNRS / LABORATOIRE DE MICROBIOLOGIE MARINE France 137 REC GOV
IFREMER CNRS / LEGOS France 57 REC GOV
84
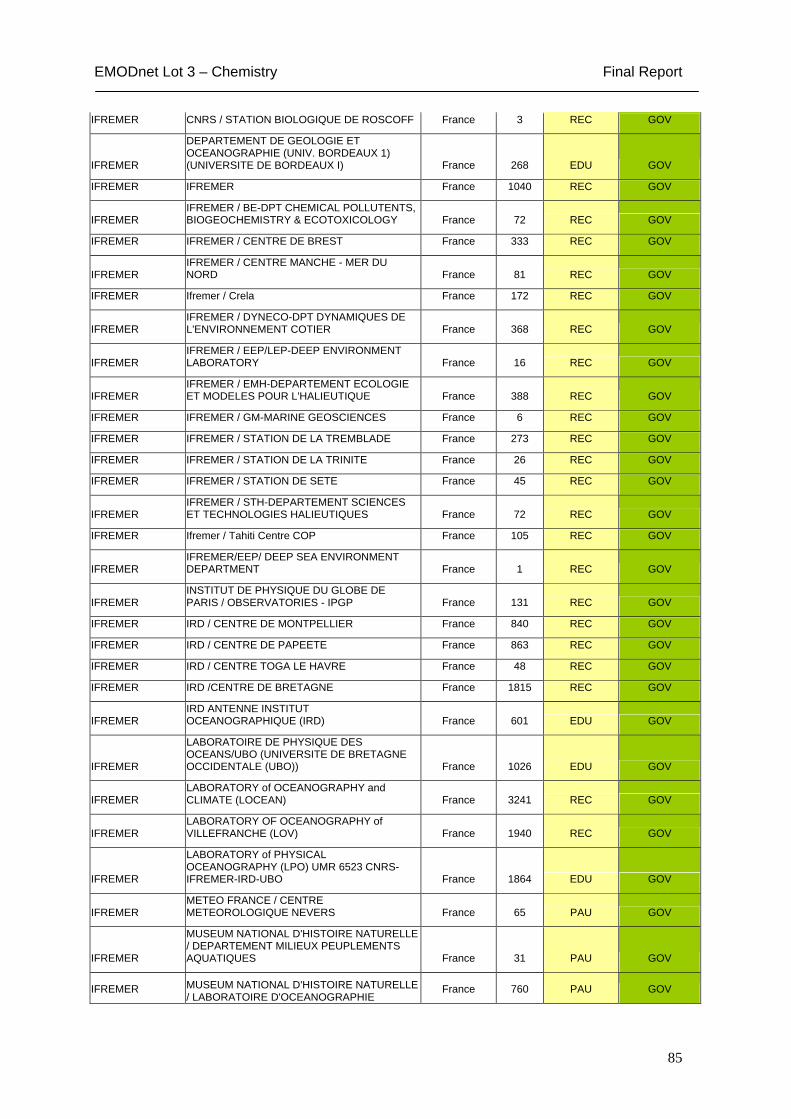
EMODnet Lot 3 – Chemistry Final Report
IFREMER CNRS / STATION BIOLOGIQUE DE ROSCOFF France 3 REC GOV
IFREMER
DEPARTEMENT DE GEOLOGIE ET OCEANOGRAPHIE (UNIV. BORDEAUX 1) (UNIVERSITE DE BORDEAUX I) France 268 EDU GOV
IFREMER IFREMER France 1040 REC GOV
IFREMER IFREMER / BE-DPT CHEMICAL POLLUTENTS, BIOGEOCHEMISTRY & ECOTOXICOLOGY France 72 REC GOV
IFREMER IFREMER / CENTRE DE BREST France 333 REC GOV
IFREMER IFREMER / CENTRE MANCHE - MER DU NORD France 81 REC GOV
IFREMER Ifremer / Crela France 172 REC GOV
IFREMER IFREMER / DYNECO-DPT DYNAMIQUES DE L'ENVIRONNEMENT COTIER France 368 REC GOV
IFREMER IFREMER / EEP/LEP-DEEP ENVIRONMENT LABORATORY France 16 REC GOV
IFREMER IFREMER / EMH-DEPARTEMENT ECOLOGIE ET MODELES POUR L'HALIEUTIQUE France 388 REC GOV
IFREMER IFREMER / GM-MARINE GEOSCIENCES France 6 REC GOV
IFREMER IFREMER / STATION DE LA TREMBLADE France 273 REC GOV
IFREMER IFREMER / STATION DE LA TRINITE France 26 REC GOV
IFREMER IFREMER / STATION DE SETE France 45 REC GOV
IFREMER IFREMER / STH-DEPARTEMENT SCIENCES ET TECHNOLOGIES HALIEUTIQUES France 72 REC GOV
IFREMER Ifremer / Tahiti Centre COP France 105 REC GOV
IFREMER IFREMER/EEP/ DEEP SEA ENVIRONMENT DEPARTMENT France 1 REC GOV
IFREMER INSTITUT DE PHYSIQUE DU GLOBE DE PARIS / OBSERVATORIES - IPGP France 131 REC GOV
IFREMER IRD / CENTRE DE MONTPELLIER France 840 REC GOV
IFREMER IRD / CENTRE DE PAPEETE France 863 REC GOV
IFREMER IRD / CENTRE TOGA LE HAVRE France 48 REC GOV
IFREMER IRD /CENTRE DE BRETAGNE France 1815 REC GOV
IFREMER IRD ANTENNE INSTITUT OCEANOGRAPHIQUE (IRD) France 601 EDU GOV
IFREMER
LABORATOIRE DE PHYSIQUE DES OCEANS/UBO (UNIVERSITE DE BRETAGNE OCCIDENTALE (UBO)) France 1026 EDU GOV
IFREMER LABORATORY of OCEANOGRAPHY and CLIMATE (LOCEAN) France 3241 REC GOV
IFREMER LABORATORY OF OCEANOGRAPHY of VILLEFRANCHE (LOV) France 1940 REC GOV
IFREMER
LABORATORY of PHYSICAL OCEANOGRAPHY (LPO) UMR 6523 CNRS-IFREMER-IRD-UBO France 1864 EDU GOV
IFREMER METEO FRANCE / CENTRE METEOROLOGIQUE NEVERS France 65 PAU GOV
IFREMER
MUSEUM NATIONAL D'HISTOIRE NATURELLE / DEPARTEMENT MILIEUX PEUPLEMENTS AQUATIQUES France 31 PAU GOV
IFREMER MUSEUM NATIONAL D'HISTOIRE NATURELLE / LABORATOIRE D'OCEANOGRAPHIE
France 760 PAU GOV
85

EMODnet Lot 3 – Chemistry Final Report
PHYSIQUE
IFREMER Observatoire Oceanologique De Banyuls (Université de Paris VI) France 655 EDU GOV
IFREMER SHOM (SERVICE HYDROGRAPHIQUE ET OCEANOGRAPHIQUE DE LA MARINE) France 401 REC GOV
IFREMER Universite D'Angers / Laboratoire Des Bio-Indicateurs Actuels Et Fossiles (Biaf) France 26 REC GOV
IFREMER UNIVERSITE DE BORDEAUX I / IGBA TALENCE France 19 REC GOV
IFREMER UNIVERSITE DE BORDEAUX I / INSTITUT DE BIOLOGIE MARINE France 27 REC GOV
IFREMER Universite de Bordeaux I / Laboratoire De Physico Et Toxico-Chimie Ism France 19 REC GOV
IFREMER
UNIVERSITE DE BRETAGNE OCCIDENTALE (UBO) / LAB. D'OCEANO. CHIMIQUE LOC - IUEM France 150 EDU GOV
IFREMER UNIVERSITE DE LA MEDITERRANNEE (U2) / CENTRE D'OCEANOLOGIE DE MARSEILLE France 100 EDU GOV
IFREMER
UNIVERSITE DE LA MEDITERRANNEE (U2) / COM - LAB. OCEANOG. & BIOGEOCHIMIE - LUMINY France 1469 EDU GOV
IFREMER
UNIVERSITE DE MONTPELLIER II / LABORATOIRE DYNAMIQUE DE LA LITHOSPHERE France 73 EDU GOV
IFREMER UNIVERSITE DE PERPIGNAN / CEFREM France 31 EDU GOV
IFREMER IRD / CENTRE DE CAYENNE- GUYANE French Guiana 477 REC GOV
TSU-DNA
Iv.Javakhishvili Tbilisi State University, Centre of Relations with UNESCO Oceanological Research Centre and GeoDNA (UNESCO) Georgia 43 EDU GOV
GAMMA Scientific - Research Firm GAMMA Georgia 308 REC PUC
BSH-DOD Alfred Wegener Institute for Polar and Marine Research (AWI), Geophysics Department Germany 3775 REC GOV
BSH-DOD Alfred-Wegener-Institute for Polar- and Marine Research Germany 5271 REC GOV
BSH-DOD Baltic Sea Research Institute Warnemuende (IOW) Germany 1316 REC GOV
BSH-DOD Elbe River Water Authority Germany 715 REC GOV
BSH-DOD Federal Institute of Hydrology (BFG) Germany 10 REC GOV
BSH-DOD Federal Maritime and Hydrographic Agency Germany 3382 REC GOV
BSH-DOD Federal Research Centre for Fisheries (Cuxhaven) Germany 57 REC GOV
BSH-DOD Federal Research Centre for Fisheries (Hemburg) Germany 212 REC GOV
BSH-DOD German Hydrographic Institute Germany 26 REC GOV
BSH-DOD GKSS Research Center Germany 122 REC GOV
BSH-DOD Institute of Biochemistry and Food Chemistry, University Hamburg Germany 27 EDU GOV
BSH-DOD Institute of Biogeochemistry and Marine Chemistry (IfBM), University of Hamburg Germany 80 EDU GOV
BSH-DOD Lower Saxony Water Management, Coastal Defense and Nature Conservation Agency Germany 341 PAU GOV
86
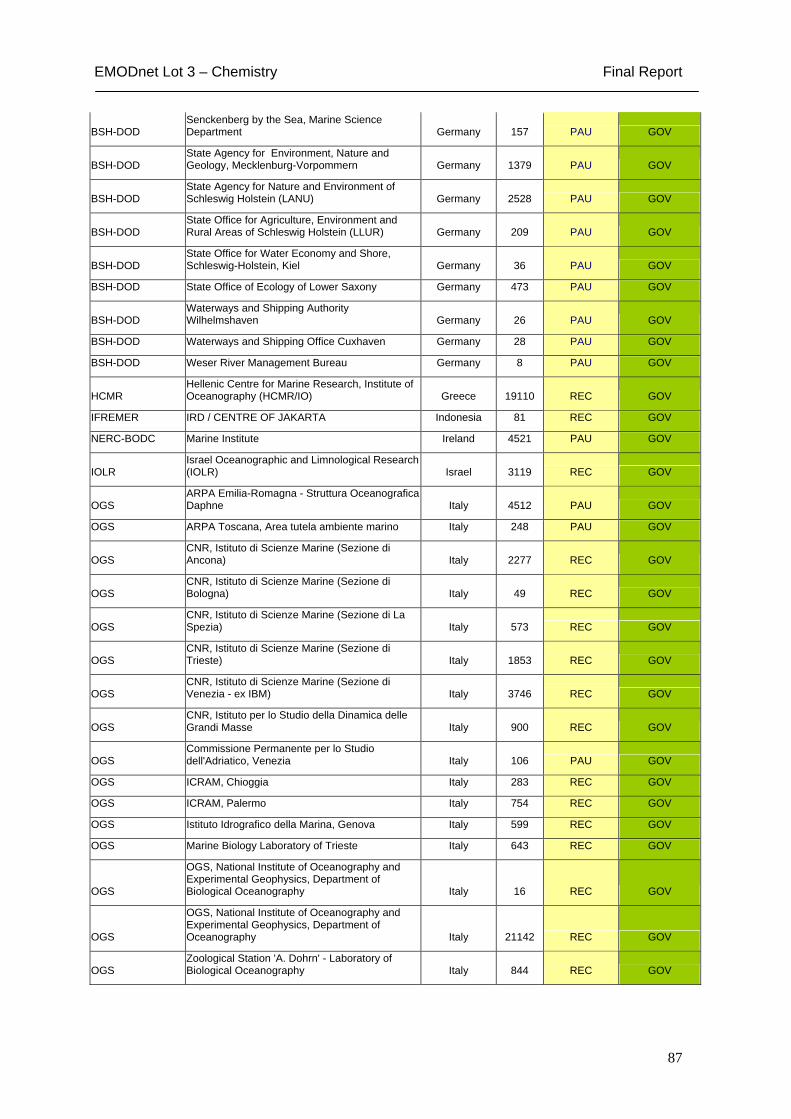
EMODnet Lot 3 – Chemistry Final Report
BSH-DOD Senckenberg by the Sea, Marine Science Department Germany 157 PAU GOV
BSH-DOD State Agency for Environment, Nature and Geology, Mecklenburg-Vorpommern Germany 1379 PAU GOV
BSH-DOD State Agency for Nature and Environment of Schleswig Holstein (LANU) Germany 2528 PAU GOV
BSH-DOD State Office for Agriculture, Environment and Rural Areas of Schleswig Holstein (LLUR) Germany 209 PAU GOV
BSH-DOD State Office for Water Economy and Shore, Schleswig-Holstein, Kiel Germany 36 PAU GOV
BSH-DOD State Office of Ecology of Lower Saxony Germany 473 PAU GOV
BSH-DOD Waterways and Shipping Authority Wilhelmshaven Germany 26 PAU GOV
BSH-DOD Waterways and Shipping Office Cuxhaven Germany 28 PAU GOV
BSH-DOD Weser River Management Bureau Germany 8 PAU GOV
HCMR Hellenic Centre for Marine Research, Institute of Oceanography (HCMR/IO) Greece 19110 REC GOV
IFREMER IRD / CENTRE OF JAKARTA Indonesia 81 REC GOV
NERC-BODC Marine Institute Ireland 4521 PAU GOV
IOLR Israel Oceanographic and Limnological Research (IOLR) Israel 3119 REC GOV
OGS ARPA Emilia-Romagna - Struttura Oceanografica Daphne Italy 4512 PAU GOV
OGS ARPA Toscana, Area tutela ambiente marino Italy 248 PAU GOV
OGS CNR, Istituto di Scienze Marine (Sezione di Ancona) Italy 2277 REC GOV
OGS CNR, Istituto di Scienze Marine (Sezione di Bologna) Italy 49 REC GOV
OGS CNR, Istituto di Scienze Marine (Sezione di La Spezia) Italy 573 REC GOV
OGS CNR, Istituto di Scienze Marine (Sezione di Trieste) Italy 1853 REC GOV
OGS CNR, Istituto di Scienze Marine (Sezione di Venezia - ex IBM) Italy 3746 REC GOV
OGS CNR, Istituto per lo Studio della Dinamica delle Grandi Masse Italy 900 REC GOV
OGS Commissione Permanente per lo Studio dell'Adriatico, Venezia Italy 106 PAU GOV
OGS ICRAM, Chioggia Italy 283 REC GOV
OGS ICRAM, Palermo Italy 754 REC GOV
OGS Istituto Idrografico della Marina, Genova Italy 599 REC GOV
OGS Marine Biology Laboratory of Trieste Italy 643 REC GOV
OGS
OGS, National Institute of Oceanography and Experimental Geophysics, Department of Biological Oceanography Italy 16 REC GOV
OGS
OGS, National Institute of Oceanography and Experimental Geophysics, Department of Oceanography Italy 21142 REC GOV
OGS Zoological Station 'A. Dohrn' - Laboratory of Biological Oceanography Italy 844 REC GOV
87

EMODnet Lot 3 – Chemistry Final Report
Latvian Institute of Aquatic Ecology Latvian Institute of Aquatic Ecology Latvia 134 PAU GOV
IFREMER IRD / CENTRE OF MADAGASCAR Madagascar 1 REC GOV
University Of Malta Malta Centre for Fisheries Sciences Malta 128 REC GOV
NODC Netherlands Institute for Ecology, Centre for Estuarine and Marine Ecology (NIOO-CEME) Netherlands 7987 REC GOV
NODC NIOZ Royal Netherlands Institute for Sea Research Netherlands 4137 REC GOV
NODC Rijkswaterstaat Waterdienst Netherlands 13050 PAU GOV
IFREMER IRD CENTRE DE NOUMEA New Caledonia 4839 REC GOV
IFREMER IRD / CENTRE DE LA REUNION Reunion 1549 REC GOV
NIMRD National Institute for Marine Research and Development Grigore Antipa Romania 3374 REC GOV
RIHMI-WDC Atlantic Scientific Research Institute for Marine Fishery and Oceanography
Russian Federation 48 REC GOV
RIHMI-WDC Far Eastern Regional Hydrometeorological Research Institute
Russian Federation 49 REC GOV
RIHMI-WDC P.P.Shirshov Institute of Oceanology, RAS Russian
Federation 644 REC GOV
RIHMI-WDC
Specialized Center for Hydrometeorology and Monitoring of Environment of Black and Azov Seas (SC HME BAS)
Russian Federation 16 REC GOV
RIHMI-WDC State Oceanographic Institute (SOI) Russian
Federation 13208 REC GOV
IFREMER IRD / CENTRE OF HANN Senegal 153 REC GOV
NIBM National Institute of Biology - NIBMarine Biology Station Slovenia 3242 REC GOV
IEO Baleares Islands University. Environmental Biology Department. UIB Spain 223 EDU GOV
Canary Institute of Marine Sciences Spain 144
IEO Centre for Advanced Studies of Blanes (CEAB-CSIC) Spain 256 REC GOV
IEO IEO/ Murcia Oceanographic Centre Spain 1225 REC GOV
IEO IEO/ Balearic Islands Oceanographic Centre Spain 670 REC GOV
IEO/ Gijon Oceanographic Centre Spain 711
IEO IEO/ La Coruna Oceanographic Centre Spain 968 REC GOV
IEO IEO/ Malaga Oceanographic Centre Spain 1266 REC GOV
IEO/ Oceanographic Centre of Canary Island Spain 268
IEO IEO/ Santander Oceanographic Centre Spain 1827 REC GOV
IEO IEO/ Vigo Oeanographic Centre Spain 1111 REC GOV
IEO Institute of Marine Research (IIM-CSIC) Spain 56 REC GOV
IEO
Institute of Marine Sciences. Mediterranean Marine and Environmental Research Centre (CMIMA-ICM-CSIC) Spain 509 REC GOV
IEO Spanish Oceanographic Institute Spain 2074 REC GOV
SMHI Geological Survey of Sweden, SGU Sweden 3 PAU GOV
SMHI IVL Swedish Environmental Research Institute Sweden 198 REC GOV
SMHI Stockholm Marine Research Centre, SMF Sweden 870 REC GOV
88

EMODnet Lot 3 – Chemistry Final Report
SMHI Swedish Meteorological and Hydrological Institute, SMHI Sweden 54913 PAU GOV
SMHI Umea Marine Sciences Centre, UMF Sweden 1639 REC GOV
IMS-METU Ankara University Turkey 24 EDU GOV
IMS-METU Dokuz Eylul University, Institute of Marine Science and Technology Turkey 77 REC GOV
IMS-METU Institute of Marine Sciences, Middle East Technical University Turkey 3080 EDU GOV
IMS-METU Istanbul University, Institute of Marine Science and Management Turkey 173 REC GOV
IMS-METU Karadeniz Technical University, Faculty of Marine Sciences Turkey 34 REC GOV
IMS-METU Sinop University, Fisheries Faculty Turkey 183 EDU GOV
MHI State Oceanographic Institute, Sebastopol Branch (SB SOI)
U.S.S.R. (deprecated) 855 REC GOV
MHI Institute of Biology of the Southern Seas, NAS of Ukraine Ukraine 339 REC GOV
MHI Marine branch of Ukrainian Hydrometeorological Institute Ukraine 1209 REC GOV
MHI Marine Hydrophysical Institute Ukraine 2050 REC GOV
RIHMI-WDC Odessa Branch of SOI (State Oceanographic Institute) Ukraine 37742 REC GOV
RIHMI-WDC Odessa National I.I.Mechnikov University Ukraine 826 EDU GOV
MHI Scientific Research Institute of Ecological Problems (USRIEP) Ukraine 4 REC GOV
MHI Taurida V.I. Vernadsky National University Ukraine 39 EDU GOV
MHI Ukrainian scientific center of Ecology of Sea (UkrSCES) Ukraine 4691 REC GOV
NERC-BODC Agri-Food and Biosciences Institute (AFBI) United
Kingdom 477 PAU GOV
NERC-BODC British Antarctic Survey (BAS) United
Kingdom 411 PAU GOV
NERC-BODC Centre for Environment, Fisheries and Aquaculture Science, Lowestoft Laboratory
United Kingdom 2215 PAU GOV
NERC-BODC Dunstaffnage Marine Laboratory (DML) United
Kingdom 717 PAU GOV
NERC-BODC Fisheries Research Services, Aberdeen Marine Laboratory
United Kingdom 4658 PAU GOV
NERC-BODC Institute of Oceanographic Sciences Deacon Laboratory
United Kingdom 156 PAU GOV
NERC-BODC Institute of Oceanographic Sciences Wormley Laboratory
United Kingdom 320 PAU GOV
NERC-BODC Institute of Oceanographic Sciences, Bidston Laboratory
United Kingdom 277 PAU GOV
NERC-BODC Marine Scotland Science United
Kingdom 3298 PAU GOV
NERC-BODC National Oceanography Centre (NOC), Southampton
United Kingdom 117 PAU GOV
NERC-BODC Newcastle University Department of Marine Science and Coastal Management
United Kingdom 1 EDU GOV
89

EMODnet Lot 3 – Chemistry Final Report
NERC-BODC Northern Ireland Environment Agency (NIEA), Water Management Unit
United Kingdom 709 PAU GOV
NERC-BODC Plymouth Marine Laboratory (PML) United
Kingdom 259 REC GOV
NERC-BODC Proudman Oceanographic Laboratory (POL) United
Kingdom 1040 PAU GOV
NERC-BODC Proudman Oceanographic Laboratory (POL) United
Kingdom 119 PAU GOV
NERC-BODC Scottish Association for Marine Science (SAMS) United
Kingdom 304 REC GOV
NERC-BODC Scottish Environment Protection Agency (SEPA) United
Kingdom 2089 PAU GOV
NERC-BODC
Scottish Office Agriculture and Fisheries Department (SOAFD) - Aberdeen Marine Laboratory
United Kingdom 2303 PAU GOV
NERC-BODC
Scottish Office Agriculture Environment and Fisheries Department (SOAEFD) - Aberdeen Marine Laboratory
United Kingdom 419 PAU GOV
NERC-BODC Southampton Oceanography Centre United
Kingdom 130 PAU GOV
NERC-BODC The Environment Agency (EA) United
Kingdom 3428 PAU GOV
NERC-BODC University of Cambridge Department of Earth Sciences
United Kingdom 16 EDU GOV
NERC-BODC University of Plymouth, Institute of Marine Studies
United Kingdom 3 EDU GOV
NERC-BODC University of Southampton Department of Oceanography
United Kingdom 73 EDU GOV
University of Southampton Department of Oceanography
United Kingdom 46
NERC-BODC University of Wales, School of Ocean Sciences United
Kingdom 222 EDU GOV
UNKNOWN Unknown 3359
90

EMODnet Lot 3 – Chemistry Final Report
ANNEX IV – EXPLANATION OF CONCEPTS AND TERMINOLOGY CDI The CDI provides an ISO19115 based index (metadatabase) to describe individual data sets (such as samples, time series, profiles, trajectories, etc). It gives users a highly detailed insight in the availability and geographical spreading of marine data. Specifically the CDI metadata supplies core information about Who, When, Where, How, What measured. ODV4 format It is one of the official data transport (ASCII) formats. The last version has been extended with a SeaDataNet semantic header. The ODV4 format can be used directly in the popular Ocean Data View (ODV) analysis and presentation software package, which is being upgraded as part of SeaDataNet.
DIVA It's the official interpolation software chosen by the Chemistry Lot. The DIVA (Data-Interpolating Variational Analysis) software tool developed by GHER group allows to spatially interpolate (or analyse) those observations on a regular grid in an optimal way. The analysis is performed on a finite element grid allowing for a variable spatial resolution and a good representation of the coastline and isobaths. DIVA also supports parameter estimation by cross-validation, anisotropic error covariances, estimation of the a posteriori error variance and isolating trends and cycles in the observations. To facilitate the use of DIVA, a web-based interface has been built called Diva-on-web.
ODV
For the Chemical Lot the tool is specifically used and suggested to visualize data and to generate time series plots for data with a not suitable coverage for DIVA analysis.
The Ocean Data View (ODV) tool developed by AWI is a software package for the interactive exploration, analysis and visualization of oceanographic and other geo-referenced profile or sequence data. ODV runs on Windows (7, Vista, XP, 9x, Me, NT, 2000), Mac OS X, Linux, and UNIX (Solaris, Irix, AIX) systems. ODV data and configuration files are platform-independent and can be exchanged between different systems.
CAMIOON It is a catalogue of products, developed and maintained by IFREMER.
Products metadata have to be collected in xml format have to be adopted to to help users on the products search and browsing.
OceanBrowser The Gher group has developed the software OceanBrowser in order to give a common viewing service to the interpolated products. It is based on open standards from the Open Geospatial Consortium (OGC), in particular Web Map Service (WMS) and Web Feature Service (WFS).
The previous standards are requested as a core element for the interoperability between Emodnet Lots and for INSPIRE compliance.
91
EMODnet Lot 3 – Chemistry Final Report
OceanBrowser currently supports the following operations:
Horizontal sections of the 4-dimensional fields (longitude, latitude, depth and time) can be visualized at a selected depth and time. The climatological fields can also be interpolated and visualized on arbitrary vertical sections.
The maps displayed in the browser are created dynamically and therefore several options are made available to the user to customize the graphical rending of those layers. Layers can be displayed either using interpolated shading, filled contours or simple contours and several options controlling the color-map are also available.
The horizontal and vertical sections can be animated in order to study the evolution in time.
Image can be saved in raster format (PNG) and vector image formats (SVG, EPS, PDF). It can also be saved as a KML file so that the current layer can be visualized in programs like Google Earth and it can be combined with other information imported in such programs.
The underlying 4-dimensional NetCDF file can be either downloaded as a whole from the interface or only as a subset using the linked OPeNDAP server.
The web interface can also import third-party layers by using standard WMS requests. The user needs only to specify the URL of the WMS server and its supported version.
92