International Journal of Emerging Technologies in Learning (iJET ...
Upload
khangminh22Category
view
0download
0
© F
lickr
_NRE
L
EMERGING CLIMATE TECHNOLOGIES IN THE ENERGY SUPPLY SECTOR

2© F
lickr
_Roy
Har
rym
an

TABLE OF CONTENTS
Acronyms............................................................................................................................................................................2
Foreword ............................................................................................................................................................................3
Executive summary ..........................................................................................................................................................4
1. Introduction .................................................................................................................................................................7
1.1. Objective ............................................................................................................................................................................. 7
1.2. Scope .................................................................................................................................................................................... 8
1.3. Methodological approach .............................................................................................................................................. 9
2. Emerging technologies for primary energy supply ............................................................................................11
2.1. Airborne wind energy (TRL 3-8) ................................................................................................................................ 11
2.2. Floating wind systems (TRL 8+) ................................................................................................................................. 16
2.3. Floating solar photovoltaic systems (TRL 8+) ........................................................................................................20
2.4. Wave power systems (TRL 5-8) .................................................................................................................................22
2.5. Tidal power systems (TRL 5-8) ...................................................................................................................................24
2.6. Ocean thermal energy conversion systems (TRL 5-6) ........................................................................................ 26
2.7. Bioenergy associated with carbon capture and storage (TRL 6-8) .......................................................................... 28
3. Emerging energy transformation and storage technologies to enable clean end-use energy .................32
3.1. Green hydrogen (TRL 8+) .............................................................................................................................................32
3.2. Next-generation batteries for behind-the-meter and utility-scale storage (TRL 3-8+) .......................... 36
3.3. Thermal energy storage (TRL 3-8+)..........................................................................................................................40
3.4. Heat pumps (TRL 8+) ..................................................................................................................................................... 43
4. Policy options for effective deployment of emerging technologies ...............................................................49
5. Final recommendations ...........................................................................................................................................53
6. References ..................................................................................................................................................................55
Acknowledgements .......................................................................................................................................................66

2
ACRONYMS
AR5 Fifth Assessment Report
ARPA Advanced Research Projects Agency
ARPA-E Advanced Research Projects Agency–Energy
AWE airborne wind energy
BECCS bioenergy with carbon capture and storage
CAPEX capital expenditure
CCS carbon capture and storage
CCU carbon capture and utilization
CO2 carbon dioxide
CSP concentrating solar power
DARPA Defence Advanced Research Projects Agency
EEZ exclusive economic zone
EOR enhanced oil recovery
FSF floating solar PV field
GHG greenhouse gas
H2 hydrogen
IEA International Energy Agency
IPCC Intergovernmental Panel on Climate Change
IRENA International Renewable Energy Agency
LCOE levelized cost of energy
NASA National Aeronautics and Space Administration
NH3 ammonia
OTEC ocean thermal energy conversion
PEM proton exchange membrane fuel cell
PV photovoltaic
R&D research and development
SDGs Sustainable Development Goals
SOFC solid oxide fuel cell
TCP technology coordination partnership
TEC Technology Executive Committee
TRL Technology Readiness Level
UNFCCC United Nations Framework Convention on Climate Change
WEC wave energy converter

3
FOREWORD
The technology framework adopted under article 10, paragraph 4, of the Paris Agreement underlines that accelerating, encouraging and enabling innovation is critical for an effective, long-term global response to climate change and for promoting economic growth and sustainable development.
In providing overarching guidance to the work of the Technology Executive Committee while serving the Paris Agreement, the technology framework emphasizes the need to accelerate and strengthen technological innovation and the importance of upscaling and diffusing emerging climate technologies.
It is against this background that the Technology Executive Committee agreed to produce this technical paper on emerging climate technologies in the energy supply sector.
To achieve the goals of the Paris Agreement, countries are required to peak greenhouse gas emissions as soon as possible and achieve climate neutrality by mid-century. It is of paramount importance to make efforts to transform and decarbonize energy systems in order to align with the Paris goals. The energy supply sector offers a wide range of emerging decarbonization technologies with high potential for climate change mitigation along with multiple social and environmental co-benefits.
The paper reviews a group of emerging low greenhouse gas primary energy supply and transformation and storage technologies, and answers the following three questions for each technology:
• What is this technology, and where and how could it be useful?
• What is this technology’s potential contribution to mitigating climate change?
• What are the initial and ongoing social, institutional, economic and business conditions for successful uptake?
The result is a clear and thorough analysis of the technologies’ social, institutional, economic and business challenges and solutions related to their development and deployment, including new market access and social acceptability. The analysis also identifies ways for policymakers to effectively support the deployment of these technologies, especially using a systemic approach to innovation, commercialization, risk reduction and market uptake to normalize new sustainable supply and enabling technologies.
We believe that this paper provides policymakers and other relevant stakeholders with a set of information and analysis to help their decision- making when defining national and regional strategies for accelerating the scale-up and diffusion of these technologies.
We would like to express our heartfelt appreciation to the members of the innovation task force of Technology Executive Committee and all experts who have provided their valuable contributions to this paper. We look forward to further work of the TEC in the area of innovation.
Stephen MinasChair of the Technology Executive
Committee
Mareer Mohamed HusnyVice-chair of the Technology Executive
Committee

4
EXECUTIVE SUMMARY
The UNFCCC Technology Executive Committee reviewed a group of emerging low GHG primary energy supply and transformation and storage technologies (airborne wind energy, tidal energy, wave energy, floating wind, floating solar PV, ocean thermal energy conversion, bioenergy with carbon capture and storage, green hydrogen, thermal energy storage, advanced batteries, and heat pumps). Using a structured literature review, we asked the following three questions for each technology:
• What is this technology, and where and how could it be useful? How does the technology work? Where and when is it likely to contribute to producing globally significant amounts of primary or transformed end-use energy? What markets could it fulfil? What are its co-benefits and costs?
• What is this technology’s potential contribution to mitigating climate change? Given the latter question, what does this technology provide that other already commercialized and/or relatively less expensive low-GHG technologies cannot in globally significant quantities?
• What are the initial and ongoing social, institutional, economic, and business conditions for successful uptake? Including but going beyond the simple upfront and life cycle cost of bulk and firming electricity, what market structure characteristics, cultural preferences and objections, (missing) enabling institutions, and regulatory and liability issues may affect the ultimate penetration of this technology?
Some of the technologies reviewed are very likely to provide global-scale climate and broader SDGs benefits (floating wind, floating solar PV, green hydrogen, advanced batteries, thermal energy storage, and heat pumps). However, some of the technologies that have been reviewed are unlikely to provide a large, globally significant contribution to meeting climate change goals in the near to medium term (airborne wind energy, wave energy, tidal energy, ocean thermal energy conversion), but they may be critical to some countries’ or subregions’ efforts. For this latter group, subgroups of countries may wish to cooperate, and these technologies may yet surprise us in their scale if engineering and business case challenges are overcome.
© U
nspl
ash_
Roha
n M
akhe
cha

5
Policies to support commercialization and uptake of these technologies will vary by region, but must include components for clear directionality towards net-zero emissions, innovation, and market shaping to drive their uptake. Stringent carbon pricing or performance regulations to capture the social damage associated with emissions are a necessary but insufficient condition for these technologies to penetrate. More R&D support is also a necessary but insufficient condition. The most expensive stage of technology development, when most companies fail, is mid- to full-scale piloting, when expenses are at a maximum, but no revenue is generated; technologies that have demonstrated themselves at the small scale need the most support at this stage. This very expensive and risky stage can be made more bearable by entering into partnership with regions and governments with similar interest in the technology succeeding. These partnerships can also help unblock key technical or other challenges.
After full-scale piloting, lead or niche markets must be found that only these technologies can service, or niche markets/allocated market share incentives are required to hit early critical economies of scale and innovation. These early markets are also critical for reducing perceived risk for the financial community to invest as a normal matter of course, and can be included as a sub-component of renewable portfolio standards or feed-in-tariffs, actualized as contracts for difference. In many markets, financial policy support is no longer necessary for standard solar PV and onshore wind beyond maintenance of a declining GHG intensity standard, and these funds and market share could be transferred to the emerging technologies in this report. All this points to the need for a systemic approach to innovation, commercialization, risk reduction, and lead and broad market uptake to normalize new sustainable supply and enabling technologies.
Table 1 Summary of key technology characteristics for emerging primary energy supply technologies
Technology TRL Current and eventual levelized cost 2019 USD/kWh
Size and generalityof resource if available
Key co-benefits, non-monetized costs, key barriers and other considerations
Airborne wind energy
3-8 <0.30 for current first commercial systems, 0.14 by 2030
Large but vague; offshore AWE technical potential for United States of America: roughly 1,293 GW for a 5 MW system, up to 9,029 GW onshore
Can potentially be used for remote sites far from grid with poor solar radiation; floating offshore potential; grid connection in sparsely populated areas. Lower material use per kWh produced
Floating solar PV
8+ 0.35 historic, current low auction bids at 0.05, projected 2030 ~0.05, ~0.04 2050
Very large and broadly geographically spread: 4,251 to 10,616 TWh/year
When tied with existing hydropower frees water resource for use as firm power, utilizes existing transmission, and reduces evaporation losses
Floating wind 8+ Current auctions at 0.13-0.15
Very large and confined to large lakes and ocean EEZs: <=83,229 TWh/year
When placed in deep ocean very large resource with low siting conflicts
Wave power 5-8 Current 0.30-0.55. 0.22 by 2025 and0.165 by 2030.
Moderate: 2 TW globally, but highly regional
Highly regional. No convergence on design.
Tidal power 3-8 Current 0.20-0.45. 0.11 by 2022-2030.
Moderate: very regional, can be locally large
Highly regional. Tidal barrages are unlikely to be approved, floating axial turbines showing promise
Ocean thermal energy conversion
5-6 Current 0.20-0.67 for 10 MW units falling to 0.04-0.29 for 100 MW units
Very large but localized: 4,000-13,000 TWh/year
Can be located anywhere between 30° north and south with access to 1km+ ocean depth. Desalinization co-benefit
Bioenergy with carbon capture and storage (BECCS)
6-8 Variable with application. Fossil unit cost plus CCS cost minus carbon revenue benefit
Very large Net-neutrality is sensitive to biomass feedstock and how it is extracted. CCS should be ~$50-$100/t, but is only proven with ethanol production

6
Table 2 Summary of key technology characteristics for emerging enabling technologies
Technology TRL Cost 2019 USD Key applications Key barriers
Green hydrogen
8+ USD4.5-6/kg, could fall to less than USD2 by 2030 with economies of scale and innovation
Storage of variable renewable electricity; high process heat; steel reduction; ammonia fertilizers; heavy transport
Unfamiliarity of end users with handling; fast and invisible flammability; lack of storage and transport infrastructure
Next-generation batteries
3-8+ Lithium-ion batteries are now USD150-300/kWh, and expected to fall to <USD75 by 2030
Small and large vehicles; supply and end-use in electricity grids; portable electronic and motor devices
Design for recyclability and recyclability standards are still lacking
Thermal energy storage
3-8+ Highly variable As a supplement to residential heating; electricity firm power
High CAPEX and low utilization rates lead to high use costs
Heat pumps 8+ At least double the cost of boilers, usually more
Residential and commercial heating and cooling; industrial steam
Supply chains are not yet set up; some customer confusion about performance
© U
nspl
ash_
Kars
ten
Wür
th

7
1. INTRODUCTION
1.1. Objective
Meeting the challenge of climate change, as crystallized in the Paris Agreement’s goal of “Holding the increase in the global average temperature to well below 2°C above pre-industrial levels and pursuing efforts to limit the temperature increase to 1.5°C above pre-industrial levels”, requires energy system CO2 emissions to reach net-zero by mid-century, with 2050 being the CO2 net-zero date for 1.5°C (with 5-20 Gt CO2 negative emissions per year thereafter) and 2070 the net-zero date for 2°C (Edenhofer et al., 2014; Masson-Delmotte et al., 2018). All greenhouse gases (GHGs) must hit net-zero roughly 20 years later. This requires that all currently emitting sources are retrofitted or replaced with abatement technology or new non-emitting sources.
The scale of this challenge is huge; GHG emissions must fall by a nominal (non-compounded) 3.5% of the 2020 level per year, and much of the existing global energy using technology stock (e.g. buildings, power generation and industrial boilers) will last longer than this (Tong et al., 2019). Just as one metric, both the IEA and IRENA, using independent 1.5°C scenarios, found the annual incremental additional investment needed is over USD 4 trillion per year through 2050 (IEA, 2021; IRENA, 2021a).
While almost all economy-wide Paris Agreement compatible deep decarbonization studies make use of some mix of energy and material efficiency, bioenergy, low-GHG hydrogen, CCU, CCS and natural and technical negative emissions, electrification using low-GHG generation is a core “backbone” strategy (Bataille et al., 2016; Clarke et al., 2014; Williams et al., 2012, 2021); the IEA estimated in its Net Zero Emissions (NZE) scenario (IEA, 2021) that not only must all economies decarbonize their electricity supply, but developed economies must also at least double their output, and developing economies triple to quintuple it to meet development needs. Given this requirement, any and all new low-GHG supply sources must be considered, especially if they are preferential to the old fossil supply, for example, they use less water or emit less local air pollution. Much, and likely most in most regions, of the new electricity-generating stock will be variable renewables offering relatively inexpensive bulk electricity and heat but often not when and where it is needed. A more flexible and integrated grid with market design, and supply and demand business models will be needed to maximize the value of variable renewables (IRENA, 2019a), including responsive demand, more transmission to link areas with different resources and demands, and storage on multiple timescales: for example, batteries over the microsecond to overnight time frame, hydrogen over the hours to weeks time frame, and pumped hydro over the hours to seasonal time frame. Renewably sourced heat will also need to be stored economically, perhaps seasonally for buildings. What material impact could emerging technologies have to meet these needs? How ready are they for early commercialization, and what enabling conditions could accelerate this? What barriers and enabling conditions are relevant given: market access; social, institutional and economic preconditions; and social acceptability?
The purpose of this report to analyse a group of preselected key emerging primary energy supply, transformation, and storage technologies and elaborate on elements that may affect their successful deployment, commercialization, and long-term sustainability. The report:
• provides an overview of the technologies, their state of play, and potential climate change mitigation and adaptation impacts;
• analyses the technologies’ social, institutional, economic and business challenges and solutions related to their development and deployment, including new market access and social acceptability;
• identifies ways for policymakers to effectively support the deployment of these technologies, especially using a systemic approach to innovation, commercialization, risk reduction, and lead and broad market uptake to normalize new sustainable supply and enabling technologies.
The overall objective is to provide policymakers and other relevant stakeholders with a set of information and the beginnings of a practical transformative “theory of change” that may help their decision-making when defining national and/or regional strategies for accelerating the scale-up and diffusion of these technologies.

8
1.2. Scope
Technology development stage
Climate technologies that are at early stages of development, that is, still in a conceptualization phase or undertaking preliminary laboratory analytical measurements, were not considered in this work. The focus was on a preselected list of technologies with tested climate change mitigation and adaptation potential but not yet operational technologies from TRL 4 (early prototype, proven in test conditions) to TRL 8 (first-of-a-kind commercial, commercial demonstration).1 This approach avoids overlapping with and duplicating work conducted by the TEC in the thematic area of implementation of its rolling workplan for 2019-2022, where the focus is on commercially available technologies that are awaiting diffusion or uptake.
Technology sector
The analysis under this work addresses selected key emerging technologies in the energy supply sector, including generation and enabling transformation and storage technologies. The power sector is the largest contributor to global GHGs. In 2010, the energy supply sector was responsible for approximately 35% of total anthropogenic GHG emissions.2 As shown in the mapping of emerging climate technologies considered by the TEC at its 21st meeting,3 the energy supply sector offers a wide range of emerging decarbonization technologies with high potential for climate change mitigation.
Emerging decarbonization technologies for energy supply also come with potential environmental impacts, for instance in terms of reduced local air emissions and changes in land and water use. Although the topic around energy supply may place an emphasis on climate change mitigation, its relevance to the multiple social and environmental co-benefits (e.g. employment and income generation for local communities, reduced impact on water and land, where data on these are available) of such technologies would also allow consideration of climate change adaptation.
Specific focus
It is crucial for the TEC not to duplicate analysis of emerging climate technologies produced by other organizations and to make its efforts both different from what has already been produced and attractive to different audiences. The TEC, at its 21st meeting, provided guidance in this regard and identified the following elements related to the development, diffusion and impacts of emerging decarbonization technologies that should be the focus of analysis under this work:
Access to new markets
Markets adopt new technologies at various paces, depending on the broader ecosystem (e.g. services, standards, regulations) that supports them. Penetration rates of new technologies — the percentage of workers in a country using them and their diffusion across the population — remain low among developing countries and countries with economies in transition. The penetration and diffusion of climate technologies in developing countries is often too low to sustain new markets that depend on them. Factors that account for the low penetration levels span from country-specific characteristics (e.g. political risk) to general bottlenecks (business models, access to finance, and infrastructure, among other factors), that are common in developing economies.
1 The Technology Readiness Level scale, as originally developed by NASA and eventually modified by the IEA, is a common framework applied to assess the maturity of technologies. It is a scale ranging from 1 (initial idea, basic principles defined) to 11 (mature technology, proof of stability reach). See Energy Technology Perspectives 2020 by the IEA, available at https://bit.ly/38MGeSR.
2 See https://www.ipcc.ch/site/assets/uploads/2018/02/ipcc_wg3_ar5_chapter7.pdf.3 See https://bit.ly/3qGz1dc.

9
Social, institutional, economic and business preconditions
When seeking to identify the key ingredients to effectively deploy climate technologies, it is very important to consider the interplay between technological, institutional, economic, business and social factors. Successful deployment is an interplay of several heavily context-specific factors. Innovative emerging technologies without connections to the context may be hopelessly ineffective. Traditional technology transfer models and sustainable development efforts — whether for developing or developed countries – pay insufficient attention to first creating enabling socio-political, economic and business conditions.
Social acceptability
Social acceptance is a major driver of the success of climate technologies. Technologies that are economically and technically feasible may not be implemented owing to social resistance, or lack of awareness of technology. Social or public “acceptance” is defined as a positive attitude towards a technology or measure, which leads to supporting behaviour if needed or requested, and the counteracting of resistance by others. People’s perception and awareness help to determine if the technologies are acceptable and in what forms. This is a complex issue depending upon the variety of factors ranging from understanding of the technologies, the public’s perception of their risk, the associated security implications, potential changes to the landscape, and the economic and political power at play.
1.3. Methodological approach
To accommodate the above objectives and elements, analysis of each technology has been sorted into:
• What is this technology, and where and how could it be useful? How does the technology work? Given this, where and when is it likely to produce or contribute to producing globally significant amounts of primary or transformed end-use energy? What co-benefits and costs may affect its uptake?
• What is this technology’s potential contribution to mitigating climate change? Given the latter question, what does this technology provide that other already commercialized and/or relatively less expensive low-GHG technologies cannot in globally significant quantities?
• What are the initial and ongoing social, institutional, economic, and business conditions for successful uptake? Including but going beyond the simple upfront and life cycle cost of bulk and firming electricity, what market structure characteristics, cultural preferences and objections, (missing) enabling institutions, and regulatory and liability issues may affect the ultimate penetration of this technology?
To answer these questions, the TEC conducted a multi-stage, multi-focus literature review. Existing Intergovernmental Panel on Climate Change (IPCC) chapters from the IPCC Assessment Report 5 (Edenhofer et al., 2014) and the Special Report on 1.5°C (Masson-Delmotte et al., 2018) were consulted first. IEA and IRENA eports were reviewed. Google Scholar was used to search for the latest high-quality, peer-reviewed literature review papers for each technology. Topic-specific papers containing the technologies as search terms from high-quality energy and climate economics and policy journals (e.g. non-exclusively, the Nature family of journals, Science, Energy Economics, Climate Policy, Applied Energy, Energy Policy, Climate Economics) with high citation levels were reviewed. Wikipedia was consulted for the information it contained for each technology, given that it is one of the most widely accessed sources for general knowledge, but the results were cross-checked against the foregoing papers. Finally, a brief review of active companies in the area was carried out to assess their continued business.
Each of the technologies is classified with a TRL. The scope of this project was TRL 4-8, but some applications of these technologies (e.g. floating solar on hydro reservoirs, the first floating wind farms) could be classified as TRL 9. The initial TRL scale was developed by the NASA and went from 1 to 9, but the IEA has expanded it to 11, (see table 3) (IEA, 2020a), and this scale is entering into general use in the energy community.

10
Table 3 Technology Readiness Levels and policy implications (using IEA and NASA definitions)
Broad stage TRL Narrow stage Policy and financial requirement implications
Conceptual or research phase
1 Initial idea, basic principles observed At scale of researcher, small company or individual. Broad R&D support sufficient
2 Application formulated, technology concept formulated
At scale of researcher, small company or individual. Broad R&D support sufficient
3 Concept needs validation, experimental proof of concept
Moderate funds may be needed
Small prototype (development phase)
4 Early prototype, technology validated in lab
Moderate: 2 TW globally, but highly regional
Large prototype (development phase)
5 Large prototype, technology validated in relevant environment (industrially relevant environment in the case of key enabling technologies)
Moderate costs, no revenue, significant support needed. Realm of ARPA-style funding
6 Full prototype at scale, technology demonstrated in relevant environment (industrially relevant environment in the case of key enabling technologies)
Large costs, no revenue, significant support needed. Realm of ARPA-style funding
Demonstration (deployment phase)
7 Pre-commercial demonstration, system prototype demonstration in operational environment
Very large costs, no revenue, significant support needed. Funding needed beyond typical ARPA funding, large firm, venture or state capital investment
8 First-of-a-kind commercial, system complete and qualified
Strong natural or created lead market necessary, makes compensating revenue generation to balance costs possible
9 Commercial operation in relevant environment, actual system proven in operational environment
Strong natural or created lead market necessary
Early adoption 10 Integration needed at scale Moderate natural or lead market support necessary
Mature 11 Proof of stability reached Natural or created lead market no longer necessary
© U
nspl
ash_
Ram
ón S
alin
ero

11
2. EMERGING TECHNOLOGIES FOR PRIMARY ENERGY SUPPLY
2.1. Airborne wind energy (TRL 3-8)
What is airborne wind energy, and where and how is it useful?
Airborne wind energy aims to harness the potential of high-altitude winds that are hundreds or even thousands of metres above the surface of the Earth, using flying aircraft that are tethered to the ground. Conventional wind turbine designs that are mounted on towers are not tall enough to take advantage of high-altitude wind energy, as even the tallest4 are only around 200m in height. Wind movements at high altitudes (e.g. 500m+) are much faster than those close to the surface of the Earth (Archer, 2013; Archer and Caldeira, 2009; Bechtle et al., 2019) and thus contain much more kinetic energy. It has been estimated that the total energy contained in high-altitude winds is around 4x the level available to tower-mounted turbines, and 100x the primary energy demand of the entire world (Marvel et al., 2013). An additional advantage for airborne designs over fixed towers is that an airborne system could, in principle, dynamically adjust its height and orientation to maximize its generation output over time, leading to higher capacity factors and better returns on investment (Archer et al., 2014).
4 At the time of writing, the tallest commercially available wind turbine is the Vestas 164, with a total height of 220 m/722 ft.
© S
kySa
ils P
ower

12
The various concepts that exist for airborne wind energy systems can be split into two groups: those where the electricity generator itself is airborne; and those where the flying parts of the system are used to mechanically drive a ground-mounted electricity generating station (Cherubini et al., 2015).
Designs with a ground station generator are sometimes called “pumping kite generators” (Argatov et al., 2009) or, more simply, “energy kites”, because the airborne elements that drive the system typically have wing surfaces that resemble kites. As at 2018, more than 60 between research institutes and small and medium-sized enterprises were involved in airborne wind energy R&D activities around the globe (Schmehl and Tulloch, 2019; IRENA, 2021b). A number of companies are working to commercialize energy kites, including KiteGen (Abbate and Saraceno, 2019; Canale et al., 2009), Ampyx Power (Kruijff and Ruiterkamp, 2018; Ruiterkamp and Sieberling, 2013; Vimalakanthan et al., 2018), SkySails Power (Erhard and Strauch, 2018), Kitepower (Salma et al., 2020), and EnerKite (Bormann et al., 2013; Candade et al., 2020; Weiss, 2020).
Designs where the electricity-generating unit itself is mounted onboard a balloon or a flying wing are sometimes called “airborne wind turbines” or “fly-gen systems” (Penedo et al., 2013; Ali and Kim, 2021). This space has seen a number of high-profile companies go out of business in the last decade, including Makani Power (Vance, 2009; Vander Lind, 2013; Wijnja et al., 2018; Weiss, 2021) and Sky Windpower Corporation (Roberts, 2018; Roberts et al., 2007), and new companies come into business, such as Kitekraft, a spin-off of the Technical University of Munich. While there is not sufficient information to be definitive, it would seem that the firms working on this technology are stuck at the very expensive large prototype development stage, before any revenue or new large commercial financing can be generated.
The concept of airborne wind energy has been under development since at least the 1970s. Momentum in the sector has gathered pace particularly in the last two decades, with the worldwide community growing to around 40-50 R&D groups with various commercial spin-offs (Khan and Rehan, 2016). At the time of writing, a few companies have produced power-generating prototypes as large as 600 kWe in size (Vermillion et al., 2021), and regional feasibility studies on high-altitude wind energy resources have been carried out in promising locations (Bechtle et al., 2019; Lunney et al., 2017; Yip et al., 2017). The first market-ready systems are available for commercial deployment.5 The TRL of various individual airborne wind energy systems is estimated to lie on a spectrum between TRL 3 (concept needs validation, experimental proof of concept) and TRL 8 (first-of-a-kind commercial, system complete and qualified) (Watson et al., 2019). The International Energy Agency ranks the field as a whole at TRL 4 (i.e. early prototype, technology validate in lab) (IEA, 2020a).
5 See https://skysails-group.com/blog/series-production-of-awes-starts/ and https://thekitepower.com/news/.
© A
mpy
x Po
wer

13
Potential contribution of airborne wind energy to climate mitigation efforts
Renewable energy resources feature strongly in nearly all global and regional analyses of decarbonization pathways that aim to stabilize the climate below 1.5°C of warming above pre-industrial temperatures. Airborne wind energy specifically, however, does not feature in major assessments (e.g. IEA (2021)). This is likely due to the immature state of the technology, the lack of widely agreed-upon development road maps, and the uncertainties in the data on long-term costs and performance (van Hussen et al., 2018).
Weber et al. (2021) indicate that early commercial systems may cost USD USD0.23/kWh, eventually falling to USD0.14/kWh by 2030. This would make them competitive with diesel-driven systems, especially those in remote locations where the diesel must be shipped in by boat or aircraft.
The urgency of taking early action to reduce emissions in order to mitigate the worst effects of climate change (IPCC, 2018) makes a focus on solutions that are market-ready today and available for immediate deployment a priority. As promising as they might appear, airborne wind energy systems do not currently fall into this category. This does not rule out a longer-term contribution to climate stabilization efforts (which are likely to take many decades) from airborne wind energy but it does make any near-term role for the technology highly uncertain. The subject of airborne wind energy continues to feature regularly in discussions on innovation for wind power at major industry workshops and discussion forums (Veers et al., 2019); for instance, a new IEA Wind Task 486 on Airborne Wind Energy systems will be launched at the end of 2021.
6 Kick-off meeting planned for 27-28 October 2021, see also https://iea-wind.org/task48/.
© K
item
ill

14
Social, institutional, economic and business preconditions for airborne wind energy
The size of the future market for airborne wind energy devices is difficult to assess, as the breakthrough moment for the technology to be commercially viable has yet to materialize. From a physics perspective, the size of the potential exploitable resource is very large, and the costs of the energy harvesting units themselves are potentially low because they are made of lightweight (but high technology) materials, which in principle makes for a strong value proposition (Zillmann and Bechtle, 2018). They also possess a strong competitive advantage in adding new potential resource extraction zones, with minimal needs for steel and concrete supports and the land and seabed they sit on and in (IRENA, 2021b; van Hagen, 2021). However, it is not yet clear in which markets and when airborne wind energy systems will achieve cost competitiveness at scale with other renewable energy technologies (van Hussen et al., 2018); the first commercial systems claim to be cost-competitive with diesel-generated electricity (i.e. LCOE below USD USD0.23/kWh) (see footnote 5). It is notable that one of the most prominent companies in the field, Makani Power, even when backed by companies as large and well-resourced as Google and Shell, recently exited the market, suggesting that the unresolved barriers to commercialization remain significant. However, in the Makani case the fast up-scaling and chosen concept (fly-gen) and early testing in very challenging conditions (offshore) may have been overambitious.
From a technology perspective, safety and reliability remain the main concerns (Salma et al., 2020). The control system for an airborne wind system is much more complex than that of a tower-mounted turbine. At the time of writing, the prototypes that have been demonstrated have had only a limited number of flying hours to test their ability to generate electricity as a proof of concept. For airborne wind energy systems to become a credible source of renewable energy, the sector will need to develop (and prove) the capability to enable extended automated operation, including take-off and landing. As well as the control systems, the materials and components used in airborne wind energy units (particularly the tethers which attach the flying elements to the ground) must also be tested to prove their long-term operation and safety. Finally, airborne wind energy developers have yet to demonstrate how safe operation would be maintained in adverse weather conditions including high wind speeds, lightning, ice, rain and snowfall, a set of challenges which must also be resolved. Until more is known about how airborne wind energy systems perform over extended periods of operation, the eventual cost of the energy produced is likely to remain only speculative. A key fundamental challenge is that companies in this space are stuck in a cycle where they have low flying hours demonstrated and not much data to prove their reliability to investors, so nobody approves them for further demonstrations – there may be a role for governments and/or consortia of private actors in helping to accumulate flying hours to prove the commercial concept.
From a regulatory perspective, there is no standardized approach towards airborne wind energy systems in the same way as one exists for commercial freight and passenger aircraft. Current prototypes tend to operate with special, time-limited permits to utilize small pockets of airspace for testing purposes based on ad-hoc local safety assessments (Salma et al., 2018). This means that the entire regulatory and permitting framework for airborne wind energy has yet to be established. Public resistance towards airborne wind energy systems was expected to be on a similar level to, or greater than, that for conventional wind turbines (van Hussen et al., 2018). However, this issue is currently being investigated in more depth as pilot systems fly more hours. Anecdotal interviews with those living in neighbouring communities to airborne wind energy systems suggest that visual impacts are less pronounced. Noise and safety are expected to be the main sources of concern, followed by the environmental impacts on bird populations (Bruinzeel et al., 2018).
A promising early niche application for airborne wind energy systems is believed to be providing
power in remote locations where energy costs are already relatively high and the established competition tends to be diesel generators and
solar power

15
Governments can, if they choose, assist in several key areas, such as providing funding for fundamental research in materials and control systems, expanding the (often very limited) number and size of testing sites, and facilitating future market access through the development of regulatory standards for commercial operations. Obtaining additional data on performance, costs, and reliability, as well as establishing a track record of safe operation, will be key to securing further investor funding and building public trust in airborne wind technology. The main cross-cutting solution is to obtain more information from small-scale demonstration projects.
Most new technologies that eventually become commercialized have an initial niche application that only they can fill (see policy section), which pushes innovation and drives down costs, for example, in satellites and remote sensing for solar. A promising early niche application for airborne wind energy systems is believed to be providing power in remote locations where energy costs are already relatively high and the established competition tends to be diesel generators and solar power (Kamp et al., 2018). Airborne wind energy may have a niche application for off-grid loads bigger than that which can be met with solar, or in regions with poor solar insolation or needing more 24-hour power than solar and batteries can provide (e.g. mining camps or deep ocean island grids). For this to occur, however, the technology needs to evolve to a higher level of robustness and autonomy, as well as involve lower costs.
© E
nerK
ite

16
2.2. Floating wind systems (TRL 8+)
What are floating wind systems, and when and where are they useful?
The majority of existing offshore wind farms are found in water 50m or less in depth (IRENA, 2020a). Floating wind energy generators have the potential to exploit wind energy resources found in much deeper waters than fixed offshore wind towers. The main difference between floating wind turbines and fixed offshore wind towers is the support system. Rather than fixed foundations on the sea floor, floating wind turbines are held in place with various anchoring systems (Jonkman and Matha, 2011; Manzano-Agugliaro et al., 2020), with the “best” design for any given installation depending on multiple criteria (Leimeister et al., 2018). There are two main designs receiving large commercial investment: spar buoys (e.g. the Equinor lead Hywind project in Scotland) and spar submersibles (e.g. the Principle Power lead Windfloat project in Portugal, and the Ming Yang Yangxi Shapa III floating prototype in China). Spar buoys are single-cylinder designs moored to the seabed, and are simpler and less costly to initially build, but turbine installation is harder, needing speciality ships, and they need deeper water (i.e. >100m). Spar submersibles are more complex (like small oil rigs), but can be built and assembled, and turbine installed in port and towed to their installation area (International Renewable Energy Agency (IRENA), 2016; IRENA, 2021b).
The main rationale for developing floating wind energy is that, in many ocean territories, the sea floor rapidly deepens with distance from the coastline, leaving very few locations shallower than 50m to install conventional offshore wind turbines. Many regions have strong offshore wind energy potential but also have deep and difficult territorial sea floor geography (known as bathymetry). Examples include Japan (Bardenhagen and Nakata, 2020; Utsunomiya et al., 2020), Portugal (Castro-Santos et al., 2020), Spain (Colmenar-Santos et al., 2016), California, United States of America (Beiter et al., 2020; Dvorak et al., 2010), Brazil (de Assis Tavares et al., 2020), Mozambique, South Africa, Somalia, Madagascar and Morocco (Elsner, 2019). In these regions, many sites with attractive wind speeds and wind power density have been identified that could in principle be accessed with floating wind energy platforms.
© W
ikim
edia
Com
mon
s_O
le.s
tobb
e.of
fsho
re

17
There are other advantages to floating wind energy that are worth mentioning. In principle, the floating turbines can be assembled on land in the controlled waters of ports and then towed offshore to their intended generation sites. This avoids the requirement of constructing the turbines and especially their generating units in the marine environment, as well as exposure to risks from rough weather, etc., which overall has the potential to significantly reduce costs (International Renewable Energy Agency (IRENA), 2016). In mid-depth conditions (30-50m), they may in time offer a lower-cost alternative to bottom-fixed foundations, given the potential for standardization of foundation designs and the use of low-cost, readily available installation vessels. Floating turbines can also be completely removed at the end of their life, with the anchor system taken up and the generating platform towed away for reuse or recycling, something that is difficult to do with a fixed tower turbine where the foundation is typically left behind on the seabed (Topham and McMillan, 2017).
Floating wind energy designs are found at a variety of Technology Readiness Levels (TRLs). The most technologically mature designs are floating horizontal axis wind turbines at TRL 8-9, with other designs, such as floating vertical axis wind turbines, at TRL 4-5 (Watson et al., 2019). Overall, the International Energy Agency (IEA) rates floating offshore wind turbines at TRL 8 (i.e. first-of-a-kind commercial, system complete and qualified) (IEA, 2020a). Various technology demonstration prototypes (typically just one turbine for testing) have been in operation since 2007, with the world’s first full-scale floating wind farm opening in Scotland in 2017. Early operational data from the Scottish plant (Hywind, developed by Statoil/Equinor) have exceeded expectations, demonstrating capacity factors over 60% and the ability to survive exposure to hurricane-force storms (Dinh and McKeogh, 2019). A second floating wind farm (WindFloat) has been operational in Portugal since 2020. The largest floating wind farm at the time of writing (July 2021) is the Kincardine 50 MW+ project, which comprises a single 2 MW pilot and five 9.65 MW Vestas turbines. In Norway, Hywind Tampen, which began construction in 2020, is projected to be one of the largest floating offshore wind facilities worldwide, with 88 MW of installed capacity (IRENA, 2020b).
Potential contribution of floating wind energy to climate mitigation efforts
The market for floating offshore wind energy grew from 0 to 57 MW in the period 2008–2018 (Hannon et al., 2019), while the total global offshore wind energy potential is estimated as being as high as 329,600 TWh/year for capacity factors above 20% when only suitable areas for development are considered (Bosch et al., 2018) (i.e. within non-disputed EEZs and at reasonable depths). According to Bosch et al. (2018), if only the potentials in locations with the highest quartile (25%) of capacity factors are summed, 83,229 TWh per year wind energy potential is available. This indicates that multiple order of magnitude increases in the market size for floating wind energy are possible; using the 25% capacity factor limit, the Bosch et al. estimate is double the extra generation needed under the IEA NZE scenario (International Energy Agency (IEA), 2021). Industry expects floating wind energy designs to become commercially competitive during the 2020s (deCastro et al., 2019). Several countries and territories (California, United States of America and France, for example) have recently released tender offers for floating offshore wind projects. Several very large floating wind farms have been proposed on the western and eastern seaboards of the United States of America using very large units (e.g. the 10 MW+ GE Haleide-X system).
The need for large-scale deployment of renewable energy generators in historically unprecedented quantities is a mainstay result of climate mitigation analyses that show reasonable chances of limiting anthropogenic warming to 1.5°C (Bruckner et al., 2014; L Clarke et al., 2014; IPCC, 2018). Wind and solar photovoltaic energy are generally thought of as the frontrunner technologies for renewable power generation, with hydropower being largely constrained by the geographical distribution of hydrological resources (deep geothermal, using precision drilling developed for fracking, may provide a surprise). Moving air and sunlight are much more ubiquitous resources. An important constraint on wind energy has always been the challenge of finding generation locations that are not constrained by wind availability, restrictive community planning policies, seabed geography, or “Not-In-My-BackYard-ism” (NIMBYism) (Graham et al., 2009).
18
The biggest long-term limitation to uptake of offshore floating wind energy is not likely technical or resource availability, but cost. Auction-based solar PV prices in the early 2020s in high solar insolation location are at USD USD0.025/kWh and still falling, while onshore wind is at USD USD0.03-0.04/kWh, and fixed offshore wind is at USD0.05-0.08/kWh (IRENA, 2021b). All three still have a very large amount of development ahead of them before promising, low-conflict sites are exhausted. What floating offshore wind offers at USD USD0.13-USD0.15/kWh is higher-capacity factors comparable to fossil plants, and very large untapped resources with highly reduced land-use and seascape-use conflicts.
Put simply, commercially available floating wind would mean, in principle, that offshore wind power would become much easier to install in many more locations. This could make a significant contribution to climate mitigation efforts. For much of the last decade, floating wind turbines did not generally feature in long-term decarbonization pathway analyses because the costs and feasibility of the technologies were not well understood, but this has recently changed. Floating wind turbines now feature in the International Energy Agency’s latest net-zero transition road map (IEA, 2021), where they are expected to make a major contribution from the 2030s onwards. IRENA projects that for a 1.5°C scenario, 2000 GW of offshore wind energy will be needed, and that 300 GW will likely be from floating systems (IRENA, 2021b). They are also starting to appear explicitly in net-zero road maps for major economies, such as the United States of America (Larson et al., 2020).
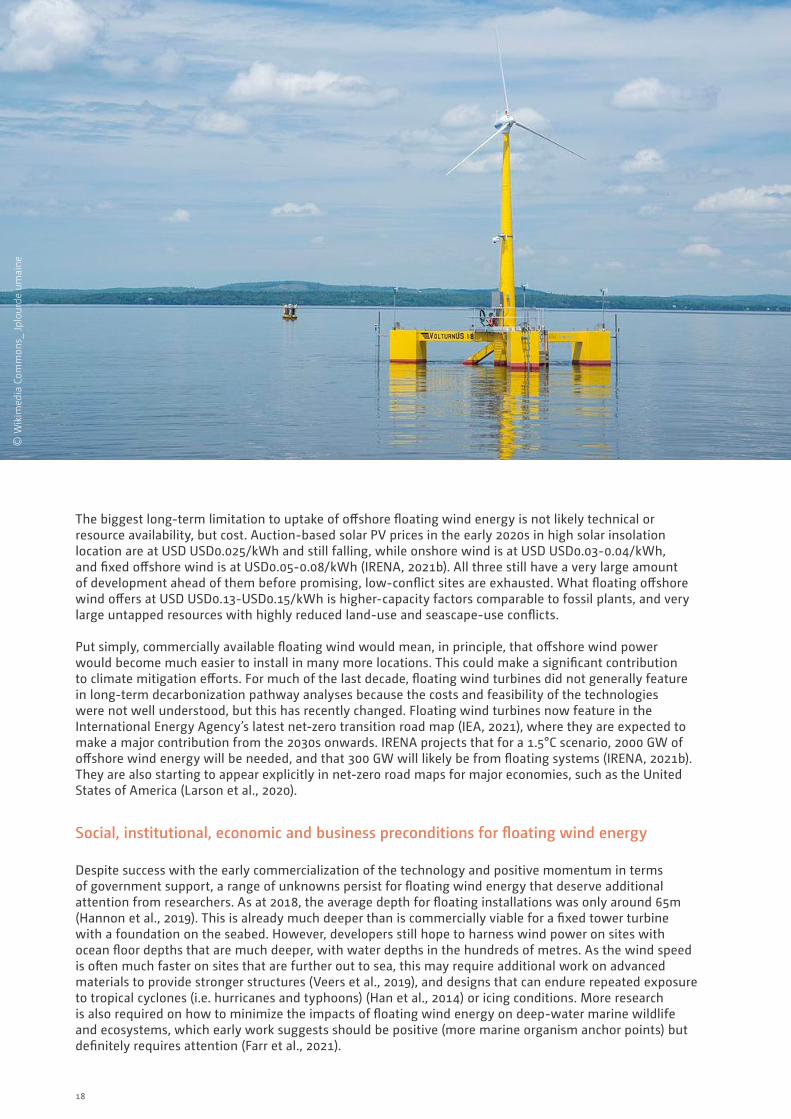
Social, institutional, economic and business preconditions for floating wind energy
Despite success with the early commercialization of the technology and positive momentum in terms of government support, a range of unknowns persist for floating wind energy that deserve additional attention from researchers. As at 2018, the average depth for floating installations was only around 65m (Hannon et al., 2019). This is already much deeper than is commercially viable for a fixed tower turbine with a foundation on the seabed. However, developers still hope to harness wind power on sites with ocean floor depths that are much deeper, with water depths in the hundreds of metres. As the wind speed is often much faster on sites that are further out to sea, this may require additional work on advanced materials to provide stronger structures (Veers et al., 2019), and designs that can endure repeated exposure to tropical cyclones (i.e. hurricanes and typhoons) (Han et al., 2014) or icing conditions. More research is also required on how to minimize the impacts of floating wind energy on deep-water marine wildlife and ecosystems, which early work suggests should be positive (more marine organism anchor points) but definitely requires attention (Farr et al., 2021).
© W
ikim
edia
Com
mon
s_ Jp
lour
de u
mai
ne

19
Existing floating wind energy systems tend to use marine structures that are adapted from designs used in the offshore oil and gas industry (i.e. they were originally designed for something completely different). It is believed that there remains significant scope to optimize the design of floating wind generators from first principles in order to reduce costs and increase performance (Watson et al., 2019). Multiple possible configurations of floating platforms and anchoring systems still need to be explored and tested (González and Diaz-Casas, 2016; Uzunoglu et al., 2016). For example, using vertical axis wind turbines instead of horizontal axis wind turbines (Hand and Cashman, 2020), using multiple turbines on a single floating platform (Bashetty and Ozcelik, 2020), or hybridizing floating wind power installations with other marine energy generation technologies, such as floating solar power (Golroodbari et al., 2021) and wave energy generation (Hu et al., 2020).
Another key issue is transmission planning, and broader integration with the grid. Germany and Denmark provide a positive example, where a joined high voltage direct current system has been constructed to allow two-way voltage balancing and more offshore wind from both countries to come to market (IRENA, 2021b). The United Kingdom and Norway have also recently built more two-way transmission to allow Norway’s hydropower balancing potential to aid uptake of renewables in the United Kingdom.
There are also regulatory issues concerning the installation of floating energy systems in the deep ocean. Local seas can be very active with shipping and fisheries, and marine spatial planning with intensive stakeholder consultation is needed to allocate space and corridors to allow floating wind systems to work with other uses – Belgium’s experience in this area to allow fixed offshore wind is instructive (IRENA, 2021b, p 90). Coastal States have the exclusive right to engage in economic activities, including energy production, in their EEZ up to 200 nautical miles from the coastline. This provides a solid legal basis for regulation and expansion of this activity, except where there are disputed maritime boundaries between States. In the latter case, settlement or agreement between the States concerned would be a prerequisite to encourage the installation of floating wind systems in deeper waters. There is also a need to comply with existing rules and standards on decommissioning of offshore installations, as set out in the United Nations Convention on the Law of the Sea,7 the International Maritime Organization Guidelines and Standards for the Removal of Offshore Installations and Structures,8 and various regional instruments. Issues include protection of the marine environment and safety of navigation.
Given the multi-decade effort to commercialize floating wind and the very large size of the eventual prize, a mutually supportive effort between governments and private industry is required. Support mechanisms for governments to consider include: primary research funding into floating wind energy components and control systems, funding technology demonstration projects in partnership with industry, making sites available for development, and assisting in early market formation through assigned portions of renewable power standards, assigned feed-in-tariffs, capital grants and tax incentives for early commercialization (Bento and Fontes, 2019). See the policy section for a broader discussion.
7 https://www.un.org/depts/los/convention_agreements/convention_overview_convention.htm.8 https://www.imo.org/en/KnowledgeCentre/IndexofIMOResolutions/Pages/A-1987-89.aspx.
Given the multi-decade effort to commercialize floating wind and the very large size of the eventual prize, a mutually supportive effort between governments and private industry
is required

20
2.3. Floating solar photovoltaic systems (TRL 8+)
What are floating solar photovoltaic systems, and where and how are they useful?
FSFs are not a new technology, but the combination of fully commercialized high TRL technologies combined in new ways, for example, moored flat-bottom boats and solar photovoltaic systems, including panels, transmission and inverters from direct to alternating current. They offer a new place to install solar PV that does not conflict with habitation, agriculture or biodiversity as long as key marine environments are respected, with several very large possible economic and non-economic co-benefits. The literature indicates two classes of opportunities: when the FSF is stand-alone; and when it is retrofitted to or built with a hydroelectric facility as a hybrid. All the characteristics of stand-alone systems apply to hybrid hydroelectric systems, so we address the stand-alone facilities first, then the hybrid ones.
The potential benefits of a stand-alone floating solar PV system include:
• No new land use. This has been of prime importance in areas with early adoption (e.g. in south-east Asia).
• Potentially fewer obstacles to solar incidence. This depends on the local topography.
• Potentially higher efficiency from built-in cooling. The theoretical improvement is 5-15% (Sahu et al., 2016), but observed values for early simple projects have been 0.3-2.6% (Oliveira-Pinto and Stokkermans, 2020). There is a natural cooling effect from sitting on water, but various postulated active mechanisms that have not yet been commercialized could increase energy harvesting by up to 8-10%.
• Lower potential evaporation losses for hydroelectric dams and irrigation storage dams. The benefits of this could be quite large but depend on climate conditions, percentage of the covered surface, and the design of the FSF (Assouline et al., 2011; Sahu et al., 2016). Covers to prevent evaporation are expensive, and if the FSF can partially serve as evaporative cover, it could prevent other capital expenditures.
• Lower costs and less complex installation and decommissioning. Floating PV plants are more compact than land-based plants, their management is simpler and their construction and decommissioning straightforward. There are no permanent alterations to the landscape (e.g. concrete foundations), so their installation can be totally reversible. Potential retrofits with higher efficiency panels would be faster and easier.
• Solar tracking (which increases solar harvesting) is potentially easier and cheaper. A large floating platform can be designed to be turned and perform vertical axis tracking without the need for a complex mechanical apparatus as required for land-based PV plants. A floating PV plant equipped with a tracking system has a limited additional cost, while the energy gain can range from 15 to 25% (Sahu et al., 2016).
© F
lickr
_Den
nis
Schr
oede
r /
NRE
L

21
The additional benefits of an FSF associated with a hydroelectric dam include (Lee et al., 2020):
• The capacity to hybridize with existing hydroelectric systems. Solar PV adds energy capacity to existing hydroelectric dam facilities, while the dams offer dispatchability. This can potentially greatly reduce curtailment in regions with large amounts of installed solar and wind.
• When hybridized, the PV system can piggyback on existing transmission. Access to transmission is one of the biggest constraints to new wind and solar PV generation projects.
Potential contribution of floating solar photovoltaic systems to climate mitigation efforts
Using a combination of geospatial, water body, solar incidence and practical constraints (e.g. distance from shore), Lee et al. (2020) estimate annual possible generation results from FSFs ranging from 4,251 to 10,616 TWh per year, roughly 12.5-25% of the extra clean power generation needed under the IEA NZE scenario, without increasing land requirements.
Floating solar PV associated with hydroelectric generation also does not need firm “on-demand” power support, reducing overall system needs for firm power (Jenkins et al., 2018; Sepulveda et al., 2018). These are very large potential contributions, but will require appropriately designed water use, electricity, and climate policies in order for them to materialize. Electrification with low-carbon electricity is a key strategy in all low-carbon development pathways (Bataille et al., 2016; L Clarke et al., 2014; Davis et al., 2018; Williams et al., 2021), but requires combinations of policies to drive decarbonization of the electricity supply, as well as broad switching to electricity in buildings, transport and industry.
Once the industry is established, the LCOE for FSFs is likely to be about USD USD0.01-0.02 per kWh.
Social, institutional, economic and business preconditions for floating solar photovoltaic systems
Most water bodies have associated stakeholders who may have some reason for the solar field not being built there (e.g. in-shore fisheries, viewscapes from shore, swimming and water sports). We have focused on hydroelectric reservoirs not just because of their proximity to transmission and good pairing with turbine generation, but because utilities operating hydroelectric dams usually control use of the water body as well.
Hydroelectric operators may or may not be aware of the potential for floating solar PV to improve their business model, and they are often highly constrained in their choice of investment in generation and transmission assets. International electric utility associations may be key to acclimatizing hydropower operators with the opportunity.
All marine environments carry wind and storm risk, and the FSFs must be designed to withstand these.©
Flic
kr_D
enni
s Sc
hroe
der
/ N
REL

22
2.4. Wave power systems (TRL 5-8)
What is wave power, and where and how could it be useful?
All wave power systems operate on the principle that moving water carries a substantial amount of energy, transferred from wind to the water by well understood physics. In principle, there is a very large wave power resource, estimated to be roughly 2 TW, but is it highly localized to certain parts of the globe (e.g. north-west Europe, north-west Pacific) (Gunn and Stock-Williams, 2012). Estimates of how much of this could be captured vary hugely from 4.6% across the entire potential to 80+% for site-specific applications. Wave power is related to the consistency of wind over the distance the waves are created (termed the “fetch”), and ranges from highly variable to highly consistent by site, meaning that wave power can be classified as a variable or firm resource depending on the site.
Wave power has been explored for centuries, with the first applications for power generation being tested at small scale in the late 1800s and early 1900s. The modern study of wave energy did not begin until the late 1940s and was only seriously pursued starting in the 1970s following the 1973 global oil crisis. The physics of how waves accumulate, carry and disperse energy are well understood, and there many different potential wave energy converter (WEC) designs that use different methods to capture wave energy – the challenge is building something with high conversion efficiency that can survive the challenging marine environment while not interfering with local ecosystems, fisheries, etc. Power must also be transmitted to shore, entailing a transmission network that is expensive to install and maintain. Versions of wave energy conversion systems include:
• A point absorber buoy (TRL 7) uses the rise and fall of swells to generate power, using a linear, linear to rotary, or hydraulic generator.
• A surface attenuator (TRL 8) has multiple floating segments that translate the wave motion into a mechanical bending motion that turns a generator, either directly or through hydraulics.
• An oscillating wave surge converter (TRL 7) is attached to the sea floor, and the up and down motion is used by various means (e.g. floats, flaps, pistons) to make electricity.
• An oscillating water column (TRL 8) uses the up and down energy of the wave to compress air, which is then used to generate electricity via an air turbine.
• An overtopping device (TRL 9) essentially creates a small hydro dam from waves transferring water into a storage chamber with a turbine.
• Submerged pressure differential (TRL 6) devices typically use a flexible membrane to capture the pressure differential induced by waves at various depths, transferring this energy to a hydraulic fluid. They can be near the surface, mid-depth or on the ocean floor, and can be moved and adjusted with incoming waves.
Potential contribution of wave power to climate mitigation efforts
Wave power is highly localized, with some regions having huge potential (e.g. the United Kingdom) and others none. It is also at a much lower level of technical development compared to solar PV, onshore wind, offshore fixed wind, and offshore floating wind, all of which will capture most near-term investment and cumulative global economies of scale and innovation. For all these reasons, it is not possible to reasonably assess the potential global contribution of wave power.

23
The current levelized cost of energy for wave power is estimated at USD USD0.30-0.55/kWh. Recent estimations by developers with active projects show that costs may be lower, reaching USD USD0.22/kWh by 2025 and USD USD0.165/kWh by 2030 (IRENA, 2020c). These high-cost levels mean wave power systems are not at a level of development where their contribution to climate mitigation can be discussed, but similar criticism was levelled at solar PV and wind before early commercialization and economies of scale and innovation brought their costs down.
Social, institutional, economic and business preconditions for wave power
All the social, institutional, and governance challenges listed for offshore floating wind systems above apply to wave power systems. Wave power systems are not yet at a TRL where competitiveness can be discussed.
Given the precarious health of many ocean ecosystems and fisheries globally, there is an increased focus now on potential damage caused by ocean energy harvesting. There is concern about wave energy devices interfering with fish and other marine life during their installation, operation, maintenance and decommissioning, both directly and with food sources. All marine environments carry high energy storm risk, and the WEC must be designed to withstand all likely seas; the ocean has very high energy flows, and there are floating lost containers, logs, other debris, etc., that can interfere with wave energy conversion devices.
Finally, regulatory protocols for seaborne energy are still being developed and are currently based on offshore oil and gas regulations. As with tidal energy, the United Kingdom is perhaps the most advanced in this area, and the state of this technology can be described as being where wind power was in the 1980s and 1990s, with less potential to be expanded elsewhere beyond maritime nations.
Wave power systems are not at a level of development where their contribution to climate
mitigation can be discussed
© W
ikim
edia
Com
mon
s_U
S D
epar
tmen
t of E
nerg
y, P
ublic
dom
ain
24
2.5. Tidal power systems (TRL 5-8)
What is a tidal power system, and where and how could it be useful?
Tidal power makes use of the compound gravitational effects of the moon travelling around the Earth and the Earth travelling around the sun, raising and lowering the water level and generating strong currents with very high-power density compared to air. There are four main types of tidal power systems that have different potentials and social, institutional, economic and business preconditions: tidal barrages, tidal stream generators, dynamic tidal power systems, and tidal lagoons. All share the advantage that moving water carries about 800 times the energy of wind at the same speed, and the disadvantage of working in maritime conditions, with large and random moving obstructions (e.g. lost containers, logs, large marine life), corrosive salt conditions, and relatively large costs for installation, maintenance and decommissioning.
Tidal barrages (TRL 9)
Tidal barrages make use of strong tidal flows in existing natural estuaries to create temporary hydropower dams. Effectively, the estuary is blocked with a dam that lets seawater in, the dam is closed, and the seawater is let out through a turbine. Tidal barrages can be designed to work bidirectionally as well. The power generated is a function of the volume of water and the height that the water falls. The largest existing tidal power facilities are tidal barrages at La Rance in France (240 MW), and Sihwa in the Republic of Korea (245 MW). This is a well understood, fully commercialized technology.
Tidal barrages dramatically alter the flow of water in and out of estuaries, however, and have very large ecological impacts for those with substantial aquatic life. They can also lead to substantial accumulation of toxic agricultural by-products, as happened at Sihwa (the design was modified to partly mitigate this, cutting its potential power in half). Recognition of this fact has largely ended development of new tidal barrages globally, but there are still legacy proponents for projects in India (Gulf of Kutch, 50 MW), the United Kingdom (Wyre Barrage, 61.4 MW; Mersey Barrage, 700 MW; Severn Barrage, 8640 MW), Republic of Korea (Garorim Bay, 520 MW; Incheon, 1320 MW), the Philippines (Dalupiri Blue, 2200 MW), and by far the largest proposed project, Penzhin Bay at the isthmus of the Kamchatka peninsula in the Russian Federation (87000 MW). If the latter project went forward, it would be the largest power project in the world by a wide margin.
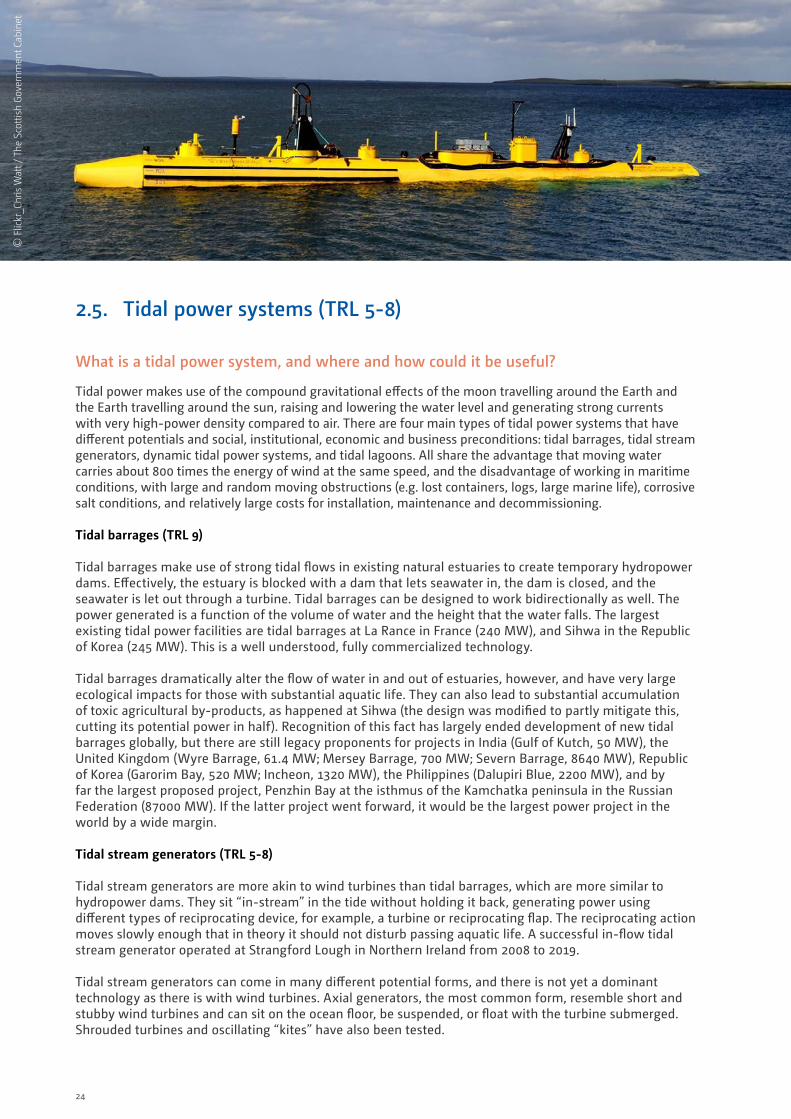
Tidal stream generators (TRL 5-8)
Tidal stream generators are more akin to wind turbines than tidal barrages, which are more similar to hydropower dams. They sit “in-stream” in the tide without holding it back, generating power using different types of reciprocating device, for example, a turbine or reciprocating flap. The reciprocating action moves slowly enough that in theory it should not disturb passing aquatic life. A successful in-flow tidal stream generator operated at Strangford Lough in Northern Ireland from 2008 to 2019.
Tidal stream generators can come in many different potential forms, and there is not yet a dominant technology as there is with wind turbines. Axial generators, the most common form, resemble short and stubby wind turbines and can sit on the ocean floor, be suspended, or float with the turbine submerged. Shrouded turbines and oscillating “kites” have also been tested.
© F
lickr
_Chr
is W
att /
The
Sco
ttish
Gov
ernm
ent C
abin
et

25
Dynamic tidal power (TRL 4)
Dynamic tidal power is a newer concept that takes advantage of differential tide states along a coast to create pressure or head differences from which power can be generated. Discrete differential tide states are created by long barrages (~30km) that extend into the ocean without entrapping any water bodies, in theory preserving the existing dynamic tidal ecosystems. An optional “T” is placed at the end to maximize power. One barrage is estimated to have the potential to provide the necessary power for several million people, but unfortunately the effects do not scale down to shorter barrages. No full-scale dynamic tidal power station has yet been built, but the concept, pioneered by two Netherlands engineers, is being explored in China.
Tidal lagoons (TRL8+)
Tidal lagoons are simple concepts in that effectively an artificial encircled barrage is built in open water. Existing ecosystems are not affected. Only very small tidal lagoons have been piloted to date.
Potential contribution of tidal power to climate mitigation efforts
The potential contribution of tidal power to climate mitigation efforts is highly localized to maritime regions, if it can be commercialized, and highly uncertain. No new large tidal barrages are likely to be allowed for environmental reasons. For tidal power to succeed, it is likely that some form of tidal stream generator will need to be commercialized that is both highly robust and amenable to different environments and conditions globally. This may require a jump forward in maritime engineering.
The current levelized cost of energy for tidal power is estimated at USD USD0.20-0.45/kWh. As with wave power, recent estimations by developers with active projects show that costs may be lower, and an LCOE of USD USD0.11/kWh is expected to be reached between 2022 and the early 2030s (IRENA, 2020c). This would make tidal power competitive with floating ocean wind auction prices for the early 2020s today, which will keep improving, and its prospects must be seen in this light. Again, similar criticism was levelled at solar PV and wind before early commercialization and economies of scale and innovation brought their costs down.
Social, institutional, economic and business preconditions for tidal power
For tidal stream generators to succeed commercially, especially against already commercialized solar PV, onshore and offshore fixed and floating wind, they will need to first prove their robustness and that they are cheaper or have an application that is not met by the other renewable sources. The United Kingdom is perhaps the most advanced in this area, and the state of technology can be described as being where wind was in the 1980s and 1990s. Marine estuary blockage systems are incredibly disruptive to local sea life and fisheries and are highly unlikely to be approved in the future. Future systems, to meet complex multi-attribute social and economic goals, must be able to “sit in” the tidal flow without disrupting fisheries, local sea life, tourism, etc.
© W
ikim
edia
Com
mon
s_Pu
blic
dom
ain

26
2.6. Ocean thermal energy conversion systems (TRL 5-6)
What is ocean thermal energy conversion, and where and how could it be useful?
OTEC is a fairly simple and theoretically well understood potential source of primary energy that utilizes the difference between ocean temperatures at the surface (it is therefore a form of derivative solar energy) and at depths of 1000+m. It requires a 20°C thermal differential, and because the temperature of the ocean is at a roughly constant 4°C at depth, this means that the surface temperature must exceed 25°C, which only occurs between 30° north and 30° south. While there are various basic designs (e.g. “closed cycle” systems using ammonia or another working fluid, “open cycle” systems directly using seawater, and hybrid systems) they all draw in cold water from the deep ocean using long pipe systems and utilize the temperature differential with surface water to run a heat engine and thereby generate electricity. Most OTEC designs also have several promising co-benefits: they provide firm, round-the-clock power, in contrast to solar PV and wind; they can produce cold water for air conditioning; and, perhaps most importantly in some contexts, they can produce desalinated water for drinking and irrigation. This has spurred interest in these systems for island needs in the deep ocean.
OTEC faces several technical and potentially costly to fix challenges to widespread adoption. First and foremost is building and maintaining the piping system in deep water in the face of ocean energies and storm potential. Shore-mounted OTEC piping must pass through the wave shore, and ocean-mounted OTEC piping has to transmit back to shore. Secondly, because ocean water must contact the heat exchangers at some point in either a closed or open system, microbial fouling has proven difficult to avoid without using chemicals that are toxic to marine life, and only a small amount of fouling can dramatically reduce efficiency. These challenges have, by and large, been overcome in pilot facilities, but at considerable cost.
© F
lickr
_ N
ASA
God
dard
Spa
ce F
light
Cen
ter

27
Potential contribution of ocean thermal energy conversion systems to climate mitigation efforts
OTEC technology is still in the R&D and early prototype phase, and unlike wave and tidal technologies, the players are not commercial but are mainly research institutes and universities. The technology saw a surge in interest from the 1970s through to the late 1980s, which ended in the early 1990s. While there are many site-specific case studies and conference presentations, there is very little high-quality peer-reviewed literature on OTEC, with much of it predating 2005. The only modern, systematic and peer-reviewed literature review we could find was Langer et al. (2020), and it found numerous methodological deficiencies in the existing 2005-2020 literature (e.g. lack of systematic costing, handling of interest rates, discounting, absence of technological learning).
While the potential primary energy from OTEC has been calculated using a global marine circulation model to be very large (~30 TW), translating to roughly 44,000 TWh per year, with a technical potential of 3.4-10 TW (Langer et al., 2020), the complexities and capital costs of operating in the ocean environment will likely limit its use to deep ocean islands that need locally sourced firm “round-the-clock” power and desalination services. Even in these conditions, OTEC will be competing against solar PV, wind, and green hydrogen made using electrolysis as a storage medium. It is indicative that most large experiments with OTEC have been conducted in Japan (with its large population to surface area and large deep ocean contact), Hawaii, and at remote island United States military bases. Several 100 kW-sized pilot systems have been successfully run, and 10 MW-sized systems have been comprehensively studied for United States military bases in the Pacific and Indian Oceans.
Mainly owing to capital costs and operating in a marine environment, costs per kWh are estimated across many studies at USD 2019 USD0.20-0.67 per kWh for 10 MW-sized units (Langer et al., 2020), falling to USD 2019 USD0.04-0.29 per kWh for 100 MW-sized units with experience and scale, which puts it above solar PV (USD0.02-0.05 per kWh) and wind (USD0.03-0.07 per kWh) costs including battery (+USD0.01-0.02 per kWh for overnight kWh) or hydrogen storage (+USD0.02-0.05 per kWh plus pressure vessel storage at 40-50% round trip efficiency). The key advantage of OTEC compared with other renewables is likely to be its capacity to produce desalinated water for drinking and irrigation on arid islands with limited space for solar PV and wind, but this will limit economies of scale and lessons learned compared with other renewables.
Social, institutional, economic and business preconditions for ocean thermal energy conversion systems
While there are as yet no fundamental social or institutional barriers to OTEC (large-scale MW systems may provoke resistance by local ocean users such as fisher people owing to the discharge of deep ocean water in the local ecology), there are very serious economic and business barriers to widespread adoption of OTEC.
A project in the Republic of Korea has successfully seasonally operated a 20 KW OTEC system, and is now working to build a 1 MW system for Kiribati, which would represent 1/6 of its electricity generation system. This pilot project will provide both engineering data and feedback on the social, institutional, and business conditions for operating OTEC systems (IRENA, 2020c).
The complexities and capital costs of operating in the ocean environment will likely limit the use of OTEC technology to deep ocean islands that need locally sourced firm “round-the-clock” power and
desalination services

28
2.7. Bioenergy associated with carbon capture and storage (TRL 6-8)
What is bioenergy associated with carbon capture and storage, and where and how could it be useful?
To set the stage for our discussion, bioenergy refers to plants (i.e. biomass) that can be harvested and used to extract energy, from the simplest forms of wood burning to sophisticated gasification and refining techniques more familiar to fossil hydrocarbons and alcohols. It can include plants (e.g. corn for making ethanol), food waste, forestry waste, pelletized wood, sugar bagasse waste (which is used in Brazil and other places for making ethanol), grasses, almost anything that is grown. The net CO2 effect of using bioenergy is highly dependent on the type of biomass and how it was extracted (Hepburn et al., 2019) – very broadly speaking, cutting a forest for bioenergy while destroying soil cover will tend towards a carbon-positive effect, while growing annual switchgrass for bioenergy on degraded agricultural lands (thereby increasing soil carbon) will tend towards a carbon-neutral effect. The results are, however, highly site-, process- and ecology-specific.
Very simplistically, there are four ways by which biomass is turned into energy: burning, which produces mainly CO2 and steam; anaerobic digestion to CO2 and methane; fermentation to CO2 and alcohols (methanol and ethanol); and cellulosic transformation of woody biomass to hydrocarbons or alcohols by a multi-stage process that transforms woody cellulose into fermentable sugars, again with by-product CO2.
Bioenergy with Carbon Capture and Storage (BECCS) refers to the use of biologically derived fuels or feedstocks (as above), either in energy generation or manufacturing, combined with the means to capture the CO2 waste stream. This latter step prevents the release of CO2 to the atmosphere and the corresponding contribution to anthropogenic global warming. The captured CO2 can then either be processed for long-term geological storage (CCS) or used in a variety of industrial applications, often referred to as carbon capture utilization (CCU). The final net GHG effects vary according to retention time and method of final disposal (i.e. to the atmosphere as waste, or into geological sequestration). BECCS is frequently discussed as if it is a single technology category or a type of technological artefact, but is more akin to a type of supply chain strategy that could have different inputs and performance characteristics when implemented in different regions. Widespread real-world deployment of BECCS might involve a mixture of different fuel types (e.g. from agricultural by-products, energy crops, harvested wood from forestry management activities), CCS approaches (e.g. saline aquifers, depleted oil fields), and target industries (e.g. power and/or heat generation, manufacturing, synthetic fuel production).
© F
lickr
_Sta
tkra
ft

29
BECCS has the potential to be a negative-emission technology, one that (on balance) removes atmospheric CO2 and contributes to a reduction in mean global surface temperatures (Gasser et al., 2015; van Vuuren et al., 2013). For this to be the case, the bioenergy fuel used in the process would need to absorb more CO2 from the atmosphere during the plant growth cycle than is used in cultivation, and most of the waste stream would need to be captured and stored (Hepburn et al., 2019; Smith et al., 2015). BECCS can be considered an early-stage technology, with only five operational facilities found worldwide; one of which is a large-scale facility (in Decatur, Illinois, United States of America) and four of which are demonstration or pilot-scale plants (Global CCS Institute, 2019). Depending on the application (power generation or industry) the International Energy Agency considers BECCS to be at TRL 7 or 8, in other words, it is considered to be either pre-commercial demonstration, or first-of-a-kind commercial (IEA, 2020a).
Potential contribution of bioenergy associated with carbon capture and storage to climate mitigation efforts
The earliest mention of the concept of sequestering emissions from bioenergy use in the peer-reviewed literature appeared in 2001 (Obersteiner et al., 2001) as a so-called “backstop” technology (Nordhaus et al., 1973), something to be used when the preferred course of action (i.e. mitigation through more established technologies) has failed. BECCS as a technology category within energy models and energy scenarios saw a rise in prominence during the 2010s, appearing with increasing frequency in modelling assessments as the most prominent of negative-emission technologies in the IPCC Fifth Assessment Report (AR5). This emergence in the literature can be tied to institutions working on climate mitigation increasing the stringency of their transition pathways in line with increasing global and national levels of ambition. BECCS is the focus of much discussion in work aimed at understanding how to implement the Paris Agreement goal of “net zero” emissions by the mid-century (UNFCCC, 2015).
The IPCC AR5 (L Clarke et al., 2014) found that 101 of the 116 scenarios (87%) that would limit warming to below 2°C required BECCS to deliver this transition (Fuss et al., 2014). Since the time that the AR5 was prepared, a broader range of climate mitigation options, including reductions in energy demand (Grubler et al., 2018), afforestation and land-use change (Humpenöder et al., 2014; Reilly et al., 2012; Smith et al., 2015), and direct air capture (Fasihi et al., 2019; Keith et al., 2018; Sanz-Pérez et al., 2016; Wilcox et al., 2017), have come to feature more prominently. Transition pathway analyses that use these alternative options often find that their absolute reliance on BECCS to achieve climate stabilization is reduced, but usually not eliminated. For example, the IPCC Special Report on 1.5 °C (IPCC, 2018) shows a strong role for BECCS at scale, as does the International Energy Agency’s latest net-zero study, but at a reduced level (International Energy Agency (IEA), 2021). BECCS in various forms also continues to be prominent in detailed regional studies of transitions towards net-zero emissions, for example, for the United States of America (Larson et al., 2020; Williams et al., 2021), China (Huang et al., 2020) and the European Union (Solano-Rodríguez et al., 2016).
Social, institutional, economic and business preconditions for bioenergy associated with carbon capture and storage
As noted above, BECCS is an early-stage technology that (at the time of writing) is just moving past the demonstration stage towards limited commercial deployment. Owing to relatively high costs compared with other mitigation options, the uptake of BECCS would need to be driven mainly by climate policy initiatives in different regions. The complexity of the overall supply chain and the lack of non-climate-related incentives makes it unlikely that BECCS projects would spontaneously emerge under current market forces. If BECCS is to ever be deployed at scale, a very strong climate policy environment with targets linked to the Paris Agreement and appropriate transition planning to introduce the technology would be mandatory. The other preconditions for BECCS deployment are the availability of both bioenergy fuels and CCS infrastructure, which face their own social, institutional and economic barriers.

30
Bioenergy resources
The sustainability potential of bioenergy has been the subject of intense debate (Searchinger et al., 2009, 2008). The production, processing and transportation of the bioenergy fuel itself may generate emissions that offset or reduce the negative-emission potential of BECCS. In an extreme case, if more emissions are generated in cultivating the fuel input to BECCS than is captured from the atmosphere, then this would compromise the assumption that BECCS is a negative-emission technology (Agostini et al., 2013; Vaughan and Gough, 2016). In order to avoid this possibility, the use of BECCS would need to be accompanied by robust regulations stipulating that low-carbon bioenergy inputs are used, trusted standards to certify the life cycle emissions of the fuel are employed, and that capable institutions are empowered to monitor and enforce compliance. Establishing a life cycle accounting and management process for validation and verification of the whole supply chain for BECCS fuels is likely to be challenging and would require significant investment and an accompanying incentive structure.
Depending on the source, bioenergy fuel requires many of the same inputs as food production (i.e. water, fertilizer, land, etc.). Much analysis has explored whether the use of land for bioenergy might negatively impact food prices for consumers, ecosystem diversity, and agricultural livelihoods (Creutzig et al., 2015; Tilman et al., 2009). Supplying bioenergy fuel to meet the upper range of BECCS use found in model assessments that stabilize the climate at 1.5 or 2°C has potentially onerous requirements. Studies have contextualized the scale of the challenge by illustrating that widespread use of BECCS might involve land use comparable to the total surface area of India (Anderson and Peters, 2016), and water use that is equal to double the amount used globally for agriculture (Fajardy and Mac Dowell, 2017).
It is difficult to conclude with the kind of certainty desired by policy decision makers exactly how much bioenergy can be produced in the future before competition with food production or with natural ecosystems might make this activity socially unacceptable or ecologically irresponsible, and the upper and lower bounds of estimates can be wildly divergent depending on a range of broadly plausible assumptions (Slade et al., 2014). The suggested remedy for this lack of policy certainty found in the literature is to incrementally fund progressively more ambitious energy crop demonstration projects with a view to obtaining more data on the costs and trade-offs involved.
Carbon capture and storage infrastructure
From a technological perspective, carbon capture and storage is a mature process with few knowledge barriers – it reutilizes known oil and gas extraction and processing technologies in new ways. The process of injecting CO2 into oilfields as a means of enhancing flow rates, a process called enhanced oil recovery (EOR), has been employed in the oil extraction industry for decades. The barriers to widespread deployment are largely socioeconomic and institutional in nature. While captured CO2 can and does have a variety of industrial applications, the investment required to capture CO2 from power generation is relatively expensive compared to the value of the CO2 itself. As a result, carbon pricing market structures sufficiently broad and stringent to incentivize the development of the extensive infrastructures needed for carbon capture and storage have not existed to date and may only be coming into existence now. In effect, the price of emitting CO2 must reach at least USD20-40 per tonne on all emissions to trigger CCS for existing concentrated flows, and USD50-USD125 per tonne to trigger post-combustion CCS projects (Kearns et al., 2021; Leeson et al., 2017; Mac Dowell et al., 2017). The market for CCS and BECCS, like many emission mitigation technologies, must be politically constructed as part of a deliberate effort to transition away from the status quo (Meadowcroft, 2013). Even in high-income countries with climate policy agendas, the policy support for carbon capture and storage has historically been weak and inconsistent (Scott et al., 2013). Active policy support from governments to directly fund or create market incentives for the technology is required (e.g. direct fiscal payments, carbon taxation).
With appropriate policy support, long-term storage of carbon in reservoirs would mainly be constrained by geology and societal preferences. Captured CO2 can potentially be stored in a variety of geological structures, such as depleted oil fields, coalbeds, and usually most securely, deep saline aquifers. The distance of these geological formations from power generation or industrial generation facilities and the costs of infrastructure to connect from polluting sources to the CO2 injection sites are key considerations that may influence the viability of CCS at scale (Rubin et al., 2015).

31
Research into the public perception of carbon capture and storage reveals a mixture of perspectives. Different actors in the public sphere perceive CCS differently, with, for example, NGOs being more sceptical of CCS than governments (Fridahl, 2017). There is also a heterogeneity of viewpoints both within countries and between different countries. Broadly speaking, studies have shown that the issue of storage is perhaps the most controversial aspect of CCS for the public. The perceived risk of leakage from CO2 storage reservoirs is often mentioned as a major concern (Johnsson et al., 2009), with residents who live close to proposed storage sites being significantly more likely to oppose CCS than those that live further away (Braun, 2017). Widespread public opposition to CCS projects has already led to projects being cancelled in the Netherlands (Brunsting et al., 2011) and in Germany (Dütschke et al., 2016), with the degree of opposition being so great in Germany that CCS has been almost completely absent from climate policy planning over the last decade (Vögele et al., 2018). A wide-ranging meta-analysis of 42 different studies on public attitudes to CCS in 14 countries found that framing the role of CCS in the context of broader efforts to control GHG pollution is required to counter the perception that the technology represents an unwarranted “tampering” with nature (L°Orange Seigo et al., 2014). Successful CCS (and, by extension, BECCS) deployment will require sustained communication and outreach efforts by governments to obtain a social licence to operate, and regionally differentiated strategies are likely to be required (Gough and Mander, 2019).
BECCS appears in model-based exercises as an extremely important technology for future efforts to stabilize the climate but is simultaneously under-prioritized in terms of policy support and investment relative to other mitigation options (Fridahl, 2017). The anticipated political and social constraints to BECCS deployment are expected to be high (Fridahl and Lehtveer, 2018), and the controversies about the long-term sustainable use of bioenergy and the societal acceptability of long-term storage of CO2 underground persist. There remain concerns that net-zero pathways that emphasize BECCS are placing too much emphasis on a technology that may never be used at the scale imagined in models (Buck, 2016; Kartha and Dooley, 2015), and that this distracts from an important focus on other approaches to climate mitigation (Creutzig et al., 2021; Larkin et al., 2018).
For any of the mitigation potential of BECCS shown in model assessments to be realized in future, a number of hurdles would need to be overcome. Governments would need to successfully align the interests of agricultural producers, power generators and manufacturing industries in order to create a new supply chain for emissions sequestration. Policy support for BECCS would need to be massively increased over the current levels through market design or direct payments, as well as successfully obtaining societal buy-in from the public. A credible emissions accounting system for bioenergy fuels would need to be established alongside regional limits on land and water use to protect established ecosystems and food production. Lingering concerns about the safety of long-term CO2 storage underground would also need to be addressed.
© F
lickr
_Dav
id C
ornw
ell

32
3. EMERGING ENERGY TRANSFORMATION AND STORAGE TECHNOLOGIES TO ENABLE CLEAN END-USE ENERGY
The next four technologies are not energy supply technologies, but technologies that expand the supply of end-use energy available using clean but variable primary energy sources, such as the ones listed in the previous section.
3.1. Green hydrogen (TRL 8+)
What is green hydrogen, and where and how is it useful?
Hydrogen is a highly combustible, energetic gas that produces no GHGs when oxidized (combusted), widely used as a chemical industry and refinery feedstock. It can be used for direct process heating at all widely used temperatures, is a potential end-use fuel in internal combustion engines and turbines and is transformable into electricity using fuel cells for vehicles or stationary use. It is widely suggested as an alternative or complementary pathway to electrification for economy-wide decarbonization (Bataille et al., 2018; L. Clarke et al., 2014; Davis et al., 2018; International Energy Agency (IEA), 2019; IRENA, 2019b; Williams et al., 2021). How the hydrogen is made, however, is critical to its GHG impact.
© F
lickr
_Sun
fire®

33
While, ideally, hydrogen GHG intensity would be reported on the basis of its CO2 emitted per kg produced, a common nomenclature has evolved around hydrogen production that works passably well but is not strictly informative as to the GHG intensity of the different production methods (International Energy Agency (IEA), 2019):
• Black hydrogen is made via steam methane reformation of coal into H2 and carbon monoxide or dioxide, generally for use as a chemical feedstock – it is the most GHG-intensive way of producing hydrogen.
• Grey hydrogen is made via steam methane reformation of fossil methane, usually followed by a water gas shift reaction to maximize the amount of hydrogen extracted from methane. It is usually the most economical way to create hydrogen today, usually for hydrotreating in crude oil refineries (i.e. the addition of hydrogen to carbon chains to make them “lighter”, generally more liquid and more combustible). It is also how most hydrogen is made for ammonia (NH3) fertilizers globally, with the hydrogen and nitrogen catalysed into NH3 using the Haber Bosch process, and then into urea.
• Blue hydrogen is the same as grey hydrogen, but the CO2 produced by the steam reformation and gas shift reactions are captured and sequestered, normally underground. With 90%+ capture, a 30-40% energy loss from combusting methane is incurred, but there is a 90%+ reduction in CO2 released. The net GHG intensity of blue hydrogen is, however, like all uses of methane highly contingent on the methane leakage rate from well to reformer.
• Green hydrogen is a fundamentally different process for making hydrogen, where electricity is used in an electrolyser to split water into hydrogen and oxygen. Electrolysis has been commercialized since the 1880s using large and heavy alkaline electrolysers. However, there are two new ways to make green hydrogen that are entering the market. The first is the proton exchange membrane electrolyser (PEM, TRL 8), which is lighter, smaller and more modular, and therefore better suited to vehicles. It also typically uses expensive platinum catalysts. The second is solid oxide fuel cells (SOFC, TRL 6-7), which are larger, heavier and operate at higher temperatures, but are potentially more efficient and can operate in a dual directional mode, making them ideal for electricity to H2 back to electricity operations. When operated at higher temperatures they do not need the expensive platinum catalysts used in PEM fuel cells. Because of the high temperatures at which they operate, they can also operate on lighter hydrocarbons such as methane, propane, butane, etc. If paired with CCS to capture the resulting CO2, SOFCs can be used to make clean electricity. There is another thermal version of electrolysis, where 600-800°C heat is used to separate hydrogen and oxygen (this has been done commercially with nuclear reactors), and is often termed purple hydrogen.
Blue hydrogen is currently much cheaper than green hydrogen in most regions (USD1.5 versus USD4-5+ per kg), and will likely continue to be so until at least 2030 (International Energy Agency (IEA), 2019). The cost of green hydrogen is highly dependent on two things: the capital cost of electrolysers (currently more than USD900/KW); and the cost of electricity (which needs to be USD0.02 per kWh or less to be remotely competitive with blue hydrogen (IRENA, 2020d). Economies of production are building for PEM electrolysers, however, and over the coming decade or so their capital costs could fall to USD500/KW and perhaps even to USD200/KW. In regions with exceptional sun, poor CCS geology and strong hydrogen demand (e.g. southern Europe), green hydrogen could be cheaper than blue hydrogen by the end of the 2020s. This could start a virtuous circle of stronger demand and resulting lower costs, which will lead to more demand. Most global deep decarbonization scenarios show green hydrogen taking over from blue hydrogen by the late 2030s or early 2040s and dominating thereafter (CCC, 2020; International Energy Agency (IEA), 2021). Blue hydrogen will likely hold market share well into the 2050s in regions with very cheap methane and good CCS geology (e.g. North America, the Middle East, and the Russian Federation).

34
Potential contribution of green hydrogen to climate mitigation efforts
The key attribute of green hydrogen is that it allows a means for transforming variable intermittent wind and solar PV electricity into a highly useful, storable energy carrier that can also be transformed back to electricity as needed. Round trip efficiencies are about 30-40% today but are expected to rise to 49% by 2030 with innovation (International Energy Agency (IEA), 2019); this effectively means that wind and solar produced for USD0.02-0.03 per kWh can be resold when needed as firm on-demand power for USD0.05-0.07 per kWh, which could eventually transform the decarbonization of electricity grids. It also reduces the loss of renewable wind and solar through curtailment. In effect, it has the potential to add time and space option value to instantaneously generated wind and solar electricity for on-demand electricity, process heat, or chemical feedstocks (e.g. for making fertilizer, upgrading biogasification products, reducing iron ore to make steel). The potential contribution of green hydrogen could be very large but is highly contingent on the availability of relatively inexpensive wind and solar PV electricity. The IEA NZE report shows a quintupling of hydrogen use by 2050, with the contribution of green hydrogen rising from 5% to 63% by 2050 as solar PV and electrolyser costs fall. It is the largest single use of electricity by 2050 in the IEA NZE report 2021.
Social, institutional, economic and business preconditions for green hydrogen
The only commonly discussed objection to hydrogen in general is its flammability, with much of its cultural reputation being associated with the Hindenburg zeppelin disaster. All energy forms have handling and storage issues (e.g. electricity, natural gas, gasoline, liquefied petroleum gas, diesel, ammonia); however, the only additional characteristic that may make hydrogen more difficult to handle is that it burns very quickly and transparently, with no colour. It also has no smell – methane does not have a smell either, so mercaptan is added to identify leaks, which smells like sulphur or rotten eggs. These issues, while relatively simple to resolve technically (e.g. through the addition of inert chemicals that give it a smell or visible flame), may face some challenges if and when hydrogen is in more general use. At present, beyond specialist industrial firms, there is no common knowledge of safe hydrogen production, storage and handling procedures (e.g. design storage with lots of ventilation and a clear line of site upwards in the event of an explosion). Even one or two well-publicized accidents could impede its market take-up.
Hydrogen is also corrosive to steel in that it scavenges carbon atoms from stainless steel. Dedicated hydrogen pipelines and storage tanks would need special steel grades or plastic liners to prevent corrosion while operating at the higher pressures and volumes needed to deliver the same amount of energy in the same time as methane (hydrogen has 1/3 the energy per unit volume at the same pressure compared with methane). Plastic gas piping is impervious to hydrogen corrosion, which is partly why blue hydrogen is being experimented with as a heating fuel in northern England, where the gas piping has all been replaced with plastic.
Perhaps the greatest challenge hydrogen faces is the “chicken and egg” problem of infrastructure and end-use supply and demand. Substantial amounts of hydrogen are already made and used for fertilizer production and hydrotreating in crude oil refining. In both cases, the hydrogen is made, generally from methane or coal, on site where it is to be used. In early applications of green hydrogen, likely as chemical feedstocks for making ammonia fertilizers (Philibert and IEA, 2017), reducing agents for iron ore reduction (Vogl et al., 2018), or making CCU- or biomass-sourced CO2 methanol (IRENA, 2021c), the hydrogen will likely be made and stored on site.
The greatest challenge hydrogen faces is the “chicken and egg” problem of infrastructure and
end-use supply and demand

35
Another earlier bulk application is where green hydrogen is stored in salt caverns to provide on-demand electricity (using turbines or fuel cells) when wind- and solar-based systems cannot meet demand. Balancing through transmission and batteries is likely to provide most firm power support on a day-to-day scale; where stored hydrogen will matter is in providing seasonal support, for example, for the weeks without wind in the northern continental winter.
A simple challenge in all businesses is that demand is required to justify supply investment. Beyond the niche applications described above, where dedicated hydrogen would be made and stored on site, the presence or absence of infrastructure to transport hydrogen to heavy truck fuelling sites, etc., may determine the speed of its long-term uptake, as well as its success against alternatives like battery electrification and biofuels.
Innovation is crucial to reduce costs and improve the performance of electrolyzers. The ultimate goals are to: 1) reduce costs by standardizing and simplifying manufacturing and design to allow for industrialization and scale-up; 2) improve efficiency to reduce the amount of electricity required to produce one unit of hydrogen; and 3) increase durability to extend the equipment lifetime and spread the cost of the electrolyser facility over a larger hydrogen production volume. Governments can support innovation in electrolysers by issuing clear long-term signals that support policy on:
• Facilitating investment in production, logistics and utilization of green hydrogen, including all areas that will help this low-carbon energy carrier to become competitive: technology costs and performance improvements, material supply, business models and trading using common standards and certifications.
• Establishing regulations and designing markets that support investments in innovation and scale up the production of green hydrogen. This includes approaches such as setting manufacturing or deployment targets, tax incentives, mandatory quotas in hard-to-decarbonize sectors and other de-risking mechanisms, while enabling new business models that can guarantee predictable revenues for the private sector to invest at scale.
© F
lickr
_Com
mSc
ope

36
3.2. Next-generation batteries for behind-the-meter and utility-scale storage (TRL 3-8+)
What advancements are available for next-generation batteries, and when and where could they be useful?
The use of electrochemical batteries for portable power in consumer electronics, industrial equipment and vehicles has come to be a daily experience for people worldwide in a way that would be unrecognizable three or four decades ago. Over this time, manufacturers have pioneered the development of new battery chemistries, making consistent incremental improvements to proven battery technologies. Most consumers will be familiar with lithium-ion batteries, which have been the dominant form of energy storage in portable electronic devices such as computers and mobile phones over the last two decades, and lead-acid batteries, which are used in internal-combustion vehicles to provide the initial current to engine starter motors. The only battery chemistry family that comes anywhere near to lithium-ion across key performance parameters such as energy density, power density, charge time, life cycle and safety is nickel-metal hydride, which continues to be used in niche applications where energy density is less critical.
Lithium-ion batteries are a family of electrochemical devices with heterogeneous characteristics in terms of their exact chemistry, size, shape and performance (Goodenough and Park, 2013). Incremental improvements over time, such as experimenting with new materials, new chemistries and new physical cell structures have led to great improvements in performance and cost. On average, lithium-ion battery costs have fallen 91% since their commercial introduction in 1999, while the maximum possible energy density in finished products has risen by a factor of 3.5x (Ziegler and Trancik, 2021). These continual improvements have already brought lithium-ion batteries into new markets beyond portable electronics. Market solutions for both electric vehicles and electricity storage, whether grid-connected or installed behind-the-meter (i.e. in a home or at a business), are already commercially available at the time of writing. These technologies are finding success in profitable niches, such as electric bicycles, scooters and motorcycles (Weiss et al., 2015), passenger cars (Rietmann et al., 2020), and uninterruptible power supplies in data centres.
The competitiveness of battery systems appears likely to continue improving rapidly. A promising breakthrough in 2021 has meant that solid-state lithium-metal batteries, long considered “the holy grail” of lithium-ion battery technology, have now moved from the realm of theory into reality (Ye and Li, 2021). These next-generation batteries offer large non-marginal improvements over existing battery technology in terms of energy density,9 battery durability and safety, while also enabling charging times that are extremely rapid by today’s standards. If production can be successfully scaled, the use of solid-state batteries could be transformative, particularly for the automotive market, as it potentially enables the development of electric vehicles with batteries that have lifetimes comparable to internal combustion engine cars (10-15 years), which have driving ranges that compete with gasoline and diesel fuels (e.g. 300+ miles/480+ km), and that can be fully recharged in as little as 10-20 minutes. Solid-state lithium batteries could also be safer than existing batteries, which have flammable electrolytes and can create a self-heating chemical reaction that ends in an explosion if short-circuiting occurs, such as after a collision (Feng et al., 2018).
Going beyond the all-solid-state lithium battery, breakthroughs in lithium-air technology might provide a similar step change in the energy density available from batteries. There is of course a big difference in performance between a battery in idealized laboratory conditions and a commercially deployed battery pack, but, even so, simple back-of-the-envelope calculations show that lithium-air batteries potentially provide the kind of energy densities10 that compete directly with or even supersede those of fossil fuels, bringing, for example, electrification of large aircraft within the realms of technological possibility (Schäfer et al., 2019; Viswanathan and Knapp, 2019).
9 For example, a typical lithium-ion battery with a liquid electrolyte might have an energy density of 260 Wh/kg (Janek and Zeier, 2016), while the recent laboratory prototype for a solid-state battery developed by Ye and Li performs at 631 Wh/kg (Ye and Li, 2021), which is an improvement of at least 2x.
10 Laboratory-constructed lithium-air battery prototypes already show energy density in the range of 1600 Wh/kg, and theoretically could be as high as 5000 Wh/kg (Kribus and Epstein, 2021). This vastly outperforms a conventional lithium-ion battery with 260 Wh/kg (Janek and Zeier, 2016). For perspective, liquid fossil fuels like gasoline and aviation jet fuel (kerosene) have an energy density of around ~1200 Wh/kg.

37
Batteries for energy storage applications have different design constraints and possibilities when compared to batteries for transport. Stationary batteries do not need to be mobile or packaged into a vehicle, so weight and energy density are less of a concern, as is a requirement to tolerate mechanical damage in a hypothetical collision accident. At the same time, the market for energy storage batteries points towards a need for longer lifetimes, better performance across a range of temperature conditions, and lower per unit costs (Trahey et al., 2020). Lithium-ion batteries are already cost competitive and used for grid electricity storage in a range of markets (Hesse et al., 2017), and, in the near future, so-called flow batteries may also emerge as stiff competition for lithium-ion batteries (United States Department of Energy, 2020a).
Unlike traditional batteries which have the electrolytes and electrodes packaged together in the same container, flow batteries keep the electrolytes separate in external holding tanks and pump them through the power-generating stack when needed (Soloveichik, 2015). Flow batteries have a much lower energy density than lithium-ion batteries, and as a result are much heavier and bulkier by comparison. However, they possess other key advantages. Flow batteries do not compete with automotive applications for lithium, can discharge and provide power for as much as 10 hours, use components that do not degrade from cycling, have very long lifetimes (30+ years), and do not use flammable electrolytes, making them potentially safer to operate (Skyllas-Kazacos et al., 2013). At the time of writing, pricing looks to be competitive for grid-scale systems (e.g. 100 MW, 10-hour duration), with flow batteries being slightly more expensive in capital cost terms than lithium-ion batteries, but offering lower overall annualized costs owing to their longer lifetimes (United States Department of Energy, 2020b). For these reasons, industry projections estimate that flow batteries could capture almost half of the global utility-scale energy storage market by 2030 (Bloomberg New Energy Finance, 2020a).
Alternative battery chemistries to lithium are a popular subject for battery research, for example, sodium, potassium, magnesium, calcium, and aluminium (Zhao et al., 2018). Having a wider variety of battery chemistries available potentially reduces costs (if cheaper and more abundant metals are used), lowers the dependence of future battery technologies on lithium alone (Kribus and Epstein, 2021), and mitigates the risk that supply shortages for one or a few critical materials introduce price volatility (Ballinger et al., 2019; Grandell et al., 2016). Within this family of lithium alternatives for high energy density applications, aluminium batteries are perhaps the most well researched (Das et al., 2017; Leisegang et al., 2019).
While alternative battery chemistries do show promise, lithium-ion batteries currently dominate across a range of industries, due to their technological maturity and the ability of existing supply chains to already manufacture and distribute such batteries at great scale. In technological development terms, the timescale for efforts to limit warming to 1.5°C by mid-century in line with the Paris Agreement (UNFCCC, 2015) is extremely short, and immediate action is required to avoid the most damaging effects of anthropogenic warming (IPCC, 2018). For these reasons, it is likely that lithium-ion batteries or their direct successors will, at least initially, be the main component of key climate mitigation technologies such as electric vehicles and grid-connected electricity storage, potentially defining their early market success or failure during this decade. The International Energy Agency ranks lithium-ion batteries at Technology Readiness Level 9 (commercial operation in relevant environment, actual system proven in operational environment) for grid-scale electricity storage, and 10 (integration needed at scale) for electric vehicles (IEA, 2020a). The same reference source ranks flow batteries at TRL 8 (first-of-a-kind commercial, system complete and qualified) for electricity storage.
© U
nspl
ash_
Kum
pan
Elec
tric

38
Potential contribution of next-generation batteries to climate mitigation efforts
Both global-scale models (International Energy Agency (IEA), 2021) and detailed studies of decarbonization in major world economies (Larson et al., 2020; Tsiropoulos et al., 2019) that explore strategies consistent with achieving the climate targets linked to the Paris Agreement are remarkably consistent across regions in that nearly all personal transport becomes electrified. The implication is that nearly all forms of transport that are currently powered by fossil fuelled engines are replaced by electric drive motors with energy stored in batteries. The more rapidly this can occur, the better the outcomes are for climate stabilization (IPCC, 2018).
The electricity used to power the personal transport fleet must also be produced with close to zero emissions for the environmental benefits of electrification to be realized. This means that the power grid needs a rapid transition to non-polluting forms of generation. When compared to the big picture for electric vehicles, which is remarkably consistent globally, there is less agreement between national studies about the best way to approach power system decarbonization, but electrical energy storage at a variety of scales is often considered to be potentially transformative for the grid (Lott and Kim, 2014). Improved batteries potentially increase the rate at which renewable energy resources can be used as storage in batteries, enabling the time shifting of energy demand (Arbabzadeh et al., 2019; Kittner et al., 2017).
Batteries for energy storage, whether dedicated behind-the-meter or utility stationary or transport batteries, have another large potential benefit as “virtual power lines” (International Renewable Energy Agency (IRENA), 2019; IRENA, 2020e). Variable resources by definition are unmatched to demand, and are dependent on the capacity of the transmission system to transfer the power to end-use demand. But new transmission is difficult to site and expensive to build. Storage near generation and demand, which utilizes unused off-peak capacity in existing transmission, increases the value of variable generation and existing transmission, and makes end-use electrification cheaper. These financial and mitigation values are potentially very large, but highly dependent on regional context and scenario assumptions. Key to their realization are regulatory and market institutional environments that value and encourage their potential multi-service business cases (e.g. transmission deferral, frequency regulation, black start, instantaneous demand response and ramping, reduced generation curtailment, system redundancy) as well as the digital supply–storage–end-use connection that allows and encourages these strategies and the physical storage they enable (Griesheim et al., 2020; IRENA, 2019c).
Social, institutional, economic and business preconditions for next-generation batteries
Lithium-ion batteries are currently used mostly in personal electronics (laptops, phones, etc.) but, as discussed above, could soon also become much more widespread in transportation and in the power grid. These are large markets. Taking the United States economy as an example, personal electronics represent only 2% of total energy use, while transport and the electricity grid account for 66%; this means that the size of the potential market for next-generation batteries is at least a full order of magnitude (i.e. 10x) larger than the present-day battery market (Crabtree et al., 2015).
At least one recent industry battery price survey puts the average cost of producing lithium-ion battery packs at USD137 per kWh, with some manufacturers in China already able to deliver at USD100 per kWh (Bloomberg New Energy Finance, 2020b). This means that the long-held target of USD125/kWh for a battery pack posited by the United States Department of Energy and a number of major auto manufacturers (Blomgren, 2017) has either already been achieved or is about to be achieved imminently. Even without dramatic technology breakthroughs (e.g. radically new chemistries), continued reductions in the costs of existing technology will make electric vehicles cost-competitive with combustion-engine cars this decade (Crabtree, 2019). Lithium-ion batteries (alongside flow batteries) are also likely to be one of the most competitive options for the majority of electricity storage applications from 2030 onwards (Schmidt et al., 2019).
Storage near generation and demand, which utilizes unused off-peak capacity in existing transmission, increases the value of variable
generation and existing transmission, and makes end-use electrification cheaper

39
Any future advances in battery technology beyond current technologies have the potential to rapidly accelerate the deployment of electric vehicles and renewable electricity generation. Researchers at the European Union Joint Research Centre have explored a number of scenarios where the rapid growth of the electric car market would create the innovation conditions that drive costs down in the battery electricity storage market (Tarvydas et al., 2018), as there are clear synergies between the two in terms of supply chains. With batteries and the use of battery-using devices already intertwined into the fabric of daily life in much of the world, the societal barriers to their use are already low. Reduced costs and improved performance seem to be the main prerequisites to driving increased adoption.
Accelerating battery technology development and deployment requires continued investments in fundamental research and electrochemistry (Trahey et al., 2020). This is true for almost all promising new battery types that are under investigation, such as lithium-air (Liu et al., 2020) and aluminium-ion (Leisegang et al., 2019), but also for continued improvements in conventional lithium-ion batteries, which are far from obsolete (Grey and Hall, 2020). As well as fundamental research, continued funding of work investigating state-of-the-art manufacturing and production methods is also required to scale new innovations beyond laboratory settings (Liu et al., 2021). For example, a key challenge for solid-state lithium batteries is that entirely new production processes need to be developed and applied (Schnell et al., 2018). Owing to the size, scale and immediacy of the climate challenge, contemporary innovation policy thinking suggests that a strong role for governments in directly or indirectly funding the required research would be appropriate and necessary (Mazzucato, 2018; Myslikova and Gallagher, 2020).
Finally, there are rapidly developing issues regarding security of supply for key materials in batteries, as well as recycling systems to process them. Suffice to say, new supplies of lithium and electrode materials are emerging quickly, driven by price surges in these materials. More problematic in the long run is the lack of clear development of a recycling system for battery materials or standards of design for recyclability. This is an area for significant new research and rapid policy development to keep up with the growing global stock of operating batteries.
© F
lickr
_UN
DP
Clim
ate

40
3.3. Thermal energy storage (TRL 3-8+)
What is thermal energy storage, and when and where could it be useful?
Thermal energy storage allows heat or cooling energy to be stored and used at a later date across multiple time and spatial scales (with steam or hot water transport), and as such is a useful complement to variable renewable energy sources, such as direct solar heating (IRENA, 2020f). Its economic value is in its capacity to transfer operationally free variable renewable energy to the time period when it is needed (Sodano et al., 2021). It thus also has the capacity to help reduce strain on and investment needs in other parts of the energy system, especially electricity supply and transmission.
There are three primary forms of thermal energy storage: sensible, latent, and thermochemical. Sensible is the most direct and intuitive, where a material is heated, stored in an insulated container, and the heat released as needed. Latent is based on a phase change, for example, from gas to liquid, or liquid to solid, where the phase changes but not the temperature. Thermochemical is based on a reversible exothermic (heat extruding) or endothermic (heat absorbing) chemical reaction in a specific material.
All three primary methods of thermal energy storage enjoy the same basic advantages in that they use typically free solar energy as the energy source, and the same disadvantage in that they are capital and material intense.
Sensible direct thermal energy storage
Many materials are used for sensible thermal energy storage: rock and concrete, molten salts, water, silicon and metals (like aluminium). All have different thermal capacities and costs in a given application.
Rock and concrete, because they are cheap and ubiquitous, are very commonly used for thermal energy storage in passive building applications. They are typically placed behind glass (which has a greenhouse heat-trapping effect) with an air gap towards the sun. They heat through the day and release their heat at night. The performance of these systems depends entirely on the building design, orientation, thermal envelope efficiency, and local climate.
© F
lickr
_San
dia
Labs

41
Molten salts are the current storage medium of choice in concentrated solar applications, where a system of mirrors is used to heat the liquid salts which are stored in a system of insulated tanks. Water is run through the salt in an isolated loop and becomes steam, running an electricity generation turbine as needed, and then recirculates back. The salts, which become liquid at 130°C, are typically cycled from 288°C to 566°C and back. This method has been used to successfully power a concentrated solar power tower system around the clock in Spain for 36 days, but the technology cannot yet be described as fully reliably commercialized.
Underground thermal energy systems are a derivative of commercial ground-source heat pumps, which use electricity and working heat transfer fluid to move naturally occurring underground heat energy into a building. A heat exchanger is used to transfer the heat into the building while the fluid is relooped underground. In a storage mode, thermal energy is moved underground in water into natural or constructed impermeable formations in times of surplus (day/summer), and then extracted in times of need (night/winter). While very efficient and inexpensive in operation, both ground-source heat pumps and their use for heat storage are subject to the capital costs (which can be >10x the cost of a natural gas furnace) for drilling the access boreholes, as well as pumps and heat exchangers.
Latent phase change energy storage
Latent phase change energy storage makes use of the heat absorbing and extruding nature of some materials when changing phase from solid to liquid to gas. Materials that experience these properties include various salts, polymers, gels, waxes, metal alloys and ice. With the significant exception of ice as a coolant, there are no broad uses of phase change materials for energy storage to date, but many have been tested because of their capacity to hold significant amounts of energy without a large temperature change, in contrast to sensible thermal storage.
Thermochemical energy storage
Thermochemical energy storage is based on using reversible endothermic (heat absorbing) and exothermic (heat giving) chemical reactions to store energy. There are many possible reactions, but a simple example with a potentially broad utility is the use of salt hydrates from commonly available chemicals (e.g. sodium hydroxide). Solar energy could be used to evaporate a 50% solution of sodium hydroxide, leaving salts. When water is added again, heat is released at 50°C. The system is especially useful for seasonal energy storage for building heating, because the salts for a heating season for a family home could be stored in 4-8 m3 , or purchased on the open market (https://www.merits.eu/heat_battery). Experimentation is ongoing with different salt compounds.
Potential contribution of thermal energy storage to climate mitigation efforts
At one time, many predicted that CSP towers with molten salt storage would be the biggest source of solar-generated power, but solar PV panels seem to have fundamentally outcompeted them on bulk cost per kWh, limiting this potential use of high temperature storage. Wind and solar PV provide intermittent and variable power, however, whereas CSP is dispatchable, so there may yet be a need for large storage for CSP projects once large amounts of wind and solar PV are installed and more electricity is needed for low-GHG electrification.
© F
lickr
_NAV
FAC

42
Given this, the biggest contributions that could be made by thermal energy storage are likely to be in buildings and the light industry, where there is the largest potential to transform and transfer solar or ambient heat in the range of 25-50°C into useful heat for other time periods, including low temperature steam, both as is and with the use of heat pumps, which use electricity to concentrate heat from a source (the ground, air, or a district heating loop) and move it somewhere else (e.g. into a building). Industrial-scale heat pumps, if they have enough access to sufficient lower-temperature heat, regularly lift temperatures to 80-90°C, and the current generation of state-of-the-art industrial heat pumps can go to 150°C, meeting most lower-grade steam needs (see the next section on heat pumps). Residential thermal energy systems could have a very large impact in cold, low-humidity regions where heat pumps are less effective (e.g. in parts of the Canadian Prairies), but much development and commercialization work needs to be done first.
A key area for future research, investigation and deployment of thermal energy systems outside the scope of this project is in developing and newly industrialized country “cold chains”, especially for food, for example, (Dong et al., 2020), to minimize the need for clean electrification for refrigeration. The author was present for a presentation by Chinese researchers, unfortunately not possible to reference, which indicated that the Chinese cold chain is responsible for at least a 1 Gt CO2 per year of electricity use.
Social, institutional, economic and business preconditions for thermal energy systems
Passive solar water heating and storage systems (i.e. black plastic water tanks on top of buildings with optional heating arrays) for residences and buildings are a commercial technology already in use around the world.
In terms of more sophisticated systems, heating systems, especially in residences, apartments, and small- and medium-sized enterprises, are mostly not a conscious choice of homeowners, building owners or light industrial firms – they use what is made available to them by local infrastructure and the market. While ground-source thermal storage systems can be retrofitted to existing homes and buildings, they are significant projects with relatively large capital outlays, time and physical disturbances to the tenant and grounds, and require a skilled contractor. They are more likely to be incorporated into new buildings, either through owner specification or local regulations.
Solar heating and thermal storage systems for light industry (e.g. food processing, beer making) are highly viable in most latitudes and are gaining ground, but not at a sufficient pace to make a large dent in energy demand or climate targets. Most literature on the use of solar energy for industrial purposes to date focuses on supplementing other electric and gas sources to reduce GHG emissions, not replacing them entirely as overnight and seasonal storage allows.
To be reliable and cost effective, solar heating and thermal storage systems require specialist design and construction with good knowledge of the client facility’s needs. Enabling more uptake, to the point where it is self-sustaining based on demand and capacity to deliver, would likely require education and finance programmes, ideally delivered by specialist contractors hired by government agencies to enhance market uptake.
The biggest contributions that could be made by thermal energy storage are likely to be in buildings
and the light industry, where there is the largest potential to transform and transfer solar or ambient
heat in the range of 25-50°C into useful heat for other time periods

43
3.4. Heat pumps (TRL 8+)
What are heat pumps, and where and when are they useful?
Heat pumps are a family of heating devices found in domestic, commercial and industrial settings that take low temperature heat from a source location and use it to increase the temperature in a target space. The simplest way to think about a heat pump is that it operates on the same thermodynamic principles as a refrigerator, but in reverse. A refrigerator maintains a cold interior that is used for chilled food storage by taking thermal energy out of the air inside the cabinet and rejecting it via cooling coils at the rear of the unit. A domestic heat pump, on the other hand, takes thermal energy from the surrounding environment (air, water, or the ground) or another heat source (like industrial waste heat), and pumps it to a target destination (like inside a home), raising the temperature. Just like a refrigerator, a heat pump needs electricity to operate,11 but is a significantly more efficient way to provide heat than direct electric heating (e.g. an electric fan or bar heater).
The global installed base of heat pumps was estimated at 800 million units in 2010 (IEA, 2011), with year-on-year growth since that time in excess of tens of millions of units annually (Zhao et al., 2017). In terms of the regional breakdown, China is the world’s largest heat pump market, with Japan second (IEA, 2020b). It is estimated that around 10% of households in the United States of America use heat pumps as their main heating source (Kaufman et al., 2019), partly because heat pumps can also act as cooling air conditioners. In Europe it is challenging to precisely compare official statistics on heat pump installations across the region (Zimny et al., 2015), but overall market growth is on a strong upward trajectory (Thomaßen et al., 2021).
Heat pumps are a well-established technology, but also one where innovations continue to be made in areas like improved refrigerants, compressors, heat exchangers and control systems (Zogg, 2008), which has resulted in strong performance and efficiency gains over time. It is challenging to assess how heat pumps for home heating compare across different markets and over time as this is affected by climate, building thermal standards, and the precise technical specifications of the units being compared. However as a guide, the typical seasonal performance factor over the year for most new air-source building heat pumps at the time of writing is believed to be around 4 (IEA, 2020b), whereas values around 2.5 were typically found in field studies from the early 2000s (Lazzarin, 2007).12
11 Heat pumps that operate without electricity and instead use heat provided from a fuel source do also exist, although when discussing climate mitigation technologies, the electrically driven heat pump features far more prominently in discussions because of the potential to use zero-carbon electricity.
12 Higher numbers reflect improved efficiency, and express heating energy extracted per unit of electrical energy input. A value of 4 indicates that for every 1 unit of electricity consumed, 4 units of heat would be produced (on average, over a defined period, usually the heating season). By comparison, an electric resistance heater at 100% efficiency produces only 1 unit of heat for each unit of electricity consumed.
© F
lickr
_Ann
e St
eens
trup
-Duc
h

44
Historically, most building heat pump installations have used ambient air as the heat source, and were installed in comparatively mild climates (Lazzarin, 2007). This is changing, not only as thermal standards for buildings improve (which makes it easier to use the same heat pump in a colder climate) but also because of ongoing performance improvements for heat pumps to operate in cold weather. New state-of-the-art air-source heat pumps can provide reliable heat even in locations that frequently experience temperatures well below freezing for extended periods, such as northern China or Canada (IEA, 2020b). Using thermal energy from the ground rather than the air (ground-source or geothermal heat pumps), in locations where it is technically possible to do so13 can further improve performance in cold climates.
Another option for heat pumps that is gaining traction is for them to be used as the heat source in existing district heating networks, which supply heat to homes via a buried network of centrally heated hot water pipes (David et al., 2017; Kontu et al., 2019). This potentially enables these large networks, common in northern Europe, northern China, and northern North America, to switch from fossil fuels to electricity without needing entirely new units to be installed in every connected building. The IEA ranks air-source and water-source heat pumps for building heating at Technology Readiness Level 10 (Integration needed at scale), state-of-the-art cold climate air-source heat pumps at TRL 8 (full-scale commercial demonstration has been completed – they are now dominant in some Canadian markets), and large-scale heat pumps for district heating at TRL 9, where solutions are commercially available (IEA, 2020a).
Heat pumps have been used in industry to supply process heat at low temperatures since at least 1877 (Zogg, 2008). Different industrial applications require different temperatures to perform processes such as drying, evaporating, boiling and steaming. Most industrial applications require heat in excess of 80°C, which was not possible to achieve using 20th century heat pump technology (compressors, refrigerants, materials, etc.). However, in the last ten years there has been a significant improvement in delivered temperatures available from heat pumps, and commercial solutions from multiple manufacturers are now able to supply heat in the 90-150°C range (Arpagaus et al., 2018).
Around 30% of industrial process heating needs are believed to be below 150°C (Bataille et al., 2018), so the appearance of high-temperature heat pumps in the last decade that can produce these temperatures opens up many possibilities for electrification of industry, particularly in the paper and food sectors (Madeddu et al., 2020). Going above 150°C is also likely to be possible in the near future, with many demonstration and commercialization projects either recently completed or close to completion. Work to supply heat from electric heat pumps at between 280-400°C, which would enable heat pumps to electrify parts of the chemical processing industry, are at the concept stage (Zühlsdorf et al., 2019).
Potential contribution of heat pumps to climate mitigation efforts
The buildings and industry sectors account for around 56% of global emissions, around 28% each (IEA, 2020c, 2019). In the buildings sector, around 33% of final energy demand is heat for space heating and between 12 and 24% is for providing hot water (Ürge-Vorsatz et al., 2015), while in industry, process heat amounts to around 46% of all energy consumed (Eisentraut and Brown, 2014).
Clean electrification of all sectors is a core strategy of most global,14 regional,15 and sectoral16 analyses of technological options for decarbonizing the energy system, and especially building heating and cooling. Achieving targets that are compatible with the Paris Agreement (UNFCCC, 2015) for limiting anthropogenic global warming to 1.5°C is not believed to be possible without large-scale electrification of heat demand (IPCC, 2018). Heat pumps are the frontrunner technology for electrifying heat owing to their track record, technological maturity, ability to be manufactured and distributed at scale, and ongoing continual development. Studies consistently show that heat pumps, powered by low-GHG electricity, are a core strategy for heating and cooling needs.
13 Air-source heat pumps take heat from the air, and can therefore be installed anywhere where there is space to mount the units on the outside of a building, whereas ground-source heat pumps require heat collection coils to be run in the ground, which can be challenging if the building owner does not own any adjacent land or does not have sufficient space available.
14 For example, International Energy Agency (IEA, 2021).15 For example, United States of America (Larson et al., 2020), European Union (Tsiropoulos et al., 2019) and China (Shi et al., 2016).16 For example, buildings (GlobalABC/IEA/UNEP, 2020) and industry (Bataille et al., 2018; Napp et al., 2014).

45
Social, institutional, economic and business preconditions for heat pumps
The potential future growth in the market for heat pumps is very large. For example, heat pumps cover only 5% of the global building space heating market but have the potential to supply as much as 90% of global space heating and water demand (IEA, 2020b). If industrial applications for heat pumps are considered, then there is the potential for at least an order of magnitude (i.e. 10x) growth in the market in the coming decades. Heat pumps are already a rapidly growing market segment in many countries; market research firms put annual growth trajectories for the 2020s as high as 8-10% per annum (Allied Market Research, 2019; Market Study Report, 2021). Analysis of housing market data based on 150 million homes in the United States of America suggests that heat pumps are increasingly popular with some consumers, and that residences with a heat pump enjoy a 4-7% price premium over equivalent homes in 23 out of the 50 States (Shen et al., 2021). Despite these encouraging signs, achieving emission reduction targets aligned with the Paris Agreement is likely to require additional support from governments to accelerate the transition to electric heating, as heat pumps are starting from a very low installed base.
Heat pumps face several economic, regulatory, infrastructural and societal barriers to deployment in the buildings sector. The upfront costs of heat pumps in markets without widespread deployment are often higher than fossil fuelled alternatives, a factor which research suggests is creating a deterrent to adoption (Barnes and Bhagavathy, 2020; Karytsas, 2018). Past experience in markets with high penetration of heat pumps suggests that their increased roll-out over time will help push them down the cost curve (Kiss et al., 2014). A variety of policy tools are available to reduce costs, including direct public procurement to stimulate market development, establishing streamlined guidance on installation and code compliance within the construction industry, and public information campaigns for consumers. During the early deployment stage, governments can also consider direct subsidies, low-interest loans, or other financial incentives to bring the costs of heat pumps in line with fossil fuelled alternatives, such as China has done with its electric heating policy initiatives (Wang et al., 2020).
© F
lickr
_Dav
id S
eibo
ld

46
Heat pump performance and operational costs are closely correlated with the energy efficiency of the buildings in which they are installed. Optimum outcomes are realized when heat pumps are installed in well-insulated buildings. Alignment with building construction codes has been identified as particularly important for encouraging heat pump uptake. This means that any policies to stimulate growth in the heat pump market must also be carried out in concert with a broader set of measures to raise energy efficiency standards for new buildings construction and to have a strategy for retrofitting older buildings that might have lower thermal performance (Chaudry et al., 2015; Hannon, 2015). Efforts to enact a market-push policy for heat pumps without also addressing energy efficiency in the building stock may stall or fail.
Large-scale deployment of heat pumps in markets that have not historically seen large electric heating loads in winter may require additional electrical generation and reinforcement of existing electrical distribution infrastructure to handle increased peak demand. Different regions can integrate varying levels of additional electric heating before additional investment is required in the broader electrical system. Studies suggest that 53% of heating can be electrified in the United States of America without additional infrastructure (Waite and Modi, 2020), while for the European Union the equivalent figures (depending on each European Union member State) range from 29 to 45% (Thomaßen et al., 2021).
In some countries, existing actors in the building heating market (e.g. in the United Kingdom (Martiskainen et al., 2021)) have a vested interest in maintaining their market share, which is often directly threatened by a future large-scale shift to electric heating. Research shows that in response to the threat of losing market share to electrification, incumbent heating providers have assembled resources to push an alternative narrative of “green gas”, namely reusing the existing gas grid with alternative fuels such as hydrogen, synthetic natural gas, or biogases (Lowes et al., 2020). However, the technical feasibility, costs and safety of these suggested approaches (particularly hydrogen) remain unknown. A large-scale hydrogen gas replacement programme is being conducted in the northern United Kingdom to assess the feasibility of heating buildings directly using reformed methane-based hydrogen with CCS; this project is made feasible by the fact that the retail gas network, dating from the 1880s era of town gas, has been replaced with plastic piping impervious to hydrogen corrosion over the last two decades.
Other than for legacy high-value buildings that are hard to retrofit with heat pumps or district heating, the window of opportunity for decarbonized gases to be the dominant pathway for reducing GHG emissions from building heating has arguably already passed. To be competitive at the global level outside of a few niche environments, the technology would already need to be market-ready for deployment at scale in the 2020s, and it is not. While it is true that hydrogen/methane blends are fairly well researched (Melaina et al., 2013), direct methane combustion for building heating has no future in a net-zero emissions world unless combined with carbon dioxide removal technologies such as direct air capture of CO2, itself a technology with uncertain future costs and performance (Chatterjee and Huang, 2020; Realmonte et al., 2019), or BECSS, a technology that is similarly plagued by uncertainties surrounding costs and feasibility (Fuss et al., 2014; Smith et al., 2015). Typically, these have been thought of as so-called “backstop” technologies (Nordhaus et al., 1973) to be used in hypothetical desperate situations of climate emergency when nearly all other avenues for climate stabilization have failed (Hanna et al., 2021). In terms of technological complexity and affordability, the challenge of adding more capacity to the electricity grid is arguably very small compared to the challenge of decarbonizing the gas grid. Some amount of biogenic or synthetic net-zero methane will likely be required to allow portions of the buildings stock to decarbonize until they are ready to be torn down and replaced (Bataille et al., 2018).
In industry, increasing the uptake of heat pumps needs to be carried out in the context of a broader policy package for decarbonizing the industrial base so that potentially scarce resources, like sustainably produced bioenergy, can be allocated effectively (Bataille, 2020; Bataille et al., 2018; Rissman et al., 2020). As noted above, heat pumps that can produce temperatures above 150°C are not yet market-ready at the time of writing but temperatures in the 250-400°C range are believed to be on the cusp of technological feasibility. Continued investment in fundamental research is required to improve heat pump components to resist higher temperatures and increase cycle efficiencies (Arpagaus et al., 2018), as well funding technology demonstration projects with cross-industry collaborators to facilitate learning-by-doing (Arrow, 1962) and investigate the best way to integrate heat pumps into existing process chains. Accelerating the deployment of industrial heat pumps is also likely to require upfront investments in educational and training materials, industrial standards and guidelines (de Boer et al., 2020).

47
Heat pumps are a key emerging climate technology for decarbonizing heat in buildings and industry. They are at an advanced stage of technological maturity, continue to be improved over time, and can be scaled to meet the needs of the global decarbonization challenge. Their market growth in recent years has been very strong in several regions but deployment rates must be substantially accelerated to meet the Paris Agreement targets. The main challenges for heat pumps in buildings stem from high upfront costs, the need to align policy measures for heat pumps with those for the energy efficiency of buildings and the electric grid, and the potentially disruptive nature of the switch to electric heating, which in some markets threatens incumbent business interests. The main challenges for heat pumps in industry are to improve performance to enable a wider range of delivery temperatures for process heat, and to better understand and share knowledge on how to integrate them into new and existing industrial facilities.
© F
lickr
_Nik
las
Mor
berg
Heat pumps are a key emerging climate technology for decarbonizing heat in buildings and industry.
They are at an advanced stage of technological maturity, continue to be improved over time, and
can be scaled to meet the needs of the global decarbonization challenge
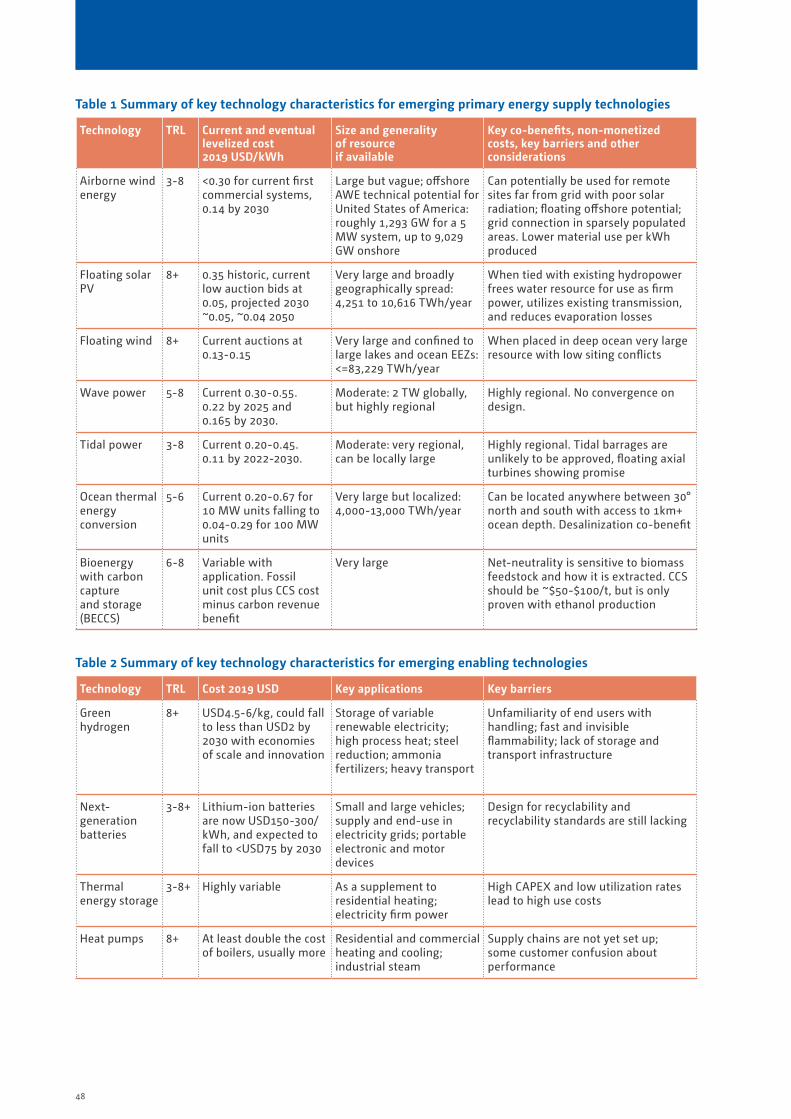
48
Table 1 Summary of key technology characteristics for emerging primary energy supply technologies
Technology TRL Current and eventual levelized cost 2019 USD/kWh
Size and generalityof resource if available
Key co-benefits, non-monetized costs, key barriers and other considerations
Airborne wind energy
3-8 <0.30 for current first commercial systems, 0.14 by 2030
Large but vague; offshore AWE technical potential for United States of America: roughly 1,293 GW for a 5 MW system, up to 9,029 GW onshore
Can potentially be used for remote sites far from grid with poor solar radiation; floating offshore potential; grid connection in sparsely populated areas. Lower material use per kWh produced
Floating solar PV
8+ 0.35 historic, current low auction bids at 0.05, projected 2030 ~0.05, ~0.04 2050
Very large and broadly geographically spread: 4,251 to 10,616 TWh/year
When tied with existing hydropower frees water resource for use as firm power, utilizes existing transmission, and reduces evaporation losses
Floating wind 8+ Current auctions at 0.13-0.15
Very large and confined to large lakes and ocean EEZs: <=83,229 TWh/year
When placed in deep ocean very large resource with low siting conflicts
Wave power 5-8 Current 0.30-0.55. 0.22 by 2025 and0.165 by 2030.
Moderate: 2 TW globally, but highly regional
Highly regional. No convergence on design.
Tidal power 3-8 Current 0.20-0.45. 0.11 by 2022-2030.
Moderate: very regional, can be locally large
Highly regional. Tidal barrages are unlikely to be approved, floating axial turbines showing promise
Ocean thermal energy conversion
5-6 Current 0.20-0.67 for 10 MW units falling to 0.04-0.29 for 100 MW units
Very large but localized: 4,000-13,000 TWh/year
Can be located anywhere between 30° north and south with access to 1km+ ocean depth. Desalinization co-benefit
Bioenergy with carbon capture and storage (BECCS)
6-8 Variable with application. Fossil unit cost plus CCS cost minus carbon revenue benefit
Very large Net-neutrality is sensitive to biomass feedstock and how it is extracted. CCS should be ~$50-$100/t, but is only proven with ethanol production
Table 2 Summary of key technology characteristics for emerging enabling technologies
Technology TRL Cost 2019 USD Key applications Key barriers
Green hydrogen
8+ USD4.5-6/kg, could fall to less than USD2 by 2030 with economies of scale and innovation
Storage of variable renewable electricity; high process heat; steel reduction; ammonia fertilizers; heavy transport
Unfamiliarity of end users with handling; fast and invisible flammability; lack of storage and transport infrastructure
Next-generation batteries
3-8+ Lithium-ion batteries are now USD150-300/kWh, and expected to fall to <USD75 by 2030
Small and large vehicles; supply and end-use in electricity grids; portable electronic and motor devices
Design for recyclability and recyclability standards are still lacking
Thermal energy storage
3-8+ Highly variable As a supplement to residential heating; electricity firm power
High CAPEX and low utilization rates lead to high use costs
Heat pumps 8+ At least double the cost of boilers, usually more
Residential and commercial heating and cooling; industrial steam
Supply chains are not yet set up; some customer confusion about performance

49
4. POLICY OPTIONS FOR EFFECTIVE DEPLOYMENT OF EMERGING TECHNOLOGIES
There is a wide and ranging literature on the effective deployment of emerging technologies, with some disagreement but also a lot of functional agreement based on first principles.
One of the fundamental challenges faced by both energy efficiency investments and most types of renewable energy technologies is that the initial capital expenditure is higher, compensated by typically lower energy costs in the long run. For private sector households and firms, which must make most of the investments in the energy transition, this is extremely important. They must borrow more money upfront, pay interest on it and pay it down, for a payback later. This fundamentally reduces the value of the investment for private sector actors, and the higher the real interest rate they must pay, the greater the value reduction. Governments of all types, and especially national governments, have the capacity to borrow capital less expensively than firms and households. They can also justify borrowing money to make investments to protect future generations. This indicates that there is a strong role for governments to work with households and firms to transfer their lower long-term cost of borrowing to them for long-term social goals, for example., via lower-interest loans tied to the investment, tax credits, and direct investment-related subsidies. These issues are particularly acute in developing countries, because their risk-weighted costs of capital are higher. This speaks to the need for some sort of global facility to help reduce the risk-weighted cost of capital for investments in emerging mitigation technologies in developing countries.
For the demand and supply sides of markets to incorporate climate damage, this damage must be included as GHG pricing, regulation, some form of performance regulation, or other constraint on emissions. While carbon markets are evolving fast (e.g., in the European Union, United Kingdom, California, Canada, the north-east United States of America, China and elsewhere,17 the damage associated with climate change is mostly not costed into goods and services, or otherwise constrained. The coverage of these systems is usually less than all emissions, and the prices are far below most estimates of damage (Ricke et al., 2018). Simply put, low- and high-GHG intensity electricity provides the exact same service to the end user and, until recently, the former was much more costly. All the low-GHG primary electricity technologies listed in this report, with the possible exceptions of floating solar PV and floating wind in some cases, are much more expensive than coal-, oil- or gas-based electricity generation in the absence of a sufficiently high carbon price. However, pricing or regulation is normally not enough to bring emerging clean energy technologies to market; some form of research, development, piloting, and early- and late-stage commercialization plan is required (Geels et al., 2017).
Economic and technological systems have physical and institutional inertia on both the supply and demand sides (Geels et al., 2019; Rosenbloom et al., 2020), and participants will keep on doing what they are doing unless there is a shock or a significantly better way of providing the needed service, however that is defined. Supply chains for supply and end-use equipment often take decades to reach maturity. End users cannot switch to a new technology that needs a new fuel if there is no supply, and a supplier cannot sell if there is no demand. The supply and demand sides of the market must evolve together, often starting with small “niche” or “lead” markets, which can grow given the opportunity.
New technologies, whether pushed or not, often penetrate in niche or lead markets where they provide a better service, and from there build innovation and production economies of scale. The first niche application of solar PV was powering satellites, and then remote electronics (Kavlak et al., 2018a). It then moved to calculators, etc., building economies of innovation and production scale, leading to today’s “cheapest electricity in history”(International Energy Agency (IEA), 2020).
17 https://carbonpricingdashboard.worldbank.org/map_data.

50
The large capital investments, risks and lead times necessary to bring emerging technologies with social value to market are often beyond the capacity of single firms, and consortia and/or public–private partnerships are necessary to take a technology through to commercialization. Two of the most successful public–private emerging technology partnerships have been the United Kingdom Offshore Wind Accelerator and the family of United States (Defence) Advanced Research Projects Agency (DARPA) initiatives.
The United Kingdom Offshore Wind Accelerator (Carbon Trust, 2017; Jennings et al., 2020) was the result of the United Kingdom Government identifying that it had a very large offshore wind potential at very high capacity factors (60-70%), but the technology to exploit them was blocked somehow. The United Kingdom Carbon Trust was tasked with bringing together the existing turbine companies to sit down and analyse the key blockages to commercialization, which turned out to be, among other things, servicing vessels. The United Kingdom Government allocated funds to solve these challenges collectively with the firms. Once solved, all parties walked away with the intellectual property, and the normal reverse auction mode of allocating licences was resumed. This programme, among other efforts, can be partially credited with the arrival of USD0.05-0.07 per kWh USD offshore wind auctions.
The United States DARPA model18 is also held up as a model for public–private partnerships to advance technology, funding, among other things, the early pilot of the Internet (ARPANET) and providing early funding for mRNA vaccines. The ARPA model is not designed for early R&D or late commercialization; its method is to: 1) identify key, socially important unsupported areas to support; 2) gather information from potential stakeholders and fundees; 3) enter into supportive, low transaction cost partnerships with ideas between these stages, including providing financing and networking; 4) provide continued support if progress is being made; and 5) exit if a technology stalls. Failure of some technologies is expected and is not counted as an overall programme failure.
Some new technologies have global applications (e.g. technologies working with solar PV or wind), and economies of scale and learning will be global, but some do not, with lower potential economies of scale and learning. Countries and regions with specific regional resources (e.g. wave or tidal energy) may need to partner with others with the same type of resource if they wish to make progress with commercialization.
New technologies that can “plug into” existing infrastructure will find it easier (e.g. electric versus hydrogen fuel cell cars), but governments will likely have a role in establishing key new infrastructure. For example, while there is a widespread electricity transmission network, the existing hydrogen transmission network is minimal, and used only for transport of chemical feedstock hydrogen. Early application of green hydrogen will likely require that the end-use (e.g. on-demand electricity, fertilizer feedstock or steel reduction) is co-located with the producing electrolysers and storage (Bataille, 2020; Bataille et al., 2018; Rissman et al., 2020). On the other hand, because of minimum economies of scale (“network externalities”), governments will likely have a role in facilitating and investing in infrastructure for clean energy technologies, for example, regulation and basic investment in core charging or refuelling networks (Till et al., 2019).
New technologies with co-benefits will find market uptake easier. Floating solar PV, for example, not only plugs easily into the existing network, it provides several potential market co-benefits: it does not consume new land; it can add bulk power to hydropower, allowing the water in the dam to be used for on-demand firming power; and it lowers evaporation from hydropower or irrigation dams. OTEC, on the other hand, is much more expensive than solar PV, wind and battery backup, and its key co-benefit may be to operate where there is no land for solar PV or wind, or where bulk desalinization for drinking water or irrigation is required.
Variable energy resources have a highly varying value (from on-demand market value to zero) on regional electricity grids or paired with enabling technologies that transform them into on-demand services. On the other hand, enabling technologies like batteries, green hydrogen, and heat pumps need low-GHG electricity to be useful. Their technological development and deployment to first lead/niche markets and then broader markets should be considered and planned in this context.
18 https://www.nature.com/articles/d41586-021-01878-z.

51
More broadly, emerging technologies must cost less, provide a better service, or be somehow pushed into the market, justified by a social benefit. How can these technologies be “pushed”, and to what extent should they be? There is no question that more R&D are required, but full-scale piloting is expensive and generates almost no revenue, making it very difficult for smaller firms to invest. Bigger decadal-scale projects are also risky for bigger firms (e.g. in steel decarbonization). Full-scale piloting must also be followed by some form of revenue-generating niche market that can pay the usually initially higher costs. How do we get these technologies from TRL 4 to 8 and 9, keeping in mind that society’s resources are limited and time is fleeting to meet the Paris Agreement goals? Most technologies with a non-priced social benefit will need some level of support to get to a competitive lift-off point, but not all technologies will lift off - when do we quit and refocus our resources on other technologies?
Some principles for policy packages, and specific policies to include, to support emerging energy technologies are suggested below. These are divided into two broad classes: policies for directionality toward the social goal; and market shaping to meet those social goals.
Directionality
• Given the Paris Agreement goals and need for net-zero emissions by 2050-2070, economy-wide scenario formation and planning, with input from all key stakeholders, is required (Waisman et al., 2019). All key stakeholders, especially those with an effective veto on action in any key sector must be included to hear their challenges and options for how the society-wide objective can be achieved, and to help them understand the constraints under which other sectors are operating. Ideally, a working consensus can be achieved to allow the government of the day and any political opposition to proceed with stable policy package formation.
• Based on the planning exercises above, specific social goals must be defined that allow technological agnosticism and measurable performance standards (e.g. to reduce overall GHG intensity per kWh generated to less than 30 grams CO2 per kWh by 2050 (Bataille et al., 2016; Williams et al., 2021)). This also allows the promotion of unexpected positive outcomes, for example, as-yet unknown technologies (i.e. “white swans”), or technology reapplications from other uses. These metrics can also be used as guidance for minimum performance standards for market inclusion.
• Standard sets of co-benefits, ideally corresponding to the SDGs, should be defined or at least acknowledged, and their pursuit included in support policies. These should include, at a minimum, minimization of local air pollutants and water use by energy technologies. By their nature, wind and solar PV use far less water than thermal generation technologies. The ability for OTEC to provide desalinated water would potentially be included as a co-benefit, depending on the site application. Associated employment and maintainability in less-than-ideal conditions by lower-skilled labour with limited access to repair supply chains could also be included.
• Expanded research, development and small-scale piloting funding for emerging primary energy supply and enabling technologies. Access to the funding should be based on projected capacity to meet the direct decarbonization and SDG goals listed above.
• Countries and regions need to assess their potential competitive advantages and their capacity to capitalize on them on their own and seek out partnerships with others in the same situation where necessary. Fully commercializing airborne wind, OTEC, wave and tidal energy may be beyond any one country, and research, development and commercialization partnerships should be established by those jurisdictions with the necessary resources and interest.
• Based on all the above, establish targeted innovation and early commercialization programmes as needed to identify and break commercialization blockages, for example, the United Kingdom Offshore Wind Accelerator or the United States ARPA-E (Advanced Research Projects Agency-Energy).

52
Market shaping to meet social goals
• Lead markets are needed to support economies of innovation and production, followed by full carbon pricing to support commercialized technologies. Once a technology has reached the early commercial stage it will likely be more expensive than incumbent technologies but have a social competitive advantage that must be monetized somehow. Lead/niche markets are needed to build learning, economies of scale and innovation, and familiarity with the technologies (Agora Energiewende and Wuppertal Institut, 2020; Sartor and Bataille, 2019). This can be done through renewables obligations or feed-in-tariffs with carve-outs for early-stage technologies. The early market success of solar PV and wind, after initial R&D and niche applications in space and at remote locations, was directly due to renewable portfolio standards and feed-in-tariffs in the United Kingdom, European Union, and various North American jurisdictions. The renewable portfolio standards and feed-in-tariffs were actualized through contracts for difference (Sartor and Bataille, 2019). If electricity market prices were less than the necessary minimum price for the technology to be invested in and operated, a dynamic subsidy pegged to the market prices was provided. If market prices were high enough, no subsidy was provided.
• Removal of fossil fuel subsidies and full carbon pricing will be needed for uptake once the technologies are commercialized. In most cases, carbon pricing cannot be raised quickly enough or highly enough to justify high risk innovation, but it can help support technologies effectively once they are commercialized (Cullenward and Victor, 2020).
• Phase-outs of high-emitting, not retrofittable technologies to reduce emissions and make room for new, lower-emitting technologies. While electrification with low-GHG power is identified as a key strategy in all net-zero pathways, practically it will be difficult for low-GHG power sources to build economies of scale and innovation until there are widespread coal, oil and then gas power phase-outs.
© U
nspl
ash_
Gid
on W
essn
er

53
5. FINAL RECOMMENDATIONS
The core technologies for wind and solar PV can be described as being commercialized to the point where market forces and moderate carbon pricing or GHG intensity performance standards can ensure their continued uptake and development. Their commercialization took broad-scale R&D, innovation, and supply and demand development and policies spanning several countries and regions (the United States of America, Germany and China, among many others), and decades in the case of solar PV (see Kavlak et al. (2018)). The surprisingly successful integration of high levels of variable renewables came from the synergies of different innovations across different dimensions, such as technology, market design, business models and systems operation (IRENA, 2019a). Far more grid flexibility was found in the system than was expected. This now allows many new permutations of wind and solar to be experimented with, but, with its very success, it requires the accelerated development of enabling technologies like batteries, green hydrogen and heat pumps so that variability and specific heat needs do not become a barrier to the uptake of cheap wind and solar PV.
If the Paris Agreement goals are to be met, we do not have decades to find out if the primary energy supply and enabling technologies listed in this report will become commercially available, and we do not have more decades for this to happen if successful. At a minimum, as identified by the IEA (IEA, 2021) and IRENA (IRENA, 2021a), on- and offshore wind, green hydrogen, heat pumps of all sizes and temperature, thermal storage technologies for building, and floating solar PV all need to be commercially available by 2030 (batteries are cheap but need to become cheaper and more recyclable); no new emitting technologies can be invested in past this date if the Paris Agreement goals are to be met. BECCS or its cousin direct air capture and storage) will also need to be commercially viable in the 2030s (Masson-Delmotte et al., 2018).
A key consideration is that many of the markets for these technologies will be in in developing countries or countries with economies in transition, which cannot be expected to fund their development along with all their other priorities. Ambitious and fast research, development, piloting, and early commercialization programmes are needed to test whether these technologies are viable in the short term, and worth investing in for the long term. These programmes will be expensive and will be more effective if implemented by several countries with a long-term interest.
© U
nspl
ash_
NAS
A

54
Some technology needs are shared, some are not – finding partners
Countries and sectors need to develop net-zero decarbonization pathways (Waisman et al., 2019) based on their physical resources, sustainable development needs and local politics. If their physical resources and need for clean energy for electrification and heat indicate that one or more of the technologies discussed in this report may be useful (e.g. if a Caribbean island State has little land for solar, lacks a clean firm power source, and has a strong need for desalinated water for drinking and irrigation it may wish to join a coalition to commercialize OTEC), they need to find governmental and firm partners to work with to make the technology happen.
Breaking technology logjams – shared accelerator projects and saving accumulated technology
As noted above, not all these technologies will succeed or be needed, but speed is of the essence to determine which ones can make a significant contribution to achieving the goals under the Paris Agreement. Many of the companies working on airborne wind, wave, tidal, thermal storage and OTEC are very small and subject to failure and loss of accumulated knowledge and capacity if their funding runs out. For example, a very promising Scandinavian manufacturer of the world’s highest temperature industrial heat pumps, Viking Ltd., failed when orders did not materialize. Hundreds of millions of USD of Norwegian Government money was lost, and the intellectual property went up for sale for a few million USD – it is unknown if it will be revived at the time of writing. Failure is one of the risks of business, but the climate change goals under the Paris Agreement indicate that accumulated knowledge of these technologies should not be lost with companies. Some form of international heat pump accelerator programme, with shared investment by international firms and governments, could have taken on Viking Ltd.’s technology with lower risk to all parties. The same could be said of many of the emerging technologies discussed in this report. There are existing IEA Technology Coordination Partnerships (TCPS) that could form the core of such accelerators, or the United Kingdom model for the Offshore Wind Accelerator could be duplicated – there are many possibilities.
Ad hoc, start and stop innovation will not do – a systemic innovation and market uptake approach is needed
Over the last decade, there has been spectacular success in reducing the cost of variable renewables and integrating them in grids at far higher market shares than anyone expected. This was not accidental. There were conscious efforts by many governments over many years on R&D, commercialization of and market making for wind and solar. The integration of a high level of variable renewables was enabled by such physical flexibility options as grid strengthening, demand-side management, energy storage, sector coupling and flexible conventional generation, but also institutional and market innovations such as feed-in-tariffs, contracts for difference and renewable portfolio standards. Policy efforts must encompass the complete technology innovation life cycle and all aspects of integration in the energy supply and demand system, including demonstration, early and later deployment (technology learning) and early and broad commercialization stages (International Renewable Energy Agency, 2017; IRENA, 2019a). Furthermore, the innovation ecosystem should extend across a whole range of activities, including creating new market designs, building innovative enabling infrastructure, creating new ways to operate energy systems, establishing standards and quality control systems, and implementing new regulatory measures.
While some of the technologies that have been reviewed in this report are unlikely to provide a large, global-level contribution to meeting the climate change goals under the Paris Agreement and the SDGs (airborne wind energy, wave energy, tidal energy, OTEC), they may be critical to some countries’ efforts, and may yet surprise us in their scale if engineering and business case challenges are overcome. Some of the technologies are very likely to provides global-scale benefits (floating wind, floating solar PV, green hydrogen, batteries, thermal energy storage, and heat pumps), and need to be fully commercialized and brought to market as soon as possible. Policies to support this will vary by region, but must include components of clear directionality, innovation and market shaping to drive their uptake.

55
6. REFERENCES
Abbate, G., Saraceno, E., 2019. What Else is Emerging from the Horizon? pp. 177–213. doi:10.1007/978-3-030-05636-0_10
Agora Energiewende, Wuppertal Institut, 2020. Breakthrough Strategies for Industry in Europe Industry in Europe 38.
Agostini, A., Giuntoli, J., Boulamanti, A., Marelli, L., 2013. Carbon accounting of forest bioenergy: Conclusions and recommendations from a critical literature review. European Commission Joint Research Centre (EC-JRC), European Commission Joint Research Centre (EC-JRC).
Ali, Q.S., Kim, M.-H., 2021. Design and performance analysis of an airborne wind turbine for high-altitude energy harvesting. Energy 230, 120829. doi:10.1016/j.energy.2021.120829.
Allied Market Research, 2019. Heat Pump Market by Type (Air-to-Air, Water Source, and Geothermal) and Application (Residential, Industrial, and Commercial): Global Opportunity Analysis and Industry Forecast, 2019–2026.
Anderson, K., Peters, G., 2016. The trouble with negative emissions. Science 354, 182–183. doi:10.1126/science.aah4567
Arbabzadeh, M., Sioshansi, R., Johnson, J.X., Keoleian, G.A., 2019. The role of energy storage in deep decarbonization of electricity production. Nature Communications 10, 3413. doi:10.1038/s41467-019-11161-5.
Archer, C., 2013. An Introduction to Meteorology for Airborne Wind Energy. pp. 81–94. doi:10.1007/978-3-642-39965-7_5
Archer, C., Caldeira, K., 2009. Global Assessment of High-Altitude Wind Power. Energies 2, 307–319. doi:10.3390/en20200307.
Archer, C., Delle Monache, L., Rife, D.L., 2014. Airborne wind energy: Optimal locations and variability. Renewable Energy 64, 180–186. doi:10.1016/j.renene.2013.10.044.
Argatov, I., Rautakorpi, P., Silvennoinen, R., 2009. Estimation of the mechanical energy output of the kite wind generator. Renewable Energy 34, 1525–1532. doi:10.1016/j.renene.2008.11.001.
Arpagaus, C., Bless, F., Uhlmann, M., Schiffmann, J., Bertsch, S.S., 2018. High temperature heat pumps: Market overview, state of the art, research status, refrigerants, and application potentials. Energy. doi:10.1016/j.energy.2018.03.166
Arrow, K.J., 1962. The Economic Implications of Learning by Doing. The Review of Economic Studies 29, 155–173. doi:10.2307/2295952.
Assouline, S., Narkis, K., Or, D., 2011. Evaporation suppression from water reservoirs: Efficiency considerations of partial covers. Water Resources Research 47, 1–8. doi:10.1029/2010WR009889.
Ballinger, B., Stringer, M., Schmeda-Lopez, D.R., Kefford, B., Parkinson, B., Greig, C., Smart, S., 2019. The vulnerability of electric vehicle deployment to critical mineral supply. Applied Energy 255, 113844. doi:10.1016/j.apenergy.2019.113844.
Bardenhagen, Y., Nakata, T., 2020. Regional Spatial Analysis of the Offshore Wind Potential in Japan. Energies 13, 6303. doi:10.3390/en13236303.
Barnes, J., Bhagavathy, S.M., 2020. The economics of heat pumps and the (un)intended consequences of government policy. Energy Policy 138, 111198. doi:10.1016/j.enpol.2019.111198.
Bashetty, S., Ozcelik, S., 2020. Design and Stability Analysis of an Offshore Floating Multi-Turbine Platform, in: 2020 IEEE Green Technologies Conference(GreenTech). IEEE, pp. 184–189. doi:10.1109/GreenTech46478.2020.9289785.
Bataille, C., 2020. Physical and policy pathways to net-zero emissions industry. Wiley Interdisciplinary Reviews: Climate Change. doi:10.1002/wcc.633.
Bataille, C., Åhman, M., Neuhoff, K., Nilsson, L., Fischedick, M., Lechtenböhmer, S., Solano-Rodriquez, B., Denis-Ryan, A., Steibert, S., Waisman, H., Sartor, O., Rahbar, S., 2018. A review of technology and policy deep decarbonization pathway options for making energy intensive industry production consistent with the Paris Agreement. Journal of Cleaner Production 187, 960–973. doi:10.1016/j.jclepro.2018.03.107.

56
Bataille, C., Waisman, H., Colombier, M., Segafredo, L., Williams, J., Jotzo, F., 2016. The need for national deep decarbonization pathways for effective climate policy. Climate Policy 16, S7–S26. doi:10.1080/14693062.2016.1173005.
Bechtle, P., Schelbergen, M., Schmehl, R., Zillmann, U., Watson, S., 2019. Airborne wind energy resource analysis. Renewable Energy 141, 1103–1116. doi:10.1016/j.renene.2019.03.118.
Beiter, P., Musial, W., Duffy, P., Cooperman, A., Shields, M., Heimiller, D., Optis, M., 2020. The Cost of Floating Offshore Wind Energy in California Between 2019 and 2032. Golden, CO (United States). doi:10.2172/1710181.
Bento, N., Fontes, M., 2019. Emergence of floating offshore wind energy: Technology and industry. Renewable and Sustainable Energy Reviews 99, 66–82. doi:10.1016/j.rser.2018.09.035.
Blomgren, G.E., 2017. The Development and Future of Lithium Ion Batteries. Journal of The Electrochemical Society 164, A5019–A5025. doi:10.1149/2.0251701jes.
Bloomberg New Energy Finance, 2020a. Emerging storage technologies: looking beyond lithium.
Bloomberg New Energy Finance, 2020b. 2020 Lithium-Ion Battery Price Survey.
Bormann, A., Ranneberg, M., Kövesdi, P., Gebhardt, C., Skutnik, S., 2013. Development of a Three-Line Ground-Actuated Airborne Wind Energy Converter. pp. 427–436. doi:10.1007/978-3-642-39965-7_24.
Bosch, J., Staffell, I., Hawkes, A.D., 2018. Temporally explicit and spatially resolved global offshore wind energy potentials. Energy 163, 766–781. doi:10.1016/j.energy.2018.08.153.
Braun, C., 2017. Not in My Backyard: CCS Sites and Public Perception of CCS. Risk Analysis 37, 2264–2275. doi:10.1111/risa.12793.
Bruckner, T., Bashmakov, I.A., Mulugetta, Y., Chum, H., De la Vega Navarro, A., Edmonds, J., Faaij, A., Fungtammasan, B., Garg, A., Hertwich, E., Honnery, D., Infield, D.G., Kainuma, M., Khennas, S., Kim, S., Bashir Nimir, H., Riahi, K., Strachan, N., Wiser, R., Zhang, X., 2014. Energy Systems, in: Edenhofer, O., Pichs-Madruga, R., Sokona, Y., Farahani, E., Kadner, S., Seyboth, K., Adler, A., Baum, I., Brunner, S., Eickemeier, P., Kriemann, B., Savolainen, J., Schlömer, S., von Stechow, C., Zwickel, T., Minx, J.C. (Eds.), Climate Change 2014: Mitigation of Climate Change. Contribution of Working Group III to the Fifth Assessment Report of the Intergovernmental Panel on Climate Change. Cambridge University Press, Cambridge, United Kingdom and New York, NY, USA, p. 139.
Bruinzeel, L., Klop, E., Brenninkmeijer, A., Bosch, J., 2018. Ecological Impact of Airborne Wind Energy Technology: Current State of Knowledge and Future Research Agenda. pp. 679–701. doi:10.1007/978-981-10-1947-0_28.
Brunsting, S., Best-Waldhober, M. de, Feenstra, C.F.J. (Ynke), Mikunda, T., 2011. Stakeholder participation practices and onshore CCS: Lessons from the dutch CCS case barendrecht. Energy Procedia 4, 6376–6383. doi:10.1016/j.egypro.2011.02.655.
Buck, H.J., 2016. Rapid scale-up of negative emissions technologies: social barriers and social implications. Climatic Change 139, 155–167. doi:10.1007/s10584-016-1770-6.
Canale, M., Fagiano, L., Milanese, M., 2009. KiteGen: A revolution in wind energy generation. Energy 34, 355–361. doi:10.1016/j.energy.2008.10.003.
Candade, A.A., Ranneberg, M., Schmehl, R., 2020. Structural analysis and optimization of a tethered swept wing for airborne wind energy generation. Wind Energy 23, 1006–1025. doi:10.1002/we.2469
Carbon Trust, 2017. Carbon Trust Offshore Wind Accelerator Program. https://www.carbontrust.com/offshore-wind/owa/ (accessed 9.29.16).
Castro-Santos, L., Silva, D., Bento, A.R., Salvação, N., Guedes Soares, C., 2020. Economic feasibility of floating offshore wind farms in Portugal. Ocean Engineering 207, 107393. doi:10.1016/j.oceaneng.2020.107393.
CCC, 2020. The Sixth Carbon Budget: The UK’s path to Net Zero. Committee on Climate Change 448.
Chatterjee, S., Huang, K.-W., 2020. Unrealistic energy and materials requirement for direct air capture in deep mitigation pathways. Nature Communications 11, 3287. doi:10.1038/s41467-020-17203-7.
Chaudry, M., Abeysekera, M., Hosseini, S.H.R., Jenkins, N., Wu, J., 2015. Uncertainties in decarbonising heat in the UK. Energy Policy 87, 623–640. doi:10.1016/j.enpol.2015.07.019.
Cherubini, A., Papini, A., Vertechy, R., Fontana, M., 2015. Airborne Wind Energy Systems: A review of the technologies. Renewable and Sustainable Energy Reviews 51, 1461–1476. doi:10.1016/j.rser.2015.07.053.

57
Clarke, L., Jiang, K., Akimoto, K., Babiker, M., Blanford, G., Fisher-Vanden, K., Hourcade, J.-C., Krey, V., Kriegler, E., Löschel, A., McCollum, D., Paltsev, S., Rose, S., Shukla, P.R., Tavoni, M., van der Zwaan, B.C.C., van Vuuren, D.P., 2014. IPCC AR5 Chapter 5: Assessing Transformation Pathways, in: Edenhofer, O., Pichs-Madruga, R., Sokona, Y., Farahani, E., Kadner, S., Seyboth, K., Adler, A., Baum, I., Brunner, S., Eickemeier, P., Kriemann, B., Savolainen, J., Schlömer, S., Stechow, V., Zwickel, T., Minx, J.C. (Eds.), Climate Change 2014: Mitigation of Climate Change. Contribution of Working Group III to the Fifth Assessment Report of the Intergovernmental Panel on Climate Change. Cambridge University Press, Cambridge, United Kingdom and New York, NY, USA, pp. 413–510.
Clarke, L., Jiang, K., Akimoto, K., Babiker, M., Blanford, G., Fisher-Vanden, K., Hourcade, J.-C., Krey, V., Kriegler, E., Löschel, A., McCollum, D., Paltsev, S., Rose, S., Shukla, P.R., Tavoni, M., van der Zwaan, B.C.C., van Vuuren, D.P., 2014. Assessing Transformation Pathways, in: Edenhofer, O., Pichs-Madruga, R., Sokona, Y., Farahani, E., Kadner, S., Seyboth, K., Adler, A., Baum, I., Brunner, S., Eickemeier, P., Kriemann, B., Savolainen, J., Schlömer, S., Stechow, V., Zwickel, T., Minx, J.C. (Eds.), Climate Change 2014: Mitigation of Climate Change. Contribution of Working Group III to the Fifth Assessment Report of the Intergovernmental Panel on Climate Change. Cambridge University Press, Cambridge, United Kingdom and New York, NY, USA, pp. 413–510.
Colmenar-Santos, A., Perera-Perez, J., Borge-Diez, D., DePalacio-Rodríguez, C., 2016. Offshore wind energy: A review of the current status, challenges and future development in Spain. Renewable and Sustainable Energy Reviews 64, 1–18. doi:10.1016/j.rser.2016.05.087.
Crabtree, G., 2019. The coming electric vehicle transformation. Science 366, 422–424. doi:10.1126/science.aax0704.
Crabtree, G., Kócs, E., Trahey, L., 2015. The energy-storage frontier: Lithium-ion batteries and beyond. MRS Bulletin 40, 1067–1078. doi:10.1557/mrs.2015.259.
Creutzig, F., Erb, K., Haberl, H., Hof, C., Hunsberger, C., Roe, S., 2021. Considering sustainability thresholds for BECCS in IPCC and biodiversity assessments. GCB Bioenergy 13, 510–515. doi:10.1111/gcbb.12798.
Creutzig, F., Ravindranath, N.H., Berndes, G., Bolwig, S., Bright, R., Cherubini, F., Chum, H., Corbera, E., Delucchi, M., Faaij, A., Fargione, J., Haberl, H., Heath, G., Lucon, O., Plevin, R., Popp, A., Robledo-Abad, C., Rose, S., Smith, P., Stromman, A., Suh, S., Masera, O., 2015. Bioenergy and climate change mitigation: an assessment. GCB Bioenergy 7, 916–944. doi:10.1111/gcbb.12205.
Cullenward, D., Victor, D., 2020. Making Climate Policy Work. John Wiley & Sons, Ltd.
Das, S.K., Mahapatra, S., Lahan, H., 2017. Aluminium-ion batteries: developments and challenges. Journal of Materials Chemistry A 5, 6347–6367. doi:10.1039/C7TA00228A.
David, A., Mathiesen, B.V., Averfalk, H., Werner, S., Lund, H., 2017. Heat Roadmap Europe: Large-Scale Electric Heat Pumps in District Heating Systems. Energies 10, 578. doi:10.3390/en10040578.
Davis, S.J., Lewis, N.S., Shaner, M., Aggarwal, S., Arent, D., Azevedo, I.L., Benson, S.M., Bradley, T., Brouwer, J., Chiang, Y.-M., Clack, C.T.M., Cohen, A., Doig, S., Edmonds, J., Fennell, P., Field, C.B., Hannegan, B., Hodge, B.-M., Hoffert, M.I., Ingersoll, E., Jaramillo, P., Lackner, K.S., Mach, K.J., Mastrandrea, M., Ogden, J., Peterson, F., Sanchez, D.L., Sperling, D., Stagner, J., Trancik, J.E., Yang, C.-J., Caldeira, K., 2018. Net-zero emissions energy systems. Science 9793. doi:10.1126/science.aas9793.
de Assis Tavares, L.F., Shadman, M., de Freitas Assad, L.P., Silva, C., Landau, L., Estefen, S.F., 2020. Assessment of the offshore wind technical potential for the Brazilian Southeast and South regions. Energy 196, 117097. doi:10.1016/j.energy.2020.117097.
de Boer, R., Marina, A., Zühlsdorf, B., Arpagaus, C., Bantle, M., Wilk, V., Elmegaard, B., Corberán, J., Benson, J., 2020. Strengthening Industrial Heat Pump Innovation: Decarbonizing Industrial Heat.
deCastro, M., Salvador, S., Gómez-Gesteira, M., Costoya, X., Carvalho, D., Sanz-Larruga, F.J., Gimeno, L., 2019. Europe, China and the United States: Three different approaches to the development of offshore wind energy. Renewable and Sustainable Energy Reviews 109, 55–70. doi:10.1016/j.rser.2019.04.025.
Dinh, V.N., McKeogh, E., 2019. Offshore Wind Energy: Technology Opportunities and Challenges. pp. 3–22. doi:10.1007/978-981-13-2306-5_1.
Dong, Y., Xu, M., Miller, S.A., 2020. Overview of cold chain development in china and methods of studying its environmental impacts. Environmental Research Communications 2. doi:10.1088/2515-7620/abd622.
Dütschke, E., Wohlfarth, K., Höller, S., Viebahn, P., Schumann, D., Pietzner, K., 2016. Differences in the public perception of CCS in Germany depending on CO 2 source, transport option and storage location. International Journal of Greenhouse Gas Control 53, 149–159. doi:10.1016/j.ijggc.2016.07.043.

58
Dvorak, M.J., Archer, C.L., Jacobson, M.Z., 2010. California offshore wind energy potential. Renewable Energy 35, 1244–1254. doi:10.1016/j.renene.2009.11.022.
Edenhofer, O., Pichs-Madruga, R., Sokona, Y., Farahani, E., Kadner, S., Seyboth, K., Adler, A., Baum, I., Brunner, S., Eickemeier, P., Kriemann, B., Savolainen, J., Schlömer, S., von Stechow, C., Zwickel, T., Minx, J., Editors, 2014. IPCC, 2014: Climate Change 2014: Mitigation of Climate Change. Contribution of Working Group III to the Fifth Assessment Report of the Intergovernmental Panel on Climate Change, IPCC, 2014. ed. Cambridge University Press, Cambridge.
Eisentraut, A., Brown, A., 2014. Heating Without Global Warming: Market Developments and Policy Considerations for Renewable Heat. International Energy Agency (IEA), International Energy Agency (IEA), Paris, France.
Elsner, P., 2019. Continental-scale assessment of the African offshore wind energy potential: Spatial analysis of an under-appreciated renewable energy resource. Renewable and Sustainable Energy Reviews 104, 394–407. doi:10.1016/j.rser.2019.01.034.
Erhard, M., Strauch, H., 2018. Automatic Control of Pumping Cycles for the SkySails Prototype in Airborne Wind Energy. pp. 189–213. doi:10.1007/978-981-10-1947-0_9.
Fajardy, M., Mac Dowell, N., 2017. Can BECCS deliver sustainable and resource efficient negative emissions? Energy Environ. Sci. 10, 1389–1426. doi:10.1039/C7EE00465F.
Farr, H., Ruttenberg, B., Walter, R.K., Wang, Y.-H., White, C., 2021. Potential environmental effects of deepwater floating offshore wind energy facilities. Ocean and Coastal Management 207, 105611. doi:10.1016/j.ocecoaman.2021.105611
Fasihi, M., Efimova, O., Breyer, C., 2019. Techno-economic assessment of CO 2 direct air capture plants. Journal of Cleaner Production 224, 957–980. doi:10.1016/j.jclepro.2019.03.086.
Feng, X., Ouyang, M., Liu, X., Lu, L., Xia, Y., He, X., 2018. Thermal runaway mechanism of lithium ion battery for electric vehicles: A review. Energy Storage Materials 10, 246–267. doi:10.1016/j.ensm.2017.05.013.
Fridahl, M., 2017. Socio-political prioritization of bioenergy with carbon capture and storage. Energy Policy 104, 89–99. doi:10.1016/j.enpol.2017.01.050.
Fridahl, M., Lehtveer, M., 2018. Bioenergy with carbon capture and storage (BECCS): Global potential, investment preferences, and deployment barriers. Energy Research and Social Science 42, 155–165. doi:10.1016/j.erss.2018.03.019.
Fuss, S., Canadell, J.G., Peters, G.P., Tavoni, M., Andrew, R.M., Ciais, P., Jackson, R.B., Jones, C.D., Kraxner, F., Nakicenovic, N., Le Quéré, C., Raupach, M.R., Sharifi, A., Smith, P., Yamagata, Y., 2014. Betting on negative emissions. Nature Climate Change 4, 850–853. doi:10.1038/nclimate2392.
Gasser, T., Guivarch, C., Tachiiri, K., Jones, C.D., Ciais, P., 2015. Negative emissions physically needed to keep global warming below 2 °C. Nature Communications 6. doi:10.1038/ncomms8958.
Geels, B.F.W., Benjamin, K., Schwanen, T., Sorrell, S., 2017. Accelerating innovation is as important as climate policy. Science 357, 1242–1244.
Geels, F., Sharpe, S., Victor, D., 2019. Accelerating the low carbon transition. Department for Business, Energy & Industrial Strategy 99.
Global CCS Institute, 2019. Bioenergy and Carbon Capture and Storage.
GlobalABC/IEA/UNEP, 2020. GlobalABC Roadmap for Buildings and Construction: Towards a zero-emission, efficient and resilient buildings and construction sector.
Golroodbari, S.Z.M., Vaartjes, D.F., Meit, J.B.L., van Hoeken, A.P., Eberveld, M., Jonker, H., van Sark, W.G.J.H.M., 2021. Pooling the cable: A techno-economic feasibility study of integrating offshore floating photovoltaic solar technology within an offshore wind park. Solar Energy 219, 65–74. doi:10.1016/j.solener.2020.12.062.
González, S.F., Diaz-Casas, V., 2016. Present and Future of Floating Offshore Wind. pp. 1–22. doi:10.1007/978-3-319-27972-5_1.
Goodenough, J.B., Park, K.-S., 2013. The Li-Ion Rechargeable Battery: A Perspective. Journal of the American Chemical Society 135, 1167–1176. doi:10.1021/ja3091438.
Gough, C., Mander, S., 2019. Beyond Social Acceptability: Applying Lessons from CCS Social Science to Support Deployment of BECCS. Current Sustainable/Renewable Energy Reports 6, 116–123. doi:10.1007/s40518-019-00137-0.

59
Graham, J.B., Stephenson, J.R., Smith, I.J., 2009. Public perceptions of wind energy developments : Case studies from New Zealand. Energy 37, 3348–3357. doi:10.1016/j.enpol.2008.12.035.
Grandell, L., Lehtilä, A., Kivinen, M., Koljonen, T., Kihlman, S., Lauri, L.S., 2016. Role of critical metals in the future markets of clean energy technologies. Renewable Energy 95, 53–62. doi:10.1016/j.renene.2016.03.102.
Grey, C.P., Hall, D.S., 2020. Prospects for lithium-ion batteries and beyond—a 2030 vision. Nature Communications 11, 6279. doi:10.1038/s41467-020-19991-4.
Griesheim, T.O., GIZ, R.S., IDB, L.D.C., OLADE, M.C., Torón, J., Barrera, F., Gönül, G., Parthan, B., Marshall, C., 2020. Electricity Storage Valuation: Assessing systme value and ensuring project viability.
Grubler, A., Wilson, C., Bento, N., Boza-Kiss, B., Krey, V., McCollum, D.L., Rao, N.D., Riahi, K., Rogelj, J., Stercke, S., Cullen, J., Frank, S., Fricko, O., Guo, F., Gidden, M., Havlík, P., Huppmann, D., Kiesewetter, G., Rafaj, P., Schoepp, W., Valin, H., 2018. A low energy demand scenario for meeting the 1.5 °C target and sustainable development goals without negative emission technologies. Nature Energy 3, 515. doi:10.1038/s41560-018-0172-6.
Gunn, K., Stock-Williams, C., 2012. Quantifying the global wave power resource. Renewable Energy 44, 296–304. doi:10.1016/j.renene.2012.01.101.
Han, T., McCann, G., Mücke, T.A., Freudenreich, K., 2014. How can a wind turbine survive in tropical cyclone? Renewable Energy 70, 3–10. doi:10.1016/j.renene.2014.02.014.
Hand, B., Cashman, A., 2020. A review on the historical development of the lift-type vertical axis wind turbine: From onshore to offshore floating application. Sustainable Energy Technologies and Assessments 38, 100646. doi:10.1016/j.seta.2020.100646.
Hanna, R., Abdulla, A., Xu, Y., Victor, D.G., 2021. Emergency deployment of direct air capture as a response to the climate crisis. Nature Communications 12, 368. doi:10.1038/s41467-020-20437-0.
Hannon, M., Topham, E., Dixon, J., McMillan, D., Collu, M., 2019. Offshore Wind, Ready to Float? Global and UK Trends in the Floating Offshore Wind Market. doi:10.17868/69501.
Hannon, M.J., 2015. Raising the temperature of the UK heat pump market: Learning lessons from Finland. Energy Policy 85, 369–375. doi:10.1016/j.enpol.2015.06.016.
Hepburn, C., Adlen, E., Beddington, J., Carter, E.A., Fuss, S., Mac Dowell, N., Minx, J.C., Smith, P., Williams, C.K., 2019. The technological and economic prospects for CO2 utilization and removal. Nature 575, 87–97. doi:10.1038/s41586-019-1681-6.
Hesse, H., Schimpe, M., Kucevic, D., Jossen, A., 2017. Lithium-Ion Battery Storage for the Grid—A Review of Stationary Battery Storage System Design Tailored for Applications in Modern Power Grids. Energies 10, 2107. doi:10.3390/en10122107.
Hu, J., Zhou, B., Vogel, C., Liu, P., Willden, R., Sun, K., Zang, J., Geng, J., Jin, P., Cui, L., Jiang, B., Collu, M., 2020. Optimal design and performance analysis of a hybrid system combing a floating wind platform and wave energy converters. Applied Energy 269, 114998. doi:10.1016/j.apenergy.2020.114998.
Huang, X., Chang, S., Zheng, D., Zhang, X., 2020. The role of BECCS in deep decarbonization of China’s economy: A computable general equilibrium analysis. Energy Economics 92, 104968. doi:10.1016/j.eneco.2020.104968.
Humpenöder, F., Popp, A., Dietrich, J.P., Klein, D., Lotze-Campen, H., Bonsch, M., Bodirsky, B.L., Weindl, I., Stevanovic, M., Müller, C., 2014. Investigating afforestation and bioenergy CCS as climate change mitigation strategies. Environmental Research Letters 9, 64029. doi:10.1088/1748-9326/9/6/064029.
IEA, 2021. Net Zero by 2050: A Roadmap for the Global Energy Sector.
IEA, 2020a. Energy Technology Perspectives (ETP) Clean Energy Technology Guide.
IEA, 2020b. Heat Pumps Tracking Report - June 2020.
IEA, 2020c. Industry Tracking Report - June 2020.
IEA, 2019. Perspectives for the Clean Energy Transition: The Critical Role of Buildings.
IEA, 2011. Technology Roadmap: Energy-efficient Buildings: Heating and Cooling Equipment.
IEA, 2021. Net Zero by 2050: A Roadmap for the Global Energy Sector. Paris.
IEA, 2020. World Energy Outlook 2020. Paris.
IEA, 2019. The Future of Hydrogen. OECD, Paris, France. doi:10.1787/1e0514c4-en.

60
IPCC, 2018. IPCC Special Report on Global Warming of 1.5 °C.
IRENA, 2017. Accelerating the Energy Transition through Innovation.
IRENA, 2019. Behind-The-Meter Batteries [WWW Document].
IRENA, 2016. Floating Foundations: A Game Changer for Offshore Wind Power 1–8.
IRENA, 2021a. World Energy Transitions Outlook: 1.5°C Pathway, /publications/2021/Jun/World-Energy-Transitions-Outlook.
IRENA, 2021b. OFFSHORE An action agenda for deployment.
IRENA, 2021c. Renewable Methanol.
IRENA, 2020a. Renewable Power Generation Costs in 2020, International Renewable Energy Agency.
IRENA, 2020b. Fostering A Blue Economy, Offshore Renewable Energy, The International Renewable Energy Agency.
IRENA, 2020c. Innovation outlook: Ocean energy technologies, International Renewable Energy Agency.
IRENA, 2020d. Green Hydrogen Cost Reduction: Scaling up Electrolysers to Meet the 1.5 C Climate Goal, /publications/2020/Dec/Green-hydrogen-cost-reduction.
IRENA, 2020e. Virtual Power Lines Innovation Landscape Brief .
IRENA, 2020f. Innovation Outlook: Thermal Energy Storage.
IRENA, 2019a. Innovation landscape for a renewable-powered future: Solutions to integrate variable renewables, International Renewable Energy Agency, Abu Dhabi.
IRENA, 2019b. Hydrogen: a Renewable Energy Perspective, Irena.
IRENA, 2019c. Utility-Scale Batteries Innovation Landscape Brief [WWW Document]. International Renewable Energy Agency.
Janek, J., Zeier, W.G., 2016. A solid future for battery development. Nature Energy 1, 16141. doi:10.1038/nenergy.2016.141.
Jenkins, J.D., Luke, M., Thernstrom, S., 2018. Getting to Zero Carbon Emissions in the Electric Power Sector. Joule 2, 2498–2510. doi:10.1016/j.joule.2018.11.013.
Jennings, T., Tipper, H.A., Daglish, J., Grubb, M., Drummond, P., 2020. Policy, innovation and cost reduction in UK offshore wind.
Johnsson, F., Reiner, D., Itaoka, K., Herzog, H., 2009. Stakeholder attitudes on carbon capture and storage — An international comparison. Energy Procedia 1, 4819–4826. doi:10.1016/j.egypro.2009.02.309.
Jonkman, J.M., Matha, D., 2011. Dynamics of offshore floating wind turbines-analysis of three concepts. Wind Energy 14, 557–569. doi:10.1002/we.442.
Kamp, L.M., Ortt, J.R., Doe, M.F.A., 2018. Niche Strategies to Introduce Kite-Based Airborne Wind Energy. pp. 665–678. doi:10.1007/978-981-10-1947-0_27..
Kartha, S., Dooley, K., 2015. The risks of relying on tomorrow’s “negative emissions” to guide today’s mitigation ambition. Stockholm Environment Institute (SEI).
Karytsas, S., 2018. An empirical analysis on awareness and intention adoption of residential ground source heat pump systems in Greece. Energy Policy 123, 167–179. doi:10.1016/j.enpol.2018.08.001
Kaufman, N., Sandalow, D., Rossi Di Schio, C., Higdon, J., 2019. Decarbonizing Space Heating with Air Source Heat Pumps.
Kavlak, G., McNerney, J., Trancik, J.E., 2018a. Evaluating the causes of cost reduction in photovoltaic modules. Energy Policy 123, 700–710. doi:10.1016/j.enpol.2018.08.015.
Kavlak, G., McNerney, J., Trancik, J.E., 2018b. Evaluating the causes of cost reduction in photovoltaic modules. Energy Policy 123, 700–710. doi:10.1016/j.enpol.2018.08.015.
Kearns, D., Liu, H., Consoli, C., 2021. Technology Readiness and Costs of CCS https://www.globalccsinstitute.com/resources/multimedia-library/technology-readiness-and-costs-of-ccs/.
Keith, D.W., Holmes, G., St. Angelo, D., Heidel, K., 2018. A Process for Capturing CO2 from the Atmosphere. Joule 2, 1–22. doi:10.1016/j.joule.2018.05.006.
Khan, Z., Rehan, M., 2016. Harnessing Airborne Wind Energy: Prospects and Challenges. Journal of Control, Automation and Electrical Systems 27, 728–740. doi:10.1007/s40313-016-0258-y.

61
Kiss, B., Neij, L., Jakob, M., 2014. Heat Pumps: A Comparative Assessment of Innovation and Diffusion Policies in Sweden and Switzerland.
Kittner, N., Lill, F., Kammen, D.M., 2017. Energy storage deployment and innovation for the clean energy transition. Nature Energy 2, 17125. doi:10.1038/nenergy.2017.125.
Kontu, K., Rinne, S., Junnila, S., 2019. Introducing modern heat pumps to existing district heating systems – Global lessons from viable decarbonizing of district heating in Finland. Energy 166, 862–870. doi:10.1016/j.energy.2018.10.077.
Kribus, A., Epstein, M., 2021. Thermochemically regenerative flow batteries for solar electricity generation and storage, in: Ultra-High Temperature Thermal Energy Storage, Transfer and Conversion. Elsevier, pp. 35–56. doi:10.1016/B978-0-12-819955-8.00002-8.
Kruijff, M., Ruiterkamp, R., 2018. A Roadmap Towards Airborne Wind Energy in the Utility Sector. pp. 643–662. doi:10.1007/978-981-10-1947-0_26.
L’Orange Seigo, S., Dohle, S., Siegrist, M., 2014. Public perception of carbon capture and storage (CCS): A review. Renewable and Sustainable Energy Reviews 38, 848–863. doi:10.1016/j.rser.2014.07.017.
Langer, J., Quist, J., Blok, K., 2020. Recent progress in the economics of ocean thermal energy conversion: Critical review and research agenda. Renewable and Sustainable Energy Reviews 130, 109960. doi:10.1016/j.rser.2020.109960.
Larkin, A., Kuriakose, J., Sharmina, M., Anderson, K., 2018. What if negative emission technologies fail at scale? Implications of the Paris Agreement for big emitting nations. Climate Policy 18, 690–714. doi:10.1080/14693062.2017.1346498.
Larson, E., Greig, C., Jenkins, J., Mayfield, E., Pascale, A., Zhang, C., Drossman, J., Williams, R., Pacala, S., Socolow, R., Baik, E., Birdsey, R., Duke, R., Jones, R., Haley, B., Leslie, E., Paustian, K., Swan, A., 2020. Net-Zero America: Potential Pathways, Infrastructure, and Impacts.
Lazzarin, R.M., 2007. Technological innovations in heat pump systems. International Journal of Low-Carbon Technologies 2, 262–288. doi:10.1093/ijlct/2.3.262.
Lee, N., Grunwald, U., Rosenlieb, E., Mirletz, H., Aznar, A., Spencer, R., Cox, S., 2020. Hybrid floating solar photovoltaics-hydropower systems: Benefits and global assessment of technical potential. Renewable Energy 162, 1415–1427. doi:10.1016/j.renene.2020.08.080.
Leeson, D., Fennell, P., Shah, N., Petit, C., Mac Dowell, N., 2017. A Techno-economic analysis and systematic review of carbon capture and storage (CCS) applied to the iron and steel, cement, oil refining and pulp and paper industries. International Journal of Greenhouse Gas Control 61, 71–84. doi:10.1016/j.ijggc.2017.03.020.
Leimeister, M., Kolios, A., Collu, M., 2018. Critical review of floating support structures for offshore wind farm deployment. Journal of Physics: Conference Series 1104, 012007. doi:10.1088/1742-6596/1104/1/012007.
Leisegang, T., Meutzner, F., Zschornak, M., Münchgesang, W., Schmid, R., Nestler, T., Eremin, R.A., Kabanov, A.A., Blatov, V.A., Meyer, D.C., 2019. The Aluminum-Ion Battery: A Sustainable and Seminal Concept? Frontiers in Chemistry 7. doi:10.3389/fchem.2019.00268.
Liu, T., Vivek, J.P., Zhao, E.W., Lei, J., Garcia-Araez, N., Grey, C.P., 2020. Current Challenges and Routes Forward for Nonaqueous Lithium–Air Batteries. Chemical Reviews 120, 6558–6625. doi:10.1021/acs.chemrev.9b00545.
Liu, Y., Zhang, R., Wang, J., Wang, Y., 2021. Current and future lithium-ion battery manufacturing. iScience 24, 102332. doi:10.1016/j.isci.2021.102332.
Lott, M.C., Kim, S.-I., 2014. Technology Roadmap: Energy storage. Energy Technology Perspectives 64. doi:10.1007/SpringerReference_7300.
Lowes, R., Woodman, B., Speirs, J., 2020. Heating in Great Britain: An incumbent discourse coalition resists an electrifying future. Environmental Innovation and Societal Transitions 37, 1–17. doi:10.1016/j.eist.2020.07.007.
Lunney, E., Ban, M., Duic, N., Foley, A., 2017. A state-of-the-art review and feasibility analysis of high altitude wind power in Northern Ireland. Renewable and Sustainable Energy Reviews 68, 899–911. doi:10.1016/j.rser.2016.08.014.
Mac Dowell, N., Fennell, P.S., Shah, N., Maitland, G.C., 2017. The role of CO2 capture and utilization in mitigating climate change. Nature Climate Change 7, 243–249. doi:10.1038/nclimate3231.

62
Madeddu, S., Ueckerdt, F., Pehl, M., Peterseim, J., Lord, M., Kumar, K.A., Krüger, C., Luderer, G., 2020. The CO2 reduction potential for the European industry via direct electrification of heat supply (power-to-heat). Environmental Research Letters IN press, 28. doi: doi.org/10.1088/1748-9326/abbd02.
Manzano-Agugliaro, F., Sánchez-Calero, M., Alcayde, A., San-Antonio-Gómez, C., Perea-Moreno, A.-J., Salmeron-Manzano, E., 2020. Wind Turbines Offshore Foundations and Connections to Grid. Inventions 5, 8. doi:10.3390/inventions5010008.
Market Study Report, 2021. Global Heat Pumps Market Size study, by Type (Air Source, Water Source, Geothermal (Ground) Source), by End use industry (Industrial, Commercial, Institutional), and Regional Forecasts 2020-2027.
Martiskainen, M., Schot, J., Sovacool, B.K., 2021. User innovation, niche construction and regime destabilization in heat pump transitions. Environmental Innovation and Societal Transitions 39, 119–140. doi:10.1016/j.eist.2021.03.001.
Marvel, K., Kravitz, B., Caldeira, K., 2013. Geophysical limits to global wind power. Nature Climate Change 3, 118–121. doi:10.1038/nclimate1683.
Masson-Delmotte, V., Zhai, P., Pörtner, H.-O., Roberts, D., Skea, J., Shukla, P.R., Pirani, A., Moufouma-Okia, W., Péan, C., Pidcock, R., Connors, S., Matthews, J.B.R., Chen, Y., Zhou, X., Gomis, M.I., Lonnoy, E., Maycock, T., Tignor, M., Waterfield, T., 2018. IPCC Special Report: Global Warming of 1.5°C. Summary for Policymakers [WWW Document]. Intergovernmental Panel on Climate Change. doi:10.1017/CBO9781107415324.
Mazzucato, M., 2018. Mission-oriented innovation policies: challenges and opportunities. Industrial and Corporate Change 27, 803–815. doi:10.1093/icc/dty034.
Meadowcroft, J., 2013. Exploring negative territory Carbon dioxide removal and climate policy initiatives. Climatic Change 118, 137–149. doi:10.1007/s10584-012-0684-1.
Melaina, M.W., Antonia, O., Penev, M., 2013. Blending Hydrogen into Natural Gas Pipeline Networks: A Review of Key Issues. Golden, CO (United States). doi:10.2172/1068610.
Myslikova, Z., Gallagher, K.S., 2020. Mission Innovation is mission critical. Nature Energy 5, 732–734. doi:10.1038/s41560-020-00694-5.
Napp, T.A., Gambhir, A., Hills, T.P., Florin, N., Fennell, P.S., 2014. A review of the technologies, economics and policy instruments for decarbonising energy-intensive manufacturing industries. Renewable and Sustainable Energy Reviews. doi:10.1016/j.rser.2013.10.036.
Nordhaus, W.D., Houthakker, H., Solow, R., 1973. The Allocation of Energy Resources. Brookings Papers on Economic Activity 1973, 529. doi:10.2307/2534202.
Obersteiner, M., Azar, C., Kossmeier, S., Mechler, R., Möllersten, K., Nilsson, S., Read, P., Yamagata, Y., Yan, J., 2001. Managing climate risk. International Institute for Applied Systems Analysis (IIASA), Laxenburg, Austria.
Oliveira-Pinto, S., Stokkermans, J., 2020. Assessment of the potential of different floating solar technologies – Overview and analysis of different case studies. Energy Conversion and Management 211, 112747. doi:10.1016/j.enconman.2020.112747.
Penedo R.J.M., Pardal T.C.D., Silva P.M.M.S., Fernandes N.M., Fernandes T.R.C. (2013) High Altitude Wind Energy from a Hybrid Lighter-than-Air Platform Using the Magnus Effect. In: Ahrens U., Diehl M., Schmehl R. (eds) Airborne Wind Energy. Green Energy and Technology. Springer, Berlin, Heidelberg. doi.org/10.1007/978-3-642-39965-7_29.
Philibert, C., IEA, 2017. Renewable Energy for Industry: From Green Energy to Green Materials and Fuels https://www.iea.org/publications/insights/insightpublications/Renewable_Energy_for_Industry.pdf.
Realmonte, G., Drouet, L., Gambhir, A., Glynn, J., Hawkes, A., Köberle, A.C., Tavoni, M., 2019. An inter-model assessment of the role of direct air capture in deep mitigation pathways. Nature Communications 10, 3277. doi:10.1038/s41467-019-10842-5.
Reilly, J., Melillo, J., Cai, Y., Kicklighter, D., Gurgel, A., Paltsev, S., Cronin, T., Sokolov, A., Schlosser, A., 2012. Using Land To Mitigate Climate Change: Hitting the Target, Recognizing the Trade-offs. Environmental Science and Technology 46, 5672–5679. doi:10.1021/es2034729.
Ricke, K., Drouet, L., Caldeira, K., Tavoni, M., 2018. Country-level social cost of carbon. Nature Climate Change 8, 895–900. doi:10.1038/s41558-018-0282-y.

63
Rietmann, N., Hügler, B., Lieven, T., 2020. Forecasting the trajectory of electric vehicle sales and the consequences for worldwide CO2 emissions. Journal of Cleaner Production 261, 121038. doi:10.1016/j.jclepro.2020.121038.
Rissman, J., Bataille, C., Masanet, E., Aden, N., Morrow, W.R., Zhou, N., Elliott, N., Dell, R., Heeren, N., Huckestein, B., Cresko, J., Miller, S.A., Roy, J., Fennell, P., Cremmins, B., Koch Blank, T., Hone, D., Williams, E.D., de la Rue du Can, S., Sisson, B., Williams, M., Katzenberger, J., Burtraw, D., Sethi, G., Ping, H., Danielson, D., Lu, H., Lorber, T., Dinkel, J., Helseth, J., 2020. Technologies and policies to decarbonize global industry: Review and assessment of mitigation drivers through 2070. Applied Energy 266, 114848. doi:10.1016/j.apenergy.2020.114848.
Roberts, B.W., 2018. Quad-Rotorcraft to Harness High-Altitude Wind Energy. pp. 581–601. doi:10.1007/978-981-10-1947-0_23.
Roberts, B.W., Shepard, D.H., Caldeira, K., Cannon, M.E., Eccles, D.G., Grenier, A.J., Freidin, J.F., 2007. Harnessing High-Altitude Wind Power. IEEE Transactions on Energy Conversion 22, 136–144. doi:10.1109/TEC.2006.889603.
Rosenbloom, D., Markard, J., Geels, F.W., Fuenfschilling, L., 2020. Why carbon pricing is not sufficient to mitigate climate change—and how “sustainability transition policy” can help. Proceedings of the National Academy of Sciences 117, 8664–8668. doi:10.1073/pnas.2004093117.
Rubin, E.S., Davison, J.E., Herzog, H.J., 2015. The cost of CO2 capture and storage. International Journal of Greenhouse Gas Control 40. doi:10.1016/j.ijggc.2015.05.018.
Ruiterkamp, R., Sieberling, S., 2013. Description and Preliminary Test Results of a Six Degrees of Freedom Rigid Wing Pumping System. pp. 443–458. doi:10.1007/978-3-642-39965-7_26.
Sahu, A., Yadav, N., Sudhakar, K., 2016. Floating photovoltaic power plant: A review. Renewable and Sustainable Energy Reviews 66, 815–824. doi:10.1016/j.rser.2016.08.051.
Salma, V., Friedl, F., Schmehl, R., 2020. Improving reliability and safety of airborne wind energy systems. Wind Energy 23, 340–356. doi:10.1002/we.2433.
Salma, V., Ruiterkamp, R., Kruijff, M., van Paassen, M.M., Schmehl, R., 2018. Current and Expected Airspace Regulations for Airborne Wind Energy Systems. pp. 703–725. doi:10.1007/978-981-10-1947-0_29.
Sanz-Pérez, E.S., Murdock, C.R., Didas, S.A., Jones, C.W., 2016. Direct Capture of CO2 from Ambient Air. Chemical Reviews 116, 11840–11876. doi:10.1021/acs.chemrev.6b00173.
Sartor, O., Bataille, C., 2019. IDDRI Policy Brief: Decarbonising basic materials in Europe : How Carbon Contracts-for-Difference could help bring breakthrough technologies to market..
Schäfer, A.W., Barrett, S.R.H., Doyme, K., Dray, L.M., Gnadt, A.R., Self, R., O’Sullivan, A., Synodinos, A.P., Torija, A.J., 2019. Technological, economic and environmental prospects of all-electric aircraft. Nature Energy 4, 160–166. doi:10.1038/s41560-018-0294-x.
Schmehl, R. and Tulloch O., 2019. Book of abstract. Airborne Wind Energy Conference, 15-16 October 2019, Glasgow, United Kingdom. doi: 10.4233/uuid:57fd203c-e069-11e9-9fcb-441ea15f7c9c.
Schmidt, O., Melchior, S., Hawkes, A., Staffell, I., 2019. Projecting the Future Levelized Cost of Electricity Storage Technologies. Joule 3, 81–100. doi:10.1016/j.joule.2018.12.008.
Schnell, J., Günther, T., Knoche, T., Vieider, C., Köhler, L., Just, A., Keller, M., Passerini, S., Reinhart, G., 2018. All-solid-state lithium-ion and lithium metal batteries – paving the way to large-scale production. Journal of Power Sources 382, 160–175. doi:10.1016/j.jpowsour.2018.02.062.
Scott, V., Gilfillan, S., Markusson, N., Chalmers, H., Haszeldine, R.S., 2013. Last chance for carbon capture and storage. Nature Climate Change 3, 105–111. doi:10.1038/nclimate1695.
Searchinger, T.D., Hamburg, S.P., Melillo, J., Chameides, W., Havlik, P., Kammen, D.M., Likens, G.E., Lubowski, R.N., Obersteiner, M., Oppenheimer, M., Robertson, G.P., Schlesinger, W.H., Tilman, G.D., 2009. Climate change. Fixing a critical climate accounting error. Science (New York, N.Y.) 326, 527–528. doi:10.1126/science.1178797.
Searchinger, T.D., Heimlich, R., Houghton, R.A., Dong, F., Elobeid, A., Fabiosa, J., Tokgoz, S., Hayes, D., Yu, T.-H., 2008. Use of U.S. Croplands for Biofuels Increases Greenhouse Gases Through Emissions from Land-Use Change. Science 319, 1238–1240. doi:10.1126/science.1151861.
Sepulveda, N.A., Jenkins, J.D., de Sisternes, F.J., Lester, R.K., 2018. The Role of Firm Low-Carbon Electricity Resources in Deep Decarbonization of Power Generation. Joule 2, 2403–2420. doi:10.1016/j.joule.2018.08.006.

64
Shen, X., Liu, P., Qiu, Y. (Lucy), Patwardhan, A., Vaishnav, P., 2021. Estimation of change in house sales prices in the United States after heat pump adoption. Nature Energy 6, 30–37. doi:10.1038/s41560-020-00706-4.
Shi, J., Chen, W., Yin, X., 2016. Modelling building’s decarbonization with application of China TIMES model. Applied Energy 162, 1303–1312. doi:10.1016/j.apenergy.2015.06.056.
Skyllas-Kazacos, M., Menictas, C., Lim, T., 2013. Redox flow batteries for medium- to large-scale energy storage, in: Electricity Transmission, Distribution and Storage Systems. Elsevier, pp. 398–441. doi:10.1533/9780857097378.3.398.
Slade, R., Bauen, A., Gross, R., 2014. Global bioenergy resources. Nature Climate Change 4, 99–105. doi:10.1038/nclimate2097.
Smith, P., Davis, S.J., Creutzig, F., Fuss, S., Minx, J., Gabrielle, B., Kato, E., Jackson, R.B., Cowie, A., Kriegler, E., van Vuuren, D.P., Rogelj, J., Ciais, P., Milne, J., Canadell, J.G., McCollum, D., Peters, G., Andrew, R., Krey, V., Shrestha, G., Friedlingstein, P., Gasser, T., Grübler, A., Heidug, W.K., Jonas, M., Jones, C.D., Kraxner, F., Littleton, E., Lowe, J., Moreira, J.R., Nakicenovic, N., Obersteiner, M., Patwardhan, A., Rogner, M., Rubin, E., Sharifi, A., Torvanger, A., Yamagata, Y., Edmonds, J., Yongsung, C., 2015. Biophysical and economic limits to negative CO2 emissions. Nature Climate Change 6, 42–50. doi:10.1038/nclimate2870.
Sodano, D., DeCarolis, J., Rodrigo de Queiroz, A., Johnson, J.X., 2021. The Symbiotic Relationship of Solar Power and Energy Storage in Providing Capacity Value. Renewable Energy. doi:10.1016/j.renene.2021.05.122.
Solano-Rodríguez, B., Drummond, P., Ekins, P., 2016. Decarbonizing the EU energy system by 2050: an important role for BECCS. Climate Policy 17, 93–110. doi:10.1080/14693062.2016.1242058.
Soloveichik, G.L., 2015. Flow Batteries: Current Status and Trends. Chemical Reviews 115, 11533–11558. doi:10.1021/cr500720t.
Tarvydas, D., Tsiropoulos, I., Lebedeva, N., 2018. Li-ion batteries for mobility and stationary storage applications: Scenarios for costs and market growth. doi:10.2760/87175.
Thomaßen, G., Kavvadias, K., Jiménez Navarro, J.P., 2021. The decarbonisation of the EU heating sector through electrification: A parametric analysis. Energy Policy 148, 111929. doi:10.1016/j.enpol.2020.111929.
Till, B., Cazzola, P., D’Amore, L., Gorner, M., Scheffer, S., Schuitmaker, R., Signollet, H., Tattini, J., Paoli, J.T.L., 2019. Global EV Outlook 2019 to electric mobility. OECD iea.org 232.
Tilman, D., Socolow, R., Foley, J.A., Hill, J., Larson, E., Lynd, L., Pacala, S., Reilly, J., Searchinger, T., Somerville, C., Williams, R., 2009. Beneficial Biofuels--The Food, Energy, and Environment Trilemma. Science 325, 270–271. doi:10.1126/science.1177970.
Tong, D., Zhang, Q., Zheng, Y., Caldeira, K., Shearer, C., Hong, C., Qin, Y., Davis, S.J., 2019. Committed emissions from existing energy infrastructure jeopardize 1.5 °C climate target. Nature. doi:10.1038/s41586-019-1364-3.
Topham, E., McMillan, D., 2017. Sustainable decommissioning of an offshore wind farm. Renewable Energy 102, 470–480. doi:10.1016/j.renene.2016.10.066..
Trahey, L., Brushett, F.R., Balsara, N.P., Ceder, G., Cheng, L., Chiang, Y.-M., Hahn, N.T., Ingram, B.J., Minteer, S.D., Moore, J.S., Mueller, K.T., Nazar, L.F., Persson, K.A., Siegel, D.J., Xu, K., Zavadil, K.R., Srinivasan, V., Crabtree, G.W., 2020. Energy storage emerging: A perspective from the Joint Center for Energy Storage Research. Proceedings of the National Academy of Sciences 117, 12550–12557. doi:10.1073/pnas.1821672117
Tsiropoulos, I., Nijs, W., Tarvydas, D., Ruiz Castello, P., 2019. Towards net-zero emissions in the EU energy system by 2050.
UNFCCC, 2015. Adoption of the Paris Agreement: Proposal by the President: Draft decision -/CP.21. United Nations Framework Convention on Climate Change (UNFCCC).
Ürge-Vorsatz, D., Cabeza, L.F., Serrano, S., Barreneche, C., Petrichenko, K., 2015. Heating and cooling energy trends and drivers in buildings. Renewable and Sustainable Energy Reviews 41, 85–98. doi:10.1016/j.rser.2014.08.039.
United States Department of Energy, 2020a. Energy Storage Grand Challenge: Energy Storage Market Report.
United States Department of Energy, 2020b. 2020 Grid Energy Storage Technology Cost and Performance Assessment.
Utsunomiya, T., Sato, I., Shiraishi, T., 2020. Floating Offshore Wind Turbines in Goto Islands, Nagasaki, Japan. pp. 359–372. doi:10.1007/978-981-13-8743-2_20.

65
Uzunoglu, E., Karmakar, D., Guedes Soares, C., 2016. Floating Offshore Wind Platforms. pp. 53–76. doi:10.1007/978-3-319-27972-5_4.
van Hagen, L., 2021. Life Cycle Assessment of a Multi-megawatt Wind Energy Converter [WWW Document]. Tu Delft.
van Hussen, K., Dietrich, E., Smeltink, J., Berentsen, K., van der Sleen, M., Haftner, R., Fagiano, L., 2018. Study on challenges in the commercialisation of airborne wind energy systems..
van Vuuren, D.P., Deetman, S., van Vliet, J., van den Berg, M., van Ruijven, B.J., Koelbl, B., 2013. The role of negative CO2 emissions for reaching 2 °C—insights from integrated assessment modelling. Climatic Change 118, 15–27. doi:10.1007/s10584-012-0680-5.
Vance, E., 2009. Wind power: High hopes. Nature 460, 564–566. doi:10.1038/460564a.
Vander Lind D. (2013) Analysis and Flight Test Validation of High Performance AirborneWind Turbines. In: Ahrens U., Diehl M., Schmehl R. (eds) Airborne Wind Energy. Green Energy and Technology. Springer, Berlin, Heidelberg. doi.org/10.1007/978-3-642-39965-7_28.
Vaughan, N.E., Gough, C., 2016. Expert assessment concludes negative emissions scenarios may not deliver. Environmental Research Letters 11, 95003. doi:10.1088/1748-9326/11/9/095003.
Veers, P., Dykes, K., Lantz, E., Barth, S., Bottasso, C.L., Carlson, O., Clifton, A., Green, J., Green, P., Holttinen, H., Laird, D., Lehtomäki, V., Lundquist, J.K., Manwell, J., Marquis, M., Meneveau, C., Moriarty, P., Munduate, X., Muskulus, M., Naughton, J., Pao, L., Paquette, J., Peinke, J., Robertson, A., Sanz Rodrigo, J., Sempreviva, A.M., Smith, J.C., Tuohy, A., Wiser, R., 2019. Grand challenges in the science of wind energy. Science 366, eaau2027. doi:10.1126/science.aau2027..
Vermillion, C., Cobb, M., Fagiano, L., Leuthold, R., Diehl, M., Smith, R.S., Wood, T.A., Rapp, S., Schmehl, R., Olinger, D., Demetriou, M., 2021. Electricity in the air: Insights from two decades of advanced control research and experimental flight testing of airborne wind energy systems. Annual Reviews in Control. doi:10.1016/j.arcontrol.2021.03.002
Vermillion, C., Glass, B., Rein, A., 2013. Lighter-Than-Air Wind Energy Systems. pp. 501–514. doi:10.1007/978-3-642-39965-7_30..
Vimalakanthan, K., Caboni, M., Schepers, J.., Pechenik, E., Williams, P., 2018. Aerodynamic analysis of Ampyx’s airborne wind energy system. Journal of Physics: Conference Series 1037, 062008. doi:10.1088/1742-6596/1037/6/062008.
Viswanathan, V., Knapp, B.M., 2019. Potential for electric aircraft. Nature Sustainability 2, 88–89. doi:10.1038/s41893-019-0233-2.
Vögele, S., Rübbelke, D., Mayer, P., Kuckshinrichs, W., 2018. Germany’s “No” to carbon capture and storage: Just a question of lacking acceptance? Applied Energy 214, 205–218. doi:10.1016/j.apenergy.2018.01.077.
Vogl, V., Åhman, M., Nilsson, L.J., 2018. Assessment of hydrogen direct reduction for fossil-free steelmaking. Journal of Cleaner Production 203, 736–745. doi:10.1016/j.jclepro.2018.08.279.
Waisman, H., Bataille, C., Winkler, H., Jotzo, F., Shukla, P., Colombier, M., Anandarajah, G., Boer, R., Cho, Y., Criqui, P., Denis-Ryan, A., Dhar, S., Fischedick, M., Gaeta, M., Gesteira, C., Haley, B., Hourcade, J.-C., Kainuma, M., La Rovere, E.L., Liu, Q., Lugovoy, O., Masui, T., Mathy, S., Oshiro, K., Parrado, R., Pathak, M., Patshnikov, V., Pye, S., Safonov, G., Samadi, S., Sawyer, D., Siagian, U., Spencer, T., Teng, F., Tovilla, J., Trollip, H., Virdis, M.-R., Williams, J., Young, S., 2019. A pathway design framework for national low greenhouse gas emission development strategies . Nature Climate Change 9. doi:10.1038/s41558-019-0442-8.
Waite, M., Modi, V., 2020. Electricity Load Implications of Space Heating Decarbonization Pathways. Joule 4, 376–394. doi:10.1016/j.joule.2019.11.011.
Wang, J., Zhong, H., Yang, Z., Wang, M., Kammen, D.M., Liu, Z., Ma, Z., Xia, Q., Kang, C., 2020. Exploring the trade-offs between electric heating policy and carbon mitigation in China. Nature Communications 11, 6054. doi:10.1038/s41467-020-19854-y.
Watson, S., Moro, A., Reis, V., Baniotopoulos, C., Barth, S., Bartoli, G., Bauer, F., Boelman, E., Bosse, D., Cherubini, A., Croce, A., Fagiano, L., Fontana, M., Gambier, A., Gkoumas, K., Golightly, C., Latour, M.I., Jamieson, P., Kaldellis, J., Macdonald, A., Murphy, J., Muskulus, M., Petrini, F., Pigolotti, L., Rasmussen, F., Schild, P., Schmehl, R., Stavridou, N., Tande, J., Taylor, N., Telsnig, T., Wiser, R., 2019. Future emerging technologies in the wind power sector: A European perspective. Renewable and Sustainable Energy Reviews 113, 109270. doi:10.1016/j.rser.2019.109270.

66
Weber, J., Marquis, M., Cooperman, A., Draxl, C., Hammond, R., Jonkman, J., Lemke, A., Lopez, A., Mudafort, R., Optis, M., Roberts, O., Shields, M., Matt, 2021. Airborne Wind Energy, Green Energy and Technology. doi:10.1007/978-3-642-39965-7.
Weiss P., 2020. Airborne wind energy prepares for take off. Engineering 6(2), 107-109. doi: 10.1016/j.eng.2019.12.002
Weiss P., 2021. After highflyer crashes, airborne wind energy regroups. Engineering7(3), 277-279. doi: 10.1016/j.eng.2021.01.004.
Weiss, M., Dekker, P., Moro, A., Scholz, H., Patel, M.K., 2015. On the electrification of road transportation – A review of the environmental, economic, and social performance of electric two-wheelers. Transportation Research Part D: Transport and Environment 41, 348–366. doi:10.1016/j.trd.2015.09.007.
Wijnja, J., Schmehl, R., De Breuker, R., Jensen, K., Vander Lind, D., 2018. Aeroelastic Analysis of a Large Airborne Wind Turbine. Journal of Guidance, Control, and Dynamics 41, 2374–2385. doi:10.2514/1.G001663.
Wilcox, J., Psarras, P.C., Liguori, S., 2017. Assessment of reasonable opportunities for direct air capture. Environmental Research Letters 12, 65001. doi:10.1088/1748-9326/aa6de5.
Williams, J.H., DeBenedictis, A., Ghanadan, R., Mahone, A., Moore, J., Morrow, W.R., Price, S., Torn, M.S., 2012. The technology path to deep greenhouse gas emissions cuts by 2050: the pivotal role of electricity. Science (New York, N.Y.) 335, 53–9. doi:10.1126/science.1208365.
Williams, J.H., Jones, R.A., Haley, B., Kwok, G., Hargreaves, J., Farbes, J., Torn, M.S., 2021. Carbon-Neutral Pathways for the United States. AGU Advances 2. doi:10.1029/2020av000284.
Ye, L., Li, X., 2021. A dynamic stability design strategy for lithium metal solid state batteries. Nature 593, 218–222. doi:10.1038/s41586-021-03486-3.
Yip, C.M.A., Gunturu, U.B., Stenchikov, G.L., 2017. High-altitude wind resources in the Middle East. Scientific Reports 7, 9885. doi:10.1038/s41598-017-10130-6.
Zhao, H., Gao, Y., Song, Z., 2017. Strategic outlook of Heat pump development in China, presentation at the 12th IEA Heat Pump Conference 2017.
Zhao, H., Xu, J., Yin, D., Du, Y., 2018. Electrolytes for Batteries with Earth-Abundant Metal Anodes. Chemistry - A European Journal 24, 18220–18234. doi:10.1002/chem.201802438.
Ziegler, M.S., Trancik, J.E., 2021. Re-examining rates of lithium-ion battery technology improvement and cost decline. Energy and Environmental Science 14, 1635–1651. doi:10.1039/D0EE02681F.
Zillmann, U., Bechtle, P., 2018. Emergence and Economic Dimension of Airborne Wind Energy. pp. 1–25. doi:10.1007/978-981-10-1947-0_1.
Zimny, J., Michalak, P., Szczotka, K., 2015. Polish heat pump market between 2000 and 2013: European background, current state and development prospects. Renewable and Sustainable Energy Reviews 48, 791–812. doi:10.1016/j.rser.2015.04.005.
Zogg, M., 2008. History of Heat Pumps: Swiss Contributions and International Milestones.
Zühlsdorf, B., Bühler, F., Bantle, M., Elmegaard, B., 2019. Analysis of technologies and potentials for heat pump-based process heat supply above 150 °C. Energy Conversion and Management: X 2, 100011. doi:10.1016/j.ecmx.2019.100011.
ACKNOWLEDGEMENTS
The TEC extends its appreciation to Dr Chris Bataille of the Institute for Sustainable Development and International Relations (IDDRI.org) and Dr Francis Li (CEng) for the development of this technical paper, and to the representatives of observer organizations participating in the TEC task force on innovation for the inputs provided throughout the preparation of this document.

67 © U
nspl
ash_
Paw
el N
olbe
rt

About the Technology Executive Committee
The Technology Executive Committee is the policy component of the Technology Mechanism, which was established by the Conference of the Parties in 2010 to facilitate the implementation of enhanced action on climate technology development and transfer. The TEC analyses climate technology issues and develop policies that can accelerate the development and transfer of low-emission and climate resilient technologies.
Contact Details
The Technology Executive Committee may be contacted through the United Nations Climate Change Secretariat
Platz der Vereinten Nationen 1, 53113 Bonn, Germany Email: [email protected]
Website: www.unfccc.int/ttclear/tec
© UNFCCC December 2021 United Nations Framework Convention on Climate Change
All right reserved
This publication is issued for public information purposes and is not an official text of the Convention in any legal or technical sense. Unless otherwise noted in captions or graphics all matter may be freely reproduced in part or in full, provided the source is acknowledged.
A digital copy of this report can be downloaded from:https://unfccc.int/ttclear/tec/energysupplysector.html
#climatetech
Copyright © 2022 FDOKUMEN