Elimination voltammetry with linear scan as a new detection
17
Sensors 2005, 5, 448-464 sensors ISSN 1424-8220 © 2005 by MDPI http://www.mdpi.org/sensors Elimination Voltammetry with Linear Scan as a New Detection Method for DNA Sensors Libuse Trnkova 1* , Frantisek Jelen 2 , Jitka Petrlova 3 , Vojtech Adam 3 , David Potesil 3 , Rene Kizek 3 Dedicated to Professor Emil Palecek, on the Occasion of His 75 th Birthday 1 Department of Theoretical and Physical Chemistry, Masaryk University, Faculty of Science, Kotlarska 2, 611 37 Brno, Czech Republic 2 Institute of Biophysics, Academy of Sciences of the Czech Republic, Kralovopolska 135, 612 65 Brno, Czech Republic 3 Department of Chemistry and Biochemistry, Mendel University of Agriculture and Forestry, Zemedelska 1, 613 00 Brno, Czech Republic * Author to whom correspondence should be addressed e-mail: [email protected] Received: 23 February 2005 / Accepted: 4 April 2005 / Published: 14 November 2005 Abstract: The paper describes successful coupling of adsorptive transfer stripping (AdTS) and elimination voltammetry with linear scan (EVLS) for the resolution of reduction signals of cytosine (C) and adenine (A) residues in hetero-oligodeoxynucleotides (ODNs). Short ODNs (9-mers and 20-mers) were adsorbed from a small volume on a hanging mercury drop electrode (HMDE). After washing of the ODN-modified electrode by water and its transferring to an electrochemical cell, voltammetric
Transcript of Elimination voltammetry with linear scan as a new detection

Sensors 2005, 5, 448-464
sensors ISSN 1424-8220
© 2005 by MDPI
http://www.mdpi.org/sensors
Elimination Voltammetry with Linear Scan as a New
Detection Method for DNA Sensors
Libuse Trnkova1*, Frantisek Jelen2, Jitka Petrlova3, Vojtech Adam3, David Potesil3,
Rene Kizek3
Dedicated to Professor Emil Palecek, on the Occasion of His 75th Birthday
1 Department of Theoretical and Physical Chemistry, Masaryk University, Faculty of Science,
Kotlarska 2, 611 37 Brno, Czech Republic 2 Institute of Biophysics, Academy of Sciences of the Czech Republic, Kralovopolska 135,
612 65 Brno, Czech Republic 3 Department of Chemistry and Biochemistry, Mendel University of Agriculture and Forestry,
Zemedelska 1, 613 00 Brno, Czech Republic
* Author to whom correspondence should be addressed e-mail: [email protected]
Received: 23 February 2005 / Accepted: 4 April 2005 / Published: 14 November 2005
Abstract: The paper describes successful coupling of adsorptive transfer stripping (AdTS) and
elimination voltammetry with linear scan (EVLS) for the resolution of reduction signals of cytosine (C)
and adenine (A) residues in hetero-oligodeoxynucleotides (ODNs). Short ODNs (9-mers and 20-mers)
were adsorbed from a small volume on a hanging mercury drop electrode (HMDE). After washing of
the ODN-modified electrode by water and its transferring to an electrochemical cell, voltammetric

Sensors 2005, 5 449
curves were measured. The AdTS EVLS was able to determine of C/A ratio of ODNs through the
elimination function conserving the diffusion current component and eliminating kinetic and charging
current components. This function, which provides the elimination signal in a peak-counterpeak form,
increased the current sensitivity for A and C resolution, and for the recognition of bases sequences in
ODN chains. Optimal conditions of elimination experiments such as pH, time of adsorption, and scan
rate were found. The combination of EVLS with AdTS procedure can be considered as a new
detection method in a DNA sensor.
Keywords: Oligodeoxynucleotide, DNA biosensor, linear sweep voltammetry, elimination
voltammetry with linear scan, reduction of adenine and cytosine, mercury electrode, sequence of
nucleotides
1. Introduction
Although the structure of DNA was described more than 50 years ago [1], DNA still remains
one of the most studied biological molecule. According to Web of Science database more than thirty-
nine thousands articles dealing with DNA analysis have been published in 2004. From a number of
methods and procedures used, probably agarose and polyacrylamide electrophoresis and capillary
electrophoresis [2-5] are the most commonly applied methods for DNA analysis, including DNA
separation and DNA sequencing. In addition to these electrophoretic techniques, electrochemical
methods based on electroactivity of nucleic acid bases are frequently used as well. Palecek was the
first who published papers about electrochemical activity of nucleic acids [6,7], and during the next
four decades he and his colleagues found that DNA and RNA produce redox signals at mercury or
carbon electrodes due to purine and pyrimidine base residues [7-13]. Recently, it has been shown that
the voltammetric techniques can be use not only for the study of redox properties of nucleic acid but
also for the analysis of structure and damage of DNA, and for sequence detection in DNA
biosensors[13-21]. Research and development of electrochemical sensors for DNA hybridization and
damage is closely connected with adsorptive and redox properties of oligodeoxynucleotides (ODNs)
that are adsorbed strongly on electrode/electrolyte interfaces. This phenomenon is utilized in
adsorptive stripping (AdSV) and/or adsorptive transfer stripping voltammetry (AdTSV) [22,23],
reviewed in[13]. In AdTSV, an electrode with adsorbed DNA layer is transferred into a medium not
containing DNA in bulk solution.

Sensors 2005, 5 450
Generally, DNA biosensors based on nucleic acid recognition processes are aimed at fast,
simple and inexpensive testing of genetic and infections diseases. Electrochemical hybridization
biosensors rely on the immobilization of a single-stranded DNA probe onto the tranducer surface that
converts the duplex formation into a useful electrical signal [24]. For these purposes various
modifications of working electrode surfaces have been used [11,13,25-30]. Considerable improvement
of the sensitivity of nucleic acids determination has been achieved by applying different
electrochemical methods in combination with nucleic acids labelling by redox labels such as osmium
and ruthenium complexes [15,16,18,31-33]. In addition, selectivity in electrochemical analysis of
DNA has been addressed by a new method using paramagnetic or polymeric beads with modified
surface [14,34,35]. The method is also known as double – surface technique [14,16,36-38].
Recently, the elimination voltammetry with linear scan (EVLS) was successfully applied to
data analysis of ODNs signal, aiming at better understanding of basic electrochemical processes on
working electrode surfaces, and for better resolution of voltammetric signals of adenine (A) and
cytosine (C) in ODNs [39-43]. The EVLS, resulting in elimination functions as linear combinations of
currents measured at different scan rates provides a significant increase of voltammetric signal
sensitivity [39,40].
The present paper deals with the application of EVLS in combination with AdTS technique to
the analysis of short synthetic ODNs with 9- and 20-mers (the former ODNs contained only A or C
residues, the latter included random sequences) we addressed particularly the following points: (a) to
increase the sensitivity in ODN voltammetric responses, (b) to resolve A and C reduction signals, (c)
to determine the ratio A/C, and (d) the mutual position of A and C in ODN chain.
2. Materials and methods
2.1. Chemicals
Chemicals used were prepared by Sigma Aldrich Chemical Corp. USA (purity: ACS).
Phosphate buffer, of 0.1 M NaH2PO4 + 0.1 M Na2HPO4, was used. All solutions were prepared using
deionized ACS water (Sigma Aldrich). The pH of the phosphate buffer was checked by pH-meter
Präcitronic (type MV870, Germany). The pH value was measured using WTW inoLab Level 3 with
terminal Level 3 (Weilheim, Germany), controlled by personal computer program (MultiLab Pilot;
Weilheim, Germany). The pH-electrode (SenTix-H, pH 0–14/3M KCl) was regularly calibrated by a
set of WTW buffers (Weilheim, Germany).

Sensors 2005, 5 451
2.2. Oligonucleotides
In our experiments we used synthetic oligodeoxynucleotides (ODNs) purchased from Thermo
Electron, Ulm, Germany: ODN A9 :5´- AAA AAA AAA -3´; ODN C9:- 5´- CCC CCC CCC -3´;
ODN A3: 5´- CCC AAA CCC -3´; ODN A3a: 5´- CCC ACA ACC -3´; ODN A2: 5´- CCC AAC CCC
-3´; ODN A1: 5´- CCC ACC CCC -3´; ODN (20a): 5´- CCT ICC CCA ATC CCT TTA TT -3´; ODN
(20b): 5´- GGG AGG TTT CGT ATA GGG AA -3´; ODN (20c): 5´- AAT AAA GGG ATT GGG
GCA GG -3´. The stock solutions of ODNs were prepared in ACS water (Sigma-Aldrich, USA) and
stored in the dark at -20 °C. Working solutions were prepared daily by dilution of the stock solutions.
2.3. Voltammetric measurements
Linear sweep voltammetry (LSV) measurements were performed with an AUTOLAB analyzer
(EcoChemie, Netherlands) connected to the VA-Stand 663 (Metrohm, Switzerland). The
electrochemical standard cell consisted of three electrodes. The working electrode was a hanging
mercury drop electrode (HMDE) with an area of 0.4 mm2, the reference electrode was Ag/AgCl/3M
KCl. Platinum wire was used as an auxiliary electrode. Solutions were deoxygenated prior to analysis
by purging with 99.9 % argon gas for at least 7 minutes. Our measurements were performed by
adsorptive stripping voltammetry with transfer step - AdTS (Fig. 1).
LSV experimental parameters: start potential 0V, vertex potential –1.8 V, step potential 5 mV,
scan rates from 100 to 2 400 mV/s, equilibrium time 5s, scan rates for EVLS: 400, 800, and 1 600
mV/s, reference scan rate 800mV/s with the same step potential. All experiments were carried out at
room temperature in phosphate buffer under standard conditions. The raw data were treated using the
Savitzky and Golay filter (level 4) integrated to the GPES software (EcoChemie). The data processing
and statistic analysis were performing by Excel (Microsoft, USA).
Sensors 2005, 5 452
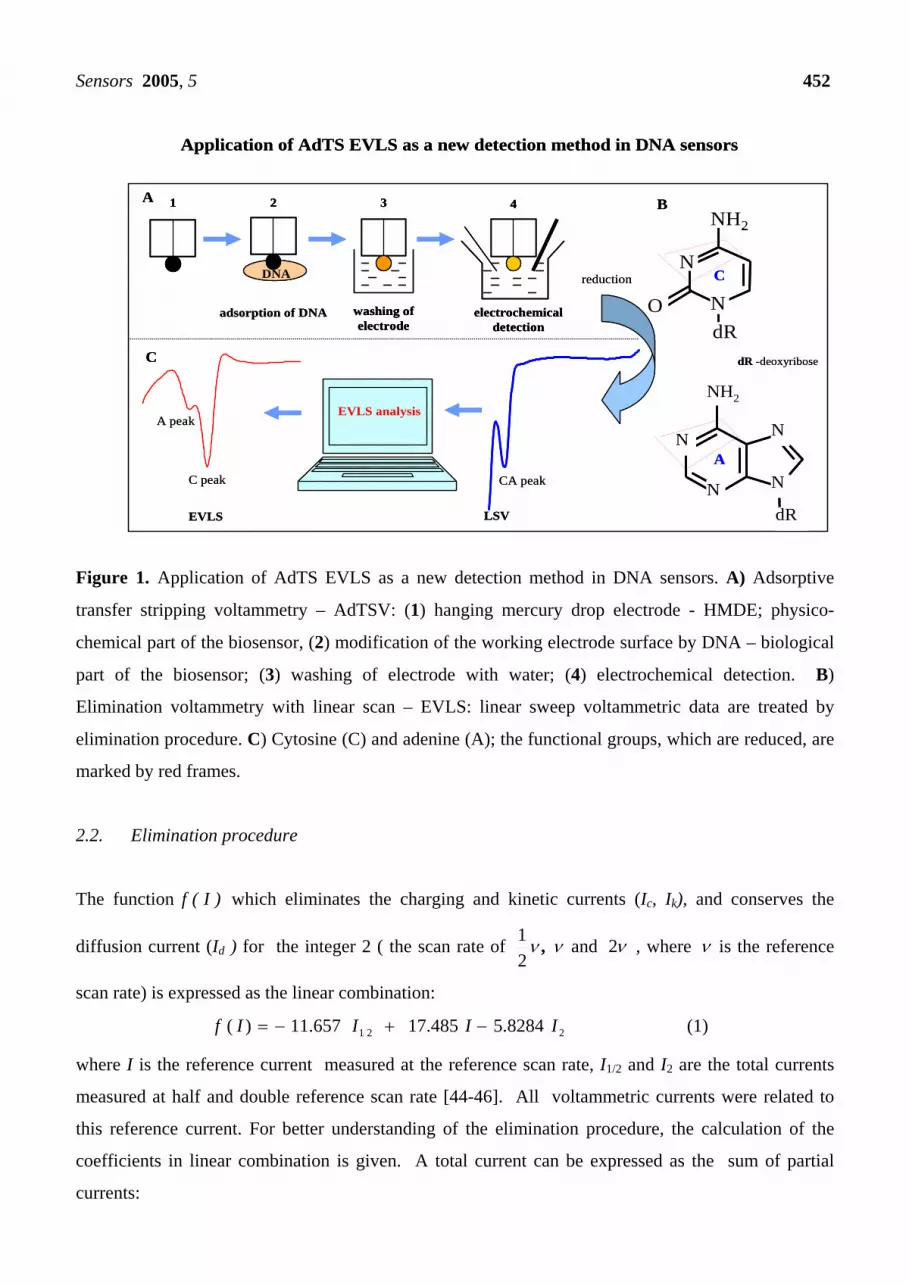
Figure 1. Application of AdTS EVLS as a new detection method in DNA sensors. A) Adsorptive
transfer stripping voltammetry – AdTSV: (1) hanging mercury drop electrode - HMDE; physico-
chemical part of the biosensor, (2) modification of the working electrode surface by DNA – biological
part of the biosensor; (3) washing of electrode with water; (4) electrochemical detection. B)
Elimination voltammetry with linear scan – EVLS: linear sweep voltammetric data are treated by
elimination procedure. C) Cytosine (C) and adenine (A); the functional groups, which are reduced, are
marked by red frames.
2.2. Elimination procedure
The function )I(f which eliminates the charging and kinetic currents (Ic, Ik), and conserves the
diffusion current (Id ) for the integer 2 ( the scan rate of νν ,21 and ν2 , where ν is the reference
scan rate) is expressed as the linear combination:
221 8284.5485.17657.11)( IIIIf −+−= (1)
where I is the reference current measured at the reference scan rate, I1/2 and I2 are the total currents
measured at half and double reference scan rate [44-46]. All voltammetric currents were related to
this reference current. For better understanding of the elimination procedure, the calculation of the
coefficients in linear combination is given. A total current can be expressed as the sum of partial
currents:
1
washing ofelectrode
3
electrochemicaldetection
4A
DNA
2
adsorption of DNA
EVLS analysis
N
N N
N
NH2
dR
N
N
NH2
dRO
A
dR -deoxyribose
reduction
LSV
C
B
Application of AdTS EVLS as a new detection method in DNA sensors
CA peakC peak
A peak
EVLS
C
11
washing ofelectrode
3
washing ofelectrode
3
electrochemicaldetection
4
electrochemicaldetection
4A
DNADNA
22
adsorption of DNA
EVLS analysis
NN
NN NN
NN
NH2NH2
dRdR
NN
NN
NH2NH2
dRdROO
A
dR -deoxyribose
reduction
LSV
C
B
Application of AdTS EVLS as a new detection method in DNA sensors
CA peakC peak
A peak
EVLS
C

Sensors 2005, 5 453
......IIII kcd +++= (2)
The diffusion, charging and kinetic current component at the same potential can be written:
2121 v.const)E(YI dd =ν= , 11 v.const)E(YI cc =ν= , and 0ν== .const)E(YI kk. Total currents
recorded at three above mentioned scan rates are:
21212121 )()()( kcd IIII ++= or ( ) ( ) )()(21)(21 1121
1211 kcd IaIaIaIa ++=
)()()( kcd IIII ++= or )()()( 2222 kcd IaIaIaIa ++=
2222 )()()( kcd IIII ++= or ( ) ( ) )()(2)(2 3321
323 kcd IaIaIaIa ++=
= dI = 0 = 0
For the simultaneous elimination of cI + kI with dI conserved the requirements shown below the
arrows must be fulfilled. According to these requirements three equations can be written:
( ) ( ) dddd IIaIaIa =++ )(2)()(21 2132
211
( ) ( ) 0)(2)()(21 321 =++ ccc IaIaIa (3)
0)()()( 321 =++ kkk IaIaIa
The solution of throse equations yields the coefficients 1a , 2a , and 3a in the elimination function
defined by Eq. 1 :
657.111 −=a 485.172 =a 828.53 −=a
For adsorbed electroactive substance this elimination function provides an EVLS signal, i.e. a
peak ( pI ), which passes directly to a large and sharp counter peak ( cpI ), and creates the characteristic
peak-counterpeak signal ( cpp II + ) [39-41,43]. The theoretical value of the ratio )II(I cppp + , where
pI and cpI represent the heights of the current peak and counter-peak, is 0.4097 [41,43,46,47].
Linear sweep voltammetric data obtained at the scan rate of νν,21 and ν2 were exported into
Microsoft Excel (Microsoft, USA). The particular elimination function was calculated using Microsoft
Visual Basic 6.0. The EVLS program for fast calculation of coefficients of the above mentioned
elimination function is available from the corresponding author of this publication on request.

Sensors 2005, 5 454
3. Results and discussion
The detection of homo- and/or hetero-ODNs on the mercury electrode surface consists in the
reduction responses of A and C at negative potentials (about –1.4 V vs. Ag/AgCl/3M KCl) represented
by one overlapped voltammetric peak, which cannot be distinguished by common electrochemical
methods, such as linear sweep, square wave, and differential pulse voltammetry. Recently we have
applied the EVLS to the resolution of reduction signals of A and C in homo-deoxyoligonucleotides A9
and C9, and have shown that this method in connection with adsorptive stripping technique (AdS) is as
a useful electroanalytical tool for the ODNs research [41,43]. Our results evoked the idea of coupling
of the EVLS and the adsorptive stripping voltammetry with transfer step (AdTS) to perform the ODN
analysis with higher ability in A and C resolution in very small sample volumes (units of microliters).
Since AdTSV enabled to analyze microliter volumes of ODN samples yielding results very close to
those obtained by conventional voltammetry (reviewed in[13]), we could expect improved
voltammetric results using the elimination procedure.
Therefore, ODNs were immobilized at a HMDE surface from a small drop of the analyzed
solution (5 µL), then the ODN-modified electrode was washed and immersed into the buffer solutions
(not containing ODN) to perform the voltammetric measurements. Using LSV we obtained
voltammetric data for reduction of A and C at three scan rates. From these data we calculated the
EVLS function eliminating kinetic and charging currents and conserving the diffusion current (see
equation in section Elimination procedure). The whole procedure is schematically shown in Fig.1.,
where the EVLS analysis contributed to the transformation of the LSV data (overlapped signal) to
EVLS data (resolved signal).
3.1. Analysis of homo-oligodeoxynucleotides (A9 and C9)
Recently we have found that EVLS in combination with AdS (without transfer step) enabled
the separation of A and C signals of A9 and C9 mixtures in acetate buffer at pH 5.3 [41]. In contrast, in
the present paper, we studied the two ODNs using AdTS (i.e, with transfer step) as a function of scan
rate and pH (Fig. 2). The pH of phosphate buffer was changed from 5.0 to 7.7, and LSV peak heights
were measured at a scan rate of 800 mV/s. While with increasing pH the peak height of C9 increased
up to the maximum value at neutral pH and decreased at higher pH, the peak height of A9 dropped
already from pH 5.0 to reach only 3% of maximum value at pH 6.0. The peaks of both C9 and A9 were
linearly growing with increasing scan rate with slopes of 763 nA/V.s-1 and 345 nA/V.s-1, respectively
(not shown).

Sensors 2005, 5 455
Figure 2. Analysis of homo-oligodeoxynucleotides A9 and C9. A) Influence of pH (0.1 M phosphate
buffer) on peak heights of ODNs. D) Elimination voltammograms of A9 and C9 suitable for the
function eliminating kinetic and charging currents, and conserving the diffusion current (reference
scan rate of 800 mV/s, pH 5.4). LSV experimental parameters: start potential 0 V, vertex potential –1.7
V, step potential 5mV, adsorption time 120s.
If we simultaneously eliminated the charging and kinetic currents and maintained the diffusion current,
we observed elimination signals in the peak-counterpeak form indicating strongly adsorbed
electroactive substances for both ODNs (Fig.2B). It was found that the C9 elimination curve is smaller
and less pronounced then the A9 elimination curve. While the ratio )II(I cppp + ( pI and cpI are the
heights of the current peak and counter-peak, respectively) for A9 (0.409) agreed with the theoretical
value of 0.4097 [41,46] the ratio )II(I cppp + it indicated a more complex electrode process for
cytosine (0.612). For more details see Trnkova et al. [39,41,48].
0
400
800
1200
1600
2000
5.0 5.4 6.0 6.5 6.9 7.2 7.7
C9
A9
Peak
heig
ht(n
A)
pH
Effect of pH EVLS
-1.50 -1.40 -1.30 -1.40 -1.30 -1.20Potential (V)Potential (V)
0.5 µA
A9 C9 scanscan
Homo-oligodeoxynucleotides (9-mer)
A B
0.1 µA
pH 5.4
0
400
800
1200
1600
2000
5.0 5.4 6.0 6.5 6.9 7.2 7.7
C9
A9
Peak
heig
ht(n
A)
pH
Effect of pH EVLS
-1.50 -1.40 -1.30-1.50 -1.40 -1.30 -1.40 -1.30 -1.20-1.40 -1.30 -1.20Potential (V)Potential (V)
0.5 µA0.5 µA
A9 C9 scanscanscanscan
Homo-oligodeoxynucleotides (9-mer)
A B
0.1 µA0.1 µA
pH 5.4
Sensors 2005, 5 456
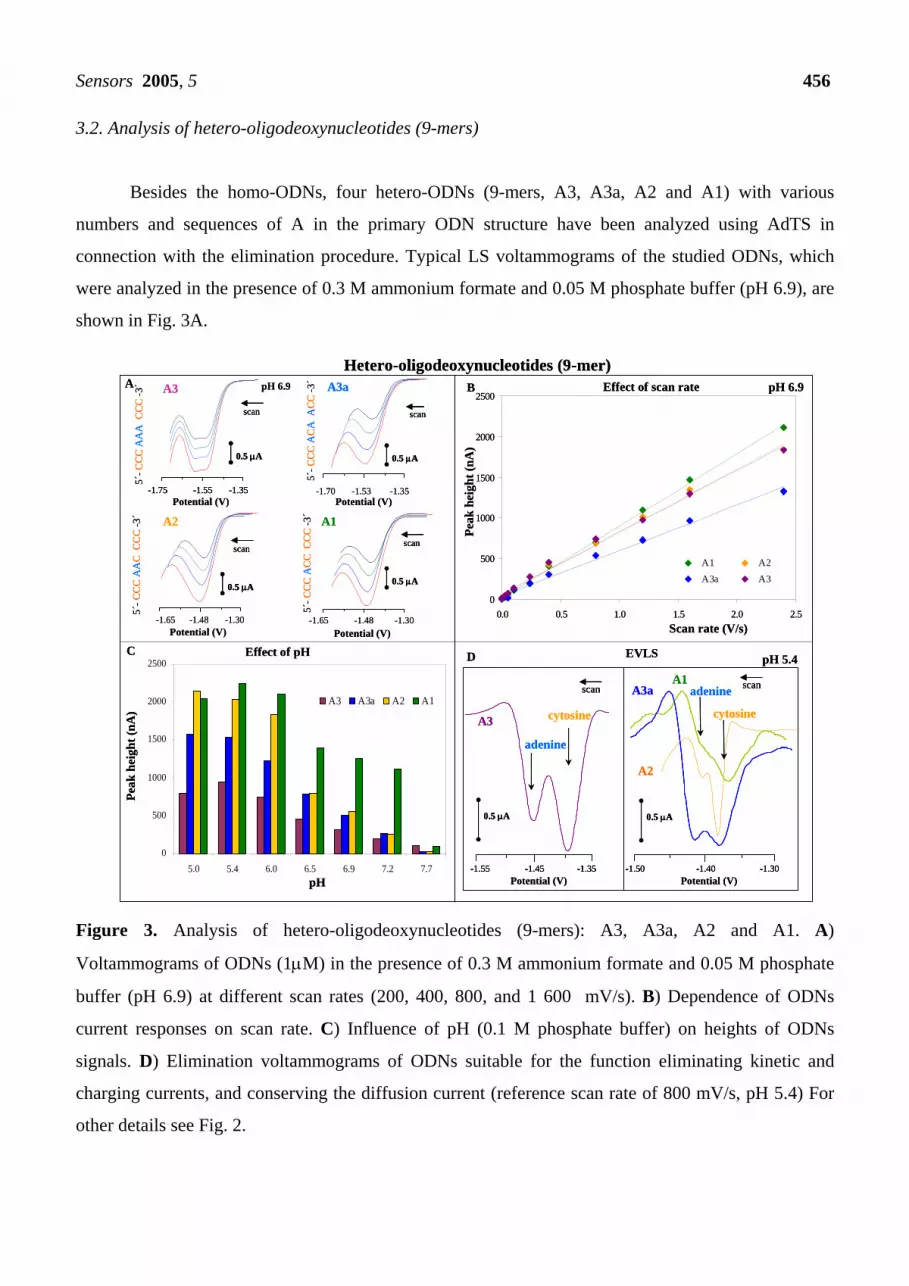
3.2. Analysis of hetero-oligodeoxynucleotides (9-mers)
Besides the homo-ODNs, four hetero-ODNs (9-mers, A3, A3a, A2 and A1) with various
numbers and sequences of A in the primary ODN structure have been analyzed using AdTS in
connection with the elimination procedure. Typical LS voltammograms of the studied ODNs, which
were analyzed in the presence of 0.3 M ammonium formate and 0.05 M phosphate buffer (pH 6.9), are
shown in Fig. 3A.
Figure 3. Analysis of hetero-oligodeoxynucleotides (9-mers): A3, A3a, A2 and A1. A)
Voltammograms of ODNs (1µM) in the presence of 0.3 M ammonium formate and 0.05 M phosphate
buffer (pH 6.9) at different scan rates (200, 400, 800, and 1 600 mV/s). B) Dependence of ODNs
current responses on scan rate. C) Influence of pH (0.1 M phosphate buffer) on heights of ODNs
signals. D) Elimination voltammograms of ODNs suitable for the function eliminating kinetic and
charging currents, and conserving the diffusion current (reference scan rate of 800 mV/s, pH 5.4) For
other details see Fig. 2.
A3
adenine
cytosine
-1.55 -1.45 -1.35Potential (V)
0.5 µA
scan
0
500
1000
1500
2000
2500
0.0 0.5 1.0 1.5 2.0 2.5
A1 A2A3a A3
scan
-1.65 -1.48 -1.30Potential (V)
A1
scan
-1.70 -1.53 -1.35Potential (V)
A3a
5´-C
CC
AC
AA
CC
-3´
-1.65 -1.48 -1.30Potential (V)
A2
scan
0.5 µA
5´-C
CC
AA
CC
CC
-3´
5´-C
CC
AC
CC
CC
-3´
A3
5´-C
CC
AA
AC
CC
-3´
-1.75 -1.55 -1.35Potential (V)
scan
0.5 µA
Effect of scan rate
Peak
heig
ht(n
A)
Scan rate (V/s)
A3a
A2
A1
Peak
heig
ht(n
A)
0.5 µA
0.5 µA
EVLS
adenine
cytosine
-1.50 -1.40 -1.30Potential (V)
Hetero-oligodeoxynucleotides (9-mer)A
C D
B
scan
0
500
1000
1500
2000
2500
5.0 5.4 6.0 6.5 6.9 7.2 7.7
A3 A3a A2 A1
Effect of pH
pH 6.9 pH 6.9
0.5 µA
pH
pH 5.4
A3
adenine
cytosine
-1.55 -1.45 -1.35-1.55 -1.45 -1.35Potential (V)
0.5 µA0.5 µA
scanscan
0
500
1000
1500
2000
2500
0.0 0.5 1.0 1.5 2.0 2.5
A1 A2A3a A3
scanscan
-1.65 -1.48 -1.30Potential (V)
A1
scanscan
-1.70 -1.53 -1.35Potential (V)
A3a
5´-C
CC
AC
AA
CC
-3´
-1.65 -1.48 -1.30Potential (V)
A2
scanscan
0.5 µA0.5 µA
5´-C
CC
AA
CC
CC
-3´
5´-C
CC
AC
CC
CC
-3´
A3
5´-C
CC
AA
AC
CC
-3´
-1.75 -1.55 -1.35-1.75 -1.55 -1.35Potential (V)
scanscan
0.5 µA0.5 µA
Effect of scan rate
Peak
heig
ht(n
A)
Scan rate (V/s)
A3a
A2
A1
Peak
heig
ht(n
A)
0.5 µA0.5 µA
0.5 µA0.5 µA
EVLS
adenine
cytosine
-1.50 -1.40 -1.30-1.50 -1.40 -1.30Potential (V)
Hetero-oligodeoxynucleotides (9-mer)A
C D
B
scanscan
0
500
1000
1500
2000
2500
5.0 5.4 6.0 6.5 6.9 7.2 7.7
A3 A3a A2 A1
Effect of pH
pH 6.9 pH 6.9
0.5 µA0.5 µA
pH
pH 5.4

Sensors 2005, 5 457
While A3a, A2 and A1 yielded only one common peak corresponding to the reduction of A and C, the
A3 provided a wide signal with a small plateau indicating the presence of two reduction processes. In
addition, we studied the dependence of LSV ODNs signals on different scan rates (5, 10, 25, 50, 100,
200, 400, 800, 1200, 1600 and 2400 mV/s)(Fig.3B). The plots of peak height vs. scan rate were linear
for all four hetero-ODNs (1µM), and ODNs peaks shifted to more negative potentials with increasing
scan rate (not shown).
It is known that due to the protonization of A and C [49] pH values of the supporting
electrolyte markedly influences the electrochemical behaviour of ODNs. The study of the effect of pH
on the height of ODNs signals (Fig 3C) showed that the highest current responses were observed at
lower pH values (5.0 and 5.4). Moreover, the highest current response was observed for A1 at all
studied pH values except the lowest pH, where the A2 provided the highest response. In the range of
pH from 6.5 to 7.7 the heights of A3a and A2 signals are almost similar. From these results it follows
that adenine was responsible for the observed changes in the peak heights. The peak potentials shifted
with increasing pH to more negative potentials, similarly as in the case of homo-ODNs.
The elimination voltammograms of these 9-mers are shown in Fig. 3D. At pH 5.4 two well-
developed and separated signals of A and C were observed. With increasing number of A in the ODN
chain the EVLS adenine signals increased from A1 (11%) to A3a (33%). The best resolution between
signals of adenine and cytosine were observed for ODN A3 (three successive adenines in the middle of
ODN chain).
Table 1. Characterization of ODNs (20-mers) by the ratio of A:C in ODNs (pH 5.4).
ODNs Content of
adenine
Content of
cytosine
True Ratio
value1
EVLS
experimental
Ratio value2
Difference
between
experimental
and true Ratio
value3
Difference
between
experimental and
true Ratio value
(%)4
ODN(20a) 3 9 0.33 0.39 0.06 18
ODN(20b) 5 1 5 4.65 -0.35 7
ODN(20c) 7 1 7 6.34 -0.66 1
1 … True ratio value = Content of adenine/Content of cytosine 2 … EVLS experimental Ratio value = EVLS adenine peak height/EVLS cytosine peak height 3 … Difference between true and experimental Ratio value = EVLS experimental Ratio value - True ratio value 4 … Difference between experimental and True Ratio value (%) = (│Difference between true and experimental Ratio
value│*100)/True ratio value

Sensors 2005, 5 458
3.3. Analysis of hetero-oligodeoxynucleotides (20-mers)
In order to test the possibility to resolve the reduction signals of A and C in hetero-ODNs with
different nucleic bases including guanine, thymine and inosine, the EVLS was applied.
Voltammograms of ODNs (20a), (20b) and (20c), which were analysed in the presence of 0.3 M
ammonium formate and 0.05 M phosphate buffer (pH 6.9), are shown in Fig. 4A.
Figure 4. Analysis of hetero-oligodeoxynucleotides (20-mers): ODN(20a), ODN(20b), and ODN(20c)
with the A:C ratio the in primary structure of ODNs of 3:9, 5:1, and 7:1, respectively. A)
Voltammograms of ODNs (1µM) in the presence of 0.3 M ammonium formate and 0.05 M phosphate
buffer (pH 6.9) at different scan rates (200, 400, 800 and 1 600 mV/s). B) Dependence of ODNs
current responses on scan rate. C) Influence of pH (0.1 M phosphate buffer) on the height of ODNs
signals. D) Elimination voltammograms of ODNs suitable for the function eliminating kinetic and
charging currents, and conserving the diffusion current (reference scan rate of 800 mV/s, pH 5.4). For
other details see Fig. 2.
0
500
1000
1500
2000
0.0 0.5 1.0 1.5 2.0 2.5
ODN(20a)ODN(20b)ODN(20c)
5´-G
GG
AG
G T
TT C
GT
ATA
GG
G A
A-3
´
-1.60 -1.42 -1.25Potential (V)
0.1 µA
scan
ODN(20b)
0.5 µA
scan
-1.75 -1.50 -1.25Potential (V)
ODN(20a)
5´-C
CT
ICC
CC
AA
TCC
CT
TTA
TT -3
´
0.1 µA
-1.60 -1.42 -1.25Potential (V)
scan
ODN(20c) 5´
-AA
T A
AA
GG
G A
TT G
GG
GC
AG
G -
3´
pH
Peak
heig
ht(n
A)
Peak
heig
ht(n
A)
Effect of pH
Effect of scan rate
Hetero-oligodeoxynucleotides (20-mer)A
C
B
0
200
400
600
800
1000
1200
5.0 5.4 6.0 6.5 6.9 7.2 7.7
ODN(20a) ODN(20b) ODN(20c)
Scan rate (V/s)
ODN(20c)ODN(20b)ODN(20a)3A:9C
0.5 µA
EVLSD
scan
Potential (V)
-1.50 -1.40 -1.30 -1.55 -1.45 -1.35 -1.55 -1.45 -1.35
scanscan
Potential (V) Potential (V)
adenine
adenineadenine
cytosinecytosinecytosine
5A:1C 7A:1C
pH 6.9
pH 5.4
0
500
1000
1500
2000
0.0 0.5 1.0 1.5 2.0 2.5
ODN(20a)ODN(20b)ODN(20c)
5´-G
GG
AG
G T
TT C
GT
ATA
GG
G A
A-3
´
-1.60 -1.42 -1.25Potential (V)
0.1 µA
scan
ODN(20b)
5´-G
GG
AG
G T
TT C
GT
ATA
GG
G A
A-3
´
-1.60 -1.42 -1.25Potential (V)
-1.60 -1.42 -1.25Potential (V)
0.1 µA0.1 µA
scanscan
ODN(20b)
0.5 µA
scan
-1.75 -1.50 -1.25Potential (V)
ODN(20a)
5´-C
CT
ICC
CC
AA
TCC
CT
TTA
TT -3
´
0.5 µA0.5 µA
scanscan
-1.75 -1.50 -1.25Potential (V)
-1.75 -1.50 -1.25Potential (V)
ODN(20a)
5´-C
CT
ICC
CC
AA
TCC
CT
TTA
TT -3
´
0.1 µA
-1.60 -1.42 -1.25Potential (V)
scan
ODN(20c) 5´
-AA
T A
AA
GG
G A
TT G
GG
GC
AG
G -
3´
0.1 µA0.1 µA
-1.60 -1.42 -1.25Potential (V)
-1.60 -1.42 -1.25Potential (V)
scanscan
ODN(20c) 5´
-AA
T A
AA
GG
G A
TT G
GG
GC
AG
G -
3´
pH
Peak
heig
ht(n
A)
Peak
heig
ht(n
A)
Effect of pH
Effect of scan rate
Hetero-oligodeoxynucleotides (20-mer)A
C
B
0
200
400
600
800
1000
1200
5.0 5.4 6.0 6.5 6.9 7.2 7.7
ODN(20a) ODN(20b) ODN(20c)
Scan rate (V/s)
ODN(20c)ODN(20b)ODN(20a)3A:9C
0.5 µA0.5 µA
EVLSD
scanscan
Potential (V)
-1.50 -1.40 -1.30-1.50 -1.40 -1.30 -1.55 -1.45 -1.35-1.55 -1.45 -1.35 -1.55 -1.45 -1.35-1.55 -1.45 -1.35
scanscanscanscan
Potential (V) Potential (V)
adenine
adenineadenine
cytosinecytosinecytosine
5A:1C 7A:1C
pH 6.9
pH 5.4
Sensors 2005, 5 459
From the dependence of LSV signals on different scan rates (5, 10, 25, 50, 100, 200, 400, 800, 1 400
and 2 400 mV/s) it follows that dependences were linear at two different ODNs concentrations (1 and
0.5 µM) with R2 values close to 0.99. In Fig 4B the plot of peak height versus scan rate is shown for
these ODNs (1 µM) at pH 6.9. All observed ODNs signals shifted to more negative potentials with
increasing scan rate. It was found that the ODNs with higher content of adenine – ODN(20b) and ODN
(20c) gave the highest electrochemical response at pH 5 - 5.5. While their signals markedly decreased
with increasing pH, the signal of ODN (20a), containing the highest number of C residues of all
studied hetero-ODNs, increased and reached the maximum at pH 6.9 (Fig 4C). We were able to
observe the change of one nucleotide in the primary ODNs structure and to estimate the content of A
and C in the analysed ODNs by the technique used (Fig. 4D).
It was possible to determine the ratio between the number of A and C in the primary DNA structure
(Tab.1).
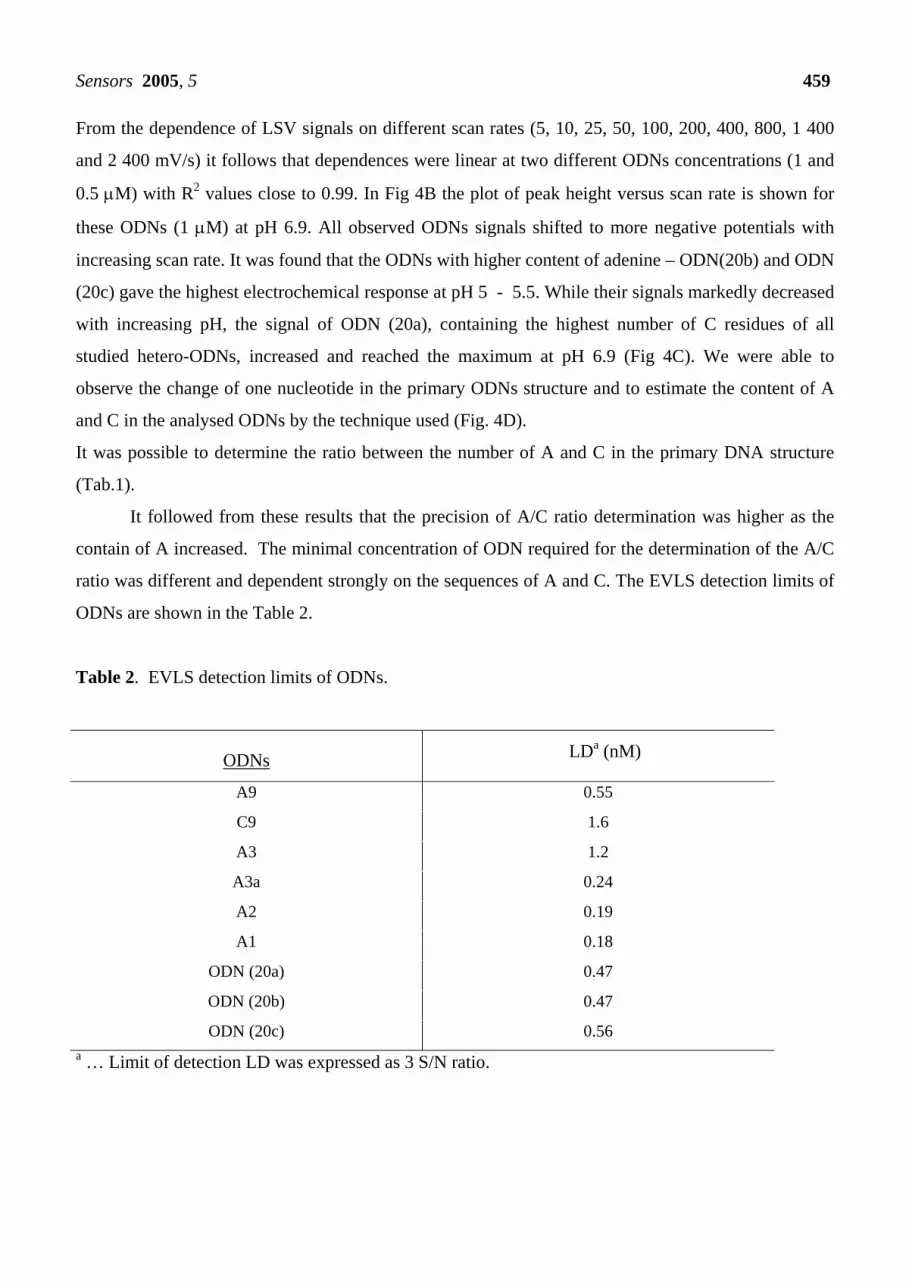
It followed from these results that the precision of A/C ratio determination was higher as the
contain of A increased. The minimal concentration of ODN required for the determination of the A/C
ratio was different and dependent strongly on the sequences of A and C. The EVLS detection limits of
ODNs are shown in the Table 2.
Table 2. EVLS detection limits of ODNs.
ODNs LDa (nM)
A9 0.55
C9 1.6
A3 1.2
A3a 0.24
A2 0.19
A1 0.18
ODN (20a) 0.47
ODN (20b) 0.47
ODN (20c) 0.56 a … Limit of detection LD was expressed as 3 S/N ratio.

Sensors 2005, 5 460
Conclusion
Electrochemical analysis of DNA still represents a suitable tool for the design of simple,
dependable and low cost devices. In the paper we suggested a new, original detection method for
DNA biosensors consisting in the combination of adsorptive transfer stripping (AdTS) technique and
elimination voltammetry with linear scan (EVLS). We were able to analyze the primary DNA
structure, to resolve changes in the primary DNA structure at one nucleotide level, and to determine
the ratio between content of A and C (A/C). This was demonstrated in experiments where (i) ODNs (5
µl) were adsorbed (120 s) on a surface of the working electrode (HMDE), (ii) low-molecular and non-
adsorbed molecules were removed by rinsing the surface with distilled water and supporting
electrolyte, (iii) the ODN modified electrode was placed into electrochemical cell containing
phosphate buffer at various pH. The linear sweep voltammograms measured at suitable pH were
treated by EVLS procedure.
The AdTS EVLS offers a new tool for very good resolution of A and C in ODNs, and for a
qualitative and quantitative sensing device for changes in the primary structure of
oligodeoxynucleotide chains. It can be expected that in case of identical number of reducible bases the
technique will even make it possible to distinguish between neighbouring and non- neighbouring bases.
Acknowledgements
This work was supported by the Grant Agency of the Czech Republic (No. 525/04/P137), the research
project INCHEMBIOL (MSM 0021622412) of the Ministry of Education, Youth and Sports of the
Czech Republic, and by a purpose-endowment from the Ministry of
Industry and Trade of the Czech Republic (project 1H-PK/42).
References
1. Watson, J.D.; Crick, F.H.C. A Structure for Deoxyribose Nucleic Acid. Nature 1953, 171, 737-738.
2. Hartley, J.A.; Souhami, R.L.; Berardini, M.D. Electrophoretic and chromatographic separation
methods used to reveal interstand cross-linking of nucleic acids. J. Chromatogr .Biomed.Appl. 1993,
618, 277-288.
3. Townsend, K.M.; Dawkins, H.J.S. Field alternation gel electrophoresis-status quo. J. Chromatogr.
Biomed. Appl. 1993, 618, 223-249.
Sensors 2005, 5 461
4. Guttman, A.; Ronai, Z. Ultrathin-layer gel electrophoresis of biopolymers. Electrophoresis 2000, 21,
3952-3964.
5. Brody, J.R.; Kern, S.E. History and principles of conductive media for standard DNA
electrophoresis. Anal. Biochem. 2004, 333, 1-13.
6. Palecek, E. Oszillographiche Polarographie der Nucleinsauren und ihrer Bestandteile. Naturwiss.
1958, 45, 186-187.
7. Palecek, E. Oscillographic polarography of highly polymerized deoxyribonucleic acid. Nature 1960,
188, 656-657.
8. Palecek, E. New trends in electrochemical analysis of nucleic acids. Bioelectrochem. Bioenerg.
1988, 20, 179-194.
9. Palecek, E. From polarography of DNA to microanalysis with nucleic acid-modified electrodes.
Electroanalysis 1996, 8, 7-14.
10. Palecek, E.; Fojta, M. Detecting DNA hybridization and damage. Anal.Chem. 2001, 73, 74A-83A.
11. Palecek, E. Past, present and future of nucleic acids electrochemistry. Talanta 2002, 56, 809-819.
12. Palecek, E.; Jelen, F. Electrochemistry of nucleic acids and development of DNA sensors. Crit.
Rev. Anal. Chem. 2002, 32, 261-270.
13. Palecek, E.; Fojta, M.; Jelen, F.; Vetterl, V. Electrochemical analysis of nucleic acids. In The
Encyclopedia of Electrochemistry; Vol. 9 Bioelectrochemistry; Bard, A. J., Stratsmann, M. Eds.;
Wiley-VCH: Weinheim, 2002, pp. 365-429.
14. Palecek, E.; Billova, S.; Havran, L.; Kizek, R.; Miculkova, A.; Jelen, F. DNA hybridization at
microbeads with cathodic stripping voltammetric detection. Talanta 2002, 56, 919-930.
15. Fojta, M.; Havran, L.; Kizek, R.; Billova, S. Voltammetric microanalysis of DNA adducts with
osmium tetroxide,2,2 '-bipyridine using a pyrolytic graphite electrode. Talanta 2002, 56, 867-874.
16. Fojta, M.; Havran, L.; Billova, S.; Kostecka, P.; Masarik, M.; Kizek, R. Two-surface strategy in
electrochemical DNA hybridization assays: Detection of osmium-labeled target DNA at carbon
electrodes. Electroanalysis 2003, 15, 431-440.

Sensors 2005, 5 462
17. Fojta, M. Electrochemical sensors for DNA interactions and damage. Electroanalysis 2002, 14,
1449-1463.
18. Fojta, M.; Havran, L.; Kizek, R.; Billova, S.; Palecek, E. Multiply osmium-labeled reporter probes
for electrochemical DNA hybridization assays: detection of trinucleotide repeats. Biosens. Bioelectron.
2004, 20, 985-994.
19. Wang, J. Carbon-Nanotube Based Electrochemical Biosensors: A Review. Electroanalysis 2005,
17, 7-14.
20.Drummond, T.G.; Hill, M.G.; Barton, J.K. Electrochemical DNA sensors. Nature Biotech. 2003, 21,
1192-1199.
21. Masarik, M.; Kizek, R.; Kramer, K.J.; Billova, S.; Brazdova, M.; Vacek, J.; Bailey, M.; Jelen, F.;
Howard, J.A. Application of avidin-biotin technology and adsorptive transfer stripping square-wave
voltammetry for detection of DNA hybridization and avidin in transgenic avidin maize. Anal.Chem.
2003, 75, 2663-2669.
22. Palecek, E.; Fojta, M.; Tomschik, M.; Wang, J. Electrochemical biosensors for DNA hybridization
and DNA damage. Biosens. Bioelectron. 1998, 13, 621-628.
23. Palecek, E.; Postbieglova, I. Adsorptive stripping voltammetry of biomacromolecules with transfer
of the adsorbed layer. J. Electroanal. Chem. 1986, 1986, 359-371.
24. Gooding, J.J. Electrochemical DNA hybridization biosensors. Electroanalysis 2002, 14, 149-156.
25. Wang, J. Electrochemical nucleic acid biosensors. Anal. Chim. Acta. 2002, 469, 63-71.
26. Wang, J.; Rivas, G.; Cai, X.; Palecek, E.; Nielsen, P.; Shiraishi, H.; Dontha, N.; Luo, D.; Parrado,
C.; Chicharro, M.; Farias, P.A.M.; Valera, F.S.; Grant, D.H.; Ozsoz, M.; Flair, M.N. DNA
electrochemical biosensors for environmental monitoring. A review. Anal.Chim. Acta 1997, 347, 1-8.
27. Wang, J.; Cai, X.H.; Rivas, G.; Shiraishi, H.; Farias, P.A.M.; Dontha, N. DNA electrochemical
biosensor for the detection of short DNA sequences related to the human immunodeficiency virus.
Anal. Chem. 1996, 68, 2629-2634.
28. Thorp, H.H. Cutting out the middleman: DNA biosensors based on electrochemical oxidation.
Trends Biotechnol. 1998, 16, 117-121.

Sensors 2005, 5 463
29. Thorp, H.H. Reagentless detection of DNA sequences on chemically modified electrodes. Trends
Biotechnol. 2003, 21, 522-524.
30. Kizek, R.; Havran, L.; Kubicarova, T.; Yosypchuk, B.; Heyrovsky, M. Voltammetry of two single-
stranded isomeric end-labeled -SH deoxyoligonucleotides on mercury electrodes. Talanta 2002, 56,
915-918.
31. Gupta, N.; Grover, N.; Neyhart, G.A.; Liang, W.G.; Singh, P.; Thorp, H.H. [RuO(DPPZ)(TPY)]2+ -
A DNA cleavage agent with high DNA affinity. Angew. Chem. Int. Edit. 1992, 31, 1048-1050.
32. Havran, L.; Fojta, M.; Palecek, E. Voltammetric behavior of DNA modified with osmium tetroxide
2,2 '-bipyridine at mercury electrodes. Bioelectrochem. 2004, 63, 239-243.
33. Kizek, R.; Havran, L.; Fojta, M.; Palecek, E. Determination of nanogram quantities of osmium-
labeled single stranded DNA by differential pulse stripping voltammetry. Bioelectrochem. 2002, 55,
119-121.
34. Kawde, A.N.; Wang, J. Amplified electrical transduction of DNA hybridization based on
polymeric beads loaded with multiple gold nanoparticle tags. Electroanalysis 2004, 16, 101-107.
35. Wang, J.; Polsky, R.; Merkoci, A.; Turner, K.L. "Electroactive beads" for ultrasensitive DNA
detection. Langmuir 2003, 19, 989-991.
36. Fojta, M.; Havran, L.; Vojtiskova, M.; Palecek, E. Electrochemical detection of DNA triplet repeat
expansion. J. Am. Chem. Soc. 2004, 126, 6532-6533.
37. Jelen, F.; Kourilova, A.; Pecinka, P.; Palecek, E. Microanalysis of DNA by stripping transfer
voltammetry. Bioelectrochem. 2004, 63, 249-252.
38. Jelen, F.; Yosypchuk, B.; Kourilova, A.; Novotny, L.; Palecek, E. Label-free determination of
picogram quantities of DNA by stripping voltammetry with solid copper amalgam or mercury
electrodes in the presence of copper. Anal. Chem. 2002, 74, 4788-4793.
39. Trnkova, L.; Kizek, R.; Dracka, O. Application of elimination voltammetry to adsorptive stripping
of DNA. Electroanalysis 2000, 12, 905-911.
40. Trnkova, L. Electrochemical behavior of DNA at a silver electrode studied by cyclic and
elimination voltammetry. Talanta 2002, 56, 887-894.

Sensors 2005, 5 464
41. Trnkova, L.; Jelen, F.; Postbieglova, I. Application of elimination voltammetry to the resolution of
adenine and cytosine signals in oligonucleotides. I. Homooligodeoxynucleotides dA(9) and dC(9).
Electroanalysis 2003, 15, 1529-1535.
42. Trnkova, L.; Kizek, R.; Vacek, J. Square wave and elimination voltammetric analysis of
azidothymidine in the presence of oligonucleotides and chromosomal DNA. Bioelectrochem. 2004, 63,
31-36.
43. Trnkova, L.; Postbieglova, I.; Holik, M. Electroanalytical determination of d(GCGAAGC) hairpin.
Bioelectrochem. 2004, 63, 25-30.
44. Dracka, O. Theory of current elimination in linear scan voltammetry. J. Electroanal. Chem. 1996,
402, 19-28.
45. Trnkova, L.; Dracka, O. Elimination voltammetry. Experimental verification and extension of
theoretical results. J. Electroanal. Chem. 1996, 413, 123-129.
46. Trnkova, L. Electrochemical elimination methods. Chem. Listy 2001, 95, 518-527.
47. Trnkova, L.; Kizek, R.; Dracka, O. Elimination voltammetry of nucleic acids on silver electrodes.
Bioelectrochem. 2002, 55, 131-133.
48. Trnkova, L.; Friml, J.; Dracka, O. Elimination voltammetry of adenine and cytosine mixtures.
Bioelectrochem. 2001, 54, 131-136.
49. Dryhurst, G. Electrochemistry of biological molecules; Academic Press: New York, 1977.
© 2005 by MDPI (http://www.mdpi.org). Reproduction is permitted for noncommercial purposes.