EGEA 2007 - egeaconference.com
159
EGEA 2007 FOURTH EDITION International Conference THE ROLE OF FRUIT AND VEGETABLES IN THE FIGHT AGAINST OBESITY Conference organised by Aprifel with the support of DG SANCO, DG AGRI and the EU Platform of Diet Platform for Diet, Physical activity and Health PRESIDENTS Martine LAVILLE Elio RIBOLI SCIENTIFIC COMMITTEE Marie-Laure FRELUT Pilar GALAN Martine LAVILLE Teresa NORAT HONORARY SCIENTIFIC COMMITTEE John BLUNDELL, Adam DREWNOWSKI,Tim LANG, Martine LAVILLE, Tim LOBSTEIN, Elio RIBOLI, Bernhard WATZL ORGANIZING COMMITTEE APRIFEL FRESHFEL AREFLH CONFERENCE SUPPORTED BY: DG SANCO DG AGRI EU Platform for Diet, Physical Activity and Health SCIENTIFIC COORDINATOR Saida BARNAT
-
Upload
khangminh22 -
Category
Documents
-
view
0 -
download
0
Transcript of EGEA 2007 - egeaconference.com

EGEA 2007 FOURTH EDITION
International Conference
THE ROLE OF FRUIT AND VEGETABLES IN THE FIGHT AGAINST OBESITY
Conference organised by Aprifel with the support of DG SANCO, DG AGRI and the EU Platform of Diet Platform for Diet, Physical activity and Health
PRESIDENTS Martine LAVILLE
Elio RIBOLI
SCIENTIFIC COMMITTEE Marie-Laure FRELUT
Pilar GALAN
Martine LAVILLE
Teresa NORAT
HONORARY SCIENTIFIC COMMITTEE
John BLUNDELL, Adam DREWNOWSKI,Tim LANG, Martine LAVILLE, Tim LOBSTEIN, Elio RIBOLI, Bernhard WATZL
ORGANIZING COMMITTEE APRIFEL
FRESHFEL
AREFLH
CONFERENCE SUPPORTED BY: DG SANCO
DG AGRI
EU Platform for Diet, Physical Activity and Health
SCIENTIFIC COORDINATOR Saida BARNAT


PREFACE
������������� �
��������������� ����� ����� ��������� �� ������������� ����������� ������������������ �� ������������������� ��������������������������� ����������!������� ������ �� ������������� ���������������"�#����� ��� ��� ������� �� ���� � �� �����!��� �� �� ���������������� �� ������� �������������#�� �$����� �������#�������� !���!�� ��� ���� ����� !�������� ������ �� �����������!������"����������� ���������������!���������������#����� �������� ��#��������������������� ��
������% ������ ���� ��&����"�����!���� ���!�������# ����������������� ���� ������������ � ������ ��� ��� ����� ������ #���� ���� � �� ���!� ����� ��� ��� ��� ������ � �� � ����� � � ��� �������!������������������������'���� ����#�� ������������� ��������#��������� ����!������ �����#����� ������� �����������������������#����#�������� ��
$�������#��������������� �����"������������#��������� ��� ��������������� ������( ������� ����������������)���������������������� ����������"�� ���� ����������������"���������� �� � �� ��� )� ��� ��� � �� �� � � ���������� �� ����� ������ �#������ ��� ��� �� ������� � � ���� ��� ����������!� �� ��
� �� ����� ����% ������ �"�*++,� ������ ��� ���������� � �������� ��������������� ����!��� �����-�.���� ���� ������ �� ��/��"�.������������!��������&�����#����� ����������� ������� ��# �� ��
���������#���� ��� � �� ��� �� ��� �� �� ��$����.���� �������� ��������������� ����!��� ������$���� .���� #���� ��� �� ��� � �� ����� ��� % ������ �� ���� ����� � � ��� ��� 0���� 1����� ��� �����!��� �� ��������������������� ������������ #��!��� ���������������!��� ���
� #�� ���������� �� ������ ������ ���������� �� ��� �������� ���"������������������)���!�����2��������������� ���������������)����� ������#����� �������� ����!���� � ���� #������������� �������(��"������������������������ ��� �� ������!� ���� ��
������������� ������������� ����������������


TABLE OF CONTENTS
pages
Official opening - Official Welcome – M. Fischer Boel 7 - Welcome – E. Riboli 9 - Keynote: The multiple factors implicated in obesity prevention – P. James 10 - The position of the European Commission on obesity and F&V consumption – R. Madelin 20
FRUIT AND VEGETABLES AND THE PREVENTION OF OBESITY AND ITS ASSOCIATED DISEASES
SESSION 1: Obesity - The real cost of obesity - A. Drewnowski 23 - Natural history of the disease - A. Basdevant 28 - Obesity related diseases - E. Riboli 31 - Treatment of obesity: Place of the dietary recommendations in the global approach - M. Laville 35
SESSION 2: Fruit and vegetables - The components of a healthy diet: comparison across the world - A. Trichopoulou 39 - Why F&V are considered healthy? Epidemiologic overview - T. Norat 41 - Latest evidence on the health-promoting effects of F&V constituents - B. Watzl 44 - Fruit and vegetables for health – WHO initiative to promote fruit and vegetables - U.Trübswasser 49
SESSION 3: Fruit and vegetables and Obesity: Potential mechanisms of prevention - What do we know about the relationship between fruit and vegetable consumption and body weight (satiety, eating patterns)? H. Blanck
52
- Dietary fibre and body weight regulation - M. Bes-Rastrollo 57 - Exercise alone is not enough: a healthy diet is also needed - J. Blundell 60
SESSION 4: The special case of childhood - Childhood obesity: When and how to react? - ML Frelut 64 - Childhood obesity and the early metabolic process leading to atherosclerosis: a protective role of fruit and vegetable consumption - C. Maffeis
68
- Early childhood development of taste for F&V as the basis for liking and consumption in later life - S. Issanchou 71
FOCUSING ON PROMOTING FRUIT AND VEGETABLES INTAKE, A KEY COMPONENT OF OBESITY PREVENTION SESSION 5: What are the barriers to reaching the recommendations for F&V, in the context of obesity prevention?
- Pesticides residues and the risk to consumers - B.A. Ames 75 - Price of F&V a barrier to consumption: Reality or myth? - P. Combris 80 - Marketing impact on food consumption - T. Lobstein 85 - Efficiency of marketing actions on increased fruit and vegetable consumption (case study by major retailer) L. Damiens
90
- Availability and access to healthy food in areas of disadvantage - E. Dowler 92 - Public initiatives to overcome barriers to dietary change - A. Drewnowski 98
POLICIES AND POLITICAL COMMITMENTS TO INCREASE F&V CONSUMPTION WITHIN AN OBESITY PREVENTION STRATEGY
SESSION 6: Policies and political commitments to increase F&V consumption within an obesity prevention strategy
- Round table: The challenges to increase F&V consumption – chaired by T. Lang 104
INDEX OF ABSTRACTS 130


OFFICIAL WELCOME
EGEA 2007, Page 7
Mariann FISCHER BOEL European Commissioner for Agriculture and Rural Development
Ladies and gentlemen, It's a pleasure to join you at this fourth EGEA Conference. The topic for your conference is indeed very important nowadays: "The role of fruit and vegetables in the fight against obesity". Whenever I can, I like to give people good news. So before I speak about the problems of obesity and low fruit and vegetable consumption, let me tell you about a pilot project of mine. Very simply, I recently picked on a small group of people on a certain occasion, provided them with fruit, and observed whether they ate it. They did! I have now repeated the experiment every week with the same group, and the results do even improve. Admittedly, the group is quite exclusive: it contains only 26 people apart from me. But I like to think that, if members of the Commission's College can be tempted to change their behaviour in this way, so can other people! Actually this experience started on the day where the fruit and vegetables proposal was adopted by the Commission. After all, the Commission does like to lead from the front. The first phrase in my title for today is "Healthy business, healthy people". Of course, health is not my area of responsibility within the Commission, but I think we should all be concerned about the obesity problem which is creeping up on the European Union. The situation is frightening if we look at the US and they are sometimes ahead of us. So therefore we need to take action. The relevant figures are shocking. It's shocking that 27 per cent of men and 38 per cent of women in the European Union are now regarded as overweight or obese. It's shocking that obesity affects more than 5 million children in the Union of 25 Member States (latest figures that we have), and that around 300 000 new cases of child obesity appear every year. One aspect of this problem is, of course, low consumption of fruit and vegetables. As you know, there are only two Member States in which the average daily intake per head is 400 grams or more - which is the minimum recommended by the World Health Organisation. I repeat: this figure is the recommended minimum. As a point of comparison: the Chinese eat about 1 kilogram per day. The issue of obesity raises some difficult questions. To what extent is it a private issue, and to what extent a public one? It's not for me to answer this question. Surely that will be one of the topics you will discuss during the next days of conference. But it's interesting to note that, in many European countries, the State is
now choosing to intervene more actively than it did in the past. Certain advertising has been more heavily regulated, or banned. Sugary, fatty foodstuffs are no longer permitted in some school vending machines. Whatever may be the appropriate role for the State, the Common Agricultural Policy (CAP) has its part to play in fighting obesity. It is playing a part already, and will do so more effectively in the future with the fruit and vegetables reform. Let me come back to the first phrase in my title, "Healthy business, healthy people". In the case of the fruit and vegetable sector, the two things should coincide. We want people to eat more fruit and vegetables. The European Union has many producers of high-quality fruit and vegetables, some of whom would like to sell more. It doesn't take a genius to balance this equation. Higher fruit and vegetable consumption could be a win-win scenario: a win for consumers, a win for producers. Given that we can't actually compel people to eat a healthy diet, the key must surely lie in promotion. To put it another way: we must remind people that they need to eat the right things if they want to feel good and look good, and then we must remind them that some of these things are produced in Europe to some of the highest standards in the world! Moreover, residues of pesticides in the European Union are extremely low compared to elsewhere. Within the CAP, the Community already supports a significant level of promotion of fruit and vegetables. The Community budget co-funds a "5-a-day" campaign throughout the European Union, which includes material for children, teachers and parents. "Producer Organisations" – which bring together fruit and vegetable producers – can also claim European funding for generic promotion programmes. Additionally, under the current scheme for withdrawing produce from the market when prices are low, those withdrawals can be used for free by charitable organisations and schools. With the fruit and vegetables reform, this will be 100% financed by the European Union. Outside the fruit and vegetables CMO, I should mention that many Member States run their own promotion programmes. A well-known example is the Food Dudes programme piloted in the UK and Ireland. We therefore have a solid platform on which to build. But there is clearly room to do more. Now is the time to do it. Most of the CAP has undergone fundamental reform over the last few years, and we should extend this process to the fruit and vegetable CMO and later this year to the wine sector. To this end, the Commission made proposals in January, and I hope the Council and the European Parliament will find

OFFICIAL WELCOME
EGEA 2007, Page 8
consensus on them as soon as possible. What have I proposed in respect of promotion? First, with regard to our EU-wide promotional activities: I want to increase the annual budget from €4 million to €10 million. For promotion activities targeted at young consumers the funding would be 60 per cent co-financing rather than the usual 50 per cent. Secondly, in their generic promotion activity, all Producer Organisations should have to direct some of their efforts at young consumers. Thirdly, when we withdraw produce from the market, not only charitable organisations and schools should be eligible as beneficiaries, but also all public education institutions and children's holiday camps. If you have further ideas, they are welcome! Ladies and gentlemen, It's essential that we use well-funded, well-targeted promotion to bring demand for fruit and vegetables closer to the level needed for healthy living. But this cannot be the only goal of the fruit and vegetable CMO. The objectives of the reformed CAP for other agricultural sectors are also relevant to the fruit and vegetable sector. These objectives include:
• to support farmers' efforts to be competitive and market-oriented; - I mentioned before healthy business; and
• to encourage the provision of public goods – for example, the high environmental standards which the public clearly expects from farming.
My recent proposals for the fruit and vegetable sector reflect these aims very clearly. With regard to being competitive, the cornerstone of my proposals is a stronger role for Producer Organisations. The fruit and vegetable sector, more than many other sectors, needs a good level of organisation to face up to the price-setting power of the retailers. But the level of organisation varies enormously from one Member State to another. Some countries market more than 80 per cent of their production through Producer Organisations; in 11 Member States, the level is even below 10 per cent. The principle of the Producer Organisation is a good one, but we obviously need to make membership more attractive in some regions, and reinforce these groups to become more efficient. I have therefore proposed that the level of European co-financing of Producer Organisations' operational programmes should rise from 50 per cent to 60 per cent in a number of cases. For example, we should
do this where the sector is particularly fragmented. This is true in the Outermost Regions. It's also true in many of the New Member States, where there are a number of structural problems – as our report of last year on red fruit made clear. I will not go into details but I would like to mention that a more fundamental reform which I have proposed for the fruit and vegetable CMO is its integration into what is called the Single Payment Scheme (SPS) – which already includes most sectors covered by the CAP. The purpose is to create a competitive and sustainable European agricultural sector and to provide for simplification. The SPS holds twin advantages. It makes farmers much more competitive by setting them free to produce what the market requires. And it gives them an extra incentive to farm in the way that the public wants. Finally, a comment about environmental issues: Good environmental standards are already built into the fruit and vegetable CMO, and the introduction of full cross-compliance would move us further in the right direction. Even so, I think we could do more. Concerns about the environment are growing, and we must show that farming is part of the solution. I have therefore proposed that Producer Organisations should have to devote at least 20 per cent of the spending in their operational programmes to environmental measures. Also, Producer Organisations which included organic farming in their operational programmes would receive a co-financing rate of 60 per cent from the European budget, rather than 50 per cent. Ladies and gentlemen, today's rapid spread of obesity is a problem which we must fight on several fronts. One of these fronts is fruit and vegetable consumption: raising this would be a very important victory. We can't force people to eat the right things. But as I have argued today, we can encourage a change in behaviour the best we can, and the right promotion tools will be essential to do so. At the same time, we need a fruit and vegetable CMO which supports producers in their efforts to be responsive to the market, to organise themselves appropriately and to respect high environmental standards. Healthy people and healthy business: this is what we need, and this is what my reform proposal is all about. I hope you will give them your support to find a positive compromise to fight obesity problems in the future. Thank you.

OFFICIAL WELCOME
EGEA 2007, Page 9
Elio RIBOLI Head of the Division of Epidemiology, Public Health and Imperial College, London, UK
Thank you, Saida, and thank you Laurent, and all the friends from Aprifel who have made possible to meet for the 4th time. I think it was very important for us to have the Introduction to the Conference from the Commissioner and to see how the agricultural sector is now open and strongly interested in arguments related with public health. This is extremely important because I believe, and this may be shared by many of you, that any progress in society is the result of interactions between knowledge, science, cultures, but also between business and policy. We all know that probably one of the worst disaster over the past century and the first half of the century we are living now, has been and is going to be, tobacco smoking. That experience should not be repeated in other areas. It was already known in 1955, beyond any reasonable doubt, that tobacco was a carcinogen. Today, tobacco is a product that is available everywhere around the street. Now we don’t want to repeat that with obesity, obviously. We know beyond any reasonable doubt that obesity is really a serious killer at the population level. And we have a strong knowledge about the link between obesity and reduced life expectancy, increased health damages, increased cost to the society. Now the issue is how to act. Several lifestyle changes that have occurred in the society over the past half a century have had a negative impact in the health of the populations. The changes that are occurring in developing countries are mainly in the wrong direction. And our keynote speaker, Philip James, is certainly going to address, in-depth, this point. I’ll just like to come back to my point about interactions in the society. I think that EGEA has played an important role in bringing together policymakers, food producers, colleagues working in the public health area and other scientists. There is a support for this Conference from the DG Public Health and collection of consumers, DG SANCO. This is very important because it creates the possibility of understanding each other. If we are here to talk about health and fruit and vegetables, we should not forget it is possible because there is a science behind this discussion. We are expressing opinions, we are bringing together what is scientifically sound trying to make a difference between belief and science.
I have no problem to say that one of the probably most cited papers we published in the EPIC study is the study showing the absence of association between fruit and vegetables and breast cancer risk. Because we have to make a distinction between belief and science, you should not go out and say, tell women that if they eat more of fruit and vegetables, they will reduce their breast cancer risk. These results have been published in the Journal of the American Medical Association one year ago. But, there is evidence that consuming more fruit and vegetables could probably reduce the incidence of other cancer sites, but also can reduce the risk of myocardial infarction, diabetes, and the risk of becoming obese. Two hundred and fifty years ago, there was the belief that tomatoes and potatoes were not edible stuff. So obviously, there has been a knowledge intervening, so that now we can say that eating tomatoes is good, and we have even a paper on press that shows that high level of lycopene in blood are associated with significant reduction in prostate cancer. There has been 200 years in between the belief that tomatoes were a poison, and the idea that maybe consuming more tomato may actually reduce prostate cancer risk. It’s not by selling the idea that fruit and vegetables are good for everything, that we will solve all the health problems in Europe. But it is an important component of the health message. And what is important is to give real messages to the population. And this is why I think it is always important to see the difference between knowledge and belief. So I close here just these few remarks where the key message is that we have to talk, create bridges between science, business, policy, although we know that not always science, business, and policy get together. And tobacco was an example; it still is an example, for we are selling death by selling tobacco. But we know that progress is not a linear development. It goes up and down. And I think this conference will be bring the opportunity to talk to each other and to discuss what could be done, what could be transformed to policy that would ultimately help public health.
KEYNOTE PRESENTATION
EGEA 2007, Page 10
The multiple factors implicated in obesity prevention Philip JAMES
Professor, Chairman of the International Obesity TaskForce IOTF, LSHTM & IOTF/IASO, London, UK
Friends, Martine, Elio, I gather that there is a very wide range of people attending here. And as I look round, I see world-renowned, outstanding scientists who will talk and spell out in detail the whole spectrum of issues, which I have therefore, to some extent, deliberately avoided. What I’d like to do is perhaps to illuminate what the Commissioner started off by saying. Recognizing that it must be now 10 years ago that I was privileged as one of 10 people to help both a predecessor, Mr. Fishler, and Mr. Burnley, health commissioner, in looking at agricultural policy in Europe. And I’m looking round to see who is with us. We have representatives from every aspect of the food chain. And it became very obvious that we had a very unusual development of agriculture, an agricultural policy in Europe. And that’s been going on for a long time. And I thought it might help if I just illustrated this. But first, it’s a pity that the Commissioner is not here, because I was going to actually congratulate her. I hope there are a few officials here because we need to take the agenda one stage on. When we actually launched the Platform a couple of years ago many of you have seen these slides, but some of you have not. And since I gather there are politicians and businessmen within the audience, I will ignore some of my scientific colleagues and just emphasize one or 2 simple things. If you look at this graph, it’s not perfect. What it does, it actually highlights in men and women the proportion of the population in different countries who are either overweight or obese. And this is roughly speaking, taking the whole of the adult population [Slide on European national overweight and obesity rates].Now, for those at the back, you might not be able to read the numbers, but this is not 8% at the bottom left, it’s 80%. And so we have this extraordinary phenomenon where if you look at the range with different countries, you have a surprising proportion of countries where, roughly speaking, more than half the adult population is already overweight and obese. Now those of you who read newspapers will doubtless hear that you don’t run into trouble until you are obese. Actually those criteria for classifying overweight were a compromise that we had to come up with 15 years ago, because the Americans believed that it would be very nice if our normal body weights got bigger every year, so the Americans would never be classified as getting fatter. And we had to use American data to show that the body weights corresponding to what is called BMI 25, was actually a crude measure, and it was a generous measure. And in fact, the Japanese and the Chinese members wanted it to be much lower. So
this is an underestimate of the degree to which weights are in excess of the desirable. So, as Elio made clear, we have an enormous problem. I mean, it’s quite extraordinary. And we haven’t actually taken on board what the significance of this might be. Now people can really understand that these figures were so extraordinary, the dark blue signifies those people who are obese. And the lighter colour, those people are overweight. So in general, crudely speaking, you have twice as many people who are overweight, as obese. And if you look down there, you will discover that on the whole, women have a greater tendency to obesity which the thin, aristocratic men amongst you must assume I guess, as simply because you are so superior. When in fact it’s not true at all. In fact, women are more susceptible to obesity for good, biological reasons. And we can spend some fun, if you want later on, discussing that. So that was alright, I mean, everybody says, well, it’s all your fault if you’re fat. And therefore, it’s all your fault for 50-60% of the adult population. But this is what got everybody when we produced this graph some time ago, actually 3 years ago, and it stunned people. And the figures have been revised since, but what it stunned people for was that we took now an internationally accepted classification of overweight and fat, obese children, and we looked at different age spectrum. And if you look, crudely speaking, up in the north where the Commissioner comes from, Denmark, the Scandinavian countries, they have actually lower rates than the Mediterranean, which is totally and utterly astonishing. And members here, there are some scientists here contributed to these figures. And if you actually want to have an argument with me about the latest data, I have to say that these are measured, children that have been measured, not what their parents tell you they weigh. And it’s very important to know, as Elio said, that we use good science. And this is based on pretty reasonable science. But when we launched the Platform, we were asked, at 48 hours notice, actually, to produce an updated list. And I’ve just chosen one of them. But these are the 7- to 11-year olds. And people were completely stunned to see that as we went through, you see the Netherlands at the bottom, Malta—it’s not national, necessarily—there is Sicily, it’s not yet become independent, I gather, Spain, Gibraltar is another, Crete, Portugal, and so on. In other words, it reaffirms the fact that in Europe we have an astonishing range of problems. And it’s not true, as we anticipated that the people in the north

KEYNOTE PRESENTATION
EGEA 2007, Page 11
would be fatter, that the children would be fatter, contrary to what we understood. This looks as though it’s genuine. And you could have a discussion later, perhaps, as to why that is so. So Elio highlighted the terrible problems of tobacco. Actually, if you look at this problem of overweight and obesity--this is Tim Lobstein’s data recently published, and he will speak later on--but you can see that this applies throughout the world, and this is the escalating problem as the years go by. And I just put in “EGUK” because normally I try to make ministers in the UK very depressed. But that’s the European, the 3rd line there is Europe. You will be intrigued to see that the Middle East is above Europe, and North America is at the top. But when you are talking about China or India, wherever you go, you see that this is almost a universal feature. Therefore, we’ve got a global pandemic emerging for astonishing reasons. Now, here are new data which will be published shortly involving beautiful WHO collections, which just simply take adolescence, and it only takes European data. And the question is, children are getting fatter, how much faster are they getting fatter? And the line goes up which means that every year that’s going by, the rate at which children are getting fatter is getting faster and faster every year. So we are not dealing with a static phenomenon, it’s racing, and it’s getting worse. And if you go back, it’s roughly speaking, isn’t it, the mid-70’s or early 80’s that things really took off. And the big issue is what have we done to society since then, or in association with that, which we now have to think about coherently in terms of prevention? And here, you have all sorts of fancy, very scientific graphs specifying why people or children or adults become overweight. And this is my simplification in life. Let’s imagine that I’m a 25-year old. Elio said that he met me 20 years ago, I was doing some quick calculations, it was nearly 30 years ago, and he’s getting really quite old, whereas, I’m getting younger. I’m 25 years of age, and let’s imagine that I’m eating 3,000 calories. But then the problem is that I grow a little older, and people persuade that I’ve got to start, you know, I’m a respectable doctor, and so I need a car, don’t I? And I take up with cars. And now I spend my time with computers, and people ask me if I’ve seen this latest television program, and usually I haven’t. I’m beginning to feel completely inadequate because I’m not watching enough television. And as you think about it, we are getting less and less active. Now what that means, contrary to what people generally understand, is that the amount of food that we need to eat should have gone down progressively. And we originally did some calculations which were much criticized for the United Kingdom, where we
used crude data to suggest that the intake had gone down. People said how can you get fatter if your food intake’s less than it used to be 30 years ago? And of course the answer is because we’ve got even more inactive. And in fact, you have to drop your intake if you’re bone idle like me. In fact, you have to be on very modest energy intakes to be able to be the tycoon businessmen that you are. And I doubt whether many of you do half marathons twice a week. So here we are in a position where the United States, the data is excellent, where there has actually been an increase in food intake, which is why they have such an appalling problem. So the question is what is going on, and what determines this? And I’m just going to touch on the physical activity, because everywhere I go, particularly if I’m dealing with people in the food chain, they promptly accuse me of neglecting the importance of physical activity. I don’t at all. But, before we get into physical activity and what’s been happening, let me remind you, in agricultural terms, that what the Commissioner has been talking about is an attempt to reverse policies that are actually coming through, at least for the last 60-70 years in Europe, and are based on concepts that go back to the beginning of the last century. When I opened the first conference for Europe with ministers of agriculture and health, actually in Budapest over 20 years ago, I produced these slides to show that the original agriculture of Europe was based purely on the crops. At the top left, you don’t have to read each, see the big, broad bands; they are dealing with the intrinsic crops that could be grown given the climatic and other conditions. And what we’ve seen since is a transformation in that, and people used to eat whatever they grew locally. Whereas now the whole era has changed. So, on the right at the top, yes I have to admit that this is how I spent my childhood in the hills of Wales, where in fact it was normal for everything to do pretty heavy manual work. And the question was why have we ever gone from there? Is it just because we’ve been clever? The answer is: not really. I’d like to take you now, scientifically, to some experiments which involved, as it happens, people in the U.K., but there were other studies conducted, actually in Germany just after the war, and in the United States. And the problem here originally was that we didn’t worry about obesity; it was considered a silly, rare condition. What we were really worried about was children and adults who really didn’t have enough to eat. And there were enormous, thousands, and hundreds of thousands, millions of children before the war who were short, who were in tough circumstances, and their diets were awful. And

KEYNOTE PRESENTATION
EGEA 2007, Page 12
indeed, 100 years ago everybody was saying if you were short, that actually is because you were intrinsically, genetically short. And the fact, of course, we now know that most of us are taller than our parents, and certainly taller than our grandparents, shows that that is not completely true. So, some experiments were done. And they took groups of children, this is science conducted, oh, about 80 years ago, and they gave children either a basic diet on the left, which is in purple. Or they added different components in very careful amounts, they added sugar, butter, a sort of casein, a protein mixture, and then they added milk. And you see on the left is the increase in height. And to their astonishment, these supposedly genetically stunted children started growing faster. And in fact, they grew best on milk. And when you look on the right-hand side at the weight of these children, the yellow bar shows that actually, when you give them extra sugar, their weight goes up. And butter is even better. And milk and butter? That’s wonderful. So suddenly, it was not a genetic problem, it was something to do with the quality and amount of what people ate. And therefore there was a huge battle that involved extraordinary developments in France, and it was where people advocated that we’ve got to feed the poor working-class much better. And the studies were conducted showing that they were on terrible diets. Then what happened was that the war came. And the war was quite extraordinary because suddenly food and your business became an issue of national security. Why? Because in the U.K., for example 75% of all the food was imported from our colonies. And with the submarines destroying so many ships, it became clear that the British people were going to be starved into defeat, not beaten on the battlefield. So Winston Churchill was sent, by my predecessors, the details of these feeding studies and told that this is a crisis. And he introduced a scheme where you see children at school being fed on milk, and have any of you had cod liver oil for some strange vitamins? I can’t remember what they are. And this weird concoction called orange juice, which was also produced. This became the standard for all children, and actually pregnant and breast-feeding mothers. And they then introduced a rationing system. And it was introduced almost by accident that Churchill said that this was critical. And the British got a series of prizes up after the war, because not only did they change the priorities for feeding people, the health of the people, actually despite war casualties, improved substantially. The children grew faster, and agriculture, of course as you know, our Queen became a land girl and very good at mending tractors. And we went from 25, to 60, to 70% of whole food production within a matter of 2 or 3 years.
You may say, why am I dealing with this funny story? For the simple reason that it became clear after the war, that in fact, agriculture was fundamental. And that actually what you produced was key. And this was a matter of national security because the whole of Europe was devastated, and many of you may have memories of that time. The head of the feeding systems, British Army, and then for the preliminaries of the League of Nations, someone told me that he calculated there were at least 7 million people starving in Europe. So the development of the Common Agricultural Policy was a brilliant scheme to resuscitate agriculture in Europe. But what were the priorities? Meat, milk, butter, sugar. Why? Because we all needed more protein and more energy, wherever it comes from. Oh, and you must take a bit of fruit and vegetables because, you know, you have some vitamins that you eat, it was all about a balanced diet. And actually when I talked to the previous Commissioner only 10 years ago, you can look at an agricultural policy, and I’ve run an agricultural institute for 17 years and been involved in agricultural policy for 25. The whole of agriculture across the world, developing countries, of course Europe, and the United States, was totally based on these concepts which came from wartime experience. And what you are trying to do now--and it’s marvellous the Commissioner is on the battlefield, trying to shift this—not only to redress, change the balance of priorities, but you have to understand that the whole of the food system has changed over this last 40-50 years because of systematic, perennial, annual, vast subsidies and inducements to produce things other than fruit and vegetables. And so there is a fundamental problem because there has been an enormous effort to make sure, putting it crudely, now that we have a different perspective, that we eat the wrong diet. And if you look at the change--and we will hear about it later from other speakers—over the last 20 years, 30 years, there has been an extraordinary change, and it affects not simply the Mediterranean countries, but also central and eastern Europe. And it’s now rampantly developing throughout the developing world. So here is the transformation in agriculture, with a huge emphasis on protein production, animal production, and so on. And meanwhile, what are we doing? We are mechanizing the whole time. So here am I now, with 3,000 calories at the age of 25. These are beautiful studies from Baltimore, actually. But if I am now—I’m not quite—70 years of age, I have dropped my intake needs by 1,200 calories every day. So I have to, if I do less, and the occupational activity and so on, if I do less, I have to eat less. Why is it that as we get older we put on weight? Because we are challenging our brains the whole time to eat

KEYNOTE PRESENTATION
EGEA 2007, Page 13
progressively less. And that’s one of our major problems. Now, what we’ve also made mistakes, not only in food policy, but in transport policy. And some countries have done brilliantly, such as Denmark and the Netherlands. They systematically decided to develop transport scenes, schemes, systems, to help children and adults to cycle and walk. The British are recognized to be the ultimate disaster. They transform their cities exclusively for the use of motorcars. And the top urban planners down in the U.K. believe that Britain is the wonderful example, apart from the United States, of what not to do. And if you look at what goes on, of course things change. And you are not going to get rid of computers and cars and so on. But there is a whole list of issues here which are actually not something to do with telling everybody to run round the block 10 times after they come home from work. The fundamental decisions by local government, the European Union, national government, as to how to organize a city, and people automatically change their activity if the environment is different. And I won’t deal with the detail, but if you actually decide to cycle to work as in Copenhagen, or increasingly in Barcelona, or go to work by bus, or you have—because you are such a grand character, you have a car—you can show that the difference in energetics are extraordinary because you actually make a difference which amounts to 140 to 280 calories every day simply by that decision that’s being made. So this isn’t mystery at all. It’s strict science using the latest, accepted United Nations data. Therefore, what we do in Europe, in the environment, in the world in which people live, has a fundamental effect on something like obesity. And here is the downward trend as you get old on the left, and children at different times, they become less and less active. And of course, this is the environment that we now have for children. Why is it that parents don’t let children go out and play? For very good reasons. When they go out and play, they are likely to be killed in some parts of Britain. And therefore, every sensible parent will tell their child not to go out. And when they go out, they have a feast of inappropriate messages coming at them. Now, everybody says that the answer is that we should encourage people to exercise. That’s a very good idea. The evidence on it is that it’s not a very good strategy for changing activity patterns. And the question is--and I’ll show you shortly—but if we are so inactive, what it means is that we’ve got to be brilliant as having a superb diet, because that’s a better way of balancing the whole thing out. So we need to change physical activity, we cannot do it, necessarily. The evidence is you get poor results from telling everybody to do more exercise. It’s
valuable to tell them, but you’ve also got to change the environment. What’s happening on food? Well, this is the outcome of what I was talking about, the change in agricultural policy, the promotion of high fat diets, and as you go to the right, you have countries with higher and higher fat intakes. And up at the axis you show that that actually means that it’s associated with higher proportions of population who are overweight. Now you say, well, that just happens to be so. Well, you can to go particular countries like Brazil where you have a huge range of diets and food intake patterns. And again, you see as the fat intake goes up on the bottom there, up goes the body weight of the people, whatever the nature of the diet, crudely speaking. And if you do simple experiments, because Elio said that we’ve got to be very scientific, in science you now have to do studies on groups or individuals where they don’t know the purpose of the experiments. But you quietly, secretly manipulate half the group to go on one thing, and the other half on the other. In Figure 1, you have people who came from experiments in Copenhagen for 10 weeks, and they thought they were on a psychological experiment. And what the experiment was, one group was given soft drinks full of sugar, and the others had soft drinks full of sweetener. And the blue line going steadily up for 10 are weeks are the people on the sugar drinks. And the ones spontaneously coming down without realizing it, are the people where they’ve removed all the calories from the drinks. That’s where the sugar story comes from.
2.5
1.5
0.5
-0.5
-1.5
-2.5
Weeks
0 2 4 6 8 10
Sucrose
Sweetener
Weight changes (kg)
Figure 1. Hidden sugary drinks evade appetite regulation and lead to weight gain Source: Raben et al., Am J Clin Nutr 2002; 76: 721-9 Then on the left there are 3 groups of people, so I could divide you all up into 3 groups, tonight you are going to have a meal, and you are not actually going to know what the fat intake is. But if I secretly manipulate it so it is 60% fat, in red, you will automatically eat your normal amount of food, and promptly start storing an amazing number of calories, because of all the fat in the diet. Whereas, if

KEYNOTE PRESENTATION
EGEA 2007, Page 14
I keep you on a classic, ancient Mediterranean diet, at least for many parts of the Mediterranean, and it’s 20% fat, you eat the same amount of food, but it doesn’t have nearly so much energy, and you don’t put on weight. So actually, our brains are not very good at discriminating how many calories we are eating in the short term. Then they struggle, and we are making their struggle much more difficult. And here is the point about nobody saying that activity or diet is unimportant. On the right-hand side is where I’ve got people on 60%--this is James Stubbs who worked with me at […], did the studies in Cambridge. If you are an inactive character like me in yellow, and you are actually on a high, terrible diet, you will put on an enormous amount of yellow fat. And actually, if you are on such a bad diet, even though you are physically active as shown in red, you still put on weight. In the middle is 40% diet, the classic northern European diet of the 1980’s and ‘90’s. And there, depending on whether you are active or not, you either put on weight, or you lose a bit of weight. But here on the left is if you are on a superb diet, full of fruit and vegetables. Low in fat and sugars, and you are actually your brain is telling you to eat more because when you are physically active, you are likely to lose some weight and your brain can now start working, as it worked for millions of years, making sure you don’t starve. It’s not very good at making sure that you don’t become obese. So we now talk about something called the Energy Density of Food, and you are going to hear about that, because if I pack the food with fat and sugars, and then I take out fruit and vegetables, I have a classic diet of burgers and supermarket pies and so on, full of fat and really very energy-dense. And at the bottom you have African foods or classic Italian, Mediterranean foods that are low in fat and low in energy density. Well, fine. You’ve already heard that fruit and vegetables are classified now by WHO as helping to prevent obesity. And it [bulks] up the diet and that’s one mechanism by which it works. So what are we going to do about it? I’ve been told that all we got to do is to prevent it. And the Commissioner just highlighted the fact, you can’t tell people what to eat or whether they should do two half marathons a week. But you can change the environment. And we spend our time telling people to work individually when, in practice, this poor guy, who is very famous as you know, is actually operating against enormous problems of the environment. The question is, shouldn’t we start changing the environment to make it easier for them to implement what we recommend? And that’s the challenge, and the question is, what should we do?
Well, it’s very simple you see, if you listen to most politicians, they say, well, if you are getting fat, it’s very simple, just eat less and exercise more. But if you speak to the people who are in that circumstance, they say it’s very difficult, because don’t you realize that I live in a really quite difficult environment, and it’s not that easy to go out and exercise, and actually I have to eat in the canteen and I have no idea what’s in the food. And the canteen people, you go to and you talk to the people organizing the area around the apartments, and they say, actually, it’s not our fault, it’s the community and it’s local government that’s fundamentally responsible for all this, because if the local government did things better. And you then talk to the local government and they say, don’t talk rubbish, it’s all this national government. And you’ve heard the politicians say, no, it’s not us, Doctor, it’s the European Commission that does all the wrong things. In other words, one of the challenges, which is why it’s been so difficult to work on smoking--it’s even more so on obesity--because everybody says it’s not my problem, it’s somebody else who is responsible. And the question is, how do you begin to work on this system in a coherent, logical manner, trying to work out what the most important factors are? That’s the challenge. Well, we hear that everything has got to taste wonderfully, and you are going to hear later on how important it is to get children automatically taking fruit and vegetables very early as a primary learning experience, and so forth. But once you’ve actually dealt with the issue of whether a food is something that you like, these are the 3 things that every big business knows can change the whole of their sales and if you look at populations: the price, relative price; the availability, is it always there and immediately accessible and affordable; and what am I being told about these things? These are the 3 fundamental drivers. And you know, surely, I speak with people on the main boards of international companies, they absolutely understand this, and that’s why it’s such fierce, competitive business. Well, we’ve done very well so far in terms of price. Because these are the world prices of foods which have shown a progressive fall. A progressive fall relating to sales: palm oil, rice, wheat, cereals, soy beans, sugars. And here is an analysis, and I deliberately was tactful because others will deal with Europe. But shows actually U.S. agricultural policy has led to an increase in the relative cost of fruits and vegetables, both fresh and total fruits and vegetables. That’s the bars going up, do you see? The ‘relative’ cost has gone up. Whereas, the relative cost of the fats and soft drinks and so on, on the right-hand side below the line, has come down. So you’ve actually had a policy which has been promoting all these developments, and that is true of Europe as well as

KEYNOTE PRESENTATION
EGEA 2007, Page 15
the United States. It’s true of most countries. Is it any wonder that people have changed their habits? And here, the authors are in the audience, I hope you don’t mind my showing, these are gorgeous data, superb data from France. And on the right-hand side at the bottom, you see the most expensive commodities that there are, and going up, you see how energy-dense they are. There are the wonderful fruit and vegetables at the bottom right-hand side. We’ve now, in Europe, got relatively expensive commodities compared with the fats and oils show up at the top left, which are extraordinarily cheap and highly energy-dense, which is what we don’t want. That was not true when we started agricultural policy. I will say this is a result of market forces, which I do not believe. And the question is how do you actually compensate for this? Because this is the outcome, not of 10 years’ policies, but of 60 years of coherent policy, as I know, from having talked with negotiators here in Brussels, on the pricing system on butter, milk, and so on. I’ve talked with many ministries about the standard subsidies for dairy farming, butter production and so on, […] systematic and involved 100’s of millions of euros equivalent. Is it a good idea to actually change? Yes, because--and this is the only slide of this nature—if you take elderly Europeans and ask how do they manage, and you get actual death rates, as Elio has highlighted. If you are on a Mediterranean diet, you have a lower risk of heart disease, lower risk of death, lower risk of strokes, lower risk of cancers as a whole, and a lower risk of other causes. In other words, it’s not an issue that we don’t know. We actually managed to manipulate the diets of Europeans, unwittingly. So in fact, we make it most difficult for them to be on optimum diet. And here is the traditional diet of the Mediterranean, beautiful data produced many years ago before the second World War, where 400 to 600, 800 grams of fruit and vegetables was a routine. And the 400 grams came in 1990. I was privileged to chair a WHO meeting, and we actually took that figure as the minimum based on our estimates of what these sort of diets were when the evidence looked as though that was compatible with good health. And what we now discover--and here are data from the United States I’ve not seen in Europe—that the more expensive the relative cost of fruit and vegetables going across to the right, up there you see the fatter the children are getting. You will see in a moment, that if you put up the price of fruit and vegetables, they reduce their consumption. And they are much more likely to be fat in Houston, which I was in Houston 2 or 3 weeks ago, and they are enormous. The cost of fruit and vegetables, for some reason in Houston, is high, whereas, in other cities in the United States it’s much lower, and children are
then not becoming obese. And here are studies that you can do. You can drop the price even for children, not adults, of fruit and vegetables. And in blue you see a marked increase in sales at a school where they did an experiment. In other words, it’s not just a question of providing fruit and vegetables, it’s a question of children realizing that this is a good buy or not a very good buy. And that is something that we are going to have to cope with. Now, we’ve heard that actually in Europe, the cooperatives do better. And we had a big discussion with the previous commissioner about the importance of cooperatives. And the cooperatives, traditionally, haven’t been very good, as I understand it, in the fruit and vegetable arena. But there have been marvellous cooperative systems backed by government, previously, on the milk, the butter, the meat, and so forth. And if you look at this analysis of the food chain, what we have to understand now is that the supermarkets have suddenly become far more influential than they ever were 20 years ago. And they are now called by Corinna Hawkes, the brilliant analyst from the International Food Policy Research Institute in Washington, they are now called the “food-consuming industry.” Because as the Tesco chairman stated yesterday, they have brilliant analyses of consumer behaviour, and they can actually manipulate systems so, in fact, they can change the whole purchasing pattern of the public. And the question is how are we going to help you to become effective, to overcome so many of these disadvantages? In Chile, they had a problem. On the left, children came in--and that’s the blue column--at the beginning of the academic year. At the end of that year—in purple—they were much fatter. Why? Because government systematically funded extra food for these poor children that were rich in sugar, and fat, and refined cereals. And they decided to change policy. And they decided to allow local farmers to produce fruit and vegetables and other crops for purchase by the local school. The government paid no more, they just changed the whole agricultural policy. The kids by the middle, they stopped the children getting any fatter. They got terribly fat over these 8 years. And now it’s in reverse. In other words, you can combine health criteria with agriculture and policy criteria that can make a difference and benefit the win-win situation. Benefit both farmers and the public’s health. And here (Figure 2) is something that the Commissioner might need to take account. From the Food Resource Economic Institute in Copenhagen, where they show that if you study the purchasing habits of thousands of consumers and their families over 4 years, and work out what makes them change

KEYNOTE PRESENTATION
EGEA 2007, Page 16
their purchasing pattern, if you actually manipulate the price by only a small amount, reducing the tax on vegetables and fruit, increasing the tax on those things that have been subsidized for years, and add a modest sugar tax, with no change in government funding. This is the change where the so-called “fibres,” that’s fruit and vegetables, goes up. And on the right-hand side are the poorest sections of the community. They are most sensitive to price. And this “price elasticity,” as some of you will understand the jargon, is extremely important, particularly for poorer people. And they’ve shown, on the basis of purchasing habits of people in Denmark, that this is the nature of the change that you could induce simply on the basis of price changes. We ought to learn from that.
MMaanniippuullaattiinngg ssaalleess ttaaxxeess ccaann bbeenneeffiitttthhee ddiieett ooff tthhee ppoooorr
Smed S & Denver S. Food & Resource Economics Ints. KVL Univ., Denmark, April 2005.
-20
0
20
40
60% Intake changes
Saturated
Suga
Fibre
1 2 3 4 5SSOOCCIIAALL CCLLAASSSS
TThhee rriicchh tthhee ppoooorr
Figure 2 The marketing issue was touched on. You do know, don’t you, that there is essentially incontrovertible evidence now that the intense marketing to children is not only inappropriate because their brains do not work to discriminate what a mother or a father is telling the child, and what they see in an advert. And it’s not until the age of 12 or 14 that they can begin to realize that some people are trying to manipulate them, and they need to think about what’s going on. That’s a biological, intrinsic feature of aging. So in fact, we should not be actually manipulating these children, except in the traditional upbringing mode. And commercial action should be limited, as many countries are now considering. If you allow what goes on at the moment, you can show for sure that children are confused, they demand inappropriate food, they manipulate their parents to buy the wrong things. If you advertise a particular brand of cake or soft drink, it’s not just that brand that goes up, it’s the whole category, so you are manipulating the total diet to the disadvantage of children. The evidence is overwhelming. And of course, people at the present don’t know what to purchase because they cannot understand all these weird set of numbers on a package, called
“nutritional labelling.” And many of you will know there is a battle going on, on whether, in fact, our traffic light labelling--and the U.K. government, we actually proposed this about 20 years ago! But it’s now being done on an official basis. And here are supermarket data to show that if you have certain criteria which are based on the calories, the fat, the saturated fat, salt, or total sugar content of the food, if you have foods of the same type with a lot of green, up go the purchases. If you have some reds, down go the purchases. In other words, it’s completely meaningful. Consumers change their behaviour on that basis. But they don’t ban, they do not take these things. So it’s really quite a sophisticated way of actually getting information across. And some of you will know, and it’s not in your interest, I don’t think, if you are in the fruit and vegetable world, to get involved in this battle as to whether we should talk in terms of the nutrition profiling and so on, or whether you are talking so-called “dietary allowances” and so on. This is a scheme favoured by people, in my terms, who do not want to consume, as to understand. Consumers in all surveys have shown that actually they prefer the traffic light system. Overwhelming, over 80% of consumers come up for preferences for traffic lighting. You have a lot to gain from promoting that on an industrial basis. I won’t bore you, there are a whole lot of objections which Tim Lobstein and others have to deal with, from Britain and in fact from Brussels, have put forward to show that if you’d simply take these amounts. They are misleading, they refer to crude entities of adult men. There are some women in the world who would like to know, and how does it apply to children? And if I had to eat so much fat or energy, that’s alright for me if I happen to know exactly how much energy I have. But the energy is a nonsense on this basis, and scientifically untenable. So a traffic light system is a better way of doing it (Figure 3).
JS Ham & Pineapple Thin & Crispy Pizza 335g
1 red, 2 amber, 2 green
JS Ham and Pineapple Pizzeria 356
all 5 GREEN on WoH
42%55%
WWhheeeell ooff HHeeaalltthh((WWooHH))
JS Ham & Pineapple Thin & Crispy Pizza 335g
1 red, 2 amber, 2 green
'Be Good to Yourself' Chocolate sponge
puddings 4 Green, 1 amber
42%89%
Sainsbury's Supermarket presentation to The National Heart Forum, UK., 2006.
Figure 3. Consumer purchases in response to traffic light food labelling of principal nutrients as in healthy (green), reasonable (yellow), or unhealthy (red) amounts.

KEYNOTE PRESENTATION
EGEA 2007, Page 17
Source: Sainsbury's Supermarket presentation to The National Heart Forum, UK., 2006. Finally, we are beginning to turn the corner. I’d like to finish by trying to cheer you up. Because, in fact, in Istanbul on November the 17th, 48 ministries actually signed up to this. And the interesting thing was, and bear it in mind, that quite often it was the ministers of transport or the ministers of agriculture and food who were more enthusiastic than the ministers of health. Ministers of health are obsessed with hospital waiting lists and costs of illness and so on. They are very bad at thinking in strategies for prevention. But the agriculture ministries and the transport ministries understood. And this is an extraordinary opportunity which I don’t think you should miss. Because they spell out, not the idea that you should just tell people what to do. The scientific analysis done in the most rigorous way shows that even if doctors tell patients to change their diet, you get a minute change, which is of significance, but it’s pathetic compared with what we want. Therefore, in fact, of course you should still have advice going, but the fundamental issue is you need policy changes and that involves local action, it involves local government, it involves national
government, and it also involves the EU. And a code of marketing is one of the regulatory approaches that’s being produced. And there is a big battle going on, as some of you know, to do with that. If we don’t do this, we are locked into an absolutely inevitable catastrophe. It’s not an exaggeration. “Even the miserable economist,” this is from the Economist, summed it up beautifully, “by showing that in evolutionary terms, this is the most extraordinarily difficult thing to counteract, because it’s not a question of just a quick manipulation of the diet. It’s a biologically, intrinsic feature, where the whole population is responding to the new circumstances that we’ve created.” So in summary, I’d like to encourage you, because you are in a good business. And the big thing now is to get the fruit and vegetable industry and farming world locked in with the health people, because we need to change the nature of the debate. And you need to actually demand quite dramatic changes because dramatic changes are needed to cope with this crisis. Thank you very much, indeed.
Q&A Q: Thank you so much, Philip, for this lesson of history, sociology, economy, politics, and maybe philosophy. I think we have a little time left, and we can have some question from the audience to Philip James. I think it’s a rare opportunity to have such good speaker, and if you want to have some question? Maybe I can have a question. Philip, are you really optimist for the future, for our future? And if you have a key issue, what would you promote? The traffic light is a good solution? Can you comment more, please? A: I’m always being asked to please give 3 simple solutions. And the evidence is, that if you go for 3 solutions, you are not going to win. If you look at the policy people in Sweden, in Denmark, the Nordic ministries, and the Nordic ministries of agriculture, transport, environment, food, you name, it, and health, of course, they’ve all come up with a new charter. And in Norway, the Prime Minister has now introduced a new strategy which, in fact, is multiple-levelled. So I think the biggest mistake is to go from a single magic bullet, because if you think about fruit and vegetable production, sales, support systems that you need, price support, governmental and local interaction. At the end of the meeting I’ve got to give 5 proposals and I’m going to put them there. But I think that we have to understand that we have to operate at the multiple level. And a big challenge is, how do you get people organized in a sensible, coherent way, so it, in fact, it proceeds? When people listen to me, they say this is a very gloomy prospect because, you know, everybody is so terrible at understanding this problem. That the technical solution will be that the pharmaceutical industry will develop some new pills to deal with obesity, and diabetes, and cancer, and all these sort of things, and will never deal with this problem. Well, cheer up if you want to. Go for the worst scenario, because it’s quite clear that before you get there, there is no government in the world that can cope with the economic consequences of this. The United States is now changing, not the White House, but the companies and the industrialists, because of the costs to their employees from health is so enormous that they are becoming uncompetitive. And we are actually trying to analyze in Europe what is the element of poor competition? The problem, depending on the health insurance system is, who pays? If it’s the government, then they think about it in a different way. In America, it’s the people, and therefore, it’s terribly important. But there is no country in the world that can cope with this problem economically. What is going to happen is more and more people are going to become diabetic, have diabetes, and as soon as you get diabetes, then more and more

KEYNOTE PRESENTATION
EGEA 2007, Page 18
people are going to go blind, and you are going to have kidney problems. And the number of kidney machines are going to have to go up, and up, and up. The cost of every person on a kidney machine is of the order of 40,000 euros a year. And it’s completely unsustainable economically. So we’ve got to get to a point where this is seen by advisors to treasuries as a socio and economic policy issue, not a health issue. And that’s where we’ve actually got to have you, in the industrial mode, actually keep saying this. Because this is where you have to be given a major priority in national, not just agriculture policy, in national policymaking. Q: Yes, first I want to thank you for your excellent presentation. I learned a lot, I must say. But looking at the prevalence data for obesity in overweight adults, I noticed that Germany is 2nd in your list. But If you look at the children, they are the 2nd lowest. So obviously, we still manage with the children, that we have quite a low prevalence of obesity. But what’s wrong when they age so that our adults have the 2nd highest obesity and overweight rate in Europe? Do you have an explanation for this? A: It’s quite interesting, actually, because the linkage between childhood and adult obesity has not been worked out very well. I mean, these children data are relatively recent. And don’t forget that the adult data include adults of all ages. So in fact, you are trying to cheer yourself up by saying Germany may actually get better. The evidence on the whole is that that’s not going to be true. The data on the children, they are not brilliant. Only some of them—I’m trying desperately to remember if this is national German data. I don’t think it’s national. I think we had to take some of the […] where we had data, to actually come up with that German data. But perhaps you will correct me. I think that the evidence is that if you get teenagers who are overweight or obese, the probability goes up from roughly 60 to 80% that they will remain overweight into early adult life. Once you are overweight in adult life and you are young, the evidence is overwhelming that that’s particularly bad. So I’m expecting in Germany to see really a huge problem, in public health terms, because you’ve actually been overweight for quite a long time. If you look at your health statistics on heart disease and so on, Germany, for complicated political reasons, has made very few major policy initiatives. And we can have a discussion if you want to go into detail, because I’ve been on the Potsdam Institute discussing this with federal officials over many years. Germany has a problem. I don’t think you should assume. There is some preliminary evidence that Denmark may be turning a corner. I know of no other country that’s turning the corner. Q: Philip, thank you for a very persuasive analysis, which as I understand it suggests that the only way to combat the epidemic is through structural engineering on a scale by economics and public health policy and so on, that effectively structural social engineering, that is normally only undertaken in wartime. And that’s going to be an ambitious objective and requires strong implementation, even autocratic policies. And the terms that I missed in your analysis, although I’m sure they were implied all the time, were “values,” cultural values. It seems to me that in order to make these changes, there is going to have to be also a change in cultural values, not just of politicians, but also of people like you and me that we meet every day. And although we may not like to admit it, it is not a sin to eat high fat food. It is not evil or against the law to eat foods high in fats or sugar. It is not illegitimate, you are not a criminal if you eat these sorts of foods, and you are not a criminal if you become obese. And it strikes me that people don’t see themselves as operating illegitimately or in a criminal fashion if they eat foods which they like and if they gain weight. My point is, that there is going to be required a change in these sorts of cultural values, which will be very difficult to bring about because values, like habits, are very, very difficult to shed. And in a world arena where you don’t have any clear moral values, and it’s appropriate to launch an attack on a Third World country which one might regard as illegitimate or evil, how evil is it in comparison with that? To eat a doughnut or to put on some weight? Well, that is very easy to answer, isn’t it, don’t you think? This business of culture is very interesting. When I had to write the first European food policy with 3 colleagues in the mid-80’s, I was taken from my education to Finland. And a very, very famous world-renowned leader sat me down and said, you know, I really want you to come and have a meal with me because we’ve really made such a wonderful difference. And I just heard the mayor of Kuopio saying that he was outraged because in that area, north Karelia of Finland, the only major social events that they could think of was attending funerals. There were so many people dying. And they demanded the doctors and the government that they do something about it. And the government said, well, it’s very complicated. And the doctors, who were very sophisticated said, it’s even more complicated, we are not really sure. And the mayor and the local community said, we’ve got to do something, this is a disaster! And in the end, this is what he said, it was translated from the Finnish for me. In the end, they actually had to force the medicos to come through and produce the policy which is now world famous, and to which I’ll refer in my closing remarks at this Conference.

KEYNOTE PRESENTATION
EGEA 2007, Page 19
However, my good friend invited me to dinner, and it was appalling. It was so disgusting. High in fat, unbelievably--and he knew that this was a wonderful improvement and he wanted to demonstrate how good it was. I didn’t say anything because I come from Wales, so we are always polite in Wales. And I went back 10 years later and had dinner with him. And he said, I’ve got to take you out to dinner again, Phil. So we went out to dinner. And the food was completely transformed. And he said, you see, we are still eating this good food in Finland. He, himself, as one of the world authorities on diet, nutrition, and health, involved in policymaking, hadn’t even realized that his cultural perception had changed by virtue of 19 innovations which I’d heard from the government that they’d done, and I’ll talk about it. So what I’m saying is, no, you don’t blame individuals because they like something, or eat something inappropriately. What you have to do, yes, is to culturally shift the whole acceptance of what is normal. And I think you can do that with role models like there are chefs who go in for fighting for changes in school food, that are past the process. That you can actually shift the whole thinking by a series of strategic changes, in association with the general information. And it’s not necessary to get into a blame culture. Because I think that that has been shown, again and again, not to work. So the cultural perception will have to change. I think it’s quite clear that it can change. And the best evidence for that, you see the same thing in Norway where the fantastic 1962 developments on agricultural policy where, did you know, fruits and vegetables had to be distributed to the north of Norway, sold at the same price as Lazlo. And there was subsidy for the transport so that it was absolutely available. The Norwegians will tell me I’m wrong, and then I’ll have to correct them. Because that was the key issue to insuring fruit and vegetable consumption right up in the Arctic, and so forth. Now, it’s seen as perfectly appropriate that people should eat fruit and vegetable. So it was a price subsidy policy thing changed the perception of the public. So I am constantly being told, let’s get on the television, and John will ask the question--and I have done so many television shows, I’m not sure that the evidence is we’ve done any good. And the question is, shouldn’t we choose a different route?

INTRODUCTORY PRESENTATION
EGEA 2007, Page 20
The position of the European Commission on obesity and F&V consumption Robert MADELIN
Director-General for Health and Consumer Protection (DG SANCO), European Commission, Brussels, Belgium
Mr Riboli, ladies and gentleman, Thank you very much for coming to have your conference this year in Brussels. I was saying to the organisers before the proceedings began this morning that I think it is a work in support of the public good for networks such as yours to come to Brussels in order to ensure that those of us who are too lazy to travel to your meetings around the rest of the world get the benefit of your wisdom. So I think it’s a very good symbol that you’ve chosen to be in the heart of Europe, as it were, for this session this week and I’m pleased on the behalf of the European Commissions and the Health Director General to play our part in making your stay here enjoyable. Although the names attributed to the rooms in this building are very distinguished so here we think of Mr. [Spark] who signed the fifty year old treaty on behalf of the Belgian government. I think we also have to acknowledge that this is a rather tired building and the norm at the time it was designed of having people organised in the way the desks are organised may not be the most conducive to interaction and some of you, by the time I have stopped speaking, may have a crick in your neck so I apologise for that. But at least the hospitality is part of that. I’m going to also be part of the panel tomorrow so I don’t intend to go through a long slide show this morning. I wanted just to say a few words about the work of your conference seems to me to fit into the things that we are doing at the EU level and on the European Commission side around nutrition and the role of fruit and vegetables. Maybe there are two things to say. Firstly, yesterday I was speaking at another conference which was happening at another building not 500 yards from here about what the food sector would look like in thirty years time. And in that discussion there was a lot of, I think, I hope, unfounded speculation about pills that we would swallow and gunge of different colours that we would be told by our personal computers to assimilate into our bodies. But there was also quite a lot about food still needing to be fun. And the most optimistic of the visionaries, although their work continues today, were saying that actually they thought that as the approach to what cooking means continues to evolve, the idea that preparing food for ourselves would continue to be a driver should be accepted and maybe it would even become more popular. That was what some of the food processors and retailers were seeing from their own customer surveys across Europe. Against that background,
outsiders like me could perhaps be forgiven for thinking that fruit and vegetables is the low-tech end of the food chain in the sense that it grows and it’s very bucolic but then it just gets put on a stall and sold. Now I have learned in three or four years I have been working as a food chain regulator, because I am an amateur in this business that nothing could be further from the truth. But I think that it’s clear that we still have a long way to go to ensure that today and in the decades ahead we have a clear vision how to ensure that the important part fruit and vegetables should play in the diet of human beings is, in fact, being fulfilled in the habits and cultures of Europe as we go forward. It’s clear today that this is not the case and if I just give some of the figures which we have in our mind. In this decade most children in the European Union don’t eat fruit and vegetables as a category every day. They don’t just eat five a day; they don’t eat one a day. There are only four countries of the twenty seven, France, Italy, Spain and Greece where anything like the dietary guidelines for fruit and vegetables are met. And at this time, these two, I think, rather shocking facts, go alongside continued rising obesity levels increasing between ten and forty percent across Europe depending on which country you look at in that same decade. You look across Europe and you see fruit and vegetable under consumption being one of the top six or seven contributors to a risk factor for premature death and excess morbidity. Blood pressure, cholesterol problems, smoking, overweight, fruit and vegetable intake, physical inactivity and abuse of alcohol, in that order, are the big drivers of death and disease in Europe. So we have a clear problem, not just related to obesity but also related to the range of bad things that are happening to our population because they don’t understand and don’t have effective access and don’t have the aspiration to benefit from the offerings of fruit and vegetables that exist in our continent. So what are we doing about it? Firstly, let me say what we are doing about nutrition, physical activity in the broadest sense. This year the Commission will come forward with a proposal for a European strategy on nutrition, hopefully before the summer. We are trying to prepare that through a variety of actions as many of you will know, having participated in it. We have been engaged in consultations around Europe on this theme. We have been working now for just over two years in a European plate-form of all stakeholders including your sector on nutrition and physical activity. We have been funding pilot projects under the public health programme. We have been working, last year

INTRODUCTORY PRESENTATION
EGEA 2007, Page 21
in particular, at a ministerial meeting of the WHO in the European region at Istanbul to build alliances beyond the borders of the EU 27. And we’ve been linking up our policy within the Commission between the public health work, for example, that is done in my part of the world and the world of agriculture where as, I think, as explained to you already, the reform of the sector has been, in part to a degree, unprecedented in agricultural policy, I think I can say, driven by public health concerns and the recognition that it’s not just a productionist approach, “let’s have more apples” it’s also “let’s have more apples and make sure people eat them because that is what we need in Europe”. So there’s a lot going on and we hope in conjunction with the different stakeholders in the NGO sector, in the public sector, in the private sector, to bring this together in a strategy this year. What will that strategy say? That’s a little bit early to go into detail but I can say that I think one of the things we want to continue to push is this broad partnership approach for what we want to do in the next couple of years compared to the last few, where we’ve set up this cooperative approach in Europe at the EU level, is to try to encourage communities, regions, member states where public private partnerships don’t yet exist to consider creating them. I think that in the public health field the notion of a partnership is necessarily fraught with risk. People say “Well, can I partner with anybody, do they all adhere to public health goals?” and I think that’s a legitimate worry. I think what we’re seeing in European society is an evolution in our ability to define ways of working together such that
partnerships between public and private operators can safely pursue public health goals without somehow putting private sector operators at the steering wheel of public policy. And so, certainly my vision and I hope what the college of commissioners will say by the middle of June is that such partnerships, which we’re beginning to use more at the European Union level, should also have their counterparts at the grassroots. And one of the things I think it’s worth thinking about in a conference such as this is what role can the institutions that you come from play in using such partnerships to get broader understanding of the work that you are doing. I think it should be seen not as yet another task but rather a potential opportunity to bring the work of this conference, the work of your institutions, into the strategic thinking, the policy shaping that actors who perhaps do not pay enough attention to your work so far. And it’s on that note that I’d like to stop because I think what is good about a conference like this as I say you come here and hopefully we then listen better, it’s not that you have to listen to us. So what I’m looking forward to is the results of the conference such as this and to see how even at this stage they can influence and shape the tone and content of the nutrition strategy we’re producing this year. So, thank you for being here. Enjoy your work. I’m told that before your next session starts at 9 o’clock, if there’re are questions or comments in this session, that’s ok, and I am certainly happy to take them but above all thank you and good luck for the work today and tomorrow. Thank you very much.
Q&A Q: Philip James. Mr. Madelin, I wonder whether, in all the work that you are now doing for the Commission, you are putting this issue of public health in an economic context. So that traditionally, as you know better than I, the agricultural development has been primarily a major economic development issue for Europe. Are you beginning to be able to put the challenge of public health in an economic context so that the commissioners who don’t readily relate to you can see that it has significance? A: I think that’s a very interesting question because it raises the question, it is enough to say “here’s the science that proves that eating fruit and vegetables is good for you”. Or do you have to say “how good and how many extra years of healthy life will you have?”. The answer is yes, we are beginning to do it but when you get down from the principle to the detail it’s very difficult. So we’re beginning to do it and indeed the heads of state and government in Europe began very solemnly to do it in the spring of 2005 when they revised the Lisbon strategy. Most people think the Lisbon strategy is all about competitiveness which, of course, that’s the title. But it has, like all good strategies, performance indicators and one of the performance indicators adopted by the European Council in 2005 for what is designed to be an economic policy was the healthy life years lived by Europe’s citizens. The healthy life year is, as you know, one way of measuring life different to life expectancy at birth or at sixty and which makes the difference between dying old but the last twenty years being of a very poor quality. Or, which is the aspiration, living many years but also in good health. And I think that it’s a strategic moment therefore that Europe, for the first time says, we care about economic performance, one of the reasons we care about it is to the extent it will deliver healthier life years. So that’s the hook on which we hang our efforts. The difficulty when you get down to the detail is a difficulty of two orders. The first order is many people have not noticed this important strategic change. Some of my colleagues say, at the moment, for example, “don’t try to make a link between wide spread obesity and lost productivity. We don’t really understand it because we know that fat people go to work in factories and we say you

INTRODUCTORY PRESENTATION
EGEA 2007, Page 22
haven’t understood clearly. The problem is that if the whole population is obese and overweight, many people will be invalided out of the work force, younger they will be falling ill more, etc. But making that link for economists is still counter intuitive so we need data. And then if I come to the data which is the second order of difficulty. And we say, ok, let’s look at the valuation of the statistical life. Let’s look at the valuation of quality life years which is a technique familiar is some parts of public health and health service management. There’s still there also not enough understanding, not enough general use of that language, for the detailed work, the detailed data to be used. So, it is an area where the answer is yes, we are doing things but I think it’s also an area where the more people begin to think about it and to maybe bring economists into their study groups so that your work may not be finished when you demonstrate that they’re a good impact of fruit and vegetable consumption. But also then if you can try to encourage some economists to try to put a figure on it or talk about the link between your finding and this Lisbon goal of healthy life years and competitiveness, you would, I think, be helping us to advance this goal of making the link to the economic world, which isn’t the most important but which does seem to motivate a whole series of powerful actors who we find it difficult to reach with just a public health message. Q: I have a quick question. Is quick the question but probably not the answer. You rightly put the accent on the need of knowing more. Knowing more about obesity, knowing more what is related to obesity, what are the health consequences, what are the social consequences? Now, as a researcher, we often found us in between two seats, between the public health division and the research division. Sometimes formulating questions about nutrition and health, we have been told by the […] research that this sounds more like public health and then formulating the same question to the DG public health. We have been told this sounds more like research. So, the question is, to what extent what you plan to do to integrate between public health and research. This area which covers clearly areas which are more, almost sociological and extend it to maybe more proper medical research. A: I think the answer is that the seventh framework programme is a lot better at doing this than the research programme that you are working under so far. So the example I quoted of linking up nutrition policy from a public health perspective with agriculture was just one example. I could also have told you about, maybe I should have told you more about, the bridge building that we have successfully engaged in between the research strategy under the seventh programme and nutrition and other public health objectives. The short version of the answer would say simply there is more money for public health focused work in the seventh framework programme. We are working very closely with our colleagues to arrange that the specific calls set the right tone. I think therefore that the operational conclusion would be to say that it may be worth engaging afresh with preparations under the seventh programme even if you’ve had disappointing experiences […] the two. And it’s always very fruitful to talk to both of us at once and we have good relations with […] and the people on the public health side in the research Directorate General. And also with Mr. […] and his colleagues on the food side and I think we would be very open to organising sort of trilogues, as it were, with researchers who had ideas about how the words in the framework programme needed to be moved towards specific sorts of calls. So I think that there is scope for this, both in terms of the public health agenda and under things like the food technology platform where, I think, there as well you’re looking at food for life as they call it and clearly there has to be some research element but it’s not purely food processing, at least, in my conception. (Break in the recording) A: …and the answer is yes and we could probably, my colleagues here could probably give you the references in both the consultative document that’s already out on our website and in the strategy proposals that will be coming this summer. We do make the link not just the sort of the upside towards healthy life years but also the downside. Our headline figure would be that if you accumulate the different nutrition-related disease burden elements partly to the health system partly lost productivity, you come out with a figure higher than the cost of tobacco. So a lot of people say, you know, half a million people per year die of tobacco, obesity is not the big issue. But if you look at the costs to society and you accumulate them, ill health related to poor nutrition, overweight, lack of physical activity, pile it all together, it’s worse. Maybe not as maybe people are dying but the burden on our healthy active living in a society is just as big.

FRUIT AND VEGETABLES AND THE PREVENTION OF OBESITY AND ITS ASSOCIATED DISEASES
EGEA 2007, Page 23
SESSION 1: Obesity
- The real cost of obesity - A. Drewnowski - Natural history of the disease - A. Basdevant - Obesity related diseases - E. Riboli - Treatment of obesity: Place of the dietary recommendations in the global approach - M. Laville
SESSION 2: Fruit and vegetables
- The components of a healthy diet: comparison across the world - A. Trichopoulou - Why F&V are considered healthy? Epidemiologic overview - T. Norat - Latest evidence on the health-promoting effects of F&V constituents - B. Watzl - Fruit and vegetables for health – WHO initiative to promote fruit and vegetables - U.Trübswasser
SESSION 3: Fruit and vegetables and Obesity: Potential mechanisms of prevention
- What do we know about the relationship between fruit and vegetable consumption and body weight (satiety, eating patterns)? H. Blanck - Dietary fibre and body weight regulation - M. Bes-Rastrollo - Exercise alone is not enough: a healthy diet is also needed - J. Blundell
SESSION 4: The special case of childhood
- Childhood obesity: When and how to react? - ML Frelut - Childhood obesity and the early metabolic process leading to atherosclerosis: a protective role of fruit and vegetable consumption - C. Maffeis - Early childhood development of taste for F&V as the basis for liking and consumption in later life - S. Issanchou

SESSION 1: Obesity
EGEA 2007, Page 24
The real cost of obesity Adam DREWNOWSKI
School of Public Health and Community Medicine, Director Center for Public Health Nutrition, and Exploratory Center for Obesity Research, University of Washington, Seattle, USA
I’m going to be talking about the real hidden costs of the obesity epidemic. And I’m going to be talking about the economic aspects of obesity. This is a very interesting crossroads of nutrition science, policy making and political action. The fact that we are in Brussels is actually extremely appropriate. This is where things happen. I am going to be asking some tough questions. The first issue is this. Is obesity really an economic issue? Are we seeing disparities in obesity rates not only among countries, but also within countries? Yesterday, Phil James gave a brilliant presentation of how obesity rates vary among European countries from a low in the Netherlands to a high in Greece with Germany and France in between. But that is because Phil deals with ministries of health and talks to heads of state. I operate at a much lower level. I’m lucky if a county executive returns my calls. So I’m going to talk about obesity disparities at a much lower local level. Remember the motto that all politics is local and research about obesity ought to be local as well. If you take a look at this map of the United States at county level, you will see that obesity in the United States is not randomly spread throughout the nation, it is actually concentrated in the South West and what you see is the highest obesity rates in Mississippi, Alabama, Louisiana and down South. Everyone who watched the evacuation following Katrina will know that the people who were left behind were not only African American but also poor and also obese and diabetic. I mean that was really seen on television very clearly. So we really do have pockets of obesity which are concentrated not only in parts of the nation, but also at a finer level within a given county. This is a map of Seattle showing obesity rates at the level of postal codes, zip codes. Those are unique data because health data never get geo-coded by fine geographic location. It’s actually very difficult to get data which are coded at a very small geographic level. Notice here is the map of Seattle with Lake Washington and Mercer Island in the middle, Pacific Ocean to the left and you see the obesity corridor extending down for the central Seattle area and that is the same area which has got unemployment, poverty and low property values. When you look at disparities by zip code you see a certain pattern but when you look at median incomes and median home values, you see the exact reverse. The high incomes are on the East side of Seattle, that’s where Microsoft is and for out of state audiences, they always have this question, I have the answer, that’s where Bill Gates lives. It’s in a very nice area where there is no obesity whatsoever.
If you look at another iconic map, that is the map of Manhattan, you see again, there are huge disparities within Manhattan. If you go from the Upper East Side to East Harlem and cross 96 street, you find that obesity rates quadruple and the rates of diabetes go up seven times. These are huge, enormous disparities by very small geographic area. You cross one street in Manhattan, you go from Upper East Side to East Harlem, the rates of diabetes go up seven times. My position is that obesity rates at the level of nations are to a very large extent meaningless because in a given nation you have the rich and you have the poor and it very much depends on sampling practices, the nature of your survey, the results that you will get will depend on that almost entirely. We need to look at obesity rates at the small scale local level and then ask a very tough question, how come you have obesity and low incomes and poverty in East Harlem but none on the Upper East Side? What has, in fact, protected people from obesity? Is it possible it is income and wealth? The tough question that really needs to be asked is, is obesity largely an economic issue? People have begun to write and publish papers on this. There are some very nice publications coming out of the Pan American Health topic Organization dealing with obesity rates in South and Latin America I’m impressed with. It’s very nice work. And I’ve been trying to do this kind of work, looking at the issue of food costs. How come that we have got this structure of why consumers make decisions at the same time when we come to public health interventions we don’t follow our own structure. So I have here a kind of animated version of Phil James’ talk from yesterday because I deal with these aspects of food choice; taste, energy density, cost, and convenience. Unfortunately, and I say unfortunately as a health professional, health and variety are lesser concerns when it comes to consumer food choice. Taste, cost, convenience are the primary ones and when you start looking at taste, well it’s going to be sugar and fat. They taste good. If you’re going to be looking at the energy density of foods, well, it’s going to be grains, sugar and fat. Cost, no coincidence, is still driven by cheap sugar and fat. Convenience, what’s accessible? Sugar and fat. And to a lesser extent, because people don’t care about health or variety, you end up with an obesity epidemic. So that’s the short version. Now let me give you a slightly longer version of the same argument. First of all, there is a bit of a disconnect between the ideal diet and the reality. We know what a healthy diet is, there are very nice foods for people to eat and yes they are healthy but the reality for most people is going to be different, and

SESSION 1: Obesity
EGEA 2007, Page 25
cost is everything to do with it. Because when you look at the advertising in American magazines we see they feature 99 cents, one dollar, 3 dollars 99 cents, and my favourite caption is, “it does not get better than free”. People really want to spend the lowest amount of money possible on food and when you do that the only things affordable for very low amounts of money are going to be sugar and fat. There’s a whole history of subsidies and hierarchy of food prices and all kinds of things have contributed to this over the past several decades. This is not something that happened just recently. We have been going up to this point for the past several decades because of deliberate and conscious agricultural policies. So let me ask the first tough question and that is, do energy dense foods cost less? I am defining energy density as calories per one hundred grams and I’m defining energy cost as dollars or euros per thousand calories. This is a kind of build up to the slide that was shown yesterday, we’re looking at energy density on a vertical axis, that’s your calories per one hundred grams. We’re looking at the cost on the horizontal axis, and notice that you can get about a thousand calories of oil for about 10 euro cents. But when you want to eat sugar, it is also extremely cheap, notice that with soft drinks you get a thousand calories for under a euro. But the moment you start moving to grains and then dairy products, cheese and yoghurt and then meat and then fish and shellfish and then vegetables and then fruit things become more expensive. Because these are Paris prices, we couldn’t do without including wine and alcohol, apéritifs and digestifs, so we have those too. Notice that this scale goes to the right in a disparity cost per calorie becomes huge. It is in the order of 1000 or 10000 percent. This is a logarithmic scale where each increment is, in fact, a ten fold increase in cost. So when you go from sugar where you can get 1000 calories for about 5 cents to say sugar in fresh raspberries, well the amount of money you have to pay for the same amount of calories increases dramatically. But I want to make a major point here and I will come back to it later, that is the price per calorie. If you want to look at the price per nutrient, then things change completely because then vegetables and fruit become good value, because they pack a lot of nutrients per your euro. Not calories, but nutrients. The nutrient to calorie ratio is going to be extremely favourable. I want to show you that the same prices operate in Seattle, this is now a slide showing prices in Seattle. It’s pretty much exactly the same as the previous one. The previous one was prices in France. These are current prices in Seattle supermarkets, showing the same relationship and the same exact hierarchy of food prices. Whether you are in America or in France or elsewhere in Europe, sugar is going to be cheaper than raspberries every time, so the same hierarchy of prices is preserved.
Another set of data from Seattle shows prices in Seattle supermarkets in 2004 and 2006. Same supermarkets, same foods, same package sizes, same everything, just two years later. We stratified those foods by energy density so the low energy density quintile, bottom 20 percent were the fresh vegetables and fruit. In the top one were the sugars and fats. Notice that for the low energy density foods, the cost increase outpaced inflation; we saw, almost 20% increase in two years whereas sugars and fats actually dropped in price in two years. There is an increasing differential in terms of the healthy diet being less affordable to the average consumer as we go on. And this is a dramatic demonstration. Long term trends previously seen over twenty years actually operate on a local level and can be seen within twenty four months. We actually did see it. The next issue is this. Energy dense foods are cheap. Energy dense foods taste good. But there is a down side. Energy dense foods also tend to be nutrient poor. In order to work out nutrients per calorie and nutrients per unit cost, we needed to have access to some kind of a nutrient profiling score. This is a big issue in Europe right now because of the European Commission regulations about nutrient profiling. The food industry is now looking at nutrient profiling of foods in order to improve the quality of their product portfolio. The regulatory agencies are looking at it as well. So my colleague Nicole Darmon together with Mathieu Maillot who is actually here today, have developed a scoring system to start looking at the relationship between diet quality or food quality and food cost. And Mathieu’s paper will be coming out in the Journal of Nutrition shortly. What I want to show you is the relationship between energy density and nutrient density. This is it. Notice that it’s very similar to the previous slide I showed you but the previous slide was energy density plotted against energy cost. This slide shows energy density on the vertical axis and the nutrient density score on the horizontal axis. Notice that fruits and vegetables are both energy dilute and nutrient rich. Soft drinks, on the left, are energy dilute because they contain mostly water, but they are nutrient poor. So the critical distinction is not so much energy density, calories per gram, but nutrient density or nutrients per calorie. Fruits and vegetables are right there on the extreme right with most favourable scores. Again you see the same relationship between oils and sugars that are nutrient poor and vegetables and fruit that are nutrient rich. But since you have this inverse relationship between energy density and energy cost and energy density and nutrient density, obviously there will be a positive relationship between nutrient density and nutrient cost, which means nutrient dense foods are going to be slightly more expensive per calorie. What you see here on the next slide is a huge variation. Vegetables and fruits are picked out as

SESSION 1: Obesity
EGEA 2007, Page 26
green squares on the slide. All the other foods are yellow circles. Notice that for vegetables and fruit there’s a huge range in price from inexpensive to medium expensive to more expensive. It’s not that every vegetable and fruit is expensive. Some are and others are not. And you get a whole range of nutrient densities. This is an interesting way of looking at things because we’re looking at energy density, nutrient density, and nutrient cost and looking at how those factors inform consumer choices. The next question is this – if you have nutrient dense foods which cost a bit more and energy dense foods which cost less, do energy dense diets cost less? If you have an energy dense diet, are you, in fact, saving money? Here we did some analysis again with Nicole Darmon and Mathieu Maillot of the French INCA dataset. This is a representative study of a large number, I believe about 1500, French adults who all filled in seven day food records. Here we were able to estimate the cost of each diet using French national food prices provided to us by French economic agency and also by private market research companies. These INCA data, stratified by intakes, show an inverse relationship between energy density and daily diet cost in euros per day or, weekly diet cost in terms of euros per week. This is for people who consume approximately one thousand calories per day. This is for people who consume two thousand approximately per day, three thousand, four thousand, or five thousand calories/day. Regardless of calorie intake if you eat an energy dense diet, you save money so that a diet of chocolate, potato chips, and cereals is both energy dense and actually cheaper than a diet of lean meat, fish, fresh vegetables and fruit. It is, of course, less nutritious but it’s another issue. If you eat an energy dense diet, chances are you may overeat. There is a positive relationship between energy density of the diet and total energy intakes. With energy dense diets there’s a possibility of overeating and indeed many people do. The last question is this - what happens when you stratify diets by energy cost? Generally we believe that the more calories we eat, the more nutrients we get. If you eat a thousand calories, you get so many nutrients but if you eat two thousand calories you will get twice as many nutrients. Well not necessarily, not if those calories are empty calories. If you eat a low cost diet, you may eat more empty calories and fewer nutrients. This is from a paper that we published in The European Journal of Clinical Nutrition a while back with Elise Andrieu as the first author. These data showed the following. If you stratify the diets from a large scale INCA study by diet cost, you see on the horizontal axis that going up from 4.5 euros per day to 5 euros per day to 6 euros per day to 7 euros per day changes diet quality. The next line shows energy cost per 10 mega joules, 5, 6, 7 and 9
euros per 10 mega joules. You see that as the diets become more expensive, you get more nutrients and you get fewer calories so the energy density of the diet drops, the nutrient to calorie ratio becomes much more favourable, and the diet is better and higher quality. In the end you eat fewer calories. But it costs you more. So you have a bit of a paradox. Energy dense diets may be of lower quality, but they cost less and are highly palatable. In contrast a more nutrient rich diet is certainly better but it tends to be more expensive and you eat less. So that increasing nutrient density of the diet might be a way of fighting the obesity epidemic because energy dense diets are actually associated with lower diet costs. Finally, let me make the point that the current structure of food prices is the result of long standing agricultural and other nutrition related policies. What do we know about food prices, health and income? There has been some work on this topic conducted in the United Kingdom back in 1937 by John Boyd Orr who was, I believe, Phil James’ predecessor at the Rowett Institute in Scotland some years ago. John Boyd Orr published a very nice graph based on English eating habits from several decades ago which pretty much replicates Engel’s law. As people get richer and have higher incomes, they may spend more money on food but they spend a proportionately lower percentage of their income on food. You see the same thing reflected in a panel on the right hand side which shows that in the United States, the proportion of disposable income, spent on food has been declining. Americans right now are spending the lowest proportion of income on food in the world. Food consumed at home only accounts for 7.4 percent of disposable income. Food consumed away from home accounts for another 4 percent. Altogether, Americans spend approximately 11 percent of their income on food and beverages. That is it. The French spend double that, the Japanese spend triple that. The less you spend, the more you’re likely to get a diet composed of sugars and fats. Another set of slides from 1937 shows that, the consumption of fruit and fish and vegetables and meat is positively tied to incomes. Which means the wealthier, the more affluent people eat more and this has not changed in the intervening 70 years,. On the other hand, note here that the consumption of bread and potatoes and lard and sugar is income neutral. These days especially the consumption of sugar is negatively linked to incomes which means lower income people consume more sugar. On the one hand, you have a positive relationship with income for some foods and a negative relationship with income for other foods. As I have said before, it is the lower income groups that are, in fact, the most obese. This pattern of food prices has been around for a long time. The next slide shows data from Wilbur Atwater who’s credited with developing nutritional

SESSION 1: Obesity
EGEA 2007, Page 27
science in the United States. These data go back to 1867. They show that protein can come in packages of various costs. I re-plotted Atwater’s data in terms of energy density and energy cost just as in the previous slides. I then noticed that beans, cheese, white bread, potatoes, beef, liver were the lowest cost sources of protein whereas oysters and oranges cost much more. Another example from a more contemporary American source, the Thrifty Food Plan, shows the reliance on low cost sources of energy. The Thrifty Food Plan is the nutritional diet for families that can be obtained at a cost of three dollars and eighty cents per person per day. Three dollars and eighty cents per person per day means about twenty five dollars per person per week. What you get for that is a lot of calories from oil shortening, margarine, mayonnaise, sugar, crackers and white bread. The amount of vegetables and fruit included in the Thrifty Food Plan is, in fact, minuscule. This has to do again with affordability and the cost. To summarise: the issue is access to healthy foods. It’s not really a question of preference or individual choice. This is very much a question of affordability. This is also a question of accessibility and a question of convenience and time constraints. To cook all the foods in the Thrifty Food Plan, nutritious as though they are, someone calculated it would take about 16
hours per week. A typical American working woman does not spend more than 7 hours shopping and cooking per week. So 16 hours is two and a half times that. On the one hand, government is encouraging people to consume low cost healthy foods and is encouraging them also to work away from home. You actually cannot do both if you’re on a Thrifty Food Plan. This is the major challenge for public health nutrition. We know what the perfect diet is. Can we afford it? Is it accessible? What policy and political measures need to be put in place to make sure that such diets are affordable to all? There was an editorial a while back in a Lancet which said the following, if a meal of grilled chicken, broccoli and fresh fruit costs more and is less convenient than a burger and fries, then the battle against obesity will be lost. The whole thing comes back to the issue of time and cost and convenience and yes, I’m sorry to say this, money. It is actually possible to spend less and eat more. This is a paper we published in the American Journal of Clinical Nutrition back in 2004. What was showing here is that as food cost and food expenditures go down, diets become of necessity more energy dense. They have more sugar and fat, diet quality goes down and intakes make paradoxically go up. By saving money on food you may end up being overfed but undernourished. Thank you.
Q&A Q: Thank you. This was really excellent. There is something that personally I’m able to understand which, to me, sounds like a paradox. You have showed this clear data that indicated that as people get richer, country get richer, the proportion of income spent on food decreases. So, in fact, this means that there is more money available that is spent for other commodities other than food. So, it seems that, on the one hand, as you quoted the Lancet, it’s important that we offer good food at the low cost. On the other hand, it’s a paradox, because people now tend to spend more in cinemas, bars and pint of beer than on food so there must be an issue of perception that goes much beyond money. A: It’s a very interesting point, thank you for asking that. Yes you’re absolutely right. There are only two segments of expenditures that have gone down in cost in the past fifteen or twenty years. Those segments are food and clothing. Everything else like telecommunications, everything else has gone way up. Manufacturers in the United States have produced cheap clothing by moving production off-shore and manufacturers of food have reduced cost by increasing the consumption of sugar and fat. So think of sugar and fat as the dietary equivalent of, you know, inexpensive clothing made outside European Community. Q: Thank you very much. Adam. I have a question that follows on from the previous one and it’s to do with the exclusivity of the relationships that you present and I don’t have any trouble with the argument and the correlations and the deep analysis which I think are perfectly correct but one comment you made didn’t resonate too sharply with me and that’s what you said that in the Upper East Side of Manhattan there is no obesity. Now I’m sure I’ve seen the odd fat person upon ninety-sixth street or so and it is a fact that even if you eat the perfect diet, it does not prohibit obesity developing and there are many of these people who are in the higher income brackets so obesity is not a preserve of the lower income groups although it’s found predominantly there. A: Yes, you’re absolutely correct John. I misspoke. The prevalence of obesity in the Upper East Side of Manhattan is exactly 5.3 percent. So it does exist but the rate is much lower than in East Harlem where they are 32 percent. And in Seattle, the rich areas around 5 percent, but the low income areas 32 percent. This is a six fold disparity which is actually much higher than any kind of disparity by race or ethnicity. Another important point is that this is a gradient. It is not a threshold relationship with a poor being obese and everyone else being thin. It is actually a

SESSION 1: Obesity
EGEA 2007, Page 28
continuous gradient which goes all the way up and actually obesity rates don’t start reaching zero according to my calculations until the income hits about 200,000 dollars per household. So at about 200,000 dollars you’re pretty much safe, but below that beware. Q: Thank you very much for the paper which I really enjoyed. I wanted to comment on one of the previous questions and then perhaps add in one final question which is that, of course, although as income goes up, the proportion of income spent on food goes down, that doesn’t mean the absolute amount goes down. Richer people spend much more than poorer people on food and it’s important to keep that in mind. They buy different things. Food is cheaper, as in clothing, for some of the same reasons that production can be off shore much more cheaply. I think the same analysis would apply in the food system as well as in clothing. But my whole comment and question relates to the final point that you were making. I am from the United Kingdom and just before Christmas last year one of our major supermarkets was advertising the ingredients, the things that you need, to have a good Christmas and the main thrust of all the television and newspaper advertisements were, if you come to us, you can buy all the things you need for Christmas much more cheaply than anywhere else. In other words, for the major festival, whether you are a Christian or not, in our society, come and get it cheaper. I think that says a great deal about the way we value food certainly in British society and that may be true in other countries as well. And I wondered if you could comment on what the role is therefore of those of us who work in public health or other disciplines that are represented here, in trying to change that very fundamental mindset promoted through industry, perhaps even through government, certainly through the media which is that the only good food is cheap food. I’m not talking about fats and sugars necessarily. I’m talking about the whole notion that it is appropriate to advertise, the main thing that you can advertise about food is that it’s cheap and cheaper in our shops than somewhere else. A: I would completely agree with that. I would say that we need to restructure our thinking and talk not about cheap food in terms of cheap calories but perhaps affordable nutrients because, very often, when people say cheap food, they mean most calories for your money and that inevitably takes them back to sugar and fat. I would say that the new nutrient profiling schemes will make it easier for us to focus on the beneficial nutrients in food and look at those nutrients in relation to cost. Then we will realize that some of those nutrients are in fact affordable and presented in a nice package in foods.

SESSION 1: Obesity
EGEA 2007, Page 29
Natural history of the disease Arnaud BASDEVANT
Director of the Department of Clinical nutrition, Hôtel-Dieu, Paris, France
My purpose today is to take you through the natural history of obesity in order to identify the different possible levels of preventive and curative interventions. I will do this from a medical point of view which may to a certain extent differ from the previously outlined perspective, though there exist several points of convergence. The majority of individuals gain and lose weight and do not become obese. A small proportion of the population becomes obese, i.e. affected by this disease or at risk of becoming so. Weight gain is a gradual process which leads to a chronic disease – obesity- in certain persons. This process goes through different stages of weight gain, maintenance of excess weight, the increasingly chronic nature of excess weight, and finally attempts- usually in vain- to lose the weight. It is in terms of this process that we will consider two questions: first I propose to consider the hypothesis that weight gain is in fact an adaptation to changing environments and to economic transition as has been broadly discussed in earlier presentations; this process of adaptation leads to a pathology of organs, a disease of adipose tissue with systemic consequences. The other point has to do with the phenotype heterogeneity of obesity. It is an extremely heterogeneous entity and thus one cannot speak of obesity in the singular; there are several obesities because in terms of pathophysiology, phenotype and health consequences, the situations are very variable. Let us analyse this process from the start. The initial phase of weight gain is mainly determined by behavioural factors which lead to an excess energy intake relative to energy expenditure. Individual behavioural factors are variable. They depend on dietary behaviours, cultural factors, learning, conditioning, possibly eating disorders, physical activity, response to stress and many other factors. These individual factors are of course variable, and this can be illustrated through two examples: dietary intake and physical activity. There is not a unique pathway to hyperphagia. Certain persons consumed excessively at meals, either due to excessive appetite or hunger, or due to an alteration of satiety mechanisms, or difficulty in estimating dietary intakes. Other have excessive dietary intake outside of meals i.e. snacking, impulsive or compulsive habits and so forth. If we now consider eating disorders, a new heterogeneity of situations appears: certain people eat too much due to problems such as anxiety, stress response, dietary restrictions, family and social factors and so forth. Possibly certain
iatrogenic factors such as medication, economic factors and genetic factors (lesions) also play a role. There is even heterogeneity of situations in terms of energy expenditure: it is recognised in most countries that there is a relation between corpulence and time spent in front of the television. However time passed in from a book absolutely does not favour obesity. Thus the sedentariness parameter is also one that merits further detailed study. Returning to the evolution of the process, the first stage is weight gain. The question of individual factors has been considered. Let us now look at the role of the environment. There are two major contributors to the evolution of the dietary system and of the environment. The role of dietary availability and energy density has been raised. Nutritional density appears as a major determinant of overconsumption. Energy density of foods depends in large part on the quantity of lipids in food and of sugars in drinks. High fat foods are more energy dense that low fat foods but given a situation of equal fat intake, it has been shown that energy density can vary as a function of the number of fruit and vegetable portions consumed. No matter what the types of high energy density, those with energy dense diets have a clearly higher obesity level than those who consumed low energy dense diets. Portion size is also an important parameter which has not yet been discussed. The percentage of “super size” portions, large portions on offer in the United States, has increased from less than 10% to 70% between 1970 and 1999. A recent study illustrates the impact of portion size: cinema spectators who were are offered either 240g or 120g of popcorn consumed respectively 58g to 85g, a difference of 45%. The caloric density plays an important role as does portion size. Thus during the weight gain phase, there is an effect of the environment, behaviour and of course well-documented genetic predisposition. Claude Bouchard carried out the most vivid study in this area: the study Thus during the weight gain phase, there is an effect of the environment, behaviour and of course well documented genetic predisposition. Claude Bouchard carried out the most vivid study in this area: the study addresses weight gain as a response to overeating of 1000 calories per day over a period of three months. Certain subjects gained 4 kg, others 14 kg and homozygous twins had comparable weight gain. This clearly shows the role of predisposition on the effects of the environment and of behaviour. To

SESSION 1: Obesity
EGEA 2007, Page 30
date over 200 areas on all chromosomes have been identified as having an association with obesity. In reality it is a genetic predisposition to the effects of the environment; most likely several genes are required to have a clear effect. We are still speaking of the dietary system, we are still speaking of reducing physical activity, but we cannot forget other potential contributors which have been remarkably tested by Keith a few years ago. The reduction of smoking, the reduction of sleep time, the reduction of the room temperature variability, of pollutants, the iatrogenic effects of medicine and other factors, in particular intra uterine factors. When we consider the physiopathology of obesity one must definitely consider these important contributors which are diet and physical activity but there are many other factors. For example we must focus on the role of inequality and poverty. A study on the prevalence of obesity by a group at INSERM with Marie Aline Charles since 1997 show that in ten years obesity prevalence increased from 12 to 18% in the most disadvantaged groups of people. At the same time, the prevalence of obesity in the most privileged households whose income was 4% versus 12% in 1997; contrary to the increase that we can observe in low income households, high income groups in France have a tendency to stabilise and even reduce obesity prevalence. There are considerable social differences. After the initial weight gain phase, the process enters into a phase of worsening and chronicity. This disease is linked to behaviour and environment and becomes a pathology of organs. How does this occur? There are profound alternations to the cellular biology of adipose tissue. The cells increase in volume but can also increase in number by recruiting preadipocytes which are then transformed into adipocytes. The biological pathways of this recruitment are extremely well knows; they depend in large part on elements produced by nutrients. They also depend on other factors most likely not related to diet. We thus go from the stage of hypertrophy to hyperplasia. Not only the number of cells increases and the vascularisation of tissues increases but there are also phenomena of inflammation around the adipose tissue which becomes fibrous. The adipose tissue becomes pathological, it loses its capacity of dialogue with other tissues and in particular with the brain: it modifies it signals to the brain and brain modifies its capacity to receive the signals from adipose tissue. The central nervous system becomes gradually resistant to signals which usually inform about the inflation of adipose tissue. A new state of equilibrium is established. The adipose tissue which is now diseases produces a certain number of substances which can contribute to the emergence of complications. For example estrogens, which will increase risk of endometrial cancer, substances such as cytokines which contribute to diabetes, hypertension of inflammatory diseases… We know
that asthma is twice as important in the case of obesity. Thus the tissue has become diseased and pathogenic. We understand that under these circumstances as a function of different stages described above the clinical situations are extremely variable: we cannot treat in the same way all patients because their individual situation is definitely variable with time. It is the schema of chronic diseases related to environment and behaviour. The chronic pathologies linked to behaviour and environment are evolving pathologies one must differentiate preventive approaches and therapeutic initiatives as a function of the stage of evolution. It is useful to consider among the complications of obesity hypertension, diabetes, dyslipidaemia and coronary heart disease. It is absolutely certain that obesity and in particular abdominal obesity is a vascular risk factor. Besides these metabolic and vascular complications, there are mechanical complications which are largely underestimated in the health system. The alterations of joints, gastroesophageal reflux, sleep troubles, respiratory problems, urinary incontinence and others are important. These mechanical complications can appear very early in young people who are rapidly 120 kg and who are carriers of sleep apnoea and mechanical complications at a very young age. Health services are preoccupied with knowing whether these children will become hypertensive in 20 years whereas in reality some mechanical complications can develop extremely early. I will not get into the question of cancer which will shall be discussed by Prof Elio Riboli. The risk of cancer linked to obesity has been completely underestimated for two reasons: first, because the population of obese persons was not very extensive, and then because longevity was reduced for cardiovascular reasons. The medical questions of obesity are becoming more and more complex and largely surpass diabetes and hypertension. The heart can be affected by a series of mechanisms. An obese person’s heart is not only sick with diabetes, hypertension, dyslipidaemia, insulin resistance, but a great deal of other factors that do not have direct links with cardiovascular diseases, but which aggravate the cardiovascular situation: inflammation, thromboembolic disease, chronic hypoxia, apnoeas, and so forth. Also of note are other major complications such as psychosocial complications linked to stigmatisation and discrimination and to consequences on income and social development, and iatrogenic complications: the medical system can have detrimental effects by always focusing on guilt-ridden and ineffective dietary restrictions. In conclusion, one must of course consider that during the initial phase, the process can be reversed by behavioural and social approaches and that at this
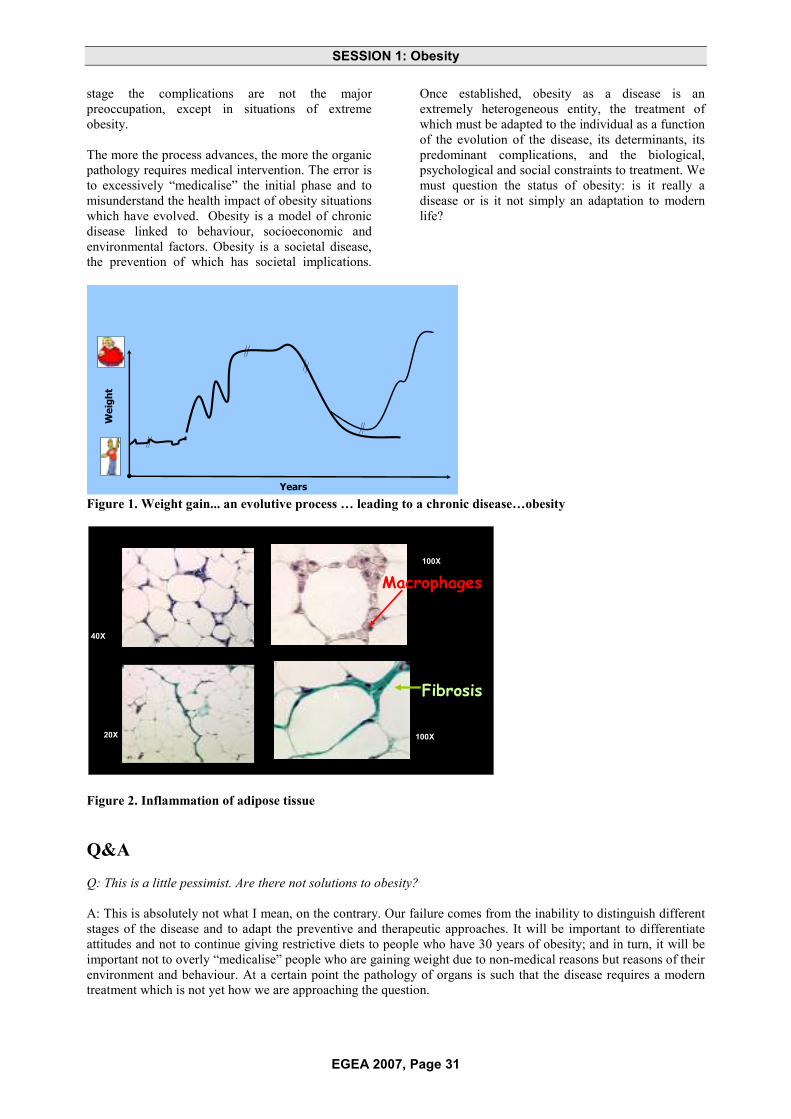
SESSION 1: Obesity
EGEA 2007, Page 31
stage the complications are not the major preoccupation, except in situations of extreme obesity. The more the process advances, the more the organic pathology requires medical intervention. The error is to excessively “medicalise” the initial phase and to misunderstand the health impact of obesity situations which have evolved. Obesity is a model of chronic disease linked to behaviour, socioeconomic and environmental factors. Obesity is a societal disease, the prevention of which has societal implications.
Once established, obesity as a disease is an extremely heterogeneous entity, the treatment of which must be adapted to the individual as a function of the evolution of the disease, its determinants, its predominant complications, and the biological, psychological and social constraints to treatment. We must question the status of obesity: is it really a disease or is it not simply an adaptation to modern life?
Wei
ght
Years
Figure 1. Weight gain... an evolutive process … leading to a chronic disease…obesity
Cancello et al Diabetes 2005
100X
100X20X
40X
A
A
Macrophages
Fibrosis
Figure 2. Inflammation of adipose tissue
Q&A Q: This is a little pessimist. Are there not solutions to obesity? A: This is absolutely not what I mean, on the contrary. Our failure comes from the inability to distinguish different stages of the disease and to adapt the preventive and therapeutic approaches. It will be important to differentiate attitudes and not to continue giving restrictive diets to people who have 30 years of obesity; and in turn, it will be important not to overly “medicalise” people who are gaining weight due to non-medical reasons but reasons of their environment and behaviour. At a certain point the pathology of organs is such that the disease requires a modern treatment which is not yet how we are approaching the question.

SESSION 1: Obesity
EGEA 2007, Page 32
Obesity-related diseases Elio RIBOLI
Head of the Division of Epidemiology, Imperial College London, London, UK
A. Basdevant’s presentation inspired a comment which I had not included in my slides. Why do we sometimes miss the evident points? Why have we waited until the late 1980s and the early 1990s to start taking seriously the link between obesity and cancer? This is interesting because the first studies on the link between obesity and cancer published in 1914 demonstrated that if we transplanted cancer in thin mice on a low caloric intake, these mice faired relatively well; whereas if we transplanted cancer in obese mice the tumour developed. In the 1940s there were a series of studies in rodents on the link between obesity and tumours; a series of experimental studies on the relation between obesity and cancer were published in Cancer Research. This exception series of studies were replicated a few years later demonstrating that if the rodents put on weight they developed more cancers ; with the same caloric intake but physical activity (using a wheel), they developed less cancers. These experiments with controlled caloric intake also showed that rodents in a cold room (where they expended more energy) developed less tumours than rodents in ambient temperature. In 1955 there were already experimental data showing that in mice and rate obesity is a factor which favours cancers combined with carcinogenic chemicals. In humans a large study done by Metropole Life Insurance on tens of thousands of subjects was published in 1938 and clearly showed that the mortality attributable to cancer increased in obese subjects. From the 1950s the focus of cancer research turned to the role of chemical substances, carcinogens and all factors were considered a waste of time. Thus we did not consider obesity in terms of cancer because for the following 20-30 years epidemiological studies were carried out without even recording the weight of study participants. And we cannot find what we do not look for. The IARC centre in Lyon had recalled words by Charles de Gaulle, that “we have found researchers who search; we are still searching for researchers who find”. Obesity, components of the metabolic syndrome and cancer I will present you some of the results here that come from the EPIC study but the results also that come from other studies. In two words, while we are in the best place possible to talk about EPIC because EPIC is a study that was supported by the program Europe Against Cancer set up by the public health program
of the European Commission which started in 1989, it has been a long story now. The idea was and is to look prospectively by collecting data on lifestyle including nutrition and physical activity and very detailed information on reproductive history and so on. And collecting biological samples from the original plan was 350,000 subjects and we ended up with 521,000. We collected blood samples and stored blood samples. This is a typical prospective study, it’s a lifetime engagement where you spend about a decade to collect the data and it’s obviously not a one man show. It requires a lot of collaboration. Antonia Trichopoulou was among the first to join the team and she knows how much work it takes to collect the data from tens of thousands of samples, to collect biological samples, to store them. Then to have the follow up, and once you have spent another several years of your professional life then finally you can look at what we would call the [sociological studies] where you link the probability or fact of getting a cancer with the baseline data. This is obviously a much stronger approach then going to the hospital and asking people who already have cancer about what they were doing twenty years before because of those difficulties. Sometimes it works, it was very clear for smoking. But for things like diet it is difficult to say now what we were eating twenty years ago. In the prospective study, you ask what people are doing now and then you follow up and you measure their diet repeatedly. We were the first large prospective study in the world to setup a Bio-bank. We have millions of samples stored. We are actually very, very actively using now studies from genetics and bio markers and hormones. I will now in the presentation touch some specific cancer for which the data on obesity and physical activity are more evident, here is more data and some conclusions could be reached. Whenever possible I will show this graphical presentation and then some results from it. This indicates the relative risk. You see there is a 1, 2, 3, 4. So when it is 1, it means that for the obese people versus the lean people there is no difference in the probability of having a colon cancer in relation to the body mass index. If it is higher then 1, it says that it is twice, three times as likely to develop colon cancer if you are obese and so on. Here is a table presenting the results of case control studies and they indicates that in all these studies, subjects were either in the fourth quartile or fifth quintile of the distribution compared to those who were in the lowest quintile, those who were clearly obese versus those who were lean have about 1.5 to 2 tomes or a 50% to 100% increase in the probability of getting colon cancer if you are obese. You will see that the first studies were published in

SESSION 1: Obesity
EGEA 2007, Page 33
1988, so this was the turning point. Now we have just published in the Journal of National Cancer Institute the results from EPIC. What we are adding is that it is not only obesity but it is total body mass. It is something that happens early in life because height is associated with incidence of colon cancer and also breast cancer. This is not a discovery. It has been reported by other prospective studies recently and it is very intriguing from the point of view of the metabolism. You see in men, just being taller then 1,80, everything (else) has been equal, coming from the same population, having the same diet, smoking, drinking, and so on, is associated with a 30% increase. “Adjusted” means that it has been adjusted for all possible confounding factors. The same is seen in women where the association with the height is even stronger. That tells us that something extremely important that happens before age 20 has a long lasting imprinting effect on the cancer process. When we looked at obesity through BMI, we looked at men, and we found what we expected to find, just a linear increase up to 1.6, 1.5 exactly like the other studies. Most of the studies published before EPIC found that the association was stronger in men then in women. That remained a little a mystery. Why there is a stronger association of obesity in men then in women, in all populations, North America, Europe and Sweden. But I think that we found why and this is why that the paper was published on JNCI is that if we stratify women by if they take hormone replacement therapy or not, you will find that the women who do not take HRT there is exactly like in men a linear increase in the risk of developing colon cancer. But in the women who take HRT there is no association. The combination of oestrogen with progesterone that constitutes hormonal replacement therapy after menopause must completely effect of obesity. And depending on the proportion or prevalence of women taking HRT you may or may not see the association among women. This is quite important because there is an interesting observation that the use of HRT with a slight reduction of colon cancer. There is a complex story there that says we know enough but we do not know everything. We know enough to say that for colon cancer, both case control studies show the association with obesity, that the association with the overweight is approximately linear even for a BMI between 23 and 30, will increase the risk from 25% to 50% and we have found out now why apparently it was different in men and women. A similar relationship is seen for colon adenomas which is very important because it says that the association is probably influencing the entire process from normal mucous in the colon to adenomas that are precursors of cancer. Breast cancer becomes even more complex and interesting. It is quite clear, breast cancer after menopause is clearly associated with obesity, there is about a 50% increase in overweight, obese women with a BMI above 30 or 32. Here as well there were
some intriguing discordant results in epidemiology and something that was first reported by the Harvard cohorts was immediately replicated in EPIC and we showed that yes like for colon we find a clear association between: this is the risk of becoming obese among women who do not take hormone replacement therapy; this is the risk of developing breast cancer if women take HRT. That says that lean women who take HRT double their risk of breast cancer, obese women increase it a little and for very obese women it has no effect. Again it says that the HRT increases the risk of breast cancer but masks the effect of obesity. There is a possible explanation, taking oestrogen orally, oestrogen goes to the liver and stimulates the production of sex hormone binding globally that is a globule that links in active form with estrogens. So paradoxically taking estrogens would for us reduce the viability of endogenously produced estrogens. This is just a hypothesis. We also confirm that even more then obesity there is a weight gain that is associated linearly with the risk of developing breast cancer. This is how many kilograms have been gained in weight between age 20 and the age at which cancer developed, typically 40 to 60. So it goes up by about 50%.
0,0
0,5
1,0
1,5
2,0
2,5
3,0
3,5
+/-2 kg 2-15 kg >15 kg
no
yes
Rel
ativ
eR
isk
Weight gain (kg)
Currenthormone use
3.06
2.50 2.67
1.001.20
1.49
Ref
eren
ceBreast cancer risk and weight gain
between age 18 and age 40-60, by HRT use
We have also done a metabolic study trying to understand which hormones are changed with obesity and we have done this study in 1171 subjects from EPIC. And we have found a very impressive relationship. This is BMI and this is the concentration of [oestrogen] and as you see it goes up absolutely linearly, it looks almost fake. This is the sex hormone binding globally and this decreases with obesity and this has a critical role in all hormone metabolism particularly in women because oestrogen’s and androgens in an inactive form so that 0.5, 1, 1.5 of estrogens are free to act on the target organs say the breast.. So if there are more sex hormones binding globally there is less free estrogens and if there is less estrogens there is less stimulation to the breast tissue. It is very important to know that the main regulator of sex hormone binding globally in insulin. So the more you eat, the more you produce insulin, the more insulin you produce

SESSION 1: Obesity
EGEA 2007, Page 34
the less sex hormone binding globally. Conversely if you eat less you have less insulin and the liver will produce more sex hormone binding globally. So this is a mechanism by which obesity through insulin resistance stimulates more plasma insulin, stimulates more insulin like factors and stimulates reduction in sex hormone binding globally. Simultaneously there is an increased production of androgen by the ovary and the end result is that there are more free estrogens which we believe is the main cause, active agent that regulates and stimulates breast cancer in post menopause women. The relationship with breast cancer after menopause is quite clear and is strong and linear and is now considered in breast cancer after menopause. Unfortunately things are not so clear in breast cancer before menopause. We just published recently this paper from EPIC of breast cancer in pre menopausal women. This is a real nightmare that you would not like to have published in the newspapers, because what we find is that before menopause sex hormone binding globally has nothing to do with breast cancer. Estrogens have nothing to do with breast cancer. Apparently only androgens are associated with an increased risk of breast cancer. Progesterone is if anything a little protective. And this is the nightmare: we thought that sounds like obesity is not associated with breast cancer before menopause, it may be that there is something related to the metabolic system that paradoxically protects and we recently published the results using c-peptide which as you know is a marker of insulin production. We looked at the risk of developing breast cancer depending on age and depending on levels of c-peptide. So the black is the risk that goes up in women that are 60 or more, the blue and the yellow are the women that are around the menopause at the time of breast cancer incidence and the pink is the risk of developing breast cancer for increasing levels of c-peptide in women who are less than 50. So the puzzle is before age 50, women who are slightly overweight and insulin resistant have a 20% reduction in risk of breast cancer. We absolutely don’t know why. We cannot go and say that women should become overweight before 50 to prevent breast cancer. We have to try to understand why that condition is associated paradoxically with a reduction of breast cancer risk. Endometrial cancer was the only cancer that in the 70’s everyone was saying was associated with obesity. Clearly, because the Adipose tissue converts the androgens into estrogens through enzymes and the relative risk is huge. Here you see that we are one scale above, the relative risk is about 2 to 4. There is very strong evidence. Obesity is the main known cause of endometrial cancer in Europe. Adenocarcinoma of the oesophagus: probably if you are not familiar with cancer, just a reminder that the
oesophagus has two types of cancer. One is called the squamous carcinoma which is mainly due to tobacco and alcohol. When I started working on cancer epidemiology in the start of the 70’s, 90% or 95% of the cancers of the oesophagus were squamous carcinoma in Europe and were due to alcohol and tobacco. Now 60% of the cancers are Adenocarcinoma which was a rare variety and the Adenocarcinoma is basically linked to obesity. So people drink less, particularly men. Believe it or not in the southern Europe the consumption of alcohol was reduced by about 50% in the past 50 years. So men drink and smoke less, women smoke more depends where you are, but the end result is that there are less extreme drinkers and smokers compared to the 50’s.So the incidence of oesophageal cancer have been decreasing and is now increasing again because the adenocarcinoma that is the lower third of the oesophagus near the stomach and is mainly linked to reflux and is clearly associated with obesity. So that is a new disease that has started increasing in the United States first among white educated men overweight. And it has progressed as a new epidemic of cancer. Kidney cancer is strongly associated with obesity. It is obesity insulin resistance and diabetes are the only clearly identified factors for kidney cancer besides smoking. The association is quite strong, the relative risk is about 2 to 3 fold increased risk.
0
2
4
6
8
10
12
14
16
Fink
leet
al.(
1993
)H
iatt
etal
.(19
94)
Hia
ttet
al.(
1994
)H
eath
etal
.(19
97)
Hea
thet
al.(
1997
)C
how
etal
.(20
00)
McL
augh
linet
al.(
1984
)M
cLau
ghlin
etal
.(19
84)
Goo
dm
anet
al.(
1986
)G
oodm
anet
al.(
1986
)A
sale
tal.
(198
8)A
sale
tal.
(198
8)M
aclu
re&
Will
ett(
1990
)M
aclu
re&
Will
ett(
1990
)Ta
lam
inie
tal.
(199
0)M
cCre
dit&
Stew
art(
1992
)M
cCre
dit&
Stew
art(
1992
)M
cLau
ghlin
etal
.(19
92)
McL
augh
linet
al.(
1992
)B
enha
mou
etal
.(19
93)
Ben
ham
ouet
al.(
1993
)K
reig
eret
al.(
1993
)K
reig
eret
al.(
1993
)Li
ndbl
adet
al.(
1994
)Li
ndbl
adet
al.(
1994
)M
elle
mga
ard
etal
.(19
94)
Mel
lem
gaar
det
al.(
1994
)M
usca
teta
l.(1
994)
Mus
cate
tal.
(199
4)C
how
etal
.(19
96)
Cho
wet
al.(
1996
)B
oein
get
al.(
1997
)Yu
anet
al.(
1998
)Yu
anet
al.(
1998
)1
Rel
ativ
eris
k
Cohort Case-control studiesstudies
M
F
F
M
F
MF
F
M
MF
M F
M
F
M
F
M
F
M FM
F
M F M
F
FM
1
The good news is that physical activity can mitigate the effects of obesity in two ways. The first is keeping weight under control. The second because for the same BMI, people are physically active have a lower risk of developing a number of cancers. First of all colon cancers: now all the relative risks are below 1. So that basically says that if people are more physically active compared to those who have a sedentary lifestyle have a 20 to 40% reduction in the risk of developing colon cancer, 0,6 to 0,8. Colon cancer is the first cancer for which a relationship with physical activity was shown by studies conducted in Sweden. Everybody was laughing when this was first published in the mid 80s. Maria Diverdia was the first one to publish two consecutive

SESSION 1: Obesity
EGEA 2007, Page 35
studies showing the protective effect of physical activity. The other good news is that being physically active whatever is the age, pre-menopause, post-menopause does reduce the risk of breast cancer by a factor of 20% to 30%. Overall the effect of obesity alone is quite major. This is the proportion of cancer that was estimated in 2001 to be attributed to obesity. But this is going to increase because there are more obese people and because the relative risk was still somewhat underestimated. So anything between 10 and 40% of these cancers is related to the combination of obesity and sedentary lifestyle. Adiposity and inactivity appear to be the most important a cause for all these cancers. This is quite impressive; it comes from the Eurostat barometer, though I do not know to what extent it can be reliable. It shows the proportion of people when asked if the practice some physical activity they say no I am totally sedentary. It should be taken with a pinch of salt but it is quite astonishing to see the trend North to South. Either the question was totally misunderstood in the same way or it was correctly understood. It shows that clearly three years
ago there were substantial proportions, a third of the populations that declared themselves sedentary in southern Europe. Obesity we have heard from Philip James yesterday, so this is just a projection of where we are going with obesity based on current trends. This is made by WHO, Brazil, Australia , Mauritius, England, USA. Just to give an idea, by 2030, if there is no reversal of the trend the figures are astonishing. A projection is always interesting because not many people will be there in 2050 to see what happens so you can say whatever you want. The estimate is that there will be almost a doubling of people with diabetes worldwide only because of obesity. This is actually the conclusion that based on what we know we can already act and try to put together with politicians and administrators, public health people plans with clear targets in terms of BMI. We know that this is difficult; we know that this is not on voluntary basis, we know that we know changes in the society. But on the other hand there is probably still a lot that we do not know about the link between obesity and chronic diseases and we need to investigate. Thank you.
Q&A Q: I want to know if we are obese and then we lose weight, what is the risk? A: Good question, difficult answer. The big problem is that in the best epidemiological data we have nowadays are prospective cohort studies in Europe or North America or Japan. In the best prospective cohort studies we measured height, weight and waistline. We also measured waist, hip and seating height. And we measured weight 3, 4, 5 years later in a follow up. What happens is that in the general population, you have very few people who lose weight. So we are doing a study funded by the European Commission on determinants of weight gain but we have a ridiculously small number of people who reduced weight. So from observational studies given that people gain weight with age we cannot say what happens if they lose weight. There are a few studies in the United States among the Harvard cohort. They looked at women who lost weight. This is very complicated because to lose weight you must have been obese otherwise there is no point in losing weight. Again from a purely observational point of view, this is not an intervention, a clinical trial; it is difficult to disentangle the medical reason that forced a subject that convinced a subject to lose weight, from the consequences. The short answer is that as far as cancer is concerned we have very little data. Now based on other studies [M..] function, hypertension or changes in cholesterol and so on we have strong reasons to believe that losing weight is good. Q: You said that the determinants of cancer are very early in the life? A: Very early and very late, it is probably a lifetime process. It is interesting you see that for breast cancer obesity, overweight before age 40, actually doesn’t matter. Paradoxically women who were somewhat overweight at age 18 and did not gain weight are at lower risk of breast cancer than women who were very lean at age 18 and did not gain weight. So there is something very complicated, during menarche there is a short but acute phase of insulin resistance. So there are things that we do not know and this is why I was saying that we need more research there.

SESSION 1: Obesity
EGEA 2007, Page 36
Treatment of obesity: Place of the dietary recommendations in the global approach
Martine LAVILLE Professor of University, Endocrinology-Diabetology-Nutrition Department, Hopital E Herriot, Lyon, France
Professor Arnaud Basdevant showed us that if we intervene at late stages of obesity treatment becomes very difficult. This is why it is important to treat as early as possible. The classic approach to treatment takes into consideration the energy balance, weight gain linked to a lack of balance between intake and expenditure of energy. Today I will not speak to you about medical treatments such as surgery which is one of the options; I will limit myself to aspects of energy expenditure and dietary intake.
Can we treat obesity by increasing energy expenditure? This appears desirable, potentially easy. If we consider the composing elements of this energy expenditure it is striking that the largest part of daily energy expenditure is linked to our resting metabolism. This metabolism depends on our age, sex, lean body mass, thyroid functioning, genetic makeup and other individual factors. If we want for an obese person to increase resting metabolism, the best way is to increase lean body mass ; increase lean body mass generally implies increasing mass altogether because when we add adipose tissue we also take on lean mass. This is not necessarily the best path for treatment. Thermogenesis is a more minor parameter of energy expenditure; it is mainly linked to energy used for body heat. However in our general environments we tend to increase the heating to warm up or to cover up. The other aspect of thermogenesis is linked to diet and corresponds to energy expenditure related to the metabolism of food consumed. Here again if we could increase thermogenesis either by wearing less clothing – though in our environment we tend not to do this – or by eating more, and that is not the solution.
There remains physical activity, an important parameter. In fact in a sedentary person physical activity represents only a small amount of energy, 17% of the total energy expenditure for someone who uses 1800 kcals a day. Increasing physical activity by 300 kcals a day raises energy expenditure by 30%, but what must one do to attain this level? This corresponds to approximately one hour of cycling, at least one hour of fast walking, and as explained by Philip James yesterday, in a fixed environment it is true that one must make a considerable effort to be able to find one hour of daily physical activity. It is difficult for people who are not obese and so it is that much harder for those who are.
Another parameter became recently clear when it was elucidated by Levine who was interested in physical behaviour of people who report being sedentary. He compared the behaviour of thin
persons to those who were obese. In fact the sedentary thin persons still spend more time upright or walking without doing sports and far less time sitting than obese persons. This difference of behaviour explains a difference in energy expenditure to the order of 300 kcals. Unfortunately it is a difficult parameter to control and which corresponds to a considerable level of energy expenditure. Treating obesity by increasing energy expenditure is no so simple. Physical activity during sport is not the most important element of energy expenditure. It is certain that the environment is going to have to be altered in order to increase energy expenditure and this will be essential for prevention and for treatment of obesity, but it won’t be sufficient. Thus we are forced to also look at energy intake.
With regards to energy intake, the classic recommendations to lose weight are simple: one must reduce the quantity of calories consumed by reducing lipids (to 35% of total caloric intake) and by increasing complex sugars and the consumption of fruit and vegetables. Are these recommendations interesting? Are they based on evidence?
There are simple arguments namely to increase the consumption of fruit and vegetables, which is that fruit and vegetables are low in fat, high in water, fibre and thus have a low energy density. By increasing them in our diet we reduce the energy content thus mechanically reduce energy intake.
Studies have shown that high intake of fruit and vegetable can increase short term satiety, reduce hunger and thus reduce energy intake while remaining dietary volume. Moreover it is pleasant for us doctors to be able to give positive messages i.e. to increase fruit and vegetables instead of systematically forbidding fats, sugar and so forth. At the short term, this works well, theoretically. There are very few epidemiological studies focusing on the link between weight and fruit and vegetable consumption. Essentially we use studies carried out for other types of interventions such as cardiovascular disease prevention or cancer prevention, where fruit and vegetable counselling is provided. For example the Women’s Health Study is a large observational study spanning 12 years and including a large cohort. If we compare the number of women who most increased their intake of fruit and vegetable over the 12 years, it becomes clear when comparing to those who increased the least that they have a tendency to weight loss, though not very strong. These studies do not point to a significant reduction in weight from a high consumption of fruit

SESSION 1: Obesity
EGEA 2007, Page 37
and vegetables; the conclusion is that if the only advice is to increase fruit and vegetables without referring to the total energy intake there is no evidence for weight reduction. There are even some studies were encouragement was general and even included fruit juices. However in intervention studies where the goal is to reduce weight, if one of the directives is to increase fruit and vegetables, the rate of success is greater. This is exemplified by a study on families where at least one parent was obese and where at least one child was not. They were divided into two groups: the first group were asked to control their weight by increasing fruit and vegetables and reducing fat and sugar intake. The parents who followed the recommendation on fruit and vegetable increased their intake and in parallel reduced their fat intake and lost some weight. In children there is no reduction of weight in either group but perhaps one year of intervention was too short to draw conclusions.
If we consider the studies which have recommended to increase consumption of fruit and vegetables while reducing fats or total caloric intake, there are enough studies showing a reduction of weight or a maintenance of weight. Weight reduction is not always significant within the cohort, however in terms of subgroups we can see that those who have in effect consumed most fruit and vegetables are those who have lost the most weight. Thus the difficulty seems to be in the real application of recommendations on the increase of fruit and vegetables because in all of these long term studies there were no provisions as done in short term studies where fruit and vegetables were provided.
Obesity is a disease in itself but it is associated to many other complications: cancer, diabetes, and hypertension. Fruit and vegetables have a role on these complications. The famous DASH study showed the beneficial effect of diets rich in fruit and vegetables and low dairy products on arterial hypertension (Figure 1). In diabetes a study based on the Women’s Health Study cohort in which diabetes risk in women with high fruit and vegetable intakes was compared to those consuming less fruit and vegetables: the women consuming more had a significantly reduced risk of diabetes but when it was adjusted for weight the risk was no longer found. It seems that the prevention of diabetes obtained through fruit and vegetable consumption was linked to the effect of this consumption on weight. There are thus many arguments to support the thesis that there is an interest in recommending a greater consumption of fruit and vegetables in the treatment of obesity.
Is there perhaps a magic substance which could be isolated and replace fruit and vegetables? We already know that there are plenty of magical elements to fruit and vegetables such as vitamins, fibre, carotenoids and lycopene.
I would like to speak about other magical elements which have a role in body mass and metabolic aspects. I would like to speak to you first of all about osmotin. Osmotin is a protein found a great deal of plants.
Figure 1. FV are also efficient on Hypertension Source : Appel, NEJM 1997
It is a protective protein against mushroom attacks and it is found in fruit and vegetables and certain nuts. Osmotin is known to plan specialists and it has a structural analogy to adiponectin. It is a recently discovered hormone produced by adipose tissue and contrarily to other such hormones, it is a “good hormone” in that it is associated with a reduction of insulin reduction. Japanese specialists of adiponectin found in genes a structural similarity between the receptor of adiponectin and the receptor of plant osmotin. If osmotin is placed in front of adiponectin receptors it is capable of tying the adiponectin receptor and to affect it. If adiponectin is linked to receptors R1 and R2, it is capable of stimulating AMP-kinase in different tissues and to have extremely interesting effects at the metabolic level, such as increase the uptake of glucose by muscle and oxidation of lipids by the muscle and liver. It is thus potentially very interesting for the treatment of obesity and its metabolic complications. There remains the question of whether osmotin found in fruit and vegetables will be sufficient to confer the properties of adiponectin, but this is nonetheless an interesting area to examine.
Another interesting element is kaempferol, a flavonoid such as quercetin. It is found in many fruit and vegetables. It is capable of increase the consumption of oxygen (though these are at the moment in vitro studies on muscle cells). The mechanisms seem linked to an action on the desiodase 2 enzyme which is able to transform inactive T4 thyroid hormone into active T3 hormone with an increase in the expression of several mitochondrial genes such as CPT1 (allows oxidation of fatty acids CP3) and PGC1 Alpha (cofactor of extremely important genes in the control of mitochondrial activity).

SESSION 1: Obesity
EGEA 2007, Page 38
This substance is found in common fruit and vegetables and appears to have an extremely interesting metabolic potential. Of course these data which are in vitro and with high concentrations will have to be confirmed at more physiological doses. Finally, fruit and vegetables substances such as resveratrol have been demonstrated at very high doses to have a metabolic role. Mice treated with high fat diets will gain weight, but those on high fat diets and resveratrol will gain less. This resistance to weight gain is explained by an increase in energy expenditure of the mice when they are treated by resveratrol, by a mechanism implicating the activation of sirtuins and of PGC1 Alpha with in turn an increase in mitochondrial activity. These are only in vitro data with
pharmacological disease but it would seem that these may be magical elements of fruit and vegetables which are associated to several elements. There is still a lot to learn about the beneficial effects of fruit and vegetables. In conclusion, fruit and vegetables certainly have an interesting role in the battle against obesity. If we increase their consumption and at the same time reduce calorie intake it has a satiogenic effect and allows positive messages to be emitted. Also fruit and vegetables have specific effects on the complications of obesity. Finally fruit and vegetables are rich in elements which appear to have a great role in energy metabolism. There is thus a great deal to learn in this area of research.
Source: A prospective study of fruit and vegetable intake and the risk of type 2 diabetes in women. Diabetes care, 27(12).
Source: Epstein, LH et al, 2001. Increasing fruit and vegetable intake and decreasing fat and sugar intake in families at risk for childhood obesity. Obesity Research 9(3).
Q&A Q: I would like to ask you about osmotin: how much is the concentration in fruits and vegetables for this proteins and second, is it able to be digested or not? In other words, digestion is able to inactivate the protein. How much fruit is absorbed after a mixed meal in a human? Thank you very much. A: I am not a specialist of osmotin, but I know that it is digestible, I do not know exactly the concentration but I suppose it is rather low as adiponectin in human is at a very high concentration. That is the point. The activity in human is at a very high level mg/dl; if we have to increase, we need certainly to have a lot of osmotine. Q: Have certain studies shown that polyphenols can diminish the absorption of lipids? A: I don’t know. If you say it I believe you, but with which bioavailability, which concentration? I think when we isolate an element we find ourselves with the same questions but perhaps you have an answer.

SESSION 2: Fruit and vegetables
EGEA 2007, Page 39
The components of a healthy diet: comparison across the world Antonia TRICHOPOULOU
Associate Professor of Preventive Medicine and Nutrition, University of Athens, Athens, Greece
Mr. Chairman, dear colleagues and friends, I am happy to attend such an interesting Conference. I have been impressed by the presentations. And I am grateful to the organizers for giving me the opportunity to be here, to attend the Conference, and to present the topic “components of a healthy diet and comparisons across the world”. When I started preparing my presentation, I had difficulties conceptualizing comparisons between single dietary components of a healthy diet, because many authors, including ourselves, are inclined to believe that whole dietary patterns are more important than single foods with respect to health and disease. Several indices have been proposed, with the attempt to accommodate intake of foods and nutrients, variety, adequacy, balance as well as origin and cultural aspects. There are inherent problems, however, between the objectives of consolidation and analytic comparisons. A somewhat vague, but apparently effective, compromise has been reached by the Food and Agriculture Organization and the World Health Organization. They have postulated that a diet low in saturated fats, sugar, and salt, high in vegetable and fruits, together with regular physical activity, would reduce morbidity and mortality. Focusing on fruit and vegetables, and taking under consideration the recommendation of WHO that every adult should consume at least 400 grams of fruit and vegetables per day, we note that in Europe many persons do not meet those recommendations. Even in Greece, where we have the highest intake of fruit and vegetable, we have found that about 50% of the population does not consume the recommended quantity of these foods. In many other countries, this proportion is much higher. I certainly agree with Professor Drewnowski who stressed that we should concentrate on individuals or, at least, small groups, at documented or presumed high risk. We also need to clarify the differential health implications of the various food entities lumped together in the fruits and vegetables category. Are fresh fruits and vegetables more beneficial and, if so, for which diseases? Do fruit and vegetable juices promote obesity as suggested by Dr Laville? The consumption of juices is increasing in several
European countries, as is the consumption of processed fruits and vegetables. Is this really a welcome phenomenon? And then there is the issue of health claims. In order to be useful to the consumer, health claims should be directly associated with foods-provided, of course, that they are well documented. This requires nutrient profiling and some accounting of the fact that combinations of foods and vegetables can provide a whole spectrum of, say, anti-oxidants, that cannot be provided by any single food. The issue has also been considered by other speakers, who have pointed out that variety is an important issue in food recommendations. The need to assure variety underlines the importance of combinations that refer not only to various plant foods within the respective categories of vegetables, fruits and legumes, but also on balanced combination of the various food groups- with attention to avoid excess energy intake and preserve adequate levels of physical activity. We can look at the traditional Mediterranean pattern in this context. It is a dietary pattern that focuses on a plethora of plant foods, integrated through the ample consumption of olive oil, without exclusion of moderate intake of foods of animal origin, or consumption of wine, particularly during meals. Biomedical evidence, ecological studies and, in particular, analytical epidemiologic investigations (the results of which I had the opportunity to highlight) appear to converge in demonstrating the health promoting properties of the traditional Mediterranean diet. Unfortunately, this diet is becoming less prevalent in Mediterranean countries, as the evidence in support of its beneficial potential accumulates. No dietary pattern can claim universal applicability. Many Asian diets are rich in plant foods, low in saturated fats and, apparently, conducive to good health. Although health is the overriding priority, diet should also respect local traditions, aspects of the local economy and preservation of the environment. Proper diet is a prerequisite of a long and healthy life, but it is also an important component of our lifestyle and our traditions. Serving all objectives is not contradictory and may be mutually enhancing. Thank you very much for your attention.

SESSION 2: Fruit and vegetables
EGEA 2007, Page 40
0
50
100
150
200
250
300
GR IT ES PT FR DE LUX BE UK IE AT SE FI NO PL HU
Average daily availability of vegetables in the DAFNE countries, circa 1998 (quantity/person/day)*
Vegetables, fresh (g) Vegetables, processed (g) Vegertable juices (ml)
* In Poland the data were collected in 1988Source: The DAFNE databank
South Europe Central/North Europe East Europe
0
50
100
150
200
250
300
350
GR ES IT PT DE AT FI LUX NO BE IE FR UK SE HU PL
Average availability of fruit in the DAFNE countries, circa 1998 (quantity/person/day)*
Fruits, fresh (g) Fruits, processed (g) Fruit juices (ml)
South Europe Central/North Europe East Europe
* In Poland the data were collected in 1988 Source: The DAFNE databank
Q&A Q: Maybe I ask a question about the food part just to have your view. Actually, there are 2 views which are not mutually exclusive. One is to try to identify specific food components which may have an effect on health, for good or for bad. I don’t know a particular component. And then the other one is the kind of black box approach that we have discussed many times, that is the food pattern. Now, once you have identified the food pattern, you would still like to understand which are the foods in the food pattern that are important. What is your view on how you translate a food pattern? A: We have found out that it is the pattern which is associated with the reduction of mortality for many diseases. On the other hand, when we are looking to individual foods, we didn’t find strong associations(except, perhaps, for olive oil, meats and dairy products, and even then rather moderate associations). I think that in order to find an explanation, we have to focus on the combination, on the synergistic effects of the nutrients, including the micro-components which this diet provides. By analyzing especially traditional foods, we have been surprised by what they are offering on the micro-component level. They are mainly originating from vegetables, not so much from fruits.

SESSION 2: Fruit and vegetables
EGEA 2007, Page 41
Why F&V are considered healthy? Epidemiologic overview Elio RIBOLI on behalf of Teresa NORAT
Epidemiologist, Imperial College, London, UK
Unfortunately, Teresa Norat has not been able to come for a serious last minute problem. But Teresa sent the slides, so I’m going to present the slides and I hope you will bear with me. The presentation is a review on epidemiologic studies on the relationship between the consumption of fruit and vegetables and a number of chronic diseases.
First we will show the results of a metanalysis of prospective cohort studies that was published recently on the Journal of Nutrition, on the association between fruit and vegetables consumption and the risk of coronary heart diseases. The results consistently indicate that individuals with higher intakes of fruit and vegetables, and both fruit and vegetables combined, have a significant reduction of risk compared to individuals with lower levels of intake. Similar results were obtained using data from the Harvard cohorts, in health professional, in nurses, in a multi-centric study in women in United States, in the Alpha-Tocopherol Beta-Carotene study in Finland, the, and in other studies. Most of the studies are from North America. The relative risks estimated from observational studies indicate that there is a 20 to 40% for possible reduction of coronary heart disease risk.
A metanalysis of studies on stroke published in 2006 indicates that there is a protective effect of fruit and vegetable intake against the risk of stroke. There are 2 major type of stroke. In the ischemic stroke there is a formation of a thrombus and mechanistically is closer to myocardial infarction.
Hemorrhagic stroke is a break of the veins, and therefore a hemorrhagic invasion of destruction of the brain. Hemorrhagic stroke was more frequent in Japan where salt consumption was higher and hypertension was more frequent, but not arteriosclerosis. Studies in different countries indicate that there is a significant reduction in risk of both ischemic and hemorrhagic stroke associated with increasing consumption of fruit and vegetables. This is very important because stroke is a very serious disease that can be lethal or seriously limit physic and intellectual functions.
An analysis in the Nurses’ study that indicates that women who increased the consumption of fruit and vegetables during follow-up experienced a reduced weight gain over 10 or 15 years, independently of BMI at the beginning of the follow-up.
The EPIC Norfolk study in UK has shown that glycated haemoglobin, a marker of hyperglycemia is lower in people will consume fruit and vegetables 4 or more days per week compared to people with lower consumption of fruit and vegetables. High levels of glycated haemoglobin indicate that there is
not enough insulin, or there is too much insulin resistance to keep glucose glycaemia under control.
A study conducted in Iranian women in the town of Tehran, unique for the population looked at some components features of the metabolic syndrome in relation to the consumption of fruit and vegetables. This study showed that women who have high intake of fruit have a smaller waist circumference, lower level of triglycerides, lower levels of plasma glucose, and lower risk of hypertension. This is important for the debate that we had before about social class confounding.
There are countries where fruit and vegetable consumption are not associated with education or socioeconomic status. In some countries, consumption of fruit and vegetables is a local tradition, determined by availability. In southern Europe, fruit and vegetables is the food of the poor, and meat was the food of the rich. Meat consumption increased by 300% in Italy in the 60’s. So the study in Iranian women is particularly interesting because it’s unlikely to be confounded.
Plasma C-reactive is a specific marker of inflammation. It has been observed that higher intake of fruits and vegetables are significantly associated with lower level of C-reactive protein, both men and women, suggesting an anti-inflammatory effect of fruit and vegetables which may be pharmacologically plausible.
In the 90’s, scientists summarized the evidence linking nutrition and cancer, simultaneously in France, in United States, and the U.K. Based on the data available in those days, the three groups independently concluded that there was convincing evidence that consumption of fruits and vegetables was associated with a significant reduction of the risk of developing several cancers
The evidence indicated that the protective effect could be explained mainly by intake of green vegetables, cruciferous vegetables, tomato and citrus fruits. After 1997 we conducted a metanalysis of all the published epidemiologic studies for cancer of the mouth, pharynx, larynx and oesophagus and overall, there was a suggestion of a relative risk around 0.6-0.8, so significant protection, particularly related to consumption of fruit.
For cancer of the colour or rectum and stomach, the results from cohort and case control studies are less consistent This may suggest that either cohort studies, because they are referred to diet 10-15 years before, don’t focus the correct time period, or that case control study may have some bias, selection and recall bias. The protective effect is more apparent

SESSION 2: Fruit and vegetables
EGEA 2007, Page 42
from case control than cohort studies. This was published in the American Journal of Clinical Nutrition.
The EPIC study has taken advantage of the large variability in consumption that we have across Europe. In EPIC we have participants from Spain, Murcia, Turin, Italy, Florence, St. Sebastian, Spain, Granada, Varese (northern Italy), Sweden, Denmark, Copenhagen, UK general populations, UK vegetarians, Denmark, and Germany, The figure shows an impressive gradient, from 150 grams of fruits per day to more than 400 grams of fruit per day depending on the geographic region.
We have conducted several studies on fruit and vegetables, and the results have been mixed. Probably the strongest evidence we have is for colorectal cancer when we look at fibre as an index of consumption of fruit, vegetables, and cereals, and legumes. In the EPIC cohorts from Italy, Denmark, Sweden, cereals are by far the main source of fibre. In U.K. Healthy Conscious, U.K. Cambridge, the proportion is much lower. Women tend to consume more fruit and vegetables than men everywhere in Europe. (Figure 1)
There are several mechanisms to explain why fibre from fruit, vegetables, cereals, and legumes may be protective against colon cancer-related to the regulation of the function of the colon, the bacterial mass, the production of short-chain fatty acid, particularly butyrate, and a reduction in transit times.
So for all these reasons, there are good biological reasons to believe that natural fibres are good. We have shown that there is a decrease in the incidence of colorectal cancer associated to high fibre intake.
In the model after correction for imprecision in the measurement, if the half of the Europeans who eat less than 20 grams of fibre, would consume fibre as much as the other half of the European, we could reduce at least 30%, of colorectal cancer. In the same issue of Lancet, there was a parallel publication from a study done in United States on colorectal polyps that brings more support to this association. This study showed that high consumption of fruit, vegetables, cereals, and legumes prevents both polyps and the subsequent transformation of polyps to colorectal cancer.
We did not find an association between vegetable or fruit intake and prostate cancer. This was published in the International Journal of Cancer. We don’t find that consumption of fruit and vegetables has a measurable effect on the risk of developing prostate cancer. And similarly for breast cancer.
This study showing no relationship of fruit and vegetables with breast cancer risk was published in
the Journal of the American Medical Association. It was a debatable question, the issue of: is consumption of fruit and vegetables preventing breast cancer? And we found there was no difference in risk between low, medium, and high level of consumption.
So to protect against breast cancer, the focus should be on obesity and physical activity. Fruits and vegetables may be good, but once you adjust for physical activity and BMI, there is not a residual additional benefit that could be measured.
We observed a protective effect of fruit and vegetables on lung cancer in EPIC. The major, by far, greatest risk factor of lung cancer is tobacco. The protective effect of fruits was found after carefully adjusting for smoking. The association was not present in non-smokers. So it’s possible that for cancer of the respiratory tract, there maybe a 20-30% reduction in risk associated to high intake of fruits. There was no association with vegetables. There was no protection on the risk of developing cancer of the kidney, for which we observed a clear increased risk with obesity. We found a modest but not statistically significant protection of citrus fruits, approximately 20% risk reduction for stomach cancer, and no relationship with vegetables. We found a clear protection of total fruits for adenocarcinoma of the oesophagus. It appears that tobacco-related cancers are more likely to be protected by fruit and vegetables, in addition to colon.
Statistical models show that possibly are those individuals consuming very little fruit and vegetables that may be at increased risk of adenocarcinoma. This is consistent with a study in China where there was a higher incidence of squamous cell carcinoma of the oesophagus in non-smokers in a population with very low consumption of fruit and vegetables.
Fruit and vegetables are related to ovarian cancer in EPIC. We found an interesting protective effect associated with consumption of nuts and seeds, particularly in women and on colour cancer, but that needs confirmation.
The World Cancer Research Fund and American Institute for Cancer Research are now completing an overall global review of the entire epidemiologic evidence. This work has taken 4 years. In this figure we show the number of papers that were reviewed 10 years ago for the previous report and the number of articles that have been reviewed for each cancer site for the new report. The Second Global report will be presented to the public on the 2nd of November this year. This report will bring some new results, but will basically confirm that overall a balanced diet, including fruit and vegetables is good for health. Thank you for your attention.

SESSION 2: Fruit and vegetables
EGEA 2007, Page 43
Colorectal cancer and dietary fibre
Statistical model adjusted for : energy, height, weight, physical activity, alcohol and tobacco
0,2
0 ,4
0 ,6
0 ,8
1 ,0
10,0 15,0 20,0 25,0 30,0 35,0 40,0
fibre (g/day)
RR
est
ima
quintile s
orig inal
co rrec ted
S. Bingham et al. , The Lancet, May 21, 2003
Figure 1

SESSION 2: Fruit and vegetables
EGEA 2007, Page 44
Latest evidence on the health-promoting effects of F&V constituents Bernard WATZL
Acting Head, Institute of Nutritional Physiology, Head of the Nutritional Immunology Group, Federal Research Centre for Nutrition and Food, Karlsruhe, Germany
Thank you, Elio. I would also like to thank the organizers, especially Saida, for inviting me to this very interesting Conference. I will give you a short overview about the health-promoting effects of vegetables and fruits, also focusing on the active constituents in vegetables and fruits which may mediate these health-promoting effects. First, I would like to make a historical reference: one of my colleagues at our centre, a stamp collector, showed me some stamps, which you can see here. Please look carefully at the date. This is a letter stamped in Hamburg in 1931, and the other letter was stamped in Bremen in 1932. The German inscription “[Ess mehr Früchte und ihr bleibt gesund]”, means “Eat more fruits and you will stay healthy.” There are two issues here. First, marketing of fruit was already being practised 75 years ago. Second, either data about vegetables were scarce, or vegetables were so common that there was no need to try to increase their share of the market. In the last few decades, however, scientists have been able to present quite a large number of studies which clearly show that today vegetables as well as fruit should be marketed. Which brings us nicely to, one of the rationales for our meeting here today, namely to improve marketing and information about the health benefits of vegetables and fruits. The number of diseases which are associated with the intake of vegetables and fruits have been listed and intensively explained by the previous speaker. Diseases which have not been mentioned include osteoporosis, cataract formation, chronic obstructive pulmonary disease, and neural diseases. Accumulating data clearly show that fruits and vegetables also may be beneficial for the prevention of all these diseases. Here is a summary of what I think are all the health-promoting constituents to be found in fruits and vegetables. We have on one side, the very well-studied, well-known essential nutrients, such as vitamins, minerals, and trace elements. We know a lot about dietary fibre, and we have learned a lot about prebiotics during the last few years. On the other side we have a large list of phytochemicals. And it is on these that I would now like to focus. We have convincing data from the literature showing that these different chemical classes of constituents may affect significant physiological processes which are associated with disease prevention. I will focus on some of these chemical groups.
Then there are the different chemical groups. Some might be very familiar to you, while others might be quite unknown. Carotenoids have been very well-studied. The phytosterols are very popular and already there is a margarine, or rather there are several margarines and other products enriched with phytosterols on the market in Europe. If you consume a certain amount of these margarines and other products, you will significantly reduce your cholesterol level. However, there has not been much discussion about the saponines, another group which is associated with cereals and legumes, for example. Glucosinolates have been very well-studied. They occur in all the different varieties of cabbage and broccoli, and there are a number of studies showing clear anticarcinogenic activity for the different varieties of glucosinolates. Flavonoids are well-known phenolics. Protease inhibitors were formerly seen as negative constituents of plant food, but now we think a certain amount might also be beneficial to humans. Monoterpenes are all the flavour-producing compounds which we find in herbs or in citrus fruits. Phytoestrogens, mostly derived from soy beans and cereals, are also very popular. Finally there are the sulfides which occur in all the allium vegetables, i.e. garlic, onions, leek, etc. Different letters in Figure 1 (not shown) indicate the experimental evidence for a physiological effect in humans of these different chemical classes of phytochemicals. As you can see, for all these different groups, clear experimental evidence from both in vitro and animal studies, and even some data from human intervention studies, that these chemical groups can interfere with carcinogenesis - antibacterial effects, for example. It was not very popular to work on antibacterial effects until maybe 10 years ago. In the 1930s and ‘40s it had been very popular, but when antibiotics emerged researchers suddenly lost interest. The 1990s saw the publication of new studies showing, for example, that a high intake of cranberry juice can decrease the incidence of urinary tract infections, and several studies have been published in recent years supporting these effects. Antioxidative effects which have been very well-studied include antithrombotic effects, a strong effect of carotenoids and flavonoids on the immune system, anti-inflammatory effects, effects on blood pressure, on cholesterol level, and also on blood glucose concentrations. Now if you think about the chemistry and all the different chemical structures, you’ll see that phytochemicals are much more complicated than essential nutrients or vitamins. If you look at the high

SESSION 2: Fruit and vegetables
EGEA 2007, Page 45
and often unknown number of chemical structures, you get some feeling of how complicated it is to draw any conclusions about the occurrence, the metabolism, or the physiological effects of these phytochemicals. Take carotenoids for example - we know that more than 700 different structures have been identified in plants, overall. Fortunately, we have limited our selection of plant food to maybe 30-40 different plants, so we end up with 40-50 carotenoids which occur in food. We do not know how many saponines occur in plant food, but we do know that there are over 7,000 different structures of flavonoids. This should give you some idea of the complexity of chemical structures which occur in fruits and vegetables and other plant food. Phytochemicals which are currently being very intensively investigated due to their potential anticarcinogenic effects include carotenoids (lycopene), glucosinolates which you find in cabbage and broccoli (sulforaphane, indole carbinol), and sulfides which occur in garlic (diallyl sulfide). Other phytochemicals can be found in herbs and spices, for example curcumin. According to the National Cancer Institute of the USA there are more than 1,000 phytochemicals with anticarcinogenic activity.
Figure 1. Fruit consumption is associated with reduced risk of cancer (according to results of meta-analyses)
Next I want to show you the results of a recent animal study which we carried out at our centre. We investigated the potential of apple juice to prevent colon cancer using an animal model and chemically induced colon carcinogenesis. The animal diet was supplemented with regular apple juice. 99% of apple juice consumed has been clarified. Traditionally, however, apple juice was not clear, but cloudy, and so contained more constituents of the apple, including more pectin and also more of the complex polyphenols which are associated with these pectins. This cloudy variety of apple juice was given to another group of animals. We were interested in using early markers of colon carcinogenesis and therefore measured genotoxicity in colon epithelial cells, the capacity of coloncytes to proliferate, and pre-malignant lesions in the colon
called aberrant crypt foci. All the fluid these animals received was in the form of water (controls), clear apple juice, or cloudy apple juice. We used a chemical to induce colon carcinogenesis and after 7 weeks we sacrificed the animals. This slide shows the results for the 3 markers we measured, genotoxicity, hyperproliferation, and aberrant crypt foci formation. The supplementation with cloudy apple juice significantly reduced genotoxicity, hyperproliferation and aberrant crypt foci formation compared with the control. In contrast, the clear apple juice group did not differ from the control. So this study clearly shows that the way you process fruits, can affect their bioactivity. We are currently investigating which components in cloudy apple juice mediate this effect. These constituents are, obviously, very effective in interfering with the processes of colon carcinogenesis. In addition, we heard in the previous presentation about data from the EPIC study reporting an interaction between the intake of fibre and the risk of colon cancer. This is supportive of our animal data. We think that part of the beneficial effect of cloudy apple juice really comes from the pectin in apples. Next, I would like to switch to cardiovascular disease. We clearly see from epidemiological studies that with a higher intake of vegetables and fruit per day, there is a reduced risk of cardiovascular disease. There are several recently published studies which have looked at whether one can affect blood pressure by increasing the serving size or the number of servings of vegetables and fruit. The study shown here has educated a group of people about the beneficial effects of a higher intake of vegetables and fruit. After 6 months increased intake of vegetables and fruits (1.4 servings more), the systolic blood pressure decreased by 4, and the diastolic blood pressure decreased by 1.5. This does not sound like a very strong effect, but there are clear data available which allow us to deduce what it would mean with regard to risk of stroke and other cardiovascular diseases. A decrease in the systolic blood pressure by 4 to 5, over diastolic blood pressure by 2 to 3, results in a decrease in stroke or coronary heart disease risk of 10 to 20%. So this is clearly a very significant biological effect. Another recent animal study looked at the contribution of vegetables to the prevention of arteriosclerosis. This animal model clearly indicated that, compared to a control group which did not receive any vegetables, adding some vegetables reduced arteriosclerotic changes by 38 % as indicated by aortic cholesteryl esters. Another epidemiological study within EPIC suggests that increasing the intake of vegetables and fruits by 50 grams per day can reduce mortality from all causes, including cardiovascular disease, by 20%.

SESSION 2: Fruit and vegetables
EGEA 2007, Page 46
The interesting point for me was that this inverse association can also be seen if you look at plasma vitamin C concentration. The effect was linear and independent of various other factors. Importantly, dietary supplements, including vitamin C, were not associated with reduced risk. This could mean that vitamin C is a good indicator for vegetable and fruit intake, but is not the active constituent which mediates this beneficial effect. Clearly even a small increase in vegetable and fruit intake may have a large effect on disease risk. You have no doubt also heard something about the C-reactive protein (CRP). This is a nonspecific biochemical marker of inflammation which normally occurs in very high concentrations (100-1,000 mg per litre) in the blood when there is inflammation anywhere in the body. In the last few decades, however, it has become clear that with high sensitivity assays, scientists can differentiate between 1 mg in plasma, or 2 or 3 mg of CRP. This small difference correlates with an increased or decreased risk of cardiovascular disease. The risk was doubled here as you can see with plasma CRP concentrations of higher than 2.5 compared to those of below 1 mg/litre. There are also epidemiological data from colon cancer studies showing an inverse relation. Other epidemiological studies clearly show that fruit and vegetable intake, dietary fibre intake, and also intake of beta carotene, are inversely related to CRP concentrations. Until recently, however, there were no data available from human intervention studies. Next I would like to show you one intervention study carried out at our centre. We recruited 63 subjects and asked them not to eat more than 2 servings of fruit and vegetable per day for a period of 4 weeks. We had comparable conditions for all the 63 study subjects during the first 4 weeks, and then we split them into 3 groups. For an additional 4 week-period group 1 continued to receive 2 servings per day, the second group received 5, and a third group 8 servings/day. For example, this is a picture of the 2-servings group. Their vegetable intake on that day consisted of only one serving of peas. In contrast, the 8-servings group had a double portion of peas, a plate with salad, and as a dessert, one piece of fruit; all of which adds up to 4 servings for lunch. Figure 2 represents the plasma total carotenoid concentrations in the three groups. As you can see, we did not find significant changes in the 2-servings group over the 8-week period. However, in the 5-servings group, and more especially in the 8-servings group, we saw a significant increase in plasma total carotenoid concentrations. Here you see the changes in CRP. Subjects who continued after the first 4 weeks for another 4-week period with only 2 servings of
vegetables and fruit showed an increase in CRP concentration. In contrast, subjects whose intake increased from 2 to 8 servings had a lower CRP concentration, and this change was significant compared when with the 2-servings group.
Pla
sma
tota
lcar
oten
oids
(µM
/L)
0
1
2
3
4 BaselineWeek 4Week 8
*
*
2 Serv./d 5 Serv./d 8 Serv./d
Figure 2. Plasma total carotenoid concentrations Source: Watzl et al. Am J Clin Nutr 2005 * P < 0.01 vs. 2 servings/d
So clearly there is an effect of high intake of vegetables and fruits on these inflammatory processes, which are associated with the metabolic syndrome or with arteriosclerosis. We tried to correlate the CRP concentrations with the carotenoids which we measured in plasma, and we found significant inverse correlations only with beta-carotene and with alpha-carotene, but not with other carotenoids such as lycopene. Thus, only certain carotenoids may be beneficial in counteracting these inflammatory processes. Lastly, I would like to present a study related to the tomato. It has been suggested that tomatoes can decrease the risk of prostate cancer. Some studies have reported a lower incidence in subjects who have a high intake of tomato and lycopene. Last year I noticed that there was one product in British supermarkets which claimed to inhibit platelet aggregation. It belonged to the new generation of functional foods and included an extract from tomatoes. At the time the product was introduced to supermarkets, there were no scientific data supporting this health claim, but a recent report published in the American Journal of Chemical Nutrition presents data about the efficacy of this product. As you can see here, platelet aggregation in men and women was reduced compared to the control. This means that with the equivalent of 2 tomatoes one can achieve such an effect. An even stronger effect, at least in men, can be seen with the equivalent of 6 tomatoes. So clearly, there are components in vegetables such as the tomato which have effects which can be demonstrated in clinical studies. We currently do not know the active

SESSION 2: Fruit and vegetables
EGEA 2007, Page 47
compounds. Probably the effect is caused by a mixture of carotenoids, flavonoids, and other components which are not yet well-identified. So this clearly leaves a window open for a number of effects from vegetables and fruits constituents which are maybe still unknown. Time does not permit me to talk about all the mechanisms which underlie these health-promoting effects of vegetable and fruit constituents. I can only list these different mechanisms. There are extensive data available which clearly demonstrate how the different phytochemicals affect these different processes, such as the modulating phase I-/II enzyme activities which are important for detoxifying carcinogens. We know a lot about the importance of fibre for intestinal flora, and we know a lot about the different processes like cell differentiation and apoptosis proliferation which are involved in carcinogenesis. From our own studies and from others, we also know that these constituents affect the immune system in different ways. In conclusion we can say that the health-promoting effects of vegetables and fruits are due to their high nutrient density, coupled with low energy density, as we heard in the first presentation this morning. Fruits and vegetables are clearly excellent sources of folic acid, vitamin C, vitamin K, potassium - all well-known nutrients. Vegetables and fruits are also an excellent source of a large variety of non-nutritive constituents including phytochemicals, dietary fibre,
and prebiotics. Data are available which clearly demonstrate that there are physiological effects beyond those which can be induced by the essential nutrients. Clearly, all the vitamin studies were not as successful as those we saw earlier, which show that a high intake of vegetables and fruit are inversely related to disease risk. This is certainly not only related to the vitamins in vegetables and fruits. Vegetables and fruit constituents clearly impair the pathophysiological processes concomitant with obesity and its associated diseases. If you were to ask me what would be the appropriate recommendation regarding certain flavonoids, carotenoids, or phytoestrogens to enhance health and to prevent diseases, the answer would be ‘nobody knows’. Nobody knows which are the important phytochemicals or which are the appropriate intake levels. This is why we endorse the recommendation to consume at least 5 servings of vegetables and fruits per day. With my last picture, I would, again, like to make a small excursion into history. During my last summer vacation I paid a visit to one of EPIC centres in Spain. I found this picture in Oviedo in a local museum. As you can see, Eve is offering an apple to Adam, but if you look behind Adam, you will notice that he has a bag with a number of apples. At least he knew even then that it was not enough to have one apple a day: that you need at least 5 servings of vegetables and fruits per day. Thank you very much.
Q&A Q: We’ve also been working on this very difficult task of identifying food components that are specifically associated with cancer prevention, with prevention of cardiovascular disease. And it has been a long, tiring, and somewhat frustrating experience. In the EPIC study, we analyzed the 9 carotenoids in thousands of subjects, we analyzed 26 fatty acids in 10,000 subjects. We have done extensive analysis on vitamin C, now we are working on vitamin D. And still, when we see the results of intervention on the mouse trials, we are always disappointed because each time we find something that, we collectively in the field, that looks promising, when that substance is given in isolated form as a pill, most often doesn’t work. So what is your feeling, after many years of work? A: Well, my impression is that although we keep trying to find the magic bullet, there is actually no magic bullet. It is obviously the mixture which is important. This sounds very trivial, but my conclusion is that there is really no evidence to suggest that one substance, or only one group of phytochemicals such as phytoestrogens, are important. It is just not that simple. We clearly have to continue to isolate and identify compounds, to look at interactions and synergistic effects. There is still a long way to go. Q: With all these substances that are found, I mean, you mentioned more than 1,000. There must also be some negative effects. What is known about that? I mean, we’ve known solanine in potatoes, for example. I would believe there would be some that could be pro-carcinogenic. What is known? A: When I started to work on phytochemicals in the mid-80s, you only found information on toxicology in textbooks. The major literature focused on toxic effects. Most of this experimental data came from extreme dietary regimes which had been used in studies in which animals received only one type of food for months. So, for me, it is clear that the food which we use in Europe and all over the world, is food which has been selected throughout the evolution of human beings. These plants can be used safely as food. We know that certain plants have to be heated or treated by chemicals in order to be health-beneficial. Physical methods have been used to counteract the potential negative effects of some constituents. We have adapted the way we prepare food, and although there are still some

SESSION 2: Fruit and vegetables
EGEA 2007, Page 48
negative effects with saponines if they are present in too high concentrations, for example, the overall renewal of epithelial cells in the large intestinal tract is so great, and the amount of saponines which we absorb with some legumes so minute that we cannot measure any negative effects. Q: In a very recent paper dealing with the content of sulforaphane in broccoli--I don’t know if sulforaphane is the name—they were mentioning that the availability is influenced by the way of processing. And I think that, especially for vegetables, which they are not eaten all of them raw, but cooked, might be important also to consider the way of preparation. A: Yes, this is a very important point. After gaining all the information about the potential beneficial effects of these plant constituents, scientists are now investigating how food and processing technologies affect these phytochemicals. Now people are interested in looking at what happens when you prepare food. Do you increase bioavailability by cooking? How does heating change the chemical structure? Then, a lot of these compounds are associated with the outer layers of the plant materials. Do you eliminate these by removing the outer layers? There are many new questions which we have to answer.

SESSION 2: Fruit and vegetables
EGEA 2007, Page 49
Fruit and vegetables for health – WHO initiative to promote fruit and vegetables
Ursula TRÜBSWASSER World Health Organization, Regional Office for Europe, Nutrition and food security (NFS), Copenhagen, Denmark
Thank you very much. Dear ladies and gentlemen, I want to thank the organizers for inviting me to this Conference. I will speak about the WHO Initiative to promote fruit and vegetables.
First I want to give you an overview of the disease burden related to fruit and vegetable intake. I will show you some data on fruit and vegetables intake and the supply in Europe. Then I will show you some examples of national strategies on fruit and vegetable promotion and the strategies of the WHO. I will talk about the fruit and vegetable promotional initiative, the framework for promoting fruit and vegetables, and then the implementation and specific activities at the European level.
The following graph shows the death by broad cause. On the right-hand side, you can see the WHO European region, where a majority of the deaths are attributed to non-communicable diseases, which is shown in orange. Among the top 10 risk factors for deaths worldwide, 7 are related to diet or physical activity, namely blood pressure, cholesterol, underweight, fruit and vegetable intake, high body mass index, physical inactivity, and alcohol.
Low intake of fruit and vegetable is estimated to cause about 19% of gastrointestinal cancers, 31% is ischemic heart diseases, and 11% of strokes. So potentially 2.7 million deaths could be prevented, and 26.7 million DALYs could be gained with adequate fruit and vegetable intake. In 2003, a WHO/FAO consultation came up with a set of population dietary goals. The goal for fruit and vegetable intake was set at a minimum of 400 grams of fruit and vegetables per day.
I will compare this recommendation now with the actual intake in Europe. This data was taken from different surveys, applying different methodologies and also from different dates. It still gives an overall picture of the situation in Europe. We can see that most of the countries do not reach the recommendation of 400 grams per day. And the countries that are above the recommendation are mainly southern European countries.
Let us go a step further to the household level and look at the availability. This is data from the DAFNE Initiative on fruit availability. Here we can see that in the southern European countries, fresh fruit availability is a lot higher than in other European countries. Data on food supply is available from food balance sheets of the FAO databank. We can see that not even half of the countries reach the required theoretical supply of fruit and vegetables of 600 grams, which is needed in order to achieve an intake of 400 grams of fruit and vegetable per day.
And another important issue, is the price determinant. We know that price is a major driver for consumption. This picture shows the relation of cost and energy in fruit and vegetables. So the cost is a lot higher than the energy content of fruit and vegetables. Another example shows that, the same amount of calories from an apple is about 50 times higher from vegetable oil.
We made a survey in 2003 on fruit and vegetable policies, which we are currently updating, so we are looking at policy documents and also at specific programs to promote fruit and vegetables. I want to illustrate our findings along the different stages of the food supply chain.
National strategies on FV promotion
Diets of individuals
Availability in local settings
Food processing and retail
Agricultural production
• 28 countries have recommendations• 15 countries have • FV campaigns, such as 5/6 a day
• Russia: rooftop gardens, huge potential (2000t in one district)
• NL: Community supported agriculture:consumers directly support local growers
• Finland: farmers´ markets
•Norway: lower prices on FV
5 a day partnerships (eg. DK, Germany)
• School fruit schemes: UK, NL, Nor, DK• Fruit vending machines: Hungary• School gardens: Russia• Cooking classes: UK
At the individual level, we could see that 28 countries, out of the 35, that responded to the survey, have recommendations available that mention fruit and vegetable, either as portions (5 or 6), or in grams (400-600) per day. Fifteen countries stated to have specific fruit and vegetable campaigns such as 5- or 6-A-Day campaigns.
If we look at the availability at the local setting, we can find a number of activities, specifically in schools. There are a number of programs going on in workplaces and in schools there are, for example, school fruit schemes in place in the U.K., Netherlands, Norway, and Denmark. Hungary has introduced apple vending machines in schools and in Russia there are school gardens where the school children are educated to cultivate, harvest, and process the fruit and vegetables. There are also cooking classes, for example, in the United Kingdom. There are only a few countries that have mentioned the potential of introducing price regulations for fruit and vegetables. The Norwegian Action Plan from the National Nutrition Council stated specifically that prices of fruit and vegetable need to be reduced and exempted from the VAT.

SESSION 2: Fruit and vegetables
EGEA 2007, Page 50
An example for how to link food industry with the retail, are the 5-A-Day partnerships or platforms, such as the ones in Denmark, Germany, and many other countries. On the level of agricultural production, we could find only a small number of programs. In St. Petersburg for instance, there are rooftop gardens which have quite a huge potential to provide vegetables to the urban population. Another example from the Netherlands, is “community-supported agriculture”, where the consumer directly supports the farmers. In Finland, farmer’s markets are supported, and farmers get training in production, but also how promotion and distribution of fruit and vegetables.
So we can see that on the individual level, there are a lot of programmes and recommendations are widely available. And also in local settings there are many programs in place. But obviously, the link between the health sector and the agricultural sector is not so fully established in many countries.
WHO aims to fill this gap between health and agriculture. The Global Strategy on Diet, Physical Activity, and Heath which was adopted in 2004, clearly stated that national food and agricultural policies should be consistent with the protection and promotion of public health. Further, governments are encouraged to examine food and agricultural policy for the potential effect on health. Within the framework of the development of the Global Strategy, the Fruit and Vegetable Promotion Initiative was launched in 2003. This Initiative strengthened initiatives on the national and international level, which should be based on policies, programs, to promote increased supply of access to, and consumption of, fruit and vegetables. This meeting in Geneva also came up with a new research agenda. More information is needed on the relation between diet and health, as well on the determinants on the demand and the supply side and on the consumption of fruit and vegetable. This Initiative also clearly defined the role of WHO, which should be to foster the Initiative as part of the implementation of the Global Strategy and strengthen existing surveillance systems on non-communicable disease risk factors such as fruit and vegetables. The role of the FAO should be to promote fruit and vegetable consumption as part of food security programs, and programs for poverty alleviation, and also to maintain databases on fruit and vegetable production, distribution, and trade.
On the national level, fruit and vegetable programs should be integrated in national policies. They should be integrated and also based on food-based dietary guidelines, taking socioeconomic inequalities and food security issues into account. Within this Initiative, the first WHO joint WHO/FAO workshop was held in Japan in 2004 which had the aim to develop a framework to guide national initiatives on fruit and vegetable promotion. It provided the tool for the countries aiming to plan such an initiative.
Such an initiative should be based on the following guiding principles: availability, accessibility, affordability, acceptability and equity.
It should be based on a holistic, integrated approach, on sustainability, and taking marketing, and also creating awareness of fruit and vegetable, into account. This Initiative identified different types of consumer domains, such as rural small holders that produce their own fruit and vegetables; market-dependent consumers, living often urban or peri-urban areas, dependent on the cash economy; and institutional consumers related to schools, workplaces, hospitals or the military. There are different entry points and barriers on those three consumer domains. I just want to concentrate on the market-dependent consumer. One possible entry point could be the promotion of own-production, the creation and support of local markets, and collaboration with the commercial suppliers, retail and supermarkets. Possible barriers could be high prices of retail supermarkets and also changes in employment and lifestyle due to urbanization. There are different possibilities for national fruit and vegetable initiatives at the different stages of the food supply chain. First of all, there are different goals for the different stages. On the individual level, we want to change the knowledge, attitudes and behaviour in order to increase fruit and vegetable intake. We want to increase availability and affordability. At the stage of agricultural production stage, we want to increase and diversify fruit and vegetable production, quality, and safety.
There are also different actions to be taken to achieve these goals. On the individual level, educational tools addressing health benefits, cooking, and storage techniques, could be used, as well as mass media campaigns. On the local setting, schools are an important setting, where school gardens could be established, the supply of fruits and vegetables could be improved for instance through vending machines. And also classes in cooking and food skills could be included in the curriculum. In the area of catering, for example, the fruit and vegetable utilization should be increased. And the promotion of small scale production in urban areas could be an intervention at this stage.
In food processing and retail, it’s important to improve transport systems. Retail outlets are often outside towns which increases the socioeconomic inequalities. Another option could be to promote complementary distribution approaches to supermarkets to encourage them, for example, to stock from local produce.
At the level of agricultural production, it would be important to work with peri-urban small scale producers, and to improve the supply chain with appropriate technological innovations. Other actions could include the creation of local markets and

SESSION 2: Fruit and vegetables
EGEA 2007, Page 51
agricultural training on production, distribution and promotion of the products.
Possible national actions to promote FV
Diets of individuals
Availability in local settings
Food processing and retail
Agricultural production • Work with peri-urban small scale producers• Improve supply chain• Agricultural training
• Improve transport systems• Promote complementary distribution
approaches to supermarkets• Promote small scale production
• Schools: gardens, canteens, vending machines, cooking and food skills
• Increased FV utilization in catering• Promote small scale production
• Education on health benefits, cooking and storage techniques
• Mass media campaigns
Within this Fruit and Vegetable Initiative of the WHO, several workshops were organized to implement the framework in Member States and also to discuss the revision of past and ongoing activities to promote fruit and vegetables. One workshop has already been held in Portuguese-speaking countries in 2005. Another one took place in Latin America last year. And this year, another workshop is planned in African Francophone countries.
On the European level, the European Charter on Counteracting Obesity was adopted last year at the Ministerial Conference in Istanbul. This Charter clearly states that access to, and availability of healthy foods such as fruit and vegetables should be
ensured. And further, countries are urged to implement schemes to offer free fruit in schools.
As part of the implementation of the Charter on Counteracting Obesity, the 2nd European Action Plan for food and nutrition policies is being drafted. This Action Plan should go a step further than the Charter. It should propose a specific set of actions which the countries should consider. It will also make a strong focus on the supply side, addressing not only the responsibility of the individual but of the whole society. Specifically in the action area of ensuring safe healthy food supply, there will be a focus on actions on local horticulture to increase the availability at the local level. Food retail shops shall also be addressed through those actions, for example, through encouraging them to stock local produce. Another important area will be the food supply in public institutions and catering establishments. The issue of economic tools, should be considered and potential effects should be evaluated.
So to conclude, we need a population-wide environmental approach for fruit and vegetable initiatives, with an increased focus on availability and accessibility. Furthermore, it appears that in some countries the link between health and agricultural sector is not fully established. We need to improve this intersectoral collaboration and support Member States in the struggle of implementation by providing specific tools, such as the fruit and vegetable framework. Thank you.
Q&A
Q: Thank you very much for this very interesting talk and truly excellent plan with very laudable goals. I hope it will succeed. I notice you are supporting a number of initiatives in various places. And I wanted to ask what form the support will take. Is there a budget that’s been set aside to consolidate the support or to strengthen the support? How many resources will be put at the disposal of the WHO to make sure that the support is there to implement the goals?
A: We are developing tools together with different collaborating centres which we can use for our country work and try the different actions we are proposing. For example, on fruit and vegetables we are supporting initiatives on fruit and vegetable promotion in schools in some Member States. We will provide these tools to countries, but also conduct pilot projects to test them in specific countries. We definitely have a budget for such pilot projects and specific country work.
Q: You have a budget, now this is interesting important point because the European office has a key role in promoting this health initiatives. And do you develop this with some kind of collaboration with a European Commission or ways by which additional funds, over and above the budget of the [region] office that is generally not huge, are available?
A: We collaborate with the European Commission on different issues. The Ministerial Conference on counteracting obesity for instance was a joint initiative. And also in the process of the second action plan, we are involving the Commission and exchanging information on our activities. Further, we are involved in several EU projects which is a useful way to put our actions into practice.

SESSION 3: Fruit and vegetables and obesity: Potential mechanisms of prevention
EGEA 2007, Page 52
What do we know about the relationship between fruit and vegetable consumption and body weight (satiety, eating patterns)?
Heidi BLANCK Epidemiologist, Centers for Disease Control & Prevention, Atlanta, USA
Good afternoon. I would like to thank the organisers for inviting me to this beautiful city and such an important conference. Today I have been tasked with linking this morning’s issues of obesity and fruits and vegetables. So the objective today is to provide a scientific overview that would ensure connecting fruit and vegetables and bodyweight. Three components of this will be linking to energy density which you have heard about this morning as a concept. Looking at what the research tells us and I am thinking about the caveats if we put this in place or practice. When I think about energy density we tend to talk about that humans eat a constant volume of food. Volume is one of those aspects that help people to feel full, a sensory mechanical stimulation. Then feeling full helps humans stop eating. Fruits and vegetables are high in volume and low in energy. They can help us feel full while eating less energy. You probably experienced that during the breaks and during lunch. Regarding energy density, it was brought up this morning that the concept is the energy content in a given weight of food. We present this in our research findings usually as kilojoules per gram or calories per gram. Water and fibre add weight and volume to food and decrease energy density whereas fat increases the energy density. This concept is shown here with these [marks] to illustrate the density of the caloric energy density of food components. It’s a basic premise that is taught to many nutrition students but it’s been lost on many of our macronutrient aspects. Really here we show that fat is the most dense in energy having almost 38 kilojoules per gram. Then going down to fibre 6.3 to 10.5 and water really adding weight and volume but not adding energy. This just shows the effect of water content on energy density and when we will look across different snacks different options that people would have we see here that all these snacks have around 420 kilojoules or 100 calories. This is a small amount of jellybeans, a little bit more of a fat free pretzel, orange sections and this large amount of strawberries. So these are all options that people have but they can be really different in quantity based on the fibre and water that is in the food. The research that I am going to look at today really is the effects of satiety and satiation in intervention trials and then what we know from epidemiological studies. There were two reviews in 2004 by Barbara Rolls and colleagues and by Beth Carlton Tohill and
Barbara Rolls and I have augmented that literature from the current day. I am going to talk a little about satiety and the next speaker will as well when she talks about fibre but this is really the effect of food on subsequent hunger fullness and food intake. There have been many studies from the 70’s and 80’s and in the early 90’s Gustafsson looked at meals with added vegetables and he found that there was a threshold around 200grams where spinach and carrots when assessed at 200 minutes after eating were able to reach a high satiety. That’s one way of looking at satiety in the laboratory setting. Another is to look at what we would call a preload study and this is when individuals are given a first course. In America it is typical at a restaurant to be invited with a bread basket early on, but that for many of us is not an ample preload. Many times people order soup or a salad. Barbara Rolls and colleagues in 2006 looked at the research question, looking at two aspects of this, the volume of the first course can effect subsequent meal intake and energy density can effect subsequent meal intake. So they looked at the research question of whether both energy density and portion size for this first course could impact the main meal energy. So they took individuals and put them into 6 groupings of different types of salad. This was their preload and then they allowed individuals to eat as much pasta as they would like. What we have here is: the first column would be a low energy dense salad around 1.3 Kilojoules per gram, next medium: this 2.5 and the third set of salads would be high. To adjust the energy density the cheese and dressing were modified but they really tried to ensure palatability so that that would not be a factor. The top salads are 150grams and then down below we have a big salad at 300grams. When they allowed participants to then consume a pasta meal after eating these preloads they found that the lowest amount of total meal energy was consumed by the individuals who ate the large salad with the low energy density. These numbers in the flags represent that meal and overall meal energy density. So we can see that even though a salad having a pretty low amount of calories, if it is high energy dense and is large, these individuals actually overate and consumed over a 1000 kilojoules then those that ate a low energy dense salad that was large. So this shows both portion size and energy density affecting what people ate. Another topic separate from satiety is satiation and this really is defined here as the effect of food on the

SESSION 3: Fruit and vegetables and obesity: Potential mechanisms of prevention
EGEA 2007, Page 53
termination of eating within a meal. What I talked about before was about preload or first course. This is actually incorporating fruits or vegetables into the meal; so say a casserole, a soup, a lasagne where you are adding more shredded vegetables, broccoli, carrots and other components; A study by [Barbara Rolls and colleagues] in 1998 looked at two days and basically included fruits and vegetables in pastas and casseroles. This led to spontaneous decreases in energy intake, around 500 calories over the two days. So briefly regarding satiety and satiation, fruits and vegetables have been shown to increase satiety but this seems to be with a larger portion of about 200grams. Consumption of low energy dense foods such as a salad at the start of a meal can reduce overall meal energy intake. For low energy dense preloads the bigger portion or the bigger salad can lead to a bigger reduction in meal energy intake then smaller portions. If the palatability is similar increasing vegetables within a meal can lead to decreased energy intake due to a similar weight of food eaten. Moving on to what we know from clinical intervention trials or studies, we really look at three aspects. Those that looked at increased fruit and vegetables: those that want to increase fruits and vegetables and reduce fat: and those that want to increase fruit and vegetables that aid in weight management. This middle section was mainly for chronic disease and didn’t have an energy restriction aspect. When we looked at the studies that looked for just fruit and vegetable intake, there have been 4 studies and some of this was discussed this morning three of them showed weight maintenance but one actually did show weight gain. This was the Djuric study and it did allow for fried vegetables to be counted as the fruit and vegetable components. All 4 studies did encourage juice intake at some time in unlimited quantities. When we look at clinical studies that try to increase fruit and vegetable and decrease fat without advice about energy or weight loss there have been at least 17 studies and most showed weight maintenance or loss. But there was difference in advice adherence and really information on energy density of the diet. The next aspect is looking at advice to eat increased fruit and vegetables for weight control. To date there has been at least 8 trials found and there is a couple more posters out that I would like you to look at during the break that looked at weight loss or weight maintenance. In the 2004 review there are only 5 at the time that were included, including one by Fitzwater and now there have been a couple more. When we look at these intervention trials: one of the early studies was by Roland Weinsier’s group at the University of Alabama. This is what is now called the “Eat right” program and this was a focus on eating lower fat complex carbohydrates and
unlimited fruits and vegetables so it is more of an eating pattern then per se fruits and vegetables. It has 213 obese adults that were on an energy restricted diet and 7% of the subjects lost an average of 6.3 kilograms and after two years 3% of the subjects continued to lose weight for a mean weight loss of 8 kilograms. So this is basically showing that a dietary pattern with complex carbohydrates and fruits and vegetables could lead to weight loss and successful weight loss maintenance. Since that time another published paper came from that group last year by Green et al: it followed individuals again, 74 after one year on being on this “eat right” program, again it’s a low energy dense program, complex carbohydrates and fruits and vegetables. 64% were women, the subjects lost on the program an average of 4 kilograms. After 2.2 years the weight change was about .59 kilograms and 78% had gained less then 5% of their bodyweight back with 46% having no weight gain or weight loss. This is quite impressive when we look at the scale of people having weight gains. This is really successful weight loss maintenance. When they looked at their data they found that despite eating less energy the maintainers ate a similar amount of food, this resulted in a significantly lower energy dense pattern and some of this had to do with fruit and vegetable consumption. This is a study that’s in press from Barbara Rolls. This was looking at the concept of energy density from two different aspects. One was to have a reduced fat group. This was reducing fat intake and restricting portions. As we looked at the components of energy density we found it was one of those important components. But we know that eating fruits and vegetables that are high in water and fibre is another way to reduce energy density. So what we call here the “ED” group was to increase intake of high water, high fibre foods, vegetables fruits and soups and they were also asked to exercise portion control of the energy dense foods : the high fat foods and foods with low moisture content: pretzels and other things I showed earlier. This was a 12 month study. The individuals in this group were not told to count calories or count grams. This shows two phases. Phase one, the first 6 months and the second phase. On the Y axis here is the change in body weight in kilograms, the darker green line is the reduced fat group, the energy dense group with the greater emphasis on fruits and vegetables and water based soups in yellow. As you can see here, both groups were successful at losing weight but the energy dens group lost more weight. This was significant both at the 6 month and 12 month time period. They looked at the fat differences in these groups and they found that fat intake was actually similar, hunger and palatability was similar but the energy density did differ between the two groups, this was significant in the main group. Then we looked at intake of fruits and vegetables and you can

SESSION 3: Fruit and vegetables and obesity: Potential mechanisms of prevention
EGEA 2007, Page 54
see that looking at gram intakes of around that 400 most of the participants through and toward the end of that study were able to consume that 400 grams and this was highly significant compared to the group that was told to just reduce fat and reduce portion size. This is adjusted for the differences in the energy density at the baseline but it does exclude juices, and fried foods. Another study that Barbara Rolls et al has in the press currently in the American Journal of Clinical Nutrition is a large multi-centre study testing the influence of diet on blood pressure. This is similar to what was shown earlier with the Dash trial, but we call this the advanced Dash. The first group which is the comparison group received advice and educational session to think about factors affecting blood pressure and then there is both an established group and an established plus Dash. The weight loss goal was around 7 kilograms and there was a physical activity goal of about 180 minutes per week. There were also alcohol goals and sodium goals. The Established group dietary goal was to reduce food portion and energy. The Established plus Dash was to have 9 to 12 servings of fruits and vegetables per day. This is more in line with the American dietary guidelines for all Americans who are increasing beyond that 5 a day based on sex, age and physical activity. The Established group was also takings some low dairy products and a more restricted fat diet. When we look at this data: we have the Advice group which is more of a comparison, our Established and the Established plus Dash: you can see that over the course of the 6 months we have a decrease in total energy intake. The Established and Established plus Dash are significantly different to the Advice. The Established and Established plus Dash both lost between 5 and 6 kilograms. This was significantly more then the Advice group. When we look at energy density we can se also that the Established plus Dash had much more of a reduced energy density compared just to the reduced fat and Advice group. Then when we look at this aspect of food weight, how much food the individuals actually consumed the Dash group was significantly more then the Established group or Advice group. This goes into those positive messages about eating more. So you can be eating a larger volume of food, so you can greatly increase the adherence to this type of diet. What we have learned from the intervention trials, that many early studies do not specifically assess fruits and vegetables from the other dietary changes. The new studies have been able to separate out just fat from fat and fruits and vegetables. The new studies also show improved cardio vascular risk. I didn’t show it in the Dash study results slides but systolic blood pressure was improved in the
Established and Established plus Dash groups as well as many serum metabolic parameter levels as well as increased fibre and other dietary aspects. So we see from these studies you can improve the health aspects in addition to just weight. At least two studies have now shown in recent years, weight loss maintenance and this is definitely an area that is under research. We know that many people can lose weight but can they actually keep that weight loss. Next we move into epidemiological studies and my group at the CDC has been working with Barbara Rolls for the last 4 years really looking at these aspects. We house the surveillance for many of the US studies in our group and this is why we have collaborated with her. Some of the early studies had mixed findings when they looked at fruits and vegetables in free living populations and there were very mixed methodologies used. A couple of the recent studies have come out recently looking at energy and weight status. One of the is from a large cohort of 191,000 Americans, this includes at least 5 ethnic groups, Japanese Americans, Hispanic Americans, African Americans, Caucasian and Hawaiian Islanders and this mainly takes part both in the islands and in Los Angeles, California. What this study looked was both ethic and sex groups. What the found was that about 1 kilojoules gram higher energy density was associated with 1 kilogram per metre squared of BMI. This includes when they adjusted for physical activity and even after adjusted for fibre. When they looked back at what types of foods the people were eating really this increased fruits and vegetables pattern was associated with the lower BMI. Some of the studies from our other national surveys: the continuing survey of food intake in NHANES study our National Health and Nutrition Examination survey. Some of this data was shown this morning. This is when we tried to look at both the fat component and fruits and vegetables. So although the lowest energy density food pattern was when the individuals consumed over 9 fruits and vegetables this still holds up when you look at the stratification by high fat. So this is not what we call good or bad fat, the saturated fats, but in the American diet from the time this data was collected we know that there is not a lot of olive oil, there was a lot of the saturated fats. So you can see here, even in this high fat diet the energy density is about 1.41 and in a low fat diet with people up to 9 fruit and vegetables you have 1.22. This really shows that despite the fat, increasing fruits and vegetables in your eating pattern can really reduce the energy density and really increase the bulk and amount of food that you consume. This is shown as well, which on the axis here looks at the prevalence of obesity and you can

SESSION 3: Fruit and vegetables and obesity: Potential mechanisms of prevention
EGEA 2007, Page 55
see in these two groups that you have a reduction in the prevalence of obesity both in the high fat and low fat groups when individuals were consuming more then 9 fruits and vegetables. Really the middle group here are consuming 5 to 9 which is where most of our 5 a day messages have been. We really don’t see much difference to those in the less than 5 group. In our analysis as well we did exclude fried and dried food s as well as juice. So this energy density is based on food only. So the epidemiological studies of adults show associations between fruit and vegetable consumption and weight and between lower energy density. This caveat is that most of these are cross sectional and we are not looking at the prospective nature]. Both the sex and ethic groups seem to hold up for these patterns and again at that energy density a variety of eating patterns including the high fat can be lowered by adding fruits and vegetables.
02468
101214161820
<5 5 to 9 >9 <5 5 to 9 >9
BM
I≥30
(%)
High Fat (> 30%) Low Fat (≤ 30%)
1413
6
1817
9
aa
bc
abab
c
Fruit & vegetable servings/day
Figure 1. Epidemiologic Study: Food patterns defined by fruit, vegetable and fat intake: % obese Source: Ledikwe, Blanck, Khan et al. AJCN, 2006
When we think about applications of this to individuals we have to keep a few things in mind. One has to do with the form. There have been studies and some of them have pointed out when you look at the whole form versus juice, really the fibre aspects of eating a complete apple versus just the clear apple juice can really impact satiety. So we need to be specific when giving advice about the whole form versus fruit juices. Preparation methods can really increase the energy density, when we are talking about a sweet potato casserole with increased butter and cream, we are talking about casseroles with beans and cream soups. In the preparation or how people cook them, if they are not using good oils. I live in the south and the Body Mass Index map was show this morning and in
the region I live in many people cook their beans with Ham hock or other kind of fat. So really the preparation method and those traditional aspects need to brought in when we talk about increasing food and vegetable consumption. Then we talk about modifying favourite foods or substituting fruit and vegetables. This is an aspect of the education aspect. This slide shows a person making choices of low energy dense foods throughout the day and this one shows selection of high energy dense foods throughout the day. Each meal contains the same amount of calories, so 1575 kilocalories per day or about 6594 kilojoules. So you look at this group: this person is going to be full, this is a lot of fruits and vegetables, this is a chicken salad sandwich with increased nuts lettuce and grapes, a broth based soup, increasing the different fruits and vegetables that a person can make. So we can make modifications to our favourite foods. In America there are many slides where we show a hamburger to which we have added low fat cheese, we have added tomato, we have added lettuce. But maybe that is not moving far enough, maybe it really is getting people to substitute those high energy dense foods. So what we know from the literature really is that fruit and vegetables may aid in satiety, they help avoid feelings of depravation, so this really is a positive message about eating more. The intervention studies of low energy dense have looked at low fat and high fruit and vegetables and they show that they can lead to weight loss as well as weight loss maintenance. And our epidemiological studies in free living conditions show associations between low energy dense eating patterns mainly high fruits and vegetables but not based solely on fat and obesity prevalence. At our institution we develop what we call a research to practice series and so it is taking the scientific basis and turning it into different tools for practitioners. We have a piece that is mainly for our local health department, so it is for the physicians , the nurses, for the people out in the field to read something two pages long and really get the crux of the science behind it. We have created a tip and tool sheet for the local public. In addition to this there is a PowerPoint presentation and you can contact us and contact myself and you can probably take that PowerPoint and change it and make it practical for your populations. So we have a number of tools on our website that hopefully individuals in the audience could find helpful. Thank you.

SESSION 3: Fruit and vegetables and obesity: Potential mechanisms of prevention
EGEA 2007, Page 56
Q&A Q: Why is the Centre for Disease Control not making the advice not 5 a day but 9 a day then. Your evidence points to 9 a day not 5 a day. A: In February 2005 the US Department of Agriculture and Department of Health and Human Services came out with our dietary guidelines for all Americans and those really are what we would say are the 9 and up. But they are tailored for the individual. So someone who is sedentary and a female has a different cups or servings. But really 9 is really the minimum we are at. So our 5 a day program is really no longer…Our program is now called the National Fruit and Vegetable Program and we are partnering with programs for better health. Our new brand is “Fruits and Vegetables - more matters”. So we are really trying to push this “more” aspect. So really as to any data we collect from beyond 2005 will not be looking at just 5 a day. But as a nation one of our performance indicators is looking at consumption of at least 2 fruits and consumption of at least 3 vegetables. So that aspect for some of our surveillance will hang out to 2010. Q: That was a very good political answer but you didn’t answer my question. Is it yes or no, 9 or 5, which. A: I am a surveillance researcher and there are others in the audience from the United States who are working on and changing our farm bill and really trying to look at the Health and Agriculture on these aspects. Q: Very nice presentation. I would like to know if in any of the studies that you reported, has it been studied the change of taste appreciation for a food like Vegetable and Fruit for people who maintain the weight loss. I want to know if people who maintain the weight loss have also changed food preference. I mean the taste for Fruit and Vegetables has it been higher? A: That’s a very good question. In these studies that Barbara Rolls has conducted, I don’t think they looked at long term preferences. I know we have some anecdotal data looking at smoking changes with individuals and we know this] about better taste regarding young children through breast feeding and young introduction of foods changing their taste preferences. And we know from individuals who have stopped smoking that their palate and taste preferences change over time. In these studies I am not aware of weight loss and maintenance affecting them. Q: I have a question regarding vegetables. As a group, did you or somebody else differentiate between cooked and raw vegetables, if it makes a difference? A: No but some of the early studies that looked at satiety, which are in the Rolls review in 2004, specifically looked at cooked carrots versus none. There were some differences. It did look like the water content was some of that added benefit to the satiety. So there has been some of that small laboratory based studies that have tried to determine that.

SESSION 3: Fruit and vegetables and obesity: Potential mechanisms of prevention
EGEA 2007, Page 57
Dietary fibre and body weight regulation Maira BES-RASTROLLO
Epidemiologist, Dept. of Preventive Medicine and Public Health. University of Navarra, Pamplona, Spain
Good afternoon, First of all I would like to thank the organisers for their kind invitation to participate in this interesting conference. This is the outline that I am going to follow. And basically what I am going to talk about is how dietary fibre intake can regulate body weight. It is known that obesity has reached epidemic proportions around the world. It is one of the most important public problems of the public health. This slide represents the prevalence of obesity in adult females. As you can see, dark colours show higher prevalences. Europe hasn’t reached the prevalence of obesity compared to the United States. However, there are some countries in Europe such as Malta, England or Czech Republic with prevalences of obesity above 25%. Among adult males the numbers are lower, but the picture is still disappointing. The excess of body weight accounts for more than 1 million deaths per year in the European countries. So the question at this point is: How we can fight against obesity? The World Health Organisation in its report of 2002 pointed out as one of the key risk factors for the major chronic disease a reduction in the intakes of complex carbohydrates and dietary fibre. So, it is recommended that a minimum of 25 grams per day of dietary fibre and 400 grams per day of fruits and vegetables. Here, I would like to emphasize the exclusion of the tubers like potatoes in the category of vegetables. But what is exactly dietary fibre? Well, it’s a tricky question because the term of dietary fibre has no universally accepted definition. So, basically it refers to the carbohydrates which cannot be digested into simple sugar molecules. It was coined in the early 50’s by Hipsley referring to the non-digestible constituent from the plant cell wall. In the 70’s a group of authors included in the definition all indigestible plant polysaccharides. In the mid 80’s the Association of Official Analytical Chemists supported the first official method to quantify total dietary fibre. We can classify fibre into categories, soluble fibre and non soluble fibre. Soluble fibre produce a gel when is mixed with liquid while insoluble fibre does not. As a consequence of the definition fibre is present in all plants that are eaten for food including fruits, vegetables, grains and legumes. Therefore, the main sources of fibre are these categories of food.
We confirmed that these food items were the main sources of fibre in our Mediterranean cohort established in Spain, the SUN study. The SUN Study is a dynamic cohort of university graduates. The name SUN stands for the Spanish words “Seguimiento Universidad de Navarra” whose meaning is “Follow up University of Navarra”. It is based on the Nurses’ Health study and Health Professionals Follow-up Study models. As a dynamic cohort, we are still recruiting participants. Here it is written the participants that are included in the cohort so far. This slide represents the food items that explained the cumulative proportion variability of dietary fibre. As you can see, the major source of fibre was fruits and vegetables. Coming back to the idea of obesity, it is clear that obesity is a long term and sustained energy imbalance where energy intake exceeds energy expenditure. In this context, I am going to briefly describe the different mechanisms how dietary fibre can regulate body weight. All these mechanisms lead finally to a decrease in total energy intake. And, all of them are related to the gastro intestinal tract. So we can start with the mouth. A food rich in fibre due to its large bulk increases the chewing and the mastication. So, this effort and this time produce an increase in the satiation and so finally lead to a decrease in the energy intake. At the same time also it increases the secretion of saliva and gastric juice in the stomach. This results in a distension of the stomach producing an increase in the satiety. Again, we have finally a decrease in the energy intake. Also, the jell-like properties of the fibre normally produce a delay in gastric emptying and reduce intestinal absorption. This leads to a decrease in the postprandial glycaemia, so the insulin secretion was lower and again this produces and helps to increase the higher levels of satiety. In the colon, the fibre could be partially fermented by the anaerobic fermentation by the bacteria. This fermentation produces an increase in the short chain fatty acids that produce a decrease in the hepatic glucose and free fatty acid production. This improved insulin sensitivity producing again a decrease in the insulin secretion and an increase in the satiety. Another potential mechanism is that overall, absorption of fat and protein could be decreased, therefore, total energy intake could be lower. We should keep in mind that the fibre that has not been digested does not bring an additional energy intake. And finally, also another mechanism that leads to a decrease in the energy intake due to an increase in the satiety is the secretion of gut

SESSION 3: Fruit and vegetables and obesity: Potential mechanisms of prevention
EGEA 2007, Page 58
hormones, including the circulation of the cholecystokinine. So, all of these possible mechanisms could explain the reliable data from the epidemiological studies. First, the most basic epidemiological design comes from the ecological studies. The results from the Seven Countries study showed that dietary fibre was significantly associated with a lower subscapular skinfold. In fact, each additional gram of fibre was associated with minus 13 millimetres of the subscapular skinfold. What about prospective studies? Well, the results from the Cardia cohort showed that people with higher levels of fibre presented the lowest body weight after ten years of follow-up after adjusting for potential confounders. This association was found among white men and women and also among black men and women. When changing dietary fibre intake was assessed, these results have been presented similarly before by Professor Riboli. This represents the quintiles of change. The 5 quintile represents people who increase their dietary fibre intake while the first quintile represents people who in fact, decreased their fibre intake. So you can see that people who increased their fibre intake experienced the lowest weight gain during follow-up. Similar results were shown from the Health Professionals follow up study. Here again, the same as before, the linear trend was highly significant.
0.670.61
0.810.74
0.97
0
0.2
0.4
0.6
0.8
1
1.2
1.4
Q1 (ref) Q2 Q3 Q4 Q5
Energy-adjusted dietary fiber intake (quintiles)
Wei
ghtc
hang
e(k
g)(9
5%C
I)
Adjusted weight change during 28 month follow up
[Adjusted for age, gender, baseline weight, smoking, snacking, physical activity, fast-food consumption, sugar-sweetened soft drinks]
Figure 1. SUN Study (Europe) Source: unpublished
This slide represents our results from the Mediterranean cohort the SUN study. It is the first time that I present these results. Here, I represented the mean weight change in kg according to quintiles
of dietary fibre intake. As you can see, people with the highest levels of dietary fibre intake exhibited the lowest weight gain during follow-up. When dietary patterns were assessed, the results from the big Potsdam-EPIC cohort study showed that the high fibre dietary pattern was associated with a lower weight gain. This represents the mean adjusted weight gain in kg for the extreme quintiles. Howarth and colleagues in 2001 published a systematic review of clinical trials of healthy people in which changing body weight were compared to higher and lower fibre treatments matching them approximately for the same amount of food fat and the same amount of total energy intake. They found that for each additional 14 grams of dietary fibre the total energy intake was decreased by 10% and it was also associated with 1.9 kilos over almost 4 months of follow up (the average) for the 12 studies that the fibre was taken ad libitum. This graph represents the mean adjusted weight change in grams per day for both groups, the group with higher fibre consumption and the control group. As you can see, the association was statistically significant. We have also another source of fibre. We have the dietary fibre, but also we can use supplement fibre. Future research should address the question if both types of fibre produce the same effect. Howarth and colleagues conclude in the systematic review that I’ve just mentioned, that the beneficial effects of fibre on energy reduction was seen using foods naturally high in fibre and fibre supplements as well. In fact, they included both kinds of studies. However, 2 years later a pilot study suggested no effect for short term use of fermentable and non fermentable fibre supplements. In addition, one meta-analysis about the use of soluble fibre supplements reported that they are not effective for weight loss in short term randomized trials. As we can see here in the plot, the clinical trials using fibre supplements are represented, and here, the global association. The body weight reduction is just zero kilos. Based on these results it seems that the effects of dietary fibre are different to the effect of the fibre supplements. Also it could be that the protective effect from the long term prospective studies that I have shown before are based more on the different components of the food such for example the multitude of phytochemicals present in the fruit and vegetables other than the fibre alone. Finally in conclusion, the evidence is convincing that a high dietary fibre intake, associated with high fruit and vegetable consumption, helps to protect against obesity and weight gain. Thank you for your attention.

SESSION 3: Fruit and vegetables and obesity: Potential mechanisms of prevention
EGEA 2007, Page 59
Q&A Q: I am sure you read the Nature article at the end of last year which showed that obese people have a different intestinal flora compared to lean individuals. Do you think that the intake of fibres might be important for the metabolic activities for certain strains of bacteria? A: Yes, I think so, as we have seen the fermentation of the fibre have an effect on the colon and producing the fatty acids and then these produce a decrease in the hepatic glucose. So, definitively, yes. Q: A strange point was that the obese people had the intestinal flora which were much more efficient at extracting energy from the dietary material compared with the lean individuals or lean mice as it was demonstrated. So to me its not clear right now why obese individuals have more efficient capabilities to extract energy from intestinal material from fibre and not the lean individuals but I think nobody right now has an answer to this. Other questions? Q: Thank you for a very excellent talk. Your last slide indicated that high dietary fibre intake is associated with high fruit and vegetable intake. It is probably the case that people who eat fruit and vegetables eat a high fibre diet because they are also eating grains and cereals and so on which are very rich in fibre. Do you know in a high fibre diet how much of that fibre is actually contributed by the fruits and vegetables as opposed to the grains and cereals and so on? A: I know the results from our Spanish cohort and as I presented before the main sources of dietary fibre were the fruits and vegetables but it is true that grains have a very high content of fibre. However, in our cohort according to the frequency of consumption fruits and vegetables are the main sources of dietary fibre among the participants.

SESSION 3: Fruit and vegetables and obesity: Potential mechanisms of prevention
EGEA 2007, Page 60
Exercise alone is not enough: a healthy diet is also needed John BLUNDELL*
Professor of Psychobiology, Institute of Psychological Sciences, University of Leeds, UK
Physical activity and energy balance In the recently published European Charter on counteracting obesity, Item 2.4.8 stipulates that’ Action should be aimed at ensuring an optimal energy balance by stimulating a healthier diet and physical activity’. This recommendation specifically draws attention to the issue of energy balance, which demands an understanding of the interaction between physical activity and energy intake (EI). As described by Blundell and King (1999), this has both theoretical and practical implications. More than 40 years ago, the common sense view implied that ‘the regulation of food intake functions with such flexibility that an increase in energy output sue to exercise is automatically followed by an equivalent increase in caloric intake’ (Mayer et al, 1956 p169). Mayer went on the point out the fallacies inherent in such an attitude. Mayer’s own findings demonstrated that physical activity was not invariably coupled to EI, and even produced evidence that very low physical activity (sedentariness) was associated with a high EI. Today there is considerably more evidence that EI (food consumption) is only weakly coupled to exercise-induced metabolic activity (e.g. Blundell and King, 1998). Indeed this may be one example of a more general phenomenon indicating a weak relationship between metabolic variables and food intake or eating patterns. One possible reason for this is that EI cannot simply be considered as the self-administration of fuel. EI really means eating behaviour, and behaviour is shaped and driven by both biological (under the skin) and environmental (beyond the skin) variables as well as by mental events. Indeed, it can be noted in passing that while behaviour can represent between 20 to 60% of energy expenditure (EE), food intake (EI) is 100% behaviour. These behavioural patterns are held in place by environmental contingencies as well as by more obvious social and cultural influences. The importance of this perspective is that, once a pattern of behaviour is established, it can be maintained independently of many physiological events. In other words, there can be a lack of tight coupling between the behaviour that forms the basis for EI (eating), the behavioural vehicle for EE (physical activity) and the metabolism associated with EE. This loose coupling between EI and EE suggests that physical activity should be a good technique to bring about weight loss. However, the results of exercise trials are frequently disappointing. There may be a number of reasons why this is the case. For example, it is likely that many people make poor evaluations of the amount of energy that can be expended during exercise, and the amount that can be ingested during
eating. Indeed, a single bout of exercise can be considered relatively slow method of ‘removing’ energy from the system because the rate of EE (kcal/min) is low. Consequently the time spent exercising has to be significantly long in order to expend a meaningful amount of energy. For example to expend 600 kcal an individual with a VO2 max of 3L/min (medium fitness) would have to exercise for 60 minutes at approximately 75% VO2 max. Someone with a lower level of fitness may expend only 250 kcal for a 60 minute session of equivalent intensity. However, any individual (independent of fitness) could consume 600 kcal of food energy within a matter of minutes. Consequently there is a biological mismatch between the rates at which the body can ingest and expend energy. It is likely that most people are completely unaware of the energy values of either physical activity or food items, and therefore they fail to make the appropriate adjustments to both of these behaviours that are necessary to achieve a negative energy balance. This is one reason why exercise commonly fails to be a successful method of weight loss. More than 10 years ago we demonstrated the simple fact that the selection of high fat (high energy dense) foods after exercise could completely reverse the negative energy balance created by exercise (King and Blundell, 1995). Therefore, exercise should not be seen as providing permission to abandon any restraint over eating, or to indulge excessively on available foods. Indeed, exercise is most effective for weight control when combined with a low fat (high carbohydrate) diet. Compensation for energy expenditure Another reason why exercise may fail to produce a desired weight loss is because, over a longer period of time, the energy expenditure induces the onset of compensatory mechanisms that oppose the negative energy balance. There is considerable variability in the capacity of different individuals to demonstrate this adaptive response. Indeed it can be perceived that there is considerable variability in the weight loss responses to imposed exercise. This is apparent even though most studies that evaluate the effect of exercise report mean data and overlook individual variability. __________________________________________ *John Blundell1, Phillipa Caudwell1, Mark Hopkins2 and Neil King3.
1PsychoBiology Group, Institute of Psychological Sciences, University of Leeds, UK, 2Dept of Sport, Health, Leisure & Nutrition, Leeds Trinity and All Saints College, University of Leeds, and 3Institute of Health and Behavioural Innovation, Queensland University of Technology, Brisbane, Australia.

SESSION 3: Fruit and vegetables and obesity: Potential mechanisms of prevention
EGEA 2007, Page 61
Some of this variability is obviously due to a lack of compliance, and this is likely to be one reason why exercise often fails to produce an expected weight loss. However, it is very unlikely that a fixed dose of physical activity will produce the same effect in all individuals. Some will respond well to the exercise and will lose weight; these can be called the non-compensators. Others will fail to show the anticipated weight loss based on the amount of energy expended; these can be called compensators. These two types can also be referred to as being resistant or susceptible to weight loss. The concept of resistance and variability to weight gain has been discussed previously (18). The classic genetic studies conducted by Claude Bouchard were instrumental in identifying the variability in response to over-feeding interventions in twins (19). It has also been demonstrated that there is a large inter-individual variability in improvements in maximal aerobic capacity (VO2max) in responses to exercise interventions (20,21). Therefore, the phenomenon of variability in the VO2max response to exercise interventions, and variability in body weight to dietary interventions has been documented before. However, the phenomenon of variability in the changes in exercise-induced body weight has not been exposed fully. It is a relatively new concept to consider individuals who could be resistant or susceptible to exercise-induced weight loss. Some individuals will be predisposed to compensatory responses that render them resistant to the weight loss benefits theoretically associated with an exercise-induced increase in EE. The identification of such individuals would be helpful in devising appropriate treatment strategies. Recently, we have carried out a study to examine individual variability. (King et al, 2007). Participants were subjected to a 12 week exercise program that was individually designed to expend 500 kcal per session at approximately 70% HR max 5 days per week. The exercise sessions were carefully monitored to ensure that the exercise was completed as prescribed. Hence, any subsequent differences in weight loss observed at the end of 12 weeks could not be ascribed to a lack of compliance. Although the exercise was fixed, the participants were free to select their own diet and choose their own foods. Indeed this aspect of the study was one of the key variables we used to detect the nature of any adaptive responses. At the end of the study period there was a mean loss of body fat for the whole group of 3.7 kg. However there was considerable individual variability ranging from a loss of -9.5 kg to a gain of +2.6 kg. Since the amount of energy expended in exercise was known (because it had been measured), the amount of weight loss could be predicted. At the end of 12 weeks, by comparing the actual to the predicted
weight loss, it was possible to separate the participants into non-compensators – who had lost equal to, or more than the predicted weight loss; and compensators – who had lost less weight than predicted.
0
10
20
30
40
50
60
wk0 wk12Prop
ortio
nof
ener
gyde
rived
from
fat(
%)
GR PR
Figure 1. Weight loss response and consumption of fat
Interestingly, over the 12 week period, the compensators had offset the potential negative energy balance from the exercise by increasing their daily food intake, whilst the non-compensators actually reduced their daily food intake by a small amount. The two groups had also adjusted the pattern of eating and the selection of foods. The compensators significantly increased the amount of fat consumed, whilst the non-compensators did not. In addition the two groups altered their selection of fruits and vegetables so that, at the end of the 12 week period, there was a significant difference between the two groups, with the compensators eating a smaller amount of fruits and vegetables.
0
1
2
3
4
5
6
7
wk0 wk12Frui
tand
vege
tabl
epo
rtion
s(p
ortio
nspe
rda
y)
GR PR
Figure 2. Weight loss response and consumption of fruit and vegetables These results show that in response to a prescribed period of physical activity, not everyone responds in the same way. It is not a case of ‘one size fits all’. For some individuals the exercise generates physiological regulatory processes that oppose the negative energy balance. One consequence of the strong physiological regulation is that food intake is driven up together with the energy density of the diet. One effect of this is that the compensators start

SESSION 3: Fruit and vegetables and obesity: Potential mechanisms of prevention
EGEA 2007, Page 62
eating more high fat foods and fewer fruits and vegetables. It therefore follows that, for some individuals, exercise alone is not enough. For these people, who start to compensate through their food selection behaviour, it would be sufficient for them to maintain or increase their fruit and vegetable intake during the exercise period. It would not be necessary for them to eat less energy overall, but the selection of low energy dense fruits and vegetables would prevent the energy intake from creeping up. This is a good outcome because, for those individuals who compensate when undergoing physical activity (approximately 50%), and who can be regarded as resistant to weight loss, there is a very clear solution. References
Blundell JE, King NA. Effects of exercise on appetite control: loose coupling between energy expenditure and energy intake Int J Obes 1998;22:1-8. King NA, Blundell JE. High-fat foods overcome the energy expenditure due to exercise after cycling and running. Eur J Clin Nutr 1995;49:114-123 King NA, Hopkins M, Caudwell P, Stubbs RJ and Blundell JE (2007) Individual variability following 12 weeks of supervised exercise: identification and characterization of compensation for exercise induced weight loss. Int J Obes advance online publication 11 September 2007. Mayer J, Roy P and Mitra KP (1956) Relationship between caloric intake, body weight and physical work: studies in an industrial male population in West Bengal. Amer J Clin Nutr 4: 169 – 175.
Q&A Q: Is there any chance that some of that gain is due to muscle gain? A: Yes there is. In some of these people that actually gained weight, they did increase muscle mass, they did increase lean tissue. Which means that for some people exercise is actually anabolic, it’s making them eat more food and they are gaining more lean tissue. Their fat tissue does not change. That’s one explanation for some of those people who gained weight. It’s not the explanation for those people who lost very small amounts of weight. But you are certainly correct that there is a change in body composition for all and you would expect that after 12 weeks of exercise. It’s one of the benefits of doing exercise that body composition does change and that should help in energy balance. Q: Did you differentiate between the types of fat? A: The short answer is no we didn’t. In energy balance studies normally people regard all types of fat as having the same energetic value, 9kilocalories per gram. It would be possible to undertake a more refined analysis of the behaviour under free selection, to see whether or not people were using saturated fats foods or foods based on olive oil or vegetable fats. My guess is that the type of fat would not be a big predictor of food that was chosen. But I have been spectacularly wrong before so maybe don’t pay too much attention to my predictions. Q: I would like to know if you measure before entering the study the preferences in the subjects , because it could be that people who likes high fat maybe more resistant to change their feeding behaviour during the protocol. A: It’s a good question. We didn’t specifically measure their food preferences, or at least not in a form that I can easily recount here. We have measured their liking and wanting of foods at various stages. Of course we also have the dietary records ate the baseline at week zero so we know what their nutrients intakes are at week zero. I think there were no differences of nutrient intake at baseline. So I don’t think that can account for it but we will pay a bit more attention to that. Q: I have 2 questions. You mentioned that on the energy expenditure side we have 20% to 40% which we can modulate by increase in physical exercise. What happens to your basic metabolic rate if you start to exercise? This will also add to your energy expenditure overall. A: The 20% to 40% was just an example of how it could vary. In fact you could change it much more if you undertook a lot of physical activity and resting metabolic activity could change in two ways first of all physical activity could change the amount of lean tissue which would therefore contribute to more resting metabolic rate and that certainly happens. There could also be a direct effect of the exercise on daily measured metabolic energy. You have to do very intense and very long exercises to have a long lasting effect on your daily metabolic output, like running a marathon or playing a very serious game of rugby and then there is a post exercise oxygen change.

SESSION 3: Fruit and vegetables and obesity: Potential mechanisms of prevention
EGEA 2007, Page 63
Q: The second question is what I know from the literature that the imbalance is not a tremendous amount of calories that is taken up daily. It is more like 50 calories per day. If this is true then actually only need tour stairways which you have to use instead of the escalator, in order to keep your energy balance. Is that correct? A: It is theoretically correct that if you convert weight changes over a long period of time to change in energy balance in a day to day basis it may amount to between 50 and 100 calories. But that is not how our bodies or food consumption work. We don’t operate on the basis of miniscule measured quantities inside the energy balance system. So although that is theoretically how it can happen, on a day to day basis and on individual to individual, the intakes are going up and down by much greater amplitude. So this idea that we could change our energy balance just by making a small change in our behaviour, say failing to take an extra 2 or 3 vehicles worth of food to the mouth, in principle we could do that but the body could not monitor it and I don’t think people could actually sustain it, in the light of everything else that goes on in the energy budget. I think it is better to aim for something rather larger then to try to make a 50 calorie change per day. Having said that, every little helps. So I think taking the stairs instead of the escalator helps and I think health professionals should certainly do it because they set an example. If we do not do it we cannot expect our colleagues to do it. Q: Very beautiful lecture as usual. Thank you very much. I have a very personal question. I saw in one of the last slides you running. So my question is what do you say to yourself before running? Do you say this is good for my health or let’s go and have fun. What would you say in the same way to your patient? This is a fundamental. We know what to do to be healthy. The problem is to convince people to do. A: It’s a good question. People are individuals. And each person is not the best example for the person next to them because that person has a different physiology, different background. Not everybody can run long distances. I am fortunate that I can and more fortunate that I enjoy it on a day to day basis. I am the cause of constant irritation to my wife I should say because I run 3 or 4 times a week thirty miles. On the other days I walk to my office which is 40 minutes each way so I do exercise on every day of the week. And I eat a very judicious diet and I am not losing weight. This is what is required for me in order to prevent weight gain. My wife is extremely irritated by that of course because she does less exercise then I do and she eats more then I do and she wonders why her weight is going up in increments whereas mine is stable. So this is my way of answering your question, that everybody is different physiologically, they are different mentally as well. Many people regard me as a nutcase for doing this but we are different and it is certainly wrong of someone like me who certainly enjoys this sort of activity to impose that regime on others. People have to adapt their activity to their own capacity and in the study that I have spoken about that my colleagues have carried out they start very gently with overweight and obese subjects with a very small amount of exercise to get them used to it, build up, they can vary what they do if they feel they are injured they can take a rest and so on. So this is rather long and roundabout way of answering your question.

SESSION 4: The special case of children
EGEA 2007, Page 64
Childhood obesity: When and how to react? Marie-Laure FRELUT
Pediatrician, Saint Vincent de Paul Hospital, Paris, France
What are the reasons for particularly addressing obesity in childhood? Simply that childhood is an absolutely unique period in life during which obligatory and irreversible changes occur. Thus when obesity is established in childhood it has the probability of being associated with complications which are more serious, longer term and even more transferable to the next generations than when obesity is established later in life. Earlier we heard that there is a genetic basis to obesity: this is clearly not different in children. However it is important to note that in children it is a continuous phenomenon meaning a phenomenon that will begin in utero and continues until the end of growth. This is a true characteristic of childhood obesity in that if you want to prevent tobacco smoking you focus on the key age where children start to smoke; if you want to prevent obesity, you don’t have that choice because as early as conception, as early as life in utero, the risk factors can be aggravated. Thus the process begins in utero and it is effectively at this stage of growth that the genetic heritage of the parents will express itself as well as the complex phenomena of nutrigenomics: the dietary environment of the mother will modify not the genetic heritage itself but the expression the expression of that genetic heritage. A pregnant woman with a given genetic makeup and depending on whether she has a certain diet and a certain level of physical activity will give birth to a child with a more or less high risk of obesity or disease. Childhood is this a period of absolutely extraordinary dynamism, reflected in part by growth curves. Most precocious childhood obesity has to do with an absence of the regression of the development of fatty body mass. Everything occurs as if the children continued to develop at the maximal speed of the beginning of life. Thus this fundamental period reflects that the genetic heritage is at its highest level of expression that the adipose tissue is at its maximal phase of multiplication. Yet irreversible stages are also establishing themselves where the child learns a lifestyle according to its environment. At not other moment in life do these factors converge as powerfully so that they can become either factors of protection or factors of risk and of disaster. Very recently a French study began to study the impact on diet on early development in children. The findings at this stage demonstrate that if a woman is obese during her pregnancy there is nearly six times more risk of developing gestational diabetes; of course far greater risk of having complications at the moment of delivery, thus requiring a caesarean section; and also twice the risk of giving birth to an
overweight baby, which is referred to as a macrosomia in medicine. These overweight babies have themselves a risk of remaining overweight in childhood and in adulthood. The impact is evident even before the child has begun to feed him- or herself and have an independent life. Breastfeeding plays a protective role against obesity. Why is that? The mechanisms involved are probably much more complex than the simple different of composition between milks. It is probable that the protective effective of maternal milk which exceeds 20% and the effect of which stops after puberty, is linked in part to the composition of macronutrients in milk that is proteins, lipids, carbohydrates and linked to the quality of neuropeptides which are made from milk protein. When proteins are digested there are not immediately amino acids; there are intermediary substances called neuropeptides which are very powerful regulators of growth, behaviour and thus all of early childhood development. The question which is now on the table is that of the evolution of the composition of maternal milk because we know that in this milk the quality of fatty acids consumed by the mother will affect the development of adipose tissue of the child. Yet the mother’s diet varies and develops, the quality of fatty acids in the milk is changing and the question which is not answered is to know what is the impact of this change in quality. The question of the link between the environment of the child and the risk of obesity is important. We know from population studies on genetics that the role of the environment is dominant relative to genetic makeup. This environment can be broken down into three domains: first energy intake, i.e. what is consumed and what is expended, and then psychological factors and social factors which will modify the way a child eats or expends energy. The psychological and social factors are of course specific to childhood because the stages of development of a young child are not met again in life. Today there is increasing sedentary behaviour in children as well as problems related to diet composition. Sedentary behaviour is an indicator of lifestyle and a reflection of household socioeconomic status. Here is an illustration: in Europe there is a gradient in obesity in children with more obese children in the south than in the north. When we consider how children are physically active in

SESSION 4: The special case of children
EGEA 2007, Page 65
Europe, it becomes clear that in countries where children are thinner, children are more active with an average of 2 hours a day of a good level of exercise; in those countries where children are more overweight, they have an average of less than one hour of physical activity. But this link is verified at the level of the family as a function of the socioprofessional category of parents. In France it is clear that as early as 3 years of age and during all of childhood (we come back to this question of the continuous phenomenon) the parents’ socioprofessional category will influence the physical activity of children. As of 3 years of age, the higher the socioeconomic status of parents, the more children will be active. Another point to keep in mind is that as soon as children start becoming obese their physical activity diminishes. As of 4 years of age, obese children will begin moving less and this phenomenon will only increase with growth. What then of their diet and its impact since physical activity in children who normally like to play and be active is already in question? Here is a food pyramid which you all recognise. This pyramid has the merit of reminding us that there is a hierarchy is what we should be consuming and the proportions by food groups. If we now consider the price of foods the reflection which arises is that all that we should be consuming in large quantities, outside of cereals, will cost a great deal. As soon as infants are weaned and their diet becomes more diversified i.e. when they start learning about fruit and vegetables, there is in certain socioeconomic groups budgetary constraints which will mean that these children will not necessarily learn to eat fruit and vegetables at an age which is important to do so. Another extremely important element is that there are key ages in childhood for learning to eat a balanced diet. Before 3 years, if the child is no longer hungry, he will refuse to continue eating; beyond 3 years, he will eat to please and thus at this stage if he has not learned to eat in a varied way, if he hasn’t been exposed to different foods and if he feels pressure to eat the right proportions he may be on a dangerous path in terms of his nutrition. Remember this age, it is very important, it corresponds in many countries to the age where children are sent to kindergarten; these schools are also good opportunities (if they provide good and varied foods) to discover foods which are not served at home and to continue developing good eating habits. In an American study it was found that in young children (2-4 years), the lower the socioeconomic status, the higher the portion size served to children, the more narrow the choice of foods and the higher the energy intake of children. All of this has been said in different ways throughout the day but here it is demonstrated in very young children. Thus already
at a young age, socioeconomic status will determine the level of physical activity and also dietary habits. In France, between 1994 and 1999 we saw an evolution in the consumption of pastries, pizzas etc. It is striking in these data that the increase is enormous and also the parallel between children and adults (Figure 1).
Food items Adults Children Pastries + 90 % + 84 % Pizza, sandwiches + 87 % + 80 % Fruit juices + 4 % + 17 % Sodas + 17 % + 17 % Cakes 0 + 24 % Pasta and rice + 24 % + 32 %
Enquête INCA, Tec & DOC, 2000
Figure 1. Comparison of ASPCC (1994) and INCA (1999) surveys There is no doubt that children are thus the perfect imitators of their parents and other adults around them. Our responsibility as adults is fundamental because we have to lead by example. Childhood obesity is associated very early on to low consumption of fruit and vegetables; we have example through dietary surveys but we also have examples illustrates through low levels of plasma vitamin A, folic acid and vitamin C. This has consequences: you know that during obesity one of the greatest complications is liver disease with excessive fat to the liver. In France we like foie gras, but only in geese… What determines the aggravation of these hepatic conditions associated to cardiovascular disease with early onset hardening of the arteries? It is on the one hand the quantity of insulin secreted which is linked to the degree of obesity and it is also the consumption of folic acid from fruit and vegetables. 75% of very obese adolescents have well under the recommended nutritional intake. And this low level of folic acid consumption is in itself clearly correlated to liver disease. Thus children’s environment prompts them to buy and consume via several channels: advertising, vending machines and easy access foods e.g. in fast food outlets. Here Tim Lobstein talked about the number of ads presented per hour on television channels where in most countries the proportion of food ads is about 50%. Within our group of European paediatricians we asked ourselves what could be the pyramid of advertised food, compared to the recommended food pyramid. You have here the results from Poland which represent the number of hours advertised to the general public and not specifically to children and you can see that this is clearly not the ideal food pyramid.

SESSION 4: The special case of children
EGEA 2007, Page 66
If we now turn to what is happening in Italy on television programmes for children, you can see the total absence of advertising of any health foods such as fruit and vegetables. This is a real problem: advertising to children is strong and increases during the holidays. For this we have French data: the number of ads during the holidays was compared to non-holiday period and the former was far more intensive. What is the impact of these ads? Reasonably if advertising had no impact then it would not exist. A report by the American Academy of Sciences showed that children as young as 2 years old are affected by advertising, that the effect is cumulative and that a 2 year old will have an influence (50% of the time) on parental purchases in supermarkets. Moreover it has been demonstrated that obese children are even more sensitive than others to obesity. This raises a particular problem: the development of children. Children are aware of the stages of neuropsychological development which characteristically are based on trust; when a baby is born the first person with whom it is in contact is his mother and then little by little the circle of trust grows to the father, the rest of the family, friends, the school teacher and so froth. But the basis of this development is the absolute trust of the child in those who surround him and particularly in adults. Along with this absolute trust comes a capacity to criticise ones environment; this period is only established at the beginning of adolescence. Adolescence is characterised by the desire to remove oneself from the behaviours of the family and its habits. As of 12 years of age, the critical capacity authorises children to reject what is presented to them. Before 12, trust in the family environment takes precedent. This can induce large distortions in a family life if a child sees his parents allowing him to watch advertising, to not criticise, and at the same time to be opposed when the child asks to purchase something seen on television or the internet. Thus this behaviour means that children remain vulnerable for a long time. Must we prevent children from having access to the exterior world? Must we make them live in a world that is devoid of advertising, marketing and other environmental influences? No, probably not. Nevertheless if we consider the codes of consumption and the legal documents which exist in our countries it is clear that in order to protect consumers when we wish to sell them something we have to verify that the object is up to the standard that is advertised. This is the principle of veracity. The second principle vis-à-vis all consumers is that
we must verify that consumers understand the product and to take into consideration particular vulnerabilities. To my knowledge all legal texts stipulate that it is forbidden to abuse of vulnerable people. However law makers generally consider this vulnerability to be related to mental deficiencies, people who are elderly and ill, affected by diseases such as Alzheimer’s, and so forth. Law makers have not a priori included in their understanding of ‘vulnerable’ those who are vulnerable by nature: children represent the great majority of vulnerable persons. In reality, if we applied these legal texts which are destined to protect vulnerable people including children, then advertising to children would be entirely forbidden in our countries. This is not the case and we are trying to find new ways of circumventing these obstacles and imposing a certain amount of limits. This refers to public health laws; in France for example there are laws which forbid the sales of candies and ‘junk food’ based on the principle that children do not have nutritional need for such products. Other laws on consumer protection and on television regulation exist in different countries, for example in Sweden and United Kingdom. The problem is that Internet and satellite or cable channels circumvent this law. Thus these measures are at the moment insufficient in their coverage if we really want to protect children from detrimental environmental factors. What can we do to try and protect children? This is a long term process, from youth to young adulthood. Yet in many countries adulthood is at 18 years so an effective prevention strategy should target the first 18 years, according to the needs of each age group. Obviously a 2-year-old is not going to respond to the same messages as preadolescents. These measures of protection must be proportional to the environment in which children live. This includes children’s life circumstances, their nutrition, and access to fruit, vegetables and other healthy foods. The rhythm of children has to be taken into consideration. How much time is allocated to children’s physical activity, to games? Where can children play in safe environments? This is a great challenge, making obesity a specific subject because doctors are not the only ones to be able to address it. WHO has made enormous steps in this direction and I must say that we doctors have been relieved to see others are now involved in this battle in a constructive way. Thank you.
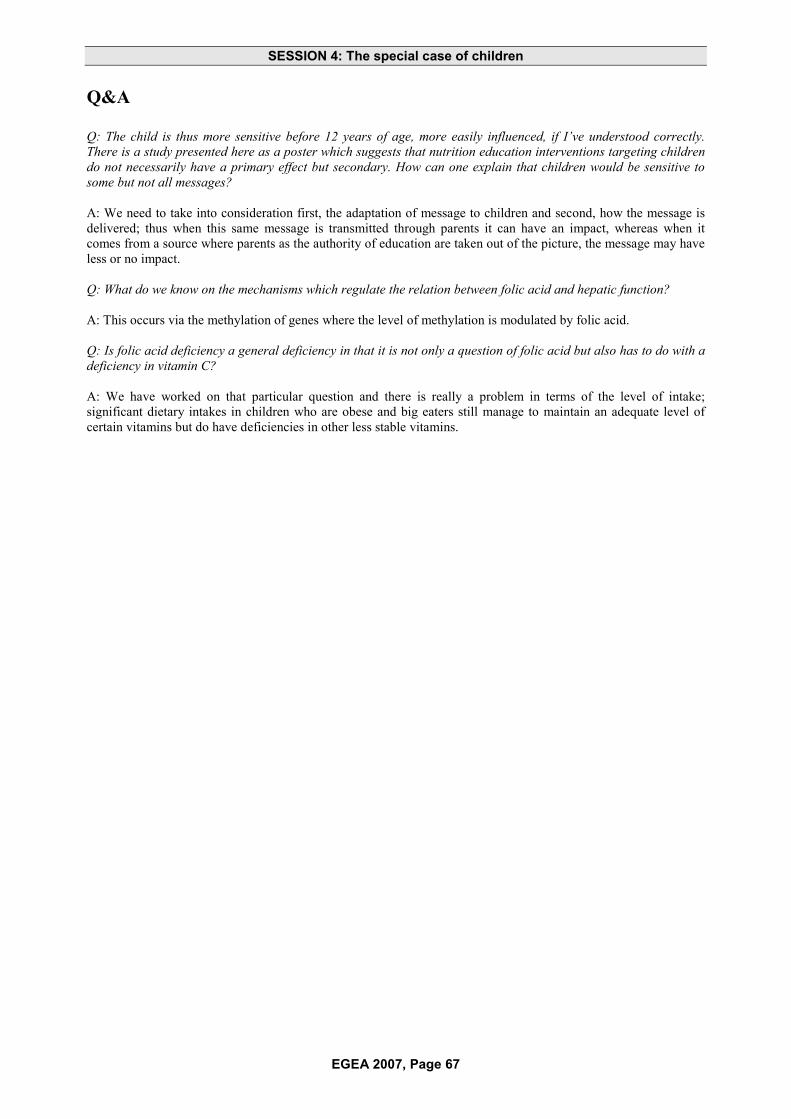
SESSION 4: The special case of children
EGEA 2007, Page 67
Q&A Q: The child is thus more sensitive before 12 years of age, more easily influenced, if I’ve understood correctly. There is a study presented here as a poster which suggests that nutrition education interventions targeting children do not necessarily have a primary effect but secondary. How can one explain that children would be sensitive to some but not all messages? A: We need to take into consideration first, the adaptation of message to children and second, how the message is delivered; thus when this same message is transmitted through parents it can have an impact, whereas when it comes from a source where parents as the authority of education are taken out of the picture, the message may have less or no impact. Q: What do we know on the mechanisms which regulate the relation between folic acid and hepatic function? A: This occurs via the methylation of genes where the level of methylation is modulated by folic acid. Q: Is folic acid deficiency a general deficiency in that it is not only a question of folic acid but also has to do with a deficiency in vitamin C? A: We have worked on that particular question and there is really a problem in terms of the level of intake; significant dietary intakes in children who are obese and big eaters still manage to maintain an adequate level of certain vitamins but do have deficiencies in other less stable vitamins.

SESSION 4: The special case of children
EGEA 2007, Page 68
Childhood obesity and the early metabolic process leading to atherosclerosis: a protective role of fruit and vegetable consumption
Claudio MAFFEIS Associate Professor of Paediatrics, Department of Mother & Child, University of Verona, Italy
First of all I would like to thank the organisers of this meeting who invited me to present this lecture. Three of the main reasons why we have to prevent to treat childhood obesity: The first reason is that the prevalence is continuously increasing. The second is that the persistence of obesity from childhood into adulthood is very high from 30% to 80% of children maintain overweight in adulthood. The third factor is the high rate of metabolic disturbance associated with childhood obesity. Interestingly in this study Oters demonstrated that exposition to overweight in early ages is able to promote a bad metabolic situation in adulthood. In fact in this study they showed that obese adults who were obese in childhood have threefold metabolic syndrome in adulthood in comparison to obese adults who were not obese in childhood. If we look at the end of all the metabolic disturbances associated with obesity we may find that in the vessels we may demonstrate the damage early in life. In this study they found that the flow dilation is significantly impaired and reduced in obese children. In the same way the Carotid artery thickness is significantly reduced in the same subjects. Therefore we have some functional studies which have demonstrated that the function of the vessel is reduced. In the same way this post mortem study demonstrated very clearly that the fatty streaks and the raised lesions were found in very young adults and that this kind of lesions were associated with the BMI of the individuals and interestingly in each of the different BMI categories the subjects that had the highest fatness had the worst lesions. Why do children start to have in their vessels this kind of damage associated with their exposition to obesity? We know that obesity is associated with insulin resistance and insulin resistance has association with the metabolic syndrome. But we also know that obesity promotes lipotoxicity which is a phenomenon by which we have an increase of triglyceride accumulation in several tissues, liver, skeleton muscle, pancreas and tissues. All these organs when they have an increase rate of triglycerides inside their cells promote also insulin resistance. But interestingly recent data have demonstrated that obesity is really an inflammatory disease and in fact there is an association between overweight and inflammation. Several studies have demonstrated that in children too we have an increase of cytokines production; we have also an increase of synthesis of acute reactance
and we also have an activation of inflammatory signalling pathways.
Figure 1. The association between obesity and inflammation
The National Health and Nutrition Examination Survey clearly demonstrated that there is a relationship between the numbers of metabolic abnormalities and C reactive protein in the circulation. The same study demonstrated also that subjects who have an abnormal risk factor have a low HDL or high blood pressure or high triglycerides or high waist circumference: these subjects have a significantly C reactive protein in their blood in comparison to the others. Therefore an inflammatory process has been demonstrated in the children. But what is the origin of this inflammatory process. Recently it was demonstrated that the adipose tissue is an endocrine organ but also this organ has the capacity to produce a very high number of cytokines. The cytokines have several actions also at a distance. A recent study we performed at our university was able to demonstrate that in the adipose tissue of overweight pre puberty children you may find some elementary lesion. So you have some area in the tissue in which you can demonstrate that there is an inflammation and in this area you can find microphages; you can find lymphocytes; you can find droplets of lipids. From these inflammatory lesions it is likely that microphages may produce and secrete a lot of cytokines who may exert their effect both locally and at a distance. In fact we know that the architectural organisation of the adipose tissue, which is organising cells but also there are some vessels and microphages is so close to that of the liver and in fact the deposition of that into the liver is the second step of the increased toxicity of excess adipose tissue in the body. Interestingly the functional unit that control key metabolic and

SESSION 4: The special case of children
EGEA 2007, Page 69
immune functions have evolved from common structures. In humans the adipose tissue, liver and haemopoyatic systems have maintained their developmental heritage which was shared in early organisms. Therefore common or overlapping pathways regulating both metabolic and immune function through common key regulatory molecules and signalling systems are likely. Therefore the regulation of metabolic and immune response may go together. This is the reason why, if we look at the development of the inflammatory markers and mediators production by the adipose cells we may say that the first phenomenon that is promoting the production of these inflammatory markers is the stress in the adipose cells. The increase of triglycerides in the cells stimulates stiromide production and the reactive oxygen spaces and also the stress of the endoplasma reticulos. All these factors promote an activation of JNK and IKK. This promotes a cascade in which the nuclear factor key is translocated and we have possibility to express the genes which are codifying for inflammatory markers and mediators. Therefore an accumulation of fat in the adipose cells may stimulate these kind of reactions but also it is able to impair insulin action the way. Several other factors outside the cells, for instance the increase of glycaemia or fatty acids in the cell circulation or also other chemokines or other inflammatory factors may promote the same kind of phenomenon. Interestingly we may see that this kind of activation of the immune cascade may also stimulate the endothelia adhesion molecules expression of the surface of the endothelium and this can promote the development of multiple sclerosis. If we look at nutrition and the association between nutrition and inflammatory complications of obesity we may start to look at this simple evidence. We know that if we reduce food intake and in this study it was demonstrated that in this group of subjects who were calorie restricted (and they were baselined one year after) demonstrated a significant reduction of all the cardiovascular factors in comparison to controls. So reducing food intake is able by itself to reduce all the cardiovascular factors. This study conducted in animals (this is a provocative one) demonstrated that if you changed the diet and make your diet more similar to our hunter-gatherer we may find that in this kind of diet by 2 mechanisms, the first is the reduction when this intake is associated with this kind of diet and also by the reduction of influence we are able to find a better metabolic profile. In fact in these animals they tried to compare the paleorithic diet with the cereal diet and they found that after a while they demonstrated that all the cardiovascular factors were reduced in the paleorithic diet. But that this is stressing the rule of diet composition. We said the reduction of energy intake is able to reduce inflammatory and cardiovascular metabolic risk factor. But also that diet composition may affect this kind of relationship. In fact in this
study which Sir James presented yesterday was conducted in the UK, the researchers were able to demonstrate that if you have a high fat diet, the high content of fat in your diet is able to stimulate a positive energy balance and a positive weight gain. On the contrary if you have a low fat diet, this kind of diet is able to promote a negative energy balance and a negative weight gain. It is not just fat that is important in the diet, it is also the composition of fat. In this study they tried to measure the relationship between polyunsaturated fatty acids and saturated fatty acids in a group of subjects divided into quartiles and they found that there is an inverse relationship between this ration and interlakin 6. Interlakin 6 is a pro inflammatory cytokine. So if we have a high polyunsaturated saturated fat ratio we have a higher interlakin 6 in your blood. If fat is important in nutrition the role of fibre is also very important. This is a very interesting long term study in the Finnish Diabetes Prevention study they tried to look at the effect of four different diets; one is low in fat and high in fibre; the other are low in fat , low in fibre and so on. In this they demonstrated that the first one , low in fat and high in fibre, is the diet that is able to reduce the risk of overweight and diabetes. In this green column you have the data adjusted for all confounders and also weight change. So the high fibre low fat diet is the best diet to prevent diabetes in this population. But there are several studies which try to look at the relationship between diet and cardiovascular risk factors and there is sclerosis risk and community study, the Bocalusa study, the Boyer cohort study, the coronary heart risk developing young adults study and the multiethnic study of atherosclerosis. All these studies clearly demonstrated that there is an association between a high intake of vegetable and fruit and a reduction of cardiovascular risk. If you look at intervention studies, this study demonstrated that if parents are advised to increase their fruit and vegetables consumption or if they are exposed a reduced level of fat and sugar in their diet, the first procedure, fruit and vegetables, was able to promote a significant weight loss compared to the subjects who were following the second diet. This is true in adults, but in their children this approach was not effective. In fact we have no difference in the overweight rate in this group of children. Our intervention is able to promote a reduction of overweight if we give an advice to increase the vegetable and fruit intake in the parents. This is not certainly effective in the same way in their children. It is important to change a little the strategy to change the nutrient behaviour in children. I would like to present to you this other study in which an interesting relationship was found between antioxidants in particular vitamin C and IGF1,

SESSION 4: The special case of children
EGEA 2007, Page 70
AGFBP3 concentrated in blood. Here you can see that IGF concentrations are higher, AGFBP3 are lower, or both are associated with reduced risk of heart disease, heart failure and heart disease mortality. Therefore this kind of relationship was clearly demonstrated and they tried to measure and they found that the total fruit and vegetable intake did relate significantly to a IGF1 or AGFBP3. But there is a positive dose response association with dietary vitamin C intake with IGF1 concentration. An inverse response association was found with vitamin C intake with concentration AGFBP3 in these subjects. My comment on this result is that the biological mechanism through which vitamin C from food by increasing IGF1 and decreasing AGFBP3 concentration are not known. This result is interesting for considering further studies in that direction. At the end of my talk I would like to underline a concept. This is the same group who demonstrated that there is damage in the vessels of obese children. You can see here obese children have lower flow mediated vessel dilation, but if these children underwent a 6 month exercise program, you can see they have an improvement of their vessel dilation in comparison to controls. Therefore exercise by itself is able to promote an increase and an improvement in
cardiovascular risk factor and in vessel function. The second point I would raise is that fat is correlated with total body fat and physical activity among 8 years old children in risk of obesity. Therefore if you increase your physical activity you reduce your adipose tissue and the adipose tissue associated to inflammation. Therefore exercise or physical activity is very important to control inflammation. In fact if you look at the healthy eating pattern proposed from Harvard University, you can see that the days of the healthy eating pattern you have daily exercise and weight control. Therefore exercise is not to be forgotten when you are facing the problem of obesity in children. We may conclude that low grade inflammation is common in obese children; consistent evidence of a link between inflation and adipose tissue, immune system and insulin resistance; that fruit and vegetables may contribute to reduce the inflammatory conditions associated with obesity and the mechanism by which fruit and vegetable may contribute to metabolic control needs further investigation. Thank you.
00
- 5- 5
00
55
1010
1515
11 22 33 4
fat balancefat balance
time (days)time (days)
- 10- 10
2020
5 6 7 00
- 5- 5
00
55
1010
1515
11 22 33 4
energy balanceenergy balance
time (days)time (days)
- 10- 10
2020
5 6 7
MJMJ MJMJ
high fathigh fat
medium fatmedium fat
low fatlow fat
Figure 2. Covert manipulation of dietary fat and energy density: effect on substrate flux and food intake in men eating ad libitum Source: Stubb RJ, et al. AJCN 1995; 62:316-29

SESSION 4: The special case of childhood
EGEA 2007, Page 71
Early childhood development of taste for F&V as the basis for liking and consumption in later life
Sylvie ISSANCHOU INRA (Institut National de la Recherche Agronomique), Dijon, France
First of all, I would like to thank the organising committee for inviting me to this interesting conference. In order for fruit and vegetables to be consumed on a regular basis, their sensory characteristics must be appreciated. My presentation will be on the appreciation of these products by children and the factors which can modulate their appreciation very early on in childhood. My presentation will complement that of Dr Frelut, by focusing on the importance of early childhood in sensory terms. To begin with I will present results from a study carried out by Sophie Nicklaus as part of thesis. Sophie has had access to a database provided by Dr Vincent Boggio who is a paediatrician in Dijon. He is responsible for the hospital nursery in which has been set up a system of self service for children aged between 2 and 3 years. These data have been collected for 17 years, an important database. In all 420 children were followed for an average of 110 meals each. The self service system was as follows: children could choose among 8 options comprised of 2 main dishes, two dairy products and bread, the absence of desserts was the nursery management’s choice. Sweetened foods were presented in the form of morning snack (fruit juice, fruit or cake) or a snack in the afternoon. In all over 200 food options were proposed to these children who thus had the possibility of choosing from a great variety of foods. The variables analysed are the number of times a child chooses each food and the variety of choice of each child. Figure 1 presents the average choices where foods have been grouped into 20 categories (those that are labelled are specified only for those concerning fruit and vegetables). The categories in red represent meats, fish and eggs; in yellow starches; in green vegetables and in blue, dairy products. You will note that vegetables appear rather in the second part of choices: the smaller the bar, the less the number of times the food was chosen by children. You will also note that amongst vegetables we had a variation of choices which seems to be linked to the method of preparation: the cooked vegetables were more chosen than raw vegetables, generally presented as crudités with vinaigrette, therefore more acidic. Mixed vegetables were less appreciated: most likely one disliked vegetable would lead a child to reject the mixture of vegetables entirely. You can thus observe that in this age group (2-3 years) vegetables are on average not much appreciated.
Nevertheless hidden behind these averages there are great differences between individuals that cannot be detailed here but which we have tried to explain. We looked for differences between boys and girls: there weren’t any. We also did not observe an effect due to body mass index, nor of the method of feeding at birth (breast or bottle). However the variety of choices is a little higher in girls and tends to increase with the length of breastfeeding.
0 0.05 0.1 0.15 0.2 0.25 0.3
Vegetables
Dairy products
Meat, fish, eggs
Starchy foods
Combination meat-starchy foods
Cooked vegetables
Raw vegetables
Fruit
Mixed cooked vegetablesMixed raw vegetables
Figure 1. Food preferences in very young children Source: Nicklaus et al., 2005. Acta Pædiatrica, 94:943-951 Sophie Nicklaus then sought to understand the dietary choices of these children, their preferences and the variety of their dietary repertoire several years later. She had the possibility of tracking down many of these children: the youngest were between 4 and 7 and the eldest were between 17 and 22. The ideal situation would have been to set up once again a self service system but unfortunately this was impossible! Preferences were thus measured by questionnaire. The preferences thus measured were modelled to see who they could be predicted according to the choices observed between 2 and 3 years of age and to other factors particularly by the age at which they were re-interrogated. Results obtained for vegetables showed that choices at 2 or 3 years positively influenced later preferences but for girls alone (represented in red). For boys this is not significant. Age also has an impact for both genders; we can see that even for children who did not really like vegetables at 2 or 3 years the preferences increased according to age. Some of the preferences observed at a later age can be explained even though both effects are highly significant for girls. Since these choices seem to have repercussions at adult age and since there exist great differences between

SESSION 4: The special case of childhood
EGEA 2007, Page 72
individuals the question that arises is where do the inter-individual differences observed as early as 2 years of age come from? Preferences and rejections of foods at age 2 can be influenced by genetic factors, specifically by our olfactory or taste sensitivity. Generally we are attracted to sweet and reject bitterness. But for example this rejection of bitterness can be more or less important according to our individual taste receptors. Nevertheless, next to these genetic factors we know that most of our sensory preferences are learned very early and can be learned before birth because of certain aromas of food that the mother passes through the amniotic fluid and as of 7 months the olfactory system of children is functional. Children can thus learn the odours to which they are exposed. Then in the same way the aromatic elements of food from the mother can pass through breast milk and here again the child will b exposed to different flavours. Breastfed children are thus exposed to a more important variety of flavours than bottle fed children. Another important period is weaning: the moment where foods are introduced, the way they are introduced, and most likely the age at which they are introduced. All these factors can influence later food preferences. Moreover all these exposures take place in a family context with parents who will have different attitudes and different practices which can have an effect on the behaviour of children vis-à-vis foods. Let us talk about a few examples which will allow an illustration of the effects of pre and post natal exposure. First I will cite work by Julie Mennella at the Monel Chemical Senses Centre. This researcher recruited three groups of mothers, mothers who had consumed carrot juice at the end of their pregnancy but who did not consume any during breastfeeding, contrary to a group which did not consume any during pregnancy but only during breastfeeding, and a third control group which consumed carrot juice neither during pregnancy nor during breastfeeding. The children were tested when they were about 6 months of age. Their reaction vis-à-vis cereals mixed with carrot juice and cereals mixed with water were observed. The difference in response and in behaviour was analysed. The reaction was measured according to three variables: the number of negative facial mimics, the perception of the mother (i.e. how she perceived whether the child likes or dislikes the food served) and the consumption of cereals. Pre-exposure to carrot juice led to fewer negative facial mimics, a mother assuming that the child likes the food and a greater consumption of cereals with carrot relative to cereals with water. The next example is that emerging from work by Sullivan and Birch on the impact of breastfeeding on the evolution of acceptance of vegetables. Here children were at the beginning of weaning between 4
and 4 months. At the beginning of the study the infants were given a certain vegetable for the first time and were then fed it 10 times. This vegetable differed according to groups of children: peas or green beans in a salted and non salted version. Some children were breastfed and others had received formula. At the start there was no significant different even though the consumption was a little higher for those that had been breastfed. After exposure there was an important increase in the groups of breastfed children and which continues when the children are tested well after exposure. Inversely, in children that have not been breastfed the increase is less and plateaus. There is thus clearly an effect of breastfeeding which induced a greater impact of repeated exposure on the reaction to vegetables. The third example is from a study carried out by Gerrish and Mennella. In this study children had received cereals but never vegetables or meat before the study. All children in this study were bottle fed and three groups were made up. All children received carrot on the first day in the laboratory and afterwards there was a period of exposure at home. One group continued to receive carrots for the duration of the study, a second group receive only potatoes and the third group was exposed to a variety of three vegetables (peas, potatoes and squash) successively presented and thus with changes each day. Then children returned to the laboratory and again carrot was presented; that which I will present today is their reaction to a new food, chicken, which was introduced the 12th day of the study. The ‘varied’ group consumed more of this new product relative to the group which received only carrots. In the context of a thesis carried out by Andrea Maier in collaboration with Benoist Schaal from the European Centre for Taste and Smell, and Nestlé, we have reproduced and broadened this work by recreating the same experimental elements with a monotone group (C0) which always received carrot during the period of exposure at home, a ‘High variety’ groups with 10 changes (C10) during the period of exposure, and a ‘Low variety’ group which received the same three vegetables but during three days in a row with only four changes (C4). First of all why have we compared these different patterns? We had seen in a first survey that in two regions where we wanted to carry out the study (in Dijon, France and Aalen, Germany), the most usual pattern used by mothers to introduce foods was rather a monotone pattern in Germany and a ‘High variety’ type in France. The ‘Low variety’ pattern is rather the pattern recommended to allow the detection of possible diseases. The question is to know whether these two patterns (high and low variety) lead to the same results or not and if the effects were different between the groups of children who were breastfed

SESSION 4: The special case of childhood
EGEA 2007, Page 73
and those who were not. Results of this study showed that children had about the same age in the two regions with a slightly longer period of breastfeeding in Aalen. The new food introduced after the period of exposure was a mixture of courgette and tomato. In Dijon breastfed children consume more of this new food and amongst these children those from C10 group also consumed more of this new vegetable mixture compared to groups C0 and C4: that which seems most important is thus the number of changes rather than the number of foods. These results were confirmed in Aalen where a positive effect of breastfeeding on the consumption of a new vegetable and an effect of variety were also detected (for breastfed children and those who were not), with a higher consumption for group C10. Thus we can clearly see an effect of breastfeeding and an effect of the number of changes of vegetables on the consumption of a new vegetable. During ten days children then received at home alternatively this new vegetable mixture and carrots and they came back to the laboratory and we introduced a new food: peas. We find the same effect of breastfeeding in Aalen but not in Dijon and we find in both countries the effect of the number of changes. What is have just presented are average results but of course there are inter-individual differences of reaction and of acceptation of foods, regardless of the group. Thus you can observe that characteristic mimics of a child who has not liked the pea and a child who appears to want more. Very early on there exist differences between children in terms of their accepting a food as a function of its sensory characteristics. Thus two months later but this time only in Aalen we asked mother of these same children to identify a food that the children did not like and one that they particularly did like. There were differences in the choice of disliked food however all mother chose the carrot as the food particularly enjoyed by their child. We then asked the mothers to propose the disliked and liked foods successively during 16 days (8 days each). Figure 2 presents the results of these studies. For the ‘liked’ food – in this case the carrot – the quantity consumed increased slightly during this period of exposure. It was also observed that if mothers persisting in feeding the ‘disliked’ food without any pressure – because each time, we asked them to stop after three refusals from the infant – after 8 exposures they attained the same level of consumption than the ‘liked’ vegetable. Breastfed children at first consume a little more of the ‘disliked’ vegetable but after 6 exposures they were at the same level as the formula fed children. Nine months later we asked by questionnaire whether different foods were consumed and
appreciated. We have thus been able to observe what occurred with this initially ‘disliked’ food and noted that the increased appreciation was considerably maintained as 63% of the children continued to eat and appreciate this food which was at first disliked.
0
50
100
150
200
250
1 2 3 4 5 6 7 8
Exposure (days)
Inta
ke(g
)
Breast-fed - Liked
Breast-fed - Disliked
Formula-fed - Liked
Formula-fed - Disliked
Figure 2. Effects of repeated exposure on acceptance of initially disliked vegetables in 7-month old infants Source: Maier et al., 2007. Food Qual. Pref., doi:10.1016/j.foodqual.2007.04.005 This is important because we have seen from a survey that in general, mothers give up quite quickly and few mothers insist 4 or 5 times on feeding a same food once they find that their child does not like it. However we see that it requires rather 8 to 10 exposures on average even though there are differences between children in terms of their acceptance. I have been up to now talking essentially about the role of olfactory and taste characteristics. The role of experience with texture seems equally important: studies by Irene Blossfeld have been recently published as presented here. She evaluated in 1 year old children the quantities of carrots consumed presented in two different textures, either pureed or mashed. On average the pureed version was far more consumed than the mashed. But there exist great variations between individuals. She sought to understand whether one can predict consumed quantities and estimated that an important indicator of consumption is familiarity with texture. In other words children who had been used to consume other textures than purees were more likely to consume mashed carrots. Is there then a particular period at which to introduce different textures and tastes so that preference is maintained at long term? This remains a question. In conclusion these precocious experiences seem important, the initial acceptance of a new food is often poor and this is particularly true for bitter or acidic foods or those with certain textures. For example the peas that were less consumed according to Andrea Maier’s experience were in a thicker puree and thus more difficult to manage by a child. When

SESSION 4: The special case of childhood
EGEA 2007, Page 74
sensory characteristics are rejected, more exposure is needed so that there is learning associated to it. It is possible that there are specific periods of particular influence; other studies by Beauchamp and Mennella have demonstrated that bitterness and acidity were more accepted by children fed with hydrolysed milk formula (bitter and acidic milk formulas). They also showed that if these formulas are introduced during the first months of life they are well accepted and if they are tasted after 6 or 7 month there is a strong rejection of bitter and acidic formulas.
All these studies that I have presented are experimental studies and the effects need to be put
into a more realistic context. So in Dijon, at the European Centre for Taste and Smell we designed a longitudinal study. We follow sensory exposure of children even before birth as we recruit mothers during their pregnancy and follow their diet during the last trimester. We then study the infant’s feeding and we measure olfactory and taste reactions at different ages. All these measures serve to eventually explain dietary preferences and rejection at age 2. This study is called OPALINE which stands for “Observatoire des Préférences ALImentaires du Nourrisson et de l’Enfant” or the Observatory for dietary preferences of infants and children.
Many thanks for your attention. Q&A
Q: Is there a link between early dietary diversification i.e. between 5 months and a year and later dietary choices? You have demonstrated results on 2 and 3 year olds but during the first months when dietary diversification occurs, is it too rapid a process?
A: We do not know. We do not really know the influence of diversification on behaviours at 2-3 years of age and even less later on in life. We think that given the importance of effects presented before 2 years and in particular during the first months it is important and could continue until 2 years. Since preferences and rejections observed at 2 years are partially found in adult age we can assume that the way diversification occurs could have an impact far beyond 2 years of age. However we have not yet demonstrated this and this is why we are carrying out this longitudinal study. In this study we have the budget to follow children until 2 years of age, and we hope to continue following these children, though more irregularly, to see how their dietary choices evolve. What is clear by for example Sophie’s work is that as of 2 years there is a period of neophobia, the rejection of novel things. Children at this age start becoming autonomous and it is perhaps a developing protection mechanism to avoid tasting everything. Above and beyond this children can start disliking foods which they liked before; there is a restriction in their repertoire of dietary preferences after 2 or 3 years. Nevertheless the extent of the phenomenon could be linked to familial context. This is also a question which needs to be studied in depth, as well as the way dietary behaviour evolves after the period of neophobia.
Q: At the earliest age, there is thus even more evidence of the influence of formula milks: does all of this not go against the acceptance of foods with very different taste?
A: We have not studied this point. The formula milks are not longer flavoured but there has been a study from Germany on adults which as infants had received growth milks which were at the time flavoured with vanilla; they were compared to breastfed children and it was demonstrated that as adults if you add a little bit of vanilla in ketchup, at a barely detectable dose, those who had been fed with vanilla flavoured formula preferred vanilla-flavoured ketchup to basic ketchup.
Q: I wish to speak about the role of the food industry in generating preferences for fruit and vegetables in children in the sense that a product prepared with fresh fruit and vegetables has a slightly superior palatability to fresh fruit and vegetables. I would like your views on these vegetable croquettes seen in markets, on compotes etc. Is this perhaps a way to encourage fruit and vegetable consumption in children without of course avoiding the perfect case scenario?
A: I don’t have numbers…It is rather a personal than scientific view. There are textures which will be more easily appreciated by children; if this can be a way to start encourage the taste of vegetables, this is a good thing. Nevertheless it isn’t good to maintain easily accessible textures for too long because they will not transfer easily to real products. There will always be a resistance to consume fruit and vegetables which are a little fibrous. Here as well there is a possible learning experience with prepared products (it isn’t necessary to make everything at home!). The food industry could propose products with different textures to encourage them in children.
Q: And above and beyond texture, would you tolerate a small quantity of added sugar and fats?
A: I do think that adding sugar and fats can be a good way to encourage the consumption of certain foods. It has been demonstrated that if a certain flavour is not appreciated at first, sugar can help. This cannot last however because the day where foods are no longer sweetened, they are rejected. These are double-edged measures which must thus be used with caution.
SESSION 5: What are the barriers to reaching the recommendations for F&V, in the context of obesity prevention?
EGEA 2007, Page 75
Pesticide cancer risks in perspective Bruce A AMES
Director of the National Institute of Environmental Health Sciences Center, University of California, Berkeley Children's Hospital Oakland Research Institute, Oakland, California, USA
Cancer is related to age, as are many of the other things you will find out soon enough come along with getting older. If you ask the top epidemiologists what's causing cancer, many had a go at it: Sir Richard Peto and Sir Richard Doll, Brian Henderson, Walter Willett, and they all generally agree. About a third of cancer is due to smoking, a third due to bad diets. I think diet may turn out to be even more than a third. They don't discuss aging, but when we eliminate all of these other things, there still will be this power of age that we have to fight, but we're making progress on that.
What is important about diet? That has been a difficult question. One thing that's becoming very clear is obesity is linked to many different types of cancer and is a big risk for cancer. I make the case here that micronutrient deficiency is very important as a cause of cancer. Micronutrients include the vitamins and minerals you require for cell metabolism. Most people don't get enough of one or more micronutrients and the evidence suggests it gives them cancer. Fibre is very important for health. Where do you get your fibre? From fruits and vegetables. You also get lots of your vitamins and minerals from fruits and vegetables, so they are quite important for health.
When you have a chronic infection, e.g. Hepatitis B virus in the liver, your white cells are fighting the invader. What they do is pour out oxygen radicals: hypochlorite bleach, nitrogen oxide, hydrogen peroxide, they are all mutagens, and they are all designed to kill invading bacteria or viruses. Thus if you have a chronic infection, it leads to cancer. Hormones and occupation may cause some cancer as well. Pollution, e.g. pesticide residues, is the big distraction. That's where we are putting all our money compared to anything else, and there is really not much evidence that it is important. Epidemiology studies do not have the power to find minor risks. They can find big things like smoking or bad diets, but they can't find minor risks. There is no convincing epidemiological evidence, and even if there was a tiny amount, you couldn't find it. Toxicologically, tiny traces of pesticides are implausible as cancer risks.
When Vincent Van Gogh, a neighbour of yours, was in a good mood, he painted sunflowers. He painted this Skull With Cigarette in 1885, possibly when he was depressed. He had a good intuition. Smoking isn't good for you. Smoking causes a third of the cancer, a quarter of the heart disease, and 8 years off your life if you are a 2-pack a day smoker. Each
cigarette is about 10 minutes off your life. That's a big killer out there.
People have been saying, there is an epidemic of cancer due to the chemical industry. It's just not true. One must correct the cancer rate for age. You have to do that because the population lives longer and longer, which means there is more total cancer. If you correct for age, that is, look at cancer in a group of 50-year olds now and before, and you adjust for smoking, cancer rates have been coming down, not up. A leading epidemiologist, Sir Richard Peto, has analyzed this extensively. Modern technology is good for us, not bad.
People got cancer in the chemical industry back in the late 19th century, because when the aniline dye industry came in, there were no precautions at all. Workers were dipping their hands in the chemicals, they were breathing in huge amounts, there were enormous doses. Some of the workers working with beta-naphthylamine got bladder cancer, and scientists made that connection, so it was discovered chemicals could cause cancer. That was the first time people realized that, and after it was discovered they said, let's test chemicals on rats and mice, we don't want them tested on our workers, and that was very reasonable.
Now what about animal cancer tests? I think that is where a lot of the problem is. A lot of assumptions were made and they all turned out to be wrong. The first problem was that since a third of the animals are getting cancer anyway just on an ordinary diet, you have the problem of statistics in small numbers of animals. So they decided to use the maximum tolerated dose (MTD) in all the animal cancer tests--you find the level of a chemical that will kill the animal, and then you back off just a little bit so they only lose 10% of their weight. Almost all cancer tests are done at this huge dose, and sometimes also at half the MTD. Now we are trying to protect people at a million times below the MTD. The assumption was made we could go from this high dose to a low dose. Another assumption was made that carcinogens at the MTD were going to be rare and that we could eliminate them all. A third assumption was that they were going to be synthetic industrial chemicals. All of those assumptions have turned out to be wrong. And that's what I'd like to demonstrate.
My colleague, Lois Gold and I, set up a database of every animal cancer test ever done to calculate potencies, so we became experts on animal cancer tests. I wanted to do that because we had developed a mutagenicity test, and I wanted to look at the relation, and nobody had done it, so we just did it.

SESSION 5: What are the barriers to reaching the recommendations for F&V, in the context of obesity prevention?
EGEA 2007, Page 76
We have been doing this for 20 years. The first conclusion is carcinogens aren't rare. Over half of all the chemicals ever tested at the MTD, whether natural or synthetic, turn out to be positive, they give cancer to rats or mice at these huge doses. Half of the naturally occurring chemicals were carcinogens at the MTD, exactly the same as synthetic chemicals. Plants make natural pesticides to kill off insects, and other predators. Every time you eat a plant you get 50 to 100 natural toxic chemicals or so. Each plant is different. Half of all chemicals tested come out positive, in high dose cancer tests, whether nature’s pesticides in our veggies, mould toxins, or natural chemicals in coffee. I think the problem is these high-dose animal cancer tests are a high-dose artefact. And I'll give you the evidence why I think that.
Chemicals tested in both rats and mice All Chemicals 377/636 (59%)Naturally-occurring chemicals 86/152 (57%)Synthetic chemicals 291/484 (60%)
Chemicals tested in rats and/or mice All Chemicals 748/1430 (52%)Natural pesticides 39/73 (53%)Mold toxins 15/24 (63%)Natural chemicals in roasted coffee 21/30 (70%)Commercial pesticides 79/196 (40%)Mutagens 287/382 (75%)Non-mutagens 200/428 (47%)
INNES negatives chemicals retested 16/34 (47%)PDR drugs with reported cancer tests 117/241 (49%)FDA database of drug submission 125/282 (44%)
Figure 1. Proportion of Chemicals Evaluated as Carcinogenic
Back in the 60's, a scientist named Innis took a few 100 industrial chemicals and said, let's test all of these chemicals in mice and see what percentage of chemicals are carcinogenic. And he found 9% were positive and everybody said, okay, carcinogens are rare, we'll identify and eliminate them, and then we won't get any more cancer. But in fact, the tests were only done on mice; they killed them after 16 months instead of letting them go to the full lifetime they do in a modern test; and they weren't using the maximum tolerated dose. So we went back and we took all the Innis negative chemicals and asked had any been retested in a modern test, and when you do that, half of them are positive. So carcinogens aren't rare, half of all the chemicals ever tested at the MTD are positive. And it doesn't mean anything for extrapolating to low doses. You can't eat anything in the grocery store that doesn't have natural carcinogens as defined in this way.
Why do plants have natural pesticides to kill off the insects. Plants don't have teeth, they don't have immune systems, they can't run away. All plant evolution is chemical warfare, cyanic compounds, all sorts of things like that. Should we worry about
eating cabbage? No. Cabbage is good for you, but it's filled with carcinogenic chemicals, as defined by rodent tests at the MTD. Nature's pesticides. Nobody ever bothered asking, well, what happened if you test these things in an animal cancer test? Well, the Japanese have been testing lots of natural chemicals, and in fact, half of them come out positive, just like synthetic chemicals. And the amounts of nature’s pesticides we eat are huge compare to the amounts of synthetic pesticides. The natural pesticides are in parts per thousand or million, where synthetic chemicals are in parts per billion. There is nothing you can eat that doesn't have chemicals in it, and when you test them in high doses in rats or mice, half of them cause cancer. Some of these are known mutagens, the psoralens, the hydrazines, as well as carcinogens. Mushrooms are full of hydrazines, the mushrooms we eat. Mustard is parts per thousand in allyl isothiocyanate, which is a mutagen and carcinogen. Nobody cares. But we are told to worry about some incredibly low level of a synthetic chemical.
And the modern human diet is completely different than a hunter-gatherer's diet. A European diet is completely different than it was 500 years ago. The potato came from the New World, the tomato came from the New World. Every new plant you eat has 50 different chemicals in it. Humans are designed to deal with toxic chemicals because that's what's in our diet. The largest source of poisoning in children is from eating some plant in the garden. We bred plants to be not quite so toxic; we eat a little bit of a lot of things. We made a comparison, synthetic pesticides, you eat 0.05 milligrams a day, and there are about 100 chemicals in the parts per billion range, while natural pesticides are 5,000 or so chemicals in the parts per million range. A part per billion is an awfully tiny amount, it's 1 person in all of China. Unless it's Mao, you just don't want to worry about it. Aflatoxin, a mould toxin, is active at microgram levels, and alcohol is a carcinogen at gram levels. So in order to compare things, you have to do how much humans are getting as a percent of what gives half the rodent’s cancer, we set up a scale like that. Natural chemicals completely dominated the list. Synthetic chemicals, like DDT at its highest level, was very tiny compared to those. And there is no evidence DDT ever really hurt people. When you get down to regulation, regulatory agents were regulating parts per hundred or parts per thousand. Now they are trying to regulate at parts per trillion, because that's what regulatory agencies do, they try and expand their turf. That's their incentive, as a monopoly. But whether it has anything do with human cancer, I very much doubt it, there is really no good evidence. Besides pesticides lower the price of fruits and vegetables, which is a good thing. And you get more food out of less land which is a good thing for the environment. So I think pesticides are a good thing.

SESSION 5: What are the barriers to reaching the recommendations for F&V, in the context of obesity prevention?
EGEA 2007, Page 77
Dr. Gold and I published a paper listing all the natural pesticides that have been tested around the world in animal cancer tests. They are present in apple, apricot, banana, basil, beer, broccoli, Brussels sprouts (sorry), cabbage --- rutabaga, soybeans, tomatoes, turnip, and everything in-between. Chocolate also (sorry). There is nothing you can eat that doesn't have natural carcinogens as defined by high-dose rodent tests. You don't want to scare people about a thousand minor hypothetical risks, because then you are lost; no one knows what is important any more. And that's where we are now, the public doesn't know what's important anymore because they've been scared about too many hypothetical implausible risks. There are more carcinogens in one cup of coffee than pesticide residues you get in a year. But we don't worry about coffee and I don't think there is any reason to worry about coffee, there is no good evidence that it hurts us.
Carcinogens: N=37 Acetaldehyde methylformylhydrazone, allyl isothiocyanate, arecoline.HCL, benzaldehyde, benzyl acetate, caffeic acid, capsaicin, catechol, clivorine, coumarin, crotonaldehyde, 3,4-dihydrocoumarin, estragole, ethyl acrylate, N2- γ -glutamyl-p-hydrazinobenzoic acid.HCL, hydroquinone, 1-hydroxyanthraquinone, lasiocarpine, d-limonene, 3-methoxycatechol, 8-methoxypsoralen, N-methyl-N-formylhydrazone, 4-methylcatechol, methylhydrazine, monocrotaline, pentanal methylformylhydrazone, petasitenine, quercetin, reserpine, safrole, safrole, senkirkine, sesamol, symphytine Noncarcinogens: N=34 Atropine, benzyl alcohol, benzylixothiocyanate, benzyl thiocyanate, biphenyl, d-carvone, codeine, deserpidne, disodium glycirrhysinate, ephedrine sulphate, epigallocatechin, eucalyptol, eugenol, gallic acid, geranyl acetate, β-N-[γ-/(+)-glutamyl]-4-hydroxymethylphenylhydrazine, glycyrrhetirric acid, p-hydrazino-benzoic acid, isosafrole, kaempferol, dl-menthol, nicotine, norharman, phenethyl, isothiocyanate, pilocarpine, piperidine, protocatechaic acid, rotenone, rutin sulfate, sodium benzoate, tannic acid, 1-trans-δ9-tetrahydrocannabinol, turmeric oleoresin, xinblastine These rodent carcinogens occur in: absinthe, allspice, anise, apple, apricot, banana, basil, beer, Broccoli, Brussels sprouts, cabbage, cantaloupe, caraway, cardamom, carrot, cauliflower, celery, cherries. Chili pepper, chocolate, cinnamon, cloves, coffee, collard greens, comfrey herb tea, corn, coriander, currants, dill., eggplant, endive, fennel, garlic, grapefruit., grapes, guava, honey, honeydew, melon, horseradish, kale, lemon, lentils, lettuce, licorice, lime, mace, mango, marjoram, mint, mushrooms, mustard, nutmeg,m onion, orange, paprika, parsley, parsnip, peach, pear, peas, black pepper, pineapple, plum, potato,radish, raspberries, rhubarb, rosemary, rutabaga, sage, savory,
Figure 2. Carcinogenicity Status Of Natural Pesticides Tested In Rodents
Now I'd like to talk about what's really important. To run your metabolism, you need about 15 minerals and about 15 vitamins and some essential fatty acids and amino acids. These are the micronutrients you need in addition to fuel. And the argument I'm going to make is whenever you are short of a micronutrient, it's likely to shorten your life span and increase cancer risk, and damage your brain.
Are we getting enough micronutrients? The answer is "NO." Look at iron: menstruating women are losing iron, about 16% of them in the United States are more than 2 standard deviations below the RDA.
The RDA is the Recommended Dietary Allowance. Two standard deviations below that is the EAR which is a measure of population inadequacy. About 16% of menstruating women in the United States are < EAR and too low.
% Ingesting < EAR *
From FoodPopulation GroupNutrient
% Ingesting < EAR *
From FoodPopulation GroupNutrient
12 %AllZinc
56 %AllMagnesium
16 %Women 14 - 50 yearsIron
12 %AllZinc
56 %AllMagnesium
16 %Women 14 - 50 yearsIron
31 %AllC
93 %AllE
16 %Adult WomenFolate
49 %Women > 70 yearsB6
31 %AllC
93 %AllE
16 %Adult WomenFolate
49 %Women > 70 yearsB6
Minerals
Vitamins
* USDA What we Eat in America (NHANES 2001-2002) Sept. 2005Figure 3. Micronutrient undernutrition in Americans Low iron is bad in many ways. Magnesium, 56% of the U.S. population is low (< EAR) for magnesium. Where do you get magnesium? It's in the centre of the chlorophyll molecule. So anytime you eat something green, you are getting some magnesium. You also get some from whole grains. And people just aren't eating enough; about 90% of teenagers are below the EAR for magnesium. Much of the population is too low in zinc, vitamin C, vitamin B-6, folate; they add folates to flour, and even with that, half of all women are too low in folate. Vitamin E, practically everybody is too low. I got interested in micronutrients because Dr. Jim McGregor came on sabbatical to my lab. He had just shown that folic acid deficiency in mice, causes broken chromosomes. He irradiated mice and found broken chromosomes, but he found the same thing by a deficiency of folic acid. Folia is the Latin word for "leaf." You get folic acid from your spinach and things like that. What does folic acid do? It moves one-carbon units around. My graduate student, Ben Blount, worked out why a deficiency of folic acid breaks chromosomes. Methylene-THF helps to methylate uracil to thymine, when you don't have enough folic acid, you put uracil in your DNA. Your DNA repair enzymes are always taking out the uracil, so you are breaking the DNA. It's just like radiation; radiation gives you clusters of electrons to create nearby lesions on opposite strands, and the ‘repair’ causes the chromosome to fall apart. That's the dangerous part of radiation. Folic acid deficiency does the same thing to DNA and works in a very similar way. We had a paper comparing folic acid deficiencies and radiation.
People are worried about incredibly tiny levels of radiation, but they did not appreciate that half the poor had broken their chromosomes because they just didn't eat enough folic acid. So it's lack of

SESSION 5: What are the barriers to reaching the recommendations for F&V, in the context of obesity prevention?
EGEA 2007, Page 78
micronutrients that's likely to be important, not a trace of synthetic chemical. McGregor did a study in humans showing folic acid breaks chromosomes, and we did some studies together. And when I realized that half the poor were at the level of folic acid where they had broken chromosomes, I had an epiphany and gave up worrying about minor risks. Folic acid doesn't cost anything, less than a penny for a daily dose. All of the vitamins and minerals are inexpensive. Two billion women in the world are short of iron: iron is rusty nails. The cost is trivial. It's a matter of paying attention to important things instead of spending all our time on unimportant things. Fenech in Australia showed folate deficiency and vitamin B-12 deficiency, both cause chromosome breaks. We looked at iron and too little iron, the mitochondria pour out oxygen radicals. You're aging faster. About 2 billion women and children eat too little iron. Too much iron is bad for you, also. A lot of men eat too much meat, and they are getting the same problem with their mitochondria because they eat too much iron. So there is a balance. Low iron in pregnant women causes low birth rate babies, and pre-term babies.
Dr. Joyce McCann and I have just written four big reviews on the developing brain. When you are a foetus and in the first 2 years of your life, you make almost a trillion neurons, and each neuron has a 100 or so connections. If you don't have enough iron, the brain doesn't develop well. Kids don't do well in school, it's irreversible. Same thing with DHA, an omega-3 fatty acid, which is 30% of the brain fatty acids. Everybody is short of omega-3 fatty acids. We are not paying enough attention to the shortage. They weren't even adding DHA to baby formula in the United States until recently. They do it in Europe.
Now we have submitted a review on vitamin D. Vitamin D deficiency may cause 30% of the cancer in the United States, particularly in dark-skinned people, as they need 6 times as much sunshine as light-skinned people to make the same amount of vitamin D. Dark-skinned people in northern climates, in Europe, in northern United States, are in trouble. They have such low levels of vitamin D. It's not only a big risk factor for cancer, but the brain is full of vitamin D receptors, it's doing something important in the brain.
We are using human cells in culture, and making them slightly deficient in one micronutrient after another, and every time we do this, we see DNA damage. Micronutrient zinc deficiency gives you DNA damage, as does magnesium deficiency, vitamin B6 deficiency and biotin deficiency. Magnesium, B6, or biotin deficiency also shortens the lifespan of human cells in culture. Those are the only three we have tested in cells for senescence acceleration and all three shorten their lifespan. So I looked in the literature, and anytime anybody tested a, deficiency caused DNA damage or was associated with cancer.
I started thinking, why is nature causing DNA damage when there is a micronutrient deficiency? I realized nature wants it this way. Think of the 15 minerals. Every living creature requires about 15 minerals. Magnesium, calcium, copper, iron, and all the usual metals that are used in biochemistry. Are they spread evenly through the world? No. Organisms throughout evolution were often becoming deficient in iron, or magnesium, or some other metal. What does nature want? It wants survival so that maybe it can reproduce a bit. And any metabolism that affects the long term gets cut out. Well, DNA damage is long term, it doesn't show up as cancer for 20 years. On shortage nature will lose the magnesium from DNA repair enzymes and keep it in places like the mitochondria and the heart. The adaptive immune system goes out, there are papers that if you don't have enough vitamin B-6, the adaptive immune system goes out. That's long term. You might die of an infection in 3-4 years, but that isn't important if it's a matter of survival. I call all of this triage, and elaborate it in a recent paper in P.N.A.S.
To summarize, if you don’t eat right or take supplements, you may look perfectly fine, but if you are not getting your magnesium or you are not getting your omega-3 fatty acids you're likely to be getting long term damage. Your immune system isn't working as well, your DNA is getting damage, your brain, all these things that don't show up right away in your biochemistry.
Now what about obesity? A third of the children at Children's Hospital where I work now are obese, mainly blacks and Hispanics, it tends to be the poor. And you look at their numbers, they are deficient in everything. The diet of the obese is amazingly deficient in vitamins and minerals. It's as we heard from several speakers, refined food that's cheap and high in calories, fat and carbohydrate, is very low in vitamins and minerals. And being fat is associated with 40 different diseases, including cancer, and heart disease, and diabetes. And the cost is going to be astronomical.
These are the 10 leading sources of calories in the United States. A sugary soft drink, is an abomination. It’s 40 grams of sugar and no nutritive value. A doughnut is an abomination, it's all this sugar and no nutrients. You can go down the list, there are not a lot of veggies on this list. People that are obese are short of fibre, they are short of all these vitamins and minerals. And I suspect it's making them hungry all the time. If you are not getting your magnesium, which obese people aren't, maybe the body is craving that magnesium. I suspect that nature would rather have you fat and fertile than thin and nonfertile. So you keep on eating trying to find that missing magnesium, but it's scarce in your diet because you are eating the wrong kinds of food. We are trying to prove that. That's still very hypothetical.

SESSION 5: What are the barriers to reaching the recommendations for F&V, in the context of obesity prevention?
EGEA 2007, Page 79
Obesity is likely to be due to the bad diet, not just calories in and exercise out. Exercise is important, too, and people aren't getting enough. There still is a lot to learn about obesity, and about diet and cancer. If we are going to have any impact on public health, you have to work on important issues and not on unimportant things like traces of pesticides. No company would survive that spent all its time on unimportant things, and didn't address the important things. The important things, if we really
want to improve public health, are smoking and getting people on good diets. And all this fuss about pesticides is a distraction. We are spending incredible amounts of money on trivia and it hurts the economy. It isn't helping public health to worry about a part per billion of this and that. Thank you
Q&A Q: Can you satisfy your micronutrient requirement through vitamin pills? A: I think everybody in the world should take a multivitamin mineral pill as insurance. The nutrition community dislikes that, but they've been telling the poor to eat more fruits and vegetables for 30 years with little success. Maybe we should tell the poor to take a multivitamin as insurance, and also to eat a good diet. We don't understand everything about diet, and we shouldn't just take a pill and forget about a good diet, as you won't get your fibre from a pill, and you won't get your omega-3 fatty acids, or your potassium, but the multi will help. I think a supplement should be an adjunct to telling people about eating a good diet. I have an Italian wife and I eat a wonderful Mediterranean diet, but I take my multivitamin mineral pill every day as insurance. Q: You said tiny residues of synthetic chemicals are a distraction. What is the cost of this distraction? Economic cost, I mean, globally speaking, in the world? A: I don't know the cost in Europe. In the U.S., people estimate that the Environmental Protection Agency cost $10 billion a year, and that's not salaries to them, but it's the cost to society. I suspect it's much larger than that. We are spending far more money worrying about a part per billion of some chemical, than we are on teaching people about large risks, such as obesity, bad diets, or the hazards of smoking. It's just misplaced priorities. It doesn't mean you don't want rules; you don't want every chemical company dumping all their garbage out the back door into the local river. You need rules. But you just don't want to shoot yourself in the foot by spending all of your efforts on minor hypothetical risks.

SESSION 5: What are the barriers to reaching the recommendations for F&V, in the context of obesity prevention?
EGEA 2007, Page 80
Fruit and Vegetable consumption: is price a barrier?
Pierre COMBRIS Research Director, INRA (Institut National de la Recherche Agronomique), Ivry-sur-Seine, France
My presentation is about the question of whether price is a barrier to fruit and vegetable consumption, and, more generally, about economic obstacles to the increase of consumption. First I will give you an overview of the trends in fruit and vegetable consumption in France, focusing, of course, on price trends and their influence on consumption. Then, I will turn to income, because if price is a barrier to consumption, then income should also have a significant influence. But income, as you will see, is not the only factor explaining differences in consumption. Fruit and vegetable consumption is correlated with a lot of sociodemographic factors, among which age is one of the most important. Then I will discuss the point of whether barriers to consumption arise mainly from preferences or from prices, using two examples: first, age and generation effects, and second, price sensitivity of low-income households. This presentation is going to be mostly about the French situation, but before turning to the conclusion, I will illustrate with an encouraging example in two U.S school cafeterias, how targeted actions could increase fruit and vegetable consumption. Trends in fruit and vegetable consumption in France First let's have a look at the evolution of fruit and vegetable consumption in France. Trends in quantities consumed of the main food groups from 1950 to 2000 show that fruit and vegetable consumption has increased a lot during this period. The outstanding fact is that fruit and vegetables have overtaken bread and potatoes at the beginning of the 80's. Measured in kilograms, fruit and vegetables are since then the first food group in the French diet. Another important point is that the increasing rate of fruit and vegetable consumption is slowing down. Since the beginning of the 90's, the increasing rate is very low and consumption has flattened. It is important to keep in mind that this levelling off concerns all food groups, not only fruit and vegetables. It is the result of saturation: people are eating enough of each category of food and those substitutions between foods groups that were important till the end of the eighties are coming to an end. This is a major characteristic of food consumption in developed countries. Looking into more details, it can be seen that the slowdown in consumption concerns more fresh than processed fruit and vegetables. Processed fruit and
vegetables have increased a lot since the beginning of the sixties and since the beginning of the nineties fruit and vegetable juices are more and more popular among French consumers. An important question is to know whether price have played a major role in this evolution, and especially in the relative trends of fresh and processed products. The overall evolution of food prices from 1960 to 2005 shows that fruit and vegetable prices varied very much, but were close to the average price trend of food and beverages. Unfortunately during the same period, the prices of some major foods groups have actually decreased a lot relatively to the mean of food and beverage prices. This is the case for meat and poultry, milk and dairy products, and to a very large extent for fats and oils, which price is now 30% less than it was in the 60's compared to the average price of food. If we split the fruit and vegetable group between fresh and processed products, the picture is totally different, and we can observe that, over the whole period, the price of fresh vegetable has increase by 40% more than food and beverage mean price, and that the price of processed product has decreased by the same amount. For fruit, the difference is much smaller, and the widening gap between fresh and processed products appeared only at the end of the eighties. These differences in price trends can be related to differences in productivity between the fresh and the processing sectors. Production, storage and distribution costs are more important in the fresh sector, and for a given level of technology and agronomic knowledge there is not much that can be done to change that. Consumptions trends for fresh and processed products are the exact reverse of their price trends. Consumption trends appear even more contrasted than price trends. This does not come as a surprise, because besides being less and less expansive compared to their fresh counterparts, processed fruit and vegetables are also more convenient and adapted to consumers increasing time constraints. Income influence on fruit and vegetable purchases in France If price has a strong impact on consumption, income should be important too. This is exactly what can be seen from purchase data. TNS Worldpanel records food purchases of a large representative sample of French households all year long. From this data, it is

SESSION 5: What are the barriers to reaching the recommendations for F&V, in the context of obesity prevention?
EGEA 2007, Page 81
possible to study how fruit and vegetable expenditures and quantities purchased vary according to income. Classifying households according to quartiles of income level per person, it can be seen that quantities purchased increase dramatically between low-income (the bottom 25%) and high-income (the top 25%) households. In 1997, the wealthiest households bought more than twice as much fresh vegetable and three times more fresh fruit than the poorest households. It should be stressed also that these differences are not between marginal groups of the population: there is a continuous increase of purchased quantities across the four income quartiles. The difference is much lower for processed products that appear to be cheap substitutes to fresh products. Surprisingly, income differences are more important for fruit and vegetables than for most other food groups, like meat, fat or dairy products for example. The same analysis performed with the 2005 data, shows that purchase differences across income quartiles for fresh products do not seem to diminish with time. Retrospective data, going back to 1969, suggest that these differences in purchased quantities of fresh fruit and vegetables have remained quite stable through time. Socio-demographic correlates of fruit and vegetable purchases in France The question we turn to now, is whether income is the most important factor explaining differences in fruit and vegetable consumption, or are there other socio-demographic factors that have more impact? As we know, socio-demographic characteristics of households are correlated (income and education, income and age, age and education,…) which makes it sometimes difficult to assess the impact of each factor independently of the influence of others. For example, fruit and vegetable consumption increases with both income and age. But as income and age are positively correlated, it is not always easy to separate the effects of the two factors. To disentangle the various influences, regression models have been applied to TNS Worldpanel data collected from almost 3,000 household that have recorded their fruit and vegetable purchases during an average of 48 weeks in 2005. These records give a pretty good picture of fruit and vegetable purchases by households over the whole year. The regression model simply assumes that the quantity of, say, vegetables, that is annually purchased by a household is a linear function of its characteristics, namely: income, age of head, education, social group, region, household composition. The presence or absence of
obese adults in the household has been taken into account. The results for fresh vegetables are shown on a bar chart (Figure 1). The origin of the horizontal axis represents the average quantity purchased that is 47 kilograms per person and per year. Horizontal bars indicate deviations from the mean increase, or decrease, relatively to the mean according to the different characteristics that are listed on the left of the figure. For example, on the top of the graph, you can see that households belonging to the first quartile of income (the bottom 25% of the income distribution), have bought 9 kilograms less than the average. On the opposite, households belonging to the top 25% of the income distribution have bought around 8 kilograms more than the mean. As can be seen from this graph, age has a much larger influence than income. When the household head is less than 40 years old, purchases are almost 14 kilograms below the mean, and if the head of the household is more than 65, purchases are around 14 kilograms above the mean. Education of household adults has also a very significant impact. In households with no diploma fresh vegetable purchases are almost 9 kilograms below the mean, but they are almost 5 kilograms above in households with college or university degree. As shown by the error bars socioeconomic status has no significant impact. This does not mean that there are no differences, but that they are no longer significant once purchases have been corrected for income, age, education, and all the other variables that were taken into account in the statistical model. Some regional effects are significant, in particular for households living in the South-East, the Mediterranean part of France. Family composition is also very significantly related to purchases: positively for women living alone (almost 20 kg above the mean) and negatively for single men and for households with children (more than 10 kg below the mean). Finally, it appears that the presence of obese adults in the household is not significantly correlated with fresh vegetable purchases. Looking at fresh fruit purchase’s, brings the same conclusions, with two differences: age has a much larger influence than for fresh vegetables, and the impact of income is slightly lower.

SESSION 5: What are the barriers to reaching the recommendations for F&V, in the context of obesity prevention?
EGEA 2007, Page 82
-17 -15 -13 -11 -9 -7 -5 -3 -1 1 3 5 7 9 11 13 15 17 19 21 23
1st quartile2nd quartile3rd quartile4th quartile
Age 20 to 40Age 41 to 50Age 51 to 65Age over 65
No diplomaJunior high school
High schoolCollege, university
Farmers (own account)Self employed professionals
Professionals, ManagersAssociate professionals
Clerks, non-manual workersManual workers
RetiredEconomically inactive
Parisian regionEast
NorthWest
Centre-WestCentre-EastSouth-EastSouth-West
Single womanSingle man
Adults no childrenAdults with children
No obeseOne or more obese
kg / capita / year
47
Source : TNS Worldpanel 2005Figure 1. Fresh vegetable purchases by French households in 2005
For processed vegetables, the picture is different: income has much less influence, and age has a strong negative impact on purchases after 65. Interestingly, education has a negative impact on purchases, which could mean that more educated households consider processed vegetables a less valuable option than fresh ones. Households living in the South-East buy significantly more processed vegetables than average, which means a strong preference for vegetables given that they also buy more fresh products. Household composition has again a large impact. Single women purchase much more than the mean and households with children a lot less, which tends to support the idea that, fresh or processed, children do not seem to appreciate vegetables very much. Finally, there is a significant correlation between purchases of processed vegetables and the presence of obese adults in the household. These different effects highlight the diversity and importance of factors influencing fruit and vegetable consumption. If we leave aside, the very high level of purchases of single women, we observe that besides income and education, age appears to be the most important factor of variations in fresh fruit and vegetable purchases. The influence of children in the household points towards age as a major factor as well. So the idea emerges of individual preferences having a more important influence than prices in preventing fresh fruit and vegetable consumption
from increasing. To clarify this point age effects must be analysed more deeply. Barriers to consumption: age or price? There are two different possible interpretations of age effects, whether you consider age alone or generation. The pure age effect, or life cycle effect, is the consequence of getting older. If it is the dominant influence, fresh fruit and vegetable consumption will increase as the population will get older. The generation effect is the consequence of being born at a certain date and having specific habits that individuals carry with them as time goes. If this is the main effect, consumption of fresh fruit and vegetables will decrease in the coming years due to the decreasing consumption of young generations. A study by the Credoc, a French Research Centre studying living standards, has used the Household Budget Survey conducted every five years to follow generation cohorts. The dotted line shows fruit expenditures according to age in 1979. It shows that expenditures increase with age till 48-57 and then decrease. Solid lines are generation cohorts followed from 1979 to 2000. The graph shows that the youngest generations deviate from the path followed by older generations. Clearly, their consumption will reach a lower maximum. The same pattern can be observed for vegetables.

SESSION 5: What are the barriers to reaching the recommendations for F&V, in the context of obesity prevention?
EGEA 2007, Page 83
A very interesting difference appears when you split the generation cohorts according to households' income level. For the high-income quartile (the top 25%), the generation effect disappears almost completely and consumption increases with age for all cohorts. For the low-income quartile (the bottom 25%), the situation is the exact opposite: the generation effect is very strong and consumption decreases sharply with age. This is true for both fruit and vegetables, and, again, points towards economic factors as being very influential in the evolution of fresh product consumption. So age and generation effects are not independent of economic factors and studying them together improve our understanding of the barriers that prevent consumption from increasing. Using price to increase fruit and vegetable consumption? The major influence of economic constraints on fruit and vegetable consumption leads to the question of knowing what would happen if prices were actually lower. Would that help people, and in particular those with low income, to consume more? To answer this question, we have to look at price elasticities, which measure the sensitivity of consumption to price variations. And especially we have to find out whether low-income households have a different sensitivity to prices than high-income households. Insights into that question can be drawn from the work of France Caillavet, a researcher at the French Institute for Agricultural Research (INRA), who has estimated price elasticities for low-income households and the rest of the population. Her results show that, for low-income households, price elasticities for fresh products are much smaller than for processed products, the reverse being true for high-income households. This means that if fresh fruit and vegetable prices went down, high-income households would increase their consumption much more than low-income households. As a consequence, a nutritional taxation scheme decreasing the price of fruit and vegetables and increasing the price of fat and sugar-rich products, for example, would not necessarily lead low-income household to adopt a more balanced diet. This could amount to subsidizing the fresh fruit and vegetable
consumption of high-income household, by means of a tax paid by low-income household who consume more caloric foods and are less sensitive to fresh product prices. A better way to help people changing their food habits would be to undertake targeted actions. To finish on an optimistic note, I would like to take an example of a successful intervention to increase fruit and vegetable consumption, drawn from the work of Simone French and her colleagues. They used nutritional pricing to help people making more healthy choices in cafeterias, the idea is that the influence of price would be more effective in an environment with a limited number of substitutes. In this intervention study, prices of fruit and baby carrots were cut by 50% during 3 weeks in two US high school cafeterias, one in an urban, low-income, environment, and the other in a suburban, middle-income, setting. During the low-price period, sales of fruit increased by about fourfold, and carrot sales by about twofold. The magnitude of the effect was larger for fruit in the urban school, and for carrots in the suburban one. This example brings interesting views about the kind of action that could be undertaken to tackle the problem of low fruit and vegetable consumption among teenagers in different socio-economic environments. To conclude, I'd like to say that, at the moment, the context for fruit and vegetables is extremely positive. All dietary recommendations are in favour of an increase in consumption. Unfortunately, price trends, and low convenience, prevent the consumption of fresh products to increase as it should. In the long run, the widening price gap with processed products is certainly a handicap for fresh produce, because a majority of consumers always choose the cheapest options. We've seen as well that household characteristics impact strongly on fresh fruit and vegetable consumption. So if price is clearly a barrier, it is not the only obstacle that has to be overcome to increase consumption. So both price and individual preferences have to be taken into account. In my opinion this is the best path we can follow if we want to be successful in increasing fruit and vegetable consumption. Thank you very much for your attention.

SESSION 5: What are the barriers to reaching the recommendations for F&V, in the context of obesity prevention?
EGEA 2007, Page 84
Q&A Q: Thank you very much, it was absolutely fascinating.. It looks to me like the most vulnerable group are going to be younger, low income children because if they do not learn to appreciate fresh fruits and vegetables early on, later on they will have no chance. So what interventions can we put into place to just specifically with that group that's most vulnerable and most in need of intervention?
A: Yes, yes, I agree with that and I think what we can do it, work on school canteens and foods and education at school. Yesterday, Sylvie Issanchou has shown us how important it was to get used to the taste of fruit and vegetable very early in life, and I think that's in your social life, too. You should start early. Q: Thank you very much. I was impressed for your result which you are showing that in the family with children, the total fruit and vegetable intake is lower. I would like to ask if you think it was taken in account that in younger children, it is obvious that the energy intake is lower and the total vegetable intake is lower because they are smaller. A: I've just looked at the quantities that are purchased in the households, but not at the energy equivalents because we have to convert, according to the kind of fruit and vegetable they have bought, and it's much more complicated. But I think you are right, if we account for that, and for example, if we use unit consumption scales, for example, a thing like that, maybe this difference will be lower. But not by that much, I think. Q: Thank you for your fascinating talk, especially for me. What do you think happens to women when they partner and have children? From your data, something very strange goes on. It could just be, if one was being cynical, it's the influence of the men whose purchases were completely the opposite direction. But there is plenty of data that suggests that it's not that. So I was going to ask the same question as the previous questioner about the way in which those data are averaged, because that clearly might be important. But you have other explanations as to--I know these are cross-section, you are not looking at patterns. A: Yeah, these are cross-sections, these are the total annual purchases in quantities of fruit and vegetable for the household divided by the number of household members. Not taking into account their age, but taking into account the number of meals that they are taking at home, because these are purchases that are food for home consumption. And there is a huge difference between households on the number of meals that are taken from that domestic provisioning, and so this is also an important scale factor. But you are right, I would like to see in more details this influence of the composition of the household. [...] yesterday, or the day before, also asked me about single women with children. And I think that single mother, for example, would be a very interesting example because sometimes they have low income because they are alone, they have not much time, and that would be interesting to see if there is a difference. And I think that this data, I just wanted to have a quick look at the data, especially the influence of the presence of one obese adult in the household, and you understand why. But I'm also fascinating with this data and will go into more details quickly.

SESSION 5: What are the barriers to reaching the recommendations for F&V, in the context of obesity prevention?
EGEA 2007, Page 85
Marketing impact on food consumption Tim LOBSTEIN
Childhood Obesity Programme Coordinator, IASO – IOTF, London, UK
Thank you Adam, thank you everybody for turning up again this morning after a long day yesterday. I hope to try and amuse you a bit more today than some of those papers yesterday which I found quite confusing, because I'm not a biochemist. So today there will be a few graphs, but I think mostly there will be more amusing pictures, I hope. Okay, I want to talk a little bit about marketing to children. I work on children's obesity issues for the International Obesity Task Force. I just want to remind you of the figures, we saw some of them yesterday, about the dramatic rise, the absolutely extraordinary rise, in the number of children who are overweight in many European countries. All the European countries are showing a rise. I think the only one that you could classify as showing a fall is Russia during the 1990's when the economic conditions were so terrible. So, all countries in Europe are facing a dramatic rise in the numbers of overweight children. And we have to see what sort of causes and what sort of solutions we can think of for this problem.
Prices relative to all-food price index UK: 1980-2000
0.4
0.6
0.8
1
1.2
1.4
1.6
1980 1985 1990 1995 2000
Soft drinks
Figure 1. Increasing relative price of fresh fruit, and decreasing relative price of soft drinks, UK 1980-2000 As you can see, basically, the real takeoff began in the late 80's, early 90's that is dramatically continuing. I think we now have Spanish data showing over 40% of their school children are overweight. So, you know, this is a serious problem. Estimates are for the EU 25, it's EU 27 now, of course. But for last year when it was still 25, we estimated approximately 22 million children in the EU are overweight. And of these, some 5 million are obese. And that figure is rising by 330,000 every year, so it's not some insignificant problem. This is quite serious. Now we've heard from most speakers that we have to think very clearly about diet and physical activity, that we must talk about the
reduction of energy-dense foods, fats and sugars, particularly, and increases in fruit and vegetable consumption, as well as increasing physical activity. I don't think any of us are really going to object to these intentions, these targets, and these goals for change. We have to think about marketing, because marketing is how the industry, particularly, gets their products from the factories or fields, or wherever, onto our plates or into our homes. And as we've heard already this morning, price is one of the key factors in how our choices are influenced. Just to say a few words about price, we've heard quite a lot about it, but I'll just add a couple more. I, too, have been looking at trends over the last few years. The U.K. data isn't as thorough as it is in France, but U.K. data does show some interesting trends. The fresh fruit trends compared with overall average food prices have increased in the same period in the last 20-30 years. The soft drinks prices, carbonated and still soft drinks, have been falling relative to average food prices. So if we are to follow Pierre's argument, we can see that there would be a tendency to decrease our consumption of fresh fruit, or to find it more difficult, particularly if you are on a low income, to buy fresh fruit, but easier and easier to buy soft drinks. But we also have to think back a little, what is the cause of these changes in prices? Yes, the manufacturing changes and productivity changes. But those are investments, investments in our agricultural production, which we have a chronic overproduction of sugar and butter. And that are not my words, those are the words of the Court of Auditors. And low cost calories from oils, sugars, and starches is really the theme of the common agriculture policy for the last 40-50 years. The emphasis on grains, meat, dairy products, and their support for horticulture, fruit and vegetable production, has largely been to remove products from the market and to keep prices high for producers. And we end up with a situation where, as we've seen from Adam's figures earlier, you get a high price for 100 calories out of fruit and vegetables, and a very low price for 100 calories from oils, sugars, and starches. But I'm not going to focus on price, we've heard a lot about price. I'd like to think more about some of the other aspects of marketing and what gets food into your hands. For example, how do they formulate foods? How is it possible to take a food and make it more attractive, and yet cheaper to produce than something like this? And the answer is, of course,

SESSION 5: What are the barriers to reaching the recommendations for F&V, in the context of obesity prevention?
EGEA 2007, Page 86
they take the colours, the flavours, the textures, and put then into much cheaper products, starches and sugars in this case, and fats perhaps, using those very same techniques. The fruit-flavoured candy, that can be chewy-textured, that can be very interesting to a child, particularly, using the tricks that the fruit and vegetable 'originals' had, flavours and textures and so on, but in much cheaper products. And so we have to consider the formulation of food, the use of additives, and in particular these cosmetic additives, colours and flavours, which have no nutritional value in themselves. These additives are selling low quality food to children. And I would like to see a review of the use of additives, non-nutritive additives, and their value in our diet, which I think is very negative. Portion size, of course, is a huge issue. We've got a nice picture yesterday of the coffee and croissant traditional versus Starbucks. We can say the same for McDonald's from the 1950's through to the 2000's where their standard portions and their large portions have increased and increased. And we have seen a trend in average portion sizes being introduced, as new larger portions have come in. Every year, more and more of these portions, large sizes, king size, double size, two-for-one, and so on, are being introduced. And very rarely do you see a company promoting smaller and smaller portions, as if that was some value to us. And it's not surprising, we do like to think that we are getting more for our money, it's a very good sales method. What else is there? Well, there is position. How is food displayed? How is it made available to us in the place where we get our food from? Now we can do some very interesting mapping of how far different communities are from their fruit and vegetables, or from fast food and snacks and confectionery outlets, and so on. And these sorts of maps are now beginning to be developed. This is an interesting one from Brent. Sorry the quality is not very high, but you get the idea that you can do locational mapping to see where different communities have access to different types of food. This is an urban area on the edge of London, so it has some dark areas, some light areas. But I won't go into the details. More graphically, you can see this sort of area in a housing estate where the shops are small and the crime level is quite high, and the sorts of products that you will find in these shops are largely the confectionery, snack foods, tin foods, long shelf life foods, not perishable foods like fresh fruit or vegetables. And of course, things like alcohol and tobacco will be there, as well. So the products for a bad lifestyle are all available at the closest shop. Whereas, fresh fruits and vegetables are likely to be some distance away. And in fact, Suzi Leather, one of the pioneers in this work, commented that it's easier to buy soft drugs, illegal drugs, on some of these housing estates, than it is to buy a fresh apple.
"Food out of reach," yes, that's quite nice. These are from Sweden, showing how children are largely excluded from access to fruits and vegetables. The size of a child that makes it hard for them, perhaps, to reach up there. But for ice creams and their displays, and for some of these snack foods, crisps and confectionery products, children can easily reach. And in fact, there is some new marketing methods that take it even lower still, right down to floor level, so even a child in their buggy can reach these, so that you don't even have to be walking. And what's the purpose, what are these objects on the floor doing? They are selling sweets to children, directly to children, using these cartoon characters to make them attractive and interesting. And you can see the battles that will develop between a child and a parent because of these sorts of things available directly to the child. And it's a battle, of course, that shouldn't be waged between a parent and a child. It's a public health battle. And that brings me to promotion and advertising. Now, just to remind ourselves of the scientific evidence, we've had 2 major reviews, systematic reviews, of whether advertising does affect sales and consumption. And the main defence that advertisers give is that, no, it only involves brand switching. It doesn't, as they say, "grow the market," it doesn't increase overall sales. But the two systematic reviews, including one for the U.K., the Hastings review, suggests that it does increase consumption, increase the market for that type of food. And there is now sufficient evidence to show that food promotion has a direct effect on children, affecting not only their preferences in purchase behaviour, but their consumption. And because the industry challenged this systematic review, a review of the review was then held, and that, too, confirmed that the initial findings were correct, and it was likely to understate the effects of advertising on children because it didn't include other types of marketing activities. It was largely television they were looking at, or the indirect effect of advertising acting through other members of the family. The second evidence review is from the Institute of Medicine from the U.S.A. which agreed that marketing strongly influences children's food preferences, requests, and consumption. And the food and drinks advertising on TV is associated with obesity, so they actually linked it up to obesity. Strong evidence for children, weaker evidence for youth. Largely weak because the evidence isn't there, the studies have not been done. And companies know that they have this effect. If you look at the trade magazines, this is from the Grocer Magazine, which is a magazine for retailers to read, they know what sells. This is Bernard Matthews, a producer of, in this case, Chicken

SESSION 5: What are the barriers to reaching the recommendations for F&V, in the context of obesity prevention?
EGEA 2007, Page 87
Nuggets, Jetta's Drummers, and Golden Fishes, products with a lot of starch and fat added to small amounts of meat product, and shaped to make it attractive to children. And you can see the child there pestering the parent, pulling at the parent’s sleeve. This is "pester power." Industry will deny in public--and it did deny it at one of our Parliamentary Committee meetings where the industry was asked about pester power. “Oh, no, we don't use pester power.” But they do. They know it. And they acknowledge it in these sorts of circumstances. Just to consider television for the moment, figures from the U.K. (and I don't have figures for other countries in Europe) but for the U.K., children actually are calculated to spend more time on average watching television than they spend in a school classroom. It seems difficult to believe. Television, on average, is 3 hours a day, 365 days of the year, that's to say probably 2 hours during the weekday, 3 or 4 hours at weekends, 3 or 4 hours every day during the holidays on average. But in schools for about 200 days of the year, they are exposed to about 4 hours of class time, maybe 5. So the figures work out in TV's favour: children are seeing more television than they are seeing a teacher. And on commercial television, in the U.K., at least, we are getting roughly 6 food adverts every 30 minutes on children's television, and you can do the sums yourself, that will give you about 77,000 messages, food advertising messages, delivered directly to children through the television over the period of their childhood. 77,000, which you might call "health messages," because it's influencing their diet, but health messages of a certain sort, because most of those messages are for foods high in sugars, salts, and fats. And of the ones that aren't, they will be for things like instant coffee or tea that has no nutritive value at all. And if you compare the different countries' quantities of advertising, numbers of ads for sweet and fatty foods delivered to children per hour, or in this case, for 20 hours, and relate this to the prevalence of overweight among children in those same countries, this is 7 EU countries, the USA, and Australia, you get a statistically significant association, even within just those few countries. Now I don't want to assume causality here, I'm not jumping to conclusions, but there is such a strong link. In fact, you don't get it if you look at the numbers of other types of advertising to children, so it's not a general advertising thing. It's about sweet and fatty food advertising that you get a relationship like this. Just to put some figures to it, the U.K. government acknowledged that the amount of money spent on this type of advertising on the U.K., some 743 million, compared very poorly with the amount of money spent by the government in promoting
healthier eating. Approximately 100 pounds for every pound spent by the government. And what sort of foods are we seeing, and how are they doing it? Well, here are some examples, they are getting a bit dated now, but I like them nonetheless. Shrek, the movie being used to attract children to this soft drink, a soft drink that contains 36 grams of sugar in just one carton. It's promoted as a black currant juice drink, sold to parents as having a lot of vitamin C, but it's delivering a huge amount of sugar.
Figure 2. UK data. Graphic from Choosing Health Source: UK Department of Health 2004 Sweet cereals, here we are using two different tactics, another film, Star Wars, but also the famous Tony the Tiger who's been on those types of cereal packets for years and years. A child-friendly cartoon. The sort of cartoon that children will recognize, they will recognize that image more readily than they recognize, for example, photos of their own grandparents. Other examples, for quite young children, such as these little pots of yogurt, using the Teletubbies. And the Smurfs, as we call them, or I think you have other phrases - Schtroumf? Now McDonald's changes their free gifts every few weeks, so that is quite difficult to collect all the different models within one set unless you go to McDonald's several times within the 2 or 3 weeks, and they will then change it to another set of creatures or whatever. To be fair, the Teletubbies one is an interesting issue because just over a year ago, the BBC, which is our non-commercial public service broadcasting, was responsible for the Teletubbies on television. But they were licensing out the use of Teletubbies for different commercial purposes, and the BBC decided that there was enough parent pressure and criticism of allowing their Teletubbies to be used on high sugar foods like that, that they would change their criteria and you now will not find products like this

SESSION 5: What are the barriers to reaching the recommendations for F&V, in the context of obesity prevention?
EGEA 2007, Page 88
with sugar in it using the Teletubbies or the other BBC characters - Thimbles and various other ones - on products like this. So it is possible to move forward through voluntary action like that. But you have to find a company or organization that's prepared to take those steps. The Simpsons are very commonly used to promote junk food. Perhaps there is a class issue here, socioeconomic issue, be interesting to look at. And here is Kinder, with the free toys inside every egg, not only the regular ones, but there is some special ones that come out at special times of the year. And of course, the food product is just sugar and fat. The use of sports personalities - these are two U.K. footballing sports personalities, Gary Lineker, once the U.K. captain, David Beckham, is he still the captain? But he has been a strong promoter of Pepsi through a lot of his career. And Gary Lineker of Walker's Crisps. In fact, Pepsi manages to get into football through most of the best UK players - this was the Master United team, I think, or was it the English team? Every single one of them there drinking Pepsi with Pepsi on the strip on their shirts. And it gets to sports in the other direction, too. Not only are sporting stars branded, but even if you want to do a bit of sports at school, you may find that your school has signed up to some free kit from McDonald's so that you are branded even when you are doing your sports at school. The internet - well, this is going to be one of the biggest issues over the next few years. How do we regulate marketing to children on the internet? Here are some examples, this is Coca Cola offering ring tones to children, send in your phone number, you can download your ring tone for your phone, download logos to put on your phone and so on. And of course, the companies get your e-mail address and possibly also your phone number in return for sending this stuff to you. And you will use these ring tones and load those, and spread them around to your friends. For younger children, here is Naquin, a sugary beverage, hot beverage, for children. Here is an adventure where they go round and they pick up various tokens, they spot the Naquin colours so you get real branding awareness, among very young children, as they go around this site. There is a little parental warning, you can see the "Parents, click here," down on the bottom left. And if you click there, it says, "If you are a parent, you may want to consider whether this is suitable for your child." But by then the child is involved, it's far too late. This is the latest, extraordinary one from Burger King. You'd hardly know it's Burger King except for the small print across the bottom there. What you do is you type in a message to this person dressed up as a chicken, like "lie down" or "sit down" and they will
do it, you'd press a button and they'd do it. And it's one of these sites that everyone gets to hear about from their friends: “Have you seen the Subservient Chicken that will do what you tell it to do?” Alright, this is fairly innocuous, you don't think it's going to matter very much, but children can spend quite a long time on this site, and quite a large number of children can visit it. The figures I saw about 3 months ago was that this site had 460 million hits. And even if children are visiting 2 or 3 times, that's still 200 or 300 million children have now visited Burger King's Subservient Chicken site. Now the interesting thing about the internet, of course, is that whereas a TV ad might last 30 seconds or even possibly a whole minute, and might be repeated 2 or 3 times in the evening, children can spend 5-10 minutes on this, they will then tell their friends, they will go and have a look at it again. So there is a real what is called "stickiness" about these sorts of sites. The children will stay there for a long time. And the message is completely subconscious. However much they might be educated and trained to be anti-advertising or to understand how advertising works, these things work subconsciously, and you cannot defend yourself against subconscious advertising of this sort. It just gets in. We were amused by it, I bet some of you will go and look for the Subservient Chicken. No doubt, when you are at work. But you could call it part of your research, it's very important. A few other tricks that they get up to. Younger children, still the target. Here is McDonald's selling Barbie McDonald's, a drive-in Barbie. Is that Ken sitting at the drive-in in his wife's sports-car? They do a similar one for Pizza Hut. High branding, high awareness for kids, who will then play the McDonald's game. This is an interesting trick from Nestlé where they get you to send in your name to the company, and the company will send you back a little storybook that parents can read to their children. And in the book, the child's name is one of the actors in the adventure that happens. So the storybook comes back to the child who is featured in that book, and it really sort of grabs the child in. I don't think it has a high marketing content in the book, but the whole process is involving, and involves this Nestlé Milky bar kid in the adventure, so there is a sort of spin-off marketing in there, and a brand awareness will be in there. Another method of marketing, what's coming next, is moving into educational materials. Is this an educational book? Yes, it is because what you do is you count the Cheerio’s that you put onto the page there, so you can get the Cheerio’s and say, 1-2-3. And then, of course, they will eat them as soon as you've done the counting. Now, all right, cereals, I'm

SESSION 5: What are the barriers to reaching the recommendations for F&V, in the context of obesity prevention?
EGEA 2007, Page 89
told, cereals are part of a healthy diet, even these sweet ones might be. But we are moving on now, the M & M's counting book, so you place M & M's straight on the page, add them up, and then eat them. I'm getting to the end now, but this is one of my favourites. Where you win your own weight in these Maxi Bar confectionery. Of course, if you then eat it, your weight has gone up, so you should really have won a bit more, and you eat that, and – well, you cannot finish. Now there are some moves to protect children. We are not sitting here just taking this lightly. Politicians, even, have begun to get worried about this. Parents are certainly upset about it, and we are getting some changes. We know that the French have introduced a new regulation on putting health warnings on TV adverts, or else the advertiser must pay a higher fee, and I think most of them are putting on the warning, but making it look like a health claim. We have new rules in the U.K. coming in over the next few months that will limit some exposure to fatty and sugary food advertising during children's television, but it doesn't limit it during programs that a lot of children watch. A little later in the evening, about 7:00-8:00, there are a lot of programs children are watching, and advertising is not regulated then. An interesting initiative in Latvia, referring back to my concern about cosmetic additives, is that they are now developing a ban on additives in children's school food. Be interesting to see how that works out. The WHO, World Health Organization, had an excellent consultation last May in Norway and came up with a draft report -- well, we have the full report now of that meeting -- which called for the development of a code of marketing, an international code of marketing. The experts there felt that this was going to be the only way that some control could be brought, particularly where companies are operating across borders, that you cannot have controls in one country alone. You will need an international code. And this was echoed in the European Charter On Obesity signed last November
by nearly all the members of the region, health ministers, and some other ministers, too, were involved in this, which specifically talked about the need to reduce the extent of impact of commercial promotion of energy-dense foods to children, and that there were needs for a code. So I'm delighted to say that at my organization we are now joining with Consumers International to start drafting such a code. And we hope in the next few months to have a preliminary draft of a code. We know WHO, itself, can't do it because they haven't been specifically mandated to do it, so it has to come from outside. So we are going to have a stab at it. And I know one of the main issues on that, which will be of interest to us here, is whether you go down the route of Quebec in Canada, and to some extent, Sweden, where you simply say we don't want any advertising to children. Now the advantage of that is it's very easy to regulate. You don't need definitions of different types of things. At Quebec, in order to implement that regulation, it costs Quebec the cost of one person in one office to keep an eye that this is happening. And when he comes upon an infringement, he goes straight to the prosecutors. The alternative, and it's one that you will probably be most sympathetic to, is to have permission to advertise, for example, fruit to children. But once you start saying, yes you can start to advertise fruit, can you also advertise processed food, and fruit juices, and fruit-flavoured juices, and so on? And you start coming into the problem of definitions. And when we get into definitions, we then have to start thinking, well, how do you categorize foods into, yes you can advertise, and no you can't? And that's where things like nutrient profiling, the profile of a food according to its nutrients, and a classification scheme, becomes quite interesting. It will be harder to regulate on that, there will be a lot of arguments. But the nutrient profiling scheme is going to have to be the solution to that problem if we go down that road. Thank you very much.
Q&A Q. Do you think there is evidence that industry has been selectively targeting specific children by ethnic, or minority groups, or by low income groups? Because those are the groups that are the most obese. A. I'm not aware of that happening in Europe, specifically. I am aware of the evidence in the U.S. from Shiriki Kumanyika’s group that, indeed, there is differential advertising according to the likely target. I think the problem in Europe is that it's harder to have local TV stations that only focus on certain communities. We are so much more densely packed in Europe that you tend to get broader marketing.
SESSION 5: What are the barriers to reaching the recommendations for F&V, in the context of obesity prevention?
EGEA 2007, Page 90
Efficiency of marketing actions on increased fruit and vegetable consumption (case study by major retailer)
Laurent DAMIENS Chairman of the Agency for research and information on produce for better health (Aprifel), Paris, France
The modern marketing tools (packaging, advertising and promotion at point of purchase) have had an enormous impact on consumer choice for processed packaged food items, and have changed consumer food purchasing behaviors. Consumers now buy food according to these marketing tools (packaging, advertising and promotion at point of purchase) as they have influenced consumer preferences. Indeed, a food product does not only need to meet a consumer taste; nowadays, a food product needs marketing to reach the mind, the wallet and then the mouth of a consumer. Packaging However, a lack of modern marketing tools has distanced the modern consumer from fresh fruit & vegetables. For example, to sell an apple, would it be more efficient to lose the natural aspect and the freshness of a fresh fruit or vegetable? Shall we put a fresh apple in a can? Many in the sector have innovative approaches to make fruit & vegetables more accessible, practical for all ages, even without packaging labels. We need to empower the F&V sector with innovative actions on accessibility. Advertising Advertising has become THE marketing tool to create demand for a product. A new product can not be launched without an advertising campaign. It has become inevitable to reach the consumers, their mind and wallet. In advertising, money makes the difference, as demonstrated in Figure 1. Advertising for fruit and vegetables should not be considered as a simple necessity, but as mandatory, in order to increase fruit & vegetable consumption, and change consumer behaviour. But to change consumers’ behaviours is not an easy task. Consumer behaviour science tells us that there are many types of consumers motivated by different arguments and needs. A 1999 sociological study assessed dietary habits of different types of consumers and concluded that only 24% of the studied population could change their behaviour based on nutritional arguments. Importantly, this implies that ¾ of the population use other criteria to choose, such as taste, pleasure, fun, peer pressure, culinary preferences and so forth. This means that increasing fruit and vegetable consumption requires more than a nutritional argument: we need broader strategies in advertising to satisfy the different groups of consumers by
making the fruit & vegetables more desirable for all groups. Promotion at point of purchase As fruit and vegetables do not have any packaging, there is little opportunity for promotion at point of purchase. Nevertheless, modern marketing promotion actions may even be more effective on fresh fruit and vegetables than on processed items. In May 2006 a large French retailer carried out a pilot test over a 10-day period; during this 10-day period, a €1 coupon was offered for every €5 spent on fresh fruit and vegetables. The results were amazing:
• During this 10-day period, there was a significant increase in sales – both in terms of volume and euros;
• Moreover, the period following this 10-day promotion also showed an increase in sales –in volume and euros even though customers had a rebate of €1 per purchase of fruit and vegetables: this increase corresponds to +3,23% in euros;
• 1.7 million coupons of a 1€ value were given out during the 10-day promotional period;
• almost 300 000 coupons were used for further purchase of fruit and vegetables (which represents a 17% return rate); and
• overall a 4% increase of the average ticket value was observed.
A 17% return rate is exceptional on promotional activities in the retail sector. Usually, the average return rate on a packaged product is about 3%. This means that the power of promotional activity for fresh fruit & vegetable could be at least 5 times superior to processed foods. Hence, we need to encourage retail to focus more on marketing action at store level, to increase fruit and vegetable sales Conclusions Marketing tools are very powerful to change consumer tastes and preferences, the fruit & vegetable sector must build financial and marketing capacity to develop:
• innovation on accessibility (whole and pre-cut fresh fruit or vegetable packaging, innovative merchandising…)
• a proper advertising budget, that could counter-balance the budgets promoting processed foods

SESSION 5: What are the barriers to reaching the recommendations for F&V, in the context of obesity prevention?
EGEA 2007, Page 91
• modern promotional activities at point of purchase
A new strategy for promoting fresh fruit and vegetable consumption can only be possible through multisectoral collaboration, and public-private partnerships, involving communication and
marketing activities, such as collective marketing plans and social marketing. All stakeholders should work together to make the difference regarding consumer choices and to rebalance investment in fresh fruit & vegetable marketing.
Figure 1. Investment in fruit and vegetable is almost negligible (millions of euros per year)

SESSION 5: What are the barriers to reaching the recommendations for F&V, in the context of obesity prevention?
EGEA 2007, Page 92
Availability and access to healthy food in areas of disadvantage
Elizabeth DOWLER Reader in Food and Social Policy, Public Health Nutritionist, University of Warwick, Coventry, UK
Thank you very much for the invitation to speak today, which is an honour. I’m also very grateful to a number of colleagues who have given me permission to use their slides within my presentation today. My topic follows from those we’ve already heard this morning; it is to look at availability and access in areas of disadvantage. Why? Well, we know, it’s very widely recognized, that there is a variation by socioeconomic status in the quality of diets which are purchased and consumed, particularly fruits and vegetables. We’ve heard it several times the last couple of days, many of you will know these data very well. And in epidemiological studies, socioeconomic status has been variously measured (by occupation, attained education level, household income equivalence), that predict childhood obesity, and also by area-level deprivation, which also predicts obesity in adults and in children. In the health arena, generally, there has been a great deal of interest in these measures of inequality, particularly relative measures of inequality of income or wealth, which might in themselves be significant: that people don’t have enough money. Much more recently, the work has been done using relative indicators which are markers of social inequalities in control: self-control, self-efficacy, social capital. And there is a lot of debate about the relationship between those kinds of factors, and with income, itself, and the significance of those relationships for health outcomes. I think it’s fair to say there’s been rather less work in the field of nutrition and diet on the significance of different kinds of socioeconomic variables and their role, both in predicting outcomes and in explaining them. We are still very much working on cross-sectional modelling of relationships. I think that’s partly because the whole business of purchasing, making choices and purchasing food (which is what mostly happens in European and North American countries, and increasingly throughout the world; people don’t so much grow their own food or exchange it now), represents a very complicated set of decisions that people go through. It looks simple, but actually it isn’t at all. And it’s very difficult to disentangle for any given place and time, what are the social conditions which actually shape the dietary and nutritional outcomes that we are interested in. We are wanting to generalize, of course, we want to be able to show that X, Y, or Z contribute to key decision-making and shopping for food. But research, as I said, increasingly shows how complicated these decisions are. And that is
particularly so for low-income consumers for whom several factors may be jostling for supremacy on any given day when food purchases are made – factors which can vary from week to week. We can also, of course, use qualitative research to investigate people’s thinking and motivations. There are methods such as accompanied shopping trips where you ask people to talk out loud about why they are making the decisions that they are. You can thus observe practice at specific times and places. And of course, dietary surveys, large and small, which try to measure regular patterns of food behaviour and outcomes, and link those to the kinds of outcomes that we are interested in (today, of obesity). There are some quite sophisticated quantitative modelling examples throughout now. For instance, there was a paper just a few months ago from Australia which was multi-level modelling of both household and neighbourhood factors. (There have not been very many studies like this.) There have been a number of U.S. studies looking at the strength of environment factors and explaining variants in individual outcomes, whether of nutrient intakes or obesity, body size, and there have been a few recent studies in the United Kingdom, which I’ll refer to shortly, looking at the impact of retail density, and household and individual factors across a city. Let’s ask ourselves the key question: why is it that those who have low incomes, who may also be living in poorer, more disadvantaged neighbourhoods, are less likely to eat well? And what is causing the low income, or disadvantage in a neighbourhood, and does that also have an effect on food choice? I think without some of that understanding, we are always looking for a ‘magic bullet’, something which we can ‘make happen and everything will then be all right’. We need a more sophisticated understanding of the forces which are driving disadvantage and its effects. We have seen some of these forces already this morning: advertising and marketing, which have differential effects on consumers of different income levels, of course. But there are others, as well. I’m not going to say very much about whether or not poorer and marginalized households are always found in disadvantaged areas. I don’t think there is a complete overlap; certainly there is not in the United Kingdom, although there has been an increasing polarization over the last 3 decades. Nowadays you are more likely to find poor people living in poor areas, but there are also poor people who live in areas that are not necessarily disadvantaged. One

SESSION 5: What are the barriers to reaching the recommendations for F&V, in the context of obesity prevention?
EGEA 2007, Page 93
reason this matters is that, in terms of intervention, you have to decide whether you are going to target households or areas. But I should also point out, of course, there are likely to be differences in factors which operate in major cities versus the suburbs, versus areas where perhaps key industries, and therefore jobs, have gone, with not much to replace them, versus rural areas. I want briefly to review some of the evidence on the material determinants of food choice. Do people have enough money to spend on food? What can we say about variation in food prices; what do we know about geographic variation in shop access? What is the evidence that these factors affect food choices? I’m not going to say much, if anything, about institutional access, by which I mean food obtained through schools and work places, although these are obviously crucial for many people at different ages. (Partly because I don’t have time, but mostly because I those issues are covered by other speakers.) I want to conclude with a brief glance at the sort of initiatives and shifts that have been going on in the public and the voluntary sectors, leaving out the major retailing issues, again because of time and others covering them. I said just now that it’s always important to understand something about local circumstances, but having said that, I want to generalize a bit about who are likely to be the poorest within industrialized richer societies. Recent data from Europe shows that those who are poorer are more likely to be in households that contain women rather than men, children rather than parents, and lone parents rather than two parents. In other words, the gender gap gets worse as you get older, particularly if you live on your own. Recent data also suggest that those who are poor are more likely to be caring for other people, dependents of one kind or another. They may well be unemployed, or if they are working, they are living at or below minimum wages, on insecure jobs. The instability of family life has played a significant role in generating and maintaining poverty across Europe. And that has all kinds of implications for the way families operate, and particularly the way they manage food. There is also a large number of people who have come into the food welfare agenda over the last 10-20 years or more: migrant labourers, asylum seekers, and those who are homeless, whether rough sleepers or temporarily housed. These people often don’t figure in national survey data, and their conditions may well be worse than others’. In all European countries and also North America, Canada and U.S.A., Australia etc, there are social transfers, social systems in place to prevent destitution, which may or may not take account of food needs. They have very variable impact on household income.
Across Europe broadly, as we have seen, there is a difference between the proportion of income spent on food by income, by quartile/quintile/decile, whichever slice you take; but those who are poorest, they may spend a higher proportion of their income on food, but they spend less in absolute amounts, of course. These things are obvious, but can easily be overlooked: on low incomes ‘health’ factors are a lower priority in food choice. That doesn’t mean to say people don’t care about health, they do. But they don’t have the luxury to express that care. What is also clear is lowest income groups, as you might expect, spend much less on transport, recreation, leisure, health education, and they rely much more on State social services. Therefore, the levels of minimum wage and poverty cut-offs for access for social security are critically important for people on low income. Within Europe there is much more work being done, not just on income issues, but on inequalities and on the experience of exclusion, which includes food. For example, there have been a number of surveys which have used much more experiential evidence about poverty. People talk a lot about lacking basic necessities, of which, being able to have a family meal together, being able to celebrate festivals, is a part. So it’s not just about nutrients, it is about the pleasure in eating, what we were just hearing about, the hedonistic side of life, if you like. And poverty, as a lived experience, is a pretty miserable story in many parts of Europe. And just to highlight, of course, that many of those who are income poor are also time poor. They are very often indebted. They owe money to all kinds of people, including the State, and often to independent money lenders who charge very high interest rates, and who can be quite violent if they are not paid back. Such things have to be prioritized over food. And therefore, there is no space to try things out, to experiment. You can’t afford to get it wrong. So, what can we then say about food security and entitlement: access to food. In Europe this usually means buying food, for which people need enough money, that can be spent on food, and to be able to reach shops that stock the foods needed for health at affordable prices. But people also need an element of pleasure and self-respect, self-efficacy, to be able to enjoy the choice, of food appropriate for their own culture and group. The thing that is really difficult to measure is whether or not people are free from anxiety about whether they can eat properly. And yet if we are talking about entitlement food, which is used very much by the international community, then this sense of anxiety also has to be addressed. Since previous speakers have given an overview I will mention briefly relatively recent work in the UK about whether people had enough money for food, which is quite difficult to investigate. You can either

SESSION 5: What are the barriers to reaching the recommendations for F&V, in the context of obesity prevention?
EGEA 2007, Page 94
look at what people do, and we’ve seen some of that this morning, or you can ask people, ‘how is life? what do you spend money on?’ You can also ask, how much of various commodities do people need, and how much do they cost? This is a tricky issue because you’ve then got to match what people might want to do, with what scientists say they should do, to be healthy, and people aren’t machines, they don’t shop and eat according to a ‘least-cost diet’ program. If nonetheless you take a budget standards approach (which is used in many parts of Europe including the UK), the UK Family Budget Unit has costed the food that is needed to meet healthy diet guidelines. They’ve done it for different household sizes, and a major supermarket’s prices. The data I am showing in the figures were updated in 2001 from the original publication in 1999 (I apologize that these are not in euros). But the point I’m trying to make is a relative one. These data show how much money would be needed to buy a healthy diet for different sized families for a week – in theory (though the diets were in fact tested out by typical families).
enough money for food?• UK Family Budget Unit costed food to meet healthy
diet guidelines; supermarket prices, uprated Feb 2001(Parker et al, 1999, Family Budget Unit)
2-parent family lone parent family +2 children (10+4yrs) +2 children (10+4yrs) (1 p-t earner) £61.97 (p-t earner) £ 39.25(no earners) £57.88 (no earner) £ 35.16
• in practice, families in medium city local health projectspent ~ £30-£35 a week to feed 4 Dobson andKellard, (2000) Evaluation Saffron Food & Health Project, CRSP Loughborough University)
benefit rates: £162 (couple) £132 (lone parent)
At the same time, in a different study, families living in a medium-sized midlands city who attended a local health project were asked, ‘roughly how much do you spend on food a week?’ You can see the amount of money that these families actually spent was about half what they would technically need to have done, to be able to meet the healthy diet guidelines. And at the time this research was done, the social security benefit rates, you can see, were about £160 for a couple, and about £130 for lone parents. That would mean that a couple would in theory have to spend over a third of their income in order to meet healthy diet guidelines. And no parent can afford to do that. Or if they do, they will very rapidly find themselves thrown out of their home because they are not paying their rent, etc. The benefit rates were insufficient to enable a family of different sizes to spend enough money to buy food appropriate for health. Much the same was true of the minimum wage, at that time.
More recent work from LSHTM and others has used similar methods to look at the costs for an old-age pensioner to feed themselves healthily. A single person needs about £122 for all healthy living (including about £32 for food) and a couple about £192 a week (about £63 for food).
enough money for food?LSHTM/Age Concern/Zacchaeus Trust costed healthy living needs pensioners England April 2005:
• single: £122.70/week - £32.30 for food State Pension £82.05/week (£109.45 PCG)
• couple: £192.60/week - £63.70 for food State Pension £131.20/week (£167.05 PCG)
• recent work Greater London Authority calculated ‘living wage’ : £7.05/hour
The state pension at that time, including extra money for those with no other income source, was about £13-£25 below what is needed to live healthily – heating the house, reading a newspaper, eating properly etc. Research has also shown that however much people care about food and health, they tend to cut back on food if they are short of money –food is the flexible expenditure item. Finally, there has been recent work using the same kind of methodology, partly consensual budget standards, by the Greater London Authority, under the Mayor of London’s jurisdiction, calculating a ‘living wage’ as opposed to a ‘minimum wage’ – the former is higher. They and some pressure groups have persuaded some of the big City of London firms, particularly in Canary Wharf, to offer these living wages to their cleaners. Some of the richest companies in the City pay very low wages to the people who keep their offices clean, work in the lifts etc. What does food cost? We’ve seen quite a lot about prices today, including the fact of variation. I’m just going to show you a couple of data sets. A great deal of research has been done on this in Britain. Its quite hard to present the data in meaningful ways and to interpret it; I’m giving you a fairly crude presentation here (also, I forgot to put in any fruit and vegetables, for which apologies; the pattern is the same). Some work we did a few years ago in NW London, near the area of the map of distance to snack shops that Tim Lobstein showed. We did a census of all the shops in the area, with a list of ‘more’ or ‘less’, typical healthy foods that one would need (not a prescriptive list). The average of all shops in that area, about a 2-Km radius from a quite tough local authority housing estate, is shown, excluding garage forecourt shops and Off Licences, which are expensive. You can get the food very cheaply in a large local superstore, but if you couldn’t get to that shop but had to use a local

SESSION 5: What are the barriers to reaching the recommendations for F&V, in the context of obesity prevention?
EGEA 2007, Page 95
store, the right-hand column shows the prices you might have to pay, for exactly the same commodities. We’ve compared like for like here, this is not including ‘own’ brands. Baked beans or milk, for instance, are loss leaders: they are sold below cost price in supermarkets, to attract customers in. This is not to criticise shop practices, these are widespread and make economic sense to the retailers. But they make life very hard for those who juggle low incomes. Some more recent data (2001) are shown here from Martin White and his colleagues, funded by the Food Standards Agency in the UK, from a very large survey of the retail sector in Newcastle – it’s a very interesting study, with a huge amount of data. I’m just going to highlight from their very comprehensive report, some variation this time in fruits and vegetables, as well as a couple of other commodities that contribute to a healthy diet. The baked beans are still the same price, interestingly (these are quite high in salt and sugar, this particular brand). There was a great deal of variation, as you can see. On the left is the minimum price for which you could obtain that commodity in New- castle; then the maximum, then the median. These are astonishing differences in price. There are many ways of presenting these data which are discussed in the report. There was not only a lot of variation throughout the city between different types of stores, but also between branches of the same retailer. That isn’t peculiar to Newcastle, let me tell you, it’s a very common finding, particularly stores of different sizes but of the same branch. Now, of course, as White and his colleagues point out, people on the whole don’t buy individual items, they ‘go shopping’, they go to a supermarket and buy the food for the family for a week. So supposing we looked instead at a cost of a kind of basket of goods. I have put here 3 different kinds of the stores they investigated, with White’s construction of a ‘healthy’ basket and a ‘unhealthy’ basket. Some commodities were matched up, so there is ‘Weetabix’ as a cereal in the ‘healthy’ basket, and ‘Frosties’ in the ‘unhealthy’ basket.
variations in food pricesdata from shops in west London, 1999
cheapest
27p
57p
19p
18p
25p
9p
average of shops*
38p
82p
64p
49p
76p
30p
dearest
49p
£1.89
£1.29
89p
£1.02
59p
pt semi-skimmed
12 weetabix
500g pasta
lge sliced white loaf
lge sliced wh’meal
410g baked beans
*excluding garage forecourts, off-licences, newsagents; mean including these shops is higher. Donkin et al, 2000, Public Health Nutrition, 3, 31-38
And you can see here, again, there is a considerable variation in price for the same commodities in different types of stores; the cheapest is the discount store, which is much more likely to be found in the place where poorer people live. But many poor people also shopped at the convenience store. I should also point out that White and colleagues surveyed about 560 food shops throughout Newcastle. And 90% of the population surveyed shopped at multiples or discount stores, which were only 38 of the shops: 7%. Which gives you a sense of the power of those retailers. And I might also add that the ‘healthy’ basket median price was £20; Tesco’s median price was also £20, their cheapest £15, and their most expensive was £21.26, so there was quite a variation, even in the same large retailer within the same city, in the price of a basket of the same goods.
variations in food pricesdata from Newcastle (White et al, 2004, FSA)
cost in pence minimum maximum medianapples 40 253 108oranges 25 200 98tomatoes 30 306 121onions 20 358 59ss-milk 22 138 70baked bean 9 91 33
cost of ‘basket’ of goodscost in £ ‘multiple’ ‘discount’ ‘convenience’‘healthy’ basket 12.04 10.49 22.15‘less healthy’ 3.50 3.69 8.9410 fruit veg 7.53 7.16 14.38
Why does this matter? Well, the price is twice as high in the convenience stores as in the multiples, and as you saw the other day, in the data that Professor James showed from Sturm and Datar in the US, if you were to compare families with identical incomes and sociodemographic characteristics, living in 2 cities in the United States, BMI gain in kindergarten children would change depending on the price of fruit and vegetables where those children lived. I’ve already said that people on low incomes operate on a very tight budget. They don’t have much flexibility. This has led to a lot of statements about ‘food deserts’: places where there are too few shops in which people could buy healthy food at good prices without a car. However, this term has been quite contested in the last few years, not least by Cummins and McIntyre, who have shown by doing sample surveys (not censuses as we did), or using others’ data, across large cities, that the availability and price are no worse where poor people live in Glasgow, Brisbane, or New York State, than they are where richer people live. And what White and his

SESSION 5: What are the barriers to reaching the recommendations for F&V, in the context of obesity prevention?
EGEA 2007, Page 96
colleagues found in Newcastle (the study was specifically done to look at food deserts), was that, although there was a marked social pattern in the usage of stores, disadvantaged peoples tended to use local discount stores, which are usually very cheap; but they also used the convenience stores, which are more expensive. Poorer people were also more likely to use public transport than private cars; they also have much poorer ‘health knowledge’. But White et al also showed, as also did Ball and her colleagues in a recent study in Melbourne, that factors such as the type and density of store are not major predictors of the food patterns for either the majority of the population, or even low income areas. It is household factors which predict household dietary outcomes. This is quite a challenging finding to interpret. Although there are generally fewer shops in poorer areas (and White talks about this in some detail for Newcastle), there are, nonetheless, in many of the poorer areas, not only more minority ethnic food shops, there are also more freezer centres which tend to have slightly cheaper food, and green grocers. This isn’t universally true; it varies by city. What we also know is that small shops really struggle to survive. Retail factors have little independent role in predicting the healthiness of diets in Newcastle, but what is clear from both White’s findings and our own, is that small shops do struggle against the larger retailers. They particularly struggle because of the demise in wholesalers - places where they can obtain the fresh produce and other commodities they need to sell at reasonable prices to survive. There are many powerful maps in White et al’s report. For instance, roads colour-coded to show spatial proximity to shops which sell at least 5 out of 14 fruits and vegetables in Newcastle. ‘Red’ roads are less than 250m from such shops; ‘purple’ are less than 500m; most of the roads are coded red or blue (hence my comment). However, if you code roads showing proximity to shops selling more than 5 out of 14 fruit and vegetables, then the coverage is not so good. White and his colleagues also plotted travel vectors, driving vectors; these maps more or less disappear under black lines: most people travel by car to shop. So, we have to ask, what happens to the people who can’t travel by car? Our own work in Sandwell in the West Midlands documented a very similar sort of finding, shown in this next slide. At the top is a map showing roads (darker lines) that are within 500m of a shop selling food in general (also a shop which sells cigarettes, sweets, or fizzy drinks). Below is the map showing roads within 500m of a shop that sells at least 8 kinds of fresh fruit and vegetables, and where food is reasonably priced. The only places with marked roads now are the town centres – the shopping centres. So, although the general statements from Cummins and McIntyre and others may be true for large cities such as Glasgow or even Newcastle,
there are nonetheless urban areas where householders who do not have access to a car could not easily buy fruit and vegetables, whether reasonably priced or not. They would have to go to, and return from, the main town centres by public transport or taxi to be able even to buy fruit and vegetables. What is being done to counter this? I won’t say more about the retail side but will mention the voluntary sector, who either bypass or partner with the private sector, working through food cooperatives, shops, and cafés to try and address problems. I should say before I begin that I don’t think that this is the whole answer to low income. These can be very positive, but they work with a very tiny proportion of the population, and they struggle to survive. There is also example of the public sector working with local retailers. And increasingly, though I don’t have time to cover it at all today, there is a lot of quite interesting work going on in Britain, Italy, and in France on public procurement: providing for schools and hospitals from local producers rather than from the mainstream food retail systems. Local food initiatives with coops, cafés and so forth, as I said, despite their inability to reach large numbers of people, do engage and empower local communities. And the key to their success is local ownership and funding. [plays clip from video from Health Scotland, taken from food co-operative in S Scotland. information from http://www.communityfoodandhealth.org.uk/]
“[first voice – development worker]… we’re interested in talking poverty. We want to increase fruit and vegetables consumption. And it is improved. The knowledge of eating healthy, and how to cook and prepare it […]. There is going to be 6 tons of fruit and vegetables come through our warehouse a week. We get it, we get all those from the central delivery […], but we then deliver to them in the local food co-op and community owned shop. So it’s really handy too for the people who live in the area to come in, and get in and shop, and really cheap. You’d never do it if you had to go into the centre, you’d never get round to it, I wouldn’t. It’s not just the fruit and vegetables, there are also other factors with regeneration communities, so that the volunteering, and the skills and confidence-building, and so on, goes on. It all contributes to community cohesion and community identity, and a regeneration of communities like […].” There is a whole raft of food co-operatives that operate together, as you could see in the video, in a partnership. I want also to highlight, though, that the notion of buying local food is not just, as is often claimed, a ‘middle-class’ niche. Here is a picture of a farmer’s market in Bristol (part of our recent research funded by the Economic and Social

SESSION 5: What are the barriers to reaching the recommendations for F&V, in the context of obesity prevention?
EGEA 2007, Page 97
Research Council). Not particularly middle-class, but lots of people enjoying the pleasure of buying food. (This work has been written up elsewhere.) There is evidence that this shifts behaviour and gives pleasure. Building on the work that was going on in Sandwell, the mapping that I showed you, there have been ‘food interest groups’ with local people from quite a deprived area talking about what kinds of foods they want to be able to buy and use. There has also been small scale but systematic work to improve the local shops, and particularly their selling of fresh produce – to improve the display of fresh fruit and vegetables, to improve the sales (which it has done). So, to conclude, food access and availability are clearly fundamental structural issues. There is some
controversy over how they can be reliably identified and measured, and how the data can be interpreted. But clearly, access, which is about availability, price, the location of stores and how they are reached are fundamental for low income communities. Secondly, I’ve tried to show that the money to take part in society can’t be ignored. It comes back to whose responsibility these problems are: if the answer is always ‘change the way people think’, that puts the problem and the solution on the most vulnerable members of society, if you are talking about low income communities. There are some initiatives and new things being tried; these remain to be discussed later. Thank you for your attention.

SESSION 5: What are the barriers to reaching the recommendations for F&V, in the context of obesity prevention?
EGEA 2007, Page 98
Public initiatives to overcome barriers to dietary change
Adam DREWNOWSKI School of Public Health and Community Medicine, Director Center for Public Health Nutrition, and Exploratory
Center for Obesity Research, University of Washington, Seattle, USA
The next speaker really doesn’t need an introduction since he has appeared before you 2 or 3 times already. I will just remind you that Adam Drewnowski is a Professor of Epidemiology and Medicine at the University of Washington. His career and his life have been an odyssey. He was born in Poland, lived in the United Kingdom and Switzerland, and is now a resident in the United States. You will see in the abstract booklet that his biography is brief and very modest. If it was printed in full, it would weigh several kilograms. So I’ll ask Adam to present another talk. My presentation today will take the positive side. We’ve been talking about challenges and it’s now time to start talking about solutions. So I want to talk about public initiatives that promote fruit and vegetable consumption, and I will outline two such health initiatives. One from Washington State where I live, and one from Paris where I would like to live. And you will see that they correspond to each other exactly. I want to begin by emphasizing a few things. First of all, it is very important to have local data to justify public policy. All politics is local and research ought to be local, as well. In Washington State, policymakers say I don’t want to hear what’s happening in Texas, I don’t care what’s happening in Georgia, I want to know what’s happening in Washington State, county by county. Because only that allows me to go to legislature and get some money for interventions; for research; and for public health programs. So policymakers will respond to local data on obesity, diabetes, and childhood obesity; on fruit and vegetable consumption patterns, on access to food, prices, and even the impact of labelling and health claims. Seattle is considering legislation banning trans-fats. This is happening very much at the local level. Of course, Chicago bans foie gras, but this is another story. So in order to have this kind of effort, you need to build coalitions, and those coalitions typically involve researchers, that is to say a university, they involve public health authorities, public health agencies, and they also involve the local policymakers. So when you have three groups represented, you can move ahead. And let me stress here that what is very important is the presence of political will. You really do have to talk to policymakers.
So let’s start with the basic evaluation. Washington State data track United States major trends. As you see there, the prevalence of overweight within the State has been going up (Figure 1). The prevalence of obesity has been going up. What you see on the panel on the bottom right-hand side is that the data for the State and for the entire nation correspond to each other. These are data from the Washington State Behavioral Risk Factor study. This is a study of every state paid for and funded by the Centres for Disease Control, and it’s approximately 2,000 households per state, surveyed by telephone every year. Washington State pays extra to have more people tested than what the CDC pays for, and also Washington State geocodes the addresses of the respondents by postal code, by zip code. So because of that we have data for smaller geographic areas. These are data for Washington State. You see that the prevalence of obesity goes up with age and comes down as people get older, about the age of 70-75. On the right-hand side you see that the prevalence of obesity is higher among minorities, and then on the top right-hand side, you see the influence of income and then education. As income rates go up, obesity rates come down. And as education goes beyond high school into college, again, obesity rates come down. And those data are exactly the same as what we see for the United States. Those are data, as I say, at state level. We, of course, have data for obesity and diabetes at a finer geographic scale. In order to do that, we have collaborated both with the Epidemiology Evaluation Unit of the local health agency, Public Health - Seattle & King County. We have also collaborated with geographers and people at the School of Architecture and Urban Planning, because these days in obesity research, you talk to architects and transportation system analysts, more than to physicians, paediatricians, or metabolic scientists, because it has become a very interdisciplinary area of research. Because of our collaboration with architects and urban planners, we were able to get obesity data at the zip code level, and you saw some of those yesterday. What you see on the right-hand side is the same data for diabetes… Notice that the prevalence of obesity within the small geographic area of King County can vary from 5% in rich areas to about 32-35% in the poor areas, a disparity of 7 times, a 7-fold disparity, which is unheard of. What we have done is to look at the relationship between obesity rates and real estate

SESSION 5: What are the barriers to reaching the recommendations for F&V, in the context of obesity prevention?
EGEA 2007, Page 99
values, and this is actually interesting because socioeconomic status is measured, generally, in terms of education and income. In Europe, it is measured also in terms of occupation. My belief is that we ought to be looking at accumulated wealth, which is a much better index of socioeconomic position, than is income. And in the United States, perhaps here as well, property values, the value of one’s home, represent approximately half of accumulated wealth of the average American. So what we are seeing here is the contrast between the very rich and the very poor, and obesity rates follow it exactly. What you see on the next slide is the relationship between obesity and diabetes, those rates decline as property values go up. And what I have done here is a regression analysis, and if you continue the regression line, you can find out where it crosses the horizontal axis, that is the statistical point at which obesity rates, statistically, become zero. You are not at risk for being obese, you can eat anything you want, and you don’t have to be running 3 times a week, 30 miles a day. The magic value is your house has to be approximately $750,000. Probably nobody is obese in Paris these days, or London. The Washington State Behavioral Risk Factor Survey actually asks respondents by telephone about how often certain foods are eaten. They specify fruit juices, fruit, green salad, potatoes other than French fries, and carrots. And then they derive the composite measure from that. Again remember, how often an item is eaten is not exactly the same as the number of servings. This is a telephone measure of frequency, it is not necessarily a measure of amount. The questions are listed on the right side, and you see, again, they mention fruit juices, orange, grape, or tomato juice, other fruit, green salad, potatoes, carrots, and then other vegetables as well. These are again Washington State data just for Washington State residents, and notice the same exact trends obtained at the state level as at the national level. There is a huge age effect of the very type observed in France. Notice that produce consumption is lowest among young adults ages 25-34, and it dramatically increases as you go to the 55 and over, and 65 and over, so these are very much the same data as presented earlier on today (Figure 2). Then the consumption of vegetables and fruit goes up with education. Notice that college graduates consume several times more than people who never finished high school. And then of course, there is an early steep gradient with income, but not really as steep a grade as with age. So this is data for Washington State based on 2,000 people, correspond exactly to the French national data presented earlier on today. So again, the fruit and vegetable patterns in Washington State track the US trends, and again, just as in France, the consumption has been fairly stagnant since 1994. So again, we see similar trends,
similar patterns. And what you see on the right-hand side is, again, distribution by income and education. What I did in this slide was to plot fruit and vegetable consumption by county, and obesity rates by county (Figure 3). What you see on the left is a very nice negative relationship meaning that more fruit and more vegetables are consumed in counties which are least obese. The outlier county on the top left-hand side is San Juan County, that’s a very nice set of islands in Vancouver Sound, and maybe the consumption of fruit and vegetables is high because that is where the legal counsel of Dole Corporation has got his summer retreat. As you can imagine, income rates are extremely high. So is it really a question of money, is it a question of access? What is the major issue here? What we did here, we actually mapped the location of all food stores in King County. This was using geographic information systems, this was using information provided to us by Public Health in King County because they keep a list of all food establishments for inspection purposes. They are not supposed to give it out, but they did. So we mapped grocery stores and supermarkets, we mapped convenience stores, we mapped fast food restaurants, we mapped Starbuck’s, and we are just about in the process of mapping all of the farmer’s markets in Seattle-King County. I think we have about 26. And there is one point I want to mention, Seattle does not really have food deserts. What we found was that, in fact, lower income people live in closer proximity to all foods, including fast foods, of course, but also grocery stores, also ethnic markets, also ethnic restaurants, and so on. So this is now density of grocery stores in Seattle-King County, and notice that they distributed pretty much evenly throughout the entire area, with the highest concentration in areas of greater population density, that is to say, downtown and slightly north of the ship canal, the University is towards the top left-hand corner of the map. But when you look at convenience stores, they are again pretty much spread out throughout the city. On the other hand, fast foods are going to be downtown, but also in the lower central corridor because that is where more lower income people live. So there is a distribution which is not random throughout the space, it does follow both population density and to some extent, income. I think that this is well seen by this contrasting slide which shows you Starbuck’s and fast foods. So it’s interesting here that Starbuck’s sells a coffee latté which is 600-700 calories for $5 to the more affluent people in north Seattle, whereas, fast foods sell their 600 calories at much lower price, to the lower income people in south Seattle. But so far, Starbuck’s has not been

SESSION 5: What are the barriers to reaching the recommendations for F&V, in the context of obesity prevention?
EGEA 2007, Page 100
implicated in your obesity epidemic. It’s a question, again, of distribution and access, and you actually see this contrast very clearly with Starbuck’s and fast foods. You don’t really see it nearly as well with convenience stores, grocery stores, and markets and so on. So Seattle is not that segregated, it does not have food “deserts,” it is actually a reasonably wealthy city. This is the slide that people cite a lot. It is based on data from the United States Department of Agriculture showing that the price of vegetables and fruit has risen disproportionately relative to all other foods, whereas, sweetened beverages and sugars have held their price for the past 20 years and even now. The Washington State Health Department has been asking consumers whether or not they can access healthy foods, specifically vegetables and fruit in their local grocery store. And interestingly enough, most of them say yes. So the people respond that the fresh fruits and vegetables I can find are of high quality, that I can find brightly coloured fruits and vegetables, and that I can find fresh fruits and vegetables and salad ingredients, and also they respond “yes” to low fat dairy products, lean meats and fish, and so on. The cost is the 2nd bar graph here, only 40% say the cost of fruit and vegetables make it easy to include them in my diet. So cost is a bit of an issue, but it’s not a huge issue. Generally the response here is positive, fresh fruits and fresh vegetables are available to the average Seattle consumer. So we in Public Health Nutrition do have a statewide nutrition objective. We do want to increase the consumption of vegetables and fruit, we want to improve access by the average consumer to help promoting foods, and that means both physical access and economic access. The point I want to stress again, is that those measures are multiple broad-ranging measures, and they do require public policy initiatives at the local, or the state, or regional level. In other words, what we need is a state plan. Well, as luck would have it, we do have a state plan. So I’ll tell you how this state plan came to be. First of all, the State got money from Centres for Disease Control. And I’ll return to this point later on. The State did not advance any of its own money, it applied for money to the federal government which it then got. It was not a huge amount of money. The plan was then developed by the Washington State Department of Health in collaboration with the University of Washington. One advice, when you are developing a state plan, get yourself a huge, big nutrition and physical activity advisory board, which is now numerous, that no one person can be blamed for anything. This is a way of spreading the blame, and as you will see, it comes in very useful later on. So I have the privilege of being on this list, but I am by no means the only one, so don’t blame me. So
then you get input from researchers and health professionals. The State selected one community to implement. Notice the money was very limited, so it was only implemented in one community, it’s called Moses Lake, in the centre of the State. And then the 2nd community, this is being tested in Mt. Vernon. My preference was to implement in the San Juans, but no one listened to me. What’s important here is the Plan (Figure 4) is subject to regular evaluation to state and local level. Again, let me emphasize the need to “evaluate” what you are doing. People very often rush into interventions without fully evaluating the impact, so at the end you don’t know if it has been successful or not. So notice this is the formulation of the State Plan. First of all, it is focused on the obesity epidemic. Washington State health officer, Maxine Hays, says up front that “obesity and overweight is reaching nearly epidemic levels across the nation and in Washington State. This plan takes a bold step in addressing this crisis and related health conditions.” Well, bold, yes. But backed by budget? No. You have the vision, this is the vision of the Washington State Plan, you have indicators of epidemic, and then what I’ve just said, the Plan emphasizes building a strong foundation at the institutional, community, and policy levels to make it easier for individuals to choose healthy lifestyles. The notion of choice is still there, because in the United States, we insist on the notion of personal freedom, personal choice, and personal responsibility. But the idea here is to focus on the environment and make it easy for consumers to make those healthy choices. So the objectives of the State Plan are to increase access to health-promoting foods. The 2nd one is to reduce hunger and to put in security. And the 3rd major one is to increase the proportion of mothers who breast-feed their infants and toddlers. And then on the right-hand side are the physical activity objectives, again, about increasing access to recreational opportunities for physical activity for both children and for adults. We do have a theory-based model, this is a standard socio-ecological model which you have seen. The State indicated with a blue arrow as to where they see themselves. So, indeed, they are the ones in charge of the local, state, and federal policies. And then there is a logic model, which gives you inputs on the left, funds and guidance from the Centres for Disease Control, and Department of Health staff time and money. The various systems also include nongovernmental and community organizations. You take this alliance together and you bring it forward into a number of planned activities which include communication, partnering, technical assistance, development of materials, and so on. But also notice that this also includes legislation and policy development. So this is not just about community

SESSION 5: What are the barriers to reaching the recommendations for F&V, in the context of obesity prevention?
EGEA 2007, Page 101
organizations, this is also about going to legislature and trying to get some laws changed. And also there are some pilot programs specifically targeting vending in schools. And then we have development of local action plans, again at the localized community level, using some of these strategies. There is evaluation of short term outcomes, how is it working in the short term? This involves process evaluation, how people come together. Have they talked? Has anything come out of that? What is the next step? And then you have the intermediate outcomes, changes in policy, changes in the environment, improved physical activity, improved dietary behaviour. And the longer term outcome is decreased obesity. I think we are still right in the middle of this chart, we have not decreased obesity in the State of Washington, but this is the plan, this is the set of shorter term and longer term targets, and the set of outcomes. Let me just point to some similarities with some other plans. Here we have increasing the consumption of vegetables and fruit, both at the community level, and at the work place, also in schools. We have hunger and food, and food insecurity issues, and we have breast-feeding. Notice that access to healthy foods is very important. The idea is to have whole grain foods available in local grocery stores, also low fat milk, also lean meat and fish, also fresh fruits and vegetables. They mention here both affordable and high quality. So those specific things are in the State Plan. Fresh, brightly coloured, affordable, and high quality. So these are all good things they mention in the State Plan. These are now plans for work sites. Again, the plan is to have low fat milk, fresh fruit and vegetables, water, 100% juices and low fat snacks available in cafeterias. Also in vending machines. Such foods ought to be labelled as healthy in order for promotion. And there are also recommendations for policies for healthy foods in meetings, place for employees to sit, and so on, in the work place. Notice there are also things here about the breast-feeding and physical activity which I’m not going in to. I will move on to schools, and the plan here is to promote healthy foods and beverages in schools. Again, focusing on low fat milk, fresh fruits and vegetables, water, juice, and low fat snacks. And the idea is that each school district will adopt, implement, and evaluate its own nutrition policy. That is actually a bit of a disadvantage because if every school district has its own policy, those policies are never the same, so actually we are now working at coordinating it at the state, or maybe even the regional level, and we are actually talking a bit to the State of California which is, you know, sometimes people don’t like to do that.
So we are looking at here the nutritional objectives and priority recommendations. And now, I want to move to other types of plans which are, in fact, remarkably similar. For example, this is the almost literal translation of the Washington State Plan. “A good consumption of fruit and vegetables for all. Improving the foods on offer in educational institutions, having a specific focus on disadvantaged populations in terms of food and nutrition, promoting breastfeeding and reinforcing local actions and linkd between the national, ragional and local levels”. And this is almost word-for-word by coincidence, the same as Washington State Plan. I say by coincidence because those very phrases are then elaborated further in the Plan. “In terms of the nutrition prevention action plan the government has decided to take on childhood and adult obesity by mobilising concerned actors”. I couldn’t have said it better myself. You know exactly where this is coming from, this iwording is exactly the same as the Washington State Plan and it was arrived at completely independently by the people in Paris. And notice that one plan morphs very easily into the other plan, because the ideas and the constructs, and the idea of synergy among the various stakeholders, are in fact, exactly the same. I will not go through the details of the various proposals, but in fact, they are pretty much exactly the same as the ones in the Washington State Plan, because we are looking here at access, we are looking at cost, we are looking at affordability, we are looking at “la facilité”, exactly what we have been talking about. So we are really talking about the idea of cost, and quality, and pleasure in the taste and so on. And these are the exact same ideas as in State of Washington, the same thing exact applies to the schools. But there is one difference between the Washington State Plan and the French PNNS And of course, that difference is the point of controversy. And that point, of course, is money. The Washington State Plan is supported by everybody precisely because it makes no demands on a budget. Everyone agrees it’s a good idea because it does not drain the State budget. There is some money coming from the CDC, but the State has not really at this point—we hope that it will—apportioned any money to actually implement this throughout this State. The basic implementation grant from Centre for Disease Control will cover one community, Mt. Vernon, it is not sufficient to implement this for the entire State. So everyone is in favour of this plan because, in a word, it costs them nothing. On the other hand, from what I understand, the French plan has been extremely controversial

SESSION 5: What are the barriers to reaching the recommendations for F&V, in the context of obesity prevention?
EGEA 2007, Page 102
because of very specific ideas about how this money was going to be collected, taxed, apportioned, administered, spent, and so on. And so the moment you do that, you again run into a controversy. There are probably ways around that, and this is where we need to talk later on this afternoon to various policymakers, and a fiscal specialist, and a budget-control specialist, and an economist, and so on. Because in nutrition and public health, you can take work up to a certain point, but beyond that, you really do need to talk to the Minister of Agriculture and other people like that. So what I want to conclude here is the following. Yes, there are barriers, social and economic, to the adoption of healthier diets by all members of the
community. I want to stress that many of those barriers are beyond individual control. We must make it easier for individuals to make the right choices. Those measures probably need to involve policy change. Actually, I should be more direct, I should say those initiatives will have to involve policy change, because we cannot depend on the motivation, or the good will, or the efforts of the individual. This will require community and organization and support for policy action. This will involve political will. And as always, the questions of the budget and money to pay for it will be crucial. And I hope that you will address those this afternoon. Thank you.
Obesity Prevalence, Adults age 18 and older, Washington and the United States, 1990-2005
5
7
9
11
13
15
17
19
21
23
25
1990
1991
1992
1993
1994
1995
1996
1997
1998
1999
2000
2001
2002
2003
2004
2005
Year
Perc
ent
WAHP2010USA
Data Source: Washington Behavioral Risk Factor Surveillance System, 1990-2005, Age-adjusted to the U.S. standard population; crude rates for the US from http://apps.nccd.c
Figure 1. Rising prevalence of obesity in WA state and in the US. Healthy People 2010 (HP2010) goals on graph
Prevalence of eating fruits and vegetables 5+ times per day
WA State and US, BRFSS 1994 - 2005
15
20
25
30
1994
1996
1998
2000
2002
2003
2005
Age
-Adj
uste
dPe
rcen
t
WA US
R2 = 0.39
10
15
20
25
30
35
10 15 20 25 30 35Obesity rate by county (BRFSS 2003-2005)
Perc
ent"
EatF
+V5+
times
/day
"
Figure 2. Prevalence of fruit and vegetable consumption in WA State, Data from WA State BRFSS supplied by the Department of Health
Figure 3. Prevalence of fruit and vegetable consumption and obesity rates in WA State, Data from WA State BRFSS supplied by the Department of Health

SESSION 5: What are the barriers to reaching the recommendations for F&V, in the context of obesity prevention?
EGEA 2007, Page 103
Q&A Q: In France the French Plan for Nutrition and Health is not accompanied by a food and nutrition policy which responds to the situation where foods on offer in supermarkets are always the same. Recommendations are not sufficient. I am under the impression that you have exactly the same problems in the United States thus how can we change what is on offer in supermarkets? A: The point made was that the French Plan for Nutrition and Health was not really accompanied by a change in food and agricultural policy, and as a result, the type of foods in supermarkets and grocery stores are exactly the same as before. That is a very good point. It is a very difficult point to deal with. In the United States we have some hope for the Farm Bill which will be voted on sometime this year, and the Farm Bill takes into account not only agricultural subsidies, but also support for nutrition programs, support for schools’ nutrition, and other nutrition initiatives, all coming up for a vote later this year. So we are at least hoping for some degree of change because of that. I’m not sure what the French legislature situation regarding agricultural subsidies, but they now involve more than France and the European Union, and I’m not an expert on that. But I would say, as I said before, that those behavioural and public health measures really do have to be followed by agricultural policy, yes.
Q: You were saying Mr Drewnowski that in order to remove obstacles we have to have a common understanding, and we all agree on this principle. I wonder about two points on previous interventions: the way to link everything said here, and I have a question on the previous vision which was one to link low income and poor nutrition. Isn’t the first problem the issue of low income which should be addressed before linking it to fruit and vegetable consumption; producers of fruit and vegetables are probably supportive of developing strategies to address this collectively.
The second question that I ask myself has to do with the importance of price and the ideal of free products, though there is always someone paying at some stage. And this notion makes me think of the indispensable added value and sustainable economy. When I speak of price I think of perceived vs. real prices, to the comparison we make with other foods, to the intrinsic value of foods, the cost of production, the dietary value and then at each stage of the market process, added value, the analysis of value, and so forth. I think it would be worth carrying out in depth analyses of all of these factors before focusing on the issue of price, which is relatively higher as it grew relatively faster while others fell. This might be explained by the relatively higher manpower needed in the production of fresh produce. It was Paul Eluard who suggested that things transform themselves according to the way I look at them. I propose that we carry out a communal task force on accessibility in order to address all of these problems and to assign them a relative value.
A: Thank you for the comment. I’m going to just deal very briefly with the comment which had to do with the value of fruit and vegetables, and the relatively high cost of producing them. I would say what I said yesterday, and that is that fruits and vegetables produce a very good nutrient package which is very affordable for the consumer. And so the relatively higher cost, in terms of calories, is perfectly justified. I agree that in many cases, the perceived barrier of the high cost of fruits and vegetables is more perceived than real. But that perception, again, varies as a function of socioeconomic status.
There was a study just recently published showing that the perceived barrier was of food costs was pretty much zero for middle-class people, and very apparent for lower income people. Consumption is stratified by socioeconomic status, whether or not people view this as a barrier. I would absolutely support the idea of having a task force to investigate this question in greater detail, and again, I would stress the need to bring together public health interventionists with economists, and also with agriculture specialists and with policymakers. Because we can only succeed if there is a great coalition driving this point forward.
Q: Yes, about agriculture policy, we were told some hours ago about surprise about the cost of the distraction, as Bruce Ames said, the distraction about residue. There is another problem nobody told about. It’s about fear, fear of pesticides, fear of the residue. Residue is not only a sanitary question, it’s not only a question of cost of distraction, it’s also a question of fear. I mean, I will ask this question simply: Does Greenpeace want German people obese? Okay? And can we get people to understand that there is no problem, really, about residues?
A: Okay, I can’t speak for Greenpeace, and I wouldn’t presume to. I would say that the fear, when it comes to the average American consumer is not so much a fear of pesticides when it comes to fruit, it really is a kind of dual fear that it won’t taste good, and it will spoil fast. Those are like the major issues for the consumer. I don’t think that pesticide residue on fruit is a major concern of the American consumer right now. This could change, but for now, it’s important to understand consumer opinions and impressions, that’s exactly correct.
Adam, thank you very much. Colleagues, I sense that we are getting on to political issues which will be dealt with this afternoon. It’s been an outstanding morning in this Conference, I’d like to thank all of the speakers.

SESSION 6: POLICIES AND POLITICAL COMMITMENTS TO INCREASE F&V CONSUMPTION WITHIN AN OBESITY PREVENTION STRATEGY
EGEA 2007, Page 104
ROUND TABLE
The Challenges to Increase F & V Consumption
Chaired by Tim LANG Professor of Food Policy, Centre for Food Policy, London, UK
Session organized in coordination with the EU platform for diet, physical activity and health
Panellists and tasks:
Lars Hoelgaard Encouraging consumption of fruit & vegetables - how can the CAP (Common Agricultural Policy) contribute?
Antonio di Giulio
F&V consumption and research
Robert Madelin Role of F&V strategies within a comprehensive nutrition and physical activity approach at European level
Beatrice Patrie Subsidies for F&V producers
Pilar Rodriguez Iglesias F&V and health claims
Philip James Governmental actions to increase vegetable and fruit consumption
Jim Murray: European Consumer’s organisation
Liselotte Schafer Elinder: Social marketing strategies to increase fruit and vegetable consumption (or "What is being done to increase F&V in Sweden")
François Laffitte Taste aspects of F&V
Rozenn Marechal Accessibility of F&V through vending machines
Bernard Bruyere Availability and marketing strategies to promote F&V
Laurence Swan Freshfel Europe

SESSION 6: POLICIES AND POLITICAL COMMITMENTS TO INCREASE F&V CONSUMPTION WITHIN AN OBESITY PREVENTION STRATEGY
EGEA 2007, Page 105
������������ ��������������������������� ����������������������������
Lars HOELGAARD ���������������� �����!������������� ��!������������� �������������������"�#�����
��$�������!�%�� �� !�%��������
Reform of Fruit & Vegetables sector - general objective: The goal intake of fruit and vegetables in a healthy diet is set at a minimum of 400 g per day by the WHO/FAO. This threshold is only reached at the moment by a small group of Member states. What are the instruments of the F&V reform? First, POs will continue to be able to include generic promotion and promotion of POs' brands in their Operational Programs, and OPs will have to include an action targeted at promoting consumption of F&V by young consumers. Then, under crisis management, promotion and communication are eligible measures for funding by OPs; market withdrawals, which are 100% EU co-financed, can be distributed in the EU for free also to schools and public education institutions and children's holiday camps. Finally there are horizontal measures: Council Regulation (EC) No 2826/2000 is being amended in order to increase the EU co-financing rate to 60% in the case where the promotion of F&V is targeted towards young consumers. The indicative ceiling for expenditure to promote fresh F&V is raised from 4 to 10 Mio€ In terms of the EU co-financed promotion of fruit & vegetables, the principles of EU promotion policy on the internal market are to be maintained. These principles refer to the following:
• Generic information and promotion of European agricultural products
• Measures shall not favour particular brand names or product origins
• Messages on product characteristics and general themes: quality, nutritional value, safety, traceability, production methods, product image.
• Close consultation with SANCO on products and messages.
Moreover, the main messages for the promotion of fresh F&V on the internal market are to remain as follows:
• To promote a “Five-a-day” approach (recommendation of at least five servings of fruit and/or vegetables per day);
• The products are natural and fresh;
• Quality of fresh F&V (safety, nutritional value and taste, production methods, etc.) produced in the EU;
• Enjoyment;
• Balanced diet;
• Variety and seasonal nature of the supply of fresh products;
• Traceability; and
• Accessibility and ease of preparation as many F&V require no cooking.
Figure 1 shows the EU contributions to internal market promotion by sector programmes (2002-2007), with fresh fruit and vegetables accounting for 29%, by far the largest category. This corresponds to M € 57,3.
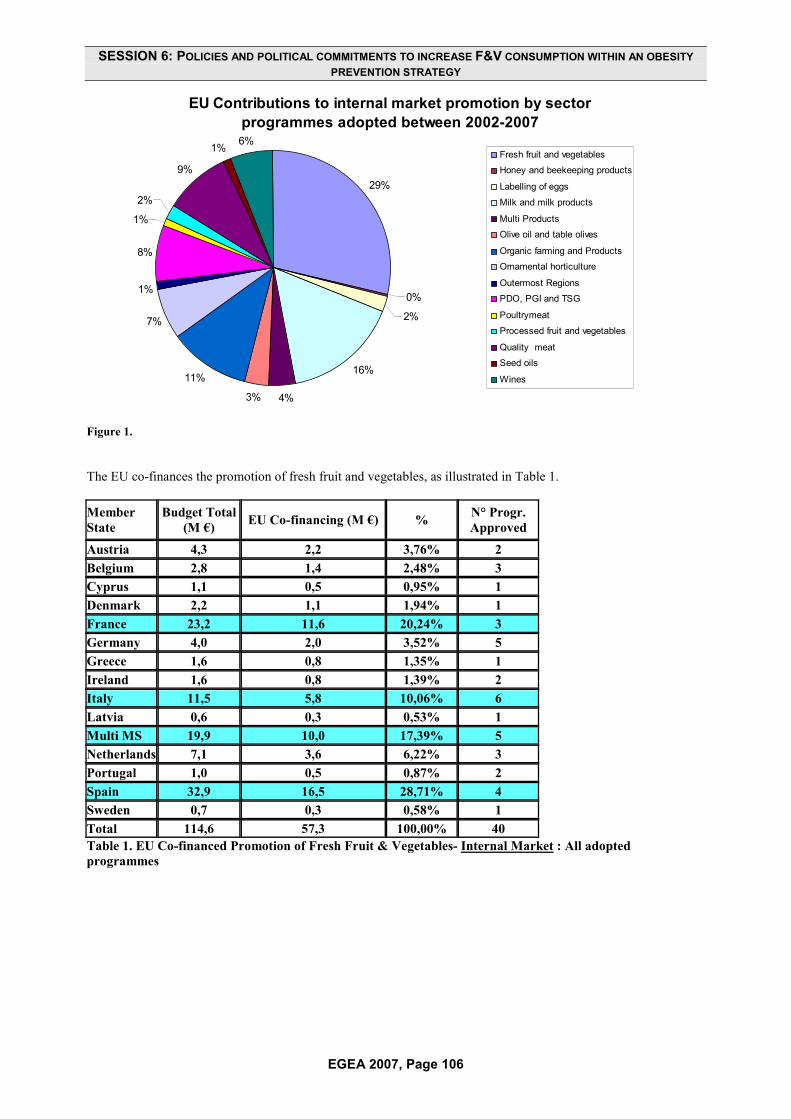
SESSION 6: POLICIES AND POLITICAL COMMITMENTS TO INCREASE F&V CONSUMPTION WITHIN AN OBESITY PREVENTION STRATEGY
EGEA 2007, Page 106
EU Contributions to internal market promotion by sector programmes adopted between 2002-2007
29%
0%
2%
16%
4%3%
11%
7%
1%
8%
1%
2%
9%
1% 6%Fresh fruit and vegetables
Honey and beekeeping products
Labelling of eggs
Milk and milk products
Multi Products
Olive oil and table olives
Organic farming and Products
Ornamental horticulture
Outermost Regions
PDO, PGI and TSG
Poultrymeat
Processed fruit and vegetables
Quality meat
Seed oils
Wines
Figure 1.
The EU co-finances the promotion of fresh fruit and vegetables, as illustrated in Table 1. Member State
Budget Total (M €) EU Co-financing (M €) % N° Progr.
Approved
Austria 4,3 2,2 3,76% 2Belgium 2,8 1,4 2,48% 3Cyprus 1,1 0,5 0,95% 1Denmark 2,2 1,1 1,94% 1France 23,2 11,6 20,24% 3Germany 4,0 2,0 3,52% 5Greece 1,6 0,8 1,35% 1Ireland 1,6 0,8 1,39% 2Italy 11,5 5,8 10,06% 6Latvia 0,6 0,3 0,53% 1Multi MS 19,9 10,0 17,39% 5Netherlands 7,1 3,6 6,22% 3Portugal 1,0 0,5 0,87% 2Spain 32,9 16,5 28,71% 4Sweden 0,7 0,3 0,58% 1Total 114,6 57,3 100,00% 40 Table 1. EU Co-financed Promotion of Fresh Fruit & Vegetables- Internal Market : All adopted programmes

SESSION 6: POLICIES AND POLITICAL COMMITMENTS TO INCREASE F&V CONSUMPTION WITHIN AN OBESITY PREVENTION STRATEGY
EGEA 2007, Page 107
In summary, options for change are proposed:
1. In terms of operational programs:
a. If a promotional program is included, there must be a focus on young consumers
b. Promotional actions targeted at young consumers are 60% EU co-financed
2. In terms of free distribution:
a. Schools, public educational institutions and children’s holiday camps are eligible
To exemplify the above and as a conclusion, two case studies are outlined below: Case study 1: School milk scheme
• The annual budget of this programme is approximately M € 63;
• Total quantity 274.000 tonnes p.a.
• In 2004/2005, scheme implemented in 23 Member states
• However there are no EU data on impact on target group;
• Legal base is currently under review.
Case study 2: Food Dudes
• This programme was developed at the University of Bangor, Wales;
• Pilot projects have been carried out in UK and Ireland since 2005;
• In Ireland, M € 1.2 budget (50 EU : 20 IE : 30 Trade) has been made available for 150 schools over a three year period;
• This programme is supported by the EC under Commission regulation 2826/2000;
• In Ireland as of April 2007, it was available to all primary schools (4 to 6 years old) due to an additional M € 4 per annum allocated via EC-approved state aid.

SESSION 6: POLICIES AND POLITICAL COMMITMENTS TO INCREASE F&V CONSUMPTION WITHIN AN OBESITY PREVENTION STRATEGY
EGEA 2007, Page 108
Food and Vegetables consumption and Research Antonio DI GIULIO
���"��������&��������"!���������"�'���(����!������������� ��!����� ���#� ������������������ �����!�%�� �� !�%�������
�
Scientific research supports the important relationship between diet, lifestyle and health. In this vein, DG RTD promotes European research on the following areas: 1) Protective effects of bioactive compounds contained in F&V against obesity, CVD, cancer; 2) Understanding of consumer attitudes/behaviour and determinants of food choices to ensure that the healthy choice for the consumers becomes the easy choice; 3) Determinants of obesity i.e. genetic factors (biological predisposition, interaction gene-nutrient, early nutritional programming) and environmental factors (dietary habits, lifestyle, physical activity, cultural, social,…). What evidence has come out of DG Research funded projects? 1) Protective effects of bioactive compounds contained in F&V, namely a) Consumption of F&V contributes to a balanced diet and an increase of their consumption will help to reduce the energy intake thanks to their low content in calorie and to protect against diseases because of their profile rich in nutrients such as carotenoids, vitamin C, vitamin E, folates, polyphenols and flavonoids. Projects such as FLORA, FLAVO, COS, LYCOCARD, ISAFRUIT are examples of projects supporting this research area. 2) The use of pharmaceutical supplements is very often used to overcome the malnutrition. However, studies have demonstrated that certain micronutrients (vitamins) do not have the same protective effect against cancer when used as supplement than when it is available in a diet rich in F&V. 3) Media, advertisement, availability, the few ready-to-eat form of F&V, lack of information influence consumers attitudes/behaviours and their food choices (ISAFRUIT, PROCHILDREN (see Figure 1), HELENA, IDEFICS). 4) Determinants of obesity namely a) high intake of energy dense foods and
sedentary lifestyle are the factors underlying the onset of obesity, b) Evidences of the early programming on obesity, cardiovascular diseases, immune function, bone health (EU childhood obesity, EARNEST), c) Scientists estimate that 40-70% of the variation in fat mass between individuals is determined by genetic factors (NUGENOB, DIOGENES, DIABESITY); d) Obesogenic environment with alterations of behaviour, unhealthy dietary habits and low physical activity play an important role on the obesity prevalence and determine the expression of genes in individuals (IDEFICS, HELENA); e) Intake of F&V for 11 year-old in Europe below the WHO recommended goals of 400g/day. The FP7 offers research opportunities to promote F&V consumption and to prevent obesity on the following areas: 1) Mechanisms of action of bioactive compounds contained in F&V against diseases; 2) Mechanisms of interaction between diet, genes and environment; 3) Cognitive sciences for a better understanding of the consumer perception, behaviour/attitudes and preferences (taste, texture, smell, packaging, etc) toward food and to identify the determinants of the food choice in order to modify them; and 4) Development of products (e.g. reformulation, preservation) offering a variety of attractive products. Research to link health to nutrients, food and diet, and to make the translation of nutrient requirements into food-based dietary guidelines in taking into account the regional, cultural and social dietary habits. This will provide guidance on contribution of foods to overall diet

SESSION 6: POLICIES AND POLITICAL COMMITMENTS TO INCREASE F&V CONSUMPTION WITHIN AN OBESITY PREVENTION STRATEGY
EGEA 2007, Page 109
Figure 2. Mean consumption of vegetables shown as subgroups and total (g/day) Source: Prochildren EU project published in Ann.Nutr. Metab. 2005; 49:236-245. A. Yngve at al. Information EU research: http://europa.eu.int/comm/researchSeventh Framework Programme: http://europa.eu.int/comm/research/future/index_en.cfmInformation on research programmes and projects: http://www.cordis.luRTD info magazine: http://europa.eu.int/comm/research/rtdinfo/Information requests: [email protected]

SESSION 6: Policies and political commitments to increase F&V consumption within an obesity prevention strategy: ROUND TABLE
EGEA 2007, Page 110
Role of F&V strategies within a comprehensive
Nutrition and Physical Activity approach Robert MADELIN
Director-General for Health and Consumer Protection (DG SANCO), European Commission, Brussels, Belgium
Improve population diet and physical activity levels
Increase consumption of fruit and vegetables
How?
Includes
Figure 1. What are our goals?
Increase consumption of fruit and vegetables
How?
EU added value?
EU competence?
Can the EU positively influence the actions of other stakeholders?
Can it target priority groups (children and lower SE categories)?
Figure 2. Criteria for EU action
Role of the White Paper 1) Bring together all existing Community actions into comprehensive strategic framework
• SANCO actions (regulatory, 1) stakeholder initiatives, projects)
• AGRI, RTD, EUROSTAT, EAC etc 2) Make proposals for future actions based on Community competence 3) Propose how Community can support
• Member States • Other stakeholders (industry, NGO etc) to
act
Some guiding principles Actions should
• Seek to improve diet and physical activity levels across whole population
• Contribute to shaping the environment into one which supports individual decision-making
An emphasis on • a global, comprehensive approach • building effective partnerships • stronger monitoring (overall indicators such
as obesity prevalence, and continuous monitoring of what works)

SESSION 6: Policies and political commitments to increase F&V consumption within an obesity prevention strategy: ROUND TABLE
EGEA 2007, Page 111
Fruits & Vegetables and Health Claims Pilar RODRÍGUEZ IGLESIAS
���"����&�����������������"��� !���)��*�����������"�)���������������+!������!�,������
This presentation briefly discusses regulation on nutrition and health claims made on foods, scientific substantiation of health claims by EFSA and authorisation of health claims by risk managers. The EC Regulation No 1924/2006 on Nutrition and Health Claims made on foods has as its key objectives the harmonisation of national provisions on claims (internal market) keeping high level of consumer protection in mind, and information and communication of truthful messages. A key aspect is scientific substantiation of claims. The mission of EFSA is to provide scientific advice and scientific and technical support for the Community’s legislation and policies in all fields which have a direct or indirect impact on food and feed safety, including nutrition ; a high level of scientific excellence, independence and transparency ; and risk communication.
EFSA’s tasks in terms of the Regulation (EC) No 1924/2006 include addressing nutrient profiles (Article 4) ; substantiation of health claims i.e. “function” claims (Article 13) (related to growth, development and functions of the body, psychological & behavioural functions, and slimming, weight-control, sense of hunger, and energy from diet) and reduction of disease risk claims and claims on children’s development & health (Article 14). Other relevant articles include Articles 8, 18, 24 & 28. According to Regulation (EC) No 1924/2006, ‘health claim’ is defined as “Any claim that states, suggests or implies that a relationship exists between a food (e.g. F&V) and health (e.g. bowel function.” Reduction of disease risk claims is defined as “Any health claim that states, suggests or implies that the consumption of a food (e.g. F&V) significantly reduces a risk factor (e.g. faecal bulk and bowel movement) in the development of a human disease (e.g. colon cancer)”

SESSION 6: Policies and political commitments to increase F&V consumption within an obesity prevention strategy: ROUND TABLE
EGEA 2007, Page 112
Governmental actions to increase vegetable and fruit consumption WPT JAMES
Chairman of the International Obesity TaskForce (IOTF), LSHTM & IOTF/IASO, London, UK
Good afternoon, I’ve been asked to talk about the science and take the big picture. I’m always accused of being diplomatic, so I’ll try and overcome that approach. The first thing that I’d like to say is everybody is obsessed, despite the evidence, with the idea that consumer choice dominates the whole pattern of consumption across Europe. The evidence for this idea has been overwhelmingly refuted, looked at repeatedly. It just is not true. And the critical determinacy of a population's consumption pattern which we’ve all discussed for 2 days, is crudely stated all down to three critical features of food: its price, availability, and marketing. We have to recognize that in Europe agriculture has been brilliantly successful since World War II. Having been involved in directing a large institute of agriculture research for nearly 20 years, and involved in agriculture policy, I know the basis for the whole development of funding for agriculture in the EU, and it’s been fantastically successful. Because my predecessors said that everybody should eat more meat, fat, butter, and sugar that is exactly what happened. It was accepted that the odd bit of vegetable and fruit that could be consumed to avoid vitamin deficiency so there seemed little need to support this sector . So I think that we have to understand that we’ve actually got into a state where we’ve neglected the modern science relating food and health. I highlight poor breast-feeding rates, poor weaning practices, and other features of the "obesogenic" toxic environment which we have systematically, conjointly, helped to induce. We actually have a big problem in Europe because we don’t actually have a coherent public health system. So we are in danger of relying on political gimmicks to solve our health problems. We go for immediate, special marketing and health education approaches without recognizing the sheer breadth and depth of the strategy that’s going to be needed to overcome the extraordinary change in our food systems and physical environment that we have induced in Europe. So the keys to success unfortunately involve huge industrial interests which are entirely legitimate in a modern market economy. But we now have to understand how to invoke and help to get the industrialist on our side. I was asked to produce 5 measures. I think that if you want to make a real difference, then I propose the Finnish policy of providing vegetables and fruit free as an intrinsic proponent to the cost of a meal. Second, I think we
ought to recognize the latest scientific analyses of children’s behaviour: they need to live in a “controlled” environment with good food and appropriate physical activity where they get the correct messages and nothing else from industrial or other sources. We ought then to ensure that government funding should guarantee high quality foods in all food outlets supported by public money and they should automatically set standards for the whole public sector. This does not currently happen. Local food production supplied to guaranteed markets e.g. schools/local government could transform the well being of farmers. If you look at the agricultural development across Europe, we could have done much better. But we concentrated, as we all know full well on the wrong policies. And we need to admit that we got it wrong. Price differentials have been shown to make a difference. And we haven’t really understood the importance of price differentials. So price, availability and marketing have been shown to make a difference. A trebling of vegetal intake occurred in Finland: the biggest dietary change of a total population at a speed never seen outside wartime, on the basis of policies tackling price availability and marketing. Even children respond when fruit is cheaper to buy.. Local production, can bring you get a win-win for both health and agriculture as shown in Chile where the epidemic of childhood obesity went on increasing until for the same government funding to preschools and schools local farmers produced vegetables, frit and other quality food for local schools with an arrest and now the beginning of a reversal of the epidemic. The Danish Food and Resources Economic Research Institute has shown that in Denmark anyway if the price of different foods change then there is a market flexibility in response to price change. Increase the cost of fat and sugar, decrease the cost of fruits and vegetables, and the people who benefit most are the disadvantaged. I think we have to understand that we have to change the whole way that we think. We have to understand that no country in Europe can afford the medical costs of what’s going on. And until the health sector begins to challenge the rest of the EU sectors on economic issues, we are not going to change our policies.. The idea that the EU treaties relating to public health have been implemented is not true. In the Three Wise Men report that I was privileged to write with two other members of the top scientific committee of Europe, we proposed a Food and Public Health Authority. Everybody threw out the public health because they thought it was unimportant. And the European Parliament stupidly

SESSION 6: Policies and political commitments to increase F&V consumption within an obesity prevention strategy: ROUND TABLE
EGEA 2007, Page 113
changed the food "standards" concept to "food safety" because they did not understand the real challenges to health. The challenges to health that we’re describing because of the quality of our food are 100 to 1,000 times more important than the burden and costs of poor food safety. That’s the evidence. So we have to develop a proper structure for public health. We need to actually have the European
Parliament educated: they are currently pretty hopeless and have very poor and limited technical input. This needs to be rectified. And the public disillusion with the role of the Commission which disaffects the whole EU could be changed if we persuaded the Commission take, consumer affairs and public health as a priority? We might even then make the EU Commission the best friend of the people of Europe. Thank you very much.
Vegetables (kg/hd/wk)
0
0.4
0.8
1.2
1970 1980 1990
Denmark
Finland
020406080
100
Average School 1urban
School 2Suburban
Baseline 1Low priceBaseline 2
Fruit Sales as a Function of PriceFruit Sales as a Function of Price
Average vs each school
French et al, 1997
Average vs each school
French et al, 1997
Mea
nw
eekl
yfr
uits
ales
School feeding makes children obese
Chile: policy changes favour local Chile: policy changes favour local agriculture agriculture -- prevent obesityprevent obesity
0
5
10
15
20
25
1992 2000 2004
M archNovember
%
School feeding makes children obese!
New school feeding programme reversing obesity
Finnish meals with "free" vegetables /salad bars
Denmark: manipulating prices can Denmark: manipulating prices can selectively benefit the poorselectively benefit the poor
Smed S & Denver S. Food & Resource Economics Ints. KVL Univ., Denmark, April 2005.
-20
0
20
40
60 % Intake changesSaturated fat
Sugar
Fibres
1 2 3 4 5SOCIAL CLASSSOCIAL CLASS
RICH POOR
Figure 1. Evidence for actions proposed
SESSION 6: Policies and political commitments to increase F&V consumption within an obesity prevention strategy: ROUND TABLE
EGEA 2007, Page 114
Jim MURRAY
BEUC, European Consumer’s Organisation, %�� �� !�%������
Thanks for the invitation, my apologies because I have to go before the absolute end of the session. I want to show a little bit of the approach which BEUC is taking in this area. I don’t pretend to have the full answer. As to who we are, we are a federation of consumer organizations, and our only job is to try to influence the decision-making process at the European level. Now here is a quote which, if you haven’t seen before, you won’t guess who it came from. “Obesity is the terror within. Unless we do something about it, it will dwarf 9-11 or any other terrorist attempt.” In fact, it was the U.S. Surgeon General, a military doctor, a former naval doctor who said this. He was talking to a military audience about the problems of maintaining an army in the field, because even among those who want to join the U.S. Army--and I can think of reasons why some people might not want to, - but among those who do want to, there are huge problems of obesity, as there are problems of obesity in the police services, and the fire services, and so on. So even for those who say obesity is just a problem for people who don’t look after themselves, we can see there is a wider issue. We all need to be able to have a police force, and fire brigades and other services even if we, ourselves, are only concerned about our own health. Now this looks as if I’m disagreeing with Philip James, but I am not. I can’t even remember occasions when I’ve disagreed with Philip, as it happens. But I acknowledge the point that a key aspect in any diet is what people decide or chose to eat. But of course, the question is what influences those choices? And this is the role, our role, as a consumer organization. We don’t promote physical activity, we don’t do other things that might help to combat obesity but we are looking in particular at the factors which influence consumers’ choices in this area, for themselves and for their children - and looking at the relation between consumers and suppliers of food. To echo what Philip was saying, there are 3 key influences: availability, of course, first, then price, and then environment. I don’t mean the physical climate-changing environment, but the everyday world in which people live. On a global level within Europe, it’s hard to say that availability is a problem. But it clearly is a problem in some local areas. It clearly is a problem deriving from social inequalities, among other causes and these clearly have to be addressed. I hope to spend a week in Connemara in the West of Ireland during the
summer, and if previous experience is any guide, I will find it difficult during that week to find some good quality fruits and vegetables. I’ll have to bring some with me in some cases. This is not unusual in some rural areas and in some urban areas also. Lowering price would certainly help to increase consumption. I’m not sure—I have to be very careful about saying this as a consumer organization—of course we want lower prices, but only to focus on price, in itself, would not be enough in our view. Indeed, there isn’t necessarily a correlation between the richness of a country, richness in monetary terms, and its consumption of fruit and vegetables, in particular. But environment in the sense of which I used it is everything. It’s the culture in which we are, it’s the formation we have, it’s the education we have, it’s the promotional efforts we are surrounded by, it’s the external influences. And these, as I say, are one of the most important aspects so far as we’re concerned. Just to say one thing about price—prices mostly can be lowered by things like competition and concentration but they can’t easily be lowered by direct intervention in the market. A lot of the interventions in the market that have taken place haven’t had the effect of lowering prices, but of increasing prices. In the reform of the fruit and vegetable regime sector, the key must be to promote consumption and to give that a much wider stress than I suspect has been given, for example, in relation to school milk and other things. It’s not obvious these days that, (but maybe there is evidence, an impact analysis somewhere) that we need to promote more school milk. But we certainly need to promote more fruit and vegetables - there is no doubt about that. And we start with children, of course, and their parents. To some degree, there is a lost generation further up. But it may still be possible to do something about parents and parents who are under pressure. Some things have been done. We’ve welcomed the fact, as you have heard from Pilar Rodriguez Iglesias, there has been some progress made on trying to limit the amount of health claims that can be made for certain types of food that but these new rules need to be implemented. We also need better nutritional information, and we strongly support the idea of simplified nutritional labelling which will give people a very quick, as quick as you need in a supermarket when you are just making almost in impulse purchase, sign as to what it is there or what you are going to buy. But this needs to be done much

SESSION 6: Policies and political commitments to increase F&V consumption within an obesity prevention strategy: ROUND TABLE
EGEA 2007, Page 115
more effectively, so that people very quickly can grasp the nutritional facts and can compare nutritional inputs. Have a look at the next two slides. You know the first one, this is what we should eat:
The way we should eat
Some of our members looked at what was advertised on television in their countries and they made up another slide and they got this:
Foods most advertised on TV
When you look at what’s most promoted on television, you get an almost exact inverse of what we should eat. And that’s why we in BEUC have asked also for limitations on the promotion of foods high in fats, sugar and salt to and for children on television. The European Parliament in an own initiative opinion condemned the commercial practices used to promote foods high in sugar fat or salt but any proposals or amendments which were put in to suggest any practical action were voted down in the final text of the resolution! So there is a lot more work to do there on that. Thank you.

SESSION 6: Policies and political commitments to increase F&V consumption within an obesity prevention strategy: ROUND TABLE
EGEA 2007, Page 116
Social marketing strategies to increase fruit and vegetable consumption
Liselotte SCHÄFER ELINDER Research manager and Associate Professor, Karolinska Institute, Stockholm Centre for Public Health, Sweden
Thank you very much for inviting me to this meeting. I’ve been asked to talk about social marketing strategies to increase food and vegetable consumption. And I’ll take a little of your time for the science and then I’ll come back to the policy. And of course, this is very relevant to the question that has been posed by the previous speakers, namely, is diet up to individual choice? With regard to social marketing, the question you ask is can you sell health like shoes? And in order to answer that question, I will just let you know the definition of social marketing. Its been defined by Andreasen in 1995 as the “application of commercial marketing technologies to the analysis, planning, execution, and evaluation of programs designed to influence the voluntary behaviour of target audiences in order to improve their personal welfare, and that of society.” So it’s about influencing voluntary behaviour, not mainly to the benefit of the sender, as in commercial marketing, but to the benefit of the receiver and to society. Social marketing is a planning model for health rather than a theory of behaviour change. But often, theories of behaviour change are used when people do social marketing interventions. But still there is no clear consensus on what social marketing is. Therefore, a group in the Institute of Social Marketing in the U.K. has developed 6 benchmark criteria:
1. Behaviour change 2. Consumer research 3. Segmentation and targeting 4. Marketing mix
a. Promotion b. Product c. Price d. Place
5. Exchange 6. Competition
If you talk about social marketing, then there should be specific measurable behavioural objectives. There should be consumer research to identify target consumer characteristics and needs, and on the basis of that, there should be a segmentation of the population, and the intervention should be tailored to the target groups. There is a marketing mix of elements which consist of the four P’s of marketing which we heard this morning by Tim Lobstein: promotion, product, price, and place. And you can use different combinations of
them. And maybe the most specific thing about social marketing is this idea about exchange. The consumer should get something in return for behaving well. This could be tangible things like a present or gift, or it can be intangible things like praise or whatever you can think of. Another component is the analysis of competing products or behaviors. For example, what is often competing with fruit and vegetables are soft drinks and energy-dense snacks. So you also look at these products and see what is competing with the message I want to get through. And therefore, social marketing is a typical “downstream strategy” addressing the individual level, while upstream measures, such as regulatory action or health and other policies, are not addressed. A positive thing about social marketing is that it really reminds us to focus on our target group and identify the specific needs. Here are some recent Swedish data, the share of Swedish men and women eating less than 130 grams per day of fruit and vegetables that is less than a fourth of the recommended intake, which is 500 grams in Sweden. And as you can see gender, employment, and income are strong determinants of fruit and vegetable intake.
Share of Swedish men and women(18-64 years) eating <130g/day of fruitand vegetables
0 10 20 30 40 50 60Percent
Men, blue-collar, low income
Men, middle and upper white-collar, low income
Men, blue-collar, high income
Women, blue-collar, low income
Men, middle and upper white-collar, high income
Women, blue-collar, high income
Women, middle and upper white-collar, low income
Women, middle and upper white-collar, high income
Source: National Survey of Public Health 2005, National Institute of Public Health.
You see here that our main target group should really be men on low incomes and women with blue collar jobs. And children, of course, also, but these are not included in this data. So what do we know about these groups? What research has been done on these groups? How can we reach them?

SESSION 6: Policies and political commitments to increase F&V consumption within an obesity prevention strategy: ROUND TABLE
EGEA 2007, Page 117
Well, we know something about barriers to healthy eating in low income groups, we’ve heard more of that this morning. For example 70% of low income men and women claim to eat healthily, but only 18% eat 5 or more portions of fruit and vegetables per day. So clearly, here is some misconception about what constitutes a healthy diet. Low income women are more into traditional foods, they are not so willing to try new things. They experience time constraints due to work and demand more convenience foods, for example pre-packaged, they have more fast foods in neighbourhoods in Scotland, Australia, U.S.A., and as we heard this morning, also in the U.K. Low-income women perceive healthy foods as being more expensive, and are less concerned with health and body weight. Other health risks such as crimes, drugs, and emotional well-being appear more important. So this is really what we have to address. There haven’t been many studies in men, but I found a recent one interviewing men. In general, men display cynicism about government health messages, and a rejection of healthy food on grounds of poor taste and inability to satisfy. So this is really something we have to address if you want to increase consumption. A systematic review on the effectiveness of social marketing nutrition interventions from the Institute of Social Marketing in the U.K is just about to be published and the authors were so kind to provide me with the draft report. They have analyzed 18 studies examining the effect on fruit and vegetable intake. They have identified the studies on the basis of these 6 benchmark criteria I showed you before. The “A” is for adults, and the “C” is studies in children. Table 1. A systematic review on the effectiveness of social marketing nutrition interventions Of 18 studies examined effects on F&V intake:
(A/C)
10 studies were effective overall (8/2) 6 studies produced mixed results (1/5) 1 study showed no change (0.1) 1 study was counter-productive (0.1)
Source: McDormott et al 2006. Institute for Social Marketing, University of Sterling & The Open University, UK As you can see, ten studies were effective in increasing intake. Of these, eight in adults and two in children. Six studies produced mixed or moderate results, one in adults and five in children. One study
in children showed no change. And one study in children was actually counterproductive. So the conclusion, I think, we can make is that social marketing seems to work better in adults than in children. And in other systematic reviews, not being social marketing, have shown that availability and accessibility are, of course, very important factors when it comes to children. The positive results in these ten studies were obtained among low income women on “WIC” support, which is a special support program in the United States, church members, boy scouts, primary care patients, public health employees, the North Karelia population, and 4- to 11-year old children. I don’t really agree in calling the North Karelia project a social marketing intervention though. It was much broader than that. They addressed the whole community, and national policies, which is probably necessary when aiming at major changes in the population’s diet. These other groups were really motivated groups, they are not really representative of the general population. And maybe they belong to these 24% who we can reach by nutrition education. But the other 75%, I think, are harder to reach. And then there is a lack of social marketing studies concerning men. So what are the obstacles? Well, I think that people who are easily motivated to improve their diet can be reached through social marketing, being an individual level approach. However, disadvantaged groups, older children and men, are more difficult to target. And of course, we can do a lot through the retail sector. I’m sure that a lot more can be done to target these groups at the point of purchase, as we heard this morning. But when you want to reach these hard-to-reach groups, we need additional actions to social marketing. And therefore, a wider health promotion approach may be needed, addressing both availability and accessibility, and including education, regulation, and economic instruments. So, to conclude, social marketing has relevance and can be used, but I don’t think it’s the right strategy to reduce inequalities in health. Thank you.

SESSION 6: Policies and political commitments to increase F&V consumption within an obesity prevention strategy: ROUND TABLE
EGEA 2007, Page 118
Taste aspects of fruit and vegetables François LAFFITTE
AREFLH (Fruit Vegetable and Horticultural European Regions Assembly) Administrator, Bordeaux, France
�
Thank you. I am a grower and also in charge of the Marketing Commission in the association called AREFLH, it is a European association joining regional authority and professional like me. I will try to talk about the taste of fruit and vegetables, that’s probably difficult. I think the first point is that taste can be difficult and polemic. I will try to forget all these subjective aspects, like all cultural or educational factors influencing on taste. I will just talk about the very technical aspects of the taste of fruit and vegetable. Firstly, visual aspects can have an effect of what we are thinking like a taste. The second part is the texture, balance of the products. And the other part is the components balance, like fibers, sugars, acids, aroma or flavors, nutrients. All of these are determined by several factors. Firstly, most important factors are, in fact, varieties. And when we talk about varieties, we talk about the plant genetics. It’s, of course, you understand on the aspects all the research made on [progressing] plants, evolutions of the growing of these plants, adaptation of these plants, but also the taste of this products at the end. The second main condition is also the culture conditions. And inside the culture condition we can talk about the soil characteristics, we can talk about the climate effects; we talk also about the techniques of culture, and size of technique of culture. Of course, we have the irrigation aspects, fertilizations, plants pruning, that’s part of very important sort of things determining very early in the season the quality of the future products, future fruits, of course. But also thinning of flowers can determine the quality of the vegetable or some fruit, also. Etc., etc., it will be difficult to give you all the details of technical condition of the culture. The other aspects also determine the taste of the products of fruit and vegetable is the harvest conditions. Of course, what we look after is optimum stage of harvest. And we can’t resume things that there are two main aspects, classification. We have the climacteric fruit and vegetable. This products, we determine the optimum stage of harvest, checking the sugar level, the acidity, and sometimes dry matter. We have a second class of products called the nonclimacteric fruit and vegetables. Of course the best condition for maintaining the taste quality, but also the conservations of these qualities is the determinations of the optimum stage.
The third point, it’s of course for fruit and vegetable, the cool storing and transport conditions. The use of refrigeration conditions, it’s depending on the products. The maintaining the freshness and the taste, of course, is most important for us. According to the pricebility of the produce, the shelf life of the products is between 2 days for some vegetables, like few months for other products like apples, for example. Taste can be affected by too long transport condition, also. And the aspects of packaging conditions. Why packaging conditions? Because we try to preserve the quality obtained at the production stage. Of course, you need to understand that at this stage, for fresh fruit and vegetable, it’s not more possible to improve quality and taste. All aspects of taste have been done during the growing season, growing period, and the harvest. After that, of course, as it’s a natural, nonprocessed produce, it’s impossible to improve the quality and the taste. Also, what we try to do with packaging, according to the pricebility of the produce, we have bulk presentation for the produce like apples, for example, bananas, orange, where there is no many risk of [persability]. But we can also have liners or basket packaging with protective bins like for vegetables or strawberries, for example, depending of the products. The other important point will be the way of consumption. Mainly for vegetables, we talk about raw vegetables, of course, the main factors is the freshness. When we talk about the cooked vegetables, of course, we have aspects of the cooking, modifications of taste by cooking. We improve the quality of the taste cooking the product. And for fruit, this is mainly the balance between sugar and organic acids, plus, of course, the aroma development. Very important for the high quality taste of the products. Well, at the end, I will say that the taste of the fruit and vegetable, in fact, [the…] of all the actors of the fruit and vegetable industry, and it’s very important to understand that if you have just only one [actor] missing its responsibility, of course, we are inside the link from the grower to the retailer, to all […] consumers the best products, the best, tasty products. And I think the most important it’s also to understand that the responsibility, it’s part of all these factors. Thank you very much.

SESSION 6: Policies and political commitments to increase F&V consumption within an obesity prevention strategy: ROUND TABLE
EGEA 2007, Page 119
���� �����������������������$�"��������� Rozenn MARECHAL
European Vending Association
Hello, first please accept the apologies for Mr. Vrijlandt, he couldn’t make it so I’m replacing him, and I only knew it yesterday, which is why I don’t have any slides. The representative of the European Commission for the CAP( agriculture) talked about milk. I will start with coffee, and you are wondering why you came to a conference on fruits and vegetables, aren’t you? Actually the vending industry in Europe is mainly a coffee business. 70% of our machines are hot drinks machines. The remaining 30% is cold drink machines, snack machines, and any other type of food and drink machines you may think of. This clearly limits the number of machines in which you can sell fruits and vegetables. There are around 3 million machines in Europe managed by what we call operators. The vending operators are those companies that fill, clean, service, collect money from the machine; in short they run the machines. It’s a much atomized market because there are at least 10,000 operating businesses in Europe. There are very few multinational companies, and one of these is Selecta, which employs the person I’m standing in for today. Selecta is the market leader but only has a 4 percent market share. So it’s a bit difficult to really reach everybody out there. We are a founding member of the European Platform (for Diet, Physical Activity and Health), and through this, we got in touch with Freshfel. We started to discuss about fruits and vegetables in vending machines because Freshfel was very interested, and we heard that a lot of people were thinking “why don’t you just put fruits and vegetables in machines and it will solve the problem”. It’s important to understand that a vending machine is a one square meter retail shop. There are about 40 different products sold in a food machine. So only top sellers will win their way to the machine, otherwise it will just not be economically sustainable. Different companies started in the past months to introduce some fruits in the machines. In some cases it has been successful, in some others, not. Where it has, fruits were sold in one spiral, these were mainly apples. Selling fruits or vegetables in a vending
machine is not easy. The reasons why are outlined in a wish list, which we produced for Freshfel. If you are a member of Freshfel, you probably received the list, and we are awaiting your comments. If you want to put fruits in a vending machine, you need mono-packaged fruits. Fruits must be packaged for hygienic reasons. The fruits have to be washed and ripe to be consumed immediately, because obviously vending is an on-the-go consumption channel. All what the previous speakers have just explained on the transport chain and the taste of the fruits is really crucial to vending. Most machines are chilled, which means that if you put a banana in a machine, it will get spots, which will discourage customers from buying them. With the transport chain, just like already explained, it has to be cold. The problem that most of our vans are ambient, so that’s an issue, also. In most food machines, the products fall. A number of relatively new machines are fitted with a little elevator, but this is still an exception. If you have a mainstream machine, you select the product, then it falls. So imagine you are buying a peach. This explains why most fruits sold in vending machines are apples. The incoming delivery should be on pallets, products should be easy to pick and dispatch into the cars or vans. If you are a big retail chain, you have a big storage area, so you arrive with, let’s say, a 38-ton truck. You just deliver the fruit and it’s okay. But vending operators have little cars or small vans, so every time a person has to pick the case, put each product in the machine, pick the case again and go to another machine. It has to be easy. Vending is a business, not a charity. So it has to sell, and the price, the margin, must be equivalent to any other product sold in the machines, unless somebody kindly decides to subsidize fruits, in which case there is no problem. Just as I said, the selections are limited, so we only take the 2 or 3 top sellers, i.e. the best fruits available. We also need a low waste rate because, otherwise, it’s not economically viable. In summary, there are a lot of very down-to-earth, business-oriented issues, but we are really open for discussions and proposals. Thank you very much.

SESSION 6: Policies and political commitments to increase F&V consumption within an obesity prevention strategy: ROUND TABLE
EGEA 2007, Page 120
Laurence SWAN Freshfel Europe
Well, now if Tim was visible to you above the podium, and Robert was slightly down, on account of my stature I’m going to disappear completely! I want to talk about finance. It’s the afternoon, you’re tired, and you don’t really want to hear about figures. But, that’s what brings it all down to earth. I’m in the industry, if we don’t have money, we don’t go anywhere. We can discuss doing all the wonderful things in world and have excellent research, but we’ve got to have money. Okay? I’ve no slides, but I want you to imagine a great neon tube here on the wall. Can you hear me? I suppose I can shout loud enough. “€130 Billion”. Right? That’s the figure that’s flashing on and off in red neon there. This is Tim Lobstein’s figure for what it’s costing in medical terms, per year in the EU, by not having people eating sufficient fruit and vegetables and being obese. Can we ignore it? Make no mistake, we are in a war zone, we need to be on a war footing, and we are not really moving along very fast at all. I asked at one of the meetings on the DG-Sanco Platform for “out-of-the-box” thinking. And I got a mild rebuke from Robert Madelin for saying that, saying that he believed that there was out-of-the-box thinking. But I don’t think we’ve got anywhere near the level of out-of-the-box thinking that’s needed yet. Really, we are not motoring at all regarding the obesity issue. If we look at the common agricultural policy (CAP), there’s €50 billion for agriculture in total of which, 20 billion for cereals, 10 billion for beef, 10 billion for dairy, and 1.5 for fruit and vegetables. Hey! Something’s not right. It’s 3% of the budget for fruit and vegetables, but with this split we really are supporting calorie-rich and of nutrient-poor foods. We heard about that in the research. I want some “out-of-the-box” thinking on that one! If we look at the promotion money that DG AGRI has, and I sit on a Advisory EU committee. I support DG AGRI on that. That budget has gone from €90 million, to 50 million, to 40 million, to the region of 30 million now. So you might say, ah, they are reducing it because we are so successful in counteracting obesity. We bloody well know that’s not true. Forgive the sarcasm! Again, maybe the spend on promotion is diminishing because less products have to be covered – but that’s not time either as potatoes have been added. You again, may be it’s because we’ve got less countries in the EU because the same money has to cover all that. But
that’s not true, either, it’s gone 12, 15, 25, 27! So what is the thinking behind this? “Out-of-the-box” thinking is needed. Someone mentioned the Food Dudes, I think it was Lars mentioned the Food Dudes Programme. And I don’t want to go into it except to say that I’m one of the poor fellows who goes around knocking at the doors to get money from the industry to contribute to that section, which is the money that DG AGRI expects industry to provide. And it’s really, really hard work. And if we look at the food chain in fruit and vegetable distribution from the grower, the shipper, the packer, the prepacker, packing again, distributor, and then the retailer, I don’t want to be critical, but I think we know the profits are loaded at the far or retail end. They are often the most difficult people to get money from. I was ambushed by a multiple once but they said they were ambushed by me! I went into a meeting, they said they wanted 45,000 euros for a promotion to last 6 weeks. I said I would give them 45,000 if they gave me just €15,000 for the Food Dude Programme. They went home and reported to their chief executive that I had ambushed them! So I think we need some thinking on the flow there, and how we get money as if the industry is going to have to supply it, it won’t happen, because it’s not there at the moment. Finally, at the hearing on Monday, we had in the EU Parliament building, we had members from DG AGRI, MEPs, DG SANCO there, and we had a very useful exchange. And Laurent Damiens, on behalf of the industry, presented a proposal that was mentioned earlier by Lars, looking for the Free Milk Program to be copied somewhat but for fruit and vegetable industry, because the mechanism is there already, it exists and it doesn’t have to be reinvented, and it works well. And I would just refer you again to the imaginary “€130 Billion Euro Per Year” sign I mentioned earlier that’s still flashing on and off on my right there, and say to you, can we afford not to find something like that? We, also heard that Lars said, correct me, of course, if I’m wrong, that it was looking like the budget from DG AGRI was going to be reduced. We can’t let that happen! Thank you very much.

SESSION 6: Policies and political commitments to increase F&V consumption within an obesity prevention strategy: ROUND TABLE
EGEA 2007, Page 121
Bernard BRUYÈRE
Euro Commerce/ Organization of European Retailers
I have been asked to speak to you about the availability of fruit and vegetables in particularly the distribution sector and to discuss the best strategy for their promotion. One must start from the availability of products to reach consumers. The distributor is thus placed as a middle person, but without real added value on the product. The question that we must ask ourselves is how to adapt the product and its distribution to the changes in dietary choices and purchases of consumers? I would put forth that our job is straightforward: it is a question of consistently putting oneself in the shoes of the consumer. The implication is the adaptability of products to these behavioural changes, i.e. the adaptability of distribution and marketing of products. What is the role of the fresh fruit and vegetable sector? it is to optimise the taste, as noted by François Lafitte. The extent of choice, conditioning and the unit of consumption, the necessity to have professionals and other specialists at each stage of marketing, from farm to fork. In terms of distribution, there is thus a need to conform to the expectations of the consumer, to put on offer all of the benefits of the fruit and vegetable specialist in the supermarket setting. There has to date never been so much communication on the health benefits of fresh fruit and vegetables; a guilt-free pleasure, once could say! Since 2000 different retailers have proposed low prices related to the “10-a-day” (and the “5 to 10”) message. The health ministry has carried out its healthy nutrition plan, the food industry also contribute to the health benefit message of fruit and vegetables, soups, fruit juices, fruit compotes, dairy products with fruit. Furthermore there are new communication data, new advertising regulations on high fat, high sugar and high salt products as cited in the health nutrition plan. Finally there is the increased accessibility of broad dissemination in terms of television advertising, particularly on fruit and vegetable via distribution brands. What is current situation? We have noted stagnation on the consumption of fresh fruit and vegetables. The reasons are different according to different sources. The competitive context of the food industry and the lack of access to fresh fruit and vegetable are often decried by industry-generated advertisements. The media often propose the high price of fruit and vegetables as an indicative factor of low consumption; price is often an alibi. We have thus thought through a new mode of distribution and there is renewed hope based upon encouraging results: for those with the incentive to increase fruit and
vegetable consumption, new development axes are absolutely possible. Supermarkets in France account for 75% of the market and thus it is imperative to increase the visibility of the fruit and vegetables aisles. What have we observed during the past 2 years? An important increase of market shares of stores which have become specialised in terms of actively advertising fresh fruit and vegetables. This year in the distribution sector there has been a 9% increase in volume and 14% increase in value. The fruit and vegetable specialist stores put the emphasis on quality, taste, varieties and advice. The priorities of consumers have been shown to be quality, the pleasant environment, the making purchases easy i.e. parking spaces, access to tills. Surprisingly price is cited last on the list of priorities. Thus a group such as Casino, to which I belong, has the will to put forth as much as possible fruit and vegetable consumption. Since November 2006, a new concept in the fruit and vegetable section has been developed with very encouraging results and by the end of the year it will be promoted in 70% of hypermarkets and a large number of supermarkets. This new concept is based upon the creation of a greater physical space for fruit and vegetables. This changes the perception of consumers, giving them the impression that they are shopping for food in a specialist environment and no longer in a generalist store. This contributes to generating the desire to purchase and consumer more fruit and vegetables, benefiting both the consumer and the market. Action must be carried out at three levels. The first level is the human factor. In order to professionalize personnel in terms of training, knowledge of products, advice to clients, one must invest in personnel by increasing the work hours in the fruit and vegetable section. This is being done so that over 50% of work hours are attributed to this activities. It is equally important to motivate personnel. The second level is the structural factor, to provide a better quality product with a 50% increase of reference with added-value products; all in all this amounts to 250 to 300 references according to seasons, outside of prepared and ready-to-eat, organic or exotic fresh fruit and vegetables. The third factor has to do with revised marketing, inspired by specialists. The displays are adapted to give products visual priority; water sprays systems are set up to ensure freshness; a dark non-slippery floor increases cleanliness and security, and the area should also be brightly lit. There should also be areas

SESSION 6: Policies and political commitments to increase F&V consumption within an obesity prevention strategy: ROUND TABLE
EGEA 2007, Page 122
for organic products, market gardeners, exotic products and fair trade. Fresh fruit and vegetables have always existed. There has been relatively little work on creation, conception and adaptation of the product in response to the needs of the consumer. The increase of distribution networks, the emergence of brands, the birth of advertising and the importance of packaging in the experience of a purchase are steps that have distanced the consumer from fresh fruit and vegetables. The consumer may see the fruit and vegetable as a basic product with little added value. There is no possible comparison with other products in terms of price, price/kg, but little in terms of consumption unit. Prices can vary from one day to the next, from one season to the next and from origin to another. Furthermore there are no nutritional indications on the product. It is thus essential to create modernity around fruit and vegetables and to give consumers points of reference by bringing out brands. We have thus created a real process of reflection regarding brands, the birth of brands and their emergence in fruit and vegetables, creating strategies related to packaging, adapting wrapping to children’s
consumption of fruit and vegetables with brands such as Tom & Pilou for Casino, and Ric & Roc for other companies. I would end by talking about the importance of professionalizing all stages from production to distribution, and at the crucial moment at which the consumer makes a purchase. In the latter context there is still a lack of professionalism which is an impediment to a client’s decision to purchase and consume fruit and vegetables. It is thus necessary to professionalize commercial managers and section managers, and to highlight the role of managers of fruit and vegetables in light of the emphasis which has to date been put on the professionalization of the fishmonger, butcher, pastry chef and so forth (all those ‘less healthy’ products). We are thus working towards professionalizing the managers of fruit and vegetable sections in the supermarket through state-supported diplomas. We need people who are more trained and more professional in terms of developing fruit and vegetable consumption. These are the political engagements of the Federation of Commerce and Distribution [Fédération du Commerce et de la Distribution] to develop the sales of fruit and vegetables and to support their consumption. Many thanks for your time.

SESSION 6: Policies and political commitments to increase F&V consumption within an obesity prevention strategy: ROUND TABLE
EGEA 2007, Page 123
ROUND TABLE DISCUSSION
Chaired by Tim LANG
I want to ask all the panellists to come up here; we are going to do this slightly differently. I want you to think of 3 things, around 3 questions, what do you think is needed to be done? A lot of people have given you their ideas. What priorities? And who is going to do it? It seemed to me we heard an awful lot of ideas, and essentially, unless I’m different to you, complexity is what came up. No absolute clarity about particular quick things that needed to be done. Any questions? Karen… Hi, I’m Karen Lock, I’m quite a simple scientist from London, I’m in Study for Vegetable Intake. From what I understand, all sectors agree it’s good to increase fruit and vegetable intake, health producers. There is clear evidence, and has been for awhile, of what works. Key factors increasing intake are access, availability, price. And the minor issues that are always mentioned, in terms of individual choice, health promotions, social marketing, seem to be relatively small in their impact. So my question is to Mr. Lars Hoelgaard, because I was confused that he mentioned he was not sure what role DG AGRI had in increasing intake after this. So my specific question, which has sort of 2 parts, is following on from Laurence Swan, why can’t DG AGRI propose a school fruit and vegetables measure that’s adaptable and flexible for individual Member States? And secondly, because I was confused by his second case study, confirmation that DG AGRI are not proposing that short term health promotion schemes, like for example, the 16-day Food Dudes Program he showed, should replace the need for long term supply and availability in schools. Thank you. I’m going to part that question last, if you will wait a bit. Next question, any other questions? I’ve been studying consumer behaviour on the fruit and vegetable market for the last 7-8 years, I come from Poland, and of course, different groups of consumers have different factors influence their choice. Men, women, children, some prefer taste where others it is price that decides what they choose. But there is one common thing which is very characteristic for the fruit and vegetable consumption, and this one thing was not mentioned here during this Conference, and that is seasonality. I mean, maybe it is something that some people don’t remember. Now it is April and we are getting strawberries here, very nice strawberries, very tasty. But they are very expensive. In the poorer countries,
among poorer people, let’s say, what we are talking about is increasing the intake and consumption of apples and seasonal fruit and vegetables during summer and during autumn. My question is, the interventions which were carried out, some of them work, some of them don’t. Do we know if this is linked, if their efficiency or outcome is linked to when they were implemented? Is it not that they work if they are implemented in the right time? If we look at other seasonal food products, for example, I don’t know, I was thinking ice cream. The ice cream producers promote their products just before the season or during season. That’s when, from the economical point of view, it is mostly efficient. From the health point of view, of course we would like people to eat fruits and vegetables all round the whole year, 5-10 times a day. But maybe this would be the first step to look at the seasonality of consumption, the natural behaviour of consumers, and maybe start with seasonal implementation of the promotion initiative. Thank you. Question? Good afternoon, my name is PJ Jones, I am a fellow Irishman, well, there are 3 of us here, and I couldn’t let Mr. Swan away with this, so I just want to make one question to Philip James if I could, please. I came over here yesterday morning, and I seem to be going home here more frustrated than I came over. For the main reason, I’m a grower and a grower’s representative in northern—I’ve been growing vegetables for the last 30 years. And […] […] has done absolutely nothing for me, only made my life harder. To get to the point, Mr. James said, when are we going to the industrialists on site? They are the people, if you look at the latest figures from Tesco and the U.K., 2.1 billion. 2,700 pound a minute they are making. Now, we heard in the last 2 days about how people less fortunate than ourselves on poor income, cannot afford to eat fruit and vegetables. The reason that they can’t afford to eat it is, in my opinion, I’m not selling it to […] because I’m getting the same price for it now as I was 10 years ago. And I’m hardly able to stay in business. And that’s across Europe. So it’s not our fault, we have the product, but the people aren’t getting it. We’re being told over here that economic classes can’t afford to buy it. They can’t afford to buy it because it’s out-priced on the shelf. A lot of people, by no fault of their own, are in what we’d call--I’m speaking from an Irish perspective on this--they live in apartment blocks. There is no supermarket there, they won’t build a supermarket there because they are not going to make any money

SESSION 6: Policies and political commitments to increase F&V consumption within an obesity prevention strategy: ROUND TABLE
EGEA 2007, Page 124
there. So they go to a convenience store which they won’t get fruit and vegetables in that convenience store. As somebody pointed out today, they will probably get soft drugs easier. Now, this, I think, can be very simple. There is a lot of people far more intelligent, far better educated than I am around this room. I have the product. I tell you, most of my counterparts all over Europe, to get this thing up and running, would actually put the product in free because the more of it that people can eat, that’s how I’m going to stay in business. The only way I can stay in business is produce more. And I’m at a level now, no matter how much I produce, it’s not enough because I can’t keep financially going. So I have to produce more. Which […] people can’t afford to pay what I am growing, through no fault of their own. It’s out-priced when they go through […]. They live in an area where they can’t get it in the first place. And then people are saying that these people are obese. Now—I’m completely confused at this! Because go back to what we said--I’m sorry for labouring this—take the Food Dudes Program, take what Laurence Swan just said. We all know what to do. A simple thing like that may fall on its feet. Like a little country like our own, 4 million, that’s one euro per head of population our government is willing to throw out. Now if you take the whole of the population of Europe, I’m not sure what it is, but if everybody threw in a euro, like where we’re trying to do in Ireland, where would we be at to try to rectify this problem? I’m not saying that throwing money at it is the answer. What I am saying is, me, as a producer producing good quality product for the same price as I was producing I for 20 years ago, and people can’t afford to buy it? There is something drastically wrong. So I’m hearing a lot of frustration which is well-made and well-stated. And your question is how the agricultural policy is putting you in that position, that’s one question. And the second question is, why are others making the money and you are being squeezed? And your third is, surely, can’t we have a win-win all around where more consumption is made available, more consumption actually occurs. Those are good questions, I’m going to partner that. I’m trying to summarize. Yeah, sorry for labouring it. No, no, it’s nice to hear a rant, it’s a great pleasure. It brings some emotion to the dead hand of science. Next question? Robert Petersen from the Danish Cancer Society and 6 A Day in Denmark. I guess first I want to be diplomatic and I want to commend DG AGRI on including health in the reform of the agricultural policy. I think that’s a big first step. And some of the
issues mentioned, they target specifically children in increasing their fruit and vegetable consumption. But I think we need to do much more, and I speak from experience with implementing school fruit and vegetable programs, and also doing a lot of comparative analysis, both on school fruit and vegetable programs in Europe and the rest of the world. And I wanted to ask a question based on something that came up at the briefing on Tuesday. One of the things you mentioned was that in order to do this, we need to build public support. And we are gathered here, members of the fruit and vegetable industry, NGOs, civil society working with public health, and I want to ask you, how can we help you to build that public support? That’s a good question. Next question? I work in France on sustainable lifestyles. When you go in a supermarket, a regular size, you can find easily a dozen of different colas, 30 or 25 at least, kinds of cereals for the morning for the kids. And when you go to the vegetable part of the store, then you find one kind of potato, one or 2 kinds, even if it’s the right season, of tomatoes. So my question now would be, on diversity and varieties, I think Mr. Bruyère and Lafitte were mentioned. And when you know about for tomatoes, we register at least about 500 kinds of tomatoes. Before waiting that science creates another genetically modified and maybe unnecessary kind, why can’t we see much more of this sexy, different, nice tomatoes with several tastes, shapes, and use difference? That’s my first question, how come there is such a lack of the diversity? The second question is also about information and transparency about this information for consumers, not only about the pesticides that’s on, I wanted to know more also about nutrition, but also about unization, which is kindly called this way, but it’s irradiation. We know that we have several plants in Spain now. Becomes more and more common in China. And I kept over 2 months a tomato in the refrigerator, and I can tell you that I did not feel like eating it. Although it looks like really in plastic, like really very nice tomato, didn’t change from when it left the supermarket. Thank you. Next question. Is this alright? I’m just going to have the questions coming. And then I’ll summarize, and all of the Panel will answer brilliantly in 20 seconds each. Yeah? Patty Randall from the International Baby Food Action Network. And I was very pleased that Phil mentioned breast-feeding there, and the importance of breast-feeding in his presentation. But I wanted to expand a little on that in terms of the taste profile of,

SESSION 6: Policies and political commitments to increase F&V consumption within an obesity prevention strategy: ROUND TABLE
EGEA 2007, Page 125
not just breast-feeding, but the complementary foods, and the early introduction of complementary foods. And this is something that IBFAN, my organization, has been working for 3 decades now to try and protect mothers from the misleading claims and promotional practices that the companies use to get mothers to think that the formulas and the packaged foods are as good, if not better than breast milk. And we know that that has worked because in the U.K. we’ve done a survey, and 30% of mothers said that they believed the breast milk substitutes were as good, if not better. Forgive me, I know Patty very well, forgive me interrupting her. The evidence about the women eating particular foods having an affect on breast milk was put as one of the positive messages for fruit and vegetables, so. Good. But if you can tailor your questions to fruit and vegetables, that would be great. I will, what I was going to say, in the same thing about what we’ve learned is about independent information going to parents. That’s the point I’m trying to say is that actually, if you don’t have “independent” information going to children about what is a good and healthy diet, or what is a fruit and vegetable, they will end up thinking that fruity-flavoured pudding or whatever, is the same. And we have to be really careful. And the food irradiation, all these other things, will get masked and confused in children’s minds. They really won’t know the difference. So it’s a plea for school education materials to be absolutely [clear]. Next? Yes, Marise [Lenas] from the Platform. I also wanted to start with the article I have seen in the abstracts showing that the childhood taste is developed through breast, picking up the various flavours babies get. But my question is, seeing from the statistics we have here and the difference in gender for selection of fruit and vegetables, does anybody have thought about researching into it, how the gender equality, with more men shopping and cooking, influence on vegetable and fruit cooking and shopping? And then I have a question to DG AGRI, I want to know if the school milk program is subsidizing milk, or also milk which is flavoured and sweetened? Thank you. Okay, so a question really about finance. Next? Okay, that will keep us going for about 3 weeks, I think. So we are not going to do it. These are all good points well-made.
* * *
I’m going to ask DG AGRI to respond, if possible, very quickly before we get some other questions. The stress on production, that was a very interesting theme across many of the presentations. Far from putting you into the defensive mode, everyone, I think, is thrilled from health and from consumption end, that AGRI is now taking fruit and vegetables so seriously. But there is pressure on you undoubtedly on how to allocate funds, and how to increase production. Any thoughts? Well, we certainly don’t get into wanting to promote more production, as such. I think we’ve been accused of, for the last 30 years, of promoting too much production. And having surpluses and all that. But not in fruit and vegetables. And in fruit and vegetables we’ve had situations where we’ve been withdrawing product, destroying it, and getting a hell of a lot of criticism from the Court of Auditors, from European Parliament, budget people, and the media and all the rest, so I don’t think that’s really the avenue. And I don’t understand what the gentleman from Ireland is really talking about. We have done nothing to prevent anybody from producing as much as they want, good quality, we have marketing standards which allows trade to take place. So I think that point was a little bit misplaced. Coming to the different points which were made, why has the budget for promotion gone down? It hasn’t gone down because we’ve been wanting to make savings. It’s simply because we don’t get enough programs in which qualify for being able to be assisted. And it’s because we are quite strict, we are talking about taxpayer’s money. And it has to be a well-laid out program, it has to be something which has a good target group, it has to be generic, it has to be well-managed, etc. And unfortunately, we were not getting the kind of quality applications which would justify us to increase the budget. And that’s the reason why the budget has been going down. Now we would like to redress that, and that’s why we were saying that we would like to target higher funding if we can have young people in schools, etc., being targeted. So we are all in favour of using more money on it. But it’s not our fault that it’s not happening. As to the question about can’t we substitute actions like the Dude Program, with more long term action on the school fruit? I don’t think those two exclude each other. I’m taking note of the suggestion, I’m not ruling out anything. This is an idea which has surfaced just these last days here. And I’m taking it home. What else should I address? Varieties, I was thinking. Varieties is not our business. No, it’s not really.

SESSION 6: Policies and political commitments to increase F&V consumption within an obesity prevention strategy: ROUND TABLE
EGEA 2007, Page 126
As I say, we have marketing standards, and in that sense, it’s very much the market which will determine what is going to be produced. We should not sit here in Brussels and dictate what should be produced, what kind of varieties. We allow the possibilities. As I say, we have a marketing standards which are established on an international basis, these marketing standards are minimum standards. They are also very much to the benefit of the Third World because they do not have the possibility to establish those marketing standards in the same that we have, but it does facilitate trade. And a lot of the consumption of fruit and vegetables, of course, originates in the tropics, and allows trade to take place. So we lay the ground work, we lay the framework. We are talking about 1.5 billion euros for the budget for fruit and vegetables. You say that’s not very much compared to cereals and others, but that’s by the nature of the product. And now, as you know, we have decoupled payments so there is no longer an amount of money which is now being reserved to the cereal sector, and so much to the dairy sector, and so much to the beef sector. It’s very much now to the responsibility of each producer to take the decision based on decoupled income support payment, which is a kind of a income insurance against weather and other conditions. But it’s up to the producer, it’s up to the market, it’s up to the trade, it’s up to the consumer to determine what is going to be produced and what is going to be consumed. Thank you very much. Does anyone want to comment on that? Anyone from the industry, from growing, on the issue of diversity and variety? Because this is an issue that comes up, certainly in qualitative research. Talking about the variety, it’s just explaining that it needs time. Of course, all people investing in research and trying to find new varieties with natural, normal way, it’s normally at minimum of 10 or 20 years before to have a range of new products available with new taste or new qualities. It means it’s a long term of efforts from people on the research centres, depending if it’s vegetables or, of course, fruits. But is a long term. Quality and the research are depending of a panel of experts trying to, in this time, what is the need and the average [ask] of the consumer. And this is first part. The second part is the ability to have a standard product to be able to be ready to it on your supermarket, on your retail store. And of course, what’s happened mainly is that we have more urban consumers, and I think that you realize that you probably are buying your products maybe one time per week. And if you realize you are buying your products one time per week, you need to understand that our tree or our vegetables are growing every day. Also what we try to fix, it’s antagonist between your requirements. It means fresh products just the day
when I arrive. And our plants, our trees and our vegetables, growing every days. Also, we try to have sort of systems, or new varieties, to maintain the freshness of the products. And sometimes we have some people saying, well, we have lost the taste of the products. Sometimes it’s true, sometimes it’s not really true. But that’s a real difficult deal. Thank you, this is a complex one. Can I turn to the questions for DG research? It seemed to me there were a number which focused on you. One was consumer information, independence of information, Patty’s point. And possibly irradiation. I would say that consumer science in the last 6-7 years, I’m just counting years, but I could count in framework program. The last previous framework program, Program 6. But even Framework Program 5, I’m going back with the years, has been really one of the major component for the food research. With the new FP 7, we really tried, shortly of […] on you to invest more in what we call […]. And I’ve seen that other speakers have also commented on that. There is one point coming out of the different research, some consumer aspects. One is the extremely important segmentations of the consumers. Some of you have mentioned whether we, in the projects, are taking note of the gender issues. I would say yes. That is a challenge, because it is really segmenting, segmenting, segmenting the consumer. And does not exist just a single, or I would say, a stereotype of consumer. There is many consumers, and we need to take care of them. The other aspect is “at home,” I’ve heard how do we actually establish, and I also mention how do we promote, a cultural food? At home, we really don’t know what is going on. And when I say “at home,” we don’t know how the parents are behaving with their children in teaching the culture of food. We see in schools, the children leave more than three quarter of the food. But organic food, food which is chosen by according to dietary requirements, they are actually not eating it, and three quarter of this food is going to charity in the afternoon, at the end of school. That makes us wondering what is our role, and I speak also as a parent, as a father, what is our role in establishing the culture? I don’t think that we need once a year, the governments or other institutions to establish new pyramids for eating food. The third question is about unization. And there I would also like to ask more my colleagues who are regulators. As far as science, we have no indications that, you know, that these are actually harmful so far, data. And according the fact that the tomatoes can last longer, we had a Conference 2 days ago, one of the plans is to make sure the shelf life is actually prolonged. Is that a bad thing? Well, for some of you it might be a bad thing. But we also have consumers asking longer shelf lives, because this adapts better

SESSION 6: Policies and political commitments to increase F&V consumption within an obesity prevention strategy: ROUND TABLE
EGEA 2007, Page 127
to their style of life. Single, you know, we have mono families. This is also another problem. So there are different aspects that we try to take into consideration when we promote research, and we are not neglecting--I’d like to underline—the consumer aspect, because the consumer is the final driver for the production of food. Thank you. Pilar, did you want to comment from EFSA about safety of irradiation, […] yet dealing with it? The only thing I can say is concerning any advice, scientific advice SFSA has given to the Commission and Member States concerning irradiation, not particularly on fruit and vegetable, but it was in the past. EFSA by the previous system, which was the Scientific Committee on Food […] […] by the European system that gave advice as to the safety of food stuffs irradiated, and that there was, as Antonio said, no indications of […] effects. A number of scientific opinions already provided that issue. I cannot comment more on that. In the 1980’s, when I was heavily involved in the irradiation debate here in Brussels, we ended up with an argument that good food goes bad. Think about it. “Good food goes bad.”
* * *
I want to now turn to the issue that I think was a theme, and Robert, I’m going to ask you to kick off on this. And I’m going to ask all of you. It seems to me that one of the things that this session has done is underline the complexity of the task. From growing, through to consumption, through to waste. From technology, to medical science, to social science. From policymakers, European level down to very local level. Something very big has got to happen. A shift in European diets has got to occur. And yet, we heard very convincing evidence from almost everyone, I did not hear anyone disagree with this, that actually the priority is people on low incomes, the disenfranchised, people who are not eating enough due to lack of income, age differences, gender differences, and children, particularly. But let it not be said, it’s not just a question that we have to target certain groups. All of Europe has to eat differently, everyone, the whole population has to shift. The evidence is clear about that. So it seems to me, what we’ve heard this afternoon, I don’t know if my colleagues here disagree, is that everyone has got to do something. It’s not a question that DG AGRI has got to do it, and DG SANCO has got to do it, and no one else has got to do it. Or retailers must charge different prices. Actually, everyone has got to do everything. At the beginning of the session, I asked three questions: What do we want to do? What priorities? And who is to do it? It seems to me in this session, we’ve actually heard some answers to that,
which is that everyone’s got to do something. It’s not to be left to any one particular group. But, Robert, I’m coming to you. There was a question, the one question we haven’t answered is about building support. Now you in the Platform has tried to, as a friend of mine from the Lake District says, to get everyone onto the same carpet, if they are not on the same carpet, how can they talk together? If they are in different rooms, there is the dialogue of the deaf. Is the support emerging hard enough, strong enough, and fast enough to shift Europe’s culture of fruit and vegetable consumption? Do we think we are doing it harder? What do we need to do more of, to build the support, to change policy, change what’s grown, change who eats what, and get the at-risk groups along with everyone? I want to quickly go down all of you, but I’ll start with Robert. Thank you, too. And I’m sure that all the people who asked questions recognize in this admirable synthesis, their own questions. So if we attempt an answer to Tim’s question, I hope everybody thinks that we’ll have answered theirs, as well. But I wanted to pick out one particular point which is that I shall go home and tell my wife that there is now scientific evidence that sending men shopping leads to bad diets. I don’t think it’s true, but I know that she would agree, and it might get me out of one job on a Saturday morning. More seriously, it seems to me, that the debate in an area like this, fruit and vegetables, if you like, it’s a small carpet, to pick up Tim’s metaphor. And if the way to fix the nutrition and physical activity challenges in the European Union, to get everybody together, then you need a bigger carpet. Now, the challenge for us in any community is to recognize that our piece of a bigger carpet is good enough, because we are actually usually are much happier on our own carpet […] […] doing our own thing. And I think the conclusion that I personally feel emerging in my head as I listen to this discussion is, well, maybe if we can’t get the volume of activity, which is what I’m hearing, the problem is that we don’t have the volume of actors, and so we have to somehow get people to do things that will drag the fruit and vegetable demand side forward without selling it as the “fruit and vegetable agenda.” Because if you say it’s about the fruit and vegetable agenda, and you link it to the nutrition platform, this is the community. But none of us seem to have the answer, and from the nature of the exchange, I conclude that we don’t have the critical mass. If I link that to my experience over the last 2 years in the Platform, I think that we need to go to crosscutting initiatives which are in the same settings, with the same target groups, of which fruit and vegetables becomes a part. And I think that by doing that, by saying not what can nutrition policy

SESSION 6: Policies and political commitments to increase F&V consumption within an obesity prevention strategy: ROUND TABLE
EGEA 2007, Page 128
do for fruit and vegetables, but what can fruit and vegetables do for nutrition policy? We will find that we are engaging more actors in actions that will lead to sustained increase and demand. For example, the heretical out-of-the-box thought that crosses my mind listening to this discussion is, why do we have on separate pages in our story of evidence, the sort of echoed type project which is multi-stakeholder primary school intervention against obesity and poor physical activity? That’s one page. That’s one activity. And in completely different thoughts, we have Food Dudes which is multi-stakeholder targeted primary school-aged children around fruit and vegetables. And the reason I ask the question today is one of the last things I did before going on my Easter holiday was to be part of the launch of the Europewide network trying to get the echoed type tool in the hands of as many medium-sized town leaders as possible across the 27 Member States. So is there an opportunity to hitch our--speaking in this from a fruit and vegetable wagon, to other trains such as that in order to get the volume? And if you could do this, and let’s talk about cheque books whose owners aren’t in the room. Maybe it then becomes something which is feasible for presentation to those who own structural fund money, or education budgets in national administrations, as well. So we can expand the numbers of cheque books on which we’re trying to draw. But the last bit I didn’t say. The conclusion is just we need a bigger carpet. But it involves the abandonment of ego and the change of labelling. I think that’s a very diplomatic and clever answer. Antonio di Giulio and Lars, are you okay, you’ve had goes? Pilar? Yeah, come in, Antonio. Because it’s important that we get, also, the results of the ongoing work which is put through the project, you know, as a promise pathway for increasing consumer. I’d like just quickly to quote, we have an ongoing thing, I mean, finishing, but it’s still work in process, is poor children. I like just to quote that the results we’re getting are extremely positive and they are telling us that at school, if fruit and vegetables are provided in a ready-to-eat form, so in a way, we get out of the commodity type and we get into more service. Okay? We see that there is an increase of 23% in fruits and 18% in vegetables. Nevertheless, girls are more positive than boys. Next, to Phil, do you have a comment on the building or support? You gave an impassioned radical plea for policy shake-up. Well, I don’t think that we’re going to get terribly far unless that we recognize that we haven’t got this whole issue up at a different political level. There is not enough understanding by non-agricultural,
nonhealth people, that this is a fundamental issue that affects society. The economist advised the treasury in the U.K. and said the problems of smoking, obesity, and physical activity, they are not health problems. They have health consequences. They are socioeconomic problems of a fundamental nature, and you need therefore to lock in at a different level. I think that we, in the public arena, have been failing DG SANCO and DG Agriculture and so on, because we haven’t been able to engage the big political players to make it easier for them to really shift, both in terms of what happens in Europe, but also to shift the thinking of a national government who haven’t yet admitted that they need to radically change. So I think there is a big political picture here that we’ve not yet recognized. I think that’s well-said. Liselotte? As several people have said, we have to address this question at all levels, from the individual to the highest policy level. And if we want to be credible at a policy level, we have to get the policies right from the beginning. And we still have something to do here, and I would like to comment on what was said from DG AGRI that the budgets are being cut down, and of course, in a way, depending on how you see it, but I think it’s the right development that the agriculture policy is going now. But still there are big sums of money which are spent on the wrong things. For example, imagine the positive attitude you would get if you would convert the current consumption aids for butter to consumption aids for fruit and vegetable. That would be a huge PR thing for the Commission to propose that to the Member States. And I know that it’s in many cases, it’s the Member States which are the stumbling blocks. Simple things like that need to be explained. And we have a role to play here. And these are really a […] of the major drivers, and we have to get the major drivers right before we can tell the individual you have to do your thing. Thank you, again, well-said. The danger of meetings in Brussels is everyone comes long distances to give the Eurocrats, as we say in English, a hard time. I think that well-said, Liselotte. Actually, we, at the national levels, have to give our national governments a lot of carrot, not just stick, in both senses of the word. Francois? As a European grower, we say that of course […] that the European community haven’t been able to offer us more subsidize. You realize that the fruit and vegetable industry is about 70% of the total value of the agriculture products. And we have only the 3% of the agricultural budget. But, well!

SESSION 6: Policies and political commitments to increase F&V consumption within an obesity prevention strategy: ROUND TABLE
EGEA 2007, Page 129
Of course, the critics will say you’re the future. You’re unsubsidized, growing a lot. We talk about the future, and we’re not doing a lot. Yes, I’m right with you, we are talking about the future. For future, I’m optimist, as grower in Europe. Why? For 2 main reasons. First, healthy reasons, today and yesterday we talk a lot the healthy issue, and of course, because our products offer large range of qualities, and you recognize that it’s important to eat more fruit and vegetable, fresh fruit and vegetables. But for us, opportunity that we would like to be able to take. And I hope that we will be able to offer to our consumers the best quality of our products. That’s main first issue. The second issue is also the sustainability issues. Why? Because our products are natural products. And we are probably the lower on volume on total costs products. As we have natural products, our fruit have their own skins like package, if you are to packaging, as we say this morning. And of course, we not creating large expenses of energy when we try to produce our products and we try to transport our products to you. Also I think the second main reason for me to be optimistic is this second, and for that reason, I think something will change quickly. Very good, that’s nice to hear. Some optimism. I, too, am an optimist. I think this issue is coming, it’s an argument that's time has come. But I’m wrong about almost everything. Rosanne? I don’t know exactly what to say because this is—(Well, you are going to stay selling coffee, you said that. Stick to coffee.) Yeah, I will just go on with the coffee, stick—maybe people should stop with apples and start coffee, I don’t know! (You are not going to sell smoothies?) Well, it works very well, smoothies or pre-cuts. (They are very expensive for the rich, let alone for the poor.) Yeah, but it’s very real because people, even in normal vending machine, people are ready to buy a […] at one euro, and if you go to the normal retail store, for that price you have, I don’t know, 4 maybe. So sometime I think it’s not only a question of price, it’s always a question of what price you want to put to what thing. I don’t know, cabbage, it’s very cheap, so everybody should be eating cabbage. So I think it’s not really only a question of price. And I would like to stress again that we are member of the Platform, and through the Platform, one benefit is that we met with the people from the fruit and vegetable, so I think I would encourage any other national platform to have interaction between retail and fruit and vegetable to have some kind of healthy dialogue and not be on the hard positions. And see that we can work together. Thank you. Bernard?
I have noted that the Commission was ready to help the interprofession develop consumption of fruit and vegetables by different actions that we have throughout the year and I think that my colleagues at Interfel will be not miss this opportunity to work with us. Laurence? You gave a plea for having some financial rationality, reminding the big money that’s going on bad diets, the cost of bad diets. I think most finance ministers couldn’t have put it better. I just want to say 2 things really, encouragement. Through the Platform, not only EVA, the Vending Association, but Fresh Vale has made contact with the Restaurant Association, and FIRCO, and EMRA, and these are contacts which would never have happened if the Platform hadn’t been there and we were all busy with our own agendas working away. And as far as DG AGRI is concerned, it’s not a one-way street. In the consultative meetings that we have, they listened to the problems we have with the program in Ireland, the co-funded Food Dude Program in Ireland. Which when I was first set up, unfortunately it was maybe ahead of its time, the cost of the fruit and vegetables and their distribution was not a cost that could legitimately be borne by the Project. So it meant that the industry was not doing 30%, it was doing over 40%. That has since been rectified. Also, not for us, but for others who come after us, it’s a much better system. When it comes to monitoring, there was a budget there for monitoring the Program, but it only was really checking to see that things were in position, like the people that were there. Whereas, we wanted to monitor--and Mike Maloney there set it up, and it worked very well—an independent monitoring. Now, people coming after us will be able to monitor, so those are 3 very good things that DG AGRI did by listening. Very good. I would like to say, although I know Fergus Lowe, who funded the Food Dudes very well, it’s not the only form of marketing. We must take very seriously this rather limited evidence about the value of marketing processes that have been developed so far. I wouldn’t like the Commission to put all its money just into certain baskets. I think it would be a mistake and premature. […]
I ‘ve just reviewed with Liz Dowler and David Hanton in Scotland, Phil James’s imaginative Scottish Diet Acton Plan of 10-12 years ago, and we found absolutely no improvement in the Scottish diet, absolutely none. There are 2/3 of Scottish children who neve, ever eat any green vegetables- ever! I think this is the extent in some areas in Europe of change that has to happen, and is not going to be altered by a little bit of social marketing. Something very dramatic has got to change. So, I think we have to all be fairly urgent and the final point that we’ll ended with, is that whatever the differences of nuances, the difference of approach that we have, the

SESSION 6: Policies and political commitments to increase F&V consumption within an obesity prevention strategy: ROUND TABLE
EGEA 2007, Page 130
different policies that we are wedded to, and support, there has to be some unity around this. This is one of the only areas I khow, where everyone, whether they are in production or consumption whith a little bit of science they are in, everyone can come together with
this and if we don’t come together on, this will collude with the continuation of diet related enormous costs. Laurent, I’m going to end with you. I think we need to thank him and also Saida for their fantastic work.

ABSTRACTS
EGEA 2007, Page 131
N° Poster Name Title
30 Cammisa, M School snack: how to increase fruit intake among primary school children Best EGEA 2007 poster
1 Mullie, P Coronary heart disease and consumption of fruit and vegetables.
2 Rafraf, M Dietary fibre intake, obesity and serum lipid profiles in childbearing age women
3 Vasilopoulou, E Traditional spoon sweets
4 Bes-Rastrollo, M Fruits and vegetable consumption in the prevention of weight gain. Results of a Mediterranean cohort: the SUN study.
5 Geeroms, N Promoting fruit and vegetable intake: need for motive-related health audience segmentation
6 Thorsen, AV Organizing and evaluating F&V consumption in a worksite canteen intervention
7 Mekhancha-Dahel, C Consumption of fruits and vegetables and nutritional transition in Algeria
8 Alexandrova, K Fresh Fruit and Vegetables Consumption in Overweight Bulgarians at high Cardio-vascular Risk
9 Péneau, S Consumption of fruits and vegetables and plasma levels of antioxidant vitamins.
10 Estaquio, C Relationship between fruit and vegetables consumption and 4-year change in weight in middle-aged adults participating in the SU.VI.MAX (SUpplémentation en VItamines et Minéraux AntioXydants) STUDY (1996-2000)
11 Krešić, G Relationship between dieting practices, body mass index and consumption of fruit and vegetables in a group of Croatian university students
12 Houshiarrad, A Assessment of obesity and overweight status with consumption pattern of fruit and vegetable in Iranian households
13 Abdollahi, M Comparison of consumption pattern of fruit and vegetable and fat intake in overweight and obese households with normal households
14 Clarys, P Fruit and vegetable intake amongst fitness clients in different stages of fitness behaviour
15 Aerenhouts, D Fruits and vegetable intake in adolescent sprint athletes
16 Makni, M Beneficial effects of mixture flax and pumpkin seeds on lipid parameters and lipid peroxidation in rats fed high-cholesterol diet
17 Chapman, K Influencing fruit and vegetable purchasing decisions
18 Fieldhouse, P Manitoba School Nutrition Policy Intervention
19 Perl Piricki, A Differences at acceptance of sweet potatoes dumplings and cakes among different weight categories of pre-school children
20 Adibi, H Fruit and vegetable intake in relation to BMI of adults in rural areas of capital city (Tehran)
21 Cosgrove, M Dietary nutrient intakes and skin ageing appearance among middle-aged

ABSTRACTS
EGEA 2007, Page 132
N° Poster Name Title
American women
22 Sekula, W Income inequalities and their effect on the distribution of fruit and vegetable consumption in Poland
23 Darmon, N A two-dimensional system to characterise the nutritional quality of individual foods
24 Darmon, N Nutrient-dense foods of vegetable origin are needed to improve the nutritional quality of food aid in France
25 Maillot, M More foods of vegetable origin and less foods of animal origin are needed to obtain a nutritionally adequate diet at a minimal cost
26 Mikkelsen, BE Working in public private partnerships to create sustainable environmental change - a review of evidence from five-a-day school fruit projects.
27 Bach-Faig, A Fruit and vegetables consumption in the context of the Spanish Mediterranean Diet: trends during the past two decades
28 Prevost, ML Gender differences in response to treatment of obesity in adolescents
29 Camilli, F A community intervention to improve eating habits in children
31 Caroli, M The taste shop: how to sell new flavours to children
32 Deriemaeker, P Macronutrient and micronutrient indicators for fruit and vegetable intake in matched groups of vegetarians versus non-vegetarians
33 Kocoglu, G Food consumption frequency and BMI of children
34 Finlaysson, G A procedure to measure ‘liking’ and ‘wanting’ for fruit and vegetables
35 Lock, K How can we increase fruit and vegetable consumption in Europe: what interventions are effective?
36 Caudwell, P Increased Fruit and Vegetable Consumption Is Associated With Improved Exercise-Induced Weight Loss
37 Mandic, M Differences in consumption of fruits and vegetables among normal and overweight participants estimated by 24-hours recall
38 Dilis, V Greek traditional tomato paste
39 Alphan, ME Consumption of fruits, vegetables and legumes and health status of an adult population living in a low socio-economic area in Istanbul
40 Bollare, C Evaluation of a school-based intervention to promote fruit intake
41 Loppert, R Role of Jerusalem artichoke as a lipid lowering dietary agent
42 Reyes Sanchez, L A way out of obesity through participatory action
43 Halicka, E Trends and specificities of fruit and vegetable consumption in Poland
44 Landrier, JF Adiponectin is positively regulated by vitamin E
45 Oberti Padilla, B Fruit and vegetable consumption, obesity and socio-economic environment in a country in food transition: The case of Algeria
46 El-Aoufi, S Variation of the liver enzymatic activities during a hypercaloric diet

ABSTRACTS
EGEA 2007, Page 133
The poster below has been selected by EGEA Scientific Committee as the best EGEA 2007 poster
School snack: how to increase fruit intake among primary school children (P30) CAMMISA Maria, CARDONE Maria, CAROLI MargheritaNutrition Unit Department of Prevention AUSL Brindisi, Italy Corresponding author: Margherita Caroli, Nutrition Unit, Dept. of Prevention Via per Ceglie 72021 Francavilla Fontana (Brindisi), Italy, [email protected]
Background: In the Italian primary school system children consume a snack brought from home during a midmorning break. Previous research has shown that the most represented snacks consisted in foods rich in fat, salt and/or sugar with high calorie content. Aim: To increase the use of healthful foods as school snack among this age group. Methodology: 2 groups of children (age range 6-11 years) attending 2 public primary schools in two different towns of the Region of Puglia. Intervention group: 351 children, control group: 615 children. Class teachers reported children’s school snacks in October 2006 and in January 2007. Intervention group: planning and implementation of a weekly snack menu: 2 days fruit, 1 day yoghurt, 2 days bread or similar products, 1 day free choice. Children were allowed to choose one food of the day group. No education or information was given to children, their families, or teachers. Control group no intervention at all. Statistical analysis: t-test, χ² test. Results:
Intervention group Control group
Initial % Final% Initial % Final% Junk food 72.2 44.1 66 58 Bread and vegetables 6.1 8.3 3 4 Bread similar products 13.6 39.9 27.2 34 Yoghurt 1.7 3.5 1.3 1.3 Fruit 0.3 4.2 2.3 2.3
No difference between the two groups before the intervention; after 4 months of weekly menu the rate of children consuming healthful snacks was significantly higher in the intervention group (p<0.0001). Discussion: A very simple approach such as a planned weekly menu including fruit two days a week is an efficient tool to increase the number of children who spontaneously brought fruit as snack during the free day. Such results confirm the nutritional education rule that a more frequent contact and consumption increases the preference for a specific food and thus its choice by the subject. A planned weekly menu is a useful, costless tool to positively modify children’s school snack and can be implemented as a reinforcement tool after other more active interventions.
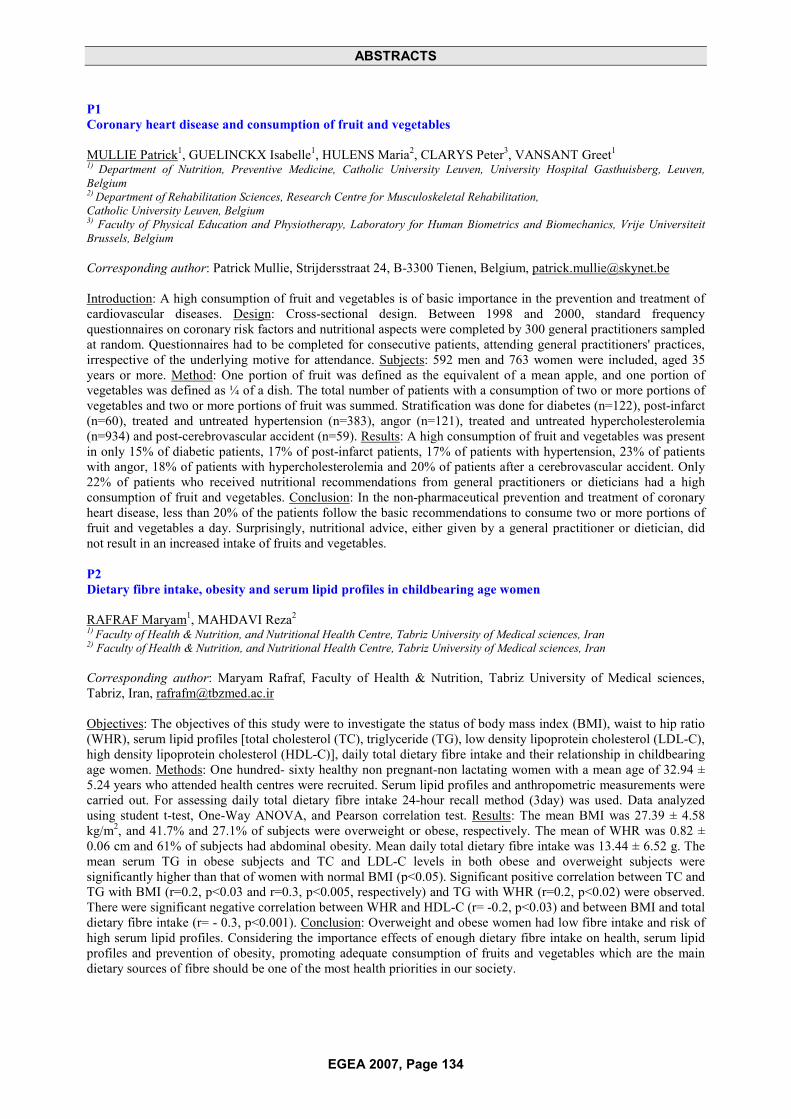
ABSTRACTS
EGEA 2007, Page 134
P1 Coronary heart disease and consumption of fruit and vegetables MULLIE Patrick1, GUELINCKX Isabelle1, HULENS Maria2, CLARYS Peter3, VANSANT Greet1
1) Department of Nutrition, Preventive Medicine, Catholic University Leuven, University Hospital Gasthuisberg, Leuven, Belgium 2) Department of Rehabilitation Sciences, Research Centre for Musculoskeletal Rehabilitation, Catholic University Leuven, Belgium 3) Faculty of Physical Education and Physiotherapy, Laboratory for Human Biometrics and Biomechanics, Vrije Universiteit Brussels, Belgium Corresponding author: Patrick Mullie, Strijdersstraat 24, B-3300 Tienen, Belgium, [email protected]
Introduction: A high consumption of fruit and vegetables is of basic importance in the prevention and treatment of cardiovascular diseases. Design: Cross-sectional design. Between 1998 and 2000, standard frequency questionnaires on coronary risk factors and nutritional aspects were completed by 300 general practitioners sampled at random. Questionnaires had to be completed for consecutive patients, attending general practitioners' practices, irrespective of the underlying motive for attendance. Subjects: 592 men and 763 women were included, aged 35 years or more. Method: One portion of fruit was defined as the equivalent of a mean apple, and one portion of vegetables was defined as ¼ of a dish. The total number of patients with a consumption of two or more portions of vegetables and two or more portions of fruit was summed. Stratification was done for diabetes (n=122), post-infarct (n=60), treated and untreated hypertension (n=383), angor (n=121), treated and untreated hypercholesterolemia (n=934) and post-cerebrovascular accident (n=59). Results: A high consumption of fruit and vegetables was present in only 15% of diabetic patients, 17% of post-infarct patients, 17% of patients with hypertension, 23% of patients with angor, 18% of patients with hypercholesterolemia and 20% of patients after a cerebrovascular accident. Only 22% of patients who received nutritional recommendations from general practitioners or dieticians had a high consumption of fruit and vegetables. Conclusion: In the non-pharmaceutical prevention and treatment of coronary heart disease, less than 20% of the patients follow the basic recommendations to consume two or more portions of fruit and vegetables a day. Surprisingly, nutritional advice, either given by a general practitioner or dietician, did not result in an increased intake of fruits and vegetables. P2 Dietary fibre intake, obesity and serum lipid profiles in childbearing age women RAFRAF Maryam1, MAHDAVI Reza2
1) Faculty of Health & Nutrition, and Nutritional Health Centre, Tabriz University of Medical sciences, Iran 2) Faculty of Health & Nutrition, and Nutritional Health Centre, Tabriz University of Medical sciences, Iran Corresponding author: Maryam Rafraf, Faculty of Health & Nutrition, Tabriz University of Medical sciences, Tabriz, Iran, [email protected]
Objectives: The objectives of this study were to investigate the status of body mass index (BMI), waist to hip ratio (WHR), serum lipid profiles [total cholesterol (TC), triglyceride (TG), low density lipoprotein cholesterol (LDL-C), high density lipoprotein cholesterol (HDL-C)], daily total dietary fibre intake and their relationship in childbearing age women. Methods: One hundred- sixty healthy non pregnant-non lactating women with a mean age of 32.94 ± 5.24 years who attended health centres were recruited. Serum lipid profiles and anthropometric measurements were carried out. For assessing daily total dietary fibre intake 24-hour recall method (3day) was used. Data analyzed using student t-test, One-Way ANOVA, and Pearson correlation test. Results: The mean BMI was 27.39 ± 4.58 kg/m2, and 41.7% and 27.1% of subjects were overweight or obese, respectively. The mean of WHR was 0.82 ± 0.06 cm and 61% of subjects had abdominal obesity. Mean daily total dietary fibre intake was 13.44 ± 6.52 g. The mean serum TG in obese subjects and TC and LDL-C levels in both obese and overweight subjects were significantly higher than that of women with normal BMI (p<0.05). Significant positive correlation between TC and TG with BMI (r=0.2, p<0.03 and r=0.3, p<0.005, respectively) and TG with WHR (r=0.2, p<0.02) were observed. There were significant negative correlation between WHR and HDL-C (r= -0.2, p<0.03) and between BMI and total dietary fibre intake (r= - 0.3, p<0.001). Conclusion: Overweight and obese women had low fibre intake and risk of high serum lipid profiles. Considering the importance effects of enough dietary fibre intake on health, serum lipid profiles and prevention of obesity, promoting adequate consumption of fruits and vegetables which are the main dietary sources of fibre should be one of the most health priorities in our society.

ABSTRACTS
EGEA 2007, Page 135
P3 Traditional spoon sweets
VASILOPOULOU Effie, DILIS Vardis, TRICHOPOULOU Antonia Dept. of Hygiene and Epidemiology, Medical School, University of Athens, 75 Mikras Asias St., 115 27 Athens, Greece, [email protected]
Introduction: Sweets are not an essential element of a traditional diet and their consumption is mainly connected to the festivities and religious holidays. Nevertheless, spoon sweets, were directly related to the seasonal agricultural production and due to the excess availability of seasonal fruits and vegetables, in conjunction with their extended time of preservation, spoon sweets were prepared in satisfactory quantities and consumed all year round. Consequently, they had a higher consumption than other traditional sweets and were intertwined with the traditional diet of Greece. Objectives: Spoon sweets are based on the conservation of fresh fruit or vegetables and nuts, after having been boiled in a sweetening substance, namely honey, molasses from must or sugar. The recipes, which varied depending on the production of each region, were transmitted from mother to daughter. Therefore, the study of Greek spoon sweets not only preserves important elements of the cultural inheritance but may also elucidate their role in the beneficial traditional Greek diet. Methodology: In the context of the systematic investigation of traditional Greek foods we studied two typical spoon sweet recipes: the quince spoon sweet in Nemea (Peloponnesus) and the watermelon peel spoon sweet in Nea Karvali (Kavala – northern Greece). The recipes were prepared by elderly residents and their nutritional composition was determined by chemical analyses. Results: Part of the nutritional composition of the studied spoon sweets are presented below. Since they are based on fruits boiled in syrup, they present a low lipid content which virtually derives from the nuts included in the recipe. Moreover, they provide dietary fibre and vitamins depending on the type of fruit or vegetable used. Conclusion: Today, after so many centuries, the tradition of spoon sweets is still alive and perpetuating. Scientific evident supports that they may be incorporated into the habitual diet as they are savoury no cholesterol sweet desserts with a negligible amount of fat.
Food (100g) Water (g) Prot. (g) Lip. (g) Carb (g) Dietary fibre (g)
Energy (Kcal)
Quince spoon sweet 19.1 0.6 2.9 75.1 2.3 379
Water-melon peel spoon sweet
22.6 2.6 0.3 70.5 3.4 295
This research was co-funded by the Hellenic Secretariat of Research and Technology and the European Union. P4 Fruits and vegetables consumption in the prevention of weight gain- Results of a Mediterranean cohort: the SUN study
BES-RASTROLLO Maira1,2, BASTERRA-GORTARI F. Javier1, TOLEDO Estefanía1, SANCHEZ-VILLEGAS Almudena1,3, MARTINEZ J. Alfredo4, MARTINEZ-GONZALEZ Miguel Angel1*
1) Dept. of Preventive Medicine and Public Health, University of Navarra, Spain; 2) Dept. of Nutrition, Harvard School of Public Health, Boston, MA, USA; 3) Dept. of Clinical Sciences, University of Las Palmas de Gran Canarias, Spain; 4) Dept. of Human Physiology and Nutrition, University of Navarra, Spain
Corresponding author: Miguel Angel Martinez Gonzalez, Universidad de Navarra, Dept. Medicina Preventiva y Salud Publica, Ed. Investigacion, c/ Irunlarrea, 1, 31080 Pamplona (Navarra), Spain, [email protected]
Although fruits and vegetables have been consistently associated with lower risk of cardiovascular disease, longitudinal data on the long-term relationship between fruit and vegetable (F&V) consumption and changes in body weight are limited. The aim of this study was to examine the association between F&V consumption and changes in body weight in a free-living Mediterranean cohort. We followed-up for an average of 28 months a Spanish dynamic cohort composed of 8,899 university graduates (the SUN study): Mean age was 38 years, 60% of participants were women. F&V consumption was assessed with a previously validated semi-quantitative food-frequency questionnaire. Self-reported weight was validated in a subsample of the cohort. We used linear regression models to estimate the association between baseline F&V consumption (quintiles) and weight change during follow-up. Most participants tended to gain weight during follow-up. Those in the upper quintile of baseline F&V consumption exhibited 347g (95% confidence interval (CI): 614 to 79) less weight gain than those who were in the lowest quintile of F&V consumption after adjusting for potential confounders. Considering changes in F&V consumption during follow-up, participants with medium F&V consumption at baseline who increased their F&V consumption during follow-up experienced the lowest weight gain, with an adjusted difference of -535 g ( 95% CI: -847 to -223) versus those with the lowest baseline consumption and a consistent or reduced F&V consumption during follow-up. These results add evidence to support the recommendation of replacing other food items with F&V in order to tackle the obesity epidemic.

ABSTRACTS
EGEA 2007, Page 136
P5 Promoting fruit and vegetable intake: need for motive-related health audience segmentation GEEROMS Nele1, VAN KENHOVE Patrick1, VERBEKE Wim2
1) Department of Marketing, Ghent University, Belgium 2) Department of Agricultural Economics, Ghent University, Belgium Corresponding author: Nele Geeroms, Ghent University, Faculty of Economics and Business Administration, Department of Marketing, Tweekerkenstraat 2, 9000 Gent, [email protected]
Objectives and method: Based on the domain-specific application of a general taxonomy of consumer motives in the context of health motivation, a heterogeneous health audience (N=615) was segmented according to people’s health-related motive orientations, i.e. relatively enduring beliefs that people hold about the fundamental meaning of health. After identifying consumer segments and assessing differences in fruit and vegetable consumption among these segments, the major aim was to explore the effectiveness of different motive-related health advertisements to motivate each of the segments to increase fruit and vegetable intake. Results: The results of a two-step cluster analysis revealed five different health segments for which health has another distinct meaning, named Energetic Experimenters, Harmonious Enjoyers, Normative Carers, Rationalists and Conscious Experts. Significant differences were found between the health segments with regard to category-specific fruit and vegetable consumption (e.g. bananas, potatoes, cooked vegetables), which indicates that different (fruit and vegetable) product features and/or health-related benefits are likely to be instrumental to achieve different health-related motive orientations. In addition, significant differences existed between the segments with regard to their reactions toward fruit and vegetable health advertising. Compared to the other segments, all health audience segments responded more positively toward the advertisement that was hypothesized and designed to be most responsive to their health-related motive orientations. Moreover, when comparing the most appropriate motive-related advertisement to a general advertisement, a segment’s reactions toward the motive-related advertisement were significantly more positive than its reactions toward the general advertisement. Conclusions: These findings provided a test of the proposition that targeted or segment-specific motive-related health advertising is likely to be more effective than a general message. Based on the results of this study, practical suggestions and recommendations were offered for health communicators to use when developing motive-related health advertisements in the context of fruit and vegetable intake promotion. P6 Organizing and evaluating F&V consumption in a worksite canteen intervention THORSEN Anne Vibeke1, 2; LASSEN Anne1, JØRGENSEN Michael Søgaard 21) Department of Nutrition, National Food Institute, Technical University of Denmark 2) Department of Manufacturing Engineering and Management, Technical University of Denmark. Corresponding author: Anne Vibeke Thorsen, Department of Nutrition, National Food Institute, Technical University of Denmark, Mørkhøj Bygade 19, DK-2860 Søborg, Denmark, [email protected]
Objectives: The objective of the study is to analyze the long term sustainability of a worksite canteen intervention of serving more fruit and vegetables (F&V). Methodology: In the so-called 6-a-day project, having 600g F&V consumption-a-day as target, 5 worksites canteens increased the F&V lunchtime consumption significantly based on a worksite canteens intervention. In this 5 year follow-up study the F&V-consumption at lunchtime was analysed in the original 5 canteens. Data was likewise the original study collected by the canteen staff themselves during a 3 week continually period. The daily F&V-intake was measured by weighing fruits and vegetables served subtracting waste. The results were analysed and compared to the data at baseline before intervention, after intervention and a one-year follow-up to evaluate the sustainability of the intervention. Results: The 5 year follow-up data collection shows that 4 of the 5 worksite canteens were able to either maintain the intervention or even increase the consumption of F&V by using different strategies (the development in total F&V for each canteen is seen in the figure). The method developed during the canteen intervention focused on co-operation between a consultant and the canteen personnel and management in defining, planning and implementing the F&V-intervention. The method developed also focused on providing ideas for increased F&V for lunch, making environmental changes in the canteens by giving access to tasteful and healthy food choices and reducing availability of unhealthy options. Conclusion: Worksites seem to be a promising setting for promoting healthier eating if the canteen manager and staff are given the right tools and conditions. From a public health perspective the worksites address a large number of individuals including many unlikely to engage in preventive health behaviours. This study shows that future worksite canteen interventions should be based on: participatory approach, long-term intervention, environmental change, dialogue with suppliers and networking among worksite canteens.

ABSTRACTS
EGEA 2007, Page 137
Keywords: Sustainability of intervention, Worksite canteens, Fruit and vegetables The figure shows the development in total F&V for each of the 5 canteens. The measurements are taken continually over a 3 week period (number of days n=15), from before intervention (baseline), after intervention (end-point) to 1 year follow-up and 5 year follow-up. To avoid seasonal changes baseline and the follow-up measurements are all taken within the same 3 weeks of the year for each canteen.
Total fruit and vegetable consumption over time for 5 Danish canteens 2001-2006 - by worksite
0
50
100
150
200
250
300
350
Baseline End-point 2002 Follow-up 2006 Follow-up
Frui
tand
vege
tabl
eco
nsum
ptio
n(g
/mea
l/cus
tom
er)
Military base
ElectroniccomponentdistributorBank
Townhall
Waste handling
P7 Consumption of fruits and vegetables and nutritional transition in Algeria MEKHANCHA-DAHEL Corinne, MEKHANCHA Djamel-Eddine, NEZZAL Lahcène Laboratoire de recherche ALNUTS, INATAA, Université Mentouri Constantine, 25000 Constantine, Algeria [email protected]
The nutritional transition is a phenomenon present in Algeria. It is characterized by a modification of the diet and the emergence of no transmissible chronic diseases related to the diet. The progressive modification of the structure and the balance of the food ration reflect this change. In Algeria, in 2001, the Food Energy Availabilities were of 3 010 kcal per capita/day. The structure of the energy contribution changed in 1965 to 2000, in particular by a reduction of carbohydrate intake. FAO estimates the availabilities of fruits and vegetables per capita at 368 g/day and their food energy availability at 6% (2000-2002). According to study "STEP WISE WHO Algeria 2003" carried out with persons aged between 24 and 64 years in Sétif and Mostaganem, the mean fruit consumption observed was 2.5 days per week and that of vegetables 5 days per week. Among the 84.1% of the persons who consume less than 5 portions of fruits/day, women (55-64 years), in urban environment, of high socio-economic level, are most numerous. The 80.4% who consume less than 5 portions of vegetables/day are in rural area and have low socio-economic level. The study shows prevalence of 26% of HTA, 14.6% of obesity and 2.5% of diabetes. In the group of person with chronic diseases, the prevalence of fruit and vegetable consumption of less than 5 portions is 55.3%. A national program against the non transmissible diseases was elaborated in 2003 but is not launched yet. These diseases have multiple causes and any adequate approach must be coordinated by the various actors. Suitable policies and interventions are necessary in Algeria to limit the negative effects of the transition and to build a durable food and nutritional system by developing the local products. The promotion of the consumption of fruits and vegetables and its accessibility seems essential.

ABSTRACTS
EGEA 2007, Page 138
P8 Fresh fruit and vegetables consumption in overweight Bulgarians at high cardio-vascular risk ALEXANDROVA Krassimira1, POPOVA Stoyanka1, FESCHIEVA Nevyana1, DIMITROV Dimitar2
1) Department of Social Medicine and Health Care Management, Medical University of Varna, Bulgaria 2) Varna Nutrigenomics Centre, Medical University of Varna, Bulgaria Corresponding author: Krassimira Alexandrova, 40 Patriarhi Evtimii Str., 9000 Varna, Bulgaria, [email protected]
Purpose: There is compelling evidence of protective role of diet rich in fruits and vegetables on lowering the risk of heart disease and stroke. We aimed to examine the patterns of fruit and vegetables intake in overweight Bulgarians at high cardio –vascular risk. Methods: 530 adults, aged 40 – 75 years, with average BMI 29 ± 11 were randomly selected to participate in a survey. Anthropometric status was measured with standardised scales. Food frequency questionnaire comprised by 50 food items was applied to measure participant's usual food intake during the winter and summer season of the previous year. For each food item, participants were asked to indicate their usual consumption, choosing from 5 frequency categories ranging from "never or less than once/month" to "3 or more times per day". Results: There is a pronounced seasonality of fresh fruit and vegetables consumption in the studied population. 75% of all subjects do not consume any fresh vegetables in winter compared to 5 % in summer. Fresh fruits are consumed every day by 15% of the subjects in winter, while by 65 % in summer. The intake of preserved fruits and vegetables is traditional for the Bulgarians and is reported to be high in winter. Significant differences in dietary patterns are observed by place of residence (urban/rural), age, gender and Body Mass Index status. Men, rural and obese subjects prove to have the most unfavourable diet, respectively the lowest fresh fruits and vegetables intake. Conclusions: The results underline the presence of seasonal variations in fresh fruit and vegetables consumption in overweight Bulgarians at high risk for cardio-vascular mortality. Further targeted research is needed to explain the specifics of the observed seasonality. Health education interventions should focus on men, rural and overweight people not just the population as a whole.
P9 Consumption of fruits and vegetables and plasma levels of antioxidant vitamins PÉNEAU S1, Dauchet L1, Bertrais S1, Vergnaud AC1, Estaquio C1, Kesse E1, Czernichow S1, FAure H2, Favier A2,Galan P1, Hercberg S1
1) UMR U557 INSERM, INRA, CNAM; Paris 13 / CRNH I-d-F, Bobigny, France 2) Département de Biologie Intégrée, CHU La Tronche, Grenoble, France Corresponding author: Sandrine Péneau, [email protected]
Aim: To assess the relationship between fruit and vegetable consumption and vitamin plasma antioxidant levels. The importance of specific groups of fruits and vegetables is evaluated. Method: A total of 3,521 subjects (1,487 men and 2,034 women), aged 35-60 years, who participated in the SU.VI.MAX cohort were included in this study. Blood samples of volunteers were analysed for beta-carotene, vitamin C, alpha-tocopherol and retinol. Each subject had completed at least 6 dietary records during the first 2 years of the study. Results: Women had higher mean beta-carotene and vitamin C plasma levels than men, but lower alpha-tocopherol and retinol plasma levels. Plasma beta-carotene and vitamin C levels were correlated with consumption of vegetables+fruits+juices, with vegetables alone and with fruits alone, as well as with most of the food groups tested. These relationships persist after adjustment for confounding factors. Regression analysis showed a linear dose response relationship. Conclusion: In our study population, plasma concentrations of beta-carotene and vitamin C were associated with fruit and vegetable intake whereas alpha-tocopherol and retinol were not. Root vegetables and citrus fruits were shown to be specifically associated with beta-carotene plasma status as were citrus fruits with vitamin C plasma status.

ABSTRACTS
EGEA 2007, Page 139
P10 Relationship between fruit and vegetables consumption and 4-year change in weight in middle-aged adults participating in the SU.VI.MAX (SUpplémentation en VItamines et Minéraux AntioXydants) Study (1996-2000)
Estaquio C, Vergnaud AC, PÉNEAU S, Dauchet L, Czernichow S, Chat-Yung S, Hercberg S, Galan P, Bertrais S UMR Inserm U557; Inra 1125; Cnam; Paris 13 / CRNH Ile de France, 74 rue Marcel Cachin, 93017 Bobigny
Corresponding author: Carla Estaquio, UMR Inserm U557; Inra 1125; Cnam; Paris 13 / CRNH Ile de France, 74 rue Marcel Cachin, 93017 Bobigny, [email protected]
Objectives: Intervention studies showed that advice to increase fruit and vegetable consumption and decrease dietary fats is an effective strategy for weight management. The purpose of this prospective observational study was to examine the relationship between consumption of fruits and vegetables and change in weight over a 4-year period. Materials and Methods: The SU.VI.MAX study included middle-aged adults (45-60 years) who were followed for an 8-year period. Every two years, participants underwent a clinical examination, including anthropometric measurements. All subjects were invited to complete a 24h records every two months. We selected subjects who completed at least 6 dietary records between 1996 and 2000 (provided that at least 3 dietary records were completed in 1996-1998 and 1998-2000) with no missing covariates. We examined the relationships between weight change and consumption of fruits (including fruit juice) and vegetables (excluding potatoes) separately, fruits/vegetables combined and soups. Consumption (g/day) was divided into sex-specific quartiles. Analyses were performed by sex comparisons were adjusted for age, education, tobacco use, total energy intake, physical activity, television watching and body mass index in 1996. Results: The sample consisted of 1761 adults (985 men, 776 women). In men, combined fruit and vegetable consumption in the top quartile (i.e. 7 servings/day) was associated with a lower mean weight gain compared to the first quartile (1.5 vs. 2.3 kg, p=0.04). When analyzed separately, weight change was related to fruit consumption only (p=0.01). Heavy soup consumers compared to occasional or non-consumers have a mean weight gain of 1.41 vs. 2.19 kg (p=0.01). No significant associations were found in women. Conclusion: Heavy consumers of fruits or soups had a lower mean weight gain in men in the SU.VI.MAX study. Further analyses on the association of dietary patterns and fruit and vegetable consumption are needed.
P11 Relationship between dieting practices, body mass index and consumption of fruit and vegetables in a group of Croatian university students
KREŠIĆ Greta1, KENĐEL Gordana2, PAVIČIĆ ŽEŽELJ Sandra2, ŠIMUNDIĆ Borislav 3 1) Faculty of Tourism and Hospitality Management, University of Rijeka, Department of Food and Nutrition, Primorska 42, P.O. Box 97, 51 410 Opatija, Croatia; 2) Teaching Public Health Institute of Primorsko-Goranska County, Health Ecology Department, Krešimirova 52a, 51000 Rijeka, Croatia; 3) Faculty of Tourism and Hospitality Management, University of Rijeka, Department of Food and Nutrition, Primorska 42, P.O. Box 97, 51 410 Opatija, Croatia
Corresponding author: Greta Kresic, Faculty of Tourism and Hospitality Management, University of Rijeka, Department of Food and Nutrition, Primorska 42, P.O. Box 97, 51 410 Opatija, Croatia, [email protected]
Behaviours on fruit and vegetables consumption and dieting practices are not completely understood. Since university students are in a period of heightened concern over obesity, this study aimed to assess the dieting practices among underweight, normal weight and overweight students and to examine the related fruit and vegetables consumption. Dieting practices were examined among 602 Croatian university students (143 males, 459 females) with average age of 22.6±1.19 years and average BMI of 21.63±2.71 kgm-2. Study included specially designed survey questionnaire consisted of demographic variables, questions on recent dieting practices and quantified food frequency questionnaire. Descriptive statistics and parametric variables were analysed using Student’s t-test, ANOVA and Pearson’s r correlations coefficients. During the survey, 29.2% of students reported dieting while 70.8 % of students were classified as non-dieters. Among dieters, 1.7% were underweight, 85.2% were normal weight and 13.1% were overweight. Among non-dieters the mentioned distributions according to BMI were 7.7%, 83.8% and 8.5%, respectively. According to dieting practices, significant differences were observed among underweight groups in BMI (p<0.000), while among those with normal weight differences were established in intake of energy (p<0.03), polyunsaturated fatty acids (p<0.02) and cereals (p<0.04). Food group analysis showed that dieting practices were inversely correlated to consumption of vegetables (r=-0.32, p<0.44), nuts (r=-0.40, p<0.32), citrus fruits (r=-0.03, p<0.45) and other fruit (r=-0.6, p<0.09). Statistically significant difference was observed in consumption of potatoes (r=-0.10, p<0.01). Conclusively, results indicated differences in food habits according to dieting practices but they were not related to overall amounts of fruit and vegetables consumed. However gender specific differences were observed. Female dieters reported less consumption of legumes and potatoes (P< 0.05) while males dieters reported fewer consumption of fruit (P< 0.05) compared to non-dieters.

ABSTRACTS
EGEA 2007, Page 140
P12 Assessment of obesity and overweight status with consumption pattern of fruit and vegetable in Iranian households HOUSHIARRAD Anahita, ALIPOUR Setareh, ABDOLLAHI Morteza, ESMAEILI Mina, MAZAHERI Neda National Nutrition and Food Technology Research Institute, National Nutrition and Food Technology Research Department, Tehran, IR. Iran Corresponding author: Setareh Alipour, National Nutrition and Food Technology Research Institute; Nutrition Research Department; 46,West Arghavan St.,Farahzadi Blvd., Shahrak Qods, Zip Code:1981619573 , P.O. Box:19395-4741, Tehran, IR. Iran, [email protected]
Introduction: Obesity is a condition caused by many factors. Fruits and vegetables are naturally low in calories, and may be an important way to prevent and treat obesity. Diets that are high in fibre are associated with lower body weight. The purpose of this study was to assess obesity and overweight status with consumption pattern of fruit and vegetable in Iranian households. Methodology: We used data of national comprehensive study on household food consumption pattern and nutritional status Iran (2001-2003).Dietary pattern of 7158 households chosen by a systematic stratified sampling design was assessed. Data on food consumption were collected by a combination of weighing and recall method for three consecutive days. Mean weighted average intakes were calculated. Obesity and overweight were defined as BMI>27. Results: The prevalence of obesity and overweight in Iran were 42%. Mean daily per capita intake of total fruit and vegetable in Iran was 371 g consisting of 142g fruit (range 65 to 187g) and of 229g vegetable (range 166 to 277g). Fruit and vegetable contribution to total intake of food basket (1384g) were 27%. Conclusion: Based on findings, total intake of fruit and vegetable were less than WHO recommendation (400g/day) and prevalence of obesity and overweight were high in Iran. Thus, there is a need to apply useful strategy to encourage Iranian to consume more fruit and vegetable.
P13 Comparison of consumption pattern of fruit and vegetable and fat intake in overweight and obese households with normal households ABDOLLAHI M., MAZAHERI N., HOUSHIARRAD A., ALIPOUR S., ESMAEILI M. National Nutrition and Food Technology Research Institute, Nutrition Research Department, Tehran, Iran Corresponding author: Neda Mazaheri, National Nutrition and Food Technology Research Institute, 46, West Arghavan St., Farahzadi Blvd., Shahrak Qods, zip Code: 1981619573, P.O.Box: 19395-4741, Tehran, IR.Iran., [email protected]
Introduction: Fruits and vegetable are a major component of a healthy diet and adequate daily intake can help prevent chronic disease such as obesity. It is recommended to eat daily a minimum of 5 (which is equivalent to approximately 400 grams) to 10 servings of fruit and vegetable. The purpose of the present study was to compare consumption pattern of fruit and vegetable and fat intake in overweight and obese households with normal households. Methods: We used data of national comprehensive study on household food consumption pattern and nutritional status Iran (2001-2003). Dietary pattern of 7158 households chosen by a systematic stratified sampling design was assessed that 3301 households had overweight and obese subjects and 3857 households had normal subjects. Data on food consumption were collected by a combination of weighing and recall method for three consecutive days. Mean weighted average intakes were calculated. Obesity and overweight were defined as BMI>27. Results: Mean daily per capita consumption of fruit and vegetable in normal households were131.6 and 217.6 g and in obese households were 153 and 242 g, respectively. Mean daily total energy intakes in normal and obese households were 2615 and 2660 Kilocalories. The contribution of fat to total energy intake in normal and obese households was 24.3% and 24.7%, respectively. Conclusion: Consumption of fruit and vegetable in obese households is higher than normal households but their total energy intake and portion of fat intake is almost equivalent. So we should develop more effective interventions for increasing fruit and vegetable consumption and simultaneously decreasing fat intake which may help to avoid weight gain.

ABSTRACTS
EGEA 2007, Page 141
P14 Fruit and vegetable intake amongst fitness clients in different stages of fitness behaviour CLARYS Peter, VAN CAUWENBERG Jelle, MULLIE Patrick, DE RIDDER Dolf, VANDENABEELE Eric, HEBBELINCK Marcel Department of Human Biometry and Biomechanics, Faculty of Physical Education and Physical Therapy, Belgium Corresponding author: Peter Clarys, Vrije Universiteit Brussels, Belgium - Pleinlaan 2, 1050 Brussels, [email protected]
Objectives: Some health behaviours and health behaviour changes seem to be related. It was the aim of our study to evaluate the willingness to change eating habits in subjects in different fitness behaviour stages (action- versus habituation phase). We focussed on fruit and vegetable intake since they are important components of a healthy nutrition. Methods: In 8 fitness clubs 201 subjects were contacted (107 females and 94 males), ranging from 16 to 63 years of age. All of them completed a questionnaire concerning their intention towards behavioural changes for nutrition, fitness behaviour, and a food frequency questionnaire concerning fruit and vegetable intake. Results: Of the female subjects 44% were in the action phase of fitness behaviour compared to 33% for the male subjects. The rest of the female and male subjects were in the habituation phase. Concerning nutritional habit changes 57% of the females were in the precontemplation phase, 17% in the contemplation phase and 26% in the action and/or habituation phase. For the males these percentages were respectively 64%; 18% and 18%. More subjects in the fitness action phase considered changes in nutritional behaviour compared to those in the habituation phase. Having healthy eating habits was the reason for not considering changes in such behaviour for 35% of the females and 32% of the males. Fruit intake reached the recommendations of 250 g/day for 40% of the females (mean intake 211 ± 173g) and 43% of the males (mean intake 248 ± 244 g). Only 8% of the females (mean intake 138 ± 108g) and 5% of the males (mean intake 121 ± 80g) reached the recommended vegetable intake of 300g/day. When comparing fruit and vegetable intake in contemplators and subjects in the action phase with precontemplators no differences were found for the fruit and vegetable intake. Fruit and vegetable intake differed significantly when comparing the self reported healthy eaters with the rest of the group: respectively for fruit 258 ± 219 g versus 178 ± 232g (p = .003) and for vegetables 145 ± 109g versus 91 ± 82 g (p = .013). Conclusion: More subjects in the fitness action phase show willingness to change their eating habits compared to subjects in the habituation phase. No differences were found for fruit and vegetable consumption between subjects changing or not their eating habits. Hence, we may assume that other components of the intake were changed.
P15 Fruit and vegetable intake in adolescent sprint athletes AERENHOUTS Dirk, DERIEMAEKER Peter, CLARYS Peter Department of Human Biometry and Biomechanics, Faculty of Physical Education and Physical Therapy, Vrije Universiteit Brussels, Belgium - Pleinlaan 2, 1050 Brussels, Belgium, Corresponding author: Dirk Aerenhouts, [email protected]
Introduction: The contribution of fruit and vegetables in a qualitative and quantitative balanced diet for health and performance is well documented. The aim of the present experiment was to estimate fruit and vegetable intake and their respective contribution to several macro- and micronutrients in adolescent sprint athletes. Subjects and methods: Twenty-three sprint athletes (11 boys aged 15.1 ± 1.4 yrs and 12 girls aged 14.1 ± 1.5 yrs) volunteered. During 7 consecutive days they completed a food diary and activity questionnaire. The BECEL program Bins3.0 was used for analysis of all food diaries. Energy expenditure was estimated using the metabolic constants of seven different activity levels. Results: In spite of a mean fruit intake of 333 ± 237 g/day, only 14 out of 23 subjects reached the RDI of 250 g/day. Mean vegetable consumption of 150 ± 90g/day was beneath the RDI of 300g/day (p < .05) with only 1 subject reaching the RDI. Fruit and vegetables contributed for 13.4 ± 8.9% of total fluid intake (2185.6 ± 486.5 ml) which was lower (p < .01) than the recommended intake (2944,3 ± 307,9 ml). Total energy intake covered total energy expenditure (2483.2 ± 392.3 vs. 2520.9 ± 207.5 kcal/day). For all subjects, total intake of fibre and Ca was too low, only for girls Fe intake did not reach RDI with values respectively 50, 22 and 34% beneath the RDI. Conclusion: Although mean fruit intake was acceptable, several subjects did not reach the RDI. Only one subject reached the RDI for vegetables. These results advocate for an individual nutritional advice. Since the water content of fruit and vegetables is high and they are equally rich in minerals and vitamins, an augmentation of fruit and vegetable intake may result in a better nutritional status and water balance.

ABSTRACTS
EGEA 2007, Page 142
P16 Beneficial effects of mixture flax and pumpkin seeds on lipid parameters and lipid peroxidation in rats fed high-cholesterol diet Mohamed MAKNI 1,2, Nabil Kamel GARGOURI 2, Najiba ZEGHAL1
1) Animal Physiology Laboratory, UR 08-73, Sciences Faculty of Sfax, BP 802, 3018 Sfax. Tunisia 2) Agro-alimentary Department, ISET Sidi Bouzid, BP 377, 9100 Sidi Bouzid, Tunisia Corresponding author: Najiba ZEGHAL, Animal Physiology Laboratory, UR 08-73, Sciences Faculty of Sfax, BP 802, 3018 Sfax. Tunisia, [email protected]
Objectives: The potential health benefits of various dietary seeds and oils in relation to cardiovascular diseases and cancer are currently receiving considerable attention. This study investigated the effects of diet enriched with mixture seeds (flax and pumpkin), on plasma and liver total lipids, plasma lipid parameters and lipid peroxidation in rats. Methodology: Thirty male Wistar rats (SIPHAT, Tunisia) were fed, ad-libitum for four weeks. They were divided into three groups of ten animals each: The first one the control group (CD) consumed standard diet, the second one high-cholesterol group (1% cholesterol) (CD-chol) and the third group fed with high-cholesterol diet supplemented (33% w/w) with mixture of flax and pumpkin seeds at a ratio 5/1 of omega 6/omega 3 fatty acids (MS-chol). At the end of the feeding period, the rats were sacrificed after anaesthesia, blood and liver samples were analyzed for total lipids, plasma triglycerides (TG), total and HDL-Cholesterol (TC and HDL-C), and malondialdehyde (MDA). Results: In hypercholesterolemic group, we have observed a significant increase in total plasma and liver lipids by +65 % and +41% respectively compared to those of control group, whereas the supplementation of seeds’ mixture to diet induced a decrease in total plasma and liver lipids of (MS-chol) group by -12% and -15% respectively compared to (CD-chol) group. The plasma total cholesterol and triglyceride levels were significantly higher (+55% and +57%) in (CD-chol) group than those of controls, whereas we have observed a significant decrease in plasma total cholesterol and triglyceride levels by (-7% and -39 %) in (MS-chol) group compared to (CD-chol). Evaluated lipid peroxidation by MDA considered as an indicator of tissue oxidative stress showed a significant increase in plasma and liver levels by 80% and 51% respectively in (CD-chol) group compared to (CD); Mixture seeds have provoked a significant decrease in plasma and liver levels by -27% and -25% respectively compared to controls. Conclusion: Feeding diet supplemented with mixture of flax and pumpkin seeds rich on PUFAs improve plasma and liver lipid profile and lipid peroxidation. Key words: Flax, Pumpkin, Lipid profile, Lipid peroxidation
P17 Influencing fruit and vegetable purchasing decisions CHAPMAN Kathy The Cancer Council NSW, PO Box 361, KINGS CROSS NSW 1340, Australia, [email protected]
Promoting fruit and vegetable (F&V) consumption is a key goal of cancer organisations around the world. F&V may be directly protective against cancer and are essential for a healthy weight, with obesity being a convincing risk factor for a range of cancers. The Cancer Council underwent a rigorous planning process to develop an intervention program for promoting F&V consumption. The behaviour to be influenced as part of the program is the purchase of F&V. Four focus groups were held in regional Australia with parents who have responsibility for family shopping. Barriers to F&V purchasing and participant reaction to intervention strategies were explored. Many factors influence parents’ decisions about what foods to buy. Convenience is often the most critical, with parents keen to choose meals and snacks that are easy and quick to prepare. Other factors identified in the research were habit, budget, and children’s preferences. Few participants mentioned nutrition as a factor which influences their food purchasing decisions. To bring about the behaviour change of increased purchase of F&V, it will be important to create motivation to purchase more F&V, minimize the impact of other obstacles which stand in the way of F&V consumption, and also impart practical skills. Strategies, such as signage and brochures on the health benefits of F&V consumption, will be more effective at increasing awareness of the importance of consuming F&V to a broad audience. Strategies which are most likely to overcome key barriers, such as inconvenience of preparing F&V, and children’s resistance, are signage and brochures containing practical tips, recipe leaflets, and cooking classes. The strategies which are most likely to build cooking skills, and developing budgeting and shopping skills, are cooking classes, recipe leaflets and supermarket tours. The results of the focus groups, as well other research, will be developed into an implementation plan for the intervention program.

ABSTRACTS
EGEA 2007, Page 143
P18 Manitoba School Nutrition Policy Intervention FIELDHOUSE Paul Manitoba Health & Healthy Living and University of Manitoba, 300 Carlton St., Winnipeg, Manitoba, Canada R3B 3M9, [email protected]
With the goal of improving access to nutritious food choices in schools, the Manitoba provincial government requires that all publicly funded schools develop and implement a written school nutrition policy beginning in the 2007-08 school year. To assist schools in doing this, and following a consultation process to identify opportunities and challenges, government developed a School Nutrition Handbook which includes Guidelines for Foods available in K-12 Schools – based on a serve more often / serve less often system, sample policy statements, a guide to the school nutrition policy development process and other tips and tools. A food in schools website has also been created to provide more detailed information such as fact sheets, food ideas for special events, and as a forum for schools to exchange success stories. Further support is offered through a toll-free school nutrition phone line and workshops for educators and dieticians. To enhance student involvement, a Student Leadership Award scheme: ‘Taking Action for Healthy Food in Schools’, was designed to encourage youth to take leadership action on promoting healthy eating in schools and improving school food environments. To date, nineteen schools have received awards and have undertaken a variety of food and nutrition related projects. Options for a school fruit and vegetable program are now under consideration. While it is too early yet to assess the initiative, program evaluation tools include an annual school report on policy implementation, and a baseline survey of school nutrition practices and food environment that was conducted in May 2006 and that will be repeated following the policy intervention to gauge changes at a policy and school environment level.
P19 Differences at acceptance of sweet potatoes dumplings and cakes among different weight categories of pre-school children PERL PIRICKI Antonija 1, BOBAN Katica 2, PRIMORAC Ljiljana 1, BANJARI Ines 11) University J.J. Strossmayer in Osijek, Faculty of Food Technology, Kuhaceva 18, HR-31107, Osijek, Croatia 2) Office of the State Administration in Virovitica-Podravina County, Trg Ljudevita Patacica 1, HR-33000, Virovitica, Croatia Corresponding author: Antonija Perl Piricki, University J.J. Strossmayer in Osijek, Faculty of Food Technology, Kuhaceva 18, HR-31107, Osijek, Croatia, [email protected]
Obesity is connected with a large scale of serious medical conditions including premature death, type 2 diabetes, hearth diseases, stroke, sleep apnoea, osteoarthritis, gallbladder diseases, asthma, cancer, and depression. It is important to start prevention measures at the earliest age because the obesity in earliest childhood and adolescence is the strongest predictor for obesity later in life. Intake of fruits and vegetables among children is lower than among adults. Therefore, the aim of this study was to explore the acceptance of new food in pre-school children: sweet potatoes dumplings and cakes. This root vegetable can be classified as an antioxidant, anti-inflammatory and anti-diabetic food. The facial hedonic 7-point scale was used to determine the acceptance level for this new food. In this study 158 pre-school children had participated (75 girls and 83 boys, 2–6 yr). The mean hedonic score for all children was 5.49 and 3.02 for dumplings and cakes, respectively (p<0.001). Although hedonic score for dumplings acceptance (5.41, 5.55 and 5.77 for healthy weight, at risk of overweight and overweight, respectively) nor for cake acceptance (3.20, 2.77 and 2.46 for healthy weight, at risk of overweight and overweight, respectively) did not have any statistically significant difference, for cakes was found certain negative trend between acceptability and BMI of children. This study did not affirm the hypothesis that the overweight children have better acceptance for new food such as sweet potatoes dumplings and cakes.

ABSTRACTS
EGEA 2007, Page 144
P20 Fruit and vegetable intake in relation to BMI of adults in rural areas of capital city (Tehran) ADIBI Hossein1, HOSHIARRAD Anahita2, EBRAHIMOF Samira2, MAGHBOULI Zh1, HOSSEIN-NEZHAD Arash1, LARIJANI Bagher1
1) Endocrinology and Metabolism Research Centre of Tehran Medical University, Iran 2) Nutrition and Food Technology Research Institute of Shaheed Beheshti Medical University, Iran Corresponding author: Arash Hossein-Nezhad, Endocrinology and Metabolism Research Centre, 5th floor, Shariati Hospital, Northern Karegar Ave, Tehran, 14114, Iran, [email protected]
Introduction: Obesity is one of the major health problems of the present century and different dietary patterns have been studied to prevent obesity. This survey conducted to evaluate fruit and vegetable intake of rural population of Tehran in relation to their weight. Methods: 278 subjects (80 men and 198 women) aged 19-75 years were studied. Data on fruit and vegetable intake were assessed using a 24 hour food recall. Weight and height were measured by standard methods. BMI was calculated and subjects were divided into four groups; underweight (BMI<19), normal (19>BMI<25), overweight (25>BMI<30) and obese (BMI<30). Results: Based on BMI, 7% were underweight, 40% normal, 32% overweight and 21% obese. Total mean ± SD of fruit and vegetable intake was 412.74±369.5 g daily. A significant positive pearson correlation was observed between weight and vegetable intake (r=0.124, p<0.05). Mean daily fruit and vegetable intake in g underweight group, g normal weight group, g overweight group and g obese groups were 259.7±217.5, 416.6±337.6, 452.6±419.7, and 399.3±382.1gr respectively. Fruit and vegetable intake showed no significant difference in four groups. Conclusion: Fruit and vegetable intake in obese and overweight subjects were similar to the normal group which is less than five a day. It seems that the contribution of fruit and vegetable to total weight of food basket in obese and overweight subjects is lower than the normal group.
P21 Dietary nutrient intakes and skin ageing appearance among middle-aged American women COSGROVE Maeve, PhD1; FRANCO Oscar H, MD, DSc, PhD1; RENNIE Kirsten L, PhD1, MURRAY Peter, MPhil, CStat2, MAYES Andrew E, PhD1
1) Unilever Corporate Research 2) Unilever Statistics Group Corresponding author: Maeve Cosgrove, Unilever Corporate Research, Colworth Park, Sharnbrook, Bedford, MK44 1LQ, United Kingdom, [email protected]
Background: Different nutritional factors have been found to play a relevant role in the normal functioning of the skin. However, little is known about the effects of the diet on skin ageing appearance. Objectives: Our objective is to calculate the potential effects that diet has on skin ageing appearance in middle aged women. Methods: Using data from the First National Health and Nutrition Examination Survey (NHANES I), associations between nutrient intakes and signs of skin ageing were examined in 4025 women aged 40-74 years. Nutrients were estimated from a 24-hr recall. A clinical examination of the skin was carried out by trained dermatologists to determine three independent conditions of skin ageing: a wrinkled appearance, senile dryness and skin atrophy. Results: Women with a wrinkled appearance and senile dryness had significantly lower vitamin C intakes and women with senile dryness and skin atrophy had significantly lower linoleic acid intakes. An increase of vitamin C intake was associated with a significantly lower likelihood of having a wrinkled appearance (OR 0.76, 95% CI 0.64-0.91) and senile dryness (OR 0.84, 95% CI 0.71-0.98). Furthermore, an increase of linoleic acid intake was associated with a significantly lower likelihood of having senile dryness (OR 0.51, 95% CI 0.36-0.72) and skin atrophy (OR 0.48, 95% CI 0.29-0.81). These effects were independent of age, race, education, history of sunlight exposure, total family income, menopausal status, BMI, supplement use, and levels of daily physical activity and total energy intake. Conclusion: There might be a beneficial role for diets higher in vitamin C and linoleic acid on skin ageing appearance. Since the main dietary sources of these nutrients are fruit, vegetables and nuts, the current dietary recommendations may have benefits for skin appearance in addition to other health outcomes.

ABSTRACTS
EGEA 2007, Page 145
P22 Income inequalities and their effect on the distribution of fruit and vegetable consumption in Poland SEKUŁA Włodzimierz, FIGURSKA Katarzyna, BARYSZ Agnieszka National Food and Nutrition Institute, Warsaw, Poland Corresponding author: Włodzimierz Sekula, 61/63 Powsińska Str., 02-903 Warsaw, Poland, [email protected]
The results of the country wide, representative household budget surveys carried out in 2004 showed that 20% of the households with the highest incomes concentrated 42% of total income of all households represented in the surveys while the share of those with the lowest incomes amounted to only 6%. In view of the positive relationship between the income level and the fruit and vegetable consumption the subject of the study was to examine its distribution with regard to the percentage shares of the quintile groups in the total amounts of these food products consumed by the entire household sample. It was showed that the 20% of the households with the highest incomes consumed 32% of the total household fruit consumption while 20% of the households with the lowest incomes were able to consume only 11%. These inequalities varied depending on the fruit types and were the most drastic in the case of the imported citrus fruits: 37% of total consumption vs. 8%. Inequalities were less evident in the distribution of the apple consumption, where the relative shares of the highest and the lowest quintile amounted to 25% and 15%, respectively. Income level affected vegetable consumption also but the positive relationship between these variables was weaker in comparison to fruits. Thus, inequalities in the quantities consumed and in the consumption distribution were less pronounced. It was showed that 20% of the households representing the highest quintile consumed 25% of the total vegetable quantity while those representing the lowest quintile- 15%. That reflected relatively weak effect of the income on the consumption of such vegetable types as beets, cabbages, carrots and onions, and a stronger one with regard to tomatoes. Due to it, the shares of the opposite quintiles in the total tomato consumption were 30% and 13%, respectively.
P23 A two-dimensional system to characterise the nutritional quality of individual foods DARMON Nicole1, DARMON Michel1, MAILLOT Matthieu1, DREWNOWSKI Adam2, MARTIN Ambroise3
1) INSERM 476; INRA 1260; Aix-Marseille 2, Marseille F-13385, France 2) Centre for Public Health Nutrition, University. Washington, Seattle, USA 3) Faculté de Médecine Grange-Blanche, Université Claude Bernard, Lyon, France Corresponding author: Nicole Darmon, Nutrition Research Unit INSERM/INRA, 27 Bd Jean Moulin, 13385 Marseille Cedex 05, France, [email protected]
Objective: Each individual food contributes to the overall quality of the diet. Nutrient profiling is aimed at categorizing foods according to their nutritional quality and their contribution to a healthy diet. Most existing systems are based on i) the healthy aspects of foods only; ii) the unhealthy aspects only; or iii) a composite index of both. We propose a two-dimensional system providing quantitative information on both aspects. Methods: The "healthy" indicator is the nutrient density score (NDS), i.e. a mean percent nutrient adequacy per 100 kcal of food. A 15 nutrients-score was selected, because of a better accuracy than a 5 nutrient score and easier implementation from nutritional databases than a 23 nutrient score. The "unhealthy" quality indicator is the restricted nutrient score (RNS), calculated as the mean percent of maximal recommended values for added sugar, saturated fats and sodium per 100g. The scoring system was applied to 619 foods from a French food composition database. Results: An individual food with a very high content in few nutrients scored as well as a food with an intermediate content in most nutrients. The system favoured energy-dilute nutrient-dense foods, such as sea-food, fruit and vegetables, but was not adapted for foods such as soft drinks and added fats. A graphic representation, using threshold values for NDS and RNS, was developed to show the distribution of foods within 4 categories (high NDS-low RNS, high NDS-high RNS, low NDS-high RNS, low NDS-low RNS). Specific recommendations could be proposed for each of those categories. Conclusions: The proposed system should be used for non-enriched foods only. It seems to take into account the well-known complementation between different foods to satisfy nutritional requirements. Its ability to discriminate foods according to their contribution to nutrient adequacy of diets is currently under evaluation.

ABSTRACTS
EGEA 2007, Page 146
P24 Nutrient-dense foods of vegetable origin are needed to improve the nutritional quality of food aid in France DARMON Nicole1, RAMBELOSON Zo1, MAILLOT Matthieu1, FERGUSON Elaine2
1) INSERM 476; INRA 1260; Aix-Marseille 2, Marseille F-13385, France 2) Department of Human Nutrition, University of Otago, Dunedin, New Zealand Corresponding author: Nicole Darmon, Nutrition Research Unit INSERM/INRA, 27 Bd Jean Moulin, 13385 Marseille Cedex 05, France, [email protected]
Objective: There is a high prevalence of obesity, hypertension and nutrient deficiencies among food aid recipients in France and their diets are virtually devoid of fruits and vegetables. The objective of the present study was to assess the nutritional quality of food bank delivered food aid, in France and to identify practical modifications to improve it. Methods: The nutrient content of food aid distributed by French food banks in 2004 was estimated and it was compared with French nutritional recommendations for adults. Starting with the actual donation and allowing acceptable new foods into the food aid donation, linear programming was used to identify the minimum number of changes required, in the actual donation, to achieve the recommendations. Results: Food bank delivered food aid did not achieve the recommendations for fibre, ascorbic acid, vitamin D, folate, magnesium, omega-3 fatty acids and % energy from saturated fatty acids. Linear programming analysis showed that these recommendations were achievable if more fruits, vegetables, legumes and fish were collected and less cheese, refined cereals and foods rich in fat, sugar and/or salt. In addition, new foods were needed particularly nuts, wholemeal bread and rapeseed oil. These changes increased the edible weight (42%) and economic value (55%) of the food aid donation, with 33% of its edible weight coming from fruits and vegetables, 33% from staples (of which > 50% were unrefined staples), 25% from dairy products (of which < 10% were cheese) and approximately 10% from meat/fish/eggs (of which > 25% were fish). Conclusion: We convinced the French Food Banks to adopt these percentages as actual recommendations within their network. However, their implementation will require important changes in the types and amounts of food collected.
P25 More foods of vegetable origin and less foods of animal origin are needed to obtain a nutritionally adequate diet at a minimal cost MAILLOT Matthieu1, DARMON Nicole1, FERGUSON Elaine2
1) INSERM 476; INRA 1260; Aix-Marseille 2, Marseille F-13385 France 2) Department of Human Nutrition, University of Otago, Dunedin, New Zealand Corresponding author: Matthieu Maillot, Nutrition Research Unit INSERM/INRA, 27 Bd Jean Moulin, 13385 Marseille Cedex 05, France, [email protected]
Objective: To identify food selection changes required, in low cost diets, to increase levels of dietary quality and palatability. Methods: Linear programming was used to select 21 isocaloric diets of lowest cost (minimised), for each gender, which differed in the nutritional (3 sets) and palatability (7 sets) constraints used. Nutritional constraints ensured achievement of macronutrient recommendations (1st set), macro- and micronutrient estimated average requirement levels (2nd set) or macro- and micronutrient recommended dietary allowance levels (3rd set). Increasingly stringent levels of diet palatability were achieved via sets of constraints on specified food groups, sub-groups or families. The models’ food list (n=619 foods) and palatability constraint levels were defined using dietary data collected in the latest French national food consumption survey (INCA 1; n=562 men; n=696 women). Diet costs were based on mean retail food prices. Results: 1.The cost (minimized) of modelled diets increased from 1.30€/d and 0.45€/d (at the lowest nutritional quality and palatability constraint levels) to 3.37€/d and 3.04€/d (at the highest nutritional quality and palatability constraint levels) for men and women, respectively. 2. Both the number of foods selected and their total weights increased as the levels of nutritional quality, in the modelled diets, increased. 3. Modelled diets with the highest nutritional quality and palatability contained more energy from staples, fruit and vegetables and less energy from meat/fish/eggs, dairy products and sweets and salted snacks than was observed in the mean French diet. Conclusions: 1) Both food habits and nutritional quality affect diet cost, 2) For low cost diets, good nutritional quality is associated with low energy density and high levels of food diversity, 3) For men or women on low food budgets, more foods of vegetable origin and less foods of animal origin are needed to achieve a nutritionally adequate diet.

ABSTRACTS
EGEA 2007, Page 147
P26 Working in public private partnerships to create sustainable environmental change - a review of evidence from five-a-day school fruit projects MIKKELSEN Bent Egberg
National Food Institute, Danish Technical University, Danish Technical University, Mørkhøj Bygade 19, DK-2860 Søborg, Denmark, [email protected]
An increased intake of fruit and vegetables among young people is called for in many nutrition policies and strategies across Europe and especially the school is a preferred setting for the promotion of an increased intake. Where as such strategies traditionally rely mostly on public agencies, modern public health nutrition strategies seems to be heavily influenced by modern governing principles in which public private partnerships plays a central role. In such partnerships also NGO’s and the market are involved in decision making processes as well as in carrying out practical policy measures. Evidence on the impact of such programmes on the health behaviour of individuals are quite strong but in contrast papers dealing with the process evaluation and formative aspects of the development and maintenance of partnership approaches to school fruit programmes are scarce. Although partnerships as a generic approach to promotion of healthy eating has been strongly advocated for in policy papers little is known about which types of partnerships are effective and which are not. The aim of this paper is to review the evidence of the effectiveness and process requirements of working in public private partnerships in five-a-day school fruit projects. It is based on desk review of literature on 5 a day school fruit partnership working as well as on a soft system methodology based interview with key stakeholders in American and European school fruit programs. The paper concludes that following process requirements are essential: documentation and consensus among stakeholders, understanding political decision-making and the use of different kinds of evidence, the development of a simple and clear idea, a common understanding of goals as well as possible barriers and possibilities, organizational readiness among partners, fair ownership management, availability of resources, leadership and know-how, comprehensive evaluation of process and outcome and acceptance of conflicts of interests. P27 Fruit and vegetables consumption in the context of the Spanish Mediterranean Diet: trends during the past two decades
BACH-FAIG Anna1,2, ROMAN Blanca1, CARRASCO Josep-Lluís2, CRISTIÀ Esther1, BERTOMEU Isabel1,GELEVA Daniela3, SERRA-MAJEM Lluís1
1) Mediterranean Diet Foundation, Barcelona, Spain 2) Biostatistics, Department of Public Health, University of Barcelona, Barcelona, Spain 3) Department of Family and Consumer Sciences, Seattle Pacific University, Seattle, United States
Corresponding Author: Anna Bach-Faig, Mediterranean Diet Foundation, C/Calvet 60, 4-1; 08021 Barcelona, Spain, [email protected]
Objectives: The objective of this study is to describe the specific contribution of Fruit and Vegetables (F+V) to the MD adherence, and to analyse F+V consumption trends in Spain during the past two decades. Methodology: Food availability trends data was obtained from household food consumption surveys conducted by the Spanish Ministry of Agriculture, Fisheries and Food. The sample consisted of 2.500 households in 1987 and increased to 6.200 in 2005. A variation of the Mediterranean Adequacy Index (MAI), a quotient resulting from dividing the calories provided by Mediterranean foods by the calories provided by non-Mediterranean food items, was used to measure the MD pattern adherence. In order to measure the specific contribution of F+V to the index, an adapted MAI without fruits and vegetables was also applied. The significance of the analysed trends was evaluated using regression models. Results: A significant decrease in the MAI from 1987 until the end of the 1990s was observed, and appears to have stabilised from then on. When analysing the household availability of fruits and vegetables together (in g/person/day), and of fruits and vegetables separately, the trend remains somewhat similar: there is a significant decrease in consumption from 1987 until the late 90s, and significantly recovering from subsequently. Fruit-and-vegetable-specific MAI (the difference between applying MAI with or without F+V) followed a similar pattern during this time period. Fruit consumption and fruit-specific MAI trends were more prominent when compared to the vegetable trend. Separate fruit-and-vegetable-specific weights on the index remained stable during the studied period. However, there was a significant increase in the F+V specific weight (relative difference, %) on the index during the past two decades. Conclusion: Even though there is a significant increase of 4.3% along the period in the specific F+V contribution to Mediterranean products consumption, community measures aimed at preserving the best of the traditional Spanish dietary pattern are needed.
Acknowledgments: This project was conducted in collaboration with the Ministry of Agriculture, Fisheries and Food, and the Barcelona City Council.

ABSTRACTS
EGEA 2007, Page 148
P28 Gender differences in response to treatment of obesity in adolescents PREVOST1 Marie-Laure, HUGE Marie1, BILLIET Conny1, BANNEEL Mieke², DE BODE Patrick², FRANCKX Hilde², BRAET Caroline³, VAN WINCKEL Myriam³ 1) Zeepreventorium, Koninklijke baan 5, 8420 De Haan, Belgium 2) Zeepreventorium De Haan, Belgium 3) Universiteit Gent, Belgium Corresponding author: Mieke Banneel, Dietician, Zeepreventorium, Koninklijke baan 5, 8420 De Haan, Belgium, [email protected]
Introduction: A prospective descriptive cohort study was designed in order to study gender differences in obese adolescents in response to the same residential multicomponent treatment. Based on 1600 kcal daily diet, an according to Belgian recommendations, a daily intake of fruit (250g) and vegetables (300g) is offered. Practise and study shows us that this is the most difficult part of the therapy. Population: Twenty boys (15.3 yrs±1.4; BMI 34.4 kg/m²±5) and 19 girls (15.2yrs±1.4; BMI 34.7 kg/m²±4.4), starting residential treatment of obesity in September 2003 entered the study. Both groups were comparable regarding age, Tanner stage of puberty, BMI of parents, and adjusted BMI at start of treatment. One girl and 5 boys left residential treatment after 6 months, because of normalising their BMI. Method: Weight and height were recorded at start, 3, 6 and 9 months. Body composition (fat-mass and fat-free-mass) was determined using bioelectrical impedance analysis. Dietary intake over a 4-week period was calculated thrice from food diaries and menus. Nature and duration of physical activities were noted. Results: Boys lost significantly more weight than girls during all phases of treatment. Boys versus girls lost a comparable amount of fat mass (-13kg), but significantly more fat-free mass (-13kg versus -3kg). Energy intake was higher in boys (1425Kcal/d versus 1273Kcal/d), but energy intake/theoretic needs was higher in girls (55% versus 60%). Duration of physical activities was comparable, but boys spent more time on activities of high intensity. Conclusion: Despite comparable dietary intake and physical activity, boys lost more weight than girls. Boys lost comparable amounts of fat mass compared to girls, but girls conserved fat-free mass better. Ongoing study should show us in the future the absence of fruit and vegetables in the diet of extreme obese adolescents.
P29 A community intervention to improve eating habits in children CAMILLI Francesca1, CARDONE Maria2, CAROLI Margherita2
1) SOROPTIMIS International d’Italia, Club Brindisi, Italy 2) Nutrition Unit, Dept. of Prevention, AUSL Brindisi, Italy Corresponding author: Margherita Caroli, Nutrition Unit, Dept. of Prevention Via per Ceglie 72021 Francavilla Fontana (Brindisi), Italy, [email protected]
Aim: To improve the eating habits of the primary school children in Brindisi, a town in southern Italy, where the excess weight rate in 8-9 year old children is 38%. Methodology: First part. In April 2005, 4500 pamphlets were distributed in all public primary schools in town. The pamphlet was divided in 3 parts: 1) a short story of a thin child (Maz) and a fat one (Oby), 2) a short questionnaire on the eating habits and leisure activities of the child, and 3) a blank story with Oby and Maz to be written by the children. 1659 children returned the filled questionnaires. Results: 90% of children reported eating breakfast at home. School snacks consisted mostly of foods rich in fat, salt, or sugar; 80% of leisure activities were sedentary. Second part. From September 2005 to April 2006 meetings with parents, children and teachers were held to show the results and to discuss eating habits and leisure activities of the children stressing the need to improve their life style. Results: Vegetables and legumes were the most disliked foods. 600 children and their parents decided to write a recipe book on their less preferred foods. Mothers and children worked together creating, writing and designing recipes for disliked foods. The new recipes had funny names and looks, and used positive cooking techniques replacing the less adequate ones. Mothers reported that the project was effective in promoting the consumption of previously disliked foods. A committee of mothers, teachers, and experts selected some recipes based on originality and difficulty of preparation. The book was published and distributed to all the primary schools in Brindisi. Conclusions: The approach of actively involving children, parents, and teachers seems to give positive results as evidenced by the consumption of previously disliked foods. The results are difficult to be objectively judged since a universal approach was used, but the high number of subjects reached and the high rate of active participation give stimulus to continue in this direction.

ABSTRACTS
EGEA 2007, Page 149
P31 The taste shop: how to sell new flavours to children
CAROLI Margherita, CAMMISA Maria, MASI Antonella, CARDONE Maria Nutrition Unit, Department of Prevention, AUSL Brindisi, Italy
Corresponding author: Caroli Margherita, Nutrition Unit, Dept. of Prevention Via per Ceglie 72021 Francavilla Fontana (Brindisi), Italy, [email protected]
Aim: To encourage primary school children to eat fruit as school snack. Methodology: Four third year primary school classes. Two classes, 48 children, as intervention group, two classes, 44 children, as control group. The teachers of four classes reported the snacks brought by the children the week before, one month, one and two years after the intervention. Intervention: During a two hours taste shop, children meet 4 different kinds of fruit. Using the five senses, the children describe the texture, smell, sound, shape, and flavour of each fruit introduced. At the end they rate their fruit preference. Statistical analysis: t-test, t-paired test. Results: Before the intervention none of the children brought fruit to school for a snack. Intervention group: After one month almost 21% of children (p=0.0001) consumed fruit; after one and two years respectively 12.5% (p=0.013), and 10.4% (p=0.024) of children still had fruit-snacks two- three times a week. Control group: no variation after one month and one year; only at the two years report two children out of 42 brought fruit twice a week (p=ns). The two groups showed a significant difference at one month (p=0.0001), and at one year (p=0.012), but not at two year follow-up. Conclusions: The taste shop can be considered a useful tool to encourage children between the ages of 8 and 10 to increase their fruit intake and change their habits, accustomed to fatty, sugared or salty foods. The taste shop is a nutritional socio-educational instrument through which children learn how to use their five senses to gain personal knowledge and appreciation of specific foods, eliminating negative values coming from economical, advertising, familiar, and social factors. The absence of statistical difference between the two groups at the year follow-up highlights that nutrition education interventions cannot be of short duration and need the followed up of reinforcing tools to maintain the positive behaviour over time. P32 Macronutrient and micronutrient indicators for fruit and vegetable intake in matched groups of vegetarians versus non-vegetarians DERIEMAEKER Peter, ALEWAETERS Katrien, AERENHOUTS Dirk, HEBBELINCK Marcel, CLARYS Peter Department of Human Biometry and Biomechanics, Faculty of Physical Education and Physical Therapy, Vrije Universiteit Brussels, Belgium - Pleinlaan 2, 1050 Brussels Corresponding author: Peter Deriemaeker, [email protected]
Introduction: It is well accepted that a vegetarian diet can have several health advantages. A well planned and qualitative vegetarian diet implies the consumption of considerable amounts of fruits and vegetables. However, health advantages may partly be explained by other health related behaviours. It was the aim of the present study to compare the macro- and micronutrient indicators for fruit and vegetable intake in vegetarians versus non-vegetarians. Subjects and methods: Hundred and six vegetarians (V) were compared with 106 non-vegetarians (NV). V&NV were properly matched for the following characteristics: gender, age, BMI, physical activity, smoking behaviour and alcohol consumption. The BECEL program was used for analysis of all 3-day food diaries. The following nutrients originate mainly from vegetable sources: carbohydrate, fibre, ß-carotene, vitamin C and folic acid while fat, cholesterol and vitamin A were mainly from animal sources. Results: Macronutrient intake (E%) significantly (p<.05) differed when comparing V&NV, with intakes closer to the recommendations for the V: fat (V:29±7E%, NV:34±7E%; ref:15-30E%), cholesterol (V:122±90mg/d, NV:222±101mg/d; ref:<300mg/d), protein (V:13±2E%, NV:16±5E%; ref:10-15E%), carbohydrate (V:55±8E%, NV:47±8E%; ref:55-75E%) and fibre (V:33±13g/d, NV:18±7g/d; ref:33g/d). Moreover, V had higher calcium, zinc, iron and a lower sodium intake compared to NV. The ß-carotene (V: 3034±2334µg/d, NV: 520±650µg/d) intake was higher in the V while the vitamin A intake (V: 850±430µg/d, NV: 3330±8440µg/d; ref: 600µg/d) was higher in NV. The folic acid (plant origin) intake was much higher in the vegetarian group, whereas the vitamin C intake (V: 110±98mg/d, NV: 99±84mg/d; ref: 70mg/d) was comparable. Conclusion: The nutrient analyses indicate higher fruit and vegetable intake in the V compared to the NV. The comparable vitamin C intake indicates equally a high fruit intake in the NV. The latter finding may be an indication that the reference group was also health conscious.

ABSTRACTS
EGEA 2007, Page 150
P33 Food consumption frequency and BMI of children KOCOGLU Gulay, OZDEMİR Levent, SUMER Haldun
Department of Public Health, Faculty of Medicine, Cumhuriyet University, 58140-Sivas-Turkey Corresponding Author: Gulay Kocoglu, [email protected]
Obesity and also childhood obesity is getting to be a more prevailing disease all over the world. This study was performed to find out any relation in between food consumption frequency and BMI, of 11-14 yrs old children in Sivas (Turkey) province. Height and weight of 2701 children were measured and their food consumption behaviour was inquired through face to face interviewing. BMI values higher than 85 percentile were accepted as overweight and those <3 percentile as underweight. Meat, fish, chicken, milk, yogurt, cheese, egg, fruit, vegetable, bread, rice, lentil, pastry, chocolate, toast, potato, sugar, jam, tea, beverages, nut consumption patterns were compared by the BMI classification of the children. At the end, no relationship was found in between BMI and food consumption frequency except the beverages and yogurt consumption pattern. Key words: food consumption frequency, childhood, obesity, BMI P34 A procedure to measure ‘liking’ and ‘wanting’ for fruit and vegetables
FINLAYSON Graham1, KING Neil2, BLUNDELL John3
1) Division of Psychology, Glasgow Caledonian University, UK 2) Institute of Health & Biomedical Innovation, Queensland University of Technology, Australia 3) Institute of Psychological Sciences, University of Leeds, UK
Corresponding Author: Graham Finlaysson, Division of Psychology, Glasgow Caledonian University, UK, , [email protected]
We have developed a methodological platform (Finlayson et al, 2007) that can be used to evaluate preferences for fruits and vegetables compared with preferences for other food categories. The procedure can be used to assess baseline preferences and to monitor changes in preferences over time. The procedure makes use of a package of photographic stimuli comprising fruits, vegetables and less healthy options in the savoury and sweet snack categories, and can also be adapted to include different food items of interest and importance. The examination of preference towards the target stimuli is configured using software that will allow testing to be carried out using a PC and is also appropriate for smaller-screen, portable systems such as palm-tops or PDAs for use in the field. The experimental presentation of foods is programmed automatically, with on-line data capture and storage. The procedure is part of a ‘hedonic toolbox’ and measures explicit (overt, conscious, declared) liking and wanting for fruits and vegetables using rating scales, and implicit (covert, underlying) wanting using a forced-choice procedure in which fruits and vegetables are compared against other snack food items. The procedure is largely non-verbal and can be used to assess preferences, liking and wanting across cultures and with children. The procedure has the capacity and flexibility to be able to collect data from small groups of carefully monitored subjects in laboratory conditions, and from large groups of subjects at a distance.
Supported by MRC (CASE) #G78/8223 in conjunction with NRC, Lausanne. Finlayson G, King N & Blundell J 2007. Is it possible to separate liking and wanting in humans? A novel experimental procedure. Physiol Behav, 90, 36-42.
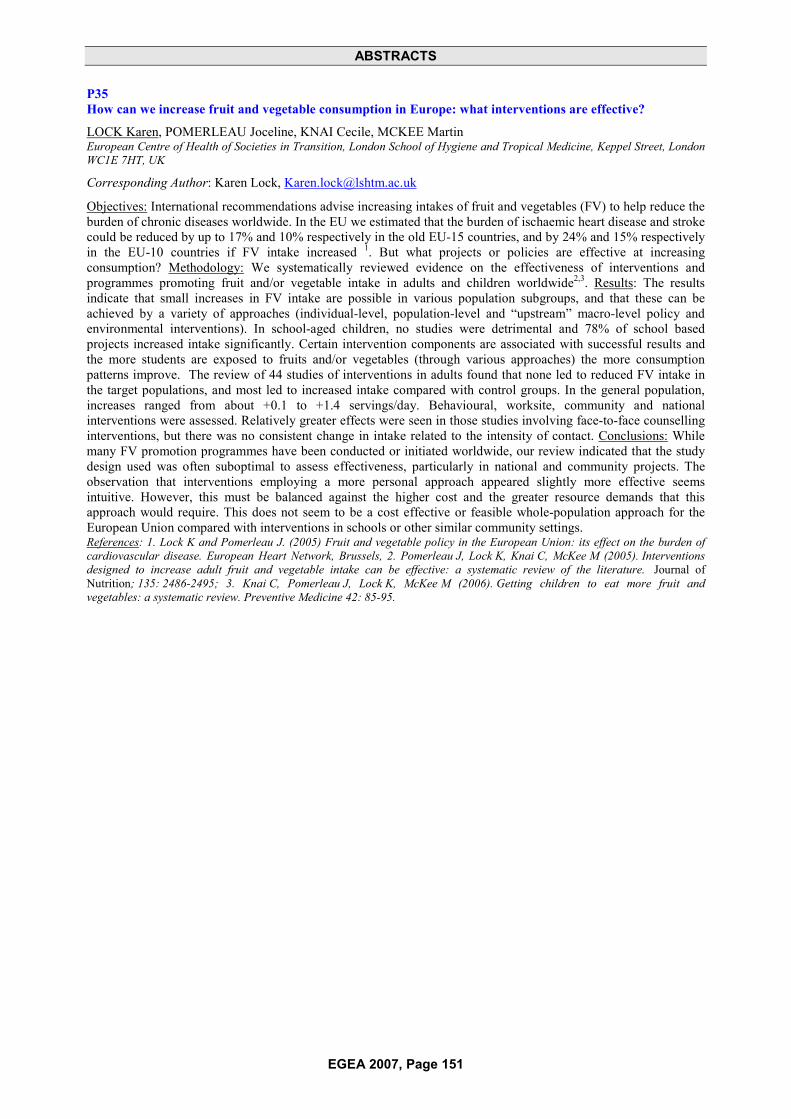
ABSTRACTS
EGEA 2007, Page 151
P35 How can we increase fruit and vegetable consumption in Europe: what interventions are effective?
LOCK Karen, POMERLEAU Joceline, KNAI Cecile, MCKEE Martin European Centre of Health of Societies in Transition, London School of Hygiene and Tropical Medicine, Keppel Street, London WC1E 7HT, UK
Corresponding Author: Karen Lock, [email protected]
Objectives: International recommendations advise increasing intakes of fruit and vegetables (FV) to help reduce the burden of chronic diseases worldwide. In the EU we estimated that the burden of ischaemic heart disease and stroke could be reduced by up to 17% and 10% respectively in the old EU-15 countries, and by 24% and 15% respectively in the EU-10 countries if FV intake increased 1. But what projects or policies are effective at increasing consumption? Methodology: We systematically reviewed evidence on the effectiveness of interventions and programmes promoting fruit and/or vegetable intake in adults and children worldwide2,3. Results: The results indicate that small increases in FV intake are possible in various population subgroups, and that these can be achieved by a variety of approaches (individual-level, population-level and “upstream” macro-level policy and environmental interventions). In school-aged children, no studies were detrimental and 78% of school based projects increased intake significantly. Certain intervention components are associated with successful results and the more students are exposed to fruits and/or vegetables (through various approaches) the more consumption patterns improve. The review of 44 studies of interventions in adults found that none led to reduced FV intake in the target populations, and most led to increased intake compared with control groups. In the general population, increases ranged from about +0.1 to +1.4 servings/day. Behavioural, worksite, community and national interventions were assessed. Relatively greater effects were seen in those studies involving face-to-face counselling interventions, but there was no consistent change in intake related to the intensity of contact. Conclusions: While many FV promotion programmes have been conducted or initiated worldwide, our review indicated that the study design used was often suboptimal to assess effectiveness, particularly in national and community projects. The observation that interventions employing a more personal approach appeared slightly more effective seems intuitive. However, this must be balanced against the higher cost and the greater resource demands that this approach would require. This does not seem to be a cost effective or feasible whole-population approach for the European Union compared with interventions in schools or other similar community settings. References: 1. Lock K and Pomerleau J. (2005) Fruit and vegetable policy in the European Union: its effect on the burden of cardiovascular disease. European Heart Network, Brussels, 2. Pomerleau J, Lock K, Knai C, McKee M (2005). Interventions designed to increase adult fruit and vegetable intake can be effective: a systematic review of the literature. Journal of Nutrition; 135: 2486-2495; 3. Knai C, Pomerleau J, Lock K, McKee M (2006). Getting children to eat more fruit and vegetables: a systematic review. Preventive Medicine 42: 85-95.

ABSTRACTS
EGEA 2007, Page 152
P36 Increased fruit and vegetable consumption is associated with improved exercise-induced weight loss CAUDWELL Phillipa1, HOPKINS Mark1, KING Neil2, BLUNDELL John1
1) Biopsychology Group, Institute of Psychological Sciences, University of Leeds, UK 2) Institute of Health and Biomedical Innovation, Queensland University of Technology, Australia Corresponding author: Phillipa Caudwell, Biopsychology Group, Institute of Psychological Sciences, University of Leeds, UK, [email protected]
An increase in healthy food consumption combined with an increase in energy expenditure will certainly prevent a worsening of the current obesity epidemic. This aimed to determine how changes in fruit and vegetable consumption improved the efficacy of exercise to induce successful weight loss. 38 overweight and obese men and women (age; 38.7±10.3 yrs, BMI; 31.5±3.9) took part in a 12 week exercise intervention to expend 500kcal per exercise session, 5 times per week at 70% HR max. 24hr energy intake was measured at weeks 0 and 12 using ad libitum test meals in the research unit and 3 day food dairies for measuring intake under free-living conditions. Mean weight loss for the whole group was 3.7±3.6kg. However, there was large variability within the group of -14.7 to +1.7kg. Using individual exercise-induced energy expenditures, the group was divided into good (GR) and poor responders (PR) depending on participants’ actual relative to their predicted weight loss. GR ate significantly more fruit and vegetables at week 12 compared to the poor responders in both the free-living situation and in the research unit test meals (4.2±1.4vs. 2.4±1.8 portions per day, t= 3.43, df = 36 p = 0.002). The PR did not significantly increase overall food intake (2295 ± 696 kcal at wk0 vs. 2408 ± 780 at wk12, t = 0.689, df = 19, p = 0.50). However, they significantly increased the proportion of energy intake from fat (31.3±5.6 vs. 35.1±7.4% fat, t = 3.02, df = 19, p = 0.007). These data suggest that improving the quality of nutrient intake via fruit and vegetable consumption contributes to improved exercise-induced weight loss. This study forms part of a larger project funded by the Biotechnology and Biological Sciences Research Council (BBS/B/05079).
P37 Differences in consumption of fruits and vegetables among normal and overweight participants estimated by 24-hours recall MANDIC Milena L, PERL PIRICKI Antonija, CACIC KENJERIC Daniela, PRIMORAC Ljiljana
University J.J. Strossmayer in Osijek, Faculty of Food Technology, Kuhaceva 18, HR-31107, Osijek, Croatia Corresponding author: Milena L. Mandic, University J.J. Strossmayer in Osijek, Faculty of Food Technology, Kuhaceva 18, HR-31107, Osijek, Croatia, [email protected]
Dietary patterns abundant in fruits and vegetables are associated with reduced risk of chronic diseases, but their intake in most of the countries is usually insufficient. There is also evidence that substitution of high energy foods for fruits and vegetables can be very effective strategy for weight management. The aim of this study was to compare the total daily energy intake and fruits and vegetables consumption, for normal and overweight (BMI ≥25) participants. In this study 120 healthy volunteers had participated, age 19–54 yr (36 overweight; BMI 28.1 kg/m2 and 84 normal weight participants; BMI 21.7 kg/m2). Method of 24-hour recall was used to determine the dietary intake of total energy and fruits and vegetables consumption, and was repeated 10 times during one year. Both groups had almost the same average daily energy intake (2022.4 kcal/day and 1962.7 kcal/day for overweight and normal weight participants, respectively). The results for the mean daily consumption of fruits and vegetables (without potatoes), 409 g for overweight and 393 g for normal weight participants, are in agreement with recommendations. In comparison with normal weight participants, overweight had higher fruits consumption (210 g and 156 g, p<0.05). In conclusion, equal intake of energy and a higher fruits consumption of overweight than normal weight participants, can be justified with underreporting of consumption for some food groups, especially high energy foods, by one part of overweight participants.

ABSTRACTS
EGEA 2007, Page 153
P38 Greek traditional tomato paste
DILIS Vardis, VASILOPOULOU Effie, TRICHOPOULOU Antonia
Dept. of Hygiene and Epidemiology, Medical School, University of Athens, 75 Mikras Asias St., 115 27 Athens, Greece, [email protected]
Introduction: Although tomato (Lycopersicon esculentum) was not systematically cultivated and consumed in Greece prior to the 20th century, it is nowadays considered as one of the most important elements of the Greek cuisine. A number of empirical methods have been developed in order to facilitate its usage in cookery also during the winter months, when fresh tomatoes were traditionally unavailable. Objectives: During summer, the preparation of tomato paste was one of the most common practices to preserve the excess family tomato production. However, this does no longer apply for the contemporary Greek household, where the industrial analogues are offered in abundance and in a ready-to-use form. Even in rural and remote areas of Greece the traditional preparation of tomato paste is now rarely applied and is thus endangered to be totally abandoned. It is thus important to preserve our cultural inheritance and also to elucidate the role of individual traditional foods on the favourable health impact of the traditional Mediterranean diet. Methodology: In the context of the systematic investigation of traditional foods we visited the village Filaki in the island of Crete, to study the traditional preparation procedure of tomato paste as still applied by local inhabitants. All technological aspects of the production were studied. The nutritional composition of the final product and the primary ingredients used was also determined via chemical analyses. Results: Part of the nutritional composition of the traditional tomato paste is presented below. Although the overall preparation procedure was time consuming (8 days), the final product may be preserved out of the cold chain, despite that no thermal treatment was applied. Conclusion: Given that tomato and its products are abundantly used in the cotemporary Greek cuisine, and in view of an increased demand for natural food products, the traditional preparation procedure of tomato paste may provide a prosperous developmental suggestion for the food industry. A pilot study on the potential industrialization of the traditional tomato paste is currently underway.
The above research project was co-funded by the Hellenic Secretariat of Research and Technology and the European Union.
P39 Consumption of fruits, vegetables and legumes and health status of an adult population living in a low socio-economic area in Istanbul
ALPHAN M Emel, ÇALIK Burcu, KIYAK Mithat, AVCI Suleyman Marmara University, Health Education Faculty, İstanbul, Turkey
Corresponding author: M. Emel Alphan, Marmara University, Saglik Egitim Fakultesi. E-5 Yanyol, Cevizli Kartal/İstanbul, Turkey, [email protected]
Purpose: This study is done to determine Body Mass Index (BMI), consumption of vegetables, fruits and legumes and prevalence of several diseases of the adults of low socio-economic areas. Material and method: The study area is Basıbuyuk, district of Maltepe which is one of the socio-economically undeveloped and immigration area and where we are conducting “The social development and the improvement of health” Project. A questionnaire was applied by face to face interview technique to one member of each family, randomly selected from 4000 houses. A number of 342 men and 1367 women were interviewed. Dietary habits, including the frequency of vegetables, fruits and legume consumption of the members of the family was asked, as well as the prevalence of several diseases. We assessed the consumption of pastry (borek, macaroni rice-bulgur pilafs) and bread (∼1-2 bread for each person in a day) to eat one’s fill, according to the focus group interviews. The questionnaire included also height and weight (measured in a health institution within one month). BMI was calculated. In total, the data of 2106 men and 2332 women over 18 years old (total 4438 people) were obtained by these interviews. Findings: The mean age of the participants were 37.26�11,8 years in female 41.2�11.92 years in male. In the study population, 17% of female and 44.1% of male were smokers Diagnosed hypertension was reported by 351 women (%15.1) and 134 men (%6.4), cardiac disease by 134 women (%5.8) and 94 men (%4.5), diabetes by 142 women (%6.1) and 80 men (%3.8). High total cholesterol level was reported by 5.8% of the women and 4.5% of male. Based on the BMI, 35,2% and 36,2% of the female and male population over 18 years were overweight, and 21,8% and 19,7% respectively were obese. When we evaluated dietary habits, the percentage of study participants that consume daily fruit and vegetables was only 44.9%; legumes was consumed only once in a week in 49.4% of the participants. Results: In this population, where bread and pastry are the main food sources, the prevalence of overweight and obesity is very high, the consumption of vegetables and fruits is inadequate. The frequency of legume consumption is higher than that of meat. These results indicate that health improvement should include actions to modify dietary habits in this population.
Food (100g) Dietary fibre (g) Vit. B6 (mg) Niacin (mg) Thiamin (mg) Riboflavin (mg)
Traditional Tomato Paste
3.5 0.07 1.19 0.47 0.06

ABSTRACTS
EGEA 2007, Page 154
P40 Evaluation of a school-based intervention to promote fruit intake BOLLARS Caroline, VAN HOECKE Lien Flemish Institute for Health Promotion, Brussels, Belgium Corresponding author: BOLLARS Caroline, Vlaams Instituut voor Gezondheidspromotie vzw, G. Schildknechtstraat 9, 1020 Brussels, Belgium, [email protected], [email protected]
Objective: Tutti Frutti is an intervention aimed at increasing the consumption of fruit in young people by offering fruit on a weekly basis in their school environment. We want to assess the impact of this school-based project. Methods: The study used a post-test design. 2761 primary and secondary school pupils, as well as 1867 parents of nursery and primary school pupils were questioned. Comparisons are made between (a) pupils participating in the program for 1 year, (b) pupils participating in the program ≥ 2 years and (c) pupils receiving no intervention. Results: The intervention groups show a higher intention to eat fruit compared to the control group. Thus the pupils participating in the project are more likely to eat fruit than pupils of the control group. Primary school pupils lack the ability to convert their intentions of fruit consumption into actual behaviour. Secondary school pupils do have the skills and aptitude to convert their intentions into behaviour. Parents of the intervention groups report a more positive attitude towards fruit and fruit consumption than parents of the control group. Conclusion: The intervention has a positive effect on the fruit consumption of pupils. Extra attention should be made to increase skills and handle obstacles concerning fruit consumption, especially in primary school pupils. So schools should be encouraged to use the corresponding educational materials that are especially developed for this initiative. The project also has a positive influence on the home environment.
P41 Role of Jerusalem artichoke as a lipid lowering dietary agent LÖPPERT Renate1, CIESLIK Eva2, PRAZNIK Werner1
1) University of Natural Resources and Applied Life Sciences, Vienna, Austria [email protected];[email protected]) Agricultural University, Institute for Human Nutrition, Krakow, Poland Corresponding author: Renate Löppert, Department of Chemistry, Muthgasse 18, A-1900 Vienna, Austria, [email protected]
Jerusalem artichoke is a well known vegetable which has been a part of the French Cuisine used in delicious preparations for long time. Moreover the tubers of Jerusalem artichoke are useful as weight reducing diet in the fight against obesity because of its particularly low calorie value and its high content of dietary fibre, soluble (FructoOligoSaccharides FOSs and inulin) as well as insoluble (cellulose). The tubers can be easily processed by dehydration and made available throughout the year independent from seasons. The water free product contains the same composition of soluble and insoluble carbohydrates as is present in the fresh tubers and can be applied in a broad range of meals in a reduction diet with a high prebiotic effect. FOSs and inulin are not digested in the human intestine, only fermented in the colon and thus can be designated as soluble dietary fiber. The fermentation of FOSs and inulin in the colon causes additional effects like reduction of lipids and cholesterol as well as an enhanced availability of minerals (Ca, Mg…). Physiological investigations on rats fed with Jerusalem artichoke powder substituting for a part of diet indicate significant reduction of glucose as well as cholesterol and triglyceride concentrations in blood serum. Weight (bodymass) of these rats decreased significantly compared to those of control group. Additionally, inulin has been reported for increasing the bioavailability of Ca, Mg. In the present study inulin-fed rats compensated a 75% mineral deficiency observed in the control group rats. Along with that no bone porosity was observed and subsequently liability to fractures was reduced. The high amount of dietary fibre as well as the heath promoting effect provides sufficient evidence for Jerusalem artichoke to have antiobesity attributes.

ABSTRACTS
EGEA 2007, Page 155
P42 A way out of obesity through participatory action REYES SÁNCHEZ Leticia1, DEVOS Etienne Rue des Moulins, 28 , B-7700 Mouscron, Belgium, Nutritionist, Familles du Monde, [email protected]
In a poor area of Mouscron, a CBO* manages to gather people who used to live with very little contact with others. Those persons frequently present serious chronicle overweight and obesity problems (“when I feel down, fruits and vegetables go off in my fridge”…). Our intervention dealt with food habits and other health determinants. The group identified the overweight as central problem for further discussion and action. The objective of the workshops was, thus, with the patients themselves, to find a way out of the different so called ‘vicious circles’ maintaining them in obesity and its collateral damages. We went through a process of thinking with the patients on causes and consequences of the overweight for them, explaining them the different steps of the ‘problem tree’, and giving them explanations on food habits as required. The problem tree ended as follow, in a very summarised way: Consequences: Social Emotional/Behavioural Physiological Central problem: Overweight/Obesity Causes: Social Emotional/Behavioural Physiological The patients understood, in this exercise, that the only way to solve their overweight / obesity problems and related diseases was to go down to the root causes of their obesity and bring a solution to these, in the three roots. They also identified by themselves a vicious circle in each ‘sector’: loneliness/isolation in the social side, depression in the emotional side and lack of physical activity in the physiological one. The way out of this vicious circle requires
a solution to the problems deeper in the root causes. Some patients made their way down to those root causes and have reached sustainable improvement in their health condition (significant diminution of their overweight); they are undergoing a psychological and medical work and manage to improve and sustain their food habits. Social interaction is under development. This exercise shows that fighting obesity and overweight requires a wider view to the problems the patients face: what we call lifestyle diseases factors (above identified as ‘root causes of obesity’).
1 Member of IAPO (International Alliance of Patients Organisations), member of HISPASANTE (Belgium) * CBO community based organization.
Corporal composition evolution
0 kg
20 kg
40 kg
60 kg
80 kg
100 kg
120 kg
4/03
/200
4
3/04
/200
4
3/05
/200
4
2/06
/200
4
2/07
/200
4
1/08
/200
4
31/0
8/20
04
30/0
9/20
04
30/1
0/20
04
29/1
1/20
04
29/1
2/20
04
28/0
1/20
05
27/0
2/20
05
29/0
3/20
05
28/0
4/20
05
28/0
5/20
05
27/0
6/20
05
27/0
7/20
05
26/0
8/20
05
25/0
9/20
05
25/1
0/20
05
24/1
1/20
05
24/1
2/20
05
23/0
1/20
06
22/0
2/20
06
24/0
3/20
06
23/0
4/20
06
23/0
5/20
06
22/0
6/20
06
22/0
7/20
06
21/0
8/20
06
20/0
9/20
06
20/1
0/20
06
19/1
1/20
06
19/1
2/20
06
18/0
1/20
07
Dates
Wei
ght
Non fat Fat Water
Lastconsultation

ABSTRACTS
EGEA 2007, Page 156
P43 Trends and specificities of fruit and vegetable consumption in Poland HALICKA Ewa Warsaw Agricultural University, Faculty of Human Nutrition and Consumer Studies, Nowoursynowska 159c 02-776 Warsaw, Poland, [email protected]
The aim of the study was to evaluate the changes in fruit and vegetable consumption in Poland (1996-2006) based on three sources of information: balance sheets, household budget surveys and questionnaires. Primary research was undertaken among selected two groups of consumers: women and school-children. Seasonal variations in fruit availability were also calculated and the determinants of consumer behaviour investigated. The per capita supply of fruit in Poland is lowest in comparison to other EU countries, however shows a systematic growing trend. The observed increase is due to high supply of imported fruits, such as citrus and grapes. In the case of vegetables the supply is similar to EU-average level, but is characterised by poor diversification: onions, cabbage and carrots dominate in the diet. The conducted primary studies showed that Polish consumers in general are not aware of nutritional recommendations regarding fruits and vegetables. The main determinants of food choice are: freshness, sensory properties (taste, smell etc.) and price. Survey-based research showed that children do not have sufficient access to vegetable-based products and meals in schools. Women living in urban households declared that they purchase fruit mainly for their children. The consumption of fruit and vegetables in Poland is characterised by high seasonal fluctuations resulting from changes in price, supply level and habits. Seasonality of consumption has decreased in the last decade due to the development of foreign trade and changes in consumer preferences. The studies proved the necessity to undertake activities aimed at increasing the consumption through education and promotion of fruit and vegetables, especially in the off-season months. Interventions could be focused on women and children, who know that these products are healthy, but are not aware of the fact, that they are eating them in too small quantities.
P44 Adiponectin is positively regulated by vitamin E LANDRIER Jean-François, THAP Sinay, EL YAZIDI Claire, MALEZET Christiane, BOREL Patrick, AMIOT Marie-Josèphe, MARGOTAT Alain INSERM 476; INRA 1260; Aix-Marseille 2, Marseille F-13385 France Corresponding author: Jean-François Landrier, Nutrition Research Unit INSERM/INRA, 27 Bd Jean Moulin, 13385 Marseille Cedex 05, France, [email protected]
In several studies performed in human (Mayer-Davis et al. 2002; Manning et al. 2004) or in animal models (Laight et al. 1999), it has been reported a positive effect of vitamin E on insulin resistance. Because adiponectin is one the major actors involved in this physiopathological process, we evaluated the ability of vitamin E to regulate adiponectin expression, which could provide a molecular basis for the reported observations. 3T3-L1 differentiated cells have been treated with vitamin E within physiological concentration range. Mice were force fed for 4 days with gamma–tocopherol. Transient transfections of the human adiponectin promoter were performed in Cos-1 cells using JetPEI transfection mix. Gene expression has been evaluated by qPCR. Protein expression levels were quantified by ELISA. Adiponectin mRNA levels were induced by vitamin E (both alpha and gamma-tocopherol) in 3T3-L1 cells. These effects were shown to be time-dependant. During transient tansfections in Cos-1 cells, both alpha and gamma vitamers were able to induce the luciferase gene reporter under control of human adiponectin promoter, confirming thus the transcriptional origin of this regulation. This effect seems to be PPARgamma-dependant since the transactivation of luciferase reporter required PPARgamma expression vector co-transfection. Finally this regulation was confirmed in vivo, where gamma-tocopherol force feeding for four days in mice resulted in an induction of adiponectin at mRNA and protein levels, supporting thus the physiological relevance of this regulation. Vitamin E appears to be able to up-regulate adiponectin expression. This could be molecular basis for positive effect of this vitamin on insulin resistance, previously reported in several studies.

ABSTRACTS
EGEA 2007, Page 157
P45 Fruit and vegetable consumption, obesity and socio-economic environment in a country in food transition: The case of Algeria
OBERTI Bénédicte1, LEBECHE Rabih2, HOUTI Leïla3, PADILLA Martine1, EYMARD-DUVERNAY Sabrina4,MAIRE Bernard4
1) CIHEAM-IAMM/UMR MOÏSA, Montpellier, France; 2) CNES, Alger, Algeria; 3) LABSIS- Faculty of Medicine, Oran, Algeria; 4) IRD-UR 106, Montpellier, France
Corresponding author: Bénédicte Oberti, CIHEAM-IAMM, 3191 route de Mende, 34093 Montpellier Cedex 5, France, [email protected]
Objectives: Linking the consumer environment to fruit and vegetable intakes and obesity rates. Method: 4,818 households were surveyed in June 2005 (TAHINA project) out of which one adult per household (35-70 years) was randomly drawn. Body height and weight were measured and a 24-hour food list, and a weekly food frequency questionnaire of 15 items were completed. At the socio-economic level, a composite index composed of the population structure, sanitary conditions and ways of life was set up. This indicator of Sanitary and Social Development (IDSS) allowed a seven-category classification of region. Within each region, the environment is homogeneous. Results: The vegetable consumption and fruit consumption frequency is below the recommended level (5 a day): it is respectively 0,83 and 0.53 per day globally, the highest frequency is in the South (1,20 and 0.85) and the lowest one in rural area (0,77 and 0.50). The overall prevalence of overweight is 57.4% and of obesity 22.1%. Overweight is higher in the Tell Atlas than in the Plateau area and the South (respectively 59.3%, 55.9% and 47.4%). The food consumption structure in the Tell Atlas is westernizing with higher intakes of manufactured food-product leading to obesity rates close to European ones. In the Southern region, food consumption remains traditional although fat-rich. Obesity rates increase in the Plateau area despite low food diversity. A mapping of these data is provided. Crossing data on consumption frequency, obesity rates with the IDSS allows to observe an negative correlation between fruit and vegetable consumption and obesity rates. But it’s essential to take into account the “confounding factors” such as ways of living and socio-economic aspects to explain this correlation. P46 Variation of the liver enzymatic activities during a hypercaloric diet
EL-AOUFI Salima1, MAOUCHE Boubekeur2, SENNOUNE Souad3, GRIENE Lakhdar 4
1) Faculté des Sciences Biologiques, L.B.P.O, USTHB, Alger, Algeria; 2) Laboratoire de Physicochimie Théorique et de Chimie informatique ; USTHB, Alger, Algeria; 3) Department of Physiology; Texas Tech University Health Sciences Center; Lubbock, Texas, USA; 4) Laboratoire d’Hormonologie, Centre Pierre et Marie Curie, C.H.U Mustapha, Alger, Algeria
Corresponding author : Salima El-Aoufi, Faculté des Sciences Biologiques, L.B.P.O, USTHB, Alger, Algeria, [email protected]
Introduction: From its chronicity and the gravity of its complications, diabetes (D-2) is an extremely expensive and dramatic disease particularly for the Third World countries. The threat exerted D-2 on the heart is well known but we know more and more that it constitutes also a threat for the liver. Aim: Through study of a Psammomys obesus (P.os) population, we show that serious abnormalities of the enzymologic activities of the liver are induced by a high calorie diet. The current observation shows that there is a direct interaction between the hepatic metabolism, and the glucose homeostasis. A study of the nutri-induced dysfunction of liver can be a good indicator in the study of the pathogenesis of intolerance to glucose in hepatic affections and in the diabetes itself. Methods: In this contribution we have used 10 Wistars (Rattus norvegicus), 10 gerbils (Gerbillus gerbillus) and 69 P.os. The Wistars and gerbils were fed with laboratory chow pellets (hypercaloric diet; 10 g/day (equivalent to 32.5 cal/day and salty water, NaCl 0.9 %, ad libitum). The 69 P.os were divided into three groups: 24 controls were fed with the naturally occurring hypocaloric diet (based on halophiles, Suaeda mollis, plants (50 g/day which is equivalent to 20-22 cal/day), 38 treated animals were fed with a high-calorie diet, 32.5 cal/d and salty water (0.9%) ad libitum and 7 P.os received a hypocaloric diet, 10 cal/d. essentially made up of spinach. The experiment lasted 15 months. Nine experimental studies were carried out and the activity of 20 enzymes investigated. Results: The healthy P.o group presents extremely weak activities of lipolytic enzymes. The natural deficiency in G6P worsens during the HCD by the increase in G6Pase which increases the rate of glucose in the blood. The phosphorylase and UDPG-synthetase, active in the obese P.os are absent in the diabetics. For the P.os in IDDM state we note a hyperactivity of lysosomal enzymes and growth of the alkaline phosphatase which indicates the presence of hepatocellular necrosis. Conclusion: The liver of the P.os in HCD undergoes major pathological modifications. The enzymologic disturbances of the hepatocytes are similar to those observed in human D-2. This study reinforces the idea that the endocrine disorders may actually cause a lot of liver diseases and that there is a reciprocal link between liver diseases and diabetes. Our polygenic animal reproduces this correlation and seems to be an excellent model naturally adapted to research on the interactions between environment, diet, endocrine diseases and their pathological consequences.

EGEA 2007, Page 158

EGEA 2007, Page 159
EGEA IV Brussels – April 17-19, 2007
would like to acknowledge the support of the following partners :
EU-European Union
French Ministry of Agriculture and Fisheries
INTERFEL
VINIFLHOR
EU Platform on Diet, Physical activity and Health
AREFLH
FRESHFEL EUROPE
IFAVA
Fruit Logistica
CSO
Dole
Food Chain Partnership – Bayer
Eurofruit