efficacy of cluster-based approach for the revival of handloom ...
369
EFFICACY OF CLUSTER-BASED APPROACH FOR THE REVIVAL OF HANDLOOM CO-OPERATIVE SOCIETIES IN KERALA with Special Reference to Thiruvananthapuram and Kannur Districts Thesis Submitted to COCHIN UNIVERSITY OF SCIENCE AND TECHNOLOGY for the Award of the Degree of Doctor of Philosophy in Economics Under the Faculty of Social Sciences By Mr. SEBASTIAN THOMAS Reg.No.3252 Under the guidance of Dr. M.Meera Bai Professor Department of Applied Economics, Cochin University of Science and Technology DEPARTMENT OF APPLIED ECONOMICS COCHIN UNIVERSITY OF SCIENCE AND TECHNOLOGY KOCHI-22, KERALA July, 2013
-
Upload
khangminh22 -
Category
Documents
-
view
0 -
download
0
Transcript of efficacy of cluster-based approach for the revival of handloom ...

EFFICACY OF CLUSTER-BASED APPROACH
FOR THE REVIVAL OF HANDLOOM
CO-OPERATIVE SOCIETIES IN KERALAwith Special Reference to
Thiruvananthapuram and Kannur Districts
Thesis Submitted to COCHIN UNIVERSITY OF SCIENCE AND TECHNOLOGY for the Award of the Degree of Doctor of Philosophy in
EconomicsUnder the Faculty of Social Sciences
By
Mr. SEBASTIAN THOMASReg.No.3252
Under the guidance of
Dr. M.Meera BaiProfessor
Department of Applied Economics,Cochin University of Science and Technology
DEPARTMENT OF APPLIED ECONOMICS
COCHIN UNIVERSITY OF SCIENCE AND TECHNOLOGY KOCHI-22, KERALA
July, 2013


DEPARTMENT OF APPLIED ECONOMICSDEPARTMENT OF APPLIED ECONOMICSCOCHIN UNIVERSITY OF SCIENCE AND TECHNOLOGYCOCHIN UNIVERSITY OF SCIENCE AND TECHNOLOGY
KOCHI – 682 022, KERALA, S. INDIAKOCHI – 682 022, KERALA, S. INDIA
Dr. M. Meera Bai Ph: 0484 – 2576030(Off) 2575289(R)Professor Mob: 9048320616
This is to certify that the thesis entitled “Efficacy of Cluster-
Based Approach for the revival of Handloom Co-operative
Societies in Kerala- with special reference to
Thiruvananthapuram and Kannur Districts” is a bonafide
research work done by Shri. Sebastian Thomas, under my
guidance and supervision. Thesis is approved by the Doctoral
Committee for the submission for the degree of Doctor of
Philosophy in Economics.
Dr. M.Meera Bai Place: Kochi-22Date:


Declaration
I, hereby, declare that the thesis entitled “Efficacy of
Cluster-Based Approach for the revival of Handloom Co-
operative Societies in Kerala- with special reference to
Thiruvananthapuram and Kannur Districts” is carried out by
me under the supervision and guidance of Dr. M Meera Bai,
Professor, Department of Applied Economics, CUSAT, Kochi-
22. I further declare that this thesis has not previously formed
the basis for the award of any degree, diploma, associateship,
fellowship or other similar titles of recognition
Place: Kochi-22
Sebastian Thomas
Date:


Acknowledgement
First and foremost, I am grateful and deeply indebted to my
supervising guide Dr. M.Meera Bai, Professor, Department of
Applied Economics, CUSAT for her valuable guidance for the
successful completion of my research work.
I would like to place on record my heartfelt thanks and
gratitude to Dr. P Arunachalam, Professor & Head of the
Department for his valuable support and encouragement. My
sincere thanks to Dr. D. Rajasenan,, Dr. S. Harikumar and Dr.
K.P. Manoj, Faculty Members, Department of Applied Economics,
CUSAT, for the help and support extended to me throughout the
study. My sincere thanks to the Librarian and the office staff of the
Department of Applied Economics for their help and co-operation.
A special thanks to Dr.Saji Gopinath, Professor, IIM-
Kozhikode, and Dr.K..J.Joseph ,Chair Professor, Centre for
Development Studies (CDS), Trivandrum. for their valuable inputs. I
thank Shri. Sriram V., Chief Librarian, CDS, Trivandrum, for
keeping me in his chain of “knowledge sharing” and helping me with
articles and data relevant to my study. A special thanks to
Shri.Vinodkumar, Research Officer, State Planning Board,
Trivandrum and Shri. Van Roy, Manager, K-Bip,
Thiruvananthapuram for their help.
The success of Sectoral Study to a larger extent depends on
the support that we get from stakeholders, such as industrialists,
policy makers, government departments etc. I have received
support from the Directorate of Handlooms & Textiles, Govt of

Kerala, Weavers Service Centre, Textile Committee, NHDC, DIC etc,
My special thanks to Shri.Ittycheria, Directorate of Handlooms &
Textiles, and Shri. P. R.Luis, former Director of Handlooms &
Textiles, for their encouragement and support. A special thanks to
Shri.C.Muthuswami, Deputy Director, Weavers Service Centre and
Shri.S.Rajkumar Chief Manager, National Handloom Development
Corporation (NHDC), and Shri.S.V.Mohanachandran, Asst.
Director ,Textile Committee, Kannur. A special thanks to
Mr.Muralikumar, Hantex, and CDEs of all the handloom clusters
who were kind enough to extend their valuable time during my visits
for data collection.
For a part time research scholar from the Non -Teaching
Government sector, the support from his organisation is very critical
for the success of the research. I sincerely thank my organisation,
Kerala State Industrial Development Corporation Ltd (KSIDC),
for having supported me in my sojourn of knowledge. A special
thanks to Shri.V.Somasundram, I.A.S (Addl. Chief Secretary),
Shri.P. H. Kurian, I.A.S. (Prl.Secy. (IT) & former MD, KSIDC), and
Shri.T.P Thomas Kutty, Executive Director, KSIDC for their
encouragement and support.
My thanks to K. Aravindhakshan, Rajesh Jacob,
Varghese Malakkaran, and E.P. Suresh Babu my colleagues in
KSIDC, for helping me in this study in many ways. The
encouragement by K.Madhavan and support by M.Sugathan, staff
of KSIDC require a special mention. I thank my friend, Shri.
Muhammed Yusuf and his family for their support.

Words cannot express my gratitude to Shri. Venu Nallur,
former Executive Director, KSIDC, and Shri.K.J Jacob, my close
friend and Editor, Independent Media, Kochi who helped me
throughout the study and kept me focused whenever I missed the
track.
Last, but not least, I thank my wife Sunitha Kurup, my 13 year
old daughter Archana and my 9 year old son Rohit for their patience
and support.
This research work is a fulfillment of my promise to my father
late Shri Thomas P.P , who taught me to ‘Dream Big’. A special
remembrance of my mother late Smt Clara Thomas who
taught me to work relentlessly to achieve success in life.
Above all, I thank The God Almighty for his blessings.
SebastianThomas
Contents Chapter No. Title Pages
I Introduction1-65
1.1 Kerala Economy: The Role of manufacturing andindustrial sectors 2
1.2 Role of MSME and Traditional Industries5
1.3 Challenges of Traditional Industries: 9

1.4 Cluster Approach10
1.4.1 Cluster: Definition and its Meaning.11
1.4.2 Types of Clusters13
1.4.2.1 By Development13
1.4.2.2 By Knowledge14
1.4.2.3. By spatial characteristics15
1.4.3 Cluster: Historical, Conceptual and Theoreticalperspective: 16
1.4.4 UNIDO Model of Cluster Development19
1.4.5 UNIDO Tools for Evaluating the Efficacy of Clusters21
1.4.6 Cluster Movement in India23
1.4.7 Operationalisation of Cluster34
1.4.8 Institutional Mechanism for the Implementation ofClusters 34
1.4.8.1 Objectives 34
1.4.8.2 Strategy and Approach: 35
1.4.8.3 Formation of a Cluster35
1.4.8.4 Project Approval Monitoring and Evaluation:37
1.4.9 Cluster Programmes in India37

1.4.10 Cluster Development Activities in Kerala39
1.4.11 The Implementation & Monitoring Mechanism for Cluster Development in Kerala
41
1.4.12 MSME Development Institute and ClusterDevelopment in Kerala.................................................................................41
1.4.13 Clusters in Kerala –Current Status42
1.4.14 Handloom Clusters in Kerala44
1.4.14.1 Swarnajayanthi Grama Swarozgar Yogana(SGSY) 44
1.4.14.2 Integrated Handloom Cluster Development Scheme (IHCDS) 45
1.4.14.3 The Integrated Handlooms DevelopmentScheme –Cluster Development Programme(IHDS-CDP)
46
1.4.14.4 IHDS –Group Approach 46
1.5 Statement of the Problem47
1.6 Objectives of the Study48
1.7 Research Methodology 49
1.7.1 Research Approach49
1.7.2 Methodology: 49

1.7.3 Measurement of Impact:50
1.8 Tools used for Data Analysis52
1.9 Selection of the Study Area 54
1.10 Sample Selection57
1.10.1 Cluster Sample58
1.10.1.1 Selection of the Sample Handloom ClusterMember Workers (CMW)
58
1.10.1.2 Selection of the Sample Handloom ClusterMember Societies (CMS)
59
1.10.2 Non-Cluster Sample59
1.10.2.1 Selection of the Non–Cluster Member Workers (N-CMW) 59
1.10.2.2 Selection of the Non –Cluster Member Societies (N-CMS) 60
1.11 Data collection61
1.12 Secondary Data Sources62
1.13 Period of Study63
1.14 Limitations of the Study64
1.15 Plan of the Thesis64
II Review of Literature67-77

2.1 Small Firms 67
2.2 Small Scale Industries in India70
2.3 Clusters in India73
2.4 Handloom Industry and Handloom clusters in Kerala 75
III Handloom Industry in Kerala –An Overview79-107
3.1 Challenges in the Post-Multi- Fibre Agreements (MFA)Period80
3.2 Handloom Industry in India:82
3.3 Handloom Industry in Kerala84
3.3.1 Handloom Societies, Looms & Workers85
3.3.2 Production of Cloth87
3.3.3 Products and the Main Centres of Production87
3.3.4 Raw Material Sources88
3.3.5 Technology and Handloom Production process88
3.3.6 Marketing of the Handloom Products91
3.3.6.1 Own Showrooms and Exhibitions92
3.3.6.2 Through Apex Organizations - Hantex andHanveev 92
3.3.6.3 The Master Weavers 92

3.4 Financial Assistance92
3.4.1 Long Term Capital 92
3.4.2 Working Capital94
3.5 Institutional Mechanism for the Handloom Industry96
3.5.1 Government of India Institutions96
3.5.2 Institutions under Government of Kerala 98
IV Overview of the IHDS-CDP, Study Area and Select Handloom Clusters
109-139
4.1 Integrated Handlooms Development Scheme (IHDS) 109
4.2 Integrated Handloom Development Scheme- Cluster Development Programme (IHDS- CDP)
110
4.2.1 Objectives of the Scheme110
4.2.2 Definition of Cluster under IHDS –CDP111
4.2.3 Project Cost and the Activities Envisaged 111
4.2.4 Quantum of Assistance 113
4.2.5 State Level Project Committee (SLPC)113
4.2.6 Cluster Implementing Agency113
4.2.7 Submission of the Proposals and Release ofFinancial Assistance
114

4.2.7.1 Initial Proposal for the Baseline Survey andDiagnostic Study......................................................................114
4.2.7.2 Submission of Project Report of ClusterDevelopment, Action Plan and Release ofAssistance......................................................................115
4.3 Profile of the Study area and Select Handloom Clusters in Thiruvananthapuram and Kannur
116
4.3.1 Thiruvananthapuram116
4.3.1.1 Handloom in Thiruvananthapuram119
4.3.2 Profile of the Study Area-II. Kannur121
4.3.2.1 Handloom & Handloom Clusters in Kannur 125
4.4 Profile of Select Handloom Clusters 126
4.4.1 A brief Profile of the Select Handloom Clusters128
4.4.1.1 Kozhode Handloom Cluster128
4.4.1.2 Ramapuram Handloom Cluster129
4.4.1.3 Travancore Handloom Cluster:130
4.4.1.4 Ooruttambalam Handloom Cluster131
4.4.1.5 Swadesi Handloom Cluster132
4.4.1.6 Naveena Handloom Cluster132

4.4.1.7 Thettivila Handloom cluster 133
4.4.1.8 Neyyatinkara Handloom Cluster134
4.4.1.9 Payyannur Handloom cluster134
4.4.1.10 ICON Handloom Cluster136
4.4.1.11 Morazha Handloom Cluster 136
4.4.1.12 Kalliassery Handloom Cluster 137
4.4.1.13 Chirakkal Handloom Cluster 138
V Analysis 141-221
5.1 An Institutional Analysis142
5.1.1 Human Force143
5.1.1.1 Trend in the Number of Registered Membersin the Society 144
5.1.1.2 Trend in the Number of Active/WorkingMembers in the Society
148
5.1.1.3 Trend in the Number of Working Looms inthe Society 150
5.1.1.4 Composition of the Society152
5.1.1.5 Trend in the Age of the Society 153

5.1.1.6 No of Persons in the Household Employedin Handloom 154
5.1.1.7 Handloom Sector as an Occupation155
5.1.1.8 Wages & Other Emoluments 157
5.1.1.9 Job Security160
5.1.1.10 Training Programmes162
5.1.1.11 Exposure Visits 163
5.1.1.12 New Designs and Products165
5.1.1.13 Output per Worker168
5.1.2 Network of Supplying the Raw Materials170
5.1.2.1 Raw Material Purchase from Open Market.172
5.1.2.2 Raw Material Purchase fromHantex/Hanveev 172
5.1.2.3 Raw Material Purchase from Yarn Bank173
5.1.3 Network for Marketing175
5.1.3.1 Increasing the Selling Channels176
5.1.3.2 Increasing the Product profile179
5.1.3.3 Using Marketing and AdvertisementActivities 181
5.1.4 Network for Accessing Technology and InfrastructureUp-gradation: 184

5.1.4.1 Tie up with Fashion Design Institutes186
5.1.4.2 Participation in National & International Fashion Shows/Trade Fairs, Technology Exhibitions and Seminars.
187
5.1.4.3 Exposure Visits:188
5.1.4.4 Training Programmes 189
5.1.5 Increase in Finance & Investment Aid193
5.1.5.1 Long Term Investments: 193
5.1.5.2 Short Term Investments: 199
5.1.6 Co-ordinating Entity202
5.1.6.1 Project Cost and Operational Results204
5.1.6.2 Allocation & Utilisation of Funds for DifferentActivities 205
5.1.6.3 Conducting Various Programmes207
5.1.6.4 Completion of Different Works underClusters 207
5.2 An Enterprise Analysis211
5.2.1 Turnover212
5.2.2 Net Profit/Loss214
5.2.3 Accumulated Loss216

5.2.4 Net Worth219
VI Findings, Suggestions and Conclusions223-243
6.1 Major findings on the Impact of Cluster DevelopmentProgramme on Handloom Industry
224
6.1.1 Human Force 225
6.1.2 Network for Supply of Raw Materials.227
6.1.3 Technology/Infrastructure Up-gradation228
6.1.4 Network for Accessing Market: 229
6.1.5 Finance and Investment Aid: 231
6.1.6 Co-ordination232
6.2 Weaknesses/Drawbacks of the IHDS-CDP233
6.3 Suggestions Based on the Study 235
6.3.1 Human Force235
6.3.2 Network for Supply of Raw Materials 236
6.3.3 Technology and Infrastructure Up-gradation. 236
6.3.4 Network for Accessing Market237
6.3.5 Financial Supply and Investment Aid238
6.3.6 Co-ordination Entity.239

6.4 Areas for Further Study/Research240
6.5 Conclusions 240
Bibliography245-254
Appendix I255-266
Appendix II267-278
Appendix III279-289


List of Tables
Table No. Title Page No.
1.1 Sector-wise contribution to the GSDP since 1987....................................................................................
3
1.2 Growth of manufacturing sector in GSDP (Kerala) )
Base Year (2004-05)....................................................................................
4
1.3 Central Sector Investment in Selected States as on
31.03.2011....................................................................................
5
1.4 District-wise details of working SSI/MSME units
registered in Kerala 2010 -11....................................................................................
6
1.5 Segment –wise Plan Fund Allocation....................................................................................
7
1.6 Clusters v/s Non Clusters....................................................................................
13
1.7 Number of Items included in the SSI Reservation
List over the Years....................................................................................
25
1.8 Number of Items De-Reserved Since 1997

....................................................................................
26
1.9 Classification of MSMEs ....................................................................................
30
1.10 Evolution of Promotional Policy Framework for
Small-Scale Sector....................................................................................
33
1.11 Core areas of intervention under Cluster ....................................................................................
36
1.12 Major Cluster Development Programmes in India....................................................................................
37
1.13 Key milestones by Government for the cluster
development activity in Kerala ....................................................................................
40
1.14 Common Facility Centres (CFC) in Kerala as on
31.03.2012....................................................................................
43
1.15 District-wise list of Clusters Identified in the initial
Survey of Industries Department....................................................................................
44
1.16 Strategy for evaluating the performance of handloom
clusters in Kerala

....................................................................................
52
1.17 District-wise details of Handloom Co-operative
societies in Kerala....................................................................................
55 ....................................................................................
1.18 District-wise details of working handloom clusters in
Kerala....................................................................................
55
1.19 Selection of Cluster Member Workers (CMW)....................................................................................
58
1.20 Total Sample Selection ....................................................................................
60
3.1 Size of Indian Textile Industry -2010....................................................................................
80
3.2 Employment in Textile Industry-2010....................................................................................
82
3.3 Sector-wise Production of Cloth....................................................................................
83
3.4 Trend in the number of handloom co-operative
societies in Kerala....................................................................................
85
3.5 Number of Handloom Co-operative Societies and its
Members....................................................................................
86
3.6 Production and Sales of Handloom cloths....................................................................................
87
3.7 Allocation of funds by the GoI for handloom projects
during the 11th Five Year Plan ....................................................................................
93
3.8 Product Pricing Method by Hantex....................................................................................
106
4.1 Components of the Integrated Handlooms
Development Scheme (IHDS)....................................................................................
110
4.2 Activities covered under IHDS-CDP....................................................................................
112
4.3 General Profile of Thiruvananthapuram District at a
Glance....................................................................................
117
4.4 MSMEs in Thiruvananthapuram District....................................................................................
118
4.5 Major industrial parks/estates in
Thiruvananthapuram District

....................................................................................
119
4.6 General Profile of Kannur District at a Glance....................................................................................
122
4.7 MSME in Kannur District....................................................................................
124
4.8 Major industrial parks/estates in Kannur District....................................................................................
124
4.9 District- wise list of Handloom clusters....................................................................................
126
4.10 District-wise list of working clusters....................................................................................
127
4.11 Approved Project Cost for Sample Clusters....................................................................................
128
4.12 Member details of Kozhode Cluster....................................................................................
129
4.13 Member details of Ramapuram Cluster....................................................................................
130
4.14 Member details of Travancore Cluster....................................................................................
130
4.15 Member details of Ooruttambalam Cluster

....................................................................................
131
4.16 Member details of Swadesi Cluster....................................................................................
132
4.17 Member details of Naveena Cluster....................................................................................
133
4.18 Member details of Thettivila Cluster....................................................................................
133
4.19 Member details of Neyyatinkara Cluster....................................................................................
134
4.20 Member details of Payyannur Cluster....................................................................................
135
4.21 Member details of ICON Cluster....................................................................................
136
4.22 Member details of Kalliassery Cluster....................................................................................
137
4.23 Member details of Chirakkal Cluster....................................................................................
138
5.1 Total Registered Members in the Cluster Member
Societies (CMS)....................................................................................
145

5.2 Total Registered Members in the Non-Cluster Member
Societies (N-CMS)....................................................................................
146
5.3 Change in the no. of Registered Members of the
Sample Handloom Co-operative Societies (2005-
2012)....................................................................................
147
5.4 Comparison of Percentage Change of Registered
Members in the Sample Societies from Pre-IY
(2008) to the Post IY (2012)....................................................................................
148
5.5 Change in the no. of Working Members of the
Sample Handloom Co-operative Societies (2005-
2012) ....................................................................................
149
5.6 Comparison of Percentage Change of Working
Members in the Sample Societies from Pre-IY
(2008) to the Post IY (2012)....................................................................................
150
5.7 Change in the no. of Working Looms of the Sample
Handloom Co-operative Societies (2005-2012)....................................................................................
151
5.8 Composition of the Society

....................................................................................
153
5.9 Year of Registration of the Society....................................................................................
154
5.10 Number of persons in the household employed in
handloom in 2012....................................................................................
155
5.11 Reasons for adopting handloom occupation....................................................................................
156
5.12 Years of Experience of Weavers - 2012....................................................................................
156
5.13 Comparison of the Average Wage per Day per
Weaver....................................................................................
157
5.14 Comparison of the percentage Change in the
Amount of Wages & Emoluments paid by Sample
Societies between Pre-IY (2008) to the Post IY
(2012)....................................................................................
158
5.15 Year–wise Comparison of the amount spent on
Wages and Compensation in societies from 2005 to
2012 in Rs

....................................................................................
159
5.16 Comparison of the average working days per year
received by weavers....................................................................................
161
5.17 Opinion of weavers on Job Security....................................................................................
161
5.18 Comparison of the No. of weavers who attended
Training Programme....................................................................................
162
5.19 Comparison of Training Programme organized by
sample societies....................................................................................
163
5.20 Exposure Visits by workers-a Comparison ....................................................................................
164
5.21 Comparison of Exposure Visit organised by societies....................................................................................
164
5.22 Comparison of the New Designs introduced by
societies....................................................................................
165
5.23 Year–wise Comparison of the Change in no. of new
products in societies from 2005 to 2012

....................................................................................
166
5.24 Comparison of Change in number of new products
introduced by the societies between Pre-IY (2008) to
the Post IY (2012))....................................................................................
167
5.25 Comparison of Change in Output per worker (Rs) in
the societies from 2005 to 2012....................................................................................
168
5.26 Comparison of the % Change in the Average Output
per worker per Pre-IY (2008) to the Post IY (2012)....................................................................................
170
5.27 Comparison of societies which directly purchase
Raw material from the Open Market....................................................................................
172
5.28 Comparison of No.of societies which procure raw
materials from Hantex/Hanveev....................................................................................
173
5.29 Comparison of No.of societies which use Yarn Bank
for purchase of Raw material....................................................................................
173
5.30 Comparison of use of various channels for purchase
of raw material by Societies and Weavers

....................................................................................
174
5.31 Comparison of No.of societies which depend on
Open market/Middle men for marketing their
products....................................................................................
176
5.32 Comparison of No. of societies which use Domestic
Marketing as a channel for Marketing....................................................................................
177
5.33 Comparison of No. of societies using Exhibition as a
channel for Marketing....................................................................................
177
5.34 Comparison of No. of societies using
Hantex/Hanveev as a channel for Marketing....................................................................................
178
5.35 Comparison of No. of societies which use Export as
a channel for Marketing....................................................................................
179
5.36 Comparison of no. of societies which introduced
New Products ....................................................................................
180
5.37 Comparison of No. of societies which have
introduced Forward Integration

....................................................................................
181
5.38 Comparison of no.of Societies which introduced
website ....................................................................................
181
5.39 Comparison of No.of societies which have resorted
to Advertisement....................................................................................
182
5.40 Comparison of No. of societies which have resorted
to Branding....................................................................................
183
5.41 Comparison of No. of societies which have utilised
adopted Handloom Mark as a Marketing Tool ....................................................................................
184
5.42 Comparison of No. of societies which have made
Tie- ups with Fashion Design Institutes....................................................................................
187
5.43 Comparison of no. of societies which have
participated National & International Fashion
Shows/Trade fair....................................................................................
188
5.44 Comparison of No. of societies which have
participated in the Exhibitions and seminars
....................................................................................
188
5.45 Comparison of No of societies which have organised
Exposure Visits ....................................................................................
189
5.46 Comparison of No of weavers who have attended
Training Programmes....................................................................................
189
5.47 Comparison of No of societies which have
undertaken Training Programmes for accessing
technology ....................................................................................
190
5.48 Comparison of Level of Technological Intervention
after introduction of cluster (%)....................................................................................
192
5.49 The Percentage Change in Share Capital of the
societies from 2005 to 2012....................................................................................
195
5.50 Percentage Change in Share Capital from the Pre-IY
(2008) to the Post IY (2012)....................................................................................
196
5.51 Percentage Change in the Grant & Subsidy received
by the societies from the Pre-IY (2008) to the Post IY

(2012)....................................................................................
197
5.52 Change in Grant & Subsidy received by societies from
2005 to 2012....................................................................................
197
5.53 Borrowings from Banks and FI....................................................................................
199
5.54 Availability and % Change of Primary W/C (PW/C)
from Commercial Banks/FIs as on 31.03.2012....................................................................................
200
5.55 Availability and % Change of Secondary Working
capital (S W/C) as on 31.03.2012....................................................................................
201
5.56 Availability and % Change of Incremental Working
capital (I W/C) as on 31.03.2012....................................................................................
201
5.57 Total Project Cost, its sharing and funds received by
Sample clusters....................................................................................
204
5.58 Sanctioned Project Cost & co-ordinating agencies....................................................................................
205

5.59 The Pattern of Allocation of Funds for different
activities & its Utilisation ....................................................................................
205
5.60 Fund utilization & Co-ordinating Agencies....................................................................................
206
5.61 Activities /Programmes conducted by Co-ordinating
Agencies....................................................................................
207
5.62 Status of Cluster activities completed....................................................................................
210
5.63 Change in Turnover of Societies from 2005 to2012....................................................................................
213
5.64 The Change in Net Profit (-Loss) Societies from
2005 to 2012....................................................................................
215
5.65 Change in Net Profit (-Loss) of the Societies from
2005 to 2012....................................................................................
217
5.66 Percentage of Accumulated Loss to Paid up Share
Capital ....................................................................................
218

5.67 Change in Net worth of the societies from 2005
to2012....................................................................................
219
6.1 No. of average working days per year....................................................................................
226
6.2 Procurement of Raw material by the weavers....................................................................................
228


List of Figures
Figure No. Title Page No.
1.1 Segment –wise Plan Fund Allocation ............................................................................
8
1.2 The formation of a cluster ............................................................................
35
1.3 Types of Population............................................................................
57
1.4 Schedules of Survey............................................................................
61
3.1 Production process in handloom sector............................................................................
89
3.2 Photographs of Production process in
handloom sector............................................................................
90
3.3 Institutional mechanism for the handloom
industry in Kerala............................................................................
100
3.4 A quick glance of the working environment in
Handloom Industry............................................................................
103-104

5.1 Change in the av. No. of Registered Members
from 2005 to 2012............................................................................
147
5.2 Change in the av. No. of Working Members
from 2005 to 2012............................................................................
149
5.3 Change in the av. No. of Working Looms from
2005 to 2012............................................................................
152
5.4 Wages & Compensation paid by societies
from2005 to2012............................................................................
160
5.5 Average no. of products of the societies from
2005 to 2012 ............................................................................
167
5.6 Average output per worker from 2005 to 2012............................................................................
169
5.7 Photographs of Training Programmes in
Session............................................................................
191
5.8 Level of Technological intervention in the
socities (%)

............................................................................
192
5.9 Average Share Capital of Societies from 2005
to 2012............................................................................
195
5.10 Average Grant & Subsidy received by Societies
(2005-2012)............................................................................
198
5.11 Average Turnover of the societies (2005-2012)............................................................................
213
5.12 Average Net Profit/Loss (2005-2012)............................................................................
216
5.13 Average Accumulated Loss(2005-2012)............................................................................
218
6.1 Wages & Compensation paid by societies
(2005-2012)............................................................................
227
6.2 Level of Technological Intervention in Handloom
societies ............................................................................
229
6.3 Average no. of products (2005-2012)............................................................................
230

6.4 Average Accumulated Loss(2005-2012)............................................................................
232

List of Maps
Map. No. Title Page No.
4.1 Handloom Clusters in Thiruvananthapuram District under IHDS-
CDP 121
4.2 Handloom Clusters in Kannur District under IHDS-CDP.........126
4.3 Handloom Clusters in Kerala under IHDS-CDP......................139


ABBREVIATIONS
CAGR Compound Annual Growth Rate
CDA Cluster Development Agent
CDCG Cluster Development Co-operative Group
CDE Cluster Development Executives
CDF Cluster Development Foundation
CDP Cluster Development Programme
CFC Common Facility Centre
CMS Cluster Member Societies
CMW Cluster Member Worker
DC MSME Development Commissioner, Micro, Small and Medium
Industries
DIC Directorate of industries and Commerce
DIPP Department of Industrial Policy and Promotion (Ministry of
Commerce and Industry)
DoH Directorate of Handloom
DRDA District Rural Development Agency
EDII Entrepreneurship Development Institute of India
GATT General Agreement on Trade & Tariff
GoI Government of India
GoK Government of Kerala
GSDP Gross State Domestic Products
IHCDP Integrated Handloom Cluster Development Programme
IHDS-CDP Integrated Handloom Development Scheme-Cluster
Development Programme
IIHT Indian Institute of Handloom Technology
KINFRA Kerala Industrial Infrastructure Development Corporation
KSIDC Kerala State Industrial Development Corporation
KVIC Khadi and Village Industries Commission
MSME Micro, Small and Medium Enterprise
NABARD National Agriculture Bank for Rural Development
NCAER National Council for Applied Economic Research
N-CMS Non-Cluster Member Societies
N-CMW Non-Cluster Member Worker
NGO Non-Governmental Organisation
NHDC National Handloom Development Corporation
NLDP National Leather Development Programme
NMCC National Manufacturing Competitiveness Council
OGL Open General Licence
PWCS Primary Weavers Co-operative Societies
R & D Research & Development
RBI Reserve Bank of India
RRBs Regional Rural Banks
Rs. Indian Rupees
SBI State Bank of India
SHGs Self Help Groups
SIDBI Small Industries Development Bank of India
SLPC State Level Project Committee
SMEs Small & Medium Entreprises
UNIDO United Nations Industrial Development Organization
WSC Weavers Services Centre
WTO World Trade Organisation
The need for special support to the small-scale industry has been a topic
of contention among economists. Some see great economic value in it and want
the government to support it, while others oppose such a help. However, both
the schools agree that the sector helps reduce regional economic imbalances.
Studies by economic historians such as Paul Bairoch and Angus
Maddisson had found that India was an economic superpower till the middle of
the 19th century with share of world GDP of over 28 per cent, thanks mainly to
its village industries and trade. They also held colonialism responsible for
India’s slide to poverty. Karl Marx shared the view, pointing out that India’s
village system of agriculture and manufacturing gave its people an independent
organisation and social life in those days. (Gurumoorthy 2013).
The village and traditional industries were given an iconic stature during the
nation’s freedom struggle, with Mahatma Gandhi insisting on its varied benefits,
not just economic. However, India, beset with large scale unemployment and
underemployment in the early post-Independent period, looked up to large
industries to solve its problems. That too, without much success.
Having understood that the sector can play an important role in the
nation’s economic development, and that it can survive and succeed only with
its support, the government of India in the 1990’s introduced cluster-based
development approach for their revival. Kerala is one of the states that pursues
cluster based approach for the revival of its micro and medium scale enterprises
and traditional industries.
1.1 Kerala Economy: The Role of Manufacturing and Industrial Sectors

Introduction
Kerala has been following a unique pattern of economic development for
over two centuries. Though it promoted large industries, the prime focus was on
investing in social infrastructure. The State advanced remarkably well in the
social sector and this advancement continued uninterruptedly despite the
changes in the political power patterns. Moreover, Kerala possesses an active
civil society, which constantly pressed for the delivery of social goods. The
anti-caste movement, missionary activities and left movement in Kerala have
aided in raising human development and social security for the poor.
(Neera, 2012). Thus organized and empowered, the people resisted the gross
indignities of inequality that marred social life and abolished pre-capitalist
relations in land. The result was a society that best approximated the
constitution’s vision of liberal democracy among all Indian States (Arun 2013)
This growth pattern, particularly in the field of land reforms, health and
universal education, attracted widespread international attention. Unlike most
other Indian States, Kerala’s achievements have cut across caste and gender
barriers, and have been carried to regions across the State (Ramachandran,
1996). However, for all these developments, per capita domestic product and
per capita manufacturing value added in Kerala are substantially lower than the
corresponding national figures. The manufacturing and industrial sector in the
State have not been significantly contributing to the GDP. This is evident from
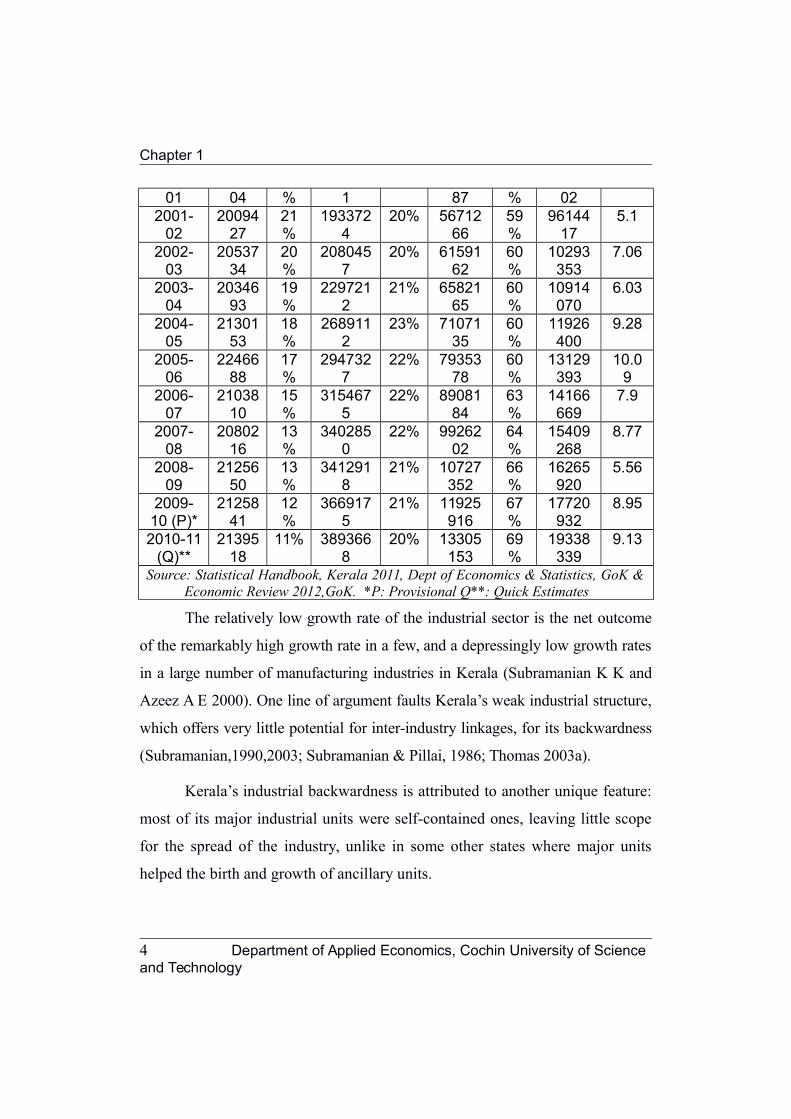
the fact that for the last two decades, the contribution of the secondary sector
varied from 17 to 25 per cent of the Gross State Domestic Product (GSDP)
while that of the tertiary sector often crossed 50 per cent (see Table No.1.1).
Industrialisation in Kerala, in other words, is certainly far from commensurate
with the socioeconomic achievements for which the State is famous for (Ibid).
It is by now clear that states with high social development indicators might or
might not be states with highest incomes. (Neera,2012). This finding has been
substantiated by the Human Development Report 2010 “one of the most
Department of Applied Economics, Cochin University of Science and Technology 2

Introduction
surprising results of Human development research in recent years…..is the lack
of a significant correlation between economic growth and improvement in
health and education (UNDP HDR 2010). The sector-wise contribution to
GSDP is shown in Table No.1.1
Table No.1.1 Sector-wise contribution to the GSDP since 1987
(Rs.lacs)
YEAR
Primary
sector
%Share
Secondary
sector
%Shar
e
Tertiary
Sector
%Share
GSDPGrow
thrate
1987-88
1253701
28%
793548 17% 2505361
55%
4552610
1.5
1988-89
1449727
29%
862296 17% 2656012
53%
4968035
9.12
1989-90
1424489
28%
978418 19% 2776407
54%
5179314
4.25
1990-91
1549560
27%
1025100
18% 3078449
54%
5653109
9.15
1991-92
1677932
30%
1051016
18% 2958850
52%
5687798
0.61
1992-93
1684567
28%
1145944
19% 3169806
53%
6000317
5.49
1993-94
1759989
27%
1392787
21% 3361616
52%
6514392
8.57
1994-95
1923444
27%
1521185
22% 3576109
51%
7020738
7.72
1995-96
1906029
26%
1595731
22% 3788267
52%
7290027
3.84
1996-97
1951771
26%
1599411
21% 3986338
53%
7537520
3.39
1997-98
1855913
24%
1668479
21% 4272001
55%
7796393
3.43
1998-99
1909009
23%
1820710
22% 4572783
55%
8302502
6.49
1999-00
1961312
22%
1797743
20% 5063008
57%
8822063
6.26
2000- 19765 22 186341 20% 53082 58 91482 3.7
Department of Applied Economics, Cochin University of Science and Technology 3
Chapter 1
01 04 % 1 87 % 022001-
0220094
2721%
1933724
20% 5671266
59%
9614417
5.1
2002-03
2053734
20%
2080457
20% 6159162
60%
10293353
7.06
2003-04
2034693
19%
2297212
21% 6582165
60%
10914070
6.03
2004-05
2130153
18%
2689112
23% 7107135
60%
11926400
9.28
2005-06
2246688
17%
2947327
22% 7935378
60%
13129393
10.09
2006-07
2103810
15%
3154675
22% 8908184
63%
14166669
7.9
2007-08
2080216
13%
3402850
22% 9926202
64%
15409268
8.77
2008-09
2125650
13%
3412918
21% 10727352
66%
16265920
5.56
2009-10 (P)*
2125841
12%
3669175
21% 11925916
67%
17720932
8.95
2010-11(Q)**
2139518
11% 3893668
20% 13305153
69%
19338339
9.13
Source: Statistical Handbook, Kerala 2011, Dept of Economics & Statistics, GoK &Economic Review 2012,GoK. *P: Provisional Q**: Quick Estimates
The relatively low growth rate of the industrial sector is the net outcome
of the remarkably high growth rate in a few, and a depressingly low growth rates
in a large number of manufacturing industries in Kerala (Subramanian K K and
Azeez A E 2000). One line of argument faults Kerala’s weak industrial structure,
which offers very little potential for inter-industry linkages, for its backwardness
(Subramanian,1990,2003; Subramanian & Pillai, 1986; Thomas 2003a).
Kerala’s industrial backwardness is attributed to another unique feature:
most of its major industrial units were self-contained ones, leaving little scope
for the spread of the industry, unlike in some other states where major units
helped the birth and growth of ancillary units.
4 Department of Applied Economics, Cochin University of Science and Technology

Introduction
The other reasons for the slow growth of manufacturing sector in the State
are the high cost for skilled labor, the rapidly propelling land prices and the
preference of the local population for white collar jobs. Also being a traditionally
service oriented economy with a high density of population, the State has not been
able to find a balanced growth strategy for manufacturing sector.
The income from manufacturing sector to Gross State Domestic
Products (GSDP) and its growth rate are given in Table No. 1.2
Table No.1.2 Growth of manufacturing sector to GSDP (Kerala) ) Base
Year (2004-05)
At Constant Prices * At Current Prices
Year Rs.LacsGrowth Rate
(%)Rs.Lacs
Growth Rate(%)
2004-5 1022058 -- 1022058 ---2005-6 1043330 2.08 1092095 6.852006-7 1117876 7.12 1229466 12.582007-8 1316450 17.76 1508223 22.672008-9 1344072 2.10 1735690 15.082009-10 1348502 0.33 1756980 1.22
2010-11(P) 1461866 8.41 2020037 14.972011-12(Q) 1555314 6.39 2291924 13.46
*Base Year 2004-05: Source: Economic Review 2012,GoK. P: Provisional Q: Quick Estimates
It is also interesting to note that in 2010-11 the Service Sector has
contributed to 70 per cent to the GSDP where as the combined total of
Secondary and Primary sector was just 31%.
To top it all, Kerala has not been a major recipient of Central investment.
The Central Sector Investment in Kerala was a meager Rs. 28455.29 crore (2.3%)
during 2010-11 against the All India figure of Rs. 1263664.85 crore. State-wise
analysis shows that other southern states have higher investment in Central PSEs.
Andhra Pradesh ranked 2nd, Tamil Nadu 3rd and Karnataka 10th. Kerala ranked
Department of Applied Economics, Cochin University of Science and Technology 5

Chapter 1
16th. (Economic Review 2012). Central Sector Investment in selected states are
given in Table No.1.3
Table No.1.3 Central Sector Investment in Selected States as on
31.03.2011
Name ofState
GrossBlock(Rs.Crores)
% of Total GrossBlock
RankNo
Andhra
Pradesh
91305.35 7.23 2
Tamil Nadu 89254.98 7.06 3Karnataka 46889.25 3.71 10Kerala 28455.29 2.25 16
Source: Economic Review 2012, Planning Board, GoK
Thus, the State developed a model where neither the private sector nor
the public sector were able to establish a strong industrial base and inter-
industry linkages.
1.2 Role of MSME and Traditional Industries
While modern industries followed a wax-and-wane mode of existence,
MSME’s, especially the traditional industries such as coir, handloom, cashew,
khadi & village industries, handicraft, bamboo, beedi and tiles continued to play
their stabilizing role in the industrial sector, providing employment to nearly 10
lakhs persons. Traditional industries produce marketable products, using local
raw materials, human skills (local craftsmanship), and indigenous technology.
The Kerala economy has been endowed with eco-friendly products of the
traditional industrial sector, which include handloom products, coir fiber,
cashews, tiles and bricks, handicrafts, spices, and marine products. This sector
of the economy generates employment opportunities in rural areas and also
earns foreign exchange through exports. This is shown in Table No.1.4
6 Department of Applied Economics, Cochin University of Science and Technology

Introduction
Table No. 1.4 District-wise details of working SSI/MSME units registeredin Kerala 2010 -11
DistrictNumber of
SSI/MSME unitsEmploymentprovided (No)
Thiruvananthapuram 26821 124035Kollam 13135 92717Pathanamthitta 7359 41964Alappuzha 14946 80641Kottayam 21510 67537Idukki 4393 24227Ernakulam 24450 154339Thrissur 26189 99604Palakkad 13044 57698Malappuram 9915 42219Kozhikode 15487 69926Wayanad 2467 13181Kannur 9795 44214Kasargod 5397 29679Total 194908 941981Source: Statistical Handbook, Kerala 2011, Dept of Economics & Statistics, GoK
Realising the importance of the traditional sectors, in terms of
employment generation, upholding the entrepreneurial spirit, innovation and
fostering competitiveness in the economy, Government of Kerala accorded
increasing attention and special support for nurturing the sector. This is evident
from the State plan fund allocations to the village and small scale sector to
which traditional sectors belongs.
The Table 1.5 shows the allocation of funds to different segments under
Industries in various Five year Plans.
Table No.1.5 Segment –wise Plan Fund Allocation
(Rs.Lacs)
Segment Village &Small
Mediumand Large
Mining
Department of Applied Economics, Cochin University of Science and Technology 7

Chapter 1
industries Scale
PlanOutlay %
Outlay %
Outlay % Total
First Plan (1951-56) 112 100 0 0 0 0 112Second Plan (1956 –
61) 582 85 102 15 0 0 684Third Plan (1961-66) 1265 74 454 26 0 0 1719Annual Plan(1966-67 to
1968-69) 512 50 485 48 17
1.
7 1014
Fourth Plan (1969 –74) 1022 46 1181 53 5
0.
2 2208
Fifth Plan ( 1974 -78) 1604 26 4471 73 79
1.
3 6154Annual Plan (1978-79 &
1979-80) 891 21 3285 78 51
1.
2 4227
Sixth Plan (1980-85) 4450 27
1184
1 72 168
1.
0 16459
Seventh Plan (1985-90) 7041 33
1413
5 66
279.
5
1.
3 21455Annual Plan (1990-91 &
1991-92) 6555 41 9300 58 125
0.
8 15980
Eighth Plan (1992-97)
3224
6 39
4965
5 60 1305
1.
6 83206
Ninth Plan (1997-02)
3501
3 32
7311
0 67 747
0.
7 108870
Tenth Plan (2002-07)
4156
5 42
5788
3 58 246
0.
2 99695Eleventh Plan (2007-
2012)
6261
4 55
5069
6 45 500 0 113810Source: Compiled using “Plan Outlay and Expenditure Kerala (1951-2007” and Draft
Proposal for 11th Five Year Plan-), Kerala State Planning Board and-GoK
The Plan outlay to the Village & Small industries which was higher
than Medium and Large scale industries during the initial 3 plan periods, started
coming down to its lowest of 26 per cent and 27 per cent respectively during
8 Department of Applied Economics, Cochin University of Science and Technology

Introduction
the 5th and 6th Five year Plan. However, it went up since then and became
higher than the allocation for Medium and Large scale industries during the 11 th
Plan. The support is intended to contributes greatly towards domestic & export
marketing and foreign exchange earnings by producing variety of products
ranging from traditional to modern. The segment – wise details of the fund
allocated by the Govt of Kerala is shown in Figure 1.
Figure No.1 Segment –wise Plan Fund Allocation (in Rs.lacs)
01000020000300004000050000600007000080000
Village and Small IndustriesMedium & Large Scale Industries
The lower rate of Plan outlay for Medium and large scale industries till
4th plan indicate the prominence of Village & Small Industries for the economic
development of the state during these periods. In other words, Medium and
large scale industries came into attention of policy makers as a segment to be
reckoned with only since 4th Plan. This increased attention given to the
Department of Applied Economics, Cochin University of Science and Technology 9

Chapter 1
Medium and large scale industries continued till 9th plan. Thereafter, Village &
Small Industries came into prominence, and in the 11th Plan, the outlay
overtook the outlay for the medium and large scale industries.
1.3 Challenges of Traditional Industries:
Policies specific to protection and reservation of small scale enterprises
in India has its historical roots way back in the pre-Independence period.
Planners conceived a vision of industrialized India with growing capitalist
enterprises either by transforming the existing merchant capital or by
transforming the pre-capitalist producers. The Governments, even after
independence remained the prime movers of the economy. Government
invested heavily in large industries and created infrastructure. It protected the
job-creating Micro, Small and Medium Enterprises (MSME) sector from
competition from large industries—Indian and foreign—using tools such as
licensing and import restrictions.
The liberalisation process initiated in the early 1990’s changed all that.
The Government chose to move behind the scene as a facilitator of economic
growth and handed over the prime mover’s role to the private sector.
The new regime changed the game for Indian industry forever, and it
impacted MSME sector the most. The removal of import and licensing
restrictions, adopted as part of the liberalisation regime, resulted in the sector
facing increasing competition from multinational companies and business
conglomerates that had advantages of economies of scale, access to better
technology and cheap finance. The new policies affected traditional industries,
which thrived in a protected environment. The rise in input cost resulting from
the removal of government schemes made them non-competitive in the new
open market.
10 Department of Applied Economics, Cochin University of Science and Technology

Introduction
While the industrialisation process had its impact on Kerala which
resulted in the setting up of a few big units, the traditional industries such as
handloom and coir had their slow but measured growth. They procured the raw
material locally, used old technology, equipment and the easily available
manpower to produce limited quantities and sold them in the local market – a
very few lucky ones in the export market as well. They mostly serviced the
local population and hence never saw a great leap in business. While militant
trade unionism placed unreasonable demand on the management and led to the
closure or near death of several units, it had a different avatar in the traditional
sector. The unions desisted from raising monetary demands but resisted all
attempts at modernization and use of newer and efficient technologies on the
plea that they would result in loss of jobs. The managements who wanted to
reform their units, however, failed to convince the trade unions on the urgency
of modernization. In course of time, technologies and equipment became
outdated and unviable but the managements could not go in for modernization.
They had to let units die a slow death, instead. We have little history to show
that the managements were alive to the avenues which newly opened up before
them or at attempts on developing new marketing strategies. The products
continued to be limited in number with little improvement or diversification.
They continued to sell in the local market and there was little effort to explore
new markets.
1.4 Cluster Approach
The government, recognizing the contribution of the MSME and
traditional sectors in creating employment and sustaining the rural economy,
stepped in to save them. Finding that their survival depended on reducing the
cost of production, increasing investment on plant modernization, adopting
Department of Applied Economics, Cochin University of Science and Technology 11

Chapter 1
product diversification and technological innovation, the Government of India
in the nineties introduced cluster-based development model for them. It
essentially sought to strengthen the competitiveness of the sectors through
leveraging the economies of scale.
With the threat of the assaults of globalization nearly eliminating the
change-resisting traditional sectors, the State government has chosen to intervene
by introducing a cluster-based approach (State Industrial Policy 2003).
1.4.1 Cluster: Definition and its Meaning.
Michael Porter, a leading authority on company strategy and the
competitiveness of nations and regions introduced the term ‘industry cluster’ in
The Competitive Advantage of Nations (1990). Paul Krugman in Geography
and Trade (1991) brought to attention the importance of economic geography,
or more correctly geographicalal economics. Cluster development has since
become a focus of many government programmes.
In the words of Michael Porter (1998) “Clusters are a geographically
proximate group of interconnected companies and associated institutions in a
particular field linked by commonalities and complementarities. Clusters
encompass an array of linked industries and other entities important to
competition …including governmental and other institutions – such as
universities, standard setting agencies, think tanks, vocational training providers
and trade associations”
…geographically bounded concentration of similar, related or
complementary businesses, with active channels for business transactions,
communications and dialogue, that share specialized infrastructure, labour markets
12 Department of Applied Economics, Cochin University of Science and Technology

Introduction
and services, and that are faced with common opportunities and threats.”
(Rosenfeld (1997)
Regional clustering has been used to describe industrial districts of small
craft firms, high technology centers, agglomerations of financial and business
service firms in cities, company towns, and large branch plants and their supply
chains.” Enright (1998)
UNIDO (United Nations Industrial Development Organisation), (1995)
defines a cluster as a “sectoral and geographical concentration of enterprises,
especially small and medium, which share a future, both in terms of
opportunities and threats”. It says MSMEs operating in such clusters derive a
clear competitive advantage from:
the proximity to sources of raw material inputs,
the availability of suitably customised business development services,
the abundance of clients attracted by the cluster tradition in that
industry, and
the presence of a skilled labour force.
Thus a cluster, in other words, is a geographical concentration of
interconnected businesses, suppliers, and associated institutions in a particular
field. Clusters are considered to increase the productivity by which companies
can compete, nationally and globally.
While defining a cluster, it is to be seen that too wide a product range
will make product group meaningless because the common opportunities and
threats cannot be said to exist for wide range; and also too large a geographical
area will not allow the firms in the cluster to take benefit of development
through proactive joint action. Also, defining product too narrowly will make
Department of Applied Economics, Cochin University of Science and Technology 13

Chapter 1
the cluster mapping process meaningless. It is pertinent to mention that
conglomeration of firms does not necessarily imply a ‘cluster’.
Table No.1.6 gives a glimpse of what is not a cluster and why:
Table No.1.6 Clusters v/s Non Clusters
Cluster “NOT” a Cluster A ‘sector’ that is present in ageographicalal location
A ‘sector’ that is present in various placesall over a state or a country, as too largea geographicalal area deprives unitsadvantages of proactive joint action
An industrial estate or anindustrial park having singleproducts
An industrial estate or an industrial parkhaving multiple products, as too wide aproduct range means no commonopportunities and threats. Hence, littlescope of joint action
A large net work (big group) ofenterprises producing similarproducts
A small net work (small group) ofenterprises producing similar products astoo small a number does not offersignificant scope for variety of jointactions.
A group of villages, town or cityconsisting of enterprisesproducing a similar products orservices
A group of villages, town or cityconsisting of enterprises producing adiverse range of products or services. These are clusters in a different senseand are not enterprises based clusters
Source: Compiled using various sources
1.4.2 Types of Clusters
The cluster is known by the name of the product being produced by principal
firms and the place they are located in. However, Clusters are broadly divided into
three based on development, knowledge and spatial characteristics (UNIDO,2000.).
1.4.2.1 By Development
Following development of the concept of interorganizational networks
in Italy, Germany and practical development of clusters in the United Kingdom
14 Department of Applied Economics, Cochin University of Science and Technology

Introduction
and several other countries, many perceive there to be four methods by which a
cluster can be identified:
Geographical cluster –Thirupur (Tamil Nadu ,India) as a textile cluster,
Ludhiana (Punjab, India ) leather cluster.
Sectoral clusters-a cluster of businesses operating together from within
the same commercial sector e.g. marine, rubber, handloom
Horizontal cluster-interconnections between businesses at a sharing of
resources level e.g. knowledge management
Vertical cluster i.e. a supply chain cluster
1.4.2.2 By Knowledge
Based on different kinds of knowledge, several types of business clusters
are recognized:
High-tech clusters - These clusters are high technology-oriented, well
adapted to the knowledge economy, and typically have as a core
renowned universities and research centers like Silicon Valley.
Historic know-how-based clusters - These are based on more traditional
activities that maintain their advantage in know-how over the years,
(and for some of them, over the centuries). They are often industry
specific. For example: London as financial center.
Factor endowment clusters - They are created because a comparative
advantage they might have linked to a geographical position. For
example, wine production clusters because of sunny regions surrounded
by mountains, where good grapes can grow. (Certain areas in France,
Spain, Chile or California).
Department of Applied Economics, Cochin University of Science and Technology 15

Chapter 1
Low-cost manufacturing clusters - These clusters have typically
emerged in developing countries within particular industries, such as
automotive production, electronics, or textiles. Examples include
electronics clusters in Mexico (e.g. Guadalajara) and Argentina
(e.g. Cordoba). Cluster firms typically serve clients in developed
countries. Drivers of cluster emergence include availability of low-cost
labor, geographical proximity to clients (e.g. in the case of Mexico for
U.S. clients; Eastern Europe for Western European clients).
Knowledge services clusters - Like low-cost manufacturing clusters,
these clusters have emerged typically in developing countries. They
have been characterized by the availability of lower-cost skills and
expertise serving a growing global demand for increasingly
commoditized (i.e. standardized, less firm-specific) knowledge services,
e.g. software development, engineering support, analytical
services. Examples include Bangalore, India; Recife, Brazil; Shanghai,
China. Multinational corporations have played an important role in
'customizing' business conditions in these clusters. One example of this
is the establishment of collaborative linkages with local universities to
secure the supply of qualified, yet low-cost engineers.
1.4.2.3. By Spatial Characteristics, Inter-Firm Linkages or Both.
Marshallian: Clusters comprising primarily of locally owned, small and
medium-sized firms concentrated in craft-based, high-technology, or
producer services industries. Substantial trade is transacted between
firms. Specialized services, labour markets and institutions develop to
serve firms in the cluster.
16 Department of Applied Economics, Cochin University of Science and Technology

Introduction
Hub and spoke: These are clusters dominated by one or several large
firms surrounded by smaller suppliers and related activities. Co-
operation exists between small and large firms but noticeably absent is
much co-operation among competitor firms to spread risks, stabilize
markets and share innovations.
Satellite platforms: Industry clusters dominated by branch facilities of
externally-based multi-plant firms. These branch plants are large and
relatively independent. Minimal trade or networking takes place among
the clusters' branch plants and the incidence of spin-off activities is
relatively small.
1.4.3 Cluster: Historical, Conceptual and Theoretical Perspective
Appearing in economic literature, clusters or agglomerations of related
industrial activities were first explained in the late 19th century with reference to
so-called Marshallian externalities (Marshall, 1890). Industrial districts are
‘large number of small businesses of a similar kind in the same locality’
(Marshall, 1920). He stated that proximity’s most notable advantages are a pool
of qualified workers, the local availability of inputs and knowledge spillovers.
The major advantages of industrial clusters arise from simple propinquity
(nearness in space or time) of firms, which allows easier recruitment of skilled
labour and rapid exchanges of commercial and technical information through
informal channels.
Marshall’s ideas were revisited in the 1970s when Italian scholars
(Bagnasco, 1977) explored the economic, social and cultural dynamics of
industrial districts to capture the success of agglomerations of small firms in
these areas of the country. These investigations revealed that in a number of
sectors where small firms predominated, groups of firms clustered together in
Department of Applied Economics, Cochin University of Science and Technology 17
Chapter 1
specific regions seemed to be able to grow rapidly, develop niches in export
markets and offer new employment opportunities. Such clusters were able to
establish a strong position in world markets in a number of so-called traditional
products - shoes, leather handbags, knitwear, furniture, tiles, musical
instruments, food processing - and also in the industries which supply
machinery to these sectors. In a traditional industry, such as shoes, clusters of
SMEs were able to expand production and exports in the 1970s and 1980s at a
time when large enterprises in Britain and Germany were in decline. Perhaps
most important, such clusters seemed to have the capacity to innovate their
production.
The success of the Italian districts was not only due to falling demand in
period of recession, but also to a shift in the nature of demand that underscored
the need for customization and small lots of products, suggesting new
opportunities for SMEs and a reduction of interest in mass production, a market
dominated by transnational companies (Menkveld and Thurik, 1999; Roper,
1997). This change in demand led Piore and Sabel to identify flexibility and
specialization as alternatives to the Fordist model (Sabel1984; Piore, 1990).
(Fordism, exemplified by the mass-production systems used by car maker
Henry Ford (1863-1947), gave workers high wages in return for intensive work.
Fordism is associated with a distinctive spatial pattern of economic activity or
spatial division of labour.) In the Flexible Specialization model of Piore and
Sabel, clusters are viewed as models of flexible specialization, where efficiency
in production and organisational adaptability can be enhanced by economies of
scale and scope in regional and sectoral settings. In this model, labour is
considered as a flexible factor of production contributing to the overall
performance of production; flexibility refers to the ability of multi-skilled
workers to shift across jobs as and when production requires. Successful
18 Department of Applied Economics, Cochin University of Science and Technology

Introduction
clusters were associated with trust relationships between employers and
workers, the latter sorted new problems and issues, and constantly learnt new
skills. In this framework, labour is ‘a resource to be developed and invested in,
not a cost to be minimized’ (Holmström, 1993).
Almost at the same time in the early 1990’s Porter through his studies
introduced the notion that proximity increases competitiveness of firms in the
cluster. He stated the primary role of the region or the city as a source of
competitive advantage and unique environment for competing in the industry.
Proximity facilitates the diffusion of information about new organizational and
production processes and product innovations, and lowers transactional costs,
and enduring competitive advantage in a global market increasingly lies in local
features, that distant competitors cannot match (Porter, 1990; 1998). For Porter,
clusters are geographical and sectoral concentrations of interconnected firms
and institutions, including suppliers of specialized inputs and infrastructure, and
also encompass governmental agencies and other institutions, such as
universities, trade associations and vocational training providers. Michael
Porter claims that clusters have the potential to affect competition in three
ways: by increasing the productivity of the companies in the cluster, by driving
innovation in the field, and by stimulating new businesses in the field. Clusters
are an alternative organisation of the value chain, promoting both competition
and cooperation; without competition, a cluster will fail. Much of the
cooperation is vertical, involving companies in related industries and local
institutions, and coexistence of competition and cooperation is possible,
because they occur in differing dimensions and among different players (Porter,
1998).
Department of Applied Economics, Cochin University of Science and Technology 19

Chapter 1
The introduction of the concept of ‘collective efficiency’ by Schmitz in
the year 1999 was a major shift in the theory of cluster. Schmitz’s definition of
‘collective efficiency’ as ‘the competitive advantage derived from local external
economies and joint action’, acting as a catalyst for growth, became then
popular. According to him, ‘clustering opens up efficiency gains that individual
enterprises can rarely attain’ (Schmitz, 1999), and it enables investments that
isolated firms cannot consider. With the ‘collective efficiency’ theory, the high
road to growth was made accessible with fostering of horizontal and vertical
co-operation between local firms and institutional bodies, focusing on the intra-
cluster productive and cooperative networks.
All the above theories underpinned the need for co-operation and jont
action for better productivity to save on scarce capital.
1.4.4 UNIDO Model of Cluster Development
UNIDO has adopted this cluster-based approach as one of its strategies
for contributing to the development of small and medium enterprises in
developing countries and as a means of promoting sustainable and equitable
growth. Over the last fifteen years, it has worked intensively in the field of
SME cluster/network development in over a dozen countries in Africa, Latin
America and Asia.(UNIDO, 2003). Clusters are regarded as tools to promote
poverty reduction and the development of competitive industries. Building on
the experience gathered in the field, UNIDO designed a methodology for the
formulation and implementation of cluster development projects. The UNIDO
methodology is based on the following steps:
Cluster selection, which entails the identification of the cluster(s) to be
assisted;
20 Department of Applied Economics, Cochin University of Science and Technology

Introduction
Diagnostic study, an action-oriented analysis of strengths, weaknesses,
opportunities and threats of the cluster(s);
Vision building and action planning, which refers to the formulation of a
vision and a corresponding development strategy shared by the entire
cluster;
Implementation, i.e. the management and co-ordination of the activities
outlined in the action plan, including the establishment of horizontal and
vertical networks.
Monitoring & Evaluation (M&E) of the qualitative and quantitative
outcomes of the project.
UNIDO has formulated a number of tools that can be implemented as
components of a cluster development project or stand-alone measures.
They include:
Cluster mapping, the formulation of a taxonomy of existing clusters in a
region or country.
Awareness raising initiatives, i.e. events to sensitize promoters of cluster
development.
Training for policy makers, project managers and policy advisors
involved in cluster development. Training programmes are delivered in
the beneficiary countries as well as at the regional and global level and
last from a few days to several months.
Department of Applied Economics, Cochin University of Science and Technology 21
Chapter 1
Study tours to grant beneficiary firms and institutions exposure to the
organizational forms, policies, institutional arrangements and
technologies adopted by one or more dynamic clusters.
Cluster twinning initiatives, including business-to-business networks,
inter-institutional partnerships and alliances between cluster
associations.
Development of horizontal and vertical networks and export consortia.
Monitoring and evaluation of networks and cluster development
programmes. This can have different levels of intensity ranging from the
appointment of a full time cluster development advisor, to regular
monitoring missions by UNIDO experts.
Training and support for the implementation of Corporate Social
Responsibility (CSR) practices
1.4.5 UNIDO Tools for Evaluating the Efficacy of Clusters
The success of a cluster depends to a large extent on the active
involvement and interaction among the cluster agents so that collective result
can be obtained. In other words, individual action should lead to collective
action and result in collective good. The structural components and the factors
behind formation, performance and success of industrial cluster are as follows:
1. Expert and professional workforce and pleasant work environment for
the personnel
2. Proper technology that has the ability of competition
3. Co-operative spirit among small and medium size agencies which
have the primary potentials for being put into clusters
22 Department of Applied Economics, Cochin University of Science and Technology

Introduction
4. The existence of a inter-agency networks, relation between agencies
and customers, suppliers of raw materials and machineries for rapid
and proper flow of the information that is required in the cluster
5. Possibility of having enough access to technology and innovation
between agencies
6. Possibility of supplying raw material and repairing and maintaining
the equipment, using the experience of other agencies
7. Existence of research and consulting entities
8. The existence of a co-ordinating entity for regulating the relations
between agencies
9. Access to the market, marketing, commerce, distribution and selling
10. Possibility of funding and providing investment aid
11. Proper policies of local government and supportive entities
12. Existence of proper physical structures (energy, roads, etc networks)
13. The independence of agencies from large industries and having a type
of relation that the performance of small agencies is not influenced by
the policies and plans of bigger agencies.
The performance and the efficacy of cluster can be understood through
changes in the following structural components and the factors:
1. Human force
2. Network of supplying the raw materials
3. Technology
4. Network for accessing the market
Department of Applied Economics, Cochin University of Science and Technology 23

Chapter 1
5. Financial supply and investment aid
6. Co-ordinating entity
Most of the developing countries including India have adopted UNIDO
model of cluster development.
1.4.6 Cluster Movement in India
Policies specific to protection and reservation of small scale enterprises
in India has its historical roots way back in the pre-Independence period.
Planners conceived a vision of industrialized India with growing capitalist
enterprises either by transforming the existing merchant capital or by
transforming the pre-capitalist producers. Despite the fact that there were
varying perspectives on account of the path of this transformation to modernism
especially between Nehruvian and Gandhian way, small enterprises gained
importance in policy resolutions both in pre- and post-Independence period.
This was also driven by political considerations during the Independence
movement primarily to integrate the peasant mass into the movement and also
in addressing the massive growth of urban unemployment during that period. In
the Second Five year Plan within the Mahalanobis Model, the role of small
enterprises was conceived to be the sector producing consumer goods,
especially wage goods for the economy.
The Industrial Policy Resolution of 1956 specified the fields of activity
for the public and private sectors in industry and listed the broad objectives of
24 Department of Applied Economics, Cochin University of Science and Technology

Introduction
industrial policy, explaining their rationale and suggesting strategies to fulfil the
objectives. One of the objectives of this resolution was related to the small
industry sector. The resolution says:
The Government of India would, in this context, stress the role
of cottage and village and small scale industries in the
development of the national economy. They provide
immediate large scale employment; they offer a method of
ensuring a more equitable distribution of the national income
and they facilitate an effective mobilisation of resources of
capital and skill which might otherwise remain unutilised.
Some of the problems that unplanned urbanisation tends to
create will be avoided by the establishment of small centres of
industrial production all over the country. (Industrial Policy
Resolution 1956)
The policy statements issued by the government of India in 1977 and in
1980 also reflected government's continued concern for this sector. In a labour-
abundant, capital-scarce economy like India, one of the prime objectives of
protecting and promoting small enterprises was for the creation of employment
for the huge labour force, who were otherwise employed in agriculture sector
where the marginal productivity of the labor was zero or minus. (Sandesara,
1988). The choice fell on small units because they operate at less capital-
income ratio compared to large enterprises. However, their higher unit costs
make them market-unfriendly, necessitating governmental support by way of
protection and reservation
Department of Applied Economics, Cochin University of Science and Technology 25

Chapter 1
Reservation of products for exclusive manufacture in the small scale
sector as a policy instrument was started with the introduction of the Industries
(Development & Regulation) Act, 1951 (section 11B). The reservation policy,
initiated in 1967 with 47 items, was extended to 504 items by 1978.
Table No.1.7 shows the number of reserved items over the years.
Table No.1.7 Number of Items included in the SSI Reservation List
over the Years
Year No. o f items reserved1967 471970 551974 1771978 5041980 8331984 8731986 8631989 8361991 807
Source: laghu-udyog.com
Economic liberalization of the nineties resulted in the rapid increase in
FDI inflow into diverse sectors of industry. This had given rise to not only
threats through greater competition, particularly in non-durable consumer goods
industries but also opportunities for outsourcing in durable consumer goods and
capital goods industries, to small enterprises. Moreover, the declining role of
the public sector, which had been a major customer of small enterprises in
India, has resulted in reduced growth or even absolute reduction in public sector
26 Department of Applied Economics, Cochin University of Science and Technology
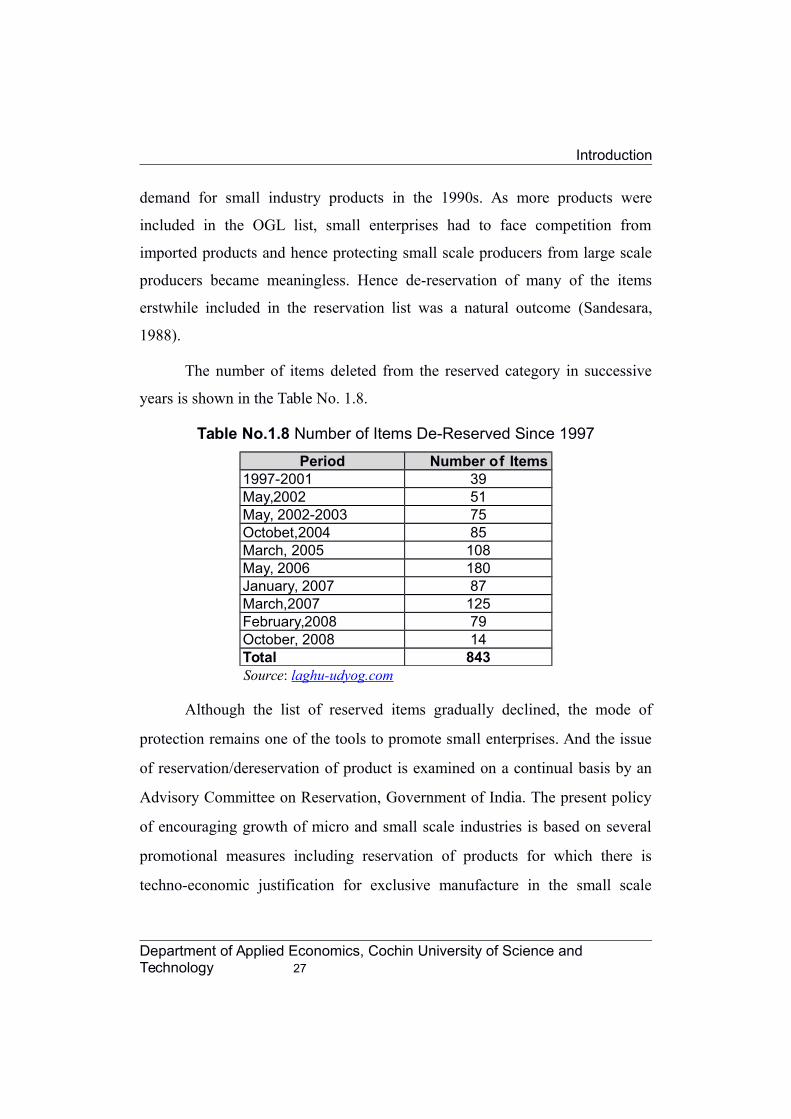
Introduction
demand for small industry products in the 1990s. As more products were
included in the OGL list, small enterprises had to face competition from
imported products and hence protecting small scale producers from large scale
producers became meaningless. Hence de-reservation of many of the items
erstwhile included in the reservation list was a natural outcome (Sandesara,
1988).
The number of items deleted from the reserved category in successive
years is shown in the Table No. 1.8.
Table No.1.8 Number of Items De-Reserved Since 1997
Period Number of Items1997-2001 39May,2002 51May, 2002-2003 75Octobet,2004 85March, 2005 108May, 2006 180January, 2007 87March,2007 125February,2008 79October, 2008 14Total 843Source: laghu-udyog.com
Although the list of reserved items gradually declined, the mode of
protection remains one of the tools to promote small enterprises. And the issue
of reservation/dereservation of product is examined on a continual basis by an
Advisory Committee on Reservation, Government of India. The present policy
of encouraging growth of micro and small scale industries is based on several
promotional measures including reservation of products for which there is
techno-economic justification for exclusive manufacture in the small scale
Department of Applied Economics, Cochin University of Science and Technology 27
Chapter 1
sector. By 2010, there were only 21 items reserved for exclusive manufacture
by micro and small enterprise sector.
In this context what seems to be important for MSME is to enhance
competitiveness which is a cumulative process of capability building. This
does not depend only on the scale of operation and the efficiency does not
necessarily increase with size. The rise in efficiency along with the scale of
operation reaches a critical limit beyond which costs either remains same or
even increases. The SME is very often too small to capture full market
opportunities because of the sub-optimal plant-capacity, quality-standards,
procurement and marketing capabilities. They were unable to achieve
economies of scale. The small size itself did not permit investment in training,
technology, quality, market intelligence etc and they could not achieve job-
specialisation, division of labour, innovation etc. Because of the continuous
struggle for survival, owners and managers are generally focused on routine
matters; they lack long term perspective. To be competitive in the global
context, they need to fight technological obsolescence, poor product-quality,
information deficiencies, market-linkages etc. Engaging with a vast market
basically reduces the size advantages of an individual firm while spatial
agglomeration could help deriving benefits of such huge markets. And
especially as more and more job gets compartmentalized and standardized the
less would be the advantages of vertical integration. This scenario led to the
promotion of small and medium enterprise clusters in India that could on the
one hand emerge as appropriate industrial organization suitable for the current
global structure of manufacture and also could take care of the problem of
creating gainful employment.
28 Department of Applied Economics, Cochin University of Science and Technology

Introduction
Realizing the importance of small enterprises in the development and
growth of the economy, Govt of India constituted an Expert Committee on
Small Enterprises in 1996 headed by Prof Abid Hussain (Report of the Expert
Committee on Small Enterprises, chaired by Prof Abid Hussein, Govt of India,
1996). The Abid Hussain Committee observed that reservations had played only
a limited role in promoting small scale industries while restricting large
industries in these industries as reservation policy did not allow small
enterprises to grow above a certain investment limit. This provides a perverse
incentive to accumulate capital by moving horizontally to build a number of
small units, rather than moving vertically up to become a larger unit. Moreover
manufacture of many reserved items at appropriate quality and efficiency levels
requires an investment which is well above the existing investment limits. The
Expert Committee advocated cluster-support policies as the fulcrum of the
small enterprises development and recommended its promotion rather than
protection. They also advocated involvement of associations, NGOs and
private sector in formulation and execution of promotional schemes, besides
public institutions focused on group of enterprises (cluster) targeted as
beneficiaries. The Ministry of MSME [earlier known as Ministry of Small
Scale Industries and Agro & Rural Industries (SSI & ARI)] came into being
from 1999 to provide focused attention to the development and promotion of
the sector.
Though State Bank of India (SBI), Small Industries Development
Organisation (SIDO), National Bank for Agriculure and Rural Development
(NABARD) etc introduced technology focused cluster development program in
select clusters in 1980’s and 1990’s, it was only with the Recommendations of
Department of Applied Economics, Cochin University of Science and Technology 29

Chapter 1
Abid Hussain Committee on Small Scale Industry in 1996 that cluster approach
was adopted as strategy for support to small and medium enterprises in India, in
a big way.
The ministry of Micro, Small & Medium Enterprises, Government of
India laid special emphasis for development of clusters and launched a scheme
for technology up-gradation and management called UPTECH in 1998.
Although it was having a cluster based approach for development of SMEs, it
was mainly technology–focused comprising of a diagnostic study, setting up of
a demonstration plant and organizing workshops, seminars etc for quicker
diffusion of technology across the cluster of small enterprises. In the same year
UNIDO conducted a number of cluster development programme primarily to
develop clusters so that they could be integrated to the global market in course
of time. The outcome of these studies largely influenced government policies on
cluster development. Subsequently, in several Budget speeches the emphasis
was made on adoption of cluster based approach to increase the productivity
and competitiveness of small and medium enterprises. On 10th August 2005,
the Government of India announced a policy package whereby cluster
development was made the plank for making Indian SMEs globally
competitive. The earlier scheme of Industrial Infrastructure Development (IID)
was subsumed in the new scheme of Small Industry Cluster Development
Programme (DC, Ministry of MSME, 2007).
Subsequently in 2007, GoI introduced the landmark Micro, Small and
Medium Enterprises Development (MSMED) Act, 2006. The act seeks to
facilitate the development of these enterprises as also enhance their
30 Department of Applied Economics, Cochin University of Science and Technology

Introduction
competitiveness. It provides the first-ever legal framework for recognition of
the concept of “enterprise” which comprises both manufacturing and service
entities. It defines medium enterprises for the first time and seeks to integrate
the three tiers of these enterprises, namely, micro, small and medium. The Act
also provides for a statutory consultative mechanism at the national level with
balanced representation of all sections of stakeholders, particularly the three
classes of enterprises with a wide range of advisory functions. Establishment of
specific Funds for the promotion, development and enhancing competitiveness
of these enterprises, notification of schemes/programmes for this purpose,
progressive credit policies and practices, preference in Government
procurement to products and services of the micro and small enterprises, more
effective mechanisms for mitigating the problems of delayed payments to micro
and small enterprises and assurance of a scheme for easing the closure of
business by these enterprises are some of the other features of the Act.
Subsequent to implementation of Micro, Small and Medium Enterprises
Development Act, 2006 with effect from October 2006 filing of Entrepreneurs
Memorandum Part-I and Part-II came into vogue. (DC, Ministry of MSME,
2009).
Table No. 1.9 shows the Classification of MSMEs as per the MSME Act,
2006
Table No.1.9 Classification of MSMEs
Enterprises
Investment in Plant &Machinery (Manufacturing)
Investment inEquipment(Service)
Micro Upto ` 25 lakh Upto ` 10 lakh Small Above ` 25 lakh upto ` 5 crore Above ` 10 lakh upto ` 2
Department of Applied Economics, Cochin University of Science and Technology 31

Chapter 1
crore Medium Above ` 5 crore upto ` 10 crore Above ` 2 crore upto ` 5
crore Ministry of MSME, GoI
As per the provisions of the Act, all MSMEs are required to file
Entrepreneurs Memorandum (Part-I) at District Industries Centres (DICs).
After commencement of the project, the entrepreneur concerned is required to
file Entrepreneurs Memorandum (Part-II) [EM (Part-II)]. Prior to enactment of
the MSMED Act, 2006 there was a system of registration of small scale
industrial units by the DICs. This simplified the procedures in starting a
MSME unit in India.
The Budget speech of 2006-07 pointed out that “The Cluster
Development model can be usefully adopted not only to promote manufacturing
but also to renew industrial towns and build new industrial townships”.
Thereafter an Empowered Group of Ministers (EGoM) under the chairmanship
of the External Affairs Minister was constituted to lay down the comprehensive
policy for cluster development and oversee its implementation by different
ministries of the Government of India. State Governments of Gujarat, Madhya
Pradesh, Andhra Pradesh, Kerala, etc. in their Industrial Policy made the cluster
development approach as a means to support, develop and enhance productivity
of SMEs and make them globally competitive. The Office of Development
Commissioner (Small Scale Industries) issued an office memorandum on
March, 2006 elaborating on the guidelines of the Small Industries Cluster
Development Programme (SICDP). The scheme was devised to assist all the
stakeholders in formulating proposals for financial support from the Ministry of
32 Department of Applied Economics, Cochin University of Science and Technology

Introduction
Small Scale Industries for implementation of cluster development initiatives
under the Small Industries Cluster Development Programme (SICDP). In
October 2007, SICDP' was renamed as 'Micro and Small Enterprises - Cluster
Development Programme (MSE-CDP)'. The 'Integrated Infrastructural
Development (IID)' Scheme was also subsumed in MSE-CDP for providing
developed sites for new enterprises and upgradation of existing industrial
infrastructure. A comprehensive MSE-CDP was introduced by the office of
Development Commissioner (MSME), the Ministry of MSME.
With the promulgation of the MSMED Act, 2006, the restrictive 24%
ceiling prescribed for equity holding by industrial undertakings, whether
domestic or foreign, in the MSEs has been done away with and MSEs are
defined solely on the basis of investment in plant and machinery
(manufacturing enterprises) and equipment (service enterprises). Thus, the
present policy on FDI in MSE permit FDI subject only to the sectoral equity
caps, entry routes and other relevant sectoral regulations.
Limited Liability Partnership (LLP) Act, 2008: The LLP is an alternative
corporate business vehicle that would give the benefits of limited liability but
would allow its members the flexibility of organizing their internal structure as a
partnership based on an agreement. While the LLP will be a separate legal entity,
liable to the full extent of its assets, the liability of the partners would be limited
to their agreed contribution in the LLP. Further, no partner would be liable on
account of the independent or unauthorized actions of other partners, thus
allowing individual partners to be shielded from joint liability created by another
partner's wrongful business decisions or misconduct. The LLP Act is expected to
Department of Applied Economics, Cochin University of Science and Technology 33

Chapter 1
pave way for greater corporatisation of the Small and Medium Enterprises –
thereby enhancing their access to equity and funds from the market.
The policy framework for the small sector to bestow ‘protection’ and
financial, marketing and technological support extended through the Successive
Five Year Plans (FYPs) adopted by Government of India and accompanying
Industrial Policies are given in the table no.1.10.
Table No 1.10 Evolution of Promotional Policy Framework for Small-
Scale Sector
Year
SignificantDevelopment
Objective
1948
Industrial PolicyResolution
Support through Policy and fiscal measures toCottage and small scale industries for betterutilization of local resources and achievement of‘local sufficiency’
1951
First Five Year Plan Advocated elaborate & determined state policyintervention covering Finance, Raw materials,Technical and Marketing guidance Mooted‘protection’ of spheres of production for the sector
1955
InternationalPlanning team (Ford Foundation),
Setting up of institutional framework for Technical,marketing, credit assistance; provided basis forSmall Industries. Development Board (nowDCMSME), National Small scale IndustriesCorporation (NSIC) to come up
1956
Second Five YearPlan
Laid foundation for establishment of promotionaland support institutions: NSIC, SISIs, StateFinancial Corporations Provided for developmentof Industrial Estate
1956
Karve Committee Report (1956) (Under Planning Commission)
Stepping stone for future small sector policies Recommended state intervention in ensuringaccess to raw materials; institutional finance;technology; markets; skills; power; commonfacilities; industrial estates; raw material andproducer cooperatives differential taxation;cooperative marketing
1977
Industrial Policy Statement
Declared ‘ whatever can be produced by small andcottage industries must only be so produced’;Took protection to new heights; reserved items inSSIs expanded from 180 to 807. Mooted the
34 Department of Applied Economics, Cochin University of Science and Technology

Introduction
concept of District Industry Centers (DICs) Tinysector defined within the small scale sector
1980
Industrial Policy Statement
Focused ancillarisation and creation of nucleusplants Modernization and technological up-gradation
1992
Eighth Five YearPlan
Advocated reform agenda: lifting of QRs, removalof licensing, quotas; Stressed technologicalupgradation and marketing support, Mooted‘Growth Center Approach’ (which later crystallizedinto the cluster development approach in India)
1991
Industrial Policy Measures
Paradigm shift in policies: ‘protection to promotion’Industrial licensing done away with and Backedremoval of Quantitative Restrictions on importsand process of de-reservation of SSIs
1997
Expert Group onSmall Enterprises (Abid HussainCommittee) Report
Comprehensively reviewed past policies andadvocated change of course; Suggested‘Protection to promotion’; de-reservation but withtechnological and marketing support Changed focus of support from unit level to groupsof industries; brought industrial clusters in focus
1999
Setting up of TheMinistry of MSME in
Focused attention to the development andpromotion of the sector
2006
Micro, Small andMedium EnterprisesDevelopment Act,2006
Aims at faster development of these enterprisesas also enhance their competitiveness. It providedthe first-ever legal framework for recognition of theconcept of “enterprise” which comprises bothmanufacturing and service entities
2008
Limited LiabilityPartnership (LLP)Act, 2008
The LLP Act should pave the way for greatercorporatisation of the Small and MediumEnterprises – thereby enhancing their access toequity and funds from the market
Source: Compiled using data from the Five Year Plan documents, Planning Commission;Industrial Policies, Ministry of Commerce and Industry, GoI
1.4.7 Operationalisation of Cluster-
India started implementing the cluster model in an extensive manner
through the Ministry of Small Scale Industries since January 1997 with funds
from Italian Government and Swiss Agency for Development and Cooperation
(SDC). The major objectives of the cluster model were to:
Strengthen the competitiveness of selected SME clusters by enhancing
collective efficiency and cooperation (networking),
Department of Applied Economics, Cochin University of Science and Technology 35

Chapter 1
Develop and disseminate a methodology for cluster development suited
to Indian conditions,
Promote a cluster development movement in India and
Enhance the contribution of cluster development to the development
objective of poverty-alleviation. (Development Commissioner, Ministry
of Textiles, GoI)
1.4.8 Institutional Mechanism for the Implementation of Clusters
As mentioned earlier, India started implementing cluster through the
scheme viz MSE-CDP.
1.4.8.1Objectives
The broad objectives of the MSE-CDP scheme are given below:
1.To support the sustainability and growth of MSEs by addressing common
issues such as improvement of technology, skills and quality, market
access, access to capital, etc.
2.To build capacity of MSEs for common supportive action through
formation of self help groups, consortia, upgradation of associations, etc.
3.To create/upgrade infrastructural facilities in the New/existing industrial
areas/ clusters of MSEs.
4.To set up common facility centres (for testing, training centre, raw
material depot, effluent treatment, complementing production processes, etc).
1.4.8.2 Strategy and Approach:
The MSE-CDP scheme is aimed at addressing the needs of the
industries, through well defined clusters and geographicalal areas. This is aimed
at enabling the industries achieving the economies of scale in terms of
deployment of resources as well as focusing on the specific needs of similar
industries. The capacity building of associations, setting up of special purpose
vehicles (SPVs), consortia, etc. which are integral part of the scheme would
enable the MSEs to leverage their resources and also to have better access to
36 Department of Applied Economics, Cochin University of Science and Technology

Introduction
public resources, linkages to credit and enhance their marketing
competitiveness.
1.4.8.3 Formation of a Cluster
The ten main steps are involved in the implementation of a typical
cluster .They are given schematically in Figure No.1.2
Figure No. 1.2 Formation of a cluster
There are several core areas of intervention envisaged under the scheme.
They are given in the Table No 1.11
Table No.1.11 Core areas of intervention under Cluster
Components Key Activity Result1 Diagnostic
Study
Map all the business processes
of the cluster units and find out
their Strengths, Weaknesses,
A well-drawn action
plan
Department of Applied Economics, Cochin University of Science and Technology 37

Chapter 1
Threats and Opportunities
(SWOT),2 Soft
InterventionsCreation of general awareness,
counselling, motivation and
trust building, exposure visits,
participation in seminars,
workshops and training
programmes
General attitudinal
changes necessary
to initiate
improvement in the
existing style of
working of the MSEs
in the cluster.3 Detailed
Project
Report (DPR)
Preparation of a technically
feasible and financially viable
project report
Conceptual clarity on
the activities to be
done and sourcing
funds based on the
activities planned4 Hard
Interventions
Creation of tangible "assets"
such as Common Facility
Centers, Design Centres,
Testing Facilities, Training
Centre, R&D Centres, Effluent
Treatment Plant, Marketing
Display/Selling Centre,
Common Logistics Centre,
Common Raw Material
Bank/Sales Depot, etc.
Balancing/correcting/i
mproving production
line that cannot be
undertaken by
individual units
thereby reducing the
input costs.
5 Infrastructure
Development
Creation of infrastructural
facilities like power distribution
network, water,
telecommunication, drainage
and pollution control facilities,
roads, banks, raw materials,
Better product at a
lower a input cost
38 Department of Applied Economics, Cochin University of Science and Technology

Introduction
storage and marketing outlets,
common service facilities and
technological backup services
etc,.Source: Compiled using various published documents on IHDS-CDP by the
Ministry of Textiles, GoI
1.4.8.4 Project Approval Monitoring and Evaluation:
The proposals under the scheme will be considered for approval by the
Steering committee of the MSE-CDP with Secretary (MSME) as Chairman. The
Development Commissioner (MSME) acts as the apex body for co-ordinating
and overseeing the progress of the projects. The concerned State Governments
should monitor the projects implemented by their autonomous bodies and SPVs
to ensure satisfactory and time-bound implementation of the activities. Each State
Government has to constitute a Project Steering Committee under the
chairmanship of Secretary or Director of Industries and consisting of
representatives of all stakeholders for this purpose. In case of cluster
development projects not covered as above, the office of DC (MSME) directly
monitors the progress with the assistance of or through its field level offices.
1.4.9 Cluster Programmes in India
Pursuant to implementing the cluster development programme, several
schemes and programme were launched by Central Ministries/Departments and
its agencies and also various state Governments and its institutions. The details
of such schemes and programmes are given in the table no. 1.12.
Table No.1.12 Major Cluster Development Programmes in India
S.No.
Name of the Scheme Name of theMinistry/Department/Ag
Focus of theScheme
Department of Applied Economics, Cochin University of Science and Technology 39

Chapter 1
enies
1Scheme for IntegratedTextile Parks (SITP)
Ministry of Textiles InfrastructureDevelopment
2Baba Saheb AmbedkarHastshilp Vikas Yojna
DevelopmentCommissioner(Handicrafts), Ministry ofTextiles
DevelopmentofHandicraftsclusters
3
Integrated Handloom Development Scheme (IHDS) / Integrated Handloom Cluster Development Scheme (IHCDS)
DevelopmentCommissioner(Handlooms), Ministry ofTextiles
DevelopmentofHandloomclusters
4
National Programme forcapacity building of textiles SMEs through cluster based approach
Textiles Committee,Ministryof Textiles
CapacityBuilding
5
Micro and SmallEnterprises ClusterDevelopment Programme (MSECDP)
DevelopmentCommissioner(MSME), Ministry ofMSME
ProductivityandCompetitiveness
6National Small IndustriesCorporation (NSIC)
National Small IndustriesCorporation
Machinery andEquipment
7National Programme forRural Industrialization (NPRI)
National Bank forAgricultureand Rural Development
Skill andtechnology
8
Scheme of Fund forRegeneration of TraditionalIndustries (SFURTI)
Khadi and VillageIndustriesCommission and CoirBoardunder the Ministry ofMSME
ProductivityandCompetitiveness
9
Industrial Infrastructure Up gradation Scheme (IIUS)
Department of IndustrialInfrastructure Policy andPromotion,Government of India
Infrastructure
10NMDFC Micro Financing Scheme
National MinoritiesDevelopment & FinanceCorporation (NMDFC)
Employment
11 SBI Project UPTECH State Bank of India Technology12 SIDBI Technological Small Industries Competitivene
40 Department of Applied Economics, Cochin University of Science and Technology

Introduction
Upgradation Fund Scheme (TUFS)
DevelopmentBank of India (SIDBI)
ss
13 SIDBI-Financing andDevelopment of SMEs
Small IndustriesDevelopmentBank of India (SIDBI)
Credit
14NABARD ClusterDevelopment Programme
National Bank forAgricultureand Rural Development
Competitiveness
15NMCC-Project Vikas withsupport from Microsoft
National ManufacturingCompetitive Council
Competitiveness
16
Margin Money Scheme forCluster Development Activities
Department of Industries,Government of Kerala
ProductivityandCompetitiveness
17Grant Assistant to ClusterDevelopment Activities
Industries Department,Government of Kerala
Training/Skill
18Scheme for Assistance toCluster Development
IndustriesCommissionorate,Government of Gujarat
Competitiveness
19Integrated ClusterDevelopment Programme
Rural IndustriesDepartment,Government of MadhyaPradesh
Promotion ofTraditionalproducts
20Craft Village Scheme(Shilpgram Yojna)
Department ofHandicrafts,Government of OrissaDirector (Handicrafts)
Employment
21 Cluster Development Programme
Government ofRajasthan,Industries Department
Productivityandcompetitiveness
22
Boosting employmentthrough Small IndustriesDevelopment
International LabourOrganisation
Health &Hygiene
23MSECDP of West Bengal
Government of WestBengalDirectorate of Micro andSmall Scale Enterprises
ProductivityandCompetitiveness
24 Scheme for promotionof
Bureau of EnergyEfficiency
Energy
Department of Applied Economics, Cochin University of Science and Technology 41

Chapter 1
Energy Efficiency inMSMEs
Source: Ministry of MSME, GoI
Thus in India, cluster is implemented across different sectors by different
Ministries of the Central and State Governments through the agencies and
departments under them.
1.4.10 Cluster Development Activities in Kerala
Government of Kerala adopted Cluster Development as an important
postulate of the Industrial Policy of the year 2003. Since then several steps
have been taken at the apex level of the Government for Cluster
Development. Industrial Policy-2003 had stated that sector specific clusters of
industrial units would be promoted with the assistance of financial institutions
and skill development facilitated through common facility centres and training
institutions. The policy envisaged creating a system of decentralized production
and centralized marketing, centralized designing and centralized quality control
to be implemented in the MSME sector. New Tool rooms, Testing Centres and
Sub-contracting Exchanges to facilitate buyer seller interaction were also to be
set up in the State. (Industrial Policy, Government of Kerala, 2003)
In line with the objectives stated under the Industrial Policy,
Government of Kerala initiated several steps aimed at ensuring committed
efforts towards development of clusters in the State. A few of these are
explained below: The key milestones in the introduction of cluster development
activity in the Kerala MSME sector is shown in Table No. 1.13
42 Department of Applied Economics, Cochin University of Science and Technology

Introduction
Table No.1.13 Key milestones by Government for the cluster
development activity in Kerala
Activity Date PurposeVisit of Korean team September
2003
Tie up for Raw material supply for the
manufacture of coir productsInteractive Meeting
with Senior Expert
Service (SES),
Germany, on Expert
Services & Cluster
Development
April 2004 To explore the possibility of business
tie up with the existing Consortium
members
Awareness
Workshop for Lead
Bank Managers
August
2004
Sensitise on the role of the Financial
Institutions in Cluster Development
programmeTraining Programme
for Bankers & other
Financial Institutions
September
2004
Sensitise on the role of the Financial
Institutions in Cluster Development
programmeTraining programme
for officials of
Department of Coir
as CDA’s
October
2004
To provide Training programme for
CDA’s in Coir
One day session to
CDA’s on Product
Marketing
May 2005 For enhancing marketing linkages in
the value chain
Interactive Session
with CDA’s &
Cluster Members
June 2006 Cluster Experience sharing
Source: K-BiP, Department of Industries, Government of Kerala
Department of Applied Economics, Cochin University of Science and Technology 43

Chapter 1
The above process helped to sensitise the stakeholders on the role and
importance of cluster development initiatives for the development and growth
of MSME in the state. Concurrently, Ministry of MSME on their part and other
ministries such as Textiles introduced clusters in Kerala.
In order to establish the areas where Government interventions are
required, diagnostic studies for each Cluster were conducted with special
emphasis on assessing limitations in terms of quality, facilities for testing and
research, technical knowledge, information channels, organisation skills, market
linkages and export potential. Based on the results of the diagnostic study, a
detailed action plan for Cluster development was charted out and implemented.
Officials of the Industries Department were given intensive training in
association with UNIDO and with the help of EDI Experts, to act as Cluster
Development Agents (CDAs). (K-Bip, 2003)
1.4.11 The Implementation & Monitoring Mechanism for Cluster
Development in Kerala
The Cluster Development activities in the State are implemented by the
Department of Industries & Commerce through the Directororate of Industries &
Commerce(DIC). The District Industries Centers under the DIC directly
monitors the implementation of the clusters in their respective Districts. As per
the Kerala Government’s Industries Policy, the role of DICs is to act as the Key
Resource Group for the initiative. DICs offer critical intervention services at all
stages of the programme, act as a mentor to the CDAs, co-ordinate the cluster
development efforts, suggest mid-course corrections, organise refresher and
interaction programmes for the CDAs and liaise with the major players in the
44 Department of Applied Economics, Cochin University of Science and Technology

Introduction
programme, including national and international level agencies. Kerala Bureau of
Industrial Promotion (K-BIP) is the co-ordinating Agency of the Department for
implementation of the Cluster Development Programme in the State.
1.4.12 MSME Development Institute and Cluster Development in Kerala
In sectors where DIC or other departments are not involved (on behalf of
the state Government), the Government of India through the MSME
Development Institute, Thrissur Kerala (MSME-DI Thrissur), implements the
Cluster in the State. MSME Development Institute, Thrissur Kerala (MSME-
DI Thrissur) is the field outfit of Development Commissioner (MSME) under
the Ministry of MSME, Government of India to take care of the needs of
MSME sector in the State of Kerala and the Union Territory of Lakeshadweep,
in the areas of Techno-economic and managerial consultancy services. They
have taken up 6 clusters for development in the State. They are in the areas of
Gold ornaments, Dies & Moulds, Notebooks, Rice Milling, General
Engineering and Diamond and the work thereon is in Progress (Economic
Review, Government of Kerala, 2012)
Other than DIC and MSME-DI, in certain sectors, concerned
departments act as the implementing agency for the various cluster programmes
implemented in them.
1.4.13 Clusters in Kerala –Current Status
The cluster development activities initiated in the identified areas /
sectors in the State are in various stages of implementation. The first legally
constituted consortium in Kerala “Rubber Cluster at Changanacherry named as
Natural Rubber and Fiber Product Manufacturing Consortium (P) Ltd (Rubber
Department of Applied Economics, Cochin University of Science and Technology 45

Chapter 1
cluster, Kottayam) was established in the year 2003. The success of the Rubber
Cluster, Kottayam, gave thrust to Cluster Development activities by
emphasising promotion of Sector Specific Clusters.
As on date, the Ministry has accorded approval to set up 13 Nos. Common
Facility Centres (CFC) projects in various locations of our State. Out of this, 6
Nos. CFC projects has already been Commissioned and the remaining are in
various stages of implementation. The details are enclosed in Table No. 1.14
Table No.1.14 Common Facility Centres (CFC) in Kerala as on 31.03.2012
I CFC Projects alreadycommissioned
Location
1 Rubber Cluster Changanacherry
2 Plastic Cluster Aluva, Ernakulam
3 Terra Tile Cluster Thrissur, Ernakulam
4 Plywood Cluster Perumbavoor, Ernakulam
5 Rice Millers Cluster Kalady, Ernakulam
6 Furniture Cluster Perumbavoor, Ernakulam
II CFC Projects in various
stages of implementation
Location
7 Valluvanad Wood Cluster Perinthalmanna, Malappuram
8 General Engineering Cluster Manjeri, Malappuram
9 Wood Cluster Chadayamangalam, Kollam
10 Furniture Cluster Taliparamba, Kannur
III CFC Projects for which
approval received from
Government of India
Location
11 Screwpine Cluster Vaikkom, Kottayam
12 Ethnic Food Cluster Pala, Kottayam
13 Offset Printers Cluster ErnakulamSource: K-BiP, Department of Industries, Government of Kerala
46 Department of Applied Economics, Cochin University of Science and Technology

Introduction
The initial survey conducted by DIC revealed the need for adopting
Cluster Development Programme in many of the districts in Kerala in an
extensive manner across different sectors. They are given in Table No.1.15
Table No.1.15 District-wise list of Clusters Identified in the initial Survey of
Industries Department
District ClustersKasaragod Handicrafts, garmentsKannur Handloom, Garments, Plywood, Printing PressWayanad Coffee Powder, Curry Powder & GarmentsKozhikkode Ethnic Food, Footwear and JewelleryMalappuram Rubber, Food, Wood & Garments Palakkad Ethnic Food, Bell Metal, Agricultural EquipmentsThrissur Diamond, Wood, Tiles, Re-threading M/Cs,
NotebookErnakulam Plywood Food (3)& Rubber, Light Engineering, Elect
& Electronics, Plastic, Wood, Paint Garment, Mineral
WaterIdukki Garments & bambooKottayam Leather Garments & FoodAlappuzha Bell Metal, Stone MetalPathanamthitt
a
Food, General Engineering
Kollam Clay, Wood, Food, PencilThiruvanantha
puram
Wood, Handicraft, Printing, Cane, Handloom
Source: K-BiP, Department of Industries, Government of Kerala
1.4.14 Handloom Clusters in Kerala
Department of Applied Economics, Cochin University of Science and Technology 47

Chapter 1
One of the sectors where cluster based approach was introduced is
handloom sector. Government of Kerala has been actively implanting a number
of cluster schemes of GoI in the handloom industry. The major clusters
schemes are given below;
1.4.14.1 Swarnajayanthi Grama Swarozgar Yogana (SGSY)
The Scheme, being implemented by National Rural Livelihood Mission
(NRLM), Ministry of Rural Development envisages empowering and enabling
the rural people thereby eradicating poverty. It was introduced as an innovative
project for the social and economic development of Marginal Handloom
Weavers through the creation of micro enterprises involved in the delivery of
handloom products to exporters and big domestic players, by augmenting the
infrastructure facilities and by adopting appropriate social and technology
intervention strategies Under this scheme, the cluster was to have a 3000
weavers, ie 300 groups of 10 weavers each.
There are only 2 clusters in Kerala. They are Thanima Cluster in
Thiruvananthapuram and Krithika Cluster in Kannur. These two projects are
implemented by Hanveev.
1.4.14.2 Integrated Handloom Cluster Development Scheme (IHCDS)
Development Commissioner, Ministry of Textiles, GoI introduced
clusters in Handloom industry through a programme called The ‘Integrated
Handloom Development Scheme’ in the year 2005-06. It is implemented as a
Centrally Sponsored Scheme aimed at enhancing the competitiveness in the
textile industry both in the national and international markets and exploiting the
free trade opportunities emerging in the post Multi Fibre Agreement (MFA)
environment. The Integrated Handlooms Development Scheme (IHDS) is an
48 Department of Applied Economics, Cochin University of Science and Technology

Introduction
attempt to facilitate the sustainable development of handloom weavers located
in and out side identified handloom clusters into a cohesive self managing and
competitive socio - economic unit.
Accordingly 20 clusters having a minimum number of 5000 looms were
identified for handloom clusters all over India at a cost of Rs. 2.00 crore per
cluster. Out of this, one cluster is Trivandrum Cluster in Kerala. Kerala State
Handloom Development Corporation Ltd, is the Implementing Agency for
setting up of Handloom cluster at Trivandrum, in Kerala State. (Economic
Review, GoK 2010)
1.4.14.3 The Integrated Handlooms Development Scheme –Cluster
Development Programme (IHDS-CDP)
Development Commissioner, Ministry of Textiles, Government of India
introduced Integrated Handlooms Development Scheme –Cluster Development
Programme (IHDS-CDP) in Dec. 2007 with the objective of integrated and
holistic development of the Handloom Sector. In India, the Cluster
Development Programme is implemented in Handloom as part of IHDS. As
per the Programme, clusters each having 300-500 handlooms will be developed
with ceiling of Rs.60.00 lakh per cluster in a time period of 3 years. The
guiding principles underlying the design of cluster is to create local level
accountable institutions, which can integrate the production chain in a manner
that caters to the business needs of the local Enterprises. In brief, the main
objective of cluster approach is to assist the weavers and others to provide
adequate training and Human Resource Development (HRD) inputs along with
appropriate market linkages etc. (Source: Ministry of Textiles, GoI)
Department of Applied Economics, Cochin University of Science and Technology 49
Chapter 1
Government of India sanctioned 24 projects submitted by State
Government and Directorate of Handlooms and Textiles, GoK is the
co-ordinating agency for these clusters.
1.4.14.4 IHDS –Group Approach
Handloom Weavers who are not covered by the above cluster schemes
will be covered under Group Approach. A Group should have more than 10
weavers, which can be in the form of Self Help Groups (SHG), Primary
Weavers Co-operative Societies (PWCS) and other independent / individual
weavers in groups. Assistance to such a group of weavers will be provided for
basic inputs, skill up-gradation, Construction of work-shed etc.
A total of 192 groups were identified in the State for getting benefits
under the Group approach for development of handlooms, out of which 21
Groups were approved by Government of India.
1.5 Statement of the Problem
As already mentioned, one of the key sectors, identified by the
Department of Industries Government of Kerala, for the cluster development
initiative is Handloom, which gives employment to over over 50,000 people
directly. Despite its age old tradition and fame, the performance of the sector
vis-à-vis power looms is not very rosy owing to (i) competition from cheap
power loom cloth from other states (ii) scarcity of quality yarn (iii) price
escalation of yarn, dyes, chemicals and other raw materials (iv) the shrinking
market for handlooms in Kerala (v) non-demand based production and
inadequacy of new designs and (vi) inefficiencies in the system, particularly in
the co-operative sector. Cluster based approach is adopted in the handloom
sector with the objective of providing necessary support mechanism to come
50 Department of Applied Economics, Cochin University of Science and Technology

Introduction
out of the crisis that the sector faces now. While four cluster schemes are being
implemented in Kerala, it is under IHDS-CDP that the State got a sizeable
number of clusters benefiting a large number of societies and weavers- 24
handloom clusters, bringing 152 handloom co-operative societies and over
19,800 handloom workers under the Programme.
This research attempts to revisit the underlying rationale and context of
the new direction and would attempt to broadly analyze the growth trends under
the influence of cluster model adopted by the State IHDS-CDP for the revival
of handloom sector through a detailed study of the handloom co-operative
societies in Kerala. If handloom sector in Kerala can be revived using cluster
based approach, it can be easily concluded that cluster is capable of taking the
MSME in Kerala to a ‘high growth path.’ The study is aimed at understanding
how best clusters emerge as appropriate industrial organization suitable for the
current global structure of manufacture.
1.6 Objectives of the Study
Traditionally, it has been accepted that the textile industry in general and
handloom industry in particular is highly employment intensive. Therefore, the
prospects of this sector have a bearing on the lives of a number of people
employed in the sector. As the growth in the handloom sector has not been
upto the expectations and is beset with a number of problems with technology,
market and capital having a bearing for the future of this sector, it was decided
to take up the efficacy of the cluster development programme, designed for
revival of this sector, for this research.
While the broader objective of this research is to understand the effectiveness of
cluster as a growth model for MSME and traditional industries in Kerala, the
specific objectives of the research are:
Department of Applied Economics, Cochin University of Science and Technology 51

Chapter 1
1. To understand in detail, the operational weaknesses of handloom co-
operative societies in Kerala.
2. To critically examine and evaluate the efficacy of cluster based approach
in overcoming operational weaknesses of handloom co-operative
societies in Kerala and;
3. To make suggestions, which would aid the Government or cluster
implementing agencies in achieving the objectives in new clusters, if
any, being planned in the handloom sector.
1.7 Research Methodology
Clusters are complex and dynamic structures that are subject to
continuous change. Strong clusters can promote economic growth through
leveraging the innovation and business potential of a region. The performance
of clusters depend on favorable framework conditions such as infrastructure or
regulation, the composition of and interaction between cluster participants and
the quality of the cluster management organization. So the success or failure of
a cluster can be studied and determined only by evaluating its achievements in
all the aspects of Collective Efficiency.
1.7.1 Research Approach
The following two approaches are commonly used in social science
research for analysing the efficiency and impact of a development programme;
“Before and After Approach”
&
“With or Without Approach”.
52 Department of Applied Economics, Cochin University of Science and Technology

Introduction
In the “Before and After approach”, the impact of a particular
phenomenon is studied by comparing the same set of sample population at two
points of time i.e. before the application of the stimulus and after its application.
“With or Without Approach” refers to the method of knowing the impact
of a particular phenomenon by comparing one set of sample in which stimulus
is applied with another set of samples in which stimulus is not applied at a
particular point of time.
1.7.2 Methodology:
UNIDO has formulated methodologies for analysing the efficacy of
cluster-based approach for industrial development, universally.
Seyed V. M. Hosseini, and M. R. Ghanbari (2011) developed the
structural components and the factors to understand the performance and
efficacy of clusters based on UNIDO methodologies viz:
1. Human force
2. Network of supplying the raw materials
3. Technology
4. Network for accessing the market
5. Financial supply and investment aid
6. Co-ordinating entity
1.7.3 Measurement of Impact:
Different methods and a wide range criteria and research techniques are
in use to measure the Impact of Clusters. Economists have designed several
models to analyze behavioral and functional dimensions of clusters viz
Department of Applied Economics, Cochin University of Science and Technology 53

Chapter 1
interrelations of enterprises within a certain cluster, upstream and downstream
relations amongst clusters as well as overflow and clusters' overlapping.
Bergman & Feser (1999) categorize clusters analysis methods as the
following:
a. Expert viewpoint
b. Location factor
c. Matching based on input-output table
d. Network-based analysis
e. General census
Expert viewpoint method is used whenever there is no proper and
enough information and also enough time and budget to collect them. This is
mainly resorted to when the present information is unreliable. In this case,
simple survey and/or repeatable survey of experts would be used.
Location factor method is used to represent import or export states of
the cluster using national information and particularly local factors of
employment and its interference in local statistics. Inter-cluster interference
state is then analyzed by using of obtained factors. It does not focus on or
compare or study other clusters and/or local parts and other regions
Matching based on input-output table method scrutinizes national and
regional input-output tables and their coefficients. Inter-cluster interference
coefficient would be analyzed through upgrading and comparing with regional
wages' level.
Network-based analysis is a method in which, because of lack of
enough opportunity and cost, a main enterprise of a certain cluster is selected
and then some decisions will be taken about state of the cluster through
studying behavior of its enterprise.
54 Department of Applied Economics, Cochin University of Science and Technology

Introduction
General census method is indeed the most expensive and most precise
method to analyze clusters. It is able to bring about precise and reliable
information for complete and precise analysis of clusters; hence it may be used
as the basis of policy making. Bergman & Feser (1999)
To understand the efficacy of the Cluster Based Approach, the
researcher has analysed the structural components of clusters in
the two phases of ‘Before and After Approach’ and With or
Without Approach’, using the General Census method.
A three-pronged strategy is used for evaluating the overall performance
of handloom clusters in Kerala. They are given in Table No.1.16.
Table No.1.16 Strategy for evaluating the performance of handloom
clusters in Kerala
Strategy No. Objective Tools1 Evaluating
clusters for
their ability to
enhance
Collective
Efficiency of
the handloom
co-operative
societies in its
institutional
aspects.
To assess the impact the cluster
approach has made to the
handloom sector in the pre-and
post cluster intervention
scenario, by analyzing the
aggregates for the key
parameters such as human
force, development of network
for raw material procurement,
skill up-gradation,
diversification, adoption of
modern technology, Network for
accessing the market, Financial
Field Survey for
two period viz
2008 as Pre-
Intervention Year
and 2012 as Post
Intervention Year
Department of Applied Economics, Cochin University of Science and Technology 55

Chapter 1
supply and investment aid
2
Evaluating
clusters for
their ability to
enhance
Collective
Efficiency of
the handloom
co-operative
societies in its
enterprise
aspects
The success or failure in
enhancing Collective Efficiency
of the handloom co-operative
societies in its enterprise
aspects is evaluated by
analyzing the turnover, and
profitability that it achieved on
account of adoption of cluster
approach.
Financial
statements of the
handloom co-
operative societies
from 2005-2012
3
Evaluating
clusters from
their functional
& operational
aspects:
The success or failure of
clusters in its functional &
operational aspects is
evaluated by analyzing the
handloom cluster scheme and
the clusters in the selected
pockets.
Cluster
Development
Executives of the
clusters, Hantex,
Hanveev, the
Directorate of
Handloom &
Textiles, GoK, Source: Compiled by the researcher
1.8 Tools used for Data Analysis
The research is both analytical and descriptive in nature using both
primary and secondary data. While the former included field visits to various
weaving centers for primary data collection, the latter consisted of archival
research, as well as the compiling of data from official and non-official
published sources. Data was obtained from the financial statements of the
clusters, balance sheets of the co-operative societies etc for detailed analysis
and study. Discussions/ interviews were held with Government officials, Cluster
56 Department of Applied Economics, Cochin University of Science and Technology

Introduction
Development Executives (CDE’s), Nodal Officers of cluster programme,
weavers, handloom workers ,Presidents and Secretaries of various co-operative
societies-both Cluster member and non-Cluster member.
The research has chosen two main modes of presenting data, i.e.,
statistical and qualitative with the data collated from earlier reports and
records as well as data from sample surveys. A schedule was formulated
with the intention of getting some base level data on the cluster scheme
implemented, facilities created utilizing the fund in the loom, work shed,
training programme and exposure visits conducted, support services
provided to the weavers, and so on.
The following tools are widely used in the study for the analysis of the data;
1. Per centage analysis
2. Accounting Ratios
3. Growth rates – both simple and compound
Compound Growth Rate - The formula used is
CGR = [n√Pn∕Po-1] x 100
Where n = Number of years
Pn = Variable at the end of the period
Po = Variable at the beginning
The researcher has also used independent sample t-test and Analysis of
Variance (ANOVA) in a very limited way to analyse the pattern of fund
utilization of different clusters.
1.9 Selection of the Study Area
Department of Applied Economics, Cochin University of Science and Technology 57

Chapter 1
Development Commissioner (Handlooms) Government of India in 2006-
07 implemented 382 handloom clusters across the country. Out of the 382
clusters implemented across India, 24 cluster (6 per cent ) are in Kerala.
First, the researcher collected the list of 24 handloom clusters
implemented in the state from Directorate of Handlooms and Textiles , GoK. A
pilot study was carried out at the beginning of the research, to a get a quick
glimpse of the general functioning of the handloom clusters in Kerala. Major
findings of the pilot study are;
1. 24 clusters are sanctioned under IHDS in Kerala
2. Clusters are implemented only in seven districts in Kerala
3. Only 20 clusters are working. Three clusters in Thiruvananthapuram and
one cluster in Palakkad are not functioning. The main reason for non
working of clusters is attributed to the lack of co-operation among its
members. All the closed-down clusters are at an abandoned stage.
4. Highest number of handloom clusters and working clusters are in
Thriruvananthapuram and Kannur. They are 11 and 8 respectively.
5. A study on cluster needs a group of clusters together, say at least 5 or
more in one geographical area. This is to avoid wide variations in the
sample characteristics.
6. Only two Districts have 5 or more clusters
District-wise list of Handloom co-operative societies in Kerala, its
members, the number of clusters sanctioned and main products is given in the
Table No.1.17
58 Department of Applied Economics, Cochin University of Science and Technology

Introduction
Table No.1.17 District-wise details of Handloom Co-operative societies
in Kerala
Sl.No
DistrictSociet
ies
RegdMemb
ers
No ofcluste
rsMain Products
1 Kasaragod 8 1259 0 Sarees
2 Kannur 43 4432 5Made-ups, Furnishing, Turkish towels, and Lungies Earezha thorthu
3 Wayanad 4 117 0Furnishing ,Jacquard products, Bedsheets, Table mats
4 Kozhikkode 31 5719 2Furnishing, Jacquard products, Bedsheets, Table mats
5 Malappuram 10 717 0 Saree & lungies6 Palakkad 29 3740 3 Dhotis, lungies
7 Thrissur 15 3114 1'Koothampally saree' set mundu, Dhothies, lungies
8 Ernakulam 15 3498 1Chennamangalam saree, double dhothies
9 Idukki 5 386 0 Sarees, lungies10
Kottayam 10 1160 0Earezhathorthu, panimundu & lungies
11
Alappuzha 9 546 0Dhotis, sarees, lungies, & earezhathorthu
12
Pathanamthitta
3 378 0 Lungies and dhothies
13
Kollam 40 5537 1 Lungies & furnishing items
14
Thiruvananthapuram
247 26802 11
Grey sarees with kasavu, set-mundu and 'Mundum Nereyathum' Lungies, and furnishing items
Total 469 57405 24Source: Compiled using data from Directorate of Handlooms & Textiles, GoK,
This means that 35 per cent of the total handloom workers and 29 per
cent of the co-operative societies in Kerala are covered under these 24 clusters
in Kerala. Out of these 24 clusters only 20 of them are working now. Table
No.1.18 shows the details of the working clusters in Kerala.
Table No.1.18 District-wise details of working handloom clusters in Kerala
District Cluster
Department of Applied Economics, Cochin University of Science and Technology 59

Chapter 1
No. ofClusters
No. of Handloomworkers
No. ofSocieties
1Thiruvananthapuram
08 2859 28
2 Kollam 01 364 163 Ernakulam 01 340 24 Thrisur 01 328 15 Palakkad 02 744 46 Kozhikode 02 740 197 Kannur 05 1952 23
Total 20 7327 93Source : Field Visit
As can be noted from the table, only Thiruvananthapuram and Kannur
have five or more handloom clusters. These two districts put together
constitute 65 per cent of working clusters being implemented in Kerala.
Therefore, to understand the working of the handloom clusters in Kerala, the
handloom clusters in Thiruvananthapuram and Kannur Districts were taken for
a detailed study for the following reasons;
1. Among the 14 districts in Kerala, the two Districts of
Thiruvananthapuram and Kannur have the highest concentration of
handloom co-operative Societies. Thiruvananthapuram tops with 247
handloom societies whereas Kannur has 43. A micro study on this larger
population is expected to give better insights of the sector.
2. While maximum numbers of Handloom societies are registered in
Trivandrum District, the highest export of handloom products are from
Kannur District. Kannur was declared a town of Center of Export
Excellence, by GoI in the year 2006.
3. The Integrated Handloom Cluster Development Programme has already
been implemented in these two Districts.
60 Department of Applied Economics, Cochin University of Science and Technology

Introduction
4. Thiruvananthapuram and Kannur Districts produce a range of products
from traditional Sarees and Thorth Mundu to furnishing materials. The
handloom co-operative societies in other districts produce either of these
products or a combination of them. Hence, these handloom clusters can
be a true representation of the handloom clusters in the state.
It was thought that a study of the efficacy of the clusters in these two
pockets of Kannur and Thiruvananthapuram would be useful in understanding
the impact and efficacy of clusters in reviving the handloom sector in Kerala.
Hence the researcher has taken the sample as a single unit for the study and
analysed using ‘Pre & Post Approach’ and ‘Before & After Approach’.
1.10 Sample Selection
As mentioned earlier, the State was sanctioned 24 clusters under IHDS-
CDP, covering 19800 handloom workers in 152 handloom co-operative
societies. This means that 35 per cent of the total handloom workers and 32 per
cent of the co-operative societies are covered under these 24 clusters in Kerala.
At the same time, 37605 handloom workers and 317 societies, out of the
total 57405 handloom workers and 469 handloom co-operative societies have
not opted for cluster based approach.
Thus, there are two categories of population as given in Figure No. 1.3.
Figure No. 1.3 Types of Population
Department of Applied Economics, Cochin University of Science and Technology 61

Chapter 1
This necessitates the selection of sample from these two population of
those who have “joined” and “not joined” the cluster.
1.10.1 Cluster Sample
1.10.1.1 Selection of the Sample Handloom Cluster Member Workers
(CMW)
As per the guidelines of the IHDS, a cluster should have a minimum of
300 members. All the handloom clusters selected for the study have more than
300 members. From each cluster, 10 per cent weavers were taken at random as
sample of CMW. Table No.1.19 shows the selection of the sample CMW;
Table No.1.19 Selection of Cluster Member Workers (CMW)
Name of the Cluster
No of handloom workers in the cluster
Sample selected (CMW)
1 Kozhode 325 332 Ramapuram 310 31
62 Department of Applied Economics, Cochin University of Science and Technology

Introduction
3 Travancore 396 404 Ooruttambalam 498 505 Swadeshi 350 356 Naveena 320 327 Thettivila 300 308 Neyyattinkara 360 369 Payyannoor 363 3610 Chirakkal 497 5011 Morazha 325 3312 Kalliassery 404 4013 ICON 363 36 Total 4811 481
% sample(@ 10% of the total handloom workers in the cluster)
10%
Source: Field Survey
Thus the 13 clusters selected contain 4811 handloom workers out of
which 10 per cent of the total handloom cluster member workers (481) were
selected as sample. Utmost care was given to include weavers, master weavers,
designers, allied workers as sample handloom cluster member workers for the
interview based on the questionnaire.
All the registered members in the society need not be members in the
cluster and in most cases the number of cluster members are less than that of
registered members. The total registered members in the case of cluster
member societies from Thiruvananthapuram and Kannur districts come to
12083 but, the workers who joined the cluster is only 4811.
1.10.1.2 Selection of the Sample Handloom Cluster Member Societies
(CMS)
As can be noted from the Table 1.18, there are 28 handloom co-operative
societies in the 8 clusters in Thiruvananthapuram District and 23 societies in the
5 clusters in Kannur, ie a total number of 51 handloom co-operative societies in
Department of Applied Economics, Cochin University of Science and Technology 63

Chapter 1
the 13 clusters in these two districts put together. All the 51 co-operative
societies were selected as sample for the study as sample CMS.
1.10.2 Non-Cluster Sample
Out of the 469 handloom co-operative societies in Kerala, only 152
handloom co-operative societies, covering 19800 handloom workers have got
the opportunity to adopt or join the cluster approach. The remaining 317
societies with 37605 handloom workers have not joined cluster scheme or have
not got the opportunity to join the scheme, due to one reason or the other.
Hence, with a view to understanding whether the cluster method had made any
significant impact on the performance of handloom societies and its workers
who joined the cluster, it is necessary to study the performance of the workers
and societies who have not joined the cluster.
1.10.2.1 Selection of the Non–Cluster Member Workers (N-CMW).
Total handloom workers in Kannur and Thiruvananthapuram, put
together comes to 31234. From these two pockets, the number of workers who
joined cluster is 4811 and those who have not joined is 26423. Out of this,
26423 Non-Cluster handloom Workers, a sample was set which would equal to
the 20 per cent of sample selected for clusters members (20 per cent of 481).
Thus 96 workers were selected at random as sample for N-CMW. This is 0.36
per cent of the total Non-Cluster Workers in these pockets.
1.10.2.2 Selection of the Non –Cluster Member Societies (N-CMS).
Out of the 317 societies which are not part of the cluster programme, 10
Societies were selected at random as sample for Non cluster Members Societies.
This is 4.1 per cent of the total Non-Cluster Societies and is equal to 20 per cent of
societies (51) under Sample Cluster Member Societies. Here five societies each
64 Department of Applied Economics, Cochin University of Science and Technology

Introduction
from Thiruvananthapuram and Kannur were selected at random to analyse the
working of the cluster and compare under “with or without” approach.
The Total Sample selected for the study is given in Table No. 1.20.
Table No.1.20 Total Sample Selection
Thiruvananthapura
m &Kannur
Sample
Selected
%
Cluster Sample
Clusters 13 13 100%Societies 51 51 100%Handloom workers 4811 481 10%
Non-Cluster Sample
Clusters NA NA NA
Societies 239 10
4.1% of the Non-Cluster Societies which is 20% sample selected for cluster
Handloom workers (Total handloom workers in Kannur and Tvm-workers who joined cluster i.e. 31234-4811=26423
26423 96
0.36% of the Non-Cluster Workers which is 20% of sample selected for cluster
Though the research is based on total cluster population in the select
pockets, viz Thiruvananthapuram and Kannur, two clusters in
Thiruvananthapuram District viz Ramapuram Handloom Cluster and Naveena
handloom Cluster did not co-operate with the study at all. Similarly one
society each from Travancore cluster at Thiruvananthapuram and Chirakkal
cluster at Kannur did not co-operate with the study.
Department of Applied Economics, Cochin University of Science and Technology 65

Chapter 1
1.11 Data Collection
The Study is based on both primary and secondary data. Primary data
was collected from Cluster Development Executives of the handloom clusters
and the secretaries of the Handloom Co-operative Societies and primary
workers and Self Help Groups (SHG’s) who are members in the cluster.
A Five structure schedule is used for data collection-the first for the 13
clusters, the second for the 51 Cluster Member Societies (CMS), the third for
10 Non-Cluster Member Societies (N-CMS), the fourth for the Cluster Member
Workers (CMW) in CMS and the fifth for the 96 Non-Cluster Member Workers
(N-CMW) in N-CMS. The details is shown in Figure 1.4
Figure No.1.4 Schedules of Survey
The following procedure was followed for collecting data;
The addresses of the 24 clusters was collected from the Directorate of
Handloom and Textiles, Vikas Bhavan, Thiruvananthapuram.
The addresses of societies who are participating members of the clusters
were collected from the clusters concerned.
66 Department of Applied Economics, Cochin University of Science and Technology

Introduction
The addresses of the non-cluster member societies were collected from
District Industries Centre, Thiruvananthapuram and Kannur.
The data from the weavers were collected with the help of the co-
operative societies concerned.
A structured interview schedule for the five categories was prepared
after consulting two experts on cluster. The schedules were finalized after pilot
study. Since most of the workers in the cottage type societies operate from
home, the researcher had to go to their residence and collect information. The
secretaries of the societies facilitated the survey of primary weavers, by
introducing the researcher and the purpose of visit to the weavers. In a few
exceptional cases, the secretary had convened meetings to facilitate my
interviews. In the factory type, most of the workers were interviewed in the
factory itself. Before asking question, rapport was established with the
respondents and the purpose of the interview was clearly explained to them.
Then the researcher asked them questions in the local language and marked the
information in the schedules. The data so collected was cross checked on the
basis of discussion with the concerned secretaries who keep close contact with
the workers and also cross checking with Attendance register, ledger etc,
wherever possible. Participatory observation was also adopted in some cases.
1.12 Secondary Data Sources
Cluster necessitates active interaction among the stakeholders, consisting
of weavers, co-operative societies, its members, and representatives, supporting
institutions like government departments etc. Most of the data on the cluster
are scattered with different agencies and institutions of the State and Central
Department of Applied Economics, Cochin University of Science and Technology 67

Chapter 1
Government. Some of the important secondary data sources researcher made
use of are given below:
1) Directorate of Handloom and Textiles, GoK, Thiruvananthapuram, 2)
District Industries Centre, Thiruvananthapuram & Kannur, (3)Institute of
Handloom Textile Technology(IHTT), Kannur, (4) Weavers Service Centre,
Kannur, (5) HANVEEV, Kannur, & Thiruvananthapuram (6) Kerala Handloom
Weavers Welfare Fund Board, Thiruvananthapuram, (7)HANTEX,
Thiruvananthapuram, (8) Kerala Handloom Export Organisation, Kannur,
(9)Kerala State Textile Corporation, Thiruvananthapuram, (10) Hantex Process
House, Thiruvananthapuram, (11) Textiles Committee, Kannur, (12) Textile
Project Development Centre (TPDC), Balaramapuram, (13) National Handloom
Development Corporation, Kannur,
1.13 Period of Study
The Government of Kerala introduced the concept of cluster in 2003 and
the handloom industry started adopting the concept in 2006. The GoI scheme
of IHDS was introduced across India in 2007. The handloom clusters in Kerala
under the Scheme got approved in 2008 and started implementation by
disbursing fund in 2009 - to be completed over a period of three years, by 2011.
Hence the period of study is an eight-year period from 2005 to 2012. To make
the comparative study under the ‘Before and After Approach’, the researcher
has fixed 2008 as Base Year for Pre-Implementation and 2012 as Base Year for
Post-Implementation.
1.14 Limitations of the Study
68 Department of Applied Economics, Cochin University of Science and Technology
Introduction
1. UNIDO has formulated methodologies for analysing the efficacy of
cluster-based approach for industrial development, universally. The
researcher was unable to find out published research data on localised
tools. Hence the structural components and the factors developed by
Seyed V. M. Hosseini, and M. R. Ghanbari (2011) to understand the
performance and efficacy of clusters based on UNIDO methodologies
were used in the study.
2. Two clusters from Thiruvananthapuram did not provide primary data
required for the study and hence they were not included in the analysis.
However, the researcher sourced the secondary data on these clusters
from Handloom Directorate, the implementing agency for the
programme.
3. In Kerala, handloom clusters are implemented under four schemes.
Under the scheme IHDS-CDP, 24 clusters are implemented. The
number of clusters under these schemes are very few. Hence only the
IHDS-CDP is taken for a detailed study.
1.15 Plan of the Thesis
The thesis has been prepared in the following manner :
Chapter I tries to give an introduction to the research by giving a quick
overview of the industrial scenario of the State, role of MSME and traditional
industries, and the policy framework in India for the promotion of the MSME.
It also gives an overview of the evolution of clusters, its theoretical framework
and broad outline of clusters being implemented across the sectors. This
chapter also states the Research Problem, Objectives and Design to give an idea
about the framework of the study.
Department of Applied Economics, Cochin University of Science and Technology 69

Chapter 1
Chapter II gives a glimpse of the review of related literature.
Chapter III depicts an overview of the Handloom Industry in Kerala unfolding
the Strengths and Operational Weaknesses of the sector.
Chapter IV gives an overview of the Clusters scheme and a brief profile of the
study area and the select handloom clusters in Thiruvananthapuram and Kannur
in its operational aspects.
Chapter V analyses the institutional and enterprise aspects of the performance
of the handloom clusters in Kerala.
Chapter VI deals with the findings of the analysis, suggestions which
emanated from the study and conclusion.
……… ………
70 Department of Applied Economics, Cochin University of Science and Technology

Introduction
Department of Applied Economics, Cochin University of Science and Technology 71

The Review of literature covers the following four distinct areas:
1. Small firms- covers how small firms’ came into prominence across the
globe and the academic works on industrial clusters.
2. Small scale Industries in India - focuses on the emergence of academic
interest on small scale industries in India
3. Clusters in India - gives a quick glimpse of the works done on Indian
clusters in general and handloom clusters in particular
4. Handloom Industries and Handloom clusters in Kerala.
2.1 Small Firms
The literature on small firms is wide ranging. Some consider these firms
as aberrations in the development process, while others acknowledge their
potential to play key role in peripheral development. (Schmitz, 1995). It is only
with the identification of the ‘informal’ sector and its role in redressing the
growth-led inequalities by Sethuraman (1976) that small firms came to be an
important object of study in low income economies. It was found that this
sector, comprising primarily of small firms, contributed not only to production
of consumer goods for the low income segment while generating employment,
but also produced certain items within the capital goods sector. The Studies
found that these firms, operated with out-dated technologies and beyond the
realm of formal legislation, derived their advantage essentially from their
ability to exploit labour better.

Review of Literature
This framework has been used fruitfully to understand the character of
urban economies in the peripheral region. The characterization of the urban
peripheral economy has been broadly in terms of a hegemonic, modern
capitalist sector that subordinates other segments to its own logic, either
through surplus extraction or by a relative lack of access to resources. Harris
(1982) and Harris, Kannan and Rodger (1990) on small scale production and
urban markets in Coimbatore, Berman on small urban economy of Gujarat
(1976) and Boss on the informal economy in Calcutta (1974) are important
studies in this regard. Apart from these works, investigations of specific
manufacturing sectors operating in the informal realm too have been carried
out. In the Indian context, Studies by Isaac (1984) Kalpagam (1981) Singh
(1990) stand out. All these studies stress the need for capital to perpetuate
‘informal’ conditions to sustain accumulation.
On the other hand, there has been a stream of thought inspired by
Schumpeter’s perspective that place small firms at the centre of innovation
activity in all economy, especially in the advanced capitalist economies. Small
firms, it is argued, face fewer constraints in certain areas compared to the big
firms, which gives them an edge in their ability to adapt to new market
conditions. (Malecki 1997). Burdened less by rigidity and path dependence,
small firms can adopt new process or enter into product lines more easily. This
view has specially gained currency with recent changes in product market
conditions that require firms to adapt their production capabilities rapidly to
changes in output markets. The rise of flexible manufacturing technologies in
tandem with the greater emphasis on scope rather than scale economies has
strengthened the case for such ‘flexibly specialised’ small firms. Important
small firms networking with each other are seen as both benefitting from the
Department of Applied Economics, Cochin University of Science and Technology 68

Review of Literature
adaptability acquired from being ‘small’ as well as overcoming their inability to
acquire resources when they operate as independent units.
The recognition of a dynamic role of small firms and the study of
clusters of firms rather than the single firm dates to the early 1980’s following
the studies on Third Italy1, undertaken in the late 1970’s by Bagnasco
(Holmstrom, 1999) After Piore and Sabel (1984) pointed to the changing
product market characteristics and the importance of flexibility to organization,
studies on inter-firm networks as an organizational form gained currency in
Europe. Brusco (1990) and Beccatini (1991) on Italian Clusters, Best (1990)
and Sengenberger and Pyke (1991) on other European regions like Germany are
among the first work of this kind.
During the same time, scholars like Scoll, (1992), Paderson, Sverisson
and Dijk, (1994) Saxenian (1994) analisyed the characteristics of individual
clusters in the peripheral regions. Many clusters were found to be stagnant and
many unlike those observed in the core capitalist region leading to the
formation of the ‘low road’ hypothesis. Nadvi and Schmtz (1998) provide an
excellent review of studies on cluster in peripheral regions and identify
important gaps to be pursued. Despite the widely held view that clusters can
play an important role in fostering incipient industrial development, especially
in poor regions (Schmitz and Nadvi, 1999), little is known of the impact that
clusters have on reducing poverty. The very presence of a cluster changes the
context in which the poor live, by enhancing the ability of individual cluster
actors, be they workers or producers, to potentially improve their well-being.
1 The prosperous firm structures experienced in the Northeast and Centre of Italy is called Third Italy, and the stagnating situation in the poor South is called the ‘second Italy’ and the recession in the traditionally rich and early industrialized NorthWest is called ‘first Italy’.
Department of Applied Economics, Cochin University of Science and Technology 69

Chapter 2
Clusters allow local small producers to make more effective use of
underutilized resources, such as small scale savings or family labour, generating
incomes that they could not avail by operating in isolation. This is because the
process of clustering engenders various benefits. This includes agglomeration
gains to clustered firms, such as externalities in the markets for labour, inputs,
know-how and information, economies of scale and scope as individual firms
take on specialized tasks through a division of labour. In resource poor regions,
or at early stages of industrial development, this can be especially significant,
promoting specialization by way of "small steps" (Schmitz and Nadvi, 1999).
2.2 Small Scale Industries in India.
After independence, the government of India adopted a planned
approach to industrialisation of the country. A series of Industrial Policy
Resolutions clearly indicating the cherished pattern of industrialisation, the role
of small, medium and large industries and the role of public and private sector,
were brought out by the Government. The successive Five year Plans also
came out with various programmes for industrialisation. Numerous controls and
regulations were clamped on big industries from time to time. The overall
objective was to promote employment and reduce regional disparities, promote
exports, self reliance, and reduction of concentration and control of monopoly.
Interestingly, academic interest also focused on examining the industrial
progress, its structure, efficiency and the role of small and cottage industries.
The question of industrial efficiency and spatial concentration of
industrial activity was the theme of many studies. Mehta’s (Mehta, 1961) study
on size, location and integration in Indian Industries covered the period prior to
independence. By making a reference to various definitions and the conceptual
problems, he examines the question of efficiency in major industries based on
70 Department of Applied Economics, Cochin University of Science andTechnology

Review of Literature
size-cost relationship, profitability etc. The study revealed that large units are
more efficient. On location, the study concluded that there is a gradual
movement of productive activity to centres of regions commanding most
favorable transport relation in regard to distribution of various productive
factors. A more theoretical study on clustering of industrial activity was that of
Alagh’s (1972). The regional aspects of Indian Industrailsiation was examined
by adopting industrial base techniques. Based on the existing technological
information on industrial inter-relation, he defined the blocks of industries and
using the existing most disaggregated industrial level data by region, industrial
base of each region was estimated. The study revealed that regional clustering
is associated with agglomeration economies and, therefore, emphasised the
need for detailed inter-industry, interregional analysis to determine the efficient
investment paths in terms of inter industry and inter regional allocation of
resources. As for regional analysis, the case of Andhra Pradesh was examined
by Sharma (1982). According to the Study, backward areas although showed
some progress, no significant reduction in regional inequalities was revealed by
planned development as backward areas are still bedeviled with problems of
inequalities. The book also discusses the role and problems of small scale
industries in Andhra Pradesh. Similarly, Kaur (1983) examined the case of
Haryana.
Other studies like that by Dhar and Lyndall (1961), and Sandesara
(1981;1988) represent attempts at an understanding of the technological
condition of small firms and the impact of Government policies on this sector.
Tyabji (1989) explores the context of changing nature of Government Policy
formulation with regard to Indian Small Scale Sector.
Department of Applied Economics, Cochin University of Science and Technology 71

Chapter 2
Similarly, Charles (1975) argued that efficiency has to be measured by
the concept of social efficiency in terms of employment, use of non-renewable
energy and pollution, rather than by private market efficiency and if such social
costs are considered, cottage industries are no less efficient. However,
methodical studies examining these issues and their implications are scarce.
Whatever may be the case, since Independence, India has adopted a policy in
favor of small and cottage industries. To a large extent, it was thrust upon the
economy by resource endowment, surplus labor and very little capital. A
number of studies also examined the economics of small industries, their
problems and role.
The problem and prospects of small industry in India was examined by
National Council for Applied Economic Research (NCAER,1970). According
to this study, although small industries are faced with problems of raw material,
finance etc, if nurtured properly, they can contribute more efficiently to
country’s product and foreign exchange earnings. Further the study pointed out
that being faced with multiple problems, most of the small units are unable to
utilise exisiting capacity. This also results in lower efficiency and if these
problems are taken care of, many of these may be able to contribute efficiently
to the economy.
A brief study of small industries of Coimbatore by Harris (1982)
revealed economic subordination and exploitation of small units by large units
at varying degrees through sub contract. Further according to him, the policy of
promotion of small industries has not made any dent on the concentration of
economic power, as they largely serve the interest of big capital.
72 Department of Applied Economics, Cochin University of Science andTechnology

Review of Literature
2.3 Clusters in India
In India, a number of studies on various clusters have been carried out.
The Agra Footwear Cluster (Knorringa 1996), diesel engine manufacturing in
Rajkot (Basant 1997), brass metal parts in Jamnagar and brass ware in
Moradabad (Awathi 1997 and Akbar 1997 resply), the diamond polishing
cluster in Surat (Kashyap and Tiwari 1986), Engineering and electronics cluster
in Bangalore (Holmstorm 1998) textile printing cluster in Jodhpur (Du Pont
1995) the diamond cutting cluster in Trichur (Joseph 1995), the bicycle industry
and woolen knitwear cluster of Ludhiana (Kattuman 1998) Tewari 1999 resply)
garment cluster in Ahmedabad and Delhi (Das 1996b, Alam 1994 resply) floor
tile cluster in Gujarat (Das 1996 a), leather tanning in Palar Valley (Kennedy
1999) pump manufacturing cluster in Coimbatore (Pillai 2000) and cotton
knitwear cluster in Tirupur (Cawthrone 1993; 1995, Swaminathan and Jayarajan
1994; 1997;1999) are some of the major works in the Indian context. Changes
in the lines of enquiry of their writings can be discerned. These studies mainly
examined the role of historical factors in influencing the pattern of industrial
formation. (Tiwari,1998, Kamuman 1998) Soon the academic interest was
shifted to understanding the factors constraining the cluster units from moving
on to the high road. Here the role of socio-economic ties, government policies
and other specificities like inter-firm networks are analysed to understand
possible constraints to them by dynamism. However, very few clusters are
found to exhibit the kind of dynamism anticipated among policy makers. The
cotton knitwear cluster in Tirupur is considered to be one of these select few
that do. The investigation of the Tirupur knitwear cluster shows that a demand-
led growth does not necessarily result in a development on a high road to
growth, a path supposing innovation and increased productivity (Pyke et al.,
1990). The effectiveness of ‘collective efficiency’, the competitive advantage
Department of Applied Economics, Cochin University of Science and Technology 73

Chapter 2
resulting from the combination of the externalities linked to proximity and joint
action (Schmitz, 1999), is then discussed in the light of the experiences of an
Uttar Pradesh saddlery cluster and Tamil Nadu leather clusters. Surajit
Sengupta et. al (2008) who made a study on the “development of handloom for
jute based diversified fabrics modifying traditional cotton handloom” speaks
about the scope of diversified products such as decorative, upholstery,
furnishing and even outer part of the apparel, from jute and jute based yarns.
Arup Mukherjee & Ashis Mitra (2007) in their paper “On-loom finishing of
handloom products-an innovative and indigenous approach” made a scientific
study on the scope of product diversification/ product innovation in handloom.
They made an innovative and indigenous approach on trial basis for on-loom
application of finish on handloom, and it has been proved that this indigenous
approach is both technically and economically feasible for not only piece goods
but also for bulk application, provided some other accessories like cottage level
finishing chamber/steamer, sealing fan, drier etc can be arranged.. Ashis Mitra
et.al (2009) in “ a diagnostic report on cluster development programme of
Shantipur handloom cluster, Nadia, West Bengal” studies the cluster
development programme of Shantipur handloom cluster to formulate a
sustainable business plan as well as marketing plan to assist this cluster to
compete in the ever challenging textile business. It also describes the
evolution/historical background of the cluster, its geographical location,
existing cluster structure and infrastructure analysis to facilitate formulation of
a sustainable business-cum marketing plan..Not many studies have exclusively
been found devoted to examine the economics of Handloom clusters in India
74 Department of Applied Economics, Cochin University of Science andTechnology

Review of Literature
2.4 Handloom Industry and Handloom Clusters in Kerala
There are umpteen number of studies on the problem and prospects of
handloom industry in Kerala. While examining the question of implementation
of minimum wages for handloom weavers in Kerala, the Committee of
Government of Kerala (1960) documented the problem of weavers. Oomen
(1972) in his study of small industries in Kerala has compared handloom with
powerloom. According to this study, surplus generation although is high in
handloom compared to powerloom, re-investible surplus turned out to be
considerably low due to high propensity to consume. However he holds the
view that as there is considerable underutilization in powerlooms, if given a
proper deal, chances of generating surplus is more. Mohanan 1977) discussed
the issues of widespread unemployment among weavers of Cannanore and
identified the related problems as lack of innovation, the role of intermediaries,
unplanned protection and the failure of Government in building a firm base for
the industry. To Nedungadi (1977) lack of internal demand appears as more
important and to him unless internal demand is created there can be no durable
solution to the problem of handloom industry. Narayanan (1982) and Ramunny
(1983) emphasized the problems of raw material, its price, lack of research and
development, the futility of the rebate system, lack of contacts with overseas
markets, wage policy, quota policy and competition form powerlooms.
The State Planning Board, Kerala (1983) reviewed the progress of
export promotion projects and intensive handloom development projects. The
study pointed to the slow pace of progress of the programme and persistence of
acute problem of unemployment even among weavers covered by the
programmes. The inefficiency of the implementing agency, the Kerala
Handloom Development Corporation, was also focused by the Study. Krishnan
Department of Applied Economics, Cochin University of Science and Technology 75

Chapter 2
(1985) made a detailed examination on the review of organization, status,
investment, productivity, return and marketing of products of Handlooms in
Cannanore district. The study pointed out that the industry as elsewhere is
unorganised, its capital structure is highly lop-sided, production methods are
antiquated and traditional and labour is not formally trained. The technology of
production is age old with no attempt to upgrade. Entrepreneurship is lacking
and only the middlemen in the handloom gets the best out of the game. Labor
is exploited and quality is compromised. The study calls for a totally different
strategy and programmes to resuscitate the otherwise collapsing industry. There
may not be much justification, on purely economic grounds, to encourage them.
But social and economic reasons compel a helping hand to the households
engaged in the handloom craft. In a Study of “Traditional Handloom Industry
of Kerala” KKN Kurup, (2007), made an attempt to describe the evolution of
traditional handloom industry in Kerala from “pit loom” traditional technology
to the modern “flying shuttle” from its infancy to the present day factory
system. It also describes in detail how the present day capitalist mode of
production alienated the craftsmen and converted them into wage labourers
Martin (2012) discussed the issues of large scale exiting of weaving job
by weavers for more lucrative jobs. The weavers are exiting their traditional
jobs in hordes because they cannot earn more than wage of Rs.150 daily
whereas other jobs offer upto Rs.700 a day for skilled worker.
There are umpteen number of studies on the problem and prospects of
handloom industry in Kerala. Studies by Oomen (1972) Mohanan K.P(1977)
Ramachandran (1978) Narayanan (1982) Ramunny Murkoth (1983)
K.K.N. Kurup, (2007) and a series of newspaper articles depict the sorrow state
of affairs of the sector.
76 Department of Applied Economics, Cochin University of Science andTechnology

Review of Literature
No studies have been so far reported to have been made on the
handloom clusters in Kerala, except certain action taken report by the
implementing agencies. There is acute dearth a literature in this area. Hence a
detailed study based on field work and primary data is highly essential for
understanding the success of cluster in reviving the small firms, especially in
handloom sector.
……… ………
Department of Applied Economics, Cochin University of Science and Technology 77

Chapter 2
78 Department of Applied Economics, Cochin University of Science andTechnology

The Indian Textile Industry occupies a unique place in the economy of
the country by virtue of its contribution to the industrial output, employment
generation and foreign exchange earnings. India is the second largest producer
of textiles and garments after China. It is also the second largest producer of
cotton in the world. One of the earliest to come into existence in India, the
textile industry is the second largest employment provider in India after
agriculture. The textile industry provides employment to nearly 108.73 lakh
people and currently accounts for 8 per cent of the G.D.P., 20 per cent of the
industrial production and 35 per cent of the export earnings. (Ministry of
Textiles, Office of the Textile Commissioner, Mumbai, 2011)
The FICCI white paper on 'Challenges in Textile and Apparel Industry',
February 2012 highlights the following
1 The domestic textile and apparel market in India is worth
Rs.5800.crores and has the potential to grow at a CAGR of 9 per cent, to
reach Rs. 14100 crores by 2021.
2 India's textile and apparel exports were at Rs.3100 crores in 2011 and
are growing at an annual rate of 10 per cent since 2005.
3 Apparel exports contribute the most to the overall exports in terms of
value, followed by contributions from fibre, yarn and fabrics. India's
share of the world's textile and apparel exports stands at 4.5 per cent.
4 It is estimated that due to the increasing shift of textile and apparel
production to Asian nations and the deteriorating export-

Handloom Industry in Kerala-An Overview
competitiveness of China, this figure will grow to 8 per cent by 2020,
with a total exports value of Rs. 8200 crores.
5 This growth, from 4.5 per cent to 8 per cent of world trade, will open up
huge potential for Indian players.
6 Investment in weaving and processing segments is required to
strengthen value chain and bankers commitment level should increase to
serve the clients in the sector.
7 Rising raw material cost and increase in volatility in raw material prices,
labor unrest, poor work environment and supply chain problem (lead
time) are few challenges which needs to be addressed immediately.
(The FICCI white paper on 'Challenges in Textile and Apparel Industry’,
February 2012)
The size of the Indian Textile Industry is given in Table No.3.1
Table No. 3.1 The Size of the Indian Textile Industry -2010
Rs. croresParticulars Domestic Sales Export Sales Total Apparel 3600.00 1100.00 4700.00Home Textiles 400.00 300.00 700.00Textiles 1200.00 1100.00 2300.00Total 5200.00 2500.00 7700.00Source: Ministry of Textiles, GoI
3.1 Challenges in the Post-Multi- Fibre Agreements (MFA) Period
The barriers and quantitative restrictions of Multi-Fibre Agreement
(MFA) in the import and export of textile items by third world countries were
completely removed in January 2005. Since then, countries can export and
import textile products, without restrictions. As a result of this, the Indian
Department of Applied Economics, Cochin University of Science and Technology 80

Handloom Industry in Kerala-An Overview
textile market has to compete with textile products of superior quality at lower
price, produced by technologically advanced countries.
At the same time the Indian Textile Industry is now passing through
unprecedented crisis caused by haphazard structure of establishment, excess
spinning and weaving capacities, use of obsolete plant and machinery, outdated
technology for production, sub-standard quality of inputs, high cost of
production, very low machine and labour productivities, outdated labour laws,
low earnings of workers, etc. The Industry is therefore, becoming
uncompetitive and incapable of facing the challenges of globalisation and WTO
regime. At the same time, several third world countries have made much
headway and achieved appreciable progress in restructuring the textile industry
by timely implementation of appropriate technology upgradation and
modernisation programmes. This has enabled several developing countries to
make the textile products globally competitive both in quality and price. To
survive, Indian textile industry has to be competitive in both domestic and
global market. Government policies have largely been favorable to the textile
industry. The policies aim to ensure that the industry is internationally
competitive in terms of manufacturing and exports. Besides various schemes,
there are various other statutes, including fiscal policies, (governing customs,
excise, sales tax etc) rules, initiatives, incentives, etc through which government
extends support to the industry. To be competitive the best quality superior
product has to be produced at a lesser cost. Realising this, the Government of
India has launched innovative schemes such as
Technology Fund UpgradationScheme (TUFS).
Scheme for integrated Textile Parks (SITP).
Department of Applied Economics, Cochin University of Science and Technology 81

Chapter 3
Group Work-shed Scheme (GWS).
Group Insurance Scheme for development of Powerloom sector.
Integrated Scheme for Powerloom Cluster Development.
Marketing Development Programme for Powerloom Sector etc
Integrated Handloom Development Scheme –Cluster Development
Programee (IHDS-CDP)
3.2 Handloom Industry in India:
India is perhaps the only country in the world which makes handloom
products on a commercial basis. It is also the largest employment provider under
textile sector. The employment in textile industry is given in Table No.3.2.
Table No.3.2 Employment in Textile Industry-2010(Figures in lakhs)
SL.No.
ItemHandloom Industry
Power loomIndustry(B)
Total(A+B)Full-time Part-time
Total(A)
1. Weaving 22.43 21.33 43.76 43.40 87.162. Preparatory work 10.95 10.62 21.57 - 21.57
Total 33.38 31.95 65.33 43.40 108.73
Source: Ministry of Textiles, GoI
Table 3.2 reveals that the handloom industry provides employment
opportunity to 65.33 lakh persons, constituting 40 per cent of the total
employment in this sector. This indicates the relevance of handloom in
generating employment especially among the rural poor. The “Swadeshi”
movement, successfully practiced and propagated by the Father of our Nation
during our freedom struggle in the early 20th Century, has created a deep rooted
culture of wearing handloom cloth, which exists even today. Even though the
recently adopted globalisation movement has brought in many “Videshi”
82 Department of Applied Economics, Cochin University of Science and Technology

Handloom Industry in Kerala-An Overview
(foreign) products, the handloom industry still plays a very important role in the
socio-economic life of the nation, as is evident from the data on production of
handloom cloth in India. Table No.3.3 gives the total cloth production and
contribution of handloom for the last two decades.
Table No. 3.3 Sector-wise Production of Cloth (Million Sq.mtr)
SectorKhadi,Wool &
SilkMill Handloom Hosiery
Powerloom
Total
Yea
r
Qty %
to
tota
l Qty %
to
tota
l Qty %
to
tota
l Qty %
to
tota
l Qty %
to
tota
l
1995-
96
49
8
1.5
6
20
196.32
720
2
22.5
4
503
8
15.7
6
172
01
53.8
2
319
582000-
01
55
8
1.3
9
16
704.15
750
6
18.6
6
669
6
16.6
4
238
03
59.1
6
402
332005-
06
76
9
1.5
5
16
563.34
610
8
12.3
2
104
18
21.0
1
306
26
61.7
7
495
772010-
11 (P)
79
8
1.2
8
22
053.52
690
7
11.0
4
146
34
23.3
9
380
15
60.7
7
625
59Source: Compiled by using the data collected from the Ministry of Textiles, Govt Of
India
It may be noted from the above table that the share of handloom sector
to the total cloth production in the country has been 22 per cent in 1995-96.
This has declined over the years and reached 11.04 per cent in the year 2010-11
ie a reduction of 50 per cent in a span of just 15 years. The major reason for the
decline has been the unprecedented growth of powerloom and hosiery sectors
over these years. While the share of powerloom in 1995-95 has increased from
53 per cent to 60 per cent in 2010-11, share of hosiery sectors increased from 15
per cent in 1995-95 to 23 per cent in 2010-11. Nevertheless, the rate of decline
of handloom production is coming down over the years and the decline is at a
deceasing rate (4,6 and 1.38 per cent respectively 2000-01, 2005-06 and 2010-
Department of Applied Economics, Cochin University of Science and Technology 83
Chapter 3
11), indicating that the rate of decline of handloom production has been
substantially reduced or checked by 2011.
3.3 Handloom Industry in Kerala
The handloom sector has a very discernible presence in Kerala.
Communities of weavers concentrated in certain centres in the state have
propelled the development of this sector in the state. There are several legends
behind the development of handloom industry in Kerala. It is believed that
about 350 years ago, the Raja of Travancore brought six families of weavers
from Devagiri and settled them at Kottar near Nagarkoil. In the later part of the
19th century, His Highness Visakhom Tirunal Maharaja of Travancore brought
weaver families from Tirunelveli and settled them at Neyyattinkara and
Balaramapuram near Thiruvananthapuram.
As regards the development of the industry at Kannur, it is believed that
the Chirakkal Rajas of Kannur brought weaver families from the traditional
weaving communities of Saliya from other regions and settled them in colonies.
However it was Basel Mission which institutionalised the weaving activities in
a planned manner. Legend exists that though Basel Mission commenced its
activities in India in 1834 at Mangalore, weaving was taken up only in 1844.
Weaving establishments in early days were attached to the Mission House itself.
In 1844 they set up Common Wealth Trust India Ltd, at Calicut, the first unit in
Kerala to be run under factory system. Later establishments were started at
Kannur (1852) and by 1913, both these establishments had huge complexes
with over 600 workers each. It was Basel Missionaries who introduced frame
looms in Kannur.
Today, the Handloom Industry in the state is mainly concentrated in
Thiruvananthapuram and Kannur Districts and in some parts of Kozhikode,
Palakkad, Thrissur, Ernakulam, Kollam and Kasargod Districts.
84 Department of Applied Economics, Cochin University of Science and Technology

Handloom Industry in Kerala-An Overview
Chendamangalam in Ernakulam and Kuthampully in Thrissur are the most well
known centres of handloom industry in Kerala, apart from Balaramapuram and
Kannur. All these centres are famous for their own speciality products.
3.3.1 Handloom Societies, Looms & Workers
The Handloom Industry is dominated by the Co-operative sector covering
94% of total looms. The remaining six per cent of Handlooms units is owned by
Industrial entrepreneurs. The Co-operative sector consists of factory type and
cottage type societies. There were 591 registered Primary Handloom Weavers
Co-operative Societies in the State on March, 2012 of which 166 are factory type
and 425 are Cottage type societies. (Economic Review, GoK, 2012).
Table No.3.4 shows the trend in the number of handloom co-operative
societies in Kerala.
Table No.3.4 Trend in the number of handloom co-operative societies in
Kerala
Sl.No
Item 2007-08 2008-09
2009-10
2010-11
2011-12
a Factory Type1 Working 109 109 110 108 1082 Dormant 47 48 40 41 393 Under
Liquidation17 17 15 16 17
4 Not StartedWorking
2 2 2 2 2
Total (a) 175 176 167 167 166b Cottage Type1 Working 263 260 260 260 2592 Dormant 111 112 117 117 1133 Under
Liquidation40 40 41 41 43
4 Not StartedWorking
11 11 11 11 10
Total (b) 425 423 429 429 425Grand Total 600 599 596 596 591
Department of Applied Economics, Cochin University of Science and Technology 85

Chapter 3
(a+b)Source: Economic Review 2012, Government of Kerala
The Handloom sector in Kerala stands second only to the coir sector in
providing employment among the traditional industries of the state. A survey
report on the handloom sector published by the Department of Economics and
Statistics, GoK revealed that there are 469 co-operative societies in the state
with 57405 active handloom workers as shown in Table No.3.5
Table No.3.5 Number of Handloom Co-operative societies and its
Members
Sl.No
DistrictNo of
SocietiesNo of
MembersNo of Looms
1 Kasaragod 8 1259 1232 Kannur 43 4432 14033 Wayanad 4 117 04 Kozhikkode 31 5719 9645 Malappuram 10 717 1346 Palakkad 29 3740 15777 Thrissur 15 3114 12988 Ernakulam 15 3498 9199 Idukki 5 386 0
10 Kottayam 10 1160 18011 Alappuzha 9 546 148
12Pathanamthitta 3 378 4
13 Kollam 40 5537 914
14Thiruvananthapuram 247 26802 9815
Total 469 57405 17479Source: Report on Survey of Handloom Sector in Kerala (2009), Department of Economics
and Statistics, GoK
When one considers the number of societies, Pathanamthitta is at the
bottom with 3 societies followed by Wayanad with 4 societies. The highest
number of societies are noticed in Thiruvananthapuram district followed by
Kannur with 247 and 43 members respectively.
86 Department of Applied Economics, Cochin University of Science and Technology

Handloom Industry in Kerala-An Overview
About 47.25% of the total membership of the societies in Kerala is
contributed by Thiruvananthapuram district. The district has 26802 members in
the societies. Wayanad is at the bottom with 117 members followed by Idukki
with 388 members. Out of 57405 members who are active in the industry, only
35896 members are doing weaving or weaving related works as on 31.03.2012.
There are 17479 looms in this industry. Thiruvananthapuram district tops
the list with 9815 looms followed by Palakkad with 1577 looms. The least
number of looms are in Pathanamthitta, only 4 nos. (Department of Economics
and Statistics, GoK)
3.3.2 Production of Cloth
The production of handloom cloth in Kerala is on the decline. The cloth
production which was 68.88 million metres in 2001-02 has come down to just
23.95 million meters in 2009-10. However, of late, there is a slight increase in
the overall production of handloom cloth by Handloom Industry of Kerala.
The total production of handloom cloth shows an increase of about 5 per cent
from 26.68 million metres in 2010-11 to 27.89 million metres in 2011-12. The
total value of production has increased by 6 per cent from Rs. 190.96 crore to
Rs. 202.14 crore during the period. (Economic Review 2012)
Table No. 3.6 shows the production and sales details of handloom cloths
from the State.
Table No.3.6 Production and Sales of Handloom cloths
Production of Handloom cloths (in Million Metres)
Sales inRs.crores
2004-05 62.30 280.352005-06 62.30 280.722006-07 62.48 281.20
Department of Applied Economics, Cochin University of Science and Technology 87

Chapter 3
2007-08 70.88 318.962008-09 20.20 146.382009-10 23.95 165.332010-11 26.68 190.962011-12 27.89 202.14
Directorate of Handloom, GoK
3.3.3 Products and the Main Centres of Production
The major varieties produced in the handloom sector of the State are
dhothis, furnishing material, bed sheets, grey saree and lungi. Details show that
the production of these items contribute 67 per cent of the total. About 77.62
per cent of the major items are produced in the southern region followed by the
North (12.81%) and Central (5.33%) regions. Of the total production, 95.76 per
cent are contributed by the co-operative sector and the balance of 4.24 per cent
is by the units in the entrepreneurial sector. (Economic Review, Kerala State
Planning Board, GoK 2011)
3.3.4 Raw Material Sources
The handloom industry in Kerala predominantly uses cotton (yarn) as
raw material. A few combinations of fibres like cotton and viscose or polyester
and viscose are also used. Yarn is procured mostly in the hank form. Some of
co-operative societies also procure yarns in the form of readymade warps from
Tamilnadu. Yarn is procured from Hantex, Hanveev, National Handloom
Development Corporation (NHDC) or directly from the mill sector.
3.3.5 Technology and Handloom Production process
There are several stages involved in the process of production of handloom
cloth starting from the stage of purchase of yarn. They are dyeing, twisting,
winding, warping, sizing, piecing and the warp with the loom for weaving.
88 Department of Applied Economics, Cochin University of Science and Technology

Handloom Industry in Kerala-An Overview
Yarn is usually purchased either from the local market or from the
co-operative societies. If the yarn is undyed, it has to be processed before it
forms the warp and weft. The next work involves twisting, rewinding and
warping of the yarn. Rewinding of weft yarns or “picks” is done by women
workers with the help of charka & swift wheels. After rewinding, the yarn has
to be warped. The warp yarn is usually wrapped on a round wooden frame.
The process of loosening, twisting, rewinding and warping are usually done by
the family members in the co-operative societies. Dressing and sizing are
usually done at the time of dyeing and repeated after warping. After sizing, the
warp yarn is starched, spread and dried in sun. For this purpose, cross –wise
bamboo rods are used. After these processes, the warp is removed from one
end of the bamboo and is wound on a hank till it reaches the other end. The
warp is then ready for the next process of piecing. Piecing refers to joining of
the thread ends of the old warp with the thread ends of the new warp. Each
loom contains one reed and one set of healds. The reed has dents (“teeth”) and
the number of dents per inch determines the fineness of the cloth. After piecing,
warp yarn is divided by many segments and is fixed into the loom. One end of
it is fixed to the cloth beam and the other end to warp beam. The ordinary
check and stripe designs are prepared by the segmentation of warp and weft
yarn. In the case of figured patterns (eg. Flowers), Dobby or Jacquard is used,
depending on the size of the pattern.
The production process in Kerala handloom sector is shown in Figure
Nos.3.1 and 3.2 respectively.
Figure No. 3.1 Production process in handloom sector
Department of Applied Economics, Cochin University of Science and Technology 89

Chapter 3
Figure No.3.2 Photographs of Production process in handloom sector
Raw YarnWashing, Scouring/
Bleaching, Colouring &Dyeing
Bobbin Winding(Tharuchuttu)
Wound Bobbins Creeling Creeling Process
90 Department of Applied Economics, Cochin University of Science and Technology

Handloom Industry in Kerala-An Overview
Pre-Warping Process Warping Beaming
Beaming in progress Gaiting(Drawing) Gaiting(Piecing)
Product Inspection Final Product
The handloom production process, as mentioned above is labour
intensive. However, there are certain areas in the production chain, where
technological interventions are possible to improve efficiency and to optimise
resources. The efforts in technology development in handloom sector have been
oriented towards improving machine and labour productivity without
sacrificing traditional labour involvement. This is necessary to sustain the
employment generating potential of this industry
For winding, Cycle wheel charka and winding machine have been
recommended to wind long and continuous lengths of yarn on bobbins and
pirns. Introduction of Drum Warping and sectional warping machines has been
Department of Applied Economics, Cochin University of Science and Technology 91

Chapter 3
recommended to improve productivity in warping operations against the
conventional street warping procedure. Attachment of beaming mechanism and
measuring and full beam stop motion on these warping machines will further
improve warping productivity.
The loss in loom efficiency due to warp breaks, shuttle changes etc
accounts for 15 per cent to 20 per cent of the total losses. Operations like
adjusting let-off, take-up, head shaft and temples occur very frequently,
resulting in frequent stoppage of work. This can be reduced by modified let-off
and take-up motions, use of roller temples with flanges.
Other auxiliary mechanism used in the handloom industry includes
multi-treads, dobbies and jacquards. Multi treads are used for weaving twills,
satin, fancy shirting and suiting. Different types of dobbies are used for
weaving extra warp designs in sarees and for weaving all-over patterns.
3.3.6 Marketing of the Handloom Products
The co-operative societies adopt broadly three methods for marketing
their products in the domestic market. These are:
3.3.6.1 Own Showrooms and Exhibitions
Some societies run own showrooms most often close to their production
centres. A few societies set up showrooms in cities to effectively take care of
the orders of commercial agents, PSUs and other outside parties, private
hospitals etc. Exhibitions, often confined within the state, are organised during
festivals like Onam, Vishu and Christmas. They also attend the exhibition sales
as part of Trade fairs.
3.3.6.2 Through Apex Organizations - Hantex and Hanveev
92 Department of Applied Economics, Cochin University of Science and Technology

Handloom Industry in Kerala-An Overview
Hantex has three systems for marketing its products, namely, cash sales
through own showrooms, exhibitions & authorised agents and credit sales to
government servants & sales to government departments. Both Hantex and
Hanveev depend heavily on rebate period to sell their products.
3.3.6.3 The Master Weavers
The master Weavers of the entrepreneur sector produce fabrics against
orders as also against local demand. The independent weavers of the Northern
Region, especially Kannur, take orders from foreign customers. In this context,
it may be worth mentioning that substantial portion of the exports of handloom
products from Kerala is contributed by the handloom exporters of Kannur.
3.4 Financial Assistance
3.4.1 Long Term Capital
Both the Central and State Governments pursue various plans and
schemes for the overall development of handloom sector and the welfare of
weavers, who currently face stiff competition from international
markets, powerloom and mill sector. The Government of India have come out
with 5 Schemes during the 11th Plan with a special focus on the capacity
building, infrastructure support, design & quality up-gradation, marketing &
raw material support, health care etc. The five schemes are:
( i) Integrated Handlooms Development Scheme
(ii) Marketing and Export Promotion Scheme
(iii) Handloom Weavers Comprehensive Welfare Scheme
(iv) Mill Gate Price Scheme
(v) Diversified Handloom Development Scheme
Department of Applied Economics, Cochin University of Science and Technology 93

Chapter 3
Allocation of funds for the last three years from 2008-09 to 2011-12 is
given in Table No.3.7
Table No. 3.7 Allocation of funds by the GoI for handloom projects
during the 11th Five Year Plan
(Rs. In Crore)Sl.No
Name ofScheme
2008-09
2009-10
2010-11
2011-12 (up to9.3.12)
1 IntegratedHandloomDevelopmentScheme
108.98 125.00 172.05 164.70
2 Marketing &Export PromotionScheme
46.00 50.00 61.00 55.60
3 HandloomWeaversComprehensiveWelfare Scheme
125.17 120.00 170.00 119
4 Mill Gate PriceScheme
29.59 30.60 65.00 55.60
5 DiversifiedHandloomDevelopmentScheme
16.24 15.78 20.00 24.10
Source: GoI, Ministry of Textile, Answer to the questions in Lok Sabha.
The handloom industry in Kerala is a beneficiary of the above schemes
implemented by GoI. The schemes implemented by Government of Kerala,
with financial assistance from the Central Government, for the development of
handloom industry in Kerala include:
Deen Dayal Hathkargha Protsahan Yojana (DDHPY)
Swarnajayanthi Gram Swarozgar Yojana (SGSY)
Handloom Export Scheme
Special Project for Factory Type Societies
94 Department of Applied Economics, Cochin University of Science and Technology
Handloom Industry in Kerala-An Overview
Textile Centre Infrastructure Development Scheme at Kannur and
Thiruvananthapuram
Integrated Handloom Training Project
Strengthening of Hantex and Hanveev under DDHPY
Margin money to powerloom and handloom units
Welfare scheme like Contributory Thrift Fund, Health Package and
House-cum-Work Shed Scheme
Quality Raw Material Distribution Scheme under CENVAT
Promotion of exquisite handloom products as work of art
Integrated Handloom Development Scheme (IHDS)
3.4.2 Working Capital
The handloom weavers rely on co-operative banks, nationalized and
private banks and various other financial institutions for their working capital
requirements. NABARD is providing refinance facilities to State Co-operative
Banks for financing the production and marketing activities of primary weaver
societies. Most of the societies are now not getting working capital from these
sources as they had already exceeded the Cash Credit (CC) limit and have huge
loan arrears to the State and District Co-operative banks by way of interest,
apart from the principal. To come out of the crisis, they borrow funds from
private individuals at high rate of interest putting further constraints on the day-
to day operations of the societies.
Government of India has taken a number initiatives to address the issue
of availability of institutional credit and availability of cheap hank yarn to
Department of Applied Economics, Cochin University of Science and Technology 95

Chapter 3
handloom sector in order to compete with powerloom and mill sector. They are
summarized below
i. The Government of India has approved Financial Package for loan
waiver of over dues of weavers’ co-operative societies and individuals as on
31-3-2010 with a total outlay of Rs.3884 crore. This will throw open
the choked credit lines of weavers’ co-operative societies and individual
weavers.
ii. Further, for easy credit availability to handloom weavers not covered
under financial package, the Government will provide margin money
assistance @ Rs 4200/- per weaver, interest Subvention of 3 per cent per
annum for 3 years from the date of first disbursal /and credit guarantee for
3 years by the Credit Guarantee Fund Trust for Micro and Small
Enterprises (CGTMSE) for which the Government will pay the required
guarantee fee and annual service fee.
iii. For availability of cheap hank yarn, 10 per cent price subsidy on silk and
cotton hank yarn will be provided by the Government to ensure supply of
subsidized yarn to handloom sector.
iv. The Government has further approved enhancement in the freight
reimbursement for transportation of different types of yarn used by the
handloom sector in order to offset the increase in fuel cost.
v. In order to provide relief to the silk weavers due to very high prices of
domestic as well as imported raw silk, on the initiatives of the Ministry of
Textiles, Ministry of Finance reduced the existing basic customs duty on
raw silk from 30 - to 5 per cent, which has resulted in reduction of silk
yarn prices.
96 Department of Applied Economics, Cochin University of Science and Technology

Handloom Industry in Kerala-An Overview
To ensure effective implementation of the schemes and optimum utilization
of funds for the benefit of handloom weavers, regular monitoring of the schemes is
being done through field visits, calling for physical and financial progress reports
and quarterly meetings with the State Directors in-charge of Handlooms.
3.5 Institutional Mechanism for the Handloom Industry.
There are various state and central government agencies which work in
tandem for the upliftment of the handloom sector.
3.5.1 Government of India Institutions
1. Ministry of Textiles: The Ministry of Textiles is responsible for policy
formulation, planning, development, export promotion and trade
regulation in respect of the textile sector. The developmental activities of
the Ministry are oriented towards making adequate quantities of raw
material available to all sectors of the textile industry and augmenting the
production of fabrics at reasonable prices from the organized and
decentralised sectors of the industry. Special emphasis is given to the
development of handlooms in view of its large employment potential. The
Ministry monitors the techno-economic status of the industry and provides
the requisite policy framework for modernisation and rehabilitation.
2. Development Commissioner, (Handlooms) New Delhi: Office of the
Development Commissioner for Handlooms was set up in 1975 under
the Ministry of Commerce. At present it is functioning under the
Ministry of Textiles. 25 Weavers’ Service Centres in 20 States are
functioning under the administrative control of Office of the
Development Commissioner for Handlooms as Field Units to look after
Department of Applied Economics, Cochin University of Science and Technology 97

Chapter 3
the needs of the handloom weavers like their skill up-gradation, design
development etc.
3. Weavers Service Center: This is a Govt. of India organization meant for
the training and skill up gradation of weavers. In Kerala it is located at
Kannur. This organization has Design, Weaving, Dyeing, Printing,
Photography, Library & Documentation sections for carrying out the
design development, design adoption, design dissemination, technical
inputs in the form of research in looms, dyes, dyeing techniques and in
innovations in appliances and accessories used by the weavers.
4. National Handloom Development Corporation (NHDC): This is a
central government undertaking under the Development .Commissioner.
(Handlooms) for the supply of the basic raw material to the weavers of
the handloom sector at the Mill gate prices without charging any
transportation charges and the other local taxes. The NHDC office in
Kerala is located in Kannur
5. Textiles Committee- It is a statutory body set up under the Textiles
Committee Act, 1963 (41 of 1963), under the Ministry of Textiles, GoI for
promoting quality and excellence in the Indian Textiles Industry to make it
globally competitive, and to provide basic infrastructure and guidance to
support and enhance quality in the textile industry.
6. Handloom Export Promotion Council (HEPC):In order to motivate,
co-ordinate and facilitate exports of hand-woven goods, GoI
constituted HEPC in 1965. It provides a variety of services to
firms registered with it. It advices government and other
authorities on problems and measures in relation with handloom.
98 Department of Applied Economics, Cochin University of Science and Technology

Handloom Industry in Kerala-An Overview
It gets grant-in-aid from Government for its export promotion
activities like organization of fairs/ exhibitions/ seminars/ buyer
seller meets etc.
3.5.2 Institutions under Government of Kerala
1. Ministry for Industries and Information Technology: The ministry has a
mandate to transform Kerala into a vibrant entrepreneurial society
with faster, inclusive and sustainable economic growth in order to
achieve global standards in every domain.
2. The Department of Industries & Commerce: It is headed by the Hon'ble
Minister (Industries & Commerce). The administrative head of the
Industries & Commerce Department is the Additional Chief
Secretary/Principal Secretary (Industries & Commerce). The Directorate
of Industries & Commerce, the functional arm of the Industries
Department is located at Vikas Bhavan, Thiruvananthapuram. It is
headed by the Director (Industries & Commerce). District Industries
Centers, located in all district head quarters comes under the Director
(Industries & Commerce).
3. Directorate of Handlooms & Textiles: Directorate of Handlooms &
Textiles is the wing under Department of Industries, GoK to co-ordinate
activities regarding the development of Handloom sector and implements
financial and welfare schemes to weavers of Kerala. It advices Government
in evolving policies and schemes aimed at developing the harmonious
growth of Handlooms, Power looms and Textile Sector. The Director of
Handlooms and Textiles is the functional Registrar for the Weavers co-
Department of Applied Economics, Cochin University of Science and Technology 99

Chapter 3
operative societies (Handlooms and Power looms) in the State who has
been vested with the powers under the Kerala State Co-operatives Act
1969.
4. Hantex: Channel credit from central institutions to the societies, Procure
and supply yarn and other raw materials and provide technical inputs in
the form of improved design and know how, and market the products of
the member societies
5. Hanveev: The “Kerala Handloom Finance Corporation” Hanveev is set
up with the prime objective of promoting private handloom sector by
providing finance for both working capital and for investment. In 1975,
the name of the corporation was changed to the “Kerala Handloom
Finance & Trading Corporation” and subsequently to Hanveev.
6. Institute of Handloom and Textile Technology: Institute of Handloom and
Textile Technology (IHTT) is an Institution set up by the Government of
Kerala under the Ministry of Industries for giving input of Science and
Technology to the Traditional Handloom Textile Industry. The Institute
was established and registered under the Societies Registration Act of
1860 in the year 1987. It conducts various training programmes in Fabric
Forming Technology (FFT),Dyeing and Processing Technology (DPT),
Fashion designing, Interior Decoration etc.
The institutional mechanism in place for the handloom industry in
Kerala, as detailed above, is given in Figure No.3.3
100 Department of Applied Economics, Cochin University of Science and Technology

Handloom Industry in Kerala-An Overview
Figure No.3.3 Institutional mechanism for the handloom industry in
Kerala
The Handloom Co-operative Societies in Kerala suffer from certain
inherent and operational problems. The inherent problems of the Handloom
Co-operative Societies in Kerala are those related to its structure, constitution
and related issues of its co-operative nature. Some of the inherent weaknesses
of Co-operative Societies in Kerala are delay in decision making, lack of
consensus between members, lack of profit motive, less market-driven and high
political interference. Bringing perceptible changes in these areas are rather
difficult and time-consuming as inherent problems are embedded in the social
system and are connected with the political and economic environment. On the
other hand, the handloom co-operative societies in Kerala face a lot of
operational problems-problems that are connected with the operational aspects
Department of Applied Economics, Cochin University of Science and Technology 101

Chapter 3
of the industry, viz promotion, financing, production, marketing of handloom-
that can be addressed by external interventions both fiscal and financial
interventions. The principal operational problems faced by the handloom co-
operative societies in Kerala are summarised below:
a) Dearth of expert weavers: Dearth of expert weavers exist in most of the
centres of handloom production in Kerala. Weaving is largely an
occupation of certain communities of people, Eg: the ‘Salia’ community
who came down from Tamilnadu and settled at Balaramapuram. It is no
secret that weavers do not send their children to this work. The
expertise and tacit knowledge is gradually declining. This would
seriously affect the industry in the long term unless the sector is taken to
the high growth path. The younger generation of such communities are
generally not interested in pursuing this occupation for a variety of
reasons including poor remuneration.
b) Poor remuneration: Poor remuneration derived from weaving as an
occupation prompts even the old generation weavers to look for
alternate jobs, of late, job under employment guarantee scheme of GoI.
c) Competition from Powerlooms: Competition from Powerlooms pose
serious threat to the handloom industry; Products manufactured in
Powerlooms, available in the markets at cheaper prices, substitute
handloom fabrics. On one hand the productivity of powerlooms is 10-12
times more than that of handlooms while on the other hand, powerlooms
can easily replicate most products of the handloom sector. In fact there
has been a practice of marketing products manufactured in powerlooms
under the label of handloom items. It was learnt during the field visits
that some people are selling powerloom products in the label of
‘handloom products’ specifically mentioning the geographical names of
certain popular handloom pockets in Kerala.
102 Department of Applied Economics, Cochin University of Science and Technology

Handloom Industry in Kerala-An Overview
d) Difficulties in procuring raw materials in adequate quantities, especially
on account of working capital shortages, absence of diversified product
range, inappropriate technology, poor loom conditions and incapability
for professional marketing also pose severe constraints in the
development of the handloom sector.
e) Lack of working capital: Though NABARD provides refinance facilities to
the State co-operative banks and RRBs for financing requirements of
primary and apex weavers’ cooperative societies, the service charges levied
by these institutions result in the doubling of interest rates for the societies.
f) Poor infrastructure & Working environment: Investment in handloom
sector has thus far been limited to input supply costs. There is no
investment intended towards the overall growth of the sector. While
there have been some piece-meal projects such as workshed-cum-
housing and project package schemes, they merely perpetuate the
existing conditions. The production and working environment in the
handloom industry is poor and in the case of cottage-type handloom
societies, where the loom is attached to the houses of the weavers, the
situation is pathetic. The pit-looms in the cottage type make the
weaving practically difficult during rainy season, making these
handloom workers virtually unemployed. Though the work shed and
factory type societies offer a better environment compared with the
cottage type societies, the poor infrastructure facilities pose huge
limitation for their proper tapping of the resources.
Some of the photographs taken during the field visits are given in Figure
No.3.4 for giving a quick glance of the working environment in handloom
Co-operative societies in Kerala.
Department of Applied Economics, Cochin University of Science and Technology 103

Chapter 3
Figure No. 3.4 A quick glance of the working environment in Handloom
Industry
Inside view of Ooruttabalam Society in TVM. The pit is wet, especiallyduring rainy season.
A view of Thettivila HWCS and Ooruttabalam Society in TVM fromoutside
Inside view of Puzhathi HWCS in Kannur, and Vanaja HWCS at Kannurwhere workers are working among the large number of abandoned looms
104 Department of Applied Economics, Cochin University of Science and Technology

Handloom Industry in Kerala-An Overview
Outside view of Royal HAWCS at kannur and KamukincodeHWCS at TVM
g) Lack of Facilities for Dyeing and other pre-loom operations: Another
major problem facing handloom sector is lack of good infrastructure to
develop dyeing and other pre-loom operations. The co-operative
societies are not in a position to come out with better dyeing units,
which is economical at large size and require huge investment. Only few
societies have dyeing centres with modern facilities such as water
softening plants or dyeing chambers. Dyeing is unorganized and marked
with low end applications. The regulatory bodies like Panchayath do not
give statutory permission to set up dye house as it is a polluting activity
and likely to harm the environment if proper treatment facility is not set
up to treat the waste. Setting up of Dye Houses individually is costly
and hence not feasible. Hence majority of the co-operative societies /
weavers still undertake the dyeing activity through dyeing houses in
neighboring states or buy processed yarn, which is ready to use. All this
has a significant bearing on the quality of final products, wages weavers
get and the profit societies make.
Department of Applied Economics, Cochin University of Science and Technology 105

Chapter 3
h) Lack of forward Integration: Societies seldom undertake any forward
integration due to lack of funds and also lack of infrastructure support
for design capabilities.
i) Marketing : The supply chain in the handloom industry in Handloom
sector in Kerala is extremely fragmented mainly due to lack of co-
ordination between industry and relevant trade bodies. With the
existence of many intermediaries between the weaver and the final
consumer, each intermediary not only leads to lengthening of lead times,
but also adds to costs. By the time the product reaches the final
consumer, its price increases manifold.
j) Co-ordinating agencies: The problems of the handloom industry are not
new. The issues and the means to solve the problems were discussed at
length by the academicians, policy makers and financial institutions over
the last 6 decades. All these studies have pointed out one thing in
common. The handloom industry is a “Low Market, Low Margin”
industry and the government support is more on ‘emotional’ and
‘political’ considerations. To change this and make the industry
sustainable, the handloom sector should come out with products;
a) that people need
b) with trendy designs
c) of high quality and
d) at most competitive price
If the above are ensured, the demand will pick up automatically. These
necessitate a high level co-ordination by the departments and agencies working
under it-to conduct, if necessary, international handloom trade fairs in Kerala,
106 Department of Applied Economics, Cochin University of Science and Technology

Handloom Industry in Kerala-An Overview
Global fairs in Kerala, National/International Handloom Fashion shows,
International exhibitions, roping prominent local textile manufacturers and
traders for undertaking forward integration activities and associating with trade
bodies like CII, FICCI, Chamber of Commerce etc for better brand building and
technology transfer. However, despite the liberal support extended to the sector
by the government, many such things are yet to happen. The activities of the
Directorate of Handloom & Textiles confine most often to implementing
schemes announced by the governments and it seldom travels beyond the
customary routes of providing funds to the intended beneficiaries. The
inefficiency of the developmental and promotional agencies like Hantex and
Hanveev added further blow to the sector deepening the crisis.
The costing on a select few products procured from the weavers are
given in the Table No.3.8
Table No. 3.8: Product Pricing Method by Hantex as on 2.05.2012
(in Rupees)
Sl.No
Name of theFabric
Basic ProductCost at the
time ofprocurementfrom Weavers
Charges levied byHantex on the
product FinalProduct cost
AdmnOH of20% of
PC
Margin15 & on
B
1 Bed Sheet Colour 237 47.4 42.66 327.06
2
Pillow Cover
White (18X 28) 76.33 15.266 13.7394 105.34
3
Bed Sheet Colour
(90X108) 493.2 98.64 88.776 680.62
4
Satin Sheet
(60X90) 553.84 110.768 99.6912
764.29
9Source: Hantex
Department of Applied Economics, Cochin University of Science and Technology 107

Chapter 3
All the products procured by Hantex are sold using the same costing
method. Moreover, the payments from Hantex and Hanveev is not prompt
which in turn affect the working capital availability of these societies who are
already crippled by the dearth of working capital from banks. The inefficiencies
connected with Hantex/Hanveev, its deficiencies in the procurement and
marketing networks, lack of adaptability and excessive political interference
etc., limit or affect their ability to deliver enhanced customer satisfaction and
economic value through synchronized management of the flow of goods and
customer feedbacks. This probably could be due to the fact that Hantex and
Hanveev are independent government agencies not having organic links with
the manufacturing sector.
Thus the handloom industry in Kerala needs improvement in the
following operational areas;
1. Labour Force
2. Raw material procurement
3. Marketing
4. Credit & Investment
5. Technology and Infrastructure
6. Co-ordination for effective Supply Chain Management.
……… ………
108 Department of Applied Economics, Cochin University of Science and Technology

Handloom Industry in Kerala-An Overview
Department of Applied Economics, Cochin University of Science and Technology 109

As already mentioned in Chapter 1, the Government of India has been
following a policy of promoting and encouraging handloom sector through a
number of policies and programmes. Most of the schematic interventions of the
Government of India in the Ninth and Tenth Plan period have been through
subsidies and grants. However, in the face of growing competitiveness in the
textile industry both in the national and international markets and the free trade
opportunities emerging in the post MFA environment, a growing need has been
felt for adopting a focused, yet flexible and holistic approach in the sector to
facilitate handloom weavers to meet the challenges of a globalised environment.
A need has also been felt to empower weavers to equip them for growth and
diversification in line with the emerging market trends. The objective of the 11th
Plan for the handlooms sector was to develop a strong, competitive and vibrant
sector that would provide sustainable employment leading to economic
development, particularly of rural areas. Accordingly, during the 11th Plan, the
Government of India implemented the Integrated Handlooms Development
Scheme (IHDS). The scheme is an attempt to facilitate the sustainable
development of handloom weavers located in and outside identified handloom
clusters into a cohesive, self-managing and competitive socio-economic unit.
4.1 Integrated Handlooms Development Scheme (IHDS)
Integrated Handlooms Development Scheme (IHDS), implemented during
the XI Plan, has been formulated as a Centrally Sponsored Plan Scheme by merging
the essential components, with or without modifications, of the four schemes i.e.
Deen Dayal Hathkargha Protsahan Yojana (DDHPY), Integrated Handloom Training

Overview of the IHDS – CDP, Study Area and Select Handloom Clusters
Project (IHTP), Integrated Handloom Cluster Development Scheme (IHCDS) and
Workshed-cum-Housing Scheme, implemented during the 10th Plan. There are four
components of the Scheme as shown in the Table No. 4.1.
Table No.4.1 Components of the Integrated Handlooms Development
Scheme (IHDS)
Sr. Scheme ComponentsA. Cluster Development
Programme Clusters having weavers in the range of 300-500 nos
B Group Approach To be implemented in the project mode outside the cluster incontiguous geographical areas for small weaver group of 10 Nos
C Handloom Organisations
Marketing Incentive for Strengthening of Handloom Organisations
D Others For encouraging innovative ideas, projects and products
Source: Development Commissioner, (Handlooms) Ministry of textiles, GoI
Of the four components offered, the Cluster Development Programme under
IHDS is the one that promotes clusters in Handloom. Hence the research is on
the Cluster Development Programme implemented as part of the IHDS.
4.2 Integrated Handloom Development Scheme- Cluster Development
Programme (IHDS- CDP)
The cluster development approach focuses on formation of weavers’
groups as a visible entity so that the groups become self-sustainable. 625
clusters, each covering about 300 to 500 handlooms was planned during the XI
Plan period. This included the 100 clusters for which diagnostic study have
been completed during the year 2006-07 and the clusters announced in the
Budget for the year 2007-08.
4.2.1 Objectives of the Scheme
The main objective of Cluster Development Programme under IHDS:
Department of Applied Economics, Cochin University of Science and Technology 110

Overview of the IHDS – CDP, Study Area and Select Handloom Clusters
1. to focus on formation of handloom weavers’ groups as a visible
production group in a selected handloom clusters,
2. to assist the handloom Weavers Groups for becoming self –sustainable,
3. to adopt an inclusive approach to cover weavers both within and outside
the Co-operative fold,
4. to up-grade the skills of handloom weavers/workers to produce
diversified products with improved quality to meet the market
requirements,
5. to provide suitable workplace to weavers to enable them to produce
quality products with improved productivity,
6. to provide market orientation by associating entrepreneurs, designers and
professionals for marketing, designing and managing the production,
7. to facilitate process of credit from financial institutions/banks.
8. to encourage co-operatisation of weavers and
9. to provide need based inputs specific to each Cluster/group in a holistic
and flexible manner.
4.2.2 Definition of Cluster under IHDS -CDP
The handloom cluster under IHDS-CDP is defined as a place where
there is a large concentration of handlooms, producing handloom fabrics that
would be in tune with the market demands. A cluster can be formed by
handlooms in the range of 300-500, located in close proximity in two adjoining
revenue subdivisions/ villages within an administrative district or across two
(mostly adjoining) districts.
4.2.3 Project Cost and the Activities Envisaged
The financial assistance for Cluster Development will be a for a
maximum project cost of Rs. 60.00 lacs per cluster, for a project period of 3
Department of Applied Economics, Cochin University of Science and Technology 111

Chapter 4
years. The project proposals are to be prepared in accordance with the
requirements and priorities of the cluster. Activities covered and the maximum
amount allotted under the IHDS-CDP is summarised in the Table No.4.2.
112 Department of Applied Economics, Cochin University of Science and Technology

Overview of the IHDS – CDP, Study Area and Select Handloom Clusters
Department of Applied Economics, Cochin University of Science and Technology 113
Tab
le N
o.4
.2 A
cti
viti
es c
ove
red
un
der
IHD
S-C
DP

Chapter 4
4.2.4 Quantum of Assistance
The quantum of assistance is need based, depending on the requirement
of the cluster, the scope of the activities envisaged in the cluster development
project, technical, financial and managerial capacity of the Cluster
Organization, level of maturity and past track record of the cluster etc. The
maximum permissible project cost for each cluster will not exceed Rs.60.00
lakhs per cluster for a project period of 3 years (including the assistance to the
individual weavers) and will include Central, State and Implementing
agencies/beneficiaries share.
4.2.5 State Level Project Committee (SLPC)
The State Level Project Committee (SLPC) will be headed by the State
Commissioner/ Director of Handlooms & Textiles with representatives drawn
from a reputed NGOs working in the Handloom Sector, Handloom
Organization (Apex Weavers’ Coop. Society or State Handloom Corporation),
leading Exporter, Officer In-charge, Weavers’ Service Centre concerned and a
weaver from the group of SHGs. SLPC will be responsible for scrutinizing the
project proposals, validating the action plan, monitoring, evaluation etc. and
will also recommend the implementing agency
4.2.6 Cluster Implementing Agency
State Governments/UTs will receive proposals from the Implementing
Agencies i.e; State Government offices like; Directorate of Handlooms and
allied offices, State Handloom Corporations, Apex Societies, NGOs
(recommended by the State Governments and approved by Office of the
Development Commissioner for Handlooms). The Implementing Agencies (IA)
are Director of Handlooms & Textiles and allied offices of the State Govt., State
114 Department of Applied Economics, Cochin University of Science and Technology
Overview of the IHDS – CDP, Study Area and Select Handloom Clusters
Handloom Corp., Apex Co-operative Societies, Organisations and NGOs
recommended by the State Govt. and approved by this office, National Level
Handloom Organisations and Central Government Organisations.
i. To identify the Cluster Development Executive (CDE),
ii. To interact with the State Govt./State Level Project Committee for
training of the CDEs,
iii. To conduct the baseline survey and diagnostic study,
iv. To prepare a project on the basis of diagnostic study conducted by the
CDE, specifying inter-alia annual action plans, clearly indicating the
requirement of the cluster, activities and expected outputs,
outcomes/deliverables and submit the proposal to the SLPC for its
approval.
v. To implement the project mentioned above within the time limit.
vi. To submit physical & financial progress report periodically and also,
completion report to the State Govt.
4.2.7 Submission of the Proposals and Release of Financial Assistance
4.2.7.1 Initial proposal for the Baseline Survey and Diagnostic Study
Development of each Cluster will be taken up through the State Govts.
or its Implementing Agencies as a Centrally Sponsored Scheme in a project
mode. State Government will invite proposals from Implementing Agencies for
undertaking the Baseline Survey and Diagnostic Study of a cluster(s), which
will be scrutinized and recommended by the SLPC to the Office of the
Department of Applied Economics, Cochin University of Science and Technology 115

Chapter 4
Development Commissioner (Handlooms). Office of the Development
Commissioner for Handlooms will sanction 50 per cent of the amount for
undertaking Baseline Survey and Diagnostic Study of the identified handloom
clusters. Remaining 50 per cent will be released to the IA through the State
Government after submission of the Project Report containing Baseline Survey,
Diagnostic Study Report and the Action Plan duly recommended by the SLPC,
Utilization Certificate (UC) for the amount released towards baseline survey &
diagnostic study, audited accounts etc.
4.2.7.2 Submission of Project Report of Cluster Development, Action Plan
and Release of Assistance.
The Project Report will be considered by a State Level Project
Committee (SLPC), concerned for scrutiny, verification etc. Only proposals that
are found viable and beneficial for the socio-economic development of the
weavers in the cluster will be recommended by the SLPC. The State
Government will forward such project proposals to the Development
Commissioner for Handlooms for approval. After due scrutiny & approval of
such proposals by the Office of the Development Commissioner for
Handlooms, financial assistance shall be released in three installments i.e. upto
30 per cent as 1st installment, upto 40 per cent as 2nd installment and balance
as 3rd installment to the Implementing Agency (IA) for implementation of the
Cluster Development Programme. Release of Central assistance will be made to
the IA through the State Government based on submission of utilization
certificates, audited accounts, physical progress as per action plan etc. as
specified in the project. IA will maintain the records as per the relevant General
116 Department of Applied Economics, Cochin University of Science and Technology

Overview of the IHDS – CDP, Study Area and Select Handloom Clusters
Financial Rules (GFR). State Governments may also send composite Project
Reports, encompassing both the Baseline Survey and Diagnostic Study and the
Cluster Development Action Plan. In such cases, the total cost of the Baseline
Survey and Diagnostic Study as well as upto 30 per cent cost of proposed
Action Plan may be released by the Office of the Development Commissioner
for Handlooms as first installment. In the case of WSC is the implementing
agency, the fund is directly given to it by DC (H) and not through State
Government. The time frame for completion of the cluster project is 3 years.
4.3 Profile of the Study Area and Select Handloom Clusters in
Thiruvananthapuram and Kannur
The geographical area covered by the study includes the revenue
districts of Thiruvananthapuram and Kannur in Kerala State. A brief profile of
these two pockets is given below:
4.3.1 Thiruvananthapuram
Thiruvananthapuram District is the Capital of Kerala. It is located in the
South of the state, bordered by Tirunelveli (Tamil nadu) in the East,
Kanyakumari (Tamil Nadu) in the South and Kollam district in the North and
Arabian Sea in the West. Proximity to the high mountains on the east and the
ocean and lakes on the west has blessed the district with a temperate climate.
Table No.4.3 gives a quick overview of the profile of the
Thriuvananthapuram District.
Department of Applied Economics, Cochin University of Science and Technology 117

Chapter 4
Table No.4.3 General Profile of Thiruvananthapuram District at a
Glance
Thiruvananthapuram at a GlanceArea 2192 Square Kilometers (5.6 per cent of
the total land area of Kerala)District Headquarters ThiruvananthapuramNeighboring District Kanyakumari (Tamilnadu), Thirunelveli
(Tamilnadu) & Kollam (Kerala). Total Population (2011 Census)
33,07,284
Sex Ratio (Females Per 1000 Males) (2011 Census)
1088
Population Density (2011 Census)
1509/Sq.Km
Total Literacy Rate (2011 Census)
92.66 per cent
Taluks 4 – Chirayinkeezhu, Nedumangadu, Neyyattinkara, Thiruvananthapuram.
Villages 120Grama Panchayats 78Block Panchayats 12Muncipalities 4 – Neyyattinkara, Nedumangadu, Varkala,
AttingalMuncipal Corporations 1 – Thiruvananthapuram CorporationLok Sabha Seats 2 – Thiruvananthapuram and
ChirayinkeezhuNiyama Sabha Seats 14Total Cropped Area 1,62,176 HaAverage Annual Rain Fall
1,500mm/annum
Heavy Industries 81 UnitsSmall Scale Industries 23,756 UnitsNational Highways 1 – NH 47 (Covers 80 kms within district)State Highways 1 – MC Road (55 kms)Railway Routes & Stations
82 kms & 20 Stations
Airports 1 – Thiruvananthapuram International
118 Department of Applied Economics, Cochin University of Science and Technology

Overview of the IHDS – CDP, Study Area and Select Handloom Clusters
Airport (Domestic and International)Number of Harbours 1 – VizhinjamCentres of Excellence Technopark, Vikram Sarabhai Space Centre
(VSSC), Rajiv Gandhi Centre forBiotechnology, Indian Institute of ScienceEducation & Research, National Institute forInterdisciplinary Science & Technology, HLLLifecare Limited, BrahMos Aerospace Limited,Central Tuber Crops ResearchInstitute, Tropical Botanic Garden & ResearchInstitute, Sri Chitra Tirunal Institute for MedicalSciences & Technology, Regional CancerCentre, Trivandrum Medical College, Collegeof Engineering Trivandrum, Centre forDevelopment Studies.
Source: Compiled using data from KSIDC/Department of Information-PublicRelations, Government of Kerala
The district is said to be one of the industrially advanced districts in the
state, with the presence of a number of medium and large scale industries. The
district has got 2 Central Sector, 14 State Sector, 1 co-operative sector, 4 joint
sector and 60 private sector medium and large scale industries. The district also
has got a number of small and medium enterprises. The units include oil mills,
cashew factories, cotton textiles, saw mills, printing units, rubber industrial
units, chemical units, match factories, general engineering units and automobile
workshops. Among the traditional industries, coir and handloom are the major
employment providing sectors in the district.
The details of the MSMEs in the District is given in Table No.4.4.
Table.No.4.4 MSMEs in Thiruvananthapuram District
# Type of Industry No. Units
Employment (Nos)
1 Agro Based 4994 125092 Ready made Garments & Embroidery 2495 115983 Wood & Wooden-based furniture 499 14344 Paper & paper products 250 711
Department of Applied Economics, Cochin University of Science and Technology 119

Chapter 4
5 Rubber, Plastic 998 33926 Engineering units 2987 133697 Electrical machinery and transport
equipment
499 2145
8 Repairing & Servicing 250 9359 Others 8991 78617
Total 21962 124710Source: DIC Thiruvananthapuram
There is an Industrial Estate at Pappanamcode and Industrial
Development Centre at Kochuveli. Technopark, the first park for the
development of electronics and information technology in the country was set
up in Thiruvananthapuram. KINFRA, has set up three industrial parks and
KSIDC has set up one Life Science park in the District. The details of the
major industrial parks/estates in the District are given in Table No.4.5.
Table No.4.5 Major industrial parks/estates in the Thiruvananthapuram
District
# Name of the ParkNo.
UnitsInvestment(Rs. lakh)
Employment (Nos)
Area(acre)
Industrial Estate, Veli 14
6
NA NA 108.
63DP Monvila 37 NA NA 27.5
3KINFRA Small Industries
Park, Thiruvananthapuram
56 5271 1508 40
KINFRA International
Apparel
Park,Menamkulam,Thiruv
ananthapuram
20 13590.6 6771 45
KINFRA Film and Video
Park, Thiruvananthapuram
21 23735.35 4268 50
KSIDC –Life Science Park NA NA NA 30Source: Compiled using dada from Economic Review 2011 and data collected
from KSIDC/KINFRA/DIC
120 Department of Applied Economics, Cochin University of Science and Technology

Overview of the IHDS – CDP, Study Area and Select Handloom Clusters
4.3.1.1 Handloom in Thiruvananthapuram
The capital city, apart from its historical importance, has got a prominent
place in the textile map of the country, through its age old traditional handloom
products. It is said that the weavers belong to Saliya community had migrated
from Nagarcoil and Thirunalveli in Tamil Nadu during the time of Balarama
Varma, about 250 years back. Here they produced super fine 'Mundum
Neriyathu; for the need of the Royal family. Soon, the technique of producing
the superfine fabric, spread from them to the local weavers in Balaramapuram
and the surrounding places. Initially they were producing 'Mundu' for men with
0.4cm of width of 'kara' (cross border) with black garn. About 100 years back
the jeri from Surat was brought to Balaramapuram and 'Kasavu Sarees'
production was started. Production at almost all stages use traditional
technologies – hand –plied yarn for plying, pit looms and fly shuttle looms for
weaving and so on.
There was a remarkable continuity in the type of goods that were being
produced in Travancore. In 1883, the cloth in use among the local people was
essentially waist and head cloth. By 1906 the range had widened to include
Neriyathu, dupatta, Kavani and Muri. By 1940, the major products were Mundu
Thoruthu, Neriyathu. Even today all types of mundu (double Veshties, single
veshties, settu mundu) neriyathu and thorthu constitute the bulk of the product
mix in south Trivandrum, suggesting that the product mix in this region had
remained unchanged since last 70 years or so.
As mentioned earlier, the industry in Travancore was traditionally
differentiated in its product mix. While one set of the industry produced fine
Department of Applied Economics, Cochin University of Science and Technology 121

Chapter 4
varieties, catering to the royal, aristocratic and other higher strata of Travancore
society, the remaining section concentrated on the production of coarse
variation of cloth. It may also be noted that the industry in Travancore was
essentially oriented towards the domestic market. Today the district has got 247
societies and 26802 weavers producing fine cotton textures.
Considering the handloom tradition and wide prevalence of the
handloom co-operative societies of the district, Government of India under
IHDC-CDP sanctioned 11 handloom clusters for the District, out of which 8
Clusters are working. The District map in Map No. 4.1 shows the location of
the handloom clusters in Thiruvananthapuram
Map. No. 4.1 Handloom Clusters in Thiruvananthapuram District under IHDS-CDP
122 Department of Applied Economics, Cochin University of Science and Technology

Overview of the IHDS – CDP, Study Area and Select Handloom Clusters
Source: Compiled.
4.3.2 Profile of the Study Area-II. Kannur
Kannur District or Cannanore District is one of the 14 districts in the
state of Kerala, India. The town of Kannur is the district headquarters. Kannur
District is bounded by Kasaragod District to the north and Kozhikode District to
the south. To the east the district is bounded by the Western Ghats range, which
forms the border with Karnataka state, in its districts of Kodagu and
Chamarajanagar. The Arabian Sea lies to the west.
Kannur is one the most urbanised districts in Kerala having more than 50
per cent people living in urban areas. Kannur has an urban population of
1,212,898 which is second largest in Kerala after Ernakulam district. Table No.
4.6 gives a quick overview of the profile of the Kannur District
Department of Applied Economics, Cochin University of Science and Technology 123
Non Working

Chapter 4
Table No.4.6 General Profile of Kannur District at a Glance
Area 2,996 Square Kilometers (7.7 per cent of the total land area of Kerala)
Neighboring District Kasargod, Wayanad, Kozhikode
Total Population (2011 Census)
25,25,637
Sex Ratio (Females Per 1000 Males) (2011 Census)
1,133
Population Density (2011 Census)
852/Sq.Km
Life Expectancy at Birth (2011 Census)
75.6 years
Per Capita Income (2009-10) (Constant Prices)
Rs 50,623/
Total Literacy Rate (2011 Census)
95.41 per cent
Taluks 3 – Kannur, Thaliparamba, Thalassery
Villages 129
Grama Panchayats 81
Block Panchayats 11
District Panchayat Constituencies
26
Municipalities 6 – Kannur, Thaliparamba, Koothuparamba, Thalassery, Payyannur, Mattannur
Lok Sabha Seats 1 – Kannur
Niyama Sabha Seats 11
Total Cropped Area 2,42,181 Ha
Average Annual Rain Fall 3,438 mm/annum
Heavy/Medium Industries 12
Small Scale Industries 11,282 Units
National Highways 1 – NH 17
Airports Kannur International Airport is under construction near Mattannur
124 Department of Applied Economics, Cochin University of Science and Technology

Overview of the IHDS – CDP, Study Area and Select Handloom Clusters
Centres of Excellence National Institute of Fashion Technology, Institute of Handloom and TextileTechnology, Apparel Training and Design Centre,Indian Naval Academy.
Source: Compiled using data from KSIDC/Department of Information-Public Relations, Government of Kerala
Kannur district has had its industrial importance from very early days.
Blessed with a variety of factors such as good soil, salubrious climate, rich
forests, enormous fishing potential, minerals as well as infrastructural facilities
like road, rail, inland water transport, etc., the district offers ample scope for the
development of industries. Nevertheless, Kannur is an industrially backward
district in the state. There are only one major and five mini industrial estates in
the district. Keltron Complex, Mangattuparamba and Western India Plywood's,
Valappattanam are the only two major industries. The Western India Plywoods
is one of the biggest wood based industrial complexes in South East Asia. The
district has 12 medium-scale industries, most of which are either cotton textile
or plywood manufacturing. There are 6934 small scale industrial units in the
district. Only 4828 units are working now. About one lakh people depend on
the textile industry for livelihood. (DIC, Kannur)
Textiles, beedi and coir are the important traditional industries in the
district. The textile industry which accounts for 40 per cent of all SSI units in
the district was introduced in early 19th century by the German Basal Mission.
The first ready-made garment unit at Kannur and the first hosiery unit at
Kuthuparamba were started at the end of the 19th century. The beedi industry
provides employment to about 28,000 people. Famous beedi co-operatives like
Department of Applied Economics, Cochin University of Science and Technology 125

Chapter 4
'Dinesh Beedi' is in Kannur district. The coir industry which uses traditional
technology provides employment to about 11,000 workers.
Details of the MSME in the District are given in the Table 4.7.
Table No. 4.7 MSME in Kannur District
# Type of Industry No ofunits
Employment(Nos)
1 Cotton Textile 112 5862 Wood & Wood-based furniture 44 2304 Paper & paper products 10 485 Leather Based 9 296 Rubber, Plastic & Petro based 4 26
Engineering units 148 4587 Electrical machinery and
transport equipment10 47
8 Glass & ceramics 2 69 IT & ITES 16 68.
10 IT Hardware 1 411 Plastics 10 6612 Food & Agro based 100 41413 Service activities 55 19814 Miscellaneous 218 964
Total 739 3144Source: DIC, Kannur
The major industrial enterprises in Kannur are based on Textile,
Handloom and Wood-based industry. The hosiery industry allied to the
handloom and cotton textiles is one of the oldest and most important. The
126 Department of Applied Economics, Cochin University of Science and Technology

Overview of the IHDS – CDP, Study Area and Select Handloom Clusters
handloom clothes of Kannur had won international reputation. The district
houses a few industrial parks for the promotion of industries.
Major industrial parks in the District is given in the Table No.4.8.
Table No.4.8 Major industrial Parks/Estates in Kannur District
# Name of the ParkNo ofUnits
Investment(Rs. lakh)
Employment (Nos)
Total Land( acre)
1 DP Andoor 167 NA NA 59.312 KSIDC Industrial Growth
Centre, Kuthuparamba28 4700.00 1100 252
3 Kinfra Textile Park,
Nadukani12* 3057.8 3095 127
4 KINFRA Small Industries
Park, Thalassery22** 4267.42 1133 50
Source: Compiled using data from Economic Review 2011 & 2012 and data collected from KSIDC/KINFRA/DIC*9 & **12 units are under implementation.
4.3.2.1 Handloom & Handloom Clusters in Kannur
Kannur - the land of looms and lures is situated towards the northern
part of Kerala. The evolution of the industry in Kannur can be traced from the
records of the Basel Mission Activities. Legend was it that the Chirakkal Rajas
of Kannur brought weaver families from the traditional weaving communities
of Saliya from other regions and settled them in colonies. Though Basel
Mission commenced its activities in India in 1834 at Mangalore, weaving was
taken up only in 1844. Weaving establishments in early days were attached to
the Mission house itself. Later establishments were started at Kannur (1852)
and Calicut (1859). By 1913, both these establishments had huge complexes
with over 600 workers each. In 1911, for better management, these were
merged under the name Basel Mission United Weaving Establishment. It was
Basel Missionaries who introduced frame looms in Kannur (today almost all
Department of Applied Economics, Cochin University of Science and Technology 127

Chapter 4
looms in Kannur are of this type, the co-operative societies which are covered
in the survey had all framelooms, except Morazha which had 3 pitlooms for silk
weaving) as early as 1847. Also the introduction of fly shuttle looms, jacquard
looms (1872) by the missionaries helped the weavers of Kannur widen the
range of their products. They were mainly tablecloths, napkins, handkerchiefs,
cotton check shirts, superior damask linen and so on. Later, furnishing and
upholstery fabrics for which the industry is now well known came into being.
It became more and more specialized in export-oriented production.
Considering the importance of the handloom products from the region,
especially for the export oriented products, Govt of India sanctioned 5 handloom
clusters in the Kannur District, second highest number of clusters after
Thiruvananthapuram. All the 5 clusters are working. The District map in Map
No. 4.2 shows the location of the 5 handloom clusters in
Map No. 4.2. Handloom Clusters in Kannur District under IHDS-CDP
Source: Compiled.
4.4 Profile of Select Handloom Clusters
128 Department of Applied Economics, Cochin University of Science and Technology

Overview of the IHDS – CDP, Study Area and Select Handloom Clusters
Under the IHDS, GoI had sanctioned 24 clusters in Handloom sector in
Kerala during 2006-2007. The district wise list of Handloom clusters approved
under IHDS-CDP is shown in the Table No.4.9
Table No.4.9 District-wise List of Handloom clusters
District Sl.NoThiruvananthapuram 11Kollam 1Pathanamthitta 0Alappuzha 0Kottayam 0Idukki 0Eranakulam 1Thrissur 1Palakkad 3Malappuram 0Kozhikkode 2Wayanad 0Kannur 5Kasaragod 0Total 24Source: Directorate of Handlooms & Textiles, GoK
Out of the above 24 clusters only 20 are functioning. The details of the
working clusters are given in Table 4.10
Table No.4.10 District-wise list of working clusters
District (No ofclusters)
Nos
Name of thecluster
Implementing Agency
Thiruvananthapuram (8)
1 Kozhode Cluster Consortex 2 Ramapuram
ClusterConsortex
3 Travancore Cluster
Haneev
4 Ooruttambalam Cluster
Hantex
5 Swadeshi Cluster Consortex 6 Naveena Cluster Consortex7 Thettivila Cluster Hantex
Department of Applied Economics, Cochin University of Science and Technology 129

Chapter 4
8 Neyyatinkara Cluster
Consortex
Kollam(1) 1 Chathannoor Cluster
Hantex
Ernakulam (1) 1 Chennamangalam cluster
Hantex
Thrissur (1) 1 Kuthampully HantexPalakkad (2) 1 Elappully Cluster Elappully HWCS Ltd
No.F-10192 Palakkad cluster Hanveev
Kozhikkode (2) 1 Vadakara Cluster DIC KOzhikode2 Kozhikkode
clusterHantex
Kannur (5) 1 Payyanoor, Cluster
WSC, Kannur
2 ICON Cluster Irinavu Weavers Co-operative Society
3 Morazha, Cluster Morazha WICS Ltd, No.C-5
4 Kalliasseri Cluster Kalliasseri WICS Ltd, No.C-12
5 Chirakkal Cluster Kannur Handloom Weavers Societies Consortium (HANCO)
Total (20) 20Source: Directorate of Handlooms and Textiles, GoK & Field Survey
Out of the four clusters which are not working 3 clusters (Nedumangad
Cluster, Bhagavathi Nada, Krishna Mahila) are in Thiruvananthapuram
District and the remaining one cluster (Sree Padam) in Palakkad. All the
clusters became inactive because of the clash of interest by the
members.
Out of Rs.1429 lacs sanctioned For 24 clusters under the Programme,
the 13 sample clusters received an amount of Rs.771.71 lacs. This is 54 per
cent of the total amount sanctioned for the state.
The details of the project cost approved for the 13 sample clusters and its
sharing pattern is given in the Table No.4.11
130 Department of Applied Economics, Cochin University of Science and Technology

Overview of the IHDS – CDP, Study Area and Select Handloom Clusters
Table No.4.11 Approved Project Cost for Sample Clusters (Rs.lacs)
No
Name of theCluster
Sharing of Project Cost TOTALCentr
alState IA/Ben
Total ProjectCost
A TVM
1 Kozhode Cluster 51.72 7.53 0.47 59.72
2Ramapuram Cluster
53.27 5.96 0.67 59.90
3Travancore Cluster
52.11 6.48 1.40 60.00
4Ooruttambalam Cluster
52.72 6.08 1.20 60.00
5 Swadeshi Cluster 53.32 5.66 0.67 59.65
6 Naveena Cluster 53.32 5.66 0.67 59.65
7 Thettivila Cluster 53.98 5.02 1.00 60.00
8Neyyatinkara Cluster
53.75 5.78 0.45 59.99
Total424.1
948.17 6.53 478.91
per cent 89 10 1 --
B KNR
1Payyanoor Cluster
45.23 7.48 0.80 53.50
2 ICON Cluster 50.86 7.73 0.93 59.50
3 Morazha Cluster 52.38 6.62 0.90 59.90
4Kalliasseri Cluster
52.48 6.52 0.90 59.90
5 Chirakkal Cluster 51.08 8.12 0.80 60.00
Total252.0
236.46 4.33 292.80
per cent 86 12 1 --
Grand Total (A+B)
676.21
84.63 10.86 771.71
per cent as against the total received
88 11 1 100.00
Source: Directorate of Handlooms and Textiles, GoK & Field Survey
Department of Applied Economics, Cochin University of Science and Technology 131

Chapter 4
4.4.1 A Brief Profile of the Select Handloom Clusters
4.4.1.1 Kozhode Handloom Cluster
The Kozhode Handloom Weavers Cluster No. T2881/2007 was
registered under the charitable societies Act. The Cluster consists of 325
weavers having their own looms in their homes and weavers in the co-operative
fold working in common work shed. The members from 3 handloom co-
operative societies in Thiruvananthapuram form part of this cluster.
The details of societies and its members who are part of the Kozhode
cluster are given in Table 4.12
Table No. 4.12 Member details of Kozhode Cluster
Sl.No
Name of the societyYear of
formationNo of
members1 Kozhode HWCS Ltd No.3567 1955 2032 Janatha HWCS Ltd No.H IND (T) 324 1979 67
3Athiyannoor Panchayath Model HWCS
LTD No H (T) 3091977 55
Total 325Source: Field Survey
The cluster is spread over the area of Kozhode and Athiyannoor in
Neyyattinkara Taluk, Thiruvananthapuram The weavers under the Kozhode
Cluster formed SHG’s namely Sreemuruka Handloom Weavers Swayam
Sahaya Sangam, Prabodhini Handloom Weavers Swayam Sahaya Sangam,
Dhanalekshmi Handloom Weavers Swayam Sahaya Sangam to become self
sufficient.
The total project cost, as approved by the DC Handlooms, GoI comes to
Rs.59.72 lacs. The cluster implementing agency is Consortex. Consortex is a
Handloom consortium of Nine Industrial Handloom weavers' co-operative
132 Department of Applied Economics, Cochin University of Science and Technology
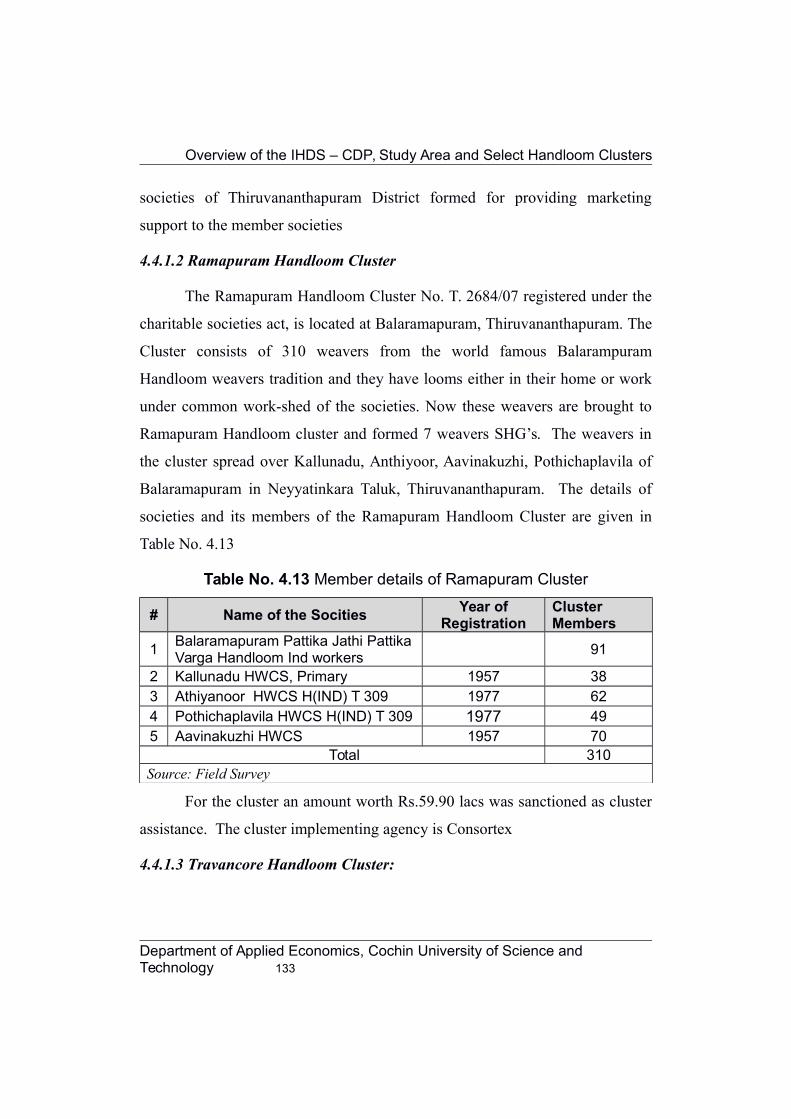
Overview of the IHDS – CDP, Study Area and Select Handloom Clusters
societies of Thiruvananthapuram District formed for providing marketing
support to the member societies
4.4.1.2 Ramapuram Handloom Cluster
The Ramapuram Handloom Cluster No. T. 2684/07 registered under the
charitable societies act, is located at Balaramapuram, Thiruvananthapuram. The
Cluster consists of 310 weavers from the world famous Balarampuram
Handloom weavers tradition and they have looms either in their home or work
under common work-shed of the societies. Now these weavers are brought to
Ramapuram Handloom cluster and formed 7 weavers SHG’s. The weavers in
the cluster spread over Kallunadu, Anthiyoor, Aavinakuzhi, Pothichaplavila of
Balaramapuram in Neyyatinkara Taluk, Thiruvananthapuram. The details of
societies and its members of the Ramapuram Handloom Cluster are given in
Table No. 4.13
Table No. 4.13 Member details of Ramapuram Cluster
# Name of the SocitiesYear of
RegistrationCluster Members
1Balaramapuram Pattika Jathi PattikaVarga Handloom Ind workers
91
2 Kallunadu HWCS, Primary 1957 383 Athiyanoor HWCS H(IND) T 309 1977 624 Pothichaplavila HWCS H(IND) T 309 1977 495 Aavinakuzhi HWCS 1957 70
Total 310Source: Field Survey
For the cluster an amount worth Rs.59.90 lacs was sanctioned as cluster
assistance. The cluster implementing agency is Consortex
4.4.1.3 Travancore Handloom Cluster:
Department of Applied Economics, Cochin University of Science and Technology 133

Chapter 4
Travancore Handloom cluster covers the Kodangavila, Nellimoodu and
Edathekonam of Neyyattinkara Taluk of Thiruvananthapuram. The beneficiaries
of the cluster are 396 weavers of Table No.4.14
Table No. 4.14 Member details of Travancore Cluster
# Name of the SocitiesYear of
RegistrationCluster Members
1Kamukincode HWCS Society 1954
150
2 Punnakulam Society 1954 1863 Sabarimuttam HCWS LTD 1987 60
Total 396Source: Field Survey
The Approved Project Cost is Rs. 60.00 lacs. Hanveev, Regional
Office, Nemom, Thiruvananthapuram is the Implementing Agency for the
Travancore Cluster
4.4.1.4 Ooruttambalam Handloom Cluster
Ooruttambalam Handloom Cluster comprises 498 members in the 9
primary handloom co-operative Societies in the Ooruttambalam handloom
circle. It is a society registered under charitable Societies Act. The cluster
covers members from the panchayaths of Malayinkizhil, Maranallur, Pallichal,
and Balaramapuram of Thiruvananthapuram District. The rural artisan weavers
of this areas are famous in making the Balaramapuram Sarees and Dothies,
Kasavu Sarees of super fine cotton texture with handcrafted special designs,
Matching Sets and Curtain materials.
The details of societies and its members of the Ooruttambalam
Handloom Cluster are given in Table No.4.15
Table No. 4.15 Member details of Ooruttambalam Cluster
# Name of the SocietiesYear of
Formation
ClusterMembers
134 Department of Applied Economics, Cochin University of Science and Technology

Overview of the IHDS – CDP, Study Area and Select Handloom Clusters
1 Narimamoodu HWSC Ltd No.3326, 1954 81
2Visakhom Hanloom Weavers Co-operative Society Ltd No. H.IND (T) 623
1996 28
3 Valiyarathal HWCS Ltd H.124 1956 83
4Kumaranasan Memorial Handloom Weavers Co-operative Society H. IND (T) 384
1984 49
5 Vellappally HWCS Ltd H T 314 1976 73
6 Thempamuttam HWCS Ltd no:H. IND T.339 1980 65
7Anchiravila Vanitha Handloom Weavers Co-operative Society Ltd T 634HWCS
1996 40
8 Gandhismaraka HWCS 1981 36
9Ooruttambalam Handloom Weavers Co-operative Society Ltd No.3437
1954 43
Total 498
Source: Field Survey
Approved Project Cost for the Ooruttambalam Handloom Cluster is
Rs.60.00 lacs. Hantex, Thiruvananthapuram is the implementing agency.
4.4.1.5 Swadesi Handloom Cluster
The Swadeshi Handloom cluster. No. T 2671/07 was registered under the
charitable Societies Act. The Swadeshi Handloom cluster consists of 350
traditional weavers Balaramapuram handloom weavers, Neyyatinkara Taluk,
Thiruvananthapuram. It covers individual weavers having their own looms at
home. weavers under master weavers and weavers in the co-operative fold
working in common work shed. Now these weavers are brought in to Swadeshi
Handloom cluster and formed seven BPL weavers self help group viz. Pulari
Weavers Self Help Group, Probhodhini Weavers Self Help Group, Kairali
Weavers Self Help Group, Sivasakthi Weavers Self Help Group, Gandhi
Smaraka Weavers Self Help Group, Gurukrupa Weavers Self Help Group,
Gurupadam Weavers Self Help Group. The details of the societies and
members of the Swadeshi handloom clusters are given in Table No.4.16
Table No. 4.16 Member details of Swadesi Cluster
Department of Applied Economics, Cochin University of Science and Technology 135

Chapter 4
# Name of the SocietiesYear of
FormationCluster
Members1 Keezhathil HWCS 1958 1252 Karichal HWCS 1954 150
3 Kuttaninnathil HWCS 1957 75
Total 350Source: Field Survey
Approved Project Cost for the Swadesi Handloom Cluster is Rs. 59.65
lacs . The cluster implementing agency is Consortex.
4.4.1.6 Naveena Handloom Cluster
The Naveena Handloom Cluster No. 2706/07 was registered under the
charitable societies act. It consists of 320 weavers from Balaramapuram area
having own loom at home or weavers under master weavers. The details of the
societies and its members of the cluster are given in Table No. 4.17
Table No. 4.17 Member details of Naveena Cluster
# Name of the SocietiesYear of
FormationCluster Members
1 Arumathura HIWCS Ltd no 157 1957 245
2Thirupuram Harijan Vanitha HWICS
H(IND) T 382 1981 75
Total 320Source: Field Survey
They are now formed into five weavers self help group viz, Vaishnavi
Weavers Self Help Group, Pulari Weavers Self Help Group, Sai Weavers Self
Help Group, Kripa Weavers Self Help Group, Daya Weavers Self Help Group.
Narivammodu, Neyyatinkara Taluk, Thiruvananthapuram.
The approved Project Cost for the Naveena handloom Cluster is
Rs. 59.65 lacs. The cluster implementing agency is Consortex
136 Department of Applied Economics, Cochin University of Science and Technology

Overview of the IHDS – CDP, Study Area and Select Handloom Clusters
4.4.1.7 Thettivila Handloom Cluster
Thettivila handloom cluster, consisting of 300 members in the 2 handloom
co-operative societies, viz Sree Vellayani HWCS Ltd No.328, and Thettivila
HWCS, is operating from Balaramapuram. The area of the cluster is spread over
Kalloyoor, Peringamala and includes traditional weaving centres situated in
Peringamala Trivandrum District. The village is near to Balaramapuram. The Table
No.4.18 shows the membership details of the handloom cluster.
Table No. 4.18 Member details of Thettivila Cluster
# Name of the SocietiesYear of
FormationCluster Members
1Sree Vellayani HWCS Ltd
No.3281979 200
2 Thettivila HWCS 1996 100Total 300
Source: Field Survey
The approved Project Cost for Thettivila Handloom cluster is Rs. 60.00
lacs and Hantex is the implementing agency for the Cluster.
4.4.1.8 Neyyatinkara Handloom Cluster
The Neyyattinkara Handloom cluster (No.T. 1031/08) was registered
under the Charitable Societies Act on 25.06.2008. It consists of 360 traditional
weavers from Balaramapuram. The cluster covers individual weavers having
their own looms in their home, weavers under master weavers and weavers in
the Balaramapuram handloom industrial co-operative society working in
common work shed. Now these weavers are brought under Neyyattinkara
Handloom cluster and formed 9 weavers self help group out of which seven are
women handloom weavers self help group. It covers the area of Anthiyoor,
Ampellor Desam of Kottukal Village and No1,2,3 ward of Neyyatinkara
Department of Applied Economics, Cochin University of Science and Technology 137

Chapter 4
Municipality. The structure of the Neyyatinkara handloom cluster is given in
Table No.4.19.
Table No. 4.19 Member details of Neyyatinkara Cluster
# Name of the SocietiesYear of
FormationCluster Members
1 Individual weavers --- 1502 SHG’s 2007 180
3Balaramapuram Handloom WCIS
Ltd No.HIND (T) 2581969 30
Total 360Source: Field Survey
The approved Project Cost for the Neyyatinkara Handloom Cluster is
Rs. 59.99 lacs and its implementing agency is Consortex.
4.4.1.9 Payyannur Handloom Cluster
The Payyannur Handloom weavers consortium is registered under
charitable society Act No. S. No. 1050/08, Act XXI of 1860 dated 10.12.2008.
The cluster is located at Payyannur and covers grama Panchayaths of
Karivellur, Kodakka, Kunhimangalam, Churuthazham, Panapuzha, Madayi and
one Payyannur Municipality. The cluster has 8 general weavers Self Help
Groups (SHGs); 8 B.PL. Vanitha Weavers SHGs and 5 Vanitha Weavers SHGs
and covers 363 Handloom Weavers. 80 per cent of the members are women.
These weavers are working mainly in the common work shed of the following
weavers co-operative societies and nearby weavers house hold. The details of
the members under the cluster is shown in Table No.4.20.
Table No. 4.20 Member details of Payyannur Cluster
SlNo
Name of the SocietyYear of
Incorporation
No ofWeavers
1 Payyannur Weavers co-operative Society 1947 25
138 Department of Applied Economics, Cochin University of Science and Technology

Overview of the IHDS – CDP, Study Area and Select Handloom Clusters
Ltd2 Theru-Mamabalam Weavers Industrial Co-
operative Society Ltd1983 46
3 Kunhimangalam Weavers Co-operative
(P&S) Society Ltd1967 46
4 Kulapuram Weavers Industrial (W.S) Co-
operative Society Ltd1995 50
5 Vellur Weavers co-operative (P& S) Society
Ltd1978 100
6 Karivallur Weavers co-operative Society
Ltd1948 48
7 Sasi Weavers co-operative Society Ltd 1965 48Total 363
Source: Field Survey
Approved Project Cost for the Cluster is Rs. 53.61 lacs. The Weavers
Service Centre, under the Development Commissioner for Handlooms, Ministry
of Textiles, Govt, of India, New Delhi, is the implementing agency for
Payyannur Handloom Cluster. It is noticed that the cluster is widely spread
across the district.
4.4.1.10 ICON Handloom Cluster
ICON handloom cluster is located in the Village of Irinavu, about 12
kms north of Kannur city. The products of these societies have been in the
export market for more than 25 years, supplying to clients in USA, CANADA,
Europe, Japan, Hong-Kong and Australia. The range of products includes
cotton, Linen, silk, furniture cloth, curtain, cushion cover, Table cover, Made-
Department of Applied Economics, Cochin University of Science and Technology 139

Chapter 4
ups, Bed and Bath Linen, Kitchen Linen etc. The cluster consists of 363
members in the following 6 co-operative societies as shown in Table No. 4.21.
Table No. 4.21 Member details of ICON handloom Cluster
SlNo
Name of the SocietyYear of
Incorporation
No ofWeavers
1 Kairali Harijan Weavers Industrial (workshop)
Society Ltd
198435
2 Kulathuvayil Weavers Industrial
(workshop)Co-operative Society Ltd
197764
3 Pappinissery Weavers Industrial
(workshop)Co-operative Society Ltd
1972112
4 Kannapuram Weavers Industrial
(workshop)Co-operative Society Ltd
199540
5 Kannapuram Weavers Co-operative P & S
Society Ltd
195843
6 Taliparamba Weavers (workshop)Co-operative
P & S Ltd
193869
Total 363Source: Field Survey
The approved Project Cost for the Cluster is Rs. 59.51 lacs and its
implementing agency is Irinau Handloom Weavers Societies Consortium,
Kannur.
4.4.1.11 Morazha Handloom Cluster
Morazha handloom Cluster is formed with just one society viz Morazha
Weavers Co-operative P & S Society Ltd, No F1291 with over 325 members. It
is located at Morazha Village Taliparamba Taluk Kannur District, 16 kms north
to Kannur City. The society has 5 production centres at Morazha, Ozhacrome,
Kunharayal, Vellikil and Kadaberi. The society has got its own dye house
140 Department of Applied Economics, Cochin University of Science and Technology

Overview of the IHDS – CDP, Study Area and Select Handloom Clusters
operating from Vellikel, Morazha and Kunharayal. The head office is situated at
Morazha wherefrom the distribution is done. Almost 80 per cent of the
workers are women. Currently the society has 275 active looms with over 400
workers. Approved Project Cost Cluster is Rs. 59.90 lacs. The implementing
agency is Morazha Weavers Industrial Co-operative Society Ltd
4.4.1.12 Kalliassery Handloom Cluster
The Kalliassery Handloom Consortium, located at Kalliassery,
Thaliparamba taluk, Kannur District is registered under the charitable societies
Act XXI of 1860 with registration No.987/08. There are 2 weavers co-operative
societies in this cluster viz, Kalliassery Weavers Industrial co-operative Society
and Irinavu Weavers Industrial Co-operative Society, and cover 404 Handloom
weavers as shown in Table No.4.22.
Table No. 4.22 Member details of Kalliassery Cluster
SlNo
Name of the SocietyYear of Incorporation
of the SocietyNo of
Weavers1 Kalliassery Weavers Industrial co-
operative Society1963 200
2 Irinavu Weavers Industrial Society 1975 204Total 404
Source: Field Survey
The approved Project Cost for the Cluster is Rs. 59.90 lacs and its
Implementing Agency is Kalliassery Weavers Industrial Co-operative Society
whose secretary is the CDE for the cluster.
Department of Applied Economics, Cochin University of Science and Technology 141

Chapter 4
4.4.1.13 Chirakkal Handloom Cluster
The cluster consists of 7 co-operative societies with 497 members spread
over 5 panchayaths, viz Mayyil, Chirakkal, Puzhathi, Azhikode, Pallikunnu.
The cluster is famous for the use of organic cotton materials with herbal dyes,
producing shirting, sarees, dress materials and bed spreads with markets in
USA,UK, Israel, Australia, apart from the domestic market. The cluster
consists of 497 members in 7 societies as shown in Table No.4.23.
Table No. 4.23 Member details of Chirakkal Cluster
SlNo
Name of the SocietyYear of
IncorporationNo of
Weavers1 Chirakkal Weavers Co-operative (P&S)
Society Ltd
1946200
2 Mayyil Weavers Industrial (Workshop) Co-
operative Society Ltd
1977160
3 Vanaja Weavers Industrial Co-operative
Society Ltd
196925
4 Azhikkal Weavers (S&S) Industrial Co-
operative Society Ltd
197737
5 Puzhathi Weavers Industrial (Workshop) Co-
operative Society Ltd
198225
6 Royal Weavers co-operative Society Ltd 1958 257 Pallikkunnu Weavers co-operative Society
Ltd
198325
Total 497Source: Field Survey
Approved Project Cost for the Cluster is Rs. 60.00 lacs. Kannur Weavers
Societies Consortium is the implanting agency for Chirakkal handloom Cluster.
The Map No.4.3 shows the location of the sample handloom clusters
sanctioned under IHDS-CDP in Kerala during 2006-07.
142 Department of Applied Economics, Cochin University of Science and Technology

Overview of the IHDS – CDP, Study Area and Select Handloom Clusters
Map No. 4.3. Handloom Clusters in Kerala under IHDS-CDP
Source: Compiled.
Department of Applied Economics, Cochin University of Science and Technology 143

Chapter 4
……… ………
144 Department of Applied Economics, Cochin University of Science and Technology

The competitiveness and growth of industries in a cluster environment
depends to a great extent, on the interactions of similar sized firms and how
they respond to changing markets. Their strength lies in clustering together
with co-operative competition that opens up efficiency and flexibility gains,
which individual units can rarely attain. A cluster is said to be a success, when it
attains Collective Efficiency-which is the net outcome of both individual action
and consciously pursued joint action. The Integrated Handloom Development
Scheme (IHDS) was a similar attempt for the revival of the handloom sector.
Instead of extending piece-meal financial help and assistance to individual
units, the scheme provides a platform for the Government to extend support in a
comprehensive manner to bigger Groups for the benefit of a larger population.
It tries to facilitate sustainable development of handloom weavers located in
and outside identified handloom clusters into a cohesive, self managing and
competitive socio-economic unit.
The purpose of forming a cluster is to promote the economic and social
well being of its members, mainly the weavers and allied workers. Most of
these weavers are members in any of the handloom co-operative societies.
Thus in the case of handloom clusters in Kerala, its members are both weavers
as well as the societies (to which the handloom workers are members).
The pertinent question, here is whether cluster could improve the
conditions of its members, both weavers as well as the co-operative societies by
facilitating their sustainable development; whether cluster could make
meaningful interventions for the revival of handloom co-operative societies in

Analysis
Kerala; In the micro level, one should be able to answer the following relevant
questions; “how many members have benefited from the Scheme and to what
extent? What are the various channels and avenues available for them to better
their performance? How many of them have effectively utilised these channels
for the betterment of the performance and growth. How many members failed
to receive any benefit and for what reasons? Finally, in what way the individual
actions result in the betterment of the performance of the units, in specific and
industry, in general.
This Chapter is divided into two parts; Part I institutional aspects and
Part II Enterprise aspects. In Part-I, Institutional Analysis, an attempt is made
to analyse whether the cluster-based approach helped the handloom
co-operative societies in Kerala in overcoming operational weakness. If the
cluster based approach really helped, to what extent and its implication vis-à-vis
profitability and sustainability of operations of the handloom co-operative
societies in Kerala is examined in Part II-Enterprises Aspects.
PART-I INSTITUTIONAL ANALYSIS
5.1 An Institutional Analysis
A Cluster can be said to be efficient if it allows its members to make
effective use of resources such as small scale savings or family labour, for
generating incomes that they could not get by operating in isolation. Here, the
role of cluster does not end with conferring members the benefits of collective
action, but should enable and equip them to continuously use resources at their
disposal, optimally and efficiently.
This warrants for creation of a proper operational system within the
societies, which in turn can take the handloom industry to ‘high road to
growth’. This can be done by introducing certain cardinal interventions in the
Department of Applied Economics, Cochin University of Science and Technology 142

Analysis
Institutional aspects of the co-operative societies for eliminating the operational
weaknesses that stand in the way of strengthening and streamlining the
operational system.
The components of the operational system of the handloom industry
consists of human force, raw material, technology & infrastructure, marketing,
financial supply & co-ordinating entity. If cluster could put in place a proper
operational system in these institutional areas, the cluster can be said to be
efficient in meeting the long term growth challenges of the industry. In short,
the efficacy of clusters in overcoming the operational weakness of the
handloom co-operative societies in Kerala can be better analysed by
understanding how best cluster could introduce changes in the operational
system through the following six institutional factors;
A Human force
B Network of supplying the raw materials
C Network of Marketing
D Technology & Infrastructure Up-gradation
E Financial supply and investment aid
F Co-ordinating Entity
5.1.1 Human Force
Handloom sector for its survival requires a professional work force
which consists mainly of weavers and allied workers who are directly involved
in the production of handloom goods. Though designers, secretaries and
governing body members of the co-operative societies, marketing agencies etc
are stakeholders of the sector, and are involved in the entire value chain, their
Department of Applied Economics, Cochin University of Science and Technology 143
Chapter 5
role is limited in the absence of weavers and allied workers for the manufacture
of handloom products.
In handloom industry, both the quantity and quality of products are
directly linked with the tacit knowledge of the weavers, the training they get for
weaving new and trendy designs and the infrastructure facilities provided to
them, especially at work place. Therefore, Human force is of high importance
in the industry, compared with other industries.
Here, under the head Human force, apart from analysing the profile of the
existing workforce in the handloom sector, an attempt is made to evaluate how
handloom clusters in Kerala help to retain expert and professional workforce and
provide pleasant work environment for them, ie retention of human force. In
short, the section throws open a quick view of the change occurred in the profile
of the handloom industry, under Cluster Development Approach.
5.1.1.1 Trend in the Number of Registered Members in the Society
Members constitute the very foundation of any co-operative
organisation. An individual takes membership in a co-operative society with
the expectation of achieving certain benefit. If the society fails to provide the
benefit expected by the member, he will turn passive and dormant. The
membership position of the societies under CMS and N-CMS is given in Tables
Nos.5.1 and 5.2 respectively
144 Department of Applied Economics, Cochin University of Science and Technology

Analysis
Table No. 5.1 Total Registered Members in the Cluster Member Societies (CMS)
No.
Name of the Society
Membership position
As on31.03.2012
1 Kozhode HWCS Ltd No.3567 520
2 Janatha HWCS Ltd No.H IND (T) 324 405
3 Athiyannoor Panchayath Model HWCS LTD No H (T) 309 340
4 Kamukincode HWCS Society 331
5 Punnakulam Society 169
6 Narimamoodu HWSC Ltd No.3326, 174
7Visakhom Hanloom Weavers Co-operative Society Ltd No. H.IND (T) 623
83
8 Valiyarathal HWCS Ltd H.124 249
9Kumaranasan Memorial Handloom Weavers Co-operative Society H. IND (T) 384
111
10
Vellappally HWCS Ltd H T 314 314
11 Thempamuttam HWCS Ltd no:H. IND T.339 186
12
Anchiravila Vanitha Handloom Weavers Co-operative Society Ltd T 634HWCS
49
13
Gandhismaraka HWCS 101
14
Ooruttambalam Handloom Weavers Co-operative Society Ltd No.3437
125
15
Keezhathil HWCS 179
16
Karichal HWCS 334
17
Kuttaninnathil HWCS 110
18
Sree Vellayani HWCS Ltd No.328 656
19
Thettivila HWCS 153
2 Balaramapuram Handloom WCIS Ltd No.HIND (T) 258 307
Department of Applied Economics, Cochin University of Science and Technology 145

Chapter 5
0
21
Chirakkal Weavers Co-operative P & S Society Ltd, No F1291, Chirakkal
318
22
The Mayyil Weavers Industrial (Workshop) Co-operative Society Ltd No.24, Mayyil
461
23
The Azhikkal Weavers Industrial (WS) co-operative Society Ltd No.20, Azhikkal
284
24
The Royal Weavers Industrial Co-operative Society Ltd No211, Alavil
247
25
Vanaja Weavers Ind Co-op Society Ltd, Panankavu, Chirakkal 242
26
Puzhathi Weavers Industrial (WS) Co-operative Society Ltd, No.HL IND © 27
166
27
Payyannur Weavers Co-operative (P&S) Society Ltd.NO1305, Payyannur
393
28
Theru-Mambalam Weavers Industrial Workshop Co-operative Society Ltd.NoHL IND © 42 , Payyannur
227
29
Kunhimangalam Weavers Co-operative (P&S) Society Ltd No.HLIND © 9, Kunhimangalam
282
30
Kulappuram Weavers Industrial (W/S) Co-operavtive Society LtdNo.HL IND © 48, Vilayamcode
110
31
Vellur Weavers Co-operative Society Ltd No.HL IND (C) 32 ,Vellur
271
32
Karivallur Weavers Co-operavive Society Ltd.No.F1391, Karivellur
423
33
Sasi Weavers Co-operative Society Ltd, HL (IND (C( 6, Karivellur
321
34
Thaliparamba Weavers Co-operative society, Thaliparamba 882
35
Pappinisseri Weavers Industrial (WS) Co-Operative Society, Pappinissery
378
36
Kolathuvayalil Weavers Industrial (WS) Co-Operative Society 256
37
Kairali Harijan Weavers Industrial Co-operative Society 237
38
Kannapuram Weavers Industrial (WS) Co-operative Society LTD.
156
146 Department of Applied Economics, Cochin University of Science and Technology

Analysis
39
Kannapuram Weavers Industrial (WS) Co-Operative P & S Society, No.H206, Cherukunnu
435
40
Morazha Weavers Co-operative P & S Society Ltd, No F1291, Chirakkal
437
41
The Kalliassery Weavers Indl Co-Op Society Ltd, Kannur 376
42
Irinave Weavers Industrila Co-operative Society Ltd 285
Source: Balance Sheet of the Societies
Table No. 5.2 Total Registered Members in the Non-Cluster Member
Societies (N-CMS)
No
Name of the Society
Membership
positionAs on
31.03.2012
TVM
1 Peringamala Handloom Weavers Co-operative Society Ltd H 27 564
2Santhipuram Vanitha Handloom Weavers (Production Cum -Sale) Co-operative Society Ltd No. T.630
115
3Kalliyoor Handloom Weavers (Production -cum Sale) Co-operative Society Ltd No. 3392
554
4Ambadi Vanitha Handloom Weavers Co-operative Society Ltd.No. H.IND (T) 644
142
5Maramangalam Handloom Weavers Co-operative Society Ltd H.177
191
KANNUR
6 Kuthupramba Weavers Co-operative Society Ltd No.L.L 85 682
7Pinarayi Weavers Industrial (Work Shop) Co-Op Society Ltd No.HL IND © 25
419
8 Loknath Weavers Industrial Co-operative Society Ltd No. LL 99 84
9 Kausallya Weavers Industrial Co-operative Society Ltd. LL 98 18510
The Chowa Weavers P & S Co-operative Society Ltd LL 76 577
Source: Balance Sheet of the Societies
The year-on-year (y-o-y) details of the total registered members in the
CMS and N-CMS from 2005 to 2012 are given in Table No. 5.3
Department of Applied Economics, Cochin University of Science and Technology 147

Chapter 5
Table No 5.3 Change in the no. of Registered Members of theSample Handloom Co-operative Societies (2005-2012)
YEAR P
P
31.0
3.05
31.0
3.06
31.0
3.07
31.0
3.08
31.0
3.09
31.0
3.10
31.0
3.11
31.0
3.12
TO
TA
L CM
S 11599
1166011795
11860 119171200
01210
01208
32.25 1.88
N-
CM
S
3455
2894 2893
2909 2904 2921 2942 2936 -15.8 0.93
AV
ER
AG
E
CM
S
276.2
277.6280.
8282.4 283.7 285.7
288.1
287.7
-- --
N-
CM
S
345.5
289.4 289.3
290.9 290.4 292.1 294.2
293.6
-- --
Source: Audited Balance Sheet of the Societies
In the case of CMS, for the number of registered members had increased
by 2.25 percent the period from 2005 to 2008 and for the period from 2008 to
2012, it increased only by 1.88 percent by 2012. In the case of N-CMS, there
was decrease in the registered members and it was higher during the period
from 2005 to 2008 (-16 percent ). However, the decline has come down to
just 0.93 percent during the period from 2008 to 2012 period. This is shown in
Figure No. 5.1
Figure No.5.1 Change in the av. no of Registered Members from
2005 to 2012
148 Department of Applied Economics, Cochin University of Science and Technology
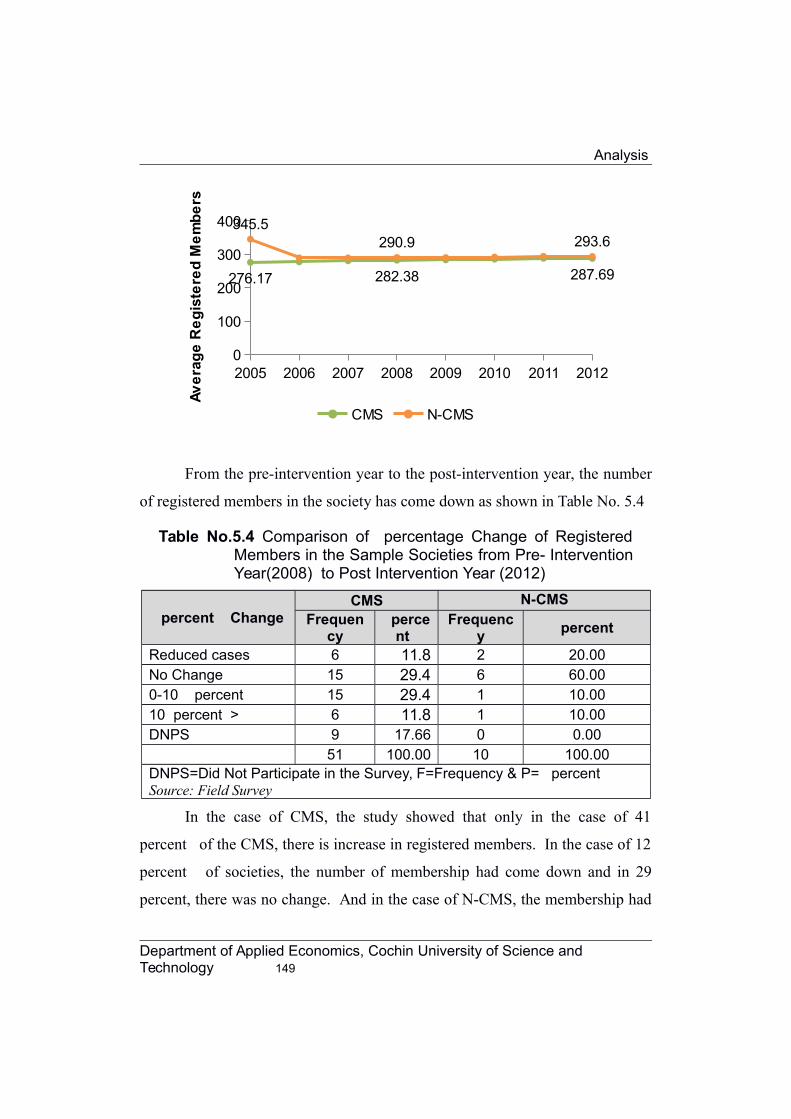
Analysis
2005 2006 2007 2008 2009 2010 2011 20120
100
200
300
400
276.17 282.38 287.69
345.5290.9 293.6
CMS N-CMS
Av
era
ge
Re
gis
tere
d M
em
be
rs
From the pre-intervention year to the post-intervention year, the number
of registered members in the society has come down as shown in Table No. 5.4
Table No.5.4 Comparison of percentage Change of RegisteredMembers in the Sample Societies from Pre- InterventionYear(2008) to Post Intervention Year (2012)
percent ChangeCMS N-CMS
Frequency
percent
Frequency
percent
Reduced cases 6 11.8 2 20.00No Change 15 29.4 6 60.000-10 percent 15 29.4 1 10.0010 percent > 6 11.8 1 10.00DNPS 9 17.66 0 0.00
51 100.00 10 100.00DNPS=Did Not Participate in the Survey, F=Frequency & P= percent Source: Field Survey
In the case of CMS, the study showed that only in the case of 41
percent of the CMS, there is increase in registered members. In the case of 12
percent of societies, the number of membership had come down and in 29
percent, there was no change. And in the case of N-CMS, the membership had
Department of Applied Economics, Cochin University of Science and Technology 149

Chapter 5
increased only in the case of 20 percent of the societies surveyed. In the case
of 60 percent of the societies, there is no change and in the case of 20
percent, there was decrease in the number of registered members as well.
5.1.1.2 Trend in the Number of Active/Working Members in the Society
In a co-operative society, all the registered members need not be its
active workers/members and a decrease in the number of registered members
need not necessarily indicate downward trend in the operations of the society.
It is the active, working members who decide the fortune and prospects of a
society, and therefore any downward trend in the number of active working
member is a cause of concern for societies. Table No.5.5 shows that the y-o-y
details of the number of active working members from 2005 to 2012 period.
Table No.5.5 Change in the no. of Working Members of theSample Handloom Co-operative Societies (2005-2012)
YEAR pe
rce p
erc
e
31.0
3.05
31.0
3.06
31.0
3.07
31.0
3.08
31.0
3.09
31.0
3.10
31.0
3.11
31.0
3.12
TO
TA
L CM
S 4902
4856478
74766 4687 4676 4700 4672 -2.77 -1.97
N-
CM
S 865 866 848 847 795 771 770 784 -2.08 -7.44
AV
ER
AG
E
CM
S
116.7
115.6114.
0113.5 111.6 111.3 111.9
111.2
-- --
N-
CM
S 86.5 86.6 84.8 84.7 79.5 77.1 77.0 78.4 -- --
Source: Audited Balance Sheet of the Societies
In the case of CMS, the total working members which was 4766 in 2008
had come down to 4672 in 2012, and the average working members had come
down by 1.97 percent by 2012. The decrease is noticed much higher in N-
CMS, where between the two periods of 2008 & 2012, the average working
150 Department of Applied Economics, Cochin University of Science and Technology

Analysis
members per society had come down by 7.44 percent. This is shown in the
Figure 5.2
Figure No.5.2 Change in the av. No. of Working Members from 2005-
2012
2005 2006 2007 2008 2009 2010 2011 20120
20
40
60
80
100
120
140116.71 113.48 111.24
86.5 84.7 78.4
CMS N-CMS
Ave
rag
e W
ork
ing
Me
mb
ers
The rate of decrease in N-CMS is increasing faster than CMS, since
2008. The survey results also show a declining trend in the number of active
working members in the handloom societies under study. The Table 5.6 shows
the survey results.
Table No.5.6 Comparison of percentage Change of WorkingMembers in the Sample Societies from Pre-Intervention Year(2008) to Post Intervention Year(2012)
percent ChangeCMS N-CMS
F P F PReduced cases 16 31.4 6 60.00No Change 17 33.3 2 20.000-10 percent 7 13.7 0 00.0010 percent > 2 3.9 2 20.00
Department of Applied Economics, Cochin University of Science and Technology 151

Chapter 5
DNPS 9 17.6 0 0.00Total 51 100.00 10 100.00DNPS=Did Not Participate in the Survey, F=Frequency & P= percent Source: Balance Sheet of the Societies
From the table 5.6, it is observed that there is decrease in the number
of working members by 31 percent of the CMS and 60 percent of N-CMS,
indicating that the decrease was higher in N-CMS. Increase in the number of
working members were noticed only in 17 percent of the societies.
5.1.1.3 Trend in the Number of Working Looms in the Society
One of the important growth indicators as far as handloom industry is
concerned is the number of working looms. An increase in working looms
indicates that the sector is lucrative enough to attract investment. A reduction in
the number of working looms indicates either the number of working members
is coming down or there is not much money to modernise the obsolete looms or
the sector is not worth investing. Since governments had been pursuing with
various schemes aimed at modernisation of existing looms, the only main
reason attributed for the reduction in number of working loom is lack of
weavers. The y-o-y change in the working looms of the sample societies are
given in Table No.5.7
Table No.5.7 Change in the no. of Working Looms of the SampleHandloom Co-operative Societies (2005-2012)
Year p
p
31.
03.0
5
31.
03.0
6
31.
03.0
7
31.
03.0
8
31.0
3.0
9
31.0
3.1
0
31.0
3.1
1
31.0
3.1
2
TO
TA
L CM
S 32
38
319
9
323
83174 3112 315
3
312
5
308
3
-
1.98
-
2.8
N-
CM
S
58
3589 589 593 583 584 589 625 1.72 5.4
0
152 Department of Applied Economics, Cochin University of Science and Technology

Analysis A
VE
RA
GE
CM
S 77.
176.2
77.
175.6 74.1 75.1 74.4 73.4 -- --
N-
CM
S
58.
358.9 58.
959.3 58.3 58.4 58.9 62.5 -- --
Source: Audited Balance Sheet of the Societies
The study revealed that there is a decrease in the number of working
looms in the case of CMS between the two period of pre-cluster intervention
and post-cluster intervention. In the case of CMS, the decrease which was just
1.98 percent during the period from 2005 to 2008 had increased by 2.78
percent in 2008- 2012 period. However in the case of N-CMS, the number of
working looms is increasing by 1.72 percent for the period of 2005 to 2008
and 5.4 percent for 2008- 2012 period. The Figure No.5.3 shows the y-o-y
trend clearly.
Department of Applied Economics, Cochin University of Science and Technology 153

Chapter 5
Figure No.5.3 Change in the av. No. of Working Looms from 2005
to2012
2005 2006 2007 2008 2009 2010 2011 20120
10
20
30
40
50
60
70
80
9077.1 75.57 73.4
58.3 59.3 62.5
CMS N-CMS
Ave
rag
e W
ork
ing
Lo
om
s
5.1.1.4 Composition of the Society
As already mentioned, cottage type and factory type are two types of
societies in the handloom industry. The factory type society is said to have
some definite advantage over cottage type as they operate under one roof and
hence have better control over resources, leading to better productivity. It is
rather easy for implementing any governmental scheme and packages in factory
type societies. As on March, 2009, there were 469 registered Primary
Handloom Weavers Co-operative Societies in the State of which 117 were
factory type and 352 were Cottage type societies, ie 75 percent are Cottage
type societies. The study revealed that more factory type societies have come
forward to take advantage of the cluster scheme than the cottage type factories
and the details are shown in the Table No. 5.8.
154 Department of Applied Economics, Cochin University of Science and Technology

Analysis
Table No.5.8 Composition of the Society
Type of societyCMS N-CMS
Frequency percentage
Frequency percentage
Factory 23 45.10 5 50.00
Cottage 19 37.25 5 50.00
DNPS 9 17.65 0 0.00
Total 51 100.00 10 100.00DNPS=Did Not Participate in the Survey, F=Frequency & P= percent Source: Balance Sheet of the Societies & Field Survey
Out of the 51 societies in the cluster surveyed, 45 percent are of factory
type societies and cottage type societies are only 37.25 percent . The study
also revealed that in the case of taking advantage of the of IHDS, factory type
societies are well ahead of cottage type societies.
It is said that most of the cottage type industries are family run, under
the clutches of a few families / family members. Some such societies are not
even working. Some are working only seasonally, to take advantage of rebates
and subsidies. Most of such societies keep themselves away from such
developmental initiatives. Therefore, it is only better, if the cottage type
societies are encouraged to move to factory type societies as the benefit of any
governmental intervention can be better implemented.
5.1.1.5 Trend in the Age of the Society
Generally in handloom sector, the age and level of technological
obsolescence go hand in hand. Table no. 5.9 shows the trend in the age of the
handloom co-operative societies under study.
Department of Applied Economics, Cochin University of Science and Technology 155
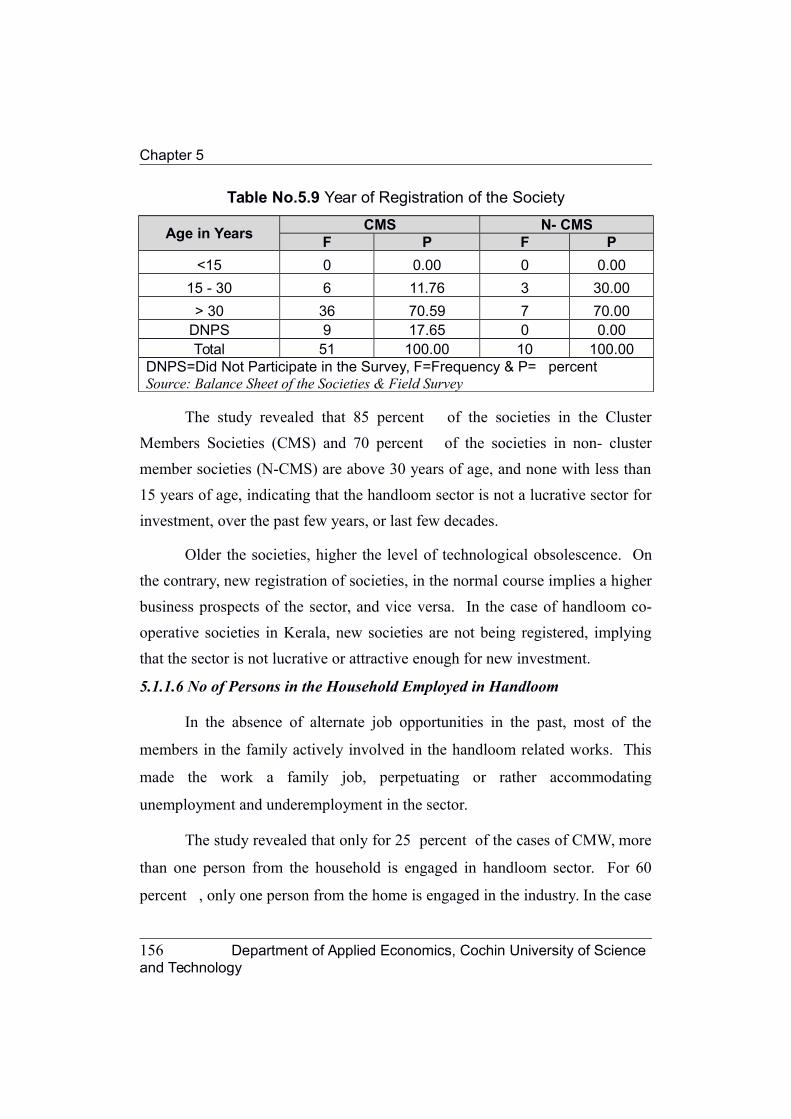
Chapter 5
Table No.5.9 Year of Registration of the Society
Age in YearsCMS N- CMS
F P F P
<15 0 0.00 0 0.00
15 - 30 6 11.76 3 30.00
> 30 36 70.59 7 70.00DNPS 9 17.65 0 0.00Total 51 100.00 10 100.00
DNPS=Did Not Participate in the Survey, F=Frequency & P= percent Source: Balance Sheet of the Societies & Field Survey
The study revealed that 85 percent of the societies in the Cluster
Members Societies (CMS) and 70 percent of the societies in non- cluster
member societies (N-CMS) are above 30 years of age, and none with less than
15 years of age, indicating that the handloom sector is not a lucrative sector for
investment, over the past few years, or last few decades.
Older the societies, higher the level of technological obsolescence. On
the contrary, new registration of societies, in the normal course implies a higher
business prospects of the sector, and vice versa. In the case of handloom co-
operative societies in Kerala, new societies are not being registered, implying
that the sector is not lucrative or attractive enough for new investment.
5.1.1.6 No of Persons in the Household Employed in Handloom
In the absence of alternate job opportunities in the past, most of the
members in the family actively involved in the handloom related works. This
made the work a family job, perpetuating or rather accommodating
unemployment and underemployment in the sector.
The study revealed that only for 25 percent of the cases of CMW, more
than one person from the household is engaged in handloom sector. For 60
percent , only one person from the home is engaged in the industry. In the case
156 Department of Applied Economics, Cochin University of Science and Technology

Analysis
of N-CMW, the study showed that only one person is engaged in the industry
for 70 percent. Table No.5.10 shows the situation clearly.
Table No.5.10 Number of persons in the household employed in
handloom in 2012
Personsemployed
CMW N-CMWF P F P
One 287 59.7 69 71.9Two 122 25.4 25 26.0More than two 9 1.9 2 2.1DNPS 63 13.1 0 0.0Total 481 100.0 96 100.0DNPS=Did Not Participate in the Survey, F=Frequency & P= percent Source: Field Survey
It is worthwhile here to note that the industry was once blended with
weaver families and every member in the household used to contribute, in
whatever way possible. Less number of people in the family, and attractive job
opportunities in other sectors and low salary in the handloom sector etc are
attributed as the reasons for less number of people from the same family. The
positive aspect of such a change is that it reduced the underemployment that was
prevalent in the handloom sector a few decades back and we can safely say that
underemployment is less in traditional industries now, compared with the past.
5.1.1.7 Handloom Sector as an Occupation
Handloom industry is considered as one of the traditional industries in
India, because, the job is done by the families for generations. In the case of
Kerala Handloom, the industry can no longer be called a “traditional industry”,
as families who were traditionally employed in the sector are fast disappearing
from the scenario. In the case of Thiruvananthapuram a recent study by Crown,
Robin and Kamath, Anand, (2012) also showed that the Salayar families in
Balaramapuram had come down from 3000 to 100. This is true because unlike
Department of Applied Economics, Cochin University of Science and Technology 157

Chapter 5
in the past, job opportunities, both within and outside the state are higher today.
Further, advancement in education has drastically changed the landscape of the
job market for people in Kerala, offering a number of alternative employment
avenues at better wages. The trend in the job market in handloom industry is
shown in Table No. 5.11.
Table No.5.11 Reasons for adopting handloom occupation
Reasons CMW N-CMW
Frequency
percent
Frequency
percent
A good Full-timeOccupation
180 37.432 33.3
Part-time Job of Choice 226 47.0 58 60.4A lucrative Job 0 0.0 4 4.2Others 12 2.5 2 2.1DNPS 63 13.1 0 0.0Total 481 100.0 96 100.0DNPS=Did Not Participate in the Survey, F=Frequency & P= percent Source: Field Survey
In the case of the 481 weavers surveyed, only for 49 percent the job is full
time. For others it is a part time affair. Moreover, it is interesting here to note that
of late new people are not coming to the sector. This is evident from Table 5.12
that the weavers with less than 5 years of experience are only 2 percent .
Table No.5.12 Years of Experience of Weavers - 2012
Experience CMW N-CMW
Frequency percent Frequenc
y percen
t Below 5 Years 22 4.6 4 4.25 - 10 Years 65 13.5 18 18.810 - 15 Years 119 24.7 26 27.115 - 20 Years 212 44.1 48 50.0DNPS 63 13.1 0 0.0Total 481 100.0 96 100.0DNPS=Did Not Participate in the Survey, F=Frequency & P= percent
158 Department of Applied Economics, Cochin University of Science and Technology

Analysis
Source: Field Survey
This implies that new people are not getting attracted to this job. The
labour market in handloom sector which was occupationally linked to castes
and families, moved away and has become market determined. However the
depressant side is that new people are not getting attracted to the job, due to the
lower remuneration it offers compared with the other occupations, which are
most often unskilled/semi skilled. Thus the industry is said to be in a peculiar
situation, where it is neither a traditional industry accommodating large scale
employment nor has it moved up in the ladder to join the ‘Core Sectors’/
‘Emerging sectors’ of the economy where market forces determines the supply
and demand for labour and wages. Other things remaining the same, Sectors
which offer a higher return on investment is normally considered as core sector.
5.1.1.8 Wages & Other Emoluments
One of the reasons for large number of job attrition in the handloom
sector was due to the low remuneration it fetched for the work. The average
remuneration of a handloom worker varies from Rs.50/- day to Rs.250/- per
day. Study revealed that 25.57 percent of the weavers are getting an average
salary of ranging between Rs.50/-to Rs.100/- per day. The workers are mainly
part-time workers who spend their leisure time for an extra money. The survey
results on comparison between the two types of sample societies on the average
Wage per Day of its Weavers are shown in Table No.5.13.
Table No.5.13 Comparison of the Average Wage per Day per
Weaver
CMW N-CMWWageRange
2008 2012 2008 2012F P F P F P F P
Rs. 50 – 100
123 25.57 6 1.25 15 15.63 7 7.29
Department of Applied Economics, Cochin University of Science and Technology 159

Chapter 5
Rs. 100 – 150
201 41.79 89 18.5 29 30.21 38
39.58
Rs. 150 – 200 68 14.14 248 51.56 37 38.54 32
33.33
Rs. 200 – 250 19 3.95 46 9.56 12 12.50 16
16.67
>250 7 1.46 29 6.03 3 3.13 3 3.13DNPS 63 13.1 63 13.1 0 0.00 0 0.00
Total481 100 481 100 96
100.00 96
100.00
DNPS=Did Not Participate in the Survey, F=Frequency & P= percent Source: Field Survey
The study also revealed that the number of weavers who drew a wage
below Rs.100/- had come down from 25.57 percent in 2008 to 1.25 percent
in 2012, workers getting Rs.150/- to Rs.200/- per day has increased from 14.14
percent to 51.56 percent and Rs.200/- to Rs.250/- per day has also increased
from 3.95 percent to 9.56 percent by 2012. The regular full time workers get
a higher wage. In the case of N-CMS, though there is improvement in the wage
the weavers get, and the improvement higher in CMS.
So there is an overall improvement towards a higher wage rate after the
intervention. The study also revealed that N-CMW is not getting wages that
they used get in 2008. This is reflected in the change in the amount spent by
the sample societies on salary and other emoluments, a comparison of which is
shown in Table No.5.14
Table 5.14 Comparison of the percentage Change in the Amountof Wages & Emoluments paid by Sample Societies fromPre- Intervention Year(2008) to Post Intervention Year(2012)
percent ChangeCMS N-CMS
F P F PReduced cases 12 23.5 8 80.00No Change 0 0 0 0.000-25 percent 13 25.5 1 10.00
160 Department of Applied Economics, Cochin University of Science and Technology

Analysis
25-50 percent 8 15.7 0 10.0050 percent > 9 17.65 1 10.00DNPS 9 17.65 0 0.00
51 100.00 10 100.00DNPS=Did Not Participate in the Survey, F=Frequency & P= percent Source: Balance Sheet of the Societies & Field Survey
From the table, it may be noted that the amount spent on salary and other
emoluments have come down or reduced in the case of 80 percent of the
societies under N-CMS. The declining phenomenon is attributed to the low
market on account of economic recession of 2009 period. In the case of CMS,
the amount spent by the societies has increased considerably. This is attributed
to the higher product range and the resultant widening of the market which is
shown under a separate head in the study under Network for Marketing.
This is well reflected in the total amount spent by the societies for wages
and other emoluments during the period from 2005 to 2012, as shown in Table
No.5.15
Table No.5.15 Comparison of the amount spent on Wages andCompensation by Sample handloom co-operativesocieties from 2005 to 2012 (Rs.)
Year p
p
31.0
3.05
31.0
3.06
31.0
3.07
31.0
3.08
31.0
3.09
31.0
3.10
31.0
3.11
31.0
3.12
TO
TA
L
CM
71125262
62985001
62558543
64547769
70034948
66396409
73436434
74795534
-9.25
15.88
N-
CM
S
19027590
20099749
17133628
18765427
21310096
15685561
17465029
14577849
-1.38
-22.3
2
AV
ER
AG
E
CM
S
1693459
1499643
1489489
1536852
1667499
1580867
1748487
1780846
-- --
N-
CM
S
1902759
2009975
1713363
1876543
2131010
1568556
1746503
1457785
-- --
Source: Audited Balance Sheet of the Societies
Department of Applied Economics, Cochin University of Science and Technology 161

Chapter 5
The average wages and other emoluments paid by the CMS were lesser
than the average wages paid by the N-CMS in 2008. It was Rs. 1536852/- for
CMS and Rs. 1876543/- for N-CMS, ie the amount spent by N-CMS were
higher than CMS by 22 percent in 2008. However, in the post intervention
year, it is found that the wages and other emoluments paid by the CMS are
higher than the N-CMS. It has improved from Rs. 1536852/- in 2008 to
Rs.1780846/- by 2012, a 16 percent increase over 2008.
Figure 5.4 Wages & Compensation paid by societies from 2005 to 2012
(Rs.)
2005 2006 2007 2008 2009 2010 2011 20120
500000
1000000
1500000
2000000
2500000
16934591536852
17808461902759 1876543
1457785
CMS N-CMS
Ave
rag
e W
ag
es
& C
om
pe
nsa
tio
n
The decrease in the lower wages and the resultant lower amount spent on
wages and other emoluments by the societies is mainly attributed to the sharp
decline in turnover, both domestic and export market of the N-CMS during the
period from 2009 to 2012. Highest drop in the wage paid is noticed in Pinarayi
162 Department of Applied Economics, Cochin University of Science and Technology

Analysis
Weavers Co-operative Society Ltd No.L.L 85 and The Chowa Weavers P & S
Co-operative Society Ltd LL 76, both at Kannur. The failure of N-CMS to
come out with better designs and new products also added further blow to the
downfall of the turnover and the resultant wages.
5.1.1.9 Job Security
After the introduction of clusters, the workers find increased job
opportunity in the handloom sector, compared with the pre-cluster period,
arguably on account of shortage labor supply and price elasticity nature of the
handloom industry. The survey results on the job security is shown in Table
No. 5.16.
Table No.5.16 Comparison of the average working days per yearreceived by weavers
CMW N-CMWAverage
Working Days2008 2012 2008 2012
F P F P F P F PUpto 150 days 70 14.6 41 8.5 8 8.3 0 0.00150-175 247 51.4 201 41.8 32 33.3 40 41.67175-200 67 13.9 122 25.4 36 37.5 42 43.75200-225 32 6.7 46 9.6 17 17.7 8 8.33>225 2 0.4 8 1.7 3 3.1 6 6.25DNPS 63 13.1 63 13.1 0 0.0 0 0.00Total 481 100.0 481 100.0 96 100.0 96 100.00DNPS=Did Not Participate in the Survey, F=Frequency & P= percent Source: Field Survey
This is evident from the fact that workers who feel a job security has
increased from 8.5 percent in 2008 to 13.3 percent in 2012. They argue that
apart from salary, they get PF, Gratuity, Overtime Allowance, Medical
Insurance (Health Card), Need based loans etc. Table 5.17 shows the survey
results on the Opinion of weavers on Job Security.
Table No.5.17 Opinion of weavers on Job Security
CMS N- CMS
Department of Applied Economics, Cochin University of Science and Technology 163

Chapter 5
Job Security2008 2012 2008 2012
F P F P F P F PYes 41 8.5 64 13.3 29 30.2 25 26.0
No 377 78.4 354 73.6 67 69.8 71 74.0
DNPS 63 13.1 63 13.1 0 0.0 0 0.0
Total 481 91.5 481 100.0 96 100.0 96 100.0DNPS=Did Not Participate in the Survey, F=Frequency & P= percent Source: Field Survey
Though there is some increase in the wages and the fringe benefits that
the weavers get, more than 70 percent of the weavers still consider that there is
no job security in the handloom sector, indicating that the sector is still not able
to give full time employment to the workers at an attractive wage. Only if the
job security in the sector is improved, new people will get attracted to the
sector. This again is linked with the demand for the product that they make and
its market and increasing the linkages.
5.1.1.10 Training Programmes
Training and skill up-gradation are critical inputs for handloom
weavers/workers to adapt to produce diversified products with improved quality
to meet changing market trends. Training programmes improve their skill sets
and enhance employability, making the unskilled and semi skilled workers to
skilled workers, enhancing their employability. This would, in a long run, result
in a set of labor force with tacit knowledge and regional embeddings, producing
a better products and perhaps a higher quantity. Agencies like Weavers Service
Center, IIHT, EDI provided both in-house and field-level training programmes
to the weavers. The training programme ranged from 3 days, 7 days 15 days
and 30 days depending upon the availability of weavers. The training were
mainly in the areas of Dyeing, design workshop and technology transfer.
164 Department of Applied Economics, Cochin University of Science and Technology

Analysis
The survey revealed that in the pre-intervention period only 17 percent
of the weavers had got the opportunity to attend such training programmes
which is shown in Table No. 5.18.
Table No.5.18 Comparison of the No. of weavers who attended TrainingProgramme
CMW N- CMW Training Programme
2008 2012 2008 2012 F P F P F P F P
Attended 70 14.6 379 78.8 19 20.43 41 42.71Not Attended 348 72.3 39 8.1 74 79.57 55 57.29DNPS 63 13.1 63 13.1 0 0.00 0 0.00
Total 481 100.0 481100.
0 93 100.00 96 100.00DNPS=Did Not Participate in the Survey, F=Frequency & P= percent Source: Field Survey
The cluster could provide training and skill upgradation to about 80
percent of the weavers. However in the case of N-CMW only 57.29 percent
of the workers got opportunity for attending training programmes. This can
also be understood in a different way from survey results of the societies which
had organised training. Table 5.19 shows the trend noted from the survey.
Table No.5.19 Comparison of Training Programme organised by samplesocieties
CMS N-CMS Training Programme
Attended2008 2012 2008 2012
F P F P F P F P
At least one4 7.8 29 56.9 0 0.0 2
20.
0
More than one0 0 11 21.6 0 0.0 0
0.0
0
Not even one 3874.
52 3.9 10
100.
08
80.
0DNPS 9 17. 9 17.6 0 0.0 0 0.0
Department of Applied Economics, Cochin University of Science and Technology 165

Chapter 5
6
Total 5110
051 100.0 10
100.
010
100
.0DNPS=Did Not Participate in the Survey, F=Frequency & P= percent Source: Field Survey
In the case of CMS, 78 percent of the societies had organised training
programme for its members, where as in the case of N-CMS only 20 percent
of the societies had done so. The increase in high is CMS because of the better
co-ordination by the CDE for such training programmes.
5.1.1.11 Exposure Visits
Kerala labors are generally said to be change resistant, and are organised
especially against the introduction of new machines in the production process.
One of the tools implemented under the cluster development programme to
overcome such phenomenon is the introduction of exposure visits. The
objective of the programme is to sensitize people about the changes in the
textile sector by facilitating visit to other clusters or handloom societies. This is
expected to make easy flow of knowledge transfer. It helps members to have
clarity and confidence and provides an opportunity to experience and
experiment the new methods. It also provides an opportunity to interact with
his peers and get motivated to bring changes.
Table No. 5.20 shows the survey results of number of weavers who had
undertaken the awareness and exposure visits.
Table No.5.20 Exposure Visits by workers-a Comparison
CMW N-CMW Exposure Visits
2008 2012 2008 2012 F P F P F P F P
Visited 37 7.7 324 67.4 6 6.25 11 11.46
Not Visited 381 79.2 94 19.590
93.7
5 85 88.54DNPS 63 13.1 63 13.1 0 0 0 0.00
166 Department of Applied Economics, Cochin University of Science and Technology

Analysis
Total 481100.
0481 100.0
96 100 96 100.00DNPS=Did Not Participate in the Survey, F=Frequency & P= percent Source: Field Survey
The survey on the handloom workers revealed that 67 percent in the
CMW attended exposure visits. In the case of N-CMW, it is just 11 percent. It
is worth mentioning here that just 7 percent of the weavers in CMS had the
opportunity to attend exposure visits in the pre-intervention period.
As far as the handloom co-operative societies which joined the cluster are
concerned, it offered them an increased opportunity to arrange exposure visits to its
members. The survey results are shown in Table No. 5.21.
Table 5.21 Comparison of Exposure Visit organised by societies
CMS N-CMS
Exposure Visit2008 2012 2008 2012
F P F P F P F PVisited 0 0.0 40 78.4 0 0.0 0 0.0
Not visited 42 82.4 2 3.9 10100.
010 100.0
DNPS 9 17.6 9 17.6 0 0.0 0 0.0
Total 51100.
051 100.0 10
100.
010 100.0
DNPS=Did Not Participate in the Survey, F=Frequency & P= percent Source: Field Survey
The study revealed that due to the cluster programme close to 80
percent of the handloom co-operative societies could organize such exposure
visits, whereas none of the N-CMS could organise exposure visits. The access to
exposure visits is higher for weavers and societies under the Cluster, mainly on
account of the Cluster scheme participation.
5.1.1.12 New Designs and Products
Department of Applied Economics, Cochin University of Science and Technology 167

Chapter 5
The introduction of new designs and products have an implication with
human force in the society as it shows their adaptability to the changing need of
the customers and their willingness for experiments with new methods, their
realization for the need for adoption of new products etc. Table No. 5.22 shows
the result of the survey conducted on the sample societies on the new designs
introduced by them.
Table No.5.22 Comparison of the New Designs introduced by societies
CMS N-CMS New Designs
2008 2012 2008 2012 F P F P F P F P
Introduced 18 35.29 42 82.4 1 10 4 40.0Not
Introduced 24 47.060 0.0
9 906 60.0
DNPS 9 17.65 9 17.6 0 0 0 0.0
Total51
100.0
051
100.
010 100.0 10 100.0
DNPS=Did Not Participate in the Survey, F=Frequency & P= percent Source: Field Survey
It may be noted that all the societies tried new designs during the period
and the highest number of new products was introduced by the Kalliassery
Weavers Indl Co-op. Society Ltd, Kannur under the Kalliassery Handloom
Cluster (28 Nos) .
The survey results on the new designs introduced were supported and
validated with the data on the number of new products brought out by the
societies during these periods, as new designs normally lead to the introduction
of new products. The y-o-y change in the new designs introduced by the
societies from 2005 to 2012 is given in Table No.5.23.
Table No. 5.23 Year-wise Comparison of the Change in no of new products insocieties from 2005 to 2012
168 Department of Applied Economics, Cochin University of Science and Technology

Analysis
Year
31.0
3.05
31.0
3.06
31.0
3.07
31.0
3.08
31.0
3.09
31.0
3.10
31.0
3.11
31.0
3.12
per
cen
tch
ang
e f
rom
per
cen
tch
ang
e fr
om
TO
TA
L
CM
920 932 947 983 1053 1097 1114 1140 6.8
5
15.9
7N-
CM
S
205 205 205 169 169 169 169 169 -
17.0.00
AV
ER
AG
E
CM
S
21.9 22.2 22.5 23.4 25.1 26.1 26.5 27.1 -- --
N-
CM
S
20.5 20.5 20.5 16.9 16.9 16.9 16.9 16.9 -- --
Source: Audited Balance Sheet of the Societies
The study found that from the period from 2008 to 2012 the CMS could
come out with an average of 15 new products, whereas the increase was only
6.85 percent from the period from 2005 to 2008. At the same time, there is
sharp decline in the products being brought out from the N-CMS. This has
come down to 17.56 percent from 2005 to 2008 and from 2008 to 2012, new
products are not coming from these societies. The Figure No.5.5 shows the y-
o-y movement clearly;
Department of Applied Economics, Cochin University of Science and Technology 169

Chapter 5
Figure 5.5 Average no. of Products of the societies from 2005 to2012
2005 2006 2007 2008 2009 2010 2011 20120
5
10
15
20
25
30
21.923.4
27.14
20.516.9 16.9
CMS N-CMS
Av
era
ge
Nu
mb
er
of
Pro
du
cts
The analysis of the change in the number of new products introduced by
the society in the Post Intervention Year (2012) is shown in Table No.5.24
Table No. 5.24 Comparison of Change in number of new productsintroduced by the societies between Pre- InterventionYear(2008) to Post Intervention Year (2012)
percentChange
CMS N-CMSF P F P
Reduced cases 4 7.8 0 0
No Change 11 21.6 10 10
0-50 percent 19 37.3 0 0
50 percent > 8 15.7 0 0
DNPS 9 17.6 0 0
51 100.0 10 100DNPS=Did Not Participate in the Survey, F=Frequency & P= percent Source: Field Survey
170 Department of Applied Economics, Cochin University of Science and Technology

Analysis
There is increase in the new products in the case of 53 percent of
CMS. In the case of N-CMS, the study revealed no society has come out with
new products.
The reduction in the number of new products in the N-CMS is mainly
due to the stopping of production of certain items for want of export orders.
This shows that the capacity of the CMS to come out with new products are
higher compared to the N-CMS. It also shows that the CMS are able to
withstand external setbacks, by swiftly moving with better products in an
expanded local market.
5.1.1.13 Output per Worker
The very purpose of introducing the cluster based approach in the
handloom sector is to increase productivity and reduce the product cost. One of
the ways by which cost can be reduced is by increasing the productivity.
Productivity is said to increase, when the output per worker is increased at a
unit cost of workers. Exposure visits, training programmes, skill up-gradation
etc are introduced with a view to increasing the output per worker. The output
per worker is obtained by total production divided by the number of workers in
the society. The y-o-y movement from 2005 to 2012 for the output per worker
in the sample handloom co-operative societies are given in Table 5.25 .
Table No.5.25 Comparison of Change in Output per worker (Rs) in the
societies from 2005 to 2012
Year
31.0
3.05
31.0
3.06
31.0
3.07
31.0
3.08
31.0
3.09
31.0
3.10
31.0
3.11
31.0
3.12
per
cent
chan
ge fr
om
per
cent
chan
ge f
rom
CM
45269 42876 42196 48885 50612 41579 47016 48355 7.99 -1.09
Department of Applied Economics, Cochin University of Science and Technology 171

Chapter 5T
OT
AL
N-
CM
S
44253 36335 42160 45926 47470 38027 44530 42095 3.78 -8.34
Source: Audited Balance Sheet of the Societies
The study revealed that from 2005 to 2008, the output per worker in
CMS had increased by 8 percent and for the period from 2008 to 2012, it
came down by 1 percent. However, in the case of N-CMS the out per worker
is falling at a rate higher (8.34 percent) than the CMS (1 percent). The
output per worker during the pre-cluster period was Rs. 48885/- for CMW.
This has come down to Rs. 48355/- in the post-cluster period. The average
output per worker for N-CMW which stood at Rs. 45926/- in 2009 has come
down to Rs.42095/-.
The Figure 5.6 shows the changes in the output per worker for both
CMS and N-CMS during the pre and post intervention years;
Figure 5.6 Average Output per Worker from 2005 to 2012
2005 2006 2007 2008 2009 2010 2011 20120
10000
20000
30000
40000
50000
60000
4526948885 48355
44253 4592642095
CMS N-CMS
Ave
rage
Out
put p
er W
orke
r
Further analysis of the changes in the output per worker of the individual
societies revealed that the decrease in the output per worker of CMS is mainly
172 Department of Applied Economics, Cochin University of Science and Technology

Analysis
due to decrease in output per worker of 32 percent of CMS (see Table No.
5.26). This reduction in the output per worker is higher to set off the increase
out per worker in other societies. It is true in the case of N-CMS too. In the
case of N-CMS, though there is increase in the output per worker 50 percent of
the societies, the average output per worker has not increased as there is
reduction in output per worker for 50 percent of the societies as shown in
Table No.5.26
Table No.5.26 Comparison of the percent Change in theAverage Output per worker per society in the PostIntervention Year (2012)
percent ChangeCMS N-CMS
F P F PReduced cases 16 31.4 5 50No Change 0 0 0 00-50 percent 16 31.4 5 5050 percent > 10 19.6 5 0DNPS 9 17.6 0 0Total 51 100.0 10 100DNPS=Did Not Participate in the Survey, F=Frequency & P= percent Source: Field Survey t
With the introduction of exposure visits training programmes, skill up-
gradation, etc the output worker for the CMS has remained stable and has
started improving over the years and the Output per workers is expected only to
increase in the years to come, due to the intervention made through training
programme and exposure visits etc.
The study revealed that the cluster based approach helped, though in a
small way, in improving on many fronts for a sustainable development of the
Human force.
5.1.2 Network of Supplying the Raw Materials
Department of Applied Economics, Cochin University of Science and Technology 173

Chapter 5
The handloom industry in Kerala predominantly uses cotton (yarn) as
raw material. A few combinations of fibres like viscose and polyester are also
used. Yarn is procured mostly in the hank form. Some of co-operative societies
also procure yarn in the form of readymade warps from Tamilnadu. Yarn is
procured from Hantex, Hanveev, National Handloom Development Corporation
(NHDC) or directly from the mill sector. Timely procurement of adequate raw
material is very important for the smooth production flow. The access to raw
material sources, the ease in doing business with them and the time required for
the delivery of the raw material, its cost, quality etc matters most in handloom
sector. It also helps in organizing and scheduling working capital required for
organising the raw material. IHDS envisages helping handloom weavers
developing necessary network for the efficient supply of the raw materials
among its members.
One of the difficulties faced by the weavers in the pre-cluster period was
the difficulty in timely procurement of raw material and at competitive price.
Currently NHDC, supply yarn to the weavers at Mill Gate price Scheme., ie..
they supply yarn at the price at which they procure yarn from the Mill, without
charging any transportation or administrative cost. The weaver/societies are
required to pay NHDC an advance amount for purchase of yarn from NHDC
and they deliver the yarn in a time frame of about 3-4 weeks. This delays the
production process. Thus, in order to ensure regular availability of yarn of
requisite counts, one-time assistance of Rs. 3.00 lakh is provided to each cluster
to be deposited with the NHDC as a corpus fund to enable it to ensure supply of
yarn to the weavers through the yarn depot/yarn Bank at the cluster. NHDC will
supply yarn to the yarn Bank for supply to the weavers against payment. The
Scheme, as envisaged in the cluster had twin objective of utilizing the services
of NHDC in procurement of raw materials thereby making NHDC more active
174 Department of Applied Economics, Cochin University of Science and Technology

Analysis
in the supply chain and to make available quality yarn at less price to the
weavers. When bulk order is placed, the unit cost will be less and societies
can save on time and transportation cost.
The following section analyses the impact the programme made among
the handloom co-operative societies in creating a proper network for supplying
of raw materials.
5.1.2.1 Raw Material Purchase from Open Market.
The study revealed that 82 percent of the CMS during the pre-cluster
period depended on open market for procurement of yarn, but only 16 percent
of them procured raw materials from open market in the post-cluster period. In
the case of N-CMS in 2008, 70 percent of the societies depend on open market.
This has slightly come down to 50 percent by 2012. This is given in Table
No.5.27
Table No. 5.27 Comparison of no. of societies which directly purchaseraw material from the open market
Purchase from OpenMarket
CMS N-CMS2008 2012 2008 2012
F P F P F P F P
Yes 42 82.4 8 15.7 7 70.0 5 50.0No 0 0.0 34 66.7 3 30.0 3 50.0DNPS 9 17.6 9 17.6 0 0.0 0 0.0
Total 51100.
051 100.0 10
100.
010 100.0
DNPS=Did Not Participate in the Survey, F=Frequency & P= percent Source: Field Survey
The reduction in the dependency in the case of CMS is on account of
opening up of other channels for procurement of raw materials such as yarn
bank through Cluster.
5.1.2.2 Raw Material Purchase from Hantex/Hanveev
Department of Applied Economics, Cochin University of Science and Technology 175

Chapter 5
The study revealed that close to 60 percent of the societies in the CMS
purchased raw materials from Hantex/Hanveev during post and pre-cluster
period. However, in the case of N-CMS, purchase remains at 50 percent
during pre-and post cluster period. Table No.5.28 shows the survey results.
Table No.5.28 Comparison of No of societies which procure rawmaterials from Hantex/Hanveev
Purchase from Hantex/Hanveev
CMS N-CMS2008 2012 2008 2012
F P F P F P F PYes 30 58.8 31 60.8 5 50.0 5 50.0No 12 23.5 11 21.6 5 50.0 5 50.0DNPS 9 17.6 9 17.6 0 0.0 0 0.0
Total 51100.
051
100.0
10100.
010
100.0
DNPS=Did Not Participate in the Survey, F=Frequency & P= percent Source: Field Survey
Most of the societies opined that they continue to procure raw material
fro Hantex/Hanveev, as they still act as one of the marketing channels for many
of these societies.
5.1.2.3 Raw Material Purchase from Yarn Bank
The yarn Bank is a novel concept brought in through the cluster scheme,
under which the cluster will form a Yarn Bank for procurement of yarn and the
yarn so procured will be distributed to all the members in the cluster according
to their requirement, upon payment. The cost in such cases would be
comparatively lower as bulk order is placed and the weaver need not worry
about yarn, as Yarn Bank will attend to its timely delivery. By the end of 2012,
weavers in 67 percent of the societies got the benefit of yarn bank system
apart from the other channels of yarn purchase as mentioned earlier.
Table No.5.29 Comparison of No of societies which use Yarn Bank forpurchase of Raw material
Purchase through Yarn Bank
CMS N-CMS2008 2012 2008 2012
176 Department of Applied Economics, Cochin University of Science and Technology

Analysis
F P F P F P F P
Yes 0 0.0 34 66.7 NANA
NA
NA
No 42 82.4 8 15.7 NANA
NA
NA
DNPS 9 17.6 9 17.6 NANA
NA
NA
Total 51100.
051
100.0
NANA
NA
NA
DNPS=Did Not Participate in the Survey, F=Frequency & P= percent Source: Field Survey
The presence of multiple channels for raw materials’ supply and its
network offers a unique advantage for weavers in getting a raw material at
competitive rates. This phenomenon is noticed from the change that had
occurred in the raw material procurement preference of the weavers, which is
shown in Table 5.30.
Table 5.30 Comparison of use of various channels for purchase of raw materialby Societies and Weavers
Channel
CMS N-CMS CMW N-CMW200
8 2012 2008 2012 2008 2012 2008 2012F F F F F F F F
Open
market42 8 7 5 210 112 6 11
Hantex/Ha
nveev30 12 5 5 139 99 3 1
Societies NA NA NA NA 69 207 87 84
Yarn Bank 0 8 NA NA NA NA NA NA
DNPS 9 9 0 0 63 63 0 0
DNPS=Did Not Participate in the Survey, F=Frequency.Source: Field Survey
It may be noted that in the pre-intervention period 210 CMW weavers
purchased raw materials from the Open Market. However, with the
introduction of yarn Bank, the number of CMW who purchase raw materials
from the open market had come down to 112. Purchase from Hantex/Hanveev
Department of Applied Economics, Cochin University of Science and Technology 177

Chapter 5
also come down from 139 to 99. However, the number of CMW who
purchased yarn from societies had increased from 69 to 207.
The changing trend in the purchase of raw materials indicate that raw
material purchase by the weavers and societies are fast becoming centralised
through Yarn bank, though other channels of raw material procurement are still
active. This joint action is expected to result in collective efficiency in
procurement of raw material, leading to saving on time and money.
5.1.3 Network for Marketing
One of the cardinal issues faced by the handloom co-operative societies in
Kerala is the inefficiencies in the marketing network. The inefficiencies in the
value chain has hampered the development of a proper marketing network and the
industry has seldom travelled beyond the customary markets in Kerala. It never
tried to broad base its product line, increasing its design capabilities and finding
new markets for its products, both in domestic and international markets. As a
result the both production and markets contracted, over a period of time.
The cluster method under IHDS aims to provide market orientation by
associating entrepreneurs, designers and professionals for marketing, designing
and managing the production, diversification, creation of new market through
widening the product range, and widening the market through better outreach.
This section examines the support extended by the cluster to weavers/
co-operative societies in setting up a proper network for marketing their
handloom products.
178 Department of Applied Economics, Cochin University of Science and Technology

Analysis
The weavers in the pre-cluster period mainly sold their products in the
open market at a throw away price, leaving good chunk of the profit to the
middlemen or trader. This is because of the subsistence nature of the job and
financial condition of the weavers. They seldom had any bargaining power as it
was a desperate sale, most often for buying raw material for the next day and
partially for funding their sustenance (utilise a portion of money for himself
/herself.) The cluster offered a common platform for common marketing and
fund was earmarked for advertisement, publicity, market development,
attending Buyer Seller Meets, Trade fairs etc. This reduced the dependency of
weavers on the open market via intermediaries and middlemen. As can be
noted from Table No.5.31
Table No.5.31 Comparison of No of societies which depend onOpen market/Middle men for marketing their Products
CMW N- CMWSale
throughOpen
Market
2008 2012 2008 2012
F P F P F P F P
Yes 391 81.3 187 39 92 95.8 87 90.6
No 27 5.6 231 48 4 4.2 9 9.4
DNPS 63 13.1 63 13 0 0 0 0
Total 481 100 481 100 96 100 96 100DNPS=Did Not Participate in the Survey, F=Frequency & P= percent Source: Field Survey
In the pre-cluster period, 81 percent of weavers in CMW and 95
percent of N-CMW marketed their products through the open market. After
the introduction of the cluster, the dependency of the weavers on the open
market for selling their product had come down and in 2012 only 39 percent
of the weavers depended on open market. However in the case of N-CMW, it
has come down from 95 percent in 2008 to 90 percent in 2012. The
Department of Applied Economics, Cochin University of Science and Technology 179

Chapter 5
change in CMW is attributed to the concerted efforts put in by the cluster for
establishing a proper network for better marketing. They have utilized three
interventions viz;
1. Increasing the selling channels
2. Increasing the Product profile
3. Using marketing and advertisement
The use of these sources are described in detail here below;:
5.1.3.1 Increasing the Selling Channels
a) Domestic Market
One of the major markets for the handloom products is the domestic
market. The products included customary sarees, dhothies, set mundu etc. The
domestic market was steady, though small. The study revealed that all the
societies use domestic market as one of their sources of selling their products.
Table No.5.32 Comparison of No of societies which use DomesticMarketing as a channel for Marketing
Salethrough
DomesticMarket
CMS N-CMS2008 2012 2008 2012
F P F P F P F P
Yes 42 82.4 42 82.4 10 100.0 10 100.0
No 0 0.0 0 0.0 0 0.0 0 0.0
DNPS 9 17.6 9 17.6 0 0.0 0 0.0
Total 51 100.0 51 100.0 10 100.0 10 100.0DNPS=Did Not Participate in the Survey, F=Frequency & P= percent Source: Field Survey
This again proves that handloom industry is still heavily dependent on
the domestic market, and domestic market still continues to be the biggest
selling channel for handloom products, indicating that the industry is still
heavily domestic market dependent.
180 Department of Applied Economics, Cochin University of Science and Technology

Analysis
Exhibition Sales
The survey revealed that all the societies participate in the exhibition
sales organized by various government agencies. The major attraction for the
exhibitions sales is the ‘Rebate on sales ’ attached to such exhibitions sales.
Table No.5.33 shows the survey results.
Table No.5.33 Comparison of No of societies using Exhibition as a channel forMarketing
CMS N-CMS Sale through Exhibition
2008 2012 2008 2012
F P F P F P F P
Yes 42 82.4 42 82.4 10 100.0 10 100.0No 0 0.0 0 0.0 0 0.0 0 0.0DNPS 9 17.6 9 17.6 0 0.0 0 0.0
Total 51100.
051
100.
010 100.0 10 100.0
DNPS=Did Not Participate in the Survey, F=Frequency & P= percent Source: Field Survey
Even today exhibition sale is one of the major outlet for handloom co-
operative societies in Kerala for selling their products, both CMS and N-CMS
as can be noted from the table above. 82 percent of the CMS and 100 percent
of N-CMS still use exhibition as a channel for marketing their products.
Sales through Hantex & Hanveev
One of the main channels for marketing handloom products was sale
through Hantex/Hanveev. The primary objective of creating these apex societies
were to increase sale under common brand and create proper marketing
linkages with end users. However, their contribution for marketing is limited to
the small order that they place with weavers. Most of the societies attribute that
the lack of organic links with the market limit the agencies like
Department of Applied Economics, Cochin University of Science and Technology 181

Chapter 5
Hantex/Hanveev in marketing these products. The survey results on the no. of
societies which use hantex/hanveev as a channel for marketing their products is
shown in Table No. 5.34
Table No.5.34 Comparison of No of societies using Hantex/Hanveev as achannel for Marketing
CMS N-CMS Sale through Hantex/Hanveev
2008 2012 2008 2012
F P F P F P F P
Yes 42 82.4 24 47.1 10100
.05 50.0
No 0 0.0 18 42.9 0 0.0 5 50.0DNPS 9 17.6 9 17.6 0 0.0 0 0.0
Total 51 100.0 51 100.0 10100
.010 100.0
DNPS=Did Not Participate in the Survey, F=Frequency & P= percent Source: Field Survey
The study revealed that only 47 percent societies in the CMS make use
of this channel now. This was 82 percent in 2008. Similarly in N-CMS, only
50 percent of the societies make use of this channel for sales in 2012, whereas
it was 100 percent in 2008.
b) Export Market
Export market gives us an opportunity to reach out to wider markets, and
most often fetches a better price realization. The products for the export market
mainly included furnishing materials. In 2008, 39 percent of the CMS make
use of this route to sell their products through export market. By 2012, this has
come down to 29 percent . In the case of N-CMS 50 percent of the societies
had sale through export channels in 2008. This has come down to 20 percent
in 2012.
182 Department of Applied Economics, Cochin University of Science and Technology
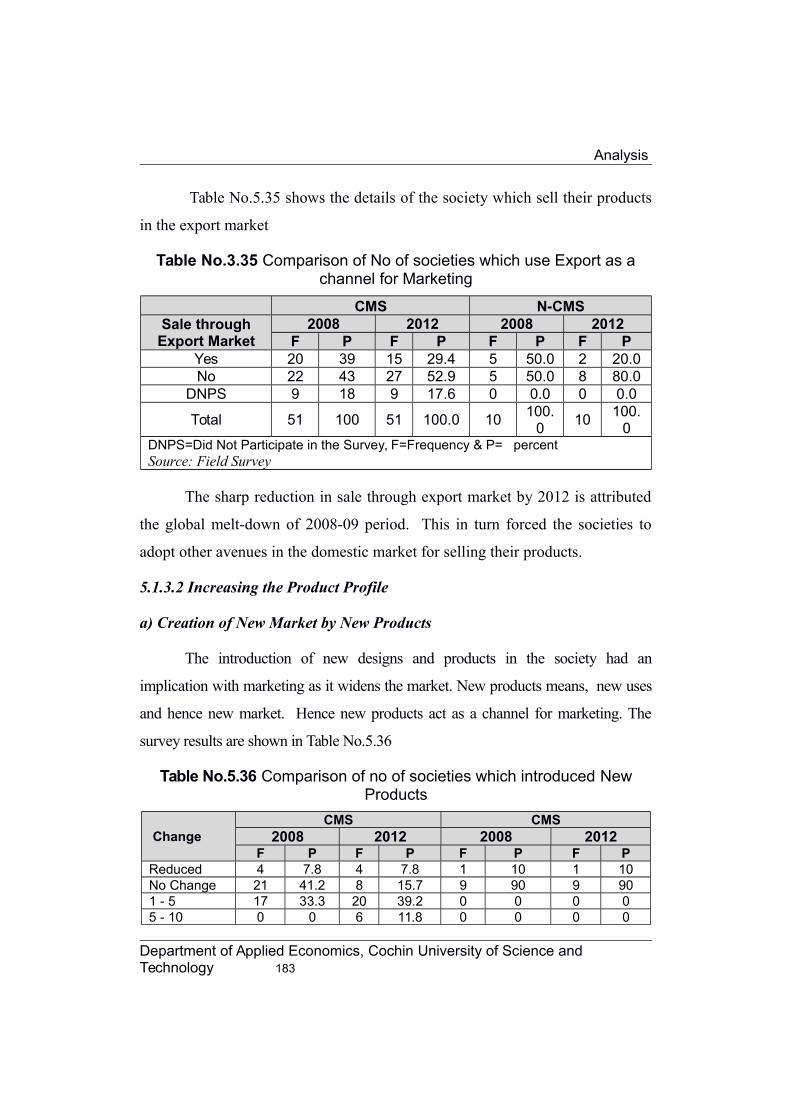
Analysis
Table No.5.35 shows the details of the society which sell their products
in the export market
Table No.3.35 Comparison of No of societies which use Export as achannel for Marketing
CMS N-CMSSale through
Export Market2008 2012 2008 2012
F P F P F P F PYes 20 39 15 29.4 5 50.0 2 20.0No 22 43 27 52.9 5 50.0 8 80.0
DNPS 9 18 9 17.6 0 0.0 0 0.0
Total 51 100 51 100.0 10100.
010
100.0
DNPS=Did Not Participate in the Survey, F=Frequency & P= percent Source: Field Survey
The sharp reduction in sale through export market by 2012 is attributed
the global melt-down of 2008-09 period. This in turn forced the societies to
adopt other avenues in the domestic market for selling their products.
5.1.3.2 Increasing the Product Profile
a) Creation of New Market by New Products
The introduction of new designs and products in the society had an
implication with marketing as it widens the market. New products means, new uses
and hence new market. Hence new products act as a channel for marketing. The
survey results are shown in Table No.5.36
Table No.5.36 Comparison of no of societies which introduced NewProducts
ChangeCMS CMS
2008 2012 2008 2012F P F P F P F P
Reduced 4 7.8 4 7.8 1 10 1 10No Change 21 41.2 8 15.7 9 90 9 901 - 5 17 33.3 20 39.2 0 0 0 05 - 10 0 0 6 11.8 0 0 0 0
Department of Applied Economics, Cochin University of Science and Technology 183

Chapter 5
Above 10 0 0 4 7.8 0 0 0 0DNPS 9 17.6 9 17.6 0 0 0 0Total 51 100 51 100.0 10 100 10 100DNPS=Did Not Participate in the Survey, F=Frequency & P= percent Source: Field Survey
The study revealed that 59 percent of the CMS introduced new
products in the post intervention period. It was 33 percent during the pre
intervention period. In the case of N-CMS, the study revealed 90 percent of
societies could not introduce any new products. For the remaining 10 percent,
the product range had come down and the trend is the same during the two
period under study. Thus the higher products range indicate wider market and
creates a new market.
b) Adoption of Forward Integration
Just as new products help creation of new markets, forward integration
helps creation of new products to move up in the value chain. In handloom, by
forward integration, one can develop new sections for value addition. They include
setting up garment division, embroidery division, retail shops, etc. The study
revealed that despite ample scope for forward integrations, societies are not able to
undertake such activities, for want of investment. In the case of CMS, the forward
integration activities were undertaken in a small way in 33.3 percent of societies
in 2012. This was 9.8 percent in 2008. In the case of N-CMS too, the position is
no different. Only 10 percent of the societies could do forward integration
activities, ie Pinarayi Handloom Co-operative societies in Kannur. They make
shirts and other readymade garments, mainly intended for exports. The survey
results are shown in Table No. 5.37.
Table No.5.37 Comparison of No of societies which have introduced Forwardintegration
CMS N-CMS Forward Integration
2008 2012 2008 2012F P F P F P F P
184 Department of Applied Economics, Cochin University of Science and Technology

Analysis
Yes 5 9.8 17 33.3 0 0.0 1 10.0No 37 88.1 25 49.0 10 100.0 9 90.0DNPS 9 17.6 9 17.6 0 0.0 0 0.0Total 51 100.0 51 100.0 10 100.0 10 100.0DNPS=Did Not Participate in the Survey, F=Frequency & P= percent Source: Field Survey
5.1.3.3 Using Marketing and Advertisement Activities
a) Creation of Website
Website has become one of the fastest ways for marketing products and
services. Its acceptance is mainly on account of its low cost and wider reach.
The cluster Programme has earmarked funds for creating of website. The study
revealed that societies are not very keen in utilizing these channels in an
aggressive manner. However the Programme helped 30 percent of CMS
societies to develop and maintain website as a tool for marketing. Interestingly,
30 percent of the N-CMS also use website as a channel for marketing their
products. The survey results are shown in Table No.5.38
Table No. 5.38 Comparison of no of Societies which introduced website
Introductionof Website
CMS N-CMS2008 2012 2008 2012
F P F P F P F PYes 0 0.0 15 29.4 1 10.0 3 30.0No 42 82.4 27 52.9 9 90.0 7 70.0DNPS 9 17.6 9 17.6 0 0.0 0 0.0Total 51 100.0 51 100.0 10 100.0 10 100.0DNPS=Did Not Participate in the Survey, F=Frequency & P= percent Source: Field Survey
b) Adoption of Advertising
In the case of handloom industry in Kerala, societies seldom undertake
advertisement of their own. The cluster helped a few societies to overcome
this shortcoming. The study revealed that close to 8 percent of the CMS
societies started advertising their products using various channels such as way-
Department of Applied Economics, Cochin University of Science and Technology 185

Chapter 5
side hoarding and small paid advertisements. The survey details are shown in
Table No. 5.39
Table No.5.39 Comparison of No of societies which have resorted to
Advertisement
Advertisement
CMS N-CMS2008 2012 2008 2012
F P F P F P F PYes 0 0.0 4 7.8 2 20.0 2 20.0No 42 82.4 38 74.5 8 80.0 8 80.0DNPS 9 17.6 9 17.6 0 0.0 0 0.0
Total 51 100.0 51100.
010 100.0 10 100.0
DNPS=Did Not Participate in the Survey, F=Frequency & P= percent Source: Field Survey
Many societies cite shortage of funds as the major deterrents to
undertaking aggressive advertisement campaign. A few societies, especially
those who make conventional products opined that advertisements do not make
much difference to their sale as customer pockets are defined, production
limited and customer specific.
c) Adoption of Branding
One of the problems that limit the societies from undertaking
advertisement campaign for marketing their products is the absence of brands/
brandable products. Most of the societies are producing generic items such as
cloth veshti, set mundu, saree etc,. And none of them are sold under brand name.
The survey results are shown in Table No.5.40
186 Department of Applied Economics, Cochin University of Science and Technology

Analysis
Table No.5.40 Comparison of no of societies which have resorted to Branding
BrandingCMS N-CMS
2008 2012 2008 2012F P F P F P F P
Yes 0 0.0 6 11.8 1 10.0 1 10.0No 42 82.4 36 70.6 9 90.0 9 90.0DNPS 9 17.6 9 17.6 0 0.0 0 0.0Total 51 100.0 51 100.0 10 100.0 10 100.0DNPS=Did Not Participate in the Survey, F=Frequency & P= percent Source: Field Survey
The cluster method helped 11 percent of the CMS societies to undertake
branding as a tool for marketing. The researcher could understand that most of the
societies are ignorant of the benefit that may result form branding their products.
d) Use of Handloom Mark:
The Office of the Development Commissioner for Handlooms,
Government of India has introduced the "Handloom Mark" which provides a
collective identity to the handloom products and can be used not only for
popularizing the hand woven products but also serve as a guarantee for the
buyer that the product being purchased is genuine. Besides, this would provide
a distinctive name in identifying the product or the manufacturer. The mark is in
two forms. One for Domestic use: the word Handloom is written beneath the
logo and the other for International marketing: same logo with the word Hand
woven in India written beneath it.
Department of Applied Economics, Cochin University of Science and Technology 187

Chapter 5
The Handloom Mark scheme is operational throughout the country since
2005. The Textiles Committee has been engaged as the Implementation Agency
for the implementation of the Handloom Mark scheme across the country.
Individual weavers, Apex and primary handloom weavers' co-operative
societies, Master weavers, Handloom Development Corporations, Retailers, and
Exporters are entitled to participate in the scheme and avail benefits. As per the
data given by Regional office of Textile Committee, in Kerala, 264 handloom
weavers co-operative societies registered for Handloom Mark. However the
study revealed that most of the societies are not utilizing these for marketing
their products. The survey results are given in Table No.5.41
Table no.5.41 Comparison of no of societies which have utilised adoptedHandloom Mark as a Marketing Tool
Use ofHandloom
Mark
CMS N-CMS2008 2012 2008 2012
F P F P F P F PYes 0 0.0 6 11.8 1 10.0 1 10.0No 42 82.4 36 70.6 9 90.0 9 90.0DNPS 9 17.6 9 17.6 0 0.0 0 0.0Total 51 100.0 51 100.0 10 100.0 10 100.0DNPS=Did Not Participate in the Survey, F=Frequency & P= percent Source: Field Survey
The study showed CMS have started realizing the need for making use
of the brand name of Handloom Mark as is evident from the table.
The programme in short, helped the handloom co-operative societies in
undertaking activities which would help them for a better outreach, though a lot
more is required to be done to make it sustainable
5.1.4 Network for Accessing Technology and Infrastructure Up-
gradation:
188 Department of Applied Economics, Cochin University of Science and Technology

Analysis
Many of the traditional industries are not able to compete in the market
place because of lack of technology inputs for modernization and the absence of
skill development efforts. Development of proper technology that has the
ability of competition, possibility of having enough access to such technology
and innovation between agencies are essential for the continued growth of the
sector.
The handloom industry is less technology intensive, with high labor
content. However, technological interventions are still possible in certain areas
to improve efficiency, to optimise resources, to improve productivity, to
undertake product diversification and to reduce the drudgery of the handloom
weavers. Office of the Development Commissioner for Handlooms, Ministry
of Textiles has been disseminating various technological interventions through
different on-going programmes. Cluster Development Programme has also
projects that support Technological & Infrastructure Up-gradation. Efforts are
also made to popularise them through Design Exhibitions-cum-Dyeing
Workshops, Awareness Programmes, Training Programmes organized through
Weavers’ Service Centres. As a result, a number of these interventions are being
used in some handloom pockets, benefitting handloom weavers in terms of
increased productivity and reduced drudgery. However, there is still a need for
further dissemination and deeper penetration of these innovations. Access to
such technological interventions and its adoption depends on a number of
factors including the development of network for accessing such information.
The Cluster Programme tried to fill the gap by facilitating support for proper
linkages with Technological up-gradation.
In handloom industry, a Network for Accessing Technology is said to
exist, when there is periodic exposure visits to other units, opportunity to attend
Department of Applied Economics, Cochin University of Science and Technology 189

Chapter 5
training programmers, seminars , exhibitions, trade fairs, chance to conduct or
attend national or international fashion shows and a mechanism to have tie ups
with fashion design institutes, ie industry academia interactions. The following
session would discuss how handloom clusters helped development of Network
for accessing Technology, that has the ability of competition, and having
enough access to technology and innovation between agencies.
5.1.4.1 Tie up with Fashion Design Institutes
A key factor behind the turning point of the industry was the
establishment of the National Institute of Fashion Technology (NIFT) in 1986.
Set up under the aegis of the Ministry of Textiles, GoI, the school was created
to inject home-grown creativity into the garment making industry which,
despite bringing in foreign exchange revenues through exports, was lacking in
originality and innovative design. Today the country has 9 NIFT’s set up either
by the Central Govt or State Govt concerned. In Kerala NIFT started operating
form 2008 from its Campus at Kannur. Apart from NIFT, there is Indian
Institute Of Handloom Technology (IIHT), National Institute of Design (NID),
Weavers Service Center etc in the areas of providing new design capabilities to
the weavers.
The Study revealed that only very few societies have developed
networks for getting new designs through these design Institutes. It is very low
and not upto the desired level. The industry academia interaction is not well
developed in Kerala industry and the same is true in the case of handloom
sector as well, as only 3.9 percent of the societies have direct interaction with
such institutes. The survey results are in Table No.5.42.
190 Department of Applied Economics, Cochin University of Science and Technology

Analysis
Table No.5.42 Comparison of No. of societies which have made Tie- upswith Fashion Design Institutes
Tie-ups made
CMS N-CMS2008 2012 2008 2012
F F F F F F F FYes 0.0 0.0 2 3.9 0.0 0.0 0.0 0.0
No 42.0 82.4 40.0 78.4 10.0100.
08.0 80.0
DNPS 9.0 17.6 9.0 17.6 0.0 0.0 0.0 0.0
Total 51.0100.
051.0 100.0 10.0
100.
0
10.
080.0
DNPS=Did Not Participate in the Survey, F=Frequency & P= percent Source: Field Survey
5.1.4.2 Participation in National & International Fashion Shows/Trade Fairs,
Technology Exhibitions and Seminars.
Another important platform for the technology transfer in the textile
sector is National & International Fashion Shows/Trade fair. Technology
Exhibitions and seminars, give an opportunity to know the latest developments
taking place, especially on changing customer needs and technology used for
such changes. Such programmes offer an opportunity for weavers and societies
to interact with international suppliers of machines, accessories and services for
textile processing offering latest machines, equipment, processes and services
for processing textiles and other flexible materials. to interact with the
customers. It provides technology suppliers and clothing manufacturers an ideal
platform for a mutual exchange of ideas.
India International Handwoven Fair 2012, (organised by Handloom
Export Promotion Council (HEPC), IITF, (Chennai,) VASTRA – An
International Textile and Apparel Fair 2012” (VASTRA – 2012) (organised by
Rajasthan State Industrial Development and Investment Corporation Ltd.
Department of Applied Economics, Cochin University of Science and Technology 191

Chapter 5
(RIICO) and Federation of Indian Chambers of Commerce and Industry
(FICCI)) are few such national exhibitions participated by the cluster members.
Table No. 5.43 gives the survey result of the Technology exhibitions and
seminars attended by the societies.
Table 5.43 Comparison of no. of societies which have participatedNational & International Fashion Shows/Trade fair
Fashion Shows /trade fairs
CMS N-CMS2008 2012 2008 2012
F F F F F F F FAttended 0.0 0.0 15.0 29.4 0.0 0.0 2.0 20.0
Not Attended 42.0 82.4 27.0 52.9 10.0100.
08.0 80.0
DNPS 9.0 17.6 9.0 17.6 0.0 0.0 0.0 0.0
Total 51.0100.
051.0 100.0 10.0
100.
010.0
100.
0DNPS=Did Not Participate in the Survey, F=Frequency & P= percent Source: Field Survey
The study revealed that 82.4 percent of CMS got opportunity to attend
technology Exhibitions and Seminar by 2012 as against the 15 percent in
2008. In the case of N-CMS, only 40 percent got such opportunity during the
period. This is shown in Table No.5.44.
Table 5.44 Comparison of No. of societies which have participated in theExhibitions and seminars
Exhibitions and Seminars
CMS N-CMS2008 2012 2008 2012
F F F F F F F F
Attended 8.0 15.7 42.0 82.4 0.0 0.0 4.0 40.0Not
Attended34.0 66.7 0.0 0.0 10.0 100.0 6.0 60.0
DNPS 9.0 17.6 9.0 17.6 0.0 0.0 0.0 0.0
Total 51.0 100.0 51.0100.
010.0 100.0 10.0 100.0
192 Department of Applied Economics, Cochin University of Science and Technology

Analysis
DNPS=Did Not Participate in the Survey, F=Frequency & P= percent Source: Field Survey
5.1.4.3 Exposure Visits:
The study revealed that 82.4 percent CMS could arrange exposure
visits for its workers, opening the doors for technology transfer and adoption of
technological improvements by the societies. The efforts under Cluster was
instrumental in this as none of the societies in N-CMS could organize such
visits. Table No 5.45 shows the survey details.
Table No 5.45 Comparison of No of societies which have organised ExposureVisits
CMS N-CMSExposure Visit
2008 2012 2008 2012P F P F P F P F
Visited 0 0.0 40 78.4 0 0.0 0 0.0Not Visited 42 82.4 2 3.9 10 100.0 10 100.0DNPS 9 17.6 9 17.6 0 0.0 0 0.0Total 51 100.0 51 100.0 10 100.0 10 100.0DNPS=Did Not Participate in the Survey, F=Frequency & P= percent Source: Field Survey
5.1.4.4 Training Programmes
Training programmes are aimed at imparting specialized training for
skill development and its upgradation in line with the changing technology and
fashion trends. In handloom sector training programmes are usually conducted
by Entrepreneur Development Institute India, Ahmedabad, Weavers Service
Centres, Indian Institute of Handloom Technology (IIHT), etc.
The survey conducted among weavers revealed that in the pre-
intervention period only 17 percent of the weavers had opportunity to attend
such training programmes. Thesurvey results are shown Table No. 5.46.
Department of Applied Economics, Cochin University of Science and Technology 193

Chapter 5
Table No 5.46 Comparison of No of weavers who have attended TrainingProgrammes
Training Programme
CMW N-CMW2008 2012 2008 2012
F P F P F P F PAttended 70 14.6 379 78.8 19 20.43 41 42.71Not Attended 348 72.3 39 8.1 74 79.57 55 57.29DNPS 63 13.1 63 13.1 0 0.00 0 0.00
Total 481 100.0 481100.
0 93 100.00 96 100.00DNPS=Did Not Participate in the Survey, F=Frequency & P= percent
The cluster could provide training and skill upgradation to about 80
percent of the weavers. However in the case of N-CMW, only 57.29 percent of
the workers got opportunity for attending training programmes. This can also be
understood in a different way from the number of societies which had organized
training. In the case of CMS, 78 percent of the societies had organized training
programme for its members, where as in the case of N-CMS only 20 percent of
the societies had done so. Table No.5.47 shows the trend as noted in the survey.
Table No 5.47 Comparison of No of societies which haveundertaken Training Programmes for accessingtechnology
Training Programme
CMS N-CMS2008 2012 2008 2012
P F P F P F P FUndertaken 4 7.8 40 78.4 0 0.0 2 20.0Not
Undertaken38 74.5 2 3.9 10 100.0 8 80.0
DNPS 9 17.6 9 17.6 0 0.0 0 0.0Total 51 100 51 100.0 10 100.0 10 100.0DNPS=Did Not Participate in the Survey, F=Frequency & P= percent Source: Field Survey
The study revealed that the CMS who attended training programme had
increased from 7.8 percent in 2008 to 78 percent after the cluster programme
194 Department of Applied Economics, Cochin University of Science and Technology

Analysis
in 2012. In the case of N-CMS only 20 percent of the societies got the
opportunity to undertake training programmes during the same period.
The Figure 5.7 shows two photographs are taken while undertaking
survey work for the study.
Department of Applied Economics, Cochin University of Science and Technology 195

Chapter 5
Figure No.5.7. Photographs of Training Programmes in Session
Mr.Rajan T.Nair, Project Officer,Entrepreneurship DevelopmentInstitute of India taking a class atSwatheshi Cluster inThiruvanathapuram, as part of theTraining Programme.
Mr.Pradeep.P.N, Project AssociateEntrepreneurship DevelopmentInstitute of India taking a class atNaveena Cluster inThiruvanathapuram, as part of theTraining Programme.
The following are the important technological interventions
implemented in different handloom pockets of the country. The exposure visits
and training programmes are intended to sensitize the weavers and encourage
them to adopt the skill sets.
a. pneumatic jacquard system and motorized jacquard on the existing
handloom so as reduce fatigue and improve productivity,
b. take-up & let off motions on the existing handloom so as reduce fatigue
and improve productivity and efficiency by 15 percent .
c. multiple box motion for continuous weaving of two different kinds of
weft, thereby reducing fatigue and improving efficiency by more than
20 percent.
d. improved frame loom fitted with take up, let off motion, fly wheel,
roller temple, multiple box motion etc increases more than 50 percent
efficiency and reduces fatigue.
196 Department of Applied Economics, Cochin University of Science and Technology
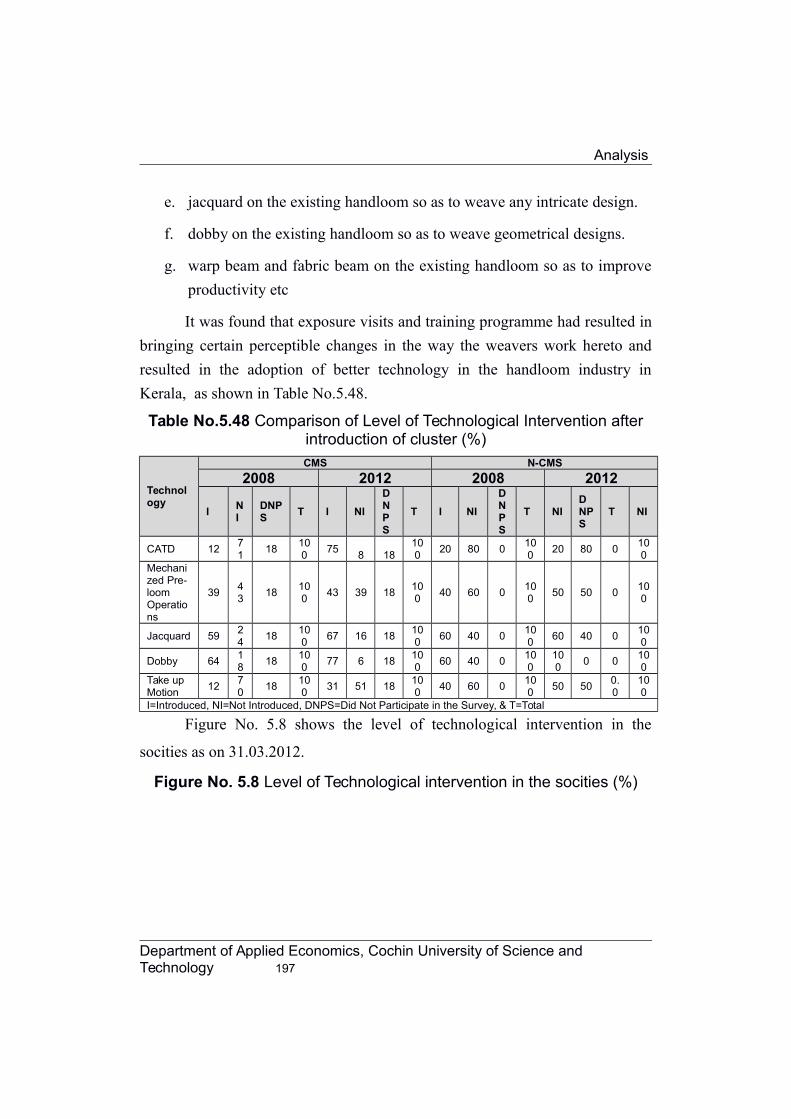
Analysis
e. jacquard on the existing handloom so as to weave any intricate design.
f. dobby on the existing handloom so as to weave geometrical designs.
g. warp beam and fabric beam on the existing handloom so as to improve
productivity etc
It was found that exposure visits and training programme had resulted in
bringing certain perceptible changes in the way the weavers work hereto and
resulted in the adoption of better technology in the handloom industry in
Kerala, as shown in Table No.5.48.
Table No.5.48 Comparison of Level of Technological Intervention afterintroduction of cluster (%)
Technology
CMS N-CMS
2008 2012 2008 2012
INI
DNPS
T I NI
DNPS
T I NI
DNPS
T NIDNPS
T NI
CATD 1271
18100
758 18
100
20 80 0100
20 80 0100
Mechanized Pre-loom Operations
3943
18100
43 39 18100
40 60 0100
50 50 0100
Jacquard 5924
18100
67 16 18100
60 40 0100
60 40 0100
Dobby 6418
18100
77 6 18100
60 40 0100
100
0 0100
Take up Motion
1270
18100
31 51 18100
40 60 0100
50 500.0
100
I=Introduced, NI=Not Introduced, DNPS=Did Not Participate in the Survey, & T=Total
Figure No. 5.8 shows the level of technological intervention in the
socities as on 31.03.2012.
Figure No. 5.8 Level of Technological intervention in the socities (%)
Department of Applied Economics, Cochin University of Science and Technology 197

Chapter 5
0
20
40
60
80
100
12
39
59 64
12
75
43
6777
31
Technological Intervention in CMS
2008 2012
0
20
40
60
80
100
120
20
40
60 60
40
20
5060
100
50
Technological Intervention in N-CMS
2008 2012
The cluster facilitated a higher level of technological interventions in the
select handloom co-operative societies. Cluster assistance had sowed the seeds
for such technological interventions and change in the handloom societies,
which is otherwise known for its resistance to change. These individual actions
of the societies are expected to increase efficiency and result in better
productivity and turnover.
5.1.5 Increase in Finance & Investment Aid
Compared with other segments of the textile industry, Handloom sector
is capable of producing a much larger volume of output for any given level of
investment. The sector has the ability to come out with products which can be
really competitive both at national and international markets, provided proper
infrastructure facilities are made. This would necessitate investment for
product management, both for production and post-production. Adequate
capital is required to produce high quality products and to create proper
linkages with the market, as well.
198 Department of Applied Economics, Cochin University of Science and Technology

Analysis
However, investment in handloom sector has seldom attracted private
investment, as is evident from the fact that 94 percent of the production from
Kerala comes from the co-operative sector. These societies depend on
Government schemes and packages for meeting their investment needs. The
Government investment has thus far been limited to certain piece-meal projects
such as workshed-cum-housing and project package schemes.
This section analyses how the Cluster Programme helped in creating a
proper system for uninterrupted production and post production fund
requirements of the handloom co-operative societies in Kerala, both its long
term and short term fund requirements.
5.1.5.1 Long Term Investments:
The handloom co-operative societies generally need Long Term
investments for setting up the production facilities, say the weaving unit. Apart
from this, fund is required for land, building, plant and machinery and
construction of the production unit. Fund is also required for establishing
proper marketing linkages. The main sources for meeting the long term funds
requirements of the handloom industry in Kerala are;
a) Share Capital,
b) Grant & Subsidy and
c) Borrowing from banks/FI
a) Share Capital
As far as the handloom co-operative societies in Kerala are concerned,
share capital from members, (normally subscribed at the time of membership)
constitutes the main sources of fund for long term investment. This is normally
low as new membership is not taking place in a big way. In addition to the
share contribution from by way of membership, Government funds come to the
Department of Applied Economics, Cochin University of Science and Technology 199

Chapter 5
Societies by way of Share Capital. The Share participation by Government is
normally given with a view to enhancing the Net Disposable Resources position
of the societies, and also for undertaking specific activities such as establishing
Mini Pre-loom Process Centres (warping and sizing units), setting up of Dye
House etc, construction of common works shed, purchase of new looms and to
meet other long term fund requirements. The ceiling for share capital from the
Government to is fixed at Rs.5.00 lacs per year per society. Thus, a portion of
the long term fund requirements in the handloom co-operative societies in
Kerala is met by the Share Contribution from members and Government. Since
share capital from the members are marginal, an increase in share capital in the
case of handloom co-operative societies in Kerala denote an increased share
participation by the Government. The y-o-y movement of share capital from
the period from 2005 to 2012 is given in Table No.5.49
Table No.5.49 The percentage Change in Share Capital of the societies
from 2005 to 2012
Year p
p
31.0
3.05
31.0
3.06
31.0
3.07
31.0
3.08
31.0
3.09
31.0
3.10
31.0
3.11
31.0
3.12
TO
TA
L
CM
47752
153
49058
710
51716
366
48200
117
60322
895
64245
229
65377
599
67140
080
.94 39.2
9N-
CM
S
87796
86
90187
84
93965
95
96446
70
11572
424
12531
724
13002
149
13895
8219.85
44.0
8
AV
ER
AG
E
CM
S
11369
56
11680
65
12313
42
11476
22
14362
59
15296
48
15566
10
15985
73-- --
N-
CM
S
87796
9
90187
8
93966
0
96446
7
11572
42
12531
72
13002
15
13895
82-- --
Source: Audited Balance Sheet of the Societies
From 2005 - 2012, the average share capital of the CMS increased from
Rs.1136956/- to Rs.1598573/-, ie an average increase of just Rs.4,61,617/- in a
period of eight years.
200 Department of Applied Economics, Cochin University of Science and Technology

Analysis
Figure No. 5.9 Average Share Capital of societies from 2005 to 2012
(Rs.)
2005 2006 2007 2008 2009 2010 2011 20120
500000
1000000
1500000
2000000
1136956 1147622
1598573
877969 964467
1389582
CMS N-CMS
Av
era
ge
Sh
are
Cap
ital
The survey results of the share capital received by the societies under
study are shown in Table No.5.50
Table No. 5.50 Percentage Change in Share Capital from the Pre-IY
(2008) to the Post IY (2012)
CMS N-CMS percent Change F P F PReduced cases 4 7.8 1 10No Change 0 0 2 200-25 percent 17 33.3 3 3025-50 percent 7 13.7 2 2050 percent > 13 25.5 2 20DNPS 9 17.6 0 0 51 100.0 10 100DNPS=Did Not Participate in the Survey, F=Frequency & P= percent Source : Audited Balance Sheet of the Societies & Field Survey
The study revealed that in the case of the 72 percent of CSM and 70
percent of N-CMS there is increase in the share capital received, which shows
that majority of the societies are alive to this channel as a source for fund.
b) Grant & Subsidy
Department of Applied Economics, Cochin University of Science and Technology 201

Chapter 5
The Grant and Subsidy given by the State and Central Govt constitute the
most important instruments for the handloom co-operative societies for funding
their investment needs. It is extended to handloom co-operative socities for a
number of schemes & programmes such as Marketing and Export Promotion
Scheme, Training and Skill Development Programme, Upgradation to
Powerloom/ Modernisation of Factory Type Societies, Hank Yarn subsidy,
Revitalisation and strengthening of Handloom Co-operatives and Apex societies
and Handloom Development Corporation (Flagship Programmes), Promotion of
Master Weavers to set up Production Units, Establishment of Weavers Service
Centre for Skill Up gradation Training for handloom Weavers, Development of
Regional Brand in Handloom Industry, Partial Mechanisation of Pre loom
Processing, Training, study and propaganda for encouraging the use of Handloom
cloth, Establishment of Hank Yarn Production Centres and Group Insurance
Scheme for Handloom Weavers (Mahatma Gandhi Bunkar Bima Yojna), &
Health Insurance Scheme for Handloom Weavers under Comprehensive Welfare
Scheme (CSS), etc. The survey results are shown in Table No.5.51
Table No.5.51 Percentage Change in the Grant & Subsidy received by the societies from the Pre-IY (2008) to the Post IY (2012)
percent ChangeCMS N-CMS
F P F PReduced cases 12 23.5 5 50.00No Change 7 13.7 3 30.000-25 percent 6 11.8 0 0.0025-50 percent 5 9.8 0 0.0050 percent > 12 23.5 2 20.00DNPS 9 17.65 0 0.00
51 100.00 10 100.00DNPS=Did Not Participate in the Survey, F=Frequency & P= percent Source: Balance Sheet of the Societies & Field Survey
202 Department of Applied Economics, Cochin University of Science and Technology

Analysis
The study revealed that N-CMS are better off in getting grant and
subsidy than CMS. This is mainly because the CMS cannot apply for certain
grant and subsidy as they are covered under cluster scheme. The Change in
Grant & Subsidy received by the handloom co-operative societies from 2005 to
2012 are given in Table No. 5.52
Table No.5.52 Change in Grant & Subsidy received by societies from2005 to 2012 (Rs.)
Year p
p
31.0
3.05
31.0
3.06
31.0
3.07
31.0
3.08
31.0
3.09
31.0
3.10
31.0
3.11
31.0
3.12
TO
TA
L
CM
34277
019
51564
645
49302
074
51940
109
59133
679
61692
635
60723
118
64264
347
51.5
3
23.7
3N-
CM
S
45517
03
49964
23
46800
99
58285
63
87135
73
11170
332
10720
974
10471
798
28.0
5
79.7
7
AV
ER
AG
E
CM
S
81612
0
12277
30
11738
59
12366
69
14079
45
14688
72
14457
89
15301
04-- --
N-
CM
S
45517
0
49964
2
46801
0
58285
6
87135
7
11170
33
10720
97
10471
80-- --
Source: Audited Balance Sheet of the Societies
In the case of CMS, the study revealed that the average Grant and
subsidy has increased by 51 percent in from 2005 to 2008 and from 2008 to
2012 by 23 percent . In the case of N-CMS, it has increased by 28 percent
from 2005 to 2008 and from 2008 to 2012 by 79 percent. The Figure No.5.10
shows the changes in the grant and subsidy received by the societies during the
period.
Figure. No.5.10 Average Grant & Subsidy received by societies (2005 -
2012)
Department of Applied Economics, Cochin University of Science and Technology 203

Chapter 5
2005 2006 2007 2008 2009 2010 2011 20120
200000400000600000800000
10000001200000140000016000001800000
816120
1236669
1530104
455170582856
1047180
CMS N-CMS
Ave
rag
e G
ran
t &
Su
bsi
dy
c) Borrowing from Banks/Financial Institutions
The co-operative societies in Kerala seldom avail financial assistance
from Financial Institutions like KSIDC/KFC/Commercial banks etc for meeting
the long term investments. The study revealed that none of the co-operative
societies have taken loan from Banks other than the District co-operative Banks
for the working capital needs. The survey results on the borrowing availed by
from the financial institutions are shown in Table No. 5.53.
204 Department of Applied Economics, Cochin University of Science and Technology

Analysis
Table No.5.53 Borrowings from Banks and FI
CSM N-CSM2008 2012 2008 2012
F P F P F P F PKSIDC 0 0 0 0 0 0 0 0KFC 0 0 0 0 0 0 0 0District Co-
Operative Banks
26 51 26 51 7 70 7 70
Other Banks 4 7.8 4 7.8 2 20 2 20No Borrowing from
Banks
12 23.5 12 23.5 1 10 1 10
DNPS 9 17.6 9 17.6 0 0 0 0Total 51 100.0 51 100.
0
10 100 10 10
0DNPS=Did Not Participate in the Survey, F=Frequency & P= percent Source: Field Survey
5.1.5.2 Short Term Investments:
Short Term Investments are nothing but working capital that are required
for the purchase of raw materials and to meet the day-to-day expenses of the
unit. Small scale industries have a distinct set of characteristics such as lower
credit on purchases, poor financial strength, high level of variability due to
dependence on local factors, low bargaining power leading to problems of
receivables etc. This in turn leads to inadequacy of working capital, which is
often stated as one of the major reasons for sickness of the industry. The banks
are reluctant to extend working capital assistance to these small firms. The
banks argue that most firms face problems of inadequate working capital due to
credit indiscipline. Firms, often, divert working capital to meet long term
requirements or to acquire other assets.
The situation of the handloom co-operative societies in Kerala is no
different. The societies used to avail working capital loan from District Co-
Department of Applied Economics, Cochin University of Science and Technology 205

Chapter 5
operative banks. Since they have huge outstanding liabilities in the bank, Bank
had stopped extending working capital assistance or new credit. Only a very
few societies have a running account. Most of the societies have reported
Shortage of working capital as one of the major problems that stands in the way
of smooth production flow in the handloom sector.
The section here analyses the availability of working capital in the
handloom co-operative societies in Kerala.
a) Primary Working Capital Borrowing from Banks:
This is the credit borrowing from the commercial banks and other
financial institutions. The PR Nayak Committee (1991) that was appointed to
devise norms for assessing the working capital requirement of small-scale
industries arrived at a simplified norm of pegging the Working Capital bank
financing at 20 percent of the projected annual turnover, subject to a Promoter
bringing in a margin of 5 percent of the projected annual turnover.
Quantum of Working Capital bankfinancing
20 percent of the projectedannual turnover
The working capital availability of the handloom co-operative societies
as on 31.03.2012 was tested against the above norm put forth by the PR Nayak
Committee to understand whether the handloom co-operative societies in
Kerala has access to enough bank finance for working capital requirements.
The test results are shown in Table No.5.54.
Table No.5.54 Availability and percent Change of Primary W/C(PW/C) from Commercial Banks/FIs as on 31.03.2012
% Change of P W/C
CMS N-CMS
F P F PLess than 0 5 9.8 1 100-20 percent 6 11.8 4 40
206 Department of Applied Economics, Cochin University of Science and Technology

Analysis
20 percent > 31 60.8 5 50DNPS 9 17.6 0 0 Total 51 100.00 10 100DNPS=Did Not Participate in the Survey, F=Frequency & P= percent Source: Field Survey
b) Secondary Working Capital:
The secondary sources of working capital consists of provisions such as
interest, depreciation, reserves and undivided profits, which are diverted/
temporarily used to meet the working capital requirements. These provisions
are made in the Profit & Loss account of the Balance sheet for the societies.
Table No.5.55 shows the study results.
Table No.5.55 Availability and percent Change of Secondary Workingcapital (S W/C) as on 31.03.2012
% Change S W/CCMS N-CMS
F P F PNo W/C facility 5 9.8 0 00-20 percent 8 15.7 6 6020 percent > 29 56.9 4 40DNPS 9 17.6 0 0 Total 51 100.00 10 100DNPS=Did Not Participate in the Survey, F=Frequency & P= percent Source: Field Survey
c) Incremental Working Capital:
The Incremental Working capital is fund available from the Gross profit
generated for the year. If the Gross Profit generated is at least equal to 20
percent of the turnover, the firm is said to generate the required working capital
through incremental working capital source within in the system. If the system is
not generating enough gross profit to cover the working capital requirement, it
would mean that there is erosion in the networth in such cases as the share capital
gets diluted to the extent of loss. The study results are shown in Table No.5.56
Table No.5.56 Availability and percent Change of Incremental Working capital(I W/C) as on 31.03.2012
Department of Applied Economics, Cochin University of Science and Technology 207

Chapter 5
% Change IW/C
CMS N-CMS
F P F P
Less than 0 4 7.8 2 500-20 percent 21 41.2 5 5020 percent > 17 33.3 3 30DNPS 9 17.6 0 0 Total 51 100.00 10 100DNPS=Did Not Participate in the Survey, F=Frequency & P= percent Source: Field Survey
With respect to the availability of short term fund for working capital
requirements, the study found that majority of the societies have access to
multiple sources for working capital. A few societies which do not have access
to such sources of funds depend either on unsecured sources or on advance for
job works.
Cluster provided Margin Money Assistance to weavers organized in
Self-Help Groups and Co-operatives @ Rs. 6,000.00 per weaver, subject to a
maximum ceiling 25 percent of the permissible project cost of a cluster viz.
Rs.60.00 lakh per cluster. This way a cluster can get fund upto a maximum of
Rs.15.00 lacs for working capital.
The study also found that a few societies have effectively utilized this
support. Rather than utilising the margin money for one time, they deposited
the fund so collected in Banks for getting additional working capital loan. This
shows the improved bargaining power and better negotiation skills of the
weavers. This phenomenon is widely noticed in clusters in Thiruvanathapuram.
Though the societies still need long term fund for infrastructure
development, the cluster programme helped them realize the need to have
proper financial discipline for uninterrupted operations. The individual
societies have felt the importance of investing. It also made them realise the
208 Department of Applied Economics, Cochin University of Science and Technology

Analysis
need to have prudential utilisation of the financial support for attaining long
term investments needs as well.
5.1.6 Co-ordinating Entity
Handloom, as already mentioned is a traditional industry, employing not
so highly educated people. Most of them are not aware of the developments
taking place in the sector at a different locations, let alone the changes in other
sectors. They do not have the time and seldom feel the need for knowing such
things.
One of the important operational weaknesses of the handloom industry
in Kerala was the lack of proper co-ordination by the various stake holders.
Only a department with commitment and dedication can bring changes in such
a society. The various co-ordinating agencies should also work in tandem and
proactively support and supplement one another to make perceptible changes in
the sector.
The cluster Development Programme was perhaps the first
comprehensive package given by the Government, with the intention to
improve the all-round development of the handloom sector. The weavers and
co-operative societies were not equipped enough to undertake such a big
Programme without proper co-ordination at various levels. The role of
Secretaries of the Societies, CDE, Implementing agencies, Directorate,
Departments, Hantex, Hanveev, WSC, NHDC, IHTT etc all important to bring
operational results in the sector.
This section analyses how capable and effective are the various
governmental agencies in implementing schemes like this in handloom sector.
This has a bearing on the long term growth of the industry as sector like
Department of Applied Economics, Cochin University of Science and Technology 209

Chapter 5
handloom needs strategic thinking and planning to take it to the high road to
growth. The co-ordinating agency can be said to be efficient and effective, if
they could bring operational results for the cluster programme. In this section,
a brief analysis is made to understand the operational results of the Cluster to
evaluate the co-ordinating various agencies.
5.1.6.1 Project Cost and Operational Results
As already mentioned, the maximum project cost under cluster
assistance is limited to Rs.60.00 lacs per cluster. The fund is released in 3
stages, based on the utilization of funds released in the previous stage.
The total amount sanctioned for the 24 handloom clusters in Kerala comes
Rs.1428 lacs. Out of this, the project cost for the 13 sample clusters alone comes
to Rs.772 lacs. The details of the project cost approved for the 13 sample
clusters and its sharing pattern and the fund disbursed is given in Table No.5.57.
Table No. 5.57 Total Project Cost, its sharing and funds received bysample clusters (Rs.)
No
Name of theCluster
Project
Cost
Sharing of ProjectCost Total
disbursed
Balancenot
disbursed
Central
State
IA/Ben
1 Kozhode Cluster 59.72 51.72 7.53 0.47 51.72 8.00
2Ramapuram Cluster
59.90 53.27 5.96 0.67 53.27 6.63
3Travancore Cluster
60.00 52.11 6.48 1.40 38.23 21.77
4Ooruttambalam Cluster
60.00 52.72 6.08 1.20 52.72 7.28
5Swadeshi Cluster
59.65 53.32 5.66 0.67 53.32 6.33
6 Naveena Cluster 59.65 53.32 5.66 0.67 53.32 6.337 Thettivila Cluster 60.00 53.98 5.02 1.00 28.63 31.37
210 Department of Applied Economics, Cochin University of Science and Technology

Analysis
8Neyyatinkara Cluster
59.99 53.75 5.78 0.45 53.76 6.23
9Payyanoor Cluster
53.50 45.23 7.48 0.80 34.52 18.98
10 ICON Cluster 59.50 50.86 7.73 0.93 45.06 14.4511 Morazha Cluster 59.90 52.38 6.62 0.90 30.88 29.02
12Kalliassery Cluster
59.90 52.48 6.52 0.90 52.48 7.42
13Chirakkal Cluster
60.00 51.08 8.12 0.80 51.08 8.92
Total 771.7
1676.2
184.6
310.86 214.02 78.79
% as against the total received
-- 88 11 1 77.62 22.38
Source: Field Survey
With respect to the sample clusters, 78 percent of the funds were
disbursed, leaving 22 percent undisbursed.
With respect to the sanctioning of the Fund for Project, all the
implementing agencies show almost same amount. There is no significant
difference in the amount sanctioned for the clusters under them, and among the
implementing agencies. The study result is shown in Table No. 5.58.
Table No.5.58 Sanctioned Project Cost & Co-ordinating Agencies
Implementing Agency
Mean SD dfF -
valuep - value
Hantex 59.978 0.025
3 & 16 0.759 0.533Handveev 60.000 0.000Consortex 59.782 0.155Others 58.886 2.384Total 59.549 1.434Source: Field Survey
5.1.6.2 Allocation & Utilisation of Funds for Different Activities
Department of Applied Economics, Cochin University of Science and Technology 211

Chapter 5
The Table No. 5.59 shows component-wise utilization of funds in the
sample clusters.
Table No.5.59 The Pattern of Allocation of Funds for different activities &its Utilisation (Rs.)
NoComponents of the IHDS
considered forassistance
Fundsanctioned Fund utilised
Fundunutilised
Amount
%Share
Amount
%Amou
nt %
1Baseline Survey, diagnostic Study, formation of SHG 9 1.17 9
100.0 0.0 0.0
2 Formation of Consortium5.25 0.68 5.25
100.0 0.0 0.0
3Corpus Fund for Yarn Depot (one Time Assistance) 39 5.05 39
100.0 0.0 0.0
4Skill upgradation (ceiling of15 percent of the project cost) 68.25 8.84 64.75 94.9 3.5 5.1
5Design Development & Product Diversification 96 12.44 74 77.1 22.0
22.9
6CFC/Dye House (ceiling of50 percent of the total Project Cost)
227.92 29.53
142.206 62.4 85.7
37.6
7Publicity & Marketing (ceiling of 20 percent of the Total Project Cost 117.1 15.17 92 78.6 25.1
21.4
8 Project Management Cost 72.1 9.34 69.2 96.0 2.9 4.0
9 Basic Inputs108.5
9 14.07 75.075 69.1 33.530.9
10 Construction of Work shed28.5 3.69 28.5
100.0 0.0 0.0
Total771.7
1100.0
0598.98
1 77.6 172.722.4
Source: Field Survey
With reference to fund unutilized, it is noted that non-utilisation of fund
is highest in item No.6 above ie, Common Facility Centre and Dye House. For
this item only 62 percent of fund is utilized and the balance 38 percent is
unutilised. Interestingly, allocation of fund is also highest in this item. Out of
the total project cost of Rs,770.71 lacs, for the 13 clusters, 227.92 lacs ie 30
212 Department of Applied Economics, Cochin University of Science and Technology
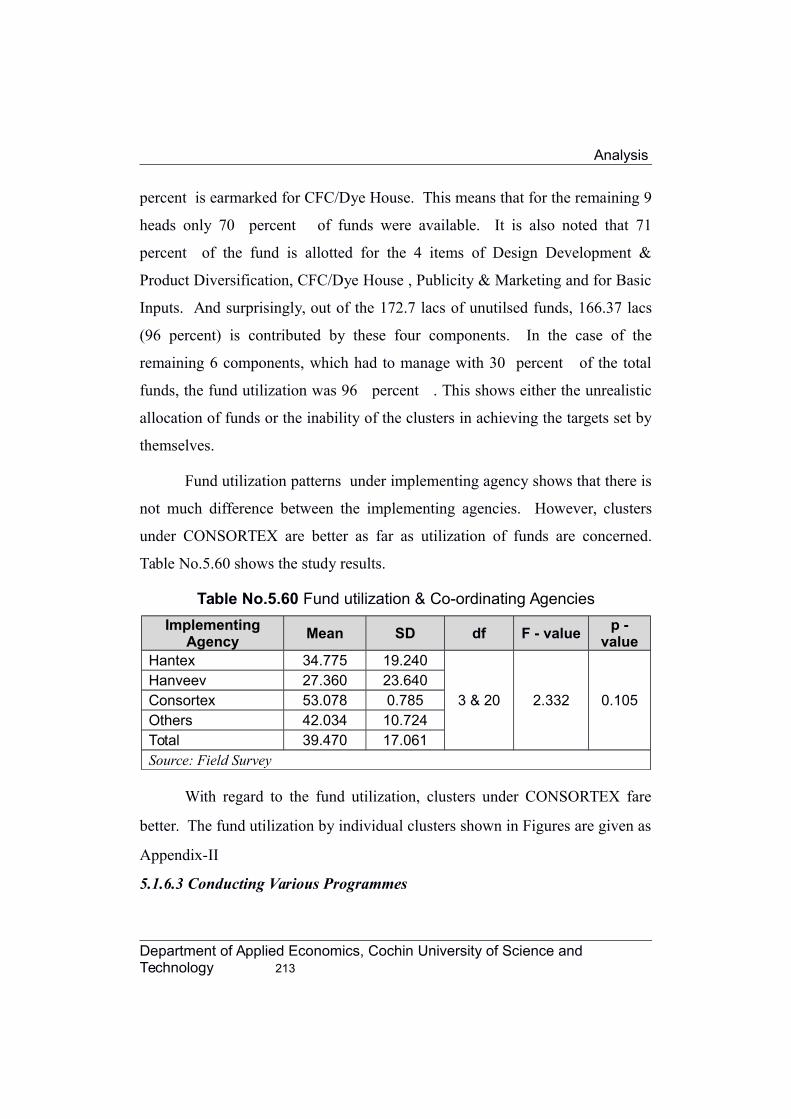
Analysis
percent is earmarked for CFC/Dye House. This means that for the remaining 9
heads only 70 percent of funds were available. It is also noted that 71
percent of the fund is allotted for the 4 items of Design Development &
Product Diversification, CFC/Dye House , Publicity & Marketing and for Basic
Inputs. And surprisingly, out of the 172.7 lacs of unutilsed funds, 166.37 lacs
(96 percent) is contributed by these four components. In the case of the
remaining 6 components, which had to manage with 30 percent of the total
funds, the fund utilization was 96 percent . This shows either the unrealistic
allocation of funds or the inability of the clusters in achieving the targets set by
themselves.
Fund utilization patterns under implementing agency shows that there is
not much difference between the implementing agencies. However, clusters
under CONSORTEX are better as far as utilization of funds are concerned.
Table No.5.60 shows the study results.
Table No.5.60 Fund utilization & Co-ordinating Agencies
ImplementingAgency
Mean SD df F - valuep -
valueHantex 34.775 19.240
3 & 20 2.332 0.105Hanveev 27.360 23.640Consortex 53.078 0.785Others 42.034 10.724Total 39.470 17.061Source: Field Survey
With regard to the fund utilization, clusters under CONSORTEX fare
better. The fund utilization by individual clusters shown in Figures are given as
Appendix-II
5.1.6.3 Conducting Various Programmes
Department of Applied Economics, Cochin University of Science and Technology 213

Chapter 5
The programme warranted various agencies under government initiate
actions for conducting exposure visits, training programmes, exhibitions,
national & International trade fairs, etc The details such programme
undertaken/co-ordinated are given in Table No.5.61
Table No.5.61 Activities /Programmes conducted by co-ordinatingagencies
Activities in Nos
Year
Exposure
visits
TrainingProgrammes by
WSC
Conducting Local
exhibitions
Orgaisingparticipationto local trade
fairs /exhibitions
Attendingnational
tradefairs
Attendinginternational trade
fairs
200
8
0 3 5 4 1 0
200
9
2 22 7 4 1 0
201
0
15 20 10 4 1 0
201
1
20 22 15 3 1 1
201
2
25 22 22 3 3 1
Source: Directorate of Handlooms & Textiles, GoK, IIHT, EDI, WSC & Field Survey
5.1.6.4 Completion of Different Works under Clusters
A cluster identified for interventions is said to have undergone five
distinct stages as shown below. The programme only stands completed when
all these five important stages are successfully completed. It is only then that a
complete assessment of the impact can be undertaken and the performance of
the co-ordinating agencies can be evaluated. The five stages are detailed below:
Stage I - Completion of Diagnostic Study and Soft interventions: This stage
stands completed when the CDE undertakes a diagnostic study and based on
214 Department of Applied Economics, Cochin University of Science and Technology
Analysis
this the cluster is identified and soft interventions initiated. This Stage can get
prolonged if the CDE is not appointed on time and adequately trained and
equipped to carry out the diagnostic study and effectively initiate soft
interventions. Stage I may also be prolonged due to the delayed release of
funds, as well as the delayed approval and consent of the State Government,
which is essential for the initiation of the programme in any state.
Stage II - Formation and registration of Special Purpose Vehicle (SPV): The
work in this Stage involves formation of the SPV and the formal registration of
the SPV. It is often difficult and time consuming to get individual units to come
together and form an SPV and register it in the most suitable institutional form.
The successful completion of Stage II also depends on suitability of the
identified cluster, which was decided based on the diagnostic study and on the
effectiveness of the soft interventions carried out.
Stage III - Approval of Detailed Project Report by DC, Handlooms: The third
Stage or Stage III stands completed after the DPR for the CFC is formulated
along with detailed estimates of the cost, and then approved by the Development
Commissioner, Handlooms, GoI. Stage III involves the careful selection of the
CFC and the formulation of a Detailed Project Report (DPR), and the acceptance
and approval of the proposal by the sponsors. Arriving at a consensus on the
choice of the most appropriate CFC is itself a difficult and time consuming
process. The formulation of a DPR often involves prolonged consultations with
experts, and equipment manufacturers. Access to affordable expertise either from
individuals or institution is not easy and often comes at a fairly high cost. The
process of approval may also prove to be very cumbersome and time consuming
and clusters are likely to get ‘stuck’ in this stage.
Department of Applied Economics, Cochin University of Science and Technology 215

Chapter 5
Stage IV - Initiating for Setting up of Common Facility Centre (CFC): The
fourth Stage or Stage IV, involves taking steps for the setting up of the CFC.
The pace of construction depends on the timely supply of equipment and
machinery. This will happen only on timely disbursement of payments. Delays
in the Stage IV can lead to cost escalation, causing further delays in
successfully completing this stage.
Stage V - Commissioning of CFC: The final Stage or Stage V is reached when
the CFC is fully commissioned and becomes functional and starts being used by
individual cluster units. Each of these stages is likely to take varying lengths of
time for completion. It may be mentioned that since no specific timeline is
prescribed for each stage, there is a tendency for the entire process to drag on.
Each of these stages involves different activities and are marked by specific
problems and constraints. The final Stage V involves the commissioning of the
CFC and ensuring the full utilization of the capacity created. The proper testing
of installed machinery the conduct of trial runs, the removal of teething
problems which often takes time as equipment suppliers do not attend to the
need for prompt after sales services. The purchase agreements are also not
properly framed to incorporate the timely provision of such services. The
proper training of workers who are required to operate these machines may also
create problems in the initial phase of operations. The pricing of services
provided by the CFC is also an important issue as both under pricing or over
pricing brings with it a host of other problems affecting the equitable utilization
of the facility by individual units in the cluster.
The status of completion of the different stages by sample clusters
studied is given in Table No.5.62.
216 Department of Applied Economics, Cochin University of Science and Technology

Analysis
Table 5.62 Status of Cluster activities completed
SlNo
Stages completed I II III IV V VI
1 Kozhode Cluster C C C C NC --2 Ramapuram Cluster DNPS DNPS -- -- -- --3 Travancore Cluster C C C NC -- --
4Ooruttambalam Cluster
C C C C C --
5 Swadeshi Cluster C C C C NC --6 Naveena Cluster DNPS DNPS -- -- -- --7 Thettivila Cluster C C C NC -- --
8Neyyatinkara Cluster
C C C C C --
9 Payyanoor Cluster C C C C NC --10 ICON Cluster C C C C C --11 Morzazha Cluster C C C C NC --12 Kalliasseri Cluster C C C C C --13 Chirakkal Cluster C C C C C --
C=Completed, NC= Not Completed, DNPS = Did Not Participate in the SurveySource: Field Survey
The study revealed that 85 percent of the sample clusters could
complete the Stage-1 and II successfully. This indicates that handloom clusters
in Kerala selected for CDP were apt, appropriate and had carried out the soft
interventions effectively. This can also be construed as the success of the CDE
in evaluating the common requirements of weavers /societies in the cluster,
taking all the stakeholders into confidence. The study further revealed that 9
clusters except Travancore and Thettivila could complete upto Stage III. This
is 69 percent of the sampled clusters. The reason for the slow implementation
of clusters in these two clusters is attributed to lack frequent change of Clusters
Development Executive. In the case of Travancore, the difference of opinion
among the participating societies members is also attributed to its slow
implementation.
Department of Applied Economics, Cochin University of Science and Technology 217

Chapter 5
With respect to the implementation of Stage IV, the study revealed that
38 percent of the sampled clusters could undertake successfully. The reason
for delay in initiating steps for setting up the CFC is attributed to the failure of
the cluster members in arriving at consensus on the location of the CFC and
also partially because of the objection of the local bodies. Further the study
revealed that none of the sample cluster could commission the CFC, ie the
Stage V.
Thus none of the clusters could complete all stages successfully
indicating weak linkages in the implementation of the cluster. All the sample
clusters have failed in executing the stage V, ie commissioning of the CFC.
This is because of the lack of consensus on the choice of location. Another
important factor that stood in their way of implementing the Dye House is the
objection from the local bodies. All 11 clusters except Travancore and
Thettivila could complete upto Stage III. This is 85 percent of the sampled
clusters. The reason for the slow implementation of works in these two clusters
is attributed to lack/ frequent change of Clusters development Executive. In the
case of Travancore, the difference of opinion among the participating societies
members is also attributed to its slow implementation. It is equally interesting
here to note that 38 percent of the sample clusters have completed stage IV
also. This indicates that the CDE’s are performing fairly well in almost all
clusters except in Thettivila and Travancore.
PART-II AN ENTERPRISE ANALYSIS
5.2 An Enterprise Analysis
The Part -1 of the analysis presented the performance of the Handloom
Co-operative societies in Thiruvananthapuram and Kannur Districts during the
pre and post cluster intervention period from its institutional aspect. In general,
it tried to give an overview of the impact of cluster development programme in
218 Department of Applied Economics, Cochin University of Science and Technology

Analysis
overcoming the operational weakness of the handloom co-operative societies
which joined the Programme. The next exercise is to understand whether such
intervention was meaningful and if it was meaningful, to what extent, it helped
the revival of handloom co-operative societies in Kerala. Intervention can be
said to be meaningful, if it made positive changes / impact on the profitability
and sustainability of operations of the handloom co-operative societies which
joined the cluster. This is examined through the following aspects;
1. Turnover
2. Net Profit/Net Loss
3. Accumulated Loss
4. Net worth
The data for the financial analysis are mainly taken from the financial
statements (both audited and unaudited) and the record of the co-operative
societies selected for the study.
5.2.1 Turnover
Turnover is the sales volume, net of all discounts and sales tax. It
represents the value of goods and services provided to the customers during a
specified time period, usually a year. It generally indicates the income
generating capacity of a unit over a period. Higher the turnover, better the
income generation. The handloom industry in Kerala is a “low volume -low
market- low margin” business. For such an industry, a fall in volume will push
the margin further down, making survival of the industry difficult.
The study revealed that the turnover of the CMS during the pre-
intervention period was at an increasing rate. However it had come down by 3
percent for the period from2008 to 2012, mainly attributed to the Global
Department of Applied Economics, Cochin University of Science and Technology 219

Chapter 5
Meltdown. In the case of N-CMS, the decline which was 15 percent during
the period from 2008 to 2012, indicating that the societies are still struggling to
get out of the crisis. Table No.5.63 shows the situation clearly.
Table No.5.63 Change in Turnover of Societies form 2005 to 2012 (Rs.)
Year per
per
31.0
3.05
31.0
3.06
31.0
3.07
31.0
3.08
31.0
3.09
31.0
3.10
31.0
3.11
31.0
3.12
TO
TA
L
CM
2219075
76
20820
7378
20199
3669
23298
5850
23721
9762
19442
4705
22097
6407
22591
2486
4.99 -3.04
N-
CM
S
3827853
4
31465
715
35751
779
38898
902
37738
925
29318
952
34288
481
33002
4241.62
-
15.1
AV
ER
AG
E
CM
S
528351449573
19
48093
73
55472
82
56480
90
46291
60
52613
43
53788
69-- --
N-
CM
S
382785331465
72
35751
78
38898
90
37738
93
29318
95
34288
48
33002
42-- --
Source: Audited Balance Sheet of the Societies
The average turnover of the societies which was Rs.5283514/- in 2005 had
increased to Rs. 5547282/- in 2008 and then got reduced to Rs. 5378869/-. This
means that CMS could arrest/check the decline in the turnover.
The Figure No. 5.11 shows the changes in the turnover of handloom co-
operative societies under study, pertaining to the period from 2005 to 2012.
Figure No5.11 Average Turnover of societies (2005-2012)
220 Department of Applied Economics, Cochin University of Science and Technology

Analysis
01000000200000030000004000000500000060000005283514 5547282 5378869
3827853 38898903300242
CMS N-CMS
Ave
rag
e T
urn
ove
r (R
s.)
It can be seen that total turnover for CMS and N-CMS move almost in
the same fashion. The increase in the turnover of the societies during 2006, 07
& 08 period was mainly attributed to the Marketing incentive extended by the
Central Government. The withdrawal of Marketing subsidy by the Central
Government in 2009 and the global recession during 2008-09 made a big
impact on the turnover of the societies and as is seen from the chart above, the
turnover of CMS and N-CMS had come down to the lowest in the decade in
2010. However, the turnover started picking up since 2011 and the momentum
continued in the case of CMS. This is attributed to certain sustainable systems
put in place due to the cluster intervention in these societies.
5.2.2 Net Profit/Loss
Net profit is a measure of the profitability of a venture, after accounting
for all costs. In accounting, Net profit is equal to the Gross Profit minus
overheads minus interest payable for a given time period. Profit commonly
Department of Applied Economics, Cochin University of Science and Technology 221

Chapter 5
means excess of total revenue over the total expenses of that business. It is also
called net income. (Gupta & Radhaswamy,1984). One of the important
objectives of every business concern is to earn a surplus of income over
expenses. The success of any business depends to a great extent on its profit
earning capacity, called profitability. While gross profit is the excess of sales
over cost of goods sold, Net Profit shows the true profit after providing for all
expenses.
Net Profit = Gross Profit - All expenses and losses
This research has taken Net Profit/Loss to understand the profitability of
operation of the societies. The average net profit/loss of the CMS and non-
CMS are given in the Table No.5.64
Table No.5.64 The Change in Net Profit (-Loss) Societies from 2005to2012
Year p
e p
e
31.0
3.05
31.0
3.06
31.0
3.07
31.0
3.08
31.0
3.09
31.0
3.10
31.0
3.11
31.0
3.12
TO
TA
L
CM
-
1263756
-
21904
-
14475
-
96015
-
12110
-
89767
-
10261
-
17592
24.0
2
81.6
8N-
CM
S
-
1940741
-
57151
-
38131
-
33333
-
59027
-
46653
-
63147
-
51328
-
71.7
-
53.9
AV
ER
AG
E
CM
S
-300894-
52152
-
34464
-
22860
-
28833
-
21373
-
24431-41888 -- --
N-
CM
S
-194074-
57151
-
38131
-
33333
-
59027
-
46653
-
63147
-
51328-- --
Source: Audited Balance Sheet of the Societies
The study revealed that the CMS had an average Net loss of Rs.228608/-
during the year ending 31.07.2008 and that has come down to 41888/- during
the year 2012, ie for the period from 2005 to 2008, the Net Loss has come down
by 24 percent and for the period from 2008 to 2012, it came further down by
81 percent. And the trend is likely to continue. The downward movement of
222 Department of Applied Economics, Cochin University of Science and Technology

Analysis
Net Loss or reduction in the loss shows that the profitability of operation is
increasing year after year. On the other hand, in the case of the N-CMS, Net
Loss for the period from 2005 to 2008 increased by 71 percent and the period
from 2008 to 2012 by 53 percent, indicating the N-CMS improve their
performance.
The Figure 5.12 shows movement of the Profitability of the operations
of these two types of handlooms societies since 2005 to 2012.
Department of Applied Economics, Cochin University of Science and Technology 223

Chapter 5
Figure 5.12 Average Net Profit/Loss (2005-2012)
2005 2006 2007 2008 2009 2010 2011 2012
-700000
-600000
-500000
-400000
-300000
-200000
-100000
0
-300894
-228608
-41888-194074
-333337
-513282
CMS N-CMS
Ave
rag
e N
et
Pro
fit/
Lo
ss (
Rs.
)
The Net Loss of N-CMS was lower in 2005 and was more or less similar
for CMS and N-CMS in 2006. It gradually started reducing during 2007 and
2008, mainly because of the high turnover reported these years due to the
Marketing Incentive by the Central and state Government. The net loss went up
again in 2009 due to the global recession and the withdrawal of Marketing
Subsidy by Central government. In 2010 the net loss started coming down.
While the decrease in Net loss in CMS has come down steadily. It even crossed
the 2005 point -where the net loss was very minimum- to limit the Net loss to
less than Rs.50,000/-, indicating higher profitability of operations.
5.2.3 Accumulated Loss
In addition to the Net Profit /Loss, the accumulated Loss of the societies
over the years will give a clear picture of their profitability from operations.
The y-o-y movement of Accumulated Loss is shown in Table 5.65.
224 Department of Applied Economics, Cochin University of Science and Technology

Analysis
Department of Applied Economics, Cochin University of Science and Technology 225
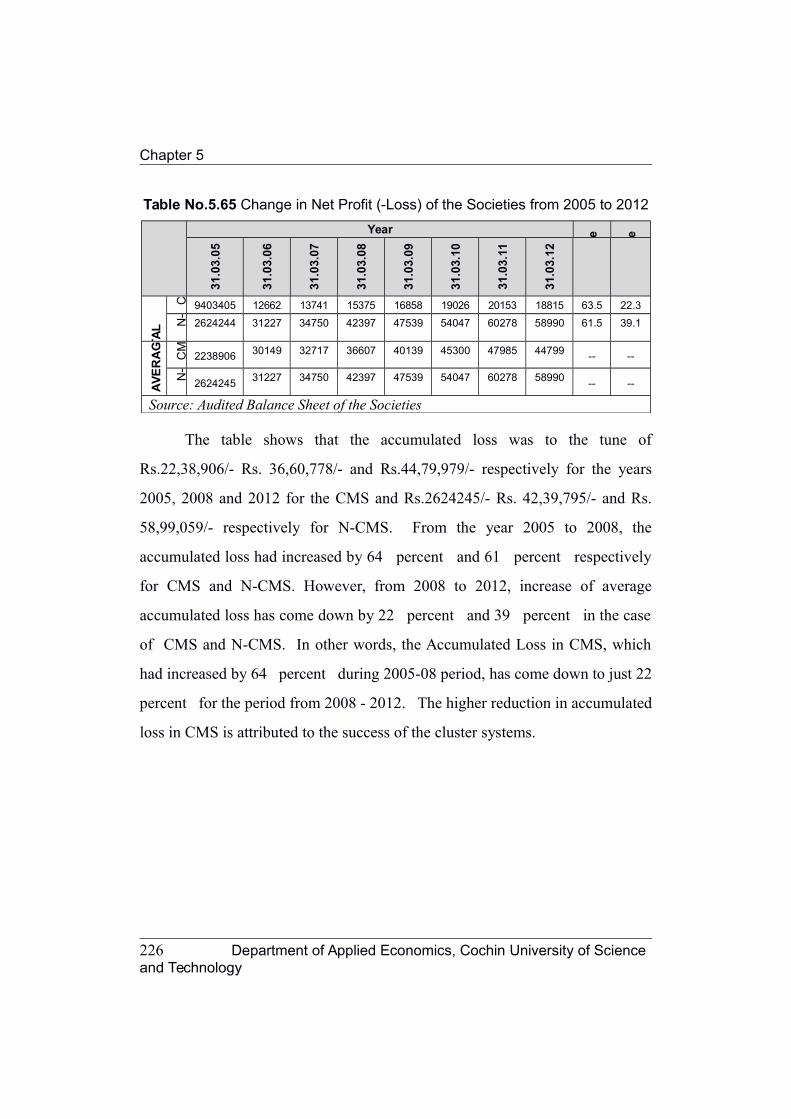
Chapter 5
Table No.5.65 Change in Net Profit (-Loss) of the Societies from 2005 to 2012
Year p
e p
e
31.0
3.05
31.0
3.06
31.0
3.07
31.0
3.08
31.0
3.09
31.0
3.10
31.0
3.11
31.0
3.12
TO
TA
L
CM
9403405
9
12662
8251
13741
5468
15375
2674
16858
3978
19026
4131
20153
7847
18815
9113
63.5
1
22.3
8
N-
CM
S
2624244
5
31227
266
34750
398
42397
954
47539
407
54047
203
60278
172
58990
592
61.5
6
39.1
4
AV
ER
AG
E
CM
S
2238906 30149
58
32717
97
36607
78
40139
04
45300
98
47985
20
44799
79
-- --
N-
CM
S
262424531227
27
34750
40
42397
95
47539
41
54047
20
60278
17
58990
59
-- --
Source: Audited Balance Sheet of the Societies
The table shows that the accumulated loss was to the tune of
Rs.22,38,906/- Rs. 36,60,778/- and Rs.44,79,979/- respectively for the years
2005, 2008 and 2012 for the CMS and Rs.2624245/- Rs. 42,39,795/- and Rs.
58,99,059/- respectively for N-CMS. From the year 2005 to 2008, the
accumulated loss had increased by 64 percent and 61 percent respectively
for CMS and N-CMS. However, from 2008 to 2012, increase of average
accumulated loss has come down by 22 percent and 39 percent in the case
of CMS and N-CMS. In other words, the Accumulated Loss in CMS, which
had increased by 64 percent during 2005-08 period, has come down to just 22
percent for the period from 2008 - 2012. The higher reduction in accumulated
loss in CMS is attributed to the success of the cluster systems.
226 Department of Applied Economics, Cochin University of Science and Technology

Analysis
Figure No.5.13 Average Accumulated Loss (2005-2012)
2005 2006 2007 2008 2009 2010 2011 20120
1000000
2000000
3000000
4000000
5000000
6000000
7000000
2238906
36607784479979
2624245
4239795
5899059
CMS N-CMS
Av
era
ge
Ac
cu
mu
late
d L
os
s (
Rs
.)
The percentage accumulated loss to paid up share capital shows the
pathetic fiancing position of the socities. Table No5.66 shows the study result.
Table No.5.66 Percentage of Accumulated Loss to Paid up Share
Capital
YearCMS N-CMS
2008 2012 2008 2012
Average Accumulated Loss
36607
784479979
42397
95
58990
59
Average Paid up share capital
11476
221598573
96446
7
13895
82
percent age of Accumulated Loss
to Paid up Share Capital
319
perce
nt
280
percent
440
perce
nt
425
perce
nt Source: Audited Balance Sheet of the Societies
It may be noted that in the case of CMS, the erosion of networth is not
severe compared to N-CMS. In the post intervention year the percentage of
Department of Applied Economics, Cochin University of Science and Technology 227

Chapter 5
Accumulated Loss to the Paid up share capital was 319 percent. This has
come down in the case of CMS in the post intervention by 280 percent.
However, in the case of N-CMS the percent age of Accumulated Loss to Paid
up Share Capital which was 440 percent has come down to 425 percent.
Though CMS are comparatively better off than N-CMS, the higher percent
age of Accumulated Loss to Paid up Share Capital that is prevalent in the
handloom co-operative societies in Kerala are not encouraging and promising.
5.2.4 Net Worth
The net worth, sometimes called net assets, is the total assets minus total
outside liabilities of an individual or a company. It is a key measure of how
much an entity is worth. A consistent increase in net worth indicates good
financial health; conversely, net worth may be depleted by annual operating
losses or a substantial decrease in asset values relative to liabilities. In the
business context, net worth is also known as book value or shareholders' equity.
The y-o-y movement of the Networth of the handloom co-operative is given
Table No.5.67.
Table No.5.67 Change in Net worth of the societies from 2005 to2012(Rs.)
Year per
per
31.0
3.05
31.0
3.06
31.0
3.07
31.0
3.08
31.0
3.09
31.0
3.10
31.0
3.11
31.0
3.12
TO
TA
L
CM
8677690
1
73832
489
69592
579
59038
621
70022
245
36511
035
29559
341
56064
979
-
31.9
-5.04
N-
CM
S
-
8894014
-
12939
-
16129
-
22055
-
22380
-
26078
-
30986
-
27809
-
147.
-
26.0
AV
ER
AG
E
CM
S
206611717579
16
16569
66
14056
81
16671
96
86931
0
70379
4
13348
80-- --
N-
CM
S
-889401-
12939
-
16129
-
22055
-
22380
-
26078
-
30986
-
27809-- --
Source: Audited Balance Sheet of the Societies
228 Department of Applied Economics, Cochin University of Science and Technology

Analysis
The networth of the societies were Rs. 2066117, Rs. 1405681, Rs.
1334880/- for CMS during 2005 , 2008 and 2012. It was Rs.(-)889401/-, Rs. (-)
2205565/-, and Rs.(-)2780982/- for N-CMS during the same period. For the
period form 2005 to 2008 the networth of the CMS had come down by 31
percent . However, the rate of reduction in the networth was much less during
the period from 2008 to 2012. It had decreased by just 5 percent . In the case
of N-CMS, the Networth had reduced by 140 percent during the 2005-2008
period. For the period from 2008 to 2012, networth had reduced by only 26
percent.
The Figure No.5.14 shows the y-o-y movement of Networth of the
societies under study.
Figure No.5.14 Average Networth (2005-2012)
-4000000
-3000000
-2000000
-1000000
0
1000000
2000000
30000002066117
1405681 1334880
-889401
-2205565-2780982
1 2 3 4 5 6 7 8
CMS N-CMS
Av
era
ge
Ne
two
rth
(R
s.)
The performance of sample handloom clusters are individually analysed
using the same key parameters employed for the analysis of the performance
Department of Applied Economics, Cochin University of Science and Technology 229

Chapter 5
variations of the handloom co-operative societies, studied. The results of the
analysis are shown in Figures in Appendix No.III.
The analysis of the enterprise aspects reveals that there is an
improvement in the profitability of operations of the handloom co-operative
societies which joined the Programme and the trend is likely to be more
sustainable as these societies have made cardinal interventions in their
institutional aspects to overcome the operational weakness.
……… ………
230 Department of Applied Economics, Cochin University of Science and Technology

Analysis
Department of Applied Economics, Cochin University of Science and Technology 231

The primary declared objective of the IHDS-CDP was to make holistic
and flexible interventions in the selected handloom clusters with a view to
making them self–sustainable by providing need-based inputs specific to each
cluster/group. Converting handloom weavers’ groups as a visible production
group by upgrading their skills to produce diversified products to meet
changing market requirements, providing them suitable workplace to produce
quality products with improved productivity, providing market orientation by
associating entrepreneurs, designers and professionals for marketing, designing
and managing the production, facilitating adequate credit from financial
institutions/banks etc were the focus of this new Development Programme.
Kerala was sanctioned 24 clusters under the Integrated Handloom
Development Scheme-Cluster Development Programme (IHDS-CDP) during
2006-07, covering 19,800 handloom workers in 152 handloom co-operative
societies. These 24 clusters are spread across seven out of the 14 districts of Kerala.
Of them, 16 clusters (66 per cent) were in two districts: Thiruvananthapuram and
Kannur. Out of this, 13 clusters are functioning now. Therefore, handloom clusters
in Thiruvananthapuram and Kannur Districts were taken for the detailed study to
understand the effectiveness of cluster based approach under IHDS as a growth
model.

Findings, Suggestions & Conclusion
The study, which essentially tried to evaluate the efficacy of cluster-
based approach in overcoming the operational weaknesses of handloom co-
operative societies in Kerala, was conducted using the Before and After
Approach & With or Without Approach. It covered an eight-year period from
2005 to 2012. To make the comparative study under the ‘Before and After
Approach’, the researcher has fixed 2008 as base year for Pre-Implementation
and 2012 as base Year for Post-Implementation.
The specific structural components of clusters covered under the study
were 1. Human force, 2. Network for supplying the Raw material, 3.
Technology and infrastructure up-gradation, 4. Network for accessing Market,
5. Finance and Investment Aid and 6. Co-ordination.
Under the CDP, each cluster received an assistance of up to Rs 60 lacs in
three installments. This amount was to be spent in three years on specified
areas.
The study revealed that the scheme brought in certain radical changes in
the way the handloom sector operated till then, though there were some
shortcomings.
6.1 Major Findings on the Impact of Cluster Development
Programme on Handloom Industry
During the period implementation of the Programme, the entire
handloom sector underwent a series of changes which showed sharp variations
between the societies who have joined the cluster and societies which have not,
in terms of turnover, production, profits etc.
Department of Applied Economics, Cochin University of Science and Technology 224

Findings, Suggestions & Conclusion
6.1.1 Human Force
By making some cardinal intervention in Human force, the Programme
helped formation of handloom weavers groups as a visible production group in
the selected handloom clusters. Amply supported by training programmes and
exposure visits, the Programme helped the members become self–sustainable
by upgrading their skills to produce diversified products with improved quality
to meet the market requirements. It also made them realise the ground realities
of the sector by throwing light on the challenges it faces and the need to change
in the new globalised scenario.
Training programmes and exposure visits, organised as part of the
Programme, opened the doors for technological upgradation in most of the
change-resistant handloom co-operative societies. It gave the weavers and
others stakeholders an insight and overview of the technology available in the
handloom sector in particular, and textile sector in general. It enabled the
members to produce quality products with improved productivity. It also
activated the dormant Government agencies like Weavers Service Centre for a
better outreach for training.
One of the issues that used to plague the industry was the seasonal
nature of employment. However, the programme has been successful in evening
out big disparities. The number of employment days has increased from less
than 120 to 180 - 200 days.
Department of Applied Economics, Cochin University of Science and Technology 225

Chapter 6
Table No.6.1 No of average working days per year
CMW N-CMW2008 2012 2008 2012
Frequency
Percent
Frequency
Percent
Frequency
Percent
Frequency
Percent
Upto 150 days
70 14.6 41 8.5 8 8.3 0 0.00
150-175 247 51.4 201 41.8 32 33.3 40 41.67
175-200 67 13.9 122 25.4 36 37.5 42 43.75
200-225 32 6.7 46 9.6 17 17.7 8 8.33
>225 2 0.4 8 1.7 3 3.1 6 6.25
Did No Participate
63 13.1 63 13.1 0 0.0 0 0.00
Total 481 100.0 481 100.0 96 100.0 96100.0
0
After the introduction of clusters, the workers find an increased job
opportunity in the handloom sector, compared with the pre-cluster period,
arguably on account of shortage labor supply and price elasticity nature of the
handloom industry.
Similarly, there was also sharp difference between the average wages
and other emoluments paid by the CMS and the N-CMS. Before the
introduction of the programme,the average wages and other emoluments paid
by the CMS were lesser than the average wages paid by the N-CMS in 2008. It
was Rs. 1536852/- for CMS and Rs. 1876543/- for N-CMS, ie the amount
spent by N-CMS were higher than CMS by 22 per cent in 2008. However, in
the post intervention year, it is found that the wages and other emoluments paid
by the CMS are higher than the N-CMS. It has improved from Rs. 1536852/-
in 2008 to Rs.1780846/- by 2012, a 16 per cent increase over 2008. This is
mainly because of the sharp decline in turnover, both domestic and export
market of the N-CSM during the period from 2008 to 2012. Highest drop in the
wage paid is noticed in Pinarayi Weavers Co-operative Society Ltd No.L.L 85
and The Chowa Weavers P & S Co-operative Society Ltd LL 76, both at
226 Department of Applied Economics, Cochin University of Science and Technology

Findings, Suggestions & Conclusion
Kannur. The failure of N-CSM to come out with better designs and new
products also added further blow to the downfall of the turnover and the
resultant wages.
The Figure No. 6.1 shows the wage and compensation paid by the
societies during the two periods of 2008 and 2012.
Figure 6.1 Wages & Compensation paid by societies (2005 - 2012)
2005 2006 2007 2008 2009 2010 2011 20120
500000
1000000
1500000
2000000
2500000
16934591536852
17808461902759 1876543
1457785
CMS N-CMSAv
era
ge
Wag
es
& C
om
pe
nsa
tio
n (
Rs.
)
This shows that despite large scale drop out of workers, and despite ups
and downs of business, the CMS spent more or less same amount as wage and
compensation.
Department of Applied Economics, Cochin University of Science and Technology 227

Chapter 6
6.1.2 Network for Supply of Raw Materials.
The CDP sowed the seeds of laying a proper network for raw material
supply for members of the clusters. It eliminated the monopoly of private raw
material suppliers by linking National Handloom Development Corporation
(NHDC) directly with the weavers for supply of raw materials. It also ensured
competitive prices for raw material bought by clusters.
228 Department of Applied Economics, Cochin University of Science and Technology

Findings, Suggestions & Conclusion
Table No.6.2 Procurement of Raw material by the weavers
CMW N-CMW2008 Pre-IY 2012 Post- IY 2008 2012F P F P F P
Open market 210 44 112 23.3 5557.
2957 59.38
Hantex/Hanv
eev139 29 99 20.6 18
18.
7513 13.54
Societies 69 14 207 43.0 2323.
9626 27.08
Did Not
Participate63 13 63 13.1 0 0 0 0.00
Total 481 100 481 100.0 96 100 96100.0
0
It may be noted from Table No.6.2, in the pre-intervention period 44 per
cent of weavers purchased raw materials from the Open Market. However, with
the introduction of ‘Yarn Bank’, the number of weavers who purchase raw
materials from the open market had come down to 23.3 per cent. Purchase from
Hantex/Hanveev also came down from 29 per cent to 20.6 per cent . However,
the yarn purchase by weavers from societies (Yarn Bank) had increased from 14
per cent to 43 per cent. In the case of N-CMW, the dependency on the Open
Market is still higher, depicting an overall weak raw material procurement system
compared with CMW.
6.1.3 Technology/Infrastructure Up-gradation
The programme provided the members of the cluster an opportunity to
attend Technology awareness programme by EDI, Technology Exhibitions and
Seminars, Tie up with Fashion Design Institutes etc. A few clusters got
opportunity to attend International Trade fair –an important platform for the
technology transfer in the textile sector. Such efforts had a great result on use
of technology in the handloom. Weavers started using pneumatic jacquard
Department of Applied Economics, Cochin University of Science and Technology 229

Chapter 6
system and motorized jacquard, take-up & let off motions, on the existing
handloom so as reduce fatigue and improve productivity, multiple box motion
for continuous weaving of two different kinds of weft, use of jacquard on the
existing handloom to weave any intricate design, use of dobby on the existing
handloom so as to weave geometrical designs, use warp beam and fabric beam
on the existing handloom so as to improve productivity etc .
Figure No.6.2 Level of technological Intervention in Societies in (%)
0102030405060708090
1239
59 64
12
75
4367 77
31
Technological Intervention in CMS
2008 2012
020406080
100120
2040
60 6040
2050 60
100
50
Technological Intervention in N-CMS
2008 2012
The Dye house and Common Facilities Centre, which are being set up,
will enable faster absorption of of technology in clusters.
The Programme facilitated a higher level level of technological
interventions in the CMS and this penetration of technology is higher than N-
CMS. The increase in the number of products in the CMS is partially attributed
to their ability adopt new technology.
6.1.4 Network for Accessing Market:
230 Department of Applied Economics, Cochin University of Science and Technology

Findings, Suggestions & Conclusion
The Programme also sensitised the members to the need for proper
marketing linkages for the long term growth of the sector. Cluster gave an
overview of different channels for marketing, the changing trends in marketing
and marketing strategies being adopted globally. The Programme provided
market orientation to the members by associating entrepreneurs, designers and
professionals for new products. A few societies also got opportunity to attend
fairs in foreign countries, enabling them to understand the trends in the global
market.
The study revealed that the societies who could introduce new products
in the range of 1-5 has increased from 33 per cent in the pre intervention period
to 45 per cent in post intervention period in the case of CMS. In the case of
N-CMS, the study revealed 90 per cent of societies could not introduce any new
products. For the remaining 10 per cent, the product range had come down and
the trend is the same during the two period under study.
The Figure No.6.3 the trend in the number of new products being
brought by the CMS and N-CMS from 2005 to 2012.
Figure No.6.3 Average No. of Products (2005-2012)
Department of Applied Economics, Cochin University of Science and Technology 231

Chapter 6
2005 2006 2007 2008 2009 2010 2011 20120
5
10
15
20
25
30
21.923.4
27.14
20.516.9 16.9
CMS N-CMS
Av
era
ge
Nu
mb
er
of
Pro
du
cts
The average number of products from the CMS was in the range of 23.4
during the pre intervention period. This had increased to 27.1. The increase
mainly happened because they experimented new products for the domestic
market. In the case of N-CMS, the average number was 16.9 and it had come
down to 13.7 by 2012. The dip on the number of products in the N-CMS is
because they have stopped producing certain items which they were producing
earlier for the export market. This is attributed to the lack of orders, mainly
export. This shows that the capacity of the CMS to come out with new
products are higher compared to the NCMS. It also shows that the CMS are
able to withstand external setbacks, by swiftly moving with better products in
an expanded market.
6.1.5 Finance and Investment Aid:
The Programme facilitated easy access to credit from financial
institutions/banks, and encouraged weavers for collective bargaining, even in
232 Department of Applied Economics, Cochin University of Science and Technology

Findings, Suggestions & Conclusion
financial matters. It also taught the weavers (weaver groups through SHGs) to
negotiate with banks and prudentially convert the margin money given under
cluster scheme as seed capital for working capital borrowing from banks. The
cluster made societies aware of the need to have financial discipline and to have
prudential financial planning, both for long term and short term.
The study revealed that profitability of operation of CMS has been
increasing year after year as they could reduce their Net loss during this period.
However, in the case of N-CMS, the study showed an increase in the Net Loss
during these period indicating less Profitability of operations.
Figure 6.4 Average Net Profit/Loss (2005-2012)
2005 2006 2007 2008 2009 2010 2011 2012
-700000
-600000
-500000
-400000
-300000
-200000
-100000
0
-300894
-228608-41888
-194074
-333337
-513282
CMS N-CMS
Av
era
ge
Ne
t P
rofi
t/L
os
s
The Net Loss of N-CMS was lower in 2005 and it was more or less
similar for CMS and N-CMS in 2006. It gradually started reducing during 2007
Department of Applied Economics, Cochin University of Science and Technology 233

Chapter 6
and 2008, mainly because of the high turnover reported during these years due
to the Marketing Incentive by the Central and State Governments. The net loss
went up again in 2009 due to the global recession and the withdrawal of
Marketing Subsidy by Central government. In 2010 the net loss started
reducing and CMS could continue this momentum and substantially reduce
their net loss by 2012. Net Loss is relatively higher in the N-CMS without
showing any signs of significant shift in the profitability of operations.
6.1.6 Co-ordination
Till the introduction of the Programme, the issues pertaining to the
handloom sector were confined most often to the societies alone. Cluster, which
advocates attaining a ‘high road to growth’ through co-operation between local
firms and institutional bodies, warranted an increased involvement of all the
stakeholders including governmental departments and educational institutions
for its success. The Programme helped the developmental agencies to have a
closer look at the issues the sector faced. The Programme also helped the sector
get a better acceptance and image among the policymakers.
Thus, the Programme helped to instill the much needed confidence
among the workers, societies and other stakeholders. This was translated into
better performance as the scheme provided them with material assistance:
easier, regular supply of raw material at competitive prices; introduction of new
technology leading to production of new products and better productivity;
opening of better and diverse marketing channels and access to new markets;
better access to credit and implementation of methodical financial management
systems and better monitoring and co-ordination by regulatory authorities.
6.2 Weaknesses/Drawbacks of the IHDS-CDP
234 Department of Applied Economics, Cochin University of Science and Technology

Findings, Suggestions & Conclusion
It is true that the cluster-based approach has sown seeds for sustainable
development of the sector by focusing on factors such as supply of raw materials,
technology, skill development and common facilities to make the sector
competitive as against the reliance on subsidy which was the practice in the past for
extending support by the government to this sector. Under the cluster, the sector
could improve substantially on skill development, design, and marketing.
However, the research found the following drawbacks or weaknesses in the
existing clusters scheme implemented in the handloom sector in Kerala.
Unrealistic Fund Allocation: The scheme too ambitious as it aims to
solve most of the issues that affect the sector. It contains too many targets as
against fund earmarked. This has resulted in an unbalanced fund allocation
among activities vis-à-vis actual requirements. For some items, fund allocation
was meager and for some other components, fund allocation was found to be
higher than what was required.
i. Lack of flexibility in the allocation of funds: The fund allotted is against
specific activities and there is hardly any scope for need - based
utilization among the components.
ii. Insufficient Timeframe: The time frame for completion of the cluster
project is 3 years. While most of the clusters availed funds within the
stipulated time, the same momentum could not be kept in executing the
projects by most of the clusters.
iii. There is no proper physical monitoring by the implementing agencies,
other than through the CDE’s.
iv. The CDE’s role necessitates continuity, commitment & vision in
implementing the Programme in the most befitting manner. The frequent
Department of Applied Economics, Cochin University of Science and Technology 235

Chapter 6
change of CDE’s coupled with lack of proper physical monitoring by the
implementing agencies affect the timely implementation of the project.
v. Lack of consensus and differences of opinion among the cluster
members has affected the performance of certain clusters. There is no
mechanism for the timely redressal of such issues, which is highly
essential for the smooth functioning of the clusters.
vi. Continuous training is highly essential for the development and growth of
sectors like handloom, the market of which changes with fashion and
trends in the market. The scheme does not provide for or there is no
mechanism for regular and continuous on-the-job training for the workers
in the cluster.
vii. Interdependence and knowledge sharing among the clusters are rather
weak or nil. The scheme does not provide for a mechanism for the free
flow of information, knowledge and technical know-how, which are
essential and integral part of any cluster scheme aimed at collective
efficiency. The interaction and co-operation among the handloom clusters
in the nearby areas are rather less and the clusters most often act in
isolation. The inter-cluster relationships need to be strengthened for
better bargaining power and collective efficiency. The scheme does not
have any component for strengthening inter-cluster and intra-cluster
relationships.
viii. Innovation is key for the long term sustainability of any industry and the
scheme neither provide for forging links with fashion and design houses
to update products and designs nor for acquiring new machines and
equipment for converting new ideas to products. The scheme does not
236 Department of Applied Economics, Cochin University of Science and Technology

Findings, Suggestions & Conclusion
provide any incentive to the workers for the updating of technology,
which in the long run make its product outdated.
ix. The scheme does not provide any incentive for successful
implementation of the scheme in terms of additional resource support or
a second level support system which can encourage the cluster members
to implement the project in full, on time.
6.3 Suggestions Based on the Study
6.3.1 Human Force
The Programme has been successful in convincing workers on the future
of the handloom industry. This needs to be sustained. The sector must become
attractive for the new generation of employees, if it were to make use of the
new opportunities that open up before it. This may be ensured by:
a) Offering wages equivalent to those for skilled jobs in other sectors
b) Attracting youngsters with better salaries, better working environment
and job security
c) Setting up a mechanism for regular and continuous on-the-job training
6.3.2 Network for Supply of Raw Materials
The entry of NHDC has remarkably changed the raw material supply
system. However, it can be made more effective by:
a) Eliminating the delay of 45 days for supply from the date of placing the
order by the societies.
b) Ensuring the NHDC bouquet has every type of raw material various
clusters require.
Department of Applied Economics, Cochin University of Science and Technology 237

Chapter 6
c) Setting up a regional depot of NHDC in Thiruvananthapuram as has
already been done in Kannur.
6.3.3 Technology and Infrastructure Up-gradation.
There is an ever growing demand for handloom products. However, to
exploit the new potential, the sector has to be trendy. This demands that sector
use state-of-the art technology and equipment. The Programme has already
initiated the change in this traditional industry. It needs to be sustained and
strengthened by:
a) Forging links with fashion and design houses to update products and
designs
b) Acquiring new machines and equipment for converting new ideas to
products
c) Providing Incentive to societies for the updating of technology
d) Most of the handloom co-operative societies in Kerala, especially the
factory type societies in Kannur have land varying from 50 to 100 cents.
However, they all operate from very dilapidated old buildings, which are
beyond repair. The only option is to demolish and construct new
building, by infusing further fund which the societies are unable to meet
in the existing environment. If the handloom industry is to be
perpetuated, these types of Factory type societies are to be liberally
funded for factory modernization. This can be a mechanism to
encourage Cottage type societies to become factory type.
6.3.4 Network for Accessing Market
238 Department of Applied Economics, Cochin University of Science and Technology

Findings, Suggestions & Conclusion
New products discover new markets. This is true for the handloom
industry also. The programme has succeeded in pushing the societies to change
their product profile drastically. This needs to be sustained; new markets must
be discovered. For this:
a) The government may consider additional resource support for market
development for identifiable, genuine products for specific uses from
identifiable geographic locations through the use of ‘Handloom Mark’-
the tool introduced by Government of India for popularizing the hand
woven products.
b) Provide incentive to societies to track new fashion trends, and change
the product bouquet.
c) Encourage participation in international and national expos.
d) Encourage better linkages with retail chains in Kerala, especially for
premium products over and above the existing ones.
e) Products from Kerala are well-accepted even in western markets.
Forging links with Kerala’s tourism industry will promote marketing of
its premium products in the local market as well.
f) Make the most of the environment-friendly nature of handloom,
especially in western markets.
6.3.5 Financial Supply and Investment Aid
The Programme has helped the societies stabilize part of their working
capital requirements and has introduced better financial management systems.
Other than very few facilities such as dye houses and common facilities centre,
the Programme did not provide for creation of infrastructure, either for the
Department of Applied Economics, Cochin University of Science and Technology 239

Chapter 6
clusters or for the individual societies. Societies will have to find own resources
to meet their growth requirements. Most of the societies would find it difficult
to do so, virtually weakening the progress they have already made. To stop this
from happening and strengthening them instead, the following measures may be
taken:
a) The government may follow up the Programme with a scheme offering
funds for the creation of infrastructure, which includes new buildings.
b) The government may set up a permanent mechanism for ensuring
financial discipline through regular and statutory audits.
c) The study revealed an unbalanced fund allocation among activities vis-
à-vis requirements. Moreover, the fund allocation is uniform all over
India, except for some minor deviations for less developed states. The
study revealed that the fund requirements of Thiruvananthapuram and
Kannur differs from one another. While Kannur needs more funds for
aggressive marketing and market development both in the domestic and
foreign market, the clusters in Thiruvananthapuram need a higher share
of funds for product development. For some items, fund allocation was
meager and for some other components, fund allocation was found to be
higher than what was required. The role of the regulatory bodies like
Panchayat whose approval is required for setting up dye house, was not
factored into while earmarking funds for activities, resulting in higher
under-utilisation of funds for some items. This reinforces the need for a
meaningful and flexible allocation of funds with provision for need
based utilization among the components.
6.3.6 Co-ordination Entity
240 Department of Applied Economics, Cochin University of Science and Technology

Findings, Suggestions & Conclusion
The Programme has helped societies getting an active involvement of
different stakeholders for the development of the sector. It also made them
realise the cardinal issues that stand in the way of growth and the ways and
means to overcome the issues. However, to keep the momentum going, active
involvement, proper follow-up and co-ordination is required. The following
measures can be taken in this direction:
Government has to review its guidelines and policies and co-ordinate
with other development agencies like Panchayath, as otherwise, even well
meaning initiatives such as support for setting up a Dye House are nullified by
objections/restrictions imposed them. Involve more technical people in the
programme.
The interaction and co-operation among the handloom clusters in the
nearby areas are rather less and the clusters most often act in isolation. The inter-
cluster relationships need to be strengthened for better bargaining power and
collective efficiency. The CDEs have to take a pro-active role in such matters.
There is a tendency among the implementing agencies like Hantex and
Hanveev to change the CDE’s, frequently. The CDE’s role necessitates
continuity, commitment & vision in implementing the Programme in the most
befitting manner.
Extending the services of the CDE for a suitably long period to enable
the weavers to take up the long term challenges.
The time frame for completion of the cluster project is 3 years. While
most of the clusters availed funds within the stipulated time, the same
momentum was not kept in executing the projects. This indicates a weak
follow-up by the departmental agencies.
Department of Applied Economics, Cochin University of Science and Technology 241

Chapter 6
6.4 Areas for Further Study/Research
Further research is also required to know whether Group approach or
Cluster Approach is better in achieving the objectives
GoI has been supporting the handloom sector by extending different
schemes and packages. Most of them are intended at meeting the long term
fund requirement of the units. Despite the well defined schemes, many of the
co-operative societies report dearth of fund as one of the reasons for their poor
performance. This offers tremendous scope for further research on the
adequacy of government support in handloom industry and the need for
flexibility vis-à-vis their requirements. It also needs to be further studied
whether other traditional sectors also get the same type of support like
handloom industry.
6.5 Conclusions
The performance of handloom co-operative societies in the pre-cluster
period was dependant or based on support in the form of subsidy provided to
the handloom industry by the Central and State governments. The withdrawal
of subsidy in 2008 by the Central Government resulted in a sharp decline in
their fortunes. The economic slowdown started in 2009 dealt another blow to
the sector, pulling it further down.
The Government intervention through the cluster-based approach has
resulted in checking the downtrend and showing a gradual upward trend in
growth, which is likely to be more sustainable, in view of the support being
focused on making the sector competitive with infrastructure and other support
mechanism.
242 Department of Applied Economics, Cochin University of Science and Technology

Findings, Suggestions & Conclusion
The cluster-based approach has sown seeds for sustainable development
of the sector by focusing on factors such as supply of raw materials, technology,
skill development and common facilities to make the sector competitive as
against the reliance on subsidy which was the practice in the past for extending
support by the government to this sector. Under the cluster, the sector could
improve substantially on skill development, design, and marketing.
The cluster development scheme has helped widen or enlarge the market
for handloom products, including the domestic market. This ensures better
prospects for growth for the handloom products in the future. The appointment
of Cluster Development Executives has greatly enhanced/influenced the
performance of the clusters. However to ensure commitment of CDEs, a fixed
long term tenure is necessary.
The inability of the handloom societies to attract the work force to the
sector in view of the remuneration/rewards not matching with those available
with other sectors of the economy still poses a threat to the survival of the
sector, despite governmental efforts for the promotion of handloom industry.
The societies need to be large enough to capitalise on the opportunities
of a global scale but small and autonomous enough to respond flexibly to rapid
shifts in customer demand. The scalability of the societies needs to be
increased suitably to meet the growth in demand, at least for products where the
demand is high.
The issues connected with the allotment of funds to individual societies
for certain programmes, its utilization and monitoring, can best be overcome,
when funds are allotted collectively to clusters for giving support for individual
societies. This could save substantially on time, money and effort. This
Department of Applied Economics, Cochin University of Science and Technology 243
Chapter 6
endorses the popular perception that funds are best utilized when allotted
collectively, rather than individually.
This is perhaps the first comprehensive Programme targeted for
improving the performance of the handloom sector. Instead of addressing
problems in an ad-hoc way, the Programme was designed to solve some of the
basic problems that plague handloom societies. The study has found out that
this strategy worked. The societies are in better shape now to consolidate their
strengths and face the challenges the dynamic global market offers.
The researcher is of the view that the problems that visit the small scale
sector across various industries in our country can be solved with comprehensive
rehabilitation programmes and their imaginative implementation. Such an
approach is necessary as the sector plays a significant role in sustaining our
economy and in creating employment.
While the study has highlighted some of the improvements which have
taken place due to the CDP in the handloom sector, the study also reveals that a
lot more needs to be done as is evident from the fact that CDP has not resulted
in the sector being financially viable (continuing to incur losses though they
have come down). It is hoped that some of the suggestions made in this report
would merit serious consideration by the authorities for making necessary
modifications/ additions in the scheme.
……… ………
244 Department of Applied Economics, Cochin University of Science and Technology

Findings, Suggestions & Conclusion
Department of Applied Economics, Cochin University of Science and Technology 245

Survey Schedule-IHandloom Cluster
PART-A1 Name of the Cluster2 No. of Members 3 Member Societies of the cluster
# Name of the SocietyTotal No. ofmembers in
society
ClusterMembers
4 Date of forming the cluster 5 Date of formal approval by GoI6 Implementing Agency7 Date of commencing the
activitiesPART-B
YearParticulars 20
05
2006
2007
2008
2009
2010
2011
2012
Fund sanctioned by GOIFund received from GOIFund contributed by membersAmount of fund lapsed, if any. Reasons for non- utilisation of funds
PART-C1 No of training Programme conducted by the cluster,
its duration and the no. of societies / weavers
attended. 2 No of Exposure Visits conducted by the cluster, and
the no. of societies / weavers attended.

Appendices
3 Whether the cluster set up Yarn Bank of NHDC 4 Whether the cluster appointed designer5 The details of the national & International exhibitions
attended by the cluster6 Whether new products introduced, If so, its nos 7 Steps taken for common brand building8 Whether any programme undertaken jointly with the
handloom clusters in the nearby areas. 9 Additional comments, if any,
PART-DCompletion of activities envisaged under Cluster (tick whichever is
applicable)# Activity Started In-
progres
s
Comple
ted
1 Status of Diagnostic Study and Soft
Interventions 2 Formation and Registration of Special
Purpose Vehicle (SPV)3 Approval of Detailed Project Report 4 Whether steps taken for setting up of
Common facility Center (CFC)5 Commissioning of CFC
PART-E1 Reasons, if the cluster could not achieve the targets2 If the cluster could achieve the targets, what are the future
plans of the cluster? 3 If the cluster could not achieve the targets, what are your
plans to overcome the difficulties?5 Do you get sufficient support from the cluster implementing
agency? Any suggestions for better implementation
Survey Schedule-IIHANDLOOM CO-OPERATIVE SOCIETIES (CMS)
PART-A1 Name & Address of the society
Department of Applied Economics, Cochin University of Science and Technology 256

Appendices
2 District (Kannur/Trivandrum)3 Date of formation of the society4 Name and address of the cluster in which the
society is a member.PART –B
2008 2012Human Force
1 No of Registered Members2 No of Active Members3 Total no of Members joined in the cluster4 Total no of looms 5 Total no of working looms 6 Steps take to improve the quality of labour7 Whether conducted any Training
Programmes for the weavers8 Whether conducted any Exposure visits for
the weaversRaw material
1 Whether purchase from Open Market1 Whether purchase from Hantex/Hanvee2 Whether member of Common Purchase/Raw
Material Bank/others2a Its Impact on availability 2b Impact on prices raw material 3 Others
Technology 1 No of looms2 Whether introduced Computer Aided Design
Technology(CATD)3 Whether introduced Mechanised Pre-loom
Operations4 Whether Jacquard Introduced5 Whether Dobby Introduced 6. Whether take-up motion is used7 Any other (indigenous) technology
developed/ or being usedNetwork for accessing the market
Department of Applied Economics, Cochin University of Science and Technology 257

Appendices
1 Domestic Sales1a Exhibition Sales1b Sale through hantex /Hanveev2 Foreign Sales3 Steps taken for increasing the Product
profile3.a Advertising & Publicity3.b Have developed Bands, If so Nos3.c Use of Handloom Marl3.d Website
Financial supply and investment aid and1 Credit1.a Availability of Primary Working Capital1.2 Availability of Secondary working Capital1.3 Availability of Incremental Working Capital2 Investment2.1 Form GoI2.2 Form GoK2.3 By Society
Co-ordinating entity1 Problems encountered by the society as member in the cluster2 Do you attend any meeting on Cluster 3 Are you happy with the support of the CDE and the Directorate?.
Explain your expectation on their role in improving the performance of
the handloom industry4 Drawback/limitation of cluster in improving the activities of the society, if
any ( tick whichever is applicable)5 Any suggestion to improve the functioning of the cluster?6 Further Support required from the cluster implementing agency7 Any other comment, suggestions & remarks
PART-C (Date based on Balance Sheets)
YearParticulars 20
05
2006
2007
2008
2009
2010
2011
2012
1 Share capital (Rs)2 Value of production (Rs)3 Value of Domestic Sales (Rs)4 Value of Export Sales (Rs)
258 Department of Applied Economics, Cochin University of Science and Technology

Appendices
5 Turnover of the society (Rs)6 Net profit (loss) of the society
(Rs)7 Credit/grant to the society (Rs)8 No of products9 Working Capital10 Term Loan from banks and FI11 Reserves & Surplus12 Accumulated Loss13 Networth
Department of Applied Economics, Cochin University of Science and Technology 259

Appendices
Survey Schedule-IIIHANDLOOM CO-OPERATIVE SOCIETIES (N-CMS)
PART-A1 Name & Address of the society2 District (Kannur/Trivandrum)3 Date of formation of the society4 Reasons for Not joining the Cluster (Not Interested/Not
aware/Any other reasons) 5 Will you join the cluster, if given an opportunity
(No/Yes.Dont Know) PART –B
2008 2012Human Force
1 No of Registered Members2 No of Active Members3 Total no of looms 4 Total no of working looms 5 Whether conducted any Training
Programmes for the weavers6 Whether conducted any Exposure visits for
the weaversRaw material
1 Whether purchase from Open Market1 Whether purchase from Hantex/Hanvee2 Whether member of Common
Purchase/Raw Material Bank/others2a Its Impact on availability 2b Impact on prices raw material 4 Others
Technology 1 No of looms2 Whether introduced Computer Aided Design
Technology(CATD)3 Whether introduced Mechanised Pre-loom
Operations
260 Department of Applied Economics, Cochin University of Science and Technology
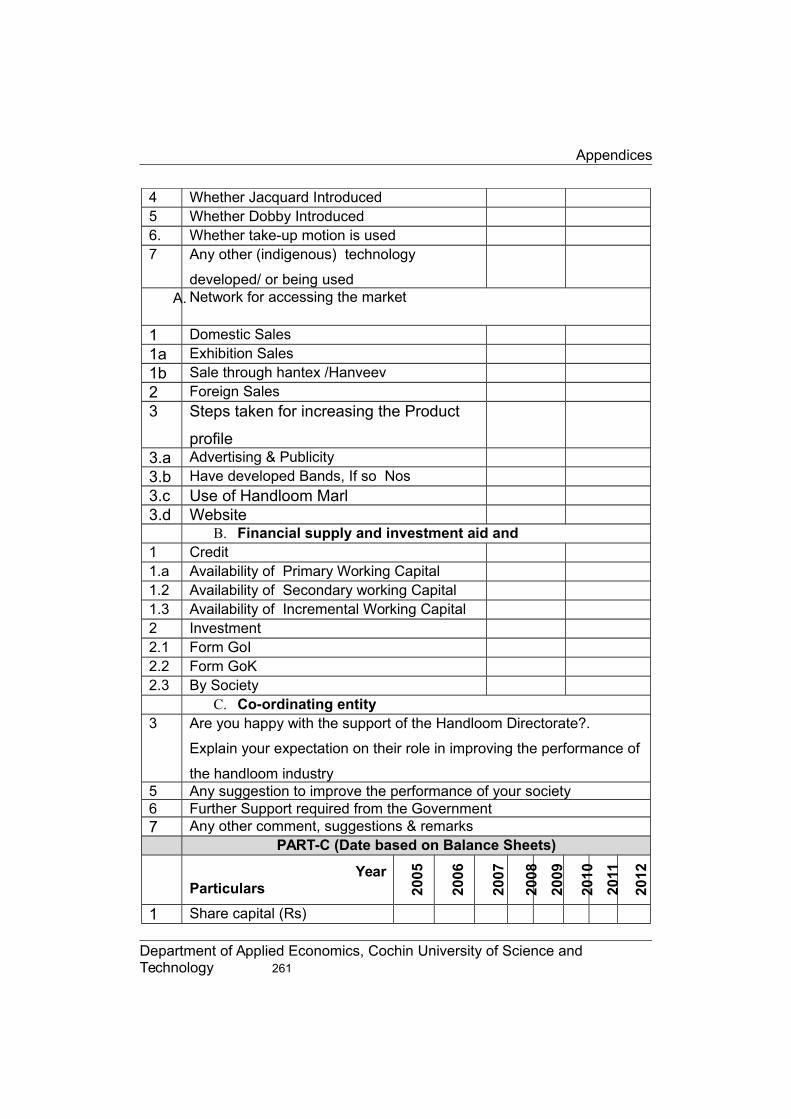
Appendices
4 Whether Jacquard Introduced5 Whether Dobby Introduced 6. Whether take-up motion is used7 Any other (indigenous) technology
developed/ or being usedA. Network for accessing the market
1 Domestic Sales1a Exhibition Sales1b Sale through hantex /Hanveev2 Foreign Sales3 Steps taken for increasing the Product
profile3.a Advertising & Publicity3.b Have developed Bands, If so Nos3.c Use of Handloom Marl3.d Website
B. Financial supply and investment aid and1 Credit1.a Availability of Primary Working Capital1.2 Availability of Secondary working Capital1.3 Availability of Incremental Working Capital2 Investment2.1 Form GoI2.2 Form GoK2.3 By Society
C. Co-ordinating entity3 Are you happy with the support of the Handloom Directorate?.
Explain your expectation on their role in improving the performance of
the handloom industry5 Any suggestion to improve the performance of your society 6 Further Support required from the Government 7 Any other comment, suggestions & remarks
PART-C (Date based on Balance Sheets)
YearParticulars 20
05
2006
2007
2008
2009
2010
2011
2012
1 Share capital (Rs)
Department of Applied Economics, Cochin University of Science and Technology 261

Appendices
2 Value of production (Rs)3 Value of Domestic Sales (Rs)4 Value of Export Sales (Rs)5 Turnover of the society (Rs)6 Net profit (loss) of the society
(Rs)7 Credit/grant to the society
(Rs)8 No of products9 Working Capital10 Term Loan from banks and FI11 Reserves & Surplus12 Accumulated Loss13 Networth
262 Department of Applied Economics, Cochin University of Science and Technology

Appendices
Survey Schedule-IV
Handloom Workers in the Cluster (CMW )
General Particulars1. Name 2. Age3. Sex4. Place5. Education status6. Marital Status Singl
e
Marrie
d
Wido
w
Separated widow
7. No of
dependents
other than
children
1 2 3 4 More than
4
8. Category of
employment
Wind
er
Wrapp
er
Weav
er
Master
weaver
Others
9. Reasons for adopting this occupation (tick whichever is applicable)10. a) Traditional occupation
b) A good job opportunity of your choice
c) A Lucrative job
d) Others specify11. No of persons in the household employed in handloom
One Two Three Four Five1
2.
No of weavers in the household
One Two Three Four Five1
3.
Years of experience in the handloom sector
Below5 years
5 -10years
10-15years
15-20years
25 years
Economic Particulars2008 2012
A1 Salary (Wage per day)
Department of Applied Economics, Cochin University of Science and Technology 263

Appendices
2 Housing3 Medical4 PF5 Other (CTF, Chits)6 No of working days in an year
B Training & Skill Up gradation1 Training Programme attended2 Exposure visit3 Job rotation/ Value addition in job (no
of job)4 Output (Change in quantity) 5 Output (Change in quality/nature of
work)6 Changes in working environment7 Others
C Where do you procure raw materials
from
(Open
market/Hantex/Societies/NHDC)D Whom do you sell your product
(Master
Weavers/Hantex/Societies/Open
market) E As a weaver, what is your suggestion to improve the performance of
the handloom industry.
264 Department of Applied Economics, Cochin University of Science and Technology

Appendices
Survey Schedule-V
SURVEY SCHEDULE – (N-CMW)
General Particulars12. Name 13. Age14. Sex15. Place16. Education status17. Marital Status Singl
e
Marrie
d
Wido
w
Separated widow
18. No of
dependents
other than
children
1 2 3 4 More than
4
19. Category of
employment
Wind
er
Wrapp
er
Weav
er
Master
weaver
Others
20. Reasons for adopting this occupation (tick whichever is applicable)21. e) Traditional occupation
f) A good job opportunity of your choice
g) A Lucrative job
h) Others specify22. No of persons in the household employed in handloom
One Two Three Four Five1
2.
No of weavers in the household
One Two Three Four Five1
3.
Years of experience in the handloom sector
Below5 years
5 -10years
10-15years
15-20years
25 years
Economic Particulars2008 2012
A1 Salary (Wage per day)
Department of Applied Economics, Cochin University of Science and Technology 265

Appendices
2 Housing3 Medical4 PF5 Other (CTF, Chits)6 No of working days in an year
B Training & Skill Up gradation1 Training Programme attended2 Exposure visit3 Job rotation/ Value addition in job (no
of job)4 Output (Change in quantity) 5 Output (Change in quality/nature of
work)6 Changes in working environment7 Others
C Where do you procure raw materials
from
(Open
market/Hantex/Societies/NHDC)D Whom do you sell your product
(Master
Weavers/Hantex/Societies/Open
market) E As a weaver, what is your suggestion to improve the performance of
the handloom industry. F Reason for not joining the clusterG Would you join the cluster in given an opportunity
266 Department of Applied Economics, Cochin University of Science and Technology

Fund Utilization Pattern By the 24 Handloom Clusters In
Kerala, Sanctioned under IHDS-CDP during 2006-07
Baseli
ne S
urve
y, d
iagno
stic
Study
, for
mat
ion o
f SHG
Basic
Input
s00.10.20.30.40.50.60.70.80.91
Fund Utilization - Nedumangadu Cluster
Baseline Survey, diagnostic Study, formation of SHG0
0.10.20.30.40.50.60.70.80.9
1
Fund Utilization - Ramapuram Cluster

Appendices
Baseli
ne S
urve
y, d
iagno
stic
Study
, for
mat
ion o
f SHG
Basic
Input
s00.10.20.30.40.50.60.70.80.91
Fund Utilization - Bhagavathy Nada Cluster
Baseli
ne S
urve
y, d
iagno
stic
Study
, for
mat
ion o
f SHG
Basic
Input
s00.10.20.30.40.50.60.70.80.91
Fund Utilization - Swadeshi Cluster
Department of Applied Economics, Cochin University of Science and Technology 268

Appendices
Baseli
ne S
urve
y, d
iagno
stic
Study
, for
mat
ion o
f SHG
Basic
Input
s00.10.20.30.40.50.60.70.80.91
Fund Utilization - Thettivila Cluster
Baseli
ne S
urve
y, d
iagno
stic
Study
, for
mat
ion o
f SHG
Basic
Input
s00.10.20.30.40.50.60.70.80.91
Fund Utilization - Krishnamahila Cluster
Department of Applied Economics, Cochin University of Science and Technology 269

Appendices
Baseli
ne S
urve
y, d
iagno
stic
Study
, for
mat
ion o
f SHG
Basic
Input
s00.10.20.30.40.50.60.70.80.91
Fund Utilization - Kozhode Cluster
Baseli
ne S
urve
y, d
iagno
stic
Study
, for
mat
ion o
f SHG
Basic
Input
s00.10.20.30.40.50.60.70.80.91
Fund Utilization - Travancore Cluster
270 Department of Applied Economics, Cochin University of Science and Technology

Appendices
Department of Applied Economics, Cochin University of Science and Technology 271

Appendices
Baseli
ne S
urve
y, d
iagno
stic
Study
, for
mat
ion o
f SHG
Basic
Input
s00.10.20.30.40.50.60.70.80.91
Fund Utilization - Ooruttambalam Cluster
Baseli
ne S
urve
y, d
iagno
stic
Study
, for
mat
ion o
f SHG
Basic
Input
s00.10.20.30.40.50.60.70.80.91
Fund Utilization - Naveena Cluster
272 Department of Applied Economics, Cochin University of Science and Technology

Appendices
Baseli
ne S
urve
y, d
iagno
stic
Study
, for
mat
ion o
f SHG
Basic
Input
s00.10.20.30.40.50.60.70.80.91
Fund Utilization - Neyyattinkara Cluster
Baseli
ne S
urve
y, d
iagno
stic
Study
, for
mat
ion o
f SHG
Basic
Input
s00.10.20.30.40.50.60.70.80.91
Fund Utilization - Chathannoor Cluster
Department of Applied Economics, Cochin University of Science and Technology 273

Appendices
Baseli
ne S
urve
y, d
iagno
stic
Study
, for
mat
ion o
f SHG
Basic
Input
s00.10.20.30.40.50.60.70.80.91
Fund Utilization - Chennamangalam Cluster
Baseli
ne S
urve
y, d
iagno
stic
Study
, for
mat
ion o
f SHG
Basic
Input
s00.10.20.30.40.50.60.70.80.91
Fund Utilization - Kuthampully Cluster
274 Department of Applied Economics, Cochin University of Science and Technology

Appendices
Baseli
ne S
urve
y, d
iagno
stic
Study
, for
mat
ion o
f SHG
Basic
Input
s00.10.20.30.40.50.60.70.80.91
Fund Utilization - Elappully Cluster
Baseli
ne S
urve
y, d
iagno
stic
Study
, for
mat
ion o
f SHG
Basic
Input
s00.10.20.30.40.50.60.70.80.91
Fund Utilization - Palakkad Cluster
Department of Applied Economics, Cochin University of Science and Technology 275

Appendices
Baseli
ne S
urve
y, d
iagno
stic
Study
, for
mat
ion o
f SHG
Basic
Input
s00.10.20.30.40.50.60.70.80.91
Fund Utilization - Sreepadam Cluster
Baseli
ne S
urve
y, d
iagno
stic
Study
, for
mat
ion o
f SHG
Basic
Input
s00.10.20.30.40.50.60.70.80.91
Fund Utilization - Kozhikode Cluster
276 Department of Applied Economics, Cochin University of Science and Technology

Appendices
Department of Applied Economics, Cochin University of Science and Technology 277

Appendices
Baseli
ne S
urve
y, d
iagno
stic
Study
, for
mat
ion o
f SHG
Basic
Input
s00.10.20.30.40.50.60.70.80.91
Fund Utilization - Vadakara Cluster
Baseli
ne S
urve
y, d
iagno
stic
Study
, for
mat
ion o
f SHG
Basic
Input
s00.10.20.30.40.50.60.70.80.91
Fund Utilization - ICON Cluster
278 Department of Applied Economics, Cochin University of Science and Technology

Appendices
Baseline Survey, diagnostic Study, formation of SHG0
0.10.20.30.40.50.60.70.80.9
1
Fund Utilization - Kalliassery Cluster
Department of Applied Economics, Cochin University of Science and Technology 279

Appendices
Baseli
ne S
urve
y, d
iagno
stic
Study
, for
mat
ion o
f SHG
Basic
Input
s00.10.20.30.40.50.60.70.80.91
Fund Utilization - Payyannoor Cluster
280 Department of Applied Economics, Cochin University of Science and Technology

Appendices
Baseli
ne S
urve
y, d
iagno
stic
Study
, for
mat
ion o
f SHG
Basic
Input
s00.10.20.30.40.50.60.70.80.91
Fund Utilization - Morazha Cluster
Baseli
ne S
urve
y, d
iagno
stic
Study
, for
mat
ion o
f SHG
Basic
Input
s00.10.20.30.40.50.60.70.80.91
Fund Utilization - Chirakkal Cluster
Department of Applied Economics, Cochin University of Science and Technology 281

Appendices
282 Department of Applied Economics, Cochin University of Science and Technology

Appendices
Kozhode Handloom Cluster
Department of Applied Economics, Cochin University of Science and Technology 283
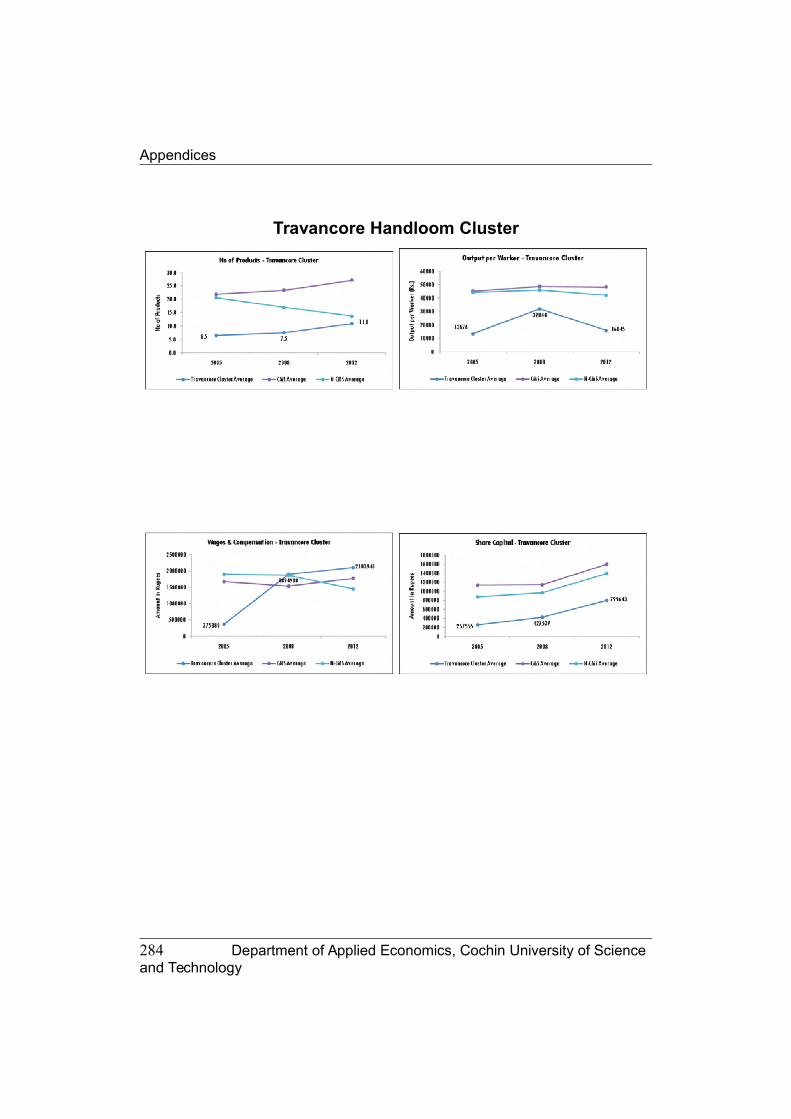
Appendices
Travancore Handloom Cluster
284 Department of Applied Economics, Cochin University of Science and Technology

Appendices
Ooruttambalam Handloom Cluster
Department of Applied Economics, Cochin University of Science and Technology 285

Appendices
286 Department of Applied Economics, Cochin University of Science and Technology

Appendices
Swadeshi Handloom Cluster
Department of Applied Economics, Cochin University of Science and Technology 287

Appendices
288 Department of Applied Economics, Cochin University of Science and Technology

Appendices
Thettivila Handloom Cluster
Department of Applied Economics, Cochin University of Science and Technology 289

Appendices
290 Department of Applied Economics, Cochin University of Science and Technology

Appendices
Neyyatinkara Handloom Cluster
Department of Applied Economics, Cochin University of Science and Technology 291

Appendices
292 Department of Applied Economics, Cochin University of Science and Technology

Appendices
Payyannoor Handloom Cluster
Department of Applied Economics, Cochin University of Science and Technology 293

Appendices
ICON Handloom Cluster
294 Department of Applied Economics, Cochin University of Science and Technology

Appendices
Department of Applied Economics, Cochin University of Science and Technology 295
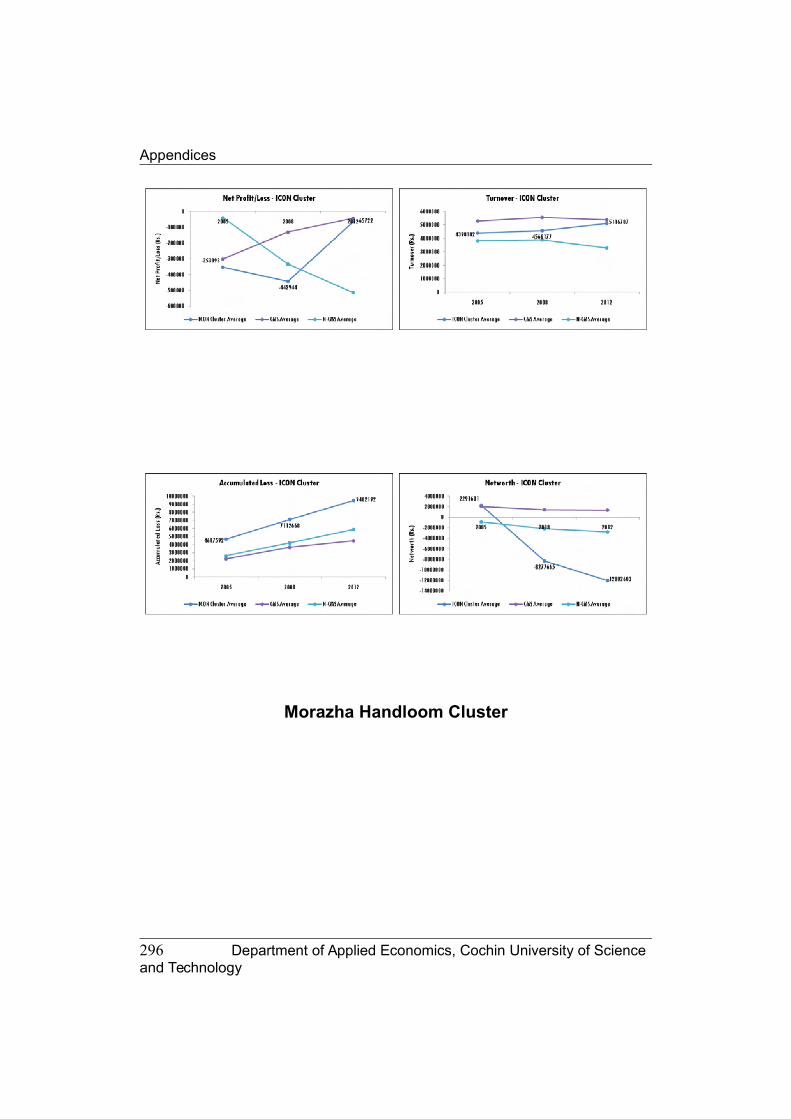
Appendices
Morazha Handloom Cluster
296 Department of Applied Economics, Cochin University of Science and Technology
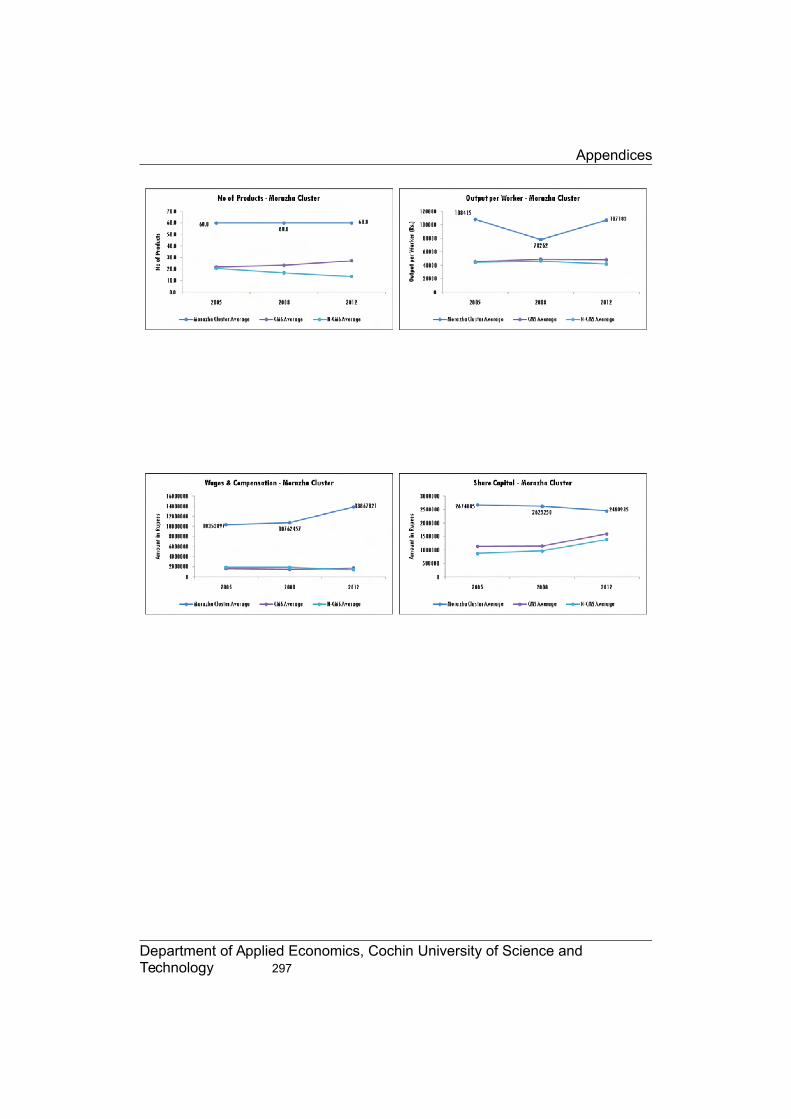
Appendices
Department of Applied Economics, Cochin University of Science and Technology 297

Appendices
Kalliassery Handloom Cluster
298 Department of Applied Economics, Cochin University of Science and Technology

Appendices
Department of Applied Economics, Cochin University of Science and Technology 299

Appendices
Chirakal Handloom Cluster
300 Department of Applied Economics, Cochin University of Science and Technology

Appendices
Department of Applied Economics, Cochin University of Science and Technology 301

Appendices
302 Department of Applied Economics, Cochin University of Science and Technology

1. Ahluwalia, I.J. “Productivity and Growth in Indian Manufacturing”,
Oxford University Press, Delhi, 1991.
2. Alagh Y K, (1972) “Regional Aspects of Indian Industrialisation”,
University of Bombay, Bombay.
3. Alagh Y. K. Dr: “Cluster Development in India”, The White Book,
Foundation of MSME Clusters, New Delhi
4. Arun T.K (2013), “It’s Empowerment, Stupid”, The Economic Times,
20 June, 2013 P.10
5. Ashis Mitra, Prabir Kumar Choudhari and Arup Mukherjee et.al
(2009), “A Diagnostic report on cluster development programme of
Shantipur handloom cluster,West Bengal. Part I-Evolution of the
cluster and cluster analysis”, Indian Journal of Traditional Knowledge
Vol. 7 (1), October ,2009, pp.502-507
6. Bagnasco, A. (1977). “Tre Italia; La Problematica territorial Dello
sviuppo Italiano”, Bologna .II Mulino.
7. Bairoch, Paul (2005), “Deindustrialization in 18th and 19th Century
India: Mughal Decline, Climate Shocks and British Industrial Ascent”
Harvard University Press, Cambridge
8. Baker G., M. Gibbs and B. Holmström (1993), “Hierarchies and
Compensation”, European Economic Review (37), 366-378
9. Becattini, G. (1990). “The Marshallian Industrial District as a Socio-
economic Notion”, in F. Pyke, G. Beccatini, and W. Sengenberger

References
246 Department of Applied Economics, Cochin University of Science and Technology
(edsj, Industrial Districts and Inter-Firm Co-operation in Italy
International Institute of Labour Studies, Geneva:.
10. Beddig, Clarisse (2008). “Cluster Development Policy rooted in the
Collective Efficiency Approach: An Effective Poverty Alleviation Tool
in the Indian Handloom Sector? Case studies: the Varanasi and
Chanderi Handloom Clusters” (2007-08), Graduate Institute of
International and Development studies, Geneva.
11. Bergman, E. M., and E. J. Feser. (1999). “Industrial and Regional
Clusters: Concepts and Comparative Applications”. Web Book in
Regional Science, Regional Research Institute, West Virginia
University.
12. Best, M. H. (1990). “The New Competition: Institutions of Industrial
Restructuring”. Harvard University Press, Cambridge
13. BRUSCO, S. (1992), “Small Firms and the Provision of Real
Services’, in Industrial Districts and Local Economic Regeneration”,
eds. F. Pyke and W. Sengenberger, International Institutes for Labour
Studies, Geneva: 177-196
14. Chandhoke, Neera, (2012), “Modi’s Gujarat and Its Illusions”.
Economic and Political Weekly Vol 67 No.49, pp 10-11.
15. Charles, K.J, (1975) “Are Cottage industries efficient”, Directorate of
Industries, Khadi and Village Industries Commission, Bombay
16. Crown, Robin and Kamath, Anand, (2012), ‘Informal knowledge
exchanges under complex social relations; A network study of
handloom clusters in Kerala”, United Nations University, Maastricht,
The Netherlands.

References
Department of Applied Economics, Cochin University of Science and Technology 247
17. Deepa T.S and Thattil, Gabbriel Simon (2011), “Cluster Development
Porgramme in Kerala”, JIBMER, Vol 2, Issue 4 (April 2011).
18. Dhar, P. N. and H. F. Lyndall (1961). “Role of Small-scale enterprises
in Indian Economic Development” (Bombay: Asia Publishing House).
19. ENRIGHT, M. (1998). “Regional clusters and firm strategy. The
dynamic firm. The role of technology, strategy, organization and
regions”, Oxford University Press, Oxford.
20. FICCI, (2012) The FICCI white paper on “Challenges in Textile and
Apparel Industry”, New Delhi, 2012
21. Government of India (1956). “Industrial Policy Resolution, (30th
April, 1956)”, Ministry of Industrial Development, New Delhi.
22. Government of India (1997), “Report of the Expert Committee on Small
Scale Enterprises, [Abid Hussain Committee]”, Ministry of Industries,
Government of India, New Delhi.
23. Government of India (2001) “Report of the Study Group on
Development of Small Scale Enterprises”, Planning Commission, ,
New Delhi.
24. Government of India, (2005), “Integrated Handloom Development
Scheme: Guidelines”, Office of the Development Commissioner for
Handlooms, Ministry of Textiles, New Delhi.
25. Government of India, (2007), “Modified Guidelines of MSE-CDP, ,
Development Commissioner, Ministry of Micro, Small and Medium
Enterprises (MSME)”, New Delhi
26. Government of India, (2009), “Evaluation Study of MSME-CDP
(2009)”, Development Commissioner, Ministry of Micro, Small and
Medium Enterprises (MSME), New Delhi

References
248 Department of Applied Economics, Cochin University of Science and Technology
27. Government of Kerala (1960), “Committee of Report of the Minimum
Wage Committee on employment in Handloom Industry”, Government
of Kerala Trivandrum,
28. Government of Kerala (1983), “Intensive Handloom Development
Project and the Export Promotion Project, An evaluation Study”, State
Planning Board, Kerala, Trivandrum
29. Government of Kerala (2012) “Budget Committee –IV-Annual
Performance Report 2010-11”, Directorate of Handloom and Textiles,
Thiruvanthapuram.
30. Government of Kerala, (2003) “Industrial Policy 2003”, Department
of Industries, Thiruvananthapuram accessed through
http://www.keralaindustry.org/ cluster_devlop. html
31. Government of Kerala, (2006), “Cluster Tidings”, K-Bip,
Thiruvananthapuram. Vol. 3 No. 8; August 2006, 2-3.
32. Government of Kerala, (2007), “Draft Proposal for 11th Five Year
Plan”, Kerala State Planning Board, Thiruvananthapuram.
33. Government of Kerala, (2009) “Report on Survey of Handloom Sector
in Kerala (2009)”, Department of Economics and Statistics,
Thiruvananthapuram
34. Government of Kerala, (2009), “The Problems of the Handloom
Industry in Kerala, and its solutions-A Report”, Directorate of
Handlooms and Textiles, Thiruvanathapuram.
35. Government of Kerala, (2010), “Plan Outlay and Expenditure Kerala
(1951-2007) Vol. I & II,” Kerala State Planning Board,
Thiruvananthapuram.

References
Department of Applied Economics, Cochin University of Science and Technology 249
36. Government of Kerala, (2011), “Statistical Handbook, Kerala 2011”,
Dept of Economics & Statistics, Thiruvananthapuram.
37. Government of Kerala, (2013), “Economic Review 2012”. State
Planning Board Thiruvananthapuram
38. Gurumurthy S, (2013), “Boss, Read the true history before speaking”,
06th April, 2013, The New Indian Express
39. Harriss, J. (1982). “Character of an Urban Economy: "Small-scale"
Production and Labour Markets in Coimbator”', The Economic and
Political Weekly, 17/23: 945-54, 17/24: 993-1002.
40. Humphrey, J. (1995) “Industrial Reorganization in Developing
Countries: From Models to Trajectories”, World Development
23.1:149-162.
41. Isaac, T. M. (1984). “Class Struggle and Industrial Structure: A Study
of Coir Weaving Industry in Kerala: 1859-1980”, unpublished
Doctoral Dissertation (New Delhi: Jawaharal Nehru University).
42. Kalpagam, U (1981). “Labour in Small Industry: Case of Export
Garments Industry in Madras”, Economic and Political Weekly,
16/48: 1957-68.
43. Kannan K. P and G. Rodgers (1990). “Urban Labour Market Structure
and Job Access in India”, International Institute for Labour Studies,
Geneva
44. Karl Marx (1853), “The British Rule in India”, New York Harold
Tribune, June 25, 1853
45. Kaur, Winder (1983), “Structure of Industries in India; Pattern –
Framework-Disparities”, Deep & Deep Publications, New Delhi.

References
250 Department of Applied Economics, Cochin University of Science and Technology
46. Krishnan Kutty A.C (1985). “Economics of Handloom Industry in
Cannanore District, Kerala”, PhD Thesis Bangalore University,
Bagalore.
47. Krugman,P., 1991, “Geography and Trade”, MIT Press Cambridge.
48. Kurup, K.K.N, (2008) “Traditional Handloom Industry of Kerala”,
Indian Journal of Traditional Knowledge, Vol.7 (1), January, 2008,
pp.50-52.
49. Laghu Udyog Samachar, 50 Years of SIDO, Commemorative Issue on
Golden Jubilee of Small Industries Development Organisation [1954-
2004], A Publication of Development Commissioner [SSI], Ministry
of SSI, Government of India, New Delhi.
50. Maddisson, Angus, (2001), “World Economic History-A Millennial
Perspective in 2001”, Development Institute Studies, The Organisation
for Economic Co-operation and Development [OECD], Paris.
51. Malecki, E. J. (1997). “Technology and Economic Development: The
Dynamics of Local, Regional and National Competitiveness”. Addison
Wesley Longman, Essex.
52. Marshall, A. (1920), “Principles of Economics”, 8th edn, Macmillan
Publication, London.
53. Martin K.A, (2012), “Traditional Weaving Societies in shreds” The
Hindu (A national daily in English), October 6, 2012.
54. Mehta, M.M, (1961), “Structure of Indian Industry”, Popular Book
Depot, Bombai.
55. Menkveld, A. J., Thurik, R. (1999), “Firm Size and Efficiency in
Innovation’, in Small Business Economics”, ed. Springer Netherlands,
12 (1): 97-101

References
Department of Applied Economics, Cochin University of Science and Technology 251
56. Mohanan, K. P. (1977) “Unemployment widespread in Handlooms”
Mathrubhoomi (A national daily in Malayalam) April 14 1977
57. Nadvi, K. and Schmitz, H. (1999) “Clustering and Industrialization:
Introduction”, World Development 27.9:1503-1514
58. Narayanan C, (1982) “Crisis in Handloom Sector” Mathrubhoomi (A
national daily in Malayalam) March 25, 1982
59. NCAER (1970), “Study of selected small industrial units”, National
Council for Applied Economic Research, New Delhi
60. Nedungadi P.V.K.(1977) “Basic Problem of Handloom is Internal
Markets” Mathrubhoomi (A national daily in Malayalam) April 19, 1977
61. Oomen M.A, (1972), “Small Industry in Indian Economic Growth, A
case Study of Kerala”, Research Publications Society, Delhi
62. Paderson, A. Sverisson and M. P. van Dijk (eds) (1994). “Flexible
Specialisation: The Dynamics of Small-scale Industry in the South”
Intermediate Technology Publications, London.
63. Piore, M. J. (1990), “Work, Labor and Action: Work Experience in a
System of Flexible Production in Transforming Organizations”, eds. T.
A. Kochan and M. Useem, Oxford University Press, Oxford, pp.307-336
64. Porter, M. (1990). “The Competitive Advantage of Nations”,
Macmillan; New York.
65. Porter, M. E. (1998), “Clusters and New Economics of Competition”,
in Harvard Business Review, Nov.-Dec. 1998: 77-90
66. Ramachandran, V.K (1996), “On Kerala’s Development
Achievements,” In. J. Drze and A. Sen (Eds) India’s Development:
Selected Regional Perspectives, Oxford University Press, New Delhi

References
252 Department of Applied Economics, Cochin University of Science and Technology
67. Ramunny Murkoth, (1983) “Problems of Handlooms in Kerala, Indian
Express (A national daily in English), Dec 9, 1983.
68. Roper, S (1997) “Modeling Small Business Growth and Profitability”,
Working Paper 32, Northern Ireland Economic Research Centre,
Belfast.
69. Rosenfiled S.A (1997), “Bringing Business Clusters into the Mainstream
of Economic Development”, European Planning Studies 5(1) 3-25.
70. Sabel, C. F. (1984). “Work and Politics: The Division of Labour in
Industry” Cambridge University Press, Cambridge.
71. Sanel C.F (1994). 'Flexible Specialisation and the Re-emergence of
Regional Economies' in Amin, A.(ed), Cambridge University Press,
Cambridge.
72. Saxenian, A. L. (1994). “Regional Advantage: Culture and Competition
in Silicon Valley and Route” , Harvard University Press, Cambridge.
73. Schmitz, H. (1995) “Collective Efficiency: Growth Path for Small-
Scale Industry”, Journal of Development Studies 31.4:529-566.
74. Schmitz, H. (1995) “Small Shoemakers and Fordist Giants: Tale of a
Super cluster”, World Development 23.1:9-28.
75. Schmitz, H. (1999), “Responding to Global Competitive Pressure:
Local Co-operation and Upgrading in the Sinos Valley, Brazil”, IDS
Working Paper 82, Brighton: IDS
76. Scoll (1992). “Recent Developments in the Small-scale Enterprises
Sector in India: Economic and Social Aspects”, Discussion Paper,
no.48, (Geneva: International Institute of Labour Studies).

References
Department of Applied Economics, Cochin University of Science and Technology 253
77. Sengenberger, W. and F. Pyke (1992). “Small Firm industrial districts
and local economic regeneration: research and policy issues”, in
Pyke, F. and W. Sengenberger (eds.), 3-29.
78. Sethuraman, S. V. (1976). “The Urban Informal Sector: Concepts,
Measurement and Policy”, International Labour Review, 114/11: 69-82.
79. Seyed Valiollah Mir Hosseini, and Mohammad Reza Ghanbari (2011),
“Investigation and analysis of the performance of industrial clusters in
Islamic Republic of Iran” International Journal of Business and Social
Science, Vol. 2 No. 15; August 2011, p231.
80. Sharma, Ramakrishna, (1982), “Industrial Development in Andhra
Pradesh”, Himalaya Publishing House, New Delhi.
81. SIDBI (2000), “Report on Small Scale Industries in India”, Small
Industries Development Bank of India, April 2000.
82. Singh, M. (1990). “The Political Economy of the Unorganised
industry: A Study of Labour Process”, Sage Publications, New Delhi.
83. Soundarapandian, M. Dr. (2002), “Growth and Prospects of Handloom
sector in India”, NABARD, Mumbai, 2002.
84. Subramanian K.K and Pillai, P.M. (1986). “Kerala’s Industrial
Backwardness: exploration of alternate hypothesis”. Economic and
Political Weekly Vol 21 No.14, p.577-592.
85. Subramanian, K. K., and Azeez, A. E. (2000). “Industrial growth in
Kerala: Trends and explanations”. Centre for Development Studies,
Working Paper no. 310. 75
86. Subramanian, K.K (1990), “Development Paradox in Kerala: Analysis
of Industrial Stagnation.” Economic and Political Weekly Vol 25
No.37, p.2053.

References
254 Department of Applied Economics, Cochin University of Science and Technology
87. Subramanian, K.K (2003), “Regional Industrial Growth under
Economic Liberalisation: A case study of selected issues with
reference to Kerala State”. Manak Publishers, New Delhi.
88. Thomas, J.J. (2003). “State Policy Industrial Structure and
Industrialisation. The case of Kerala,” PhD thesis, Indira Gandhi Institute
of Development Research, Mumbai
89. UNIDO (2003), “Report on Expert Group Meeting on Cluster and
Network Development, with Special Emphasis on Monitoring and
Evaluation Issues”, UNIDO, 2003.
90. UNIDO, (2000), “Cluster Development and Promotion of Business
Development Services (BDS): UNIDO’s Experience in India”, Private
Sector Development Branch, Working Paper, No. 6.
91. UNIDO,(1999), “SME Cluster and Network Development in
Developing Countries: the Experience of UNIDO”, Private Sector
Development Branch, Working Paper No.2.
92. United Nations Development Programme (2010). “The Human Development
Report -Power, Voices and Rights, Asia and the Pacific”. UNDP, New York.
………………

1) 1-6,9-56,59-60,65-
3) 79-88,91-102,105-
4) 109-120,123-124,127-138
5) 141-146,153-158,161-166,171-182,185-190,193-194,199-212,221-
6) 223-226,233-