Efficacy of breast cancer screening by age. New results swedish two-county trial
11
2507 Efficacy of Breast Cancer Screening by Age New Results from the Swedish Two-County Trial Laszlo Tabar, M.D.,* Gunnar Fagerberg, M.D.,t, Hsiu-Hsi Chen, M.Phil.,$ Stephen W. D U B ,M.Sc.,§ Charles R. Smart, M.D.,II Adel Gad, M.D.,7 and Robert A. Smith, Ph.D.# Background. Several studies have found a smaller effect of breast cancer screening on breast cancer mortal- ity in women aged younger than 50 years compared with older women. Various possible reasons have been sug- gested for this, but none firmly is established. Methods. The Swedish Two-County Study is a ran- domized trial of breast cancer screening of women aged 40-74 years, comprising with 133,065 women with a 13- year follow-up of 2467 cancers. The Breast Cancer Detec- tion Demonstration Project (BCDDP) is a nonrandomized screening program in the United States, with a 14-year follow-up of 3778 cancers in women aged 40-74 years. The Swedish results by age were updated. The lesser effect of screening at ages 40-49 years was investigated in terms of sojourn time (the duration of the preclinical but detectable phase) size, lymph node status, and histologic type of the tumors diagnosed in the Swedish Study and their subsequent effect on survival using survival data from both studies. Results. In the Swedish Trial, a 30% reduction in mortality associated with the invitation to screening of women aged 40-74 years was maintained after 13-years of follow-up. The reduction was 34% for women aged 50- 74 years and 13% for women aged 40-49 years. Results indicated that the reduced effect on mortality for women From the "Mammography Department, Central Hospital, Falun, Sweden; the Department of TRadiology, University Hospital, Linkop- ing, Sweden; the Department of $Community Medicine. University of Cambridge, Cambridge, United Kingdom; §MRC Biostatistics Unit, Cambridge, United Kingdom; "Retired Chief, Early Detection Branch, National Cancer Institute, Department of Health and Human Ser- vices, Bethesda, Maryland; Department of TPathology, Central Hos- pital, Falun, Sweden; and the #American Cancer Society, Inc., At- lanta, Georgia. ((Current address: 1262 Chandler Drive, Salt Lake City, UT. The authors thank Dr Gilda Cardenosa, M.D., for comments on Address for reprints: Dr Laszlo Tabar, Mammography Depart- Received August 8, 1994; revision received November 28, 1994; a previous draft. ment, Central Hospital, 79182 Falun, Sweden. accepted December 22, 1994. aged 40-49 years was due to a differential effect of screen- ing on the prognostic factors of tumor size, lymph node status, and histologic type. The mean sojourn times in the age groups 40-49 years, 50-59 years, 60-69 years, and 70- 74 years were 1.7,3.3,3.8, and 2.6 years, respectively. Conclusions. These results suggest that much, al- though not all, of the smaller effect of screening on mor- tality in women aged 40-49 years is due to faster progres- sion of a substantial proportion of tumors in this age group and the rapid increase in incidence during this de- cade of life. It is concluded that the interval between screenings should be shortened to achieve a greater ben- efit in this age group. It is estimated that a 19% reduction in mortality would result from an annual screening re- gime. Cancer 1995; 75:2507-17. Key words: breast cancer, breast screening, age-specific effects, sojourn time, interscreening interval. The Swedish Two-County Trial of mammographic screening for breast cancer began in 1977.' The first re- sults of the trial after 7 years of follow-up indicated that invitation to screening reduced breast cancer mortality by approximately 30% for women aged 40-74 years,' and this remained approximately constant during the years. This benefit, also observed in other was seen primarily for women aged 50 years or older. An overview of Swedish trials of mammography found a 10-13% mortality reduction in the age group 40-49 years and a 29-3170 reduction for the age group 50- 69 years.4 The benefit of screening women aged 40-49 years would seem to be smaller than that observed for older women. It is, therefore, timely to seek explana- tions for this, and if possible, to develop strategies to improve screening performance for women aged 40-49 years. It has been suggested that the smaller benefit of screening younger women may be attributed to various
-
Upload
independent -
Category
Documents
-
view
0 -
download
0
Transcript of Efficacy of breast cancer screening by age. New results swedish two-county trial
2507
Efficacy of Breast Cancer Screening by Age New Results from the Swedish Two-County Trial
Laszlo Tabar, M.D.,* Gunnar Fagerberg, M.D.,t, Hsiu-Hsi Chen, M.Phil.,$ Stephen W. D U B , M.Sc.,§ Charles R. Smart, M.D.,II Adel Gad, M.D.,7 and Robert A. Smith, Ph.D.#
Background. Several studies have found a smaller effect of breast cancer screening on breast cancer mortal- ity in women aged younger than 50 years compared with older women. Various possible reasons have been sug- gested for this, but none firmly is established.
Methods. The Swedish Two-County Study is a ran- domized trial of breast cancer screening of women aged 40-74 years, comprising with 133,065 women with a 13- year follow-up of 2467 cancers. The Breast Cancer Detec- tion Demonstration Project (BCDDP) is a nonrandomized screening program in the United States, with a 14-year follow-up of 3778 cancers in women aged 40-74 years. The Swedish results by age were updated. The lesser effect of screening at ages 40-49 years was investigated in terms of sojourn time (the duration of the preclinical but detectable phase) size, lymph node status, and histologic type of the tumors diagnosed in the Swedish Study and their subsequent effect on survival using survival data from both studies.
Results. In the Swedish Trial, a 30% reduction in mortality associated with the invitation to screening of women aged 40-74 years was maintained after 13-years of follow-up. The reduction was 34% for women aged 50- 74 years and 13% for women aged 40-49 years. Results indicated that the reduced effect on mortality for women
From the "Mammography Department, Central Hospital, Falun, Sweden; the Department of TRadiology, University Hospital, Linkop- ing, Sweden; the Department of $Community Medicine. University of Cambridge, Cambridge, United Kingdom; §MRC Biostatistics Unit, Cambridge, United Kingdom; "Retired Chief, Early Detection Branch, National Cancer Institute, Department of Health and Human Ser- vices, Bethesda, Maryland; Department of TPathology, Central Hos- pital, Falun, Sweden; and the #American Cancer Society, Inc., At- lanta, Georgia.
((Current address: 1262 Chandler Drive, Salt Lake City, UT. The authors thank Dr Gilda Cardenosa, M.D., for comments on
Address for reprints: Dr Laszlo Tabar, Mammography Depart-
Received August 8, 1994; revision received November 28, 1994;
a previous draft.
ment, Central Hospital, 79182 Falun, Sweden.
accepted December 22, 1994.
aged 40-49 years was due to a differential effect of screen- ing on the prognostic factors of tumor size, lymph node status, and histologic type. The mean sojourn times in the age groups 40-49 years, 50-59 years, 60-69 years, and 70- 74 years were 1.7,3.3,3.8, and 2.6 years, respectively.
Conclusions. These results suggest that much, al- though not all, of the smaller effect of screening on mor- tality in women aged 40-49 years is due to faster progres- sion of a substantial proportion of tumors in this age group and the rapid increase in incidence during this de- cade of life. It is concluded that the interval between screenings should be shortened to achieve a greater ben- efit in this age group. It is estimated that a 19% reduction in mortality would result from an annual screening re- gime. Cancer 1995; 75:2507-17.
Key words: breast cancer, breast screening, age-specific effects, sojourn time, interscreening interval.
The Swedish Two-County Trial of mammographic screening for breast cancer began in 1977.' The first re- sults of the trial after 7 years of follow-up indicated that invitation to screening reduced breast cancer mortality by approximately 30% for women aged 40-74 years,' and this remained approximately constant during the years. This benefit, also observed in other was seen primarily for women aged 50 years or older. An overview of Swedish trials of mammography found a 10-13% mortality reduction in the age group 40-49 years and a 29-3170 reduction for the age group 50- 69 years.4 The benefit of screening women aged 40-49 years would seem to be smaller than that observed for older women. It is, therefore, timely to seek explana- tions for this, and if possible, to develop strategies to improve screening performance for women aged 40-49 years.
It has been suggested that the smaller benefit of screening younger women may be attributed to various
2508 CANCER May 25,2995, Volume 75, No. 10
factors. First, it is believed that tumors in young women progress more r a ~ i d l y , ~ becoming clinically apparent sooner than those in older women. In the Two-County Trial, Tabar et a1.6 found that the interval cancer rates of the age group 40-49 years in the first and second year since the last negative screening were 38% and 68%, respectively, of the control incidence rate compared with the 13% and 2970, respectively, observed for women aged 50-69 years. This tendency suggests a de- creased sensitivity or shorter sojourn time (the period during which a tumor is asymptomatic but screening detectable) of younger women and is reinforced by the finding of a lower ratio of screening prevalence to ex- pected incidence in younger women.7
A second possible explanation is a higher preva- lence of women with breasts with mammographically dense tissue in this age group. This would tend to lower the sensitivity of mammography, particularly to the smaller tumors. It is, therefore, important to determine whether the more aggressive tumors tend to occur more or less often in dense tissue. Although 26% of women aged 40-49 years have mammographically dense breast tissue,' the use of optimal mammographic techniques should be aimed at early detection of the most danger- ous cancers.
Thirdly, relative survival without screening is fa- vorable in the age group 40-49 years.g Thus, substantial reductions in short term mortality likely are to be difficult to achieve. Proportional mortality from breast cancer is high in the this age group, however, because of the low death rates from other causes, with 21% of deaths of women aged 40-49 years in England and Wales due to breast cancer." Thus, breast cancer is an important cause of death in this age group, and a reduc- tion in mortality would be worthwhile.
Finally, breast cancer is a heterogeneous disease, with several studies indicating considerable variation of tumor growth rates and aggressive potential.",'* It is possible that this heterogeneity is more pronounced in younger women, manifested by a greater proportion of tumors with very favorable and very poor prognostic characteristics in women aged 40-49 years, including higher rates with very malignant and very nonaggres- sive histologic types. The former group partly may be responsible for the faster growth rates mentioned above. Therefore, histologic tumor type should be con- sidered in evaluating the efficacy of breast cancer screening.
Although conducting another trial to demonstrate the efficacy of screening in younger women has been propo~ed, '~ it would be helpful to use the information from existing studies to explore how different tumor types, growth rates, and detectability may explain the variation in screening benefits by age. Future screening
programs also would benefit from understanding the limitations of previous programs. Based on data from the Swedish Two-County Mammographic Screening Trial, this paper aims at answering the following ques- tions:
1. Are the previously reported overall and age-specific effects on mortality maintained 15 years after the commencement of the trial (with an average fol- low-up of 13 years per person)?
2. Can the differences in results between age groups be explained by differences in sojourn time, hetero- geneity of tumor types, or other prognostic factors?
3. Do the answers to questions 1 and 2 suggest future strategies or policies for screening women aged 40- 49 years and for evaluating the efficacy of such screening?
Materials and Methods
The Swedish Two-County Trial has been described elsewhere.' In summary, 77,080 women were invited to screening (active study population [ASP]) and 55,985 not invited (passive study population [PSP]). The num- ber of women aged 40-49 years in the ASP and PSP were 19,844 and 15,604, respectively. Until December 31,1992,2467 cancers had been diagnosed, 1426 in the ASP and 1041 in the PSP. These form the main re- sources for this analysis. When possible, the results from the Swedish trial were validated using data from the Breast Cancer Detection Demonstration Project (BCDDP),I4 an uncontrolled study of breast screening in the United States, which now has accumulated 14 years of follow-up for 3778 women with breast cancer diagnosed at the ages of 40-74 years.
Statistical Methods
Analysis of the effect of invitation to screening on breast cancer mortality was performed by log linear regres- sion,15 with the incorporation of Breslow's method to take account of the cluster randomization.'6 The mean sojourn time (MST) is the average duration of the pre- clinical but screening-detectable phase; it is the length of time of the window of opportunity available for screening to detect the tumor before it surfaces clini- cally, and is the maximum lead time achievable. Under the assumption of exponentially distributed sojourn times shown by Walter and DayI7 to be reasonable, MST estimates the lead time achieved in those cancers detected by screening. A rapidly developing tumor has a short MST, and, therefore, only can have a short lead time. In this work, the MST was estimated using a Mar- kov chain model of progression through three states: no
New Swedish Breast Screening Results/Tabar et al. 2509
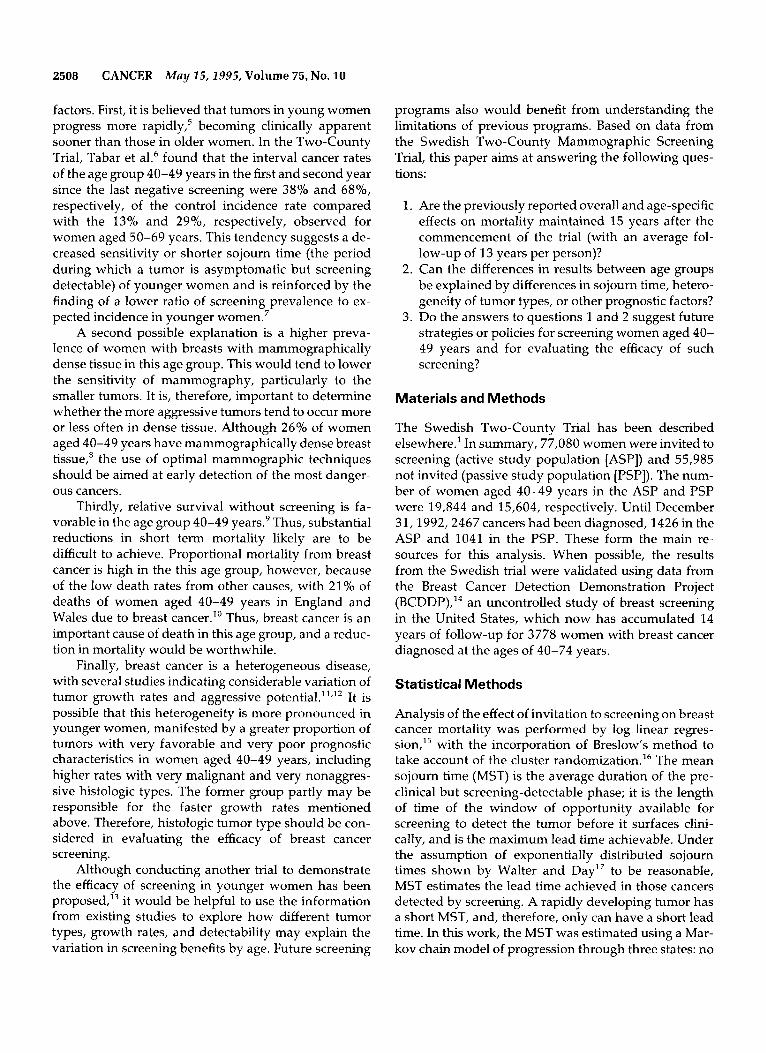
Table 1. Relative Risk of Death From Breast Cancer and 95% Confidence Intervals for the ASP Relative to the PSP in the Swedish Two-County Trial, by Age, Allowing for Cluster Randomization
Crude RR Adjusted for county
Age (yr) W E W & E
40-49 0.73 (0.37-1.41) 1.02 (0.52-1.99) 0.87 (0.54-1.41) No. of women ASP/PSP 9582/5031 10,262/10,573
No. of women ASP/PSP 11,728/5557 11,757/11,248
No. of women ASP/PSP 11,973/5555 11,439/10,714 70-74 0.76 (0.42-1.36) 0.82 (0.43-1.58) 0.79 (0.51-1.22) No. of women ASP/PSP 5306/2439
No. of women ASP/PSP 29,007/13,551 28,229/26,830
50-59 0.48 (0.29-0.77) 0.85 (0.52-1.38) 0.66 (0.46-0.93)
60-69 0.58 (0.35-0.96) 0.62 (0.43-0.91) 0.60 (0.42-0.82)
5 0 3 3 / 4 8 6 8 50-74 0.58 (0.43-0.78) 0.73 (0.56-0.97) 0.66 (0.54-0.81)
All ages (Adjusted for age) 0.60 (0.46-0.79) 0.78 (0.60-1.01) 0.69 (0.57-0.84)
RR: relative risk; ASP: active study population; PSP: passive study population; W: Kopparberg county; E: Ostergotland countv.
detectable disease, preclinical but screening-detectable disease, and symptomatic clinical disease. The method used was that of Duffy et al.” and similar to those of Walter and Day17 and Day.”
To assess whether the differences between the ben- efits of screening in different age groups could be attrib- uted to different effects of screening on prognostic fac- tors in the different age groups, the predicted death rate ratio (ASP/PSP) was compared with the observed ra- tios. The predicted rates were obtained as follows: using all tumors in both trial arms and all age groups, the rel- ative hazards of death with respect to tumor size, lymph node status, and histologic type were estimated using Cox’s proportional hazards model.” These relative haz- ards then were applied to the distributions of the three prognostic factors in the ASP and PSP in each age group to estimate predicted death rates as shown in Appendix 1. The relative hazards were calculated first from the Two-County Trial data and then from the BCDDP data to provide an independent estimate. Note that in using the BCDDP data on survival by tumor size and lymph node status, we were not generalizing the effect of screening in one study to the other study. We only were attempting to generalize the survival difference by size and lymph node status. The ratio of the ASP-predicted death rate to the PSP rate then was calculated by age group for comparison with the observed ratio. Details of the use of prognostic factors to predict death rates and the calculation of standard errors of these predic- tions are provided by Day.21
Results
Table 1 shows the results of the trial in terms of mortal- ity from breast cancer from randomization (1977) to De-
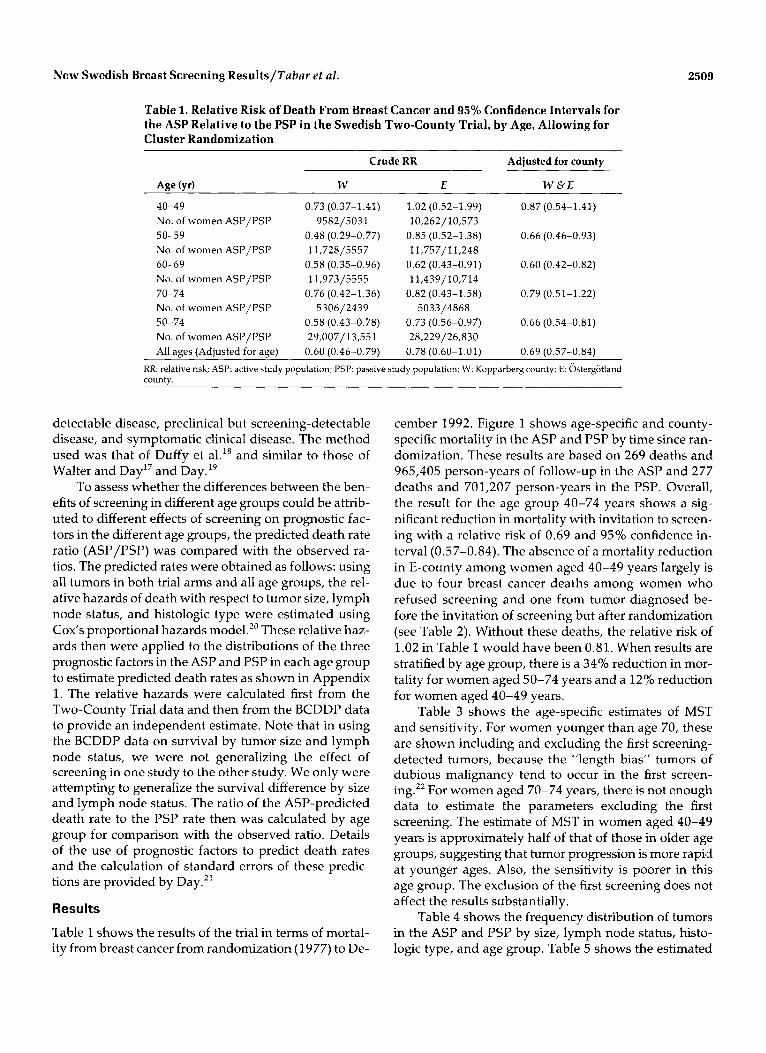
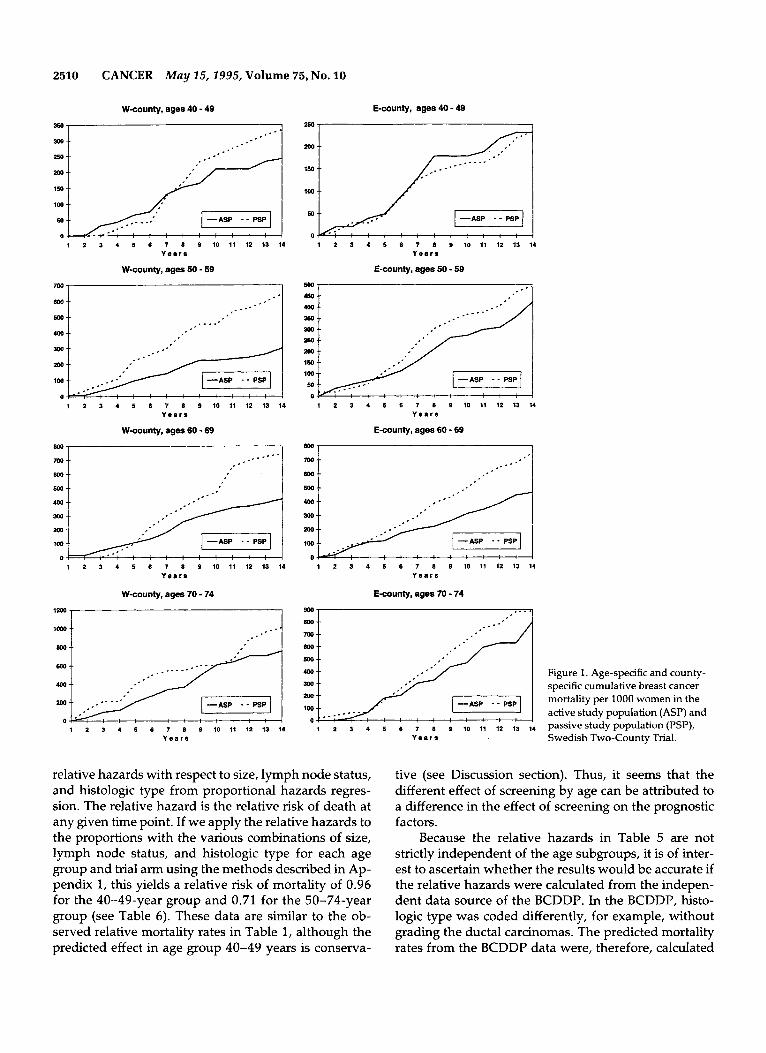
cember 1992. Figure 1 shows age-specific and county- specific mortality in the ASP and PSP by time since ran- domization. These results are based on 269 deaths and 965,405 person-years of follow-up in the ASP and 277 deaths and 701,207 person-years in the PSP. Overall, the result for the age group 40-74 years shows a sig- nificant reduction in mortality with invitation to screen- ing with a relative risk of 0.69 and 95% confidence in- terval (0.57-0.84). The absence of a mortality reduction in E-county among women aged 40-49 years largely is due to four breast cancer deaths among women who refused screening and one from tumor diagnosed be- fore the invitation of screening but after randomization (see Table 2). Without these deaths, the relative risk of 1.02 in Table 1 would have been 0.81. When results are stratified by age group, there is a 34% reduction in mor- tality for women aged 50-74 years and a 12% reduction for women aged 40-49 years.
Table 3 shows the age-specific estimates of MST and sensitivity. For women younger than age 70, these are shown including and excluding the first screening- detected tumors, because the ”length bias” tumors of dubious malignancy tend to occur in the first screen- ing2’ For women aged 70-74 years, there is not enough data to estimate the parameters excluding the first screening. The estimate of MST in women aged 40-49 years is approximately half of that of those in older age groups, suggesting that tumor progression is more rapid at younger ages. Also, the sensitivity is poorer in this age group. The exclusion of the first screening does not affect the results substantially.
Table 4 shows the frequency distribution of tumors in the ASP and PSP by size, lymph node status, histo- logic type, and age group. Table 5 shows the estimated
2510 CANCER May 25,2995, Volume 75, No. 10
low
Bw
W-county, ages 40 - 49
-- .-.’ ,-
--
350
300
-1 150
100 --
: : : : : : : 1 2 3 4 5 6 7 8 9 1 0 1 1 1 2 1 3 1 4
Y e a r a
W-county, ages 50 - 59
m , l
1 2 3 4 5 6 7 8 9 1 0 1 1 1 2 1 3 1 4 Y e a r s
W-county, ages 60 - 69
1 ... - - - - . *
i
: : : : : : : : : 1 2 3 4 5 6 7 8 9 1 0 1 1 1 2 1 3 1 4
Y e a r a
W-county, ages 70 - 74
1200 7
Y e a r s
E-county, ages 40 - 49
aso,
Mo .-
150 --
loo --
1 2 3 4 5 6 7 8 9 1 0 1 1 1 2 1 3 1 4 Y e a r s
E-county, ages 50 - 59
5w
450
250
m I: im
.- 0 Y : : : : I : : : I : : : 1 2 3 4 5 6 7 8 9 1 0 1 1 1 2 1 3 1 4
Y e a r s
E-county, ages 60 - 69
600 -i
-ASP .- : : : : : : : :
1 2 3 4 5 6 7 8 9 1 0 1 1 1 2 1 3 1 4 Y e a r s
E-county, ages 70 - 74
900- ,_. ~
Mo
m -. 0 -. sw .-
..
m -. Figure 1. Age-specific and county- 100 specific cumulative breast cancer
mortality per 1000 women in the active study population (ASP) and
.- mo 100
-- .- _ -
o: 1 3 4 5 6 7 8 Ib 11 i 2 13 14 ~ a s s i v e s t u d ~ ~ o ~ u l a t i o n ~ P S p ~ ~ Y e a r s Swedish Two-County Trial.
relative hazards with respect to size, lymph node status, and histologic type from proportional hazards regres- sion. The relative hazard is the relative risk of death at any given time point. If we apply the relative hazards to the proportions with the various combinations of size, lymph node status, and histologic type for each age group and trial arm using the methods described in Ap- pendix 1, this yields a relative risk of mortality of 0.96 for the 40-49-year group and 0.71 for the 50-74-year group (see Table 6). These data are similar to the ob- served relative mortality rates in Table 1, although the predicted effect in age group 40-49 years is conserva-
tive (see Discussion section). Thus, it seems that the different effect of screening by age can be attributed to a difference in the effect of screening on the prognostic factors.
Because the relative hazards in Table 5 are not strictly independent of the age subgroups, it is of inter- est to ascertain whether the results would be accurate if the relative hazards were calculated from the indepen- dent data source of the BCDDP. In the BCDDP, histo- logic type was coded differently, for example, without grading the ductal carcinomas. The predicted mortality rates from the BCDDP data were, therefore, calculated
New Swedish Breast Screening Results/Tabar et al. 2511
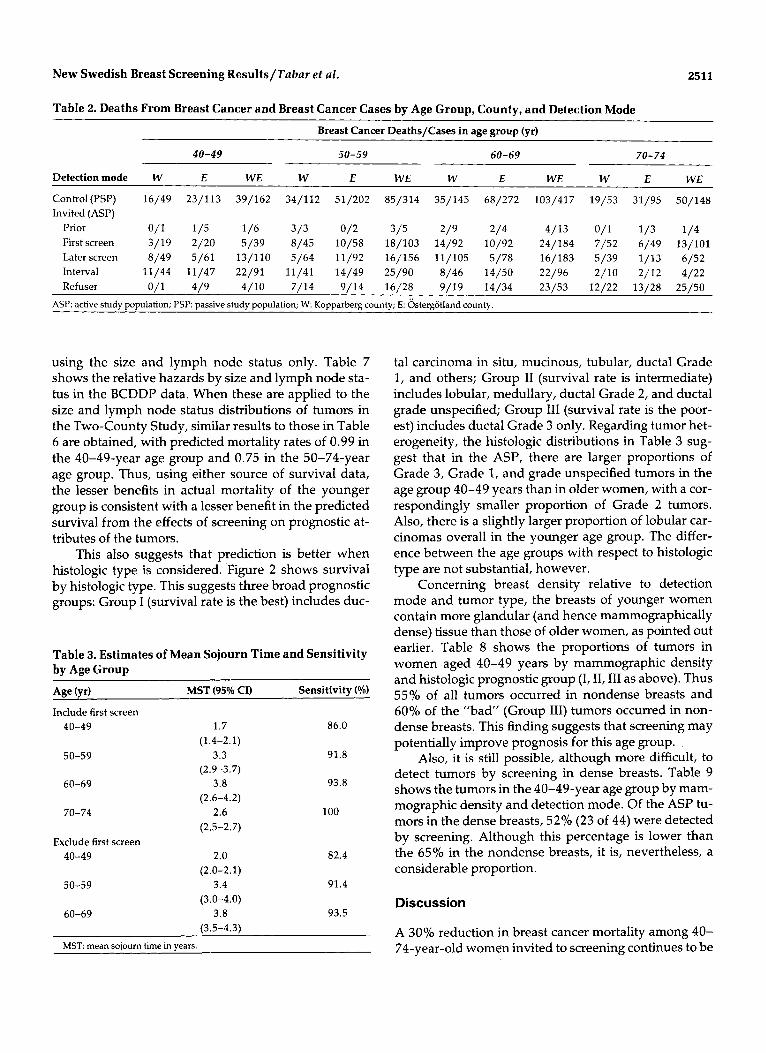
Table 2. Deaths From Breast Cancer and Breast Cancer Cases by Age Group, County, and Detection Mode
Breast Cancer Deaths/Cases in age group (yr)
40-49 50-59 60-69 70-74
Detection mode W E WE W E WE W E WE W E WE
Control(PSP) 16/49 23/113 39/162 34/112 51/202 85/314 35/145 68/272 103/417 19/53 31/95 50/148 Invited (ASP)
Prior 0/1 1/5 1/6 3/3 0/2 3/5 2/9 2/4 4/13 0/1 1/3 1/4 Firstscreen 3/19 2/20 5/39 8/45 10/58 18/103 14/92 10/92 24/184 7/52 6/49 13/101 Laterscreen 8/49 5/61 13/110 5/64 11/92 16/156 11/105 5/78 16/183 5/39 1/13 6/52 Interval 11/44 11/47 22/91 11/41 14/49 25/90 8/46 14/50 22/96 2/10 2/12 4/22 Refuser 0/1 4/9 4/10 7/14 9/14 16/28 9/19 14/34 23/53 12/22 13/28 25/50
ASP: active study population; PSI? passive study population; W: Kopparberg county; E: Ojstergotland county.
using the size and lymph node status only. Table 7 shows the relative hazards by size and lymph node sta- tus in the BCDDP data. When these are applied to the size and lymph node status distributions of tumors in the Two-County Study, similar results to those in Table 6 are obtained, with predicted mortality rates of 0.99 in the 40-49-year age group and 0.75 in the 50-74-year age group. Thus, using either source of survival data, the lesser benefits in actual mortality of the younger group is consistent with a lesser benefit in the predicted survival from the effects of screening on prognostic at- tributes of the tumors.
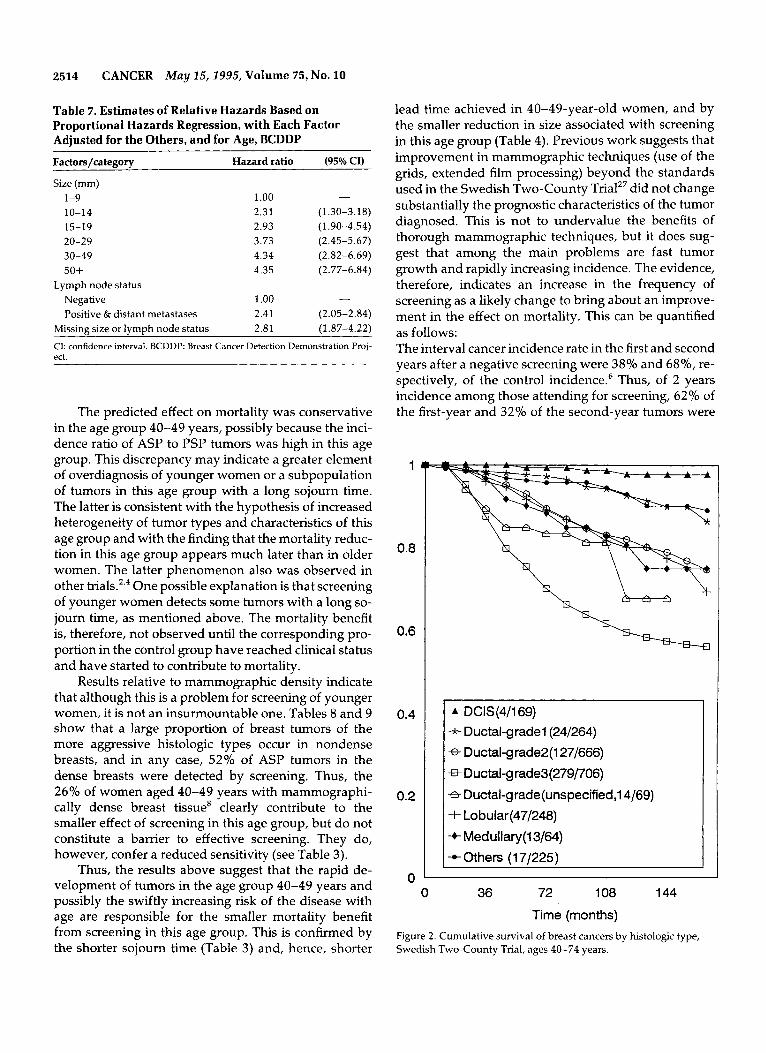
This also suggests that prediction is better when histologic type is considered, Figure 2 shows survival by histologic type. This suggests three broad prognostic groups: Group I (survival rate is the best) includes duc-
Table 3. Estimates of Mean Sojourn Time and Sensitivity by Age Group Aee (vr) MST (95% CI) Sensitivitv (%)
Include first screen 40-49
50-59
60-69
70-74
Exclude first screen 40-49
50-59
60-69
1.7 86.0
3.3 91.8
3.8 93.8
2.6 100
(1.4-2.1)
(2.9-3.7)
(2.6-4.2)
(2.5-2.7)
2.0
3.4 (3.0-4.0)
3.8 (3.5-4.3)
(2.0-2.1) 82.4
91.4
93.5
MST: mean sojourn time in years.
tal carcinoma in situ, mucinous, tubular, ductal Grade 1, and others; Group I1 (survival rate is intermediate) includes lobular, medullary, ductal Grade 2, and ductal grade unspecified; Group 111 (survival rate is the poor- est) includes ductal Grade 3 only. Regarding tumor het- erogeneity, the histologic distributions in Table 3 sug- gest that in the ASP, there are larger proportions of Grade 3, Grade 1, and grade unspecified tumors in the age group 40-49 years than in older women, with a cor- respondingly smaller proportion of Grade 2 tumors. Also, there is a slightly larger proportion of lobular car- cinomas overall in the younger age group. The differ- ence between the age groups with respect to histologic type are not substantial, however.
Concerning breast density relative to detection mode and tumor type, the breasts of younger women contain more glandular (and hence mammographically dense) tissue than those of older women, as pointed out earlier. Table 8 shows the proportions of tumors in women aged 40-49 years by mammographic density and histologic prognostic group (I, 11,111 as above). Thus 55% of all tumors occurred in nondense breasts and 60% of the "bad" (Group 111) tumors occurred in non- dense breasts. This finding suggests that screening may potentially improve prognosis for this age group.
Also, it is still possible, although more difficult, to detect tumors by screening in dense breasts. Table 9 shows the tumors in the 40-49-year age group by mam- mographic density and detection mode. Of the ASP tu- mors in the dense breasts, 52% (23 of 44) were detected by screening. Although this percentage is lower than the 65% in the nondense breasts, it is, nevertheless, a considerable proportion.
Discussion
A 30% reduction in breast cancer mortality among 40- 74-year-old women invited to screening continues to be
2512 CANCER May 15,2995, Volume 75, No. 10
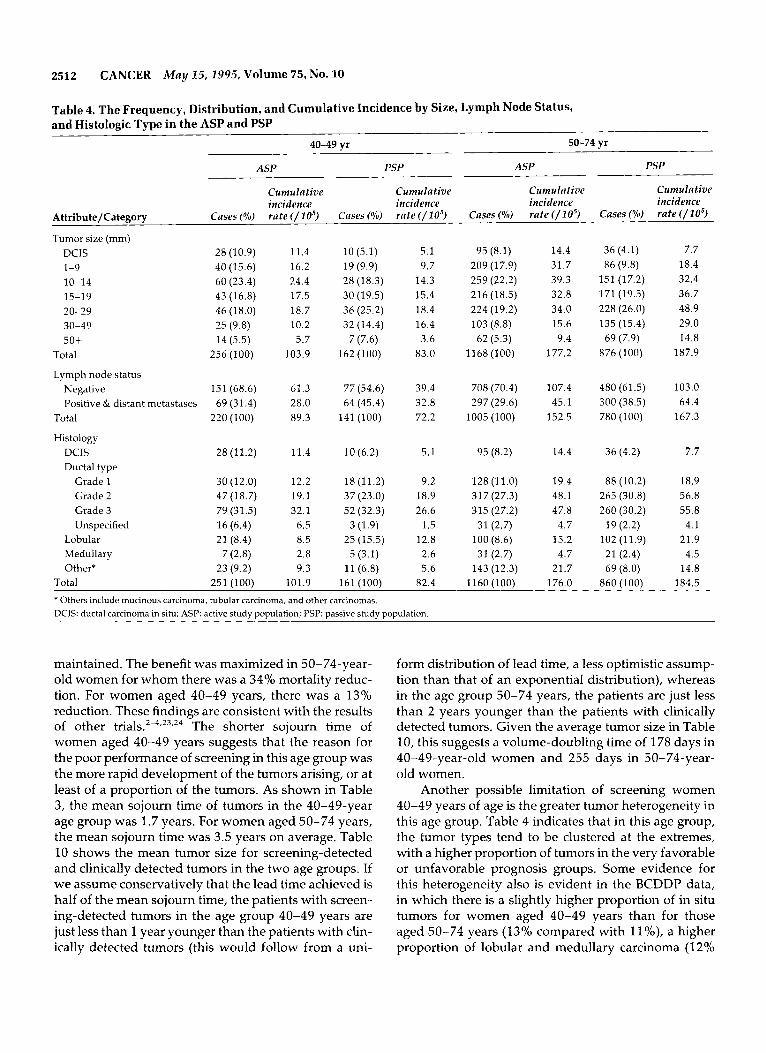
Table 4. The Frequency, Distribution, and Cumulative Incidence by Size, Lymph Node Status, and Histologic Type in the ASP and PSP
40-49 yr 50-74 yr
ASP PSP ASP PSP
Cumulative Cumulative Cumulative Cumulative incidence incidence incidence incidence
Attribute/Category Cases ( o h ) rate (/lo5) Cases (%) rate ( / l o 5 ) Cases (%) rate ( / l o 5 ) Cases (Yo) rate ( / l o 5 )
Tumor size (mm) DCIS 1-9 10-14 15-19 20-29 30-49 50+
Total
Lymph node status Negative Positive & distant metastases
Total
Histology DCIS Ductal type
Grade 1 Grade 2 Grade 3 Unspecified
Lobular Medullary OtherX
Total
28 (10.9) 40 (15.6) 60 (23.4) 43 (16.8) 46 (18.0) 25 (9.8) 14 (5.5)
256 (100)
151 (68.6) 69 (31.4)
220 (100)
28(11.2)
30 (12.0) 47 (18.7) 79 (31.5) 16 (6.4) 21 (8.4)
23 (9.2) 251 (100)
7 (2.8)
11.4 16.2 24.4 17.5 18.7 10.2 5.7
103.9
61.3 28.0 89.3
11.4
12.2 19.1 32.1
6.5 8.5 2.8 9.3
101.9
10 (5.1) 19 (9.9) 28 (18.3) 30 (19.5) 36 (25.2) 32 (14.4)
7 (7.6) 162 (100)
77 (54.6) 64 (45.4)
141 (100)
10 (6.2)
18 (11.2) 37 (23.0) 52 (32.3)
3 (1.9) 25 (15.5)
5 (3.1) 11 (6.8)
161 (100)
5.1 9.7
14.3 15.4 18.4 16.4 3.6
83.0
39.4 32.8 72.2
5.1
9.2 18.9 26.6
1.5 12.8 2.6 5.6
82.4
95 (8.1) 209 (17.9) 259 (22.2) 216 (18.5) 224 (19.2) 103 (8.8)
62 (5.3) 1168(100)
708 (70.4) 297 (29.6)
1005 (100)
95 (8.2)
128 (11.0) 317 (27.3) 315 (27.2)
31 (2.7) 100 (8.6) 31 (2.7)
143 (12.3) 1160 (100)
14.4 31.7 39.3 32.8 34.0 15.6 9.4
177.2
107.4 45.1
152.5
14.4
19.4 48.1 47.8
4.7 15.2 4.7
21.7 176.0
36 (4.1) 7.7 86 (9.8) 18.4
151 (17.2) 32.4 171 (19.5) 36.7 228 (26.0) 48.9 135 (15.4) 29.0
69 (7.9) 14.8 876 (100) 187.9
480 (61.5) 103.0 300 (38.5) 64.4 780 (100) 167.3
36 (4.2) 7.7
88 (10.2) 18.9 265 (30.8) 56.8 260 (30.2) 55.8
19 (2.2) 4.1 21.9 102 (11.9)
21 (2.4) 4.5 69 (8.0) 14.8
860 (1001 184.5 * Others include mucinous carcinoma, tubular carcinoma, and other carcinomas. DCIS: ductal carcinoma in situ; ASP: active study population; PSP: passive study population.
maintained. The benefit was maximized in 50-74-year- old women for whom there was a 34% mortality reduc- tion. For women aged 40-49 years, there was a 13% reduction. These findings are consistent with the results of other trials.2-4,23,24 The shorter sojourn time of women aged 40-49 years suggests that the reason for the poor performance of screening in this age group was the more rapid development of the tumors arising, or at least of a proportion of the tumors. As shown in Table 3, the mean sojourn time of tumors in the 40-49-year age group was 1.7 years. For women aged 50-74 years, the mean sojourn time was 3.5 years on average. Table 10 shows the mean tumor size for screening-detected and clinically detected tumors in the two age groups. If we assume conservatively that the lead time achieved is half of the mean sojourn time, the patients with screen- ing-detected tumors in the age group 40-49 years are just less than 1 year younger than the patients with clin- ically detected tumors (this would follow from a uni-
form distribution of lead time, a less optimistic assump- tion than that of an exponential distribution), whereas in the age group 50-74 years, the patients are just less than 2 years younger than the patients with clinically detected tumors. Given the average tumor size in Table 10, this suggests a volume-doubling time of 178 days in 40-49-year-old women and 255 days in 50-74-year- old women.
Another possible limitation of screening women 40-49 years of age is the greater tumor heterogeneity in this age group. Table 4 indicates that in this age group, the tumor types tend to be clustered at the extremes, with a higher proportion of tumors in the very favorable or unfavorable prognosis groups. Some evidence for this heterogeneity also is evident in the BCDDP data, in which there is a slightly higher proportion of in situ tumors for women aged 40-49 years than for those aged 50-74 years (13% compared with l l%), a higher proportion of lobular and medullary carcinoma (1 2%
New Swedish Breast Screening Results/Tabar et al. 2513
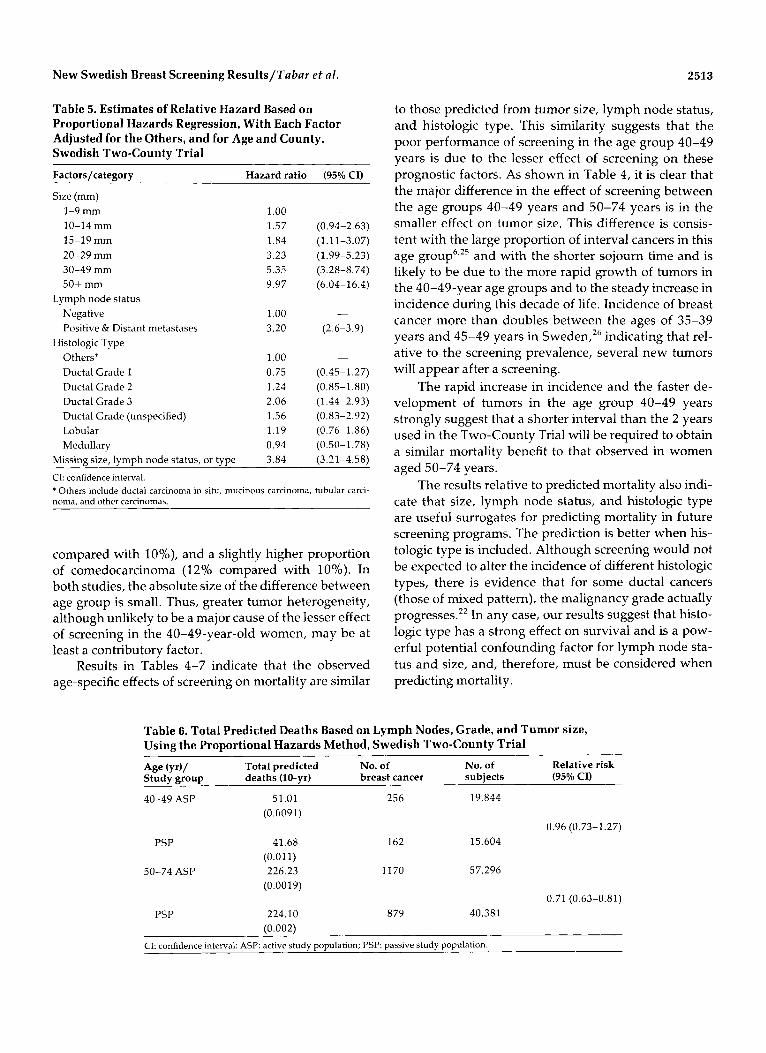
Table 5. Estimates of Relative Hazard Based on Proportional Hazards Regression, With Each Factor Adjusted for the Others, and for Age and County, Swedish Two-County Trial
Factors/category Hazard ratio
Size (mm) 1-9 mm 1.00 10-14 mm 1.57 15-19 mm 1.84 20-29 mm 3.23 30-49 mm 5.35 50+ mm 9.97
Lymph node status Negative 1.00 Positive & Distant metastases 3.20
Others* 1 .00 Ductal Grade 1 0.75 Ductal Grade 2 1.24 Ductal Grade 3 2.06 Ductal Grade (unspecified) 1.56 Lobular 1.19 Medullary 0.94
3.84
Histologic Type
Missing size, lymph node status, or type
(95% CI)
- (0.94-2.63) (1.11-3.07) (1.99-5.23) (3.28-8.74) (6.04-16.4)
-
(2.6-3.9)
-
(0.45- 1.2 7) (0.85- 1.80) (1.44-2.93) (0.83-2.92) (0.76-1.86) (0.50-1.78) (3.21-4.58)
CI: confidence interval. * Others include ductal carcinoma in situ, mucinous carcinoma, tubular carci- noma, and other carcinomas.
compared with lo%), and a slightly higher proportion of comedocarcinoma (129’0 compared with 10%). In both studies, the absolute size of the difference between age group is small. Thus, greater tumor heterogeneity, although unlikely to be a major cause of the lesser effect of screening in the 40-49-year-old women, may be at least a contributory factor.
Results in Tables 4-7 indicate that the observed age-specific effects of screening on mortality are similar
to those predicted from tumor size, lymph node status, and histologic type. This similarity suggests that the poor performance of screening in the age group 40-49 years is due to the lesser effect of screening on these prognostic factors. As shown in Table 4, it is clear that the major difference in the effect of screening between the age groups 40-49 years and 50-74 years is in the smaller effect on tumor size. This difference is consis- tent with the large proportion of interval cancers in this age g r o ~ p ~ , ’ ~ and with the shorter sojourn time and is likely to be due to the more rapid growth of tumors in the 40-49-year age groups and to the steady increase in incidence during this decade of life. Incidence of breast cancer more than doubles between the ages of 35-39 years and 45-49 years in Sweden,26 indicating that rel- ative to the screening prevalence, several new tumors will appear after a screening.
The rapid increase in incidence and the faster de- velopment of tumors in the age group 40-49 years strongly suggest that a shorter interval than the 2 years used in the Two-County Trial will be required to obtain a similar mortality benefit to that observed in women aged 50-74 years.
The results relative to predicted mortality also indi- cate that size, lymph node status, and histologic type are useful surrogates for predicting mortality in future screening programs. The prediction is better when his- tologic type is included. Although screening would not be expected to alter the incidence of different histologic types, there is evidence that for some ductal cancers (those of mixed pattern), the malignancy grade actually progresses.” In any case, our results suggest that histo- logic type has a strong effect on survival and is a pow- erful potential confounding factor for lymph node sta- tus and size, and, therefore, must be considered when predicting mortality.
Table 6. Total Predicted Deaths Based on Lymph Nodes, Grade, and Tumor size, Using the Proportional Hazards Method, Swedish Two-County Trial
Age (yr)/ Total predicted No. of Studv m O U D deaths (10-vr) breast cancer subiects (95% CI)
No. of Relative risk
40-49 ASP 51.01 256 19,844 (0.G091)
0.96 (0.73-1.27) PSP 41.68 162 15,604
50-74 ASP 226.23 1170 57,296 (0.011)
(0.0019) 0.71 (0.63-0.81)
PSP 224.10 8 79 40,381 f0.002)
CI: confidence interval: ASP: active study population; PSP: passive study population.
2514 CANCER May 25,2995, Volume 75 , No. 10
Table 7. Estimates of Relative Hazards Based on Proportional Hazards Regression, with Each Factor Adiusted for the Others, and for Age, BCDDP
Factors/cateeorv Hazard ratio (95% CI)
Size (mm) 1.00 - 1-9
10-14 2.31 (1.30-3.18) 15-19 2.93 (1.90-4.54) 20-29 3.73 (2.45-5.67) 30-49 4.34 (2.82-6.69) 50+ 4.35 (2.77-6.84)
Lymph node status Negative 1.00 - Positive & distant metastases 2.41 (2.05-2.84)
Missing size or lymph node status 2.81 (1.87-4.22)
CI: confidence interval. BCDDP: Breast Cancer Detection Demonstration Proj- ect.
The predicted effect on mortality was conservative in the age group 40-49 years, possibly because the inci- dence ratio of ASP to PSP tumors was high in this age group. This discrepancy may indicate a greater element of overdiagnosis of younger women or a subpopulation of tumors in this age group with a long sojourn time. The latter is consistent with the hypothesis of increased heterogeneity of tumor types and characteristics of this age group and with the finding that the mortality reduc- tion in this age group appears much later than in older women. The latter phenomenon also was observed in other One possible explanation is that screening of younger women detects some tumors with a long so- journ time, as mentioned above. The mortality benefit is, therefore, not observed until the corresponding pro- portion in the control group have reached clinical status and have started to contribute to mortality.
Results relative to mammographic density indicate that although this is a problem for screening of younger women, it is not an insurmountable one. Tables 8 and 9 show that a large proportion of breast tumors of the more aggressive histologc types occur in nondense breasts, and in any case, 52% of ASP tumors in the dense breasts were detected by screening. Thus, the 26% of women aged 40-49 years with mammographi- cally dense breast tissue8 clearly contribute to the smaller effect of screening in this age group, but do not constitute a barrier to effective screening. They do, however, confer a reduced sensitivity (see Table 3).
Thus, the results above suggest that the rapid de- velopment of tumors in the age group 40-49 years and possibly the swiftly increasing risk of the disease with age are responsible for the smaller mortality benefit from screening in this age group. This is confirmed by the shorter sojourn time (Table 3) and, hence, shorter
lead time achieved in 40-49-year-old women, and by the smaller reduction in size associated with screening in this age group (Table 4). Previous work suggests that improvement in mammographic techniques (use of the grids, extended film processing) beyond the standards used in the Swedish Two-County Trialz7 did not change substantially the prognostic characteristics of the tumor diagnosed. This is not to undervalue the benefits of thorough mammographic techniques, but it does sug- gest that among the main problems are fast tumor growth and rapidly increasing incidence. The evidence, therefore, indicates an increase in the frequency of screening as a likely change to bring about an improve- ment in the effect on mortality. This can be quantified as follows: The interval cancer incidence rate in the first and second years after a negative screening were 38% and 68%, re- spectively, of the control incidence.6 Thus, of 2 years incidence among those attending for screening, 62% of the first-year and 32% of the second-year tumors were
1
0.8
0.6
0.4
0.2
0
* DCIS(4/169) -k- Ductal-grade1(24/264) 8- Ductal-grade2(127/666)
8 DuctaLgrade3(279/706)
8 Ductal-grade(unspecified,l4/69) + Lobular(47/248)
-+ Medullary(l3/64) -c Others (1 7/225)
0 36 72 108 144
Time (months) Figure 2. Cumulative survival of breast cancers by histologic type, Swedish Two-County Trial, ages 40-74 years.
New Swedish Breast Screening Results/Tabar et al. 2515
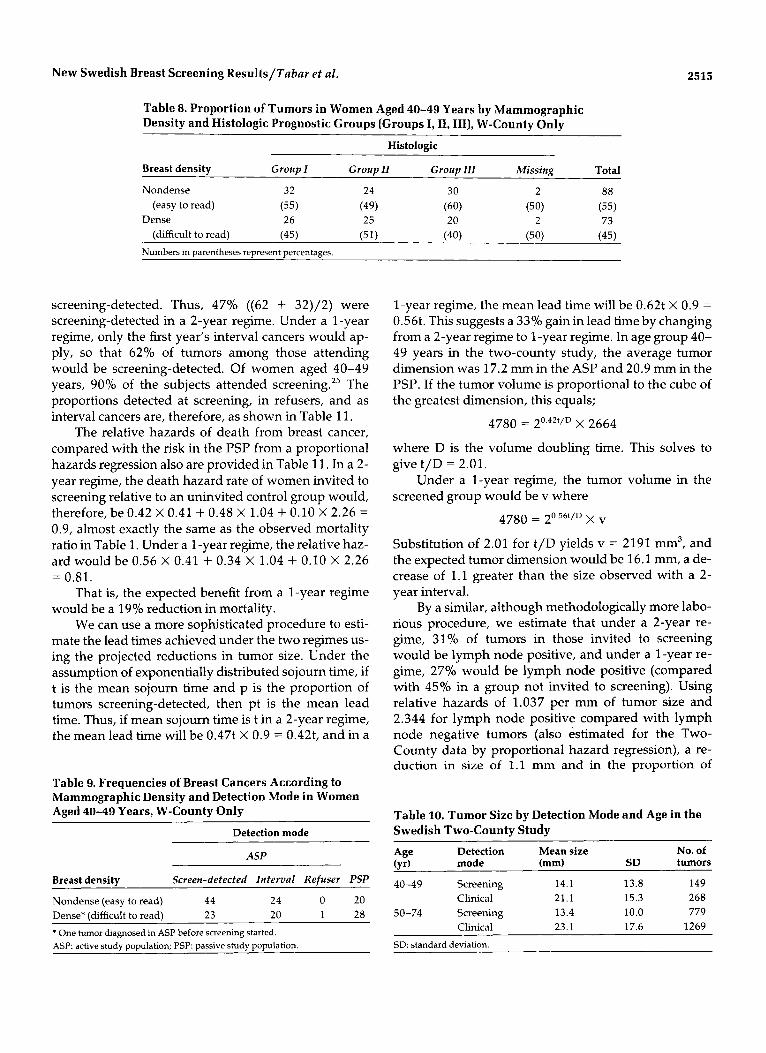
Table 8. Proportion of Tumors in Women Aged 40-49 Years by Mammographic Density and Histologic Prognostic Groups (Groups I, 11, 111), W-County Only
Histologic
Breast density Group I Group I1 Group I l l Missing Total
Nondense 32 24 30 2 88 (easy to read) (55) (49) (60) (50) (55)
Dense 26 25 20 2 73 (difficult to read) (45) (51) (40) (50) (45)
Numbers in parentheses represent percentages.
screening-detected. Thus, 47% ((62 + 32)/2) were screening-detected in a 2-year regime. Under a 1-year regime, only the first year’s interval cancers would ap- ply, so that 62% of tumors among those attending would be screening-detected. Of women aged 40-49 years, 90% of the subjects attended screeningz5 The proportions detected at screening, in refusers, and as interval cancers are, therefore, as shown in Table 11.
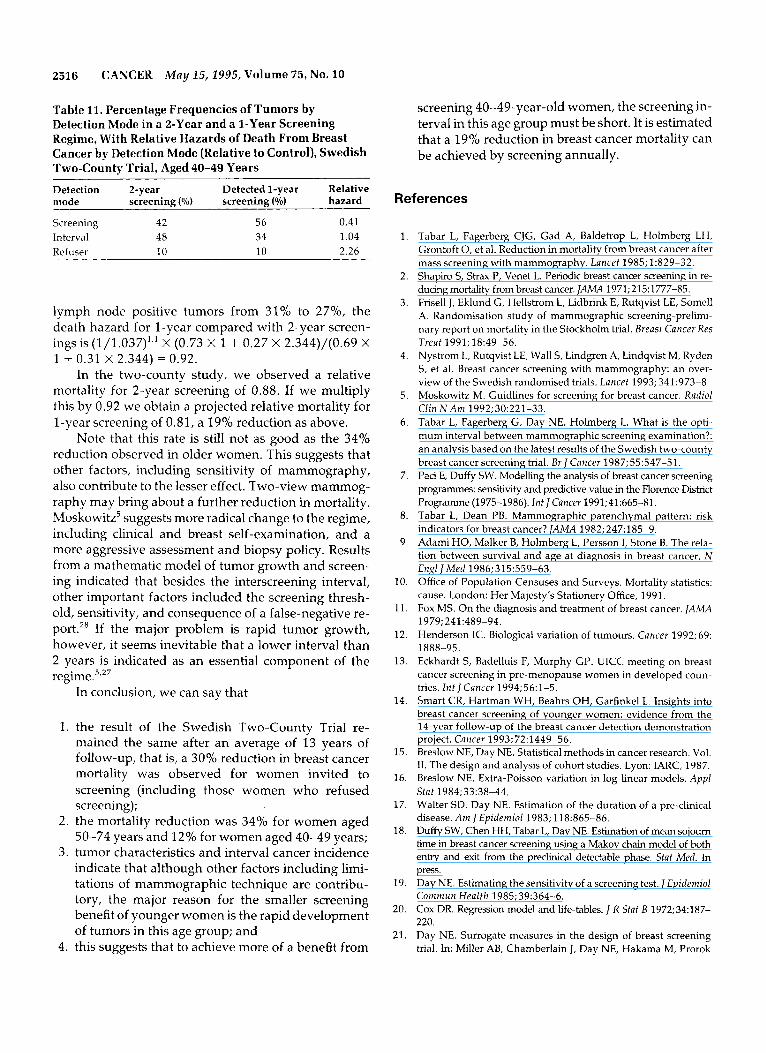
The relative hazards of death from breast cancer, compared with the risk in the PSP from a proportional hazards regression also are provided in Table 11. In a 2- year regime, the death hazard rate of women invited to screening relative to an uninvited control group would, therefore, be 0.42 X 0.41 + 0.48 X 1.04 + 0.10 X 2.26 = 0.9, almost exactly the same as the observed mortality ratio in Table 1. Under a 1-year regime, the relative haz- ard would be 0.56 X 0.41 + 0.34 X 1.04 + 0.10 X 2.26 = 0.81.
That is, the expected benefit from a 1-year regime would be a 19% reduction in mortality.
We can use a more sophisticated procedure to esti- mate the lead times achieved under the two regimes us- ing the projected reductions in tumor size. Under the assumption of exponentially distributed sojourn time, if t is the mean sojourn time and p is the proportion of tumors screening-detected, then pt is the mean lead time. Thus, if mean sojourn time is t in a 2-year regime, the mean lead time will be 0.47t X 0.9 = 0.42t, and in a
Table 9. Frequencies of Breast Cancers According to Mammographic Density and Detection Mode in Women Aged 40-49 Years, W-County Only
Detection mode ~~ ~
ASP
Breast density Screen-detected Interval Refuser PSP
Nondense (easy to read) 44 24 0 20 Dense* ldifficult to read) 23 20 1 28
* One tumor diagnosed in ASP before screening started. ASP: active study population; PSP: passive study population
1-year regime, the mean lead time will be 0.62t X 0.9 =
0.56t. This suggests a 33% gain in lead time by changing from a 2-year regime to 1-year regime. In age group 40- 49 years in the two-county study, the average tumor dimension was 17.2 mm in the ASP and 20.9 mm in the PSP. If the tumor volume is proportional to the cube of the greatest dimension, this equals;
4780 = 2°.42t/D X 2664
where D is the volume doubling time. This solves to give t/D = 2.01.
Under a 1-year regime, the tumor volume in the screened group would be v where
Substitution of 2.01 for t/D yields v = 2191 mm3, and the expected tumor dmension would be 16.1 mm, a de- crease of 1.1 greater than the size observed with a 2- year interval.
By a similar, although methodologically more labo- rious procedure, we estimate that under a 2-year re- gime, 31% of tumors in those invited to screening would be lymph node positive, and under a 1-year re- gime, 27% would be lymph node positive (compared with 45% in a group not invited to screening). Using relative hazards of 1.037 per mm of tumor size and 2.344 for lymph node positive compared with lymph node negative tumors (also estimated for the Two- County data by proportional hazard regression), a re- duction in size of 1.1 mm and in the proportion of
Table 10. Tumor Size by Detection Mode and Age in the Swedish Two-County Study
Detection Mean size No. of (yr) mode (mm) SD tumors
40-49 Screening 14.1 13.8 149 Clinical 21.1 15.3 268
Clinical 23.1 17.6 1269
Age
50-74 Screening 13.4 10.0 779
SD: standard deviation.
2516 CANCER May 25,2995, Volume 75, No. 10
Table 11. Percentage Frequencies of Tumors by Detection Mode in a &Year and a 1-Year Screening Regime, With Relative Hazards of Death From Breast Cancer by Detection Mode (Relative to Control), Swedish Two-County Trial, Aged 40-49 Years
Detection 2-year Detected 1-year Relative mode screening (%) screening (%) hazard
Screening 42 56 0.41 Interval 48 34 1.04 Refuser 10 10 2.26
lymph node positive tumors from 31% to 27%, the death hazard for 1-year compared with 2-year screen- ings is (1/1.037)'.' X (0.73 X 1 + 0.27 X 2.344)/(0.69 X 1 + 0.31 X 2.344) = 0.92.
In the two-county study, we observed a relative mortality for 2-year screening of 0.88. If we multiply this by 0.92 we obtain a projected relative mortality for 1-year screening of 0.81, a 19% reduction as above.
Note that this rate is still not as good as the 34% reduction observed in older women. This suggests that other factors, including sensitivity of mammography, also contribute to the lesser effect. Two-view mammog- raphy may bring about a further reduction in mortality. Moskowitz5 suggests more radical change to the regime, including clinical and breast self-examination, and a more aggressive assessment and biopsy policy. Results from a mathematic model of tumor growth and screen- ing indicated that besides the interscreening interval, other important factors included the screening thresh- old, sensitivity, and consequence of a false-negative re- port.28 If the major problem is rapid tumor growth, however, it seems inevitable that a lower interval than 2 years is indicated as an essential component of the regime.5,27
In conclusion, we can say that
1.
2.
3.
4.
the result of the Swedish Two-County Trial re- mained the same after an average of 13 years of follow-up, that is, a 30% reduction in breast cancer mortality was observed for women invited to screening (including those women who refused screening); the mortality reduction was 34% for women aged 50-74 years and 12% for women aged 40-49 years; tumor characteristics and interval cancer incidence indicate that although other factors including limi- tations of mammographic technique are contribu- tory, the major reason for the smaller screening benefit of younger women is the rapid development of tumors in this age group; and this suggests that to achieve more of a benefit from
screening 40-49-year-old women, the screening in- terval in this age group must be short. It is estimated that a 19% reduction in breast cancer mortality can be achieved by screening annually.
References
1.
2.
3.
4.
5.
6.
7.
8.
9.
10.
11.
12.
13.
14.
15.
16.
17.
18.
19.
20.
21.
Tabar L, Fagerberg CjG, Gad A, Baldetrop L, Holmberg LH, Grontoft 0, et al. Reduction in mortality from breast cancer after mass screening with mammography. Lancet 1985; 1:829-32. Shapiro S, Strax P, Venet L. Periodic breast cancer screening in re- ducing mortality from breast cancer. ]AMA 1971;215:1777-85. Frisell j, Eklund G, Hellstrom L, Lidbrink E, Rutqvist LE, Some11 A. Randomisation study of mammographic screening-prelimi- nary report on mortality in the Stockholm trial. Breast Cancer Res Treat 1991; 18:49-56. Nystrom L, Rutqvist LE, Wall 5, Lindgren A, Lindqvist M, Ryden S, et al. Breast cancer screening with mammography: an over- view of the Swedish randomised trials. Lancet 1993; 341:973-8 Moskowitz M. Guidlines for screening for breast cancer. Radiol Cliti N An1 1992;30:221-33. Tabar L, Fagerberg G, Day NE, Holmberg L. What is the opti- mum interval between mammographic screening examination?: an analysis based on the latest results of the Swedish two-county breast cancer screening trial. B r ] Cancer 1987; 55:547-5 1. Pad E, Duffy SW. Modelling the analysis of breast cancer screening programmes: sensitivity and predictive value in the Florence District Programme (1975-1986). I n t ] Cancer 1991;41:665-81. Tabar L, Dean PB. Mammographic parenchymal pattern: risk indicators for breast cancer? ] A M 1982;247:185-9. Adami HO, Malker B, Holmberg L, Persson I, Stone B. The rela- tion between survival and age at diagnosis in breast cancer. N Engl ] M e d 1986;315:559-63. Office of Population Censuses and Surveys. Mortality statistics: cause. London: Her Majesty's Stationery Office, 1991. Fox MS. On the diagnosis and treatment of breast cancer. IAMA
Henderson IC. Biological variation of tumours. Cancer 1992; 69:
Eckhardt S, Badelluis F, Murphy GP. UICC meeting on breast cancer screening in pre-menopause women in developed coun- tries. Itit ] Cancer 1994;56:1-5. Smart CR, Hartman WH, Beahrs OH, Garfinkel L. Insights into breast cancer screening of younger women: evidence from the 14-year follow-up of the breast cancer detection demonstration project. Cancer 1993; 72:1449-56. Breslow NE, Day NE. Statistical methods in cancer research. Vol. 11. The design and analysis of cohort studies. Lyon: IARC, 1987. Breslow NE. Extra-Poisson variation in log-linear models. Appl Stat 1984;33:38-44. Walter SD, Day NE. Estimation of the duration of a pre-clinical disease. A m J Epidemiol 1983; 118:865-86. Duffy SW, Chen HH, Tabar L, Day NE. Estimation of mean sojourn time in breast cancer screening using a Makov chain model of both entry and exit from the preclinical detectable phase. Stat Med. In press. Day NE. Estimating the sensitivity of a screening test. ] Epidemiol Conirnun Health 1985;39:364-6. Cox DR. Regression model and life-tables. R Stat B 1972;34:187- 220. Day NE. Surrogate measures in the design of breast screening trial. In: Miller AB, Chamberlain J, Day NE, Hakama M, Prorok
1979; 241:489-94.
1888-95.
New Swedish Breast Screening Results/Tabar et al. 2517
PC, editors. Cancer screening. Cambridge, England: Cambridge University Press, 199 1 : 39 1-403,
22. Duffy SW, Tabar L, Fagerberg G, Gad A, Groutoft 0, South MC, et al. Breast screening, prognostic factors and survival-results from the Swedish two county study. Br ] Cancer 1991;64:1133- 8. Miller AB, Baines CJ, Wall C. Canadian National Breast Screening Study: 1. Breast cancer detection and death rates among women aged 40-49 years. Can MedAssocI 1992; 1471459-76.
24. Miller AB, Baines CJ, To T, Wall C. Canadian National Breast Screen- ing Study: 2. Breast cancer detection and death rates among women aged 50-59 years. Can Med Assoc] 1992; 147:1477-88.
25. Tabar L, Fagerberg G, Duffy SW, Day NE, Gad A, Grontfot 0. Up- date of the Swedish Two-County program of mammographic screening for breast cancer. Radiol CIin North A m 1992;30:187-210.
26. Muir CS, Waterhouse J, Mack T, Powell J, Whelan SL. Cancer incidence in Five Continents, Vol VI. Lyon: IARC, 1987.
27. Tabar L, Duffy SW, Burhenne LW. New Swedish breast cancer de- tection results for women aged 40-49. Cancer 1993; 72:1437-48.
28. Pelikan S, Moskowitz M. Effects of lead time, length bias and false-negative assurance on screening for breast cancer. Cancer
23.
1993:71:1998-2003.
Appendix
To estimate the predicted mortality rates from the re- sults of proportional hazards regression, the procedure is as follows:
1. The average 10-year survival rate for the baseline category of three variables including size, negative lymph node status, and histologic type should be calculated. The baseline categories are size < 10 mm, negative lymph node status, and "good" prog- nosis histologic type (including ductal carcinoma in situ mucinous carcinoma, tubular carcinoma, and others). In this case, the average 10-year survival rate for these baseline categories is 96%.
2. For each combination of categories of the three prognostic factors, the predicted 10-year death rate is calculated as
1 - exp[(& X size) X (/Iz X nodes)
X ( P 3 X histology) X (P4 X missing)]
X In (1 - baseline death rate) where PI, P2, P3, and P4 are the respective relative hazard for size, lymph node status, histologic type, and missing data from Table 5.
3. For each combination of categories, the predicted 10-year death rate is multiplied by the number of tumors with that combination, to give the number of predicted deaths from tumors with those partic- ular categories.
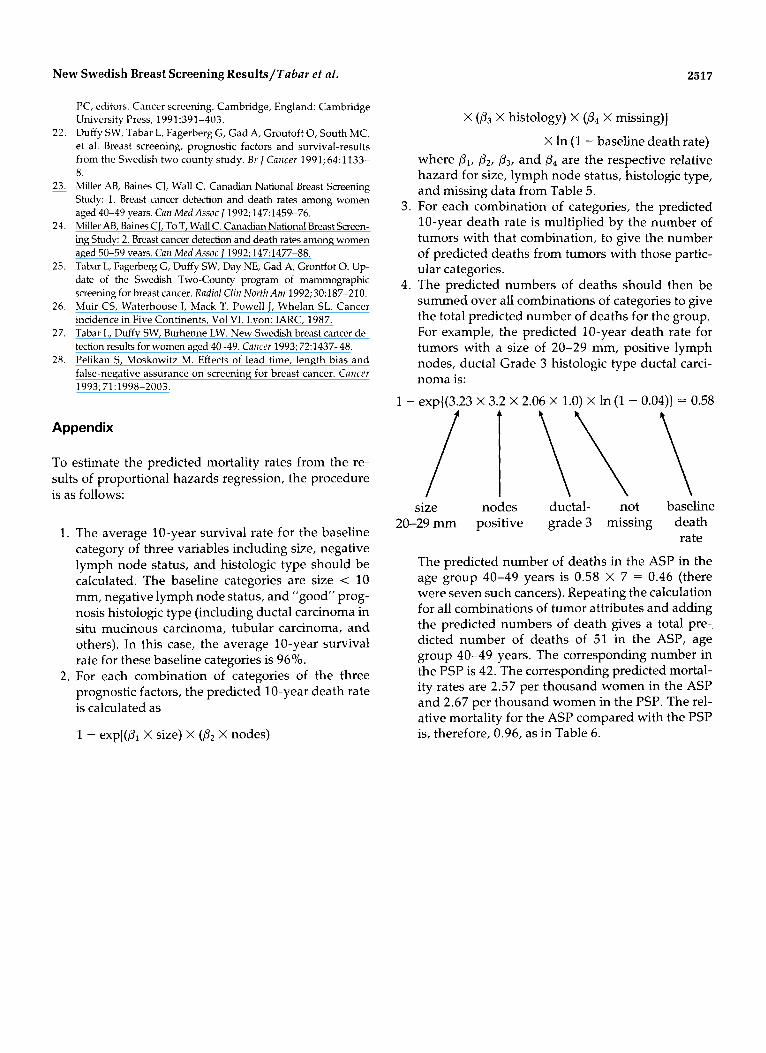
4. The predicted numbers of deaths should then be summed over all combinations of categories to give the total predicted number of deaths for the group. For example, the predicted 10-year death rate for tumors with a size of 20-29 mm, positive lymph nodes, ductal Grade 3 histologic type ductal carci- noma is:
1 - exp((3.23 X 3.2 X 2.06 X 1.0) X In (1 - 0.04)) = 0.58
size nodes ductal- not baseline 20-29 mm positive grade 3 missing death
The predicted number of deaths in the ASP in the age group 40-49 years is 0.58 X 7 = 0.46 (there were seven such cancers). Repeating the calculation for all combinations of tumor attributes and adding the predicted numbers of death gives a total pre-, dicted number of deaths of 51 in the ASP, age group 40-49 years. The corresponding number in the PSP is 42. The corresponding predicted mortal- ity rates are 2.57 per thousand women in the ASP and 2.67 per thousand women in the PSP. The rel- ative mortality for the ASP compared with the PSP is, therefore, 0.96, as in Table 6.
rate