Effects of texture on the determination of elasticity of polycrystalline ϵ-iron from diffraction...
12
E¡ects of texture on the determination of elasticity of polycrystalline O-iron from di¡raction measurements Siegfried Matthies a; 1 , Se ¤bastien Merkel b;c , Hans Rudolf Wenk a; *, Russell J. Hemley b , Ho-kwang Mao b a Department of Earth and Planetary Science, University of California, Berkeley, CA 94720, USA b Geophysical Laboratory and Center for High Pressure Research, Carnegie Institution, Washington, DC 20015, USA c Laboratoire des Sciences de la Terre, Ecole Normale Supe ¤rieure de Lyon, Lyon, France Received 26 June 2001; received in revised form 28 September 2001; accepted 2 October 2001 Abstract X-ray diffraction experiments on textured polycrystalline aggregates in the diamond anvil cell can be used to determine the single-crystal elastic properties of the material under high pressure. We describe a direct method to extract the elastic moduli of O-Fe from diffraction data without assumptions used in previous models to evaluate the requirements on measurement precision. Assuming elastic properties and a realistic texture, variations of d-spacings with orientation have been calculated. From these data, and assuming a sufficient precision, it was possible to retrieve the elastic moduli used in input. We establish the feasibility of the method, which is also applicable to other materials. This is important for explaining the discrepancies between the experimental results and those from first-principles calculations. Implications for the seismic anisotropy in the Earth’s inner core are discussed. ß 2001 Elsevier Science B.V. All rights reserved. Keywords: iron; elasticity; textures; anisotropy 1. Introduction Seismic observations have established that the solid inner core of the Earth is anisotropic and that seismic waves travel 3^4% faster along the axis of the Earth, than in the equatorial plane [1]. Knowledge of the single-crystal elastic moduli and the preferred orientation pattern of O-iron, the principal constituent of the inner core [2], is crucial for understanding anisotropy in the Earth’s core. Preferred orientation can originate from growth [3,4], £ow induced by Maxwell stresses [5,6], or by thermal convection [7]. In view of these ¢ndings determination of the elastic moduli in O-Fe under high pressure has been of great interest. Studies include ¢rst-principles cal- culations [8^12], radial di¡raction experiments to above 200 GPa [13,14], and Raman spectroscopy [15] but the results of di¡erent methods do not agree. There is fair agreement between ¢rst-prin- ciples calculations cited above (all for 0 K) but 0012-821X / 01 / $ ^ see front matter ß 2001 Elsevier Science B.V. All rights reserved. PII:S0012-821X(01)00547-7 * Corresponding author. Fax: +1-510-486-7379. E-mail address: [email protected] (H.R. Wenk). 1 Present address: Mueller-Berset-Str. 3, D-01309 Dresden, Germany. Earth and Planetary Science Letters 194 (2001) 201^212 www.elsevier.com/locate/epsl
-
Upload
independent -
Category
Documents
-
view
0 -
download
0
Transcript of Effects of texture on the determination of elasticity of polycrystalline ϵ-iron from diffraction...

E¡ects of texture on the determination of elasticity ofpolycrystalline O-iron from di¡raction measurements
Siegfried Matthies a;1, Sebastien Merkel b;c, Hans Rudolf Wenk a;*,Russell J. Hemley b, Ho-kwang Mao b
a Department of Earth and Planetary Science, University of California, Berkeley, CA 94720, USAb Geophysical Laboratory and Center for High Pressure Research, Carnegie Institution, Washington, DC 20015, USA
c Laboratoire des Sciences de la Terre, Ecole Normale Superieure de Lyon, Lyon, France
Received 26 June 2001; received in revised form 28 September 2001; accepted 2 October 2001
Abstract
X-ray diffraction experiments on textured polycrystalline aggregates in the diamond anvil cell can be used todetermine the single-crystal elastic properties of the material under high pressure. We describe a direct method toextract the elastic moduli of O-Fe from diffraction data without assumptions used in previous models to evaluate therequirements on measurement precision. Assuming elastic properties and a realistic texture, variations of d-spacingswith orientation have been calculated. From these data, and assuming a sufficient precision, it was possible to retrievethe elastic moduli used in input. We establish the feasibility of the method, which is also applicable to other materials.This is important for explaining the discrepancies between the experimental results and those from first-principlescalculations. Implications for the seismic anisotropy in the Earth's inner core are discussed. ß 2001 Elsevier ScienceB.V. All rights reserved.
Keywords: iron; elasticity; textures; anisotropy
1. Introduction
Seismic observations have established that thesolid inner core of the Earth is anisotropic andthat seismic waves travel 3^4% faster along theaxis of the Earth, than in the equatorial plane[1]. Knowledge of the single-crystal elastic moduli
and the preferred orientation pattern of O-iron,the principal constituent of the inner core [2], iscrucial for understanding anisotropy in theEarth's core. Preferred orientation can originatefrom growth [3,4], £ow induced by Maxwellstresses [5,6], or by thermal convection [7]. Inview of these ¢ndings determination of the elasticmoduli in O-Fe under high pressure has been ofgreat interest. Studies include ¢rst-principles cal-culations [8^12], radial di¡raction experiments toabove 200 GPa [13,14], and Raman spectroscopy[15] but the results of di¡erent methods do notagree. There is fair agreement between ¢rst-prin-ciples calculations cited above (all for 0 K) but
0012-821X / 01 / $ ^ see front matter ß 2001 Elsevier Science B.V. All rights reserved.PII: S 0 0 1 2 - 8 2 1 X ( 0 1 ) 0 0 5 4 7 - 7
* Corresponding author. Fax: +1-510-486-7379.E-mail address: [email protected] (H.R. Wenk).
1 Present address: Mueller-Berset-Str. 3, D-01309 Dresden,Germany.
EPSL 6045 17-12-01
Earth and Planetary Science Letters 194 (2001) 201^212
www.elsevier.com/locate/epsl

models based on experimental data produce muchmore anisotropic values. Moreover, recent calcu-lations predict major changes as a function oftemperature at high pressure that reverse thesign of the elastic anisotropy [16]. Thus, there isa need to clarify both the preferred orientationand elastic properties in O-Fe under high pressureand temperature.
Recently the elasticity of O-Fe at high pressurewas examined by X-ray di¡raction experimentscarried out with the diamond anvil cell. System-atic variations of d-spacings were analyzed as afunction of orientation of corresponding latticeplanes to the diamond cell axis (Fig. 1). Thetheory used in the analysis of the radial di¡rac-tion experiments on O-Fe [17] assumed a randomorientation of the crystallites in the sample andthat the state of stress on all crystallographicplanes is identical. However, it is well-establishedthat O-Fe samples prepared under these conditionsare highly textured [18,19], with c-axes preferen-tially aligned parallel to the axis of compression.This provides an opportunity to determine theelastic constants directly from di¡raction data,without assumptions used in previous analyses.Single-crystal elastic constants can be determinedfrom di¡raction experiments on stressed and tex-tured polycrystals, either by observing changes ind-spacings while the applied stress is varied, orinvestigating, at constant stress, variations of d-spacings with orientation of lattice planes to thestress axis [20]. The latter method is applicable todiamond anvil cell experiments.
We present a new approach to analyze the ob-servations from the radial di¡raction experiments.We begin by brie£y reviewing key concepts ofelasticity and preferred orientation and then de-scribe the theoretical elements necessary to com-bine the elasticity and preferred orientation in theanalysis of the radial di¡raction results. We dem-onstrate the applicability of the method by gener-ating synthetic `experimental' data from assumedelastic moduli and experimental conditions, andthen retrieving the moduli from those data. Fi-nally, we apply this methodology to data from aprevious experiment and discuss how the analysiscould improve understanding the elasticity of O-Feat high pressure.
2. Elasticity and preferred orientation
2.1. Elasticity
The single-crystal elastic properties of a materi-al can be characterized in terms of compliancesSijkl or sti¡nesses Cijkl which, in linear elasticitytheory, relate stress and strain in the sample usingthe relation [21] :
c ij � CijklO kl; O ij � Sijklc kl �1�
They are components of twice symmetric fourthrank tensors 0S and 0C with properties :0S � �0C�31; Sijkl � Sjikl � Sklij; i; j; k; l � 1; 2; 3
�2�
In the case of hexagonal crystals, such as O-iron,the crystal symmetry reduces the set of 21 inde-pendent moduli to ¢ve (0C1111, 0C1122, 0C1133,0C3333, 0C2323). The remaining moduli, which arenot identical to zero follow from Eq. 2 and therelations:0C2222 � 0C1111;
0C2233 � 0C1133;0C1313 � 0C2323;
and 0C1212 � �0C111130C1122�=2 �2a�
The 0C quantities can be used to evaluate proper-ties such as bulk modulus, shear modulus andsound velocities in a single crystal. Because of
Fig. 1. Experimental setup for the diamond anvil cell radialdi¡raction experiments. The powdered sample is con¢nedunder non-hydrostatic stress between the two diamond an-vils. c33d is the axial stress imposed by the diamonds andc11g the radial stress imposed by the gasket. The cell is ro-tated about an axis R to vary irT in y = (B,T).
EPSL 6045 17-12-01
S. Matthies et al. / Earth and Planetary Science Letters 194 (2001) 201^212202

the anisotropic nature of the elastic moduli ten-sors, the seismic velocities will exhibit anisotropy.
2.2. Preferred orientation
Although individual crystals might exhibit elas-tic anisotropy, macroscopic polycrystalline aggre-gates are elastically isotropic if their crystallitesare randomly oriented. But materials with pre-ferred orientation (or `texture') display aniso-tropic properties [22]. In order to include the ef-fects of preferred orientation on the physicalproperties of a macroscopic polycrystalline sam-ple, such as the propagation of seismic velocities,one has to introduce the orientation distributionfunction (ODF) f(g) de¢ned as follows. Let KA bethe macroscopic polycrystalline sample coordinatesystem and KB a right-handed Cartesian coordi-nate system placed in the specimen (crystal coor-dinate system) ¢xed to the crystal lattice of a crys-tallite of the sample. The transformation to bringthe KA coordinate system onto KB can be un-equivocally given by three numbers (noted g)that represent a set of three well-de¢ned rotations(g describes the orientation of the crystal relativeto KA). One choice for g is the set of Euler anglesK, L, Q [23] with:
g � g�K ; L ; Q �rfK ; L ; Q g; dg � dK sinL dL dQ ;
g q G : 0 9 K ; Q 9 360�; 0 9 L 9 180� �3�
The ODF f(g) describes the probability density toexpect crystallites that have the orientation gwithin dg ; thus:
f �g�v0;ZG
f �g�dIg � 1; where dIg � 18Z2dg �4�
The degree of anisotropy in a polycrystalline sam-ple is represented by the texture sharpness F2
F2 �ZG
�f �g��2dIg �5�
For a material with random texture, F2 = 1, for atextured material, F2 s 1.
2.3. Methods for estimating single-crystalelastic moduli under pressure
Single-crystal elastic moduli can be determinedexperimentally using acoustic methods or Bril-louin scattering [24] but these techniques so farare applicable only over a limited pressure range,or can be used reliably only for transparent (orsemi-transparent) samples. Raman spectroscopyalong with phenomenological modeling providesdirect information on the C2323 elastic modulusof hexagonal crystals [25]. This was applied to O-Fe up to a pressure of 150 GPa [15] but thismethod can not be used to extract other elasticmoduli directly.
New experimental techniques have been devel-oped to extract elasticity information from resultsof X-ray and neutron di¡raction on polycrystalsunder non-hydrostatic stress conditions [17,20,26^32]. Fig. 1 shows the experimental setup used inthe case of the ultrahigh-pressure experiment witha diamond anvil cell. The very ¢ne-powderedsample (grain size estimated to be V1 Wm) iscon¢ned in a diamond anvil cell without any pres-sure medium to enhance the e¡ect of non-hydro-static stress. The diamonds induce a loading stresscomponent c33 that is larger than the radial stresscomponent c11 =c22 induced by the Be gasket. A¢nely collimated X-ray beam of cross section inthe order of 10 Wm allows accurate measurementson the sample. Di¡raction is measured throughthe gasket and the cell is rotated to study thein£uence of the stress condition on the di¡ractionpatterns. The original theory used in the analysisof these experiments to extract the elastic moduliassumed a random orientation of the crystallitesin the sample [13,14] and this limits the analysis.The present study develops a theory that can beused to obtain the high-pressure single-crystalelastic properties of hexagonal O-Fe from radialdi¡raction experiments on textured polycrystallineaggregates.
EPSL 6045 17-12-01
S. Matthies et al. / Earth and Planetary Science Letters 194 (2001) 201^212 203

3. Theory of stress and strain in theradial di¡raction experiment
3.1. Strain
The stress conditions applied to the sample canbe expressed by the following tensor:
c �c 110
0c 11
00
264375 � c hydro0
0c hydro
00
264375� 3t=30
03t=3
00
264375
�6�
where chydro is the mean normal stress (equivalenthydrostatic pressure) and t =c333c11 the uniaxialstress component. The deviatoric stress compo-nents are:
c 033 � 2t=3; c 011 � c 022 � 3t=3 �7�
The equivalent hydrostatic pressure chydro deter-mines the reference values of the hexagonal crys-tal structure parameters a0, c0/a0 that are esti-mated using a previously measured equation ofstate for O-iron [33]. Using parameters a0 andc0/a0 (noted `0P(chydro)') the interplanar spacingsunder the equivalent hydrostatic pressure chydro
are:
d0�0P; hkl� � a0������������������������������������������������������43�h2 � hk � k2� � l2
�c0=a0�2
s �8�
The equivalent hydrostatic pressure also deter-
mines the set of elastic moduli 0S(chydro) that weare determining.
In the experiment, the di¡raction direction de-¢nes a `laboratory coordinate system' KL withthe axis ZL parallel to the scattering vector N(bisector between the incoming beam and the dif-fracted X-ray beam collected by the detector) andXL inside the plane containing the incident anddi¡racted beam and pointing towards the side ofthe detector (Fig. 2). The sample coordinate sys-tem KA is de¢ned by the stress environment onthe sample with ZA parallel to the diamonds axis.The crystal coordinate system KB is de¢ned foreach crystallite according to the crystal structure.In KB of a crystallite under consideration thedirection of the normal to a di¡racting (hkl)plane is given by hi. The scattering vector de-scribed in KA is called y. The (hkl) planes ob-served in the spectrometer are a subset of the(hkl) planes of all crystallites de¢ned by the con-dition (yNhi). The observed interplanar spacings ddepend on the quasi-hydrostatic equivalent pres-sure cell parameters 0P(chydro), the elastic moduli0S(chydro), the ODF f, the uniaxial stress t, thecrystallographic plane (hkl), and the direction ofmeasurement y. They can be expressed as fol-lows:
d�hkl; y� � d�0P; 0S; f ; t; hkl; y�rd0�0P; hkl�
1� d�0P; 0S; f ; t; hkl; y�3d0�0P; hkl�d0�0P; jkl�
� ��
d0�0P; hkl��1� O 0�0P; 0S; f ; t; hi; y�� �9�
Fig. 2. Coordinate systems used in the analysis. The sample coordinate system KA is de¢ned by the stress environment on thesample. ZA is parallel to the diamonds axis. For the laboratory coordinate system KL, ZL is parallel to the bisector between theincoming and di¡racted X-ray beam and XL is in the plane containing the incoming and di¡racted beam, pointing towards theside of the detector. The crystallite coordinate system KB is de¢ned according to the crystallographic structure.
EPSL 6045 17-12-01
S. Matthies et al. / Earth and Planetary Science Letters 194 (2001) 201^212204

The averaging symbol (overline) denotes that thedi¡raction peak from a polycrystalline sample isformed by contributions of all crystallites in re-£ection position (yNhi), i.e. with the orientationsgp of the two paths g�p , g3p through the G-space:
g�p � f�hi; ~Bg31fy; 0g; g3p � f3hi; ~Bg31fy; 0g;
09~B9360� �10�
The number of these crystallites is obviously re-lated to the texture of the sample, entering theaverage through f(gp).
In KL, the strain symbol OP in Eq. 9 can beinterpreted as the 33 component of a strain ten-sor, i.e. :
d�0P; 0S; f ; t; hkl; y� �
d0�0P; hkl�Z1� O 0L33�0P; 0S; f ; t; hi; y�u �11�
3.2. Relation to elastic moduli
We apply now Hooke's law in the laboratorycoordinate system KL. The strain may be ex-pressed in terms of stress cPL and compliancesSL, thus:
O 0L33 � SL33ij�0P; 0S; f ; hi; y�c 0Lij �12�
The compliance components SL33ij given in KL are
then converted into the mixed laboratory samplecoordinate system (KL,KA)-related stress factorsSLA
33kl , using the rotation matrix {y,0} (KLCKA),that determines the main y-dependence of the ex-perimental d :
SLA33kl � SL
33mnfy; 0gmkfy; 0gnl �13�
Using the stress factors, OPL33 is directly propor-tional to the deviatoric stresses (Eq. 7) given inKA by:
O 0L33 � SLA3333�0P; 0S; f ; hi; y�c 033�
SLA3311�0P; 0S; f ; hi; y�c 011�
SLA3322�0P; 0S; f ; hi; y�c 022 �
�2 SLA33333SLA
33113SLA3322�t=3 �14�
The `di¡ractive compliances' SL(0P, 0S, f ; hi, y)also depend on the direction of di¡raction ythrough their dependence of f(g) (cf. Eq. 10),but in case of a randomly textured material, thisdependence disappears due to f(g)r1.
Next we have to relate the single-crystal elasticmoduli, 0S, expressed in the coordinate systemsKj
B of the individual crystallite j, to the e¡ective`di¡ractive compliances' SL(0P, 0S, f ; hi, y). Thisdepends on the micro-mechanical model used tobring the average over the di¡racting grains gp
(with individual microscopic strains and stressesin the solid polycrystalline sample) into the fac-torized form (Eq. 14) with the macroscopic load-ing stress components.
3.3. Preferred orientation
A number of micro-mechanical models havebeen used in the past. The Voigt [34] and Reuss[35] approximations assume continuity of strainand stress, respectively, across grains in the sam-ple. In terms of the ODF, these approximationscan be represented as simple arithmetic meanswith f(g) or f(gp) weights, respectively. Other ap-proaches use linear combinations of values deter-mined in the Reuss and Voigt approximations asin the Voigt^Reuss^Hill average or in Hill-likemodels [36]. More sophisticated self-consistentvariants, involving grain interactions on the mi-croscopic level, have been shown to be physicallymore appropriate. Explicit SL expressions for allthese models in the case of random texture havebeen published [17,26,28,29,37].
In the case of a hexagonal crystal with randomtexture, diamond anvil experiments provide onlythree independent combinations of the ¢ve com-ponents of the elastic moduli tensor 0S. Therefore,the use of two additional bulk properties, such asbulk and shear moduli, is necessary to deduce thefull set of elastic moduli [13]. For textured sam-ples, the 0S-dependencies of SL are more compli-cated. Analytical expressions containing only asmall number of transparent ODF-related quanti-ties are given in [38] for the Reuss approximation
EPSL 6045 17-12-01
S. Matthies et al. / Earth and Planetary Science Letters 194 (2001) 201^212 205

and in [39] for the `bulk-path-geo approximation'(BPGeo). The latter approximation e¡ectivelyconsiders aspects of grain interaction from macro-scopic to microscopic levels. The results of thisapproximation that uses elements of a simple geo-metric average are very close to those from moresophisticated self-consistent calculations. Becauseof the non-linear character of both models, newcombinations of 0S components arise.
For a relatively sharp texture with a distribu-tion only around one orientation (`texture compo-nent'), a single crystal with the right orientationcan approximate the sample. This greatly im-proves the reliability of the results and simpli¢esthe analysis, because in this case the results of allphysically correct micro-mechanical polycrystalmodels must agree; i.e. the di¡erence between re-sults using simple Reuss, or more sophisticatedapproximations, must be relatively small.
3.4. Speci¢c aspects of high-pressure experiments
In the case of diamond anvil cell experiments,several di¤culties arise. Uncertainties in the cellparameters 0P(chydro) directly in£uence the quasi-hydrostatic interplanar spacings d0, introducingerrors in Eq. 8 and 9. In order to avoid this sit-uation, we evaluate a mean value:
d�0P; 0S; f ; t; hkl� � d�0P; 0S; f ; t; hkl; y�Y�15�
calculated for a su¤ciently large number of mea-suring points y. Then introducing the quantityDrd/d the critical d0 cancels out, and by Eq. 11we have:
D�0P; 0S; f ; t; hkl; y� � d=d �
1� O 0L33�0P; 0S; f ; t; hi; y�1� O 0L33�0P; 0S; f ; t; hi; y�Y
�16�
A second problem related to the diamond anvilcell experiments is the uncertainty in the uniaxialstress component t. But due to the special form ofEq. 14 and the 0S-dependence of the SLA compo-
nents (homogeneous function of degree one) wecan introduce the dimensionless Z quantities:0Zijkl � 0Sijklt=3; SLA
33ij Wt=3 �
ZLA33ij�0P; 0Z; f ; hi; y� � SLA
33ij�0P; 0Z; f ; hi; y��17�
Combining Eqs. 16 and 14 we obtain:
D�0P; 0S; f ; t; hkl; y� � D�0P; 0Z; f ; hkl; y� �
1� 2ZLA33333ZLA
33113ZLA3322
1� 2ZLA33333ZLA
33113ZLA3322
Y�18�
i.e. uncertainties in the uniaxial stress t will notin£uence the ¢tting procedures to determine the0Z from the experimental D values, but only enterin the ¢nal step, when calculating the componentsof the tensor elastic moduli 0S from 0Z.
4. Analysis of experimental data
4.1. Previous results for elasticity
The high-pressure determination of elastic mod-uli for crystals of hexagonal symmetry using dia-mond anvil cells and X-ray di¡raction is in anearly stage of development. The conventional dia-mond anvil cell con¢guration was modi¢ed to ob-serve di¡raction from lattice planes oriented atdi¡erent angles relative to the diamond axis, ZA,in the sample-related coordinate system [13,14,18].Polychromatic synchrotron X-rays are incident onthe sample at 84³ to the diamond anvil axis anddi¡raction patterns are collected with an energy-dispersive detector in a symmetrical position(2a= 12³). During an experiment, the cell is ro-tated around an axis perpendicular to the dia-mond anvil cell axis to bring di¡erent latticeplanes into di¡raction condition (Fig. 1).
For the present analysis, we will use results onO-Fe at a pressure of 54 GPa [13]. Data for eight(hkl) and the T region 0^90³ (y = (B,T)) were col-lected, and the dependence in y of the interplanarspacings expected from Eq. 9 was observed (Fig.
EPSL 6045 17-12-01
S. Matthies et al. / Earth and Planetary Science Letters 194 (2001) 201^212206
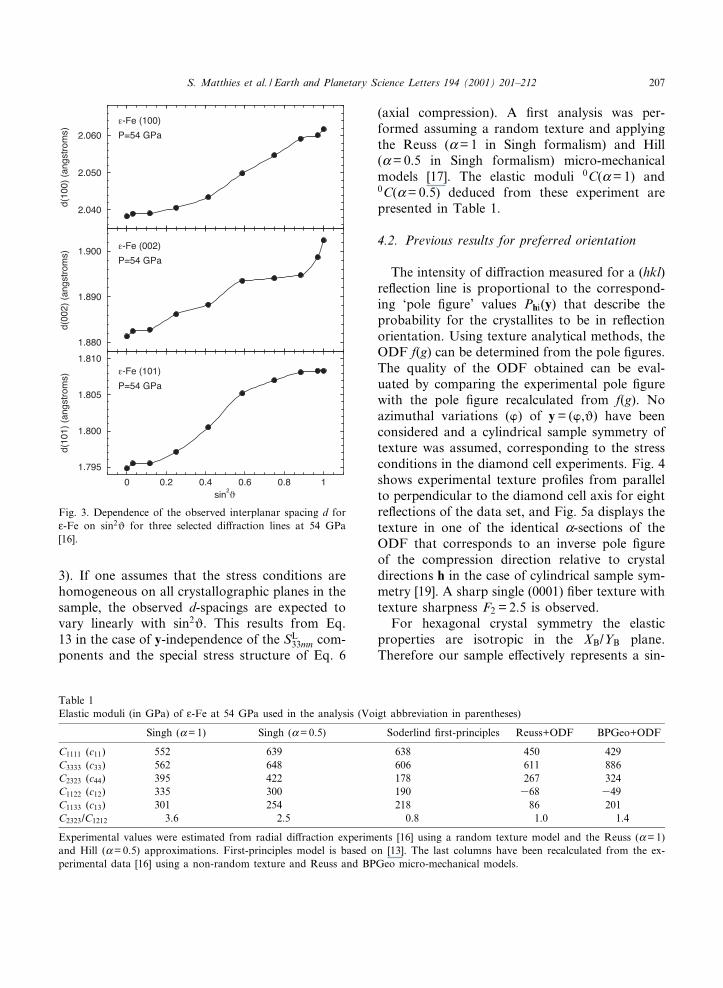
3). If one assumes that the stress conditions arehomogeneous on all crystallographic planes in thesample, the observed d-spacings are expected tovary linearly with sin2T. This results from Eq.13 in the case of y-independence of the SL
33mn com-ponents and the special stress structure of Eq. 6
(axial compression). A ¢rst analysis was per-formed assuming a random texture and applyingthe Reuss (K= 1 in Singh formalism) and Hill(K= 0.5 in Singh formalism) micro-mechanicalmodels [17]. The elastic moduli 0C(K= 1) and0C(K= 0.5) deduced from these experiment arepresented in Table 1.
4.2. Previous results for preferred orientation
The intensity of di¡raction measured for a (hkl)re£ection line is proportional to the correspond-ing `pole ¢gure' values Phi(y) that describe theprobability for the crystallites to be in re£ectionorientation. Using texture analytical methods, theODF f(g) can be determined from the pole ¢gures.The quality of the ODF obtained can be eval-uated by comparing the experimental pole ¢gurewith the pole ¢gure recalculated from f(g). Noazimuthal variations (B) of y = (B,T) have beenconsidered and a cylindrical sample symmetry oftexture was assumed, corresponding to the stressconditions in the diamond cell experiments. Fig. 4shows experimental texture pro¢les from parallelto perpendicular to the diamond cell axis for eightre£ections of the data set, and Fig. 5a displays thetexture in one of the identical K-sections of theODF that corresponds to an inverse pole ¢gureof the compression direction relative to crystaldirections h in the case of cylindrical sample sym-metry [19]. A sharp single (0001) ¢ber texture withtexture sharpness F2 = 2.5 is observed.
For hexagonal crystal symmetry the elasticproperties are isotropic in the XB/YB plane.Therefore our sample e¡ectively represents a sin-
Fig. 3. Dependence of the observed interplanar spacing d forO-Fe on sin2T for three selected di¡raction lines at 54 GPa[16].
Table 1Elastic moduli (in GPa) of O-Fe at 54 GPa used in the analysis (Voigt abbreviation in parentheses)
Singh (K= 1) Singh (K= 0.5) Soderlind ¢rst-principles Reuss+ODF BPGeo+ODF
C1111 (c11) 552 639 638 450 429C3333 (c33) 562 648 606 611 886C2323 (c44) 395 422 178 267 324C1122 (c12) 335 300 190 368 349C1133 (c13) 301 254 218 86 201C2323/C1212 3.6 2.5 0.8 1.0 1.4
Experimental values were estimated from radial di¡raction experiments [16] using a random texture model and the Reuss (K= 1)and Hill (K= 0.5) approximations. First-principles model is based on [13]. The last columns have been recalculated from the ex-perimental data [16] using a non-random texture and Reuss and BPGeo micro-mechanical models.
EPSL 6045 17-12-01
S. Matthies et al. / Earth and Planetary Science Letters 194 (2001) 201^212 207

gle crystal with the c-axis aligned in the maximumstress direction. Thus the 0S (or 0C) parametersets that would be calculated using the same ex-perimental data as [13], but including texture ef-fects, are likely to be di¡erent from the results inTable 1, which assumed a random orientation ofthe crystallites in the sample.
4.3. Theoretical test case
The analysis based on a hypothesis of randomtexture could only provide three combinations ofthe elastic moduli [13]. Therefore, assumptionshad to be made about two bulk properties ofthe material (cf. Section 3.3). Ideally, we wouldlike to determine all of the unknown componentsof 0S using the data obtained from the di¡ractionexperiments, without additional information suchas approximated bulk properties. Eq. 18 cannotbe solved for the 0Z analytically, but can be ana-lyzed by numerical model calculations. We pro-
ceed by assuming a set of elastic moduli 0S*and model the d data that would be observed ina radial di¡raction experiment [13]. We then usethese theoretically modeled d data to re-extractthe elastic moduli 0S* that were included in themodel. We only show results for the (101) latticeplane but the analysis was done on all eight latticeplanes of the experimental set. For the numericaltest case we did not use the experimental texture(Fig. 5a), but rather a theoretical texture modeledafter the experimental texture, for higher accura-cy. This model ODF is stronger than the exper-imental texture and consists of a (0001) ¢ber witha halfwidth of 30³ and isotropic background 0.1m.r.d. (Fig. 5b), providing a texture strength ofF2 = 8.4.
Fig. 6 shows the modeled D(0P, 0S*, f, t ; hkl, y)for the (101) plane as a function of sin2T, where Tis the polar angle of y (i in [20]). The D wascalculated with standard accuracy, using the¢rst-principles sti¡ness coe¤cients [10] in Table1 (0Cab initio), and the two micro-mechanical mod-els Reuss and BPGeo with the following parame-ters (chydro = 52 GPa, t = 15 GPa, c0/a0 = 1.6). Therandom texture case results in straight lines,whereas the textured case produces slightly curvedlines.
Deviations from a straight line are emphasizedin Fig. 7 where the derivative of D(0P, 0S*, f, t ;hkl, y) versus sin2T for the (101) plane is shown as
Fig. 5. Inverse pole ¢gures of the compression direction forO-Fe. (a) Experimental inverse pole ¢gure at 54 GPa calcu-lated from the pole density pro¢les in Fig. 4 [22], maximumpole density is 6.4 m.r.d., (b) idealized texture expressed by asingle ¢ber component which is used for the test calculationsin this paper, maximum pole density is 18.3 m.r.d. Equalarea projections. Contour scale is indicated.
Fig. 4. Texture of O-Fe at P = 54 GPa expressed as pro¢lesof pole densities for eight di¡raction peaks from parallel toperpendicular to the diamond cell axis. Pole densities are ex-pressed in multiples of a random distribution (m.r.d.) [22].
EPSL 6045 17-12-01
S. Matthies et al. / Earth and Planetary Science Letters 194 (2001) 201^212208

a function of sin2T. The di¡erent curves are rela-tively close to each other because of the almostisotropic structure of the microscopic 0Cab initio setof elastic moduli. Nevertheless, the set of elasticmoduli used in the model could be recalculated inthis textured case with an accuracy of at least twodecimals. It is appropriate to emphasize that forthe present model the D values had an accuracy
of at least ¢ve decimals, and the micro-mechanicalmodels used to produce the `experimental' D val-ues and to re-extract the unknown 0S were iden-tical. The example shows the accuracy in experi-mental D values required to obtain reliable resultson single-crystal elasticity.
4.4. Application to experimental data
In Fig. 8 we plot the experimental D(0P, 0S, f,t ; hkl, y) as a function of sin2T for (101) from theexperiment at 54 GPa, with an estimated t of 4.5GPa [16]. The other curves are for the BPGeomodel, the ODF in Fig. 3, and three sets of elasticmoduli. The ¢rst-principles results [10] are shown;K= 1 refers to values obtained with the Reussapproximation and K= 0.5 to those obtainedwith the Hill approximation [13]. None of themodeled D(0P, 0S, f, t ; hkl, y) can reproducethe non-linear behavior of the experimental datawith su¤cient accuracy. Table 1 also presents twohypothetical sets of elastic moduli of O-Fe at 54GPa deduced from the experimental d values andusing the texture in Figs. 4 and 5 under the Reussand BPGeo approximations, without additionalassumptions about bulk properties of the sample.The D(0P, 0S, f, t ; hkl, y) curves recalculated us-ing these moduli and the appropriate micro-me-chanical models are plotted in Fig. 9 as a functionof sin2T for (101). The results from both models
Fig. 8. Experimental D values for (101) and calculated valuesusing the ¢rst three 0C parameter sets of Table 1, the BPGeomicro-mechanical model and the ODF from Fig. 3.
Fig. 7. Variation of DD/D(sin2T) with sin2T for D values ofthe (101) re£ection line calculated using the ¢rst-principlesset of elastic moduli from Table 1. Results are plotted fortwo micro-mechanical models (Reuss and BPGeo) supposingrandom texture or a model ODF, containing a (001) ¢bercomponent.
Fig. 6. Variation of the D values of the (101) re£ection linecalculated using the ¢rst-principles set of elastic moduli fromTable 1 as a function of sin2T. Results are plotted for twomicro-mechanical models (Reuss and BPGeo) supposing ran-dom texture or the model ODF from Fig. 5b, containing a(001) ¢ber component.
EPSL 6045 17-12-01
S. Matthies et al. / Earth and Planetary Science Letters 194 (2001) 201^212 209

(BPGeo and Reuss) are very close because of thestrong preferred orientation in the sample. Therecalculated d values using a random texturemodel and the elastic moduli for the Reuss ap-proximation from Singh et al. [13] are also indi-cated. They appear as a linear function of sin2T,as expected for a random texture model.
The analysis of the curves for the other (hkl)re£ections provided similar results. In all cases,curves resulting from calculations that includedthe texture and used the Reuss or BPGeo micro-mechanical models appear to be more appropri-ate. Unfortunately, the scatter in the currentlyavailable experimental d values does not permitus to obtain a unique set of elastic moduli. Hence,the signi¢cance of features obtained with the lat-ter two models, such as the large value of C1111/C3333 and negative C1122, needs to be exploredwith further measurements.
5. Conclusions
We introduced a new theoretical approach forthe analysis of high-pressure radial di¡ractionmeasurements on hexagonal materials. In thisstudy, we demonstrated how the sample texturecould be introduced in the estimation of the elas-tic moduli. Several micro-mechanical models for
the grain interactions in the sample and texturehypothesis were analyzed. We ¢nd that the mod-els using the Reuss or BPGeo approximation,along with the observed texture properties, weremost appropriate. Unfortunately, the accuracy ofthe experimental results is not su¤cient to extractthe elastic moduli of O-Fe; in fact a large range ofelastic moduli is compatible with the data. Theanalysis suggests that the accuracy of the mea-surements needs to be improved by an order ofmagnitude to obtain accurate determination ofthe moduli. Both a highly anisotropic elasticity[13,14] as well as a weakly anisotropic elasticity(estimated from ¢rst-principles [9,10]) is compat-ible with the experimental data within the marginof error. Despite this current ambiguity, we canestimate with the hypothetical moduli calculatedhere the compressional wave anisotropy of thematerial. Fig. 10 shows preliminary seismic veloc-
Fig. 10. Compressive and shear velocities for a single crystalof O-Fe and the ¢ve 0C parameter sets of Table 1. Vmax ofeach set is normalized to 1000. From the top: 0Cfirstÿprinciples,0C(K= 1) Reuss/random, 0C(K= 0.5) Hill/random,0CBPGeo=ODF, 0CReuss=ODF. T is the angle to the [0001]-axis.
Fig. 9. Experimental D values (101) and recalculated valuesfor the BPGeo/ODF, Reuss/ODF, and Reuss/random (K= 1)0C parameter sets of Table 1 derived by ¢ts using the corre-sponding micro-mechanical models, the ODF of Fig. 3 or as-suming a random texture.
EPSL 6045 17-12-01
S. Matthies et al. / Earth and Planetary Science Letters 194 (2001) 201^212210

ity anisotropies in O-Fe calculated with the sets ofelastic moduli from Table 1. All, except the ¢rst-principles calculations, have an anisotropy greaterthan 10%.
The conditions required to obtain precise infor-mation on the elastic moduli of the sample fromsuch an experiment are: (i) improved accuracy inthe measurement of the d-spacings, (ii) precisetexture characterization, (iii) accurate estimationof the uniaxial stress component in the sample.The characterization of the texture for the caseof O-iron in these experiments is fairly accurate[19], and it shows a very strong preferred orienta-tion, with the c-axis parallel to the compressionaxis. Therefore the question of texture character-ization does not limit the quality of the elasticmoduli determination. The accuracy of the d-spacing measurements could be improved by in-creasing the number of data points in the analysisand better characterization of the position of thesample while rotating the diamond anvil cell,thereby reducing the errors in the measurements.Repeating the experiments several times under thesame conditions will directly show the degree ofuncertainty of the experimental d-spacings andreveal problems that may be related to grain sta-tistics. Preliminary experiments, carried out re-cently with monochromatic radiation, show im-proved accuracy and precision relative to theprevious work [40]. The application of any modelto describe the variation of d (h,y) for a polycrys-talline sample implicitly assumes a large numberof grains in re£ection position. Critical minimumnumbers can be deduced from numerical models,as described in Section 4.3, but using sets of singlegrains with individual orientations representing acertain texture type, rather than a continuousODF. The question of the uniaxial stress compo-nent characterization remains open. Three solu-tions can be proposed: (i) the use of a calibrationstandard [14], (ii) an independent estimation ofone of the elastic moduli such as C2323 in thecase of O-Fe [15] to scale the results, (iii) ¢nite-element modeling of the stress conditions in theexperiment [41].
Acknowledgements
H.R.W. acknowledges support from IGPP-LANL and NSF (EAR 99-02866). This researchalso pro¢ted from an exchange visit of H.R.W. toENS-Lyon sponsored by the UC EducationAbroad Program and ENS. He is appreciativefor the hospitality while at Lyon. S.M. acknowl-edges support during a Berkeley visit in 1999when this research was initiated. R.J.H. andH.K.M. are grateful for support from NSF(EAR-9814819) and the Center for High PressureResearch.[SK]
References
[1] X. Song, Anisotropy of the Earth's inner core, Rev. Geo-phys. 35 (1997) 297^313.
[2] A.P. Jephcoat, P. Olson, Is the Earth's inner core pureiron?, Nature 325 (1987) 332^335.
[3] S. Yoshida, I. Sumita, M. Kumazawa, Growth model inthe inner core coupled with the outer core dynamics andthe resulting elastic anisotropy, J. Geophys. Res. 101(1996) 28085^28103.
[4] M.I. Bergman, Measurements of the elastic anisotropydue to solidi¢cation texturing and the implication forthe Earth's inner core, Nature 389 (1997) 60^63.
[5] S. Karato, Seismic anisotropy of the Earth's inner coreresulting from £ow induced by Maxwell stresses, Nature402 (1999) 871^873.
[6] B. Bu¡et, H.R. Wenk, Texturing of the inner core byMaxwell stresses, Nature 413 (2001) 60^64.
[7] H.R. Wenk, J.R. Baumgardner, R.A. Lebensohn, C.N.Tome, A convection model to explain the anisotropy ofthe inner core, J. Geophys. Res. 105 (2000) 5663^5667.
[8] L. Stixrude, R.E. Cohen, D.J. Singh, Iron at high pres-sure: Linearized-augmented-plane-wave computations inthe generalized-gradient approximation, Phys. Rev. B 50(1994) 6442^6445.
[9] L. Stixrude, R.E. Cohen, High-pressure elasticity of ironand anisotropy of Earth's inner core, Science 267 (1995)1972^1975.
[10] P. Soderlind, J.A. Moriarti, J.M. Wills, First principlestheory of iron up to Earth-core pressure: Structural, vi-brational, and elastic properties, Phys. Rev. B 53 (1996)14063^14072.
[11] G. Steinle-Neumann, L. Stixrude, R.E. Cohen, First-prin-ciples elastic constants for the hcp transition metals Fe,Co, and Re at high pressure, Phys. Rev. B 60 (1999) 791^799.
EPSL 6045 17-12-01
S. Matthies et al. / Earth and Planetary Science Letters 194 (2001) 201^212 211

[12] A. Laio, S. Bernard, G.L. Chiarotti, S. Scandolo, E. To-satti, Physics of iron at Earth's core conditions, Science287 (2000) 1027^1030.
[13] A.K. Singh, H.K. Mao, J. Shu, R.J. Hemley, Estimationof single crystal elastic moduli from polycrystalline X-raydi¡raction at high pressure: Application to FeO and iron,Phys. Rev. Lett. 80 (1998) 2157^2160.
[14] H.K. Mao, J. Shu, G. Shen, R.J. Hemley, B. Li, A.K.Singh, Elasticity and rheology of iron above 220 GPaand the nature of the Earth's inner core, Nature 396(1998) 741^743; correction, Nature 399 (1999) 280.
[15] S. Merkel, A.F. Goncharov, H.K. Mao, P. Gillet, R.J.Hemley, Raman spectroscopy of iron to 152 gigapascals:implications for Earth's inner core, Science 288 (2000)1626^1629.
[16] G. Steinle-Neumann, L. Stixrude, R.E. Cohen, O. Gu«lse-ren, Elasticity of iron at the temperature of the Earth'sinner core, Nature 413 (2001) 57^60.
[17] A.K. Singh, C. Balasingh, H.K. Mao, R.J. Hemley, J.Shu, Analysis of lattice strains measured under nonhydro-static pressure, J. Appl. Phys. 83 (1998) 7567^7575.
[18] R.J. Hemley, H.K. Mao, G. Shen, J. Badro, P. Gillet, M.Han£and, D. Ha«usermann, X-ray imaging of stress andstrain of diamond, iron, and tungsten at megabar pres-sures, Science 276 (1997) 1242^1245.
[19] H.R. Wenk, S. Matthies, R.J. Hemley, H.K. Mao, J. Shu,Deformation mechanisms of iron at inner core pressures,Nature 405 (2000) 1044^1047.
[20] S. Matthies, H.-G. Priesmeyer, Di¡raction determinationof thermo-elastic single crystal constants using polycrys-talline samples, Proc. Int. Conf. Textures of Materials(ICOTOM 12), NRC Research Press, Ottawa, 1999, pp.439^444.
[21] J.F. Nye, Physical Properties of Crystals: Their Represen-tation by Tensors and Matrices, Clarendon Press, Oxford,1957.
[22] U.F. Kocks, C.N. Tome, H.R. Wenk, Texture and Ani-sotropy, Preferred Orientations in Polycrystals and theirE¡ect on Material Properties, Cambridge UniversityPress, Cambridge, 2000.
[23] S. Matthies, G.W. Vinel, K. Helming, Standard Distribu-tions in Texture Analysis, Akademie-Verlag, Berlin, Vol. 1(1987), Vol. 2 (1988), Vol. 3 (1990).
[24] E. Schreiber, O.L. Anderson, N. Soga, Elastic Constantsand Their Measurement, McGraw-Hill, New York, 1973.
[25] H. Olijnyk, A.P. Jephcoat, Optical zone-centre phononmodes and macroscopic elasticity in hcp metals, SolidState Commun. 115 (2000) 335^339.
[26] F. Bollenrath, V. Hauk, E.H. Mu«ller, Zur Berechnung dervielkristallinen Elastizita«tskonstanten aus den Werten derEinkristalle, Z. Met.kd. 58 (1967) 76^82.
[27] I.C. Noyan, J.B. Cohen, Residual Stress ^ Measurement
by Di¡raction and Interpretation, Springer, New York,1987.
[28] A.K. Singh, C. Balasingh, The lattice strains in a speci-men (hexagonal system) compressed nonhydrostatically inan opposed anvil high pressure setup, J. Appl. Phys. 75(1994) 4956^4962.
[29] T. Gna«upel-Herold, P.C. Brand, H.J. Prask, The calcula-tion of single crystal elastic constants for cubic crystalsymmetry from powder di¡raction data, J. Appl. Crystal-logr. 31 (1998) 929^935.
[30] Ch. Bittorf, S. Matthies, H.G. Priesmeyer, R. Wagner,Di¡ractive determination of thermo-elastic single crystalconstants, Intermetallics 7 (1998) 251^258.
[31] C.J. Howard, E.H. Kisi, Measurement of single-crystalelastic constants by neutron di¡raction from polycrystals,J. Appl. Crystallogr. 32 (1999) 624^633.
[32] S. Matthies, H.G. Priesmeyer, M.R. Daymond, On thedi¡ractive determination of single crystal constants usingpolycrystalline samples, J. Appl. Crystallogr. 34 (2001)585^601.
[33] H.K. Mao, Y. Wu, L.C. Chen, J.F. Shu, A.P. Jephcoat,Static compression of iron to 300 GPa and Fe0:8Ni0:2alloy to 260 GPa: implications for composition of thecore, J. Geophys. Res. 95 (1990) 21737^21742.
[34] W. Voigt, Lehrbuch der Kristallphysik, Teubner, Leipzig,1928.
[35] A. Reuss, Berechnung der Fliessgrenze von Mischkris-tallen auf Grund der Plastizitaetsbedingung fuer Einkris-talle, Z. Angew. Math. Mech. 9 (1929) 49^58.
[36] J.P. Watt, G.F. Davies, R.J. O'Connell, The elastic prop-erties of composite materials, Rev. Geophys. Space Phys.14 (1976) 541^563.
[37] V. Hauk, H. Kockelmann, Ermittlung der Einkristallkoef-¢zienten aus den mechanischen und ro«ntgenographischenElastizita«tskonstanten des Vielkristalls, Z. Met.kd. 70(1979) 500^502.
[38] S. Matthies, Moment pole ¢gures in residual stress anal-ysis, Textures Microstruct. 25 (1996) 229^236.
[39] S. Matthies, M. Humbert, Ch. Schuman, On the use ofthe geometric mean approximation in residual stress anal-ysis, Phys. Stat. Sol. (b) 186 (1994) K41^K44.
[40] S. Merkel, H.-R. Wenk, G. Shen, J. Shu, P.G. Uet, R.J.Hemley, H.K. Mao, Diamond anvil cell investigations oflattice strains and preferred orientations in iron at highpressure, EOS, Trans. Am. Geophys. Union (2001) inpress.
[41] S. Merkel, R.J. Hemley, H.K. Mao, D.M. Teter, Finite-element modeling and ab initio calculations of megabarstresses in the diamond anvil cell, in: M.H. Manghnani,W.J. Nellis, M.F. Nicol (Eds.), Science and Technology ofHigh Pressure, University Press, 2000, pp. 68^73.
EPSL 6045 17-12-01
S. Matthies et al. / Earth and Planetary Science Letters 194 (2001) 201^212212