Effects of preharvest, harvest and postharvest factors on the quality of pear (cv. ` Rocha') stored...
12
Effects of preharvest, harvest and postharvest factors on the quality of pear (cv. ÔRocha’) stored under controlled atmosphere conditions Andrea C. Galvis-S anchez, Susana C. Fonseca, Alcina M.M.B. Morais, F. Xavier Malcata * Escola Superior de Biotecnologia, Universidade Cat olica Portuguesa, Rua Dr. Ant onio Bernardino de Almeida, P-4200-072 Porto, Portugal Received 6 May 2003; accepted 22 September 2003 Abstract Pears (cv. ÔRocha’) grown at two locations and picked up at various times during the harvest season were assessed for firmness and colour, following 9 mo of storage under air or under controlled atmosphere conditions. A second-order polynomial was able to accurately fit the effect of time of harvest on pear’s quality, in an essentially empirical modelling effort; the best estimates of the parameters therein depend on the growing location, as well as on the atmosphere gas composition prevailing during storage. Ó 2003 Elsevier Ltd. All rights reserved. Keywords: Storage; Gas composition; Date of harvest; Growing location; Firmness; Colour; Modelling 1. Introduction The fresh pear market faces two major problems: one such problem is caused by unfavorable handling and storage practices––harvest at the wrong stage of matu- rity, refrigeration at excessively slow rates and inade- quate temperatures of storage (Klahre et al., 1987); the second problem derives from the intrinsic variability in terms of fruit quality, which is determined primarily by specific varietal characteristics, and by environmen- tal conditions prevailing during the growing season (Hansen & Mellenthin, 1979; Saltveit, 2003). Controlled atmospheres (CA) have been applied to fresh pears with the goal of providing fruits throughout the marketing season with guaranteed uniform charac- teristics (Allen, 1939; Kupferman, 1994); several studies encompassing CA storage have assessed the main fac- tors that may influence loss of pear quality after said storage (Avelar, 1984; Kupferman, 1987). The physio- logical stage of the fruit at harvest, commonly referred to as harvest maturity, was claimed (Meheriuk, Evans, Talley, & Kupferman, 1988) to be a limiting factor in CA storage; the response of pears to specific CA con- ditions depends not only on the pear variety and culti- var, but also on the CA regime applied (Hansen & Mellenthin, 1962; Hansen, 1999). In the case of ÔRocha’ variety, it is known (Galvis- S anchez, Fonseca, Morais, & Malcata, 2003) that it possesses an excellent storage capacity, which allows its preservation for up to 9 mo under controlled conditions; however, the sensorial quality of that variety is influ- enced by such storage factors as duration of storage and concentration of overhead O 2 . This research effort was designed and conducted so as to determine the response of ÔRocha’ pears, harvested at several degrees of maturity and grown in two different locations, to selected CA storage conditions. 2. Materials and methods 2.1. Plant material and experimental design Experimental studies were conducted with pears harvested in August 1999, in the western region of Portugal at two different locations (Sobrena––location 1, and Clone––location 2), at three harvest dates: Au- gust 10th, 17th and 24th (i.e. Pick 1, 2 and 3 for location (1); and August 17th, 24th and 31st (i.e. Pick 1, 2 and 3 for location (2). Pears were immediately stored under Journal of Food Engineering 64 (2004) 161–172 www.elsevier.com/locate/jfoodeng * Corresponding author. Tel.: +351-22-5580004; fax: +351-22- 5090351. E-mail address: [email protected] (F.X. Malcata). 0260-8774/$ - see front matter Ó 2003 Elsevier Ltd. All rights reserved. doi:10.1016/j.jfoodeng.2003.09.027
-
Upload
independent -
Category
Documents
-
view
1 -
download
0
Transcript of Effects of preharvest, harvest and postharvest factors on the quality of pear (cv. ` Rocha') stored...

Journal of Food Engineering 64 (2004) 161–172
www.elsevier.com/locate/jfoodeng
Effects of preharvest, harvest and postharvest factors on the qualityof pear (cv. �Rocha’) stored under controlled atmosphere conditions
Andrea C. Galvis-S�anchez, Susana C. Fonseca, Alcina M.M.B. Morais,F. Xavier Malcata *
Escola Superior de Biotecnologia, Universidade Cat�olica Portuguesa, Rua Dr. Ant�onio Bernardino de Almeida, P-4200-072 Porto, Portugal
Received 6 May 2003; accepted 22 September 2003
Abstract
Pears (cv. �Rocha’) grown at two locations and picked up at various times during the harvest season were assessed for firmness
and colour, following 9 mo of storage under air or under controlled atmosphere conditions. A second-order polynomial was able to
accurately fit the effect of time of harvest on pear’s quality, in an essentially empirical modelling effort; the best estimates of the
parameters therein depend on the growing location, as well as on the atmosphere gas composition prevailing during storage.
� 2003 Elsevier Ltd. All rights reserved.
Keywords: Storage; Gas composition; Date of harvest; Growing location; Firmness; Colour; Modelling
1. Introduction
The fresh pear market faces two major problems: onesuch problem is caused by unfavorable handling and
storage practices––harvest at the wrong stage of matu-
rity, refrigeration at excessively slow rates and inade-
quate temperatures of storage (Klahre et al., 1987); the
second problem derives from the intrinsic variability in
terms of fruit quality, which is determined primarily
by specific varietal characteristics, and by environmen-
tal conditions prevailing during the growing season(Hansen & Mellenthin, 1979; Saltveit, 2003).
Controlled atmospheres (CA) have been applied to
fresh pears with the goal of providing fruits throughout
the marketing season with guaranteed uniform charac-
teristics (Allen, 1939; Kupferman, 1994); several studies
encompassing CA storage have assessed the main fac-
tors that may influence loss of pear quality after said
storage (Avelar, 1984; Kupferman, 1987). The physio-logical stage of the fruit at harvest, commonly referred
to as harvest maturity, was claimed (Meheriuk, Evans,
Talley, & Kupferman, 1988) to be a limiting factor in
CA storage; the response of pears to specific CA con-
*Corresponding author. Tel.: +351-22-5580004; fax: +351-22-
5090351.
E-mail address: [email protected] (F.X. Malcata).
0260-8774/$ - see front matter � 2003 Elsevier Ltd. All rights reserved.
doi:10.1016/j.jfoodeng.2003.09.027
ditions depends not only on the pear variety and culti-
var, but also on the CA regime applied (Hansen &
Mellenthin, 1962; Hansen, 1999).In the case of �Rocha’ variety, it is known (Galvis-
S�anchez, Fonseca, Morais, & Malcata, 2003) that it
possesses an excellent storage capacity, which allows its
preservation for up to 9 mo under controlled conditions;
however, the sensorial quality of that variety is influ-
enced by such storage factors as duration of storage and
concentration of overhead O2.
This research effort was designed and conducted so asto determine the response of �Rocha’ pears, harvested at
several degrees of maturity and grown in two different
locations, to selected CA storage conditions.
2. Materials and methods
2.1. Plant material and experimental design
Experimental studies were conducted with pears
harvested in August 1999, in the western region of
Portugal at two different locations (Sobrena––location
1, and Clone––location 2), at three harvest dates: Au-gust 10th, 17th and 24th (i.e. Pick 1, 2 and 3 for location
(1); and August 17th, 24th and 31st (i.e. Pick 1, 2 and 3
for location (2). Pears were immediately stored under

162 A.C. Galvis-S�anchez et al. / Journal of Food Engineering 64 (2004) 161–172
one of two CA conditions: 2%(v/v) O2 + 0.5%(v/v) CO2,and 2.5%(v/v) O2 + 0.7%(v/v) CO2. Two experimental
chambers (with an individual capacity of 225 kg) were
employed for each storage atmosphere; the temperature
therein was kept at 0–0.5 �C, and the relative humidity
at 90–95%; the error in the target overhead gaseous
concentration was ±0.1%(v/v). Pears stored in air were
used as control. After 4, 6 and 9 mo of storage, pears
selected at random were removed from the chamber atthe appropriate storage condition, and were allowed to
ripen in air at room temperature (19–20 �C). Pears werethen randomly selected (for each previous storage con-
dition) and evaluated in terms of firmness and colour, by
1, 4 and 7 d in the case of location 1, and by 2, 5 and 8 d
in the case of location 2.
2.2. Firmness and colour evaluations
Firmness assessment was performed with an universal
testing machine, model 4501 (from Instron, CantonMA, USA), equipped with an 8 mm-probe that was
programmed to penetrate 5 mm in a normal direction, at
a crosshead speed of 10 mm/min, using a 100 N load
cell. Two sets of 10 pears were used as replicates.
Firmness results were expressed as the maximum force
(N) to puncture the equatorial surface of a whole skin-
less pear. The colour of the flesh was assessed with a
(hand-held) tristimulus reflectance colorimeter, model
Table 1
Quality parameters of �Rocha’ pears from two growing locations and picked
Quality parameter Growing location Harvest date
Firmness (N ) 1 1
2
3
2 1
2
3
Hunter’s a� 1 1
2
3
2 1
2
3
Hunter’s b� 1 1
2
3
2 1
2
3
aData are means of 10 replicates ± standard deviation.bMeans separation within columns by Duncan’s multiple range test (P ¼ 0
CR-300 (from Minolta, Ramsey IL, USA); colour wasrecorded using a Hunter’s L� a� b� system. Two sets of
10 pears each were again employed as replicates. The
colour parameters selected for further considerations
were a� and b�, because these were the best indicators ofthe influence of the processing factors tested. Despite the
classical representation of colour as hue angle, the axial
coordinates a� and b� were preferred in view of the
higher informational content of the latter approach––even at the expense of a higher number of figures.
2.3. Statistical analysis and model parameter estimation
The firmness and colour results were subject to
analysis of variance (ANOVA), and Duncan’s multiple
range test was applied to detect significant differences.
The use of ANOVA will be valid if the experimental
errors are independent and normally distributed, and if
they possess a constant variance. In order to validate
this assumption, the original experimental data offirmness had to be previously transformed using a log-
arithmic function.
The influence of storage time (X1), ripening time (X2),
concentrations of oxygen (X3) and carbon dioxide (X4)
of the CA, and harvest date (X5) were considered for
pears from the two growing locations; the three harvest
dates were coded as 1, 2 and 3 in terms of variable X5.
The effects of the processing factors upon the quality
at three harvest dates, by 1 and 7 d of ripening (18–20 �C)a
Time of ripening (d)
1 7
52.7± 9.0 abb 48.5± 12.0 a
54.8± 6.3 a 44.0± 8.1 a
47.1± 7.1 b 45.2± 10.1 a
69.8± 10.1 a 64.4± 8.9 a
58.2± 7.5 b 64.0± 5.9 a
63.9± 8.5 ab 59.7± 6.1 a
)3.1± 0.7 b )2.8± 0.4 b
)2.5± 0.7 ab )2.8± 0.4 b
)2.2± 0.7 a )2.3± 0.3 a
)3.4± 0.7 a )3.3± 0.9 a
)3.2± 1.0 a )3.1± 0.7 a
)2.7± 0.5 a )2.8± 0.4 a
13.2± 1.8 a 13.3± 2.0 a
13.2± 1.9 a 12.5± 2.3 a
11.2± 2.0 a 10.4± 0.7 b
13.1± 1.7 a 11.5± 2.4 a
10.9± 0.8 b 11.2± 1.8 a
10.6± 1.9 b 11.4± 1.8 a
:05); significantly different means are followed by different letters ða; bÞ.

Fig. 1. Changes in firmness of �Rocha’ pears from Location 1, at different dates of harvest (pick 1: �; pick 2: h; pick 3: n), throughout time in the
open air at room temperature, after storage for 4 (a), 6 (b) and 9 (c) mo in air (1), under 2%(v/v) O2 + 0.5%(v/v) CO2 (2) and under 2.5%(v/v)
O2 + 0.7%(v/v) CO2 (3). Each datum represents the average of at least 15 experimental values, and bars represent the associated standard deviation;
the lines represent the fitted model (depicted as Eq. (1), with estimated parameters as listed in Table 2).
A.C. Galvis-S�anchez et al. / Journal of Food Engineering 64 (2004) 161–172 163
parameters were empirically modelled according to a
second-order polynomial, using X1, X2, X3, X4 and X5 as
regressors, and firmness (Y1), Hunter’s a� parameter (Y2)and b� parameter (Y3) as dependent variables, accordingto:
Y ¼ b0 þ b1X1 þ b2X2 þ b3X3 þ b4X4 þ b5X5
þ b11X 21 þ b12X1X2 þ b13X1X3 þ b14X1X4
þ b15X1X5 þ b22X 22 þ b23X2X3 þ b24X2X4
þ b25X2X5 þ b33X 23 þ b34X3X4 þ b35X3X5
þ b44X 24 þ b45X4X5 þ b55X 2
5 ð1Þ
where b0 is the intercept; b1, b2, b3, b4 and b5 are linearparameters; b11, b22, b33, b44 and b55 are quadratic pa-
rameters; and b12, b13, b14, b15, b23, b24, b25, b34, b35 and
b45 are two-way interaction parameters. The experi-
mental data were fitted to by Eq. (1) via multiple linear
regression using the software SPSS (v. 9.0, from SPSS,
USA), with F P 0:005 set as criterion of significance for
the adjustable parameters. Experimental data arising
from replicates that were more than two standard de-viations apart from their average were rejected as out-
liers.
3. Results and discussion
3.1. Influence of growing location, date of harvest and
atmosphere gas composition on firmness changes
3.1.1. At harvest
The values of firmness of pears from locations 1 and 2
at the three harvest dates are presented in Table 1.

Table 2
Second-order polynomial model including only the statistically significant parameters (P < 0:05), and best fit estimates of parameters ± confidence
intervals (CI) coupled with actual value for the adjusted coefficient of determination (R2adj), pertaining to firmness of �Rocha’ pears from two different
growing locations
Location Model Parameter Estimated value±CI
(95%)
Unit R2adj
1 ln Y1 ¼ b0 þ b2X2 þ b3X3 þ b5X5 þ b11X12
þb12X1X2 þ b13X1X3 þ b14X1X4
þb15X1X5 þ b22X 22 þ b55X 2
5
b0 1.88±0.04 Dimensionless 0.92
b2 )0.092± 0.010 d�1
b3 )0.002± 0.002 (% v/v)�1
b5 )0.13±0.04 Dimensionless
b11 )0.003± 0.000 mo�2
b12 )0.004± 0.001 mo�1 ·d�1
b13 0.001± 0.000 mo�1 · (%v/v)�1
b14 0.023± 0.003 mo�1 · (%v/v)�1
b15 0.005± 0.002 mo�1
b22 )0.005± 0.001 d�2
b55 0.019± 0.008 Dimensionless
2 ln Y1 ¼ b0 þ b1X1 þ b2X2 þ b3X3 þ b11X 21
þb12X1X2 þ b13X1X3 þ b23X2X3
þb25X2X5 þ b35X3X5
b0 1.78±0.08 Dimensionless 0.89
b1 0.11±0.02 mo�1
b2 )0.196± 0.007 d�1
b3 0.009± 0.002 (% v/v)�1
b11 )0.011± 0.003 mo�2
b12 0.014± 0.000 mo�1 ·d�1
b13 )0.0015± 0.0004 mo�1 · (% v/v)�1
b23 0.0020± 0.0007 d�1 · (% v/v)�1
b25 )0.006± 0.002 d�1
b35 )0.0008± 0.0002 (% v/v)�1
164 A.C. Galvis-S�anchez et al. / Journal of Food Engineering 64 (2004) 161–172
Analyses of these experimental data revealed that firm-
ness was different (P 6 0:05) between pears grown in the
two locations. Firmness of pears from the two locations
was also influenced by the date of harvest and the rip-
ening time. By 1 d of exposure to the open air, pears
from location 1 and from the second harvest date were
firmer than those from the third date (see Table 1).
The firmness of pears decreased after 7 d of exposure tothe open air at room temperature; however, no signifi-
cant differences (P 6 0:05) were found between the
firmness of pears picked up at the various dates (see
Table 1).
For pears grown in location 2 and by 1 d of exposure
to the open air at room temperature, significant differ-
ences were found between fruits picked at sequential
dates (see Table 1). By 7 d of exposure to the open air atroom temperature, no statistically significant differences
could be found between firmness values. As reported by
Kv�ale (1977), firmness of pears was lower at late harvest
dates, but those differences tended to vanish as ripening
time elapsed.
3.1.2. After storage
Pears from the first harvest date grown in location 1
were significantly firmer than those from the second
and third. The effect of the date of harvest persisted
throughout storage in pears stored under all conditions;
however, this effect became less apparent as time in the
open air elapsed (see Fig. 1). When pears were exposed
to the open air at room temperature, firmness decreased
in pears stored under all conditions, as confirmed by the
negative value of parameters b2 and b22 (see Table 2).
Firmness also tended to decrease throughout storage in
pears under all conditions, as confirmed by the negativevalue of parameter b11 (Table 2); the interaction of
storage time with time of exposure to the open air exhi-
bited a negative influence upon firmness, as confirmed
by the negative value of b12.For pears grown in location 2 the differences after
storage and throughout ripening, between pears picked
at different dates of harvest were larger for fruits stored
under air than for those stored under CA conditions (seeFig. 2). Furthermore, the effect conveyed by the date of
harvest confirms that fruits picked later exhibited a
tendency for a lower firmness after they were removed
from storage. From 4 to 6 mo of storage, the changes in
firmness of pears under all conditions were essentially
negligible, whereas from 6 to 9 mo one detected a de-
crease in firmness of pears from all conditions. When
pears were exposed to the open air at room temperature,their firmness decreased irrespective of the processing
conditions (as apparent from the negative value for
parameter b2), especially until 4 d of exposure to the
open air (see Table 2). The concentration of O2 played,

Fig. 2. Changes in firmness of �Rocha’ pears from Location 2, at different dates of harvest (pick 1: �; pick 2: h; pick 3: n), throughout time in the
open air at room temperature, after storage for 4 (a), 6 (b) and 9 (c) mo in air (1), under 2%(v/v) O2 + 0.5%(v/v) CO2 (2) and under 2.5%(v/v)
O2 + 0.7%(v/v) CO2 (3). Each datum represents the average of at least 15 experimental values, and bars represent the associated standard deviation;
the lines represent the fitted model (depicted as Eq. (1), with estimated parameters as listed in Table 2).
A.C. Galvis-S�anchez et al. / Journal of Food Engineering 64 (2004) 161–172 165
nevertheless, a positive role on firmness changes (see
positive value of parameter b3); this effect was clearly
confirmed for pears stored in air, which exhibited a
higher firmness than those stored under CA conditions.
Our results encompassing firmness response to the
various storage conditions were strongly dependent on
the growing location, as reported elsewhere for apples(Sharples & Johnson, 1987). Decreases in firmness of
pears throughout storage was also observed for Doyene
du Comice pears picked at several dates of harvest, and
stored for 3, 5 and 7 mo under 2%(v/v) O2 coupled with
0.7% and 5%(v/v) CO2, as well as in air (L�opez, Mir�o, &Graell, 2001).
3.2. Influence of growing location, date of harvest and
atmosphere gas composition on Hunter’s a� parameter
3.2.1. At harvest
Hunter’s a� value pertaining to pears from locations 1
and 2 at harvest time are presented in Table 1. Analysis
of the colour data revealed differences between pearsfrom those locations. For pears grown in location 1 and
by 1 d of exposure to the open air, fruits from the first
harvest date exhibited a lower a� value than those from
the third. By 7 d in the open air at room temperature,
pears from the first and second harvest dates presented
lower a� values than those from the third.

Fig. 3. Changes in Hunter’s a� value of �Rocha’ pears from Location 1, at different dates of harvest (pick 1: �; pick 2: h; pick 3: n), throughout time
in the open air at room temperature, after storage for 4 (a), 6 (b) and 9 (c) mo in air (1), under 2%(v/v) O2 + 0.5 %(v/v) CO2 (2) and under 2.5%(v/v)
O2 + 0.7%(v/v) CO2 (3). Each datum represents the average of at least 15 experimental values, and bars represent the associated standard deviation;
the lines represent the fitted model (depicted as Eq. (1), with estimated parameters as listed in Table 3).
166 A.C. Galvis-S�anchez et al. / Journal of Food Engineering 64 (2004) 161–172
For pears grown in location 2, no significant differ-
ences were found between the dates of harvest in terms
of a� values (see Table 1).
3.2.2. After storage
For pears grown in location 1, Hunter’s a� value
decreased throughout storage time for pears under all
conditions (see Fig. 3); said decrease was confirmed by
the negative value of parameter b1 (see Table 3). Whenfruits were exposed to the open air at room temperature,
the a� value increased for pears under all conditions (see
Fig. 3) except for 6 mo of CA storage, for which this
parameter decreased between 4 and 7 d of exposure to
the open air. The influence of the date of harvest was
clear by 4 mo of storage and 1 d of exposure to the open
air (see Fig. 3). The lowest a� value was observed for
pears from the first date of harvest, and the highest forpears from the third; these differences tended to decrease
during the time of exposure to the open air. Differences
in the a� values between storage conditions were ap-
parent by 6 and 9 mo of storage (see Fig. 3). Pears stored
under air exhibited lower a� values than those stored
under CA conditions.
For pears that had been grown in location 2, as
storage time elapsed Hunter’s a� values tended to de-crease for fruits taken at every date of harvest (as ap-

Table 3
Second-order polynomial model including only the statistically significant parameters (P < 0:05), and best fit estimates of parameters ± confidence
intervals (CI) coupled with actual value for the adjusted coefficient of determination (R2adj), pertaining to Hunter’s a� parameter of �Rocha’ pears from
two different growing locations
Location Model Parameter Estimated
value±CI (95%)
Unit R2adj
1 Y2 ¼ b0 þ b1X1 þ b2X2 þ b3X3 þ b5X5 þ b11X 21
þb12X1X2 þ b13X1X3 þ b14X1X4 þ b15X1X5
þb22X 22 þ b23X2X3 þ b25X2X5 þ b35X3X5
þb44X 24 þ b55X 2
5
b0 )2.6± 0.8 Dimensionless 0.67
b1 )0.5± 0.2 mo�1
b2 0.6± 0.1 d�1
b3 )0.07± 0.02 (% v/v)�1
b5 0.9± 0.3 Dimensionless
b11 0.05± 0.02 mo�2
b12 )0.009± 0.002 mo�1 · d�1
b13 )0.020± 0.004 mo�1 · (% v/v)�1
b14 )0.3± 0.2 mo�1 · (% v/v)�1
b15 )0.03± 0.02 mo�1
b22 )0.05± 0.01 d�2
b23 )0.003± 0.002 d�1 · (% v/v)�1
b25 )0.05± 0.02 d�1
b35 )0.008± 0.005 (% v/v)�1
b44 1.0± 0.9 (% v/v)�2
b55 )0.09± 0.07 Dimensionless
2 Y2 ¼ b0 þ b1X1 þ b2X2 þ b3X3
þb5X5 þ b11X 21 þ b12X1X2 þ b13X1X3
þb14X1X4 þ b22X 22 þ b23X2X3 þ b25X2X5
þb35X3X5 þ b44X 24
b0 )2.6± 0.6 Dimensionless 0.66
b1 )0.3± 0.2 mo�1
b2 0.20± 0.09 d�1
b3 )0.06± 0.02 (% v/v)�1
b5 0.20± 0.08 Dimensionless
b11 0.04± 0.01 mo�2
b12 )0.007± 0.006 mo�1 · d�1
b13 )0.020± 0.005 mo�1 · (% v/v)�1
b14 )0.3± 0.1 mo�1 · (% v/v)�1
b22 0.007± 0.006 d�2
b23 )0.005± 0.002 d�1 · (% v/v)�1
b25 )0.020± 0.004 d�1
b35 0.006± 0.003 (% v/v)�1
b44 1.6± 0.9 (% v/v)�2
A.C. Galvis-S�anchez et al. / Journal of Food Engineering 64 (2004) 161–172 167
parent by the negative value of b1); that decrease was
influenced by the interaction between the storage time
and the concentrations of O2 and CO2 in the gas (see
Table 3). The decrease of Hunter’s a� value throughout
storage for pears stored in air was more evident than for
pears stored under CA conditions. After removal from
storage, the a� values increased for pears from the CA
conditions, but tended to remain constant for pearsstored in air (see Fig. 4 and Table 3). The influence of
the date of harvest was clear in pears from all storage
conditions; pears from the first date of harvest presented
the lowest a� values, and pears from the third the highest
ones (see positive value of parameter b5). Even stronger
differences between the dates of harvest were detected in
pears stored in air than in those stored under CA con-
ditions (see Fig. 4); however, such differences becameless apparent as time of exposure to the open air elapsed.
No clear differences in terms of a� values of pears were
observed between the two CA conditions.
3.3. Influence of growing location, date of harvest and
atmosphere gas composition on Hunter’s b� parameter
3.3.1. At harvest
Hunter’s b� values of pears grown in location 1 and 2
are shown in Table 1. For pears grown in location 1 and
by 1 d of exposure to the open air at room temperature,
no differences were observed in terms of b� for the var-ious dates of harvest (see Table 1). By 7 d of exposure to
the open air at room temperature, pears from the first
and second harvest dates presented higher b� values thanthose from the third harvest one.
For pears grown in location 2, the b� values by 1 d of
exposure to the open air at room temperature were
higher for fruits from the first harvest date than for
those from the second and third. By 7 d of exposure tothe open air, pears from all dates of harvest exhibited
essentially the same level in terms of b� value (see Table1).

Fig. 4. Changes in Hunter’s a� value of �Rocha’ pears from Location 2, at different dates of harvest (pick 1: �; pick 2: h; pick 3: n), throughout time
in the open air at room temperature, after storage for 4 (a), 6 (b) and 9 (c) mo in air (1), under 2%(v/v) O2 + 0.5%(v/v) CO2 (2) and under 2.5%(v/v)
O2 + 0.7%(v/v) CO2 (3). Each datum represents the average of at least 15 experimental values, and bars represent the associated standard deviation;
the lines represent the fitted model (depicted as Eq. (1), with estimated parameters as listed in Table 3).
168 A.C. Galvis-S�anchez et al. / Journal of Food Engineering 64 (2004) 161–172
3.3.2. After storage
Throughout storage, the b� values of pears grown in
location 1 increased for fruits under all conditions (as
concluded from the positive value of parameter b1); thatincrease was especially notorious between 4 and 6 mo of
storage (see Fig. 5). When pears were exposed to theopen air at room temperature, the b� values decreased
under all conditions, but exhibited a tendency to in-
crease after 6 d of exposure to the open air. These results
were confirmed by the regression analysis, via a negative
value for b2 and a positive value for b22 (see Table 4).
Pears stored under air showed higher b� values than
those stored under CA conditions, and this tendency
became clearer as storage time elapsed. By 4 mo of
storage, the differences between the dates of harvest
were visible in pears stored under all conditions (see Fig.
5). Pears from the first harvest date presented the highest
b� values, and those from the third the lowest. The effect
of the date of harvest decreased over time of exposure tothe open air at room temperature, and by 7 d differences
were hardly detected. By 6 mo of storage, only the pears
taken at the first date of harvest were distinct from
pears from the other harvest dates; by 9 mo of stor-
age, no differences were observed in terms of b� values
among pears from the various dates of harvest (see
Fig. 5).

Fig. 5. Changes in Hunter’s b� value of �Rocha’ pears from Location 1, at different dates of harvest (pick 1: �; pick 2: h; pick 3: n), throughout time
in the open air at room temperature, after storage for 4 (a), 6 (b) and 9 (c) mo in air (1), under 2%(v/v) O2 + 0.5%(v/v) CO2 (2) and under 2.5%(v/v)
O2 + 0.7%(v/v) CO2 (3). Each datum represents the average of at least 15 experimental values, and bars represent the associated standard deviation;
the lines represent the fitted model (depicted as Eq. (1), with estimated parameters as listed in Table 4).
A.C. Galvis-S�anchez et al. / Journal of Food Engineering 64 (2004) 161–172 169
For pears grown in location 2, the b� values tended
to increase over storage time (as apparent in the
positive value of parameter b1), especially for pears
stored in air (see Fig. 6). When pears were exposed to
the open air at room temperature, the b� values tendedto increase, especially between 5 and 8 d. Pears stored in
air presented higher b� values than those stored under
the CA conditions. The influence of the date of harvest
was also dependent on the storage conditions; pears
from the first harvest date showed higher b� values thanthose from the second, and these had in turn higher b�
values than those from the third harvest date––this
influence was more apparent in pears stored underair.
By the harvest time, pears picked earlier were less
mature, and exhibited lower a� values than those ob-
tained later. The rate of ripening (assessed by b� value
evolution) throughout storage was decreased when CA
conditions were employed. Irrespective of date of har-vest or storage condition applied, colour decay took
place, either via increase of Hunter’s a� or decrease of b�
values.
4. Conclusions
Pears from location 2 were firmer than those from
location 1. However, firmness response of pears
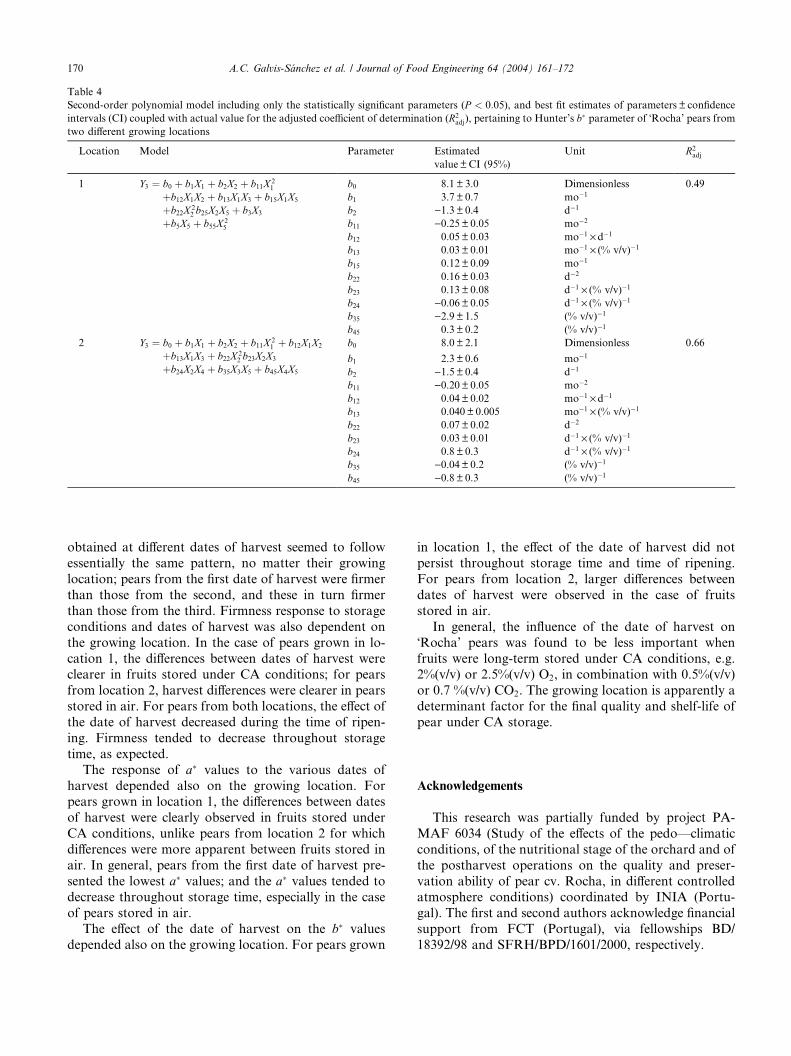
Table 4
Second-order polynomial model including only the statistically significant parameters (P < 0:05), and best fit estimates of parameters ± confidence
intervals (CI) coupled with actual value for the adjusted coefficient of determination (R2adj), pertaining to Hunter’s b� parameter of �Rocha’ pears from
two different growing locations
Location Model Parameter Estimated
value±CI (95%)
Unit R2adj
1 Y3 ¼ b0 þ b1X1 þ b2X2 þ b11X 21
þb12X1X2 þ b13X1X3 þ b15X1X5
þb22X 22 b25X2X5 þ b3X3
þb5X5 þ b55X 25
b0 8.1 ± 3.0 Dimensionless 0.49
b1 3.7 ± 0.7 mo�1
b2 )1.3 ± 0.4 d�1
b11 )0.25± 0.05 mo�2
b12 0.05± 0.03 mo�1 · d�1
b13 0.03± 0.01 mo�1 · (% v/v)�1
b15 0.12± 0.09 mo�1
b22 0.16± 0.03 d�2
b23 0.13± 0.08 d�1 · (% v/v)�1
b24 )0.06± 0.05 d�1 · (% v/v)�1
b35 )2.9 ± 1.5 (% v/v)�1
b45 0.3 ± 0.2 (% v/v)�1
2 Y3 ¼ b0 þ b1X1 þ b2X2 þ b11X 21 þ b12X1X2
þb13X1X3 þ b22X 22 b23X2X3
þb24X2X4 þ b35X3X5 þ b45X4X5
b0 8.0 ± 2.1 Dimensionless 0.66
b1 2.3 ± 0.6 mo�1
b2 )1.5 ± 0.4 d�1
b11 )0.20± 0.05 mo�2
b12 0.04± 0.02 mo�1 · d�1
b13 0.040± 0.005 mo�1 · (% v/v)�1
b22 0.07± 0.02 d�2
b23 0.03± 0.01 d�1 · (% v/v)�1
b24 0.8 ± 0.3 d�1 · (% v/v)�1
b35 )0.04± 0.2 (% v/v)�1
b45 )0.8 ± 0.3 (% v/v)�1
170 A.C. Galvis-S�anchez et al. / Journal of Food Engineering 64 (2004) 161–172
obtained at different dates of harvest seemed to follow
essentially the same pattern, no matter their growing
location; pears from the first date of harvest were firmer
than those from the second, and these in turn firmer
than those from the third. Firmness response to storage
conditions and dates of harvest was also dependent on
the growing location. In the case of pears grown in lo-
cation 1, the differences between dates of harvest wereclearer in fruits stored under CA conditions; for pears
from location 2, harvest differences were clearer in pears
stored in air. For pears from both locations, the effect of
the date of harvest decreased during the time of ripen-
ing. Firmness tended to decrease throughout storage
time, as expected.
The response of a� values to the various dates of
harvest depended also on the growing location. Forpears grown in location 1, the differences between dates
of harvest were clearly observed in fruits stored under
CA conditions, unlike pears from location 2 for which
differences were more apparent between fruits stored in
air. In general, pears from the first date of harvest pre-
sented the lowest a� values; and the a� values tended to
decrease throughout storage time, especially in the case
of pears stored in air.The effect of the date of harvest on the b� values
depended also on the growing location. For pears grown
in location 1, the effect of the date of harvest did not
persist throughout storage time and time of ripening.
For pears from location 2, larger differences between
dates of harvest were observed in the case of fruits
stored in air.
In general, the influence of the date of harvest on
�Rocha’ pears was found to be less important when
fruits were long-term stored under CA conditions, e.g.2%(v/v) or 2.5%(v/v) O2, in combination with 0.5%(v/v)
or 0.7 %(v/v) CO2. The growing location is apparently a
determinant factor for the final quality and shelf-life of
pear under CA storage.
Acknowledgements
This research was partially funded by project PA-
MAF 6034 (Study of the effects of the pedo––climatic
conditions, of the nutritional stage of the orchard and of
the postharvest operations on the quality and preser-
vation ability of pear cv. Rocha, in different controlledatmosphere conditions) coordinated by INIA (Portu-
gal). The first and second authors acknowledge financial
support from FCT (Portugal), via fellowships BD/
18392/98 and SFRH/BPD/1601/2000, respectively.
Fig. 6. Changes in Hunter’s b� value of �Rocha’ pears from Location 2, at different dates of harvest (pick 1: �; pick 2: h; pick 3: n), throughout time
in the open air at room temperature, after storage for 4 (a), 6 (b) and 9 (c) mo in air (1), under 2%(v/v) O2 + 0.5%(v/v) CO2 (2) and under 2.5%(v/v)
O2 + 0.7%(v/v) CO2 (3). Each datum represents the average of at least 15 experimental values, and bars represent the associated standard deviation;
the lines represent the fitted model (depicted as Eq. (1), with estimated parameters as listed in Table 4).
A.C. Galvis-S�anchez et al. / Journal of Food Engineering 64 (2004) 161–172 171
References
Allen, F. W. (1939). Influence of carbon dioxide in lengthening the life
of Bartlett pears. Proceedings of the American Society of Horticul-
tural Science, 37, 473–478.
Avelar, M. L. (1984). Influence of picking date on the further behavior
of �Rocha’ pear. Acta Horticulturae, 161, 25–29.
Galvis-S�anchez, A. C., Fonseca, S. C., Morais, A. M. M. B., &
Malcata, F. X. (2003). Physicochemical and sensory evaluation of
�Rocha’ pear following controlled atmosphere storage. Journal of
Food Science, 68(1), 318–327.
Hansen, E., & Mellenthin, W. M. (1962). Factors influencing suscep-
tibility of pears to carbon dioxide injury. Proceedings of the
American Society of Horticultural Science, 80, 146–153.
Hansen, E., & Mellenthin, W. M. (1979). Commercial handling and
storage practices for winter pears. Oregon State University Agri-
cultural Experimental Station No. 550. pp. 1–5.
Hansen, M. (1999). Pear storage regime can impact fruit quality. Good
Fruit Grower. Available from: <www.goodfruit.com>.
Klahre, J., Mellenthin, W., Chen, P., Valentine, F., Talley,
E., Bartram, R., & Raese, T. (1987). D’Anjou harvest matu-
rity and storage. Postharvest Pomology Newsletter, 5(2), 10–
14.
Kupferman, E. (1987). Brown core, a disorder of CA stored pears.
Postharvest Pomology Newsletter, 5(2), 15–17.
Kupferman, E. (1994). Anjou pear quality: fruit quality. Tree Fruit
Postharvest Journal, 5(1), 3–10.
Kv�ale, A. (1977). The effect of different harvest dates on shelf life and
quality of �Moltke’ pears. Acta. Agriculturae Scandinavica, 27, 326–
330.
L�opez, M. L., Mir�o, R., & Graell, J. (2001). Quality and aroma
production of Doyene du Comice pears in relation to harvest date
and storage atmosphere. Food Science and Technology Interna-
tional, 7(6), 493–500.

172 A.C. Galvis-S�anchez et al. / Journal of Food Engineering 64 (2004) 161–172
Meheriuk, M., Evans, C., Talley, E., & Kupferman, E. (1988). Harvest
maturity and storage regime for pears. Postharvest Pomology
Newsletter, 6(3), 11–15.
Saltveit, M. E. (2003). Is it possible to find an optimal controlled
atmosphere? Postharvest Biology and Technology, 27(1), 3–13.
Sharples, R. O., & Johnson, D. S. (1987). Influence of agronomic and
climatic factors on the response of apple fruit to controlled
atmosphere storage. HortScience, 22(5), 763–766.