
Effects of Methyl-Group Metabolism and Lifestyle Factors on ...
303
Effects of Methyl-Group Metabolism and Lifestyle Factors on Genome-Wide DNA Methylation Pooja Rajendra Mandaviya
-
Upload
khangminh22 -
Category
Documents
-
view
2 -
download
0
Transcript of Effects of Methyl-Group Metabolism and Lifestyle Factors on ...

Effects of Methyl-Group Metabolism and
Lifestyle Factors on Genome-Wide DNA Methylation
Pooja Rajendra Mandaviya

ACKNOWLEDGEMENTS
The work presented in this thesis was conducted at the Department of Internal
Medicine and Department of Clinical Chemistry of the Erasmus University Medical
Center, Rotterdam, the Netherlands.
This Study is funded by the Departments of Internal Medicine and Clinical Chemistry of
the Erasmus Medical Center and Erasmus University, Rotterdam, the Netherlands
Organization for Health Research and Development (ZonMw), the Research Institute
for Diseases in the Elderly (RIDE), the Ministry of Education, Culture and Science, the
Ministry for Health, Welfare and Sports, the European Commission (DG XII), and the
Municipality of Rotterdam.
This work was done within the framework of the Biobank-Based Integrative Omics
Studies (BIOS) Consortium funded by BBMRI-NL, a research infrastructure financed by
the Dutch government (NWO 184.021.007).
The infrastructure for the CHARGE consortium is supported in part by the National
Heart, Lung, and Blood Institute grant R01HL105756.
The publication of this thesis was financially supported in part by the Erasmus
University Rotterdam, the Netherlands.
Layout: Pooja R. Mandaviya
Cover design: Cheyenne Veen, Optima Grafische Communicatie and Pooja R.
Mandaviya
Printing: Optima Grafische Communicatie
ISBN: 978-94-6361-112-1
© Pooja Rajendra Mandaviya, 2018
No part of this thesis may be reproduced, stored in a retrieval system, or transmitted in
any form or by any means, without prior written permission from the author or, when
appropriate, from the publisher of the manuscript.

Effects of Methyl-Group Metabolism and
Lifestyle Factors on Genome-Wide DNA Methylation
Effecten van Methyl-Groep Metabolisme en
Leefstijlfactoren op Genoom-Brede DNA-Methylatie
Thesis
to obtain the degree of Doctor from the
Erasmus University Rotterdam
by command of the
rector magnificus
Prof.dr. H.A.P. Pols
and in accordance with the decision of the Doctorate Board.
The public defence shall be held on
Tuesday 5 June 2018 at 15:30 hrs
by
Pooja Rajendra Mandaviya
born in Porbandar, Gujarat, India

PROMOTION COMMITTEE
Promoters: Prof. Dr. A.G. Uitterlinden
Prof. Dr. J. Lindemans
Inner Committee: Prof. Dr. C.L. Relton
Prof. Dr. J.H. Gribnau
Prof. Dr. M.A. Ikram
Co-promoters: Dr. J.B.J. van Meurs
Dr. S.G. Heil
Paranymphs: C.K.A. Fleming
H.R. Mandaviya

To my parents Rajendra & Sunita
To my grandmother Sushila
To my late uncle Hasmukh


CONTENT
List of abbreviations 9
Part A Introduction
Chapter 1 General introduction and outline of thesis 13 Chapter 2 Homocysteine and DNA methylation: a review of animal and human
literature (Molecular genetics and metabolism, 2014)
31
Chapter 3 Nutrients and DNA methylation across the life course: a systematic review (To be submitted)
67
Part B Homocysteine and DNA methylation
Chapter 4 Homocysteine levels associate with subtle changes in leukocyte DNA methylation: an epigenome-wide analysis (Epigenomics, 2017)
133
Chapter 5 Genetically defined elevated homocysteine levels do not result in widespread changes of DNA methylation in leukocytes (PLoS One, 2017)
163
Chapter 6 Interaction between plasma homocysteine and the MTHFR c.677C>T polymorphism is associated with site-specific changes in DNA methylation in humans (Submitted for publication)
185
Part C Nutrition, lifestyle and DNA methylation
Chapter 7 Association of dietary folate and vitamin B12 intake with genome-wide DNA methylation; a large scale epigenome-wide association analysis in 5,841 individuals (Submitted for publication)
209
Chapter 8 Epigenetic Signatures of Cigarette Smoking (Circulation. Cardiovascular genetics, 2016)
237
Part D Discussion and summary
Chapter 9 General discussion 265 Chapter 10 Summary 285
Part E Appendices
List of publications 293 PhD portfolio 297 About the author 299 Words of gratitude 301


LIST OF ABBREVIATIONS
A Adenine
ARIC Atherosclerosis in Communities Study
BBMRI Biobanking and BioMolecular resources Research
Infrastructure
BHMT Betaine-homocysteine methyltransferase
BIOS Biobank-based Integrative Omics Studies Consortium
BMI Body mass index
C Cytosine
CBS Cystathionine β-synthase
-CH3 Methyl
CHARGE Cohorts for Heart and Aging Research in Genomic
Epidemiology
CHS Cardiovascular Health Study
CODAM Cohort on Diabetes and Atherosclerosis Maastricht
CpG Cytosine-phosphate-Guanine
CSE Cystathionine γ-lyase
DHFR Dihydrofolate reductase
DMP Differentially methylated CpG position
DMR Differentially methylated CpG region
DNA Deoxyribonucleic acid
DNMT DNA methyltransferase enzymes
EGCUT Estonian Genome Center, University of Tartu
EPIC European Prospective Investigation into Cancer
EPIC- Norfolk European Prospective Investigation into Cancer and
Nutrition-Norfolk
ERGO Erasmus Rotterdam Gezondheid Onderzoek
EWAS Epigenome-wide association study
FHS Framingham Heart Study
F5L French-Canadian family study on Factor V Leiden
G Guanine
GENOA Genetic Epidemiology Network of Arteriopathy
GOLDN Genetics of Lipid Lowering Drugs and Diet Network
GRS Genetic risk score
GTP Grady Trauma Project
GWAS Genome-wide association studies
Hcy Homocysteine
HHcy Hyperhomocysteinemia
5hmC 5-hydroxymethylcytosine

HPLC High performance liquid chromatography
InCHIANTI Invecchiare in Chianti
KORA Cooperative Health Research in the Region of Augsburg
LBC Lothian Birth Cohort
LL LifeLines
LLD LifeLinesDeep
LLS Leiden Longevity Study
LC-MS/MS HPLC tandem mass spectrometry
LUMA Luminometric methylation assay
MARTHA MARseille THrombosis Association Study
MAT Methionine adenosyltransferase
MDB Methyl-CpG-binding domain
MDBP Methylated DNA-binding proteins
MeDIP Methylated DNA immunoprecipitation
MESA Multi Ethnic Study of Atherosclerosis
MeQTLs Methylation Quantitative Trait Loci
MR Mendelian Randomization
MSR Methionine synthase reductase
MTHFR 5,10-Methylenetetrahydrofolate reductase
MTR/MS Methionine synthase
NAS Normative Aging Study
NK Natural killer
NTR Netherlands Twins Register
PAN Prospective ALS Study Netherlands
RS Rotterdam Study
SAH S-adenosylhomocysteine
SAM S-adenosylmethionine
SAHH S-adenyl-l-homocysteine hydrolase
SHMT Serine hydroxymethyltransferase
SNP Single Nucleotide Polymorphism
T Thymidine
THF Tetrahydrofolate
WBC Whole blood cell
YFS Young Finns Study

PART A
Introduction


CHAPTER 1
General introduction and outline of thesis

14 PART A: Introduction
Epigenetics is defined as the study of heritable changes in gene expression resulting
from changes in a chromosome without alterations in its DNA sequence [1-3]. These
epigenetic changes or chemical modifications occur either to the DNA, DNA binding
histones or histone binding nucleosomes, and are referred to as DNA methylation,
histone modifications and nucleosome positioning, respectively [4]. In normal
processes, epigenetic modifications are important in regulating gene and non-coding
RNA expression in response to changing conditions and maintaining normal
development. DNA methylation is currently the most widely studied epigenetic
mechanism.
DNA methylation is the addition of a methyl group to DNA and typically
occurs at the 5’ carbon position of the cytosine base in DNA to form 5-methylcytosine
[Figure 1]. This process is catalyzed by DNA methyltransferase enzymes (DNMTs) [5]
and frequently occurs at a Cytosine-phosphate-Guanine (CpG) dinucleotide where the
cytosine base is followed by a guanine base separated by a phosphodiester bond.
There are three major types of DNMTs: DNMT1, DNMT3a and DNMT3b. In mammalian
cells, DNMT1 is most abundant of the three DNMTs [6]. It is referred to as maintenance
methyltransferase because it prefers to bind to CpG sites of the hemi-methylated DNA
(when only one of two complementary strands are methylated) in order to copy the
existing methylation pattern of the DNA [7]. DNMT3a and DNMT3b are referred to as
de novo methyltransferases because they are necessary for early development. They
can bind to both hemi-methylated and non-methylated DNA [7].
Figure 1. Methylation of cytosine to 5-methylcytosine, catalyzed by DNMT enzymes. The
methyl transfer s-adenosylmethionine (SAM) donates its methyl group to cytosine to
produce s-adenosylhomocysteine (SAH).

CHAPTER 1: General introduction and outline of thesis 15
DNA methylation can influence gene function and gene expression by two
mechanisms. One, CpG methylation can interfere with the binding of the transcription
factors to the DNA, which can in turn suppress gene transcription. Two, there are
certain proteins that act as transcriptional repressors by binding to specific sequences
of the methylated DNA and are called methylated DNA-binding proteins (MDBP) [8-10].
DNA methylation is dynamic across the life course [11] and age-associated changes
have been seen both during early childhood [12] and adulthood [13, 14]. Sex-
associated DNA methylation differences have also been found [15]. DNA methylation is
an essential epigenetic process involved in regulation of genes in all biological
processes and has an essential role in embryonic development, genomic imprinting,
genomic integrity, transcriptional regulation and adult homeostasis [16, 17]. DNA
methylation is influenced by several metabolic, environmental, nutritional, lifestyle and
genetic factors [Figure 2].
Figure 2. Factors that can affect DNA methylation. Nucleotides in blue are the Adenine (A)
and Thymidine (T) bases and nucleotides in purple are the Guanine (G) and Cytosine (C)
bases, respectively. Methyl groups in red typically attach to the 5’ carbon position of the
cytosine base of DNA to form 5-methylcytosine. Cis-meQTLs (methylation Quantitative Trait
Loci) are the SNPs that correlate with a CpG that is <1 Mb away. Trans-meQTLs are SNPs
that correlate with CpGs that are >1 Mb away.
METHYL-GROUP METABOLISM AND ROLE OF B-VITAMINS
Methyl-group metabolism, also known as one-carbon metabolism, is a network of
biochemical reactions that is involved in the transfer of one-carbon units, typically as
methyl (-CH3) groups, from one metabolite to the other, and subsequently to the DNA
[18]. Several enzymes participate in the catalysis of these reactions along with dietary
micronutrients that act as cofactors, such as B-vitamins (folate, vitamin B2, B6 and
B12), choline and betaine [19] [Figure 3]. For this reason, nutrition status, particularly
micronutrient intake, has been a focal point when investigating epigenetic mechanisms

16 PART A: Introduction
[18]. The important metabolites of this pathway include s-adenosylmethionine (SAM),
s-adenosylhomocysteine (SAH) and homocysteine (Hcy). In the transmethylation
pathway, the methyl donor, SAM is biosynthesized from methionine and donates its
methyl group to the DNA, itself being converted to SAH. SAH is a potent inhibitor of
this same methyltransferase reaction and is hydrolyzed to Hcy. Due to the reversible
reaction of Hcy with SAH, Hcy needs to be transported out of the cell or be
metabolized to prevent accumulation of SAH. Hcy metabolism takes place either
through the remethylation pathway by converting back to methionine, or the
transsulfuration pathway by converting to cystathionine [20]. Impairments in the
metabolism of Hcy can lead to elevated Hcy and consequently elevated SAH and
reduced SAM:SAH ratio [21, 22]. Elevated Hcy has been associated with reduced global
methylation [22] and is a marker of several disorders such as cardiovascular diseases,
neural tube defects, cognitive decline and different types of cancers [23]. Elevated Hcy
can be a consequence of either genetic variants in one or more of the key enzymes
and/or nutritional deficiencies [24].
The most widely studied Hcy-associated genetic polymorphism includes the
methylene tetrahydrofolate reductase (MTHFR) 677C>T variant. This variant can lead
to reduced MTHFR enzyme activity of up to 45% and impairs the conversion of 5,10-
methylenetetrahydrofolate to 5-methyltetrahydrofolate (5-methyl-THF) in the
remethylation pathway, where 5-MTHF acts as a cosubstrate by converting Hcy to
methionine [24, 25]. Another commonly studied polymorphism for MTHFR includes
MTHFR 1298A>C, which is associated with 68% of reduced MTHFR activity [25, 26]. In
the remethylation pathway, methionine synthase (MTR) catalyzes the remethylation of
Hcy to methionine. The common polymorphism within the MTR gene is MTR A66G,
which results in reduced activity of the MTR enzyme and Hcy accumulation [27]. In the
transsulfuration pathway, cystathionine-beta-synthase (CBS) enzyme catalyses the
conversion of Hcy to cystathionine. Two mutations in the CBS enzyme include the rare
CBS 1330G>A [28] and CBS 833T>C [29]. Both these mutations are associated with
reduced activity of CBS enzyme and Hcy accumulation and occur in CBS deficiency.
Apart from the ones mentioned, other Hcy-associated polymorphisms were also
previously found in candidate gene studies and genome-wide association studies
(GWAS) [25, 30-32]. In a previous large GWAS of 44,147 individuals, van Meurs JB et al
found 18 variants associated with Hcy, of which 13 were common polymorphisms that
explained 5.9% of variation in Hcy [32].
Folate and vitamin B12 are widely studied co-factors, deficiencies of which
could impair the methyl-group metabolism and lead to elevated Hcy [24]. Therefore,
impaired methyl-group metabolism due to shortage of B-vitamins or genetic variants
could play a vital role in DNA methylation. A few studies until now have investigated
the association of Hcy, Hcy-associated variants particularly the MTHFR 677C>T and B-
vitamins with global DNA methylation, but showed inconsistent findings.

CHAPTER 1: General introduction and outline of thesis 17
Figure 3. A simplified figure of methyl-group metabolism, which includes the main enzymes
(purple) and dietary factors (blue). DHFR: Dihydrofolate reductase; SHMT: Serine
hydroxymethyltransferase; MTHFR: 5,10-Methylenetetrahydrofolate reductase; MSR:
Methionine synthase reductase; MS: Methionine synthase; BHMT: Betaine-homocysteine
methyltransferase; MAT: Methionine adenosyltransferase; DNMT: DNA methyltransferase;
SAHH: S-adenyl-l-homocysteine hydrolase; CBS: Cystathionine β-synthase; CSE:
Cystathionine γ-lyase. Ser: Serine; Gly: Glycine. R: Remethylation pathway; T:
Transsulfuration pathway; F: Folate cycle.
LIFESTYLE FACTORS
In addition to the one carbon metabolism and nutritional factors, other lifestyle factors
such as cigarette smoking, alcohol intake and physical activity can also affect DNA
methylation [33]. Cigarette smoking is a crucial risk factor for disorders such as
respiratory diseases, cardiovascular diseases, cancer and reproductive outcomes [34].
There are a few mechanisms known by which cigarette smoking can alter DNA
methylation [35]. One, cigarette smoke contains carcinogens such as arsenic,
chromium, polycyclic aromatic hydrocarbons, formaldehyde, and nitrosamines that
causes double-stranded breaks to the DNA causing DNA damage [36]. The enzyme
DNMT1 is recruited to repair the damage in survival cells which causes methylation of
CpGs adjacent to the repaired nucleotides [36-38]. Two, cigarette smoke can alter DNA
methylation through the effect of nicotine on DNMT1 expression. Nicotine binds to and
activates the nicotinic acetylcholine receptors that increases intracellular calcium and

18 PART A: Introduction
activates the key transcription factor (cAMP response element-binding protein) of
many genes with possible downregulation of DNMT1 [39-41]. Three, cigarette smoking
increases expression of the DNA-binding protein, Sp1, which protects CpG sites from
being methylated [42-44]. Four, cigarette smoke contains carbon monoxide that
competes with oxygen to bind to hemoglobin. This causes inadequate oxygenation of
tissues in a condition called hypoxia [45]. Hypoxia further leads to the HIF-1α-
dependent upregulation of methionine adenosyltransferase 2A, which is an enzyme
that synthesizes the methyl donor, SAM [46]. Previous EWAS studies have investigated
the association between cigarette or tobacco smoking and epigenome-wide DNA
methylation [47-56], but large-scale meta-analysis studies have not been conducted
yet. Sufficiently large sample size is necessary for detecting small effects, reliability of
results and internal and external validation [57, 58]. Such studies may further help in
identifying new smoking-related CpGs that can serve as biomarkers in smoking-related
pathologies.
METHODS TO MEASURE DNA METHYLATION
Different methods that are used to profile global and site-specific genome-wide DNA
methylation are available [59-64]. These methods vary in terms of their genomic region
coverage, DNA input and resolution. For global methylation, the high performance
liquid chromatography (HPLC) and HPLC tandem mass spectrometry (LC-MS/MS) are
regarded as the golden standards to measure the total methylated cytosine content in
the DNA [60, 61]. These methods are highly quantitative and reproducible. Since the
protocol for their assay optimization is demanding and requires relatively large
amounts of DNA (1-5 µg), other methods have been developed that use more readily
available equipment, require less DNA and are less expensive. These include PCR-based
methods which measure methylation status of genomic repeat elements such as LINE-1
and Alu, and other method includes the Luminometric methylation assay (LUMA)
which is based on polymerase extension assay using the pyrosequencing platform [60,
61]. The repeat elements are representative of the human genome since they
constitute about 45% of it [60]. However, the information on methylation levels
derived from these surrogate methods is limited to analyzed sequences and their
comparison to total methyl cytosine content in DNA is uncertain. LINE-1 assay showed
an acceptable surrogate to golden standard methods as compared to Alu assay or
LUMA [60, 61]. Considering the highest sensitivity and specificity, minimal assay-to-
assay variability and also the amount of starting material required by each assay, these
methods are recommended in order of their preference: (1) LINE-1/pyrosequencing;
(2) LC-MS/MS; and (3) LUMA [61]. For gene-specific methods, PCR-based methods
were developed wherein primers are used to amplify the gene of interest from the
bisulfite converted DNA [62].

CHAPTER 1: General introduction and outline of thesis 19
For genome-wide site-specific DNA methylation profiling, various microarray-
and sequencing-based technologies have been developed [59, 61, 62, 64]. They are
grouped into 3 categories, namely; (1) restriction enzyme based methods, (2) affinity
enrichment-based methods, and (3) bisulfite conversion-based methods. Restriction
enzyme based methods cleave DNA at specific positions to distinguish between
methylated and unmethylated DNA. Affinity enrichment-based methods use either
anti-methylcytosine antibodies (as in methylated DNA immunoprecipitation (MeDIP))
or methyl-CpG-binding domain (MDB) proteins specific for 5-methyl cytosines to enrich
methylated DNA regions. Bisulphite conversion-based methods can distinguish cytosine
base from methylated cytosine by converting cytosines to uracil and keeping
methylated cytosines as cytosines. These three types of methods are either coupled
with microarray or sequencing technologies. Each of these techniques have their own
pros and cons, and the preference for a particular technique highly depends on the
research questions, the amount of required starting material, sensitivity, specificity,
resolution, coverage and cost. Comparing with other techniques, bisulphite conversion-
based Illumina HumanMethylation450K BeadChip arrays (Illumina, Inc., San Diego, CA,
USA) provide a high coverage with high sensitivity and specificity at a single base
resolution, along with lower cost and low starting material. This makes it as the
preferred technique for our study.
EPIGENOME-WIDE ASSOCIATION STUDIES
In order to investigate associations between site-specific DNA methylation variations
and a phenotype of interest, EWASs assess a genome-wide collection of epigenetic
marks that exist in a cell at any given point in time [65]. Illumina 450K array measures
up to 485,764 CpGs per DNA sample distributed across the whole genome [66]. These
CpGs represent 99% of RefSeq genes and 96% of CpG island regions that include high
density islands and low density shores and shelves. This array also includes non-CpG
methylated sites identified in human stem cells (CHH sites), differentially methylated
CpG positions (DMPs) identified in tumor versus normal, FANTOM 4 promoters, DNase
hypersensitive sites and miRNA promoter regions. Validation and evaluation of this
technique using cell lines and tissue samples indicated that it is highly robust and
reliable and showed high concordance with the widely used pyrosequencing method
[66-68].
The human genome contains more than 28 million CpGs [69], 70-80% of
which are methylated [70, 71]. The Illumina 450K arrays measures 1.7% of the CpGs in
the genome. Among the gene regions for CpGs included on this array, most (41%) of
them are present at gene promoters, 31% at gene bodies, 3% at 3’UTR regions and 25%
at intergenic regions. Among the genome regions, most (31%) of them are present in
high density at regions known as “CpG islands” that are usually associated with
promoters. CpGs with low density (23%) are present at “CpG island shores” that are

20 PART A: Introduction
about 2 Kb away from CpG islands. CpGs with much lower density (31%) than CpG
island shores are present at “CpG island shelves” also known as CpG poor regions, that
are in turn about 2 Kb away from CpG island shores. The rest (36%) of them are the
isolated CpGs known as “Open Sea” regions [66] [Figure 4]. This gives an advantage
over other techniques that measure global methylation as the total methylated
cytosine content of the DNA, which does not indicate the specific CpGs, genes and
pathways involved. Illumina 450k arrays give opportunities to uncover novel epigenetic
markers and help explore mechanisms that could be associated with disease risks in a
hypothesis-free manner. When the knowledge of associations about a particular
phenotype and DNA methylation is limited, the hypothesis free approach gives the
benefit to eliminate the preexisting bias of traditional biology, meaning that it is
unbiased by prior pathophysiological assumptions [72]. Therefore, hypothesis-free
approach gives us the opportunity to unravel novel epigenetic markers associated with
methyl-group metabolism factors.
The design of the Illumina 450k arrays is such that it contains two different
probes; type I (28% CpGs) and type II (72% CpGs) [73]. Type I probes use two different
bead types corresponding to methylated and unmethylated probe alleles, both of
whose signals are generated in same red colour channel. Type II assay uses one bead
type corresponding to both methylated and unmethylated probe alleles whose signals
are generated in green and red colour channels, respectively.
Figure 4. Distribution of CpGs in the Illumina 450k array based on gene regions, genomic
regions and associated RNA transcripts. Figure adapted from Sandoval J et al.

CHAPTER 1: General introduction and outline of thesis 21
DIFFERENTIALLY METHYLATED REGIONS
It is known that CpGs that are closely located to each other often show similar
methylation patterns [74] and that DNA methylation is regulated in longer regions [75].
Therefore, in linear models, treating a region as a unit with two or more CpG sites
might help identify regions with consistent methylation changes. Different methods
have been developed that use different approaches to identify differentially
methylated regions (DMRs) such as IMA [76], Bumphunter [77], DMRcate [78], Comb-p
[79, 80], Probe Lasso [81], Aclust [82] and seqlm [83]. Authors of the DMRcate and
seqlm compared their method with other methods and showed that their method
performed better than the other methods [78, 83]. However, despite so many
developed methods and their approaches, they all have their pros and cons, and there
is no standard method until now. IMA package in R calculates methylation mean or
median of β-values for gene-based predefined regions such as promoter, 5’-UTR, first
exon, gene body and 3’-UTR and also other regions that are not necessarily gene-
based, such as CpG islands, shores and shelves [76]. On the other hand, methods such
as Bumphunter and DMRcate identify DMRs using region finding algorithms that are
based on sliding window and effect size cutoffs [77, 78]. These methods however might
not be well suited for the uneven distribution of the Illumina 450k CpGs. In the analysis
from this thesis, we used the method Comb-p [79, 80] that was developed considering
this uneven distribution. It uses nominal p-values as input in a sliding window and also
takes into account the correlation between CpGs associated with these p-values.
MENDELIAN RANDOMIZATION STUDIES
Classical epidemiological association studies do not indicate the cause and effect of a
particular association. They just detect association. To determine causal direction,
genetic instrumental variables of phenotypes or methylation can be used, in a concept
called Mendelian Randomization (MR) [84, 85]. The relationship of Hcy, vitamin B12
and folate with DNA methylation can be subject to substantial bias, given the strong
relationship between several lifestyle factors, diseases and methyl-group metabolism
factors. To circumvent this bias, genetic factors determining the methyl-group
metabolism factors as an instrument can be used to study the relationship between
these factors and methylation by MR. This would eliminate the effects that are possibly
caused by measurement errors, confounding and reverse causality.
STUDY POPULATION
1. Rotterdam Study (RS)
All studies described in this thesis were performed within a large population-based
cohort study of the Netherlands, the RS, also known as “Erasmus Rotterdam
Gezondheid Onderzoek (ERGO)”. The RS is a prospective study aimed at assessing the
occurrence of risk factors for chronic (cardiovascular, endocrine, locomotor, hepatic,

22 PART A: Introduction
neurological, ophthalmic, psychiatric, dermatological, oncological, and respiratory)
diseases in the elderly [86]. The study comprises 14,926 subjects in total, living in the
well-defined Ommoord district in the city of Rotterdam in the Netherlands. Genome-
wide DNA-methylation levels were determined in a random subset of 1,613 individuals
using the Illumina HumanMethylation450K BeadChip arrays [Figure 5].
Several EWASs of phenotype measures such as Hcy, the common Hcy
associated variant MTHFR 677C>T, folate intake, vitamin B12 intake, cigarette smoking,
age, gender, lipids, and anthropometry were conducted in RS. Inorder to improve the
estimates of found associations and find new loci [57, 58], the power of the study was
increased by including multiple studies in a meta-analysis approach. Several studies
participated in the following consortium efforts to achieve the goal.
2. Biobank-based Integrative Omics Studies Consortium (BIOS) consortium
Within the BIOS consortium, Biobanking and BioMolecular resources Research
Infrastructure (BBMRI)-Omics (http://www.bbmri.nl/) is the joint collection of omics
data that has collaboratively been generated and is made available for BBMRI
researchers focusing on integrative omics studies in Dutch Biobanks in the
Netherlands. RNA-sequencing (>15 M paired end reads) and genome-wide DNA
methylation data has been generated using Illumina 450k arrays and Illumina RNA
sequencing, for over 4000 samples. In addition, phenotype measures such as age,
smoking, gender, lipids, metabolomics (>200 metabolites) and anthropometry are
available within the same samples. The Netherlands-based cohorts that are a part of
this consortium are the Rotterdam Study, the Leiden Longevity Study, the Groningen
LifeLines study, the Netherlands Twins Register, the Cohort on Diabetes and
Atherosclerosis Maastricht and the Prospective ALS Study Netherlands [Figure 6].
3. Cohorts for Heart and Aging Research in Genomic Epidemiology (CHARGE) consortium
The CHARGE consortium (http://www.chargeconsortium.com/) was formed to
facilitate genome-wide association study meta-analyses and replication opportunities
among multiple large and well-phenotyped longitudinal cohort studies [87]. This
consortium is a collaboration between many cohorts studies, both from Europe and
the United States. The five founding member cohorts of this effort include the Age,
Gene/Environment Susceptibility-Reykjavik Study, the Atherosclerosis Risk in
Communities Study, the Cardiovascular Health Study, the Framingham Heart Study
and the Rotterdam Study. The additional core cohorts include the Coronary Artery Risk
Development in Young Adults, the Family Heart Study, the Health, Aging, and Body
Composition Study, the Jackson Heart Study and the Multi-Ethnic Study of
Atherosclerosis. Within this thesis, cohorts within this consortium who had both DNA
methylation data measured from the Illumina 450k arrays as well as the phenotypes of
interest, were used for the EWAS analyses [Figure 6].

CHAPTER 1: General introduction and outline of thesis 23
OUTLINE OF THIS THESIS
The aim of this thesis is to study the association of methyl-group metabolism,
nutritional and lifestyle factors with genome-wide DNA methylation. The first section
of this thesis includes two literature reviews. Chapter 2 is a literature review of Hcy and
its role in DNA methylation. Chapter 3 is a systematic literature review of the relation
between micro- and macro- nutrients and DNA methylation in humans across the life
course.
The second section of this thesis focuses on a key metabolite of the methyl-
group metabolism, Hcy. Chapter 4 is a meta-analysis of EWASs to investigate the
association between plasma Hcy and DNA methylation in leukocytes of 2,035
individuals from six cohorts. In Chapter 5, we used genetically defined elevated Hcy as
an instrument, i.e. the MTHFR 677C>T variant and the combined weighted genetic risk
score of 18 previously studied Hcy-associated variants, to test whether genetically
defined elevated Hcy levels are associated with DNA methylation changes in leukocytes
of 9,894 individuals from 12 cohorts. In Chapter 6, we conducted an interaction study
to investigate the effect of elevated Hcy in individuals by MTHFR 677C>T genotype on
genome-wide DNA methylation in leukocytes of 1280 individuals from 2 cohorts.
The third section of this thesis focuses on nutrition and lifestyle factors.
Chapter 7 is a meta-analysis of EWASs to investigate the association of folate intake
and vitamin B12 intake with DNA methylation in leukocytes of 5,841 participants from
10 cohorts. Chapter 8 focuses on association between cigarette smoking as a lifestyle
factor and DNA methylation in leukocyte assessed in 15,907 individuals (2,433 current,
6,518 former, and 6,956 never smokers) from 16 cohorts.
Figure 5. Overview of the long-term population survey of the Rotterdam Study (RS), also
known as “Erasmus Rotterdam Gezondheid Onderzoek” (ERGO) in the Netherlands. In 1989,
the first cohort, RS-I (also known as ERGO) comprised of 7,983 subjects with age 55 years or
above. In 2000, the second cohort, RS-II (also known as ERGOPLUS) was included with 3,011
subjects who had reached an age of 55 or over. In 2006, the third cohort, RS-III (also known
as EROGJONG) was further included with 3,932 subjects with age 45 years and above. In
2016, the forth cohort, RS-IV (also known as ERGOXTRA) was included with expected
recruitment of 4,000 subjects with age 40 years and above. At the Genetic Laboratory
(Department of Internal Medicine, Erasmus University Medical Center, Rotterdam, the
Netherlands), genome-wide DNA-methylation levels in 1,613 individuals mainly belonging to
ERGOJONG and ERGO-5 were determined using the Illumina HumanMethylation450K
BeadChip arrays (Illumina, Inc., San Diego, CA, USA). After quality control, 1,544 of the 1,613
individuals were used for the downstream analysis. Phenotypes of interest such as
homocysteine, MTHFR 677C>T, B-vitamin intake and cigarette smoking with overlapping
DNA methylation data were used to run EWASs in this thesis.

24 PART A: Introduction

CHAPTER 1: General introduction and outline of thesis 25
Figu
re 6
. O
verv
iew
of
the
colla
bo
rati
ng
coh
ort
s in
th
is t
he
sis.
(1
) B
IOS
con
sort
ium
(B
lue)
: R
S (R
ott
erd
am S
tud
y),
LLS
(Lei
den
Lo
nge
vity
Stu
dy)
, LL
D
(Gro
nin
gen
Lif
eLin
es s
tud
y), N
TR (
Net
her
lan
ds
Twin
s R
egis
ter)
, CO
DA
M (
Co
ho
rt o
n D
iab
etes
an
d A
ther
osc
lero
sis
Maa
stri
cht)
an
d P
AN
(P
rosp
ecti
ve
ALS
Stu
dy
Net
her
lan
ds)
. (2
) C
HA
RG
E co
nso
rtiu
m (
Red
): R
S (R
ott
erd
am S
tud
y),
LBC
(Lo
thia
n B
irth
Co
ho
rt),
Co
op
erat
ive
Hea
lth
Res
earc
h i
n t
he
Reg
ion
of
Au
gsb
urg
(K
OR
A),
Tw
insU
K,
Inve
cch
iare
in
Ch
ian
ti (
InC
HIA
NTI
) st
ud
y, F
ram
ingh
am H
eart
Stu
dy
(FH
S),
Gen
etic
s o
f Li
pid
Lo
wer
ing
Dru
gs
and
Die
t N
etw
ork
(G
OLD
N),
Ath
ero
scle
rosi
s in
Co
mm
un
itie
s St
ud
y (A
RIC
), C
ard
iova
scu
lar
Hea
lth
Stu
dy
(CH
S), M
ult
i Eth
nic
Stu
dy
of
Ath
ero
scle
rosi
s
(MES
A),
Gra
dy
Trau
ma
Pro
ject
(G
TP),
Eu
rop
ean
Pro
spec
tive
In
vest
igat
ion
in
to C
ance
r (E
PIC
), E
uro
pea
n P
rosp
ecti
ve I
nve
stig
atio
n i
nto
Can
cer
and
Nu
trit
ion
-No
rfo
lk (
EPIC
-No
rfo
lk),
Gen
etic
Ep
idem
iolo
gy N
etw
ork
of
Art
erio
pat
hy
(GEN
OA
), E
sto
nia
n G
en
om
e C
en
ter,
Un
iver
sity
of
Tart
u (
EGC
UT)
,
You
ng
Fin
ns
Stu
dy
(YFS
) an
d N
orm
ativ
e A
gin
g St
ud
y (N
AS)
(3
) O
ther
stu
die
s (G
ree
n):
MA
Rse
ille
THro
mb
osi
s A
sso
ciat
ion
Stu
dy
(MA
RTH
A)
and
Fren
ch-C
anad
ian
fam
ily s
tud
y o
n F
acto
r V
Lei
den
(F5
L) t
hro
mb
op
hili
a.

26 PART A: Introduction
REFERENCES 1. Berger SL, Kouzarides T, Shiekhattar R, Shilatifard A. An operational definition of
epigenetics. Genes Dev 2009;23:781-3. 2. Goldberg AD, Allis CD, Bernstein E. Epigenetics: a landscape takes shape. Cell
2007;128:635-8. 3. Bird A. Perceptions of epigenetics. Nature 2007;447:396-8. 4. Portela A, Esteller M. Epigenetic modifications and human disease. Nat Biotechnol
2010;28:1057-68. 5. Bestor TH. Cloning of a mammalian DNA methyltransferase. Gene 1988;74:9-12. 6. Robertson KD, Uzvolgyi E, Liang G, Talmadge C, Sumegi J, Gonzales FA, Jones PA. The
human DNA methyltransferases (DNMTs) 1, 3a and 3b: coordinate mRNA expression in normal tissues and overexpression in tumors. Nucleic Acids Res 1999;27:2291-8.
7. Hermann A, Goyal R, Jeltsch A. The Dnmt1 DNA-(cytosine-C5)-methyltransferase methylates DNA processively with high preference for hemimethylated target sites. J Biol Chem 2004;279:48350-9.
8. Jones PA, Laird PW. Cancer epigenetics comes of age. Nat Genet 1999;21:163-7. 9. Kass SU, Pruss D, Wolffe AP. How does DNA methylation repress transcription? Trends
Genet 1997;13:444-9. 10. Tate PH, Bird AP. Effects of DNA methylation on DNA-binding proteins and gene
expression. Curr Opin Genet Dev 1993;3:226-31. 11. Heyn H, Li N, Ferreira HJ, Moran S, Pisano DG, Gomez A, et al. Distinct DNA
methylomes of newborns and centenarians. Proc Natl Acad Sci U S A 2012;109:10522-7.
12. Xu CJ, Bonder MJ, Soderhall C, Bustamante M, Baiz N, Gehring U, et al. The emerging landscape of dynamic DNA methylation in early childhood. BMC Genomics 2017;18:25.
13. Kananen L, Marttila S, Nevalainen T, Jylhava J, Mononen N, Kahonen M, et al. Aging-associated DNA methylation changes in middle-aged individuals: the Young Finns study. BMC Genomics 2016;17:103.
14. Reynolds LM, Taylor JR, Ding J, Lohman K, Johnson C, Siscovick D, et al. Age-related variations in the methylome associated with gene expression in human monocytes and T cells. Nat Commun 2014;5:5366.
15. Inoshita M, Numata S, Tajima A, Kinoshita M, Umehara H, Yamamori H, et al. Sex differences of leukocytes DNA methylation adjusted for estimated cellular proportions. Biol Sex Differ 2015;6:11.
16. Li E, Beard C, Jaenisch R. Role for DNA methylation in genomic imprinting. Nature 1993;366:362-5.
17. Messerschmidt DM, Knowles BB, Solter D. DNA methylation dynamics during epigenetic reprogramming in the germline and preimplantation embryos. Genes Dev 2014;28:812-28.
18. Anderson OS, Sant KE, Dolinoy DC. Nutrition and epigenetics: an interplay of dietary methyl donors, one-carbon metabolism and DNA methylation. J Nutr Biochem 2012;23:853-9.
19. Selhub J. Folate, vitamin B12 and vitamin B6 and one carbon metabolism. J Nutr Health Aging 2002;6:39-42.
20. Blom HJ, Smulders Y. Overview of homocysteine and folate metabolism. With special references to cardiovascular disease and neural tube defects. J Inherit Metab Dis 2011;34:75-81.
21. Fu W, Dudman NP, Perry MA, Young K, Wang XL. Interrelations between plasma homocysteine and intracellular S-adenosylhomocysteine. Biochem Biophys Res Commun 2000;271:47-53.

CHAPTER 1: General introduction and outline of thesis 27
22. James SJ, Melnyk S, Pogribna M, Pogribny IP, Caudill MA. Elevation in S-adenosylhomocysteine and DNA hypomethylation: potential epigenetic mechanism for homocysteine-related pathology. J Nutr 2002;132:2361S-2366S.
23. Stover PJ. One-carbon metabolism-genome interactions in folate-associated pathologies. J Nutr 2009;139:2402-5.
24. Selhub J. Homocysteine metabolism. Annu Rev Nutr 1999;19:217-46. 25. Sunder-Plassmann G, Fodinger M. Genetic determinants of the homocysteine level.
Kidney Int Suppl 2003:S141-4. 26. Weisberg I, Tran P, Christensen B, Sibani S, Rozen R. A second genetic polymorphism in
methylenetetrahydrofolate reductase (MTHFR) associated with decreased enzyme activity. Mol Genet Metab 1998;64:169-72.
27. Leclerc D, Wilson A, Dumas R, Gafuik C, Song D, Watkins D, et al. Cloning and mapping of a cDNA for methionine synthase reductase, a flavoprotein defective in patients with homocystinuria. Proc Natl Acad Sci U S A 1998;95:3059-64.
28. Kluijtmans LA, Boers GH, Stevens EM, Renier WO, Kraus JP, Trijbels FJ, et al. Defective cystathionine beta-synthase regulation by S-adenosylmethionine in a partially pyridoxine responsive homocystinuria patient. J Clin Invest 1996;98:285-9.
29. Masud R, Qureshi IZ. Tetra primer ARMS-PCR relates folate/homocysteine pathway genes and ACE gene polymorphism with coronary artery disease. Mol Cell Biochem 2011;355:289-97.
30. Clifford AJ, Chen K, McWade L, Rincon G, Kim SH, Holstege DM, et al. Gender and single nucleotide polymorphisms in MTHFR, BHMT, SPTLC1, CRBP2, CETP, and SCARB1 are significant predictors of plasma homocysteine normalized by RBC folate in healthy adults. J Nutr 2012;142:1764-71.
31. Lange LA, Croteau-Chonka DC, Marvelle AF, Qin L, Gaulton KJ, Kuzawa CW, et al. Genome-wide association study of homocysteine levels in Filipinos provides evidence for CPS1 in women and a stronger MTHFR effect in young adults. Hum Mol Genet 2010;19:2050-8.
32. van Meurs JB, Pare G, Schwartz SM, Hazra A, Tanaka T, Vermeulen SH, et al. Common genetic loci influencing plasma homocysteine concentrations and their effect on risk of coronary artery disease. Am J Clin Nutr 2013;98:668-76.
33. Lim U, Song MA. Dietary and lifestyle factors of DNA methylation. Methods Mol Biol 2012;863:359-76.
34. National Center for Chronic Disease P, Health Promotion Office on S, Health. 2014. 35. Lee KW, Pausova Z. Cigarette smoking and DNA methylation. Front Genet 2013;4:132. 36. Huang J, Okuka M, Lu W, Tsibris JC, McLean MP, Keefe DL, Liu L. Telomere shortening
and DNA damage of embryonic stem cells induced by cigarette smoke. Reprod Toxicol 2013;35:89-95.
37. Mortusewicz O, Schermelleh L, Walter J, Cardoso MC, Leonhardt H. Recruitment of DNA methyltransferase I to DNA repair sites. Proc Natl Acad Sci U S A 2005;102:8905-9.
38. Cuozzo C, Porcellini A, Angrisano T, Morano A, Lee B, Di Pardo A, et al. DNA damage, homology-directed repair, and DNA methylation. PLoS Genet 2007;3:e110.
39. Lee EW, D'Alonzo GE. Cigarette smoking, nicotine addiction, and its pharmacologic treatment. Arch Intern Med 1993;153:34-48.
40. Shen JX, Yakel JL. Nicotinic acetylcholine receptor-mediated calcium signaling in the nervous system. Acta Pharmacol Sin 2009;30:673-80.
41. Satta R, Maloku E, Zhubi A, Pibiri F, Hajos M, Costa E, Guidotti A. Nicotine decreases DNA methyltransferase 1 expression and glutamic acid decarboxylase 67 promoter methylation in GABAergic interneurons. Proc Natl Acad Sci U S A 2008;105:16356-61.

28 PART A: Introduction
42. Mercer BA, Wallace AM, Brinckerhoff CE, D'Armiento JM. Identification of a cigarette smoke-responsive region in the distal MMP-1 promoter. Am J Respir Cell Mol Biol 2009;40:4-12.
43. Di YP, Zhao J, Harper R. Cigarette smoke induces MUC5AC protein expression through the activation of Sp1. J Biol Chem 2012;287:27948-58.
44. Kadonaga JT, Carner KR, Masiarz FR, Tjian R. Isolation of cDNA encoding transcription factor Sp1 and functional analysis of the DNA binding domain. Cell 1987;51:1079-90.
45. Olson KR. Carbon monoxide poisoning: mechanisms, presentation, and controversies in management. J Emerg Med 1984;1:233-43.
46. Liu Q, Liu L, Zhao Y, Zhang J, Wang D, Chen J, et al. Hypoxia induces genomic DNA demethylation through the activation of HIF-1alpha and transcriptional upregulation of MAT2A in hepatoma cells. Mol Cancer Ther 2011;10:1113-23.
47. Breitling LP, Yang R, Korn B, Burwinkel B, Brenner H. Tobacco-smoking-related differential DNA methylation: 27K discovery and replication. Am J Hum Genet 2011;88:450-7.
48. Breitling LP, Salzmann K, Rothenbacher D, Burwinkel B, Brenner H. Smoking, F2RL3 methylation, and prognosis in stable coronary heart disease. Eur Heart J 2012;33:2841-8.
49. Wan ES, Qiu W, Baccarelli A, Carey VJ, Bacherman H, Rennard SI, et al. Cigarette smoking behaviors and time since quitting are associated with differential DNA methylation across the human genome. Hum Mol Genet 2012;21:3073-82.
50. Wan ES, Qiu W, Carey VJ, Morrow J, Bacherman H, Foreman MG, et al. Smoking-Associated Site-Specific Differential Methylation in Buccal Mucosa in the COPDGene Study. Am J Respir Cell Mol Biol 2015;53:246-54.
51. Zeilinger S, Kuhnel B, Klopp N, Baurecht H, Kleinschmidt A, Gieger C, et al. Tobacco smoking leads to extensive genome-wide changes in DNA methylation. PLoS One 2013;8:e63812.
52. Shenker NS, Ueland PM, Polidoro S, van Veldhoven K, Ricceri F, Brown R, et al. DNA methylation as a long-term biomarker of exposure to tobacco smoke. Epidemiology 2013;24:712-6.
53. Shenker NS, Polidoro S, van Veldhoven K, Sacerdote C, Ricceri F, Birrell MA, et al. Epigenome-wide association study in the European Prospective Investigation into Cancer and Nutrition (EPIC-Turin) identifies novel genetic loci associated with smoking. Hum Mol Genet 2013;22:843-51.
54. Guida F, Sandanger TM, Castagne R, Campanella G, Polidoro S, Palli D, et al. Dynamics of smoking-induced genome-wide methylation changes with time since smoking cessation. Hum Mol Genet 2015;24:2349-59.
55. Qiu W, Wan E, Morrow J, Cho MH, Crapo JD, Silverman EK, DeMeo DL. The impact of genetic variation and cigarette smoke on DNA methylation in current and former smokers from the COPDGene study. Epigenetics 2015;10:1064-73.
56. Gao X, Jia M, Zhang Y, Breitling LP, Brenner H. DNA methylation changes of whole blood cells in response to active smoking exposure in adults: a systematic review of DNA methylation studies. Clin Epigenetics 2015;7:113.
57. Michels KB, Binder AM, Dedeurwaerder S, Epstein CB, Greally JM, Gut I, et al. Recommendations for the design and analysis of epigenome-wide association studies. Nat Methods 2013;10:949-55.
58. Lin X, Barton S, Holbrook JD. How to make DNA methylome wide association studies more powerful. Epigenomics 2016;8:1117-29.
59. Yong WS, Hsu FM, Chen PY. Profiling genome-wide DNA methylation. Epigenetics Chromatin 2016;9:26.

CHAPTER 1: General introduction and outline of thesis 29
60. Lisanti S, Omar WA, Tomaszewski B, De Prins S, Jacobs G, Koppen G, et al. Comparison of methods for quantification of global DNA methylation in human cells and tissues. PLoS One 2013;8:e79044.
61. Kurdyukov S, Bullock M. DNA Methylation Analysis: Choosing the Right Method. Biology (Basel) 2016;5.
62. Harrison A, Parle-McDermott A. DNA methylation: a timeline of methods and applications. Front Genet 2011;2:74.
63. Guerrero-Bosagna C. DNA Methylation Research Methods. Mater Methods 2013;3:206. 64. Bibikova M, Fan JB. Genome-wide DNA methylation profiling. Wiley Interdiscip Rev Syst
Biol Med 2010;2:210-23. 65. Rakyan VK, Down TA, Balding DJ, Beck S. Epigenome-wide association studies for
common human diseases. Nat Rev Genet 2011;12:529-41. 66. Sandoval J, Heyn H, Moran S, Serra-Musach J, Pujana MA, Bibikova M, Esteller M.
Validation of a DNA methylation microarray for 450,000 CpG sites in the human genome. Epigenetics 2011;6:692-702.
67. Dedeurwaerder S, Defrance M, Calonne E, Denis H, Sotiriou C, Fuks F. Evaluation of the Infinium Methylation 450K technology. Epigenomics 2011;3:771-84.
68. Roessler J, Ammerpohl O, Gutwein J, Hasemeier B, Anwar SL, Kreipe H, Lehmann U. Quantitative cross-validation and content analysis of the 450k DNA methylation array from Illumina, Inc. BMC Res Notes 2012;5:210.
69. Stirzaker C, Taberlay PC, Statham AL, Clark SJ. Mining cancer methylomes: prospects and challenges. Trends Genet 2014;30:75-84.
70. Bird A. DNA methylation patterns and epigenetic memory. Genes Dev 2002;16:6-21. 71. Ehrlich M, Gama-Sosa MA, Huang LH, Midgett RM, Kuo KC, McCune RA, Gehrke C.
Amount and distribution of 5-methylcytosine in human DNA from different types of tissues of cells. Nucleic Acids Res 1982;10:2709-21.
72. Kitsios GD, Zintzaras E. Genome-wide association studies: hypothesis-"free" or "engaged"? Transl Res 2009;154:161-4.
73. Touleimat N, Tost J. Complete pipeline for Infinium((R)) Human Methylation 450K BeadChip data processing using subset quantile normalization for accurate DNA methylation estimation. Epigenomics 2012;4:325-41.
74. Eckhardt F, Lewin J, Cortese R, Rakyan VK, Attwood J, Burger M, et al. DNA methylation profiling of human chromosomes 6, 20 and 22. Nat Genet 2006;38:1378-85.
75. Lienert F, Wirbelauer C, Som I, Dean A, Mohn F, Schubeler D. Identification of genetic elements that autonomously determine DNA methylation states. Nat Genet 2011;43:1091-7.
76. Wang D, Yan L, Hu Q, Sucheston LE, Higgins MJ, Ambrosone CB, et al. IMA: an R package for high-throughput analysis of Illumina's 450K Infinium methylation data. Bioinformatics 2012;28:729-30.
77. Jaffe AE, Murakami P, Lee H, Leek JT, Fallin MD, Feinberg AP, Irizarry RA. Bump hunting to identify differentially methylated regions in epigenetic epidemiology studies. Int J Epidemiol 2012;41:200-9.
78. Peters TJ, Buckley MJ, Statham AL, Pidsley R, Samaras K, R VL, et al. De novo identification of differentially methylated regions in the human genome. Epigenetics Chromatin 2015;8:6.
79. Kechris KJ, Biehs B, Kornberg TB. Generalizing moving averages for tiling arrays using combined p-value statistics. Stat Appl Genet Mol Biol 2010;9:Article29.
80. Pedersen BS, Schwartz DA, Yang IV, Kechris KJ. Comb-p: software for combining, analyzing, grouping and correcting spatially correlated P-values. Bioinformatics 2012;28:2986-8.

30 PART A: Introduction
81. Butcher LM, Beck S. Probe Lasso: a novel method to rope in differentially methylated regions with 450K DNA methylation data. Methods 2015;72:21-8.
82. Sofer T, Schifano ED, Hoppin JA, Hou L, Baccarelli AA. A-clustering: a novel method for the detection of co-regulated methylation regions, and regions associated with exposure. Bioinformatics 2013;29:2884-91.
83. Kolde R, Martens K, Lokk K, Laur S, Vilo J. seqlm: an MDL based method for identifying differentially methylated regions in high density methylation array data. Bioinformatics 2016;32:2604-10.
84. Burgess S, Timpson NJ, Ebrahim S, Davey Smith G. Mendelian randomization: where are we now and where are we going? Int J Epidemiol 2015;44:379-88.
85. Zheng J, Baird D, Borges MC, Bowden J, Hemani G, Haycock P, et al. Recent Developments in Mendelian Randomization Studies. Curr Epidemiol Rep 2017;4:330-345.
86. Ikram MA, Brusselle GGO, Murad SD, van Duijn CM, Franco OH, Goedegebure A, et al. The Rotterdam Study: 2018 update on objectives, design and main results. Eur J Epidemiol 2017;32:807-850.
87. Psaty BM, O'Donnell CJ, Gudnason V, Lunetta KL, Folsom AR, Rotter JI, et al. Cohorts for Heart and Aging Research in Genomic Epidemiology (CHARGE) Consortium: Design of prospective meta-analyses of genome-wide association studies from 5 cohorts. Circ Cardiovasc Genet 2009;2:73-80.

CHAPTER 2
Homocysteine and DNA methylation: a review of animal
and human literature
Pooja R. Mandaviya, Lisette Stolk, Sandra G. Heil
Mol Genet Metab. 2014 Dec;113(4):243-52

32 PART A: Introduction
ABSTRACT
Homocysteine (Hcy) is a sulfur-containing non-protein forming amino acid, which is
synthesized from methionine as an important intermediate in the one-carbon pathway.
High concentrations of Hcy in a condition called hyperhomocysteinemia (HHcy) are an
independent risk factor for several disorders including cardiovascular diseases and
osteoporotic fractures. Since Hcy is produced as a byproduct of the methyltransferase
reaction, alteration in DNA methylation is studied as one of the underlying mechanisms
of HHcy-associated disorders. In animal models, elevated Hcy concentrations are
induced either by diet (high methionine, low B-vitamins, or both), gene knockouts
(Mthfr, Cbs, Mtrr or Mtr) or combination of both to investigate their effects on DNA
methylation or its markers. In humans, most of the literature involves case–control
studies concerning patients. The focus of this review is to study existing literature on
HHcy and its role in relation to DNA methylation. Apart from this, a few studies
investigated the effect of Hcy-lowering trials on restoring DNA methylation patterns, by
giving a folic acid or B-vitamin supplemented diet. These studies which were conducted
in animal models as well as humans were included in this review.
HIGHLIGHTS
o Hyperhomocysteinemia in animals is associated with high SAH and low
SAM/SAH ratio, but changes in SAM were not consistent.
o SAM:SAH ratio is not a good proxy for DNA methylation levels in
hyperhomocysteinemic animal models.
o Both diet- and genetically induced hyperhomocysteinemic animal models
have altered methylation indicating homocysteine as a keyplayer.
o Global DNA methylation was not consistently altered in humans with
hyperhomocysteinemia.
o Homocysteine-lowering trials did not result in a clear improvement of DNA
methylation patterns in most studies.

CHAPTER 2: Homocysteine and DNA methylation: a review 33
1. INTRODUCTION
Homocysteine (Hcy) is a sulfur-containing non-protein forming amino acid, which
occurs naturally in the blood plasma. It is biosynthesized as an intermediate in the one-
carbon pathway from methionine, via two main cofactors: S-adenosylmethionine
(SAM) and S-adenosylhomocysteine (SAH). SAM acts as an important cosubstrate and
is used by the DNA methyltransferase enzymes in transferring methyl groups to the
DNA. The product of this reaction, SAH, is then synthesized to Hcy in a reversible
manner. The concentrations of Hcy are maintained by two routes; namely: the
remethylation pathway, where Hcy is converted back to methionine, and the
transsulfuration pathway, where Hcy is converted to cystathionine to form cysteine [1].
A basic illustration of the Hcy pathway is given in Fig. 1.
Figure 1. A simplified figure of homocysteine pathway as present in the liver, which includes
the main enzymes and dietary factors described in this review. DHFR: Dihydrofolate
reductase; SHMT: Serine hydroxymethyltransferase; MTHFR: 5,10-
Methylenetetrahydrofolate reductase; MSR: Methionine synthase reductase; MS:
Methionine synthase; BHMT: Betaine-homocysteine methyltransferase; MAT: Methionine
adenosyltransferase; DNMT: DNA methyltransferase; SAHH: S-adenyl-l-homocysteine
hydrolase; CBS: Cystathionine β-synthase; CSE: Cystathionine γ-lyase. Light gray boxes: B-
vitamins; Dark gray boxes: enzymes; Black boxes: Homocysteine and DNA methylation; the
dashed line divides the remethylation from the transsulfuration pathway.

34 PART A: Introduction
Almost 20 years ago, high concentrations of Hcy in a condition called
hyperhomocysteinemia (HHcy), were shown to be an independent risk factor for
several disorders including cardiovascular diseases [2] and osteoporotic fractures [3].
Since the reaction from SAH to Hcy is reversible, high concentrations of Hcy increase
the concentrations of SAH, which acts as a competitive inhibitor of the
methyltransferase reaction [4]. Elevated SAH leads to lower SAM:SAH ratio, which
could result in less donation of methyl groups to the DNA by SAM. Elevated SAH is
shown to be associated with global DNA hypomethylation, but this phenomenon is
tissue-specific and the mechanisms are unknown [5]. Since Hcy is produced as a
byproduct of the methyltransferase reaction, alterations in DNA methylation levels are
studied as one of the underlying mechanisms of HHcy-associated disorders.
The primary causes of HHcy are dietary and/or deficiencies of the key
enzymes of the Hcy metabolism pathway [Fig. 1]. These dietary factors and enzymes
that play a role in the remethylation and transsulfuration pathway, balance the
concentrations of Hcy by converting it to methionine or cystathionine. The essential
dietary factors include methionine and B vitamins (folate, vitamin B6 and vitamin B12).
Low vitamin B12 and/or folate are associated with high Hcy [6] and associated risks like
cardiovascular disease [7], pregnancy complications [8] and neural tube defects [9].
Besides methionine and B-vitamins, dietary choline and betaine are also important co-
factors of the one-carbon pathway. Low dietary choline or with its association with
dietary betaine is associated with elevated Hcy in both mice and humans [10–12].
Dietary choline undergoes oxidation to produce betaine and helps in the synthesis of
SAM, thus being an indirect methyl donor contributing to the SAM:SAH ratio. Due to
limited literature on choline deficient diets, we have focused this review only on high
methionine (HM) and B-vitamin deficient diets.
Polymorphisms in genes encoding for enzymes like
methylenetetrahydrofolate reductase (MTHFR), cystathionine β-synthase (CBS), and
methionine synthase (MS) are important determinants of Hcy concentrations [13].
MTHFR converts 5,10-methylenetetrahydrofolate to 5-methyltetrahydrofolate (5-
MTHF). 5-MTHF acts as a cosubstrate in the remethylation pathway by converting Hcy
to methionine. The enzyme MS encoded by the MTR gene, is reductively activated by
methionine synthase reductase (MSR) enzyme, which is encoded by MTRR. MS
catalyzes the remethylation of methionine from Hcy. The enzyme CBS plays a role in
the transsulfuration pathway by catalyzing the conversion of Hcy to cystathionine.
Depending on the severity of one or more dietary and/or enzyme deficiencies, HHcy
may occur at different levels. Hcy concentrations < 15 μmol/L are referred to as mild,
between 15 and 30 μmol/L are referred to as moderate, between 30 and 100 μmol/L
as intermediate, and >100 μmol/L as severe HHcy [14].
The focus of this review is to study existing literature on HHcy and its role in
relation to DNA methylation. We included studies with effects of diet and/or genotype

CHAPTER 2: Homocysteine and DNA methylation: a review 35
on plasma or serum Hcy and its consequent role in the alteration of global, gene-
specific or genome-wide DNA methylation. Scientific papers based on both animal and
human experiments were reviewed in PubMed. A literature search with varied terms of
Hcy and DNA methylation was done, in order to filter out relevant articles which were
published from 2001 until 2014. In the animal literature, we focused on mice and rat
studies. We included all papers which measured plasma or serum Hcy and either or all
of the methylation markers like SAM and SAH or global or gene-specific DNA
methylation. We divided the animal literature in three subtopics, namely 1) diet-
induced HHcy, 2) genetically-induced HHcy, and 3) genetically- and diet-induced HHcy.
A hyperhomocysteinemic (HH) diet mainly involves either HM, low folate (LF) or
vitamin B12 or their combination. In addition, low concentrations of choline, riboflavin
and pyridoxine might be present. From the human literature, studies which measured
plasma or serum Hcy and DNA methylation levels were included, and only if the main
aim of the study was to test the association between the two. We focused at vascular
diseases, cancer, renal disease and brain disorders.
Methylation can be measured at 3 levels: global, genome-wide and gene-
specific. We used the term “global” in this review for studies that report DNA
methylation as the total 5-methyl cytosine content, using techniques like cytosine
extension assay and LC–MS/MS. Some groups measured methylation of LINE-1, B1 and
Alu repetitive elements, which are suggested to be surrogate markers of global
methylation levels. We used the term “genome-wide” for methylation measures from
DNA-methylation arrays. “Gene-specific” methylation measures methylation levels of
cytosines located at specific genes or within their promoters.
2. ANIMAL STUDIES
2.1. Diet-induced HHcy
Diet with an excess of methionine and/or deficient in one or more of the B vitamins like
folate, vitamin B6 or vitamin B12, play a role in elevating the concentrations of Hcy.
The resulting deregulation of global or gene-specific DNA methylation and the
methylation markers SAM and SAH is demonstrated with experiments involving
different rat and mouse models [Table 1]. The apolipoprotein E (ApoE)- deficient
mouse, a model that develops spontaneous atherosclerosis, have often been used in
experiments to study the dietary impact of Hcy-induced DNA methylation alteration in
vascular pathologies. A few other experiments are done in mice and rats without gene
knock- outs to investigate similar effects.
2.1.1. High methionine diet
Among the many diseases linked to HHcy, vascular pathologies are mostly explored in
the literature of Hcy and DNA methylation. In 2001, Dayal and associates showed in
both Cbs (+/+) mice and Cbs (+/−) mice models from C57BL/6J background that, even in

36 PART A: Introduction
the absence of folate deficiency, HHcy and endothelial dysfunction occur in mice fed
with a HM diet for 15 weeks. SAM was lower in brain at 7 weeks and SAH was higher in
liver at 15 weeks. Both in the brain and liver, SAM:SAH ratio was markedly reduced at
15 weeks, which had a strong correlation with high plasma Hcy [15].
In 2007, Jiang et al. investigated the effects of HHcy on DNA methylation of
the B1 repetitive elements, in relation to atherosclerosis. They gave a HM diet with
different concentrations of 1%, 1.5% and 2% to healthy Sprague–Dawley rats for 4
weeks to achieve HHcy. B1 elements, as quantified by real-time PCR, were
hypomethylated to 26.2%, 20.1% and 22.2%, respectively for the three diet
concentrations. Aortic SAM decreased and SAH increased, leading to a 3- to 4-fold
decrease in SAM:SAH ratio [16]. In order to further examine these effects of HHcy on
the pathogenesis of atherosclerosis more thoroughly, the same group also studied an
ApoE-deficient mouse model. For 15 weeks, the mice were given a HM diet to induce
HHcy. Methylation of both global DNA and B1 elements was measured in the aorta, by
both methylation-dependent restriction analysis and nested methylation- specific PCR
(MSP). The HM group showed a lower methylation of global DNA and B1 elements,
compared to controls. Aortic SAM and SAH were 1.35- and 1.86-fold higher,
respectively. SAM:SAH ratio showed an opposite trend of being 1.46-fold higher unlike
previous study, and the atherosclerotic lesions were also larger [17]. In a similar study,
ApoE-deficient mice when given a HM or HM-B-vitamin deficient diet showed an
increase in plasma Hcy in the HM diet group, with a more remarkable increase in HM-
B-vitamin deficient group. Plasma SAH was higher in both groups, compared to the
ApoE-deficient mice with control diet. The atherosclerotic lesion areas were 53% and
95% larger in the HM and HM-B-vitamin deficient groups, respectively. Aortic global
methylation identified by detection antibodies and quantified by an ELISA, was lower in
both groups [18]. Another similar study examined HHcy effects on cardiac injury by
gene-specific DNA methylation alteration in ApoE-deficient mice induced by a HM diet.
Lower cardiac SAM and 5.2% lower methylation of the key cardiac apoptotic gene,
Trp53, was observed compared to the ApoE-deficient mice with regular diet, as
measured by nested MSP. It remains unclear what the effect of these small changes in
methylation is on cardiovascular phenotypes of these mice [19].
In addition to vascular pathologies, methionine-induced HHcy is explored in
relation to other disorders like bone loss and neurodegeneration. A HM diet given for
20 weeks to female Wistar rats, induced HHcy and accumulated Hcy in bone tissue by
13 times leading to a reduced bone strength and cancellous bone loss. SAM and SAH
concentrations were increased and the SAM:SAH ratio was decreased in the plasma
and bone [20]. The same authors in a later study gave a HM diet to female Wistar rats
for 5 months to study the effects of HHcy in relation to neurodegeneration. As a result,
SAH was higher and SAM:SAH ratio was lower in plasma, brainstem and frontal cortex
of rats on HM diet, compared to the rats on control diet. SAM concentrations were

CHAPTER 2: Homocysteine and DNA methylation: a review 37
higher in the plasma and brainstem [21].
2.1.2. B vitamin deficient (folate, B6, B12) diets
Similar to HM diet, a B-vitamin deficient diet to induce HHcy in animal models has been
studied too. Caudill et al. administered a diet low in methionine and deficient in folate
and choline to C57BL/6J mice. After 24 weeks, Hcy was higher, compared to the control
diet mice. SAM concentrations and SAM:SAH ratio were lowered in all the analyzed
tissues; liver, kidney, brain and testes. SAH was higher in the liver, but not in other
tissues. However, global DNA methylation measured by cytosine extension assay did
not change in any of the tissues [22].
In the context of vascular pathologies, effects of HHcy induced by a B-vitamin
deficient diet were not as clear as compared to the effects by the HM diet. In a study
by Liu et al., B-vitamin deficient diet with or without HM was given to a group of ApoE-
deficient mice. The aortic sinus plaque areas were shown to be larger as a result of HM
diets, but not with B-vitamin deficient diet alone. Plasma Hcy was elevated, but there
was no change in the plasma SAH or aortic global methylation levels [18]. Another
study investigated the effects of folate and/or vitamin B12 deficiency on endothelium-
dependent relaxation in rats. Serum Hcy was higher in the folate deficient (FD) and
folate-vitamin B12 deficient diet groups, compared to controls. Liver SAM and SAM:
SAH ratio were lower, and SAH showed no difference. However no association of
folate, vitamin B12, Hcy, SAM, SAH or SAM:SAH ratio was found with vascular reactivity
[23]. In yet another study, moderate HHcy resulted when ApoE-deficient mice were
treated with either a FD or folate, vitamin B6 and B12 deficient diet for 16 weeks. The
hepatic SAM:SAH ratio for both the diets were reduced up to 80 and 90% respectively.
However, they showed no association with atherosclerosis and global DNA methylation
of the vascular or liver tissue, even after an increased atherosclerotic lesion formation
in the aortic arch [24,25].
In relation to pregnancy outcomes, maternal folate status affects the
homeostasis of Hcy pathway in their offsprings. In a study by Blaise et al., female
Wistar rats were fed a diet deficient in vitamin B12, B2, folate and choline from one
month before pregnancy until weaning at day 21. Hcy concentrations were moderately
elevated in mothers. The pups, who were fed on dams with such a deficient diet, also
developed HHcy and had a decline in hepatic SAM:SAH ratio due to the decrease in
SAM. Cbs, Mthfr and Ms activities in the liver were extremely lower in deficient pups in
comparison to normal fed pups [26]. In another similar study of a FD diet given to
female pregnant rats starting 2 weeks before mating until gestation at day 21, 4.5-fold
increased maternal plasma Hcy concentrations were seen. However in this case, no
change in the global DNA methylation levels was observed in the maternal or fetal rat
livers [27]. Similarly, Mejos et al. randomly administered a FD or a folate supplemented
(FS) diet to male and female rats for 4 weeks until mating. Hcy concentrations were

38 PART A: Introduction
elevated in the postnatal rats of either or both of the deficient parents, in comparison
to the postnatal rats of both FS parents. There was a marked reduction of hepatic
folate and global DNA methylation levels as identified by detection antibodies and
quantified using an ELISA [28]. In another study, pregnant Mthfr (+/+) mice were fed a
FD diet to induce HHcy. Hepatic SAM concentrations were decreased and SAH
concentrations were increased, which was accompanied by a reduction of SAM:SAH
ratio. Placental SAH also increased with decrease in SAM:SAH ratio [29].
Two other studies measured the levels of DNA methylation and its
metabolites in the brain of FD diet induced HH rats. The treatment periods for the
studies were 30 days and 36 weeks. SAM, SAH and SAM: SAH ratio remained unaltered
in both cases. In the first case, global DNA methylation measured by in vitro methyl
acceptance capacity assay, was lowered in the deficient group compared to controls
[30]. Interestingly, in the second case, at 18 and 36 weeks, the global DNA methylation
levels quantified by high-performance liquid chromatography–(electrospray)-mass
spectrometry, were higher in the FD diet group, as compared to controls, although the
same mice group had also shown global hypomethylation in the liver, when quantified
by the cytosine extension assay [31,32]. The trend in the alteration of DNA methylation
differed between studies, or might suggest a different mechanism with prolonged
treatment period. Furthermore in an additional study, such a similar HH model of Cbs
(+/+) mice showed elevated SAH with lower SAM:SAH ratio in the brain [33].
Folate deficiency, which is also implicated in relation to colon cancer, was
experimented in the colon of HH rats by two groups. In the first study, SAM
concentrations of the colonic mucosa and methylation of Trp53 promoter region
remained unchanged in the FD diet group. A 3–3.5 fold higher SAH and 64–71% lower
SAM:SAH ratio was observed at 5 weeks, in comparison to controls. A 30% higher
colonic global DNA methylation, measured by an in vitro methyl acceptance capacity
assay was observed only at 3 weeks, which directly correlated with plasma Hcy [34].
The second study group conducted a FD treatment of 24 weeks. An ~11% lower hepatic
SAM:SAH ratio was observed, in comparison to controls. But no change was found in
colonic SAM and SAH concentrations or their ratio. Global DNA methylation in the liver
and colon did not lower significantly, even after this longer treatment period of 24
weeks [35].
In general, different diets may have variable effects on Hcy, DNA methylation
and its markers. Devlin and associates conducted a study, where they assigned one of
the 3 diets for 7–15 weeks to random groups of both Mthfr (+/+) and Mthfr (+/−) mice;
1) HM 2) LF 3) HM-LF. Plasma Hcy showed no difference between control and the HM
diet group. But higher Hcy was observed in the LF and HM-LF group, as compared to
controls. Hepatic and brain SAM:SAH ratio were lower in all experimental diet groups,
being the most in the LF and HM-LF groups. In the liver, the lower SAM:SAH ratio in LF
and HM-LF groups was due to higher SAM, whereas, in the HM group, it was due to

CHAPTER 2: Homocysteine and DNA methylation: a review 39
higher SAH. No effect on global hepatic or brain DNA methylation was observed in any
of the three cases [36].
2.2. Genetically-induced Hhcy
Genetic variants in the key enzymes of the one-carbon pathway like MTHFR, MTRR, MS
or CBS are associated with disease risks. These enzymes help balance Hcy
concentrations within the pathway. In order to study Hcy-induced change in DNA
methylation or its markers by such enzyme deficiencies, a few study groups used gene
knockout mice models [Table 2].
2.2.1. MTHFR deficiency
MTHFR is one of the common enzymes that could be deficient leading to alterations in
Hcy metabolism. In relation to vascular pathology, Chen et al. generated two groups of
Mthfr (+/−) and Mthfr (−/−) mice, which showed 1.6 and 10-fold higher plasma Hcy,
respectively, compared to Mthfr (+/+) mice. SAM and SAH concentrations in the brain,
ovaries, testes and liver were altered, and global DNA methylation, measured by
cytosine extension assay, was lowered in the brain and ovaries. This was accompanied
by an abnormal lipid deposition in the aorta for both knockout groups, and a 76.4%
reduced survival of Mthfr (−/−) mice [37]. In 2004, Devlin et al. used the Mthfr (+/−)
mice that were generated by Chen et al. They observed lower SAM: SAH ratio in the
liver and brain tissue compared to Mthfr (+/+) mice. Disrupted Mthfr gene also
sensitized the mice to diet-induced HHcy and endothelial dysfunction [36]. In yet
another study, Mthfr (−/−) mice showed lower global DNA methylation which was
quantified by thin layer chromatography in the cerebellum, as compared to the control
mice. They also found lower methylation of CpG dinucleotide 4 within first exon 17 of
the Nr3c1 gene encoding the glucocorticoid receptor in the hippocampus, which was
measured by pyrosequencing. This was accompanied by more mRNA and protein of the
Nr3c1 gene, behavioral anomalies, disrupted cognitive function, increased apoptosis
and other neurobiological changes [38].
2.2.2. CBS deficiency
In 2001, Caudill and coworkers studied the effects of HHcy on Cbs (+/−) mice. As a
result, SAM and SAM:SAH ratio were lower in all the analyzed tissues; liver, kidney,
brain and testes, as compared to the Cbs (+/+) mice. SAH showed an increase in the
liver and testes, but not in the kidney and brain. DNA methylation was measured by
cytosine extension assay and did not show to be hypomethylated in any of the tissues,
but the testes [22]. In the same year, Dayal et al. set up a similar Cbs (+/−) mouse
model to induce HHcy. In the liver and brain, SAH were 2-fold higher and SAM:SAH
ratios were lowered. In addition, an approximately 20% lower thrombomodulin activity
was observed in the aortic arch of the Cbs (+/−) mice, which correlated with SAH [15].
Sontag et al. in their defined HH model also showed an ~27% lower methylation of

40 PART A: Introduction
protein phosphatase 2, regulatory subunit A, alpha (Ppp2r1a) gene in the brain. The
methylation was identified by detection antibodies and quantified by ELISA [33]. In
three studies that followed, severe HHcy showed in Cbs (−/−) mice. In the first study,
SAH concentrations were 8 times higher in the liver and kidney and 190 times higher in
the brain, as compared to Cbs (+/+) mice. The SAM:SAH ratio was observed to be 80%
in the liver, 87% in the kidney and 100% in the brain. Only in the liver tissue, SAM
concentrations were higher and global DNA methylation measured by the in vitro
methyl acceptance capacity assay was lower [39]. In the second study, 20-fold higher
liver Hcy in 4- to 6-month old Cbs (−/−) mice were seen, as compared to Cbs (+/+).
Hepatic SAM and SAH concentrations were also higher [40]. In the third study, Cbs
(−/−) mice developed fatty livers at 2 weeks, which became less apparent at 8 weeks.
The fatty livers at 2 weeks also showed a decline in global protein arginine methylation.
The liver SAM and SAH concentrations increased at both weeks, showing a 2-fold
decrease of the SAM:SAH ratio at 8 weeks [41].
2.2.3. MSR deficiency
The enzyme MSR is required for the normal functioning of the MS enzyme, which helps
in Hcy remethylation. In 2005, Dayal et al. com- pared Mtr (+/−) mice with Mtr (+/+)
mice, and demonstrated that higher plasma Hcy was observed in the Mtr (+/−) mice,
compared to the Mtr (+/+) mice. However, no effect was seen on methylation markers
of the liver or brain tissue [42]. In 2007, Elmore et al. generated HH mice with either a
heterozygous or a homozygous knockout for the Mtrr gene, encoding MSR. No
difference in SAM and SAH was observed in the kidney and brain. Heart tissue showed
higher SAH and lower SAM:SAH ratio, as compared to the Mtrr (+/+) mice. But
unexpected opposite trends were observed in the liver, which showed higher SAM and
lower SAH with higher SAM:SAH ratio [43] study demonstrated that maternal Mtrr
(−/−) mice influences the placental methylation levels of their Mtrr (+/+) grandprogeny,
both globally and in about 45–70% of the studied imprinted genes. In this case, global
DNA methylation was identified using detection antibodies and methylation of the
imprinted genes was quantified by bisulfite pyrosequencing [44].
2.3. Genetically- and diet-induced Hhcy
Dietary deficiencies affect Hcy concentrations and consequently DNA methylation.
However if dietary deficiencies are accompanied by enzyme deficiencies, then a more
sensitive effect on Hcy and DNA methylation can be expected [Table 3]. A few studies
in rat and mouse models have shown a combined effect of diet and gene knockout to
investigate the same.
2.3.1. Diet and CBS deficiency
Caudill et al. studied the HHcy effects from a diet deficient in methionine, choline and
folate, in a Cbs (+/−) mice. SAM and SAM:SAH ratio were lowered in all analyzed

CHAPTER 2: Homocysteine and DNA methylation: a review 41
tissues; liver, kidney, brain and testes, compared to Cbs (+/+) mice with regular diet.
SAH concentrations were higher in the liver, brain and testes, but not in the kidney.
Using the cytosine extension assay, global DNA was found to be hypomethylated only
in the brain and testes [22].
In relation to vascular pathologies, several studies administered a HM-LF diet
to Cbs (+/−) mice to induce HHcy. Using such a mouse model, tissue-specific alterations
of methylation in the maternal differentially methylated domain of the H19 gene were
observed. This domain was hypomethylated in the liver, and hypermethylated in the
brain and aorta, as compared to the Cbs (+/+) mice with control diet. SAH
concentrations increased and SAM:SAH ratio decreased in the liver and brain. The
expression of H19 transcripts in the aorta increased by 2.5-fold [45]. In a similar study,
when giving a HM-LF diet to Cbs (+/−) mice, Glier et al. reported mildly higher Hcy. SAH
concentrations were higher and SAM:SAH ratio was lower in the liver, but not in the
brain, as compared to Cbs (+/+) mice with control diet. Lower SAM:SAH ratio in the
liver was accompanied by lower methylation in the maternal H19 DMD allele which
was measured by bisulfite sequencing. Interestingly, higher methylation in this domain
was observed in the brain, despite no effect in brain SAM:SAH ratio. This also suggests
tissue-specific differences [46]. Previously, the authors observed alteration of the SAM
and SAH in the liver and brain at 7 and 15 weeks of diet treatment, with a lower
SAM:SAH ratio at 15 weeks [15]. In another recent study, 12 weeks of HM-LF diet given
to a Cbs (+/−) mice showed hypermethylation of the promoter transcripts of the Nr3c1
gene, measured using bisulfite pyrosequencing. This epigenetic silencing of Nr3c1 gene
in the aorta was associated with HHcy [47].
With a combination of Cbs knockout and HM-LF diet in mice, studies have
also been conducted in relation to HHcy associated liver pathologies. In the first study,
a fatty acid desaturase enzyme of the liver, which is encoded by Fads2 gene and
involved in fatty acid synthesis, was epigenetically silenced with hypermethylation in its
promoter in Cbs (+/−) mice with HM-LF diet, compared to Cbs (+/+) mice with control
diet. This was accompanied by lower SAM:SAH ratio, which associated with
phospholipid and fatty acid metabolism in the liver [48]. In a similar study, the liver acyl
CoA:cholesterol acyl transferase 2 (Acat2) enzyme responsible for the production of
cholesteryl esters, had lower expression levels in Cbs (+/−) mice with HM-LF diet,
compared to Cbs (+/+) mice with regular diet. Soat2 which encodes Acat2, had an
altered methylation which was quantified by bisulfite pyrosequencing at the CpG rich
region of its 5′ portion, compared to Cbs (+/+) mice with control diet. This was also
accompanied by higher methylation of the B1 repetitive elements that were quantified
by the same technique [49].

42 PART A: Introduction
3. HUMAN STUDIES
Besides in animals, effects of Hcy on DNA methylation are also investigated in humans.
Most of these concerned patients and a few healthy volunteers [Table 4]. In a study, 71
vegetarians, 58% of whom were vitamin B12 deficient, were evaluated for their
methylation markers and their relationship with peripheral blood DNA methylation.
Serum Hcy was higher than 12 μmol/L in 45% of the vegetarians, which was higher
than in omnivores. It showed no association with SAM, SAH or SAM:SAH ratio.
Methylation levels of 3 CpG sites in Alu-repetitive elements correlated with SAH and
SAM:SAH ratio, but not with Hcy or SAM. In addition, the methylation status of the
SHC1 promoter was investigated, however this was not correlated with Hcy, SAM, SAH
or SAM:SAH ratio [50].
In another study, healthy adult women with elevated Hcy had a 2.6-fold lower
lymphocyte global DNA methylation, which was measured by cytosine extension assay.
Plasma SAH concentrations were 2-fold elevated, which decreased SAM:SAH ratio by
one-half. This SAM:SAH ratio showed a direct relation with intracellular lymphocyte
SAM:SAH ratio [51,52]. In a study by Perng et al. plasma Hcy positively correlated to
LINE-1 methylation, which was quantified by pyrosequencing in healthy middle-aged
adults. However, Alu methylation did not significantly correlate with plasma Hcy [53].
A study by Farkas and group divided Hcy concentrations of 56 blood leukocyte
samples into low (5–10 μmol/L) and high (20–113 μmol/L) Hcy and considered them as
well-nourished and poorly nourished subjects, respectively. Site-specific methylation
differences quantified by pyrosequencing were observed in 17 CpG sites of the RFC1
gene between the groups. [54].
In relation to pregnancy, LINE-1 methylation in blood and folate- related
parameters from 24 pregnant women, all of whom were under folate diet, were
determined using pyrosequencing. Cord plasma Hcy showed inverse correlation with
LINE-1 methylation in cord blood [55]. This study was later extended by using DNA
methylation arrays in 12 pregnant women in order to assess correlation of genome-
wide methylation patterns with plasma Hcy and LINE-1 methylation. Univariate
regression analysis identified 298 autosomal and 8× chromosome CpG sites associated
with Hcy. In addition, methylation of 146 autosomal CpGs mostly located within CpG
islands, was associated with LINE-1 methylation [56].
A few more studies were performed in individuals having specific diseases,
which have known to be associated with high Hcy. We focused this review at vascular
disease, cancer, renal diseases and brain disorders.
3.1. Vascular disease
Two case-control studies were performed to evaluate Hcy effects on global DNA
methylation in vascular diseases, measured using cytosine extension assays. The first
study measured global DNA methylation in leukocytes, which was lower in

CHAPTER 2: Homocysteine and DNA methylation: a review 43
atherosclerotic patients (N = 17), as compared to controls (N = 15) and had an inverse
correlation with plasma Hcy. In addition, plasma SAH concentrations were higher and
SAM:SAH ratio was lower, which also correlated with Hcy [57]. The second study
measured global DNA methylation in peripheral blood lymphocytes. In this case, Hcy
and global DNA methylation were higher in 137 coronary artery disease cases
compared to 150 controls, with a positive association between the two [58]. In another
study, LINE-1 methylation was measured at baseline in 712 elderly men either at low
risk or with high risk for ischemic heart disease or stroke. Plasma Hcy was higher and
LINE-1 methylation was lower in the case of individuals at risk. However, the two were
not correlated [59].
DNA methylation was further studied in a few candidate gene studies. Two
case–control studies with atherosclerotic patients were performed. In the first study
(54 cases, 28 controls), elevated Hcy concentrations positively correlated with DNA
methylation of CpG islands at the estrogen receptor alpha (ESR1) promoter, which
were quantified using nested MSP [60]. In the second study (197 cases, 165 controls),
elevated Hcy was correlated with MSP measured DNA hypomethylation of human
telomerase reverse transcriptase (hTERT) and its downregulation, which was
accompanied by shortened leukocyte telomere length. This was also confirmed in
methionine fed HH mouse model [61]. High Hcy was also inversely correlated with site-
specific methylation of the SHC1 promoter which was quantified using Sequenom
EpiTyper in peripheral blood leukocytes of coronary artery disease patients. [62] . In a
group of 192 patients that underwent coronary artery bypass grafting, there was no
correlation between Hcy and DDAH2 methylation of the internal mammary artery, but
with NOS2 methylation of the internal mammary artery and punch aortic fragments
[63].
In a study by Heil and group, heparin blood samples were used to isolate
genomic DNA from 9 CBS deficient patients treated with Hcy lowering therapy and 8
healthy controls. Hcy, SAM and SAH were higher in patients than in controls. However,
no difference in SAM:SAH ratio was found. In addition, global DNA methylation and
gene- specific methylation of H19 DMR were measured, which showed no difference
compared to controls [64].
3.2. Cancer
In 2003, Pufulete et al. observed 26% lower colonic global DNA methylation in patients
with colorectal adenoma (N = 35) and 30% lower methylation in 28 patients with
colorectal cancer, as compared to 76 controls. DNA methylation was quantified using in
vitro methyl acceptance capacity assay. Plasma Hcy, even though not significantly
higher in patients, showed an association with colonic DNA methylation [65]. The same
group also generated methylation indexes of the ESR1 and mutL homologue 1 (MLH1)
genes by PCR and pyrosequencing in the same subjects, which were higher in patients

44 PART A: Introduction
compared to controls. The methylation indexes of the ESR1 promoter correlated
positively with Hcy, while those at MLH1 did not show any correlation [66]. Similarly, a
colorectal cancer case–control study investigated the relation between variables of
one-carbon metabolism and promoter methylation of an eight-gene panel (CDKN2A,
MLH1, CACNA1G, NEUROG1, RUNX3, SOCS1, IGF2, and CRABP1) of archival colorectal
tumor tissue in colorectal cancer cases (N = 190). The methylation of these genes did
not associate with Hcy [67].
In summary, these studies demonstrate that MLH1 gene methylation was not
correlated with Hcy in colorectal cancer patients. However, in patients with esophageal
diseases (N = 124), promoter MLH1 hyper- methylation as quantified by restriction
enzyme-based methylation analysis, was observed in 63.5% of cancer cases and in
53.8% of precancer cases, which showed association with elevated plasma Hcy [68].
Two further studies were conducted in breast cancer patients, where in
promoter methylation of the targeted genes was quantified by MSP. In the first study,
the RARB promoter and exon 1 regions of ESR1 in breast tumor tissue of 137 primary
breast cancer cases were hypermethylated and showed elevated Hcy [69]. In the
second study (179 cases), elevated Hcy correlated with BRCA1 promoter
hypermethylation in the breast cancer tissue and corresponding peripheral blood of all
breast cancer types. In addition, RASSF1 promoter hypermethylation was studied in
breast cancer tissue of estrogen receptor (ER)-negative and progesterone receptor
(PR)-negative breast cancer cases and was also shown to correlate with Hcy [70].
3.3. Renal disease
Ingrosso et al. investigated the effects of HHcy on global DNA methylation in 32
patients with uremia who had elevated Hcy, and compared them with 11 healthy
controls. DNA methylation of peripheral blood mononuclear cells (PBMCs) measured
by cytosine extension assay and southern blotting was lower in patients, which
associated with HHcy. This change in global DNA methylation was associated with loss
of imprinting of the H19 DMR [71]. In two other studies, global DNA methylation was
measured in leukocytes of 78 stages 2–4 chronic kidney disease or 20 chronic
hemodialysis patients. However, in these studies, global DNA methylation was not
associated with plasma or serum Hcy [72,73].
3.4. Brain disorders
Patients with Alzheimer's disease showed a negative association of plasma SAM:SAH
ratio with plasma Hcy. In addition, SAM and SAH concentrations were higher in
patients [74]. Case–control studies were per- formed with euthymic bipolar or
schizophrenia patients by Bromberg et al. Hcy was elevated in schizophrenia patients,
but not in euthymic bipolar patients compared to controls. Global methylation levels in
peripheral blood leukocytes did not differ between either of the cases and controls,

CHAPTER 2: Homocysteine and DNA methylation: a review 45
and was not associated with Hcy [75,76]. A similar study performed in schizophrenia
patients (N = 42), examined the effect of plasma Hcy on genome-wide DNA
methylation of peripheral leukocytes measured by arrays. Patients had moderate
concentrations of Hcy, as compared to controls. Out of the analyzed CpGs, 1338 of
them, annotated at different gene regions, showed to be differentially methylated with
elevated Hcy. 56.6% of these sites were located in the CpG islands and their flanking
regions. Two of them included the methylated sites from the SLC18A2 and GNAL genes,
which had previously shown to associate with schizophrenia. However no correction
for multiple testing was used [77].
3.5. MTHFR 677C>T
Multiple studies looked at differences in Hcy and DNA methylation comparing MTHFR
677CNT (rs1801133) CC and TT genotypes. Two studies investigated levels of global
DNA methylation, one in PBMCs using LC Ion Trap LC/MS and the other in leukocytes
using cytosine extension assay. In both studies, the MTHFR TT genotype had lower
levels of methylation, in comparison to subjects carrying the CC genotype, which
positively correlated with folate status and negatively correlated with plasma Hcy
[78,79]. Two other studies were conducted in young women who participated in a
regime of folate depletion and repletion diet for 2 consecutive periods of 7 weeks.
Global DNA methylation in leukocytes was measured at baseline, weeks 7 and 14. In
the first study, methylation levels did not decrease significantly after 7 weeks of folate
depletion. But at 14 weeks, the methylation increased only in women with the TT
genotype. Folate concentrations were reduced and plasma Hcy were elevated in
women with TT genotype, both post-depletion and post-repletion. Hcy directly
correlated with DNA methylation only during depletion [80]. In the second study, there
was no difference in methylation levels post-depletion, but they were lower after post-
repletion. A delay in methylation response to folate in- take was suggested here, and
no correlation was observed with Hcy [81].
Three other studies assessed methylation in controls of colorectal cancer
subjects according to their genotypes. However, no difference in global DNA
methylation of lymphocytes, colon or colonic mucosa was observed when stratifying
between MTHFR CC and TT genotypes. Also, no association was found between Hcy
and methylation [82,83], except in colonic mucosa, where plasma Hcy showed a 110%
increase in individuals of TT genotypes [84].
4. EFFECT OF HCY-LOWERING THERAPY IN RELATION TO METHYLATION
4.1. Animal studies
Few studies investigated the effect of Hcy-lowering therapy on DNA methylation by
giving a B-vitamin supplemented diet to either rat or mouse models [Table 5]. Three
studies investigated the effect on liver DNA methylation. A study using male Wistar rats

46 PART A: Introduction
given a 40 mg/kg high folate diet for 4 weeks, showed lower plasma Hcy, compared to
controls. But no change was observed in hepatic SAM, SAH, SAM:SAH ratio or global
DNA methylation [85]. Another study fed Sprague–Dawley rats a vitamin B12 deficient
diet for 6 weeks to induce high Hcy. In addition, these rats were simultaneously given a
high folate diet of 100 mg/kg. Similar to the previous study, Hcy concentrations were
normalized by this treatment, but there was no change in hepatic and brain SAM, SAH,
SAM:SAH ratio or hepatic global DNA methylation [86]. Later, when Sie et al.
investigated the effect of high maternal and post-weaning folate diet on the offspring
of female Sprague–Dawley rats, contrasting results were observed. At weaning, hepatic
global DNA methylation which was quantified by in vitro methyl acceptance capacity,
was decreased by 25% due to maternal folate diet of 5 mg/kg. Hcy and site-specific
methylation of Pparg, Esr1, Trp53 and Apc genes measured by methylation-sensitive
restriction enzyme, were also decreased. At 14 weeks of post-weaning, Hcy decreased
due to both maternal and post-weaning folate diet, and methylation levels of Pparg,
Trp53 and P16 genes were increased. A decrease in global DNA methylation and
increase in methylation of Esr1 and Apc genes were also observed, but only due to
post-weaning supplementation [87].
In the case of colon tissue, male Sprague–Dawley rats on a 8 mg/kg high
folate diet for 5 weeks, showed no modulation of SAM, SAH, SAM:SAH ratio or DNA
methylation at any measured time-point, as compared to controls [34]. Yet again,
contrasting results were seen when Sie et al. in 2011 investigated maternal and post-
weaning folate diet effects on colonic global DNA methylation quantified by liquid
chromatography–electrospray ionization mass spectrometry. Hcy at weaning
decreased due to maternal high folate diet of 5 mg/kg, and colonic global DNA
methylation increased by 3%. At 14 weeks of post-weaning, Hcy similarly decreased
due to both maternal and post-weaning supplementation, but colonic global DNA
methylation decreased only due to post-weaning supplementation [88].
For brain tissue, 30 days of 8 or 40 mg/kg high folate diet did not modulate
brain methylation markers [30]. Another recent study used a Cbs (+/−) mouse model
on a HM diet for 4 weeks to induce HHcy, which increased brain DNA methylation. To
investigate the effects of high folate diet, they supplemented 0.0057 μg/g bodyweight
per day dose of folic acid in drinking water to these mice. As a result, Hcy
concentrations were lowered in the HHcy mice, and brain methylation was lower,
although not significant. Global DNA methylation was detected using antibodies and
quantified by ELISA [89].
4.2. Human studies
In humans, Hcy-lowering therapy studies did not lead to promising results for restoring
DNA methylation patterns [Table 6]. In case of colorectal adenoma patients, Pufulete
and coworkers performed a placebo-control trial with a short-term folate diet given

CHAPTER 2: Homocysteine and DNA methylation: a review 47
400 μg/day to patients with colorectal adenoma for 10 weeks. As a result, 12% lower
plasma Hcy was observed. Successively, global DNA methylation measured by in vitro
methyl acceptance capacity in leukocytes and colonic mucosa were higher by 31% and
25%, respectively, suggesting that DNA methylation can be reversed by this therapy
[90]. The same authors also investigated whether 400 μg/day folate diet re- stores
methylation in CpGs of the ESR1 and MLH1 genes of colonic mucosa, since they were
previously shown to be hypermethylated in case of colorectal tumors. After
supplementation, Hcy decreased in folate diet group, but no effect was found on ESR1
and MLH1 methylation [91]. Another placebo-control study was conducted with a 6
months daily supplementation of 5 mg/day folate diet and 1.25 mg/day vitamin-B12 to
patients with previous colorectal adenomas. Again, Hcy concentrations were lower.
However no methylation change was determined in the promoter of 6 tumor
suppressor and DNA repair genes in rectal biopsies [92].
Ingrosso et al. gave a folate treatment of 15 mg/day oral
methyltetrahydrofolate to patients with HHcy and uremia for 2 months, as a result,
plasma Hcy was decreased. Global DNA of PBMCs which was hypomethylated before
treatment, restored methylation levels showing an increase. This was measured by
cytosine extension assay and southern blotting. In addition, folate was able to restore
loss of imprinting of the H19 gene [71]. When giving 5 mg/day folate diet to patients
with intermediate HHcy for 8 weeks, Hcy concentrations were restored with an
increase in plasma SAM and SAM:SAH ratio. However, no change in plasma SAH or
global methylation levels of PBMCs was observed [93].
End stage renal failure patients have increased global DNA methylation in
peripheral lymphocytes. In order to investigate whether Hcy-lowering therapy could
reduce lymphocytic methylation, long- term stable dialysis patients were given a short
term folate diet (15 mg thrice weekly) with or without an additional supplementation
of vitamin B12 (1000 μg once a week). At 12 weeks, plasma Hcy was lower in folate diet
group, compared to controls. However, lymphocyte global DNA methylation measured
at 20 weeks, did not change [94]. Also a 1 year Hcy-lowering treatment with B-vitamins
(folate diet: 5 mg/day, pyridoxine: 100 mg/day and vitamin B12: 1 mg/day) in stage 2–4
chronic kidney disease patients, showed no change in global DNA methylation in
leukocytes [72].
Three other long-term studies were conducted for either 1, 2 or 3 years. In
the first study, the effect on whole blood LINE-1 methylation was studied by
supplementing adult subjects with B (folate diet: 500 μg/day, vitamin B12: 500 μg and
vitamin B6: 50 mg) and D vitamins (1200 IU) for 1 year. As a result, no change in LINE-1
methylation levels was observed, but the plasma Hcy decreased [95]. In the second
study, a Hcy-lowering therapy of 1 mg/day folate and B vitamins (vitamin B12: 500
μg/day and vitamin B6: 10 mg) given to an older healthy group with elevated Hcy of
N13 μmol/L showed a reduction in plasma Hcy after 2 years, while no difference was

48 PART A: Introduction
found in the plasma SAM, SAH and the SAM:SAH ratio [96]. On the third study, a
placebo-control trial of participants with moderately elevated Hcy between 13 μmol/L
and 26 μmol/L was investigated with a daily supplementation of 0.8 mg/ day folate diet
for 3 years. After supplementation, plasma Hcy decreased by 21.6%. However, no
difference in global DNA methylation in peripheral blood leukocytes was observed
between the treatment groups [97].
In addition to therapies, a recent study investigated the impact of folic acid
fortification of the US food supply on leukocyte global DNA methylation in 408
postmenopausal women. After nearly 2 years of fortification, they observed a
reduction in plasma Hcy and increase in RBC folate. There was no change in leukocyte
global DNA methylation. However, when these women were grouped into highest and
lowest tertiles of RBC folate distribution, they observed that the group with the highest
tertile had elevated mean DNA methylation in the pre-fortification period and lower
mean DNA methylation in the post-fortification period, in comparison to the lowest
tertile group. Global DNA methylation was negatively correlated with plasma Hcy in the
pre-fortification period and positively in the post-fortification period. Thus RBC folate
and plasma Hcy were proved to be important predictors of leukocyte global DNA
methylation [98].
5. DISCUSSION AND CONCLUSION
We reviewed the current literature on Hcy and DNA methylation. Although in most
studies, a clear association between Hcy and DNA hypomethylation was observed,
results were not always consistent. In animals, the association between Hcy and DNA
hypomethylation was clear whereas in humans, several contradictory findings were
published. This might be caused by the pathophysiological effects of the underlying
disease or might be explained by genetic differences between humans.
HH animal models in general have higher SAH, lower SAM:SAH ratio and
lower global DNA methylation compared to normohomocysteinemic animals. However,
a few studies showed higher SAM [15,20,21]. In addition, Cbs (−/−) mice with severe
HHcy also showed higher SAM concentrations in the liver with lower SAM:SAH ratio
[39,41]. Despite higher SAM concentrations, lower SAM:SAH ratio might be the result
of severely elevated SAH, which is due to severely higher concentrations of Hcy in Cbs
(−/−) mice. Hence, severely elevated SAH concentrations act as a strong inhibitor of
methyltransferase reaction, despite of the higher SAM. On the contrary, two other
studies in Mtrr (+/−) and Mtrr (−/−) mice found higher SAM, lower SAH and higher
SAM:SAH ratio in the liver [17,43,44]. This suggests that different genetic backgrounds
influence the outcomes differently.
SAM:SAH ratio, also called the methylation potential, did not seem to be a
proxy for DNA methylation levels in HH animal models. Some studies showed a similar
trend between the two, but in other cases, a clear opposite trend was observed. Jiang Y

CHAPTER 2: Homocysteine and DNA methylation: a review 49
et al. observed higher aortic SAM:SAH ratio with lower global DNA methylation [17],
while Devlin AM et al. observed a lower brain and hepatic SAM:SAH ratio with higher
global DNA methylation [45,48].
Hcy concentrations did not seem to be dependent on the type of treatment
i.e. by diet, gene knockout or both. However, three studies which investigated both
independent and combined effects of diet and genotype, observed higher Hcy
concentrations in HH genetic model, a similar or a higher effect in HH diet model, and a
markedly higher effect in the combined model, as compared to the control model
[15,22,36]. Despite these difference in Hcy, SAM:SAH ratios did not always show a clear
difference between the three models. Hence, the association between Hcy and
methylation markers seems independent of the underlying cause; i.e. effects were
consistently shown in diet-induced animal models, genetic animal models and in the
combination of both.
DNA methylation was not consistently altered in humans with HHcy. Global
DNA was not always hypomethylated, but was also found to be hypermethylated in
participants with high Hcy [52,58]. Studies were not similar considering tissue types,
participants and the region measured. For example, global DNA methylation was
measured in leukocytes and peripheral lymphocytes of vascular disease patients.
Global DNA in leukocytes was hypomethylated [57], whereas in peripheral lymphocytes
it was hypermethylated [58]. Disease-specific studies are limited and tissues are not
always similar. Despite the clear association observed between Hcy and global or gene-
specific methylation in vascular disease patients, we could not derive strong
conclusions. In case of other diseases, a few studies showed association, while others
did not. Hence, there is a need for more disease-specific studies which can evaluate
and compare similar regions and tissues.
Furthermore, not many large scale genome-wide studies have been published
until now, except for two [56,77]. In patients with schizophrenia and HHcy, no change
in leukocytic global DNA methylation was observed [75], but genome-wide changes in
DNA methylation were found [77]. Hence, more genome-wide studies should also be
done to evaluate more site-specific genome regions and genes involved in Hcy-induced
DNA methylation alteration.
Moreover, variable tissue types must be measured for DNA methylation and
its markers to explore Hcy effects tissue-specifically. Two studies conducted in a
heterozygous Cbs knockout mice observed tissue-specific effects in the H19 DMD of
the liver, brain and aorta when given a HM-LF diet to induce HHcy [45,46]. Looking at
all the studies, we did not notice any strongest effects of homocysteine metabolism on
methylation in the liver tissue, as compared to other tissues. Although this might be
expected, since plasma Hcy reflects liver stores primarily. In human studies, there is
limited availability of the variable tissue data, which is clearly a major obstacle and may
contribute to the lack of association between plasma Hcy and accessible tissues such as

50 PART A: Introduction
blood. In most studies, leukocytes are used as proxies for other tissues as they are
easily accessible. However, it remains questionable whether DNA methylation in
leukocytes is representative of what is occurring in tissues. A few recent studies have
investigated this possible correlation between DNA methylation in blood and other
tissues. For example, leukocytic DNA methylation of selected imprinted genes like
insulin-like growth factor 2 (IGF2) may serve as a proxy for mammary tissue DNA
methylation in women with or without breast cancer [99]. In addition, leukocytic DNA
methylation of LINE-1 repetitive elements may also serve as a proxy showing its
correlation with that of colon tissue [100]. Similar studies comparing leukocytic DNA
with tissue DNA, but in relation to Hcy metabolism should be performed to account for
tissue-specificity.
In both animal and human studies, SAM:SAH ratio was usually observed to be
lowered in HH mice or participants, in comparison to controls. In animals, not many
studies were able to show strong tissue-specificity, except for one [43], where
SAM:SAH ratio was increased in the liver and lowered in the heart of HH Mtrr (+/−) and
Mtrr (−/−) mice as compared to Mtrr (+/+) mice. Tissue-specificity on the relationship
of Hcy concentrations and SAM:SAH ratio was also observed in few studies showing
lowered SAM:SAH ratio in the liver, but no change in the brain and colon of HH mice
and rats, as compared to their controls [15,31,32,35,46]. As mentioned before, since
plasma Hcy reflects liver stores primarily, it might suggest that this relationship could
be the strongest in the liver, as compared to other tissues.
In Hcy-lowering trials, animal studies showed contrasting results in the liver,
colon or brain tissues. Some studies restored methylation patterns, while others did
not. But as mentioned before, this might be due to different pathophysiology between
models. In humans, Hcy-lowering trials did not result in a clear improvement of DNA
methylation patterns in most studies. All the reviewed trials were able to restore Hcy
concentrations, but this only restored DNA methylation levels in 2 out of 10 studies
[71,84]. In few studies, despite the longer trials of 1, 2 or 3 years, the methylation
patterns did not change.
ACKNOWLEDGMENTS
We gratefully thank Prof. Jan Lindemans (Department of Clinical Chemistry, Erasmus
University Medical Center, Rotterdam, the Netherlands) for his valuable comments on
the manuscript.

CHAPTER 2: Homocysteine and DNA methylation: a review 51
S
UP
PL
EM
EN
TA
RY
MA
TE
RIA
L
Tab
le 1
. Die
t-in
du
ced
HH
cy a
nd
DN
A m
eth
ylat
ion
in a
nim
als
Die
t gi
ven
A
(v/s
. Co
ntr
ol)
Tr
eat
men
t p
eri
od
(w
eek
s)
Hcy
B (
↑)
(Pla
sma/
Seru
m)
SAM
(T
issu
e)
SAH
(T
issu
e)
SAM
:SA
H r
atio
(T
issu
e)
DN
A M
eth
ylat
ion
(T
issu
e)
Ge
no
me
regi
on
R
efer
ence
HIG
H M
ETH
ION
INE
DIE
T
HM
(C
bs
+/+
mic
e)
7 o
r 1
5
Mild
↓
(B
rain
) [A
t 7
wks
], N
S (L
ive
r)
↑ (
Live
r) [
At
15
wks
], N
S (B
rain
) ↓
(Li
ver,
Bra
in)
[At
15
wks
] N
Q
NQ
D
ayal
S,
20
01
HM
(Sp
ragu
e-
Daw
ley
rats
) 4
In
term
ed
iate
↓
(A
ort
a)
↑ (
Ao
rta)
↓
(A
ort
a)
↓ (
Ao
rta)
B
1 e
lem
ents
Ji
ang
Y,
20
07
HM
(A
po
E -/
- m
ice)
1
5
Mo
der
ate
↑
(A
ort
a)
↑ (
Ao
rta)
↑
(A
ort
a)
↓ (
Ao
rta)
G
lob
al,
B1
ele
men
ts
Jian
g Y,
2
01
2
HM
(A
po
E -/
- m
ice)
8
N
Q
NQ
↑
(P
lasm
a)
NQ
↓
(A
ort
a)
Glo
bal
Li
u C
, 2
00
8
HM
(A
po
E -/
- m
ice)
1
5
Mo
der
ate
↓
(C
ard
iac)
N
S (C
ard
iac)
N
S (C
ard
iac)
↓
(C
ard
iac)
Tr
p5
3
Ma
S,
20
13
HM
(W
ista
r ra
ts)
20
Se
vere
↑
(P
lasm
a, B
on
e)
↑ (
Pla
sma,
Bo
ne)
↓
(P
lasm
a, B
on
e)
NQ
N
Q
Her
rman
n
M, 2
00
9
HM
(W
ista
r ra
ts)
~22
Se
vere
↑
(P
lasm
a,
Bra
inst
em
),
NS
(Fro
nta
l co
rte
x)
↑ (
Fro
nta
l co
rtex
, P
lasm
a,
Bra
inst
em
)
↓ (
Fro
nta
l co
rtex
, P
lasm
a,
Bra
inst
em
) N
Q
NQ
O
be
id R
, 2
01
1
HM
(M
thfr
+/+
mic
e)
7-1
5
Mild
[N
S]
↓ (
Bra
in),
N
S (L
iver
) ↑
(Li
ver,
Bra
in)
↓ (
Live
r, B
rain
) N
S (L
iver
, Bra
in)
Glo
bal
D
evlin
AM
, 2
00
4
HM
(C
57B
L/6J
mic
e)
4 o
r 8
M
od
erat
e
NQ
N
Q
NQ
↓
(C
ircu
lati
ng
leu
cocy
tes)
CTC
F b
ind
ing
site
s o
n m
TER
T p
rom
ote
r
Zhan
g D
, 2
01
3
B-V
ITA
MIN
DEF
ICIE
NT
(FO
LAT
E, B
6, B
12)
DIE
TS
FD-M
D
(C5
7BL/
6J m
ice)
2
4
Mild
↓
(Li
ver,
Bra
in,
Kid
ney
, Tes
tes)
↑ (
Live
r),
NS
(Bra
in,
Kid
ney
, Tes
tes)
↓ (
Live
r, B
rain
, K
idn
ey, T
este
s)
NS
(Liv
er,
Bra
in,
Kid
ney
, Tes
tes)
G
lob
al
Cau
dill
MA
, 2
00
1
LF-L
B6
-LB
12
(Ap
oE
-/-
mic
e)
8
NQ
N
Q
NS
(Pla
sma)
N
Q
NS(
Ao
rta)
G
lob
al
Liu
C,
20
08
HM
-LF-
LB6-
LB12
(A
po
E -/
- m
ice)
8
N
Q
NQ
↑
(Pla
sma)
N
Q
↓ (
Ao
rta)
G
lob
al
Liu
C,
20
08
FD o
r FD
-B12
D
(Wis
tar
rats
) 8
N
Q
↓ (
Live
r)
NS
(Liv
er)
↓ (
Live
r)
NQ
N
Q
Hir
sch
S,
20
08
FD o
r FD
-B6D
-B1
2D
16
M
od
erat
e
↓ (
Live
r)
↑ (
Live
r)
↓ (
Live
r)
NS
(Liv
er, A
ort
a,
Glo
bal
M
cNei
l CJ,

52 PART A: Introduction
Die
t gi
ven
A
(v/s
. Co
ntr
ol)
Tr
eat
men
t p
eri
od
(w
eek
s)
Hcy
B (
↑)
(Pla
sma/
Seru
m)
SAM
(T
issu
e)
SAH
(T
issu
e)
SAM
:SA
H r
atio
(T
issu
e)
DN
A M
eth
ylat
ion
(T
issu
e)
Ge
no
me
regi
on
R
efer
ence
(Ap
oE
-/-
mic
e)
Tun
ica
adve
nti
tia,
H
eart
,)
20
11
, 20
12
FD-B
12D
-B2
D
(Wis
tar
rats
)
4 (
bef
ore
p
regn
ancy
un
til
wea
nin
g o
f O
ffsp
rin
g)
[Mo
ther
s]
Mo
der
ate
[M
oth
ers]
, M
ild
[Off
spri
ng]
↓D
[Off
spri
ng]
N
SD
[Off
spri
ng]
↓
D
[Off
spri
ng]
N
Q
NQ
B
lais
e S,
2
00
5
FD (
Ro
wet
t H
oo
ded
rat
s)
2 (p
rio
r to
mat
ing
un
til D
ay 2
1 o
f ge
stat
ion
)
NQ
(M
ate
rnal
se
rum
) N
Q
NQ
N
Q
NS
(Mat
ern
al
& f
etal
live
rs)
Glo
bal
M
alo
ney
C
A,2
00
7
FDE (
Spra
gue
-D
awle
y ra
ts)
4 (u
nti
l mat
ing)
[P
aren
ts]
Mild
/Mo
der
ate
[O
ffsp
rin
g]
NQ
N
Q
NQ
↓
(Li
ver)
[O
ffsp
rin
g]
Glo
bal
M
ejo
s K
K,
20
13
FD (
Mth
fr
+/+B
ALB
/c m
ice)
1
0-1
2
[Mo
ther
s]
Inte
rme
dia
te
[Mo
ther
s]
↓ (
Live
r)
[Mo
ther
s],
NS
(Pla
cen
ta)
[Em
bry
os]
↑ (
Live
r)
[Mo
ther
s]
↑ (
Pla
cen
ta)
[E
mb
ryo
s]
↓ (
Live
r)
[Mo
ther
s]
↓ (
Pla
cen
ta)
[Em
bry
os]
NQ
N
Q
Mik
ael L
G,
20
13
FD (
Spra
gue
-D
awle
y ra
ts)
4.3
M
ild
NS
(Bra
in)
NS
(Bra
in)
NS
(Bra
in)
↓ (
Bra
in)
Glo
bal
P
arte
arro
yo
T, 2
01
3
FD-M
D
(Fis
her
34
4 ra
ts)
36
N
Q
↓ (
Live
r),
NS
(Bra
in)
NS
(Liv
er, B
rain
) ↓
(Li
ver)
, N
S (B
rain
) ↓
(Li
ver)
, ↑
(B
rain
) G
lob
al
Po
grib
ny
IP,
20
06
, 20
08
HM
-LF
(Cb
s +
/+
C5
7BL/
6J m
ice)
~3
5
Mild
N
Q
↑ (
Bra
in)
↓ (
Bra
in)
NQ
N
Q
Son
tag
E,
20
07
FD (
Spra
gue
-D
awle
y ra
ts)
5
NQ
N
S (C
olo
nic
m
uco
sa)
↑ (
Co
lon
ic
mu
cosa
) ↓
(C
olo
nic
m
uco
sa)
↑ (
Co
lon
) [A
t 3
wks
] G
lob
al
Soh
n K
J,
20
03
FD (
Ho
od
ed-L
iste
r (R
ow
ett
stra
in)r
ats)
2
4
NQ
N
S (L
iver
, Co
lon
) N
S (L
iver
, Co
lon
) ↓
(Li
ver)
, N
S (C
olo
n)
NS
(Liv
er, C
olo
n)
Glo
bal
D
uth
ie S
J,
20
10
LF
(Mth
fr +
/+ m
ice)
7-
15
M
ild
↓ (
Live
r),
NS
(Bra
in)
↑ (
Bra
in),
N
S (L
iver
) ↓
(Li
ver,
Bra
in)
NS
(Liv
er, B
rain
) G
lob
al
Dev
lin A
M,
20
04
HM
-LF
(Mth
fr +
/+ m
ice)
7-
15
M
ild
↓ (
Live
r),
NS
(Bra
in)
↑ (
Bra
in),
N
S (L
iver
) ↓
(Li
ver,
Bra
in)
NS
(Liv
er, B
rain
) G
lob
al
Dev
lin A
M,
20
04
A D
iet
give
n:
HM
= H
igh
Met
hio
nin
e; L
F =
Low
fo
late
; FD
= F
ola
te d
efic
ien
t; M
D =
Met
hio
nin
e d
efic
ien
t; B
6D
= V
itam
in B
6 d
efic
ien
t; B
12
D =
Vit
amin
B1
2 d
efic
ien
t; L
B6
= Lo
w v
itam
in B
6;
LB1
2 =
Lo
w v
itam
in B
12
, B H
cy c
on
cen
trat
ion
s: M
ild =
<1
5 μ
mo
l/L;
Mo
der
ate
= b
etw
een
15
& 3
0 μ
mo
l/L;
In
term
edia
te =
bet
wee
n 3
0 &
100
μm
ol/
L; S
ever
e =
>10
0 μ
mo
l/L,
C N
S =
No
sig
nif
ican
t ch
ange
, NQ
= N
ot
qu
anti
fied
, D T
issu
e n
ot
men
tio
ned
, E F
ola
te d
efi
cien
t (v
/s. F
ola
te s
up
ple
men
ted
) d
iet

CHAPTER 2: Homocysteine and DNA methylation: a review 53
Ta
ble
2. G
enet
ical
ly-i
nd
uce
d H
Hcy
an
d D
NA
met
hyl
atio
n in
an
imal
s
A H
cy c
on
cen
trat
ion
s: M
ild =
<1
5 μ
mo
l/L;
Mo
der
ate
= b
etw
een
15
& 3
0 μ
mo
l/L;
Inte
rmed
iate
= b
etw
een
30
& 1
00
μm
ol/
L; S
ever
e =
>10
0 μ
mo
l/L
B H
cy m
easu
red
in t
he
live
r ti
ssu
e, C
NS
= N
o s
ign
ific
ant
chan
ge, N
Q =
No
t q
uan
tifi
ed
Mic
e (
v/s.
n
on
-kn
ock
ou
t m
ice)
Hcy
A (
↑)
(Pla
sma/
Se
rum
)
SAM
(T
issu
e)
SAH
(T
issu
e)
SAM
:SA
H r
atio
(T
issu
e)
DN
A M
eth
ylat
ion
(T
issu
e)
Ge
no
me
regi
on
R
efer
ence
Mth
fr +
/-
mic
e
Mild
↓
(Te
stes
, Ova
ries
),
NS
(Liv
er, B
rain
) ↑
(Li
ver,
Bra
in),
N
S(Te
stes
, Ova
ries
) N
Q
↓ (
Bra
in, O
vari
es),
N
S (L
iver
, Tes
tes)
G
lob
al
Ch
en Z
, 20
01
Mild
↓
(Li
ver)
, NS
(Bra
in)
↑ (
Bra
in),
NS
(Liv
er)
↓ (
Live
r, B
rain
) N
S (L
iver
, Bra
in)
Glo
bal
D
evlin
AM
, 20
04
Mth
fr -
/- m
ice
Inte
rme
dia
te
↓(B
rain
, Tes
tes,
O
vari
es),
NS
(Liv
er)
↑ (
Live
r, B
rain
, Te
stes
, Ova
ries
) N
Q
↓ (
Bra
in, O
vari
es),
N
S (L
iver
, Tes
tes)
G
lob
al
Ch
en Z
, 20
01
NQ
N
Q
NQ
N
Q
↓ (
Cer
ebel
lum
) G
lob
al
Jad
avji
NM
, 20
12
NQ
N
Q
NQ
N
Q
↓ (
Hip
po
cam
pu
s)
Nr3
c1ex
on
re
gio
n
Jad
avji
NM
, 20
12
Cb
s +/
- m
ice
Mild
↓
(Li
ver,
Kid
ney
, B
rain
, Tes
tes)
↑
(Li
ver,
Tes
tes)
, N
S (K
idn
ey,
Bra
in)
↓ (
Live
r, K
idn
ey,
Bra
in, T
este
s)
↓ (
Test
es),
N
S (L
iver
, Kid
ney
, Bra
in)
Glo
bal
C
aud
ill M
A, 2
00
1
Mo
der
ate
↑
(B
rain
), N
S (L
iver
) ↑
(Li
ver,
Bra
in)
↓ (
Live
r, B
rain
) N
Q
NQ
D
ayal
S, 2
00
1
Mild
N
Q
NQ
N
Q
↓ (
Bra
in)
Pp
p2
r1a
So
nta
g E,
20
07
Cb
s -/
- m
ice
Seve
re
↑ (
Live
r),
NS
(Kid
ne
y, B
rain
) ↑
(Li
ver,
Kid
ney
, B
rain
) ↓
(Li
ver,
Kid
ney
, B
rain
) ↓
(Li
ver)
, N
S (K
idn
ey,
Bra
in)
Glo
bal
C
ho
um
enko
vitc
h S
F,
20
02
NQ
B
↑ (
Live
r)
↑ (
Live
r)
NQ
N
Q
NQ
A
lber
to J
M, 2
00
7
Seve
re
↑ (
Live
r)
↑ (
Live
r)
↓ (
Live
r)
NQ
N
Q
Iked
a K
, 20
11
Mtr
+/-
mic
e
NS
NS
(Liv
er, B
rain
) N
S (L
iver
, Bra
in)
NS
(Liv
er, B
rain
) N
Q
NQ
D
ayal
S, 2
00
5
Mtr
r +
/- m
ice
M
ild
↑ (
Live
r)
↓ (
Live
r), ↑
(H
eart
) ↑
(Li
ver)
, ↓ (
Hea
rt)
NQ
N
Q
Elm
ore
CL,
20
07
Mtr
r -/
- m
ice
Mo
der
ate
↑
(Li
ver)
↓
(Li
ver)
, ↑ (
Hea
rt)
↑ (
Live
r), ↓
(H
eart
) N
Q
NQ
El
mo
re C
L, 2
00
7
Mo
der
ate
[M
oth
ers]
N
Q
NQ
N
Q
↓ (
Live
r, U
teru
s) [
Mo
the
rs],
↓
(P
lace
nta
) [W
ild-t
ype
gran
dp
roge
ny]
G
lob
al
Pad
man
abh
an N
, 20
13
Maj
ori
ty ↑
(P
lace
nta
) [W
ild-t
ype
gran
dp
roge
ny]
Im
pri
nte
d lo
ci
(45
-70
% o
f D
MR
s)

54 PART A: Introduction
Tab
le 3
. Gen
etic
ally
- an
d d
iet-
ind
uce
d H
Hcy
in a
nim
als
A D
iet
give
n: H
M =
Hig
h M
eth
ion
ine;
LF
= Lo
w f
ola
te; F
D =
Fo
late
def
icie
nt;
FR
= F
ola
te r
eple
te; M
D =
Met
hio
nin
e d
efic
ien
t B
Hcy
co
nce
ntr
atio
ns:
Mild
= <
15
μm
ol/
L; M
od
erat
e =
bet
wee
n 1
5 &
30
μm
ol/
L; In
term
edia
te =
be
twee
n 3
0 &
10
0 μ
mo
l/L;
Sev
ere
= >1
00
μm
ol/
L C
NS
= N
o s
ign
ific
ant
chan
ge, N
Q =
No
t q
uan
tifi
ed
Mic
e (
v/s.
n
on
-kn
ock
ou
t m
ice)
Die
tA
(v/s
. C
on
tro
l)
Tre
atm
ent
per
iod
(w
eek
s)
Hcy
B (↑
) (P
lasm
a/Se
rum
) SA
M
(Tis
sue)
SA
H
(Tis
sue)
SA
M /
SA
H
(Tis
sue)
DN
A
Met
hyl
atio
n
(Tis
sue
) G
en
om
e re
gio
n
Ref
.
Cb
s +/
- m
ice
MD
or
FD-M
D
24
M
od
erat
e
↓ (
Live
r, K
idn
ey,
Bra
in, T
este
s)
↑ (
Live
r,
Test
es, B
rain
),
NS
(Kid
ne
y)
↓ (
Live
r,
Kid
ney
, Bra
in,
Test
es)
↓ (
Test
es,
Bra
in),
N
S (L
iver
, K
idn
ey)
Glo
bal
C
aud
ill M
A,
20
01
HM
-LF
~39
-52
In
term
ed
iate
N
S (L
iver
, Bra
in)
↑ (
Live
r, B
rain
) ↓
(Li
ver,
B
rain
)
↓ (
Live
r),
↑ (
Bra
in),
↑
(A
ort
a)
H19
DM
D
Dev
lin A
M,
20
05
HM
-LF
3
Mild
N
S (L
iver
, Bra
in)
↑ (
Live
r),
NS
(Bra
in)
↓ (
Live
r),
NS
(Bra
in)
↓ (
Live
r),
↑ (
Bra
in)
Mat
ern
al H
19
D
MD
G
lier
MB
, 2
01
3
HM
-FR
7
Mo
der
ate
↑
(B
rain
),
NS
(Liv
er)
↑ (
Live
r, B
rain
) ↓
(Li
ver)
, N
S (B
rain
) N
Q
NQ
D
ayal
S,
20
01
1
5
Mo
der
ate
N
S (B
rain
, Liv
er)
↑
(Li
ver,
Bra
in)
↓ (
Live
r,
Bra
in)
HM
-LF
12
M
od
erat
e
NQ
N
Q
NQ
↑
(A
ort
a)
Nr3
c1 [
pro
mo
ter
tran
scri
pts
] Su
listy
on
ingr
um
D
C, 2
01
2
HM
-LF
3-9
In
term
ed
iate
N
S (L
iver
) ↑
(Li
ver)
↓
(Li
ver)
↑
(Li
ver)
Fa
ds2
pro
mo
ter
Dev
lin A
M,
20
07
HM
-LF
3-1
2
Inte
rme
dia
te
NQ
N
Q
NQ
↓
[So
at2
] (L
iver
) ↑
[B
1] (
Live
r)
5' p
ort
ion
of
the
Soat
2, B
1
rep
eti
tive
el
eme
nts
Dev
lin A
M,
20
10

CHAPTER 2: Homocysteine and DNA methylation: a review 55
Ta
ble
4. H
Hcy
an
d D
NA
met
hyl
atio
n in
hu
man
s
Pa
rtic
ipan
ts
Pla
sma
H
cyA (
↑)
SAM
SA
H
SAM
:SA
H
rati
o
DN
Am
eth
ylat
ion
(Ti
ssu
e)
Re
gio
n
Ref
eren
ce
Hea
lth
y V
ege
tari
ans
(n=
71)
v/s.
Om
niv
ore
s (n
=79)
M
ild
NQ
N
Q
NQ
N
Q (
Per
iph
eral
blo
od
)U
Glo
bal
(A
lu r
ep
eat
ele
me
nts
) G
eise
l J, 2
00
5
3 C
pG
sit
es in
th
e p
66
shc
pro
mo
ter
Hea
lth
y A
du
lt F
emal
es
Mild
N
S (P
lasm
a)
↑ (
Pla
sma,
Ly
mp
ho
cyte
s)
↓
(Pla
sma)
↓
(Ly
mp
ho
cyte
s)N
Glo
bal
M
eln
yk S
, 20
00
; Yi
P, 2
00
0
Hea
lth
y M
idd
le-a
ged
Ad
ult
s M
ild
NQ
N
Q
NQ
N
Q (
Per
iph
eral
leu
kocy
tes)
P
LIN
E-1
P
ern
g W
, 20
14
Hig
h (
n=
25)
v/
s. L
ow
(n
=25
) H
cy s
amp
les
Mo
der
ate
/ In
term
ed
iate
/ Se
vere
N
Q
NQ
N
Q
↓ [
14
Cp
Gs]
N,
↑ [
3 C
pG
s]P
(Leu
kocy
tes)
R
FC1
gen
e: 1
7 C
pG
s Fa
rkas
SA
, 20
13
PR
EGN
AN
CY
Pre
gnan
t W
om
en
(n
=2
4)
Mild
(F
etal
Co
rd)
NQ
N
Q
NQ
↓
(C
ord
blo
od
)N
Glo
bal
(LI
NE-
1
elem
en
ts)
Frye
r A
A, 2
00
9
Feta
l co
rd b
loo
d s
amp
les
(n=1
2)
Mild
(C
ord
) N
Q
NQ
N
Q
↑↓
(C
ord
blo
od
)P,N
G
eno
me
-wid
e C
pG
s:
29
8 a
uto
som
al,
8 X
ch
rom
oso
me
Fr
yer
AA
, 20
11
VA
SCU
LAR
DIS
OR
DER
S
Ath
ero
scle
roti
c p
atie
nts
(n
=1
7)
v/s.
co
ntr
ols
(n
=1
5)
Mild
N
S (P
lasm
a)
↑
(Pla
sma)
↓
(P
lasm
a)
↓ (
Leu
kocy
tes)
N
Glo
bal
C
astr
o R
, 20
03
CA
D p
atie
nts
(n
=13
7)
v/s.
co
ntr
ols
(n
=1
50)
Mild
/ M
od
erat
e/
Inte
rme
dia
te
NQ
N
Q
NQ
↑
(P
erip
her
al ly
mp
ho
cyte
s)P
Glo
bal
Sh
arm
a P
, 20
08
Eld
erly
me
n (
n=7
12)
[No
Isch
emic
hea
rt
dis
ease
or
stro
ke (
n=4
70)
, Isc
hem
ic h
eart
d
isea
se (
n=
212)
, str
oke
(n
=51
), Is
chem
ic
hea
rt d
isea
se o
r st
roke
(n
=2
42)]
Mild
[N
S]
NQ
N
Q
NQ
↓
(B
loo
d)U
LI
NE-
1
Bac
care
lli A
, 20
10
Ath
ero
mat
osi
s p
atie
nts
(n
=54
) v/
s. c
on
tro
ls (
n=
28)
M
od
erat
e
NQ
N
Q
NQ
↑
(B
loo
d)P
ESR
1 p
rom
ote
r H
uan
g YS
, 20
09
Ath
ero
scle
rosi
s p
atie
nts
(n
=1
97)
v/s.
co
ntr
ols
(n
=1
65)
M
od
erat
e
(Ser
um
) N
Q
NQ
N
Q
↓ (
Leu
kocy
tes)
N
hTE
RT
pro
mo
ter
Zhan
g D
, 20
13
CA
D p
atie
nts
M
ild/
Mo
der
ate
N
Q
NQ
N
Q
↓ (
Per
iph
eral
blo
od
le
uko
cyte
s)N
SHC
1 p
rom
ote
r re
gio
n
Kim
CS,
20
11

56 PART A: Introduction
Pa
rtic
ipan
ts
Pla
sma
H
cyA (
↑)
SAM
SA
H
SAM
:SA
H
rati
o
DN
Am
eth
ylat
ion
(Ti
ssu
e)
Re
gio
n
Ref
eren
ce
Pat
ien
ts w
ho
un
der
wen
t co
ron
ary
arte
ry b
ypas
s gr
afti
ng
(n=
192
) M
od
erat
e
NQ
N
Q
NQ
↑
(In
tern
al m
amm
ary
arte
ry)P
, ↓
(P
un
ch a
ort
ic f
ragm
ents
)N
NO
S2 p
roxi
mal
p
rom
ote
r R
od
rigu
ez-
Esp
arra
gon
F, 2
01
2
Pat
ien
ts w
ith
CB
S d
efic
ien
cy
(Tre
ate
d w
ith
Hcy
-lo
we
rin
g th
erap
y)
v/s.
Co
ntr
ols
) In
term
ed
iate
↑
(P
lasm
a)
↑
(Pla
sma)
N
S (P
lasm
a)
NS
(Hep
arin
blo
od
)U
Glo
bal
, H
19 D
MR
H
eil S
G, 2
00
7
CA
NC
ER
Co
lore
ctal
neo
pla
sia
pat
ien
ts (
can
cer,
n
=28
; ad
en
om
a, n
=35)
v/
s. c
on
tro
ls (
n=
76)
M
ild
NQ
N
Q
NQ
↓
(N
orm
al-a
pp
eari
ng
colo
nic
mu
cosa
) (L
euko
cyte
s)N
Glo
bal
P
ufu
lete
M, 2
00
3
Co
lore
ctal
neo
pla
sia
pat
ien
ts (
can
cer,
n
=28
; ad
en
om
a, n
=35;
hyp
erp
last
ic
po
lyp
s, n
=1
7) v
/s. c
on
tro
ls (
n=
76)
Mild
N
Q
NQ
N
Q
↑ (
No
rmal
-ap
pea
rin
g co
lore
ctal
mu
cosa
)P ES
R1
pro
mo
ter
regi
on
A
l-G
hn
anie
m R
, 2
00
7
Co
lore
ctal
can
cer
case
s (n
=190
) v/
s. D
ou
ble
, mat
che
d r
efe
ren
ts
Mild
[N
S]
NQ
N
Q
NQ
N
S (C
olo
rect
al t
um
or)
U
CD
KN
2A, M
LH1
, C
AC
NA
1G, N
EUR
OG
1,
RU
NX
3, S
OC
S1, I
GF2
&
CR
AB
P1
pro
mo
ter
Van
Gu
elp
en
B,
20
10
Eso
ph
agea
l dis
ease
pat
ien
ts (
incl
ud
ing
can
cer)
(n
=124
) v/
s. c
on
tro
ls
≥ M
od
erat
e
NQ
N
Q
NQ
↑
(W
ho
le b
loo
d)P
M
LH1
pro
mo
ter
Vas
avi M
, 20
06
Pri
mar
y b
reas
t ca
nce
r p
atie
nts
(n
=1
37)
Mild
N
Q
NQ
N
Q
↑ (
Bre
ast
tum
or)
P
RA
RB
pro
mo
ter
exo
n,
ESR
1 e
xon
1 r
egio
ns
Pir
ou
zpan
ah S
, 20
10
Spec
ime
ns
fro
m b
reas
t ca
rcin
om
as
(n =
40)
& p
eri
ph
era
l blo
od
sam
ple
s (n
=
13
9) f
rom
bre
ast
can
cer
pat
ien
ts
NQ
N
Q
NQ
N
Q
↑ (
Bre
ast
can
cer
tiss
ue
&
corr
esp
on
din
g p
erip
her
al
blo
od
)P
BR
CA
1 p
rom
ote
r
Nau
shad
SM
, 20
14
↑ (
Bre
ast
can
cer
tiss
ue)
P
RA
SSF1
pro
mo
ter
(ER
/PR
-neg
ativ
e b
reas
t ca
nce
rs)
REN
AL
DIS
EASE
S
Ure
mia
pat
ien
ts (
n=
32)
v/s
. co
ntr
ols
(n
=11)
In
term
ed
iate
N
Q
NQ
N
Q
↓ (
PB
MC
s)N
Glo
bal
In
gro
sso
D, 2
00
3
Stag
e 2
-4 c
hro
nic
kid
ney
dis
ease
pat
ien
ts
(n=7
8)
Mo
der
ate
N
Q
NQ
N
Q
NQ
(Le
uko
cyte
s)U
Glo
bal
N
anay
akka
ra P
W,
20
08
Ch
ron
ic h
em
od
ialy
sis
pat
ien
ts (
n=2
0)
v/s.
No
rmal
su
bje
cts
(n=
20)
Mo
der
ate
(S
eru
m)
NQ
N
Q
NQ
N
S (P
erip
her
al b
loo
d
leu
kocy
tes)
U
Glo
bal
H
su C
Y, 2
01
2

CHAPTER 2: Homocysteine and DNA methylation: a review 57
P
art
icip
ants
P
lasm
a
Hcy
A (
↑)
SAM
SA
H
SAM
:SA
H
rati
o
DN
Am
eth
ylat
ion
(Ti
ssu
e)
Re
gio
n
Ref
eren
ce
BR
AIN
DIS
OR
DER
S
Alz
hei
mer
’s p
atie
nts
(n
=26)
v/
s. c
on
tro
ls (
n=
29)
Mild
/ M
od
erat
e
↑
(Pla
sma)
↑
(P
lasm
a)
↓
(Pla
sma)
N
Q
NQ
Se
lley
ML,
20
07
Euth
ymic
bip
ola
r p
atie
nts
(n
=40
) v/
s. H
ealt
hy
con
tro
ls (
n=2
7)
Mild
N
Q
NQ
N
Q
NS
(Per
iph
eral
blo
od
le
uko
cyte
s)U
Glo
bal
B
rom
ber
g A
, 20
09
Sch
izo
ph
ren
ia p
atie
nts
(n
=2
8)
v/s.
Hea
lth
y co
ntr
ols
(n
=26)
M
ild/
Mo
der
ate
N
Q
NQ
N
Q
NS
(Per
iph
eral
blo
od
le
uko
cyte
s)U
Glo
bal
B
rom
ber
g A
, 20
08
Sch
izo
ph
ren
ia p
atie
nts
(n
=4
2)
v/s.
co
ntr
ols
(n
=4
2)
Mo
der
ate
N
Q
NQ
N
Q
↑↓
(Le
uko
cyte
s)P
,N
1,3
38
Cp
Gs
[Gen
om
e-w
ide]
K
ino
shit
a M
, 20
13
GEN
ETIC
VA
RIA
NTS
Sub
ject
s w
ith
Mth
fr 6
77
TT
v/s.
Mth
fr 6
77
CC
M
od
erat
e
NQ
N
Q
NQ
↓
(P
BM
Cs)
N
Glo
bal
Fr
iso
S, 2
00
2
Sub
ject
s w
ith
Mth
fr 6
77T
T
Mild
N
Q
NQ
N
Q
↓ (
Leu
kocy
tes)
N
Glo
bal
C
astr
o R
, 20
04
Sub
ject
s w
ith
Mth
fr
67
7 TT
v/s
. Mth
fr
67
7 C
C
Wee
k 7
(Fo
late
p
ost
-de
ple
tio
n)
Mild
NQ
N
Q
NQ
↓ (
Leu
kocy
tes)
N
Glo
bal
Sh
eln
utt
KP
, 20
04
W
eek
14
(Fo
late
p
ost
-re
ple
tio
n)
Mild
↑
(Le
uko
cyte
s)P [
In s
ub
ject
s w
ith
Mth
fr 6
77
TT o
nly
]
Sub
ject
s w
ith
Mth
fr
67
7 TT
v/s
. Mth
fr
67
7 C
C
Wee
k 7
(Fo
late
p
ost
-de
ple
tio
n)
Mild
NQ
N
Q
NQ
NS
(Le
uko
cyte
s)U
Glo
bal
A
xum
e J,
20
07
W
eek
14
(Fo
late
p
ost
-re
ple
tio
n)
Mild
↓
(Le
uko
cyte
s)N
Sub
ject
s w
ith
Mth
fr 6
77
TT
v/s.
Mth
fr 6
77
CC
M
ild
NQ
N
Q
NQ
N
S (L
ymp
ho
cyte
s)U
Glo
bal
N
aray
anan
S, 2
00
4
Sub
ject
s w
ith
Mth
fr 6
77
TT
v/s.
Mth
fr 6
77
CC
M
ild [
NS]
N
Q
NQ
N
Q
NS
(Co
lon
)U
Glo
bal
H
anks
J, 2
01
3
Sub
ject
s w
ith
Mth
fr 6
77
TT
v/s.
Mth
fr 6
77
CC
M
od
erat
e
NQ
N
Q
NQ
N
S (C
olo
nic
mu
cosa
)U
Glo
bal
P
ufu
lete
M, 2
00
5
A H
cy c
on
cen
trat
ion
s: M
ild =
<1
5 μ
mo
l/L;
Mo
der
ate
= b
etw
een
15
& 3
0 μ
mo
l/L;
Inte
rmed
iate
= b
etw
een
30
& 1
00
μm
ol/
L; S
ever
e =
>10
0 μ
mo
l/L
N N
egat
ive
corr
elat
ion
wit
h H
cy, P
Po
siti
ve c
orr
ela
tio
n w
ith
Hcy
, U U
nd
efin
ed
tre
nd
of
corr
elat
ion
C
NS
= N
o s
ign
ific
ant
chan
ge, N
Q =
No
t q
uan
tifi
ed

58 PART A: Introduction
Tab
le 5
. Eff
ects
of
Hcy
-lo
wer
ing
ther
apy
in A
nim
als
A N
S =
No
sig
nif
ican
t ch
ange
; FA
= F
olic
aci
d, N
A =
No
t ap
plic
able
, NQ
= N
ot
Qu
anti
fied
B
Effe
ct d
ue
to m
ater
nal
su
pp
lem
ent
alo
ne
C
Effe
ct d
ue
to p
ost
-wea
nin
g su
pp
lem
enta
tio
n a
lon
e, D
Effe
ct d
ue
to b
oth
mat
ern
al a
nd
po
st-w
ean
ing
sup
ple
men
tati
on
*Du
rin
g p
regn
ancy
& la
ctat
ion
An
ima
l Typ
e
Am
ou
nt
(Fo
late
)
Trea
tmen
t p
erio
d
(wee
ks)
Hcy
(P
lasm
a)
SAM
(T
issu
e)
SAH
(T
issu
e)
SAM
:SA
H
rati
o
(Tis
sue)
DN
A m
eth
ylat
ion
(T
issu
e)
Ge
no
me
regi
on
R
efer
ence
Rat
s 4
0 m
g FA
/kg
die
t 4
↓
N
S (L
iver
) N
S (L
iver
) N
S (L
iver
) N
S (L
iver
) G
lob
al
Ach
on
M,
20
07
Rat
s (u
nd
er B
12D
d
iet)
1
00
mg
FA/k
g d
iet
6
↓
NS
(Liv
er, B
rain
) N
S (L
iver
, Bra
in)
NS
(Liv
er, B
rain
) N
S (L
iver
) G
lob
al
Min
H,
20
09
Rat
off
spri
ngs
[A
t w
ean
ing]
5
mg
FA/k
g d
iet
[Mat
ern
al]
3*
↓
N
Q
NQ
N
Q
↓ (
Live
r) [
Glo
bal
, P
pa
rg, E
sr1
, Tr
p5
3, A
pc]
Glo
bal
P
pa
rg p
rom
ote
r;
Esr1
pro
mo
ter;
Tr
p5
3 e
xon
reg
ion
;
Ap
c ex
on
re
gio
n;
p1
6 p
rom
ote
r
Sie
KK
, 2
01
3
Rat
off
spri
ngs
[A
t P
ost
-wea
nin
g]
NA
[P
ost
-wea
nin
g]
11
↓
NQ
N
Q
NQ
↓ (
Live
r) [
Glo
bal
]C
↑ (
Live
r) [
Pp
arg
, Tr
p5
3, p
16
]B,C
[E
sr1
, Ap
c]C
Rat
s 8
mg
FA/k
g d
iet
5
↓
NS
(Co
lon
ic
mu
cosa
)
NS
(Co
lon
ic
mu
cosa
)
NS
(Co
lon
ic
mu
cosa
)
NS
(Co
lon
)
Glo
bal
; Tr
p5
3
pro
mo
ter
&
exo
n r
egi
on
Soh
n K
J,
20
03
Rat
off
spri
ngs
[A
t w
ean
ing]
5
mg
FA/k
g d
iet
[Mat
ern
al]
3*
↓
N
Q
NQ
N
Q
↑
(Co
lon
)B
Glo
bal
Si
e K
K,
20
11
R
at o
ffsp
rin
gs
[At
Po
st-w
ean
ing]
N
A
[Po
st-w
ean
ing]
11
↓
N
Q
NQ
N
Q
↓
(Co
lon
)B,D
Rat
s 8
or
40 m
g FA
/kg
~4
NS
NS
(Bra
in)
NS
(Bra
in)
NS
(Bra
in)
NS
(Bra
in)
Glo
bal
P
arte
arro
yo
T, 2
01
3
CB
S +/
- m
ice
(u
nd
er H
M d
iet)
0.0
05
7 μ
g/g
bo
dyw
eig
ht
per
day
FA
in d
rin
kin
g w
ate
r 4
↓
N
Q
NQ
N
Q
NS
(Bra
in)
Glo
bal
K
alan
i A,
20
14

CHAPTER 2: Homocysteine and DNA methylation: a review 59
Ta
ble
6. E
ffec
ts o
f H
cy-l
ow
erin
g th
erap
y in
hu
man
s
A N
Q =
No
t q
uan
tifi
ed; N
S =
No
sig
nif
ican
t ch
ange
; FA
= F
olic
aci
d, N
A =
No
t ap
plic
able
B H
cy-l
ow
erin
g tr
ial s
ign
ific
antl
y re
sto
red
DN
A m
eth
ylat
ion
pat
tern
s, C
Mea
sure
d S
AM
, SA
H a
nd
SA
M:S
AH
rat
io
Pa
rtic
ipan
ts
Die
tary
su
pp
lem
ent
Am
ou
nt
Trea
tmen
t p
erio
d
Pla
sma
H
cy
DN
A M
eth
ylat
ion
(T
issu
e)
Re
gio
n
Ref
eren
ce
Co
lore
ctal
ad
eno
ma
pat
ien
ts
Fola
te
400
µg/
day
(FA
) 10
wee
ks
↓
↑ (
Leu
kocy
tes)
b
Glo
bal
P
ufu
lete
M, 2
00
5
Co
lore
ctal
ad
eno
ma
pat
ien
ts
Fola
te
400
µg/
day
(FA
) 10
wee
ks
↓
NS
(Co
lon
ic m
uco
sa)
Cp
Gs
of
ESR
1&
MLH
1 g
en
es
Al-
Gh
nan
iem
A
bb
adi R
P, 2
01
2
Pat
ien
ts w
ith
pre
vio
us
colo
rect
al a
de
no
ma
Fo
late
& v
itam
in
B12
5
mg/
day
(FA
),
1.25
mg/
day
(V
it B
12)
6 m
on
ths
↓
NS
(Rec
tal m
uco
sa)
Pro
mo
ter
me
thyl
atio
n o
f 6
tum
or
sup
pre
sso
r &
DN
A
rep
air
gen
es
van
den
Do
nk
M,
20
07
Pat
ien
ts w
ith
HH
cy &
u
rem
ia
Fola
te
15 m
g/d
ay (
ora
l m
eth
ylte
trah
ydro
fola
te)
2 m
on
ths
↓
↑ (
PB
MC
s)b
Glo
bal
In
gro
sso
D, 2
00
3
Par
tici
pan
ts w
ith
in
term
edia
te H
Hcy
Fo
late
5
mg/
day
(FA
) 8
we
eks
↓
NS(
PB
MC
s)
Glo
bal
P
izzo
lo F
, 20
11
Lon
g-te
rm s
tab
le d
ialy
sis
pat
ien
ts
Fola
te (
or)
Fo
late
&
vit
amin
B1
2
15 m
g th
rice
wee
kly
(FA
);
1000
µg
on
ce a
wee
k (V
it
B12
)
12-2
0 w
eeks
↓
N
S(Ly
mp
ho
cyte
) G
lob
al
Sto
pp
er
H, 2
00
8
Stag
e 2
-4 c
hro
nic
kid
ney
d
isea
se p
atie
nts
B
-vit
amin
s 5
mg/
d (
FA),
10
0 m
g/d
(p
yrid
oxi
ne)
, 1 m
g/d
(V
it B
12)
1
year
N
Q
NS
(Le
uko
cyte
s)
Glo
bal
N
anay
akka
ra
PW
, 20
08
Ad
ult
s B
& D
vit
amin
s
500
µg/
d (
FA),
50
0 µ
g (V
it B
12),
50
mg
(Vit
B6)
, 12
00
IU (
Vit
D),
456
mg
(cal
ciu
m)
1 ye
ar
↓
NS
(Wh
ole
blo
od
) LI
NE-
1
Hu
bn
er
U, 2
01
3
Old
er h
ealt
hy
gro
up
wit
h
elev
ate
d H
cy o
f >1
3 µ
mo
l/l
Fola
te &
B
vita
min
s 1
mg/
d (
fola
te),
500
µg/
d (
Vit
B
12),
10
mg
(Vit
B6)
2
year
s ↓
N
S (P
lasm
a)c
NQ
G
ree
n T
J, 2
01
0
Par
tici
pan
ts w
ith
m
od
erat
e H
Hcy
Fo
late
0.
8 m
g/d
ay (
FA)
3 ye
ars
↓
NS
(Per
iph
eral
blo
od
le
uko
cyte
s)
Glo
bal
Ju
ng
AY,
20
11
Po
stm
en
op
ausa
l wo
me
n
Fola
te f
ort
ific
atio
n
NA
2
year
s ↓
N
S (L
eu
kocy
tes)
G
lob
al
Bae
S, 2
01
4

60 PART A: Introduction
REFERENCES 1. J. Selhub, Homocysteine metabolism, Annu. Rev. Nutr. 19 (1999) 217–246. 2. C.J. Boushey, et al., A quantitative assessment of plasma homocysteine as a risk factor
for vascular disease. Probable benefits of increasing folic acid intakes, JAMA 274 (13) (1995) 1049–1057.
3. J.B. van Meurs, et al., Homocysteine levels and the risk of osteoporotic fracture, N. Engl. J. Med. 350 (20) (2004) 2033–2041.
4. W. Fu, et al., Interrelations between plasma homocysteine and intracellular S-adenosylhomocysteine, Biochem. Biophys. Res. Commun. 271 (1) (2000) 47–53.
5. S.J. James, et al., Elevation in S-adenosylhomocysteine and DNA hypomethylation: potential epigenetic mechanism for homocysteine-related pathology, J. Nutr. 132 (8 Suppl) (2002) 2361S–2366S.
6. J. Selhub, et al., Vitamin status and intake as primary determinants of homocysteinemia in an elderly population, JAMA 270 (22) (1993) 2693–2698.
7. N. Mahalle, et al., Vitamin B12 deficiency and hyperhomocysteinemia as correlates of cardiovascular risk factors in Indian subjects with coronary artery disease, J. Cardiol. 61 (4) (2013) 289–294.
8. N.E. Bergen, et al., Homocysteine and folate concentrations in early pregnancy and the risk of adverse pregnancy outcomes: the Generation R Study, BJOG 119 (6) (2012) 739–751.
9. T. Zhang, et al., Maternal serum vitamin B12, folate and homocysteine and the risk of neural tube defects in the offspring in a high-risk area of China, Public Health Nutr. 12 (5) (2009) 680–686.
10. K.A. da Costa, et al., Choline deficiency in mice and humans is associated with increased plasma homocysteine concentration after a methionine load, Am. J. Clin. Nutr. 81 (2) (2005) 440–444.
11. S.E. Chiuve, et al., The association between betaine and choline intakes and the plasma concentrations of homocysteine in women, Am. J. Clin. Nutr. 86 (4) (2007) 1073–1081.
12. J. Chan, et al., Low dietary choline and low dietary riboflavin during pregnancy influence reproductive outcomes and heart development in mice, Am. J. Clin. Nutr. 91 (4) (2010) 1035–1043.
13. J.B. van Meurs, et al., Common genetic loci influencing plasma homocysteine concentrations and their effect on risk of coronary artery disease, Am. J. Clin. Nutr. 98 (3) (2013) 668–676.
14. S.S. Kang, P.W. Wong, M.R. Malinow, Hyperhomocyst(e)inemia as a risk factor for occlusive vascular disease, Annu. Rev. Nutr. 12 (1992) 279–298.
15. S. Dayal, et al., Endothelial dysfunction and elevation of S-adenosylhomocysteine in cystathionine beta-synthase-deficient mice, Circ. Res. 88 (11) (2001) 1203–1209.
16. Y. Jiang, et al., Hyperhomocysteinemia-mediated DNA hypomethylation and its potential epigenetic role in rats, Acta Biochim. Biophys. Sin. 39 (9) (2007) 657–667.
17. Y. Jiang, et al., The comprehensive effects of hyperlipidemia and hyperhomocysteinemia on pathogenesis of atherosclerosis and DNA hypomethylation in ApoE−/− mice, Acta Biochim. Biophys. Sin. 44 (10) (2012) 866–875.
18. C. Liu, et al., Plasma S-adenosylhomocysteine is a better biomarker of atherosclerosis than homocysteine in apolipoprotein E-deficient mice fed high dietarymethionine, J. Nutr. 138 (2) (2008) 311–315.
19. S. Ma, et al., Hyperhomocysteinemia induces cardiac injury by up-regulation of p53-dependent Noxa and Bax expression through the p53 DNA methylation in ApoE(−/− ) mice, Acta Biochim. Biophys. Sin. 45 (5) (2013) 391–400.

CHAPTER 2: Homocysteine and DNA methylation: a review 61
20. M. Herrmann, et al., Hyperhomocysteinemia induces a tissue specific accumulation of homocysteine in bone by collagen binding and adversely affects bone, Bone 44 (3) (2009) 467–475.
21. R. Obeid, et al., Folate is related to phosphorylated neurofilament-H and P-tau (Ser396) in rat brain, J. Neurochem. 117 (6) (2011) 1047–1054.
22. M.A. Caudill, et al., Intracellular S-adenosylhomocysteine concentrations predict global DNA hypomethylation in tissues of methyl-deficient cystathionine beta-synthase heterozygous mice, J. Nutr. 131 (11) (2001) 2811–2818.
23. S. Hirsch, et al., Lack of effect of diet-induced hypomethylation on endotheliumdependent relaxation in rats, Clin. Nutr. 27 (6) (2008) 895–899.
24. C.J.McNeil, et al., Differential effects of nutritional folic acid deficiency andmoderate hyperhomocysteinemia on aortic plaque formation and genome-wide DNAmethylation in vascular tissue from ApoE−/− mice, Clin. Epigen. 2 (2) (2011) 361–368.
25. C.J. McNeil, et al., Nutritional B vitamin deficiency disrupts lipid metabolism causing accumulation of proatherogenic lipoproteins in the aorta adventitia of ApoE null mice, Mol. Nutr. Food Res. 56 (7) (2012) 1122–1130.
26. S. Blaise, et al., Mild neonatal hypoxia exacerbates the effects of vitamin-deficient diet on homocysteine metabolism in rats, Pediatr. Res. 57 (6) (2005) 777–782.
27. C.A. Maloney, S.M. Hay, W.D. Rees, Folate deficiency during pregnancy impacts on methyl metabolism without affecting global DNA methylation in the rat fetus, Br. J. Nutr. 97 (6) (2007) 1090–1098.
28. K.K. Mejos, et al., Effects of parental folate deficiency on the folate content, global DNA methylation, and expressions of FRalpha, IGF-2 and IGF-1R in the postnatal rat liver, Nutr. Res. Pract. 7 (4) (2013) 281–286.
29. L.G. Mikael, et al., Low dietary folate and methylenetetrahydrofolate reductase deficiency may lead to pregnancy complications through modulation of ApoAI and IFN-gamma in spleen and placenta, and through reduction of methylation potential, Mol. Nutr. Food Res. 57 (4) (2013) 661–670.
30. T. Partearroyo, et al., Dietary folic acid intake differentially affects methionine metabolism markers and hippocampus morphology in aged rats, Eur. J. Nutr. 52 (3) (2013) 1157–1167.
31. I.P. Pogribny, et al., Epigenetic alterations in the brains of Fisher 344 rats induced by long-term administration of folate/methyl-deficient diet, Brain Res. 1237 (2008) 25–34.
32. I.P. Pogribny, et al., Irreversible global DNA hypomethylation as a key step in hepatocarcinogenesis induced by dietary methyl deficiency, Mutat. Res. 593 (1–2) (2006) 80–87.
33. E. Sontag, et al., Protein phosphatase 2A methyltransferase links homocysteine metabolism with tau and amyloid precursor protein regulation, J. Neurosci. 27 (11) (2007) 2751–2759.
34. K.J. Sohn, et al., The effect of dietary folate on genomic and p53-specific DNA methylation in rat colon, Carcinogenesis 24 (1) (2003) 81–90.
35. S.J. Duthie, et al., Folate deficiency alters hepatic and colon MGMT and OGG-1 DNA repair protein expression in rats but has no effect on genome-wide DNA methylation, Cancer Prev. Res. 3 (1) (2010) 92–100.
36. A.M. Devlin, et al., Effect of Mthfr genotype on diet-induced hyperhomocysteinemia and vascular function in mice, Blood 103 (7) (2004) 2624–2629.
37. Z. Chen, et al., Mice deficient in methylenetetrahydrofolate reductase exhibit hyperhomocysteinemia and decreased methylation capacity, with neuropathology and aortic lipid deposition, Hum. Mol. Genet. 10 (5) (2001) 433–443.

62 PART A: Introduction
38. N.M. Jadavji, et al., Severe methylenetetrahydrofolate reductase deficiency in mice results in behavioral anomalies with morphological and biochemical changes in hippocampus, Mol. Genet. Metab. 106 (2) (2012) 149–159.
39. S.F. Choumenkovitch, et al., In the cystathionine beta-synthase knockout mouse, elevations in total plasma homocysteine increase tissue S-adenosylhomocysteine, but responses of S-adenosylmethionine and DNA methylation are tissue specific, J. Nutr. 132 (8) (2002) 2157–2160.
40. J.M. Alberto, et al., Mice deficient in cystathionine beta synthase display altered homocysteine remethylation pathway, Mol. Genet. Metab. 91 (4) (2007) 396–398.
41. K. Ikeda, et al., Triacylglycerol/phospholipid molecular species profiling of fatty livers and regenerated non-fatty livers in cystathionine beta-synthase-deficient mice, an animal model for homocysteinemia/homocystinuria, Anal. Bioanal. Chem. 400 (7) (2011) 1853–1863.
42. S. Dayal, et al., Cerebral vascular dysfunction in methionine synthase-deficient mice, Circulation 112 (5) (2005) 737–744.
43. C.L. Elmore, et al., Metabolic derangement of methionine and folate metabolism in mice deficient in methionine synthase reductase, Mol. Genet. Metab. 91 (1) (2007) 85–97.
44. N. Padmanabhan, et al., Mutation in folate metabolism causes epigenetic instability and transgenerational effects on development, Cell 155 (1) (2013) 81–93.
45. A.M. Devlin, et al., Tissue-specific changes in H19 methylation and expression in mice with hyperhomocysteinemia, J. Biol. Chem. 280 (27) (2005) 25506–25511.
46. M.B. Glier, et al., Tissue-specific relationship of S-adenosylhomocysteine with allele specific H19/Igf2methylation and imprinting in mice with hyperhomocysteinemia, Epigenet. 8 (1) (2013) 44–53.
47. D.C. Sulistyoningrum, R. Singh, A.M. Devlin, Epigenetic regulation of glucocorticoid receptor expression in aorta from mice with hyperhomocysteinemia, Epigenet. 7 (5) (2012) 514–521.
48. A.M. Devlin, et al., Hypermethylation of Fads2 and altered hepatic fatty acid and phospholipid metabolism in mice with hyperhomocysteinemia, J. Biol. Chem. 282 (51) (2007) 37082–37090.
49. A.M. Devlin, et al., Hepatic acyl-coenzyme a:cholesterol acyltransferase-2 expression is decreased in mice with hyperhomocysteinemia, J. Nutr. 140 (2) (2010) 231–237.
50. J. Geisel, et al., The vegetarian lifestyle and DNA methylation, Clin. Chem. Lab. Med. 43 (10) (2005) 1164–1169.
51. S. Melnyk, et al., Measurement of plasma and intracellular S-adenosylmethionine and S-adenosylhomocysteine utilizing coulometric electrochemical detection: alterations with plasma homocysteine and pyridoxal 5′-phosphate concentrations, Clin. Chem. 46 (2) (2000) 265–272.
52. P. Yi, et al., Increase in plasma homocysteine associated with parallel increases in plasma S-adenosylhomocysteine and lymphocyte DNA hypomethylation, J. Biol. Chem. 275 (38) (2000) 29318–29323.
53. W. Perng, et al., Dietary intake, plasma homocysteine, and repetitive element DNA methylation in the Multi-Ethnic Study of Atherosclerosis (MESA), Nutr. Metab. Cardiovasc. Dis. 24 (6) (2014) 614–622.
54. S.A. Farkas, et al., Epigenetic alterations in folate transport genes in placental tissue from fetuses with neural tube defects and in leukocytes from subjects with hyperhomocysteinemia, Epigenet. 8 (3) (2013) 303–316.
55. A.A. Fryer, et al., LINE-1 DNA methylation is inversely correlated with cord plasma homocysteine in man: a preliminary study, Epigenet. 4 (6) (2009) 394–398.

CHAPTER 2: Homocysteine and DNA methylation: a review 63
56. A.A. Fryer, et al., Quantitative, high-resolution epigenetic profiling of CpG loci identifies associations with cord blood plasma homocysteine and birth weight in humans, Epigenet. 6 (1) (2011) 86–94.
57. R. Castro, et al., Increased homocysteine and S-adenosylhomocysteine concentrations and DNA hypomethylation in vascular disease, Clin. Chem. 49 (8) (2003) 1292–1296.
58. P. Sharma, et al., Detection of altered global DNA methylation in coronary artery disease patients, DNA Cell Biol. 27 (7) (2008) 357–365.
59. A. Baccarelli, et al., Ischemic heart disease and stroke in relation to blood DNA methylation, Epidemiology 21 (6) (2010) 819–828.
60. Y.S. Huang, Y.F. Zhi, S.R.Wang, Hypermethylation of estrogen receptor-alpha gene in atheromatosis patients and its correlation with homocysteine, Pathophysiology 16 (4) (2009) 259–265.
61. D. Zhang, et al., Homocysteine-related hTERT DNA demethylation contributes to shortened leukocyte telomere length in atherosclerosis, Atherosclerosis 231 (1) (2013) 173–179.
62. C.S. Kim, et al., Homocysteine promotes human endothelial cell dysfunction via site-specific epigenetic regulation of p66shc, Cardiovasc. Res. 92 (3) (2011) 466–475.
63. F. Rodriguez-Esparragon, et al., Homocysteinylated protein levels in internal mammary artery (IMA) fragments and its genotype-dependence. S-homocysteine induced methylation modifications in IMA and aortic fragments, Mol. Cell. Biochem. 369 (1–2) (2012) 235–246.
64. S.G. Heil, et al., DNA methylation status is not impaired in treated cystathionine beta-synthase (CBS) deficient patients, Mol. Genet. Metab. 91 (1) (2007) 55–60.
65. M. Pufulete, et al., Folate status, genomic DNA hypomethylation, and risk of colorectal adenoma and cancer: a case control study, Gastroenterology 124 (5) (2003) 1240–1248.
66. R. Al-Ghnaniem, et al., Methylation of estrogen receptor alpha and mutL homolog 1 in normal colonic mucosa: association with folate and vitamin B-12 status in subjects with and without colorectal neoplasia, Am. J. Clin. Nutr. 86 (4) (2007) 1064–1072.
67. B. Van Guelpen, et al., One-carbon metabolism and CpG island methylator phenotype status in incident colorectal cancer: a nested case-referent study, Cancer Causes Control 21 (4) (2010) 557–566.
68. M. Vasavi, et al., DNA methylation in esophageal diseases including cancer: special reference to hMLH1 gene promoter status, Tumori 92 (2) (2006) 155–162.
69. S. Pirouzpanah, et al., The effect of modifiable potentials on hypermethylation status of retinoic acid receptor-beta2 and estrogen receptor-alpha genes in primary breast cancer, Cancer Causes Control 21 (12) (2010) 2101–2111.
70. S.M. Naushad, et al., Impact of hyperhomocysteinemia on breast cancer initiation and progression: epigenetic perspective, Cell Biochem. Biophys. 68 (2) (2014) 397–406.
71. D. Ingrosso, et al., Folate treatment and unbalanced methylation and changes of allelic expression induced by hyperhomocysteinaemia in patients with uraemia, Lancet 361 (9370) (2003) 1693–1699.
72. P.W. Nanayakkara, et al., Association between global leukocyte DNA methylation, renal function, carotid intima–media thickness and plasma homocysteine in patients with stage 2–4 chronic kidney disease, Nephrol. Dial. Transplant. 23 (8) (2008) 2586–2592.
73. C.Y. Hsu, et al., Global DNA methylation not increased in chronic hemodialysis patients: a case–control study, Ren. Fail. 34 (10) (2012) 1195–1199.
74. M.L. Selley, A metabolic link between S-adenosylhomocysteine and polyunsaturated fatty acid metabolism in Alzheimer's disease, Neurobiol. Aging 28 (12) (2007) 1834–1839.

64 PART A: Introduction
75. A. Bromberg, et al., No association between global leukocyte DNA methylation and homocysteine levels in schizophrenia patients, Schizophr. Res. 101 (1–3) (2008) 50–57.
76. A. Bromberg, et al., Global leukocyte DNA methylation is not altered in euthymic bipolar patients, J. Affect. Disord. 118 (1–3) (2009) 234–239.
77. M. Kinoshita, et al., Plasma total homocysteine is associated with DNA methylation in patients with schizophrenia, Epigenet. 8 (6) (2013) 584–590.
78. S. Friso, et al., A common mutation in the 5,10-methylenetetrahydrofolate reductase gene affects genomic DNA methylation through an interaction with folate status, Proc. Natl. Acad. Sci. U. S. A. 99 (8) (2002) 5606–5611.
79. R. Castro, et al., 5,10-methylenetetrahydrofolate reductase (MTHFR) 677C→T and 1298A→Cmutations are associated with DNA hypomethylation, J. Med. Genet. 41 (6) (2004) 454–458.
80. K.P. Shelnutt, et al., Methylenetetrahydrofolate reductase 677C→T polymorphism affects DNAmethylation in response to controlled folate intake in young women, J. Nutr. Biochem. 15 (9) (2004) 554–560.
81. J. Axume, et al., The MTHFR 677TT genotype and folate intake interact to lower global leukocyte DNA methylation in young Mexican American women, Nutr. Res. 27 (1) (2007) 1365-1317.
82. S. Narayanan, et al., Associations between two common variants C677T and A1298C in the methylenetetrahydrofolate reductase gene and measures of folate metabolism and DNA stability (strand breaks, misincorporated uracil, and DNA methylation status) in human lymphocytes in vivo, Cancer Epidemiol. Biomarkers Prev. 13 (9) (2004) 1436–1443.
83. J. Hanks, et al., The association between MTHFR 677C N T genotype and folate status and genomic and gene-specific DNA methylation in the colon of individuals without colorectal neoplasia, Am. J. Clin. Nutr. 98 (6) (2013) 1564–1574.
84. M. Pufulete, et al., Influence of folate status on genomic DNAmethylation in colonic mucosa of subjects without colorectal adenoma or cancer, Br. J. Cancer 92 (5) (2005) 838–842.
85. M. Achon, et al., Supranormal dietary folic acid supplementation: effects on methionine metabolism in weanling rats, Br. J. Nutr. 98 (3) (2007) 490–496.
86. H. Min, Effects of dietary supplementation of high-dose folic acid on biomarkers of methylating reaction in vitamin B(12)-deficient rats, Nutr. Res. Pract. 3 (2) (2009) 122–127.
87. K.K. Sie, et al., Effect of maternal and postweaning folic acid supplementation on global and gene-specific DNA methylation in the liver of the rat offspring, Mol. Nutr. Food Res. 57 (4) (2013) 677–685.
88. K.K. Sie, et al., Effect of maternal and postweaning folic acid supplementation on colorectal cancer risk in the offspring, Gut 60 (12) (2011) 1687–1694.
89. A. Kalani, et al., Nutri-epigenetics ameliorates blood–brain barrier damage and neurodegeneration in hyperhomocysteinemia: role of folic acid, J. Mol. Neurosci. 52 (2) (2014) 202–215.
90. M. Pufulete, et al., Effect of folic acid supplementation on genomic DNAmethylation in patients with colorectal adenoma, Gut 54 (5) (2005) 648–653.
91. R. Al-Ghnaniem Abbadi, P. Emery, M. Pufulete, Short-term folate supplementation in physiological doses has no effect on ESR1 and MLH1 methylation in colonic mucosa of individuals with adenoma, J. Nutrigenet. Nutrige. 5 (6) (2012) 327–338.
92. M. van den Donk, et al., Folic acid and vitamin B-12 supplementation does not favorably influence uracil incorporation and promoter methylation in rectal mucosa DNA of subjects with previous colorectal adenomas, J. Nutr. 137 (9) (2007) 2114–2120.

CHAPTER 2: Homocysteine and DNA methylation: a review 65
93. F. Pizzolo, et al., Folic acid effects on s-adenosylmethionine, s-adenosylhomocysteine, and DNA methylation in patients with intermediate hyperhomocysteinemia, J. Am. Coll. Nutr. 30 (1) (2011) 11–18.
94. H. Stopper, et al., Reduction of the genomic damage level in haemodialysis patients by folic acid and vitamin B12 supplementation, Nephrol. Dial. Transplant. 23 (10) (2008) 3272–3279.
95. U. Hubner, et al., Effect of 1 year B and D vitamin supplementation on LINE-1 repetitive element methylation in older subjects, Clin. Chem. Lab. Med. 51 (3) (2013) 649–655.
96. T.J. Green, et al., Homocysteine-lowering vitamins do not lower plasma S-adenosylhomocysteine in older people with elevated homocysteine concentrations, Br. J. Nutr. 103 (11) (2010) 1629–1634.
97. A.Y. Jung, et al., No effect of folic acid supplementation on global DNA methylation in men and women with moderately elevated homocysteine, PLoS One 6 (9) (2011) e24976.
98. S. Bae, et al., Impact of folic acid fortification on global DNA methylation and one-carbon biomarkers in the Women's Health Initiative Observational Study cohort, Epigenet. 9 (3) (2014) 396–403.
99. L. Barault, et al., Leukocyte DNA as surrogate for the evaluation of imprinted Loci methylation in mammary tissue DNA, PLoS One 8 (2) (2013) e55896.
100. J.E. Ashbury, et al., Biomarkers measured in buccal and blood leukocyte DNA as proxies for colon tissue global methylation, Int. J. Mol. Epidemiol. Genet. 5 (2) (2014) 120–124.

66 PART A: Introduction

CHAPTER 3
Nutrients and DNA methylation across the life course:
a systematic review
Kim V.E. Braun*, Pooja R. Mandaviya*, Oscar H. Franco, Jana Nano, Carolin Thomas,
Wichor M. Bramer, Taulant Muka, Jenna Troup, Joyce B.J. van Meurs, Sandra G. Heil,
Trudy Voortman
*These authors contributed equally as first authors
To be submitted

68 PART A: Introduction
ABSTRACT
Background and objectives: DNA methylation can be modified by environmental
factors, including nutrition. In order to gain more insight in effects of nutrients on DNA
methylation, we conducted a systematic review on the relation between nutrients and
DNA methylation in humans across the life course.
Methods: The literature search was designed by an experienced biomedical
information specialist. Six bibliographic databases (Embase.com, Medline (Ovid), Web-
of-Science, PubMed, Cochrane Central and Google Scholar) were searched. We
selected studies that examined the association between nutrients (blood levels; dietary
intake; or dietary supplements) and DNA methylation (global, site specific, or genome-
wide) in humans of any age, with no restrictions on year of publication, language, or
study design. Abstract screening, full text selection, and data extraction was performed
by two independent reviewers, with a third reviewer available to solve any
disagreements.
Results: We identified 3774 references, of which 98 studies met all inclusion criteria.
The majority was performed in adult study populations, and folate was the main
nutrient of interest. Several candidate gene and epigenome-wide association studies
reported differential DNA methylation of CpG sites in response to folate (e.g. IGF2,
H19, HOX), fatty acids (e.g. PPRAGC1A, TNFα), and vitamin D (CYP24A1). Some of these
observed associations were specific to life course stage (e.g. IGF2 in early life) and
tissue (e.g. opposite directions for PPRAGC1A in muscle versus fat tissue).
Conclusions: To date, promising results have been reported in the field of nutrition and
DNA methylation in humans at different stages across the life-course; especially for
nutrients known to be involved in one-carbon metabolism, including folate, but also
others, such as fatty acids and vitamin D. Studies on other nutrients, such as other
macronutrients and several minerals are still scare. Further large-scale studies of high
quality are needed to expand our understanding on the role of nutrition in DNA
methylation and its effects on health and disease.

CHAPTER 3: Nutrients and DNA methylation: a systematic review 69
1. INTRODUCTION
DNA methylation is prone to modification by environmental factors, including
nutrition. The susceptibility of change in DNA methylation in response to nutrition is
particularly high during early life (1). Nevertheless, nutrition has also been reported to
be associated with DNA methylation in other stages of the life course, for instance,
during adolescence and adulthood (2).
Nutrients that are known to be involved in DNA methylation through their
role in one-carbon metabolism are B-vitamins and methionine. However, also other
nutrients such as fatty acids, protein, and vitamin D, are suggested to have an effect on
DNA methylation (3). To date, many studies have been carried out investigating the
role of nutrition on DNA methylation, in animal studies as well as human studies.
Although evidence from animal studies demonstrates that nutrition has effects on DNA
methylation, findings from studies in humans are inconsistent (4).
In order to gain more insight in effects of several nutrients on DNA
methylation across the life-course, a clear overview of the current knowledge is of
importance. Identifying which nutrients affect DNA methylation, either globally or at
specific CpG sites, will provide insight in the mechanisms that are responsible for the
effect of nutrition on several health outcomes. Therefore, we conducted a
comprehensive systematic review on the relationship between status and intake of
nutrients with DNA methylation in humans across the life course.
2. METHODS
This systematic review was performed and reported in accordance with the Preferred
Reporting Items for Systematic Reviews and Meta-Analyses (PRISMA) statement (5).
Literature search
A literature search was designed for six electronic databases by an experienced
biomedical information specialist. The search engines Embase.com (Medline and
Embase), Medline (Ovid), Cochrane Central, Web-of-Science, PubMed, and Google
Scholar were searched from inception until May 10th 2016 (date last searched) to
identify published studies that examined the association between nutrients and DNA
methylation. The full search strategies of all databases are provided in Supplement 1.
Study selection and inclusion criteria
We selected studies that examined the association between nutrients (blood levels;
dietary intake; and/or dietary supplements) and DNA methylation (global, site specific,
and/or genome-wide) in humans. We excluded studies that were performed among
only patients with chronic diseases (e.g. Alzheimer’s disease, diabetes, anorexia
nervosa, cardiovascular diseases, etc.) and case reports (n<5). No restrictions were set
on year of publication, language, or study design. We excluded studies on caloric
intake, alcohol intake, glucose levels, triglyceride levels, and cholesterol levels as these

70 PART A: Introduction
were outside the scope of our review. Two reviewers screened the retrieved titles and
abstracts and selected eligible studies according to predefined selection criteria
independently of each other (Supplement 2). Discrepancies between the two
reviewers were resolved through discussion, with an arbitrator available if no
consensus was reached. We retrieved full texts for studies that satisfied all selection
criteria. These full-text articles were evaluated in detail once more by two investigators
against the selection criteria.
Data extraction
A structured database was developed prior to the data extraction. Detailed
characteristics of individual studies were extracted including study design, study size,
country, characteristics of the study population, and details on exposure and outcome
assessment. In addition, we extracted information on covariate adjustments, and
conclusions. The association of each nutrient with each methylation measure, either
global or genome-wide site-specific or gene-specific, was extracted separately to report
each specific analysis. Gene-specific studies were considered per gene separately.
Quality analysis
The quality of included studies was evaluated by two reviewers using a predefined
scoring system. This quality score (QS) was previously developed for its use in
systematic reviews and meta-analyses including studies with various study designs (6).
A score of 0, 1 or 2 points was allocated to each of the following five items: 1) study
design; 2) size of the population for analysis; 3) quality of the methods used for
exposure assessment or appropriate blinding of an intervention; 4) quality of the
methods used for outcome assessment; and 5) adjustment for potential confounders
or adequate randomization of an intervention. The combined scores resulted in a total
QS between 0 and 10 points, with 10 representing the highest quality. Details on the
QS are presented in Supplement 3.
3. RESULTS
Characteristics of the included studies
From the literature search we identified 3,774 unique references, of which 3,523 were
excluded after screening of title and abstract based on the selection criteria. Of the 251
remaining references, full-texts were retrieved and reviewed, of which 98 studies met
all criteria and were included in this systematic review (Figure 1). Of the included
studies, 25 studies investigated the association between maternal nutrition and
offspring DNA methylation, nine studies were carried out during infancy, childhood, or
adolescence, and 70 studies were performed in adults (Table 1, Figure 2). Most studies
examined associations between nutrients and gene-specific DNA methylation, of which
the majority focused on folate as nutrient of interest (Tables 2-18). Summaries of the

CHAPTER 3: Nutrients and DNA methylation: a systematic review 71
findings of all included studies are presented below per nutrient or nutrient groups and
per life stage. Detailed information of population characteristics, DNA methylation
assessment, confounder adjustment, and description of results is included in the online
supplementary material.
Figure 1. Flow chart of included studies
Unique records identified through database searching
n = 3,774
Studies included
n = 98
Records excluded based
on title and abstract n = 3,523
Full-text articles excluded
n = 153
Records screened
n = 3,774
Records given full text detailed assessment
n = 251

72 PART A: Introduction
Table 1. Number of studies per category of life course stage, nutrient group, and DNA
methylation type
Maternal nutrition & offspring DNA methylation
Infant, child, & adolescent
nutrition & DNA methylation
Adult nutrition & DNA methylation
TOTAL To
tal
Glo
bal
Ge
ne
-sp
ecif
ic
Ge
no
me-
wid
e
Tota
l
Glo
bal
Ge
ne
-sp
ecif
ic
Ge
no
me-
wid
e
Tota
l
Glo
bal
Ge
ne
-sp
ecif
ic
Ge
no
me-
wid
e
MICRONUTRIENTS
Vitamin A, α-carotene & β-carotene
0 0 0 0 1 1 0 0 3 1 2 0 4
Folate 16 6 7 4 3 3 1 0 43 34 12 1 59
Vitamin B1 0 0 0 0 0 0 0 0 1 1 0 0 1
Vitamin B2 1 0 1 0 0 0 0 0 5 5 0 0 6
Vitamin B3 1 0 1 0 0 0 0 0 1 1 0 0 2
Vitamin B6 1 0 1 0 0 0 0 0 11 11 1 0 12
Vitamin B12 4 2 2 0 2 1 1 0 22 18 7 0 26
Vitamin C 0 0 0 0 0 0 0 0 5 1 4 0 5
Vitamin D 3 0 2 1 3 1 2 1 5 3 3 0 10
Vitamin E 0 0 0 0 0 0 0 0 4 1 3 0 4
Choline & betaine 2 2 1 0 0 0 0 0 3 3 1 0 3
Minerals & trace elements
0 0 0 0 1 1 0 0 7 6 2 0 8
Combined nutrients
1 0 0 1 0 0 0 0 6 3 2 1 7
Bioactive compounds
0 0 0 0 0 0 0 0 6 1 5 0 6
MACRONUTRIENTS
Fat & fatty acids 5 2 3 1 2 0 0 2 18 4 10 5 25
Carbohydrates & fiber
2 1 1 0 0 0 0 0 6 4 3 0 8
Protein & amino acids
2 1 1 0 0 0 0 0 7 5 3 0 9
TOTAL 25 9 13 6 9 4 4 3 70 42 26 7 98

CHAPTER 3: Nutrients and DNA methylation: a systematic review 73
Figu
re 2
. D
istr
ibu
tio
n o
f st
ud
ies
(N=9
8)
pe
r ca
tego
ry o
f lif
e co
urs
e st
age,
nu
trie
nt
gro
up
, an
d D
NA
me
thyl
atio
n o
utc
om
e ty
pe.
Vit
amin
(V
it)
A,
incl
ud
es c
aro
ten
oid
s; C
ho
line,
incl
ud
es c
ho
line
an
d b
etai
ne;
Min
era
ls, i
ncl
ud
e m
iner
als
and
tra
ce e
lem
ents
; C
N, C
om
bin
ed n
utr
ien
ts;
BC
, Bio
acti
ve
com
po
un
ds;
Fat
s, in
clu
de
fats
an
d f
atty
aci
ds;
Car
bo
hyd
rate
s (C
arb
s), i
ncl
ud
e fi
ber
s; P
rote
ins,
incl
ud
e p
rote
ins
and
am
ino
aci
ds.
05
10
15
20
25
30
35
40
45
50
PregnancyChildhoodAdulthood
PregnancyChildhoodAdulthood
PregnancyChildhoodAdulthood
PregnancyChildhoodAdulthood
PregnancyChildhoodAdulthood
PregnancyChildhoodAdulthood
PregnancyChildhoodAdulthood
PregnancyChildhoodAdulthood
PregnancyChildhoodAdulthood
PregnancyChildhoodAdulthood
PregnancyChildhoodAdulthood
PregnancyChildhoodAdulthood
PregnancyChildhoodAdulthood
PregnancyChildhoodAdulthood
PregnancyChildhoodAdulthood
PregnancyChildhoodAdulthood
PregnancyChildhoodAdulthood
Vit
AFo
late
Vit
B1
Vit
B2
Vit
B3
Vit
B6
Vit
B1
2V
it C
Vit
DV
it E
Ch
olin
eM
iner
als
CN
BC
Fats
Car
bs
Pro
tein
s
Ge
no
me-
wid
eG
en
e-sp
ecif
icG
lob
al

74 PART A: Introduction
MICRONUTRIENTS
Vitamin A, α-carotene, and β-carotene
Vitamin A in infancy, childhood, and adolescence and DNA methylation
Perng et al (QS: 6) showed that higher plasma vitamin A levels in children aged 5 to 12
years were associated with global DNA hypomethylation in blood (7).
Vitamin A in adulthood and DNA methylation
Piyathilake et al. (QS: 6) observed no association between plasma vitamin A levels and
global DNA methylation in either PBMCs or cervical cells (8). Bollati et al (QS: 6)
investigated the association of intake of α-carotene, β-carotene, and retinol with
methylation of CD14, Et-1, HERV-w, iNOS and TNFα in blood. They observed an
association of higher intake of β-carotene with hypermethylation of HERV-w and
higher intake of β-carotene and retinol was associated with hypomethylation of TNFα.
However, no significant association was observed for the other genes (9). Stidley et al
(QS: 6) did not find an association of α-carotene, β-carotene, and retinol intake with
methylation index of genes (p16, MGMT, DAPK, RASSF1A, PAX5α, PAX5β, GATA4, and
GATA5) in sputum (10).
Folate
Maternal folate and offspring DNA methylation
Sixteen unique studies investigated the association between maternal folate and
offspring DNA methylation, six at a global level, seven gene-specific, and four at a
genome-wide level. Of the four studies investigating global DNA methylation in cord
blood (QS: 2-6), one found that an increased dietary folate as well as RBC folate were
associated with global hypomethylation (11), whereas the other three studies reported
no significant association with folate (12-14). In contrast, studies investigating DNA
methylation in other fetal tissues, including placenta, brain and heart, showed that
higher maternal folate levels were associated with global hypermethylation (15, 16).
Four studies investigated the association between levels or intake of maternal folate
and IGF2 methylation in offspring (QS: 5-7). Three of these studies measured
methylation in cord blood. In these studies, higher folate intake was shown to be
associated with IGF2 hypermethylation (11) and no association was observed between
serum folate and DNA methylation (17). Higher RBC folate showed association with
IGF2 hypermethylation in one study (18) and no association in another study (11). One
observational study found IGF2 hypermethylation in offspring at 12-18 months in
mothers who used folate supplements during pregnancy compared to those of
mothers who did not (19). Furthermore, Hoyo et al. (QS: 5 and 7) found an association
of maternal folate supplements and erythrocytes with H19 hypomethylation in cord

CHAPTER 3: Nutrients and DNA methylation: a systematic review 75
blood (18, 20). Maternal intake and erythrocyte folate were found to be associated
with PEG3 hypomethylation in cord blood (11, 18), whereas no association was found
with maternal RBC folate (QS: 5-7) (11). Furthermore, higher maternal erythrocyte
folate was also associated with hypermethylation of PEG1/MEST and hypomethylation
of PEG10/SGCE in cord blood (QS: 7) (18). Higher maternal erythrocyte folate was
associated with hypomethylation of MEG3, MEG3-IG (intergenic), NNAT and PLAGL1
promoters in cord blood (QS:7) (18). Van Mil et al. showed that supplement use and
venous blood levels of folate were associated with NR3C1 hypermethylation, and
higher folate supplement use was associated with 5-HTT hypomethylation in cord
blood (QS: 6 and 7) (21). Furthermore, no associations were observed between
maternal folate intake or RBC and SNRPN or ZAC1 methylation in cord blood (QS: 5 and
6) (11, 22).
Of the four studies investigating maternal folate levels and epigenome-wide
DNA methylation in cord blood, three used Illumina 450K arrays and identified several
CpG sites. Amarasekera et al. (QS: 4, N=23) found seven differentially methylated
regions, of which ZFP57 was validated using Sequenom EpiTyper platform (23). Joubert
et al. (QS: 8, N=1988) identified 443 CpG sites annotated to 320 genes, of which some
novel genes included APC2, GRM8, SLC16A12, OPCML, PRPH, LHX1, KLK4 and PRSS21
(24). Gonseth et al. (QS: 6, N=347) found that maternal folate intake was associated
with three CpG sites annotated to genes TFAP2A, STX11 and CYS1 (25). The fourth
EWAS (QS: 6, N=200) did not find associations between maternal folate levels and
genome-wide DNA methylation (26).
Folate in infancy, childhood, and adolescence and DNA methylation
Three unique studies investigated the association between folate levels and global DNA
methylation during infancy or childhood, of which one also examined gene-specific
DNA methylation. Two studies (QS:4 and 5) examined the association between folate
levels and global DNA methylation in cord blood: Haggerty et al. showed that RBC
folate was associated with global hypomethylation whereas Fryer et al. observed no
association (11, 13). Perng et al. (QS: 4) studied the association between erythrocyte
folate and global methylation in children aged 5-12 years, but found no association (7).
Haggerty et al. (QS: 6) also examined the association between RBC folate and DNA
methylation of IGF2, PEG3 and SNRPN in cord blood. In line with their findings for
maternal folate and offspring DNA methylation, they found that RBC folate at birth was
also associated with IGF2 hypermethylation, PEG3 hypomethylation and no difference
in SNRPN methylation (11).
Folate in adulthood and DNA methylation
There were 41 unique studies that investigated the association between folate and
adult DNA methylation. Thirty-three studies examined DNA methylation at a global

76 PART A: Introduction
level, 12 gene-specific, and one at a genome-wide level. In observational studies that
measured DNA methylation in blood, folate intake was associated with DNA
hypomethylation in one study (QS: 5) (27), DNA hypermethylation in three studies (QS:
3-5) (28-30), but no difference in methylation was observed in majority of the studies
(QS: 1-6) (12, 31-35). Higher blood levels of folate were associated with DNA
hypomethylation in one study (QS: 6) (36), whereas DNA hypermethylation in six
studies (QS: 4-6) (37-42). A few studies showed no difference in methylation (QS: 3-6)
(34, 43-45). Overall, dietary intake and levels of folate in these observational studies
tend to be more often associated with global DNA hypermethylation than
hypomethylation. In contrast, intervention studies with folate supplements showed an
effect of folate on DNA hypomethylation in three studies (QS: 2-8) (46-48), DNA
hypermethylation in two studies (QS: 3) (49, 50) and no effect on methylation in three
studies (QS: 3-8) (51-53). The direction of effect in these intervention studies were
contradictory to those shown in the observational studies. In studies that measured
DNA methylation in colonic tissue, higher folate intake was associated with global DNA
hypomethylation on one side of the colon (QS: 3) (54), whereas folate in blood levels
(54-57) and colonic tissue (55) showed no association with DNA methylation (QS: 4-6).
Furthermore, Llanos et al. measured DNA methylation in breast tissue and observed no
association with folate levels from plasma and breast tissue (QS: 6) (58). In an
intervention study, Aarabi et al. found a significant association between higher folate
supplements and DNA hypomethylation (QS: 4) (59).
Two studies investigated the association between levels or intake of folate
and methylation in IGF2 and H19. In contrast to the studies that examined the same
genes in maternal-offspring (11, 18-20), Hanks et al. (QS: 7) did not find an association
between folate in serum, RBC and colonic tissue with IGF2 methylation in adults (55).
In addition, in an intervention study by Aarabi et al. (QS: 5), no effect was observed
between folate supplements and methylation in H19 (59).
Higher folate intake was associated with promotor hypomethylation of TNFα
and methylation index of genes (p16, MGMT, DAPK, RASSF1A, PAX5α, PAX5β, GATA4,
and GATA5) in blood and sputum, respectively. However, no association was observed
with promoter TLR2, CD14, Et-1, HERV-w, iNOS and IL-6 methylation in blood (QS: 5-6)
(9, 30, 60). Dhillon et al. (QS: 5) showed no significant association between folate
intake and GSTM1 methylation in serum. However, when analysis was stratified for
MTHFR genotype, low folate intake was associated with lower methylation of GSTM1
methylation for CT and TT group only (61). Two studies investigated the association of
levels of folate in serum, RBC, plasma, and colonic tissue with gene-specific
methylation in colonic tissue or rectal mucosa (QS: 6-7). Hypermethylation of MYOD,
SFRP1, SFRP2 and methylation index of genes (HPP1, APC, SFRP1, SFRP2, SOX17, WIF1,
ESR1, MYOD, N33) was observed with higher folate levels. However, no significant
associations were observed for methylation of individual genes: APC, MYOD1, MLH1,

CHAPTER 3: Nutrients and DNA methylation: a systematic review 77
N33, SOX17 and/or ESR1 (55, 57). Ottini et al. (QS: 5) reported that higher folate levels
in plasma were associated with hypomethylation of methylation index of genes (p16,
FHIT, RAR, CDH1, DAPK1, hTERT, RASSF1A, MGMT, BRCA1 and PALB2) (62).
Some studies observed associations for nutrient levels in a tissue specific
manner. Tapp et al. (QS: 6) investigated the association of folate levels with HPP1 and
WIF1 methylation in rectal mucosa. They observed hypermethylation of HPP1 and
WIF1 in association with higher plasma folate levels, but not with higher RBC folate
levels (57). Hanks et al. (QS: 7) examined the association between folate levels and
MGMT methylation in colonic tissue. They observed hypomethylation of MGMT in
association with higher serum folate levels, but not with higher folate levels in RBC and
colonic tissue (55). In women with HPV, higher plasma folate levels were associated
with HPV 16 hypermethylation (promoter) in blood (QS: 5) (63). In healthy women,
higher plasma and breast folate levels were associated with hypomethylation of
p16INK4a (QS: 7) (64). In intervention studies, folate supplementation had no effect on
ESR1 and MLH1 methylation in colonic mucosa, and DLK1/GTL2, MEST, SNRPN, PLAGL1
and KCNQ1OT1 methylation in sperm (QS: 5 and 7) (59, 65). Song et al. (QS: 4)
performed an EWAS of folate levels in breast tissue in women, and found two
differentially methylated CpG sites. One CpG site near JAG2 was hypomethylated and
another CpG site near DNAJC2 was hypermethylated (66).
Vitamin B1
Vitamin B1 in adulthood and DNA methylation
Marques-Rocha et al. (QS: 5) showed that higher vitamin B1 intake was associated with
global DNA hypomethylation in blood (67).
Vitamin B2
Maternal vitamin B2 and offspring DNA methylation
Azzi et al. (QS: 6) showed that higher vitamin B2 intake during pregnancy was
associated with hypermethylation of ZAC1 in cord blood (22).
Vitamin B2 in adulthood and DNA methylation
Five studies (QS: 3-5) investigated the association between vitamin B2 intake and
global DNA methylation in blood or colonic tissue (27, 30, 35, 54, 67), and only one
study found an association: that higher vitamin B2 intake was associated with DNA
hypermethylation in blood (67). In addition, Figueiredo et al. (QS: 4) found no
association between vitamin B2 levels in plasma with global methylation in colonic
tissue (54). Zhang et al. (QS: 5) showed that vitamin B2 intake was not associated with
methylation of IL-6 in blood (30).

78 PART A: Introduction
Vitamin B3
Maternal vitamin B3 and offspring DNA methylation
Azzi et al. (QS: 6) showed that vitamin B3 intake during pregnancy was not associated
with methylation of ZAC1 in cord blood (22).
Vitamin B3 in adulthood and DNA methylation
Marques-Rocha et al. (QS: 5) showed that higher vitamin B3 intake was associated with
global DNA hypomethylation in blood (67).
Vitamin B6
Maternal vitamin B6 and offspring DNA methylation
Azzi et al. (QS: 6) reported that vitamin B6 intake during pregnancy was not associated
with methylation of ZAC1 in cord blood (22).
Vitamin B6 in adulthood and DNA methylation
Eight studies (QS: 3-5) investigated the association between vitamin B6 intake with
global DNA methylation in blood or colonic tissue (7, 27, 29-31, 34, 35, 54), and only
one study found an association and reported that higher vitamin B6 intake was
associated with global hypomethylation in blood (31). Two other studies (QS: 4 and 6)
investigated the association of vitamin B6 levels in plasma and venous blood with
global DNA methylation in blood or colonic tissue, but did not find any association (38,
54). An intervention study by Hübner et al. (QS: 3), showed that vitamin B6
supplementation had no effect on global DNA methylation in blood (51). Zhang et al.
(QS: 5) showed that vitamin B6 intake was not associated with methylation of IL-6 in
blood (30).
Vitamin B12
Maternal vitamin B12 and offspring DNA methylation
Two studies investigated the association of intake and serum levels of vitamin B12 with
global DNA methylation in cord blood (QS: 5 and 6). Higher serum levels of vitamin B12
were associated with hypermethylation (14), whereas no difference in methylation was
observed with higher vitamin B12 intake (12). For the gene-specific studies, Ba et al.
(QS: 6) showed that higher vitamin B12 levels in serum were associated with IGF2
promoter hypomethylation in cord blood (17). Azzi et al. (QS: 6) showed that higher
vitamin B12 intake during pregnancy was associated with hypermethylation of ZAC1 in
cord blood (22).

CHAPTER 3: Nutrients and DNA methylation: a systematic review 79
Vitamin B12 in infancy, childhood, and adolescence and DNA methylation
In children aged 5 to 12 years, no association was observed between plasma vitamin
B12 levels and global DNA methylation in blood (QS: 4) (7). In cord blood, McKay et al.
(QS: 7) showed that higher serum vitamin B12 levels were associated with
hypomethylation of IGFBP3 (14).
Vitamin B12 in adulthood and DNA methylation
Eight studies (QS: 3-6) found no association between vitamin B12 intake and global
DNA methylation (12, 27, 29-32, 34, 35). Also for vitamin B12 levels in plasma or serum,
no associations were found with global DNA methylation in blood, colonic tissue or
rectal mucosa in eight studies (QS: 3-6) (34, 38, 43-45, 54, 56, 57). However, in one
study (QS: 6), higher plasma vitamin B12 levels were associated with global
hypermethylation in blood clots (68). An intervention study (QS: 3) showed that
vitamin B12 supplements had no effect on global DNA methylation in blood (69). For
gene-specific studies, vitamin B12 intake was not associated with methylation of CD14,
Et-1, HERV-w, iNOS, TNFα, IL-6, and TLR2 in blood (QS: 5-6) (9, 30, 60). In addition,
Tapp et al (QS: 6) found no association between vitamin B12 levels in plasma and
methylation of HPP1, APC, SFRP1, SFRP2, SOX17, WIF1, ESR1, MYOD, N33 and
methylation index of these genes (57). Al-Ghnaniem et al. (QS: 6) observed that higher
vitamin B12 levels in venous blood were associated with hypomethylation of ERα in
colonic mucosa (70). Furthermore, plasma vitamin B12 levels were associated with
hypermethylation of HPV 16 (QS: 5) and no difference in methylation index of genes
(p16, FHIT, RAR, CDH1, DAPK1, hTERT, RASSF1A, MGMT, BRCA1 and PALB2) (QS: 3) (62,
63).
Vitamin C
Vitamin C in adulthood and DNA methylation
Piyathilake et al. (QS: 6) investigated the association between plasma vitamin C levels
and global DNA methylation in PBMCs and cervical cells, but did not find a significant
association (8). Two studies (QS: 6) investigated the association between vitamin C
intake and gene-specific promoter DNA methylation. One study found that higher
intake of vitamin C was associated with hypomethylation of PON1 in venous blood (71),
whereas the other study did not find an association of vitamin C intake with
methylation index of genes (p16, MGMT, DAPK, RASSF1A, PAX5α, PAX5β, GATA4, and
GATA5) in sputum (10). Furthermore, Bollati et al (QS: 6) investigated the association of
intake of ascorbic acid with methylation of CD14, Et-1, HERV-w, iNOS and TNFα in
blood, but no significant association was observed (9). Piyathilake et al. (QS: 5) found
no association between vitamin C levels in plasma and HPV 16 methylation in blood
(63).

80 PART A: Introduction
Vitamin D
Vitamin D and offspring DNA methylation
One study (QS: 5) found that higher maternal vitamin D levels in plasma were
associated with hypomethylation of RXRA in umbilical cord tissue (72), whereas
another study (QS: 4) did not find an association between maternal vitamin D levels in
serum and CYP24A1 methylation in placenta (73). Mozhui et al (QS: 6) conducted an
EWAS of vitamin D levels, but found no significant CpG site associations in cord blood
(26).
Vitamin D in infancy, childhood, and adolescence and DNA methylation
For vitamin D, Zhu et al. (QS: 7) found that higher plasma vitamin D levels as well as an
intervention with vitamin D supplementation were associated with global
hypermethylation in blood (74). In neonates, Novakovic et al (QS: 4) found no
association between serum vitamin D levels and CYP24A1 methylation in placenta (73).
Zhu et al. (QS: 4) investigated the associated between plasma vitamin D levels and
gene-specific methylation in blood among children around 16 years of age. Higher
vitamin D levels were found to be associated with hypomethylation of CYP2R1,
hypermethylation of CYP24A1, and differential methylation in opposite directions of
two CpG sites annotated to DHCR7 (75). In an EWAS of vitamin D levels, Zhu et al. (QS:
5) identified two differentially methylated CpG sites: higher vitamin D levels were
associated with hypomethylation of DOI3 and hypermethylation of MAPRE2 (75).
Vitamin D in adulthood and DNA methylation
Three studies, of which two were cross-sectional (QS: 5) and one intervention (QS: 3)
found no effect of vitamin D supplementation or vitamin D levels in plasma or serum
on global DNA methylation in blood or rectal mucosa (51, 57, 76). In gene-specific
studies, Bollati et al (QS: 6) found no association between vitamin D intake and
promoter methylation of CD14, Et-1, HERV-w, iNOS and TNFα (9). Tapp et al. (QS: 6)
investigated the association between plasma vitamin D levels and gene-specific
methylation of HPP1, APC, SFRP1, SFRP2, SOX17, WIF1, ESR1, MYOD and N33 in rectal
mucosa. They found that higher vitamin D levels were associated with
hypomethylation of index of these genes and also individual genes such as APC, WIF1
and MYOD. No association was found for the other individual genes (57). Furthermore,
Ashktorab et al. (QS: 7) found no significant association between serum vitamin D
levels and DKK1 methylation in blood (77).

CHAPTER 3: Nutrients and DNA methylation: a systematic review 81
Vitamin E
Vitamin E in adulthood and DNA methylation
Piyathilake et al. (QS: 6) observed that higher levels of plasma vitamin E were
associated with global hypomethylation in PBMCs, but not with global methylation in
cervical cells (8). In a gene-specific study, Stidley et al (QS: 6) did not find an association
of vitamin E intake with methylation index of any of the studied genes (p16, MGMT,
DAPK, RASSF1A, PAX5α, PAX5β, GATA4, and GATA5) in sputum (10).
Choline and Betaine
Maternal choline and betaine and offspring DNA methylation
Boeke et al. (QS: 6) showed that higher choline or betaine intake during pregnancy
were associated with global DNA hypomethylation in cord blood (12). In contrast, Jiang
et al. (QS: 6), in an intervention study, reported that higher supplemental choline
intake during pregnancy was associated with global DNA hypermethylation in placenta,
but not in cord blood (78). For gene-specific studies, an intervention study by Jiang et
al. (QS: 5) showed that higher supplemental choline intake during pregnancy was
associated with hypermethylation of promoter CRH and NR3C1 in placenta. In contrast
to placental tissue, in cord blood promoter CRH and NR3C1 were hypomethylation in
response to a higher supplemental choline intake. No effect of choline
supplementation was observed in methylation of GNAS-AS1, IGF2, IL-10, or LEP in
placenta or cord blood (78).
Choline and betaine in adulthood and DNA methylation
Shin et al. (QS: 3) showed that choline supplementation was associated with global
DNA hypermethylation in blood, but only for subjects with the MTHFR 677CC genotype
(79). However, another intervention study (QS: 4) showed no effect of choline
supplementation on global DNA methylation in blood (78). In addition, in a cross-
sectional study by Boeke et al. (QS: 6), choline and betaine intake was not associated
with global DNA methylation in blood in pregnant women (12). In an intervention study
by Jiang et al. (QS: 5) a higher supplemental choline intake was not associated with
methylation of promoter CRH and NR3C1 in blood among pregnant women (78).
Minerals and trace elements
Minerals and trace elements in infancy, childhood, and adolescence and DNA
methylation
In a cross-sectional study among children aged 5 to 12 years, Perng et al (QS: 4)
investigated the association of plasma levels of ferritin and serum levels of zinc with
global DNA methylation in blood, but no significant associations were observed (7).

82 PART A: Introduction
Minerals and trace elements in adulthood and DNA methylation
Marques-Rocha et al. (QS: 5) showed that higher intakes of both copper and iron were
associated with global DNA hypermethylation in blood (67). In contrast, Gomes et al
(QS: 3) reported that higher intakes of magnesium were associated with DNA
hypomethylation in blood (31). Two studies (QS: 3 and 5) examined associations
between zinc intake and global DNA methylation in blood, but both observed no
significant associations (31, 32). Furthermore, Tapp et al. (QS: 5) reported that higher
plasma levels of selenium were associated with global DNA hypermethylation in rectal
mucosa, but only in women (57). McChelland et al. (QS: 6) reported that higher serum
levels of phosphate were associated with global DNA hypomethylation in blood (80). In
an intervention study by Hubner et al. (QS: 3) no effect was observed of calcium
supplementation on global DNA methylation in blood (51).
For gene-specific studies, Shimazu et al. (QS: 6) investigated the associations
of salt intake with methylation of miR-124a-3, EMX1 and NKX6-1 in gastric mucosa, but
observed no significant associations (81). Tapp et al. (QS: 6) examined associations of
plasma selenium levels with methylation of HPP1, APC, SFRP1, SFRP2, SOX17, WIF1,
ESR1, MYOD, N33 and an index of these genes. They observed that higher levels of
selenium were associated with hypermethylation of N33, but only in males. No
significant associations were observed for the other genes or index (57).
Combined nutrients
Maternal combined vitamins and minerals and offspring DNA methylation
In an intervention study, Khulan et al. examined the effect of maternal micronutrient
supplementation on genome-wide DNA methylation in cord blood (QS: 6) and
peripheral blood during infancy (QS:6) (82). In cord blood 14 CpG sites were identified
in males and 21 CpG sites in females, with no overlap between the two. In addition, in
infant blood 108 CpG sites were identified in males and 106 CpG sites in females, with
only 5 (XIRP1, MEOX1, GNA11, C1orf54, KRTAP21-1) in agreement between male and
female infants. Within each sex a significant proportion of the identified CpG sites in
cord bloods were also observed in infants (males 7/14: MEOX1, SPAG4L, SPATA22,
NRN1L, C1orf54, PIP, PTPN20B; females 8/21: HSPC176, XIRP1, BPIL1, MGMT, CHIT1,
C14orf152, KLRC2, DEFB123).
Combined vitamins and minerals in adulthood and DNA methylation
Two studies investigated the association between folate and vitamin B12 combined
with global DNA methylation. Piyathilake et al. (QS: 6) reported that higher vitamin B12
and folate in plasma were associated with global hypermethylation in PBMCs, but not
in cervical cells (8). However, in an intervention study by Fenech et al. (QS: 6) vitamin
B12 and folate supplements had no effect on global DNA methylation (43). Pusceddu et
al. (QS:5) studied the effect of vitamin B12, vitamin B6, folate, vitamin D and calcium

CHAPTER 3: Nutrients and DNA methylation: a systematic review 83
supplementation on global DNA methylation After intervention LINE-1
hypermethylation was observed (83). For gene-specific studies, Stidley et al. (QS: 6)
observed that higher intake of multivitamins was associated with hypomethylation of
methylation index (p16, MGMT, DAPK, RASSF1A, PAX5α, PAX5β, GATA4, and GATA5)
(10). In an intervention study by Zhou et al. (QS: 5), vitamin D and calcium
supplementation led to hypomethylation of CYP24A1, but had no effect on CYP2R1,
CYP27A1, and CYP27B1 (84). Kok et al. studied the effect of vitamin B12 and folate
supplementations on epigenome-wide DNA methylation (QS: 8). After intervention 162
CpG sites were identified as compared to baseline. Comparisons of folic acid and
vitamin B12 versus placebo revealed one CpG sites (cg19380919) and 6 differentially
methylated regions (DMRs), with pronounced changes in DIRAS3, ARMC8, and NODAL.
In addition, serum levels of folate and vitamin B12 were related to DNA methylation of
173 and 425 regions, respectively, including several members of the developmental
HOX genes (85).
Bioactive compounds
Bioactive compounds in adulthood and DNA methylation
Bollati et al (QS: 6) investigated the association of intake carotenoids, polyphenols, and
flavonoids with methylation of CD14, Et-1, HERV-w, iNOS and TNFα in blood. They
observed an association of higher intake of carotenoids with hypermethylation of
HERV-w and with hypomethylation of TNFα. However, no significant association was
observed for the other genes (9). De la Iglesia et al. (QS: 6) observed that that higher
lycopene intake was associated with PON1 hypomethylation (71). Zhong et al. (QS: 6)
reported that flavonoid intake was associated with TLR2 hypomethylation (60). Stidley
et al (QS: 6) did not find an association of carotene, lutein, zeaxanthin, and lycopene
intake with methylation index of genes (p16, MGMT, DAPK, RASSF1A, PAX5α, PAX5β,
GATA4, and GATA5) in sputum (10).
MACRONUTRIENTS
Fat and fatty acids
Maternal fat and fatty acids and offspring DNA methylation
Rerkasem et al. (QS: 3) found no association between total fat intake during pregnancy
and global DNA methylation in blood of children around 20 years of age (86). Godfrey
et al. (QS: 3) also found no association between total fat intake during pregnancy and
methylation of RXRA and eNOS in cord blood (87). For individual fatty acids, an
intervention study by Lee et al. (QS: 8) found that higher ω-3 PUFA supplementation
during pregnancy had an effect on global hypermethylation in cord blood (88). In the
same study, Lee et al. (QS: 8) investigated gene-specific DNA methylation and found

84 PART A: Introduction
that higher ω-3 PUFA supplementation during pregnancy had an effect on
hypermethylation of IGF2, but no association was found for methylation of IFNγ, TNFα,
IL-13, GATA3, STAT3, IL-10 and FOXP3 in cord blood (88). In an intervention by
Amarasekera et al. (QS: 8), no significant effects of ω-3 PUFA were found on genome-
wide DNA methylation in cord blood (89).
Maternal fat and fatty acids in infancy, childhood, and adolescence and DNA
methylation
Voisin et al. (QS: 5) conducted an EWAS and identified four, 130, 158 and 16 CpG sites
in blood significantly associated with intake of total fat, (MUFA+PUFA)/SFA, MUFA/SFA
and PUFA/SFA, respectively, in children around the age of 10 years (90). On the other
hand, in an intervention study by Lind et al. (QS: 8) found no epigenome-wide CpG site
associations of ω-3 PUFA supplementation as fish oil (91).
Fat and fatty acids in adulthood and DNA methylation
Total fat: Four studies (QS: 3-4) investigated the association between total fat intake
and global DNA methylation in blood, of which two found that higher fat intake was
associated with global DNA hypomethylation (31, 34), whereas the other two studies
did not find an association (30, 35). Gómez-Uriz et al. (QS: 4) found that higher total fat
intake was associated with TNFα hypomethylation in blood (92). However, Bollati et al.
and Zhang et al (QS: 5 and 6) investigated the association of intake of total fat with
methylation of CD14, Et-1, HERV-w, iNOS, TNFα and IL-6 in blood, but no significant
association was observed (9, 30). In addition, Stidley et al. (QS: 6) found no association
of total fat as well as animal fat intake with methylation index of genes (p16, MGMT,
DAPK, RASSF1A, PAX5α, PAX5β, GATA4, and GATA5) in sputum (10). Brøns and Gillberg
et al. (QS: 6) investigated the effect of high fat overfeeding in healthy men on promoter
PPARGC1A methylation (93, 94). They found that high fat overfeeding in men with
normal birthweight was associated with PPARGC1A hypomethylation in muscle tissue
(93), whereas high fat overfeeding in men with low birthweight was associated with
PPARGC1A hypermethylation in subcutaneous adipose tissue (94). In an EWAS by Irvin
et al. (QS: 8), fatty acids were not associated with epigenome-wide DNA methylation
after correcting for multiple testing (69). In an intervention study among healthy men,
Jacobsen and Gillberg et al (QS: 6) investigated the effect of high fat overfeeding on
epigenome-wide DNA methylation. They observed that high fat overfeeding affected
methylation at 652 CpG sites (including in CDK5, IGFBP5 and SLC2A4) in subcutaneous
adipose tissue (95). Furthermore, change in DNA methylation of 7,909 CpG sites
(including, DNM2, MGMT, SLC2A3/GLUT3, MRC1 and ACAT2) in skeletal muscle
biopsies was observed in response to high fat overfeeding. Within the same study, it
was shown that these changes in genome-wide DNA methylation were more

CHAPTER 3: Nutrients and DNA methylation: a systematic review 85
pronounced in participants with a low birth weight, compared to those with a normal
birthweight (96).
Individual fatty acids: Zhang et al. (QS: 4) found no association between PUFA
intake and global DNA methylation in blood (30, 35). For methylation measured in
blood, one study found that higher ω-6 PUFA intake was associated with
hypomethylation of TNFα (97) and another study found that higher PUFA intake was
associated with hypermethylation of CLOCK (98). However, Zhang et al (QS: 5) and
Bollati et al (QS: 6) observed no association of intake of total PUFA and ω-3 PUFA with
methylation of CD14, Et-1, HERV-w, iNOS, TNFα and IL-6 in blood (9, 30). Furthermore,
Ma et al. (QS: 7) found that higher ω-3 PUFA levels in erythrocytes were associated
with hypomethylation of IL-6 promoter (99). In another study by Ma et al. (QS: 7),
higher levels of erythrocyte EPA were associated with hypomethylation of ABCA1
promoter. In addition, higher erythrocyte ALA was associated with hypomethylation of
APOE for the CC genotype, whereas higher erythrocyte ALA was associated with
hypermethylation of APOE for the AA genotype (100). In an EWAS by Aslibekyan et al.
(QS:6), higher levels of ω-3 PUFA in erythrocytes were associated with 27 CpG sites
(including NAV1, CCL17, ACTA2/FAS and AHRR) in blood. Zhang et al. (QS: 4) found no
association between MUFA intake and global DNA methylation in blood (30, 35).
Milagro et al. (QS: 4) found that higher intake of MUFA was associated with
hypomethylation of CLOCK in blood (98). However, Zhang et al. (QS: 5) and Bollati et al
(QS: 6) investigated the association of intake of MUFA with methylation of CD14, Et-1,
HERV-w, iNOS, TNFα and IL-6 in blood, but no significant association was observed (9,
30). Zhang et al. (QS: 4) observed that higher SFA intake was associated with global
DNA hypomethylation when methylation was measured using pyrosequencing (35),
whereas no association was observed when methylation was measured using PCR
technique (30). Zhang et al. (QS: 5) and Bollati et al (QS: 6) investigated the association
of intake of SFA with methylation of CD14, Et-1, HERV-w, iNOS, TNFα and IL-6 in blood,
but no significant association was observed (9, 30).
Carbohydrates and fiber
Maternal carbohydrates and fiber and offspring DNA methylation
Rerkasem et al. (QS: 3) investigated the association between intake of carbohydrates
during pregnancy and global DNA methylation in their offspring around the age of 20
years, but observed no significant association (86). Godfrey et al. (QS: 3) explored the
association between carbohydrate intake during pregnancy and gene-specific promoter
DNA methylation in cord tissue. They observed that higher intake of carbohydrate was
associated with RXRA hypomethylation, but no significant association was observed
with eNOS methylation (87).

86 PART A: Introduction
Carbohydrates and fiber in adulthood and DNA methylation
Four studies investigated the association between carbohydrate intake and global DNA
methylation in blood. One study (QS:3) reported that higher intake of carbohydrate
was associated with global DNA hypomethylation (31), whereas the other three studies
(QS:4) observed no significant associations (30, 34, 35). Three studies (QS: 4-6) were
conducted on the association of carbohydrate and fiber intake and gene-specific DNA
methylation in blood, of which one observed that higher carbohydrate intake was
associated with hypermethylation of BMAL1 (101), but in the other two studies no
significant associations were observed with CD14, Et-1, HERV-w, iNOS, TNFα, and IL-6
(9, 30).
Protein and amino acids
Maternal protein and amino acids and offspring DNA methylation
Rerkasem et al. (QS: 3) observed no associations between intake of protein during
pregnancy and global DNA methylation in their offspring around the age of 20 years
(86). Godfrey et al. (QS: 3) found no association of protein intake during pregnancy
with promoter methylation of RXRA or eNOS in cord tissue (87).
Protein and amino acids in adulthood and DNA methylation
Three studies (QS: 3-4) investigated the association between protein intake and global
DNA methylation in blood, but no significant associations were observed (30, 31, 35). In
addition, the four studies (QS: 3-4) that explored associations between methionine
intake and global DNA methylation in blood showed no significant associations (29, 30,
32, 35). Two studies (QS: 5 and 6) investigated associations of protein intake and
methylation of CD14, Et-1, HERV-w, iNOS, TNFα, and IL-6 in blood, but reported no
significant associations (9, 30). Similarly, two studies (QS: 5 and 6) that examined the
associations of methionine intake with IL-6 and TLR2 promoter methylation in blood
showed no significant associations (30, 60).
4. DISCUSSION
This is the first systematic review on nutrients and DNA methylation in humans. This
review included studies examining associations between all nutrients with different
types of methylation outcomes in all life-course stages. The majority of the studies
performed on this topic investigated the association of folate, other B-vitamins, or fatty
acids with DNA methylation, whereas studies for other nutrients are scarce or even
absent, such as for vitamin K. The evidence so far shows that folate and fatty acids are
associated with DNA methylation on a global, gene-specific, and genome-wide level.
Several candidate gene and epigenome-wide association studies reported differential
DNA methylation of CpG sites in response to folate (e.g. IGF2, H19, HOX), fatty acids
(e.g. PPRAGC1A, TNFα), and vitamin D (CYP24A1). Some of these observed associations

CHAPTER 3: Nutrients and DNA methylation: a systematic review 87
were specific to life course stage (e.g. IGF2 in early life) and tissue (e.g. opposite
directions for PPRAGC1A in muscle vs. fat tissue). However, the directions of these
associations are inconsistent across the different studies. Reasons that may explain
these discrepancies in findings include the differences in the type of tissue used to
measure nutrient levels as well as DNA methylation and differences across life course
stages.
DNA methylation across the life course
Age affects methylation patterns via transcriptional regulation (102). Evidence from
our systematic review, suggests age-specific differences in folate associations with
global DNA methylation in blood. In early life, higher folate intakes and levels were
associated with global DNA hypomethylation (11), whereas during adulthood higher
folate intakes and levels were associated with DNA hypermethylation (28-30, 37-42).
This pattern could not be observed for the other nutrients due to the limited number
of studies across the different life course stages or null associations, but we expect
similar patterns for other nutrients. Indeed, some studies on gene-specific DNA
methylation observed similar age-specific differences. Methylation of some genes in
blood may be specifically prone to environmental influences during early life. For
example, evidence from our systematic literature review shows that during pregnancy,
at birth and during childhood, higher folate intake and levels were associated with IGF2
hypermethylation (11, 18, 19). However, when this association was studied in adults,
no significant associations were observed (55). Possibly, methylation of this gene is no
longer susceptible to changes during adulthood. Similarly, higher choline intake during
pregnancy was associated with CRH and NR3C1 hypomethylation in cord blood, but no
association was found within pregnant women (78). Several studies included in our
review suggested that IGF2 methylation could also be affected by vitamin B12 and
PUFAs (17, 103). Higher folate during pregnancy and at birth was associated with PEG3
hypomethylation in cord blood (11, 18). Due to the absence of studies in adults, we
cannot determine age-related associations in relation to these nutrients. Future studies
should be conducted in order to establish the life course patterns of these nutrients on
DNA methylation.
DNA methylation across nutrients
We were interested in exploring how different nutrients may affect methylation of the
same genes, because this can be indicative of which genes are susceptible to
nutritional influences in general. As it is difficult to compare findings across studies due
to the different population structure, lab techniques, batch effects and analytical
methods used, we compared the associations of different nutrients with methylation
of the same genes within the same study to discard the bias caused by heterogeneity.
From these studies that explored associations between multiple individual nutrients

88 PART A: Introduction
and gene-specific methylation for the same genes and same tissues, we observed that
genes such as CD14, eNOS, ESR1, Et-1, IL-6, iNOS, N33 and SOX17 were not susceptible
to any nutritional influence (9, 30, 57, 87). Methylation of some other genes, such as
APC, HERV-w, HPP1, RXRA, TLR2, SFRP1, SFRP2 and methylation index of genes (p16,
FHIT, RAR, CDH1, DAPK1, hTERT, RASSF1A, MGMT, BRCA1 and PALB2) showed
susceptibility to only one nutrient (9, 57, 60, 87). This suggests that methylation of
these genes could be responsive to one particular nutrient due to a certain pathway in
which they are involved. However, for certain other genes, such as CLOCK, HPV 16,
MYOD, PON1, TNFα, WIF1, ZAC1, and methylation indexes of genes (HPP1, APC, SFRP1,
SFRP2, SOX17, WIF1, ESR1, MYOD and N33; p16, MGMT, DAPK, RASSF1A, PAX5α,
PAX5β, GATA4 and GATA5), methylation was susceptible to multiple nutrients (9, 10,
22, 57, 63, 71, 98). Of these genes, HPV 16 and ZAC1 were hypermethylated in
association with folate, vitamin B2 or vitamin B12, but not other nutrients (22, 63),
suggesting a possible role in one-carbon metabolism. Overall, these findings suggest
that methylation of some genes is susceptible to nutritional influences in general,
whereas methylation of other genes is only responsive to specific nutrients.
DNA methylation across nutrient tissues
The tissue used to measure nutrient exposure might contribute to the nutrient-
methylation association. For certain types of tissues it may be easier to detect
associations of nutrients with DNA methylation, due to a better reflection of long-term
status of these nutrients (104). Within studies that investigated the association
between folate from different tissues or intake and same gene-specific methylation
using same methylation tissue, we observed that some genes (H19 and p16INK4a (18,
20, 64), MYOD, NR3C1_a, SFRP1, SFRP2 and methylation index (HPP1, APC, SFRP1,
SFRP2, SOX17, WIF1, ESR1, MYOD, N33)) showed differential methylation in association
with folate regardless of the source: for plasma, RBC and dietary folate (21, 57).
However, methylation of HPP1, MGMT, PEG3, and WIF1 consistently showed no
association with RBC folate, but showed differential methylation in association with
plasma, serum or dietary folate within the same studies (11, 55, 57). Even though RBC
folate has shown associations that are in line with other folate tissues in most studies,
these four studies have shown discrepancies in their findings, which might be
explained by the difference in reflection of long-term folate status between RBC and
other tissue of folate (105).
DNA methylation across methylation tissues
In addition to levels from different tissues or methods used to measure intake of
nutrients, tissue-specificity in DNA methylation is an important factor to take into
account when interpreting findings of the studies included in this review. A few studies
explored associations of specific nutrients with gene-specific DNA methylation

CHAPTER 3: Nutrients and DNA methylation: a systematic review 89
measured in different tissues within the same subjects. For example, an intervention
study by Jiang et al. showed opposite directions of association between choline intake
during pregnancy and CRH or NR3C1 methylation in placenta versus cord blood, which
shows that associations may differ between tissues (78). Another intervention study
showed tissue-specific PPARGC1A methylation in muscle biopsy and subcutaneous
adipose tissue in opposite directions in association with high-fat overfeeding diet (93,
94).
DNA methylation of genes that were replicable
Replication of results across different study populations is of utmost importance in
order to confirm findings. In this systematic review, we identified different studies
examining same nutrient and gene-specific methylation associations within the same
stage of the life course. Different measures of folate during pregnancy were associated
with hypomethylation of PEG3 and hypermethylation of IGF2 in offspring, and these
findings were replicated across different studies (11, 18, 19). Methylation of TNF-α was
not replicable across studies, possibly due to differences in population characteristics.
One study explored this association in normal-weight young women, whereas the
other study explored this association in overweight older adults, which may explain the
non-replicability (9, 97).
Genome-wide DNA methylation
In this systematic review, we identified five EWASs of folate, of which four studies were
conducted in relation to maternal nutrition and offspring DNA methylation (23-26), and
one study in relation to nutrition in adulthood and DNA methylation (66). We
investigated whether any genes whose methylation showed significant associations in
gene-specific studies in relation to folate, were also found to be genome-wide
significant in these EWASs. In line with the gene-specific study of Hoyo et al., who
found an association of maternal folate supplements and erythrocytes with H19
hypomethylation in cord blood (18, 20), Joubert et al. in their EWAS of maternal
plasma folate also found genome-wide significant hypomethylation of H19 (24).
Furthermore, this EWAS found hypomethylation of SNRPN which showed null
association in relation to folate intake in a gene-specific study (11). Two EWASs of
vitamin D levels were conducted by Mozhui et al. (26) and Zhu et al. (75) but the
former found null association and the later showed no comparison in genes with
previous gene-specific studies.
Methodological considerations
In this systematic review, a comprehensive overview is provided on the current
evidence on associations between nutrients and DNA methylation in humans of all ages
and during all life stages. We included studies examining nutrient intake from diet and
supplements, as well as nutrient levels measured in blood or other tissues.

90 PART A: Introduction
Furthermore, we included studies using different tissues to measure DNA methylation,
which enabled us to provide more insight on tissue-specific DNA methylation. The
literature was designed by an experienced biomedical information specialist and
multiple search engines were used, limiting the probability of undetected references.
Furthermore, the selection process was performed by two independent reviewers. In
order to objectively measure study quality, we used a quality score based on a
predefined scoring system developed for systematic reviews. Study quality was
determined by five study characteristics: study design, sample size, quality of exposure
assessment, quality of outcome assessment, and confounder adjustment.
Overall, most studies are of medium to high quality. A majority of studies
(28%) have a quality score 6 and 77% of the studies were of the quality score 5 or
above (Figure 4, Table 1). However, many studies did not properly adjust for
confounding. Even though age, sex, and sometimes lifestyle covariates were often
taken into account, other factors important in DNA methylation studies, such as
leukocyte proportion, were rarely included in the models. Lack of adjustment for these
covariates may have led to spurious findings. As the majority of the included studies
were of observational nature, causal inference from these studies is not possible. Only
a few studies tested for effect modification by sex of genetic variation. This should be
considered in future studies, as some studies show that associations may be different
for males and females or different genotypes, such as MTHFR. There were a few EWASs
included in our review, enabling the possibility to identify novel CpG sites in relation to
certain nutrients. Nevertheless, with this type of approach caution must be taken when
interpreting the results. As EWAS follows a hypothesis-free approach, significant
findings could be the result of false positives caused by multiple testing. To solve this
issue, several statistical methods could be used, such as Bonferroni correction or false
detection rate (FDR). Furthermore, in these type of studies that use a hypothesis-free
approach, there is a need for replication. Therefore, to ensure that findings are true-
positives, a discovery and a replication cohort should be used. Even though almost all
EWAS included in this review used a proper method for multiple testing, not all studies
included a replication cohort in their study. Therefore, findings from these studies still
need to be replicated in other cohorts in order to confirm that novel CpG sites
identified in EWAS are true positives. On the other hand, the EWAS approach is also
prone to type II error, or false-negatives. Usually, this is caused by lack of power due to
a small sample size. Out of the included studies that used EWAS, only five had a sample
size of >100 participants. Possibly, potential associations between nutrients and
genome-wide DNA methylation may have been overlooked in studies with a small
sample size.

CHAPTER 3: Nutrients and DNA methylation: a systematic review 91
CONCLUSIONS
To date, promising results have been reported in the field of nutrition and DNA
methylation in humans at different stages across the life-course. In particular, nutrients
known to be involved in one-carbon metabolism, such as folate, have been shown to
be related to DNA methylation at a global, gene-specific and genome-wide level. In
addition, also other nutrients, such as fatty acids, are suggested to be involved in DNA
methylation. However, further large-scale studies of high quality are needed to expand
our understanding on the role of nutrition in DNA methylation and its effects on health
and disease.

92 PART A: Introduction
Tab
le 2
. Stu
dy
char
acte
rist
ics
and
res
ult
s: V
itam
in A
, α-c
aro
ten
e, a
nd
β-c
aro
ten
e
Nu
trit
ion
al e
xpo
sure
Fi
rst
auth
or,
yea
r St
ud
y d
esig
n
N
Co
un
try
Exp
osu
re a
sses
smen
t G
en
es
Tiss
ue
D
irec
tio
n r
esu
lts
Q
S
CH
ILD
HO
OD
GLO
BA
L
Vit
amin
A
Per
ng,
20
12
C
ross
-sec
tio
nal
56
8
Co
lom
bia
P
lasm
a
NA
B
loo
d
Hyp
o
6
AD
ULT
HO
OD
GLO
BA
L
Vit
amin
A
Piy
ath
ilake
, 20
11
Cro
ss-s
ecti
on
al
376
U
SA
Pla
sma
N
A
PB
MC
N
o
6
Vit
amin
A
Piy
ath
ilake
, 20
11
Cro
ss-s
ecti
on
al
376
U
SA
Pla
sma
N
A
Ce
rvic
al c
ells
N
o
6
GEN
E-SP
ECIF
IC
Vit
amin
A (
Ret
ino
l)
Bo
llati
, 20
14
Cro
ss-s
ecti
on
al
165
It
aly
FFQ
C
D1
4
Blo
od
N
o
6
Vit
amin
A (
Ret
ino
l)
Bo
llati
, 20
14
Cro
ss-s
ecti
on
al
165
It
aly
FFQ
Et
-1
Blo
od
N
o
6
Vit
amin
A (
Ret
ino
l)
Bo
llati
, 20
14
Cro
ss-s
ecti
on
al
165
It
aly
FFQ
H
ERV
-w
Blo
od
N
o
6
Vit
amin
A (
Ret
ino
l)
Bo
llati
, 20
14
Cro
ss-s
ecti
on
al
165
It
aly
FFQ
iN
OS
Blo
od
N
o
6
Vit
amin
A (
Ret
ino
l)
Bo
llati
, 20
14
Cro
ss-s
ecti
on
al
165
It
aly
FFQ
TN
Fα
Blo
od
H
ypo
6
Vit
amin
A (
Ret
ino
l)
Stid
ley,
20
10
Cro
ss-s
ecti
on
al
1101
U
SA
FFQ
In
dex
*
Spu
tum
N
o
6
Car
ote
no
ids
(α-c
aro
ten
e)
Bo
llati
, 20
14
Cro
ss-s
ecti
on
al
165
It
aly
FFQ
C
D1
4
Blo
od
N
o
6
Car
ote
no
ids
(α-c
aro
ten
e)
Bo
llati
, 20
14
Cro
ss-s
ecti
on
al
165
It
aly
FFQ
Et
-1
Blo
od
N
o
6
Car
ote
no
ids
(α-c
aro
ten
e)
Bo
llati
, 20
14
Cro
ss-s
ecti
on
al
165
It
aly
FFQ
H
ERV
-w
Blo
od
N
o
6
Car
ote
no
ids
(α-c
aro
ten
e)
Bo
llati
, 20
14
Cro
ss-s
ecti
on
al
165
It
aly
FFQ
iN
OS
Blo
od
N
o
6
Car
ote
no
ids
(α-c
aro
ten
e)
Bo
llati
, 20
14
Cro
ss-s
ecti
on
al
165
It
aly
FFQ
TN
Fα
Blo
od
N
o
6
Car
ote
no
ids
(α-c
aro
ten
e)
Stid
ley,
20
10
Cro
ss-s
ecti
on
al
1101
U
SA
FFQ
In
dex
*
Spu
tum
N
o
6
Car
ote
no
ids
(β-c
aro
ten
e)
Bo
llati
, 20
14
Cro
ss-s
ecti
on
al
165
It
aly
FFQ
C
D1
4
Blo
od
N
o
6
Car
ote
no
ids
(β-c
aro
ten
e)
Bo
llati
, 20
14
Cro
ss-s
ecti
on
al
165
It
aly
FFQ
Et
-1
Blo
od
N
o
6
Car
ote
no
ids
(β-c
aro
ten
e)
Bo
llati
, 20
14
Cro
ss-s
ecti
on
al
165
It
aly
FFQ
H
ERV
-w
Blo
od
H
ype
r
6
Car
ote
no
ids
(β-c
aro
ten
e)
Bo
llati
, 20
14
Cro
ss-s
ecti
on
al
165
It
aly
FFQ
iN
OS
Blo
od
N
o
6
Car
ote
no
ids
(β-c
aro
ten
e)
Bo
llati
, 20
14
Cro
ss-s
ecti
on
al
165
It
aly
FFQ
TN
Fα
Blo
od
H
ypo
6
Car
ote
no
ids
(β-c
aro
ten
e)
Stid
ley,
20
10
Cro
ss-s
ecti
on
al
1101
U
SA
FFQ
In
dex
*
Spu
tum
N
o
6
*In
dex
(p
16
, MG
MT,
DA
PK
, RA
SSF1
A, P
AX
5α
, PA
X5
β, G
ATA
4, a
nd
GA
TA5
)

CHAPTER 3: Nutrients and DNA methylation: a systematic review 93
Ta
ble
3. S
tud
y ch
arac
teri
stic
s an
d r
esu
lts:
Fo
late
Firs
t au
tho
r, y
ear
Stu
dy
des
ign
N
C
ou
ntr
y Ex
po
sure
ass
essm
ent
Ge
nes
M
eth
ylat
ion
Tis
sue
D
irec
tio
n r
esu
lts
QS
MA
TER
NA
L O
FFSP
RIN
G R
ELA
TIO
NSH
IP
GLO
BA
L
Frye
r, 2
00
9
Cro
ss-s
ecti
on
al
24
U
K
Qu
esti
on
nai
re (
sup
ple
me
nts
) N
A
Co
rd b
loo
d
No
2
Bo
eke,
20
12
Cro
ss-s
ecti
on
al
534
U
SA
FFQ
N
A
Co
rd b
loo
d
No
6
Hag
gart
y, 2
013
C
ross
-sec
tio
nal
91
3
UK
FF
Q
NA
C
ord
blo
od
H
ypo
4
Hag
gart
y, 2
013
C
ross
-sec
tio
nal
91
3
UK
R
BC
N
A
Co
rd b
loo
d
Hyp
o
5
McK
ay, 2
012
C
ross
-sec
tio
nal
19
7
UK
R
BC
N
A
Co
rd b
loo
d
No
5
Ch
ang,
20
11
C
ross
-sec
tio
nal
2
0
Ch
ina
B
loo
d
NA
Ti
ssu
esT
Hyp
er
2
Par
k, 2
005
C
ross
-sec
tio
nal
10
7
Ko
rea
Seru
m
NA
P
lace
nta
H
ype
r 6
GEN
E-SP
ECIF
IC
Ho
yo, 2
011
C
ross
-sec
tio
nal
43
8
USA
Q
ues
tio
nn
aire
H
19
Co
rd b
loo
d
Hyp
o
5
Azz
i, 2
014
C
ross
-sec
tio
nal
20
02
Fran
ce
FFQ
& 2
4h
rec
all
ZAC
1
Co
rd b
loo
d
No
6
Azz
i, 2
014
C
ross
-sec
tio
nal
20
02
Fran
ce
FFQ
& 2
4h
rec
all (
sup
ple
me
nts
) ZA
C1
C
ord
blo
od
N
o
6
van
Mil,
201
4
Cro
ss-s
ecti
on
al
463
N
eth
erla
nd
s FF
Q (
sup
ple
men
ts)
NR
3C1_
a
Co
rd b
loo
d
Hyp
er
6
van
Mil,
201
4
Cro
ss-s
ecti
on
al
463
N
eth
erla
nd
s FF
Q (
sup
ple
men
ts)
5HTT
_b
Co
rd b
loo
d
Hyp
o
6
Stee
gers
-Th
eu
nis
sen
, 200
9
Cro
ss-s
ecti
on
al
120
N
eth
erla
nd
s Q
ues
tio
nn
aire
(su
pp
lem
en
ts)
IGF2
W
ho
le b
loo
d
Hyp
er
5
Hag
gart
y, 2
013
C
ross
-sec
tio
nal
91
3
UK
FF
Q
IGF2
C
ord
blo
od
H
ype
r 5
Hag
gart
y, 2
013
C
ross
-sec
tio
nal
91
3
UK
FF
Q
PEG
3
Co
rd b
loo
d
Hyp
o
5
Hag
gart
y, 2
013
C
ross
-sec
tio
nal
91
3
UK
FF
Q
SNR
PN
C
ord
blo
od
N
o
5
Hag
gart
y, 2
013
C
ross
-sec
tio
nal
91
3
UK
R
BC
IG
F2
Co
rd b
loo
d
No
6
Hag
gart
y, 2
013
C
ross
-sec
tio
nal
91
3
UK
R
BC
P
EG3
C
ord
blo
od
N
o
6
Hag
gart
y, 2
013
C
ross
-sec
tio
nal
91
3
UK
R
BC
SN
RP
N
Co
rd b
loo
d
No
6
Ho
yo, 2
014
C
ross
-sec
tio
nal
49
6
USA
R
BC
M
EG3
(Pro
mo
ter)
C
ord
blo
od
H
ypo
7
Ho
yo, 2
014
C
ross
-sec
tio
nal
49
6
USA
R
BC
N
NA
T (P
rom
ote
r)
Co
rd b
loo
d
Hyp
o
7
Ho
yo, 2
014
C
ross
-sec
tio
nal
49
6
USA
R
BC
P
EG1
0/SG
CE
(Pro
mo
ter)
C
ord
blo
od
H
ypo
7

94 PART A: Introduction
Firs
t au
tho
r, y
ear
Stu
dy
des
ign
N
C
ou
ntr
y Ex
po
sure
ass
essm
ent
Ge
nes
M
eth
ylat
ion
Tis
sue
D
irec
tio
n r
esu
lts
QS
Ho
yo, 2
014
C
ross
-sec
tio
nal
49
6
USA
R
BC
M
EG3
-IG
(P
rom
ote
r)
Co
rd b
loo
d
Hyp
o
7
Ho
yo, 2
014
C
ross
-sec
tio
nal
49
6
USA
R
BC
P
LAG
L1 (
Pro
mo
ter)
C
ord
blo
od
H
ypo
7
Ho
yo, 2
014
C
ross
-sec
tio
nal
49
6
USA
R
BC
P
EG3
(Pro
mo
ter)
C
ord
blo
od
H
ypo
7
Ho
yo, 2
014
C
ross
-sec
tio
nal
49
6
USA
R
BC
P
EG1
/MES
T (P
rom
ote
r)
Co
rd b
loo
d
Hyp
er
7
Ho
yo, 2
014
C
ross
-sec
tio
nal
49
6
USA
R
BC
H
19
Co
rd b
loo
d
Hyp
o
7
Ho
yo, 2
014
C
ross
-sec
tio
nal
49
6
USA
R
BC
IG
F2 (
Pro
mo
ter)
C
ord
blo
od
H
ype
r 7
Ba,
201
1
Cro
ss-s
ecti
on
al
99
C
hin
a
Seru
m
IGF2
(P
rom
ote
r)
Co
rd b
loo
d
No
6
van
Mil,
201
4
Cro
ss-s
ecti
on
al
463
N
eth
erla
nd
s V
en
ou
s b
loo
d
NR
3C1_
a
Co
rd b
loo
d
Hyp
er
7
GEN
OM
E-W
IDE
Go
nse
th, 2
01
5
Cro
ss-s
ecti
on
al
347
U
SA
FFQ
N
A
Neo
nat
al b
loo
d
Hyp
er/
Hyp
o
6
Am
aras
eker
a, 2
014
C
ross
-sec
tio
nal
2
3
Au
stra
lia
Seru
m
NA
C
ord
blo
od
H
ype
r/H
ypo
4
Jou
ber
t, 2
01
6
Cro
ss-s
ecti
on
al
1988
N
eth
erla
nd
s,
No
rway
P
lasm
a
NA
C
ord
blo
od
H
ype
r/H
ypo
8
Mo
zhu
i, 2
015
C
ross
-sec
tio
nal
20
0
USA
P
lasm
a/Se
rum
N
A
Co
rd b
loo
d
(fro
m b
uff
y co
ats)
N
o
6
CH
ILD
HO
OD
GLO
BA
L
Frye
r, 2
00
9
Cro
ss-s
ecti
on
al
24
U
K
Co
rd s
eru
m
NA
C
ord
blo
od
N
o
4
Hag
gart
y, 2
013
C
ross
-sec
tio
nal
91
3
UK
R
BC
N
A
Co
rd b
loo
d
Hyp
o
5
Per
ng,
20
12
C
ross
-sec
tio
nal
56
8
Co
lom
bia
R
BC
N
A
Blo
od
N
o
4
GEN
E-SP
ECIF
IC
Hag
gart
y, 2
013
C
ross
-sec
tio
nal
91
3
UK
R
BC
IG
F2
Co
rd b
loo
d
Hyp
er
6
Hag
gart
y, 2
013
C
ross
-sec
tio
nal
91
3
UK
R
BC
P
EG3
C
ord
blo
od
H
ypo
6
Hag
gart
y, 2
013
C
ross
-sec
tio
nal
91
3
UK
R
BC
SN
RP
N
Co
rd b
loo
d
No
6
AD
ULT
HO
OD
GLO
BA
L
On
o, 2
012
C
ross
-sec
tio
nal
38
4
Jap
an
FFQ
&24
h r
ecal
l N
A
Blo
od
H
ypo
5

CHAPTER 3: Nutrients and DNA methylation: a systematic review 95
Fi
rst
auth
or,
yea
r St
ud
y d
esig
n
N
Co
un
try
Exp
osu
re a
sses
smen
t G
en
es
Me
thyl
atio
n T
issu
e
Dir
ecti
on
res
ult
s Q
S
Pro
tiva
, 20
11
C
ross
-sec
tio
nal
2
0
USA
3d
qu
esti
on
nai
res
& 2
4h
rec
alls
N
A
Blo
od
N
o
1
Go
mes
, 201
2
Cro
ss-s
ecti
on
al
126
B
razi
l 24
h r
ecal
l on
3 d
N
A
Ve
no
us
blo
od
N
o
3
Hu
ang,
20
12
C
ross
-sec
tio
nal
49
3
USA
FF
Q (
sup
ple
men
ts +
die
t +
fo
rtif
ied
) N
A
Blo
od
N
o
3
Hu
ang,
20
12
C
ross
-sec
tio
nal
49
3
USA
FF
Q (
DFE
s)
NA
B
loo
d
No
3
Hu
ang,
20
12
C
ross
-sec
tio
nal
49
3
USA
FF
Q (
Nat
ura
l)
NA
B
loo
d
Hyp
er
3
Bo
eke,
20
12
Cro
ss-s
ecti
on
al
534
U
SA
FFQ
N
A
Blo
od
N
o
6
Per
ng,
20
14
C
ross
-sec
tio
nal
98
7
USA
FF
Q
NA
B
loo
d
No
3
Ago
di,
201
5
Cro
ss-s
ecti
on
al
177
It
aly
FFQ
N
A
Wh
ole
blo
od
H
ype
r 5
Zhan
g 20
12
C
ross
-sec
tio
nal
16
5
US
FFQ
N
A
WB
C
No
4
Zhan
g 20
12
C
ross
-sec
tio
nal
16
5
US
FFQ
N
A
WB
C
Hyp
er
5
Zhan
g 20
12
C
ross
-sec
tio
nal
16
5
US
FFQ
N
A
WB
C
No
4
Zhan
g, 2
011
C
ross
-sec
tio
nal
14
9
US
FFQ
N
A
Per
iph
era
l blo
od
le
uko
cyte
s N
o
4
Zhan
g, 2
011
C
ross
-sec
tio
nal
14
9
US
FFQ
N
A
Per
iph
era
l blo
od
le
uko
cyte
s N
o
4
Zhan
g, 2
011
C
ross
-sec
tio
nal
14
9
US
FFQ
N
A
Per
iph
era
l blo
od
le
uko
cyte
s N
o
4
Ulr
ich
, 201
2
Cro
ss-s
ecti
on
al
173
U
S FF
Q
NA
Ly
mp
ho
cyte
s N
o
4
Figu
eir
ed
o, 2
00
9
Cro
ss-s
ecti
on
al
388
N
ort
h A
mer
ica
FF
Q
NA
C
olo
nic
bio
psi
e
NA
(Q
uar
tile
s)
3
Bad
iga,
20
14
Cro
ss-s
ecti
on
al
325
U
SA
Pla
sma
N
A
Blo
od
H
ypo
6
Pils
ne
r, 2
007
C
ross
-sec
tio
nal
29
4
Ban
glad
esh
P
lasm
a
NA
B
loo
d
Hyp
er
6
Piy
ath
ilake
, 20
13
Cro
ss-s
ecti
on
al
470
U
SA
Pla
sma
N
A
Blo
od
H
ype
r 4
Gad
gil,
201
4
Cro
ss-s
ecti
on
al
49
In
dia
P
lasm
a
NA
B
loo
d
No
3
Nar
ayan
an, 2
00
4
Cro
ss-s
ecti
on
al
408
Sc
otl
and
P
lasm
a
NA
V
en
ou
s b
loo
d
No
4
Tap
p, 2
013
C
ross
-sec
tio
nal
18
5
UK
P
lasm
a
NA
R
ecta
l mu
cosa
N
o
5
Llan
os,
20
15
Cro
ss-s
ecti
on
al
121
U
SA
Pla
sma
N
A
Bre
ast
tiss
ue
N
o
6
Figu
eir
ed
o, 2
00
9
Cro
ss-s
ecti
on
al
388
N
ort
h A
mer
ica
P
lasm
a
NA
C
olo
nic
bio
psi
e
NA
(Q
uar
tile
s)
4
Han
ks, 2
013
C
ross
-sec
tio
nal
33
6
UK
Se
rum
N
A
Co
lon
ic t
issu
e b
iop
sies
N
o
6

96 PART A: Introduction
Firs
t au
tho
r, y
ear
Stu
dy
des
ign
N
C
ou
ntr
y Ex
po
sure
ass
essm
ent
Ge
nes
M
eth
ylat
ion
Tis
sue
D
irec
tio
n r
esu
lts
QS
Pu
fule
te, 2
00
5
Cro
ss-s
ecti
on
al
68
U
K
Seru
m
NA
C
olo
nic
mu
cosa
N
o
5
Ulr
ich
, 201
2
Cro
ss-s
ecti
on
al
173
U
S Se
rum
N
A
Lym
ph
ocy
tes
No
5
Wan
g, 2
012
C
ross
-sec
tio
nal
11
5
Ch
ina
Se
rum
N
A
Wh
ole
blo
od
H
ype
r 6
Fen
ech
, 19
98
C
ross
-sec
tio
nal
10
6
Au
stra
lia
RB
C
NA
B
loo
d
No
6
Bae
, 20
14
C
ross
-sec
tio
nal
40
8
USA
R
BC
(P
refo
rtif
icat
ion
per
iod
) N
A
Blo
od
H
ype
r 6
Bae
, 20
14
C
ross
-sec
tio
nal
40
8
USA
R
BC
(P
ost
fort
ific
atio
n p
eri
od
) N
A
Blo
od
H
ype
r 6
Figu
eir
ed
o, 2
00
9
Cro
ss-s
ecti
on
al
388
N
ort
h A
mer
ica
R
BC
N
A
Co
lon
ic b
iop
sie
N
A (
Qu
arti
les)
4
Han
ks, 2
013
C
ross
-sec
tio
nal
33
6
UK
R
BC
N
A
Co
lon
ic t
issu
e b
iop
sies
N
o
6
Pu
fule
te, 2
00
5
Cro
ss-s
ecti
on
al
68
U
K
RB
C
NA
C
olo
nic
mu
cosa
N
o
5
Tap
p, 2
013
C
ross
-sec
tio
nal
18
5
UK
R
BC
N
A
Rec
tal m
uco
sa
No
5
Fris
o, 2
002
C
ross
-sec
tio
nal
29
2
Ital
y V
en
ou
s b
loo
d
NA
W
ho
le b
loo
d
Hyp
er
6
Fris
o, 2
005
C
ross
-sec
tio
nal
19
8
Ital
y V
en
ou
s b
loo
d
NA
W
ho
le b
loo
d
Hyp
er
5
Han
ks, 2
013
C
ross
-sec
tio
nal
33
6
UK
C
olo
nic
tis
sue
N
A
Co
lon
ic t
issu
e b
iop
sies
N
o
6
Llan
os,
20
15
Cro
ss-s
ecti
on
al
121
U
SA
Bre
ast
tiss
ue
N
A
Bre
ast
tiss
ue
N
o
6
Jaco
b, 1
998
In
terv
enti
on
N
8
USA
R
estr
icte
d d
iet
NA
B
loo
d
Hyp
o
2
Ram
per
sau
d, 2
000
In
terv
enti
on
N
33
U
SA
Die
t N
A
Leu
kocy
tes
Hyp
er
3
Hü
bn
er,
201
3
Inte
rven
tio
nN
50
G
erm
any
Sup
ple
men
tati
on
N
A
Blo
od
N
o
3
Axu
me
, 20
07
Inte
rven
tio
nN
43
U
SA
Fola
te d
ep
leti
on
fo
llow
ed b
y re
ple
tio
n#
NA
B
loo
d
Hyp
o
5
Aar
abi,
201
5
Inte
rven
tio
nN
28
C
anad
a
Folic
aci
d (
5m
g/d
ay)
for
6 m
N
A
Sper
m
Hyp
o
4
Shel
nu
tt, 2
00
4
Inte
rven
tio
nN
41
U
SA
Fola
te d
ep
leti
on
fo
llow
ed b
y re
ple
tio
n#
NA
Le
uko
cyte
s H
ype
r 3
Jun
g, 2
011
In
terv
enti
on
D
216
N
eth
erla
nd
s
FFQ
; FA
(0.
8 m
g/d
) o
r p
lace
bo
N
A
Blo
od
N
o
8
Cri
der
, 201
1
Inte
rven
tio
nD
1108
C
hin
a
FA s
up
ple
men
tati
on
fo
r 6m
N
A
Blo
od
T H
ypo
8
Bas
ten
, 200
6
Inte
rven
tio
nD
61
U
K
Pla
sma
N
A
Wh
ole
blo
od
N
o
5
Bas
ten
, 200
6
Inte
rven
tio
nD
61
U
K
RB
C
NA
W
ho
le b
loo
d
No
5
Bas
ten
, 20
06
In
terv
enti
on
D
61
U
K
Lym
ph
ocy
tes
NA
W
ho
le b
loo
d
No
5
GEN
E-SP
ECIF
IC

CHAPTER 3: Nutrients and DNA methylation: a systematic review 97
Fi
rst
auth
or,
yea
r St
ud
y d
esig
n
N
Co
un
try
Exp
osu
re a
sses
smen
t G
en
es
Me
thyl
atio
n T
issu
e
Dir
ecti
on
res
ult
s Q
S
Bo
llati
, 20
14
C
ross
-sec
tio
nal
16
5
Ital
y FF
Q
CD
14
(Pro
mo
ter)
B
loo
d
No
6
Bo
llati
, 20
14
C
ross
-sec
tio
nal
16
5
Ital
y FF
Q
Et-1
(P
rom
ote
r)
Blo
od
N
o
6
Bo
llati
, 20
14
C
ross
-sec
tio
nal
16
5
Ital
y FF
Q
HER
V-w
(P
rom
ote
r)
Blo
od
N
o
6
Bo
llati
, 20
14
C
ross
-sec
tio
nal
16
5
Ital
y FF
Q
iNO
S (P
rom
ote
r)
Blo
od
N
o
6
Bo
llati
, 20
14
C
ross
-sec
tio
nal
16
5
Ital
y FF
Q
TNFα
(P
rom
ote
r)
Blo
od
H
ypo
6
Zho
ng,
201
5
Cro
ss-s
ecti
on
al
573
U
S FF
Q
TLR
2 (P
rom
ote
r)
Wh
ole
blo
od
N
o
6
Zhan
g 20
12
C
ross
-sec
tio
nal
16
5
US
FFQ
IL
-6 (
Pro
mo
ter)
W
BC
N
o
5
Zhan
g 20
12
C
ross
-sec
tio
nal
16
5
US
FFQ
IL
-6 (
Pro
mo
ter)
W
BC
N
o
5
Zhan
g 20
12
C
ross
-sec
tio
nal
16
5
US
FFQ
IL
-6 (
Pro
mo
ter)
W
BC
N
o
5
Stid
ley,
20
10
Cro
ss-s
ecti
on
al
1101
U
SA
FFQ
In
dex
*
Spu
tum
H
ypo
6
Dh
illo
n, 2
00
7
Cro
ss-s
ecti
on
al
379
In
dia
Q
ues
tio
nn
aire
G
STM
1 (P
rom
ote
r)
Sem
en
Hyp
o
5
Ott
ini,
20
15
Cro
ss-s
ecti
on
al
21
It
aly
Pla
sma
In
dex
**
Blo
od
H
ypo
5
Piy
ath
ilake
, 20
14
Cro
ss-s
ecti
on
al
315
U
SA
Pla
sma
H
PV
16
(Pro
mo
ter)
B
loo
d
Hyp
er
5
Llan
os,
20
15
Cro
ss-s
ecti
on
al
138
U
SA
Pla
sma
p
16IN
K4a
(P
rom
ote
r)
Bre
ast
tiss
ue
H
ypo
7
Tap
p, 2
013
C
ross
-sec
tio
nal
18
5
UK
P
lasm
a
Ind
ex**
*
Rec
tal m
uco
sa
Hyp
er
6
Tap
p, 2
013
C
ross
-sec
tio
nal
18
5
UK
P
lasm
a
HP
P1
R
ecta
l mu
cosa
H
ype
r 6
Tap
p, 2
013
C
ross
-sec
tio
nal
18
5
UK
P
lasm
a
AP
C
Rec
tal m
uco
sa
No
6
Tap
p, 2
013
C
ross
-sec
tio
nal
18
5
UK
P
lasm
a
SFR
P1
R
ecta
l mu
cosa
H
ype
r 6
Tap
p, 2
013
C
ross
-sec
tio
nal
18
5
UK
P
lasm
a
SFR
P2
R
ecta
l mu
cosa
H
ype
r 6
Tap
p, 2
013
C
ross
-sec
tio
nal
18
5
UK
P
lasm
a
SOX
17
R
ecta
l mu
cosa
N
o
6
Tap
p, 2
013
C
ross
-sec
tio
nal
18
5
UK
P
lasm
a
WIF
1
Rec
tal m
uco
sa
Hyp
er
6
Tap
p, 2
013
C
ross
-sec
tio
nal
18
5
UK
P
lasm
a
ESR
1
Rec
tal m
uco
sa
No
6
Tap
p, 2
013
C
ross
-sec
tio
nal
18
5
UK
P
lasm
a
MYO
D
Rec
tal m
uco
sa
Hyp
er
6
Tap
p, 2
013
C
ross
-sec
tio
nal
18
5
UK
P
lasm
a
N3
3
Rec
tal m
uco
sa
No
6
Han
ks, 2
013
C
ross
-sec
tio
nal
33
6
UK
Se
rum
M
LH1
(P
rom
ote
r)
Co
lon
ic t
issu
e b
iop
sies
N
o
7
Han
ks, 2
013
C
ross
-sec
tio
nal
33
6
UK
Se
rum
M
GM
T (P
rom
ote
r)
Co
lon
ic t
issu
e b
iop
sies
H
ypo
7
Han
ks, 2
013
C
ross
-sec
tio
nal
33
6
UK
Se
rum
A
PC
(P
rom
ote
r)
Co
lon
ic t
issu
e b
iop
sies
N
o
7

98 PART A: Introduction
Firs
t au
tho
r, y
ear
Stu
dy
des
ign
N
C
ou
ntr
y Ex
po
sure
ass
essm
ent
Ge
nes
M
eth
ylat
ion
Tis
sue
D
irec
tio
n r
esu
lts
QS
Han
ks, 2
013
C
ross
-sec
tio
nal
33
6
UK
Se
rum
IG
F2 (
Pro
mo
ter)
C
olo
nic
tis
sue
bio
psi
es
No
7
Han
ks, 2
013
C
ross
-sec
tio
nal
33
6
UK
Se
rum
M
YOD
1 (P
rom
ote
r)
Co
lon
ic t
issu
e b
iop
sies
N
o
7
Han
ks, 2
013
C
ross
-sec
tio
nal
33
6
UK
Se
rum
N
33
(Pro
mo
ter)
C
olo
nic
tis
sue
bio
psi
es
No
7
Han
ks, 2
013
C
ross
-sec
tio
nal
33
6
UK
Se
rum
ES
R1
(Pro
mo
ter)
C
olo
nic
tis
sue
bio
psi
es
No
7
Han
ks, 2
013
C
ross
-sec
tio
nal
33
6
UK
R
BC
M
LH1
(P
rom
ote
r)
Co
lon
ic t
issu
e b
iop
sies
N
o
7
Han
ks, 2
013
C
ross
-sec
tio
nal
33
6
UK
R
BC
M
GM
T (P
rom
ote
r)
Co
lon
ic t
issu
e b
iop
sies
N
o
7
Han
ks, 2
013
C
ross
-sec
tio
nal
33
6
UK
R
BC
A
PC
(P
rom
ote
r)
Co
lon
ic t
issu
e b
iop
sies
N
o
7
Han
ks, 2
013
C
ross
-sec
tio
nal
33
6
UK
R
BC
IG
F2 (
Pro
mo
ter)
C
olo
nic
tis
sue
bio
psi
es
No
7
Han
ks, 2
013
C
ross
-sec
tio
nal
33
6
UK
R
BC
M
YOD
1 (P
rom
ote
r)
Co
lon
ic t
issu
e b
iop
sies
N
o
7
Han
ks, 2
013
C
ross
-sec
tio
nal
33
6
UK
R
BC
N
33
(Pro
mo
ter)
C
olo
nic
tis
sue
bio
psi
es
No
7
Han
ks, 2
013
C
ross
-sec
tio
nal
33
6
UK
R
BC
ES
R1
(Pro
mo
ter)
C
olo
nic
tis
sue
bio
psi
es
No
7
Tap
p, 2
013
C
ross
-sec
tio
nal
18
5
UK
R
BC
In
dex
***
R
ecta
l mu
cosa
H
ype
r 6
Tap
p, 2
013
C
ross
-sec
tio
nal
18
5
UK
R
BC
H
PP
1
Rec
tal m
uco
sa
No
6
Tap
p, 2
013
C
ross
-sec
tio
nal
18
5
UK
R
BC
A
PC
R
ecta
l mu
cosa
N
o
6
Tap
p, 2
013
C
ross
-sec
tio
nal
18
5
UK
R
BC
SF
RP
1
Rec
tal m
uco
sa
Hyp
er
6
Tap
p, 2
013
C
ross
-sec
tio
nal
18
5
UK
R
BC
SF
RP
2
Rec
tal m
uco
sa
Hyp
er
6
Tap
p, 2
013
C
ross
-sec
tio
nal
18
5
UK
R
BC
SO
X1
7
Rec
tal m
uco
sa
No
6
Tap
p, 2
013
C
ross
-sec
tio
nal
18
5
UK
R
BC
W
IF1
R
ecta
l mu
cosa
N
o
6
Tap
p, 2
013
C
ross
-sec
tio
nal
18
5
UK
R
BC
ES
R1
R
ecta
l mu
cosa
N
o
6
Tap
p, 2
013
C
ross
-sec
tio
nal
18
5
UK
R
BC
M
YOD
R
ecta
l mu
cosa
H
ype
r 6
Tap
p, 2
013
C
ross
-sec
tio
nal
18
5
UK
R
BC
N
33
R
ecta
l mu
cosa
N
o
6
Han
ks, 2
013
C
ross
-sec
tio
nal
33
6
UK
C
olo
nic
tis
sue
M
LH1
(P
rom
ote
r)
Co
lon
ic t
issu
e b
iop
sies
N
o
7
Han
ks, 2
013
C
ross
-sec
tio
nal
33
6
UK
C
olo
nic
tis
sue
M
GM
T (P
rom
ote
r)
Co
lon
ic t
issu
e b
iop
sies
N
o
7
Han
ks, 2
013
C
ross
-sec
tio
nal
33
6
UK
C
olo
nic
tis
sue
A
PC
(P
rom
ote
r)
Co
lon
ic t
issu
e b
iop
sies
N
o
7
Han
ks, 2
013
C
ross
-sec
tio
nal
33
6
UK
C
olo
nic
tis
sue
IG
F2 (
Pro
mo
ter)
C
olo
nic
tis
sue
bio
psi
es
No
7
Han
ks, 2
013
C
ross
-sec
tio
nal
33
6
UK
C
olo
nic
tis
sue
M
YOD
1 (P
rom
ote
r)
Co
lon
ic t
issu
e b
iop
sies
N
o
7
Han
ks, 2
013
C
ross
-sec
tio
nal
33
6
UK
C
olo
nic
tis
sue
N
33
(Pro
mo
ter)
C
olo
nic
tis
sue
bio
psi
es
No
7

CHAPTER 3: Nutrients and DNA methylation: a systematic review 99
Fi
rst
auth
or,
yea
r St
ud
y d
esig
n
N
Co
un
try
Exp
osu
re a
sses
smen
t G
en
es
Me
thyl
atio
n T
issu
e
Dir
ecti
on
res
ult
s Q
S
Han
ks, 2
013
C
ross
-sec
tio
nal
33
6
UK
C
olo
nic
tis
sue
ES
R1
(Pro
mo
ter)
C
olo
nic
tis
sue
bio
psi
es
No
7
Llan
os,
20
15
Cro
ss-s
ecti
on
al
138
U
SA
Bre
ast
tiss
ue
p
16IN
K4a
(P
rom
ote
r)
Bre
ast
tiss
ue
H
ypo
7
Aar
abi,
201
5
Inte
rven
tio
nN
30
C
anad
a
FA (
5mg/
d)
for
6m
H
19
Sper
m
No
5
Aar
abi,
201
5
Inte
rven
tio
nN
30
C
anad
a
FA (
5mg/
d)
for
6m
D
LK1
/GTL
2
Sper
m
No
5
Aar
abi,
201
5
Inte
rven
tio
nN
30
C
anad
a
FA (
5mg/
d)
for
6m
M
EST
Sp
erm
N
o
5
Aar
abi,
201
5
Inte
rven
tio
nN
30
C
anad
a
FA (
5mg/
d)
for
6m
SN
RP
N
Sper
m
No
5
Aar
abi,
201
5
Inte
rven
tio
nN
30
C
anad
a
FA (
5mg/
d)
for
6m
P
LAG
L1
Sper
m
No
5
Aar
abi,
201
5
Inte
rven
tio
nN
30
C
anad
a
FA (
5mg/
d)
for
6m
K
CN
Q1O
T1
Sper
m
No
5
Al-
Gh
nan
iem
Ab
bad
i, 2
013
In
terv
enti
on
D
29
U
K
FA (
400
µg/
d)
or
pla
ceb
o
for
10w
ES
R1
(Pro
mo
ter)
C
olo
nic
mu
cosa
T N
o
7
Al-
Gh
nan
iem
Ab
bad
i, 2
013
In
terv
enti
on
D
29
U
K
FA (
400
µg/
d)
or
pla
ceb
o
for
10w
M
LH1
(P
rom
ote
r)
Co
lon
ic m
uco
saT
No
7
GEN
OM
E-W
IDE
Son
g, 2
016
C
ross
-sec
tio
nal
8
1
USA
B
reas
t ti
ssu
e
NA
B
reas
t ti
ssu
e
Hyp
er/
Hyp
o
4
N N
on
-blin
ded
, D D
ou
ble
-blin
ded
, FA
= F
olic
Aci
d
T Ti
ssu
es: B
rain
, ski
n, h
eart
, kid
ney
, lu
ng
& li
ver;
Co
lon
ic m
uco
sa (
No
rmal
-ap
pea
rin
g); B
loo
d (
Co
agu
late
d &
un
coag
ula
ted
) # Fo
late
dep
leti
on
(7
w, 1
15
or
13
5 µ
g D
FE/d
) fo
llow
ed b
y re
ple
tio
n (
7w
, 40
0 o
r 8
00
µg
DFE
/d)
*In
dex
(p
16
, MG
MT,
DA
PK
, RA
SSF1
A, P
AX
5α
,PA
X5
β, G
ATA
4 &
GA
TA5
) (P
rom
ote
r)
**In
dex
(p
16
, FH
IT, R
AR
, CD
H1
, DA
PK
1, h
TER
T, R
ASS
F1A
, MG
MT,
BR
CA
1 &
PA
LB2
) (P
rom
ote
r)
***I
nd
ex (
HP
P1
, AP
C, S
FRP
1, S
FRP
2, S
OX
17,
WIF
1, E
SR1
, MYO
D &
N3
3)
Tab
le 4
. Stu
dy
char
acte
rist
ics
and
res
ult
s: V
itam
in B
1
Firs
t au
tho
r, y
ear
Stu
dy
des
ign
N
C
ou
ntr
y Ex
po
sure
ass
essm
ent
Ge
nes
Ti
ssu
e
Dir
ecti
on
res
ult
s Q
S
AD
ULT
HO
OD
GLO
BA
L
Mar
qu
es-R
och
a, 2
016
C
ross
-sec
tio
nal
15
6
Bra
zil
72h
fo
od
rec
ord
N
A
WB
Cs
Hyp
o
5

100 PART A: Introduction
Tab
le 5
. Stu
dy
char
acte
rist
ics
and
res
ult
s: V
itam
in B
2
Firs
t au
tho
r, y
ear
Stu
dy
des
ign
N
C
ou
ntr
y Ex
po
sure
ass
essm
ent
Ge
nes
Ti
ssu
e
Dir
ecti
on
res
ult
s Q
S
MA
TER
NA
L O
FFSP
RIN
G R
ELA
TIO
NSH
IP
GEN
E-SP
ECIF
IC
Azz
i, 2
014
C
ross
-sec
tio
nal
20
02
Fran
ce
FFQ
& 2
4h
rec
all
ZAC
1
Co
rd b
loo
d
Hyp
er
6
MA
TER
NA
L O
FFSP
RIN
G R
ELA
TIO
NSH
IP
GEN
E-SP
ECIF
IC
Mar
qu
es-R
och
a, 2
016
C
ross
-sec
tio
nal
15
6
Bra
zil
72h
fo
od
rec
ord
N
A
WB
Cs
Hyp
er
5
On
o, 2
012
C
ross
-sec
tio
nal
38
4
Jap
an
FFQ
& 2
4h
rec
all
NA
B
loo
d
No
5
Zhan
g 20
12
C
ross
-sec
tio
nal
16
5
USA
FF
Q
NA
W
BC
s N
o
4
Zhan
g, 2
011
C
ross
-sec
tio
nal
14
9
USA
FF
Q
NA
P
erip
he
ral b
loo
d le
uko
cyte
s N
o
4
Figu
eir
ed
o, 2
00
9
Cro
ss-s
ecti
on
al
388
N
ort
h A
mer
ica
FF
Q
NA
B
iop
sies
fro
m r
igh
t an
d le
ft c
olo
n
NA
(Q
uar
tile
s)
3
Figu
eir
ed
o, 2
00
9
Cro
ss-s
ecti
on
al
388
N
ort
h A
mer
ica
P
lasm
a
NA
B
iop
sies
fro
m r
igh
t an
d le
ft c
olo
n
NA
(Q
uar
tile
s)
4
Tab
le 6
. Stu
dy
char
acte
rist
ics
and
res
ult
s: V
itam
in B
3
Firs
t au
tho
r, y
ear
Stu
dy
des
ign
N
C
ou
ntr
y Ex
po
sure
ass
essm
ent
Ge
ne
s Ti
ssu
e
Dir
ecti
on
res
ult
s Q
S
MA
TER
NA
L O
FFSP
RIN
G R
ELA
TIO
NSH
IP
GEN
E-SP
ECIF
IC
Azz
i, 2
014
C
ross
-sec
tio
nal
20
02
Fran
ce
FFQ
& 2
4h
rec
all
ZAC
1
Co
rd b
loo
d
No
6
AD
ULT
HO
OD
GLO
BA
L
Mar
qu
es-R
och
a, 2
016
C
ross
-sec
tio
nal
15
6
Bra
zil
72h
fo
od
rec
ord
N
A
WB
Cs
Hyp
o
5

CHAPTER 3: Nutrients and DNA methylation: a systematic review 101
Ta
ble
7. S
tud
y ch
arac
teri
stic
s an
d r
esu
lts:
Vit
amin
B6
Firs
t au
tho
r, y
ear
Stu
dy
des
ign
N
C
ou
ntr
y Ex
po
sure
ass
essm
ent
Ge
nes
Ti
ssu
e
Dir
ecti
on
res
ult
s Q
S
MA
TER
NA
L O
FFSP
RIN
G R
ELA
TIO
NSH
IP
GEN
E-SP
ECIF
IC
Azz
i, 2
014
C
ross
-sec
tio
nal
20
02
Fran
ce
FFQ
& 2
4h
rec
all
ZAC
1
Co
rd b
loo
d
No
6
AD
ULT
HO
OD
GLO
BA
L
Go
mes
, 201
2
Cro
ss-s
ecti
on
al
126
B
razi
l 24
h r
ecal
l on
3 d
iffe
ren
t d
ays
NA
V
en
ou
s b
loo
d
Hyp
o
3
On
o, 2
012
C
ross
-sec
tio
nal
38
4
Jap
an
FFQ
& 2
4h
rec
all
NA
B
loo
d
No
5
Hu
ang,
20
12
C
ross
-sec
tio
nal
49
3
USA
FF
Q
NA
B
loo
d
No
3
Per
ng,
20
14
C
ross
-sec
tio
nal
98
7
USA
FF
Q
NA
B
loo
d
No
3
Zhan
g, 2
011
C
ross
-sec
tio
nal
14
9
USA
FF
Q
NA
P
erip
he
ral b
loo
d le
uko
cyte
s N
o
4
Ulr
ich
, 201
2
Cro
ss-s
ecti
on
al
173
U
SA
FFQ
N
A
Lym
ph
ocy
tes
No
4
Zhan
g 20
12
C
ross
-sec
tio
nal
16
5
USA
FF
Q
NA
W
BC
s N
o
4
Figu
eir
ed
o, 2
00
9
Cro
ss-s
ecti
on
al
388
N
ort
h
Am
eric
a
FFQ
N
A
Bio
psi
es
fro
m r
igh
t an
d le
ft
colo
n
NA
(Q
uar
tile
s)
3
Figu
eir
ed
o, 2
00
9
Cro
ss-s
ecti
on
al
388
N
ort
h
Am
eric
a
Pla
sma
N
A
Bio
psi
es
fro
m r
igh
t an
d le
ft
colo
n
NA
(Q
uar
tile
s)
4
Fris
o, 2
002
C
ross
-sec
tio
nal
29
2
Ital
y V
en
ou
s b
loo
d
NA
W
ho
le b
loo
d
No
6
Hü
bn
er,
201
3
Inte
rven
tio
n (
No
n-b
lind
ed
) 50
G
erm
any
Sup
ple
men
ts
NA
B
loo
d
No
3
GEN
E-SP
ECIF
IC
Zhan
g 20
12
C
ross
-sec
tio
nal
16
5
USA
FF
Q
IL-6
W
BC
s N
o
5

102 PART A: Introduction
Tab
le 8
. Stu
dy
char
acte
rist
ics
and
res
ult
s: V
itam
in B
12
Firs
t au
tho
r, y
ear
Stu
dy
des
ign
N
C
ou
ntr
y Ex
po
sure
ass
essm
ent
Ge
nes
Ti
ssu
e
Dir
ecti
on
res
ult
s Q
S
MA
TER
NA
L O
FFSP
RIN
G R
ELA
TIO
NSH
IP
GLO
BA
L
Bo
eke,
20
12
Cro
ss-s
ecti
on
al
534
U
SA
FFQ
N
A
Co
rd b
loo
d
No
6
McK
ay, 2
012
C
ross
-sec
tio
nal
15
8
UK
Se
rum
N
A
Co
rd b
loo
d
Hyp
er
5
GEN
E-SP
ECIF
IC
Azz
i, 20
14
Cro
ss-s
ecti
on
al
2002
Fr
ance
FF
Q &
24
h r
ecal
l ZA
C1
C
ord
blo
od
H
ype
r 6
Ba,
201
1
Cro
ss-s
ecti
on
al
99
Ch
ina
Se
rum
IG
F2
Co
rd b
loo
d
Hyp
o
6
CH
ILD
HO
OD
GLO
BA
L
Per
ng,
20
12
C
ross
-sec
tio
nal
56
8
Co
lom
bia
P
lasm
a
NA
B
loo
d
No
4
GEN
E-SP
ECIF
IC
McK
ay, 2
012
C
ross
-sec
tio
nal
15
8
UK
Se
rum
co
rd b
loo
d
IGFB
P3
C
ord
blo
od
H
ypo
7
AD
ULT
HO
OD
GLO
BA
L
Go
mes
, 201
2
Cro
ss-s
ecti
on
al
126
B
razi
l 24
h r
ecal
l (3
d)
NA
V
en
ou
s b
loo
d
No
3
On
o, 2
012
C
ross
-sec
tio
nal
38
4
Jap
an
FFQ
&24
h r
ecal
l N
A
Blo
od
N
o
5
Hu
ang,
20
12
C
ross
-sec
tio
nal
49
3
USA
FF
Q
NA
B
loo
d
No
3
Per
ng,
20
14
C
ross
-sec
tio
nal
98
7
USA
FF
Q
NA
B
loo
d
No
5
Bo
eke,
20
12
Cro
ss-s
ecti
on
al
534
U
SA
FFQ
N
A
Blo
od
N
o
6
Ulr
ich
, 201
2
Cro
ss-s
ecti
on
al
173
U
SA
FFQ
N
A
Lym
ph
ocy
tes
No
4
Zhan
g 20
12
C
ross
-sec
tio
nal
16
5
USA
FF
Q
NA
W
BC
s N
o
4
Zhan
g, 2
011
C
ross
-sec
tio
nal
14
9
USA
FF
Q
NA
P
erip
he
ral b
loo
d le
uko
cyte
s N
o
4
Figu
eir
ed
o, 2
00
9
Cro
ss-s
ecti
on
al
388
N
ort
h A
me
rica
P
lasm
a
NA
B
iop
sie
fro
m r
igh
t an
d le
ft c
olo
n
NA
(Q
uar
tile
s)
4
Nar
ayan
an, 2
00
4
Cro
ss-s
ecti
on
al
408
Sc
otl
and
P
lasm
a
NA
V
en
ou
s b
loo
d
No
4
Qu
inliv
an, 2
013
C
ross
-sec
tio
nal
37
6
Ch
ina
P
lasm
a
NA
C
oag
ula
ted
Blo
od
clo
ts v
s. u
nco
agu
late
d
EDTA
-Blo
od
cel
ls
Hyp
er
4
Qu
inliv
an, 2
013
C
ross
-sec
tio
nal
37
6
Ch
ina
P
lasm
a
NA
B
loo
d c
lots
H
ype
r 6
Gad
gil,
201
4
Cro
ss-s
ecti
on
al
49
Ind
ia
Pla
sma
N
A
Blo
od
N
o
3

CHAPTER 3: Nutrients and DNA methylation: a systematic review 103
Fi
rst
auth
or,
yea
r St
ud
y d
esig
n
N
Co
un
try
Exp
osu
re a
sses
smen
t G
en
es
Tiss
ue
D
irec
tio
n r
esu
lts
QS
Tap
p, 2
013
C
ross
-sec
tio
nal
18
5
UK
P
lasm
a
NA
R
ecta
l mu
cosa
N
o
5
Fen
ech
, 19
98
C
ross
-sec
tio
nal
10
6
Au
stra
lia
Seru
m
NA
B
loo
d
No
6
Fris
o, 2
002
C
ross
-sec
tio
nal
29
2
Ital
y ve
no
us
blo
od
N
A
Wh
ole
blo
od
N
o
6
Ulr
ich
, 201
2
Cro
ss-s
ecti
on
al
173
U
SA
Seru
m
NA
Ly
mp
ho
cyte
s N
o
5
Pu
fule
te, 2
00
5
Cro
ss-s
ecti
on
al
68
UK
Se
rum
N
A
Co
lon
ic m
uco
sa
No
3
Hü
bn
er,
201
3
Inte
rven
tio
n (N
on
-blin
de
d)
50
Ger
man
y Su
pp
lem
ents
N
A
Blo
od
N
o
3
GEN
E-SP
ECIF
IC
Bo
llati
, 20
14
C
ross
-sec
tio
nal
16
5
Ital
y FF
Q
CD
14
B
loo
d
No
6
Bo
llati
, 20
14
C
ross
-sec
tio
nal
16
5
Ital
y FF
Q
Et-1
B
loo
d
No
6
Bo
llati
, 20
14
C
ross
-sec
tio
nal
16
5
Ital
y FF
Q
HER
V-w
B
loo
d
No
6
Bo
llati
, 20
14
C
ross
-sec
tio
nal
16
5
Ital
y FF
Q
iNO
S B
loo
d
No
6
Bo
llati
, 20
14
C
ross
-sec
tio
nal
16
5
Ital
y FF
Q
TNFα
B
loo
d
No
6
Zhan
g 20
12
C
ross
-sec
tio
nal
16
5
USA
FF
Q
IL-6
W
BC
s N
o
5
Zho
ng,
201
5
Cro
ss-s
ecti
on
al
573
U
SA
FFQ
TL
R2
W
ho
le b
loo
d
No
6
Piy
ath
ilake
, 20
14
Cro
ss-s
ecti
on
al
315
U
SA
Pla
sma
H
PV
16
B
loo
d
Hyp
er
5
Ott
ini,
20
15
Cro
ss-s
ecti
on
al
22
Ital
y P
lasm
a
Ind
ex*
B
loo
d
No
3
Tap
p, 2
013
C
ross
-sec
tio
nal
18
5
UK
P
lasm
a
Ind
ex**
R
ecta
l mu
cosa
N
o
6
Tap
p, 2
013
C
ross
-sec
tio
nal
18
5
UK
P
lasm
a
HP
P1
R
ecta
l mu
cosa
N
o
6
Tap
p, 2
013
C
ross
-sec
tio
nal
18
5
UK
P
lasm
a
AP
C
Rec
tal m
uco
sa
No
6
Tap
p, 2
013
C
ross
-sec
tio
nal
18
5
UK
P
lasm
a
SFR
P1
R
ecta
l mu
cosa
N
o
6
Tap
p, 2
013
C
ross
-sec
tio
nal
18
5
UK
P
lasm
a
SFR
P2
R
ecta
l mu
cosa
N
o
6
Tap
p, 2
013
C
ross
-sec
tio
nal
18
5
UK
P
lasm
a
SOX
17
R
ecta
l mu
cosa
N
o
6
Tap
p, 2
013
C
ross
-sec
tio
nal
18
5
UK
P
lasm
a
WIF
1
Rec
tal m
uco
sa
No
6
Tap
p, 2
013
C
ross
-sec
tio
nal
18
5
UK
P
lasm
a
ESR
1
Rec
tal m
uco
sa
No
6
Tap
p, 2
013
C
ross
-sec
tio
nal
18
5
UK
P
lasm
a
MYO
D
Rec
tal m
uco
sa
No
6
Tap
p, 2
013
C
ross
-sec
tio
nal
18
5
UK
P
lasm
a
N3
3
Rec
tal m
uco
sa
No
6
Al-
Gh
nan
iem
,20
07
C
ross
-sec
tio
nal
73
U
K
Ve
no
us
blo
od
ER
α
No
rmal
-ap
pea
rin
g co
lon
ic m
uco
sa
Hyp
o
6
*In
dex
(p
16
, FH
IT, R
AR
, CD
H1
, DA
PK
1, h
TER
T, R
ASS
F1A
, MG
MT,
BR
CA
1 &
PA
LB2
), *
*In
dex
(H
PP
1, A
PC
, SFR
P1
, SFR
P2
, SO
X1
7, W
IF1
, ESR
1, M
YOD
& N
33)

104 PART A: Introduction
Tab
le 9
. Stu
dy
char
acte
rist
ics
and
res
ult
s: V
itam
in C
Firs
t au
tho
r, y
ear
Stu
dy
des
ign
N
C
ou
ntr
y Ex
po
sure
ass
essm
ent
Ge
nes
Ti
ssu
e
Dir
ecti
on
res
ult
s Q
S
AD
ULT
HO
OD
GLO
BA
L
Piy
ath
ilake
, 20
11
Cro
ss-s
ecti
on
al
376
U
SA
Pla
sma
N
A
PB
MC
N
o
6
Piy
ath
ilake
, 20
11
Cro
ss-s
ecti
on
al
376
U
SA
Pla
sma
N
A
Ce
rvic
al c
ells
N
o
6
GEN
E-SP
ECIF
IC
Bo
llati
, 20
14
C
ross
-sec
tio
nal
16
5
Ital
y FF
Q
CD
14
Blo
od
N
o
6
Bo
llati
, 20
14
C
ross
-sec
tio
nal
16
5
Ital
y FF
Q
Et-1
B
loo
d
No
6
Bo
llati
, 20
14
C
ross
-sec
tio
nal
16
5
Ital
y FF
Q
HER
V-w
B
loo
d
No
6
Bo
llati
, 20
14
C
ross
-sec
tio
nal
16
5
Ital
y FF
Q
iNO
S B
loo
d
No
6
Bo
llati
, 20
14
C
ross
-sec
tio
nal
16
5
Ital
y FF
Q
TNFα
B
loo
d
No
6
Stid
ley,
20
10
Cro
ss-s
ecti
on
al
1101
U
SA
FFQ
In
dex
(p
16
, MG
MT,
DA
PK
, RA
SSF1
A,
PA
X5α
, PA
X5β
, GA
TA4
, an
d G
ATA
5)
Spu
tum
N
o
6
Piy
ath
ilake
, 20
14
Cro
ss-s
ecti
on
al
315
U
SA
Pla
sma
H
PV
16
B
loo
d
No
5
de
la Ig
lesi
a, 2
014
In
terv
enti
on
N
47
Spai
n
48 h
wei
ghe
d f
oo
d r
eco
rd
PO
N1
V
en
ou
s b
loo
d
Hyp
o
6
N N
on
-blin
ded

CHAPTER 3: Nutrients and DNA methylation: a systematic review 105
Ta
ble
10
. Stu
dy
char
acte
rist
ics
and
res
ult
s: V
itam
in D
Firs
t au
tho
r, y
ear
Stu
dy
des
ign
N
C
ou
ntr
y Ex
po
sure
ass
essm
ent
Ge
nes
Ti
ssu
e
Dir
ecti
on
res
ult
s Q
S
MA
TER
NA
L O
FFSP
RIN
G R
ELA
TIO
NSH
IP
GEN
E-SP
ECIF
IC
No
vako
vic,
20
16
C
ross
-sec
tio
nal
6
8
Can
ada
Se
rum
C
YP24
A1
P
lace
nta
N
o
4
Har
vey,
20
14
Cro
ss-s
ecti
on
al
230
U
K
Pla
sma
R
XR
A
um
bili
cal c
ord
H
ypo
5
GEN
OM
E-W
IDE
Mo
zhu
i, 2
015
C
ross
-sec
tio
nal
14
7
USA
P
lasm
a/Se
rum
N
A
Co
rd b
loo
d f
rom
bu
ffy
coat
s N
o
6
CH
ILD
HO
OD
GLO
BA
L
Zhu
, 20
16
C
ross
-sec
tio
nal
45
4
USA
P
lasm
a
NA
P
erip
he
ral B
loo
d
Hyp
er
6
Zhu
, 20
16
In
terv
enti
on
D
58
U
SA
Sup
ple
men
ts
NA
P
erip
he
ral B
loo
d
Hyp
er
7
GEN
E-SP
ECIF
IC
Zhu
, 20
13
C
ross
-sec
tio
nal
2
2
USA
P
lasm
a
DH
CR
7
Wh
ole
blo
od
leu
kocy
tes
Op
po
site
4
Zhu
, 20
13
C
ross
-sec
tio
nal
2
2
USA
P
lasm
a
CYP
2R1
W
ho
le b
loo
d le
uko
cyte
s H
ypo
4
Zhu
, 20
13
C
ross
-sec
tio
nal
2
2
USA
P
lasm
a
CYP
24A
1
Wh
ole
blo
od
leu
kocy
tes
Hyp
er
4
No
vako
vic,
20
16
C
ross
-sec
tio
nal
6
8
Can
ada
Se
rum
C
YP24
A1
P
lace
nta
N
o
4
GEN
OM
E-W
IDE
Zhu
, 20
13
C
ross
-sec
tio
nal
2
2
USA
P
lasm
a
NA
W
ho
le b
loo
d le
uko
cyte
s H
ype
r/H
ypo
5
AD
ULT
HO
OD
GLO
BA
L
Tap
p, 2
013
C
ross
-sec
tio
nal
18
5
UK
P
lasm
a
NA
R
ecta
l mu
cosa
N
o
5
Nai
r-Sh
allik
er,
20
14
C
ross
-sec
tio
nal
20
8
Au
stra
lia
Seru
m
NA
Ly
mp
ho
cyte
s N
o
5
Hü
bn
er,
201
3
Inte
rven
tio
nN
50
G
erm
any
Sup
ple
men
ts
NA
B
loo
d
No
3
GEN
E-SP
ECIF
IC
Bo
llati
, 20
14
C
ross
-sec
tio
nal
16
5
Ital
y FF
Q
CD
14
B
loo
d
No
6
Bo
llati
, 20
14
C
ross
-sec
tio
nal
16
5
Ital
y FF
Q
Et-1
B
loo
d
No
6

106 PART A: Introduction
Firs
t au
tho
r, y
ear
Stu
dy
des
ign
N
C
ou
ntr
y Ex
po
sure
ass
essm
ent
Ge
nes
Ti
ssu
e
Dir
ecti
on
res
ult
s Q
S
Bo
llati
, 20
14
C
ross
-sec
tio
nal
16
5
Ital
y FF
Q
HER
V-w
B
loo
d
No
6
Bo
llati
, 20
14
C
ross
-sec
tio
nal
16
5
Ital
y FF
Q
iNO
S B
loo
d
No
6
Bo
llati
, 20
14
C
ross
-sec
tio
nal
16
5
Ital
y FF
Q
TNFα
B
loo
d
No
6
Ash
kto
rab
, 201
1
Cro
ss-s
ecti
on
al
187
U
SA
Seru
m
DK
K1
W
ho
le b
loo
d
No
7
Tap
p, 2
013
C
ross
-sec
tio
nal
18
5
UK
P
lasm
a
Ind
ex*
R
ecta
l mu
cosa
H
ypo
6
Tap
p, 2
013
C
ross
-sec
tio
nal
18
5
UK
P
lasm
a
HP
P1
R
ecta
l mu
cosa
N
o
6
Tap
p, 2
013
C
ross
-sec
tio
nal
18
5
UK
P
lasm
a
AP
C
Rec
tal m
uco
sa
Hyp
o
6
Tap
p, 2
013
C
ross
-sec
tio
nal
18
5
UK
P
lasm
a
SFR
P1
R
ecta
l mu
cosa
N
o
6
Tap
p, 2
013
C
ross
-sec
tio
nal
18
5
UK
P
lasm
a
SFR
P2
R
ecta
l mu
cosa
N
o
6
Tap
p, 2
013
C
ross
-sec
tio
nal
18
5
UK
P
lasm
a
SOX
17
R
ecta
l mu
cosa
N
o
6
Tap
p, 2
013
C
ross
-sec
tio
nal
18
5
UK
P
lasm
a
WIF
1
Rec
tal m
uco
sa
Hyp
o
6
Tap
p, 2
013
C
ross
-sec
tio
nal
18
5
UK
P
lasm
a
ESR
1
Rec
tal m
uco
sa
No
6
Tap
p, 2
013
C
ross
-sec
tio
nal
18
5
UK
P
lasm
a
MYO
D
Rec
tal m
uco
sa
Hyp
o
6
Tap
p, 2
013
C
ross
-sec
tio
nal
18
5
UK
P
lasm
a
N3
3
Rec
tal m
uco
sa
No
6
N N
on
-blin
ded
D
Do
ub
le-b
lind
ed
*In
dex
(H
PP
1, A
PC
, SFR
P1
, SFR
P2
, SO
X1
7, W
IF1
, ESR
1, M
YOD
, N3
3)

CHAPTER 3: Nutrients and DNA methylation: a systematic review 107
Ta
ble
11
. Stu
dy
char
acte
rist
ics
and
res
ult
s: V
itam
in E
Firs
t au
tho
r, y
ear
Stu
dy
des
ign
N
C
ou
ntr
y Ex
po
sure
ass
essm
ent
Ge
nes
Ti
ssu
e
Dir
ecti
on
res
ult
s Q
S
AD
ULT
HO
OD
GLO
BA
L
Piy
ath
ilake
, 20
11
Cro
ss-s
ecti
on
al
376
U
SA
Pla
sma
N
A
PB
MC
H
ypo
6
Piy
ath
ilake
, 20
11
Cro
ss-s
ecti
on
al
376
U
SA
Pla
sma
N
A
Ce
rvic
al c
ells
N
o
6
GEN
E-SP
ECIF
IC
Bo
llati
, 20
14
C
ross
-sec
tio
nal
16
5
Ital
y FF
Q
CD
14
B
loo
d
No
6
Bo
llati
, 20
14
Cro
ss-s
ecti
on
al
165
It
aly
FFQ
Et
-1
Blo
od
N
o
6
Bo
llati
, 20
14
C
ross
-sec
tio
nal
16
5
Ital
y FF
Q
HER
V-w
B
loo
d
No
6
Bo
llati
, 20
14
C
ross
-sec
tio
nal
16
5
Ital
y FF
Q
iNO
S B
loo
d
No
6
Bo
llati
, 20
14
C
ross
-sec
tio
nal
16
5
Ital
y FF
Q
TNFα
B
loo
d
No
6
de
la Ig
lesi
a, 2
014
In
terv
enti
on
N
47
Spai
n
48 h
wei
ghe
d f
oo
d r
eco
rd
PO
N1
V
en
ou
s b
loo
d
Hyp
o
6
Stid
ley,
20
10
Cro
ss-s
ecti
on
al
1101
U
SA
FFQ
In
dex
*
Spu
tum
N
o
6
N N
on
-blin
ded
*In
dex
(p
16
, MG
MT,
DA
PK
, RA
SSF1
A, P
AX
5α
, PA
X5
β, G
ATA
4 &
GA
TA5
)
Tab
le 1
2. S
tud
y ch
arac
teri
stic
s an
d r
esu
lts:
Ch
olin
e an
d b
etai
ne
Nu
trit
ion
al e
xpo
sure
Fi
rst
auth
or,
ye
ar
Stu
dy
des
ign
N
C
ou
ntr
y Ex
po
sure
ass
essm
ent
Ge
ne
s Ti
ssu
e
Dir
ecti
on
res
ult
s Q
S
MA
TER
NA
L O
FFSP
RIN
G R
ELA
TIO
NSH
IP
GLO
BA
L
Ch
olin
e
Bo
eke,
20
12
C
ross
-sec
tio
nal
53
4
USA
FF
Q
NA
C
ord
blo
od
H
ypo
6
Ch
olin
e
Jian
g, 2
012
In
terv
enti
on
N
24
USA
12
-wk
con
tro
lled
fee
din
g st
ud
y N
A
Pla
cen
ta
Hyp
er
4
Ch
olin
e
Jian
g, 2
012
In
terv
enti
on
N
24
USA
12
-wk
con
tro
lled
fee
din
g st
ud
y N
A
Co
rd b
loo
d
No
4
Bet
ain
e
Bo
eke,
20
12
C
ross
-sec
tio
nal
53
4
USA
FF
Q
NA
C
ord
blo
od
H
ypo
6
GEN
E-SP
ECIF
IC

108 PART A: Introduction
Nu
trit
ion
al e
xpo
sure
Fi
rst
auth
or,
ye
ar
Stu
dy
des
ign
N
C
ou
ntr
y Ex
po
sure
ass
essm
ent
Ge
ne
s Ti
ssu
e
Dir
ecti
on
res
ult
s Q
S
Ch
olin
e
Jian
g, 2
012
In
terv
enti
on
N
24
USA
12
-wk
con
tro
lled
fee
din
g st
ud
y C
RH
C
ord
blo
od
H
ypo
5
Ch
olin
e
Jian
g, 2
012
In
terv
enti
on
N
24
USA
12
-wk
con
tro
lled
fee
din
g st
ud
y N
R3
C1
C
ord
blo
od
H
ypo
5
Ch
olin
e
Jian
g, 2
012
In
terv
enti
on
N
24
USA
12
-wk
con
tro
lled
fee
din
g st
ud
y G
NA
S-A
S1
Co
rd b
loo
d
No
5
Ch
olin
e
Jian
g, 2
012
In
terv
enti
on
N
24
USA
12
-wk
con
tro
lled
fee
din
g st
ud
y IG
F2
Co
rd b
loo
d
No
5
Ch
olin
e
Jian
g, 2
012
In
terv
enti
on
N
24
USA
12
-wk
con
tro
lled
fee
din
g st
ud
y IL
10
C
ord
blo
od
N
o
5
Ch
olin
e
Jian
g, 2
012
In
terv
enti
on
N
24
USA
12
-wk
con
tro
lled
fee
din
g st
ud
y LE
P
Co
rd b
loo
d
No
5
Ch
olin
e
Jian
g, 2
012
In
terv
enti
on
N
24
USA
12
-wk
con
tro
lled
fee
din
g st
ud
y C
RH
P
lace
nta
H
ype
r 5
Ch
olin
e
Jian
g, 2
012
In
terv
enti
on
N
24
USA
12
-wk
con
tro
lled
fee
din
g st
ud
y N
R3
C1
P
lace
nta
H
ype
r 5
Ch
olin
e
Jian
g, 2
012
In
terv
enti
on
N
24
USA
12
-wk
con
tro
lled
fee
din
g st
ud
y G
NA
S-A
S1
Pla
cen
ta
No
5
Ch
olin
e
Jian
g, 2
012
In
terv
enti
on
N
24
USA
12
-wk
con
tro
lled
fee
din
g st
ud
y IG
F2
Pla
cen
ta
No
5
Ch
olin
e
Jian
g, 2
012
In
terv
enti
on
N
24
USA
12
-wk
con
tro
lled
fee
din
g st
ud
y IL
10
P
lace
nta
N
o
5
Ch
olin
e
Jian
g, 2
012
In
terv
enti
on
N
24
USA
12
-wk
con
tro
lled
fee
din
g st
ud
y LE
P
Pla
cen
ta
No
5
AD
ULT
HO
OD
GLO
BA
L
Ch
olin
e
Bo
eke,
20
12
C
ross
-sec
tio
nal
53
4
USA
FF
Q
NA
B
loo
d
No
6
Ch
olin
e
Jian
g, 2
012
In
terv
enti
on
N
24
USA
12
-wk
con
tro
lled
fee
din
g st
ud
y N
A
Blo
od
N
o
4
Ch
olin
e
Shin
, 20
10
In
terv
enti
on
N
60
USA
In
terv
enti
on
*
NA
Le
uko
cyte
s H
ype
r 3
Bet
ain
e
Bo
eke,
20
12
C
ross
-sec
tio
nal
53
4
USA
FF
Q
NA
B
loo
d
No
6
GEN
E-SP
ECIF
IC
Ch
olin
e
Jian
g, 2
012
In
terv
enti
on
N
24
USA
12
-wk
con
tro
lled
fee
din
g st
ud
y C
RH
B
loo
d
No
5
Ch
olin
e
Jian
g, 2
012
In
terv
enti
on
N
24
USA
12
-wk
con
tro
lled
fee
din
g st
ud
y N
R3
C1
B
loo
d
No
5
N N
on
-blin
ded
*In
terv
enti
on
(1
2-w
k o
f 3
00
, 55
0, 1
100
, or
22
00
mg/
d)

CHAPTER 3: Nutrients and DNA methylation: a systematic review 109
Ta
ble
13
. Stu
dy
char
acte
rist
ics
and
res
ult
s: M
iner
als
and
tra
ce e
lem
ents
Nu
trit
ion
al e
xpo
sure
Fi
rst
auth
or,
ye
ar
Stu
dy
des
ign
N
C
ou
ntr
y Ex
po
sure
ass
essm
ent
Ge
nes
Ti
ssu
e
Dir
ecti
on
res
ult
s Q
S
CH
ILD
HO
OD
GLO
BA
L
Iro
n (
Ferr
itin
) P
ern
g, 2
01
2
Cro
ss-s
ecti
on
al
568
C
olo
mb
ia
Pla
sma
N
A
Blo
od
N
o
4
Zin
c P
ern
g, 2
01
2
Cro
ss-s
ecti
on
al
568
C
olo
mb
ia
Seru
m
NA
B
loo
d
No
4
AD
ULT
HO
OD
GLO
BA
L
Cal
ciu
m
Hü
bn
er,
201
3
Inte
rven
tio
nN
50
Ger
man
y Su
pp
lem
ents
N
A
Blo
od
N
o
3
Co
pp
er
Mar
qu
es-R
och
a, 2
016
C
ross
-sec
tio
nal
15
6
Bra
zil
72h
fo
od
rec
ord
N
A
WB
Cs
Hyp
er
5
Iro
n
Mar
qu
es-R
och
a, 2
016
C
ross
-sec
tio
nal
15
6
Bra
zil
72h
fo
od
rec
ord
N
A
WB
Cs
Hyp
er
5
Mag
nes
ium
G
om
es, 2
01
2
Cro
ss-s
ecti
on
al
126
B
razi
l 24
h r
ecal
l o(3
d)
NA
V
en
ou
s b
loo
d
Hyp
o
3
Ph
osp
hat
e
McC
hel
lan
d, 2
01
6
Cro
ss-s
ecti
on
al
666
U
K
Seru
m
NA
se
rum
Blo
od
H
ypo
6
Sele
niu
m
Tap
p, 2
013
C
ross
-sec
tio
nal
18
5
UK
P
lasm
a
NA
R
ecta
l mu
cosa
H
ype
r 5
Zin
c P
ern
g, 2
01
4
Cro
ss-s
ecti
on
al
987
U
SA
FFQ
N
A
Blo
od
N
o
5
Zin
c G
om
es, 2
01
2
Cro
ss-s
ecti
on
al
126
B
razi
l 24
h r
ecal
l (3
d)
NA
V
en
ou
s b
loo
d
No
3
GEN
E-SP
ECIF
IC
Sod
ium
(Sa
lt)
Shim
azu
, T20
15
C
ross
-sec
tio
nal
28
1
Jap
an
FFQ
m
iR-1
24
a-3
G
astr
ic m
uco
sa
No
6
Sod
ium
(Sa
lt)
Shim
azu
, T20
15
C
ross
-sec
tio
nal
28
1
Jap
an
FFQ
EM
X1
G
astr
ic m
uco
sa
No
6
Sod
ium
(Sa
lt)
Shim
azu
, T20
15
C
ross
-sec
tio
nal
28
1
Jap
an
FFQ
N
KX
6-1
G
astr
ic m
uco
sa
No
6
Sele
niu
m
Tap
p, 2
013
C
ross
-sec
tio
nal
18
5
UK
P
lasm
a
HP
P1
R
ecta
l mu
cosa
N
o
6
Sele
niu
m
Tap
p, 2
013
C
ross
-sec
tio
nal
18
5
UK
P
lasm
a
AP
C
Rec
tal m
uco
sa
No
6
Sele
niu
m
Tap
p, 2
013
C
ross
-sec
tio
nal
18
5
UK
P
lasm
a
SFR
P1
R
ecta
l mu
cosa
N
o
6
Sele
niu
m
Tap
p, 2
013
C
ross
-sec
tio
nal
18
5
UK
P
lasm
a
SFR
P2
R
ecta
l mu
cosa
N
o
6
Sele
niu
m
Tap
p, 2
013
C
ross
-sec
tio
nal
18
5
UK
P
lasm
a
SOX
17
R
ecta
l mu
cosa
N
o
6
Sele
niu
m
Tap
p, 2
013
C
ross
-sec
tio
nal
18
5
UK
P
lasm
a
WIF
1
Rec
tal m
uco
sa
No
6
Sele
niu
m
Tap
p, 2
013
C
ross
-sec
tio
nal
18
5
UK
P
lasm
a
ESR
1
Rec
tal m
uco
sa
No
6
Sele
niu
m
Tap
p, 2
013
C
ross
-sec
tio
nal
18
5
UK
P
lasm
a
MYO
D
Rec
tal m
uco
sa
No
6
Sele
niu
m
Tap
p, 2
013
C
ross
-sec
tio
nal
18
5
UK
P
lasm
a
N3
3
Rec
tal m
uco
sa
No
6
Sele
niu
m
Tap
p, 2
013
C
ross
-sec
tio
nal
18
5
UK
P
lasm
a
Ind
ex*
R
ecta
l mu
cosa
N
o
6
N N
on
-blin
ded
, *In
dex
(H
PP
1, A
PC
, SFR
P1
, SFR
P2
, SO
X1
7, W
IF1
, ESR
1, M
YOD
, N3
3)

110 PART A: Introduction
Tab
le 1
4. S
tud
y ch
arac
teri
stic
s an
d r
esu
lts:
Co
mb
ined
nu
trie
nts
Nu
trit
ion
al e
xpo
sure
Fi
rst
auth
or,
ye
ar
Stu
dy
des
ign
N
C
ou
ntr
y Ex
po
sure
ass
essm
ent
Ge
nes
Ti
ssu
e
Dir
ecti
on
res
ult
s Q
S
MA
TER
NA
L O
FFSP
RIN
G R
ELA
TIO
NSH
IP
GEN
OM
E-W
IDE
Mu
ltiv
itam
in
Kh
ula
n, 2
01
2
Inte
rven
tio
nD
59
Gam
bia
Su
pp
lem
ents
N
A
Co
rd b
loo
d
Hyp
er/
Hyp
o
6
Mu
ltiv
itam
in
Kh
ula
n, 2
01
2
Inte
rven
tio
nD
25
Gam
bia
Su
pp
lem
ents
N
A
Per
iph
era
l Blo
od
fro
m
infa
nts
(~
9m
old
) H
ype
r/H
ypo
6
AD
ULT
HO
OD
GLO
BA
L
Fola
te &
Vit
B1
2
Piy
ath
ilake
, 20
11
Cro
ss-s
ecti
on
al
376
U
SA
Pla
sma
N
A
PB
MC
H
ype
r 6
Fola
te &
Vit
B1
2
Piy
ath
ilake
, 20
11
Cro
ss-s
ecti
on
al
376
U
SA
Pla
sma
N
A
Ce
rvic
al c
ells
N
o
6
Vit
B6,
B12
, D, F
ola
te &
C
alci
um
(V
s. C
on
tro
l: V
it D
&
Cal
ciu
m)
Pu
sced
du
, 20
16
Inte
rven
tio
nD
65
Ger
man
y Su
pp
lem
ents
; Se
rum
aft
er 1
y N
A
Blo
od
H
ype
r/H
ypo
5
Vit
D &
Cal
ciu
m
Pu
sced
du
, 20
16
Inte
rven
tio
nD
65
Ger
man
y Se
rum
N
A
Blo
od
H
ypo
5
Fola
te &
Vit
B1
2
Fen
ech
, 199
8
Inte
rven
tio
nD
64
Au
stra
lia
Sup
ple
men
ts
NA
B
loo
d
No
6
GEN
E-SP
ECIF
IC
Mu
ltiv
itam
in
Stid
ley,
20
10
Cro
ss-s
ecti
on
al
1101
U
SA
FFQ
In
dex
**
Spu
tum
H
ypo
6
Cal
ciu
m &
Vit
D
Zho
u, 2
014
In
terv
enti
on
N
446
U
SA
Sup
ple
men
ts*
C
YP24
A1
Se
rum
H
ypo
5
Cal
ciu
m &
Vit
D
Zho
u, 2
014
In
terv
enti
on
N
446
U
SA
Sup
ple
men
ts*
C
YP2R
1
Seru
m
No
5
Cal
ciu
m &
Vit
D
Zho
u, 2
014
In
terv
enti
on
N
446
U
SA
Sup
ple
men
ts*
C
YP27
A1
Se
rum
N
o
5
Cal
ciu
m &
Vit
D
Zho
u, 2
014
In
terv
enti
on
N
446
U
SA
Sup
ple
men
ts*
C
YP27
B1
Se
rum
N
o
5
GEN
OM
E-W
IDE
Fola
te &
Vit
B1
2
Ko
k, 2
01
5
Inte
rven
tio
nD
92
Net
her
lan
ds
Sup
ple
men
ts;
Seru
m a
fter
2y
NA
B
uff
y co
ats
Hyp
er/
Hyp
o
8
Fola
te &
Vit
B1
2
Ko
k, 2
01
5
Inte
rven
tio
nD
92
Net
her
lan
ds
Sup
ple
men
ts;
Seru
m a
fter
2y
NA
B
uff
y co
ats
Hyp
er/
Hyp
o
8
N N
on
-blin
ded
; D D
ou
ble
-blin
ded
; Vit
: Vit
amin
; *Su
pp
lem
ents
(V
itam
in D
(1
10
0 IU
/d)
& c
alci
um
(1
400
-15
00
mg/
d))
**In
dex
(p
16
, MG
MT,
DA
PK
, RA
SSF1
A, P
AX
5α
, PA
X5
β, G
ATA
4, a
nd
GA
TA5
)

CHAPTER 3: Nutrients and DNA methylation: a systematic review 111
Ta
ble
15
. Stu
dy
char
acte
rist
ics
and
res
ult
s: B
ioac
tive
co
mp
ou
nd
s
Nu
trit
ion
al e
xpo
sure
Fi
rst
auth
or,
yea
r St
ud
y d
esig
n
N
Co
un
try
Exp
osu
re a
sses
smen
t G
en
es
Tiss
ue
D
irec
tio
n r
esu
lts
QS
AD
ULT
HO
OD
GLO
BA
L
Car
ote
ne
P
iyat
hila
ke, 2
011
C
ross
-sec
tio
nal
37
6
USA
P
lasm
a
NA
P
BM
C
No
6
Car
ote
ne
P
iyat
hila
ke, 2
011
C
ross
-sec
tio
nal
37
6
USA
P
lasm
a
NA
C
erv
ical
cel
ls
No
6
GEN
E-SP
ECIF
IC
Car
ote
no
ids
Bo
llati
, 20
14
Cro
ss-s
ecti
on
al
165
It
aly
FFQ
C
D1
4
Blo
od
N
o
6
Car
ote
no
ids
Bo
llati
, 20
14
Cro
ss-s
ecti
on
al
165
It
aly
FFQ
Et
-1
Blo
od
N
o
6
Car
ote
no
ids
Bo
llati
, 20
14
Cro
ss-s
ecti
on
al
165
It
aly
FFQ
H
ERV
-w
Blo
od
H
ype
r 6
Car
ote
no
ids
Bo
llati
, 20
14
Cro
ss-s
ecti
on
al
165
It
aly
FFQ
iN
OS
Blo
od
N
o
6
Car
ote
no
ids
Bo
llati
, 20
14
Cro
ss-s
ecti
on
al
165
It
aly
FFQ
TN
Fα
Blo
od
H
ypo
6
Car
ote
ne
P
iyat
hila
ke, 2
014
C
ross
-sec
tio
nal
31
5
USA
P
lasm
a
HP
V 1
6
Blo
od
N
o
5
Car
ote
ne
St
idle
y, 2
010
C
ross
-sec
tio
nal
11
01
USA
FF
Q
Ind
ex*
Sp
utu
m
No
6
Lyco
pe
ne
St
idle
y, 2
010
C
ross
-sec
tio
nal
11
01
USA
FF
Q
Ind
ex*
Sp
utu
m
No
6
Lyco
pe
ne
d
e la
Igle
sia,
20
14
Inte
rven
tio
nN
47
Spai
n
48h
wei
ghe
d f
oo
d r
eco
rd
PO
N1
V
en
ou
s b
loo
d
Hyp
o
6
Flav
on
oid
s Zh
on
g, 2
015
C
ross
-sec
tio
nal
57
3
USA
FF
Q
TLR
2
Wh
ole
blo
od
H
ypo
6
Po
lyp
he
no
ls &
Fla
von
oid
s B
olla
ti, 2
014
C
ross
-sec
tio
nal
16
5
Ital
y FF
Q
CD
14
B
loo
d
No
6
Po
lyp
he
no
ls &
Fla
von
oid
s B
olla
ti, 2
014
C
ross
-sec
tio
nal
16
5
Ital
y FF
Q
Et-1
B
loo
d
No
6
Po
lyp
he
no
ls &
Fla
von
oid
s B
olla
ti, 2
014
C
ross
-sec
tio
nal
16
5
Ital
y FF
Q
HER
V-w
B
loo
d
No
6
Po
lyp
he
no
ls &
Fla
von
oid
s B
olla
ti, 2
014
C
ross
-sec
tio
nal
16
5
Ital
y FF
Q
iNO
S B
loo
d
No
6
Po
lyp
he
no
ls &
Fla
von
oid
s B
olla
ti, 2
014
C
ross
-sec
tio
nal
16
5
Ital
y FF
Q
TNFα
B
loo
d
No
6
Lute
in &
zea
xan
thin
St
idle
y, 2
010
C
ross
-sec
tio
nal
11
01
USA
FF
Q
Ind
ex*
Sp
utu
m
No
6
N N
on
-blin
ded
*In
dex
(p
16
, MG
MT,
DA
PK
, RA
SSF1
A, P
AX
5α
, PA
X5
β, G
ATA
4, a
nd
GA
TA5
)

112 PART A: Introduction
Tab
le 1
6. S
tud
y ch
arac
teri
stic
s an
d r
esu
lts:
Fat
an
d f
atty
aci
ds
Nu
trit
ion
al e
xpo
sure
Fi
rst
auth
or,
ye
ar
Stu
dy
des
ign
N
C
ou
ntr
y Ex
po
sure
ass
essm
ent
Ge
nes
Ti
ssu
e
Dir
ecti
on
res
ult
s Q
S
MA
TER
NA
L O
FFSP
RIN
G R
ELA
TIO
NSH
IP
GLO
BA
L
Fat
Rer
kase
m, 2
015
C
ross
-sec
tio
nal
24
9
Thai
lan
d
FFQ
& 2
4h
rec
all
NA
V
en
ou
s b
loo
d
No
3
PU
FA n
-3*
Le
e, 2
01
3
Inte
rven
tio
nD
261
M
exic
o
Sup
ple
men
ts
NA
C
BM
Cs
Hyp
er
8
GEN
E-SP
ECIF
IC
Fat
Go
dfr
ey, 2
01
1
Cro
ss-s
ecti
on
al
78
UK
FF
Q
RX
RA
C
ord
tis
sue
N
o
3
Fat
Go
dfr
ey, 2
011
C
ross
-sec
tio
nal
78
U
K
FFQ
eN
OS
Co
rd t
issu
e
No
3
PU
FA n
-3*
Le
e, 2
01
3
Inte
rven
tio
nD
261
M
exic
o
Sup
ple
men
ts
IFN
γ C
BM
Cs
No
9
PU
FA n
-3*
Le
e, 2
01
3
Inte
rven
tio
nD
261
M
exic
o
Sup
ple
men
ts
TNF-
α
CB
MC
s N
o
9
PU
FA n
-3*
Le
e, 2
01
3
Inte
rven
tio
nD
261
M
exic
o
Sup
ple
men
ts
IL13
C
BM
Cs
No
9
PU
FA n
-3*
Le
e, 2
01
3
Inte
rven
tio
nD
261
M
exic
o
Sup
ple
men
ts
GA
TA3
C
BM
Cs
No
9
PU
FA n
-3*
Le
e, 2
01
3
Inte
rven
tio
nD
261
M
exic
o
Sup
ple
men
ts
STA
T3
CB
MC
s N
o
9
PU
FA n
-3*
Le
e, 2
01
3
Inte
rven
tio
nD
261
M
exic
o
Sup
ple
men
ts
IL1
0
CB
MC
s N
o
9
PU
FA n
-3*
Le
e, 2
01
3
Inte
rven
tio
nD
261
M
exic
o
Sup
ple
men
ts
FOX
P3
C
BM
Cs
No
9
PU
FA n
-3*
Le
e, 2
01
4
Inte
rven
tio
nD
261
M
exic
o
Sup
ple
men
ts
IGF2
C
BM
Cs
Hyp
er
9
GEN
OM
E-W
IDE
PU
FA n
-3
Am
aras
eker
a, 2
014
In
terv
enti
on
D
70
Au
stra
lia
Inte
rven
tio
n (
Fish
oil)
# N
A
Co
rd b
loo
d
No
8
CH
ILD
HO
OD
GEN
OM
E-W
IDE
Fat
Vo
isin
. 20
14
Cro
ss-s
ecti
on
al
69
Gre
ece
24
h r
ecal
ls (
3 d
) N
A
Per
iph
era
l wh
ole
blo
od
H
ype
r/H
ypo
5
MU
FA/S
FA
Vo
isin
. 20
14
Cro
ss-s
ecti
on
al
69
Gre
ece
24
h r
ecal
ls (
3 d
) N
A
Per
iph
era
l wh
ole
blo
od
H
ype
r/H
ypo
5
PU
FA/S
FA
Vo
isin
. 20
14
Cro
ss-s
ecti
on
al
69
Gre
ece
24
h r
ecal
ls (
3 d
) N
A
Per
iph
era
l wh
ole
blo
od
H
ype
r/H
ypo
5
(MU
FA+P
UFA
)/SF
A
Vo
isin
. 20
14
Cro
ss-s
ecti
on
al
69
Gre
ece
24
h r
ecal
ls (
3 d
) N
A
Per
iph
era
l wh
ole
blo
od
H
ype
r/H
ypo
5
PU
FA n
-3
Lin
d, 2
015
In
terv
enti
on
D
12
Den
mar
k In
terv
enti
on
(Fi
sh o
il)
NA
B
uff
y co
ats
No
8
AD
ULT
HO
OD

CHAPTER 3: Nutrients and DNA methylation: a systematic review 113
N
utr
itio
nal
exp
osu
re
Firs
t au
tho
r, y
ear
St
ud
y d
esig
n
N
Co
un
try
Exp
osu
re a
sses
smen
t G
en
es
Tiss
ue
D
irec
tio
n r
esu
lts
QS
GLO
BA
L
Fat
Zhan
g 20
12
Cro
ss-s
ecti
on
al
165
U
SA
FFQ
N
A
WB
Cs
No
4
Fat
Zhan
g, 2
011
C
ross
-sec
tio
nal
14
9
USA
FF
Q
NA
P
erip
he
ral b
loo
d le
uko
cyte
s N
o
4
Fat
Ulr
ich
, 201
2
Cro
ss-s
ecti
on
al
173
U
SA
FFQ
N
A
Lym
ph
ocy
tes
Hyp
o
4
Fat
(Lip
ids)
G
om
es, 2
012
C
ross
-sec
tio
nal
12
6
Bra
zil
24h
rec
all o
(3 d
) N
A
Ve
no
us
blo
od
H
ypo
3
MU
FA
Zhan
g 20
12
Cro
ss-s
ecti
on
al
165
U
SA
FFQ
N
A
WB
Cs
No
4
MU
FA
Zhan
g, 2
011
C
ross
-sec
tio
nal
14
9
USA
FF
Q
NA
P
erip
he
ral b
loo
d le
uko
cyte
s N
o
4
PU
FA
Zhan
g 20
12
Cro
ss-s
ecti
on
al
165
U
SA
FFQ
N
A
WB
Cs
No
4
PU
FA
Zhan
g, 2
011
C
ross
-sec
tio
nal
14
9
USA
FF
Q
NA
P
erip
he
ral b
loo
d le
uko
cyte
s N
o
4
SFA
Zh
ang
2012
C
ross
-sec
tio
nal
16
5
USA
FF
Q
NA
W
BC
s N
o
4
SFA
Zh
ang,
201
1
Cro
ss-s
ecti
on
al
149
U
SA
FFQ
N
A
Per
iph
era
l blo
od
leu
kocy
tes
Hyp
o
4
GEN
E-SP
ECIF
IC
Fat
(An
imal
) St
idle
y, 2
01
0
Cro
ss-s
ecti
on
al
1101
U
SA
FFQ
In
dex
**
Spu
tum
N
o
6
Fat
Zhan
g 20
12
Cro
ss-s
ecti
on
al
165
U
SA
FFQ
IL
-6
WB
Cs
No
5
Fatt
y ac
ids
(cir
cula
tin
g A
LA)
Ma,
201
6 -
AJC
N
Cro
ss-s
ecti
on
al
991
U
SA
RB
C
AP
OE
C
D4
+ T c
ells
(f
rom
bu
ffy
coat
s)
NA
7
Fatt
y ac
ids
(cir
cula
tin
g EP
A)
Ma,
201
6 -
AJC
N
Cro
ss-s
ecti
on
al
991
U
SA
RB
C
AB
CA
1
CD
4+ T
cel
ls
(fro
m b
uff
y co
ats)
N
A
7
Fat
(Lip
ids)
B
olla
ti, 2
014
C
ross
-sec
tio
nal
16
5
Ital
y FF
Q
CD
14
B
loo
d
No
6
Fat
(Lip
ids)
B
olla
ti, 2
01
4
Cro
ss-s
ecti
on
al
165
It
aly
FFQ
Et
-1
Blo
od
N
o
6
Fat
(Lip
ids)
B
olla
ti, 2
01
4
Cro
ss-s
ecti
on
al
165
It
aly
FFQ
H
ERV
-w
Blo
od
N
o
6
Fat
(Lip
ids)
B
olla
ti, 2
01
4
Cro
ss-s
ecti
on
al
165
It
aly
FFQ
iN
OS
Blo
od
N
o
6
Fat
(Lip
ids)
B
olla
ti, 2
01
4
Cro
ss-s
ecti
on
al
165
It
aly
FFQ
TN
Fα
Blo
od
N
o
6
Fat
(Lip
ids)
G
óm
ez-U
riz,
20
14
C
ross
-sec
tio
nal
12
Sp
ain
FF
Q
TNF-
α
Wh
ole
blo
od
H
ypo
4
MU
FA
Zhan
g 20
12
Cro
ss-s
ecti
on
al
165
U
SA
FFQ
IL
-6
WB
Cs
No
5
MU
FA
Bo
llati
, 20
14
C
ross
-sec
tio
nal
16
5
Ital
y FF
Q
CD
14
B
loo
d
No
6
MU
FA
Bo
llati
, 20
14
C
ross
-sec
tio
nal
16
5
Ital
y FF
Q
Et-1
B
loo
d
No
6
MU
FA
Bo
llati
, 20
14
C
ross
-sec
tio
nal
16
5
Ital
y FF
Q
HER
V-w
B
loo
d
No
6
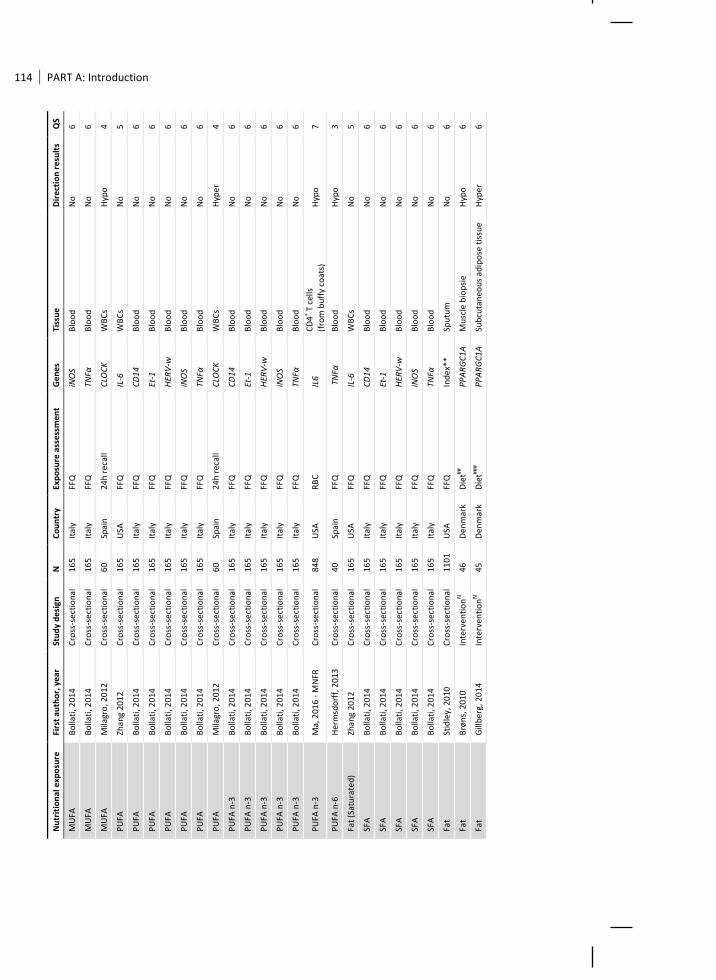
114 PART A: Introduction
Nu
trit
ion
al e
xpo
sure
Fi
rst
auth
or,
ye
ar
Stu
dy
des
ign
N
C
ou
ntr
y Ex
po
sure
ass
essm
ent
Ge
nes
Ti
ssu
e
Dir
ecti
on
res
ult
s Q
S
MU
FA
Bo
llati
, 20
14
C
ross
-sec
tio
nal
16
5
Ital
y FF
Q
iNO
S B
loo
d
No
6
MU
FA
Bo
llati
, 20
14
C
ross
-sec
tio
nal
16
5
Ital
y FF
Q
TNFα
B
loo
d
No
6
MU
FA
Mila
gro
, 20
12
Cro
ss-s
ecti
on
al
60
Spai
n
24h
rec
all
CLO
CK
W
BC
s H
ypo
4
PU
FA
Zhan
g 20
12
Cro
ss-s
ecti
on
al
165
U
SA
FFQ
IL
-6
WB
Cs
No
5
PU
FA
Bo
llati
, 20
14
C
ross
-sec
tio
nal
16
5
Ital
y FF
Q
CD
14
B
loo
d
No
6
PU
FA
Bo
llati
, 20
14
C
ross
-sec
tio
nal
16
5
Ital
y FF
Q
Et-1
B
loo
d
No
6
PU
FA
Bo
llati
, 20
14
C
ross
-sec
tio
nal
16
5
Ital
y FF
Q
HER
V-w
B
loo
d
No
6
PU
FA
Bo
llati
, 20
14
C
ross
-sec
tio
nal
16
5
Ital
y FF
Q
iNO
S B
loo
d
No
6
PU
FA
Bo
llati
, 20
14
C
ross
-sec
tio
nal
16
5
Ital
y FF
Q
TNFα
B
loo
d
No
6
PU
FA
Mila
gro
, 20
12
Cro
ss-s
ecti
on
al
60
Spai
n
24h
rec
all
CLO
CK
W
BC
s H
ype
r 4
PU
FA n
-3
Bo
llati
, 20
14
C
ross
-sec
tio
nal
16
5
Ital
y FF
Q
CD
14
B
loo
d
No
6
PU
FA n
-3
Bo
llati
, 20
14
C
ross
-sec
tio
nal
16
5
Ital
y FF
Q
Et-1
B
loo
d
No
6
PU
FA n
-3
Bo
llati
, 20
14
C
ross
-sec
tio
nal
16
5
Ital
y FF
Q
HER
V-w
B
loo
d
No
6
PU
FA n
-3
Bo
llati
, 20
14
C
ross
-sec
tio
nal
16
5
Ital
y FF
Q
iNO
S B
loo
d
No
6
PU
FA n
-3
Bo
llati
, 20
14
C
ross
-sec
tio
nal
16
5
Ital
y FF
Q
TNFα
B
loo
d
No
6
PU
FA n
-3
Ma,
201
6 -
MN
FR
Cro
ss-s
ecti
on
al
848
U
SA
RB
C
IL6
C
D4
+ T c
ells
(f
rom
bu
ffy
coat
s)
Hyp
o
7
PU
FA n
-6
Her
msd
orf
f, 2
01
3
Cro
ss-s
ecti
on
al
40
Spai
n
FFQ
T
NFα
B
loo
d
Hyp
o
3
Fat
(Sat
ura
ted
) Zh
ang
2012
C
ross
-sec
tio
nal
16
5
USA
FF
Q
IL-6
W
BC
s N
o
5
SFA
B
olla
ti, 2
01
4
Cro
ss-s
ecti
on
al
165
It
aly
FFQ
C
D1
4
Blo
od
N
o
6
SFA
B
olla
ti, 2
01
4
Cro
ss-s
ecti
on
al
165
It
aly
FFQ
Et
-1
Blo
od
N
o
6
SFA
B
olla
ti, 2
01
4
Cro
ss-s
ecti
on
al
165
It
aly
FFQ
H
ERV
-w
Blo
od
N
o
6
SFA
B
olla
ti, 2
01
4
Cro
ss-s
ecti
on
al
165
It
aly
FFQ
iN
OS
Blo
od
N
o
6
SFA
B
olla
ti, 2
01
4
Cro
ss-s
ecti
on
al
165
It
aly
FFQ
TN
Fα
Blo
od
N
o
6
Fat
Stid
ley,
20
10
C
ross
-sec
tio
nal
11
01
USA
FF
Q
Ind
ex**
Sp
utu
m
No
6
Fat
Brø
ns,
20
10
Inte
rven
tio
nN
46
Den
mar
k D
iet##
P
PA
RG
C1A
M
usc
le b
iop
sie
H
ypo
6
Fat
Gill
ber
g, 2
014
In
terv
enti
on
N
45
Den
mar
k D
iet##
# P
PA
RG
C1A
Su
bcu
tan
eou
s ad
ipo
se t
issu
e
Hyp
er
6

CHAPTER 3: Nutrients and DNA methylation: a systematic review 115
N
utr
itio
nal
exp
osu
re
Firs
t au
tho
r, y
ear
St
ud
y d
esig
n
N
Co
un
try
Exp
osu
re a
sses
smen
t G
en
es
Tiss
ue
D
irec
tio
n r
esu
lts
QS
GEN
OM
E-W
IDE
PU
FA n
-3
Asl
ibe
kyan
, 20
14
C
ross
-sec
tio
nal
18
5
USA
R
BC
s N
A
Blo
od
H
ype
r/H
ypo
6
Fat
Jaco
bse
n, 2
012
In
terv
enti
on
N
21
Den
mar
k D
iet
(Res
tric
ted
hig
h
fat
die
t fo
r 5
d)
NA
Sk
elet
al M
usc
le b
iop
sies
H
ype
r/H
ypo
6
Fat
Jaco
bse
n, 2
014
In
terv
enti
on
N
40
Den
mar
k D
iet
(Res
tric
ted
hig
h
fat
die
t fo
r 5
d)
NA
Sk
elet
al M
usc
le b
iop
sies
H
ype
r/H
ypo
6
Fat
Gill
ber
g, 2
016
In
terv
enti
on
N
34
Den
mar
k D
iet##
# + 7
wk
of
ove
rfee
din
g N
A
Sub
cuta
neo
us
adip
ose
tis
sue
H
ype
r/H
ypo
6
Fatt
y ac
ids
Irvi
n, 2
014
In
terv
enti
on
N
1048
U
SA
Die
t (R
estr
icte
d)
NA
B
loo
d
No
8
*PU
FA n
-3 [
do
cosa
hex
aen
oic
aci
d (
DH
A)]
**In
dex
(p
16
, MG
MT,
DA
PK
, RA
SSF1
A, P
AX
5α
, PA
X5
β, G
ATA
4, a
nd
GA
TA5
) # In
terv
enti
on
; 3.7
g o
f fi
sh o
il (w
ith
56
.0%
as
DH
A &
27
.7%
as
EPA
) o
r p
lace
bo
in c
apsu
les
dai
ly f
rom
20
wee
ks o
f ge
stat
ion
un
til d
eliv
ery
##D
iet
(3d
co
ntr
ol d
iet
incl
ud
ing
30
% f
at &
5d
hig
h-f
at o
verf
eed
ing
die
t co
nta
inin
g 5
0%
) ex
tra
calo
ries
& 6
0%
fat
) ##
# Die
t (5
-d h
igh
-fat
ove
rfee
din
g d
iet
(60
E% f
at, 5
0% e
xtra
cal
ori
es)
& a
wei
ght
mai
nta
inin
g co
ntr
ol d
iet
(30
E% f
at);
6-8
wk
of
was
h-o
ut)
CB
MC
s (C
ord
blo
od
mo
no
nu
clea
r ce
lls)

116 PART A: Introduction
Tab
le 1
7. S
tud
y ch
arac
teri
stic
s an
d r
esu
lts:
Car
bo
hyd
rate
s an
d f
iber
Nu
trit
ion
al e
xpo
sure
Fi
rst
auth
or,
ye
ar
Stu
dy
des
ign
N
C
ou
ntr
y Ex
po
sure
ass
essm
ent
Ge
nes
Ti
ssu
e
Dir
ecti
on
res
ult
s Q
S
MA
TER
NA
L O
FFSP
RIN
G R
ELA
TIO
NSH
IP
GLO
BA
L
Car
bo
hyd
rate
s R
erka
sem
, 201
5
Cro
ss-s
ecti
on
al
249
Th
aila
nd
FF
Q &
24
h r
ecal
l N
A
Ve
no
us
blo
od
N
o
3
GEN
E-SP
ECIF
IC
Car
bo
hyd
rate
s G
od
frey
, 20
11
C
ross
-sec
tio
nal
78
U
K
FFQ
R
XR
A
Co
rd t
issu
e
Hyp
o
3
Car
bo
hyd
rate
s G
od
frey
, 20
11
C
ross
-sec
tio
nal
78
U
K
FFQ
eN
OS
Co
rd t
issu
e
No
3
AD
ULT
HO
OD
GLO
BA
L
Car
bo
hyd
rate
s G
om
es, 2
012
C
ross
-sec
tio
nal
12
6
Bra
zil
24h
rec
all (
3 d
) N
A
Ve
no
us
blo
od
H
ypo
3
Car
bo
hyd
rate
s Zh
ang,
201
1
Cro
ss-s
ecti
on
al
149
U
SA
FFQ
N
A
Per
iph
era
l blo
od
leu
kocy
tes
No
4
Car
bo
hyd
rate
s Zh
ang
2012
C
ross
-sec
tio
nal
16
5
USA
FF
Q
NA
W
BC
s N
o
4
Car
bo
hyd
rate
s U
lric
h, 2
012
C
ross
-sec
tio
nal
17
3
USA
FF
Q
NA
Ly
mp
ho
cyte
s N
o
4
GEN
E-SP
ECIF
IC
Car
bo
hyd
rate
s Sa
mb
las,
20
16
C
ross
-sec
tio
nal
61
Sp
ain
Q
ues
tio
nn
aire
B
MA
L1
Wh
ole
blo
od
H
ype
r 4
Car
bo
hyd
rate
s B
olla
ti, 2
01
4
Cro
ss-s
ecti
on
al
165
It
aly
FFQ
C
D14
B
loo
d
No
6
Car
bo
hyd
rate
s B
olla
ti, 2
01
4
Cro
ss-s
ecti
on
al
165
It
aly
FFQ
Et
-1
Blo
od
N
o
6
Car
bo
hyd
rate
s B
olla
ti, 2
01
4
Cro
ss-s
ecti
on
al
165
It
aly
FFQ
H
ERV
-w
Blo
od
N
o
6
Car
bo
hyd
rate
s B
olla
ti, 2
01
4
Cro
ss-s
ecti
on
al
165
It
aly
FFQ
iN
OS
Blo
od
N
o
6
Car
bo
hyd
rate
s B
olla
ti, 2
01
4
Cro
ss-s
ecti
on
al
165
It
aly
FFQ
TN
Fα
Blo
od
N
o
6
Car
bo
hyd
rate
s Zh
ang
2012
C
ross
-sec
tio
nal
16
5
USA
FF
Q
IL-6
W
BC
s N
o
5
Fib
er
Bo
llati
, 20
14
C
ross
-sec
tio
nal
16
5
Ital
y FF
Q
CD
14
Blo
od
N
o
6
Fib
er
Bo
llati
, 20
14
C
ross
-sec
tio
nal
16
5
Ital
y FF
Q
Et-1
B
loo
d
No
6
Fib
er
Bo
llati
, 20
14
C
ross
-sec
tio
nal
16
5
Ital
y FF
Q
HER
V-w
B
loo
d
No
6
Fib
er
Bo
llati
, 20
14
C
ross
-sec
tio
nal
16
5
Ital
y FF
Q
iNO
S B
loo
d
No
6
Fib
er
Bo
llati
, 20
14
C
ross
-sec
tio
nal
16
5
Ital
y FF
Q
TNFα
B
loo
d
No
6

CHAPTER 3: Nutrients and DNA methylation: a systematic review 117
Ta
ble
18
. Stu
dy
char
acte
rist
ics
and
res
ult
s: P
rote
in a
nd
am
ino
aci
ds
Nu
trit
ion
al e
xpo
sure
Fi
rst
auth
or,
ye
ar
Stu
dy
des
ign
N
C
ou
ntr
y Ex
po
sure
ass
essm
ent
Ge
nes
Ti
ssu
e
Dir
ecti
on
res
ult
s
QS
MA
TER
NA
L O
FFSP
RIN
G R
ELA
TIO
NSH
IP
GLO
BA
L
Pro
tein
R
erka
sem
, 20
15
C
ross
-sec
tio
nal
24
9
Thai
lan
d
FFQ
& 2
4h
rec
all
NA
V
en
ou
s b
loo
d s
amp
les
in c
hild
ren
N
o
3
GEN
E-SP
ECIF
IC
Pro
tein
G
od
frey
, 201
1
Cro
ss-s
ecti
on
al
78
UK
FF
Q
RX
RA
C
ord
tis
sue
N
o
3
Pro
tein
G
od
frey
, 201
1
Cro
ss-s
ecti
on
al
78
UK
FF
Q
eNO
S C
ord
tis
sue
N
o
3
AD
ULT
HO
OD
GLO
BA
L
Pro
tein
G
om
es, 2
012
C
ross
-sec
tio
nal
12
6
Bra
zil
24h
rec
all (
3 d
) N
A
Ve
no
us
blo
od
N
o
3
Pro
tein
Zh
ang
2012
C
ross
-sec
tio
nal
16
5
USA
FF
Q
NA
W
BC
s N
o
4
Pro
tein
Zh
ang,
201
1
Cro
ss-s
ecti
on
al
149
U
SA
FFQ
N
A
Per
iph
era
l blo
od
leu
kocy
tes
No
4
Met
hio
nin
e
Hu
ang,
201
2
Cro
ss-s
ecti
on
al
493
U
SA
FFQ
N
A
Blo
od
N
o
3
Met
hio
nin
e
Per
ng,
20
14
C
ross
-sec
tio
nal
98
7
USA
FF
Q
NA
B
loo
d s
amp
le
No
3
Met
hio
nin
e
Zhan
g 20
12
Cro
ss-s
ecti
on
al
165
U
SA
FFQ
N
A
WB
Cs
No
4
Met
hio
nin
e
Zhan
g, 2
011
C
ross
-sec
tio
nal
14
9
USA
FF
Q
NA
P
erip
he
ral b
loo
d le
uko
cyte
s N
o
4
GEN
E-SP
ECIF
IC
Pro
tein
B
olla
ti, 2
01
4
Cro
ss-s
ecti
on
al
165
It
aly
FFQ
C
D14
B
loo
d
No
6
Pro
tein
B
olla
ti, 2
01
4
Cro
ss-s
ecti
on
al
165
It
aly
FFQ
Et
-1
Blo
od
N
o
6
Pro
tein
B
olla
ti, 2
01
4
Cro
ss-s
ecti
on
al
165
It
aly
FFQ
H
ERV
-w
Blo
od
N
o
6
Pro
tein
B
olla
ti, 2
01
4
Cro
ss-s
ecti
on
al
165
It
aly
FFQ
iN
OS
Blo
od
N
o
6
Pro
tein
B
olla
ti, 2
01
4
Cro
ss-s
ecti
on
al
165
It
aly
FFQ
TN
Fα
Blo
od
N
o
6
Pro
tein
Zh
ang
2012
C
ross
-sec
tio
nal
16
5
USA
FF
Q
IL-6
W
BC
s N
o
5
Met
hio
nin
e
Zhan
g 20
12
Cro
ss-s
ecti
on
al
165
U
SA
FFQ
IL
-6
WB
Cs
No
5
Met
hio
nin
e
Zho
ng,
201
5
Cro
ss-s
ecti
on
al
573
U
SA
FFQ
TL
R2
W
ho
le b
loo
d
No
6

118 PART A: Introduction
SUPPLEMENTARY MATERIAL
Supplement 1: Details on the search strategy for each of the databases
References identified Unique references identified
Embase.com 2337 2294
Medline Ovid 1547 249
Web of science 1714 943
Cochrane 87 19
PubMed publisher 149 133
Google scholar 200 136
Total 5874 3774
Embase.com 2337
(diet/exp OR 'dietary intake'/exp OR 'food intake'/de OR 'caloric density'/exp OR
'caloric intake'/exp OR 'carbohydrate intake'/exp OR 'diet restriction'/exp OR 'dietary
reference intake'/exp OR 'electrolyte intake'/exp OR 'fat intake'/exp OR 'fluid
intake'/exp OR 'food deprivation'/exp OR 'mineral intake'/exp OR 'protein intake'/exp
OR 'vitamin intake'/exp OR 'vitamin blood level'/exp OR 'diet supplementation'/exp OR
'mineral supplementation'/exp OR 'vitamin supplementation'/exp OR
supplementation/de OR 'nutrition'/de OR 'child nutrition'/de OR 'diet therapy'/exp OR
'food intake'/exp OR 'infant nutrition'/exp OR 'maternal nutrition'/de OR nutrient/exp
OR 'nutritional status'/exp OR (diet OR nutrition OR ((dietar* OR food* OR beverage*
OR alcohol* OR mineral* OR nutrient* OR micronutrient* OR macronutrient* OR
vitamin* OR calor* OR energ* OR protein* OR fat OR folic-acid* OR folate* OR
vegetabl* OR fruit* OR cholin* OR methionin* OR betain* OR fatty-acid* OR pufa OR
pufas OR mufa OR mufas OR safa OR safas OR sfa OR sfas) NEAR/6 (intake* OR ingest*
OR supplement* OR consum* OR restrict* OR depriv* OR level OR concentration OR
blood OR plasma OR serum OR pattern*)) OR fasting OR ((well OR under) NEXT/1
nourish*) OR ((well OR under) NEXT/1 nourish*)):ab,ti) AND ('DNA methylation'/exp
OR (((dna OR 'long interspersed' OR gene OR genes) NEAR/6 (demethylat* OR
methylat* OR hypermethylat* OR hypomethylat*))):ab,ti) NOT ([animals]/lim NOT
[humans]/lim) AND ('observational study'/exp OR 'cohort analysis'/exp OR 'longitudinal
study'/exp OR 'retrospective study'/exp OR 'prospective study'/exp OR 'health
survey'/de OR 'health care survey'/de OR 'epidemiological data'/de OR 'case control
study'/de OR 'cross-sectional study'/de OR 'correlational study'/de OR 'population
research'/de OR 'family study'/de OR 'major clinical study'/de OR 'multicenter
study'/de OR 'comparative study'/de OR 'follow up'/de OR 'clinical study'/de OR
'clinical article'/de OR 'clinical trial'/exp OR 'randomization'/exp OR 'intervention
study'/de OR 'open study'/de OR 'community trial'/de OR 'review'/exp OR 'systematic
review'/exp OR (((observation* OR epidemiolog* OR famil* OR comparativ* OR
communit*) NEAR/6 (stud* OR data OR research)) OR cohort* OR longitudinal* OR
retrospectiv* OR prospectiv* OR population* OR (national* NEAR/3 (stud* OR survey))

CHAPTER 3: Nutrients and DNA methylation: a systematic review 119
OR (health* NEAR/3 survey*) OR ((case OR cases OR match*) NEAR/3 control*) OR
(cross NEXT/1 section*) OR correlation* OR multicenter* OR multi-center* OR follow-
up* OR followup* OR clinical* OR trial OR random* OR review* OR meta-analy*):ab,ti)
NOT ([Conference Abstract]/lim OR [Letter]/lim OR [Note]/lim OR [Editorial]/lim)
Medline Ovid 1547
(exp Diet/ OR exp "Eating"/ OR "Recommended Dietary Allowances"/ OR "food
deprivation"/ OR vitamins/bl OR "Dietary Supplements"/ OR "Nutritional Physiological
Phenomena"/ OR exp "Diet Therapy"/ OR "Maternal Nutritional Physiological
Phenomena"/ OR "nutritional status"/ OR (diet OR nutrition OR ((dietar* OR food* OR
beverage* OR alcohol* OR mineral* OR nutrient* OR micronutrient* OR
macronutrient* OR vitamin* OR calor* OR energ* OR protein* OR fat OR folic-acid* OR
folate* OR vegetabl* OR fruit* OR cholin* OR methionin* OR betain* OR fatty-acid*
OR pufa OR pufas OR mufa OR mufas OR safa OR safas OR sfa OR sfas) ADJ6 (intake*
OR ingest* OR supplement* OR consum* OR restrict* OR depriv* OR level OR
concentration OR blood OR plasma OR serum OR pattern*)) OR fasting OR ((well OR
under) ADJ nourish*) OR ((well OR under) ADJ nourish*)).ab,ti.) AND ("DNA
Methylation"/ OR (((dna OR "long interspersed" OR gene OR genes) ADJ6 (demethylat*
OR methylat* OR hypermethylat* OR hypomethylat*))).ab,ti.) NOT (exp animals/ NOT
humans/) AND ("observational study"/ OR exp "Epidemiologic Studies"/ OR "health
surveys"/ OR "multicenter study"/ OR exp "clinical study"/ OR "Random Allocation"/
OR "review"/ OR (((observation* OR epidemiolog* OR famil* OR comparativ* OR
communit*) ADJ6 (stud* OR data OR research)) OR cohort* OR longitudinal* OR
retrospectiv* OR prospectiv* OR population* OR (national* ADJ3 (stud* OR survey))
OR (health* ADJ3 survey*) OR ((case OR cases OR match*) ADJ3 control*) OR (cross
ADJ section*) OR correlation* OR multicenter* OR multi-center* OR follow-up* OR
followup* OR clinical* OR trial OR random* OR review* OR meta-analy*).ab,ti.) NOT
(letter OR news OR comment OR editorial OR congresses OR abstracts).pt.
Cochrane 87
((diet OR nutrition OR ((dietar* OR food* OR beverage* OR alcohol* OR mineral* OR
nutrient* OR micronutrient* OR macronutrient* OR vitamin* OR calor* OR energ* OR
protein* OR fat OR folic-acid* OR folate* OR vegetabl* OR fruit* OR cholin* OR
methionin* OR betain* OR fatty-acid* OR pufa OR pufas OR mufa OR mufas OR safa OR
safas OR sfa OR sfas) NEAR/6 (intake* OR ingest* OR supplement* OR consum* OR
restrict* OR depriv* OR level OR concentration OR blood OR plasma OR serum OR
pattern*)) OR fasting OR ((well OR under) NEXT/1 nourish*) OR ((well OR under)
NEXT/1 nourish*)):ab,ti) AND ((((dna OR 'long interspersed' OR gene OR genes)
NEAR/6 (demethylat* OR methylat* OR hypermethylat* OR hypomethylat*))):ab,ti)

120 PART A: Introduction
Web of science 1714
TS=(((diet OR nutrition OR ((dietar* OR food* OR beverage* OR alcohol* OR mineral*
OR nutrient* OR micronutrient* OR macronutrient* OR vitamin* OR calor* OR energ*
OR protein* OR fat OR folic-acid* OR folate* OR vegetabl* OR fruit* OR cholin* OR
methionin* OR betain* OR fatty-acid* OR pufa OR pufas OR mufa OR mufas OR safa OR
safas OR sfa OR sfas) NEAR/5 (intake* OR ingest* OR supplement* OR consum* OR
restrict* OR depriv* OR level OR concentration OR blood OR plasma OR serum OR
pattern*)) OR fasting OR ((well OR under) NEAR/1 nourish*) OR ((well OR under)
NEAR/1 nourish*))) AND ((((dna OR "long interspersed" OR gene OR genes) NEAR/5
(demethylat* OR methylat* OR hypermethylat* OR hypomethylat*)))) AND
((((observation* OR epidemiolog* OR famil* OR comparativ* OR communit*) NEAR/5
(stud* OR data OR research)) OR cohort* OR longitudinal* OR retrospectiv* OR
prospectiv* OR population* OR (national* NEAR/2 (stud* OR survey)) OR (health*
NEAR/2 survey*) OR ((case OR cases OR match*) NEAR/2 control*) OR (cross NEAR/1
section*) OR correlation* OR multicenter* OR multi-center* OR follow-up* OR
followup* OR clinical* OR trial OR random* OR review* OR meta-analy*)) NOT
((animal* OR rat OR rats OR mouse OR mice OR murine) NOT (human* OR patient*)))
AND DT=(article)
PubMed publisher 149
(Diet[mh] OR "Eating"[mh] OR "Recommended Dietary Allowances"[mh] OR "food
deprivation"[mh] OR vitamins/bl[mh] OR "Dietary Supplements"[mh] OR "Nutritional
Physiological Phenomena"[mh] OR "Diet Therapy"[mh] OR "Maternal Nutritional
Physiological Phenomena"[mh] OR "nutritional status"[mh] OR (diet OR nutrition OR
((dietar*[tiab] OR food*[tiab] OR beverage*[tiab] OR alcohol*[tiab] OR mineral*[tiab]
OR nutrient*[tiab] OR micronutrient*[tiab] OR macronutrient*[tiab] OR vitamin*[tiab]
OR calor*[tiab] OR energ*[tiab] OR protein*[tiab] OR fat OR folic-acid*[tiab] OR
folate*[tiab] OR vegetabl*[tiab] OR fruit*[tiab] OR cholin*[tiab] OR methionin*[tiab]
OR betain*[tiab] OR fatty-acid*[tiab] OR pufa OR pufas OR mufa OR mufas OR safa OR
safas OR sfa OR sfas) AND (intake*[tiab] OR ingest*[tiab] OR supplement*[tiab] OR
consum*[tiab] OR restrict*[tiab] OR depriv*[tiab] OR level OR concentration OR blood
OR plasma OR serum OR pattern*[tiab])) OR fasting OR well nourish*[tiab] OR under
nourish*[tiab])) AND ("DNA Methylation"[mh] OR (((dna OR "long interspersed" OR
gene OR genes) AND (demethylat*[tiab] OR methylat*[tiab] OR hypermethylat*[tiab]
OR hypomethylat*[tiab])))) NOT (animals[mh] NOT humans[mh]) AND ("observational
study"[mh] OR "Epidemiologic Studies"[mh] OR "health surveys"[mh] OR "multicenter
study"[mh] OR "clinical study"[mh] OR "Random Allocation"[mh] OR "review"[mh] OR
(((observation*[tiab] OR epidemiolog*[tiab] OR famil*[tiab] OR comparativ*[tiab] OR
communit*[tiab]) AND (stud*[tiab] OR data OR research)) OR cohort*[tiab] OR
longitudinal*[tiab] OR retrospectiv*[tiab] OR prospectiv*[tiab] OR population*[tiab]

CHAPTER 3: Nutrients and DNA methylation: a systematic review 121
OR (national*[tiab] AND (stud*[tiab] OR survey)) OR (health*[tiab] AND survey*[tiab])
OR ((case OR cases OR match*[tiab]) AND control*[tiab]) OR (cross section*[tiab]) OR
correlation*[tiab] OR multicenter*[tiab] OR multi-center*[tiab] OR follow-up*[tiab] OR
followup*[tiab] OR clinical*[tiab] OR trial OR random*[tiab] OR review*[tiab] OR meta-
analy*[tiab])) NOT (letter[pt] OR news[pt] OR comment[pt] OR editorial[pt] OR
congresses[pt] OR abstracts[pt]) AND publisher[sb]
Google scholar
diet|nutrition|dietary|nutrients|micronutrients|macronutrients|vitamins|"folic
acid"|folate|vegetables|fruit|choline
"dna demethylation|methylation|hypermethylation|hypomethylation"
Supplement 2: Detailed selection criteria
Inclusion criteria
1. Any study design
Including cross-sectional studies, case-control studies, cohort studies or intervention studies.
2. Studies investigating associations of dietary factors with DNA methylation.
Nutrients: Including nutrient blood levels; intake of nutrients; or dietary supplements.
DNA methylation: Including global DNA methylation, gene specific DNA methylation, or genome-wide DNA methylation.
3. Studies conducted at any age or life stage (e.g., during pregnancy, childhood, adulthood, etc.)
4. No language or date restriction
Exclusion criteria
1. Studies not carried out in humans 2. In vitro studies 3. Studies conducted in only patients with chronic diseases (cancer, diabetes, CHD, etc.). Note:
some studies have healthy control groups and report associations within these groups separately, these should be included.
4. Letters, reviews, opinions papers, guidelines, case-reports (n<5), editorials 5. Studies examining only the following exposures:
eating disorders;
alcohol dependency/alcoholism (but not actual alcohol intake);
weight loss (unless the weight-loss intervention is solely a restricted diet, not combined with other lifestyle changes).
Dietary patterns or food groups without examining individual nutrients

122 PART A: Introduction
Supplement 3: Quality score
Two independent reviewers evaluated the quality of included studies using the
following quality score. The score is composed of 5 items, and each item was allocated
0, 1 or 2 points. This allowed a total score between 0 and 10 points, 10 representing
the highest quality. The following items are included in the score:
1. Study design
o 0 for cross-sectional studies
o 1 for longitudinal studies (including repeated measurements)
o 2 for interventional studies
2. Population
o 0 if n<30
o 1 if n 30 to 100
o 2 if n>100
3. Exposure
o Observational studies
0 if the study used no appropriate standard diet or nutrient
concentration assessment method (see below) or if not
reported
1 if the study used food records, a 24h recall or an FFQ
2 if the study used blood levels
o Interventional studies
0 if the intervention diet was not described or not blinded
1 if the intervention diet was adequately single-blinded
2 if the intervention is adequately double-blinded
4. Outcome
o 0 Global DNA methylation
o 1 Gene-specific DNA methylation
o 2 Genome-wide DNA methylation
5. Adjustments
o 0 if findings are not controlled for potential confounders*
o 1 if findings are controlled for at least basic confounders: age and
sex, and multiple testing in case of an EWAS
o 2 if an intervention study is adequately randomized or if findings are
controlled for additional confounders (on top of those described
above), such as: technical covariates, WBC, BMI, smoking, alcohol,
etc.
* ‘Controlled for’ includes: adjustment for in the statistical analyses (e.g. with
multivariable regression); stratification in the analyses (e.g. men and women
separately); or restriction or narrow selection criteria of study participants on this
covariate.

CHAPTER 3: Nutrients and DNA methylation: a systematic review 123
REFERENCES 1. Richmond RC, Timpson NJ, Sorensen TI. Exploring possible epigenetic mediation of
early-life environmental exposures on adiposity and obesity development. Int J Epidemiol. 2015;44(4):1191-8.
2. Friso S, Udali S, De Santis D, Choi SW. One-carbon metabolism and epigenetics. Mol Aspects Med. 2017;54:28-36.
3. Milagro FI, Mansego ML, De Miguel C, Martínez JA. Dietary factors, epigenetic modifications and obesity outcomes: Progresses and perspectives. Mol Asp Med. 2013;34(4):782-812.
4. Anderson OS, Sant KE, Dolinoy DC. Nutrition and epigenetics: An interplay of dietary methyl donors, one-carbon metabolism and DNA methylation. J Nutr Biochem. 2012;23(8):853-9.
5. Liberati A, Altman DG, Tetzlaff J, Mulrow C, Gotzsche PC, Ioannidis JP, et al. The PRISMA statement for reporting systematic reviews and meta-analyses of studies that evaluate healthcare interventions: explanation and elaboration. Br Med J 2009;339:b2700.
6. Voortman T, Vitezova A, Bramer WM, Ars CL, Bautista PK, Buitrago-Lopez A, et al. Effects of protein intake on blood pressure, insulin sensitivity, and blood lipids in children: a systematic review. Br J Nutr. 2015;113(3):In press.
7. Perng W, Rozek LS, Mora-Plazas M, Duchin O, Marin C, Forero Y, et al. Micronutrient status and global DNA methylation in school-age children. Epigenetics. 2012;7(10):1133-41.
8. Piyathilake CJ, Macaluso M, Alvarez RD, Chen M, Badiga S, Siddiqui NR, et al. A higher degree of LINE-1 methylation in peripheral blood mononuclear cells, a one-carbon nutrient related epigenetic alteration, is associated with a lower risk of developing cervical intraepithelial neoplasia. Nutrition. 2011;27(5):513-9.
9. Bollati V, Favero C, Albetti B, Tarantini L, Moroni A, Byun HM, et al. Nutrients intake is associated with DNA methylation of candidate inflammatory genes in a population of obese subjects. Nutrients. 2014;6(10):4625-39.
10. Stidley CA, Picchi MA, Leng S, Willink R, Crowell RE, Flores KG, et al. Multivitamins, folate, and green vegetables protect against gene promoter methylation in the aerodigestive tract of smokers. Cancer Res. 2010;70(2):568-74.
11. Haggarty P, Hoad G, Campbell DM, Horgan GW, Piyathilake C, McNeill G. Folate in pregnancy and imprinted gene and repeat element methylation in the offspring. Am J Clin Nutr. 2013;97(1):94-9.
12. Boeke CE, Baccarelli A, Kleinman KP, Burris HH, Litonjua AA, Rifas-Shiman SL, et al. Gestational intake of methyl donors and global LINE-1 DNA methylation in maternal and cord blood: Prospective results from a folate-replete population. Epigenetics. 2012;7(3):253-60.
13. Fryer AA, Nafee TM, Ismail KM, Carroll WD, Emes RD, Farrell WE. LINE-1 DNA methylation is inversely correlated with cord plasma homocysteine in man: a preliminary study. Epigenetics. 2009;4(6):394-8.
14. McKay JA, Groom A, Potter C, Coneyworth LJ, Ford D. Genetic and non-genetic influences during pregnancy on infant global and site specific DNA methylation: role for folate gene variants and vitamin B 12: journals.plos.org; 2012.
15. Chang H, Zhang T, Zhang Z, Bao R, Fu C. Tissue-specific distribution of aberrant DNA methylation associated with maternal low-folate status in human neural tube defects. The Journal of nutritional …. 2011.
16. Park BH, Kim YJ, Park JS, Lee HY, Ha EH, Min JW, et al. Folate and homocysteine levels during pregnancy affect DNA methylation in human placenta. J Prev Med Pub Health. 2005;38(4):437-42.

124 PART A: Introduction
17. Ba Y, Yu H, Liu F, Geng X, Zhu C, Zhu Q, et al. Relationship of folate, vitamin B12 and methylation of insulin-like growth factor-II in maternal and cord blood. Eur J Clin Nutr. 2011;65(4):480-5.
18. Hoyo C, Daltveit AK, Iversen E, Benjamin-Neelon SE, Fuemmeler B, Schildkraut J, et al. Erythrocyte folate concentrations, CpG methylation at genomically imprinted domains, and birth weight in a multiethnic newborn cohort. Epigenetics. 2014;9(8):1120-30.
19. Steegers-Theunissen RP, Obermann-Borst SA. Periconceptional maternal folic acid use of 400 µg per day is related to increased methylation of the IGF2 gene in the very young child: journals.plos.org; 2009.
20. Hoyo C, Murtha AP, Schildkraut JM, Jirtle R, Demark-Wahnefried W, Forman MR, et al. Methylation variation at IGF2 differentially methylated regions and maternal folic acid use before and during pregnancy. Epigenetics. 2011;6(7):928-36.
21. Van Mil NH, Bouwl-Both MI, Stolk L, Verbiest MMPJ, Hofman A, Jaddoe VWV, et al. Determinants of maternal pregnancy one-carbon metabolism and newborn human DNA methylation profiles. Reproduction. 2014;148(6):581-92.
22. Azzi S, Sas TCJ, Koudou Y, Le Bouc Y, Souberbielle JC, Dargent-Molina P, et al. Degree of methylation of ZAC1 (PLAGL1) is associated with prenatal and post-natal growth in healthy infants of the EDEN mother child cohort. Epigenetics. 2014;9(3):338-45.
23. Amarasekera M, Martino D, Ashley S, Harb H, Kesper D, Strickland D, et al. Genome-wide DNA methylation profiling identifies a folate-sensitive region of differential methylation upstream of ZFP57-imprinting regulator in humans. FASEB J. 2014;28(9):4068-76.
24. Joubert BR, Den Dekker HT, Felix JF, Bohlin J, Ligthart S, Beckett E, et al. Maternal plasma folate impacts differential DNA methylation in an epigenome-wide meta-analysis of newborns. Nat Commun. 2016;7.
25. Gonseth S, Roy R, Houseman EA, de Smith AJ, Zhou M, Lee ST, et al. Periconceptional folate consumption is associated with neonatal DNA methylation modifications in neural crest regulatory and cancer development genes. Epigenetics. 2015;10(12):1166-76.
26. Mozhui K, Smith AK, Tylavsky FA. Ancestry Dependent DNA Methylation and Influence of Maternal Nutrition. PLoS ONE. 2015;10(3).
27. Ono H, Iwasaki M, Kuchiba A, Kasuga Y, Yokoyama S, Onuma H, et al. Association of dietary and genetic factors related to one-carbon metabolism with global methylation level of leukocyte DNA. Cancer Sci. 2012;103(12):2159-64.
28. Agodi A, Barchitta M, Quattrocchi A, Maugeri A, Canto C, Marchese AE, et al. Low fruit consumption and folate deficiency are associated with LINE-1 hypomethylation in women of a cancer-free population. Genes Nutr. 2015;10(5).
29. Huang WY, Su LJ, Hayes RB, Moore LE, Katki HA, Berndt SI, et al. Prospective study of genomic hypomethylation of leukocyte DNA and colorectal cancer risk. Cancer Epidemiol Biomarkers Prev. 2012;21(11):2014-21.
30. Zhang FF, Santella RM, Wolff M, Kappil MA, Markowitz SB, Morabia A. White blood cell global methylation and IL-6 promoter methylation in association with diet and lifestyle risk factors in a cancer-free population. Epigenetics. 2012;7(6):606-14.
31. Gomes MVM, Toffoli LV, Arruda DW, Soldera LM, Pelosi GG, Neves-Souza RD, et al. Age-Related Changes in the Global DNA Methylation Profile of Leukocytes Are Linked to Nutrition but Are Not Associated with the MTHFR C677T Genotype or to Functional Capacities. PLoS ONE. 2012;7(12).
32. Perng W, Villamor E, Shroff MR, Nettleton JA, Pilsner JR, Liu Y, et al. Dietary intake, plasma homocysteine, and repetitive element DNA methylation in the Multi-Ethnic Study of Atherosclerosis (MESA). Nutr Metab Cardiovasc Dis. 2014;24(6):614-22.

CHAPTER 3: Nutrients and DNA methylation: a systematic review 125
33. Protiva P, Mason JB, Liu Z, Hopkins ME, Nelson C, Marshall JR, et al. Altered folate availability modifies the molecular environment of the human colorectum: Implications for colorectal carcinogenesis. Cancer Prev Res. 2011;4(4):530-43.
34. Ulrich CM, Toriola AT, Koepl LM, Sandifer T, Poole EM, Duggan C, et al. Metabolic, hormonal and immunological associations with global DNA methylation among postmenopausal women. Epigenetics. 2012;7(9):1020-8.
35. Zhang FF, Morabia A, Carroll J, Gonzalez K, Fulda K, Kaur M, et al. Dietary patterns are associated with levels of global genomic DNA methylation in a cancer-free population. J Nutr. 2011;141(6):1165-71.
36. Badiga S, Johanning GL, Macaluso M, Azuero A, Chambers MM, Siddiqui NR, et al. A lower degree of PBMC L1 methylation in women with lower folate status may explain the MTHFR C677T polymorphism associated higher risk of CIN in the US post folic acid fortification era. PLoS ONE. 2014;9(10).
37. Bae S, Ulrich CM, Bailey LB, Malysheva O, Brown EC, Maneval DR, et al. Impact of folic acid fortification on global DNA methylation and one-carbon biomarkers in the Women's Health Initiative Observational Study cohort. Epigenetics. 2014;9(3):396-403.
38. Friso S, Choi SW, Girelli D, Mason JB. A common mutation in the 5, 10-methylenetetrahydrofolate reductase gene affects genomic DNA methylation through an interaction with folate status. Proceedings of the …. 2002.
39. Friso S, Girelli D, Trabetti E, Olivieri O, Guarini P, Pignatti PF, et al. The MTHFR 1298A>C polymorphism and genomic DNA methylation in human lymphocytes. Cancer Epidemiol Biomarkers Prev. 2005;14(4):938-43.
40. Pilsner JR, Liu X, Ahsan H, Ilievski V, Slavkovich V, Levy D, et al. Genomic methylation of peripheral blood leukocyte DNA: Influences of arsenic and folate in Bangladeshi adults. Am J Clin Nutr. 2007;86(4):1179-86.
41. Piyathilake CJ, Badiga S, Alvarez RD, Partridge EE, Johanning GL. A Lower Degree of PBMC L1 Methylation Is Associated with Excess Body Weight and Higher HOMA-IR in the Presence of Lower Concentrations of Plasma Folate. PLoS ONE. 2013;8(1).
42. Wang TC, Song YS, Wang H, Zhang J, Yu SF, Gu YE, et al. Oxidative DNA damage and global DNA hypomethylation are related to folate deficiency in chromate manufacturing workers. J Hazard Mater. 2012;213-214:440-6.
43. Fenech M, Aitken C, Rinaldi J. Folate, vitamin B12, homocysteine status and DNA damage in young Australian adults. Carcinogenesis. 1998;19(7):1163-71.
44. Gadgil MS, Joshi KS, Naik SS, Pandit AN, Otiv SR, Patwardhan BK. Association of homocysteine with global DNA methylation in vegetarian Indian pregnant women and neonatal birth anthropometrics. J Matern -Fetal Neonatal Med. 2014;27(17):1749-53.
45. Narayanan S, McConnell J, Little J, Sharp L, Piyathilake CJ, Powers H, et al. Associations between two common variants C677T and A1298C in the methylenetetrahydrofolate reductase gene and of measures of folate metabolism and DNA stability (strand breaks, misincorporated uracil, and DNA methylation status) in human lymphocytes in vivo. Cancer Epidemiol Biomarkers Prev. 2004;13(9):1436-43.
46. Axume J, Smith SS, Pogribny IP, Moriarty DJ, Caudill MA. The methylenetetrahydrofolate reductase 677TT genotype and folate intake interact to lower global leukocyte DNA methylation in young Mexican American women. Nutr Res. 2007;27(1):13-7.
47. Crider KS, Quinlivan EP, Berry RJ, Hao L, Li Z, Maneval D, et al. Genomic DNA methylation changes in response to folic acid supplementation in a population-based intervention study among women of reproductive age. PLoS ONE. 2011;6(12).
48. Jacob RA, Gretz DM, Taylor PC, James SJ. Moderate folate depletion increases plasma homocysteine and decreases lymphocyte DNA methylation in postmenopausal women. Journal of nutrition. 1998.

126 PART A: Introduction
49. Shelnutt KP, Kauwell GPA, Gregory JF. Methylenetetrahydrofolate reductase 677C→ T polymorphism affects DNA methylation in response to controlled folate intake in young women. The Journal of nutritional …. 2004.
50. Rampersaud GC, Kauwell GPA, Hutson AD, Cerda JJ, Bailey LB. Genomic DNA methylation decreases in response to moderate folate depletion in elderly women. Am J Clin Nutr. 2000;72(4):998-1003.
51. Hubner U, Geisel J, Kirsch SH, Kruse V, Bodis M, Klein C, et al. Effect of 1 year B and D vitamin supplementation on LINE-1 repetitive element methylation in older subjects. Clin Chem Lab Med. 2013;51(3):649-55.
52. Jung AY, Smulders Y, Verhoef P, Kok FJ, Blom H, Kok RM, et al. No effect of folic acid supplementation on global DNA methylation in men and women with moderately elevated homocysteine. PLoS ONE. 2011;6(9).
53. Basten GP, Duthie SJ, Pirie L, Vaughan N, Hill MH, Powers HJ. Sensitivity of markers of DNA stability and DNA repair activity to folate supplementation in healthy volunteers. Br J Cancer. 2006;94(12):1942-7.
54. Figueiredo JC, Grau MV, Wallace K, Levine AJ, Shen L, Hamdan R, et al. Global DNA hypomethylation (LINE-1) in the normal colon and lifestyle characteristics and dietary and genetic factors. Cancer Epidemiol Biomarkers Prev. 2009;18(4):1041-9.
55. Hanks J, Ayed I, Kukreja N, Rogers C, Harris J, Gheorghiu A, et al. The association between mthfr 677C>T genotype and folate status and genomic and gene-Specific dna methylation in the colon of individuals without colorectal neoplasia1-4. Am J Clin Nutr. 2013;98(6):1564-74.
56. Pufulete M, Al-Ghnaniem R, Rennie JA, Appleby P, Harris N, Gout S, et al. Influence of folate status on genomic DNA methylation in colonic mucosa of subjects without colorectal adenoma or cancer. Br J Cancer. 2005;92(5):838-42.
57. Tapp HS, Commane DM, Bradburn DM, Arasaradnam R, Mathers JC, Johnson IT, et al. Nutritional factors and gender influence age-related DNA methylation in the human rectal mucosa. Aging Cell. 2013;12(1):148-55.
58. Llanos AAM, Marian C, Brasky TM, Dumitrescu RG, Liu Z, Mason JB, et al. Associations between genetic variation in onecarbon metabolism and LINE-1 DNA methylation in histologically normal breast tissues. Epigenetics. 2015;10(8):727-35.
59. Aarabi M, San Gabrie MC, Chan D, Behan NA, Caron M, Pastinen T, et al. High-dose folic acid supplementation alters the human sperm methylome and is influenced by the MTHFR C677T polymorphism. Hum Mol Genet. 2015;24(22):6301-13.
60. Zhong J, Colicino E, Lin X, Mehta A, Kloog I, Zanobetti A, et al. Cardiac autonomic dysfunction: Particulate air pollution effects are modulated by epigenetic immunoregulation of Toll-like receptor 2 and dietary flavonoid intake. J Am Heart Assoc. 2015;4(1).
61. Dhillon VS, Shahid M, Husain SA. Associations of MTHFR DNMT3b 4977 bp deletion in mtDNA and GSTM1 deletion, and aberrant CpG island hypermethylation of GSTM1 in non-obstructive infertility in Indian men. Mol Hum Reprod. 2007;13(4):213-22.
62. Ottini L, Rizzolo P, Siniscalchi E, Zijno A, Silvestri V, Crebelli R, et al. Gene promoter methylation and DNA repair capacity in monozygotic twins with discordant smoking habits. Mutat Res Genet Toxicol Environ Mutagen. 2015;779:57-64.
63. Piyathilake CJ, Macaluso M, Chambers MM, Badiga S, Siddiqui NR, Bell WC, et al. Folate and vitamin B12 may play a critical role in lowering the HPV 16 methylation - Associated risk of developing higher grades of CIN. Cancer Prev Res. 2014;7(11):1128-37.
64. Llanos AA, Dumitrescu RG, Brasky TM, Liu Z, Mason JB, Marian C, et al. Relationships among folate, alcohol consumption, gene variants in one-carbon metabolism and

CHAPTER 3: Nutrients and DNA methylation: a systematic review 127
p16INK4a methylation and expression in healthy breast tissues. Carcinogenesis. 2015;36(1):60-7.
65. Al-Ghnaniem Abbadi R, Emery P, Pufulete M. Short-Term Folate Supplementation in Physiological Doses Has No Effect on ESR1 and MLH1 Methylation in Colonic Mucosa of Individuals with Adenoma. J Nutrigenet Nutrigenomics. 2013;5(6):327-38.
66. Song MA, Brasky TM, Marian C, Weng DY, Taslim C, Llanos AA, et al. Genetic variation in one-carbon metabolism in relation to genome-wide DNA methylation in breast tissue from healthy women. Carcinogenesis. 2016;37(5):471-80.
67. Marques-Rocha JL, Milagro FI, Mansego ML, Mourão DM, Martínez JA, Bressan J. LINE-1 methylation is positively associated with healthier lifestyle but inversely related to body fat mass in healthy young individuals. Epigenetics. 2016;11(1):49-60.
68. Quinlivan EP, Crider KS, Zhu JH, Maneval DR, Hao L, Li Z, et al. Hypomethylation of Serum Blood Clot DNA, but Not Plasma EDTA-Blood Cell Pellet DNA, from Vitamin B12-Deficient Subjects. PLoS ONE. 2013;8(6).
69. Irvin MR, Zhi D, Aslibekyan S, Claas SA, Absher DM, Ordovas JM, et al. Genomics of post-prandial lipidomic phenotypes in the Genetics of Lipid Lowering Drugs and Diet Network (GOLDN) study. PLoS ONE. 2014;9(6).
70. Al-Ghnaniem R, Peters J, Foresti R, Heaton N, Pufulete M. Methylation of estrogen receptor α and mutL homolog 1 in normal colonic mucosa: Association with folate and vitamin B-12 status in subjects with and without colorectal neoplasia. Am J Clin Nutr. 2007;86(4):1064-72.
71. de la Iglesia R, Mansego ML, Sánchez-Muniz FJ, Angeles Zulet M, Alfredo Martinez J. Arylesterase activity is associated with antioxidant intake and Paraoxonase-1 (PON1) gene methylation in metabolic syndrome patients following an energy restricted diet. EXCLI J. 2014;13:416-26.
72. Harvey NC, Sheppard A, Godfrey KM, McLean C, Garratt E, Ntani G, et al. Childhood bone mineral content is associated with methylation status of the RXRA promoter at birth. J Bone Miner Res. 2014;29(3):600-7.
73. Novakovic B, Galati JC, Chen A, Morley R, Craig JM, Saffery R. Maternal vitamin D predominates over genetic factors in determining neonatal circulating vitamin D concentrations. Am J Clin Nutr. 2012;96(1):188-95.
74. Zhu H, Bhagatwala J, Huang Y, Pollock NK, Parikh S, Raed A, et al. Race/ethnicity-specific association of Vitamin D and global DNA methylation: Cross-sectional and interventional findings. PLoS ONE. 2016;11(4).
75. Zhu H, Wang X, Shi H, Su S, Harshfield GA, Gutin B, et al. A genome-wide methylation study of severe vitamin d deficiency in African American adolescents. J Pediatr. 2013;162(5):1004-9.e1.
76. Nair-Shalliker V, Dhillon V, Clements M, Armstrong BK, Fenech M. The association between personal sun exposure, serum vitamin D and global methylation in human lymphocytes in a population of healthy adults in South Australia. Mutat Res Fundam Mol Mech Mutagen. 2014;765:6-10.
77. Ashktorab H, Nguza B, Fatemi M, Nouraie M, Smoot DT, Schäffer AA, et al. Case-control study of vitamin D, dickkopf homolog 1 (DKK1) gene methylation, VDR gene polymorphism and the risk of colon adenoma in African Americans. PLoS ONE. 2011;6(10).
78. Jiang X, Yan J, West AA, Perry CA, Malysheva OV, Devapatla S, et al. Maternal choline intake alters the epigenetic state of fetal cortisol-regulating genes in humans. FASEB J. 2012;26(8):3563-74.
79. Shin W, Yan J, Abratte CM, Vermeylen F, Caudill MA. Choline intake exceeding current dietary recommendations preserves markers of cellular methylation in a genetic subgroup of folate-compromised men. J Nutr. 2010;140(5):975-80.

128 PART A: Introduction
80. McClelland R, Christensen K, Mohammed S, McGuinness D, Cooney J, Bakshi A, et al. Accelerated ageing and renal dysfunction links lower socioeconomic status and dietary phosphate intake. Aging (Albany NY). 2016.
81. Shimazu T, Asada K, Charvat H, Kusano C, Otake Y, Kakugawa Y, et al. Association of gastric cancer risk factors with DNA methylation levels in gastric mucosa of healthy Japanese: a cross-sectional study. Carcinogenesis. 2015;36(11):1291-8.
82. Khulan B, Cooper WN, Skinner BM, Bauer J, Owens S, Prentice AM, et al. Periconceptional maternal micronutrient supplementation is associated with widespread gender related changes in the epigenome: A study of a unique resource in the Gambia. Hum Mol Genet. 2012;21(9):2086-101.
83. Pusceddu I, Herrmann M, Kirsch SH, Werner C, Hübner U, Bodis M, et al. Prospective study of telomere length and LINE-1 methylation in peripheral blood cells: the role of B vitamins supplementation. Eur J Nutr. 2015.
84. Zhou Y, Zhao LJ, Xu X, Ye A, Travers-Gustafson D, Zhou B, et al. DNA methylation levels of CYP2R1 and CYP24A1 predict vitamin D response variation. J Steroid Biochem Mol Biol. 2014;144(PART A):207-14.
85. Kok DEG, Dhonukshe-Rutten RAM, Lute C, Heil SG, Uitterlinden AG, van der Velde N, et al. The effects of long-term daily folic acid and vitamin B-12 supplementation on genome-wide DNA methylation in elderly subjects. Clinical Epigenetics. 2015;7.
86. Rerkasem K, Rattanatanyong P, Rerkasem A, Wongthanee A, Rungruengthanakit K, Mangklabruks A, et al. Higher Alu methylation levels in catch-up growth in twenty-year-old offsprings. PLoS ONE. 2015;10(3).
87. Godfrey KM, Sheppard A, Gluckman PD, Lillycrop KA, Burdge GC, McLean C, et al. Epigenetic gene promoter methylation at birth is associated with child's later adiposity. Diabetes. 2011;60(5):1528-34.
88. Lee HS, Barraza-Villarreal A, Hernandez-Vargas H, Sly PD, Biessy C, Ramakrishnan U, et al. Modulation of DNA methylation states and infant immune system by dietary supplementation with v-3 PUFA during pregnancy in an intervention study. Am J Clin Nutr. 2013;98(2):480-7.
89. Amarasekera M, Noakes P, Strickland D, Saffery R, Martino DJ, Prescott SL. Epigenome-wide analysis of neonatal CD4+ T-cell DNA methylation sites potentially affected by maternal fish oil supplementation. Epigenetics. 2014;9(12):1570-6.
90. Voisin S, Almén MS, Moschonis G, Chrousos GP, Manios Y, Schiöth HB. Dietary fat quality impacts genome-wide DNA methylation patterns in a cross-sectional study of Greek preadolescents. Eur J Hum Genet. 2015;23(5):654-62.
91. Lind MV, Martino D, Harsløf LBS, Kyjovska ZO, Kristensen M, Lauritzen L. Genome-wide identification of mononuclear cell DNA methylation sites potentially affected by fish oil supplementation in young infants: A pilot study. Prostaglandins Leukotrienes Essent Fatty Acids. 2015;101:1-7.
92. Gómez-Uriz AM, Goyenechea E, Campión J, De Arce A, Martinez MT, Puchau B, et al. Epigenetic patterns of two gene promoters (TNF-α and PON) in stroke considering obesity condition and dietary intake. J Physiol Biochem. 2014;70(2):603-14.
93. Brøns C, Jacobsen S, Nilsson E, Rönn T, Jensen CB, Storgaard H, et al. Deoxyribonucleic acid methylation and gene expression of PPARGC1A in human muscle is influenced by high-fat overfeeding in a birth-weight-dependent manner. J Clin Endocrinol Metab. 2010;95(6):3048-56.
94. Gillberg L, Jacobsen SC, Rönn T, Brøns C, Vaag A. PPARGC1A DNA methylation in subcutaneous adipose tissue in low birth weight subjects - Impact of 5 days of high-fat overfeeding. Metab Clin Exp. 2014;63(2):263-71.

CHAPTER 3: Nutrients and DNA methylation: a systematic review 129
95. Gillberg L, Perfilyev A, Brøns C, Thomasen M, Grunnet LG, Volkov P, et al. Adipose tissue transcriptomics and epigenomics in low birthweight men and controls: role of high-fat overfeeding. Diabetologia. 2016;59(4):799-812.
96. Jacobsen SC, Gillberg L, Bork-Jensen J, Ribel-Madsen R, Lara E, Calvanese V, et al. Young men with low birthweight exhibit decreased plasticity of genome-wide muscle DNA methylation by high-fat overfeeding. Diabetologia. 2014;57(6):1154-8.
97. Hermsdorff HH, Mansego ML, Campión J, Milagro FI, Zulet MA, Martínez JA. TNF-alpha promoter methylation in peripheral white blood cells: Relationship with circulating TNFα, truncal fat and n-6 PUFA intake in young women. Cytokine. 2013;64(1):265-71.
98. Milagro FI, Gómez-Abellán P, Campión J, Martínez JA, Ordovás JM, Garaulet M. CLOCK, PER2 and BMAL1 DNA methylation: Association with obesity and metabolic syndrome characteristics and monounsaturated fat intake. Chronobiol Int. 2012;29(9):1180-94.
99. Ma Y, Smith CE, Lai CQ, Irvin MR, Parnell LD, Lee YC, et al. The effects of omega-3 polyunsaturated fatty acids and genetic variants on methylation levels of the interleukin-6 gene promoter. Mol Nutr Food Res. 2016;60(2):410-9.
100. Ma Y, Follis JL, Smith CE, Tanaka T, Manichaikul AW, Chu AY, et al. Interaction of methylation-related genetic variants with circulating fatty acids on plasma lipids: A meta-analysis of 7 studies and methylation analysis of 3 studies in the Cohorts for Heart and Aging Research in Genomic Epidemiology consortium. Am J Clin Nutr. 2016;103(2):567-78.
101. Samblas M, Milagro FI, Gomez-Abellan P, Martinez JA, Garaulet M. Methylation on the Circadian Gene BMAL1 Is Associated with the Effects of a Weight Loss Intervention on Serum Lipid Levels. J Biol Rhythms. 2016.
102. Peters MJ, Joehanes R, Pilling LC, Schurmann C, Conneely KN, Powell J, et al. The transcriptional landscape of age in human peripheral blood. Nat Commun. 2015;6:8570.
103. Lee HS, Barraza-Villarreal A, Biessy C, Duarte-Salles T, Sly PD, Ramakrishnan U, et al. Dietary supplementation with polyunsaturated fatty acid during pregnancy modulates DNA methylation at IGF2/H19 imprinted genes and growth of infants. Physiol Genomics. 2014;46(23):851-7.
104. Piyathilake CJ, Robinson CB, Cornwell P. A practical approach to red blood cell folate analysis. Anal Chem Insights. 2007;2:107-10.
105. De Bruyn E, Gulbis B, Cotton F. Serum and red blood cell folate testing for folate deficiency: new features? Eur J Haematol. 2014;92(4):354-9.


PART B
Homocysteine and
DNA methylation


CHAPTER 4
Homocysteine levels associate with subtle changes
in leukocyte DNA methylation: an
epigenome-wide analysis
Pooja R. Mandaviya*, Dylan Aïssi*, Koen F. Dekkers*, Roby Joehanes*, Silva Kasela*,
Vinh Truong*, Lisette Stolk, Diana van Heemst, M. Arfan Ikram, Jan Lindemans, P. Eline
Slagboom, David-Alexandre Trégouët, André G. Uitterlinden, Chen Wei, Phil Wells,
BIOS consortium, France Gagnon**, Marleen MJ van Greevenbroek**, Bastiaan T.
Heijmans**, Lili Milani**, Pierre-Emmanuel Morange**,
Joyce B.J. van Meurs**, Sandra G. Heil**
*These authors contributed equally as first authors
**These authors contributed equally as senior authors
Epigenomics. 2017 Nov;9(11):1403-1422

134 PART B: Homocysteine and DNA methylation
ABSTRACT
Aim: Homocysteine is a sensitive marker of one-carbon metabolism. Higher
homocysteine levels have been associated with global DNA hypomethylation. We
investigated the association between plasma homocysteine and epigenome-wide DNA
methylation in leukocytes.
Methods: Methylation was measured using Illumina 450k arrays in 2,035 individuals
from 6 cohorts. Homocysteine-associated differentially methylated positions (DMPs)
and regions (DMRs) were identified using meta-analysis.
Results: Three DMPs cg21607669 (SLC27A1), cg26382848 (AJUBA) and cg10701000
(KCNMA1) at chromosome 19, 14 and 10, respectively, were significantly associated
with homocysteine. In addition, we identified 68 homocysteine-associated DMRs, the
most significant of which was a 1.8 kb spanning domain (TNXB/ATF6B) at chromosome
6.
Conclusion: We identified novel epigenetic loci associated with homocysteine levels, of
which the specific role needs to be further validated.
SUMMARY POINTS
1) Plasma homocysteine is significantly associated with a modest number of
differentially methylated positions (DMPs) in leukocyte DNA.
2) 68 DMRs related to 114 genes were significantly associated with plasma
homocysteine. These genes were involved in folate biosynthesis,
glycosaminoglycan biosynthesis, arachidonic acid metabolism and
glycerophospholipid metabolism.

CHAPTER 4: Homocysteine levels and DNA methylation 135
INTRODUCTION
Homocysteine (Hcy), an intermediate of the one-carbon metabolism, is an independent
risk factor of diseases like osteoporotic fractures [1] and cardiovascular disorders [2]. In
addition, Hcy is often used as sensitive marker of folate- and vitamin B12 deficiency.
Recent intervention trials were not able to show that lowering of plasma Hcy by B-
vitamin intervention led to a reduction in disease risk such as myocardial infarction [3-
5] and osteoporotic fractures [6]. Identification of the underlying pathophysiological
mechanism of Hcy is warranted to understand its role as biomarker of several disease
states.
Hcy is formed by a demethylation reaction from methionine. In the
methionine cycle, s-adenosylmethionine (SAM) donates its methyl group to the DNA
resulting in s-adenosylhomocysteine (SAH) as a by-product and a potent inhibitor of
this methyltransferase reaction. SAH is hydrolyzed to Hcy in a reversible manner.
Elevated Hcy in a condition known as hyperhomocysteinemia (HHcy) is associated to
and increased SAH level, which is linked to alterations in DNA methylation [7-9]. This is
one of the possible mechanisms in Hcy-related pathologies and the rational to study
the effect of Hcy on genome-wide DNA methylation.
Hcy is a sensitive marker of one-carbon metabolism and will increase when
remethylation or transsulfuration is impaired. Shortage of folate, vitamin B12 or
vitamin B6 result in elevated Hcy levels. Although folate levels are important, we
believe it is not necessary to correct for folate in our analysis as Hcy is strongly
correlated to folate and belongs to the same pathway. This would have cancelled out
the effect of Hcy itself on DNA methylation. The general hypothesis of this study was
that Hcy is associated with changes in DNA methylation irrespective of the cause.
Normal circulating Hcy levels ranges from 8 to 10 µmol/L for women and 10
to 12 µmol/L for men [10]. Mild or moderate HHcy is referred to Hcy concentrations
between 15-30 µmol/L, whereas intermediate and severe HHcy is referred to Hcy
concentrations between 30-100 µmol/L and >100 µmol/L, respectively [10-12]. HHcy
has been shown to be associated with both global- and gene-specific DNA
hypomethylation, which was recently reviewed by us [13].. In candidate gene studies of
animal models, genes whose methylation have shown association with Hcy are the
hypomethylation of imprinted genes (e.g. IGF2/H19 locus) [14, 15], cardiac Trp53 [16],
leukocytic mTERT promoter [17], brain Nr3c1 exon region [18], brain Ppp2r1a [19] and
liver 5’ portion of Soat2 [20], and hypermethylation of the aortic Nr3c1 promoter [21]
and liver Fads2 promoter [22]. In human studies, HHcy has been shown to be
associated with altered methylation of the RFC1 gene [23]. For patients with vascular
disorders, HHcy has shown association with hypomethylation of the leukocytic hTERT
promoter [17], leukocytic SHC1 promoter [24], punch aortic NOS2 proximal promoter
[25], and hypermethylation of the blood ESR1 promoter [26] and internal mammary
artery NOS2 proximal promoter [25]. For patients with colorectal, esophageal and

136 PART B: Homocysteine and DNA methylation
breast cancer, HHcy has shown association with hypermethylation of ESR1 promoter
[27] and exon 1 [28], MLH1 promoter [29], RARB promoter exon [28], BRCA1 and
RASSF1 promoter [30].
In animal models, HHcy was also shown to associate with global
hypomethylation [18, 31-33]. Human studies included mostly small-scale studies in
renal or vascular patients with HHcy in which global DNA hypomethylation was
observed [10, 34, 35]. Most studies showed significant associations of Hcy with DNA
methylation, however, also null associations have been found [36, 37]. Hence, the
association between Hcy and DNA methylation is complex, contradictory and remains
to be fully understood. Mild HHcy can occur due to either genetic or environmental
factors such as low intake of B vitamins. Regardless of the cause, Hcy itself is thought
to be the most prominent key player in altering DNA methylation patterns and
associated disease risks.
In the current manuscript, we explored the association of Hcy in relation to
genome-wide CpG site level in leukocytes to assess its role in DNA methylation. In this
study, we performed a meta-analysis in 2,035 individuals of 6 individual cohorts using
the high-resolution Infinium Illumina 450k BeadChip arrays.
MATERIALS AND METHODS
Cohorts
Six cohorts participated in the analysis, Rotterdam study [38] (RS, n=700), Leiden
Longevity Study [39] (LLS, n=550), Cohort on Diabetes and Atherosclerosis Maastricht
[40] (CODAM, n=186), MARseille THrombosis Association study [41] (MARTHA, n=293),
Estonian Biobank [42] (EGCUT, n=96), and French-Canadian family study on Factor V
Leiden (F5L) thrombophilia [41] (F5L, n=210). This added up to a total sample size of
2,035 for the meta-analysis. The ethics review committees approved each study at
their relevant organizations. Characteristics of each study are provided in Table 1 and
Text S1.

/I!t¢9w пΥ IƻƳƻŎȅǎǘŜƛƴŜ ƭŜǾŜƭǎ ŀƴŘ 5b! ƳŜǘƘȅƭŀǘƛƻƴ 137
Ta
ble
1: C
har
acte
rist
ics
of
coh
ort
s in
clu
ded
in t
he
Hcy
met
a-an
alys
is.
Co
ho
rt
(Co
un
try)
N
Ty
pe
(P
ath
op
hys
iolo
gy)
Wo
men
(%
)
Hcy
‡
[Med
ian
(R
ange
)]
HH
cy
(%)
Met
ho
d
Tota
l P
reci
sio
n
[C.V
.%]
Tim
e
bet
wee
n
blo
od
co
llect
ing
&
fre
ezin
g
Age
[M
ean
±SD
] G
ran
[M
ean
±SD
] Ly
m
[Mea
n±S
D]
Mo
no
[M
ean
±SD
]
RS
(NL)
7
00
P
rosp
ecti
ve,
Po
pu
lati
on
-bas
ed
A
54.7
11
.5
(5.9
-35.
4)
19.4
LC
-MS/
MS
5.5
A
SAP
59.8
±8
.0
4.2±
1.5
2
.4±0
.7
0.4
±0.4
LLS
(NL)
5
50
P
rosp
ecti
ve,
Fam
ily-b
ased
A
51.8
12
.2
(5.3
-31.
6)*
18
.2
Co
mp
eti
tive
Im
mu
no
assa
y N
A
ASA
P 58
.7±
6.6
4.
4±1
.3
2.0
±0.6
0
.4±0
.1
CO
DA
M
(NL)
1
86
P
rosp
ecti
ve,
Ob
serv
atio
nal
B
54.8
10
.5
(5.6
-29.
9)
11.3
LC
-MS/
MS
<4.0
<2
hrs
65
.3±
7.0
0.
3±0
.1
0.1±
0.1
W
0.3±
0.1
X
0.2±
0.1
Y
0.1±
0.0
Z
0.1
±0.1
MA
RTH
A
(FR
) 2
93
R
etro
spec
tive
C
80.3
10
.3
(3.4
-33.
8)
10.2
C
om
pe
titi
ve
Imm
un
oas
say
5.0
<2
hrs
43
.5±
14.
3
4.4±
1.6
1
.9±0
.6
0.3
±0.1
EGC
UT
(EE)
96
P
op
ula
tio
n-b
ase
dA
50.0
13
.3
(6.3
-34.
0)*
32
.3
LC w
ith
P
ho
tom
etr
ic
det
ecti
on
N
A
No
fr
eezi
ng
52.4
±2
3.7
3.
8±1
.3
2.0
±0.7
0
.5±0
.2
F5L
(CA
) 2
10
P
edig
ree
-bas
edA
,D
52.4
8.
3
(3.7
-28.
2)
3.3
Fl
uo
resc
ence
P
ola
riza
tio
n
Imm
un
oas
say
5.2
1-
3 h
rs
39.8
±1
6.8
0.
6±0
.1
0.0±
0.0
W
0.2±
0.1
X
0.1±
0.1
Y 0.
1±0
.0Z
0.1
±0.0
*No
n-f
asti
ng;
‡H
cy c
on
cen
trat
ion
s in
µm
ol/
L; N
A=N
ot
Ava
ilab
le, A
SAP
(A
s so
on
as
po
ssib
le),
HH
cy=H
cy c
on
cen
trat
ion
s >1
5 µ
mo
l/L
Gra
n, L
ym, M
on
o (
Mea
sure
d c
ell c
ou
nts
in 1
09 /L
), W
CD
8T,
X C
D4
T, Y N
K, Z B
cell
(Ho
use
man
est
imat
ed p
erc
enta
ge c
ell c
ou
nts
)
Pat
ho
ph
ysio
logy
: AM
ain
ly h
ealt
hy,
BM
ildly
incr
ease
d D
M2
/CV
D r
isk
fact
ors
, CP
atie
nts
wit
h V
eno
us
Thro
mb
oem
bo
lism
, DP
rob
and
s w
ith
VTE

138 PART B: Homocysteine and DNA methylation
Homocysteine measurements
Total Hcy was measured in EDTA plasma. Measurements in non-fasting state were
performed in the LLS and EGCUT study, while rest of the studies measured Hcy in
fasting state. Details of each method is depicted in Table 1. Since the absolute values of
Hcy in all studies were skewed to the right, logarithmic transformation of base 10 was
used to achieve normal distribution. For a sample to be considered as an outlier, an
outlier detection strategy [43] was used with four parameters of the Hcy log10
transformed data: quartile 1 (Q1), quartile 3 (Q3), interquartile range (IQR) and a
multiplying factor (M). The lower end outliers (LO) were detected by the formula,
LO=Q1–(M*IQR), and upper end outliers (UO) were detected using UO=Q3+(M*IQR).
Any value less than or equal to LO and greater than or equal to UO was considered as
an extreme outlier, using the multiplying factor 3. A logarithmic transformation of base
10 and removal of outliers showed a clear improvement towards normal distribution
[Figure S1].
DNA methylation assessment
Genomic DNA was extracted from whole blood and was bisulfite converted. Infinium
Illumina HumanMethylation 450k BeadChip arrays (Illumina Inc., San Diego, USA) were
used to perform DNA methylation profiling according to the manufacturers’ protocol.
This assay covers methylation status of a wide range of CpGs at more than 450,000
sites at regions of CpG islands, shores and shelves. The sites annotate to various gene
regions like promoters, enhancers, gene bodies, exons and UTRs [44]. Standard beta
values were considered for the methylation analysis in all studies. These contain values
ranging from 0 to 1, representing the percentage of methylation. Beta values are
calculated from the methylated (M) and unmethylated (U) probe intensities using the
formula of β=M/(M+U+α), with the default alpha (α) of 100. These values were
normalized using methods, such as DASEN [45] or SWAN [46]. Details of DNA
methylation assessment, pre-processing methods, and sample and probe quality
control used by each cohort are provided in Text S1 and Table S1.
Differentially Methylated Positions (DMPs)
Statistical analysis to identify DMPs was performed using R programming scripts, which
were send around to each cohort and run by each cohort separately with log10
transformed Hcy as the exposure variable and DNA methylation as an outcome. This
association analysis was performed using linear mixed models of the lme4 package in
R. The association model was adjusted for technical covariates and biological
covariates like age, sex and differential white blood cell (WBC) counts. Array number
and position on array were used as technical covariates, and were treated as random
effects. For cohorts that did not contain measured WBC counts, the counts were

CHAPTER 4: Homocysteine levels and DNA methylation 139
inferred using the Houseman method as implemented in the minfi package [47] [Table
1].
Association analyses provided summary statistics from each study. A fixed
effect meta-analysis was performed in 2,035 individuals of 6 cohorts using the classical
approach of the METAL software [48] that combines effect size estimates and standard
errors of each study summary statistics. Probes with SNPs at single base extension site
were removed to avoid confounding and spurious signals. Probes with improper
binding were also removed to avoid co-hybridization with alternate homologous
sequences [49]. In addition, we removed probes that were present in less than 4
studies since each cohort had different probe exclusions. This resulted in 468,108
probes remaining. Benjamini-Hochberg (BH) method was used to define statistical
significance for a false discovery rate (FDR) less than 0.05. The genomic inflation factor
(λ) was calculated [50] and cohort heterogeneity was considered by taking into account
the heterogeneity I2 parameter [48]. CpGs for nearby genes were annotated using the
Genomic Regions Enrichment of Annotations Tool (GREAT) [51]. This assigns extension
up to 5 kb upstream and 1 kb downstream to a basal regulatory region from its
transcription start site and a maximum up to 1 Mb extension distance, as defined by
UCSC [52].
IGF2/H19 locus
We also looked up for the three DMRs of IGF2/H19 locus at chromosome 11, which
were previously related with Hcy [14, 15]. The seven 450k array CpGs underlying the
three DMRs of this locus were identified using literature [36, 53, 54]. Multiple testing
using the Bonferroni method was applied on these 7 CpGs to test for their significance
with Hcy.
Enrichment of previously found folate-associated CpGs
Because Hcy is associated with folate, we additionally focused our analysis on the
previously found 443 CpGs in cord blood of newborns associated with maternal plasma
folate during pregnancy [55]. In order to check for their significant enrichment, we
compared their p-values with the p-values of randomly selected 443 CpGs from the
array, using the Fisher’s exact test.
Differentially Methylated Regions (DMRs)
DMRs were identified using the python library of the comb-p software [56]. Absolute p-
values from the meta-analysis of DMP analysis were given as input to combine them
[57] adjacently at varying distance lags of 50 base pairs (bp) in a sliding-window of 500
bp, in order to calculate auto-correlation between them. As weighted according to this
auto-correlation, each p-value is adjusted according to its adjacent p-values. An FDR
correction using the BH method is then calculated on these adjusted p-values. A peak-
finding algorithm then finds enrichment regions on these FDR corrected adjusted p-

140 PART B: Homocysteine and DNA methylation
values, and using Stouffer-Liptak correction as implemented in comb-p [56, 58, 59], it
then assigns new p-values to the identified regions using the original absolute p-values
from the meta-analysis. Finally, these assigned new p-values of the of the identified
regions are multiple tested using the Sidak correction [60], where the defined
statistical significance for the identified regions was Sidak corrected P less than 0.05.
The number of tests for a region in the Sidak correction is the total bases covered by
input probes divided by the region size [56].
Differentially Methylated Regions (DMRs): Pathway Analysis
For the pathway analysis, we annotated the regions for genes using the tool GREAT
[51]. We used WEB-based GEne SeT AnaLysis Toolkit (WebGestalt) [61] online resource
for pathway analysis. KEGG database were used for enrichment. BH method in
WebGestalt was used to define statistical significance for an FDR less than 0.05.
RESULTS
Cohort characteristics
Meta-analysis comprised of 6 cohorts with a total of 2,035 individuals. All individuals
were of European ancestry. The study design was mainly population based, but also
included cohorts with increased risk of diabetes, cardiovascular disorders and venous
thromboembolism. Study characteristics for all the participating cohorts are given in
Table 1.
Differentially Methylated Positions (DMPs)
Meta-analysis on 468,108 CpGs was done on the summary statistic of the 6 cohorts
[Figure S2] comprising of 2,035 individuals. The p-values of this analysis showed a
genomic inflation factor of 1.2 [Figure S3]. Three DMPs [Table 2A, Figure 1] were
significantly associated with Hcy (FDR less than 0.05). All 3 DMPs showed 1% increase
in methylation with each unit increase in the 10 logarithmic Hcy value. The DMP
cg21607669 located near the gene SLC27A1 at chromosome 19 had the lowest p-value
of 7.71E-08 (FDR=0.04). The 2 other DMPs were cg26382848 (nearest gene AJUBA)
located at chromosome 14 with p-value 1.67E-07 (FDR=0.04) and cg10701000 (nearest
gene KCNMA1) located at chromosome 10 with p-value 2.38E-07 (FDR=0.04). These 3
DMPs showed no substantial cohort heterogeneity I2 (I2 less than 35). The direction of
effects were mostly similar between all studies [Figure 2A, 2B & 2C].
IGF2/H19 locus
We did a lookup for CpGs at the 3 DMRs of the IGF2/H19 gene (DMR0, DMR2, H19-
DMR3), that have been previously studied in humans [36, 53, 54]. Data from our 450k
arrays contained 7 CpGs at these DMRs: 2 at DMR0, 4 at DMR2 and 1 at H19-DMR3.

CHAPTER 4: Homocysteine levels and DNA methylation 141
However, none of the 7 CpGs showed an association with Hcy with a Bonferroni cut off
of 7.14E-03 [Table 2B, Figure S5].
Enrichment of previously found folate-associated CpGs
For the previously found 443 CpGs in cord blood of newborns associated with maternal
plasma folate during pregnancy [55], we compared their nominal p-values with 443
randomly selected CpGs in the array using 100 permutations. Based on our significant
threshold (P less than 0.05), 20 of the 443 folate-related CpGs met the threshold as
compared to the 32 of the 443 randomly selected CpGs in the array. Using the fisher’s
exact test, we found no significant enrichment (p-value=0.97) in the folate-related
CpGs.
Differentially Methylated Regions (DMRs)
We identified 68 DMRs significant at Sidak P less than 0.05 [Table 3, Figure 3, Figure
S4]. The most significant was the DMR at chromosome 6 (spanning a region of 1,8 Kb)
with a p-value of 4.34E-24 (Sidak P = 1.12E-21) containing 55 CpGs. CpGs within this
region were annotated to gene TNXB and ATF6B. Pathway analysis on the 114 genes
annotated to the 68 DMRs showed 14 significant pathways [Table 4]. Top 5 pathways
were metabolic pathways, folate biosynthesis, glycosaminoglycan biosynthesis –
heparan sulfate, phagosome and MAPK signaling pathway. Furthermore, results of the
GO enrichment analysis showed many biological processes related to embryogenesis
and development [Table 5].

142 PART B: Homocysteine and DNA methylation
Figure 1. Manhattan plot showing the association between homocysteine and genome-wide
DNA methylation in 2,035 samples, with 3 significant DMPs at chromosomes 10, 14 and 19,
at FDR less than 0.05 (red line). Nearest genes for these 3 DMPs are reported.
Figure 3. Manhattan plot showing the association between homocysteine and genome-wide
DNA methylation in 2,035 samples, with 68 significant DMRs, at FDR less than 0.05 (red line)
of autocorrelation adjusted p-values in comb-p. Nearest genes for the top 5 DMRs are
reported.
Chromosome
Chromosome
-lo
g 10(p
) -l
og 1
0(p
)

CHAPTER 4: Homocysteine levels and DNA methylation 143
Figure 2A. Forest plot showing the association between homocysteine and the first
significant DMP cg21607669 across the 6 cohorts.
Effect size
Effect size
Stan
dar
d e
rro
r

144 PART B: Homocysteine and DNA methylation
Figure 2B. Forest plot showing the association between homocysteine and the second
significant DMP cg26382848 across the 6 cohorts.
Effect size
Effect size
Stan
dar
d e
rro
r

CHAPTER 4: Homocysteine levels and DNA methylation 145
Figure 2C. Forest plot showing the association between homocysteine and the third
significant DMP cg10701000 across the 3 cohorts.
Effect size
Effect size
Stan
dar
d e
rro
r

146 PART B: Homocysteine and DNA methylation
Tab
le 2
A. H
om
ocy
stei
ne-
asso
ciat
ed D
MP
s
Ran
k C
pG
N
Ef
fect
St
dEr
r P
valu
e
FDR
H
etIS
q
Nea
rby
Ge
ne
(±b
p)
Ch
r B
p
Loca
tio
n
1
cg21
607
669
2,
035
0
.01
0.
001
7.
71E-
08
0.
036
0
SL
C2
7A1
(+4
0)
19
1
75
81
29
2
Pro
mo
ter
2
cg26
382
848
2,
035
0
.01
0.
001
1.
67E-
07
0.
037
31
.1
AJU
BA
(-3
9)
14
2
34
51
88
9
Pro
mo
ter
3
cg10
701
000
1,
346
0
.01
0.
003
2.
38E-
07
0.
037
0
K
CN
MA
1 (
-14
3,62
6), D
LG5
(+
145
,25
8)
10
7
95
41
02
5
-
Effe
ct: B
eta
co
eff
icie
nts
bas
ed o
n lo
g tr
ansf
orm
ed H
cy, H
etIS
q: H
eter
oge
nei
ty I^
2 p
aram
eter
Bp
: Bas
e p
air
loca
tio
n b
ased
on
Illu
min
a an
no
tati
on
, Lo
cati
on
: Bas
ed
on
Illu
min
a an
no
tati
on
, der
ived
fro
m U
CSC
FDR
th
resh
old
= 0
.05
Tab
le 2
B. H
om
ocy
stei
ne-
asso
ciat
ed D
MP
s at
th
e 3
IGF2
/H1
9 D
MR
reg
ion
s at
ch
rom
oso
me
11
DM
R
Cp
G
N
Effe
ct
Std
Err
Pva
lue
B
on
ferr
on
i H
etIS
q
Bp
H19
-DM
R3
cg
222
59
242
15
32
0.00
32
0.
004
8
0.50
14
N
o
8.6
2
02
12
43
DM
R2
cg
131
65
070
18
49
0.00
41
0.
011
0.
713
N
o
0
21
54
11
3
DM
R2
cg
117
17
189
17
53
-0.0
079
0.
014
3
0.58
24
N
o
0
21
54
13
2
DM
R2
cg
070
96
953
20
35
-0.0
02
0.
010
6
0.84
7
No
0
2
15
42
55
DM
R2
cg
026
13
624
20
35
0.00
84
0.
007
2
0.24
21
N
o
32.9
2
15
43
86
DM
R0
cg
002
73
464
20
35
0.02
4
0.00
94
0.
010
7
No
54
.2
21
70
41
2
DM
R0
cg
176
65
927
20
35
0.00
54
0.
009
8
0.58
4
No
30
.3
21
70
44
3
Effe
ct: B
eta
co
eff
icie
nts
bas
ed o
n lo
g tr
ansf
orm
ed H
cy, H
etIS
q: H
eter
oge
nei
ty I^
2 p
aram
eter
Bp
: Bas
e p
air
loca
tio
n b
ased
on
Illu
min
a an
no
tati
on
, Bo
nfe
rro
ni t
hre
sho
ld =
7.1
4E-
03

CHAPTER 4: Homocysteine levels and DNA methylation 147
Ta
ble
3. H
om
ocy
stei
ne-
asso
ciat
ed D
MR
s
Ran
k C
hr
Star
t En
d
Bp
len
gth
#
Cp
Gs
P
Sid
ak-P
M
ean
eff
ect
siz
e
An
no
tate
d g
en
es
Loca
tio
n
1
6
3206
339
4
320
652
12
18
18
55
4.34
E-2
4
1.12
E-2
1
-0.0
4
TNX
B (
-50
39
8),
ATF
6B (
+31
71
4)
-
2
22
31
3177
64
31
31
854
7
783
12
1.
28E-
11
7.
67E-
09
-0
.04
M
OR
C2
(+4
60
31
), O
SBP
2 (
+22
73
63
) En
han
cer
3
6
3214
514
6
321
467
80
16
34
29
6.53
E-1
0
1.87
E-0
7
-0.0
1
AG
PA
T1 (
-11
06
), R
NF5
(-1
68
) P
rom
ote
r
4
7
2714
210
0
271
428
11
71
1
15
2.70
E-0
9
1.78
E-0
6
-0.0
2
HO
XA
2 (
-26
) -
5
15
91
4730
59
91
47
357
0
511
9
2.
59E-
09
2.
37E-
06
-0
.02
H
DD
C3
(+2
46
1),
MA
N2
A2
(+2
58
95
) P
rom
ote
r
6
22
32
5984
79
32
59
871
7
238
4
5.
87E-
09
1.
16E-
05
-0
.03
R
FPL2
(+8
66)
-
7
17
48
4737
57
48
47
410
0
343
4
1.
16E-
08
1.
59E-
05
-0
.02
LR
RC
59
(+
98
5)
-
8
2
3180
635
2
318
068
99
54
7
6
1.94
E-0
8
1.66
E-0
5
-0.0
3
XD
H (
-16
90
45
), M
EMO
1 (
+429
00
0)
-
9
11
45
8272
60
45
82
769
6
436
6
1.
61E-
08
1.
73E-
05
-0
.01
C
RY2
(-4
14
79
), S
LC35
C1
(+15
21
) -
10
2
1
296
59
316
12
96
599
47
631
6
5.
12E-
08
3.
80E-
05
-0
.04
H
S6ST
1 (
-58
348
1)
-
11
1
5
3151
575
0
315
164
82
73
2
9
1.34
E-0
7
8.55
E-0
5
-0.0
3
KLF
13
(-1
02
94
2),
TR
PM
1 (-
626
40
) En
han
cer
12
1
0
12
335
52
68
123
356
042
77
4
5
1.62
E-0
7
9.81
E-0
5
-0.0
6
FGFR
2 (+
22
62
), W
DR
11
(+7
44
96
8)
-
13
2
72
0792
76
72
07
961
0
334
6
7.
86E-
08
1.
10E-
04
-0
.04
C
YP2
6B1
(+2
95
72
4),
DYS
F (+
38
56
11
) -
14
2
0
3643
863
36
4419
3
330
5
8.
80E-
08
1.
25E-
04
-0
.02
G
FRA
4 (
+18)
-
15
1
4
10
632
15
51
106
322
430
87
9
7
2.89
E-0
7
1.54
E-0
4
0.01
TM
EM1
21
(+3
29
051
) -
16
6
1
260
80
132
12
60
807
24
592
4
2.
57E-
07
2.
03E-
04
-0
.02
N
CO
A7
(-2
18
79
), H
EY2
(+9
70
2)
-
17
3
1
426
66
108
14
26
664
77
369
4
2.
04E-
07
2.
59E-
04
-0
.04
P
CO
LCE2
(-5
82
48
), P
AQ
R9
(+1
58
85
) -
18
1
2
422
20
475
24
22
209
26
451
4
3.
66E-
07
3.
80E-
04
-0
.04
M
AP
1LC
3C (
-58
32
6),
PLD
5 (+
46
71
19
) -
19
5
54
2811
98
54
28
173
4
536
8
5.
68E-
07
4.
96E-
04
-0
.02
ES
M1
(+2
5)
Enh
ance
r
20
1
6
8797
883
9
879
792
03
36
4
3
6.93
E-0
7
8.91
E-0
4
-0.0
4
BA
NP
(-2
46
03
), C
A5
A (
-88
99
) -
21
5
1
347
35
544
13
47
359
15
371
8
8.
01E-
07
1.
01E-
03
-0
.02
H
2AFY
(-4
18)
-
22
2
1
186
16
155
11
86
165
77
422
5
1.
08E-
06
1.
20E-
03
-0
.04
IN
SIG
2 (-
22
96
84
), D
DX
18
(+
441
40
) -
23
1
6
8968
981
1
896
902
63
45
2
3
1.37
E-0
6
1.42
E-0
3
-0.0
4
SPA
TA33
(-3
41
73
), D
PEP
1 (
+3
03
7)
-
24
1
3
2341
225
0
234
126
23
37
3
4
1.22
E-0
6
1.53
E-0
3
-0.0
6
SGC
G (
-34
265
4)
-
25
6
32
8053
98
32
80
569
3
295
6
1.
21E-
06
1.
91E-
03
-0
.02
TA
P2
(+9
58
) P
rom
ote
r

148 PART B: Homocysteine and DNA methylation
Ran
k C
hr
Star
t En
d
Bp
len
gth
#
Cp
Gs
P
Sid
ak-P
M
ean
eff
ect
siz
e
An
no
tate
d g
en
es
Loca
tio
n
26
7
47
6484
5
4765
313
46
8
4
2.01
E-0
6
2.01
E-0
3
-0.0
3
AP
5Z1
(-5
01
74
), F
OX
K1
(+4
31
39
) P
rom
ote
r, E
nh
ance
r
27
1
3
2331
018
8
233
106
76
48
8
6
2.36
E-0
6
2.26
E-0
3
-0.0
4
SGC
G (
-44
465
9)
-
28
8
48
7441
76
48
74
460
3
427
5
2.
19E-
06
2.
40E-
03
0.
01
CEB
PD
(-9
27
42
), P
RK
DC
(+1
28
35
3)
-
29
7
21
2093
38
21
20
978
2
444
4
2.
38E-
06
2.
51E-
03
-0
.03
SP
8 (-
38
30
55
), S
P4
(-2
58
092
) En
han
cer
30
8
1
413
59
539
14
13
597
87
248
4
1.
34E-
06
2.
53E-
03
-0
.04
TR
AP
PC
9 (
+10
90
15
), C
8o
rf17
(+
41
62
47
) En
han
cer
31
7
99
7241
12
99
72
444
4
332
4
1.
99E-
06
2.
80E-
03
-0
.01
M
BLA
C1
(-3
9)
Pro
mo
ter
32
1
1
396
686
39
7078
39
2
3
3.42
E-0
6
4.07
E-0
3
-0.0
6
PK
P3
(+2
66
5),
SIG
IRR
(+1
809
4)
-
33
2
0
6236
769
8
623
682
57
55
9
8
5.46
E-0
6
4.56
E-0
3
0.02
SL
C2
A4
RG
(-3
23
6),
LIM
E1 (
-17
) P
rom
ote
r
34
4
15
7043
93
15
70
484
5
452
8
4.
79E-
06
4.
95E-
03
-0
.01
B
ST1
(+4
6)
-
35
1
5
8142
634
7
814
266
70
32
3
9
3.71
E-0
6
5.36
E-0
3
0.03
M
ESD
C2
(-1
44
29
0),
IL1
6 (
-91
23
2)
-
36
5
1
407
62
229
14
07
625
83
354
4
4.
62E-
06
6.
09E-
03
-0
.03
P
CD
HG
A7
(-6
1)
-
37
1
17
6345
43
17
63
471
7
174
4
2.
33E-
06
6.
25E-
03
-0
.02
P
AD
I4 (
-62
) -
38
1
6
4802
600
48
0299
1
391
4
5.
69E-
06
6.
79E-
03
0.
01
ZNF5
00 (
+14
42
3),
NU
DT1
6L1
(+5
91
01
) -
39
2
0
4388
330
7
438
837
47
44
0
4
6.81
E-0
6
7.22
E-0
3
-0.0
2
SLP
I (-3
22
) -
40
2
2
2516
003
3
251
604
07
37
4
6
8.42
E-0
6
1.05
E-0
2
-0.0
3
PIW
IL3
(+1
04
63
), G
GT1
(+1
61
05
2)
-
41
7
54
7324
78
54
73
275
2
274
2
6.
94E-
06
1.
18E-
02
-0
.03
SE
C6
1G (
+95
05
2),
VST
M2
A (
+1
22
59
7)
-
42
7
27
1872
69
27
18
769
2
423
9
1.
23E-
05
1.
35E-
02
-0
.01
H
OX
A5
(-4
19
4),
HO
XA
6 (-
88
) -
43
1
5
4237
151
1
423
719
68
45
7
7
1.49
E-0
5
1.51
E-0
2
-0.0
2
PLA
2G4
E (-
28
35
2),
PLA
2G4D
(+
150
12
) En
han
cer
44
2
14
8078
9
1481
098
30
9
3
1.02
E-0
5
1.54
E-0
2
-0.0
4
TPO
(+
63
71
1),
PX
DN
(+2
67
33
4)
-
45
2
86
0384
23
86
03
880
3
380
4
1.
38E-
05
1.
69E-
02
-0
.02
A
TOH
8 (+
57
59
6),
ST3
GA
L5 (
+77
52
4)
Enh
ance
r
46
1
5
3898
853
3
389
888
61
32
8
4
1.23
E-0
5
1.74
E-0
2
-0.0
2
THB
S1 (
-88
45
97
), R
ASG
RP
1 (-
13
16
90
) -
47
8
55
2945
36
55
29
488
3
347
6
1.
34E-
05
1.
79E-
02
-0
.01
SO
X1
7 (-
75
78
5),
MR
PL1
5 (
+2
46
94
0)
Enh
ance
r
48
2
2
2000
906
3
200
092
76
21
3
2
8.62
E-0
6
1.88
E-0
2
-0.0
1
AR
VC
F (-
48
39
), T
AN
GO
2 (
+53
9)
Pro
mo
ter
49
1
1
4432
786
9
443
281
55
28
6
2
1.26
E-0
5
2.04
E-0
2
-0.0
2
ALX
4 (+
37
04
), E
XT2
(+2
10
265
) -
50
3
72
7043
24
72
70
470
2
378
4
1.
71E-
05
2.
09E-
02
-0
.03
R
YBP
(-2
08
44
4),
SH
Q1
(+1
931
18
) En
han
cer
51
1
0
12
457
82
09
124
578
545
33
6
4
1.60
E-0
5
2.21
E-0
2
-0.0
4
CU
ZD1
(+3
19
32
), D
MB
T1 (
+2
58
19
6)
-
52
5
66
4622
93
66
46
266
3
370
3
1.
78E-
05
2.
23E-
02
-0
.03
C
D18
0 (+
30
14
9),
MA
ST4
(+5
70
28
9)
Pro
mo
ter,
En
han
cer

CHAPTER 4: Homocysteine levels and DNA methylation 149
R
ank
Ch
r St
art
End
B
p le
ngt
h
# C
pG
s P
Si
dak
-P
Mea
n e
ffe
ct s
ize
A
nn
ota
ted
ge
nes
Lo
cati
on
53
2
0
4372
643
1
437
267
66
33
5
3
1.64
E-0
5
2.27
E-0
2
-0.0
3
KC
NS1
(+3
15
4),
STK
4 (+
131
48
4)
Pro
mo
ter
54
1
0
13
509
21
04
135
092
242
13
8
2
8.19
E-0
6
2.74
E-0
2
-0.0
2
AD
AM
8 (
-18
01)
-
55
2
2
332
51
770
23
32
521
71
401
4
2.
72E-
05
3.
13E-
02
0.
02
ALP
PL2
(-1
95
82
), A
LPP
(+
87
27
) En
han
cer
56
7
1
564
00
711
15
64
009
91
280
4
2.
02E-
05
3.
32E-
02
-0
.04
SH
H (
-79
58
84
), C
7o
rf1
3 (+
32
49
7)
-
57
1
0
10
419
62
06
104
196
542
33
6
5
2.44
E-0
5
3.34
E-0
2
-0.0
2
CU
EDC
2 (
-39
56)
-
58
4
81
2622
1
8126
659
43
8
4
3.31
E-0
5
3.47
E-0
2
0
AFA
P1
(-1
84
78
7),
AB
LIM
2 (+
33
99
6)
-
59
2
0
4295
547
2
429
557
82
31
0
3
2.47
E-0
5
3.66
E-0
2
-0.0
2
FITM
2 (-
15
81
8),
R3
HD
ML
(-99
99
) -
60
2
2
3259
951
1
325
996
49
13
8
5
1.13
E-0
5
3.77
E-0
2
-0.0
5
RFP
L2 (
-11
6)
-
61
6
27
1856
76
27
18
607
7
401
4
3.
54E-
05
4.
04E-
02
-0
.05
P
RSS
16 (
-29
62
5),
HIS
T1H
2AH
(+7
10
16
) -
62
1
2
13
300
03
83
133
000
831
44
8
4
4.13
E-0
5
4.23
E-0
2
0.02
G
ALN
T9 (
-31
00
34
), M
UC
8 (
+50
11
9)
-
63
1
1
465
51
565
14
65
517
45
180
2
1.
68E-
05
4.
27E-
02
-0
.02
P
RK
AB
2 (+
92
46
8),
NB
PF1
2 (
+177
59
9)
-
64
6
28
6012
69
28
60
152
0
251
14
2.
43E-
05
4.
44E-
02
-0
.03
SC
AN
D3
(-4
62
83
), T
RIM
27
(+2
90
37
1)
-
65
7
1
178
54
304
11
78
546
35
331
3
3.
48E-
05
4.
81E-
02
-0
.02
A
NK
RD
7 (-
10
26
0),
NA
A3
8 (+
303
84
) P
rom
ote
r
66
6
30
6564
99
30
65
669
3
194
7
2.
06E-
05
4.
86E-
02
0.
01
PP
P1
R1
8 (
-92
4)
-
67
3
49
7239
47
49
72
429
2
345
3
3.
75E-
05
4.
96E-
02
-0
.02
R
NF1
23
(-2
81
2),
MST
1 (
+23
66
) -
68
1
6
129
230
12
9563
33
3
3
3.63
E-0
5
4.98
E-0
2
0.01
M
PG
(+1
14
1),
NP
RL3
(+
592
72
) P
rom
ote
r
Tab
le 4
. KEG
G p
ath
way
an
alys
is u
sin
g W
ebG
esta
lt t
oo
l
Pa
thw
ays
Enri
chm
en
t R
atio
ra
wP
ad
jP
No
. o
f G
enes
G
en
es
MET
AB
OLI
SM
Met
abo
lic p
ath
way
s 4.
13
3.
60E-
05
0.
000
6
12
MA
N2
A2
, GG
T1, A
LPP
L2, G
ALN
T9, A
LPP
, AG
PA
T1,
TPO
, BST
1, S
T3G
AL5
, EX
T2, X
DH
, PLA
2G
4E
Fola
te b
iosy
nth
esis
70
.64
0.
000
4
0.00
34
2
A
LPP
L2, A
LPP
Gly
cosa
min
ogl
ycan
bio
syn
thes
is -
hep
aran
su
lfat
e
29.8
9
0.00
2
0.01
13
2
H
S6ST
1, E
XT2
Ara
chid
on
ic a
cid
met
abo
lism
13
.17
0.
010
2
0.02
17
2
G
GT1
, PLA
2G
4E
Gly
cero
ph
osp
ho
lipid
met
abo
lism
9.
71
0.01
82
0.
031
4
2
PLA
2G
4E,
AG
PA
T1

150 PART B: Homocysteine and DNA methylation
CEL
LULA
R P
RO
CES
SES
Ph
ago
som
e
7.62
0.
007
3
0.02
07
3
TA
P2
, SEC
61
G, T
HB
S1
ENV
IRO
NM
ENTA
L IN
FOR
MA
TIO
N P
RO
CES
SIN
G
MA
PK
sig
nal
ing
pat
hw
ay
5.80
0.
005
2
0.02
07
4
FG
FR2
, RA
SGR
P1
, STK
4, P
LA2
G4
E
ECM
-rec
epto
r in
tera
ctio
n
9.14
0.
020
4
0.03
14
2
TH
BS1
, TN
XB
OR
GA
NIS
MA
L SY
STEM
S
Fat
dig
esti
on
an
d a
bso
rpti
on
16
.89
0.
006
3
0.02
07
2
P
LA2
G4
E, A
GP
AT1
Saliv
ary
secr
etio
n
8.73
0.
022
2
0.03
14
2
D
MB
T1, B
ST1
Fc g
amm
a R
-med
iate
d p
hag
ocy
tosi
s 8.
27
0.02
46
0.
032
2
2
PLA
2G
4D
, PLA
2G4
E
Pan
crea
tic
secr
etio
n
7.69
0.
028
1
0.03
41
2
B
ST1
, PLA
2G
4E
GEN
ETIC
INFO
RM
AT
ION
PR
OC
ESSI
NG
Pro
tein
pro
cess
ing
in e
nd
op
lasm
ic r
eti
culu
m
7.06
0.
009
0.
021
7
3
ATF
6B
, SEC
61
G, R
NF5
HU
MA
N D
ISEA
SES
Hyp
ert
rop
hic
car
dio
myo
pat
hy
(HC
M)
9.36
0.
019
5
0.03
14
2
SG
CG
, PR
KA
B2
Tab
le 5
: GO
an
alys
is u
sin
g W
ebG
esta
lt t
oo
l
GO
Id
Des
crip
tio
n
Enri
chm
en
t R
atio
ra
wP
ad
jP
No
. o
f G
en
es
Ge
nes
BIO
LOG
ICA
L P
RO
CES
S
GO
:00
485
68
em
bry
on
ic o
rgan
dev
elo
pm
ent
5.89
8.
31E-
07
0.
000
9
12
HEY
2, H
S6ST
1, I
NSI
G2,
FG
FR2
, ALX
4, H
OX
A2
, HO
XA
5, S
HH
, TP
O, H
OX
A6
, SO
X1
7, S
TK4
GO
:00
030
02
re
gio
nal
iza
tio
n
5.79
2.
95E-
06
0.
001
11
C
YP26
B1
, HEY
2, F
GFR
2, A
LX4
, PR
KD
C, H
OX
A2
, HO
XA
5, S
HH
, HO
XA
6,
SOX
17
, SP
8
GO
:00
073
89
p
atte
rn s
pec
ific
atio
n p
roce
ss
4.89
2.
25E-
06
0.
001
13
C
YP26
B1
, HEY
2, F
OX
K1
, FG
FR2
, ALX
4, P
RK
DC
, HO
XA
2, H
OX
A5
, SH
H, H
OX
A6
, SO
X1
7, S
P8,
STK
4
GO
:00
097
90
em
bry
o d
evel
op
me
nt
3.25
7.
56E-
06
0.
002
18
C
YP26
B1
, IN
SIG
2, F
OX
K1
, PR
KD
C, T
PO
, EX
T2, S
P8
, HEY
2, D
MB
T1, H
S6ST
1
ALX
4, F
GFR
2, H
OX
A2,
HO
XA
5, S
HH
, HO
XA
6, S
OX
17
, STK
4
GO
:00
487
05
sk
elet
al s
yste
m m
orp
ho
gen
esis
7.
27
1.42
E-0
5
0.00
3
8
CYP
26B
1, I
NSI
G2
, FG
FR2
, ALX
4, H
OX
A2
, HO
XA
5,
HO
XA
6, T
HB
S1
GO
:00
604
84
lu
ng-
asso
ciat
ed
mes
en
chym
e
dev
elo
pm
en
t 48
.77
2.
62E-
05
0.
004
6
3
FGFR
2, H
OX
A5,
SH
H

CHAPTER 4: Homocysteine levels and DNA methylation 151
G
O Id
D
escr
ipti
on
En
rich
me
nt
Rat
io
raw
P
adjP
N
o.
of
Ge
nes
G
en
es
GO
:00
099
52
an
teri
or/
po
ste
rio
r p
atte
rn s
pec
ific
atio
n
6.25
4.
17E-
05
0.
006
2
8
HEY
2, A
LX4,
PR
KD
C, H
OX
A2
, HO
XA
5, S
HH
, HO
XA
6, S
OX
17
GO
:00
485
98
em
bry
on
ic m
orp
ho
gen
esis
3.
94
4.90
E-0
5
0.00
64
12
C
YP26
B1
, IN
SIG
2, F
GFR
2, A
LX4
, HO
XA
2, H
OX
A5
, SH
H, H
OX
A6
, SO
X1
7, E
XT2
, SP
8, S
TK4
GO
:00
485
14
b
loo
d v
esse
l mo
rph
oge
nes
is
4.13
6.
83E-
05
0.
007
6
11
HEY
2, H
S6ST
1, F
GFR
2, H
OX
A5
, SH
H, A
DA
M8
, ESM
1, S
OX
17
, XD
H,
STK
4, T
HB
S1
GO
:00
430
09
ch
ord
ate
emb
ryo
nic
dev
elo
pm
en
t 3.
78
7.30
E-0
5
0.00
76
12
H
EY2,
HS6
ST1
, DM
BT1
, FG
FR2
, ALX
4, P
RK
DC
, HO
XA
2, H
OX
A5
, SH
H, H
OX
A6
, SO
X1
7, S
TK4
GO
:00
097
92
em
bry
o d
evel
op
me
nt
en
din
g in
b
irth
or
egg
hat
chin
g 3.
74
8.15
E-0
5
0.00
77
12
H
EY2,
HS6
ST1
, DM
BT1
, FG
FR2
, ALX
4, P
RK
DC
, HO
XA
2, H
OX
A5
, SH
H, H
OX
A6
, SO
X1
7, S
TK4
GO
:00
605
23
p
rost
ate
epit
hel
ial c
ord
elo
nga
tio
n
108.
37
0.
000
1
0.00
8
2
FGFR
2, S
HH
GO
:00
511
50
re
gula
tio
n o
f sm
oo
th m
usc
le
cell
dif
fere
nti
atio
n
32.5
1
9.71
E-0
5
0.00
8
3
HEY
2, F
GFR
2, S
HH
GO
:00
609
16
m
esen
chym
al c
ell p
rolif
erat
ion
in
volv
ed
in lu
ng
dev
elo
pm
ent
81.2
8
0.00
02
0.
012
3
2
FGFR
2, S
HH
GO
:00
015
68
b
loo
d v
esse
l dev
elo
pm
ent
3.63
0.
000
2
0.01
23
11
H
EY2,
HS6
ST1
, FG
FR2,
HO
XA
5, S
HH
, AD
AM
8, E
SM1
, SO
X1
7, X
DH
, ST
K4,
TH
BS1
GO
:00
607
37
p
rost
ate
glan
d m
orp
ho
gen
eti
c gr
ow
th
81.2
8
0.00
02
0.
012
3
2
FGFR
2, S
HH
GO
:00
610
31
en
do
der
mal
dig
esti
ve t
ract
m
orp
ho
gen
esis
81
.28
0.
000
2
0.01
23
2
FG
FR2,
SO
X17
GO
:00
019
44
va
scu
latu
re d
eve
lop
me
nt
3.46
0.
000
3
0.01
65
11
H
EY2,
HS6
ST1
, FG
FR2,
HO
XA
5, S
HH
, AD
AM
8, E
SM1
, SO
X1
7, X
DH
, ST
K4,
TH
BS1
GO
:00
015
25
an
gio
gen
esis
4.
1
0.00
03
0.
016
5
9
HS6
ST1,
FG
FR2
, HO
XA
5, S
HH
, AD
AM
8, E
SM1
, SO
X1
7, S
TK4
, TH
BS1
GO
:00
485
62
em
bry
on
ic o
rgan
mo
rph
oge
nes
is
5.24
0.
000
4
0.01
99
7
IN
SIG
2, H
OX
A6,
FG
FR2
, ALX
4, H
OX
A2
, HO
XA
5, S
HH
GO
:00
451
65
ce
ll fa
te c
om
mit
me
nt
5.1
0.
000
4
0.01
99
7
C
YP26
B1
, HEY
2, F
GFR
2, S
OX
17
, PR
KD
C, H
OX
A2
, SH
H
GO
:00
604
41
ep
ith
elia
l tu
be
bra
nch
ing
invo
lve
d in
lu
ng
mo
rph
oge
nes
is
19.5
1
0.00
05
0.
023
7
3
FGFR
2, H
OX
A5,
SH
H
GO
:00
485
65
d
iges
tive
tra
ct d
evel
op
men
t 7.
39
0.00
06
0.
024
1
5
FGFR
2, S
OX
17, A
LX4
, HO
XA
5, S
HH
GO
:00
015
01
sk
elet
al s
yste
m d
eve
lop
men
t 3.
78
0.00
06
0.
024
1
9
CYP
26B
1, I
NSI
G2
, FG
FR2
, ALX
4, H
OX
A2
, HO
XA
5, S
HH
,HO
XA
6, T
HB
S1
GO
:00
487
06
em
bry
on
ic s
kele
tal s
yste
m
dev
elo
pm
en
t 7.
46
0.00
06
0.
024
1
5
HO
XA
6, A
LX4
, HO
XA
2, H
OX
A5
, SH
H
GO
:00
308
55
ep
ith
elia
l cel
l dif
fere
nti
atio
n
4.24
0.
000
6
0.02
41
8
H
EY2,
DM
BT1
, FG
FR2,
HO
XA
5, S
HH
, SO
X1
7, S
TK4
, XD
H
GO
:00
104
67
ge
ne
exp
ress
ion
1.
51
0.00
08
0.
024
6
44
BA
NP
, SIG
IRR
, ATO
H8,
INSI
G2
, LIM
E1, S
HQ
1, A
TF6
B,
SEC
61
G, S
LC2
A4
RG
,

152 PART B: Homocysteine and DNA methylation
GO
Id
Des
crip
tio
n
Enri
chm
en
t R
atio
ra
wP
ad
jP
No
. o
f G
en
es
Ge
nes
KLF
13,
TR
IM27
, EX
T2, S
P8
, TH
BS1
, HEY
2, I
L16
, PA
DI4
, GA
LNT9
, H2
AFY
, P
IWIL
3, C
RY2
, SO
X17
, MR
PL1
5, C
EBP
D, R
YBP
, CYP
26
B1
, FO
XK
1, Z
NF5
00
P
RK
DC
, NA
A3
8, S
T3G
AL5
, SP
4, C
UZD
1, M
AN
2A
2, H
S6ST
1, F
GFR
2, A
LX4
, H
OX
A2
, HO
XA
5, S
HH
, NC
OA
7, H
OX
A6
, AD
AM
8, X
DH
GO
:00
604
62
lu
ng
lob
e d
eve
lop
men
t 46
.44
0.
000
8
0.02
46
2
FG
FR2,
SH
H
GO
:00
604
63
lu
ng
lob
e m
orp
ho
gen
esis
46
.44
0.
000
8
0.02
46
2
FG
FR2,
SH
H
GO
:00
347
66
n
egat
ive
reg
ula
tio
n o
f io
n
tran
sme
mb
ran
e tr
ansp
ort
46
.44
0.
000
8
0.02
46
2
TR
IM27
, TH
BS1
GO
:00
606
64
ep
ith
elia
l cel
l pro
life
rati
on
invo
lve
d
in s
aliv
ary
glan
d m
orp
ho
gen
esis
46
.44
0.
000
8
0.02
46
2
FG
FR2,
SH
H
GO
:00
603
49
b
on
e m
orp
ho
gen
esis
9.
7
0.00
08
0.
024
6
4
CYP
26B
1, I
NSI
G2
, FG
FR2
, TH
BS1
GO
:00
551
23
d
iges
tive
sys
tem
dev
elo
pm
ent
6.89
0.
000
8
0.02
46
5
FG
FR2,
SO
X17
, ALX
4, H
OX
A5
, SH
H
GO
:00
015
70
va
scu
loge
nes
is
9.56
0.
000
8
0.02
46
4
H
EY2,
SO
X1
7, X
DH
, SH
H
GO
:00
604
39
tr
ach
ea m
orp
ho
gen
esis
40
.64
0.
001
0.
026
8
2
HO
XA
5,S
HH
GO
:20
012
12
re
gula
tio
n o
f va
scu
loge
nes
is
40.6
4
0.00
1
0.02
68
2
H
EY2,
XD
H
GO
:00
511
51
n
egat
ive
reg
ula
tio
n o
f sm
oo
th m
usc
le
cell
dif
fere
nti
atio
n
40.6
4
0.00
1
0.02
68
2
H
EY2,
SH
H
GO
:00
330
89
p
osi
tive
re
gula
tio
n o
f T
cell
dif
fere
nti
atio
n
in t
hym
us
40.6
4
0.00
1
0.02
68
2
A
DA
M8,
SH
H
GO
:00
456
47
n
egat
ive
reg
ula
tio
n o
f er
yth
rocy
te
dif
fere
nti
atio
n
40.6
4
0.00
1
0.02
68
2
K
LF1
3, H
OX
A5
GO
:00
351
08
lim
b m
orp
ho
gen
esis
6.
25
0.00
12
0.
029
1
5
CYP
26B
1, F
GFR
2, A
LX4
, SP
8, S
HH
CEL
LULA
R C
OM
PO
NEN
T
GO
:00
312
25
an
cho
red
to
me
mb
ran
e
6.64
0.
000
3
0.01
58
6
G
GT1
, DP
EP1,
ALP
PL2
, ALP
P, B
ST1
, GFR
A4
GO
:00
125
05
en
do
mem
bra
ne
syst
em
2.16
0.
000
2
0.01
58
24
C
YP26
B1
, MA
P1L
C3
C, I
NSI
G2
, ATF
6B
, SEC
61G
, AG
PA
T1, S
LC3
5C
1, T
RIM
27
, ST
3GA
L5, E
XT2
, CU
ZD1
, PLA
2G
4D
, MA
N2A
2, D
MB
T1, H
S6ST
1, G
ALN
T9,
FITM
2, D
YSF,
TA
P2
, C8
orf
17
, LR
RC
59, A
DA
M8
, RN
F5, R
ASG
RP
1
GO
:00
425
89
zy
mo
gen
gra
nu
le m
em
bra
ne
39
.84
0.
001
1
0.03
85
2
C
UZD
1, D
MB
T1

CHAPTER 4: Homocysteine levels and DNA methylation 153
DISCUSSION
This is the first large-scale epigenome-wide site-specific collaborative meta-analysis
studying the relationship between plasma Hcy levels and methylation at a genome
wide level. Our results show that plasma Hcy concentrations were associated with 3
DMPs and 68 DMRs. Identification of this relatively low number of DMPs is surprising,
given the central role of Hcy in the methylation cycle.
The most significant of the 3 DMPs, cg21607669 is located at chromosome 19
near the promoter region of the gene SLC27A1 (+40 bp downstream). SLC27A1 assists
in the transport of fatty acids across cell membrane, and its highest levels are found in
muscle and adipose tissue [62]. Results from a recent meta-analysis demonstrated that
omega-3 polyunsaturated fatty acid supplementation was associated with Hcy lowering
[63]. It was hypothesized that the omega-3 fatty acid, docosahexaenoic acid (DHA)
upregulates metabolic enzymes of the one-carbon pathway like methionine adenosyl-
transferase resulting in increased SAM bioavailability [63]. The exact role of
hypermethylation of SLC27A1 should be further investigated to understand its possible
role in the relation between polyunsaturated fatty acids and HHcy.
The second significant DMP, cg26382848 is located at chromosome 14 near
the promoter region of the gene AJUBA (-39 bp upstream). AJUBA plays a role in
cellular processes such as cell migration, proliferation and differentiation [64, 65]. It
functions as a negative regulator of the retinoic signalling [66] and Hippo signalling
pathway [67], and is involved in tumors [68]. However, the precise role of this gene is
less clear and future replication studies are necessary to establish the role of this gene
in relation to Hcy.
The third significant DMP cg10701000 at chromosome 10 annotated to the
nearby gene KCNMA1 (-143,626 bp upstream). KCNMA1 is a potassium calcium-
activated channel and has its prominent role in many physiological processes of
smooth muscles, hair cells and diseases of nervous system and cancer [69]. A recent
study has shown that elevated cellular Hcy increases the activity of potassium calcium-
activated channel in GH3 pituitary cells [70], while two other previous studies have
reported that Hcy inhibits these channels of artery smooth muscle cells [71, 72]. Our
finding of hypermethylation near the KCNMA1 gene supports the involvement of Hcy in
potassium calcium-activated channel.
We specifically studied the IGF2/H19 locus, the most frequently studied locus
in relation to Hcy levels, and found that, none of the CpGs on the array that were
annotated to this locus showed an association with Hcy. We, could therefore not
corroborate results from 2 earlier studies that did find a relationship between Hcy
levels and methylation at the IGF2/H19 locus [14, 15]. The reason could be that these
studies were performed in HHcy mice models with heterogeneous knockout of the CBS
gene, fed with high methionine and low folate diet. CBS deficiency is an inborn error of
metabolism which leads to Hcy concentrations much higher at intermediate to severe

154 PART B: Homocysteine and DNA methylation
levels, as compared to the ones present in our study. Furthermore, in human studies of
patients with HHcy and uremia, the influence of Hcy on H19 methylation is also
observed at a concentration of Hcy much higher at intermediate levels, as compared to
the mild levels present in our study, and the monoallelic expression of H19 is shown to
be reversed by folate supplementation [10]. Therefore, our results cannot be directly
extrapolated in other populations where Hcy is higher especially in chronic renal failure
and rare diseases of metabolism. However, our results are in line with another human
study which did not find differences in intermediate HHcy patients with CBS deficiency
and controls [36]. These patients were under Hcy-lowering therapy which would have
prevented the association with H19 DMR. Therefore, mildly elevated Hcy levels do not
seem to be related to differences in methylation of the IGF2/H19 region in circulating
leukocytes. Furthermore, focusing our analysis on the previously found CpGs in
newborns in relation to maternal plasma folate during pregnancy, we did not find
significant enrichment. We expected some enrichment because of the strong
association of Hcy with folate. The reason for not finding enrichment could be related
to the different study design of mother-offspring relationship compared to population-
based cohorts.
Regional analysis using the comb-p software identified 68 DMRs significant at
Sidak P less than 0.05. The most significant was 1.8 Kb DMR located at chromosome 6
spanning 55 CpGs. This DMR was annotated to the gene TNXB and ATF6B. TNXB is
located within the class III region of the major histocompatibility complex [73] had
multiple CpG sites previously shown to be hypermethylated in anorexia nervosa
patients compared to controls [74, 75]. Another gene located near this DMR is the
Activating Transcription Factor 6 Beta (ATF6B) gene. This gene is involved in the
unfolded protein response during ER stress and has been shown to be activated upon
Hcy treatment to human endothelial cells [76]. More specifically a putative ATF6-
binding motif was identified, which was shown to be demethylated upon treatment
with Hcy, supporting our findings of possible involvement of altered methylation of
ATF6B in relation to HHcy.
Among the other DMRs there were a number of interesting regions that had
prior studies connecting Hcy to the genes annotated near the CpGs. For example, the
DMR Chr.6:32,145,146-32,146,780 is annotated to the genes AGPAT1 and RNP5. This
region was previously found associated to serum vitamin B12 in elderly subjects with
elevated Hcy in our previous study of B-vitamins for the PRevention Of Osteoporotic
Fractures (B-PROOF) [77]. Other DMRs, Chr.7:27,142,100-27,142,811 and
Chr.7:27,187,269-27,187,692 were annotated to the HOX genes, which were previously
shown to be differentially methylated after a 2-year intervention with folic acid and
vitamin B12 [77]. Another gene DPEP1 annotated to the DMR Chr.16:89,689,811-
89,690,263, is involved in renal function and contains SNPs previously shown to be
associated with Hcy [78-80]. Furthermore, gene PADI4 of DMR Chr.1:17,634,543-

CHAPTER 4: Homocysteine levels and DNA methylation 155
17,634,717 previously showed to citrullinate DNMT3A, and therefore interacting with it
to control DNA methylation [81]. And lastly, 2 out of 8 CpGs of DMR Chr.5:54,281,198-
54,281,734 were significantly shown associated with maternal plasma folate levels
during pregnancy, in cord blood [55]. These regions are promising to be replicated in
future studies.
DMR analysis is recommended as a part of the analysis pipeline in addition to
CpG site analysis [82, 83]. It has been shown that methylation is regulated in genomic
regions, which merits the identification of DMRs in addition to single CpGs. Several
software packages are available to perform DMR analysis, with their own strengths and
weaknesses (i.e. Bumphunter, DMRcate) [84]. In this paper we applied comb-p, which
constructs regions based on the autocorrelation between the p-values at varying lags in
a sliding window, which is a good approach for the unevenly spaced CpGs in the 450k
array [56]. A recent paper has shown that Comb-p has good sensitivity. However, if the
data signal is weak, comb-p has the tendency to return false-positives particularly in
presence of low effect size [85]. We therefore decided to check the DMR results of
comb-p in the Rotterdam Study subset of 700 individuals, and compare them with the
DMR results of another package, DMRcate [84]. Of the 49 significant DMRs within the
subset of 700 individuals we found using comb-p package, we saw an overlap of 60%,
with the DMRs found using DMRcate (data not shown). Results of comp-b seem valid
but further studies are also necessary to validate these findings further.
Pathway analysis on the 114 genes annotated to the 68 DMRs identified
pathways related to metabolism such as folate biosynthesis, glycosaminoglycan
biosynthesis, arachidonic acid metabolism and glycerophospholipid metabolism. This
could suggest how elevated Hcy can affect other important pathways via DNA
methylation impairment. Folate pathways contained 2 genes: ALPPL2 and ALPP. An
important paralog of these genes, which is ALPL, previously showed polymorphisms
that were associated with vitamin B6 that suggests its possible role in vitamin B6
catabolism [86]. However, these genes need to be further replicated because of its low
number in the pathway. Results of the GO enrichment analysis showed many biological
processes related to embryogenesis and development, where Hcy has most variedly
shown to play a role by previous studies.
Most of the studies until now investigated this association by measuring DNA
methylation at a global level. The strength of our study is that the association of mild
HHcy with genome-wide DNA methylation using 450k arrays was studied. Second, this
is the largest epigenome wide association study on Hcy including 2,035 individuals.
Limitations of our study are that clinical heterogeneity between cohorts may
have prevented us of finding additional true significant associations. Cohorts were
either population based, or cases with venous thromboembolism, or have a mildly
increased risk to develop type 2 diabetes and/or cardiovascular disease. Hcy
concentrations and related mechanisms may vary with such different

156 PART B: Homocysteine and DNA methylation
pathophysiologies [87]. Furthermore, Hcy median concentrations were generally low in
each cohort, with only 10.2-32.3% of individuals in the mild HHcy range >15 µmol/L
[Table 1], which could explain the subtle findings. Second, we acknowledge that Hcy
levels were measured using different techniques in each study, either in fasting or non-
fasting state, as well as there were differences in sample collections per cohort.
However, the methylation analyses were done in each cohort separately, and the
results of each separate study were then meta-analysed. Our results are therefore not
biased by the differences in Hcy measurement methods, state of fasting, or sample
collection. Nevertheless, these heterogeneity across cohorts could have resulted in
null-findings. Third, we did not account for differences in nutritional folate and/or
vitamin B12 intake and B-vitamin supplementation, or homocysteine-related diseases
like renal insufficiency that could have confounded the results of our study [87]. We
also did not account for the genetic background of individuals, especially MTHFR
677C>T that is associated with Hcy [88]. We could have accounted for these
confounding factors, but not all of this data was available to us. In addition, these
confounding factors like folate, vitamin B12 and MTHFR 677C>T belong to the same
pathway and are highly correlated with Hcy. This would have cancelled out the effect
of Hcy itself on DNA methylation. We had hypothesized that Hcy is associated with
DNA methylation regardless of the cause. However, adjusting for MTHFR 677C>T in the
linear mixed model analysis in RS-III and CODAM did not change the findings (data not
shown). Forth, we did not account for population stratification in the methylation
analysis of each cohort because all individuals were of European ancestry. But in order
to check the influence of this, we reran the analysis only in the Rotterdam Study by
additionally adjusting for 4 genetic PCs. The results still showed no significant DMPs
(FDR<0.05). In addition, the 3 significant DMPs of meta-analysis showed same direction
of effects with and without the 4 genetic PCs correction [Figure S6]. Therefore, adding
additional genetic PCs as covariates did not seem necessary and moreover, would
reduce statistical power. Fifth, Hcy effect could be exclusive to certain other tissues like
heart, liver and brain. Future studies still need to explore such findings. And lastly, even
though we included 2,035 individuals from all the possible studies to our knowledge
who had Hcy and DNA methylation data measured at the same time point, statistical
power might still be low to identify significant DMP signals. As such, replication was not
easily tractable, a main limitation of our results.
CONCLUSIONS
In conclusion, our meta-analysis showed 3 DMPs at chromosome 19, 14 and 10 with
nearby genes of SLC27A1 and AJUBA, and 68 DMRs associated with Hcy concentrations.
Knowing the prominent role of Hcy in donation of methyl groups, we expected to find
more DMPs. However, DMR analysis does show promising findings, but their role in
relation to one-carbon metabolism needs to be further investigated.

CHAPTER 4: Homocysteine levels and DNA methylation 157
ADDITIONAL INFORMATION
Supplementary Information accompanies this paper at
https://www.futuremedicine.com.
REFERENCES
1. van Meurs JB, Dhonukshe-Rutten RA, Pluijm SM, van der Klift M, de Jonge R, Lindemans J, et al. Homocysteine levels and the risk of osteoporotic fracture. N Engl J Med 2004;350:2033-41.
2. Boushey CJ, Beresford SA, Omenn GS, Motulsky AG. A quantitative assessment of plasma homocysteine as a risk factor for vascular disease. Probable benefits of increasing folic acid intakes. Jama 1995;274:1049-57.
3. Toole JF, Malinow MR, Chambless LE, Spence JD, Pettigrew LC, Howard VJ, et al. Lowering homocysteine in patients with ischemic stroke to prevent recurrent stroke, myocardial infarction, and death: the Vitamin Intervention for Stroke Prevention (VISP) randomized controlled trial. JAMA 2004;291:565-75.
4. Lonn E, Yusuf S, Arnold MJ, Sheridan P, Pogue J, Micks M, et al. Homocysteine lowering with folic acid and B vitamins in vascular disease. N Engl J Med 2006;354:1567-77.
5. Bonaa KH, Njolstad I, Ueland PM, Schirmer H, Tverdal A, Steigen T, et al. Homocysteine lowering and cardiovascular events after acute myocardial infarction. N Engl J Med 2006;354:1578-88.
6. van Wijngaarden JP, Swart KM, Enneman AW, Dhonukshe-Rutten RA, van Dijk SC, Ham AC, et al. Effect of daily vitamin B-12 and folic acid supplementation on fracture incidence in elderly individuals with an elevated plasma homocysteine concentration: B-PROOF, a randomized controlled trial. Am J Clin Nutr 2014;100:1578-86.
7. Fu W, Dudman NP, Perry MA, Young K, Wang XL. Interrelations between plasma homocysteine and intracellular S-adenosylhomocysteine. Biochem Biophys Res Commun 2000;271:47-53.
8. James SJ, Melnyk S, Pogribna M, Pogribny IP, Caudill MA. Elevation in S-adenosylhomocysteine and DNA hypomethylation: potential epigenetic mechanism for homocysteine-related pathology. J Nutr 2002;132:2361S-2366S.
9. Yi P, Melnyk S, Pogribna M, Pogribny IP, Hine RJ, James SJ. Increase in plasma homocysteine associated with parallel increases in plasma S-adenosylhomocysteine and lymphocyte DNA hypomethylation. J Biol Chem 2000;275:29318-23.
10. Ingrosso D, Cimmino A, Perna AF, Masella L, De Santo NG, De Bonis ML, et al. Folate treatment and unbalanced methylation and changes of allelic expression induced by hyperhomocysteinaemia in patients with uraemia. Lancet 2003;361:1693-9.
11. Kang SS, Wong PW, Malinow MR. Hyperhomocyst(e)inemia as a risk factor for occlusive vascular disease. Annu Rev Nutr 1992;12:279-98.
12. Weiss N, Keller C, Hoffmann U, Loscalzo J. Endothelial dysfunction and atherothrombosis in mild hyperhomocysteinemia. Vasc Med 2002;7:227-39.
13. Mandaviya PR, Stolk L, Heil SG. Homocysteine and DNA methylation: a review of animal and human literature. Mol Genet Metab 2014;113:243-52.
14. Devlin AM, Bottiglieri T, Domann FE, Lentz SR. Tissue-specific changes in H19 methylation and expression in mice with hyperhomocysteinemia. J Biol Chem 2005;280:25506-11.
15. Glier MB, Ngai YF, Sulistyoningrum DC, Aleliunas RE, Bottiglieri T, Devlin AM. Tissue-specific relationship of S-adenosylhomocysteine with allele-specific H19/Igf2 methylation and imprinting in mice with hyperhomocysteinemia. Epigenetics 2013;8:44-53.

158 PART B: Homocysteine and DNA methylation
16. Ma S, Zhang H, Sun W, Gong H, Wang Y, Ma C, et al. Hyperhomocysteinemia induces cardiac injury by up-regulation of p53-dependent Noxa and Bax expression through the p53 DNA methylation in ApoE(-/-) mice. Acta Biochim Biophys Sin (Shanghai) 2013;45:391-400.
17. Zhang D, Wen X, Wu W, Xu E, Zhang Y, Cui W. Homocysteine-related hTERT DNA demethylation contributes to shortened leukocyte telomere length in atherosclerosis. Atherosclerosis 2013;231:173-9.
18. Jadavji NM, Deng L, Leclerc D, Malysheva O, Bedell BJ, Caudill MA, Rozen R. Severe methylenetetrahydrofolate reductase deficiency in mice results in behavioral anomalies with morphological and biochemical changes in hippocampus. Mol Genet Metab 2012;106:149-59.
19. Sontag E, Nunbhakdi-Craig V, Sontag JM, Diaz-Arrastia R, Ogris E, Dayal S, et al. Protein phosphatase 2A methyltransferase links homocysteine metabolism with tau and amyloid precursor protein regulation. J Neurosci 2007;27:2751-9.
20. Devlin AM, Singh R, Bottiglieri T, Innis SM, Green TJ. Hepatic acyl-coenzyme a:cholesterol acyltransferase-2 expression is decreased in mice with hyperhomocysteinemia. J Nutr 2010;140:231-7.
21. Sulistyoningrum DC, Singh R, Devlin AM. Epigenetic regulation of glucocorticoid receptor expression in aorta from mice with hyperhomocysteinemia. Epigenetics 2012;7:514-21.
22. Devlin AM, Singh R, Wade RE, Innis SM, Bottiglieri T, Lentz SR. Hypermethylation of Fads2 and altered hepatic fatty acid and phospholipid metabolism in mice with hyperhomocysteinemia. J Biol Chem 2007;282:37082-90.
23. Farkas SA, Bottiger AK, Isaksson HS, Finnell RH, Ren A, Nilsson TK. Epigenetic alterations in folate transport genes in placental tissue from fetuses with neural tube defects and in leukocytes from subjects with hyperhomocysteinemia. Epigenetics 2013;8:303-16.
24. Kim CS, Kim YR, Naqvi A, Kumar S, Hoffman TA, Jung SB, et al. Homocysteine promotes human endothelial cell dysfunction via site-specific epigenetic regulation of p66shc. Cardiovasc Res 2011;92:466-75.
25. Rodriguez-Esparragon F, Serna-Gomez JA, Hernandez-Velazquez E, Buset-Rios N, Hernandez-Trujillo Y, Garcia-Bello MA, Rodriguez-Perez JC. Homocysteinylated protein levels in internal mammary artery (IMA) fragments and its genotype-dependence. S-homocysteine-induced methylation modifications in IMA and aortic fragments. Mol Cell Biochem 2012;369:235-46.
26. Huang YS, Zhi YF, Wang SR. Hypermethylation of estrogen receptor-alpha gene in atheromatosis patients and its correlation with homocysteine. Pathophysiology 2009;16:259-65.
27. Al-Ghnaniem R, Peters J, Foresti R, Heaton N, Pufulete M. Methylation of estrogen receptor alpha and mutL homolog 1 in normal colonic mucosa: association with folate and vitamin B-12 status in subjects with and without colorectal neoplasia. Am J Clin Nutr 2007;86:1064-72.
28. Pirouzpanah S, Taleban FA, Atri M, Abadi AR, Mehdipour P. The effect of modifiable potentials on hypermethylation status of retinoic acid receptor-beta2 and estrogen receptor-alpha genes in primary breast cancer. Cancer Causes Control 2010;21:2101-11.
29. Vasavi M, Ponnala S, Gujjari K, Boddu P, Bharatula RS, Prasad R, et al. DNA methylation in esophageal diseases including cancer: special reference to hMLH1 gene promoter status. Tumori 2006;92:155-62.

CHAPTER 4: Homocysteine levels and DNA methylation 159
30. Naushad SM, Reddy CA, Kumaraswami K, Divyya S, Kotamraju S, Gottumukkala SR, et al. Impact of hyperhomocysteinemia on breast cancer initiation and progression: epigenetic perspective. Cell Biochem Biophys 2014;68:397-406.
31. Jiang Y, Zhang H, Sun T, Wang J, Sun W, Gong H, et al. The comprehensive effects of hyperlipidemia and hyperhomocysteinemia on pathogenesis of atherosclerosis and DNA hypomethylation in ApoE-/- mice. Acta Biochim Biophys Sin (Shanghai) 2012;44:866-75.
32. Chen Z, Karaplis AC, Ackerman SL, Pogribny IP, Melnyk S, Lussier-Cacan S, et al. Mice deficient in methylenetetrahydrofolate reductase exhibit hyperhomocysteinemia and decreased methylation capacity, with neuropathology and aortic lipid deposition. Hum Mol Genet 2001;10:433-43.
33. Choumenkovitch SF, Selhub J, Bagley PJ, Maeda N, Nadeau MR, Smith DE, Choi SW. In the cystathionine beta-synthase knockout mouse, elevations in total plasma homocysteine increase tissue S-adenosylhomocysteine, but responses of S-adenosylmethionine and DNA methylation are tissue specific. J Nutr 2002;132:2157-60.
34. Castro R, Rivera I, Struys EA, Jansen EE, Ravasco P, Camilo ME, et al. Increased homocysteine and S-adenosylhomocysteine concentrations and DNA hypomethylation in vascular disease. Clin Chem 2003;49:1292-6.
35. Baccarelli A, Wright R, Bollati V, Litonjua A, Zanobetti A, Tarantini L, et al. Ischemic heart disease and stroke in relation to blood DNA methylation. Epidemiology 2010;21:819-28.
36. Heil SG, Riksen NP, Boers GH, Smulders Y, Blom HJ. DNA methylation status is not impaired in treated cystathionine beta-synthase (CBS) deficient patients. Mol Genet Metab 2007;91:55-60.
37. Hsu CY, Sun CY, Lee CC, Wu IW, Hsu HJ, Wu MS. Global DNA methylation not increased in chronic hemodialysis patients: a case-control study. Ren Fail 2012;34:1195-9.
38. Hofman A, Brusselle GG, Darwish Murad S, van Duijn CM, Franco OH, Goedegebure A, et al. The Rotterdam Study: 2016 objectives and design update. Eur J Epidemiol 2015;30:661-708.
39. Westendorp RG, van Heemst D, Rozing MP, Frolich M, Mooijaart SP, Blauw GJ, et al. Nonagenarian siblings and their offspring display lower risk of mortality and morbidity than sporadic nonagenarians: The Leiden Longevity Study. J Am Geriatr Soc 2009;57:1634-7.
40. van Greevenbroek MM, Jacobs M, van der Kallen CJ, Blaak EE, Jansen EH, Schalkwijk CG, et al. Human plasma complement C3 is independently associated with coronary heart disease, but only in heavy smokers (the CODAM study). Int J Cardiol 2012;154:158-62.
41. Antoni G, Morange PE, Luo Y, Saut N, Burgos G, Heath S, et al. A multi-stage multi-design strategy provides strong evidence that the BAI3 locus is associated with early-onset venous thromboembolism. J Thromb Haemost 2010;8:2671-9.
42. Leitsalu L, Haller T, Esko T, Tammesoo ML, Alavere H, Snieder H, et al. Cohort Profile: Estonian Biobank of the Estonian Genome Center, University of Tartu. Int J Epidemiol 2015;44:1137-47.
43. Graham Upton IC. Understanding Statistics. Oxford University Press 1996. 44. Bibikova M, Barnes B, Tsan C, Ho V, Klotzle B, Le JM, et al. High density DNA
methylation array with single CpG site resolution. Genomics 2011;98:288-95. 45. Pidsley R, CC YW, Volta M, Lunnon K, Mill J, Schalkwyk LC. A data-driven approach to
preprocessing Illumina 450K methylation array data. BMC Genomics 2013;14:293. 46. Maksimovic J, Gordon L, Oshlack A. SWAN: Subset-quantile within array normalization
for illumina infinium HumanMethylation450 BeadChips. Genome Biol 2012;13:R44.

160 PART B: Homocysteine and DNA methylation
47. Aryee MJ, Jaffe AE, Corrada-Bravo H, Ladd-Acosta C, Feinberg AP, Hansen KD, Irizarry RA. Minfi: a flexible and comprehensive Bioconductor package for the analysis of Infinium DNA methylation microarrays. Bioinformatics 2014;30:1363-9.
48. Willer CJ, Li Y, Abecasis GR. METAL: fast and efficient meta-analysis of genomewide association scans. Bioinformatics 2010;26:2190-1.
49. Bonder MJ, Luijk R, Zhernakova DV, Moed M, Deelen P, Vermaat M, et al. Disease variants alter transcription factor levels and methylation of their binding sites. Nat Genet 2017;49:131-138.
50. Devlin B, Roeder K. Genomic control for association studies. Biometrics 1999;55:997-1004.
51. McLean CY, Bristor D, Hiller M, Clarke SL, Schaar BT, Lowe CB, et al. GREAT improves functional interpretation of cis-regulatory regions. Nat Biotechnol 2010;28:495-501.
52. Speir ML, Zweig AS, Rosenbloom KR, Raney BJ, Paten B, Nejad P, et al. The UCSC Genome Browser database: 2016 update. Nucleic Acids Res 2016;44:D717-25.
53. Koukoura O, Sifakis S, Soufla G, Zaravinos A, Apostolidou S, Jones A, et al. Loss of imprinting and aberrant methylation of IGF2 in placentas from pregnancies complicated with fetal growth restriction. Int J Mol Med 2011;28:481-7.
54. Guo L, Choufani S, Ferreira J, Smith A, Chitayat D, Shuman C, et al. Altered gene expression and methylation of the human chromosome 11 imprinted region in small for gestational age (SGA) placentae. Dev Biol 2008;320:79-91.
55. Joubert BR, den Dekker HT, Felix JF, Bohlin J, Ligthart S, Beckett E, et al. Maternal plasma folate impacts differential DNA methylation in an epigenome-wide meta-analysis of newborns. Nat Commun 2016;7:10577.
56. Pedersen BS, Schwartz DA, Yang IV, Kechris KJ. Comb-p: software for combining, analyzing, grouping and correcting spatially correlated P-values. Bioinformatics 2012;28:2986-8.
57. Dai H, Leeder JS, Cui Y. A modified generalized Fisher method for combining probabilities from dependent tests. Front Genet 2014;5:32.
58. Stouffer SA, ed et al. The American Soldier: Adjustment During Army Life, Volume I. Princeton University Press, Princeton, NJ 1949.
59. P L. On the Combination of Independent Tests. Magyar Tudomanyos. Akademia Matematikai Kutato Intezetenek Kozlemenyei, 3 1958:171–197.
60. Sida`k Z. Rectangular confidence region for the means of multivariate normal distributions. J. Am. Stat. Assoc. 1967:626–633.
61. Wang J, Duncan D, Shi Z, Zhang B. WEB-based GEne SeT AnaLysis Toolkit (WebGestalt): update 2013. Nucleic Acids Res 2013;41:W77-83.
62. Martin G, Nemoto M, Gelman L, Geffroy S, Najib J, Fruchart JC, et al. The human fatty acid transport protein-1 (SLC27A1; FATP-1) cDNA and gene: organization, chromosomal localization, and expression. Genomics 2000;66:296-304.
63. Dawson SL, Bowe SJ, Crowe TC. A combination of omega-3 fatty acids, folic acid and B-group vitamins is superior at lowering homocysteine than omega-3 alone: A meta-analysis. Nutr Res 2016;36:499-508.
64. Goyal RK, Lin P, Kanungo J, Payne AS, Muslin AJ, Longmore GD. Ajuba, a novel LIM protein, interacts with Grb2, augments mitogen-activated protein kinase activity in fibroblasts, and promotes meiotic maturation of Xenopus oocytes in a Grb2- and Ras-dependent manner. Mol Cell Biol 1999;19:4379-89.
65. Kanungo J, Pratt SJ, Marie H, Longmore GD. Ajuba, a cytosolic LIM protein, shuttles into the nucleus and affects embryonal cell proliferation and fate decisions. Mol Biol Cell 2000;11:3299-313.

CHAPTER 4: Homocysteine levels and DNA methylation 161
66. Hou Z, Peng H, White DE, Negorev DG, Maul GG, Feng Y, et al. LIM protein Ajuba functions as a nuclear receptor corepressor and negatively regulates retinoic acid signaling. Proc Natl Acad Sci U S A 2010;107:2938-43.
67. Das Thakur M, Feng Y, Jagannathan R, Seppa MJ, Skeath JB, Longmore GD. Ajuba LIM proteins are negative regulators of the Hippo signaling pathway. Curr Biol 2010;20:657-62.
68. Tanaka I, Osada H, Fujii M, Fukatsu A, Hida T, Horio Y, et al. LIM-domain protein AJUBA suppresses malignant mesothelioma cell proliferation via Hippo signaling cascade. Oncogene 2015;34:73-83.
69. Contreras GF, Castillo K, Enrique N, Carrasquel-Ursulaez W, Castillo JP, Milesi V, et al. A BK (Slo1) channel journey from molecule to physiology. Channels (Austin) 2013;7:442-58.
70. Gaifullina AS, Yakovlev AV, Mustafina AN, Weiger TM, Hermann A, Sitdikova GF. Homocysteine augments BK channel activity and decreases exocytosis of secretory granules in rat GH3 cells. FEBS Lett 2016;590:3375-3384.
71. Au AL, Seto SW, Chan SW, Chan MS, Kwan YW. Modulation by homocysteine of the iberiotoxin-sensitive, Ca2+ -activated K+ channels of porcine coronary artery smooth muscle cells. Eur J Pharmacol 2006;546:109-19.
72. Cai B, Gong D, Pan Z, Liu Y, Qian H, Zhang Y, et al. Large-conductance Ca2+-activated K+ currents blocked and impaired by homocysteine in human and rat mesenteric artery smooth muscle cells. Life Sci 2007;80:2060-6.
73. Bristow J, Tee MK, Gitelman SE, Mellon SH, Miller WL. Tenascin-X: a novel extracellular matrix protein encoded by the human XB gene overlapping P450c21B. J Cell Biol 1993;122:265-78.
74. Booij L, Casey KF, Antunes JM, Szyf M, Joober R, Israel M, Steiger H. DNA methylation in individuals with anorexia nervosa and in matched normal-eater controls: A genome-wide study. Int J Eat Disord 2015;48:874-82.
75. Kesselmeier M, Putter C, Volckmar AL, Baurecht H, Grallert H, Illig T, et al. High-throughput DNA methylation analysis in anorexia nervosa confirms TNXB hypermethylation. World J Biol Psychiatry 2016:1-13.
76. Zhang D, Xie X, Chen Y, Hammock BD, Kong W, Zhu Y. Homocysteine upregulates soluble epoxide hydrolase in vascular endothelium in vitro and in vivo. Circ Res 2012;110:808-17.
77. Kok DE, Dhonukshe-Rutten RA, Lute C, Heil SG, Uitterlinden AG, van der Velde N, et al. The effects of long-term daily folic acid and vitamin B12 supplementation on genome-wide DNA methylation in elderly subjects. Clin Epigenetics 2015;7:121.
78. Pare G, Chasman DI, Parker AN, Zee RR, Malarstig A, Seedorf U, et al. Novel associations of CPS1, MUT, NOX4, and DPEP1 with plasma homocysteine in a healthy population: a genome-wide evaluation of 13 974 participants in the Women's Genome Health Study. Circ Cardiovasc Genet 2009;2:142-50.
79. van Meurs JB, Pare G, Schwartz SM, Hazra A, Tanaka T, Vermeulen SH, et al. Common genetic loci influencing plasma homocysteine concentrations and their effect on risk of coronary artery disease. Am J Clin Nutr 2013;98:668-76.
80. Zinck JW, de Groh M, MacFarlane AJ. Genetic modifiers of folate, vitamin B-12, and homocysteine status in a cross-sectional study of the Canadian population. Am J Clin Nutr 2015;101:1295-304.
81. Deplus R, Denis H, Putmans P, Calonne E, Fourrez M, Yamamoto K, et al. Citrullination of DNMT3A by PADI4 regulates its stability and controls DNA methylation. Nucleic Acids Res 2014;42:8285-96.

162 PART B: Homocysteine and DNA methylation
82. Wright ML, Dozmorov MG, Wolen AR, Jackson-Cook C, Starkweather AR, Lyon DE, York TP. Establishing an analytic pipeline for genome-wide DNA methylation. Clin Epigenetics 2016;8:45.
83. Bock C. Analysing and interpreting DNA methylation data. Nat Rev Genet 2012;13:705-19.
84. Peters TJ, Buckley MJ, Statham AL, Pidsley R, Samaras K, R VL, et al. De novo identification of differentially methylated regions in the human genome. Epigenetics Chromatin 2015;8:6.
85. Kolde R, Martens K, Lokk K, Laur S, Vilo J. seqlm: an MDL based method for identifying differentially methylated regions in high density methylation array data. Bioinformatics 2016;32:2604-10.
86. Tanaka T, Scheet P, Giusti B, Bandinelli S, Piras MG, Usala G, et al. Genome-wide association study of vitamin B6, vitamin B12, folate, and homocysteine blood concentrations. Am J Hum Genet 2009;84:477-82.
87. Selhub J. Homocysteine metabolism. Annu Rev Nutr 1999;19:217-46. 88. Murakami H, Iemitsu M, Sanada K, Gando Y, Ohmori Y, Kawakami R, et al. Associations
among objectively measured physical activity, fasting plasma homocysteine concentration, and MTHFR C677T genotype. Eur J Appl Physiol 2011;111:2997-3005.

Chapter 4: Homocysteine levels and DNA methylation 163
CHAPTER 5
Genetically defined elevated homocysteine levels
do not result in widespread changes of
DNA methylation in leukocytes
Pooja R. Mandaviya*, Roby Joehanes*, Dylan Aïssi*, Brigitte Kühnel*, Riccardo E.
Marioni*, Vinh Truong*, Lisette Stolk, Marian Beekman, Marc Jan Bonder, Lude Franke,
Christian Gieger, Tianxiao Huan, M. Arfan Ikram, Sonja Kunze, Liming Liang, Jan
Lindemans, Chunyu Liu, Allan F. McRae, Michael M. Mendelson, Martina Müller-
Nurasyid, Annette Peters, P. Eline Slagboom, John M. Starr, David-Alexandre Trégouët,
André G. Uitterlinden, Marleen M.J. van Greevenbroek, Diana van Heemst, Maarten
van Iterson, Philip S. Wells, Chen Yao, Ian J. Deary**, France Gagnon**, Bastiaan T.
Heijmans**, Daniel Levy**, Pierre-Emmanuel Morange**, Melanie Waldenberger**,
Sandra G. Heil**, Joyce B.J. van Meurs**, on behalf of the
CHARGE Consortium Epigenetics group and BIOS Consortium
*These authors contributed equally as first authors
**These authors contributed equally as senior authors
PLoS One. 2017 Oct 30;12(10):e0182472.

164 PART B: Homocysteine and DNA methylation
ABSTRACT
Background: DNA methylation is affected by the activities of the key enzymes and
intermediate metabolites of the one-carbon pathway, one of which involves
homocysteine. We investigated the effect of the well-known genetic variant associated
with mildly elevated homocysteine: MTHFR 677C>T independently and in combination
with other homocysteine-associated variants, on genome-wide leukocyte DNA-
methylation.
Methods: Methylation levels were assessed using Illumina 450k arrays on 9,894
individuals of European ancestry from 12 cohort studies. Linear-mixed-models were
used to study the association of additive MTHFR 677C>T and genetic-risk score (GRS)
based on 18 homocysteine-associated SNPs, with genome-wide methylation.
Results: Meta-analysis revealed that the MTHFR 677C>T variant was associated with 35
CpG sites in cis, and the GRS showed association with 113 CpG sites near the
homocysteine-associated variants. Genome-wide analysis revealed that the MTHFR
677C>T variant was associated with 1 trans-CpG (nearest gene ZNF184), while the GRS
model showed association with 5 significant trans-CpGs annotated to nearest genes
PTF1A, MRPL55, CTDSP2, CRYM and FKBP5.
Conclusions: Our results do not show widespread changes in DNA-methylation across
the genome, and therefore do not support the hypothesis that mildly elevated
homocysteine is associated with widespread methylation changes in leukocytes.

CHAPTER 5: Genetically defined homocysteine levels and DNA methylation 165
INTRODUCTION
DNA methylation, an important epigenetic mechanism has gained interest in the field
of cancer and aging over the last decade [1, 2]. DNA methylation is affected by the
activities of the key enzymes and intermediate metabolites of the one-carbon pathway,
one of which involves homocysteine (Hcy).
Our aim was to investigate the role of genetically defined Hcy levels on
genome-wide DNA methylation. A number of earlier studies have reported a link
between Hcy and DNA methylation [3]. In these studies, DNA methylation was
quantified as a global measure, that represents the total methyl cytosine content of
the DNA. In animal models, both diet- and genetically- induced elevated Hcy have been
related to altered global methylation patterns in tissues of aorta, brain, liver and colon.
In human subjects, global DNA methylation in blood was not consistently altered with
elevated Hcy. The relationship between Hcy and methylation can be subject to
substantial bias, given the strong relationship between several lifestyle factors,
diseases and Hcy. A way to circumvent this bias is to use genetic factors determining
Hcy concentrations as an instrument to study the relationship between Hcy and
methylation. The use of genetically defined elevated Hcy eliminate the effects that are
possibly caused by measurement errors, confounding and reverse causality. One of the
most consistent genetic variants causing elevated Hcy is the MTHFR 677C>T
(rs1801133), which explains 5.3% variance in Hcy [4]. Furthermore, we recently
published 18 variants including MTHFR 677C>T to be robustly associated with Hcy [5].
The Genetic Risk Score (GRS) of these 18 Hcy-associated variants explained 5.9%
variance in Hcy [5]. In the current study, we used MTHFR 677C>T independently and
the combined weighted GRS of these 18 variants, to test whether genetically defined
elevated Hcy concentrations are associated with DNA methylation changes in blood
cells.
A number of studies [3] have examined the relationship between the MTHFR
677C>T variant and global DNA methylation in humans. In 5 studies, individuals with
the MTHFR 677TT genotype were compared to those with the MTHFR 677CC genotype
[6-10]. Lower global methylation in blood cells was observed in two studies [6, 7]. The
remaining three studies showed no association in the lymphocyte or colonic tissue. All
published studies until now had small sample sizes of less than 200. To the best of our
knowledge, associations of genetically defined Hcy with site-specific CpG methylation
on a genome-wide scale have not been done up to now. In order to investigate this, we
analyzed DNA methylation data measured with the Infinium Illumina 450k arrays, in a
large meta-analysis of 9,894 individuals comprising 12 cohorts. We hypothesize that
genetically defined elevated Hcy is associated with altered DNA methylation.

166 PART B: Homocysteine and DNA methylation
MATERIALS AND METHODS
Study population
All participants provided a written informed consent, and each study was approved at
the relevant organizations by their respective ethics review committees [RS,
Institutional review board (Medical Ethics Committee) of the Erasmus Medical Center;
LLS, Ethical committee of the Leiden University Medical Center; LL, Ethics committee of
the University Medical Centre Groningen; NTR, Central Ethics Committee on Research
Involving Human Subjects of the VU University Medical Centre; CODAM, Medical
Ethical Committee of the Maastricht University; MARTHA, “Departement santé de la
direction générale de la recherche et de l'innovation du ministère” (Projects DC: 2008-
880 & 09.576); EGCUT; Research Ethics Committee of the University of Tartu; F5L,
Research ethics boards of the University of Toronto and the Ottawa Hospital Research
Institute; FHS, IRB (institutional review board); KORA, Local Ethics Committee;
LBC1921, Lothian Research Ethics Committee (Wave 1: LREC/1998/4/183); LBC1936,
Multi-Centre Research Ethics Committee for Scotland (Wave 1: MREC/01/0/56), and
the Lothian Research Ethics Committee (Wave 1: LREC/2003/2/29)].
The analyses comprised of large population with 9,894 participants from 12
cohorts of European ancestry. Most of the cohorts were part of either the Cohorts for
Heart and Aging Research in Genomic Epidemiology (CHARGE) consortium [11] and/or
Biobank-based Integrative Omics Studies (BIOS) consortium [12]. All participants
provided a written informed consent for the DNA collection and its use for genetic
analyses. Each study was approved at the relevant organizations by their respective
ethics review committees. Cohort-specific characteristics are provided in the S1 Text
and S1 Table.
MTHFR 677C>T and homocysteine-associated SNPs
18 independent Hcy-associated SNPs from our GWAS meta-analysis [5], were selected
to assess the relationship between mildly elevated Hcy concentrations and genome-
wide DNA methylation. The genotypes of these SNPs were extracted from the
genotyping data. Cohort-specific details of the quality control and the SNP imputation
methods are provided in the S2 Table.
DNA methylation assessment
Whole blood samples were collected from the participants for DNA extraction. The
genomic DNA was bisulfite converted using the Zymo EZ-96 DNA-methylation kit (Zymo
Research, Irvine, CA, USA). Methylation profiling was performed using the Infinium
Illumina HumanMethylation 450k BeadChip arrays (Illumina Inc., San Diego, USA)
according to the manufacturers’ protocol. Beta values from 0 to 1, which represent the
percentage of methylation, were calculated from the extracted raw methylated (M)
and unmethylated (U) probe intensities and a default alpha (α) of 100. This is defined

CHAPTER 5: Genetically defined homocysteine levels and DNA methylation 167
by the formula of β=M/(M+U+α). Normalization was performed on these raw beta
values using DASEN [13] or SWAN [14] methods. Poor quality probes were excluded
based on the detection p-values mostly >0.01 in >5% of samples. Cohort-specific data
preprocessing methods are provided in the Table 1. Global methylation levels per
sample was calculated by the mean of all CpGs as well as mean according to CpG
islands, shores, shelves or non-coding regions [15].
Statistical analysis
Two models were run independently by each participating study. Firstly, an additive
model for MTHFR 677C>T alone was used to investigate its independent association
with genome-wide DNA methylation in a linear manner. For the MTHFR 677C>T
variant, genotypes were coded as CC=0, CT=1 and TT=2 to study the effect in
methylation per MTHFR 677T allele.
In the second analysis, a weighted Genetic Risk Scores (GRS) was constructed
from all the 18 Hcy-associated variants to investigate their combined and additive
effect on genome-wide DNA methylation. Weighted GRS were calculated on the basis
of their effect sizes [5] and number of corresponding risk alleles. The product of the
two was calculated for each SNP and then summed up for all SNPs. The GRS was
calculated using the equation below, where N is the number of elevated Hcy causing
risk alleles for each SNP (0, 1 or 2 per genotype).
𝑮𝑹𝑺 =
0.1583 𝑥 𝑁(𝑟𝑠1801133: 𝐴) + 0.0542 𝑥 𝑁(𝑟𝑠2275565: 𝐺) +
0.0718 𝑥 𝑁(𝑟𝑠234709: 𝐶) + 0.0435 𝑥 𝑁(𝑟𝑠4660306: 𝑇) +
0.0453 𝑥 𝑁(𝑟𝑠1801222: 𝐴) + 0.101 𝑥 𝑁(𝑟𝑠12134663: 𝐶) +
0.0529 𝑥 𝑁(𝑟𝑠12780845: 𝐴) + 0.056 𝑥 𝑁(𝑟𝑠2851391: 𝑇) +
0.0449 𝑥 𝑁(𝑟𝑠9369898: 𝐴) + 0.0422 𝑥 𝑁(𝑟𝑠838133: 𝐴) +
0.0864 𝑥 𝑁(𝑟𝑠7422339: 𝐴) + 0.1242 𝑥 𝑁(𝑟𝑠7130284: 𝐶) +
0.0963 𝑥 𝑁(𝑟𝑠154657: 𝐴) + 0.0597 𝑥 𝑁(𝑟𝑠548987: 𝐶) +
0.0395 𝑥 𝑁(𝑟𝑠42648: 𝐺) + 0.0512 𝑥 𝑁(𝑟𝑠2251468: 𝐶) +
0.045 𝑥 𝑁(𝑟𝑠957140: 𝐺) + 0.090 𝑥 𝑁(𝑟𝑠12921383: 𝐶) (1)
Both the analyses were based on linear mixed models of lme4 package in R.
We also analyzed the effect of MTHFR 677C>T and GRS on global methylation levels,
where we calculated the overall mean levels per individual as well as categorized the
means as per CGI annotations [15]. The models were adjusted for technical covariates
and biological covariates like age, sex and differential white blood cell (WBC) counts
(see S1 Table for details about covariates for each cohort). The technical covariates
were cohort-specific and treated as random effects. WBC counts were either used as
measured counts, or they were imputed based on the Houseman method as
implemented in the minfi package [17], or the modified version of the Houseman
method (Documentation and R script: https://github.com/mvaniterson/wbccPredictor)

168 PART B: Homocysteine and DNA methylation
that uses partial least-squares [18] to handle multivariate responses and high-
dimensional covariates and has been previously used [19]. This method from van
Iterson used the R package pls [18] to fit the linear model based on the DNA
methylation data, to predict the white blood cell composition as percentages that sum
up to almost 100%. Age and gender were used as covariates.
Meta-analysis
Summary statistics for the two models were obtained from each study. Because of the
different probe exclusions in each cohort [Table1], we removed probes that were
present in ≤4 studies. We also excluded probes with SNPs at single base extension site,
and probes with improper binding [12], leaving a total of 465,694 probes for the meta-
analysis. Meta-analysis was performed using the fixed effect model in METAL [20], with
the classical approach that uses effect size estimates and standard errors as input
obtained from the individual study summary statistics for each CpG probe. The output
of meta-analysis gave the combined effect size estimates, standard errors and p-values
per probe. These p-values were corrected using the Benjamini Hochberg method of
false discovery rate (FDR), where FDR <0.05 was considered statistically significant. For
the MTHFR 677C>T model, positive effect sizes correspond to percentage increase in
methylation per MTHFR 677T allele. For the GRS model, positive effect sizes
correspond to percentage increase in methylation per unit increase in GRS. We also
took into account heterogeneity of the meta-analysis by I2 which was calculated using
METAL per probe and excluded significant probes if I2<40. We also calculated the
genomic inflation factor (λ) [21] to estimate the inflation in test statistics that may be
caused by population structure or other unknown confounding factors. This λ was
estimated for the distribution of p-values using the median method, which is defined as
the ratio of the observed median of the test statistic distribution and the expected
median 0.455 [21, 22].
Genomic Regions Enrichment of Annotations Tool (GREAT) was used for
annotating CpGs for nearby genes, that assigns a basal regulatory region to extend up
to 5 kb upstream and 1 kb downstream from its transcription start site and a maximum
extension distance up to 1 Mb [23], as defined by UCSC [24]. Furthermore, strength of
the instrument or allele score was calculated using the F-statistics, using the tool,
mRnd [25]. We took into account cohort heterogeneity I2 and excluded significant
probes if I2<40.
Identifying cis- and trans-CpG effects
We defined the CpGs as “cis” when the CpG was annotated within 1Mb upstream or
downstream of the SNP. Trans-CpGs were defined as CpGs that were associated with
the SNP, and were annotated >1Mb apart. We defined the CpGs in the GRS model the
same way by accounting for the bp distance of the CpGs from each of the 18 SNPs. For

CHAPTER 5: Genetically defined homocysteine levels and DNA methylation 169
the significant trans-CpGs that were 1-5Mb apart from any of the 18 SNPs, we
performed a conditional analysis adjusting for that SNP to investigate whether they
were trans-CpGs associated with Hcy GRS or long range cis-CpGs driven by the nearby
SNPs that were part of the GRS. In the conditional analysis, if the bonferroni corrected
p-values were no longer significant, we considered those trans-CpGs as long-range cis-
CpGs. For the significant trans-CpGs that were >5Mb apart from any of the 18 SNPs, we
looked up for their tested individual association with each of the 18 SNPs in our
previous trans-CpG mapping analysis [12]. This is to see whether the association of
these trans-CpGs was Hcy GRS driven or driven by a single SNP that was a part of GRS.
In order to confirm these trans-CpG effects, we performed a similar conditional
analysis by including the respective SNP as a covariate in the model. Both conditional
analyses were performed on a subset of 3,786 samples from 6 cohorts, and the results
were compared with the unconditional analysis in the same subset.
H19/IGF locus
Three Differentially Methylated Regions (DMRs) of IGF2/H19 locus at chromosome 11
have been reported to be related with homocysteine [26, 27]. We identified seven
CpGs on the 450k array that were underlying the three DMRs of this locus, for their
association with MTHFR 677C>T variant or GRS. Bonferroni method was applied on
these 7 CpGs to check for multiple testing.
Enrichment of folate-associated CpGs
We further focused our analysis on the 443 previously identified CPGs, of which
methylation in cord blood of newborns were associated with maternal plasma folate
levels [28]. We compared the p-values of these 443 CpGs from the MTHFR 677>T and
the GRS results, and compared them to the p-values of 100 random CpGs with 1000
permutations, to check for their significant enrichment, using the Fisher’s exact test.

170 PART B: Homocysteine and DNA methylation
Tab
le 1
. Det
ails
of
met
hyl
atio
n 4
50
k p
re-p
roce
ssin
g: Q
ual
ity
con
tro
l , n
orm
aliz
atio
n a
nd
ass
oci
atio
n m
od
el
P
RO
BES
EX
CLU
SIO
N
SAM
PLE
EX
CLU
SIO
N
NO
RM
ALI
ZATI
ON
*
ASS
OC
IATI
ON
MO
DEL
Cohorts
Detection
p-value criteria
Cross-reactive
& polymorphic
XY
Final
Criteria
(Method)
Dye bias
correction
Normalization
method
WBC
counts
Technical
covariates
Additional
adjustments
CH
AR
GE
CO
NSO
RT
IUM
RS-
III
>0.0
1 in
>5
% s
amp
les
Incl
ud
ed
Excl
ud
ed
46
3,45
6
Sam
ple
Cal
l Rat
e >
99%
,
Po
or
bis
ulf
ite
con
vers
ion
,
Faile
d c
hro
mo
som
e X
& Y
clu
ster
ing
No
D
ASE
N
Mea
sure
d
Arr
ay, a
rray
po
siti
on
N
o
LBC
19
21
>0
.01
in >
5%
sam
ple
s In
clu
ded
In
clu
ded
44
6,85
1
>0.0
1 d
et.
p-v
alu
e in
>5%
pro
bes
,
Po
or
bis
ulf
ite
con
vers
ion
N
o
No
ne
M
easu
red
A
rray
, arr
ay p
osi
tio
n,
pla
te, h
ybri
diz
atio
n d
ate
N
o
LBC
19
36
>0
.01
in >
5%
sam
ple
s In
clu
ded
In
clu
ded
44
6,85
1
>0.0
1 d
et.
p-v
alu
e in
>5%
pro
bes
,
Po
or
bis
ulf
ite
con
vers
ion
N
o
No
ne
M
easu
red
A
rray
, arr
ay p
osi
tio
n,
pla
te, h
ybri
diz
atio
n d
ate
N
o
KO
RA
>0
.01
In
clu
ded
In
clu
ded
44
1,48
7
>0.0
1 d
et.
p-v
alu
e in
>20
% p
rob
es
Yes
BM
IQ
Imp
ute
d
Arr
ay, a
rray
po
siti
on
N
o
FHS
No
ne
In
clu
ded
In
clu
ded
48
5,51
2
Mis
mat
ched
sex
,
Ou
tlie
rs b
ased
on
pri
nci
pal
co
mp
on
en
ts
No
D
ASE
N
Imp
ute
d
Arr
ay, a
rray
po
siti
on
,
pri
nci
pal
co
mp
on
en
ts
No
BIO
S C
ON
SOR
TIU
M
RS
>0.0
1 in
>5
% s
amp
les
Incl
ud
ed
Excl
ud
ed
41
9,93
7
Po
or
bis
ulf
ite
con
vers
ion
N
o
DA
SEN
Im
pu
ted
A
rray
, arr
ay p
osi
tio
n
No
LLS
>0.0
1 in
>5
% s
amp
les
Incl
ud
ed
Excl
ud
ed
41
9,55
0
Po
or
bis
ulf
ite
con
vers
ion
N
o
DA
SEN
Im
pu
ted
A
rray
, arr
ay p
osi
tio
n
No
LLD
>0
.01
in >
5%
sam
ple
s In
clu
ded
Ex
clu
de
d
420,
591
P
oo
r b
isu
lfit
e co
nve
rsio
n
No
D
ASE
N
Imp
ute
d
Arr
ay, a
rray
po
siti
on
N
o
NTR
>0
.01
in >
5%
sam
ple
s In
clu
ded
Ex
clu
de
d
420,
341
P
oo
r b
isu
lfit
e co
nve
rsio
n
No
D
ASE
N
Imp
ute
d
Arr
ay, a
rray
po
siti
on
N
o
CO
DA
M
>0.0
1 in
>5
% s
amp
les
Incl
ud
ed
Excl
ud
ed
41
0,04
2
Po
or
bis
ulf
ite
con
vers
ion
N
o
DA
SEN
Im
pu
ted
A
rray
, arr
ay p
osi
tio
n
No
OTH
ER C
OH
OR
TS
MA
RTH
A
>0.0
5 in
>5
% s
amp
les
Excl
ud
ed
In
clu
ded
38
8,12
0
Sam
ple
PC
A
Yes
SWA
N
Mea
sure
d
Arr
ay, a
rray
po
siti
on
N
o
F5L
>0.0
5 in
>5
% s
amp
les
Excl
ud
ed
Ex
clu
de
d
378,
594
Sa
mp
le P
CA
Ye
s SW
AN
Im
pu
ted
A
rray
, arr
ay p
osi
tio
n
Fam
ily
stru
ctu
re
*NO
RM
ALI
ZATI
ON
: Bac
kgro
un
d c
orr
ect
ion
was
do
ne
in a
ll st
ud
ies
MET
A-A
NA
LYSI
S: R
emo
ved
pro
bes
wit
h S
NP
s at
SB
E &
pro
bes
wit
h im
pro
per
bin
din
g [1
2],
pro
bes
th
at w
ere
abse
nt
in ≥
8 s
tud
ies,
cis
-pro
bes
wit
h <
5 M
b d
ista
nce
fro
m H
cy-S
NP
s

CHAPTER 5: Genetically defined homocysteine levels and DNA methylation 171
RESULTS
Population Characteristics
The meta-analysis included 9,894 adults from 12 cohorts. Studies were population-
based, except for the Cohort on Diabetes and Atherosclerosis Maastricht, MARseille
THrombosis Association study and the French-Canadian family study, where individuals
were selected based on mildly increased diabetes mellitus type 2 and cardiovascular
risk factors, cases of venous thrombosis and probands with venous thromboembolism,
respectively.
Meta-analysis of MTHFR 677C>T and GRS model
The explained variance in Hcy by MTHFR 677C>T is 5.3% [4] and by GRS is 5.9% [5]. For
a sample size of 9,894, the F-statistics of the additive MTHFR 677C>T and GRS was 554
and 621, respectively. Meta-analysis of 456,694 probes identified 35 cis- [S3 Table] and
1 trans- [S5 Table, Table 2] CpGs for the MTHFR model [Fig 1a] and 113 cis- [S4 Table]
and 30 trans- [S6a, S7a and S8 Tables] CpGs for the GRS model [Fig 1b]. The λ was 1.01
for the MTHFR 677C>T SNP and 0.92 for GRS [S1 Fig].
Cis-CpGs
Meta-analysis on 465,694 CpGs of the MTHFR 677C>T variant showed association with
35 cis- CpGs on chromosome 1 with FDR<0.05 [Fig 1a, S3 Table]. These cis-CpGs
showed a range from 2.4% increase to 1.7% decrease in methylation per MTHFR 677T
allele. The nearest genes associated with this cis-region included MTHFR itself,
AGTRAP, CLCN6, NPPA, NPPB, PLOD1, MFN2 and TNFRSF8. For the GRS model, we
observed 113 cis-CpGs with FDR<0.05 [Fig 1b, S4 Table]. Out of the 113, 16 cis-CpGs
showed overlap with the MTHFR 677C>T analysis, which involved a smaller region of
238 Kb [Fig 1c].
Trans-CpGs
For the MTHFR 677C>T model, meta-analysis of 465,694 CpGs identified 1 significant
trans-CpG which was located on chromosome 6 [Fig 1a, S5 Table]. This trans-CpG
(cg05411165) showed 1% decrease in methylation per MTHFR T allele. It was
annotated near ZNF184 (25414 bp upstream) and HIST1H2BL (309398 bp downstream).
For the GRS model, we observed 30 significant trans-CpGs [Fig 1b]. These trans-CpGs
showed a range from 5.6% increase to 5.1% decrease in methylation per 0.1 unit
increase in GRS. Of these 30 trans-CpGs, 23 were negatively associated with the GRS
model. To assess overlap between two models, we evaluated association of the trans-
CpG of the MTHFR 677 C>T model within the GRS model. This trans-CpG (cg05411165)
showed a 10% decrease in methylation in the GRS model but was not FDR significant
(raw p-value = 0.01).

172 PART B: Homocysteine and DNA methylation
Critical evaluation of the 30 trans-CpGs of GRS model demonstrated that 14
trans-CpGs were located in a large region of 3,08 Mb length within chromosome 6. The
GRS model consists of 18 SNPs including a SNP on chromosome 6. The 14 trans CpG
identified with the GRS model were at a distance between 1 and 5 Mb away from the
Hcy-associated variant rs548987 of the SLC17A3 gene at chromosome 6 [S6a Table].
Conditional analysis: Chromosome 6 region near rs548987
To investigate whether the 14 trans-CpGs on chromosome 6 near rs548987 were
influenced by this variant, we performed conditional analysis on a subset of 3,786
samples from 6 cohorts. After correction of the model for rs548987 as a covariate,
none of the 14 trans-CpGs were significant at a bonferroni threshold of 3.57E-03 [S6b
Table].
Conditional analysis: Influence of SNPs within the GRS model
To further investigate the remaining 16 trans-CpGs from the 30, whether any of them
were driven by a single variant, rather than the combined effect of the 18
homocysteine-associated variants, we checked the trans-CpG mapping analysis of the
single SNPs using the BIOS dataset [12]. We observed that 7 of the 16 remaining trans-
CpGs located >5 Mb from the Hcy-associated variants, were directly associated with
either rs548987 SNP of SLC17A3 gene at chromosome 6, or rs154657 SNP of DPEP1
gene at chromosome 16 [S7a Table]. After correction for these 7 trans-CpGs by
including the respective SNP as a covariate in the model, none of the 7 trans-CpGs
remained significant at a bonferroni threshold of 7.14E-03 [S7b Table]. After correction
for cis-effects of Hcy-associated SNPs in the GRS model, we identified a remaining list
of 9 Hcy-associated trans-CpGs, 4 of which had substantial heterogeneity I2 [S8 Table].
Overlapping trans-CpG between MTHFR and GRS models
When doing a lookup in the MTHFR 677C>T model for the finally identified 5 trans-
CpGs, all of them showed similar direction of effect, but did not achieve genome-wide
significance (Lowest raw p-value = 3.36E-03) [Table 2].
Trans-CpGs affecting Gene Expression
We evaluated whether methylation levels of the observed trans-CpG from the MTHFR
677C>T model and 5 trans-CpGs from the GRS model were associated with expression
levels of the nearby genes, in the BIOS dataset [12]. None of the trans-CpGs was
associated with mRNA expression differences of nearby genes.
H19/IGF2 locus
We specifically focused on the IGF2-H19 region for differential methylation, since
methylation at this locus has repeatedly been linked to the homocysteine metabolism
in a number of studies [29-31]. S4 Fig shows the results of the whole IGF2-H19 region,

CHAPTER 5: Genetically defined homocysteine levels and DNA methylation 173
and the 7 CpGs annotated to 3 DMRs of the IGF2/H19 gene that had previously been
reported to be differentially methylated (DMR0, DMR2, H19-DMR3). Data from our
450k arrays contained 2 CpGs at DMR0, 4 CpGs at DMR2 and 1 CpG at H19-DMR3.
None of them showed an association with MTHFR 677C>T or GRS with a Bonferroni cut
off of 7.14E-03 [S9 Table, S4 Fig].
Enrichment of previously found folate-associated CpGs
Next we focused on a set of 443 CpGs that were identified to be differentially
methylated in children at birth according to the folate levels in the mothers [28]. We
found a highly significant enrichment for significant p-values in the MTHFR model in
the 443 CpGs as compared to a random set of other CpGs (>3 times enrichment of
significant p-values, enrichment p=0.0079). However, we did not find a significant
enrichment for the GRS model.
Global DNA methylation changes
In addition to genome-wide DNA methylation changes we analyzed the effect of
MTHFR 677C>T and GRS models on overall mean methylation levels. There was no
significant association between the MTHFR 677C>T or GRS on global methylation
overall or mean methylation of CpG islands, shores, shelves or non-coding regions
[Table 3] [15].

174 PART B: Homocysteine and DNA methylation
Figure 1a. Manhattan plot. Association between MTHFR 677C>T (rs1801133) and genome-
wide DNA methylation in 9,894 samples, with 35 cis-meQTLs at chromosome 1 (black/grey)
and 1 trans-meQTL at chromosome 6 (green) with FDR<0.05.
Figure 1b. Manhattan plot. Association between GRS of 18 Hcy-associated SNPs and
genome-wide DNA methylation in 9,894 samples, with 113 cis-meQTLs (black/grey) and 30
trans-meQTLs (green), at FDR<0.05.
Chromosome
Chromosome
-lo
g 10(
p)
-lo
g 10(
p)

CHAPTER 5: Genetically defined homocysteine levels and DNA methylation 175
Figure 1c. Regional manhattan plot (chr1: 11824095- 12184574) for MTHFR 677C>T and
GRS – cis overlap. 35 (black) and 16 (green) cis-meQTLs of the MTHFR 677C>T and GRS
model respectively, in 9,894 samples. The overlap involved a small region of 238 kb (green
rectangular line).
Chromosome 1 position(Mb)
-lo
g 10(
p)

176 PART B: Homocysteine and DNA methylation
Tab
le 2
: Gen
om
e-w
ide
tra
ns-
Cp
Gs
wit
h F
DR
<0.0
5; a
sso
ciat
ed w
ith
th
e M
THFR
67
7C
>T m
od
el o
r G
enet
ic R
isk
Sco
re o
f 1
8 H
cy-a
sso
ciat
ed v
aria
nts
.
Cp
G
N
Bet
a SE
P
FD
R
I2
Bet
a
SE
P
Ne
are
st G
en
es
Ch
r B
p
MTH
FR 6
77C
>T M
OD
EL
LOO
KU
P IN
GR
S M
OD
EL
cg0
541
11
65
9
894
-0
.00
5
0.00
1
1.02
E-0
6
1.40
E-0
2
0
-0.0
095
0.
003
8
1.16
E-0
2
ZNF1
84 (
-25
41
4),
HIS
T1H
2B
L (+
30
93
98
) 6
2
74
66
33
4
GR
S M
OD
EL
LOO
KU
P IN
MTH
FR 6
77C
>T M
OD
EL
cg1
280
56
29
6
277
-0
.01
8
0.00
4
3.15
E-0
6
1.23
E-0
2
0
-0.0
023
0.
001
1
3.81
E-0
2
MR
PL5
5 (
+66
98
), A
RF1
(+1
99
54
) 2
1
15
65
65
3
cg08
586
21
6+
98
94
-0.0
02
0.
001
1.
49E-
05
4.
89E-
02
37
.6
-0.0
003
0.
000
1
4.17
E-0
2
TULP
1 (
-13
16
81
), F
KB
P5
(+
44
39
1)
6
35
61
23
51
cg0
062
00
62
9
894
0.
004
0.
001
2.
83E-
06
1.
12E-
02
0
0.
000
7
0.00
03
3.
36E-
03
P
TF1
A (
+62
92)
1
0
23
48
77
75
cg0
067
745
5*
93
34
-0.0
03
0.
001
8.
76E-
06
3.
09E-
02
0
-0
.00
04
0.00
02
3.
63E-
02
C
TDSP
2 (
-26
9)
12
5
82
41
03
9
cg0
125
97
82
6
194
0.
015
0.
004
1.
33E-
05
4.
52E-
02
0
0.
002
1
0.00
10
2.
68E-
02
C
RYM
(+4
54)
1
6
21
31
39
73
Bet
a: R
egre
ssio
n c
oef
fici
ents
, SE
: St
and
ard
err
ors
of
the
regr
essi
on
co
eff
icie
nts
, FD
R:
Fals
e d
isco
very
rat
e ad
just
ed P
-val
ue,
th
resh
old
= 0
.05
, I2
: H
eter
oge
nei
ty I
2
par
amet
er, *
Pro
mo
ter-
asso
ciat
ed, + En
han
cer-
asso
ciat
ed, E
nh
ance
r an
no
tati
on
fro
m Il
lum
ina
45
0k
ann
ota
tio
n
Tab
le 3
: Ass
oci
atio
n o
f M
THFR
67
7C
>T a
nd
Ge
net
ic R
isk
Sco
re o
n m
ean
glo
bal
met
hyl
atio
n le
vels
Me
thyl
atio
n
N
I2
Bet
a SE
P
MTH
FR 6
77C
>T
G
LOB
AL
3,78
6
0.14
4.
00E-
06
1
.50
E-0
5
0.8
1
CG
I 3,
786
0.
58
-1.9
0E-
05
4
.90
E-0
5
0.7
0
SHE
3,
786
0.
59
3.70
E-0
5
5.5
0E-
05
0
.50
SHO
3,
786
0.
14
-9.0
0E-
06
4
.80
E-0
5
0.8
5
NC
3,
786
0.
61
2.70
E-0
5
4.9
0E-
05
0
.57
GR
S
GLO
BA
L 3,
786
0.
67
-1.3
0E-
05
5
.60
E-0
5
0.8
1
CG
I 3,
786
0.
07
-1.8
4E-
04
1
.81
E-0
4
0.3
1
SHE
3,
786
0.
00
2.29
E-0
4
2.0
1E-
04
0
.25
SHO
3,
786
0.
52
-1.2
0E-
04
1
.76
E-0
4
0.5
0
NC
3,
786
0.
07
1.94
E-0
4
1.7
8E-
04
0
.28
Bet
a: R
egre
ssio
n c
oef
fici
ents
, SE:
Sta
nd
ard
err
ors
of
the
regr
essi
on
co
eff
icie
nts
, I2 : H
eter
oge
nei
ty I2 p
aram
eter
CG
I = C
pG
Isla
nd
s, S
HE
= C
pG
Sh
elve
s, S
HO
= C
pG
Sh
ore
s, N
C =
Cp
Gs
at N
on
-Co
din
g re
gio
ns

CHAPTER 5: Genetically defined homocysteine levels and DNA methylation 177
DISCUSSION
This is the first large-scale study to investigate the effect of Hcy-associated SNPs on
genome-wide DNA methylation using the Illumina 450k arrays in 9,894 individuals. The
results showed no widespread trans-effects of the MTHFR 677C>T SNP on DNA
methylation, apart from 1 trans-CpG at chromosome 6. The GRS model showed 5
trans-CpGs, after carefully examining the direct effects of individual SNPs with
conditional analyses.
In this current study, we used MTHFR 677C>T independently and the
combined weighted GRS of the 18 Hcy-associated variants [5], to test whether mildly
elevated Hcy concentrations induce DNA methylation changes in blood cells. Our goal
was to investigate genetically defined elevated Hcy on genome-wide DNA methylation.
The use of genetic variants is less sensitive to confounding and bias as compared to
classical epidemiological studies [32].
We calculated the strength of our exposure variables: MTHFR 677C>T and
GRS using the F-statistics. For a strong exposure, the value of the F-statistics is
expected to be greater than 10 [33]. With our large sample size (n=9,894) and
proportion of variance explained being 5.3 to 5.9%, the F-statistics was 554 and 621
respectively, indicating very high strength and enough power of our analysis. However,
we did not observe widespread trans-effects despite of having strong additive MTHFR
677C>T and GRS.
We observed a single trans-CpG for the MTHFR 677C>T variant. This CpG is
located near ZNF184 and HIST1H2BL. Both these genes are thought to play a role in
transcriptional regulation. For the GRS, we found 30 trans-CpGs associated, 14 of which
are spread over a region of 3,08 Mb at chromosome 6. These CpGs were annotated to
genes that included ZNF322 and HIST1H2BJ, HLA-J, HLA-A, HLA-G, but also the proximal
region of ZFP57 gene, which was previously identified as a folate-sensitive region in a
genome-wide methylation study of 23 women [34]. However, when we performed a
conditional analysis on these 14 CpGs in this region, by adjusting for the nearby variant
rs548987 of the SLC17A3 gene, the effect sizes significantly attenuated and the
nominal p-values were no more significant. The results indicate that this region was
influenced by the rs548987 SNP of SLC17A3 gene and was not Hcy-associated.
We finally observed 5 trans-CpGs associated to genetically defined Hcy using
the GRS, after carefully examining the direct effects of individual SNPs with conditional
analyses and discarding CpGs that showed substantial cohort heterogeneity I2. A total
of 3 CpGs showed hypomethylation, one of which was annotated to the FKBP5 gene.
FKBP5 encodes for the FK506-binding protein 51 (FKBP51) whose expression has
recently been shown to decrease DNMT1 activity and thereby decreasing global
methylation [35].
Furthermore, when looking at our methylation-expression results [12], none
of the 5 trans-CpGs was associated with mRNA expression differences of nearby genes.
178 PART B: Homocysteine and DNA methylation
The possible explanation for these negative findings could be that these CpG sites
might have an effect further away on trans-genes. Conversely, it has been shown that
the methylation-expression correlation in cis are not best predicted using the CpG
position alone, but by using specific chromatin marks [36]. Furthermore, it could also
be that these correlations are specific to other tissues, but not in blood.
We observed that the IGF2-H19 locus did not show association with
methylation according to genetically defined elevated homocysteine. This is in contrast
to the previous findings in mice, where tissue-specific changes in H19 DMR methylation
were found in liver, brain and aorta, and increased expression of H19 was found in
aorta [26, 27]. Similar to what we found, the H19-DMR3 between CBS deficient
patients and controls also did not show a significant difference, in a previous study
[29]. Our results show that this imprinted locus is not deregulated by long-term
genetically defined mildly elevated homocysteine. However, previously it was reported
that MTHFR 677C>T variant shows changes in DNA methylation in peripheral blood
mononuclear cells, only through an interaction with folate [7]. Hence, further studies
are needed to study the effect of MTHFR 677C>T variant in the presence of blood
folate levels.
We did not see widespread methylation changes associated to mildly
elevated plasma Hcy concentrations. This result is not in line with a number of earlier
reports, which have shown global methylation changes in association with the MTHFR
677C>T variant and Hcy concentrations [3]. Previous two studies on this topic have
shown contradictory results. There has been reports that showed a lower circulating
global methylation level in individuals with the MTHFR 677TT genotype [6],[7].
However, there are also a few negative studies that showed no relation between the
MTHFR 677TT genotype and global methylation levels [8-10]. All these studies had
modest sample sizes (upto 300 individuals were studied), and measured methylation
on a global level using the LINE-1 assay, which measures a repetitive sequence, of
which the function is unknown. In contrast, we here studied a genome wide site-
specific analysis focused on functional regions of the genome [15]. We here show
convincing evidence that there is no association between the MTHFR 677C>T or GRS on
overall methylation levels, nor is there a relationship between methylation of CpG
islands, shores, shelves or non-coding regions separately, which supports the previous
null associations.
Furthermore, in order to test for causal effect in a mendelian randomization
study, an instrument, which is in our case MTHFR 677C>T or GRS, should satisfy the 3
basic assumptions [37, 38]. One, the instrument should be associated with the
exposure, which is in our case Hcy. Two, the instrument should not affect the outcome,
which is in our case DNA methylation, except through the exposure Hcy. Three, the
instrument should not be associated with any confounder of the exposure-outcome

CHAPTER 5: Genetically defined homocysteine levels and DNA methylation 179
association. Although assumptions one and two are satisfied in our case [5], the GRS
model might violate assumption three [37, 38].
The GRS model contains a few SNPs which are, in addition to the association
with Hcy, also associated with other traits. For example, the variants near to HNF1A
gene have been associated with a number of other traits [39-44]. This could also be the
reason why the results of the MTHFR 677C>T and GRS models are quite different.
Nevertheless, the MTHFR 677C>T variant explains most of the variation in Hcy, as
compared to the other variants in the GRS model and is therefore a strong instrument
to examine the effect of deregulation of the one-carbon metabolism on methylation.
The relationship between MTHFR 677C>T and DNA methylation is modified by
folate levels. Only in individuals with low folate status, the effect of the MTHFR 677TT
genotype is seen [7]. Unfortunately, we were unable to study this interaction, since
folate levels were not available in our study. Another prerequisite to be able to
perform MR is that the relationship between Hcy and methylation is known. The
relationship between Hcy and DNA methylation is only known in studies until now
where methylation is measured at a global level. Therefore, the estimation of the
causal effect could not be done. Unfortunately, we also did not have Hcy data available
in all cohorts of this study, and therefore were unable to perform a full mendelian
randomization study. We rather focused on the association of genetically defined
elevated Hcy levels with DNA methylation.
We did not find widespread differences in methylation related to genetically
defined homocysteine levels. The association was not observed in global methylation
levels nor in widespread CpGs including the previously known H19/IGF2 locus. There
are a number of possible explanations for this finding. First, it is known that the
relationship between MTHFR 677C>T and DNA methylation is modified by folate levels,
as described above. The effect of MTHFR 677C>T is seen in individuals with low folate
status [7], which could have masked possible relationships between the MHTFR variant
and methylation. A second possible explanation for the relative low number of
identified CpGs, is that we have studied the wrong tissue. Most methylation measures
are conducted in blood leukocytes as this tissue is readily available. However, the
causal effect of Hcy could be specific to other tissues like liver, heart and brain.
Therefore, the possible effect of mildly elevated Hcy on such specific tissues cannot be
excluded. Third, there is little variation in the one-carbon metabolism in the normal
population. This metabolism is pivotal to cell survival and function and therefore tidily
regulated. It could be that there is a correlation between homocysteine and more
pronounced effects on methylation when homocysteine levels are more extreme.

180 PART B: Homocysteine and DNA methylation
CONCLUSIONS
We observed 1 trans-CpG (nearest genes ZNF184 and HIST1H2BL) on chromosome 6
associated with the MTHFR 677C>T variant. The GRS model showed 5 significant trans-
CpGs, which do not overlap with the MTHFR trans-CpG. In conclusion, our results do
not show widespread statistically significant trans-effects of MTHFR and GRS models,
and therefore do not support the hypothesis that genetically defined mildly elevated
Hcy concentrations are associated with widespread methylation changes in leukocytes.
More studies with measured Hcy concentrations are needed to confirm this.

CHAPTER 5: Genetically defined homocysteine levels and DNA methylation 181
S1
Tab
le. C
oh
ort
ch
arac
teri
stic
s [A
dd
itio
nal
su
pp
lem
enta
ry m
ater
ial a
cco
mp
anie
s th
is p
aper
at
htt
p:/
/jo
urn
als
.plo
s.o
rg/p
loso
ne.
]
Stu
dy
Co
ho
rts
N
Wo
men
[%
]
MTH
FR g
eno
typ
e
GR
S2
[Mea
n(S
.D.)
] A
ge
[Mea
n(S
.D.)
] G
ran
[M
ean
(S.D
.)]
Lym
[M
ean
(S.D
.)]
Mo
no
[M
ean
(S.D
.)]
Stu
dy
Des
ign
%
CT
%
TT
CH
AR
GE
con
sort
ium
RS-
III-I
7
29
54
.0
41.6
(3
03)
8.6
(6
3)
1.09
(0
.19)
59
.86
(8
.16)
4.
21
(1.5
1)
2.42
(0
.67
) 0
.42
(0
.42
) P
rosp
ecti
ve,
Po
pu
lati
on
-bas
ed
LBC
19
21
4
36
60
.3
45.0
(1
96)
12.4
(2
4)
1.13
(0
.19)
79
.10
(0
.60)
4.
6 (1
.34)
0.
17
(0.1
7)
0.02
(0
.04)
1.
71
(1.1
2)
0.5
4
(0.1
8)
Pro
spec
tive
, p
op
ula
tio
n-b
ased
LBC
19
36
9
05
49
.4
43.2
(3
91)
11.4
(1
03)
1.17
(0
.18)
69
.60
(0
.80)
4.
5 (1
.54)
0.
17
(0.1
3)
0.04
(0
.04)
1.
90
(1.4
3)
0.5
3
(0.1
9)
Pro
spec
tive
, p
op
ula
tio
n-b
ased
KO
RA
17
99
51.1
4
5
(779
) 10
.6
(183
) 1.
11
(0.1
8)
60.9
8
(8.8
9)
0.33
(0
.09)
0.
10W
(0
.07)
0.
16X
(0.0
6)
0.0
2Y
(0.0
2)
0.0
5Z
(0.0
3)
0.1
2
(0.0
3)
Pro
spec
tive
, p
op
ula
tio
n-b
ased
FHS
2408
54
.3
58.9
(1
206)
18
.2
(306
) 1.
12
(0.1
7)
66.4
(8
.93)
0.
49
(0.0
9)
0.10
W
(0.0
6)
0.19
X
(0.0
6)
0.0
2Y
(0.0
2)
0.0
4Z
(0.0
3)
0.1
3
(0.0
3)
Pro
spec
tive
, p
op
ula
tio
n-b
ased
BIO
S co
nso
rtiu
m
RS-
II-3
/ R
S-III
-2
72
2
57.8
43
.2
(312
) 12
.3
(89)
1.
15
(0.1
9)
67.6
0
(5.9
8)
48.3
2N
(7.0
4)
2.74
E
(0.7
3)
0.68
B
(0.1
8)
39.6
6
(9.7
1)
7.1
9
(1.3
0)
Pro
spec
tive
, p
op
ula
tio
n-b
ased
LLS
73
9
51.7
48
.0
(355
) 11
.8
(87)
1.
14
(0.1
8)
58.9
8
(6.7
0)
58.1
4N
(7.9
3)
2.63
E
(1.1
7)
0.64
B
(0.2
5)
29.5
2
(6.1
8)
5.6
8
(1.1
6)
Pro
spec
tive
, fa
mily
-bas
ed
LLD
7
44
57
.8
44.2
(3
29)
9.9
(7
4)
1.13
(0
.17)
45
.56
(1
3.3
2)
54.1
5N
(7.2
2)
2.93
E
(1.4
9)
0.54
B
(0.2
5)
33.4
7
(7.1
0)
8.1
4
(1.5
3)
Pro
spec
tive
, p
op
ula
tio
n-b
ased
NTR
6
91
68
.5
41.8
(2
89)
10.3
(7
1)
1.12
(0
.18)
33
.95
(1
2.1
1)
52.5
9N
(7.6
6)
2.81
E
(1.2
1)
0.47
B
(0.4
1)
35.1
1
(7.8
1)
7.7
2
(2.0
8)
-
CO
DA
M
16
1
45.3
43
.5
(70)
12
.4
(20)
1.
14
(0.1
7)
65.4
0
(6.7
7)
40.6
7N
(6.9
7)
2.80
E
(0.6
3)
0.75
B
(0.2
0)
51.1
1
(14.
06
) 7
.95
(1
.63
) P
rosp
ecti
ve,
Ob
serv
atio
nal
Oth
er c
oh
ort
s
MA
RTH
A
34
9
78.5
48
.1
(168
) 11
.7
(41)
1.
14
(0.1
8)
43.7
7
(14.
09)
4.
58
(0.3
8)
1.87
(0
.62
) 0
.32
(0
.13
) R
etro
spec
tive
F5L
21
1
52.1
48
.8
(103
) 20
.9
(44)
1.
15
(0.1
8)
39.7
(1
6.8
0)
0.56
(0
.13)
0.
04W
(0
.04)
0.
22X
(0.0
8)
0.1
0Y
(0.0
5)
0.1
0Z
(0.0
3)
0.0
8
(0.0
3)
Ped
igre
e-b
ased
N N
eutr
op
hils
, E Eo
sin
op
hils
, B B
aso
ph
ils (
Imp
ute
d),
W C
D8
T, X
CD
4T,
Y NK
, Z Bce
ll (I
mp
ute
d);
Pat
ho
ph
ysio
logy
= M
ain
ly h
ealt
hy
(exc
ept
CO
DA
M =
Mild
ly in
crea
sed
DM
2/C
VD
ris
k fa
cto
rs, M
AR
THA
= P
atie
nts
wit
h v
eno
us
thro
mb
oem
bo
lism
, F5
L =
Pro
ban
ds
wit
h V
TE)

182 PART B: Homocysteine and DNA methylation
REFERENCES 1. Ehrlich M. DNA methylation in cancer: too much, but also too little. Oncogene
2002;21:5400-13. 2. Klutstein M, Nejman D, Greenfield R, Cedar H. DNA Methylation in Cancer and Aging.
Cancer Res 2016;76:3446-50. 3. Mandaviya PR, Stolk L, Heil SG. Homocysteine and DNA methylation: a review of animal
and human literature. Mol Genet Metab 2014;113:243-52. 4. Borges MC, Hartwig FP, Oliveira IO, Horta BL. Is there a causal role for homocysteine
concentration in blood pressure? A Mendelian randomization study. Am J Clin Nutr 2016;103:39-49.
5. van Meurs JB, Pare G, Schwartz SM, Hazra A, Tanaka T, Vermeulen SH, et al. Common genetic loci influencing plasma homocysteine concentrations and their effect on risk of coronary artery disease. Am J Clin Nutr 2013;98:668-76.
6. Castro R, Rivera I, Ravasco P, Camilo ME, Jakobs C, Blom HJ, de Almeida IT. 5,10-methylenetetrahydrofolate reductase (MTHFR) 677C-->T and 1298A-->C mutations are associated with DNA hypomethylation. J Med Genet 2004;41:454-8.
7. Friso S, Choi SW, Girelli D, Mason JB, Dolnikowski GG, Bagley PJ, et al. A common mutation in the 5,10-methylenetetrahydrofolate reductase gene affects genomic DNA methylation through an interaction with folate status. Proc Natl Acad Sci U S A 2002;99:5606-11.
8. Narayanan S, McConnell J, Little J, Sharp L, Piyathilake CJ, Powers H, et al. Associations between two common variants C677T and A1298C in the methylenetetrahydrofolate reductase gene and measures of folate metabolism and DNA stability (strand breaks, misincorporated uracil, and DNA methylation status) in human lymphocytes in vivo. Cancer Epidemiol Biomarkers Prev 2004;13:1436-43.
9. Hanks J, Ayed I, Kukreja N, Rogers C, Harris J, Gheorghiu A, et al. The association between MTHFR 677C>T genotype and folate status and genomic and gene-specific DNA methylation in the colon of individuals without colorectal neoplasia. Am J Clin Nutr 2013;98:1564-74.
10. Pufulete M, Al-Ghnaniem R, Rennie JA, Appleby P, Harris N, Gout S, et al. Influence of folate status on genomic DNA methylation in colonic mucosa of subjects without colorectal adenoma or cancer. Br J Cancer 2005;92:838-42.
11. Psaty BM, O'Donnell CJ, Gudnason V, Lunetta KL, Folsom AR, Rotter JI, et al. Cohorts for Heart and Aging Research in Genomic Epidemiology (CHARGE) Consortium: Design of prospective meta-analyses of genome-wide association studies from 5 cohorts. Circ Cardiovasc Genet 2009;2:73-80.
12. Bonder MJ, Luijk R, Zhernakova DV, Moed M, Deelen P, Vermaat M, et al. Disease variants alter transcription factor levels and methylation of their binding sites. Nat Genet. 2017 Jan;49:131-138.
13. Pidsley R, CC YW, Volta M, Lunnon K, Mill J, Schalkwyk LC. A data-driven approach to preprocessing Illumina 450K methylation array data. BMC Genomics 2013;14:293.
14. Maksimovic J, Gordon L, Oshlack A. SWAN: Subset-quantile within array normalization for illumina infinium HumanMethylation450 BeadChips. Genome Biol 2012;13:R44.
15. Slieker RC, Bos SD, Goeman JJ, Bovee JV, Talens RP, van der Breggen R, et al. Identification and systematic annotation of tissue-specific differentially methylated regions using the Illumina 450k array. Epigenetics Chromatin 2013;6:26.
16. Bonder MJ, Kasela S, Kals M, Tamm R, Lokk K, Barragan I, et al. Genetic and epigenetic regulation of gene expression in fetal and adult human livers. BMC Genomics 2014;15:860.

Chapter 5: Genetically defined homocysteine levels and DNA methylation 183
17. Aryee MJ, Jaffe AE, Corrada-Bravo H, Ladd-Acosta C, Feinberg AP, Hansen KD, Irizarry RA. Minfi: a flexible and comprehensive Bioconductor package for the analysis of Infinium DNA methylation microarrays. Bioinformatics 2014;30:1363-9.
18. Mevik B.H WR. The pls Package: Principal Component and Partial Least Squares Regression in R. Journal of Statistical Software 2007;18.
19. Dekkers KF, van Iterson M, Slieker RC, Moed MH, Bonder MJ, van Galen M, et al. Blood lipids influence DNA methylation in circulating cells. Genome Biol 2016;17:138.
20. Willer CJ, Li Y, Abecasis GR. METAL: fast and efficient meta-analysis of genomewide association scans. Bioinformatics 2010;26:2190-1.
21. Devlin B, Roeder K. Genomic control for association studies. Biometrics 1999;55:997-1004.
22. Tsepilov YA, Ried JS, Strauch K, Grallert H, van Duijn CM, Axenovich TI, Aulchenko YS. Development and application of genomic control methods for genome-wide association studies using non-additive models. PLoS One 2013;8:e81431.
23. McLean CY, Bristor D, Hiller M, Clarke SL, Schaar BT, Lowe CB, et al. GREAT improves functional interpretation of cis-regulatory regions. Nat Biotechnol 2010;28:495-501.
24. Speir ML, Zweig AS, Rosenbloom KR, Raney BJ, Paten B, Nejad P, et al. The UCSC Genome Browser database: 2016 update. Nucleic Acids Res 2016;44:D717-25.
25. Brion MJ, Shakhbazov K, Visscher PM. Calculating statistical power in Mendelian randomization studies. Int J Epidemiol 2013;42:1497-501.
26. Devlin AM, Bottiglieri T, Domann FE, Lentz SR. Tissue-specific changes in H19 methylation and expression in mice with hyperhomocysteinemia. J Biol Chem 2005;280:25506-11.
27. Glier MB, Ngai YF, Sulistyoningrum DC, Aleliunas RE, Bottiglieri T, Devlin AM. Tissue-specific relationship of S-adenosylhomocysteine with allele-specific H19/Igf2 methylation and imprinting in mice with hyperhomocysteinemia. Epigenetics 2013;8:44-53.
28. Joubert BR, den Dekker HT, Felix JF, Bohlin J, Ligthart S, Beckett E, et al. Maternal plasma folate impacts differential DNA methylation in an epigenome-wide meta-analysis of newborns. Nat Commun 2016;7:10577.
29. Heil SG, Riksen NP, Boers GH, Smulders Y, Blom HJ. DNA methylation status is not impaired in treated cystathionine beta-synthase (CBS) deficient patients. Mol Genet Metab 2007;91:55-60.
30. Koukoura O, Sifakis S, Soufla G, Zaravinos A, Apostolidou S, Jones A, et al. Loss of imprinting and aberrant methylation of IGF2 in placentas from pregnancies complicated with fetal growth restriction. Int J Mol Med 2011;28:481-7.
31. Guo L, Choufani S, Ferreira J, Smith A, Chitayat D, Shuman C, et al. Altered gene expression and methylation of the human chromosome 11 imprinted region in small for gestational age (SGA) placentae. Dev Biol 2008;320:79-91.
32. Palmer TM, Lawlor DA, Harbord RM, Sheehan NA, Tobias JH, Timpson NJ, et al. Using multiple genetic variants as instrumental variables for modifiable risk factors. Stat Methods Med Res 2012;21:223-42.
33. Pierce BL, Ahsan H, Vanderweele TJ. Power and instrument strength requirements for Mendelian randomization studies using multiple genetic variants. Int J Epidemiol 2011;40:740-52.
34. Amarasekera M, Martino D, Ashley S, Harb H, Kesper D, Strickland D, et al. Genome-wide DNA methylation profiling identifies a folate-sensitive region of differential methylation upstream of ZFP57-imprinting regulator in humans. Faseb J 2014;28:4068-76.

184 PART B: Homocysteine and DNA methylation
35. Gassen NC, Fries GR, Zannas AS, Hartmann J, Zschocke J, Hafner K, et al. Chaperoning epigenetics: FKBP51 decreases the activity of DNMT1 and mediates epigenetic effects of the antidepressant paroxetine. Sci Signal 2015;8:ra119.
36. Wagner JR, Busche S, Ge B, Kwan T, Pastinen T, Blanchette M. The relationship between DNA methylation, genetic and expression inter-individual variation in untransformed human fibroblasts. Genome Biol 2014;15:R37.
37. Swanson SA, Hernan MA. Commentary: how to report instrumental variable analyses (suggestions welcome). Epidemiology 2013;24:370-4.
38. Martens EP, Pestman WR, de Boer A, Belitser SV, Klungel OH. Instrumental variables: application and limitations. Epidemiology 2006;17:260-7.
39. Ligthart S, de Vries PS, Uitterlinden AG, Hofman A, group CIw, Franco OH, et al. Pleiotropy among common genetic loci identified for cardiometabolic disorders and C-reactive protein. PLoS One 2015;10:e0118859.
40. Below JE, Gamazon ER, Morrison JV, Konkashbaev A, Pluzhnikov A, McKeigue PM, et al. Genome-wide association and meta-analysis in populations from Starr County, Texas, and Mexico City identify type 2 diabetes susceptibility loci and enrichment for expression quantitative trait loci in top signals. Diabetologia 2011;54:2047-55.
41. Bonnycastle LL, Willer CJ, Conneely KN, Jackson AU, Burrill CP, Watanabe RM, et al. Common variants in maturity-onset diabetes of the young genes contribute to risk of type 2 diabetes in Finns. Diabetes 2006;55:2534-40.
42. Lauc G, Essafi A, Huffman JE, Hayward C, Knezevic A, Kattla JJ, et al. Genomics meets glycomics-the first GWAS study of human N-Glycome identifies HNF1alpha as a master regulator of plasma protein fucosylation. PLoS Genet 2010;6:e1001256.
43. Hegele RA, Cao H, Harris SB, Hanley AJ, Zinman B, Connelly PW. The private hepatocyte nuclear factor-1alpha G319S variant is associated with plasma lipoprotein variation in Canadian Oji-Cree. Arterioscler Thromb Vasc Biol 2000;20:217-22.
44. Pierce BL, Ahsan H. Genome-wide "pleiotropy scan" identifies HNF1A region as a novel pancreatic cancer susceptibility locus. Cancer Res 2011;71:4352-8.

Chapter 5: Genetically defined homocysteine levels and DNA methylation 185
CHAPTER 6
Interaction between plasma homocysteine and the
MTHFR c.677C>T polymorphism is associated with
site-specific changes in DNA methylation in humans
Alexander J Nash1*, Pooja R Mandaviya2,3*, Marie-Joe Dib5, André G. Uitterlinden3,
Joyce van Meurs3, Sandra G Heil2**, Toby Andrew4** and Kourosh R Ahmadi5**
*These authors contributed equally as first authors
**These authors contributed equally as senior authors
Submitted for publication

186 PART B: Homocysteine and DNA methylation
ABSTRACT
One-carbon metabolism provides a direct link between dietary folate/vitamin B12
exposure, the activity of the enzyme methylenetetrahydrofolate reductase (MTHFR)
and epigenetic regulation of the genome via DNA methylation. Previously, Friso et al.
(2002) showed that the common c.677C>T polymorphism in MTHFR influences global
DNA methylation status through a direct interaction with folate status and (indirectly)
with homocysteine (tHcy) levels. To build on this observation, we investigated whether
interaction between mildly elevated plasma tHcy and the c.677C>T polymorphism is
associated with site-specific changes in DNA methylation in humans. We used data on
plasma tHcy levels, c.677C>T polymorphism, and site-specific DNA methylation levels
for a total of 915 Caucasian females and 335 males from the TwinsUK (n=610) and
Rotterdam study (n=670). We carried out methylome-wide association analyses in each
cohort to model the interaction between levels of tHcy and c.677C>T genotypes on
DNA methylation beta values. Our meta-analysis identified a total of 13 probes
significantly associated with [rs1801133 x tHcy] levels (FDR<0.05). The most significant
associations were with a cluster of probes at the AGTRAP-MTHFR-NPPA/B gene locus
on chromosome 1 (FDR=1.3E-04), with additional probes on chromosomes 2, 3, 4, 7,
12, 16 and 19. Our top 2 hits on chromosome 1 were functionally associated with
variability in expression of the TNFRSF8 gene/locus on this chromosome. This is the
first study to provide a direct link between perturbations in one-carbon metabolism,
through an interaction of tHcy and the activity of MTHFR enzyme on epigenetic
regulation of the genome via DNA methylation.
SIGNIFICANCE STATEMENT
A previous study by Friso et al. (PNAS 2002) has shown that folate status is associated
with reduced genomic DNA methylation through a direct interaction with the common
c.677C>T polymorphism in the MTHFR gene. This has highlighted an important
epigenetic mechanism that links dietary exposure to aberrant genome regulation. To
build on this observation, we sought to provide a direct link between perturbations in
folate mediated one-carbon metabolism and epigenetic regulation of the genome via
site-specific DNA methylation through an interaction between total
plasma homocysteine - an integrative biomarker of one-carbon metabolism - and the
activity of MTHFR enzyme. We identify a number of sites/loci that are dynamically
regulated by this interaction.

CHAPTER 6: Homocysteine levels x MTHFR 677C>T and DNA methylation 187
INTRODUCTION
One-carbon metabolism (1-CM), comprising of the folate cycle and methionine
pathway, plays fundamental roles in a variety of essential biochemical processes
pertinent to healthy development and ageing, most notably provision of methyl
residues (-CH3) to DNA, proteins and hormones [1]. Perturbations in 1-CM function can
occur either through low dietary exposure to 1-carbon donors, the most studied of
which is folate, malabsorption of the cofactor vitamin B12, and/or genetic variation
within genes that play important functions in normal 1-CM, most notably the MTHFR
c.677C>T (SNP rs1801133). The consequences of perturbed 1-CM, irrespective of the
cause, include reduced remethylation of homocysteine (tHcy) into methionine leading
to elevated plasma tHcy levels, as well as a reduction in cellular methylation potential
[2].
Mild elevations in plasma tHcy has been unequivocally associated with
increased risk of a myriad of adverse outcomes in observational studies, including
cardiovascular and cerebrovascular disease, as well as increased rate of cognitive
impairment and vascular dementia [3-5]. Whilst there is strong interest and growing
evidence linking 1-CM function to aberrant DNA methylation [6-9], there are currently
no systematic studies investigating the combined contribution of 1-CM function and
the activity of the enzyme methylenetetrahydrofolate reductase (MTHFR) to epigenetic
regulation of the genome via DNA methylation. Notably, a previous study by Friso et al.
(2002) has shown that the common c.677C>T polymorphism in MTHFR influences
global DNA methylation status through a direct interaction with folate status [10]. The
Friso et al. study very elegantly showed that whilst global DNA methylation was
independently associated with folate status, tHcy levels, and the MTHFR c.677C>T
polymorphism, the association was principally driven by the interaction between the
TT genotypes in MTHFR and low folate status culminating in a 50% reduction in the
level of genomic DNA methylation in this group. Importantly, homozygosity for the
c.677C>T polymorphism, especially in combination with low folate status, is also known
to predispose to high plasma levels of fasting tHcy [11].
To build on these important observations and to systematically assess the
impact of this interaction on site-specific DNA methylation patterns across the
methylome in humans, we used total plasma Hcy (tHcy), MTHFR c.677C>T
polymorphism, and site-specific DNA methylation levels from the Illumina 450k array of
1,280 individuals from two cohorts; TwinsUK (n=610) and Rotterdam study (n=670)
respectively. We decided to focus on tHcy, as opposed to folate status, for two
reasons. First, inadequate data coverage for folate meant that we were able to carry
out the desired MWAS analysis in only n=200 samples from TwinsUK; folate levels were
not available in the RS samples with methylation data. Secondly, we were more
interested in unravelling the relationship between MTHFR c.677C>T, site-specific DNA
methylation and tHcy. As tHcy has been shown to be a powerful integrative biomarker

188 PART B: Homocysteine and DNA methylation
of 1-CM function in health and disease we focused our analyses on this biomarker. Our
overarching hypothesis was that elevated tHcy, a direct proxy for low folate status, in
subjects harbouring at least one copy of the rs1801133 T allele is significantly
associated with decreased DNA methylation levels at specific sites in the methylome.
To this end, we performed a meta-analysis of the two cohorts to identify differentially
methylated positions (DMPs) associated with MTHFR c.677C>T x tHcy interaction.
Through this study we examined an important paradigm and gained novel mechanistic
insight into the epigenetic consequences of this gene-nutrient interaction.
MATERIAL AND METHODS
Study populations
A total of 610 female twins from the TwinsUK registry (Table 1) and 670 participants
from the Rotterdam study cohort with data on age, sex, height/weight used to
calculate BMI, total plasma tHcy concentrations, smoking status, cell counts and site-
specific DNA methylation based on the 450k array were included in the study. All
participants were of North European descent and between 18 and 87 years old. In the
TwinsUK cohort, we excluded subjects from the study that were on (i) any long-term
medication(s) and/or with self-reported history of chronic diseases including
hypertension or on any B-vitamin dietary supplements in the three months before
participation. The Rotterdam cohort consisted of a randomly selected sub-sample of
the Rotterdam study cohort (supplementary notes). We also excluded samples in both
cohorts that showed evidence of being potential outliers or showing residual
methylation array batch effects using iterative robust regression methods (see
Methods).
This study was conducted according to the guidelines laid down in the
Declaration of Helsinki and all procedures involving human subjects/patients were
approved by the St. Thomas’ Hospital Research Ethics Committee (EC04/015 TwinsUK)
and Institutional review board (Medical Ethics Committee) of the Erasmus Medical
Centre. Written informed consent was obtained from all subjects.
GENOME-WIDE DNA METHYLATION ANALYSIS
Methylation array data preparation and quality control
Genomic DNA was isolated from whole blood using the NORGEN DNA Purification Kit in
TwinsUK (Norger Biotek Corporation) according to the manufacturer’s protocol or by
standardized salting out methods in Rotterdam. Approximately 700ng of each DNA
sample was bisulphite converted using the EZ-96 DNA Methylation Kit (Zymo Research)
according to the supplier’s protocol. Bisulphite-treated DNA was then quantified using
the NanoDrop ND-100 (NanoDrop Technologies).

CHAPTER 6: Homocysteine levels x MTHFR 677C>T and DNA methylation 189
Methylation profiling was performed on the bisulphite-converted DNA
samples using the Illumina Infinium HumanMethylation450 BeadChip. Briefly, 5 µl of
each bisulphite-converted DNA sample was processed following the Illumina protocol.
The HumanMethylation450 BeadChip targets 485,764 methylation sites across the
genome and interrogates the methylation state of each site using two assay designs:
the Infinium I assay which has two bead types per CpG site, one each for the
methylated and unmethylated states; and the Infinium II assay which has one bead
type and determines methylation state with a single base extension step. The
BeadChips were scanned with the Illumina HiScan SQ scanner and the raw data was
imported to the GenomeStudio v.2010.3 software with the methylation module 1.8.2
for extraction of the image intensities.
Signal intensities for the methylated and un-methylated states were then
quantile normalized for each probe type separately and beta values were calculated
using R. The methylation state of each site is represented by a beta value (β), which is
the ratio of the intensity of the methylated bead type (M) to the combined locus
intensity (M+U+α) and ranges from 0 to 1. Data normalization [12] was performed on
raw β values using Bioconductor packages implemented in R [13].
MTHFR 677C>T polymorphism
Genotypes for the MTHFR c.677C>T single nucleotide polymorphism (SNP rs1801133)
were extracted from existing whole-genome Illumina/HumanHap array data from each
cohort and utilised for the study analyses.
Exploratory Analysis and Model Fitting
Following Friso et al., we first used genomic methylation summary data from both the
TwinsUK and Rotterdam Study cohorts to assess the relationship between genome-
wide methylation and plasma tHcy levels and to control for technical variation in order
to select a best-fit model to implement as part of the methylome wide association
study. To do this, we first calculated the median genomic methylation level for each
sample based upon the Illumina 450k array data that passed quality control. Using
univariate and multiple regression analyses, median genomic methylation levels were
regressed upon technical covariates to control for plate layout and batch effects,
measured blood cell composition and key demographic variables such as age, sex,
smoking status and body mass index.
Removal of outliers
Samples with different collection dates between methylation and tHcy data and
samples that showed evidence of residual methylation array batch effects were
identified. Only samples with tHcy values within the 95% of the distribution (between
5-30μmol/l) were retained and included in the analysis. Additional sample outliers

190 PART B: Homocysteine and DNA methylation
were identified and removed (TwinsUK n=40 and Rotterdam n= 27) by regressing
genomic median methylation levels upon total tHcy plasma using iterative robust
regression methods implemented in Stata (rreg procedure) and R (rlm function).
STATISTICAL ANALYSIS
Methylome-wide association study (MWAS)
DNA methylation at each Illumina probe was assessed for association with tHcy
stratified by the MTHFR c.677C>T polymorphism (with rs1801133 genotypes coded 0
for CC and 1 for CT/TT). In TwinsUK, a mixed linear regression model was implemented
in R using the LME4 package with DNA methylation at each probe regressed upon age,
batch, cell count data and position on the BeadChip as fixed effects, and zygosity and
family identifier included as random effects for the Null model. A similar model was
implemented in Rotterdam Study, but batch effects were used as random effects. The
Full model was identical to the Null but included two additional variables of interest to
model the interaction between tHcy and the rs1801133 genotype. The interaction
model for each methylation probe was parameterised to include two nested
interaction terms with the first parameter (tHcy0) used to estimate the regression
coefficient between probe methylation and tHcy for individuals with the rs1801133
genotype CC and a second parameter (tHcy1) to model the strength of association
between methylation and tHcy for individuals with the CT/TT genotypes. Both
regression lines were conservatively assumed to share the same intercept term for the
MWAS. The potential interaction at each probe was then assessed by comparison of
the full- and nested sub-model using a likelihood ratio (LLR) test. The model p value
generated to assess potential differential methylation at each probe was calculated
using the likelihood ratio test statistic, which is asymptotically Chi-squared with k
degrees of freedom, where k is the number of model parameters estimated. For this
test, the p-value of the effect of tHcy stratified by c.677C>T was calculated from the
Chi-square distribution with 2 degrees of freedom. Multiple test correction was
performed using the qvalue package in R. CpG probes with a false discovery rate (FDR)
< 5% were considered significant.
Meta-analysis of MWAS results
All MWAS probe p-values from each cohort were meta-analysed using Fisher’s
combined probability test. Only those probes in which the direction of effect for the
probe methylation response to tHcy concentration was consistent between the two
cohorts were reported in the final meta-analysis (referred to here as concordant
probes). This gave rise to a total of 182,227 concordant probes with potentially
consistent results. All probes declared to be differentially methylated were also
explicitly tested for a significant interaction term in order to ensure results were driven

CHAPTER 6: Homocysteine levels x MTHFR 677C>T and DNA methylation 191
by the interaction between tHcy and the MTHFR polymorphism that compromises
folate metabolism and not just by tHcy levels or the genotype in isolation. To obtain a
p-value for the interaction between c.677C>T and tHcy, a Wald test was used to assess
the difference in slope for the two regression lines fitted to the nested interaction
model (i.e. as presented in a scatterplot of methylation vs tHcy with two fitted
regression lines). Equivalently, a cross classification model was used, which includes
one main effect for c.677C>T, a main effect for tHcy and an interaction term between
the two main effects (c.677C>T x tHcy). A multiple test correction was performed as
described above. Probes that were significant with a false discovery rate of 5% or less,
nominally significant and showing similar direction of effect in both cohorts were
declared to be significant in the meta-analysis.
In-silico functional annotation of MWAS results
To characterise the genomic locations and properties of each region encompassing the
most significant probes from the MWAS, the locations and relationship to specific
genomic features were annotated using the Illumina Infinium HumanMethylation450
BeadChip manifest file and Genomic Regions Enrichment of Annotations Tool
(great.stanford.edu). Finally, we looked at the association between any significant
probes from the meta-analysis and differential gene expression using data from the
BIOS QTL browser [14, 15].
Differentially Methylated Region Analysis
Where statistically significant probes from the meta-analysis were located in close
proximity to one another other, the region was further analysed. For each of the top
probes, the regression beta coefficients were stratified by genotype and plotted. A
lowess fitted trend line was overlaid to assess the region as a differentially methylated
site in response to disrupted folate and methionine metabolism.
RESULTS
A total of 1,280 Caucasian individuals from 2 independent cohorts – TwinsUK and
Rotterdam study – with existing data on plasma tHcy, genotype data on the MTHFR
c.677C>T polymorphism, and site-specific DNA methylation levels from the Illumina
450k array were included in the present study. Briefly, the TwinsUK cohort (n=610) was
composed of generally healthy women with age ranging from 26-81 years (mean age=
58). The Rotterdam cohort (n=670) was a population-based sample of men and women
(54%) with a mean age of 60 years. Table 1 provides demographic, biochemical, and
descriptive summaries for each cohort.

192 PART B: Homocysteine and DNA methylation
Table 1. Study population characteristics for TwinsUK and Rotterdam Study samples.
Values are presented as medians and standard deviations (SD).
TwinsUK Rotterdam
N 610 670
Age (years) 58.2 (9.4) 59.8 (8.1)
BMI (kg/m2) 25.7 (4.8) 27.4 (4.8)
Smoking, % Never 13.7 27.3
Sex, % female 100 54
Methylation Beta 0.68 (0.02) 0.52 (0.02)
Homocysteine (µmol/L) 12.3 (3.4) 12.2 (3.6)
CELL COUNTS
Granulocytes 4.00 (1.4) 4.2 (1.5)
Lymphocytes 1.8 (0.6) 2.4 (0.7)
Monocytes 0.4 (0.2) 0.4 (0.4)
Neutrophils 3.8 (1.4) -
Exploratory Analysis and Model Fitting results
We carried out mixed linear and robust iterative regression analyses to test for the
interaction between total genomic methylation and tHcy stratified by MTHFR c.677C>T
genotype in both TwinsUK and Rotterdam cohort. Our analysis showed that the
observed association between total genomic methylation and tHcy is primarily driven
by individuals with high tHcy values and carrying one or more copies of the MTHFR
c.677C>T allele. Whilst the interaction term is only marginally significant (P=0.08,
adjusted for age, smoking status and technical covariates), the result is consistent with
Friso et al. (PNAS 2002) and the over-arching hypothesis for this study. Figure 1A
illustrates that the negative relationship between genomic methylation and tHcy is only
significant for individuals with the CT/TT genotype (p= 0.02) and not for those with the
CC genotype (p=0.93) in individuals from TwinsUK. In the Rotterdam cohort, we failed
to replicate this finding and the results indicate a null relationship between genomic
methylation and tHcy levels.
Our exploratory analyses identified estimated cell count and technical factors
such as batch effect and position on the BeadChip to be strongly associated with total
genomic DNA methylation. These were all included as nuisance covariates in the final
model used for the methylome-wide association study (MWAS) to control for technical
variation. Of the phenotypic variables, age had the largest influence on genomic DNA
methylation.
The final model selected to take forward for the MWAS included tHcy levels
stratified by MTHFR rs1801133 (coded CC vs CT/TT), observed blood cell counts, age,
BMI, batch effect and BeadChip position as fixed effects and family identifier and
zygosity as random effects (TwinsUK) or alternatively, gender as fixed effect and
array/bead chip positions as random effects (Rotterdam Study).

CHAPTER 6: Homocysteine levels x MTHFR 677C>T and DNA methylation 193
Cohort-specific MWAS and meta-analyses
We carried out individual cohort MWAS followed by a meta-analysis of the results
generated for a total of 1,280 individuals of European ancestry (Table 2). The analysis
of the TwinsUK data identified a total of 127 CpGs associated with [tHcy x c.677C>T] as
the predictor (FDR≤ 5%). Analysis of the Rotterdam study alone included no significant
probes at FDR threshold ≤ 5% for these data. Figures 2 presents the QQ and Manhattan
plots for the TwinsUK and Rotterdam study methylome scan. Meta-analysis identified
13 significant hits (Table 2) with consistent direction of effects between both cohorts.
These included sites on chromosome 1 (meta-analysis p=3.7E-09, NPPA), chromosome
2 (p=6.2E-07, DYNC2LI1/PLEKHH2), chromosome 3 (p=7.5E-06, VEPH1/SHOX2),
chromosome 4 (p=2.3E-06, PROM1), chromosome 7 (p=9.5E-07, GLI3/C7orf25),
chromosome 12 (p=4.8E-06, ALG10), and chromosome 19 (p=5.4E-06, HIF3A).
Female-only MWAS and meta-analysis
When meta-analysis was restricted to females only for both cohorts – based on the
rational that the TwinsUK cohort was primarily composed of female subjects – the total
number of significant probes dropped from 13 to 7 but otherwise remained the same
(chromosome 1: cg06770735, cg06193043; chromosome 3: cg04897900; chromosome
4: cg17858192; chromosome 12: cg10588893; chromosome 17: cg12432807 and
chromosome 19: cg00192046). This is consistent with our assumption that the
epigenetic signals at these loci do not differ between women and men, with the
reduced number of observed significant probes due to the reduced power for the
female-only analysis (n=960).
Chromosome 1 Analysis
Since all 4 significant probes on chromosome 1 (Figure 3A & B) were within 119Kb of
one another, with two probes 148bp apart (cg06193043 and cg24844545), the extent
to which the rest of the surrounding probes showed coordinated changes in DNA
methylation in response to increasing tHcy were investigated. For the probes within a
50kb region surrounding the index probe cg24844545 (indicated by a dashed line in the
figure), there appears to be correlated responses to tHcy, with the direction of the
response dependent on genotype at rs1801133 (see Figure 3C) and the response
consistent between the two cohorts. The correlated response at this locus is likely to
indicate a [tHcy x c.C677T] dependent, differentially methylated region.
In-silico functional annotation of MWAS results
Finally, we used the BIOS QTL [14] browser to gain functional insight into the 13
significant probes from the meta-analysis and assess their putative impact on
differential gene expression. Of the 13 sites, our top 2 hits on chromosome 1
(cg06193043 and cg24844545) were shown to be functionally associated with

194 PART B: Homocysteine and DNA methylation
variability in expression of the TNFRSF8 gene/locus on this chromosome although no
obvious link can be drawn between aberrant methylation at these sites, differential
gene expression of the TNFRSF8 gene/locus and 1-CM function. None of the other sites
were shown to be associated with cis or trans differential gene expression.
Figure 1. Graphical representation of the genomic methylation model. Median genomic
methylation levels were regressed upon homocysteine (tHcy) stratified by MTHFR c.677C>T
genotype, illustrating a differential impact of tHcy on genomic methylation levels by
genotype in (A) TwinsUK and (B) Rotterdam. (A) TwinsUK data shows a significant negative
relationship between median genomic methylation and serum homocysteine for individuals
with rs1801133 genotypes CT/TT (p=0.02), but no relationship for individuals carrying the
CC genotype (p=0.93; interaction or difference between the 2 slopes, p = 0.08). (B)
Rotterdam data shows no significant relationship between median genomic methylation
and serum homocysteine for all individuals, regardless of genotype.
Interaction p = 0.6 Interaction p = 0.08

CHAPTER 6: Homocysteine levels x MTHFR 677C>T and DNA methylation 195
Ta
ble
2. G
eno
me
-wid
e si
gnif
ican
t m
eth
ylat
ion
pro
bes
iden
tifi
ed
fro
m m
eta
-an
alys
is o
f Tw
insU
K (
fem
ale)
an
d R
ott
erd
am S
tud
y (m
ale
&
fem
ale)
sam
ple
s. R
esu
lts
are
pre
sen
ted
fo
r p
rob
es w
ith
a s
ign
ific
ant
FDR
(q
-val
ue)
of
≤ 0
.05
, no
min
ally
sig
nif
ican
t (p
<0.1
0)
and
sh
ow
ing
sim
ilar
dir
ecti
on
of
effe
ct in
bo
th c
oh
ort
s.
Pro
be
ID
CH
R
Ge
no
mic
A
sso
ciat
ed
Ge
nes
Tw
insU
K
Ro
tte
rdam
M
eta-
anal
ysis
po
siti
on
(kb
) b
p
-val
ue
b
p
-val
ue
p
-val
ue
q
-val
ue
cg0
677
07
35
1
1
1,8
40,0
31
M
THFR
(+2
610
4), A
GTR
AP
(+4
391
4)
0.83
2.
20E-
04
1
.33
3
.90
E-0
6
1.8
0E-
08
3
.60
E-0
4
cg0
619
30
43
1
1
1,9
08,1
99
N
PP
A (
-384
) 1.
23
1.30
E-0
3
1.4
4
8.7
0E-
06
2
.10
E-0
7
2.3
0E-
03
cg2
484
45
45
1
1
1,9
08,3
47
N
PP
A (
-484
) 1.
89
9.60
E-0
5
1.3
8
1.7
0E-
06
3
.70
E-0
9
1.2
0E-
04
cg2
743
20
85
1
1
1,9
58,5
72
N
PP
B (
-39
557
), K
IAA
2013
(+2
79
36)
-0.2
3
9.50
E-0
2
-1.8
1
4.0
0E-
06
6
.00
E-0
6
3.2
0E-
02
cg1
711
03
64
2
4
3,9
03,2
27
D
YNC
2LI1
(-9
7974
), P
LEK
HH
2 (
+387
65)
0.72
1.
30E-
04
2
.6
2.6
0E-
04
6
.20
E-0
7
5.7
0E-
03
cg0
470
66
55
2
9
7,1
36,5
56
N
EUR
L3 (
+34
561)
, NC
AP
H(+
135
049)
5.
23
9.30
E-0
7
0.8
3
7.8
0E-
02
1
.30
E-0
6
9.9
0E-
03
cg0
489
79
00
3
15
7,2
45
,10
8
VEP
H1
(-2
3997
), S
HO
X2
(+5
78
819)
1.
29
6.00
E-0
6
1.2
8
8.1
0E-
02
7
.50
E-0
6
3.6
0E-
02
cg1
785
81
92
4
1
6,0
77,8
07
P
RO
M1
(-43
) 0.
98
1.40
E-0
4
3
9.9
0E-
04
2
.30
E-0
6
1.6
0E-
02
cg2
464
35
14
7
2
3,2
21,2
83
N
UP
L2 (
-18
6)
2.07
6.
90E-
02
5
.24
2
.00
E-0
6
2.3
0E-
06
1
.50
E-0
2
cg1
111
97
46
7
4
2,5
33,1
33
G
LI3
(-25
654
0), C
7orf
25 (
+41
8993
) 5.
36
6.60
E-0
7
2.1
5
8.1
0E-
02
9
.50
E-0
7
7.8
0E-
03
cg2
616
17
47
7
10
1,5
62
,34
8
SH2B
2 (-
366
032)
, CU
X1
(+1
014
91)
0.03
6.
10E-
03
3
.78
2
.20
E-0
5
2.3
0E-
06
1
.50
E-0
2
cg1
058
88
93
12
3
4,4
64,0
89
A
LG10
(+
2888
98)
3.
82
3.60
E-0
4
2.5
1
8.4
0E-
04
4
.80
E-0
6
2.6
0E-
02
cg0
287
96
62
19
4
6,8
00,4
67
H
IF3A
(+1
89)
2.
23
1.80
E-0
4
2.6
7
1.9
0E-
03
5
.40
E-0
6
2.9
0E-
02

196 PART B: Homocysteine and DNA methylation
Figure 2. QQ and Manhattan plots for the (A) TwinsUK, (B) Rotterdam Study full cohort
MWASs, (C) and Meta-analysis.
A
B
C
Chromosome
Chromosome
Chromosome Expected – log10(p)
Expected – log10(p)
Expected – log10(p)
Ob
serv
ed –
log 1
0(p
) O
bse
rved
– lo
g 10(
p)
Ob
serv
ed –
log 1
0(p
)
log 1
0(p
) lo
g 10(
p)
log 1
0(p
)

CHAPTER 6: Homocysteine levels x MTHFR 677C>T and DNA methylation 197
Serum Homocysteine Serum Homocysteine
Serum Homocysteine Serum Homocysteine
Met
hyl
atio
n (
no
rmal
ize
d B
eta)
Met
hyl
atio
n (
no
rmal
ize
d B
eta)
M
eth
ylat
ion
(n
orm
aliz
ed
Bet
a)
Met
hyl
atio
n (
no
rmal
ize
d B
eta)
p=1e-05
p=8.8e-05
p=7.1e-05
p=0.03
Met
hyl
atio
n (
no
rmal
ize
d B
eta)
Met
hyl
atio
n (
no
rmal
ize
d B
eta)
Plasma Homocysteine Plasma Homocysteine
p=4e-06 p=1e-06
A
B
cg27432085 cg24844545
cg06770735
cg06770735
cg06193043
cg06193043

198 PART B: Homocysteine and DNA methylation
Figure 3. Chromosome 1 methylation probe association with tHcy is contingent upon
MTHFR genotype: (A) TwinsUK and (B) Rotterdam Study. This figure illustrates the
differential methylation for the probes on chromosome 1 with probe methylation plotted
on the Y-axis and tHcy plotted on the X-axis with individuals distinguished by whether they
carry a CC MTHFR c.C677T genotype (green) or a CT/TT genotype (red). All four
chromosome 1 probes show an interaction between tHcy and SNP in both TwinsUK and
Rotterdam Study. The strength of relationship between probe methylation and tHcy
significantly differs depending upon the MTHFR genotype carried. (C) Correlated response
to [tHcy x c.C677T] for the probes within a 50kb region surrounding the index probe
cg24844545 (indicated by a dashed line in the figure).
Reg
ress
ion
Bet
a C
oef
fici
ent
Plasma Homocysteine Plasma Homocysteine
Met
hyl
atio
n (
no
rmal
ize
d B
eta)
Met
hyl
atio
n (
no
rmal
ize
d B
eta)
P=2e-06 P=3e-06
Genomic Position
C TwinsUK Rotterdam
cg24844545 cg27432085

CHAPTER 6: Homocysteine levels x MTHFR 677C>T and DNA methylation 199
DISCUSSION
There is growing evidence suggesting that perturbations in 1-carbon metabolism (1-
CM), in part due to variable dietary exposure or genetic variation - for example the
common MTHFR c.677C>T polymorphism within the MTHFR gene - can affect patterns
of DNA methylation and affect the regulation of gene expression throughout the
course of life[2, 16]. A large number of epidemiological studies, including observational
and experimental, have now shown associations between either low/normal levels of
folate/vitamin B12 or mild elevations in plasma tHcy – an integrative marker and
indicator of perturbed 1-CM - and increased risk of a range of vascular and
neurodegenerative diseases[4, 17, 18]. Interestingly, a previous study by Friso et al.
(2002) was the first to highlight that the relationship between folate status and global
DNA methylation is strongly modulated by the MTHFR c.677C>T polymorphism and the
activity of the MTHFR enzyme. However, to date there are no studies that have sought
to identify differentially methylated sites in the human genome that are dynamically
affected by the interaction between plasma tHcy and the MTHFR c.677C>T
polymorphism.
To this end, we carried out a methylome-wide association study in two large,
independent cohorts followed by a meta-analysis of the results, to identify specific
sites across the methylome that are differentially methylated as a consequence of the
interaction between MTHFR c.677C>T polymorphism and mild tHcy elevation.
Methylome-wide association studies of total homocysteine
Our initial exploratory analysis in TwinsUK underlined a significant negative
relationship between DNA methylation and tHcy levels only with CT/TT genotype, but
not CC. This is in accordance with previous studies that have investigated the
interrelationships between concentrations of tHcy, the MTHFR c.677C>T polymorphism
and global DNA methylation [19-21]. It’s important to note that contrary to approach
used by Friso et al.’s and subsequent studies [22, 23], our study did not explicitly use
folate status and instead focused on tHcy as the principle exposure variable of interest.
As explained previously in the introduction, the available TwinsUK data on folate was
measured by a clinical laboratory that used a cut-off value of >20 ng/ml, all values
above 20 ng/ml were assigned >20 ng/ml making nearly a third of the data unreliable
and therefore not amenable to quantitative association analysis. We also had
substantially fewer subjects with both folate and methylation data; N=200 as opposed
to N= 610 with complete tHcy and methylation data. More importantly, however,
although motivated by the findings from the Friso et al. study, we were more
interested in unravelling the consequences of the interaction between aberrant 1-CM
function, MTHFR c.677C>T and site-specific DNA methylation. Levels of total Hcy have
been shown to be a powerful integrative biomarker of 1-CM function in health and
disease and would allow a more holistic approach.

200 PART B: Homocysteine and DNA methylation
Our results show that the previous observations by Friso et al. (2002) on
global DNA methylation are supported by our meta-analysis of 2 independent MWAS
which identified a total of 13 differentially methylated positions (DMPs) on
chromosomes 1, 2, 3, 4, 7, 12 and 19 significantly associated with [c677C>T x tHcy]
levels. The most significant associations were with a cluster of probes at the AGTRAP-
MTHFR-NPPA/B gene cluster on chromosome 1. In-silico analysis showed that
differential methylation at this region is functionally associated with variability in
expression of the TNF Receptor Superfamily Member 8 (TNFRSF8) gene[14].
Two recent MWASs by Mandaviya et al. (2017) have sought to identify
associations between (1) tHcy; and (2) the MTHFR C677T variant and site-specific
leukocyte DNA methylation levels [24, 25]. They identified 3 DMPs at or near genes
SLC27A1, AJUBA and KCNMA1 on chromosome 19, 14 and 10, respectively – as well as
68 differentially methylated regions (DMR) – associated with tHcy levels[24]. They
further identified a DMR pertaining to the MTHFR locus in cis (≤ 1Mb upstream or
downstream) and a single trans-CpG (> 1Mb upstream or downstream) associated with
the MTHFR C677T variant [25]. Notably, the DMR at the MTHFR locus, identified by
Mandaviya et al. to be associated with the MTHFR c.677C>T variant, overlaps with our
top hits in the present study that include 4 CpGs at the AGTRAP-MTHFR-NPPA/B gene
cluster on chromosome 1. So, could our top hit actually be a genetically-driven finding
as opposed to a true consequence of the interaction between MTHFR c677C>T and
tHcy given (1) the inherent lack of power associated with finding true interactions; and
(2) that the MTHFR DMR was not associated with tHcy? The data provides strong
evidence for an interaction between rs1801133 genotype and serum homocysteine
levels that impacts upon site-specific methylation levels and as such, we believe that
our results represent a more realistic biological consequence of the interaction
between 1-CM and genetic variation. It is also important to note that a true interaction
between two or more exposure variables does not preclude main effect associations
although a true biological interaction can manifest in the absence of independent main
effects. So, it is very likely that both the MTHFR c.677C>T variant and the interaction
[c.677C>T x tHcy] are associated with the DMR at the MTHFR locus. Furthermore, we
would like to highlight that none of the other findings by Mandaviya et al. overlap with
any of the remaining 9 loci identified at other chromosomes in the current study,
emphasising the importance of appropriately modelling and identifying site-specific
DNA methylation outcomes that are dynamically responsive to this interaction.
DMPs in AGTRAP-MTHFR-NPPA/B gene cluster on chromosome 1 and cardiovascular
function
Our top hits pertain to a cluster of probes at the AGTRAP-MTHFR-NPPA/B gene locus
on chromosome 1. The NPPA gene encodes for a protein from the natriuretic peptide
family, which is involved in the control of extracellular fluid volume and electrolyte

CHAPTER 6: Homocysteine levels x MTHFR 677C>T and DNA methylation 201
homeostasis. Similarly, the protein NPPB‘s biological functions include natriuresis,
diuresis, as well as the inhibition of renin and aldosterone secretion thus potentially
playing a role in regulating blood pressure and cardiovascular function. Also, the
adjacent gene AGTRAP encodes for the angiotensin II receptor associated protein,
which is postulated to be involved in the regulation of blood pressure. Recent studies
suggest that AGTRAP, or ATRAP, which is expressed in heart tissue plays a regulatory
role of the cardiac SERCA2a uptake of calcium, and that it is associated with long-term
inhibition of ventricular hypertrophy when hypomethylated [26, 27].
We used data from the BIOS QTL browser to assess whether differential
methylation at the AGTRAP-MTHFR-NPPA/B gene cluster was functionally associated
with variability in expression of any genes in cis of this gene cluster (±500kb)[14]. Our
in-silico look up identified the expression of the TNFRSF8 gene on chromosome 1 to be
significantly associated with differential methylation of the probe cg06193043 probe at
this gene cluster (P= 1.5E-04). TNFRSF8 encodes a protein of the tumor necrosis factor-
receptor superfamily (CD30) that mediates the signal transduction pathway leading to
NF-kB activation and so is a positive regulator of apoptosis. Expression of CD30 has
been previously associated with autoimmune function [28] and cancer therapy [29] but
no over-obvious link can be drawn to 1-CM function.
DMPs in HIF3A are associated with aspects of metabolic syndrome
The CpG sites at loci on chromosomes 2 (PLEKHH2), 7 (SH2B2) and 19 (HIF3A) were
shown to be significantly associated with [c.677C>T x tHcy] levels in both cohorts and
thought to play roles in aspects of metabolic syndrome. HIF3A is thought to act as a
transcriptional regulator in adaptive response to low oxygen tension and plays a role in
glucose, lipid and amino acid metabolism as well as adipocyte differentiation [30, 31].
Interestingly, hyper-methylation at the HIF3A locus has been previously positively
associated with variability in BMI [32], adipose tissue dysfunction [33], and risk of
gestational diabetes mellitus[34]. There have also been speculations about the role of
genetic variants in the PLEKHH2 region as a potential risk factor for diabetic
neuropathy [35]. To date, no human studies have been carried out to investigate site-
specific DNA methylation patterns related to 1-CM that may influence risk of obesity
and metabolic syndrome. There is compelling evidence in mouse models to suggest a
role of 1-CM in mediating the risk of metabolic syndrome through altered DNA
methylation and how the provision of methyl donor supplements can avert
transgenerational effects of obesity [36]. There is however robust observational data
both supporting or refuting an observational link between 1-CM function – through
studies on tHcy, folate, or vitamin B12 as well as genetic studies, based on either the
MTHFR polymorphism alone [37] or a cassette of genetic markers [38] - and aberrant
metabolic function [39, 40], obesity, or type 2 diabetes [41, 42]. Results from the
current study add further evidence to this literature and motivate future functional

202 PART B: Homocysteine and DNA methylation
work on these identified loci which may allow more robust conclusions to be drawn
with regard to the role of 1-CM function in metabolic disease aetiology [34, 43, 44].
DMPs in genes associated with cellular structure/function and cancer
Finally, we also identified significant associations with CpG sites on chromosome 2
(located within/near genes DYNC2LI1, NCAPH, NEURL3) and 4 (PROM1) which are
thought to play putative roles in cellular structure and function. NCAPH has been found
to be highly expressed in colon cancerous (CC) tissue and harbours a number of
mutations in CC patients, serving as a prime therapeutic target for CC [45]. Similarly,
PROM1 (CD133) is associated with recurrent glioma [46] and melanoma [47]. Due to
their involvement in cellular differentiation and transport, we can hypothesise that
alterations in the expression of these genes due to epigenetic modifications caused by
1-CM imbalance may lead to cell metabolism imbalances, potentially leading to a
number of complications, including cellular atrophy, neurodegeneration and different
types of cancers.
Strengths and limitation
Our study has specific strengths and limitations which warrant further discussion. Our
study is the first to systematically investigate site-specific DNA methylation as a
consequence of interaction between the MTHFR c.677C>T polymorphism and tHcy.
Furthermore, the utility of two independent cohorts followed by a meta-analysis
reduces potential biases, the chance of false positive findings whilst possibly increasing
our power to detect loci of significant biological effect. Finally, utilising an established
MWAS analytical approach incorporating and correcting for technical and biological
covariates into our analysis provides reassurance that our results represent genuine
findings.
A potential limitation of our study is the unbalanced constituency of gender
among our cohorts. For historical reasons, the TwinsUK cohort is predominantly made
up of female twins whereas the Rotterdam cohort included a balanced number of
males and females. Thus, inherent male/female differences in either the exposure
(tHcy) and/or outcome (site-specific DNA methylation levels) may distort the molecular
consequences to the discordant tHcy levels in males and females. Such gender
differences have been identified in tHcy levels previously. Total Hcy concentrations
have been found to be significantly higher in men than in women in both the
Framingham Offspring Cohort study and the Hordaland Homocysteine study which
demonstrated ~11% higher tHcy in men than women[48, 49]. In our study, we also
note a significant difference in tHcy levels between males and females in the
Rotterdam cohort matching those reported in the HHS (~11%). To overcome this
limitation, we included sex as a covariate in the Rotterdam MWAS and notably we
identified some of the same significant loci in both the female-only meta-analysis and

CHAPTER 6: Homocysteine levels x MTHFR 677C>T and DNA methylation 203
the full cohort (male + females) meta-analysis. Another potential limitation is that DNA
was extracted from whole blood and so the site-specific methylation values represent
those from across various types of leukocytes. To minimise the influence of cell
composition we adjusted our analysis for either measured or estimated leukocytes
composition but there is still a possibility that observed differential methylation was
confounded by either tHcy or ageing induced shifts in leukocyte distribution. Finally,
although we used the latest technology for assessing DNA methylation patterns from
across the human genome, the450 BeadChip array still only targets ~2% of all CpGs in
the genome. Thus, although not strictly a shortcoming of our study, it is quite likely
that we would have missed a number of relevant genomic regions.
CONCLUSIONS
This study has allowed us to test and further examine an important paradigm that
there are associations between DNA methylation patterns and [c.677C>T x tHcy] at
specific sites in the epigenome, and to gain novel potential mechanistic insight into the
epigenetic consequences of this gene by nutrient/metabolite interaction. Indeed,
identifying [c.677C>T x tHcy]-sensitive DMPs, and their effect on nearby genes has
provided a step forward in (1) identifying loci that can be used as candidate genes or
regions in specific diseases, and (2) generating opportunities for better/well-informed
study design, driving us towards more targeted preventative public health approach.

204 PART B: Homocysteine and DNA methylation
REFERENCES 1. Carmel R, Jacobsen DW, Homocysteine in Health and Disease. 2001, Cambridge, UK. 2. Mandaviya PR, Stolk L, Heil SG. Homocysteine and DNA methylation: a review of animal
and human literature. Mol Genet Metab 2014;113:243-52. 3. Clarke R, Smith AD, Jobst KA, Refsum H, Sutton L, Ueland PM. Folate, vitamin B12, and
serum total homocysteine levels in confirmed Alzheimer disease. Arch Neurol 1998;55:1449-55.
4. Seshadri S, Beiser A, Selhub J, Jacques PF, Rosenberg IH, D'Agostino RB, et al. Plasma homocysteine as a risk factor for dementia and Alzheimer's disease. N Engl J Med 2002;346:476-83.
5. Wald DS, Kasturiratne A, Simmonds M. Serum homocysteine and dementia: Meta-analysis of eight cohort studies including 8669 participants. Alzheimers Dement 2011;7:412-7.
6. Rampersaud GC, Kauwell GP, Hutson AD, Cerda JJ, Bailey LB. Genomic DNA methylation decreases in response to moderate folate depletion in elderly women. Am J Clin Nutr 2000;72:998-1003.
7. Ingrosso D, Cimmino A, Perna AF, Masella L, De Santo NG, De Bonis ML, et al. Folate treatment and unbalanced methylation and changes of allelic expression induced by hyperhomocysteinaemia in patients with uraemia. Lancet 2003;361:1693-9.
8. Fryer AA, Nafee TM, Ismail KM, Carroll WD, Emes RD, Farrell WE. LINE-1 DNA methylation is inversely correlated with cord plasma homocysteine in man: a preliminary study. Epigenetics 2009;4:394-8.
9. Dominguez-Salas P, Cox SE, Prentice AM, Hennig BJ, Moore SE. Maternal nutritional status, C(1) metabolism and offspring DNA methylation: a review of current evidence in human subjects. Proc Nutr Soc 2012;71:154-65.
10. Friso S, Choi SW, Girelli D, Mason JB, Dolnikowski GG, Bagley PJ, et al. A common mutation in the 5,10-methylenetetrahydrofolate reductase gene affects genomic DNA methylation through an interaction with folate status. Proc Natl Acad Sci U S A 2002;99:5606-11.
11. Verhoef P, Kok FJ, Kluijtmans LA, Blom HJ, Refsum H, Ueland PM, Kruyssen DA. The 677C-->T mutation in the methylenetetrahydrofolate reductase gene: associations with plasma total homocysteine levels and risk of coronary atherosclerotic disease. Atherosclerosis 1997;132:105-13.
12. Teschendorff AE, Marabita F, Lechner M, Bartlett T, Tegner J, Gomez-Cabrero D, Beck S. A beta-mixture quantile normalization method for correcting probe design bias in Illumina Infinium 450 k DNA methylation data. Bioinformatics 2013;29:189-96.
13. Wilhelm-Benartzi CS, Koestler DC, Karagas MR, Flanagan JM, Christensen BC, Kelsey KT, et al. Review of processing and analysis methods for DNA methylation array data. Br J Cancer 2013;109:1394-402.
14. Bonder MJ, Luijk R, Zhernakova DV, Moed M, Deelen P, Vermaat M, et al. Disease variants alter transcription factor levels and methylation of their binding sites. Nat Genet 2017;49:131-138.
15. Zhernakova DV, Deelen P, Vermaat M, van Iterson M, van Galen M, Arindrarto W, et al. Identification of context-dependent expression quantitative trait loci in whole blood. Nat Genet 2017;49:139-145.
16. Castro R, Rivera I, Ravasco P, Camilo ME, Jakobs C, Blom HJ, de Almeida IT. 5,10-methylenetetrahydrofolate reductase (MTHFR) 677C-->T and 1298A-->C mutations are associated with DNA hypomethylation. J Med Genet 2004;41:454-8.
17. Stover PJ. One-carbon metabolism-genome interactions in folate-associated pathologies. J Nutr 2009;139:2402-5.

CHAPTER 6: Homocysteine levels x MTHFR 677C>T and DNA methylation 205
18. Schalinske KL, Smazal AL. Homocysteine imbalance: a pathological metabolic marker. Adv Nutr 2012;3:755-62.
19. Axume J, Smith SS, Pogribny IP, Moriarty DJ, Caudill MA. The MTHFR 677TT genotype and folate intake interact to lower global leukocyte DNA methylation in young Mexican American women. Nutr Res 2007;27:1365-1317.
20. Stern LL, Mason JB, Selhub J, Choi SW. Genomic DNA hypomethylation, a characteristic of most cancers, is present in peripheral leukocytes of individuals who are homozygous for the C677T polymorphism in the methylenetetrahydrofolate reductase gene. Cancer Epidemiol Biomarkers Prev 2000;9:849-53.
21. Shelnutt KP, Kauwell GP, Gregory JF, 3rd, Maneval DR, Quinlivan EP, Theriaque DW, et al. Methylenetetrahydrofolate reductase 677C-->T polymorphism affects DNA methylation in response to controlled folate intake in young women. J Nutr Biochem 2004;15:554-60.
22. Amarasekera M, Martino D, Ashley S, Harb H, Kesper D, Strickland D, et al. Genome-wide DNA methylation profiling identifies a folate-sensitive region of differential methylation upstream of ZFP57-imprinting regulator in humans. FASEB J 2014;28:4068-76.
23. Kok DE, Dhonukshe-Rutten RA, Lute C, Heil SG, Uitterlinden AG, van der Velde N, et al. The effects of long-term daily folic acid and vitamin B12 supplementation on genome-wide DNA methylation in elderly subjects. Clin Epigenetics 2015;7:121.
24. Mandaviya PR, Aissi D, Dekkers KF, Joehanes R, Kasela S, Truong V, et al. Homocysteine levels associate with subtle changes in leukocyte DNA methylation: an epigenome-wide analysis. Epigenomics 2017;9:1403-1422.
25. Mandaviya PR, Joehanes R, Aissi D, Kuhnel B, Marioni RE, Truong V, et al. Genetically defined elevated homocysteine levels do not result in widespread changes of DNA methylation in leukocytes. PLoS One 2017;12:e0182472.
26. Mederle K, Gess B, Pluteanu F, Plackic J, Tiefenbach KJ, Grill A, et al. The angiotensin receptor-associated protein Atrap is a stimulator of the cardiac Ca2+-ATPase SERCA2a. Cardiovasc Res 2016;110:359-70.
27. Wang TJ, Lian GL, Lin X, Zhong HB, Xu CS, Wang HJ, Xie LD. Hypomethylation of Agtrap is associated with long-term inhibition of left ventricular hypertrophy in prehypertensive losartan-treated spontaneously hypertensive rats. Mol Med Rep 2017;15:839-846.
28. Shinoda K, Sun X, Oyamada A, Yamada H, Muta H, Podack ER, et al. CD30 ligand is a new therapeutic target for central nervous system autoimmunity. J Autoimmun 2015;57:14-23.
29. Muta H, Podack ER. CD30: from basic research to cancer therapy. Immunol Res 2013;57:151-8.
30. Hatanaka M, Shimba S, Sakaue M, Kondo Y, Kagechika H, Kokame K, et al. Hypoxia-inducible factor-3alpha functions as an accelerator of 3T3-L1 adipose differentiation. Biol Pharm Bull 2009;32:1166-72.
31. Sheng L, Liu Y, Jiang L, Chen Z, Zhou Y, Cho KW, Rui L. Hepatic SH2B1 and SH2B2 regulate liver lipid metabolism and VLDL secretion in mice. PLoS One 2013;8:e83269.
32. Dick KJ, Nelson CP, Tsaprouni L, Sandling JK, Aissi D, Wahl S, et al. DNA methylation and body-mass index: a genome-wide analysis. Lancet 2014;383:1990-8.
33. Pfeiffer S, Kruger J, Maierhofer A, Bottcher Y, Kloting N, El Hajj N, et al. Hypoxia-inducible factor 3A gene expression and methylation in adipose tissue is related to adipose tissue dysfunction. Sci Rep 2016;6:27969.
34. Haertle L, El Hajj N, Dittrich M, Muller T, Nanda I, Lehnen H, Haaf T. Epigenetic signatures of gestational diabetes mellitus on cord blood methylation. Clin Epigenetics 2017;9:28.

206 PART B: Homocysteine and DNA methylation
35. Greene CN, Keong LM, Cordovado SK, Mueller PW. Sequence variants in the PLEKHH2 region are associated with diabetic nephropathy in the GoKinD study population. Hum Genet 2008;124:255-62.
36. Waterland RA, Dolinoy DC, Lin JR, Smith CA, Shi X, Tahiliani KG. Maternal methyl supplements increase offspring DNA methylation at Axin Fused. Genesis 2006;44:401-6.
37. Zhong JH, Rodriguez AC, Yang NN, Li LQ. Methylenetetrahydrofolate reductase gene polymorphism and risk of type 2 diabetes mellitus. PLoS One 2013;8:e74521.
38. Kumar J, Ingelsson E, Lind L, Fall T. No Evidence of a Causal Relationship between Plasma Homocysteine and Type 2 Diabetes: A Mendelian Randomization Study. Front Cardiovasc Med 2015;2:11.
39. Buysschaert M, Dramais AS, Wallemacq PE, Hermans MP. Hyperhomocysteinemia in type 2 diabetes: relationship to macroangiopathy, nephropathy, and insulin resistance. Diabetes Care 2000;23:1816-22.
40. Patterson S, Flatt PR, Brennan L, Newsholme P, McClenaghan NH. Detrimental actions of metabolic syndrome risk factor, homocysteine, on pancreatic beta-cell glucose metabolism and insulin secretion. J Endocrinol 2006;189:301-10.
41. Hoogeveen EK, Kostense PJ, Jakobs C, Dekker JM, Nijpels G, Heine RJ, et al. Hyperhomocysteinemia increases risk of death, especially in type 2 diabetes : 5-year follow-up of the Hoorn Study. Circulation 2000;101:1506-11.
42. Meigs JB, Jacques PF, Selhub J, Singer DE, Nathan DM, Rifai N, et al. Fasting plasma homocysteine levels in the insulin resistance syndrome: the Framingham offspring study. Diabetes Care 2001;24:1403-10.
43. Main AM, Gillberg L, Jacobsen AL, Nilsson E, Gjesing AP, Hansen T, et al. DNA methylation and gene expression of HIF3A: cross-tissue validation and associations with BMI and insulin resistance. Clin Epigenetics 2016;8:89.
44. Mok A, Solomon O, Nayak RR, Coit P, Quach HL, Nititham J, et al. Genome-wide profiling identifies associations between lupus nephritis and differential methylation of genes regulating tissue hypoxia and type 1 interferon responses. Lupus Sci Med 2016;3:e000183.
45. Yin L, Jiang LP, Shen QS, Xiong QX, Zhuo X, Zhang LL, et al. NCAPH plays important roles in human colon cancer. Cell Death Dis 2017;8:e2680.
46. Sun B, Wan Z, Shen J, Ni L, Chen J, Cui M, et al. DNA hypomethylation of CD133 promoter is associated with recurrent glioma. Oncol Rep 2016;36:1062-8.
47. Madjd Z, Erfani E, Gheytanchi E, Moradi-Lakeh M, Shariftabrizi A, Asadi-Lari M. Expression of CD133 cancer stem cell marker in melanoma: a systematic review and meta-analysis. Int J Biol Markers 2016;31:e118-25.
48. Nygard O, Refsum H, Ueland PM, Vollset SE. Major lifestyle determinants of plasma total homocysteine distribution: the Hordaland Homocysteine Study. Am J Clin Nutr 1998;67:263-70.
49. Jacques PF, Bostom AG, Wilson PW, Rich S, Rosenberg IH, Selhub J. Determinants of plasma total homocysteine concentration in the Framingham Offspring cohort. Am J Clin Nutr 2001;73:613-21.

CHAPTER 6: Homocysteine levels x MTHFR 677C>T and DNA methylation 207
PART C
Nutrition, Lifestyle
And DNA methylation

208 PART B: Homocysteine and DNA methylation

CHAPTER 6: Homocysteine levels x MTHFR 677C>T and DNA methylation 209
CHAPTER 7
Association of dietary folate and vitamin B12 intake
with genome-wide DNA methylation; a large scale
epigenome-wide association analysis
in 5,841 individuals
Pooja R. Mandaviya*, Roby Joehanes*, Jennifer Brody*, Juan E. Castillo-Fernandez*,
Koen K. F. Dekkers*, Anh N. Do*, Mariaelisa Graff*, Ismo K. Hänninen*, Toshiko
Tanaka*, Ester A.L. de Jonge, Jessica C. Kiefte-de Jong, Devin M. Absher, Stella
Aslibekyan, Yolanda B. de Rijke, Myriam Fornage, Dena G. Hernandez, Mikko A. Hurme,
M. Arfan Ikram, Paul F. Jacques, Anne E. Justice, Douglas P. Kiel, Rozenn N Lemaitre,
Michael M. Mendelson, Vera Mikkilä, Ann Z. Moore, Tess Pallister, Olli T. Raitakari,
Casper G. Schalkwijk, Jin Sha, Eline P. E. Slagboom, Caren E. Smith, Coen D.A.
Stehouwer, Pei-Chien Tsai, André G. Uitterlinden, Carla J.H. van der Kallen, Diana D.
van Heemst, BIOS Consortium, CHARGE Consortium Epigenetics group, CHARGE
Consortium Nutrition group, Donna K. Arnett# [28], Stefania Bandinelli#, Jordana T.
Bell#, Bastiaan B. T. Heijmans#, Terho Lehtimäki#, Daniel Levy#, Kari E. North# [9], Nona
Sotoodehnia# [5], Marleen M.J. van Greevenbroek#, Joyce B.J. van Meurs#,
Sandra G. Heil#
*These authors contributed equally as first authors
**These authors contributed equally as senior authors
Submitted for publication

210 PART C: Nutrition, lifestyle and DNA methylation
ABSTRACT
Background: Folate and vitamin B12 are essential micronutrients involved in the
donation of methyl groups in cellular metabolism. Folate and vitamin B12 intake have
been shown to increase DNA methylation in mostly animal studies. However,
associations between intake of these nutrients and genome-wide DNA methylation
levels have not been studied comprehensively in humans.
Objective: To assess whether folate or vitamin B12 intake are asssociated with
genome-wide changes in methylation in leukocytes.
Design: A large-scale epigenome-wide association study of folate and vitamin B12
intake was performed on DNA from 5,841 participants from 10 cohorts using Illumina
450k arrays. Folate and vitamin B12 intakes were calculated from food frequency
questionaires. Continuous and categorical (low vs. high intake) linear regression mixed
models were applied per cohort, controlling for confounders. Meta-analysis was
performed to identify significant differentially methylated positions (DMPs) and regions
(DMRs). Pathway analysis was done on the DMR annotated genes using the WEB-based
GEne SeT AnaLysis Toolkit.
Results: Folate intake was associated with 6 novel DMPs annotated to FAM64A,
WRAP73, FRMD8, CUX1 and LCN8 genes, which have a role in cellular processes
including centrosome localization, cell proliferation and tumorigenesis. Regional
analysis showed 74 folate associated DMRs annotated to 117 genes. The most
significant DMR was a 400 bp spanning region annotated to LGALS3BP that is
implicated in immune response and tumorigenesis. Signaling pathways regulating
pluripotency of stem cells are overrepresented among the folate associated DMR
genes. Vitamin B12 intake was associated with 29 DMRs annotated to 48 genes, of
which the most significant was a 1,100 bp spanning region annotated to CABYR, which
is involved in lung and hepatocellular cancers. Vitamin B12 intake was not associated
with DMPs.
Conclusions: We identified several novel differentially methylated loci that could be
mechanistic indicators of low folate and vitamin B12 intake.

CHAPTER 7: Dietary B-vitamins and DNA methylation 211
INTRODUCTION
Folate and vitamin B12 are essential micronutrients of the one-carbon pathways that
are involved in the donation of methyl groups to the DNA, RNA and proteins [1]. Folate
is a methyl-donor itself, where its active form, 5-methyltetrahydrofolate, donates its
methyl group to the re-methylation of homocysteine to methionine. Vitamin B12 is a
cofactor in this reaction.
Folate and vitamin B12 status has been connected to diverse diseases. Low
levels of folate and vitamin B12 during pregnancy are independently associated with
the risk of neural tube defects in the child [2-4]. IN addition, low levels of folate and/or
vitamin B12 are associated with risk for a wide range of diseases, such as
cardiovascular diseases and osteoporosis [5-8]. Severe vitamin B12 and folate
deficiencies result in megaloblastic anemia, which for vitamin B12 deficiency is
associated with severe neurological abnormalities [9]. Diagnosis of vitamin B12
deficiency is hampered by the lack of diagnostic accuracy of available biomarkers. DNA
methylation is a possible mechanism underlying the previously identified relationships
between folate or vitamin B12 deficiency and disease risk, and specific alterations in
methylation patterns could serve as future biomarkers for these nutrient related
disease risks. Therefore, it is important to assess the association of these nutrients with
DNA methylation.
The relationship between folate and/or vitamin B12 intake and DNA
methylation has been investigated mostly in studies examining individuals with a
particular disease, which might confound the observed associations [10-12]. A limited
number of human studies were conducted in disease-free individuals [13-17].
Importantly, in all previous studies, global DNA methylation levels were assessed either
as total 5-methyl cytosine content, or LINE-1 or Alu repeat methylation as a proxy for
global methylation status in blood leukocytes. The results from these studies were
inconsistent [13-17]. The relation between maternal folate intake and fetal DNA
methylation was investigated in a few studies showing that maternal intake was
associated with changes in DNA methylation [18-20]. The previous studies related to
folate and vitamin B12 and DNA methylation have been limited with respect to
outcome (e.g. global methylation levels only), sample size and participants (e.g.
maternal-fetal exposures), and to date there are no large-scale epigenome-wide
association studies (EWASs) in adults examining the relationship between B-vitamin
intake and DNA methylation.
In this study, we undertook a large-scale EWAS of folate and vitamin B12
intake, analysing the association with methylation at up to 485,512 CpGs assessed in
whole blood measured in up to 5,841 individuals across ten cohorts from Europe and
North America. Since folate and vitamin B12 are important in the transfer of methyl
groups to DNA, we hypothesize that low intake of folate or vitamin B12 is associated
with genome-wide DNA hypomethylation in the normal population.

212 PART C: Nutrition, lifestyle and DNA methylation
MATERIALS AND METHODS
Study populations
Data from 10 cohorts with a total of 5,520 individuals of European ancestry and 321
African American individuals were included in this meta-analysis. Written informed
consent was given by all participants for genetic research. Descriptions of each cohort
are provided in Text S1. For all participating studies, individuals with prevalent cancer
were excluded from analyses due to potential differences in dietary patterns in
response to their disease [21, 22] and different methylation patterns [23, 24].
DNA methylation assessment
Genomic methylation profiling was performed on whole blood in 10 cohorts using the
Infinium Illumina HumanMethylation 450k BeadChip arrays (Illumina Inc., San Diego,
USA) according to the manufacturer’s protocol. The Genetics of Lipid Lowering Drugs
and Diet Network (GOLDN) study used CD4+ T cells from buffy coats. The Illumina array
measures methylation status of 485,512 CpG sites in the gene and non-gene regions of
CpG islands, shores and shelves of the human genome [25]. Poor quality samples and
probes were excluded based on cohort-specific criteria [Table S1]. Quantile [26],
DASEN [27], Subset-quantile Within Array Normalization (SWAN) [28], Beta MIxture
Quantile dilation (BMIQ) [29] or Functional normalization [30] was used to correct the
raw beta values that represents the methylation percentage per CpG for every sample.
The normalized beta values were used for the association analysis in each cohort.
Data collection and Dietary assessment
Dietary intake data were derived in each cohort from structured self-administered food
frequency questionnaires (FFQs) varied from 78 to 560 food items [Table 1]. Exposure
variables for the nutrients folate and vitamin B12 were calculated in micrograms per
day from dietary intake data using national food composition tables [Table 1]. This
included foods with folic acid fortification if this was the case, but did not include B-
vitamin supplement intake. Participants with missing dietary data, or who reported
very low (<500) or very high (>5000) total energy intake were excluded.
In order to reduce the magnitude of the systematic measurement error of the
FFQ, each nutrient was adjusted for total energy intake, using the residual method
[31]. Next, unstandardized residuals from this regression of each nutrient and total
energy intake were used for association analyses. B-vitamin supplement intake was
available in all cohorts for use as a covariate. Since these supplement data were
recorded in different forms (B-vitamins, multivitamins or folic acid supplements) and
different units (frequency per day or per week) in each cohort, we harmonized these
data across all cohorts by grouping individuals as supplement users and non-users.

CHAPTER 7: Dietary B-vitamins and DNA methylation 213
STATISTICAL ANALYSES
Differentially Methylated Positions (DMPs): Cohort-specific association analyses
Each participating cohort used linear mixed models to investigate the associations
between each nutrient and genome-wide DNA methylation. Models were adjusted for
age, sex, body mass index (BMI), differential white blood cell (WBC) counts, smoking
status, physical activity, B-vitamin supplement intake, and alcohol (grams per day or
drinks per week) and coffee (grams per day or servings per day) consumption as fixed
effects, except for those studies for whom some covariates were not present [Table 2].
Technical covariates such as array number and position on array were also adjusted
for, and were treated as random effects. Differential WBC counts were either
represented as percentage of measured cell counts, or imputed using the Houseman
method [32]. We first used a continuous model (Model 1), where the unstandardized
residuals of each nutrient were used as continuous variables to estimate their
association with genome-wide DNA methylation. To determine whether large
differences in nutrient intake effect DNA methylation, we also performed a categorical
analysis where the individuals of each residual nutrient were divided into tertiles, and
the first and third tertiles were used to define low and high nutrient intakes,
respectively (Model 2). Food intake measured by FFQ is prone to measurement error,
but is ideal for ranking individuals based on their intake [33]. Thus, a model based on
categorical ranks rather than absolute intake is the recommended analytical approach.
In addition, we performed a sensitivity analysis of both folate and vitamin B12 intake in
non-users of B-vitamin supplements only (Model 3).
Differentially Methylated Positions (DMPs): Meta-analyses
Figure 1 shows the stepwise study design that was followed. Using the software
GWAMA [34], fixed effect meta-analyses as weighted by inverse variance were
performed from the summary statistics of each participating cohort on the continuous
(Model 1), categorical (Model 2) and supplement non-users sensitivity models (Model
2a) of folate and vitamin B12 intake EWASs. An additional sensitivity meta-analysis was
also performed with limitation to studies that had FFQ data at the same time point as
DNA methylation measurements (Model 2b). Heterogeneity (I2) was considered to
account for differences between cohorts using fixed effect meta-analysis. The probes
with SNPs at single base extension and probes with improper binding [35] were
excluded to avoid spurious signals and co-hybridization with alternate homologous
sequences. All participating cohorts had different probe exclusions for quality control
and therefore at this stage, we removed probes if they were not present in at least 5
cohorts. The significance was defined by the Benjamini-Hochberg (BH) method [36] of
the false discovery rate (FDR) <0.05. The gene annotations for the DMPs we identified
were performed using the Genomic Regions Enrichment of Annotations Tool (GREAT)

214 PART C: Nutrition, lifestyle and DNA methylation
[37] with University of California, Santa Cruz (UCSC) [38] where they assigned a
regulatory domain consisting of a basal domain to each gene, that extends up to 5 kb
upstream and 1 kb downstream from its transcription start site. The DMP is annotated
with a gene if it overlaps with its basal domain, In addition, DMP is annotated to a gene
if an extension is reached up to the basal regulatory domain of the nearest upstream
and downstream genes within 1 Mb. The genomic inflation factor (λ) [39] were
computed to estimate the rate of false positives due to population structure. Although
such measure has been successfully applied in genome-wide association studies
(GWAS), its application to EWAS may not confer the same benefit due to the inherent
nature of the correlation structure in CpG sites of interdependent pathways and
environment exposure [40].
Differentially Methylated Regions (DMRs)
We identified DMRs for each nutrient using the software comb-p [41], through analysis
of the nominal p-values of DMPs generated from the meta-analysis (Figure 1, Model 3).
Nominal p-values of DMPs were adjusted according to their weighted correlation with
adjacent p-values using the Stouffer–Liptak–Kechris method, in a sliding window of 500
base pairs (bp) with varying lags of 50 bp [41]. Regions were identified by the peak
finding algorithm on the adjusted p-values that qualified according to the BH FDR
threshold <0.05. The identified regions were then given new p-values and corrected for
multiple testing using the Sidak correction [41]. The significance for DMRs was defined
as Sidak <0.05 for each nutrient. The gene annotations for the identified DMRs were
performed using the GREAT tool [37] with the same extensions as applied for the DMP
gene annotations.
Pathway analysis was performed for genes annotated to the DMRs related to
each nutrient, using the WEB-based GEne SeT AnaLysis Toolkit [42].
Overrepresentation enrichment analysis was performed for the GREAT annotated
genes of the folate and vitamin B12 associated DMRs, respectively, and compared
against the reference genome, in the KEGG pathways. The multiple testing was set to
FDR <0.05 and the minimum number of genes in a functional gene set category was set
to two.
Previously published DMPs using Illumina 450k arrays
We also investigated whether previously published DMPs related to maternal folate
[19, 20] and DMPs related to folate and vitamin B12 intervention [43] were associated
with folate and vitamin B12 intake in our population-based meta-analysis in adults.
Gonseth et al. observed four DMPs (cg22664307, cg21039708, cg15219145 and
cg13499966) in neonatal blood which were associated with maternal folate intake
(n=167) [19]. In a second study examining cord blood methylation with maternal
plasma folate (n=1988), 443 DMPs in cord blood were identified [20]. In a 2-year folic

CHAPTER 7: Dietary B-vitamins and DNA methylation 215
acid and vitamin B12 intervention study, one DMP (cg19380919) had the greatest
change in methylation in the treatment group compared to the controls with marginal
significance [43]. We compared the nominal p-values and beta coefficients to examine
the direction of effects. In addition, we also checked for the enrichment of these
previously found DMPs in our meta-analysis by comparing these CpGs to the same
number of randomly selected CpGs from the array using 100 permutations. From both
the CpG sets, the number of CpGs that had nominal p-value <0.05 were determined
and compared. Using Fisher’s exact test, the significant enrichment was then
determined.

216 PART C: Nutrition, lifestyle and DNA methylation
Fi
gure
1.
An
alys
is f
low
sch
em
e.
(1)
Met
a-an
alys
is o
f co
nti
nu
ou
s m
od
el E
WA
S o
f fo
late
an
d v
itam
in B
12
in
take
as
wel
l as
(2
) m
eta
-an
alys
is o
f
cate
gori
cal
mo
del
EW
AS
wer
e p
erf
orm
ed.
Sign
ific
ant
(FD
R <
0.0
5)
hit
s o
f th
e fo
late
in
take
cat
ego
rica
l m
eta-
anal
ysis
wer
e lo
oke
d u
p i
n t
he
fola
te
inta
ke c
on
tin
uo
us
met
a-an
alys
is a
nd
vit
amin
B1
2 i
nta
ke c
ateg
ori
cal
met
a-an
alys
is.
Met
a-an
alys
es o
f ca
tego
rica
l EW
AS
wer
e fo
llow
ed b
y (2
a)
sen
siti
vity
met
a-an
alys
es o
f B
-vit
amin
su
pp
lem
en
t n
on
-use
rs w
hic
h i
ncl
ud
ed l
oo
kup
of
the
fola
te i
nta
ke a
sso
ciat
ed C
pG
s o
f th
e m
ain
mo
del
, (2
b)
sen
siti
vity
me
ta-a
nal
ysis
of
stu
die
s w
ith
FFQ
co
llect
ion
at
sam
e ti
me
po
int
as D
NA
met
hyl
atio
n m
eas
ure
me
nts
, (3
) D
MR
an
alys
es t
o f
ind
re
gio
ns
of
asso
ciat
ion
, an
d la
stly
, (4
) co
mp
aris
on
to
pre
vio
usl
y id
enti
fied
DM
Ps
asso
ciat
ed w
ith
mat
ern
al f
ola
te in
take
.

CHAPTER 7: Dietary B-vitamins and DNA methylation 217
RESULTS
Cohort Characteristics
Among the European cohorts, the median intakes of dietary folate ranged from 193
µg/d in the Leiden Longevity Study to 415 µg/d in the Rotterdam Study. Among the
American cohorts, the median intakes of dietary folate ranged from 234 µg/d in the
Genetics of Lipid Lowering Drugs and Diet Network (GOLDN) study to 405 µg/d in the
Framingham Heart Study (FHS). Among the European cohorts, the median intake of
dietary vitamin B12 ranged from 4.0 µg/d in the Leiden Longevity Study (LLS) to 7.4
µg/d in the Young Finns Study (YFS). For the American cohorts, the median intake of
dietary vitamin B12 ranged from 4.5 µg/d in the GOLDN study to 6.3 µg/d in the ARIC
Study. Characteristics of each participating study are given in Table 1.
Study participants were adults (44-100% women) with the mean age ranging
from 40-77 years. There were 7-25% current smokers and 3-58% of B-vitamin,
multivitamin or folic acid supplement users. Since the use of supplements may be a
confounder to the analysis, we also performed a sensitivity analysis in non-users of B-
vitamin, multivitamin or folic acid supplements. Further characteristics such as BMI,
WBC counts, physical activity, alcohol and coffee intake of each cohort are provided in
Table 2.
MODELS
Model 1: Continuous (Differentially methylated positions)
Meta-analysis of the 5,815 individuals from the EWAS analysis of the folate intake
continuous model showed no significant DMP associations (FDR <0.05). Meta-analysis
of the 5,302 individuals of the EWAS analysis of the vitamin B12 intake continuous
model also showed no significant DMP associations (FDR <0.05).
Model 2: Categorical (Differentially methylated positions)
Meta-analyses of 3,894 individuals evaluated categorically from the EWASs of folate
intake showed 6 significant DMP associations (FDR <0.05) [Table 3, Figure 2 (a-g) and
S2]. These 6 DMPs showed consistent association with nominal significance (p <0.05) in
the continuous model [Table 3]. The most significant DMP was at cg23465990
(P=3.87E-08, FDR=0.018) on chromosome 17, annotated to the nearest gene FAM64A
(605 bp upstream), and showed 0.12% decrease in methylation per micrograms per
day increase in residual folate intake. Other significant DMPs at cg11832534,
cg03249011, cg14398883, cg00826902 and cg14145338 were annotated to the nearest
genes WRAP73 (2,648 bp downstream), FRMD8 (41931 bp downstream), CUX1 (62,673
bp upstream), WRAP73 (2,692 bp downstream) and LCN8 (3,667 bp downstream),
respectively of chromosomes 1, 11, 7 and 9. All identified DMPs were negatively
218 PART C: Nutrition, lifestyle and DNA methylation
associations between folate intake and methylation levels with 0.12-0.79% decrease in
methylation per micrograms per day increase in residual folate intake.
EWAS results of the vitamin B12 intake categorical model did not show
significant DMPs in the meta-analysis of 3,566 individuals [Figure S2]. Of the 6
significant DMPs from the folate intake analysis, two DMPs (cg23465990 and
cg14398883) showed borderline nominal significance in the same direction as folate
intake in the categorical model of vitamin B12 intake (p = 0.02 and 0.04, respectively)
[Table S3].
Model 2a: Sensitivity model in supplement non-users
A sensitivity analysis was further performed to reduce heterogeneity in the models
caused by the use of B-vitamin supplements. This may potentially help with finding
new true positive DMPs. In sensitivity analyses performed in supplement non-users,
there were no significant DMPs in the meta-analysis of 2,183 individuals for the
categorical model of folate intake [Figure S3]. The 6 significant DMPs identified in the
full categorical model were nominally associated (p <0.05) in the same direction with
folate intake in the non-users [Table 3]. The effect sizes were similar to the full
categorical model with 0.12-0.74% decrease in methylation per micrograms per day
increase in residual folate intake. Furthermore, no significant DMPs were identified
either in the individual cohort results nor the meta-analysis of 1,855 individuals for the
categorical model of vitamin B12 intake.
Model 2b: Sensitivity model time of measurements
To determine whether there is a confounding effect by studies with a time-lag between
DNA methylation and folate or vitamin B12 intake assessment, a second sensitivity
meta-analysis was performed including only studies where DNA methylation
measurements and FFQ collection were assessed at the same time. The FHS, YFS and a
subset of the RS cohort had FFQ collection 4-7 years apart of DNA collection, and
therefore, these three cohorts were left out in model 2b. Meta-analysis of the 2,183
individuals for the categorical model of folate intake did not result in significant DMPs
[Figure S4]. The 6 significant DMPs associated with folate intake in the full categorical
model had consistent associations with nominal significance [Table 3]. Furthermore,
sensitivity meta-analysis of the 1,865 individuals for the categorical model of the
vitamin B12 intake also did not identify significant DMPs.
Model 3: Categorical (Differentially methylated regions)
Folate intake
We additionally performed DMR analysis using p-values of the folate and vitamin B12
intake meta-analyses of the categorical model (Model 2). By investigation of significant
regions (Sidak P<0.05) using the software comb-p, we observed 74 significant DMRs

CHAPTER 7: Dietary B-vitamins and DNA methylation 219
associated with folate intake [Table 5, Figure 4a]. Most (73/74) DMRs were negatively
associated with methylation. The most significant DMR associated with folate intake
was the chr17:76,975,944-76,976,358 (P =1.47E-14) containing a 414 bp region of 8
DMPs, which annotates to the LGALS3BP gene. Overrepresentation enrichment
analysis for the 117 genes of the folate associated 74 DMRs showed one significant
pathway: signaling pathways regulating pluripotency of stem cells (P =1.61E-04).
Vitamin B12 intake
Regional analysis using comb-p found 29 significant DMRs with Sidak P<0.05 associated
with vitamin B12 intake [Table 6, Figure 4b], of which 15 showed negative direction of
effects. The most significant DMR associated with vitamin B12 intake was the
chr18:21,718,458-21,719,569 (P =1.09E-13) containing a 1,111 bp region of 18 DMPs,
and annotates to the promoter region of the gene CABYR. The vitamin B12 associated
DMRs did not overlap with the folate intake associated DMRs. Enrichment analysis for
the 48 genes of the vitamin B12 associated 29 DMRs did not reveal significant
pathways.
PREVIOUSLY PUBLISHED DMPS USING ILLUMINA 450K ARRAYS
Maternal folate exposure and cord blood DMPs
We analysed previously identified DMPs that have previously been reported to be
associated in neonates with maternal folate intake. In the current folate intake meta-
analysis (Categorical Model 2), one (cg15219145) of the four previously identified
DMPs from the Gonseth et al study [19] showed a nominal significance (P <0.05) with
similar direction. None of these four CpGs were significant with vitamin B12 intake
[Table S4]. Next, 28 and 27 of the 443 previously identified DMPs in newborns from the
Joubert et al study [20] were associated with folate and vitamin B12 intake respectively
in the same direction with nominal significance (P <0.05) in our study [Table S5].
However, no enrichment of significant p-values was found in these 443 DMPs in either
folate (p = 0.60) or vitamin B12 (p = 0.22) intake models in our study.
Folic acid and Vitamin B12 Intervention study
The previously identified DMP (cg19380919) of a 2-year folic acid and vitamin B12
intervention study [43] was not associated with either folate intake (p = 0.78) or
vitamin B12 intake (p = 0.43) in the current study [Table S6].

220 PART C: Nutrition, lifestyle and DNA methylation
Tab
le 1
. Die
tary
ass
essm
ent
in p
arti
cip
atin
g co
ho
rts.
Co
ho
rts
CO
UN
TRY
N
(5
,84
1)
Fort
ific
atio
n
No
. o
f Fo
od
it
ems
Yea
r o
f d
ieta
ry
dat
a co
llect
ion
Ref
eren
ce t
able
Ti
ne
gap
(Y
ears
)
RS
NL
900
N
o
389
20
06-2
012
Th
e D
utc
h F
oo
d C
om
po
siti
on
Tab
les
(NEV
O t
able
, 20
06
) 0
(4
6%
sam
ple
s h
ad ~
7y
gap
)
LLS
NL
430
N
o
183
20
06-2
007
FQ
13V
200
6122
1 (W
age
nin
gen
20
06
),
calc
ula
tio
ns
bas
ed o
n D
utc
h F
oo
d C
om
po
siti
on
Dat
abas
e (N
EVO
tab
le, 2
00
6)
0
CO
DA
M
NL
154
N
o
178
20
06-2
009
N
EVO
tab
le, 2
00
1
0
InC
HIA
NTI
IT
48
4
No
23
6
1998
-20
00
Ital
ian
Tab
les
of
Foo
d C
om
po
siti
on
, 19
98
0
YFS
FI
155
N
o
128
20
07
Fin
nis
h T
able
s o
f Fo
od
Co
mp
osi
tio
n, 2
00
7
4
Twin
sUK
U
K
568
Ye
s 13
1
1994
-20
01,
2007
M
cCan
ce a
nd
Wid
do
wso
n’s
Th
e C
om
po
siti
on
of
Foo
ds
Edit
ion
6, 2
00
2
0
FHS
USA
1,
657
Ye
s 12
6
2005
-20
08
Har
vard
FFQ
Nu
trie
nt
Dat
abas
e, 2
00
9
5-6
GO
LDN
U
SA
983
Ye
s 12
4
2002
-20
04
The
US
Dep
artm
ent
of
Agr
icu
ltu
re's
19
94
–1
99
6
Co
nti
nu
ing
Surv
ey o
f Fo
od
Inta
kes
by
Ind
ivid
ual
s 0
AR
IC
USA
32
1
No
78
19
93-1
995
U
SDA
. Co
mp
osi
tio
n o
f fo
od
s: a
gric
ult
ure
han
db
oo
k n
o. 8
ser
ies.
W
ash
ingt
on
, DC
: U
S D
epar
tmen
t o
f A
gric
ult
ure
, 19
75
–1
98
9
0
CH
S U
SA
188
N
o
131
19
89-1
990
H
arva
rd F
FQ N
utr
ien
t D
atab
ase,
19
96
0
N: N
um
ber
of
sam
ple
s af
ter
excl
usi
on
of
ind
ivid
ual
s w
ith
pre
vale
nt
can
cer
and
ver
y lo
w (
<50
0)
or
very
hig
h (
>50
00
) to
tal e
ne
rgy
inta
ke
Fort
ific
atio
n: C
oh
ort
s th
at in
clu
ded
fo
od
s w
ith
fo
lic a
cid
fo
rtif
icat
ion

CHAPTER 7: Dietary B-vitamins and DNA methylation 221
Ta
ble
2. D
emo
grap
hic
an
d li
fest
yle
char
acte
rist
ics
of
par
tici
pat
ing
coh
ort
s.
Mea
sure
d c
ell c
ou
nts
in 1
09 /L
; Gra
nu
locy
tes:
a Eosi
no
ph
ils a
nd
bN
eutr
op
hils
, Ho
use
man
imp
ute
d p
erce
nta
ge c
ell c
ou
nts
: C
D8
T, C
D4
T, N
K, B
cell
Alc
oh
ol i
nta
ke: a gr
ams/
day
, Co
ffee
inta
ke: a gr
ams/
day
or
bse
rvin
gs/d
ay; c FH
S u
sed
caf
fein
e in
take
in g
ram
s/d
ay
Ph
ysic
al a
ctiv
ity:
a Tota
l MET
ho
urs
/wee
k, b
Tota
l sco
re o
f al
l act
ivit
ies,
c Ho
urs
per
wee
k m
od
erat
e ac
tivi
ty, d
Tota
l MET
min
ute
s/w
eek,
eK
iloca
lori
es
NA
: No
t av
aila
ble
, NA
p: N
ot
app
licab
le, *
No
t in
clu
ded
in a
nal
yses
(o
nly
ava
ilab
le t
o N
=17
4 in
div
idu
al),
Su
pp
(Su
pp
lem
ent)
Co
ho
rts
Age
[M
ean
(S
D)]
Wo
men
[%
]
BM
I [M
ean
(S
D)]
WB
C
Cu
rren
t sm
oke
rs
[%]
Alc
oh
ol
inta
ke
[Mea
n
(SD
)]
Co
ffee
in
take
[M
ean
(S
D)]
Ph
ysic
al
acti
vity
[M
ean
(S
D)]
O
r A
ctiv
e [%
]
Sup
p
use
rs
[%]
Fola
te
(µg/
day
) [M
edia
n
(Ran
ge)]
Vit
B1
2
(µg/
day
) [M
edia
n
(Ran
ge)]
Gra
nu
locy
tes
[Mea
n (
SD)]
Ly
mp
ho
cyte
s [M
ean
(SD
)]
Mo
no
cyte
s [M
ean
(SD
)]
RS
64.5
(9
.0)
57.4
2
7.6
(4
.1)
0.4
(0.1
) 0.
1 (0
.1),
0.2
(0.
1)
0.1
(0.1
), 0
.1 (
0.0)
0.
1 (0
.0)
7.4
12
.3
(15.
7)a
385.
8
(240
.0)a
63
.4
(64
.2)a
32.1
4
15
.2
(53
.9-1
17
3.9
) 4
.6
(0.6
-14
.1)
LLS
58.6
(6
.3)
51.3
2
5.3
(3
.8)
4.3
(1.3
) 2.
0 (0
.6)
0.4
(0.1
) 12
.3
16.7
(1
5.1)
N
A
NA
26
.3
19
2.7
(6
8.0
-41
5.4
) 4
.0
(0.9
-11
.0)
CO
DA
M
65.5
(6
.9)
44.2
2
8.6
(4
.2)
0.3
(0.1
) 0.
1 (0
.1),
0.3
(0.
1)
0.2
(0.1
), 0
.1 (
0.0)
0.
1 (0
.0)
15.6
12
.5
(14.
2)a
491.
9
(276
.8)a
71
50
.4
(49
55
.3)b
3
.2
20
0.3
(9
6.2
-36
4.7
) 4
.2
(0.8
-10
.8)
InC
HIA
NTI
62
.6
(15.
7)
54.1
2
7.1
(3
.9)
0.03
1 (0
.02)
a
0.59
(0.
08)
b
0.32
(0.
08)
0.
05 (
0.0
1)
18.6
16
.5
(21.
7)
2.4
(1
.4)b
5
1
NA
2
73
.9
(88
.9-6
45
.9)
NA
YFS
40.2
(3
.3)
61.9
2
5.6
(4
.4)
0.5
(0.1
) 0.
1 (0
.0),
0.2
(0.
1)
0.1
(0.1
), 0
.1 (
0.0)
0.
1 (0
.0)
24.5
6.
9
(7.3
) 40
9.9
(2
65.8
)a 7
7.4
39
.4
33
2.8
(1
59
.1-7
32
.0)
7.4
(3
.0-1
6.9
)
Twin
sUK
58
.9
(9.9
) 10
0.0
2
6.4
(4
.8)
0.5
(0.1
) 0.
1 (0
.0),
0.2
(0.
1)
0.1
(0.0
), 0
.1 (
0.0)
0.
1 (0
.0)
10.9
7.
4
(11.
2)
NA
N
A
53.3
3
76
.7
(12
2.6
-97
6.3
) 6
.0
(0.5
-16
.0)
FHS
64.8
(8
.6)
57.1
2
8.2
(5
.4)
0.5
(0.1
) 0.
1 (0
.1),
0.2
(0.
1)
0.0
(0.0
), 0
.0 (
0.0)
0.
1 (0
.0)
10.3
10
.1
(15.
4)
157.
2
(123
.8)c
88
.3
57.7
4
05
.9
(99
.2-1
14
1.0
) 5
.5
(0.0
-18
.2)
GO
LDN
49
.0
(16.
0)
53.0
2
8.3
(5
.7)
NA
p
NA
p
NA
p
7.0
6.
0
(20.
0)
277.
5
(427
.1)
2.9
7
(2.4
7)c
58.0
2
33
.6
(0.0
-11
43
.6)
4.5
(0
.0-3
1.2
)
AR
IC
59.5
(5
.8)
67.6
3
0.5
(6
.4)
1.7
(2.2
)a
54.1
(10
.2)b
N
A
5.3
(3.4
) 23
.4
2.7
(1
0.0)
8.
9
(12.
1)
66
.8
(52
.0)d
*
24.3
2
48
.1
(36
.0-8
11
.2)
6.3
(0
.7-2
6.3
)
CH
S 77
.3
(4.9
) 66
.5
27.
5
(4.8
) 0.
5 (0
.15)
0.
1 (0
.1),
0.2
(0.
1)
0.1
(0.1
), 0
.1 (
0.0)
0.
1 (0
.04)
7.
98
2.34
(6
.6)
0.73
(1
.1)b
7
63
.9
(11
88
.1)
33.0
3
60
.0
(93
.7-8
86
.7)
5.5
(0
.8-2
8.7
)

222 PART C: Nutrition, lifestyle and DNA methylation
Tab
le 3
. Dif
fere
nti
ally
me
thyl
ated
po
siti
on
s si
gnif
ican
tly
asso
ciat
ed w
ith
fo
late
inta
ke a
t th
e e
pig
eno
me
-wid
e le
vel i
n t
he
met
a-an
alys
is.
Cp
G
[Ch
r]
Nea
rest
Gen
e
Cat
ego
rica
l Mo
del
:
All
Ind
ivid
ual
s
(Mo
del
2;
N=3
,894
)
Cat
ego
rica
l Mo
del
:
Sen
siti
vity
An
alys
is o
f
Sup
ple
men
t N
on
-use
rs
LOO
KU
P (
Mo
del
2a;
N=
2,1
83)
Cat
ego
rica
l Mo
del
:
Sen
siti
vity
An
alys
is o
f
Sam
e ti
me
po
int
FFQ
& D
NA
m
LOO
KU
P (
Mo
del
2b
; N
=2,
193
)
Co
nti
nu
ou
s M
od
el:
All
Ind
ivid
ual
s
LOO
KU
P (
Mo
del
1;
N=5
,81
5)
Effe
ct
SE
P
FDR
I2
Effe
ct
SE
P
Effe
ct
SE
P
Effe
ct
SE
P
cg23
465
99
0
[17
] FA
M64
A (
-60
5)
-0.0
01
2.
2E-0
4
3.9E
-08
0.
02
0.02
-0
.00
1
2.6E
-04
5.
3E-0
6
-0.0
01
2
.9E-
04
9.
2E-
04
-4
.0E-
06
1
.0E-
06
2
.4E-
05
cg11
832
53
4
[1]
WR
AP
73 (
+26
48)
,
TPR
G1L
(+
22
467
) -0
.00
4
7.7E
-04
9.
0E-0
8
0.02
0
-0
.00
3
9.6E
-04
7.
9E-0
4
-0.0
04
9
.7E-
04
2.
2E-
05
-1
.5E-
05
3
.0E-
06
8
.9E-
06
cg0
324
90
11*
[11
]
SCYL
1 (
-96
57
6),
FRM
D8
(+4
193
1)
-0.0
08
1.
4E-0
3
1.8E
-07
0.
03
0
-0.0
07
1.
8E-0
3
4.2E
-05
-0
.00
8
1.9
E-0
3
3.0
E-0
5
-1.6
E-0
5
6.0
E-0
6
7.5
E-0
3
cg14
398
88
3
[7]
MYL
10
(-1
256
33),
CU
X1
(-6
267
3)
-0.0
08
1.
6E-0
3
5.1E
-07
0.
05
0
-0.0
05
1.
4E-0
3
5.2E
-04
-0
.00
7
2.2
E-0
3
2.9
E-0
3
-2.8
E-0
5
6.0
E-0
6
1.0
E-0
6
cg00
826
90
2
[1]
WR
AP
73 (
+26
92)
,
TPR
G1L
(+
22
423
) -0
.00
5
9.8E
-04
5.
9E-0
7
0.05
0.
49
-0.0
05
1.
2E-0
3
1.5E
-05
-0
.00
3
1.2
E-0
3
3.4
E-0
2
-1.9
E-0
5
4.0
E-0
6
3.2
E-0
6
cg14
145
33
8
[9]
LCN
6 (
-60
84)
,
LCN
8 (
+36
67)
-0.0
06
1.
2E-0
3
6.2E
-07
0.
05
0.05
-0
.00
6
1.4E
-03
2.
1E-0
5
-0.0
04
1
.5E-
03
6.
2E-
03
-2
.2E-
05
5
.0E-
06
2
.0E-
05
Effe
ct: B
eta
co
eff
icie
nts
bas
ed o
n u
nst
and
ard
ized
res
idu
als
of
fola
te in
take
, ad
just
ed f
or
tota
l en
ergy
inta
ke
I2 : Het
ero
gen
eity
I^2
par
amet
er
Bp
: Bas
e p
air
loca
tio
n b
ased
on
Illu
min
a an
no
tati
on
*Lo
cati
on
=En
han
cer,
bas
ed o
n Il
lum
ina
ann
ota
tio
n, d
eriv
ed f
rom
UC
SC
FDR
th
resh
old
= 0
.05

CHAPTER 7: Dietary B-vitamins and DNA methylation 223
Figure 2a: Manhattan plot of the folate categorical model, adjusted for BMI, WBC counts,
smoking status, physical activity, B-vitamin supplement intake, and alcohol and coffee
consumption and batch effects: showing the association between folate intake and
genome-wide DNA methylation (model 2), with 6 significant DMPs at FDR <0.05 (red line), in
3,894 individuals. Nearest genes for these 6 DMPs are reported.
Figure 2b: Manhattan plot of the vitamin B12 categorical model, adjusted for BMI, WBC
counts, smoking status, physical activity, B-vitamin supplement intake, and alcohol and
coffee consumption and batch effects: showing the association between vitamin B12 intake
and genome-wide DNA methylation (model 2), with no significant DMPs at FDR <0.05 (red
line), in 3,566 individuals.
Chromosome
Chromosome
-lo
g 10(
p)
-lo
g 10(
p)

224 PART C: Nutrition, lifestyle and DNA methylation
Figure 3a: Forest plot of the categorical folate intake model 2: showing the association
between folate intake and the most significant DMP cg23465990 (FAM64A) across all
studies and in meta-analysis of 3,791 individuals.
Figure 3b: Forest plot of the categorical folate intake model 2: showing the association
between folate intake and the DMP cg11832534 (WRAP73) across all studies and in meta-
analysis of 3,894 individuals.
Effect size
Effect size

CHAPTER 7: Dietary B-vitamins and DNA methylation 225
Figure 3c: Forest plot of the categorical folate intake model 2: showing the association
between folate intake and the DMP cg03249011 (FRMD8) across all studies and in meta-
analysis of 3,894 individuals.
Figure 3d: Forest plot of the categorical folate intake model 2: showing the association
between folate intake and the DMP cg14398883 (CUX1) across all studies and in meta-
analysis of 3,894 individuals.
Effect size
Effect size

226 PART C: Nutrition, lifestyle and DNA methylation
Figure 3e: Forest plot of the categorical folate intake model 2: showing the association
between folate intake and the DMP cg00826902 (WRAP73) across all studies and in meta-
analysis of 3,894 individuals.
Figure 3f: Forest plot of the categorical folate intake model 2: showing the association
between folate intake and the DMP cg14145338 (LCN8) across all studies and in meta-
analysis of 3,894 individuals.
Effect size
Effect size

CHAPTER 7: Dietary B-vitamins and DNA methylation 227
Figure 4a: Manhattan plot of the folate intake categorical model 3: showing the
association between folate intake and genome-wide DNA methylation, with 74 significant
DMRs at Sidak <0.05 in 3,894 samples. The red line represents the threshold of FDR <0.05 of
the correlation adjusted p-values. Green circles are the CpGs that are present within the
DMRs, whereas black/grey circles are the single CpGs that do not represent DMRs. Nearest
genes for the top 5 DMRs are reported.
Figure 4b: Manhattan plot of the vitamin B12 intake categorical model 3: showing the
association between vitamin B12 intake and genome-wide DNA methylation, with 29
significant DMRs at Sidak <0.05 in 3,565 samples. The red line represents the threshold of
FDR <0.05 of the correlation adjusted p-values. Green circles are the CpGs that are present
within the DMRs, whereas black/grey circles are the single CpGs that do not represent
DMRs. Nearest genes for the top 5 DMRs are reported.
Chromosome
Chromosome
-lo
g 10(
p)
-lo
g 10(
p)

228 PART C: Nutrition, lifestyle and DNA methylation
DISCUSSION We have conducted the first large-scale EWAS of the association between folate and
vitamin B12 intake and genome-wide DNA methylation in humans. We identified 6
novel DMPs and 74 DMRs significantly associated with dietary folate intake, and 29
DMRs significantly associated with dietary vitamin B12 intake. These novel epigenetic
loci might become promising future biomarkers in folate- and vitamin B12 related
pathologies.
We identified 6 novel DMPs for folate intake, of which several were located
close to genes with functional relevance to centrosome, cell proliferation and
tumorigenesis. The most significant DMP at cg23465990 is annotated to the gene
family with sequence similarity 64 member A (FAM64A) on chromosome 17. FAM64A
protein interacts with Calmodulin (CALM) and leukemogenic CALM/AF10 fusion
protein, where it is identified as a marker for cell proliferation control [44, 45]. The
DMPs at cg11832534 and cg00826902 on chromosome 1 are annotated to WD repeat
containing, antisense to TP73 (WRAP73). WRAP73 protein is localized in the
centrosome and it ensures proper spindle morphology [46]. It is a centriolar satellite
and functions in ciliogenesis by promoting ciliary vesicle docking [47]. The DMP at
cg14398883 on chromosome 7 is annotated to cut like homeobox 1 (CUX1). CUX1 is a
tumor suppressor and its deficiency leads to tumor growth via the activity of
phosphoinositide 3-kinase signaling [48]. The DMP at cg03249011 annotated to FERM
domain containing 8 (FRMD8) is in an enhancer region on chromosome 11. FRMD8 is
associated with survival rate in patients of lung adenocarcinoma [49]. Lastly, the DMP
at cg14145338 is annotated to lipocalin 8 (LCN8) on chromosome 9. LCN8, along with
other related lipocalin genes, express in epididymis and are suggested to be involved in
male fertility [50]. Further studies are needed to understand how these CpGs with
seemingly no obvious link with B-vitamin homeostasis are involved in folate
metabolism. In addition, validation is needed to characterize the causal relation of
vitamin B intake on the function of these CpGs on nearby genes and one-carbon
metabolism.
In contrast to the relatively small number of DMPs for folate intake, we
observed 74 significant DMRs in association with folate intake, with several of potential
relevance to immune function and stem cell function. The most significant DMR was
the chr17 locus spanning 414 bp region including 8 CpGs annotating to the galectin 3
binding protein (LGALS3BP) gene, which is implicated in immune response. Signaling
pathways regulating pluripotency of stem cells are overrepresented among the genes
annotated near the folate associated DMR CpGs, comprised of AKT serine/threonine
kinase 3 (AKT3), inhibitor of DNA binding 2, HLH protein (ID2), Wnt family member 6
(WNT6), WNT9B and WNT10A genes. This suggests a relationship between folate
intake and methylation of genes involved in development related pathways [51]. In
addition, downregulation of LGALS3BP associates with some cancers through WNT

CHAPTER 7: Dietary B-vitamins and DNA methylation 229
signalling [52, 53]. Studies show a relation between low folate intake and some cancers
[54-57], indicating that this relation could be via hypermethylation of LGALS3BP.
We identified one significant DMP at cg18642459 on chromosome 12
annotated to the FGF6 gene. FGF6 plays a role in cellular differentiation and a potential
role in muscle regeneration [58-60]. Vitamin B12 was previously shown to play a role in
reparative regeneration of skeletal muscle [61] which could involve hypermethylation
of the FGF6 gene. In contrast to the limited findings for vitamin B12 and DMP, regional
analysis showed 29 significant DMRs associated with vitamin B12 intake. The most
significant DMR was the chr18 locus spanning 1,111 bp containing 18 DMPs and a
promoter of calcium binding tyrosine phosphorylation regulated (CABYR). CABYR is
expressed in lung and hepatocellular cancers [62, 63]. No significant pathways were
observed in the enrichment analysis for the vitamin B12 associated DMR genes,
possibly due to the limited number of genes. Differential methylation findings for the
vitamin B12, were similar to those of folate, in that DMR associations were more
numerous than those of DMP. Surprisingly, there was no overlap of DMPs or DMRs
between the folate and vitamin B12 intake despite the correlation between folate and
vitamin B12 intake. Thus, suggesting that their roles may be specific to different genes
and pathways.
To investigate whether the previously identified transgenerational effects of
maternal folate intake or levels on methylation in newborns, also generalize in adults
[19, 20], we conducted a look up in our population-based meta-analysis of leukocytes
in adults. A minority showed nominal significance with mostly negative direction of
effects, and no significant enrichment was found in these previously identified folate-
associated DMPs in both folate and vitamin B12 intake in our study. This suggests that
the folate-related DMPs in newborns and adults are not similar and might differ across
the life course.
In a two-year intervention study (BPROOF) with folic acid and vitamin B12, a
single DMP (cg19380919) annotated to endothelial PAS domain protein 1 (EPAS1) was
reported compared to placebo. This DMP was not significant in our meta-analyzed
findings for either folate (p = 0.78) or vitamin B12 intake (p = 0.43) [Table S6]. A
possible explanation for this difference is that the intervention study was specific to
individuals with elevated homocysteine (greater than 15 µmol/L) [43], whereas
participants in our study were generally healthy. In addition, in this intervention study
the change in methylation over a 2-year time period was assessed, which might lead to
different findings compared to our association study in which data at a single time
point was investigated.
We hypothesized that low levels of folate give rise to DNA hypomethylation
[13, 16, 17]. However, all 6 folate associated DMPs and most (73/74) DMRs were
negatively associated with folate intake. For vitamin B12 intake, we see this negative
association in 15 of the 29 DMRs. The occurrence of general hypomethylation with

230 PART C: Nutrition, lifestyle and DNA methylation
higher folate is contrary to our hypothesis, where higher folate would transfer
additional methyl groups and result in relative genome-wide hypermethylation.
However, our results are in line with the study from Ono et al., who showed that higher
folate intake was associated with lower global methylation [15]. Our results are also in
line with the studies with maternal folate intake which showed a majority of identified
DMPs in newborns to be negatively associated to folate intake [19, 20]. An intervention
study of folic acid supplementation in a mice demonstrated inhibition of
methylenetetrahydrofolate reductase (MTHFR) activity and reduced S-
adenosylmethionine (SAM) and SAM/S-adenosylhomocysteine [64]. The inhibition of
MTHFR due to higher folate intake may explain the relatively lower DNA methylation
observed in our study.
Our study is also consistent with earlier work in that we observed more DMPs
and DMRs correlated with folate intake as compared to vitamin B12 intake [13-17].
Based on the amount of DMPs and DMRs identified, folate seems to have a larger
effect on DNA methylation. This may be due to impaired vitamin B12 uptake by
medications, health disorders, genetic defects and other lifestyle factors. As a result of
these conditions, vitamin B12 intake in elderly people does not necessarily reflect
vitamin B12 status [65]. Alternately, folate may have a larger relationship with
leukocyte DNA methylation as compared to vitamin B12 [13-17].
The strengths of our study are that this is the first epigenome-wide
association study and meta-analysis conducted in a large sample size of 5,841
individuals from 10 well characterized cohorts, using the Illumina 450k methylation
data. The nutrient data was harmonized across studies and all studies ran similar
models with the same covariates.
While our study has yielded a number of interesting findings, among the most
important insights is that folate or vitamin B12 intake, a major determinant of B-
vitamin status, is not related to large-scale differences in genome-wide methylation
profiles. There are a number of possible explanations for these observations. First,
dietary data is prone to measurement errors, which can lead to misclassification and
can compromise our ability to detect statistically significant associations. However, we
addressed these limitations by using categorical models. While this analysis reduces
statistical power due to the one-third reduction in sample size, greater effects were
observed because the comparison is made between extreme tertile groups of the
nutrient intakes. Second, vitamin B12 intake does not provide a good reflection of
vitamin B12 status in older individuals as a consequence of issues related to absorption
[66]. Given the fact that the mean ages in the majority of the cohorts were over 60
years, it is highly likely that use of intake could result in misclassification of vitamin B12
status. Third, although we removed individuals with prevalent cancer because of their
potentially adopted dietary patterns [21, 22], the possibility of changes in dietary
habits due to other reasons such as lifestyle changes cannot be excluded. Also, there

CHAPTER 7: Dietary B-vitamins and DNA methylation 231
may be ethnic variation, since the ARIC sample is of African-American origin.
Furthermore, there were differences in nutrient intake ranges across cohorts which
could be related to the number and type of food items used in the FFQs, and the types
of food composition reference tables used to calculate the nutrient data. Large
differences in median intakes were also seen in Netherlands based studies, where the
Rotterdam Study (RS) used 389 food items and the Leiden Longevity Study (LLS) used
183 food items. Fourth, despite our inclusion of the known confounders as covariates,
the possibility of inter-correlations of these confounders with each other or belonging
along the causal pathway could nullify the findings. Fifth, we did not account for the
most common MTHFR 677C>T variant that affects DNA methylation through its interact
with folate status [67]. Sixth, our study includes DMPs that approach borderline
significance and have modest effect sizes. In such cases, the comb-p package for DMR
analysis may return false positive DMRs [68]. Therefore, replication of our findings
would be necessary before definite conclusions can be drawn. We should therefore
interpret all findings of the DMR analysis with caution. Seventh, the variation in intake
may not be large enough for overall hypomethylation. It may be that the genes and
regions that are identified here, are only the most sensitive ones. Also, none of the
cohorts had median intake of vitamin B12 that was lower than the European or
American RDI. This could mean that the vitamin B12 intake was consistently high
enough and our population was relatively healthy to prevent any measurable effects
on methylation. Lastly, we acknowledge the possibility that blood cells may not be the
ideal tissue for evaluating the association between B-vitamin intake and methylation,
and that larger tissue-specific effects may be present but remain undetected in our
study.
Among the European cohorts, the median intake of dietary folate ranged
from 193 µg/d in the Leiden Longevity Study to 415 µg/d in the Rotterdam Study. This
is slightly lower than the European recommended dietary allowance (RDA) of 200 µg/d
[69]. The Rotterdam Study had the highest median folate intake being 415 µg/d.
Among the American cohorts, the median intakes of dietary folate were 234 and 360
µg/d in the Genetics of Lipid Lowering Drugs and Diet Network (GOLDN) and CHS
cohorts, respectively, which is less than the American RDA of 400 µg/d (except for
ARIC) [69]. The Framingham Heart Study (FHS) and ARIC fulfilled the American RDA for
their median dietary folate intake being 406 and 448 µg/d, respectively. Furthermore,
there could be misclassification of folate intake in the GOLDN study. This is because
dietary data was collected between 2002-2004 after the mandated folic acid
fortification was implemented. However, the food composition table that was used for
nutrient calculations originated from before fortification was implemented (i.e. before
1996, table 1].

232 PART C: Nutrition, lifestyle and DNA methylation
CONCLUSIONS
We observed 6 DMPs associated with dietary folate intake. Regional associations
showed 74 DMRs for dietary folate intake and 29 DMRs for dietary vitamin B12 intake.
Our meta-analysis identified several novel differentially methylated loci that could
serve as potential biomarkers in folate and vitamin B12 related pathologies. Further
studies should validate results by measuring folate and vitamin B12 levels in plasma.
ADDITIONAL INFORMATION
Supplementary material is available on request.

CHAPTER 7: Dietary B-vitamins and DNA methylation 233
REFERENCES 1. Friso S, Udali S, De Santis D, Choi SW. One-carbon metabolism and epigenetics. Mol
Aspects Med 2017;54:28-36. 2. Kirke PN, Molloy AM, Daly LE, Burke H, Weir DG, Scott JM. Maternal plasma folate and
vitamin B12 are independent risk factors for neural tube defects. Q J Med 1993;86:703-8.
3. Molloy AM, Mills JL, Kirke PN, Weir DG, Scott JM. Folate status and neural tube defects. Biofactors 1999;10:291-4.
4. Molloy AM, Kirke PN, Troendle JF, Burke H, Sutton M, Brody LC, et al. Maternal vitamin B12 status and risk of neural tube defects in a population with high neural tube defect prevalence and no folic Acid fortification. Pediatrics 2009;123:917-23.
5. Ma Y, Peng D, Liu C, Huang C, Luo J. Serum high concentrations of homocysteine and low levels of folic acid and vitamin B12 are significantly correlated with the categories of coronary artery diseases. BMC Cardiovasc Disord 2017;17:37.
6. Peng Y, Dong B, Wang Z. Serum folate concentrations and all-cause, cardiovascular disease and cancer mortality: A cohort study based on 1999-2010 National Health and Nutrition Examination Survey (NHANES). Int J Cardiol 2016;219:136-42.
7. Ebesunun MO, Umahoin KO, Alonge TO, Adebusoye LA. Plasma homocysteine, B vitamins and bone mineral density in osteoporosis: a possible risk for bone fracture. Afr J Med Med Sci 2014;43:41-7.
8. Herrmann M, Peter Schmidt J, Umanskaya N, Wagner A, Taban-Shomal O, Widmann T, et al. The role of hyperhomocysteinemia as well as folate, vitamin B(6) and B(12) deficiencies in osteoporosis: a systematic review. Clin Chem Lab Med 2007;45:1621-32.
9. H.B. Castellanos-Sinco COR-P, A. Santoyo-Sánchez, J. Collazo-Jaloma, C. Martínez-Murillo, E. Montaño-Figueroa, A. Sinco-Ángeles. Megaloblastic anaemia: Folic acid and vitamin B12 metabolism. Revista Médica Del Hospital General De México 2015;78:135-143.
10. Jung AY, Botma A, Lute C, Blom HJ, Ueland PM, Kvalheim G, et al. Plasma B vitamins and LINE-1 DNA methylation in leukocytes of patients with a history of colorectal adenomas. Mol Nutr Food Res 2013;57:698-708.
11. Schernhammer ES, Giovannucci E, Kawasaki T, Rosner B, Fuchs CS, Ogino S. Dietary folate, alcohol and B vitamins in relation to LINE-1 hypomethylation in colon cancer. Gut 2010;59:794-9.
12. Piyathilake CJ, Johanning GL, Macaluso M, Whiteside M, Oelschlager DK, Heimburger DC, Grizzle WE. Localized folate and vitamin B-12 deficiency in squamous cell lung cancer is associated with global DNA hypomethylation. Nutr Cancer 2000;37:99-107.
13. Zhang FF, Morabia A, Carroll J, Gonzalez K, Fulda K, Kaur M, et al. Dietary patterns are associated with levels of global genomic DNA methylation in a cancer-free population. J Nutr 2011;141:1165-1171.
14. Perng W, Villamor E, Shroff MR, Nettleton JA, Pilsner JR, Liu Y, Diez-Roux AV. Dietary intake, plasma homocysteine, and repetitive element DNA methylation in the Multi-Ethnic Study of Atherosclerosis (MESA). Nutr Metab Cardiovasc Dis 2014;24:614-622.
15. Ono H, Iwasaki M, Kuchiba A, Kasuga Y, Yokoyama S, Onuma H, et al. Association of dietary and genetic factors related to one-carbon metabolism with global methylation level of leukocyte DNA. Cancer Sci 2012;103:2159-2164.
16. Zhang FF, Santella RM, Wolff M, Kappil MA, Markowitz SB, Morabia A. White blood cell global methylation and IL-6 promoter methylation in association with diet and lifestyle risk factors in a cancer-free population. Epigenetics 2012;7:606-14.
17. Agodi A, Barchitta M, Quattrocchi A, Maugeri A, Canto C, Marchese AE, Vinciguerra M. Low fruit consumption and folate deficiency are associated with LINE-1 hypomethylation in women of a cancer-free population. Genes Nutr 2015;10:480.

234 PART C: Nutrition, lifestyle and DNA methylation
18. Amarasekera M, Martino D, Ashley S, Harb H, Kesper D, Strickland D, et al. Genome-wide DNA methylation profiling identifies a folate-sensitive region of differential methylation upstream of ZFP57-imprinting regulator in humans. FASEB J 2014;28:4068-4076.
19. Gonseth S, Roy R, Houseman EA, de Smith AJ, Zhou M, Lee ST, et al. Periconceptional folate consumption is associated with neonatal DNA methylation modifications in neural crest regulatory and cancer development genes. Epigenetics 2015;10:1166-1176.
20. Joubert BR, den Dekker HT, Felix JF, Bohlin J, Ligthart S, Beckett E, et al. Maternal plasma folate impacts differential DNA methylation in an epigenome-wide meta-analysis of newborns. Nat Commun 2016;7:10577.
21. Supportive PDQ, Palliative Care Editorial B. Nutrition in Cancer Care (PDQ(R)): Health Professional Version. 2002.
22. Hebuterne X, Lemarie E, Michallet M, de Montreuil CB, Schneider SM, Goldwasser F. Prevalence of malnutrition and current use of nutrition support in patients with cancer. JPEN J Parenter Enteral Nutr 2014;38:196-204.
23. Hanley MP, Hahn MA, Li AX, Wu X, Lin J, Wang J, et al. Genome-wide DNA methylation profiling reveals cancer-associated changes within early colonic neoplasia. Oncogene 2017;36:5035-5044.
24. Ye D, Jiang D, Li Y, Jin M, Chen K. The role of LINE-1 methylation in predicting survival among colorectal cancer patients: a meta-analysis. Int J Clin Oncol 2017;22:749-757.
25. Bibikova M, Barnes B, Tsan C, Ho V, Klotzle B, Le JM, et al. High density DNA methylation array with single CpG site resolution. Genomics 2011;98:288-95.
26. Lehne B, Drong AW, Loh M, Zhang W, Scott WR, Tan ST, et al. A coherent approach for analysis of the Illumina HumanMethylation450 BeadChip improves data quality and performance in epigenome-wide association studies. Genome Biol 2015;16:37.
27. Pidsley R, CC YW, Volta M, Lunnon K, Mill J, Schalkwyk LC. A data-driven approach to preprocessing Illumina 450K methylation array data. BMC Genomics 2013;14:293.
28. Maksimovic J, Gordon L, Oshlack A. SWAN: Subset-quantile within array normalization for illumina infinium HumanMethylation450 BeadChips. Genome Biol 2012;13:R44.
29. Teschendorff AE, Marabita F, Lechner M, Bartlett T, Tegner J, Gomez-Cabrero D, Beck S. A beta-mixture quantile normalization method for correcting probe design bias in Illumina Infinium 450 k DNA methylation data. Bioinformatics 2013;29:189-96.
30. Fortin JP, Labbe A, Lemire M, Zanke BW, Hudson TJ, Fertig EJ, et al. Functional normalization of 450k methylation array data improves replication in large cancer studies. Genome Biol 2014;15:503.
31. Willett WC, Howe GR, Kushi LH. Adjustment for total energy intake in epidemiologic studies. Am J Clin Nutr 1997;65:1220S-1228S; discussion 1229S-1231S.
32. Houseman EA, Accomando WP, Koestler DC, Christensen BC, Marsit CJ, Nelson HH, et al. DNA methylation arrays as surrogate measures of cell mixture distribution. BMC Bioinformatics 2012;13:86.
33. Preacher KJ, Rucker DD, MacCallum RC, Nicewander WA. Use of the extreme groups approach: a critical reexamination and new recommendations. Psychol Methods 2005;10:178-92.
34. Magi R, Morris AP. GWAMA: software for genome-wide association meta-analysis. BMC Bioinformatics 2010;11:288.
35. Bonder MJ, Luijk R, Zhernakova DV, Moed M, Deelen P, Vermaat M, et al. Disease variants alter transcription factor levels and methylation of their binding sites. Nat Genet 2017;49:131-138.
36. Benjamini Y, Hochberg Y. Controlling the False Discovery Rate: A Practical and Powerful Approach to Multiple Testing Journal of the Royal Statistical Society 1995;57:289-300.

CHAPTER 7: Dietary B-vitamins and DNA methylation 235
37. McLean CY, Bristor D, Hiller M, Clarke SL, Schaar BT, Lowe CB, et al. GREAT improves functional interpretation of cis-regulatory regions. Nat Biotechnol 2010;28:495-501.
38. Speir ML, Zweig AS, Rosenbloom KR, Raney BJ, Paten B, Nejad P, et al. The UCSC Genome Browser database: 2016 update. Nucleic Acids Res 2016;44:D717-25.
39. Devlin B, Roeder K. Genomic control for association studies. Biometrics 1999;55:997-1004.
40. Liu L, Li Y, Tollefsbol TO. Gene-environment interactions and epigenetic basis of human diseases. Curr Issues Mol Biol 2008;10:25-36.
41. Pedersen BS, Schwartz DA, Yang IV, Kechris KJ. Comb-p: software for combining, analyzing, grouping and correcting spatially correlated P-values. Bioinformatics 2012;28:2986-8.
42. Wang J, Duncan D, Shi Z, Zhang B. WEB-based GEne SeT AnaLysis Toolkit (WebGestalt): update 2013. Nucleic Acids Res 2013;41:W77-83.
43. Kok DE, Dhonukshe-Rutten RA, Lute C, Heil SG, Uitterlinden AG, van der Velde N, et al. The effects of long-term daily folic acid and vitamin B12 supplementation on genome-wide DNA methylation in elderly subjects. Clin Epigenetics 2015;7:121.
44. Archangelo LF, Glasner J, Krause A, Bohlander SK. The novel CALM interactor CATS influences the subcellular localization of the leukemogenic fusion protein CALM/AF10. Oncogene 2006;25:4099-109.
45. Archangelo LF, Greif PA, Holzel M, Harasim T, Kremmer E, Przemeck GK, et al. The CALM and CALM/AF10 interactor CATS is a marker for proliferation. Mol Oncol 2008;2:356-67.
46. Hori A, Morand A, Ikebe C, Frith D, Snijders AP, Toda T. The conserved Wdr8-hMsd1/SSX2IP complex localises to the centrosome and ensures proper spindle length and orientation. Biochem Biophys Res Commun 2015;468:39-45.
47. Kurtulmus B, Wang W, Ruppert T, Neuner A, Cerikan B, Viol L, et al. WDR8 is a centriolar satellite and centriole-associated protein that promotes ciliary vesicle docking during ciliogenesis. J Cell Sci 2016;129:621-36.
48. Wong CC, Martincorena I, Rust AG, Rashid M, Alifrangis C, Alexandrov LB, et al. Inactivating CUX1 mutations promote tumorigenesis. Nat Genet 2014;46:33-8.
49. Galvan A, Frullanti E, Anderlini M, Manenti G, Noci S, Dugo M, et al. Gene expression signature of non-involved lung tissue associated with survival in lung adenocarcinoma patients. Carcinogenesis 2013;34:2767-73.
50. Suzuki K, Lareyre JJ, Sanchez D, Gutierrez G, Araki Y, Matusik RJ, Orgebin-Crist MC. Molecular evolution of epididymal lipocalin genes localized on mouse chromosome 2. Gene 2004;339:49-59.
51. Okita K, Yamanaka S. Intracellular signaling pathways regulating pluripotency of embryonic stem cells. Curr Stem Cell Res Ther 2006;1:103-11.
52. Piccolo E, Tinari N, D'Addario D, Rossi C, Iacobelli V, La Sorda R, et al. Prognostic relevance of LGALS3BP in human colorectal carcinoma. J Transl Med 2015;13:248.
53. Lee JH, Bae JA, Lee JH, Seo YW, Kho DH, Sun EG, et al. Glycoprotein 90K, downregulated in advanced colorectal cancer tissues, interacts with CD9/CD82 and suppresses the Wnt/beta-catenin signal via ISGylation of beta-catenin. Gut 2010;59:907-17.
54. Zhao Y, Guo C, Hu H, Zheng L, Ma J, Jiang L, et al. Folate intake, serum folate levels and esophageal cancer risk: an overall and dose-response meta-analysis. Oncotarget 2017;8:10458-10469.
55. Du L, Wang Y, Zhang H, Zhang H, Gao Y. Folate intake and the risk of endometrial cancer: A meta-analysis. Oncotarget 2016;7:85176-85184.
56. Donnenfeld M, Deschasaux M, Latino-Martel P, Diallo A, Galan P, Hercberg S, et al. Prospective association between dietary folate intake and skin cancer risk: results from

236 PART C: Nutrition, lifestyle and DNA methylation
the Supplementation en Vitamines et Mineraux Antioxydants cohort. Am J Clin Nutr 2015;102:471-8.
57. He H, Shui B. Folate intake and risk of bladder cancer: a meta-analysis of epidemiological studies. Int J Food Sci Nutr 2014;65:286-92.
58. Floss T, Arnold HH, Braun T. A role for FGF-6 in skeletal muscle regeneration. Genes Dev 1997;11:2040-51.
59. Armand AS, Launay T, Pariset C, Della Gaspera B, Charbonnier F, Chanoine C. Injection of FGF6 accelerates regeneration of the soleus muscle in adult mice. Biochim Biophys Acta 2003;1642:97-105.
60. Fiore F, Sebille A, Birnbaum D. Skeletal muscle regeneration is not impaired in Fgf6 -/- mutant mice. Biochem Biophys Res Commun 2000;272:138-43.
61. Kovalenko TM. Reparative regeneration of skeletal muscle in mammals receiving vitamin B12. Bull Exp Biol Med 1960;49:517-520.
62. Luo C, Xiao X, Liu D, Chen S, Li M, Xu A, et al. CABYR is a novel cancer-testis antigen in lung cancer. Clin Cancer Res 2007;13:1288-97.
63. Li H, Fang L, Xiao X, Shen L. The expression and effects the CABYR-c transcript of CABYR gene in hepatocellular carcinoma. Bull Cancer 2012;99:E26-33.
64. Christensen KE, Mikael LG, Leung KY, Levesque N, Deng L, Wu Q, et al. High folic acid consumption leads to pseudo-MTHFR deficiency, altered lipid metabolism, and liver injury in mice. Am J Clin Nutr 2015;101:646-58.
65. Institute of Medicine Standing Committee on the Scientific Evaluation of Dietary Reference I, its Panel on Folate OBV, Choline. 1998.
66. Hughes CF, Ward M, Hoey L, McNulty H. Vitamin B12 and ageing: current issues and interaction with folate. Ann Clin Biochem 2013;50:315-29.
67. Friso S, Choi SW, Girelli D, Mason JB, Dolnikowski GG, Bagley PJ, et al. A common mutation in the 5,10-methylenetetrahydrofolate reductase gene affects genomic DNA methylation through an interaction with folate status. Proc Natl Acad Sci U S A 2002;99:5606-11.
68. Kolde R, Martens K, Lokk K, Laur S, Vilo J. seqlm: an MDL based method for identifying differentially methylated regions in high density methylation array data. Bioinformatics 2016;32:2604-10.
69. Bolzetta F, Veronese N, De Rui M, Berton L, Toffanello ED, Carraro S, et al. Are the Recommended Dietary Allowances for Vitamins Appropriate for Elderly People? J Acad Nutr Diet 2015;115:1789-97.

CHAPTER 8
Epigenetic Signatures of Cigarette Smoking
Roby Joehanes*, Allan C. Just*, Riccardo E. Marioni*, Luke C. Pilling*, Lindsay M.
Reynolds*, Pooja R. Mandaviya*, Weihua Guan*, Tao Xu*, Cathy E. Elks*, Stella
Aslibekyan*, Hortensia Moreno-Macias*, Jennifer A. Smith*, Jennifer A Brody*;
Radhika Dhingra*; Paul Yousefi, James S. Pankow, Sonja Kunze, Sonia Shah, Allan F.
McRae, Kurt Lohman, Jin Sha, Devin M. Absher, Luigi Ferrucci, Wei Zhao, Ellen W.
Demerath, Jan Bressler, Megan L. Grove, Tianxiao Huan, Chunyu Liu, Michael M.
Mendelson, Chen Yao, Douglas P. Kiel, Annette Peters, Rui Wang-Sattler, Peter M.
Visscher, Naomi R. Wray, John M. Starr, Jingzhong Ding, Carlos J. Rodriguez, Nicholas J.
Wareham, Marguerite R. Irvin, Degui Zhi, Myrto Barrdahl, Paolo Vineis, André G.
Uitterlinden, Albert Hofman, Joel Schwartz, Elena Colicino, Lifang Hou, MD, Pantel S.
Vokonas, Dena G. Hernandez, Andrew B. Singleton, Stefania Bandinelli, Stephen T.
Turner, Erin B. Ware, Alicia K. Smith, Torsten Klengel, Elisabeth B. Binder, Bruce M.
Psaty, Kent D. Taylor, Sina A. Gharib, Brenton R. Swenson, Liming Liang, Dawn L.
DeMeo, MD, MPH52; George T. O'Connor, Zdenko Herceg, Kerry J. Ressler, Karen N.
Conneely**, Nona Sotoodehnia**, Sharon L. R. Kardia**, David Melzer**, Andrea A.
Baccarelli**, Joyce B. J. van Meurs**, Isabelle Romieu**, Donna K. Arnett**, Ken K.
Ong**, Yongmei Liu**, Melanie Waldenberger**, Ian J. Deary**, Myriam Fornage**,
Daniel Levy**, Stephanie J. London**
*These authors contributed equally as first authors
**These authors contributed equally as senior authors
Circ Cardiovasc Genet. 2016 Oct;9(5):436-447.

238 PART C: Nutrition, lifestyle and DNA methylation
ABSTRACT
Background - DNA methylation leaves a long-term signature of smoking exposure and
is one potential mechanism by which tobacco exposure predisposes to adverse health
outcomes, such as cancers, osteoporosis, lung, and cardiovascular disorders.
Methods and Results - To comprehensively determine the association between
cigarette smoking and DNA methylation, we conducted a meta-analysis of genome-
wide DNA methylation assessed using the Illumina BeadChip 450K array on 15,907
blood derived DNA samples from participants in 16 cohorts (including 2,433 current,
6,518 former, and 6,956 never smokers). Comparing current versus never smokers,
2,623 CpG sites (CpGs), annotated to 1,405 genes, were statistically significantly
differentially methylated at Bonferroni threshold of p<1x10⁻⁷ (18,760 CpGs at False
Discovery Rate (FDR)<0.05). Genes annotated to these CpGs were enriched for
associations with several smoking-related traits in genome-wide studies including
pulmonary function, cancers, inflammatory diseases and heart disease. Comparing
former versus never smokers, 185 of the CpGs that differed between current and never
smokers were significant p<1x10⁻⁷ (2,623 CpGs at FDR<0.05), indicating a pattern of
persistent altered methylation, with attenuation, after smoking cessation.
Transcriptomic integration identified effects on gene expression at many differentially
methylated CpGs.
Conclusions - Cigarette smoking has a broad impact on genome-wide methylation that,
at many loci, persists many years after smoking cessation. Many of the differentially
methylated genes were novel genes with respect to biologic effects of smoking, and
might represent therapeutic targets for prevention or treatment of tobacco-related
diseases. Methylation at these sites could also serve as sensitive and stable biomarkers
of lifetime exposure to tobacco smoke.

CHAPTER 8: Cigarette smoking and DNA methylation 239
INTRODUCTION
Cigarette smoking is a major causal risk factor for various diseases including cancers,
cardiovascular disease (CVD), chronic obstructive pulmonary disease (COPD)1, and
osteoporosis1. Worldwide cessation campaigns and legislative actions have been
accompanied by a reduction in the number of cigarette smokers and corresponding
increases in the number of former smokers. In the US, there are more former smokers
than current smokers1. Despite the decline in the prevalence of smoking in many
countries, it remains the leading preventable cause of death in the world, accounting
for nearly 6 million deaths each year2.
Even decades after cessation, cigarette smoking confers long-term risk of
diseases including some cancers, chronic obstructive pulmonary disease, and stroke1.
The mechanisms for these long-term effects are not well understood. DNA methylation
changes have been proposed as one possible explanation.
DNA methylation appears to reflect exposure to a variety of lifestyle factors3,
including cigarette smoking. Several studies have shown reproducible associations
between tobacco smoking and altered DNA methylation at multiple cytosine-
phosphate-guanine (CpG) sites4–15. Some DNA methylation sites associated with
tobacco smoking have also localized to genes related to coronary heart disease5 and
pulmonary disease16. Some studies have found different associated CpGs in smokers
versus non-smokers8,11. Consortium-based meta-analyses have been extremely
successful in identifying genetic variants associated with numerous phenotypes, but
large-scale meta-analyses of genome-wide DNA methylation data have not yet been
widely employed. It is likely that additional novel loci, differentially methylated in
response to cigarette smoking remain to be discovered by meta-analyzing data across
larger sample sizes comprising multiple cohorts. Differentially methylated loci with
respect to smoking may serve as biomarkers of lifetime smoking exposure. They may
also shed light on the molecular mechanisms by which tobacco exposure predisposes
to multiple diseases.
A recent systematic review13 analyzed published findings across 14
epigenome-wide association studies of smoking exposure across various DNA
methylation platforms of varying degrees of coverage and varying phenotypic
definitions. Among these were 12 studies (comprising 4,750 subjects) that used the
more comprehensive Illumina Human Methylation BeadChip 450K array (Illumina
450K), which includes and greatly expands on the coverage of the earlier 27K platform.
The review compares only statistically significant published results and is not a meta-
analysis which can identify signals that do not reach statistical significance in individual
studies17.
In the current study, we meta-analyzed association results between DNA
methylation and cigarette smoking in 15,907 individuals from 16 cohorts in the
Cohorts for Heart and Aging Research in Genomic Epidemiology (CHARGE) consortium

240 PART C: Nutrition, lifestyle and DNA methylation
using a harmonized analysis. Methylation was measured on DNA extracted from blood
samples using the Illumina Human Methylation BeadChip 450K array. In separate
analyses, we compared current smokers and past smokers to non-smokers and
characterized the persistence of smoking-related CpG methylation associations with
the duration of smoking cessation among former smokers. We integrated information
from genome-wide association studies (GWAS) and gene expression data to gain
insight into potential functional relevance of our findings for human diseases. Finally
we conducted analyses to identify pathways that may explain the molecular effects of
cigarette exposure on tobacco-related diseases.
MATERIALS AND METHODS
Study participants
This study comprised a total of 15,907 participants from 16 cohorts of the Cohorts for
Heart and Aging Research in Genetic Epidemiology Consortium (Supplementary Table
1). The 16 participating cohorts are ARIC, FHS Offspring, KORA F4, GOLDN, LBC 1921,
LBC 1936, NAS, Rotterdam, Inchianti, GTP, CHS European Ancestry (EA), CHS African
Ancestry (AA), GENOA, EPIC Norfolk, EPIC, and MESA. Of these, 12,161 are of
European Ancestry (EA) and 3,746 are of African Ancestry (AA). The study was
approved by institutional review committees for each cohort and all participants
provided written informed consent for genetic research.
DNA methylation sample and measurement
For most studies, methylation was measured on DNA extracted from whole blood, but
some studies used CD4+ T cells or monocytes (Supplementary Table 1). In all studies,
DNA was bisulfite-converted using the Zymo EZ DNA methylation kit and assayed for
methylation using the Infinium HumanMethylation 450 BeadChip, which contains
485,512 CpG sites. Details of genomic DNA preparation, bisulfite conversion, and
methylation assay for each cohort can be found in the online Supplementary Materials.
Raw methylated and total probe intensities were extracted using the Illumina
Genome Studio methylation module. Preprocessing of the methylated signal (M) and
unmethylated signal (U) was conducted using various software tools, primarily DASEN
of wateRmelon18 and BMIQ19, both of which are R packages. The methylation beta (β)
values were defined as β = M/(M+U). Each cohort followed its own quality control
protocols, removing poor quality or outlier samples and excluding low quality CpG sites
(with detection p-value>0.01). Each cohort evaluated batch effects and controlled for
them in the analysis. Details of these processes can be found in the online
Supplementary Materials.

CHAPTER 8: Cigarette smoking and DNA methylation 241
Smoking phenotype definition
Self-reported cigarette smoking status was divided into three categories. Current
smokers were defined as those who have smoked at least one cigarette a day within 12
months prior to the blood draw, former smokers were defined as those who had ever
smoked at least one cigarette a day, but had stopped at least 12 months prior to the
blood draw, and never smokers reported never having smoked. Pack years was
calculated based on self-report as the average number of cigarettes per day smoked
divided by 20 multiplied by the number of years of smoking, with zero assigned to
never smokers. A few cohorts recorded the number of years since each former smoker
had stopped smoking.
Cohort specific analyses and meta-analysis
Each cohort analyzed its data using at least two linear mixed effect models. Each model
was run separately for each CpG site. Model 1 is as follows:
β = Smoking phenotype + Sex + Age + blood count + technical covariates, (1)
where blood count comprises the fractions of CD4+ T-cells, CD8+ T-cells, NK cells,
monocyte, and eosinophils either measured or estimated using the Houseman et al.
method20. The blood count adjustment was performed only in cohorts with whole
blood and leukocyte samples. Familial relationship was also accounted for in the model
when applicable (e.g., for FHS, see Supplementary Material for details). Acknowledging
that each cohort may be influenced by a unique set of technical factors, we allow each
cohort to choose its cohort-specific technical covariates. Model 2 added to model 1
body mass index (BMI) because it is associated with methylation at some loci, making it
a potential confounder21. Only three cohorts participated in model 2 analysis: FHS,
KORA, and NAS. Model 3 substituted smoking phenotypes for pack years. Only three
cohorts participated in model 3 analysis: FHS, Rotterdam, and Inchianti. The pack year
analysis was performed only on two subsets: current vs. never smokers and former vs.
never smokers. Combining all three categories would require accurate records of time
of quitting, which among the three cohorts was available for only FHS. To investigate
cell type differences, we removed blood counts from Model 1 and called it Model 4.
Only three cohorts participated in this analysis: FHS, KORA, and NAS. All models were
run with the lme4 package22 in R23, except for FHS (See Supplementary Materials for
details).
Meta-analysis was performed to combine the results from all cohorts. Due to
the variability of available CpG sites after quality control steps, we excluded CpG sites
that were available in fewer than three cohorts. The remaining 485,381 CpG sites were
then meta-analyzed with a random-effects model using the following formula:
Ei = µ + si + ei, (2)
where Ei is the observed effect of study i, µ is the main smoking effect, si is the
between-study error for study i, and ei is the within-study error for study i, with both si

242 PART C: Nutrition, lifestyle and DNA methylation
and ei are assumed to be normally distributed. The model is fitted using the restricted
maximum likelihood (REML) criterion in R’s metafor24 package. Multiple-testing
adjustment on the resulting p-values was performed using the False Discovery Rate
(FDR) method of Benjamini and Hochberg25. In addition, we also report results using
the Bonferroni-corrected threshold of 1 x 10⁻⁷ (~ 0.05/485,381).
The regression coefficient β (from meta-analysis) is interpretable as the
difference in mean methylation between current and never smokers. We multiplied
these by 100 to represent the percentage methylation difference where methylation
ranges from 0-100%.
Literature review to identify genes previously associated with smoking and
methylation
We used the same literature search strategy published previously26. A broad query of
NCBI's PubMed literature database using medical subject heading (MeSH) terms
(“((((DNA Methylation[Mesh]) OR methylation)) AND ((Smoking[Mesh]) OR smoking))”)
yielded 775 results when initially performed on January 8, 2015 and 789 studies when
repeated to update the results on March 1, 2015. Results were reviewed by abstract to
determine whether studies met inclusion criteria: 1) performed in healthy human
populations, 2) agnostically examined >1,000 CpG sites at a time, 3) only cigarette
exposure was considered, and 4) with public reporting of P-values and gene
annotations. A total of 25 publications met inclusion criteria, listed in the fourth
supplementary table of Joubert et al.26. CpG level results (P-values and gene
annotations) for sites showing genome-wide statistically significant associations
(FDR<0.05) were extracted and resulted in 1,185 genes previously associated with adult
or maternal smoking. All CpGs annotated to these 1,185 genes were marked as
“previously found”.
Gene set enrichment analysis (GSEA)
Gene-Set Enrichment Analysis (GSEA)27 was performed in the website
(http://software.broadinstitute.org/gsea/msigdb/annotate.jsp) on significant findings
to determine putative functions of the CpG sites. We selected gene ontology (GO)
biological process (C5-BP) and collected all categories with FDR<0.05 (up to 100
categories).
Enrichment analysis for localization to different genomic features
Enrichment analysis on genomic features were performed using the annotation file
supplied by the Illumina (version 1.2, downloaded from manufacturer’s website,
http://support.illumina.com/array/array_kits/infinium_humanmethylation450_beadch
ip_kit/downloads.html), which contains information of CpG location relative to gene
(i.e., body, first exon, 3’ UTR, 5’UTR, within 200 base pairs of Transcriptional Start Site
[TSS200], and TSS1500), the relation of CpG site to a CpG island (i.e., island, northern

CHAPTER 8: Cigarette smoking and DNA methylation 243
shelf, northern shore, southern shelf, and southern shore), whether the CpG site is
known to be in differentially methylated regions, and whether the CpG site is known to
be an enhancer or a DNAse I Hypersensitive Site (DHS). Enrichment analysis was
performed using one-sided Fisher’s exact set for each feature, using R’s fisher.test.
Genome-wide association study (GWAS) analysis
We intersected our results with SNPs having genome-wide association study (GWAS) p-
values≤5 x 10⁻⁸ in the NHGRI GWAS catalog (accessed November 2, 2015)28. The catalog
contained 9,777 SNPs annotated to 7,075 genes associated with 865 phenotypes at
p≤5x10⁻⁸. To determine the genes, we looked up each significant CpG on the
annotation file supplied by Illumina. Enrichment analysis was performed on a per gene
basis using one-sided Fisher’s exact test.
For bone mineral phenotype enrichment, we included all SNPs including
terms “bone mineral density” or “osteoporosis”. For cardiovascular disease (CVD), we
included all SNPs containing terms “cardiovascular disease”, “stroke”, “coronary
disease”, “cardiomyopathy”, or “myocardial infarction”. For CVD risk factors, we
included all SNPs containing terms “blood pressure”, “cholesterol”, “diabetes”,
“obesity”, or “hypertension”. For overall cancer enrichment, we included all SNPs
containing terms “cancer”, “carcinoma”, or “lymphoma”, while removing those
pertaining to cancer treatment effects. For overall pulmonary phenotype enrichment,
we included all SNPs containing terms “pulmonary disease”, “pulmonary function”,
“emphysema”, “asthma”, or “airflow obstruction”.
Analysis of persistence of methylation signals with time since quitting smoking
among former smokers
We examined whether smoking methylation associations were attenuated over time in
the FHS cohort, which had ascertained longitudinal smoking status of over 35 years.
The analysis was performed on seven dichotomous variables, indicating cessation of
smoking for 5, 10, 15, 20, 25, and 30 years versus never smokers. For example, for five
year cessation variable, those who quit smoking five years or more are marked as ones,
while never smokers are marked as zeroes and current smokers are excluded. For this
analysis, we used the pedigreemm package29 with the same set of covariates as in the
primary analysis. Sites with p<0.002 across all seven variables were deemed to be
statistically significant compared to never-smoker levels.
Methylation by expression (MxE) analysis
To determine transcriptomic association of each significant CpG site, we interrogated
such CpG sites in the FHS gene-level methylation by expression (MxE) database, at
genome-wide false discovery rate (FDR)<0.05. The MxE database was constructed from
2,262 individuals from the FHS Offspring cohort attending examination cycle eight
(2005-2008) with both whole blood DN methylation and transcriptomic data based on

244 PART C: Nutrition, lifestyle and DNA methylation
the Affymetrix Human Exon Array ST 1.0. Enrichment analysis was performed using a
one-sided Fisher’s exact test. We defined that the methylation CpG site and the
corresponding transcript are associated in cis if the location of the CpG site is within
500 kilobases of the transcript’s start location.
Analysis of ethnic discrepancy between African Ancestry (AA) and European Ancestry
(EA) cohorts
Meta-analysis of the current versus never smoker results of EA cohorts (FHS, KORA,
GOLDN, LBC 1921, LBC 1936, NAS, Rotterdam, Inchianti, EPIC, EPIC Norfolk, MESA, CHS-
EA) was performed separately from those of AA cohorts (ARIC, GTP, GENOA, CHS-AA).
Analysis of samples types for DNA extraction
Meta-analysis was performed on the results from cohorts with whole blood/buffy coat
samples (FHS, KORA, LBC 1921, LBC 1936, NAS, Rotterdam, Inchianti, GTP, CHS-EA,
CHS-AA, ARIC, GENOA, EPIC, and EPIC-Norfolk). CD4+ samples in GOLDN and CD14+
samples in MESA, because they comprise single cohorts, are not meta-analyzed.
Correlations of results across different cell types were performed on CpG sites with
FDR<0.05 in at least one cell type.
RESULTS
Table 1 displays the characteristics of participants in the meta-analysis. The proportion
of participants reporting current smoking ranged from 4% to 33% across the different
study populations. The characteristics of the participants within each cohort are
provided in Supplementary Table 1.
Current versus Never Smokers
In the meta-analysis of current cigarette smokers (N=2,433) versus never smokers
(N=6,956), 2,623 CpGs annotated to 1,405 genes met Bonferroni significance after
correction for 485,381 tests (P<1x10⁻⁷). Based on genome-wide false discovery rate
(FDR)<0.05, 18,760 CpG sites (CpGs) annotated to 7,201 genes were differentially
methylated. There was a moderate inflation factor30 λ of 1.32 (Supplementary Figure
1), which is consistent with a large number of sites being impacted by smoking. Our
results lend support many previously reported loci7,8,11,13, including CpGs annotated to
AHRR, RARA, F2RL3, and LRRN3 (Supplementary Table 2). Not surprisingly, cg05575921
annotated to AHRR, the top CpG identified in most prior studies of smoking, was highly
significant in our meta-analysis (P=4.6x10⁻²⁶; ranked 36, Supplementary Table 2) and
also had the largest effect size (-18% difference in methylation) which is comparable to
effect sizes in previous studies18. Of the 18,760 significant CpGs at FDR<0.05, 16,673
(annotated to 6,720 genes) have not been previously reported to be associated with
cigarette smoking – these include 1,500 of the 2,623 CpGs that met Bonferroni
significance. The 25 CpGs with lowest p-values for both overall and novel findings are

CHAPTER 8: Cigarette smoking and DNA methylation 245
shown in Table 2. Supplementary Table 2 provides the complete list of all CpGs that
were significantly differentially methylated (FDR<0.05) in analysis of current versus
never smokers. Adding body mass index (BMI) into the model did not appreciably alter
the results (Supplementary Figure 2).
Methylation can be either reduced or increased at CpG sites in response to
smoking. For the 53.2% of FDR significant CpGs with increased methylation in response
to current smoking the mean percentage difference in methylation between current
and never smokers was 0.5% (SD=0.37%, range 0.06-7.3%). For 46.8% of CpGs with
decreased methylation in response to current smoking the mean percentage difference
was 0.65% (SD=0.56, range 0.04-18%). The volcano plot can be found in Supplementary
Figure 3.
We did not observe correlation between the number of significant CpGs and
either the size of the gene or the number of exons or the coverage of the methylation
platform. We performed a formal enrichment test for each of the 7,201 genes in
regards to the length of the gene or number of exons and found only three for which
associations were observed (AHRR, PRRT1, and TNF). However, given the robust
findings for a specific CpG in AHRR in multiple studies in the literature4,7,9 as well as our
own, and its key role in the AHR pathway which is crucial in the response to
polyaromatic hydrocarbons, such as are produced by smoking31, it seems very unlikely
that the AHRR findings are false positives. Likewise there is strong support in the
literature for PRRT132 and TNF33. The enrichment results for methylation platform
coverage also yielded the same three genes.
In a subset of three cohorts (1,827 subjects), we investigated the association
of the number of pack-years smoked with the 18,760 CpGs that were differentially
methylated (FDR<0.05) between current versus never smokers. Significant dose
responses were observed for 11,267 CpGs (60.1%) at FDR<0.05 (Supplementary Table
3). To investigate the pathways implicated by these genes, we performed a gene-set
enrichment analysis34 on the annotated genes. The results suggested that cigarette
smoking is associated with potential changes in numerous vital molecular processes,
such as signal transduction (FDR=2.8 x 10-79), protein metabolic processes (FDR=1.2 x
10-43), and transcription pathways (FDR=8.4 x 10⁻³¹). The complete list of 99 enriched
molecular processes can be found in Supplementary Table 4.
Former versus Never Smokers
Meta-analysis of former (N=6,518) versus never smokers (N=6,956) restricted to the
18,760 CpG sites that were differentially methylated in current versus never smokers
identified 2,568 CpGs annotated to 1,326 genes at FDR<0.05 (Supplementary Table 5).
There were 185 CpGs (annotated to 149 genes) that also met Bonferroni correction (P<
0.05/18760 ~ 2.67x10⁻⁶). There was no evidence of inflation30 (λ=0.98) (Supplementary
Figure 4). We also confirmed previously reported findings for CpGs annotated to AHRR,

246 PART C: Nutrition, lifestyle and DNA methylation
RARA, and LRRN37,8,11,13. Effect sizes of these CpGs were all weaker than in the analysis
of current versus never smokers [61.2% ±15.3% weaker] for the 2,568 CpGs that
remained significantly differentially methylated in former vs. never smokers compared
with current vs. never smokers. Results for the top 25 CpGs are displayed in Table 3.
Adding BMI to the model did not appreciably alter the results (Supplementary Figure
5). A volcano plot can be found in Supplementary Figure 6. In a subset of three cohorts
(3,349 subjects), analyses using pack-years confirmed a significant dose response for
1,804 of the 2,568 CpGs (70%) annotated to 942 genes at FDR<0.05 (Supplementary
Table 6).
The gene-set enrichment analysis27 in the former versus never smoker
analyses on all 1,326 genes revealed enrichment for genes associated with protein
metabolic processes (FDR=1.1 x 10⁻²³), RNA metabolic processes (FDR=1.4 x 10⁻¹⁷), and
transcription pathways (FDR=3.9 x 10⁻¹⁸) (Supplementary Table 7). The gene-set
enrichment analysis on the 942 genes for which the 1,804 CpGs exhibited dose
responses with pack-years also revealed similar pathways to those summarized in
Supplementary Table 7, except with weaker enrichment FDR values.
In 2,648 Framingham Heart Study participants with up to 30 years of
prospectively collected smoking data, we examined the 2,568 CpGs that were
differentially methylated in meta-analysis of former versus never smokers and
explored their associations with time since smoking cessation. Methylation levels of
most CpGs returned toward that of never-smokers within five years of smoking
cessation. However, 36 CpGs annotated to 19 genes, including TIAM2, PRRT1, AHRR,
F2RL3, GNG12, LRRN3, APBA2, MACROD2, and PRSS23 did not return to never-smoker
levels even after 30 years of smoking cessation (Figure 1, Table 4).
The EPIC studies included cancer cases plus non-cancer controls analyzed
together, adjusting for cancer status. The other studies were population-based samples
not selected for disease status. To evaluate residual confounding by cancer status after
adjustment, we repeated the meta-analysis without the EPIC studies. The effect
estimates were highly correlated: Pearson ρ = 0.99 for current versus never smoking
and 0.98 for former smoking versus never.
Table 1. Participant characteristics
Characteristics Current Smokers Former Smokers Never Smokers
N=2,433 N=6,518 N=6,956
Sex (% Male) 0.463 0.556 0.317
Age (years)* 57.7 ± 7.7 64.8 ± 8.2 61.2 ± 9.7
BMI (kg/m2)* 27.3 ± 5.4 28.7 ± 5.0 28.6 ± 5.3
*weighted mean ± pooled standard deviation across cohorts

CHAPTER 8: Cigarette smoking and DNA methylation 247
Ta
ble
2. M
ost
sta
tist
ical
ly s
ign
ific
ant
Cp
G s
ites
th
at w
ere
asso
ciat
ed w
ith
cu
rren
t vs
. nev
er s
mo
ker
stat
us
Pro
be
ID
Ch
r Lo
cati
on
G
en
e Sy
mb
ol*
C
oef
†
S.E.
P
FD
R
25
mo
st s
ign
ific
ant
Cp
G s
ites
cg16
14
521
6
1
42
3856
62
H
IVEP
3
0.02
98
0.
00
2
6.7
× 1
0−
48
3
.3 ×
10
−4
2
cg19
40
636
7
1
66
9999
29
SG
IP1
0.
017
5
0.0
01
3
7 ×
10
−4
4
1.7
× 1
0−
38
cg05
60
398
5
1
21
6104
9
SKI
−0.0
12
2
0.0
00
9
1.8
× 1
0−
43
2
.8 ×
10
−3
8
cg14
09
968
5
11
4
754
606
8
CU
GB
P1
−0
.01
24
0.
00
09
1.
5 ×
10
−4
2
1.8
× 1
0−
37
cg12
51
361
6
5
1.77
E+08
−0.0
26
2
0.0
02
6.
1 ×
10
−4
1
5.9
× 1
0−
36
cg03
792
876‡
1
6
7324
3
−0
.01
82
0.
00
14
7.
2 ×
10
−3
8
5.9
× 1
0−
33
cg01
09
776
8
5
3788
54
AH
RR
−0
.01
66
0.
00
13
6.
8 ×
10
−3
5
4.7
× 1
0−
30
cg26
85
628
9
1
24
3075
16
SF
RS1
3A
−0.0
16
3
0.0
01
3
8.6
× 1
0−
35
5
.2 ×
10
−3
0
cg07
95
442
3
9
1.31
E+08
FA
M10
2A
−0.0
13
4
0.0
01
1
1.2
× 1
0−
34
6
.3 ×
10
−3
0
cg01
94
027
3
2
2.33
E+08
−0.0
81
5
0.0
06
7
2 ×
10
−3
4
9.8
× 1
0−
30
cg01
08
313
1
16
6
787
741
3
THA
P1
1;C
ENP
T
−0.0
15
5
0.0
01
3
3.7
× 1
0−
34
1
.6 ×
10
−2
9
cg01
01
746
4
18
4
701
809
5
SNO
RD
58A
; SN
OR
D58
B;
RP
L17
−0
.01
72
0.
00
14
1.
9 ×
10
−3
3
7.6
× 1
0−
29
cg06
12
180
8
2
1.13
E+08
SL
C2
0A1
−0
.01
43
0.
00
12
2.
1 ×
10
−3
2
7.9
× 1
0−
28
cg10
06
291
9
17
3
850
380
2
RA
RA
−0
.01
28
0.
00
11
9.
2 ×
10
−3
2
3.2
× 1
0−
27
cg20
06
618
8
22
3
767
879
1
CYT
H4
−0
.02
52
0.
00
22
1.
6 ×
10
−3
1
5.2
× 1
0−
27
cg04
55
177
6
5
3933
66
AH
RR
−0
.02
44
0.
00
21
5.
8 ×
10
−3
1
1.8
× 1
0−
26
cg11
15
241
2
15
7
492
768
8
EDC
3
−0.0
07
7
0.0
00
7
1.8
× 1
0−
30
5
× 1
0−
26
cg00
07
309
0
19
1
265
879
−0.0
19
6
0.0
01
7
4.2
× 1
0−
30
1
.1 ×
10
−2
5
cg11
90
277
7
5
3688
43
AH
RR
−0
.02
01
0.
00
18
9.
1 ×
10
−3
0
2.3
× 1
0−
25
cg25
21
245
3
17
1
509
953
SL
C4
3A2
−0
.01
01
0.
00
09
1.
4 ×
10
−2
9
3.5
× 1
0−
25
cg04
95
624
4
17
3
851
159
2
RA
RA
0.
012
2
0.0
01
1
1.5
× 1
0−
29
3
.5 ×
10
−2
5
cg13
95
179
7
16
2
204
381
TR
AF7
−0
.01
53
0.
00
14
1.
6 ×
10
−2
9
3.5
× 1
0−
25
cg11
02
807
5
10
9
720
091
1
SOR
BS1
0.
017
5
0.0
01
6
1.7
× 1
0−
29
3
.6 ×
10
−2
5
cg11
700
584†
1
4
50
0885
44
R
PL3
6AL;
MG
AT2
−0
.01
51
0.
00
13
3.
4 ×
10
−2
9
6.8
× 1
0−
25
cg11
26
399
7
11
7
025
728
0
CTT
N
0.00
5
0.0
00
5
4.3
× 1
0−
29
8
.4 ×
10
−2
5

248 PART C: Nutrition, lifestyle and DNA methylation
Pro
be
ID
Ch
r Lo
cati
on
G
en
e Sy
mb
ol*
C
oef
†
S.E.
P
FD
R
25
mo
st s
ign
ific
ant
no
vel C
pG
sit
es
cg11
70
058
4
14
5
008
854
4
RP
L36A
L; M
GA
T2
−0.0
15
1
0.0
01
3
3.4
× 1
0−
29
6
.8 ×
10
−2
5
cg22
41
773
3
6
1.53
E+08
FB
XO
5
−0.0
17
1
0.0
01
5
1.5
× 1
0−
28
2
.7 ×
10
−2
4
cg08
11
890
8
16
1
578
792
0
ND
E1
0.00
53
0.
00
05
5.
4 ×
10
−2
6
7.1
× 1
0−
22
cg14
00
326
5
9
1.4E
+0
8
TRA
F2
−0.0
10
6
0.0
01
3.
2 ×
10
−2
5
3.7
× 1
0−
21
cg02
55
639
3
3
1.69
E+08
M
ECO
M
−0.0
16
2
0.0
01
6
2.8
× 1
0−
24
2
.6 ×
10
−2
0
cg01
21
820
6
11
1.
17E+
08
SIK
3
−0.0
15
0
0.0
01
5
3.1
× 1
0−
23
2
.5 ×
10
−1
9
cg04
98
773
4
14
1.
03E+
08
CD
C4
2BP
B
0.01
49
0.
00
15
9.
0 ×
10
−2
3
6.8
× 1
0−
19
cg27
11
803
5
16
3
189
197
8
ZNF2
67
0.01
36
0.
00
14
2.
4 ×
10
−2
2
1.7
× 1
0−
18
cg18
45
025
4
3
64
2000
05
P
RIC
KLE
2
0.01
2
0.0
01
3
2.3
× 1
0−
21
1
.3 ×
10
−1
7
cg06
75
378
7
2
2.2E
+0
8
ZFA
ND
2B
0.00
63
0.
00
07
3.
2 ×
10
−2
1
1.8
× 1
0−
17
cg18
15
830
6
12
1.
33E+
08
FBR
SL1
0.
010
2
0.0
01
1
6.2
× 1
0−
21
3
.2 ×
10
−1
7
cg19
09
337
0
17
1
711
018
0
PLD
6
0.01
98
0.
00
21
8.
7 ×
10
−2
1
4.4
× 1
0−
17
cg09
18
218
9
1
17
0920
3
NA
DK
−0
.01
04
0.
00
11
2.
0 ×
10
−2
0
9.2
× 1
0−
17
cg18
36
999
0
2
1.13
E+08
FB
LN7
0.
011
6
0.0
01
3
2.3
× 1
0−
20
1
.1 ×
10
−1
6
cg24
57
885
7
17
1
711
020
7
PLD
6
0.02
0.
00
22
3.
1 ×
10
−2
0
1.4
× 1
0−
16
cg20
40
840
2
10
7
236
245
2
PR
F1
0.00
85
0.
00
09
7.
6 ×
10
−2
0
3.1
× 1
0−
16
cg04
67
344
6
22
3
987
995
1
MG
AT3
0.
006
0.
00
07
2.
0 ×
10
−1
9
8.0
× 1
0−
16
cg06
80
361
4
1
40
1335
81
N
T5C
1A
−0.0
08
8
0.0
01
2.
1 ×
10
−1
9
8.3
× 1
0−
16
cg16
27
467
8
1
1.54
E+08
TP
M3;
NU
P21
0L
−0.0
15
2
0.0
01
7
2.9
× 1
0−
19
1
.1 ×
10
−1
5
cg07
28
634
1
5
1.77
E+08
P
DLI
M7
−0
.00
77
0.
00
09
3.
4 ×
10
−1
9
1.3
× 1
0−
15
cg20
67
442
4
3
1.87
E+08
M
IR12
48;
EIF
4A2;
SN
OR
A8
1
−0.0
09
1
0.0
01
4.
2 ×
10
−1
9
1.5
× 1
0−
15
cg02
27
962
5
15
7
838
452
0
SH2D
7
0.01
05
0.
00
12
4.
8 ×
10
−1
9
1.7
× 1
0−
15
cg03
48
566
7
16
7
514
320
0
ZNR
F1
−0.0
16
8
0.0
01
9
5.0
× 1
0−
19
1
.8 ×
10
−1
5
cg03
53
121
1
6
32
9201
02
H
LA-D
MA
−0
.01
08
0.
00
12
7.
5 ×
10
−1
9
2.5
× 1
0−
15
cg09
94
067
7
14
1.
03E+
08
CD
C4
2BP
B
0.00
81
0.
00
09
1.
0 ×
10
−1
8
3.2
× 1
0−
15
*Cp
G s
ites
wit
ho
ut
gen
e n
ames
are
inte
rgen
ic. T
hes
e ar
e al
l in
clu
ded
in a
ll th
e an
alys
es; †
Co
ef s
tan
ds
for
regr
essi
on
co
effi
cien
ts; ‡
No
t p
revi
ou
sly
dis
cove
red
by
oth
er s
tud
ies
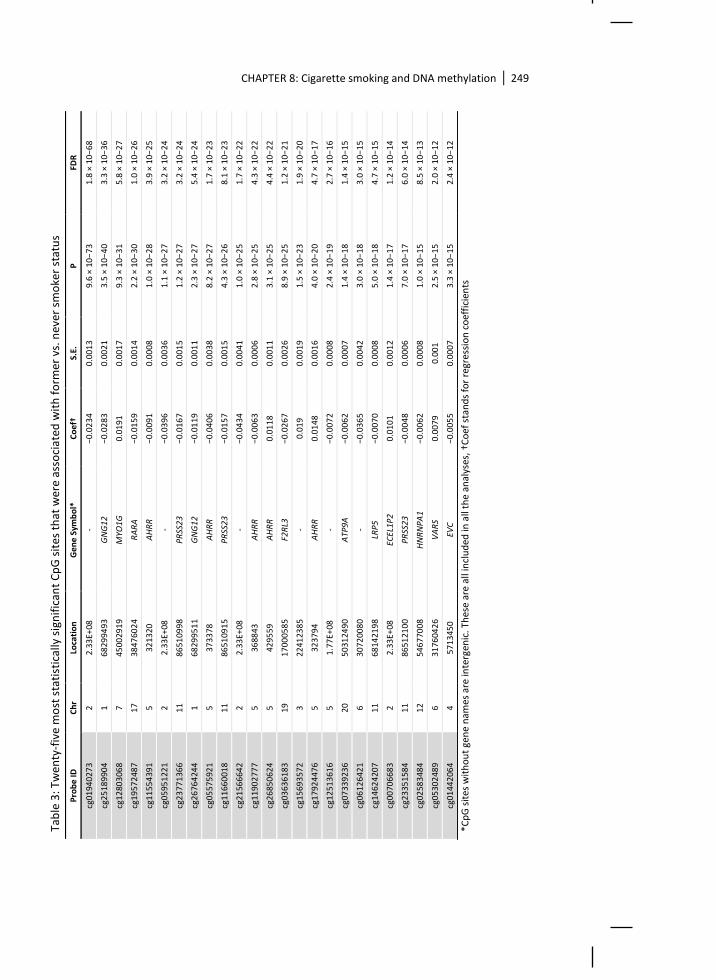
CHAPTER 8: Cigarette smoking and DNA methylation 249
Ta
ble
3: T
wen
ty-f
ive
mo
st s
tati
stic
ally
sig
nif
ican
t C
pG
sit
es t
hat
wer
e as
soci
ated
wit
h f
orm
er v
s. n
ever
sm
oke
r st
atu
s
*Cp
G s
ites
wit
ho
ut
gen
e n
ames
are
inte
rgen
ic. T
hes
e ar
e al
l in
clu
ded
in a
ll th
e an
alys
es, †
Co
ef s
tan
ds
for
regr
essi
on
co
effi
cien
ts
Pro
be
ID
Ch
r Lo
cati
on
G
en
e S
ymb
ol*
C
oef
†
S.E.
P
FD
R
cg01
940
273
2
2.
33E+
08
- −0
.02
34
0.
001
3
9.6
× 1
0−7
3
1.8
× 1
0−
68
cg25
189
904
1
68
2994
93
G
NG
12
−0.0
28
3
0.00
21
3
.5 ×
10−
40
3
.3 ×
10
−3
6
cg12
803
068
7
45
0029
19
M
YO1
G
0.01
91
0.
001
7
9.3
× 1
0−3
1
5.8
× 1
0−
27
cg19
572
487
1
7
3847
602
4
RA
RA
−0
.01
59
0.
001
4
2.2
× 1
0−3
0
1.0
× 1
0−
26
cg11
554
391
5
32
1320
A
HR
R
−0.0
09
1
0.00
08
1
.0 ×
10−
28
3
.9 ×
10
−2
5
cg05
951
221
2
2.
33E+
08
- −0
.03
96
0.
003
6
1.1
× 1
0−2
7
3.2
× 1
0−
24
cg23
771
366
1
1
8651
099
8
PR
SS2
3
−0.0
16
7
0.00
15
1
.2 ×
10−
27
3
.2 ×
10
−2
4
cg26
764
244
1
68
2995
11
G
NG
12
−0.0
11
9
0.00
11
2
.3 ×
10−
27
5
.4 ×
10
−2
4
cg05
575
921
5
37
3378
A
HR
R
−0.0
40
6
0.00
38
8
.2 ×
10−
27
1
.7 ×
10
−2
3
cg11
660
018
1
1
8651
091
5
PR
SS2
3
−0.0
15
7
0.00
15
4
.3 ×
10−
26
8
.1 ×
10
−2
3
cg21
566
642
2
2.
33E+
08
- −0
.04
34
0.
004
1
1.0
× 1
0−2
5
1.7
× 1
0−
22
cg11
902
777
5
36
8843
A
HR
R
−0.0
06
3
0.00
06
2
.8 ×
10−
25
4
.3 ×
10
−2
2
cg26
850
624
5
42
9559
A
HR
R
0.01
18
0.
001
1
3.1
× 1
0−2
5
4.4
× 1
0−
22
cg03
636
183
1
9
1700
058
5
F2R
L3
−0.0
26
7
0.00
26
8
.9 ×
10−
25
1
.2 ×
10
−2
1
cg15
693
572
3
22
4123
85
-
0.01
9
0.00
19
1
.5 ×
10−
23
1
.9 ×
10
−2
0
cg17
924
476
5
32
3794
A
HR
R
0.01
48
0.
001
6
4.0
× 1
0−2
0
4.7
× 1
0−
17
cg12
513
616
5
1.
77E+
08
- −0
.00
72
0.
000
8
2.4
× 1
0−1
9
2.7
× 1
0−
16
cg07
339
236
2
0
5031
249
0
ATP
9A
−0.0
06
2
0.00
07
1
.4 ×
10−
18
1
.4 ×
10
−1
5
cg06
126
421
6
30
7200
80
-
−0.0
36
5
0.00
42
3
.0 ×
10−
18
3
.0 ×
10
−1
5
cg14
624
207
1
1
6814
219
8
LRP
5
−0.0
07
0
0.00
08
5
.0 ×
10−
18
4
.7 ×
10
−1
5
cg00
706
683
2
2.
33E+
08
ECEL
1P2
0.
010
1
0.00
12
1
.4 ×
10−
17
1
.2 ×
10
−1
4
cg23
351
584
1
1
8651
210
0
PR
SS2
3
−0.0
04
8
0.00
06
7
.0 ×
10−
17
6
.0 ×
10
−1
4
cg02
583
484
1
2
5467
700
8
HN
RN
PA
1
−0.0
06
2
0.00
08
1
.0 ×
10−
15
8
.5 ×
10
−1
3
cg05
302
489
6
31
7604
26
V
AR
S 0.
007
9
0.00
1
2.5
× 1
0−1
5
2.0
× 1
0−
12
cg01
442
064
4
57
1345
0
EVC
−0
.00
55
0.
000
7
3.3
× 1
0−1
5
2.4
× 1
0−
12

250 PART C: Nutrition, lifestyle and DNA methylation
Tab
le 4
: Th
e to
p 3
6 m
ost
sta
tist
ical
ly s
ign
ific
ant
Cp
G s
ites
th
at d
id n
ot
retu
rn t
o n
ever
-sm
oke
r le
vels
30
yea
rs a
fter
sm
oki
ng
cess
atio
n in
the
FHS
(N=2
,64
8)
Pro
be
ID
Ch
r Lo
cati
on
G
en
e Sy
mb
ol
P
cg05
951
221
2
2.
33E+
08
- 3
.2 ×
10
−1
5
cg06
644
428
2
2.
33E+
08
- 1
.2 ×
10
−1
4
cg05
575
921
5
37
3378
A
HR
R
6.5
× 1
0−
14
cg21
566
642
2
2.
33E+
08
- 8
.6 ×
10
−1
0
cg03
636
183
1
9
1700
058
5
F2R
L3
5.7
× 1
0−
7
cg06
126
421
6
30
7200
80
-
1.3
× 1
0−
6
cg01
940
273
2
2.
33E+
08
- 1
.9 ×
10
−6
cg23
771
366
1
1
8651
099
8
PR
SS2
3
3.1
× 1
0−
6
cg17
272
563
6
32
1165
48
P
RR
T1
4.4
× 1
0−
6
cg23
916
896
5
36
8804
A
HR
R
1.3
× 1
0−
5
cg11
660
018
1
1
8651
091
5
PR
SS2
3
1.3
× 1
0−
5
cg08
118
908
1
6
1578
792
0
ND
E1
3.0
× 1
0−
5
cg13
937
905
1
2
5361
255
1
RA
RG
1
.5 ×
10
−4
cg24
172
324
2
2.
32E+
08
- 1
.7 ×
10
−4
cg10
780
313
6
33
5013
79
-
2.0
× 1
0−
4
cg14
027
333
6
32
1163
17
P
RR
T1
2.1
× 1
0−
4
cg11
245
297
1
9
8117
898
C
CL2
5
2.1
× 1
0−
4
cg01
692
968
9
1.
08E+
08
- 3
.1 ×
10
−4
cg00
706
683
2
2.
33E+
08
ECEL
1P2
3
.4 ×
10
−4
cg25
317
941
2
2.
33E+
08
ECEL
1
4.0
× 1
0−
4
cg25
189
904
1
68
2994
93
G
NG
12
4.0
× 1
0−
4
cg14
179
389
1
92
9479
61
G
FI1
4.7
× 1
0−
4
cg13
641
317
3
1.
27E+
08
- 4
.9 ×
10
−4
cg19
847
577
1
5
2921
374
8
AP
BA
2
5.1
× 1
0−
4
cg14
239
618
7
1.
1E+
08
-
5.8
× 1
0−
4
cg25
955
180
6
32
1165
38
P
RR
T1
6.3
× 1
0−
4

CHAPTER 8: Cigarette smoking and DNA methylation 251
Pro
be
ID
Ch
r Lo
cati
on
G
en
e Sy
mb
ol
P
cg00
774
149
3
52
2557
21
TL
R9
6
.4 ×
10
−4
cg21
351
392
6
1.
62E+
08
AG
PA
T4
7.1
× 1
0−
4
cg11
902
777
5
36
8843
A
HR
R
7.6
× 1
0−
4
cg07
251
887
1
7
7364
180
9
LOC
1001
309
33;
REC
QL5
7
.7 ×
10
−4
cg19
382
157
7
21
2456
6
MA
D1L
1
8.9
× 1
0−
4
cg19
925
780
1
1.
02E+
08
- 1
.1 ×
10
−3
cg03
679
544
6
1.
56E+
08
TIA
M2
1
.1 ×
10
−3
cg08
559
712
2
0
1603
067
4
MA
CR
OD
2
1.3
× 1
0−
3
cg09
837
977
7
1.
11E+
08
LRR
N3;
IMM
P2
L 1
.3 ×
10
−3
cg00
931
843
6
1.
55E+
08
TIA
M2
1
.4 ×
10
−3
*C
pG
sit
es w
ith
ou
t ge
ne
nam
es a
re in
terg
enic
. Th
ese
are
all i
ncl
ud
ed in
all
the
anal
yses
.
Figu
re 1
. Tra
ject
ori
es o
f C
pG
sit
es
that
did
no
t re
turn
to
nev
er-s
mo
ker
leve
ls w
ith
in 3
0 y
ears
aft
er c
essa
tio
n.
Year
s af
ter
qu
itti
ng
T-statistics
Ce
ssat
ion
eff
ect
of
‘lon
g-te
rm’ g
en
es

252 PART C: Nutrition, lifestyle and DNA methylation
Enrichment analysis for genes identified in GWAS of smoking related phenotypes
To identify potential relevance of the differentially methylated genes to smoking-
related phenotypes, we determined whether these genes had been associated with
smoking-related phenotypes in the NHGRI-EBI GWAS Catalog28 (accessed November 2,
2015). The catalog contained 9,777 SNPs annotated to 7,075 genes associated with 865
phenotypes at p≤5x10⁻⁸. Of the 7,201 genes (mapped by 18,760 CpG sites) significantly
differentially methylated in current versus never smokers, we found overlap with 1,791
genes (4,187 CpGs are mapped to these) associated in GWAS with 700 phenotypes
(enrichment p=2.4 x 10-52). We identified smoking-related traits using the 2014 US
Surgeon General’s (USSG) report1. Enrichment results for a selection of smoking-
related phenotypes including coronary heart disease (CHD) and its risk factors, various
cancers, inflammatory diseases, osteoporosis, and pulmonary traits, are available in
Table 5. We also performed the same enrichment analysis on the 2,568 CpGs
associated with former versus never smoking status. We identified enrichment for
CHD, pulmonary traits, and some cancers (Table 5). More detailed results are available
in Supplementary Tables 8 and 9. Differentially methylated genes in relation to
smoking status that are associated in GWAS with CHD or CHD risk factors are available
in Supplementary Table 10. We also performed enrichment analyses on phenotypes
that have no clear relationships to smoking, such as male pattern baldness (p=0.0888),
myopia (p=0.1070), thyroid cancer (p=0.2406), and testicular germ cell tumor
(p=0.3602) and did not find significant enrichment.
Enrichment analysis for genomic features
We examined the differentially methylated CpGs with respect to localization to
different genomic regions including CpG islands, gene bodies, known differentially
methylated regions, and sites identified as likely to be functionally important in the
ENCODE project such as DNAse1 hypersensitivity sites and enhancers (refer to the
Methods section for details). We performed this analysis separately for the CpGs
related to current smoking and past smoking (Supplementary Table 11). Trends were
similar for the two sets of CpGs, although the power to identify enrichment was much
greater for the larger set of 18,760 CpGs related to current smoking. There was no
enrichment for CpG islands. In contrast, significant enrichment was observed for island
shores, gene bodies, DNAse1 hypersensitivity sites, and enhancers.

CHAPTER 8: Cigarette smoking and DNA methylation 253
Table 5. Enrichment of CpGs for genome-wide association study (GWAS) phenotypes
that are regarded as causally related to cigarette smoking
GWAS Phenotype Enrichment p-value
Current vs. never smoking
Coronary heart disease (CHD) and Stroke 0.0028
Ischemic stroke 0.0095
CHD risk factors 1.2 × 10⁻¹²
Blood pressure / hypertension 8.1 × 10⁻⁶
Diastolic blood pressure 6.1 × 10⁻⁵
Systolic blood pressure 0.0008
Hypertension 0.015
Lipids 2.9 × 10⁻⁵
High density lipoprotein (HDL) 0.0009
Type 2 diabetes 0.0106
Rheumatoid arthritis (RA) 2.9 × 10⁻⁵
Bone mineral density (BMD) and osteoporosis 0.0467
All pulmonary traits 2.8 × 10⁻⁶
All chronic obstructive pulmonary disease (COPD) 0.0295
Moderate to severe COPD 0.0156
Pulmonary function 0.0044
Crohn’s Disease 9.5 × 10⁻⁷
Primary biliary cirrhosis 3.4 × 10⁻⁶
Inflammation bowel disease 3.5 × 10⁻⁵
Ulcerative colitis 9.8 × 10⁻⁵
All cancer 8.0 × 10⁻¹⁵
Lung adenocarcinoma 0.0015
Colorectal cancer 0.0014
Former vs. never smoking
CHD risk factors 7.6 × 10⁻⁵
Blood pressure / hypertension 5.8 × 10⁻⁵
Diastolic blood pressure 0.0021
Systolic blood pressure 0.0002
Hypertension 0.0023
Rheumatoid arthritis (RA) 6.3 × 10⁻⁵
All pulmonary traits 0.0217
Inflammation bowel disease 5.2 × 10⁻⁶
Crohn’s Disease 0.0064
All cancer 7.8 × 10⁻⁶

254 PART C: Nutrition, lifestyle and DNA methylation
Transcriptomic integration
Of the 18,760 statistically significant CpG sites associated with current smoking in the
meta-analysis, 1,430 were significantly associated in cis with the expression of 924
genes at FDR<0.05 (enrichment p=3.6 x 10-215, Supplementary Table 12) using whole
blood samples from 2,262 Framingham Heart Study participants. Of these, 424 CpGs
associated with the expression of 285 genes were replicated at FDR<0.0001 in 1,264
CD14+ samples from the Multi-Ethnic Study of Atherosclerosis (MESA)35. These genes
are associated with pathways similar to those described earlier (Supplementary Table
13).
Comparison between African ancestry and European ancestry
Meta-analysis of the current versus never smokers in 11 cohorts with participants of
European ancestry (N=6,750 subjects) yielded 10,977 CpGs annotated to 4,940 genes
at FDR<0.05. Meta-analysis the results of the smaller dataset of four cohorts with
African ancestry participants (N=2,639) yielded 3,945 CpGs annotated to 2,088 genes at
FDR<0.05. The effect estimates of the CpGs significant in at least one ancestry (12,927
CpGs) were highly correlated in the combined group of individuals of either ancestry
(Spearman ρ=0.89). The results by ancestry are shown in Supplementary Table 14.
We performed the same ancestry-stratified analysis on former versus never
smokers (Supplementary Table 15). Meta-analysis of the results of European ancestry
participants yielded 2,045 CpG sites annotated to 1,081 genes at FDR<0.05. Meta-
analysis of the results of African ancestry participants yielded 329 CpG sites annotated
to 178 genes at FDR<0.05. The effect estimates of the union of CpGs significant in at
least one ancestry (2,234 CpGs) were correlated in the combined group of individuals
of either ancestry (Spearman ρ=0.75). Of note, one of CpG sites showing differential
methylation in ancestry, cg00706683, mapped to gene ECEL1P2, did not return to
never-smoker levels 30 years after smoking cessation (Table 4).
To more directly compare results by ethnicity removing the effect of better
statistical power in the larger European ancestry sample size, we performed a meta-
analysis on subset of European ancestry cohorts: the Framingham Heart Study,
Rotterdam Study, and KORA, such that the total number of smokers, the major
determinant of power, would match that of African ancestry cohorts. In this subset,
similar correlations of the effect estimates were observed as in the complete analyses
suggesting that the differences in number of statistically significant CpGs are indeed
due to better power in the European ancestry cohorts (Spearman ρ=0.87 and 0.79 for
current versus never smokers and former versus never smokers, respectively).
Cell type adjustment
We adjusted our main analyses for white blood cell fractions, in studies based on either
whole blood or leukocytes from the buffy coat of whole blood, either measured or

CHAPTER 8: Cigarette smoking and DNA methylation 255
using a published method20. Reassuringly, results before and after cell type adjustment
were highly comparable. The correlation of regression coefficients before and after
adjustment is 0.85 for the current vs. never smoker analysis (Supplementary Figure 7).
Similarly for the analysis of former versus never smokers the effect estimates were
highly correlated before and after adjustment (ρ=0.93; Supplementary Figure 8). In
addition, in two cohorts we had results from specific cell fractions - CD4+ cells in
GOLDN and CD14+ cells in MESA. The correlation of results between buffy coat and
CD4+ or CD14+ for former versus never smokers are generally high (ρ > 0.74;
Supplementary Table 16).
Methylation profile across CpG sites
We assessed methylation profile in FHS cohort as a representative cohort in the study.
The profile of all 485,381 analyzed CpG sites can be found in Supplementary Figure 9.
The profile across 18,760 CpG sites significantly associated with current vs. never
smoking status can be found in Supplementary Figure 10. These plots indicate that
most CpG sites with less dynamic range are largely not statistically significant in our
results.
DISCUSSION
We performed a genome-wide meta-analysis analysis of blood-derived DNA
methylation in 15,907 individuals across 16 cohorts and identified broad epigenome-
wide impact of cigarette smoking, with 18,760 statistically significant CpGs (FDR<0.05)
annotated to over 7,000 genes, or roughly a third of known human genes. These genes
in turn affect multiple molecular mechanisms and are implicated in smoking-related
phenotypes and diseases. In addition to confirming previous findings from smaller
studies, we detected over 16,000 novel differentially methylated CpGs in response to
cigarette smoking. Many of these genes have not been previously implicated in the
biologic effects of tobacco exposure. The large number of genes implicated in this well
powered meta-analysis might on first glance raise concerns about false positives.
However, on further consideration, given the widespread impact of smoking on disease
outcomes across many organ systems and across the lifespan1, the identification of a
large number of genes at genome wide significance is not surprising. In addition, our
findings are robust and consistent across all 16 cohorts (Supplementary Tables 2 and 5)
because we accounted for inter-study variability by using random effect meta-analyses,
which is conservative when heterogeneity is present36. The implicated genes are mainly
involved in molecular machineries, such as transcription and translation. Furthermore,
differential methylation of a subset of CpGs persisted, often for decades, following
smoking cessation.
We found that genes differentially methylated in relation to smoking are
enriched for variants associated in GWAS with smoking–related diseases1 including,

256 PART C: Nutrition, lifestyle and DNA methylation
osteoporosis, colorectal cancers, chronic obstructive pulmonary disease, pulmonary
function, cardiovascular disease (CVD) and rheumatoid arthritis. We find it noteworthy
that there is enrichment of smoking-associated CpGs for genes associated with
rheumatoid arthritis because DNA methylation is one of the proposed molecular
mechanisms underlying this disease 37. It is also interesting that the most significant
association of smoking with methylation was for the gene HIVEP3 (a.k.a. Schnurri3), the
mammalian homolog of the Drosophila zinc finger adapter protein Shn38. This gene
regulates bone formation, an important determinant to osteoporosis, which was one
of the enriched GWAS phenotypes.
When we examined time since smoking cessation, we found that the majority
of the differentially methylated CpG sites observed in analysis of current versus never
smokers returned to the level of never-smokers within five years of smoking cessation.
This is consistent with the fact that risks of many smoking-related diseases revert to
nonsmoking levels within this period of time. Our results also indicate that cigarette
smoking induces long-lasting alterations in DNA methylation at some CpGs. While
speculative, it is possible that persistent methylation changes at some loci might
contribute to risks of some conditions that remain elevated after smoking cessation.
In all but two of our 14 cohorts DNA was extracted from the entire circulating
leukocyte population. Thus there is the possibility of confounding by the effects of
smoking on differential cell counts. We attempted to adjust for cell type and found that
results were generally little changed by the adjustment.
Our significant results are highly enriched for CpG sites associated with the
expression of nearby genes (i.e., in cis) even though a single measurement of gene
expression in blood is probably subject to considerably more within-subject variability
than DNA methylation,39 limiting our ability to find correlations. Differential DNA
methylation at many of the CpGs we identified in relation to smoking status may have
a functional impact on nearby gene expression. Our analysis of genomic regions further
supports the potential functional impact of our findings on gene expression. We
demonstrated enrichment for sites with greater functional impact such as island
shores, gene bodies, DNAse1 hypersensitivity sites, and enhancers, whereas we found
no enrichment for CpG islands. These results reinforce previous findings showing that
island shores, enhancers, and DHS sites are more dynamic (i.e., susceptible to
methylation changes) than CpG islands40, which may be more resistant to abrupt
changes in DNA methylation in response to environmental exposures41. Thus our
results suggest that many of the smoking-associated CpG sites may have regulatory
effects.
While identification of changes in methylation patterns may suggest
mechanisms by which exposure to tobacco smoke exerts its effects on several disease
processes, DNA methylation profiles can also serve as biomarkers of exposure to
tobacco smoke. Cotinine is a biomarker only of recent smoking; DNA methylation

CHAPTER 8: Cigarette smoking and DNA methylation 257
signals have the potential to serve as robust biomarkers of past smoking history9,42.
Indeed, several studies have identified several of such markers5,42,43. The large number
of persistently modified CpGs may be useful to develop even more robust biomarkers
to objectively quantify long-term cigarette smoking exposure for prediction of risk for
health outcomes in settings where smoking history is not available or is incomplete as
well as to validate self-reported never smoker status. Further, our analyses of both
former and current smokers show dose-dependent effects at a number of CpGs
(Supplementary Tables 3 and 7). Methylation based biomarkers could be informative
for investigating dose response relationships with disease endpoints. This is useful
because smokers often underreport the amount of smoking, both current and
historical.
It is possible that smoking related conditions or correlated exposures may
contribute to some of the methylation signatures identified. However, our studies are
nearly all population based studies composed of predominantly healthy individuals, not
selected for smoking related disease. Given the number, strength and robustness to
replication of findings for smoking across the literature and among our diverse cohorts
from various countries the likelihood that these are confounded by other exposures or
conditions related to smoking is greatly reduced.
There several potential limitations to our study. First, the cross-sectional
design limits our ability to study the time course of smoking effects. In addition, we
analyzed methylation in DNA samples from blood, which is readily accessible. Although
we demonstrated that blood derived DNA reveals a strong and robust signature of
cigarette smoking exposure, studies in target tissues for smoking-related diseases (e.g.,
heart and lung) would be of additional interest. In addition, our analyses could not
distinguish smoking’s direct effects from its indirect effects due to smoking-induced
changes in cell metabolism, organ function, inflammation, or injury that could in turn
influence methylation. However, this is the largest examination to date of the effects of
smoking on DNA methylation with 16 studies from different countries contributing.
In conclusion we identify an order of magnitude more sites differentially
methylated in relation to smoking across the genome than have been previously seen.
Many of these signals persist long after smoking cessation providing potential
biomarkers of past smoking history. These findings may provide new insights into
molecular mechanisms underlying the protean effects of smoking on human health and
disease.

258 PART C: Nutrition, lifestyle and DNA methylation
Sup
ple
men
tary
Tab
le 1
. Det
aile
d p
arti
cip
ant
char
acte
rist
ics
by
coh
ort
. [A
dd
itio
nal
Info
rmat
ion
acc
om
pan
ies
this
pap
er a
t
htt
p:/
/cir
cgen
etic
s.a
ha
jou
rna
ls.o
rg/c
on
ten
t.]
Cohort
Ethnicity
Sample
Origin
CpG at FDR<0.05
Current vs. Never
CpG at FDR<0.05
Former vs. Never
N
Mal
es
(%)
Age
(Mea
n/S
D)
BM
I
(Mea
n/S
D)
Pac
k Ye
ars
(Mea
n/S
D)
Current
Former
Never
Current
Former
Never
Current
Former
Never
Current
Former
Never
Cell types
Current
Former
AR
IC
AA
B
C
7,7
94
61
720
86
6
12
62
4
9.7
4
8.3
2
0.7
5
6.2
5.8
57
.2
5.9
56
.5
5.8
27
.9
5.8
30.2
6.2
31.3
6.3
H
25
.46
21.9
7
16.1
0
20.9
4
GTP
A
A
WB
81
0
94
64
128
3
7.2
2
6.6
2
4.2
4
3.4
11
.7
44
.6
13
.1
38
.4
12
.9
33
.0
8.3
33.3
6.8
32.9
8.7
H
N
A
NA
CH
S A
A
AA
W
B
20
0 30
66
96
4
6.7
5
3.0
18
.8
70
.4
4.9
72
.7
5.2
74
.1
5.6
25
.7
3.7
28.7
4.5
29.7
5 H
28
.5
18.3
*
22.5
19.8
*
GEN
OA
A
A
BC
12
7
6 77
11
1
232
5
0.6
4
2.3
1
5.1
5
8.7
7.9
61
.7
7.7
61
.0
7.4
28
.2
5.6
31.0
6.1
31.4
6.0
H
29
.5
17.4
23.1
22.9
FHS
EA
WB
14
,31
8
199
27
4
15
38
83
6
51
.8
51
.1
33.7
6
2.5
7.8
67
.4
8.5
65
.8
9.6
27
.7
5.6
28.5
5.2
27.9
5.4
H
37
.8
23.5
7.3
12.3
KO
RA
F4
EA
W
B
6,5
13
42
262
78
2
753
5
4.2
6
0.5
3
4.5
5
7.0
7.0
61
.1
9.0
62
.1
8.9
27
.1
4.8
28.6
5
28
4.6
H
33
.39
23.9
5
21.5
9
24.3
3
GO
LDN
EA
C
D4+
51
10
73
21
6
703
4
9.3
5
7.9
4
4.5
44
13
56
14
47
17
28
.1
5.8
28.9
5.0
28.1
5.8
N
A
18.5
7
17.8
6
18.0
9
22.4
4
LBC
19
21
EA
W
B
73
9 31
21
3
201
3
5.5
4
6.0
3
3.3
7
9.2
0.5
79
.1
0.6
79
.1
0.6
24
.9
4.0
26.4
3.7
26.1
4.4
H
LBC
19
36
EA
W
B
476
24
10
3
385
43
2
45
.6
58
.4
44
.7
69
.5
0.7
69
.6
0.8
69.5
0.8
25
.9
4.5
28.5
4.5
27.6
4.1
H
NA
S EA
W
B
176
15
26
43
1
187
1
00
.0
10
0.0
1
00
.0
68
.2
6.1
72
.3
6.6
73
.8
7.3
28
.2
4.7
28.3
4.1
27.4
3.8
H
59
.8
28.6
27.7
24

CHAPTER 8: Cigarette smoking and DNA methylation 259
RS
EA
WB
78
6
7 16
9
307
21
0
45
.0
47
.2
37
.1
58
.0
6.8
61
.6
8.6
59
.2
8.4
26
.3
3.9
28.0
4.5
27.7
4.9
M
30
.8
22.2
19.6
20.9
Inch
ian
ti
EA
WB
61
3
7 50
17
0
288
5
2.0
7
2.4
2
7.8
5
8.9
16
.8
74
.3
12
.2
72
.6
16
.6
26
.2
4.6
27.5
3.8
26.8
4.4
M
28
20.9
22.8
19.2
CH
S EA
EA
W
B
2
3 23
76
85
3
4.8
5
7.9
3
4.1
7
4.1
4.2
75
.6
5.1
76
.8
5.2
26
.8
5.2
27
4.9
27
4.8
H
N
A
NA
EPIC
-No
rfo
lk
EA
BC
84
4
11
191
46
3
529
5
3.9
6
5.0
3
4.6
5
8.3
8.4
61
.4
8.7
59
.9
8.9
25
.9
4.2
27.7
4.4
27.1
4.4
H
MES
A
EA+A
A+H
IS
CD
14+
3,
243
17
11
4
640
50
2
55
.3
55
.8
37
.8
65
8
70
9
70
10
28
6
30
5
30
6 N
A
36
27
16
20
EPIC
EA
B
C
0
0 19
6
190
51
2
0.0
0
.0
0.0
4
8.9
8.8
51
.3
8.9
54
.0
8.6
25
.0
4.8
25.5
4.7
26.2
4.3
H
N
A
NA
Tota
l
24
33
6
51
8
69
56
* Fo
r w
hic
h p
ack
year
s d
ata
are
avai
lab
le; W
B =
Wh
ole
Blo
od
; BC
= B
uff
y C
oat
s; H
= H
ou
sem
an, M
= M
easu
red

260 PART C: Nutrition, lifestyle and DNA methylation
REFERENCES 1. National Center for Chronic Disease Prevention and Health Promotion (US) Office on
Smoking and Health. The Health Consequences of Smoking—50 Years of Progress: A Report of the Surgeon General. Atlanta (GA): Centers for Disease Control and Prevention (US); 2014
2. World Health Organization. WHO global report on trends in prevalence of tobacco smoking. 2015.
3. Szarc vel Szic K, Declerck K, Vidaković M, Vanden Berghe W. From inflammaging to healthy aging by dietary lifestyle choices: is epigenetics the key to personalized nutrition? Clin Epigenetics. 2015;7:33.
4. Breitling LP, Yang R, Korn B, Burwinkel B, Brenner H. Tobacco-smoking-related differential DNA methylation: 27K discovery and replication. Am J Hum Genet. 2011;88:450–457.
5. Breitling LP, Salzmann K, Rothenbacher D, Burwinkel B, Brenner H. Smoking, F2RL3 methylation, and prognosis in stable coronary heart disease. European heart journal. 2012;33:2841-8.
6. Wan ES, Qiu W, Baccarelli A, Carey VJ, Bacherman H, Rennard SI, et al. Cigarette smoking behaviors and time since quitting are associated with differential DNA methylation across the human genome. Human molecular genetics. 2012;21:3073-3082
7. Wan ES, Qiu W, Carey VJ, Morrow J, Bacherman H, Foreman MG, et al. Smoking Associated Site Specific Differential Methylation in Buccal Mucosa in the COPDGene Study. Am J Respir Cell Mol Biol. 2014;53:246-54.
8. Zeilinger S, Kühnel B, Klopp N, Baurecht H, Kleinschmidt A, Gieger C, et al. Tobacco smoking leads to extensive genome-wide changes in DNA methylation. PLoS ONE. 2013;8:e63812.
9. Shenker NS, Ueland PM, Polidoro S, van Veldhoven K, Ricceri F, Brown R, et al. DNA Methylation as a Long-term Biomarker of Exposure to Tobacco Smoke: Epidemiology. 2013;24:712–716.
10. Shenker NS, Polidoro S, van Veldhoven K, Sacerdote C, Ricceri F, Birrell MA, et al. Epigenome-wide association study in the European Prospective Investigation into Cancer and Nutrition (EPIC-Turin) identifies novel genetic loci associated with smoking. Hum Mol Genet. 2013;22:843–851.
11. Guida F, Sandanger TM, Castagné R, Campanella G, Polidoro S, Palli D, et al. Dynamics of Smoking-Induced Genome-Wide Methylation Changes with Time Since Smoking Cessation. Hum Mol Genet. 2015;24:2349-59.
12. Qiu W, Wan E, Morrow J, Cho MH, Crapo JD, Silverman EK, et al. The impact of genetic variation and cigarette smoke on DNA methylation in current and former smokers from the COPDGene study. Epigenetics. 2015;10:1064–1073.
13. Gao X, Jia M, Zhang Y, Breitling LP, Brenner H. DNA methylation changes of whole blood cells in response to active smoking exposure in adults: a systematic review of DNA methylation studies. Clin Epigenetics. 2015;7:113.
14. Shah S, Bonder MJ, Marioni RE, Zhu Z, McRae AF, Zhernakova A, et al. Improving Phenotypic Prediction by Combining Genetic and Epigenetic Associations. Am J Hum Genet. 2015;97:75–85.
15. Beane J, Sebastiani P, Liu G, Brody JS, Lenburg ME, Spira A. Reversible and permanent effects of tobacco smoke exposure on airway epithelial gene expression. Genome Biology. 2007;8:R201.
16. Wauters E, Janssens W, Vansteenkiste J, Decaluwé H, Heulens N, Thienpont B, et al. DNA methylation profiling of non-small cell lung cancer reveals a COPD-driven immune-related signature. Thorax. 2015;70:1113-22.

CHAPTER 8: Cigarette smoking and DNA methylation 261
17. Garg AX, Hackam D, Tonelli M. Systematic Review and Meta-analysis: When One Study Is Just not Enough. Clinical Journal of the American Society of Nephrology. 2008;3:253–260.
18. Pidsley R, Y Wong CC, Volta M, Lunnon K, Mill J, Schalkwyk LC. A data-driven approach to preprocessing Illumina 450K methylation array data. BMC Genomics. 2013;14:293.
19. Teschendorff AE, Marabita F, Lechner M, Bartlett T, Tegner J, Gomez-Cabrero D, et al. A beta-mixture quantile normalization method for correcting probe design bias in Illumina Infinium 450 k DNA methylation data. Bioinformatics. 2013;29:189–196.
20. Houseman EA, Accomando WP, Koestler DC, Christensen BC, Marsit CJ, Nelson HH, et al. DNA methylation arrays as surrogate measures of cell mixture distribution. BMC Bioinformatics. 2012;13:86.
21. Dick KJ, Nelson CP, Tsaprouni L, Sandling JK, Aïssi D, Wahl S, et al. DNA methylation and body-mass index: a genome-wide analysis. Lancet. 2014;383:1990–1998.
22. Bates D, Mächler M, Bolker B, Walker S. Fitting Linear Mixed-Effects Models Using lme4. Journal of Statistical Software. 2015;67:1-48.
23. R Development Core Team. R: A Language and Environment for Statistical Computing. Vienna, Austria: 2010.
24. Viechtbauer W. Conducting Meta-Analyses in R with the metafor Package. Journal of Statistical Software. 2010;36:1-48.
25. Benjamini Y, Hochberg Y. Controlling the false discovery rate: a practical and powerful approach to multiple testing. JSSRB. 1995;57:289–300.
26. Joubert BR, Felix JF, Yousefi P, Bakulski KM, Just AC, Breton C, et al. DNA Methylation in Newborns and Maternal Smoking in Pregnancy: Genome-wide Consortium Meta-analysis. Am J Hum Genet. 2016;98:680–696.
27. Su AI, Wiltshire T, Batalov S, Lapp H, Ching KA, Block D, et al. A gene atlas of the mouse and human protein-encoding transcriptomes. Proc Natl Acad Sci USA. 2004;101:6062–6067.
28. Hindorff LA, Sethupathy P, Junkins HA, Ramos EM, Mehta JP, Collins FS, et al. Potential etiologic and functional implications of genome-wide association loci for human diseases and traits. Proc Natl Acad Sci USA. 2009;106:9362–9367.
29. Vazquez AI, Bates DM, Rosa GJM, Gianola D, Weigel KA. Technical note: an R package for fitting generalized linear mixed models in animal breeding. J Anim Sci. 2010;88:497–504.
30. Devlin B, Roeder K. Genomic control for association studies. Biometrics. 1999;55:997–1004.
31. Martey CA, Baglole CJ, Gasiewicz TA, Sime PJ, Phipps RP. The aryl hydrocarbon receptor is a regulator of cigarette smoke induction of the cyclooxygenase and prostaglandin pathways in human lung fibroblasts. Am J Physiol Lung Cell Mol Physiol. 2005;289:L391-399.
32. Teschendorff AE, Yang Z, Wong A, Pipinikas CP, Jiao Y, Jones A, et al. Correlation of Smoking-Associated DNA Methylation Changes in Buccal Cells With DNA Methylation Changes in Epithelial Cancer. JAMA Oncology. 2015;1:476-485.
33. Campesi I, Carru C, Zinellu A, Occhioni S, Sanna M, Palermo M, et al. Regular cigarette smoking influences the transsulfuration pathway, endothelial function, and inflammation biomarkers in a sex-gender specific manner in healthy young humans. Am J Transl Res. 2013;5:497–509.
34. Subramanian A, Tamayo P, Mootha VK, Mukherjee S, Ebert BL, Gillette MA, et al. Gene set enrichment analysis: a knowledge-based approach for interpreting genome-wide expression profiles. Proc Natl Acad Sci USA. 2005;102:15545–15550.
35. Liu Y, Ding J, Reynolds LM, Lohman K, Register TC, De La Fuente A, et al. Methylomics of gene expression in human monocytes. Hum Mol Genet. 2013;22:5065–5074.

262 PART C: Nutrition, lifestyle and DNA methylation
36. Han B, Eskin E. Random-effects model aimed at discovering associations in meta-analysis of genome-wide association studies. Am J Hum Genet. 2011;88:586–598.
37. Liu Y, Aryee MJ, Padyukov L, Fallin MD, Hesselberg E, Runarsson A, et al. Epigenome-wide association data implicate DNA methylation as an intermediary of genetic risk in rheumatoid arthritis. Nat Biotechnol. 2013;31:142–147.
38. Jones DC, Wein MN, Oukka M, Hofstaetter JG, Glimcher MJ, Glimcher LH. Regulation of adult bone mass by the zinc finger adapter protein Schnurri-3. Science. 2006;312:1223–1227.
39. Suderman M, Pappas JP, Borghol N, Buxton JL, McArdle WL, Ring SM, et al. Lymphoblastoid cell lines reveal associations of adult DNA methylation with childhood and current adversity that are distinct from whole blood associations. Int J Epidemiol. 2015;44:1331-40.
40. Ziller MJ, Gu H, Müller F, Donaghey J, Tsai LT-Y, Kohlbacher O, et al. Charting a dynamic DNA methylation landscape of the human genome. Nature. 2013;500:477–481.
41. Ivanova E, Chen J-H, Segonds-Pichon A, Ozanne SE, Kelsey G. DNA methylation at differentially methylated regions of imprinted genes is resistant to developmental programming by maternal nutrition. Epigenetics. 2012;7:1200–1210.
42. Zhang Y, Schöttker B, Florath I, Stock C, Butterbach K, Holleczek B, et al. Smoking-Associated DNA Methylation Biomarkers and Their Predictive Value for All-Cause and Cardiovascular Mortality. Environ Health Perspect. 2015; 124:67-74.
43. Zhang Y, Yang R, Burwinkel B, Breitling LP, Brenner H. F2RL3 Methylation as a Biomarker of Current and Lifetime Smoking Exposures. Environmental Health Perspectives. 2013;122:131-7.

CHAPTER 9: General discussion 263
PART D
Discussion and summary

264 PART D: Discussion and summary

CHAPTER 9: General discussion 265
CHAPTER 9: GENERAL DISCUSSION The aim of this thesis was to investigate the effects of key factors from the methyl-
group metabolism on genome-wide DNA methylation in a site-specific manner. In
addition, we also aimed to investigate the effects of other lifestyle factors such as
nutrition and cigarette smoking on DNA methylation. We conducted several
epigenome-wide association studies (EWASs) in blood samples of a population-based
cohort, the Rotterdam Study (RS) and collaborated with other cohorts with similar data
in a consortium based effort, to increase power and robustness of our findings.
MAIN FINDINGS
Methyl-group Metabolism and B-vitamins
In Chapter 4, we describe that plasma Hcy was associated with subtle differences in
DNA methylation of blood DNA, since we identified a small number of differentially
methylated positions (3 DMPs) associated with Hcy in leukocytes of 2,035 individuals.
Regional analysis identified 68 differentially methylated regions (DMRs) associated
with Hcy. In Chapter 5, genetically elevated Hcy levels assessed by the MTHFR 677C>T
variant and combined weighted genetic risk score (GRS) of 18 previously studied Hcy-
associated variants, did not show widespread changes in DNA methylation; identifying
a few DMPs in cis (< 1Mb upstream or downstream of the SNP) and one DMP in trans
(> 1Mb upstream or downstream of the SNP) associated with the MTHFR 677C>T
variant and five trans-CpGs associated with the GRS. In Chapter 6, we conducted an
interaction study of Hcy and the MTHFR 677C>T variant to investigate their combined
effect on genome-wide DNA methylation in leukocytes of 1280 individuals. We
identified 13 DMPs associated with [Hcy x MTHFR 677C>T]. This included four cis-DMPs
at the AGTRAP-MTHFR-NPPA/B gene cluster on chromosome 1, which were also
described in Chapter 5, indicating that this association is more likely driven by MTHFR
677C>T variant since they are cis-DMPs for the MTHFR 677C>T variant. In Chapter 7, in
leukocytes of 5,841 individuals, we identified six novel DMPs and 74 DMRs significantly
associated with dietary folate intake, and 29 DMRs significantly associated with dietary
vitamin B12 intake. No DMPs were found associated with dietary vitamin B12 intake.
In conclusion, we investigated several important markers of one-carbon
metabolism and found only subtle differences in DNA methylation that were of modest
statistical significance. When we examined overlap between the identified methylation
markers with the various factors from the methyl-group metabolism, we observed that
all identified CpGs were specific for the marker under study and no overlap was found.
Lifestyle factors
In Chapter 8, we focused on association between cigarette smoking as a lifestyle factor
and DNA methylation in leukocytes assessed in 15,907 individuals. We identified

266 PART D: Discussion and summary
widespread changes in methylation: 18,760 DMPs when comparing current versus
never smokers, and 2,623 DMPs when comparing former versus never smokers. This
indicates a pattern of persistent altered methylation, with attenuation for up to five
years, after smoking cessation.
CONSIDERATIONS OF OUR MAIN FINDINGS
Despite the fact that the methyl-group metabolism is the key metabolism delivering
methyl-groups for DNA-methylation, we did not find widespread effects of Hcy, Hcy-
associated genetic variants and dietary folate and vitamin B12 on DNA methylation
across the genome. By comparison, when we studied the relation between cigarette
smoking and DNA methylation, we identified widespread differences. There could be
several explanations for the observed minimal effects of methyl-group metabolism on
methylation pattern, that are listed below:
Mildly elevated Homocysteine levels
Hcy concentrations between 15-30 μmol/L are referred to as mild or moderate
hyperhomocysteinemia (HHcy), whereas concentrations between 30-100 μmol/L and
>100 μmol/L are referred to as intermediate and severe HHcy, respectively [1-3]. The
subtle findings in Chapter 4 and Chapter 6 may be explained by the generally low
median concentrations of Hcy in each cohort, with only about 10.2–32.3% of
individuals in the mild or moderate range of HHcy above 15 μmol/l. In other words, the
range of 3.4-35.4 μmol/l of Hcy might be too low, indicating a still balanced methyl-
group metabolism. It might be that more extreme deregulation of the methyl-group
metabolism, as present in intermediate or severe HHcy, as occurs in severe folate or
vitamin B12 deficiency, diseased individuals or inborn errors of metabolism, will lead to
deregulation of DNA-methylation.
Mildly elevated Hcy concentrations might not have resulted in altered s-
adenosylmethionine (SAM) and s-adenosylhomocysteine (SAH) levels in study
participants. The ratio of SAM:SAH is frequently used as an indicator of cellular
methylation potential, where SAM is the substrate and SAH is the product of essential
methyltransferase reactions. A few human studies have suggested that elevated Hcy
with corresponding increase in SAH is more strongly associated with global DNA
hypomethylation, as compared to corresponding alteration in SAM [4, 5]. SAM and SAH
was measured only in few previous studies, where they reported that individuals with
mild, moderate or intermediately elevated Hcy levels showed increased SAM or
increased SAH, with some showing corresponding decrease in SAM:SAH ratio [5-8].
We measured Hcy concentrations in plasma. Since methyl-group metabolism
effectively takes place intracellularly, a double-blind trial by Smith et. al. [9] showed
that FA supplementation significantly lowered plasma Hcy, but not intracellular Hcy. FA
supplementation also did not lower intracellular SAM and SAH, which is possibly the

CHAPTER 9: General discussion 267
reason why global DNA methylation as measured by liquid chromatography-tandem
mass spectrometry remained unaffected [9, 10].
Dietary data
Dietary intake of folate and vitamin B12 that are major determinants of B-vitamin
status, was associated with subtle differences in genome-wide methylation profiles. In
older individuals, vitamin B12 uptake is usually impaired as a consequence of issues
related to absorption [11], health disorders, medications or lifestyle factors [12]. Given
the fact that the mean age in the majority of our examined cohorts was over 60 years,
it is highly likely that dietary vitamin B12 intake might not accurately reflect
intracellular status and therefore, could result in misclassification of vitamin B12 status
[13, 14]. Dietary data is also prone to measurement errors, which can compromise our
ability to detect statistically significant associations. Furthermore, there were
differences in nutrient intake ranges across cohorts which could be related to the
number and type of food items used in the FFQs, and the types of food composition
reference tables used to calculate the nutrient data. Except for those studies for which
covariates were not present, in the analysis, adjustments were done for age, sex, body
mass index (BMI), differential white blood cell (WBC) counts, smoking status, physical
activity, B-vitamin supplement intake, and alcohol (grams per day or drinks per week)
and coffee (grams per day or servings per day) consumption. All these adjustments
could have reduced the amount of variability left in nutrient intake, resulting in
reduced power. Notably, the findings from previous birth cohort studies identified
much more DNA methylation changes in neonates in relation to maternal folate intake
or levels, as compared to our study in elderly [15, 16]. It could be that the effect of low
B-vitamins intake is not seen in the individual itself but that the effects of low B
vitamins are transmitted to the next generation to show an effect on DNA [17, 18].
Moreover, fetuses are very sensitive for disturbances in the methyl-group metabolism
during development due to increased placental and fetal demand for folate, and
therefore, any insufficiencies could have major implications [19-21]. Lastly, there could
be a threshold effect for a possible association, i.e., there is a possibility that regulation
of methylation is very tight and that mild differences in the metabolism can be
compensated for, but not so for more extreme deregulation. This could mean that in
our cohorts the folate and vitamin B12 status were consistently sufficiently optimal to
prevent changes in DNA methylation patterns.
Cohort heterogeneity and sample size
Hcy concentrations are associated with different pathophysiologies and it should be
noted that in our studies, the study population were either population based, or
consisted of cases with venous thromboembolism, or have a mildly increased risk to
develop Type 2 diabetes and/or cardiovascular disease. Individuals with Type 2

268 PART D: Discussion and summary
diabetes have a different metabolism due to insulin resistance and impaired insulin
secretion [22]. DNA methylation of insulin related and unrelated genes have been
previously associated with insulin resistance and Type 2 diabetes [22, 23]. In addition,
SNPs associated with type 2 diabetes [24] and/or cardiovascular diseases [25, 26] might
affect DNA methylation variability. Therefore, this clinical heterogeneity between
cohorts could have hindered identifying DMPs that are associated with Hcy.
A large sample size in EWAS studies is essential to improve statistical power in
order to detect subtle changes and can possibility compensate for cohort
heterogeneity. We performed an EWAS in relation to Hcy in 2,035 individuals and in
relation to folate and B12 in 1,280 individuals and were not able to show large
difference. In addition, we studied the effect of MTHFR 677C>T and other Hcy-
associated DNA variants on methylation in a sample size of 9,894 individuals, we again
did not find large differences in methylation. This genetic study strongly suggest that
there is no large difference in methylation patterns of circulating leukocytes in
individuals with mildly elevated homocysteine levels.
RNA or protein methylation
Hcy is an important intermediate of the methyl-group metabolism that mediates the
transfer of methyl groups to DNA as well as to RNA and proteins. Recent studies have
shown that RNA methylation at the 6 methyl position of adenine (m6A) and 5 methyl
position of cytosine (5-mC) regulates processes such as gene expression, RNA splicing,
RNA stability, RNA degradation, mRNA translation and development, the aberrant
methylation of which showing its implications in health and diseases [27-30].
Furthermore, protein methylation particularly on the nitrogen side-chains of the
arginine and lysine residues are also known to be involved in numerous cellular
processes such as DNA damage repair, RNA metabolism and gene expression [31-33]. It
could be that the effects of Hcy and other methyl-group metabolism factors are more
specific on the methylation of RNA or proteins.
In an animal model, diet-induced HHcy altered global protein arginine
methylation in a tissue-specific manner [34]. Plasma Hcy elevation is known to
parallelly increase plasma SAH elevation leading to subsequent DNA hypomethylation
[5]. When the effect of accumulation of intracellular SAH on both DNA methylation and
protein arginine methylation was further investigated in cultured human umbilical vein
endothelial cells, it was found that protein arginine methylation is more sensitive to
SAH accumulation than DNA methylation, indicating that proteins are more prone to
be hypomethylated than genomic DNA [35]. Large studies on the relation between
(factors of the) methyl-group metabolism and methylation of RNA and/or proteins are
currently missing, and it therefore remains to be discovered whether this relationship
exists.

CHAPTER 9: General discussion 269
Tissue specificity
The most commonly studied tissues in molecular epidemiology are blood and buccal
epithelial cells as they are easy to obtain and are readily available. We conducted
EWASs of Hcy level, by MTHFR 677C>T genotype and for folate/vitamin B12 intake, in
whole blood leukocytes. However these effects could be different across tissues such
as heart, brain and liver, from which methylation profiles are difficult to obtain. Few
studies have performed DNA methylome profiling of other human tissues [36-39].
Tissue specific methylation differences are also seen in genomic DNA and domain of
the H19 gene of liver, aorta, kidney and brain in mice with HHcy [40-42]. The tissue-
specific methylation reflects tissue-specific regulation of RNA expression and the
biological dynamics are explained by the turnover or maintenance of binding sites for
important transcription factors [43]. Moreover, it has been shown that the methylation
profile of blood is highly distinct and contains relatively low levels of methylation as
compared to other somatic tissues such as buccal cells [44-48]. The difference in DNA
methylation between blood as compared to buccal cells, was more prominent at
regions of low CpG density than at medium or high CpG density, while buccal cells had
more variable CpGs as compared to blood tissue [47]. This distinction of blood as
compared to other tissues was suggested to be due to the fact that blood is not a solid
tissue and that the components of blood are a part of the inflammatory and immune
systems, which are functionally related to many diseases [46, 47, 49, 50]. The other
readily available tissue, buccal cells showed a significantly larger overlap with
hypomethylated regions in a large number of other tissues in one report [44].
Therefore, buccal cells might be better than blood for large-scale epidemiological
studies. It is clear that using blood as a surrogate tissue necessitates careful
interpretation of results and correlation with the tissue of interest [51]. Depending on
the clinical interest, other tissues should be further investigated such as heart, liver,
kidney and brain.
Cellular heterogeneity
DNA methylation measurements from whole blood leukocytes is a mix of different cell
types with varying proportion of different white blood cell counts (WBCs). There are
five types of WBCs which include neutrophils (~62%), eosinophils (~2.3%), basophil
(~0.4%), lymphocytes (~30%) and monocytes (~5.3%). Neutrophils, eosinophils and
basophils together form the granulocytes. Since DNA methylation can be specific for
different cell types, its analysis might be confounded due to differences in
interindividual composition of cell types [52-57]. Therefore, DNA methylation analysis
requires cautious consideration of cell count adjustments in the model. In order to
adjust for cellular heterogeneity, RS and most other studies used measured percentage
of differential cell counts of granulocytes, lymphocytes and monocytes. Other studies
used percentage of imputed cell counts derived from the houseman method [58], to

270 PART D: Discussion and summary
adjust for cellular heterogeneity. The Houseman method uses methylation profiles to
statistically estimate relative proportions of cell type components in whole blood that
includes granulocytes, monocytes and subtypes of lymphocytes that include the B cells,
natural killer (NK) cells, and T cells. The R2 correlation between measured and
houseman imputed cell counts is 0.580, 0.645 and 0.259 in granulocytes, lymphocytes
and monocytes, respectively, in a subset of 700 samples of the Rotterdam Study
[Figure 1]. It is important to keep in mind that Houseman uses a reference-based
algorithm that is based on only six reference individuals [52]. Therefore, its estimates
are not fully optimal, and can introduce biases in association results.
Even after cell type adjustments, cellular heterogeneity could still be an issue
due to several reasons. One, if a particular cell type is underrepresented, then a change
in DNA methylation associated to it may not be detected, and can only be detected if
DNA methylation in such cell type is measured separately [52, 59]. Two, in important
cell types of blood, few CpGs in regulatory regions may have opposite methylation
patterns between the cell types. Considering these interindividual differences between
cells, cautious interpretation of the overall methylation results is needed [52]. Three, B
cells show a separate cluster and the largest number of DMPs with its associated genes
belonging to other pathways, as compared to other lymphocytes [52]. This distinct
methylation profile of B cells should be considered, and adjusting for the percentage of
total measured lymphocytes may not reduce this heterogeneity.

CHAPTER 9: General discussion 271
Figu
re 1
. C
orr
elat
ion
bet
wee
n m
easu
red
an
d h
ou
sem
an i
mp
ute
d c
ell
cou
nts
(N
=70
0,
blo
od
sam
ple
s o
f th
e R
ott
erd
am S
tud
y).
For
gran
ulo
cyte
s,
lym
ph
ocy
tes
and
mo
no
cyte
s, t
he
pea
rso
n c
orr
elat
ion
co
effi
cien
t (R
2 ) w
as 0
.58
0 (N
=69
9,
on
e o
utl
ier
rem
ove
d),
0.6
45
(N
=70
0)
and
0.2
59
(N
=69
6,
fou
r o
utl
iers
rem
ove
d),
res
pec
tive
ly, a
t p
<0
.01
.
Mo
no
cyte
s
Lym
ph
ocy
tes
Gra
nu
locy
tes
Per
cen
tage
Ho
use
man
Per
cen
tage
Ho
use
man
Per
cen
tage
Ho
use
man
Percentage Measured
Percentage Measured
Percentage Measured

272 PART D: Discussion and summary
Cigarette smoking
We observed a large epigenome-wide impact of smoking on DNA methylation pattern
with a total of 18,760 significant DMPs annotated to over 7,000 genes. Why is the
effect of smoking so much larger than Hcy and other methyl-group metabolism
factors? One, Hcy and other methyl-group metabolism factors such as folate and
vitamin B12 are associated with smoking [60-62] and with other lifestyle factors such
as physical activity [63, 64], coffee consumption [65-67] and alcohol consumption [68,
69]. Therefore, Hcy, folate and vitamin B12 cannot be seen separately from lifestyle
factors and that these factors might have masked some associations. Moreover,
despite our inclusion of these known confounders as covariates in the B-vitamin EWAS
models, the possibility of inter-correlations of these confounders with each other or
other factors belonging to the causal pathway could nullify the findings. Two, in
addition to the methyl-group metabolism, smoking could affect DNA methylation via
few other known mechanisms [70] such as:
a) Cigarette smoke contains carcinogens such as arsenic, chromium, polycyclic
aromatic hydrocarbons, formaldehyde, and nitrosamines that causes double-stranded
breaks to the DNA causing DNA damage [71]. The enzyme DNMT1 is recruited to repair
the damage in surviving cells which causes methylation of CpGs adjacent to the
repaired nucleotides [71-73].
b) Cigarette smoke can alter DNA methylation through the effect of nicotine
on DNMT1 expression. Nicotine binds to and activates the nicotinic acetylcholine
receptors that increases intracellular calcium and activates the key transcription factor
(cAMP response element-binding protein) of many genes with possible downregulation
of DNMT1 [74-76].
c) Cigarette smoking increases expression of the DNA-binding protein Sp1
which protects CpG sites from being methylated [77-79].
d) Cigarette smoke contains carbon monoxide that competes with oxygen to
bind to hemoglobin. This causes inadequate oxygenation of tissues in a condition called
hypoxia [80]. Hypoxia further leads to the HIF-1α-dependent upregulation of
methionine adenosyltransferase 2A, which is an enzyme that synthesizes the methyl
donor, SAM [81].
e) Cigarette smoking is also associated with a general inflammatory state and
cell ratios in the body [82-85], which could also alter DNA methylation.
These large effects of cigarette smoking on genome-wide DNA methylation
could further influence post-translational modifications possibly Immunoglobulin G
glycosylation [86].

CHAPTER 9: General discussion 273
METHODOLOGICAL CONSIDERATIONS
Measurement of genome-wide methylation
The human genome contains more than 28 million CpGs [87], 70-80% of which are
methylated [88]. However, the Illumina 450K arrays only measures 1.7% of the CpGs in
the genome. The CpGs are unevenly distributed across the human genome.
Methylation in promoters and enhancers create the most functional impact. Among
the gene regions for CpGs included on this array, most (41%) of them are present at
gene promoters, 31% at gene bodies, 35% at 3’UTR regions and 3% at intergenic
regions. For the enhancer regions, that are not present for a large part on the Illumina
450k arrays, but are newly incorporated as 333,265 new CpG sites identified by the
ENCODE [89, 90] and FANTOM5 [91] projects, in the recent Illumina 850k EPIC array
[92]. It is possible that Hcy effects on DNA methylation may be specific to other sites
and regions in the genome that are not measured by the Illumina 450k arrays, for
example, enhancers. Therefore, future studies in this field can use the recent Illumina
850k EPIC arrays which has similar advantages as Illumina 450k arrays and not only
contains >90% of the original content from Illumina 450K arrays but also includes high
coverage from enhancer regions. Also, when calculating and analyzing genomic DNA
methylation, i.e., the median of CpGs per sample using this Illumina 450k array data,
one needs to keep in mind that the results might be biased due to limited genome
coverage.
DATA-ANALYSIS
Normalization
A divergence between the β-values of the Infinium type I and type II probe assays was
noticed previously wherein the β-values retrieved from the type II assay were of
smaller range, less accurate and less stable as compared to the β-values retrieved from
type I assay [93, 94]. In order to overcome this bias, several correction methods were
proposed to rescale the type II β-values as per the type I β-values [93, 94] with each
method having its own pros and cons. In the RS, we investigated the performance of
these methods and although they all performed in a satisfactory manner, we decided
to use DASEN [95] or quantile normalization from CPACOR workflow (separately done
for Type 1 and Type 2 assays) [96] which performs between samples correction. The
association analysis performs regression across samples per probe, and therefore it is
important to perform between samples correction per probe instead of across probes
correction per sample.
Differentially methylated regions
In the analysis from this thesis, we used the method Comb-p [97, 98] to estimate
methylation differences across regions. This software was developed considering the

274 PART D: Discussion and summary
uneven distribution of CpGs on Illumina 450k arrays. It uses nominal p-values as input
in a sliding window and also takes into account the correlation between CpGs
associated with these p-values. This method uses only p-values as input, not only from
single EWASs but also from meta-analyses. In the results described in Chapter 4 and
Chapter 7, we found 68, 74 and 29 DMRs to be significantly associated with Hcy levels,
dietary folate and dietary vitamin B12 intakes, respectively. The number of DMRs were
much more than the observed DMPs. In addition, top DMR findings did not reflect a
strong association for one or more single CpGs that were part of the identified DMR.
Therefore, although DMR analysis on array-data is used in an increasing number of
manuscripts, a standard method is yet to be identified. Since the design of the array is
not optimal for DMR-analysis (large “gaps” between CpGs), simply “adding-up” results
from two nearby CpGs seems too simple. A better option might be to include
predefined regions based on databases with functional annotation of the genome, such
as ENCODE. However, we still know very little about actual correlation of CpGs in
different circumstances. All this, makes the “pure statistical” collapsing of different
CpGs doubtful and results from these analysis should be carefully interpreted.
IMPLICATIONS AND FUTURE DIRECTIONS
Smoking-associated methylation changes showed relatively larger differences as
compared to the factors that are more directly related to methylation-metabolism such
as Hcy, Hcy-associated variants or B-vitamin intake. First, validation or replication is
needed for the identified Hcy- , folate intake- and vitamin B12- associated DMPs. If
true, they can be used as potential biomarkers in methyl-group metabolism related
pathologies and for identification of new pathways and biological mechanisms
associated with it. In addition, the smoking-associated DMPs could serve as sensitive
markers for lifetime exposure to cigarette smoking. Although these DMPs need to have
good sensitivity and specificity to be used as biomarkers for diagnostics, their use in
diagnosis could serve many purposes [99, 100].
Since SAM is a major methyl donor and SAH is a potent inhibitor of methyl-
transferase reactions, the ratio of SAM/SAH is thought to reflect the cellular
methylation capacity [5]. Therefore, coming back to the possibilities discussed before
as to why we found limited findings, measurements of SAM and SAH would be
interesting to investigate methyl-group metabolism related methylation changes.
However, SAM is an intrinsically unstable molecule [101], which needs controlled
preanalytical conditions. Therefore, it is a challenging task to measure SAM or
SAM:SAH ratio in population-based studies, and very few studies have studied this up
to now [5-8].
Inorder to identify true effects of intermediate or severe HHcy i.e. more
extreme dysregulated methyl-group metabolism, a population with a broader range of
Hcy, i.e., individuals with severe HHcy or with folate/vitamin B12 deficiency should be

CHAPTER 9: General discussion 275
recruited. Furthermore, since dietary data is prone to measurement errors,
measurements of plasma or cellular levels of vitamin B12 and folate should be
conducted to confirm the role of these B-vitamins on DNA methylation. Tissues other
than blood need to be investigated to find specific effects and more homogenous cell
types should be studied for accuracy. Choosing the right tissue depends on the clinical
interest. However, tissues such as heart, liver, kidney and brain are not readily
available and are difficult to obtain in a substantial number of samples. Therefore, use
of surrogate tissues such as blood or buccal cells can be improved by understanding
the relationship between surrogate tissues and target tissues in an independent data
set using more information, such as from correlated CpG sites [102]. Although
methylation levels are largely conserved across tissues, it should be kept in mind that
such prediction accuracy could vary across different tissue types, populations,
phenotypes, diseases, genotypes and environmental exposure [102].
Intracellular Hcy, SAM and SAH
It could be that the effects of Hcy are seen at an intracellular level instead of plasma
level, since methyl-group metabolism effectively takes place intracellularly. It was
previously shown that plasma Hcy and intracellular SAH but not intracellular SAM were
associated with lymphocyte DNA hypomethylation [5]. Moreover, heterozygous
cystathionine β-synthase (CBS +/−) mice given a methyl-deficient diet for 24 weeks,
showed that tissue-specific alterations in global DNA methylation levels of liver, kidney,
brain and testes occurred not due to decreased intracellular SAM concentrations of
these tissues alone, but due to increased intracellular SAH with or without combination
with decreased intracellular SAM [103]. Brain and testes showed most sensitivity to
alterations in SAH and DNA methylation, as compared with liver and kidney which can
be mainly due to low SAH hydrolase activity and lack of complete transsulfuration
pathway in these tissues [103]. Since for most methyl-group metabolites, plasma
concentrations showed poor reflection of intracellular concentrations [9], future
studies should measure intracellular Hcy, SAM and SAH concentrations and investigate
their effect on genome-wide DNA methylation. This could be the reason why we did
not find large differences of plasma homocysteine on genome-wide DNA methylation.
Hydroxymethylation
Hydroxymethylation is another kind of chemical modification which occurs from 5-
methylcytosine to form 5-hydroxymethylcytosine (5hmC) catalyzed by ten-eleven
translocation (TET) enzymes [104]. 5-hmC are known to play roles in gene expression,
mammalian development, transcriptional regulation and human diseases [105]. It
could be that the role of Hcy, B vitamin diet intake, other methyl-group metabolism
factors and smoking is specific to some 5-hydroxycytosines. Like other techniques that
are based on the bisulfite treatment, the Illumina 450k array is primarily incapable to

276 PART D: Discussion and summary
differentiate 5-methylcytosines from 5-hmC because both are resistant to bisulfite
treatment [106-108]. Moreover, due to the low abundance of 5hmC as compared to 5-
methylcytosines, it is technically more challenging to measure 5hmC [108]. Essentially,
5hmC can be measured by digestion- and antibody-based techniques [109] and LC/MS-
MS [110, 111] or by TET-assisted bisulfite treatment followed by 450k arrays or
sequencing.
Mendelian randomization
The relationship of Hcy, vitamin B12 and folate with DNA methylation can be subject to
substantial bias, given the strong relationship between several lifestyle factors,
diseases and methyl-group factors. To circumvent this bias, genetic factors determining
the methyl-group factors as an instrument can be used to study the relationship
between these factors and methylation by Mendelian Randomization (MR). This would
eliminate the effects that are possibly caused by measurement errors, confounding and
reverse causality. However, in Chapter 5 we performed a MR study of MTHFR 677C>T
or genetic risk score (GRS). If a formal MR-study is conducted, the used SNPs or so
called instruments need to satisfy 3 basic assumptions [112, 113]. One, the instrument
should be associated with our exposure, Hcy. Two, the instrument should not associate
with any confounder of the exposure-outcome association. Three, the instrument
should not affect our outcome, DNA methylation, except through Hcy. This condition is
also referred to as pleiotropy. Although all three assumptions are satisfied in the case
of the MTHFR 677C>T [114], the GRS model might violate assumption three [112, 113].
Recent research in MR studies have developed several methods that can be used in the
future to correct and estimate the correct causal estimates in case of pleiotropy [115-
117].
Furthermore, the relationship between Hcy and DNA methylation should be
known, before MR can be performed [118]. This relationship is only known in studies
until now where DNA methylation is measured at a global level. Therefore, for the
MTHFR 677C>T variant, we did not perform a complete MR because in Chapter 4 we
did not find large effects of Hcy on site-specific DNA methylation, and therefore, we
could not estimate the causal effect in this case. However, we performed a genetic
study which focused on the association of genetically defined elevated Hcy levels with
DNA methylation. The results were in line with the results described in Chapter 4,
where subtle changes in genome-wide DNA methylation was observed.
Furthermore, there could be application of the MR technique for other
exposures such as cigarette smoking, which has shown a larger effect on genome-wide
DNA methylation as described in Chapter 8. A recent study of 822 individuals has
already evaluated the previously found associations of cigarette smoking with 5 DMPs,
using the MR study [119]. Using the SNPs rs4074134 for current smoking and
rs9920506 for ever smoking as instruments, they found causal effect on

CHAPTER 9: General discussion 277
hypomethylation of two of the 5 DMPs of the F2RL3 and GPR15 genes. Future studies
can conduct similar studies on the much larger list of the cigarette smoking associated
DMPs that we identified in Chapter 8.

278 PART D: Discussion and summary
REFERENCES 1. Kang SS, Wong PW, Malinow MR. Hyperhomocyst(e)inemia as a risk factor for occlusive
vascular disease. Annu Rev Nutr 1992;12:279-98. 2. Ingrosso D, Cimmino A, Perna AF, Masella L, De Santo NG, De Bonis ML, et al. Folate
treatment and unbalanced methylation and changes of allelic expression induced by hyperhomocysteinaemia in patients with uraemia. Lancet 2003;361:1693-9.
3. Weiss N, Keller C, Hoffmann U, Loscalzo J. Endothelial dysfunction and atherothrombosis in mild hyperhomocysteinemia. Vasc Med 2002;7:227-39.
4. Melnyk S, Pogribna M, Pogribny IP, Yi P, James SJ. Measurement of plasma and intracellular S-adenosylmethionine and S-adenosylhomocysteine utilizing coulometric electrochemical detection: alterations with plasma homocysteine and pyridoxal 5'-phosphate concentrations. Clin Chem 2000;46:265-72.
5. Yi P, Melnyk S, Pogribna M, Pogribny IP, Hine RJ, James SJ. Increase in plasma homocysteine associated with parallel increases in plasma S-adenosylhomocysteine and lymphocyte DNA hypomethylation. J Biol Chem 2000;275:29318-23.
6. Castro R, Rivera I, Struys EA, Jansen EE, Ravasco P, Camilo ME, et al. Increased homocysteine and S-adenosylhomocysteine concentrations and DNA hypomethylation in vascular disease. Clin Chem 2003;49:1292-6.
7. Heil SG, Riksen NP, Boers GH, Smulders Y, Blom HJ. DNA methylation status is not impaired in treated cystathionine beta-synthase (CBS) deficient patients. Mol Genet Metab 2007;91:55-60.
8. Selley ML. A metabolic link between S-adenosylhomocysteine and polyunsaturated fatty acid metabolism in Alzheimer's disease. Neurobiol Aging 2007;28:1834-9.
9. Smith DE, Hornstra JM, Kok RM, Blom HJ, Smulders YM. Folic acid supplementation does not reduce intracellular homocysteine, and may disturb intracellular one-carbon metabolism. Clin Chem Lab Med 2013;51:1643-50.
10. Jung AY, Smulders Y, Verhoef P, Kok FJ, Blom H, Kok RM, et al. No effect of folic acid supplementation on global DNA methylation in men and women with moderately elevated homocysteine. PLoS One 2011;6:e24976.
11. Hughes CF, Ward M, Hoey L, McNulty H. Vitamin B12 and ageing: current issues and interaction with folate. Ann Clin Biochem 2013;50:315-29.
12. Institute of Medicine Standing Committee on the Scientific Evaluation of Dietary Reference I, its Panel on Folate OBV, Choline. 1998.
13. Green R, Allen LH, Bjorke-Monsen AL, Brito A, Gueant JL, Miller JW, et al. Vitamin B12 deficiency. Nat Rev Dis Primers 2017;3:17040.
14. Green R. Vitamin B12 deficiency from the perspective of a practicing hematologist. Blood 2017;129:2603-2611.
15. Gonseth S, Roy R, Houseman EA, de Smith AJ, Zhou M, Lee ST, et al. Periconceptional folate consumption is associated with neonatal DNA methylation modifications in neural crest regulatory and cancer development genes. Epigenetics 2015;10:1166-1176.
16. Joubert BR, den Dekker HT, Felix JF, Bohlin J, Ligthart S, Beckett E, et al. Maternal plasma folate impacts differential DNA methylation in an epigenome-wide meta-analysis of newborns. Nat Commun 2016;7:10577.
17. Waterland RA, Jirtle RL. Transposable elements: targets for early nutritional effects on epigenetic gene regulation. Mol Cell Biol 2003;23:5293-300.
18. Heijmans BT, Tobi EW, Stein AD, Putter H, Blauw GJ, Susser ES, et al. Persistent epigenetic differences associated with prenatal exposure to famine in humans. Proc Natl Acad Sci U S A 2008;105:17046-9.

CHAPTER 9: General discussion 279
19. Molloy AM, Kirke PN, Brody LC, Scott JM, Mills JL. Effects of folate and vitamin B12 deficiencies during pregnancy on fetal, infant, and child development. Food Nutr Bull 2008;29:S101-11; discussion S112-5.
20. McPartlin J, Halligan A, Scott JM, Darling M, Weir DG. Accelerated folate breakdown in pregnancy. Lancet 1993;341:148-9.
21. Higgins JR, Quinlivan EP, McPartlin J, Scott JM, Weir DG, Darling MR. The relationship between increased folate catabolism and the increased requirement for folate in pregnancy. Bjog 2000;107:1149-54.
22. Ronn T, Ling C. DNA methylation as a diagnostic and therapeutic target in the battle against Type 2 diabetes. Epigenomics 2015;7:451-60.
23. Bansal A, Pinney SE. DNA methylation and its role in the pathogenesis of diabetes. Pediatr Diabetes 2017;18:167-177.
24. Willer CJ, Bonnycastle LL, Conneely KN, Duren WL, Jackson AU, Scott LJ, et al. Screening of 134 single nucleotide polymorphisms (SNPs) previously associated with type 2 diabetes replicates association with 12 SNPs in nine genes. Diabetes 2007;56:256-64.
25. Peden JF, Farrall M. Thirty-five common variants for coronary artery disease: the fruits of much collaborative labour. Hum Mol Genet 2011;20:R198-205.
26. Adams JN, Raffield LM, Freedman BI, Langefeld CD, Ng MC, Carr JJ, et al. Analysis of common and coding variants with cardiovascular disease in the Diabetes Heart Study. Cardiovasc Diabetol 2014;13:77.
27. Fu Y, Dominissini D, Rechavi G, He C. Gene expression regulation mediated through reversible m(6)A RNA methylation. Nat Rev Genet 2014;15:293-306.
28. Batista PJ. The RNA Modification N6-methyladenosine and Its Implications in Human Disease. Genomics Proteomics Bioinformatics 2017;15:154-163.
29. Chandola U, Das R, Panda B. Role of the N6-methyladenosine RNA mark in gene regulation and its implications on development and disease. Brief Funct Genomics 2015;14:169-79.
30. Yang X, Yang Y, Sun BF, Chen YS, Xu JW, Lai WY, et al. 5-methylcytosine promotes mRNA export - NSUN2 as the methyltransferase and ALYREF as an m5C reader. Cell Res 2017;27:606-625.
31. Clarke S. Protein methylation. Curr Opin Cell Biol 1993;5:977-83. 32. Yang XD, Lamb A, Chen LF. Methylation, a new epigenetic mark for protein stability.
Epigenetics 2009;4:429-33. 33. Bedford MT, Richard S. Arginine methylation an emerging regulator of protein
function. Mol Cell 2005;18:263-72. 34. Esse R, Florindo C, Imbard A, Rocha MS, de Vriese AS, Smulders YM, et al. Global
protein and histone arginine methylation are affected in a tissue-specific manner in a rat model of diet-induced hyperhomocysteinemia. Biochim Biophys Acta 2013;1832:1708-14.
35. Esse R, Rocha MS, Barroso M, Florindo C, Teerlink T, Kok RM, et al. Protein arginine methylation is more prone to inhibition by S-adenosylhomocysteine than DNA methylation in vascular endothelial cells. PLoS One 2013;8:e55483.
36. Lokk K, Modhukur V, Rajashekar B, Martens K, Magi R, Kolde R, et al. DNA methylome profiling of human tissues identifies global and tissue-specific methylation patterns. Genome Biol 2014;15:r54.
37. Ghosh S, Yates AJ, Fruhwald MC, Miecznikowski JC, Plass C, Smiraglia D. Tissue specific DNA methylation of CpG islands in normal human adult somatic tissues distinguishes neural from non-neural tissues. Epigenetics 2010;5:527-38.
38. Rakyan VK, Down TA, Thorne NP, Flicek P, Kulesha E, Graf S, et al. An integrated resource for genome-wide identification and analysis of human tissue-specific differentially methylated regions (tDMRs). Genome Res 2008;18:1518-29.

280 PART D: Discussion and summary
39. Slieker RC, Bos SD, Goeman JJ, Bovee JV, Talens RP, van der Breggen R, et al. Identification and systematic annotation of tissue-specific differentially methylated regions using the Illumina 450k array. Epigenetics Chromatin 2013;6:26.
40. Devlin AM, Bottiglieri T, Domann FE, Lentz SR. Tissue-specific changes in H19 methylation and expression in mice with hyperhomocysteinemia. J Biol Chem 2005;280:25506-11.
41. Choumenkovitch SF, Selhub J, Bagley PJ, Maeda N, Nadeau MR, Smith DE, Choi SW. In the cystathionine beta-synthase knockout mouse, elevations in total plasma homocysteine increase tissue S-adenosylhomocysteine, but responses of S-adenosylmethionine and DNA methylation are tissue specific. J Nutr 2002;132:2157-60.
42. Glier MB, Ngai YF, Sulistyoningrum DC, Aleliunas RE, Bottiglieri T, Devlin AM. Tissue-specific relationship of S-adenosylhomocysteine with allele-specific H19/Igf2 methylation and imprinting in mice with hyperhomocysteinemia. Epigenetics 2013;8:44-53.
43. Zhou J, Sears RL, Xing X, Zhang B, Li D, Rockweiler NB, et al. Tissue-specific DNA methylation is conserved across human, mouse, and rat, and driven by primary sequence conservation. BMC Genomics 2017;18:724.
44. Lowe R, Gemma C, Beyan H, Hawa MI, Bazeos A, Leslie RD, et al. Buccals are likely to be a more informative surrogate tissue than blood for epigenome-wide association studies. Epigenetics 2013;8:445-54.
45. Varley KE, Gertz J, Bowling KM, Parker SL, Reddy TE, Pauli-Behn F, et al. Dynamic DNA methylation across diverse human cell lines and tissues. Genome Res 2013;23:555-67.
46. Lowe R, Slodkowicz G, Goldman N, Rakyan VK. The human blood DNA methylome displays a highly distinctive profile compared with other somatic tissues. Epigenetics 2015;10:274-81.
47. Jiang R, Jones MJ, Chen E, Neumann SM, Fraser HB, Miller GE, Kobor MS. Discordance of DNA methylation variance between two accessible human tissues. Sci Rep 2015;5:8257.
48. Walton E, Hass J, Liu J, Roffman JL, Bernardoni F, Roessner V, et al. Correspondence of DNA Methylation Between Blood and Brain Tissue and Its Application to Schizophrenia Research. Schizophr Bull 2016;42:406-14.
49. Hatchwell E, Greally JM. The potential role of epigenomic dysregulation in complex human disease. Trends Genet 2007;23:588-95.
50. Li Y, Zhu J, Tian G, Li N, Li Q, Ye M, et al. The DNA methylome of human peripheral blood mononuclear cells. PLoS Biol 2010;8:e1000533.
51. Michels KB, Binder AM, Dedeurwaerder S, Epstein CB, Greally JM, Gut I, et al. Recommendations for the design and analysis of epigenome-wide association studies. Nat Methods 2013;10:949-55.
52. Reinius LE, Acevedo N, Joerink M, Pershagen G, Dahlen SE, Greco D, et al. Differential DNA methylation in purified human blood cells: implications for cell lineage and studies on disease susceptibility. PLoS One 2012;7:e41361.
53. Jaffe AE, Irizarry RA. Accounting for cellular heterogeneity is critical in epigenome-wide association studies. Genome Biol 2014;15:R31.
54. Lam LL, Emberly E, Fraser HB, Neumann SM, Chen E, Miller GE, Kobor MS. Factors underlying variable DNA methylation in a human community cohort. Proc Natl Acad Sci U S A 2012;109 Suppl 2:17253-60.
55. Lowe R, Rakyan VK. Correcting for cell-type composition bias in epigenome-wide association studies. Genome Med 2014;6:23.
56. Houseman EA, Kim S, Kelsey KT, Wiencke JK. DNA Methylation in Whole Blood: Uses and Challenges. Curr Environ Health Rep 2015;2:145-54.

CHAPTER 9: General discussion 281
57. Liang L, Cookson WO. Grasping nettles: cellular heterogeneity and other confounders in epigenome-wide association studies. Hum Mol Genet 2014;23:R83-8.
58. Houseman EA, Accomando WP, Koestler DC, Christensen BC, Marsit CJ, Nelson HH, et al. DNA methylation arrays as surrogate measures of cell mixture distribution. BMC Bioinformatics 2012;13:86.
59. Jones MJ, Islam SA, Edgar RD, Kobor MS. Adjusting for Cell Type Composition in DNA Methylation Data Using a Regression-Based Approach. Methods Mol Biol 2017;1589:99-106.
60. Chen S, Wu P, Zhou L, Shen Y, Li Y, Song H. Relationship between increase of serum homocysteine caused by smoking and oxidative damage in elderly patients with cardiovascular disease. Int J Clin Exp Med 2015;8:4446-54.
61. Haj Mouhamed D, Ezzaher A, Neffati F, Douki W, Najjar MF. Effect of cigarette smoking on plasma homocysteine concentrations. Clin Chem Lab Med 2011;49:479-83.
62. Vardavas CI, Linardakis MK, Hatzis CM, Malliaraki N, Saris WH, Kafatos AG. Smoking status in relation to serum folate and dietary vitamin intake. Tob Induc Dis 2008;4:8.
63. e Silva Ade S, da Mota MP. Effects of physical activity and training programs on plasma homocysteine levels: a systematic review. Amino Acids 2014;46:1795-804.
64. Kim YN, Hwang JH, Cho YO. The effects of exercise training and acute exercise duration on plasma folate and vitamin B12. Nutr Res Pract 2016;10:161-6.
65. Urgert R, van Vliet T, Zock PL, Katan MB. Heavy coffee consumption and plasma homocysteine: a randomized controlled trial in healthy volunteers. Am J Clin Nutr 2000;72:1107-10.
66. Nygard O, Refsum H, Ueland PM, Stensvold I, Nordrehaug JE, Kvale G, Vollset SE. Coffee consumption and plasma total homocysteine: The Hordaland Homocysteine Study. Am J Clin Nutr 1997;65:136-43.
67. Ulvik A, Vollset SE, Hoff G, Ueland PM. Coffee consumption and circulating B-vitamins in healthy middle-aged men and women. Clin Chem 2008;54:1489-96.
68. Gibson A, Woodside JV, Young IS, Sharpe PC, Mercer C, Patterson CC, et al. Alcohol increases homocysteine and reduces B vitamin concentration in healthy male volunteers--a randomized, crossover intervention study. Qjm 2008;101:881-7.
69. Bleich S, Bleich K, Kropp S, Bittermann HJ, Degner D, Sperling W, et al. Moderate alcohol consumption in social drinkers raises plasma homocysteine levels: a contradiction to the 'French Paradox'? Alcohol Alcohol 2001;36:189-92.
70. Lee KW, Pausova Z. Cigarette smoking and DNA methylation. Front Genet 2013;4:132. 71. Huang J, Okuka M, Lu W, Tsibris JC, McLean MP, Keefe DL, Liu L. Telomere shortening
and DNA damage of embryonic stem cells induced by cigarette smoke. Reprod Toxicol 2013;35:89-95.
72. Mortusewicz O, Schermelleh L, Walter J, Cardoso MC, Leonhardt H. Recruitment of DNA methyltransferase I to DNA repair sites. Proc Natl Acad Sci U S A 2005;102:8905-9.
73. Cuozzo C, Porcellini A, Angrisano T, Morano A, Lee B, Di Pardo A, et al. DNA damage, homology-directed repair, and DNA methylation. PLoS Genet 2007;3:e110.
74. Lee EW, D'Alonzo GE. Cigarette smoking, nicotine addiction, and its pharmacologic treatment. Arch Intern Med 1993;153:34-48.
75. Shen JX, Yakel JL. Nicotinic acetylcholine receptor-mediated calcium signaling in the nervous system. Acta Pharmacol Sin 2009;30:673-80.
76. Satta R, Maloku E, Zhubi A, Pibiri F, Hajos M, Costa E, Guidotti A. Nicotine decreases DNA methyltransferase 1 expression and glutamic acid decarboxylase 67 promoter methylation in GABAergic interneurons. Proc Natl Acad Sci U S A 2008;105:16356-61.
77. Mercer BA, Wallace AM, Brinckerhoff CE, D'Armiento JM. Identification of a cigarette smoke-responsive region in the distal MMP-1 promoter. Am J Respir Cell Mol Biol 2009;40:4-12.

282 PART D: Discussion and summary
78. Di YP, Zhao J, Harper R. Cigarette smoke induces MUC5AC protein expression through the activation of Sp1. J Biol Chem 2012;287:27948-58.
79. Kadonaga JT, Carner KR, Masiarz FR, Tjian R. Isolation of cDNA encoding transcription factor Sp1 and functional analysis of the DNA binding domain. Cell 1987;51:1079-90.
80. Olson KR. Carbon monoxide poisoning: mechanisms, presentation, and controversies in management. J Emerg Med 1984;1:233-43.
81. Liu Q, Liu L, Zhao Y, Zhang J, Wang D, Chen J, et al. Hypoxia induces genomic DNA demethylation through the activation of HIF-1alpha and transcriptional upregulation of MAT2A in hepatoma cells. Mol Cancer Ther 2011;10:1113-23.
82. Levitzky YS, Guo CY, Rong J, Larson MG, Walter RE, Keaney JF, Jr., et al. Relation of smoking status to a panel of inflammatory markers: the framingham offspring. Atherosclerosis 2008;201:217-24.
83. Lee J, Taneja V, Vassallo R. Cigarette smoking and inflammation: cellular and molecular mechanisms. J Dent Res 2012;91:142-9.
84. Saetta M, Turato G, Facchini FM, Corbino L, Lucchini RE, Casoni G, et al. Inflammatory cells in the bronchial glands of smokers with chronic bronchitis. Am J Respir Crit Care Med 1997;156:1633-9.
85. van der Vaart H, Postma DS, Timens W, ten Hacken NH. Acute effects of cigarette smoke on inflammation and oxidative stress: a review. Thorax 2004;59:713-21.
86. Wahl A, Kasela S, Carnero-Montoro E, van Iterson M, Stambuk J, Sharma S, et al. IgG glycosylation and DNA methylation are interconnected with smoking. Biochim Biophys Acta 2018;1862:637-648.
87. Stirzaker C, Taberlay PC, Statham AL, Clark SJ. Mining cancer methylomes: prospects and challenges. Trends Genet 2014;30:75-84.
88. Bird A. DNA methylation patterns and epigenetic memory. Genes Dev 2002;16:6-21. 89. Consortium EP. An integrated encyclopedia of DNA elements in the human genome.
Nature 2012;489:57-74. 90. Siggens L, Ekwall K. Epigenetics, chromatin and genome organization: recent advances
from the ENCODE project. J Intern Med 2014;276:201-14. 91. Lizio M, Harshbarger J, Shimoji H, Severin J, Kasukawa T, Sahin S, et al. Gateways to the
FANTOM5 promoter level mammalian expression atlas. Genome Biol 2015;16:22. 92. Moran S, Arribas C, Esteller M. Validation of a DNA methylation microarray for 850,000
CpG sites of the human genome enriched in enhancer sequences. Epigenomics 2016;8:389-99.
93. Dedeurwaerder S, Defrance M, Calonne E, Denis H, Sotiriou C, Fuks F. Evaluation of the Infinium Methylation 450K technology. Epigenomics 2011;3:771-84.
94. Touleimat N, Tost J. Complete pipeline for Infinium((R)) Human Methylation 450K BeadChip data processing using subset quantile normalization for accurate DNA methylation estimation. Epigenomics 2012;4:325-41.
95. Pidsley R, CC YW, Volta M, Lunnon K, Mill J, Schalkwyk LC. A data-driven approach to preprocessing Illumina 450K methylation array data. BMC Genomics 2013;14:293.
96. Lehne B, Drong AW, Loh M, Zhang W, Scott WR, Tan ST, et al. A coherent approach for analysis of the Illumina HumanMethylation450 BeadChip improves data quality and performance in epigenome-wide association studies. Genome Biol 2015;16:37.
97. Kechris KJ, Biehs B, Kornberg TB. Generalizing moving averages for tiling arrays using combined p-value statistics. Stat Appl Genet Mol Biol 2010;9:Article29.
98. Pedersen BS, Schwartz DA, Yang IV, Kechris KJ. Comb-p: software for combining, analyzing, grouping and correcting spatially correlated P-values. Bioinformatics 2012;28:2986-8.
99. Mikeska T, Bock C, Do H, Dobrovic A. DNA methylation biomarkers in cancer: progress towards clinical implementation. Expert Rev Mol Diagn 2012;12:473-87.

CHAPTER 9: General discussion 283
100. Leygo C, Williams M, Jin HC, Chan MWY, Chu WK, Grusch M, Cheng YY. DNA Methylation as a Noninvasive Epigenetic Biomarker for the Detection of Cancer. Dis Markers 2017;2017:3726595.
101. Hao X, Huang Y, Qiu M, Yin C, Ren H, Gan H, et al. Immunoassay of S-adenosylmethionine and S-adenosylhomocysteine: the methylation index as a biomarker for disease and health status. BMC Res Notes 2016;9:498.
102. Ma B, Wilker EH, Willis-Owen SA, Byun HM, Wong KC, Motta V, et al. Predicting DNA methylation level across human tissues. Nucleic Acids Res 2014;42:3515-28.
103. Caudill MA, Wang JC, Melnyk S, Pogribny IP, Jernigan S, Collins MD, et al. Intracellular S-adenosylhomocysteine concentrations predict global DNA hypomethylation in tissues of methyl-deficient cystathionine beta-synthase heterozygous mice. J Nutr 2001;131:2811-8.
104. Tahiliani M, Koh KP, Shen Y, Pastor WA, Bandukwala H, Brudno Y, et al. Conversion of 5-methylcytosine to 5-hydroxymethylcytosine in mammalian DNA by MLL partner TET1. Science 2009;324:930-5.
105. Richa R, Sinha RP. Hydroxymethylation of DNA: an epigenetic marker. Excli J 2014;13:592-610.
106. Jin SG, Kadam S, Pfeifer GP. Examination of the specificity of DNA methylation profiling techniques towards 5-methylcytosine and 5-hydroxymethylcytosine. Nucleic Acids Res 2010;38:e125.
107. Nestor C, Ruzov A, Meehan R, Dunican D. Enzymatic approaches and bisulfite sequencing cannot distinguish between 5-methylcytosine and 5-hydroxymethylcytosine in DNA. Biotechniques 2010;48:317-9.
108. Yong WS, Hsu FM, Chen PY. Profiling genome-wide DNA methylation. Epigenetics Chromatin 2016;9:26.
109. Kurdyukov S, Bullock M. DNA Methylation Analysis: Choosing the Right Method. Biology (Basel) 2016;5.
110. Song L, James SR, Kazim L, Karpf AR. Specific method for the determination of genomic DNA methylation by liquid chromatography-electrospray ionization tandem mass spectrometry. Anal Chem 2005;77:504-10.
111. Le T, Kim KP, Fan G, Faull KF. A sensitive mass spectrometry method for simultaneous quantification of DNA methylation and hydroxymethylation levels in biological samples. Anal Biochem 2011;412:203-9.
112. Swanson SA, Hernan MA. Commentary: how to report instrumental variable analyses (suggestions welcome). Epidemiology 2013;24:370-4.
113. Martens EP, Pestman WR, de Boer A, Belitser SV, Klungel OH. Instrumental variables: application and limitations. Epidemiology 2006;17:260-7.
114. van Meurs JB, Pare G, Schwartz SM, Hazra A, Tanaka T, Vermeulen SH, et al. Common genetic loci influencing plasma homocysteine concentrations and their effect on risk of coronary artery disease. Am J Clin Nutr 2013;98:668-76.
115. Hartwig FP, Davey Smith G, Bowden J. Robust inference in summary data Mendelian randomization via the zero modal pleiotropy assumption. Int J Epidemiol 2017;46:1985-1998.
116. van Kippersluis H, Rietveld CA. Pleiotropy-robust Mendelian randomization. Int J Epidemiol 2017.
117. Schmidt AF, Dudbridge F. Mendelian randomization with Egger pleiotropy correction and weakly informative Bayesian priors. Int J Epidemiol 2017.
118. Dekkers KF, van Iterson M, Slieker RC, Moed MH, Bonder MJ, van Galen M, et al. Blood lipids influence DNA methylation in circulating cells. Genome Biol 2016;17:138.
119. Jhun MA, Smith JA, Ware EB, Kardia SLR, Mosley TH, Jr., Turner ST, et al. Modeling the Causal Role of DNA Methylation in the Association Between Cigarette Smoking and

284 PART D: Discussion and summary
Inflammation in African Americans: A 2-Step Epigenetic Mendelian Randomization Study. Am J Epidemiol 2017;186:1149-1158.

CHAPTER 10: Summary 285
CHAPTER 10: SUMMARY
Homocysteine and DNA methylation
Homocysteine (Hcy) is a key metabolite of the methyl-group metabolism, elevated
levels of which in a medical condition called hyperhomocysteinemia (HHcy) are
associated with several disorders such as cardiovascular diseases and osteoporotic
fractures. Being a byproduct of the methyltransferase reaction, Hcy’s role in alteration
of DNA methylation levels is thought as one of the underlying mechanisms of Hcy-
associated disorders. Several studies have investigated the association between Hcy
and DNA methylation in both animal models and human subjects. We reviewed this
literature in Chapter 2 and found that in animal models, both diet- and genetically-
induced elevated Hcy showed alteration in DNA methylation indicating Hcy as a
keyplayer. However in human subjects, elevated Hcy did not show consistent
alterations in DNA methylation. These contradictory findings in humans might be
explained by the differences in tissue types, small sample sizes, pathophysiological
effects of the underlying disease, genetic differences between humans, limited studies
and the fact that DNA methylation was measured on a global scale.
To follow up on our understanding of this review, we conducted a
epigenome-wide association study (EWAS) of Hcy in Chapter 4 to investigate the
association between plasma Hcy and DNA methylation in leukocytes of 700 individuals
of the RS. We increased our sample size up to 2,035 individuals by collaborating with
other cohorts and conducted a meta-analysis of the individual EWAS results per cohort.
We found that plasma Hcy was associated with subtle changes in DNA methylation,
wherein we identified some novel epigenetic loci; three differentially methylated sites
(DMPs) and 68 differentially methylated regions (DMRs) associated with Hcy.
Given the strong relationship between several lifestyle factors, diseases and
Hcy, the relationship between Hcy and DNA methylation can be subject to substantial
bias possibly caused by measurement errors, confounding and reverse causality.
Therefore we eliminated these effects in Chapter 5 by using genetically defined
elevated Hcy, i.e. the most consistent MTHFR 677C>T variant and the combined
weighted genetic risk score (GRS) of 18 previously studied Hcy-associated variants, to
test whether genetically defined elevated Hcy levels are associated with DNA
methylation changes in leukocytes of 9,894 individuals from 12 cohorts. Except for the
cis-DMPs (< 1Mb upstream or downstream of the SNP), we did not observe widespread
changes in DNA methylation; mainly one trans-DMPs (< 1Mb upstream or downstream
of the SNP) associated with the MTHFR 677C>T variant and five trans-CpGs associated
with the GRS.
Lastly in Chapter 6, we conducted an interaction study of plasma Hcy and
MTHFR 677C>T variant to investigate their combined effect on genome-wide DNA
methylation in leukocytes of 1280 individuals from 2 cohorts. We identified 13 DMPs

286 PART D: Discussion and summary
associated with [Hcy x MTHFR 677C>T]. This included four cis-DMPs at the AGTRAP-
MTHFR-NPPA/B gene cluster on chromosome 1, which were also found in Chapter 5,
indicating that this association was driven by the MTHFR 677C>T variant. We did not
see overlaps of any other DMPs between our analysis of plasma Hcy, MTHFR
677C>T/GRS and [Hcy x MTHFR 677C>T] in Chapter 4, 5 and 6, respectively.
Nutrition, Lifestyle and DNA methylation
The metabolites and co-enzymes that participate in the methyl-group metabolism are
methionine, choline, betaine and B-vitamins, namely folate, vitamin B2, B6 and B12.
Folate and vitamin B12 are widely studied co-enzymes and are essential micronutrients
involved in the donation of methyl groups in cellular metabolism, deficiencies of which
could impair the remethylation pathway and lead to elevated Hcy. Therefore, general
nutrition intake including the status of these vitamins could play a vital role in DNA
methylation. We conducted a systematic review in Chapter 3 to study the relation
between micro- and macro- nutrients and DNA methylation in disease-free individuals
across the life course. Micronutrients included B-vitamins, where in most studies, we
found that folate but not vitamin B12 was associated with DNA methylation. However,
the directions of these associations were inconsistent across studies. This was
attributed to differences across life course and nutrient and methylation tissue type.
To study the effect of the nutritional folate and vitamin B12 intake on a large
epigenome-wide scale, we conducted meta-analyses in leukocytes of 5,841 participants
from EWASs of 10 cohorts in Chapter 7, where we identified some novel epigenetic
loci; mainly 6 novel DMPs and 74 DMRs significantly associated with dietary folate
intake, and 29 DMRs significantly associated with dietary vitamin B12 intake. Although
both dietary intake and cellular levels of folate are important determinants of plasma
Hcy, we did not see overlaps of the six folate intake-associated DMPs with our analysis
of plasma Hcy, MTHFR 677C>T/GRS and [Hcy x MTHFR 677C>T] in Chapter 4, 5 and 6,
respectively.
In addition to the one carbon metabolism and nutritional factors, smoking is a
crucial lifestyle factor for disorders such as respiratory diseases, cardiovascular
diseases, cancer and reproductive outcomes has been previously associated with
epigenome-wide DNA methylation. However, large-scale meta-analysis studies with
increased sample sizes have not been conducted yet. In Chapter 8, we focused on
association between cigarette smoking as a lifestyle factor and DNA methylation in
leukocytes, assessed in 15,907 individuals (2,433 current, 6,518 former, and 6,956
never smokers) from EWASs of 16 cohorts. We identified 2,623 DMPs at bonferroni
threshold P<1×10⁻⁷ (18,760 DMPs at false discovery rate (FDR) <0.05) when comparing
current versus never smokers, and 185 DMPs at bonferroni threshold P<1×10⁻⁷ (2,623
DMPs at FDR <0.05) when comparing former versus never smokers, indicating a
pattern of persistently altered methylation, with attenuation, after smoking cessation.

CHAPTER 10: Summary 287
HOOFDSTUK 10: SAMENVATTING
Homocysteïne en DNA-methylatie
Homocysteïne (Hcy) is een belangrijke metaboliet in het metabolisme van
methylgroepen. Verhoogde concentraties van homocysteïne in het bloed, in medische
terminologie hyperhomocysteïnemie (HHcy) genoemd, zijn geassocieerd met
verschillende stoornissen zoals hart- en vaatziekten en osteoporotische fracturen.
Omdat Hcy een bijproduct is van de DNA-methyltransferasereactie, wordt een
verandering in DNA-methylering beschouwd als één van de mogelijke pathologische
mechanismen bij Hcy-geassocieerde aandoeningen. Verschillende studies hebben de
associatie tussen Hcy en DNA-methylering bij zowel diermodellen als bij mensen
onderzocht. Wij hebben deze literatuur in Hoofdstuk 2 samengevat en daarin
aanwijzingen gevonden dat in diermodellen zowel dieet- als genetisch geïnduceerde
HHcy veranderingen in DNA-methylering tot gevolg hebben die aan Hcy worden
toegeschreven. Bij de mens vertoonde verhoogd Hcy echter geen consistente
veranderingen in DNA-methylering. Deze tegenstrijdige bevindingen kunnen worden
verklaard door verschillen in onderzochte weefseltypes, steekproefgroottes,
pathofysiologische effecten van de onderliggende ziekte, genetische verschillen tussen
mensen, opzet van de studies en het feit dat meestal globale DNA-methylering werd
gemeten.
In aansluiting op dit overzicht van de literatuur hebben wij in Hoofdstuk 4 een
epigenoom-brede associatiestudie (EWAS) van Hcy uitgevoerd om de associatie tussen
plasma Hcy en DNA-methylering in leukocyten van 700 individuen van de Rotterdam
Studie (RS) te onderzoeken. Wij hebben onze steekproefomvang verder verhoogd tot
2.035 personen door samen te werken met andere cohorten en hebben een meta-
analyse uitgevoerd van de individuele EWAS-resultaten per cohort. Wij vonden dat
plasma-Hcy geassocieerd was met subtiele veranderingen in DNA-methylering, waarbij
een aantal nieuwe epigenetische loci werd geïdentificeerd: drie differentieel
gemethyleerde posities (DMPs) en 68 differentieel gemethyleerde regio's (DMRs)
geassocieerd met Hcy.
Gezien de sterke relatie tussen verschillende leefstijlfactoren, ziekten en Hcy,
kan de relatie tussen Hcy en DNA-methylering onderworpen zijn aan substantiële bias,
veroorzaakt door meetfouten, verstorende factoren of omgekeerde causaliteit. In
Hoofdstuk 5 hebben wij getracht deze factoren te elimineren door gebruik te maken
van genetisch vastgelegde HHcy, dwz van de meest consistente MTHFR 677C>T variant
en de gecombineerde gewogen genetische risicoscore (GRS) van 18 eerder
bestudeerde Hcy-geassocieerde varianten, om te testen of deze genetisch
gedefinieerde verhoogde Hcy niveaus zijn geassocieerd met DNA-
methyleringsveranderingen in de leukocyten van 9.894 individuen uit 12 cohorten. Met
uitzondering van cis-DMP's (<1Mb stroomopwaarts of stroomafwaarts van de SNP),

288 PART D: Discussion and summary
hebben wij geen wijdverspreide veranderingen in DNA-methylering waargenomen;
wel één trans-DMP's (<1Mb stroomopwaarts of stroomafwaarts van de SNP)
geassocieerd met de MTHFR 677C>T variant en vijf trans-CpG's geassocieerd met de
GRS.
Ten slotte hebben we in Hoofdstuk 6 een interactiestudie uitgevoerd van
plasma Hcy en de MTHFR 677C>T variant om hun gecombineerde effect op genoom-
brede DNA-methylering in leukocyten van 1280 individuen uit 2 cohorten te
onderzoeken. Wij identificeerden 13 DMP's geassocieerd met [Hcy x MTHFR 677C>T].
Dit omvatte vier cis-DMP's in het AGTRAP-MTHFR-NPPA/B gencluster op chromosoom
1, die ook werden gevonden in hoofdstuk 5, en dit geeft aan dat deze associatie wordt
aangedreven door de MTHFR 677C>T variant. We hebben geen overlappingen van
andere DMP's gezien tussen onze analyses van plasma Hcy, MTHFR 677C>T/GRS en
[Hcy x MTHFR 677C>T] in respectievelijk de hoofdstukken 4, 5 en 6.
Voeding, levensstijl en DNA-methylatie
De metabolieten en co-enzymen die deelnemen aan het methyl-groep-metabolisme
zijn methionine, choline, betaïne en de B-vitamines folaat, vitamine B2, B6 en B12.
Folaat en vitamine B12 zijn veel bestudeerde micronutriënten die in het
celmetabolisme als coenzym betrokken zijn bij de overdracht van methylgroepen , en
waarvan tekorten de remethylatie-route kunnen verstoren en zo leiden tot verhoogd
Hcy. Daarom zou algemene voedingsinname inclusief de status van deze vitaminen,
een vitale rol kunnen spelen bij DNA-methylering. Wij hebben in Hoofdstuk 3 een
systematische review uitgevoerd om de relatie tussen micro- en macronutriënten en
DNA-methylering in ziektevrije individuen gedurende de levensloop te bestuderen. B-
vitaminen zijn micronutriënten, waarvan we in de meeste onderzoeken vonden dat
folaat wel maar vitamine B12 niet geassocieerd was met DNA-methylering. De richting
van deze associaties was in verschillende studies echter niet consistent. Dit werd
toegeschreven aan verschillen in levensloop, type voeding en het type weefsel
onderzocht op methylering.
Om het effect van de folaat en vitamine B12 inname uit voeding op een grote,
epigenoom-brede schaal te bestuderen, hebben we in Hoofdstuk 7 een meta-analyses
uitgevoerd in leukocyten van 5.841 deelnemers van EWASs van 10 cohorten , en daarin
enkele nieuwe epigenetische loci geïdentificeerd: zes nieuwe DMP's en 74 DMR's die
significant geassocieerd zijn met foliumzuurinname via het dieet en 29 DMR's die
significant geassocieerd zijn met de inname van vitamine B12. Hoewel zowel de
inname via de voeding als de cellulaire niveaus van folaat belangrijke determinanten
zijn van plasma Hcy, hebben we geen overlappingen gezien van de zes
foliumzuurinname-geassocieerde DMP's met onze analyses van plasma Hcy, MTHFR
677C>T/GRS en [Hcy x MTHFR 677C>T] in de hoofdstukken 4, 5 en 6.

CHAPTER 10: Summary 289
Naast het methylgroep-metabolisme en voedingsfactoren, is roken een
cruciale leefstijlfactor die wordt gerelateerd aan aandoeningen van de luchtwegen,
hart- en vaatziekten, kanker en zwangerschap én eerder is geassocieerd met
veranderingen in epigenoom-brede DNA-methylering. Er zijn echter nog geen
resultaten van grootschalige meta-analyseonderzoeken met toegenomen
steekproefgroottes bekend. In Hoofdstuk 8 hebben we ons gericht op de associatie
tussen het roken van sigaretten als leefstijlfactor en DNA-methylering in leukocyten,
door middel van EWASs bij 15.907 personen uit 16 cohorten (2.433 actieve, 6.518
voormalige en 6.956 nooit-rokers). Wij identificeerden 2.623 DMP's bij Bonferroni-
drempel P <1 × 10⁻⁷ (18.760 DMP's bij fout-positieven ratio (FDR) <0,05) bij vergelijking
van actieve versus nooit-rokers, en 185 DMP's bij Bonferroni-drempelwaarde P <1 x 10-
7 (2.623 DMP's bij FDR <0,05) bij vergelijking van voormalige versus nooit-rokers,
hetgeen wijst op een patroon van aanhoudend veranderde maar wel verzwakkende
methylering na stoppen met roken.

290 PART E: Appendices

List of publications 291
PART E
Appendices

292 PART E: Appendices

List of publications 293
LIST OF PUBLICATIONS
IN THIS THESIS
1. Mandaviya PR, Stolk L, Heil SG. Homocysteine and DNA methylation: a review of
animal and human literature. Mol Genet Metab 2014;113:243-52.
2. Mandaviya PR*, Aïssi D*, Dekkers KF*, Joehanes R*, Kasela S*, Truong V*, Stolk L,
Heemst DV, Ikram MA, Lindemans J, Slagboom PE, Trégouët DA, Uitterlinden AG,
Wei C, Wells P, Gagnon F#, van Greevenbroek MM#, Heijmans BT#, Milani L#,
Morange PE#, van Meurs JB#, Heil SG#; BIOS Consortium. Homocysteine levels
associate with subtle changes in leukocyte DNA methylation: an epigenome-wide
analysis. Epigenomics 2017;9:1403-1422.
3. Mandaviya PR*, Joehanes R*, Aïssi D*, Kühnel B*, Marioni RE*, Truong V*, Stolk L,
Beekman M, Bonder MJ, Franke L, Gieger C, Huan T, Ikram MA, Kunze S, Liang L,
Lindemans J, Liu C, McRae AF, Mendelson MM, Müller-Nurasyid M, Peters A,
Slagboom PE, Starr JM, Trégouët DA, Uitterlinden AG, van Greevenbroek MMJ, van
Heemst D, van Iterson M, Wells PS, Yao C, Deary IJ#, Gagnon F#, Heijmans BT#, Levy
D#, Morange PE#, Waldenberger M#, Heil SG#, van Meurs JBJ#; CHARGE Consortium
Epigenetics group and BIOS Consortium. Genetically defined elevated
homocysteine levels do not result in widespread changes of DNA methylation in
leukocytes. PLoS One 2017;12:e0182472.
4. Joehanes R*, Just AC*, Marioni RE*, Pilling LC*, Reynolds LM*, Mandaviya PR*,
Guan W*, Xu T*, Elks CE*, Aslibekyan S*, Moreno-Macias H*, Smith JA*, Brody
JA*, Dhingra R*, Yousefi P, Pankow JS, Kunze S, Shah SH, McRae AF, Lohman K, Sha
J, Absher DM, Ferrucci L, Zhao W, Demerath EW, Bressler J, Grove ML, Huan T, Liu
C, Mendelson MM, Yao C, Kiel DP, Peters A, Wang-Sattler R, Visscher PM, Wray
NR, Starr JM, Ding J, Rodriguez CJ, Wareham NJ, Irvin MR, Zhi D, Barrdahl M, Vineis
P, Ambatipudi S, Uitterlinden AG, Hofman A, Schwartz J, Colicino E, Hou L, Vokonas
PS, Hernandez DG, Singleton AB, Bandinelli S, Turner ST, Ware EB, Smith AK,
Klengel T, Binder EB, Psaty BM, Taylor KD, Gharib SA, Swenson BR, Liang L, DeMeo
DL, O'Connor GT, Herceg Z, Ressler KJ, Conneely KN#, Sotoodehnia N#, Kardia SL#,
Melzer D#, Baccarelli AA#, van Meurs JB#, Romieu I#, Arnett DK#, Ong KK#, Liu Y#,
Waldenberger M#, Deary IJ#, Fornage M#, Levy D#, London SJ#. Epigenetic
Signatures of Cigarette Smoking. Circ Cardiovasc Genet 2016;9:436-447.
5. Nash AJ*, Mandaviya PR*, Dib M, Uitterlinden AG, van Meurs JBJ, Heil SG#, Andrew
T# and Ahmadi KR#. Interaction between plasma homocysteine and the MTHFR
c.677C>T polymorphism is associated with site-specific changes in DNA
methylation in humans. Submitted for publication.
6. Mandaviya PR*, Joehanes R*, Brody J*, Castillo-Fernandez JE*, Dekkers KF*, Do
AN*, Graff M*, Hänninen IK*, Tanaka T*, de Jonge EAL, Kiefte-de Jong JC, Absher
DM, Aslibekyan S, de Rijke YB, Fornage M, Hernandez DG, Hurme MA, Ikram MA,

294 PART E: Appendices
Jacques PF, Justice AE, Kiel DP, Lemaitre RN, Mendelson MM, Mikkilä V, Moore AZ,
Pallister T, Raitakari OT, Schalkwijk CG, Sha J, Slagboom EPE, Smith CE, Stehouwer
CDA, Tsai P, Uitterlinden AG, van der Kallen CJH, van Heemst DD, BIOS Consortium,
CHARGE Consortium Epigenetics group, CHARGE Consortium Nutrition group,
Arnett DK#, Bandinelli S#, Bell JT#, Heijmans BBT#, Lehtimäki T#, Levy D#, North KE#,
Sotoodehnia N#, van Greevenbroek MMJ#, van Meurs JBJ#, Heil SG#. Association of
dietary folate and vitamin B12 intake with genome-wide DNA methylation; a large
scale epigenome-wide association analysis in 5,841 individuals. Submitted for
publication.
7. Braun KVE*, Mandaviya PR*, Franco OH, Nano J, Girschik C, Bramer WM, Muka T,
Troup J, van Meurs JBJ, Heil SG, Voortman T. Nutrients and DNA methylation
across the life course: a systematic review. To be submitted.
OTHER PUBLICATIONS
8. Karlsson Linnér R*, Marioni RE*, Rietveld CA*, Simpkin AJ, Davies NM, Watanabe
K, Armstrong NJ, Auro K, Baumbach C, Bonder MJ, Buchwald J, Fiorito G, Ismail K,
Iurato S, Joensuu A, Karell P, Kasela S, Lahti J, McRae AF, Mandaviya PR, Seppälä I,
Wang Y, Baglietto L, Binder EB, Harris SE, Hodge AM, Horvath S, Hurme M,
Johannesson M, Latvala A, Mather KA, Medland SE, Metspalu A, Milani L, Milne RL,
Pattie A, Pedersen NL, Peters A, Polidoro S, Räikkönen K, Severi G, Starr JM, Stolk
L, Waldenberger M; BIOS Consortium, Eriksson JG, Esko T, Franke L, Gieger C, Giles
GG, Hägg S, Jousilahti P, Kaprio J, Kähönen M, Lehtimäki T, Martin NG, van Meurs
JBC, Ollikainen M, Perola M, Posthuma D, Raitakari OT, Sachdev PS, Taskesen E,
Uitterlinden AG, Vineis P, Wijmenga C, Wright MJ, Relton C, Davey Smith G, Deary
IJ#, Koellinger PD#, Benjamin DJ#. An epigenome-wide association study meta-
analysis of educational attainment. Mol Psychiatry. 2017 Dec;22(12):1680-1690.
9. Den Dekker HT, Burrows K, Felix JF, Salas LA, Nedeljkovic I, Yao J, Rifas-Shiman SL,
Ruiz-Arenas C, DeMeo DL, Henderson AJ, Howe CG, Hivert M, Ikram MA, de
Jongste JC, Lahousse L, Mandaviya PR, van Meurs JB, Pinart M, Stolk L, Sunyer J,
Uitterlinden AG, Anto JM, Litonjua AA, Breton CV, Brusselle GG, Bustamante M,
Davey Smith G, Relton CL, Jaddoe VWV, Duijts L. Newborn DNA-methylation,
childhood lung function, and the risk of asthma and COPD across the life course.
Submitted for publication.
10. Peters FS, Peeters AMA, Mandaviya PR, van Meurs JBJ, Hofland LJ, van de
Wetering J, Betjes MGH, Baan CC, Boer K. Differentially methylated regions in T
cells identify kidney transplant patients at risk for de novo skin cancer. Submitted
for publication.
11. Lin H, Lunetta KL, Zhao Q, Mandaviya PR, Rong J, Benjamin EJ, Joehanes R, Levy D,
van Meurs JBJ, Larson MG, Murabito JM. Whole Blood Gene Expression Associated
with Clinical Biological Age. Submitted for publication.

List of publications 295
12. Luijk R, Wu H, Ward-Caviness C, Hannon E, Carnero-Montoro E, Min J, Mandaviya
PR, Mei H, van der Maarel S, Jansen R, Relton C, Mill J, Waldenberger M, Bell J,
Franke L, ‘t Hoen PAC, Boomsma DI, van Duin CM, van Greevenbroek MMJ,
Veldink JH, Wijmenga C, van Meurs JBJ19, Daxinger L, Slagboom PE, van Zwet EW,
Heijmans BT. Autosomal genetic loci are associated with variable X-chromosome
inactivation. Submitted for publication.
13. Ince-Askan H, Mandaviya PR, Felix JF, van Meurs JBJ, Hazes JMW, Dolhain RJEM.
Altered DNA methylation in children born to mothers with rheumatoid arthritis
during pregnancy. To be submitted.
14. Mandaviya PR, van Rooij J, Stutvoet MD, Felix JF, van Dongen J, Janssen R, Franke
L, ’t Hoen PAC, Claringbould AJ, Heijmans BT, van Meurs JBJ. Creating standardized
association catalogs between the functional genome (epigenetics/RNA-expression)
and BBMRI phenotypes: comparison of data analysis methodologies. In
preparation.
15. Parmar P, Lowry E, Cugliari G, Suderman M, Wilson R, Wielscher M, Karhunen V,
Teumer A, Lehne B, Milani L, de Klein N, Mishra PP, Melton PE, Mandaviya PR,
Kasela S, Muka T, Zhang Y, Uitterlinden AG, Peters A, Geiger C, Anderson D,
Boomsma DI, Grabeb HJ, Veldink JH, van Meurs JBJ, van den Berg L, Beilen L,
Franke L, van Greevenbroek MMJ, Nauck M, Kahonen M, Hurme MA, Raitakari OT,
Franco OH, Slagboom PE, van der Harst P, Kunze S, Felix SB, Zhang T, Chen W, Mori
T, Heijmans BT, Nano J, Chambers JC, Fischer K, Huang R, Waldenberger M,
Lehtimäki T, Rathmann W, Relton CL, Matullo G, Brenner H, Verweij N, Li S,
Jarvelin M, Sebert S. A meta-analysis of maternal smoking GFI1-CpGs and cardio-
metabolic phenotypes in adults. In preparation.
16. Wielscher M, Lehne B, Dehghan A, Mandaviya PR, van Meurs JBJ, Heijmans BT,
BIOS Consortium, Boomsma DI, Slagboom PE, van Greevenbroek MMJ, Veldink JH,
van den Berg L, Chambers J, Jarvelin MR, et al. Meta-analysis of genome-wide DNA
methylation and serum CRP levels. In preparation.
17. The GoDMC consortium. 250,000 independent genetic influences on DNA
methylation and the consequences of these perturbations: the GoDMC
Consortium. In preparation.
*These authors contributed equally as first authors #These authors contributed equally as last authors

296 PART E: Appendices

List of publications 297
PHD PORTFOLIO
Name: Pooja Rajendra Mandaviya
Erasmus MC Department: Internal Medicine
Clinical Chemistry
Research school: NIHES & MolMed
PhD period: August 2012 – May 2018
Promoters: Prof. Dr. André G. Uitterlinden,
Prof. Dr. Jan Lindemans
Supervisors: Dr. Joyce B.J. van Meurs
Dr. Sandra G. Heil
COURSES Month, Year (Duration)
Duration Workload (ECTS)
Research management Oct 23 - Nov 13, 2014
2 days 1.0 ECTS
Biomedical English writing Sep 9 - Oct 21, 2014
3 days 2.0 ECTS
Integrity in research Jul 15, 2014
1 day 0.3 ECTS
Biostatistical methods: Basic principles (CC02) Sep 23 - Oct 18, 2013
4 days 5.7 ECTS
Presenting Skills Apr 29 - Jun 7, 2013
3 days 1.0 ECTS
Introduction Course on SPSS Feb 19 - 21, 2013
3 days 0.8 ECTS
SNP Course Nov 19 - 23, 2012
1 week 2.0 ECTS
12.8 ECTS
CONGRESSES Month, Year (Duration)
Presentation Workload (Hours)
Cohorts for Heart and Aging Research in Genomic Epidemiology (CHARGE) Investigator Meeting, Rotterdam, Netherlands
April 18-19, 2018
Oral & Poster
16 hours
Cohorts for Heart and Aging Research in Genomic Epidemiology (CHARGE) Investigator Meeting, Boston, United States
September 27-28, 2017
Poster 16 hours
DUSRA (Dutch Society for Research on Aging), Leiden, Netherlands
May 19, 2017
Poster 8 hours
Cohorts for Heart and Aging Research in Genomic Epidemiology (CHARGE) Investigator Meeting, Charlottesville, United States
September 27-29, 2016
Poster 24 hours
Biobank-based Integrative Omics Studies (BIOS) Symposium, Amsterdam, Netherlands
September 21, 2016
No 8 hours
4th
International Vitamin Conference, Copenhagen, Denmark
May 25-27, 2016
Oral 24 hours
10th
International Conference On One Carbon Metabolism, Vitamins B and Homocysteine, Nancy, France
July 7-11, 2015
Oral & Poster
40 hours

298 PART E: Appendices
19th Molecular Medicine Day (MolMed), Rotterdam, Netherlands
March 19, 2015
Poster 8 hours
Science days 2015, Antwerpen, Belgium
January 8-9, 2015
Poster 16 hours
Dutch Society for Human Genetics (NVHG), Arnhem, Netherlands
October 2-3, 2014
Poster 16 hours
18th
Molecular Medicine Day (MolMed), Rotterdam, Netherlands
February 20, 2014
Poster 8 hours
9th International Conference On Homocysteine and One-Carbon Metabolism, Dublin, Ireland
September 8-12, 2013
Poster 40 hours
2nd Annual Infinium Human Methylation 450k Array Workshop, London, United Kingdom
April 15, 2013
Poster 8 hours
17th
Molecular Medicine Day (MolMed), Rotterdam, Netherlands
February 13, 2013
No 8 hours
Netherlands Consortium for Healthy Ageing (NCHA), The Hague, Netherlands
February 7-8, 2013
No 16 hours
240 hours
OTHER RESEARCH/TEACHING ACTIVITIES Year Workload (Hours/Months)
Conducted quality control and pre-processing of:
o The Rotterdam Study Illumina 450k methylation datasets 2015 & 2017 3 months
o An Illumina 450k methylation project titled: “Epigenetic changes in children born to mothers with Rheumatoid Arthritis” (Including analysis)
2017 2.5 months
o An EPIC (850k) array project 2017 16 hours
o The B-Vitamins for the PRevention Of Osteoporotic Fractures (BPROOF) study Illumina 450k methylation dataset
2016 3 months
Taught practical session on Bioinformatics tools for the Erasmus Summer programme “Genomics in Molecular Medicine” at Erasmus MC, Netherlands
2014 & 2016 12 hours
Referee for the journal of Clinical Biochemistry 2015 3 hours
Experience in writing an Erasmus MC grant 2014 16 hours
Assisted with homocysteine measurements 2013 32 hours

ABOUT THE AUTHOR Pooja Rajendra Mandaviya was born in Porbandar, the
coastal city of Gujarat, India, on 20th October, 1987. She
completed high school at St. Joseph’s institute and
intermediate school at Murgaon Education Society Higher
Secondary School, Goa university, Goa, India. She
obtained her bachelors’ degree in Biotechnology in May
2009 from Garden City College, Bangalore university,
Bangalore, India, which brought together concepts of cell
and molecular biology, genetics and other disciplines of
life sciences. She obtained her masters’ degree in
Bioinformatics in July 2011 from the School of Life
Sciences, Manipal University, Manipal, India. In addition to the concepts of cell and
molecular biology, her masters’ degree focused on biological databases, systems
biology, information science, biostatistics and data analysis.
During her master, she pursued a 6 months research internship at the
Bioinformatics department BiGCaT, Maastricht University, Maastricht, the Netherlands.
Her research internship focused on manual and automated extension of microRNA
target information on existing pathways for WikiPathways and Cytoscape visualization
tools. Automated extension was done by implementing a Cytoscape plug-in written in
Java programming. After her Masters’ degree, she worked as a database curator for 6
months to read and extract information of the esophageal squamous cell carcinoma for
a Not-For-Profit team, MBiome, which works for Bioinformatics solutions.
In August 2012, she started her PhD at the departments of Internal Medicine
and Clinical Chemistry of the Erasmus University Medical Center, Rotterdam, the
Netherlands, under the supervision of Dr. Sandra G. Heil and Dr. Joyce B.J. van Meurs.
She worked on the Rotterdam Study, a large prospective cohort and conducted several
epigenome-wide association analyses to investigate the associations of the key methyl-
group metabolism factors such as homocysteine, MTHFR 677C>T, B-vitamin intakes,
and other lifestyle factors such as cigarette smoking with site-specific genome-wide
DNA methylation. She collaborated with many other research groups to bring together
similar kind of data in a meta-analysis approach.
She is currently pursuing her research at the department of Internal
Medicine, Erasmus University Medical Center, Rotterdam, the Netherlands, under the
supervision of Dr. Joyce B.J. van Meurs.

300 PART E: Appendices

Words of gratitude 301
WORDS OF GRATITUDE
I would like to first thank the five important people whose guidance and support has
together made a truly great team in order to have me achieve my PhD.
To my promoters: Prof. dr. André Uitterlinden and Prof. dr. Jan Lindemans
André, during my interview process in May 2012, you had happily welcomed me in
your group. Looking back to where I started, it has been a big learning curve for me.
Your cheer and guidance during my presentations at work discussions and conferences
have always filled me with motivation to do better. I am very grateful to you for this
opportunity and your support in having me at our department for an extended period.
Jan, thank you for your huge support until the very end of my PhD. Discussions and
ideas from you about the methyl group metabolism have guided me with reasoning
and understanding different aspects. You have reviewed my thesis with so much
attention to fine details. Thank you for being so actively available and being the driving
force, even after your retirement, and congratulating me with success at every step.
To my co-promoters: Dr. Sandra G. Heil and Dr. Joyce van Meurs
Sandra, I honestly wouldn't have been so lucky if I didn’t have a supervisor like you.
When I started my PhD, I had difficulty prioritizing things and lacked organization. Your
perfectionism has helped me overcome my limitation in a way that it is now not only
helping me in my professional life, but also my personal life. I must say I am not
completely there yet, but I know I am on my way to it. You always had the time for me
even if it wasn't so important. I have enjoyed having discussions with you. One of the
qualities that I learnt from you is to think through thoroughly before making a decision.
Joyce, I have a little confession to make. I was very nervous of you initially because I
perceived you as a very strict personality. Your critical comments on my work used to
give me chills, until one day I decided that I will not pay attention to how I feel, but
only focus on progressing my work. After travelling with you at the CHARGE
conference, Charlottesville and working with you more, I realized that you are actually
very warm hearted from the inside. Your guidance has helped me perform better and
shaped our projects to the optimal level. Thank you for being so considerate, patient
and supportive for me with everything and in having me here for an extended period.
To my former co-promoter: Dr. Lisette Stolk
Lisette, I would like to express my sincere gratitude for your supervision during the first
two and a half years of my PhD. You helped me understand and have a good grip on
the different analytical methods of the DNA methylation data. I really appreciate all

302 PART E: Appendices
your contribution in helpful discussions, setting up analysis plans and helping me
connect with other research groups for effective collaborations.
To the members of the doctoral committee
Prof. Arfan Ikram, Prof. Joost Gribnau and Prof. Caroline Relton, I am very happy that
you were a part of the reading committee. Prof. Robert de Jonge, Prof. Bas Heijmans
and Prof. Lisette de Groot, thank you for agreeing to serve on my doctoral committee. I
truly appreciate the time and expertise of all the committee members in assessment of
my thesis.
To my colleagues of the Department of Internal Medicine
Eline, I genuinely thank you for all your good administrative help during my PhD. You
have been really kind. Marijn, I appreciate your continuous IT help and the nice lunches
we had with the group. Cindy, Linda, Carolina, Jeroen and Marjolein (former), thank
you for being super helpful whenever I was stuck with questions. I do look up to you
guys. Carolina, I am grateful to you for your statistical help at so many times
throughout my PhD. Jeroen, thank you for your kindness and patience whenever I
needed more explanations. I thank Fernando and all other colleagues for their effective
suggestions during my presentations. Long, I appreciate your help with my questions
regarding Microsoft word. You are really good with figuring things out. Mila, Pascal,
Michael and Joost, it has always been nice to conversate with you. Thanks for your ever
friendliness. Kate, I really think you are funny and I have enjoyed sharing laughters with
you. Thanks for being helpful always. Fjorda, you are truly a wonderful person. Thank
you for your kindness and care. Enisa, thanks for the nice sweets that you always bring
to our room. Jinluan, it has been so positive and fun having you in the room. Thanks for
your care and feeding us with all the nice Chinese food. I also thank Guan, Jia-Lian
(former), Natalia (former), Denise, Olja, Ingrid and Djawad for the nice conversations.
To my colleagues of the Department of Clinical Chemistry
Bertrand and Pieter, thank you for the insightful discussions during our epigenetics
meetings. I thank Prof. dr. Yolanda B. de Rijke for her careful evaluation of the dietary
B-vitamin EWAS manuscript. Samira, Pamela, Maja, Marianne, Ethan (former), Natanja,
Helen, Rutchanna and Chérina, I have really enjoyed having you guys around. Thanks
for the nice lunches, mince pies, lemper, plenty of nussinis’, support for my small
marathon dream (smile), and all your good help and nice conversations. Richard,
thanks for those nice walks and your IT help. I also thank Corine, Natascha and Evert
for the nice lunches and conversations. Gigi and Iqbal, I have enjoyed the food you
used to bring for me. Thanks for being so warm and caring. Cor, I thank you and your
wife for the tour you gave us to Kinderdijk and surrounding area. It was such a great

Words of gratitude 303
experience by having a local friend to show us around. Chérina, words can’t describe
how thankful I am. Thanks for being like a mentor to me and being there always.
To my colleagues of the Department of Epidemiology
Janine, I am grateful for your quick helps and good input whenever I emailed you with
questions. Jessica, Ester, Oscar, Trudy and Kim, thanks for the good discussions on the
nutrition related projects. It was a wonderful experience working with you. Kim, I also
think that you are an excellent review partner. We had a perfect grip together because
we understood each other’s OCDs. I also thank Natalie, Dina, Hata, Ashley, Jun,
Shahzad, Ivana, Ajorla and Najaf for their friendly conversations whenever we crossed
each other in the hallway. Najaf, thanks for your good advices and the useful tips you
gave me when I was starting to write my thesis introduction and discussion.
To my collaborators of the BIOS consortium, CHARGE consortium and other groups
Prof. Bas Heijmans, I thank you for your valuable guidance and discussions during my
PhD. It is a pleasure having you as a mentor. Koen Dekker, Maarten van Iterson and
Marc Jan Bonder, thank you for your good contribution to our projects and your fast
help to my emails. I am thankful to Dr. Caren E. Smith, Dr. Myriam Fornage, Dr.
Marleen MJ van Greevenbroek, Dr. David-Alexandre Trégouët, Dr. France Gagnon, Dr.
Daniel Levy, Dr. Roby Joehannes, Dr. Kourosh R Ahmadi, Dr. Toby Andrew, Dr. Paul F.
Jacques, Dr. Diana van Heemst, Dr. Michael M. Mendelson and all other collaborators
for their useful contributions, discussions and careful corrections on the manuscripts.
To my previous mentors
To the mentors of the department of BiGCaT, Maastricht University; Prof. Chris Evelo,
Dr. Susan Steinbusch-Coort, Dr. Martina Kutmon, Dr. Thomas Kelder and Dr. Lars
Eijssen. I am very glad to have done my Masters’ project with you and I am grateful
that you introduced this PhD to me. I thank my mentors of the Masters’ training:
Prashantha Hebbar, Dr. Prasad Burra and the one I connected through MBiome, Dr.
Manoj Kashyap, for their valuable guidance and support before my PhD. I thank my
mentors of school who were a great inspiration and are my well-wishers even today.
To my friends and family
I truly thank my friends and family friends for their support and presence in many ways
and in different phases during my PhD and even before. I thank my parents,
grandmother, brother, cousins and all other family members for their well-wishes,
understanding and support. I mean much more than my words can express.
You can’t connect the dots looking forward;
You can only connect them looking backwards.
(Steve Jobs)