Cerebrovascular reactivity predicts stroke in high-grade carotid artery disease
Upload
independentCategory
view
2download
0
Effects of hyperglycemia on the cerebrovascular response to rhythmic handgrip exercise
Yu-Sok Kim 1, Rikke Krogh-Madsen 3,4, Peter Rasmussen 2,4, Peter Plomgaard 3,4, Shigehiko Ogoh 5, Niels H. Secher 2,4, and Johannes J. van Lieshout 1
Department of Internal Medicine 1, Academic Medical Center, University of Amsterdam, 1100 DEAmsterdam, The Netherlands; Departments of Anesthesiology 2 and Infectious Diseases, The Center of Inflammation and Metabolism 3, The Copenhagen Muscle Research Center 4, Rigshospitalet, University of Copenhagen, Denmark; and Department of Integrative Physiology 5, University of North Texas Health Science Center at Fort Worth, Texas 76107
Short running title: Hyperglycemia and the cerebrovascular response to exerciseWord count: Abstract 248 Text and references 43592 Tables and 3 Figures
Address correspondence to:
J.J. van Lieshout, MD, PhDMedium Care Unit, Department of Internal Medicine, F7-205Academic Medical CenterUniversity of AmsterdamPO Box 22700, 1100 DE AmsterdamThe NetherlandsTelephone: 31-20-5662371Fax: 31-20-5669158e-mail: [email protected]
Page 1 of 25
Copyright Information
Articles in PresS. Am J Physiol Heart Circ Physiol (March 16, 2007). doi:10.1152/ajpheart.00045.2007
Copyright © 2007 by the American Physiological Society.

AJP H-00045-2007.R1 Hyperglycemia and the cerebrovascular response to exercise 2
Abstract
Dynamic cerebral autoregulation (CA) is challenged by exercise and may become less effective
when exercise is exhaustive. Exercise may increase arterial glucose concentration and we
evaluated whether the cerebrovascular response to exercise is affected by hyperglycemia. The
effects of a hyperinsulinemic euglycemic (EU) and hyperglycemic clamp (HY) on the
cerebrovascular (CVRi) and systemic vascular (SVRi) responses were evaluated in seven
healthy subjects at rest and during rhythmic handgrip exercise. Transfer function analysis of
the dynamic relationship between beat-to-beat changes in mean arterial pressure (MAP) and
middle cerebral artery (MCA) mean blood flow velocity (Vmean) assessed dynamic CA. At rest
SVRi decreased with HY and EU (P < 0.01). CVRi was maintained with EU but became
reduced with HY (11±3%; P < 0.01) and MCA Vmean increased (P < 0.05), whereas brain
catecholamine uptake and PaCO2 did not change significantly. HY did not affect the
normalized low-frequency gain between MAP and MCA Vmean or the phase shift indicating
maintained dynamic CA. With HY, the increase in CVRi associated with exercise was
enhanced (19±7% vs. 9±7%; P < 0.05) concomitant to a larger increase in heart rate and
cardiac output and a larger reduction in SVRi (22±4% vs. 14±2%; P < 0.05). Thus,
hyperglycemia lowered cerebral vascular tone independently of CA capacity at rest, whereas
dynamic CA remained able to modulate cerebral blood flow around the exercise-induced
increase in MCA Vmean. These findings suggest that an elevated blood glucose does not explain
that dynamic CA is affected during intense exercise.
Keywords: cerebral autoregulation; cardiac output; human; vascular tone
Page 2 of 25
Copyright Information

AJP H-00045-2007.R1 Hyperglycemia and the cerebrovascular response to exercise 3
Cerebral blood flow (CBF) is under autoregulatory control and is also influenced by regional
changes in neural activity (33, 46). Cerebral autoregulation (CA) spans the range of prevailing
demands on CBF in everyday life and comprises both fast and slow acting regulatory components
(1, 41). Static CA reflects the overall efficiency of the system whereas dynamic CA refers to the
ability to restore CBF in face of a sudden change in arterial pressure reflecting the latency of the
cerebral vasoregulatory system (2, 19, 32). Brain activation by exercise provokes an increase in
cerebral perfusion and regional as well as global CBF increases 20-30% on the transition from rest
to moderate exercise (11, 16-18, 22). During exercise middle cerebral artery (MCA) blood flow
velocity varies in response to pulse pressure and dynamic CA allows for maintenance of cerebral
circulation during the exercise-induced increase in blood pressure (30). The effectiveness of
dynamic CA may, however, become reduced by exhaustive exercise (29) and the effect of
metabolites and PaCO2 on the brain vasculature are proposed as possible causative factors (29).
Although plasma glucose concentration usually remains relatively constant during exercise,
hyperglycaemia may occur (9) and whether hyperglycemia affects CA and modifies the
cerebrovascular response to exercise is not evaluated. Dynamic CA may also be affected in patients
with small vessel disease (20), e.g. diabetes where loss of autoregulation of tissue perfusion is
attributed to persistent hyperglycemia (5, 7). Early type 1 diabetes mellitus is associated with
vasodilatation and hyperperfusion of vascular beds (27, 47). In healthy subjects sustained
hyperglycemia induces moderate vasodilatation in resting skeletal muscle and increases blood flow
in absence of changes in sympathetically mediated vasomotor tone (45). Blunted responses of
cerebral arterioles are reported in an animal model of diabetes mellitus and in diabetic patients with
impairment of CA (5, 8, 24-26). However, results from animal studies with regard to the possible
effects of glucose on CBF are inconclusive with both a reduced (13) and maintained CBF (39) in
response to acute hyperglycemia.
The primary purpose of this study was to examine whether hyperglycemia affects the CBF
Page 3 of 25
Copyright Information

AJP H-00045-2007.R1 Hyperglycemia and the cerebrovascular response to exercise 4
response to exercise. We hypothesized that sustained hyperglycemia induces cerebrovascular
vasodilatation interfering with CA. We further hypothesized that hyperglycemia would enhance the
increase in cerebral perfusion induced by rhythmic exercise. Accordingly, we set out to determine
the cerebral and systemic vascular responses and the arterial-internal jugular venous differences for
catecholamines as a marker of their net brain uptake in healthy subjects during euglycemia and
hyperglycemia at rest and during rhythmic handgrip exercise.
EXPERIMENTAL PROCEDURES
Seven healthy, recreationally active non-smoking male subjects participated in the study. Their
mean age was 25 (range 22 – 29) yr, height 185 (175 - 205) cm, and weight 81 (71 - 105) kg. Oral
and written informed consent was obtained and the study was approved by the Ethics Committee of
Copenhagen and Frederiksberg (KF 01-257245). Prior to the study, the subjects underwent
examination including blood samples for renal, hepatic, and thyroid function, hemoglobin, white
blood cell counts, electrolytes and plasma glucose and all tests proved to be normal. The subjects
abstained from caffeinated beverages for at least 6 hours and none of the subjects used any
medication.
Central hemodynamic and cerebrovascular measurements were obtained during a steady-state
hyperglycemic (HY) and a hyperinsulinemic euglycemic (EU) clamp with blood glucose
maintained at the fasting concentration. In a random order crossover design, the subjects were
studied on two days separated by at least one week in a room at 22º C. The subjects reported to the
laboratory at 8:00 AM after an overnight fast. The order of the studies was EU-HY in four subjects
and HY-EU in three subjects. Subjects were placed in the supine position and instrumented with
arterial, internal jugular and peripheral venous catheters. A standard lead II electrocardiogram was
used for monitoring purpose. Cannulas were introduced percutaneously into the brachial artery of
the non-dominant arm (19 gauge) and under local anesthesia (2% lidocaine) retrograde into the
Page 4 of 25
Copyright Information
AJP H-00045-2007.R1 Hyperglycemia and the cerebrovascular response to exercise 5
internal jugular vein (14 gauge) and advanced to its bulb. A catheter was placed in an antecubital
vein for infusion of insulin and glucose. The arterial catheter was connected to a pressure
monitoring system (Dialogue 2000, Copenhagen, Denmark) and used to obtain blood for
measurement of glucose, insulin, potassium, blood gas variables, and catecholamines. The catheter
lumens were flushed with 3 ml/hr isotonic saline. Arterial pressure was measured with a transducer
(Edwards Life Sciences, Irving, CA) calibrated and zeroed at the level of the right atrium in the
mid-axillary line. The transcranial Doppler derived blood velocity (V) was measured in the
proximal segment of the right middle cerebral artery (MCA) and insonated (DWL Multidop X4,
Sipplingen, Germany) through the posterior temporal “window”. Once the optimal signal-to-noise
ratio was obtained, the probe was secured with a headband. Both at rest and during exercise,
determination of flow velocity in the MCA has a coefficient of variation of ~5% (35). Stroke
volume (SV) was calculated from the blood pressure waveform using the Model flow method
incorporating age, sex, height, and weight (BeatScope 1.0 software, BMEye, Amsterdam, The
Netherlands) (21). This technique tracks fast changes in SV during static and dynamic exercise (18,
29, 40, 44). The signals of arterial pressure, spectral envelope of MCA V and ECG were A/D
converted at 200 Hz and stored on a hard disk for off-line analysis.
Hyperinsulinemic hyperglycemic clamp. Glucose (1000 mM) was infused intravenously to
maintain a blood level of 15 mM with the rate of infusion adjusted by a computer-controlled pump
according to the arterial blood glucose concentrations analyzed at intervals of 5 min during the first
hour, and then every 10th min (34). Steady-state blood glucose concentrations were achieved after
~1 hour. To maintain potassium at the baseline level, isotonic saline containing potassium (51
mmol/l) was infused continuously. To flush lines after blood sampling, a total of ~1000 ml of
isotonic saline was needed during the study and compensated for the blood withdrawn. Arterial
blood samples for measurements of insulin and plasma catecholamines were drawn before glucose
infusion and after steady-state hyperglycemia was achieved.
Page 5 of 25
Copyright Information

AJP H-00045-2007.R1 Hyperglycemia and the cerebrovascular response to exercise 6
Hyperinsulinemic euglycemic clamp. Insulin was infused at 0.08 IU·min-1·m-2. Glucose was
provided by a computer-controlled infusion pump adjusted to maintain blood glucose at baseline
(fasting) concentration in a manner similar to that described for hyperglycemic clamping with other
infusions. Arterial blood for measurement of insulin and catecholamines was drawn as mentioned
for hyperglycemic clamping.
Exercise. For rhythmic handgrip exercise a strain gauge dynamometer was used and force was
measured by bridge (CN801, Hellerup, Denmark). At the start of each study maximal voluntary
contraction (MVC) was determined. Exercise included 10 min of intermittent handgrip contractions
at 65% of MVC with 2 s of contraction alternated with 4 s of relaxation.
Blood samples. Blood samples obtained at baseline and during EU and HY were analyzed
(potassium, glucose concentrations, blood-gas variables (ABL 625 & 700, Radiometer,
Copenhagen, Denmark), and lactate (Yellow Springs Instruments, Yellow Springs, OH)). Plasma
catecholamines were determined using 2 CAT EIA (BA 10-1500, Labor Dianostika Nord GmbH &
Co, Nordhorn, Germany). Net brain catecholamine uptake was expressed as the arterial to internal
jugular venous (a-v) epinephrine and norepinephrine difference for the brain (15).
Data analysis. Beat-to-beat values for mean MCA blood velocity (Vmean) and mean arterial
pressure (MAP) were derived as the integral over one beat divided by the corresponding beat
interval. Heart rate (HR) was the inverse of the interbeat pressure interval, cardiac output (CO) was
the product of SV and HR. Systemic vascular resistance (SVRi) was calculated as MAP/CO and an
effect of hyperglycemia on the cerebral vascular resistance was expressed as an index (CVRi)
calculated from MAP and MCA Vmean (19). Cerebral and systemic hemodynamic values were
expressed as the averages of 6 min manifestations of MAP, HR, SV, CO, pulse pressure, SVRi,
MCA Vmean, and CVRi. Dynamic CA is frequency dependent and frequency-domain analysis of
autoregulation allows for quantifying the counter-regulatory capacity to maintain MCA Vmean
during induced or spontaneous changes in blood pressure (32, 52). In healthy subjects, MCA Vmean
Page 6 of 25
Copyright Information

AJP H-00045-2007.R1 Hyperglycemia and the cerebrovascular response to exercise 7
leads MAP by ~60º in the frequency domain around the 0.1 Hz spontaneous BP variability (12).
Dynamic CA was determined in the frequency domain from 6 min episodes of beat-to-beat data of
MAP and MCA Vmean prior to and during HY and EU. To quantify the variability of pressure and
velocity, power spectra were computed for MAP and MCA Vmean with discrete Fourier transform
after spline interpolation and resampling at 4 Hz of the beat-to-beat data sets. The data were
averaged over 6 min during baseline and EU/HY at rest and over 2 min during exercise. Results
were expressed as the integrated area in the low (LF; 0.07 to 0.15 Hz) frequency range. To examine
the strength of the relation between the LF power of the MAP and MCA Vmean, the coherence
function was calculated to estimate the fraction of output power (MCA Vmean) that can be linearly
related to the input power (MAP) at each frequency (28). Similarly to a correlation coefficient, it
varies between 0 and 1. From the MAP to MCA Vmean cross-spectrum, the transfer function gain
(cm·s-1·mmHg-1) and the MCA Vmean to MAP phase lead (degrees) were obtained in the LF area.
The transfer function gain was normalized for MAP and MCA Vmean to account for the inter subject
variability and expressed as the percentage change in cm·s-1 per percent change in mmHg (19, 20,
32). Phase was defined positive where MCA Vmean leads MAP. Baroreflex sensitivity (BRS) was
derived from frequency analysis of systolic BP (SBP) and interbeat interval (IBI) time series. Power
spectral density and cross-spectra of SBP and IBI were computed using discrete Fourier transform
(14, 50).
Statistical analysis. Data are presented as mean and SD. Two-way ANOVA for repeated
measures was used to identify differences across glycemic condition (EU vs. HY) and time. Post
hoc pairwise multiple comparisons versus rest were performed with the Holm-Sidak method and
correlation strength was assessed with Pearsons test on the average values across subjects. When
data fitted a normal distribution as indicated by Kolmogorov-Smirnov analysis a t-test was used and
a Mann-Whitney rank sum test was applied when data were not normally distributed with P<0.05
considered to indicate a statistically significant difference.
Page 7 of 25
Copyright Information

AJP H-00045-2007.R1 Hyperglycemia and the cerebrovascular response to exercise 8
RESULTS
At rest prior to glucose clamping, baseline cerebro- and cardiovascular variables and plasma
concentrations for insulin (EU vs. HY; 10.4 ± 7.7 vs. 8.0 ± 6.9 pmol·l-1), glucose (4.9 ± 0.1 vs. 4.9 ±
0.1 mmol·l-1), PaCO2, epinephrine and norepinephrine did not differ between experiments (Table 1).
Euglycemic and hyperglycemic clamping
The plasma glucose concentration was maintained at, respectively, 4.9 ± 0.1 (EU) and 14.8 ± 0.2
mmol·l-1 (HY) (Fig. 1). Plasma insulin concentrations during exercise were not different between
conditions (906 ± 46 (EU) vs. 688 ± 100 pmol·l-1 (HY); P = 0.07). During EU and HY clamping,
MAP and arterial catecholamine concentrations did not change significantly. At the same time
SVRi decreased both with HY and EU (P < 0.01). The CVRi was maintained with EU but became
reduced with HY (11 ± 3 %; P < 0.01) and MCA Vmean increased (P < 0.05; Table 1), whereas brain
catecholamine uptake and PaCO2 did not change significantly. Arterial lactate concentrations
increased both with HY and EU (P < 0.01).
Spectral and transfer function analysis
Baroreflex sensitivity was within normal limits and did not change with EU (17 ± 3 vs. 16 ± 2
ms·mmHg-1) vs. HY (19 ± 3 vs. 18 ± 3 ms·mmHg-1). Transfer function analysis of the dynamic
relationship between beat-to-beat changes in MCA Vmean and MAP assessed dynamic CA across
changes in plasma glucose. The phase and normalized transfer function gain between MCA Vmean
and MAP in the LF range was not altered across changes in the plasma glucose concentration
(Table 2).
Rhythmic handgrip exercise
During exercise MAP, HR, pulse pressure, CO and MCA Vmean increased (P < 0.05) whereas SV,
Page 8 of 25
Copyright Information

AJP H-00045-2007.R1 Hyperglycemia and the cerebrovascular response to exercise 9
PaCO2 , arterial catecholamine concentrations and A-V lactate difference did not change
significantly (Table 1). Also, the increase in MAP was similar for both glycemic conditions,
whereas the increase in HR and CO during HY vs. EU was larger (P < 0.05; Fig. 2), concomitant to
a larger reduction in SVRi (22 ± 4 % vs. 14 ± 2 %; P < 0.05; Fig. 3). During HY vs. control, the
increase in CVRi was larger (19 ± 7 % vs. 9 ± 7 %; P < 0.05) whereas net brain catecholamine
uptake and PaCO2 did not change.
DISCUSSION
The present study provides novel information regarding the influence of hyperglycemia on the
vascular responses of the cerebral and systemic circulations in humans from rest to exercise. At
rest, SVRi decreased both with HY and EU. At the same time CVRi was maintained with EU but
declined in response to HY independently of CA suggesting an important role for glucose.
Secondly, HY enhanced the decline in SVRi and the increase in CO associated with exercise. Thus,
HY lowered cerebral vascular tone independently of autoregulatory capacity at rest, whereas
dynamic CA retained the ability to modulate CBF around the exercise -induced increase in MCA
Vmean. Collectively, these findings suggest that an elevated blood glucose does not explain that
dynamic CA may become affected during intense exercise.
Hyperglycemia and hyperinsulinemia each elicit systemic vasodilatation but controversies exist
as to the vascular effects of insulin (3, 38, 45) because both systemic vasoconstrictive and -dilatory
effects of insulin are reported (6, 38, 45, 49, 51). Endothelium-dependent vasodilatation is impaired
in type 1 (42) as well as in type 2 diabetes (4, 43) but in healthy humans, acute hyperglycemia does
not impair endothelial function (37). The vascular effects of insulin may reflect the balance between
sympathetic and local NO effects with vasodilatation at elevated plasma concentrations vs.
vasoconstriction at lower concentrations (51). In addition, the effects of hyperinsulinemic
hyperglycemia are different for healthy subjects vs. IDDM patients with regional vasodilatation in
Page 9 of 25
Copyright Information

AJP H-00045-2007.R1 Hyperglycemia and the cerebrovascular response to exercise 10
healthy subjects but not in patients (23, 31). Possible differences in dose-response vascular effects
of elevated insulin levels need to be established and we cannot, therefore, exclude some vascular
contribution of a slightly higher insulin concentration during EU vs. HY.
In healthy subjects eu-insulinemic hyperglycemia induces moderate vasodilatation in skeletal
muscle in absence of changes in sympathetic tone or blood pressure (45). A new observation from
the present study is that during exercise the decline in SVRi is enhanced by hyperglycemia. This
systemic vasodilatation developed in absence of significant changes in baroreflex sensitivity,
plasma norepinephrine concentration or low frequency spectral power of arterial pressure and
interbeat interval oscillations suggesting that sympathetic activity did not change (10, 50).
In an isolated cerebral artery model, acute glucose exposure dilates cerebral arteries (8)
while following chronic exposure to hyperglycemia vascular responses diminish (26). We
hypothesized that the cerebral vasculature would respond in a similar way and evaluated the
CVRi during HY as an indicator for cerebral artery vasomotor tone. A reduction in CVRi was
demonstrated at rest HY in parallel to the systemic vasodilatation and took place without a
change in PaCO2 or brain catecholamine uptake. Yet, the finding that the MAP to MCA Vmean
transfer function gain and phase were not affected by EU and HY supports that dynamic CA
was preserved both during acute hyperinsulinemia and hyperglycemia. Sympathetic nerve
stimulation increases MAP and MCA Vmean (48) and brain activation by rhythmic exercise
results in an increase in MAP, CVRi and MCA Vmean (17, 22). During exercise with HY the
increase in MAP was comparable to that with EU but the increase in CO was larger and
accompanied by an enhanced CVRi response.
The MCA Vmean was chosen for evaluation of exercise-induced changes in CBF assuming that
changes in MCA Vmean are representative of those in CBF. Transcranial Doppler monitors blood
velocity rather than blood flow and changes in the diameter of the insonated vessel by enhanced
sympathetic activity could modulate velocity independently of flow. However, the large cerebral
Page 10 of 25
Copyright Information
AJP H-00045-2007.R1 Hyperglycemia and the cerebrovascular response to exercise 11
arteries are conductance rather than resistance vessels and moderate sympathetic activation does not
modify the luminar diameter of a systemic conduit artery (36). With exercise, MCA Vmean
demonstrates a graded increase to work rate and reflects the increase in regional CBF (11, 17, 22).
When exercising with large muscle groups, the increase in plasma norepinephrine is up to 16-fold
higher than during moderate exercise such as rhythmic handgrip. In the present study the systemic
to cerebral norepinephrine difference did not change significantly during exercise and we consider
an adrenergic vasoconstrictive effect on the MCA unlikely (35).
This study did not address the mechanism involved in the differential cerebral and systemic
circulatory responses to hyperglycemia, but the data suggest that during exercise maintained
dynamic CA counterbalanced the vasodilatatory effect of hyperglycemia manifest in other vascular
beds. Thus, hyperglycemia lowered cerebral vascular tone independently of CA capacity at rest,
whereas dynamic CA remained able to modulate CBF around the exercise-induced increase in
MCA Vmean. These findings suggest that an elevated blood glucose does not explain that dynamic
CA may become affected during intense exercise.
Page 11 of 25
Copyright Information

AJP H-00045-2007.R1 Hyperglycemia and the cerebrovascular response to exercise 12
ACKNOWLEDGEMENT
Y.S. Kim is supported by the Dutch Diabetes Foundation (Grant # 04-00-00) and P. Rasmussen is
supported by the Lundbeck Foundation. The Centre of Inflammation and Metabolism is supported
by a grant from the Danish National Research Foundation (Grant # 02-512-55).
Page 12 of 25
Copyright Information
AJP H-00045-2007.R1 Hyperglycemia and the cerebrovascular response to exercise 13
References
1. Aaslid R. Cerebral Hemodynamics. In: Transcranial Doppler, edited by Newell DW and Aaslid
R. New York: Raven Press, Ltd., 1992, p. 49-55.
2. Aaslid R, Lindegaard KF, Sorteberg W, Nornes H. Cerebral autoregulation dynamics in
humans. Stroke 20: 45-52, 1989.
3. Anderson EA, Hoffman RP, Balon TW, Sinkey CA, Mark AL. Hyperinsulinemia produces
both sympathetic neural activation and vasodilation in normal humans. J Clin Invest 87: 2246-
2252, 1991.
4. Beckman JA, Goldfine AB, Gordon MB, Creager MA. Ascorbate restores endothelium-
dependent vasodilation impaired by acute hyperglycemia in humans. Circulation 103: 1618-
1623, 2001.
5. Bentsen N, Larsen B, Lassen NA. Chronically impaired autoregulation of cerebral blood flow
in long-term diabetics. Stroke 6: 497-502, 1975.
6. Berne C, Fagius J, Pollare T, Hjemdahl P. The sympathetic response to euglycaemic
hyperinsulinaemia. Evidence from microelectrode nerve recordings in healthy subjects.
Diabetologia 35: 873-879, 1992.
7. Brownlee M. Biochemistry and molecular cell biology of diabetic complications. Nature 414:
813-820, 2001.
8. Cipolla MJ, Porter JM, Osol G. High glucose concentrations dilate cerebral arteries and
diminish myogenic tone through an endothelial mechanism. Stroke 28: 405-410, 1997.
Page 13 of 25
Copyright Information

AJP H-00045-2007.R1 Hyperglycemia and the cerebrovascular response to exercise 14
9. Coggan AR. Plasma glucose metabolism during exercise in humans. Sports Med 11: 102-124,
1991.
10. Cooke WH, Hoag JB, Crossman AA, Kuusela TA, Tahvanainen KU, Eckberg DL. Human
responses to upright tilt: a window on central autonomic integration. J Physiol 517: 617-628,
1999.
11. Delp MD, Armstrong RB, Godfrey DA, Laughlin MH, Ross CD, Wilkerson MK. Exercise
increases blood flow to locomotor, vestibular, cardiorespiratory and visual regions of the brain
in miniature swine. J Physiol 533: 849-859, 2001.
12. Diehl RR, Linden D, Lucke D, Berlit P. Phase relationship between cerebral blood flow
velocity and blood pressure. A clinical test of autoregulation. Stroke 26: 1801-1804, 1995.
13. Duckrow RB, Beard DC, Brennan RW. Regional cerebral blood flow decreases during
hyperglycemia. Ann Neurol 17: 267-272, 1985.
14. Gisolf J, Immink RV, Van Lieshout JJ, Stok WJ, Karemaker JM. Orthostatic blood
pressure control before and after space flight, determined by time-domain baroreflex method. J
Appl Physiol 98: 1682-1690, 2005.
15. Gonzalez-Alonso J, Dalsgaard MK, Osada T, Volianitis S, Dawson EA, Yoshiga CC,
Secher NH. Brain and central hemodynamics and oxygenation during maximal exercise in
humans. J Physiol 557: 331-342, 2004.
16. Hedlund S, Nyling G, Regnstrom O. The behaviour of the cerebral circulation during
muscular exercise. Acta Physiol Scand 54: 316-324, 1962.
Page 14 of 25
Copyright Information

AJP H-00045-2007.R1 Hyperglycemia and the cerebrovascular response to exercise 15
17. Hellstrøm G, Fischer-Colbrie W, Wahlgren NG, Jøgestrand T. Carotid artery blood flow
and middle cerebral artery blood flow velocity during physical exercise. J Appl Physiol 81:
413-418, 1996.
18. Ide K, Pott F, Van Lieshout JJ, Secher NH. Middle cerebral artery blood velocity depends on
cardiac output during exercise with a large muscle mass. Acta Physiol Scand 162: 13-20, 1998.
19. Immink RV, van den Born BJ, Van Montfrans GA, Koopmans RP, Karemaker JM, Van
Lieshout JJ. Impaired cerebral autoregulation in patients with malignant hypertension.
Circulation 110: 2241-2245, 2004.
20. Immink RV, Van Montfrans GA, Stam J, Karemaker JM, Diamant M, Van Lieshout JJ.
Dynamic cerebral autoregulation in acute lacunar and middle cerebral artery territory ischemic
stroke. Stroke 36: 2595-2600, 2005.
21. Jellema WT, Wesseling KH, Groeneveld AB, Stoutenbeek CP, Thijs LG, Van Lieshout JJ.
Continuous cardiac output in septic shock by simulating a model of the aortic input impedance:
a comparison with bolus injection thermodilution. Anesthesiology 90: 1317-1328, 1999.
22. Jørgensen LG, Perko G, Secher NH. Regional cerebral artery mean flow velocity and blood
flow during dynamic exercise in humans. J Appl Physiol 73: 1825-1830, 1992.
23. Makimattila S, Virkamaki A, Malmstrom R, Utriainen T, Yki-Jarvinen H. Insulin
resistance in type I diabetes mellitus: a major role for reduced glucose extraction. J Clin
Endocrinol Metab 81: 707-712, 1996.
Page 15 of 25
Copyright Information

AJP H-00045-2007.R1 Hyperglycemia and the cerebrovascular response to exercise 16
24. Mankovsky BN, Piolot R, Mankovsky OL, Ziegler D. Impairment of cerebral autoregulation
in diabetic patients with cardiovascular autonomic neuropathy and orthostatic hypotension.
Diabet Med 20: 119-126, 2003.
25. Marthol H, Brown CM, Zikeli U, Ziegler D, Dimitrov N, Baltadzhieva R, Hilz MJ. Altered
cerebral regulation in type 2 diabetic patients with cardiac autonomic neuropathy. Diabetologia
49: 2481-2487, 2006.
26. Mayhan WG, Simmons LK, Sharpe GM. Mechanism of impaired responses of cerebral
arterioles during diabetes mellitus. Am J Physiol 260: H319-H326, 1991.
27. Miller JA, Floras JS, Zinman B, Skorecki KL, Logan AG. Abnormalities in the renal and
vascular responses to LBNP in humans with early diabetes. Am J Physiol 266: Pt 2):R442-50,
1994.
28. Ogoh S, Brothers RM, Barnes Q, Eubank WL, Hawkins MN, Purkayastha S, Yurvati A,
Raven PB. The effect of changes in cardiac output on middle cerebral artery mean blood
velocity at rest and during exercise. J Physiol 569: 697-704, 2005.
29. Ogoh S, Dalsgaard MK, Yoshiga CC, Dawson EA, Keller DM, Raven PB, Secher NH.
Dynamic cerebral autoregulation during exhaustive exercise in humans. Am J Physiol Heart
Circ Physiol 288: H1461-H1467, 2005.
30. Ogoh S, Fadel PJ, Zhang R, Selmer C, Jans O, Secher NH, Raven PB. Middle cerebral
artery flow velocity and pulse pressure during dynamic exercise in humans. Am J Physiol Heart
Circ Physiol 288: H1526-H1531, 2005.
Page 16 of 25
Copyright Information
AJP H-00045-2007.R1 Hyperglycemia and the cerebrovascular response to exercise 17
31. Oomen PH, Kant GD, Dullaart RP, Reitsma WD, Smit AJ. Acute hyperglycemia and
hyperinsulinemia enhance vasodilatation in Type 1 diabetes mellitus without increasing
capillary permeability and inducing endothelial dysfunction. Microvasc Res 63: 1-9, 2002.
32. Panerai RB, Dawson SL, Potter JF. Linear and nonlinear analysis of human dynamic cerebral
autoregulation. Am J Physiol Heart Circ Physiol 277: H1089-H1099, 1999.
33. Paulson OB, Strandgaard S, Edvinsson L. Cerebral autoregulation. Cerebrovasc Brain
Metab Rev 2: 161-192, 1990.
34. Plomgaard P, Bouzakri K, Krogh-Madsen R, Mittendorfer B, Zierath JR, Pedersen BK.
Tumor Necrosis Factor-{alpha} Induces Skeletal Muscle Insulin Resistance in Healthy Human
Subjects via Inhibition of Akt Substrate 160 Phosphorylation. Diabetes 54: 2939-2945, 2005.
35. Pott F, Jensen K, Hansen H, Christensen NJ, Lassen NA, Secher NH. Middle cerebral
artery blood velocity and plasma catecholamines during exercise. Acta Physiol Scand 158: 349-
356, 1996.
36. Pott F, Ray CA, Olesen HL, Ide K, Secher NH. Middle cerebral artery blood velocity,
arterial diameter and muscle sympathetic nerve activity during post-exercise muscle ischaemia.
Acta Physiol Scand 160: 43-47, 1997.
37. Reed AS, Charkoudian N, Vella A, Shah P, Rizza RA, Joyner MJ. Forearm vascular control
during acute hyperglycemia in healthy humans. Am J Physiol Endocrinol Metab 286: E472-
E480, 2004.
Page 17 of 25
Copyright Information

AJP H-00045-2007.R1 Hyperglycemia and the cerebrovascular response to exercise 18
38. Scherrer U, Sartori C. Insulin as a vascular and sympathoexcitatory hormone: implications
for blood pressure regulation, insulin sensitivity, and cardiovascular morbidity. Circulation 96:
4104-4113, 1997.
39. Simpson RE, III, Phillis JW, Buchannan J. A comparison of cerebral blood flow during
basal, hypotensive, hypoxic and hypercapnic conditions between normal and streptozotocin
diabetic rats. Brain Res 531: 136-142, 1990.
40. Sugawara J, Tanabe T, Miyachi M, Yamamoto K, Takahashi K, Iemitsu M, Otsuki T,
Homma S, Maeda S, Ajisaka R, Matsuda M. Non-invasive assessment of cardiac output
during exercise in healthy young humans: comparison between Modelflow method and Doppler
echocardiography method. Acta Physiol Scand 179: 361-366, 2003.
41. Tiecks FP, Lam AM, Aaslid R, Newell DW. Comparison of static and dynamic cerebral
autoregulation measurements. Stroke 26: 1014-1019, 1995.
42. Timimi FK, Ting HH, Haley EA, Roddy MA, Ganz P, Creager MA. Vitamin C improves
endothelium-dependent vasodilation in patients with insulin-dependent diabetes mellitus. J Am
Coll Cardiol 31: 552-557, 1998.
43. Ting HH, Timimi FK, Boles KS, Creager SJ, Ganz P, Creager MA. Vitamin C improves
endothelium-dependent vasodilation in patients with non-insulin-dependent diabetes mellitus. J
Clin Invest 97: 22-28, 1996.
44. Van Dijk N, de Bruin IG, Gisolf J, Bruin-Bon HA, Linzer M, Van Lieshout JJ, Wieling W.
Hemodynamic effects of legcrossing and skeletal muscle tensing during free standing in
patients with vasovagal syncope. J Appl Physiol 98: 584-590, 2005.
Page 18 of 25
Copyright Information

AJP H-00045-2007.R1 Hyperglycemia and the cerebrovascular response to exercise 19
45. Van Gurp PJ, Rongen GA, Lenders JW, Al Nabawy AK, Timmers HJ, Tack CJ.
Sustained hyperglycaemia increases muscle blood flow but does not affect sympathetic activity
in resting humans. Eur J Appl Physiol 93: 648-654, 2005.
46. Van Lieshout JJ, Wieling W, Karemaker JM, Secher NH. Syncope, cerebral perfusion, and
oxygenation. J Appl Physiol 94: 833-848, 2003.
47. Vervoort G, Wetzels JF, Lutterman JA, van Doorn LG, Berden JH, Smits P. Elevated
skeletal muscle blood flow in noncomplicated type 1 diabetes mellitus: role of nitric oxide and
sympathetic tone. Hypertension 34: 1080-1085, 1999.
48. Wahlgren NG, Hellstrom G, Lindquist C, Rudehill A. Sympathetic nerve stimulation in
humans increases middle cerebral artery blood flow velocity. Cerebrovasc Dis 2: 359-364,
1992.
49. Westerbacka J, Bergholm R, Tiikkainen M, Yki-Jarvinen H. Glargine and regular human
insulin similarly acutely enhance endothelium-dependent vasodilatation in normal subjects.
Arterioscler Thromb Vasc Biol 24: 320-324, 2004.
50. Westerhof BE, Gisolf J, Karemaker JM, Wesseling KH, Secher NH, Van Lieshout JJ.
Time course analysis of baroreflex sensitivity during postural stress. Am J Physiol Heart Circ
Physiol 291: H2864 -H2874, 2006.
51. Yki-Jarvinen H, Utriainen T. Insulin-induced vasodilatation: physiology or pharmacology?
Diabetologia 41: 369-379, 1998.
52. Zhang R, Zuckerman JH, Giller CA, Levine BD. Transfer function analysis of dynamic
cerebral autoregulation in humans. Am J Physiol Heart Circ Physiol 274: H233-H241, 1998.
Page 19 of 25
Copyright Information

AJP H-00045-2007.R1 Hyperglycemia and the cerebrovascular response to exercise 20
Table 1. Systemic and cerebrovascular hemodynamic variablesClamp 1 Rest control Exercise control Rest clamp Exercise clamp
EU 89 ± 9 109 ± 11‡ 85 ± 8 105 ± 11**MAP (mmHg)
HY 91 ± 6 112 ± 14‡ 89 ± 7 111 ± 11**EU 66 ± 8 81 ± 7‡ 69 ± 10‡ 88 ± 12**
Heart rate (beats·min-1)HY 62 ± 8 86 ± 10‡ 64 ± 6 95 ± 13**
EU 84 ± 11 89 ± 11 88 ± 11 95 ± 11Stroke volume (ml)
HY 85 ± 8 85 ± 8 91 ± 14 98 ± 8
EU 4.5 ± 0.7 6.2 ± 0.9‡ 6.0 ± 0.4‡ 8.6 ± 1.0**Cardiac output (l·min-1)
HY 4.4 ± 0.7 6.4 ± 0.9‡ 5.8 ± 1.0† 9.3 ± 1.3**EU 55 ± 5 69 ± 8‡ 57 ± 8 72 ± 5*
Pulse pressure (mmHg)HY 56 ± 6 68 ± 6‡ 59 ± 6 75 ± 8**EU 1051 ± 206 953 ± 231‡ 861 ± 110‡ 742 ± 105**
SVRi (dyn·s·m-5)HY 1073 ± 166 955 ± 129 956 ± 173‡ 728 ± 83**
EU 43 ± 7 49 ± 10‡ 42 ± 9 46 ± 6MCA Vmean (cm·s-1)
HY 39 ± 6 46 ± 12‡ 43 ± 7† 47 ± 14EU 2.06 ± 0.30 2.28 ± 0.46‡ 2.07 ± 0.43 2.33 ± 0.33*
CVRi (mmHg·cm-1·s-1)HY 2.37 ± 0.37 2.58 ± 0.60 2.10 ± 0.36† 2.50 ± 0.61*EU 37.95 ± 1.59 37.43 ± 2.78 37.05 ± 2.38 36.98 ± 2.78
PaCO2 (mmHg)HY 37.28 ± 2.97 38.33 ± 3.20 36.83 ± 2.12 36.90 ± 2.97EU 189 ± 93 238 ± 114 278 ± 95 237 ± 87
NorepinephrineART (pmol·l-1)HY 217 ± 45 303 ± 76 256 ± 68 381 ± 260EU 102 ± 56 85 ± 26 95 ± 40 106 ± 32
EpinephrineART (pmol·l-1)HY 95 ± 40 108 ± 40 83 ± 59 102 ± 37EU -33 ± 69 13 ± 48 19 ± 53 -97 ± 140
NorepinephrineAV (pmol·l-1)HY -21 ± 34 -6 ± 74 -1 ± 28 1 ± 147EU 26 ± 34 4 ± 11 2 ± 8 -4 ± 24
EpinephrineAV (pmol·l-1)HY 15 ± 14 17 ± 28 17 ± 57 1 ± 28EU 0.7 ± 0.3 1.2 ± 0.4† 1.1 ± 0.2‡ 1.9 ± 0.6**
LactateART (mmol·l-1)HY 0.9 ± 0.3 1.4 ± 0.5† 1.6 ± 0.3‡ 2.8 ± 0.9**EU -0.1 ± 0.1 0.0 ± 0.1 -0.1 ± 0.1 0.0 ± 0.1
LactateAV (mmol·l-1)HY -0.1 ± 0.1 -0.2 ± 0.4 -0.1 ± 0.1 -0.1 ± 0.1EU 0.6 ± 0.2 0.6 ± 0.2 0.5 ± 0.1 0.4 ± 0.3
GlucoseAV (mmol·l-1)HY 0.5 ± 0.2 0.5 ± 0.2 -0.1 ± 0.5 0.0 ± 0.3
1 EU, euglycemia; HY, hyperglycemic clamp. † P < 0.05 versus rest control, ‡ P < 0.01 versus rest control, * P < 0.05 versus rest clamp, ** P < 0.01 versus rest clamp. Values are mean ± SD for 7 subjects. MAP, mean arterial pressure; SVRi, systemic vascular resistance index; ART, arterial; MCA Vmean, middle cerebral artery mean cerebral blood velocity; CVRi, cerebral vascular resistance index; AV, Cerebral arterio-venous difference
Page 20 of 25
Copyright Information

AJP H-00045-2007.R1 Hyperglycemia and the cerebrovascular response to exercise 21
Table 2. Transfer function gain, phase and coherence function Clamp 1 Control Clamp
EU 5.7 ± 4.2 3.6 ± 3.2MAPpower (mmHg2·Hz-1)
HY 5.7 ± 4.6 6.0 ± 5.1EU 1.8 ± 1.0 1.6 ± 0.8
MCA Vmean power ((cm·s-1)2·Hz-1)HY 2.4 ± 1.5 2.5 ± 1.9
EU 0.84 ± 0.07 0.84 ± 0.09Coherence (k2)
HY 0.81 ± 0.10 0.81 ± 0.13
EU 50 ± 6 50 ± 5Phase (degrees)
HY 49 ± 5 50 ± 5EU 0.61 ± 0.18 0.68 ± 0.26
Gain (cm·s-1·mmHg-1)HY 0.58 ± 0.09 0.60 ± 0.16EU 1.21 ± 0.26 1.32 ± 0.24
Normalized gain (%·%-1)HY 1.28 ± 0.25 1.26 ± 0.28
MAPpower, mean arterial blood pressure low frequency power; MCA Vmean power, middle cerebral artery mean blood flow velocity power. Values are mean ± SD for 7 subjects.
Page 21 of 25
Copyright Information

AJP H-00045-2007.R1 Hyperglycemia and the cerebrovascular response to exercise 22
Legends to figures
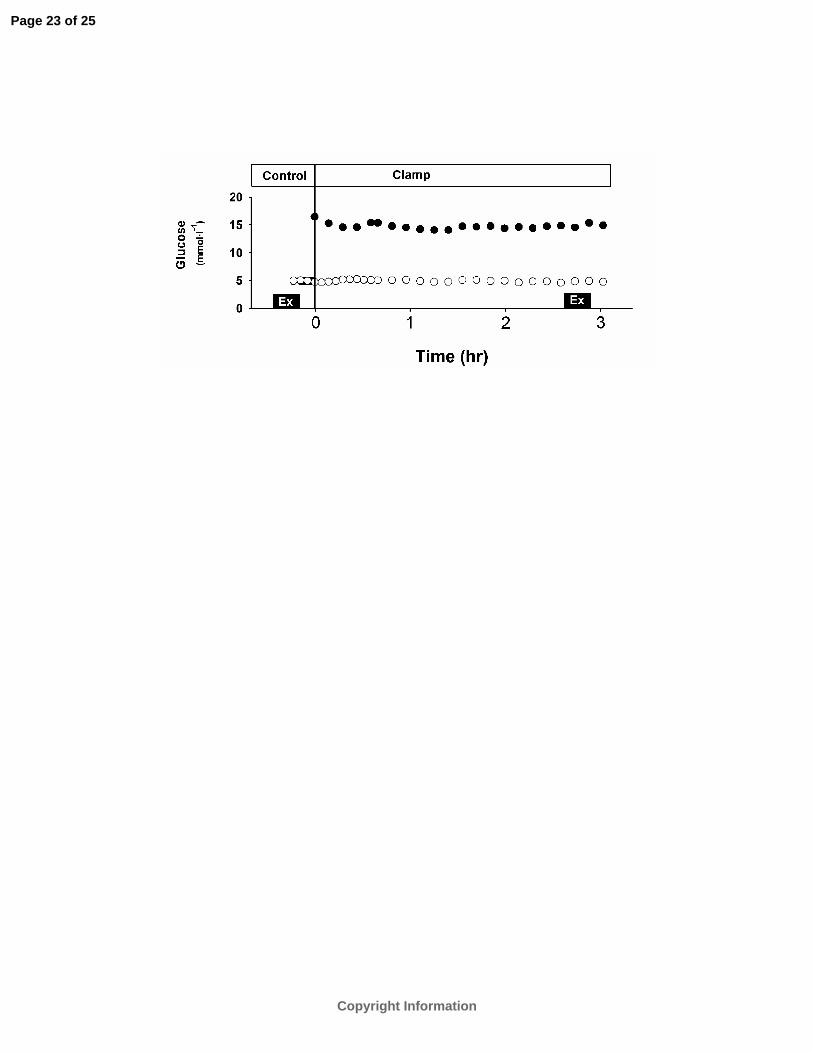
Figure 1
Plasma glucose during euglycemic (open circles) and hyperglycemic (closed circles) clamp for 7
subjects. Bars: rhythmic handgrip exercise.
Figure 2
Mean arterial pressure (MAP), middle cerebral artery blood flow velocity (MCA Vmean), heart rate
(HR) and cardiac output (CO) responses to rhythmic handgrip during euglycemia (EU: open circles)
and hyperglycemia (HY: closed circles) versus control (CTRL: squares).
† P < 0.05 vs. rest (t = -3 min); ‡ P < 0.01 vs. rest; * P < 0.05 vs. control; ** P < 0.01 vs. control.
Values are mean ± SEM for 7 subje cts. Bars: rhythmic handgrip exercise.
Figure 3
Responses of cerebral and systemic vascular resistance indices to exercise during euglycemia (EU:
open circles) and hyperglycemia (HY: closed circles) versus control (CTRL: squares). CVRi:
cerebrovascular resistance index; SVRi: systemic vascular resistance index; † P < 0.05 vs. rest (t = -3
min); ‡ P < 0.01 versus rest; * P < 0.05 vs. control, ** P < 0.01 vs. control. Values are mean ± SEM
for 7 subjects. Bars: rhythmic handgrip exercise.
Page 22 of 25
Copyright Information
Page 23 of 25
Copyright Information

Page 24 of 25
Copyright Information

Page 25 of 25
Copyright Information
Copyright © 2022 FDOKUMEN