Effects of color sample display and color sample grouping on screen layout usability for customized...
10
Effects of color sample display and color sample grouping on screen layout usability for customized product color selection Fong-Gong Wu a, * , Cheih-Ying Chen b , Ying-Jye Lee c , Rain Chen d a Department of Industrial Design, National Cheng Kung University, 1, Ta-Hsueh Road, Tainan 70101, Taiwan b Department of Multimedia Design, Fortune Institute of Technology, No.1-10, Nwongchang Rd., Daliao Township, Kaohsiung County 831, Taiwan c Department of Cultural Business Development, National Kaohsiung University of Applied Sciences, 415 Chien Kung Road, Kaohsiung 807, Taiwan d Department of Visual Communication Design, Southern Taiwan University, 1, Nantai St, Yung-Kang City, Tainan County 710, Taiwan article info Keywords: Web interface Usability Color sample grouping Color sample display Color information overload abstract This study investigates the effects of color sample display and color sample grouping on the usability (task efficiency and user preference) of a color combination interface. A 180-subject nested design exper- iment tested each of the three levels of color sample grouping (associative color number, color series, and product section) against each of the two levels of color sample display (color chip, product thumbnail) for efficiency and effectiveness (search time and error rate). A separate 30-subject experiment evaluated user preference. Of the three grouping types, product section (grouping of color chips or product thumbnails to corre- spond with modular sections of a product preview image) yielded the lowest search time and error rates. Of the two display types, product thumbnails achieved the highest user preference. Of the six formation- display configurations, color sample chips grouped by product section yielded both the lowest search time and highest preference. Ó 2009 Elsevier Ltd. All rights reserved. Fong-Gong Wu received his BSE degree in Industrial Design from National Cheng Kung University (NCKU) in 1977, and MID degree from Syracuse University in 1985. Fong-Gong was an assis- tant designer at Sino Design Co. before joining the Cheng Kung Industrial Design Department in 1977. He was invited to be the secretary general of China Industrial Designer Association (CIDA) (1989–1990). From 1989 to 1992, he was the chairman in the ID Department and the founder head of the ID Institute at NCKU. He was elected as an executive director and chairman of Southern Taiwan branch of CIDA (1991–1992). From 2007 to 2008, he was the vice dean in the Planning and Design College, NCKU. In 2006, he was awarded year of outstanding research from College of Plan- ning and Design, NCKU. In 2008, he was awarded year of outstand- ing teaching from his college. He now is a professor in department of Industrial Design, NCKU. His research interests include ergo- nomic design and design philosophy. 1. Introduction 1.1. Mass customization in product color Internet-based mass customization has become an important consumer activity in many industries. Today’s consumer prefers to choose products from a wide variety of styles that combine dif- ferent colors and forms. In the automobile industry, DaimlerChrys- ler Mercedes-Benz’s ‘‘Smart” car is a well-known example of mass customization in color choice. In the mobile phone industry, there are many choices of color for covers (e.g., Sony Ericsson, www. styleupcover.com: Design Your Own Gadgets). In the sports shoe industry, consumers can select colors, fit and materials (e.g., Nike, www.nikeid.com). Modular product design, which maximizes product variety by offering each product as a set of independently reusable and inter- changeable modules, is considered a key enabler for efficient mass customization, and it often increases the manufacturers’ strategic flexibility in a fast-paced market environment (Starr, 1965). For example, modularization of an automobile allows buyers to cus- tomize features such as exterior color, engine power, interior color and safety devices (Salvador, Forza, & Rungtusanatham, 2002). Modularity increases product variety and strategic flexibility while reducing development time, development costs and managerial complexity (Muffatto & Rovda, 2000). Color correlates highly with consumer impressions of a product (Yun, Han, Hong, & Kim, 2003). Different color combinations can achieve different visual effects and create a more pleasing and styl- ish product image (Ma, Chen, & Wu, 2007). Modularity in color choice has become a common strategy in the struggle to meet indi- vidual consumer preferences at low cost and low risk (Watanabe & Ane, 2004). Color customization is now available for many 0747-5632/$ - see front matter Ó 2009 Elsevier Ltd. All rights reserved. doi:10.1016/j.chb.2009.08.003 * Corresponding author. Tel.: +886 6 2826451; fax: +886 6 2826452. E-mail address: [email protected] (F.-G. Wu). Computers in Human Behavior 26 (2010) 51–60 Contents lists available at ScienceDirect Computers in Human Behavior journal homepage: www.elsevier.com/locate/comphumbeh
-
Upload
independent -
Category
Documents
-
view
0 -
download
0
Transcript of Effects of color sample display and color sample grouping on screen layout usability for customized...

Computers in Human Behavior 26 (2010) 51–60
Contents lists available at ScienceDirect
Computers in Human Behavior
journal homepage: www.elsevier .com/locate /comphumbeh
Effects of color sample display and color sample grouping on screen layoutusability for customized product color selection
Fong-Gong Wu a,*, Cheih-Ying Chen b, Ying-Jye Lee c, Rain Chen d
a Department of Industrial Design, National Cheng Kung University, 1, Ta-Hsueh Road, Tainan 70101, Taiwanb Department of Multimedia Design, Fortune Institute of Technology, No.1-10, Nwongchang Rd., Daliao Township, Kaohsiung County 831, Taiwanc Department of Cultural Business Development, National Kaohsiung University of Applied Sciences, 415 Chien Kung Road, Kaohsiung 807, Taiwand Department of Visual Communication Design, Southern Taiwan University, 1, Nantai St, Yung-Kang City, Tainan County 710, Taiwan
a r t i c l e i n f o
Keywords:Web interfaceUsabilityColor sample groupingColor sample displayColor information overload
0747-5632/$ - see front matter � 2009 Elsevier Ltd. Adoi:10.1016/j.chb.2009.08.003
* Corresponding author. Tel.: +886 6 2826451; fax:E-mail address: [email protected] (F.-G.
a b s t r a c t
This study investigates the effects of color sample display and color sample grouping on the usability(task efficiency and user preference) of a color combination interface. A 180-subject nested design exper-iment tested each of the three levels of color sample grouping (associative color number, color series, andproduct section) against each of the two levels of color sample display (color chip, product thumbnail) forefficiency and effectiveness (search time and error rate). A separate 30-subject experiment evaluated userpreference.
Of the three grouping types, product section (grouping of color chips or product thumbnails to corre-spond with modular sections of a product preview image) yielded the lowest search time and error rates.Of the two display types, product thumbnails achieved the highest user preference. Of the six formation-display configurations, color sample chips grouped by product section yielded both the lowest searchtime and highest preference.
� 2009 Elsevier Ltd. All rights reserved.
Fong-Gong Wu received his BSE degree in Industrial Designfrom National Cheng Kung University (NCKU) in 1977, and MIDdegree from Syracuse University in 1985. Fong-Gong was an assis-tant designer at Sino Design Co. before joining the Cheng KungIndustrial Design Department in 1977. He was invited to be thesecretary general of China Industrial Designer Association (CIDA)(1989–1990). From 1989 to 1992, he was the chairman in the IDDepartment and the founder head of the ID Institute at NCKU. Hewas elected as an executive director and chairman of SouthernTaiwan branch of CIDA (1991–1992). From 2007 to 2008, he wasthe vice dean in the Planning and Design College, NCKU. In 2006,he was awarded year of outstanding research from College of Plan-ning and Design, NCKU. In 2008, he was awarded year of outstand-ing teaching from his college. He now is a professor in departmentof Industrial Design, NCKU. His research interests include ergo-nomic design and design philosophy.
1. Introduction
1.1. Mass customization in product color
Internet-based mass customization has become an importantconsumer activity in many industries. Today’s consumer prefers
ll rights reserved.
+886 6 2826452.Wu).
to choose products from a wide variety of styles that combine dif-ferent colors and forms. In the automobile industry, DaimlerChrys-ler Mercedes-Benz’s ‘‘Smart” car is a well-known example of masscustomization in color choice. In the mobile phone industry, thereare many choices of color for covers (e.g., Sony Ericsson, www.styleupcover.com: Design Your Own Gadgets). In the sports shoeindustry, consumers can select colors, fit and materials (e.g., Nike,www.nikeid.com).
Modular product design, which maximizes product variety byoffering each product as a set of independently reusable and inter-changeable modules, is considered a key enabler for efficient masscustomization, and it often increases the manufacturers’ strategicflexibility in a fast-paced market environment (Starr, 1965). Forexample, modularization of an automobile allows buyers to cus-tomize features such as exterior color, engine power, interior colorand safety devices (Salvador, Forza, & Rungtusanatham, 2002).Modularity increases product variety and strategic flexibility whilereducing development time, development costs and managerialcomplexity (Muffatto & Rovda, 2000).
Color correlates highly with consumer impressions of a product(Yun, Han, Hong, & Kim, 2003). Different color combinations canachieve different visual effects and create a more pleasing and styl-ish product image (Ma, Chen, & Wu, 2007). Modularity in colorchoice has become a common strategy in the struggle to meet indi-vidual consumer preferences at low cost and low risk (Watanabe &Ane, 2004). Color customization is now available for many
52 F.-G. Wu et al. / Computers in Human Behavior 26 (2010) 51–60
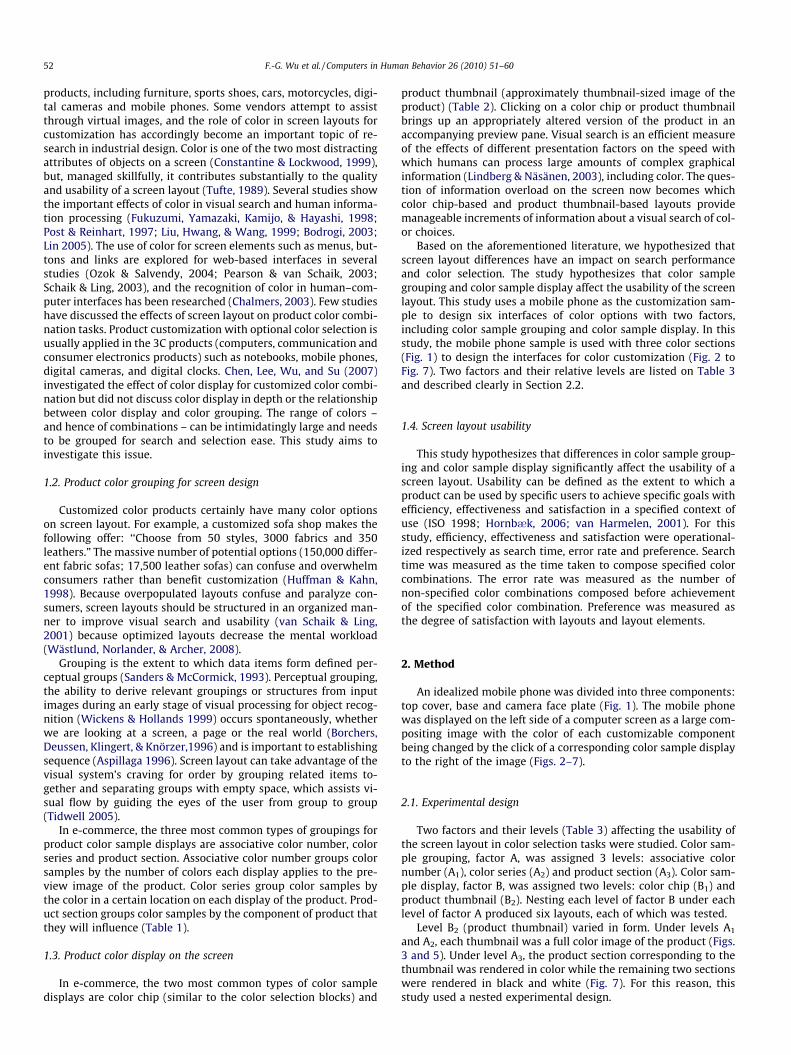
products, including furniture, sports shoes, cars, motorcycles, digi-tal cameras and mobile phones. Some vendors attempt to assistthrough virtual images, and the role of color in screen layouts forcustomization has accordingly become an important topic of re-search in industrial design. Color is one of the two most distractingattributes of objects on a screen (Constantine & Lockwood, 1999),but, managed skillfully, it contributes substantially to the qualityand usability of a screen layout (Tufte, 1989). Several studies showthe important effects of color in visual search and human informa-tion processing (Fukuzumi, Yamazaki, Kamijo, & Hayashi, 1998;Post & Reinhart, 1997; Liu, Hwang, & Wang, 1999; Bodrogi, 2003;Lin 2005). The use of color for screen elements such as menus, but-tons and links are explored for web-based interfaces in severalstudies (Ozok & Salvendy, 2004; Pearson & van Schaik, 2003;Schaik & Ling, 2003), and the recognition of color in human–com-puter interfaces has been researched (Chalmers, 2003). Few studieshave discussed the effects of screen layout on product color combi-nation tasks. Product customization with optional color selection isusually applied in the 3C products (computers, communication andconsumer electronics products) such as notebooks, mobile phones,digital cameras, and digital clocks. Chen, Lee, Wu, and Su (2007)investigated the effect of color display for customized color combi-nation but did not discuss color display in depth or the relationshipbetween color display and color grouping. The range of colors –and hence of combinations – can be intimidatingly large and needsto be grouped for search and selection ease. This study aims toinvestigate this issue.
1.2. Product color grouping for screen design
Customized color products certainly have many color optionson screen layout. For example, a customized sofa shop makes thefollowing offer: ‘‘Choose from 50 styles, 3000 fabrics and 350leathers.” The massive number of potential options (150,000 differ-ent fabric sofas; 17,500 leather sofas) can confuse and overwhelmconsumers rather than benefit customization (Huffman & Kahn,1998). Because overpopulated layouts confuse and paralyze con-sumers, screen layouts should be structured in an organized man-ner to improve visual search and usability (van Schaik & Ling,2001) because optimized layouts decrease the mental workload(Wästlund, Norlander, & Archer, 2008).
Grouping is the extent to which data items form defined per-ceptual groups (Sanders & McCormick, 1993). Perceptual grouping,the ability to derive relevant groupings or structures from inputimages during an early stage of visual processing for object recog-nition (Wickens & Hollands 1999) occurs spontaneously, whetherwe are looking at a screen, a page or the real world (Borchers,Deussen, Klingert, & Knörzer,1996) and is important to establishingsequence (Aspillaga 1996). Screen layout can take advantage of thevisual system’s craving for order by grouping related items to-gether and separating groups with empty space, which assists vi-sual flow by guiding the eyes of the user from group to group(Tidwell 2005).
In e-commerce, the three most common types of groupings forproduct color sample displays are associative color number, colorseries and product section. Associative color number groups colorsamples by the number of colors each display applies to the pre-view image of the product. Color series group color samples bythe color in a certain location on each display of the product. Prod-uct section groups color samples by the component of product thatthey will influence (Table 1).
1.3. Product color display on the screen
In e-commerce, the two most common types of color sampledisplays are color chip (similar to the color selection blocks) and
product thumbnail (approximately thumbnail-sized image of theproduct) (Table 2). Clicking on a color chip or product thumbnailbrings up an appropriately altered version of the product in anaccompanying preview pane. Visual search is an efficient measureof the effects of different presentation factors on the speed withwhich humans can process large amounts of complex graphicalinformation (Lindberg & Näsänen, 2003), including color. The ques-tion of information overload on the screen now becomes whichcolor chip-based and product thumbnail-based layouts providemanageable increments of information about a visual search of col-or choices.
Based on the aforementioned literature, we hypothesized thatscreen layout differences have an impact on search performanceand color selection. The study hypothesizes that color samplegrouping and color sample display affect the usability of the screenlayout. This study uses a mobile phone as the customization sam-ple to design six interfaces of color options with two factors,including color sample grouping and color sample display. In thisstudy, the mobile phone sample is used with three color sections(Fig. 1) to design the interfaces for color customization (Fig. 2 toFig. 7). Two factors and their relative levels are listed on Table 3and described clearly in Section 2.2.
1.4. Screen layout usability
This study hypothesizes that differences in color sample group-ing and color sample display significantly affect the usability of ascreen layout. Usability can be defined as the extent to which aproduct can be used by specific users to achieve specific goals withefficiency, effectiveness and satisfaction in a specified context ofuse (ISO 1998; Hornb�k, 2006; van Harmelen, 2001). For thisstudy, efficiency, effectiveness and satisfaction were operational-ized respectively as search time, error rate and preference. Searchtime was measured as the time taken to compose specified colorcombinations. The error rate was measured as the number ofnon-specified color combinations composed before achievementof the specified color combination. Preference was measured asthe degree of satisfaction with layouts and layout elements.
2. Method
An idealized mobile phone was divided into three components:top cover, base and camera face plate (Fig. 1). The mobile phonewas displayed on the left side of a computer screen as a large com-positing image with the color of each customizable componentbeing changed by the click of a corresponding color sample displayto the right of the image (Figs. 2–7).
2.1. Experimental design
Two factors and their levels (Table 3) affecting the usability ofthe screen layout in color selection tasks were studied. Color sam-ple grouping, factor A, was assigned 3 levels: associative colornumber (A1), color series (A2) and product section (A3). Color sam-ple display, factor B, was assigned two levels: color chip (B1) andproduct thumbnail (B2). Nesting each level of factor B under eachlevel of factor A produced six layouts, each of which was tested.
Level B2 (product thumbnail) varied in form. Under levels A1
and A2, each thumbnail was a full color image of the product (Figs.3 and 5). Under level A3, the product section corresponding to thethumbnail was rendered in color while the remaining two sectionswere rendered in black and white (Fig. 7). For this reason, thisstudy used a nested experimental design.
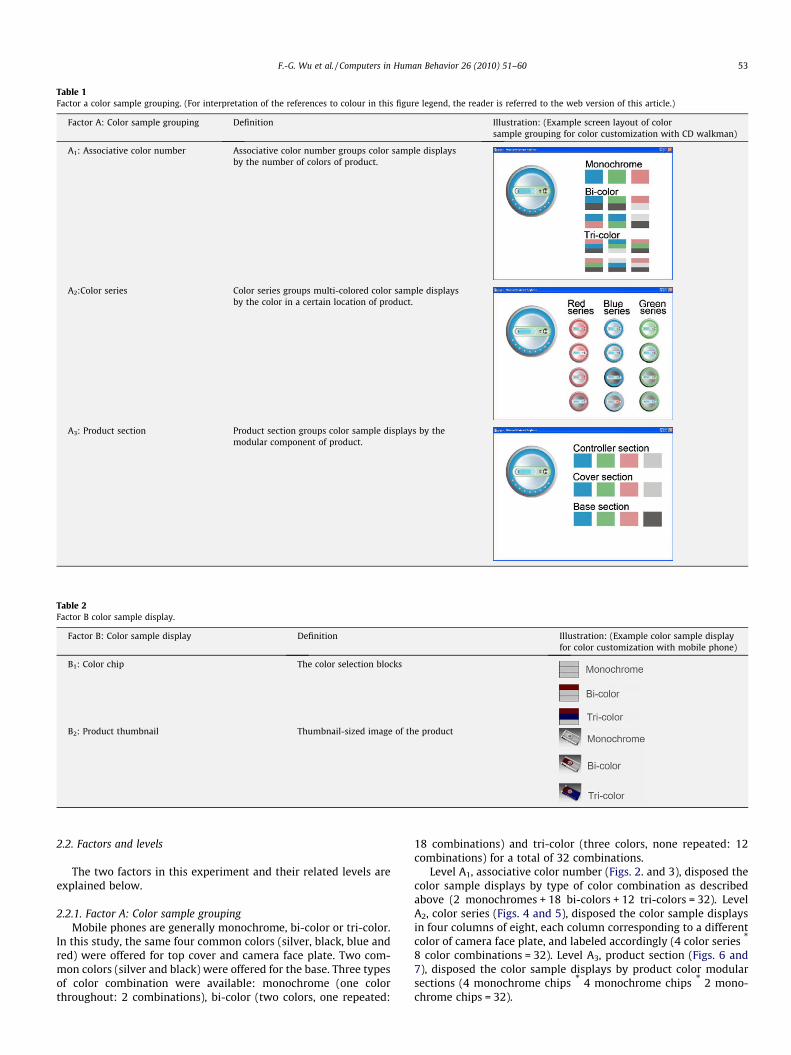
Table 1Factor a color sample grouping. (For interpretation of the references to colour in this figure legend, the reader is referred to the web version of this article.)
Factor A: Color sample grouping Definition Illustration: (Example screen layout of colorsample grouping for color customization with CD walkman)
A1: Associative color number Associative color number groups color sample displaysby the number of colors of product.
A2:Color series Color series groups multi-colored color sample displaysby the color in a certain location of product.
A3: Product section Product section groups color sample displays by themodular component of product.
Table 2Factor B color sample display.
Factor B: Color sample display Definition Illustration: (Example color sample displayfor color customization with mobile phone)
B1: Color chip The color selection blocks
B2: Product thumbnail Thumbnail-sized image of the product
F.-G. Wu et al. / Computers in Human Behavior 26 (2010) 51–60 53
2.2. Factors and levels
The two factors in this experiment and their related levels areexplained below.
2.2.1. Factor A: Color sample groupingMobile phones are generally monochrome, bi-color or tri-color.
In this study, the same four common colors (silver, black, blue andred) were offered for top cover and camera face plate. Two com-mon colors (silver and black) were offered for the base. Three typesof color combination were available: monochrome (one colorthroughout: 2 combinations), bi-color (two colors, one repeated:
18 combinations) and tri-color (three colors, none repeated: 12combinations) for a total of 32 combinations.
Level A1, associative color number (Figs. 2. and 3), disposed thecolor sample displays by type of color combination as describedabove (2 monochromes + 18 bi-colors + 12 tri-colors = 32). LevelA2, color series (Figs. 4 and 5), disposed the color sample displaysin four columns of eight, each column corresponding to a differentcolor of camera face plate, and labeled accordingly (4 color series *
8 color combinations = 32). Level A3, product section (Figs. 6 and7), disposed the color sample displays by product color modularsections (4 monochrome chips * 4 monochrome chips * 2 mono-chrome chips = 32).
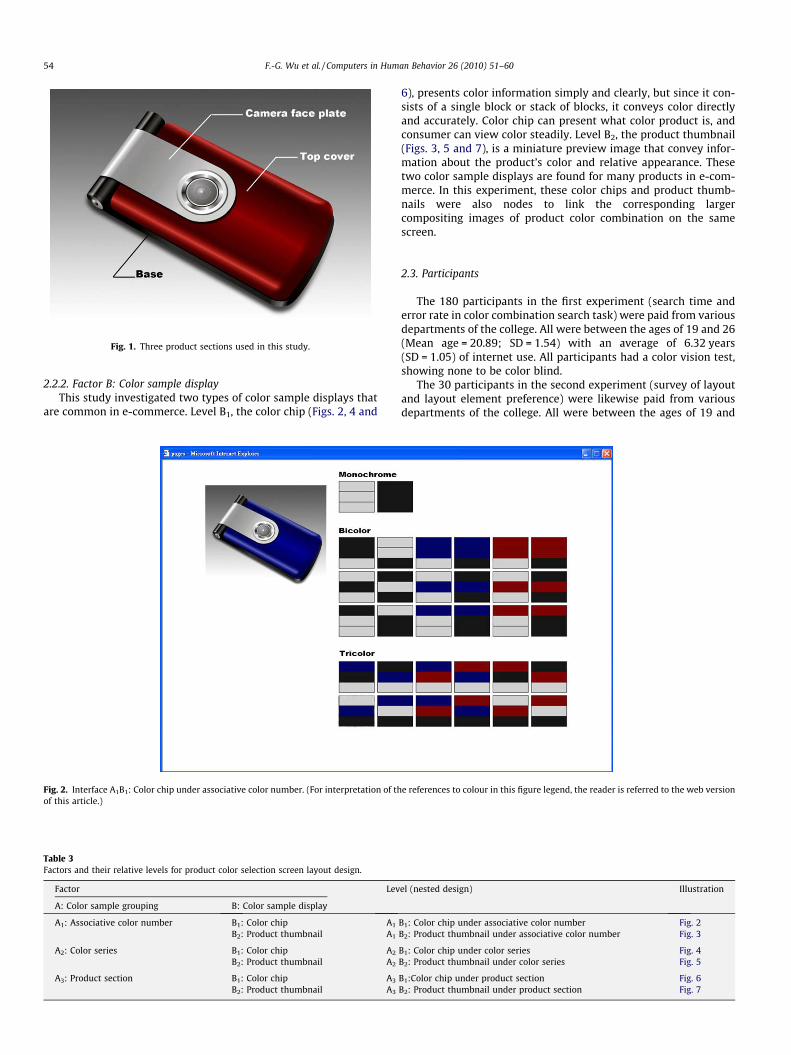
Fig. 1. Three product sections used in this study.
54 F.-G. Wu et al. / Computers in Human Behavior 26 (2010) 51–60
2.2.2. Factor B: Color sample displayThis study investigated two types of color sample displays that
are common in e-commerce. Level B1, the color chip (Figs. 2, 4 and
Fig. 2. Interface A1B1: Color chip under associative color number. (For interpretation of thof this article.)
Table 3Factors and their relative levels for product color selection screen layout design.
Factor Lev
A: Color sample grouping B: Color sample display
A1: Associative color number B1: Color chip A1
B2: Product thumbnail A1
A2: Color series B1: Color chip A2
B2: Product thumbnail A2
A3: Product section B1: Color chip A3
B2: Product thumbnail A3
6), presents color information simply and clearly, but since it con-sists of a single block or stack of blocks, it conveys color directlyand accurately. Color chip can present what color product is, andconsumer can view color steadily. Level B2, the product thumbnail(Figs. 3, 5 and 7), is a miniature preview image that convey infor-mation about the product’s color and relative appearance. Thesetwo color sample displays are found for many products in e-com-merce. In this experiment, these color chips and product thumb-nails were also nodes to link the corresponding largercompositing images of product color combination on the samescreen.
2.3. Participants
The 180 participants in the first experiment (search time anderror rate in color combination search task) were paid from variousdepartments of the college. All were between the ages of 19 and 26(Mean age = 20.89; SD = 1.54) with an average of 6.32 years(SD = 1.05) of internet use. All participants had a color vision test,showing none to be color blind.
The 30 participants in the second experiment (survey of layoutand layout element preference) were likewise paid from variousdepartments of the college. All were between the ages of 19 and
e references to colour in this figure legend, the reader is referred to the web version
el (nested design) Illustration
B1: Color chip under associative color number Fig. 2B2: Product thumbnail under associative color number Fig. 3
B1: Color chip under color series Fig. 4B2: Product thumbnail under color series Fig. 5
B1:Color chip under product section Fig. 6B2: Product thumbnail under product section Fig. 7
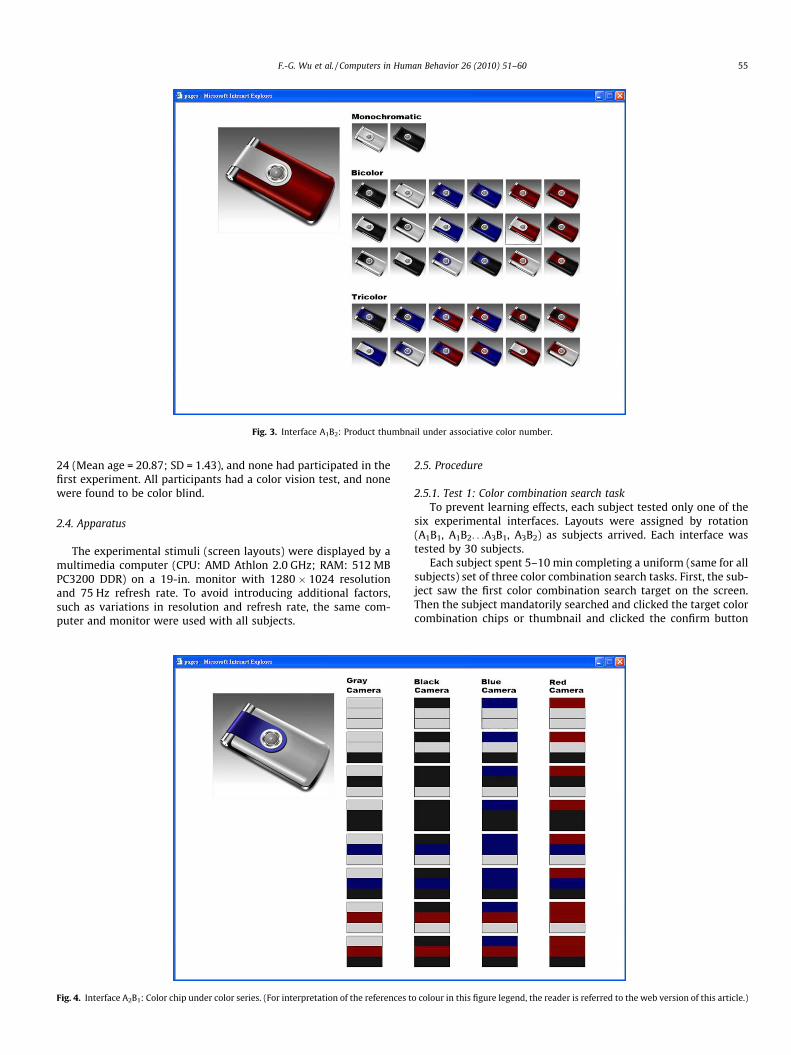
Fig. 3. Interface A1B2: Product thumbnail under associative color number.
F.-G. Wu et al. / Computers in Human Behavior 26 (2010) 51–60 55
24 (Mean age = 20.87; SD = 1.43), and none had participated in thefirst experiment. All participants had a color vision test, and nonewere found to be color blind.
2.4. Apparatus
The experimental stimuli (screen layouts) were displayed by amultimedia computer (CPU: AMD Athlon 2.0 GHz; RAM: 512 MBPC3200 DDR) on a 19-in. monitor with 1280 � 1024 resolutionand 75 Hz refresh rate. To avoid introducing additional factors,such as variations in resolution and refresh rate, the same com-puter and monitor were used with all subjects.
Fig. 4. Interface A2B1: Color chip under color series. (For interpretation of the references t
2.5. Procedure
2.5.1. Test 1: Color combination search taskTo prevent learning effects, each subject tested only one of the
six experimental interfaces. Layouts were assigned by rotation(A1B1, A1B2. . .A3B1, A3B2) as subjects arrived. Each interface wastested by 30 subjects.
Each subject spent 5–10 min completing a uniform (same for allsubjects) set of three color combination search tasks. First, the sub-ject saw the first color combination search target on the screen.Then the subject mandatorily searched and clicked the target colorcombination chips or thumbnail and clicked the confirm button
o colour in this figure legend, the reader is referred to the web version of this article.)
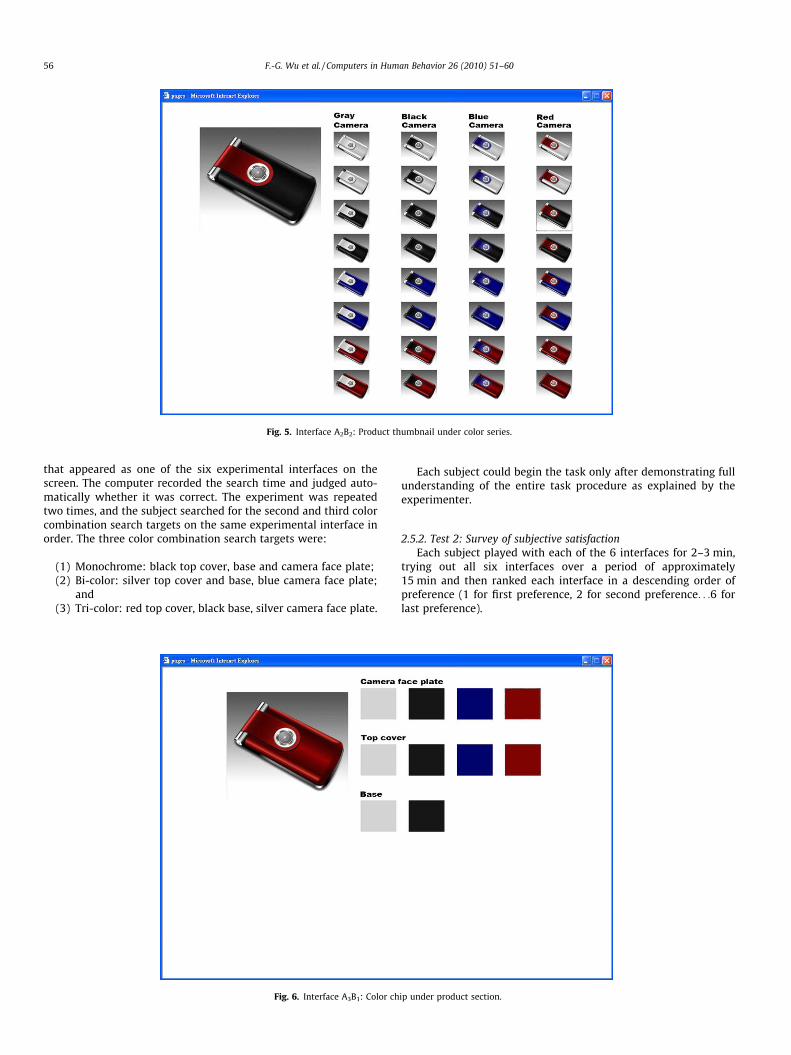
Fig. 5. Interface A2B2: Product thumbnail under color series.
56 F.-G. Wu et al. / Computers in Human Behavior 26 (2010) 51–60
that appeared as one of the six experimental interfaces on thescreen. The computer recorded the search time and judged auto-matically whether it was correct. The experiment was repeatedtwo times, and the subject searched for the second and third colorcombination search targets on the same experimental interface inorder. The three color combination search targets were:
(1) Monochrome: black top cover, base and camera face plate;(2) Bi-color: silver top cover and base, blue camera face plate;
and(3) Tri-color: red top cover, black base, silver camera face plate.
Fig. 6. Interface A3B1: Color ch
Each subject could begin the task only after demonstrating fullunderstanding of the entire task procedure as explained by theexperimenter.
2.5.2. Test 2: Survey of subjective satisfactionEach subject played with each of the 6 interfaces for 2–3 min,
trying out all six interfaces over a period of approximately15 min and then ranked each interface in a descending order ofpreference (1 for first preference, 2 for second preference. . .6 forlast preference).
ip under product section.

Fig. 7. Interface A3B2: Product thumbnail under product section.
F.-G. Wu et al. / Computers in Human Behavior 26 (2010) 51–60 57
2.6. Dependent variable
There were three measurable variables that were crucial to theevaluation of the screen layout: (1) Speed of performance (effi-ciency): how long did the subject take to complete the three spec-ified target of color combination search tasks? (2) Rate of error(effectiveness): How many errors did the subject click for thenon-specified target color combinations in completing the tasks?(3) Subjective satisfaction: while using the six screen layouts,which one did the subject like? The subject ranked each interfacein descending order of preference, indicating his satisfaction orexperience with the interfaces.
3. Results and analyses
3.1. Search time
Mean search times for all participants in the color combinationsearch task are given in Table 4. Analysis of variance (ANOVA) ofmean search times (Table 5) found the main effect of color samplegrouping to be significant (F(2, 174) = 21.669, p < 0.01), indicatingthat all three levels of color sample grouping significantly affectedmean search time. The main effect of color sample display was notfound to be statistically significant, indicating that neither type ofcolor sample display significantly affected mean search time.
Table 4Mean search time and error rate of all subjects in experiment 1.
Factor Mean searchtime (s)
A (Color Sample Grouping) B (Color Sample Display)
A 1 B 1 26.37A 1 B 2 25.67
A 1 26.02A 2 B 1 24.67A 2 B 2 20.20
A 2 22.43A 3 B 1 10.73A 3 B 2 16.37
A 3 13.55
3.1.1. Duncan test for color grouping in search timeThe three levels of color sample grouping showed significant ef-
fects on mean search time (Table 4). Results of Duncan’s multiplecomparison tests are given in Table 6. Mean search times for associa-tive color number (A1: 26.02 s) and color series (A2: 22.43 s) did notdiffer significantly; however, mean search time for the product sec-tion (A3: 13.55 s) was significantly shorter than mean search time forboth associative color number (F(1, 174) = 40.875, p < 0.01) and col-or series (F(1, 174) = 20.754, p < 0.01). Product section, which wasdivided into three different sections according to the color moduleparts of the mobile phone, utilized each section with 2 or 4 colorsas color options, and clicked on the colors of each section to link32, corresponding compositing images of color combination. Whilemany color combinations simultaneously on the screen were re-duced on the screen via product section, search times lowered.
3.1.2. Effects of color sample display on search timeBecause this experiment used a nested design, effects of color
sample displays are listed under color sample groupings (Table7). Neither color chip nor product thumbnail significantly affectedsearch time under associative color number or color series, butboth affected search time significantly under product section(F(1, 174) = 4.173, p = 0.043 < 0.05). Mean search time for colorchip under product section (A3B1: 10.73 s) was 5.64 s shorter thanfor product thumbnail under product section (A3B2: 16.37 s).
SD searchtime
Mean rateof error (%)
SD rateof error
MeanPreference
SDPreference
14.26 17.78 0.27 5.37 0.8112.24 15.56 0.23 2.60 1.19
16.6712.00 14.44 0.23 5.47 0.518.42 4.44 0.12 2.73 1.11
9.446.09 2.22 0.08 2.60 1.258.10 5.56 0.13 2.23 1.19
3.89
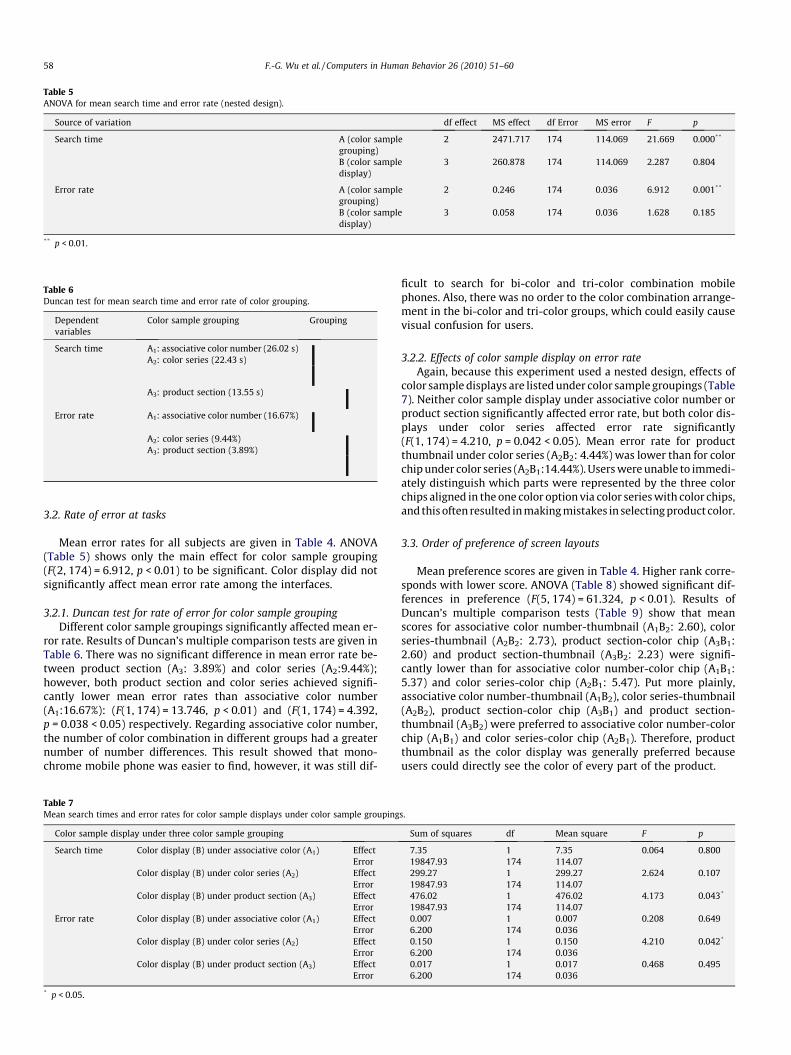
Table 5ANOVA for mean search time and error rate (nested design).
Source of variation df effect MS effect df Error MS error F p
Search time A (color samplegrouping)
2 2471.717 174 114.069 21.669 0.000**
B (color sampledisplay)
3 260.878 174 114.069 2.287 0.804
Error rate A (color samplegrouping)
2 0.246 174 0.036 6.912 0.001**
B (color sampledisplay)
3 0.058 174 0.036 1.628 0.185
** p < 0.01.
Table 6Duncan test for mean search time and error rate of color grouping.
Dependentvariables
Color sample grouping Grouping
Search time A1: associative color number (26.02 s)A2: color series (22.43 s)
A3: product section (13.55 s)
Error rate A1: associative color number (16.67%)
A2: color series (9.44%)A3: product section (3.89%)
58 F.-G. Wu et al. / Computers in Human Behavior 26 (2010) 51–60
3.2. Rate of error at tasks
Mean error rates for all subjects are given in Table 4. ANOVA(Table 5) shows only the main effect for color sample grouping(F(2, 174) = 6.912, p < 0.01) to be significant. Color display did notsignificantly affect mean error rate among the interfaces.
3.2.1. Duncan test for rate of error for color sample groupingDifferent color sample groupings significantly affected mean er-
ror rate. Results of Duncan’s multiple comparison tests are given inTable 6. There was no significant difference in mean error rate be-tween product section (A3: 3.89%) and color series (A2:9.44%);however, both product section and color series achieved signifi-cantly lower mean error rates than associative color number(A1:16.67%): (F(1, 174) = 13.746, p < 0.01) and (F(1, 174) = 4.392,p = 0.038 < 0.05) respectively. Regarding associative color number,the number of color combination in different groups had a greaternumber of number differences. This result showed that mono-chrome mobile phone was easier to find, however, it was still dif-
Table 7Mean search times and error rates for color sample displays under color sample grouping
Color sample display under three color sample grouping
Search time Color display (B) under associative color (A1) EffectError
Color display (B) under color series (A2) EffectError
Color display (B) under product section (A3) EffectError
Error rate Color display (B) under associative color (A1) EffectError
Color display (B) under color series (A2) EffectError
Color display (B) under product section (A3) EffectError
* p < 0.05.
ficult to search for bi-color and tri-color combination mobilephones. Also, there was no order to the color combination arrange-ment in the bi-color and tri-color groups, which could easily causevisual confusion for users.
3.2.2. Effects of color sample display on error rateAgain, because this experiment used a nested design, effects of
color sample displays are listed under color sample groupings (Table7). Neither color sample display under associative color number orproduct section significantly affected error rate, but both color dis-plays under color series affected error rate significantly(F(1, 174) = 4.210, p = 0.042 < 0.05). Mean error rate for productthumbnail under color series (A2B2: 4.44%) was lower than for colorchip under color series (A2B1:14.44%). Users were unable to immedi-ately distinguish which parts were represented by the three colorchips aligned in the one color option via color series with color chips,and this often resulted in making mistakes in selecting product color.
3.3. Order of preference of screen layouts
Mean preference scores are given in Table 4. Higher rank corre-sponds with lower score. ANOVA (Table 8) showed significant dif-ferences in preference (F(5, 174) = 61.324, p < 0.01). Results ofDuncan’s multiple comparison tests (Table 9) show that meanscores for associative color number-thumbnail (A1B2: 2.60), colorseries-thumbnail (A2B2: 2.73), product section-color chip (A3B1:2.60) and product section-thumbnail (A3B2: 2.23) were signifi-cantly lower than for associative color number-color chip (A1B1:5.37) and color series-color chip (A2B1: 5.47). Put more plainly,associative color number-thumbnail (A1B2), color series-thumbnail(A2B2), product section-color chip (A3B1) and product section-thumbnail (A3B2) were preferred to associative color number-colorchip (A1B1) and color series-color chip (A2B1). Therefore, productthumbnail as the color display was generally preferred becauseusers could directly see the color of every part of the product.
s.
Sum of squares df Mean square F p
7.35 1 7.35 0.064 0.80019847.93 174 114.07299.27 1 299.27 2.624 0.10719847.93 174 114.07476.02 1 476.02 4.173 0.043*
19847.93 174 114.070.007 1 0.007 0.208 0.6496.200 174 0.0360.150 1 0.150 4.210 0.042*
6.200 174 0.0360.017 1 0.017 0.468 0.4956.200 174 0.036
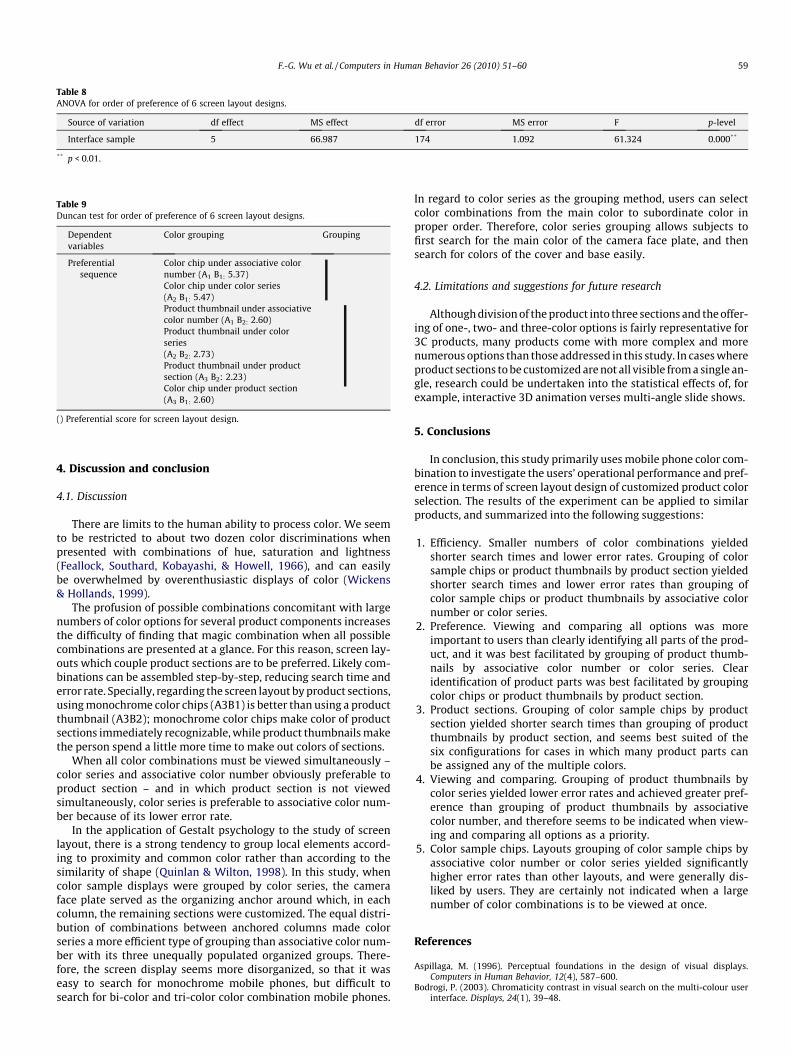
Table 8ANOVA for order of preference of 6 screen layout designs.
Source of variation df effect MS effect df error MS error F p-level
Interface sample 5 66.987 174 1.092 61.324 0.000**
** p < 0.01.
Table 9Duncan test for order of preference of 6 screen layout designs.
Dependentvariables
Color grouping Grouping
Preferentialsequence
Color chip under associative colornumber (A1 B1: 5.37)Color chip under color series(A2 B1: 5.47)Product thumbnail under associativecolor number (A1 B2: 2.60)Product thumbnail under colorseries(A2 B2: 2.73)Product thumbnail under productsection (A3 B2: 2.23)Color chip under product section(A3 B1: 2.60)
() Preferential score for screen layout design.
F.-G. Wu et al. / Computers in Human Behavior 26 (2010) 51–60 59
4. Discussion and conclusion
4.1. Discussion
There are limits to the human ability to process color. We seemto be restricted to about two dozen color discriminations whenpresented with combinations of hue, saturation and lightness(Feallock, Southard, Kobayashi, & Howell, 1966), and can easilybe overwhelmed by overenthusiastic displays of color (Wickens& Hollands, 1999).
The profusion of possible combinations concomitant with largenumbers of color options for several product components increasesthe difficulty of finding that magic combination when all possiblecombinations are presented at a glance. For this reason, screen lay-outs which couple product sections are to be preferred. Likely com-binations can be assembled step-by-step, reducing search time anderror rate. Specially, regarding the screen layout by product sections,using monochrome color chips (A3B1) is better than using a productthumbnail (A3B2); monochrome color chips make color of productsections immediately recognizable, while product thumbnails makethe person spend a little more time to make out colors of sections.
When all color combinations must be viewed simultaneously –color series and associative color number obviously preferable toproduct section – and in which product section is not viewedsimultaneously, color series is preferable to associative color num-ber because of its lower error rate.
In the application of Gestalt psychology to the study of screenlayout, there is a strong tendency to group local elements accord-ing to proximity and common color rather than according to thesimilarity of shape (Quinlan & Wilton, 1998). In this study, whencolor sample displays were grouped by color series, the cameraface plate served as the organizing anchor around which, in eachcolumn, the remaining sections were customized. The equal distri-bution of combinations between anchored columns made colorseries a more efficient type of grouping than associative color num-ber with its three unequally populated organized groups. There-fore, the screen display seems more disorganized, so that it waseasy to search for monochrome mobile phones, but difficult tosearch for bi-color and tri-color color combination mobile phones.
In regard to color series as the grouping method, users can selectcolor combinations from the main color to subordinate color inproper order. Therefore, color series grouping allows subjects tofirst search for the main color of the camera face plate, and thensearch for colors of the cover and base easily.
4.2. Limitations and suggestions for future research
Although division of the product into three sections and the offer-ing of one-, two- and three-color options is fairly representative for3C products, many products come with more complex and morenumerous options than those addressed in this study. In cases whereproduct sections to be customized are not all visible from a single an-gle, research could be undertaken into the statistical effects of, forexample, interactive 3D animation verses multi-angle slide shows.
5. Conclusions
In conclusion, this study primarily uses mobile phone color com-bination to investigate the users’ operational performance and pref-erence in terms of screen layout design of customized product colorselection. The results of the experiment can be applied to similarproducts, and summarized into the following suggestions:
1. Efficiency. Smaller numbers of color combinations yieldedshorter search times and lower error rates. Grouping of colorsample chips or product thumbnails by product section yieldedshorter search times and lower error rates than grouping ofcolor sample chips or product thumbnails by associative colornumber or color series.
2. Preference. Viewing and comparing all options was moreimportant to users than clearly identifying all parts of the prod-uct, and it was best facilitated by grouping of product thumb-nails by associative color number or color series. Clearidentification of product parts was best facilitated by groupingcolor chips or product thumbnails by product section.
3. Product sections. Grouping of color sample chips by productsection yielded shorter search times than grouping of productthumbnails by product section, and seems best suited of thesix configurations for cases in which many product parts canbe assigned any of the multiple colors.
4. Viewing and comparing. Grouping of product thumbnails bycolor series yielded lower error rates and achieved greater pref-erence than grouping of product thumbnails by associativecolor number, and therefore seems to be indicated when view-ing and comparing all options as a priority.
5. Color sample chips. Layouts grouping of color sample chips byassociative color number or color series yielded significantlyhigher error rates than other layouts, and were generally dis-liked by users. They are certainly not indicated when a largenumber of color combinations is to be viewed at once.
References
Aspillaga, M. (1996). Perceptual foundations in the design of visual displays.Computers in Human Behavior, 12(4), 587–600.
Bodrogi, P. (2003). Chromaticity contrast in visual search on the multi-colour userinterface. Displays, 24(1), 39–48.

60 F.-G. Wu et al. / Computers in Human Behavior 26 (2010) 51–60
Borchers, J., Deussen, O., Klingert, A., & Knörzer, C. (1996). Layout rules for graphicalweb documents. Computer graphics, 20, 415–426.
Chalmers, P. A. (2003). The role of cognitive theory in human–computer interface.Computers in Human Behavior, 19(5), 593–607.
Chen, C. Y., Lee, Y. J., Wu, F. G., & Su, C. F. (2007). Screen layout on color search taskfor customized product color combination selection. Lecture Notes in ComputerScience, 4551, 32–40.
Constantine, L. L., & Lockwood, L. A. D. (1999). Software for use: A practical guide tothe models and methods. Reading, MA: Addison-Wesley, Longman.
Feallock, J., Southard, J., Kobayashi, M., & Howell, W. (1966). Absolute judgments ofcolors in the Federal Standards System. Journal of Applied Psychology, 50,266–272.
Fukuzumi, S., Yamazaki, T., Kamijo, K., & Hayashi, Y. (1998). Physiological andpsychological evaluation for visual display color readability: a visual evokedpotential study and a subjective evaluation study. Ergonomics, 41(1), 89–108.
Hornb�k, K. (2006). Current practice in measuring usability: Challenges to usabilitystudies and research. International Journal of Human–Computer Studies, 64(2),79–102.
Huffman, C., & Kahn, B. E. (1998). Variety for sale: Mass customization or massconfusion? Journal of Retailing, 74(4), 491–513.
Lin, C. C. (2005). Effects of screen luminance combination and text color on visualperformance with TFT-LCD. International Journal of Industrial Ergonomics, 35(3),229–235.
Lindberg, T., & Näsänen, R. (2003). The effect of icon spacing and size on the speed oficon processing in the human visual system. Displays, 24(3), 111–120.
Liu, T. H., Hwang, S. L., & Wang, J. C. (1999). A computerized calibration servicesupporting system. II. A web interface design. International Journal of ComputerApplications in Technology, 12(1), 60–70.
Ma, M. Y., Chen, C. Y., & Wu, F. G. (2007). A design decision-making support modelfor customized product color combination. Computers in Industry, 58(6),504–518.
Muffatto, M., & Rovda, M. (2000). Developing product platforms: Analysis of thedevelopment process. Technovation, 20(11), 617–630.
Ozok, A. A., & Salvendy, G. (2004). Twenty guidelines for the design of Web-basedinterfaces with consistent language. Computers in Human Behavior, 20(2), 149–161.
Pearson, R., & van Schaik, P. (2003). The effect of spatial layout of and link colour inweb pages on performance in a visual search task and an interactive search task.International Journal of Human–Computer Studies, 59(3), 327–353.
Post, D. L., & Reinhart, W. F. (1997). Image quality of two-primary color active-matrix liquid-crystal displays. Human Factors, 39(4), 618–641.
Quinlan, P. T., & Wilton, R. N. (1998). Grouping by proximity or similarity?Competition between the Gestalt principles in vision. Perception, 27(4),417–430.
Salvador, F., Forza, C., & Rungtusanatham, M. (2002). Modularity, product variety,production volume, and component source. theorizing, beyond genericprescriptions. Journal of operations management, 20, 549–575.
Sanders, M. S., & McCormick, E. J. (1993). Human factors in engineering and design(7th ed.). New York: McGraw-Hill.
Starr, M. K. (1965). Modular-production: A new concept. Harvard Business Review,43(6), 131–142.
Tidwell, J. (2005). Designing interfaces, O’Reilly.Tufte, E. (1989). Visual design of the user interface, IBM, Armonk, New York.van Harmelen, M. (Ed.), (2001). Object modeling and user interface design: Designing
interactive systems, Addison-Wesley.van Schaik, P., & Ling, J. (2001). The effects of frame layout and differential
background contrast on visual search performance in Web pages. Interactingwith Computers, 13(5), 513–525.
van Schaik, P., & Ling, J. (2003). The effect of link colour on information retrieval ineducational intranet use. Computers in Human Behavior, 19(5), 553–564.
Wästlund, E., Norlander, T., & Archer, T. (2008). The effect of page layout on mentalworkload: A dual-task experiment. Computers in Human Behavior, 24(3),1229–1245.
Watanabe, C., & Ane, B. K. (2004). Constructing a virtuous cycle of manufacturingagility: concurrent roles of modularity in improving agility and reducing leadtime. Technovation, 24(7), 573–583.
Wickens, C. D., & Hollands, J. G. (1999). Engineering psychology and humanperformance. Englewood Cliffs: Prentice Hall.
Yun, M. H., Han, S., Hong, S., & Kim, J. (2003). Incorporating user satisfactioninto the look-and-feel of mobile phone design. Ergonomics, 46(13–14),1423–1440.