Effects of accounts receivable management on the financial ...
85
Effects of accounts receivable management on the financial performance of construction companies in Rwanda, a case of NPD Ltd. A dissertation for the award of the degree of Master of Business Administration, Finance option. MUGARURA Fred Reg No: 218014748 May 2021
-
Upload
khangminh22 -
Category
Documents
-
view
2 -
download
0
Transcript of Effects of accounts receivable management on the financial ...
Effects of accounts receivable management on the financial performance of
construction companies in Rwanda, a case of NPD Ltd.
A dissertation for the award of the degree of Master of Business
Administration, Finance option.
MUGARURA Fred
Reg No: 218014748
May 2021

i
DECLARATION
This research project entitled “Effects of accounts receivable management on the financial
performance of construction companies in Rwanda. A case of NPD Ltd”, is my original
work and has never been submitted at this or any other university or college for the award of any
academic qualification.
Signature Date
……………………………….. ………………………………..
Mugarura Fred

ii
DEDICATION
To my wife Kagaju Esther, your encouragement and support have always kept me going. To my
children Kaliza Mugarura Olga and Nshuti Mugarura Elgar, you have always put a smile on my
face.

iii
AKNOWLEDGEMENTS
I thank the almighty God for the gift of life, and for giving me all the resources that enabled me
complete this project. I also wish to sincerely thank my supervisor Dr. Twesige Daniel for his
guidance, support and encouragement. Thanks to my MBA classmates for their support during
the whole journey.
Finally, I wish to extend my sincere appreciation to my parents for the foundation they laid, upon
which I am still standing.

iv
TABLE OF CONTENTS
DECLARATION............................................................................................................................ I
DEDICATION.............................................................................................................................. II
AKNOWLEDGEMENTS .......................................................................................................... III
TABLE OF CONTENTS ........................................................................................................... IV
LIST OF TABLES ....................................................................................................................... X
LIST OF FIGURES .................................................................................................................. XII
LIST OF APPENDICES ......................................................................................................... XIII
LIST OF ABBREVIATIONS ................................................................................................. XIV
ABSTRACT ................................................................................................................................ XV
CHAPTER ONE: INTRODUCTION ........................................................................................ 1
1.0 BACKGROUND OF THE STUDY ....................................................................................... 1
1.1 STATEMENT OF THE PROBLEM .................................................................................... 3
1.2 OBJECTIVES OF THE STUDY ........................................................................................... 4
1.2.1 GENERAL OBJECTIVES OF THE STUDY ................................................................... 4
1.2.2 SPECIFIC OBJECTIVES................................................................................................... 4
1.3 RESEARCH QUESTIONS .................................................................................................... 4
v
1.4 JUSTIFICATION OF THE STUDY ..................................................................................... 4
1.5 SIGNIFICANCE OF THE STUDY ...................................................................................... 5
1.6 SCOPE OF THE STUDY ....................................................................................................... 5
1.7 ORGANISATION OF THE STUDY .................................................................................... 6
CHAPTER TWO: LITERATURE REVIEW ........................................................................... 7
2.0 INTRODUCTION................................................................................................................... 7
2.1 THEORETICAL FRAMEWORK ........................................................................................ 7
2.2 CONCEPTUAL FRAMEWORK .......................................................................................... 7
2.3 REVIEW OF RELATED LITERATURE............................................................................ 8
2.3.1 ACCOUNTS RECEIVABLE .............................................................................................. 8
2.3.2 ACCOUNTS RECEIVABLE MANAGEMENT AND PROFITABILITY .................... 8
2.3.3 ACCOUNTS RECEIVABLE MANAGEMENT AND LIQUIDITY .............................. 9
2.3.4 IMPROVING ACCOUNTS RECEIVABLE MANAGEMENT TO INCREASE
LIQUIDITY ................................................................................................................................. 10
2.4 CREDIT STANDARDS AND MANAGEMENT ............................................................... 10
2.4.1 CREDIT POLICY ............................................................................................................. 11
2.4.2 TIPS OF CREDIT MANAGEMENT .............................................................................. 12
2.4.3 CREDIT PERIOD ............................................................................................................. 13
2.4.5 CASH DISCOUNT ............................................................................................................ 14
2.4.6 COLLECTION EFFORTS ............................................................................................... 14
vi
2.5 MONITORING AND CONTROL OF ACCOUNTS RECEIVABLES .......................... 14
2.5.1 THE DAYS’ SALES OUTSTANDING (DSO)................................................................ 15
2.5.2 ACCOUNTS RECEIVABLE TURNOVER .................................................................... 15
2.5.3 SPECIAL COLLECTION EFFORTS ............................................................................. 15
2.6 RECONCILIATION AND RECOVERY ........................................................................... 16
2.6.1 HIGH-IMPACT ACTION PROGRAM .......................................................................... 17
2.6.2 LATE PAYMENT FEES AND PROMPT PAYMENT DISCOUNT ........................... 18
2.7 BENEFITS OF EFFECTIVE MANAGEMENT OF RECEIVABLES ........................... 18
CONFLICTING PRIORITIES ................................................................................................. 19
2.7.1 SPEED UP RECEIVABLES COLLECTION ................................................................ 19
2.8 EMPIRICAL REVIEW........................................................................................................ 20
2.9 SUMMARY OF LITERATURE REVIEW........................................................................ 22
CHAPTER THREE: METHODOLOGY................................................................................. 23
3.0 INTRODUCTION................................................................................................................. 23
3.1 RESEARCH DESIGN .......................................................................................................... 23
3.2 STUDY POPULATION ....................................................................................................... 23
3.3 SAMPLE DESIGN................................................................................................................ 24
3.4 SAMPLING AND SAMPLE SELECTION TECHNIQUES ............................................ 24
3.5 SOURCES OF DATA ........................................................................................................... 24

vii
3.5.1 PRIMARY DATA .............................................................................................................. 24
3.5.2 SECONDARY DATA ........................................................................................................ 24
3.6 DATA COLLECTION INSTRUMENTS ........................................................................... 25
3.6.1 DOCUMENTARY STUDY............................................................................................... 25
3.6.2 QUESTIONNAIRE............................................................................................................ 25
3.6.3 INTERVIEW GUIDE ........................................................................................................ 25
3.7 VALIDITY AND RELIABILITY ....................................................................................... 25
3.8 DATA PRESENTATION AND ANALYSIS ...................................................................... 26
3.8.1 EDITING ............................................................................................................................ 26
3.8.2 TABULATION ................................................................................................................... 26
3.8.3 DATA ANALYSIS ............................................................................................................. 26
3.8.3.1 DATA ANALYSIS; DESCRIPTIVE STATISTICS AND CORRELATION
ANALYSIS .................................................................................................................................. 26
3.9 ETHICAL CONSIDERATION ........................................................................................... 27
3.10 LIMITATIONS OF THE STUDY .................................................................................... 27
CHAPTER FOUR: DATA ANALYSIS AND INTERPRETATION ..................................... 28
4.0 INTRODUCTION................................................................................................................. 28
4.1 PART 1: ACCOUNTS RECEIVABLE MANAGEMENT IN NPD LTD ....................... 28
4.3 PART 2: MEASURING THE EFFECTIVENESS OF ACCOUNTS RECEIVABLE
MANAGEMENT IN NPD LTD. ............................................................................................... 36

viii
4.3 FINANCIAL RATIOS ANALYSIS .................................................................................... 39
4.3.1 LIQUIDITY RATIOS ....................................................................................................... 39
4.3.2 CURRENT RATIO ............................................................................................................ 39
4.3.3 QUICK RATIO .................................................................................................................. 40
4.3.4 CASH RATIO .................................................................................................................... 41
4.3.4 ANALYSIS OF NPD’S NET WORKING CAPITAL .................................................... 43
4.4 PROFITABILITY RATIOS ................................................................................................ 44
4.5 RECEIVABLES COLLECTION PERIOD ....................................................................... 47
4.6 ACTIVITY RATIOS ............................................................................................................ 48
4.6.1 DEBTORS’ (A/R) TURNOVER RATIO ......................................................................... 48
4.6.2 AVERAGE COLLECTION PERIOD ............................................................................. 50
4.6.3 BAD DEBTS TO ACCOUNTS RECEIVABLES RATIO (BDARR) ........................... 51
4.6.3 CURRENT ASSETS TURNOVER .................................................................................. 51
4.6.4 TOTAL ASSETS TURNOVER ........................................................................................ 52
4.7 DESCRIPTIVE STATISTICS ............................................................................................. 53
4.8 CORRELATION ANALYSIS ............................................................................................. 54
CHAPTER FIVE: SUMMARY, CONCLUSION AND RECOMMENDATIONS .............. 56
5.0 INTRODUCTION................................................................................................................. 56
5.1 SUMMARY OF FINDINGS ................................................................................................ 56

ix
5.2 GENERAL CONCLUSION ................................................................................................. 57
5.3 RECOMMENDATIONS ...................................................................................................... 58
5.5 SUGGESTED AREAS FOR FURTHER RESEARCH .................................................... 59
BIBLIOGRAPHY ....................................................................................................................... 60
APPENDICES ............................................................................................................................. 63

x
LIST OF TABLES
Table 4.1: Respondents’ view onNPD Ltd.’scredit policy ........................................................... 28
Table 4.2: Criteriato screen credit customers ............................................................................... 29
Table 4.3: Respondents’ view on the effective performance of accounts receivables management
....................................................................................................................................................... 30
Table 4.4: Credit period given by the company ............................................................................ 31
Table 4.5: Respondents views on whether there are Problems associated with the management of
accounts receivables ...................................................................................................................... 31
Table 4.6: Problems associated with the management of accounts receivables ........................... 32
Table 4.7: Respondents views on the solutions to solve cited accounts receivable management
problems ........................................................................................................................................ 32
Table 4.8: Respondents’ views on whether NPD Ltd classifies debtors according to their age
(aging of debtors) .......................................................................................................................... 33
Table 4.9 (i): Length of time to declare a customer doubtful and make a provision .................... 34
Table 4.9 (ii): Length of time to declare a customer a bad debtor and make a write-off ............. 35
Table 4.10: Respondents’ views on who decides bad debtors to be written off ........................... 35
Table 4.11: NPD’s accounts receivable as a component of current assets ................................... 36
Table 4.12: NPD’s accounts receivable as a component of total assets ....................................... 37
Table 4.13: NPD’s cash balances as compared to total accounts receivables .............................. 38
Table 4.14: NPD’s current ratios 2016-2018 ................................................................................ 39
Table 4.15: NPD’s Quick ratios 2016-2018 ................................................................................. 41
Table 4.16: NPD’s cash ratios 2016-2018 .................................................................................... 42

xi
Table 4.17: NPD’s net working capital 2016-2018 ...................................................................... 43
Table 4.18: NPD’s liquidity ratios 2016-2018 .............................................................................. 44
Table 4.19: NPD’s gross profit ratios 2016-2018 ......................................................................... 45
Table 4.20: NPD’s net profit ratios 2016-2018 ............................................................................ 46
Table 4.21: NPD’s return on assets 2016-2018 ........................................................................... 47
Table 4.22: NPD’s receivable collection period 2016-2018 ......................................................... 48
Table 4.23: NPD’s accounts receivable turnover 2016-2018 ...................................................... 49
Table 4.24: NPD’s ACP 2016-2018 ............................................................................................. 50
Table 4.25: NPD’s bad debts to accounts receivable ratios 2016-2018 ....................................... 51
Table 4.26: NPD’s current assets turnover 2016-2018 ................................................................. 52
Table 4.27: NPD’s total assets turnover 2016-2018 ..................................................................... 52
Table 4.28: Descriptive statistics .................................................................................................. 53
Table 4.29: Correlation analysis of NPD ...................................................................................... 54
Table 4.30: Correlation analysis of NPD ...................................................................................... 54

xii
LIST OF FIGURES
Figure 1: A conceptual framework of the relationship between the profitability of the firm and
trade receivables measures .............................................................................................................. 7
Figure 2: Optimal level of receivable management ...................................................................... 12

xiii
LIST OF APPENDICES
1. Questionnaire
2. NPD’s Financial statements 2016-2018

xiv
LIST OF ABBREVIATIONS
FRW: Rwandese Francs
ART: Accounts Receivables Turnover
ACP: Average Collection Period
BDARR: Bad Debts to Accounts Receivable Ratio
ROA: Return on Assets
AR: Accounts Receivable
DSO: Days Sales Outstanding
POD: Proof of Delivery
POC: Percentage of Completion
CCC: Cash Conversion Cycle
WCM: Working Capital Management
NSE: Nairobi Stock Exchange
SPSS: Statistical Packages for Social Sciences
GP: Gross Profit
NP: Net Profit

xv
ABSTRACT
The study focused on the effects of accounts receivable management on the performance of
Construction Companies and NPD Ltd was taken as a case study. The study had specific
objectives that included; to evaluate the effectiveness of accounts receivable management in
NPD Ltd, to ascertain the relationship between accounts receivable management and
profitability, and to recommend areas of improvement in as far as accounts receivable
management is concerned
The researcher reviewed the related literature to come up with full idea of the study conceptual
framework, both primary and secondary data in relation to the study were obtained. In collecting
primary data, the researcher used questionnaires and interviews from a sample of 30 respondents
selected based on a table for determining a sample from a given population by Morgan& Krejcie.
For secondary data, the company’s financial statements for the period 2016-2018 were analyzed
using financial techniques /ratios.
The findings revealed that A/R management in NPD Ltd was not effective especially in terms of
ACP and A/R turnover. The recommendations made include: NPD’s collection efforts of
accounts Receivables from her credit customers should be improved. This is due to the fact that
slow payment by credit customers has been realised within the company.
The company should therefore put much more effort in setting up procedures that would speed
up collection of Accounts Receivable from debtors. Slow collections have revealed bad image
while computing the ACP for the firm and this cuts the firm’s cash potential resulting in liquidity
problems and at times leading to bad and doubtful debts. Further, the firm should make critical
assessment of the credit seeking customers and credit be given to those who will pay in the credit
period given by the company. This is because the company’s debtor’s turnover has been found
unsatisfactory resulting from delayed payments from debtors who take much time than the credit
period given by the firm. Finally, the study recommended areas for further researches as;
Comparing Accounts receivables and Accounts payables management. The impact of credit

xvi
extension on customer’s purchasing decisions. This will help find out customers’ attitude on cash
purchase.

CHAPTER ONE: INTRODUCTION
This chapter includes the following; background of the study, statement of the problem, purpose
of the study, objectives of the study, research questions, scope of the study and the significance
of the study.
1.0 Background of the study
John G. Salek (2005) asserts “in today’s market places competitive market pressure and industry
practice mandate that product and service be sold on a credit vs. cash on delivery. This practice
often produce receivable that is one of the largest tangible assets on the company’s balance sheet.
Management of these receivables is a demanding task as it addresses the ramifications of
practices and processes usually outside the span of the control of the responsible manager.
Management of accounts receivable begins when the antecedents are completed, and the
receivable is posted to the detailed receivables ledger account. However, receivables are much
more fluid and an integral part in doing business so, the safeguard and acceleration of the
turnover must be accomplished”.
Berry and Jarvis (2006) said “before a firm comes up with a credit policy that will optimize the
trade receivables level, it has to weigh up the options between the increased sales revenue and
the additional administrative costs associated with the increased receivables. It should also
consider the level of risk its ready to face while extending credit to its customers since some may
be unable to pay when their debt falls due. They should also not ignore the extra investment in
debt management such as extra staff”.
Gill (2010) asserts “the main task of accounts receivable management is to optimise the balance
between management of cash flow components. Cash flow management is basically involved
with planning and control of cash inflows and outflows in any firm. It also involves the holding
of optimal level of cash by a firm at any point in time”.
According to Samiloglu (2008) “any firm with proper trade receivables management system is
able to increase profitability due to a reduction in transaction costs involved in raising extra
funds due to liquidity issues”.

2
Ahmet (2012) asserts “accounts receivable as a component of cash flow affects profitability of
any firm. Cash flow management can be described as the management of cash inflows and cash
outflows in and out of the firm. The main component of management of cash flow includes
inventory, trade receivables, planning of cash flow and trade payables”.
The issue here remains that there must be accounts receivables if the firm needs to maximise its
sales and further maximise profits. However, by doing this, effectiveness in the management of
accounts receivables is of a great importance, otherwise Credit sales would result into bad debts
and this would negatively affect the profitability and the overall performance of the firm (Ahmet
2012), specifically NPD Ltd.
While business firms would like to sale on cash, the pressure of competition and the force of
custom persuades them to sell on credit. Firms grant credit to facilitate sales. It is valuable to
customers as it augments their resources; it is appealing to those customers who cannot borrow
from other sources or find it expensive or inconvenient to do so. The credit period extended by
the business firms usually ranges from 15 to 60 days. When goods are sold on credit, finished
goods get converted into accounts receivable (trade debtors) in the books of the seller. In the
books of the buyer, the obligation arising from the credit purchase is represented as accounts
payable (trade creditors) (Ahmet 2012).
A firm’s investment in accounts receivable depends on how much it sells on credit and how long
it takes to collect receivables.
NPD Ltd’s financial statements for the year 2018 (note 5 on page 30) show that an amount of
685,698,000 Frw was written off as irrecoverable receivables while 117,821,000 Frw was
provided for as allowance for bad debts whose recoverability was highly doubtful.
The theoretical framework adopted for this study was derived from the profit maximization
theory of firms developed by D.W Stephen, J.F. Lynch, & A.E. Sorensen (1984). This theory
was adopted for this study because it mainly focuses on how the marginal revenue and marginal
cost affect the firm’s profit, so, if it is not managed effectively and strongly the credit system or
accounts receivable, it will have negative impact to the profitability.

3
Conceptually, the accounts receivable management is the process that includes forwarding
balances, identification of all uncleared invoices, and generating periodical customer statements.
Overdue receivables will be collected basing on the aged receivables listing.
However, the independent variable of accounts receivables management is: credit policies, credit
risk assessments, billings and credit collection procedure while the dependent variable of this
study the Company’s performance.
While NPD Ltd has implemented various types of construction projects, the majority of focus
has been in the area of road construction, a market segment that is typically not addressed by
traditional private sector construction companies and serves a great need in the country.
Additionally, although road construction has proven to be profitable, there is growing
competition in the sector especially from foreign firms. This competition dictates the company to
offer credit services to the esteemed customers which largely leads to nothing else but
accumulated accounts receivable on the company’s statement of financial position. The
accumulated receivables need logical management to avoid massive bad debts hence this forms
the basis through which the researcher analyzed how effective can accounts receivable be
managed to meet the company’s strategic objectives.
1.1 Statement of the problem
Accounts receivable are amounts expected to be collected from customers in the near future.
Trade receivables are amounts that arise from selling goods to credit customers, whereas non-
trade receivables are those items not directly related to the main business activities. They include
insurance claims, interest receivable or amounts due from employees. The study however
concentrates on trade receivables.
Lynch (2005) asserts “businesses must ensure proper management of trade receivables to avoid
finding their liquidity under considerable strain and to remain profitable”.
According to Emery et al. (2004) “effective accounts receivable management is important and
strategic; it affects the financial performance of a firm and a firm’s value. A firm’s competency
to synchronize cash inflows with cash inflows in formulating a cash flow management strategy is

4
important to a firm’s financial performance. The core mandate of trade receivables management
lies in shareholder wealth maximization. Receivables constitute a big investment in the firm’s
current assets. They should therefore be evaluated just like capital expenditure for their net
present values”.
NPD Ltd’s financial statements for the year 2018 (note 5 on page 30) show that an amount of
685,698,000 Frw was written off as irrecoverable receivables while 117,821,000 Frw was
provided for as allowance for bad debts whose recoverability was highly doubtful.
It is against this background that the researcher wanted to carry out an investigation and analyse
how effective is the management of accounts receivables in Rwandan business firms with
reference to NPD Ltd.
1.2 Objectives of the study
1.2.1 General objectives of the study
Analysing the effect of accounts receivable management on the financial performance of
construction companies in Rwanda, is the overall objective of the study.
1.2.2 Specific objectives
To evaluate the effectiveness of accounts receivable management in NPD Ltd.
To ascertain the relationship between accounts receivable management and profitability
1.3 Research questions
How effective is accounts receivables management in NPD Ltd?
Is there any relationship between accounts receivables management and profitability?
What challenges do NPD Ltd face in managing its accounts receivable and what would
be the proposed measures for the improved accounts receivable management?
1.4 Justification of the study
The researcher’s interest in the study is to establish the elements of accounts receivables
management, ascertain challenges encountered in accounts receivable management and its
effects on the financial performance of construction of construction companies in Rwanda; with
reference to NPD Ltd.
5
1.5 Significance of the study
The findings of the study will be useful in the following ways:
Firstly, this study will benefit the managers of construction companies’ who were
experiencing nowadays credit system problem and improving their understanding
towards the effects of accounts receivable management on firm’s profitability. Thus
helping to develop strategies for effective management of accounts receivables, this is
equally important to other companies.
Secondly, the study highlighted how effective accounts receivable management
improves the performance level of construction companies and even the components of
credit system.
Finally, the study will add some knowledge to the already existing facts about effects of
accounts receivables management on firm’s profitability to those researchers who are
interested in accounts receivable management for further research. However, this study
also generated ideas for better understanding of the relationship between accounts
receivable management and profitability as well the overall performance of
construction companies.
1.6 Scope of the study
This study focused on measuring the effectiveness of accounts receivables management,
measuring the receivable turnover ratios by comparing the ratios of different periods to ascertain
the performance trend overtime. The study was limited to NPD Ltd, one of the private
construction companies in Rwanda located in Kigali city. It thus analysed the accounts
receivable for the financial years 2016 to 2018, and the financial performance of the company for
the same period.

6
1.7 Organisation of the study
The study is divided into five chapters
Chapter 1 Introduction comprises of general background organization under study,
problem statement, research objectives, research questions scope of the study.
Chapter 2 is Literature Review, a discussion and analysis of what has been said by other
scholars on issues pertaining to accounts receivable.
Chapter 3 shows the overall approach used to collect the required data. It shows the
methodology which was employed to accomplish the study work. It explains in detail the
study design, data sources, techniques and methods of data collection, population,
sampling techniques.
Chapter 4 focused on data analysis and interpretation of collected data. The findings were
interpreted and edited in relation to the study objectives
Chapter 5 deals specifically with the summary of the findings, conclusion and
recommendation of the study and set areas for further research.

7
CHAPTER TWO: LITERATURE REVIEW
2.0 Introduction
This chapter shows the literature of different authors on issues related to the topic. It presents the
introduction, theoretical framework, review of related literature and the conceptual framework.
2.1 Theoretical framework
The theoretical framework adopted for this study was derived from the profit maximization
theory of firms developed by D.W Stephen, J.F. Lynch, & A.E.Sorensen (1984). This theory was
adopted for this study because it mainly focuses on how the marginal revenue and marginal cost
affect the firm’s profit, so, if it is not managed effectively and strongly the credit system or
accounts receivable, it will have negative impact the profitability.
2.2 Conceptual framework
This chapter reviewed the different theories developed by different authors and researchers on the
effectiveness of management of accounts receivables. The elements and areas reviewed in this
chapter if well adopted and implemented would lead to effectiveness in the accounts receivable
management. The main purpose of the conceptual framework is to help the reader to quickly
understand the proposed relationship there is between the independent variables and the dependent
variable of the study.
Figure 1: A conceptual framework of the relationship between the profitability of the firm
and trade receivables measures
Independent variables Dependent variable
Figure 2.1
(Source: Author)
Accounts receivable Management
Accounts Receivables
Turnover Ratio
Average Collection Period
Bad Debts to Accounts
Receivable Ratio
Financial performance
The firm’s profitability

8
As the above figure depicts, Accounts Receivables Turnover Ratio (ART), Average Collection
Period (ACP) and Bad Debts to Accounts Receivables Ratio (BDARR) will have effect on the
firm’s profitability level.
For the purpose of this research, the independent variables were measured using the above ratios,
whereas the dependent variable (profitability) was measured using Return on Assets (ROA).
Variable Measurement Abbreviation
Return on Assets Net Income
Total Assets
ROA
Accounts Receivable
Turnover Ratio
Credit Sales
Average debtors
ART
Average Collection Period 365
Accounts Receivable Turnover
ACP
Bad Debts to Accounts
Receivable Ratio
Bad debts
Average debtors
BDARR
2.3 Review of related literature
2.3.1 Accounts receivable
A study guide for use with financial accounting by Jeannie M. Folk (2004) states; accounts
receivables refers to the amounts due from customers for credit sales. Its subsidiary ledger lists
the amounts owed by individual customers. When a business extends credit to its customers, it
records a revenue transaction at the time it provides its customer with goods or services. The
transaction results in a revenue account increase and an increase in an asset account. Since no
cash is received, the asset account that is increased is Accounts Receivable.
2.3.2 Accounts receivable management and profitability
Brigham (1992) asserts that Accounts receivable management directly impacts the profitability
of the firm. It includes determining discount policy and credit policy for marginal customers,
investigating ways of speeding up collections and reducing bad debts, and setting terms of sale to
assure ultimate collection.

9
As part of accounts receivable management, you should appraise order entry, billing, and
accounts receivable activities to be sure that proper procedures are being followed from the time
an order is received until ultimate collection. Among the points to consider is how the average
time lag between completing the sales transaction and invoicing the customer can be reduced.
You should also consider the opportunity cost of holding receivables, that is, the return lost by
having funds tied up in accounts receivable instead of getting invested elsewhere.
Brigham (1992) asserts; accounts receivable management begins with the decision of whether or
not to grant credit. Accounts receivable management build up and also represent several
alternative means of monitoring accounts receivables.
Accounts receivable management involves the establishment of credit policies. The major
variables included in the credit policy are, credit standards, credit period, cash discount and
collection effort. These variables are related and have a bearing on the level of sales, bad debts
loss, discount taken by customers and collection expenses.
2.3.3 Accounts receivable management and liquidity
Michael sack (2006) asserts that, Liquidity is another useful determinant of credit worthiness.
Liquidity refers to the availability of cash to the business. Obviously, lenders are concerned
whether borrowers will have sufficient cash to repay loans. Liquidity is mainly a function of
profitability. Ordinarily, the more profitable the business, the more cash available. However,
liquidity is not simply a function of profitability, and firms of comparable profitability do not
necessarily have comparable liquidity.
Other factors affecting liquidity are the rates at which accounts receivable and inventory are
converted to cash. A business that collects its accounts receivable in an average of 20 days
generally has more cash on hand than a business that requires 45 days. Similarly, a business that
turns over its inventory 15 times a year has more cash on hand than a company that turns its
inventory only 10 times a year.
Another indication of relative liquidity is the ratio of current assets to current liabilities. All other
things being equal, a business that has a higher ratio of current assets to current liabilities is more
liquid than a company with a lower ratio.

10
2.3.4 Improving accounts receivable management to increase liquidity
Michael sack (2006) asserts “we are in a serious dash for cash. Whether the goal is to win market
share or merely to survive the economic spiral, companies must build sustainable cash positions.
This demands a fundamentally different and comprehensive approach to accounts receivable
(AR) management, one that looks across the entire order-to-cash process to root out payment
problems early on and design flexible solutions that release more cash and permanently lower
AR. Companies must increase their cash positions on a sustainable basis in today’s tough
economic and credit environment. They can accomplish this by better mining their own balance
sheets’ near-cash assets. To better mine these assets, companies need to revamp their AR
management. Specifically, they must improve their attention to the entire order-to-cash process,
not just focus on overdue payments. By focusing on each bucket in the order-to-cash process,
companies can identify problems earlier, design better solutions, accelerate payments, and
increase liquidity. For large companies, a 5 to 10 percent reduction in AR is achievable and
would release tens of millions of dollars of cash”.
The fundamental purpose of cash conservation is to help improve the quality and viability of a
company’s cash flow statement. To be able to achieve this goal, most of the companies focus on
improving the statement of Profit and Loss; that alone, however, is a narrow approach. As is
known, making a sale and getting the sale cashed are two different things. Further to improving
the Profit and Loss, companies have to do better in tapping the hidden cash on their statements of
financial position. Improving liquidity of the statement of financial position involves preserving
and then enhancing a company’s cash position vis a vi to its current liabilities. On the asset side
of the statement of financial position, any asset can theoretically be converted into cash; in
reality, this is not the case, as we are witnessing today. Selling long-term assets to generate cash
during periods of depressed asset prices is an act of desperation. Instead, to raise cash and boost
liquidity, managers should focus on cash equivalents on the statement of financial position,
especially near-cash assets such as inventories and accounts receivable.
2.4 Credit standards and management
Brigham (1992) also stated; the fundamental question in the credit policy of the firm is: what
standard should be taken in accepting or rejecting an account for credit granting firm has a wide

11
range of decisions in this respect. At one end of spectrum, it may decide not to extend credit to
the customer, however strong his credit rating may be. At the other hand, it may decide to grant
credit to all customers irrespective of their credit rating. Between two extreme positions lay
several possibilities, often the more practical ones.
In general, liberal credit standards tend to push sales up by attracting more customers, thesis,
however, accompanied by a higher incidence of bad debt loss, large investment in receivables
and a higher cost of collection, stiff credit standards have the opposite effects; they tend to
depress sales, reduce the incidence of bad debts loss, decrease the investment in receivables, and
lower the collection cost.
2.4.1 Credit policy
According to Brigham (1992), Credit policy effects debtor management because it guides
management about how to control debtors and how to make balance between liberal and strict
credit. If a company does not restrict to sell the products on credit after a given limit of sale, this
liberated credit policy will increase the amount of sales and profitability. But risk will also
increase with increasing of sales. If we sell the good to those debtors whose capability to pay is
not good, then it is possible that some amount will become bad debts. The company can increase
the time limit for paying by such debtors. On the other hand, if company’s credit policy is strict,
then it will increase liquidity and security, but decrease the profitability. So, finance manager
should make credit policy at optimum level where profitability and liquidity will be equal. We
can show it graphically.

12
Figure 2: Optimal level of receivable management
Source: Brigham (1992)
2.4.2 Tips of credit management
Credit management deals with control and collection of payments from customers. A good credit
management system helps to reduce the amount of money tied up in receivables and minimizes
the company’s exposure to the risk of bad debts.
Effective credit management is important to the company’s cash flow. Profitability on paper does
not necessarily mean availability of cash for continuation of business operations.
It is vital to minimize the risk of bad debts through effective credit management practices. The
below suggestions help in preparation of credit management policies and procedures:
Credit terms and conditions
Clearly state the credit terms and conditions of trade and the credit policy in writing. Drafted
terms and conditions should suit the business operations. It is advised to seek legal advice before
document finalization in order to ensure that is internally consistent and that it fully covers all the
key aspects. It is also very important to ensure that terms of the document are legal so they can
be relied on in case of any legal dispute during the debt recovery process.
13
The terms should be included on all estimates, quotes, agreements, contracts, purchase orders,
and any other related documents. Specify clearly what to supply, when to do the work, when to
expect the payment and how it will be made. Ensure an acceptance of the terms of the agreement
together with the approval of any variations to the original agreement are obtained and in
writing.
Terms and conditions to be considered include, but are not limited to:
Late payment penalties – exactly specify the fees and the interest rate;
‘title retention' clause where title to the goods is retained by the seller until payment has been
made;
The returns and refunds policy;
Refund of deposits policy;
Early payment incentives; and
Whether there is any fee charged for credit card payments. Disclose the amount or the percentage
to be charged and in which currency.
2.4.3 Credit period
According to Brigham (1992), the credit period refers to the length of time customers are
allowed to pay for their purchases. It generally varies from 15 to 60 days. When a firm does not
extend any credit, the credit period would obviously be zero. If a firm allows 30 days, say, of
credit, with no discount to induce early payment, its credit terms are stated net 30. Lengthening
of the credit period pushes sales up by inducing existing customers to purchase more and
attracting additional customers. This is however, accompanied by a large investment in debtors
and a higher incidence of bad debts loss. On the other hand, shortening of the credit period tends
to lower sales, decrease investment in debtors, and reduce the incidence of bad debts loss.

14
2.4.5 Cash discount
Brigham (1992) further urged that firms generally offer cash discounts to induce customers to
make prompt payments. The percentage discount and the period during which it is available are
reflected in the credit terms. For example, credit terms of 2/10, means that discount of 2 percent
is offered if payment is made by the tenth day. Liberalizing the cash discount policy may mean
that the discount percentage is increased, and /or the discount period is lengthened. Such an
action tends to enhance sales (because the discount is regarded as price reduction), reduce
average collection period (as the customers pay promptly), and increase the cost of discount.
2.4.6 Collection efforts
Collection program of the firm, aimed at timely collection of receivables may consist of the
following; monitoring of receivables, dispatch of letters to customers whose due date is
approaching, telegraphic and telephonic advice to customers around the due date. A rigorous
collection program tends to decrease sales, shorten the average collection period, reduce bad debt
percentage, and increase the collection expense. A lax collection program on the other hand,
would push sales up lengthen the average collection period, increase the bad debt percentage,
and perhaps the collection expense.
2.5 Monitoring and control of accounts receivables
According to Maness and zietlow (2005), the carefully devised credit policy cannot keep a
company’s credit activity from becoming a problem. Financial executives believe that
accelerating collections are the single most important short-term financial management action a
company can take. Delayed payments deny the seller the use of the money, resulting in increased
collection costs, and increase the risk that payment will never occur. So, it is vital for a company
to monitor the receivables balance and set steps it can take to improve on collection of amounts
due or past due. Various approaches have been put forward to be used in monitoring and control
of accounts receivables balance and these include; days sales outstanding, also known as the
average collection period and accounts receivables turnover. Each of these tools is discussed
below.

15
2.5.1 The days’ sales outstanding (DSO)
The DSO measure is computed by taking the latest period’s accounts receivable and dividing it
by daily credit sales. Daily credit sales in turn is computed by taking the period’s sales and
dividing it by the number of days in the period -365, when computing DSO over a yearly period.
DSO= accounts receivable
Annual credit sale /365
Therefore, DSOt= accounts receivable at time T
Average daily credit sales
One then compares the DSO for the latest period to earlier periods, and possibly to a
management target or an industry average. However, calculated, the computed DSO value is
interpreted as the number of days of credit sales remaining un collected or the average days it
takes the company to collect its credit sales.
2.5.2 Accounts receivable turnover
Accounts receivables turnover is simply DSO divided into the number of days in the calculation
period, which is usually 365. If the DSO calculated for the past year is for example 45 days,
accounts receivables turnover would be 365/45=8.1 times.
Therefore, accounts receivable turnover = 365
Average collection period.
Receivable turnover is interpreted as how many times a company investment in is accounts
receivables turns into sales during the period. The actual ratio is compared with some standard to
determine whether accounts receivables are in control.
2.5.3 Special collection efforts
John Wiley & Sons (2005) asserts “special collection efforts are initiatives focused on narrowly
defined objectives. Excellent management of the receivable asset is a broad objective.
Two common examples of narrowly defined objectives are:
1. Reducing the value and number of seriously aged open items
2. Maximizing cash collections over the next 120 days

16
Special collection efforts focus additional resource and management time on their objectives. By
concentrating resources and attention on a limited task, progress can be accelerated, and results
improved. Other tasks and duties can be deferred or delayed, while maximum resources are
devoted to the special efforts. Alternatively, additional resources can be deployed to maintain
activity levels in all areas. Often, special efforts are initiated to solve problems that have built up
over a long period of time and are not being resolved satisfactorily in the normal course of
business”.
The two special collection efforts to be directed at receivables management problems that are
common, are described below.
2.6 Reconciliation and Recovery
This effort/program is directed at significantly reducing the value and/or the number of open
aged items. These aged items are often defined as between 90 and 120 days old and they are
found in the extreme right column of the aging report on receivables. These receivables pose the
greatest risk of bad debt loss, usually lead to a high level of provisions on bad and doubtful debt
account and draw a lot of senior management and auditor attention. These items create a very
difficult situation:
If they were easily cleared, it would have been done before they reached the advanced age. It
will take much time, effort, and cost to try to collect and clear them. However, their collectability
is low, especially if there are many clutter transactions included. So companies are faced with the
prospect of expending a great deal of resources for a relatively small payback. On the other hand,
to just write them off is too costly. If the collection staff is assigned to devote a substantial
portion of its time to work on these accounts, cash flow will decrease as the normal collection
effort will be diminished. How can this dilemma be solved? The answer is a reconciliation and
recovery program.
A reconciliation and recovery program:
Identifies customer accounts with a large number of aged, clutter transactions. Customers with
less than eight such transactions and customers with just whole open invoices are excluded from

17
the program. Such accounts can be handled by the collectors in the normal course of collections
without consuming too much of their time.
Defines a format for presenting your claim and its supporting documentation to the customer.
The format is called a reconciliation pack, and contains these elements:
A customer service–oriented cover letter stating that this is a recap of the aged items open on
your records, asking them to review and prepare a response. A summary of all aged open items
by transaction types (i.e., invoice, short payments, credit memos, unapplied payments, etc.).
A detailed listing of all open transactions with transaction number, date, and original and
remaining amounts; Copies of invoices, credit memos, etc.
Copies of proofs of delivery (POD) if necessary. Sometimes it is more time efficient to exclude
them for all open invoices and await the customer’s request for the missing ones. Utilizes high-
speed procedures with decision points for assembling the packs. These procedures are developed
by an expert on staff who can document the fastest, most efficient method of assembly. Decision
points are used to maintain the cost efficiency focus. An example of a decision point is if a copy
of a one-year old invoice for a small dollar amount cannot be retrieved, then it is best to write it
off rather than expend inordinate amounts of time searching. Similarly, small clutter items may
be unilaterally written off to reduce the time and expense of reconciliation pack assembly.
Utilizes temporarily assigned clerical workers to assemble the reconciliation packs. This saves
collectors an enormous amount of time, allowing them to focus on collections. Assembly of the
packs requires customer accounting and document retrieval skills, which are less costly than
collection skills. In addition, when the program is finished, the resources can be discontinued.
2.6.1 High-Impact Action Program
A high-impact action program is a proven technique for maximizing cash collections in the short
term. The basic premise of a high-impact action program is to implement only those actions that:
Can be developed and implemented within one month, will yield results in two to three months.
This eliminates some important initiatives, such as automation, formal dispute management,
major redesign of processes, and so on, which can be addressed in a longer-term program. The
objectives of a high-impact action program are to:

18
Increase cash receipts as much as possible and as soon as possible
Clean up the portfolio (uncollectible, offsets, etc.) to produce a smaller, less complex
asset to manage in the future.
2.6.2 Late payment fees and prompt payment discount
According to John G. Salek (2005), “late payment fees and prompt payment discounts are
incentives designed to encourage customers to pay according to terms. Prompt payment
discounts offer a reward for paying “early,” and late payment fees are a penalty for paying late.
If implemented properly, they can have a substantial impact in improving receivables
management results.
Late payment fees (also known as finance charges, interest charges, or service charges) are an
assessment of the interest value of a customer enjoying the use of funds beyond the due date.
Payment terms are widely considered an integral part of the price, so if a customer is taking a
longer period to pay than agreed, the customer is receiving more value than the price being paid.
Prompt payment discounts can be an extremely powerful but expensive tool to expedite
payments. To illustrate, consider the payment terms defined as “1% 10 days, net 30 days from
date of invoice.” These terms enable the customer to deduct 1% from the total invoice amount if
it is paid within 10 days from invoice date. If the customer does not exercise this option, then the
full amount of the invoice is due within 30 days of the invoice date. When interest rates are low,
the 1% prompt payment discount is very attractive. Even if the customer has to borrow money to
pay within 10 days, it is cost effective to do so. If a company is operating on a low gross margin,
the extra 1% margin can be extremely valuable”.
2.7 Benefits of effective management of receivables
John G. Salek (2005) further highlighted the benefits of effective management of the receivables
asset as: “Increased cash flow, Higher credit sales and margins, Reduced bad debt loss, Lower
administrative cost in the entire revenue cycle, Decreased deductions and concessions losses,
Enhanced customer service, Decreased administrative burden on sales force”.
19
Conflicting priorities
Excellent receivables management requires trade-offs between conflicting goals. The trade-offs
are best balanced in accordance with the company’s overriding strategic objectives. To optimize
the trade-off, the relative ranking of these strategic objectives must be understood:
Sales growth, Profitability, Cash generation, Market share, Risk tolerance.
The conflicting objectives are to:
Loosen credit acceptance criteria and controls to boost sales versus tightening credit
controls to minimize the investment in receivables and the exposure to bad debt loss.
Achieve strong receivables management results and provide excellent financial service to
your customers versus minimizing the cost of the function.
2.7.1 Speed up receivables collection
According to Patrick Buchmann and Udo Jung (2008), “many companies are early payers and
late collectors—a formula for squandering working capital. Other companies—particularly
project-based businesses and manufacturers of large, costly products with lengthy production
cycles—have cash flow problems caused by a mismatch in timing between costs incurred and
customer payments. Therefore, efficient management of receivables and prepayments received is
crucial. An optimization can yield significant potential”.
Invoicing cycle: “The main target in this respect is to get invoices to the customers as quickly as
possible. Processes and systems should be aligned to allow invoicing promptly after dispatch or
service provision. All disruptions of the process by unnecessary interfaces should be eliminated.
Furthermore, companies should reduce invoicing lead times by multiplying their invoicing runs”.
Early reminders/dunning cycles: “Experience shows that a number of customers seem to
postpone their payments to the receipt of the first payment reminder. Early reminders and short
dunning cycles thus have a direct impact on late payments. Best-in-class companies reduce grace
periods to a minimum or remind their customers of upcoming payments even before the due
date. Establishing direct debiting with main customers is the most effective means to avoid
overdue payments”.
Payment terms: “Renegotiated payment terms will lead to reduced DSO. The first step is often a
harmonization and reduction of available conditions to decrease discretionary application. When

20
preparing negotiations, companies should analyze their customers’ bargaining power and
specific preferences in order to identify improvement potential in the terms and conditions for
payments”.
Payment schedule: “Companies operating in project business should introduce more
advantageous payment schemes that cover costs incurred. Percentage of completion (POC)
accounting helps to define relevant payments along milestones. But also, for companies with
small series productions, the introduction of prepayments and advances can significantly
improve liquidity”.
2.8 Empirical review
“Receivables management has become one of the most important issues in the organisations
where many financial executives strive to identify the basic receivables drivers and the
appropriate level of accounts receivables” (Lamberson,1995). Various academicians have
studied trade receivables either as a separate study topic, but most likely as a component of
working capital management (WCM). Bougheas et al. (2009), focused his research on the
reaction of trade receivables to changes in risk, inventory cost, liquidity and profitability. Others
authors survey the effect of optimal debtors’ management, i.e the best way of managing trade
receivables that result in maximization of a firm’s profit. Research conducted by Deloof (2003)
where he studied 1009 large Belgian non-financial companies for the time 1992-1996 found a
significantly negative relationship between accounts receivables turnover and profitability.
Jose et al. (1996) examined the relationship between aggressive receivables management and
profitability of US firms using Cash Conversion Cycle (CCC) as a measure of receivables
management where a shorter CCC represents aggressiveness of receivables management. The
results indicated a significant negative relation relationship between the CCC and profitability
indicating that more aggressive receivables management is associated is associated with higher
profitability. Firms in an industry that has less competition would focus on minimizing the
receivables to increase the cash flow. For firms in an industry where there are large number of
suppliers of materials, the focus would be on maximizing the payables. One of the earlier studies
done by Jose, Lancaster and Stevens (1996) for the twenty period from 1974 through to 1993 of

21
2,718 firms offers strong evidence that aggressive receivables management policies indicated by
shorter CCC enhance profitability.
Lazaridis and Tryfonidis (2006) also investigated the relationship between accounts receivables
management and corporate profitability for the firms listed in Anthens Stock Exchange for a
sample of 131 listed companies. The researcher used financials from 2001-2004 for the study.
The results of the study showed that there was a statistically significant relationship between
gross operating profit, a measure of profitability and the cash conversion cycle. He suggested
that by optimizing the cash conversion cycle the managers could create value for the
shareholders. Results of empirical analysis show that there is a statistical evidence for a strong
relationship between the firm’s profitability and its receivables management efficiency.
Gill (2010) studied the association between profitability and WCM of eighty-eight companies
listed on the New York Securities Exchange. The study was conducted for the period 2005-2007.
The author found no statistically significant association between profitability and average
creditor days. He also found no statistically significant relationship between average inventory
days and company’s profitability. Similarly, it was observed that there was a significant
relationship between the size of the firm and profitability. They also found a negative
relationship between Average Collection period (ACP) and profitability. The study
recommended that managers could boost the profitability of their companies by reducing the
number of days for their accounts receivable.
Mathuva (2010) investigated thirty companies listed on Nairobi Stock Exchange (NSE) for the
time 1993-2008. He establishes that there was a significant negative association between
accounts receivables management and profitability.
Finally, Waweru (2011) carried out a study on the relationship between receivables management
and the value of companies quoted at the NSE. The study used secondary data obtained from
annual reports and audited financial statements for companies listed on NSE. A sample of 22
companies listed on NSE for a period of seven years from 2003 to 2009 was studied. The 27
average stock price was used to measure the value of the firm. the study concluded that there was

22
a negative relationship between ACP, inventory turnover in days, CCC and the firm’s value. The
study results clearly pointed out to the fact that the firms with a credit policy that resulted in
minimal accounts receivables had the highest profitability.
2.9 Summary of literature review
Several studies have already been conducted on the relationship between receivables
management and financial performance of organizations. Most of the studies have concluded that
there exists a negative relationship between accounts receivables management and financial
performance of firms. Narware (2004) in his empirical study on Indian National Fertiliser
Limited, for 1990-91 to 1999-2000 signify that the receivables management and profitability of
the firm disclosed both negative and positive association. He also found evidence that increase in
the profitability of a firm was less than proportional to the decrease in accounts receivables.
As earlier noted, the issue on accounts receivable have been widely studied. However, largely
missing in the literature is the focus on construction sector and specifically on construction
companies in Rwandan market that is significantly different industry and environment setting
compared to industries where studies have been done. These studies have indeed recommended
similar studies to be done in different industries and sectors. This study therefore seeks to fill this
research gap by seeking to find out how evaluation is done on the accounts receivables
management in construction companies in Rwanda, and the impact it has on their financial
performance, taking NPD Ltd as a case study.

23
CHAPTER THREE: METHODOLOGY
3.0 Introduction
This chapter relates to processes and procedures involved in conducting a scientific research. It
explains the research design, data sources, techniques and methods of data collection, population
and sampling, data processing and analysis techniques, and shows the limitations met in the
course of carrying out this research.
3.1 Research design
The researcher used analytical, quantitative research techniques to conduct the study. Both
numerical and non-numerical (respondents’ opinions and views about the study variables) were
quantified for easy interpretation and presentation. These designs enabled the researcher to
process and analyze the findings for easy interpretation.
In particular, the researcher used ratio analysis, particularly accounts receivables turnover ratio
and days outstanding ratio to ascertain the effectiveness of accounts receivables management.
3.2 Study population
The study population for this research work was the employees of NPD Ltd specifically finance
department, accounting section, project managers, recovery committee and senior management.
It’s from this population that a sample was selected. Further senior staff were consulted for
issues regarding which decision should be taken in as far as credit extension is concerned. The
table below indicates the population from which the researcher selected a sample size.
Department /unit Total Population Sample Selected
Finance department 7 7
Recover committee 6 6
Project managers 11 11
Senior management 6 6
24
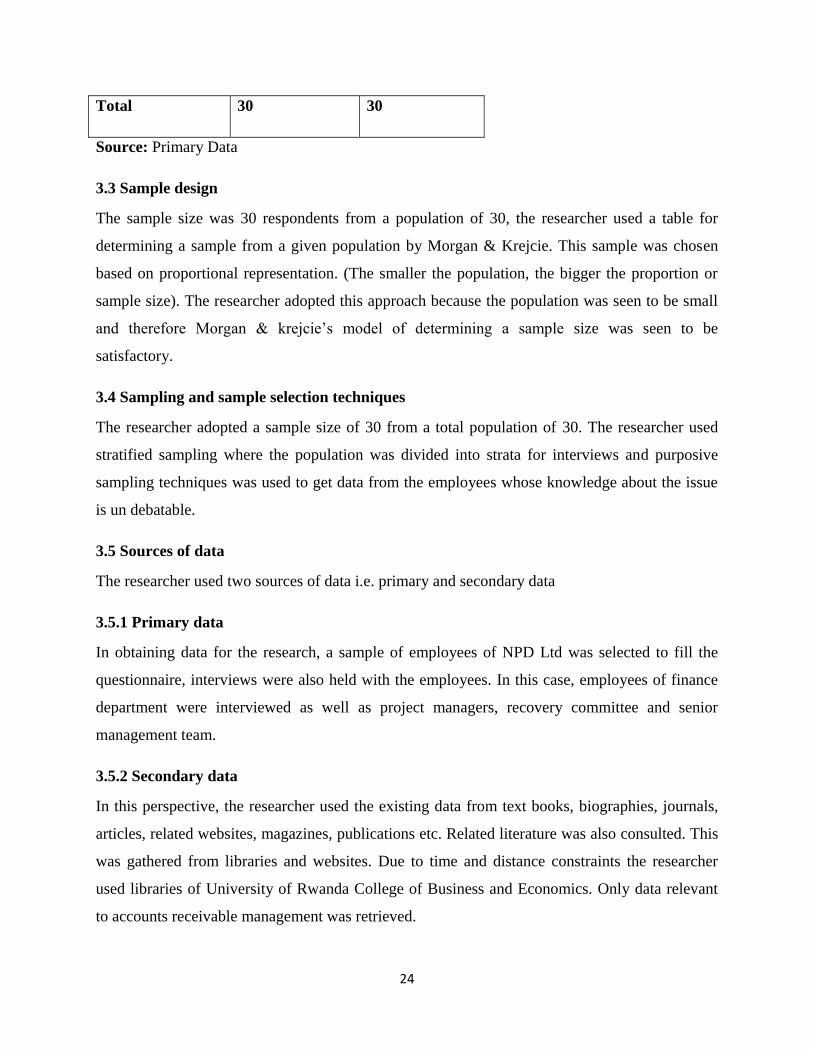
Total 30 30
Source: Primary Data
3.3 Sample design
The sample size was 30 respondents from a population of 30, the researcher used a table for
determining a sample from a given population by Morgan & Krejcie. This sample was chosen
based on proportional representation. (The smaller the population, the bigger the proportion or
sample size). The researcher adopted this approach because the population was seen to be small
and therefore Morgan & krejcie’s model of determining a sample size was seen to be
satisfactory.
3.4 Sampling and sample selection techniques
The researcher adopted a sample size of 30 from a total population of 30. The researcher used
stratified sampling where the population was divided into strata for interviews and purposive
sampling techniques was used to get data from the employees whose knowledge about the issue
is un debatable.
3.5 Sources of data
The researcher used two sources of data i.e. primary and secondary data
3.5.1 Primary data
In obtaining data for the research, a sample of employees of NPD Ltd was selected to fill the
questionnaire, interviews were also held with the employees. In this case, employees of finance
department were interviewed as well as project managers, recovery committee and senior
management team.
3.5.2 Secondary data
In this perspective, the researcher used the existing data from text books, biographies, journals,
articles, related websites, magazines, publications etc. Related literature was also consulted. This
was gathered from libraries and websites. Due to time and distance constraints the researcher
used libraries of University of Rwanda College of Business and Economics. Only data relevant
to accounts receivable management was retrieved.

25
3.6 Data collection instruments
In the process of data collection, the researcher used questionnaires, interview schedules and
documentary study.
3.6.1 Documentary study
The researcher reviewed all documentary evidence that relates to the study under investigation.
3.6.2 Questionnaire
A self-administered questionnaire of both structured and unstructured type was designed and
delivered to the respondents by the researcher. The questionnaires were distributed to all selected
respondents. It was comprised of both open and closed questionnaire. This instrument was
preferred because respondent should feel free to give frank answers and at their convenience,
since they were informed of the purpose of the research and were not asked to disclose their
names.
3.6.3 Interview guide
This method assumes that respondents interviewed have the information required. During this
course of action, the researcher interacted with respondents and noted down the answers given
on the questions asked. This method added quality to the data provided by the questionnaires.
Thus, questions that were skipped or carelessly answered were asked and answered appropriately
in the interview process.
3.7 Validity and Reliability
The instruments used in the research are valid and reliable, because they correspond to the type
of conducted research. Validity refers to the appropriateness of the instruments while reliability
refers to the consistency in measuring whatever it is intended to measure. As per the
questionnaire the researcher found it appropriate since the questions were answered by the
respondents even during their free time. Further interviews were conducted to get reliable and
first-hand information as probing was prioritized for consistency. Finally, the researcher
consulted documentary evidence such as financial statements, websites, journals and other
publications relating to the study for a thorough analytical review of accounts receivable
management.

26
3.8 Data Presentation and Analysis
In the view of data presentation, the researcher used Editing and Tabulation to make the data
more understandable.
3.8.1 Editing
This was done after collecting questionnaire and interview data from the field, the collected data
were cross checked to ensure that all answers collected are coherently and logically recorded to
provide sufficient data. Editing was done to ensure completeness, accuracy, uniformity,
consistency and legibility of information provided by the respondents.
3.8.2 Tabulation
The researcher used this technique for the proper analysis of the findings as being obtained from
respondents in respect to different questions. Further, statistical stables were used and converted
into percentages to make it so clear that one can get complete message. Ratio analysis was also
used where ratios obtained were interpreted basically for easy understanding.
3.8.3 Data Analysis
After completing data processing and presentation stage, the researcher analyzed data because
not all the data can be entirely presented; the researcher therefore presented only the data that
seemed to be relevant, and this was done through data analysis. Quantitative data analysis was
adopted.
Under quantitative analysis, the researcher analyzed data based on the NPD Ltd.’s financial
statements and primary data based on the distributed questionnaire.
3.8.3.1 Data Analysis; Descriptive statistics and correlation analysis
Independent variables of Accounts Receivable Turnover (ART), Average Collection Period
(ACP) and Bad Debts to Accounts Receivable Ratio (BDARR) together with the dependent
variable of Return on Assets (ROA) was also analyzed by way of descriptive statistics and
correlation analysis. The different variables were analyzed using descriptive statistics such as
mean and standard deviation. Correlation analysis was used to establish the relationship between
trade receivables management measures (independent variables) and profitability

27
(dependent viable). I used the Statistical Packages for Social Sciences (SPSS) due to its ability to
simplify repetitive tasks and also handle complex data manipulation and analysis.
3.9 Ethical consideration
Due to confidentiality of some company’s documents such as financial statements, auditor’s
reports and other financial reports, confidentiality of the information released was guaranteed
through formal communication that the research was conducted and provided information was
solely used for academic purposes.
3.10 Limitations of the study
Inadequate time for respondents to fill questionnaires and interviewees availability for
scheduled interviews was a major challenge for this study. However, the researcher used
short and precise interviews while probing on key areas in order to gasp the entire
interview schedules’ contents, the researcher used frequent visits and calls to the
respondents. Further the researcher was obliged to make diligent and constant follow ups to
ensure that questionnaires are filled promptly.
The researcher used to contact the respondents during their free time and leveraged on the
fact that the respondents were his workmates. The researcher requested the respondents to
spare their time to fill the researcher’s questionnaire.
Due to confidentiality of some company’s documents such as financial statements,
auditor’s reports and other financial reports this delayed the time schedule for the research.
To solve this issue, the researcher used questionnaires and interview schedule such that the
respondents could release important information which could not be obtained anyhow.
Further confidentiality of the information released like financial statements was guaranteed
through formal communication as the research will be conducted entirely for academic
purposes.
28
CHAPTER FOUR: DATA ANALYSIS AND INTERPRETATION
4.0 Introduction
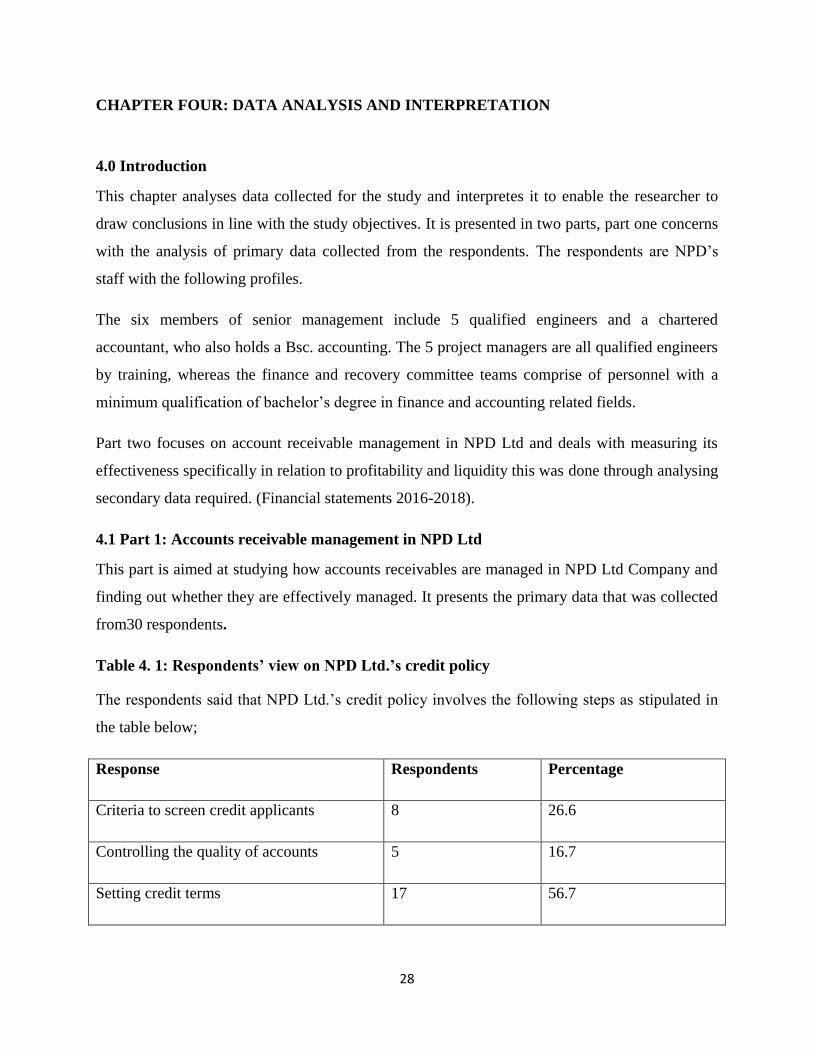
This chapter analyses data collected for the study and interpretes it to enable the researcher to
draw conclusions in line with the study objectives. It is presented in two parts, part one concerns
with the analysis of primary data collected from the respondents. The respondents are NPD’s
staff with the following profiles.
The six members of senior management include 5 qualified engineers and a chartered
accountant, who also holds a Bsc. accounting. The 5 project managers are all qualified engineers
by training, whereas the finance and recovery committee teams comprise of personnel with a
minimum qualification of bachelor’s degree in finance and accounting related fields.
Part two focuses on account receivable management in NPD Ltd and deals with measuring its
effectiveness specifically in relation to profitability and liquidity this was done through analysing
secondary data required. (Financial statements 2016-2018).
4.1 Part 1: Accounts receivable management in NPD Ltd
This part is aimed at studying how accounts receivables are managed in NPD Ltd Company and
finding out whether they are effectively managed. It presents the primary data that was collected
from30 respondents.
Table 4. 1: Respondents’ view on NPD Ltd.’s credit policy
The respondents said that NPD Ltd.’s credit policy involves the following steps as stipulated in
the table below;
Response Respondents Percentage
Criteria to screen credit applicants 8 26.6
Controlling the quality of accounts 5 16.7
Setting credit terms 17 56.7

29
Total 30 100
Source: Primary data
From the table above it is evident that NPD Ltd has set up a credit policy of setting up credit
terms by the credit seeking customers signified by 56.7% of the respondents asked, followed by
26.6% of criteria to screen credit applicants which is good practice of management of accounts
receivable management. It is clear that not all credit seeking customers are guaranteed with
credit because credit terms are first set then analyzed by screening the customers and finally a
procedure to control quality of accounts as indicated by 26.6% is undertaken. From probing,
every customer has his/her own control ledger account where payments have to be effectively
monitored. Especially where previous credits guaranteed are analyzed before credits is given to
the applicant.
Table 4.2: Criteria to screen credit customers
Response Respondents Percentage
Analysis of customers past record 16 53.3
Rely on bank reference 3 10
Customers length of time 11 36.7
Total 30 100
Source: Primary data
Table 4.2 above - involves the criteria to determine which customers should be extended credit,
what information would you need and from which sources would you get it. Generally, NPD Ltd
focuses on the character of the applicant to meet his past obligations, and the capacity to repay
the requested credit, as the requirements for extending credit to the applicant. This is determined
through examination of the applicant’s past records evidenced by 53.3% and also examining the
past recovery period for the applicants as indicated by 36.7% of the respondents. Probing
indicated that the existing clients before any credit is guaranteed their past recovery assessment
is first analyzed, and for new clients a contract is signed as binding obligation.

30
Table 1.3: Respondents’ view on the effective performance of accounts receivables
management
Response No of Respondents Percentage
Sending notice/letter 22 73.3
Reminder /personal visits 4 13.3
Telephone calls 2 6.7
All the above 2 6.7
Total 30 100
Source: Primary data
From the table above, it’s evident from what the respondents say that effective performance of
accounts receivable management is enshrined by sending notice/letter to their clients by 73.3%,
and through interviews with respondents, it was established that sending letters got majority
responses because it provides official proof of recovery/reminder letters. 13.3% said that
management of receivables is done by frequent reminder/personal visits, whereas telephone calls
and the combination of all got6.7% of the responses.
From probing it was noted that if a customer fails to pay on timely basis he/she will not be given
credit easily for the future tenders. However, even though it got majority of the respondents’
views, sending notice /letter to the clients is not a good practice of debt recovery because at times
the clients may be busy and un able to take serious attention to the letter addressed to them. An
effective management of receivables should be done through frequent reminders and personal
visits to the clients by the credit control officers.

31
Table 4.4: Credit period given by the company
Responses No of days Number of
respondents
Percentages
Standard period given 30 days 6 20
Grace period given 60days 5 16.7
Maximum period given 90days 7 23.3
Over 90 days 12 40
Total 30 100
Source: Primary data
As indicated in the table above, NPD offers credit period of over 90 days as evidenced by
the40% majority of the respondents, an indication of the poor management of accounts
receivable. From the interviews conducted, the reason behind the longer credit period is that
majority of the company’s clients are government institutions and that in most cases advance
payments are made before commencement of the works. From the analysis there is no prompt
payments by the customers because a big percentage of payments is scheduled after the 90 days
which is beyond the maximum period set by the company. Few customers pay within the
stipulated period that is to say 20% which is an indication of slow payment by the customers
hence weak recovery efforts set by the management.
Table 4.5: Respondents views on whether there are Problems associated with the
management of accounts receivables
Response Number of respondents Percentage
Yes 25 83.3
No 5 16.7
Total 30 100
Source: Primary data

32
Analysis of the responses from the respondents confirmed that there are problems associated
with the management of accounts receivables as indicated by 84.2% of the respondents asked.
15.7% of the respondents asked confirmed that there is no problem in as far as management of
accounts receivable is concerned. However, it is evident that there are a number of problems as
cited in the proceeding table.
Table 4.6: Problems associated with the management of accounts receivables
Response Number of respondents Percentage
Bad and doubtful debts 7 23.3
Increased recovery costs 8 26.7
Increase in arrears and overdue
payments
15 50
Others, specify 0 0
Total 30 100
Source: Primary data
Table 4.6 and figure 4.1 above indicated that the major problem associated with accounts
receivable management in NPD Ltd is increase in arrears and overdue payments with 50%. This
is followed by bad debts and doubtful debts, and increased recovery costs with 26.7% and 23.3%
respectively. From the figure above it’s evident that with a clear policy of accounts receivable
management, the associated problems should be minimized and therefore the existence of the
cited problems may be a sign of weak management of accounts receivables.
Table 4.7: Respondents views on the solutions to solve cited accounts receivable
management problems
Response Number of respondents Percentage
Strengthen credit control 10 33.3

33
Reducing credit period 2 6.7
Increase credit control officers 5 16.7
Frequent reminder to clients 6 20
Frequent field visit to clients 7 23.3
Any other, specify 0 0
Total 30 100
Source: Primary data
From the table above, 33.3% of the respondents asked cited strengthening credit control as the
major solution to deal with accounts receivable management problems followed by frequent field
visiting of clients and frequent reminders to clients represented by 23.3% and 20% respectively.
Increasing credit control officers and reducing credit period gained 16.7% and 6.7% respectively.
It is evident that if the above are implemented by the company, effective performance of NPD
Ltd will be realized in as far as accounts receivables management is concerned. Further majority
of the respondents said that in order to increase and monitor accounts receivables management,
the company should always Endeavour to continue keep in touch with their client and regular
updates of dues based on individual client control ledger accounts. The accounts department
should make regular updates to the management on weak repayment schedules by some clients
so as the management take appropriate decision in regulating receivables.
Table 4.8: Respondents’ views on whether NPD Ltd classifies debtors according to their
age (aging of debtors)
Response Number of respondents Percentage
Yes 30 100
No 0 0
Don’t know 0 0
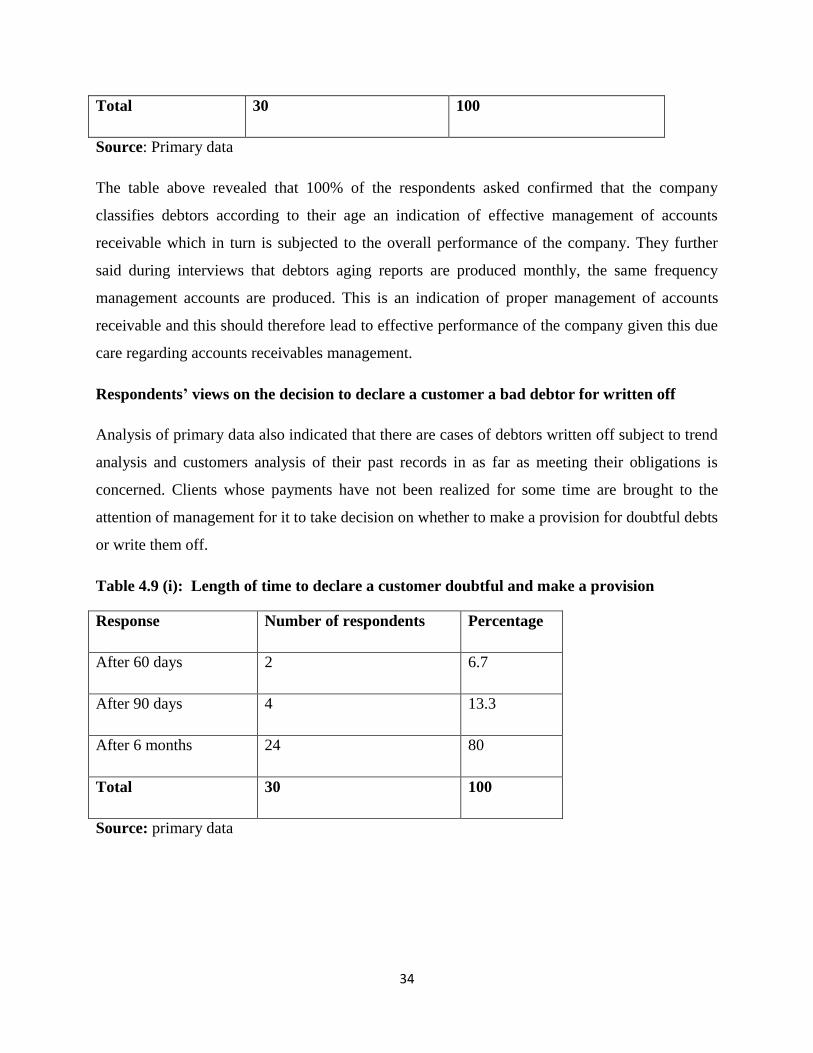
34
Total 30 100
Source: Primary data
The table above revealed that 100% of the respondents asked confirmed that the company
classifies debtors according to their age an indication of effective management of accounts
receivable which in turn is subjected to the overall performance of the company. They further
said during interviews that debtors aging reports are produced monthly, the same frequency
management accounts are produced. This is an indication of proper management of accounts
receivable and this should therefore lead to effective performance of the company given this due
care regarding accounts receivables management.
Respondents’ views on the decision to declare a customer a bad debtor for written off
Analysis of primary data also indicated that there are cases of debtors written off subject to trend
analysis and customers analysis of their past records in as far as meeting their obligations is
concerned. Clients whose payments have not been realized for some time are brought to the
attention of management for it to take decision on whether to make a provision for doubtful debts
or write them off.
Table 4.9 (i): Length of time to declare a customer doubtful and make a provision
Response Number of respondents Percentage
After 60 days 2 6.7
After 90 days 4 13.3
After 6 months 24 80
Total 30 100
Source: primary data
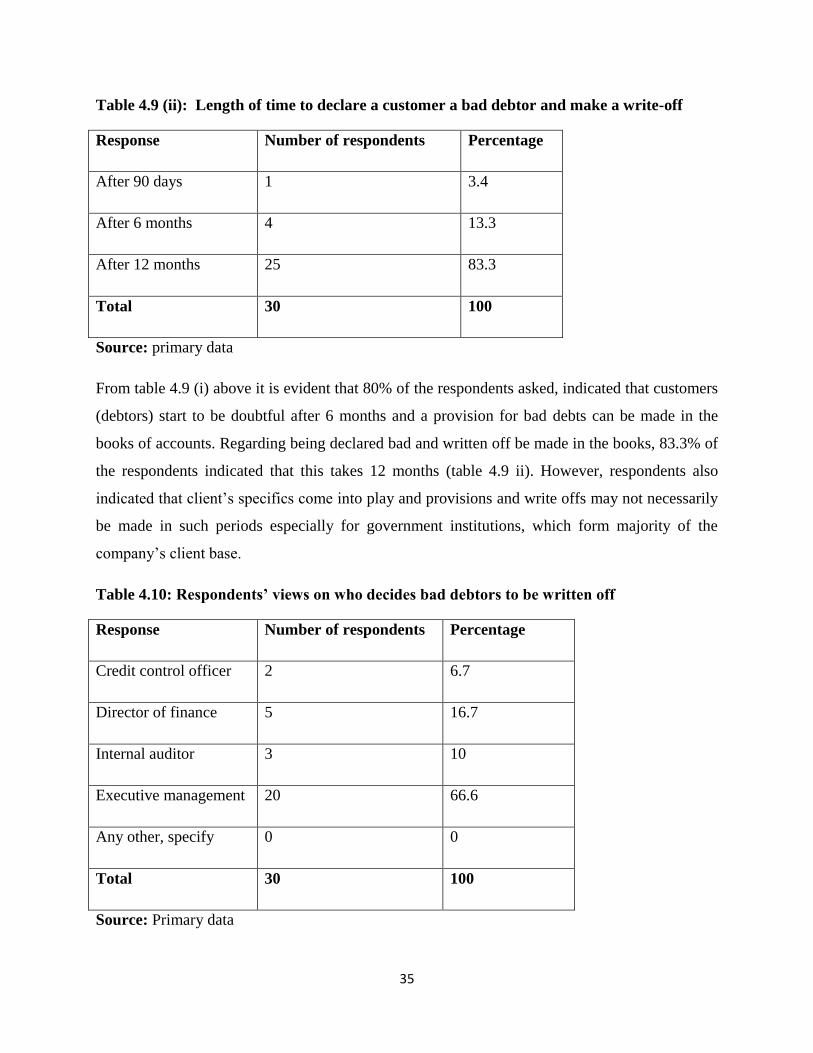
35
Table 4.9 (ii): Length of time to declare a customer a bad debtor and make a write-off
Response Number of respondents Percentage
After 90 days 1 3.4
After 6 months 4 13.3
After 12 months 25 83.3
Total 30 100
Source: primary data
From table 4.9 (i) above it is evident that 80% of the respondents asked, indicated that customers
(debtors) start to be doubtful after 6 months and a provision for bad debts can be made in the
books of accounts. Regarding being declared bad and written off be made in the books, 83.3% of
the respondents indicated that this takes 12 months (table 4.9 ii). However, respondents also
indicated that client’s specifics come into play and provisions and write offs may not necessarily
be made in such periods especially for government institutions, which form majority of the
company’s client base.
Table 4.10: Respondents’ views on who decides bad debtors to be written off
Response Number of respondents Percentage
Credit control officer 2 6.7
Director of finance 5 16.7
Internal auditor 3 10
Executive management 20 66.6
Any other, specify 0 0
Total 30 100
Source: Primary data
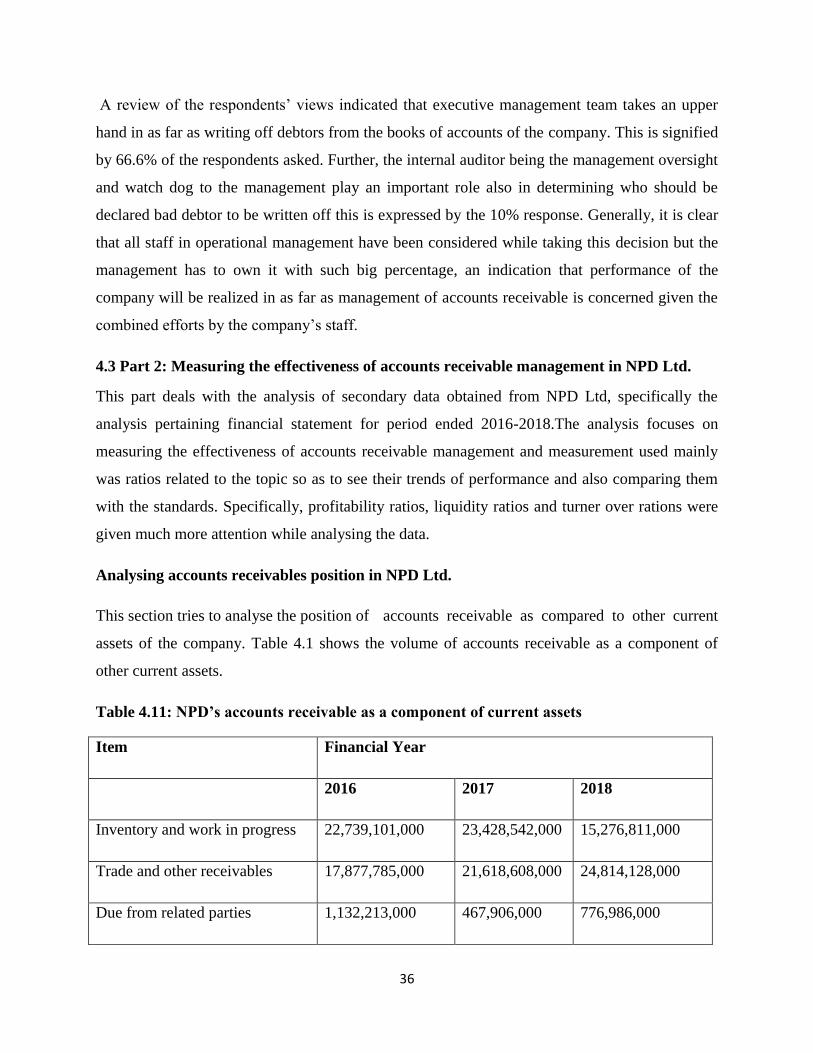
36
A review of the respondents’ views indicated that executive management team takes an upper
hand in as far as writing off debtors from the books of accounts of the company. This is signified
by 66.6% of the respondents asked. Further, the internal auditor being the management oversight
and watch dog to the management play an important role also in determining who should be
declared bad debtor to be written off this is expressed by the 10% response. Generally, it is clear
that all staff in operational management have been considered while taking this decision but the
management has to own it with such big percentage, an indication that performance of the
company will be realized in as far as management of accounts receivable is concerned given the
combined efforts by the company’s staff.
4.3 Part 2: Measuring the effectiveness of accounts receivable management in NPD Ltd.
This part deals with the analysis of secondary data obtained from NPD Ltd, specifically the
analysis pertaining financial statement for period ended 2016-2018.The analysis focuses on
measuring the effectiveness of accounts receivable management and measurement used mainly
was ratios related to the topic so as to see their trends of performance and also comparing them
with the standards. Specifically, profitability ratios, liquidity ratios and turner over rations were
given much more attention while analysing the data.
Analysing accounts receivables position in NPD Ltd.
This section tries to analyse the position of accounts receivable as compared to other current
assets of the company. Table 4.1 shows the volume of accounts receivable as a component of
other current assets.
Table 4.11: NPD’s accounts receivable as a component of current assets
Item Financial Year
2016 2017 2018
Inventory and work in progress 22,739,101,000 23,428,542,000 15,276,811,000
Trade and other receivables 17,877,785,000 21,618,608,000 24,814,128,000
Due from related parties 1,132,213,000 467,906,000 776,986,000
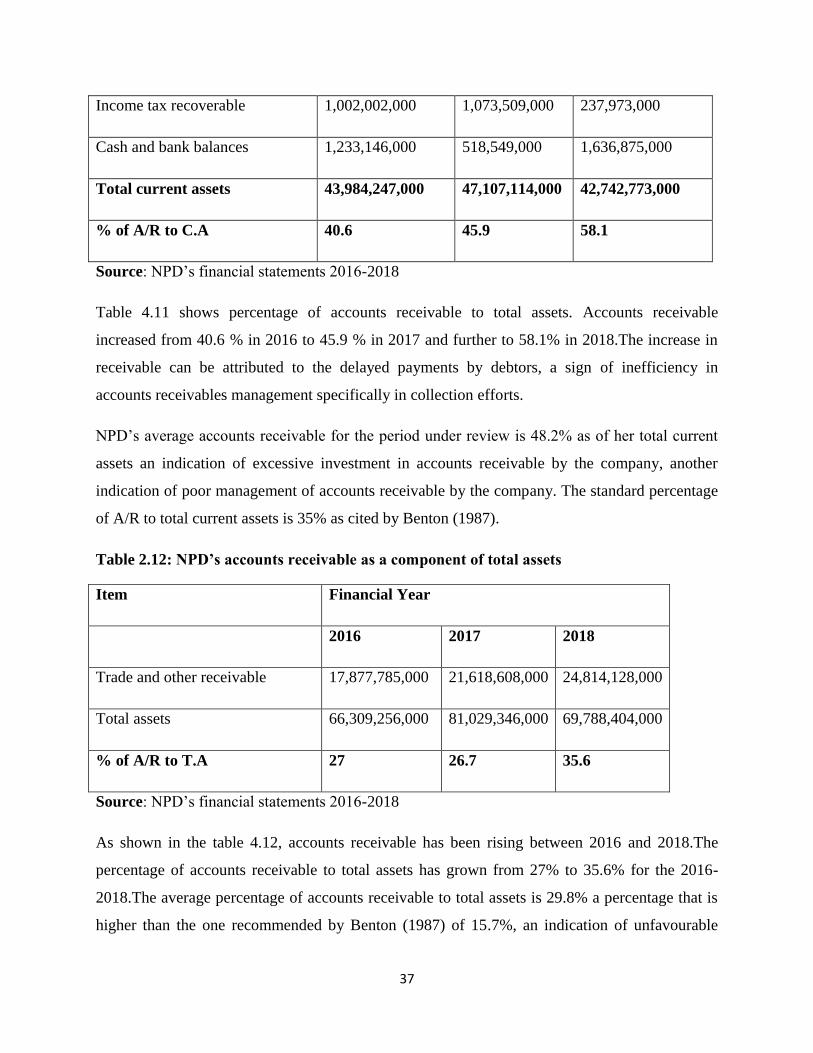
37
Income tax recoverable 1,002,002,000 1,073,509,000 237,973,000
Cash and bank balances 1,233,146,000 518,549,000 1,636,875,000
Total current assets 43,984,247,000 47,107,114,000 42,742,773,000
% of A/R to C.A 40.6 45.9 58.1
Source: NPD’s financial statements 2016-2018
Table 4.11 shows percentage of accounts receivable to total assets. Accounts receivable
increased from 40.6 % in 2016 to 45.9 % in 2017 and further to 58.1% in 2018.The increase in
receivable can be attributed to the delayed payments by debtors, a sign of inefficiency in
accounts receivables management specifically in collection efforts.
NPD’s average accounts receivable for the period under review is 48.2% as of her total current
assets an indication of excessive investment in accounts receivable by the company, another
indication of poor management of accounts receivable by the company. The standard percentage
of A/R to total current assets is 35% as cited by Benton (1987).
Table 2.12: NPD’s accounts receivable as a component of total assets
Item Financial Year
2016 2017 2018
Trade and other receivable 17,877,785,000 21,618,608,000 24,814,128,000
Total assets 66,309,256,000 81,029,346,000 69,788,404,000
% of A/R to T.A 27 26.7 35.6
Source: NPD’s financial statements 2016-2018
As shown in the table 4.12, accounts receivable has been rising between 2016 and 2018.The
percentage of accounts receivable to total assets has grown from 27% to 35.6% for the 2016-
2018.The average percentage of accounts receivable to total assets is 29.8% a percentage that is
higher than the one recommended by Benton (1987) of 15.7%, an indication of unfavourable
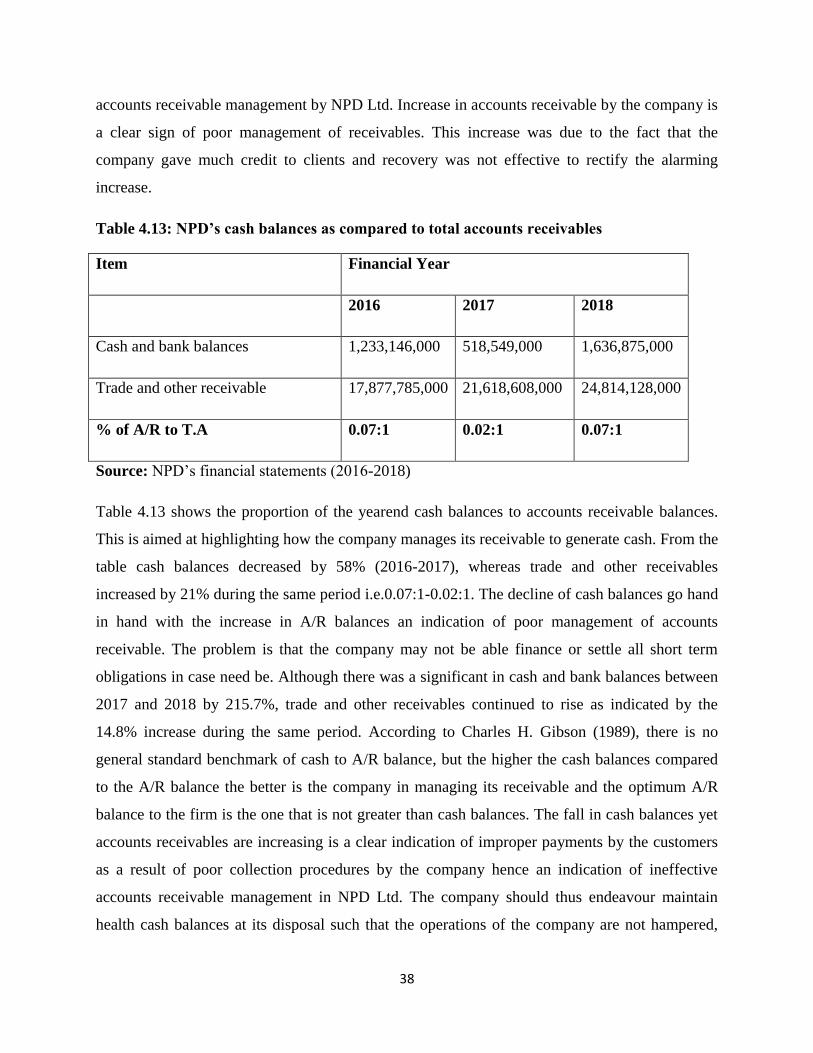
38
accounts receivable management by NPD Ltd. Increase in accounts receivable by the company is
a clear sign of poor management of receivables. This increase was due to the fact that the
company gave much credit to clients and recovery was not effective to rectify the alarming
increase.
Table 4.13: NPD’s cash balances as compared to total accounts receivables
Item Financial Year
2016 2017 2018
Cash and bank balances 1,233,146,000 518,549,000 1,636,875,000
Trade and other receivable 17,877,785,000 21,618,608,000 24,814,128,000
% of A/R to T.A 0.07:1 0.02:1 0.07:1
Source: NPD’s financial statements (2016-2018)
Table 4.13 shows the proportion of the yearend cash balances to accounts receivable balances.
This is aimed at highlighting how the company manages its receivable to generate cash. From the
table cash balances decreased by 58% (2016-2017), whereas trade and other receivables
increased by 21% during the same period i.e.0.07:1-0.02:1. The decline of cash balances go hand
in hand with the increase in A/R balances an indication of poor management of accounts
receivable. The problem is that the company may not be able finance or settle all short term
obligations in case need be. Although there was a significant in cash and bank balances between
2017 and 2018 by 215.7%, trade and other receivables continued to rise as indicated by the
14.8% increase during the same period. According to Charles H. Gibson (1989), there is no
general standard benchmark of cash to A/R balance, but the higher the cash balances compared
to the A/R balance the better is the company in managing its receivable and the optimum A/R
balance to the firm is the one that is not greater than cash balances. The fall in cash balances yet
accounts receivables are increasing is a clear indication of improper payments by the customers
as a result of poor collection procedures by the company hence an indication of ineffective
accounts receivable management in NPD Ltd. The company should thus endeavour maintain
health cash balances at its disposal such that the operations of the company are not hampered,

39
this can be done through recovery procedures to foster smooth and early payments thus
maintaining cash balances to cater for abrupt and urgent needs and obligations of the company.
4.3 Financial ratios analysis
Ratio analysis is used to compare a firm’s performance and the status to that of other firms or
itself overtime so as to make future plans. This analysis helps management to identify areas that
should be improved. In view to present NPD’s accounts receivables management and measure its
effectiveness, liquidity and activity ratios were calculated. These ratios are in one way or the
other affected by accounts receivable management policies taken by the firm. The ratio
computed are based on the data of NPD’s financial statements for the period 2016-2018.
4.3.1 Liquidity ratios
These ratios measure the firm’s ability in meeting it’s current obligations. They are computed by
establishing the relationship between cash and the current liabilities, below is thorough review.
4.3.2 Current ratio
This ratio is calculated by simply dividing current assets by current liabilities
Current ratio = Current Assets
Current Liabilities
Table 14.14: NPD’s current ratios 2016-2018
Item Financial Year
2016 2017 2018
Current assets 43,984,247,000 47,107,114,000 42,788,404,000
Current liabilities 30,533,916,000 39,507,980,000 27,598,573,000
Ratio 1.4:1 1.2:1 1.6:1
Source: NPD’s financial statements 2016-2018
From the table 4.14 above, it’s evident that NPD’s current ratio is satisfactory over the period,
the ratio shows that the company can more than cover its current liabilities using its current

40
assets. Although trend analysis indicates that there was a decline of current ratio from 1.4 to 1.2
between 2016 and 2017, the trend up between 2017 and 2018 with an increase from 1.4 to 1.6.
However, even though the company’s current ratios look better during the period under review, it
needs a mention that there is a big percentage of accounts receivable in its current assets that
form a large amount in the company’s statement of financial position which needs much more
attention, which is a sign of weak recovery and consequently poor collection procedures in place.
As cited in the table above, the percentage of current assets to current liabilities (current ratio)
have been declining between 2016-2017, although it again picked up between 2017-2018.
Despite this being a favourable ratio there is need to take much attention for the reason of the
decrease in 2017 and ensure the trend continues to rise from 2018 onwards. In case of any further
decline in the ratio, there is likely hood that the operations of the company will be hampered by
cash flows problems in future basically due to poor management of receivables which is one of
the biggest items on the company’s financial statements. Therefore, much attention is needed to
address the decline for the smooth operations of the company and effective management of
receivables in particular.
4.3.3 Quick ratio
This ratio was adopted just to indicate the relationship between quick or liquid assets and current
liabilities. This ratio considers assets which can be converted into cash immediately without a
loss of value. It was adopted to see if the company can operate effectively if its customers do not
pay on time.
It is calculated as;
Quick ratio =current assets-inventories and work in progress
Current liabilities
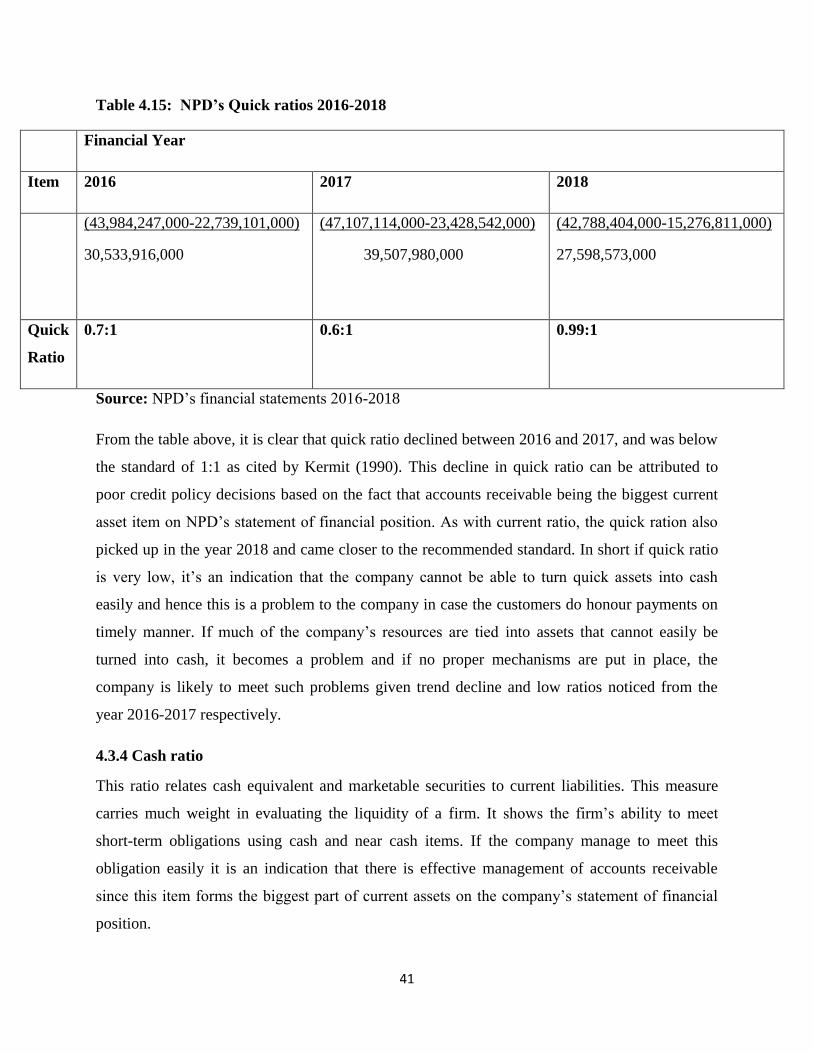
41
Table 4.15: NPD’s Quick ratios 2016-2018
Financial Year
Item 2016 2017 2018
(43,984,247,000-22,739,101,000)
30,533,916,000
(47,107,114,000-23,428,542,000)
39,507,980,000
(42,788,404,000-15,276,811,000)
27,598,573,000
Quick
Ratio
0.7:1 0.6:1 0.99:1
Source: NPD’s financial statements 2016-2018
From the table above, it is clear that quick ratio declined between 2016 and 2017, and was below
the standard of 1:1 as cited by Kermit (1990). This decline in quick ratio can be attributed to
poor credit policy decisions based on the fact that accounts receivable being the biggest current
asset item on NPD’s statement of financial position. As with current ratio, the quick ration also
picked up in the year 2018 and came closer to the recommended standard. In short if quick ratio
is very low, it’s an indication that the company cannot be able to turn quick assets into cash
easily and hence this is a problem to the company in case the customers do honour payments on
timely manner. If much of the company’s resources are tied into assets that cannot easily be
turned into cash, it becomes a problem and if no proper mechanisms are put in place, the
company is likely to meet such problems given trend decline and low ratios noticed from the
year 2016-2017 respectively.
4.3.4 Cash ratio
This ratio relates cash equivalent and marketable securities to current liabilities. This measure
carries much weight in evaluating the liquidity of a firm. It shows the firm’s ability to meet
short-term obligations using cash and near cash items. If the company manage to meet this
obligation easily it is an indication that there is effective management of accounts receivable
since this item forms the biggest part of current assets on the company’s statement of financial
position.
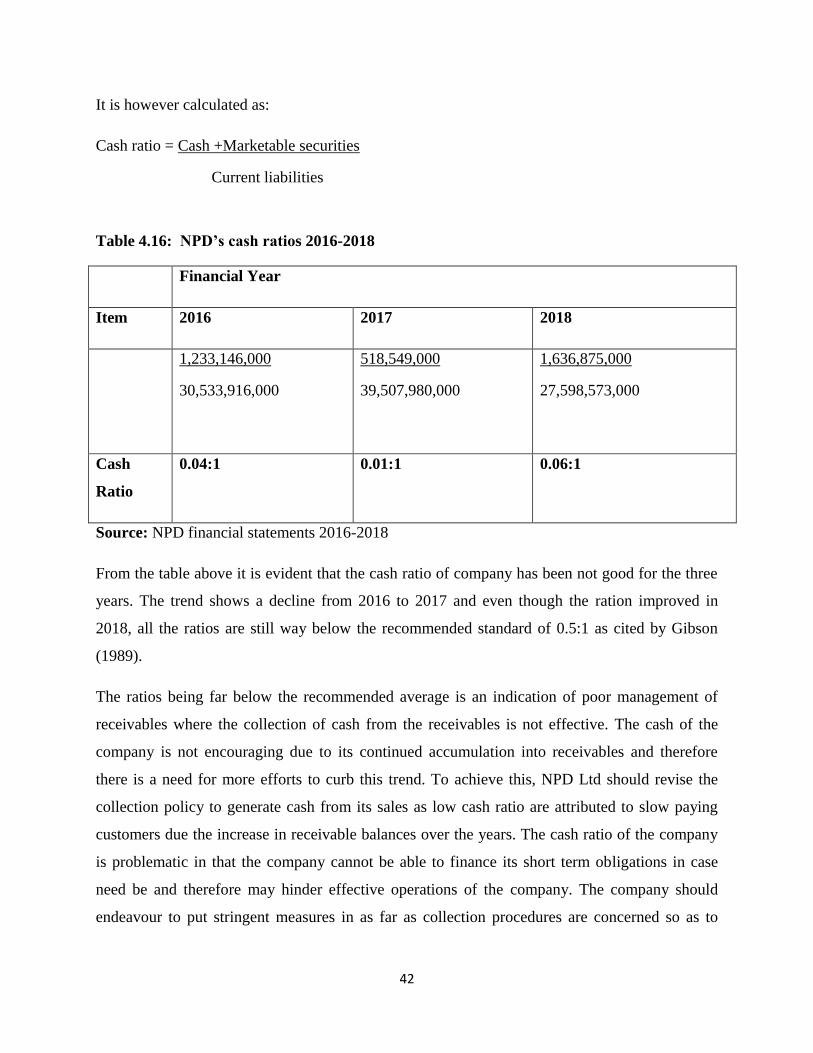
42
It is however calculated as:
Cash ratio = Cash +Marketable securities
Current liabilities
Table 4.16: NPD’s cash ratios 2016-2018
Financial Year
Item 2016 2017 2018
1,233,146,000
30,533,916,000
518,549,000
39,507,980,000
1,636,875,000
27,598,573,000
Cash
Ratio
0.04:1 0.01:1 0.06:1
Source: NPD financial statements 2016-2018
From the table above it is evident that the cash ratio of company has been not good for the three
years. The trend shows a decline from 2016 to 2017 and even though the ration improved in
2018, all the ratios are still way below the recommended standard of 0.5:1 as cited by Gibson
(1989).
The ratios being far below the recommended average is an indication of poor management of
receivables where the collection of cash from the receivables is not effective. The cash of the
company is not encouraging due to its continued accumulation into receivables and therefore
there is a need for more efforts to curb this trend. To achieve this, NPD Ltd should revise the
collection policy to generate cash from its sales as low cash ratio are attributed to slow paying
customers due the increase in receivable balances over the years. The cash ratio of the company
is problematic in that the company cannot be able to finance its short term obligations in case
need be and therefore may hinder effective operations of the company. The company should
endeavour to put stringent measures in as far as collection procedures are concerned so as to

43
have enough cash balances to effect the operations of the company in order to attain the stated
objectives of the entity, both short term and long term.
4.3.4 Analysis of NPD’s Net Working Capital
Net working capital = Current assets – current liabilities
It measures the capacity of the company to settle its obligations and continue operations without
seeking for any external financing. The higher the amount of net working capital the better is the
operations of the company and vice versa.
Table 4.17: NPD’s net working capital 2016-2018
Financial year
2016 2017 2018
Current assets 43,984,247,000 47,107,114,000 42,788,404,000
Current liabilities 30,533,916,000 39,507,980,000 27,598,573,000
Net working capital 13,450,331,000 7,599,134,000 15,189,831,000
Source: NPD’s financial statements 2016-2018
From the table above, it is evident that net working capital for the company shows a decline in
2017 from 2016, which is not a good sign in as far as working capital management is concerned.
The figure however improved in 2018 which ceteris Paribas is a good performance and effective
working capital management. However, this is not necessarily the case since from the analysis of
the company’s assets receivables take a very big portion of the assets in the company’s balance
sheet which increases year after year and therefore an indication that there is no clear policy of
receivable management in as far as collection and recovery of receivables is concerned. Much
attention should be given to receivable management if the net working capital of the company is
to depict a clear picture of the company.

44
Table 4.18: NPD’s liquidity ratios 2016-2018
Financial Year
Ratio 2016 2017 2018
Current ratio 1.4:1 1.2:1 1.6:1
Quick ratio 0.7:1 0.6:1 0.99:1
Cash ratio 0.04:1 0.01:1 0.06:1
Source: NPD’s financial statements 2016-2018
Table 4.18 above shows the trend of NPD’s liquidity ratios for the period 2016-2018.Both
current, quick, and cash ratio indicate a decline between 2016 and 2017, and an increase between
2017 and 2018. The decline can be attributed to a continuous increase in the amounts due by
customers/debtors an indication of poor management of accounts receivable. There is therefore a
need for managerial efforts among which accounts receivable management be prioritised.
Favourable accounts receivable is an indication of good management of receivables which has
not been the case for NPD Ltd in the past three years.
4.4 Profitability ratios
The profitability ratios are just what the name implies. They focus on the firm's ability to
generate a profit and an adequate return on assets and equity. They measure how efficiently the
firm uses its assets and how effectively it manages its operations.
Gross profit ratio
This ratio is calculated by dividing the Gross Profit by Sales. It is usually indicated as
percentage.
Gross Profit Ratio = Gross Profit x 100
Net Sales

45
Table 4.19: NPD’s gross profit ratios 2016-2018
Financial Year
2016 2017 2018
Gross profit ratio 11,340,597,000*100
37,578,548,000
7,885,370,000*100
33,385,259,000
9,036,174,000*100
35,883,608,000
Gross profit in % 30.2% 23.6% 25.2%
Source: NPD’s Financial Statements 2016-2018
As the gross profit is found by deducting cost of goods sold from net sales, higher the gross
profit better it is. There is no standard GP ratio for evaluation. It may vary from business to
business and industry to industry. However, the gross profit earned should be sufficient to
recover all operating expenses and to build up reserves after paying all fixed interest charges and
dividends. From the table above, the gross profit ratio expressed in percentage seem not to be
satisfactory and declined from 30.2% in 2016 to 23.6% in 2017, and although it slightly
increased to 25.2% in 2018, there is no guarantee that the company will enjoy profit but deficits
as realized in the financial years 2017 and 2018.
Net profit ratio
Net Profit (NP) ratio is used to measure the overall profitability and hence it is very useful to
proprietors. The ratio is very useful as in if the net profit is not sufficient, the firm shall not be
able to achieve a satisfactory return on its investment. This ratio also indicates the firm's capacity
to face adverse economic conditions such as price competition, low demand, etc. Obviously, the
higher the ratio the better is the profitability.

46
Table 4.20: NPD’s net profit ratios 2016-2018
Financial year
2016 2017 2018
Net profit ratio 1,193,521,000*100
37,578,548,000
(431,599,000)*100
33,385,259,000
(4,020,205,000)*100
35,883,608,000
Net profit in % 3.2% (1.3)% (11.2)%
Source: NPD’s Financial Statements 2016-2018
From the table above it is evident that net profit for the company has been decreasing year after
year from a profit of 1 billion in 2016 to a loss 4 billion in 2018. From the analysis of lower part
of the statement of comprehensive income, it is evident that the bottom line is greatly affected by
finance costs which have almost doubled during the same period from 4.6 billion in 2016 to 8.2
billion in 2018. This significant increase in finance costs can be explained by the large number of
accounts receivables that rose to over 24 billion in 2018 from 17 billion in 2016. This ties the
company’s operational cash flows into receivables forcing the company to go into borrowing to
finance its operations. This puts plain the inefficiencies in the company’s receivables
management and if no much effort put in credit collection and strengthen collection efforts there
is possibility that the company will suffer even severe deficits for the proceeding years.
Return on assets (ROA)
Return on assets is a financial ratio that shows the percentage of profit a company earns in
relation to its overall resources. It is commonly defined as net income divided by
total assets. Net income is derived from the income statement of the company and is the profit
after taxes. The assets are read from the balance sheet and include cash and cash-equivalent
items such as receivables, inventories, land, capital equipment as depreciated, and the value of
intellectual property such as patents.

47
It is calculated as;
Net Income *100
Total assets
Table 4.21: NPD’s return on assets 2016-2018
Financial year
2016 2017 2018
ROA 1,193,521,000 *100
66,309,256,000
(431,599,000) *100
81,029,346,000
(4,020,205,000) *100
69,788,404,000
ROA in % 1.8% (0.5) % (5.8) %
Like the net profit margin which shows a declining trend, return on assets as a measure of
profitability has also been on decline year on year moving from 1.8% in 2016 to -5.8% in 2018.
4.5 Receivables collection period
This is usually expressed as;
Trade receivables * 365 days
Credit sales
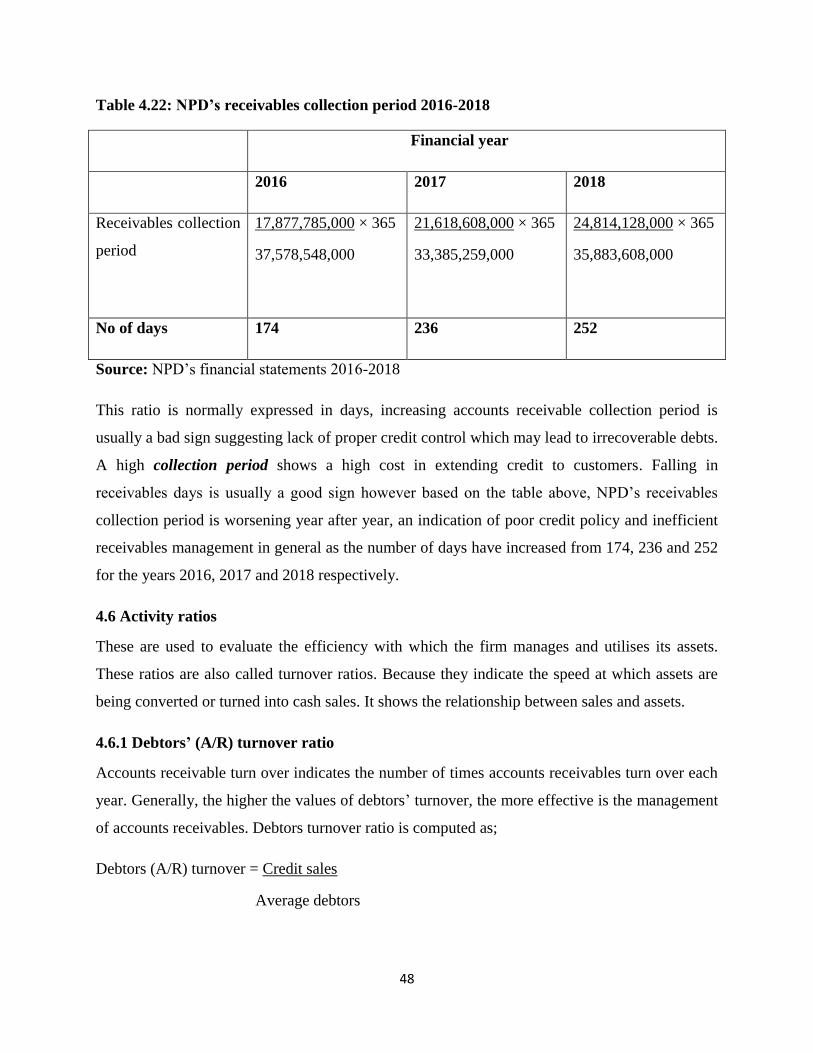
48
Table 4.22: NPD’s receivables collection period 2016-2018
Financial year
2016 2017 2018
Receivables collection
period
17,877,785,000 × 365
37,578,548,000
21,618,608,000 × 365
33,385,259,000
24,814,128,000 × 365
35,883,608,000
No of days 174 236 252
Source: NPD’s financial statements 2016-2018
This ratio is normally expressed in days, increasing accounts receivable collection period is
usually a bad sign suggesting lack of proper credit control which may lead to irrecoverable debts.
A high collection period shows a high cost in extending credit to customers. Falling in
receivables days is usually a good sign however based on the table above, NPD’s receivables
collection period is worsening year after year, an indication of poor credit policy and inefficient
receivables management in general as the number of days have increased from 174, 236 and 252
for the years 2016, 2017 and 2018 respectively.
4.6 Activity ratios
These are used to evaluate the efficiency with which the firm manages and utilises its assets.
These ratios are also called turnover ratios. Because they indicate the speed at which assets are
being converted or turned into cash sales. It shows the relationship between sales and assets.
4.6.1 Debtors’ (A/R) turnover ratio
Accounts receivable turn over indicates the number of times accounts receivables turn over each
year. Generally, the higher the values of debtors’ turnover, the more effective is the management
of accounts receivables. Debtors turnover ratio is computed as;
Debtors (A/R) turnover = Credit sales
Average debtors

49
Average debtors =Opening +closing debtors /2
But when the information about opening and closing balances of trade debtors and credit sales is
not available, then the debtor’s turnover ratio can be calculated by dividing the total sales by the
balance of debtors (inclusive of bills receivables) given. And formula can be written as follows.
Debtors Turnover Ratio = Total Sales
Debtors
Table 4.23: NPD’s accounts receivable turnover 2016-2018
Financial year Computation Number of times
2016 37,578,548,000
(20,058,417,000+17,877,785,000)
0.99
2017 33,385,259,000
(17,877,785,000+21,618,608,000)
0.85
2018 35,883,608,000
(21,618,608,000+24,814,128,000)
0.77
Source: NPD’s financial statements 2016-2018
From the table above, it is clear that the accounts receivable turnover is very low at less than 1,
and more worrying declining year on year an indication that there is a poor or no policy for
accounts receivable management of the company. Accounts receivable turnover ratio or debtor’s
turnover ratio indicates the number of times the debtors are turned over a year. The higher the
value of debtors’ turnover the more efficient is the management of debtors or more liquid the
debtors are. Similarly, low debtor’s turnover ratio implies inefficient management of debtors or
less liquid debtors. However, from the analysis in the table above, debtor’s turnover have been
low and declining from one year to the another, andthis may be due to relaxed collection efforts
and inefficient accounts receivable management in general. Thus, the overall management of
debtors for the company is not effective.

50
4.6.2 Average collection period
Average collection period measures the quality of debtors. It indicates the period of collecting
the accounts receivables, by calculating the number of days accounts receivables remain
uncollected. It is computed as;
Average collection period (ACP)=365
Debtor’s turnover
With the financial year estimated to have 365 days
Table 2.24: NPD’s ACP 2016-2018
Financial Year Computation Number of days
2016 365/0.99 387
2017 365/0.85 429
2018 365/0.77 474
Source: NPD’s financial statements 2016-2018
Average collection period measures the average number of days that accounts receivable are
outstanding. This activity ratio should be the same or lower than the company's credit terms. As
a rule, outstanding receivables should not exceed credit terms by more than 10-15 days. Kermit
D. Larson (1990). However, as shown by the above table, NPD’s ACP is much more than 10-15
Days of its credit period which is estimated to 90 days maximum meaning that the credit
customers do not fulfil the credit terms given and therefore a sign of poor management of
accounts receivable since customers do not fulfil their obligations on time. Receivables remain
un collected for a very long period, an indication of inefficient management of accounts
receivable.

51
4.6.3 Bad debts to Accounts Receivables Ratio (BDARR)
Bad-debt to Accounts Receivable ratio measures expected un-collectability on credit sales. An
increase in bad debts is a negative sign, since it indicates greater realization risk in accounts
receivable and possible future write-offs.
It is calculated as;
Bad debts
Average Accounts Receivable
Table 4.25: NPD’s bad debts to accounts receivable ratios 2016-2018
Financial year Computation BDARR
2016 55,308,000
(20,058,417,000+17,877,785,000)
0.001
2017 67,885,000
(17,877,785,000+21,618,608,000)
0.002
2018 929,092,000
(21,618,608,000+24,814,128,000)
0.02
Source: NPD’s financial statements 2016-2018
The bad debts to accounts receivable ratio calculates the percentage of accounts receivable that
were not collectible and hence written off as bad debts. The higher the ratio, the greater the risk
of un collectability for the sales made on credit. As indicated in the above table, this has been on
increase between 2016 and 2018, rising from 0.1% in 2016 to 2% in 2018, a sign of un effective
accounts receivable management in the company which massively affected its profitability.
4.6.3 Current assets turnover
The ratio shows the effectiveness of the firm in utilising its current assets. It is calculated as;

52
Current assets turnover =Sales
Current Assets
Table 4.26: NPD’s current assets turnover 2016-2018
Financial year Computation Number of times
2016 37,578,548,000
43,984,247,000
0.85
2017 33,385,259,000
47,107,114,000
0.71
2018 35,883,608,000
42,742,773,000
0.84
Source: NPD’s financial statements 2016-2018
From the table above, it is clear that the company has a very low current asset turnover, an
indication of poor management of receivable which is seen to be having a big percentage in the
company’s current assets on statement of financial position and there is a need to improve the
efficiency in the management of current assets turnover so as to maximise returns from current
assets and much attention being put on the management of accounts receivables as they occupy a
significant part of the firm’s current assets.
4.6.4 Total assets turnover
This ratio measures the firm’s ability in generating sales from all financial resources invested in
its assets. It is computed as under
Total assets turnover = sales
Total assets
Table 4.27: NPD’s total assets turnover 2016-2018
Financial year Computation Number of times
2016 37,578,548,000
66,309,256,000
0.57

53
2017 33,385,259,000
81,029,346,000
0.41
2018 35,883,608,000
69,788,404,000
0.51
Source: NPD’s financial statements 2016-2018
The lower the total asset turnover ratio, as compared to historical data for the company, the more
inefficient management of its assets.
This may indicate a problem with one or more of the asset categories composing total assets -
inventory, receivables, or fixed assets. In this case based on the financial statements of the
company it is evident that accounts receivables comprise a big percentage of total assets and
therefore an indication that there are receivable management problems based on such big portion
of receivable on the company’s statement of financial position as compared to total assets.
Finally, concerning the receivables management components of credit analysis, credit control
and collection, the findings show that NPD’s credit analysis function is not effective given that
customers with overdue debts are still granted credit without necessarily settling the overdue
receivables. This is also true for credit control and collection efforts given the huge amounts of
receivables that remain outstanding for long periods as evidenced by the continued decline in the
accounts receivable turnover ratios while the average collection period increased year on year for
the period under study.
4.7 Descriptive statistics
In this section, descriptive analysis was performed on each of the variables using SPSS. This
shows the mean and the standard deviation of ROA, ART, ACP and the BDARR as indicated in
Table 4.27 below.
Table 4.28: Descriptive statistics
Mean Std. Deviation N
Return On Assets -.015000 .0389744 3
Average Collection
Period
430.00 43.509 3
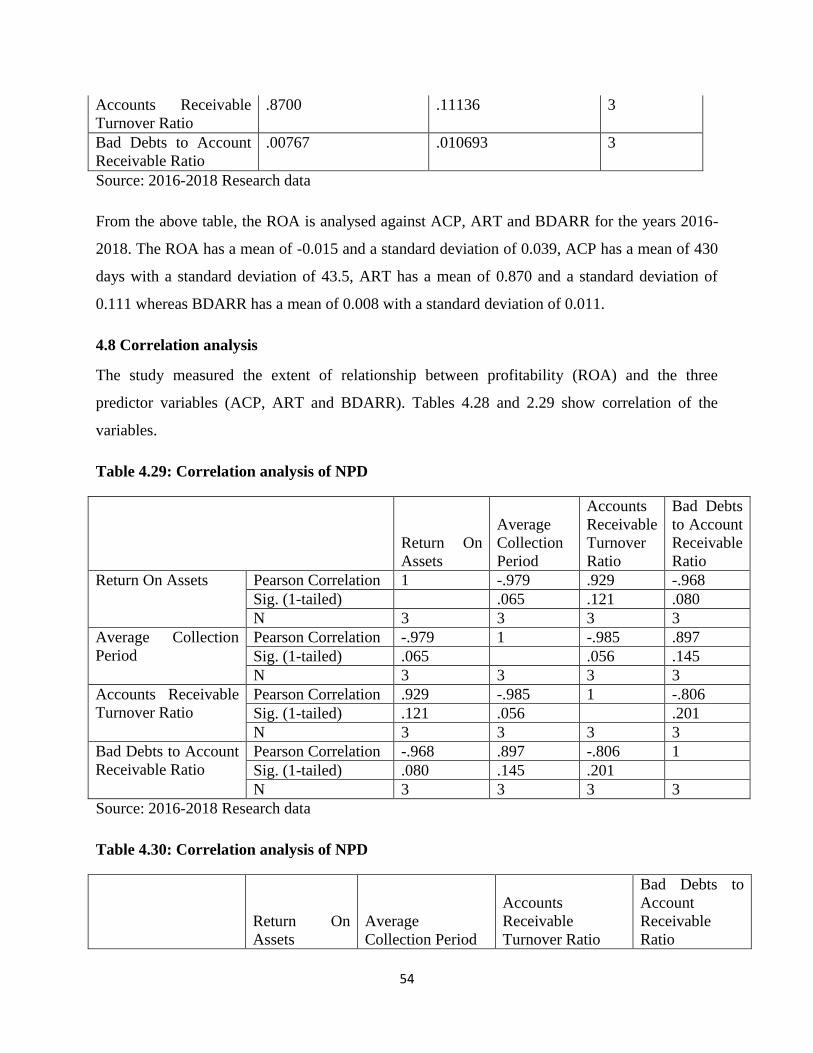
54
Accounts Receivable
Turnover Ratio
.8700 .11136 3
Bad Debts to Account
Receivable Ratio
.00767 .010693 3
Source: 2016-2018 Research data
From the above table, the ROA is analysed against ACP, ART and BDARR for the years 2016-
2018. The ROA has a mean of -0.015 and a standard deviation of 0.039, ACP has a mean of 430
days with a standard deviation of 43.5, ART has a mean of 0.870 and a standard deviation of
0.111 whereas BDARR has a mean of 0.008 with a standard deviation of 0.011.
4.8 Correlation analysis
The study measured the extent of relationship between profitability (ROA) and the three
predictor variables (ACP, ART and BDARR). Tables 4.28 and 2.29 show correlation of the
variables.
Table 4.29: Correlation analysis of NPD
Return On
Assets
Average
Collection
Period
Accounts
Receivable
Turnover
Ratio
Bad Debts
to Account
Receivable
Ratio
Return On Assets Pearson Correlation 1 -.979 .929 -.968
Sig. (1-tailed) .065 .121 .080
N 3 3 3 3
Average Collection
Period
Pearson Correlation -.979 1 -.985 .897
Sig. (1-tailed) .065 .056 .145
N 3 3 3 3
Accounts Receivable
Turnover Ratio
Pearson Correlation .929 -.985 1 -.806
Sig. (1-tailed) .121 .056 .201
N 3 3 3 3
Bad Debts to Account
Receivable Ratio
Pearson Correlation -.968 .897 -.806 1
Sig. (1-tailed) .080 .145 .201
N 3 3 3 3
Source: 2016-2018 Research data
Table 4.30: Correlation analysis of NPD
Return On
Assets
Average
Collection Period
Accounts
Receivable
Turnover Ratio
Bad Debts to
Account
Receivable
Ratio

55
Return On Assets 1
Average Collection
Period
-.979 1
Accounts Receivable
Turnover Ratio
.929 -.985 1
Bad Debts to Account
Receivable Ratio
-.968 .897 -.806 1
Source: 2016-2018 Research data
The findings reveal that ACP has a negative relationship with ROA. ACP has a coefficient of -
0.979 which means that one unit increase in ACP decreases ROA by 0.979, if ART and BDARR
are held constant. The statistical significance of ACP on ROA is 0.065 meaning that ACP
predicts ROA with 93.5% probability. At the same time BDARR also has a negative coefficient
of -0.968 which indicates that one unit increase in BDARR will decrease ROA by 0.968 units,
holding ACP and ART at constant. The statistical significance of 0.080 implies that BDARR
predicts ROA with a 92% probability.
On the other hand, ART has a positive relationship with ROA with a coefficient of 0.929. This
means that a unit increase in ART will result to a corresponding increase in ROA by 0.929,
holding ACP and BDARR constant. The statistical significance of ART is 0.121 meaning that
ART predicts ROA with 87.9% probability.
From the above findings therefore, the study found out that Average Collection Period and Bad
Debts to accounts Receivables Ratio have a negative effect on profitability while the Accounts
receivables turnover had a positive effect on profitability of construction companies in Rwanda,
considering NPD Ltd as a case study.

56
CHAPTER FIVE: SUMMARY, CONCLUSION AND RECOMMENDATIONS
5.0 Introduction
This chapter presents the summary of findings, general conclusion and recommendations. In this,
the discussion of results is made based on the statement of the problem, a conclusion is drawn,
and recommendations are made. Possible areas for the further research are also highlighted in
this section.
5.1 Summary of findings
Following the general objective of the study which is aimed at measuring the effective
performance of Accounts Receivable management, a case study approach was adopted and NPD
Ltd was taken to be the case study for the research, data was collected from both primary and
secondary sources.
It was found out that A/R management in the company begins with the company’s decision to
grant credit to its customers judging which customers should be given credit and then granting
credit to them. When a client is given a credit, he/she is expected is to pay within 30-60 days and
in case of inconveniences, he/she should not exceed 90 days. However, it was also found out that
not all credit customers pay their dues in time. There has also been a very serious problem in
collection policy that could maximally bring down accounts receivables, and this clearly
indicates that the firm has got a high risk for its accounts receivable becoming bad debts which
need management attention.
On the other side of secondary data analysis, the findings indicated slow payment by credit
customers meaning that most of the firm’s accounts receivable remains outstanding for a long
period of time; this is evidenced by high percentages of accounts receivable compared to other
current assets of the firm.
Through ratio analysis, NPD’s liquidity and activity ratios revealed unsatisfactory results, which
also showed a continuous decline. This is an indication of poor management of the firm’s assets
of which accounts receivable is one of the largest components. Generally, the firm’s accounts
receivable management was found not effective.

57
The average collection period of the company indicated a very unsatisfactory results where the
number of days in collection procedures ranged from 387, 429 and 474 days for the year 2016,
2017 and 2018 respectively, this is an indication of poor management of receivables since the
collection period is way above the credit policy set by the company and therefore there is a need
to rectify this if the company should meet its targeted performance in as far as accounts
receivable management is concerned.
The profitability ratios of the company ware also not satisfactory and the company reported net
losses in the years 2017 and 2018, and this was mainly due to high finance costs incurred in the
two years. If you consider this together with the fact that accounts receivables were also very
high in the same periods, the company is basically forced into much borrowings to finance its
working capital needs. These borrowings would have avoided or at least reduced were
company’s accounts receivable to be liquidated on time.
Finally, correlation analysis was also applied to determine the nature and extent of relationship
and to find out the effect of trade receivables management variables on the profitability
measures. The statistical analyses were also performed. Pearson correlation analysis was
performed in order to examine the relationships among variables.
The study found out that ACP, ART and BDARR affects ROA (profitability) of construction
companies in Rwanda, taking NPD as a case study.
5.2 General conclusion
The research findings indicated that the management of accounts receivable in NPD is not
effective, a conclusion based mainly on ART and ACP results. ART showed the number of times
NPD’s accounts receivable turn over each year, whereas the ACP showed the number of days the
firm’s accounts receivables remain uncollected. Both of them revealed unsatisfactory results, an
indication of slow payment by credit customers, poor collection policy by the firm and
ineffective accounts receivable management in general.
In trying to answer the research questions, the objectives of the study were achieved and it is
from this point that policies on accounts receivable management have to be improved so as to
achieve effective performance of NPD’s accounts receivable management. Here much emphasis

58
need to be put on credit selection procedures, credit terms, constant monitoring of accounts, and
improved collection efforts.
This study has also shown that ACP and BDARR negatively influence profitability whereas
ART has a positive influence on profitability. Therefore, management of the above metrics of
accounts receivable management should be used as part of best practices. This agrees with
Organdie, Idowu and Ogundipe (2012) who found that; “working capital management has a
negative relationship with market valuation as well as performance, taking into consideration
ACP, BDARR and ART as components of working capital management”. It also agrees with
Ahmet (2012) who concluded that; “efficient accounts receivable management assists a firm to
increase its profitability by reducing transaction costs of raising funds in case of liquidity crisis”.
We can therefore conclude that accounts receivables management has to be part of the entire
profitability strategy of any construction company. It is not an end to profitability by itself but
part of the means to an end. It should therefore be combined with other components of
profitability measures such as liquidity management, working capital management, capital size
structure, and growth rate.
5.3 Recommendations
The recommendations made are aimed at improving the accounts receivable management in
NPD by getting rid of the challenges encountered. It is from this point that the following
recommendations were made;
NPD’s collection efforts of accounts receivable from her credit customers should be improved.
This is due to the fact that slow payment by credit customers has been realised within the
company.
The company should therefore put much more effort in setting up procedures that would speed
up collection of accounts receivable from debtors. Slow collections have revealed bad image
while computing the ACP for the firm and this cuts the firm’s cash potential resulting in liquidity
problems and at times leads to bad debts. Therefore, stringent collection procedures should be
emphasised and prioritised such that no receivables remain outstanding beyond the prescribed
maximum credit period.

59
Further, the firm should make critical assessment of the credit seeking customers and credit be
given to those who will pay in the credit period given by the company. This is because the
company’s debtor’s turnover has been found unsatisfactory resulting from delayed payments
from debtors who take much time than the credit period given by the firm. This can also go in
hand with reducing the accounts receivable amounts which were found in excessive percentage
compared to other current assets of the company.
5.5 Suggested areas for further research
Due to limited resources, mainly time, it has not been possible to carry out a comprehensive
study in all areas related to the topic, and it’s from this point of view that further research has
been suggested by the researcher on the following;
Comparing the relationship between Accounts receivables and Accounts payables
management.
The impact of credit extension on customer’s purchasing decisions. This will help
find out customer’s attitude on cash purchases.

60
BIBLIOGRAPHY
1. Ahmet. s. (2012); Effects of working capital management on firms’ performance.
International Journal of Economics and Financial Issues. Vol. 2(4). , , 488-495
2. Berry, A & Jarvis, R. (2006). Accounting in a business context. Fourth Edition.
London.UK: Thomson
3. Boughes et al. (2009). Corporate Trade Credit and Inventories: New Evedence of a
Trade-off from Accounts Payable and Receivable. Journal of Banking & Finance 33(2):
300-307
4. Brigham E.F (1992),Fundamentals of Financial Management, 6th ed, fort worth, USA.
5. Deloof, M. (2003). Does working Capital management affect profitability of Beligan
firms. Journal of Business, Finance and Accounting, 30: 573-587
6. Emery, Finnerty, D.,J.,Stowe, et al. (2004). Corporate Financial Management. London:
Pearson: Prentice Hill
7. F. samiloglu and K. Demirgunes (2008). The effect of working capital management on
firm profitability: Evedence from Turkey, The international journal of applied economics
and Finance, 2: 44-50
8. Gilbert A .Churchill Jr (1992), Basic marketing research, 2nd edition, the Dryden press,
USA.
9. Gill. N. (2010). The relationship between working capital and profitability: Evidence
from the United States. Business and Economic journal, 1-10
10. Grinnell M and William (1990),Research in social work .1st edition , A primer, peacock
Publishers ,inc.USA
11. Jeannie M.Folk (2000), Study Guide for use with Financial Accounting, McGraw-Hill
companies inc, NEW YORK.

61
12. John G.Salek (2005),Accounts receivable management best practices, 5th edition,
Hoboken, New Jersey
13. John Wiley & Sons, Essentials of Working Capital Management: 2005. Hoboken, New
Jersey.
14. Jose M.L, Lancaste, C and Stevens J.L. (1996). Corporate returns and cash conversion
cycles. Journal of Economics and Finance, 9, 33-46.
15. Kendall and Kendall J.E (1992),System analysis and design, 2nd edition, prentice hall,
Englewood cliffs, new jersey.USA.
16. Lamberson (1995). Working Capital Management and its impact on Profitability:
Evedence from Food complex manufacturing firm in Adis Ababa.
17. Lazaridis and Tryfonidis (2006); Relationship between working capital management and
profitability of listed companies in the Anthens Stock Exchange. Journal of financial
management and analysis, vol. No.1 January-June 2006
18. Lynch F. (2005). Integrated management. Managerial level, Paper P5: Exam Kit CIMA.
Berkshire: Berkshire FTC.
19. Mathuva (2010). The influence of working capital management components on corporate
profitability; A survey of Kenyan listed firms
20. Michael sack Elmaleh (2006), financial accounting ,4th edition
21. Narware (2004). Impact of working capital management policies on corporate
performance; An empirical study of National Fertiliser Limited (NFL).
22. Patrick Buchmann and Udo Jung (2008), Best practice working capital management
techniques for optimizing inventories, receivables and payables .3rd ed ,
23. Terry S. Maness & John T. Zietlow. Short-term Financial Management, Edition3,
Illustrated, South-Western/Thomson Learning.2005

62
24. Waweru (2011). Trade Receivables management and profitability; a study on the
relationship between receivables management and the value of companies quoted at the
Nairobi Stock Exchange.

63
APPENDICES
Questionnaire
1. Which of the following functions form part of NPD Ltd.’s credit policy?
a) Criteria to screen credit applicants
b) Controlling the quality of accounts
c) Setting credit terms
2. Which of the following is relied upon while analysing credit applicants?
a) Analysis of customers past record
b) Rely on bank reference
c) Customers length of time
3. Which of the following measures of correspondence with credit customers help in the
effectiveness of accounts receivables management?
a) Sending notice/letter
b) Reminder /personal visits
c) Telephone calls
d) All the above
4. What is the average credit period offered to credit customers in NPD Ltd?
a) Standard period of 30 days
b) Grace period of 60 days
c) Maximum period of 90 days
d) Over 90 days
5. Are there problems associated with the management of accounts receivables?
a) Yes
b) No
6. Which of the problems below are associated with the management of accounts
receivables?
a) Bad and doubtful debts
b) Increased recovery costs
c) Increase in arrears and overdue payments
d) Others,
Please specify……………………………………………………………………….
7. Which of the following are the solutions to solve cited accounts receivable management
problems?

64
a) Strengthen credit control
b) Reducing credit period
c) Increase credit control officers
d) Frequent reminder to clients
e) Frequent field visit to clients
f) Any other,
Please specify……………………………………………………………………….
8. Does NPD Ltd classify her debtors according to their age (aging of debtors)?
a) Yes
b) No
c) Don’t know
9. (i) What is the length of time taken to declare a customer doubtful and make a provision?
a) After 60 days
b) After 90 days
c) After 6 months
(ii) What is the length of time taken to declare a customer a bad debtor and make a write-
off?
a) After 90 days
b) After 6 months
c) After 12 months
10. Who decides bad debtors to be written off?
a) Credit control officer
b) Director of finance
c) Internal auditor
d) Executive management
e) Any other,
Please
specify…………………………………………………………………

65
NPD’s Financial statements 2016-2018
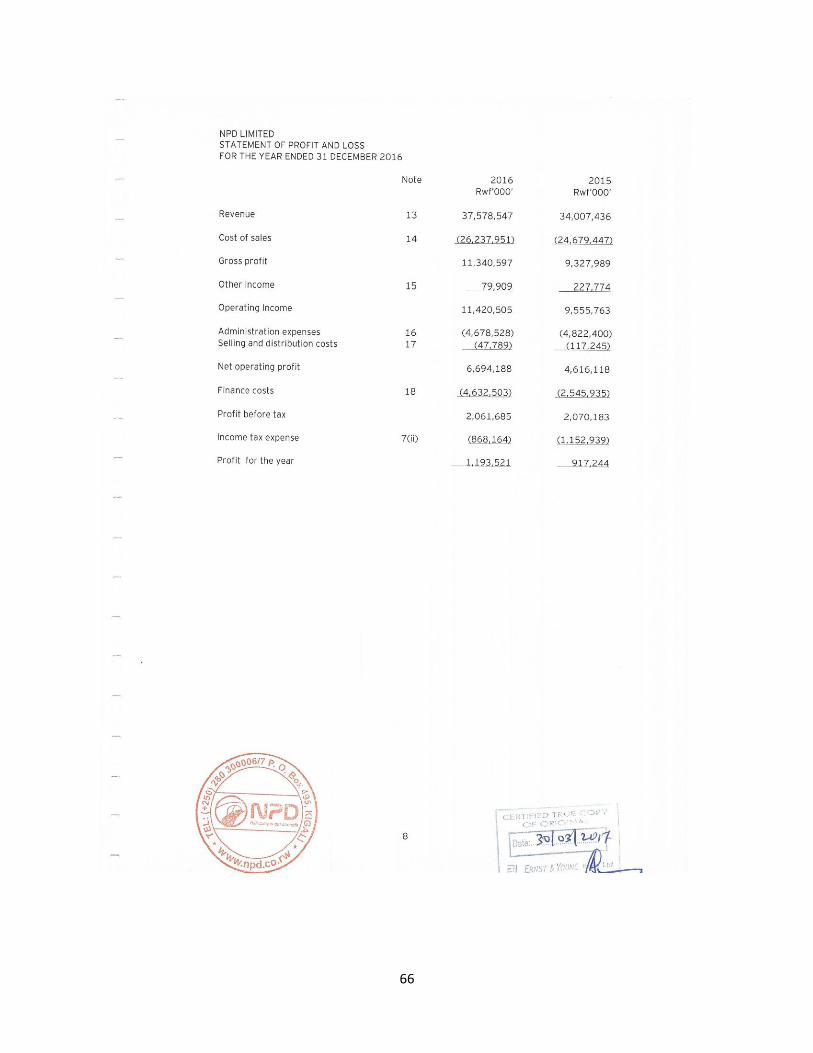
66

67

68