WHEAT Post-harvest Operations -Post-harvest Compendium WHEAT: Post-harvest Operations
Upload
independentCategory
view
0download
0
1 23
Coral ReefsJournal of the International Society forReef Studies ISSN 0722-4028Volume 31Number 2 Coral Reefs (2012) 31:321-334DOI 10.1007/s00338-012-0888-x
Effects of a single intensive harvest event onfish populations inside a customary marineclosure
S. D. Jupiter, R. Weeks, A. P. Jenkins,D. P. Egli & A. Cakacaka

1 23
Your article is protected by copyright and
all rights are held exclusively by Springer-
Verlag. This e-offprint is for personal use only
and shall not be self-archived in electronic
repositories. If you wish to self-archive your
work, please use the accepted author’s
version for posting to your own website or
your institution’s repository. You may further
deposit the accepted author’s version on a
funder’s repository at a funder’s request,
provided it is not made publicly available until
12 months after publication.
REPORT
Effects of a single intensive harvest event on fish populationsinside a customary marine closure
S. D. Jupiter • R. Weeks • A. P. Jenkins •
D. P. Egli • A. Cakacaka
Received: 26 October 2011 / Accepted: 1 February 2012 / Published online: 16 February 2012
� Springer-Verlag 2012
Abstract In September 2008, the villagers of Kia Island,
Fiji, opened their customary managed closure (Cakaulevu
tabu) to fishing for a fundraiser that lasted for 5 weeks. We
report on opportunistic before-after-control-impact surveys
describing changes to coral reef communities both 4 weeks
into the harvest and 1 year later compared with pre-harvest
conditions. Prior to the harvest, there was a gradient in
mean fish abundance and biomass per transect, with highest
levels in the north of the closure (250 fish transect-1,
8,145.8 kg ha-1), intermediate levels in the south of the
closure (159 fish transect-1, 4,672.1 kg ha-1) and lowest
levels in the control area open to fishing (109 fish tran-
sect-1, 594.0 kg ha-1). During the harvest, there were
extensive depletions in large-bodied, primary targeted fish
species, with significant loss in biomass of Acanthuridae
and Carangidae in the north and Lutjanidae and Serranidae
in the south. We also observed significant increases in
Acanthuridae, Lethrinidae and Scaridae in the control,
suggesting a ‘‘bail-out’’ effect whereby fish left the closure
in response to a rapid increase in fishing pressure. These
changes were coupled with a large increase in turf algal
cover at all survey areas, despite a large numerical increase
in small, roving acanthurids (e.g., Ctenochaetus striatus)
and scarids (e.g., Chlorurus sordidus). By 1 year later, fish
biomass was significantly lower within the closure than
before the harvest, while values in the control returned to
pre-harvest levels, suggesting non-compliance with the
reinstated fishing ban. We use the lessons learned from this
event to suggest recommendations for promoting effective
management of periodically harvested customary closures
that are a common feature across much of Oceania.
Keywords Marine protected areas � Customary
management � Tabu areas � Coral reef fisheries �Periodic harvest � Fiji
Introduction
Attempts to reduce threats to the marine environment in
Oceania, particularly from overfishing, have increasingly
focused on ecosystem-based approaches to conservation,
including the designation of marine protected areas (MPAs)
(Jupiter and Egli 2011; Aswani et al. 2012). There is strong
evidence that permanent, no-take areas provide fisheries
benefits in terms of increased numerical abundance and
biomass (Mumby and Steneck 2008; Lester et al. 2009) and
growing evidence to support density-dependent adult spill-
over and larval exchange supported by increased egg pro-
duction from larger fish (Abesamis and Russ 2005; McCook
et al. 2010). However, in many Pacific islands, there are
strong cultural and legislative barriers to placing permanent
restrictions on access to traditional fishing grounds (Foale
and Manele 2004; Ruddle and Hickey 2008; Clarke and
Jupiter 2010). Conservation organizations and practitioners
Communicated by Biology Editor Prof. Philip Munday
Electronic supplementary material The online version of thisarticle (doi:10.1007/s00338-012-0888-x) contains supplementarymaterial, which is available to authorized users.
S. D. Jupiter (&) � R. Weeks � D. P. Egli � A. Cakacaka
Wildlife Conservation Society, Fiji Country Program,
11 Ma’afu Street, Suva, Fiji
e-mail: [email protected]
R. Weeks
ARC Centre of Excellence for Coral Reef Studies,
James Cook University, Townsville, Australia
A. P. Jenkins
Wetlands International-Oceania, Suva, Fiji
123
Coral Reefs (2012) 31:321–334
DOI 10.1007/s00338-012-0888-x
Author's personal copy
working in this region, such as partners within the Locally
Managed Marine Area (LMMA) network, typically advo-
cate an integration of traditional management practices and
scientific knowledge. The LMMA network is composed of
government and non-government organizations working
together with communities to share knowledge and best
practice for coastal and marine resource management to
achieve local objectives (Govan et al. 2009). Such approa-
ches have resulted in management systems that comprise a
multitude of different strategies including no-take closures,
temporary closures, size limits, seasonal or species bans and
gear restrictions (Ban et al. 2011). Of these, periodically
harvested marine closures are the most common form of
spatial management (Govan et al. 2009).
The relative effectiveness of permanent no-take MPAs
versus other management strategies has been the subject of
much debate in the literature. There is some evidence that
periodically harvested closures can promote short-term
recovery of fish abundance and biomass (Cinner et al.
2005; Bartlett et al. 2009a), and compliance may be
stronger under these customary management systems
compared with western-style permanent no-take areas
(Cinner et al. 2006). Yet, positive perceptions by locals of
their effectiveness are not always validated by ecological
surveys, particularly for fish biomass (Bartlett et al. 2009b).
Furthermore, long-term ecological studies and meta-anal-
yses suggest that MPAs must be no-take and permanently
closed to achieve sustained fisheries benefits (Russ and
Alcala 2004; Di Franco et al. 2009; Lester et al. 2009;
Maliao et al. 2009). This is often due to focused fishing
efforts within MPA boundaries when they are opened.
Permitted periodic harvests within traditional MPAs have
been observed to remove marine resources with ‘‘alarming
efficiency’’ (Foale and Manele 2004), and fisheries benefits
from protection (e.g., increased fish size, abundance and
spillover potential) have been rapidly removed where no-
take status has been revoked (Alcala et al. 2005; Williams
et al. 2006).
It is clear that while MPAs other than permanent no-take
closures can contribute towards achieving objectives for
sustainable resource use and conservation, different man-
agement strategies are not equally effective (Mills et al.
2011). The effectiveness of a management strategy will
vary across species and habitats and in response to the
objective being measured. Given that periodically har-
vested closures are the only feasible management option
throughout much of the Pacific, science-based guidelines
for the frequency and intensity with which such MPAs can
be sustainably harvested are urgently required. Attempts to
develop such guidelines have been constrained by a lack
of empirical evidence for the impact of periodic harvests
on fish populations. Here, we report on an opportunistic
pre-, during and post-harvest (1 year later) survey of a
customary closure (tabu area) in Fiji. We investigate the
direct and indirect effects of the harvest event on coral reef
fish biomass and abundance, potential fish behavioural
responses and reef benthos. Based on these analyses, we
provide recommendations to improve the sustainability of
local coastal resource management strategies.
Methods
Study site
The Cakaulevu tabu area (15.5 km2) is located on the
exposed outer barrier reef west of Kia Island, Macuata
Province, on the island of Vanua Levu in Fiji (Fig. 1).
In 2005, the high chief of Macuata, together with the
Cokovata Qolioli Management Committee, endorsed the
establishment of a network of nine community-managed
tabu areas, including the Cakaulevu tabu. The MPA net-
work was established with the assistance of conservation
partners, led by the WWF South Pacific Programme, with
the objectives to protect reef fish stocks for the future
and to conserve marine biodiversity. Prior to 2005, the
Cakaulevu tabu was informally protected and may have
been opened periodically for subsistence use, but to our
knowledge was never previously harvested for commercial
extraction.
The residents of the three villages on Kia Island have
traditional fishing rights within their customary fishing
ground (qoliqoli) and are heavily dependent upon marine
resources for their livelihoods, as the small, steep-sloped
island contains little arable land. In September 2008, the
communities collectively decided to harvest the Cakaulevu
tabu to raise funds to support school, church and provincial
fees for island residents. Initially, the goal was to raise
FJD$12,000 (USD$7,492 based on exchange rates from 22
September 2008, the first day of the harvest) from the sale of
invertebrates (predominantly beche-de-mer) and fish. This
goal was exceeded on the first day, and upon realizing the
potential for profit, community members extended the
harvest period for 5 weeks. Residents and traditional fishing
rights owners living outside of Kia Island who returned for
the event fished in shifts over 24 h periods from Mondays
through Saturdays. Based on daily amounts paid out by
middlemen from three seafood export companies (reported
to A. Cakacaka), we estimated a total revenue to community
members of over FJD$200,000 (USD$124,871). The
majority of the catch was caught with spearguns, Hawaiian
slings, and hook and line (S. Jupiter and A. Cakacaka, pers.
obs.).
Researchers from the Wildlife Conservation Society
(WCS) surveyed reefs inside and outside the Cakaulevu
tabu in September 2008 as part of a larger project to assess
322 Coral Reefs (2012) 31:321–334
123
Author's personal copy
the effectiveness of networks of community MPAs to
increase food fish biomass (Jupiter and Egli 2011). Three
days after the start of the survey, the communities informed
WCS of their decision to open the tabu area. The WCS
team then returned to survey the same sites 4 weeks into
the harvest (October 2008) to determine the effects of the
harvest event on fish populations, and 1 year later (October
2009) to look for evidence of recovery.
Fish and benthic surveys
Underwater visual census surveys of fish and benthic
substrate were conducted on forereef sites inside (n = 4)
and outside (n = 2) of the Cakaulevu tabu area (Fig. 1)
using the methods described in Jupiter and Egli (2011).
Due to notable differences in reef geomorphology (S.
Jupiter, pers. obs.) that initially supported distinct fish
communities, the survey sites within the tabu area were
divided into two regions for analysis. The northern tabu
sites are characterized by high current and steep reef
slopes/vertical walls, and the southern tabu sites are char-
acterized by less current and a gradual slope with variable
topography and channels to 20 m. The control sites, loca-
ted on a reef to the south of the Cakaulevu tabu, share
similar reef geomorphology to the southern tabu sites. The
location and replication of survey sites were constrained
by the opportunistic nature of the study and are admittedly
not ideal for this purpose. Nevertheless, these data permit a
before-after-control-impact (BACI) analysis of the effects
of opening a customary marine closure.
At each site, trained fish observers from WCS estimated
fish size (2–5 cm, then 5 cm classes to 40 cm, and size to the
nearest cm above 40 cm) and abundance at ten replicate
5 m 9 50 m belt transects at shallow (5–8 m; n = 5) and
deep (12–15 m; n = 5) depths. They recorded fish from
the following families: Acanthuridae, Balistidae, Carangidae,
Carcharhinidae, Chaetodontidae, Chanidae, Ephippidae,
Haemulidae, Kyphosidae, Labridae, Lethrinidae, Lutjanidae,
Mullidae, Pomacanthidae, Scaridae, Scombridae, Serranidae
(subfamily Epinephelinae only), Siganidae, Sphyraenidae and
Zanclidae. We calculated biomass from size class estimates
of length (L) and existing published values from FishBase
(Froese and Pauly 2009) used in the standard length–weight
(L–W) expression W = aLb, where a and b parameter values
were preferentially selected from sites closest to Fiji (Jupiter
and Egli 2011). As many of the L–W conversions required
fork length (FL), a length–length (L–L) conversion factor was
obtained from FishBase where necessary to convert from total
length (TL) recorded during the surveys to FL before biomass
estimation. Because the biomass conversion formula resulted
in some grossly overestimated weights for fishes that sub-
stantially change morphology as they age, maximum pub-
lished weights were used for certain species when these fish
were sighted above threshold sizes, as per Jupiter and Egli
(2011). We additionally assessed which species were most
likely to be primary targets based on: market value informa-
tion from the Fiji Department of Fisheries divisional office in
Labasa; maximum length from FishBase; and position typi-
cally found in the water column (fish high in the water column
are more easily targeted by spearfishers).
Kia Island
Nor
thTa
buS
outh
Tab
uT
Con
trol
Control 2
Control 1
South 2
South 1
North 2
North 1
Cakaulevu Reefs Tabu
Tabu Areas
Coral Reefs
Qoliqoli boundary
Survey Sey ites
0 1 2 3 4 5 Kilometers
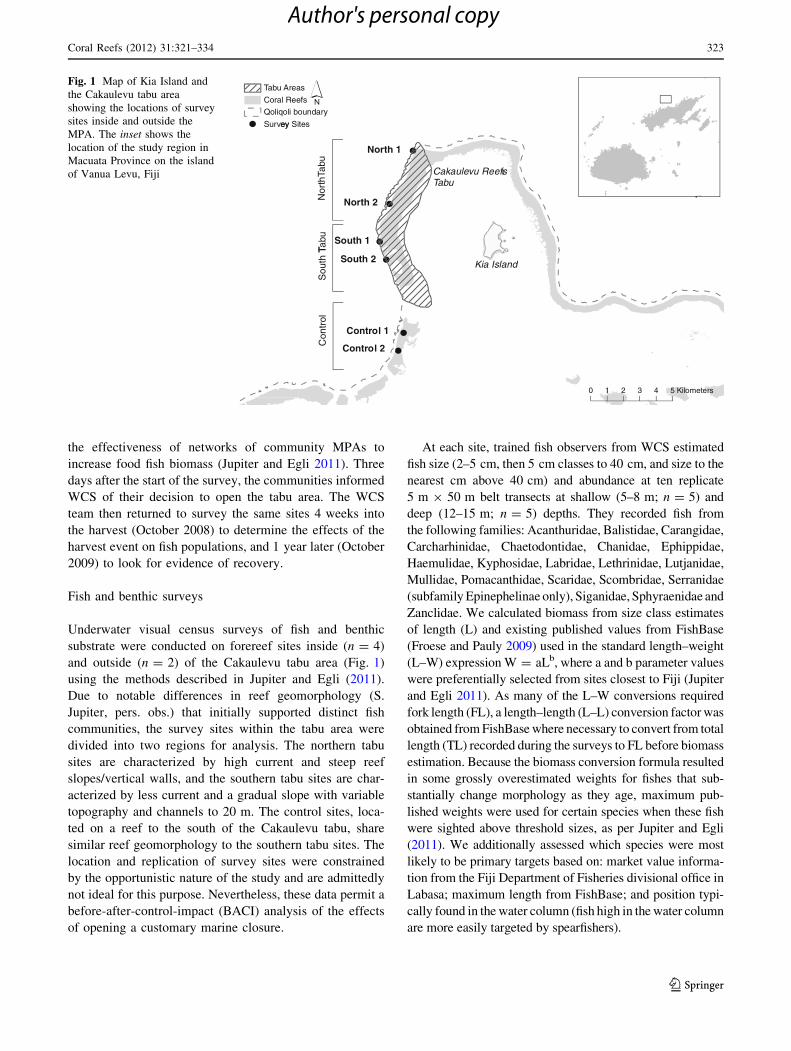
Fig. 1 Map of Kia Island and
the Cakaulevu tabu area
showing the locations of survey
sites inside and outside the
MPA. The inset shows the
location of the study region in
Macuata Province on the island
of Vanua Levu, Fiji
Coral Reefs (2012) 31:321–334 323
123
Author's personal copy
To determine associations between fish communities
and benthos both before and following the harvest, separate
observers recorded benthic life-form categories along the
same 50 m transects surveyed for fish assemblages at
0.5 m intervals using the point-intercept method. We
combined life-form categories into 6 functional strata:
fleshy algae/cyanobacteria, including cyanobacteria, algal
assemblages and fleshy macroalgae [2 cm height; live
hard coral, including Millepora and Tubipora; other soft
substrate, including soft corals, sponges, ascidians, anem-
ones and zooanthids; reef matrix, including dead coral, reef
pavement and coralline algae; turf algae, defined as algae
B2 cm height on reef matrix or dead coral; and uncon-
solidated substrate, comprised of rubble, sand or silt.
Statistical analyses
To assess how the harvest affected reef fish populations
within and outside of the Cakaulevu tabu, we conducted
permutational multivariate analysis of variance (PERMA-
NOVA) analyses with 4,999 permutations using log10
Modified Gower resemblance matrices (Anderson 2001;
McArdle and Anderson 2001) of fish abundance and biomass
summed at the transect level for total fish and for the fol-
lowing major food fish families: Acanthuridae; Carangidae;
Lethrinidae; Lutjanidae; Scaridae; and Serranidae. We first
tested the main effects models with three levels of fixed
factors: sampling period, area and site nested within area.
Samples were pooled across depths for each site. Where a
significant interaction term was found between sampling
period and area, we conducted separate post hoc pair-wise
comparisons within sampling period between each area and
within area between each sampling period (Anderson et al.
2008). Total and scarid biomass PERMANOVA analyses
were conducted with and without Bolbometopon muricatum
records, as the presence of these large fish that tend to occur
in groups may mask other impacts from fishing. To assess
potential differences in benthic structure that may influence
fish community assemblages, we performed the same PER-
MANOVA model design on a Euclidean distance similarity
matrix of percent benthic strata cover for each transect and
then conducted post hoc pair-wise comparisons within
sampling period between each area and within area between
each sampling period. We performed these analyses using
PRIMER version 6 software with PERMANOVA extension.
We assessed differences in reef fish community com-
position through time using canonical analysis of principal
coordinates (CAP) performed on a Bray–Curtis dissimi-
larity matrix of species presence–absence data using R
software. CAP is a constrained ordination procedure that
initially calculates unconstrained principal coordinate
(PCO) axes, followed by canonical discriminant analysis
on the principal coordinates to maximize separation
between groups (Anderson and Willis 2003). We selected
the number of principal coordinate axes (m) that provided
the best distinction between groups, following the method
described in Anderson and Willis (2003). The CAP pro-
cedure provides misclassification errors using a ‘‘leave-
one-out’’ method, whereby each observation is removed
from the analysis and then placed in the canonical space
determined by the rest of the observations (Anderson and
Willis 2003). The percentage of correct classifications
provides a measure of the goodness of fit. Species’ corre-
lations with the first two CAP axes were plotted to identify
those that had greatest influence on site groupings.
Results
Total fish abundance and biomass
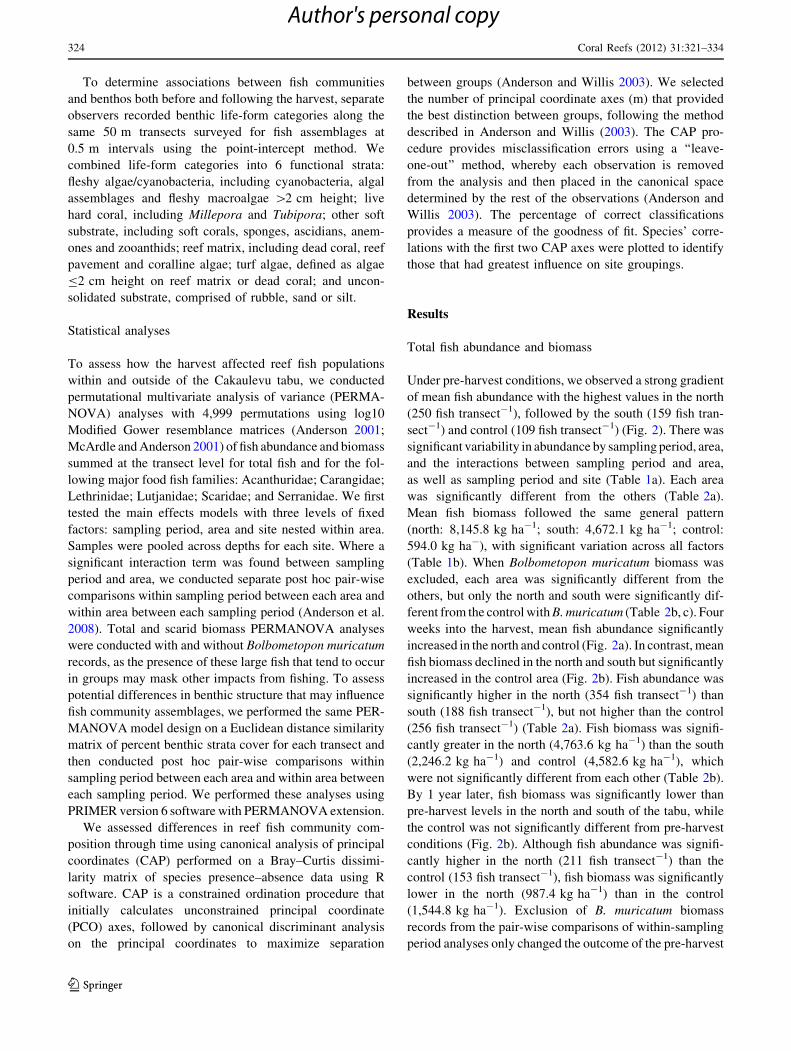
Under pre-harvest conditions, we observed a strong gradient
of mean fish abundance with the highest values in the north
(250 fish transect-1), followed by the south (159 fish tran-
sect-1) and control (109 fish transect-1) (Fig. 2). There was
significant variability in abundance by sampling period, area,
and the interactions between sampling period and area,
as well as sampling period and site (Table 1a). Each area
was significantly different from the others (Table 2a).
Mean fish biomass followed the same general pattern
(north: 8,145.8 kg ha-1; south: 4,672.1 kg ha-1; control:
594.0 kg ha-), with significant variation across all factors
(Table 1b). When Bolbometopon muricatum biomass was
excluded, each area was significantly different from the
others, but only the north and south were significantly dif-
ferent from the control with B. muricatum (Table 2b, c). Four
weeks into the harvest, mean fish abundance significantly
increased in the north and control (Fig. 2a). In contrast, mean
fish biomass declined in the north and south but significantly
increased in the control area (Fig. 2b). Fish abundance was
significantly higher in the north (354 fish transect-1) than
south (188 fish transect-1), but not higher than the control
(256 fish transect-1) (Table 2a). Fish biomass was signifi-
cantly greater in the north (4,763.6 kg ha-1) than the south
(2,246.2 kg ha-1) and control (4,582.6 kg ha-1), which
were not significantly different from each other (Table 2b).
By 1 year later, fish biomass was significantly lower than
pre-harvest levels in the north and south of the tabu, while
the control was not significantly different from pre-harvest
conditions (Fig. 2b). Although fish abundance was signifi-
cantly higher in the north (211 fish transect-1) than the
control (153 fish transect-1), fish biomass was significantly
lower in the north (987.4 kg ha-1) than in the control
(1,544.8 kg ha-1). Exclusion of B. muricatum biomass
records from the pair-wise comparisons of within-sampling
period analyses only changed the outcome of the pre-harvest
324 Coral Reefs (2012) 31:321–334
123
Author's personal copy
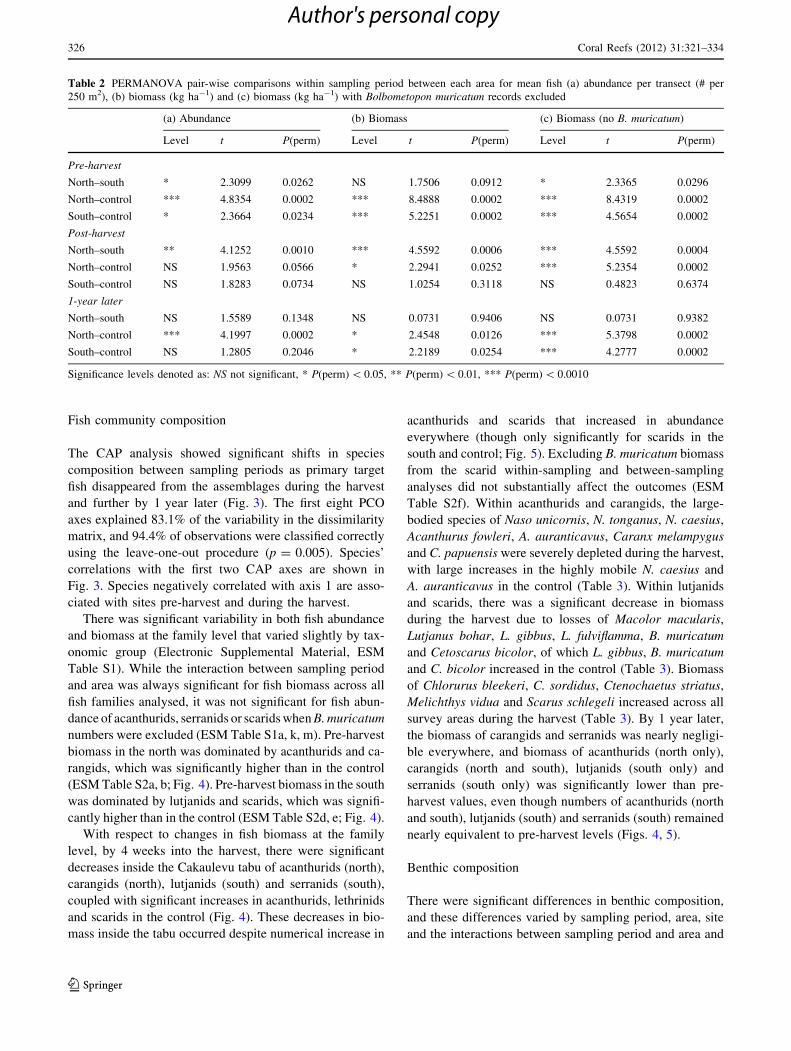
north–south comparison described above (Table 2c).
Exclusion of B. muricatum biomass records from between-
sampling period analyses only changed the outcome
of the comparison between pre-harvest and during
harvest conditions in the south, which became significantly
different.
Mea
n fis
h ab
unda
nce
(# p
er 2
50 m
2 )
010
020
030
040
0
North South Control
a
b
a
a
aa
a
b
c
Mea
n fis
h bi
omas
s (k
g ha
−1 )
020
0040
0060
0080
0010
000
North South Control
a
a
b
a
ab
b
a
b
a
Pre−harvestDuring+1 year
(a) (b)
Fig. 2 Total mean abundance (# per 250 m2) (a) and biomass
(kg ha-1) (b) per transect of reef fish at sites inside (north and south)
and outside (control) the Cakaulevu tabu area before (black bars),
during (white bars) and 1 year after (grey bars) a 5-week intensive
harvest event. Adjacent different letters indicate that a significant
difference exists between sampling periods (e.g., ‘‘a b a’’ indicates
that pre-harvest is significantly different from during harvest but not
from 1 year later, and ‘‘a ab b’’ indicates that pre-harvest is not
significantly different from during harvest but is significantly different
from 1 year later). Error bars indicate one standard error
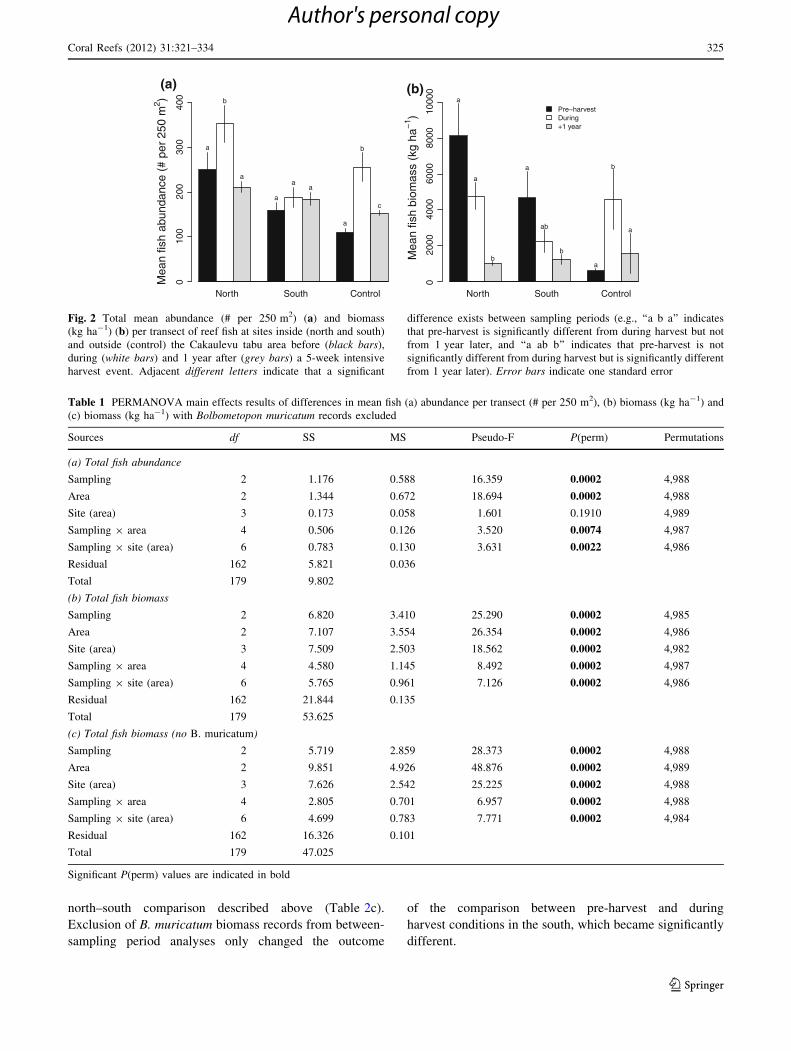
Table 1 PERMANOVA main effects results of differences in mean fish (a) abundance per transect (# per 250 m2), (b) biomass (kg ha-1) and
(c) biomass (kg ha-1) with Bolbometopon muricatum records excluded
Sources df SS MS Pseudo-F P(perm) Permutations
(a) Total fish abundance
Sampling 2 1.176 0.588 16.359 0.0002 4,988
Area 2 1.344 0.672 18.694 0.0002 4,988
Site (area) 3 0.173 0.058 1.601 0.1910 4,989
Sampling 9 area 4 0.506 0.126 3.520 0.0074 4,987
Sampling 9 site (area) 6 0.783 0.130 3.631 0.0022 4,986
Residual 162 5.821 0.036
Total 179 9.802
(b) Total fish biomass
Sampling 2 6.820 3.410 25.290 0.0002 4,985
Area 2 7.107 3.554 26.354 0.0002 4,986
Site (area) 3 7.509 2.503 18.562 0.0002 4,982
Sampling 9 area 4 4.580 1.145 8.492 0.0002 4,987
Sampling 9 site (area) 6 5.765 0.961 7.126 0.0002 4,986
Residual 162 21.844 0.135
Total 179 53.625
(c) Total fish biomass (no B. muricatum)
Sampling 2 5.719 2.859 28.373 0.0002 4,988
Area 2 9.851 4.926 48.876 0.0002 4,989
Site (area) 3 7.626 2.542 25.225 0.0002 4,988
Sampling 9 area 4 2.805 0.701 6.957 0.0002 4,988
Sampling 9 site (area) 6 4.699 0.783 7.771 0.0002 4,984
Residual 162 16.326 0.101
Total 179 47.025
Significant P(perm) values are indicated in bold
Coral Reefs (2012) 31:321–334 325
123
Author's personal copy
Fish community composition
The CAP analysis showed significant shifts in species
composition between sampling periods as primary target
fish disappeared from the assemblages during the harvest
and further by 1 year later (Fig. 3). The first eight PCO
axes explained 83.1% of the variability in the dissimilarity
matrix, and 94.4% of observations were classified correctly
using the leave-one-out procedure (p = 0.005). Species’
correlations with the first two CAP axes are shown in
Fig. 3. Species negatively correlated with axis 1 are asso-
ciated with sites pre-harvest and during the harvest.
There was significant variability in both fish abundance
and biomass at the family level that varied slightly by tax-
onomic group (Electronic Supplemental Material, ESM
Table S1). While the interaction between sampling period
and area was always significant for fish biomass across all
fish families analysed, it was not significant for fish abun-
dance of acanthurids, serranids or scarids when B. muricatum
numbers were excluded (ESM Table S1a, k, m). Pre-harvest
biomass in the north was dominated by acanthurids and ca-
rangids, which was significantly higher than in the control
(ESM Table S2a, b; Fig. 4). Pre-harvest biomass in the south
was dominated by lutjanids and scarids, which was signifi-
cantly higher than in the control (ESM Table S2d, e; Fig. 4).
With respect to changes in fish biomass at the family
level, by 4 weeks into the harvest, there were significant
decreases inside the Cakaulevu tabu of acanthurids (north),
carangids (north), lutjanids (south) and serranids (south),
coupled with significant increases in acanthurids, lethrinids
and scarids in the control (Fig. 4). These decreases in bio-
mass inside the tabu occurred despite numerical increase in
acanthurids and scarids that increased in abundance
everywhere (though only significantly for scarids in the
south and control; Fig. 5). Excluding B. muricatum biomass
from the scarid within-sampling and between-sampling
analyses did not substantially affect the outcomes (ESM
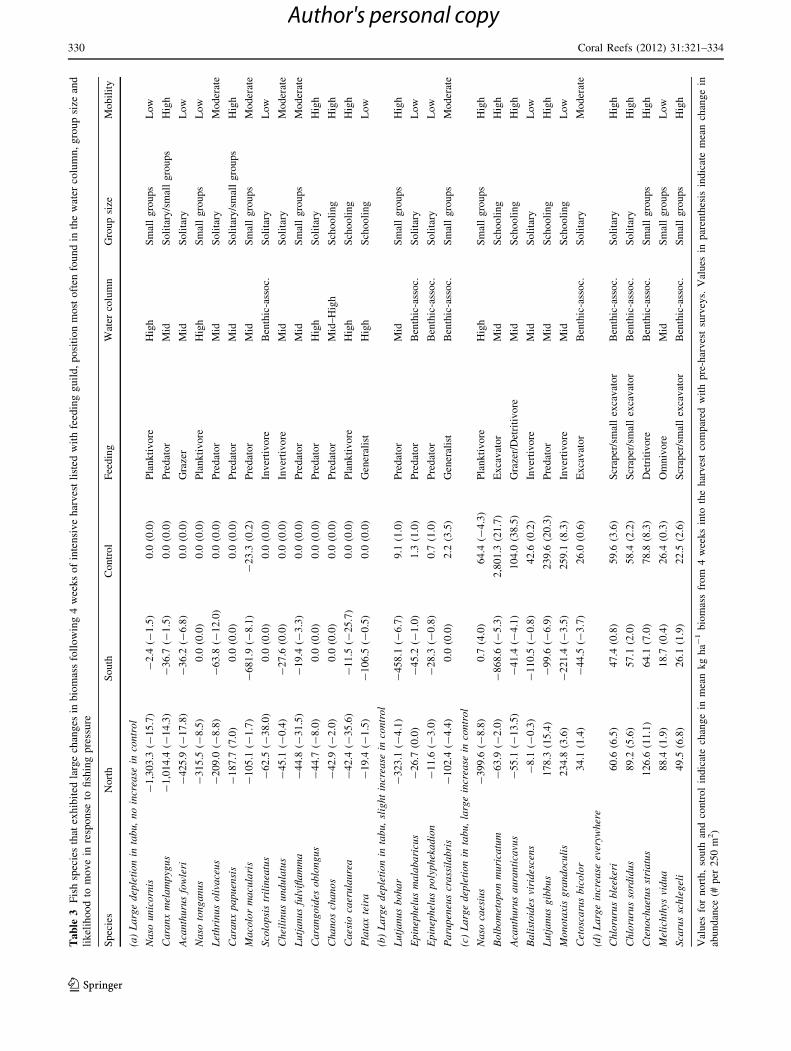
Table S2f). Within acanthurids and carangids, the large-
bodied species of Naso unicornis, N. tonganus, N. caesius,
Acanthurus fowleri, A. auranticavus, Caranx melampygus
and C. papuensis were severely depleted during the harvest,
with large increases in the highly mobile N. caesius and
A. auranticavus in the control (Table 3). Within lutjanids
and scarids, there was a significant decrease in biomass
during the harvest due to losses of Macolor macularis,
Lutjanus bohar, L. gibbus, L. fulviflamma, B. muricatum
and Cetoscarus bicolor, of which L. gibbus, B. muricatum
and C. bicolor increased in the control (Table 3). Biomass
of Chlorurus bleekeri, C. sordidus, Ctenochaetus striatus,
Melichthys vidua and Scarus schlegeli increased across all
survey areas during the harvest (Table 3). By 1 year later,
the biomass of carangids and serranids was nearly negligi-
ble everywhere, and biomass of acanthurids (north only),
carangids (north and south), lutjanids (south only) and
serranids (south only) was significantly lower than pre-
harvest values, even though numbers of acanthurids (north
and south), lutjanids (south) and serranids (south) remained
nearly equivalent to pre-harvest levels (Figs. 4, 5).
Benthic composition
There were significant differences in benthic composition,
and these differences varied by sampling period, area, site
and the interactions between sampling period and area and
Table 2 PERMANOVA pair-wise comparisons within sampling period between each area for mean fish (a) abundance per transect (# per
250 m2), (b) biomass (kg ha-1) and (c) biomass (kg ha-1) with Bolbometopon muricatum records excluded
(a) Abundance (b) Biomass (c) Biomass (no B. muricatum)
Level t P(perm) Level t P(perm) Level t P(perm)
Pre-harvest
North–south * 2.3099 0.0262 NS 1.7506 0.0912 * 2.3365 0.0296
North–control *** 4.8354 0.0002 *** 8.4888 0.0002 *** 8.4319 0.0002
South–control * 2.3664 0.0234 *** 5.2251 0.0002 *** 4.5654 0.0002
Post-harvest
North–south ** 4.1252 0.0010 *** 4.5592 0.0006 *** 4.5592 0.0004
North–control NS 1.9563 0.0566 * 2.2941 0.0252 *** 5.2354 0.0002
South–control NS 1.8283 0.0734 NS 1.0254 0.3118 NS 0.4823 0.6374
1-year later
North–south NS 1.5589 0.1348 NS 0.0731 0.9406 NS 0.0731 0.9382
North–control *** 4.1997 0.0002 * 2.4548 0.0126 *** 5.3798 0.0002
South–control NS 1.2805 0.2046 * 2.2189 0.0254 *** 4.2777 0.0002
Significance levels denoted as: NS not significant, * P(perm) \ 0.05, ** P(perm) \ 0.01, *** P(perm) \ 0.0010
326 Coral Reefs (2012) 31:321–334
123
Author's personal copy

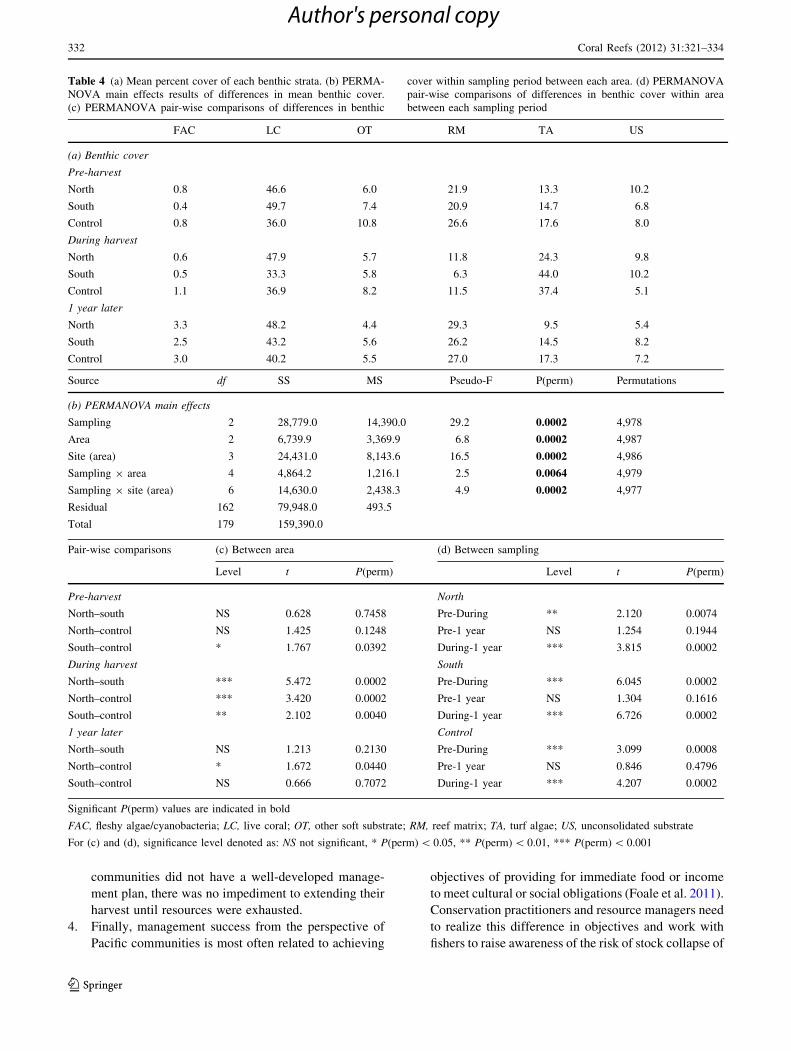
sampling periods and site (Table 4). Prior to the harvest,
the cover of benthic strata in the north was not signifi-
cantly different from the south or the control, though the
south was significantly different from the control which
had less live coral and higher cover of reef matrix, turf
algae and other soft substrate (Table 4). During the har-
vest, benthic cover in the north changed significantly, with
mean cover of turf algae increasing from 13.2 to 24.2%
and reef matrix declining from 21.9 to 11.8%. Benthic
strata cover changed significantly in the south during the
harvest and was significantly different from the north and
control due to relatively larger increases in turf algae
(14.7% to 44.0%) and reductions in live coral (49.7% to
33.3%). Benthic cover also changed significantly in the
control, with substantial increase in turf algae (17.6% to
37.4%) and consequent reduction in reef matrix (26.6 to
11.5%). By 1 year later, benthic strata cover in the north,
south and control was not significantly different from pre-
harvest conditions as turf algal cover returned to pre-
harvest levels everywhere. Overall benthic community
composition was not significantly different between the
north and the south or between the south and the control,
although the north was again significantly different from
the control (Table 4).
Discussion
Our study demonstrates that a single intensive harvest
event can quickly remove almost all positive effects of
protection on fish biomass and subsequent reproductive
output in a marine protected area. Our results echo other
findings, suggesting that substantial benefits to fisheries
from closures can be removed in a very short time period
through focused fishing efforts (Russ and Alcala 2003;
Williams et al. 2006).
The main impact of the Cakaulevu tabu harvest was seen
in loss of large-bodied fish, whose depletion differed
between the north and south and reflected initial differences
in community composition and catchability. The high cur-
rents and steep walls of the north part of the tabu supported
initial high densities of planktivorous and predatory fish,
which would have built up during the preceding years of
informal and formal protection. The largest losses from the
north unsurprisingly were from acanthurids, especially Naso
unicornis, N. tonganus, N. caesius, Acanthurus fowleri and
A. auranticavus, and from carangids, particularly Caranx
melampygus, C. papuensis and Carangoides oblongus
(Table 3). Of these, all except A. auranticavus inhabit mid-
to high position in the water column near the reef, making
−5 50
−5
50
CAP axis 1
CA
P a
xis
2
Pre−harvestDuring+1 year
Fig. 3 CAP ordination plot of
reef fish presence–absence data
from survey sites inside and
outside the Cakaulevu tabu area
at three different times of
sampling. Arrows indicate
species’ correlations with the
first two CAP axes, with
primary target species shown in
black
Coral Reefs (2012) 31:321–334 327
123
Author's personal copy

them easy targets for spearfishers. By contrast, the largest
loss of biomass in the south was principally from large lut-
janids, such as Lutjanus bohar and L. gibbus, plus Macolor
macularis and M. niger, which are also easily caught due to
their high position in the water column. Large scarids, such
as Chlorurus microrhinos, C. bleekeri and Cetoscarus
bicolor, in addition to Bolbometopon muricatum, were also
reduced, likely because they are easy targets for spearfishers
at night when they rest on the reef (e.g., Aswani and Ham-
ilton 2004).
During the harvest, fish communities in the Cakaulevu
tabu were dominated by acanthurids and scarids, which
became more numerically abundant. Similar effects have
been seen in previous studies, where scarids increased in
abundance following fishing (Russ and Alcala 1998) or
where acanthurid and siganid numbers increased with lin-
ear distance away from a no-take zone (Ashworth and
Ormond 2005). We have also observed this pattern else-
where in Fiji, where fish communities on reefs under heavy
fishing pressure are dominated by Ctenochaetus striatus,
Chlorurus sordidus, Scarus schlegeli and other non-tar-
geted species (Jupiter and Egli 2011). The prevalence of
high numbers of small herbivores and detritivores could
possibly be a consequence of a decline in territorial
aggression from the removal of large species (Vine 1974;
Robertson et al. 1979; Choat and Bellwood 1985) or a
combination of various ecological processes.
Regardless of the mechanism, although absolute num-
bers increased inside the tabu during the harvest, mean
biomass of these predominantly herbivorous acanthurids
and scarids declined. These large declines, coupled with
large increases in turf algae, suggest that by 4 weeks into
the harvest grazing capacity may have been reduced. The
interpretation is supported by herbivore exclusion manip-
ulations on the Great Barrier Reef that demonstrate the
strong role herbivores play in shaping spatial variation in
algal turfs (Bonaldo and Bellwood 2011). We are not aware
of any other study that documents a turf algal bloom
010
0020
0030
0040
00
Pre−harvestDuring+1 year
North Tabu
a
b
c
a
b
b
a ab
c
aab
aa a
a a aa
Mea
n fis
h bi
omas
s (k
g ha
−1 )
010
0020
0030
0040
00 South Tabu
a a a a abb
a
a a
a
b
b
a
ab a a b b
Acanthuridae Carangidae Lethrinidae Lutjanidae Scaridae Serranidae
010
0020
0030
0040
00 Control
a
b
aa a a a
ba a
ab
a a
b
c
a a a
(a)
(b)
(c)
Fig. 4 Mean biomass (kg ha-1) of targeted food fish families at sites
inside (a and b) and outside (c) the Cakaulevu tabu area, before (blackbars), during (white bars) and 1 year after (grey bars) a 5-week
intensive harvest event. Adjacent different letters indicate that a
significant difference exists between sampling periods within each
family group (e.g., ‘‘a b a’’ indicates that pre-harvest is significantly
different from during harvest but not from 1 year later, and ‘‘a ab b’’
indicates that pre-harvest is not significantly different from during
harvest but is significantly different from 1 year later). Error barsindicate one standard error
328 Coral Reefs (2012) 31:321–334
123
Author's personal copy
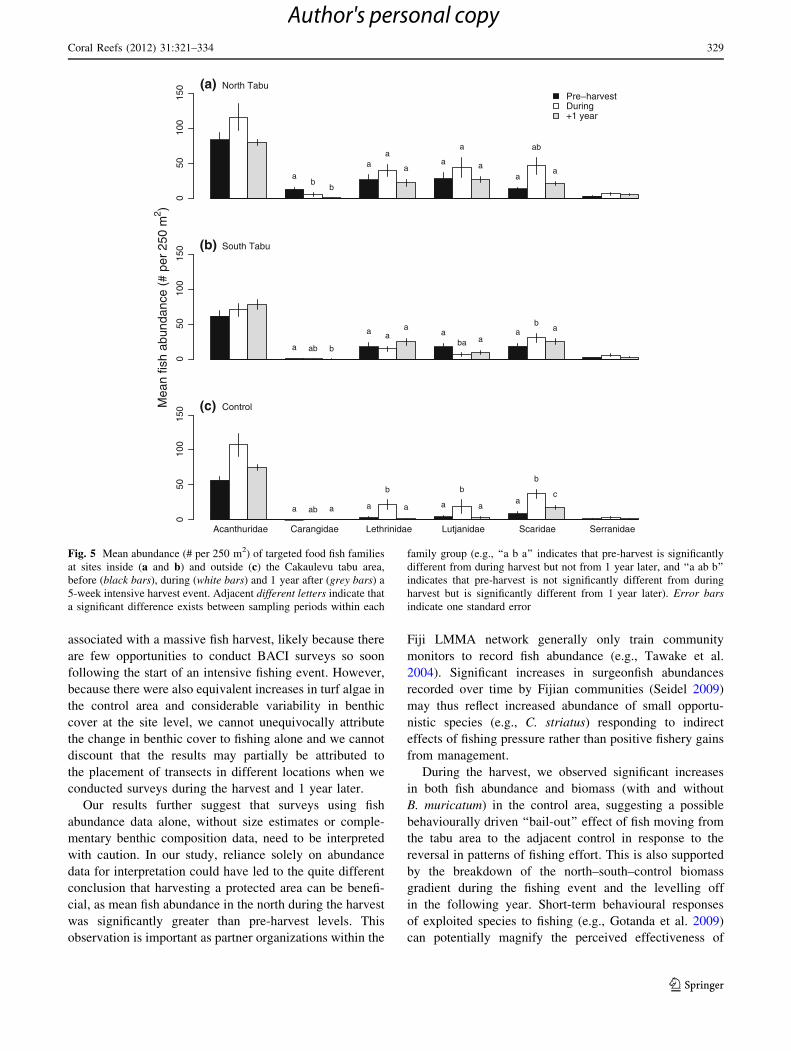
associated with a massive fish harvest, likely because there
are few opportunities to conduct BACI surveys so soon
following the start of an intensive fishing event. However,
because there were also equivalent increases in turf algae in
the control area and considerable variability in benthic
cover at the site level, we cannot unequivocally attribute
the change in benthic cover to fishing alone and we cannot
discount that the results may partially be attributed to
the placement of transects in different locations when we
conducted surveys during the harvest and 1 year later.
Our results further suggest that surveys using fish
abundance data alone, without size estimates or comple-
mentary benthic composition data, need to be interpreted
with caution. In our study, reliance solely on abundance
data for interpretation could have led to the quite different
conclusion that harvesting a protected area can be benefi-
cial, as mean fish abundance in the north during the harvest
was significantly greater than pre-harvest levels. This
observation is important as partner organizations within the
Fiji LMMA network generally only train community
monitors to record fish abundance (e.g., Tawake et al.
2004). Significant increases in surgeonfish abundances
recorded over time by Fijian communities (Seidel 2009)
may thus reflect increased abundance of small opportu-
nistic species (e.g., C. striatus) responding to indirect
effects of fishing pressure rather than positive fishery gains
from management.
During the harvest, we observed significant increases
in both fish abundance and biomass (with and without
B. muricatum) in the control area, suggesting a possible
behaviourally driven ‘‘bail-out’’ effect of fish moving from
the tabu area to the adjacent control in response to the
reversal in patterns of fishing effort. This is also supported
by the breakdown of the north–south–control biomass
gradient during the fishing event and the levelling off
in the following year. Short-term behavioural responses
of exploited species to fishing (e.g., Gotanda et al. 2009)
can potentially magnify the perceived effectiveness of
100
150
Pre−harvestDuring+1 year
North Tabu
ab
b
aa
aa
a
aa
ab
a10
015
0 South Tabu
a ab b
a aa
aba a
ab
a
Mea
n fis
h ab
unda
nce
(# p
er 2
50 m
2 )
Acanthuridae Carangidae Lethrinidae Lutjanidae Scaridae Serranidae
050
050
050
100
150 Control
a ab a a
b
a a
b
aa
b
c
(a)
(b)
(c)
Fig. 5 Mean abundance (# per 250 m2) of targeted food fish families
at sites inside (a and b) and outside (c) the Cakaulevu tabu area,
before (black bars), during (white bars) and 1 year after (grey bars) a
5-week intensive harvest event. Adjacent different letters indicate that
a significant difference exists between sampling periods within each
family group (e.g., ‘‘a b a’’ indicates that pre-harvest is significantly
different from during harvest but not from 1 year later, and ‘‘a ab b’’
indicates that pre-harvest is not significantly different from during
harvest but is significantly different from 1 year later). Error barsindicate one standard error
Coral Reefs (2012) 31:321–334 329
123
Author's personal copy
Ta
ble
3F
ish
spec
ies
that
exh
ibit
edla
rge
chan
ges
inb
iom
ass
foll
ow
ing
4w
eek
so
fin
ten
siv
eh
arv
est
list
edw
ith
feed
ing
gu
ild
,p
osi
tio
nm
ost
oft
enfo
un
din
the
wat
erco
lum
n,
gro
up
size
and
lik
elih
oo
dto
mo
ve
inre
spo
nse
tofi
shin
gp
ress
ure
Spec
ies
Nort
hS
outh
Contr
ol
Fee
din
gW
ater
colu
mn
Gro
up
size
Mobil
ity
(a)
Larg
edep
leti
on
inta
bu,
no
incr
ease
inco
ntr
ol
Naso
unic
orn
is-
1,3
03.3
(-15.7
)-
2.4
(-1.5
)0.0
(0.0
)P
lankti
vore
Hig
hS
mal
lgro
ups
Low
Cara
nx
mel
am
pyg
us
-1,0
14.4
(-14.3
)-
36.7
(-1.5
)0.0
(0.0
)P
redat
or
Mid
Soli
tary
/sm
all
gro
ups
Hig
h
Aca
nth
uru
sfo
wle
ri-
425.9
(-17.8
)-
36.2
(-6.8
)0.0
(0.0
)G
raze
rM
idS
oli
tary
Low
Naso
tonganus
-315.5
(-8.5
)0.0
(0.0
)0.0
(0.0
)P
lankti
vore
Hig
hS
mal
lgro
ups
Low
Let
hri
nus
oli
vace
us
-209.0
(-8.8
)-
63.8
(-12.0
)0.0
(0.0
)P
redat
or
Mid
Soli
tary
Moder
ate
Cara
nx
papuen
sis
-187.7
(7.0
)0.0
(0.0
)0.0
(0.0
)P
redat
or
Mid
Soli
tary
/sm
all
gro
ups
Hig
h
Maco
lor
macu
lari
s-
105.1
(-1.7
)-
681.9
(-8.1
)-
23.3
(0.2
)P
redat
or
Mid
Sm
all
gro
ups
Moder
ate
Sco
lopsi
str
ilin
eatu
s-
62.5
(-38.0
)0.0
(0.0
)0.0
(0.0
)In
ver
tivore
Ben
thic
-ass
oc.
Soli
tary
Low
Chei
linus
undula
tus
-45.1
(-0.4
)-
27.6
(0.0
)0.0
(0.0
)In
ver
tivore
Mid
Soli
tary
Moder
ate
Lutj
anus
fulv
iflam
ma
-44.8
(-31.5
)-
19.4
(-3.3
)0.0
(0.0
)P
redat
or
Mid
Sm
all
gro
ups
Moder
ate
Cara
ngoid
esoblo
ngus
-44.7
(-8.0
)0.0
(0.0
)0.0
(0.0
)P
redat
or
Hig
hS
oli
tary
Hig
h
Chanos
chanos
-42.9
(-2.0
)0.0
(0.0
)0.0
(0.0
)P
redat
or
Mid
–H
igh
Sch
ooli
ng
Hig
h
Caes
ioca
erula
ure
a-
42.4
(-35.6
)-
11.5
(-25.7
)0.0
(0.0
)P
lankti
vore
Hig
hS
chooli
ng
Hig
h
Pla
tax
teir
a-
19.4
(-1.5
)-
106.5
(-0.5
)0.0
(0.0
)G
ener
alis
tH
igh
Sch
ooli
ng
Low
(b)
Larg
edep
leti
on
inta
bu,
slig
ht
incr
ease
inco
ntr
ol
Lutj
anus
bohar
-323.1
(-4.1
)-
458.1
(-6.7
)9.1
(1.0
)P
redat
or
Mid
Sm
all
gro
ups
Hig
h
Epin
ephel
us
mala
bari
cus
-26.7
(0.0
)-
45.2
(-1.0
)1.3
(1.0
)P
redat
or
Ben
thic
-ass
oc.
Soli
tary
Low
Epin
ephel
us
poly
phek
adio
n-
11.6
(-3.0
)-
28.3
(-0.8
)0.7
(1.0
)P
redat
or
Ben
thic
-ass
oc.
Soli
tary
Low
Paru
pen
eus
crass
ilabri
s-
102.4
(-4.4
)0.0
(0.0
)2.2
(3.5
)G
ener
alis
tB
enth
ic-a
ssoc.
Sm
all
gro
ups
Moder
ate
(c)
Larg
edep
leti
on
inta
bu,
larg
ein
crea
sein
contr
ol
Naso
caes
ius
-399.6
(-8.8
)0.7
(4.0
)64.4
(-4.3
)P
lankti
vore
Hig
hS
mal
lgro
ups
Hig
h
Bolb
om
etopon
muri
catu
m-
63.9
(-2.0
)-
868.6
(-5.3
)2,8
01.3
(21.7
)E
xca
vat
or
Mid
Sch
ooli
ng
Hig
h
Aca
nth
uru
saura
nti
cavu
s-
55.1
(-13.5
)-
41.4
(-4.1
)104.0
(38.5
)G
raze
r/D
etri
tivore
Mid
Sch
ooli
ng
Hig
h
Bali
stoid
esvi
rides
cens
-8.1
(-0.3
)-
110.5
(-0.8
)42.6
(0.2
)In
ver
tivore
Mid
Soli
tary
Low
Lutj
anus
gib
bus
178.3
(15.4
)-
99.6
(-6.9
)239.6
(20.3
)P
redat
or
Mid
Sch
ooli
ng
Hig
h
Monota
xis
gra
ndocu
lis
234.8
(3.6
)-
221.4
(-3.5
)259.1
(8.3
)In
ver
tivore
Mid
Sch
ooli
ng
Low
Cet
osc
aru
sbic
olo
r34.1
(1.4
)-
44.5
(-3.7
)26.0
(0.6
)E
xca
vat
or
Ben
thic
-ass
oc.
Soli
tary
Moder
ate
(d)
Larg
ein
crea
seev
eryw
her
e
Chlo
ruru
sble
eker
i60.6
(6.5
)47.4
(0.8
)59.6
(3.6
)S
crap
er/s
mal
lex
cavat
or
Ben
thic
-ass
oc.
Soli
tary
Hig
h
Chlo
ruru
sso
rdid
us
89.2
(5.6
)57.1
(2.0
)58.4
(2.2
)S
crap
er/s
mal
lex
cavat
or
Ben
thic
-ass
oc.
Soli
tary
Hig
h
Cte
noch
aet
us
stri
atu
s126.6
(11.1
)64.1
(7.0
)78.8
(8.3
)D
etri
tivore
Ben
thic
-ass
oc.
Sm
all
gro
ups
Hig
h
Mel
ichth
ysvi
dua
88.4
(1.9
)18.7
(0.4
)26.4
(0.3
)O
mniv
ore
Mid
Sm
all
gro
ups
Low
Sca
rus
schle
gel
i49.5
(6.8
)26.1
(1.9
)22.5
(2.6
)S
crap
er/s
mal
lex
cavat
or
Ben
thic
-ass
oc.
Sm
all
gro
ups
Hig
h
Val
ues
for
nort
h,
south
and
contr
ol
indic
ate
chan
ge
inm
ean
kg
ha-
1bio
mas
sfr
om
4w
eeks
into
the
har
ves
tco
mpar
edw
ith
pre
-har
ves
tsu
rvey
s.V
alues
inpar
enth
esis
indic
ate
mea
nch
ange
in
abundan
ce(#
per
250
m2)
330 Coral Reefs (2012) 31:321–334
123
Author's personal copy
protected areas. For example, open areas with high inten-
sity of fishing pressure can cause ‘‘spill-in’’ of exploited
species into reserves (Eggleston and Parsons 2008). Con-
sequently, the reverse pattern is likely to occur when
periodic closures are opened to fishing, resulting in a ‘‘bail-
out’’ of targeted species. A small portion of this trend
observed from the Kia Island data may be simply due to
instantaneous variation in fish community assemblages
(McClanahan et al. 2007a), especially from schooling
species. This may explain, for example, why the sum of the
mean increase in lethrinid biomass during the harvest in the
control (?281.4 kg ha-1) and the north (?85.5 kg ha-1)
was in fact slightly more than the mean decrease from the
south (-234.4 kg ha-1). However, the consistent pattern
of loss of large-bodied acanthurids, carangids, lethrinids,
lutjanids and scarids in the tabu during the harvest, coupled
with a corresponding increase in numbers and biomass of
most of these taxa in the control, suggests that many of the
targeted fish that did not get caught moved. Some of the
larger individuals of vulnerable species in the Cakaulevu
tabu may have escaped predation by swimming deeper
(S. Jupiter and A. Cakacaka, pers. obs.), as has been observed
in other studies of Fijian reef fish communities from fished
locations (Goetze et al. 2011). Others that are capable of
moving large distances may have fled away from the focus of
predation (Table 3), which is supported by the work of
Januchowski-Hartley et al. (2011) who demonstrate that
body size is a strong factor associated with flight initiation
distance at higher levels of fishing pressure.
One year after the harvest event, total fish biomass had
not recovered inside the Cakaulevu tabu, and the biomass of
piscivores such as carangids and serranids was nearly
exhausted everywhere. As there were no significant differ-
ences in benthic composition inside the tabu compared with
pre-harvest conditions, it is likely that the fish communities
were still impacted by ongoing fishing. Theoretical and
empirical studies suggest that even light levels of fishing
can prevent any potential recovery to fish populations and
eliminate any benefits to surrounding areas (Westera et al.
2003; Denny and Babcock 2004; Byers and Noonburg
2007). Although the residents of Kia Island claimed to have
reinstated the ban on fishing after 5 weeks of harvesting in
2008, several community members stated that they regularly
saw boats fishing in the tabu area (S. Jupiter, pers. comm.).
Once the communities established contacts with middlemen
from local seafood companies during the harvest, the ease of
market access may have eroded compliance with local
management rules (Cinner et al. 2007; Clarke and Jupiter
2010). Additionally, if outsiders perceive that the tabu is no
longer enforced and they will not be detected, they may be
more likely to poach (Sutinen and Kuperan 1999), particu-
larly given the light penalties for non-compliance under the
Fiji Fisheries Act (Clarke and Jupiter 2010).
Studies from elsewhere in Fiji and from across Oceania
demonstrate that customary management can effectively
conserve marine resources under certain conditions (e.g.,
Cinner et al. 2005; McClanahan et al. 2006; Jupiter and Egli
2011). These conditions include secure community fishing
rights or customary marine tenure, respect for the manage-
ment authority from within and outside the community,
broad awareness of management rules and boundaries, and
limits on the duration and intensity with which managed
areas may be harvested (Aswani and Hamilton 2004; Bart-
lett et al. 2009a; Clarke and Jupiter 2010). Indeed, the highly
significant differences in fish abundance and biomass inside
versus outside of the Cakaulevu tabu prior to the harvest
confirm anecdotal reports of strong compliance with cus-
tomary management rules since 2005. These conditions are
additionally aided by the placement of customary fishing
closures in naturally productive locations (Jupiter and Egli
2011). Customary management is less likely to succeed in
areas with high population density and commercialization of
marine resources (Cinner and Aswani 2007). Given that
hundreds of periodically harvested closures have already
been established in Oceania and that the practice is rapidly
expanding (Bartlett et al. 2009b), we offer the following
recommendations to improve knowledge and planning for
management success:
1. To maintain sustainable fisheries benefits for the future,
harvests must be controlled. Control measures can
include restrictions on effort, gear, duration of opening,
access and size of catch. Moreover, during a harvest,
the amount extracted from a closure has to be lower
than the amount of build-up since initiation of protec-
tion, and in many cases, substantial build-up may take
years to decades to occur (McClanahan and Graham
2005; Babcock et al. 2010). Given that different species
have very different catchability and recovery rates
(e.g., McClanahan et al. 2007b; Babcock et al. 2010),
species- or guild-specific take guidelines may need to
be developed (Cohen and Foale 2011).
2. Catch should be monitored to ensure that some
breeding stocks remain to provide for local replenish-
ment as well as replenishment of adjacent fishing
grounds and neighbouring closures. Larger reef fish
generally have greater egg production and tend to
produce larger eggs, which may be more viable (e.g.,
Evans et al. 2008).
3. Managers should undertake broad consultation to reach
consensus for a verbal or written plan that details the
process by which openings are authorized and the
frequency, location, duration and gear type with which
they can occur. This has been done for certain areas in
Fiji (e.g., Kubulau District; WCS 2009), and generally
results in fewer uncontrolled harvests. Because the Kia
Coral Reefs (2012) 31:321–334 331
123
Author's personal copy
communities did not have a well-developed manage-
ment plan, there was no impediment to extending their
harvest until resources were exhausted.
4. Finally, management success from the perspective of
Pacific communities is most often related to achieving
objectives of providing for immediate food or income
to meet cultural or social obligations (Foale et al. 2011).
Conservation practitioners and resource managers need
to realize this difference in objectives and work with
fishers to raise awareness of the risk of stock collapse of
Table 4 (a) Mean percent cover of each benthic strata. (b) PERMA-
NOVA main effects results of differences in mean benthic cover.
(c) PERMANOVA pair-wise comparisons of differences in benthic
cover within sampling period between each area. (d) PERMANOVA
pair-wise comparisons of differences in benthic cover within area
between each sampling period
FAC LC OT RM TA US
(a) Benthic cover
Pre-harvest
North 0.8 46.6 6.0 21.9 13.3 10.2
South 0.4 49.7 7.4 20.9 14.7 6.8
Control 0.8 36.0 10.8 26.6 17.6 8.0
During harvest
North 0.6 47.9 5.7 11.8 24.3 9.8
South 0.5 33.3 5.8 6.3 44.0 10.2
Control 1.1 36.9 8.2 11.5 37.4 5.1
1 year later
North 3.3 48.2 4.4 29.3 9.5 5.4
South 2.5 43.2 5.6 26.2 14.5 8.2
Control 3.0 40.2 5.5 27.0 17.3 7.2
Source df SS MS Pseudo-F P(perm) Permutations
(b) PERMANOVA main effects
Sampling 2 28,779.0 14,390.0 29.2 0.0002 4,978
Area 2 6,739.9 3,369.9 6.8 0.0002 4,987
Site (area) 3 24,431.0 8,143.6 16.5 0.0002 4,986
Sampling 9 area 4 4,864.2 1,216.1 2.5 0.0064 4,979
Sampling 9 site (area) 6 14,630.0 2,438.3 4.9 0.0002 4,977
Residual 162 79,948.0 493.5
Total 179 159,390.0
Pair-wise comparisons (c) Between area (d) Between sampling
Level t P(perm) Level t P(perm)
Pre-harvest North
North–south NS 0.628 0.7458 Pre-During ** 2.120 0.0074
North–control NS 1.425 0.1248 Pre-1 year NS 1.254 0.1944
South–control * 1.767 0.0392 During-1 year *** 3.815 0.0002
During harvest South
North–south *** 5.472 0.0002 Pre-During *** 6.045 0.0002
North–control *** 3.420 0.0002 Pre-1 year NS 1.304 0.1616
South–control ** 2.102 0.0040 During-1 year *** 6.726 0.0002
1 year later Control
North–south NS 1.213 0.2130 Pre-During *** 3.099 0.0008
North–control * 1.672 0.0440 Pre-1 year NS 0.846 0.4796
South–control NS 0.666 0.7072 During-1 year *** 4.207 0.0002
Significant P(perm) values are indicated in bold
FAC, fleshy algae/cyanobacteria; LC, live coral; OT, other soft substrate; RM, reef matrix; TA, turf algae; US, unconsolidated substrate
For (c) and (d), significance level denoted as: NS not significant, * P(perm) \ 0.05, ** P(perm) \ 0.01, *** P(perm) \ 0.001
332 Coral Reefs (2012) 31:321–334
123
Author's personal copy
vulnerable species if openings are too frequent or
harvests are too intense. If not regulated, even a single
opening may cause a highly significant decline in fish
biomass, requiring a long period for recovery.
Acknowledgements The authors gratefully acknowledge the sup-
port from the chiefs and communities of Kia Island, staff of the WWF
South Pacific Programme for assisting with management support,
and the WCS staff and volunteers who assisted with field surveys and
data entry: S. Dulunaqio, F. Januchowski-Hartley, U. Mara, W. Moy,
A. Murphy, W. Naisilisili, Y. Nand, A. Patrick, T. Tui and P. Veileqe.
We thank participants of the symposium on the effectiveness of
community-managed MPAs (co-led by R. Weeks and S. Jupiter) at
the Society for Conservation Biology’s 1st Marine Think Tank for
insightful discussions to develop guidelines for periodic harvests,
and we are grateful to the three reviewers and topic editor whose
comments improved the manuscript. Funding for this work was
generously provided by the David and Lucile Packard Foundation
(2007-31847) and the Gordon and Betty Moore Foundation (540.01).
References
Abesamis RA, Russ GR (2005) Density-dependent spillover from a
marine reserve: long-term evidence. Ecol Appl 15:1798–1812
Alcala A, Russ GR, Maypa AP, Calumpong HP (2005) A long-term,
spatially replicated experimental test of the effect of marine
reserves on local fish yields. Can J Fish Aquat Sci 62:98–108
Anderson MJ (2001) A new method for non-parametric multivariate
analysis of variance. Austral Ecol 26:32–46
Anderson MJ, Willis TJ (2003) Canonical analysis of principal
coordinates: A useful method of constrained ordination for
ecology. Ecology 84:511–525
Anderson MJ, Gorley RN, Clarke KR (2008) PERMANOVA? for
PRIMER: guide to software and statistical methods. PRIMER-E,
Plymouth
Ashworth JS, Ormond RFG (2005) Effects of fishing pressure and
trophic group on abundance and spillover across boundaries of a
no-take zone. Biol Conserv 121:333–344
Aswani S, Hamilton RJ (2004) Integrating indigenous ecological
knowledge and customary sea tenure with marine and social
science for conservation of bumphead parrotfish (Bolbometoponmuricatum) in the Roviana Lagoon, Solomon Islands. Environ
Conserv 31:69–83
Aswani S, Christie P, Muthiga NA, Mahon R, Primavera JH, Cramer
LA, Barbier EB, Granek EF, Kennedy CJ, Wolanski E, Hacker
SD (2012) The way forward with ecosystem-based management
in tropical contexts: Reconciling with existing management
systems. Mar Policy 36:1–10
Babcock RC, Shears NT, Alcala AC, Barrett NS, Edgar GJ, Lafferty
KD, McClanahan TR, Russ GR (2010) Decadal trends in marine
reserves reveal differential rates of change in direct and indirect
effects. Proc Natl Acad Sci USA 43:18256–18261
Ban NC, Adams V, Almany GR, Ban S, Cinner J, McCook LJ, Mills
M, Pressey RL, White A (2011) Designing, implementing and
managing marine protected areas: emerging trends and oppor-
tunities for coral reef nations. J Exp Mar Biol Ecol 408:21–31
Bartlett CY, Manua C, Cinner JE, Sutton S, Jimmy R, South R,
Nilsson J, Raina J (2009a) Comparison of outcomes of
permanently closed and periodically harvested coral reef
reserves. Conserv Biol 23:1475–1484
Bartlett CY, Pakoa K, Manua C (2009b) Marine reserve phenomenon
in the Pacific islands. Mar Policy 33:673–678
Bonaldo RM, Bellwood DR (2011) Spatial variation in the effects of
grazing on epilithic algal turfs on the Great Barrier Reef,
Australia. Coral Reefs 30:381–390
Byers JE, Noonburg EG (2007) Poaching, enforcement, and the
efficacy of marine reserves. Ecol Appl 17:1851–1856
Choat H, Bellwood DR (1985) Interactions amongst herbivorous
fishes on a coral reef: influence of spatial variation. Mar Biol
89:221–234
Cinner J, Aswani S (2007) Integrating customary management into
the conservation of coral reef fisheries in the Indo-Pacific. Biol
Conserv 140:201–216
Cinner JE, Marnane MJ, McClanahan TR (2005) Conservation and
community benefits from traditional coral reef management at
Ahus Island, Papua New Guinea. Conserv Biol 19:1714–1723
Cinner JE, Marnane MJ, McClanahan TR, Almany GR (2006) Periodic
closures as adaptive coral reef management in the Indo-Pacific.
Ecology and Society 11: 31 http://www.ecologyandsociety.org/
vol11/iss31/art31
Cinner JE, Sutton SG, Bond TG (2007) Socioeconomic thresholds
that affect use of customary fisheries management tools. Conserv
Biol 21:1603–1611
Clarke P, Jupiter SD (2010) Law, custom and community-based
natural resource management in Kubulau District (Fiji). Environ
Conserv 37:98–106
Cohen P, Foale S (2011) Fishing taboos: Securing Pacific fisheries for
the future? SPC Trad Mar Res Manage Knowl Inf Bull 28:3–13
Denny CM, Babcock RC (2004) Do partial marine reserves protect
reef fish assemblages? Biol Conserv 116:119–129
Di Franco A, Bussotti S, Navone A, Panzalis P, Guidetti P (2009)
Evaluating effects of total and partial restrictions to fishing on
Mediterranean rocky-reef fish assemblages. Mar Ecol Prog Ser
387:275–285
Eggleston DB, Parsons DM (2008) Disturbance-induced ‘spill-in’ of
Caribbean spiny lobster to marine reserves. Mar Ecol Prog Ser
371:213–220
Evans RD, Russ GR, Kritzer JP (2008) Batch fecundity of Lutjanuscarponotatus (Lutjanidae) and implications of no-take marine
reserves on the Great Barrier Reef, Australia. Coral Reefs
27:179–189
Foale S, Manele B (2004) Social and political barriers to the use of
Marine Protected Areas for conservation and fishery manage-
ment in Melanesia. Asia Pac Viewpoint 45:373–386
Foale S, Cohen P, Januchowski-Hartley S, Wenger A, Macintyre M
(2011) Tenure and taboos: origins and implications for fisheries
in the Pacific. Fish Fish 12:357–369
Froese R, Pauly D (2009) FishBase. http://www.fishbase.org
Goetze JS, Langlois TJ, Egli DP, Harvey ES (2011) Evidence of
artisanal fishing impacts and depth refuge in assemblages of
Fijian reef fish. Coral Reefs 30:507–517
Gotanda KM, Turgeon K, Kramer DL (2009) Body size and reserve
protection affect flight initiation distance in parrotfishes. Behav
Ecol Sociobiol 63:1563–1572
Govan H, Tawake A, Tabunakawai K, Jenkins A, Lasgorceix A,
Schwarz A-M, Aalbersberg B, Manele B, Vieux C, Notere D,
Afzal D, Techera E, Rasalato ET, Sykes H, Walton H, Tafea H,
Korovulavula I, Comley J, Kinch J, Feehely J, Petit J, Heaps L,
Anderson P, Cohen P, Ifopo P, Vave R, Hills R, Tawakelevu S,
Alefaio S, Meo S, Troniak S, Malimali S, Kukuian S, George S,
Tauaefa T, Obed T (2009) Status and potential of locally-
managed marine areas in the South Pacific: meeting nature
conservation and sustainable livelihood targets through wide-
spread implementation of LMMAs. SPREP/WWF/WorldFish-
Reefbase/CRISP, Suva, Fiji. (http://www.spc.int/DigitalLibrary/
Doc/FAME/Reports/Govan_09_Status_LMMAs.pdf)
Januchowski-Hartley FA, Graham NAJ, Feary DA, Morove T, Cinner
JE (2011) Fear of fishers: human predation explains behavioural
Coral Reefs (2012) 31:321–334 333
123
Author's personal copy
changes in coral reef fishes. PLoS ONE 6:e22761. doi:
22710.21371/journal.pone.0022761
Jupiter SD, Egli DP (2011) Ecosystem-based management in Fiji:
successes and challenges after five years of implementation.
J Mar Biol. doi:940710.941155/942011/940765
Lester SE, Halpern BS, Grorud-Colvert K, Lubchenco J, Ruttenberg
BI, Gaines SD, Airame S, Warner RR (2009) Biological effects
within no-take marine reserves: a global synthesis. Mar Ecol
Prog Ser 384:33–46
Maliao RJ, White AT, Maypa AP, Turingan RG (2009) Trajectories
and magnitude of change in coral reef fish populations in
Philippine marine reserves: a meta-analysis. Coral Reefs 28:
809–822
McArdle BH, Anderson MJ (2001) Fitting multivariate models to
community data: a comment on distance-based redundancy
analysis. Ecology 82:290–297
McClanahan TR, Graham NAJ (2005) Recovery trajectories of coral
reef fish assemblages within Kenyan marine protected areas. Mar
Ecol Prog Ser 294:241–248
McClanahan TR, Marnane MJ, Cinner JE, Kiene WE (2006) A
comparison of marine protected areas and alternate approaches
to coral-reef management. Curr Biol 16:1408–1413
McClanahan TR, Graham NAJ, Calnan JM, MacNeil MA (2007a)
Toward pristine biomass: reef fish recovery in coral reef marine
protected areas in Kenya. Ecol Appl 17:1055–1067
McClanahan TR, Graham NAJ, Maina J, Chabanet P, Bruggemann
JH, Polunin NVC (2007b) Influence of instantaneous variation
on estimates of coral reef fish populations and communities. Mar
Ecol Progr Ser 340:221–234
McCook LJ, Ayling T, Cappo M, Choat H, Evans RD, DeFrietas DM,
Heupel M, Hughes TP, Jones GP, Mapstone B, Marsh H, Mills
M, Molloy FJ, Pitcher CR, Pressey RL, Russ GR, Sutton S,
Sweatman H, Tobin R, Wachenfeld DR, Williamson DH (2010)
Adaptive management of the Great Barrier Reef: A globally
significant demonstration of the benefits of networks of marine
reserves. Proc Natl Acad Sci USA 107:18278–18285
Mills M, Jupiter SD, Pressey RL, Ban NC, Comley J (2011)
Incorporating effectiveness of community-based management
strategies in a national marine gap analysis for Fiji. Conserv Biol
25:1155–1164
Mumby PJ, Steneck RS (2008) Coral reef management and conser-
vation in light of rapidly evolving ecological paradigms. Trends
Ecol Evol 23:555–563
Robertson DR, Polunin NVC, Leighton K (1979) The behavioural
ecology of three Indian Ocean surgeonfishes (Acanthuruslineatus, A. leucosternon and Zebrasoma scopas): their feeding
strategies, and social and mating systems. Environ Biol Fish
4:125–170
Ruddle K, Hickey F (2008) Accounting for the mismanagement of
tropical nearshore fisheries. Environ Dev Sustain 10:565–589
Russ GR, Alcala AC (1998) Natural fishing experiments in marine
reserves 1983–1993: roles of life history and fishing intensity in
family responses. Coral Reefs 17:399–416
Russ GR, Alcala AC (2003) Marine reserves: rates and patterns of
recovery and decline of predatory fish, 1983–2000. Ecol Appl
13:1553–1565
Russ GR, Alcala AC (2004) Marine reserves: long-term protection is
required for full recovery of predatory fish populations. Oeco-
logia 138:1432–1939
Seidel H (2009) Evaluating the role of science in Community Based
Adaptive Management of coastal resources in Fiji. University of
Bremen, 101 pp (http://www.reefbase.org/download/download.
aspx?type=10&docid=A0000005290_1)
Sutinen JG, Kuperan K (1999) A socio-economic theory of regulatory
compliance. Int J Soc Econ 26:174–193
Tawake A, Meo S, Cakacaka A, Aalbersberg B (2004) Community based
biological monitoring training guide. Application: FLMMA project
sites at Tagaqe Village, Tikina Korolevu-i-wai, Nadroga. Univer-
sity of the South Pacific, Suva, Fiji (http://www.reefbase.org/
download/open_download.aspx?type=10&docid=C0000000054_1)
Vine PJ (1974) Effects of algal grazing and aggressive behaviour of
the fishes Pomacentrus lividus and Acanthurus sohal on coral-
reef ecology. Mar Biol 24:131–136
WCS (2009) Ecosystem-Based Management Plan: Kubulau District,
Vanua Levu, Fiji. Wildlife Conservation Society, Suva, Fiji (http://
www.wcsfiji.org/Resources/ManagementPlans/tabid/3431/
Default.aspx)
Westera M, Lavery P, Hyndes G (2003) Differences in recreationally
targeted fishes between protected and fished areas of a coral reef
marine park. J Exp Mar Biol Ecol 294:145–168
Williams ID, Walsh WJ, Miyasaka A, Friedlander AM (2006) Effects
of rotational closure on coral reef fishes in Waikiki-Diamond
Head Fishery Management Area, Oahu, Hawaii. Mar Ecol Prog
Ser 310:139–149
334 Coral Reefs (2012) 31:321–334
123
Author's personal copy
Copyright © 2022 FDOKUMEN