Effectiveness of movement-based animal signals ... - Research Square
19
Page 1/19 Effectiveness of movement-based animal signals is a function of display structure and habitat characteristics: simulations of Australian dragons Xue Bian La Trobe University Angela Pinilla Monash University Tom Chandler Monash University Richard Peters ( [email protected] ) La Trobe University Research Article Keywords: animal communication, habitat structure, movement-based signal, visual saliency, signal evolution, 3D animation Posted Date: December 15th, 2020 DOI: https://doi.org/10.21203/rs.3.rs-124579/v1 License: This work is licensed under a Creative Commons Attribution 4.0 International License. Read Full License Version of Record: A version of this preprint was published at Scientic Reports on March 18th, 2021. See the published version at https://doi.org/10.1038/s41598-021-85793-3.
-
Upload
khangminh22 -
Category
Documents
-
view
0 -
download
0
Transcript of Effectiveness of movement-based animal signals ... - Research Square

Page 1/19
Effectiveness of movement-based animal signals isa function of display structure and habitatcharacteristics: simulations of Australian dragonsXue Bian
La Trobe UniversityAngela Pinilla
Monash UniversityTom Chandler
Monash UniversityRichard Peters ( [email protected] )
La Trobe University
Research Article
Keywords: animal communication, habitat structure, movement-based signal, visual saliency, signalevolution, 3D animation
Posted Date: December 15th, 2020
DOI: https://doi.org/10.21203/rs.3.rs-124579/v1
License: This work is licensed under a Creative Commons Attribution 4.0 International License. Read Full License
Version of Record: A version of this preprint was published at Scienti�c Reports on March 18th, 2021. Seethe published version at https://doi.org/10.1038/s41598-021-85793-3.

Page 2/19
AbstractHabitat-speci�c characteristics can affect signal transmission such that different habitats dictate theoptimal signal. One way to examine how the environment in�uences signals is by comparing changes insignal e�cacy in different habitats. Examinations of signal e�cacy between different habitats hashelped to explain signal divergence/convergence between populations and species utilising acoustic andcolour signals. Although previous research has provided evidence for local adaptations and signaldivergence in many species of lizards, comparative studies in movement-based signals are rare due totechnical di�culties in quantifying movements in nature and ethical restrictions in translocating animalsbetween habitats. We demonstrate herein that these issues can be addressed using 3D animations, andcompared the relative performance of the displays of four Australian lizard species in the habitats ofeach species under varying environmental conditions. Our simulations show that habitats differentiallyaffect signal performance, and an interaction between display and habitat structure. Interestingly, thesignal adapted to the noisier environment did not show an advantage in signal e�cacy, but the noisyhabitat was detrimental to the performance of all displays. Our study is one of the �rst studies formovement-based signals that directly compares signal performance in multiple habitats, and ourapproach has laid the foundation for future investigations in motion ecology that have been intractableto conventional research methods.
IntroductionAnimal signals evolve to be effective in the environment in which they are emitted [1–3], and therefore thediversity we see in animal communication systems is partially driven by the environment in which theanimal lives [4–5]. An effective signal requires reliable detection by an intended receiver followingtransmission through ecologically complex environments [1]. It is evident that environmental structuresand habitat-speci�c characteristics can affect signal transmission [1, 4, 6–7], such that different habitatsdictate the optimal signal for reliable detection [8]. Dynamically changing abiotic and biotic noise in theenvironment also interferes with effective communication between individuals, and animals are requiredto produce signals that could compete with these irrelevant sensory inputs [3, 9–10]. Many animalsmodify their signalling behaviour in response to changing conditions [11–15], such that these moment-to-moment adjustments to signalling strategies represent a form of behavioural plasticity to maintain signale�cacy [16–17]. Clearly, habitat-speci�c transmission properties are important in determining the optimalstructure of a signal, and it is therefore imperative that we quantify signal e�cacy in the context of therelevant noise landscape to understand in more detail the evolution of animal communication strategies.
One way to examine how the environment in�uences signals is by comparing changes in signal e�cacyin different habitats. Earlier research into quantifying acoustic characteristics of different habitat typesprovided the foundation for understanding diversity in the physical structure of avian songs [6, 18]. Cross-habitat examination of signal e�cacy between different habitats also helped to explain intraspeci�cdivergence of calling behaviours in anuran species [19]. Similarly, by contrasting signals in differenthabitats, signal divergence was described for lizard populations utilising colour-based signals [20], as
Page 3/19
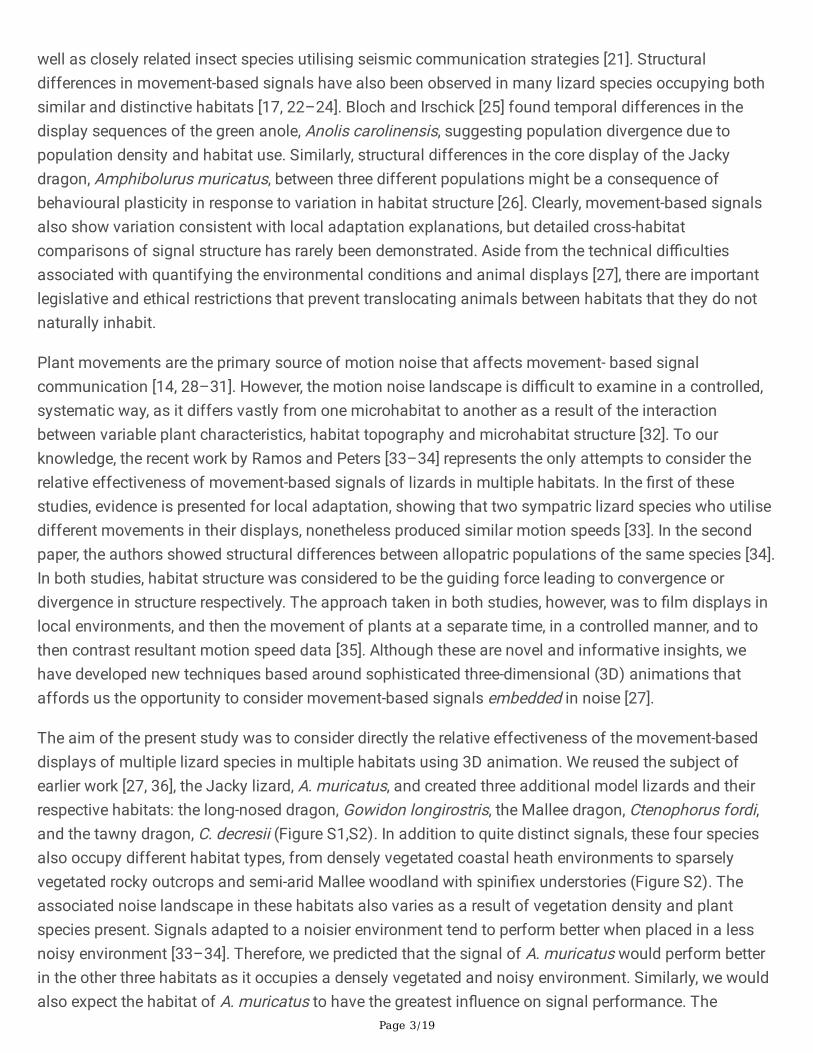
well as closely related insect species utilising seismic communication strategies [21]. Structuraldifferences in movement-based signals have also been observed in many lizard species occupying bothsimilar and distinctive habitats [17, 22–24]. Bloch and Irschick [25] found temporal differences in thedisplay sequences of the green anole, Anolis carolinensis, suggesting population divergence due topopulation density and habitat use. Similarly, structural differences in the core display of the Jackydragon, Amphibolurus muricatus, between three different populations might be a consequence ofbehavioural plasticity in response to variation in habitat structure [26]. Clearly, movement-based signalsalso show variation consistent with local adaptation explanations, but detailed cross-habitatcomparisons of signal structure has rarely been demonstrated. Aside from the technical di�cultiesassociated with quantifying the environmental conditions and animal displays [27], there are importantlegislative and ethical restrictions that prevent translocating animals between habitats that they do notnaturally inhabit.
Plant movements are the primary source of motion noise that affects movement- based signalcommunication [14, 28–31]. However, the motion noise landscape is di�cult to examine in a controlled,systematic way, as it differs vastly from one microhabitat to another as a result of the interactionbetween variable plant characteristics, habitat topography and microhabitat structure [32]. To ourknowledge, the recent work by Ramos and Peters [33–34] represents the only attempts to consider therelative effectiveness of movement-based signals of lizards in multiple habitats. In the �rst of thesestudies, evidence is presented for local adaptation, showing that two sympatric lizard species who utilisedifferent movements in their displays, nonetheless produced similar motion speeds [33]. In the secondpaper, the authors showed structural differences between allopatric populations of the same species [34].In both studies, habitat structure was considered to be the guiding force leading to convergence ordivergence in structure respectively. The approach taken in both studies, however, was to �lm displays inlocal environments, and then the movement of plants at a separate time, in a controlled manner, and tothen contrast resultant motion speed data [35]. Although these are novel and informative insights, wehave developed new techniques based around sophisticated three-dimensional (3D) animations thataffords us the opportunity to consider movement-based signals embedded in noise [27].
The aim of the present study was to consider directly the relative effectiveness of the movement-baseddisplays of multiple lizard species in multiple habitats using 3D animation. We reused the subject ofearlier work [27, 36], the Jacky lizard, A. muricatus, and created three additional model lizards and theirrespective habitats: the long-nosed dragon, Gowidon longirostris, the Mallee dragon, Ctenophorus fordi,and the tawny dragon, C. decresii (Figure S1,S2). In addition to quite distinct signals, these four speciesalso occupy different habitat types, from densely vegetated coastal heath environments to sparselyvegetated rocky outcrops and semi-arid Mallee woodland with spini�ex understories (Figure S2). Theassociated noise landscape in these habitats also varies as a result of vegetation density and plantspecies present. Signals adapted to a noisier environment tend to perform better when placed in a lessnoisy environment [33–34]. Therefore, we predicted that the signal of A. muricatus would perform betterin the other three habitats as it occupies a densely vegetated and noisy environment. Similarly, we wouldalso expect the habitat of A. muricatus to have the greatest in�uence on signal performance. The

Page 4/19
habitats of G. longirostris and C. decresii are very similar, so we predicted that these will in�uence signalperformance of all species in a similar manner, and that their displays would perform equivalently.Ctenophorus fordi, on the other hand, would produce relatively weak signals as this species utilises thesimplest motor pattern compared to the other three species.
Habitat structure is a crucial determinant of signal structure across species and modalities and here weextend this literature to include the movement-displays of lizards from different habitats. The diversehabitats are each inhabited by only one of the focal species, and experimental translocation of absentspecies would not be permissible. While we have simulated these circumstances, 3D animationtechnology is su�ciently advanced that these are excellent proxies for �lming the same circumstances innature (if it were possible). Our animations are detailed and founded on the natural systems theyrepresent, while our analytical approach is quantitative but descriptive, and shows clearly that habitatstructure is an important contributing factor for movement-based signalling systems.
MethodsStudy species
Amphibolurus muricatus (snout-vent length, SVL, 121 mm) is a well-known species that has featured inmany physiology, ecology and visual communication studies [14, 37–40]. The display of A. muricatusbegins with tail-�icking, followed by limb movements and a push-up, sometimes accompanied by throatextensions [41–42](Fig. 1a). There are two parts to the tail-�ick sequence: an initial intermittentmovement at the tip of the tail followed by a continuous and more rigorous movement of the whole tail.The tail-�icks serve as an introductory component to the rest of the display and are used to attract theattention of the intruder [31, 43]. Amphibolurus muricatus inhabits woodlands and coastal heath ofsoutheast Australia and are often seen perched on fallen timber [44]. The simulated A. muricatus habitatwas based on sites around the Croajingolong National Park, Victoria, where the habitat is denselyvegetated with a complex understory of tall grasses and shrubs (Figure S3a).
In contrast to A. muricatus, the displays of Ctenophorus fordi, are much reduced in complexity, andalmost exclusively comprised of head bobbing (Fig. 3c). Ctenophorus fordi are found in south-eastWestern Australia to western Victoria and New South Wales [44]. The species is smaller in size (SVL58 mm) and lack obvious sexual dimorphism [45–46]; although Garcia et al. [47] suggests they aresexually dimorphic in appearance in the ultraviolet region of the spectrum. Displays are performed byboth sexes and triggered when another individual (even other species of lizards) appears in their �eld ofvision [46]. The 3D model used herein was based on morphology and display footage taken from apopulation that inhabit dense clumps of spini�ex grass (Triodia sp.) and Mallee eucalyptus (Eucalyptussp.) in the Murray-Sunset National Park, Victoria (Figure S3c).
Both G. longirostris and C. decresii are highly territorial species that inhabit semi-arid rocky outcrops withlow vegetation density. Gowidon longirostris are relatively large lizards (SVL 114 mm) mainly due to theirexceedingly long tail compared to the other three species. The species is widely distributed in arid zones

Page 5/19
across western and central Australia [44]. The complex signalling sequence comprises limb waving andhead bobbing, with push-ups followed by a forward body thrust/rise usually associated with tail lashingmotions [48]. Throat and crest extensions are also common modi�ers of the display (Fig. 1b). The modellizard used herein was based on morphology and display footage taken from a population located withinand around Ormiston Gorge, within West-MacDonnell National Park, Western Australia. The habitataround Ormiston Gorge features large rocky outcrops with sparsely distributed vegetation includingEucalyptus trees, low shrubs (Acacias sp.) and a variety of native grasses and grass trees (Xanthorrhoeasp. Figure S3b).
Ctenophorus decresii are averaged sized lizards (SVL 82 mm) found across eastern South Australia,including Kangaroo Island [49]. The species exhibits diverse colouration within and between populations[50] and is known to show individual variation in their agonistic displays [51]. Other than throat/crestextension, limb waving and head bobbing, C. decresii also displays a distinctive hind-leg push up with thetail coiled in a horizontal direction [49, 52](Fig. 1d). The hind- leg push up is utilised by males to re�ectendurance and aggressiveness during territorial interactions [51]. The model lizard used herein was basedon morphology and display footages of C. decresii lizards inhabiting the rocky outcrops of the FlindersRanges National Park, South Australia. The habitat is prone to �re, so we have incorporated charred fallenbranches and sparse vegetation coverage, featuring mainly saltbush (Atriplex nummularia) and spinifexgrass (Triodia sp.), as well as sparsely distributed Eucalyptus sp. and black oaks (Casurina sp.; FigureS3d).Creating and animating the habitats
The microhabitats were modelled using Autodesk Maya©2015 based on data collected from habitatsurveys. As emphasised in Chouinard-Thuly et al. [53], the simulations created herein are based on datafrom real environments. We utilised the habitat of A. muricatus from earlier work [27, 36], while the threenew habitats were created as close replicates of the actual habitats. Brie�y, the habitat models wereconstructed in accordance with a library of reference images photographed at each site. These included360o panoramic photographs to capture the general layout of the habitat, while microhabitat detail wascaptured by photographing plants and substrates within close range of a known signalling site. Theposition of plants surrounding the signalling point were noted and spatial layout information wasincorporated into each scene.
As Maya does not provide ready-made plant models, major plant species from our study sites, such asspinifex grass and eucalyptus trees, were individually modelled and integrated with precise windcontrollers for setting the speed, intensity and frequency of plant movements. The wind controllers are setas a sliding bar to vary in the range [0, 1], resulting in increasing movement intensity. Deformation ofplant models in response to simulated wind utilised built-in scripts within Maya, which are based onphysically accurate equations [54]. By manipulating the numbers on the wind controller, we set themovements of modelled plants to visually match video recordings of actual plant movements inresponse to moderate wind conditions at each site. Video recordings of plants at each site were takenduring periods with natural wind speed close to 0 m/s and plant movements were generated using a leaf

Page 6/19
blower positioned 2 and 3 m from the plant, with wind speeds measured at the plant of 2.5 and 4 m/srespectively. The camera was positioned 2 m from the base of the target plant and angled perpendicularto the direction of the wind emanating from the leaf blower.3D lizard models and display sequences
Detailed steps on how 3D models of lizards were created are described elsewhere [27]. Lizard displaysequences were created using video recordings of each species performing movement-based displays innature. As described above, the displays of these four species are quite distinct. The temporal structure ofthe display is presented in Fig. 1, computed as the extent of body movement over time from motionanalysis (see below). The head-bob display of C. fordi generates the least movement (Fig. 1b), althoughrelatively continuous throughout the sequence. In contrast, the display of A. muricatus is characterised byintermittent movement (Fig. 1a), beginning with small movements at the tip of the tail, then utilising thewhole tail before the push-up component of the display. The temporal structure of both G. longirostrisand C. decresii involve relatively constant movement once the display begins (Fig. 1c, d respectively). Thedisplay of C. decresii involves a gradual increase in the amount of body movement before it ends, whileG. longirostris incorporates several rapid changes in body movement (rapid increase and decrease). Alllizard and habitat models were built in proportion and to scale.Scene composition and analysis
The models of all lizard species were placed into the habitat of all species (Fig. 2a,b; Figure S4). For agiven habitat, the lighting conditions, location and orientation of the lizard in the scene and the positionof the camera were matched for all lizard species. We used a single directional light to illuminate theentire scene with a uniform lighting effect. Lizard models were positioned in a given habitat according towhere the local species would typically be found and orientated side-on to the camera. The animatedsignalling sequences of all lizard displays started at the same frame in the animation timeline, and weresimilar in duration (6.4 s or 160 frames, with approximately 5 to 10 frames differences between the set).All sequences were 8 s duration and exported as images at 25 fps and 720 × 576 resolution. Wemanipulated wind conditions by systematically increasing the extent of plant motion at all sites bymanually adjusting plant controllers, con�rming incremental (but non-linear) increases in noise usingcomputational motion analysis as described in [36]. We repeated this to achieve 10 versions of eachscene varying in environmental noise conditions. All four species were placed in the habitats of eachspecies under all 10 noise conditions resulting in a �nal set of 160 sequences. For each species-habitatcombination, we also created a baseline sequence featuring only lizard movements that is required forour analytical approach.
Our analytical approach to determining salience of lizard displays was the same as previous work [27,36]. Brie�y, animation sequences featuring plant movements were analysed frame by frame usingsaliency analysis to generate a relative salience score in the range [0, 1] for all areas of the frame (Fig. 2c-e). The scores of each sequence were then multiplied by its relevant binary mask, which featured only thelizard movement, to produce a relative salience score for the lizard movements in the environmentalcontext imposed. This was repeated for all frames in the sequence to generate the relative salience over
Page 7/19
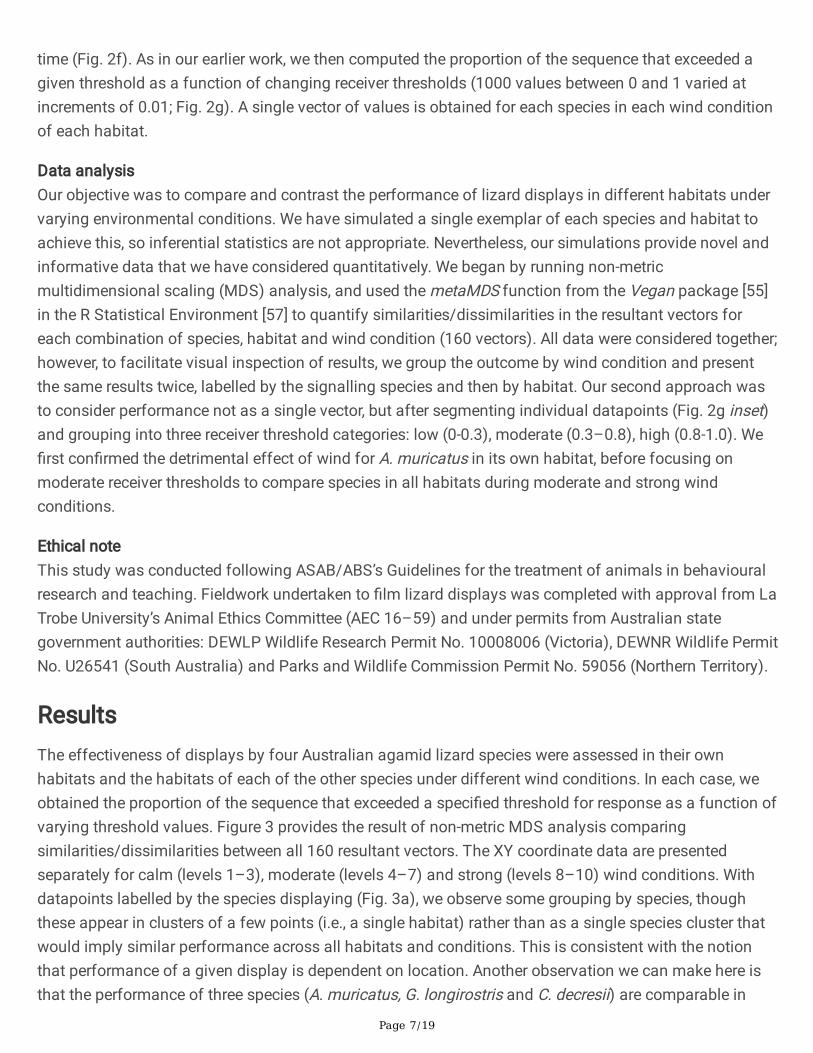
time (Fig. 2f). As in our earlier work, we then computed the proportion of the sequence that exceeded agiven threshold as a function of changing receiver thresholds (1000 values between 0 and 1 varied atincrements of 0.01; Fig. 2g). A single vector of values is obtained for each species in each wind conditionof each habitat.
Data analysisOur objective was to compare and contrast the performance of lizard displays in different habitats undervarying environmental conditions. We have simulated a single exemplar of each species and habitat toachieve this, so inferential statistics are not appropriate. Nevertheless, our simulations provide novel andinformative data that we have considered quantitatively. We began by running non-metricmultidimensional scaling (MDS) analysis, and used the metaMDS function from the Vegan package [55]in the R Statistical Environment [57] to quantify similarities/dissimilarities in the resultant vectors foreach combination of species, habitat and wind condition (160 vectors). All data were considered together;however, to facilitate visual inspection of results, we group the outcome by wind condition and presentthe same results twice, labelled by the signalling species and then by habitat. Our second approach wasto consider performance not as a single vector, but after segmenting individual datapoints (Fig. 2g inset)and grouping into three receiver threshold categories: low (0-0.3), moderate (0.3–0.8), high (0.8-1.0). We�rst con�rmed the detrimental effect of wind for A. muricatus in its own habitat, before focusing onmoderate receiver thresholds to compare species in all habitats during moderate and strong windconditions.
Ethical noteThis study was conducted following ASAB/ABS’s Guidelines for the treatment of animals in behaviouralresearch and teaching. Fieldwork undertaken to �lm lizard displays was completed with approval from LaTrobe University’s Animal Ethics Committee (AEC 16–59) and under permits from Australian stategovernment authorities: DEWLP Wildlife Research Permit No. 10008006 (Victoria), DEWNR Wildlife PermitNo. U26541 (South Australia) and Parks and Wildlife Commission Permit No. 59056 (Northern Territory).
ResultsThe effectiveness of displays by four Australian agamid lizard species were assessed in their ownhabitats and the habitats of each of the other species under different wind conditions. In each case, weobtained the proportion of the sequence that exceeded a speci�ed threshold for response as a function ofvarying threshold values. Figure 3 provides the result of non-metric MDS analysis comparingsimilarities/dissimilarities between all 160 resultant vectors. The XY coordinate data are presentedseparately for calm (levels 1–3), moderate (levels 4–7) and strong (levels 8–10) wind conditions. Withdatapoints labelled by the species displaying (Fig. 3a), we observe some grouping by species, thoughthese appear in clusters of a few points (i.e., a single habitat) rather than as a single species cluster thatwould imply similar performance across all habitats and conditions. This is consistent with the notionthat performance of a given display is dependent on location. Another observation we can make here isthat the performance of three species (A. muricatus, G. longirostris and C. decresii) are comparable in
Page 8/19
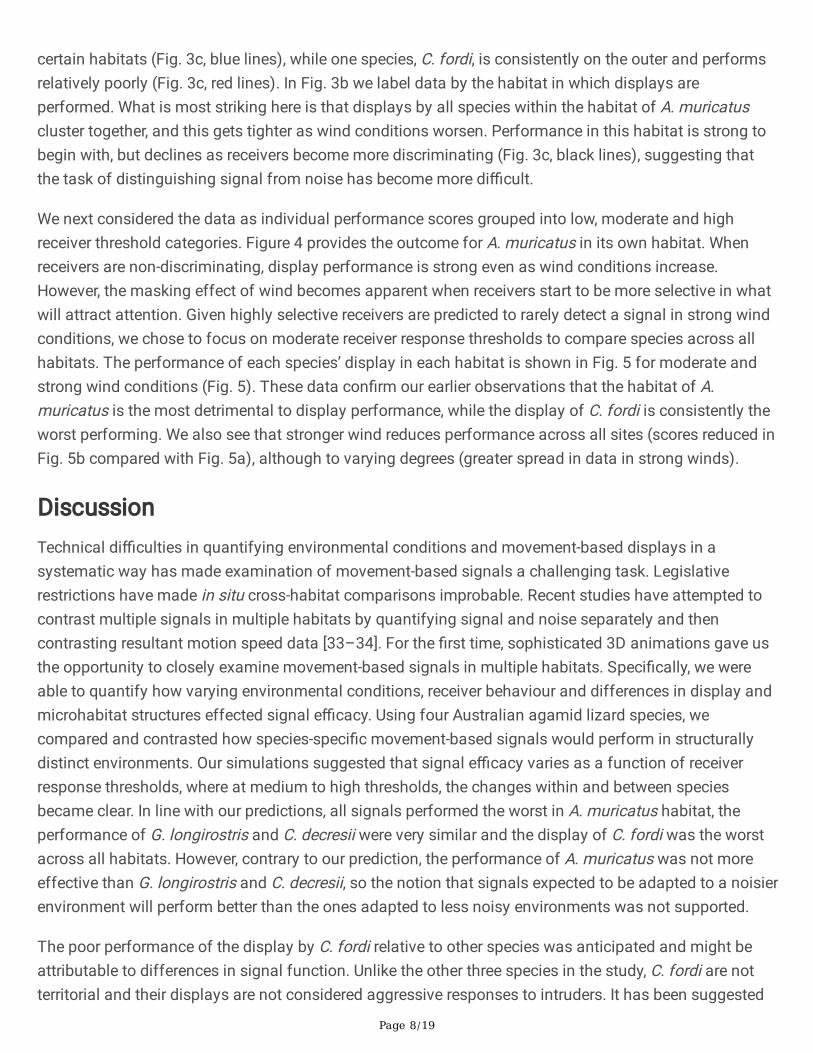
certain habitats (Fig. 3c, blue lines), while one species, C. fordi, is consistently on the outer and performsrelatively poorly (Fig. 3c, red lines). In Fig. 3b we label data by the habitat in which displays areperformed. What is most striking here is that displays by all species within the habitat of A. muricatuscluster together, and this gets tighter as wind conditions worsen. Performance in this habitat is strong tobegin with, but declines as receivers become more discriminating (Fig. 3c, black lines), suggesting thatthe task of distinguishing signal from noise has become more di�cult.
We next considered the data as individual performance scores grouped into low, moderate and highreceiver threshold categories. Figure 4 provides the outcome for A. muricatus in its own habitat. Whenreceivers are non-discriminating, display performance is strong even as wind conditions increase.However, the masking effect of wind becomes apparent when receivers start to be more selective in whatwill attract attention. Given highly selective receivers are predicted to rarely detect a signal in strong windconditions, we chose to focus on moderate receiver response thresholds to compare species across allhabitats. The performance of each species’ display in each habitat is shown in Fig. 5 for moderate andstrong wind conditions (Fig. 5). These data con�rm our earlier observations that the habitat of A.muricatus is the most detrimental to display performance, while the display of C. fordi is consistently theworst performing. We also see that stronger wind reduces performance across all sites (scores reduced inFig. 5b compared with Fig. 5a), although to varying degrees (greater spread in data in strong winds).
DiscussionTechnical di�culties in quantifying environmental conditions and movement-based displays in asystematic way has made examination of movement-based signals a challenging task. Legislativerestrictions have made in situ cross-habitat comparisons improbable. Recent studies have attempted tocontrast multiple signals in multiple habitats by quantifying signal and noise separately and thencontrasting resultant motion speed data [33–34]. For the �rst time, sophisticated 3D animations gave usthe opportunity to closely examine movement-based signals in multiple habitats. Speci�cally, we wereable to quantify how varying environmental conditions, receiver behaviour and differences in display andmicrohabitat structures effected signal e�cacy. Using four Australian agamid lizard species, wecompared and contrasted how species-speci�c movement-based signals would perform in structurallydistinct environments. Our simulations suggested that signal e�cacy varies as a function of receiverresponse thresholds, where at medium to high thresholds, the changes within and between speciesbecame clear. In line with our predictions, all signals performed the worst in A. muricatus habitat, theperformance of G. longirostris and C. decresii were very similar and the display of C. fordi was the worstacross all habitats. However, contrary to our prediction, the performance of A. muricatus was not moreeffective than G. longirostris and C. decresii, so the notion that signals expected to be adapted to a noisierenvironment will perform better than the ones adapted to less noisy environments was not supported.
The poor performance of the display by C. fordi relative to other species was anticipated and might beattributable to differences in signal function. Unlike the other three species in the study, C. fordi are notterritorial and their displays are not considered aggressive responses to intruders. It has been suggested

Page 9/19
that the likely function of the simple head bob display is for species recognition [46]. Displays areperformed at close range when lizards encounter other lizards, so the necessity to distinguish itself fromsurrounding plant motion is removed. The other three species in this study are all assumed to beterritorial species [42, 52, 57], responding to intruders at greater distances and when the intruder ispossibly unaware of the presence of the territory owner. In these circumstances, reliable detection andprocessing of territorial displays are essential for establishing social dominance [58–59].
The potential masking effect for movement-based signals is dependent on prevailing wind and thedistribution of plants in the environment [32]. Complex image motion backgrounds are expected in densevegetation, which would likely require animals to generate certain types of movements for effectivecommunication [3]. The habitat of A. muricatus is densely vegetated with tall grasses and small shrubs(Figure S1a). The plants are often positioned close to the signalling animal, with short signaller-plantdistances predicted to reduce detectability of signals [60]. In comparison, the habitats of G. longirostrisand C. decresii feature sparsely vegetated environments, with plants typically separated from thesignalling animals. However, the C. decresii habitat we modelled herein was based on a recently burntarea which would feature a reduced level of motion noise in the environment, this information couldchange for C. decresii as the vegetation recovers from the �re over the next few years. The signaller-plantdistances in the habitat of C. fordi were also very close, but in this case the dominant plant species,spinifex grass (Triodia sp.), does not generate considerable movement in response to wind at the base ofthe plant where the lizards were positioned. As such, the potential masking effect of plant environmentsis attributable to the interaction between wind conditions, the spatial position of plants in theenvironment and the structure of the plant itself that will dictate how it responds to wind.
Habitats with common structural properties, regardless of geographic location, are predicted to result insignals with similar structural characteristics [61–62]. Both G. longirostris and C. decresii inhabit sparselyvegetated rocky outcrops, and the similarities in the structure of their signals and relative signalperformance in noise could be attributed to structural similarities in the environments they inhabit.Interestingly, the performance of their displays was just as effective as the signal of A. muricatus in thehabitat of A. muricatus suggesting different movements might be equally effective. However, it is in theother habitats that we start to see subtle interactions between display and habitat structure. The displaysof G. longirostris perform best in two of these habitats, while C. decresii displays perform better in theirown habitat. Ramos and Peters [48] found no evidence for broad scale habitat characteristics in�uencingsignal use in Australian dragons, but it is intriguing to consider the possibility that the use of differentmotor patterns is partially driven by �ne-scale habitat characteristics that in�uence the motion noiseenvironment. Both G. longirostris and C. decresii signals involve almost continuous movement featuringwhole body push-ups/forward thrusts. In contrast, the push-up component of the display of A. muricatusis brief and follows an occasionally lengthy period of tail �icking [14]. Tail-�icks represent theintroductory component to the rest of the display, reportedly to capture the attention of a receiver [14, 43].It is also this component of the signal that exhibits plasticity in response to changing environmentalconditions [14], whereby the duration of tail �icking is lengthened in noisy conditions and the movementbecomes more intermittent. Tail-�icks are observed in C. decresii, although it is not a core component of

Page 10/19
the display [35], and there are no reports for tail �icking by G. longirostris [48]. Further research is neededto determine whether either of these species possess a component of their display that exhibits the kindof plasticity needed for variable environments. Alternatively, perhaps the environments that they inhabithave not selected for such plasticity as the rocky gorges provide a clear background against which thesignal can be reliably detected regardless of plant movement speeds.
This study has added to a growing literature showing that habitat characteristics and the associatednoise landscape has a signi�cant evolutionary effect on signal design and likely promotes changes insignalling strategies under certain conditions [14, 63–64]. How signals function in social interactions isanother important consideration for driving variation in signal structure [46, 58, 65–66]. Cross-habitatexamination of signal performance has been bene�cial for other communication systems [19, 20, 21, 23],but the present study is one of the �rst comparable studies for movement-based signals. Our innovativeapproach allowed for examination of different movement-based signals embedded in noise acrossdifferent habitats. We acknowledge that the results herein are generated from a single representativedisplay per species, in a single representative habitat per species. Nevertheless, our method andanalytical approach has provided quantitative data showing that the effectiveness of movement-basedanimal signals will be affected by the motion noise environment, and might indeed direct signallingbehaviour in much the same way that it has for other modes of signalling.
DeclarationsAcknowledgements
We are grateful to Bhagya Herath, Yin Qi and Jose Ramos for assistance with �eldwork to �lm lizarddisplays and document habitat characteristics. In addition, we thank Warwick Laird and Chandara Ungfor assistance with preliminary animations.
Funding
This work was supported by an Australian Research Council Discovery Project grant to RAP and TC(DP170102370).
Author Contributions
XB and RAP designed the study and conducted �eldwork
XB, AP and TC created the 3D animations
XB and RAP analysed the rendered animations and wrote the �rst draft of the manuscript.
All authors provided comments on earlier drafts and �nalised the manuscript
References

Page 11/19
1. Endler, J. A. 1992. Signals, signal conditions, and the direction of evolution. Nat. 139, S125-S153.
2. Endler, J. A. 1993. Some general comments on the evolution and design of animal communicationsystems. Trans. R. Soc. Lond. B. Biol. Sci. 340, 215-225.
3. Fleishman, L. J. 1992. The in�uence of the sensory system and the environment on motion patternsin the visual displays of anoline lizards and other vertebrates. Nat. 139, S36-S61.
4. Lythgoe, J. N. 1979. The Ecology of vision. Oxford, Oxford University Press.
5. Bradbury, J. W. and Vehrencamp, S. L. 1998. Principles of animal communication (2nd). SinauerAssociates.
�. Morton, E. S. 1975. Ecological Sources of Selection on Avian Sounds. Nat. 109, 17-34.
7. Endler, J. A. 1990. On the measurement and classi�cation of colour in studies of animal colourpatterns. J. Linn. Soc. Lond. 41, 315-352.
�. Wiley, R. H. and Richards, D. G. 1983. Adaptations for acoustic communication in birds: soundtransmission and signal detection. In: Ecology and Evolution of Acoustic Communication in Birds.Kroodsma D. E. and Miller E. H. (eds). New York, Academic Press, pp 131-181.
9. Bernard, G. D. and Remington, C. L. 1991. Color vision in Lycaena butter�ies: spectral tuning ofreceptor arrays in relation to behavioral ecology. Natl. Acad. Sci. USA. 88, 2783-2787.
10. Peters, R. A., Clifford, C. W. G. and Evans, C. S. 2002. Measuring the structure of dynamic visualsignals. Behav. 64, 131-146.
11. Narins, P. M. 1990. Seismic communication in anuran amphibians. Bioscience 40, 268-274.
12. Fleishman, L. and Persons, M. 2001. The in�uence of stimulus and background colour on signalvisibility in the lizard Anolis cristatellus. Exp. Biol. 204, 1559-1575.
13. Brumm, H. and Slabbekoorn, H. 2005. Acoustic communication in noise. Study Behav. 35, 151-209.
14. Peters, R. A., Hemmi, J. M. and Zeil, J. 2007. Signaling against the wind: modifying motion-signalstructure in response to increased noise. Biol. 17, 1231-1234.
15. Ord, T. J. and Stamps, J. A. (2008). Alert signals enhance animal communication in “noisy”environments. Natl. Acad. Sci. USA. 105, 18830-18835.
1�. Komers, P. E. 1997. Behavioural plasticity in variable environments. J. Zool. 75, 161-169.
17. Ord, T.J., Charles, G. K., Palmer, M. and Stamps, J. A. 2015. Plasticity in social communication and itsimplications for the colonization of novel habitats. Ecol. 27b 341-351.
1�. Marten, K. and Marler, P. 1977. Sound transmission and its signi�cance for animal vocalization. Ecol.Sociobiol. 2, 271-290.
19. Ryan, M. J., Cocroft, R. B. and Wilczynski, W. 1990. The role of environmental selection inintraspeci�c divergence of mate recognition signals in the cricket frog, Acris Crepitans. Evolution 44,1869-1872
20. Leal, M. and Fleishman, L. J. 2004. Differences in visual signal design and detectability betweenallopatric populations of Anolis Am. Nat. 163, 26-39.

Page 12/19
21. McNett, G. D. and Cocroft, R. B. 2008. Host shifts favor vibrational signal divergence in Enchenopabinotata Behav. Ecol. 19, 650-656.
22. Ferguson, G. W. 1971. Variation and evolution of the push-up displays of the side-blotched lizardgenus Uta (Iguanidae). Zool. 20, 79-101.
23. Martins, E. P., Bissell, A. N. and Morgan, K. K. 1998. Population differences in a lizard communicativedisplay: evidence for rapid change in structure and function. Behav. 56, 1113-1119.
24. Martins, E. P. and Lamont, J. 1998. Estimating ancestral states of a communicative display: acomparative study of Cyclurarock iguanas. Behav. 55, 1685-1706.
25. Bloch, N. and Irschick, D. 2006. An analysis of inter‐population divergence in visual display behaviorof the green anole lizard (Anolis carolinensis). Ethology 112, 370-378.
2�. Barquero, M. D., Peters, R. and Whiting, M. 2015. Geographic variation in aggressive signallingbehaviour of the Jacky dragon. Ecol. Sociobiol. 69, 1501-1510.
27. Bian, X., Chandler, T., Laird, W., Pinilla, A. and Peters, R. 2018. Integrating evolutionary biology withdigital arts to quantify ecological constraints on vision‐based behaviour. Methods Ecol. Evol. 9, 544-559.
2�. Fleishman, L. J. 1986. Motion detection in the presence and absence of background motion in anAnolis J. Comp. Physiol. A 159, 711-720.
29. Fleishman, L. J. 1988. Sensory and environmental in�uences on display form in Anolis auratus, agrass anole from Panama. Ecol. and Sociobiol. 22, 309-316.
30. Eckert, M. P. and Zeil, J. 2001. Towards an ecology of motion vision. In: Motion Vision. Zanker J.Mand Zeil J. (eds). Springer, pp 333-369.
31. Peters, R. A. and Evans, C. S. 2003. Design of the Jacky dragon visual display: signal and noisecharacteristics in a complex moving environment. Comp. Physiol. A 189, 447-459.
32. Peters, R. A. 2013. Noise in visual communication: motion from wind-blown plants. In: AnimalCommunication and Noise. Animal Signals and Communication Brumm H. (eds) Springer, BerlinHeidelberg, pp. 311-330.
33. Ramos, J. A. and Peters, R. A. 2017. Motion-based signaling in sympatric species of Australianagamid lizards. Comp. Physiol. A 203, 661-671.
34. Ramos, J. A. and Peters, R. A. 2017. Habitat-dependent variation in motion signal structure betweenallopatric populations of lizards. Behav. 126, 69-78.
35. Ramos, J. A. and Peters, R. A. 2017. Quantifying ecological constraints on motion signaling. Ecol.Evol. 5, 9.
3�. Bian, X., Chandler, T., Pinilla, A. and Peters, R. 2019. Now you see me, now you don’t: environmentalconditions, signaler behavior, and receiver response thresholds interact to determine the e�cacy of amovement-based animal signal. Ecol. Evol. 7, 130.
37. Heatwole, H. and Firth, B. T. 1982. Voluntary maximum temperature of the jacky lizard, Amphibolurusmuricatus. Copeia, 1982, 824-829.

Page 13/19
3�. Harlow, P. S. and Taylor, J. E. 2000. Reproductive ecology of the jacky dragon (Amphibolurusmuricatus): an agamid lizard with temperature‐dependent sex determination. Ecol. 25, 640-652.
39. Ord, T. J. and Evans, C. S. 2003. Display rate and opponent assessment in the Jacky dragon(Amphibolurus muricatus): an experimental analysis. Behaviour 140, 1495-1508.
40. Warner, D. A. and Shine, R. 2010. Interactions among thermal parameters determine offspring sexunder temperature-dependent sex determination. R. Soc. Lond. B. Biol. Sci. 278, 256-265.
41. Carpenter, C. C., Badham, J. A. and Kimble, B. 1970. Behavior patterns of three species ofAmphibolurus (Agamidae). Copeia, 1970, 497-505.
42. Peters, R. A. and Ord, T. J. 2003. Display response of the Jacky Dragon, Amphibolurus muricatus(Lacertilia : Agamidae), to intruders: a semi-Markovian process. Ecol. 28, 499-506.
43. Peters, R. A. and Evans, C. S. 2003. Introductory tail-�ick of the Jacky dragon visual display: signale�cacy depends upon duration. Exp. Biol. 206, 4293-4307.
44. Wilson, S. and Swan, G. 2013. A Complete guide to reptiles of Australia (second ed.) Reed NewHolland, Sydney.
45. Carpenter, C. C. 1962. A comparison of the patterns of display of Urosaurus, Uta, and Streptosaurus.Herpetologica 18, 145-152.
4�. Cogger, H. 1978. Reproductive cycles, fat body cycles and socio-sexual behaviour in the malleedragon, Amphibolurus fordi (Lacertilia: Agamidae). J. Zool. 26, 653-672.
47. Garcia, J. E., Rohr, D. and Dyer, A. G. 2013. Trade-off between camou�age and sexual dimorphismrevealed by UV digital imaging: the case of Australian Mallee dragons (Ctenophorus fordi). Exp. Biol.216, 4290-4298.
4�. Ramos, J. A. and Peters, R. A. 2016. Dragon wars: movement‐based signalling by Australian agamidlizards in relation to species ecology. Ecol. 41, 302-315.
49. Gibbons, J. R. H. 1977. Comparative ecology and behaviour of lizards of the Amphibolurus decresiispecies complex. PhD dissertation, University of Adelaide, Adelaide, South Australia
50. McLean, C. A., Moussalli, A., Sass, S. and Stuart-Fox, D. 2013. Taxonomic assessment of theCtenophorus decresii complex (Reptilia: Agamidae) reveals a new species of dragon lizard fromwestern New South Wales. Aust. Mus. 65, 51-63.
51. Osborne, L. 2005. Information content of male agonistic displays in the territorial tawny dragon(Ctenophorus decresii). Ethol. 23, 189-197.
52. Gibbons, J. R. 1979. The hind leg pushup display of the Amphibolurus decresii species complex(Lacertilia: Agamidae). Copeia, 1979, 29-40.
53. Chouinard-Thuly, L., Gierszewski, S., Rosenthal, G. G., Reader, S. M., Rieucau, G., Woo, K. L., Gerlai, R.,Tedore, C., Ingley, S. J. and Stowers, J. R. 2016. Technical and conceptual considerations for usinganimated stimuli in studies of animal behavior. Zool. 63, 5-19
54. Akagi, Y. and Kitajima, K. (2006). Computer animation of swaying trees based on physicalsimulation. Graph. 30, 529-539.

Page 14/19
55. Oksanen, J., Blanchet, F. G., Friendly, M., Kindt, R., Legendre, P., McGlinn, D., Minchin, P. R., O'Hara, R.B., Simpson, G. L., Solymos, P., Stevens, M. H. H., Szoecs, E. and Wagner, H. 2019. Vegan: CommunityEcology Package. R package version 2.5-4. https://CRAN.R-project.org/package=vegan
5�. R Core Team. 2018. R: A language and environment for statistical computing. R Foundation forStatistical Computing, Vienna, Austria. URL https://www.R-project.org/.
57. Blamires, S. 1998. Circumduction and head bobbing in the agamid lizard Lophognathus temporalis.Herpetofauna 28, 51-52.
5�. Carpenter, C. C. 1967. Aggression and social structure in iguanid lizards. In: Lizard ecology: Asymposium. Milstead W. W. (eds.). University of Missouri Press Columbia.
59. Carpenter, C. 1978. Ritualistic social behaviors in lizards. In: Behavior and Neurology of Lizards, aninterdisciplinary colloquium. Rockville, Maryland: National Institute of Mental Health, Rockville. Pp.253-267.
�0. Peters, R. A., Hemmi, J. and Zeil, J. 2008. Image motion environments: background noise formovement-based animal signals. Comp. Physiol. A 194, 441-456.
�1. Hunter, M. L. and Krebs, J. R. 1979. Geographical variation in the song of the great tit (Parus major)in relation to ecological factors. Anim. Ecol 48, 759-785.
�2. Harmon, L. J., Kolbe, J. J., Cheverud, J. M. and Losos, J. B. 2005. Convergence and themultidimensional niche. Evolution 59, 409-421.
�3. Fleishman, L. J. 1988. Sensory in�uences on physical design of a visual display. Behav. 36, 1420-1424.
�4. Ord, T. J., Peters, R. A., Clucas, B. and Stamps, J. A. 2007. Lizards speed up visual displays in noisymotion habitats. R. Soc. Lond. B. Biol. Sci. 274, 1057-1062.
�5. Hasson, O. 1991. Pursuit-deterrent signals: communication between prey and predator. Trends Ecol.Evol. 6, 325-329.
��. Hebets, E. A. and Uetz, G. W. 1999. Female responses to isolated signals from multimodal malecourtship displays in the wolf spider genus Schizocosa (Araneae: Lycosidae). Behav. 57, 865-872.
Figures
Page 15/19
Figure 1
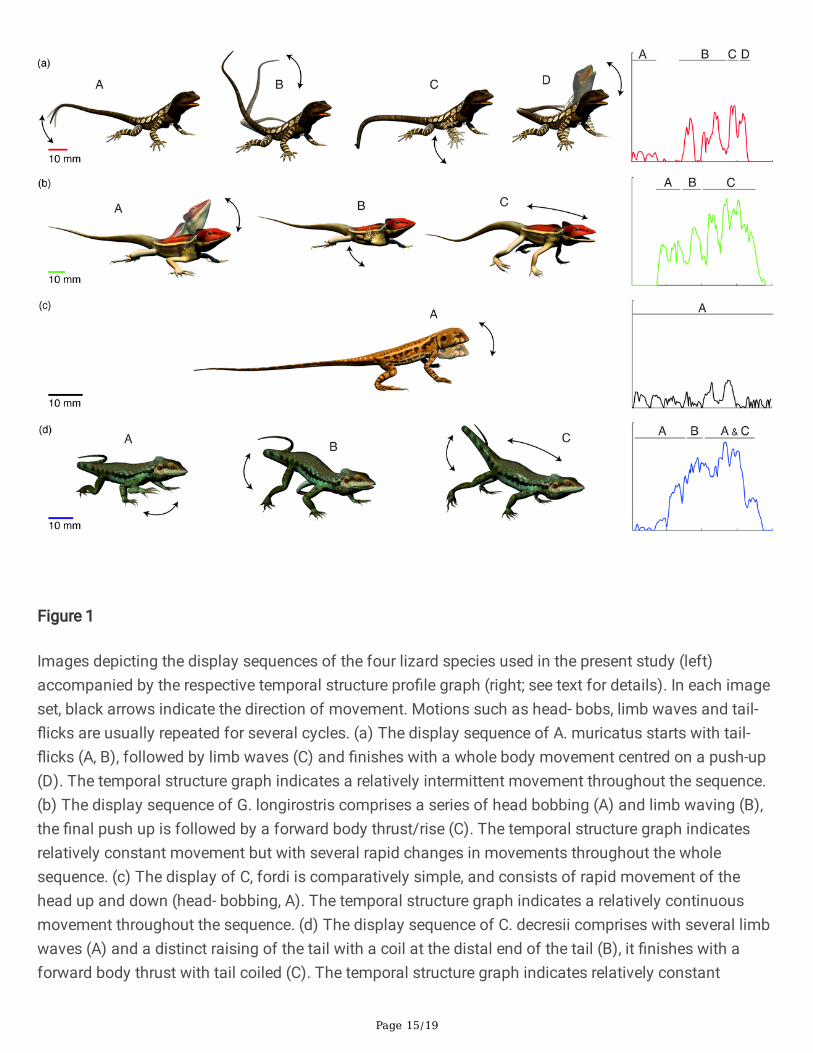
Images depicting the display sequences of the four lizard species used in the present study (left)accompanied by the respective temporal structure pro�le graph (right; see text for details). In each imageset, black arrows indicate the direction of movement. Motions such as head- bobs, limb waves and tail-�icks are usually repeated for several cycles. (a) The display sequence of A. muricatus starts with tail-�icks (A, B), followed by limb waves (C) and �nishes with a whole body movement centred on a push-up(D). The temporal structure graph indicates a relatively intermittent movement throughout the sequence.(b) The display sequence of G. longirostris comprises a series of head bobbing (A) and limb waving (B),the �nal push up is followed by a forward body thrust/rise (C). The temporal structure graph indicatesrelatively constant movement but with several rapid changes in movements throughout the wholesequence. (c) The display of C, fordi is comparatively simple, and consists of rapid movement of thehead up and down (head- bobbing, A). The temporal structure graph indicates a relatively continuousmovement throughout the sequence. (d) The display sequence of C. decresii comprises with several limbwaves (A) and a distinct raising of the tail with a coil at the distal end of the tail (B), it �nishes with aforward body thrust with tail coiled (C). The temporal structure graph indicates relatively constant

Page 16/19
movement, featuring a gradual increase in the amount of body movement. Scale bars are provided foreach species.
Figure 2
To examine the relative e�cacy of movement-based animal signals we created 3D animations of thedisplays of four Australian dragon lizards (a) and their respective habitats (b). Each species was insertedinto each habitat (c) under varying environmental conditions. We used saliency analysis (d) to computesaliency scores for all parts of the scene (e). The maximum saliency score in the area of the scenefeaturing the lizard is identi�ed for all frames in the animation sequence (f). We assumed the level ofsalience required to capture attention will vary within and between receivers and determined theproportion of the sequence that exceeded a given threshold as a function of varying receiver response

Page 17/19
thresholds (g). The performance vector comprises discrete scores at small increments in threshold values(g, inset).
Figure 3
Results of non-metric multidimensional scaling analysis to compare similarities/dissimilarities betweenvectors summarising performance of lizard displays in multiple habitats under varying wind conditions.The results are shown twice, labelling data points by the lizard species (a) and by the habitat in which thelizard was placed (b). Separate plots show performance in calm (top row), moderate (middle row) andstrong (bottom row) wind conditions. (c) To provide insight into the different clumping within MDS space,individual performance vectors are shown in strong wind for the best performing (blue lines), as well aspoorer performing (black and red lines) display species-habitat combinations.

Page 18/19
Figure 4
Results of non-metric multidimensional scaling analysis to compare similarities/dissimilarities betweenvectors summarising performance of lizard displays in multiple habitats under varying wind conditions.The results are shown twice, labelling data points by the lizard species (a) and by the habitat in which thelizard was placed (b). Separate plots show performance in calm (top row), moderate (middle row) andstrong (bottom row) wind conditions. (c) To provide insight into the different clumping within MDS space,individual performance vectors are shown in strong wind for the best performing (blue lines), as well aspoorer performing (black and red lines) display species-habitat combinations.

Page 19/19
Figure 5
The relative performance of lizard displays under moderate (a) and strong (b) wind conditions withmedium receiver response thresholds (0.3-0.8). Separate plots are showing for the habitats in whichsignalling takes place, with each showing the proportion of the sequence exceeding the threshold shownas a function of signalling species. (Am - A. muricatus; GL – G. longirostris; Cf – C. fordi; Cd – C. decresii)
Supplementary Files
This is a list of supplementary �les associated with this preprint. Click to download.
BianPinillaChandlerPetersSupplementaryMaterial.pdf