EFFECT OF SCHOOL FEES ABOLITION ON SCIENCE ...
25
Scientific Research Journal (SCIRJ), Volume VI, Issue IX, September 2018 53 ISSN 2201-2796 www.scirj.org © 2018, Scientific Research Journal http://dx.doi.org/10.31364/SCIRJ/v6.i9.2018.P0918568 EFFECTS OF SCHOOL FEES ABOLITION ON SCIENCE EDUCATION IN PUBLIC SECONDARY IN NASARAWA STATE, NIGERIA. 1 Musa W. O., 1 Yakubu A. N; 2 Ashiki G. M; 3 Audu J. Agnes, 4 Agabi .J. Y. 1 Chemistry Department, 2 Geography Department, 3 Home Economic Department, 4 Primary Education Department College of Education Akwanga, Nasarawa State, Nigeria. Corresponding Email: [email protected] GSM: +2348065988803 DOI: 10.31364/SCIRJ/v6.i9.2018.P0918568 http://dx.doi.org/10.31364/SCIRJ/v6.i9.2018.P0918568 Abstract: The Nasarawa State Government in 2014 abolished school fees in all public secondary schools in the state. This initiative was viewed overall as a positive development by various stakeholders including parents, principals and teachers as it was seen as a form of financial relieve to parents. Minimal research has been done on how the policy has affected schools with different social and political characteristics. This study aims at looking at how those impact influence the academic performance at those schools. From this information, the research determines whether or not the educational quality of secondary schools has suffered under the policy of school fees abolition. The research design targets 12 senior and junior secondary schools and three area inspectorate offices in Nasarawa Eggon, Akwanga and Wamba local government areas. The study used questionnaire and verbal interviewed to collect primary data from the study area. Data collected were analysed statistically. 66% respondents recognized increased enrolment as a positive consequence of free schooling. Most respondents also observed the free schooling has worsened the quality and efficiency of schooling in Nasarawa State. As an average of 75% of the respondent disagreed with the policy because students performance and achievement in class dropped. An average of 96% of the stakeholders suggested that the policy should not be sustained because the quality of secondary education was compromised. Key words: Fees Abolition Policy, Public Secondary Schools, Quality of Science Education. Introduction/Background Education for all and the millennium Development goals have given developing countries an incentive to attain universal education through accelerated and scaled strategies. Abolishing school fees is one such strategy which is seen as a measure to improve enrolment and participation rates. Tuition fees and other private costs of schooling are viewed as barriers to accessing and completing primary and secondary education (Sola et al, 2010). Although many Africa countries have decided to abolish school fees, because universal education is a key factor in development, this means that more education leads to the generation of human capital and economic growth (Sifuna, 2007). Documented evidence also shows that most of the countries and states of western region in Nigeria that had taken the bold step to eliminate school fees and other indirect education cost did that only at primary education level. For example South Africa prefers to maintain schools fees by exempting the poor fully or partially. Botswana and Malawi took a bold decision to reintroduce fees at secondary education level in order to spend more funds on primary education (UNESCO 2005). It is important to question how sustainable a free secondary education system can work in the Nigeria state. A fee-paying system indicates that there are inadequate funds for education and for social services in general (World Bank, 2005). In the case of Nasarawa state as soon as school fees has been abolished for all public secondary schools there was a tremendous drop in federal monthly allocation to the state which made the policy look like failure from the beginning (Akinwumi, 2014). Over the years a lot of policies and programmes were introduced in to the educational system in the state by the past government with a quest to improve the participation, quality and performance of teachers. The abolition of school fees and all levies from primary schools to secondary schools in 2014 by Governor Tanko Umaru Al-makura was also targeted to improve pupils/students participation in the public schools (NSMOE 2017). However, it was observed that some of such programme have turned out to generate more problems than they seem to have solved. The result therefore, is that quality or standard of education has been replaced by mass literacy or mass dishing out of certificates leading to the annual turn-over of half-baked unemployed graduates as against the production assets, required for societal growth and development (Amaele, 2010). Against this background, it become necessary to investigate the effect of school fees abolition policy on science education in public secondary school in Nasarawa state.
-
Upload
khangminh22 -
Category
Documents
-
view
5 -
download
0
Transcript of EFFECT OF SCHOOL FEES ABOLITION ON SCIENCE ...

Scientific Research Journal (SCIRJ), Volume VI, Issue IX, September 2018 53 ISSN 2201-2796
www.scirj.org
© 2018, Scientific Research Journal
http://dx.doi.org/10.31364/SCIRJ/v6.i9.2018.P0918568
EFFECTS OF SCHOOL FEES ABOLITION ON
SCIENCE EDUCATION IN PUBLIC SECONDARY
IN NASARAWA STATE, NIGERIA.
1Musa W. O.,
1Yakubu A. N;
2Ashiki G. M;
3Audu J. Agnes,
4Agabi .J. Y.
1Chemistry Department,
2Geography Department,
3Home Economic Department,
4Primary Education Department
College of Education Akwanga, Nasarawa State, Nigeria.
Corresponding Email: [email protected] GSM: +2348065988803
DOI: 10.31364/SCIRJ/v6.i9.2018.P0918568
http://dx.doi.org/10.31364/SCIRJ/v6.i9.2018.P0918568
Abstract: The Nasarawa State Government in 2014 abolished school fees in all public secondary schools in the state. This initiative was
viewed overall as a positive development by various stakeholders including parents, principals and teachers as it was seen as a form of
financial relieve to parents. Minimal research has been done on how the policy has affected schools with different social and political
characteristics. This study aims at looking at how those impact influence the academic performance at those schools. From this information,
the research determines whether or not the educational quality of secondary schools has suffered under the policy of school fees abolition.
The research design targets 12 senior and junior secondary schools and three area inspectorate offices in Nasarawa Eggon, Akwanga and
Wamba local government areas. The study used questionnaire and verbal interviewed to collect primary data from the study area. Data
collected were analysed statistically. 66% respondents recognized increased enrolment as a positive consequence of free schooling. Most
respondents also observed the free schooling has worsened the quality and efficiency of schooling in Nasarawa State. As an average of 75%
of the respondent disagreed with the policy because students performance and achievement in class dropped. An average of 96% of the
stakeholders suggested that the policy should not be sustained because the quality of secondary education was compromised.
Key words: Fees Abolition Policy, Public Secondary Schools, Quality of Science Education.
Introduction/Background
Education for all and the millennium Development goals have
given developing countries an incentive to attain universal
education through accelerated and scaled strategies. Abolishing
school fees is one such strategy which is seen as a measure to
improve enrolment and participation rates. Tuition fees and other
private costs of schooling are viewed as barriers to accessing and
completing primary and secondary education (Sola et al, 2010).
Although many Africa countries have decided to abolish school
fees, because universal education is a key factor in development,
this means that more education leads to the generation of human
capital and economic growth (Sifuna, 2007). Documented
evidence also shows that most of the countries and states of
western region in Nigeria that had taken the bold step to
eliminate school fees and other indirect education cost did that
only at primary education level. For example South Africa
prefers to maintain schools fees by exempting the poor fully or
partially. Botswana and Malawi took a bold decision to
reintroduce fees at secondary education level in order to spend
more funds on primary education (UNESCO 2005).
It is important to question how sustainable a free secondary
education system can work in the Nigeria state. A fee-paying
system indicates that there are inadequate funds for education
and for social services in general (World Bank, 2005). In the
case of Nasarawa state as soon as school fees has been abolished
for all public secondary schools there was a tremendous drop in
federal monthly allocation to the state which made the policy
look like failure from the beginning (Akinwumi, 2014).
Over the years a lot of policies and programmes were introduced
in to the educational system in the state by the past government
with a quest to improve the participation, quality and
performance of teachers. The abolition of school fees and all
levies from primary schools to secondary schools in 2014 by
Governor Tanko Umaru Al-makura was also targeted to improve
pupils/students participation in the public schools (NSMOE
2017). However, it was observed that some of such programme
have turned out to generate more problems than they seem to
have solved. The result therefore, is that quality or standard of
education has been replaced by mass literacy or mass dishing out
of certificates leading to the annual turn-over of half-baked
unemployed graduates as against the production assets, required
for societal growth and development (Amaele, 2010).
Against this background, it become necessary to investigate the
effect of school fees abolition policy on science education in
public secondary school in Nasarawa state.

Scientific Research Journal (SCIRJ), Volume VI, Issue IX, September 2018 54
ISSN 2201-2796
www.scirj.org
© 2018, Scientific Research Journal
http://dx.doi.org/10.31364/SCIRJ/v6.i9.2018.P0918568
Statement of the Problem
Although school fees abolition policy had thoroughly increased
enrolment in secondary schools, there is this question that school
fees abolition has also brought public secondary schools
additional problems that must dealt with in Nasarawa State.
While there are issues of implementation, administration, and
aspects that are worthy
of discussion. This research work will look specifically at critical
emerging issues of school fees abolition that affect quality of
education.
Objectives The purpose of this study is to examine the effect of school fees
abolition in teaching of sciences in public secondary school in
Nasarawa State, how school fees abolition has impacted the
educational quality of public secondary schools in the State (to
see if the policy has benefited school at all). The objects of the
research work are to:
a. Assess the impact of school fees abolition on students
learning environment.
b. Determine whether or not the educational quality of
secondary schools has suffered under the policy of school
fees abolition.
c. Observe whether or not these impact have affected students
academic performance.
The study carried out in two-part formats. The report will first
analyze whether the students learning environment have
improved and sustained or it has decline since school fees
abolition policy.
Significant of the Study
The study is significant because it will:
a. Help Nasarawa State government to:
Reconsider her position on school fees abolition in
secondary education at this time of dwindling resources.
Involve the secondary school teachers in the planning and
implementation of the policy if the policy be sustained to
achieve its goal.
b. Help other educational researchers to opined/suggest better
ways government can improve on the policy in this
deregulated economy.
Research questions
The following research questions were formulated to guide the
study:
1. Has the implementation of school fees abolition in
secondary school improved the learning circumstance for
children in school?
2. Is there an adequate resource for the implementation of
school fees abolition policy?
3. What is the extent of secondary school teacher’s job
motivation?
4. Has the new policy impacted the academic performance of
the students?
5. Is there any other benefit of secondary schools from the
school abolition policy?
Methodology This section of the study discusses the research design, area of
the study, population of the study and sampling techniques,
method of data collection and method of data analysis.
- Research design: This study adopt a case study survey
research design to assess the effect of school fees abolition
on the quality of science education in Nasarawa State
secondary schools.
- Area of the Study: The area of the study is Nasarawa
north senatorial Zone (Akwanga, Nasarawa Eggon and
Wamba LGA). Specifically, the secondary schools that
offer sciences in the areas.

Scientific Research Journal (SCIRJ), Volume VI, Issue IX, September 2018 55
ISSN 2201-2796
www.scirj.org
© 2018, Scientific Research Journal
http://dx.doi.org/10.31364/SCIRJ/v6.i9.2018.P0918568
Figure 1: Map of Nasarawa State showing study areas
(www.nasarawastate.gov.ng)
- Population of the Study: The populations of the study
are the entire stakeholder in educational processes and
implementation in the state and area of study. They were
chosen to provide first hand insight into the effects of the
free schooling initiative (principals, teachers, PTA
officials, state/area inspectorate officers).
- Sample and Sampling Techniques: The samples of the
study were 300 respondents. The sampling techniques used
shall be random sampling techniques.
- Instrument for Data Collection: Three hundred (300)
copies of the questionnaire was prepared and distributed to
the respondents directly.
- Method of Data Analysis: Tabulation method was used for
data collection and the collected data was analyzed
statistically.
Limitation There were several limitations in the execution of this research
work that may have prevented it from providing a deeper
analysis of the situation on the ground. The greatest limitation
was that this study was delayed to March 2017 because of
inadequate co-operation by school principals for lack of
authority letter from the ministry of Education Nasarawa State.
Even with the authorized letter to allow access to records and
interview of teachers, P.T.A and students, some principals and
Area Inspectorate officers declined given valuable information
and records.
Six months strike action by teachers for lack of
promotion/annual increment and lack of staff training support for
the past five (5) years was another serious limitation to this
work.
Nasarawa Eggon
Wamba
Akwanga KEY:
a

Scientific Research Journal (SCIRJ), Volume VI, Issue IX, September 2018 56
ISSN 2201-2796
www.scirj.org
© 2018, Scientific Research Journal
http://dx.doi.org/10.31364/SCIRJ/v6.i9.2018.P0918568
PRESENTATION OF RESULTS
Table 1: Agreement Scale on Effect of Free Secondary Schooling
Name of School/
A.i.o
Resource available for
teaching/ learning of
sciences
Job motivation Number of Teachers
Available
Class Performance of
Students
Yes No
No % No %
Yes No
No % No %
Yes No
No % No %
Yes No
No % No %
GSS KAGBU ERROR/
GAJE
2 5 39 95 7 24 23 76 21 44 27 56 18 50 18 50
SPORT ACADENIC
AKWANGA
17 24 53 76 8 16 42 84 32 40 48 60 15 25 45 75
GOVT. SCI. SCHOOL
ANDAHA
5 9 51 91
6 15 34 85
23 36 41 64
16 33 32 67
GSS UBBE
18 26 52 74 13 22 47 78 19 24 61 76 14 24 45 76
GOVT. SCI. SCHOOL
WAMBA
12 17 59 83 7 14 43 86 32 40 48 60 11 19 49 81
GOVT. SCI. SCHOOL
NASARAWA EGGON
11 16 59 84
5 10 45 90
23 29 57 71
20 33 40 67
GSS KAGBU 10 14 60 86 10 20 40 80 22 27 58 73 0 0 60 100
GOVT. GIRLS SEC.
SCHOOL WAMBA
19 28 51 72 9 18 41 82 37 42 45 58 24 41 35 59
GOVT. SEC. SCHOOL
GUDI
11 16 59 85 9 18 4 82 29 37 51 63 13 22 47 78
GSS MAMA
3 5 67 95 0 0 50 100 37 47 43 53 14 24 46 76
MINISTRY OF
EDUCATION AREA
OFFICE(S)
1 3 34 97
6 24 19 76
7 18 33 82
2 6 28 94
-
_
_
-
_
_
-
_
_
-
_
_
-
_
_
-
_
_
-
_
_
-
_
_

Scientific Research Journal (SCIRJ), Volume VI, Issue IX, September 2018 57
ISSN 2201-2796
www.scirj.org
© 2018, Scientific Research Journal
http://dx.doi.org/10.31364/SCIRJ/v6.i9.2018.P0918568
Table 1: Continuation of Agreement Scale on Effect of Free Secondary Schooling
NAME OF SCHOOL/
A.I.O
Enrolment rate School Financial
Sources
Fees Abolition
Benefits
Should the policy be
Sustained
Yes No
No % No %
Yes No
No % No %
Yes No
No % No %
Yes No
No % No %
GSS KAGBU ERROR/ GAJE 14 58 10 42 15 36 27 64 0 0 6 100 0 0 6 100
SPORT ACADEMIC
AKWANGA
24 60 16 40 12 18 58 82 0 0 10 100 0 0 10 100
GOVT. SCI. SCHOOL
ANDAHA
25 78 7 22
20 35 36 65
1 13 7 87
1 13 7 87
GSS UBBE
25 63 15 37 14 20 56 80 0 0 10 100 0 0 10 100
GOVT. SCI. SCHOOL
WAMBA
28 70 12 30 15 22 55 78 0 0 9 100 1 10 9 90
GOVT. SCI. SCHOOL
NASARAWA EGGON
12 35 28 65 17 24 53 76 1 10 10 90 1 20 9 80
GSS KAGBU 29 58 11 42 28 40 42 60 0 0 9 100 0 0 10 100
GOVT. GIRLS SEC. SCHOOL
WAMBA
15 39 23 61 20 29 50 71 1 10 9 90 3 30 7 70
GOVT. SEC. SCHOOL GUDI 26 65 14 35 32 46 38 54 1 10 9 90 1 10 9 90
GSS MAMA
40 100 0 0 9 13 61 87 0 0 10 100 0 0 10 100
MINISTRY OF EDUCATION
AREA OFFICE(S)
11 55 9 45
6 24 29 76
0 0 10 100
0 0 10 100
-
_
_
-
_
_
-
_
_
-
_
_
-
_
_
-
_
_
-
_
_
-
_
_

Scientific Research Journal (SCIRJ), Volume VI, Issue IX, September 2018 58
ISSN 2201-2796
www.scirj.org
© 2018, Scientific Research Journal
http://dx.doi.org/10.31364/SCIRJ/v6.i9.2018.P0918568
Table 2: Average Percentage of Agreement on Effect of Free Secondary Schooling
Average Yes (%) No (%)
Resources Available 25 75
Job Motivation 16 84
Number Of Teacher Available 34 66
Class Performance Of Students 25 75
Enrolment Rate 72 28
School Finances Source 39 61
Fees Abolition Benefits 4 96
Should the Policy be sustained 9 91
Respondents were asked to rate eight supposed effects of free
secondary schooling based on how educational policy was
implemented and sustained in the state. Responses were
measured using Yes or No indicator. Table 1 displays the
pattern of responses for each of the eight areas after fee-free
education came into place. These are resources available, job
motivation Number of Teachers available, class performance of
students, enrolment rate; school finances fee abolition benefits
and sustainability of the policy table 2.
DISCUSSION OF RESULTS
Resources Available: The results of the above finding on the
resources available for embarking on free secondary education
reveals that resources such as enough classroom blocks,
available exercise books for every student; enough chalkboards,
desk, tables and chairs, equipped science laboratories for
practical lessons, available sport facilities for games and regular
supply of stationary to schools are not available for the
implementation of the free secondary education in Nasarawa
State with average percentage of 75% of the population who
responded No: (Table 2). The finding is in agreement with Musa
and Yakubu, 2010) who found out that instructional materials
upon which all teaching and learning process hinge are not
available in most public schools.
Job Motivation: The results on job motivation shows that
secondary school teachers are rarely motivated in the job in
Nasarawa State. An
average of eighty four percent (84%) of the respondents
disagreed that there is promotion of teacher, regular payment of
full salary, workshop training and payment of hazard allowances.
It can be seen from the opinion of the teacher and school
principals that there is no motivation of teachers who are to
implement the policy. The finding is in line with the findings of
(Wiener 2010; Musa and Yakubu, 2010) who found that teachers
are generally not satisfied with the job due to poor pay.
Numbers of Science Teachers Available for the
Implementation of Free Secondary Education Policy
The result obtained, (Table 2) reveal that teacher are not
adequate for the implementation of Free Secondary Education
Policy in Nasarawa State with an average percentage of 66% of
the respondents disagreed. This reveals that teachers are not
adequate, not all the teachers are qualified, and no employment
of teachers and most teachers leave the teaching profession.
The result from the survey agrees with teachers record obtained
from various schools on number of available teachers for the
implementation of the Free Secondary Education in Nasarawa
State (Appendix). For example Government science school
Nasarawa Eggon has a total population of students in 2010 to be
1,596 with 51 teachers. In 2014 when the policy of Free
Secondary education was enacted the students population was
1,663 with 30 teachers. Similarly, GSS Mama with students
population of 236 with total number of 12 teachers at 2010. At
2014 GSS Mama student population raise to 266 with only 7
teacher available to implement the policy see appendix 1 above
on number of teachers available for other schools.
Performance of Science Students under Free Secondary
Education Policy
The result of the finding of whether performance of students has
improve on the implementation of free secondary education
shows an average percentage of 75% of respondents responded
No. This includes paying attention in class, discipline, home
work participation, improvement in test and quiz and analysis
from the students total annual average has not improved in 99%
of the schools investigated. In GSS Kagbu-erroh/Gaje the
response was 50% improvement in performance of students.
Ministry of Education through Area Inspectorate Offices who are
monitors of schools shows 94% performance failure in
supervision. Lack of performance of students under Free
Secondary Education Policy might be attributed to inadequate
qualified teachers, lack of teachers motivation and instructional
materials in schools (Musa, and Yakubu 2010).
Analysis of Science Students Enrolment: The results of
students enrolment increased for most school during the
implementation of Free Secondary Education Policy in 2014 as
shown in Table 2 with an average of 72% increased.
Not all secondary schools in Nasarawa state experienced a
significant rise in enrolment after the implementation of Free –
Secondary education in 2014 to date. Schools like Government
Girls College Wamba, Government Science School Wamba and
Government Science School Nasarawa Eggon experienced a
drop in their students enrolment.
From the result obtained 35% of the respondents disagreed that
there is increase in enrolment of students at Government Girl

Scientific Research Journal (SCIRJ), Volume VI, Issue IX, September 2018 59
ISSN 2201-2796
www.scirj.org
© 2018, Scientific Research Journal
http://dx.doi.org/10.31364/SCIRJ/v6.i9.2018.P0918568
College Wamba and Government Science School Nasarawa
Eggon (Table 1).
The decrease in enrolment of students in these schools could
possibly be because parent, have choice to enroll their children in
government day school within the town so as to reduce their
personal cost since all the schools are free. An average of 72%
respondents that responded, increase in student enrolment,
decreased in student dropout more under privileged children’s
enrolled in schools due to the fact that free secondary education
eliminated the issue of not being able to afford an education
which was the leading cost of dropouts prior to 2014.
Girls Enrolments Rate
There is a serious claim that eliminating school fee has
contributed to higher girls enrolment. Many studies have shown
that fees can burden poor families and deter enrolment and
learning (Ohba, 2009).
In poor and rural areas the work of girls is an important
supplement to household income, thus sending girls to school
poses a threat. Abolishing school fees makes it easier and less
costly for these girls to enroll and leads to a dramatic increase in
the number of children attending school (Oketeh, 2010).
Results of Girls enrolment for this work indicated that girls
enrolment rate in GSS Andaha, Sport Academic, GSS Mama,
GSS Wamba and GSS Kagbu increased dramatically from 2015
– 2016 (See table in Appendix).
School Financial Sources: School financial sources includes,
increase in government funding for schools, government
allocation of learning and teaching materials to school increased,
individual donation to school increased, NGO supporting
schools, increased in community contribution to schools and
increase in PTA projects.
The result obtained, an average of 72%, responded No, disagrees
that no increased in government funding for school, rather
government financial allocation per team is very small and
always reached the principals mostly at the middle of each
school team.
Government allocations of materials to schools are always
inadequate. NGO, supports, community contribution and PTA
projects since implementation of the policy were very poor. This
may be attributed to government inability to bring in the stake
holder in to the policy properly. It was also revealed that PTA
was band from collecting any PTA levy in all the public schools
during the declaration of the Free-Secondary education in
Nasarawa State.
Fees Abolition Benefits: The result in table 1 and 2 shows that
free secondary education has no benefits to secondary education
in Nasarawa State. An average percent of 96% of the
respondents says no benefits ninety percent (90%) of the
respondents, are of the opinion that the policy should be striped
or should not be sustained since the policy led to deteriorating
quality and efficiency of education than improving quality.
Quality of Secondary Education
The increase of enrolment in some schools following the
implementation of free secondary education resulted in further
deterioration of an already over stretched secondary education
system, characterized by poor quality and low internal
efficiency.
All key quality indicators of secondary education worsened after
the enrolment increase for example, number of teacher decreased
as the number of student increases (GSS Andaha, GSS Nasarawa
Eggon, GSS Mama, GSS Kagbu Error/Kaji, GSS Ubbe and GSS
Kagbu). There was no employment of teachers since 2010.
In all the schools with increase in enrolment no class-room was
built to meet up with increase number of students, no desk,
textbooks, no chalks nor instructional materials were supplied to
schools.
The quality of schooling is also said to have deteriorated because
of lack of teachers on declaration of the policy. PTA supporting
staff have to drop teaching because PTA are directed not to
collect any levy from students any longer.
One of the principal during the interview observed that when
school fees were charged, money was available for purchasing
teaching and learning materials.
However, after abolishing fees the money was no longer
available, there was shortage of funds for both teaching and
learning materials in schools and funds for school development
and maintenance. The government has not been able to replace
the lost income in fees. This becomes very difficult for school
principals to maintain the schools.
Majority of the stakeholders interviewed felt that the policy of
abolition of school fee in secondary school has done more harm
to quality than good. Increased accessibility to secondary
education was achieved at the expense of quality. In other words,
there was a quantity – quality trade off when school fees was that
quality was, compromised largely because of the shortage of
teachers, lack of teaching and learning materials, lack of training
of teachers, poor payment of salary and lack of promotion to
motivate teachers since the introduction of the free secondary
education policy.
Principals and teachers also felt that most students lacked
discipline, they did not take school seriously since attendants,
submission of class work most of the school work students do
them at will, because they no longer paid fees.
Teachers reported during interviewed that parents no longer
monitor their children progress in school, as schooling is free.
Interviewed with parent revealed that, since implementation of
the free secondary education and the abolishment of PTA levy,
PTA lost interest in school activities.
All the stakeholders interviewed at the school levels felt that
poor school quality had a disastrous impact on student’s
achievement. The area inspectorate, principals, teachers and PTA
members testify that class performance and achievement levels
were very poor as a result of poor quality schooling. From
questionnaire an average of 75% of the respondents disagreed
that the fees abolish policy improved performance of students
(table 2).
Most of the teachers cried out that the literacy levels among JSS
3 and SS 3 students are very low. A good number of the students
in their final year cannot read and write simple words.
Priorities for Success of Free Secondary Education Policy

Scientific Research Journal (SCIRJ), Volume VI, Issue IX, September 2018 60
ISSN 2201-2796
www.scirj.org
© 2018, Scientific Research Journal
http://dx.doi.org/10.31364/SCIRJ/v6.i9.2018.P0918568
Respondent were asked to report on their schools priorities for
successful implementation of the Free Secondary Education
Policy. Some of the priorities are mention as follows.
i. More building and furnituring of classrooms
ii. Training of more science teachers
iii. Recruiting of science teachers
iv. Provision of science textbooks and other educational
materials/equipment.
v. Provision of science laboratory for science practical class.
vi. Payment of teacher’s promotions increments and other
motivate allowances.
vii. Income generation to support school finance.
viii. Discipline and safety.
ix. Provision of equipped science laboratory for practical.
Conclusion Free Secondary Education in Nasarawa State was announced as a
political slogan. January, 2014 it was implemented without much
prior planning for results and implications or provisional support
for schools. The program was introduced as part of wide reforms
to promote and improved accessibility and equality of countless
Nasarawa State children into Secondary School.
Free Secondary Schooling has allowed poor children more
access to equitable education. It has increased enrolment by
attracting more children to school. The poor implementation of
free secondary schooling in Nasarawa State may be attributed to
various factors, including, inadequacy of teaching and learning
facilities, lack of job motivation, lack of qualified teachers poor
grants allocation to schools and lack of partnership with other
stakeholders e.g local communities, PTA and NGOs. The
success of free secondary schooling can only be guaranteed
accordant to the following findings if teaching and learning
Resources are provided, trained teachers are employ and
motivated, disbursement to schools are divorced from political
consideration and manipulations, and developed measures of
partnerships with other stakeholders. Since government cannot
implement the programme or policy alone, it should provide an
institutional frame work for others to participate in the program
as a key to the program’s sustainability. If not, most of the
stakeholders are of opinions that the progamme should be scrap
because it has worsened the quality and efficiency of secondary
schooling than improvement.
Recommendation
- Political Commitment and good will are critical to the
successful implementation of Free Secondary Education
Programme: The governors, commissioners, Members of
House of Assembly and Permanent Secretary have to be
seriously committed, presently there is no serious
commitment from government that will make this
programme successful.
- Need for capacity building: Capacity building should
include organized sensitization/workshop training of
teachers and school principals on how to manage resources
supply to schools by the government and other agencies for
successful implementation of the Free Secondary Education
Programme is very important.
- Reassurance and Confidence building: Government
should develop measures of reassuring and building
confidence among parents, teachers that Free Secondary
Education Policy has come to stay in the state. This will
prevent them from giving up under extreme pressure.
- The Roles and Responsibilities of Different Stakeholder:
There is need to organized stakeholder meetings and defines
their roles and responsibility for successful implementation
of the policy. For example the removal of P.T.A from the
Free Secondary Education Policy is not healthy for the
success of the programme in the state. Continuous dialogue
with stakeholders such as parents, local communities to
inform them on their roles will help the policy to be
sustained. Presently there is a serious misconception by
Parent and local communities that government promised to
supply everything free without need of help or contribution
from PTA and others.
- Upward review of grants (money) giving to schools
principals every school term to meet up with rising inflation
rate will help sustain the programme the grand should reflect
for the term.
- There is need to eliminate the bureaucracy in the
disbursement of Free Secondary Education Resources
Facilities. Particularly the funds should be disbursed directly
to the schools to remove the middleman leakage.
- Partnership at every level of implementation is vital for the
successful implementation of the program. The involvement
of all stakeholders, including Parent, teachers, local
communities and NGOs will help.
- Government should rewards schools that achieved desires
results it will helps to reinforce goals and standards.
- Government should put serious measures to improve and
maintain standard of equality under free secondary
schooling.
ACKNOWLEDGEMENT Our special thanks goes to TETfund for providing funds
needed for this research work. We will like to acknowledge
the Ministry of Education Nasarawa State for being
accessible and accommodating during our research period
and for giving us the background and advice we needed to
fully understand and execute this project.
Finally we would like to thank College of Education
Akwanga, Provost (Mrs Rebecca I. Umaru (Ph.D) and the
entire Management Staff for the opportunity giving to us to
carry out this research project.
REFERENCES
Al-Samarrai, S. Hassan Z. (2000) abolishing School Fees in
Malawi: The impact on Education Access and Equity.
Washington Dc; World Bank.
Alubisia, A. (2005) Universal Primary Education Myth or reality:
A re-view of experiences, challenges and lessons from
East Africa, London England Oxfam GB.

Scientific Research Journal (SCIRJ), Volume VI, Issue IX, September 2018 61
ISSN 2201-2796
www.scirj.org
© 2018, Scientific Research Journal
http://dx.doi.org/10.31364/SCIRJ/v6.i9.2018.P0918568
Amaele, S. Free Education in Nigeria: Reality and Implication.
Department of Education University of Ilorin, Nigeria.
P. 1-5
Bennell P. and Akyeampong K. (2007) teaching Motivation and
incentives in Sub-Saharan African and South Asia
(Researching the Issue, 71) London UK: Department of
International Development 12 pages.
Benta, A.; Kassahun, M., Elijah O., and Oketch M.O (2015) free
Primary Education and Implementation in Kenya the
Role of Primary School Teachers in Addressing the
Policy Gap. P. 1-6
Bentaouuett, R. (2006) “School Fees”. Background Paper
Prepared for the education for all Global Monitoring
Report. Literacy for life 2006 From: Oxford: Oxford
University Press. Retrieved 10 February, 2009.
Boyles, S., Brock, Mace, J. Sibbons, M (2002) Reaching the
poor: the costs of spending children to school. A six
country comparative study Education Research Report,
47. London: UK Department for International
Development.
Bruns B., Mingat A., and Rakotomalala R. (2003) Achieving
Universal Primary Education by 2015; A Chance for
Every Child. Washington, D.C; Work Bank.
Bruns S, B., Mingat A. and Rakotomalala 2003 Achieving
Universal, primary Education by 2015 A chance for
every chil. Washington, DC World Bank. Government
of Mozambique, 2001Action plan for the Reduction of
Absolute Poverty 2001 – 5 Maputo.
Chibuzor, T. (2013). Free Education the Politics of Free
Education in Nigeria www.articlesng.com Free
Education page 1 – 9.
Coombs, P. (1968). The World Educational Crisis A Systematic
Analysis. London Oxford University Press.
Haddad W. D., and Demsky, T., (1995) Education Policy –
planning Process: An applied frame work Paris, France:
UNESCO/IIEP.
Kenya Disputs UNESCO Report on Education Programme. “BBC
Monitoring International Reports (Nov. 19, 2015).
Academic One File. Gale. Middlebury College,
Middlebury, VT. 18 April, 2009.
http://find.galegroup.comezproxy.middlebury.edu/itx/star
t.do?prodId=AONE
Kenya: more Teachers Needed to Meet Universal Primary
Education Goal-UN.BBC Monitoring International
Reports (April 27, 2006). Academic OneFile. Gale.
Middlebury College, Middlebury, VT. 18 April, 2009)
http://find.galegroup.comezproxy.middlebury.edu/itx/star
t.do?prodId=AONE
Musa W. O., (2012) Necessity of laboratory Experiment in
Chemistry Education Akwanga Journal of Science
Education. A publication of Sciences C.O.E Akwanga 2nd
Edition pg. 114-119
Musa, W.O.; Yakubu A. N. (2010) Motivation of Science
Teachers. A Major Instrument for Creativity and
Resourcefulness: Akwanga Journal of Science –
Education 2nd
Edition pg. 106-1-113
Nasarawa State Ministry of Education (Research Unity) Lafia,
Nasarawa State Nigeria (March, 2017).
Ohba A., (2009) Does free secondary education enable the poor to
gain access? A study from rural Kenya (Create Path
Ways to Access, Research Monograph No. 21)
Oketch M., Mutisya M., Ngware M., and Ezah a.C (2010) why
are the proportionately more pupils enrolled in non-state
schools in urban Kenya in spite of FPE policy?
International Journal of Educational Development, 30,
23 – 32
Plank, D (2007). School Fees and Education for all: is abolition
the answer? Equip 2 project working paper. Academy for
Education Development. Washington DC: USAID
Richard Akinwumi (2014) FAAC Report – Allocation to States
and Local Government Area December 2013, shared in
January 2014. Premium Times August 27, 2018.
Sifuna, Daniel N. (2007). The Challenges of increasing Access
and improving Quality; An analysis of Universal Primary
Education Interventions in Kenya and Tanzania since
1970s. International Review of Education 53: 687-699.
Sola, Oyietakin and Sopeyin et al, (2010), Managing Free
Education in Partially Derequalated Economy. Vol. 4 (1)
9-13
UNESCO (2007) EFA Global Monitoring Report 2008. Education
for all by 2015: will we make it? Oxford: Oxford
University Press.
United Nations. United Nations Education, Scientific and Cultural
Organization. Challenges of Implementing Free primary
Education in Kenya (2005) UNESCO Japanese Funds –
in Trust for capacity – Building of Human Resources 8
may 2009.
Wiener B. (2010). The Development of an Attribution Based
Theory of Motivation; A History of Ideas Education
Psychologist, 45, 28-36.
World Bank (2009) Abolishing School Fees in Africa (2009)
Lessons from Ethiopia, Ghana, Kenya, Malawi and

Scientific Research Journal (SCIRJ), Volume VI, Issue IX, September 2018 62
ISSN 2201-2796
www.scirj.org
© 2018, Scientific Research Journal
http://dx.doi.org/10.31364/SCIRJ/v6.i9.2018.P0918568
Mozambique. A publication of the world Bank in
Collaboration with UNICEF. 238 pages.
Authors Profile:
1Williams Musa Ombugus received his M.Sc. in Anal.
Chemistry June 2015, PGD in Education in 2010 and currently
undergoing Ph.D in Chemistry from Federal University of
Agriculture, Makurdi, Nigeria. His first Appointment as teacher
of Science with Nasarawa State Ministry of Education in
2001/2004 and later join College of Education Akwanga as a
classroom teacher with Demonstration Secondary School,
College of Education Akwanga. His currently a Part time
Lecturer with Chemistry Department College of Education
Akwanga.
2Nathaniel Yakubu received his M.Sc. in Environmental
Chemistry from Federal University of Agriculture Makurdi. His
taught Chemistry in Public secondary school from 2001/2004
and now working with College of Education Akwanga as a
teacher with Demonstration Secondary School College of
Education Akwanga.
3Godwin Ashiki Masin received his first and Second degree in
Geography from Ahmadu Bello University Zaria in 1985 and
2016. He taught in Nasarawa State public secondary school from
1987/2000 and later join College of Education Akwanga as a
lecturer in Geography Department were his current work.
4Agabi, Jacob Yakuku is a Trained Teacher to the fullest. He
has the following GRII, NCE, BA.ED & M.ED from the
University of Jos. He has written many academic papers
including international ones. He is currently the college
examination officer.

Scientific Research Journal (SCIRJ), Volume VI, Issue IX, September 2018 63
ISSN 2201-2796
63
Appendix I

Scientific Research Journal (SCIRJ), Volume VI, Issue IX, September 2018 64
ISSN 2201-2796
64
Appendix II
Appendix III
Scientific Research Journal (SCIRJ), Volume VI, Issue IX, September 2018 65
ISSN 2201-2796
65
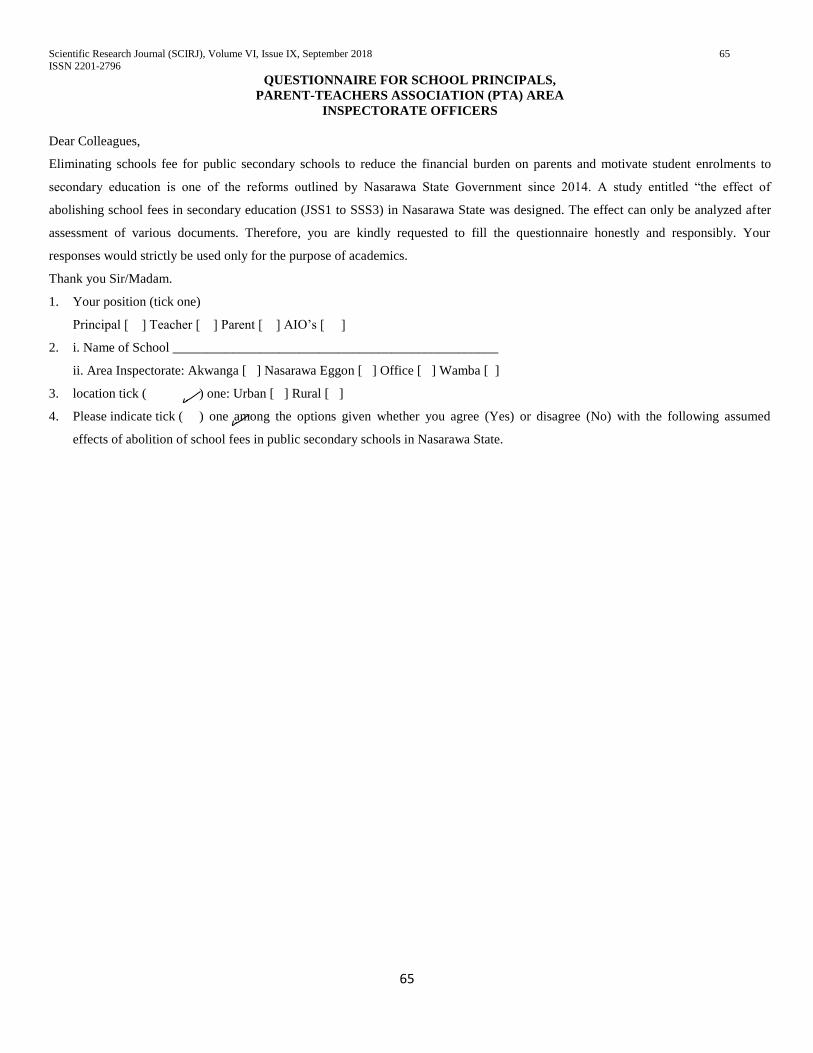
QUESTIONNAIRE FOR SCHOOL PRINCIPALS,
PARENT-TEACHERS ASSOCIATION (PTA) AREA
INSPECTORATE OFFICERS
Dear Colleagues,
Eliminating schools fee for public secondary schools to reduce the financial burden on parents and motivate student enrolments to
secondary education is one of the reforms outlined by Nasarawa State Government since 2014. A study entitled “the effect of
abolishing school fees in secondary education (JSS1 to SSS3) in Nasarawa State was designed. The effect can only be analyzed after
assessment of various documents. Therefore, you are kindly requested to fill the questionnaire honestly and responsibly. Your
responses would strictly be used only for the purpose of academics.
Thank you Sir/Madam.
1. Your position (tick one)
Principal [ ] Teacher [ ] Parent [ ] AIO’s [ ]
2. i. Name of School _________________________________________________
ii. Area Inspectorate: Akwanga [ ] Nasarawa Eggon [ ] Office [ ] Wamba [ ]
3. location tick ( ) one: Urban [ ] Rural [ ]
4. Please indicate tick ( ) one among the options given whether you agree (Yes) or disagree (No) with the following assumed
effects of abolition of school fees in public secondary schools in Nasarawa State.

Scientific Research Journal (SCIRJ), Volume VI, Issue IX, September 2018 66
ISSN 2201-2796
66
Appendix IV
Research Question 1
What are the resources available for embarking on free secondary education?
Table 1: Resources Available
S/N Teaching/Learning Material Yes No
1.1 Enough class rooms blocks/staff room
1.2 Available Library block with relevant textbooks and other reference materials
1.3 Available exercise books for every student
1.4 Enough chalkboards, Desks, tables and Chairs
1.5 Equipped Laboratories for science practical lessons
1.6 Availability of sport facilities for games and recreation
1.7 Regular supply of stationary to schools
Research Question 2
What is the extent of secondary school teachers Job motivation?
Table 2: Job Motivation
S/N Motivation Level Yes No
2.1 Regular payment of science teachers salaries
2.2 Regular promotion of teachers
2.3 Payment of hazard allowances to science teachers
2.4 In-service trainings for secondary school teachers
2.5 Payment of professional allowances

Scientific Research Journal (SCIRJ), Volume VI, Issue IX, September 2018 67
ISSN 2201-2796
67
Appendix V
Research Question 3
What number of teachers are available for the implementation of free-secondary school education policy?
Table 3: Teachers
S/N Items description Yes No
3.1 Are science teachers adequate for free secondary education policy?
3.2 Are all the secondary school teachers qualified?
3.3 Do science teachers opt out of teaching for other profession?
3.4 Are all the science teachers permanent and pensionable?
3.5 Do science teachers conduct their lessons/practical every day?
3.6 Is there enough teacher–student individual attention?
3.7 Are there untrained teachers in your school?
3.8 Was there employment of science teachers since 2014?
Research Question 4
What are the performances of students under free secondary education policy?
Table 4: Students
S/N Student Performance Yes No
4.1 Do students pay attention in class compare to before 2014?
4.2 Has discipline increased in the school since 2014?
4.3 Are students really doing their homework as expected?
4.4 Are students, being punished for not turning in home work?
4.5 Have students’ test and quiz scores improved since school fees abolition?
4.6 Have students’ annual average improved?
Scientific Research Journal (SCIRJ), Volume VI, Issue IX, September 2018 68
ISSN 2201-2796
68
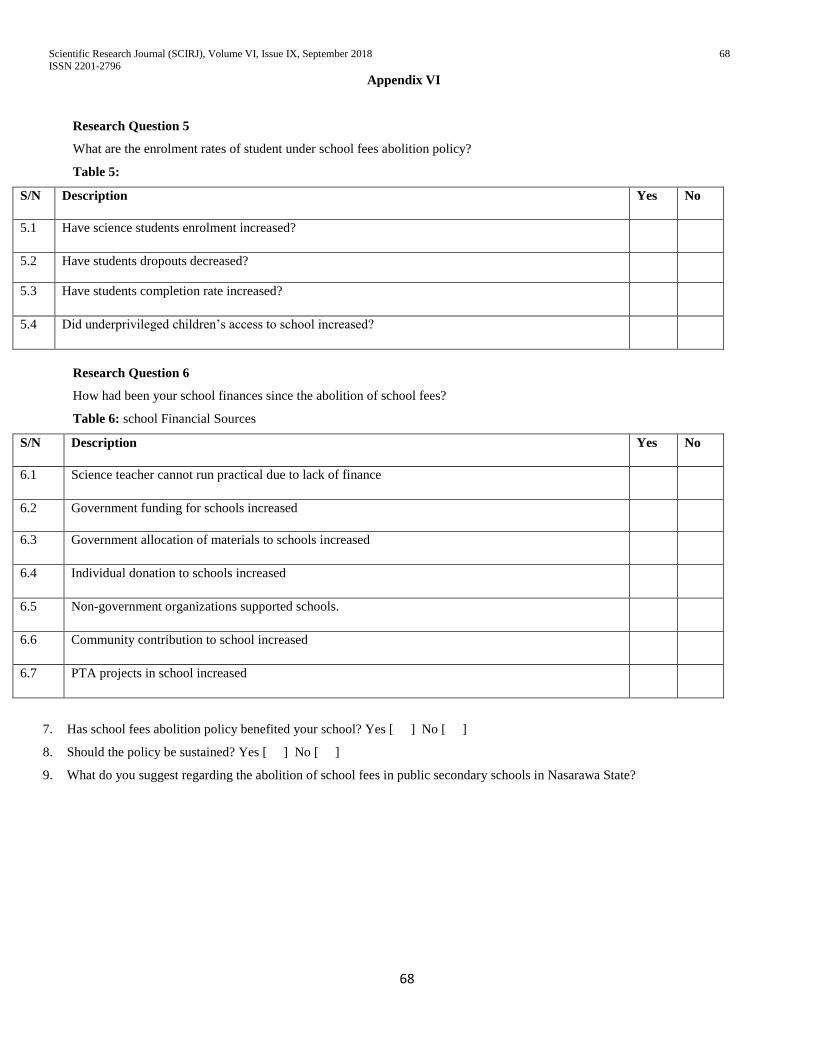
Appendix VI
Research Question 5
What are the enrolment rates of student under school fees abolition policy?
Table 5:
S/N Description Yes No
5.1 Have science students enrolment increased?
5.2 Have students dropouts decreased?
5.3 Have students completion rate increased?
5.4 Did underprivileged children’s access to school increased?
Research Question 6
How had been your school finances since the abolition of school fees?
Table 6: school Financial Sources
S/N Description Yes No
6.1 Science teacher cannot run practical due to lack of finance
6.2 Government funding for schools increased
6.3 Government allocation of materials to schools increased
6.4 Individual donation to schools increased
6.5 Non-government organizations supported schools.
6.6 Community contribution to school increased
6.7 PTA projects in school increased
7. Has school fees abolition policy benefited your school? Yes [ ] No [ ]
8. Should the policy be sustained? Yes [ ] No [ ]
9. What do you suggest regarding the abolition of school fees in public secondary schools in Nasarawa State?

Scientific Research Journal (SCIRJ), Volume VI, Issue IX, September 2018 69
ISSN 2201-2796
69
Appendix VII
Research
School level information checklist
Name of the school____________________________________________
Number of science teachers Number of classroom
Year Male Female Total Year Total
2010 2010/2011
2011 2012/2013
2012/2013 2014/2015
2014/2015 2016
2016
Class Years
Class 2010 2011 2012 2013 2014 2015 2016
M F T M F T M F T M F T M F T M F T M F T
JSS 1 35 23 58 35 23 58 35 23 58 35 23 58 34 23 57 34 23 57 39 25
JSS 2 38 31 69 38 31 69 38 31 69 38 31 69 38 31 69 38 31 69 38 31 69
JSS 3 68 53 121 68 53 121 68 53 121 68 53 121 68 53 121 68 53 121 68 53 121
SSS 1 39 26 65 39 26 65 39 26 65 39 26 65 39 26 65 39 26 65 39 26 65
SSS 2 56 45 101 58 45 103 58 45 102 58 45 107 58 45 103 58 45 103 58 45 103
SSS 3 71 69 140 71 69 140 71 69 140 71 69 140 71 69 140 71 69 140 71 69 140
Total 307 247 554 30
7
24
7
554 307 247 554 306 249 553 306 247 553 306 24
7
553 36
6
247 553
Key: M = Male, F = Female, T = Total
Government Secondary school Kagbu

Scientific Research Journal (SCIRJ), Volume VI, Issue IX, September 2018 70
ISSN 2201-2796
70
Appendix VIII
Class Years
Class 2010 2011 2012 2013 2014 2015 2016
M F T M F T M F T M F T M F T M F T M F T
JSS 1
JSS 2
JSS 3
SSS 1 71 57 128 129 134 134 93 70 163 39 39 78 15 17 32 78 73 151 81 53 134
SSS 2 54 35 89 46 44 90 102 91 193 99 82 181 28 25 53 82 57 139 88 72 160
SSS 3 65 60 125 67 94 161 74 56 130 88 130 218 63 52 115 89 81 170 75 69 144
Total 190 152 342 242 272 514 269 217 486 226 251 477 106 94 200 249 211 460 24
4
194 438
Class Years
Class 2010 2011 2012 2013 2014 2015 2016
M F T M F T M F T M F T M F T M F T M F T
JSS 1 40 35 75 51 49 100 55 33 88 79 64 143 65 46 111 75 60 135 12 8 20
JSS 2 46 37 83 41 38 79 40 50 90 56 53 109 55 50 105 56 57 113 56 69 135
JSS 3 56 36 92 51 29 80 45 65 110 62 40 102 56 55 112 59 59 118 53 80 133
SSS 1
SSS 2
SSS 3
Total
Scientific Research Journal (SCIRJ), Volume VI, Issue IX, September 2018 71
ISSN 2201-2796
71
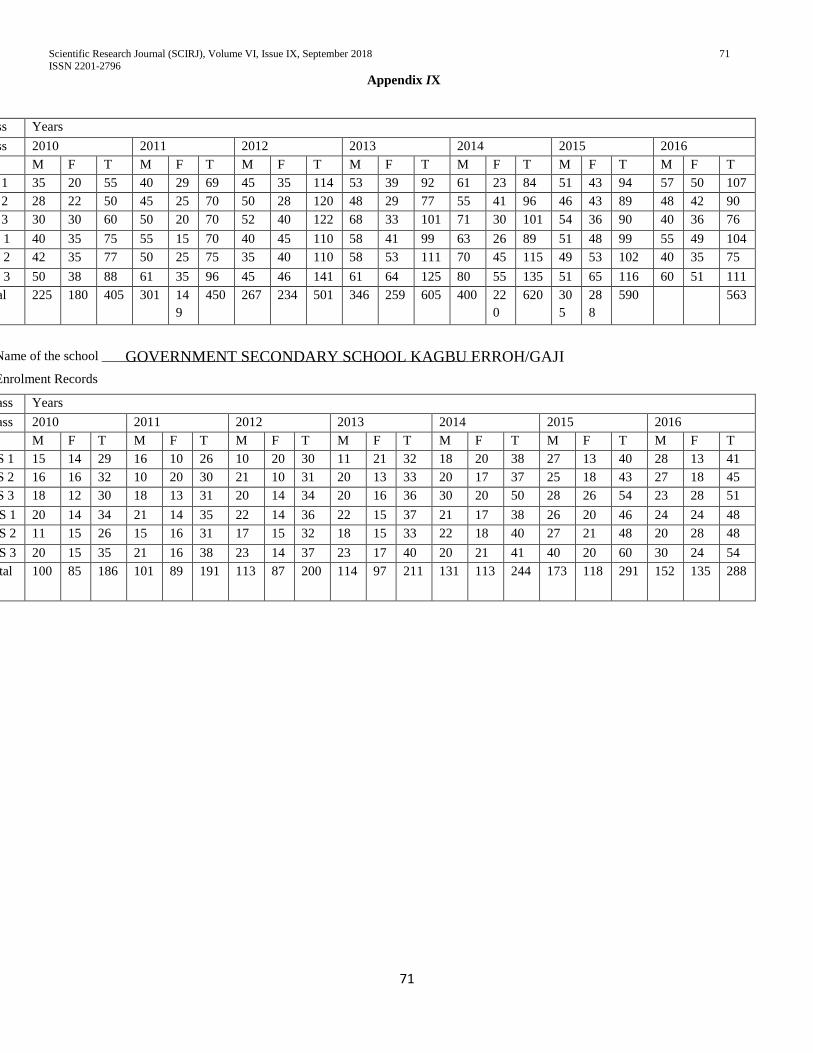
Appendix IX
Class Years
Class 2010 2011 2012 2013 2014 2015 2016
M F T M F T M F T M F T M F T M F T M F T
JSS 1 35 20 55 40 29 69 45 35 114 53 39 92 61 23 84 51 43 94 57 50 107
JSS 2 28 22 50 45 25 70 50 28 120 48 29 77 55 41 96 46 43 89 48 42 90
JSS 3 30 30 60 50 20 70 52 40 122 68 33 101 71 30 101 54 36 90 40 36 76
SSS 1 40 35 75 55 15 70 40 45 110 58 41 99 63 26 89 51 48 99 55 49 104
SSS 2 42 35 77 50 25 75 35 40 110 58 53 111 70 45 115 49 53 102 40 35 75
SSS 3 50 38 88 61 35 96 45 46 141 61 64 125 80 55 135 51 65 116 60 51 111
Total 225 180 405 301 14
9
450 267 234 501 346 259 605 400 22
0
620 30
5
28
8
590 563
Name of the school ________________________________________________________
Enrolment Records
Class Years
Class 2010 2011 2012 2013 2014 2015 2016
M F T M F T M F T M F T M F T M F T M F T
JSS 1 15 14 29 16 10 26 10 20 30 11 21 32 18 20 38 27 13 40 28 13 41
JSS 2 16 16 32 10 20 30 21 10 31 20 13 33 20 17 37 25 18 43 27 18 45
JSS 3 18 12 30 18 13 31 20 14 34 20 16 36 30 20 50 28 26 54 23 28 51
SSS 1 20 14 34 21 14 35 22 14 36 22 15 37 21 17 38 26 20 46 24 24 48
SSS 2 11 15 26 15 16 31 17 15 32 18 15 33 22 18 40 27 21 48 20 28 48
SSS 3 20 15 35 21 16 38 23 14 37 23 17 40 20 21 41 40 20 60 30 24 54
Total 100 85 186 101 89 191 113 87 200 114 97 211 131 113 244 173 118 291 152 135 288
GOVERNMENT SECONDARY SCHOOL KAGBU ERROH/GAJI

Scientific Research Journal (SCIRJ), Volume VI, Issue IX, September 2018 72
ISSN 2201-2796
72
Appendix X
Name of the school _________________________________________________________
Enrolment Records
Class Years
Class 2010 2011 2012 2013 2014 2015 2016
M F T M F T M F T M F T M F T M F T M F T
JSS 1 60 45 105 45 51 96 42 59 101 42 60 102 42 34 76 35 35 70 50 75 125
JSS 2 50 50 100 51 55 106 41 55 96 51 58 109 33 40 73 59 49 108 65 42 107
JSS 3 67 58 125 50 56 106 54 65 119 50 60 110 43 30 73 51 60 111 62 55 117
SSS 1 83 72 155 73 75 148 63 57 120 65 56 121 61 42 103 67 65 132 60 52 112
SSS 2 75 61 136 75 80 155 70 73 143 81 75 156 76 58 134 78 72 150 82 73 155
SSS 3 91 85 176 85 90 170 81 80 161 78 83 161 83 34 117 65 57 122 95 72 167
Total 426 371 497 379 40
7
786 351 388 739 36
7
39
2
759 338 230 442 355 38
8
693 41
4
36
9
783
Name of the school__________________________________________________________________
Enrolment Records
Class Years
Class 2010 2011 2012 2013 2014 2015 2016
M F T M F T M F T M F T M F T M F T M F T
JSS 1 140 110 250 124 106 230 301 93 394 130 110 240 135 116 241 80 50 130 101 62 163
JSS 2 132 122 154 180 130 310 280 107 387 120 103 223 185 141 32 101 65 167 92 42 134
JSS 3 110 92 202 105 80 185 200 116 316 108 103 211 115 83 208 163 62 165 90 55 145
SSS 1 300 150 450 200 117 317 220 180 400 112 100 212 242 155 397 102 68 170 109 67 176
SSS 2 158 102 210 160 92 252 190 105 295 115 92 207 158 102 266 100 70 170 90 55 145
SSS 3 100 80 160 155 85 240 201 94 295 106 84 190 119 109 238 108 86 194 105 72 177
Total 940 656 159
6
924 610 153
4
127
2
695 178
7
691 391 148
2
954 706 166
3
699 297 99
6
904
Appendix XI
Name of the school______________________________________________________
Enrolment Records
Class Years
Class 2010 2011 2012 2013 2014 2015 2016
M F T M F T M F T M F T M F T M F T M F T
JSS 1 40 10 50 63 33 96 53 25 78 56 49 105 52 41 93 41 38 79 55 46 101
JSS 2 35 20 55 58 14 72 57 31 88 66 58 124 59 25 84 37 30 67 56 41 97
JSS 3 25 21 46 43 18 61 67 13 80 63 51 114 48 34 82 38 29 67 45 40 85
SSS 1 48 22 70 59 37 96 82 48 130 54 46 100 51 35 86 59 44 10
3
66 53 119
SSS 2 22 13 35 68 47 115 43 39 82 82 33 115 49 45 94 70 67 13
7
63 43 106
SSS 3 128 113 241 11
5
96 211 102 87 189 98 89 187 88 79 167 87 75 16
2
84 79 163
GOVERNMENT SCIENCE SECONDARY SCHOOL ANDAHA
GOVERNMENTSCIENCE SECONDARY SCHOOL NASARAWA EGGON
GOVERNMENT SCIENCE SECONDARY SCHOOL WAMBA

Scientific Research Journal (SCIRJ), Volume VI, Issue IX, September 2018 73
ISSN 2201-2796
73
Total 298 198 497 40
6
245 651 404 243 647 419 326 745 347 259 606 332 215 59
7
36
9
21
5
584
Name of the school_________________________________________
Enrolment Records
Class Years
Class 2010 2011 2012 2013 2014 2015 2016
M F T M F T M F F T M F T M F T M F T
JSS 1 200 218 240 183 113 102 60
JSS 2 210 200 198 166 126 80 111
JSS 3 200 195 192 152 130 121 107
SSS 1 220 200 210 113 150 112 52
SSS 2 240 180 197 200 160 110 83
SSS 3 260 213 205 202 160 162 104
Total 1330 1206 1242 1016 839 687 517
Appendix XII
Name of the school_____________________________________________
Enrolment Records
Class Years
Class 2010 2011 2012 2013 2014 2015 2016
M F T M F T M F T M F T M F T M F T M F T
JSS 1 14 8 22 14 11 25 15 6 21 20 8 28 22 23 45 33 15 48 27 16 43
JSS 2 18 8 26 13 9 22 14 10 24 13 12 25 20 22 42 27 17 44 27 18 45
JSS 3 18 15 33 14 11 25 14 9 23 14 8 22 23 8 31 18 20 38 28 18 46
SSS 1 14 6 20 9 10 19 14 7 21 11 9 20 23 10 33 22 17 39 23 15 38
SSS 2 15 16 31 32 24 66 17 13 30 16 8 24 22 14 36 23 15 38 29 19 48
SSS 3 58 46 104 42 27 69 46 29 75 48 23 71 54 25 79 46 49 95 59 30 89
Total 13
7
99 236 124 92 226 120 74 194 122 68 190 164 102 266 169 133 302 193 116 309
GOVERNMENT GIRL’S COLLEGE WAMBA
GOVERNMENT SECONDARY SCHOOL MAMA

Scientific Research Journal (SCIRJ), Volume VI, Issue IX, September 2018 74
ISSN 2201-2796
74
Appendix XIII
Teachers Records and Number of Available Classrooms
Government Secondary School Kagbu
Number of teachers Number of classroom
Year Male Female Total Year Total
2010 14 02 16 2010/2011 15
2011 14 02 16 2012/2013 15
2012/2013 16 Nil 16 2014/2015 15
2014/2015 16 Nil 16 2016 15
2016 16 Nil 16
Government Junior Secondary School Ubbe
Number of teachers Number of classroom
Year Male Female Total Year Total
2010 10 12 22 2010/2011 6
2011 10 12 22 2012/2013 6
2012/2013 20 18 38 2014/2015 6
2014/2015 18 18 36 2016 6
2016 6 9 15
Government Secondary School Ubbe
Number of teachers Number of classroom
Year Male Female Total Year Total
2010 20 11 31 2010/2011 10
2011 25 9 34 2012/2013 10
2012/2013 25 9 34 2014/2015 10
2014/2015 25 9 34 2016 10
2016 34 11 45

Scientific Research Journal (SCIRJ), Volume VI, Issue IX, September 2018 75
ISSN 2201-2796
75
Appendix XIV
Nasarawa State Sport Academy Akwanga
Number of teachers Number of classroom
Year Male Female Total Year Total
2010 26 18 44 2010/2011 6
2011 25 17 42 2012/2013 7
2012/2013 27 21 48 2014/2015 7
2014/2015 32 21 53 2016 7
2016 32 21 53
Government Secondary School Kagbu Erroh/Gaji
Number of teachers Number of classroom
Year Male Female Total Year Total
2010 19 5 24 2010/2011 6
2011 19 5 24 2012/2013 6
2012/2013 17 3 20 2014/2015 6
2014/2015 17 4 21 2016 6
2016 18 4 22
Government Science Secondary School Andaha
Number of teachers Number of classroom
Year Male Female Total Year Total
2010 41 6 47 2010/2011 12
2011 40 5 45 2012/2013 14
2012/2013 35 5 40 2014/2015 17
2014/2015 30 5 35 2016 17
2016 30 5 35
Appendix XV
Government Science Secondary School Nasarawa Eggon
Number of teachers Number of classroom
Year Male Female Total Year Total
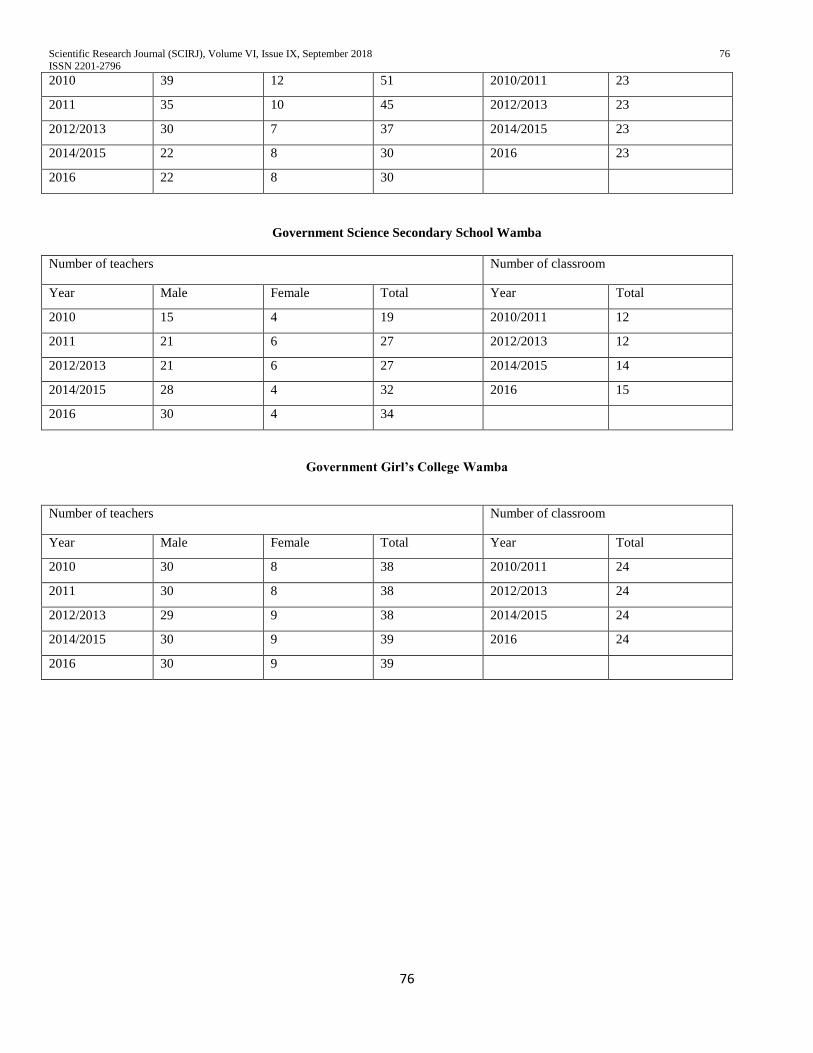
Scientific Research Journal (SCIRJ), Volume VI, Issue IX, September 2018 76
ISSN 2201-2796
76
2010 39 12 51 2010/2011 23
2011 35 10 45 2012/2013 23
2012/2013 30 7 37 2014/2015 23
2014/2015 22 8 30 2016 23
2016 22 8 30
Government Science Secondary School Wamba
Number of teachers Number of classroom
Year Male Female Total Year Total
2010 15 4 19 2010/2011 12
2011 21 6 27 2012/2013 12
2012/2013 21 6 27 2014/2015 14
2014/2015 28 4 32 2016 15
2016 30 4 34
Government Girl’s College Wamba
Number of teachers Number of classroom
Year Male Female Total Year Total
2010 30 8 38 2010/2011 24
2011 30 8 38 2012/2013 24
2012/2013 29 9 38 2014/2015 24
2014/2015 30 9 39 2016 24
2016 30 9 39

Scientific Research Journal (SCIRJ), Volume VI, Issue IX, September 2018 77
ISSN 2201-2796
77
Appendix XVI
Government Secondary School Mama
Number of teachers Number of classroom
Year Male Female Total Year Total
2010 10 2 12 2010/2011 5
2011 10 2 12 2012/2013 5
2012/2013 8 2 10 2014/2015 5
2014/2015 6 1 7 2016 5
2016 6 1 7