Effect of Pullet Vaccination on Development and Longevity of ...
18
viruses Article Effect of Pullet Vaccination on Development and Longevity of Immunity Emily J. Aston 1 , Brian J. Jordan 1,2 , Susan M. Williams 1 , Maricarmen García 1 and Mark W. Jackwood 1, * 1 Poultry Diagnostic and Research Center, Department of Population Health, College of Veterinary Medicine, University of Georgia, Athens, GA 30602, USA; [email protected] (E.J.A.); [email protected] (B.J.J.); [email protected] (S.M.W.); [email protected] (M.G.) 2 Department of Poultry Science, College of Agricultural and Environmental Sciences, University of Georgia, Athens, GA 30602, USA * Correspondence: [email protected]; Tel.: +1-706-542-5475 Received: 9 January 2019; Accepted: 30 January 2019; Published: 2 February 2019 Abstract: Avian respiratory disease causes significant economic losses in commercial poultry. Because of the need to protect long-lived poultry against respiratory tract pathogens from an early age, vaccination programs for pullets typically involve serial administration of a variety of vaccines, including infectious bronchitis virus (IBV), Newcastle disease virus (NDV), and infectious laryngotracheitis virus (ILTV). Often the interval between vaccinations is only a matter of weeks, yet it is unknown whether the development of immunity and protection against challenge when vaccines are given in short succession occurs in these birds, something known as viral interference. Our objective was to determine whether serially administered, live attenuated vaccines against IBV, NDV, and ILTV influence the development and longevity of immunity and protection against challenge in long-lived birds. Based on a typical pullet vaccination program, specific-pathogen-free white leghorns were administered multiple live attenuated vaccines against IBV, NDV, and ILTV until 16 weeks of age (WOA), after which certain groups were challenged with IBV, NDV, or ILTV at 20, 24, 28, 32, and 36 WOA. Five days post-challenge, viral load, clinical signs, ciliostasis, tracheal histopathology, and antibody titers in serum and tears were evaluated. We demonstrate that pullets serially administered live attenuated vaccines against IBV, NDV, and ILTV were protected against homologous challenge with IBV, NDV, or ILTV for at least 36 weeks, and conclude that the interval between vaccinations used in this study (at least 2 weeks) did not interfere with protection. This information is important because it shows that a typical pullet vaccination program consisting of serially administered live attenuated vaccines against multiple respiratory pathogens can result in the development of protective immunity against each disease agent. Keywords: Infectious bronchitis virus; Newcastle disease virus; infectious laryngotracheitis virus; vaccination program; immunity; respiratory disease; ciliostasis; antibody response 1. Introduction Vaccination against respiratory viral disease is standard practice in commercial poultry operations. Both live and killed vaccines are administered to poultry, and live vaccines are commonly used for a variety of pathogens because they are effective when mass applied and are relatively economical [1]. In general, live vaccines induce local and cell-mediated immunity and provide a broader protective response than killed vaccines, whereas killed vaccines primarily induce humoral immunity and tend to be antigen-specific. The duration of immunity achieved following live vaccine administration depends on the age and type of bird, levels of maternal immunity, disease targeted by the vaccine, Viruses 2019, 11, 135; doi:10.3390/v11020135 www.mdpi.com/journal/viruses
-
Upload
khangminh22 -
Category
Documents
-
view
3 -
download
0
Transcript of Effect of Pullet Vaccination on Development and Longevity of ...
viruses
Article
Effect of Pullet Vaccination on Development andLongevity of Immunity
Emily J. Aston 1 , Brian J. Jordan 1,2, Susan M. Williams 1, Maricarmen García 1
and Mark W. Jackwood 1,*1 Poultry Diagnostic and Research Center, Department of Population Health, College of Veterinary Medicine,
University of Georgia, Athens, GA 30602, USA; [email protected] (E.J.A.); [email protected] (B.J.J.);[email protected] (S.M.W.); [email protected] (M.G.)
2 Department of Poultry Science, College of Agricultural and Environmental Sciences, University of Georgia,Athens, GA 30602, USA
* Correspondence: [email protected]; Tel.: +1-706-542-5475
Received: 9 January 2019; Accepted: 30 January 2019; Published: 2 February 2019�����������������
Abstract: Avian respiratory disease causes significant economic losses in commercial poultry.Because of the need to protect long-lived poultry against respiratory tract pathogens from anearly age, vaccination programs for pullets typically involve serial administration of a variety ofvaccines, including infectious bronchitis virus (IBV), Newcastle disease virus (NDV), and infectiouslaryngotracheitis virus (ILTV). Often the interval between vaccinations is only a matter of weeks,yet it is unknown whether the development of immunity and protection against challenge whenvaccines are given in short succession occurs in these birds, something known as viral interference.Our objective was to determine whether serially administered, live attenuated vaccines againstIBV, NDV, and ILTV influence the development and longevity of immunity and protection againstchallenge in long-lived birds. Based on a typical pullet vaccination program, specific-pathogen-freewhite leghorns were administered multiple live attenuated vaccines against IBV, NDV, and ILTV until16 weeks of age (WOA), after which certain groups were challenged with IBV, NDV, or ILTV at 20,24, 28, 32, and 36 WOA. Five days post-challenge, viral load, clinical signs, ciliostasis, trachealhistopathology, and antibody titers in serum and tears were evaluated. We demonstrate thatpullets serially administered live attenuated vaccines against IBV, NDV, and ILTV were protectedagainst homologous challenge with IBV, NDV, or ILTV for at least 36 weeks, and conclude that theinterval between vaccinations used in this study (at least 2 weeks) did not interfere with protection.This information is important because it shows that a typical pullet vaccination program consistingof serially administered live attenuated vaccines against multiple respiratory pathogens can result inthe development of protective immunity against each disease agent.
Keywords: Infectious bronchitis virus; Newcastle disease virus; infectious laryngotracheitis virus;vaccination program; immunity; respiratory disease; ciliostasis; antibody response
1. Introduction
Vaccination against respiratory viral disease is standard practice in commercial poultry operations.Both live and killed vaccines are administered to poultry, and live vaccines are commonly used for avariety of pathogens because they are effective when mass applied and are relatively economical [1].In general, live vaccines induce local and cell-mediated immunity and provide a broader protectiveresponse than killed vaccines, whereas killed vaccines primarily induce humoral immunity and tendto be antigen-specific. The duration of immunity achieved following live vaccine administrationdepends on the age and type of bird, levels of maternal immunity, disease targeted by the vaccine,
Viruses 2019, 11, 135; doi:10.3390/v11020135 www.mdpi.com/journal/viruses
Viruses 2019, 11, 135 2 of 18
immunogenicity of the vaccine, method of vaccine application, number of and interval betweenboosters, virulence and similarity of the field challenge virus, interval between vaccination andchallenge, and immunocompetency of the host [1–3].
Avian coronavirus infectious bronchitis virus (IBV) is an upper respiratory tract viral pathogenof poultry and leads to reduced weight gain and feed efficiency, drops in egg production and eggquality, stunted growth, and secondary bacterial infection resulting in airsacculitis [4]. The virusinitially replicates in the upper respiratory tract, followed by systemic replication in the reproductivetract and some strains can cause lesions in the kidney [4]. Infected birds may exhibit nasal discharge,coughing, sneezing, and tracheal rales [4]. The disease is prevented by vaccination, and live vaccinesare commonly used to induce local immunity and protection. Live vaccines are generally administeredto young birds to achieve early protection, and layers and breeders are also boosted with either live orinactivated vaccines, which vary based on their similarity to the circulating field viruses [2].
Newcastle disease (ND) is caused by virulent strains of avian paramyxovirus type 1, which hasrecently been reclassified as avian avulavirus 1 (AAvV-1) [5]. Depending on the strain of the virus,clinical signs of ND infection may be absent or may involve depression, inappetence, respiratorysigns (nasal discharge, sneezing, coughing), reduced egg production and egg quality, and neurologicalsigns (torticollis, circling, paralysis) [3]. Strains of Newcastle disease virus (NDV) are characterizedas lentogenic, mesogenic, and velogenic, according to their mean death time in embryos [6].Lentogenic strains are of low pathogenicity causing mild respiratory or enteric infections, followed bymesogenic strains, while velogenic isolates are highly pathogenic often causing neurological signs andmortality [3]. Vaccination regimes against NDV vary and may utilize a combination of live, inactivated,and virus-vectored vaccines [7]. In the United States, the most widely used traditional vaccine strainscomprise lentogenic B1 (or virus clones of the B1 strain) and LaSota strains [3].
Infectious laryngotracheitis (ILT) is a respiratory disease of poultry caused by gallidalphaherpesvirus I, and is economically important worldwide [8]. Clinical manifestations of ILTinclude increased mortality, reduced egg production, decreased body weight gain, conjunctivitis,tracheitis with expectoration of bloody mucus in severe cases, depression, severe dyspnea andsusceptibility to other respiratory pathogens. Live vaccines against ILT virus (ILTV) may be ofchicken embryo origin (CEO) or tissue culture origin (TCO), in which they are passaged multipletimes in eggs or tissue culture, respectively. Although recombinant vaccines for ILT are commerciallyavailable, the CEO vaccine is the most widely used vaccine against ILTV worldwide.
Because of the need to protect chickens against different viral pathogens from an early age,vaccination programs typically include multiple vaccines against a variety of pathogens. Samplevaccination regimes in different poultry sectors are reviewed in the Merck Veterinary Manual (www.merckvetmanual.com), in which the interval between vaccinations is often only a matter of weeks.However, there is little information showing that the intervals between vaccinations are sufficientfor the birds to develop adequate immune protection against challenge for each virus. The literatureshows that sequential viral infections may result in viral interference, in which one virus blocks thesubsequent infection and/or replication of another virus in the host [9,10], but until now it is unknownwhether this phenomenon results in reduced protection from serially administered attenuated livevaccines in chickens. Interestingly, it has been reported that simultaneous administration of viruses tochickens or turkeys does not result in viral interference [11]. In this study, we investigate how a typicalcommercial vaccination schedule consisting of a combination of serially administered, live attenuatedviral respiratory disease vaccines affects the development and longevity of immunity and protectionagainst homologous challenge.
Viruses 2019, 11, 135 3 of 18
2. Materials and Methods
2.1. Viruses
A commercial IBV vaccine MILDVAC-GA-98® (Merck Animal Health, Summit, NJ, USA) wasused in this study. The vaccine was diluted according to the manufacturer’s recommendations.The challenge virus used was IBV GA98/CWL0474/98 and was prepared at a median embryoinfectious dose (EID50) of 103.19. Virus titers were calculated by the Reed and Muench method [12].A commercial NDV vaccine B1 (NEWHATCH-C2, Merck Animal Health, Summit, NJ, USA) was usedfor both vaccination and challenge and was reconstituted following the manufacturer’s instructions.Since mesogenic and velogenic strains of NDV require a biosafety level above BSL2, which isnot available in our laboratory, our experimental model for protection against NDV involvessignificantly reduced virus titers or sterile immunity against a second exposure (challenge) withthe vaccine virus. An ILTV commercial CEO vaccine (Trachivax® Merck Animal Health, Summit,NJ, USA) and pathogenic ILTV Georgia broiler strain 63140 [13] were used for vaccination andchallenge, respectively. Strain 63140 was propagated in chicken kidney cells obtained from 3- to4-week-old specific pathogen-free (SPF) chickens [14]. The CEO vaccine was prepared following themanufacturer’s recommendations. After inoculation, the median tissue culture infective dose (TCID50)was confirmed by titration of both viruses in chicken kidney cells as previously described [14].
2.2. Experimental Design
Specific-pathogen-free eggs were obtained at 18 days of incubation and hatched at the PoultryDiagnostic and Research Center, Athens, GA. Chicks were placed on fresh pine shavings in colonyhouses and pens. Chicks were vaccinated with the manufacturers recommended dose in 100 µL viathe oculonasal route according to the following schedule; IBV at 1 DOA, NDV at 2 weeks of age(WOA), IBV at 4 WOA, ILTV at 8 WOA, NDV at 12 WOA, and ILTV at 16 WOA. In addition, a controlgroup was not vaccinated. Homologous challenges were conducted at 20, 24, 28, 32, and 36 WOA,and necropsies were performed five days post-challenge (dpc). At challenge, birds received oneof four treatments: IBV GA98, NDV B1, ILTV 63140, or no challenge. The treatment groups foreach challenge virus per time point were as follows: non-vaccinated, non-challenged (n = 9–10);vaccinated, non-challenged (n = 9–10); vaccinated, challenged (n = 17–19); non-vaccinated, challenged(n = 9–10). All IBV-challenged birds received an EID50 of 1 × 103.2 per bird in 100 µL intranasally.All NDV-challenged birds received the NDV B1 vaccine in 100 µL intranasally, reconstituted accordingto the manufacturer’s protocol. All ILTV-challenged birds received the 63140 pathogenic strain at a doseof 1 × 103.5 TCID50 per bird in 100 µL split equally between eyedrop and intranasal routes. For IBVand NDV challenges, birds were observed at 5 dpc for respiratory signs, as previously described [15]:0 = absent; 1 = mild; 2 = moderate; 3 = severe. For ILTV challenges, birds were observed at 3 and5 dpc for dyspnea, conjunctivitis, depression, and mortality, as described previously [16]. The choanalcleft (IBV- and NDV-challenged and control birds at 5 dpc) or trachea (ILTV-challenged and controlbirds at 3 and 5 dpc) was swabbed for virus detection, and swabs were stored in PBS at −80 ◦C.At 28, 32, and 36 WOA, 50 µL of tears was collected by adding granulated NaCl to the eye. Bloodwas collected by wing or cardiac puncture and added to a microcentrifuge tube to collect serumfor antibody detection. Birds were humanely euthanized, and the eyelid, Harderian gland (HG),thymus, liver, spleen, cecal tonsils, and bursa of Fabricius were collected and stored at −80 ◦C forvirus detection and in 10% neutral buffered formalin. The trachea was removed, and one section wasplaced in 10% neutral buffered formalin, and the remaining portion of the trachea was submergedin tissue culture media for the ciliostasis test described below. The procedures were approved by theUniversity of Georgia Institutional Animal Care and Use Committee (AUP #: A2015 05-001-R2).

Viruses 2019, 11, 135 4 of 18
2.3. Ciliostasis Test
The ciliostasis test was performed on harvested tracheas collected in cell culture media (Dulbecco’sModified Eagle’s Medium) at 37 ◦C. For each trachea, five tracheal rings measuring approximately1 mm thick were cut and represented the proximal, middle, and distal portions [17,18]. Cilia activitywas observed using an inverted microscope (Olympus, Center Valley, PA, USA). The scoring systemfollows: 0 = all cilia beating; 1 = 75% of cilia beating; 2 = 50% of cilia beating; 3 = 25% of cilia beating;4 = no cilia beating as previously described [17]. The maximum possible score for each trachea is 20.Each tracheal ring was scored by three individuals, and the average total score for each trachea wascalculated. The ciliostasis protection score for each group was determined by the following formula:100 − [(total of the individual scores for the group)/(the number of individuals in the group × 20) ×100], and a score ≥50 was considered protected.
2.4. Tracheal Histopathology
A section of each trachea was fixed in 10% neutral buffered formalin, processed, embeddedin paraffin, and 5-µm sections were cut for hematoxylin and eosin staining. For IBV lesions,epithelial hyperplasia, lymphocyte infiltration, and epithelial deciliation were scored for each trachea.Scores were determined as follows: 1 = normal, 2 = focal, 3 = multifocal, and 4 = diffuse, as describedpreviously [19]. For NDV lesions, a descriptive analysis was performed. For ILTV lesions, microscopiclesions were scored on a scale of 0–5 (normal to very severe), as described previously [20].
2.5. RNA Extraction and Quantitative Reverse Transcriptase Polymerase Chain Reaction (qRT-PCR)
For IBV and NDV detection, viral RNA extraction from 50 µL of the PBS from each swab wasconducted using a 5× MagMAX-96 Viral Isolation Kit (Thermo Fisher, Waltham, MA, USA) on aMagMAX™ Express-96 Deep Well Magnetic Particle Processor (Thermo Scientific, Waltham, MA,USA), according to the manufacturer’s instructions. The quantitative reverse transcription polymerasechain reaction (qRT-PCR) was performed with the AgPath-IDTM One-Step RT-PCR kit (Thermo Fisher,Waltham, MA, USA), following the manufacturer’s protocol. Each 25-µL reaction mixture contained12.5 µL of 2× RT-PCR buffer, 10 µM of each primer, 4 µM of probe, 1 µL of 25× RT-PCR enzymemix, and 5 µL of viral RNA. The qRT-PCR reactions were run on the Applied Biosystems® 7500 FastRealtime PCR system (Life Technologies Ltd., Carlsbad, CA, USA) under the following conditions:one cycle of 50 ◦C for 30 min and 95 ◦C for 15 min, followed by 40 cycles of 94 ◦C for 1 s and60 ◦C for 60 s. The primers and probe for the IBV qRT-PCR were previously published [21], and arecomprised of a forward primer IBV5′GU391 (5′-GCT TTT GAG CCT AGC GTT-3′), a reverse primerIBV5′GL533 (5′-GCC ATG TTG TCA CTG TCT ATT G-3′), and a Taqman® dual-labeled probe IBV5′Gprobe (5′-FAM-CAC CAC CAG AAC CTG TCA CCT C-BHQ1-3′). Primers and probe for the NDVqRT-PCR were previously described [22] and are comprised of a forward primer NDV M+4100 (5’-AGTGAT GTG CTC GGA CCT TC-3’), a reverse primer NDV M-4220 (5’-CCT GAG GAG AGG CAT TTGCTA-3’), and a Taqman® dual-labeled probe NDV M+4169 (5’-FAM-TTC TCT AGC AGT GGG ACAGCC TGC-BHQ1-3’). The primers were obtained from Integrated DNA Technologies (Coralville,IA, USA), and the Taqman probe was synthesized by BioSearch Technologies (Novato, CA, USA).Real-time RT-PCR components and thermocycler parameters were previously described [21]. The dataare expressed as the average cycle threshold (CT) value for all samples in each group, with positive CTvalues based on the limit of detection for this test associated with virus detection in eggs [23].
Each qRT-PCR reaction plate included a standard curve as an RNA extraction control and as apositive control. GA98 IBV isolated from allantoic fluid was used as the template for the standardcurve. Negative controls were also included in each plate and consisted of PCR reagents with no RNA.
Viruses 2019, 11, 135 5 of 18
2.6. DNA Extraction
For ILTV, total DNA was extracted from the tracheal swabs using the MegaZorb® DNA extractionminiprep 96-well kit (Promega, Madison, WI, USA), as described previously [24].
2.7. qPCR
Duplex real-time PCR assay that amplifies a fragment of the UL44 viral gene in ILTV and afragment of the chicken alpha 2-collagen gene was performed, as previously described [25].
2.8. Serum Infectious Bronchitis Virus (IBV)-Specific IgG Antibody Titers
IBV-specific IgG titers were detected using a commercial IgG enzyme-linked immunosorbent assay(ELISA) IBV antibody test kit (IDEXX, Westbrook, ME, USA). Briefly, serum samples (stored at −20 ◦C)were diluted 1:500, and the procedure was performed according to the manufacturer’s protocol.
2.9. Tear-Secreted IBV-Specific IgA Antibody Titers
Tear IBV-specific IgA was detected using a commercial IgG ELISA IBV antibody test kit (IDEXX,Westbrook, ME, USA). Briefly, tears were serially diluted two-fold in PBS and incubated in duplicatein wells overnight at 4 ◦C. All wash steps were performed using PBS-Tween 20 (0.05% Tween 20).Plates were incubated at 23 ◦C for 2 h in monoclonal mouse anti-chicken IgA-BIOT (1:1000, clone A-1,Southern Biotech, Birmingham, AL, USA), followed by 1hr in Streptavidin-HRP (1:4000, SouthernBiotech, Birmingham, AL, USA). Final antibody detection steps were completed according to themanufacturer’s instructions. Endpoint titers were determined by reporting the lowest dilution atwhich the optical density (OD), recorded at 650 nm wavelength, was at least three standard deviationsabove the mean of 12 control wells incubated with no tear samples. Data from wells with a pinpointcolor change due to residual substrate or air bubbles were excluded from analysis, and results werereported as log2 of the endpoint titer.
2.10. Statistical Analysis
The data were analyzed using Prism v.6.0 software (GraphPad Software, Inc., La Jolla, CA, USA;www.graphpad.com). For viral load data, a one-way analysis of variance (ANOVA) with Dunnet’sposttest was used to compare treatment groups within each collection period. All other data wereanalyzed using a Kruskal–Wallis test with Dunn’s posttest to compare treatment groups within eachcollection period. Significant differences were determined at p < 0.05.
3. Results
3.1. Infectious Bronchitis Virus
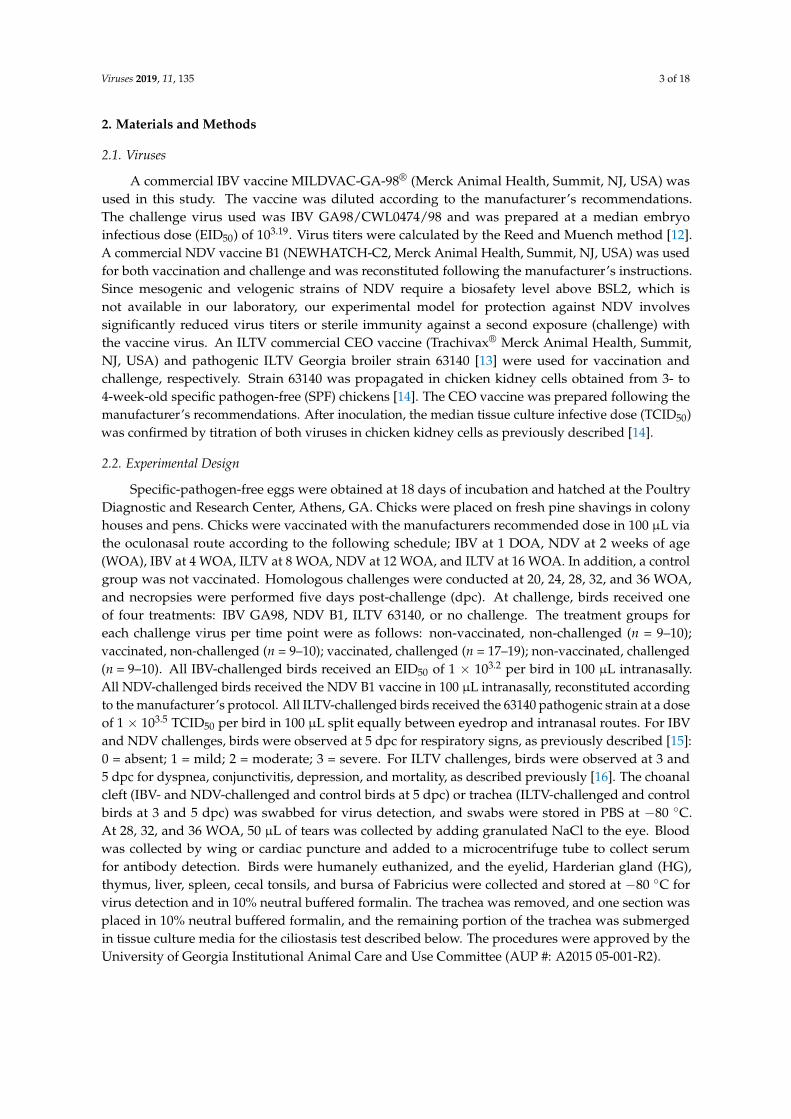
At 5 days following challenge with IBV GA98, vaccinated/challenged birds had significantlylower RNA loads compared to positive controls at all collection times and in all tissue samples, withthe exception of cecal tonsil at 24 WOA (Table 1). In vaccinated controls, no IBV RNA was detected atall collection times except in the cecal tonsils at 20 and 24 WOA and in the choanal cleft at 20 WOA.IBV loads in negative controls in all tissues were below the limit of detection using the CT value of≥36.17 as previously reported [23], at all collection times except the 24 WOA HG negative controls.
Clinical signs of IBV infection measured at 5 days post-challenge were significantly reducedin vaccinated/challenged birds when compared to positive controls in all weeks except 28 WOA,but trends in clinical sign scores were numerically lower among vaccinated/challenged birds (Table 2).Clinical signs were absent in non-challenged negative and vaccinated control birds, and signs invaccinated/challenged birds were not significantly different from signs in non-challenged controls.
Viruses 2019, 11, 135 6 of 18
Table 1. Average quantitative reverse transcription polymerase chain reaction (qRT-PCR) cyclethreshold (CT) values for infectious bronchitis virus (IBV) RNA collected from choanal cleft, Harderiangland, conjunctiva, and cecal tonsil 5 days post-challenge with IBV GA98 at 20, 24, 28, 32, and 36 weeksof age. Letters (a–d) indicate significant differences among vaccine and challenge groups for each week(p < 0.05).
WeekTreatment Mean ± SEM
Vaccine Challenge Choanal Cleft Harderian Gland Conjunctiva Cecal Tonsil
20
− − 40.0 ± 0.0 a 40.0 ± 0.0 a 40.0 ± 0.0 a 40.0 ± 0.0 a
+ − 36.5 ± 0.9 b 40.0 ± 0.0 a 40.0 ± 0.0 a 24.9 ± 1.9 b
+ + 27.9 ± 0.8 c 33.2 ± 0.6 b 31.9 ± 0.7 b 30.2 ± 1.2 c
− + 17.5 ± 0.3 d 26.1 ± 1.3 c 22.7 ± 0.6 c 21.6 ± 1.1 b
24
− − 40.0 ± 0.0 ab 34.4 ± 1.0 a 40.0 ± 0.0 a 40.0 ± 0.0 a
+ − 41.1 ± 0.5 a 39.0 ± 0.7 b 40.0 ± 0.0 a 30.7 ± 3.3 b
+ + 39.6 ± 0.4 b 33.8 ± 0.5 a 31.0 ± 0.7 b 30.5 ± 1.7 b
− + 34.3 ± 0.5 c 21.0 ± 1.5 c 24.1 ± 0.8 c 26.1 ± 2.0 b
28
− − 40.0 ± 0.0 a 39.2 ± 0.6 a 40.0 ± 0.0 a 40.0 ± 0.0 a
+ − 40.0 ± 0.0 a 40.0 ± 0.0 a 40.0 ± 0.0 a 39.6 ± 0.4 a
+ + 30.4 ± 1.2 b 30.9 ± 1.7 b 31.5 ± 1.0 b 33.7 ± 1.6 b
− + 22.3 ± 0.3 c 20.4 ± 1.3 c 22.8 ± 0.5 c 24.3 ± 1.8 c
32
− − 40.0 ± 0.0 a 38.9 ± 0.8 a 40.0 ± 0.0 a 40.0 ± 0.0 a
+ − 40.0 ± 0.0 a 38.6 ± 0.7 a 40.0 ± 0.0 a 40.0 ± 0.0 a
+ + 32.3 ± 0.5 b 34.1 ± 0.4 b 34.5 ± 1.6 b 34.5 ± 2.0 a
− + 20.6 ± 0.5 c 21.8 ± 1.3 c 24.2 ± 0.7 c 23.4 ± 1.3 b
36
− − 40.0 ± 0.0 a 40.0 ± 0.0 a 40.0 ± 0.0 a 40.0 ± 0.0 a
+ − 40.0 ± 0.0 a 40.0 ± 0.0 a 40.0 ± 0.0 a 40.0 ± 0.0 a
+ + 30.0 ± 0.8 b 30.3 ± 0.9 b 28.3 ± 1.4 b 32.5 ± 1.0 b
− + 22.2 ± 0.4 c 21.2 ± 1.4 c 25.0 ± 0.5 c 23.1 ± 1.2 c
Notes: SEM = Standard error of the mean.
Table 2. Clinical signs and microscopic lesions measured 5 days following IBV GA98 challenge. Letters(a–b) indicate significant differences among vaccine and challenge groups for each week (p < 0.05).
WeekTreatment Clinical Signs Histopathology Lesions
Vaccine Challenge Mean ± SEM Deciliation Necrosis
20
− − 0.0 ± 0.0 a 2/10 a 0/10 a
+ − 0.0 ± 0.0 a 1/9 a 1/9 a
+ + 0.0 ± 0.0 a 0/18 a 0/18 a
− + 0.7 ± 0.2 b 8/10 b 8/10 b
24
− − 0.0 ± 0.0 a 0/10 a 0/10 a
+ − 0.0 ± 0.0 a 0/9 a 1/9 a
+ + 0.1 ± 0.1 a 0/16 a 0/16 a
− + 1.0 ± 0.3 b 6/8 b 5/8 b
28
− − 0.0 ± 0.0 0/9 a 0/9 a
+ − 0.0 ± 0.0 0/9 a 0/9 a
+ + 0.1 ± 0.1 1/17 a 2/17 a
− + 0.5 ± 0.3 6/10 b 6/10 b
32
− − 0.0 ± 0.0 a 0/0 a 0/0 a
+ − 0.0 ± 0.0 a 0/9 a 0/9 a
+ + 0.1 ± 0.1 a 0/16 a 0/16 a
− + 1.2 ± 0.4 b 7/9 b 5/9 b
36
− − 0.0 ± 0.0 a 0/9 a 0/9 a
+ − 0.0 ± 0.0 a 0/9 a 0/9 a
+ + 0.1 ± 0.1 a 0/16 a 0/16 a
− + 0.4 ± 0.3 b 6/9 b 7/9 b
Notes: SEM = Standard error of the mean.
Viruses 2019, 11, 135 7 of 18
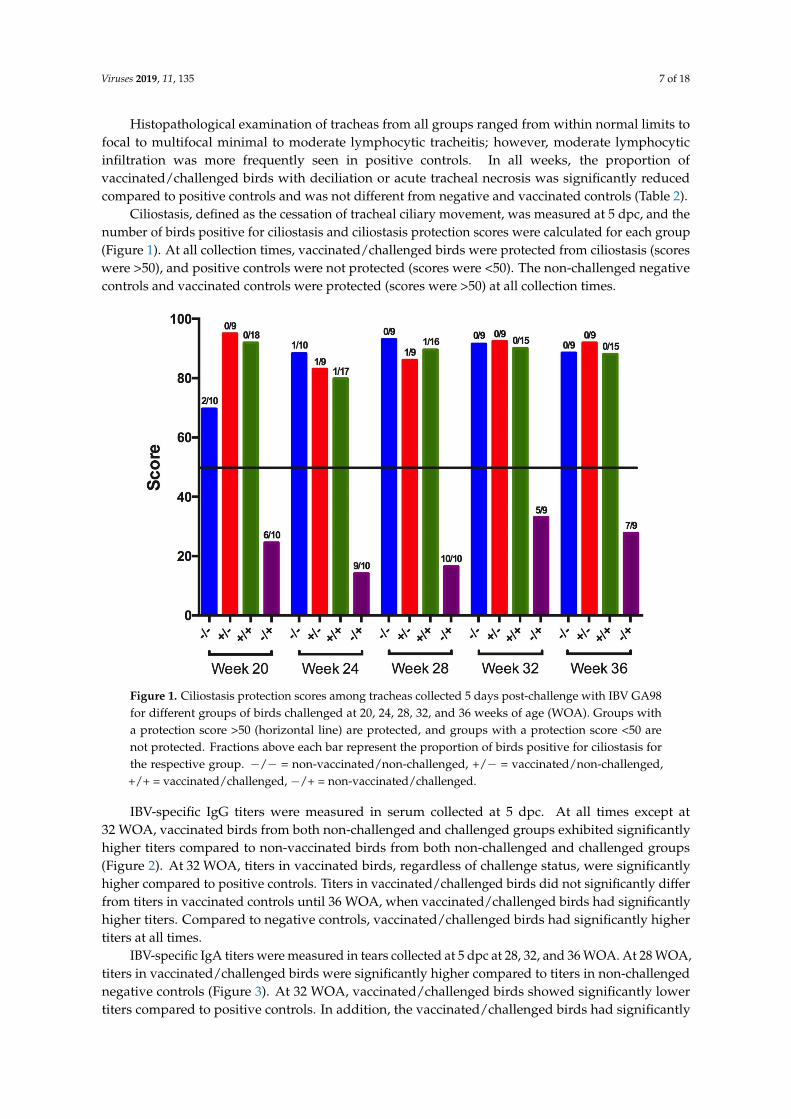
Histopathological examination of tracheas from all groups ranged from within normal limits tofocal to multifocal minimal to moderate lymphocytic tracheitis; however, moderate lymphocyticinfiltration was more frequently seen in positive controls. In all weeks, the proportion ofvaccinated/challenged birds with deciliation or acute tracheal necrosis was significantly reducedcompared to positive controls and was not different from negative and vaccinated controls (Table 2).
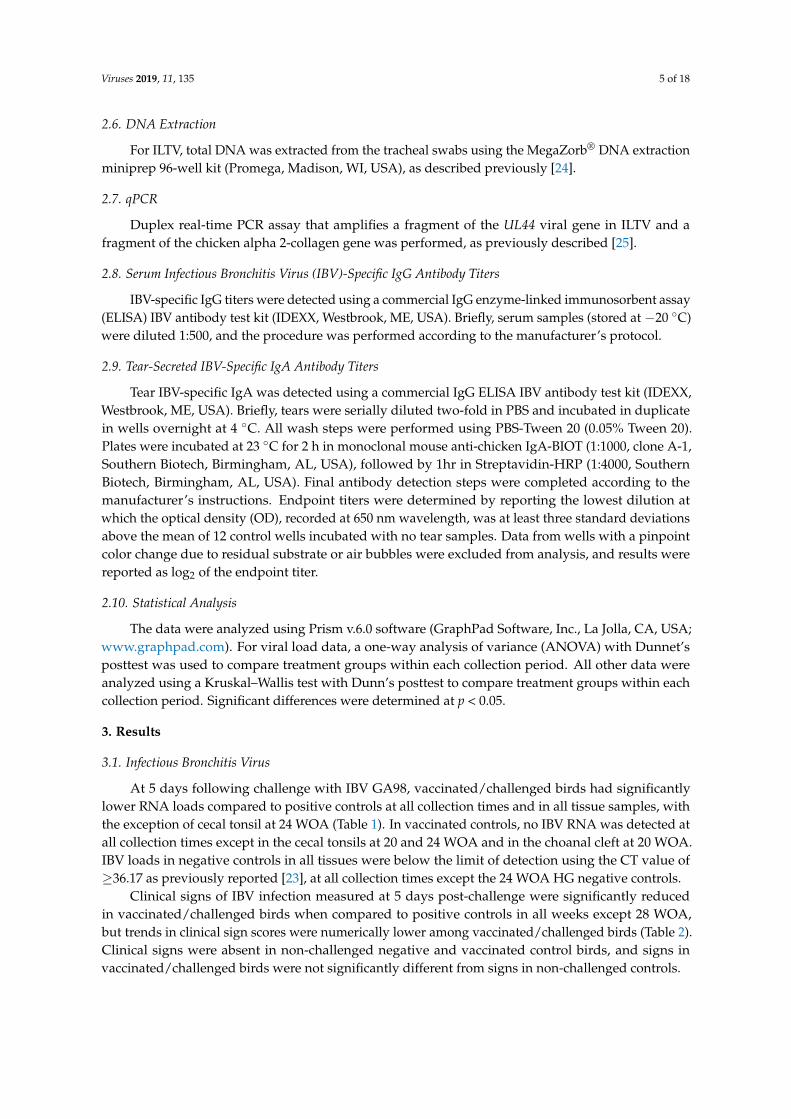
Ciliostasis, defined as the cessation of tracheal ciliary movement, was measured at 5 dpc, and thenumber of birds positive for ciliostasis and ciliostasis protection scores were calculated for each group(Figure 1). At all collection times, vaccinated/challenged birds were protected from ciliostasis (scoreswere >50), and positive controls were not protected (scores were <50). The non-challenged negativecontrols and vaccinated controls were protected (scores were >50) at all collection times.Viruses 2019, 11, x FOR PEER REVIEW 8 of 21
Figure 1. Ciliostasis protection scores among tracheas collected 5 days post-challenge with IBV GA98 for different groups of birds challenged at 20, 24, 28, 32, and 36 weeks of age (WOA). Groups with a protection score >50 (horizontal line) are protected, and groups with a protection score <50 are not protected. Fractions above each bar represent the proportion of birds positive for ciliostasis for the respective group. −/− = non-vaccinated/non-challenged, +/− = vaccinated/non-challenged, +/+ = vaccinated/challenged, −/+ = non-vaccinated/challenged.
IBV-specific IgG titers were measured in serum collected at 5 dpc. At all times except at 32 WOA, vaccinated birds from both non-challenged and challenged groups exhibited significantly higher titers compared to non-vaccinated birds from both non-challenged and challenged groups (Figure 2). At 32 WOA, titers in vaccinated birds, regardless of challenge status, were significantly higher compared to positive controls. Titers in vaccinated/challenged birds did not significantly differ from titers in vaccinated controls until 36 WOA, when vaccinated/challenged birds had significantly higher titers. Compared to negative controls, vaccinated/challenged birds had significantly higher titers at all times.
Figure 1. Ciliostasis protection scores among tracheas collected 5 days post-challenge with IBV GA98for different groups of birds challenged at 20, 24, 28, 32, and 36 weeks of age (WOA). Groups witha protection score >50 (horizontal line) are protected, and groups with a protection score <50 arenot protected. Fractions above each bar represent the proportion of birds positive for ciliostasis forthe respective group. −/− = non-vaccinated/non-challenged, +/− = vaccinated/non-challenged,+/+ = vaccinated/challenged, −/+ = non-vaccinated/challenged.
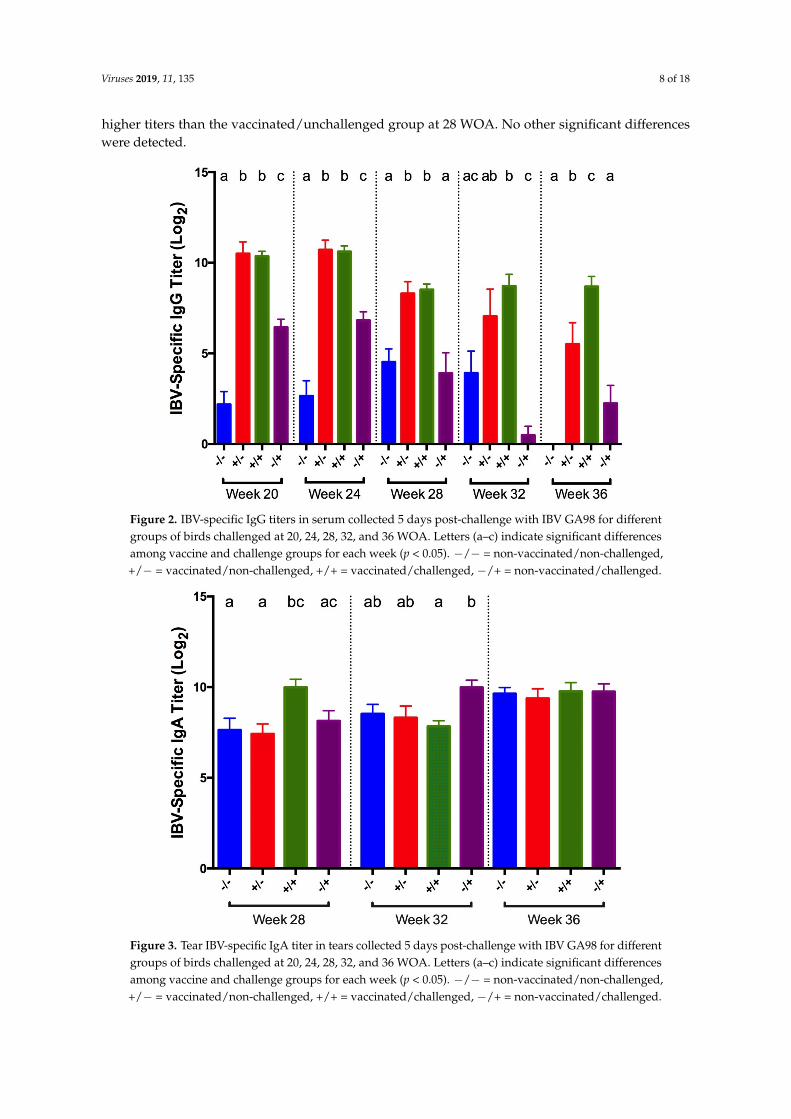
IBV-specific IgG titers were measured in serum collected at 5 dpc. At all times except at32 WOA, vaccinated birds from both non-challenged and challenged groups exhibited significantlyhigher titers compared to non-vaccinated birds from both non-challenged and challenged groups(Figure 2). At 32 WOA, titers in vaccinated birds, regardless of challenge status, were significantlyhigher compared to positive controls. Titers in vaccinated/challenged birds did not significantly differfrom titers in vaccinated controls until 36 WOA, when vaccinated/challenged birds had significantlyhigher titers. Compared to negative controls, vaccinated/challenged birds had significantly highertiters at all times.
IBV-specific IgA titers were measured in tears collected at 5 dpc at 28, 32, and 36 WOA. At 28 WOA,titers in vaccinated/challenged birds were significantly higher compared to titers in non-challengednegative controls (Figure 3). At 32 WOA, vaccinated/challenged birds showed significantly lowertiters compared to positive controls. In addition, the vaccinated/challenged birds had significantly
Viruses 2019, 11, 135 8 of 18
higher titers than the vaccinated/unchallenged group at 28 WOA. No other significant differenceswere detected.Viruses 2019, 11, x FOR PEER REVIEW 9 of 21
Figure 2. IBV-specific IgG titers in serum collected 5 days post-challenge with IBV GA98 for different groups of birds challenged at 20, 24, 28, 32, and 36 WOA. Letters (a–c) indicate significant differences among vaccine and challenge groups for each week (p < 0.05). −/− = non-vaccinated/non-challenged, +/− = vaccinated/non-challenged, +/+ = vaccinated/challenged, −/+ = non-vaccinated/challenged.
IBV-specific IgA titers were measured in tears collected at 5 dpc at 28, 32, and 36 WOA. At 28 WOA, titers in vaccinated/challenged birds were significantly higher compared to titers in non-challenged negative controls (Figure 3). At 32 WOA, vaccinated/challenged birds showed significantly lower titers compared to positive controls. In addition, the vaccinated/challenged birds had significantly higher titers than the vaccinated/unchallenged group at 28 WOA. No other significant differences were detected.
Figure 2. IBV-specific IgG titers in serum collected 5 days post-challenge with IBV GA98 for differentgroups of birds challenged at 20, 24, 28, 32, and 36 WOA. Letters (a–c) indicate significant differencesamong vaccine and challenge groups for each week (p < 0.05). −/− = non-vaccinated/non-challenged,+/− = vaccinated/non-challenged, +/+ = vaccinated/challenged, −/+ = non-vaccinated/challenged.
Viruses 2019, 11, x FOR PEER REVIEW 10 of 21
Figure 3. Tear IBV-specific IgA titer in tears collected 5 days post-challenge with IBV GA98 for different groups of birds challenged at 20, 24, 28, 32, and 36 WOA. Letters (a–c) indicate significant differences among vaccine and challenge groups for each week (p < 0.05). −/− = non-vaccinated/non-challenged, +/− = vaccinated/non-challenged, +/+ = vaccinated/challenged, −/+ = non-vaccinated/challenged.
3.2. Newcastle Disease Virus (NDV)
At 5 dpc with NDV B1, vaccinated/challenged birds either had undetectable RNA loads or significantly lower loads compared to positive control titers at all collection times and in all tissues sampled (Table 3). Non-challenged negative controls and vaccinated controls were negative for RNA virus using the CT value of ≥35.0 as previously reported [22].
Figure 3. Tear IBV-specific IgA titer in tears collected 5 days post-challenge with IBV GA98 for differentgroups of birds challenged at 20, 24, 28, 32, and 36 WOA. Letters (a–c) indicate significant differencesamong vaccine and challenge groups for each week (p < 0.05). −/− = non-vaccinated/non-challenged,+/− = vaccinated/non-challenged, +/+ = vaccinated/challenged, −/+ = non-vaccinated/challenged.

Viruses 2019, 11, 135 9 of 18
3.2. Newcastle Disease Virus (NDV)
At 5 dpc with NDV B1, vaccinated/challenged birds either had undetectable RNA loads orsignificantly lower loads compared to positive control titers at all collection times and in all tissuessampled (Table 3). Non-challenged negative controls and vaccinated controls were negative for RNAvirus using the CT value of ≥35.0 as previously reported [22].
Table 3. Average qRT-PCR CT values for NDV RNA collected from choanal cleft, Harderian gland, andconjunctiva 5 days post-challenge with NDV B1 vaccine. Letters (a–c) indicate significant differencesamong vaccine and challenge groups for each week (p < 0.05).
WeekTreatment Mean ± SEM
Vaccine Challenge Choanal Cleft Harderian Gland Conjunctiva
20
− − 40.0 ± 0.0 a 40.0 ± 0.0 a 39.7 ± 0.4 a
+ − 40.0 ± 0.0 a 40.0 ± 0.0 a 40.0 ± 0.0 a
+ + 40.0 ± 0.0 a 40.0 ± 0.0 a 38.2 ± 0.6 a
− + 29.3 ± 1.1 b 28.6 ± 0.9 b 27.6 ± 1.9 b
24
− − 40.0 ± 0.0 a 40.0 ± 0.0 a 40.0 ± 0.0 a
+ − 40.0 ± 0.0 a 40.0 ± 0.0 a 40.0 ± 0.0 a
+ + 40.0 ± 0.0 a 40.0 ± 0.0 a 39.5 ± 0.5 a
− + 26.6 ± 1.0 b 34.2 ± 1.4 b 27.8 ± 1.0 b
28
− − 40.0 ± 0.0 a 40.0 ± 0.0 a 40.0 ± 0.0 a
+ − 40.0 ± 0.0 a 40.0 ± 0.0 a 40.0 ± 0.0 a
+ + 40.0 ± 0.0 a 40.0 ± 0.0 a 37.0 ± 0.7 b
− + 24.5 ± 0.7 b 33.0 ± 1.3 b 27.9 ± 0.8 c
32
− − 40.0 ± 0.0 a 40.0 ± 0.0 a 40.0 ± 0.0 a
+ − 40.0 ± 0.0 a 40.0 ± 0.0 a 40.0 ± 0.0 a
+ + 39.2 ± 0.6 a 40.0 ± 0.0 a 40.0 ± 0.0 a
− + 27.7 ± 2.2 b 31.5 ± 1.6 b 28.6 ± 1.2 b
36
− − 40.0 ± 0.0 a 40.0 ± 0.0 a 40.0 ± 0.0 a
+ − 40.0 ± 0.0 a 40.0 ± 0.0 a 40.0 ± 0.0 a
+ + 38.0 ± 1.1 a 39.1 ± 0.7 a 39.6 ± 0.4 a
− + 24.9 ± 1.0 b 33.7 ± 1.8 b 30.3 ± 0.5 b
Notes: SEM = Standard error of the mean.
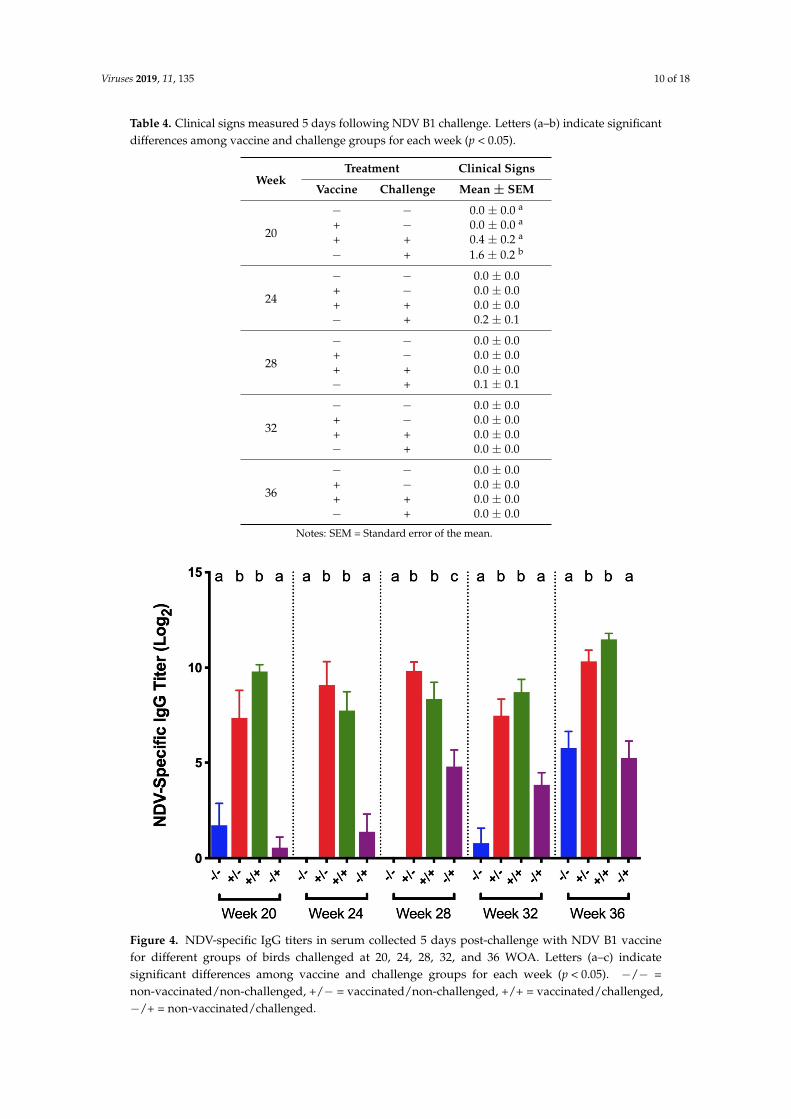
Clinical signs measured at 5 dpc were significant at 20 WOA in positive controls, after whichclinical signs in positive controls were no different from any of the other treatment groups(Table 4). No significant differences in clinical signs existed between vaccinated/challenged birdsand non-challenged controls at any time. In all weeks, histopathological examination of tracheas waswithin normal limits or revealed focal to multifocal minimal to mild lymphocytic tracheitis, and therewere no group-related differences.
Tracheas were also evaluated for ciliostasis, and no groups exhibited ciliostasis.NDV-specific serum IgG titers in vaccinated/challenged birds and vaccinated controls were
significantly higher than titers in both positive and negative controls at all collection times(Figure 4). There was no significant difference in titers between vaccinated/challenged birdsand vaccinated controls at any time. Similarly, no significant difference in titers was detectedbetween non-vaccinated/challenged and negative controls, except at 28 WOA in which titers fromnon-vaccinated/challenged controls were significantly higher.
Viruses 2019, 11, 135 10 of 18
Table 4. Clinical signs measured 5 days following NDV B1 challenge. Letters (a–b) indicate significantdifferences among vaccine and challenge groups for each week (p < 0.05).
WeekTreatment Clinical Signs
Vaccine Challenge Mean ± SEM
20
− − 0.0 ± 0.0 a
+ − 0.0 ± 0.0 a
+ + 0.4 ± 0.2 a
− + 1.6 ± 0.2 b
24
− − 0.0 ± 0.0+ − 0.0 ± 0.0+ + 0.0 ± 0.0− + 0.2 ± 0.1
28
− − 0.0 ± 0.0+ − 0.0 ± 0.0+ + 0.0 ± 0.0− + 0.1 ± 0.1
32
− − 0.0 ± 0.0+ − 0.0 ± 0.0+ + 0.0 ± 0.0− + 0.0 ± 0.0
36
− − 0.0 ± 0.0+ − 0.0 ± 0.0+ + 0.0 ± 0.0− + 0.0 ± 0.0
Notes: SEM = Standard error of the mean.Viruses 2019, 11, x FOR PEER REVIEW 13 of 21
Figure 4. NDV-specific IgG titers in serum collected 5 days post-challenge with NDV B1 vaccine for different groups of birds challenged at 20, 24, 28, 32, and 36 WOA. Letters (a–c) indicate significant differences among vaccine and challenge groups for each week (p < 0.05). −/− = non-vaccinated/non-challenged, +/− = vaccinated/non-challenged, +/+ = vaccinated/challenged, −/+ = non-vaccinated/challenged.
3.3. Infectious Laryngotracheitis Virus (ILTV)
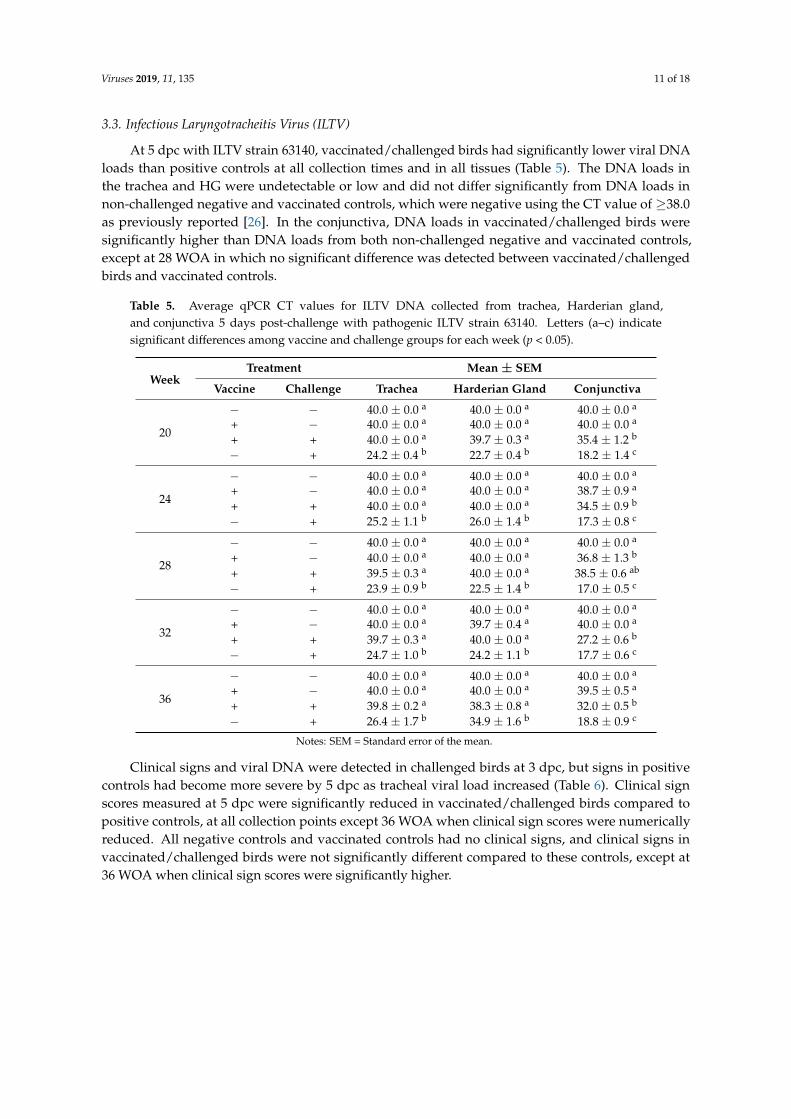
At 5 dpc with ILTV strain 63140, vaccinated/challenged birds had significantly lower viral DNA loads than positive controls at all collection times and in all tissues (Table 5). The DNA loads in the trachea and HG were undetectable or low and did not differ significantly from DNA loads in non-challenged negative and vaccinated controls, which were negative using the CT value of ≥38.0 as previously reported [26]. In the conjunctiva, DNA loads in vaccinated/challenged birds were significantly higher than DNA loads from both non-challenged negative and vaccinated controls, except at 28 WOA in which no significant difference was detected between vaccinated/challenged birds and vaccinated controls.
Figure 4. NDV-specific IgG titers in serum collected 5 days post-challenge with NDV B1 vaccinefor different groups of birds challenged at 20, 24, 28, 32, and 36 WOA. Letters (a–c) indicatesignificant differences among vaccine and challenge groups for each week (p < 0.05). −/− =non-vaccinated/non-challenged, +/− = vaccinated/non-challenged, +/+ = vaccinated/challenged,−/+ = non-vaccinated/challenged.
Viruses 2019, 11, 135 11 of 18
3.3. Infectious Laryngotracheitis Virus (ILTV)
At 5 dpc with ILTV strain 63140, vaccinated/challenged birds had significantly lower viral DNAloads than positive controls at all collection times and in all tissues (Table 5). The DNA loads inthe trachea and HG were undetectable or low and did not differ significantly from DNA loads innon-challenged negative and vaccinated controls, which were negative using the CT value of ≥38.0as previously reported [26]. In the conjunctiva, DNA loads in vaccinated/challenged birds weresignificantly higher than DNA loads from both non-challenged negative and vaccinated controls,except at 28 WOA in which no significant difference was detected between vaccinated/challengedbirds and vaccinated controls.
Table 5. Average qPCR CT values for ILTV DNA collected from trachea, Harderian gland,and conjunctiva 5 days post-challenge with pathogenic ILTV strain 63140. Letters (a–c) indicatesignificant differences among vaccine and challenge groups for each week (p < 0.05).
WeekTreatment Mean ± SEM
Vaccine Challenge Trachea Harderian Gland Conjunctiva
20
− − 40.0 ± 0.0 a 40.0 ± 0.0 a 40.0 ± 0.0 a
+ − 40.0 ± 0.0 a 40.0 ± 0.0 a 40.0 ± 0.0 a
+ + 40.0 ± 0.0 a 39.7 ± 0.3 a 35.4 ± 1.2 b
− + 24.2 ± 0.4 b 22.7 ± 0.4 b 18.2 ± 1.4 c
24
− − 40.0 ± 0.0 a 40.0 ± 0.0 a 40.0 ± 0.0 a
+ − 40.0 ± 0.0 a 40.0 ± 0.0 a 38.7 ± 0.9 a
+ + 40.0 ± 0.0 a 40.0 ± 0.0 a 34.5 ± 0.9 b
− + 25.2 ± 1.1 b 26.0 ± 1.4 b 17.3 ± 0.8 c
28
− − 40.0 ± 0.0 a 40.0 ± 0.0 a 40.0 ± 0.0 a
+ − 40.0 ± 0.0 a 40.0 ± 0.0 a 36.8 ± 1.3 b
+ + 39.5 ± 0.3 a 40.0 ± 0.0 a 38.5 ± 0.6 ab
− + 23.9 ± 0.9 b 22.5 ± 1.4 b 17.0 ± 0.5 c
32
− − 40.0 ± 0.0 a 40.0 ± 0.0 a 40.0 ± 0.0 a
+ − 40.0 ± 0.0 a 39.7 ± 0.4 a 40.0 ± 0.0 a
+ + 39.7 ± 0.3 a 40.0 ± 0.0 a 27.2 ± 0.6 b
− + 24.7 ± 1.0 b 24.2 ± 1.1 b 17.7 ± 0.6 c
36
− − 40.0 ± 0.0 a 40.0 ± 0.0 a 40.0 ± 0.0 a
+ − 40.0 ± 0.0 a 40.0 ± 0.0 a 39.5 ± 0.5 a
+ + 39.8 ± 0.2 a 38.3 ± 0.8 a 32.0 ± 0.5 b
− + 26.4 ± 1.7 b 34.9 ± 1.6 b 18.8 ± 0.9 c
Notes: SEM = Standard error of the mean.
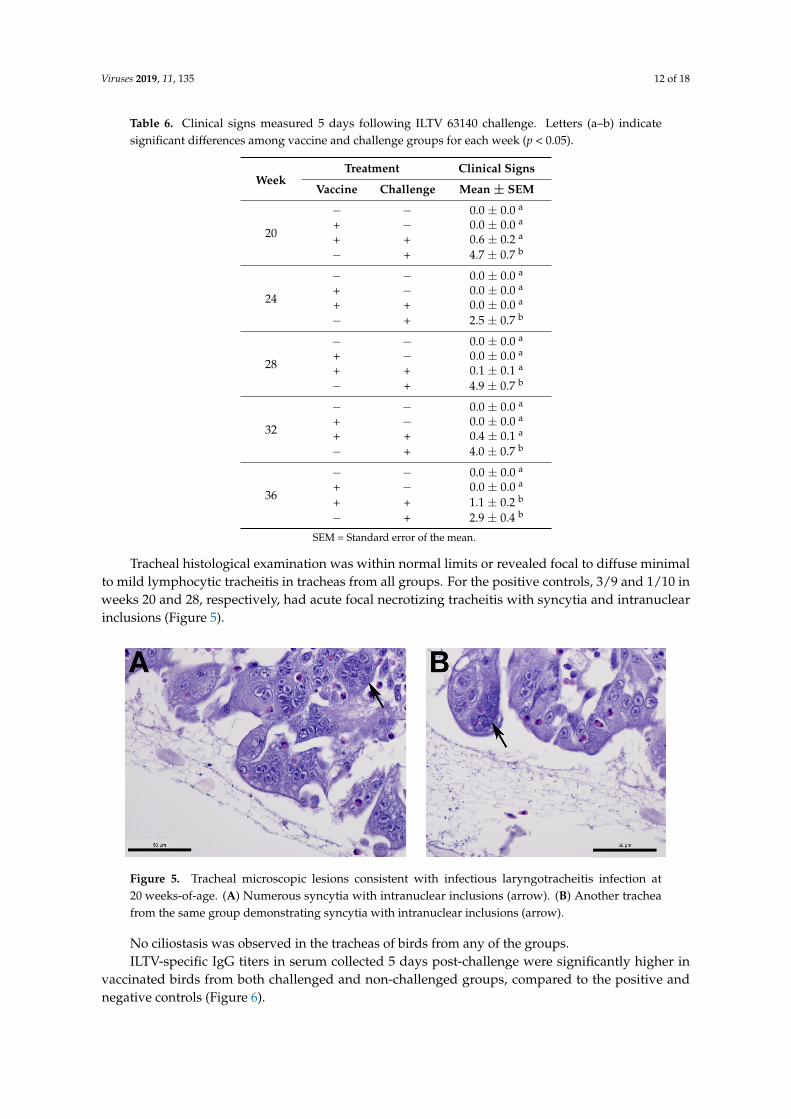
Clinical signs and viral DNA were detected in challenged birds at 3 dpc, but signs in positivecontrols had become more severe by 5 dpc as tracheal viral load increased (Table 6). Clinical signscores measured at 5 dpc were significantly reduced in vaccinated/challenged birds compared topositive controls, at all collection points except 36 WOA when clinical sign scores were numericallyreduced. All negative controls and vaccinated controls had no clinical signs, and clinical signs invaccinated/challenged birds were not significantly different compared to these controls, except at36 WOA when clinical sign scores were significantly higher.
Viruses 2019, 11, 135 12 of 18
Table 6. Clinical signs measured 5 days following ILTV 63140 challenge. Letters (a–b) indicatesignificant differences among vaccine and challenge groups for each week (p < 0.05).
WeekTreatment Clinical Signs
Vaccine Challenge Mean ± SEM
20
− − 0.0 ± 0.0 a
+ − 0.0 ± 0.0 a
+ + 0.6 ± 0.2 a
− + 4.7 ± 0.7 b
24
− − 0.0 ± 0.0 a
+ − 0.0 ± 0.0 a
+ + 0.0 ± 0.0 a
− + 2.5 ± 0.7 b
28
− − 0.0 ± 0.0 a
+ − 0.0 ± 0.0 a
+ + 0.1 ± 0.1 a
− + 4.9 ± 0.7 b
32
− − 0.0 ± 0.0 a
+ − 0.0 ± 0.0 a
+ + 0.4 ± 0.1 a
− + 4.0 ± 0.7 b
36
− − 0.0 ± 0.0 a
+ − 0.0 ± 0.0 a
+ + 1.1 ± 0.2 b
− + 2.9 ± 0.4 b
SEM = Standard error of the mean.
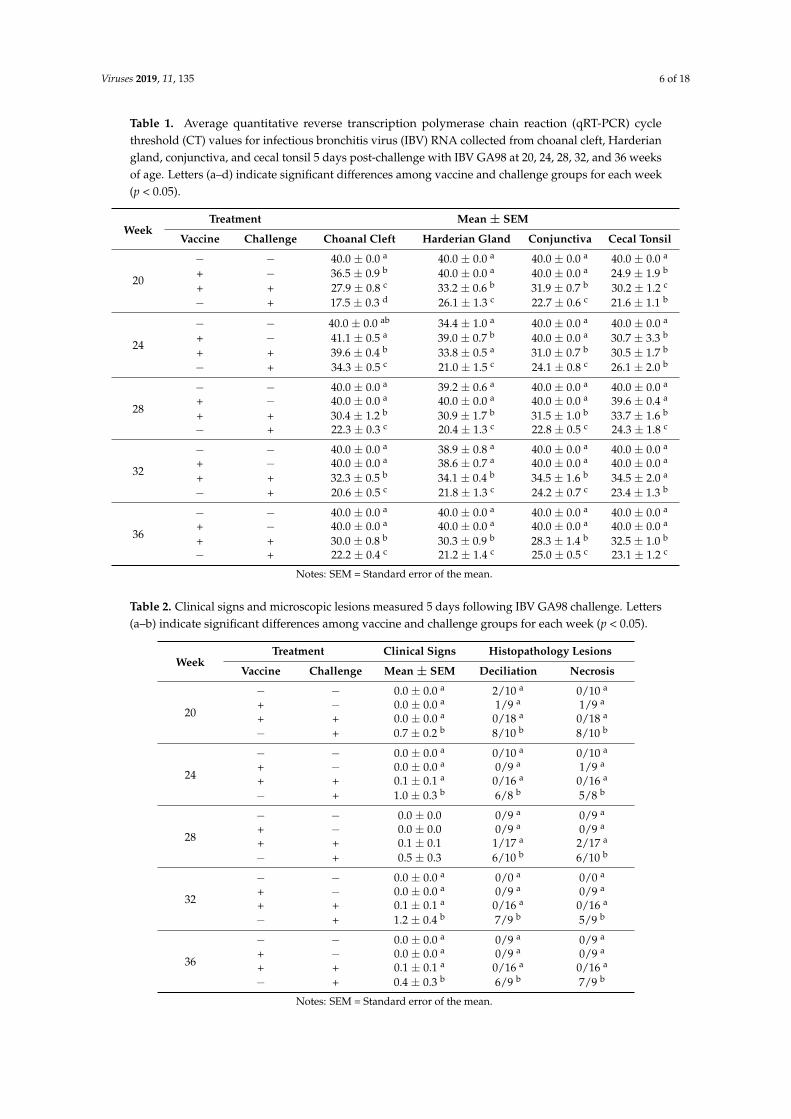
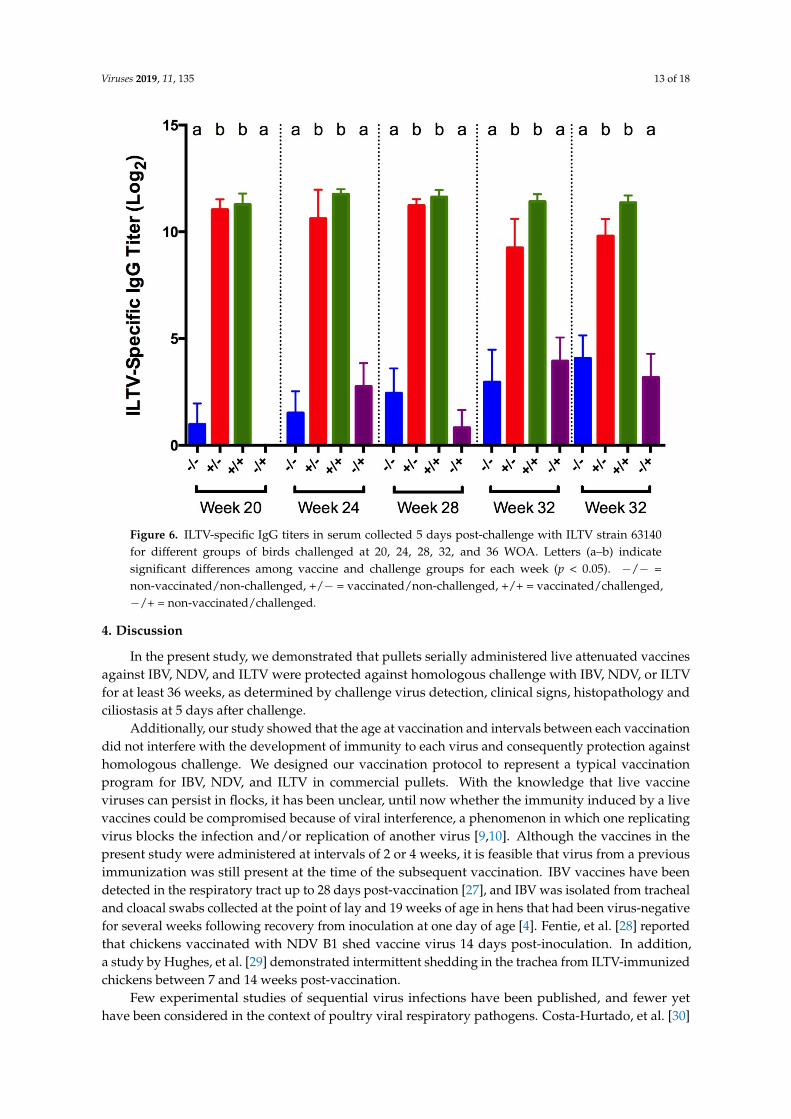
Tracheal histological examination was within normal limits or revealed focal to diffuse minimalto mild lymphocytic tracheitis in tracheas from all groups. For the positive controls, 3/9 and 1/10 inweeks 20 and 28, respectively, had acute focal necrotizing tracheitis with syncytia and intranuclearinclusions (Figure 5).
Viruses 2019, 11, x FOR PEER REVIEW 15 of 21
Table 6. Clinical signs measured 5 days following ILTV 63140 challenge. Letters (a–b) indicate significant differences among vaccine and challenge groups for each week (p < 0.05).
Week Treatment Clinical Signs
Vaccine Challenge Mean ± SEM
20
− − 0.0 ± 0.0a + − 0.0 ± 0.0a + + 0.6 ± 0.2a − + 4.7 ± 0.7b
24
− − 0.0 ± 0.0a + − 0.0 ± 0.0a + + 0.0 ± 0.0a − + 2.5 ± 0.7b
28
− − 0.0 ± 0.0a + − 0.0 ± 0.0a + + 0.1 ± 0.1a − + 4.9 ± 0.7b
32
− − 0.0 ± 0.0a + − 0.0 ± 0.0a + + 0.4 ± 0.1a − + 4.0 ± 0.7b
36
− − 0.0 ± 0.0a + − 0.0 ± 0.0a + + 1.1 ± 0.2b − + 2.9 ± 0.4b
SEM = Standard error of the mean.
Tracheal histological examination was within normal limits or revealed focal to diffuse minimal to mild lymphocytic tracheitis in tracheas from all groups. For the positive controls, 3/9 and 1/10 in weeks 20 and 28, respectively, had acute focal necrotizing tracheitis with syncytia and intranuclear inclusions (Figure 5).
Figure 5. Tracheal microscopic lesions consistent with infectious laryngotracheitis infection at 20 weeks-of-age. (A) Numerous syncytia with intranuclear inclusions (arrow). (B) Another trachea from the same group demonstrating syncytia with intranuclear inclusions (arrow).
No ciliostasis was observed in the tracheas of birds from any of the groups.
Figure 5. Tracheal microscopic lesions consistent with infectious laryngotracheitis infection at20 weeks-of-age. (A) Numerous syncytia with intranuclear inclusions (arrow). (B) Another tracheafrom the same group demonstrating syncytia with intranuclear inclusions (arrow).
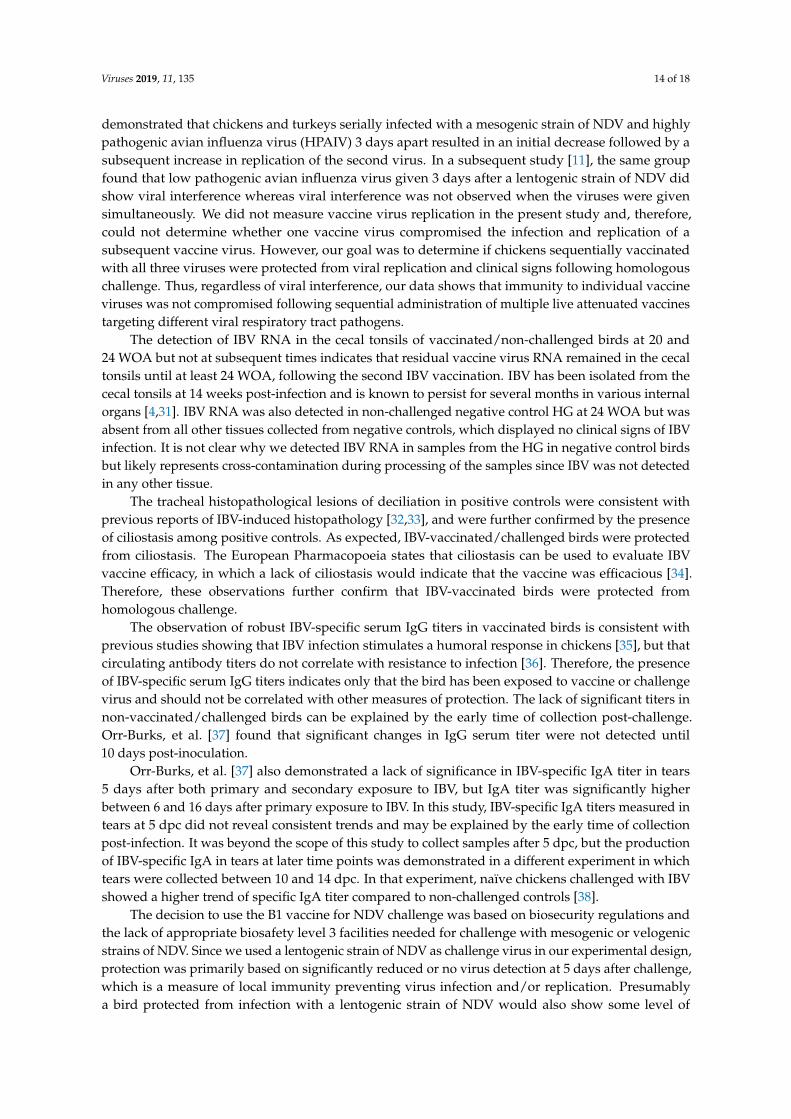
No ciliostasis was observed in the tracheas of birds from any of the groups.ILTV-specific IgG titers in serum collected 5 days post-challenge were significantly higher in
vaccinated birds from both challenged and non-challenged groups, compared to the positive andnegative controls (Figure 6).
Viruses 2019, 11, 135 13 of 18
Viruses 2019, 11, x FOR PEER REVIEW 16 of 21
ILTV-specific IgG titers in serum collected 5 days post-challenge were significantly higher in vaccinated birds from both challenged and non-challenged groups, compared to the positive and negative controls (Figure 6).
Figure 6. ILTV-specific IgG titers in serum collected 5 days post-challenge with ILTV strain 63140 for different groups of birds challenged at 20, 24, 28, 32, and 36 WOA. Letters (a–b) indicate significant differences among vaccine and challenge groups for each week (p < 0.05). −/− = non-vaccinated/non-challenged, +/− = vaccinated/non-challenged, +/+ = vaccinated/challenged, −/+ = non-vaccinated/challenged.
4. Discussion
In the present study, we demonstrated that pullets serially administered live attenuated vaccines against IBV, NDV, and ILTV were protected against homologous challenge with IBV, NDV, or ILTV for at least 36 weeks, as determined by challenge virus detection, clinical signs, histopathology and ciliostasis at 5 days after challenge.
Additionally, our study showed that the age at vaccination and intervals between each vaccination did not interfere with the development of immunity to each virus and consequently protection against homologous challenge. We designed our vaccination protocol to represent a typical vaccination program for IBV, NDV, and ILTV in commercial pullets. With the knowledge that live vaccine viruses can persist in flocks, it has been unclear, until now whether the immunity induced by a live vaccines could be compromised because of viral interference, a phenomenon in which one replicating virus blocks the infection and/or replication of another virus [9,10]. Although the vaccines in the present study were administered at intervals of 2 or 4 weeks, it is feasible that virus from a previous immunization was still present at the time of the subsequent vaccination. IBV vaccines have been detected in the respiratory tract up to 28 days post-vaccination [27], and IBV was isolated from tracheal and cloacal swabs collected at the point of lay and 19 weeks of age in hens that had been virus-negative for several weeks following recovery from inoculation at one day of age [4]. Fentie, et al. [28] reported that chickens vaccinated with NDV B1 shed vaccine virus 14 days post-inoculation.
Figure 6. ILTV-specific IgG titers in serum collected 5 days post-challenge with ILTV strain 63140for different groups of birds challenged at 20, 24, 28, 32, and 36 WOA. Letters (a–b) indicatesignificant differences among vaccine and challenge groups for each week (p < 0.05). −/− =non-vaccinated/non-challenged, +/− = vaccinated/non-challenged, +/+ = vaccinated/challenged,−/+ = non-vaccinated/challenged.
4. Discussion
In the present study, we demonstrated that pullets serially administered live attenuated vaccinesagainst IBV, NDV, and ILTV were protected against homologous challenge with IBV, NDV, or ILTVfor at least 36 weeks, as determined by challenge virus detection, clinical signs, histopathology andciliostasis at 5 days after challenge.
Additionally, our study showed that the age at vaccination and intervals between each vaccinationdid not interfere with the development of immunity to each virus and consequently protection againsthomologous challenge. We designed our vaccination protocol to represent a typical vaccinationprogram for IBV, NDV, and ILTV in commercial pullets. With the knowledge that live vaccineviruses can persist in flocks, it has been unclear, until now whether the immunity induced by a livevaccines could be compromised because of viral interference, a phenomenon in which one replicatingvirus blocks the infection and/or replication of another virus [9,10]. Although the vaccines in thepresent study were administered at intervals of 2 or 4 weeks, it is feasible that virus from a previousimmunization was still present at the time of the subsequent vaccination. IBV vaccines have beendetected in the respiratory tract up to 28 days post-vaccination [27], and IBV was isolated from trachealand cloacal swabs collected at the point of lay and 19 weeks of age in hens that had been virus-negativefor several weeks following recovery from inoculation at one day of age [4]. Fentie, et al. [28] reportedthat chickens vaccinated with NDV B1 shed vaccine virus 14 days post-inoculation. In addition,a study by Hughes, et al. [29] demonstrated intermittent shedding in the trachea from ILTV-immunizedchickens between 7 and 14 weeks post-vaccination.
Few experimental studies of sequential virus infections have been published, and fewer yethave been considered in the context of poultry viral respiratory pathogens. Costa-Hurtado, et al. [30]
Viruses 2019, 11, 135 14 of 18
demonstrated that chickens and turkeys serially infected with a mesogenic strain of NDV and highlypathogenic avian influenza virus (HPAIV) 3 days apart resulted in an initial decrease followed by asubsequent increase in replication of the second virus. In a subsequent study [11], the same groupfound that low pathogenic avian influenza virus given 3 days after a lentogenic strain of NDV didshow viral interference whereas viral interference was not observed when the viruses were givensimultaneously. We did not measure vaccine virus replication in the present study and, therefore,could not determine whether one vaccine virus compromised the infection and replication of asubsequent vaccine virus. However, our goal was to determine if chickens sequentially vaccinatedwith all three viruses were protected from viral replication and clinical signs following homologouschallenge. Thus, regardless of viral interference, our data shows that immunity to individual vaccineviruses was not compromised following sequential administration of multiple live attenuated vaccinestargeting different viral respiratory tract pathogens.
The detection of IBV RNA in the cecal tonsils of vaccinated/non-challenged birds at 20 and24 WOA but not at subsequent times indicates that residual vaccine virus RNA remained in the cecaltonsils until at least 24 WOA, following the second IBV vaccination. IBV has been isolated from thececal tonsils at 14 weeks post-infection and is known to persist for several months in various internalorgans [4,31]. IBV RNA was also detected in non-challenged negative control HG at 24 WOA but wasabsent from all other tissues collected from negative controls, which displayed no clinical signs of IBVinfection. It is not clear why we detected IBV RNA in samples from the HG in negative control birdsbut likely represents cross-contamination during processing of the samples since IBV was not detectedin any other tissue.
The tracheal histopathological lesions of deciliation in positive controls were consistent withprevious reports of IBV-induced histopathology [32,33], and were further confirmed by the presenceof ciliostasis among positive controls. As expected, IBV-vaccinated/challenged birds were protectedfrom ciliostasis. The European Pharmacopoeia states that ciliostasis can be used to evaluate IBVvaccine efficacy, in which a lack of ciliostasis would indicate that the vaccine was efficacious [34].Therefore, these observations further confirm that IBV-vaccinated birds were protected fromhomologous challenge.
The observation of robust IBV-specific serum IgG titers in vaccinated birds is consistent withprevious studies showing that IBV infection stimulates a humoral response in chickens [35], but thatcirculating antibody titers do not correlate with resistance to infection [36]. Therefore, the presenceof IBV-specific serum IgG titers indicates only that the bird has been exposed to vaccine or challengevirus and should not be correlated with other measures of protection. The lack of significant titers innon-vaccinated/challenged birds can be explained by the early time of collection post-challenge.Orr-Burks, et al. [37] found that significant changes in IgG serum titer were not detected until10 days post-inoculation.
Orr-Burks, et al. [37] also demonstrated a lack of significance in IBV-specific IgA titer in tears5 days after both primary and secondary exposure to IBV, but IgA titer was significantly higherbetween 6 and 16 days after primary exposure to IBV. In this study, IBV-specific IgA titers measured intears at 5 dpc did not reveal consistent trends and may be explained by the early time of collectionpost-infection. It was beyond the scope of this study to collect samples after 5 dpc, but the productionof IBV-specific IgA in tears at later time points was demonstrated in a different experiment in whichtears were collected between 10 and 14 dpc. In that experiment, naïve chickens challenged with IBVshowed a higher trend of specific IgA titer compared to non-challenged controls [38].
The decision to use the B1 vaccine for NDV challenge was based on biosecurity regulations andthe lack of appropriate biosafety level 3 facilities needed for challenge with mesogenic or velogenicstrains of NDV. Since we used a lentogenic strain of NDV as challenge virus in our experimental design,protection was primarily based on significantly reduced or no virus detection at 5 days after challenge,which is a measure of local immunity preventing virus infection and/or replication. Presumablya bird protected from infection with a lentogenic strain of NDV would also show some level of
Viruses 2019, 11, 135 15 of 18
protection from exposure to mesogenic or velogenic strains. Vaccinated birds at each sampling timehad significantly lower or no challenge virus RNA compared to positive control groups, indicatingthat the vaccinated birds developed a local immune response and were indeed protected whereas thenon-vaccinated positive controls were not. Because lentogenic NDV only causes a mild respiratory orenteric infection [3], it was not surprising that respiratory signs and histological changes were mild orabsent despite the presence of viral RNA. We observed clinical signs of NDV infection only at 20 WOAin positive controls, while only a few birds showed mild clinical signs at 24 and 28 WOA, and noclinical signs of disease were observed at later challenge times. This observation is consistent withexisting knowledge that ND tends to be more severe in younger birds [39].
The lack of ciliostasis observed in NDV B1-infected positive controls contrasts with previousreports demonstrating that NDV caused ciliostasis in tracheal explants. Butler, et al. [40] demonstratedthat NDV caused ciliostasis within 2 to 6 days after infection of tracheal explants, and Malo, et al. [41]reported that following vaccination of one-day-old chicks with lentogenic NDV, the peak of ciliostasisoccurred at 5 and 7 dpv and waned by 13 dpv. The discrepancy between our results and the previousstudies may be explained by the use of a different lentogenic NDV strain; B1 in our studies and LaSotain previous reports [41]. It is well established that the LaSota vaccine strain is more virulent thanB1 [42], which may explain the ciliostasis observed in LaSota-vaccinated chicks or LaSota-infectedtracheal explants, whereas ciliostasis was not observed in our study using B1 vaccine.
Robust NDV-specific circulating IgG antibody responses developed following NDV vaccinationand stayed elevated, which was consistent with prior research indicating that antibodies may bedetected for up to one year in birds immunized multiple times against NDV [39]. With the exception of28 WOA, the IgG titers in non-vaccinated/challenged birds were not significantly increased comparedto titers in negative controls. This observation is not surprising given that NDV-specific antibodies arenot detected in the serum until 6–10 days after exposure [39].
For the ILTV-challenged birds, vaccination prevented challenge virus replication in trachea andHG but did not completely block virus replication in the conjunctiva, especially at 32 and 36 WOA.This may suggest a waning of the local immunity against ILTV after the second vaccination at 16 WOA.In addition, the proximity of the conjunctiva to the inoculation site (eyedrop and intranasal) mightexplain why the local immune response was not able to completely block viral replication in theconjunctiva but successfully cleared the virus before it could replicate in HG and trachea.
Very few positive controls (non-vaccinated/challenged) demonstrated histological evidence of ILTinfection in the trachea, though all positive controls tested positive for ILT DNA by PCR. This findingis not surprising in light of a report by Guy, et al. [43], which illustrated that histological detectionof ILT is highly specific (98%) but poorly sensitive (42%). Notably, intranuclear inclusion bodies arepresent only during the initial infection (1–5 days) and disappear following epithelial cell necrosisand desquamation [44], which may explain the observation that by 5 dpc only 3/9 and 1/10 positivecontrols at 20 and 28 WOA, respectively, had histological evidence of ILT infection despite the presenceof ILT DNA in the trachea.
The absence of ciliostasis observed in both vaccinated and non-vaccinated, ILTV-challenged birdsat 5 dpc was not surprising given that Butler, et al. [40] found that only some strains of ILTV causedciliostasis and did not correlate with virulence. Moreover, the authors showed that ciliostasis rarelyoccurred before 6 days, and sometimes even 9 days, after inoculation. In addition, Gerganov andSurtmadzhiev [45] also demonstrated ciliostasis in ILTV-infected tracheal organ cultures at 7–8 dayspost-infection. Therefore, our results combined with previous studies indicate that measuring ciliostasismay not be a reliable marker of protection from ILTV infection and that ciliostasis in ILTV infectionstudies may need to be evaluated at later times post-inoculation.
The lack of significant ILTV-specific serum IgG titers in non-vaccinated positive controls may beexplained by the early time of collection post-challenge, as ILTV-specific antibodies do not becomedetectable until 5–7 dpi and peak at 21 dpi [46]. However, it is worth noting that antibody titers are not
Viruses 2019, 11, 135 16 of 18
correlated to protection from ILTV infection [44]. IgG titers were robust in vaccinated birds throughoutthe study and support previous data that antibodies may be detectable for at least a year [44].
Taken together, our data indicate that a typical pullet vaccination program consisting of seriallyadministered live attenuated vaccines against IBV, NDV, and ILTV does not interfere with immuneresponses to the individual vaccines, and the birds are adequately protected against homologouschallenge until at least 36 WOA. This information is important because it shows that consecutivelyadministered live attenuated vaccines against multiple respiratory pathogens can be an effectivevaccination strategy for the development of protective immunity against each disease agent inlong-lived birds.
Author Contributions: Conceptualization, M.W.J.; Methodology, E.J.A., B.J.J., S.W.M., M.G., and M.W.J.; Formalanalysis, E.J.A., B.J.J., S.W.M., and M.G.; Investigation, E.J.A., B.J.J., S.W.M., M.G. and M.W.J.; Resources, B.J.J.and M.W.J.; Data curation, E.J.A., B.J.J., S.W.M., M.G. and M.W.J.; Writing-original draft, E.J.A. and M.W.J.;Writing-review and editing, B.J.J., S.W.M., M.G. and M.W.J.; Supervision, B.J.J. and M.W.J.; Project administration,E.J.A.; Funding acquisition, M.W.J.
Funding: This work was funded by the USDA, NIFA, Poultry Respiratory Disease Coordinated AgriculturalProject.
Conflicts of Interest: The authors declare no conflict of interest.
References
1. Bermudez, A.J.; Stewart-Brown, B. Disease prevention and diagnosis. In Diseases of Poultry, 12th ed.;Saif, Y.M., Ed.; Blackwell Publishing: Ames, IA, USA, 2008; pp. 5–42.
2. De Wit, J.J.; Cook, J.K.A.; Van der Heijden, H.M.J.F. Infectious bronchitis virus variants: A review of thehistory, current situation and control measures. Avian Pathol. 2011, 40, 223–235. [CrossRef] [PubMed]
3. Mayers, J.; Mansfield, K.L.; Brown, I.H. The role of vaccination in risk mitigation and control of Newcastledisease in poultry. Vaccine 2017, 35, 5974–5980. [CrossRef] [PubMed]
4. Cavanagh, D.; Gelb, J., Jr. Infectious bronchitis. In Diseases of Poultry, 12th ed.; Saif, Y.M., Ed.; BlackwellPublishing: Ames, IA, USA, 2008; pp. 117–136.
5. Amarasinghe, G.K.; Bào, Y.; Basler, C.F.; Bavari, S.; Beer, M.; Bejerman, N.; Blasdell, K.R.; Bochnowski, A.;Briese, T.; Bukreyev, A.; et al. Taxonomy of the order Mononegavirales: Update 2017. Arch. Virol. 2017, 162,2493–2504. [CrossRef] [PubMed]
6. Hanson, R.P.; Brandly, C.A. Identification of vaccine strains of Newcastle disease virus. Science 1955, 122,156–157. [PubMed]
7. Dimitrov, K.M.; Afonso, C.L.; Miller, P.J.; Yu, Q. Newcastle disease vaccines-A solved problem or a continuouschallenge? Vet. Microbiol. 2017, 206, 126–136. [CrossRef] [PubMed]
8. Garcia, M. Current and future vaccines and vaccination strategies against infectious laryngotracheitis (ILT)respiratory disease of poultry. Vet. Microbiol. 2017, 206, 157–162. [CrossRef] [PubMed]
9. DaPalma, T.; Doonan, B.P.; Trager, N.M.; Kasman, L.M. Review: A systematic approach to virus–virusinteractions. Virus Res. 2010, 149, 1–9. [CrossRef]
10. Pinky, L.; Dobrovolny, H.M. Coinfections of the respiratory tract: Viral competition for resources. PLoS ONE2016, 11, e0155589. [CrossRef]
11. Costa-Hurtado, M.; Afonso, C.L.; Miller, P.J.; Spackman, E.; Kapczynski, D.R.; Swayne, D.E.; Shepherd, E.;Smith, D.; Zsak, A.; Pantin-Jackwood, M. Virus interference between H7N2 low pathogenic avian influenzavirus and lentogenic Newcastle disease virus in experimental co-infections in chickens and turkeys. Vet. Res.2014, 45, 1. [CrossRef]
12. Villegas, P. Newcastle disease virus vaccine titration. In Avian Virus Diseases: Laboratory Manual; College ofVeterinary Medicine, University of Georgia: Athens, GA, USA, 2004; p. 62.
13. Vagnozzi, A.; Riblet, S.M.; Williams, S.M.; Garcia, M.; Zavala, G. Infection of broilers with two virulentstrains of infectious laryngotracheitis virus: Criteria for evaluation of experimental infections. Avian Dis.2015, 59, 394–399. [CrossRef]
14. Rodríguez-Avila, A.; Oldoni, I.; Riblet, S.; Garcia, M. Evaluation of the protection elicited by direct andindirect exposure to live attenuated infectious laryngotracheitis virus vaccines against a recent challengestrain from the United States. Avian Pathol. J. W.V.P.A 2008, 37, 287–292. [CrossRef] [PubMed]
Viruses 2019, 11, 135 17 of 18
15. Toro, H.; Pennington, D.; Gallardo, R.A.; van Santen, V.L.; van Ginkel, F.W.; Zhang, J.; Joiner, K.S. Infectiousbronchitis virus subpopulations in vaccinated chickens after challenge. Avian Dis. 2012, 56, 501–508.[CrossRef] [PubMed]
16. Oldoni, I.; Rodriguez-Avila, A.; Riblet, S.M.; Zavala, G.; Garcia, M. Pathogenicity and growth characteristicsof selected infectious laryngotracheitis virus strains from the United States. Avian Pathol. 2009, 38, 47–53.[CrossRef] [PubMed]
17. Cook, J.K.A.; Orbell, S.J.; Woods, M.A.; Huggins, M.B. Breadth of protection of the respiratory tract providedby different live-attenuated infectious bronchitis vaccines against challenge with infectious bronchitis virusesof heterologous serotypes. Avian Pathol. 1999, 28, 477–485. [CrossRef] [PubMed]
18. De Wit, J.J.; Boelm, G.J.; van Gerwe, T.J.; Swart, W.A. The required sample size in vaccination-challengeexperiments with infectious bronchitis virus, a meta-analysis. Avian Pathol. 2013, 42, 9–16. [CrossRef][PubMed]
19. Jackwood, M.W.; Jordan, B.J.; Roh, H.-J.; Hilt, D.A.; Williams, S.M. Evaluating protection against infectiousbronchitis virus by clinical signs, ciliostasis, challenge virus detection, and histopathology. Avian Dis. 2015,59, 368–374. [CrossRef] [PubMed]
20. Guy, J.S.; Barnes, H.J.; Morgan, L.M. Virulence of infectious laryngotracheitis viruses: Comparison ofmodified-live vaccine viruses and North Carolina field isolates. Avian Dis. 1990, 34, 106–113. [CrossRef]
21. Callison, S.A.; Hilt, D.A.; Boynton, T.O.; Sample, B.F.; Robison, R.; Swayne, D.E.; Jackwood, M.W.Development and evaluation of a real-time Taqman RT-PCR assay for the detection of infectious bronchitisvirus from infected chickens. J. Virol. Methods 2006, 138, 60–65. [CrossRef]
22. Mia Kim, L.; Suarez, D.L.; Afonso, C.L. Detection of a broad range of class I and II Newcastle disease virusesusing a multiplex real-time reverse transcription polymerase chain reaction assay. J. Vet. Diagn. Investig. Off.Publ. Am. Assoc. Vet. Lab. Diagn. Inc. 2008, 20, 414–425. [CrossRef]
23. Roh, H.J.; Hilt, D.A.; Jackwood, M.W. Detection of infectious bronchitis virus with the use of real-timequantitative reverse transcriptase-PCR and correlation with virus detection in embryonated eggs. Avian Dis.2014, 58, 398–403. [CrossRef]
24. Vagnozzi, A.; García, M.; Riblet, S.M.; Zavala, G. Protection induced by infectious laryngotracheitis virusvaccines alone and combined with Newcastle disease virus and/or infectious bronchitis virus vaccines.Avian Dis. 2010, 54, 1210–1219. [CrossRef] [PubMed]
25. Vagnozzi, A.; Riblet, S.M.; Zavala, G.; García, M. Optimization of a duplex real-time PCR method for relativequantitation of infectious laryngotracheitis virus. Avian Dis. 2012, 56, 406–410. [CrossRef] [PubMed]
26. Callison, S.A.; Riblet, S.M.; Oldoni, I.; Sun, S.; Zavala, G.; Williams, S.; Resurreccion, R.S.; Spackman, E.;Garcia, M. Development and validation of a real-time Taqman PCR assay for the detection and quantitationof infectious laryngotracheitis virus in poultry. J. Virol. Methods 2007, 139, 31–38. [CrossRef] [PubMed]
27. Roh, H.-J.; Hilt, D.A.; Williams, S.M.; Jackwood, M.W. Evaluation of infectious bronchitis virus Arkansas-typevaccine failure in commercial broilers. Avian Dis. 2013, 57, 248–259. [CrossRef] [PubMed]
28. Fentie, T.; Dadi, K.; Kassa, T.; Sahle, M.; Cattoli, G. Effect of vaccination on transmission characteristics ofhighly virulent Newcastle disease virus in experimentally infected chickens. Avian Pathol. J. W.V.P.A 2014,43, 420–426. [CrossRef] [PubMed]
29. Hughes, C.S.; Williams, R.A.; Gaskell, R.M.; Jordan, F.T.; Bradbury, J.M.; Bennett, M.; Jones, R.C. Latencyand reactivation of infectious laryngotracheitis vaccine virus. Arch. Virol. 1991, 121, 213–218. [CrossRef][PubMed]
30. Costa-Hurtado, M.; Afonso, C.L.; Miller, P.J.; Shepherd, E.; DeJesus, E.; Smith, D.; Pantin-Jackwood, M.J.Effect of infection with a mesogenic strain of Newcastle disease virus on infection with highly pathogenicavian influenza virus in chickens. Avian Dis. 2016, 60 (Suppl. 1), 269–278. [CrossRef]
31. Alexander, D.J.; Gough, R.E. Isolation of avian infectious bronchitis virus from experimentally infectedchickens. Res. Vet. Sci. 1977, 23, 344–347. [CrossRef]
32. Chousalkar, K.K.; Roberts, J.R.; Reece, R. Histopathology of two serotypes of infectious bronchitis virus inlaying Hens vaccinated in the rearing phase. Poult. Sci. 2007, 86, 59–62. [CrossRef]
33. Chousalkar, K.K.; Roberts, J.R.; Reece, R. Comparative histopathology of two serotypes of infectiousbronchitis virus (T and N1/88) in laying hens and cockerels. Poult. Sci. 2007, 86, 50–58. [CrossRef]
34. Pharmeuropa. Available online: http://online6.edqm.eu (accessed on 1 May 2018).
Viruses 2019, 11, 135 18 of 18
35. Raj, G.D.; Jones, R.C. Infectious bronchitis virus: Immunopathogenesis of infection in the chicken.Avian Pathol. 1997, 26, 677–706. [CrossRef] [PubMed]
36. Raggi, L.G.; Lee, G.G. Lack of correlation between infectivity, serologic response and challenge results inimmunization with an avian infectious bronchitis virus vaccine. J. Immunol. 1965, 94, 538–543. [PubMed]
37. Orr-Burks, N.; Gulley, S.L.; Gallardo, R.A.; Toro, H.; van Ginkel, F.W. Immunoglobulin A as an early humoralresponder after mucosal avian coronavirus vaccination. Avian Dis. 2014, 58, 279–286. [CrossRef] [PubMed]
38. Aston, E.J.; Jackwood, M.W.; Gogal, R.M., Jr.; Hurley, D.J.; Fairchild, B.D.; Hilt, D.A.; Cheng, S.; Tensa, L.R.;Garcia, M.; Jordan, B.J. Ambient ammonia does not inhibit the immune response to infectious bronchitisvirus vaccination and protection from homologous challenge in broiler chickens. Vet. Immunol. Immunopathol.2018, Under Review.
39. Alexander, D.J.; Senne, D.A. Newcastle disease, other avian paramyxoviruses, and pneumovirus infections.In Diseases of Poultry; Saif, Y.M., Ed.; Blackwell Publishing: Ames, IA, USA, 2008; pp. 75–115.
40. Butler, M.; Ellaway, W.J.; Hall, T. Comparative studies on the infectivity of avian respiratory viruses for eggs,cell cultures and tracheal explants. J. Comp. Pathol. 1972, 82, 327–332. [CrossRef]
41. Malo, A.; de Wit, S.; Swart, W.A.J.M. Alternative methods to compare safety of live-attenuated respiratoryNewcastle disease vaccines in young chicks. Vet. Rec. 2017, 181, 236–242. [CrossRef] [PubMed]
42. Martinez, J.C.S.; Chou, W.K.; Berghman, L.R.; Carey, J.B. Evaluation of the effect of live LaSota Newcastledisease virus vaccine as primary immunization on immune development in broilers. Poult. Sci. 2018, 97,455–462. [CrossRef] [PubMed]
43. Guy, J.S.; Barnes, H.J.; Smith, L.G. Rapid diagnosis of infectious laryngotracheitis using a monoclonalantibody-based immunoperoxidase procedure. Avian Pathol. 1992, 21, 77–86. [CrossRef] [PubMed]
44. Guy, J.S.; Garcia, M. Laryngotracheitis. In Diseases of Poultry; Saif, Y.M., Ed.; Blackwell Publishing: Ames, IA,USA, 2008; pp. 137–152.
45. Gerganov, G.; Surtmadzhiev, K. Cultivation of various avian viruses in pheasant trachea organ cultures andchick embryos. Vet. Meditsinski Nauk. 1982, 19, 18–24.
46. Hitchner, S.B.; Shea, C.A.; White, P.G. Studies on a serum neutralization test for the diagnosis oflaryngotracheitis in chickens. Avian Dis. 1958, 2, 258–269. [CrossRef]
© 2019 by the authors. Licensee MDPI, Basel, Switzerland. This article is an open accessarticle distributed under the terms and conditions of the Creative Commons Attribution(CC BY) license (http://creativecommons.org/licenses/by/4.0/).