effect of organic and inorganic fertilizers on tue growth, yield ...
113
EFFECT OF ORGANIC AND INORGANIC FERTILIZERS ON TUE GROWTH, YIELD AND NUTRIENT UPTAKE BY RICE BY MD. ARIFUL HASAN Reg: No. 25155/00295 A Thesis Submitted to the Department of Soil Science Sher-e-Bangla Agricultural University, Dhaka in partial hilfiliment of the requirements for the degree of MASTER OF SCIENCE IN SO1l. SCIENCE SEMESTER: JANUARY-JUNE, 2007 Approved by: Co-supervisor (A.T.M. Shamsuddoha) Associate Professor Department of Soil Science Shcr-e- Bangla Agricultural University, Dhaka- 1207 u'Skisor (Dr. Md. Nurul Islam) Professor Department of Soil Science Sher-e-Bangla Agricultural University. Dhaka- 1207 Chairman (Dr. 1tlok Kumar Paul) Professor Department of Soil Science Sher-e-Bangla Agricultural University. Dhaka- 1207
-
Upload
khangminh22 -
Category
Documents
-
view
3 -
download
0
Transcript of effect of organic and inorganic fertilizers on tue growth, yield ...

EFFECT OF ORGANIC AND INORGANIC FERTILIZERS ON TUE GROWTH, YIELD AND NUTRIENT UPTAKE BY RICE
BY
MD. ARIFUL HASAN Reg: No. 25155/00295
A Thesis
Submitted to the Department of Soil Science Sher-e-Bangla Agricultural University, Dhaka
in partial hilfiliment of the requirements for the degree of MASTER OF SCIENCE
IN SO1l. SCIENCE
SEMESTER: JANUARY-JUNE, 2007
Approved by:
Co-supervisor (A.T.M. Shamsuddoha)
Associate Professor Department of Soil Science
Shcr-e- Bangla Agricultural University, Dhaka- 1207
u'Skisor (Dr. Md. Nurul Islam)
Professor Department of Soil Science
Sher-e-Bangla Agricultural University. Dhaka- 1207
Chairman (Dr. 1tlok Kumar Paul)
Professor Department of Soil Science
Sher-e-Bangla Agricultural University. Dhaka- 1207

CERTIFICATE
This is to certify that thesis entitled,"ICFFECI OF.' ORGANIC AND /NORG,1N!C
FERTILIZERS ON lifE GRO lviii, YJU!) AND N(JTRJiN IT UPTAKE BY RICE" submitted
to the Department of SOIL SCiENCE, Sher-e-l3angla Agricultural
University, Dhaka, in partial fulfillment of the requirements for the degree
of MASTER OF SCIENCE (M.S) in SOIL SCiENCE, embodies the result
ol it piece of bona Jidc' research work carried out by MD. ARIFUL
1-IASAN, Registration No. 25 155/00295 under my supervision and guidance.
No part of the thesis has been submitted for any other degree or diploma.
I further certi& that such help or source of information, as has been
availed of during the course of this investigation has duly been
acknowledged by him.
Dated ...........................
Dhaka, Bangladesh. Supervisor (Dr. Md. Nurul Islam)
Professor Department ol Soil Science
Sher-c-E3aflgla Agricultural University Dhaka- 1207

e&atdTo

ACKNOWLEDGEMENT
All praises are due to Almighty Allah Rabbul Al-Amin who kindly enabled me to
complete this work. I wish to express my sincere appreciation and profound gratitude to my
reverend supervisor Dr. Md. Nurul Islam. Professor, Department of Soil Science, Slier-c-
Bangla Agricultural University for his constant guidance, keen interest, immense advice,
generous help and encouragement throughout the period of my research work and in preparing
this dissertation.
I wish to express my extreme gratitude It) my co-supervisor Associate Professors
A.T.M. Shamsuddoha, Department of Soil Science, Sher-e-Bangla Agricultural University for
his valuable advice, technical suggestion and eonstnictive criticism on this dissertation.
I express my heartfelt thanks and gratitude to my esteemed teachers Professor Dr. Alok
Kuniar Paul, Chairman, Department of Soil Science, Sher-e-l3angla Agricultural University,
Professor Dr. Gopi Nath Chandra Sutradhar, Associate Professors Dr. Md. Asaduzzaman
Khan and Mst. Afrose Jahan, Assistant Professor Mohammad Mosharraf Flossain, Lecturers
Mohammod Issak, Mohammad Saiffil Islam Bhuiyan, Saikat Chowdhury and Mrs. Jharna Rani
Sarker, Department of Soil Science, Sher-c-Bangla Agricultural University for their constant
cooperation, direct and indirect advice, encouragement and good wishes during the work.
I am grateful to Md. Kamruzzaman, Soil Lab Analyst, BRAC Soil Analytical Lab,
Joydcbpur, Gazipur to for providing inc with the laboratory facilities and cordial cooperation.
I must thank SHURID-l3angladesh for providing the vermicompost used in this
experitneilt

Thank to my friends Shanaj, Mokier, Prince Tuhin apu , Ferdousi Rahul and milton
for their help in preparing my thesis.
I express my sincere thanks to my class maLes Subrato, Mohiuddin vai, Mokter, , Prince,
Tuhin apu. Ferdousi, Rahut, Saikat and Jharna For their help and inspiration.
I would like to acknowledge my heartfelt indebtness to my beloved parents, brothers
Al-Amin, Anis, Apple younger sister Mim for their immensurabte sacrifice, blessings and
continuous inspiration throughout my academic tile.
Finally, I express my sincere gratitude and appreciation to all of my well wisher.
AwL Place: Dhaka Md. Ariful 1-lasan
Dated: M.S. Student,
Rcg. No. 2555/00295
Dept. of Soil Science
S.A.U.

EFFECT OF ORGANIC AND INORGANIC FERTILIZERS ON ITIE GRowl'!!, YIELD AND NIJ1'RIENT UPTAKE BY RICE
A Bs'I'RAC'r
A field experiment was conducted at the Sher-c-l3angla Agricultural University Farm, Dhaka
1207 during the K/mr/f-I season of 2005 to study the efkct of organic and inorganic
fertilizers on the growth, yield, nutrient concentration and uptake by rice. The experimental
soil was silty clay in texture having 1)11 of 59. The treatments were 4 levels of
vermicomposts viz. V0 (0 t ha'), V1 (2 t ha'), V2 (4 t ha),V3 (U t haS '), and 4 levels of
chemical fertilizers viz. F0 = (0-0-0-0 kg ha' N, P205, K20, respectively), F1 = low (50-40-30
kg ha1 N. P205, K20, respectively), F2 = medium (80-60-50 kg ha1 N, P205, K20,
respectively), F3 high (110-80-70 kg haS ' N, 1)205, K20, respectively) with 16 treatment
combinations and 3 replications. The results demonstrated that the increasing doses of
vermicontposts and chemical fertilizers increased grain and straw yields of rice significantly.
The maximum significant grain and straw yields were obtained with the treatment
combinations. V3F2 . The optimum production of rice ( BR-26,Shraboni) was obtained when
6 t ha1 vcrmicornpost combined with 80, 60, and 50 kg N. P205 and K20, respectively were
applicd The highest doses of vermicompost and chemical fertilizers increased both the
conceniration and uptakes of N. P, K and S by rice plant significantly at the harvesting stage
and showed highest values with V31'3 treatment combination. Application of chemical
fertilizers alone failed to increase organic matter content of post harvest soil, whereas
combined application of vermicompost and inorganic fertilizers showed a significant positive
cfThct. Vermicompost and chemical fertilizers also inc.rcaS N P. K and S status of post
harvest soil significantly.

LIS'l' OF CONTENTS
Cl IAP1'Elt
I 2
3
- TITLE I'AGES
- ACICNOWLEL)CEMEN'I I
ABS'IRACi
LIST OF CONTENTS iv
LIST OF TABLES VII
LIST OF FIGURES ix
LIST OF APPENDICES TABLES ix
LIST OF ABBREVIATIONS XIII
INTRODUCTION 1-4
REVIEW OF LITERA'ITRE 5
2.1 Effect and importance of NPK fertilizers and 5-11
inn ukiii.0 application on rice 2.2 Effect and 11111)urta nec of N PlC fertilizers :iiicl 11-13
manure on grain viel(I and ;intrieiit uptake by rice
2.3 Effect and importance of NPK fertilizers and 14-16
manure on grain yield and soil properties.
2.4 Effect and importance of organic manure! crop 16-18
residues on rice 2.5 Integrated use of fertilizer with manure/ crop 18-19
residues on rice 2.6 Residual effect of organic mauure/ crop 19
residues oii rice 2.7 Effect and importance of verniicoinpost on crop 19-22
Effect and 11111)ortalice of vermiconipost on
2.8 nutrient sin tus a ii d crop product iOn 22-24
2.9 Effect and importance of NPK and manure 24-32
application on other crops MATERIALS AND METHODS 33
3.1 Experimental site and location 33
3.2 Description of soil 33
3.3 l)cscription of (lie rice Variety 35
3.4 Raising of seedling 35
3.5 I'repa ri lion of' the field 36
3.6 I ay out of the experiment 36
3.7 Treatments 36-38
3.8 Application of vermicompost and fertilizers 39
3.9 Transplanting 39
3.10 Cultural and management practices 39
3.11 Harvesting 40
3.12. Collection of samples 40
3.12.1 Soil Sample 40
3.12.2 Plant sample 40
3.13 Collection of, data 40
3.13.1 Plant height 41

LIST OF CONTENTS (Cont.)
lITI.E IACES
3.13.2 __
l';I ii ide lengt li(cm) 41
3.13.3 Flag leaf lengt II (ciii) 41
3.13.4 Number of grains per Panicle 41
3.13.5 % of spikelet sterility 41
3.13.6 Thousand seed weight 41
3.13.7 Grain yield 41
3.13.8 Straw yield 42
3.14 Chemical analysis of the plant and soil samples 42
3. 14.1 Pl:iti t Sa in pie analysis 42
3 14,1 a Nitrogen 42
$4 II) l'l1ospllorolIs 42
3 14. Ic Potassium 42
3.14.1d Sulphur 42
3.14.2 Soil sample analysis 43
3.14.2.a Organic carbon 43
3.14.2.b Organic matter 43
3.14.2.c Total nitrogen 43
3.14.2.d Available phosphorous 43
3. 14.2.c Exchangeable potassium 44
3.14.2.1 Available sulphur 44
3.14.3 Verniicompost 44
3.14.4 Statistical analysis 44
4 RESULTS AND DISCUSSIONS 45
4.1 Effect of vermicompOst and NPK fertilizers on 45
the growth paratiteters of rice
4.1.1 Plant height (cm) 45
4.1.2 Panicle height (cm) 47
4.1.3 Flag kaf height (cm) 48
4.2. Effect of Vermicompost and NPK on the yield 49
para meters of rice 4.2.1 Weight of 1000 grain 49
422 Grain yield 50
4.2.3 Straw yield 53
4.2.4 Number of grains per panicle 53
4.2.5 % of spiklct strility 56
4.3 Effect of vermicompost and NPK fertilizers on 57
the nutrient concentration in rice plant
4.3.1 Nitrogen content 57
4.3.2 Phosphorous content 58
4.3.3 Potassium content 60
4.3.4 Sulphttr content 61

LIST OF CONTENTS (Contd.)
4.4 Effect of vennicompost and NPIC fertilizers on 62
the uptake of n titrient by iiCC pta iii
4.4.1 Nitrogen content 62
4.4.2 Phosphorous content 64
4.4.3 Potassium content 65
4.4.4 Sulphur content 67
4.5 Effect of verniicornpost and NPK fertilizers 68
application on the nutrient status of soil after
harvest 4.5.1 Organic matter content of soil 68
4.5.2 Nitrogen content of soil 69
4.5.3 Phosphorous content of soil 71
4 5.4 Potassium content ol soil 72
$ 5.5 Sulphur content ol' soil 73
5 SUMMARY AND CONCLUSION 74-76
6 REFERENCES 77-90
7 ABJ3REVJATIONS
S APPENDICES i-li

LIST OF TABLES
TABLE TITLES OF TABLES PAGES
Initial characteristics ol the soil of the experimental held 35
2 Effect of vennicompost on the growth conlributing characters 46
of rice
3 Effect of NPK fertilizers on the growth contributing 46 characters of rice
I Combined effect of verinicompost and NPK fertilizers on the 47 growth contributing characters of rice
S Efftct of vcrniieompost on the yield contributing characters of 31 rice
6 Effect of NPK fertilizers on the yield contributing characters 32 of rice
7 Combined effect of vermicompost and NPK fertilizers on the 52
yield contributing character of rice
Effect of vermicompost on the yield contributing characters of 54 rice
9 I Utect of NIK fertilizers on the yield contributing characters 51 or rice
10 Combined effect of vcrmicompost and NPK fertilizers on the 55
yield contributing character of rice
Effect of vermicompost on the NPKS concentrations in 58 rice plant

LIST OF TABLES (Contd.)
TABLE TLTLES OF TABLES PAGES
12 Effect of NPK fertilizers on the NPKS concentrations in rice 58
plant
13 Combined cilect of vermicompost and NPK fertilizers on the 59
NPKS concentrations in rice plant
14 Effect of vermicompost on the OM, total N, available P, 68
exchangeable K. and available S contents in the soil after rice harvest
15 Effect of NPK fertilizers on the OM, total N. available P. 69
exchangeable K and available S content in the soil after rice harvest
16 Combined effect of vermiconipost and NPK JCrtilizers on the 71
OM. total N, available P. exchangeable K and available S contents in the soil after rice harvest
viii

LIST OF FIGURES
FIGURE
TITLE
PAGES
Map showing the experimental site under study 34
2 Layout of the experimental field 38
3 Effect of vermicompost on NPKS uptake by rice plant 62 4 Effcct of fertilizer on NPKS uptake by rice plant 63 5 ICombined effect of vermicompost and NPK fertilizers on 64
nitrogen uptake by rice plant 6 Combined effect of vermicompost and NPK fertilizers on 65
phosphorus uptake by rice plant 7 I Combined effect of vermicompost and NPK fertilizers on 66
potassium uptake by rice plant 8 Combined effect of vermicompost and NPK fertilizers on 67
sulphur uptake by rice plant
lx

LIST OF APPENDICES
APPENDIX TITLE
Appendix Effect of vermicompost on nitrogen, phosphorous.
Table 1 potassium and sulphur uptake by rice plant
Appendix Effect of NPKS fertilizers on nitrogen, phosphorous.
Table 2 potassium and sulphur uptake by rice plant
Appendix Combined effect olvermicompost andNPKS fertilizers on
Table 3 nitrogen, potassium, phosphorous and sulphur uptake by rice plant
PAGES

Chapter 1
Introduction

4 - 23 (Jia,ici'I ________________
rzr" ______
INTRODUCTION J'tti
Rice (0/)':c1 s(tires) is intensively cultivated in Bangladesh covering about 80% of arabic
land ( Jnlbrttinately the yield of' rice in ibis cotiniry is verY low (177 t lia ) compared Co
other rice growing countries like South Korea and Japan where the average yield is 700 and
622 t had , respectively (FAO, 1999) On the other hand, the deniand for increasing rice
production is mounting up to feed the ever increasing population.
Use of chemical Fertilizers is all essential component of modern firming and about 50% of
the world's crop production can be attributed to krtilizers use (Pradhan, 1992) The use of
icitilizers in different countries of' Asia has increased considerably with a maximum use of
509 kg ha1yr4 in the Republic of Korea as against only 102 kg ha1yr' in Bangladesh (Khan
ci cii. 1993). Nevertheless, sustainable production of crops can not be maintained by using
only chemical fertilizers and at the same time it is not possible to obtain higher crop yield by
using organic manure alone (Hair, 1990).
Soil organic matter is key factor for sustainable soil fertility and crop productivity. Organic
matter undergoes mineralization with the release of substantial quantities of N,P,K & S and
smaller amounts of micronutrients. Easily dccotiiposable part of the soil organic matter
undergoes (lU ick in i neral ization and becomes a part of soil humus, it small port ion of' wluc It
may remain in soil for the long time. In Bangladesh, most of the cultivated soils have less
than 1.0% organic matter while a good agricultural soil should contain at least 2% organic
matter, Moreover, this important component of soil is declining with time due to rapid
decomposition enhanced by high temperature and high rainfall with little or no addition of
organic manure. Addition of organic matter in soil is it pie-requisite for efficient cycling of

nutrients. Unless due attention is paid to the iniproveinent and maintenance of soil organic
matter it may not be possible to achieve the goal of increased and sustained productivity.
Ellbrts need to be made to build up and maintain a moderate level organic matter in soil.
Organic farming is the management practice that produces crop of good cttality and quantity
by using ceo-friendly technology, which can co-exist in nature. Such practices minimize the
use of chemical fertilizers, pesticides and weedicides etc. The tussle between population
growth and food supply in developing countries like Bangladesh are forced to cultivate
repeatedly the high yielding varieties (HYV) of crops that leads to a rapid depletion of the
soil nutrient reserve. To get more food, farmers are using chemical fertilizers and pesticides
in increasing amount, which are making ecological backlashes, resulting in deterioration of
soil health (Yawalkar, c/ at, 1981).
Among the diffeent sources of organic manure, vermicompost is iniportant in maintaining
and enhancing the quality of environment and conserving resources for sustainable
agriculture. Taking into account the environmcntal and public health benefits of
vermicompost farmi rig, there is it considerable potentiaL to maximize the use of
vermicompost to increase yield and to reduce unnecessary usages of chemical fertilizer for
crops production in Bangladesh.
Several researchers have compared vermicompost with the surrounding soils and reported
that have a higher base exchange capacity and are generally rich in total organic matter.
Besides, it contains substances which helps in building soil structure, stimuLation of plant
growth, particularly that of roots, drilling mud and emulsifiers (Dussere, 1992). SoiL organic
matter improves the physicoehemical properties of the soil and ultimately promotes crop
production. Its status in Bangladesh soil is very poor. Evidences from different AEZ of the
country have shown a decrease in the content of organic matter by the range of 15 to 30%

over the last 20 years ( Miah, 1994). Therefore, it is imposible to depend only on inherent
potentials of soils for higher crop production. More recently, attention is focused on the
global environmental problems; utilization of organic wastes, FYM, compost, vermicompost
and poultry manures as the most efFective measure for the purpose.
The application of different fertilizers and manures influences the physical and chemical
properties of soil and enhance the metabolic activities of soil. The organic and chemical
fertilizers are also positively correlated with soil porosity, enzymatic activity and CO2
production. Organic matter stimulates soil biological activity, enhances soil porosity by
increasing regular and irregular porus and causes a priming effect of native soil organic
matter (Marinari ci cii., 2000).
In Bangladesh, the farmers are using the chemical fertilizers continuously without knowing
the actual dose and their residual effects on soil properties. Under these imbalanced
conditions various beneficial soil microorganisms are being adversely affected. The soil is
loosing its fertility as well as productivity day by day. If this trend continues, crop production
will be seriously affected in the long run. On the contrary, if only organic matter is used the
soil physical properties will be improved but the nutrient demand of the crop can't be
satisfied due to low content of nutrients in organic matter.
So, combined applications olboth chemical and organic fertilizers need to be applied for the
improvement of soil physical properties and supply of essential plant nutrients. Information
are limited regarding the combined application of organic and inorganic fertilizers with
respect to the soil and crops of Bangladesh under the existing agro-cliniatic conditions which
needs to be studied.
3

Considering the above factors the present experiment has been undertaken with rice as the
test crop for the following objectives:
I. To study the effect of vermicompost and NPK on the yield of rice.
To know the optimum dose of vermicompost and NPK on the growth and yield of
rice. /
To see the improvement of soil fertility due to the use of vermicompost with NPK
fertilizers.
4

Chapter 2
Review of Literature

Chapter 2
Review of literature
It is now realized that agricu Ittire does not only icier to crop production hut also to various
other factors that are responsible for crop production Vcrniicompost is one of the marvelous
components in the organic Farming and eco-triendly iIirniing. Some of the published reports
relevant to research topic are reviewed under the following headings:
2.1 Effect and importance of NPK fertilizers and manure application on rice
Nieclu and Singh ( 1991 ) stated that besides chemical fertilizdrs, organic manure like poultry
manure is a good source of nutrients in soil. Experiments on the use and agronornic efficiency
of poultry manure showed that 4 t ha" poultry manure along with 60 kg N ha1 as urea
produced grain yield of rice similar to that with 120 kgN hi' as urea alone.
in l'hillippines, Meelu c/ al. (1992) obtained 0.9 t ha' mungbean grain and considerable N
saving with incorporation of uiungbean straw beibre rice transplanting. The niungbcan
residue supplemented 25 kg ha" of inorganic N. This result suggests that mungbean or a
similar short duration crop is an alternative to GM (Green manure). In this case, a farmer
should consider growing leguminous crop that would produce a cash income. The crop
residues should be incorporated in to the soil for its contribution oFN and other nutrients.
Ali (1994) conducted experiment with rice at several locations of Bangladesh during 1989-90
showed fertilizer use efficiency of over 20 kg ha" nutrient supply. Improving the soil
condition with organic manure and appropriate fertilization had further increased the
production level of rice to more than 6 tons grain ha".
Ii

Alam ci at (1994) conducted it field experiment on it sandy loatii soil during 1990-92 to
assess the effect of NPK with S and crop residues in a rice-wheat cropping sequence. The
number of rice panicles increased due to addition of N in the fertilizer regime and by S plus
crop residue. Grain development in both rice and wheat was improved due to addition of S.
11w yield" ol loth lice and wheat crops where reduced in the absence ol N.
Flynn ci ul. (1995) studied the residual cued ol broiler litter as a stippleinenlal of mineral N
and concluded that broiler litter applied in autumn at the rate 9 t hi' reduced the mineral N
from 44 kg to 22kg ha4
Zaman e/ at (1995) reported that the application ol' Sesbania @ 5 1 had (oven dry basis) once
it year prior to wet season planting along with lID kg urea N lia' y(' (80 kg for dry season
and 60 kg for wet season) and recommended doses of P, K and S gave a yield of about II
hi' yf! in a rice-rice cropping pattern on a moderate fertile soil. This practice allowed a
saving of 150 kg urea ha1 yr".
Gupta (1995) conducted field trial on different organic manure in India and reported that the
application of green manure (1(1 t hi') produced the highest grain yield (4.5 t hi') followed
by PM (Poultry Manure) and FYM (Fartu Yard Manure) which produced yield of 4.1 and
3.9 t hi' of rice grain, respectively. The increase in rice yield with organic manure was 34 to
55% higher over control and 5 to 22% higher over NPK fertilizer.
llama Singh and Sing (1995) showed that microbial bioniass C, N and P were 66. 77 and
49% grater, respectively in the straw i fertilizer treated plots than in the control. Total crop
bioniass ranged from 6.79 - 9.91 t ha"and grain yield ranged from 1.08 -1.46 t hi' both in
order control < Straw < fertilizer + straw: There were strong positive relationships between
grain yield and microbial biomass, N- mineralization and available P.
6

Medhi cial. (1996) conducted a green house experiment to study the nutrients in soil and soil
solution and growth of rice treated with organic manures and prilled Urea (P.U.). The
nitrogen was applied at 60 kg N ha4 and rice variety 'Ratna was used as the best crop.
Incorporation of organic and inorganic sources ol' N increased soil and soil solution Nil.1 N
to a peak and (lien declined to a very low level. The concentrations of P. K, Fe 2' in the soil
and soil solution were higher with P.U. and organic source than control. Addition of N.
regardless of sources, increased grain yield significantly. Nitrogen and Mn uptake by grain
also increased significantly with the addition of N,
icon c/ cii. (1996) studied the elibct of I'M (Poultry Manure) application on rice growth and
grain yield quality. They reported that 5 t rerniented chicken manure haS ' in rice field
increased N content in rice.
Singh c/ aL (1996) carried out a field experiment in India where irrigated rice was given
6080 or 120 kg N ha1 yr'1 as poultry manure, urea, poultry manure + urea. in the First year
Poultry manure (Jill not perkrm better than urea but in the linnili year 120 and 150 kg N as
poultry manure produced significantly higher grain yield than the same rates as urea. The
PM helped to sustain the grain yield of rice during the 3 years while the yield decreased with
urea application.
Mishra and sharma (1997) stated that the continuous addition of NPK fertilizers showed no
deteriorating effect on soil physical propellies; rather it significantly increased aggregation
and water transmission characteristics and reduced bulk density and penetration resistance of
the soil. The effectiveness of manures on aggregation, water transmission and hardness of the
soil was observed. Grain yield of rice, wheat and winter maize crops were also enhanced
7

significantly with continuous application of NPK f'enhlizer, Ibrinyard manure and
cyanobacteria separately as well as in combination.
Rani and Srivastava (1997) showed that vermicompost (produced by earthworms from
organic wastes) was tested in pot experi netits lbr its ability to replace a proportion of the urea
fertilizer applied to rice, compared with N fertilizer alone. Supplying one-third or one-quarter
of N as vermicompost increased plant height, grailt yield and yield components of rice.
Muthukrishnan ci cil.(1998) reported that the application of 100% or 133% of the
recommended mineral fertilizer (150: 60: 60 NPK) and 10 t farmyard manure \vitl) or
without adjustment with mineral fertilizer. 21 kg ZnSO4 and Ibliar spraying of I % Kcl in
irrigated rice. The maximum rice (cv ADT 38) yield was recorded with normal plant
populations of 500000 plants hi'( 20 x 10 cm spacing) and application of organic manure
adjusted with mineral fertilizer.
Anand Swamp Yaduvanshi (2000) reported that continuous use of fertilizer N and I' in alkali
soils significantly enhanced the yield of rice. The maximum yield was obtained with 100%
NPK plus GM (Green Manure). lie also found that application of 100% NPK plus organic
manure was significantly better than 150% NPK. Marginal improvement of N, P and K status
occurred with 100% and 150% NPK treatments.
Aulakh c/ al. (2000) found that integrating fertilizer N (FN) with legume green manures
(GM) application 0e, 60 kg FN ha (FN 60) and 20 kg GM ha' (GM 20) rice yield was
double the control yield and 6% greater than the FN 120 treatment, Nitrogen utilization by
rice was greater for GM 20 than FN, as indicated by greater fertilizer N equivalents and an
apparent N recovery by rice of 79 vs. 63%.
8

Rahaman (2001) conducted experiment with rice (Boro and T. Ainan) with N. I', K. S and Zn
fertilizers alone and with organic manures (Cow dung and Green Manure).The finding of his
experiment suggest that the integrated use of fertilizers with manure (viz. Sesbania, cow
dung) can be an efficient practice for ensuring higher crop yields without degradation of soil
lirtiIity.
Singh ci at (2001) reported the integrated effect of chemical fertilizer (NPK) with farm-yard
manure (FYM) and Blue Green Algae (BGA) on grain yield and nutrient availability in
ftopical area l3oth rice and wheat yields continued significantly with increasing NPK level
up to 100% of the recommended rate. I lowever, maximum yields of rice and wheat were
obtained where recommended rate of NPK was applied along with FYNI and BGA. Available
soil nutrients were enhanced up to rates of 75% of the recommended NPK dosage alone or
with FYM, BGA or FYM 1 BGA, compared with initial 66 t hi' was incorporated into the
soil and then wheat was grown. The results indicated that the various application rates were
significantly correlated with improvement in physical properties of soil as well as straw and
grain yields of rice.
Vijaya and Balasubrarnarnian (2002) reported that 28 days old rice seedlings were treated
with different organic amendments (Farm Yard Manure, at 50 kg N ha4 ± Urea at 50 kg N
green manure and 50 kg N ha4 Urea at 50 kg N ha', neem cake at 50 kg N ha" + urea
at 50 kg N ha, pressmud cake at 50 kg N lw' I Urea at 50 kg N ha", and Urea at 100 kg N
ha" )in a field experiment conducted in Rudwr, India, during seasons of 1996 and1997 to
develope a suitable integrated nutrient supply system to reduce blast (Pyricu/aria oiysac' )
incidence in the crop. Substitution of nitrogen through FYM has a significant effect on
reducing rice blast disease and increasing grain yield. Statistical analysis of the data showed
9

that supply of 50% of the required nitrogen thiough FY M and remaining 50% through urea
reduced the blast disease severity to a maximum extent and produced maximum yield.
Sinha etal. (2002) showed that application of BOA in combination with 90 kg N/ha recorded
favorable results in all the three rice cultivars (Saryu-52, Swarna and Jaya) and was
comparable with grain and straw yield at i'econitneiided doses of 120 kg N/ha. The response
oF J3GA in combination with green manure was very much pronounced at 30 kg N hi' and
was comparable to individual application of inorganic N at 90 and 120 kg hi' while
maximum yield was recorded at 60 kgN hi'. Residual effect of green manure and BGA was
also observed in wheat crops with Azotobactor at all levels of N. Maximum yield was
recorded at 90 kg N had I Azotobactor.
Kalccswari and Subramanian (2004) found that organic manures at 12.5 t ha" and inorganic
phosphatic fertilizer i.e., single super phosphate (SSP) and udaipur rock phosphate (RU?) at
0, 30 and 60 kg? ha'1 combined with organic manure at 12.5 t hi' and inorganic P fertilizers
recorded the highest grain yields and N, P and K uptake by rice.
Ciowda ci all (2004) conducted experiment that consisted of eight treatment including
control; 5 and lot of flesh Azolla before planting; 5 and 10 t flesh Azolla + 30 kg N ha1; and
30, 60 and 90 kg N hi'. Rice varieties phalguna and Jaya were used in K/;ar.f and Rabi,
respectively. The experimental results indicated that the application of lOt fresh Azolla + 30
kg N ha" and 90 kg N hi1 recorded significantly maximum grain yield of 4719 kg hi',
height, tillers per hill and panicles /ni2 (luring K/taut as well as during Thrin season.
Singh c/at (2005) stated the effect of integrated management of N fertilizer, vermicompost
and Azolla on grain yield and nutrient uptake of rice and on soil fertility. The highest grain
and straw yields were recorded with the application of 60 kg N ha'1 plus Azolla. They also

found that the highest N, P and K uptake with the application of 60 kg N hi' plus Azolla
treatment.
Chideshwari and Krishnawamy (2005) conducted a pot experiment with rice cv. AOl 36, to
study the effect of Zn-enriched organic manures on yield, transformation of Zn and their
availability under submerged condition. Five Zn levels (0.0. 125, 2.50. 3.75 and 5.0 mg/kg)
were enriched with 4 sources of organic manures at 1.0 t ha' (lrmyard manure (FYM),
composted coir pith (CCP), FYM + green leaf manure (GLM amd CCP± GLM) and was
compared with the application of recommended dose or organic manures (without Zn-
enrichment) at 12 t ha* The application of Zn-enriched organic manures at 1.0 mg hi' was
sufficient to get the maximum yield compared to the recommended dose of organic manures.
The enrichment of Zn at 1.25 mg/kg with organic manures increased the grain yield of rice by
26% over no Zn application. Soil Zn fractions increased with increasing levels of
enrichments. The complex organically bound and water soluble plus exchangeable fractions
significantly affected the grain and dry matter yields, DTPA- Zn. Zn content and uptake at
all stages of crop growth (maximum ill lering, panicle initiation and harvest).
2.2 Effect and importance of NPK fertilizers and manure on grain yield and nutrient uptake by rice
Bhandari et at (1992) observed from a 4-year study on integrated nutrient management in a
rice-whcat system that both rice and wheat yields continued to increase significantly with
increasing NPK levels up to 100% of recommended dose through fertilizer GM with 50%
recommended dose of NPK to rice produced as much rice yield of 6.27 t hi' to 100% NPK
dose through fertilizer produced 6.28 t hi'. They also reported that inclusion of short
duration pulse crop (mungbean) in the system substituted 50% of recommended NPK
IF

fertilizers in rice. Among different organic source of N ror rice. GM was found signiflcafflly
superior to FYM and wheat straw in increasing the crop yield and nutrient uptake.
Hundal c/al. (1992) studied the contribution of GM (Green Manure) to P nutrition of rice and
showed that fertilizer P addition increased dry matter production and P uptake by rice. Grain
yield Zt!1(I P uptake by rice were liigliesi in cowpea plots id towed by dlia india and SLUt licntp.
Khan c/cit (1993) obtained rice yields of 3.2, 5.8 and 7.2 t hi' with 0. 60 and 120 kg N ha"
when cop residues of mungbean were removed and 6.5, 7.5 t hi' residues were incorporated
into the soil increased N and P uptake by rice.
Majid ci al. (1 995) lound that when clucke,i manure was applied @) 0, 4. I . 8.25. to 15 and
33 t hi' in wheat, the grain yields, grain quality and straw yields were increased with the rate
of chicken manure. The greatest economic return was recorded by 8.25 t ha4 . The N and P
uptake increased with increasing manure rates.
Kumar and Yadav (1995) studied the effect of organic manure, fertilizers and their integrated
use in rice- wheat cropping sequence. In the lirst year. 25-50% substitution of fertilizers
through organic sources, FYM, GM and wheat straw reduced the rice yield by 6-23%
compared with 100% chemical fertilizers alone. in the following year, 25-50% N through
FYM or GM along with 50-75% fertilizers to rice gave either equal or more yields compared
with 100% NPK. The FYM and GM were found superior to wheat straw with respect to grain
yield and Nit uptake.
David and l3iswas (1996) found that when 10 1 PM Iii' was applied with 120 kg P 205 ha"
then the dry matter yield of wheat and total I' uptake were increased. P utilization was
increased when PM was applied with mineral P. Dry matter yield was highest with 120 kg
P205, with 10 t PM ha".
12
-

Pathak and Sarkar (1997) studied the effectiveness of rice straw in combination with different
proportion of urea in supplying nitrogen in rice-wheat cropping sequence. Straw and urea
combination registered lower grain yield of rice than integrated use of conventional manure
and urea. A very high dose of urea with rice straw was necessary to get good yield . At early
growth stages of rice, straw-urea materials recorded higher N uptake but they titiled to
compete with manure in later stage. Use of dhaincha plus urea in an appropriate ratio was
found to be the best in terms of yield and N uptake by rice. Beneficial effeci of rice straw
was not obsen'ed in succeeding wheat crop.
Dey and Jam (2000) observed the residual effect of GM and their enriched counterparts in
terms of yield. N uptake and efficiencies ol wheat was higher than that of urea treatment
during preceding rice season. Quadratic models can effectively explain the variations in yield
and N uptake of rice with N application up to 180 kg N ha'. Significant and positive
correlation exists between soil organic N on rice yield and N uptake of wheat. Linear model
constituted with soil organic N with rice yield and N uptake and yield of residual wheat can
significantly describe the variation.
Tiwari el of. (2001) found that the effect of farmyard manure (FYM), biocides ( bitachlor,
BHC (HCH) and Ziram) and cyanobacteria (BGA) together with recommended doses of N,
P and K on biodiversity of microbial lead, biological yield, quality of rice seeds, nutrient
uptake and soil productivity Maximum yield of rice was obtained with the treatment
receiving 10 t FY M hi' plus 131 C and algaL inoculation.
13

2.3 Effect and importance of NL'K fertilizers and manure on grain yield and soil properties.
Prasad and Kerketta (1991) conducted an experiment to assess the soil fertility, crop
production and nutrient removal under different cropping sequences in the presence of
recommended doses ol ['cmiii ixers mid cultural practices along with 5 t 1111 compost applied to
the crops. There was an overall increase in organic C, total N (83.9%). available N (69.9%),
available P (117.3%) and CEC (37.7%).
f3handari es al. (1992) reported that an application of fertilizers or their combined use with
organic manure increased the organic C status of soil The NPK fertilizers at 100% level and
their combined use with organic N sources also increased the available N and P by 5.22 kg
and 0 8-3.8 kg hi' from their initiaL values.
Meelu c/cu. (1992) reported that organic C and total N increased significantly when sesbanici
and crotalaria were applied in the preceded rice crop for two wet seasons.
Nahar el cii, (1995) had examined the soil condition aller one crop cycle (rice-wheat).
Addition of orgauic matter dun ig the rice CFOI) (lotibled the organic C content compared to its
original status. Total and available N contents were also significantly improved by addition of
organic matter, but had less impact on soil exchangeable cations.
Bcllakki and Badanur (1997) reported from field experiments during 1984-94 that in situ
incorporation of sun hemp reduced the bulk density as compared with fertilizer application.
Application of sun hemp in combination with fertilizers improved the infiltration rate, water
stable aggregates, porosity, held capacity and maximum water holding capacity under dry
lands. Continuous application of organic fertilizer increased the BCE and exchangeable Ca
while it decreased the Na and CaCO3 contents. AvailaWe N, P, K and micronutrient contents

increased significantly with organic sources of nutrients added either alone or in combination
with fertilizers over fertilizers alone.
Rani and Srivastava (1998) conducted a pot experiment with application of fertilization and
vermicompost and obtained highest grain yield and N uptake, when N, 1120S, and K20 were
applied at the rate of 60, 30 and 30 kg ha' with vermicompost.
Santhi et at (1999) observed that application of 100% NPK plus FYM decreased the bulk
density and increased the water holding capacity of soil. The decrease in bulk density in FYM
treated plots might be ascribed to better aggregation. The water holding capacity increased
due to the improvement of soil properties.
Vasanthi and Kumaraswamy K (2000) conducted field experiments on a red sandy clay loam
soil with vermicompost at S and 10 t ha4 with N, P and K at recommended levels. The result
showed that the grain yields were significantly higher in the treatments that received
vernhicompost plus N, P and K at recommended levels than in the treatment that received N,
P and K alone. Organic carbon content and fertility status as reflected by the available status
of N, P. K, micronutrients and cation exchange capacity were higher and bulk density was
lower in the treatments that received vernhicompost plus N, P and K than in the treatment
with N, P and K alone. Vermicompost at 5 1 ha" would be sufficient for a rice crop when
applied with recommended levels of N, P and K.
Singh et cxl. (2001) conducted a field experiment to study the iniluence of organic fertilizers
along with inorganic fertilizers on the rice-wheat cropping system. Five main-plot treatments
viz., (M1 ) green manure (sesbanga sesbana) , (M2) Moong legume (vigna radiata) straw at (5 t
ha S '), (M:i) Farmyard manure (5 t ha 1),
(M4) rice straw (St ha ) and (M5) weedy fhllow;
15

and five sub plot treatments viz: (170) control, (F,) 50% N, (F2) 50% N P (F3) 50% NPK and
(F4) 100% NPK of the recommended doses (120 kg N, 26.4 kg P and 49.8 kg K). Maximum
grain yield was obtained (3.7 t ha ') in the plot of (M,) while minimum grain yield was
obtained (2 1 ha ) under the fallow treatment (M,)
Bajpai ci al. (2002) found that green manure with prickly sesban or dhaincha c'Scshanici
czcze'kxia) to supplement 50% of the recommended nitrogen rate and the rest through inorganic
fertilizer and 200% recommended rate of fertilizer to wheat crop gave the maximum yield of
rice as well as wheat crops. 'lie some treatment also gave the highest net returns and
benefit: cost ratio, and produced significantly higher biornass in terms of rice equivalent
yield. Among the organic manures, the overall performance of green manure was the best
fallowed by farm yard manure and rice straw. The results showed a possibility of saving 50%
fertilizer N in rice and 25% in wheat. Application of farmyard manure and rice straw as well
as green manuring in rice significantly improved the available N and P status of soil.
2.4 Effect and importance of organic manure/crop residues on rice
Zhu ci cii. (1984) stated that the residual eIThct of GM was found to be more than those of
urea as was cvidcnced by 11w increase in grain yields. N uptake and N recovery also showed
positive effect of GM to the succeeding crops when applied to the preceding rice season
Maskina ei al. (1986) conducted an experiment with different organic manure as a nitrogen
source in rice-wheat rotation. They observed that yields with poultry manure and 80 kg urea-
N ha .' was as high as those were with 160 kg urea-N ha4 alone. Yields with FYM or pig
16
manure and 80 kg fertilizer N ha were equal to 120 kg N ha fertilizer alone. They also
reported that application of any one of the manure added to rice had residual effect equivalent
to 30 kgN and 13 kgP ha 1 in wheat.
In trial with rice-wheat cropping sequence Yadav ci (l. (I 08,7) reported the highest yield
with NPK as conventional fertilizers, intermediate yield with 50-75% NPK as conventional
fertilizer plus 25-50% NPK as FYM and the lowest with all NPK as FYM. They found that
the residual effect of NPK on wheat grain yield was in the order: FYM> conventional 75%
?'IF'K fertilizers FYM> conventional NPK fertilizers.
Rouldin (1988) viewed that the residual effects of green manure on a second crop would be
small when only one application of green manure is made, but the cumulative effects of
several annual applications are expected to give appreciable residual effects. These effects are
important not only on N supply but also on long term improvement of soil fertility and crop
productivity.
Ishikawa (1988) observed that long-term (10-I5 years) application of vetch green manure
increased organic matter and N contents olsoits,
Ciarrity and Flinn (1988) conducted a regional survey in South Southeast and East Asian
countries regarding green manure management systems. They concluded that that green
manuring is now viable practice for rice farmers in many parts of Asia.
Ahmed and Rahman ( 1991 ) reported the residual effect ol cow dung. in a treatment with cow
dung and other sources of plant nutrients, they found significantly higher yield in the
following crop from the plots which received cow dung in the previous rice.
Bhandari ci 0/. (1992) demonstrated the residual effect of FYM. In a 4-year study on
integrated nutrient management in rice-wheat cropping sequence some residual effect of
17

FYM on wheat was observed. I3enoi ci cii. (1993) pointed out that the residual effect of FYM
increased the grain yield of wheat by 230 to 520 kg hi'.
Rajput and Warsi (1992) examined the different levels of inorganic and organic sources of N
in rice and residual effect or organic sources in the following wheat crop. They found that the
residual effect of FYM alone increased the grain and straw yields significantly compared to
the control.
Miah (1994) stated that only the first crop following the application of manure recovered one-
fifth to one-hall' of the nutrients supplied by animal manure. The remainder was held as
liunius to very slow decomposition, 2.4% of nutrient clement being released per annum.
Islam (1994) found a significant yield increase with t'ertilizer-N plus cow dung compared to
fertilizer-N alone in T. Aman rice. In the ftllowing Boro rice, the yields with fertilizer-N +
residual of cow dung were higher than the fertilizer-N alone.
Santhi ci at. (1999) reviewing green manuring research in India reported that the residual
effect of green manure applied to rice was low. Previous works, (Beri and Meelu. 1981;
llesse 1984; Meelu c/uI., 1992 ) have also shown that there is little or no cumulative (over 3
to 4 years) benefit of green manuring of rice Ia the succeeding crop.
2.5 Integrated use of fertilizers with manure / crop residues of rice
Maskina ci cii. (1986) studied the effect oiN application on wetland rice in a loamy sand soil
amended with cattle manure (60 kg N hi') or PM (80 kg N hi'). In the absence of urea-N,
PM increased the rice grain yield by 98%, which was 2.6 Limes higher than cattle manure
(37%). Rice yield increased linearly with N rates whether or not the soil was amended with
organic manure. Urea-N equivalent to cattle and PM varied from 21 to 53 and 50 to 123 kg
hi', respectively. Apparent recovery of N from poultry manure ranged from 38 to 82%
compared with 51 to 69% from urea and 20 to 25% cattle manure and pig manure.
18

Besides chemical fertilizers, organic manure like poutny manure is another good source of
nutrients in soil. Experiments on the use and agronoinic efficiency of poultry manure showed
that 4 t ha1 poultry manure along with 60 kg N hit as urea produced grain yield of rice similar
to that with 120 kg N ha as urea alone (Meelu and Singh. 1991).
Studies conducted by All (1994) with rice ai several locations of Bangladesh during 1989-90
showed fertilizer use efficiency of over 20 kg per kg nutrient supply. Improving the soil
condition with organic manure and appropriate fertilization had further increased the
production level of rice to more than 6 tons grain hi
2.6 Resi(lual effect of organic manure/ crop ItSi(hIeS of rice
Residual effect of GM was found to be more than those of urea as was evidenced by the
increase in grain yields, N uptake and N recovery. Zhu a cii. (1984) also observed positive
effect of GM to the succeeding crops when applied to the preceding rice season
2.7 Effect and mi portance of veriii icon) 1)OSt on CEQI)
Verniicomposting is the managed bioconversion of organic materials through earthworm
consumption. Verniiculture and vercomposting experiments have been set up in many
countries like EngLand, France, Germany, Italy, Israel, USA, Japan, The Philippines, India
and other parts of South-East Asia, Australia, Cuba, The Bahamas and many countries in
Africa and South America (Edwards and Bohten . 1996).
When vermicasts have been compared with the surrounding soils it is observed that casts
have a high base exchange capacity and are generally rich in total organic matter, total
exchangeable bases, phosphorous, exchangeable potassium, manganese and total
exchangeable calcium. Vermicompost helps to improve and protect fertility of topsoil and
19

also helps to boost up productivity by 40% with 20 to 60% lower nutrient inputs. It also
enhances the quality of end products and thereby creating significant impact on flexibility in
marketing as well as increases the storage time. Vermiconipost contain 30 to 501/o humic
substances which help in the stimulation of plant growth, particularly that or roots, drilling
mud and emulsiiiers (Dussere, 1992).
A field experiment was conducted by Ranwa and Siugh (1999) at Ilisar, Haryana, India
during the winter seasons of 3994-96 to study the effect of integration of nitrogen with
vermicompost on wheat crop. The treatment comprised 5 levels of organic manures, viz., no
organic manure, farmyard manure at 10 t ha". vermicompost (at 5. 7.5 and 10 t ha') and 4
levels of N viz. 0, 50, tOO, 150 kg hal' and other recommended fertilizer dose. They reported
that the application of' organic manures improved yield attributes and grain, straw and
biological yields of wheat. Application of vermicompost at 7.5 or 10 tha1 resulted in higher
yields than 10 t had FYM.
Vasanthi and Kumaraswa;ity (1999) from an experintent with vermicompost and NPK
Fertilizers showed that the grain yields or rice were significantly higher in the treatments that
received vermicompost front any of the 5 to 10 t hi' organic materials (sugarcane trash,
ipomea, banana peduncle etc) with N, P and K at recommended levels than in the treatment
that received N. P and K alone. Organic carbon content and fertility status as reflected by the
available status of N, P. and K, inicronutrients and CEC were higher and bulk density were
lower in the treatments that received vern1iconlpost Plus N, P and K than in the treatments
with N, P and K alone. It was found that vermicompost at 5 t ha" would be sufficient for rice
crop when applied with recommended levels of N, P and K.
20

Rao ci al. (2000) from a field experiment carried out at the Indian Agricultural Research
Institute, New Delhi, revealed that application of 3 t verniicornpoSt ha' to chickpea improved
dry matter accumulation, grain yield and grain protein content in chickpea, soil N and P and
bacterial count, dry fodder yield of succeeding maize, total N and P uptake by the cropping
system over no vermicompost.
Vermicompost produced higher yield of tomato than the chemical fertilizer treated and
control plots. Sante margin of production was obtained in snake gourd, bitter gourd and
lady's linger. All the plots of lady's linger at one time were completely damaged due to
severe virus attack It was observed that crops grown tinder chemical fertilizer became
yellowish rapidly while crops grown under vermicompost remained green. Germination of
different seeds in the vermicomposted plots were higher than the control and chemical
fertilizer treated plots (Zahid, 2001).
A study was conducted in India on two wheat cultivars to investigate the effect of chemical
lertilizers (Nl'K fertilizers), and organic manure (vennicotnpost) Results showed that plant
height, dry matter production and grain yield were higher at higher dose of vermiconipost.
Number of tillers and leaves per plant were very low at early stages of growth and suddenly
increased after adding different doses of vermicompost and organic manure (Khandal and
Nagendra., 2002).
A Fold experiment was conducted in Orissa, India, during the khanf season of 1999 to
determine the effect of integrated application of vermicompost and chemical fertilizer on rice
cv. Lalat. Yield components were increased by integrated application of vermicompost and
chemical fertilizes compared to the other treatments. The highest results in terms of straw and
21

crop yields were obtained with 50% vermicompost + 50% chemical fertilizers (Das et cit,
2002)
1 lie comhiiied application of organic and inorganic N sustained the productivity. Soil
availabic nutrients like N, P and K increased significantly with the application of various
organic sources of nutrients in combination with fertihzers over the fertilizer alone. The
highest grain yields of ,czbi sorghum and chickpea were obtained with 50 percent N through
green manure plus 50 percent fertilizer N (Tolanur and l3adanur., 2003).
2.8 Effect and importance of vermicotupost on nutrient status and crop
production
Kumari and Kumari (2002) from an experiment stated that vermicompost is a potential
source of organic manure due to the presence of readily available plant nutrients, growth
enhancing substances and number of benehcial microorganisms like N fixing, P solubilising
and cellulose decomposing organisms.
Vermicompost contains 2.29 folds more organic carbon, 1.76 times total nitrogen, 3.02 folds
phosphorous and 1.60 times potassium than normal compost. Earthworms decrease the C: N
ratio from 14.21 to 10.11 and an average SO 03% of organic waste can be converted into
vermicompost by the activities of earLhworms in short time (Sohrab and Sarwar., 2001).
22

Vermicompost contain more organic matter, N, P. S. Ca and Mg It was shown that worm-
worked compost,.; have better texture and soil enhancing properties, hold typically higher
percentages of N, P and K (Zahid, 2001).
The organic wastes could be efficiently converted into vermicompost with a recovery of
74.65 - 87% in a composting period of 3 months. Earthworm biomass was doubled
irrespective of organic waste used in a period of 2 months. Major nutrients (N?K) and
micronutrient (Cu, Zn, Fe and Mn) contents were slightly higher in all the vermicompost
samples than in normal compost. Veriniconipost had lower C N ratio and p1-I than normal
compost irrespect$ve of the source of organic, waste. Microbial population was considerably
higher in vermicompost than in normal compost (Chowdappa ci al., 1999).
Earthworms influence the changes in various chemical parameters governing the compost
maturity of local grass, mango leaves and farm wastes. There was a decrease in C N ratio,
while humic acid, cation exchange capacity and water soluble carbohydrates increased up to
150 days of composting. Compost maturation was achieved up to a period of 120 and 150
days in farm wastes and mango leaves, respectively, while more than 150 days would be
required to reach the maturity in case of local grass. Inoculation of earthworms reduced the
composting by 13 days (Talaskilkar ci at, 1999).
Vcrmiconiposting of sugarcane trash individually and in combitiat ion with pressniud using
earthworm J'crioiiyx exc'avaius increased significantly N by 34%, p by 87%. K by 40%, Ca
by 64%, Mg by 39% and Mn by 11% over the control compost along with a reduction in C :N
(15 :1) and C : P (6 :1) ratio due to mineralization and combined action of earthworms and
microbes (Ramalingam, 1999).
23

Saerah ci cii, (1996) conducted an experiment on the effect of compost in optimizing the
physical condition of sandy soil. Compost at the rates oIO.0, 16.5. 33.0, 49.5 and 66.0 t ha4
was incorporated into the soil and then wheat was gruwn. The results indicated that the
various application rates were significantly correlated with improvement in physical
properties of soil as well as straw and grain yields of wheat.
Robinson ci al. (1992) reported that the nutrients present in vermiconipost are readily
available and the increase in earthworm populations on application of verniicornpoSt and
mulching leads to the easy transfer of nutrient to plants thus providing synchrony in
ecosystems.
Harris at al. (1990) reported that earthworm cxcreta is the excellent soil conditioning
material with higher water holding capacity and less time for releasing nitrogen into the soil.
The nutrient level of the vermicompost was about two times greater than natural compost and
the use of verniicoitpOst is important for the farmers to get better quality crop yields.
Organic manure influences favorably plant growth and yield through augmentation or
beneficial microbial population and their activities such as organic matter decomposition
(Gaur c/aL. 1971).
2.9 Effcct and importance of NPI< and manure application on other crops
Ganapathy (2006) reported that inicgratcd use of organic and inorganic manures accelerated
the growth and yield components of sunflower compared to inorganic fertilizer application.
The growth was more with NPK 2 FYM compared to 100% NPK. The organic fertilizers in
combinations with inorganic fertilizers were superior to sole inorganic fertilizer for growth
24

and yield components. Overall application o175% NPK and FYM © 10 t/ha recorded highest
seed yield and yield attributes (head diameter, number of seeds/head and 100-grain weight of
sun f1over).
A field experiment was conducted by Rayti el ciL (2006) to assess the effect of the combined
use of farmyard manure and inorganic fertilizer on the growth and yield of sorghum and on
chemical properties in it semi-arid area in northeastern Ethiopia. The combined
'Dapplication of farmyard manure and inorganic fertilizers increased post-anthesis dry-matter
produetion by 147%-390% and grain yield by 14%-36%. The main effects of farmyard
manure and inorganic fertilizers increased stover yield by 8%-21% and 14%-21%.
cspectively Farm at yard manure applicion increased total nitrogen (N) uptake by 2 l%--36%,
grain yield by 8%—I 1%, and grain protein concentration by 20%-29%. Application of
farmyard manure along with 50% of the recommended inorganic fertilizer rate resulted in a
grain yield equivalent to, or greater than that for 100% of the recommended inorganic
('4 fertilizer rate, thus affecting a 50% savings of inorganic N and phosphorus (P) fertilizer.
J at arid A hI awat (2004) reported I root a field experi nient cart ied out at the I nclia ii Agricultural
Research Institute, New Delhi, India reported that application of 3 t vermicompost ha1 to
chickpea iniproved dry matter accumulation, grain yield and grain protein content in
chickpea, soil N and P and bacterial count, dry fodder yield of succeeding maize, total N and
P uptake by the cropping system over no vermicompost treatment
rt- 'Ilie effects of NPK applied through various combinations of vermicompost, farmyard
ri manure, and chemical fertilizers on the growth and yield of wheat were studied. The
application of vermicompost significantly increased biomass production and yield of wheat.
Treatment with 75% vermicompost + 25% farmyard manure resulted in the greatest plant

height, leaf number, fresh weight, dry weight and ntmibcr of spiketets per plant, number of
seeds per spike, 1000 grain weight, grain yield per Plot and haiwest index (Agrawal ci cit,
2003).
A field experiment was conducted by Rawat and Pareek (2003) with farmyard manure at 0, 5,
10 or 15t ha" and NPK at 0: 0 :0.30 :20: 10,60 : 30 20,90:40 30or 120: 50:40 kg
ha4 respectively in wheat crop in a field experiment conducted in Jobner, Rajastan, India
during the rabi season of 1998-99 to determine the effects of FYM and NPK on the yield and
nutrient uptake of the crop. The yield and NPK content of wheat grain and straw increased
with increasing rates of FYM and NPIC uptake of the crop also increased with increasing
rates of FYM and NPK. The treatments had no significant ellects on the organic carbon and
available NPK content in the soil at harvest.
lolanur and Badanur (2003) observed that the highest grain yield and stover yield of pearl
millet was obtained with organic source of nutrients to meet 50% N in conjunction with 50%
l(IW( recommended dose of ft'itilizer) over enmity F N applied in two splits recorded the
highest yield (1767 Kg ha4) Rllowed by FYM to 'fleet 50% N with 500,o RDF (1744 Kghaj.
They also observed that grain yield of pigeonpea recorded the highest grain yield (801 Kg
ha') with 50% N through subabul with 50% RDF. They also reported that the combined
application of organic and inorganic N sustained the productivity. Soil available nutrients like
N. P and K increased siiiiiflcantly with the application of various organic sources of nutrients
in combination with trtilizers over the tërtilizer alone. 11w highest grain yield of nthi
sorghum and chickpea was obtained with 50% N through green manure plus 50 '0 fertilizer N.
25

The continuous use of organic manures along with inorganic fertilizers increased nutrient
uptake and nutrient use efficiency of major nutrients than did the inorganic fertilizers alone
(Basiar, 2003).
Application of organic manure i.e. vermicoinpost or FYM along with fertilizer NPK had
beneficial residual effect in increasing yield, uptake of nutrients in wheat crop as well as
available nutrient (NPK) in soil. The best treatment i.e. 50% NPK fertilizer along with
vermicompost @ lOt ha4 was tested in farmers fields. (Kamla Kanwar., 2002).
Song et cii. (2001) conducted an experiment with winter wheat in China to investigate the
effects of application of chemical fertilizer NI'K alone and combined with organic manure on
the growth characteristics and yield of winter wheat The application oI'fertilizer NPK alone
or fertilizer NPK combined with various sources (FYM, wheat straw and maize straw) of OM
increased the wheat's spike length, grains/spike, and plant height compared with the control
treatment, thus enhancing bioniass and grain yield of wheat. The application of fertilizer NPK
combined with OM had it better yield nierease than he application ol fertilizer N11K alone.
especially combined with farmyard manure at it higher dose. it is concluded that the
application of fertilizer NPK combined with OM not only make good use of resources, but
also enhance wheat yield.
Okaleho c/ at (1999) observed in the Kenyan highland that maize grain yield ranged
between 751 and 6836 kg ha' with lowest yields observed in the treatment receiving wheat
straw alone and higher yields associated with soybean residue incorporation and during the
second, wetter growing season. in 1998, crop benefited from more favorable rainfall,
providing grain yield increase of 141% above control treatment as a result of combining 2
ha" soybean trash and 100 kg N ha4 as urea. Larger yields were obtained when organic and
27

inorganic inputs were applied to soils, particularly when soil moisture was adequate and the
organic inputs higher in mineralisable nutrients.
Baron c't al. (1995) found that the addition of organic manure has a positive influence not
only on soil properties but also on the mineral ntil rition ol plants and yield or wheat
Gupta at aL (1996) performed an experiment on wheat cv. Wli-157 and observed that grain
yields and P and N uptake increased with increasing organic manure levels. Organic carbon
content increased with the application of organic manure.
In a field experiment on a sandy clay loam in Tami I Nadu, sunflowers were given 0, 10, 20.
30 or 40 kg K2O ha' basally or fotiar application of 1.75% KCI at critical growth stages with
0 or 20 kg P2O5 ha1. P and K application increased seed yield and seed oil content. The
highest seed yield (1.46 t hi'), seed oil content and benefit cost ratio were obtained with 40
kg K20 I 20 kg 11203. Soyabeans were grown after sunflowers on the same plots either with
only residual fertilizers or with freshly applied P and K. Both residual and freshly applied
fertilizers benefited the soyabeari crop (Annaduri etal., 1994).
A field experiment was conducted at Mymensingh. Bangladesh with wheat variety Kanchan
with no mineral fertilizer, 110 kg IN, 90 kg P or 100 : 90 : 40 kg NPK hi' and no manure or
S or 16 t biogas effluent or cattle manure/ha. Average grain yields and protein contents were
higher in plots treated with biogas effluent than with cattle manure or the control. Biogas
effluent application resulted in the tallest plants, but straw production was highest with cattle
manure There was no significant difference between yields from plots treated with S or 16
biogas effluent, and although yields increased with level of cattle manure, S t biogas effluents
gave better results than 16 t cattle manure. Assessment of the manure treatments in
combination with mineral fertilizers showed that S t biogas effluent ± NPK gave the highest
28

grain yield but 16 t biogas effluent + 100 kg N gave the highest protein content (Uddin ci of.,
1994).
A study was conducted to deiermine the effects of some ol' the fertilizer and manure
treatments on wheat yield and NI'K uptake by wheat. The application of NI' fertilizer with
and without manure resulted in signilicant yield increases over the control. The application of
NP-fertilizer and NP-manure increased grain-N from 2.03 (control) to 2.38 and 2.31,
respectively. Individual and combined application of NP-fertilizer and manure produced a
more pronounced effect on K concentration and uptake in straw than in grain (Baluch ci ul.,
1989).
Laboratory and field experiments were conducted by Guan (1989) to investigate the influence
of organic manures on the availability of nitrogen and phosphorus in an alluvial soil in
Shandong, China. The application of compost increased the availability of N and P in
comparison with the control.
Srivastava of a/. (1989) conducted a ReId experiment and observed that direct soil
incorporation of organic wastes consisting of paddy straw and water hyacinth (50: 50) in
combination with different levels of fertilizer N resulted in increased wheat yield and
improved the organic matter and soil nitrogen status. The maximum yield was obtained with
St organic wastes plus tOO kg urea haS '.
Mehta and Daflerdar (1984) round that yield of wheat was greater when compost (4.41 hi')
NPK was used than when N1'K alone was used.
Reddy and Reddy (1998) concluded that the combined use of VC(vermiconwost) at 50%
level of N with 50% N through inorganic fertilizer is suitable for maintaining good soil health
and for obtaining optimum yields in maize- soybean cropping system.
29

Manna ci at (2001) observed in a 3-year field study (1996-99), the performance of four
different composts obtained from legume straw (Glycine mar Merr.L), cereal straw (Trit/uwn
aestivurn), ollseed straw (Jirassica juncea L.), city rubbish and compared with chemical
fertilizers in terms of degree of maturity, quality of compost, improvement in soil organic
matter, biological activities of soil and yields of soybean and wheat. The matured compost
increased total P. water soluble P, citrate soluble P, total N and NO3-N and the application of
phosphocompost at the rate of 10 t ha4 gave plant growth dry matter accumulation, seed yield
and P uptake by soybean equivalent to single super phosphate at 26.2 kg P ha4
Vyas ci at (2003) reported that combined application of 5 kg Zn and lOt FYM hi' increased
grain yield, NPK contents in and uptake by soybean seed. l'he highest grain yield (1790 kg
hi') was recorded in Zn "-FYM treatnient with a record of 182% increase over control (1515
kghi').
A long-term experiment was conducted by Behera (2003) during 1995-2002 under the fine-
textured Vertisols at Indore, India to study the effect of combined use of Farm Yard Manure
(FYM), poultry manure, vermicomnpost and biolertilizers (Azotobacter phosphate
solubilizing bacteria) with 50 and 100% NPK on wheat, and residual effect on following
soybean. Grain yield of aestivum wheat in the initial 2 years and durum wheat in the later 3
years was significantly increased with 50% NPK + poultry manure @ 2.5 t hi' or FYM @
10 t ha' compared with 50 or 100% NPK alone. Soybean did not show much response to
residual effect of treatments in most years, although the yield were comparatively better
under the combined use of 100% NPK iFYM or poultry manure given to wheat.
30
Reddy et al. (2004) conducted a field experiment on a Typic Haplustert from 1992 to 1995
where in the annual treatments included four rates of fertilizer P (0, 11, 22 and 44 kg ha'
applied to both soybean and wheat) in the absence and presence of 16 t ha4 of manure
(applied to soybean only). They observed that with regular application of fertilizer P to each
crop the level of Olsen P increased significantly and linearly through the years in both
manured and unnianured plots. The mean P balance required to raise Olsen I' by I mg kg4
was 17.9 kg hi' of fertilizer P in unmanured plots and 5.6 kg ha4 of manure plus fertilizer P
in manured plots.
Ilati et at (2006) found that application of 10 kg farmyard manure and recommended NPK
(NPK + FYM) to soybean for three consecutive years improved the organic carbon content of
the surface (0-15 cm) soil from an initial value of 4.4 g kg' to 6.2 g kg and also increased
seed yield and water-usc efficiency by 103% and 76%, respectively over the control. Root
length density (RId)) up to the 30cm depth was highest in the NPK -I- FYM plots and it was
31.9% and 70.5% more than NI'K and control plots.
Ohosh ci at (2006) observed that yield and land equivalent ratio (LER) of the intererops
increased over sole crops though based on aggressivity and relative crowding coefficient
(RCC), sorghum is more competitive than soybean Soybean did not benefit from
intercropping to the same degree as sorghum under N-P-K. Nutrient application influenced
LER, RCC, and monetary advantage index and was found in the order of N-P-K plus
farmyard manure (FTh1)> N-P-K plus poultry manure (PM) > N-P-K plus phosphoeompost
(PC) > N-P-K > control. However, based on competition ratio, yield advantage was greater
under N I' K plus I'M.
3;

A long-term (30 years) soybean—wheat experiment was conducted by Kundu et al. (2006) at
I lawalbagh, Almora and observed that maxinuilll yields or soybean (2.84 Mg ha 5 and
residual wheat (1.88 Mg haj were obtained in the plots under NI'K + farmyard manure
(FYM) treatment, which were significantly higher than yields observed tinder other
treatments.
A (kid experiment on maize with soybean inteucropping system was conducted by Slut ci
at (2007) during rabi season of 2005-2006. There were S treatments comprising 2 sets of
planting geometry (PG1 & PG2) and 4 doses (NM1, NM2, NM3 and NM4) of nutrient
management package. The interaction effect between planting geometry and nutrient
management was statistically non-significant for the main crop (hybrid maize). In case of
companion crop (soybean), the highest seed yield (564 aTid 504 kg h15 was obtained with
NM1 x iG2, which was significantly higher over rest orthe conthinations.
32

Chapter 3
Materials and Methods

Chapter 3
MATERIALS AND METHODS
This chapter includes a brief description of the experimental soil, site and location, rice
variety, land preparation, experimental design, treatments, cultural operations, collection or
soil and plant samples etc and analytical methods followed in the experiment to study the
effect of vermicompost and N, P, K on the growth, yield and nutrient uptake by rice
3.1 Experimental site and location
The research work relating to the study of the effect of vermicompost and NPK on the
growth, yield and nutrient uptake by rice was conducted at the Shcr-e-llangla Agricultural
University Farm, Dhaka 1207 during the Kharif-I season of 2005. The following map shows
the specific location of experimental site ( Figure 1).
3.2 Description of soil
The soil of the experimental field belongs to the Tejgaon series under the Agroecological
Zone, Madhupur Tract (AEZ- 28) and the General soil type is Shallow Red Brown Terrace
Soils. A composite sample was made by collecting soil from several spots of the field at a
depth of 0-15 cm before the initiation of the experiment. The collected soil was air-dried,
ground and passed through 2 mm sieve and analyzed for some important physical and
chemical parameters. Some initial physical and chemical characteristics of the soil are
presented in Table I.
33

I 3'
F
tr 91. 'U")
AGROECOLOGICAL ZONES
Anarn
(Generabsed) 50 0 50 I(OPjn 26"
n \, A (INOtA) V - -
'tt:k Trpa
'k ScSikYi S g
I,
Asswn (INDIA)
West BengS
Iwarn (LNDIA)
)IA - C /
2
:'' I+fl&fi)fl p,noet P135, 161 &Søcl. MgI1ra Rn, nocIs, 2j AtA.e tst fbodØan 17 10 IMgrs-ia Ft,ve, FIooda., & 3 - Tha Itst flocdpLái 15 fl Vasu Megrn Cn.'i-e floodISa 4 KaraIya-Bargd 19 o'a bçtna EsV.Ino Fl000tas, ç' S C toavt An 8w 20 Easton, S.nn,-IGn$ro floogan o f - I ( Puwttwt fl -' 21 1 5.ct B8j QAVAN LIAR) 7. ,A.Jjg Bz,Fmtpfl,-Jwnsiz, Fboduln Nathan ard Ea&ern P,n1 fin
—: Voaig Bra)vnwjlra and .Janjna FIco%La. 23 Chttagocg Coesta ptan 0 -: lyarYrc.jn I Ioow r— s M.tt,, Cc's) IsLsnd T. Ave Ganges flOØS' Lays) BarInd Trw
tL HçhGarqosRnrfloodJan - - HqlBalrdTrsct Low Cafls Rflr PoouVam n I -. Nam.s!n Bs*.d Tract
Ii Ganges Tids Faoe, 25 IAlflasr tract 14 Goa)gnrj.)es-ia S.o' 142flsn ad Eastern Nt '& L_ Mat Sd Milan Tactic. 92.
Figure 1. Map showing the experimental site under study U
34

Table I . Initial characteristics of the soil of the experimental (kid
l.pH 59
Particle-size ( Sand 30.18 analysis of soil Silt 3805
Clay 31 77
Textural Class Silty clay
0.083
Organic matter (%) 1.09
Phosphorous (%) 0.0014
Potassium (°"°) 0.00095
8Sulphur(%) 0.00123
3.3 Description of the rice variety
Shraboni (BR-26), a high yielding variety of rice was used as the test crop in this experiment.
This variety was released by Bangladesh Rice Research Institute (BRRI), Joydebpur. Gazipur
in 1993. Life cycle of this variety ranges from 115 to 120 days. The variety is resistant to
blast disease, insect and pest attack.
3.4 Raising of seedling
The seeding of rice were raised in wet bed methods. The seed bed selected for the
experiment was open by hand spade on 26ll April 2005. Seeds (95% germination) @ S kg
hi' were soaked and incubated for 48 hrs. The seeds were sown on 5hhI May, 2005 in well
prepared seed bed. During seedling growth no fertilizer was used. Proper water and pest
management practices were followed whenever required.
35
3.5 Preparation of the field
The plot selected for the experiment was opened by power tiller driven rotovator on the 10th
May 2005, afterwards the land was ploughed and cross-ploughed several times under water
saturated condition and puddled properly. Finally, the land was leveled and the experimental
plot was partitioned into the unit plots in accordance with the experimental design mentioned
in the following section (3.6).
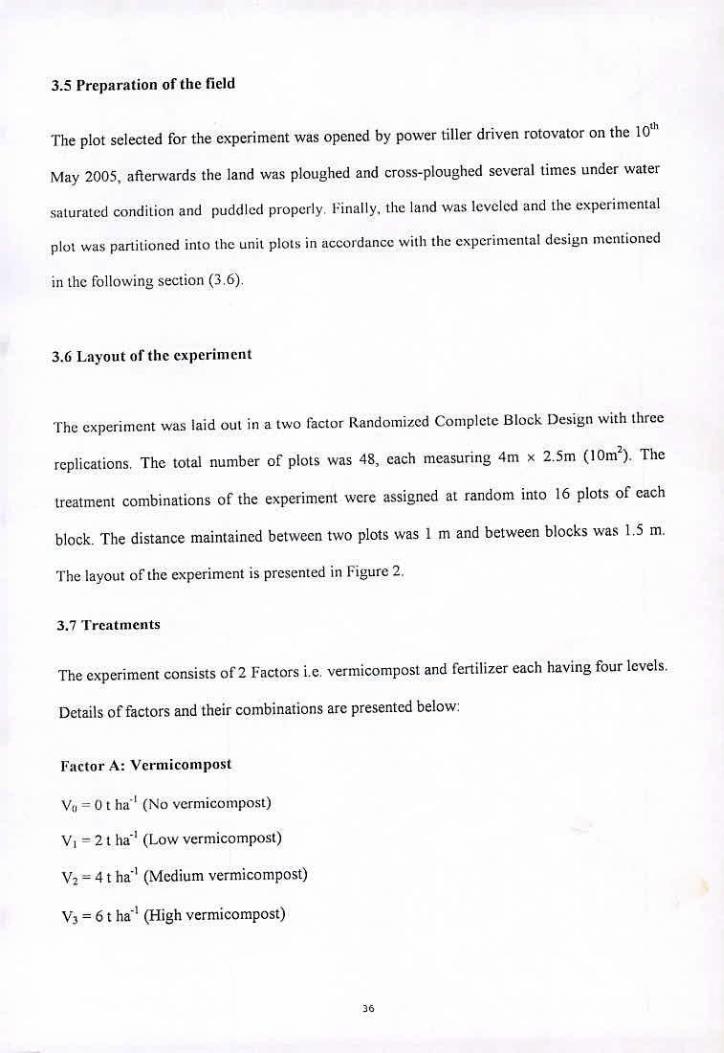
3.6 Layout of the experiment
fhe experiment was laid out in a two factor Randomized Complete Block Design with three
replications. The total number of plots was 48, each measuring 4m x 2.5m (10m2). The
treatment combinations of the experiment were assigned at random into 16 plots of each
block. The distance maintained between two plots was 1 m and between blocks was 1.5 in.
The layout of the experiment is presented in Figure 2.
3.7 Treatments
The experiment consists of 2 Factors i.e. vermicompost and fertilizer each having four levels.
Details of factors and their combinations are presented below:
Factor A: Vermicompost
V11 0 t ha' (No vermicompost)
V1 = 2 t hi' (Low vermicompost)
V2 = 4 t hi' (Medium vermicompost)
V3 = 6 t hit (High vermicompost)
36

Factor B: Fertilizer
F0 = 0 kg N ha4 + 0 kg P205 hi' + 0 kg K20 hi' (No NPK)
F, = 50 kg N ha4 + 40 kg P205 ha4 + 30 kg 1(20 hi' (Low NPK)
F2 = 80 kg N ha1 + 60 kg P205 hi' + 50 kg K20 ha' (Medium NPK)
110 kg N hi' i 80 kg l'201 ha' 1 70 kg K,O ha4 (High NPK)
1'reatmer,t combination
V0F0 =Control (No vermicompost - No NPK)
V0F, =(No vermicompost ± Low NPK)
V01;2 = (No vermicompost + Medium NPK)
V173 (No vermicompost + High NPK)
V,F0 =(Low vermicompost ± No NPK)
V,F, (Low vermicompost ± Low NPK)
V,F2 "(Low vermicompost 1- Medium NPK)
V i!:., (Low vermi compost I ugh NPK)
V2F0 = (Medium vermicompost I No NPK)
V2F1 = (Medium vermicompost ± Low NPK)
V2F2 = (Medium vermicompost -- Medium NPK)
V2F3 = (Medium vermicompost 1- High NPK)
v1i0 (High vermicompost No NPK)
V1F, = (High vermicompost I Low NI'K)
V3F2 = (High vermicompost + Medium NPK)
V3F3 = (High vermicompost + High NPK)
37

Replication -I Rcplicatioit -2 [teplication -3
C
4-11 V0F3 un
V3F1 urn
, V3F2 V1F \'1 F2
V2F1 V.tF:i
V2F3
F VI I• V2 F2
V3F3 V3P, V0F2 73V2r V0F, V3F2
V3F2
V0F0
V1F0
VIP,
V2P0 V0F0
VF1
V0F2 V3F0
V3P0 V1 Fc, V2 Fc,
V2F, V2F2 V1 F2 -
V,P1 V3F
V3 F0
V0F1
V1 F2
V0P2
\'2F2
VQPI
V;Po V,F3
I V2F3 V2F1 V3F3
Plot size: 4m x 2.5m (lOin2)
Plot to plot distance: Im Block to block distance: 1.5 in
Figure 2. Layout of the experimental field
38

3.8 Application of vcrmicornpost and fertilizers
The required amount of?, K and S fertilizers (Triple superphosphate. Muriate of Potash and
Gypsum, respectively) and 40% of N (urea) were applied as per treatment combination at a
time during final land preparation. The remaining 60% ofN (urea) was applied in two splits
at ii iax i mu ni till cling and patu etc initial mu stages. respectively. The tcttuircd al1lOtLntS of
vernhicofl)pOsl as per treatment combinations were applied urn formly itt the plot during limit
land preparation and mixed well with the soil by hand spading.
3.9 Transplanting
Twenty one days old seedlings of BR-26 were transplanted on 26 May 2005 in T. Aus
season. ]twce seedlings per hill were used following a line to line spacing of2O cm and hill
to hill spacing of 15 cm. After one week of transplanting all plots were checked for any
missing hill which was filled up with extra seedlings whenever required.
3.10 Cultural and management practices
Various intercultural operations such as weeding and spraying of insecticides were
accomplished whenever required to keep the plants healthy and the field weed free. The tield
was weeded out three times at 9, 20 and at 45 days after transplanting. The plants were
attacked by borer insects which were removed by applying diazinon (60Ec) @ of 1.70 lit.hi'.
Special care was taken to protect the crop from birds especially at the ripening stage of the
crop.
39

3.11 flarvesting
The crop was hanhestCd at maturity from I m2 area of each plot on 1 S' August 2005. The
harvested crop of each individual plot was bundled separately. Grain and straw yields were
recorded plot wise and the yields were expressed in t ha
3.12 colIcetioli of samples
3.12.1 Soil Sample
The initial soil sample was collected randomly from different spots of the field selected for
the experiment at 0-15 cm depth before the land preparation and mixed thoroughly to make a
composite sample for analysis Post harvest soil samples were collected from each plot
separately at 0-15 cm depth on 20" ,\ugust 2005. The samples were air -dried, ground and
sieved through a 2 mm (10 mesh) sieve and preserved for analysis.
3.12.2 plant sample
plant samples were collected from every Individual plot for laboratO' analys is at the
rvesting stage of the crop Ten plants were randomlY collected from each plot after
threshing The plant samples were washed first with tap water and then with distilled water
several times The plant samples were dried in the electric oven at 700 C for 48 hours. After
that the samples were ground in an electric grinding machine and stored for chemical
analysis.
3.13 collection of data
Data collection were done on the following parameters
40

3.13. I Pl;t itt height
The plant height was measured from the ground level to top of the flag leall 10 plants were
measured randomly from each plot and averaged. It was done at the ripening stage of the
crop.
3.13.2 Paniele length
Ihe panicie length was measured from the bottom to the end of the panicle after harvesting.
Ten panicles were measured randomly from each plot and averaged.
3.13.3 Flag leaf length
The flag leal length was measured from the bottom to the end of the tip of the leaf. Ten flag
leaves were measured randomly 1mm each plot and averaged. It was done at the ripening
stage.
3.13.4 No. of Grains per panicle
it was done after harvesting, at first number of grains per panicle were counted. Grains from
ID panicle were counted and averaged.
3.13.5 % of spikelet sterility
Sterile spikelet were counted after harvested panicles. Randomly ten panicles were selected
and counted its sterile spikelets and then converted into percent.
3.13.6 Thousand seed weight
Thousand seeds of rice were counted nLndonhiy from cad) plot and then weighed plot wise.
3.13.7 Grain yield
Grains obtained from 1 m2 area from the center of each unit plot were dried, weighed
careflully and then converted into t hit .
41

3.13.8 Straw yield
Straw obtained from I m2 of each individual plot were dried, weighed carefully and the yield
was expressed in t hi.
3.14 Chemical analysis of the plant, soil and verinicompost sa niples
3.14.1 Plant sample analysis
The plant samples collected at the harvesting stage of the crop were digested with cone.
FP'03 and 1-I004 mixture for the determination of P, K and S.
3.14.2. a Nitrogen
Plant samples were digested with 30% 1-1202, cone. 112504 and a catalyst mixture (K2SO4
CuSO.i.5H20 : Selenium powder in the ratio 100 10 1, respectively) for the determination
of total nitrogen by Micro-Kjeldal method. Nitrogen in the digests were determined by
distillation with 40% NaOH followed by titration of the distillate absorbed in H3B03 with
(JOIN 112SO4 (Jackson,1973).
3.14.3. b Phosphorous
Phosphorous in the digest was determined by ascorbic acid blue color method (Murphy and
Riley, 1962) with the help of a Spectrophotometer (LKI3 Novaspec, 4049).
3.14.4. c Potassium
Potassium content in plant sample was determined by flame photometer.
3.14.5. d Sulphur
Sulphur content in the digests were determined by turbidimetric method as described by Hunt
(1980) using a Spectrophotometer (LKB Novaspec, 4049) --
4'

3.14.2 Soil sample analysis
3.14.2. a Organic carbon
Soil organic carbon was determined by Watklcy and Black's wet oxidation method as
OUtlined by Jackson (1973) from the soil samples collected before sowing and also alter
harvesting the crop.
3.14.2. b Organic matter
The organic matter content was determined by multiplying the percent organic carbon with
Van l3emmelen factor 1.73 (Piper, 1950)
3.14.2. c Total nitrogen
Total nitrogen of soil samples were estimated by Micro-Kjeldahl method where soils were
digested with 30% H202 conc. H2SO4 and catalyst mixture (K2SO.;: CuSO4. 51-120 : Selenium
powder in the ratio 100 :10 •1. respectively). Nitrogen in the digests were determined by
distillation with 40% NaOl I followed by titration of the distillate absorbed in 1131303 with
0.0 IN 112SO4 (Jackson, 1973).
3.14.2. d Available Phosphorous
Available phosphorous was extracted from the soil by Bray-1 method (Bray and Kurtz,
1945). Phosphorous in the extract was determined by ascorbic acid blue color method
(Murphy and Riley. 1962) with the help of a Spectrophotometer (LKI3 Novaspec, 1949).
43

3.14.2. e Exchangeable potassium
Exchangeable potassium in the soil sample was extracted with IN neutral ammonium acetate
and the potassium content was determined by flame photometer.
3.14.2. lAvailable sulphur
Available sulphur was extracted from the soil with Ca (1`12PO.1)2. 112() (Fox ci at, 1964).
Sulphur in the extract was determined by the turbidirnetric method as described by Hunt
(1980) using a Specirophotorneter (L1C13 Novaspec, 4049).
3.14.3 Vcrmicompost
Verrniconpost sample was analyzed for organic jitalter, total N, available P. IC and S contents
Jollowing the methods used for plant and soil analysis. Vcrniicornpost contained II .0G%
organic matter, 0.6298% total N, 0.02249% available P. 0.07826% available K and 0.03 13%
available S.
3.14.4 Statistical analysis
The data obtained from the experimcnl were analyzed statistically to find out the significance
of the difference among the treatments. The mean vaLues of all the characters were evaluated
and analysis of variance was perfbrmed by the 'F' (variance ratio) test. The significance of
the differences among pairs of treatment means was estimated by the least significant
difference (LSD) test at 5% and 1% level of probability and DMRT was calculated (Gomez
and Ciomez., 1984)
44

Chapter 4
Results and Discussion
1

CIuiptt'r 4
RESULTS AND DISCUSSION
The results on different growth characteristics, yield attributes, yield and nutrient
concentrations in the plants and availability of different nutrients in the soil ada harvest of
rice are discussed in this chapter.
4.1 Effect of vermicompost and NPK on the growth parameters of rice.
4.1.1 Plant height
The effects of vermicompost and NPK fertilizers, alone and in combination, on the plant
height of rice are presented (Table 2). Signiflcant variation was observed on the plant height
of rice when the field was incorporated with different doses of vermiconipost. Among the
different doses of vermicompost, V2 (4 t ha') showed the highest plant height (112.57 cm)
which was statistically identical with the vermicompost doses of V3 (6 t hi') . On the other
hand, the lowest plant height (102.24 cm) was observed in the V0 treatment where no
vermicompost was applied. Vermicompost might have increased the soil moisture content,
soil porosity and other plant growth enhancing characters and fhr that reason increasing dose
of vermicompost increased plant height. Similar result was reported by Gorlitz (987).
Agrawal c/ al. (2003) found that the increase in soil organic matter content through the
application of FYM in wheat increased plant height.
45

Table 2. Effect ofvcrmicornpost ott the growth coxttzihutiitg eli;,r:tcters of rice
Vermicompost :
Plant height (cut) PLwiciciengtll(clfl) F liiTjj1ffeugth (cm)
V0 102.24b 21.74c 3225d
V1 103.42b 21.45c 3425c
.
V2 112.57a 23.79b 37.25a
111971'1 26.52a 3525h
Leul of (iQi
Siiniflcance -- ------ - .......... 1..__._.._._--------- ..... -------- .... -... --------------------
005
.... --------------------------------.----...----
00)
...........
in a column igurcs having sintjl;ir letter(s) do not (1111cr signi Iic:i:ttiv itercas ligitres wi iii (lissilnilar letter(s)
differ significantly as per DMRT
Table 3. Effect of NPK fertilizers on the growth contributing characters of rice
NPK Eenihzer Plant. height (cm) Panicle length (cm) I Flag leaf length (cm)
i,
101, 1 0d 22.44b 34.00c
F1 l05.23c 23.26a 32.57d
F2 110.15b
113.57a
23.85a
-- 23.98a
36.50b
- 38.75a F;
Lel of 0.01
71~ 001 001
Siguiflcance -
In a column figures having similar letter(s) do not differ signiflcaiitiv whereas figures with dissimilar letter(s) differ sigmficantly as per DMRT
Rice plants showed significant variation in respect of plant height when fertilizers in different
doses were applied (Table 3). Among the different fertilizer doses, F3 (High NPK) showed
the highest plant height (113.57cm). On the contrary, the lowest plant height (101.16 cm) was
observed in En treatment where no fertilizer was applied (Table 3). Song etal. (2001) found
that application of krtilizcr NPK increased the height of wheat plant compared with control
treatment.
Combined application of different doses of verniicompost and fertilizer had significant effect
on the plant height of rice (Table 4). The Lowest plant height (96.67 cm) was observed in the
control treatmen M0F0 (No vermicompost and No NPK). On the other hand, the highest plant
46

height (119,30 cm) was recorded with Vl? (I ugh verIflicolupost I Metlititit NPK). SiinUar
result was reported by Song ci cii. (2001). They Found that application of fertilizer NPK
combined with various sources of OM increased the height of wheat ptant compared with the
control treatment.
It is evident lFrOM the data that vermicompost at the high rate along with medium dose of
NIK resulted the lughcst plant height of rice.
Table 4. Effect of veriiiicoiiipost and NPK Fertilizers on the growth contributing characters of rice
Vcnnncontpost x Nk'K I riant nctgtit çcJu) I rainicic icugun WILL) rIU,1 1t4L 1c111111 tWil)
96.67 c 20.50 g 28.0011
99.00c 21.50fg 29.00gh
VF IDIOt) ale 21.90 ef
23.07 dc
21.00 fg
34M0cf
38.00 bcd
39.00 be
30.00 gli
V1`3
V E
V1 F,
, 1109.30 abed
98.67 de
1100.00 de 21.23 fg
V!F: 102.30cde 22.17ef 32.00fg
V1 F1 112.7Oabc 21.4Ocd 36.00bc
V2F0 I05.00bcde 22.93 de 34.00 ef
VF1 1 13.00abc 24.13 ed 37.00 cde
II 5.30 ab
- 117()) a
104.30 We
109.3 ahcd
22.93 dc 38.00 bed
v2v
- VIE,
25 17 be
25.33 be
- 26.17 Ii
40.00 abc
35.01) def
- V il'i
V3 F- 119.00 a 28.40 a 42.00 a
V1F 3 1 15.3Oab 26.27 b 41.00 ab
LeveE of Signtfieancc f
out "S" ,q - 01
In it column figures having similar letter(s) do not differ significantly whereas figures with dissimilar letter(s)
differ significantly as per DMRI
4.1.2. Panicic length(crn)
The effects of vermicompost and NPK fertilizers alone and in combination of two sources on
the panicle height of rice are presented (Table 2), Significant variation was observed on the
panicle height of rice when the field was incorporated with different doses of vermieompost.
41

Among the different doses of vermicompost. V3 (6 I ha'') showed the highest panicle height
(26.52 cm). On the other hand, the lowest panicle height (21.45 cm) was observed in cite Vi
(2 t hi') treatment where low doses of vermicompost was applied. Vermicompost might have
increased the soil moisture content, soil porosity and other plant growth enhancing characters
and for that reason increasing dose of vermicoinpost increascd plant and the panicle height as
well.
Rice plants showed significant variation in respect of panicle height when fertilizers in
different doses were applied (Table 3). Among the different fertilizer doses, F3 (High NPK)
showed the highest panicle height (23.98 cm), which was statistically identical (23.86)
and(23.26) with the fertilizer doses of F2( Medium NPK) and F,(Low of NPK).. On the
contrary, the lowest panicle height (22.44 cm) was observed in Fu treatment where no
fertilizer was applied (Table 3).
Combined application of different doses of vermicompost and fertilizer had significant effect
on the panicle height of rice (Table 4). The lowest panicle height (20.50 cm) was observed in
the treatment combination of V0F<, (No vcrniicompost and No NPK). On the other hand, the
highest panicle height (28.40 cm) was recorded with V3F2 (High verniicompost + Medium
NPK). It is evident from the data that vermicompost at the high rate along with medium dose
of NPK resulted the highest panicle height of rice.
4.1.3. Flag leaf length (cm)
The cliects of' vcrrnicon)post and NPK kit ilizcis alone and in combi tation of two sources On
the flag leaf length of rice are presented (Table 2). Significant variation was observed on the
flag leaf length of rice when the field was incorporated with different doses of vermicompost.
Among the different doses of verniieompost, V2 (4 t ha') showed the highest flag leaf length
48

(3725 cm). On the other hand. the lowest 11ap. leaf leugtli (32.25 cm) was observed ill the V1,
treatment where no vermicompost was applied.
Rice plants showed significant variation in respect of flag leaf length when fertilizers in
different doses were applied (Table 3). Among the different fertilizer doses, F3 (High NPK)
showed the highest flag leaf length (38.75 cm). On the contrary, the lowest flag leaf length
height C 32.57 cm) was observed in F, (2 c ha-') treatment where low doses of firtihizer was
applied C Table 3).
Combined application of different doses of vermicompost and fertilizer had significant effect
on the flag leaf length of rice (Table 4). The lowest flag leaf length (28.00 cm) was observed
in the control treatment (No vermicompost and No M'K). On the other hand, the highest flag
leaf length (42,00 cm) was recorded with V;cF2 (I high vermicompost 'I- Medium NPK), which
was statistically similar with V3F3 treatment. It is evident from the data that vermicompost at
the high rate along with the medium and high dose of NPK resulted the highest flag leaf
length of rice.
4.2. ElTect of vermicompost and N Plc on (lie yield piraineIers of rice.
4.2.1. Weight of 1000 grain
Significant variation was observed in the weight of 1000 seeds of when different doses of
vermicompost were applied (Table 5). The highest 1000 seed weight (22.72 g) was recorded
in V0 (No vermicompost), and the lowest 1000 seed weight (22.52 g) was recorded in the V2
(4 t ha-) treatment where low vermicompost was applied. Similar result was reported by
Shafiudditi Kaisar Zaman (2002). I Fe round that no vermicompost + no NPKS treatment
resulted in the highest 1000 seed weight.
49

Different doses of chemical fertilizers showed sigili licaut varial lUlls ill respect of weight of
1000 grain (Table 6). Among the different doses of fertilizers, F: (Medium NPK) showed the
lowest weight of 1000 seeds (22.50 g), which was statistically identical with the fertilizer
doses ofF2 (Medium NPK) and F3 (Fligh NPK), On the contrary, the highest weight of 1000
seeds (22.84 g) was observed with F0. where no fertilizer was applied. Similar result was
reported by Shaliuddin Kaisar Zaman (2002)
The combined effect of different doses of vermicompost and fertilizer on the weight of 1000
seeds of rice was significanto(Table 7). But the highest weight of 1000 seed (23.30g) was
recorded with the treatment combination of VuF0 (No vermicompost + No NPK). On the other
hand, the lowest weight of 1000 seed (22.17 g) was found in \'21;2 treatment (Medium
vermicompost and Medium Nl'K).
4.2.2 Grain yield of rice
The grain yield as affected by different doses of vermicompost was not statistically
significant (Table 5). Among the different doses of vermicompost the highest grain yield
(4.27 t ha') was observed in V. (6 t ha S '). The lowest grain yield (3 31 t had) was recorded
in the V0 treatment where no vermicompost was applied. Probably vermicompost supplied
the necessary requirements for the proper vegetative growth that helped in obtaining the
highest yield of rice. Ranwa and Sing (1999) reported that the application of vermicompost
(7.5 t ha1) improved grain yield of wheat. Fouda (1989) stated that grain yield of wheat were
increased with the increasing rate of compost application
Application of fertilizers at different treatment doses showed a significant variation on the of
grain yield of rice in Table 6. Among the different doses, F2 (Medium NPK) showed the
so

highest grain yield (4.05 ( ha") On the oilier hand, hit, lowest grain yield (3.27 I lu(') was
recorded with F0 treatment, where no fertilizer was applied. Similar results were reported by
Kadar and Csatho (1987) and Dang et at (1988). Optimum fertilizer doses increase the
vegetative growth and development of wheat that lead to the highest grain yield. Patel ci al.
(1995) showed that grain yield of wheat was increased with increasing rates of NPK fertilizer
and the highest yield was obtained with 120: 60 40 kg NPK ha", respectively.
Combined cITects of different doses of vermicompost and fertilizers on grain yield showed a
statistically significant variation (Table 7). The highest grain yield (4.30 t ha") was recorded
in the treatment combination of V3F2 (1-ugh vermicompost + Medium NPK). On the other
hand, the lowest grain yield (3.03 t ha") was found in V0F0 (No vermicompost + No NPK). It
is observed that the application of fertilizer NPK combined with OM not only make good use
of resources, but also enhance rice yield. Similar result was obtained by Deshrnukh et al.
(2005). They found that the application of recommended dose of fertilizer NPK combined
with FYM recorded the height grain yield of soybean. Similar result was obtained by Song el
al. (2001), They found that the application of NPK fertilizers combined with OM enhanced
bioiiiass production and the grain yield of wheat. Vasanti and Kurnaraswarny (2000) reported
that vermicompost at 5 I lia"would be sufficient for rice crop When applied with
recommended levels of N, P and K
51

laNe 5. Effect of vernhtcorupost on the vield cozitrihuting characters of rice
Verinicompost 1000 Lrain wught (g) Ci am ic'd (t na) Straw s icM (t ha )
V 22.72 3.3 Id 5.64d
V1 22.60 3.74b 6.12b
V2 22.52 365 b 6.35b
V; 22 60 4.27a 7.1 2n
Level ofSignificance NS 0 05 0.01
In a column figures having similar letter(s) do not differ significantly whereas figures with dissimilar letter(s) differ significantly as per DMRT
'Fable 6. Effect of NPK fertilizers on the yield contributing characters of rice
1 crtilizcr 1000 grain cight (g) Gram N icid (tha') Stray. \Kld (c ha 5 F 22.841 3,27c 361c
1:1 22.54b 3.64b 6.09b
F 22,50b 4.05a 6.76a
27 5Th 4.021 6c77a
I cvLl at SLgJUI]CaRCc U 001 001
In a column figures having similar letter(s) do riot differ significantly whereas figures with dissimilar fetter(s) differ significantly as per DMRT
52

TabLe 7. Combined cifect of vermicompost and NPK fertilizers on the yield contributing
characters of rice
Vermicompost x.NPK t000 grail)
Grain yield (t ha ) SLraW ''eld (t Ha
eittli/t wclght (.j)
23.30 a 3.03 i
5.25 f
22.33 be 320 hi - 5.50 ef
V0F2 22.70 be 3.60 efgh [ 6.00 d
V0F3 22.53 be 3.40 ghi 5.80 de
V 1 F
V1F1
V 1 F2
22.73
2
22.53 be
22.53 be
3.30 ghi
fghi
4.00 hcdc
4.20 bed
5.60 def
iSOde
6.50 c
6.60 c V 1 F3
V2F 22.73 be 3.35 ghi 5.60 dcl
V2F 1 22.43 be 3.50 efgjhi
L---7 5.80 de
V212 22.17c L 3.80 defg 6.80 c
V2F3 22.73 be 3.97 cdef 7.20 b
22.60 be
22.80 ZLb V F1
3.40 ghi
4.40 abc
6.00 d
7.25 I)
- VF: 22.60 he a 7.75 a
L
LevdofSivtfica1iCC
2140 be
OUt
4.50 ab 7.50 ab
0.01:.
lnacolunm figures having similar tenet(s) do not differ significantly whereas figures with dissimilar letter(s) differ significantly as per DMRT
53
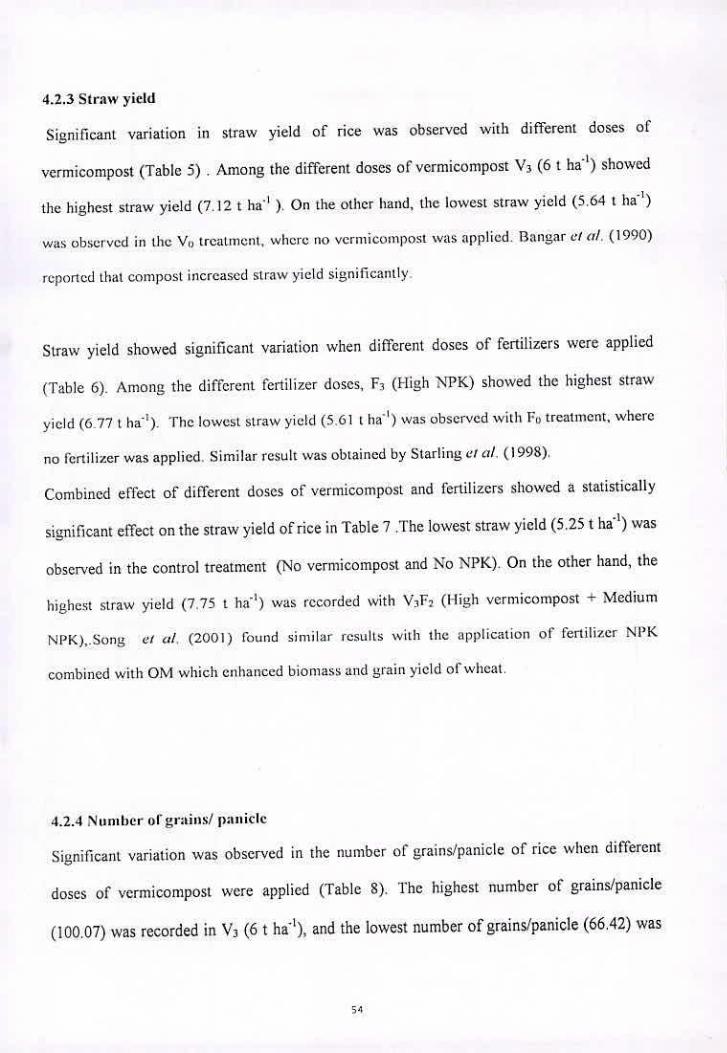
4.2.3 Straw yield
Significant variation in straw yield of rice was observed with different doses of
vermicompost (Table 5) . Among the different doses of vermicompost V3 (6 t ha') showed
the highest straw yield (7.12 t ha" ). On the other hand, the lowest straw yield (5.64 t ha')
was observed in the V1, treatment, where no vermicompost was applied. I3angar cIal. (1990)
reported that compost increased straw yield significantly
Straw yield showed significant variation when different doses of fertilizers were applied
(Table 6). Among the different fertilizer doses, F1 (High NPK) showed the highest straw
yield (6.77 t ha'). The lowest straw yield (5.61 t ha'') was observed with F0 treatment, where
no fertilizer was applied. Similar result was obtained by Starling ci cii. (1998).
Combined effect of different doses of vermicompost and fertilizers showed a statistically
significant effect on the straw yield of rice in Table 7 The lowest straw yield (5.25 t ha") was
observed in the control treatment (No vermicompost and No NPK). On the other hand, the
highest straw yield (7.75 t ha") was recorded with V3F2 (Iligh vermicompost Medium
NPK),.Song ci cii. (2001) lound similar results with the application of fertilizer NI'K
combined with OM which enhanced bioniass and grain yield of wheat.
4.2.4 Number of grains/ paiticle
Significant variation was observed in the number of grains/panicle of rice when different
doses of vermicompost were applied (Table 8). The highest number of grains/panicle
(100.07) was recorded in V3 (6 t ha"), and the lowest number of grains/panicle (66.42) was
54

reeorded in the V, treatrnenL where no vermicotupost was applied. l'he increased number of
grains/panicle may be due to favorable effects olvernilcompost on the vegetative growth and
accumulation of materials that helped proper growth and development of the rice grain.
TableS. Effect of vermicompost on the yield contributing characters of rice
Veriniconipost N
v I
I Lcd of SignitLnncc L
utijit. [Th<otspthcictsu
66.84c I 29.25b
80..17b 32.50a
100.07a 31.75a
- QUl - 00I
In a colu inn ligures lias'iiig siIn3lar letter(s) do not differ signilicanhly lacreas Figures with dissimilar letter(s)
differ significantly as per DMRT
Table 9. Effect of NPK fertilizers on the yield contributing characters of rice
NPKfettdi7eZ [ co.o1gt ains.tani % of spikeict sI
F lie 2925c
t '4
In a column figures having similar letter(s) do not differ sigmileantly whereas figures with dissimilar letter(s)
differ sigiüficzintiy as per D?v.1'
55

Table 10. Combined effect ofvermicompoSt and NI9C fertilizers oil the yield
contributing characters of rice
[Vniico;npostx NJ'K. jN Kid % ikeief of spstcnhty
Fcrtifl?er L . --'.- . ....
fl.,. ,fcnno V.
vi 63.67 hi H 30 00 ab
-- V0F' - 6913 fgti - 31JR0a1)
V.P1 r 30.00 ab
VPo 63.67 hi 26.00c
V1F; 64011 30.00 ab
VF2 71.33fgh 31.00ab
V1F3 67.678h . 30.00 ab
V2F, 76.33 ef 33.00ab
v21:; 72.00 ci - 34.00 a
V21:: 82.67 tie 30(X) ab
V211 89.67 cd 33.00 ab
V3F0 93.33e 32.00ab
V3F1 96.3 3 be 30.00 ab
V3F2 108.3 a 32.00ab
___ 102.3ab _______
I. cei ofSqpnfic4flcc 00! 001
In a column figures having similar letter(s) do nut differ sugnuiic;iiitIy whereas figures with dissinulzir letter(s)
differ signtiicantly as per DMRT
Different doses of chemical fertilizers showed significant variations in respect of number of
grains/penicle (Table 9). Among the different doses of fertilizers, F3 (High NPK) showed the
highest number ofgrains/paniCIC(83 .24). On the contrary, the lowest number ofgrains/panice
(73.17) was observed with F1,
The combined effect of different doses of vermiconipOSt and fertilizers on number of
grains/panicle of rice was signiuicant(TabklO). The 1ighest number of grains/panicle
(108.30) was recorded with the treatment combination of V3F2 (High vermicompost ±
56

Mcdi urn NPK). On the other hand the lowest in iniher of grai ns/panicle (59.33) was Ihund in
M0F0 treatment (No vermicompost and No NPK).
4.2.5 % of spikelet sterility
Significant variation was observed in die % of spikelet sterility of rice when different doses
of vcrmicoJiipoSl were applied (ToNe X) The liighesl '¼ of spikeict sterility (32.50) was
recorded in V2 (4 t ha' 1 ) which was statistically identical (31.75) with the V 3( 111gb
vermicompost) and the lowest % of spikelet sterility (29.25) was recorded in the V0 treatment
where no vermicompost was applied which was statistically identical (26.00) with the V 1
( Low vermicompost). The increased % of spikelet sterility due to increased dose of
vermicompost may be due to favorable eFfects of vermicompost on the vegetative growth and
accumulation of materials that helped proper growth and development of the rice panicles.
DiFferent doses of chemical fertilizers showed significant variations in respect of % of
spikelet sterility (Table 9). Among the different doses of fertilizers, F3 (1-ugh NPK) showed
the highest % of spikelet sterility(3 1.50), which was statistically identical (31.00) with the
lertihizer doses of F2( Medium NPK) and F 1 (Low ofNPK). on the contrary, the lowest % of
spikelet sterility (29.25) was observed with Fl).
The combined effect of different doses of vermicompost and fertilizers on % of spikelet
sterility of rice was statistically significant in Table 10. The highest % of spikelet sterility
(34.00) was recorded with the treatment combination of V 2F (Medium vermicompost + Low
NPK) which showed statistically similar results with all the treatment combinations except
v0!:1 and Vi Fu. On the other hand, the lowest % of spikelet sterility (26.00) was found in
treatment (No vermicompost and No NPK).
57
4.3 1:fft of vermicompost and NPK fertilizers on I lie iiiat rieiit colicelit Iatioiis iii rice
plant
4.3.1 Nitrogen content
A statistically significant variation was observed in nitrogen concentration in rice plant after
harvest when different doses of' vermicompost were applied (Table II). The effect of
dillérent doses of' vermicompost revealed that the highest nitrogen concentration (092 %)
was recorded in V.3 (6 1 had) . The lowest nitrogen concentration (0.67 %) was recorded in the
V0 treatment It was observed that nitrogen content in rice plant increased due to higher rate
of application of vermicompost. Jat and Ahlawat (2004) reported that application of
vermicompost to chickpea improved N and P uptake by the crop over no vermicompost
treatment.
Application of different doses of chemical fertilizers showed a statistically significant
variation in respect of nitrogen concentration in rice plant after harvest (Table 12). Among
the different fertilizer doses, F3 (High NPK) showed the highest nitrogen concentration
(1.34%) and the lowest nitrogen concentration (0.58%) was recorded in the F0 where none of
the fertilizers was applied. This may be due to more NPK application which helped to
enhance nitrogen content in rice plant.
The efl'ect of combined applications of different doses of vermicompost and fertilizers
resulted significant variations in nitrogen content in plant at the harvest of the rice (Table 13).
The highest nitrogen concentration (1.54%) was recorded in (lie treatment combination of
V3h (i-Ugh vermicompost I I Ugh NPK) On the other hand, the lowest nitrogen
concentration (0.49%) was found in V0 F0 (No vermicompost -'-No NPK) treatment
combination. The highest rates of application of vermicompost and NPK showed the highest
nitrogen content in rice straw.
58
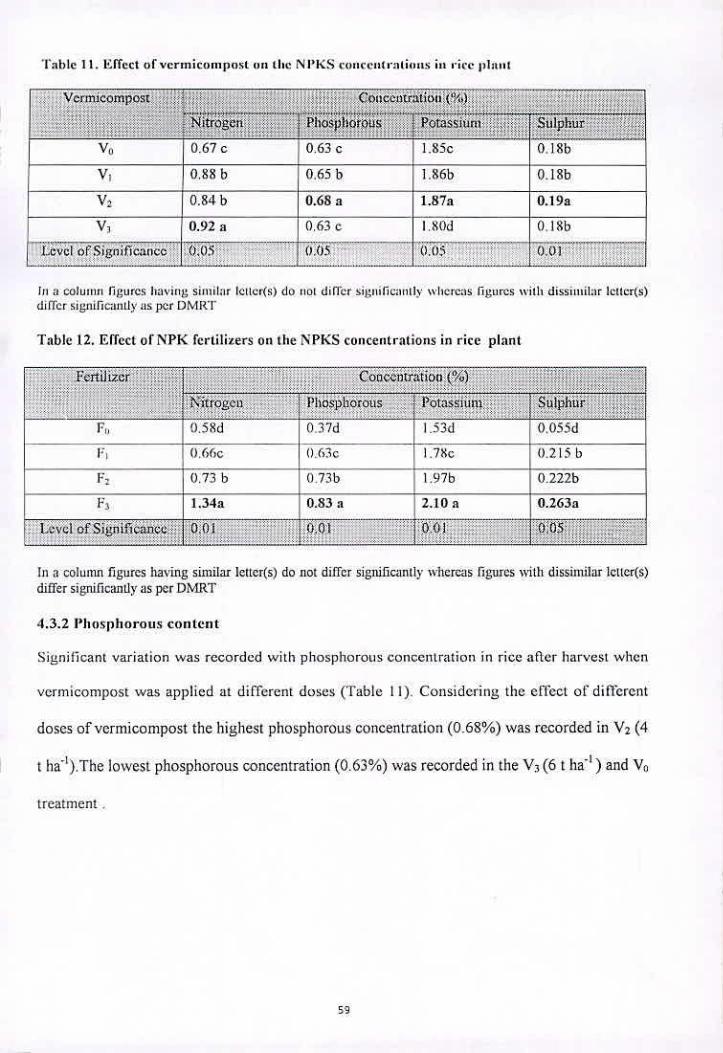
Table II. Effect of veriyiicoiti1)ost on the. Nl'lcS coiicei,ti:ifiwis III rice pI:tiit
Vertnicompost Couentratioti ('<)
Nitrogut Phophornus Potacciurn Sulphur
V 0.67 c 0.63 c I .85c 0. 18b
V1 0.88 b 0.65 b 1 ,g6b 0.I8b
V2 0.84b 0.68 a 1.87a 0.19a
V 0.92 a 0.63c I,SOd 0lSb
Levcl oSigniflcanco 0.0 - 005 005 001
Iii a colu iii,' figures luivi cig Si nil mr letter(s) do not di Ikr siginficaiil lv whereas figures with dissi utilar letter(s) dilfer significantly as per DMR'F
Table 12. Effect of NPK fertilizers on the NPKS concentrations in rice plant
Feridizer Couccutratioti (%)
i\ itrocu Phosphorous Potassium Sulphur
F, 9.5 Sd 0 3 '/d I 53(1 0,05 d
0.66c 0 63c I .7c 0.215 h
F: 0.73 b 1 073b 1 .97b 0.222b
F, — — 1.34a 0.33 a 2.10 a 0.263a
I scI ofSujnlficdncc 001 001 001 1 0 b
In a column figures having similar Icuer(s) do not differ significantly whereas figures with dissimilar letter(s) differ significanUy as per DMRT
4.3.2 Phosphorous content
Significant variation was recorded with phosphorous concentration in rice after harvest when
vermicompost was applied at different doses (Table II). Considering the effect of different
doses of vermicompost the highest phosphorous concentration (0.68%) was recorded in V2 (4
ha'5.The lowest phosphorous concentration (0.63%) was recorded in the V3 (6 t had) and V0
treatment
59

Table 13. Combined effect ofvermzcompost and NI'IC fertilizers on the NI'ICS concentrations in
rice plant
Concaitruion 1' Vermicompost x NPK . . Nitrogen •.
Fertilizer VF0 0.49 h
VF1 0611 -
V,F 0.72 dc
PliOsp!wous Potassium . Sulphur:, H:
0 43 h 1.40 g 0,056 g
0.59 g 1.91 cdc - 0207 def
0.69 de 2.01 be 0.220 edo
0.86 h 2.09 h 0.250 li
0. 4l It 1.45 g 0.060 g
0.61 fg 1.88 c 0.193 f
0.84 e
V (?, 059 f
VF1 0.72 do
V1 F 0.72 do 0.72 d 2.01 be 0.223 cd
V1 F3 1.50ab 0.83 ab 2.08 b 0.253 b
V2F0 0.63 £ 0.41 h 1.67£ 0.050 g
V2F1 0.54 g 0.65 of I.86e 0.203 cf
V2F2 0.70 e 0.78 be 1.96 bed 0.223 cd
V21:3 1.48 b 0.87 a 1.99 bcd 0.273 a
V317, 0.59 fg 0.32 i 1.60 1 0.055 g
V 3 F 11 0.76d 0.66 of 1.46 g 0.217 cde
V3F2 0,77 ci 0.74 cd 1.89 do 0.227 c
V3 F3 1.54 a 0.81 b 2.23 a 0.277 a
Ltxe' otSigmficano J
O0 _______J_00.1 L2.? :
In a coluiiitji figures having sittiil:ir leitci(s) do noi diFfer signil'ic;iiitiv whereas figures vit1t dissimilar letter(s) differ significantly as per DMRT
Different doses of chemical fertilizers resulted a significant variation in phosphorous
concentration in rice plant at the harvest (Table 12). Among the different fertilizer doses, F3
(High NPK) showed the highest phosphorous concentratin (0.83%) in plant, and the lowest
phosphorous concentration (0.37%) was recorded in the F0 treatment. It was observed that
phosphorous content increased with higher rates of application oiNI'K.
The effect of different doses of vermicompost and fertilizers at various combinations on the
phosphorous concentration in rice plant was statistically significant (Table 13). The highest

phosphorous concentration (0 87%) was recorded in I lie treaLIlicilt coniliml ion of \'2 F
(Medium vermicompost I I ugh NPK) On the other hand, the lowest phosphorous
concentration (0.41%) was found in \'2 F0 (Medium vermicompost ± No NPK) treatment
combination. The highest result might be due to optimum rate of application of vermicompost
and higher doses of NPK in V2F3 treatment.
4.3.3 Potassiniti coil tent
Statistically significant variation was not recorded in potassium concentration in rice plant
after harvest when the effects of different doses of vermicompost were compared (Table 11).
Considering the effect of different doses of vermicompost, the highest potassium
concentration (1.87%) was recorded in V2 0 t ha1), and the lowest potassium concentration
(1.80%) was recorded in the V, (6 t ha1) treatment of vermicompost
Application of different doses of chemical fertilizers resulted a significant variation in
potassium concentration in rice plant after harvest (Table 12). Among the different
combinations of fertilizer. h (1-ugh NPK) showed ilie highest potassium concentration
(2. lO%) in rice plant. On the other hand, the lowest potassium concentration (1 .53%) was
recorded with F0 where no fertilizer was applied.
Combined application of vermicompost and fertilizers at different levels showed significant
effect on potassium concentration in rice plant after harvest (Table 13). The highest
potassium concentration (2.23%) was recorded in the treatment combination of' \' 3l3 (I ugh
vermicompost ± High NPK). On the other hand, the lowest potassium concentration (1.40%)
was found in V0F0 (No vermicompost + No NPK).

4. 3.4 Su Iph ur conteti
Statistically significant variation was recorded in sulphur concentration in rice plant ater
harvest when the effects of different doses of vermicompost were compared (Table II).
Considering the effect of different doses of vermicompost, the highest sulphur concentration
(0.19%) was recorded in V2 (4 t hi1 ), and the lowest sulphur concentration (018%) was
recorded in the V1> (No vermiconipost ) treatment, which was statistically identical V) (6
ha' ),and Vi (2 t lia I) respecti vcl y
Significant variation was observed with the application of different doses or chemical
fertilizers with respect of sulphur concentration in rice plant (Table 12). Fertilizer dose. F
(High NPK) yielded highest sulphur concentration (0.26%) in plant and the lowest sulphur
concentration (0.05 5%) was recorded in F(, treatment where no fertilizer was applied.
Combined cIThct the different doses of vernucourpost and fertilizers on the sulphur
concentration in rice plant showed statistically significant difference (Table 13). The highest
sulphur concentration (0.277%) was recorded in the treatment combination of V3F3 (High
vermicompost + High NPK) which was statistically identical with V2F3 (Medium
vermicompost I l-ligli NPK). On the other hand, the lowest sulphur concentration (O.OSO%)
was found in with V21'0 (Medium vermicompost No NPK) treatment combination.
4.4 Effect of vermicompost and NPK fertilizers on the uptake of nutrients by rice plant
4.4.1 Nitrogen uptake
The effect of vermicompost on nitrogen uptake by rice plant showed significant variations
(Figure 3 and Appendix Table I). Nitrogen uptake was maximum in the treatment V3 (High
vermicompost) having ( L05.83 kg hi') Ilte mni,nuni nitrogen uptake by rice (60.09 kg
ha') was recorded with control. Baron el cii. (1995) found that the addition ot'organic manure
has a positive influence on the N uptake by wheat plants.
62

150
(5
.50
0
Application of NPK at different doses significantly influenced nitrogen uptake by rice plants
(Figure 4 and Appendix Table 2). Nitrogen uptake ranged frorn(147.42 kg ha' )with highest
in the treatment F3 (I-ugh NPK) to the lowest of (50.77 kg hi') in the control treatment ( No
NPK).
o Nitrogen u Phosphorus o Potassium U Suipher
ab a
b
VO VI V2 V$
Treatments
Figure 3. Effect of vermicompost on NPICS uptake by rice plant
0 Nitrogen • Phosphorus o Potassium o Sulpher
250
200 (5
150
1100
50
0
FO Fl F3
Treatments
Figure 4. Effect of NPK fertilizers on NPKS uptake by rice plant
63

r 9 9 ha
I 1' Uptake ofNitro2en (kz/ha)
9 5- 9'cr ----- a 00
or VoFo
VoF,
f-
__ = g zJ-
OF:
V jFa co
a =- p—I
o n - VIE2 -. 0
VIF3 ______ C- - P . .P-3.
2F1 V H = - a
- 9 a 6 2 V1F 2 ____ -
.
V3F2 - 9 V3F3!__________ 2
Ii
.!
6' 9• cr3 .—. -.
J- z ;-

a
I o
a & 8 0-
= a 4-
C
,
2
a
2:
! I
a' 00
in
— In
E
2 —
<
CD
"
a.
=
06
0
- - - 00
C 0
.
a o r r-- 0
CP - ' a •
CD -C
-
- =
C;
a.
O
CD
.,
a -C
=
a C i#C a 0
2 r .-
I
UI)talceofPhospholous(Ic! ha
0 0 0 0 0
V0F0
trr
Z o
B
CD
•
CD
a
a CD
a
CD
71
- a 9 E.
CD
-o C
o- r —
— a a -
- a -
a. t a a.
N -
In
h a.
a
<
- 0;
CD
S
0
2 2. C — CL
B
—
r v
-a CD a-

250 at) ab
200 bcd bcd
de cdc Ld ci E 150- 1
jiIIIii : i C C -
(.L. U- C ----rI"4.-$ r• , v. ,. - > Treatments
ab
I Figure 7. Combined effect of vermicompost and NPK fertilizers on ptassium uptake by
rice plant
Application of different doses of NPK fertilizers significantly influenced potassium uptake
by rice. Potassium uptake ranged from 135.98 to 218.08 kg hi' ( Figure 4 and Appendix
Table 2). The highest potassium uptake (218.08 kg hi') was recorded with the treatment, F;
(High NPK). The lowest (135.98 kg hi') in control (F( ) treatment.
The effect of combined application of different doses of vermicompost and fertilizers on
potassium uptake by rice showed statistically significant variation (Figure 7 and Appendix
Table 3). The highest uptake (234.1 Kg hi') was recorded in the treatment combination of
V 3F3 ( High vermicompost High NPK). On (lie other hand , the lowest uptake (116.0 Kg
66

35
30
25 :4
do
C
bc
iIiI a
hi') was recorded in the treatment combination of Vol--() (No vermicompost + No Nit). It
might be due to the fact that vermicompost and NPK combined application showed positive
effect on potassium uptake by rice.
4.4.4 Sulphur uptake
Sulphur uptake by rice plant showed highly siiiflcant influence due to the application of
vermicompost (Figure 3 and Appendix Table I). Sulphur uptake ranged from 18.44 to 24.75
kg hi'. The highest Sulphur uptake (24.75 kg hi') was recorded with the treatment. V3
(I ugh vermicompost). and minimum (18.44 kg hi' ) in the control treatment.
> > > > >. > > > .> > ). > >• > > >•
Tieatinenls
Figure 8. Combined effect of vermicompost and NPK fertilizers on sulphur uptake by
rice plant
Sulphur uptake by rice was sigiiiflcantly influenced due to the application of different doses
of NPK fertilizers ( Figure 4 and Appendix Table 2). The maximum value (28.51 Kg hi')
67

was Iimnd in the treatnient, H (I ligh N l'lC) the lowest value (I I 52 kg had) was recorded in
h1 treatment where no NIK fertilizers were applied.
Combined applications of different doses of vermicOmpost and fet-tilizers showed significant
variation on sulphur uptake by rice (Figure S and Appendix Table 3). The highest S uptake
(33.24 kg ha') was recorded in the treatment combination of V 3 F3 (High vermicompost ±
hugh NPK). On the other hand, the lowest uptake (11.01 kg hi') was recorded in the
treatment cci in bin at ion, V Fo wI icre I ow veil I UCOII post and no Rrc iii ?.ers were added.
4.5 Effect of verinicompost and NPIC fertilizers 8p1)l!catiofl on the nutrient status of soil
after harvest
4.5.1 Organic matter content of soil
A significant variation was observed on the content of OM after harvest where
vernilconipost was incorporated in soil (Yablel4) Among the different doses of
vermicompost, V (6 t haj treatment showed the highest OM content (1.65%) after the
harvest of crop. On the other hand, the lowest OM content (1.24%) was observed in the V0
treatment where no vermicompOSt was applied. Vermicompost added more organic matter in
the soil and as a consequence the residual amount of organic matter showed higher values
with the addition of higher amouni of vermicompost.
I a 1k 14. El feet of venD ico in post on the 0 VI, total N, available I'. excIlangCal)IC IC, and
available S contents iii the soil after rice harvest.
flVermicompos.t JOM(%).....TotalY AvmIableP..fA'aiiab1eK Available S
--------- __._._...) .j .()__'t .1 V0 1.24d 0,072c 0.0031a 0.0010d U.00lSb
V I L.41c 0.078a 0.0016c 0.0013a 0.00 17c
V 2 I50b 0.039e 0.0017b 0.0012bo.00I810
VI is a o.o: b h OOhOc o.dbii7 o.Ôozoa
Level of 0.0! 0.01 0,01
in a column figures having similar letter(s) do not diFfer significantly whereas figures vlilt dissimilar letter(s)
differ significantly as per DMRT
68

A significant variation was observed on the content of OM ailer harvest where the fertilizers
was applied in soil (Table 15). Among the different doses of fertilizers F2 (Medium NPK)
treatment showed the highest OM content (1.52%) after the harvest of crop. On the other
hand, the Lowest OM content (1.35 %) was observed in the F0 treatment where no fertilizer
was applied.
Combined application of different doses of vermicompost and fertilizers showed a significant
variation on the content of OM after harvest where the vermicompost and lertilizer was
applied in soil (Table 16). Among the different doses of vermicompost and fertilizer V3F1
(High vermicompost ± l..ow NPK) treatment showed the highest OM content (1.77%) after
the harvest of crop, which was statistically identical (1.75%) with the combined doses of V3
F: ( High vermicompost ±Medium NPK). On the other hand, the lowest OM content (1.07%)
was observed in the V0F0 ( No vermicompost + No NPK) treatment.
Table 15. Effect of NPK fertilizers on the OM, total N, available P. exchangeable K and
available S content iii the soil after rice harvest
Total IA aNd \i1I Availabkl
I P(%) K(%) S(%) -- -
F0 1.35 a 0.061 d 0.0027 a 00081d 0.0014 d
F1 1.45 c 0.068 c J 0.00 14 d OO94 cO17 c
I F2 1.52 a 0.073 b 0.0019 c 0.0013 b 0.0021 b
b 1j181 10.097 a ToTbo2lb 0.0015 a 0.0024 a
0.01 001 -. 0M1 0.01
Siniflcance I - In a cotunin figures having similar letter(s) do not ditler significantly whereas figures with dissimilar letter(s)
differ signilicantly as per DMRT
69
4.5.2 Nitrogen content of soil
Significant variation was recorded on the nitrogen content of' rice field after harvest of the
crop when the field was treated with different doses of vermicompost (Table 14). Among the
different doses of vermicompost, V1 (2 t ha1) treatment showed the highest N content
(0.078%) and the lowest N content (0.039%) was observed in the V2 (4 1 ha") treatment
where nied Ill m (loses WrJoiCoMpost was applied This was due to the lict that vernuconipost
added N in soil and reduced the loss of nitrogen and conserved more nitrogen in soil. hangar
ci cii. (1990) found that compost enriched the N content of soil.
A significant variation was recorded in the N content of soil after harvest of the rice crop
when different fertilizers in different doses were applied (Table 15). In considering the
diuibrent fertilizer doses, F3 (High NPK) showed the highest N content (0.097%) and the
lowest N content (0.06 1%) was observed in the Fo treatment where no fertilizer was applied.
Combined application of different doses of vermicompost and fertilizers showed significant
effect on the N content of soil after harvest (Tablel6). The highest N content of crop-
harvested soil (0.1 t%) was recorded in the treatment combination of \i F3 (Low
vermiconipost I high NPK). On the other hand, the lowest N content (0.053%) was recorded
in V0F0 (No vermicompost + No NPK). Tolanur and I3adanur (2003) reported that soil
available nutrients like N, P and K increased significantly with the application of various
organic sources of nutrients in combination with fertilizer.
70

Fable 16. COiItl)iiled effect of vermicompost and N IK fertilizers on the ONI, total N, available P. cxcliaiigeahle IC and available S contents itt the soil after rice I, rvrc I
Vermicoinpost ON.1 - leniNMatk blcpAvablc atl K .yai1ab1e S
NPK f (°) (%)
I ertilizer 1.07 i 0.053 g 0 00109h c 0.00061 i 0.0011 Ii
'10F 3 1.20 h 0.060 cig 0.001 12h 0.00071 lii 0.0016 efg
cdcf 0.0018 Ic 0.00120cc! i.33i0M77 - 0.0019 c VF7
Vol:, 1.37e1g 0.09K ah 0.00195cc! 0.00150 ab 0.0024 h
VFcj 1.3Sef8 0.067 defg 0.00095ij 0.00097 clg
0.O78cdef -- 0.001571 - 0.001 lOde
0.0016 t'g
V1F1 1.29 g 0.0018 ede
V1F2 1.5Sbc 0.057g 0M0196 bed 0.00150ab 0.0025b
00019c V1F3 1.40def 0.1 Ia 0.00205 be 0.00153 a
V2F0 1.47cde 0.059f 0.00107 hi 0.000SOgh 0.0012 ii
V2F1 1.SSbc 0.Oó7defg 0.00155 1 0.00IO ci 0.0017 dci
V2F2 1.43 de 0.OSOcct 0.00190 (IC 0.0013 bc 0.00I9cd
V2F3 I .SSbc 0.090bc 0.00209 b 0.00156 a 0.0024b
v31-0 Th.4scd 0.066defg 0.00089j 0.00087 igh 0.0015 g
V3F1 1.77a 0.065 defg 0.00 138 g 0.000931'g 0.0016 efg
V3F2 1.75a 0.079cde 0,00201 bed 0.00123 ed 0.0019cd
V1F3 - 1.60b 0.696bc 0.00230 a 1 0.00155 a 0.0028 a
001 0.01 .0.01
igntflcance I ____
In a column Figures having similar tetler(s) do not differ satin Ficauth' whereas fiurcs with dissimilar Ictier(s)
differ significantly as per DMR'I'
4.5.3 Phosphorous content of soil
A significant variation was observed in the P content of soil in the rice field after harvest
where the fleld was manured with dit't'ërcnt closes or vernhicoillpOSt (Tabtel 4). Among the
different doses of vermicompost, \'o (No vermicompost) treatment showed the highest P
content (0.0031%) after the harvest of crop. On the other hand, the lowest P content
(0.0016%) was observed in the V1 and V 3 treatments.
71

There was a significant variation in the P content or soil alter harvest of the crop when
different combinations of fertilizers at different doses were applied (Table 15). Among the
different combinations of fertilizer doses, Fe (No NPK) showed the highest P content
(0.027%) and the lowest P content (0.0014%) was observed in the doses ofF, (Low NPK).
Combined efThct of' different doses of vermicompost and fertilizer produced significant
vararic)n in respect 01 I' content of soil alter the harvest of rice (Table 16). The lowest P
content of crop harvested soil (0.0009%) was recorded in the treatment combination of V 3)!0
(High vermicompost -I No NPK). On the other hand, the highest P content (0.00230%) was
recorded in V3 F3 (High vermicompost + High NPK) treatments
4.5.4 Potassium content of soil
Signilicant variation was recorded in the K content of soil in the rice held after harvest ot'the
crop where different doses of venflicompost were applied (Table 14). Application of
vermicompost at the rate of 2 t hi' showed the highest K content (0.00 13%) and the lowest K
content (0.00 10%) was observed in the V0 treatment where no veriniconipost was applied.
l'},erc was a significant variation in the K content of soil allot harvest when different
combinations of fertilizers were applied (Table 16). Fertilizer dose F (I-ugh NPK) showed
the highest K content (0.0015%) and the lowest K content (0.00081%) was recorded in the Fe
treatment (No NPK).
Combined effect of different doses of' vermicompost and fertilizers produced significant
variation in respect of K content of' soil after the harvest of' rice (Table 16). The lowest K
content of crop harvested soil (0.00061%) was recorded in the treatment combination of V0F0
(No vermicompost + No NPK). On the other hand, the highest K content (0.00156%) was
72

recorded in V2F1 (Mediu in vermicompost I I Ligh N IlK) t cal mciii s, which was statistically
similar with V3F3 and V1F3 treatments.
4.5.5 Sulphur content of soil
Significant variation was recorded in the S content of soil after rice harvest where the plots
were incorporated with different doses of vermicompost (Table 14), The low dose of
verinleompost, V1 (6 t ha' ) resulted the highest S content (0.0020%) ailer the harvest of the
crop and the lowest S content (0.001 7%) was observed in the V t (2 t ha1) treatment where
low doses of vermicompost was applied.
Significant variation in the S content of soil after harvest was obtained when different
eornbmations of fertilizers at different doses were applied (Table 15). Fertilizer dose. F3
(High NPK) showed the highest S content (0.0024%) and the lowest S content (0.0014%)
was observed in the F0 treatment where no fertilizer was applied.
The effect of combined application of different doses of vermicompost and fertilizers
showed significant differences in respect of S content of soil after rice harvest (Table 16).
However, the lowest S content of crop-harvested soil (0.0011%) was recorded in the
treatment combination of V0 F0 (No vermicompost + No NPK), and the highest S content
(0.0028%) was recorded in V3 173 (High verniicoinpost + High NPK) treatment combinations.
73

Chapter 5
11< Summary and Conclusion
Ira

( Iuiph'r 5
SUMMARY AN I) (:oN(:LUSION
An experiment was conducted at the Sher-e-Bangla Agricultural University Farm (SAU Farm),
Dhaka 1207 (Tejgaon series under AEZ No.28) during the Khcjrif-i season of 2005 to study the
elect of organic and inorganic lertilizers growth ,yield, and nutrient uptake of rice. The soil
was silty loam in texture having p11 5.9, oflptcUC waiter t 09% Randomized complete block
design was followed with sixteen treatment combinations having unit plot size of 4111 x 2.5m
(1Dm2) and replicated thrice. Four rates of vermicompost 0. 2, 4. and 61 hi' (designated as V0,
V1, V2 and V3) and four rates of NPK designated as F0 (No N, No P205, No K20), F, (50, 40,
30kg ha' N, 11205, K20. respectively), F2 (80, 60. 50kg ha1 N, P20, K20, respectively) and F3
(II C), 80, 70 kg hi' N. l>205, 1(20, respectively) were used. The treatments were V0F0 Control
(No vermicompost + No NPK), V017 1 (No vermiconipost + Low NPK), V0F2 (No vermicompost
+ Medium NPK), V0F3 (No vermicompost + High NPK), V,F0 (Low vermicompost -r No
NPK), V,F1 (Low vermicompost + Low NPK), V,F2 (Low vermicompost + Medium NPK),
V,F3 (Low vermicompost -F High NPK). V2F0 (Medium vermicompost i- No NPK), V2F1
(Me(Iium vernhicornpost i Low NPK), V2 F2 (Medium vermicompost + Medium NPK), V2F3
(Medium vermicompost ± High NPK), V1-1> (I-high vermnicompost i No Nl'K), v3F1 (High
vermicompost + Low NPK), V3 F2 (High vermicompost + Medium NPK). V3F3 (High
vermicompost + High NPK). Nitrogen from urea, P205 from TSP and K20 from Muriate of
potash (NW) were used. One third of the urea and the whole required amounts of TSP and MP
fertilizers and vermiconipost were applied in plot as per treatment combination during of the
final land preparation (puddling). The rest oithe urea was top dressed in two equal splits at IS
and 35 days after transplanting oF the seedlings. Rice seedlings cv. Shraboni were transplanted
on 26th May, 2005 and the crop was harvested on 18Ih August, 2005. Intercultural operations
74

were done as and when required. The data were collected plot wise br plant height, parcic
height, flag leaf height, number of grains per panicle, % of spikelet sterility , weight of 1000
grains, grain and straw yields. The post harvest soil samples were analyzed for organic matter,
N, P, K and S contents. All the data were statistically analyzed following F-test and the mean
comparison was made by DMRT at 5% level. The results of the experiment are stated below.
Grain and straw yields of rice responded signifleantly to the application vermicompost and
NPK fertilizers. The highest grain ( 4.80 t ha ) and straw yields (7.75 t hi' ) were obtained
with V3F2 (High vermicompost -F Medium NPK) treatment. The lowest grain (3.30 t ha ')
and straw yields (5.25 t haj were recorded with V0F0, where no vermicompost nor fertilizers
were applied.
The highest (108.3) and lowest (59.33) number of grains /panicle were recorded with V3F2
and V11F1 treatments, respectively. The highest (34.0) and the lowest (26.0) percentage of
spikelet strility were obtained with V21-- 1 and V0F0 treatemtns, respectively.
The highest plant height, panicle and flag leaf length of 119 cm, 28.40 cm and 42.0 cm,
respectively were recorded with the application of high vermicompost combined with
medium doses of NPI< thrtilizers (V1 F2) The lowest plant height, panicle and flag leaf length
of 96.67 cm, 20.50 cm and 28.0 cm, respectively were obtained inthe treatment which
received no vermicompost and fertilizers (V0F0).
Both the grain and straw yields and the heights of plant, panicle and flag leaf showed decline
when theNPK doses were increased along with the high dose of vermicompost (V3F3).
Ihereibre, the application of vermiconipost at the rate ofu t ha t along with 80. 60 and 50 kg
N. 13205 and K20 ha', respectively is suitable forthe optimum production of rice (cv, BR-26,
Shraboni).
75

The N, P. K and S contents and uptake of these nutrients by rice ptant were influenced
sigm licantly by the application of vermicompost and chemical fertilizers. The highest N, K
and S content in straw (1.54%, 2.23% and 0.28% after harvest, respectively) were recorded
in \'3F3( High Vermicomposi ± High NPK) treatment except for P which showed highest
value (0.87 %) in V2F3 (Medium Vermicompost ±1-ugh NPK). The lowest N, P, K and S
content (0.49%, 0.431%, 1.40% and 0.056%, respectively) were obtained with V0F0
t rca Iii ic n
The highest uptakes 01184.8 , 97.07, 234.1 and 33.24 kg hi' of N, P, K and S respectively
were recorded with V3F3 treatments and the lowest uptakes of 40.58. 116.0 and 11.64 kg hi1
of N, K and S, respectively by rice plant at harvest stage were found in V0F0 (No
vermicompost No NPK) The lowest P uptake (30.74 kg hi') by rice straw was obtained
,'fit}) V';ç l q.
The post harvest soil properties such as organic matter, total nitrogen, phosphorus, potassium,
and sulphur contents showed increased due to the combined application of vermicompost and
fertilizers compared with their status in the soil.
76

ilL References ___ :7

REFERENCE:
J47
Agrawal, SB., Singh, A., Singh, G.D. and Dwivcdi, A. 2003. EffetTujtbmpost,
farmyard manure and chemical fertilizers on growth and yield of wheat (Triticun
czesflvztnz L.var. liD 2643). Plant—Archives. 3: 9-14.
A Ii mcd, M and ita Ii ni a ii, S 1991 I nil LI CflCC 01 organic mat icr on the yield and ml nera I
.uulrition of modern rice and soil pwpcFtics hung/tn/exit R;cc'. .1. (1-2): 107- LI 2.
Alam, M. P., Singh, R. S. and Prasad, K. 1994. Integrated nutrient management in rice—
wheat cropping sequence. J. Res. IirisaAgrit (In!. 6(2): 165-166.
All, M. 1. 1994. Nutrient balance for sustainable agriculture. Paper presented at the Workshop
on Integrated Nutrient Management fix Sustainable Agriculture held at SRDI. Dhaka.
June 26-28. 1994.
Animal, U.B. and Muthiah, N.D. 1997. Effect of potassium and organic manures on rice
yield and potassium use efficiency. I Polacsiu,n Res. 13 (1) : 45-49.
Anand, S.,Yaduvanshi, N.P.S. 2000. EfFect of integrated nutrient management on soil
properties and yield of rice in alkali soil .1. fm/ion. Soc. Soil Sc!.. 48 (2) :279-282.
Annaduri, K., Seshadri, P. and Palartiappall, S. 1994. Influence of potassium levels on yield
and oil content in sunflower-soybean sequence. .1. Pokmw/un. Rex. 10(2): 124-
129.
Aulakh, M. S., Doran, J.W., Kuldip, S. and Singh, B. S. 2000. Soil Sci. Soci. American. J. 6159:
1867-1876
flair, W. 1990. Characterization of the environment for sustainable agriculture in Semi Arid
Tropics. In Proc.: Sustainable Agriculture: Issues. Perspectives and Prospects in
Semi—Arid Tropics . Singh. R.P. Ed. Hyderabad India. Indian. Soc. Agron. 1: 90-
128.
77

Bajpai, R. K., Upadhyay. 5K., Joshi, U.S and 'I'ripathi. R.S. 2002. Productivity and
economics of, rice (Ucrzu .wslst'u) wheat ( l'ntu,un ue.sii'uFn) cropping system
under integrated nutrient suppLy systems. Inc/ic:,,. .1. Agrn:. 47 (1) : 20-25.
E3aluch, Z. A., Akhtar, it. 'vi....Thlil. A. and Sandhu, G. It. 1989. Yield and NPK uptake by
wheat as influenced by fertilizer and manure application. RACHIS (ICARAD). Barely
and Wheat Newsletter. S (1): 2 1-23.
hangar, K. C Shanker, S.. Kapoor, K K.. KuLrcja. K. and Mishra, M. N. 1990. Preparation
of nilrogen and phosphorus enriched paddy straw carry out and its etThct on yield and
nutrients uptake by wheat. IlioL Pert. Soils. 8 (4): 339-342.
Baron, R., Benitez, I. C. and Gonzalez, J. L. 1995. The influence of organic matter
additions on wheat cultivation. Agrochimica. 39(5): 280-289.
Baslar, K. (2003). Effect of integrated use of inorganic fertilizers and FYM or green leaf
manure on uptake and nutrient use efficiency of rice-rice system on an inceptisol. .1.
India,, Soc. S'oil Sc!. 5 1(1): 47-51.
Bayu, W., Rethman, N. F. 0., Hammes, P. S. and Aleniu, G. 2006, Effect of the combined
use of FYM and inorganic fertilizer on the growth and yield of sorghum and on soil
chemical properties in a semi-arid area in northeastern Ethiopia. Crop Sc!. 46: 854-
858.
Behera, U. K. 2003. Sustaining productivity of wheat-soybean cropping system through
integrated nutrient management practices in the vertisol of central India. J. Indian.
Soc. Soil Sc!. 51(2): 61-65.
Bellakki, M. A. and Badanur,V. P. 1997. Long-term effect of integrated nutrient management
on properties of Vertisol under dryland agriculture. .1. Indian. Soc. So!! Sc!. 45(3):
43-442.
l3enoi, D. I). Singh, R. G. Singh. K. S., Rachpal, S. S. and Sagar. S. 1993. Response ofdry
land wheat to fertilizer nitrogen in relation to stored water. rainfall, and residual
farmyard manure. Fert Res. 36(1): 63-70.
78

[3eri, V and Meclu, 0, P. 1 OS I Stibsi ilution at' N dirough green inainiring in rice. i/k/UI/F.
tar ;ung. 3 I(5) : O• 7.
Bliandari, A. L., Sood, A., Sharma, K. N. and Rana, D. S. 1992. Integrated Nutrient
Management in Rice-Wheat System. .1. Inc/iwt Soc Soil Sd. 40: 742-747.
!3ouldin, D. R. 1988. Effect of green manure on Soil organic Matter content are nitrogen
availability. In Green Manuring in Rice Farming. 1,,!. 111cc' 11cc. J,zsl. Manila.
Philippines. pp. 151 163.
R. If. and Kurtz, L. T. 1945. Determination of total organic and available forms of
phosphorus in soils. Soil Sd. 59 39-45.
Chideshwari, T. and Krishnaswamy, R. 2005. Transformation of zinc enriched organic
manures and the yield of rice ADT 36. Acii'ancc's inPlaid Xc/. 18(1): 207-212.
Chowdappa. P., Biddappa, C. C. and Syjatha. S. 1999. Efficient recycling of organic waste
in Arecanut (Area: ailed/sw) and coco (77:cdoniu cacao) plantation through
vermicomposting. Indian. J. Agril. Sd. 96 (8): 563-566.
Dang,Y. P., Verma, K. S. and Pannu, B. S. 1988. Effect of phosphorus, poultry manure,
biogas slurry and farm yard manure on dry matter yield and utilization of applied P by
wheat. .1. Nuclear 4gr/i Iliol. 25 (2): 89-93.
l)as, P. K., Jen, M. K. and Sahoo, K. C. 2002. Effect ol integrated application of
vcrniicompost and chemical fertilizer on growth and yield of paddy in red soil of
South Eastern Ghat Zone ofOrissa. Environ, and ltcology. 20 (1): 13-15.
David, M. S. and Biswas, 0. R. 1996. Use of phosphorus, poultry manure, biogas slut-n and
FYM on dry-matter yield and utilization of P by wheat J. NucI. Agri! B/a. 25(2):89-
93.
79
Dey, P. and Jam, M. 2000.Use olurea enriched green manuring for their efficiency to Sustain
productivity of rice-wheat system. .1. indian Soc. Soil Sc,. 118( I): 102-107.
Dusserre, C. 1992. On the effect of earthworm on the chemical condition or soil. Landhow
.1 B. Schwc'iz. 6: 75-78.
Edwards, C. A. and Bohlen, P. J. 1996. Biology and Ecology of Earthworms. Capman and
Hall, London.FAO (Food and Agricultural Organization). 1999. Yearbook ofPT ft-
-ction. I'AO .VlatisUcx Division. 53:72-73.
Flynn, It. P., Wood, C. W. and I'oucl;ton, J T 1995. Nitrogen recovery from broiler litter in
a wheat millet production system. lila-rex. ;rj, 44 (2): 165-173.
Fouda, E. E. 1989. The effect of compost manure and CaCO3 on the absorption of
micronutrients by wheat plants grown in Egyptian sandy soil. Cited from Field Crop
Abst. 48(3): 160-161
Fox, It. L., Olson, R. A. and Ithoades, II. F. 1964. Evaluating the sulphur status ol soils by
plant and soil tests Soil Sd. Soc. American .Proc. 28 : 243-246.
Ganapathy, M., Ramesh, N. and Baradhan, G. 2006. Studies on the effect of integrated
management of farmyard manure, composted bone sludge, composted press mud and
inorganic fertilizers on rice fallow sunflower crop. P.c's. ('raps. 7 (3): 640-642.
GainLy, I). P. and Flimm. J . C. 1988. In green Mannure in Itice Farming. Ii:!. Rice Rex. inst
Log Jianos. Laguna. P/nfipmws. >p. 112-129.
Gaur, A. C., Sadasivam, K. V., Virna!, o. P. and Mathur, R. S. 1971. A study of the
decomposition of organic matter in and alluvial soil, CO2 evolution , microbiological
and chemical transformations. Pkmt and SoiL 35: 17-28.
Uhosh, I'. IC., Manna, M. C., Bandyopadliyay. K. K., Ajay. T. AK., Vanjari, It. H., Hati,
Misra, A. K., Acharya, C. L. and Itao, A. S. 2006. Interspecific Interaction and
nutrient use in soybean/sorghum intereropping system..]. Indian. Soc. Soil Sd. 55
(1): 67-71.
80

$Iomcz. A. K., and Gornex, A. A. (1984) Starislicat Procecltires fbi Agricultural Research.
Second Edition. John Wiley and Suns. New YorL, I S.A
Gorlitz, I-I. 1987. Studies on the iniluence of soil humus status on yield components and
crop yield. Cited from Field Crop Abst. 40(11): 780.
Gowda, N. A. J., Kumaraswamy, A. S., Guruprasad, T. R. and 1-lerle, P. S. 2004. Effect of
Azolla biofertilizer on the growth and yield of rice in costal Karnataka. 131o/èrii/i:ers
Icc/i. 198-201.
Guan, S. Y. 1989. Studies on the factors influencing soil enzyme activitieson effects of
organic manures on soil enzyme activities and nitrogen and phosphorus
transformations. Acta-pedo/ogica-Sinice. 26(I): 72-78.
Gupta, A. P., Mit, R. S. and Nanval, K. P. 1996. Effect of various organic mannure and
fertilizer nitrogen on the perl'ormance olwheat. ,\n,ials 131o1 12(2): 188-194.
Gupta, A. P., Narwal, R. P. and Antil, P. S 1995. Effect of different levels of phosphorus and
sewage sludge on wheat. .1. Indian. Soc. Soil 5th. 41(2): 304-307.
Gupta, S. K. 1995. Effect of organic manure on rice yield and moisture retention in Alfisol
soil. J. HiliRes. 8(2): 169-173.
llama, S. and Singh, K. P. 1995. Effect of plant residue and fertilizer on grain yield of
dryland rice under reduced tillage cultivation. 34(2) :115-125.
Harris, G. 1990. Use of earthworm biotechnology for the management of effluents from
intensively housed livestock. Out look on Agriculture. 180 (2): 72-76.
Hati, K. M., Mandal, K. G., Misra, A. K., Ghosh, P. K. and J3andyopadhyay, K. K. 2006.
Effect of inorganic fertilizer and farmyard manure on soil physical properties, root
distribution, and water-use efficiency of' soybean in Vertisols of central India.
li/oRes. i'eclmo. 97: 21 52-2188.
81

1-lesse, P. R. 1984. Potentials of organic materials 101 soils improvement In organic matter
and rice. hut Rice Rex. Inst. ft'huulci. I'/n/fippn:c's pp:35-42
1-lundat, H. S., Dhillon, N. S. and Dcv, G. 1992. Contribution of different green manures to P
nutrition of rice J. Indian. Soc. Soil. 40: 76-81.
Hunt, J. 1980. Determination of total sulphur in small amount of plant material analyst.
105: 83-85.
Ishikawa, M. 1988. Green manure in rice the Japanese experience in sustainable agriculture:
green manure in rice Uirniing .1. /uu/u:n. Soc...ml Sti '19 (2) : I 20- I 22.
Islam, M. S., Amin, M. S. and Anwar, M. N. 1994. integrated soil fertility management in
Bangladesh. Paper -presented at the workshop on integrated nutrient management for
sustainable agriculture held at Soil resour. Dcv. Inst. Dhaka in June 26-28. 1994.
Jackson, ML. 1973. Soil Chemical analysis prentice hail of India private limited. New
Delhi.
Jat, It S. and Ahlawat, I P. S. 2004 Direct and residual efl'eei olverinicompost, biofertilizers
and phosphorus on soil nutrient dynamics and roductivity of chickpea-fodder maize
sequence...Jndian. .1. Soil Sc,. 12(2): 4 1-54.
leon, E., Shin, Y., Choi, I., Jeong, E. K., Shin, Y.B. Choi. 1. H. and Shin, Y. S. 1996. Effect
of organic matter application on rice growth and grain quality. .1. Agric. Rex. 38(1)
17-26.
Kadar. I, and Csatho, P. 1987. Long-term effects orsuperphosphate in winter monoculture. I.
Studies on specific effectiveness, nutrient content, nutrient uptake and residual P
effect; phonological observation. Agrokenia E S Talajtan 34 (1/2): 97-129. Cited from
Field Crop Abst. 40(9): 640.
Kaleeswari, R. K. and Subrarnanian, S. 2004. Impact of organic manure and inorganic
phosphatic fertilizer on yield and nutrient uptake in a rice-rice cropping system. Inlet'.
Rice Rev. Notes. 29 (2) 57-60.
82

Kamla, K. 2002. Recycling of organic wastes by vcrinicompositing and ii S 111il17.fltiofl in
agriculture in himachal pradcsh. Inc/lw,......oil .Sei. 24 (2) 12-25.
Khan, S. K., Mohant, S. K and Chalam, A. V. 1993. Integrated management of organic
manure and fertilizer N on rice. .1. Indian. Soc Soil Sc!. 34(3): 505-509.
Khandat, D K. and Nagendra, B. B. N. 2002. Effect of vermicompost oIEichhrnia on two
cullivars of wheat. J. Eco-1'/nwiology. 5(3-4): 143-148.
Ku mar, A and Yadav, 1995. Use of organic matter and In ii ii.ers in rice-wheat cropping
system for sustainability. Inc/san. .1. Agri c. Sd. 65: 703-708.
Kumari, M. S., Kumari, S. K. U. 2002. Effect of vermicompost enriehcd with rockphosphate
on growth and yield of cowpea (Vigs,a unguiculata). .1. Indian. Soc. Soil Sc!. 50 (2):
223-224.
Kundu, S., J3hattacharyyal, It., Prakash, V., Gupta, H. S., Pathak, II. and Ladha, K.
2006. Effects of organic and inorganic sources of nutrients on grain yield trends of
rainfed soybean- wheat system and nutrient status in a sandy loam soil. I. Indian. Soc.
Soil ScL 52 (1): 45-47.
Majid, A., Ali, A., Rabie, M. M. and Sabrah, R. E. A. 1995. Chicken manure as a bio-
fertilizer for wheat in the sandy soils of Saudi Arabia ./ Ar ci. Environ. 28 (3): 43-
420.
Manna, M. C., Ghosh, P. K. Ghosh, B. N. and Siugh. K. N. 2001. Comparative effectiveness
of phosphate-enriched compost and single superphosphate on yield, uptake of
nutrients and soil quality under soybean—wheat rotation. I. Agril. Sc!. 137(1): 45-54.
Marinari, S., Masciandaro, 0., Cenceanti, B. and Grego, S. 2000. influence of organic and
inorganic fertilizers on soil biological and physical properties. Wv. Res. Tech.
72(1): 9-13
Maskina, M. S., Khind, C. S. and Mcclii, o. P. 1986. Organic manure as N source in a rice-
wheat rotation. IRJU New. 1(2): 44.
83
Medhi, 13. 1)., Barthakur, H. P. and Barthakur. S. N. 1996 FIThet of organic and inorganic
source of nitrogen on the nutrients in soil and soil soltit ion and growth of rice. .1.
nd/an. Sod. Soil Xc/. 44 (2) 203-266.
Meelu, 0. P., Morris, R. A., Furoc, It. E. and Dizon, M. A. 1992. Grain yield response rice to
eight tropical green manure. Trap. Agric. ()-inidad). 68: 133-136.
Mehta, S. A. and Daftardar, S. Y. 1984. Effect of anaerobically prepared wheat straw
compost and city garbage compost on yield and N and I' uptake by wheat. Cited from
J:iej&j Cr01) Abst. 42 (4): 280.
Miah, M. M. U. 1994. Prospects and problems of organic farming in Bangladesh. Paper
presented at the worshop on integrated nutrient management for sustainable
agriculture. Soil Reso. Dcv. Inst. DItaka. June. 26-28. 1994.
Mishra, V. K. and Sharma, R. 13, 1997, Effect of fertilizers alone and in combination with
manure on physical Properties and productivity of entisol under rice-based cropping
systems. .1. Indian. $ow. .SoiI Xci. 45(1): 84-88.
%urphy, J. and Riley, J. P. 1962. A modified single solution method for the determination
of phosphate in natural waters. Anal. Chim. Aeta. 27: 3 1-36.
Muthukrishnan. P. Chinnamuthu, C. R., Venkatakrishnan, A. S., Ponnuswamy, K. and Santhi,
P. 1998. Maximum yield research in transplanted irrigated rice. J. Ecobia. 10 (4).
3 13-315.
Nahar, K. 1-laider, J. and Karim, A. J. M. S. 1995. Residual ERects of organic manure and
influence of nitrogen fertilizer on soil properties and performance of wheat. Annals
Bangla. .4gric. 5(2): 73-78.
Okalebo, J. R., Palm, C. A., Gichurul, M., Owuor, J. 0., Othieno, C. 0., Munyampundu, A.,
Muasya, R. M. and Woomer, P. I.. 1999. Use of wheat straw, soybean trash and
nitrogen fertiliser for maize production in the Kenyan highlands. African ('rap Sd.
1. 7(4): 423-431.
84

Pate!, D. T., Patel, E. N., Magajan, M. S. and Jawale, S M 1905 Response of irrigated
wheat varieties to NPK fertilizers. .1. Ma/,ara.v/,tra AgnL Univ. 19(2): 305-306.
Pathak, H.M.0 and Sarker, M.C. 1997. Nitrogen supplementation with straw in an ustochrept.
I. Indian Soc. Soil Sd. 45(1): 103-107.
vf5Iper, C. S. 1950. Soil and Plant analysis. Adelaide University Press, Australia.
I'radhan, S 13. 1992 Status of' leiIiizer USC ill developing coulliries of Asia and the Pacilie
Region. In Proc. Regional F,\I)INAI' Seminar (hiang Mail. Ihailaind. pp. 37-47.
Prasad, N. K. and Kerketta, R. 1991. Soil fertility as influenced by different cropping
sequences. Indian. Agric. Sal. 61: 16-19.
Rahman, M. A. 2001. Integrated use of fertilizer and manure for crop production in wheat-
rice and rice -rice cropping patterns. Phi). i/wsLs. De,N. Soil Sal. Bang/a. Agrit Utsi.
Mynzeis.ving/s.
Rajput, A. I. and Warsi, A. S. 1992. EFfect of nitrogen organic mannure on rice (osya saliva)
yield and residual effect on wheat (Triticum aesliwnn) crop. Indian. J. Agron. 37(4): 11
7 16-720.
Ramalingam, R. 1999. Vermicoinposting of crop residue sugarcane trash using an
Indian epigeic earthworm. Perionyx encavatus. .1. /t.vpernneiikil Zoolo', Inc/ia. 4 (2).
267-272.
Rani, R. and Srivasava, o. P. 1997. Vermicompost: a potential supplement to
nitrogenous fertilizer in rice nutrition. Inter. Rice Re.v. Notes. 22(3) :30-31.
Ranwa, R. S. and Singh, K. P. 1999. Effect of integrated nutrient management with
vermicompost on productivity of wheat. Inc/ici,s. .J Agr n. 4.1 (3): 554-559.
Rao, K. R , Rao, P. A. and Rao, K.T. 2000. influence of organic manure and fertilizers on the
incidence of groundnut Ieafrniner. Approacrerna Modicella Dcv Annals of Plant
Protection Sal. 9(1): 12-15.
85

Rawat, S. S., Parcek, R.G. 2003. FIThct of FYM and NI'K on Ihe growth and chemical
composition oiwheat. ,Iin,als a/.S'g,1-liio-/?cwaich. S (1) 17-19.
Reddy, B.G. and Reddy, MS. 1998. Soil health and crop productivity in Alfisols with
integrated plant nutrient supply system. I. Ausimlia Agril. 96:55-59.
Reddy, D. D., Rae, A. S. and Takkar, P. K 2004. Effects of repeated manure and fertilizer
phosphorus additions on soil phosphorus dynamics under a soybean- wheat rotation.
lJw/ogi' did /wii/iir of,Soik 25: 150-155
Robinson, C. It., I neson, P., Picarce, T. ci. and Rowland, A. I'. 1992. Nitrogen mobilization
by earthworm in limed peat soils under Picea sitchensis, J. App/icc! &oF. 29: 226-237.
Roy, S. K., Sharma, R. C. and Trehan, S. P. 2001. Integrated nutrient management by using
farmyard manure and fertilizers in potato-sunflower-paddy rice rotation in the Punjab.
.1. Agn/. Sc). 137 (3) : 27 1-278.
Saerah, R. E. A., Magid, H. MA., Abdel-Ali, S.I. and Rabie, R.K. 1996. Optimizing physical
properties of a sandy soil for higher productivity using town refuse compost in Saudi
Arabia J. Arid. Environ. 29 (2): 253-262.
Santhi, F. Velusamy, M. S. Murugappan, V.M. and Selvi, D. 1999. Effect of inorganic
fertilizers and fertilizer manure combination on soil physico- chemical properties and
dynamics oF microbial bioinass in ;in inceptisol. .1. lint/an..oc Vail ScSi 47(3): 479-
482.
Shaliuddin, K. Z. 2002. Integreted of Fertilizers and manure for sustainable soil fertility and
productivity in Rice-Rice cropping system. PhD. Thesis Dept.of Soil. Sci. in
/vIymensingh.
Shil, N. C IJlIah, M .11 . Rahman, M. M. . Ilossain, KM., Rashid, M. II. and Khan, M.S.
2007. Integrated nutrient management for maize (hybrid) with soybean
intercropping system. l&'sea,vh reporl- 2006-2007, Div/slot: of Soil Science, HA!?!.
pp. 37-41.
86

Singh. K. N Prasad, and Sinha• S.K. 2001 EfIèci of intergratcd lint dent inanagemcitt on a
typic haptaquant on yield and nutrient availability in rice wheat cropping system.
Fertilizer News. 45 51-53.
Singh,R.K.,Athokpam,I-LS.,and Zaliana, C., Singh, N.G. 2005. Integrated management of
Azolla, vermicompost and urea on yield of and nutrient uptake by rice and soil
fertility. .1. Indian. 50C...oi/Sci.. 53(1): 107-110.
Singh. ft, Singh. Y. . Mask na. M.S. and Mcclii. 0.11. 1990 The value of poultry manure for
wetland rice grown in rotation with wheat. iVuiiwit cycling cgi'O-iJcO.s3W1einx. 47 (3):
243 -250.
Singh, 13., Niranjan, R.K., and Pathak, R.K. 2001. Effect of organic matter resources and
inorganic fertilizers on yield and nutrient uptake in the rice wheat cropping system.
biter. Rice Res. Notes. 26 (2) 57-58.
Sinha, 5K., Verma, DC and Dwivedi, C.P. 2002. Role of green manure (Sesbania
mstrata) and biofertili zer (Blue-green algae and A:atobaclor) in rice-wheat
cropping system in state of Uttar Pradesh, India. Pity. zn0 Mo/c. Rio. of P/ants. 8 (1)
305- 110.
Sohrab, A. and Sanvar, J.M. 2001. Production of vermicompost and its use in upland and
horticulture crops. P,vect Report of/?cz,. (liii
Song, Y. and Yao, Z. 2001. ElTect of application of fertilizer NPK combined with organic
manure on growth characteristics and yield of winter wheat. Beijing Agril. &i. 19
(5): 15-17.
Song, Q. Gai, J.Y. M., YuHua, Song,Q. 3., Gai, J.Y. and Ma,Y.H. 1996. Canonical
correlation analysis and path coefficient analysis of protein content, oil content and
yield or summer soyabean landrace population from mtd-Yangtze River valley.
Soybean-Science. I 5(I): 11-16. •Soybe at; /c?,esearcl; Institute, Nanjing Agril.
(hil. Nwijing 210095, ('h/mi
87

Srivastava, O.P. 1989. Rote of organic matter in crop production. Inc/ian. .1 Agil. C/win. 21
(1-2): 1-14.
Starling, M.E. , Wood, C.W. and Weaver. D.B. 1998. Starter nitrogen and growth habit
effects on late-planted soybean. Agron. 1 90(5): 658-662.
Talashilkar, S.C., Bhangaraath, P.P. and Mehta, V.B. 1999. Change in chemical properties
during composting of organic residues as influenced by earthworm aetivity.J. lndia,t
Soc...nil Set. 49 (2) I 10-112
I'eixeira, J.P.F., Ramos, M.I'.B., Miranda, MAC. and Mascarenhas. FI.A.A. 1984. Relacao
entre os principais constituintes quinlicos da soja. In: Swnindrio Nacional c/c Pesquisa
cle Sofa. 3., Aiiais. EMBRAPA-CNPSo, Londrina, pp. 898-908.
Tiwari, V.N., Han, S. and Upadhyay, R.M. 2001. Effect of biocides, organic manure and
blue green Algae on yield and yield attributing characteristics of rice and soil
productivity under sodic soil condition. .1 Incliati..cc Vu/I Sc.. 49 (2). 332-
336.
Tolanur, S. 1. And Badanur, V.P. 2003. Effect of integrated use of organic manure, green
manure and fertilizer nitrogen on sustaining productivity of Rabi sorghum-chickpea
system and fertility of a verisoi .1. Inc//wi. Soc. Soil Sd. 51(1): 41-44.
Ijddin, M N., Chowdhury, M V. and Zanian. MW. 1994 fllThct of biogas cimient and
cowdung with combinations of NPK fertilizer on the yield and protein content of
wheat grain. lJanglacksi .1..ci. hit/ian. Rex, 29 (2): 55-61.
Vasanthi, D. and Kumaraswamy, K. 2000. Efficacy of vermicompost to improve soil
fertility and rice yield. Indian .1. Soc. Soil Sd. 47 (2) : 268-272.
Vasanthi, D. and Kumaraswamy. K. 1999. Effect of vermicOmpost to improve soil fertility
and rice yield. lnchiczn..tSoc.Soil Sc;. 47 (2): 268-272.
88
-a' T

Vijaya, M. and Balasubramaniam, K.A. 2002. Influence of nitrogen through integrated
sources of organic and inorganic on rice blast disease. .1 Myco. and Plan! Patho.32
(2) : 211-212.
Vyas, M.D., Jam, A.K. and Tiwari, R.J. 2003. Long-term eiThct of micronutrients and FYM
on yield of and nutricnL uptake by soybean on a typic ctu'oniusLcrt .1. intl/un. Sot'. Soil
Sd. 51(1): 45-47.
Wahhab, D.M., Mondal, M,R.I., Akbar, AM., Alam, SM., Ahmed, U.M and Begam, F.
2001. Status of oilcrop production in Bangladesh. Oil research centre Bangladesh
Agril. Res. his. Joydehpw; Gaz/pur-170/. pp. 1-5.
Yadav, D.S., Singh, SB and Aehal, R. 1987. Studies on substituting chemical fertilizers
with Iitrinyard mannure under rice-wheat system. Ntuwufrcs /kru .1. Agric. Res. 2(1):
56-60.
Yawalkar, KS., Agarwal, J. P. and Bokde, S. 1981. Manures and ferti1iers. 5ih ed., Agric-
hortcultural Publishing House, Nagpur; 440010, Indian,
Zahid, I-I.M. 2001, Production of vermiconipost and its use in upland and horticultural crops.
Annual Report of Bangladesh Agricultural Research Council, Framegate, Dhaka.
Zaman, 5K., Bhuiyan. N. and Samad, M.A. 1995. Age of green manure crops: An important
aspect olbiomass production and N accumulation. Bangladesh J. Agri. Sd. 22: 107-I
12.
Zhu, Z., Liu, C. and Jean, B. 1984. Organic matter in rice. liii. Rice Res. tact. Los Banos.
/'izi/lippines. p. 255.
39

A BI3REV IA'l'ION Al 7.
@1 C EC CR-I
CuSO..i.51I20
cv. CV% D?vlRT
cl cil
l., V M
ci I 1113O HClO. HNO3 H202 H2SO4 i.e K kg ki ha' K 2SO.i LSD S
TSP m in L 111 01
MP N NaOl I N P K NS OM
p11 OC 9"o RCBD SAC
ha GM P U P NI F PG LEft
LiST OF ABBRIVI
VUE1L WORI) Agro-Ecological Zone At the rate Cation Exchange Capacit Centimeter Green vitriol Cultivar(s) Percentage of Coefficient of \'ariance Duncan's Multiple Range Test exa 01 pie a 0(1 others I-anti YiuI \'laittire (;Ialn Boric acid Perchloric acid Nitric acid Hydrogen per oxide Suiftiric acid that is Potassium 1<1 logran Kg per hcctare Pot assi ii ii Sn I title
Least Significant Difference Sulphur Friple Super Phosphate Meter Milliliter Millimeter Muriate of Potash Nit roven Sodium I lydroxidc N it rotic 0, Phosp lu ms and Potassiu in
Not Signi licant Organic ti alter I lydrogen ion concentration Degree Celsius Percent Randomized Complete Block Design
Sher-e-Bangla Agricultural University
Ton per hectare Green Manure Poultry Manure Pt tosph on s Ni anure and 1efl iii i.er Planting Geometty Land Equivalent Ratio
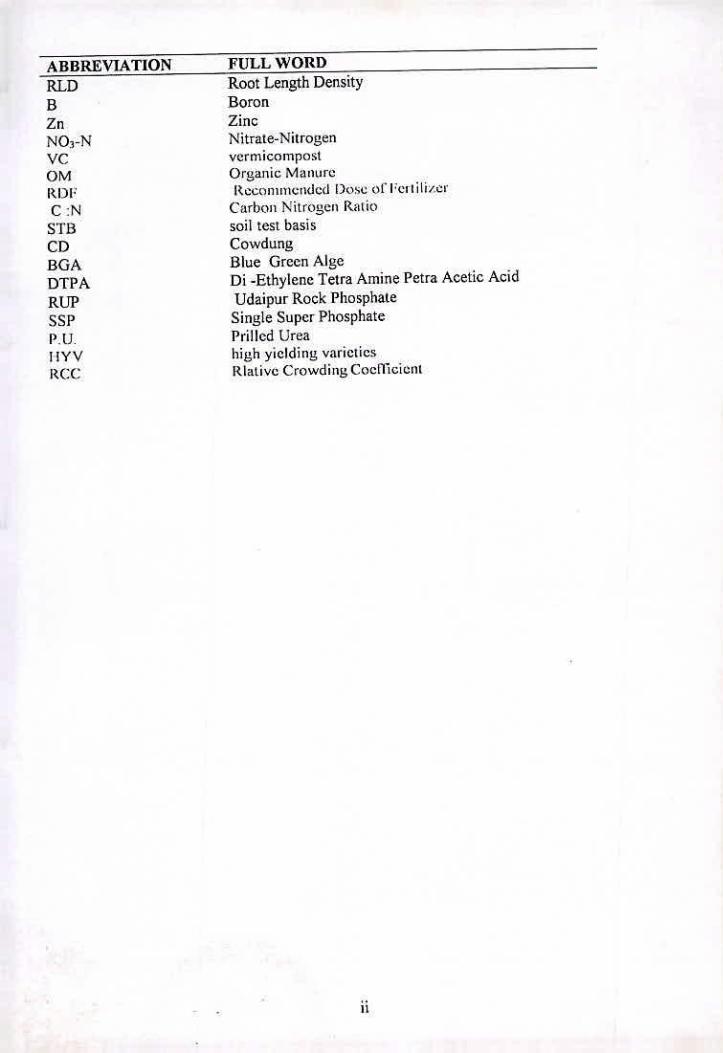
ABBREVFtTION FULL WORD RLD Root Length Density
B Boron Zn Zinc NO3-N Nitrate-Nitrogen VC vermicompost OM Organic Manure
IMF it cairn me tided Dose OiTeltilizer
C :N Carbon Nitrogen Ratio STB soil test basis CD Cowdung BOA Blue Green Atge DTPA Di -Ethylene Tetra Amine Petra Acetic Acid
RU? Udaipur Rock Phosphate
SSP Single Super Phosphate P.IJ. Prilled Urea iiv high yielding varieties R(:C Rtative Crowding Coefficient

Jippendices

Appendix 1. Effect of vermicompost on NPKS uptake by rice plant
Treatment Nitrogen (Kg/ha) Phosphorus (Kg/ha) _____________
Potassium (Kg/ha)
Suipher (Kg/ha)
V0 40.58b 35.46b 116.00c 11.64a V1 53.10a 39.42a 129.00h IhOla V2 56.08 a 36.76 ab 148.20 a 11.46 a V3 53.30 a 30.74 c 150.30 a 11.98 a Level of 0.05 Significance
0.05 0.05 0.05
In a column figures having similar letter(s) do not differ significantly whereas figures with dissimilar letter(s) differ significantly as per DMRT
Appendix 2. Effect of NPK fertilizers on NPKS uptake by rice plant
Treatment Nitrogen (Kg/ha) Phosphorus (Kg/ha) Potassium Sulphet (Kg/ha)
F0 40.58d 35.46d 1116.00 c 11.64c F1 53.08c 51.06c 166.20b 18.00b F2 69.12b 66.92b 192.70a 21.12ab F3 77.58 a 73.88 a 191.40 a 23.00 a Level of 0.05 Significance
0.05 0.05 0.05
in a column ngures flaying similar letter(s) do not ditkr significantly whereas figures with dissimilar letter(s) differ significantly as per DMRT

1j_J___tJ__ -- A.
Appendix 3. Combined effect of vermicompost and NPK fertilizers on NPKS uptake by rice plant
Treatment Nitrogen (Kg/ha) Phosphorus (Kg/ha) Potassium (Kg/ha)
Suipher (Kg/ha)
V0F0 40.581 35.46h 116.00f 11.64g V0F1 53.08h 51.06g 166.20de 18.00f V0F2 69.12% 66.92e 192.70 bed 21.I2ef v01:1 77.58 e 73.88 d 191.40 bed 23.00 de
53.10h 39.28h 129.00f 11.01g V1 F1 65.46 g 64.00 ef 1170.10 ede 17.46 f VF2 75.46 c 75.00 d 211.00 ab 23.42 de V1 F3 1 162.30 b 89.00 b 224.60 ab 27.32 be V21`0 I 56.08 h 36.51 h 148.60 ef 11.46 g V2F1 50.52h 60.24f 173.00 ede 18.88f V2F2 74.21 ef 82.65 C 207.80 abc 23.64 de V2F3 165.00 h 96.55 a 222.20 ab 30.48 ab V3 F0 53.33 h 30.741 150.30 ef 11.98 g V1F1 88.54 d 76.30 d 170.00 cde 25.28 cd V1F, 96.64c 1 92.29b 170.50de 28.48 be
184.80a 97.0Th 234.10a 33.24a Level ofSignificance
0.05 0.05 .
0.05 005
.' 'urn."" Ifgulc Javitig simnar ieuers ao not airier signhtucantly whereas tigures with dissimilar Tenet(s) differ significantly as per DMRT
;:; Açr J-ivecty
Llbrzi' y --
(71tX ( 3 J612-f7L\