Factors affecting the effectiveness of employees' performance ...
Upload
independentCategory
view
0download
0
EFFECTS OF MANAGEMENT STYLES ON EMPLOYEES PERFORMANCE
ACASE STUDY OF NORWEGIAN PEOPLE’S AID
YEI VOCATIONAL TRAINING CENTRE
SOUTH SUDAN
BY
DANIEL LODINYA STEPHEN
BABA/11/WSU/J1206
A RESEARCH DISSERTATION SUBMITED TO THE FACULTY OF BUSINESS
ADMINISTRATION AND MANAGEMENT STUDIES AS PARTIAL
REQUIREMENT FOR THE AWARD OF BACHELOR
DEGREE IN BUSINESS ADMINISTRATION
OF ST. LAWRENCE UNIVERSITY
- KAMPALA (UGANDA)
JULY - 2014
i
DECLARATIONS
I, Daniel Lodinya Stephen, do hereby declare that the content of this research dissertation paper is
my own work, and is to the best of my knowledge, where other forms of literature have been used;
it has been expressly stated and acknowledged and has never been submitted to any other
university or institution of higher learning for any award of degree.
Daniel Lodinya Stephen
Reg: BABA/11/WSU/J1206
Signature………………………….
Date……………………………….
ii
APPROVAL
This is to acknowledge that this work entitled; Effects of Management Styles on Employees
performance. A Case Study of Norwegian People’s Aids, Yei Vocational Training Centre- South
Sudan Program has been done under my research and is now ready for submission to the Faculty
of Business and management studies at St. Lawrence University – Kampala (Uganda).
Supervisor
Ms. Nakimuli Leticia
Dean of Business and Management studies
St. Lawrence University- Kampala (Uganda)
Signature: _____________________________
Date: ______________________________
iii
DEDICATION
I dedicated this work to Almighty God, and to my beloved brother Mr. ISAAC ALORO STEPHEN
for your usual support throughout my Bachelor Degree education struggle which made me break
a record of centuries in our clan and your contribution has not gone unnoticed and thank you may
almighty reward you abundantly, to my Tire less & LOVELY Dad Dickson Wongo and Mam
Jenity Anite for the support and advices you gave me throughout the period I was doing this
Bachelor Degree program.
To my cherished beloved and dedicated fiancé Suzan Poni and my Brothers wives Sadia Margret,
Jane Johnson you all took over to guarantee me advices that gave the dream for my high academic
achievements which will become real. You are a gem. I Love You All
Lastly I also dedicate this work to my late grandfather Wilson Modi and Grandmother Hellen
Konga who emphasis education as a priority to their grandchildren as the key for the future and
May soul rest on eternal peace.
Your dreams has come true thank you.
iv
ACKNOWLEDGMENT
Indeed God has been faithful to me. I offer my first and foremost thanks to God for his abundant
blessings throughout my Degree study program.
My profound gratitude goes to my able and determined supervisors, Ms. Nakimuli Leticia for her
immense contributions, comments, suggestions, monitoring and kindness shown to me. God bless
you. Your support was great and can’t go unnoticed.
I acknowledge with sincere thanks the advice and support offered to me throughout this study by
especially my Beloved Brother Mr. Isaac Aloro Stephen for your tireless contribution, Mr. 1st
Lefternal John Lodiong Stephen , Moses Kenyi Stephen, Amos Bida, Lomude Laki, Paul Banga
and Benard Lomude, Father Dickson Wongo, 2nd lefternal Father Stephen Taban, Aunt Suzan
Yabu, Reida Rejoice, grandfather Mr. Isaack Labusa, Moses Logulomo, mother Jenity Anite,
Cicilia Kadi, Mary Akiyo and Sisters Betty Akujo, Esther Aleko, Florence Talata, Eva Araba,
Sarah Sadia and Martha Ropani who have all laid the solid foundation of my education and their
tireless effort and unquenchable love and support throughout my career.
Especial gratitude and thanks goes to Mr. Otim Joseph for his trust on me since I started my first
job with him and allowing me to pursue my Bachelor Degree. Alex Moro thanks you so much for
spending our campus life together and be blessed too.
Finally, I wish to express my sincere thanks to all my family members, relatives and friends
especially those whose names I have not mentioned and those who helped me in one way or the
other through editing and additions; I say may God bless you all.
v
TABLE OF CONTENTS
DECLARATIONS ................................................................................................................................... i
APPROVAL ........................................................................................................................................... ii
DEDICATION ....................................................................................................................................... iii
ACKNOWLEDGMENT ........................................................................................................................ iv
LIST OF TABLES ............................................................................................................................... viii
LIST OF FIGURES ................................................................................................................................. x
ABSTRACT ........................................................................................................................................... xi
CHAPTER ONE ..................................................................................................................................... 1
1.0 INTRODUCTION ............................................................................................................................. 1
1.1 BACKGROUND TO THE PROBLEM ............................................................................................. 1
1.2. STATEMENT OF THE PROBLEM. ................................................................................................ 3
1.3. OBJECTIVES OF THE STUDY....................................................................................................... 3
1.4. RESEARCH QUESTION OF THE STUDY ..................................................................................... 3
1.5. SCOPE OF THE STUDY ................................................................................................................. 4
1.6. SIGNIFICANCE OF THE STUDY .................................................................................................. 4
1.7. CONCEPTUAL FRAMEWORK ...................................................................................................... 5
Domineering ........................................................................................................................................... 5
Independent ............................................................................................................................................. 5
Decisive .................................................................................................................................................. 5
Critical 5
Social Set up ........................................................................................................................................... 5
1.8. DEFINITION OF KEY CONCEPTS ................................................................................................ 6
CHAPTER TWO .................................................................................................................................... 7
LITERATURE REVIEW ........................................................................................................................ 7
2.0 INTRODUCTION ............................................................................................................................. 7
2.1.0. MANAGEMENT STYLES ........................................................................................................... 8
2.1.1. PARTICIPATORY MANAGEMENT STYLE............................................................................... 8
2.1.2. DEMOCRATIC MANAGEMENT STYLE. ................................................................................ 10
2.1.3. AUTOCRATIC MANAGEMENT STYLE .................................................................................. 11
2.2.0. EMPLOYEE PERFORMANCE .................................................................................................. 11
2.2.1. DEFINITION .............................................................................................................................. 11
2.2.2. IMPROVING PRODUCTIVITY ................................................................................................. 12
vi
2.2.3.0. QUICK DECISION MAKING PROCESS ................................................................................ 15
2.2.3.1. BUSINESS DECISION-MAKING ........................................................................................... 15
2.2.3.2. TEAM DECISION-MAKING METHODS ............................................................................... 15
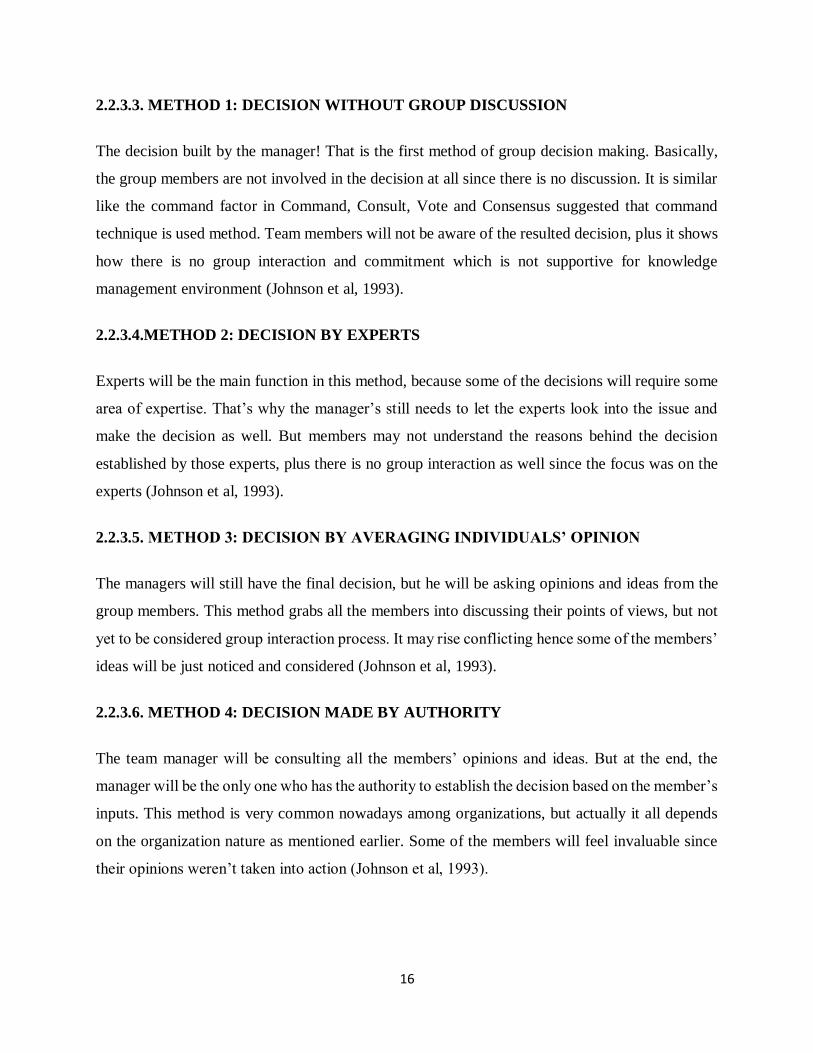
2.2.3.3. METHOD 1: DECISION WITHOUT GROUP DISCUSSION .................................................. 16
2.2.3.4. METHOD 2: DECISION BY EXPERTS .................................................................................. 16
2.2.3.5. METHOD 3: DECISION BY AVERAGING INDIVIDUALS’ OPINION ................................ 16
2.2.3.6. METHOD 4: DECISION MADE BY AUTHORITY ................................................................ 16
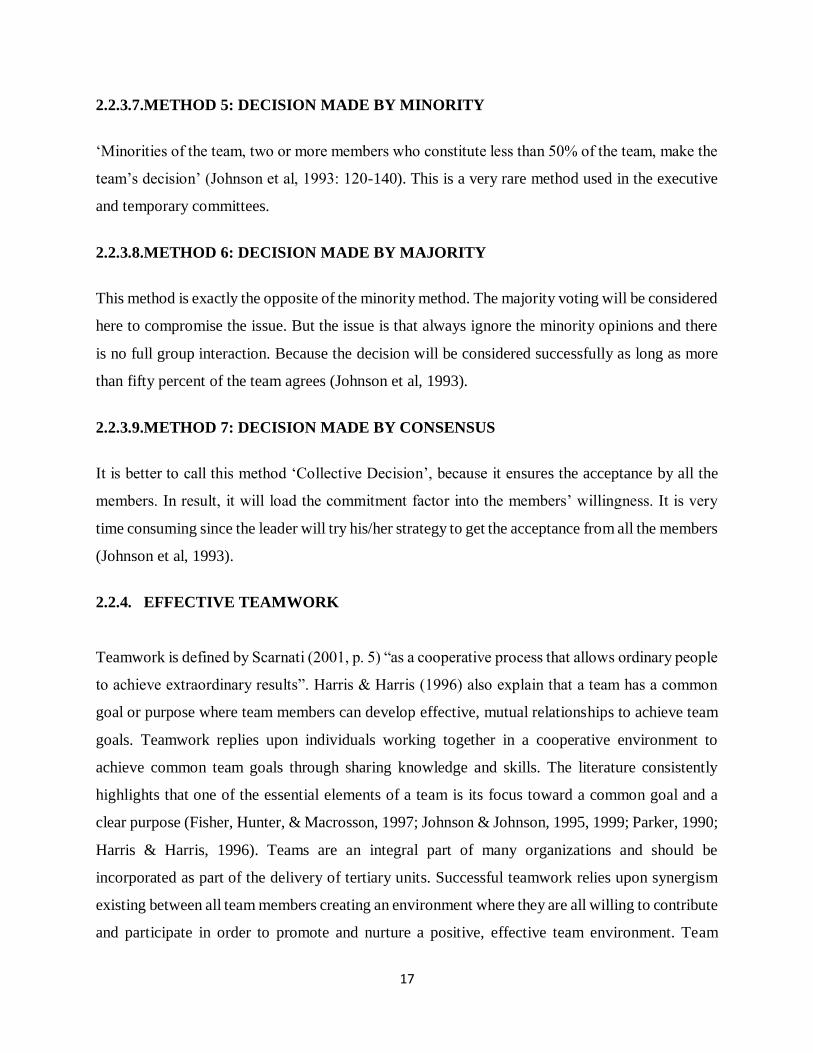
2.2.3.7. METHOD 5: DECISION MADE BY MINORITY .................................................................... 17
2.2.3.8. METHOD 6: DECISION MADE BY MAJORITY ................................................................... 17
2.2.3.9. METHOD 7: DECISION MADE BY CONSENSUS ................................................................ 17
2.2.4. EFFECTIVE TEAMWORK ........................................................................................................ 17
2.2.5.0. JOB SATISFACTION .............................................................................................................. 19
2.2.5.2. MEASUREMENTS OF JOB SATISFACTION ........................................................................ 20
2.2.6. INNOVATION AND CREATIVITY ........................................................................................... 21
2.3. ORGANIZATION POLICY ........................................................................................................... 22
CHAPTER THREE ............................................................................................................................... 25
METHODOLODY ................................................................................................................................ 25
3.0 INTRODUCTION ........................................................................................................................... 25
3.1 RESEARCH DESIGN ..................................................................................................................... 25
3.2.AREA OF POPULATION OF THE STUDY ................................................................................... 25
3.3. POPULATION OF THE STUDY ................................................................................................... 26
3.4. SAMPLE SELECTION AND SIZE ................................................................................................ 26
TABLE1. SAMPLING APPROACH..................................................................................................... 27
3.5.0 DATA COLLECTION TOOLS /INSTRUMENTS ....................................................................... 27
3.5.1. DATA SOURCES ....................................................................................................................... 28
3.5.2. RESEARCH INSTRUMENTS .................................................................................................... 28
3.6. QUALITY CONTROL ................................................................................................................... 28
3.7. PROCEDURES FOR DATA COLLECTION ................................................................................. 29
3.8. DATA ANALYSIS AND PROCESSING ....................................................................................... 29
3.9. ANTICIPATED STUDY LIMITATION......................................................................................... 29
3.10. SOLUTION TO THE STUDY LIMITATION .............................................................................. 30
CHAPTER FOUR ................................................................................................................................. 31
DATA PRESENTATION ANALYSIS AND DISCUSSION OF RESULTS .......................................... 31
vii
4.0 BACKGROUND OF ANALYSIS ................................................................................................... 31
4.1. The demographic and socio-economic characteristics of respondents .............................................. 31
4.2 MANAGEMENT STYLES ............................................................................................................. 36
4.3. EMPLOYEE PERFORMANCE. .................................................................................................... 53
4.4. RELATIONSHIP BETWEEN MANAGEMENT STYLES AND EMPLOYEE PERFORMANCE . 57
CHAPTER FIVE ................................................................................................................................... 63
SUMMARY OF FINDINGS, CONCLUSION AND RECOMMENDATIONS ...................................... 63
5.0 INTRODUCTION ........................................................................................................................... 63
5.1 FINDINGS ...................................................................................................................................... 63
5.2 CONCLUSIONS. ............................................................................................................................ 64
5.3 RECOMMENDATIONS ................................................................................................................. 65
APPENDIX I ........................................................................................................................................ 66
REFERENCES...................................................................................................................................... 66
APPENDIX II ....................................................................................................................................... 68
QUESTIONAIRE.................................................................................................................................. 68
APPENDIX III ...................................................................................................................................... 73
Map of South Sudan showing Yei Town used in the Case Study ............................................................ 73
viii
LIST OF TABLES
TABLE1. SAMPLING APPROACH ……………………………………………….27
4.1.1. Respondents on Department …………………………………………………..32
4.1.2. Job position in NPA-YVTC …………………………………………………..32
4.1.3. Sex of respondents ……………………………………………………………33
4.1.4. Manager of subordinates ……………………………………………………...33
4.1.5. Length of Work …………………………………………….…………………34
4.1.6. Respondents on Educational level …………………………………………….35
4.2.1. My manager values all the ideas and skills I bring to him. …………………...36
4.2.2. People in my team are good at celebrating our successes. ……………………37
4.2.3. My manager generally understands the problems I face in my job. …………..38
4.2.4. My manager shows a genuine interest in me as a person. …………………….39
4.2.5. Satisfaction of freedom at work ……………………………………………….40
4.2.6. The decision-making process involves fewer people………………………… 41
4.2.7. My Company acts with integrity in its internal dealings with employees. ……42
4.2.8. We are encouraged to come up with innovative solutions. …………………...43
4.2.9. Company’s Management acts on the issues/opportunities identified in
Employee value surveys. …………………………………………….…………….....44
4.2.10. People in my team are resolving issues more quickly. ………………………45
4.2.11. My manager is considerate of my life outside work. ………………………...46
4.2.12. I have stretching objectives agreed with my manager. ………………………47
ix
4.2.13. My manager trusts my judgment within my job. …………………………….48
4.2.14. My manager inspires me to give my best. …………………………………...49
4.2.15. My manager gives me regular feedback on my performance. ………………50
4.2.16. Collaboration between your team and other teams in the business? ………...51
4.2.17. People in my team are focused on delivering results………………………....52
4.3.1. Do you have an annual set of performance standards? ………………….….….53
4.3.2. Do you receive regular job performance feedback? ………………………..….54
4.3.3. Do you think there is fairness in the way your performance is assessed? ….….55
4.3.4. Do you have opportunities to advance in your line of function? ……….……..56
Computation of correlation coefficient ………………………………………..……..58
Computation of correlation coefficient ………………………………….….………..60
Computation of correlation coefficient ………………………………………………62
x
LIST OF FIGURES
Figure 4.4.1. Decision Making Process and employee Performance ……………………57
Figure 4.4.2. Team Collaboration and Employees Performance ………………………...59
Figure 4.4.3. Valuing Ideas and Performance ……………………………………………61
xi
ABSTRACT
The study aimed to investigate the effects of management styles on employee performance.
Specifically, the study identified the management styles exhibited by managers in Norwegian
People’s Aid, Yei Vocational Training Centre in South Sudan in enhancing employee performance
and specific management style that affected the performance of the employees.
The study was conducted considering the effect of three major management styles, namely,
participatory style, Democratic style and Autocratic style on the performance of employees. The
data for this study was obtained by administering questionnaires to personnel in Norwegian
People’s Aid, Yei Vocational Training Centre in South Sudan. The data received from the
respondents was analysed with the help of statistical excel software. To test for the assumption,
Pearson Coefficient correlation analysis was conducted to examine whether the theory was
accepted or rejected. It was observed that strong correlation existed between Autocratic
management style exhibited by Managers in Norwegian People’s Aid, Yei Vocational Training
and employee performance.
The autocratic management style had significant positive effect on performance and hence
productivity. It meant that the managers were very particular about getting results and only
motivated employees to give their best in order to increase productivity. Participatory and
democratic styles were very insignificant and a few negative correlations suggested a decrease in
performance by employees, probably due to management acting with strict internal rules to achieve
results. It was recommended to have a balanced management style to equally reflect much interest
in people to enhance employee performance for a competitive advantage.
1
CHAPTER ONE
1.0 INTRODUCTION
1.1 BACKGROUND TO THE PROBLEM
Management is one of the oldest professions in the world. A quick reflection revealed that nothing
can be accomplished without planning, coordination, and implementation, all of which are
functions of management. Management can be as basic as managing a household and as complex
as managing a fortune 500 corporation. Whether it is the management of a household or a
corporation, the end result is to achieve some mode of effectiveness and efficiency. The desire to
achieve this bottom line is so powerful that earliest forms of management and its practices meant
the difference between life and death in some cases (George, 1968).
Many management styles have been proposed in the last fifty years, which are claimed to have
influenced the overall effectiveness of the organizations where they have been employed. In the
competitive world both with technological changes within the business environment, it is vital that
organizations survive in a dynamic environment (Maritz, 1995; Bass 1997)
The foundation of management styles and practices can be presented by looking at the different
management styles: Participatory Management, Democratic Management, Autocratic
Management and many other published styles of management. Beginning in the mid 1950's and
continuing even today, much has been written about participatory management. It became an
acceptable practice following the published work on theory Y and theory Z management style. It
is defined as managers sharing their power and influence by regularly asking employees for input
while maintaining at a minimum a veto over their ideas. This represents a significant increase in
empowerment from traditional Management style whose philosophy is to simply figure out what
should be done and to tell people to do it (Brown et al. 1994).
On the other hand, employee performance is an important building block of an organization and
must be annualized by organizations. Since every organization cannot progress by depending on
one or two individual efforts, it is collective effort of all members of the organization. Performance
is a major multi - dimensional construct aimed to achieve results and has strong links to strategic
goals of an organization (Mwita, 2000).
2
There is variety of hybrid management styles operating in Africa, some highly adaptive to the
operating environment and successful, some are mal – adaptive with some country difference.
According to Mazrui (2007), Africa for the new millennium demands exceptional management
styles. The emergence of a new style of management is critical not only for global Africans, but
for a world confronting globalization. It is recognized that management styles, especially in Africa
is difficult. There are many challenges, particularly of political, culture, poverty illiteracy and
disunity, yet African have come together in Mombasa (and earlier in Gaborone) maximize and
affirm the potential for positive management on our continent (Rotberg,2004).
In South Sudan, no empirical research has been carried out about the dominate management style.
However, studies carried out in other African countries seem to have some relevance on South
Sudanese because of common environment. Some Authors notably Kiggunu (1988) and Chondry
(1986), who have done some empirical study on management styles in southern Africa, have
concluded that dominance style of management is authoritarian, personalized, inflexible,
insensitive and conservative. There is evidence in South Sudan to prove that, South Sudan
manager’s exhibits similar styles. They seem to lean towards the authoritarian style of management
because of our colonial experience and socio – cultural structure. The private organizations in
South Sudan plays important role in the country’s development, such as providing employment.
They are performing very well, but surprisingly, little effort has been devoted in exploring these
private organizations. According to Adei (2001), for South Sudan to move forward, there should
be in place effective management styles that are critical for improving performance and
productivity in the private organizations.
In this view, the study will establish the management styles that are exhibited at Norwegian
People’s Aid – Yei Vocational Training Centre and find how these management styles are linked
to performance of its employees. Although many factors may influence the performance of an
organization, there can be little doubts that the quality of Managers available to it will be one of
the most critical determinates of ultimate success
3
1.2. STATEMENT OF THE PROBLEM.
We often think of a manager or leader is expected to exhibit a right behavior towards employees
or subordinates. Yet it is realized that in most organizations in Republic of South Sudan, work are
task-focused and routine, with no flexibility, and yet decisions and policies are imposed on
subordinates. In such organizations where the management perceives employees as mere hands to
get job done, employees would pretend to do well due to the standards and measure being assigned
to them.
For employees to accomplish their work, managers must encourage individuals who reports to
them, co-workers, and supervisors or customers. Because of this for effective and efficient
organisations management, the human factor must be critically looked out from the employee
performance. Norwegian People’s Aid, Yei Vocational Training Centre has a set of management
standards expected to be lived by its managers with the view to improve performance. The problem
for this study was to establish the management styles that are exhibited at Norwegian People’s
Aid, Yei Vocational Training Centre, and to know how it was effecting the performance of
employees.
1.3. OBJECTIVES OF THE STUDY.
The main objective of this study was to investigate the effect of management styles on employee
performance specifically, the study sought:
1. To identify the specific management styles exhibited by managers in Norwegian People’s
Aid - Yei Vocational Training Centre.
2. To determine the composition of employee performance in Norwegian People’s Aid - Yei
Vocational Training Centre
3. To Establish the Relationship between management styles and employee performance.
1.4. RESEARCH QUESTION OF THE STUDY
The following are the main questions the research was based on
1. What are the specific management styles exhibited by managers in Norwegian People’s
Aid - Yei Vocational Training Centre?
2. What is the composition of employee performance in Norwegian People’s Aid - Yei
Vocational Training Centre?
4
3. What is the Relationship between management styles and employee performance?
1.5. SCOPE OF THE STUDY
The study was carried out in Norwegian People’s Aids, Yei Vocational Training Centre - South
Sudan Program. The study examined the effects of management styles on employee’s
performance. The study applied both qualitative and quantitative research approaches where 25
study respondents will be selected.
1.6. SIGNIFICANCE OF THE STUDY
The importance of this research dissertation is carried out as a requirement for my partial
fulfillment for the award of Bachelor degree in Business Administration –Human Resource
management at St. Lawrence University- Kampala (Uganda) faculty of Business and management
studies.
This study will examine the different management styles in relation to employee performance so
as to give an over view on the general performance of individuals in a firm. The outcome will
demonstrate and identify the different effects management styles have on overall employee
performance as opposed to managerial, interpersonal or what is referred to as interactive
knowledge for arrangement on management of Norwegian People’s Aid – Yei Vocational Training
Centre as well as to find out the ways on how to improve organizational productivity by adjusting
or adopting different styles of management.
Again management style, such as encouraging other employees to work on difficult tasks would
motivate the staff to come out with his best, because the employee would feel that the manager is
helping in his or her career development
On the other hand, a manager may adopt a democratic style when interacting with employees and
this may affect the productivity of the organisation and this will not help the employee to perform
effectively.
The study would be significant to future academic scholars and researchers since it will add more
literature on the topic effects of management styles on employees’ performance.
5
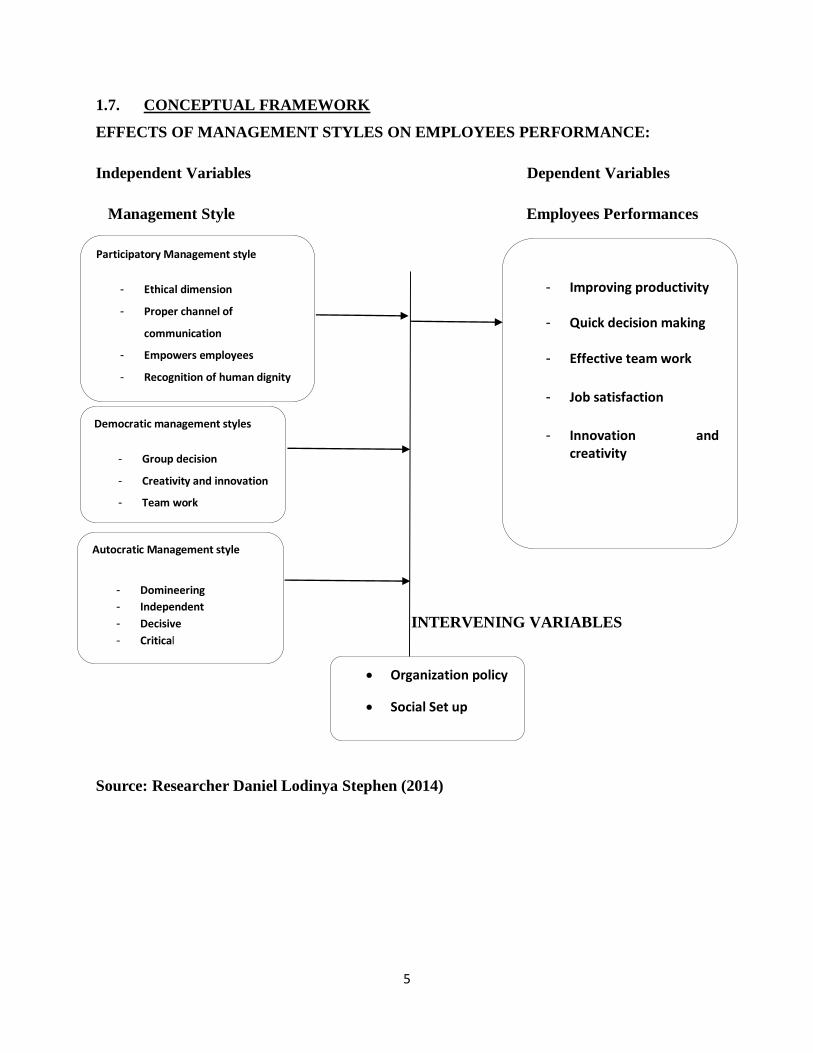
1.7. CONCEPTUAL FRAMEWORK
EFFECTS OF MANAGEMENT STYLES ON EMPLOYEES PERFORMANCE:
Independent Variables Dependent Variables
Management Style Employees Performances
INTERVENING VARIABLES
Source: Researcher Daniel Lodinya Stephen (2014)
Participatory Management style
- Ethical dimension
- Proper channel of
communication
- Empowers employees
- Recognition of human dignity
Democratic management styles
- Group decision
- Creativity and innovation
- Team work
Autocratic Management style
- Domineering
- Independent
- Decisive
- Critical
Organization policy
Social Set up
- Improving productivity
- Quick decision making
- Effective team work
- Job satisfaction
- Innovation and creativity
6
1.8. DEFINITION OF KEY CONCEPTS
Management styles: these are managerial styles of management that managers use to attained and
achieve the organizational goal and objectives through planning, organizing, leading and
controlling the activities of the organization.
Employee performance: according to Millcorvich and Bondream (1997), employee performance
refers to as the degree to which employees accomplish work requirements
7
CHAPTER TWO
LITERATURE REVIEW
2.0 INTRODUCTION
This chapter deals with the review of the study and literature of various researchers pertaining to
the topic. A review of the Management styles literature reveals an evolving series of management
styles notable participatory style, democratic management style, autocratic management style.
Each of these offers some insights onto the qualities of successful management in an organization,
but there has been a shift focus from the characteristics and behaviors of the individual to
recognition of the importance of responding to the situations and contexts and mangers role in
relation to the followers. These reviews continuous with management styles and competency
frameworks. These present a range of management framework currently being used in
organizations. They define the qualities required of people in management positions and help
inform the manager’s development processes.
The purpose of reviewing the literature on management is to have a better understanding of a
management style as a concept, to examine different management styles and to see their
effectiveness and how each style affects the relationship among the employees in the organization.
The interpretation of various management styles suggests that single management style is adequate
to run an organization effectively, rather the combination of styles is effective if used appropriately
as situations demands. More importantly, high performance should be the aim of any organization
in any country globally. Even though, there are other factors which influence management styles,
the manager’s is to some extent be instrumental in enhancing the goal and objectives of the
organization. In order to access the effects of management styles on employee performance, which
is the focus of this study, it is logical to examine various management styles.
Every manager in every organization performs certain roles/tasks for the smooth running of the
organization and improvement of the organizational performance. The manner the managers
performs these roles and directs the affairs of the organization is referred to as his/ her management
style. Management style therefore is the way a manager leads. Some managers are more interested
8
in the work while others pay more attention to the relationship with subordinates than the job.
Whether a manager emphasizes the tasks or human relations is usually considered central
management style. Managers are formulating aims and objectives of establishing structures,
managing and motivating personnel and providing management (Daresh, 2000). However Nathan
(1996) asserts that providing managerial skills is a very essential component of a manager’s role.
The management style that manager’s choose to perform in the above mentioned roles will
determine whether they will accomplish the task at hand and long term organizational goals or not.
And whether they will be able to achieve and maintain positive relationship with staff (Mazzarella
and Smith, 1989).
2.1.0. MANAGEMENT STYLES
2.1.1. PARTICIPATORY MANAGEMENT STYLE.
As noted in the brief overview of the development of management thoughts, the behavioral school
has most directly influenced the development of the concepts of participatory management. The
field of organizational behavior most impacted the practice of participatory management principles
and skills. Beginning in the mid 1950's and continuing even today, much has been written about
participatory management. It became an acceptable practice following the published work on
theory Y and theory Z management style. It is defined as managers sharing their power and
influence by regularly asking employees for input while maintaining at a minimum a veto over
their ideas. This represents a significant increase in empowerment from traditional Management
style whose philosophy is to simply figure out what should be done and to tell people to do it
(Brown et al. 1994).
While few researchers have sometimes viewed it as a confusing theory or even foolish, new-wave
types of management practice, most agree that participatory management is a viable management
style in today's global competition. It is inclusive and efficient. In fact it is popular today than ever.
A study done by the New York Stock exchange office of Economic research in 1995, survey by
Hewitt Associates in Lincolnshire Illinois to be exact asked corporations with 500 or more
employees which of the many efforts they have undertaken to improve productivity have had the
9
most impact. Of those surveyed 32% mentioned employees involvement, two-thirds of the 1,811
employers nationwide reported using some form of employee involvement to conduct work
according to recent surveys by Hewitt Associates in Lincolnshire Illinois (Badawy, M.K. 94).
Using Meta Analytic techniques, Chris Doucouliuagos, an industrial relations researcher,
synthesized the results of 43 published studies to investigate the effects on productivity of various
forms of worker participation: Workers participation in decision-making; profit sharing; worker's
ownership; etc. not surprisingly, he found out that all of these factors were positively associated
with productivity, quality, and employees morale and satisfaction (Doucouliuagos, 1995).
SUCCESS STORIES OF PARTICIPATORY MANAGEMENT
Considerable change is underway in many of America's workplaces, driven in part by international
and domestic competition, technology, and workforce development. These external forces are
interacting with a growing recognition that achieving a high productivity / high wage economy
requires changing traditional methods of labor, management relations and the organization of work
in a way that may fully develop and utilize the skills, knowledge, and motivation, of the workforce,
and share the gains produced. Data from recent focus-group interviews carried out by the Princeton
Survey Research Center report those hourly workers, professional and technical employees, and
supervisors consistently stated that among the things they value most in a job are varieties, freedom
to decide how to do their work without closed supervision. They also reported that they value
information and communication regarding things that affect their work and their firm, and
evidence that their employers seek value and act on their suggestions for improvement at their
workplace (Challenge, 1995). Thus, since the 1980's there has been a substantial expansion in the
number and variety of employee-participation efforts and workplace committees in both
establishments governed by collective-bargaining agreements and those without union
representation. These arrangements take a wide variety of forms such as: Quality Circle, employee
participation teams, etc. (Challenge 95).
Some of the major corporation who are reaping the benefits of participatory management are GE,
IBM, Allied Signal, Super Sack, just to name a few. GE Fanuc Automation North America Inc.
for example, has been transforming itself into a team- based organization since the late 1980s. In
1994, it posted its best results ever (Barrier, 1995). During an interview with Brad Eisenbarth, a
10
production manager at Super Sack manufacturing plant in Savoy Texas, for a study on the impact
of participatory management on productivity and employee morale, he responded by saying " Here,
it is a family feeling where things are a lot opened particularly, with regard to passing on and
sharing information." That sentiment was shared by Brian Suchsland, an industrial engineer also
at Super Sack who said “Here you have the enthusiasm and attitude you need for a successful
business" (Verespej, A.1995).
2.1.2. DEMOCRATIC MANAGEMENT STYLE.
Democratic management style is exhibited where the focus of power is more towards the group as
a whole, and where there is greater interaction within the group (Mullins, 2002); the manager
shares the management functions with members of the group where he or she takes part as a team
member. The manager would characteristically lay the problem before the subordinates and invite
discussion. In this respect the manager’s role is to be a conference leader rather than that of
decision taker. The manager allows the decision to emerge out of the process of the group
discussion, instead of imposing it on the group as a boss. This management style is appropriate
only in instances where the nature of the responsibility associated with the decision is such that
group members are willing to share with their manager, or alternatively the manager is willing to
accept responsibility for decisions, which he or she has not made personally.
The point of focus is sharing: the manager shares decision-making with the subordinates. Even
though he or she invites contributions from the subordinates before making a decision, he or she
retains the final authority to make decisions (consultative). The manager may also seek discussion
and agreement with teachers over an issue before a decision is taken (consensus). He or she may
allow the subordinates to take a vote on an issue before a decision is taken (democratic). He or she
coaches subordinates and negotiates their demands (Dubrin 1998).
This management style is viewed as an important aspect of empowerment, team work and
collaboration. It has been observed that an organization is more effective when those who will be
affected by the organization’s decisions are fully involved in the decision-making process. It is
believed that subordinates share a sense of responsibility for the organization when they are
11
allowed to participate actively in decision-making (Prerez, Milstein, Wood and Jacquez 1999).
Good as it is, the concern expressed by Dubrin (1998) is that the participative style of management
wastes time due to endless meetings and may lead to confusion and lack of direction. By
implication, it is not appropriate for use in times of crisis when the situation demands on-the-spot
decision. Seeking advice from an uninformed or incompetent group of subordinates may lead to
disaster. However, Goleman et al. (2002) posit that a democratic manager’s keeps staff morale
high and therefore positive climate prevails in the organization. There are significant similarities
between this style and Likert‟s systems III and IV of management styles.
2.1.3. AUTOCRATIC MANAGEMENT STYLE
In autocratic management, the manager retains most authority for himself and makes decision with
the mind that subordinates will implement it. He is not bothered about attitudes of the subordinates
toward a decision; he is rather concerned about getting the task done. He tells the staff what to do
and how to do it asserts himself and serves as an example for the subordinates. This style is viewed
as task-oriented (Dubrin, 1998). This style is similar to Likert‟s I and II management styles.
With the authoritarian style, the focus of power is more with the manager, and all interactions
within the group also move towards the manager. According to Mullins (2002), the manager solely
exercises decision-making and authority for determining policy, procedures for achieving goals,
work tasks and relationships, and control of rewards or punishments. However, this style would
be most appropriate in emergency situations, and would normally be considered justified by the
group, that is, where the general climate of the group is supportive and mature.
2.2.0. EMPLOYEE PERFORMANCE
2.2.1. DEFINITION
Employee performance is a term typical to the Human Resource field where employee
performance can refer to the ability of employees to achieve organizational goals more effectively
and efficiently. It involves all aspects which directly or indirectly affect and relate to the work of
the employees. For performance to be effective, employers should recognize the regiment desires
12
and needs of the employees. According to Koontz, H. (1988) Ways in which employee
performance can be increased include; proper incentive systems which may be financial or
nonfinancial. This should be after identifying the needs and desires of employees that can be
satisfied hence increased performance
Maxwell (2008) defines performance as an analysis of an employee's work habits undertaken at a
fixed point in time to determine the degree to which stated objectives and expectations have been
reached.
Sarin (2009), defines performance as standards for employee behavior at work. This criteria contains
much more than how an employee does the work. Employees are rated on how well they do their
jobs compared with a set of standards determined by the employer. There is no simple definition
of Employee Performance. As discussed, there are multiple facets to performance and they must
be clearly defined in fairness to the employee and the company. Whenever starting a new job, be
certain to ask all of them who, what, when, where and why's.
2.2.2. IMPROVING PRODUCTIVITY
During the last two decades, productivity research and applications have not been given adequate
importance when trying to attain excellence in the management of manufacturing enterprises
(Murugesh, Devadasan and Natarajan, 1997, pp. 310-320). Grunberg+ (2003, pp. 89-93) has
identified such an initiation to improve the manufacturing productivity on the start of industrial
era. With this origination, the demand of the customers has been long-drawn-out unlimitedly
creating more and more challenges over the manufacturing industry in an increasing competitive
environment. It has made the manufacturers eager to open up their windows toward new
productivity improvement strategies enhancing their performance to successfully meet with the
challenges. Most of the manufacturing industries are currently encountering a necessity to respond
to rapidly changing customer needs, desires and tastes (Singh and Singh, 2009, pp. 51-72). They
have experienced an unprecedented degree of change in the past, involving drastic changes in
management approaches, product and process technologies, customer expectations, supplier
attitudes as well as competitive behaviour (Ahuja, Kamba and Choudhary, 2006).
13
The performance and competitiveness of manufacturing companies is dependent on the reliability
and productivity of their production facilities (Coetzee, 1997; Madu, 2000; Fleischer, Weismann
and Niggeschmidt, 2006).Productivity of an organization expresses to which extent it extracts the
output from the given input. Inputs can be labour skills, technology and innovations etc. In order
to achieve world-class performance, more and more companies are undertaking efforts to improve
quality and productivity and reduce costs (Swanson, 2001). The improved productivity provides a
strengthen basis for improving real income and economic wellbeing by improving the quality and
quantity of the output. It motivates the employees to work for longer while giving means to the
managers to ascertain, plan, control and improve efficiency at different levels of organization. In
this scenario, the productivity improvement strategies such as Total Productive Maintenance
(TPM), Kaizan, 5 S, Lean and Six Sigma are coming into the play in the industry. An aggressive
strategy like TPM focuses on actually improving the function and design of the production
equipment (Swanson, 2001).Implementing of such maintenance strategies further require a better
level of training and sufficient amount of resources to provide a higher level of performance in the
plant and equipment.
The old models of productivity improvement strategies do not longer perform because of the
technological advancements and competitive environment of the business world. In order to
achieve the competitiveness and other goals of an organization, it is very important to the workers
to be in line with the forthcoming trends and techniques of the business world. The highly dynamic
and rapidly changing environment has made the industry well aware of the global competition
leading to a higher demand (Miyake and Enkawa, 1999, pp. 243-269).To meet the challenges
posed by the contemporary competitive environment, the manufacturing organizations must infuse
quality and performance improvement initiatives in all aspects of their operations to improve their
competitiveness (Daya and Duffuaa, 1995, pp. 20-26).
Outcome of the past researches has become an evident emphasizing the importance of having a
good understanding of the changes that manufacturing industry should have on implementation of
new production technologies (Nemetz and Fry, 1988, pp. 627-638).Further Dean and Snell (1991,
14
pp. 776-804) have found that there is a positive effect of new production technologies for the
success of an organization.
In response to this matter concerned, in facilitating the organizations and in achieving the set goals,
many of them are implementing new productivity improvement strategies for gaining sustainable
competitive advantages and enhanced performance so that the failure of new implementations are
apparent instead of keeping up their sustainability in the industrial context.
However comparing those successes of implementations it is well experienced that the
implementation of a new productivity improvement strategy is very difficult and in most cases
they are failed (Swanson, 1999, pp. 849-869). As well, one may concluded that the implementation
of new performance measurement system can have few problems (Business Intelligence, 20000).
But more literature reviews make evidence of their success such as in Kaplan and Norton (2000)
and Mobile case. Further Bourne et al. (2002) have reviewed that the growing literature is now
well addressing the difficulties of implementation and it is claimed by some that 70 percent of
performance measurement initiatives fail as McCunn (1998). Also though Bitton (1990), Dixon et
al. (1991), Kaplan and Norton (1993), Neely et al. (1996), Bitici et al. (1998) and Krause and
Mertins (1999) have explained different management processes for the design of performance
measurement, there has been less researches carried out for the success and failure of performance
measurement initiatives. These have further motivated the researchers to do research related to this
area.
The organizations adopt new procedures to resolve old problems when the actual tools do not work
(Nuslund, 2008, pp. 269-287). It will create unsuccessful results of the applied productivity
improvement techniques. Competitive pressures in the global manufacturing environment are
forcing manufacturing organizations to re-engineer in order to become more competitive in the
marketplace. Toward that end, management of these organizations is paying closer attention to the
changing nature of manufacturing performance, and the systems, processes and measures used in
its evaluation.
15
2.2.3.0. QUICK DECISION MAKING PROCESS
In this section, there will be a review of the existing decision making methods. The section will
explain the details of each decision making methods. In order to cope with the current research,
the existing literature is used by researcher to know how different management styles will effects
on employee’s performance in an organization.
2.2.3.1. BUSINESS DECISION-MAKING
First, figuring out the objectives behind the decision, which means decision makers, must know
their goals first to get the green light to be involved in the decision process. Next, the collecting of
information available data will take a place, and will be followed by analyzing these information
and data. Bowett (2009) has suggested two elements to support the collecting and analyzing steps;
he recommends that we need to look for very relevant and updated data so the decision will be
built based on up-to-date information. He suggests a method for the analyzing process, ‘A very
large spread-sheet can be used to hold all the known information about, say, pricing and the effects
of pricing on profits’ (Bowett, 2009). Now, it comes to the most important step which is making a
decision based on the collected information. He has defined the secondary steps of making a
decision as several possible solutions, but to be analyzed and evaluated to choose the best solution.
Therefore the decision will be needed to be discussed among the team or the organization by
communication. Here is the connection between decision making and management has been
related by knowledge sharing method. Implementation of the taken decision and evaluating it will
be the last two steps of the process.
2.2.3.2.TEAM DECISION-MAKING METHODS
Johnson et al (1993) have proposed several team decision making methods. They are some positive
and some negative methods as well. Actually there is decision made based on individuality, but
managers sometimes make a mistake by ignoring members’ contribution which may reflect the
effort. A brief of each of the methods suggested by Johnson et al (1993) will be explained as below.
16
2.2.3.3. METHOD 1: DECISION WITHOUT GROUP DISCUSSION
The decision built by the manager! That is the first method of group decision making. Basically,
the group members are not involved in the decision at all since there is no discussion. It is similar
like the command factor in Command, Consult, Vote and Consensus suggested that command
technique is used method. Team members will not be aware of the resulted decision, plus it shows
how there is no group interaction and commitment which is not supportive for knowledge
management environment (Johnson et al, 1993).
2.2.3.4.METHOD 2: DECISION BY EXPERTS
Experts will be the main function in this method, because some of the decisions will require some
area of expertise. That’s why the manager’s still needs to let the experts look into the issue and
make the decision as well. But members may not understand the reasons behind the decision
established by those experts, plus there is no group interaction as well since the focus was on the
experts (Johnson et al, 1993).
2.2.3.5. METHOD 3: DECISION BY AVERAGING INDIVIDUALS’ OPINION
The managers will still have the final decision, but he will be asking opinions and ideas from the
group members. This method grabs all the members into discussing their points of views, but not
yet to be considered group interaction process. It may rise conflicting hence some of the members’
ideas will be just noticed and considered (Johnson et al, 1993).
2.2.3.6. METHOD 4: DECISION MADE BY AUTHORITY
The team manager will be consulting all the members’ opinions and ideas. But at the end, the
manager will be the only one who has the authority to establish the decision based on the member’s
inputs. This method is very common nowadays among organizations, but actually it all depends
on the organization nature as mentioned earlier. Some of the members will feel invaluable since
their opinions weren’t taken into action (Johnson et al, 1993).
17
2.2.3.7.METHOD 5: DECISION MADE BY MINORITY
‘Minorities of the team, two or more members who constitute less than 50% of the team, make the
team’s decision’ (Johnson et al, 1993: 120-140). This is a very rare method used in the executive
and temporary committees.
2.2.3.8.METHOD 6: DECISION MADE BY MAJORITY
This method is exactly the opposite of the minority method. The majority voting will be considered
here to compromise the issue. But the issue is that always ignore the minority opinions and there
is no full group interaction. Because the decision will be considered successfully as long as more
than fifty percent of the team agrees (Johnson et al, 1993).
2.2.3.9.METHOD 7: DECISION MADE BY CONSENSUS
It is better to call this method ‘Collective Decision’, because it ensures the acceptance by all the
members. In result, it will load the commitment factor into the members’ willingness. It is very
time consuming since the leader will try his/her strategy to get the acceptance from all the members
(Johnson et al, 1993).
2.2.4. EFFECTIVE TEAMWORK
Teamwork is defined by Scarnati (2001, p. 5) “as a cooperative process that allows ordinary people
to achieve extraordinary results”. Harris & Harris (1996) also explain that a team has a common
goal or purpose where team members can develop effective, mutual relationships to achieve team
goals. Teamwork replies upon individuals working together in a cooperative environment to
achieve common team goals through sharing knowledge and skills. The literature consistently
highlights that one of the essential elements of a team is its focus toward a common goal and a
clear purpose (Fisher, Hunter, & Macrosson, 1997; Johnson & Johnson, 1995, 1999; Parker, 1990;
Harris & Harris, 1996). Teams are an integral part of many organizations and should be
incorporated as part of the delivery of tertiary units. Successful teamwork relies upon synergism
existing between all team members creating an environment where they are all willing to contribute
and participate in order to promote and nurture a positive, effective team environment. Team
18
members must be flexible enough to adapt to cooperative working environments where goals are
achieved through collaboration and social interdependence rather than individualized, competitive
goals (Luca & Tarricone, 2001).
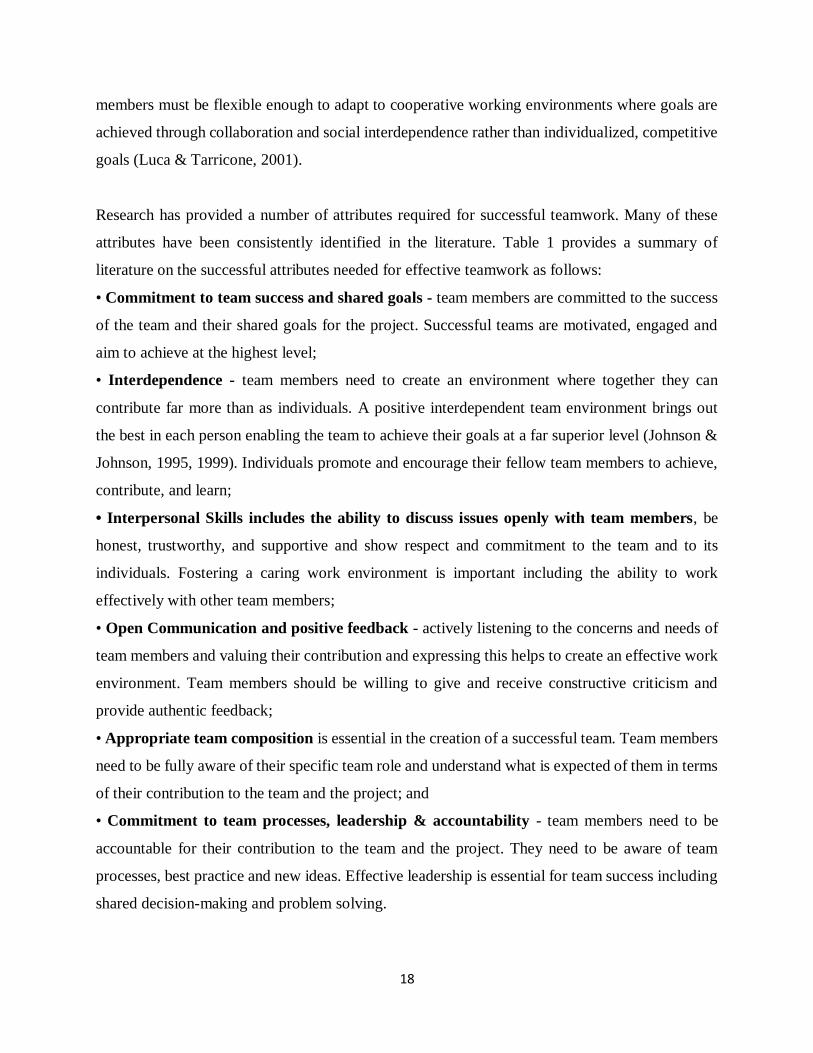
Research has provided a number of attributes required for successful teamwork. Many of these
attributes have been consistently identified in the literature. Table 1 provides a summary of
literature on the successful attributes needed for effective teamwork as follows:
• Commitment to team success and shared goals - team members are committed to the success
of the team and their shared goals for the project. Successful teams are motivated, engaged and
aim to achieve at the highest level;
• Interdependence - team members need to create an environment where together they can
contribute far more than as individuals. A positive interdependent team environment brings out
the best in each person enabling the team to achieve their goals at a far superior level (Johnson &
Johnson, 1995, 1999). Individuals promote and encourage their fellow team members to achieve,
contribute, and learn;
• Interpersonal Skills includes the ability to discuss issues openly with team members, be
honest, trustworthy, and supportive and show respect and commitment to the team and to its
individuals. Fostering a caring work environment is important including the ability to work
effectively with other team members;
• Open Communication and positive feedback - actively listening to the concerns and needs of
team members and valuing their contribution and expressing this helps to create an effective work
environment. Team members should be willing to give and receive constructive criticism and
provide authentic feedback;
• Appropriate team composition is essential in the creation of a successful team. Team members
need to be fully aware of their specific team role and understand what is expected of them in terms
of their contribution to the team and the project; and
• Commitment to team processes, leadership & accountability - team members need to be
accountable for their contribution to the team and the project. They need to be aware of team
processes, best practice and new ideas. Effective leadership is essential for team success including
shared decision-making and problem solving.
19
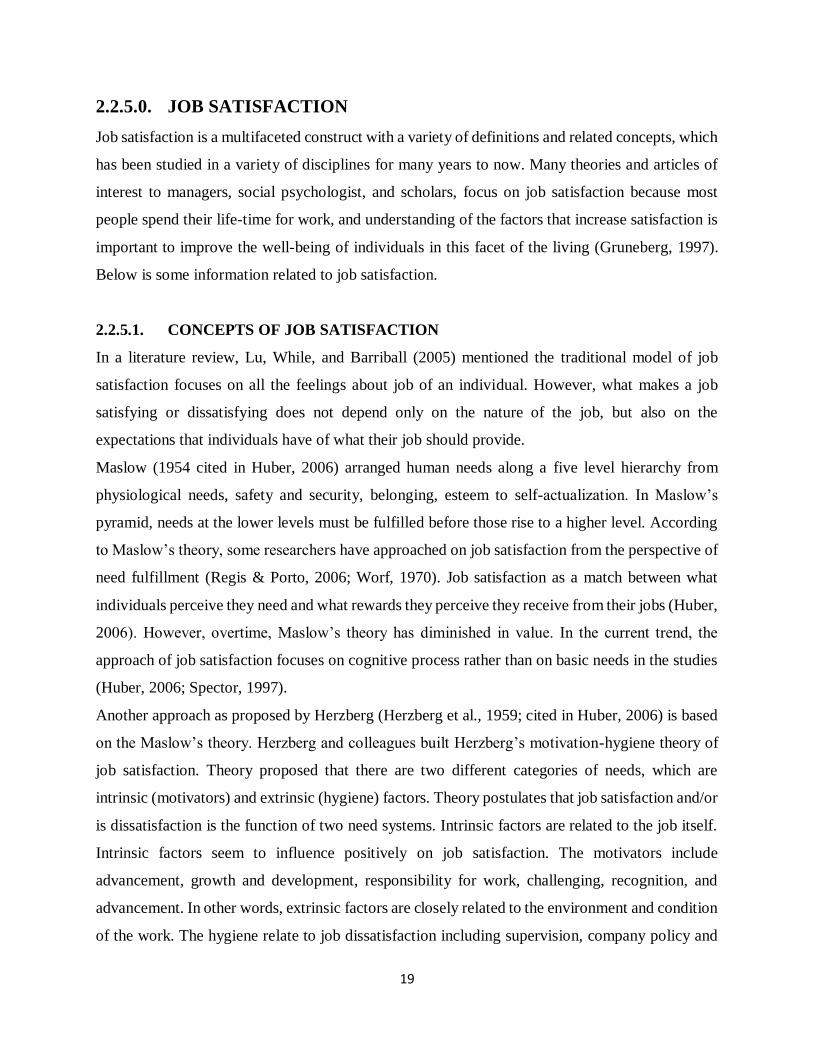
2.2.5.0. JOB SATISFACTION
Job satisfaction is a multifaceted construct with a variety of definitions and related concepts, which
has been studied in a variety of disciplines for many years to now. Many theories and articles of
interest to managers, social psychologist, and scholars, focus on job satisfaction because most
people spend their life-time for work, and understanding of the factors that increase satisfaction is
important to improve the well-being of individuals in this facet of the living (Gruneberg, 1997).
Below is some information related to job satisfaction.
2.2.5.1. CONCEPTS OF JOB SATISFACTION
In a literature review, Lu, While, and Barriball (2005) mentioned the traditional model of job
satisfaction focuses on all the feelings about job of an individual. However, what makes a job
satisfying or dissatisfying does not depend only on the nature of the job, but also on the
expectations that individuals have of what their job should provide.
Maslow (1954 cited in Huber, 2006) arranged human needs along a five level hierarchy from
physiological needs, safety and security, belonging, esteem to self-actualization. In Maslow’s
pyramid, needs at the lower levels must be fulfilled before those rise to a higher level. According
to Maslow’s theory, some researchers have approached on job satisfaction from the perspective of
need fulfillment (Regis & Porto, 2006; Worf, 1970). Job satisfaction as a match between what
individuals perceive they need and what rewards they perceive they receive from their jobs (Huber,
2006). However, overtime, Maslow’s theory has diminished in value. In the current trend, the
approach of job satisfaction focuses on cognitive process rather than on basic needs in the studies
(Huber, 2006; Spector, 1997).
Another approach as proposed by Herzberg (Herzberg et al., 1959; cited in Huber, 2006) is based
on the Maslow’s theory. Herzberg and colleagues built Herzberg’s motivation-hygiene theory of
job satisfaction. Theory proposed that there are two different categories of needs, which are
intrinsic (motivators) and extrinsic (hygiene) factors. Theory postulates that job satisfaction and/or
is dissatisfaction is the function of two need systems. Intrinsic factors are related to the job itself.
Intrinsic factors seem to influence positively on job satisfaction. The motivators include
advancement, growth and development, responsibility for work, challenging, recognition, and
advancement. In other words, extrinsic factors are closely related to the environment and condition
of the work. The hygiene relate to job dissatisfaction including supervision, company policy and
20
administration, working condition and interpersonal relation (Lephalala, Ehlers, & Oosthuizen,
2008; Shimizu et al., 2005). This theory has dominated in the study of job satisfaction, and become
a basic for development of job satisfaction assessment (Lu et al., 2005).
In summary, some previous theories have proposed many factors contributed to job satisfaction
such as the Maslow’s hierarchy of needs and the set of Herzberg’s motivation-hygiene theory. This
study is going to measure job satisfaction in two categories, including motivator and hygiene
factors, which are related to Herzberg’s theory.
2.2.5.2. MEASUREMENTS OF JOB SATISFACTION
Measuring job satisfaction is difficult, for it is abstract personal cognition that only exists in the
mind of individual. However, most researchers select a more objective and in-depth survey
instrument (Spector, 1997). Spector suggested using an existing job satisfaction scale for the
following advantages: 1) It has been reported to exhibit acceptable levels of reliability, 2) It has
been used a sufficient number of times to provide norm, 3) It has been used in research to provide
good evidence for construct validity, and4) Using known scales saves the considerable cost and
time necessary to develop a scale.
Many instruments were developed to measure the level of job satisfaction. Originally Index of
Work satisfaction (IWS) was develop in the 1972s (Stamp, 1997 cited in Norbu, 2010). It is a scale
to measure the relative importance of various components of job satisfaction. It contained six
components: 1) professional status,2) task requirements, 3) pay, 4) interaction, 5) organizational
policies, and 6) autonomy. This scale was developed based on the combination of Maslow’s theory
and Herzberg’s theory. It consisted of 48 items and ranged on a 7-point Likert scale. Previous
studies have reported the Cronbach coefficient alpha in the range of .82-.91 for the overall scale.
Originally the McCloskey/Muller Satisfaction Scale (MMSS) was developed in the 1974s
(McCloskey & Muller, 1990). This scale measures workers job satisfaction from 8 subscales: 1)
extrinsic rewards, 2) scheduling, 3) the balance of family and work, 4) co-worker, 5) interaction
opportunities, 6) professional opportunities, 7) praise and recognition, and 8) control
responsibility. This scale was developed based on theories of Maslow and Burn. It consisted of 31
items and ranged on a 5-point Likert scale. Previous studies have reported the Cronbach coefficient
21
alpha of .89 for the overall scale and validity of .556. This scale is well established instrument for
measuring job satisfaction (Arab, Pourreza, Akbari, Ramesh, & Aghlmand, 2007; Duong, 2003).
The Job Satisfaction Survey (JSS) was developed in 1985s (Spector, 1985).
This scale assesses employee attitudes about the job and aspects of job from 9 separate facets of
the job satisfaction: 1) pay and pay raises, 2) promotional opportunities, 3) fringe benefits, 4)
contingent reward, 5) supervision, 6) coworker, 7) nature of work, 8) communication within the
organization, and 9) operating procedures. The scale was summated rating scale format which is
the most popular for job satisfaction scales. It consisted of 36 items and ranged on a 6-point Likert
scale from 1-dissagree strongly to 6-agree strongly. It has some of the items written in negatives
direction. These items have to be reversing scored before summing up the score. Spector reported
coefficient alphas ranging .60-.91 for the overall measure Spector, 1997). The higher mean score
is the higher level of job satisfaction. Level of job satisfaction is low when the mean score is less
than 3.00, moderate when the mean score is 3.00-4.00, high when the mean score is greater than
4.00 (Spector, 2007).
Although, the Job Satisfaction Survey was developed to measure of employees’ job satisfaction to
human service, public, etc. However, JSS along with 9 facets was provided overall picture about
job satisfaction. Job Satisfaction Survey measured using both the positive and the negative ways.
Hence, Job Satisfaction Survey tool was selected in this study.
2.2.6. INNOVATION AND CREATIVITY
Creativity and innovation are considered to be overlapping constructs between two stages of the creative
process; both are necessary for successful enterprise (Martins & Terblanche, 2003). Creativity can be
defined as “the production of novel and useful ideas” (Amabile et al., 1996, p. 1155), while innovation
refers to the implementation or “transformation of a new idea into a new product or service, or an
improvement in organization or process” (Heye, 2006, p. 253).
By definition, creativity and innovation involve the creation of something new that “... is central to the
entrepreneurial process” (Barringer & Ireland, 2006, p. 15). Creativity and innovation are considered to be
inseparable from entrepreneurship, which is in turn manifested in the act of starting up and running an
22
enterprise. Pretorius, Millard and Kruger (2005) maintain that “creativity is clearly part and parcel of the
entrepreneurial skills required to successfully start a venture” (p. 56). Entrepreneurs and their start-ups are
considered to be “important agents of innovation” (Bosma & Harding, 2007, p. 16), not simply in terms of
the products and services they provide, but also in terms of the technologies and process that they utilize
(Bosma & Harding; Watson et al., 1998). Entrepreneurs could be argued to be, by their very nature, the
essence of creativity and innovation.
Entrepreneurs implement creative ideas to introduce innovative products or services, or to deliver products
or services in a new, more efficient, and hence innovative way. Innovation in New Product Development
could include upgrading an existing product or developing a totally new concept to create an original and
innovative product (Larsen & Lewis, 2007). This is also true for services and processes, thus innovation is
recognized in the literature as ranging from the incremental to the radical. There is broad agreement that
innovation should be present in all aspects of an organization and that it should be a mindset or a way of
life (Abraham & Knight, 2001; Kuczmarski, 1996). Innovation should permeate through the various
elements of the organization’s business model in order to make it harder to be copied by competitors (Loewe
& Dominiquini, 2006). Therefore, innovation is not only measured by the new products or services offered
by an enterprise but also by new and more efficient ways of developing, producing or delivering products
or services.
It is argued that creativity is not required solely in the domain of certain sectors or departments, or only in
the development of new products or services, but is needed at every level of every type of organization.
Creativity is seen as going beyond new products, new services and new and improved processes (Cook,
1998; Heye, 2006). Therefore if one can “better organize *one’s+ day or write a report in a new or more
effective way, then this is every bit a creative act” (Gurteen, 1998, p. 7).
2.3. ORGANIZATION POLICY
Understanding of how and why organization policy is put into effect is implementation theory
(Schofield and sausman 2004). Implementation models till date have not dealt with the ambiguity,
messiness and complexity of implementation. Implementation implies processes and ability to
convert policy into action by operationalizing the strategy in form of programs. Operationalization
of policy is not addressed in implementation literature. Policy designers cannot anticipate the
operational consequences of policy. (Schofield 2004).
23
The impact of how a program is intending to achieve its policy objectives depends upon the
receptivity of the local environment to its means and its mix of incentives and constraints.
Programs are applied unevenly across units because each local unit can react differently to the mix
of constraints and incentives depending upon the munificence and management of the local
context. (Sinclair 2001). The implementation of a policy through a series of programs is influenced
by the role played by various stake holders and interest groups (Ryan 1996) and therefore
management of these groups is one of the factors key to successful implementation (Pearson-
nelson 2005). Apart from the interest groups, the characteristics of the program/ policy which
involve the amount of change being introduced and the number and variety of components in the
program influence the degree of complexity and dynamism to be managed in the local context.
This can be managed by formal organizational mechanisms such as participation (stoker 1989),
managing the role of local implementers (Ryan 1996); use of policy feedback loop and learning
(schofield 2004) resulting in policy content being adapted to initiatives more suited to local context
called backward mapping (dyer 1999); increased coordination and cooperation both within
organization and across independent units involved in the implementation process(Ryan 1996 ;
Butler 2003; Vangen And Huxam 2003; Fenger And Klok 2001) facilitated by increased formal
and informal communication(Terpstra and havinga 2001). All these mechanisms can be influenced
by use of incentives (Brinkerhoff 1999) and power (Zahardias and Morgan2005).
It is recognised that implementing organizational policies involves a much larger number of
agencies and actors, many of which would be outside the formal hierarchical control of the lead
implementing unit and thus inter organizational coordination is a distinguishing feature
(Brinkerhoff 1999). This involves both stake holders, interested parties and other units involved
in the implementation process and the management of an order and coordination among these is
called governance( Brinkerhoff 1999) and thus involves formal and informal networks(Grantham
2001; Maeier and O’toole jr 2001). Under such conditions, where inter organizational coordination
predominates, by facilitating local independence (Lloyd et al 1999) managers may be thrust into
management roles which are a key ingredient for successful implementation (Pearson-Nelson
2005; Lloyd Et Al 1999; O’toole Jr And Maier 1999, Vangen And Huxam 2003). Management
roles promote managerial initiative taking (Pearson-nelson 2005) and facilitate management of
networks. Policy implementation is a nonlinear process (O’toole jr and Maier 1999).
24
The construct “Structure of the implementation organization” has been identified by researchers
of policy implementation. An implementation structure is the entity used by implementers to
achieve the program objectives. Using this as a unit of analysis facilitates evaluation of programs
(hjern and porter 1982). The identification of the implementation organization is necessary to
facilitate incorporation of all factors influencing policy implementation (Sinclair 2001).
The main drawback of the empirical research in policy implementation field has been that they
have not concentrated on the processes involved in implementation (Mcnulty 2003; De Leon
1999), and have only attempted to either enumerate variables involved or indicate the significance
of them.
PROBLEMS ASSOCIATED WITH THE RESEARCH IN THIS FIELD
Little is known about the policy implementation because (van horn and van meter 1974)
1. of a naïve assumption that once policy is made , implementation will occur because
implementation is simple
2. growth of planning, programming budgeting systems led to neglect of implementation(
look at growth of strategic planning in the sixties)
3. Difficulty of the task has discouraged study—because of serious boundary problems,
variables are difficult to measure, and require attention to multiple actions over an extended
period of time.
4. Studies are hampered by lack of a theoretical perspective especially a theoretical frame
work within which policy implementation can be examined
Literature on implementation theory shows substantial pluralism but little accumulation of
knowledge about the process and is fragmented and dispersed (Sinclair 2001; Deleon 1999;
Schofield and Sausman 2004). Plentiful theories, large number of variables, little consensus and
accumulated theory, improper and imprecise definition of concepts and constructs and scarce
validated findings reduce the utility of implementation research and its application to practice (o
toole 2004; Lester et al 1986). There has been predominant concentration on policy formation
variables (> 90% of articles focus on formation variables (Sinclair 2001).
The interest of researchers in policy implementation research has waxed and waned with time (o
toole jr 2000) and have been obsessed with study of failures (Deleon 1999)
25
CHAPTER THREE
METHODOLODY
3.0 INTRODUCTION
This chapter describes the research methodology to be used in the study. The research setting,
population and sampling to be used will be presented. The instruments for the data collection are
described in detail. Finally, this chapter highlights the ethical considerations that needed to be
taken into account.
3.1 RESEARCH DESIGN
The study applied a descriptive research design. A descriptive design is best suited for this study
because enabled the researcher to investigate into the causal relationship of social phenomena. The
research design enabled the researcher to examine the effect of the management styles used by
managers and how it affects employee performance in Norwegian People’s Aid – Yei Vocational
Training Centre South Sudan Program. Both quantitative and qualitative research approaches were
applied in data collection.
3.2. AREA OF POPULATION OF THE STUDY
Norwegian People’s Aids, South Sudan Program is an international organization was founded in
1987, which have many projects and have been funded by Norwegian people’s Aids, one which is
Norwegian People’s Aids- Yei Vocational Training Centre to serve as the case study. Norwegian
People’s Aids – Yei Vocational Training Centre is located in Yei River County – South Sudan
with the following objectives. To support both women and men who were drop out of school to be
trained with vocational skills in various courses that includes Building Construction, Carpentry
and Joinery and Tailoring Tie and dye. The training offered to the trainees was on zero cost with
aim of making the women and men self-reliance.
26
3.3. POPULATION OF THE STUDY
Norwegian People’s Aids has many projects and Norwegian People’s Aids – Yei Vocational
Training Centre is one of the projects which is funded by Norwegian people’s Aids and it has a
population of 45 employees. The study population included senior management officers, ICT
training section tutors, building construction section tutors, Carpentry and Joinery section Tutors,
Tailoring Tie and Dye section Tutors and Adult Literacy section teachers.
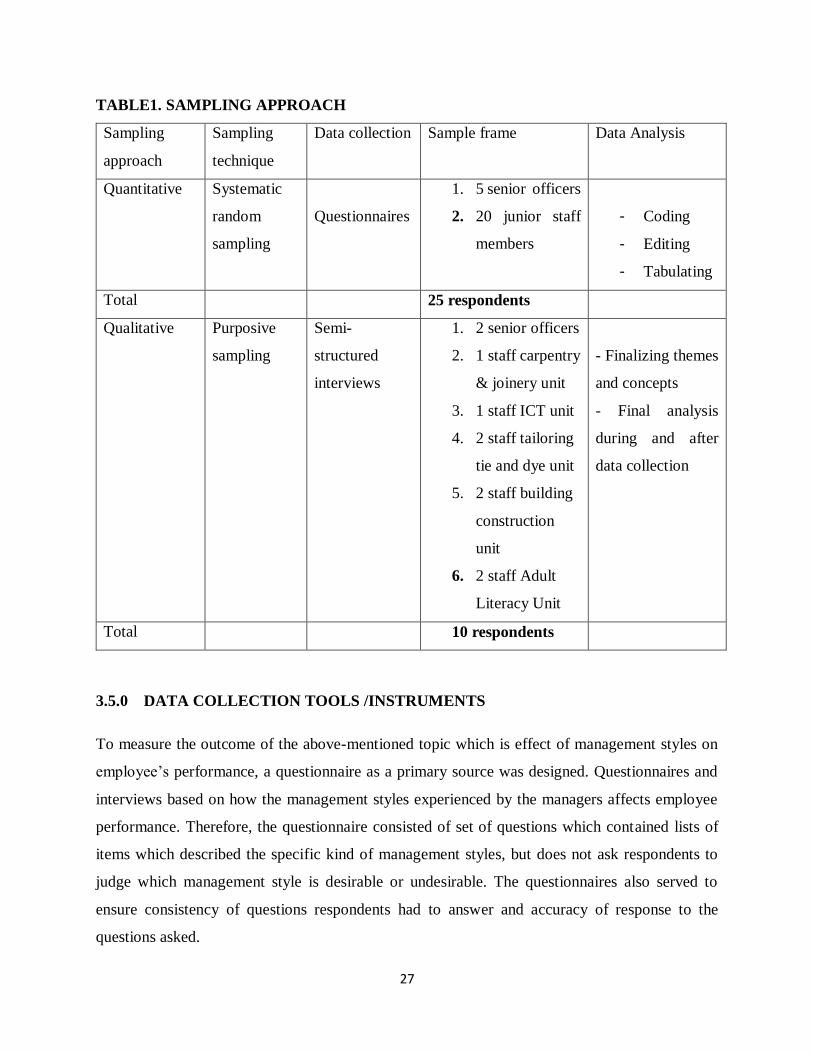
3.4. SAMPLE SELECTION AND SIZE
The study applied systematic and sampling random technique to select 25 staff members at
Norwegian People’s Aids – Yei Vocational Training Centre. The technique involved the researcher
by selecting at random from the given category of the population. Everyone in the population had
a chance to be selected. Purposive sampling was applied to key informants who included the
operation of the employee’s performance.
27
TABLE1. SAMPLING APPROACH
Sampling
approach
Sampling
technique
Data collection Sample frame Data Analysis
Quantitative Systematic
random
sampling
Questionnaires
1. 5 senior officers
2. 20 junior staff
members
- Coding
- Editing
- Tabulating
Total 25 respondents
Qualitative Purposive
sampling
Semi-
structured
interviews
1. 2 senior officers
2. 1 staff carpentry
& joinery unit
3. 1 staff ICT unit
4. 2 staff tailoring
tie and dye unit
5. 2 staff building
construction
unit
6. 2 staff Adult
Literacy Unit
- Finalizing themes
and concepts
- Final analysis
during and after
data collection
Total 10 respondents
3.5.0 DATA COLLECTION TOOLS /INSTRUMENTS
To measure the outcome of the above-mentioned topic which is effect of management styles on
employee’s performance, a questionnaire as a primary source was designed. Questionnaires and
interviews based on how the management styles experienced by the managers affects employee
performance. Therefore, the questionnaire consisted of set of questions which contained lists of
items which described the specific kind of management styles, but does not ask respondents to
judge which management style is desirable or undesirable. The questionnaires also served to
ensure consistency of questions respondents had to answer and accuracy of response to the
questions asked.
28
3.5.1. DATA SOURCES
Both primary and secondary data were collected for the study. The primary data included
information collected from the study respondents by the use of questionnaires and interview guide.
Secondary data was obtained by reviewing the literature on management styles book, business and
management journals and the internet sources. The main research instruments were:
3.5.2. RESEARCH INSTRUMENTS
a) QUESTIONARIES’
These involved the research structuring questions relating to the study objectives and
administering them to the respondents. The questionnaires were sectioned as demographic data of
respondents, the level of management styles is being practiced, employees performance in relation
to Norwegian people’s Aid – Yei Vocational Training Centre. The questionnaires method is
advantageous because it is convenient for the researcher to administer many questionnaires at once
and be collected later thus saving time.
b) INTERVIEWS
The interview guide was designed with semi – structured questions to guide the researcher while
conducting face to face interviews with the key respondents. The interview method provides for
an in depth investigation on the study problem because the researcher has one – on interaction with
respondent.
c) OBSERVATION.
This involves observation of the different management styles that were employed at the place of
work for the study. I personally having ever worked with the case study organisation for some
time, happen to have observe how management conducts its work in the organisation amongst the
employees that cannot be explained during interview.
3.6. QUALITY CONTROL
Prior to data collection, the instruments used were pre- tested to check whether they were fit for
data collection? To ensure that the items on the instruments were valid, the researcher sought an
expert opinion from the supervisor. Validity tests were aimed at ensuring that there were no
inconsistencies in structure of items on the instrument. Reliability tested has been performed by
29
the use of Cronbach Alpha’s reliability coefficient. The reliability coefficient has to be higher than
(60) for instrument to fit for data collection.
3.7. PROCEDURES FOR DATA COLLECTION
The researcher obtained an introductory letter from St. Lawrence University – Kampala (Uganda).
The letter was taken and presented to the Principal of Norwegian People’s Aid – Yei Vocational
Training Centre South Sudan Program. A letter of consent was received and the researcher
proceeded to identify the prospective respondents, appointments for the data collection. Prior to
data collection, ethical issues as respondent’s confidentiality were explained. Prospective
respondents were also briefed about the purpose of the study.
3.8. DATA ANALYSIS AND PROCESSING
Quantitative data has been analyzed by coding all responses according to the study themes.
Respondent’s socio – economic variables such as age, employment and education status will be
tabulated, frequencies obtained and graphically represented on pie- charts or column graphs. This
was made possible by the use of Microsoft excel 2010 program.
Quantitative data was analyzed during and after collection. Prior to data collection the major
themes were identified and during data collection responses coded on each data theme. The
relationship between the studies variables were measured by Pearson correlation coefficient.
3.9. ANTICIPATED STUDY LIMITATION.
In conducting the research, the research was faced with a number of methodologies and practical
impediments as highlighted below:
1. Securing key research appointment for the interview was hard: this is due to employees at
Norwegian People’s Aid – Yei vocational training centers are very busy throughout with
an aim of completing and impacting practical knowledge to the trainees.
2. Respondents were unwilling to avail the researcher with the required information due to
negative attitudes, suspiciousness and speculations. Some respondents had a negative
attitude for the study thinking that it put their jobs at risk if they reveal any unnecessary
information.
3. The time allocated for conducting the research wasn’t enough for the researcher to cover
the area of study in full since given his other academic obligations.
30
4. The researcher encountered financial constraints since the study involved costs such as
typing, printing and telephone call.
3.10. SOLUTION TO THE STUDY LIMITATION
1. To solve the problem of securing appointments, the researchers tried to highlight the
significance of the study to organization and enable respondents know that the study
required little time sacrifice of their time.
2. In order to deal with the limitation of unwillingness to provide data, the researcher ensured
that the study respondents understood that confidentiality was part of the ethical concerns.
3. Time management to solve the problem of limited time allocated for the study enabled the
researcher meets his other academic obligations.
4. To address the limitation of financial constraints, the researcher tried to save some money
for the study because it was part of the requirement for the award of his degree.
31
CHAPTER FOUR
DATA PRESENTATION ANALYSIS AND DISCUSSION OF RESULTS
4.0 BACKGROUND OF ANALYSIS
This chapter is devoted to the analysis of data gathered from the research. In all, Twenty five
questionnaires were distributed to respondents in the sample population. The total number of
questionnaires received sound was twenty five as the total given out, and these were considered
for the study. The respondents were from various functions or departments of Norwegian People’s
Aids, Yei Vocational Training Centre (Management, ICT department, Construction Department,
Carpentry Department, Tailoring Tie and Dye department and lastly Adult literacy department) at
the organization. The study is aimed to find the influence of Management style on employee
performance.
A sample of the questionnaire in the form given to respondents is found in appendix 1. Each
question in the questionnaire has the two optional answers: Yes and No
The various questions were categorized into Participatory Management style, democratic
management style and Autocratic management style, depending on the direction of the question as
found in appendix 2.
The data received from the respondents was analysed with the help of statistical excel spreadsheet
software program. To test for the hypothesis, Pearson Coefficient correlation analysis was
conducted to examine whether the hypothesis was accepted or rejected. The Management styles
(as the independent variables) impacts individually on employee performance (as the dependent
variable). That is the Management styles on employee performance. The findings are also linked
to appropriate and related literature.
4.1. The demographic and socio-economic characteristics of respondents
Characteristics of respondents are outlined as managers of subordinates, location of site, sex, level
of Education, primary function of respondents and, work experience
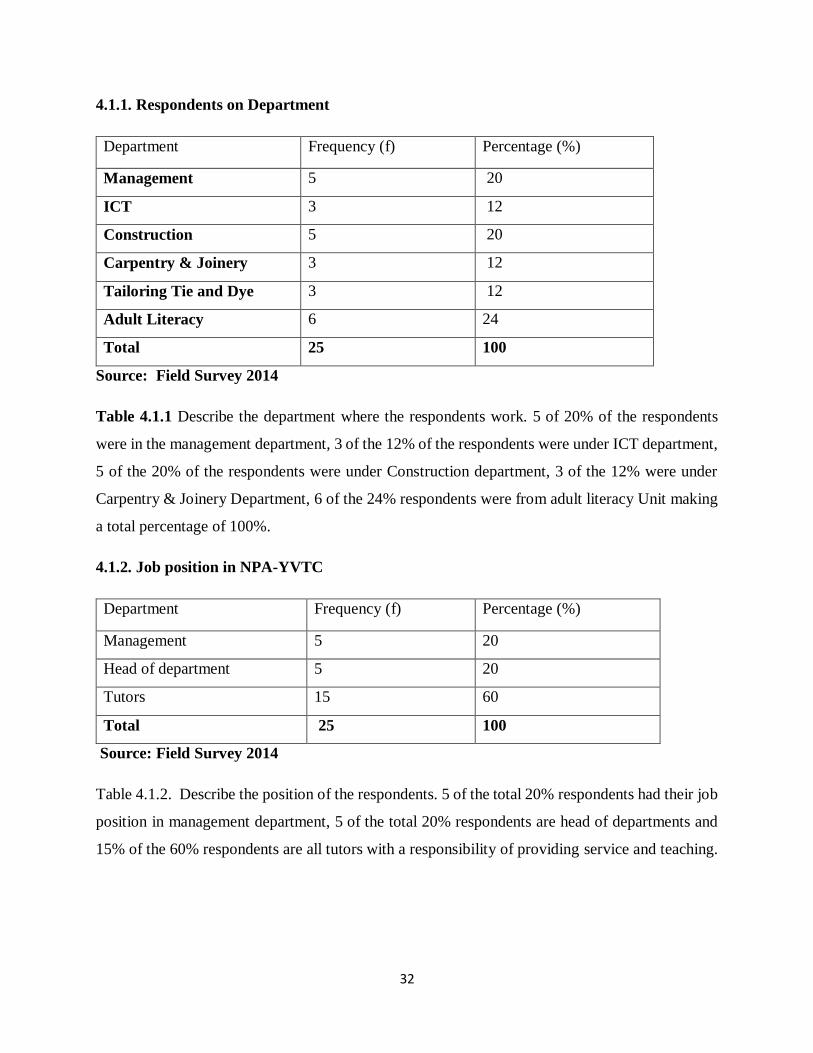
32
4.1.1. Respondents on Department
Department Frequency (f) Percentage (%)
Management 5 20
ICT 3 12
Construction 5 20
Carpentry & Joinery 3 12
Tailoring Tie and Dye 3 12
Adult Literacy 6 24
Total 25 100
Source: Field Survey 2014
Table 4.1.1 Describe the department where the respondents work. 5 of 20% of the respondents
were in the management department, 3 of the 12% of the respondents were under ICT department,
5 of the 20% of the respondents were under Construction department, 3 of the 12% were under
Carpentry & Joinery Department, 6 of the 24% respondents were from adult literacy Unit making
a total percentage of 100%.
4.1.2. Job position in NPA-YVTC
Department Frequency (f) Percentage (%)
Management 5 20
Head of department 5 20
Tutors 15 60
Total 25 100
Source: Field Survey 2014
Table 4.1.2. Describe the position of the respondents. 5 of the total 20% respondents had their job
position in management department, 5 of the total 20% respondents are head of departments and
15% of the 60% respondents are all tutors with a responsibility of providing service and teaching.
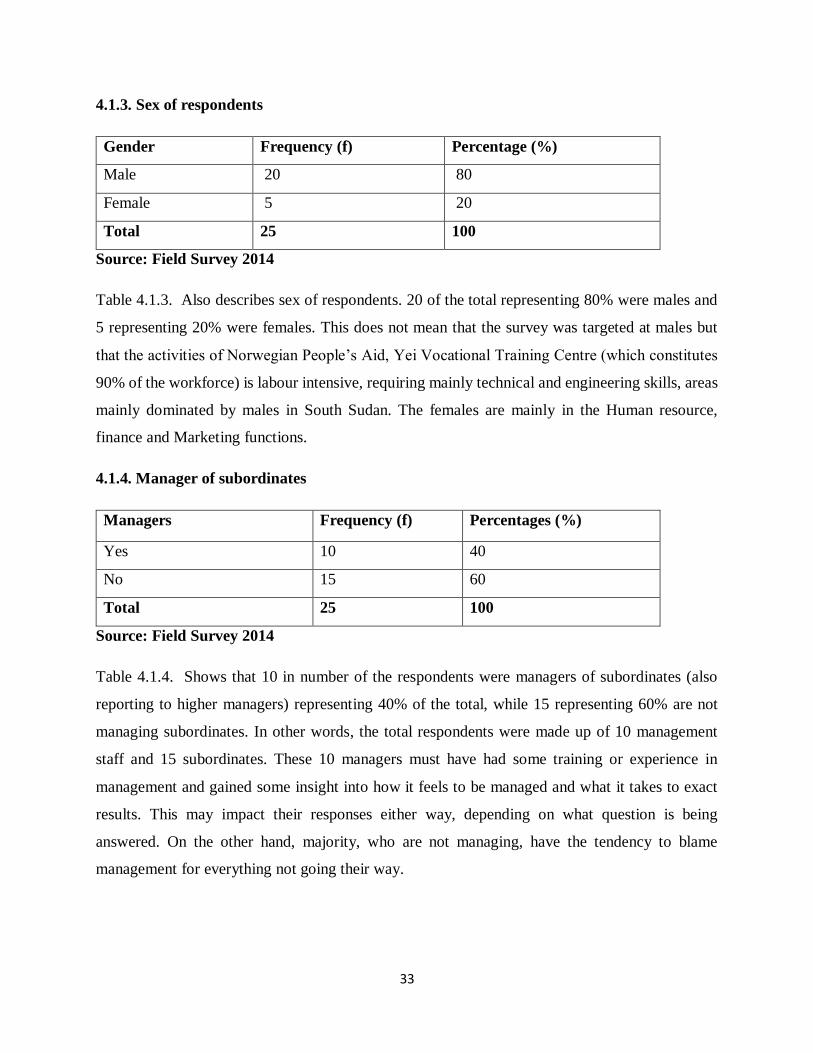
33
4.1.3. Sex of respondents
Gender Frequency (f) Percentage (%)
Male 20 80
Female 5 20
Total 25 100
Source: Field Survey 2014
Table 4.1.3. Also describes sex of respondents. 20 of the total representing 80% were males and
5 representing 20% were females. This does not mean that the survey was targeted at males but
that the activities of Norwegian People’s Aid, Yei Vocational Training Centre (which constitutes
90% of the workforce) is labour intensive, requiring mainly technical and engineering skills, areas
mainly dominated by males in South Sudan. The females are mainly in the Human resource,
finance and Marketing functions.
4.1.4. Manager of subordinates
Managers Frequency (f) Percentages (%)
Yes 10 40
No 15 60
Total 25 100
Source: Field Survey 2014
Table 4.1.4. Shows that 10 in number of the respondents were managers of subordinates (also
reporting to higher managers) representing 40% of the total, while 15 representing 60% are not
managing subordinates. In other words, the total respondents were made up of 10 management
staff and 15 subordinates. These 10 managers must have had some training or experience in
management and gained some insight into how it feels to be managed and what it takes to exact
results. This may impact their responses either way, depending on what question is being
answered. On the other hand, majority, who are not managing, have the tendency to blame
management for everything not going their way.
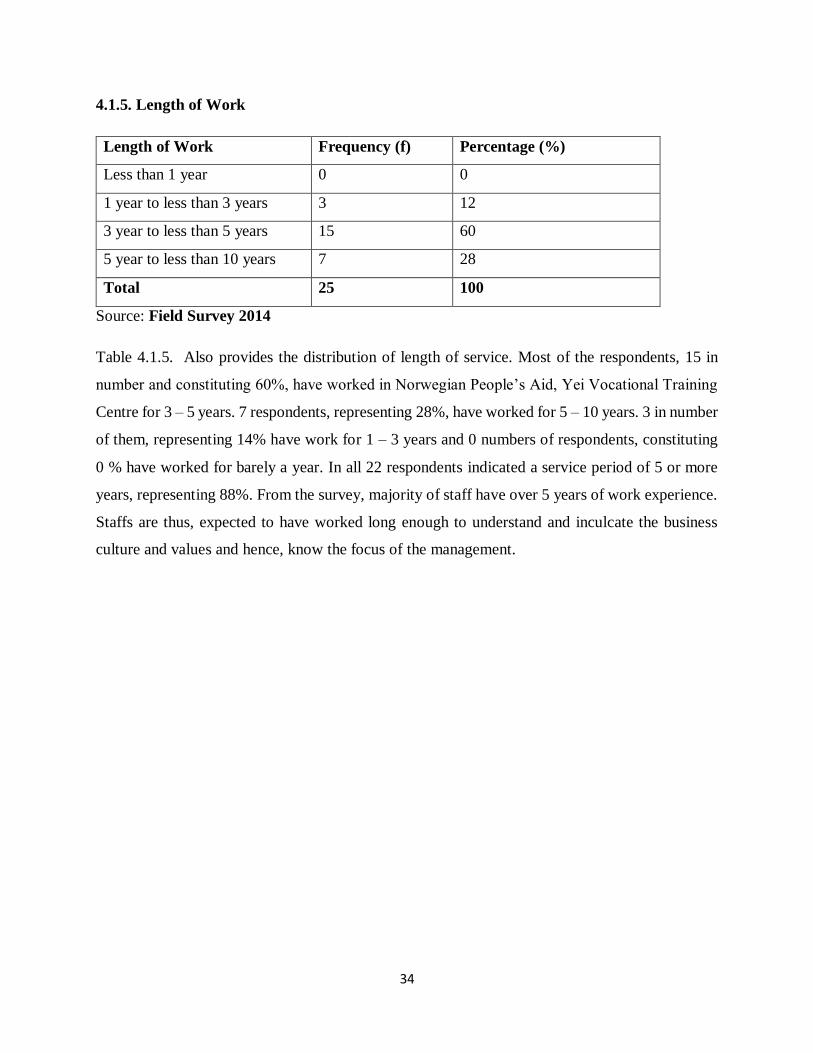
34
4.1.5. Length of Work
Length of Work Frequency (f) Percentage (%)
Less than 1 year 0 0
1 year to less than 3 years 3 12
3 year to less than 5 years 15 60
5 year to less than 10 years 7 28
Total 25 100
Source: Field Survey 2014
Table 4.1.5. Also provides the distribution of length of service. Most of the respondents, 15 in
number and constituting 60%, have worked in Norwegian People’s Aid, Yei Vocational Training
Centre for 3 – 5 years. 7 respondents, representing 28%, have worked for 5 – 10 years. 3 in number
of them, representing 14% have work for 1 – 3 years and 0 numbers of respondents, constituting
0 % have worked for barely a year. In all 22 respondents indicated a service period of 5 or more
years, representing 88%. From the survey, majority of staff have over 5 years of work experience.
Staffs are thus, expected to have worked long enough to understand and inculcate the business
culture and values and hence, know the focus of the management.
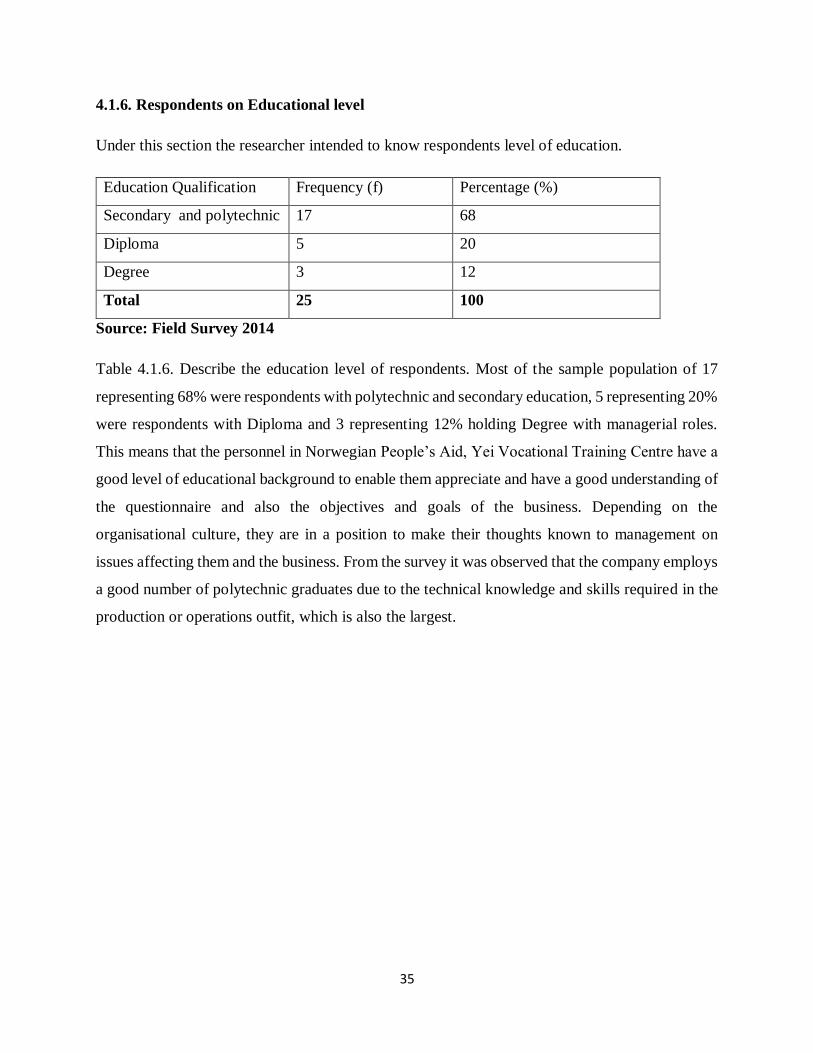
35
4.1.6. Respondents on Educational level
Under this section the researcher intended to know respondents level of education.
Education Qualification Frequency (f) Percentage (%)
Secondary and polytechnic 17 68
Diploma 5 20
Degree 3 12
Total 25 100
Source: Field Survey 2014
Table 4.1.6. Describe the education level of respondents. Most of the sample population of 17
representing 68% were respondents with polytechnic and secondary education, 5 representing 20%
were respondents with Diploma and 3 representing 12% holding Degree with managerial roles.
This means that the personnel in Norwegian People’s Aid, Yei Vocational Training Centre have a
good level of educational background to enable them appreciate and have a good understanding of
the questionnaire and also the objectives and goals of the business. Depending on the
organisational culture, they are in a position to make their thoughts known to management on
issues affecting them and the business. From the survey it was observed that the company employs
a good number of polytechnic graduates due to the technical knowledge and skills required in the
production or operations outfit, which is also the largest.
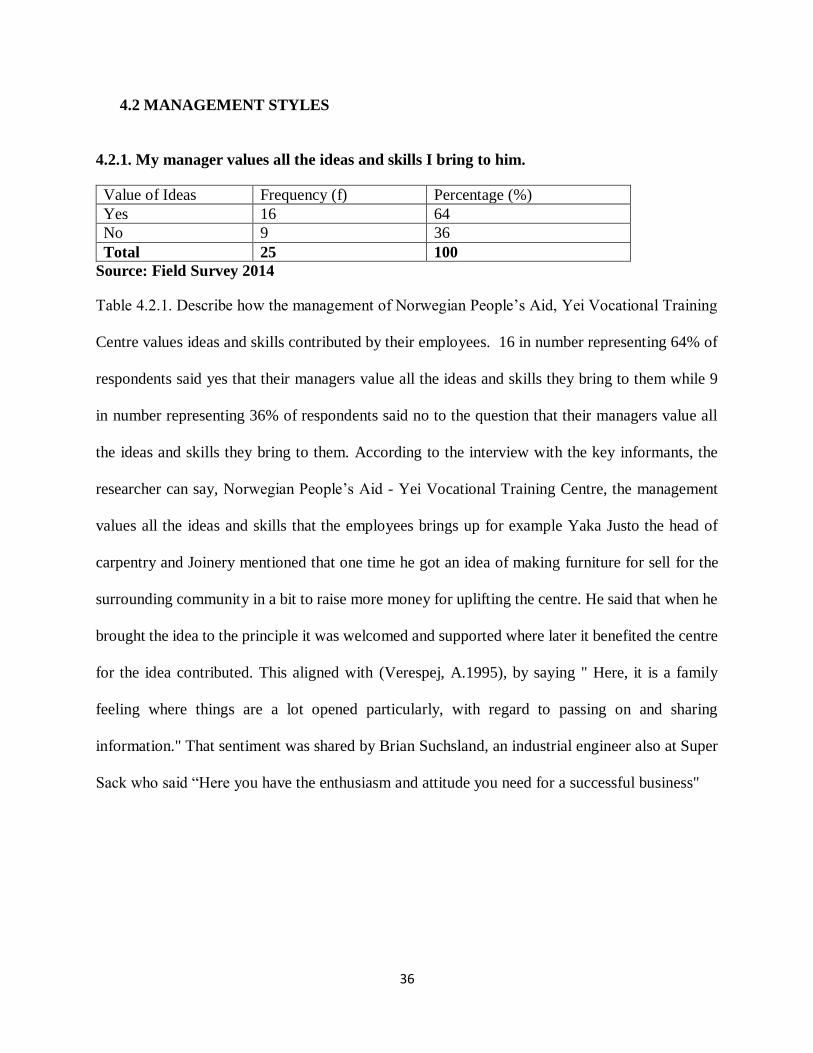
36
4.2 MANAGEMENT STYLES
4.2.1. My manager values all the ideas and skills I bring to him.
Value of Ideas Frequency (f) Percentage (%)
Yes 16 64
No 9 36
Total 25 100
Source: Field Survey 2014
Table 4.2.1. Describe how the management of Norwegian People’s Aid, Yei Vocational Training
Centre values ideas and skills contributed by their employees. 16 in number representing 64% of
respondents said yes that their managers value all the ideas and skills they bring to them while 9
in number representing 36% of respondents said no to the question that their managers value all
the ideas and skills they bring to them. According to the interview with the key informants, the
researcher can say, Norwegian People’s Aid - Yei Vocational Training Centre, the management
values all the ideas and skills that the employees brings up for example Yaka Justo the head of
carpentry and Joinery mentioned that one time he got an idea of making furniture for sell for the
surrounding community in a bit to raise more money for uplifting the centre. He said that when he
brought the idea to the principle it was welcomed and supported where later it benefited the centre
for the idea contributed. This aligned with (Verespej, A.1995), by saying " Here, it is a family
feeling where things are a lot opened particularly, with regard to passing on and sharing
information." That sentiment was shared by Brian Suchsland, an industrial engineer also at Super
Sack who said “Here you have the enthusiasm and attitude you need for a successful business"
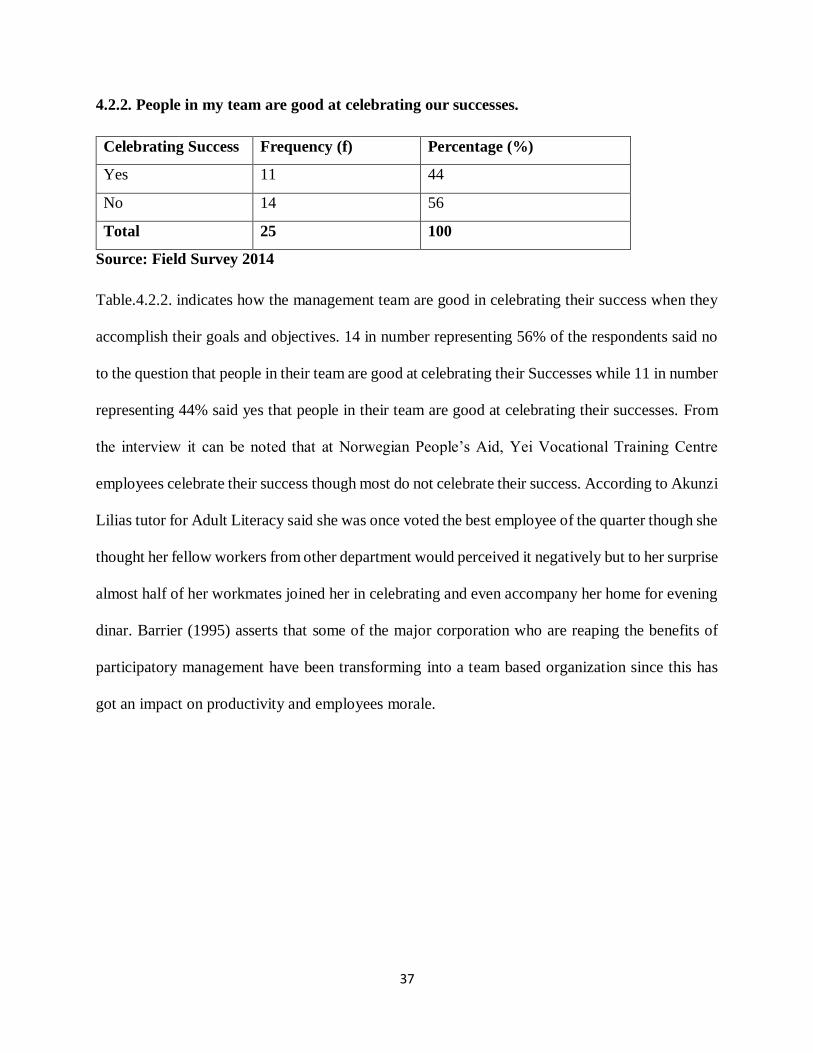
37
4.2.2. People in my team are good at celebrating our successes.
Celebrating Success Frequency (f) Percentage (%)
Yes 11 44
No 14 56
Total 25 100
Source: Field Survey 2014
Table.4.2.2. indicates how the management team are good in celebrating their success when they
accomplish their goals and objectives. 14 in number representing 56% of the respondents said no
to the question that people in their team are good at celebrating their Successes while 11 in number
representing 44% said yes that people in their team are good at celebrating their successes. From
the interview it can be noted that at Norwegian People’s Aid, Yei Vocational Training Centre
employees celebrate their success though most do not celebrate their success. According to Akunzi
Lilias tutor for Adult Literacy said she was once voted the best employee of the quarter though she
thought her fellow workers from other department would perceived it negatively but to her surprise
almost half of her workmates joined her in celebrating and even accompany her home for evening
dinar. Barrier (1995) asserts that some of the major corporation who are reaping the benefits of
participatory management have been transforming into a team based organization since this has
got an impact on productivity and employees morale.
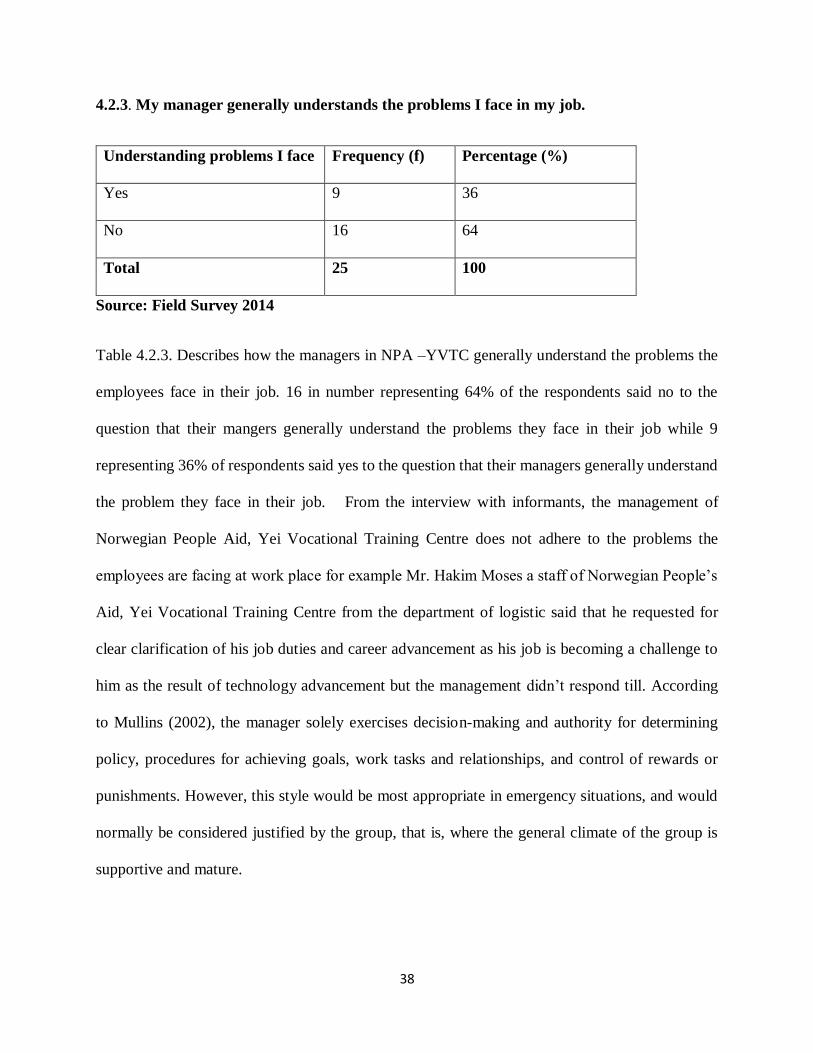
38
4.2.3. My manager generally understands the problems I face in my job.
Understanding problems I face Frequency (f) Percentage (%)
Yes 9 36
No 16 64
Total 25 100
Source: Field Survey 2014
Table 4.2.3. Describes how the managers in NPA –YVTC generally understand the problems the
employees face in their job. 16 in number representing 64% of the respondents said no to the
question that their mangers generally understand the problems they face in their job while 9
representing 36% of respondents said yes to the question that their managers generally understand
the problem they face in their job. From the interview with informants, the management of
Norwegian People Aid, Yei Vocational Training Centre does not adhere to the problems the
employees are facing at work place for example Mr. Hakim Moses a staff of Norwegian People’s
Aid, Yei Vocational Training Centre from the department of logistic said that he requested for
clear clarification of his job duties and career advancement as his job is becoming a challenge to
him as the result of technology advancement but the management didn’t respond till. According
to Mullins (2002), the manager solely exercises decision-making and authority for determining
policy, procedures for achieving goals, work tasks and relationships, and control of rewards or
punishments. However, this style would be most appropriate in emergency situations, and would
normally be considered justified by the group, that is, where the general climate of the group is
supportive and mature.
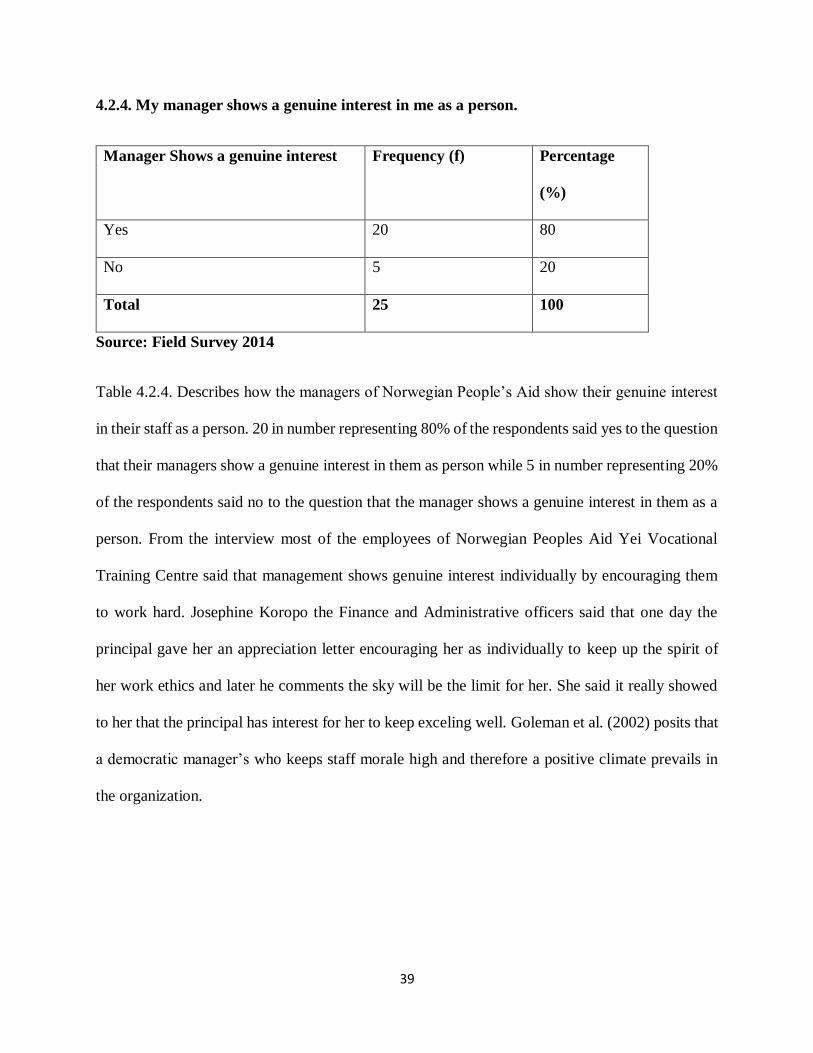
39
4.2.4. My manager shows a genuine interest in me as a person.
Manager Shows a genuine interest Frequency (f) Percentage
(%)
Yes 20 80
No 5 20
Total 25 100
Source: Field Survey 2014
Table 4.2.4. Describes how the managers of Norwegian People’s Aid show their genuine interest
in their staff as a person. 20 in number representing 80% of the respondents said yes to the question
that their managers show a genuine interest in them as person while 5 in number representing 20%
of the respondents said no to the question that the manager shows a genuine interest in them as a
person. From the interview most of the employees of Norwegian Peoples Aid Yei Vocational
Training Centre said that management shows genuine interest individually by encouraging them
to work hard. Josephine Koropo the Finance and Administrative officers said that one day the
principal gave her an appreciation letter encouraging her as individually to keep up the spirit of
her work ethics and later he comments the sky will be the limit for her. She said it really showed
to her that the principal has interest for her to keep exceling well. Goleman et al. (2002) posits that
a democratic manager’s who keeps staff morale high and therefore a positive climate prevails in
the organization.
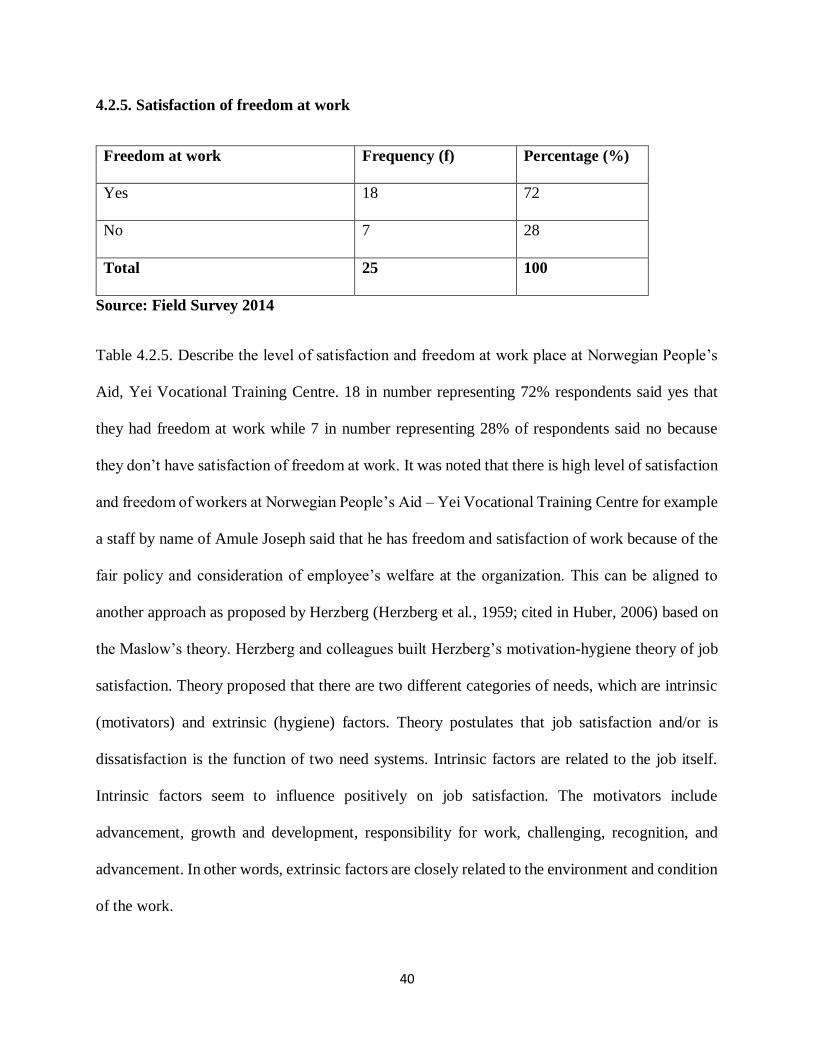
40
4.2.5. Satisfaction of freedom at work
Freedom at work Frequency (f) Percentage (%)
Yes 18 72
No 7 28
Total 25 100
Source: Field Survey 2014
Table 4.2.5. Describe the level of satisfaction and freedom at work place at Norwegian People’s
Aid, Yei Vocational Training Centre. 18 in number representing 72% respondents said yes that
they had freedom at work while 7 in number representing 28% of respondents said no because
they don’t have satisfaction of freedom at work. It was noted that there is high level of satisfaction
and freedom of workers at Norwegian People’s Aid – Yei Vocational Training Centre for example
a staff by name of Amule Joseph said that he has freedom and satisfaction of work because of the
fair policy and consideration of employee’s welfare at the organization. This can be aligned to
another approach as proposed by Herzberg (Herzberg et al., 1959; cited in Huber, 2006) based on
the Maslow’s theory. Herzberg and colleagues built Herzberg’s motivation-hygiene theory of job
satisfaction. Theory proposed that there are two different categories of needs, which are intrinsic
(motivators) and extrinsic (hygiene) factors. Theory postulates that job satisfaction and/or is
dissatisfaction is the function of two need systems. Intrinsic factors are related to the job itself.
Intrinsic factors seem to influence positively on job satisfaction. The motivators include
advancement, growth and development, responsibility for work, challenging, recognition, and
advancement. In other words, extrinsic factors are closely related to the environment and condition
of the work.

41
4.2.6. The decision-making process involves fewer people.
Decision involves few people Frequency (f) Percentage (%)
Yes 19 76
No 6 24
Total 25 100
Source: Field Survey 2014
Table 4.2.6. Tries to examine whether the decision making process involves fewer people in
Norwegian People’s Aid, Yei Vocational Training Centre. It was found out that 19 in number
representing 78% of respondents said yes that the decision making process involves fewer people
while 6 in number representing 24% of the respondents said no to the question that decision making
process involves fewer people. According to interview, the decision making processing in
Norwegian People’s Aid – Yei Vocational Training Centre involves a few people ideas hence
majority of the ideas contributed by the employees are ignored. Ms. Mary Bangu is the Assistant
Personnel raised an idea that the centre should sit down and execute strategic management plan
since Norwegian People’s Aid Yei Vocational Training Centre has no strategic management plan.
Most of the staff backed up her ideas because an organization without a strategic plan has no future
direction where it is going but the idea was rejected and it disappointed her most. According to
Johnson et al, (1993), the team manager will be consulting all the members’ opinions and ideas,
but at the end, the manager will be the only one who has the authority to establish the decision
based on the member’s inputs. This method is very common nowadays among organizations, but
actually it all depends on the organization nature as mentioned earlier. Some of the members will
feel invaluable since their opinions weren’t taken into action.
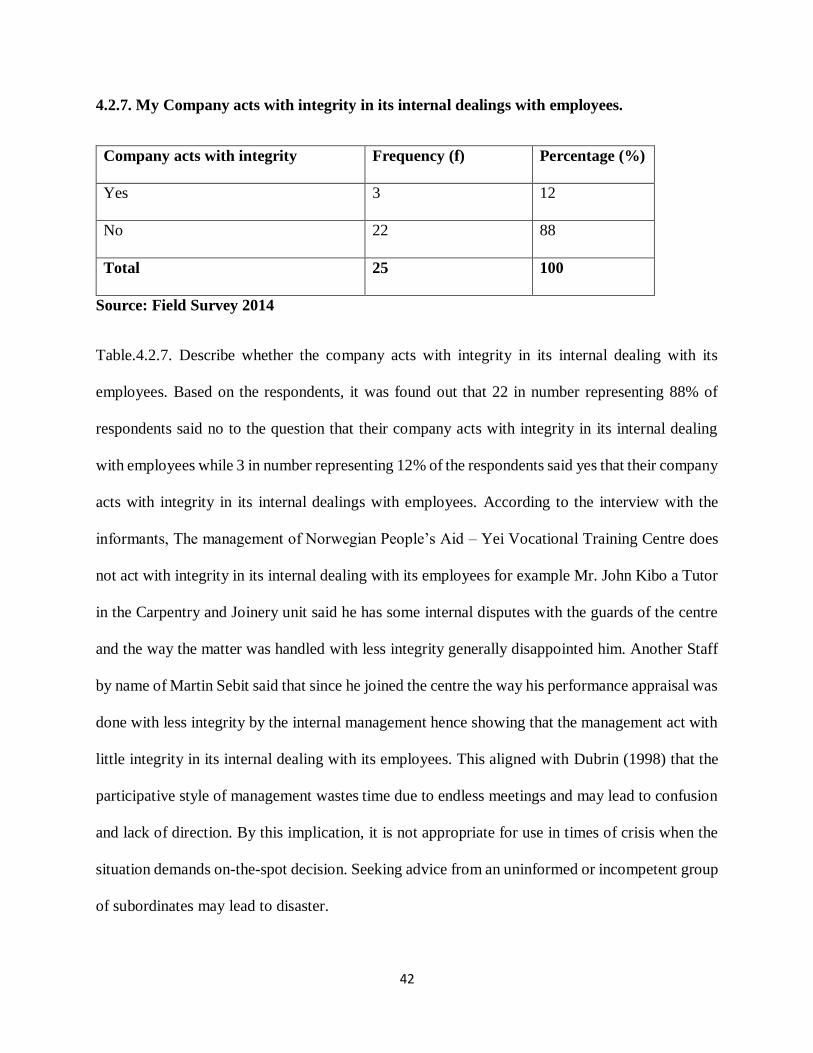
42
4.2.7. My Company acts with integrity in its internal dealings with employees.
Company acts with integrity Frequency (f) Percentage (%)
Yes 3 12
No 22 88
Total 25 100
Source: Field Survey 2014
Table.4.2.7. Describe whether the company acts with integrity in its internal dealing with its
employees. Based on the respondents, it was found out that 22 in number representing 88% of
respondents said no to the question that their company acts with integrity in its internal dealing
with employees while 3 in number representing 12% of the respondents said yes that their company
acts with integrity in its internal dealings with employees. According to the interview with the
informants, The management of Norwegian People’s Aid – Yei Vocational Training Centre does
not act with integrity in its internal dealing with its employees for example Mr. John Kibo a Tutor
in the Carpentry and Joinery unit said he has some internal disputes with the guards of the centre
and the way the matter was handled with less integrity generally disappointed him. Another Staff
by name of Martin Sebit said that since he joined the centre the way his performance appraisal was
done with less integrity by the internal management hence showing that the management act with
little integrity in its internal dealing with its employees. This aligned with Dubrin (1998) that the
participative style of management wastes time due to endless meetings and may lead to confusion
and lack of direction. By this implication, it is not appropriate for use in times of crisis when the
situation demands on-the-spot decision. Seeking advice from an uninformed or incompetent group
of subordinates may lead to disaster.
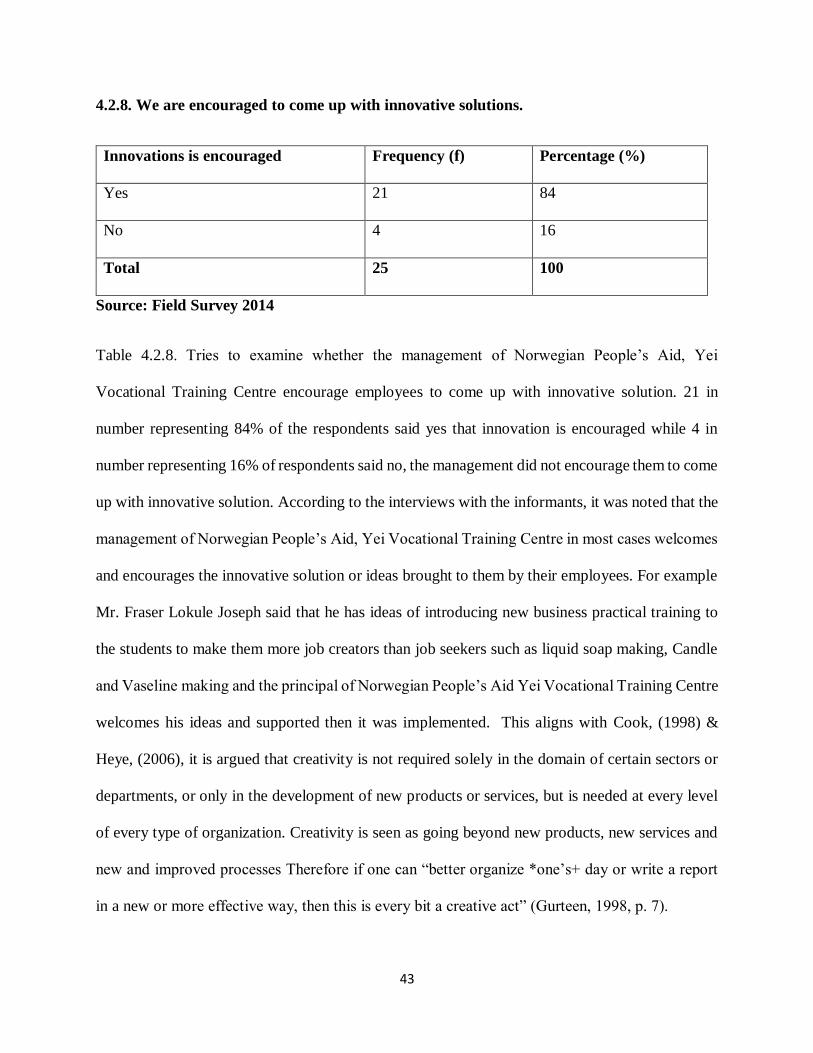
43
4.2.8. We are encouraged to come up with innovative solutions.
Innovations is encouraged Frequency (f) Percentage (%)
Yes 21 84
No 4 16
Total 25 100
Source: Field Survey 2014
Table 4.2.8. Tries to examine whether the management of Norwegian People’s Aid, Yei
Vocational Training Centre encourage employees to come up with innovative solution. 21 in
number representing 84% of the respondents said yes that innovation is encouraged while 4 in
number representing 16% of respondents said no, the management did not encourage them to come
up with innovative solution. According to the interviews with the informants, it was noted that the
management of Norwegian People’s Aid, Yei Vocational Training Centre in most cases welcomes
and encourages the innovative solution or ideas brought to them by their employees. For example
Mr. Fraser Lokule Joseph said that he has ideas of introducing new business practical training to
the students to make them more job creators than job seekers such as liquid soap making, Candle
and Vaseline making and the principal of Norwegian People’s Aid Yei Vocational Training Centre
welcomes his ideas and supported then it was implemented. This aligns with Cook, (1998) &
Heye, (2006), it is argued that creativity is not required solely in the domain of certain sectors or
departments, or only in the development of new products or services, but is needed at every level
of every type of organization. Creativity is seen as going beyond new products, new services and
new and improved processes Therefore if one can “better organize *one’s+ day or write a report
in a new or more effective way, then this is every bit a creative act” (Gurteen, 1998, p. 7).
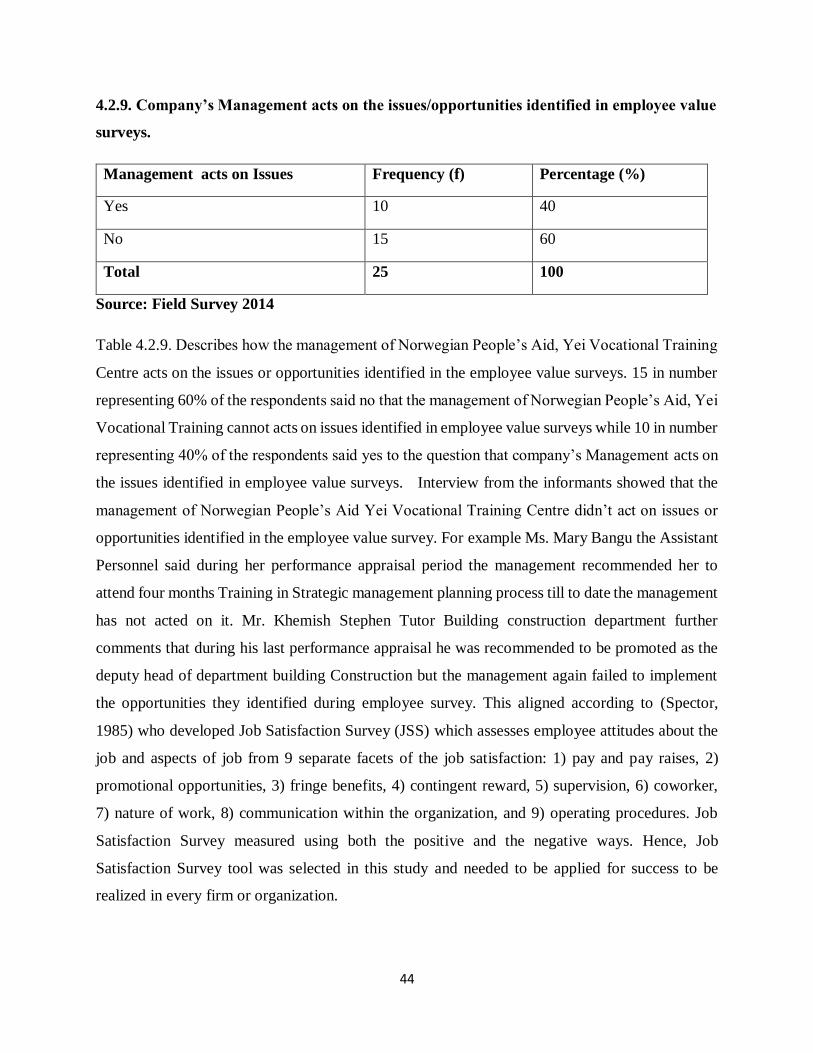
44
4.2.9. Company’s Management acts on the issues/opportunities identified in employee value
surveys.
Management acts on Issues Frequency (f) Percentage (%)
Yes 10 40
No 15 60
Total 25 100
Source: Field Survey 2014
Table 4.2.9. Describes how the management of Norwegian People’s Aid, Yei Vocational Training
Centre acts on the issues or opportunities identified in the employee value surveys. 15 in number
representing 60% of the respondents said no that the management of Norwegian People’s Aid, Yei
Vocational Training cannot acts on issues identified in employee value surveys while 10 in number
representing 40% of the respondents said yes to the question that company’s Management acts on
the issues identified in employee value surveys. Interview from the informants showed that the
management of Norwegian People’s Aid Yei Vocational Training Centre didn’t act on issues or
opportunities identified in the employee value survey. For example Ms. Mary Bangu the Assistant
Personnel said during her performance appraisal period the management recommended her to
attend four months Training in Strategic management planning process till to date the management
has not acted on it. Mr. Khemish Stephen Tutor Building construction department further
comments that during his last performance appraisal he was recommended to be promoted as the
deputy head of department building Construction but the management again failed to implement
the opportunities they identified during employee survey. This aligned according to (Spector,
1985) who developed Job Satisfaction Survey (JSS) which assesses employee attitudes about the
job and aspects of job from 9 separate facets of the job satisfaction: 1) pay and pay raises, 2)
promotional opportunities, 3) fringe benefits, 4) contingent reward, 5) supervision, 6) coworker,
7) nature of work, 8) communication within the organization, and 9) operating procedures. Job
Satisfaction Survey measured using both the positive and the negative ways. Hence, Job
Satisfaction Survey tool was selected in this study and needed to be applied for success to be
realized in every firm or organization.
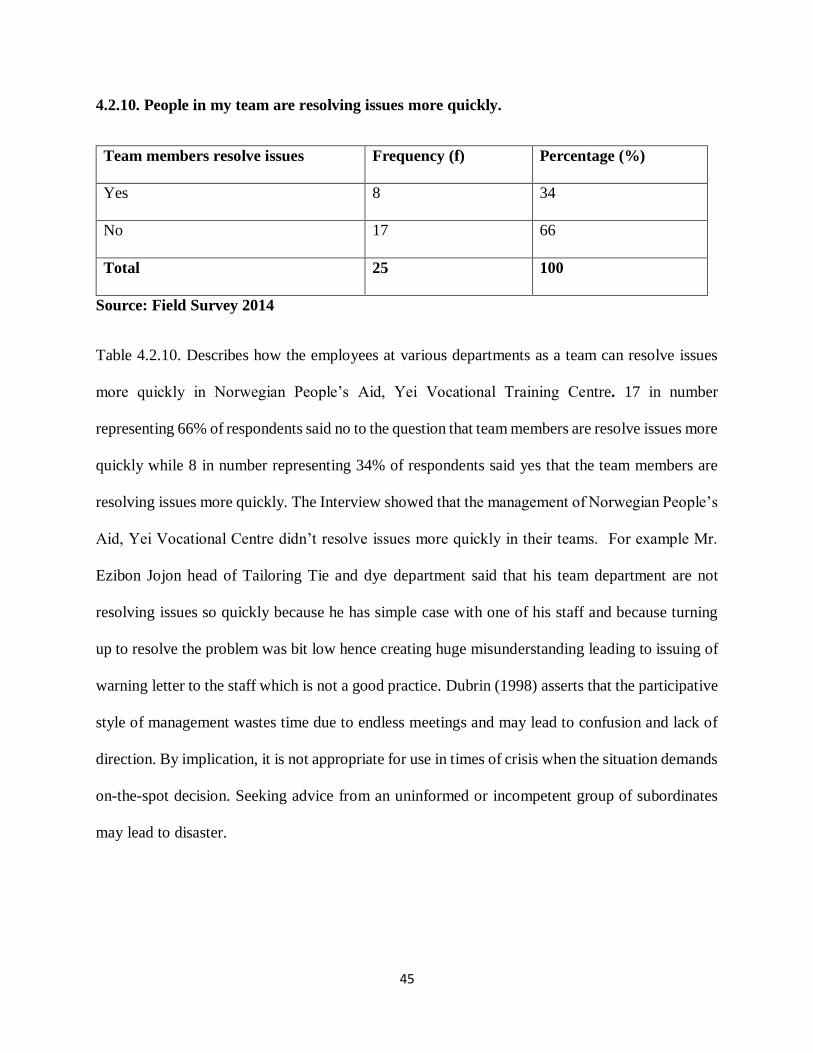
45
4.2.10. People in my team are resolving issues more quickly.
Team members resolve issues Frequency (f) Percentage (%)
Yes 8 34
No 17 66
Total 25 100
Source: Field Survey 2014
Table 4.2.10. Describes how the employees at various departments as a team can resolve issues
more quickly in Norwegian People’s Aid, Yei Vocational Training Centre. 17 in number
representing 66% of respondents said no to the question that team members are resolve issues more
quickly while 8 in number representing 34% of respondents said yes that the team members are
resolving issues more quickly. The Interview showed that the management of Norwegian People’s
Aid, Yei Vocational Centre didn’t resolve issues more quickly in their teams. For example Mr.
Ezibon Jojon head of Tailoring Tie and dye department said that his team department are not
resolving issues so quickly because he has simple case with one of his staff and because turning
up to resolve the problem was bit low hence creating huge misunderstanding leading to issuing of
warning letter to the staff which is not a good practice. Dubrin (1998) asserts that the participative
style of management wastes time due to endless meetings and may lead to confusion and lack of
direction. By implication, it is not appropriate for use in times of crisis when the situation demands
on-the-spot decision. Seeking advice from an uninformed or incompetent group of subordinates
may lead to disaster.
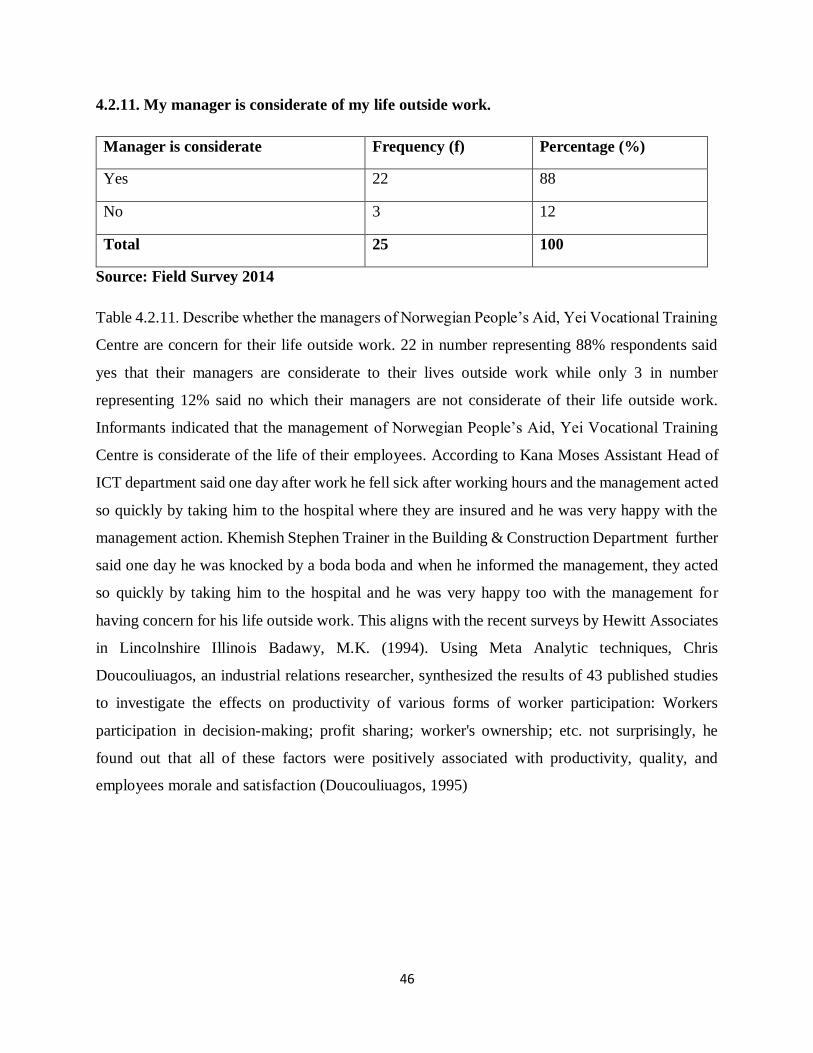
46
4.2.11. My manager is considerate of my life outside work.
Manager is considerate Frequency (f) Percentage (%)
Yes 22 88
No 3 12
Total 25 100
Source: Field Survey 2014
Table 4.2.11. Describe whether the managers of Norwegian People’s Aid, Yei Vocational Training
Centre are concern for their life outside work. 22 in number representing 88% respondents said
yes that their managers are considerate to their lives outside work while only 3 in number
representing 12% said no which their managers are not considerate of their life outside work.
Informants indicated that the management of Norwegian People’s Aid, Yei Vocational Training
Centre is considerate of the life of their employees. According to Kana Moses Assistant Head of
ICT department said one day after work he fell sick after working hours and the management acted
so quickly by taking him to the hospital where they are insured and he was very happy with the
management action. Khemish Stephen Trainer in the Building & Construction Department further
said one day he was knocked by a boda boda and when he informed the management, they acted
so quickly by taking him to the hospital and he was very happy too with the management for
having concern for his life outside work. This aligns with the recent surveys by Hewitt Associates
in Lincolnshire Illinois Badawy, M.K. (1994). Using Meta Analytic techniques, Chris
Doucouliuagos, an industrial relations researcher, synthesized the results of 43 published studies
to investigate the effects on productivity of various forms of worker participation: Workers
participation in decision-making; profit sharing; worker's ownership; etc. not surprisingly, he
found out that all of these factors were positively associated with productivity, quality, and
employees morale and satisfaction (Doucouliuagos, 1995)
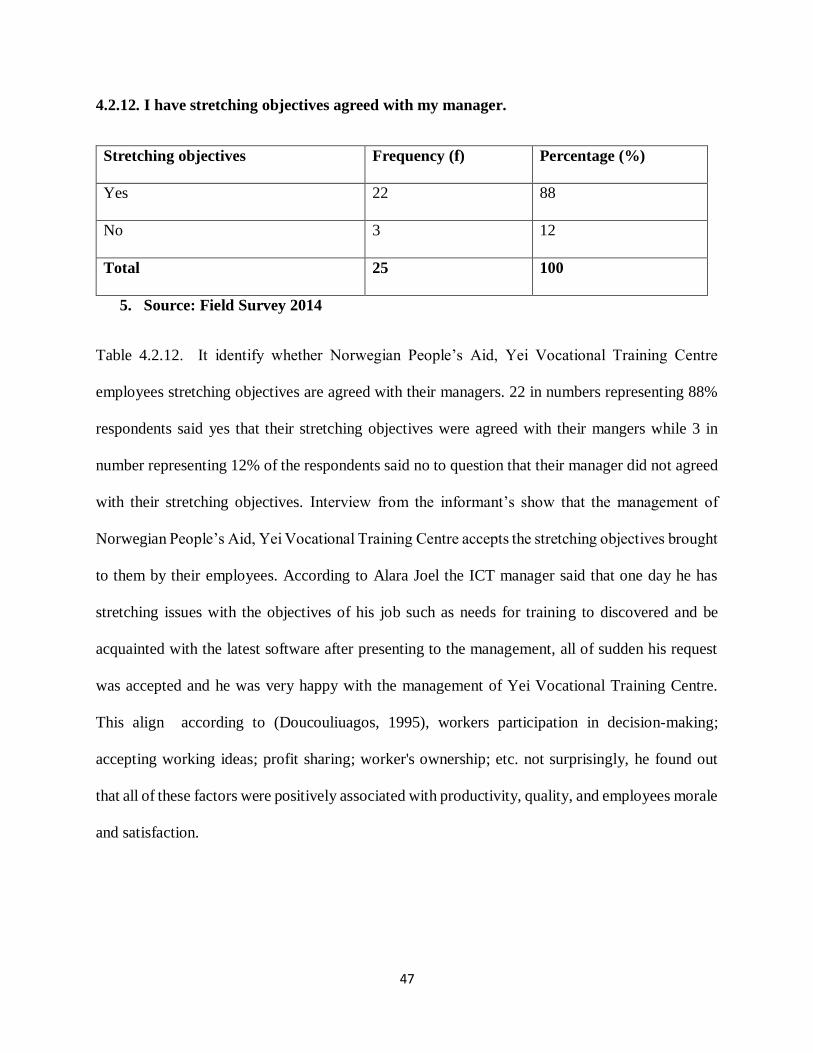
47
4.2.12. I have stretching objectives agreed with my manager.
Stretching objectives Frequency (f) Percentage (%)
Yes 22 88
No 3 12
Total 25 100
5. Source: Field Survey 2014
Table 4.2.12. It identify whether Norwegian People’s Aid, Yei Vocational Training Centre
employees stretching objectives are agreed with their managers. 22 in numbers representing 88%
respondents said yes that their stretching objectives were agreed with their mangers while 3 in
number representing 12% of the respondents said no to question that their manager did not agreed
with their stretching objectives. Interview from the informant’s show that the management of
Norwegian People’s Aid, Yei Vocational Training Centre accepts the stretching objectives brought
to them by their employees. According to Alara Joel the ICT manager said that one day he has
stretching issues with the objectives of his job such as needs for training to discovered and be
acquainted with the latest software after presenting to the management, all of sudden his request
was accepted and he was very happy with the management of Yei Vocational Training Centre.
This align according to (Doucouliuagos, 1995), workers participation in decision-making;
accepting working ideas; profit sharing; worker's ownership; etc. not surprisingly, he found out
that all of these factors were positively associated with productivity, quality, and employees morale
and satisfaction.
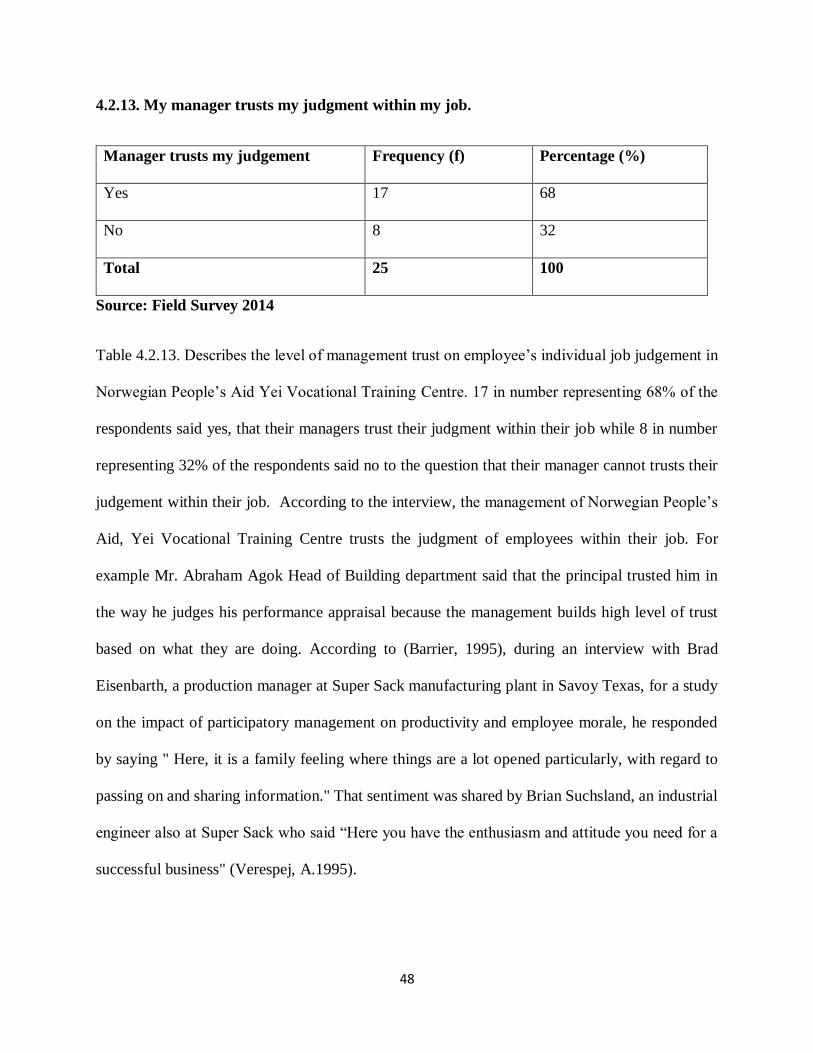
48
4.2.13. My manager trusts my judgment within my job.
Manager trusts my judgement Frequency (f) Percentage (%)
Yes 17 68
No 8 32
Total 25 100
Source: Field Survey 2014
Table 4.2.13. Describes the level of management trust on employee’s individual job judgement in
Norwegian People’s Aid Yei Vocational Training Centre. 17 in number representing 68% of the
respondents said yes, that their managers trust their judgment within their job while 8 in number
representing 32% of the respondents said no to the question that their manager cannot trusts their
judgement within their job. According to the interview, the management of Norwegian People’s
Aid, Yei Vocational Training Centre trusts the judgment of employees within their job. For
example Mr. Abraham Agok Head of Building department said that the principal trusted him in
the way he judges his performance appraisal because the management builds high level of trust
based on what they are doing. According to (Barrier, 1995), during an interview with Brad
Eisenbarth, a production manager at Super Sack manufacturing plant in Savoy Texas, for a study
on the impact of participatory management on productivity and employee morale, he responded
by saying " Here, it is a family feeling where things are a lot opened particularly, with regard to
passing on and sharing information." That sentiment was shared by Brian Suchsland, an industrial
engineer also at Super Sack who said “Here you have the enthusiasm and attitude you need for a
successful business" (Verespej, A.1995).
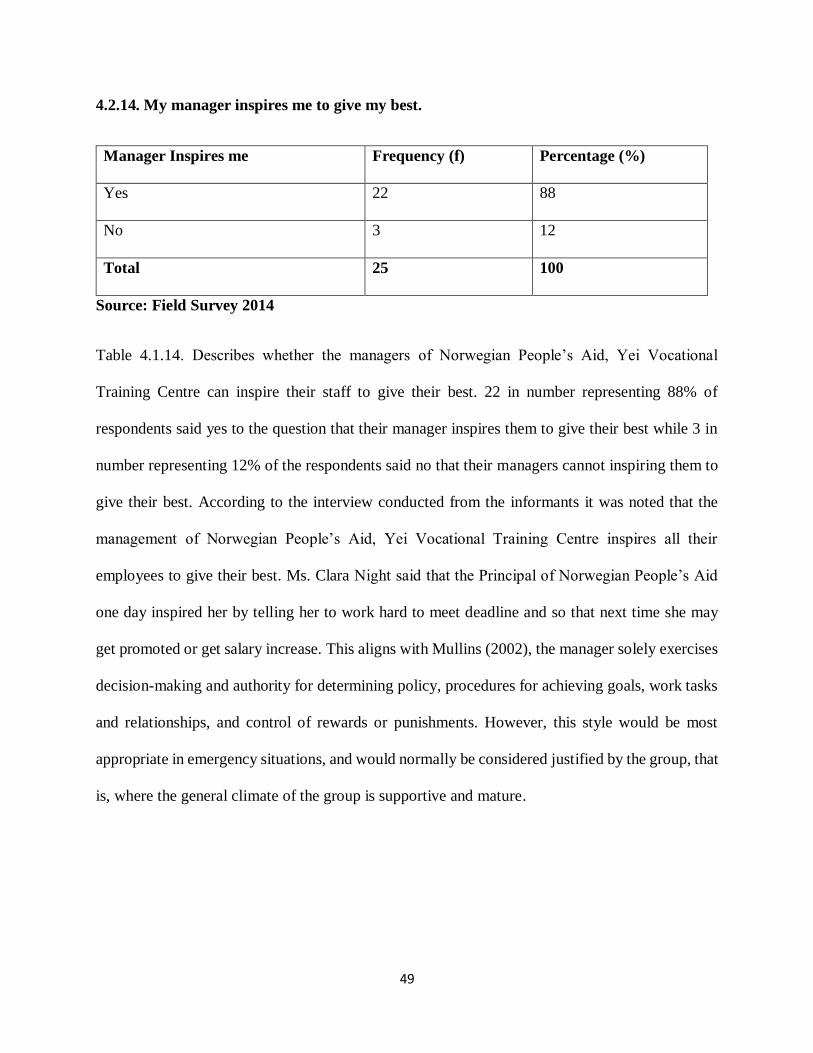
49
4.2.14. My manager inspires me to give my best.
Manager Inspires me Frequency (f) Percentage (%)
Yes 22 88
No 3 12
Total 25 100
Source: Field Survey 2014
Table 4.1.14. Describes whether the managers of Norwegian People’s Aid, Yei Vocational
Training Centre can inspire their staff to give their best. 22 in number representing 88% of
respondents said yes to the question that their manager inspires them to give their best while 3 in
number representing 12% of the respondents said no that their managers cannot inspiring them to
give their best. According to the interview conducted from the informants it was noted that the
management of Norwegian People’s Aid, Yei Vocational Training Centre inspires all their
employees to give their best. Ms. Clara Night said that the Principal of Norwegian People’s Aid
one day inspired her by telling her to work hard to meet deadline and so that next time she may
get promoted or get salary increase. This aligns with Mullins (2002), the manager solely exercises
decision-making and authority for determining policy, procedures for achieving goals, work tasks
and relationships, and control of rewards or punishments. However, this style would be most
appropriate in emergency situations, and would normally be considered justified by the group, that
is, where the general climate of the group is supportive and mature.
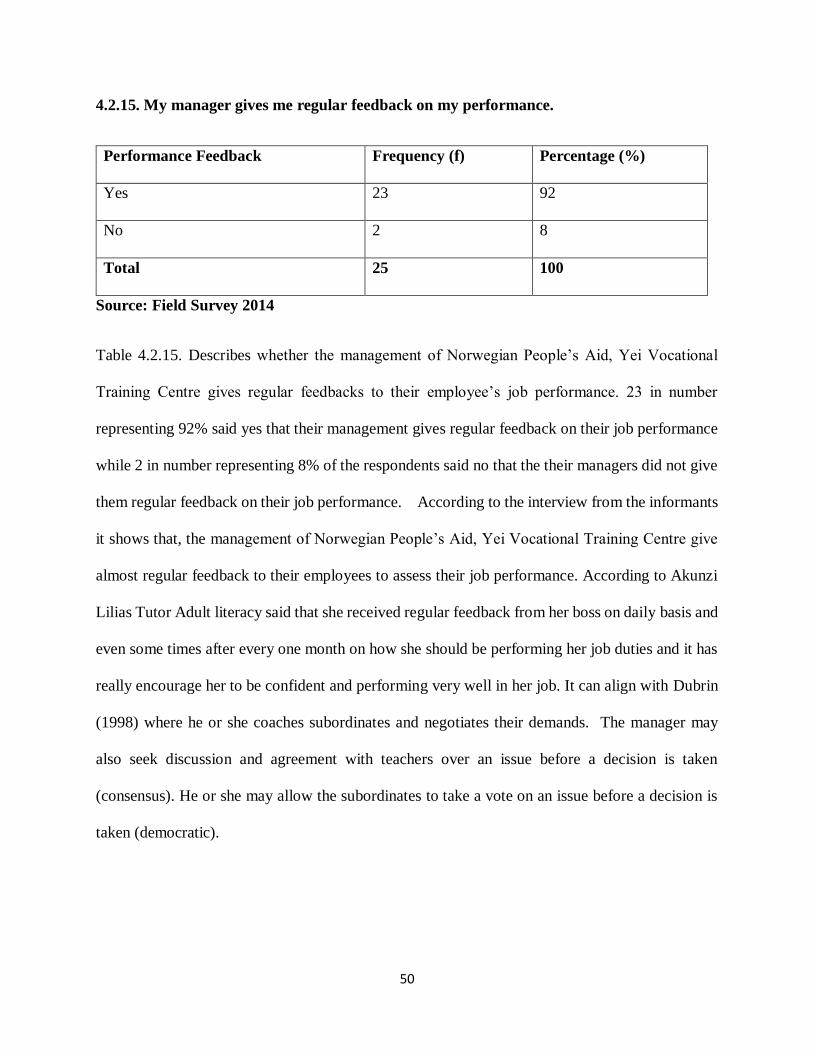
50
4.2.15. My manager gives me regular feedback on my performance.
Performance Feedback Frequency (f) Percentage (%)
Yes 23 92
No 2 8
Total 25 100
Source: Field Survey 2014
Table 4.2.15. Describes whether the management of Norwegian People’s Aid, Yei Vocational
Training Centre gives regular feedbacks to their employee’s job performance. 23 in number
representing 92% said yes that their management gives regular feedback on their job performance
while 2 in number representing 8% of the respondents said no that the their managers did not give
them regular feedback on their job performance. According to the interview from the informants
it shows that, the management of Norwegian People’s Aid, Yei Vocational Training Centre give
almost regular feedback to their employees to assess their job performance. According to Akunzi
Lilias Tutor Adult literacy said that she received regular feedback from her boss on daily basis and
even some times after every one month on how she should be performing her job duties and it has
really encourage her to be confident and performing very well in her job. It can align with Dubrin
(1998) where he or she coaches subordinates and negotiates their demands. The manager may
also seek discussion and agreement with teachers over an issue before a decision is taken
(consensus). He or she may allow the subordinates to take a vote on an issue before a decision is
taken (democratic).
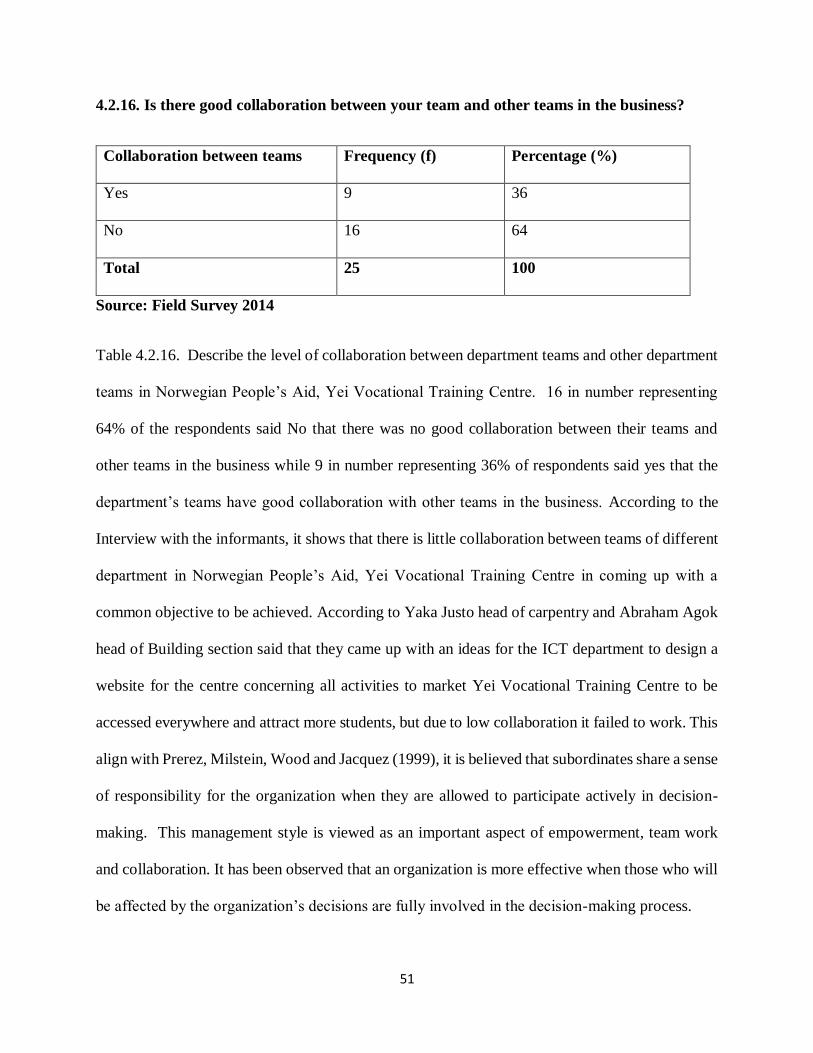
51
4.2.16. Is there good collaboration between your team and other teams in the business?
Collaboration between teams Frequency (f) Percentage (%)
Yes 9 36
No 16 64
Total 25 100
Source: Field Survey 2014
Table 4.2.16. Describe the level of collaboration between department teams and other department
teams in Norwegian People’s Aid, Yei Vocational Training Centre. 16 in number representing
64% of the respondents said No that there was no good collaboration between their teams and
other teams in the business while 9 in number representing 36% of respondents said yes that the
department’s teams have good collaboration with other teams in the business. According to the
Interview with the informants, it shows that there is little collaboration between teams of different
department in Norwegian People’s Aid, Yei Vocational Training Centre in coming up with a
common objective to be achieved. According to Yaka Justo head of carpentry and Abraham Agok
head of Building section said that they came up with an ideas for the ICT department to design a
website for the centre concerning all activities to market Yei Vocational Training Centre to be
accessed everywhere and attract more students, but due to low collaboration it failed to work. This
align with Prerez, Milstein, Wood and Jacquez (1999), it is believed that subordinates share a sense
of responsibility for the organization when they are allowed to participate actively in decision-
making. This management style is viewed as an important aspect of empowerment, team work
and collaboration. It has been observed that an organization is more effective when those who will
be affected by the organization’s decisions are fully involved in the decision-making process.
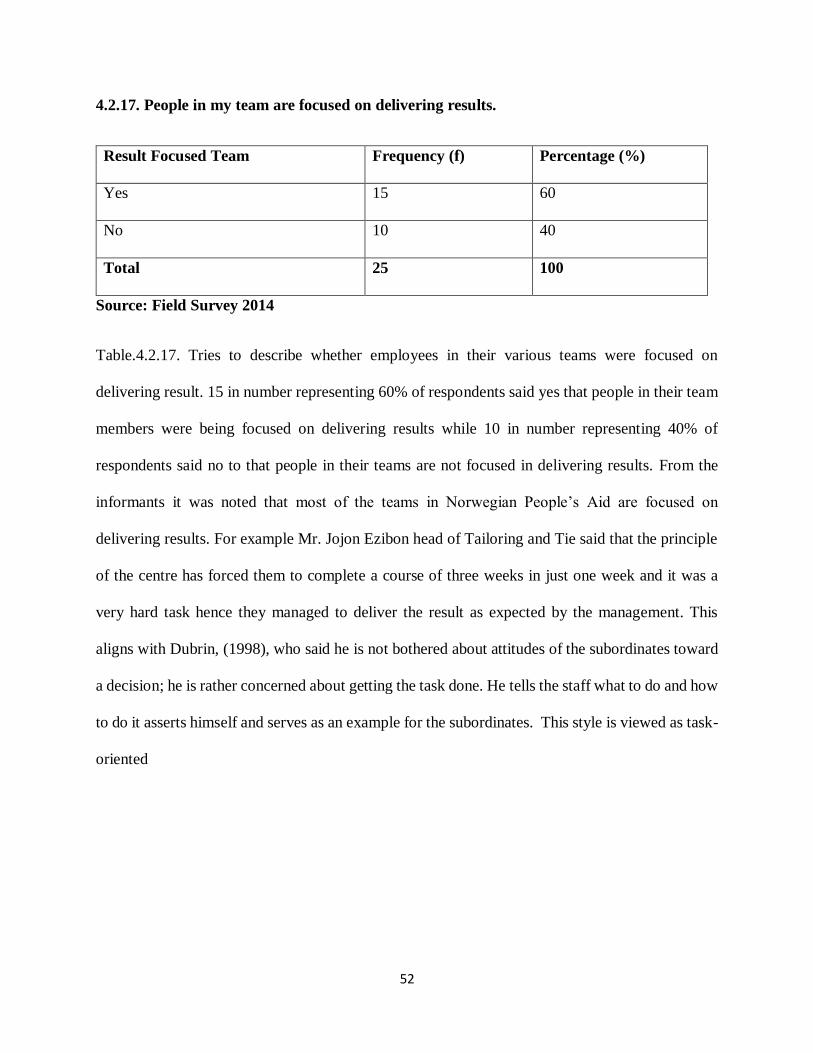
52
4.2.17. People in my team are focused on delivering results.
Result Focused Team Frequency (f) Percentage (%)
Yes 15 60
No 10 40
Total 25 100
Source: Field Survey 2014
Table.4.2.17. Tries to describe whether employees in their various teams were focused on
delivering result. 15 in number representing 60% of respondents said yes that people in their team
members were being focused on delivering results while 10 in number representing 40% of
respondents said no to that people in their teams are not focused in delivering results. From the
informants it was noted that most of the teams in Norwegian People’s Aid are focused on
delivering results. For example Mr. Jojon Ezibon head of Tailoring and Tie said that the principle
of the centre has forced them to complete a course of three weeks in just one week and it was a
very hard task hence they managed to deliver the result as expected by the management. This
aligns with Dubrin, (1998), who said he is not bothered about attitudes of the subordinates toward
a decision; he is rather concerned about getting the task done. He tells the staff what to do and how
to do it asserts himself and serves as an example for the subordinates. This style is viewed as task-
oriented
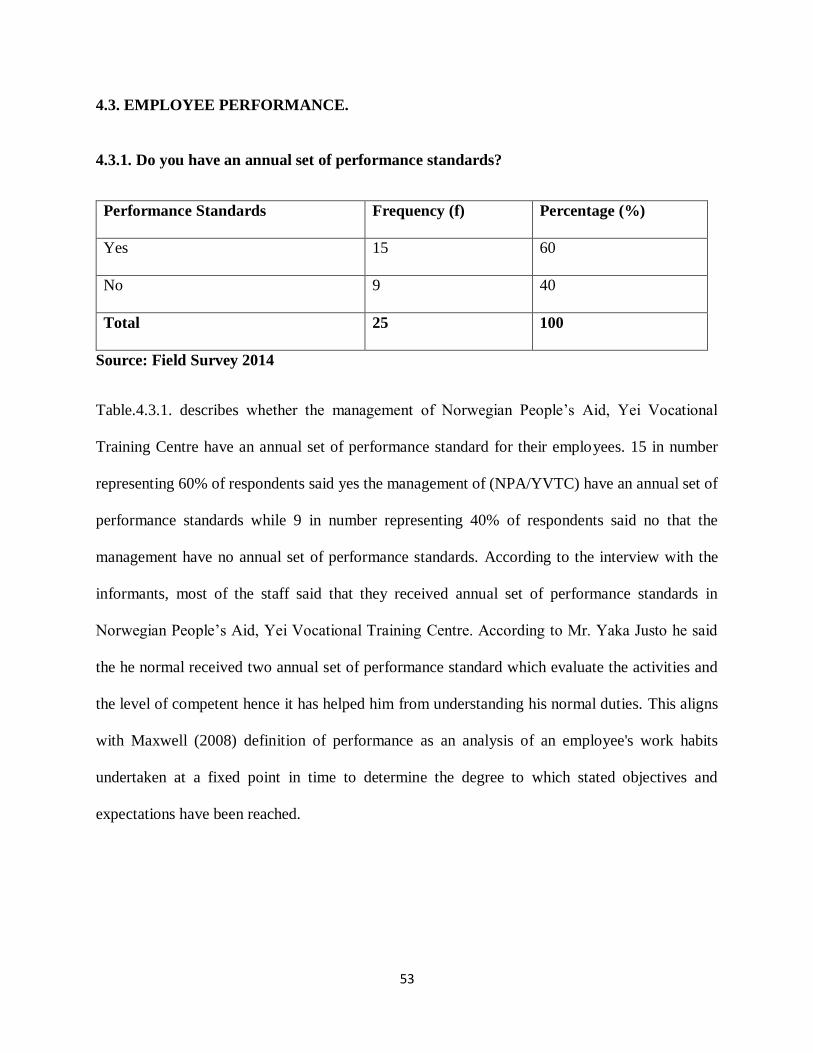
53
4.3. EMPLOYEE PERFORMANCE.
4.3.1. Do you have an annual set of performance standards?
Performance Standards Frequency (f) Percentage (%)
Yes 15 60
No 9 40
Total 25 100
Source: Field Survey 2014
Table.4.3.1. describes whether the management of Norwegian People’s Aid, Yei Vocational
Training Centre have an annual set of performance standard for their employees. 15 in number
representing 60% of respondents said yes the management of (NPA/YVTC) have an annual set of
performance standards while 9 in number representing 40% of respondents said no that the
management have no annual set of performance standards. According to the interview with the
informants, most of the staff said that they received annual set of performance standards in
Norwegian People’s Aid, Yei Vocational Training Centre. According to Mr. Yaka Justo he said
the he normal received two annual set of performance standard which evaluate the activities and
the level of competent hence it has helped him from understanding his normal duties. This aligns
with Maxwell (2008) definition of performance as an analysis of an employee's work habits
undertaken at a fixed point in time to determine the degree to which stated objectives and
expectations have been reached.
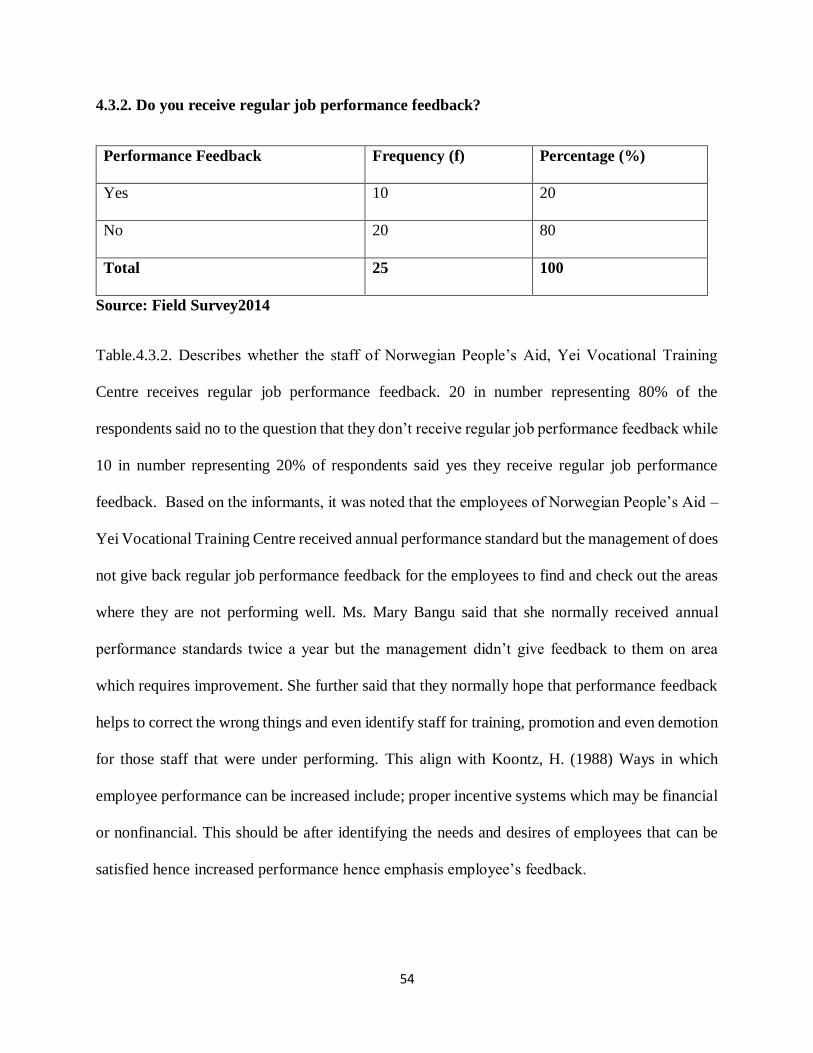
54
4.3.2. Do you receive regular job performance feedback?
Performance Feedback Frequency (f) Percentage (%)
Yes 10 20
No 20 80
Total 25 100
Source: Field Survey2014
Table.4.3.2. Describes whether the staff of Norwegian People’s Aid, Yei Vocational Training
Centre receives regular job performance feedback. 20 in number representing 80% of the
respondents said no to the question that they don’t receive regular job performance feedback while
10 in number representing 20% of respondents said yes they receive regular job performance
feedback. Based on the informants, it was noted that the employees of Norwegian People’s Aid –
Yei Vocational Training Centre received annual performance standard but the management of does
not give back regular job performance feedback for the employees to find and check out the areas
where they are not performing well. Ms. Mary Bangu said that she normally received annual
performance standards twice a year but the management didn’t give feedback to them on area
which requires improvement. She further said that they normally hope that performance feedback
helps to correct the wrong things and even identify staff for training, promotion and even demotion
for those staff that were under performing. This align with Koontz, H. (1988) Ways in which
employee performance can be increased include; proper incentive systems which may be financial
or nonfinancial. This should be after identifying the needs and desires of employees that can be
satisfied hence increased performance hence emphasis employee’s feedback.
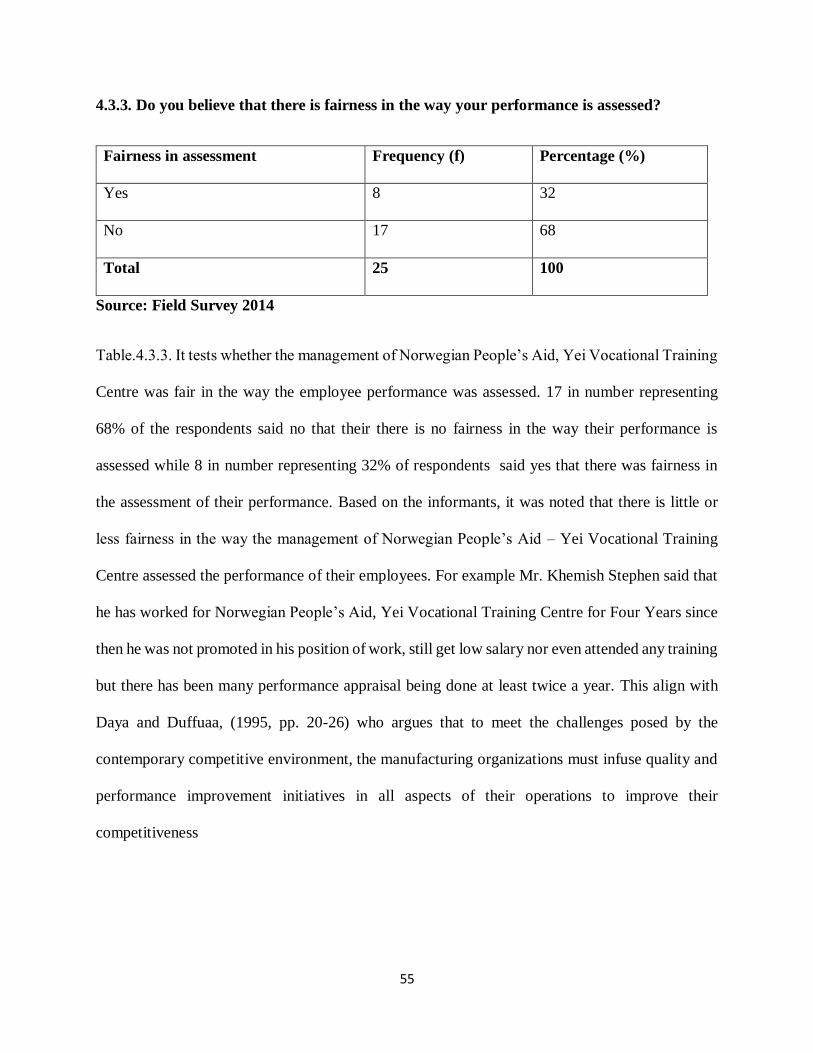
55
4.3.3. Do you believe that there is fairness in the way your performance is assessed?
Fairness in assessment Frequency (f) Percentage (%)
Yes 8 32
No 17 68
Total 25 100
Source: Field Survey 2014
Table.4.3.3. It tests whether the management of Norwegian People’s Aid, Yei Vocational Training
Centre was fair in the way the employee performance was assessed. 17 in number representing
68% of the respondents said no that their there is no fairness in the way their performance is
assessed while 8 in number representing 32% of respondents said yes that there was fairness in
the assessment of their performance. Based on the informants, it was noted that there is little or
less fairness in the way the management of Norwegian People’s Aid – Yei Vocational Training
Centre assessed the performance of their employees. For example Mr. Khemish Stephen said that
he has worked for Norwegian People’s Aid, Yei Vocational Training Centre for Four Years since
then he was not promoted in his position of work, still get low salary nor even attended any training
but there has been many performance appraisal being done at least twice a year. This align with
Daya and Duffuaa, (1995, pp. 20-26) who argues that to meet the challenges posed by the
contemporary competitive environment, the manufacturing organizations must infuse quality and
performance improvement initiatives in all aspects of their operations to improve their
competitiveness
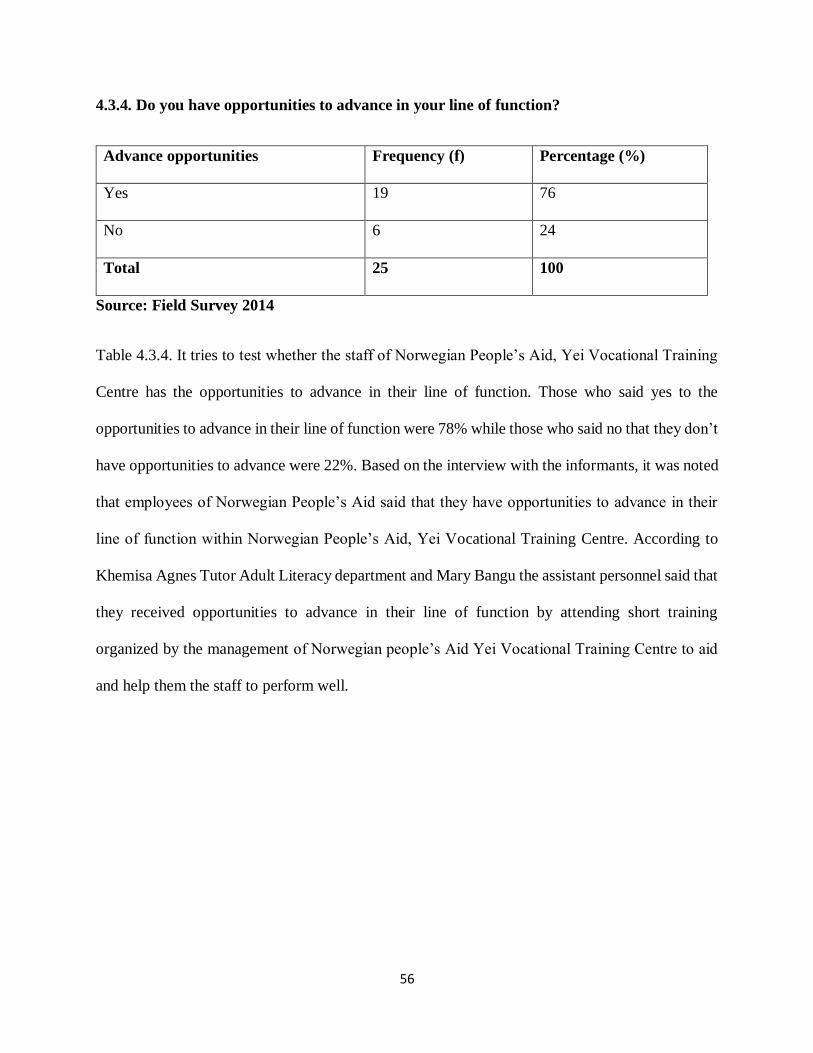
56
4.3.4. Do you have opportunities to advance in your line of function?
Advance opportunities Frequency (f) Percentage (%)
Yes 19 76
No 6 24
Total 25 100
Source: Field Survey 2014
Table 4.3.4. It tries to test whether the staff of Norwegian People’s Aid, Yei Vocational Training
Centre has the opportunities to advance in their line of function. Those who said yes to the
opportunities to advance in their line of function were 78% while those who said no that they don’t
have opportunities to advance were 22%. Based on the interview with the informants, it was noted
that employees of Norwegian People’s Aid said that they have opportunities to advance in their
line of function within Norwegian People’s Aid, Yei Vocational Training Centre. According to
Khemisa Agnes Tutor Adult Literacy department and Mary Bangu the assistant personnel said that
they received opportunities to advance in their line of function by attending short training
organized by the management of Norwegian people’s Aid Yei Vocational Training Centre to aid
and help them the staff to perform well.
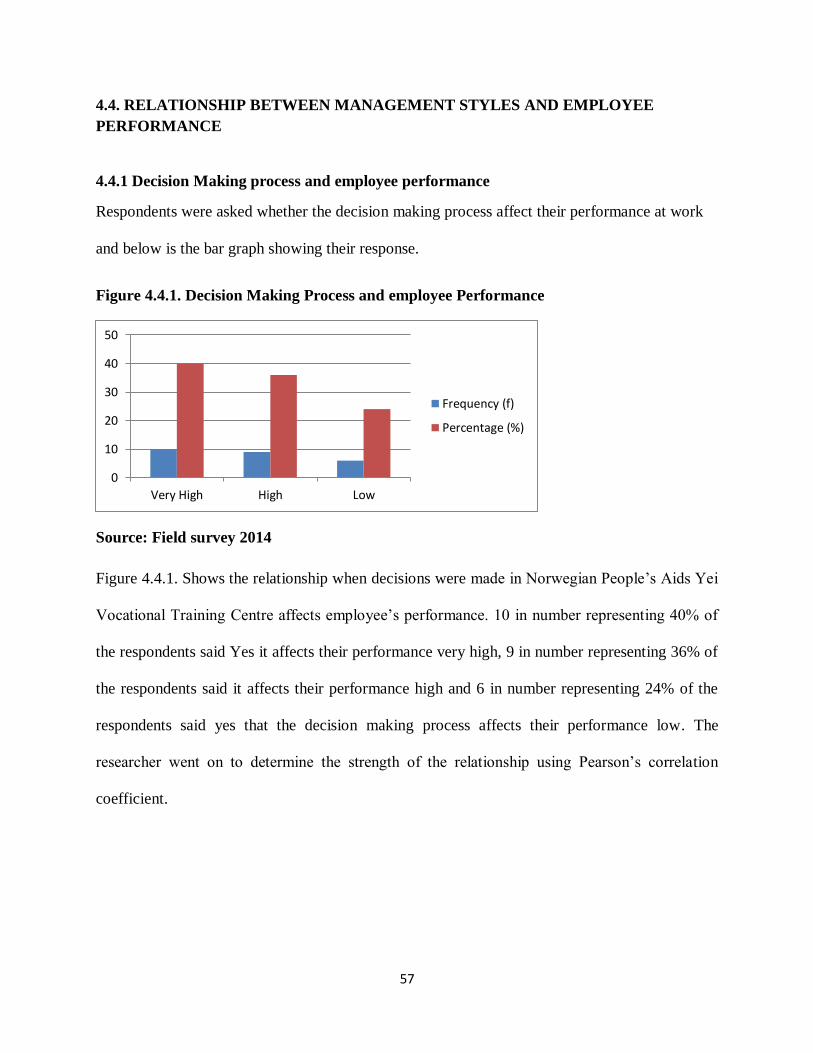
57
4.4. RELATIONSHIP BETWEEN MANAGEMENT STYLES AND EMPLOYEE
PERFORMANCE
4.4.1 Decision Making process and employee performance
Respondents were asked whether the decision making process affect their performance at work
and below is the bar graph showing their response.
Figure 4.4.1. Decision Making Process and employee Performance
Source: Field survey 2014
Figure 4.4.1. Shows the relationship when decisions were made in Norwegian People’s Aids Yei
Vocational Training Centre affects employee’s performance. 10 in number representing 40% of
the respondents said Yes it affects their performance very high, 9 in number representing 36% of
the respondents said it affects their performance high and 6 in number representing 24% of the
respondents said yes that the decision making process affects their performance low. The
researcher went on to determine the strength of the relationship using Pearson’s correlation
coefficient.
0
10
20
30
40
50
Very High High Low
Frequency (f)
Percentage (%)
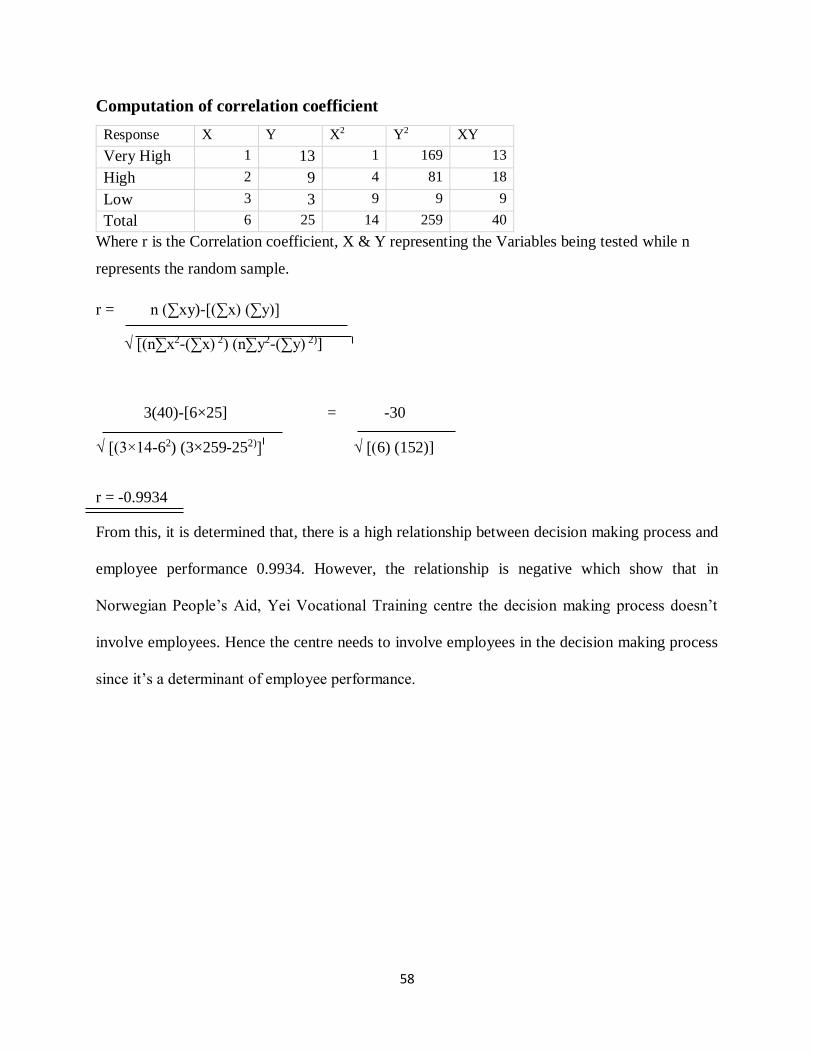
58
Computation of correlation coefficient
Response X Y X2 Y2 XY
Very High 1 13 1 169 13
High 2 9 4 81 18
Low 3 3 9 9 9
Total 6 25 14 259 40
Where r is the Correlation coefficient, X & Y representing the Variables being tested while n
represents the random sample.
r = n (∑x y)-[(∑x) (∑y)]
√ [(n∑x2-(∑x) 2) (n∑y2-(∑y) 2)]
3(40)-[6×25] = -30
√ [(3×14-62) (3×259-252)] √ [(6) (152)]
r = -0.9934
From this, it is determined that, there is a high relationship between decision making process and
employee performance 0.9934. However, the relationship is negative which show that in
Norwegian People’s Aid, Yei Vocational Training centre the decision making process doesn’t
involve employees. Hence the centre needs to involve employees in the decision making process
since it’s a determinant of employee performance.
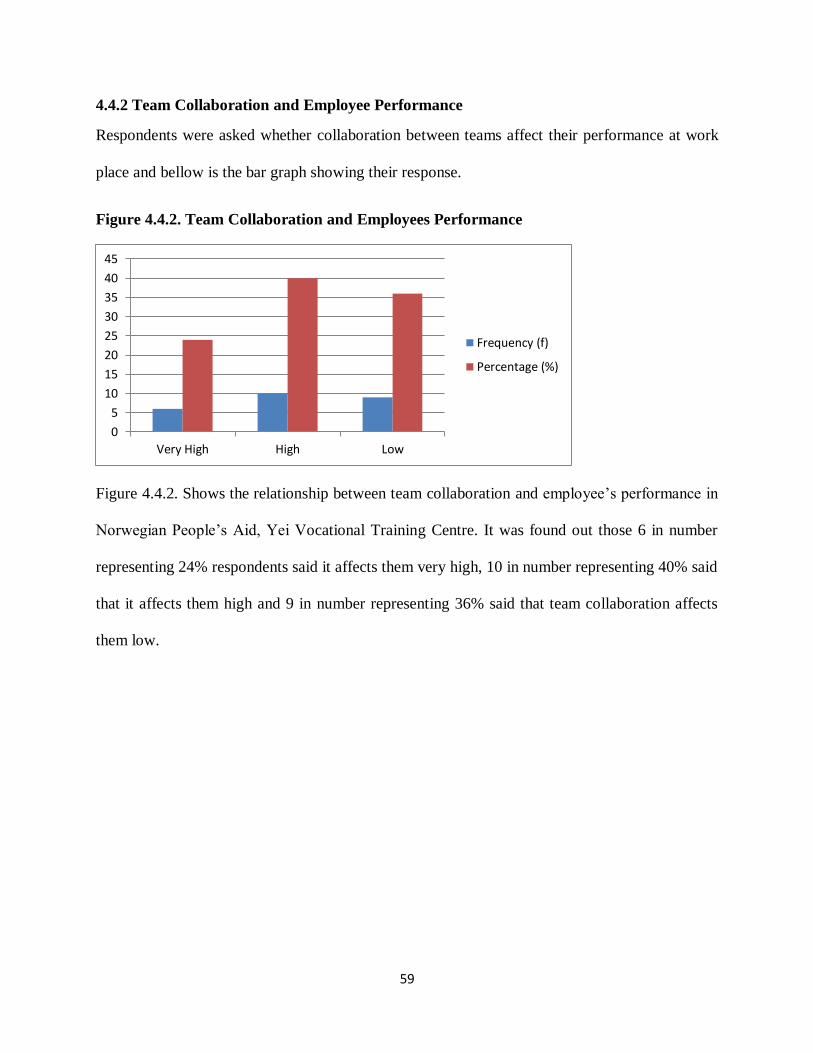
59
4.4.2 Team Collaboration and Employee Performance
Respondents were asked whether collaboration between teams affect their performance at work
place and bellow is the bar graph showing their response.
Figure 4.4.2. Team Collaboration and Employees Performance
Figure 4.4.2. Shows the relationship between team collaboration and employee’s performance in
Norwegian People’s Aid, Yei Vocational Training Centre. It was found out those 6 in number
representing 24% respondents said it affects them very high, 10 in number representing 40% said
that it affects them high and 9 in number representing 36% said that team collaboration affects
them low.
0
5
10
15
20
25
30
35
40
45
Very High High Low
Frequency (f)
Percentage (%)
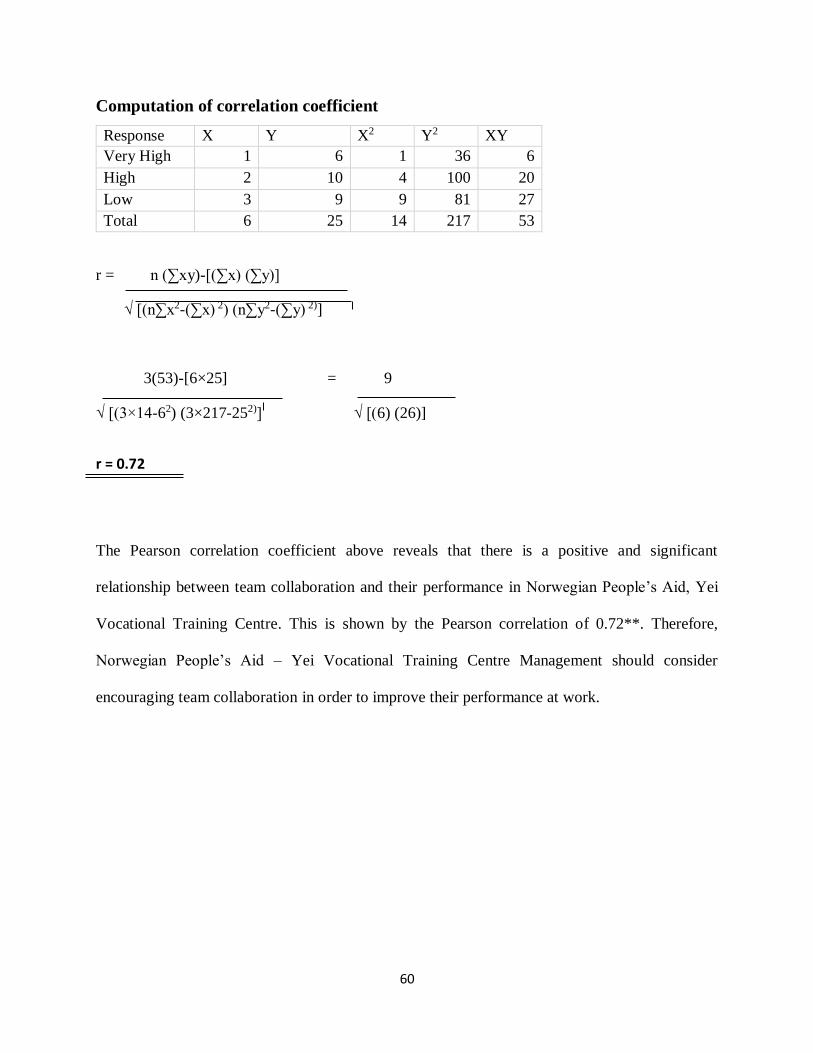
60
Computation of correlation coefficient
Response X Y X2 Y2 XY
Very High 1 6 1 36 6
High 2 10 4 100 20
Low 3 9 9 81 27
Total 6 25 14 217 53
r = n (∑x y)-[(∑x) (∑y)]
√ [(n∑x2-(∑x) 2) (n∑y2-(∑y) 2)]
3(53)-[6×25] = 9
√ [(3×14-62) (3×217-252)] √ [(6) (26)]
r = 0.72
The Pearson correlation coefficient above reveals that there is a positive and significant
relationship between team collaboration and their performance in Norwegian People’s Aid, Yei
Vocational Training Centre. This is shown by the Pearson correlation of 0.72**. Therefore,
Norwegian People’s Aid – Yei Vocational Training Centre Management should consider
encouraging team collaboration in order to improve their performance at work.
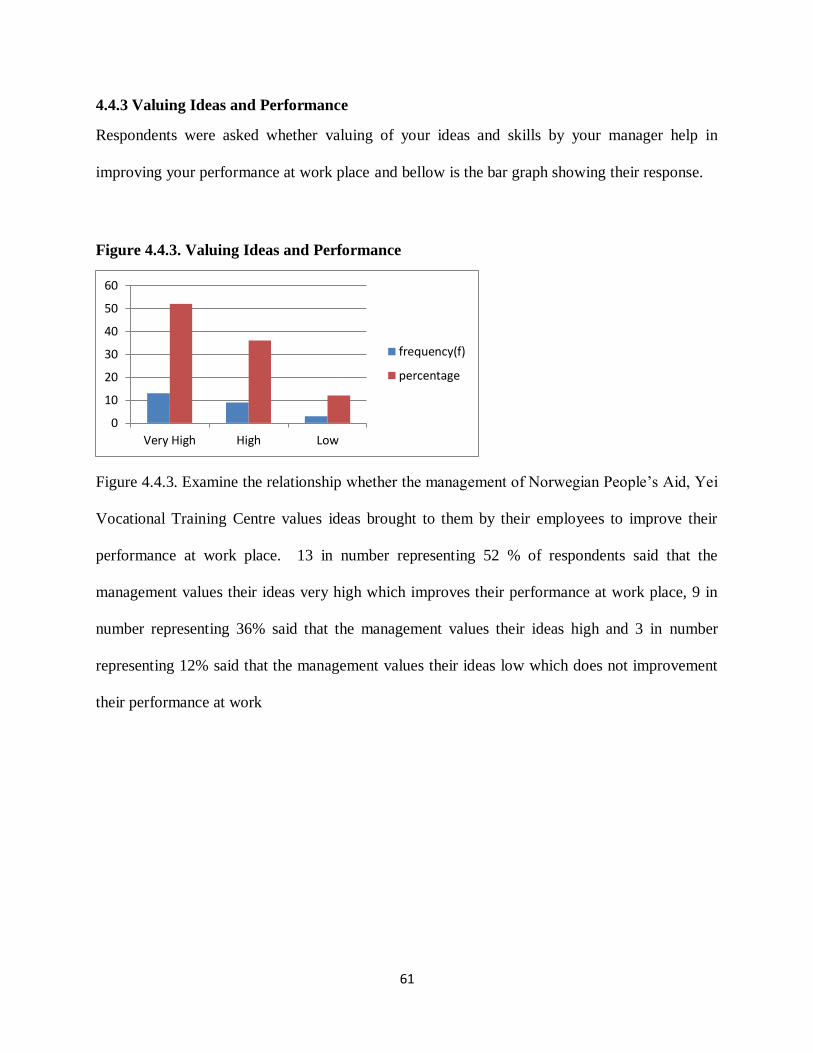
61
4.4.3 Valuing Ideas and Performance
Respondents were asked whether valuing of your ideas and skills by your manager help in
improving your performance at work place and bellow is the bar graph showing their response.
Figure 4.4.3. Valuing Ideas and Performance
Figure 4.4.3. Examine the relationship whether the management of Norwegian People’s Aid, Yei
Vocational Training Centre values ideas brought to them by their employees to improve their
performance at work place. 13 in number representing 52 % of respondents said that the
management values their ideas very high which improves their performance at work place, 9 in
number representing 36% said that the management values their ideas high and 3 in number
representing 12% said that the management values their ideas low which does not improvement
their performance at work
0
10
20
30
40
50
60
Very High High Low
frequency(f)
percentage

62
Computation of correlation coefficient
Correlation X Y X2 Y2 XY
Very High 1 13 1 169 13
High 2 9 4 81 18
Low 3 3 9 9 9
Total 6 25 14 259 40
r = n (∑x y)-[(∑x) (∑y)]
√ [(n∑x2-(∑x) 2) (n∑y2-(∑y) 2)]
3(40)-[6×25] = 30
√ [(3×14-62) (3×259-252)] √ [(6) (152)]
R = -0.9934
From this, it is determined that there is a high relationship between valuing ideas of employees
and employee performance 0.9934. However, the relationship is negative which show that in
Norwegian People’s Aid, Yei Vocational Training centre valuing ideas and skills is not considered
much. Hence the institute needs to value employee ideas and skills since it’s a determinant of
employee performance
63
CHAPTER FIVE
SUMMARY OF FINDINGS, CONCLUSION AND RECOMMENDATIONS
5.0 INTRODUCTION
This chapter captured the findings from the data and the framework used for the analysis and
presents conclusions drawn from the analysis. Recommendations are also given based on the
findings.
5.1 FINDINGS
The main objective of this study was to identify the specific management styles demonstrated by
the management in Norwegian People’s Aid, Yei Vocational Training Centre in enhancing
employee performance and to examine how these specific styles affected the performance of the
employees. From the supported material and results of the study it was observed that there is a
significant relationship or link between management styles and employee performance. This study
found that different management styles were exhibited by the management of Norwegian peoples
Aids Yei vocational Training Centre and these styles had positive effect on employee performance.
What this means is that managers are very particular about getting results and only motivate
employees to give their best in order to increase productivity. -However, it is also observed that
there is very little or minimal style of democratic and participatory management exhibited and this
negatively impacts performance. This probably suggests that management act with strict internal
rules to achieve results and the fact that the practice in Norwegian People’s Aid Yei Vocational
Training Centre is also not democratic- style to validate this.
64
The management styles practice in Norwegian Peoples Aids, Yei Vocational training Centre seems
to match the description given by Bass and Avolio, 2000 or Mester, et al., 2003 about the managers
who focus their energies on task completion and compliance and rely on organizational rewards
and punishments to influence employee performance, with reward being contingent on the
followers carrying out the roles and assignments as defined by the manager. In fact, defining and
communicating the work that must be done by their followers, how it will be done, and assisting
the followers in understanding precisely what needs to be achieved in order to meet the
organization’s objectives as is typical of an Autocratic style can only bring in marginal returns and
will not survive a competitive business environment.
5.2 CONCLUSIONS.
To ensure the organization’s survival and performance, employees of Norwegian People’s Aid,
Yei Vocational Training Centre need to be motivated to go beyond ordinary expectations by
appealing to their higher order needs and moral values. This requires Participatory styles of
management. Hughes, Ginnett and Curphy (1994) believe that participatory style also have the
ability to align people and the systems so, there is integrity throughout the organization. Again,
sharing decision-making with the subordinates generates empowerment and breeds ownership.
Exercising reasonable level of Participative management style provides a sense of belonging to
employees and makes them ready to defend the business objectives and goals. Even though he or
she invites contributions from the subordinates before making a decision, the manager retains the
final authority to make decisions (consultative).
It is also recommended that, regular performance feedback should be encouraged across all levels
of the organization since from the analysis it shows that it has one of the strongest significant
measures for the overall job performance.
65
As exhibited Management styles have direct impact on productivity, this study can be further
enhanced to explore what constitutes the right balance in management styles required to exact
expected performance delivery from employees.
Limitation of the study
Due to constraints of time, materials and financial resource, the study was confined to only
Norwegian People’s Aids, Yei Vocational Training Centre. To mitigate the impact of these
limitations, the researcher will exercise the greatest amount of care and vigilance in conducting
the study.
5.3 RECOMMENDATIONS
Finally concluding the whole research conducted it is found that management styles has direct
relationship with employee output and that depending on the style exhibited by the managers in an
organization, productivity is either enhanced or stalled . Whereas tasks are important for the day-
to-day survival of the organization, developing people and teams are important for the long-range
performance of the organization. Thus, it should be extremely important for Norwegian People’s
Aids Yei Vocational Training Centre, to balance its management styles to equally reflect much
interest in people in its pursuit to enhance employee performance and have competitive advantage.
It is extremely important to balance the ability to get things done (tasks) with keeping the team
together (people).
66
APPENDIX I
REFERENCES
Adair, J. (2002).Effective strategic Leadership London Macmillan publishers Limited
Amos, T.L., Ristow, A. and Ristow, L. 2004. Human Resource Management, 2nd Edition,
Lansdowne: Juta and Co Ltd.
Anderson, T.D., Ford, R. and Hamilton, M. (1998), Transforming Leadership: equipping yourself
and coaching others to build leadership organization, 6th edition, London: St. Lucie Press.
Armstrong, M. and Baron, A. (1998), Performance Management – The New Realities, London:
IPD.
Baird, L. (1986), Managing Performance, New York: John Wiley.
Barling, J., Salter, F., and Kelloway, E.K. (2000), "Transformational leadership and EI: an
exploratory study", Learnership & Organizational Development Journal
Bartlett, C.A. and Ghoshal, S. (1995), Changing the Role of Top Management beyond Systems to
People, Harvard Business Review; 73(3), pp.132-142.
Bass, B. (1985), Leadership and Performance Beyond Expectations, New York: Free Press.
Bass, B.M. and Avolio, B.J. (1994), Improving Organizational Effectiveness through
Tranformational Leadership, Thousand Oaks, CA: Sage Publication.
.
Brand, C., Heyl, G. and Maritz, D. (2000). “Leadership”. In Meyer, M. and Botha, E.(eds).
Brewster, C., Carey, L., Dowling, P., Grobler, P., Holland, P. and Warnich, S. (2003),
Contemporary Issues in Human Resource Management, Cape Town: Clyson Printers.
Burns, J.M., (1978), Leadership, New York; Harper and Row.
Cacioppe, R. (1997), Leadership Moment by Moment, Leadership and Organizational
Development Journal; 18(7), pp.335-345.
Campbell, J., McCloy, R., Oppler, S. and Sager, C. (1993), The Theory of Performance, New
York: Jossey-Bass.
Chen, F. and Tjosvold, D. (2006), Participative leadership by American and Chinese managers in
China: The role of leadership, Journal of Management Studies; Vol. 43, Issue 8, pp.1725-1752.
Cherrington, D.J. (1994), Organizational Behaviour. Boston: Allyn and Bacon.
67
Collis, D.J. and Montgomery, C.A. (1995), Competing on Resources, Harvard Business Review;
73(4), pp.118-128.
Corvellec, H. (1995), Stories of Achievement: Narrative Features of Organizational Performance,
Sweden: Lund University Press.
Cummings, L.L. and Schwab D.P. (1973), Performance in Organizations: Determinants and
Appraisal, Glenview: Scott, Foresman ansd Company.
Daniel, G. (2002). The New leaders: Transforming the art of leadership into the science of results.
Little brown, Zancaster press, London.
Debushis, C. (2000) leading consciously: A pilgrimage toward self-mastery. Butterworth-
Heinemann, Wildwood Avenue USA.
Fisher. S (1995). The use of non-financial Rewards in performance measurements. M (Ed)
Dissertation, Englewoods cliffs, Prentice Hall.
Gaver, K and Austin, S (1995) Additional evidence on incentive plans and inceme management.
Journal of Accounting and Economics, 19:3-28, Colorado, Santa Monica
Hersey, P and Blanchard,K.H (1988). Management of organizational behavior: Utilizing Human
Resources. Pretence Hall, Eagle wood cliffs, New Jersey.
Milgron P. and Holmstran, B. (1991) Incentive contracts, asset ownership and job design. London,
Prentice Hall printery.
Mullins, J. (2002). Management and organizational behavior: Library of congress cataloguing in
publication data, United Kingdom.
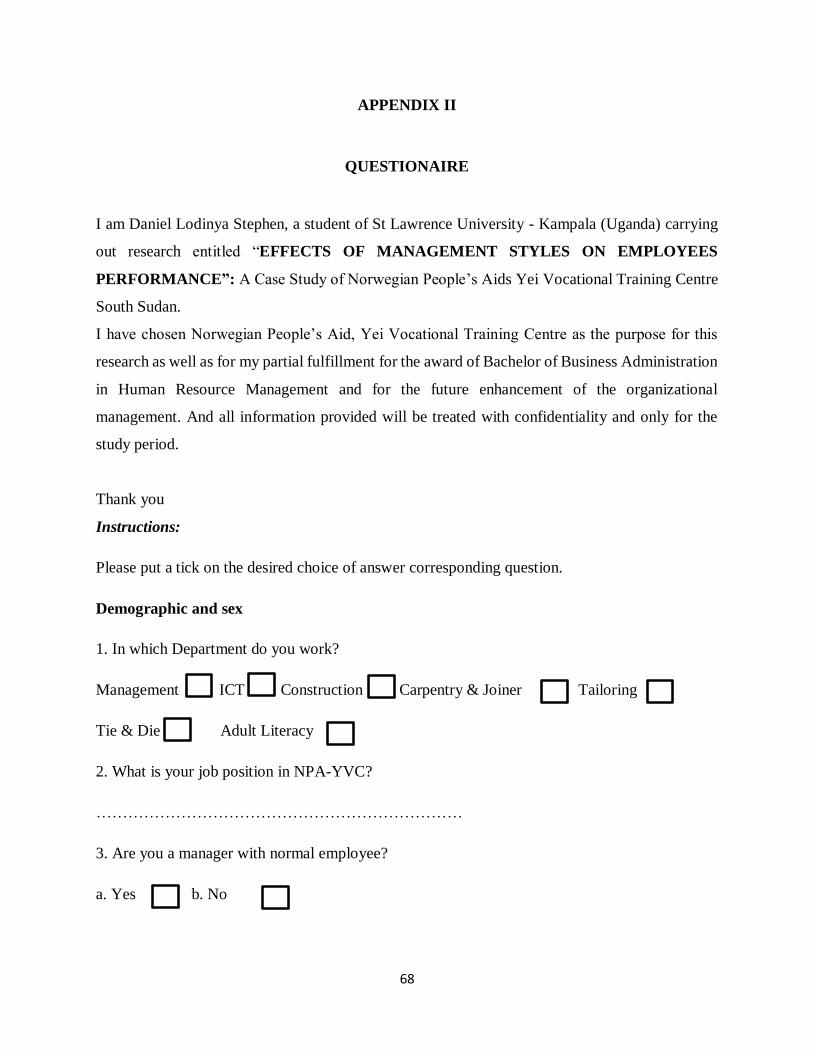
68
APPENDIX II
QUESTIONAIRE
I am Daniel Lodinya Stephen, a student of St Lawrence University - Kampala (Uganda) carrying
out research entitled “EFFECTS OF MANAGEMENT STYLES ON EMPLOYEES
PERFORMANCE”: A Case Study of Norwegian People’s Aids Yei Vocational Training Centre
South Sudan.
I have chosen Norwegian People’s Aid, Yei Vocational Training Centre as the purpose for this
research as well as for my partial fulfillment for the award of Bachelor of Business Administration
in Human Resource Management and for the future enhancement of the organizational
management. And all information provided will be treated with confidentiality and only for the
study period.
Thank you
Instructions:
Please put a tick on the desired choice of answer corresponding question.
Demographic and sex
1. In which Department do you work?
Management ICT Construction Carpentry & Joiner Tailoring
Tie & Die Adult Literacy
2. What is your job position in NPA-YVC?
……………………………………………………………
3. Are you a manager with normal employee?
a. Yes b. No
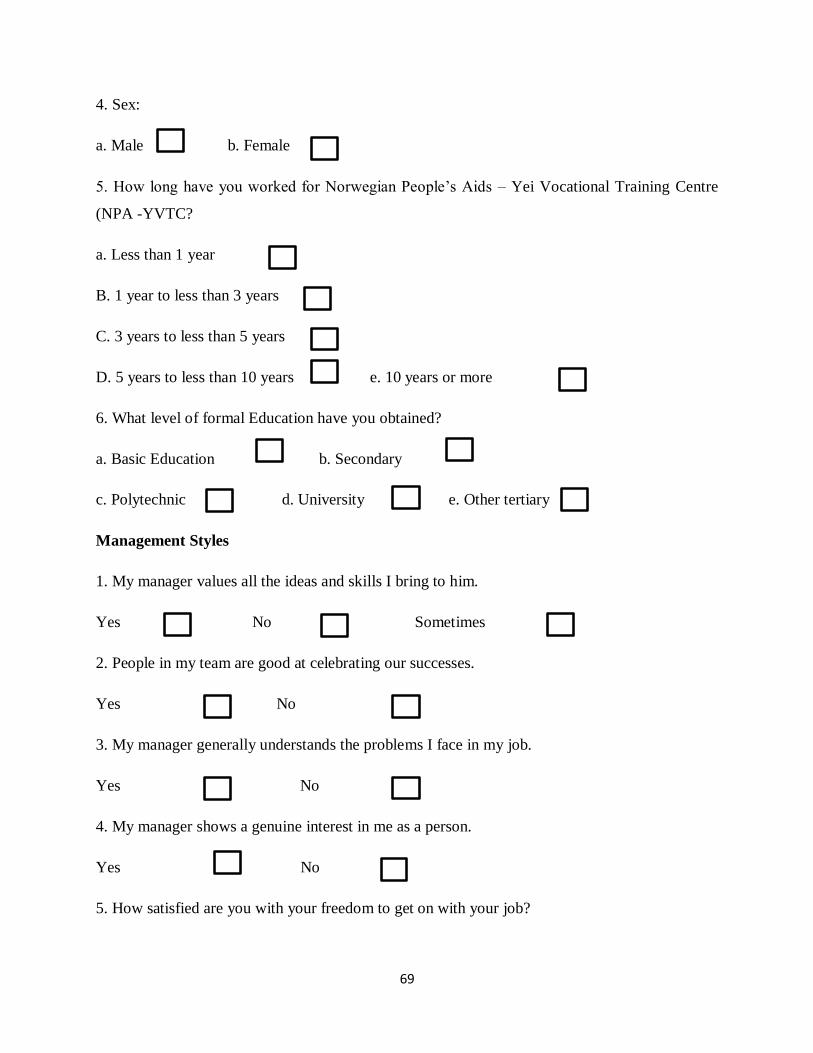
69
4. Sex:
a. Male b. Female
5. How long have you worked for Norwegian People’s Aids – Yei Vocational Training Centre
(NPA -YVTC?
a. Less than 1 year
B. 1 year to less than 3 years
C. 3 years to less than 5 years
D. 5 years to less than 10 years e. 10 years or more
6. What level of formal Education have you obtained?
a. Basic Education b. Secondary
c. Polytechnic d. University e. Other tertiary
Management Styles
1. My manager values all the ideas and skills I bring to him.
Yes No Sometimes
2. People in my team are good at celebrating our successes.
Yes No
3. My manager generally understands the problems I face in my job.
Yes No
4. My manager shows a genuine interest in me as a person.
Yes No
5. How satisfied are you with your freedom to get on with your job?
70
Very Somehow Not At All
6. The decision-making process involves fewer people.
Yes No
7. My company acts with integrity in its internal dealings with employees.
Yes No
8. We are encouraged to come up with innovative solutions.
Yes No
9. I believe my company’s leadership acts on the issues/opportunities identified in employee value
surveys.
Yes No
10. People in my team are resolving issues more quickly.
Yes No
11. My manager is considerate of my life outside work.
Yes No
12. I have stretching objectives agreed with my manager.
Yes No
13. My manager trusts my judgment within my job.
Yes No
14. My manager inspires me to give my best.
Yes No
15. My manager gives me regular feedback on my performance.
71
Yes No
16. Is there is good collaboration between my team and other teams in the business?
Yes No
17. People in my team are focused on delivering results.
Yes No
Employee performance
1. Do you have an annual set of performance standards?
Yes No
2. Do you receive regular job performance feedback?
Yes No
3. Do you believe there is fairness in the way my performance is assessed?
Yes No
4. Do you have opportunities to advance in my line of function?
Yes No
Relationship between management styles and employee performance
1. Does the decision making process affect your performance at work?
Very high
High
Low
72
2. How does collaboration between teams affect your performance at work place?
Very high
High
Low
3. Does your manager value your ideas and skills to improve performance at work place?
Very high
High
Low
Thank you
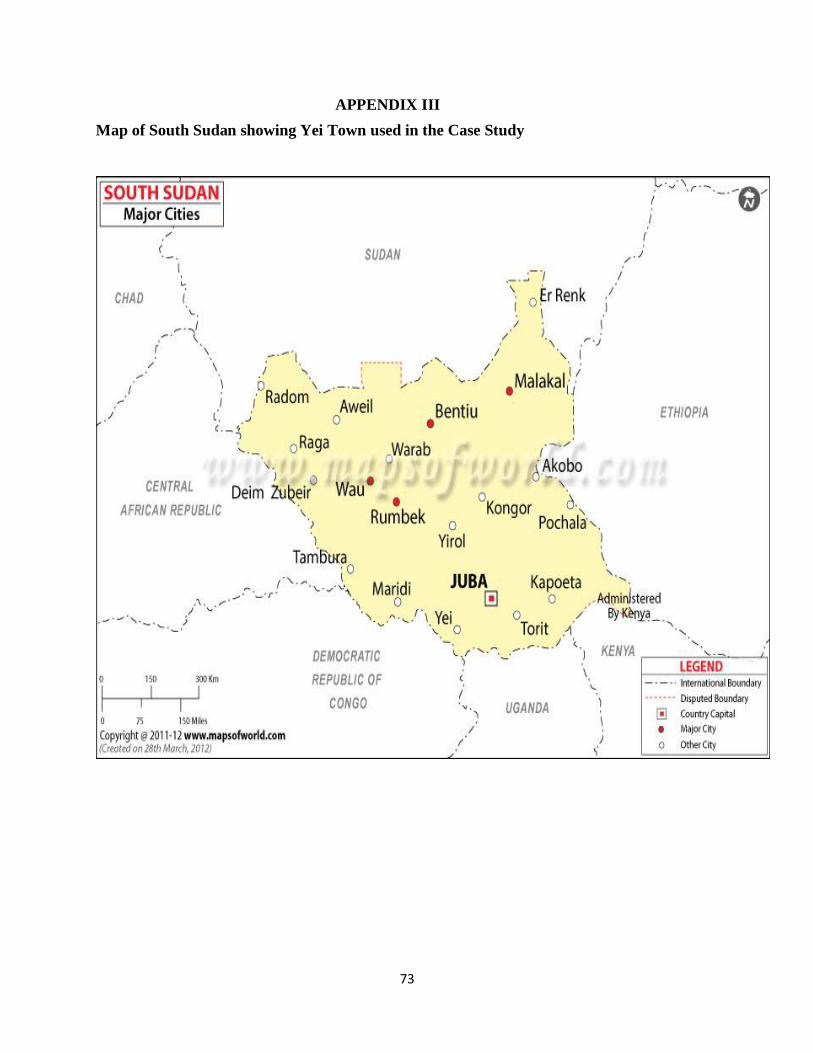
73
APPENDIX III
Map of South Sudan showing Yei Town used in the Case Study
Copyright © 2022 FDOKUMEN