Therapists' and clients' significant experiences underlying psychotherapy discourse
Upload
khangminh22Category
view
3download
0
EFFECT OF GUIDED IMAGERY ON BLOOD PRESSURE AMONG CLIENTS WITH HYPERTENSION IN A SELECTED RURAL
COMMUNITY, COIMBATORE.
REG. NO. 30091434
A Dissertation submitted to The Tamilnadu Dr. M.G.R. Medical University,
Chennai.
In partial fulfillment of the requirement for the Award of the Degree of
MASTER OF SCIENCE IN NURSING
2010

EFFECT OF GUIDED IMAGERY ON BLOOD PRESSURE AMONG CLIENTS WITH HYPERTENSION IN A SELECTED RURAL
COMMUNITY, COIMBATORE. _____________________________________________________ 1. Prof. (Mrs). W. Chitra, M. Sc (N).,
Department of Community Health Nursing, College of Nursing, Sri Ramakrishna Institute of Paramedical Sciences, Coimbatore - 641 044. ______________________________________________________ 2. Dr. G.K. Sellakumar, M. A., M. Phil., PGDPM., Ph. D., Professor in Psychology & Research Methodology, College of Nursing, Sri Ramakrishna Institute of Paramedical Sciences, Coimbatore - 641 044. ______________________________________________________ 3. Dr. S.L. Ravi Shankar, M.B.B.S., M.D.,
Department of Community Health Medicine, PSG Institute of Medical Science and Research, Coimbatore – 641 014.

Certified that this is the bonafide work of
SUGANYA.S
COLLEGE OF NURSING Sri Ramakrishna Institute of Paramedical Sciences
Coimbatore - 641 044.
Submitted in partial fulfillment of the requirement for the award of the degree of
MASTER OF SCIENCE IN NURSING
to The Tamilnadu Dr. M.G.R. Medical University, Chennai.
College Seal Prof. (Mrs.) SEETHALAKSHMI, B.Sc., R.N., R.M., M.N., M.Phil., (Ph. D)., Principal, College of Nursing, Sri Ramakrishna Institute of Paramedical Sciences, Coimbatore - 641 044, Tamilnadu, India.
COLLEGE OF NURSING Sri Ramakrishna Institute of Paramedical Sciences
Coimbatore.
2010

ACKNOWLEDGEMENT
I express my heartfelt thanks to honorable Thiru. C. Soundararaj Avl.,
Managing Trustee, SNR & Sons Charitable Trust for giving me an opportunity to
utilize all the facilities in this esteemed institution.
I am immensely grateful to Prof. Seethalakshmi, B.Sc (N)., R.N. R.M.,
M.N., M.Phil., (Ph.D)., Principal, College of Nursing, Sri Ramakrishna Institute of
Paramedical Sciences, Coimbatore for her expert guidance and valuable suggestions
throughout the study.
I extend my deep felt sincerity to Prof. R. Ramathilagam, M.Sc (N)., Vice
Principal, College of Nursing, Sri Ramakrishna Institute of Paramedical Sciences,
Coimbatore for her keen interest, enduring moral support and valuable suggestions in
completing this study.
I express my deep sense of gratitude to Prof. W. Chitra, M.Sc (N)., for her
expert guidance, valuable suggestions, encouragement and keen interest in
conception, planning and execution of the study.
I express my profound gratitude to Dr. S.L. Ravishankar, MBBS., M.D.,
Professor, Department of Community Medicine, PSG Institute of Medical Sciences
and Research, Coimbatore for his valuable suggestions and expert guidance
throughout my study.
I express my special thanks to Prof. S. Girijakumari, M. Sc (N).,
Prof.Suganthi, M. Sc (N)., Mrs. R. Renuka, M.Sc (N)., and Mrs.V. Brindha,
M.Sc (N)., and Mrs. Anusuya, M.Sc (N)., for their moral support and valuable
suggestions in completing the study.
I express my special and sincere thanks to Dr. G. K. Sellakumar, M.A.,
M.Phil., P.G.D.P.M., Ph.D., Professor, Department of Research Methodology,
Mrs.R. Ramya, M.Sc., M. Phil., Associate Professor, Department of Biostatistics for
their intelligent guidance and constant encouragement which contributed a great deal
to give meaning and enrichment of the study.

I express my special gratitude to Mrs. Shobana M.Sc (N), Asso. Professor for
her expert guidance and valuable suggestions
I owe a profound debt of gratitude to Dr. V. Ganesan, Ph. D., Former
Professor & Head of Department of Psychology, Bharathiar University Coimbatore,
Founder Director Indian institute of Behaviour Technology, Coimbatore for his
valuable expertise guidance and training.
I extend my sincere thanks to all clients who participated in my study, for
their cooperation and help.
I owe much to all faculties, staff members who have instructed and
enlightened me in the field of education and rendered and all possible help with their
heart and soul co-operation to achieve my target.
I am grateful to the Librarians of Sri Ramakrishna Institute of Paramedical
Sciences for their retrieving patience and timely helping many ways to prepare the
manuscript. I express my gratitude to all staff of Computer Park, Coimbatore for
their compute and technical assistance. There cannot be anything possible by me
without the affection, support and love of my parents, family members and my
classmates for their prayerful support and guidance throughout the course of my
studies.

CONTENTS
CHAPTER TITLE PAGE NO.
I
INTRODUCTION
1.1. Need for the Study 7
1.2. Statement of the Problem 10
1.3. Objectives 10
1.4. Operational Definition 10
1.5. Conceptual Frame Work 11
1.6. Projected Outcome 13
II LITERATURE REVIEW
2.1. Literatures Related to Hypertension 14
2.2. Literatures Related to Guided Imagery 16
2.3. Literatures Related to Guided Imagery on Blood
Pressure
19
III METHODOLOGY
3.1. Research Approach 22
3.2. Research Design 22
3.3 Setting of the Study 23
3.4. Population 23
3.5. Criteria for Sample Selection 23
3.6. Sampling 24
3.7. Variables of the Study 24
3.8. Materials used for Data Collection 24
3.9. Hypotheses 26
3.10. Pilot Study 27
3.11. Main Study 27
3.12. Techniques of Data Analysis and Interpretation 28

CHAPTER TITLE PAGE NO.
IV DATA ANALYSIS AND INTERPRETATION
4.1. Baseline Data Presentation
29
4.2. Distribution on Health History 33
4.3 Analysis on Level of Blood Pressure between
Experimental and Control Group Before Guided
Imagery
36
4.4 Analysis on Level of Blood Pressure in the
Experimental group Before and After Guided
Imagery
37
4.5 Analysis on Level of Blood Pressure in the
Control Group Before and After Guided Imagery
38
4.6 Analysis on Level of Blood Pressure between
Experimental and Control Group After Guided
Imagery
39
V RESULTS AND DISCUSSION
5.1. Baseline Data of the Samples 41
5.2. Findings Related to Health History of the Sample 42
5.3. Analysis on Effectiveness of Guided Imagery 44
VI SUMMARY AND CONCLUSION
6.1. Major Findings of the Study 48
6.2. Limitations of the Study 48
6.3. Recommendations 48
6.4. Nursing Implication 49
6.5. Conclusion 50
REFERENCES i – vi
APPENDICES
ANNEXURES

LIST OF TABLES
TABLE TITLE PAGE
NO.
4.1. Distribution of Respondents based on Baseline Data 30
4.2. Distribution of Respondents based on Health History 33
4.3. Analysis on Level of Blood Pressure between Experimental and
Control Group Before Guided Imagery
36
4.4. Analysis on Level of Blood Pressure in the Experimental Group
Before and After Guided Imagery
37
4.5. Analysis on level of Blood Pressure in the Control Group
Before and After Guided Imagery
38
4.6. Analysis on Level of Blood Pressure Between Experimental
Group and Control Group after Guided Imagery
39
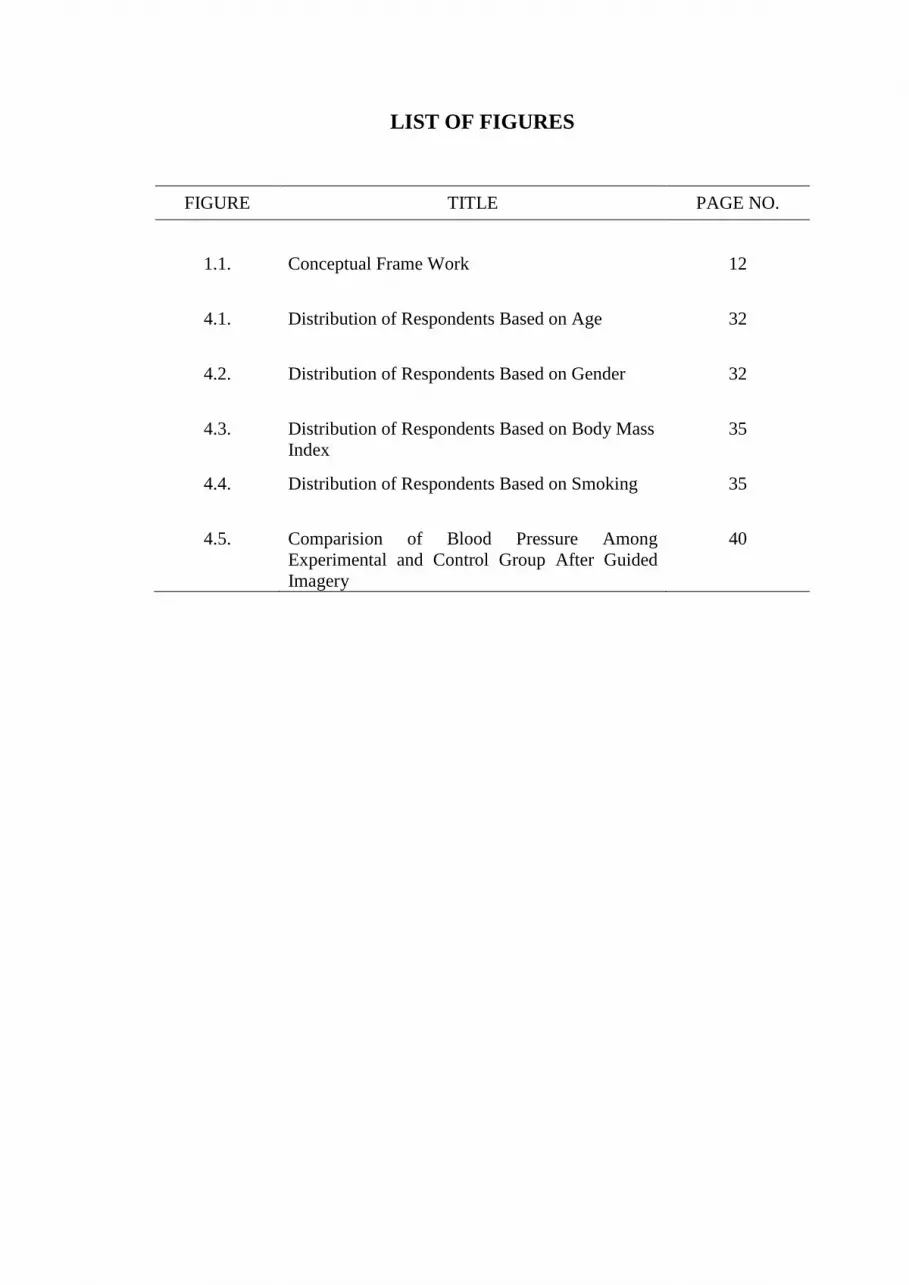
LIST OF FIGURES
FIGURE TITLE PAGE NO.
1.1. Conceptual Frame Work 12
4.1. Distribution of Respondents Based on Age 32
4.2. Distribution of Respondents Based on Gender 32
4.3. Distribution of Respondents Based on Body Mass
Index
35
4.4. Distribution of Respondents Based on Smoking 35
4.5. Comparision of Blood Pressure Among
Experimental and Control Group After Guided
Imagery
40

LIST OF ANNEXURES
ANNEXURE TITLE
I Paired ‘t’ test
II Unpaired ‘t’ test
III Karl Pearson’s Co-efficient of Correlation

LIST OF APPENDICES
APPENDICES TITLE
I Permission Letter for Conducting Study
II Letter requesting to validate the Research Tool and Content
III Training Certificate for Guided Imagery
IV Materials for Data Collection
V Lesson plan on Guided Imagery
VI Pamphlet
VII Certificate for English Editing
VIII Certificate for Tamil Editing
IX Photos during Intervention

Guided Imagery 1
BLOOD PRESSURE AMONG CLIENTS WITH HYPERTENSION
EFFECT OF GUIDED IMAGERY ON BLOOD PRESSURE AMONG
CLIENTS WITH HYPERTENSION IN A SELECTED RURAL
COMMUNITY, COIMBATORE.
REG. NO. 30091434
A Dissertation submitted to
The Tamilnadu Dr. M.G.R. Medical University,
Chennai.
In partial fulfillment of the requirement for the
Award of the Degree of
MASTER OF SCIENCE IN NURSING
2010
Guided Imagery 2
Abstract
An interventional study was undertaken to evaluate the effectiveness of guided
imagery on blood pressure among hypertensive clients at Idikarai rural community,
Coimbatore. Quasi experimental pretest post test control group design was used. The
blood pressure was measured by using digital sphygmomanometer. Purposive sample
of 80 hypertensive clients were selected for the present study. Eighty samples were
randomly assigned into experimental and control group. The data were analysed with
descriptive and inferential statistical method. Paired and unpaired ‘t’ test was used to
evaluate the effect of guided imagery on blood pressure. The study concluded that
guided imagery is an effective intervention to alleviate blood pressure.

Guided Imagery 3
Effect of Guided Imagery on Blood Pressure among Clients with
Hypertension in a Selected Rural Community, Coimbatore.
Health is a precious aspect of all human beings as it is an asset for an
individual. The enjoyment of the highest attainable standard of health is one of the
fundamental rights of every human being. Health is maintained and improved not
only through the advancement and application of health sciences, but also through the
efforts and intelligent life style choices of the individual and society like, exercise,
diet pattern, yoga and meditation practices.
Hypertension is a chronic condition due to its role in the causation of coronary
heart disease, stroke and other cardiovascular complications. It is the commonest
cardiovascular disorder, posing a major public health challenge to population in
socioeconomic and epidemiological transition in both developing and developed
countries. A significant numbers of individuals with hypertension are unaware of their
condition and treatment is frequently inadequate with diagnosed hypertension, so it is
called silent killer disease. Measures are required at a population level to prevent the
development of hypertension and to improve awareness, treatment and control of
hypertension in the community (The Lancet, 2005).
Hypertension causes 60,000 deaths per year and is directly related to more
than 250,000 deaths from stroke (The Lancet, 2005). In India the survey results shows
among the top 10 leading causes of mortality, hypertension occupies the seventh place
and among top 10 leading causes of morbidity hypertension occupies the fifth place
(Sharma, 2010).

Guided Imagery 4
A large prospective Cohort study conducted (2005) the results reveals that
approximately 153 million people affected with hypertension in China and leading to
1.27 million premature deaths from cardiovascular diseases. The author suggested that
prevention and control of this condition should receive top public health priority in
China (Hutsen, 2005).
Hypertension is a major causative factor to coronary artery disease contributed
to 740,000 deaths per year, cerebrovascular diseases contributed to 150,000 deaths per
year and kidney diseases are three leading cause of morbidity, mortality and medical
resources utilization in the USA (Dawber, 1980).
About 74.5 million people in the United States aged 20 and older have high
blood pressure. Everyone in three adults has high blood pressure. People with high
blood pressure, 77.6 percent were aware of their condition, 67.9 percent were under
current treatment, 44.1 percent had it under control and 55.9 percent did not have it
controlled (High blood pressure statistics, 2006).
In India about 50 million people suffer from hypertension. As age advances
the risk of hypertension also advances, reaching to a level upto 30%. There is steady
increase in hypertension prevalence over the last 50 years. The number of cases is
more in urban than in rural areas which accounts 25-30% and 10-15% respectively
(Alarming Hypertension Statistics, 2009).
A survey was conducted in India to screen all persons aged 20-60 years. The
Rohtak is taken to represent the urban population and village of Haryana is taken to
represent the rural population in India. The prevalence of hypertension was 59.9 and

Guided Imagery 5
69.9 per 1000 in males and females respectively in the urban population, and 35.5 and
35.9 per 1000 in males and females respectively in the rural population (Park, 2009).
Older adults often have a rise in systolic blood pressure related to decreased
vessel elasticity. Blood pressure greater than 140/ 90 mm Hg is defined as
hypertension related illness (Lewis, 2009). Persons with family history of
hypertension are at risk for developing hypertension. Modifiable risk factors include
obesity, cigratte smoking, heavy alcohol consumption, and sodium intake. Two out of
three adults in the United States are classified as overweight or obese (Manson, 2003).
Sedentary lifestyle and continued exposure to stress are also linked to
hypertension (Perry, 2009). Other factors are age greater than 60 years, dislipidemia,
diabetes, diets high in fat or salt and other co-behavioural factors like smoking,
alcoholism (Disguiseppi, 1980). A study conducted by American society of
hypertension (2000) results show women who take the birth control pill are more
susceptible to heart disease and high blood pressure.
Researchers at the University of Pittsburg have shown that hypertension may
shrink the size of the brain. This, in turn, may affect intellectual and cognitive
functions.
The medical management of hypertension with prescription drugs was steadily
improved. A class of drugs called ACE inhibitors are now often prescribed as first
line treatment. These drugs replaced earlier use of diuretics and beta blockers, whose
side effects often lead to non compliance or poor compliance (Patel& Marmot, 1987).
In 1980,s the non pharmacological management of hypertension such as the

Guided Imagery 6
behavioural interventions can be effectively used. When it combined with drug
therapy effective results were shown repeatedly (Agras, 1981: Crowther, 1983:
Ginsberg, Viskoper, et al: 1990: Patel& Marmot, 1987). The chief interventions are
exercise, weight loss programs, and relaxation techniques.
A study was conducted in Dordrecht (2009) to find out the effect of lifestyle
interventions and the medication in the treatment of hypertension, the result shows
that life style interventions including weight loss, sodium restriction, moderate
alcohol intake and behavioural modification produced a reduction in blood pressure of
9/9 mm Hg and also after the addition of various medications, an additional reduction
of 5/3 mm Hg was obtained (Elhani, 2009).
Behavioural approaches also have added advantages like improve quality of
life, improves self efficacy, improve patient feeling of being in control and improve
wellbeing. Overall contributed to reduce the number of morbidity and mortality (five
year findings, 1970. Ginsberg, Viskoper et al., Lorig, Sobel, et al: Patel& Marmot,
1999).
An alternative or complementary approach guided imagery is now finding
widespread scientific and public acceptance, and it is being used to teach psycho
physiological relaxation, alleviate anxiety and depression, relieve physical and
psychological symptoms, overcome health endangering habits, resolve conflicts, and
help patients for surgery and tolerate procedures more comfortably(Culshaw, 2002).

Guided Imagery 7
Guided imagery has been shown to promote relaxation and to improve the
quality of life specially useful for conditions that are made worse by stress, such as
high blood pressure, pain and anxiety.
1.1. NEED FOR THE STUDY
Hypertension is a worldwide challenge because of its high prevalence in the
adult population and the concominant increase in risk of stroke, myocardial infarction,
congestive heart disease, sudden cardiac death. In 2005, 1 billion people in worldwide
have high blood pressure and this number is expected to increase by 60 percent to a
total of 1.56 billion by the year 2025(Hypertension statistics, 2005). High blood
pressure killed 56, 561 people in the United States in 2006(High blood pressure
statistics, 2006).
According to American Heart Association (2004), high blood pressure is
implicated in many of the deaths and disabilities resulting from strokes. Strokes killed
143, 640 people in the United States in 1992. Nearly 58 million Americans have one
or more forms of heart or blood vessel disease. Prolonged uncontrolled or inadequate
treatment of hypertension is a major risk factor for the occurances of heart attack,
stroke, kidney failure and other cardiovascular diseases.
According to the national center for health statistics there was 35 million
outpatient visits for hypertension in 2002(Chery and Woodwell, 2002). In 2000,
44,916 deaths were attributed directly to hypertension and the disease burden were
118,000 in India (High Blood pressure statistics, 2000).
Guided Imagery 8
Behavioural therapies enhance the minds capacity to affect bodily functions
and symptoms. Healing, using mind body therapy, usually begins by promoting
physical and mental relaxation, and developing better ways of coping with stress. A
variety of techniques may be used, including biofeedback, psychotherapy, hypnosis
and guided imagery (Kozier, 2004).
Individual studies support the efficacy of imagery, relaxation training,
biofeedback with relaxation training, hypnosis, and autogenic training (Hermann,
2002: Nakao, Yaro, et al., 2003: Stetter & Kupper, 2002). These results were further
confirmed by two (2003) reviews of the medical literature. One study found evidence
of efficacy for using mind body modalities are relaxation, imagery, hypnosis and
conventional based therapy for managing hypertension (Astin & Shapiro, et al, 2003).
Guided imagery is a highly effective behavioural intervention for
hypertension. It combines deep relaxation with positive self suggestion, both of which
reduce blood pressure (Crowther, 1983; Taylor, Farquhar, et al, 1977). Researchers
from the centers for disease control and prevention have stated that ‘‘evidence for the
efficacy of certain non-pharmacologic approaches to preventing and controlling high
blood pressure is strong’’ (Labarthe & Ayala, 2002).
A study conducted in 2002 reported that relaxation techniques (Autogenic
training or progressive muscular relaxation, behavioural therapy or biofeed back
techniques), can lower elevated blood pressure by an average of 10 mmHg and 5
mmHg diastolic (Hermann, 2002).

Guided Imagery 9
Imagery is said to be a relaxation technique, similar to meditation and self
hypnosis, that has physical and psychological effects. Promotes claim it can relax the
mind and body by decreasing heart rate, lowering blood pressure, and altering
brainwaves.
A review of 46 studies that were conducted from 1966-1998 suggested that
guided imagery may be helpful in managing stress, anxiety and depression and in
lowering blood pressure, reducing pain and reducing side effects of chemotherapy
(American Cancer Society, 2000). A recent study presented at an American Heart
Association suggested that a mental relaxation have psychological benefit in reducing
high blood pressure (The Hindu, 2009).
The study was to evaluate the effectiveness of an audio relaxation tool for
lowering blood pressure. The intervention consisted of 12 sessions of guided imagery
program. The results proved a significant reduction in systolic and diastolic blood
pressure. This study provides support for the use of guided relaxation to reduce high
blood pressure in older adults (Tang, 2008).
The community health nurse is an ideal care provider at the primary and
secondary and tertiary prevention level, as well as disease management in the face of
prevalent hypertension in India and developing countries. The community health
nurse have an important role in helping clients to accept, understand and adhere to a
therapeutic plan of self care. She has major role in the secondary prevention is to
identify and assess and earlier stage, control high blood pressure and helping the
clients to overcome hypertensive consequences. To help the clients, the nurse must
understand the risk factors, management and consequences of hypertension. Guided

Guided Imagery 10
imagery is effective in resolving complications of hypertension. Hence, the researcher
tends to find out the effectiveness of guided imagery in reducing blood pressure
among hypertensive clients.
1.2. STATEMENT OF THE PROBLEM
EFFECT OF GUIDED IMAGERY ON BLOOD PRESSURE AMONG
CLIENTS WITH HYPERTENSION IN A SELECTED RURAL COMMUNITY,
COIMBATORE.
1.3. OBJECTIVES
1.3.1. To assess the level of blood pressure among hypertensive clients.
1.3.2. To administer guided imagery for hypertensive clients.
1.3.3. To evaluate the effect of guided imagery among hypertensive clients.
1.4. OPERATIONAL DEFINITION
1.4.1. Effect
The result of guided imagery on blood pressure level.
1.4.2. Guided Imagery
A client is guided in imagining a relaxing scene or series of experiences is
given in duration of 20 minutes for the study period of 12 sessions.
1.4.3. Hypertensive Clients
Client’s with hypertension residing at Idikarai village.

Guided Imagery 11
1.5. CONCEPTUAL FRAMEWORK
The conceptual framework used for this study is based on general system
model approach. General system theory serves as a model for viewing man as
interacting with environment. It was developed by Bertalanffy (1968) and modified
by J.W. Kenny and named as a open system is made up of separate components. The
components are interrelated and share a common purpose to form a whole. An open
system, such as human organism or processes like the nursing process, interacts with
the environment, exchanging information between the system and the environment.
The main concept of general system theory is input, throughput, output and
feedback.
Input
It refers to any form of information, energy or material that enters into system
through boundary. In this study researcher collected baseline data, health history and
measured the level of blood pressure by using digital sphygmomanometer.
Throughput
It refers to the process where by its transforms, creates and organize.
Researcher in this study administered the guided imagery in the duration of 20
minutes for the period of 12 sessions to the experimental group.
Output
It refers to energy, information or material as a result of throughput. In this
study output expected is change in level of blood pressure in experimental group.
Feedback
Compare the level of blood pressure in experimental and control group
respectively.

Guided Imagery 12
FIG 1.1.
MODIFIED CONCEPTUAL FRAMEWORK BASED ON GENERAL
SYSTEM THEORY BY LUDWIG VON BERTALANFFY (1968)
INPUT
Experimental group
Administer guided imagery for
the hypertensive clients with or
without antihypertensive
medications
Reassess the level of
blood pressure
THROUGHPUT OUTPUT
(i) Assessment of blood
pressure by using digital
sphygmomanometer
(ii) Collecting baseline data,
and health history of
hypertensive clients.
Control group
No intervention for the
hypertensive clients with or
without antihypertensive
medications
FEED BACK
Guided imagery was found to be
effective in reducing the level of
blood pressure on experimental
group Kozier & Erbs (2002)

Guided Imagery 13
1.6. PROJECTED OUTCOME
Administration of guided imagery among hypertensive clients helps to reduce
blood pressure level.
Guided Imagery 14
LITERATURE REVIEW
Literature review is an essential component for the researcher for a greater
understanding of the research problem and its major aspects. It provides the
investigator with an opportunity to evaluate different approaches to obtain the most
current facts, and selection or development of the theoretical or methodological
approaches to the problem.
The literature review arranged in the followed sections
2.1. Literatures related to Hypertension.
2.2. Literatures related to Guided imagery
2.3. Literatures related to Guided imagery on blood pressure level.
2.1. LITERATURES RELATED TO HYPERTENSION
Hypertension is defined as persistent elevation of the systolic blood pressure at
the level of 140 mmHg or higher and diastolic blood pressure at the level of 90 mmHg
or higher (Black, 2009).
Hypertension is prevalent in developing as well as in developed countries.
There are approximately 970 million people affected by hypertension worldwide.
which is estimated to increase to 1.56 million individuals by 2025. That translates to
about 1 out of every 4 adults being affected with hypertension. Prolonged
uncontrolled or inadequate treatment of hypertension is a major risk factor for the
occurrences of heart attack, stroke, kidney failure and other cardiovascular diseases
(Hypertension Statistics, 2005).

Guided Imagery 15
An adult blood pressure tends to rise with advancing age. The optimal blood
pressure for a healthy, middle age adult is less than 120/80 mmHg (National High
Blood Pressure Education (NHBPEP, 2003).
The study results shown that an increased age is associated with significant
increase in the prevalence of hypertension and especially of systolic hypertension
after age 60 years. Increased obesity between age 30-50 years is associated with
significant increase in diastolic blood pressure (Anderson, 1999).
A sedentary life style is a major risk factor for heart and blood vessel
(cardiovascular) disease. People who are less active and less physically fit have a
30% - 50% greater frequency of hypertension than their more active people (Makoff,
2008).
The noxious effects of smoking are related to sympathetic nervous over
activity, which increase myocardial oxygen consumption through a rise in blood
pressure, heart rate and myocardial contractility. The incidence of hypertension is
increased among those who smoke 15 or more cigarettes per day, and the coexistence
of hypertension and smoking decreases left ventricular function in asymptomatic
people (Kaplan, 2008).
It is a worldwide challenge because of its prevalence in the adult population
and the concomitant increase in risk of stroke, myocardial infarction, sudden cardiac
death and end stage renal disease. Many studies have shown that risk factors for
hypertension include older age, female gender, smoking, alcohol consumption,
unemployment, low education level, stress, family history, insufficient physical

Guided Imagery 16
activities, bad dietary habits, obesity, elevated total cholesterol and diabetes (Aslantas,
2008).
Studies are supporting that there is correlation between the development of
hypertension and psychological factors. Researchers suggest that psychological
aspects predispose to hypertension by altering central nervous system control of
baroreceptors function, opioid activity and neurotransmitter levels (Semplicini, 2009).
An elevation of the systolic and diastolic blood pressure increases the risk of
developing heart (Cardiac) disease, kidney disease, hardening of the arteries
(atherosclerosis or arteriosclerosis), eye damage, and stroke (Brain damage). These
complications of hypertension are often referred to as end-organ damage to these
organs is the end result of chronic high blood pressure (John, Cunha & Marks, 2010).
2.2. LITERATURES RELATED TO GUIDED IMAGERY
Guided imagery has been effective in many areas for the mind, body and spirit
by lowering cholesterol, reducing blood pressure and lessening the adverse effects of
chemotherapy etc (Hartford Hospital, 2002).
Guided imagery is a technique in which a person imagines pictures, sounds,
smells, and other sensations associated with reaching a goal. Imagining being in a
certain environment or situation can activate the senses, producing a physical or
psychological effect. studies have shown that practicing guided imagery may able to,
temporarily increase numbers of immune system cells to keep the rest of your body
healthy, help reduce feelings of depression, increase feelings of well-being (Mayo
clinic, 2008).

Guided Imagery 17
Guided imagery is considered a complementary therapy that works well with
traditional treatments. Guided imagery can reduce stress, anxiety, enhance personal
awareness, and improve psychological coping skills (The Cancer Section of the
Medical Librarian Association, 2004).
The value of imagery is that imagery can diagnose a problem, provide options
for change, and even promote healing and personal empowerment. Its primary
purpose is to allow the body to relax, healing the physical and emotional aspects of
person (Charles& Leviton, 2000).
Imagery is said to be a relaxation techniques, similar to meditation and self
hypnosis that has physical and psychological effects. Promotes claim it can relax the
mind and body by decreasing heart rate, lowering blood pressure, and altering brain
waves (Rose, 2010).
Guided imagery significantly improved the overall quality of life for the
participants, by reducing symptoms such as pain, improving their immune response
which improved their recovery rate and shortened the length of time of their illness,
and improved their self esteem. The relaxation response brings your system back into
balance, deepening your breathing, reducing stress hormones, slowing down your
heart rate and blood pressure, and relaxing your muscles (Segal, 2008).
Over the past 25 years, the effectiveness of guided imagery has been
increasingly established by research findings that demonstrate its positive impact on
health, creativity and performance. Even 10 minutes of imagery can reduce blood
pressure, lower cholesterol and glucose levels in the blood, and heighten short term

Guided Imagery 18
immune cell activity. The report says all along in their belief of employing images in
the brain to enliven the heart and body. Guided imagery is helping patients to use the
full range of the bodys healing capacity (Naperstek, 2000).
A study was conducted to examine the effects of three relaxation therapies for
the reduction of high blood pressure. Subjects were randomly assigned to three groups
are stretch relaxation, progressive muscle relaxation and cognitive imagery relaxation.
After 30 days the follow up session results revealed that mean reduction in systolic,
diastolic blood pressure and heart rate for all relaxation therapies (Yung, 2001).
There are hundreds of research studies documenting the effectiveness of mind
body healing techniques. The study conducted to examine the effects of mind body
healing therapies that have both positive and negative emotions influence peoples
susceptibility to infection among people with higher levels of stress or positive moods
(Speigal, 2000).
Repeatedly studies prove that mind body healing therapies, increase energy
levels, promote relaxing brainwave activity, lowers blood pressure, lowers pulse rate,
enhances immune system function, enhances the sense of wellbeing , helps to treat
heart disease, reduces cardiac events and deaths and helps recovery (Selye, 2006).
According to the Mayo Clinic health letter, Aristotle and Hippocrates had it
right all along in their belief of employing images in the brain to enliven the heart and
body. Today, guided imagery is helpful hence patients use the full range of the body’s
healing capacity (Mayo Clinic, 2008).

Guided Imagery 19
Another study conducted to examine the effect of body mind therapies as a
treatment of hypertension. The effect of those therapies is clinically significant in
reducing blood pressure level (Ali, 2007).
A study was conducted to examine the effect of guided imagery the
participants who spent 5 minutes a day practicing a guided meditation exercise
reported significantly reduction in stress levels and enhanced feelings of wellbeing
(Goldstain, 2005).
Another study was conducted among hypertensive clients to examine the
effects of the most popular mind body therapies (Meditation, Yoga, Imagery) on
systolic and diastolic blood pressure level. Mind body therapies significantly reduced
systolic and diastolic blood pressure by a mean 11.52 mmHg and diastolic blood
pressure by 6.83 mmHg. The review shows that there is some high quality scientific
literature supporting the use of mind body therapies as a treatment for hypertension,
and the magnitude of effect is clinically significant.
2.3. LITERATURES RELATED TO GUIDED IMAGERY ON BLOOD
PRESSURE
The effect of guided vivid imagery sends a message to the emotional control
center of the brain. From there the message is passed along to the endocrine, immune
and autonomic nervous system. These systems influence a wide range of bodily
functions, including heart rate, breathing rates and blood pressure (Yung, 2001).
A study suggest that practicing a guided imagery program once daily for 20
minutes results in keep positive mood, good health and high ability of vividness. The

Guided Imagery 20
subjects relaxed their mind and body, thereby reducing stress and maintaining their
health. The study concluded that regular daily practice of guided imagery program
have a possibility to conform benefits in reducing stress and improving health
(Wantanabe, 2005).
In a 1997 study at the University of Miami, researchers found that guided
imagery helped to elevate the mood and decrease stress. The participants rated their
moods before and after practicing guided imagery and had their blood levels of the
stress hormone cortisol measured. The subjects who used guided imagery reported
significant decrease in depression, fatigue, and total mood disturbance are measured
significant decrease in cortisol, as compared to the control group.
The research study conducted among 28 health care employees working in
healthcare settings. Four guided imagery sessions, one per week on the same day of
the week was administered. Study results showed a mean difference between pre and
post systolic blood pressure as 10.5000. The difference of pre and post test stress level
for guided imagery session revealed a mean of 2.774464. Data results confirmed that
the physiological response to guided imagery is evident with healthcare employees
(Kruschke, 2008).
The research study conducted on one hundred and four patients undergoing
open heart surgery were prospectively randomized to receive either complementary
therapy (preoperative guided imagery training with gentle touch or light massage and
post operative music with gentle touch or light massage and guided imagery). Results
have shown a decrease in heart rate and systolic pressure in the complementary
therapies.

Guided Imagery 21
Another study conducted to investigate the effect of guided imagery among 42
university students. Participants were offered guided imagery compact disks and
encouraged to practice daily. Results show that there was a significant reduction in
diastolic blood pressure level (Kingston, 2006).
A study conducted among 28 healthy adults guided imagery and music sessions
given for 3 week intervention. Results shown significant decrease between pre and
post session depression, fatigue, and total mood disturbance and had significant
decreases in cortisol level by follow up (Mckinney, 1997).
A study was conducted among 14 older adults. The intervention consisted of 12
sessions of a guided relaxation program. Comparing pre and post parameters for all
sessions, the intervention resulted in a statistically significant reduction in systolic
pressure and diastolic pressure. The 12 minute relaxation audio program can be used
for high blood pressure prevention or in conjunction with antihypertensive
medications for blood pressure management (Tang, 2008).

Guided Imagery 22
METHODOLOGY
The present study was designed to assess the effectiveness of guided imagery
among hypertensive clients. This chapter deals with the description of the research
approach, research design, setting, population, sample and sampling technique,
development and description of tools, procedure for data collection and plan for data
analysis.
3.1. RESEARCH APPROACH
The present study is aimed at administering guided imagery among
hypertensive clients and determining its effectiveness. Hence, an evaluative research
approach has been used for the study.
3.2. RESEARCH DESIGN
The research design used for the present study was quasi experimental -pretest
posttest control group design.
General Population
Identification of hypertensive clients through survey
Comparison (to determine the effectiveness of guided imagery)
Pretest
Experimental group Control group
Post test
Random assignment

Guided Imagery 23
3.3 SETTING
The study was conducted in Idikarai village, Coimbatore. It is a rural
community adopted by college of Nursing, SRIPMS which is 12 kms from the
College of Nursing. In Idikarai the total population is 7065. Most of the people
residing in this area are working in textile companies. People were seeking health
facilities from the subcentre located at Idikarai which is functioning under the
Vellakinaru Primary Health Centre.
3.4 POPULATION
The target population was clients with known hypertension.
3.5. CRITERIA FOR SAMPLE SELECTION
3.5.1 Inclusion criteria
Samples with the following criteria were included in the study:
1. Clients with hypertension who are 30 and above.
2. Those with adequate hearing acuity to hear verbal audio taped instructions.
3. Those who can understand Tamil.
3.5.2. Exclusion criteria
The following samples were excluded from the study,
Hypertensive clients experiencing posttraumatic stress disorder or sensory
deprivation.
Guided Imagery 24
3.6. SAMPLING
Purposive sample of eighty with known hypertensive clients were selected for
the study. The selected samples were randomly assigned into experimental and
control group.
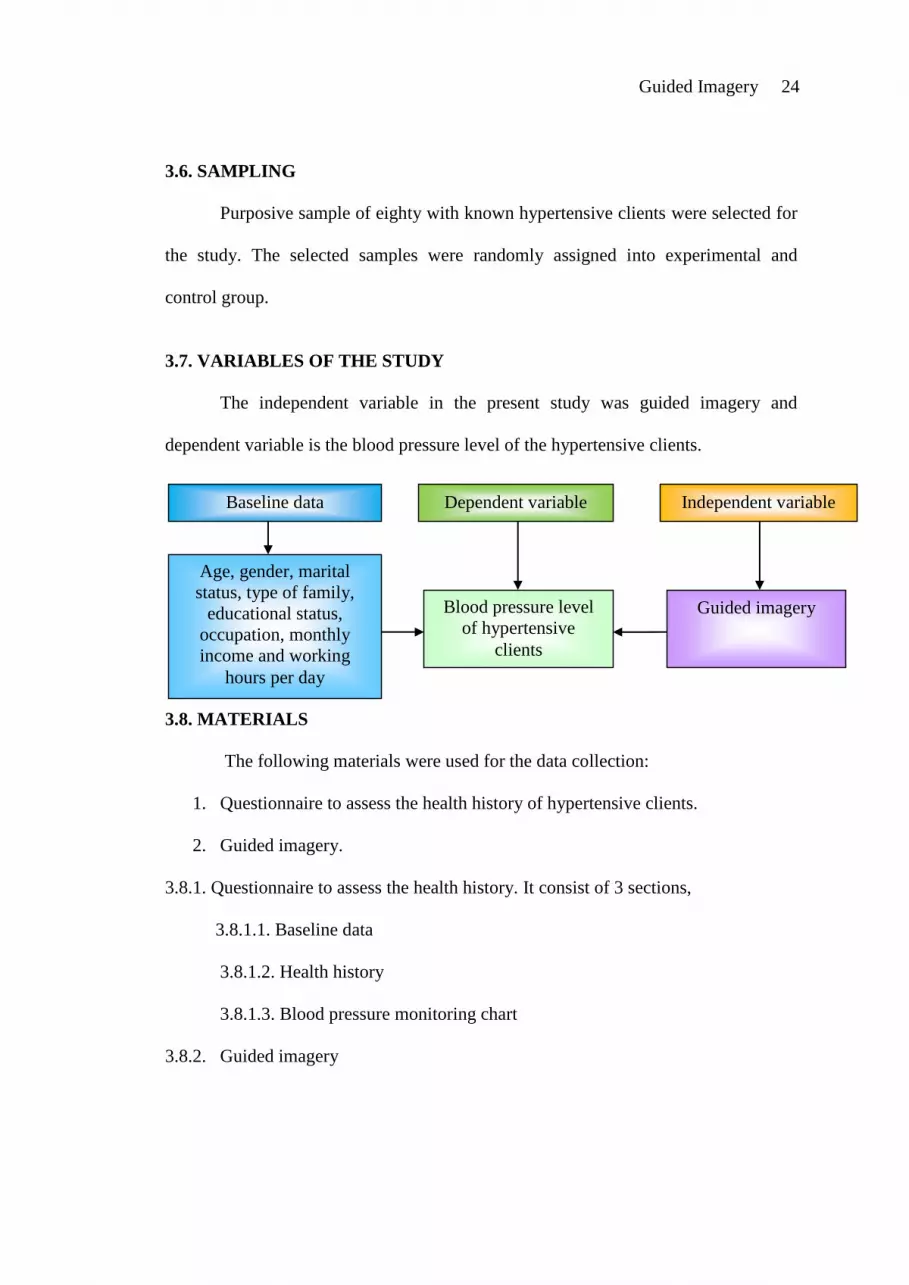
3.7. VARIABLES OF THE STUDY
The independent variable in the present study was guided imagery and
dependent variable is the blood pressure level of the hypertensive clients.
3.8. MATERIALS
The following materials were used for the data collection:
1. Questionnaire to assess the health history of hypertensive clients.
2. Guided imagery.
3.8.1. Questionnaire to assess the health history. It consist of 3 sections,
3.8.1.1. Baseline data
3.8.1.2. Health history
3.8.1.3. Blood pressure monitoring chart
3.8.2. Guided imagery
Baseline data
Age, gender, marital
status, type of family,
educational status,
occupation, monthly
income and working
hours per day
Dependent variable
Blood pressure level
of hypertensive
clients
Independent variable
Guided imagery

Guided Imagery 25
3.8.1.1. Baseline Data
Baseline data consists of age, gender, marital status, type of family,
educational status, occupation, nature of work and working hours per day.
3.8.1.2. Health History
Health history consists of height, weight, body mass index, family history,
history of taking any antihypertensive medications, personal habits like smoking,
betal nut, tobacco/pan chewing, alcohol drinking, exercise, diet, history of oral
contraceptive drugs and leisure activities.
3.8.1.3. Blood Pressure Monitoring Chart
The blood pressure monitoring chart consist of three columns, the first column
is the number of days, second column the level of blood pressure measured before
guided imagery and third column is the level of blood pressure measured after guided
imagery.
3.8.2. Guided imagery
1. Find quiet comfortable place and ask the client to sit in comfortable position.
2. Instruct the person to follow the instructions while practicing this relaxation
technique.
3. Take a few slow and deep breaths to centre the attention
4. Deeply exhale and feel all the muscles are getting in relaxed state and all the
tension is flowing out of his body.
5. Instruct them to repeat the exercise for six times.
6. Ask the person to gently close the eyes.

Guided Imagery 26
7. In this relaxed state the client should hear the audio tapped verbal instructions
and imaging themselves in the sceneries as described in the script by using all
of his senses.
8. Remain within your scene, touring its various aspects for 20 minutes.
9. After that instruct them to slowly open the eyes and then rejoin the world.
3.9. VALIDITY OF THE TOOLS
The tool was developed by the present researcher and was been validated by
five experts in the field. Standardized instruments were used to measure biophysical
variable.
3.10. HYPOTHESES
H1: There is no significant difference in the level of blood pressure between
experimental group and control group before guided imagery.
H2: There is a significant difference in the level of blood pressure in the
experimental group before and after guided imagery.
H3 : There is no significant difference in the level of blood pressure in the control
group before and after guided imagery.
H4 : There is a significant difference in the level of blood pressure in the
experimental group and control group after guided imagery.
3.11. PILOT STUDY
Pilot study was conducted to find out the feasibility, practicability, validity of
the study. The study was conducted among hypertensive clients residing at
Karuppukal Thottam and Dhanalakshmi Nagar for a period of ten days. After the
initial survey, purposive sample of 20 samples were selected for the study. After that

Guided Imagery 27
20 samples were randomly assigned into experimental and control group. The
baseline data, health history, and blood pressure were assessed for both experimental
and control group. Guided imagery was provided to experimental group in the period
of ten days and blood pressure was measured before and after giving intervention by
using Digital sphygmomanometer. And for control group without any intervention
blood pressure was measured. The data collected was carefully, analysed and there
was a significant reduction of blood pressure among hypertensive clients in the
experimental group which was found feasible.
3.12. MAIN STUDY
The main study was conducted to meet the objectives of present study. Data
was collected for a period of 30 days. The study was conducted in Idigarai, rural
community of Coimbatore. Initially in the first two days 86 hypertensive clients were
identified through survey. Purposive sampling of eighty was selected for the study.
After that 80 samples were randomly assigned into experimental group and control
group. The baseline data, health history and blood pressure were assessed for both
experimental and control group.
Experimental group practiced 20 minutes of guided imagery for 12 sessions
and the researcher assessed the blood pressure level before and after administering
guided imagery. Where as in control group there was no practice of guided imagery
but the blood pressure were measured for 12 sessions.
Guided Imagery 28
3.13. TECHNIQUES OF DATA ANALYSIS
Appropriate statistical tools such as descriptive statistics and inferential
statistics were applied to analyse the data. Paired ‘t’ test was used to find out the
significant difference between before and after administering guided imagery and the
unpaired ‘t’ test was adopted to findout the significant difference between
experimental and control group.

Guided Imagery 29
DATA ANALYSIS AND INTERPRETATION
The study was intended to find out the effect of guided imagery on reducing
blood pressure among hypertensive clients. Data was collected from a sample of 80
hypertensive clients. The findings were tabulated analyzed and interpreted in this
chapter. The data was computed using descriptive and inferential statistics.
SECTION – I
4.1. BASELINE DATA PRESENTATION
The baseline data of hypertensive clients were collected in terms of age,
gender, marital status, type of family, educational status, occupation, income and
working hours per day. The data were presented in the form of tables and graphs.

Guided Imagery 30
TABLE 4.1.
DISTRIBUTION OF RESPONDENTS BASED ON BASELINE DATA
(N=80)
Demographic
variables
Experimental group Control group
No. of
Respondents Percentage (%)
No. of
Respondents
Percentage
(%)
Age in years
31 – 40 1 2 4 10
41 -50 4 10 11 27
51 – 60 14 35 12 30
61 – 70 15 38 10 25
> 71 years 6 15 3 8
Gender
Male 6 15 9 22
Female 34 85 31 78
Marital Status
Married 40 100 39 98
Unmarried - - 1 2
Type of family
Nuclear 28 70 26 65
Joint 12 30 14 35
Educational Status
Illiterate 20 50 25 62
Primary education 10 25 7 18
Secondary
Education 8 20 8 20
Degree 2 5 - -
Occupation
Housewives 35 87 27 67
Coolie 3 8 8 20
Business 2 5 5 13
Monthly Income
(in Rs.)
None 35 87 27 67
< 1000 - - 2 5
1001 – 3000 - - 5 13
3001 – 5000 2 5 1 2
>5000 3 8 5 13

Guided Imagery 31
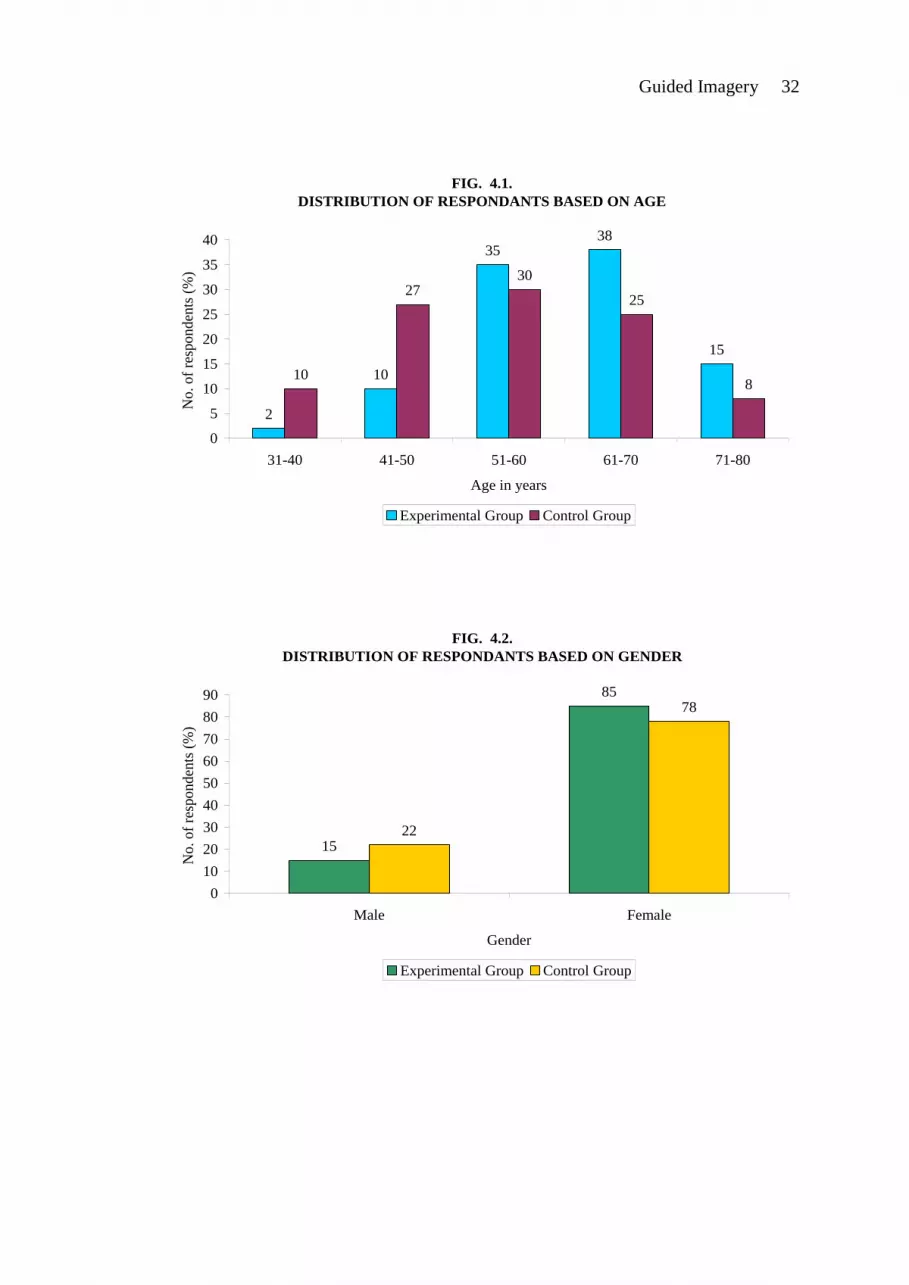
The above mentioned table reveals that in experimental group around 73
percent of them and in control group, 55 percent of them were belong to the age
groups of 51-70 years. The gender distribution reveals that in experimental group, 85
percent of them were females and 15 percent of were males. In control group, 78
percent of them were females and 22 percent of them were males and 100 percent of
them from experimental group and 98 percent of them from control group were
married.
The type of family distribution reveals 70 percent of them from experimental
group and 65 percent from control group were from nuclear families. 50 percent from
experimental group and 62 percent from control group were illiterate and 20 percent
from experimental and control group had secondary education. 87 percent of them
from experimental group and 67 percent from control group were housewives.
Guided Imagery 32
FIG. 4.1.
DISTRIBUTION OF RESPONDANTS BASED ON AGE
2
10
3538
15
10
2730
25
8
0
5
10
15
20
25
30
35
40
31-40 41-50 51-60 61-70 71-80
Age in years
No.
of
resp
onden
ts (
%)
Experimental Group Control Group
FIG. 4.2.
DISTRIBUTION OF RESPONDANTS BASED ON GENDER
15
85
22
78
0
10
20
30
40
50
60
70
80
90
Male Female
Gender
No.
of
resp
onden
ts (
%)
Experimental Group Control Group

Guided Imagery 33
SECTION- II
4.2. DATA PRESENTATION ON HEALTH HISTORY
The health history of hypertensive clients were collected in terms of body
mass index, family history of hypertension, health habits like smoking, alcoholism,
food habits and history of oral contraceptives.
TABLE 4.2.
DISTRIBUTION ON HEALTH HISTORY
(N=80)
Health History
Experimental group Control group
No. of
Respondents Percentage (%)
No. of
Respondents
Percentage
(%)
Body Mass Index
<18.50 2 5 2 5
18.51-24.99 30 75 28 70
>25 8 20 10 25
Health History
Family history
of hypertension 2 5 - -
No family history 38 95 40 100
History of taking
antihypertensive
drugs
29 73 27 67
Not taking drugs 11 27 13 33
Health habits
Smoking
Smokers 7 18 10 25
Non Smokers 33 82 30 75
Alcoholism
Alcoholic 1 2 3 8
Non Alcoholic 39 98 37 92

Guided Imagery 34
Health History Experimental group Control group
No. of
Respondents Percentage (%)
No. of
Respondents
Percentage
(%)
Food Habits
Non vegetarian 39 98 40 100
Vegetarian 1 2 - -
History of oral
contraceptive drugs
History of taking
oral contraceptive
drugs
- - 2 5
No history of oral
contraceptive drugs 40 100 38 95
The above table reveals that more than 70 percent of respondents in both the
groups had normal body weight. 95 percent from experimental group and 100 percent
from control group had no family history of hypertension. 73 percent from
experimental group and 67 percent from control group have the history of taking
antihypertensive drugs. The health distribution reveals that 18 percent from
experimental group and 25 percent from control group were smokers. 2 percent from
experimental group and 8 percent from control group were alcoholics. The diet
distribution reveals that 98 percent from experimental group and 100 percent from
control group were non vegetarians. 100 percent from experimental group and 95
percent from control group were not having history of taking contraceptive drugs.

Guided Imagery 35
FIG. 4.3.
DISTRIBUTION OF RESPONDENTS BASED ON BODY MASS INDEX
5
75
20
5
70
25
0
10
20
30
40
50
60
70
80
<18.5 18.51-24.99 > 25
Body mass index
No
. o
f re
spo
nd
ents
(%
)
Experimental Group Control Group
FIG. 4.4.
DISTRIBUTION OF RESPONDENTS BASED ON SMOKING
18
82
25
75
0
10
20
30
40
50
60
70
80
90
Smokers Non smokers
Smoking
No
. o
f re
spo
nd
ents
(%
)
Experimental Group Control Group
Guided Imagery 36
SECTION- III
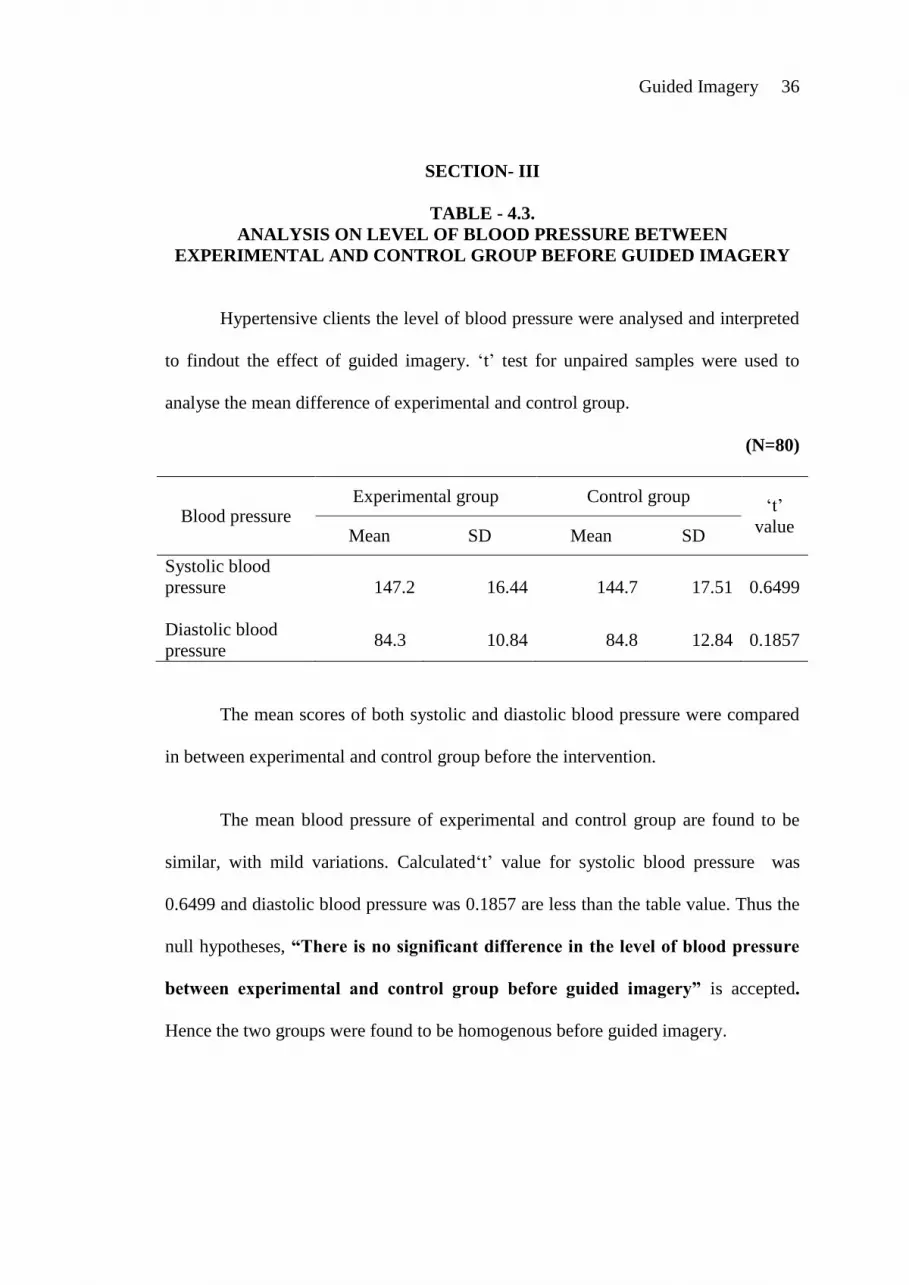
TABLE - 4.3.
ANALYSIS ON LEVEL OF BLOOD PRESSURE BETWEEN
EXPERIMENTAL AND CONTROL GROUP BEFORE GUIDED IMAGERY
Hypertensive clients the level of blood pressure were analysed and interpreted
to findout the effect of guided imagery. ‘t’ test for unpaired samples were used to
analyse the mean difference of experimental and control group.
(N=80)
Blood pressure Experimental group Control group
‘t’
value Mean SD Mean SD
Systolic blood
pressure
147.2 16.44 144.7 17.51 0.6499
Diastolic blood
pressure 84.3 10.84 84.8 12.84 0.1857
The mean scores of both systolic and diastolic blood pressure were compared
in between experimental and control group before the intervention.
The mean blood pressure of experimental and control group are found to be
similar, with mild variations. Calculated‘t’ value for systolic blood pressure was
0.6499 and diastolic blood pressure was 0.1857 are less than the table value. Thus the
null hypotheses, “There is no significant difference in the level of blood pressure
between experimental and control group before guided imagery” is accepted.
Hence the two groups were found to be homogenous before guided imagery.

Guided Imagery 37
TABLE 4.4.
ANALYSIS ON LEVEL OF BLOOD PRESSURE IN
THE EXPERIMENTAL GROUP BEFORE AND
AFTER GUIDED IMAGERY
(N=80)
Blood
pressure
Before After Mean
difference ‘t’
Mean SD Mean SD
Systolic blood
pressure 147.2 16.44 125.1 14.86 22.1 24.5381**
Diastolic
blood pressure 84.3 10.84 77.25 11.06 7.05 21.1426**
** significant at 0.01 level
The data presented in the table indicates that the mean pretest of systolic blood
pressure was 147.2 mm Hg and it reduces to 125.1 mm Hg during post test. This
shows an average decrease of systolic blood pressure was 22.1. The calculated ‘t’
value of pretest and post test of systolic blood pressure was 24.5381, is greater than
the table value.
The mean pretest of diastolic blood pressure was 84.3 mm Hg and it reduces
to 77.25 mm Hg during post test. This shows average decrease of diastolic blood
pressure was 7.05. The ‘t’ value of pretest and post test of diastolic blood pressure
was 21.1426 is greater than the table value. This reveals “There is a significant
difference found in experimental group before and after guided imagery”.

Guided Imagery 38
TABLE 4.5.
ANALYSIS ON LEVEL OF BLOOD PRESSURE IN THE
CONTROL GROUP BEFORE AND AFTER GUIDED IMAGERY
(N=80)
Control group
Before After Mean
difference ‘t’ Mean
(mmHg) SD
Mean
(mmHg) SD
Systolic blood
pressure 144.7 17.51 141.5 17.45 3.2 13.5101**
Diastolic blood
pressure 84.8 12.84 82.9 13.04 1.9 15.9606**
** significant at 0.01 level
The mean pretest systolic blood pressure was 144.7 mm Hg and it reduces to
141.5 mm Hg during post test. This shows average decrease of systolic blood pressure
of 3.2. The ‘t’ value of pretest and post test of systolic blood pressure was 13.5101is
greater than the table value.
The mean pretest diastolic blood pressure was 84.8 mm Hg and it reduces to
82.9 mm Hg during post test. This shows average decrease of diastolic blood pressure
of 1.9. The t value of pretest post test diastolic blood pressure was 15.9606 is greater
than the table value. This reveals that “There is a significant difference found in
control group before and after intervention”.
Guided Imagery 39
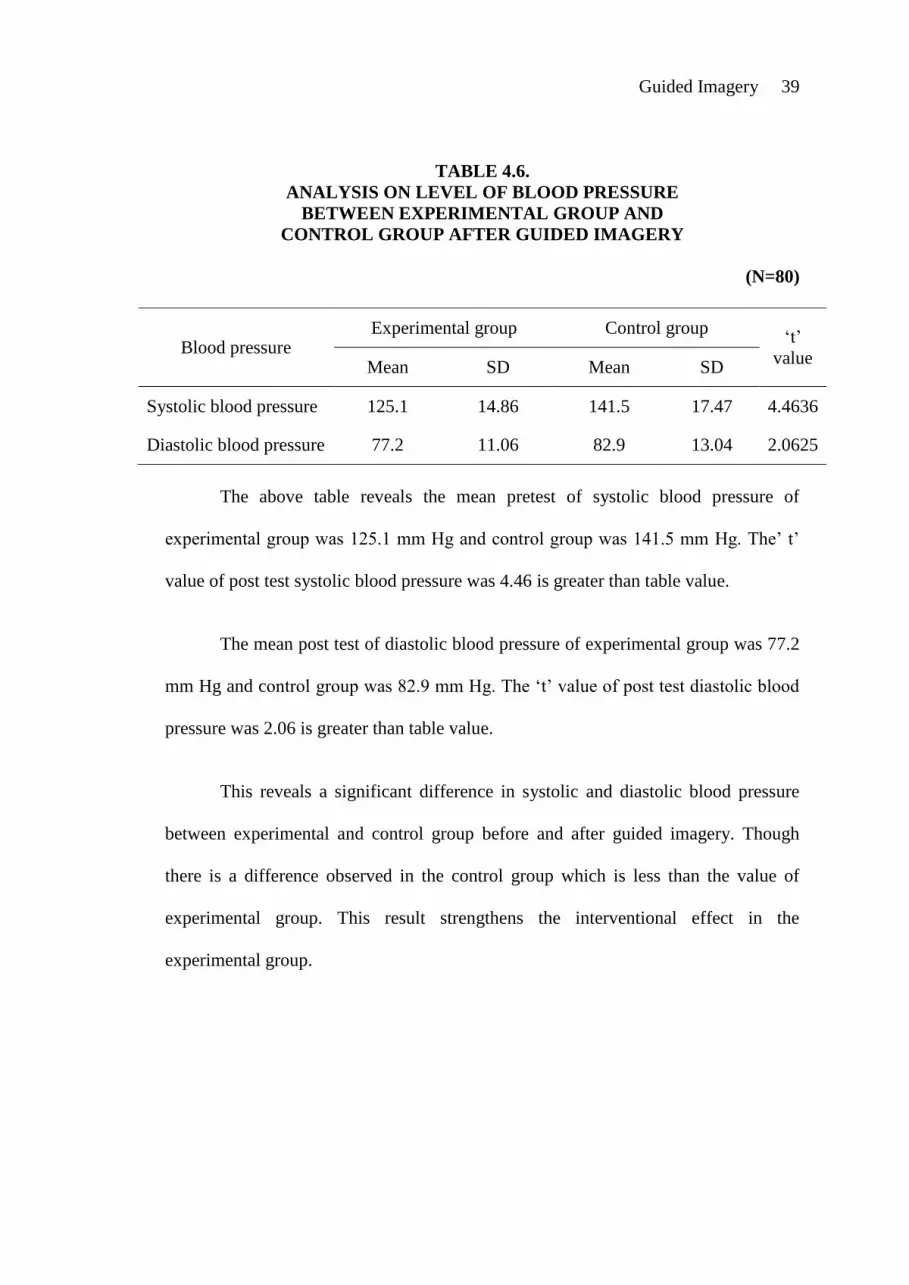
TABLE 4.6.
ANALYSIS ON LEVEL OF BLOOD PRESSURE
BETWEEN EXPERIMENTAL GROUP AND
CONTROL GROUP AFTER GUIDED IMAGERY
(N=80)
Blood pressure Experimental group Control group
‘t’
value Mean SD Mean SD
Systolic blood pressure 125.1 14.86 141.5 17.47 4.4636
Diastolic blood pressure 77.2 11.06 82.9 13.04 2.0625
The above table reveals the mean pretest of systolic blood pressure of
experimental group was 125.1 mm Hg and control group was 141.5 mm Hg. The’ t’
value of post test systolic blood pressure was 4.46 is greater than table value.
The mean post test of diastolic blood pressure of experimental group was 77.2
mm Hg and control group was 82.9 mm Hg. The ‘t’ value of post test diastolic blood
pressure was 2.06 is greater than table value.
This reveals a significant difference in systolic and diastolic blood pressure
between experimental and control group before and after guided imagery. Though
there is a difference observed in the control group which is less than the value of
experimental group. This result strengthens the interventional effect in the
experimental group.

Guided Imagery 40
FIG. 4.5.
COMPARISON OF BLOOD PRESSURE
125.1
77.2
141.5
82.9
0
20
40
60
80
100
120
140
160
Systolic blood pressure Diastolic blood pressure
Blo
od p
ress
ure
(m
mH
g)
Experimental Group Control Group

Guided Imagery 41
RESULTS AND DISCUSSION
The present chapter reveals that results and discussion in detail. The analysed
data is being discussed under various sections. It deals about baseline data, health
history and the comparison of blood pressure before and after the therapy of guided
imagery.
5.1. FINDINGS RELATED TO BASELINE DATA OF THE RESPONDENTS
In the present study, 40 respondents in experimental group and 40 respondents
in the control group were selected. Table 4.1 reveals that in experimental group 35
percent of the respondents were found between the age of 51-60 years and 38 percent
respondents were found between the age of 61-70 years but in control group 27
percent respondents were between 41-50 years of age, 30 percent of the respondents
were between 51-60 years of age and 25 percent of respondents were between the age
group of 61-70 years. This findings goes in line with the study findings of Anderson
(1999) reports that increased age is associated with a significant increase in the
prevalence of hypertension and especially of systolic hypertension after 50 years.
Among gender 85 percent respondents of experimental group and 78 percent of
respondents of control group were females. And 15 percent respondents from
experimental group and 22 percent of respondents from control group were males.
Based on marital status 100 percent of the respondents of experimental group and 98
percent of respondents from control group were married. In respect to status of type of
family, 70 percent of the respondents from experimental group and 65 percent of
respondents from control group belonged to nuclear families. And 30 percent of
respondents from experimental group and 35 percent of respondents from control

Guided Imagery 42
group were belonged to joint families. About educational status, 50 percent of the
respondents were illiterate and 25 percent of respondents had primary education and
20 percent of respondents had secondary education in experimental group and where
as in control group 62 percent of respondents were illiterate and 20 percent of
respondents had secondary education.
Based on the occupation majority of the respondents from experimental group
and control group were housewives that were 87 percent and 67 percent respectively.
And 8 percent of respondents were coolie workers and 5 percent of respondents were
doing business and 20 percent of respondents were coolie workers and 13 percent
were doing business. Based on the monthly income 5 percent of the respondents were
earning between Rs. 3001-5000 and 8 percent of respondents were earning above Rs.
5000 in the experimental group where as in control group 13 percent of respondents
earning Rs. 1001-3000 and 13 percent of respondents were earning above Rs. 5000.
5.2. FINDINGS RELATED TO HEALTH HISTORY OF THE RESPONDENTS
In experimental group 75 percent of the respondents were in the normal body
weight category and 20 percent of the respondents were obese, and where as in
control group 70 percent of the respondents were in the normal body weight category
and 25 percent of the respondents were obese. This findings goes in line with this
study by Anderson (1999) reports that increased obesity between the age of 30-50
years is associated with significant increases in diastolic blood pressure. About 95
percent of the respondents from experimental group and 100 percent of the
respondents from control group were not having the family history of hypertension. In
this study people were not aware about the health problem was existed in their family

Guided Imagery 43
members. This findings goes in line with study findings of Manson(2000) reports that
persons with family history of hypertension are more suspectible to developing
hypertension.
In experimental group, about 73 percent of the respondents were taking
antihypertensive drugs and 27 percent of respondents were not taking any
antihypertensive drugs, where as in control group 67 percent of the respondents were
taking antihypertensive drugs and 33 percent of the respondents were not taking any
anti hypertensive drugs. About 18 percent of the respondents were smokers and 82
percent of respondents were nonsmokers in experimental group. And where as in
control group 25 percent of the respondents were smokers and 75 percent of
respondents were nonsmokers.
In experimental group 98 percent of respondents were non-alcoholics and 2
percent of respondents were alcoholics where as in control group 92 percent of
respondents were non-alcoholics and 8 percent of respondents were alcoholics. Based
on food habit 98 percent of the respondents were non-vegetarians and 2 percent of
respondents were vegetarian in experimental group where as in control group 100
percent of respondents were non-vegetarians. Majority of the female respondents
from experimental and control group did not have a history of taking oral
contraceptives drugs that was 100 percent and 95 percent respectively. This findings
goes in line with this study conducted by American Society of Hypertension on
(2000) a result shows women who take the birth control pill are more susceptible to
heart disease and high blood pressure.

Guided Imagery 44
5.3.1. Assessment on level of blood pressure between experimental and control
group before guided imagery
Table.4.3. reveals, that 40 each hypertensive clients in experimental and
control group were randomly assigned and level of blood pressure were assessed. The
mean systolic blood pressure of experimental group was 147.2 mm Hg and control
group was 144.7 mm Hg. The mean diastolic blood pressure of experimental group
was 84.3 mm Hg and control group was 84.8 mm Hg. The ‘t’ values of systolic blood
pressure and diastolic blood pressure was 0.6499 and 0.1857 respectively. This
reveals the ‘t’ values are less than the table values. Hence, the hypothesis, H1 “
There is no significant difference in the level of the blood pressure between
experimental group and control group before guided imagery” is accepted. Since,
the two groups are found to be homogenous.
5.3.2. Assessment on level of blood pressure in the experimental group before
and after guided imagery
Table 4.4.shows that the blood pressure was measured before and after
intervention for the experimental group. The mean pretest systolic blood pressure was
147.2 mm Hg and it reduced to 125.1mmHg during post test. This shows average
decrease of systolic pressure was 22.1. The mean pre test diastolic blood pressure was
84.3 mmHg and it was reduced to 77.25 mmHg during post test. This shows average
decrease of diastolic blood pressure was 7.05. The calculated ‘t ‘values was found to
be systolic blood pressure and diastolic blood pressure was 24.53 and 21.14
respectively is greater than table value. Thus the hypothesis, H2 “There is a
significant difference in the level of blood pressure in the experimental group

Guided Imagery 45
before and after guided imagery” is accepted. This proved that the guided imagery
had its role in reduction of blood pressure in the experimental group.
These findings are consistent with the finding of the study(Tang, 2008) on
effect of guided imagery among older hypertensive clients. The intervention
consisted of 12 sessions of a guided relaxation program. The study results reveal that
there is a significant association in reducing blood pressure.
5.3.3. Assessment of level of blood pressure in the control group before and after
guided imagery
Table4.5 reveals the mean pretest systolic blood pressure was 144.7 mmHg
and reduced to 141.5 mmHg during post test. This shows average decrease systolic
blood pressure of 3.2. The mean pretest diastolic blood pressure was 84.8 mmHg and
it reduces to 82.9 mmHg during post test. This shows average decrease of diastolic
blood pressure 1.9. This reveals there is reduction of blood pressure and. The
calculated ‘t’ value was found to be systolic blood pressure and diastolic blood
pressure was 13.51 and 15.96 respectively greater than table value. Hence, the
hypothesis H3 “There is no significant difference in the level of blood pressure in
the control group before and after guided imagery” is rejected.
5.3.4. Assessment of blood pressure of control group and experimental group
after guided imagery
Table 4.6 shows that, the mean systolic blood pressure of control group was
141.5 mm Hg was greater than that experimental group mean systolic blood pressure
was 125.1 mm Hg. The mean diastolic blood pressure of control group was 82.9 mm
Hg was greater than the experimental group was 77.2 mm Hg. The calculated ‘t’ value

Guided Imagery 46
was found to both the systolic and diastolic blood pressure was 4.46 and 2.06
respectively greater than table value. Hence, the hypothesis H4 “There is a
significant difference in the level of blood pressure in the experimental and
control group after guided imagery” is accepted.
5.3.5. Relationship between selected demographic variables on level of blood
pressure before guided imagery
Karl Pearson’s co-efficient of correlation was calculated to find out the
influence of selected demographic variables like age and body mass index on level of
blood pressure before intervention.
The influence of age on blood pressure among hypertensive clients was
assessed and was found to has less correlation with systolic blood pressure (r=0.1128)
and negatively correlated with diastolic blood pressure(r=-0.3357). Similarly the body
mass index for the systolic pressure(r=-0.0203) and diastolic blood pressure are
(-0.0275)negatively correlated.

Guided Imagery 47
SUMMARY AND CONCLUSION
The study was conducted with the objectives to find out the effect of guided
imagery on blood pressure among hypertensive clients. Administering guided imagery
it helps the body to heal, maintain health and used in reducing stress. pain, and lowers
blood pressure. Initially the survey was conducted to find out the hypertensive clients
by using Digital sphygmomanometer in Idikarai rural community, Coimbatore.
The conceptual framework of this study was based upon J.W. Kenny’s general
system theory. An evaluate research approach has been used for the study. Review of
literature brought at many facts about hypertension, risk factors, management,
consequences and benefits of guided imagery. It also highlighted the effect of guided
imagery on blood pressure.
. The study was conducted at Idikarai rural community of Coimbatore. A quasi
experimental pretest post test control group design was adopted for the study. The
total population is 7065. The study population was 86 and purposive sampling method
was used to select the samples for the study.
The total number of samples selected during the study period was 80, 40 in
experimental group and 40 in control group. Researcher collected the baseline data,
health history and blood pressure was measured before the intervention. Experimental
group received the guided imagery and control group did not received any
intervention. After the intervention blood pressure was assessed. To know the effect,
unpaired ‘t’ test was used to compare the effect in experimental group and control
Guided Imagery 48
group. This study emphasized that guided imagery is every effective in reducing
blood pressure.
6.1. MAJOR FINDINGS OF THE STUDY
1. The demographic variables reveals that a maximum number of respondents,
88 percent from experimental group and maximum of 63 percent clients from
control group with hypertension were found in the age group of above 50
years.
2. It reveals that a maximum of 85percent of them from experimental group and
78 percent of them from control group were females.
3. It also reveals that 73 percent of them from experimental group and 67 percent
of them from control group were taking antihypertensive drugs.
4. Comparison of blood pressure level of experimental group before and after
guided imagery shows that average reduction of systolic blood pressure was
22.1 and diastolic blood pressure was 7.05 in experimental group. It is more
than the control group. It shows the guided imagery is effective in reducing
blood pressure among hypertensive clients.
6.2. LIMITATIONS
1. The study was limited only to hypertensive clients residing at the present study
setting.
2. The study was confined to small number of participants for a shorter period.
6.3. RECOMMENDATIONS
1. The same study can be replicated on large samples.
2. The study can be conducted in different settings.

Guided Imagery 49
3. The similar study can be conducted in all stress related problems like
depression and anxiety.
4. The similar study can be conducted in reducing side effects of chemotherapy
among cancer patients.
5. Guided imagery can be used as one of the nursing intervention in treating
hypertensive clients.
6.4. NURSING IMPLICATIONS
6.4.1. Nursing Education
Guided imagery helps to reduce blood pressure among hypertensive clients. It
is an oldest folk method of healing used for centuries. It is an effective and safe form
of therapy for hypertensive clients. Since it is a complementary and alternative
therapies, it can be given much importance in nursing curriculum.
6.4.2. Nursing Administration
The nurse administrator can draw written policies regarding guided imagery
on reduction of blood pressure among hypertensive clients. There by the staff nurses
are kept in pace with the evidenced based practice.
6.4.3. Nursing practice
Guided imagery can promote the quality of life among hypertensive clients.
Health education can be given regarding the technique and benefits of guided
imagery. A separate room could be arranged for group therapy in hospital settings.
Guided Imagery 50
6.4.4. Nursing Research
The study has tested the effect of guided imagery on blood pressure among
hypertension clients. More researches carried out in this area would be beneficial. The
effects of guided imagery in reducing side effects of chemotherapy could be studied.
6.5. CONCLUSION
Hypertension has emerging major health problem in India and developing
countries. Modern anti hypertensive drug therapy are available and used to reduce
high blood pressure but there are certain drawbacks like increased side effects of
drugs and irregular treatment and improper follow up. So guided imagery is one
among the complementary alternative therapies is much effective in reducing blood
pressure by natural healing process. Guided imagery in consideration with beneficial
effects, absence of side effects and complications will prove the effectiveness in
various conditions especially reducing pain, lowering stress and reducing the side
effects of chemotherapy. It is cost effective, provides secondary beneficial effects to
other systems of the body and optimizes the holistic health care to hypertensive
clients. The research findings have proved that the administrating guided imagery
among hypertensive clients has reduced the level of blood pressure.

i
References
Ali. (2007). Body Mind Therapies as a Treatment for Hypertension. Retrieved from
http://www.medicalnewstoday.com on 30.05.10.
American Heart Association. (2002). Facts About Lockering Blood Pressure National
Heart Lung and Blood Institute. Retrieved from http://www.nhlbi.
nih.gov.p://www.americalheart.org on 15 – 06 – 10.
Anderson, G. (1999). Effect of age on hypertension, Saudi Journal of Kidney Disease
& Transplantation 10(3). 286-297.
Arslantas, D. (2008). Prevalence of Hypertension Among Individuals Aged 50 years
and Over and its Impaction Health Related Quality of Life Chinese Medical
Journal, 121(16).
Black, M. J. (2009). Medical Surgical Nursing. (8th ed.), Vol. 2, India; Elsevier
Publications.
Cunha, J. (2005). High Blood Pressure. Retrieved from http://www.medicinenet.com.
Retrieved on 20 – 04 – 10.
Dena. (2008). Hypertension & High Blood Pressure Retrieved from
http://www.righthealth.com/hypertension on 18-8-10.
Elisha. G & Stefania. (2005). Mindful Solutions for Stress Anxiety Depression.
Glenda. (2008). An Active Meditative Process for Self Beating Relaxation, and Self
Awareness. Retrieved from http://www.glendercedarleaf.com on 18-10-10.

ii
Gupta, S. P. (2007). Statistical Methods. (11th Ed.). New Delhi: Sultan Chand and
Sons Publications.
Heitkemper, L. (2007). Medical Surgical Nursing. (17th ed.), India: Mosby Elsevier
Publications.
Jenei, Z. Pall, D & Katona, E. (2002). The Epidermological of Hypertension and Its
Associated Risk Factor. Journal of Public Health.
Kaplan. (1997). Smoking and Hypertension American Journal of Hypertension (10)
483-485.
Kearney, P. M. Whelton, M & Reynolds, K. (2004). World Wide Prevalence of
Hypertension; a systematic reviews. Journal of Hypertension. 22(1): 21 –24.
Kingston, J. Chadwick. P. Meron. D. & Skinner, T. C. (2006). Effect of Mindfulness
Practice on Pain tolerance, Psychological well Being, and Physiological
Activity, Journal of Pscyhosomatic Research. 297-300.
Kothari, C. R. (2007). Research Methodology. (6th Ed.), New Delhi. Wiley Eastern
Ltd.
Kozier, B. (2008). Fundamentals of Nursing. (8th ed.), India, Dorling Kindersley Pvt
Ltd.
Kruschke & Kelly. (2008). The Impact of Guided Imagery on Health Care
Employees. Retrieved from http://www.gradworks.umi.com.on 13.07.10.
Loghum, B. (2009). Hypertension Management Plan. Nether Lands Heart Journal.
116.(3). 138 – 144 on 15 – 10 – 10.
iii
Lutgendorf. (2000). Integrative Pain Management. Psychological/Mind-Body
Therapies. Retrieved from http://www.healings chronic pain. org. on 8.8.10.
Mackoff. D & Stoppler.M. (2008). High Blood Pressure and Exercise Retrieved from
http://www.medicinet.com on 18-08-10.
Mary Rose. (2010). Guided Imagery Creative Visualization for Relaxation and Sleep.
Retrieved from http://www.guided imagery.html on 08.08.10.
Mayo Clinic. (2008). Enhance Healing Through Guided Imaginary Science Daily.
Retrieved on 18 – 10 -2010.
Mayo Clinic. (2008). Enhance Healing Through Guided Imaginary Science Daily.
Mayo Clinic. (2008). Complementary Therapies Help the Patients Recover After
Heart Surgery, Science Daily Retrieved from http://www.sciencedaily.com on
12 – 07 -10.
Mayo Foundation for Medical Education and Research. (2010). Retrieved for
http:www.medicalnewstoday.com on 15-10-10.
Mckinney & Cathy, H. (1997). Journal of Health Psychology. 16(4). 390-400.
Moffat, D. (2007). Facts and Statistics about Hypertension. Retrieved from
http://www.avalonhealthinfo.com on 24 -08 -10.
Naparstek. (2000). Staying Well with Guided Imaginary. Retrieved from
www.healthjourney.com on 13.07.10.

iv
Naparstek. (1994). Staying Well with Guided Imagery. Retrieved from
http://www.miraclepainrelief.com/guidedimagery.html on 30 May 2010.
Park, K. (2009). Text book of Preventive and Social Medicine. (20th ed.), Banarsidar
Bhanot Publishers, Jabalpur.
Perrry, P. (2009). Fundamentals of Nursing. (7th ed.), India Elsevier Publications.
Polit, F. D. & Hungler, P. B. (2008). Nursing Research Principles and Methods. (6th
ed.), Philadelphia: Lippincott Publications.
Rose. M. (2010). Guided Imagery Creative Visualization for Relaxation and Sleep,
Retrieved from http://www.moodletter.com/guidedimaginary.html on 8-8-10.
Rossman. (2008). Discover the Healing Power of Guided Imagery, Medical News
Today.
Satiroglu, H. (2010). Imagine Your Way to Better Health. Retrieved from
www.alive.com on 30 May 2010.
Segal. (2008). Relaxation Technique for Stress Relief, Retrieved from
http://www.helpguide.org/stress-relief-modifationyoga-relaxation.html on 13-
07-10.
Segal, J., Saisan, J., Smith, M., Jaffe, E & Robert Segal. (2008). Relaxation
Technique for Stress Relief. Retrieved from http://www.helpguide.org/../
stressrelief on 16 - 07 - 10.
Semplicini. A. (2009). Psychological Factors in Hypertension Retrieved from
http://www.scitopics.com/psychologicalfactors-inhtml on 06 - 07 -10.

v
Spiegal, D. (2010). Mind Body Healing. Retrieved from www.naturalhealinghealth.
com/ mindbodyhealing.htm on 30 -5- 2010.
Spiegal, D. (2006) Visualization Uses Your Imagination to Produces Relaxation and
Healing. Retrieved from www.naturalhealinghealth.com/mindbody
healthy.html. on 31.05.10.
Subbaraman, G. R. (2002). Relaxing and Reevaluating a Therapeutic Journey
Towards Relaxation, Peace and Happiness. Journal of Health Action. 43-45.
Suddarth, B. (2005). Text Book of Medical Surgical Nursing. (10th ed.), Philadelphia:
Lippincott publishers.
Tang & Hsin-Yi, (2008). An Audio Relaxation Tool for Blood Pressure Reduction in
Older Adults, General Nursing 29(6), 392 – 401.
Taylor, C. (2008). Fundamentals of Nursing. (1st ed.), Philadelphia, Wolters Klower
Publishers.
The Sixth Report of the Joint National Committee on Promotion, Detection,
Evaluation and Treatment of High Blood Pressure (JNC VI) (1997). Retrieved
from http://www.nhlbi.nih.gov/guideliness/hypertension/html on 13 - 10 – 10.
Wang, Elisa. T, Fabsitz, Devere. R, Best. L, Weity. T et al (2006). Hypertension
Statistics Retrieved from http://www.healthstatus .com/en/hypertension-
statistics.html on 25-10-09.

vi
Wantanabe (2005). Efects Among Healthy Subjects of the Duration of Regularly
Practicing Guided Imagery. Retrieved on 30.04.2010
http://www.ncbi.h/m.nih.gov >bmccomplement \alternneed>5,2005
Yung, P. (2001), Relaxation Training as Complementary Therapy for Mild
Hypertension. Retrieved from www.sld.cu/galerias/pdf/
sitios/mednet/relaxation.pdf on 03-08-10.

ANNEXURE - I
Paired ‘t’ test
To test the hypothesis, ‘t’ test was applied to findout the significant difference
in blood pressure between pre and post test.
t =
n
SD
d
SD =
n
dd 2
d = Mean of difference between pretest and post test score
SD = Standard deviation of the pre-test and post test score
n = Number of samples

ANNEXURE - II
Unpaired ‘t’ test
To test the hypothesis unpaired ‘t’ test was applied to findout the significant
difference blood pressure between experimental and control group.
t = 21
2121
nn
nn
S
XX
S2 =
221
2
22
2
11
nn
XXXX
Where, 1X = mean of the first sample
2X = mean of the second sample
n1 = number of observation in the first sample
n2 = number of observation in the second sample
S = Combined standard deviation

ANNEXURE – III
KARL PEARSON’S COEFFICIENT OF CORRELATION
This was calculated to find out the influence of independent variable on
dependent variable. Influence of age, body mass index on blood pressure as assessed
through Karl Pearson’s Co-efficient of correlation in order to find the significance of
relationship between the two variables.
r = yx SDSD
yxn
xy
.
x = Mean of pretest
y = Mean of posttest
n
xy = Average of pretest and post test score
SDx = Standard deviation of pre test score
SDy = Standard deviation of post test score

APPENDIX – II

APPENDIX - III

GUIDED IMAGERY
An imaginary session can be conducted as a group session. The technique
usually begins with a short relaxation exercise.
RELAXATION TECHNIQUE
1. Assume a passive and comfortable position.
2. Deep breathing-Exhale slowly, and tell all your muscles to relax, say as you exhale,
’’I feel tension and energy flowing out of my body’’.
Repeat the exercise 5-6 times & you will become more relaxed.
GUIDED IMAGERY SCRIPT
In this relaxed state, imagine mentally you are going out for a walk. Imagine
you are slowly getting up. Stand firm on the ground feeling the hard ground surface
underneath your feet; come out of the hall; reach the verandah; reach the staircase.
Slowly get down step after the step, reach the ground floor. Sun is setting; it is cool.
You come out of the building. As you come out, there is a vast green lawn,
You enter the lawn Barefoot feeling the soft cool grass under your feet, it is so
soothing. You walk through a Lawn. You notice a few white rabbits move around
freely. On both sides of the lawn, there are Rose plants with full of roses, fully
blossomed, big and filled with fragrance. They are different colours, rose, purple,
yellow, white, red. You are filling yourself with colours & fragrance.
You move further. There is a row of jasmine plants with mature buds; some
have already blossomed. Pluck one, smell it, and feel the soft flower on your cheeks.
You move further, on the way, you notice a squirrel. On seeing you, it gets to the top
of the tree. You wonder at the marvelous capacity of the small animal.

You reach a river. You get into water. It is ankle deep. Water is clear. You are
able to see your face in the water. You take the water in both of your hands and flash
it on your face. It takes out all your strain and tiredness. You feel fresh. You are
taking out a handkerchief from your pocket; wipe your face; and move. You reach the
other side of the bank. There is a small rock. You sit on it. The sun has already set
reaching the horizon. You could see golden yellow rays coming out of the clouds.
You feel the cool breeze. The birds are returning to their nest. You observe the
various patterns they make when they fly back to their nest. You listen to their
sounds. You could also listens to the sounds of water flowing. You see the vast green
paddy fields. It looks as a green carpet spread. You smell the wet paddy. You stay on
the rock enjoying the nature’s gift for a few minutes.
You slowly get down the rock, cross the river; getting your feet wet. The sand
particles sticking to your feet fall off as you walk. You reach the lawn, then your
building. You slowly climb up the stairs, reach the verandah, enter the hall and reach
the place you were lying down and lie down. Slowly open your eyes at the count of
five. No hurry. Take your own time. One, two, three, four, five. Slowly open the eyes.

APPENDIX - IV
SECTION-A
BASELINE DATA
1. Sample Number :
2. Address :
3. Age :
4. Gender :
5. Marital status :
6. Type of family :
7. Educational status :
8. Occupation :
9. Monthly income :
10. Working hours per day :

SECTION-B
HEALTH HISTORY
1. Height :
2. Weight :
3. Calculated body mass index :
4. Family history of hypertension :
If yes, specify the relationship of the member
5. History of taking any antihypertensive medications :
If yes, specify the drug, dose, duration
PERSONAL HABITS [Duration, frequency, amount]
6. Smoking :
7. Betal nut, tobacco /pan chewing :
8. Alcohol drinking :
9. Exercise :
10. Diet :
11. History of oral contraceptive drugs :
12. Leisure activities :

SECTION – C
BLOOD PRESSURE MONITORING CHART
Day Blood pressure before guided imagery Blood pressure after
guided imagery
APPENDIX – V
LESSON PLAN ON
GUIDED IMAGERY

LESSON PLAN ON GUIDED IMAGERY
Name of the student teacher : Suganya.S
Name of the college : College of Nursing, Sri Ramakrishna Institute of Paramedical Sciences
Name of the subject : Community Health Nursing
Topic : Guided Imagery
Method of Teaching : Lecture cum demonstration
Group : Hypertensive clients
Venue : Idikarai Rural Community, Coimbatore

GENERAL OBJECTIVE
Learners will gain adequate knowledge regarding guided imagery and develop a positive attitude towards it and practices in day to day life to improve
the wellbeing.
SPECIFIC OBJECTIVES
On completion of this class the hypertensive clients will be able to
i. Meaning of guided imagery
ii. Definition of guided imagery
iii. List out the purposes of imagery
iv. Explain the steps of procedure of guided imagery
v. Enlist the benefits of guided imagery

S.
No Time
Specific
Objective Content
Teachers
Activity
Learners
Activity AV Aids Evaluation
2 mts The learner
can be able to
introduce
Guided
Imagery
Introduction
Imagery is an important complementary health care modality
one that can be used with just about any medical condition and
in any health care setting. Imagery rituals were developed in
hospital and clinic setting to enhance the effectiveness of
medical treatment and nursing interventions.
Researcher
introduces the
topic by
discussion
Listening Pamphlet What is
Guided
Imagery?
3 mts The learner
can able to
define
Guided
Imagery
Definition
Imagery involves the use of the imagination for healing.
Images involving all the senses, sight, sound, taste, smell and
kinesthetic bodily sensation, can be directed to specific healing
and life goals
Researcher
defines the
guided
imagery
Listening Pamphlet Define
Guided
Imagery.
3 mts The learner
can able to
list out the
purposes of
Guided
Imagery
Purpose
1. Increase energy levels
2. Promotes relaxing brain wave activity
3. Enhances the sense of well being
4. Ease stress and anxiety
Researcher list
out the
purposes of
guided
imagery
Listening Pamphlet List down
the
purposes of
Guided
Imagery.
S.
No Time
Specific
Objective Content
Teachers
Activity
Learners
Activity AV Aids Evaluation
10
mts
Learners can
able to
explain steps
of procedure
of Guided
Imagery
Setting
The setting should be calm and quiet comfortable dim the
lights and close the door to eliminate extraneous noise.
Researcher
explains the
steps of
procedure
Listening Pamphlet Explain the
procedure
of Guided
Imagery.
Procedure
1. Guided imagery usually begins with a short relaxation
exercise
2. Instruct the person to follow the instructions while
practicing this relaxation technique
3. Take a few slow and deep breaths to centre the attention
4. Deeply exhale and feel all the muscles are getting in
relaxed state and all the tension is following out of his
body
5. Repeat the exercise 5 – 6 times and you will become
relaxed
6. Ask the person to close the eyes to avoids distributions

S.
No Time
Specific
Objective Content
Teachers
Activity
Learners
Activity AV Aids Evaluation
7. In this relaxed state the client should learn the audio
tapped verbal instruction and imagining themselves in
the scenarios as described in the script by using all of
his sense.
8. In the script the persons should slowly come out the
building. There is a vast green lawn, you entire the lawn
with barefoot feeling the soft cool grass under your feet.
It is soothy.
9. While walking through a lawn, you notice a white
rabbits, there are rose plants with fully blossomed, row
of jasmine plants with mature buds.
10. You reach a river, it’s a clear water, take the water in
both of your hands and flash it on your face. It takes out
all your strain and tiredness.
11. You see the vast green paddy fields. You sit on the rock
enjoying the nature’s gift for a few mts.
12. After some time you slowly get down the rock and cross
the river.
13. You reach the lawn, then your building and reach the
place you are sitting down and sit down.

S.
No Time
Specific
Objective Content
Teachers
Activity
Learners
Activity AV Aids Evaluation
14. The script get finished in 20 mts.
After that instruct them to slowly open the eyes at the count of
10 and re join in your world
2 mts Learners can
able to
explain the
course of
treatment
Course of treatment
The number of sessions varies greatly, from one to ten sessions
in a therapeutic setting. It can be done for several times a day to
several times a week.
Researcher
explains about
the course of
treatment
Listening Pamphlet Explain the
course of
treatment.
3 mts Learners can
able to enlist
the benefits
of Guided
Imagery
Benefits
1. Helps to lower psychological distress for cancer patients
2. Decrease blood pressure
3. Reduce chronic pain in people of all ages
4. Helps with depression and various mood disorders
5. Help treat heart disease, and arthritis.
Researcher
enlists the
benefits of
guided
imagery
Listening Pamphlet Enlist the
benefits of
Guided
Imagery.

S.
No Time
Specific
Objective Content
Teachers
Activity
Learners
Activity AV Aids Evaluation
SUMMARY
Till now we have seen about the meaning, definition, purpose,
procedures and benefits of guided imagery and how to practice
it.
CONCLUSION
The body’s natural relaxation response is a powerful antidote
to stress. When practiced regularly the guided imagery lead to a
reduction in your everyday stress levels and about in your
feelings of joy and serenity. Guided imagery may act to boost
the effectiveness of other treatments and also simply support
them by its role as a relaxation tool.
Bibliography
http://www.guidedimageryinc.com
http://www.integratedmindcare.co.uk
http://wwwnatural-healing-health.com/mindbodyhealing

rpjwof;fg;gl;L kdj;jLkhw;wk;
cz;lhfhky; jLf;fyhk;.
7. ,nj jsh;t[ epiyapy; xyp
ehlhtpy; tpthpf;fg;gLk;
fhl;rpfis nfl;L c';fs;
midj;J czh;t[fisa[k;
cl;gLj;jp fhl;rpfis fw;gid
bra;J ghh;f;f ntz;Lk;.
8. Xt;bthU fhl;rpahf gpuahzk;
bra;J eP';fs; ,e;j tpthpf;fg;gLk;
fw;gid cyfpy; bkhj;jkhf 20
epkpl';fs; brd;W jpUk;g[fpwPh;fs;.
9. ,g;bghGJ bkJthf fz;fis
jpwe;J ek;Kila mnj giHa
cyfj;jpy; ,izfpwPhfs;;.
gapw;rp fhyk;
,e;j gapw;rpia bjhlh;e ;J 12
ehl;fSf;F bjhlh;e ;J jpdKk; 20
epkpl';fs; bra;J tu ntz;Lk;. ,e;j
gapw;rpia nkYk; bjhlh;e;J bra;tjpdhy;
ve;j tpj gf;f tpist[fSk; fpilahJ.
ed;ikfs;
1. ,uj;j mGj;jj;ij Fiwf;fpwJ.
2. cly; Mnuhf;fpaj;ij
Cf;fg;gLj;JfpwJ.
3. g[w;W nehahy;
ghjpf;fg;gl;lth;fspd; kd
mGj;jj;ij Fiwf;f cjt[fpwJ.
4. ,ja neha; kw;Wk; \l;L typapd;
jPtpuj;ijf; Fiwf;f cjt[fpwJ.
5. ,J xU rpwe;j typ epthuzpahf
bray;gLfpwJ.
tHpfhl;o fw;gidkdj;njhw;wk;
Rfd;ah/ R.brtpypah; KJepiy
,uz;lhk; Mz;L/
brtpypah; fy;Y}hp/
,uhkfpU#;zh ,d;!;oa{ol;
Mg; ghuhbkof;fy; rapd;r!;/
nfhaKj;J}h;.
APPENDIX - VI
tHpfhl;o fw;gid kdj;njhw;wk;
Kd;Diu
,e;j tHpfhl;o fw;gid
kdj;njhw;wk; kpft[k; xU
Mnuhf;fpakhd gapw;rp Kiw/ ,J
neha;fspd; jPtpuj;ij Fiwf;f cjt[k;
rpwe;j gapw;rp Kiwahf gad;gLfpwJ.
,J xU ew;gad; mspf;ff; Toa vspa
rpfpr;ir KiwahFk;.
tHpfhl;o fw;gid kdj;njhw;wk;
,e ;j tHpfhl;o fw;gid
kdj;njhw;wkhdJ vy;yhtpj
czh;t[fisa[k;/ cs;slf;fpaJ.
mjhtJ ghh;g;gJ/ nfl;gJ/ Rit thrid
kw;Wk; bjhL czh;t[fSld; kdija[k;/
cliya[k; jsh;t[ epiyf;F bfhz;L
bry;y cjt[k ; KiwahFk;. ,J
neha;fspd; jPtpuj;ijf; Fiwf;f cjt[k;
mog;gil J}z;L nfhyhf cjt[fpwJ.
nehf;f';fs;
1. cly; rf;jpia Cf;fg;gLj;Jk;
2. kd mGj;jj;ij Fiwf;f
cjt[fpwJ.
3. Mnuhf;fpakhd ey;thH;it
kpFjpg;gLj;Jk;.
4. kd ,Wf;fj;ija[k;/ gaj;ija[k;
ePf;FfpwJ.
gapw;rp bra;a[k; NH;epiy
NH;epiy kpft[k;
mikjpahdjhft[k;/ gapw;rpahsh;fSf;F
kpft[k; brsfhpakhft[k; ,Uf;f ntz;Lk;.
mjpf Nhpa btspr ;rk; ,y;yhky;/
fjt[fis \o itf;f ntz;Lk;. ,jdhy;
ftdk; rpjwof;fg;gLtij jLf;fyhk;.
gapw;rp bra;a[k; Kiw
1. fw;gid kdj;njhw;wk;
bjhl';Ftjd; Kd;g[ xU rpwpa
\r;Rg; gapw;rp mspf;fg;gLfpwJ.
2. gapw;rp jUgth; fw;gpg;gij
ftdkhf nfl;L bray;g
ntz;Lk;.
3. ,e;j jsh;t[ epiy gapw;rp
bjhlf;fj;jpy; xU MH;e;j \r;R
vLj;J bkJthf btspapy;
tplt[k;.
4. ,e;j \r;R gapw;rpahy; midj;J
jirg;gFjpfSk; jsh;t[ epiy
miltJk;/ cly; ,Wf;fk;
btspnaWtija[k; ftdpf;fyhk;.
5. ,e;j gapw;rpia bjhlh;e;J 5-6
Kiw bra;a[k; nghJ clw;KG
jsh;t[ epiyia mila[k;.
6. ,g;bghGJ fz;fis \l
ntz;Lk;. ,jdhy; ftdk;

APPENDIX – VII

APPENDIX – VIII

APPENDIX – IX
PHOTOS DURING INTERVENTION
Copyright © 2022 FDOKUMEN