Education in India 1990-91_D09852.pdf
173
FOR QFFICmi. USE ONLY EDUCATION IN INDIA VOL.II(8) 1990-91 PLANNING MONITORING AND STATISTICAL DIVISION (DEPARTMENT OF EDUCATION) MINISTRY OF HUMAN RESOURCE DEVELOPMENT GOVERNMENT OF INDIA NEW DELHI 1996 NIEPA DC III D09652
-
Upload
khangminh22 -
Category
Documents
-
view
1 -
download
0
Transcript of Education in India 1990-91_D09852.pdf
FOR QFFICmi. USE ONLY
EDUCATION IN
INDIA VOL.II(8) 1990-91
PLANNING MONITORING AND STATISTICAL DIVISION (DEPARTMENT OF EDUCATION)
MINISTRY OF HUMAN RESOURCE DEVELOPMENT GOVERNMENT OF INDIA
NEW DELHI 1996
NIEPA DC
IIID09652
« V
& UU- UiVttl i AltUN Oc^iliii *^atioaal histitute of SducatioQal ?iaonmg and Admioistricion.17‘B, Sii Autofem4* Mu|»

P R B F A C E"3DUCATION IN IHEHA VOL,II(8)” is brought out annually by the Dipartment of Education, Ministry of Human Resource Development, Njw Delhi. The publication contains All India and State-wise Financial Statistics relating to all recognised educational iistitutions in the field of school education.
Tie publication is brought out in three Volumes-Vol, I(S) cDntaining numerical data on school education; Vol. II(S) the financial data on school education, Volume III examination results of matriculation class and higher levels. The Volumes corresponding to 1(C) and 11(C) in respect of College Education are yet to be brought out. The present publication Vol.II(S) relates to the year 1990-91.
The entire publication is divided into two parts. Part-I contains an abstract and a general survey of financial data on School Education at the Centre and in the States during the year 3990-91. Part II comprises state-wise Statistical Tables based cn information collected from the State and Union Territories through forms ES-II(S).
] would like to thank the officers/ staff of State/ Union 'lerritory Administrations, Statistical Unit and CMIS Unit of the Mniistry in bringing out this publication. Due to non- reciept cf ciata from Sikkim, Dadra and Nagar Haveli, West Bengal & laksihadveep, data for the previous years have been repeated.
?his. publication has been brought out in resographic form for naki.ng available the data for official use. This data is also available on floppies.
further suggestions, if any, tor improving the public;cation are velc:ome and may be sent to Dr. R.S. Thakur, Joint Director (P) .
»ew Delhi (CHAMPAK CHATTERJI)Dated ^o\, 1996. JOINT SECRETARY
Government of India Ministry of Human Resource Development
(Department of Education)

PROJECT STAFF STATISTICS UKIT
Dr. R,S. Thakur Siri S.S. Mailkani Siri R.B. Tripathi Sit. Renu Walia
Joint Director (P)Assistant Education Officer
Senior Investigator Statistical Assistant
CMIS UNIT
Siri Krishan Kumar Siri E. Krishna Kumaran Siri V. Nagairajan Snt. Chander kanta Snt. Pushpa Bisht
ProgrammerWord processor Operator Word processor Operator Data Entry Operator Data Entry Operator
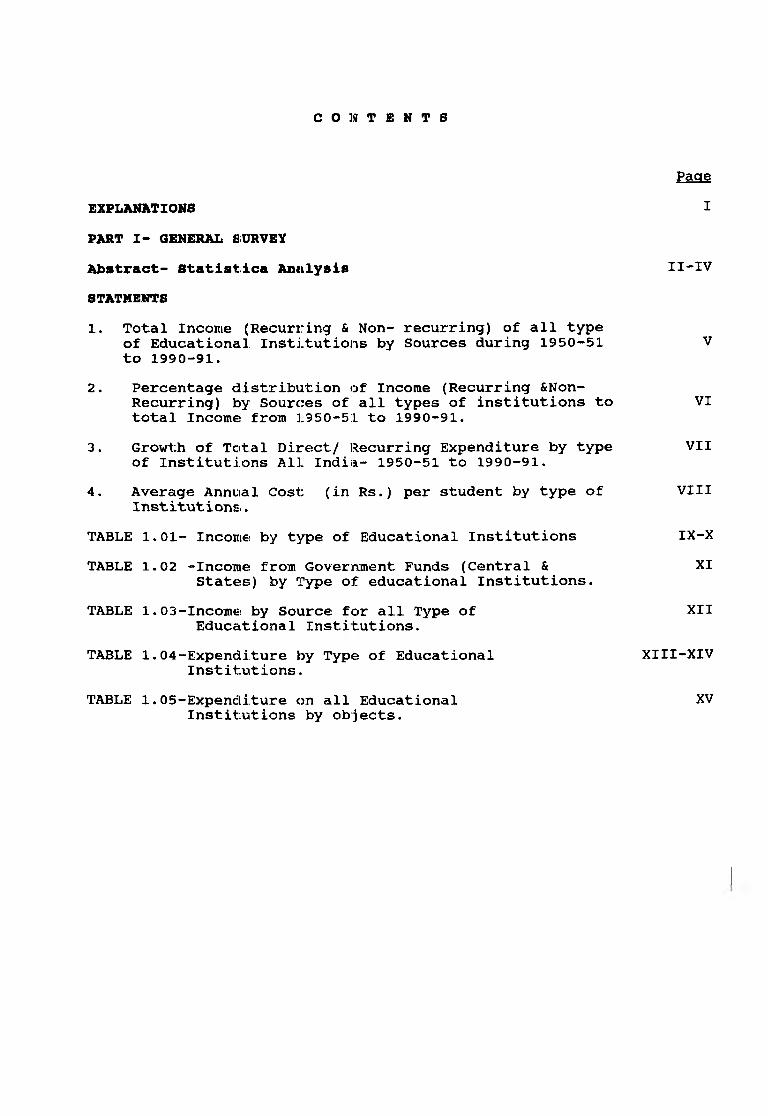
C O N T E N T S
P a g e
EXPLAHATIOMS IPART I- GENERAL SURVEYAbstract- Statlstlca Analysis II-IV
STATMEMT81. Total Income (Recurring & Non- recurring) of all type
of Educational Institutions by Sources during 1950-51 Vto 1990-91.
2. Percentage distribution of Income (Recurring &Non- Recurring) by Sources of all types of institutions to VI total Income from 1950-51 to 1990-91.
3. Growth of Total Direct/ Recurring Expenditure by type VII of Institutions All Indiisi- 1950-51 to 1990-91.
4. Average Annual Cost (in Rs.) per student by type of VIII Institutions.
TABLE 1.01- Income by type of Educational Institutions IX-X
TABLE 1.02 -Income from Government Funds (Central f i t XIStates) by Type of educational Institutions.
TABLE 1.03-Income by Source for all Type of XIIEducational Institutions.
TABLE 1.04-Expenditure by Type of Educational XIII-XIVInstitutions.
TABLE 1.05-Expenditure on all Educational XVInstitutions by objects.

PART-II STATISTICAL TABLESTABLE I Useful Computations at a Glance 1
TABLE II Item-wise Recurring Income by Sources on 2-26Edu.ca'fciona.l Institvrti.one by Typo.
TABLE III Income (Non-Recurring) by Source and Type 27-51of Institutions.
TABLE IV Total Income (Recurring & Non Recurring) 52-76Educational institutions by Type
TABLE V Recurring expenditure by Item and 77-101Type of Institutions.
TABLE VI Non- Recurring Expenditure by ItoTu and Type 102-126of Institutions
TABLE VII Total expenditure (Recurring & Non Recurring) 127-151by Type of Institutions

PART I - GENEIML SURVEY
PART-I - GENERAJL. SURVEY ABSTRACTS-STATISTICAL ANALYSIS
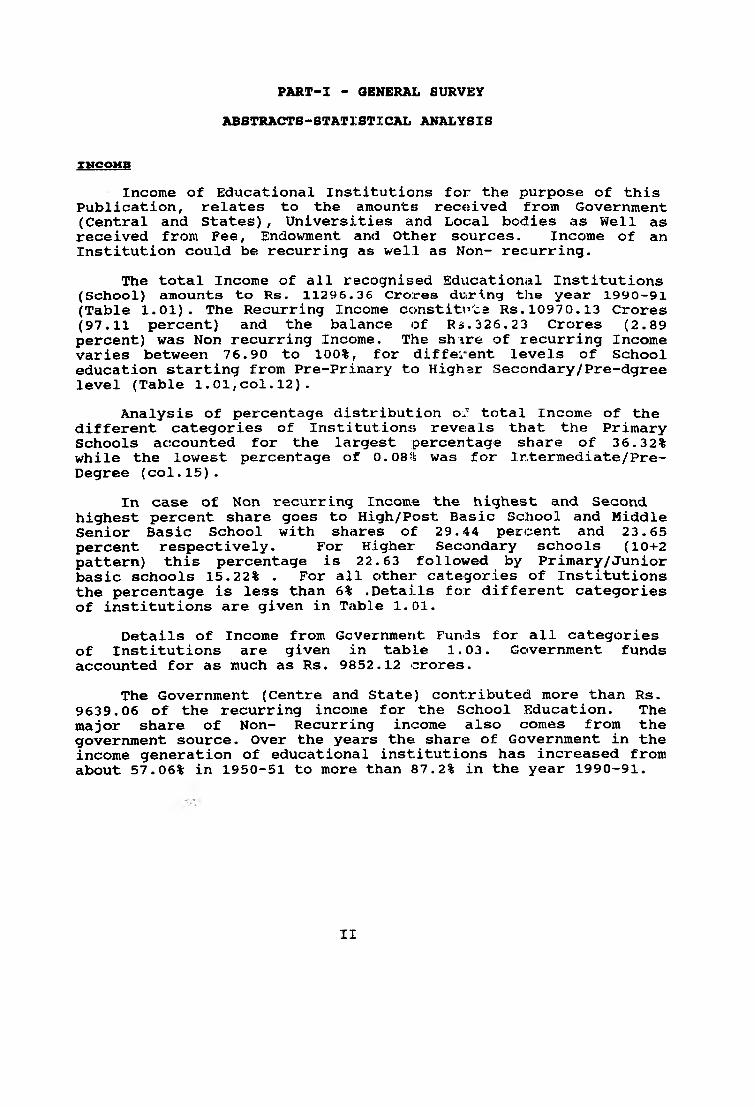
IKOOKgIncome of Educational Institutions for the purpose of this
Publication, relates to the amounts received from Government (Central and States), Universities and Local bodies as Well as received from Fee, Endowment and Other sources. Income of an Institution could be recurring as well as Non- recurring.
The total Income of all recognised Educational Institutions (School) amounts to Rs. 1129 6.3 6 Crores during the year 1990-91 (Table 1.01), The Recurring Income constitnts Rs.1097 0.13 Crores (97.11 percent) and the balance of Rs.326.23 Crores (2.89 percent) was Non recurring Income. The shire of recurring Income varies between 76.90 to 100%, for different levels of School education starting from Pre-Primary to Highsr Secondary/Pre-dgree level (Table 1.01,col.12).
Analysis of percentage distribution of total Income of the different categories of Institutions reveals that the Primary Schools accounted for the largest percentage share of 36.32% while the lowest percentage of 0.08% was for Intermediate/Pre- Degree (col.15).
In case of Non recurring Income the highest and Second highest percent share goes to High/Post Basic School and Middle Senior Basic School with shares of 29.44 percent and 23.65 percent respectively. For Higher Secondary schools (10+2 pattern) this percentage is 22.63 followed by Primary/Junior basic schools 15.22% . For all other categories of Institutions the percentage is less than 6% .Details for different categories of institutions are given in Table 1.01.
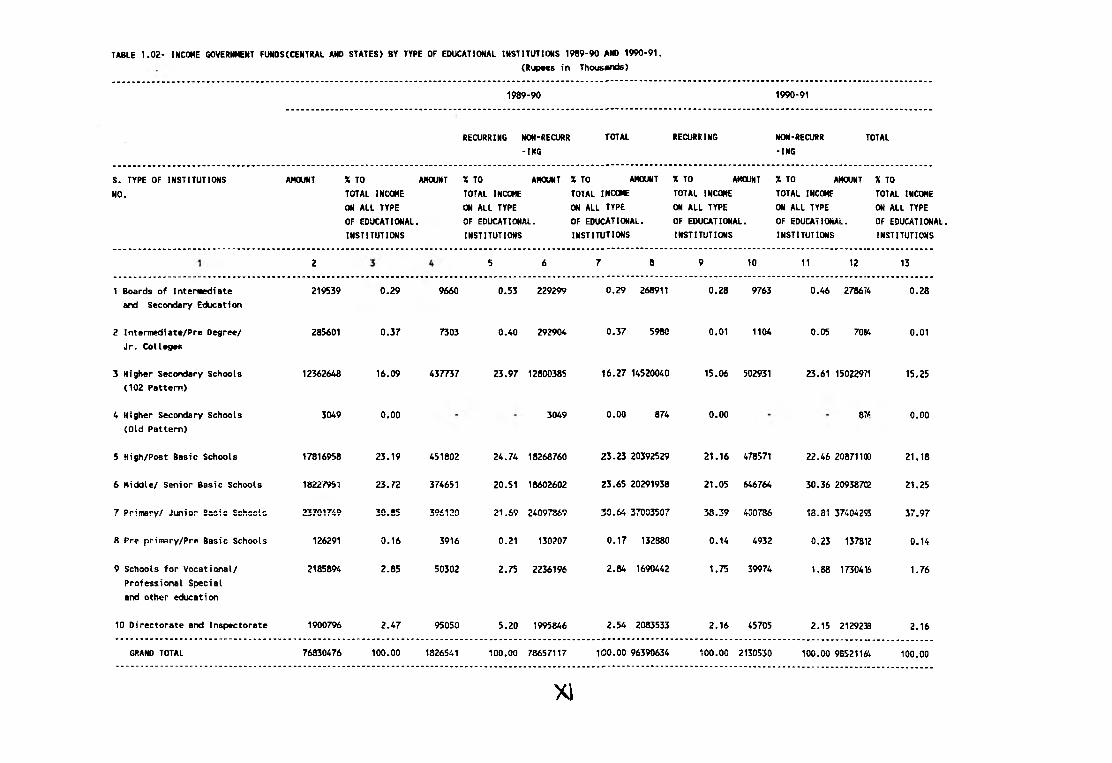
Details of Income from Government Funds for all categories of Institutions are given in table 1.03. Government funds accounted for as much as Rs. 9852.12 crores.
The Government (Centre and State) contributed more than Rs. 9639.06 of the recurring income for the School Education. The major share of Non- Recurring income also comes from the government source. Over the years th€i share of Government in the income generation of educational institutions has increased from about 57.06% in 1950-51 to more than 87.2% in the year 1990-91.
II

Bxp<nditureThe total Expenditure incurred by all types of
Institutions engaged in School Education wcis of the order of Rs. 9786.40 Crores comprising Rs. 9505.76 Crores of Recurring Expenditure (97.73%) and Rss. 2 8 0.64 Crores of Non-Recurring Expenditure (2,17%).
Of the total Recurring Expenditure on the recognised educational Institutions, the major portion was spent on Primary schools (30.14%) followed by High, Post Basic schools (24.73%) Middle/Senior Basic schools (22.83%) Hicjher secondary schools 10+2 pattern (16.97%). For all other categories of Institutions the percentage is less than 3% (Table l.(i4) ,
As for the Non-Recurring Expenditure, the highest percentage was in the case of Middle/ senior Basic Schools i.e. (26.24%) followed by Higher Secondary Schools (10+2) pattern (22.93%) Primary/Junior Basic Schools (22.03%) High Post basic Schools (21.65%). In case of each other category of Institutions, the Non-Recurring Expenditure is Iciss than 3% percent (Table 1.04).
Details of Recurring and Non Recurring Expenditure by items are given in table 1.05. It will be seen that salaies of teaching staff account for about 81.00% peircent, while the share of the salries of the Non- teaching staff is 7.56 percent. Only 0.18 percent of the Recurring Expenditure is incurred on Hostel, 0.24 percent on Libraries 0.78% percent on stipends, scholarships and other financial concessions, 0.37 percent on Apparatus, chemicals and 9.87 percent on other items.
Analysis of Statewise data (Table V in the Annexure) reveals that percentage of Recurring Expenditure on Salaries to total Recurring Expenditure on School Education varies from the lowest of 68.49% for Arunachal pradesh to the highest of 95.84% for Daman & Diu against the All India percentage of 91.21%. Except for Arunachal pradesh in all other States, the salary component consumes more than 75 percent of the total Recurring Expenditure on School Education.
Trends during 1950-51 to 1990-91.Statement No.l depicts the trends in Income of all types of
Educational Institutions from different sources during the period 1950-51 to 1990-91. It may be seen that GJovernment fund is the major source of Income for Educational Institutions. Funds provided by Local Bodies are basically transfer from Central/ State Governments.
The share of Government Funds has incrciased from 68% in 1950- 51 to 93% in 1990-91. It is also interesting to observe that the share of fees has gone down considerably from 20.39% to as low as 3.43% during the same period. The share of endowment and other Sources has also decreased considerably from 11.62% in 1950-51 to
III
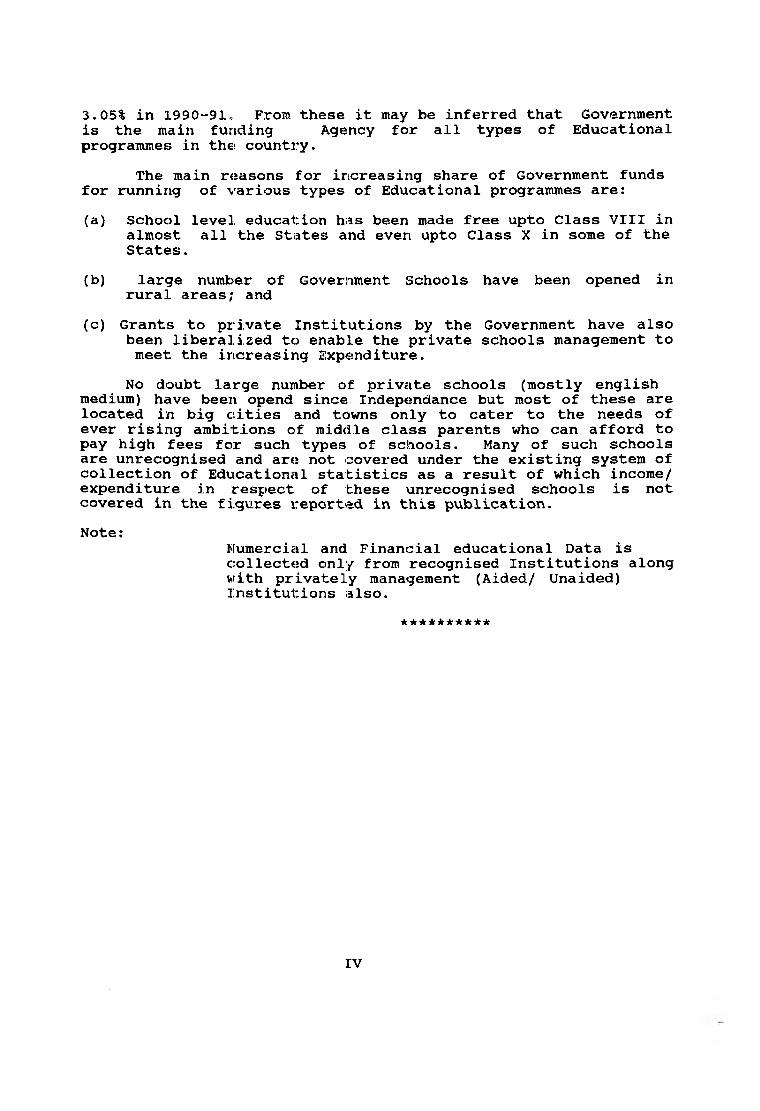
3.05% in 1990-91, From these it may be inferred that Government is the main funding Agency for all types of Educationalprogrammes in the country.
The main reasons for increasing share of Government funds for running of various types of Educational programmes are:
(a) School level education has been made free upto Class VIII in almost all the States and even upto Class X in some of the States.
(b) large number of Government Schools have been opened in rural areas; and
(c) Grants to private Institutions by the Government have alsobeen liberalized to enable the private schools management to meet the increasing Expenditure.
No doubt large number of private schools (mostly english medium) have been opend since Independance but most of these are located in big cities and towns only to cater to the needs of ever rising ambitions of middle class parents who can afford to pay high fees for such types of schools. Many of such schools are unrecognised and are not covered under the existing system of collection of Educationcil statistics as a result of which income/ expenditure in respect of these unrecognised schools is not covered in the figures reported in this publication.
Note:Numercial and Financial educational Data is collected only from recognised Institutions along with privately management (Aided/ Unaided) Institutions also.
* * * * * * * * * *
IV

Total Income (Recurring & Non recurring) of all types of Educational Institutions by Sources: during 1950-51 to 1990-91
(Figures in Thousandis of Rupees)
statement 1
Year Government Local body Universityfunds funds funds
fees Enrolment and other
Total
4
1950-511960-611961-621962-631963-641964-651965-661966-671967-681968-691969-701970-711971-721972-73 1993-741974-751975-76
652678234091427183653024765334493437244994374519495564858311166580391763876084594999387190
10511501120409321281768116523063
124987224914261906296435289710312051388733384828447554431452375703484925*
*
655499*
*
60631631906376175517111247123973152162*
*
211713*
23327259025(16.5606973765882357''88556E979356
10950161171533126486313416721432370
1718341
132885287714327220358619382864362327414439479535587335595735623656653905A
*
823039*
1143822344380039635604417477484108453450746220237697878881130568983688
10103764111828611237480713737794154495241807286521047030
1976-77 17438122 1940979 254083 2280273 1189207 231026641977-78 20279633 1910772 312761 2417396 1182109 261026711978-79 23589380 1777830 409583 2571318 1294120 296422311979-80 26220951 1620829 425275 2825775 1368306 324611361980-81 30772393 1773291 514312 3090208 1516928 376671321981-82 35097051 2192798 698126 3443991 17650B5 431970511982-83 50111646 2676401 838663 3874061 1996657 594974281983-84 46443305 3195042 916285 4273312 2153299 569812431984-85 53974960 3644171 2447876 4368611 3050020 674856381985-86 61121080 3974593 2877397 4775383 3369528 761179811986-87 73319777 4615806 3017624 5556998 3609618 901198331987-88** 61831029 4882737 8384 2999134 2222331 719436151988-89** 67663155 5474564 31500 4955019 3318865 814431031989-90** 78657017 9317471 10975 3342663 2860381 941885071990-91** 98521164 7113806 12565 3868738 3447360 112963633
* Breakup not available** The figures for the year 1987-88 to 1990--91 relate
Education only as the date concerning University and HigherEducation has been transfered to UGC from 1987-88 onwards.
N.B Figures from 1950-51 to 1986-87 relates to allEducational Institutions including University and Higher
to
types
Education■t'
Note Totals do not tally due to rounding of figures:
V

Percentage distribution of Income (Recurring and Non-Recurring by sources of all types of Institutions to total Income from 1950,51 to 1990-91.
statement 2
Year Government Local body University funds funds funds
fees Enrolment and other Source
Total
1950-511960-611961-621962-631963-641964-651965-661966-671967-681968-691969-701970-711971-72
V 1972-7319*3-741974-751975-761976-771977-781978-791979-801980-811981-821982-831983-841984-851985-861986-871987-881988-891989-901990-91
57.0667.9768.5868.47 69.0969.68 70.33 71.01 71.8773.25 75.60 75.65 75.86 76.5277.94 70.9278.5175.4877.6979.58 80.7881.7081.25 84.2281.5179.98 80.30 81.3685.94 83.0883.51 87.21
10.936.536.616.715.98 5.84 6.255.515.52 4.803.72 4.34N.A,N.A.4.24N.A.N.A.8.40 7.32 6 .004.994.71 5.08 4.50 5.615.40 5.22 5.12 6.796.72 9.89 6.30
N.A.1.131.020.910.931.241.231.36 N.A. N.A.1.37 N.A. N.A.
1.101 .2 01.38 1.31 1.37 1.62 1.41 1.61 3.63 3.78 3 .35 0 ,01 0..04 0.01 0..01
20.3917.1416.5516.7017.0116.5715.7415.6914.4414.0813.2812.81N.A.N.A.
11.12N.A.N.A.9.879.26 8.67 8.71 8 . 2 0 7.97 6.51 7.50 6.476.276.174.17 6.08 3.55 3.42
11.628.35 8.26 8.12 7.916.78 6.66 6.87 7.24 6.63 6.17 5.85N.A.N.A.5.33N.A.N.A.5.154.534.374.224.034.093.363.78 4.52 4.43 4.013.09 4.083.043.05
100.00100 .00100 .001 00 . 0 0100 .0 0100.00100 .0 0100 .00100.00100 .0 0100 . 0 0100.00100 .0 0100 . 0 0100 . 0 0100 . 0 0100.00100.00100.00100.00100.00100.00100.00100.00100 .00100.00100.00100.001 00 .0 0100.00100.00100.00
N.A. Not Available* The figures for the year 1987-88 to
Education only as thfi data concerning university Education has been transfered to UGC from 1987-88 onwards.
N.B Figures from 1950-51 to 1986-87 relatesEducational Institutions including University and education.
Note Totals do not tally due to rounding of figures:
1990-91 relate and Higher
to all higher
type!
VI

STATEMENT 3
(R u p « s« e I n ^ h o u B o n d s )
Year Primary Middle High/Hr.sec.School School School
Growth of Total Direct/Recurring Expenditure by typeof Institutions All India-1950-51 to 1990-91.
1950-51 364843 76990 2304501960-61 734461 429220 6891171961-62 826691 488418 7911851962-63 928935 555091 9154181963-64 990089 613327 10554461964-65 1087130 718423 11733711965-66 1287231 642827 13769261966-67 1444559 965787 16137931967-68 1705502 1148096 19261871968-69 1862679 1319250 21797621969-70 2089720 1528669 24362751970-71 2345663 1709368 27000011971-72 2579875 1184691 30056611972-73 2898625 2104733 33164781973-74 3316858 2441963 38786111974-75 3848572 2926359 43699651975-76 4463148 3409672 49356221976-77 5374525 4069124 61936231977-78 5901932 4324089 69514411978-79 6549863 4707451 76718461979-80 7156249 5287051 86363271980-81 8384658 5478173 101218021981-82 9716133 6826234 121216651982-83 11319083 8030570 135855911983-84 12886963 9123632 164573581984-85 14561950 10279992 191662961985-86 16601096 11794059 214803691986-87 20083943 13984499 246912201987-88 21288380 15322338 272694841988-89 22753143 17377182 291201921989-90 26544317 20882956 352567741990-91 28653528 21706042 39706520
VII
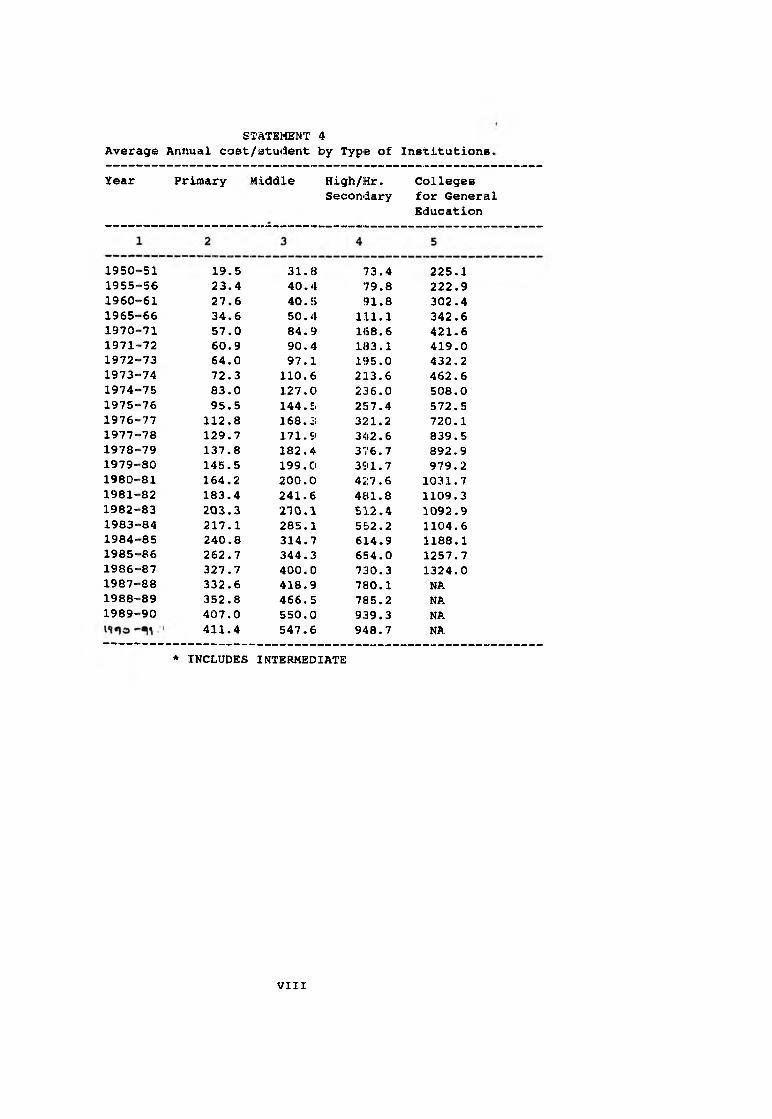
STATEMENT 4Average Annual cost/student by Type of Institutions,
Year Primary Middle High/Hr.Secondary
Colleges for General Education
1950-1955-I960-1965-1970-1971-1972-1973-1974-1975-1976-1977-1978-1979-1980-1981-1982-1983-1984-1985-1986-1987-1988-1989-
■51■56■61-66■71•72•73■74•75•76■77■78■79•80•81•82•83■84•85•86•87•88•89■90
19.523.427.634.657.0 60.964.0 72.383.095.5
112 .8129.7137.8145.5164.2 183.4203.3 217.1240.8262.7327.7332.6352.8 407.0411.4
31.840.440.550.484.990.4 97.1
110.6127.0144.5168.3171.9182.4199.0200 .0241.6 210.1 285.1314.7 344.3400.0418.9466.5550.0547.6
73.479.891.8
111.1 168.6183.1195.0213.6236.0257.4321.2342.6376.7391.7427.6481.8512.4552.2614.9654.0730.3780.1785.2939.3948.7
225.1222.9302.4342.6421.6419.0432.2462.6508.0572.5720.1839.5892.9979.2 1031.7 1109.3 1092.91104.6 1188.11257.7 1324.0NANANANA
* INCLUDES INTERMEDIATE
VIII
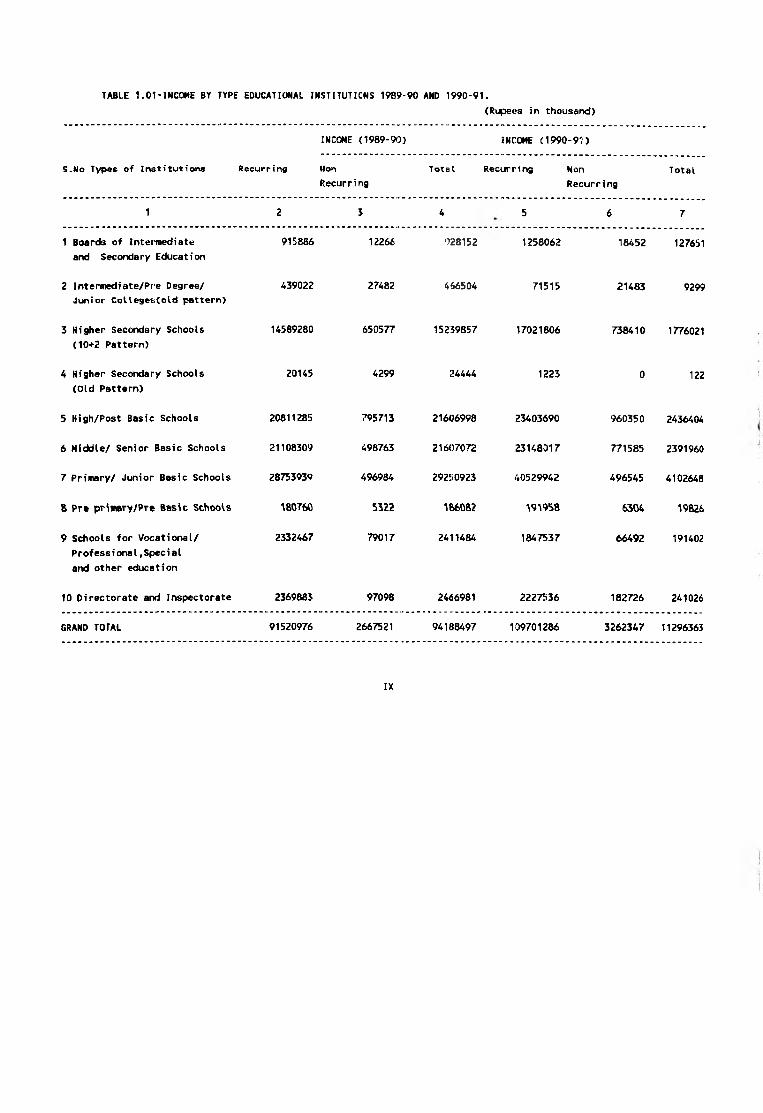
TABLE 1.01-INCOME BY TYPE EDUCATIONAL INSTITUTIONS 1989-90 AND 1990-91.
(Rupees in thousand)
INCOME (1989-M) INCOME (1990-91)
S.No Types of Institutions Recurring Mon
Recurring
Total Recurring Non
Recurring
Total
1 2 3 4 5 6 7
1 Boards of Intet'inedfate
and Secondary Education
915886 12266 928152 1258062 18452 127651
2 Intermediate/Pre Degree/
Junior CoUeges(old pattern)
439022 27482 466504 71515 21483 9299
3 Higher Secondary Schools
(10+2 Pattern)
U5S9280 650577 15239857 17021806 738410 1776021
4 Higher Secondary Schools
(Old Pattern)
20145 4299 24444 1223 0 122
5 High/Post Basic Schools 20811285 795713 21606998 23403690 960350 2436404
6 Hiddle/ Senior Basic Schools 21108309 498763 21607072 23148017 771585 2391960
7 Primary/ Junior Basic Schools 28753939 496984 29250923 40529942 496545 4102648
8 Pre pr^mary/Pr® Basic SchooU 160760 5322 1660&2 191958 6304 19826
9 Schools for Vocational/
Profess i onaI,Spec i aI
and other education
2332467 79017 2411484 1847537 66492 191402
10 Directorate and Inspectorate 2369883 97098 2466981 2227536 182726 241026
GRAND TOTAL 91520976 2667521 94188497 109701286 3262347 11296363
IX
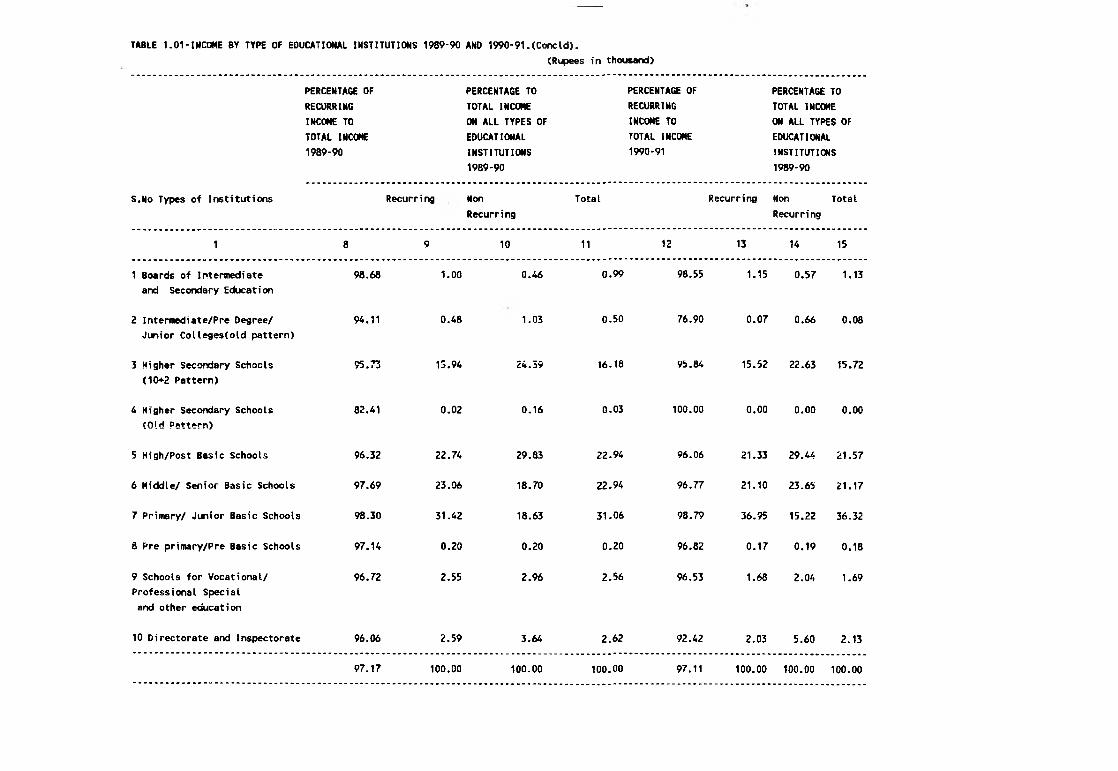
TABLE 1.01-INCOME BY TYPE OF EDUCATIONAL INSTITUTIONS 1989-90 AND 1990-91.(ConeId).
(Rupees in thousand)
PERCENTAGE OF
RECURRING
INCOME TO
TOTAL INCOME
1989-90
PERCENTAGE TO
TOTAL INCOME
ON ALL TYPES OF
EDUCATIONAL
INSTITUTIONS
1989-90
PERCENTAGE OF
RECURRING
INCOME TO
TOTAL INCOME
1990-91
PERCENTAGE TO
TOTAL INCOME
ON ALL TYPES OF
EDUCATIONAL
INSTITUTIONS
1989*90
S.No Types of Institutions Recurring Non
Recurring
Total Recurring Non
Recurring
Total
1 8 9 10 11 12 13 14 15
1 Boards of Intermediate
and Secondary Education
98.68 1.00 0.46 0.99 98.55 1.15 0.57 1.13
2 Intermediate/Pre Degree/
Junior CoUeges(old pattern)
94.11 0.48 1.03 0.50 76.90 0.07 0.66 0.08
3 Higher Secondary Schools
(10+2 Pattern)
95.73 15.94 24.39 16.18 95.84 15.52 22.63 15.72
4 Higher Secondary Schools
(Old Pattern)
82.41 0.02 0.16 0.03 100.00 0.00 0.00 0.00
5 High/Post Basic Schools 96.32 22.74 29.83 22.94 96.06 21.33 29-44 21.57
6 Middle/ Senior Basic Schools 97.69 23.06 18.70 22.94 96.77 21.10 23.65 21.17
7 Primary/ Junior Basic Schools 98.30 31.42 18.63 31.06 98.79 36.95 15.22 36.32
8 Pre primary/Pre Basic Schools 97.14 0.20 0.20 0.20 96.82 0.17 0.19 0.18
9 Schools for Vocational/
Professional Special
and other education
96.72 2.55 2.96 2.56 96.53 1.68 2.04 1.69
10 Directorate and Inspectorate 96.06 2.59 3.64 2.62 92.42 2.03 5.60 2.13
97.17 100.00 100.00 100.00 97.11 100.00 100.00 100.00
1989-90
TABLE 1.02- INCOME GOVERMMEMT FUMDSCCEMTRAL AND STATES) BY TYPE OF EDUCATIONAL INSTITUTIONS 1989-90 AMD 1990-91.
(Rupees in Thousands)
1990-91
RECURRING NON-RECURR
-ING
TOTAL RECURRING NON-RECURR
-ING
TOTAL
S. TYPE OF INSTITUTIONS
NO.
AMOUNT X TO AMOUNT % TO AMOUNT X TO AMOUNT X TO AMOUNT X TO AMOUNT X TO
TOTAL INCOME TOTAL INCOME TOTAL INCOME TOTAL INCOME TOTAL INCOME TOTAL INCOME
ON ALL TYPE ON ALL TYPE ON ALL TYPE ON ALL TYPE ON ALL TYPE ON ALL TYPE
OF EDUCATIONAL. OF EDUCATIONAL. OF EDUCATIONAL. OF EDUCATIONAL. OF EDUCATIONAL. OF EDUCATIONAL.
INSTITUTIONS INSTITUTIONS INSTITUTIONS INSTITUTIONS INSTITUTIONS INSTITUTIONS
2
219539
5 6
0.53 229299
7 8
0.29 268911
9 10
0.28 9763
11 12
0.46 278674
13
1 Boards of Intermediate
and Secondary Education
2 Intermediate/Pre Degree/
Jr. Colleges
3 Higher Secondary Schools
(102 Pattern)
4 Higher Secondary Schools
(Old Pattern)
5 High/Post Basic Schools
6 Middle/ Senior Basic Schools
7 Prinisry/ Junior Bssic Schools
8 Pre primary/Pre Basic Schools
9 Schools for Vocational/
Professional Special
and other education
10 Directorate and Inspectorate
GRAND TOTAL
17816958
1822/951
22701749
126291
2185894
1900796
76830476
0.29
3049 0.00
23.19
23.72
30.S5
0.16
2.85
9660
3049 0.00 874 0.00
451802
374651
396120
3916
50302
2.47 95050
100.00 1826541
24.74 18268760
20.51 18602602
21.69 24097S69
0.21 130207
2.75 2236196
5.20 1995846
100.00 78657117
23.23 20392529
23.65 20291938
30.64 370C35C7
0.17 132880
2.84 1690442
2.54 2083533
100.00 96390634
21.16 478571
21.05 646764
33.39 4007S6
0.14 4932
1.75 39974
2.16 45705
100.00 2130530
22.46 20871100
30.36 20938702
18.81 37404293
0.23 13; 12
1.88 1730416
2.15 2129238
100.00 9B521164
0.28
285601 0.37 7503 0.40 292904 0.37 5980 0.01 1104 0.05 70J4 0.01
12362648 16.09 437737 23.97 12800385 16.27 14520040 15.06 502931 23.61 15022971 15.25
87* 0.00
21.18
21.25
37.57
0.14
1.76
2.16
100.00
XJ

TABLE 1.03- INCOME BY SOURCE FOR ALL TYPE OF EDUCATIONAL INSTITUTIONS 1989-90 AND 1990-91.
(Rupees in Thousands)
TOTAL INCOME 1989-90 TOTAL INCOME 1990-91
AMOUNT PERCENTAGE PERCENTAGE AMOUNT PERCENTAGE PERCENTAGE
TO TOTAL TO TOTAL
INCOME IN ALL INCOME IN ALL
SOURCES SOURCES
1 2 3 4 5 6 7
RECURRING
Central Government A3702002 47.75 46.40 52017352 47.42 46.05
State Government 33128474 56.20 35.17 44373282 40.45 39.28
University Grants Commission 3034 0.00 0.00 1370 0.00 0.00
University Funds 6922 0.01 0.01 9999 0.01 0.01
Local Body Ftvxis 9046631 9.88 9.60 6826316 6.22 6.04
Fees 3342663 3.65 3.55 3868738 3.53 3.42
Enrolment and other source 2291260 2.50 2.43 2604229 2.37 2.31
Total (Recurring) 91520986 100.00 97.17 109701286 100.00 97.11
NON- RECURRING
Central Government 903113 33.86 0.96 971330 29.77 0.86
State Government 923428 34.62 0.98 1159200 35.53 1.03
University Grants Commission 591 0.02 0.00 650 0.02 0.00
University Funds 428 0.02 0.00 546 0.02 0.00
Local Body Funds 270840 10.15 0.29 287490 8.81 0.25
Other Source 569121 21.34 0.60 843131 25.84 0.75
Total (Non-Recurring) 2667521 100.00 2.83 3262347 100.00 2.89
Grand Total 94188507 112963633
Recurring and Non-Recurring)
XII

(Rupees in Thousands)
TABLE 1.04- EXPENDITURE BY TYPE OF EDUCATIONAL INSTITUTIONS 1989*90 AND 1990-91
1989-90 1990-91
S. TYPE OF INSTITUTIONS
NO. RECURRING
NON
RECURRING
TOTAL
RECURRII4G
NON
RECURRING
TOTAL
1 2 3 4 5 6 7
1 Boards of Intermediate
and Secondary Educat i on
834105 25674 s ' i rm 1054876 36550 1091426
2 Intermediate/Pre Degree/
Junior Colleges(old pattern)
447402 24956 472358 7:2350 20641 92991
3 Higher Secondary Schools
<10+2 Pattern)
14220192 559790 1',779 '82 16130990 643412 16774402
4 Higher Secondary Schools
(Old Pattern)
17339 4218 21557 •1007 - 1007
5 High/Post Basic Schools 20571841 535354 21107195 23502173 607566 24109739
6 Middle/ Senior Basic Schools 20882956 450904 21333860 21706042 736308 22442350
7 Primary/ Junior Basic Schools 26544317 595075 27139392 2865‘5528 618401 29271929
8 Pre priwary/Pre Basic Schools 174517 4446 178963 189158 5397 194555
9 Schools for Vocational/
Professional Special
and other education
1865267 88491 1953758 1655464 81182 1736646
10 Directorate and Inspectorate 1541785 214491 1756276 2092:045 56938 2148983
GRAND TOTAL 87099721 2503399 89603120 95057'633 2806395 97864028
XIII

TABLE 1.04- Percentage to Total Expenditure on All Type of Eckicational Institutions (Concld).
1989-90 1990-91
S. TYPE OF INSTITUTIONS
NO.
PERCENTAGE
OF RECURRING
EXPENDITURE
TO TOTAL
EXPENDITURE
RECURRING NON
RECURRING
TOTAL PERCENTAGNON-
OF RECURRRECURRING
EXPENDITURE
TO TOTAL
EXPENDITURE
RECURRING NON
RECURRING
TOTAL
8 9 10 11 12 13 14 15
1 Boards of Intermediate
and secondary Education
97.01 0.96 1.03 0.96 96.65 1.11 1.30 1.12
2 Intermediate/Pre Degree/
Junior Colleges(old pattern)
94.72 0.51 1.00 0.53 77.80 0.08 0.74 0.10
3 Higher Secondary Schools
(10+2 Pattern)
96.21 16.33 22.36 16.49 96.16 16.97 22.93 17.14
4 Higher Secondary Schools
(Old Pattern)
80.43 0.02 0.17 0.02 100.00 0.00 - 0.00
5 High/Post Basic Schools 97.46 23.62 21.39 23.56 97.48 24.72 21.65 24.64
6 Middle/ Senior Basic Schools 97.89 23.98 18.01 23.81 96.72 22.83 26.24 22.93
7 Primary/ Junior Basic Schools 97.81 30.48 23.77 30.29 97.89 30.14 22.04 29.91
8 Pre primary/Pre Basic Schools 97.52 0.20 0.18 0.20 97.23 0.20 0.19 0.20
9 Schools for Vocational/
Professional Special
and other education
95.47 2.14 3.53 2.18 95.33 1.74 2.89 1.77
10 Directorate and Inspectorate 87.79 1.77 8.57 1.96 97.35 2.20 2.03 2.20
GRAND TOTAL 97.21 100.00 100.00 100.00 97.13 100.00 100.00 100.00

(Rupees in Thousands)
TABLE 1.05-EXPENDITURE ON ALL SCHOOL EDUCATIONAL INSTITUTIONS 8Y OBJECTS 1989-90 AND 1990*91.
EXPENDITURE 1989-90 EXPENDITURE 1990-91
SOURCE AMOUNT PERCENTAGE PERCENTAGE
TO TOTAL
EXPENDITURE
/IMOUNT PERCENTAGE PERCENTAGE
TO TOTAL
EXPENDITURE
1 2 3 4 c 6 7
RECURRING
Salaries and allowances o
Teaching and acadefriic Staff
73063931 83.89 81.54 79.’73163 83.39 81.00
Salaries of Non Teaching
Staff
6162642 7.08 6.88 7594183 7.78 7.56
Hostels 137A61 0.16 0.15 1747319 0.18 0.18
Libraries 134560 0.15 0.15 1494Z!6 0.16 0.15
Stipends Scholarships and
other Financial Concessions
698345 0.80 0.78 765585 0.81 0.78
Apparatus Chemical Consu-
able Store
287008 0.33 0.32 3585^A 0.38 0.37
Other Items 6615774 7.60 7.38 694*1973 7.30 7.09
Total (Recurring) 87099721 100 97.21 95057633 100.00 97.13
NON-RECURRING
Libraries 81670 3.26 0.09 89236 3„18 0.09
BuiIding 665S54 26.59 0.74 662010 23.59 0.68
Other Item* 1756175 70.15 1.96 2055149 73.23 2.10
TOTAL (NON-RECURRING) 2503399 100.00 2.79 2806395 100 ,.00 2.87
GRAND TOTAL
(RECURRING* NON-RECURRING)
89603120 100.00 97864028 100.00
* Includes Middle, Primary and Pre- Pritnary Expenditure also.
XIV
PART-II STATISTICAL TABLES
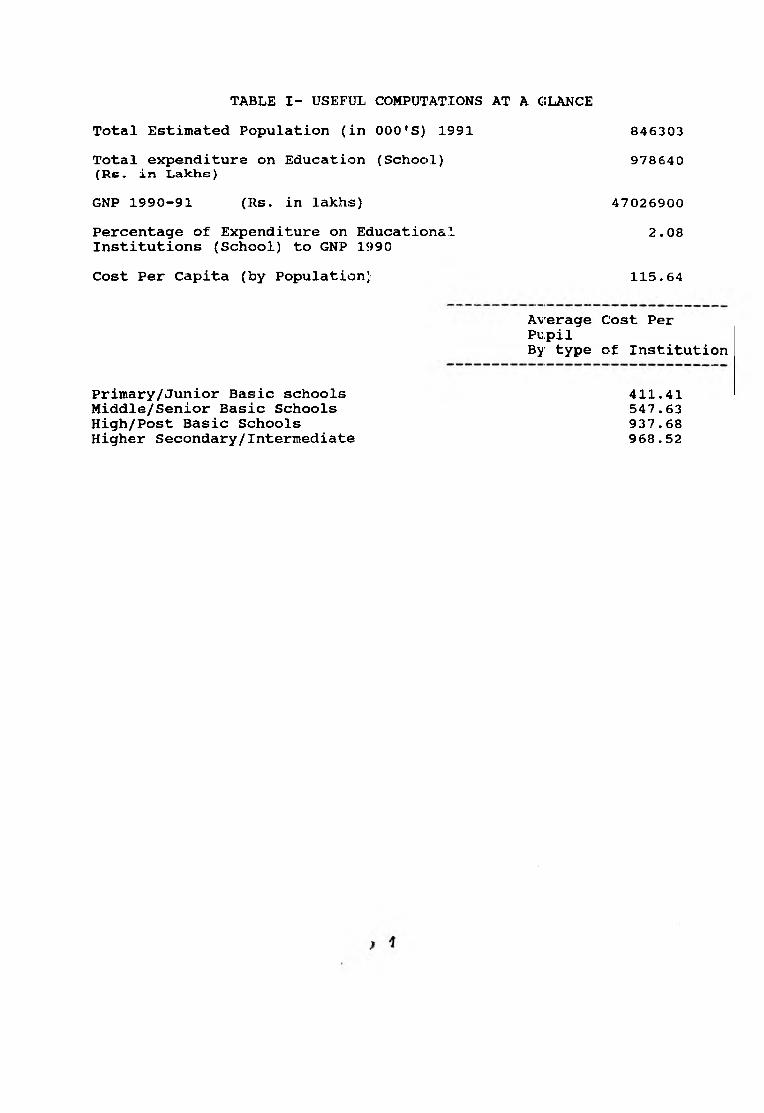
TABLE I- USEFUL COMPUTATIONS AT A GLANCE
Total Estimated Population (in 000*S) 1991
Total expenditure on Education (School)(R e . in Lakhs)GNP 1990-91 (Rs. in lakhs)
Percentage of Expenditure on Educational Institutions (School) to GNP 1990
Cost Per Capita (by Population)
846303
978640
47026900
2.08
115.64
Average Cost Per PupilBy type of Institution
Primary/Junior Basic schools Middle/Senior Basic Schools High/Post Basic Schools Higher Secondary/Intermediate
411.41547.63937.68968.52
(Rupees in Thousands)
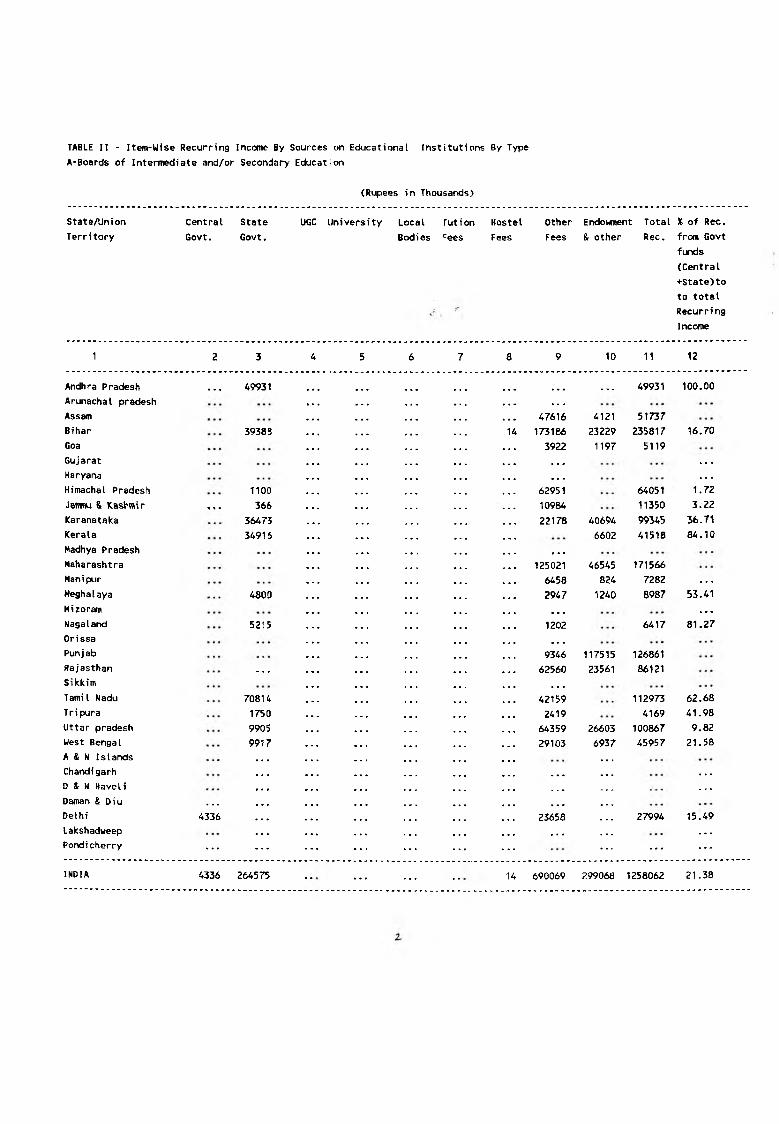
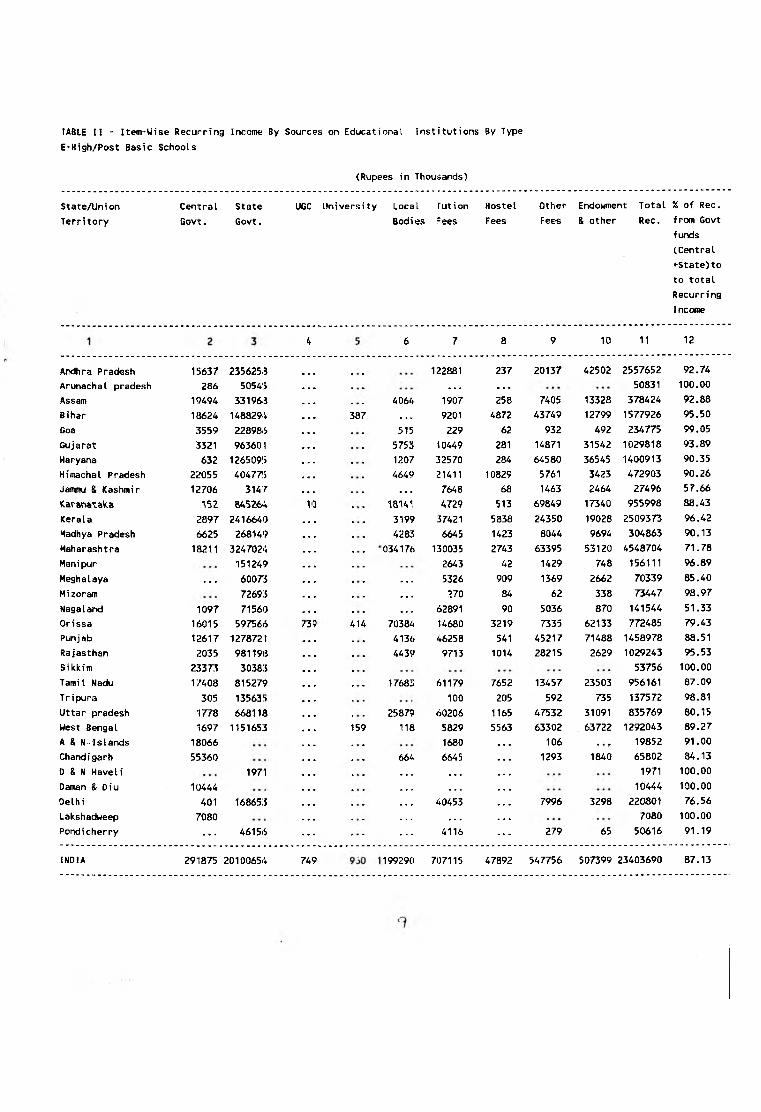
TABLE II - Item-Wise Recurring Income By Sources on Educational Institutions By Type
A'Boards of Intermediate and/or Secondary Education
StateAJnion
Territory
Central State UGC University Local Tution Hostel
Govt. Govt. Bodies 'ees Fees
Other Endowment Total X of Rec.
Fees & other Rec. from Govt
funds
(Central
+State)to
to total
Recurring
Income
1 2 3 4 5 6 7 8 9 10 11 12
Andhra Pradesh . . . 49931 ............... . . . 49931 100.00
Arunachal pradesh . . . . . . . - -Assam 47616 4121 51737
Bihar 39383 14 173186 23229 235817 16.70
Goa 3922 1197 5119
Gujarat . . . . . . . . - —Haryana . . . . . . . . . —Himachal Pradesh 1100 62951 64051 1.72
Janmu & Kashmir » « • 366 ... 10984 11350 3.22
Karanataka 36475 22178 40694 99345 zbjy
Kerala 34916 ••• .«• 6602 41518 84.10
Hadhya Pradesh . . . . . . . . .Maharashtra ... 125021 46545 171566
Manipur 6458 824 7282 —
Meghalaya 4800 ........... 2947 1240 8987 53.41
Mizoram . . . . . . . . . —Nagaland 5215 1202 6417 81.27
Orissa . . . . . . . . .Punjab 9346 117515 126861
Rajasthan . • • 62560 23561 86121
Siickim . . . . . . . . .Tamil Nadu 70814 42159 112973 62.68
T r i pura 1750 2419 4169 41.98
Uttar pradesh 9905 64359 26603 100867 9.82
West Bengal 9917 29103 6937 45957 21.58
A & N Islands •••Chandigarh . . . . . . . . . —0 & N Haveli . . . . . . . . . _Daman & Diu • . . . . . . . . • . •Delhi 4336 23658 27994 15.49
Lakshadweep . . . . . . . . . —Pondicherry . . . . . . . . . . . .
INDIA 4336 264575 . . . 14 690069 299068 1258062 21.38
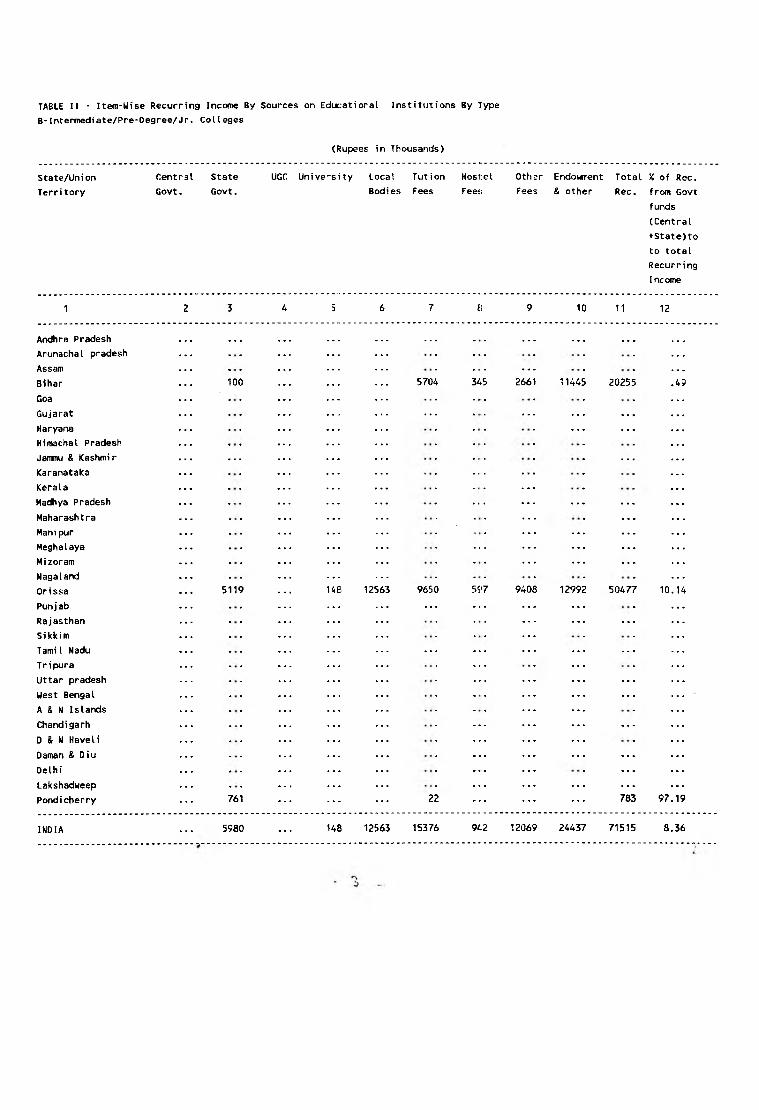
TABLE II - Item-Wise Recurring Income By Sources on Educatioral Institutions By Type
B-Intermediate/Pre-Oegree/Jr. Col leges
(Rupees in Thousands)
UGC UniversityState/Union
Terri tory
Central
Govt.
State
Govt,
Local
Bodies
Tut ion
Fees
Hostel
Fees
Other
Fees
Endowment
& other
Total % of Rec,
Rec. from Govt
funds
(Central
♦■State)to
to total
Recurr
Income
1 A 6 7 8 9 10 11 12
Andhra Pradesh • • • « « « • . • • • • • • • ...Arunachal pradesh ....Assam - , . ...Bihar ■JOO 5704 3A5 2661 11445 20255
Goa ... ...Gujarat ... ... ... ... ...Haryana ... ... ...Himachal Pradesh ...Jamnu & Kashmir — — —Karanataka ... ...Kerala ... ...Madhya Pradesh ... ... ... ... ...Maharashtra ... ...Manipur ... ... ... ...Meghalaya ... .... ... ... ...Mizoram ... ... ... ... ■Nagaland ...Or i ssa 5119 12563 9650 597 9408 12992 50477 10.14
Punjab ... ... .... ... ...Rajasthan ... ... ... ...Sikkim ... ...TamiI Nadu ... .... ... ... ...Tripura ... .... ...Uttar pradesh ... ... ... ...West Bengal ... ... ...A & N Islands ... ... ...Chandigarh ... .... ... ... ...D & N Haveli ... ... ... ...Daman & Diu ... ... ... ... ...Delhi ... ... ... ...Lakshadweep ... ... ... ... ...Pondicherry 761 22 ... ... ... 783 97.19
INDIA 5980 148 12563 15376 942 12069 24437 71515 8.36
ng

(Rupees in Thousands)
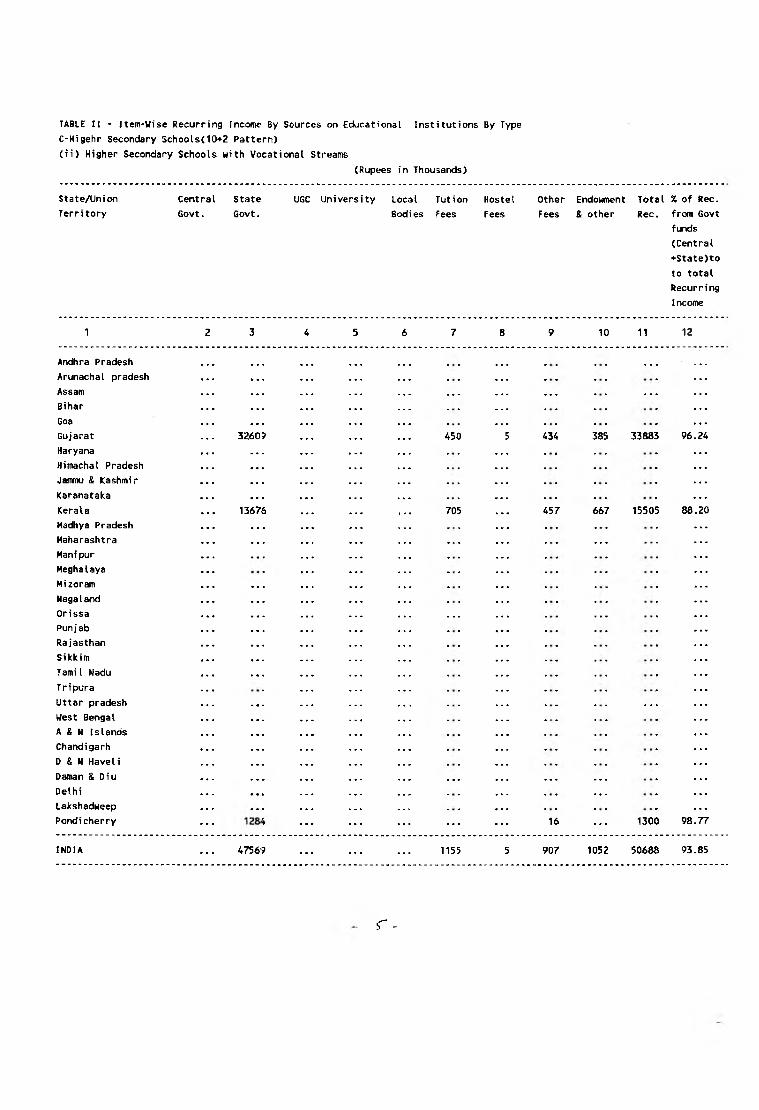
TABLE II - I tern-Wise Recurring Income 3y Sources on Educational Institutions By Type
C-Higher Secondary Schools(10+2 pattern)
(i) Higher Secondary Schools with Academic Streanis
State/Union
Territory
Central
Govt.
State
Govt.
UGC University Local
Bodies
Tution
Fees
Hostel
Fees
Other
Fees
Endowment
& other
Total % of Rec.
Rec. from Govt
funds
(Central
+State)to
to total
Recurring
Income
1 2 3 5 6 7 8 9 10 11 12
Andhra Pradesh 31284 7133 52650 11799 8369 10343 121578 31.60
Arunachal pradesh 72 57189 57261 100.00
Assam 2014 246839 1608 1844 377 3167 2758 258607 96.23
Bihar 48354 16193;? 5862 246 7695 4696 228785 91.91
Goa 947 38656 2931 637 104 43275 91.51
Gujarat 24339 1344045 3049 34627 6734 16856 7926 1438197 95.15
Haryana 89448 238055 . . . 32889 58 36550 36109 433109 75.62
Himachal Pradesh 11479 20868r> 2434 34030 2593 1636 5005 265862 82.81
Jammu & Kashmir 9984 177994 677 107 188762 99.58
ICaranataka 303 775974 55834 9888 4860 49269 2946 899074 86.34
Kerala 36684 5100 2119 4029 2796 50728 72.32
Madhya Pradesh 43080 541491 3393 29612 1439 23045 15895 657955 88.85
Maharashtra 88296 2211329 254226 50748 199 43722 42550 2691070 85.45
Manipur 2578 44021 618 21 1031 59 48328 96.42
Meghalaya 3874 2131 989 ___ 6994 55.39
Mizoram • • •Nagaland —
Orissa . •. ... —
Punjab 38378 321444 2644 1848 57243 2310 26040 22653 472560 76.14
Rajasthan 58348 77877:> 2032 31834 1095 23579 21722 917385 91.25
Sikkim 7791 1012U - • • • • • ... 17919 100.00
Tamil Nadu ... —
Tripura 2741 175072 105 271 918 442 179549 99.03
Uttar pradesh 10126 2551239 128526 273568 12022 65614 55812 3096907 82.71
West Bengal 5591 612260 3441 3842 33211 9699 666044 92.46
A & N Islands 40849 ... • • • 4201 45050 90.67
Chandigarh 50669 3 70 2662 774 1055 3056 58289 86.93
D & N Haveli 5320 • • • • . . 5320 100.00 ,
Daman & Diu 498 498 100.00
Delhi 41535 798453 9118 331733 6514 54588 19345 1261286 66.60
Lakshadweep • • • —
Pondicherry . . . 1069<* . . . 9160 . . . 1101 . . . 20955 51.03 i
INDIA 647262 11316731 621 2644 462138 9/'3353 57380 407302 263916 14131347 84.66 1!
- S
(Rupees in Thousands)
TABLE II - Item-Wise Recurring Incomt? By Sources on Educational Institutions By Type
C-Higehr Secondary Schools<10+2 Pattern)
(ii) Higher Secondary Schools with Vocational Streams
State/Union
Territory
Central
Govt.
State
Govt.
UGC University Local
Bodies
Tut ion
Fees
Hostel
Fees
Other
Fees
Endowment
& other
Total % of Rec.
Rec. from Govt
funds
(Central
+State)to
to total
Recurr
Income
1 2 3 4 5 6 7 8 9 10 11 12
Andhra Pradesh . . . . . . . . . . . . . . . . . . . . . . . . . . . . . . . . . . . . . . . . . . . . . . . . . .
Arunachal pradesh . . . . . .
Assam . . . . . . • • • . . . . . .
Sihar . . . . . .
Goa . . . . . .
Gujarat 3260? 450 434 385 33883 96.24
Haryana . . . . . .
Himachal Pradesh . . . . . .
Jarranu & Kashmir . . . . . .
Karanataka . . . • . .
Kerala 13675 705 457 667 15505 88.20
Hadhya Pradesh . . . . . .
Maharashtra . . . . . . _ ____
Manipur . . . . . .
Meghalaya . . .
Mizoram . . . . . .
Nagaland . . . . . .
Orissa . . . . . . • • . . . .
Punjab . . . . . .
Rajasthan . . . . . .
Sikkim . . . . . .
Tamil Nadu . . . . . .
Tripura . . .
Uttar pradesh . . . . . . —
West Bengal . . . . . .
A & N Islands . . . . . .
Chandigarh . . . . . .
D & N Haveli . . . . . .
Daman & Diu • . • . • . • . • • . . • . •
Delhi . . . . . . . . .
Lakshadweep « . r . . .
Pondicherry . . . 16 . . . 1300 98.77
INDIA 47569 1155 5 907 1052 50688 93.85
ng
r -

TABLE II - Item-Wise Recurring Income 8y Sources on Educational Institutions By Type
C-Higehr Secondary Schools(10*-2 pattern)
(iii) Higehr Secondary Schools with Vocational and Academic Streams
(Rupees in Thousands)
State/Union
Territory
Central State UGC University Local Tution Hostel
Govt. Govt. Bodies Fees Fees
Other Endowment Total X of Rec.
Fees & other Rec. from Govt
funds
(Central
+State)to
to total
Recurring
Income
1 3 4 7 8 9 10 11 12
Andhra Pradesh
Arunachal pradesh • . . • . . . . .
Assam • • • . • • • •
Bihar • • . . . . • . .
Goa . . . . * -
Gujarat 133756 4642 78 4783 6990 150287 89.02
Haryana • • • —Himachal Pradesh 20371 337 • • . 21123 98.37
Jamnu & Kashmir . • . . . . • • • • • •
Karanataka «• • * » * % * % • •« • • . ' . i. '
Kerala • • • . . . ■ • • • . . • . .
Madhya Pradesh • • • • . . • • .
Maharashtra • • . . . . • . •
Manipur . . . . . .
MeghaIaya
Mizoram • • « • • • • • . . . . • • .
Magaland • . • . 4 • . . > . • .
Orissa . . . • . .
Punjab 203841 5839 50 7316 5256 222302 91.70
Rajasthan • . . . . . . . . • . . • • • . . •
Sikkim • . • • . •Tamil Nadu 46669 2000671 5031 172216 12815 67293 30781 2335476 87-66
Tripura . . ^ . . . • • . • . • • • .
Uttar pradesh . - • - - • • • • • .West Bengal . . . . . •
A & N Islands 1860 «. . . • . • • • • • • • 1860 100.00
Chandigarh . . • « • . ___
D & N Haveli • . .. • • . . . . . . . . . •
Daman & Oiu ... • • • • . .Delhi 86194 4539 49 2044 1038 93864 91.83
Lakshadweep . - - . . . . . . • • .
Pondicherry 1468:5 176 . . . . . . 14859 98.82
INDIA 48962 2459516 . . . 5044 187749 12995 81440 44065 2839771 88.33
(Rupees in Thousands)
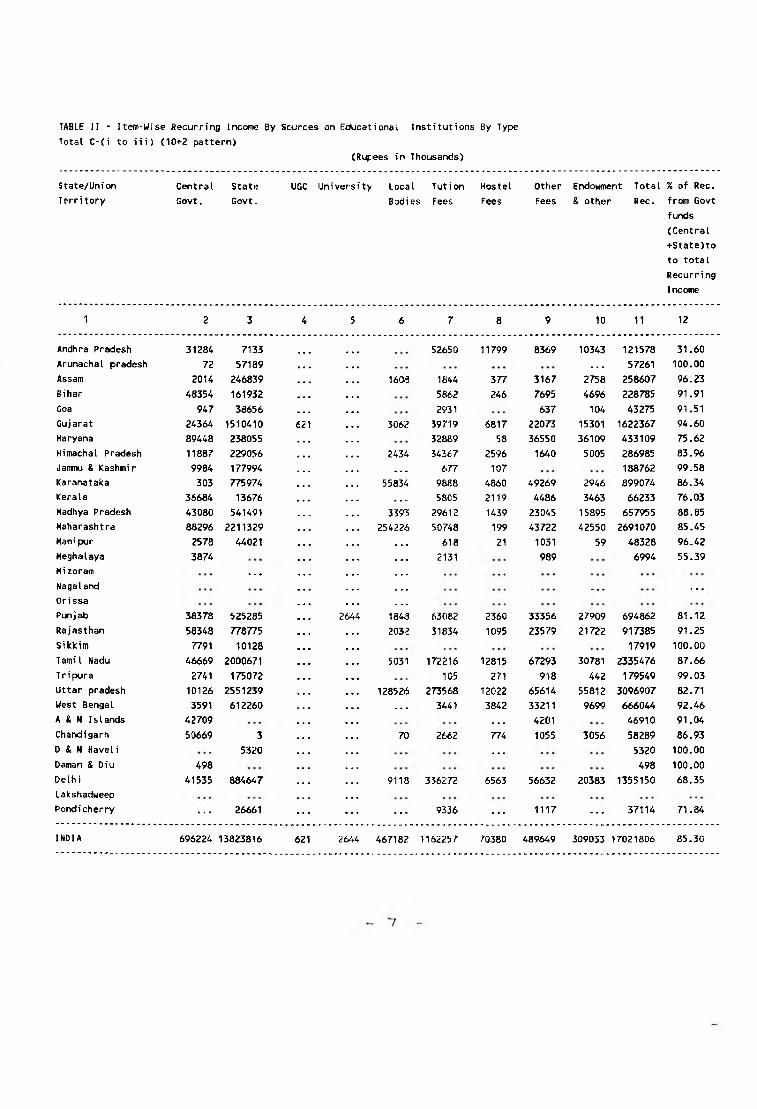
TABLE II - Item-Wise Recurring IncoTO By Sources on Educational Institutions By Type
Total C-(i to iii) (10+2 pattern)
State/Union
Territory
Central
Govt.
State
Govt,
UGC University Local Tution Hostel Other Endowment Total % of Rec.
Bodies Fees Fees Fees & other Rec. from Govt
funds
(Central
+State)to
to total
Recurring
Income
1 2 3 4 5 6 7 8 9 10 11 12
Andhra Pradesh 31284 7133 52650 11799 8369 10343 121578 31.60
Arunachal pradesh 72 57189 _ _ _ _ _ _ 57261 100.00
Assam 2014 246839 1608 1844 377 3167 2758 258607 96.23
Bihar 48354 161932 5862 246 7695 4696 228785 91.91
Goa 947 38656 2931 637 104 43275 91.51
Gujarat 24364 1510410 3062 39719 6817 22073 15301 1622367 94.60
Haryana 89448 238055 32889 58 36550 36109 433109 75.62
Himachal Pradesh 11887 229056 2434 34367 2596 1640 5005 286985 83.96
Jammu & Kashmir 9984 177994 . . . 677 107 188762 99.58
Karanataka 303 775974 55834 9888 4860 49269 2946 899074 86.34
Kerala 36684 13676 . - - 5805 2119 4486 3463 66233 76.03
Madhya Pradesh 43080 541491 3393 29612 1439 23045 15895 657955 88.85
Maharashtra 88296 2211329 254226 50748 199 43722 42550 2691070 85.45
Manipur 2578 44021 618 21 1031 59 48328 96.42
Meghalaya 3874 2131 989 6994 55.39
Mizoram . . .
Nagaland _____ . . .
Orissa
Punjab 38378 525285 2644 1848 63082 2360 33356 27909 694862 81.12
Rajasthan 58348 778775 2032 31834 1095 23579 21722 917385 91.25
Sikkim 7791 10128 17919 100.00
Tamil Nadu 46669 2000671 5031 172216 12815 67293 30781 2335476 87.66
Tripura 2741 175072 105 271 918 442 179549 99.03
Uttar pradesh 10126 2551239 128526 273568 12022 65614 55812 3096907 82.71
West Bengal 3591 612260 . . . 3441 3842 33211 9699 666044 92.46
A & N Islands 42709 • • • 4201 46910 91.04
Chandigarh 50669 3 70 2662 774 1055 3056 58289 86.93
D & N Haveli 5320 • • . 53?0 100.00
Daman & Diu 498 498 100.00
Delhi 41535 884647 9118 336272 6563 56632 20383 1355150 68.35
Lakshadweep
Pondicherry . . . 26661 . . . 9336 . . . 1117 . . . 37114 71.84
INDIA 696224 13823816 621 2644 467182 1162257 70380 489649 309033 17021806 85.30

TABLE II - Item-Wise Recurring Income Sy Sources on Educational
D-Higher Secondary Schools(Old Pattern)
Institutions By Type
(Rupees in Thousands)
UGC UniversityState/Union
Territory
Central
Govt.
State
Govt.
Local
Bodies
Tut ion
Fees
Hostel
Fees
Other
Fees
Endowment
& other
Total % of Rec.
Rec. from Govt
funds
(Central
+State)to
to total
Recurr
Income
1 2 3 4 5 6 8 9 11 12
Andhra Pradesh
Arunachal pradesh
Assam
Bihar
Goa
Gujarat
Haryana
Himachal Pradesh
JamiKj & Kashmir
Karanataka
Kerala
Madhya Pradesh
Maharashtra
Manipur
Meghalaya
Mizoram
Nagaland
Orissa
Pun j ab
Rajasthan 1223 71.46
Sikkim
Tamil Nadu
Tripura
Uttar pradesh
West Bengal
A & N Islands
Chandigarh
D & N Haveli
Daman & Diu
Delhi
Lakshadweep
Pondicherry
INDIA 87- 20 16 313 1223 71.46
ng
(Rupees in Thousands)
TABLE II - Item-Wise Recurring Incoine By Sources on Educational Institutions By Type
E-High/Post Basic Schools
State/Union
Territory
Central State UGC University Local Tution Hostel
Govt. Govt. Bodies Fees Fees
Other Endowment Total % of Rec.
Fees & other Rec. from Govt
funds
(Central
+State)to
to total
Recurring
Incoine
6 7 8 9 10 11 12
122881 237 20137 42502 2557652 92.74
• • . ... 50831 100.00
4064 1907 258 7405 13328 378424 92.88
• . 1. 9201 4872 43749 12799 1577926 95.50
515 229 62 932 492 234775 99.05
5753 10449 281 14871 31542 1029818 93.89
1207 32570 284 64580 36545 1400913 90.35
4649 21411 10829 5761 3423 472903 90.26
. • • 7648 68 1463 2464 27496 57.66
1814^ 4729 513 69849 17340 955998 88.43
3199 37421 5838 24350 19028 2509373 96.42
4283 6645 1423 8044 9694 304863 90.13
1034176 130035 2743 63395 53120 4548704 71.78
2643 42 1429 748 156111 96.89
• • » 5326 909 1369 2662 70339 85.40
. • . ?.70 84 62 338 73447 98.97
• • • 62891 90 5036 870 141544 51.33
70384 14680 3219 7335 62133 772485 79.43
4136 <►6258 541 45217 71488 1458978 88.51
4439 9713 1014 28215 2629 1029243 95.53
53756 100.00
17683 61179 7652 13457 23503 956161 87.09
100 205 592 735 137572 98.81
25879 60206 1165 47532 31091 835769 80.15
118 5829 5563 63302 63722 1292043 89.27
1680 106 - < r 19852 91.00
664 6645 1293 1840 65802 84.13
• • • 1971 100.00
• • . 10444 100.00
40453 7996 3298 220801 76.56
• • • 7080 100.00
4116 279 65 50616 91.19
199290 707115 47892 547756 507399 23403690 87.13
Andhra Pradesh 15637 2356253
Arunachal pradesh 286 5054'5
Assam 19494 33196;3
Bihar 18624 1488294
Goa 3559 22898<S
Gujarat 3321 963601
Haryana 632 1265095
Himachal Pradesh 22055 4047715
Jammu & Kashmir 12706 3147
<aranatak.a ^52 845264
Kerala 2897 2416640
Madhya Pradesh 6625 268149
Maharashtra 18211 3247024
Manipur 151249
Meghalaya — 6007:J
Mizoram 72693
Nagaland 1097 71560
Orissa 16015 597566
Pun j ab 12617 1278721
Rajasthan 2035 981193
Sikkim 23373 30383
TamiI Nadu 17408 815279
Tripura 305 13563!>
Uttar pradesh 1778 668113
West Bengal 1697 1151653
A & N-lslands 18066
Chandigarh 55360
0 & N Haveli 1971
Daman & Oiu 10444
Delhi 401 168653
Lakshadweep 7080
Pondicherry ... 46156
INDIA 291875 20100654
387
414
59
749
(Rupees in Thousands)
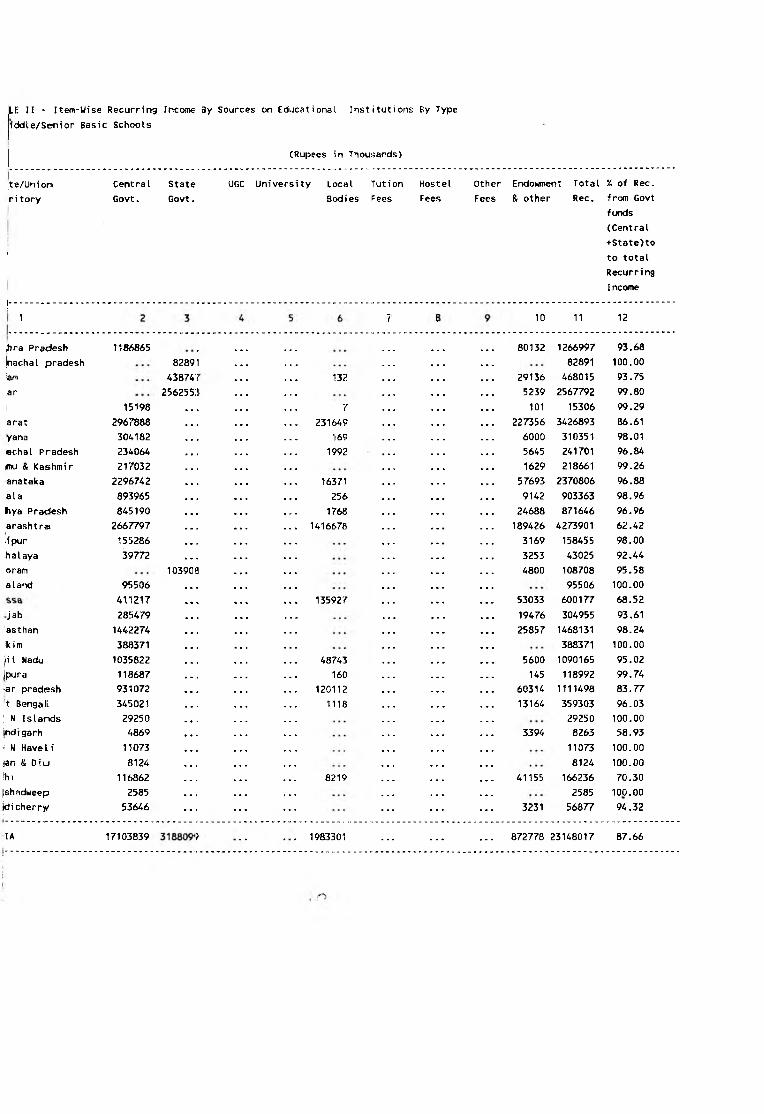
|LE II - I tern-wise Recurring Income 3y Sources on Educational Institutions By Type
iddle/Senior Basic Schools
jt e/Union
ri tory
Central
Govt.
State
Govt.
UGC University Local
Bodies
Iut i on
Pees
Hostel
Fees
Other
Fees
Endowment
& other
Total % of Rec.
Rec. from Govt
funds
(Central
+State)to
to total
Recurring
Income
1 10 11 12
80132 1266997 93.68
82891 100.00
29136 468015 93.75
5239 2567792 99.80
101 15306 99.29
227356 3426893 86.61
6000 310351 98.01
5645 241701 96.84
1629 218661 99.26
57693 2370806 96.88
9142 903363 98.96
24688 871646 96.96
189426 4273901 62.42
3169 158455 98.00
3253 43025 92.44
4800 108708 95.58
95506 100.00
53033 600177 68.52
19476 304955 93.61
25857 1468131 98.24
388371 100.00
5600 1090165 95.02
145 118992 99.74
60314 1111498 83.77
13164 359303 96.03
29250 100.00
3394 8263 58.93
11073 100.00
8124 100.00
41155 166236 70.30
2585 100.00
3231 56877 94.32
hra Pradesh
jnachal pradesh
lam
lar
1186865
8289
43874
256255
i 15198
arat 2967888
yana 304182
»chal Pradesh 234064
imu & Kashmir 217032
anataka 2296742
ala 893965
t»ya Pradesh 845190
arashtra 2667797
iipur 155286
ha I aya 39772
oram
aland 95506
411217
i jab 285479
asthan 1442274
Ikim 388371
i.ii I Nadu 1035822
jpura 118687
iar pradesh 931072
■t Bengali 345021
1 N Islands 29250
Indigarh 4869
; N Have 11 i 11073
jan & Diu 8124
ihi 116862
fshadweep 2585
jdi cherry 53646
lA 17103839
103
132
7
231649
169
1992
16371
256
1768
1416678
135927
48743
160
1201121118
8219
1983301 872778 23148017 87.66
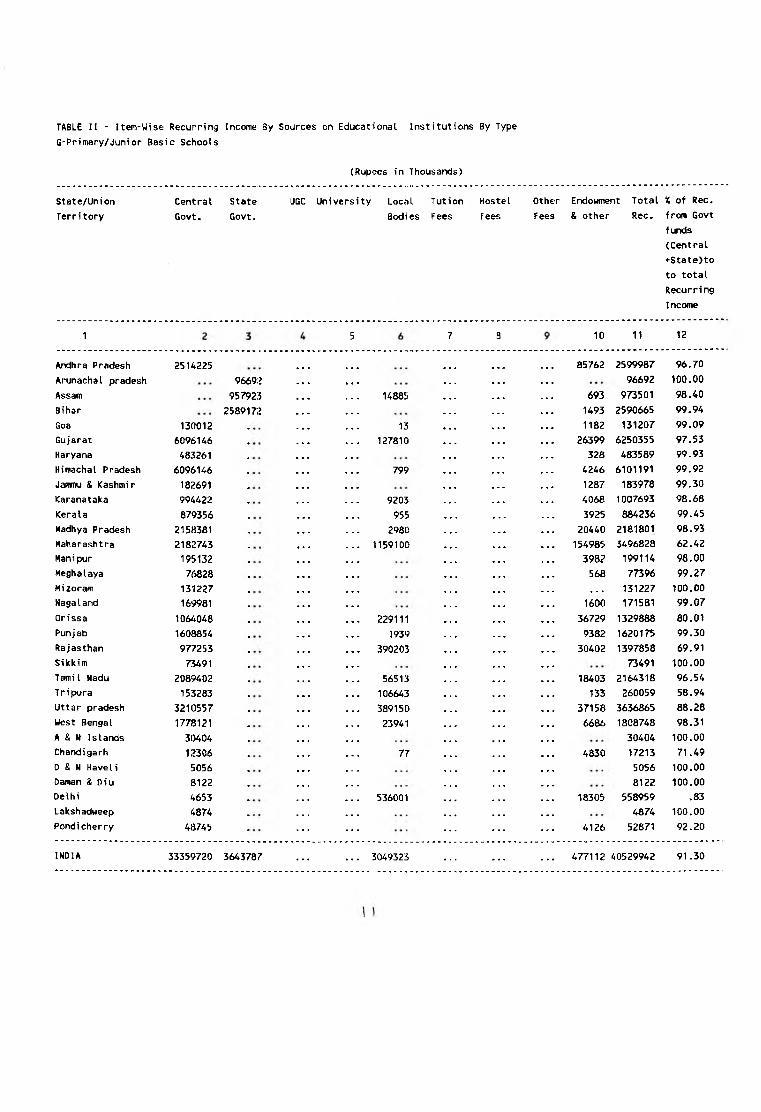
TABLE II - Item-Wise Recurring Income By Sources on Educational Institutions By Type
G-Primary/Junior Basic Schools
(Rupees in Thousands)
UGC UniversityState/Union
Territory
Central
Govt.
State
Govt.
Local
Bodies
Tut 1 on Fees
Hostel
Fees
Other
Fees
Endowment
& other
Total % of Rec.
Rec. from Govt
funds
(Central
•*-State>to
to total
Recurring
Income
1 10 11 12
85762 2599987 96.70
96692 100.00
693 973501 98.40
1493 2590665 99.94
1182 131207 99.09
26399 6250355 97.53
328 483589 99.93
4246 6101191 99.92
1287 183978 99.30
4068 1007693 98.68
3925 884236 99.45
20440 2181801 98.93
154985 3496828 62.42
3982 199114 98.00
568 77396 99.27
• • • 131227 100.00
1600 171581 99.07
36729 1329888 80.01
9382 1620175 99.30
30402 1397858 69.91
73491 100.00
18403 2164318 96.54
133 260059 58.94
37158 3636865 88,28
6686 1808748 98.31
30404 100.00
4830 17213 71.49
5056 100.00
8122 100.00
18305 558959 .83
4874 100.00
4126 52871 92.20
Andhra Pradesh
Arunachal pradesh
Assam
Bihar
Goa
Gujarat
Haryana
Himachal Pradesh
Jammu & Kashmir
Karanataka
Kerala
Madhya Pradesh
Maharashtra
Manipur
Meghalaya
Mizoram
NagaI and
Orissa
Punjab
Rajasthan
Sikkim
Tamil Nadu
T r i pura
Uttar pradesh
West Bengal
A & M Islands
Chandigarh
D & N Haveli
Daman & Diu
Delhi
Lakshadweep
Pondicherry
2514225
130012
6096146
483261
6096146
182691
994422
879356
2158381
2182743
195132
76828
131227
169981
1064048
1608854
977253
73491
2089402
153283
3210557
1778121
30404
12306
5056
8122
4653
4874
48745
96692
957923
258917;?
14885
13
127810
799
9203
955
2980
1159100
229111
1939
390203
56513
106643
389150
23941
77
536001
INDIA 33359720 3643787 3049323 477112 40529942 91.30
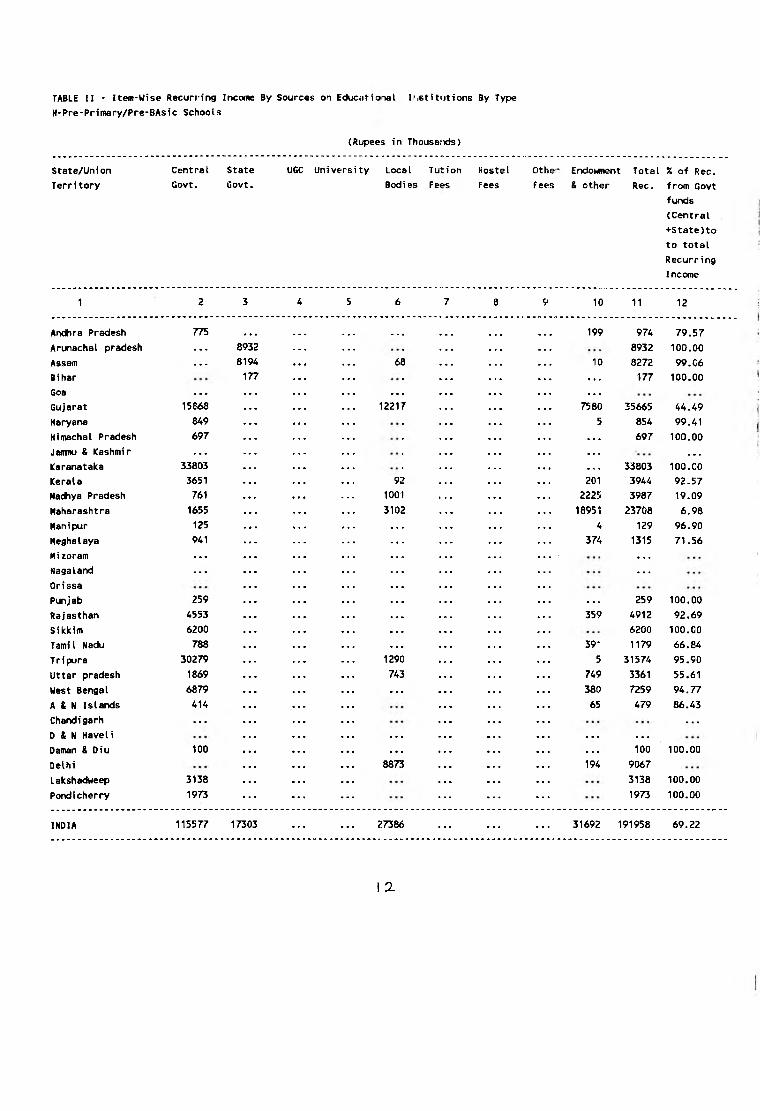
TABLE II - Item-Wise Recurring Income By Sources on Educutioial Iristftutions By Type
H-Pre*Primary/Pre-BAsic Schools
(Rupees in ThoussfxJs)
UGC UniversityState/Uni on
Territory
Central
Govt.
State
Govt.
Local
Bodies
T ut: i on
Fe«‘s
Hostel
Fees
Other
Fees
Endowment
& other
Total % of Rec.
Rec. from Govt
funds
(Central
+State)to
to total
Recurring
Income
1 2 3 4 5 6 7 8 9 10 11 12
Andhra Pradesh 775 • • • • > •••• «... 199 974 79.57
Arunachal pradesh ... 8932 — 8932 100.00
Assam _ 8194 68 10 8272 99.06
Bihar 177 ... ... 177 100.00
Goa — ... ... ... ...
Gujarat 15868 12217 7580 35665 44.49
Haryana 849 .. 5 854 99.41
Himachal Pradesh 697 .. • • >>• 697 100.00
Jammu & Kashmir — ... . . » . « . ...
Karanataka 33803 ... ... ... 33803 100.00
Kerala 3651 92 201 3944 92.57
Macttiya Pradesh 761 1001 2225 3987 19.09
Maharashtra 1655 3102 .......... 18951 23708 6.98
Manipur 125 4 129 96.90
Meghalaya 941 374 1315 71.56
Mizoram ... .. ...
Nagaland ... .. ...Orissa ..
Punjab 259 « • - - - • . ■ 259 100.00
Rajasthan 4553 359 4912 92.69
Sikkim 6200 .. 6200 100.00
Tamil Nadu 788 391 1179 66.84
Tripura 30279 1290 5 31574 95.90
Uttar pradesh 1869 743 749 3361 55.61
West Bengal 6879 __ — 380 7259 94.77
A & N Islands 414 .. 65 479 86.43
Chandigarh ... .. .. —
D & N Haveli ... — ... — _Daman & Diu 100 ... ... ... 100 100.00
Delhi 8873 .. ... 194 9067
Lakshadweep 3138 .. .. 3138 100.00
Pondicherry 1973 .. .. 1973 100.00
INDIA 115577 17303 27386 31692 191958 69.22
I a
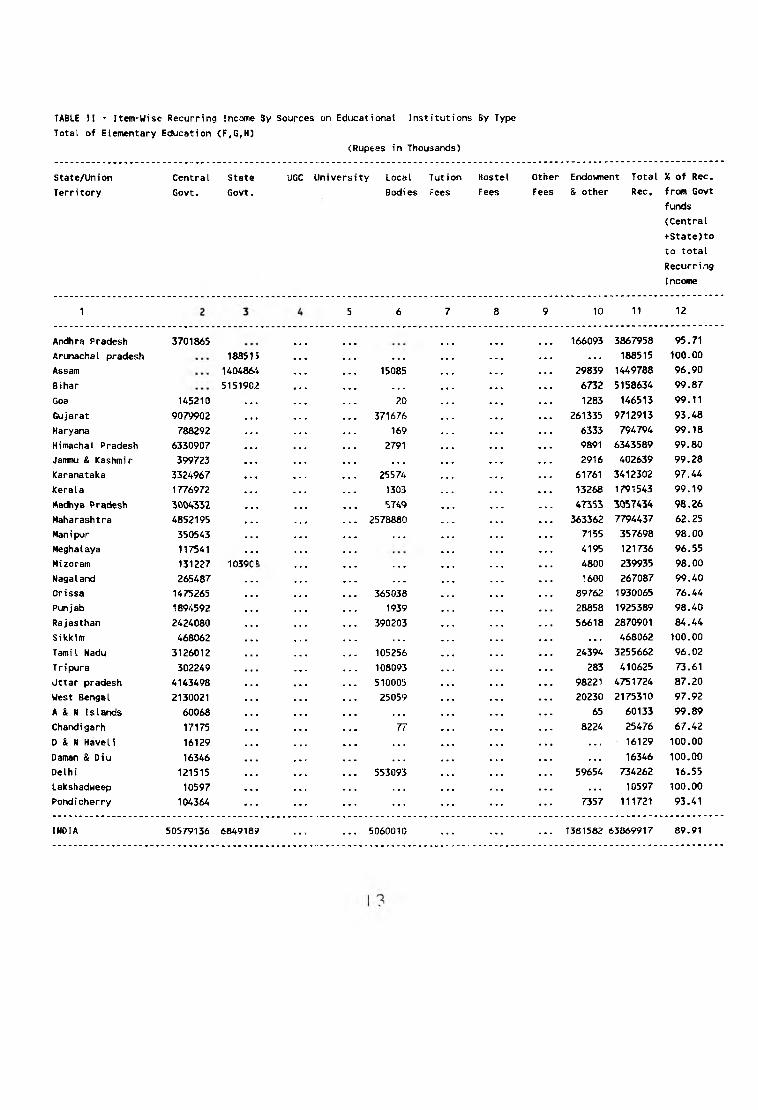
TABLE II - Item-Wise Recurring Income 3y Sources on Ediicational Institutions By Type
Total of Elementary Education (F,G,H)
(Rupees in Thousands)
State/Union
Territory
Central State UGC University Local Tution Hostel Other Endowment Total % of Rec.
Govt. Govt. Bodies Fees Fees Fees & other Rec, from Govt
funds
(Central
+State)to
to total
Recurring
Income
1 6 7 8 9 10 11 12
... 166093 3867958 95.71
• • • . . . . . . . . . 188515 100.00
15085 29839 1449788 96.90
. . . ... .......... 6732 5158634 99.87
?0 1283 146513 99.11
371676 ... 261335 9712913 93.48
169 6333 794794 99.18
2791 9891 6343589 99.80
• • . • • • 2916 402639 99.28
25574 61761 3412302 97.44
1303 13268 1791543 99.19
5749 47353 3057434 98.26
2578880 ... 363362 7794437 62.25
. • • • • • 7155 357698 98.00
4195 121736 96.55
. • « . • • 4800 239935 98.00
.... . . • 1600 267087 99.40
365038 89762 1930065 76.44
1939 28858 1925389 98.40
390203 56618 2870901 84.44
. . . . . . . . . . . . 468062 100.00
105256 24394 3255662 96.02
108093 283 410625 73.61
510005 98221 4751724 87.20
25059 20230 2175310 97.92
• • • . . . 65 60133 99.89
77 .......... 8224 25476 67.42
• • « • • > . . . . . . 16129 100.00
• • • • • . . . . . . 16346 100.00
553093 59654 734262 16.55
. . ^ • . . . . . . 10597 100.00
. . , . . . 7357 111721 93.41
Andhra Pradesh
Arunachal pradesh
Assam
Bihar
Goa
Gujarat
Haryana
Himachal Pradesh
Janmu & Kashmir
Karanataka
Kerala
Hadhya Pradesh
Maharashtra
Man i pur
Meghalaya
Mizoram
Nagaland
Orissa
Punj ab
Rajasthan
Sikkim
TamiI Nadu
T r i pura
Uttar pradesh
West Bengal
A & N Islands
Chandigarh
D & N Haveli
Daman & Diu
Delhi
Lakshadweep
Pondicherry
3701865
U5210
9079902
788292
6330907
399723
3324967
1776972
3004332
4852195
350543
117541
131227
265487
1475265
1894592
2424080
468062
3126012
302249
4143498
2130021
60068
17175
16129
16346
121515
10597
104364
188515
140486-'+
5151902
103'
INDIA 50579136 6849189 5060010 1381582 63869917 89.91
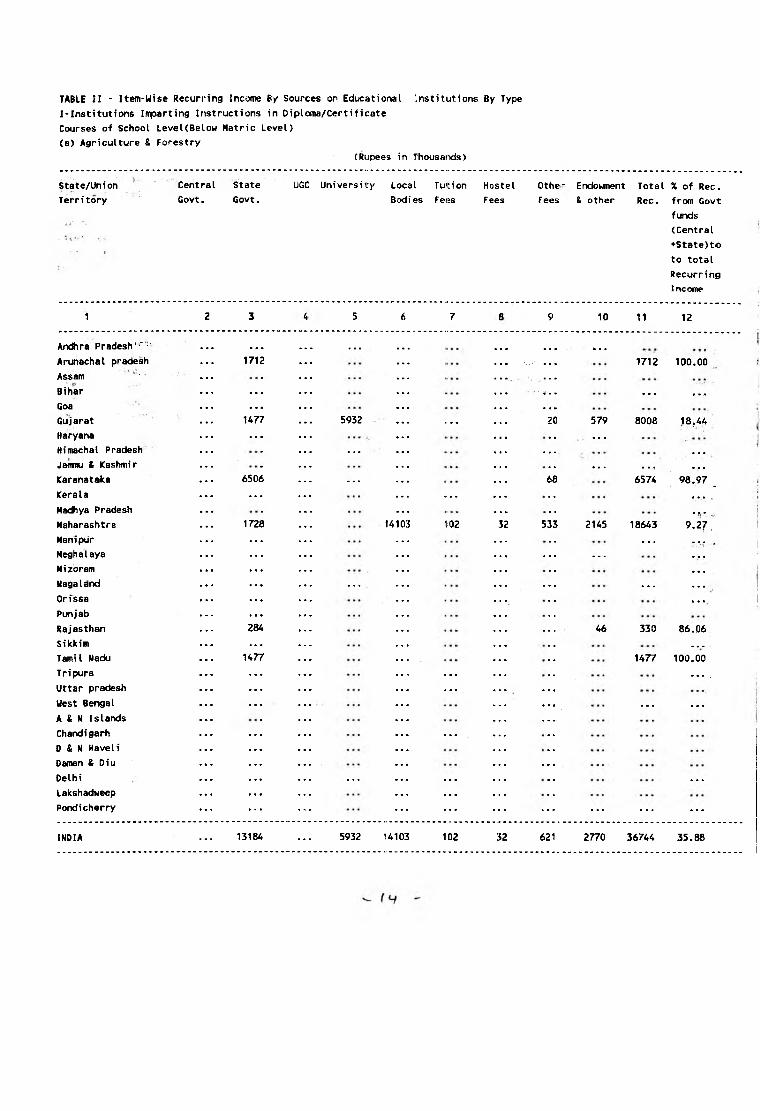
TABLE II - Item-Wise Recurring Income By Sources on Educational Institutions By Type
I-Institutions Innparting Instructions in Diploma/Certificate
Courses of School LeveUBelow Matric Level)
(a) Agriculture & Forestry
(Rupees in Thoussiids)
State/Union
Territory
Central State UGC University Local Tution Hostel Othe- Endowment Total % of Rec.
Govt. Govt. Bodies Fees Fees Fees & other Rec. from Govt
funds
(Central
+State)to
to total
Recurring
Income
1 2 3 5 7 10 11 12
kndhra Pradesh' ■'• ■' • • • ... • • « . . . k • •
Arunachal pradesh 1712 . ■i,-- ... 1712 100.00
Assam • . . ______
Bihar . . . . i.. — T • ”Goa . . . . . . .
Gujarat ... U 77 5932 .... 579 8008 18,44
Haryana . . . . . . • ■ •Himachal Pradesh ... ... ... ...
Jarnmu & Kashmir . ... ... ...
Karanataka 6506 — 6574 98.97 _
Kerala . . . . .... ... .
Madhya Pradesh . . . .
Maharashtra 1728 . 14103 ^02 533 2145 18643 9.27]Manipur . . . . — ....
Meghalaya . . . . . . . . . . • • •
Mizoram . . . . . . . . . .
Nagaland . . . . . . . . . . . . . . . — . . .
Orfssa . . . . • • • . . .
Punjab . . . . . . .
Rajasthan 28A . . . . 46 330 86.06
Sikkim M • • . . . . . . .
TamiI Nadu « • • 1477 . 1477 100.00
Tripura • • • . . . . . . . . . . ,
Uttar pradesh . . . . • - • . . .
West Bengal . . . . . . . . . . — —
A & N Islands . — —
Chandigarh . . . . • • •
D & N Haveli . . . . —
Daman & Diu . . . . . . .
Delhi . . . . . . . . . ____
Lakshadweep . . . . . . . . . .
Pondicherry . . . . . . . . . . . . . . . . . . . . . .
INDIA 13184 5932 14103 102 32 621 2770 36744 35.88
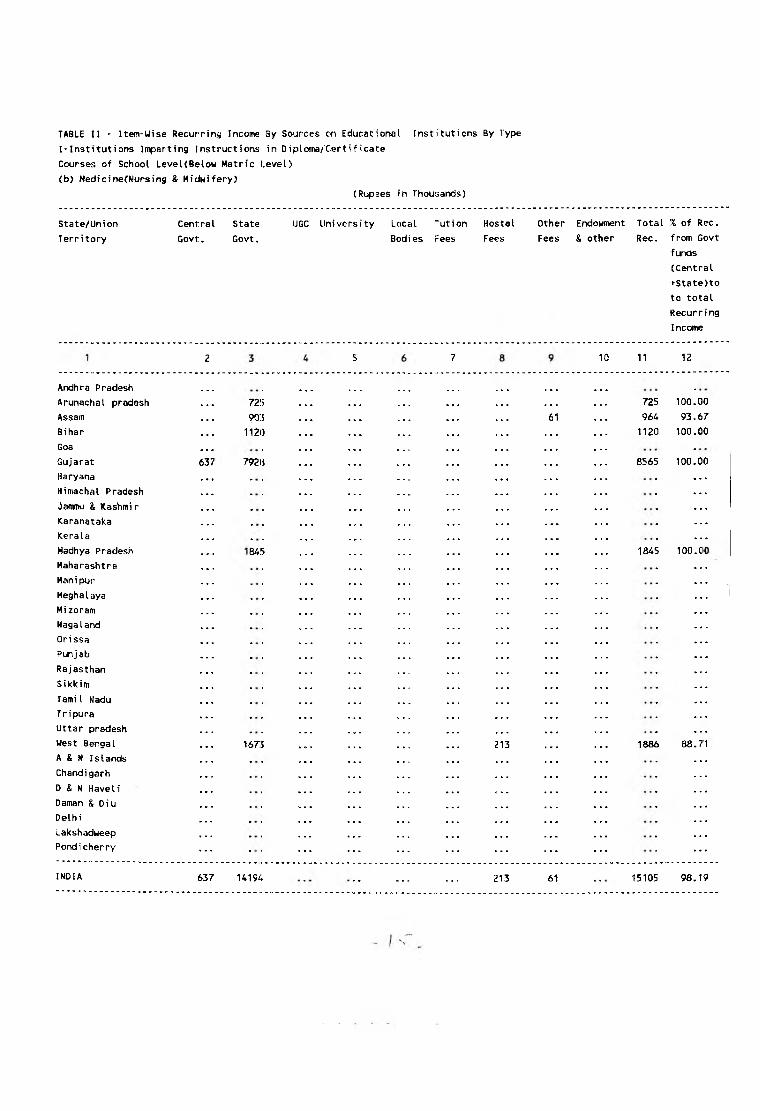
TABLE II - Item'Wise Recurrini;j Income By Sources on Educational Institutions By Type
I-Institutions Iinparting Instructions in Diploma/Certificate
Courses of School LeveUBelow Matrfc Level)
(b) Medicine(Nursing & Midwifery)
(Rupees in Thousands)
State/Union
Territory
Central
Govt.
State
Govt.
UGC University Local
Bodi es
"ution
Fees
Hostel
Fees
Other
Fees
Endowment
& other
Total X of Rec.
Rec. from Govt
funds
(Central
+State)to
to total
Recurring
Income
10 11 12
Andhra Pradesh
Arunachal pradesh
Assam
Bihar
Goa
Gujarat
Haryana
Himachal Pradesh
Jaiwnu & Kashmir
Karanataka
Kerala
Madhya Pradesh
Maharashtra
Manipur
Meghalaya
Mizoram
Nagaland
Orissa
Punjab
Rajasthan
Sikkim
Tamil Madu
Tripura
Uttar pradesh
West Bengal
A & N Islands
Chandigarh
D & N Have Ii
Daman & Diu
Delhi
Lakshadweep
Pondicherry
INDIA
72
9o:
1120
7928
84!)
167"
637 1419- 213 61
725 100 00
964 93 67
1120 100 00
8565 100 00
1845 100
1886 88
15105 98 19

TABLE II - Item-Wise Recurring Income By Sources on Educational Institutions By Type
I-Institutions Imparting Instructions in Diplorna/Certificate
Courses of School LeveUBelow Matric Level)
(c) Teacher Training(Rupee;? in Thdusarvds)
State/Union
Territory
Central
Govt.
State
Govt.
UGC University Local
Bodies
Tut ion
Fees
Hostel
Fees
Other
Fees
Endowment
& other
Total % of Rec.
Rec. from Govt
funds
(Central
+State)to
to total
Recurring
Income
1 2 3 4 6 7 B 9 10 11 12
Andhra Pradesh • • • • • • • • • • • • • « • • • • • • •
Arunachal pradesh . . . . . . . . . . . . . . . . . . . . .
Assam . . . . . . . . . . . .
Bihar . . . . . . . . . . . . . . . . . .
Goa — . . .
Gujarat 217 37399 912 1.S6 139 943 39776 94.57
Haryana . . . . . . . . . . . . . . . . . . . . . . . .
Himachal Pradesh . . . . . . . . . . . . . . . . . .
Jammu & Kashmir — — — —
Karanataka 400 88129 3581 1420 376 11509 522 106237 83.33
Kerala . . . . . . . . . . . .
MacBiya Pradesh . . . . . . . . . . . . . . . . . .
Naharashtra . . . . . . . . . . . . . . . . . .
Manipur . . . . . . . . . . . . . . . . . .
Meghalaya . . . 5108 . . . . . . . . . 89 5197 98.29
Mizoram . . . m m • . . .
Nagaland 6010 . . . . . . . . . 6010 100.00
Orissa . . . . . . . . . . . .
Punjab . . . . . . . . . . . . . . . . . . . . .
Rajasthan . . . . . . . . . . . .
Sikkim 1460 360 1820 100.00
Tami I Nacki
Tripura 80 3281 » a • 3361 100.00
Uttar pradesh 72016 166 98 195 275 72829 98.88
West Bengal . . . • - • . . . . . .
A & N Islands . . .
Chandigarh . . . . . . . . . . . .• i
0 & N Haveli . . . . . . . . .
Damarv & Diu . . . . . . . . . . . . . . . . . .
Delhi . . . . . . . . . . . . • ■ •
Lakshadweep . . . . . . . . . . . . . . . • * •5*.
Pondi cherry . . . . . . . . . . . . . . . * * * .
INDIA 2157 212303 300 3660 2498 6 0 11843 1829 235230 91.17
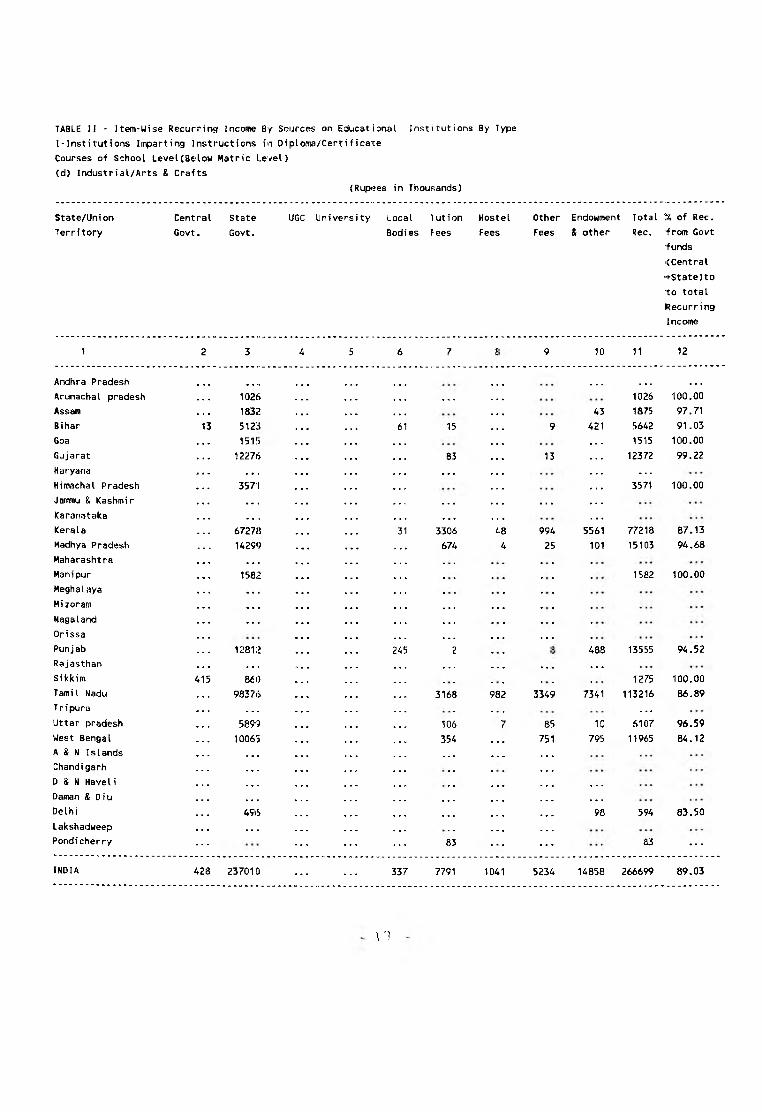
TABLE II - Item-Wise Recurring Income By Sources on Educational Institutions By Type
I-Institutions Imparting Instructions in Oiploma/Certificate
Courses of School Level(8e>low Matric l.evel)
(d) Industrial/Arts & Crafts
(Rupees in Thousands)
State/Union
Territory
Central
Govt.
State
Govt.
UGC University Local
Bodi es
Tut ion
Fees
Hostel
Fees
Other
Fees
Endowment
& other
Total % of Rec.
Rec. -from Govt
•funds
<CentraI
■+State)to
to total
Recurring
Income
1 2 3 4 5 6 7 9 10 11 12
Andhra Pradesh ........... ... . • • ■ • •
Arunachal pradesh 1026 • . • 1026 100.00
Assam 1832 43 1875 97.71
Bihar 13 5123 15 9 421 5642 91.03
Goa 151!) 1515 100.00
Gujarat 12276 83 13 12372 99.22
Haryana ... ... * •. —
Himachal Pradesh 3571 3571 100.00
Jammu & Kashmir • • • • • • • •« ■ ■ •
tCaranataka ... ... •. •
Kerala 67278 3306 48 994 5561 77218 87.13
Madhya Pradesh 14299 67A 4 25 101 15103 94.68
Maharashtra ... ...
Manipur 1582 1582 100-00
Meghalaya ... ...
Mizoram ... ... .. • . •.
Nagaland ... ... •..
Orissa
Punjab 12812
... ... ...
488 13555 94.52
Rajasthan ... ... • •. ... • • • • • •Sikkim 415 860 1275 100.00
TamiI Nadu 98376 3168 982 3349 7341 113216 86.89
Tripura ... ... __
Uttar pradesh 5899 106 85 10 6107 96.59
West Bengal 10065 354 . •. 751 795 11965 84.12
A & N Islands ... ... ... ...
Chandigarh ... ...
D & N Haveli ... ... ... • > •
Daman & Oiu ... ... • •. • • • • •.
Delhi 496 • • m .. • 98 594 83.50
Lakshadweep ... ... • • •Pondicherry ... 83 83 ...
INDIA 428 23701 a 337 7791 1041 5234 14858 266699 89.03
\'1

TABLE II - Item-Wise Recurring Income By Sources on Educational Institutions By Type
I-Institutions Imparting Instructions in Diploma/Certificate
Courses of School Level(Below Hatric Level)
(e) Music & Fine Arts ,
(Ruciees in Thousarvdsi
State/Uni cn
Terri tory
Central
Govt.
State
Govt.
UGC University Local
Bodi es
Tuition
Fees
Hostel
Fees
Other
Fers
Endowment
& other
Total % of Rec.
Rec. from Govt
funds
(Central
♦State)to
to total
Recurring
Income
1 3 4 5 6 7 3
196 28 78
1433 !!! !!! 252
6855 421 919
607 1206 118
3474 ... ... 271
785 ... . . . . . .
9 15 635
2033
...
72
2310 . . . 8
184 46 216
793
• • • « • •
• • • • • •
1 70
18679 1717 2639
10 11 12
Andhra Pradesh
Arunachal pradesh
Assam
Bihar
Goa
Gujarat
Haryana
Himachal Pradesh
Jannu & Kashmir
Karanataka
Kerala
Madhya Pradesh
Maharashtra
Manipur
Meghalaya
Mizoram
Nagaland
Orissa
Punjab
Rajasthan
Sikkim
Tamil Nadu
Tripura
Uttar pradesh
West Bengal
A & N Islands
Chandi garh
D & N Haveli
Daman & Diu
Delhi
Lakshadweep
Pondicherry
INDIA 13
8271
1958
17
2
24
90
435
44
2150
110
69
352 55.68
1695 84.54
8616 79.56
3889
3872
787
752
398
4
5
191
2811 973 26832
15.61
89.72
99.75
1.20
2593 78.40
2335 99.49
451 40.80
1490 53.22
69.66

TABLE II - Item-Wise Recurring Income 8y Sources on Educational Institutions By Type
I-lnstitutions Innparting Instructions in Diploma/Certificate
Courses of School Level(Below Matric Level)
(f) For the Handicapped
(Rupees in Thou^5ands)
State/Union
Territory
Central
Govt.
State
Govt.
UGC University Local
Bodies
Tut ion
Fees
Hostel
Fees
Other
Fees
Endowment
& other
Total % of Rec.
Rec. from Govt
funds
(Central
+State)to
to total
Recurring
Income
1 2 3 4 5 6 7 9 10 11 12
Andhra Pradesh 8916 1340 10256 86.93
Arunachal pradesh ... ... ... ... ...Assam 81 6a :> ... ... 30 753 96.02
Bihar 17 2240 ... ... 294 2551 88.48
Goa
Gujarat
...30230 94 2060 32413 93.27
Haryana 3872 ... ... 613 4485 86.33
Himachal Pradesh 813 18 831 97.83
Jammu & Kashmir 252 ... ... 45 297 84.85
Karanataka 566!) ... ... 10 8 5705 99.30
Kerala 7889 1178 241 2092 11400 69.20
Madhya Pradesh 1503 6 105 1620 92.78
Maharashtra 61 720<V 1107 13681 22055 32.94
Manipur 1376 1376 100.00
Meghalaya ... ...Mizoram ... ... ... • ...Nagaland ... ... ... ...Orissa ... ... ... ...Punjab .31 1252 382 99 1 1176 2942 43.61
Rajasthan 3889 ... ... 32 108 338 4367 89.05
Sikkim ... ... ... ...Tamil Nadu 15823 ... ... 15823 100.00
Tripura U O 1612 ... ... 22 1774 98.76
Uttar pradesh 3410 18 71 3524 96.77
West Bengal 3241 ... ... 122 170 340 3873 83.68
A & N Islands ... ... ... ...Chandigarh 810 ... ... 1 17 828 97.83
D & N Haveli ... ... ...Daman & Diu ... ... _Delhi 3983 3977 36 ... 50 1194 9296 85.63
Lakshadweep ... ... ...Pondicherry ... 1156 ... ... ... 1156 100.00
INDIA 5123 104962 2821 110 505 378 23426 137325 80.16

TABLE II - Iten-Wise Recurring Income By Sources on Eckicational Irstitutions By Tyjw
I-InstitBJtions Imparting Instructions in Diploma/Certificate
Courses <of School Level(Below Matric Level)
(g) Refoirmator/ZCertified
(Rupees '"n Thousands)
StateAJniion
Territory
Central
Govt.
State
Govt.
UGC University Local
Bodies
Tut ion
Fees
Hostel
Fees
Other
Fees
Endowment
& other
Total % of Rec.
Rec. from Govt
funds
(Central
>State)to
to total
Recurring
Income
1 2 3 4 9 10 11 12
Andhra iPradesi 6477 • • • • 0m 80 6557 98.78
Arunach.al pradesh . . . • • • . . .
Assam 84 ... . M • • • 84 100.00
Bihar 2178 2178 100.00
Goa . . . . . .
Gujarat 5039 5039 100.00
Haryana . . . . . . . . . . . .
Himachal Praoesh . . . « « • . . . . . .
Jammu & Kashnir
Karanattaka 6531
• • •
• • • 6861 95.19
KtreU 2292 1 • • • 2293 99.96
Madhya Pradesh 1426 1 1 • • 1427 99.93
Naharaishtra 10646 10673 99.75
Manipuir . . . . . . . . .
Meghal aya . . . . . . . . . . . .
Mizoram . . . . . . . . . . . .
Nagaland . . . . . . . . .
Orissa . . .
Punjab 390 390 100.00
Rajasthan . . . . . . . . . . . .
Sikkim) • • • • a • . . .
Tami I Madu 8809 8809 100.00
Tripuira • • • . . . . . . . . .
Uttar pradesh
West Bengal 33 • * • 33 100,00
A & N Islards . . . . • • • • * . . . . . .
Chandigarh . . . • • . • » * . . .)
D t H Haveli « • • . . . . • • . . . . . .
Damani & Dit
Delhi 10 938
• • .
1020 92.94
Lakshadweep . . . . . . . . .
PondScherr> . . . . . . . . .
INDIA 94 44759 42 8 271 3 187 45364 98.87
.:io

TABLE II ■ Item-Wise Recurring Incamt' Sy Sources on Educational institutions By Type
I-lnstituticns Inparting Instruction, in Diploma/Certificate
Courses of School Level(Below Hatric Level)
<h) Oriental Studies
(Rupees in Thousands)
StateAlnion
Territory
Central
Govt.
State
Govt.
UGC University Local
Bodies
Tut ion
fees
Hostel
Fees
Other
Fees
Endowment
& other
Total X ®f Rec.
Rec. friom Govt
funds
(Ctentral
♦S'tate)to
to total
Recurring
IrKCoflie
1 3 4 5 6 7 9 10 11 12
Andhra Pradesh 2957 120 381 3458 85.51
Arunachal pradesh • • • . . . . . . . . . . . .
Assam 599S 30 ■ • • 20 60 6106 98.20
Bihar • • « 3894 5 • • • • • « 138 1682 40753 95.54
Goa . . . • • . • • • « • • • • • . . .
Gujarat 27&S 134 • • . 72 3139 93.44
Haryana • • • • • • • « • • • • . . .
Himachal Pradesh • • « « « « « • • • « • . . .
Jannu & Kashmir • • • « • • • • • • • • . . .
Karanataka 727J3 15 440 . • • 5790 1221 14780 49.24
Kerala « « • . . . . . . . . . . . . • • • . . .
Madhya Pradesh • • • 3147 45 • • • 5 296 3495 90.04
Maharashtra 69 511 222 71 76 452 1474 39.35
Manipur 34 liS • • • • • N • • • . . . 4 54 92.59
Meghalaya . . . . . . • <« H • • •« . . .
Mizoram • • • • • • • W • H • • • • » • • • • . . .
Nagaland . . . • • . • « . • • • • • • • . • a . •
Orissa . . . • • • • • • • • M • 0 • • • • . . .
Punjab . • • • • • . • •
Rajasthan . . . , . • ■ a • . . .
Sikkim • • • • • • • • • . • .
Tamil Nadu 409:5 78 42 81 4315 94.86
Tripura • • • 132!i • • • • • • . . • 1325 100.00
Uttar pradesh • • • 19469 1845 . . • • • • 3466 24780 78.57
West Bengal • • • 1819‘> 37 35 1221 497 20006 90.97
A & N Islands ■ • « ... , , • • • • • ■ . . .
Chandigarh • • • • • • I* • • • • • • • M • • • . • • t • .
D & N Haveli • • • • • • • • • • • M • • • • . • * • .
Daman & Diu • • • • • • > • . • • •• • • • • • •
Delhi • • ■ M • ■ • » • • • • • • • • • •
Lakshadweep • • • a • • . . . • • « • . .
Pondicherry • • • a • • . . . . . . . . . . . . • • .
INDIA 250 104721) 15 2723 334 147 7292 8214 123695 84.86

TABLE tl - Item-Wise Recurring Income By Sources on Educational Institutions By Type
I-Institutions Imparting Instructions in Diploma/Certificate
Courses of School Level(Below Matric Level)
(i) Social (Adult) Education
(Rupees in Thousands)
State/Union
Territory
Central
Govt.
State
Govt.
IJGC University Local
Bodies
Tution
Fees
Hostel
Fees
Other
Fees
Endowment
& other
Total % of Rec.
Rec. from Govt
funds
(Central
+State)to
to total
Recurring
Income
0 11 12
72635 100.00
3361 100.00
4992 100.00
4300 100.00
48066 100.00
6231 100.00
...48704 100.00
9619 99.93
99531 100.00
10543 100.00
8526 100.00
391 100.00
12431 100.00
13299 100.00
82166 100.00
3100 100.00
73524 100.00
47675 99.20
145932 100.00
52235 99.10
768 100.00
1154 100.00
148 100.00
236 100.00
7620 100.00
100 100.00
876 100.00
758163 99.89
Ancftira Pradesh 39157 3347B
Arunachal pradesh 1101 2260
Assam 587 4405
Bihar
Goa 4300
Gujarat 34406 13660
Haryana . . .
Himachal Pradesh 4713 151fJ
Jamnu & Kashmir
Karanataka 48704
Kerala
Hadhya Pradesh 9612
Maharashtra 37170 62361
Manipur 5743 4801)
Meghalaya 4468 4053
Mizoram 391 . . .
Nagaland 9400 3031
Orissa
Punjab 260 13039
Rajasthan 8216.S
Sikkfm 3100 . . .
Tamil Nadu 47725 2579-?
Tripura 1233 46061
Uttar pradesh 92947 5298:5
West Bengal 51764
A & N Islands 768
Chandigarh 1154
D & N Haveli 143
Daman & Diu 236 . . .
Delhi 7620
Lakshadweep 100
Pondicherry . . . 875
INDIA 284659 472645
381
289
670
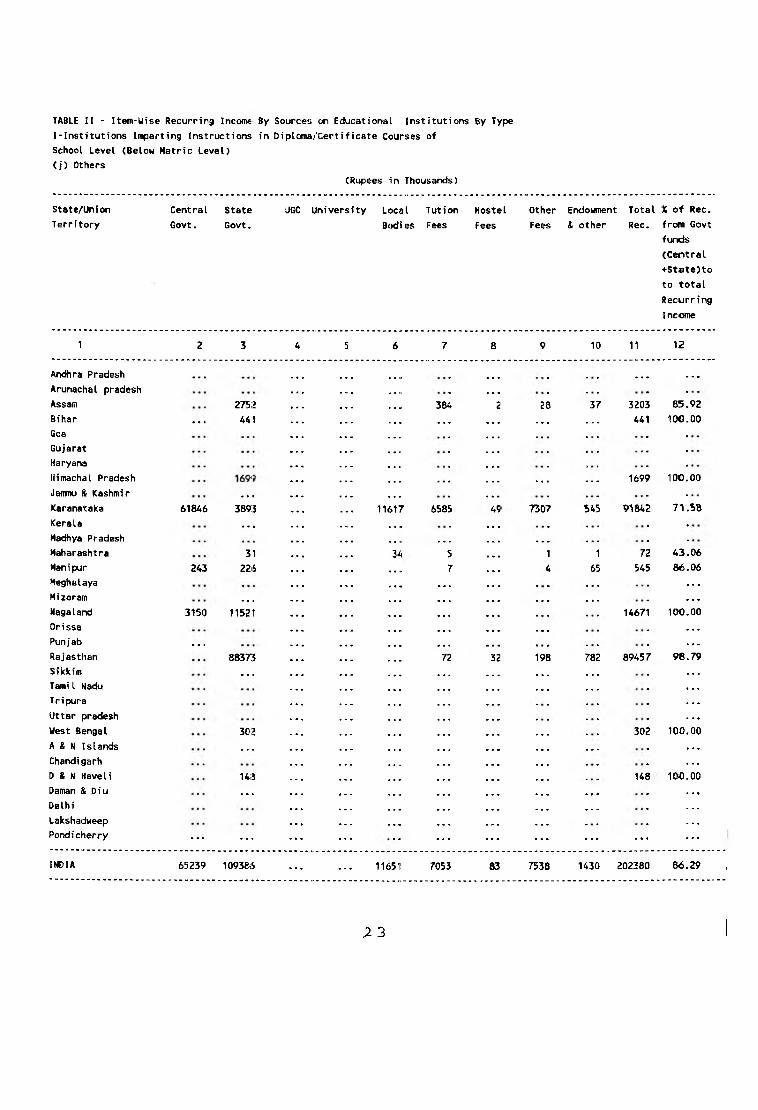
TABLE II - Item-Wise Recurring Income By Sources on Educational Institutions By Type
I-Institutions Imparting Instructions in Diploma/Certificate Courses of
School Level (Below Matric Level)
(j) Others
(Rupees in Thousands)
State/Union
Territory
Central
Govt.
State
Govt,
•JGC University Local
Bodies
T ut i on Fees
Hostel
Fees
Other
Fees
Endowment
& other
Total % of Rec.
Rec. frown Govt
funds
(Central
+State)to
to total
Recurring
Income
1 2 3 4 6 7 8 9 10 11 12
Andhra Pradesh . . . . . . • • •
Arunachal pradesh
Assam 2752 384 23 37 3203 85.92
Bihar • • • 441 . • • • • • • • • 441 100.00
Goa • . •
Gujarat
Haryana
Himachal Pradesh • • . • • . • . • 1699 100.00
Jammu & Kashmir . • ■
Karanataka 61846 3893 11617 6585 7307 545 91842 71.58
Kerala . . •
Madhya Pradesh . . . • • •
Maharashtra 31 5 1 1 72 43.06
Manipur 243 226 7 4 65 545 86.06
Meghalaya
Mizoram • • . • • • • • •
Nagaland 3150 11521 14671 100.00
Orissa - • •
Punjab
Rajasthan
. . .
8837:} 198 782 89457 98.79
Sikkim • • • • • . • • .
TamiI Nadu • . . . . .
Tripura
Uttar pradesh
West Bengal 30:2 • • . 302 100.00
A & N Islands • • • • . • • • •
Chandi garh . • •
D & N Haveli 148 • • • 148 100.00
Daman & Diu • • • • . • ...Delhi ... . . .
Lakshadweep • • •
Pondicherry . . . . . . . . . . . . . . . . . .
INDIA 65239 1093&S . . . . . . 11651 7053 83 7538 1430 202380 86.29
.2 3

TABLE II - Item-Wise Recurring Income 3y Sources on Educational Institutions By Type
I-Institutions Imparting Instructions in Diploma/Certificate Courses of
School Level (Below Matric Level)
Total (a to j)
(Rupees in Thousands)
State/Union
Territory
Central
Govt.
State
Govt.
UGC University Local
Bodies
Tution
Fees
Hostel
Fees
Other
Fees
Endowment
& other
Total % of Rec.
Rec. from Govt
funds
(Central
-^State)to
to total
Recurring
Income
1 2 3 4 5 6 7 8 9 10 11 12
Andhra Pradesh 39157 5182H 120 . . . . . . 1801 92906 97.93
Arunachal pradesh 1101 57221 . — 6824 100.00
Assam 752 16726 28 492 115 214 18329 95.36
Bihar 30 50045 61 15 147 2397 52695 95.03
Goa • • • 724H • • • • 252 8 2 7510 96.51
Gujarat 35407 117650 5932 649 1940 166 446 3804 165994 92.21
Haryana . • • 387:: • 613 4485 86.33
Himachal Pradesh 4713 760'l • • • • 18 ... 12332 99.85
Jannu & Kashmir • • • 252 • • • • • • • ... 45 297 84.85
Karanataka 62246 1673i;‘l 315 16844 8123 742 26654 2355 284592 80.66
Kerala • • •. 8093:1 • • • • 1209 3577 289 1012 7763 94783 85.39
Macfiya Pradesh 32617 • 51 674 4 39 511 33896 96.23
Maharashtra 37300 82490 • • • • 15508 815 105 634 16348 153200 78.19
Manipur 6020 8000 • •. • • • • 7 4 69 14100 99.43
Meghalaya 4468 916<i . ... ... 89 13723 99.35
Mizoratn 391 » • • • • • 391 100.00
Nagaland 12550 2056J! . 33112 100.00
Orissa • • • • • • • • • • ... ... . . .Punjab 291 2749:-; • • • • 627 3 99 9 1664 30186 92.04
Rajasthan • • . 176745 • • • • ... 144 64 396 1564 178913 98.79
Sikkim 4975 1220 «• • • • • ... 6195 100.00
Tamil Nadu 47738 156687 • • • • ... 3254 1003 3391 7426 219499 93.13
Tripura 1453 5227?> . 381 22 54135 99.26
Uttar pradesh 92947 15396ii » ... 1970 513 105 298 3827 253623 97.35
Uest Bengal • « * 86070 • • • • 327 459 352 2577 2005 91790 93.77
A & N Islands 768 • • • • • • • ... 768 100.00
Chandigarh 1964 ... ... 1 17 1982 99.09
D & N Haveli • • » 29<i • ... • • • ... 296 100.00
Daman & Diu 236 • • • • • • • ... ... 236 100.00
Delhi 3993 1303'i r • • • 51 64 51 1340 18530 91.87
Lakshadweep 100 • • • 100 100.00
Pondicherry . . . 203i! . . . . 83 . . . . . . 2115 96.08
INDIA 358600 133184^! 6247 37724 20535 2932 35781 53876 1847537 91.50
(Rupees in Thousands)
TABLE II - Item-Wise Recurring Incosne By Sources on Eckicational Institutions By Type
J. Directorate and Inspectorate
State/Union
Territory
Central
Govt.
State
Govt.
UGC University Local
Bodies
Tut ion
Fees
Hostel
Fees
Other
Fees
Endowment
& other
Total % of Rec.
Rec. from Govt
funds
(Central
+State)to
to total
Recurring
Income
1 10 11 12
Andhra Pradesh
Arunachal pradesh
Assam
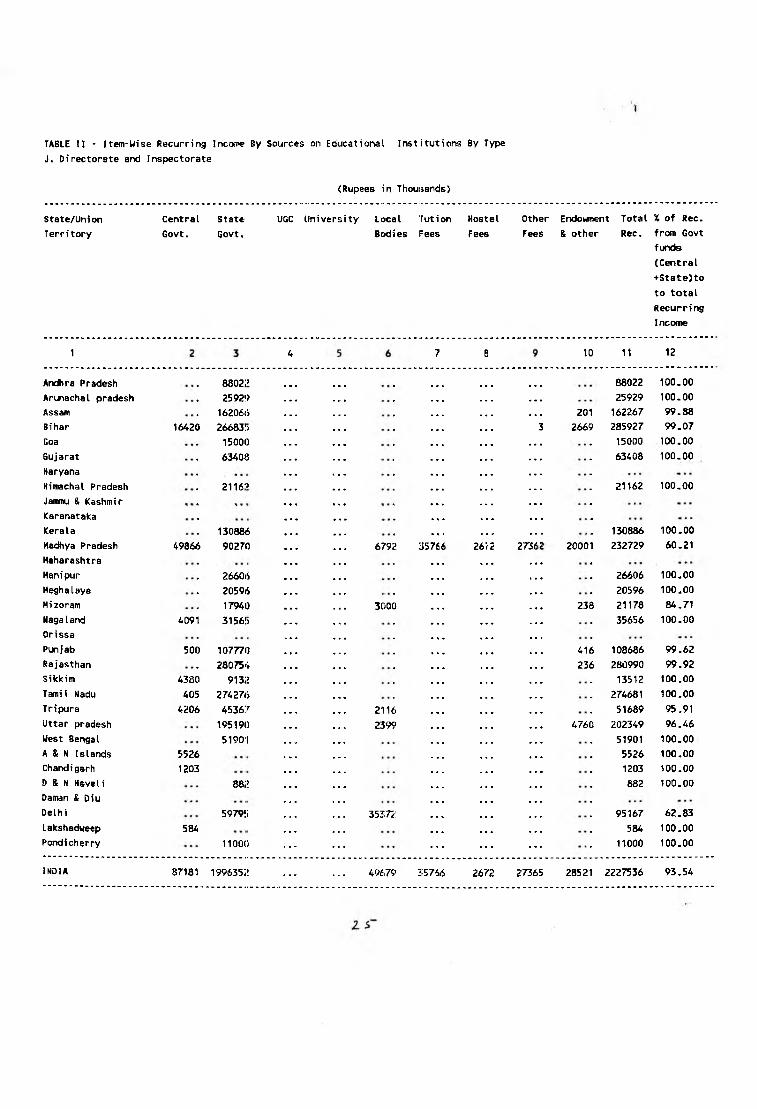
Bihar 16420
Goa
Gujarat
Haryana
Himachal Pradesh
Jammu & Kashinir
Karanataka
Kerala
Madhya Pradesh 49866
Maharashtra
Manipur
Meghalaya
Mizoram
Nagaland 409
Orissa
Punjab 500
Rajasthan
Sikkim 4380
TamiI Nadu 405
Tripura 4206
Uttar pradesh
West Bengal
A & N Islands 5526
Chandigarh 1203
D & N Hsveli
Daman & Diu
Delhi
Lakshadweep 584
Pondicherry
8802:’
25929
162066
266831)
15000
63403
211d:>
13088<S
90270
26606
20596
17940
3156!)
107770
280754
9132
274276
45367
195190
51901
882
59795
11000
1996352
6792
3000
357 26 273
2116
2399
35372
201
2669
20001
238
416
236
4760
88022
25929
162267
285927
15000
63408
130886
232729
26606
20596
21178
35656
108686
280990
13512
274681
51689
202349
51901
5526
1203
882
95167
584
11000
100.00100.00
99.88
99.07
100.00100.00
21162 100.00
100.00
60-21
100,00100.0084.71
100.00
99.62
99.92
100.00
100.00
95.91
96.46
100.00
100,00100.00
100.00
62.83
100.00
100.00
INDIA 87181 49679 35766 2672 27365 28521 2227536 93.54

(Rupees In Thousands)
TAKLE II - Item-Wise Recurring Income By Sources on Educational Institutions By Type
Grand Total - K(A to J)
State/Union
Territory
Central State UGC University Local Tution Hostel
Govt. Govt. Bodies l ees Fees
Other Endowment Total % of Rec.
Fees & other Rec. from Govt
funds
(Central
+State)to
to total
Recurring
Income
6 7 8 9 10 11 12
175651 12036 28506 220739 6778047 93.55
. . . 329360 100.00
2078S 4243 637 58303 50461 2319152 94.20
61 20782 5477 227441 63967 7560039 95.79
535 3412 62 5499 3078 452192 97.22
381140 52108 7264 37390 311982 12594500 93.68
1376 65459 342 101130 79600 2633301 90.59
9892 55778 13425 70352 18319 7201022 97.67
8325 175 12447 5425 630544 95.82
116393 22740 6115 167950 125096 5651311 92.24
5711 46803 8246 29848 50124 4634336 96.96
20268 i 2697 5538 58490 93454 4286877 94.16
J882790 131598 3047 232772 521925 15358977 68.60
3268 63 8922 8855 610125 96.54
7457 909 5305 8186 242375 90.98
3000 270 84 62 5376 334951 97.38
62891 90 6238 2470 483816 85.18
447985 24330 3816 16743 164887 2753027 76.06
8550 11)9343 3000 87928 247850 4344962 89.43
396674 41711 2173 114766 106643 5364776 87.66
Andhra Pradesh 3787943 255317:>
Ariunachal pradesh 1459 327901
As«am 22260 2162463
Biliar 83428 7158496
Goa 149716 289890
Gujarat 9142994 2655069
Haryana 878372 150702:2
Hiimachal Pradesh 6369562 663694
Jannu 6 Kashmir 422413 181759
Karanataka 3387668 1825024
Kerala 1816553 2677051
Madhya Pradesh 3103903 932527
Maharashtra 4996002 5540843
Manipur 359141 22987’ii
Meghalaya 125883 9463l>
M«zoram 131618 194541
Nagaland 283225 128902
Orissa 1491280 6026815
Punjab 1946378 1939269
Rajasthan 2484463 2218346
Siikkim 508581 5086.5
62
10
739
387
5932
315
562
2644
559444 100.00
Tamil Madu 3238232 3317727 • • • ... 127970 236649 21470 126300 86104 7154452 91.63
Tripura 310954 410103 110590 205 476 3929 1482 837739 86.07
Uttar pradesh 4248349 357841!5 668779 334287 13292 177803 220314 9241239 84.69
West Bengal 2135309 1911801 159 25504 9729 9757 128193 102593 4323045 93.62
A & N Islands 127137 > > • • • • • • >. 1680 • • • 4307 65 133189 95.46
CHiandigarh 126371 5 • •« 811 9307 775 2348 13137 152752 82.73
D & N Haveli 16129 846? • • • • • • • • • • • • • • • ... 24598 100.00
Daman & Diu 27524 27524 100.00
D«lhi 171780 1126126 • f. • 597634 376789 6563 88337 84675 2451904 52.93
Lakshadweep 18361 . •. . . « 18361 100.00
Piondi cherry 104364 86613 ... ... 13557 ... 1396 7422 213349 89.51
INDIA 52017352 44373282 1370 9999 6826448 1941069 124832 1802705 2604229 87.87
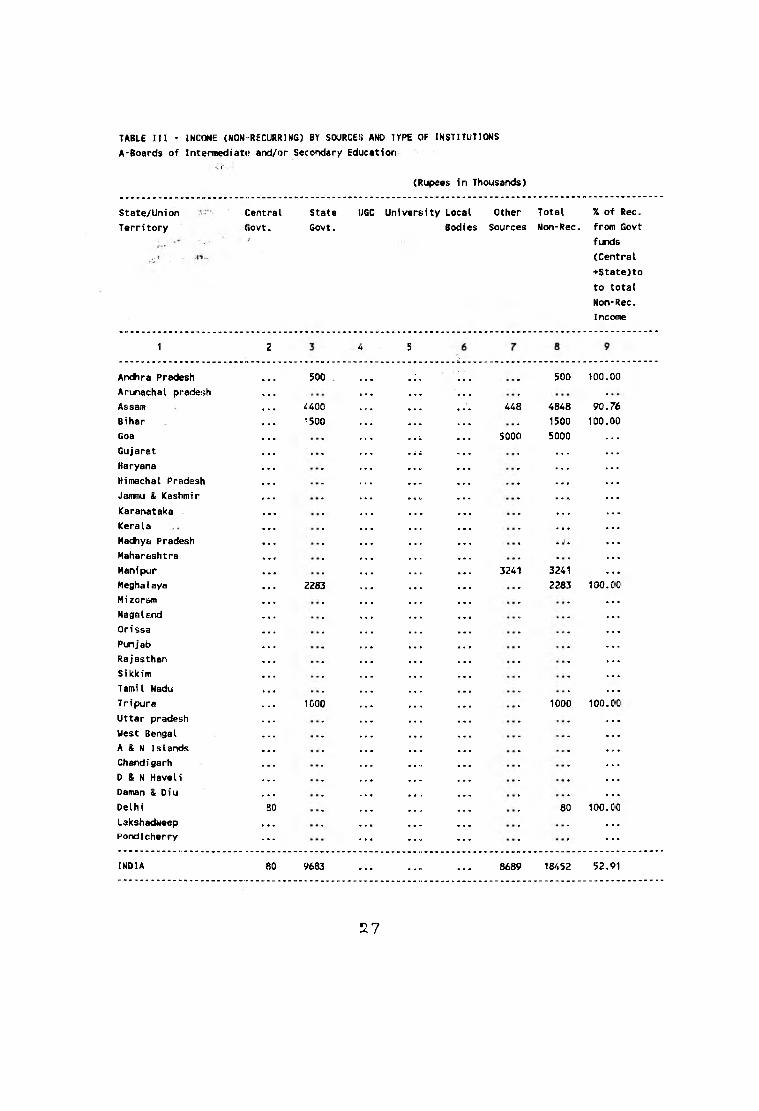
TABLE III ■ INCOME (NOM-RSCURRIMG) BY SOURCES A W TYPE OF INSTITUTIONS
A-Boards of Inter»nediat« and/or Secondary Educationr':-
(Rupees in Thousands)
State/Union
Territory
Central State IJGC University Local Other Total
(lOvt. Govt. Bodies Sources Non-Rec.
% of Rec.
from Govt
funds
(Central
+State)to
to total
Non*Rec.
Income
1
Anc^ra Pradesh
Arunachal pradesh
Assam
Bihar
Goa
Gujarat
Haryana
Himachal Pradesh
Jaflinu & Kashmir
Karanataka
Kerala
Madhya Pradesh
Maharashtra
Manipur
MeghaIaya
Mizoram
Nagaland
Orissa
Punjab
Rajasthan
Sikkim
Tamil Nadu
Tripura
Uttar pradesh
Uest Bengal
A & N Islancis
Chandigarh
D & N Haveli
Daman & Diu
Delhi
Lakshadweep
Pondicherry
INDIA
500
4400
1500
2283
1000
80 9683
448
5000
3241
500 100 00
4848 90 76
1500 100 00
5000
3241
2283 100
1000 100
80 100
8689 18452 52 91
2 7

(Rupees in Thousands)
TABLE III * INCOME (NON-RECURRING) BY SOURCES )iiND TYPE OF liHSTITUTIGNS
B-Intermediate/Pre-Degree/Jr. Col leges
State/Union
Territory
Central State UGC University local Other Total
Govt. Govt. Bodies Sourccs Non'Rec.
% of Rec.
from Govt
funds
(Central
♦State)to
to total
Non
Income
1 3 5 6 7 8 9
Andhra Pradesh • •» • • • . . . • . •Arunachal pradesh ■ • ■ . . .Assam • • •Bihar • • • 2989 2989 . • .Goa . . .Gujarat . . . . . . . . .Haryana . . . . . .Himachal Pradesh . . . . . .Jannmu & Kashmir It • • . . .Karanataka • .. . . . . . . .Kerala «Madhya Pradesh
Maharashtra . . .Manipur . . . . . .Meghalaya . . . . . . . . .Mizoram
Nagaland « • « . . . . . .Orissa • • 4 1056 8056 8947 18446 5.72
Punjab • • t* »•. . . .Rajasthan • • • «•. . . .Sikkim • > • •. • . . . . . .Tamil Nadu • • • •. • . • ■ . . .Tripura •. • . . .Uttar pradesh »• • . • • . . . . . .West Bengal • •. . . .A & N Islands » • • ... •. . . . . . .Chandigarh • • • . . . . . . . . . . . .0 & N Haveli •. • . . . . . .Daman & Diu •. • . . . •..Delhi . . . . . . . . .Lakshadweep •.. . . . • • •Pondicherry 48 . . . . . . . . . 48 100.00
INDIA 1104 387 8056 11936 21483 5.14
Rec.
x s

(Rupees in Thousands)
TABLE III - INCOME (NCN-RECyRRING) BY SOURCES AMO TYPE OF INSTITUTIONS
C-Higher Secondary SchoolsOO+2 pattern)
(i) Higher Secondary Schools with Academic Streams
State/Union
Territory
Central State UGC University Local Other Total
Govt. Govt. Bodies Sources Non-Rec.
% of Rec.
from Govt
funds
(Central
+State)to
to total
Non-Rec.
Income
1 2 * 3 4 5 6 7 8 9
Andhra Pradesh 94 ........ 132 226 41.59
Arunachal pradesh 201515 . . . . . . 20155 100.00
ASS2MTI 3935 . . . . . . 924 4859 80.98
Bihar i;>60 2070 . . . . . . 400 3730 89.28
Goa ■105 839 1 486 1431 65.97
Gujarat <>87 38520 5 1013 36838 77063 50.88
Haryana »84 4517 15 2410 7826 69.01
Himachal Pradesh 2249 3310 200 438 6197 89.70
Jammu & Kashmir 108615 • • • • • • • • • 10865 100.00
Karanataka 1153 222 496 2306 4177 27.60
Kerala 1304 . • • • . . . . . . . . 669 1973 66.09
Madhya Pradesh ►80 6604 516 4587 12187 58.13
Maharashtra 1!i06 324015 57160 64781 155852 21.76
Manipur H92 4292 204 5388 96.21
Meghalaya 3:28 . . . . . . 328 100.00
Mizoram . . . ....Nagaland . . . ....Orissa . . . ....Punjab 1«4S 11834 2824 16503 82.89
Rajasthan 1243 16736 795 18779 95.77
Sikkim 3498 . . . .... . . . 3498 100.00
Tamil Nadu . . . . . n . . . . . .Tripura 32 580<5 303 6141 95.07
Uttar pradesh 1((89 42912 5360 5788 55149 79.79
West Bengal 28141 138 4681 32960 85.38
A & N Islands 24(143 . . . .... 24043 100.00
Chandigarh 1100 . . • .... . . . 1100 100.00
D & N Haveli 452 . . . 452 100.00
Daman & Diu . . . .. .. .. .. . . . • • . . . .Delhi 9810 146201 11674 167685 93.04
Lakshadweep .. .. .... . . . . . .Pondicherry . . . 2649 . . . 2649 100.00
INDIA 52454 383396 227 64899 140240 641216 67.97

TABLE in • INCOME (NOH-RECURRING) BY SQUUCE^i AND imE Ol‘ IKST1TUTI0N»
C-Higehr Secondary Schools<10+<! Pattern)
(ii) Higher Secondary Sichools with Vocatiortal {Jtreajvs
(R<jpeesi in Thousiands)
State/Union
Territory
Central State UGC University local Other Total
Govt. Gcvt. Eodies Sources Ncfi-RKC.
% of Rec.
from Sovt
funds
(Central
+Statia)to
to total
Non-Rac.
Incom;
1 3 4 ‘.i 6 7 8 9
Andhra Pradesh
Arunachal pradesih • ^ . .1 • • • • •
Assam . .* • • . * « • • • • • • • •
Bihar • • • • • . . . . « • . • « . • • •
Goa• « % • • • * • * • « . • . «
Gujarat 2335 656 2989 78.05
Haryana > . • V • • • . . » • .
Himachal Pradesh « „ , * m m • . «
Jaimj & Kashmir » • » • , « • ■ • • • . . • . • • -
Karariiataka • • 1 t. . • • • • • • k . . .
Kerala 600 233 833 72.03
Madhya Pradesh • • • • • fi • . • . . • • • .
Maharashtra » • .. • • * . . . . . .
Manipur • » 1- • « « • • . . . . » • c
Meghalaya » • . • • • • • • • • . t • » « .
Mizoram ^ • • , „ • • • • » • * » a • * • • . .
Nagaland • * » • • ■ • • • • • . • . w
Orissa . . . . . . . . .
Pun j ab f. • • » . • • • . ft • « . . «
Rajasthan . . . . . . • M » . . .
Sikkim . . . . . .
Tamil Nadu
Tripura « » • • • • . . . . . . . . . . . .
Uttar pradesh. • • « • • • « • * • • • « •
West Bengal« ■ « • • • « • « • • • • * «
A & N Islands » • • • . • • • a . . .
Chandigarh» • « • » . • • . . .
D & N Haveli . . .
Daman & Diu
Delhi
Lakshiidweep• • •
Pondicherry 715 . . . 75 100.00
INDIA 3008 889 3897 77.19
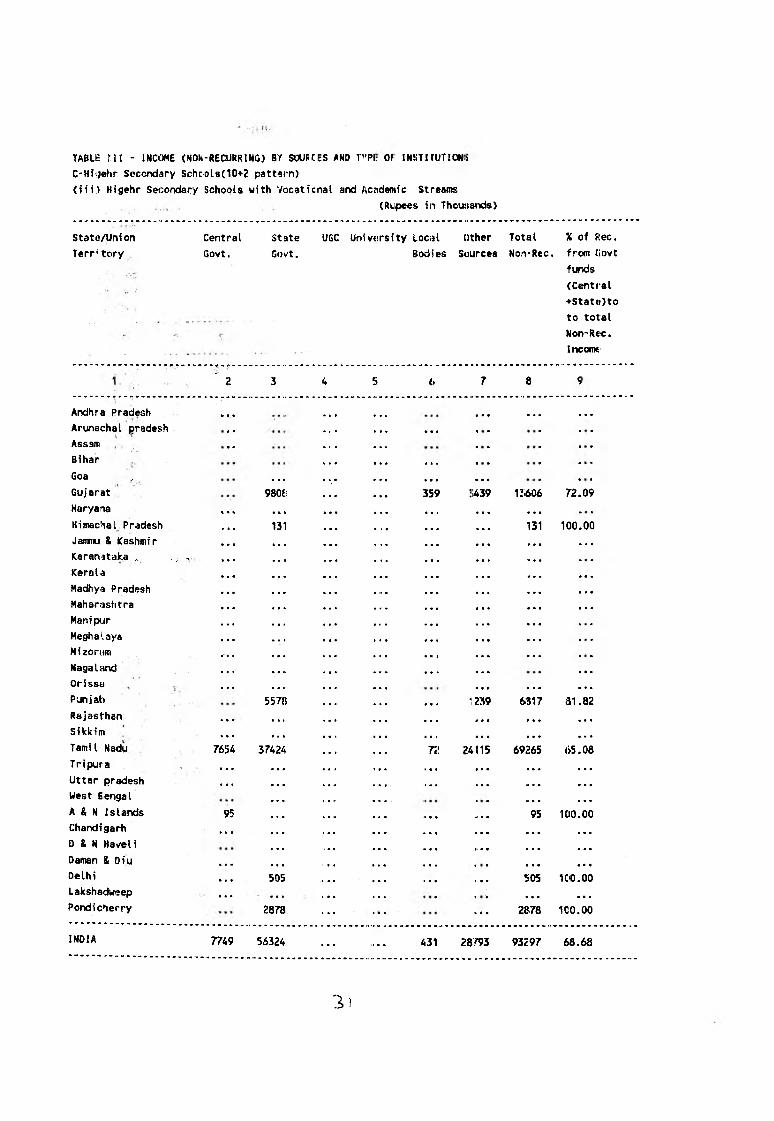
TABLE n i - 1N0.TME <NOk-RECURRING) BY SOUSCES AHO T'TI: Of INST!TUTlONis C-Higehr Seccndary Sc>idoIs(10+2 pattern)
(iii) Higehr Secondary Schools with Vocaticnal and Academic Streatns
(8i.ipces in Thoujjands)
State/Uni on
Territory
Central State UGC Urdv^srsity Local Other
Govt. Govt. Bodies Sources
Total % of (tec.
Nort-Rec. from (lovt
funds
(Central
♦State>to
to total
Mon-Resc.
Incomc!
^ 2 3 4 5 6 7 8
Andhra Pradesh . . . . . . . . . . . .
Arunachal pradesh « • . « » . . . • . »
Assam • «
Bihar . » .
Goa , « • * • • . > • •
Gujarat 980£i 359 3;439 121606 72.09
Haryana « « « . • « • • . • « • • . •
Himachal Pradesh • • • 131 • • ■ • • • 131 100.00
Jaimu & Kashmir • > « • • • • « • • • • . . . . . .
Karanijtaka . . , - » • • • • • • • • • ■ • . . .
Kerala • • • • « . • • « * • • . . . . • .
Madhya Pradesh • • • • • • • • • . . . . . . . . .
Maharashtra • « • • • • • • • • a • . . . . • .
Manipur • . « • • • • • • • t . • • . • • • . . .
Meghalaya « • • • • • • • • r < • • • . . > • . . .
Mizortim • » f 0 • ^ , « , > . • • . .
NagaUnc) • • • • • t • • • • « • • • * • • • . • »
Orissa . . « • • » • • • • . • . . .
Punjab 5578 • • >1 1239 6B17 31.82
Rajasthan • k. • • • 1 > • • « « • .... « t- • • • • . . .
Sikkim « . . • . ■ • • • a • • • • • • t . . • • . . .
Tamil Nadu 7654 37424 r<! 24115 69265 65.08
Tripura , « . . • • • • • • • . • • • m . . .
Uttar pradesh • « • « ■ • » • • » • • 1* m m . # .
West Bengal • • » • t> • • . . .
A & N Islands 95 « « • u • • .1 • • 95 100.00Chandigarh • . • • • • i • I • • • *• • • i t • m « * • . . .
D & N Haveli > * . V • • u r n m- • . . . . .
Daman & Oiu • < . • • • • . • « • » « I « • • . « • . •
Delhi• . • 505 • • • ■ • • 505 1CI0.00
Lakshadweep « . • • • » • . • . s « .
Pondic>ierry 2878 . . . 2878 1C0.00
INDIA 7749 56324 431 28793 93297 68.68
3 )
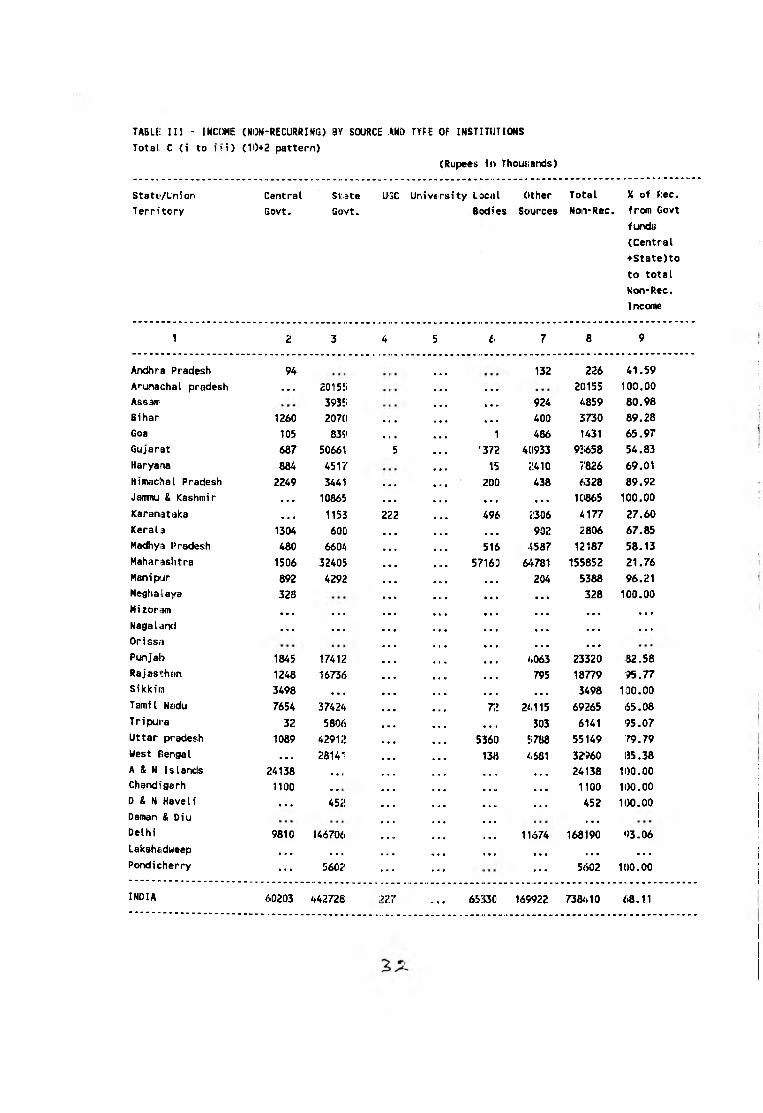
(Rupees in Thousiands)
TABLE; III - INCCME (NON-RECURRING) BY SOURCE ANO TYF'E OF INSTITUTIONS
Total C (i to in’) <10+2 pattern)
Statfc/Union
Territory
Central St.ite UGC University Local
Sovt. Govt. BxJiies
Other Total
Sources Non*Rec.
X of Riec. from Ciovt
funds
(Central
+State)to
to total
Non-Rec.
Income
1 2 3 4 5 6 7 8 9
Andhra Pradesh 94 132 226 41.59
Arunachal pradesh . • • 2015ii • ft ft 20155 100.00
Assam 3935 ft ft ft 924 4859 80.98
Bihar 1260 207(1 » « • ft ft ft 400 3730 89.28
Goa 105 839 » ■ • ft ft ft 1 486 1431 65.97
Gujarat 687 50661 5 1372 4CI933 921658 54,83
Haryana 884 4517 15 ?.410 7’826 69.01
Himachal Pradesh 2249 3441 • . • ft • ft 200 438 6328 89.92
Jammu & Kashmir . . . 10865 • • • . . . . . . 10865 100.00
Karanataka . . . 1153 222 496 2:306 4177 27.60
KeraU 1304 600 • • • • . ft ft • ft 902 2806 67.85
Madhya Pradesh 480 6604 • • . • . ft 515 ■5587 12187 58.13
Maharashtra 1506 32405 • • . 57160 6<V781 155852 21.76
Manipur 892 4292 • • > ft ft ft 204 5388 96.21
Meghalaya 328 • • • • • ft • ft ft 328 100.00
Mizoram • • . . . . • • ft ft • ft ft • ft • ft ft ft ft ft
Nagalanci • ft • . . . • • • ft ft ft ft ft • ft ft ft ft ft t
Orissa « ft ft • ft ft • ft ft ft ft ft
Punjab 1845 17412 • ft ft ft ( ft ft ft » 4063 23320 82.58
Rajasthan 1248 16736 ft.« ft « « ft ft • 795 18779 95.77
Sikkim 3498 ... ft • ft ft ft • ft ft ft 3498 1DO.OO
Tamil Nsdu 7654 37424 > ft • T,l 24115 69265 65.08
Tripura 32 5806 ft ft ft ft ft * 303 6141 95.07
Uttar pradesh 1089 42912 • ft ft 5360 5i788 55149 79.79
West Bengal • • . 28141 • ft ft ft ft ft 138 4681 32960 IJ5.38
A & N Islands 24138 • • • • •» ft ft •. ft ft ft 24138 100.00
Chandigarh 1100 • • • ft ■ ft ft I. ft • ft 1100 100.00
D & N Haveli « ft « 4521 ft» • ft ft V ft « ft 452 100.00
Daman & Diuft * . ft ft . • ft ft
Delhi 9810 146706 ft ft '• » ft 4 11.S74 168190 93.06
Lakshedueep • * « • • > ft • .1 •I ft ft » ft 1 • ft • • ft ft ft ft ft
Pondicherry . . . 5602 .... . . . . . . 5602 100.00
INDIA (f.0203 442728 i>27 6533C 169922 738410 <»8.11

(Ru|;>ees in Thousandu)
TA&IE III • INCOME (NON’RECURRING) BY SOURCi-S AKiD TYPE OF IliSTITUTIOHS
0-Kigher Secondary Schools(Old Pati:ern)
State/Union
Territory
Central State UGC University Lcical Other Total
Govt. Sovt. Bc<lies Sources NonRec.
% of Rec.
from Govt
funds
(Central
+State)to
to total
Non-Rec.
Income
■ V '• 2 4 !5 9
Andhra Pradesh . . . .... . . . . . .
Arunachal prisdesh . . . .... . . .
Assam •
Bihar
Goa " •• • •
Gujarat . . . «• •
Haryana ««•
Himachal Pradesh ... . „,.Jamnu &'lCashr:)ir ... , * Karanatcika ... I •»
Kerala ' ... ... • • • t •«
Madhya Pradesih . ... • . . • • •
MaharashVra ...
Manijaur '■ ■... ...
Meghalaya ...
Mizoram ... «• •
Nagaland ... ...
Orissa ...
Punjab ....
Rajasthan ...
Sikkfm .... • • •
TamiI Nadu
Tripiura ... .... . . .
Uttar pradesh . . . . . .
West Bengal . . . . . .
A & N Islands • . .
Chandigarh . . .
D & N Haveli . . . . . .
Oamar & Diu V '• '.
Oelhi . . .
Lakshadw>;ep • • • . . .
Pondicherry • • • . . . . . . . . .
INDIA . . . . . . . . .
3 3

(Rupees in Thousands)
TABLE III - INCOME (N0H-RECURRINi3> BY SOURCES AMD TYPE OF IMSTITUTIOHS
E*High/Post Basic Schools
State/Union
Territory
Central stare IJGC University Local Other Total
Govt. Gov’:. Bodies Sources Non-Rec.
' i of Rec. from Govt
funds
(Central
H-State)to
l:o total
Mon-Rec.
Income
1 2 3 5 6 7 8 9
Ansftira Pradesh 8642 9647 10S90 28 .79 63.77
Arunachal pradesh « • « 22020 ... ... 22020 ICO.00
Assam 49 6804 443 4108 11404 60.09
Bihar 368 16020 ... ... 21118 19206 85.33
Goa 16 1756 370 2iD30 4172 42.47
Gujarat 728 27941 1569 19<‘«8 49926 57.42
Haryana 166 3219 204 151 3740 90.51
Himachal Pradesh 2486 3479 376 4031 10372 57.51
Jammu Kashmir . • . 30998 1958 ... 32956 94.06
Karanataka • • • 3131 10 2368 150479 156008 2.01
Kerala • • • 8726 451 14413 23590 36.99
Madhya Pradesh 1652 49060 444 1()46 52802 96.04
Maharashtra 3046 62967 ... 123556 92369 281938 23.41
Manipur 9291 ... . • • »06 10097 92.02
Meghalaya ... 6539 ... ... 1»58 8397 77.87
Mizoram »• • 6778 ... ... 76 6854 93,89
Nagaland ... ...
Orissa 237 6534 13 2157 10665 19606 3<i,54
PtHijab 1312 22037 ... ... 12097 35446 615,87
Rajasthan • • • 24119 ... >.. 623 247« 97.48
Sikkim 10492 « • • ... ... 10492 100.00
Tamil k adu 305 25340 37 3712 29394 87.25
Tripura 85 4498 ... ... 2:17 4800 9!i.48
Uttar pradesh 99 11363 403 3126 149<?1 76.46
West Bengal 24 58696 420 7621 66761 87.96
A & N Islands 1^750 • • « « • • f< 1 • • • • 117150 100.00,
Chandigarh 1911 • • * « • • • • • 1 • 1911 100.00
D & N Kaveli • ■ « 140 • M » • 1 • • . • 140 100.00
Daman & Oiu • . « • • . • • •
Delhi • • • 842 • • • « M • 4056 4898 17.19
Lakshadweep 957 • * . ■ » • 957 100.00
Pondicherry ... ^2301 ... .... 12301 100.00
INDIA 44325 434246 ;»o 23 1347 16 3469JK) 960350 49.83

CRupees in Thousands)
TABLE i n • INCOME (NOM-RECURRING) HY SOUFICES AND TYPI; OF INSTITUTIC^S
F-Middlo/Senior Basiic Schools
State/Union
Territory
Central .State UGC University Local Other Total
Govt. (lovt. Bodies Sources Mon-Rec,
% of Rec.
fr<3m Govt
furids
(Central
+State)to
to total
Non-Rec,
Income
1 2 c, <> 7 8 9
Andhra Pradesh 1548 ■ • « . . . 806 2354 65.76
Arunachat prsidesh 45;!07 . 45207 100.00
As$«fii 28033 . . . i!7 649 28709 97.65
Bihar -11«33 544 12477 95.64
Goa i 404 84 48<J 82.79
Gujarat 308976 8'67 1034 318177 97,11
Haryana 111 ’8 2 13'l 84.73
Himachal Pradesh 1608 . ::ii 2041 3860 41.66
Janniu & Kashirir W 23 932 1085;; 91.41
Karanataka 47152 1196 15138 63486 74.27
Kerala 69 2638 12185 77.78
Madhya Pradesh 14341 m 2739 ^7329 82.76
Maharashtra 17480 . . . . 5723 29808 58.64
Hanipur 2894 . •. 340 3234 89,49
Meghalaya 1331 13053 14384. 9.25
Mizoram 4646 776 5422 85.59
Nagaland 37375 37375
Orissa 4982 . . . 2287 1599 8868 56.18
Punjab 4975 2682 7657 64.97
i^ajasthan 21S68 . 2039 2390? 91.47
Sikkim 6445 6445 100.00
Tamil Na<lu 3628 . 174 572 4574 83.69
Tripura 4C41 4041 100,00
Uttar prodesh 57866 .... 3716 2571 64153 90.20
West Seniial 7276 .». 2355 2800 12431 58.53
A & N Isf isnds 14200 . . . . . . 14200 100.00
Chandigarh 2363 • <'• 2363 100.00
1) & N Havel i 3273 3273 100.00
Daman & Diu . • • . . .Delhi 388 3610 3998 9,70
Lskshadw{H}p 542 . . . 542 100.00
Pondicherry 9652 . . . . .. ■ ...■ . . . 9652 100.00
rNDIA 561591 851 ?3 2507.i 59747 771585 83.82
U8RARY & DOCUMENTATrON OENTIbNational Institute of Educational PUuning and Administration.17-B, Sri Aurobindo Marg,
New Delhi-llU0i6 IN a Q C Qooc, N o ...........o,t«____ __________
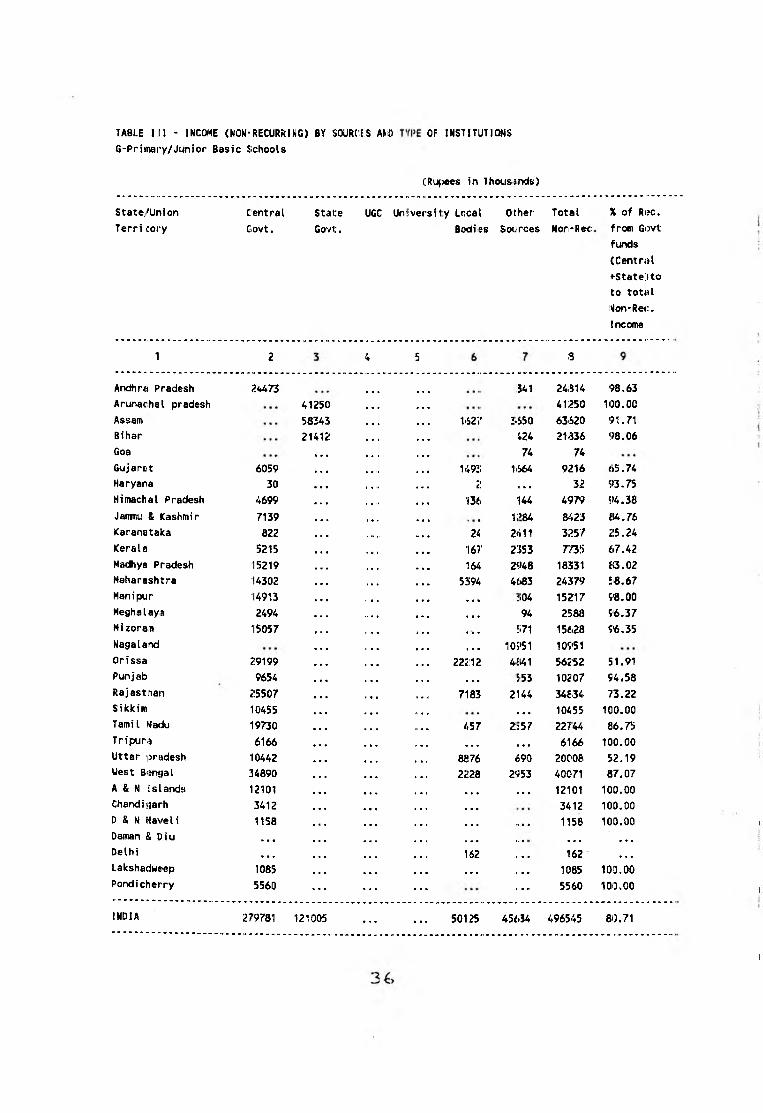
(Ruffes in Thousands)
TABLE i n • INCOME (NON-RECURRING) BY SOURCES A^O OF INSIITUTIONS
G-Pri«nary/Junior Basic Schools
State/Union
Territory
Central State UGC Uniiversity Local Other Total
Ciovt. Govt. Bodies Sources Nor-Rec:
X of Rijc.
from Govt
funds
(Central
♦•Stateilto
to total
!Kon-Re<:.
Income
1 2
24473
3
Andhre Pradesh
Arunachal pradesh
Assam
Bihar
Goa
41250
58343
21412
Gujaret 6059 • • • 14921 1<S64 9216 <)5.74
Haryana 30 « • • 2 . . . 32 93.75
Himachal Pradesh 4699 136 144 4979 94.38
Jammu & Kashmir 7139 • • » * • .. « • • i:>84 8^25 M.76
Karanataka 822 • • • 24 2411 3257 25.24
Kerala 5215 • > • 167 2353 r m 67.42
Madhya Pradesh 15219 164 2948 182131 JS.02
Maharashtra 14302 j • « 53f94 4(^3 24379 J-8.67
Manipur 14913 • • • • • V « • :i04 15?17 98.00
Meghalaya 2494 • • . • • 1 • • 94 2588 96.37
Mizoraiu 15057 . . . • . t a • Ji71 15628 S'6.35
Nagaland « « . • • • • . ■ • • 105*51 10951
Orissa 29199 • • . 1 • • 22212 4E141 56252 51.91
Punjab 9654 « « . 553 10207 94.58
Rajasthan 25507 • • « . • • 7183 2144 34834 73.22
Siki(im 10455 « • • « » • • • • 10455 100.00Tamil Maiiu 19730 • • • 457 213 57 22744 86.75
Tripura 6166 • • • « .1 • • • • • ■ 6166 100.00
Uttar prndesh 10442 • • • « • f 8876 (590 20008 52.19
West Bisngal 34890 • • • 2228 2*553 40071 87.07
A & N islands 12101 • • • • t. * • • 1 • t 12101 100.00
Chandigarh 3412 • « • m m 3412 100.00
D & N Haveli 1158 • • • • • • • • .1 • * 1158 100.00Daman & Diu . • • ■ • • » • > • • Cl • • • • • • •
Delhi • • . • • • 162 .. •.. 162 • • •
Lakshadweep 1085 • • « • • • • • 1. • n 1085 10D.00
Pondicherry 5560 . . . . . .... 5560 lOiD.OO
INDIA 279781 121005 50125 45654 496545 80.71
1627
541
3-S50
424
74
24i314
41250
63620
21836
74
98.63
100.0091.71
98.06

<Ruf>ees in Thousands)
TABLE i n • INCOME (N()M-RECURRING) BY SOURCIHS A»fD TYPE OF IKS'iiTUTIONS
H-pre-Prinary/Pre-BAsfc Schools
State/Union
Territory
Central State UGC University Lcical Other Total
(5ovt. Govt. Bc<lies Sources N<:>n*P:ec.
% of Rec.
from Govt
funds
(Central
■*-State)to
to total
Non-Rec.
Income
. . 'i - 2 4 !> 6 7 8 9
An<tira Pradeijh 9 .... ... 9 100.00
Aruf>achal pr^Ktesh ':t15 ... •M5 100.00
Assam . i. ■■ !I02 ... 302 100.00
Bihar ... ... » « • f • •
Goa ... • .... ... « 1 . • • •
Gujarat 38 ... liiS 195 4.21 9.03
Haryana ... ... • • •
Himachal Praclesh ‘ 19 ... ... 19 100.00
JaniiK & k:ashm{r ... ... ... « * » • • •
Karanetaka ... • • •
Kerala ... ... 1 53 70 . •«
Macfriya Pradesh 26 ^ . ... 4 76 106 24.53
Maharashtra ,.. ,... ... . <. 450 450 • • •
Hanipur ...
Megh&laye 451 ... 342 793 56.87
Mizcram ... • • •
Nagaland ...
Orissa ... ...
Punjab • • • ...
Rajasthan 33 ... 33 100.00
Sikkim 1300 ... ... 1300 100.00
Tamil Nadu ... ... ... 15
Tripura 500 ... 500 100.00
Uttar pr«<:iesh ... ... 52 32
West Bengal 184 ... ... 184 100.00
A & li Islands 1200 . i. ... 1200 100.00
Chandigerh ... ....
b & N Haveli ... .....
Daman & Diu ... .... •. .
Delhi ... ...
LakshadHC'iip 542 ... 542 100.00
Pondicherry 213 ... ... 213 100.00
INDIA 4515 417 ... 241 1131 6304 78.24
- : ‘,7 -

(Kup«;es in rhousards)
TABLE U l - INCOME (NON-RECURRING) BY SOURCE AND TYP!! OF INSTITUTIONS
Total Elijmentsry lEducation (F,G,H)
State/Union
Territory
Central State LGC Univ«r«ity Local Other Totel
Govt. Govt. Bodies Sources Non*Rec.
X of Rec.
from Govt
funds
(Central
+State)to
to total
Non-Rec.
Income
1 2 3 4 i; 6 7 8 9
Andhra Pradesh 26030 1147 27177 95.78
Arunachai. pradesh 86572 <.. 86572 100.00
Assam ... 86678 • • • 1 •« 1654 4299 92631 93.57
Bihar • t • 33345 ... 968 34313 97.18
Goa 404 « • • • • • 158 562 71.89
Gujarat .315073 9848 2893 327814 96.11
Haryana 141 • » • • •. 20 2 163 85.50
Himachnl Pradesh 6326 i •« 347 2185 8858 71.42
Jaitinu & ICashmir 17062 •.. ... 2216 19278 88.51
Karanataka 47974 • • * U2Q 17li49 66743 71,88
Kerala 14693 253 5044 19990 73.50
Madhya Pradesh 29586 417 5763 35766 82.72
Maharasihtra 31782 11999 10856 54637 53.17
Han i put' 17807 • • • 644 18451 95.51
Meghalaya 4275 . • < • • • 13489 17765 24.07
M i zorafi 19703 • • « • • • m ? 21050 93.60
Nagaland 4 • . 482126 48326
Orissa 34181 24499 6 h40 65120 52.49
Punjab 14629 . • • 3235 17854 81.89
Rajasthan 47408 71 S3 4183 58774 80.66
Sikkim 18200 • » • 18200 100.00
Tamil Nadu 23558 631 3 U4 27333 as. 19Tripura 10707 « > • . • « 10707 100.00
Uttar pradesh 68308 12624 3261 84193 81.13
West Bengal 42350 • •. 4553 5753 52636 80.38
A & N Islands 27501 • •« « « • t • » 27501 100.00
Chandisjarh 5775 • * • •.. • • • ■ > • 5775 100.00
D & N Saveli 4431 • • • • • • • • » 4431 100,00
Daman & Diu
Delhi 388 142 3610 4160 9.33
Lakshadweep 2169 •t . • • • * 2169 100.00
Pondicherry 1.'i425 ... ... ... 154i25 100.00
INDIA 845i<87 2136595 75440 146512 1274434 82.58
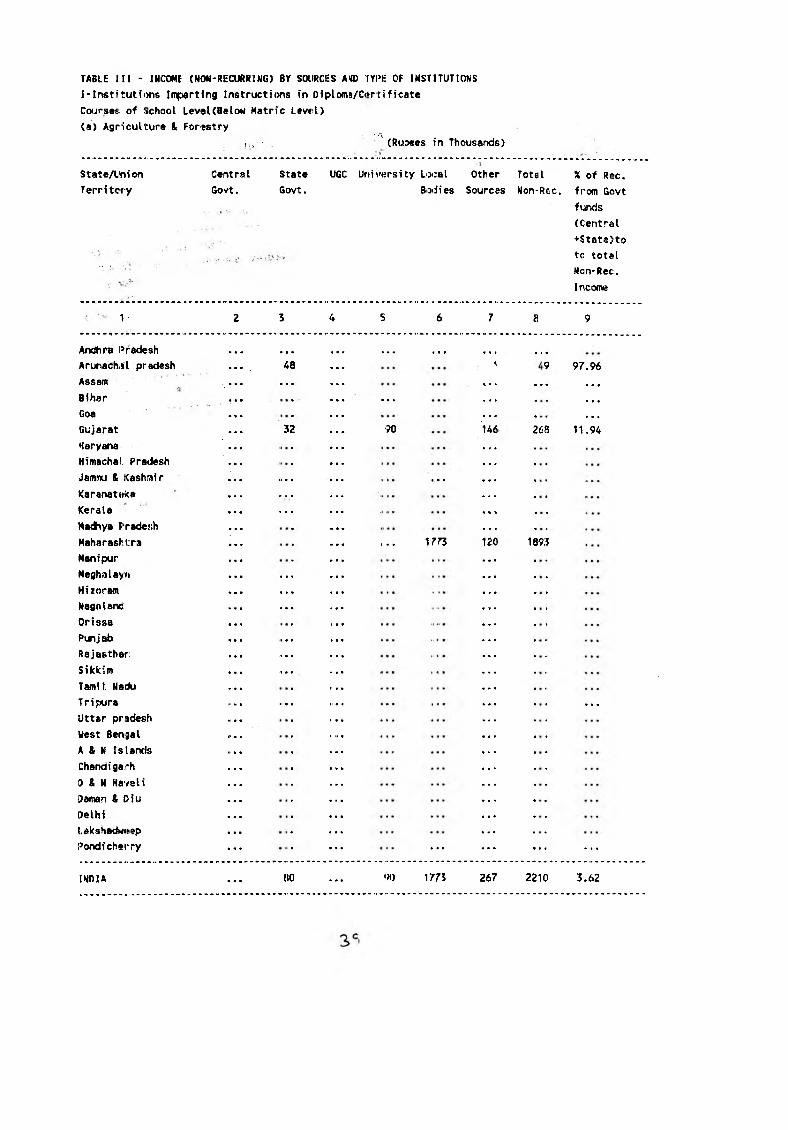
TABLE I [I - INCOME (NON-RECURRIMG) BY SOURCES A W TYPIE OF INSTITUTIONS
I-Institutions Impiarting Instructions in Diploma/D*rtificate
Courses: of 1>chool Level (Below Metri c Levol)
(a> Agriculture & Forestry
i,v ■ ' (Ruoees in Thousands)
State/Union
Territcry
Central State UGC Uni>f«rsity Local Other Total
Govt. Govt. Boiiies Sources Non-Rec.
% of Rec.
from Govt
funds
(Central
+State)to
to total
Non-Rec.
Income
1 • S 5 6 7 9
Andhrar Pradesh • • • « ■. ■ . . . . . .
AriA achiaii pradesh 48 . 97.96
Assam . . . . • « . • • «
Bihar . . . • • *
Goa . . . .
Gujarat 32 90 268 11.94
Haryana .
Himecha!. Pradesh .
Jamnu & Kashmir . ... . . . .
Karanatftka .... .
Kerala • • • .
Madhya FradeKh .
Maharashtra . . . y m 189:3
Manipur .
Meshalaya . . . .
Mizoram . . . . . . .
Nagaland . . . .
Orissa .
Punjab . . . . . . .
Rajasthan . ... .
Sikkim . ... .
Tamil NatAi .
Tripura . . . . . . .
Uttar pradesh . . . .
West Bengal .
A & N Islands .
Chandigarh .
9 & N Haveli .
Daman & I)iu .
Delhi .
lakshadwiisp .
Pondicherry . . . . . . . . . .
INDIA {)0 •N) 1775 267 2210 3.62

TABLE III - INCCME (MON-RECURRIMG) BY SOURScS AND TYPE OF INSTITUTIONS
I-Institutions Imparting Instructions in Diialoms/CertIficate
Courses of School LeveUBelow Matric Level)
(b) Medicine<Hursing & Midwifery)
(Ru|3ees in Thousonds)
State/Union
Territory
Central Sttite UCiC University Local Oi:her Total
Govt. Govt. Bodieu Sources Non-Rei;.
% of Rec.
from Govt
funds
(Central
+State)to
to total
Non-Rec.
Income
1 2 3 5 7 8 9
Andhra f>radesh . . . . . . . . .
Arunac:hiil pradesh 57 57 100.00
Assam . • • « • .
Bihar • • • • • • • • • • « •
Goa • • « . . .
Gujarat 32» • • • • * 1 328 100.00
Haryana • . I. • • •
Himachal Pradesh • • • • . «, • • • • • »
Jawnu & Kashmir • • •> • • •• • • • • • •
ICaranfitaka ■ « • • • .... • • • • • •
Keralei • • • • •• • • • • • • •
Hadhys Pradesh 134 134 100.00
Maharashtra • « • * ♦ t • • • • •
Manipttr m m m » • • u • • • ■ .
Meghalaya n • « . . .
Mizoram • • « • > •
Nagaland • • • II • • « • • ■
Orissa ■ « • .1 • . r « • • « > • •
Punjab • • • • • 4 . • •
Rajasthan • • « 1 • ■ m m 0 • • •
Sikkim • « • * • • m m *• • . •
Tamil Naidu • • • • « * • • •
Tripura • • • « • • • • •• • • •
Uttar pradesh • • • • • • ■ • • ■ • •
West Bengal • m m • • • • • *
A & N Islands • • • • • • . . . ■ • • • • • .
Chandigarh • • • . . . • • • • • • • • •
D & N Haveli • • • . . . » • • • • • • • •
Daman & Diu
Delhi
. . . . . . . . . . . .
Lakshadweep • • • . . . • • •
Pondicherry . . . . . . . . . . . .
INDIA 519 519 1013,00
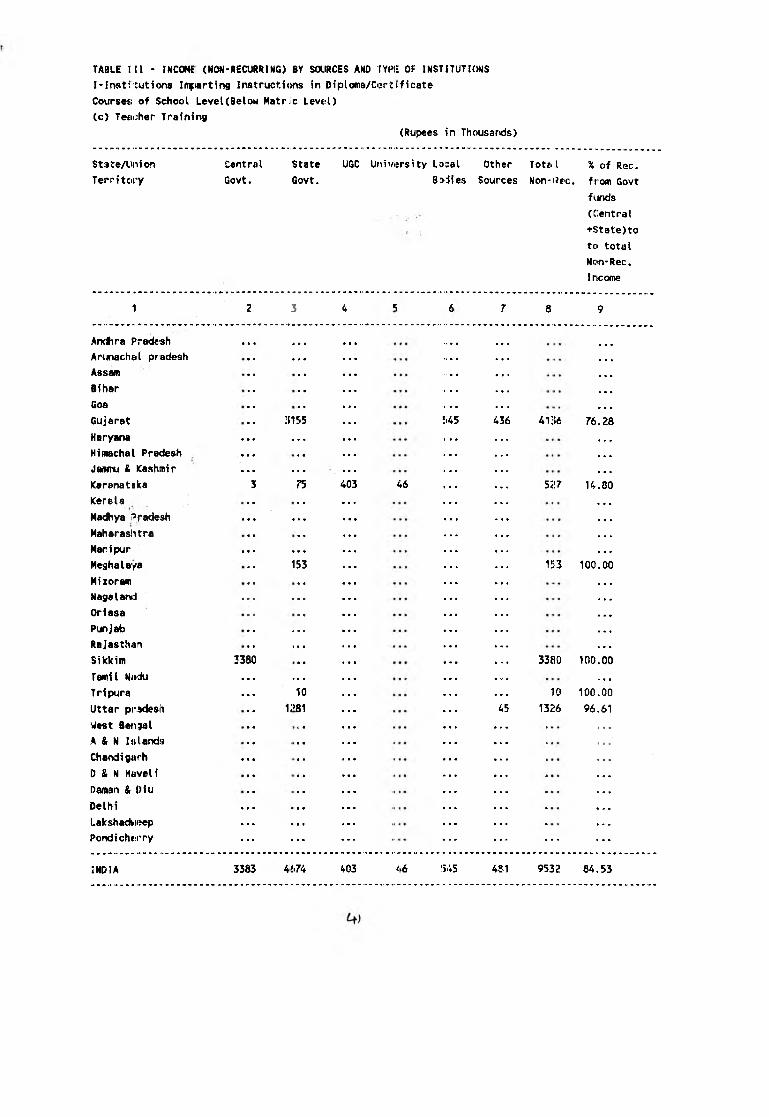
TABIE i:il - INCOME (NON'RECURRING) BY SOURCES AMO TYPE OF INSTITUTIONS
I'Institutions Iitfiarting Instructions in DiplomB/Ci^r tificate
Courseti of School LeveUBelow Matric L evd)
(c) Teticher Training
(Rupees in Thousands)
State/Linion
Territory
Central State UGC University La^al Other Tot& I
Govt. Govt. Bodies Sources Non-i?ec.
% of Rec.
from Govt
funds
(Central
+State)to
to total
Non-Rec.
Income
1 3 *1 7 8 9
Andhra Fracte«h . . . . . . .
ArunachEtl pradesh . . . .
Assam .
Bihar .
Goa .
Gujarat :ns5 . 436 4136 76.28
Haryana . . . . . . .
Himachal Pradesh . . . .
Jttimu & Kashmir
Ksranataka••• •••
3 46 5i!7 14.80
Kerela .
Madhya i>radesh . . . . . . .
Maharashtra .
Maripur . . . . . . .
Meghalaya 153 . 153 100.00
Mizoram .
Nagaland . . . . . . .
Orissa .
Punjab . . . .
Rajasthan . . . .
Sikkim 3380 . 3380 100.00
Tamil Niidu . . . . . . .
Tripura . . . 10 . 10 100.00
Uttar pi'adesh i:>8i . 1326 96,61
West Bengal .
A & N Islands .
Chandigarh . . . .
D & N Haveli .
Daman & Diu .
Delhi . . . . . . .
Lakshadvieep . . . . . . .
Pondichisrry . . . . . . . . . . . . .
INDIA 3383 4£.74 3 46 '5-V5 481 9532 84.53
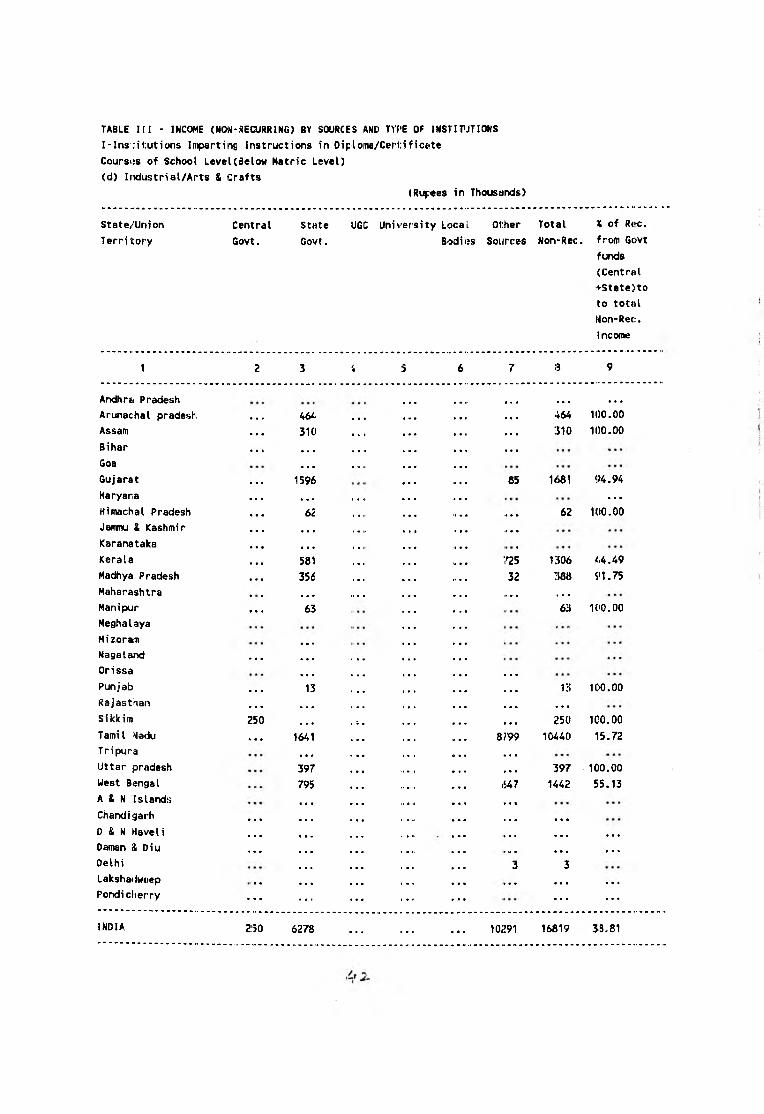
TABLE III - INCWE (NO)^-RECURRING) BY SOURCES AND TYCE OF INSTITUTIONS
I-Institutions Ifnpartinfi Instructions fn Oiploma/Cerliificeite
Courscis of School Level (Below Hatn'c Level)
<d) Irxdustn'al/Arts & Crafts
(Rufiees in Thousijnds)
State/Union
Territory
Central State UGC University Local Oi:her Total
Govt. Govt. Bodifis Sources Non*Rec.
X of R<‘C.
from Govt
funds
(CentroI
►Statelito
to totitl
Won-Rec.
Income
1 2 3 4 6 7 8 9
Andhr*! Pradesh . . . » • • • • •
Arunachal pradesh • • « 464. . • • • . » . • . 464 100.00
Assam • * • 310 • • • • . • • • 1 » « • 310 100.00
Bihar . « % • . • * • . . . .
Goa . . . »=...
Gujarat . « • 1596 85 K>81 94.94
Haryana . « • * * . 1 . M . . .
Himachal Pradesh • » • 62 1 M •< •f • • 62 100.00
Janvnu & Kashmir • » . • • . . • !■ It * • .t • .
Karanataka • • • « • . 1 • 1 ti • • •
Kerala • . . 581 1 • . 725 1306 44.49
Macftiya Pradesh . • • 356 1 . • 32 388 91.75
Maharashtra • • . . . .. • ■ • • • V m m . . .
Manipur . • « 63 63 ICO.00
Meghalaya
Mizoram • . . . • •
Magaland - « • • • • 1 » • • • »
Orissa • • • • • • < . •
Punjab . • • 13 , , , . • • 13 100.00
Rajasthan . . . • • • f • > • • • . . .
Sikkim 250 • . . 1 V . . • • . • • 250 ICO.00
Tamil i*iadu • • • 1641 • • a * • m s m 10440 15.72
Tripura • . « - • • m • •
Uttar pradesh 397 « • • > . « 397 100.00
West Bengal 795 « • • .547 1442 55.13
A & N [stands . . . • » • « « » • • • * • •
Chandiiiarh » « • * • • « • • , , a . . .
D & N Haveli • • ■ . • « .. » «. » m m . . . . . .
Daman & Diu w • • • • • • • . > « • . . . . . .
Delhi• • • 3 3
Lakshadweep . • • • • . • • . . . . . . . . .
Pondicherry . . . . . . . . . . . .
INDIA 2:50 627S . . . . . . 10;!91 16819 33.81

TABLE ni ' income: (NON-RECURRING) BY SOURCES AMD TYPE OF INSTITUTIOImS
I-lnststutiijns Inftarting Instructions in Oiploma/Curtificate
Courses of iSchool Level (Below Metr ic Levol)
(e) Mu«ic & Fine Arts
(Rupees in Thousands)
State/Union
Territory
Central State UGC University Local Other Total
Govt. Govt. Bodies Sources Non-Rec.
% of Rsc.
from Govt
funds
(Central
+State)to
to total
Non-Rec.
Income
3 4 6 7 8
An<ihra Pradesh . . . . . .
AriJiacl’ial pradesh . . . . . .
Assam 30 30 . . .
Bihar . . .
Gots 33 88 121 27.27
Gujarat <1114 422 410 2946 71.76
Haryana . . . . . .
Himachit PrJidesh . . . . . .
Jammu S: Kashmir . . . • . .
Karanataka ‘
Kerala 385 3i55
Madhya f'rad^sh . . .
Maharashtra 6
Manipur . . .
Meghalaya . . . . . . . . . . . .
MizoraiTi
Nagaland . . .
Orissa . . . . . . . . .
Punjab . . .
Rajasthftn . . . . . .
Sikkim . . .
Tomfl Nadu
Tripura . . . . . . . . .
Uttar pradesh 12 . . . 12
West Berigal . . . 8
A & N Is:lands
Chandigarh . . . . . . . . . . . .
D & N Heveli . . .
Oanvin & Diu
Delhi . . .
Lakshadkireep . . . . . .
Pondicherry . . . . . . . . .
INDIA :»U7 A34 927 3508 61.20

TABLE III - IMCOKE (NON-RECURRING) BY '.iOURCIS k W TYiJE OF 1MS1ITUTIOMS
I-Institutions Imparting Instructions in Difilcflwi/Certificate
Courses of School LeveldBelow Metric Level)
(f) For the Handicapped
i;Ruffes in Thous.ands)
State/Union
Territory
Central State UGC University Local Other Total
Govt. Govt. Bodies Sw:rces Non-Rec.
X of Rec.
from Govt
funds
(Central
fStateitto
to total
Mon-Rec.
Income
1 2 3 4 5 6 7 .3 9
Andhrti Pradesh 67!i . . . 675 100.00
Arunachfil pradesh . . . . • • • • ..
Assam 112 . . . > • .. • . • 112 100.00
Bihar . » * . . • * • « • • «
Goa
Gujaret 546 • . . 15;. 51)98 5799 9.42
Haryana 115 • • • 9 182 306 37.58
Himachal Pradesh « . « 90 .» • « • • • 90 100.00
Jammu & Kashmir •.. • • • • •».. ■• • • .... . . .
Karanetaka . a . 12G a * « II • « '120 100.00
Kerala M • • (>31 631
Madhya Pradesh • 6 • 0 • U • • 6 100.00
Maharashtra 76 • « • u • • 2186 2J!62 3.36
Manipur 224 • « 1. • B • 224 100.00
Meghalaya • • • • • * „,, • • « 1 a • < ■ 1. . . .
Mizorajn • • « I • • > • ■ f • » <. • « . . .
Nagaland • • . • • • 1 • ■ . • « . . .
Orissa • • • • • • . . • « « • a » • m • mPunjab • * • . • • • • • 53 53Rajasthan 14 « • • 154 168 8.33
Sikkim • • • • • • • • • . • « a
Tamil Nadu ... 189 •«« « • • 39 228 82.89
Tripura 50 ,, , « • « 6 56 89.29
Uttar pradesh 9 8 • . • 17 52.94 '
West Bfjncjal • • • 178 • • • „ , „ » • • 61 239 74.48
A & N Islands «. • . . . • • • • « • • • • « • •
Chandigarh • • • • ■ • . . . • • • • • • •
D & N Kaveli . . . • • • « • • • • « .1 • • • • • • • *
Daman Diu • . . • • • • • • u • « « • » • • •
Delhi 30 • • • ■ « • •f • 30 100.00
Lakshadweep . . . • • • a ■ • I- • ■ • • • • • •
Pondicherry . . . 40 . . . . . . . . . 40 100.00
INDIA 218 2256 172 8<10 110156 2;?. 38

TABLE nil - INCOME (WDN-RECURRING) BY SOURCES AND irW: OF INSTITUTKiNS
I-institutions Imparting Instructictns in Diplomi/CcrCif icate
Cwjrses of School Level(Below Matric Level)
(g) Reforn«lory/Certified
(Rujjees in Thousands)
State/Union
Territory
Central State UGC Uni vers i:y Local Othe?- Total
Govt. Govt. 8<Kiies Sources Mon-(5ec.
r> n/'*
% of Rec.
from Govt
funds
{Central
+State)to
to total
Non-Rec.
Income
2 ;s 4 9
Andhra Pradesh • • • > • ■
Arunachnl prAdesh ...
Assam V ... ....
Bihar M .
Goa ... ....
Gujarat ...
Haryana ...
Himtichal Pradesh ...
Janinu & li ashmir ... ...
Karanatal ca
Kerala
2C59•
2059
6
100,00
Madhya Pvadesh ...
Maharashtra ...
>1anipur ....
Meghalaya ...
Mizoram ■ ....
Nagaland ...
Orissa ... ...
Punjab ...
Rajasthan ...
Sikktro ...
Tamil Nadj ...
Tripura ...
Uttar priKdesh ...
West Ben{|3l ...
A & M islands ... ....
Chamdigarh ...
U & M Haveli ...
Daman & Diu ...
Delhi ... ...
Lakshadweep ...
Pondicherry ... ...
INDIA 20159 6 2065 99.71
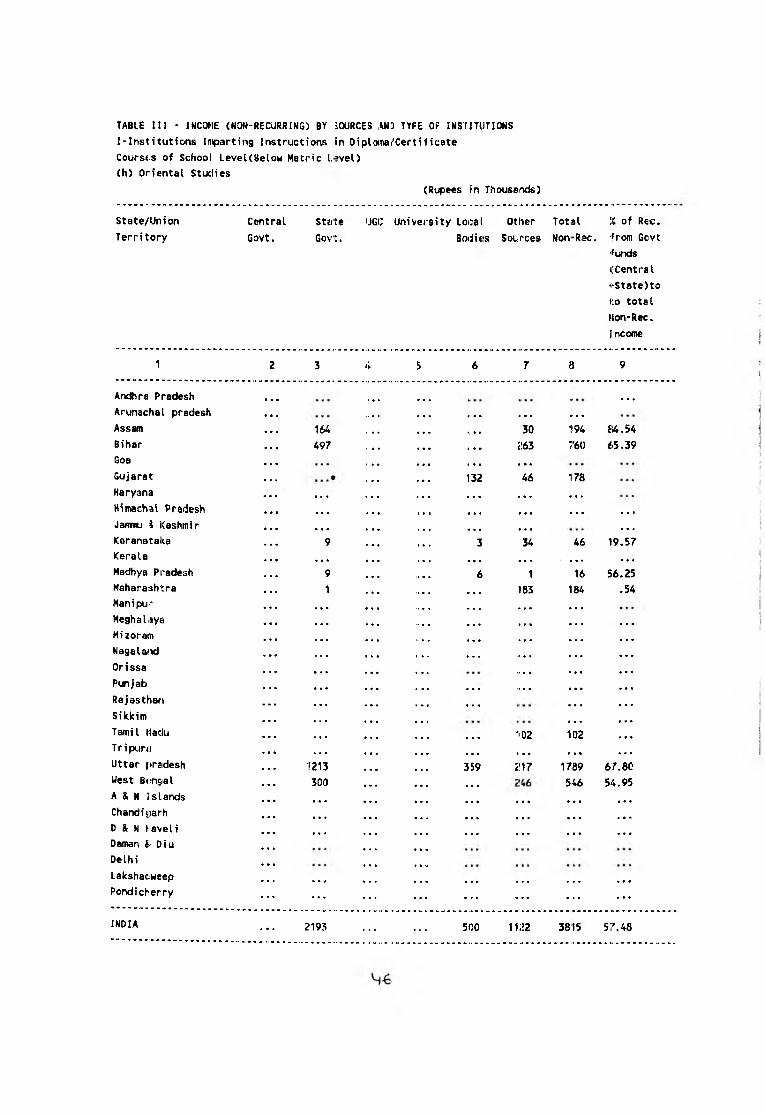
TABLE III - IMCOME (NOi^RECURRINS) BY SOURCES AKI3 TYPE OF INSTITUTIONS
I-Institutions Inparting Instructions in Diploina/Certificate
Courses of School LevsUBelow Matn'c l.»vel)
(h) Oriental Studies
(Rupees in Thoussii'xis)
State/Union
Territory
Central State iJGC Universit/ Local Other Total
Govt. Gov:. Bo(ii<*s Sources Non-Rec.
% of R€C.
■from Gcvt
'funds i;Centra I
■i-State)to
l;o total
Hon-Rec.
Income
1 2 3 <1- 6 7 a 9
Andhra Pradesh . . .
Arunachal pradesh • • • < a a . . . . . . .
Assam • • • 164 t a a 30 194 £14.54
Bihar • • • 497 • • • 1 • • :!63 760 65.39
Goa • a • . . .
Gujarat » • « 132 46 178
Haryana • • • • • • , , , • a • . . . . . .
H^machaV Pradesh • • • • w • . . . a « a • • ft a a • a a t
Jammu i Kashmir • • • • • • • • • * a a a a a « a .
Karanataka • • • 9 » • t 3 34 46 1 9 a 5 7
Kerala • • • • • • • • 1 • a • a a • a a • . a .
Madhya Pradesh « • • 9 >1 a •* 6 1 16 5 6 . 2 5
Maharashtra • • • 1 „ , „ •» a a 183 184 . 5 4
Manipur • • • « • • • a a » a a a a a
Heghaljya • ■ • • . « a » • • a a a a a a a .
Mizoram « ■ • • « a • a a a • • . . .
Nagalaixi • • • « • • . . . t a • a « a • . a
Orissa a « • • ■ ■ .... . . . a a a
Punjab • • • • • • » ■ • a a a <» a a • a » • a a
Rajasthan • • • • • • . . . . . . a a • a a a
Sikkim • II • • • « • • a . . . . . .
Tamil Madu • • ■ • • • • • ■ a a • 102 1D2 • • a
Tripura• • • • • • • a • ■ a a «. a n • a a « a a
Uttar pradesh • • ■ 1213 • « • 359 J!17 1789 67.80West Btmgial • • ■ 300 m m m • a • . . . 546 54.95A & N Islands • ■ • • • « • m m • • a « • a a a a ■ a a
Chandigarh • • « . . . . . . a a a a a a
D & N Haveli • • ■ • • « • m m n m • a a •- a a a a a a
Datnan & Oiu • • • • m m
Delhi • • • • ■ •
Lakshadweep • • 0 «> V « a « w . . . . . . . . . a a a
Pondicherry • ■ « . . . • « a . . . . . . . . . . . .
INDIA J • 4 2193 • • V 500 1122 3815 57.48
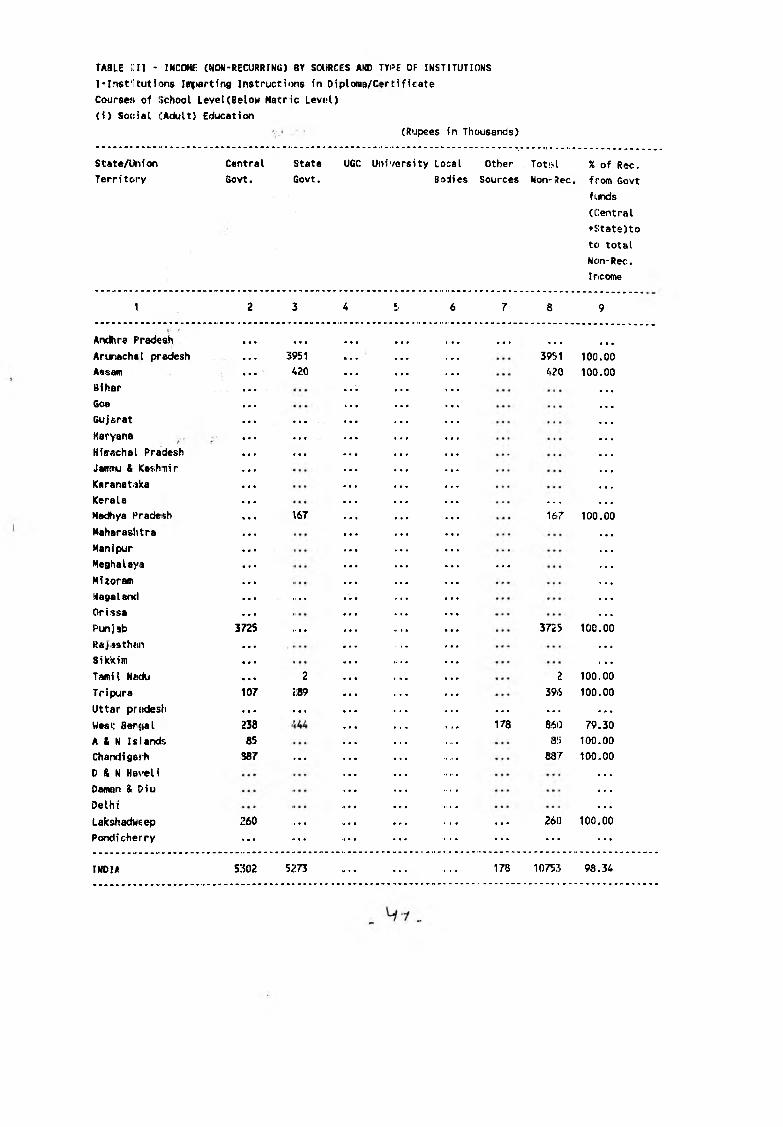
TABLE HI - income: (MON-RECURRING) BY SOURCES AND TYP£ OF INSTITUTIONS
I'Instltutions Imftarting Instructiws in Diploma/Cfrtificate
Coursen of School Level(Below Matric Lev«l)
(i) Social iIAdult) Education
(Rupees in Thousands)
State/Union
Terri tciry
Central State UGC University Local Other Totwl
Govt. Govt. Bodies Sources Non-Rec.
% of Rec.
from Govt
fi-jnds
(Central
+State)to
to total
Non-Rec.
Income
1 3 c. 7 8
Andhra Pradesh • • • ... ..
Arunachal pradesh 3951 395i1 100.00
Assiam 420 . 420 100.00
Bihar
Goa .
Gujarat ... .
Karyana ... .
Himachal Pradesh ... .
Jainrtu & Kashnir
Karanataka
Kerala __
Madhya Pradesh \67 167 100.00
Haharashtra .
Manipur
Meghalaya ...
Mizoram
MagalarKi ....
Orissa
Punjab 3725 .... 3725 100 .,00
Raj ssthttn
Sikkim
Tamil Ncxki 2 . .... 2 100.00
Tripura 107 2189 396 100.00
Uttar priidesh ... ... ... ...
WesC Bersial 238 178 860 79.30
A & N Islands; 85 8!5 100.00
Chandigarh 387 ... 887 100.00
D & N Haveli
OttVKin & Diu
Delhi .
Lakshadweep 260 .... ... 26{) 100.00
PotkH cherry . . . .... ... ... ...
INDIA 5302 5273 178 10753 98.34
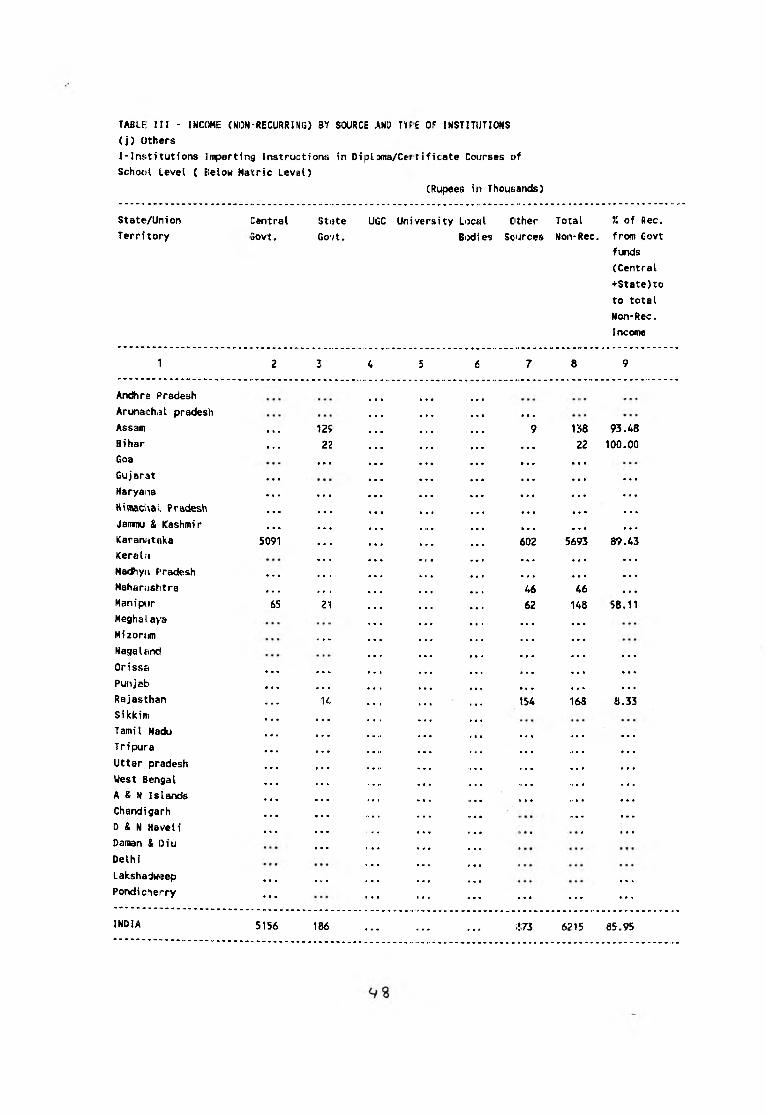
TABU; III - INCOME (N(3N-RECURRING) BY SOURCE AND TVPE OF INSTITUTIONS
(j) Others
I-Institutions Imparting Instructionsi in Diploma/Certificate Courses of
School Level { Below Matric Level)
{Rupees in Thou&ands)
State/Union
Territory
Central Stiite Ui3C University Loc«l Other Total
3ovt. Govt. BixJies Sources Non*Rec.
% of Rec.
from Govt
funds
(Central
+State)to
to total
Non-Rec.
Income
1 2 3 4 7 8 9
Andhra Pradesh
Arunachal pradesh • • • • a .
Assam . t . 125 9 1S8 93.48
Bihar • » • 22 • » a * • • « • • 22 100.00
Goa . . . . • # . . .
Gujarat • • • . « . • • • • • » • • . . . •
Haryana • « • « . . • • « • . • . . .
Himachal Pradtesh • • ■ • ■ • . • • • . ■ ■ • .
Jammu & Kashmir • • • • * • • • • » • • • « « . . .
Karanataka 5091 • • ■ • • « 602 5693 89.43
iCeralfj • • • • « » • • • • • .
Madhya Pradesh • • • . • ■ « » » • * • • . • « . •
Maharashtra « • • • «• . « • • • • * 46 46 • . .
Manipur 65 21 » • » 62 148 58.11
Meghalaya • . • . • •
Mizoram « » « • • • . • . .. • . • •
Nagaland• . ■ • • • • • .
Orissa • • « . . . . . . . . . . . . . . .
Punjab • • . • • • • • ■ • • « ■ • • • . . . . .
Rajasthan . . . U . • . 154 168 8.33
Sikkim • « • . . .
Tamil Nadu . . . • » • « ■ • ■ • • .... . . .
Tripura • • « . • • « •• • • • • .t. . • . •
Uttar pradesh - « . « • • » • ■ M . . . . .
West Bengal « « • . > » <1 • * fl » ■ . . .
A & N Islands • » • • • • II • ■ II . • «> . • • • .
Chandigarh • •• • • • • * m » . . . • . .
D & N Haveli • » « m m m t • « • * t * .
Daman & Oiu . . .
Delhi
Lakshadweep • • • . . . . . . . . .
Pondicherry . . . . . . . . . . . . . . .
INDIA 5156 186 m 6215 85.95
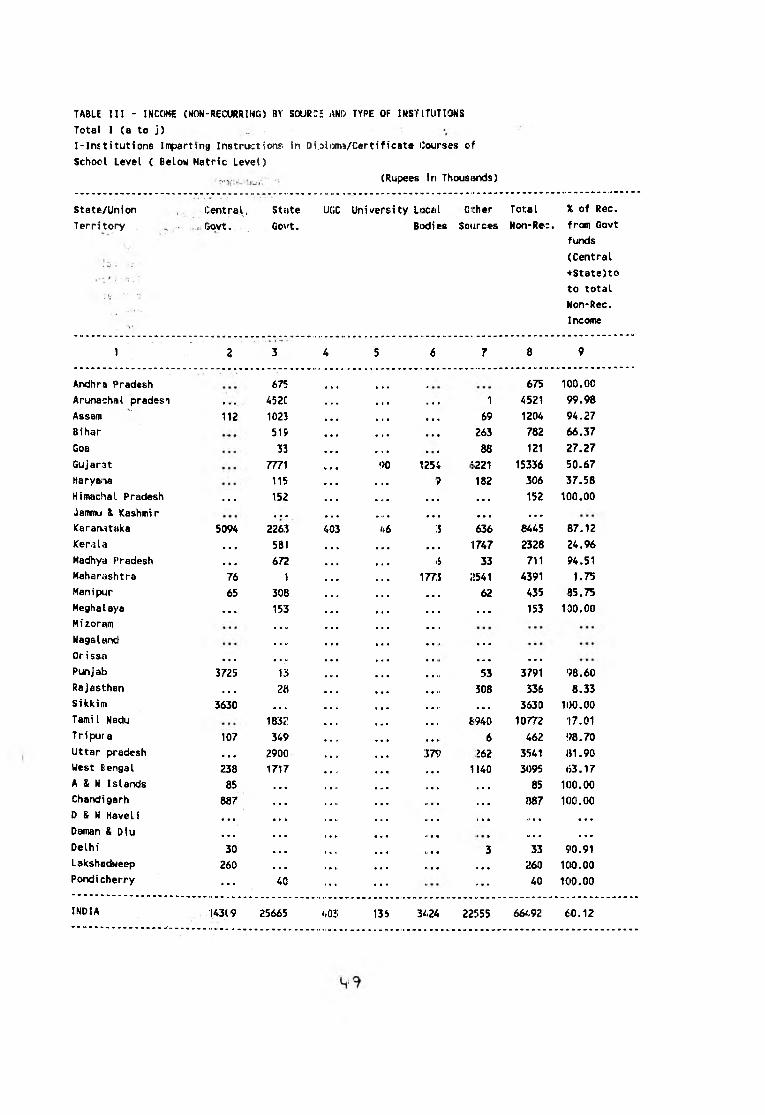
TABLE III - INCCWE (HON-RECURRING) BY SOURCE AND TYPE OF INSTITUTIONS
Total I <a to j)
I-lnstitutions Imparting Instructions in Dl,3lixn.a/Certificate Courses cf
School Level ( Below Metric Level)
; (Rupees in Thousnnds)
State/Union
Territory
Centra^. State U(;c University L<)C8il ccher Total
ijQVt. Govt. Bodies Sources Non-Rec.
% of Rec.
from Govt
funds
(Central
+State)to
to total
Non-Rec.
Income
1 Z 3 4 5 6 7 8 9
AncHira Pradesh 675 675 100.00
Arunachal pradesh • • • 452C • t . . . . 1 4521 99.98
Assam 112 1023 > • > • • • 69 1204 94.27
Bihar 519 « * • » • • 263 782 66.37
Goa 33 « > 88 121 27.27
Gujarat 7771 90 1254 (5221 15336 50.67
Haryai'ta 115 9 182 306 37.58
Himachal Pradesh . « . 152 • • • • • • • • 152 100.00
Jammu & Kashmir • • ■ • • • • i< • • • • • • • • • »
Karanataka 5094 2263 403 46 3 636 8445 87.12
Ker.5la . . . 581 • • • • • 1747 2328 24.96
Madhya Pradesh . * . 672 6 33 711 94.51
Maharashtra 76 1 M7S 2541 4391 1.75
Manipur 65 308 • t • • • • 62 435 35.75
Meghalaya . . . 153 . . . • « * • • • 153 100.00
Mizoram . . . . . . . . . . . .
Nagaland . . . . . . • • • • . » . . •
Orissa . . . . . . . . . . • • • • • • • • . . .
Punjab 3725 13 « • • • « .1 53 3791 98.60
Rajasthan . . . 28 • • • • • i> 508 336 8.33
Sikkim 3630 • ^ ♦ • • • > • • • • f • • • 3630 100.00
Tamil Nackj 1832 e * . s . 1 £i'?40 10772 17.01
Tripura 107 349 • • • t • * 6 462 98.70
Uttar pradesh . . . 2900 :s7s» 262 3541 81.90
West Bengal 238 1717 « . « > • • 1140 3095 63.17
A & N Islands 85 • • * » • .1 • • ■ • • « » « . 85 100.00
Chandigarh 887 ■ • • » w ti • • • • • • • 887 100.00
0 & N Haveli . . . ■ • • 1 « 1. • . • M • • 1 • • a . « • • •
Daman & Diu . . . • • • t • I. • • • M • • • M • • • « •
Delhi 30 • ■ • » « • « II • • 3 33 90.91
Lakshadweep 260 • • . I f . • • . n » • •1 • • 260 100.00Pondicherry
• • •40 . . . .... 40 100.00
INDIA 14309 25665 t,Ol, 136 3424 22!i55 664,92 60.12

(Rupees in Thousands)
TABLE III - INCOME (NON-RECURRING? BY '50URCE5 AND TYPE OF INSTITUTIONS
J. Directorate and Inspectorate
State/Union
Territory
Cisntral Stai:e UGC University Local Other Total
Govt. Govi:. Botiies Sources Non-Rec.
% of Rec.
from Govt
funds
(Central
+State)to
to total
Non-Rec.
Income
1 2 3 I 6 7 £i 9
Andhra Pradesh . . . 1000 . . . 1000 100.00
Arunachal pradesh 1356 11572 2928 46,31
Assam • • . 9355 . . • « . . ;J55 9710 96.34
Bihar 3700 863 . . . 133H51 138414 3.30
Goa « • • . . . . . .
Gujarat • . . .* . •
Haryanfi • . • . . . ■ • . . . . .
Himachal Pradesh • • • . . . • M • . . . . . .
Jammu & Kashmir . « • - . • ■ • • « ... . . .
Karanataka ■ > • . . . • . . • • . «• . .
Kerala « • • . . . • . • . • • . . .
Hadhya Pradesh 250 2366 • • • 9 2625 9<?.66
Maharashtra • « * • • « • . . • • • . . . . . .
Manipur • • . 9841 . . . « » • • . • 98.41 100,00
Meghalaya . . . » • . • . . . . .
Mizoram 2296 •• . . 2:45 2541 90.36
Nagalartd « • • • « • . • • . . . . . .
Orissa • . . » « . . • .
Punjab 40 476 • » • 516 100.00
Rajasthan • • » 454 • . • t . • . 454 100.00
Sikkim 880 848 ■ « • • • 1728 100.00
Tamil Kadu . p . • . . • N . • .1 .
Tripura . . . 453 «... , , • i> • 453 10(1.00
Uttar pradesh - • - 9272 505 10261 90.36
West Bengal .(•» • • . • 1 • • • . . .
A & N Islands 1456 • ■ • „ , . « ■ • • • 145'6 IOC.00
Chandigarh • • . • . • • 4 « • • • • • . . . .
D & N Haveli » m m 79 • « • 7’9 100.00
Daman & Diu • • • . . . . . . . . . . . . » . »
Delhi . . .
Lakshad!4e<^ 200 • . . . . . . . . 200 100.00Pondicherry . . . S20 . . . . . . 520 100.00
INDIA 6526 39179 484 1365:57 182726 25.01
S D
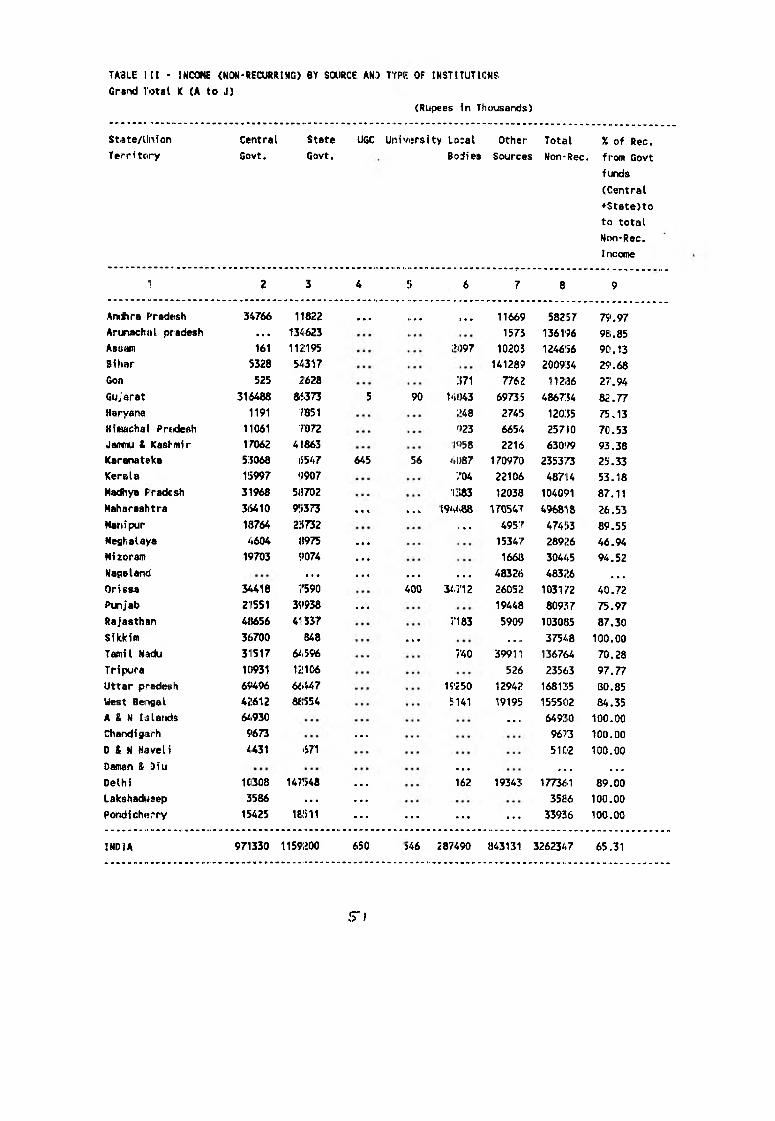
(Rupees in Ttiousands)
TA31E 111 - INCOHE (MON-RECURRIMG) BY SaiRCE AMI) TTPI: OF INSTITUTIC«S
Grartd Total K (A to J)
State/Union
Territory
Central
Govt.
State
Govt.
UGC University Lo:al
Bodies
Other
Sources
Total
Non-Rec.
% of Rec.
from Govt
funds
(Central
+State)to
to total
Non-Rec.
Income
*! 2 3 4 5 6 7 8 9
ArKfira F*radc!sh 34766 11822 • • • .... ... 11669 58257 79.97Arunachal pradesh ... 134623 1573 136196 98.85
Assam 161 1l;j:195 i»i)97 10203 124656 90.13
Bihar 5328 5-V317 141289 200934 29.68
Goa 525 2628 :571 7762 112i36 27.94
Gujarat 31<&488 8(5373 5 90 1<»l)43 69735 4867:54 82.77
Haryana 1191 7851 i’48 2745 12035 75.13
Kiinachal Predesh 11061 7072 923 6654 25710 70.53
Janmi & Kashmir 17062 41863 1958 2216 630W 93.38Karanateka 53068 (5547 645 56 i»087 170970 235373 25.33
Kerala 15997 <J907 704 22106 48714 53.18
Machya Fradesh 31968 5U702 ■I'183 12038 104091 87.11
Maharashtra 36410 9!»373 ... ... 19 v88 17054T 4968‘\8 26.53
Manipur 18764 23732 ... 4957 474i»3 89.55
Meghalaya 4604 H975 ... 15347 28926 46.94
Mitoram 19703 9074 ... 1668 304<« 5 94.52
Nagaland! ... ... ... ... 48326 48326 « • «Orissa 34418 7590 400 3^712 26052 103172 40.72
Punjab 21551 39938 ... 19448 809S7 75.97
Rajasthan 48656 41! 337 7183 5909 103085 87.30
Sikkim 36700 848 ... . • » 375A8 100.00
Tamil Nadu 31517 6 596 7’40 39911 1367d»4 70.28
Tripura 10931 12106 526 23563 97.77
Uttar pradesh 69496 6iM7 m s o 12942 168135 80.85
West Bet-tgal 42612 8«!554 5141 19195 155502 84.35
A & N I islands 64930 .. > 64930 100.00
Chard i 913 rh 9673 ... 9673 100.00
D & N Haveli 4431 fS71 5102 100.00
Daman & Oiu ... • « . . • •Delhi 1CI308 14?>48 ... 162 19343 177361 89.00
Lakshadt^eep 3586 ... ... 3586 100.00
Pondicherry 15425 181511 ... ... ... ... 33936 100.00
INDIA 971330 1159200 650 :>46 287490 843131 3262347 65.31
5"!
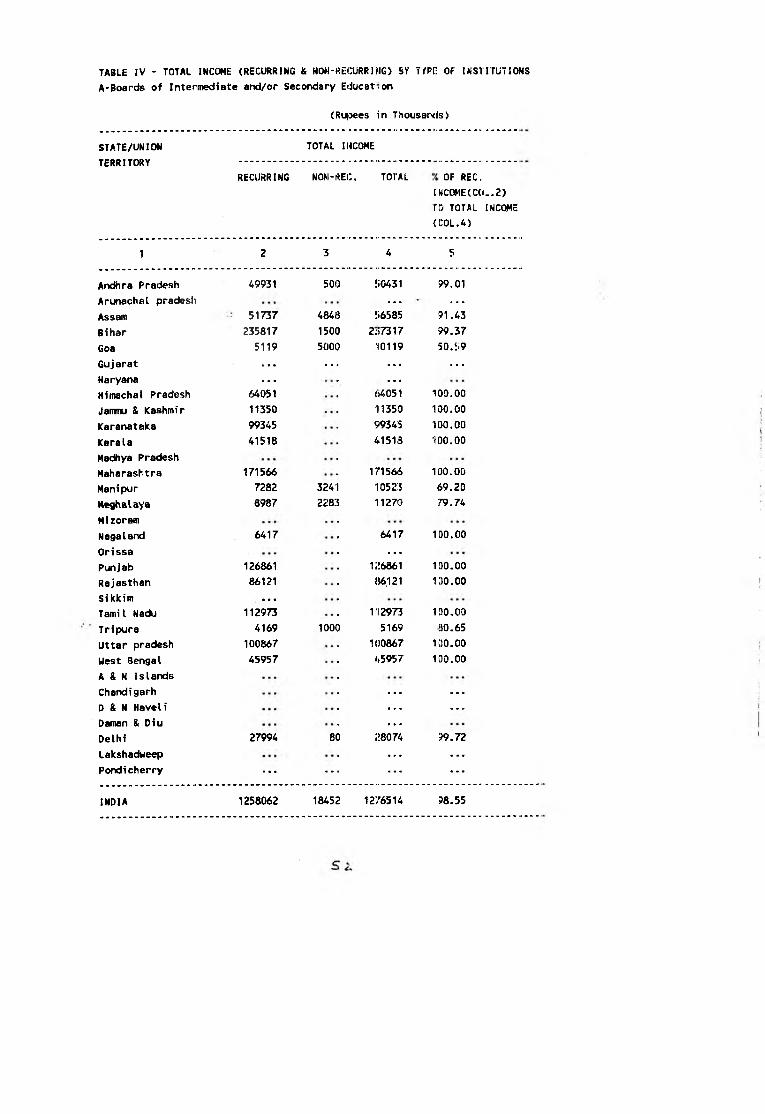
TABLE IV - TOTAL INCOME (RECURRING & MON-fiECURRIHG) &Y TfPE! OF I*iSl ITUTIGMS
A’Boards of Intermediate and/or Secondary Education
(Rujsees in Thousancis)
STATE/UNION
TERRITORY
TOTAL IHCOME
RECURRING NON-REC. TOTAL OF REG.
i:WC0ME(CC(..2)
ro TOTAL IigCOME
{COL.4)
1 2 3 4 5
Andhra Pradesh 49931 500 50431 99.01
Arunachel pradesh ... ...Assam ■ 51737 4843 56585 91.43
Bihar 235817 1500 2:573 1 7 99.37
Goa 5119 5000 10119 50.5.9
Gujarat ... ... ... ...Haryana ... ...Himachal Pradesh 64051 <>4051 100.00
Jammu & Kashmir 11350 11350 1DO.OO
Karanataka 99345 99345 lao.oo
Kerala 41518 41518 100.00
Ha<^ya Pradesh
Maharashtra 171566 171566 100.00
Manipur 7282 3241 10523 69.20
Meghalaya 8987 2283 11270 79.74
Mizoram
Nagaland 6417 6417 100.00
Orissa ...Punj ab 126861 126861 100.00
Rajasthan 86121 JJ6.121 lOO.OO
Sikkim • • •
Tamil Nadu 112973 112973 100.00
Tripura 4169 1000 5169 30.65
Uttar pradesh 100867 100867 1IJ0.00
West Bengal 45957 45957 100.00
A & N Islands
Chandigarh ... ...D & N Haveli ... ...Daman & Diu ...Delhi 27994 80 28074 99.72
Lakshadweep ... ...Pondicherry ... ... ... ...
INDIA 1258062 18452 1276514 98.55
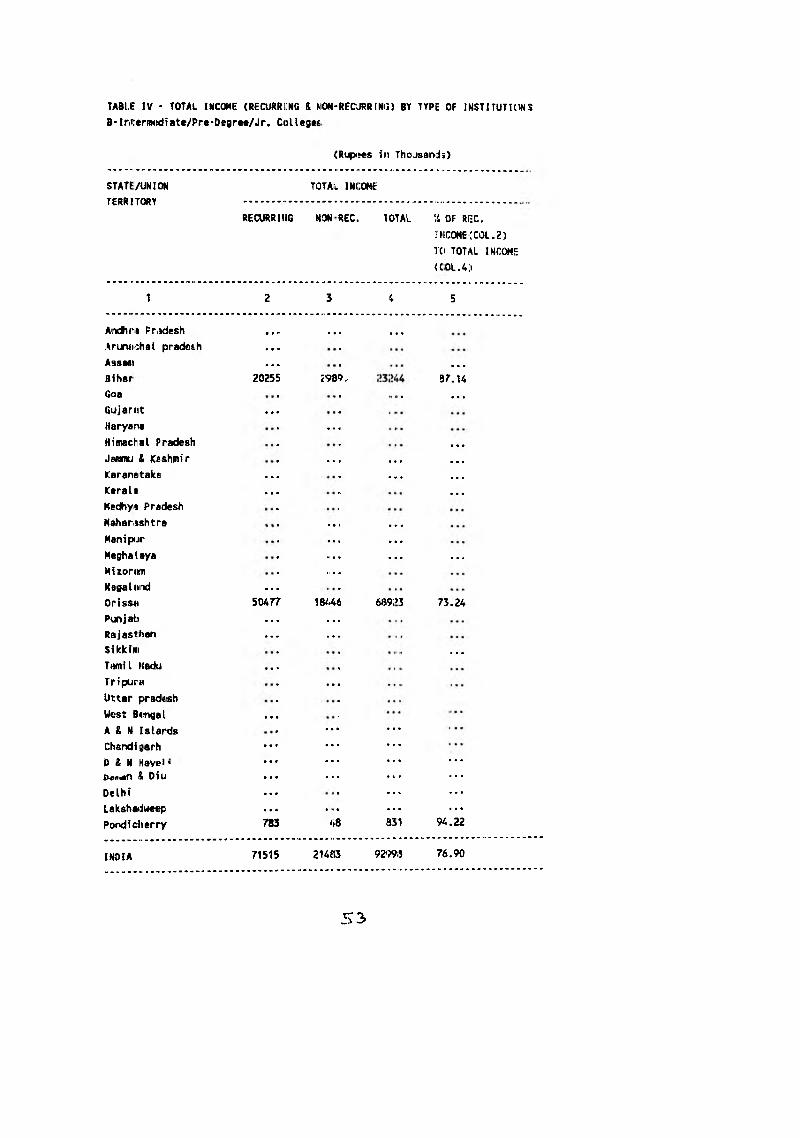
(Rupees in Thojsar>is)
TABLE IV > TOTAL IMCOME (RECURRllNG & WON-REOJRRINiJ) BY TYPE OF INSTITUTKIKS
B- Iriiseriwidi ate/Pre-Degree/Jr. Col leges
STATE/UNION
TERRITORY
TOTAL i ncome;
RECURRlliG NONREC. lOTAL U OF RF.C.
iHC0ME:C0L.2)
TCI TOTAL INCOME
<C0L.4;i
1 2 3 % 5
Andhri Pnidesh • • o ... ...
Arun«i:hal pradesh ...
Assam ... ...
Bihar 20255 i'9B9. 3 M 4
Goa . ...
Gujarat ...
Haryar« ...
Himachal Pradesh ...
Jainmu & Keshmir .. • ... ...
Karanataka • • • .., ...
Kerals • • • ...
Kedhya Pradesh
Maharashtra ... ...
Mani ptjr ... ...
Meghalaya .... ... ...
MizortKD ....
Nagaldixi ...
Oriss« 50477 18/^6 6J59:>:s 73.24
Punjab ... ...
Rajasthan ... ...
Sikkiiii ...
Tamil Nadu ...
Tripura ...
Uttar pradfi'sh
West Bet^al • • •
A & N Islands ... ...
Chsndi sarh • • » ... ...
D £ N Kavei* • • • ... ... ...
i>«n«in A Diu • • • ... ... ...
Delhi ■ • • ... ...
Lakshadweep • • * ... ... ...
Pondicherry 783 48 .B31 94.22
INDIA 71515 2Utt3 92*?9i5 76.90
S3
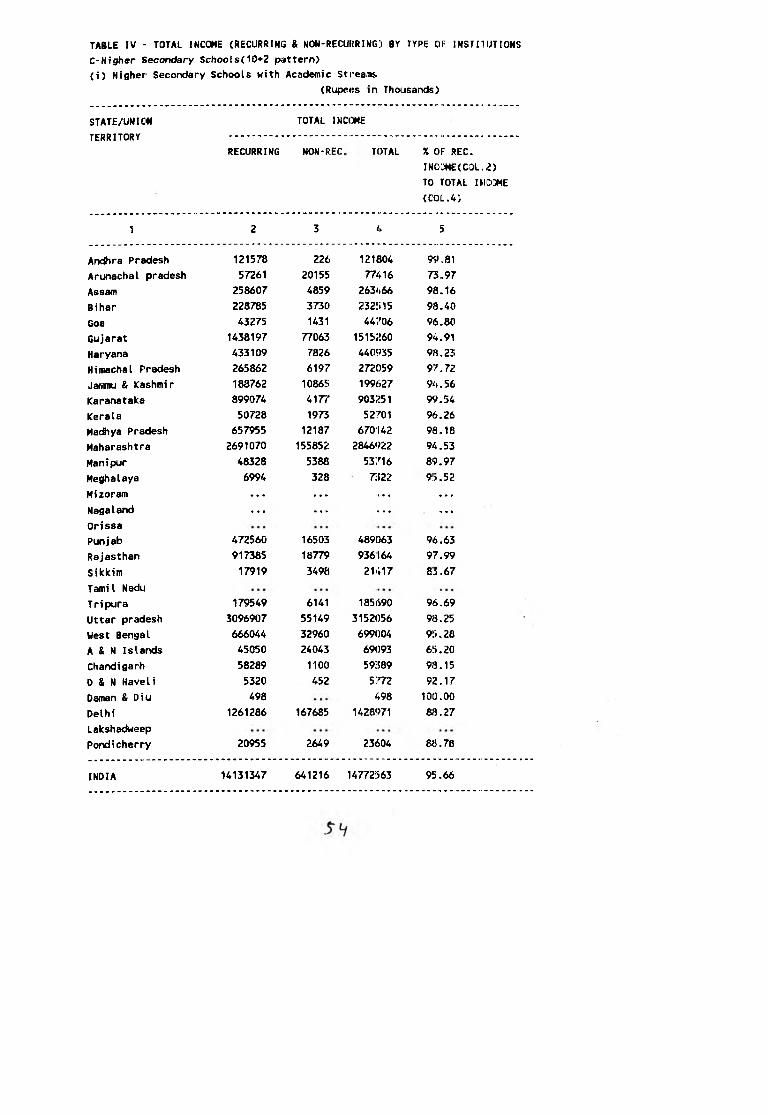
(i) Higher Secondary Schools with Academic Streanfis
(Rupees in Thousands)
TABLE IV - TOTAL INCOME (RECURRING & NON-RECUKRING;i BY TYPE OF INSTIliJTIONS
C-Higher Secondary Schools(10+2 pattern)
STATE/UNION
TERRITORY
TOTAL INCOME
RECURRING NON-REC, TOTAL % OF REC.
INCOME(COL.,2)
TO TOTAL IMCiDME
(COL.4)
1 2 3 4 5
Andhra Pradesh 121578 226 121804 99,81
ArLTiachal pradesh 57261 20155 77416 73.97
Assam 258607 4859 263466 98.16
Bihar 228785 3730 232515 98.40
Goa 43275 1431 44706 96.80
Gujarat 1438197 77063 1515260 94.91
Haryana 433109 7826 440935 98,23
Himachal Pradesh 265862 6197 272059 97,72
Jarmiu & Kashmir 188762 10865 199627 94.56
Karanataka 899074 4177 903251 99.54
Kerala 50728 1973 52701 96.26
Madhya Pradesh 657955 12187 670142 98.18
Maharashtra 2691070 155852 2846922 94,53
Manipur 48328 5388 53716 89.97
Meghalaya 6994 328 71522 9!:i.52
Mizoram . . . . . . . ... . . .
Nagaland . . . . . . . . . . . .
Orissa
Punjab 472560 16503 489063 96.63
Rajasthan 917385 18779 936164 97.99
Sikkim 17919 3498 21417 8.5,67
TamiI Nadu
Tripura 179549 6141 185690 96.69
Uttar pradesh 3096907 55149 3152056 98.25
West Bengal 666044 32960 699004 95.28
A & N Islands 45050 24043 69093 65,20
Chandigarh 58289 1100 59389 98,15
D & N Haveli 5320 452 5772 92.17
Danan & Diu 498 498 100.00
Delhi 1261286 167685 1428971 88.27
Lakshadweep
Pondicherry 20955 2649 23604 88.78
INDIA 14131347 641216 147721563 95.66
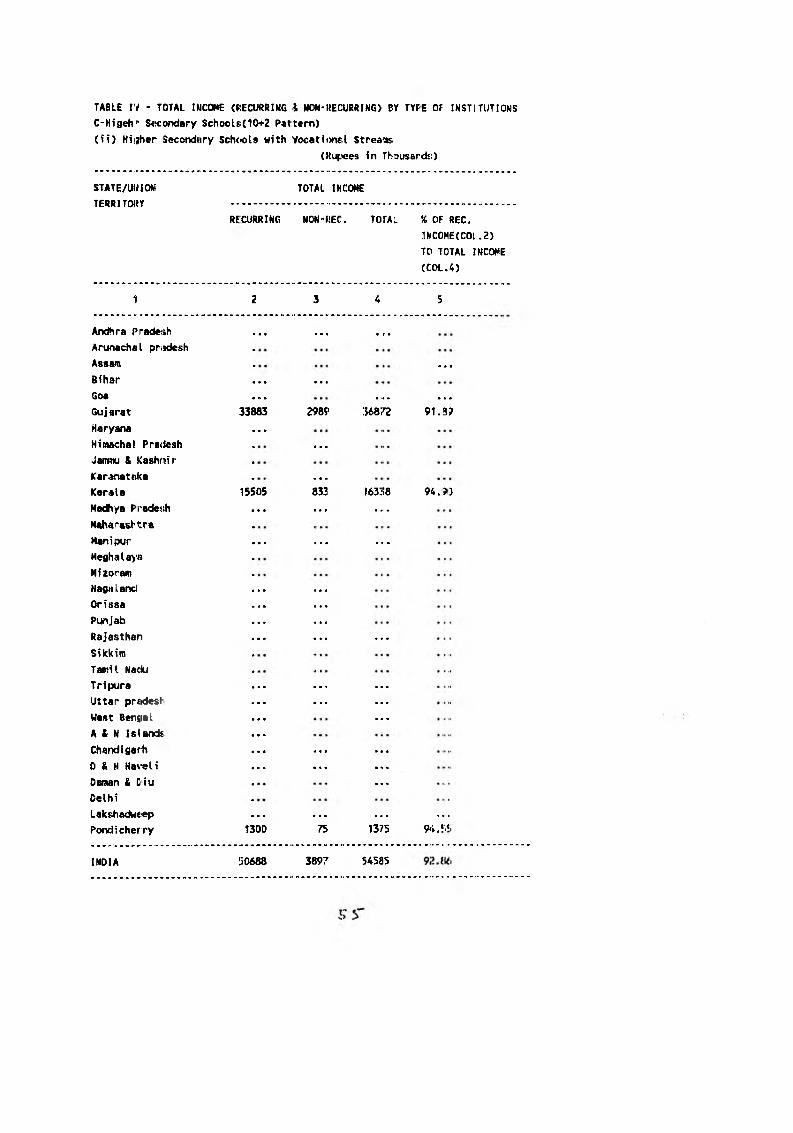
TABLE IV - TOTAL IHCOWE (RECURRING I NOM’IIECURRIMG) Br TYPE Of INSTITUTIOI^IS
C-HigehP Siicondary $chool&(10+2 Pat tern)
(ii) Hiijher Seconcbtry Sch<>ols with Vocatiwal Streains
(Ki tees in ThDUsards:)
STATE/UWIOW
TERRITOHy
TOTAL INCOME
RECURRING NON-HEC. total % Of REC.
ll«COME(COl.2)
TO TOTAL INCOME
fCOL.4)
1 3 4 5
Andhra Pradeish ... ... ...Arunachiil prudesh
Assain ...
Bihar ... . <.
Goa ... .... ...
Gujarat 33883 2989 : m n 91.3?
Haryana ...
Himachal Pra<lesh ...Jamnu & Kashmir
ICaranatiiIca ...
Kerala 15505 a32 163:;a 94.?)
Hadliya F radesh ... ... ....
Mahara^tra
Manipur ... ... ...
Meghalaya
Mizoram
Nagaland ... ...Orissa ... ...
Punjab ... ...Rajasthan ... ... ...
Sikkim
Tamil Nacki
Tripura ... ... ...
Uttar pr<tdesf<i • • • ... ...
West Beniial ... ...
A & N Islands ...
Chandigarh ... ... ...0 & H Haveli ... ... • ••
Daman & Diu ...
Delhi
Lakshadwe«p ... ... ... ...
Pondicherry 1300 75 1375 94.!i*.
INDIA 50688 3897 54585

TABLE IV - TOTAL INCOME (RECURRING & MON-RECURRING) SY TYPE OF INSTITUTIONS
C-Higehr Secondary Schools(1(H-2 pattern)
(iii) Higehr Secondary Schools with Vocational and Academic Streams
(Rupees in Thousands)
STATE/UNION
TERRITORY
TOTAL INCOME
RECURRING NON-REC. TOTAL % OF REC.
INCOME(COL.2)
TO TOTAL INCOME
(C0L.4)
1 2 3 4 5
Andhra Pradesh .. • .». ... • » c
Aruiachal pradesh ... ...
Assam ... ... ...
Bihar ... ... ...
Goa ...
Gujarat 150287 13606 16:5893 91.70
Haryana ... ... ...
Himachal Pradesh 21123 131 21254 9i?.38
Janmu & Kashmir
Karanataka
Kerala —
Madhya Pradesh
Maharashtra ...
Manipur ... ... ... ...
Meghalaya ... ... ...
Mizoram ... ...
Nagaland ... ...
Orissa ...
Punjab 222302 .S817 229119 97.02
Rajasthan ... ...
Sikkim
Tamil Nadu 2335476 69265 2404741 97.12
Tripura ... ...
Uttar pradesh ... ... ...
West Bengal ... ...
A & N Islands 1860 95 1955 95.14
Chandigarh
D & N Haveli ...
Daman & Diu
Delhi 93864 505 94369 99.46
Lakshadweep ...
Pondicherry 14859 2878 17737 8J.77
INDIA 2839771 93297 2933068 96,82
3 %

(Rupee!) in Vhousands)
TA8LE JV • TOTAL IMCOHE (RECURRINU & NOM-RECURiUNG) BY TYPE 3F INSTITUTIOhS
Total C <i to fit) (10+2 pattern)
STATE AIN IOM
TERRITORY
TOTAL INCatE
RECURRING HON-Rl'IC. 10 fM X or REC.
lN(:0Me(ClDL.2)
TO TOTAL INCOME
(:C01.4)
1 2 3 4 5
Ancflira Pradesh 121578 226 12130i 99.81
Arunachal pradesh 57261 20155 7741(S 73.97
Assam 258607 48!i9 263<;6<S 98.16
Bihar 228785 37210 232!) 1!) 98.40
Goa 43275 14J1 4470<> 96.80
Gujarat: 1622367 93658 171602!i 94. S4
Haryan«i 433109 7826 44093!! 98.>3
Himachal Pr^tdesh 286985 6328 :?933;i i 97.IJ4
Jamu I Kashmir 188762 10865 199627 94.1)6
Karanataka B99074 4177 9032:51 99,!»4
Kerala 66233 2806 69C39 95 ,94
Hadhya Pradesh 657955 12187 670142 98 , ‘18Maharashtra 2691070 155852 26146922 94,fi3
Manipur 48328 53a5 53716 »9.97
Meghalaya 6994 32a 7S22 <>5.52
Mizoram . . . • . .
Nagaland . . . . . .
Orfssa . . .
Punjab 694862 23320 718132 96.75
Rajasthan 917385 1877<) 9361(S4 97.99
Sikkim 17919 349{i 21417 €3.67
Tamil Nadu 2335476 6926!i 2404741 97.12
Tripura 179549 6141 1U56'?0 96. S9
Uttar pradesh 3096907 55149 31I520I56 98.
West Bef)(}al 666044 3296C 6'?90()4 95.25
A ft N l£;l[and» 46910 2413£ 71048 66. OS
Chandig&rh 58289 1100 •.j93«9 98. r.i
0 ft N Heveli 5320 452 571'2 92.
Daman ft Diu 498 . • . 498 10i}.00
Delhi 1555150 168190 15JI3340 8i3.9<>
laksihadwctep . . . . . . . . .
Pondicherry 37114 5602 42716 8iUl9
INDIA 17021806 738410 17760216 9ii.(U
5 7

(Rupees in Thousandsi)
TABLE IV - TOTAL INCOME (RECURRING & NON-RECURRING) BY TYPE OF INSTITUTIONS
D-Higher Secondary Schools(Ol.d Pattern)
STATE/UNION
TERRITORY
TOTAL INCOME
RECURRING NON-REC. TOTAL % OF ftEC.
IINCOME(COL.2)
TO TOTAL [NCOME
(COL.4)
1 2 3 4
Andhra Pradesh , . ,
Arunachal pradesh
Assam
Bihar
Goa
Gujarat ...Haryana ...Himachal Pradesh
Jammu & Kashmir
Karanataka
Kerala
Hadhya Pradesh
Maharashtra ...Hanipur ...Meghalaya ...Mizoram ...Nagaland ...Orissa
Punjab
Rajasthan 1223 1223 100.00
Sikkim ...Tamil Nadu
Tripura ...Uttar pradesh ...West Bengal
A & N Islands
Chandigarh
D & N Haveli
Daman & Diu
Delhi
Lakshadweep ...Pondicherry ...
INDIA 1223 1223 100.00

TABLE IV - TOTAL INCOME {RECURRING i4 NON-RECURiUHG) BY TYPE OF INSTITUTIONS
E-High/Post Basic Schools
(fiupeeu in 'housands)
STATE/UNION
TERR 1 TORY
TOTAL INCOHI:
RECURRING NON-fiEC. TOTAL % 0|: REC.
INCOME(COL.2)
TO TOTAL INCOME
a m , . 4)
1 2 3 4 *,
Andhra Pradesh 2557'652 28679 2586331 98.89
Arunachal pradesh 50S31 22020 72851 69.77
Assam 378424 11404 389328 97.07
Bihar 1577926 19206 1597132 98.80
Goa 234775 4172 238947 98.25
Gujarat 1029818 49926 1079744 95.38
Haryana 1400913 3740 UD4653 99.73
Himachal Pradesh 472903 10372 '♦.5327> 97.85
Jammu & Kashmir W T m 32956 iS045;J 45.48
Karanatak£j 955'?98 156008 111200(5 85.97
Kerala 2509373 23590 21>:5296:5 99.37
Madhya Pradesh 3041363 52802 ;j!>7<>6!) 85.24
Maharashtra 4548704 281938 4{0064;*. ?4.16
Manipur 156111 10097 1<i620« 93.93
Meghalaya 70339 8397 78736 39.34
Mizoran 73447 6854 «I0301 91.46
Nagaland 141Ji44 ■41544 100.00
Orissa 772485 19606 7’?'2091 97.52
Punjab 1458978 35446 1494424 97.63
Rajasthan 1029243 24742 1C 53985 97.65
Sikkim 53756 10492 64248 {13.67
Tamil Nadu 956161 29394 985555 97.02
Tripura 137572 4800 142372 S'6.63
Uttar pradush 835769 14991 850760 98.24
West Bengal 1292043 66761 1358804 95.09
A & N Islands. 19852 11750 31602 62.82
Chandigarh 65802 1911 57713 97,18
D & N Haveli 1971 140 2111 93.37
Daman & Diu 104£»4 • • . l')444 100.00Delhi 220831 4898 22I56W 97.85
Lakshadweep 70.30 957 IS037 88.09
Pondicherry 50616 12301 <>:>9T7 80.45
INDIA 23403690 960350 243<>^)040 96.0<>
5^

TABLE IV - TOTAL INCOME (RECURRING & NON-RECURRJNG) BY TYPE OF IMSTIfLTIONS
F“Middle/Senior Basic Schools
(Rupc«s ir. Thousands)
STATE/UNION
TERRITORY
TOTAL INCOME
RECURRING NON-REC TOTAL % OF REC.
IMCOME(COL.2)
TO TOTAL !«COME
(COL.4)
1 2 3 4 5
Andhra Pradesh 1266997 2354 1269351 519.81
Arunachal pradesh 82891 45207 128098 64.71
Assam 468015 28709 496724 94.22
Bihar 2567792 12477 2580269 ‘>9.52
Goa 15306 488 15794 96.91
Gujarat 3426393 318177 3745070 91.50
Haryana 310351 131 310482 '?9.96
Himachal Pradesh 241701 3860 245561 98.43
Jammu & Kashmir 218661 10855 229516 95.27
Karanataka 2370806 63486 24:54292 97.39
Kerala 903363 12185 91554B 98-67
Madhya Pradesh 871646 17329 838975 98.05
Maharashtra 4273901 29808 4303709 99.31
Manipur 158455 3234 161689 98.00
Meghalaya 43025 14384 57409 74.94
Mizoram 108708 5422 114130 95.25
Nagaland 95506 37375 132881 71.87
Orissa 600177 8868 609045 98.54
Punjab 304955 7657 312612 97.55
Rajasthan 1468131 23907 1492038 98.40
Siickim 388371 6445 J94816 98.37
Tamil Nadu 1090165 4574 1094739 99.58
Tripura 118992 4041 ‘123033 96.72
Uttar pradesh 1111498 64153 1175651 94.54
West Bengal 359303 12431 371734 96.66
A & N Islands 29250 14200 43450 67,32
Chandigarh 8263 2363 10626 77.76
0 & N Haveli 11073 3273 14346 77,19
Daman & Diu 8124 . . . 8124 100.00
Delhi 166236 3998 170234 97.65
Lakshadweep 2585 542 3127 82.67
Pondicherry 56877 9652 66529 85,49
INDIA 23148017 771585 23919602 96.77
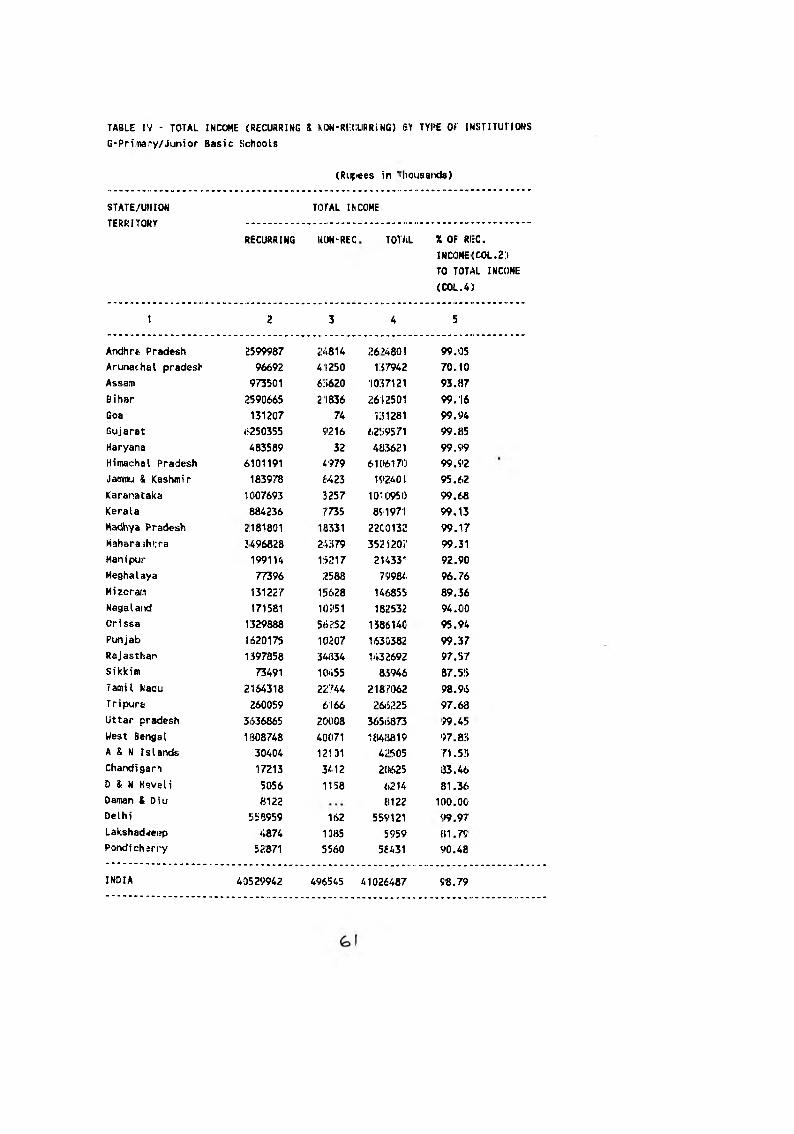
TABLE IV - TOTAL INCOME (RECURRING & KON-RliCURRlNG) UY TYPE Of INSTITUVIONS
G-Prinary/Junior Basic Schools
(Riif«es In 'ihousarKls)
STATE/UMION TOTAL IhCOME
TCDD T YOI>V1cKKi3UKY
RECURRING NON-REC TOT/iL X OF RI:C.
i n c o m e : COL. 2:»
TO TOTAL INCOME
(COL.4)
1 2 3 4 5
Andhrs Pradesh 2599987 24814 26>4801 99.05
Arunachal pradesh 96692 41250 137942 70.10
Assam 973501 6:5620 1037121 93.87
Bihar 2590665 21836 2612501 99.16
Goa 131207 74 i:51281 99.94
Gujarat 6250355 9216 62*.;9571 99.85
Haryana 483589 32 4H3621 99.W
Himachal Pradesh 6101191 4979 61(16170 99.92
Jammu & Kashmir 183978 £423 192401 95.62
Karanataka t007693 3257 1010950 99.618
Kerala 884236 7735 891971 99.13
HawJhya Pradesh 2.181801 13331 22C0132 99.17
Mahara:jhi:ra 3496828 24379 3521207 99.31
Manipur 199114 15217 214331 92.90
Meghalaya 77396 2588 79984. 96.76
Mizoraji 131227 1!){.28 146855 89.36
Nagalartd 171581 io;>5i 182532; 94.00
Orissa 1329888 56J52 138614C 95.94
Punjab 1620175 10:207 1.S3D382 99.37
Rajasthan 1397858 34iJ34 1432692 97.57
Sikkim 73491 10^i55 8.5946 87.55
Tamil Madu 2164318 22‘.%4 2187062 98.96
Tripure ,260059 6-166 ;>6(S225 97.68
Uttar pradesh 3636865 20008 365(>873 ?9.4!»
West Bengal 1I308748 40071 1«4ii819 97.83
A & N Islands 30404 12101 4:»505 71.55
Chandigarh 17213 3412 20625 1J3.46
D & N Haveli 5056 1158 6214 81.36
Daman & Diu 8122 «122 100.00
Delhi 558959 162 559121 «>9.9T
Lakshadirfetjp 4874 1085 5959 81.79
Pondicharry 52871 5560 5£431 90.48
INDIA 40529942 496545 41026487 98.79

TABLE IV ' TOTAL INCOME (RECURRING & NON-RECURRING) BY TYPE Of lUSTlTUTIONS
H-Pre-Primary/Pre-BAsic Schools
STATE/UNION
TERRITORY
TOTAL INCOME
RECURRING MON-REC. TOTAL X OF Ri:c.
INCOMES COL.2)
TO TOT/iL INCOME
(COL.4:
1 2 3 4 5
Andhra Pradesh 974 9 933 99.08
Arunachal pradesh 8932 115 9047 98.73
Assam 8 2 ^ 30J! 8574 96.48
Bihar 177 177 100.00
Goa
Gujarat 35665 421 360S6 98.83
Haryana 854 854 100,00
Himachal Pradesh 697 19 716 97.35
Jamnu & Kashmir
Karanataka 33803 33803 100.00
Kerala 3944 7C 4014 98.26
Hadhya Pradesh 3987 10£ 4093 97.41
Maharashtra 23708 450 24158 98.14
Manipur ^29 m 100.00
Meghalaya 1315 793 2108 62.38
Mizoram
Nagaland . . . . . .
Orissa
Punj ab 259 259 100.00
Rajasthan 4912 33 4945 99.33
Sikkim 6200 1300 7500 82.67
Tamil Nadu 1179 15 1194 98.74
Tripura 31574 500 32074 98.44
Uttar pradesh 3361 32 3393 99.06
West Bengal 7259 184 7443 97.53
A & N Islands 479 1200 1679 28.53
Chandi garh . . .
D & N Haveli
Daman & Diu 100 100 100.00
Delhi 9067 9067 100.00
Lakshadweep 3138 542 3680 85.27
Pondicherry 1973 213 2186 90.26
INDIA 191958 6304 198262 96.82
G 2.

TABLE IV - TOTAL INCOME (RECURRING 8. WON-RECU«RIMG) BY TYPE OF IMSTITUnONS
Total Elementary Education (F,G,H)
(Rjseiss in Thousands)
STATE/UNION TOTAL lUCOMIE
TCDDITADVTcRRlTuRT
RECURRING H0N*R1:C. TOTAL X 01= REC.
lNCt)M£(C0L.2)
TO TOTAL INCOME
(COL.4)
1 2 3 4 5
Andhra Pradesh 3867958 27177 3«t9513!> 99.30
Arunachal pradesh 168515 66572 2:7508^ 68.53
Assam U49788 52631 1*4241'? 93.99
Bihar 5158634 34313 5192947 99.34
Goa 146513 562 1470i”.i 99.62
Gujarat 9712913 327814 10C40727 96.74
Haryana 794794 163 7949‘.;7 99.98
Himachal Pradesh 4343589 B858 6352447 99.86
Jammu & Kashmir 402639 1P278 421917 95.43
Karaniitaka 3412302 6f»743 347904*. 98.08
Kerala \791S43 1V990 1811511 98.90
Madhya Pradesh 3057434 35766 30932CC 98.34
Mahartishtra 7794437 5.i637 78«.9074 99.30
Manipur 357698 113451 376149 95.09
Meghalaya 121736 17765 159501 87.127
Mizorsm 239935 21050 260985 91.93
Nagalend 267087 48326 315413 84.68
OrissE 1930065 6;M20 19?5185 96.74
Punjab 1925389 17864 1943253 99.08
Rajasthan ;2870901 5($774 29;i9675 97.99
Siickirr 468062 ni200 4<k)262 96.26
Tamil Nadu 3255662 2/'333 ]12(J2995 99.17
Tripura 410625 10707 4J!133i2 97.4^6
Uttar pradesh 4751724 84193 48'l59ir 98.2!6
West Benjgal 2175310 52686 222:7996 97.64
A & N Islands 60133 2?'501 «:7634 68.62
Chandigarh 25476 5775 21251 81.52
D & N Haveli 16129 4431 20560 78.45
Daman & [)iu 16346 <• • • 16346 100.00Delhi 734262 4160 738422 99.44
Lakshadweep 10597 2169 1276<> 83.01
Pondicherry 111721 ir><i25 127146 87.87
INDIA 63869917 1274434 65144351 98.04
63

TABLE IV - TOTAL INCOME (RECURRING & NON-RECURRING) BY TYPE OF INSTITUTIONS
I-Institutions Imparting Instructions in Oiplorua Certificate
Courses of School Level(Below Hatric Level)
(a) Agriculture & Forestry
(Rupiees in Thousands)
STATE/UNION TOTAL n\cmeItKKliUKT
RECURRING NON-REC. TOTAL % OF REC.
t«COME(COL.2)
TO TOTAL INCOME
(COL.4)
1 2 4
Andhra Pradesh • • • • • • • « •Arunachal pradesh 1712 49 1761 97.22
Assam ... ...Bihar ...Goa ...Gujarat 8008 268 8276 96.76
Haryana ...Himachal Pradesh ... ...Jammu & Kashmir ...Karanataka 6574 6574 100.00
Kerala
Madhya Pradesh
Maharashtra 1893 20536 90.78
Manipur ... ...Meghalaya ... ... ...Mizoram ...Nagaland ...Orissa ... ... ...Punjab
Rajasthan 330 ... 330 100.00
Sikkim
Tamil Nadu 1477 1477 100,00
Tripura ... ... ...Uttar pradesh ... ... ...West Bengal ... ...A & N Islands ...Chandigarh ....D & N Haveli
Daman & Diu ...Delhi
Lakshadweep • • • ... ...Pondicherry --- ... ...
INDIA 36744 2210 38954 94.33
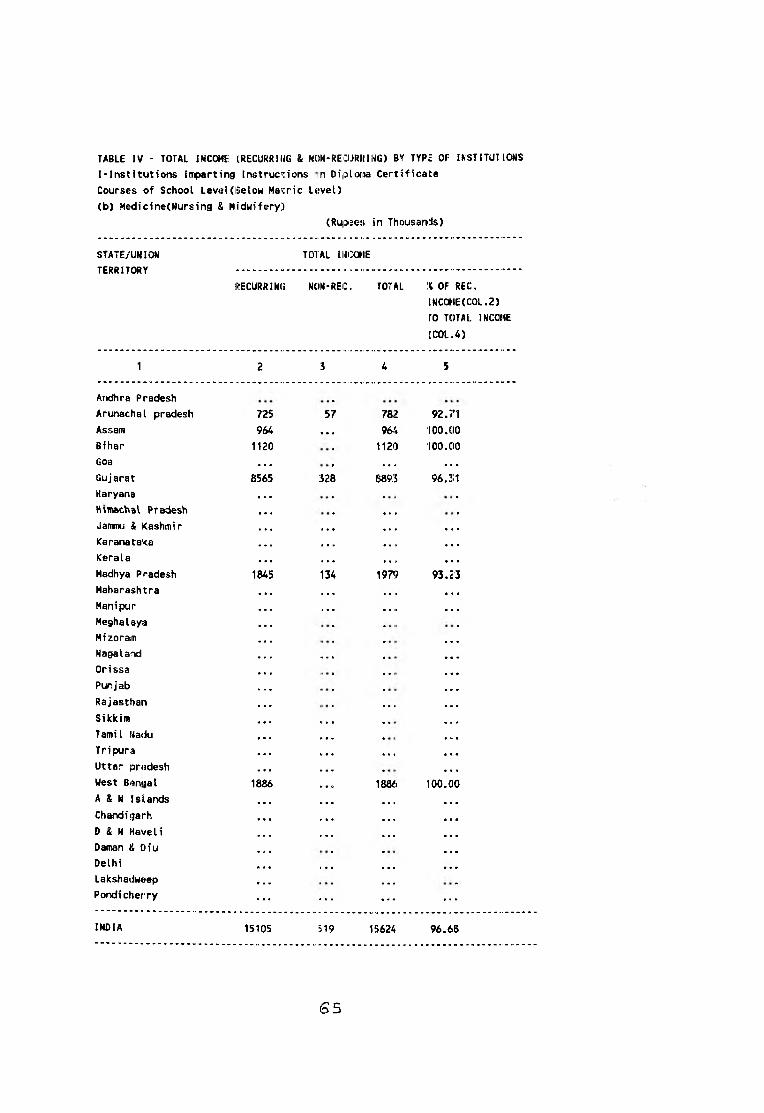
TABLE IV - TOTAL INCOME tRECURRIHG & K«ON-RECiJRRIl^G) BY TYPE OF INSTITUTIONS
I-Institutions Iirparting Instruc'tions In DipLofua Certificate
Courses of School Level(ISelow Ma^cric Level)
(b) Medicine(Nursing & Midwifery)
(Ru|>2gs in Thousands)
STATE/UNION
TERRITORY
TOTAL IHCOME
RECURRING NOM-REC. TOTAL % OF REC.
INC0HE(C0L.2)
TO TOTAL IMCOHE
(COL-4)
1 2 3 4 5
Arjdhra Pradesh
Arunachal pradesh 725 57 782 92.71
Assam 964 « • • 96 i 100.00
Bihar 1120 1120 100.00
Goa • . • . • . • . •
Gujarat 8565 328 8893 96.211
Haryana
H>n»cV^aV Pradesh • « •
Jammu & Kashmir • • • . » . • ■.
Karanataka • • • • . . • . •
Kerala • • • » • • • « »
Madhya Pradesh 1845 134 197<> 93.23
Maharashtra • • • • • » • « •
Manipur . • • •»<> . . .
Meghalaya
Mizorain . . .
Nagaland ^ • • • • • . .
Orissa « • • • •
Punjab . . .
Rajasthan • • •> •«..
Sikkim n • • • • • . •
Tamil Nadu » • • . . •
Tripura u • . • • < • . •
Uttar pradesh « • • • • •
West B«»n«}al 1886 » • e 188<. 100.00
A & N Islands « • • • • • • • •
Chandigarh * • • • • . • • >
D & N Haveli 1. • • • • ■ • • •
Daman & Diu • « •
Delhi . • • • • ■ • . •
Lakshadweep • ■ •
Pondicherry . . . . . . . . .
INDIA 15105 S19 15624 96.6S
6 5

TABLE IV - TOTAL INCOHE (RECURRING & NON-REC;URRI»/!G) BY TYPE OF INSTHTUTIODIS
I-Institutions Imparting Instructions in Diploma Certificate
Courses of School LeveUBelow Matric Level)
<c) Teacher Training
(Ru|)ees in Thousands)
STATE/UNION
TERRITORY
TOTAL INCOME
RECURRING NON-REC. TOTAL %. OF REC.
INCOME(COL.2)
TO TOTAL INCOME
(COL.4)
1 Z 3 4 5
Andhra Pradesh . . . . . . . . . . . .
Arunachal pradesh
Assam . . . . . .
Bihar
Goa . . .
Gujarat 39776 4136 43912 90.58
Haryana . . . . . .
Himachal Pradesh . . .
Jamnu & Kashmir
Karanataka 106237 527 106764 99.51
Kerala . . .
Madhya Pradesh
Maharashtra » % «
Manipur . . .
Meghalaya 5197 153 5350 97,14
Mizoram
Nagaland 6010 _____ 6010 100,00
Orissa
Punjab
Rajasthan
Sikkim 1820 3380 5200 35.00
Tamil Nadu
Tripura 3361 10 3371 99.70
Uttar pradesh 72829 132.S 74155 98.21
West Bengal
A & N Islands
Chandigarh . . .
D & N Haveli
Daman & Diu
Delhi
Lakshadweep . . .
Pondicherry . . . . . . . . .
INDIA 235230 9532 244762 96,11
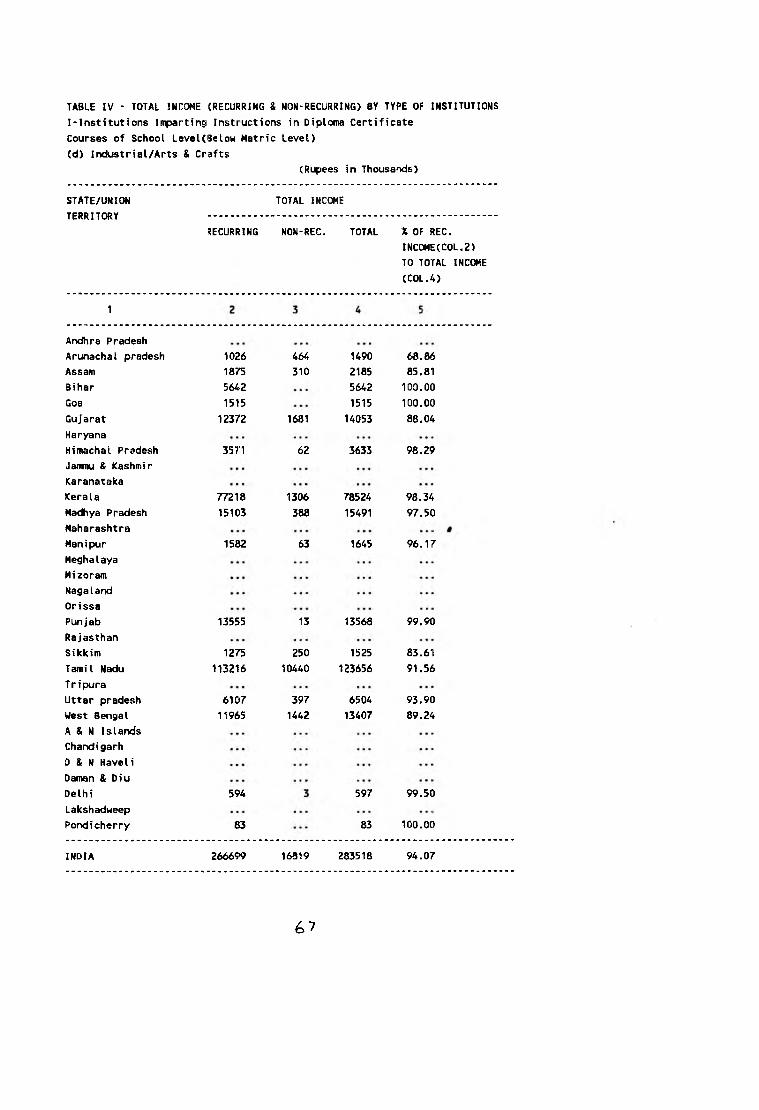
TABLE IV - TOTAL INCOME (RECURRING & NON-RECURRING) BY TYPE OF INSTITUTIONS
I-lnstitutions Imparting Instructions in Diplona Certificate
Courses of School Level(!3elow Matric Level)
(d) Industrial/Arts & Crafts
(Rupees in Thousands)
STATE/UNION
TERRITORY
RECURRING
TOTAL INCOME
NON-REC. TOTAL % OF REC.
INCOME(COL.2)
TO TOTAL INCOME
(COL.4)
1
Andhra Pradesh
Arunachal pradesh
Assam
Bihar
Goa
Gujarat
Haryana
Himachal Pradesh
Jammu & Kashmir
Karanataka
Kerala
Madhya Pradesh
Maharashtra
Manipur
Meghalaya
Mizoram
Nagaland
Orissa
Punjab
Rajasthan
Sikkim
Tamil Nadu
Tripura
Uttar pradesh
West Bengal
A & N Islands
Chandigarh
0 & N Haveli
Daman & Diu
Delhi
Lakshadweep
Pondicherry
1026
1875
5642
1515
12372
3571
77218
15103
1582
13555
1275
113216
6107
11965
594
83
266699
464
310
1681
62
1306
388
63
13
250
10440
397
1442
1490
2185
5642
1515
14053
3633
78524
15491
1645
13568
1525
123656
6504
13407
68.8685.81
100.00100.0088.04
98.29
98.34
97.50
96.17
99.90
83.61
91.56
93.90
89.24
597 99.50
83 100.00
INDIA 16819 283518 94.07
67
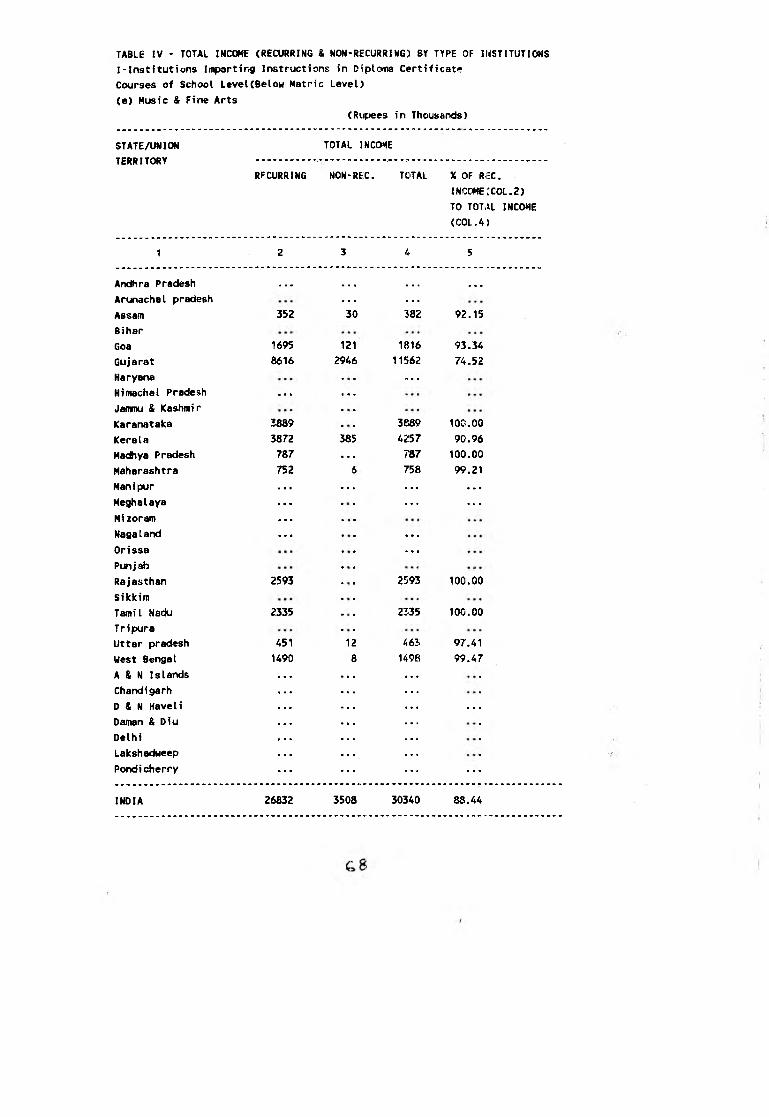
TABLE IV - TOTAL INCOME (RECURRING & NON-RECURRIXG) BY TYPE OF INSTITUTIONS
I-Instftutions Imparting Instructions in Diplotia Certificate
Courses of School Level(Below Matn'c Level)
<e) Music & Fine Arts
(Rupees in Thousands)
STATE/UNION TOTAL INCOME
TC&D r T/^DVTcRKlTORT
RFCURRING NON-REC. TOTAL X OF RJEC,
income:COL.2)
TO T O L a INCOME
(COL.4)
1 2 3 4 5
Andhra Pradesh • mm • • • a ■ « . . .
Arunachal pradesh * - • . . .
Assam 352 30 382 92.15
Bihar
Goa 1695 121 1816 93.34
Gujarat 8616 2946 11562 74.52
Haryana . . .
Himachal Pradesh • • > . . .
Janmi & Kashmir
Karanataka 2889 3889 100.00
Kerala 3872 385 4257 90.96
Hadhya Pradesh 787 « « • 787 100.00
Maharashtra 752 758 99.21
Manipur . . . . . . . . . . . .
Meghalaya . . . . . . . . .
Mizoram . . .
Nagaland . . . . . .
Orissa . . .
Punj afo
Rajasthan 2593 2593 100.00
Sikkim
TamiI Nadu 2335 2335 100.00
Tripura
Uttar pradesh A51 12 463 97.41
West Bengal 1490 8 1498 99.47
A & N Islands
Chandigarh « • •
D & N Haveli • ■ « . . .
Daman & Diu • • • • • •
Delhi
Lakshadweep • • •
Pondicherry • « • . . .
INDIA 26832 3508 30340 88.44

TABLE IV - TOTAL INCOME (RECURRING & NON-RECURRING) BY TYPE OF INSTITUTIONS
I-Institutions Imparting Instructions in Diploma Certificate
Courses of School LeveUBelow Matric Level)
(f) For the Handicapped
(Rupees in Thousands)
STATE/UNION TOTAL INCOME
TERRITORY ..........................................................
RECURRING NON-REC. TOTAL % OF REC.
INCOME(COL.2)
TO TOTAL INCOME
(COL.4)
1 2 3 4 5
Andhra Pradesh 10256 675 10931 93.82
Arunachal pradesh
Assam 753 112 865 87.05
Bihar 2551 ... 2551 100.00
Goa
Gujarat 32413 5799 38212 84.82
Haryana 4485 306 4791 93.61
Himachal Pradesh 831 90 921 90.23
Jacnmu & Kashmir 297 ... 297 100.00
Karanataka 5705 120 5825 97.94
Kerala 11400 631 12031 94.76
Madhya Pradesh 1620 6 1626 99.63
Maharashtra 22055 2262 24317 90.70
Manipur 1376 224 1600 86.00
Meghalaya
Mizoram
Nagaland
Orissa
Punjab 2942 53 2995 98.23
Rajasthan 4367 168 4535 96.30
Sikkim
Tamil Nadu 15823 228 16051 98.58
Tripura 1774 56 1830 96.94
Uttar pradesh 3524 17 3541 99.52
West Bengal 3873 239 4112 94.19
A & N Islands
Chandigarh 828 ... 828 100.00
D & N Haveli
Daman & Diu
Delhi 9296 30 9326 99.68
Lakshadweep
Pondicherry 1156 40 1196 96.66
INDIA 137325 11056 148381 92.55

TABLE IV - TOTAL INCOKE (RECURRING & NON-RECURRING) BY TYPE OF INSTITUTIONS
I-Institutions Iipparting Instructions in Diplana Certificate
Courses of School LeveKBelow Matric Level)
(g) Reformatory/Certified
(Rupees in Thousands)
STATE/UNION
TERRITORY
TOTAL INCOME
RECURRING NOH-REC. TOTAL % OF REC.
INCOME(COL.2)
TO TOT/,1. INCOME
(C0L.4J
1 2 4 5
Andhra Pradesh 6557 *.. t 6557 100.00
Arinachal pradesh ...
Assam 84 84 100.00
Bihar 2178 2178 100.00
Goa
Gujarat 5039 5039 100.00
Haryana ... —
Himachal Pradesh ...
Jaiimu & Kashmir
Karanataka 6861 2059 8920 76.92
Kerala 2293 6 2299 99.74
Madhya Pradesh 1427 1427 100.00
Maharashtra 10673 10673 100.00
Manipur
MeghaVaya
Mizoram • • • —
Nagaland • • •
Orissa
P m j a b 390 390 100.00
Rajasthan
Sikkim
Tamil Nadu 8809 8809 100.00
Tripura ■ ■ ■
Uttar pradesh ...
West Bengal 33 33 100.00
A & N Islands
Chandigarh
0 & N Haveli
Daman & Diu ...
Delhi 1020 1020 100.00
Lakshadweep
Pondicherry ... ... ... ...
INDIA 45364 2065 47429 95.65
70

TABLE IV - TOTAL IMCOKE CRECURRING & NON-RECiJRRIHG) BY TYPE OF INSTITUTIONS
I-Institutions Imparting InstriKtions in Diploma Certificate
Courses of School Level(Below Matric Level)
(h) Oriental Studies
(Rupi*es in Thousands)
STATE/UNION
TERRITORY
TOTAL INCOME
RECURRING NON-REG,. TOTAL % OF REC.
INCOME(COL.2)
TO TOTAL INCOME
(COL.4)
1 2 3 4
Andhra Pradesh 3458 • . . . 3458 100.00
Arunachal pradesh . . .
Assam 6106 194 6300 96.92
Bihar 40763 760 ■ 41523 98.17
Goa
Gujarat 3139 ' 178'' 3317 94.63
Haryana . . . . . .
Himachal Pradesh . . a . . .j.
Jamnu & Kashmir .... . . . . . .
Karanataka 14780 46 14826 9<>.69
Kerala . . . . . . . . • . . . .
Mac^ya Pradesh 3495 16 3511 9^).54
Maharashtra 1474 184 1658 « L 9 0
Manipur 54 54 100.00
Meghalaya • • • • • •
Mizoram • • • « • •
Nagaland « • «
Orissa • • »
Punjab • • • • • «
Rajasthan
Sikkim • ■ •
Tamil Nadu 4315 102 4417 97.69
Tripura 1325 1325 IOC.00
Uttar pradesh 24780 1789 26569 93.27
West Bengal 20006 546 20552 97.34
A & N Islands • • • • • •
Chandigarh • • •
0 & N Haveli • • • • • •
Daman & Diu • • • • • •
Delhi • • • • • •
Lakshadweep • • • • • •
Pondicherry . . . c • •
IMDIA 125695 3815 127510 97.01
7!

TABLE IV - TOTAL INCOME (RECURRING & NON-RECURRING) BY TYPE OF INSTITUTIONS
I-Institutions Imparting Instructions in Diploma Certificate
Courses of School LeveUBelow Metric Level)
(i) Social (Adult) Education
(Rupees in Thousands)
STATE/UNION
TERRITORY
TOTAL INCOME
RECURRING NOI«J-REC. TOTAL % OF REC.
income: (COL. 2)
TO TOTAL INCOME
(COL.f;.)
1 2 ;$ 4 5
Andhra Pradesh 72635 72635 100.00
Arunachal pradesh 3361 3951 7312 45.9^
Assam 4992 420 5412 92.2-i
Bihar
Goa 4300 4300 100.00
Gujarat 48066 48066 100.00
Haryana ... —Himachal Pradesh 6231 6231 100.00
Janinu & Kashmir
Karanataka 48704 48704 100.00
Kerala
Madhya Pradesh 9619 167 9786 98.2S'
Maharashtra 99531 99531 100.00
Manipur 10543 10543 100.ocMeghaIaya 8526 8526 100.ocMi roram 391 391 100.ocNagaland 12431 12431 100.00
Orissa
Punjab 13299 3725 17024 78.12
Rajasthan 82166 82166 100.00
Sikkim 3100 3100 100.00
Tamil Nadu 73524 2 73526 100.00
T r i pura 47675 396 48071 99.18
Uttar pradesh 145932 145932 100.00
Uest Bengal 52235 &S0 53095 98.38
A & N Islands 768 85 853 90.04
Chandigarh 1154 m7 2041 56.54
0 & N Haveli 148 148 100.00
Daman & Diu 236 236 100.00
Delhi 7620 7620 100.00
Lakshadweep 100 260 360 27.78
Pondicherry 876 ... 876 100.00
INDIA 758163 10753 768916 98.60
7 :

TABLE IV - TOTAL INCOME (RECURRING & NON-RECURRING) BY TYPE OF INSTITUTIONS
Institutions Impjarting Instructions n Diploiia Certificate Courses of
School Level (Below Matric Level)
(j) Others
(Rupees in Thousands}
STATE/UNION
TERRITORY
"OTAL INCOME
RECURRING NON-REC. TOTAL X OF REC.
in COME(COL.2)
TO TOTAL INCOME
(COL.4)
1 2 3 4 5
Andhra Pradesh ...
Arunachal pradesh
Assam 3203 138 3341 95.87
Bihar 441 22 463 95.25
Goa •. > ...
Gujarat «• • ...
Haryana • • • ..«
Himachal Pradesh 1699 1699 100.00
JaniDU & Kashmir • •« >. • « % ft
Karanataka 9184-2 5693 97535 S»4.16Kerala • ■ • ... • • •
Madhya Pradesh • • • ... . •«
Maharashtra 7'2 46 118 61.02Manipur 545 148 693 7'8.64Meghalaya •. •
Mizoram • -. • • • ...
Nagaland i46ri • • • U 6 7 1 100.00Orissa • « . • <.« • • • • •
Punjab ...
Rajasthan 89457 168 89625 S*9.81
Sikkim • • * • • • • • , • • ■
Tamil Nadu • • • * m * • • » ■ • •
Tripura >. • . . « » . • . • .
Uttar pradesh ». • . . • • • •
West Bengal 302 . « « 302 100.00A & N Islands m t m • 4 « • • • • • •
Chandigarh • • « • • • > • •
D & N Haveli • • « 148 100.00Daman & Diu . . . ... ... ...
Delhi • • « • • « • « • • • •
Lakshadweep m t m • • « ... > • ■
Pondicherry . . . . ... ... ...
INDIA 2023«0 6215 208595 97.02
*7 3
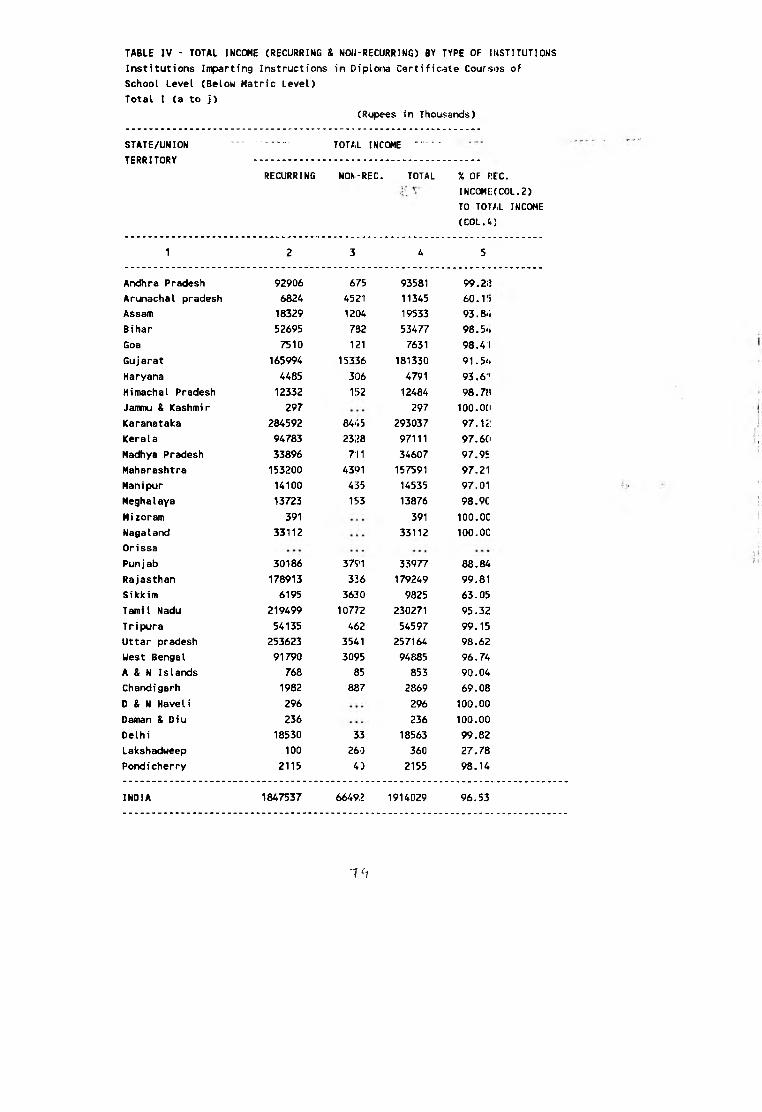
TABLE IV - TOTAL INCOME (RECURRING & NON-RECURRING) BY TYPE OF INSTITUTIONS
Institutions Imparting Instructions in Diplonia Certificate Courses of
School Level (Below Matric Level)
Total I (a to j)
(Rupees in Thousands)
STATE/UNION
TERRITORY
TOTAL INCOME .....
RECURRING NOK-REC. TOTAL % OF RE:C.
inc o m e; (COL. 2)
TO TOTAL INCOME
(C0L.5}
1 2 3 4 5
Andhra Pradesh 92906 675 93581 99.2i3
Arunachal pradesh 6824 4521 11345 60.1')
Assam 18329 1204 19533 93.8<i
Bihar 52695 7S2 53477 98.5-*
Goa 7510 121 7631 98.41
Gujarat 165994 15356 181330 91.5^
Haryana 4485 306 4791 93.6'
Himachal Pradesh 12332 152 12484 98.7{l
Jammu & Kashmir 297 297 100.0(1
Karanataka 284592 8445 293037 97.12:
Kerala 94783 2328 97111 97.6(1
Madhya Pradesh 33896 711 34607 97.95
Maharashtra 153200 4391 157591 97.21
Manipur 14100 435 14535 97.01
Meghalaya 13723 153 13876 98.9C
Mizoram 391 391 100.00
Nagaland 33112 33112 100.00
Orissa
Pun j ab 30186 3791 33977 88.84
Rajasthan 178913 336 179249 99.81
Sikkim 6195 3630 9825 63.05
TamiI Nadu 219499 10772 230271 95.32
Tripura 54135 462 54597 99.15
Uttar pradesh 253623 3541 257164 98.62
West Bengal 91790 3095 94885 96.74
A & N Islands 768 85 853 90.04
Chandigarh 1982 887 2869 69.08
D & N Haveli 296 296 100.00
Daman & Diu 236 236 100.00
Delhi 18530 33 18563 99.82
Lakshadweep 100 26D 360 27.78
Pondicherry 2115 40 2155 98.14
INDIA 1847537 66492 1914029 96.53
1^1
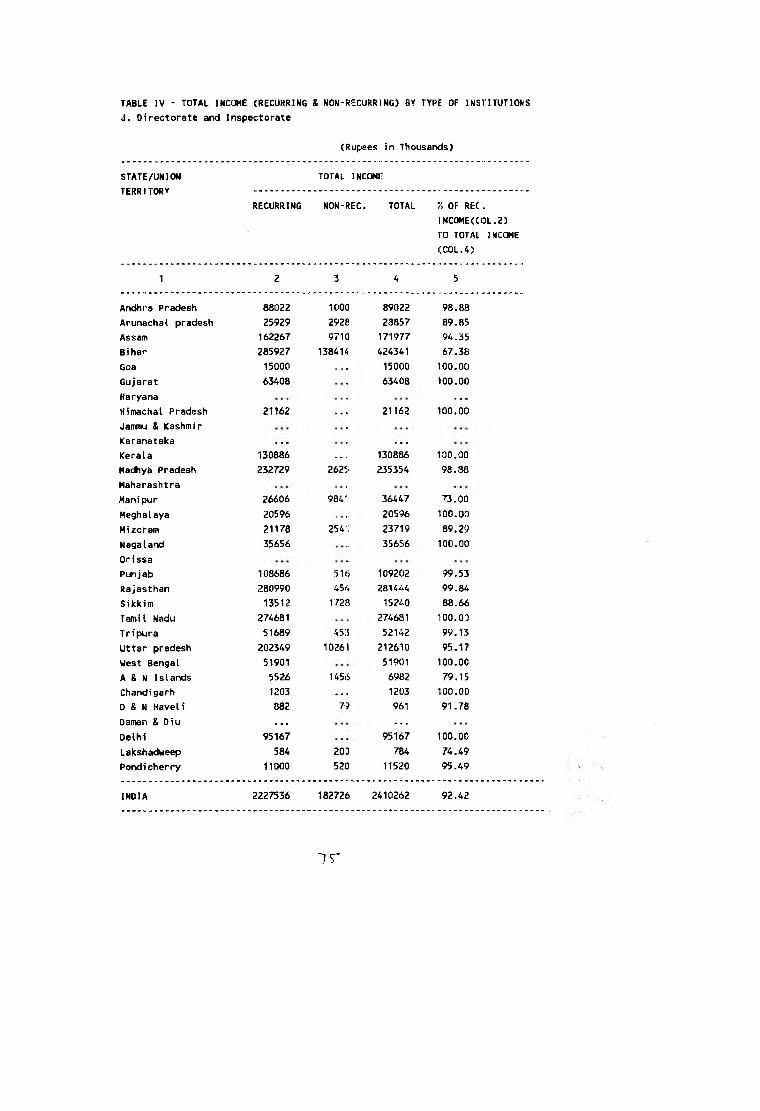
TABLE IV - TOTAL INCOIE (RECURRING & NON-RECURRING) 8Y TYPE OF INSTITUTIOWS
J. Directorate and Inspectorate
(Rupees in Thousands)
STATE/UNION
TERRITORY
TOTAL INCOMi;
RECURRING NON-REC. TOTAL % OF REC .
INCOME(COL.2)
ro TOTAl INCOME
(COL.4)
1 2 3 4 5
Andhra Pradesh 88022 1000 89022 98.88
Arunachal pradesh 25929 2928 28857 89.85
Assam 162267 9710 171977 94.35
Bihar 285927 138414 424341 67.38
Goa 15000 15000 100.00
Gujarat 63408 63408 100.00
Haryana —
Himachal Pradesh 21162 21162 100.00
Jarmu & Kashmir
Karanataka ____ —
Kerala 130886 ____ 130886 100.00
MacSiyS Pradesh 232729 2625 235354 98.88
Maharashtra
Manipur 26606 984' 36447 73.00
Meghalaya 20596 20596 100.00
Mizoram 21178 2541 23719 89.29
Nagaland 35656 35656 100.00
Orissa
Pun j ab 108686 516 109202 99.53
Rajasthan 280990 454 281444 99.84
Sikkim 13512 17215 15240 88.66
Tamil Nadu 274681 274681 100.00
Tripura 51689 45:5 52142 99.13
Uttar pradesh 202349 10261 212610 95.17
West Bengal 51901 51901 100,00
A & N Islands 5526 1456 6982 79.15
Chandigarh 1203 — 1203 100.00
D & N Haveli 882 79 961 91.78
Daman & Diu — — —
Delhi 95167 95167 100.00
Lakshadweep 584 200 784 74.49
Pondicherry 11000 520 11520 95.49
INDIA 2227536 182726 2410262 92.42
i r
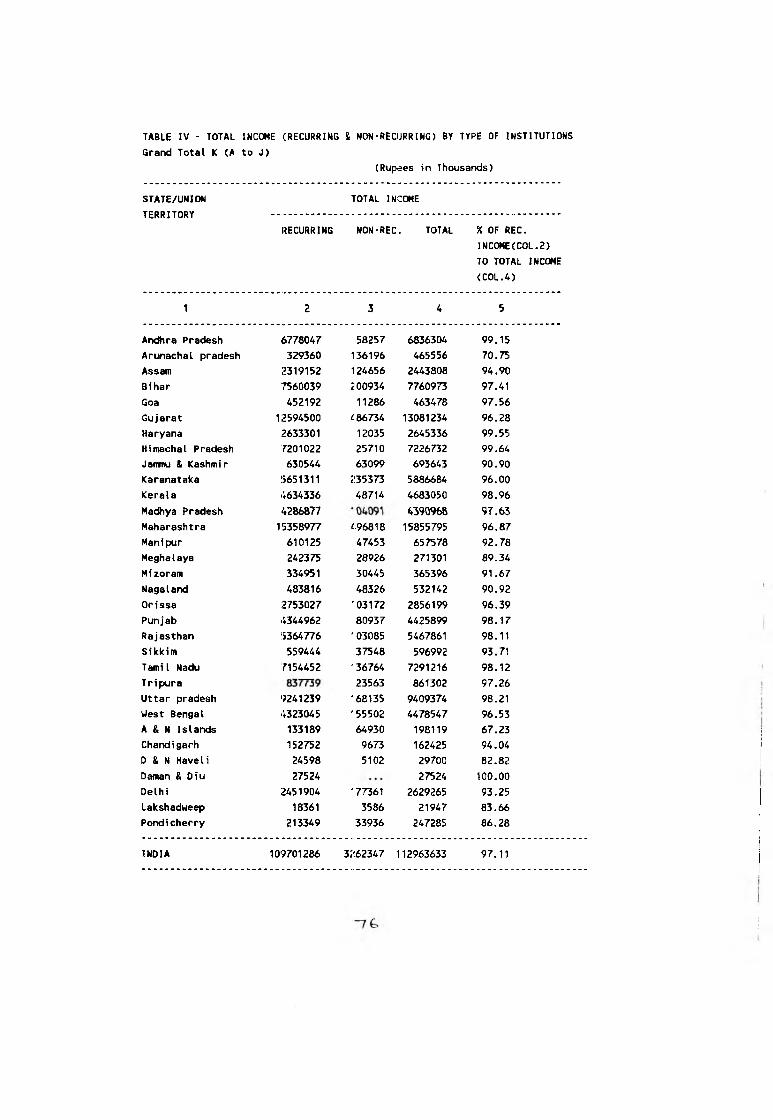
TABLE IV - TOTAL INCOME (RECURRING 4 NON-RECURRING) BY TYPE OF INSTITUTIONS
Grand Total K (A to J)
(Rupees in Thousands)
STATE/UNION TOTAL INCOME
TCDD T TADV1cKKlTORT
RECURRING NON-REC. TOTAL % OF REC.
INC0ME(C0L.2)
TO TOTAL INCOME
<C0L.4)
1 2 3 4 5
Andhra Pradesh 6778047 58257 6836304 99.15
Arunachal pradesh 329360 136196 465556 70.75
Assam 2319152 124656 2443808 94.90
Bihar 7560039 :i00934 7760973 97.41
Goa 452192 11286 463478 97.56
Gujarat 12594500 ^86734 13081234 96.28
Haryana 2633301 12035 2645336 99.55
Himachal Pradesh 7201022 25710 7226732 99.64
Jammu & Kashmir 630544 63099 693643 90.90
Karanataka 5651311 :i35373 5886684 96.00
Kerala 4634336 48714 4683050 98.96
Madhya Pradesh 4286877 4390968 97.63
Maharashtra 15358977 ^96818 15855795 96.87
Manipur 610125 47453 657578 92.78
Meghalaya 242375 28926 271301 89.34
Mizoram 334951 30445 365396 91.67
Nagaland 483816 48326 532142 90.92
Orissa 2753027 '03172 2856199 96.39
Punjab 4344962 80937 4425899 98.17
Rajasthan 5364776 '03085 5467861 98.11
Sikkim 559444 37548 596992 93.71
Tamil Nadu 7154452 '36764 7291216 98.12
Tripura 23563 861302 97.26
Uttar pradesh 9241239 '68135 9409374 98.21
West Bengal 4323045 '55502 4478547 96.53
A & N Islands 133189 64930 198119 67.23
Chandigarh 152752 9673 162425 94.04
D & N Haveli 24598 5102 29700 82.82
Daman & Diu 27524 27524 100.00
Delhi 2451904 '77361 2629265 93.25
Lakshadweep 18361 3586 21947 83.66
Pondicherry 213349 33936 247285 86.28
INDIA 109701286 3;!62347 112963633 97.11

TABLE V - Recurring Expenditure by Item and Type of Institutions
A-Boards of Intermediate and/or Secondary Education
(Rjpees in Thcxisands}
State/UTs Salaries Salaries Hos libraries Sti- ^ Appara Other Total % of Expendi
Allowan Allowan- tels perids tus. E terns (Recu- ture on Sala
ces of ces of Scholar Chemi- ring) ries of Tea
Teaching Non- ships & cals & (Col. ching Staff
and Aca Teaching other Consu 2 to Total
demic Staff Fin. mable to Recurring
staff Conce. f. tores 8 Expendi ture
1 2 3 4 5 6 7 8 9 10
Andhra Pradesh ... 6544 ... ... • • • 43387 49931 13.11
Arunachal pradesh — ... ...
Assam ... 9531 280 26323 36134 26.38
Bihar 35930 1 693 88154 124778 28-80
Goa 1495 11 1 118 7534 9159 - 16.32
Gujarat ... . i'-ri-i.
Haryana — :
Himachal Pradesh ... 15266 2 62 49371 64701 23.59
Jammu & Kashmir 814 212 378 7032 8936 9.11.
Karanataka 4629 542 86241 91412 5.66
Kerala 4811 36707 41518 11.59
Madhya Pradesh — — ...
Maharashtra 74364 373 4'818 37996 154551 48.12
Manipur — 2411 4 2926 5341 45.14
Meghalaya 3540 ... ... 3868 7408 47.79
Mizoram ... ... ...
Nagaland ... 1450 ... ... 260 80 1790 81.01
Orissa __ ■■ . . i .Punjab 1645 52253 291 634 •1236 70803 126862 42.49
Rajasthan 22550 1022 122 302 332 55230 79558 .^29.63
Sikkim — _Tamil Nadu 73814 ... 73814 100.00
Tripura 2367 — 1801 4168 56.79
Uttar pradesh 24723 76141 100864 24.51
West Bengal 14673 31284 45957 31.93
A & N Islands — — -: ■" .. i
Chandigarh ■■ ....!
D & N Haveli ... ...
Daman & Diu ... ...Delhi 5805 31 22079 27994 20.74 '
Lakshadweep ... .. i
Pondicherry ... ... ... ...
INDIA 28824 331355 672 1453 4:i615 646957 1054876 34.14
77
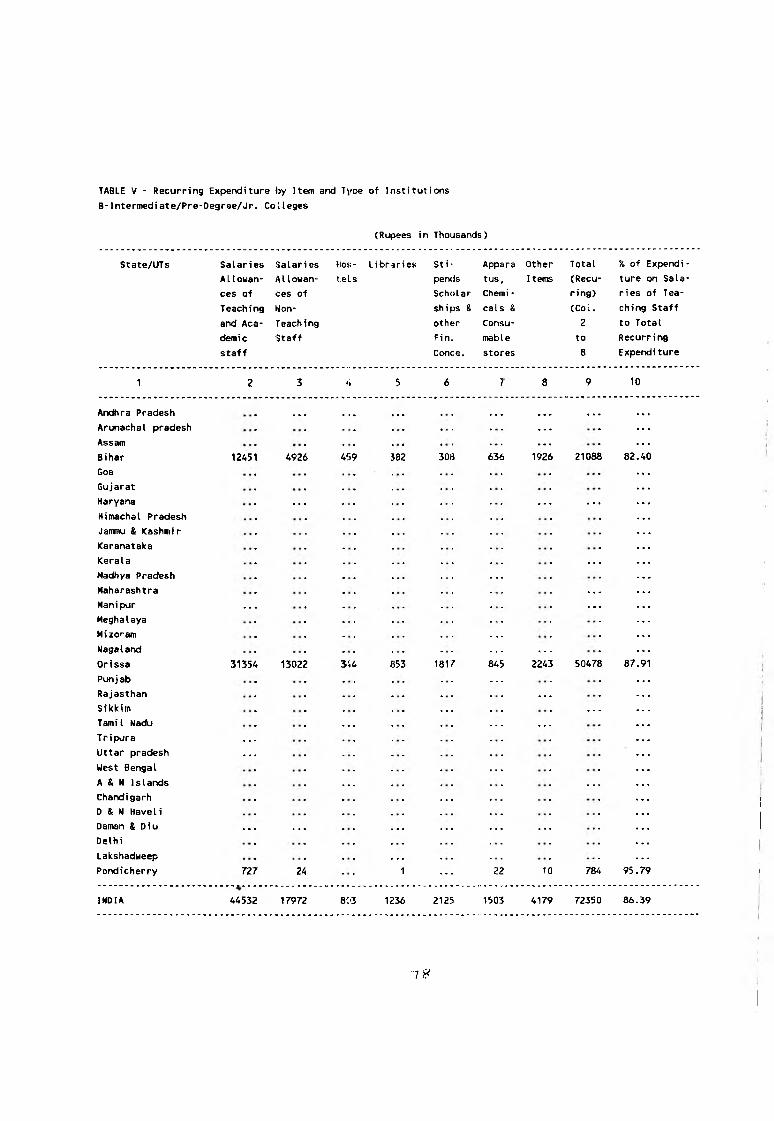
(Rupees in Thousands)
TABLE V - Recurring Expenditure by Item and Tyoe of Institutions
B-Intermedi ate/Pre-Degree/Jr. Co lieges
State/UTs Salaries Salaries Hos Libraries Sti- Appara Other Total % of Expendi
Allouan- AIlowan- tels pentis tus. Itenis (Recu ture on Sala
ces of ces of Scholar Chemi- ring) ries of Tea
T each i ng Kon- ships & cals & (Col. ching Staff
and Aca T each i ng other Consu 2 to Total
demic Staff Fin. mable to Recurring
staff Conoe. stores 8 Expendi ture
1 2 3 4 5 6 8 9 10
Andhra Pradesh ... ... ... ... ... • • •
Arunachal pradesh —
Assam _Bihar 12451 4926 459 382 308 636 1926 21088 82.40
Goa
Gujarat
Haryane — — ...
Himachal Pradesh
Jamnu & Kashmi r
Karanataka
<erala —
Madhya Pradesh _Maharashtra _Manipur _ ...
Meghalaya
Mizoram —
Nagaland — —
Orissa 31354 13022 344 853 1817 845 2243 50478 87.91
Punjab —
Rajasthan __
Sikkim __ __
Tamil Nadu — — —
T r i pura —
Uttar pradesh —
West Bengal __
A & N Islands __ __
Chandigarh __
D & N Haveli
Daman & Diu ... ... ... • • • ... ...
Delhi
Lakshadweep _Pondicherry 727 24 1 ... 22 10 784 95.79
INDIA 44532 17972 803 1236 2125 1503 4179 72350 86.39
I S

(Rupees in Thousands)
TABLE V - Recurring Expenditure by Item and Typie of Institutions
C-Higher Secondary Schools(10+2 pattern)
(i) Higher Secondary Schools with Academic Streams
State/UTs Salaries Salaries Hos Libraries Sti- j ppiara Other Total X of Expendi
Allowan- Allowan- tels; peiids :us. Items (Recu ture on Sala
ces of ces of Scholar Chemi - ring) ries of Tea
Teaching Non- ships & cals & (Col. ching Staff
and Aca Teaching otfier Consu 2 to Total
demic Staff Fin. mable to Recurring
staff Conce. stores 8 Expendi ture
1 2 3 4 5 6 7 8 9 10
Andhra Pradesh 64761 9601 1396:i 458 3570 8(13 28422 121578 61.16
Arunachal pradesh 42035 4523 698 1971 5400 444 2190 57261 81.31
Assam 196451 28139 19H 512 1688 723 5000 232711 96.51
Bihar 188088 24299 3559 472 3042 1429 11505 232394 91.39
Goa 27215 8056 () 269 37 1526 3526 40635 86.80
Gujarat 1049530 185504 78!) 6497 36417 1 ?’691 96505 1392929 88.66
Haryana 328627 39927 476 i 2328 8879 23Z9 2999S 416859 88.41
Himachal Pradesh 199275 35747 83015 245 2769 1960 7063 255864 91.85
Janmu & Kashmir 81649 8474 12 460 912 906 9182 101595 88.71
Karanataka 723604 91772 47 18709 S249 29700 867081 94.04 '
Kerala 36448 4750 355IJ 151 140 561 5105 50713 81.24
Madhya Pradesh 482352 55803 6163 1326 55512 2718 36789 640668 84.00
Maharashtra 2062511 354161 1063 11919 10043 26927 214897 2681526 90.12
Manipur 39214 5909 1182 59 107 376 1558 48405 93.22
Meghalaya 1712 1307 2086 32 295 239 667 6338 47.63
Mizoram
Nagaland ... ... ... ...Or i ssa — —Punjab 342535 47381 4561 4170 8953 -■i347 41701 452648 86.14
Rajasthan 678216 146984 6621 8156 24220 9211 27654 901062 91.58
Sikkim 7060 3581 — 201 — 4939 15781 67.43
Tamil Nadu
T r i pura 147520 17169 1704 406 6418 500 5833 179550 91.72
Uttar pradesh 2397684 473332 6565 6413 104959 14531 93424 3096906 92.71
West Bengal 495783 59621 396 2975 4605 4177 43923 611480 90.83
A & N Islands 31067 5351 90 813 1].90 935 5281 44927 81.06
Chandigarh 46141 4817 664 302 192 405 3451 55972 91.04
D & N Haveli 3567 1043 96 7 497 109 5319 67.06
Daman & Diu 500 500 100.00
Delhi 1012840 110933 5260 15209 15300 7257 63899 1230698 91.31
Lakshadweep ...Pondicherry 16640 2995 ... 64 3111 305 641 20956 93.70
INDIA 10703025 1730136 73801 65303 314(176 103056 772959 13762356 90.34
1S
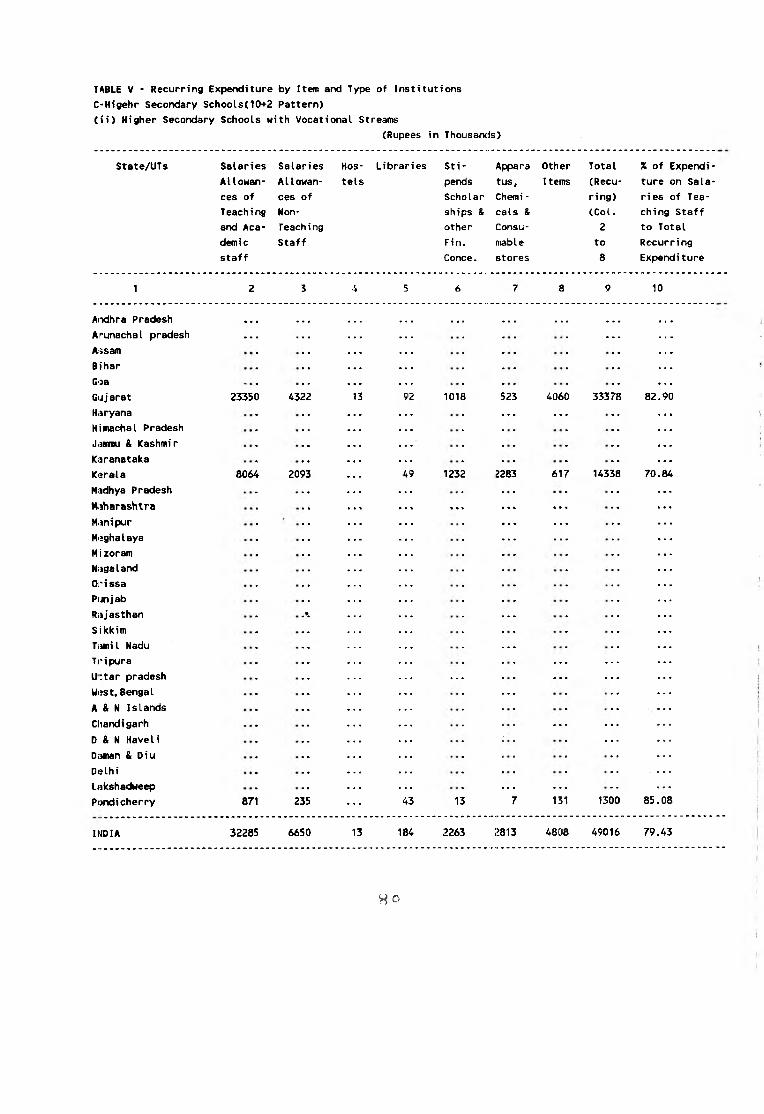
T^BLE V - Recurring Expenditure by Item and T/pe of Institutions
C-Higehr Secondary Schools(10+2 Pattern)
(ii> Higher Secondary Schools with Vocational Streams
(Rupees in Thousarels)
State/UTs Salaries
Allowan
ces of
T each i ng
and Aca
demic
staff
Salaries
Allowan
ces of
Non-
Teaching
Staff
Hos
tels
Libraries Sti
pends
Scholar
ships &
other
Fin.
Conce.
Appara
tus,
Chemi-
cals &
Consu
mable
stores
Other
IteiDS
Total
(Recu
ring)
(Col.
2
to
8
% of Expendi
ture on Sala
ries of Tea
ching Staff
to Total
Recurring
Expendi ture
1 2 5 6 8 9 10
Aixihra Pradesh ... ... ... ... ... ...Arunachal pradesh — — —Assam
Bihar
Goa
Gujarat 23350 4322 1018 523 4060 33378 82.90
Haryana ... ...Himachal Pradesh • • •Jammu & Kashmir • • •Karanataka ■ • •Kerala 8064 2093 1232 2283 617 14338 70.84
Madhya Pradesh • ■ •Maharashtra • » ft ... ... ...Manipur • • • ... ...Miighalaya ... ...M i zoram
Nagaland
Orissa
Punjab
Rajasthan ...Sikkim
Tiuni I Nadu ...Tripura ... ...U:tar pradesh ... ... ...West, Bengal ...A & N Islands
Chandigarh ... ...D & N Haveli ...DiMnan & Diu
Delhi
Lakshadweep ... ...Pondicherry 871 235 43 13 7 131 1300 85.08
iriOIA 32285 6650 13 184 2263 2813 4808 49016 79.43
H O
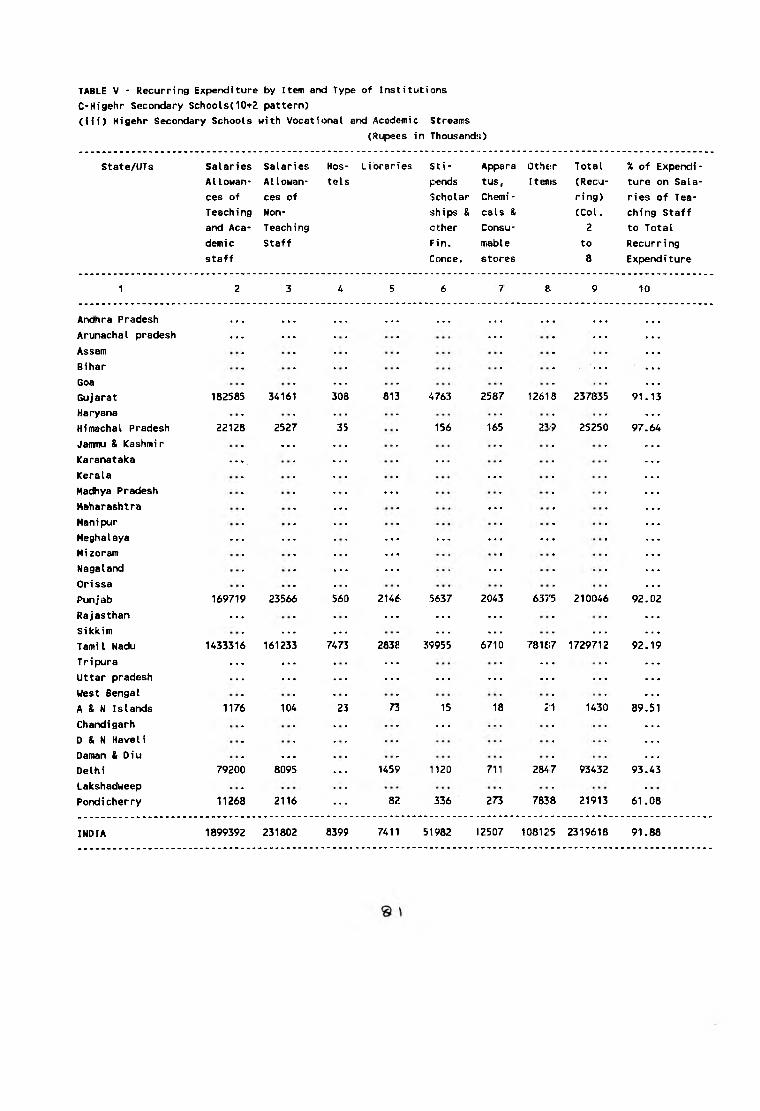
TABLE V - Recurring Expenditure by Item and Type of Institutions
C-Higehr Secondary Schools(10+2 pattern)
(iii) Higehr Secondary Schools with Vocational and Academic Streams
(Ri^es in Thousands;)
State/UTs Salaries Salaries Hos Libraries Sti Appara Other Total % of Expendi
Allowan AIlowan- tels pends tus. Items (Recu ture on Sala
ces of ces of Scholar Chemi- ring) ries of Tea
Teaching Non- ships & cals & (Col. ching Staff
and Aca T each i ng other Consu 2 to Total
demic Staff Fin. mable to Recurring
staff Conce. stores 8 Expenditure
1 2 3 4 5 6 £i 9 10
Andhra Pradesh • • . . . . • • • . . . • • • • • • . . . . . .
Arunachal pradesh . . . . . . . . . . . .
Assam
Bihar . . i
Goa * « •
Gujarat 182585 34161 308 813 4763 2587 12618 237835 91.13
Haryana
Himachal Pradesh 22128 2527 35 156 165 239 25250 97.64
Jammu & Kashmir —
Karanataka — » • > —
Kerala . . .
Hadhya Pradesh . . .
Maharashtra • • • . . . • • •
Manipur H • •
Meghalaya . . . . . . . . . . . . . . . . . . n • •
Mizoram . . .
Nagaland . . . . . . . . .
Orissa
Punjab 169719 23566 560 2146 5637 2043 637’5 210046 92.02
Rajasthan . . . . . . . . . . . .
Sikkim _____ • • • — — —
TamiI Nadu 1433316 161233 7473 2838 39955 6710 781 £17 1729712 92.19
Tripura . . . . . . . . . . . .
Uttar pradesh . . . . . . . . . . . . . . . . . . . . . . . .
West Bengal
A & N Islands 1176 104 23 73 15 18 Z!l 1430 89.51
Chandigarh . . .
D & N Haveli
Daman & Oiu —
Delhi 79200 8095 — 1459 1120 711 2847 93432 93.43
Lakshadweep
Pondicherry 11268 2116 . . . 82 336 273 78];8 21913 61.08
INDIA 1899392 231802 8399 7411 51982 12507 108125 2319618 91.88
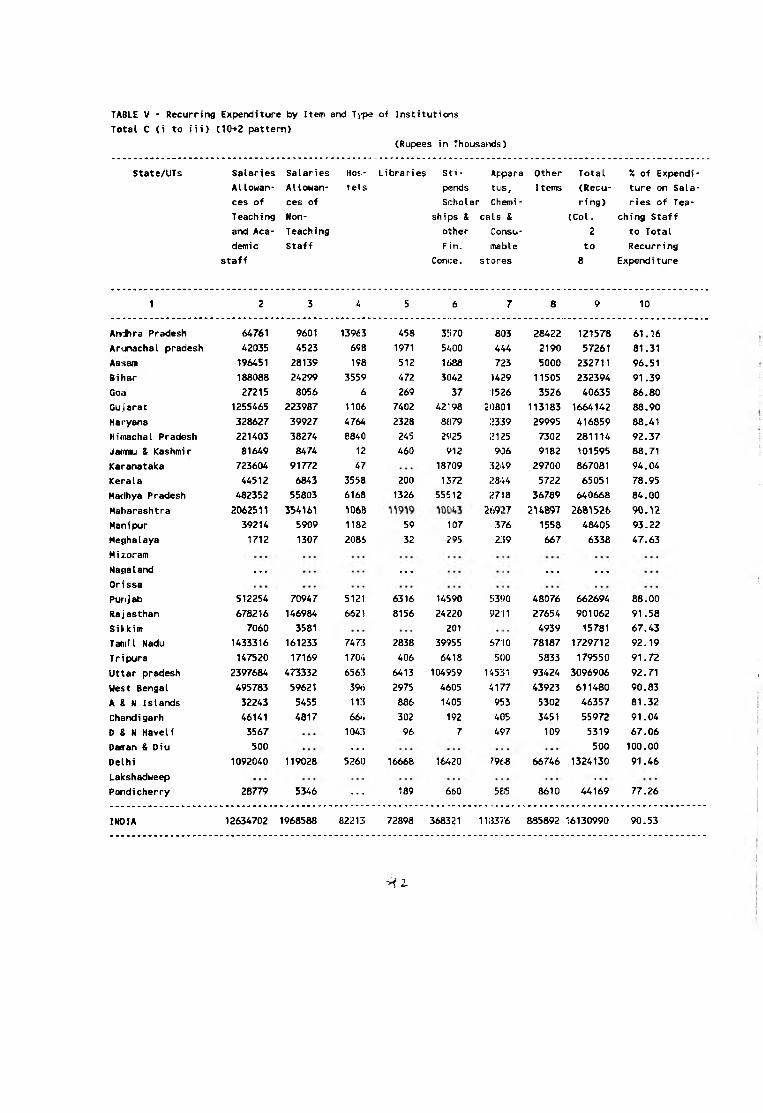
(Rupees in Thousands)
TABLE V - Recurring Expenditure by Item and Type of Institutions
Total C (i to iii) (10+2 pattern)
State/UTs Salaries Salaries Hos Libraries Sti Appara Other Total % of Expendi
Allowan- Allowan- tels pends tus. I terns (Recu ture on Sala
ces of ces of Scholar Chemi- ring) ries of Tea
T each i ng Non- ships & cals & (Col. ching Staff
and Aca Teaching other Consu 2 to Total
demic Staff Fin. mable to Recurring
staff Conce. stores 8 Expend!ture
1 2 3 U 5 6 7 8 9 10
Amdhra Pradesh 64761 9601 13963 458 3570 803 28422 121578 61.16
ArunachaL pradesh 42035 4523 698 1971 5^00 444 2190 57261 81.31
As!>aro 196451 28139 198 512 1688 723 5000 232711 96.51
B i har 188088 24299 3559 472 3042 1429 11505 232394 91.39
Goa 27215 8056 6 269 37 1526 3526 40635 86.80
Gujarat 1255465 223987 1106 7402 42198 20801 113183 1664142 88.90
Haryana 328627 39927 4764 2328 «I79 2339 29995 416859 88.41
Hifiwchal Pradesh 221403 38274 8840 245 2925 2125 7302 281114 92.37
Jarnmu & Kashmir 81649 8474 12 460 912 906 9182 101595 88.71
Karanataka 723604 91772 1,7 18709 3249 29700 867081 94.04
Kerala 44512 6843 3558 200 1372 2844 5722 65051 78.95
Madhya Pradesh 482352 55803 6168 1326 555 12 2718 36789 640668 84.00
Maharashtra 2062511 354151 106B 269,>7 2 U 8 9 7 2681526 90.12
Manipur 39214 5909 1182 59 107 376 1558 48405 93.22
Me$|halaya 1712 1307 2086 32 295 239 667 6338 47.63
Mii:oram
Nasialand ... ... ... ...Orissa
Punjab 512254 70947 5121 6316 14590 5390 48076 662694 88.00
Rajasthan 678216 146984 6621 8156 24220 5'211 27654 901062 91,58
Sikkim 7060 3581 201 4939 15781 67.43
Tamil Nadu 1433316 161233 747.5 2838 39955 £.710 78187 1729712 92.19
Tripura 147520 17169 1704 406 6418 500 5833 179550 91.72
Uttar pradesh 2397684 473332 6563 6413 104959 1'+5]11 93424 3096906 92.71
West Bengal 495783 59621 396 2975 4605 41(7 43923 611480 90.83
A S M Islands 32243 5455 113 886 1405 953 5302 46357 81.32
Chandigarh 46141 4817 66 ; 302 192 405 3451 55972 91.04
D S N Haveli 3567 1043 96 7 497 109 5319 67.06
Dairan & Diu 500 _ 500 100.00
Delhi 1092040 119028 5260 16668 16420 79«.8 66746 1324130 91.46
Lakshadweep
Pondicherry 28779 5346 .... 189 660 5S5 8610 44169 77.26
INDIA 12634702 1968588 82213 72898 368321 1113376 885892 16130990 90.53
^ 2.
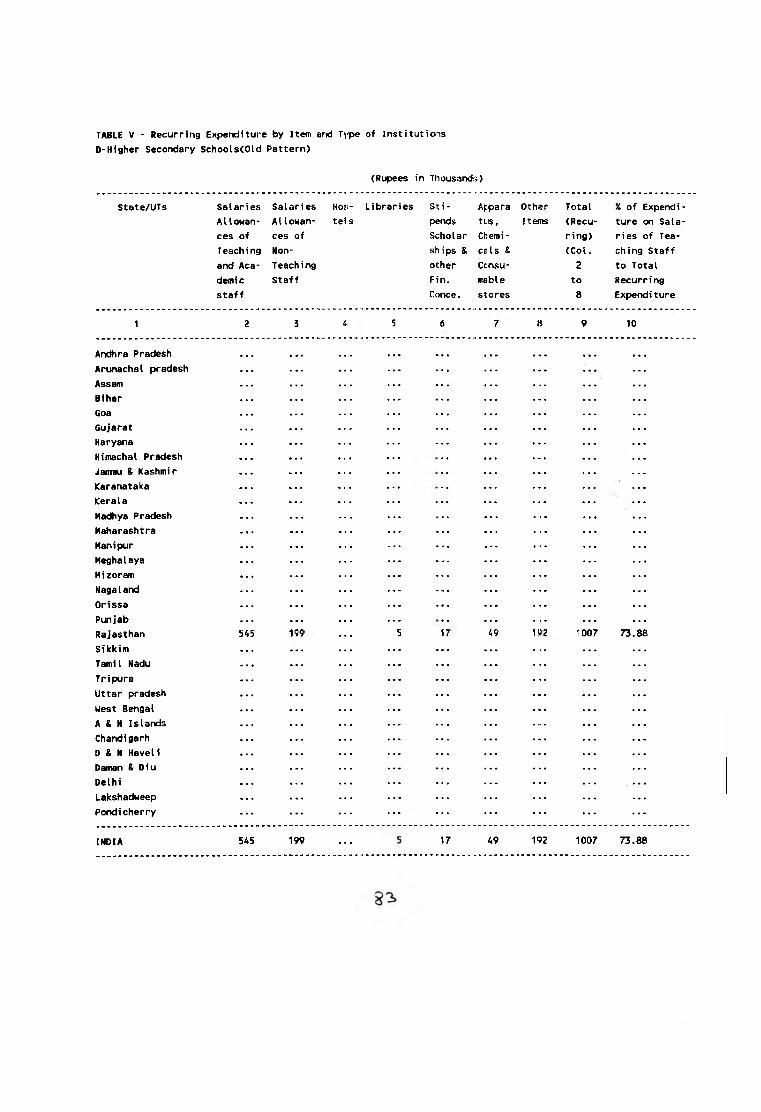
TABLE V - Recurring Expenditure by Item and Type of Institutions
D-Higher Secondary SchoolsCOld Pattern)
(Rupees in ThousandiJ)
State/UTs Salaries
Allowan
ces of
Teaching
and Aca
demic
staff
Salaries
Allowan
ces of
Non-
Teaching
Staff
Ho5!- Libraries
tels
Sti
pends
Scholar
ships &
other
Fin.
Conce.
A|:ipara
tuis,
Chemi-
c e I s &
Ccnsu-
ms'ble
stores
Other
Items
Total
(Recu
ring)
(Col.
2
to
8
% of Expendi
ture on Sala
ries of Tea
ching Staff
to Total
Recurring
Expendi ture
1 8 9 10
Andhra Pradesh • . •
Arunachal pradesh . . .
Assam . . .
Bihar
Goa . . .
Gujarat . . .
Haryana . . .
Himachal Pradesh
Jammu & Kashmir
Karanataka
Kerala . . .
Hadhya Pradesh
Maharashtra . . .
Manipur . . .
Meghalaya . . .
Mizoram . . .
Nagaland . . .
Orissa . . .
Punjab
Rajasthan 1007 73.88
Sikkim . . .
Tamil Nadu . . .
Tripura . . .
Uttar pradesh . . .
West Bengal . . .
A & N Islands . . .
Chandigarh . . .
D & N Haveli . . .
Daman & Diu
Delhi . . .
Lakshadweep . . .
Pondicherry . . .
INDIA 545 199 17 49 192 1007 73 88
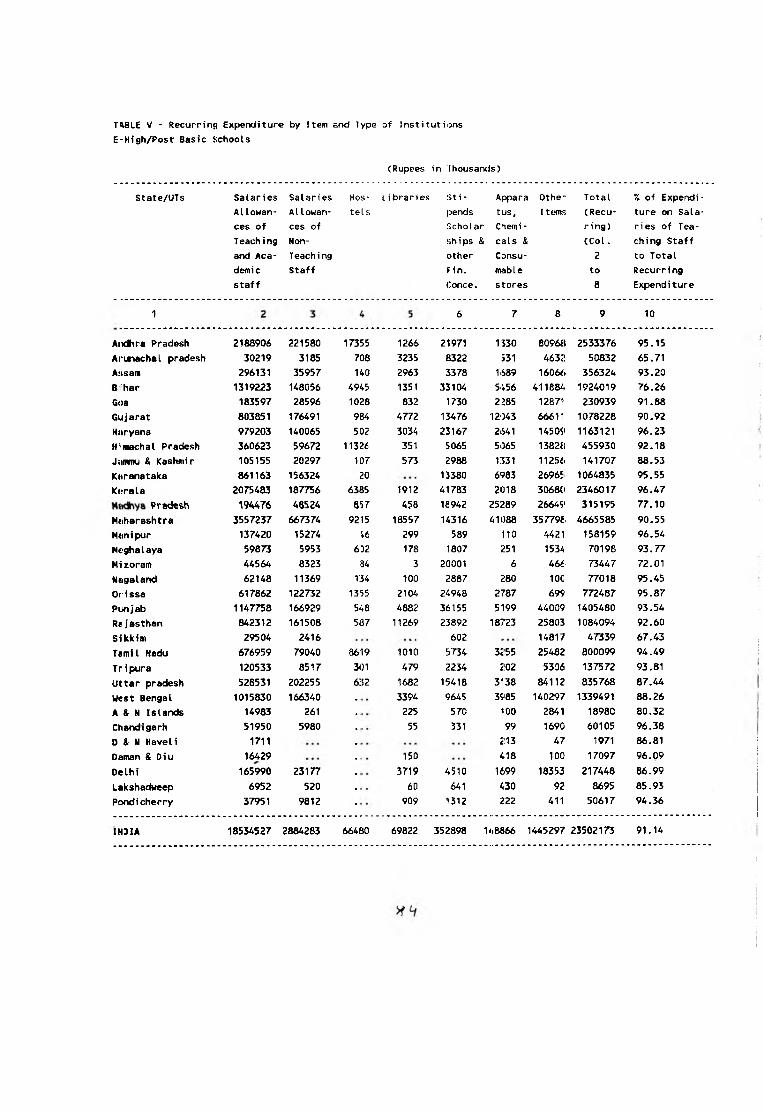
(Rupees in Thousands)
H 8 L E V - Recurring Expenditure by Item and Type of Institutions
E-Migh/Post Basic Schools
State/UTs Salaries
AIlowan-
ces of
Teaching
and Aca
demic
staff
Salaries
AI Iowan*
ces of
Non-
T each i ng
Staff
Hos
tels
Libraries Sti Appara Othe- Total % of Expendi
pends tus. Itemii (Recu- ture on Sala
Scholar Chemi- r i ng) ries of Tea
ships & cals & (Col. ching Staff
other Consu 2 to Total
Fin. mable to Recurring
Conce. stores 8 Expenditure
6 7 8 9 101
AiKlira Pradesh 2188906
Arunachal pradesh 30219
Assam 296131
Bihar 1319223
Goa 183597
Gujarat 803851
Haryana 979203
Himachal Pradesh 360623
Jiinvnu & Kashmir 105155
Karanataka 861163
K«rala 2075483
Pradesh 194476
Maharashtra 3557237
Manipur 137420
Meghalaya 59873
Mizoram 44564
Nagaland 62148
Orissa 617862
Punjab 1147758
Rejasthan 842312
Sikkim 29504
TemiI Nadu 676959
Tripura 120533
Uttar pradesh 528531
West Bengal 1015830
A & N Islands 14983
Chandigarh 51950
D & N Haveli 1711
Daman & Oiu 16429
Delhi 165990
Lakshadweep 6952
Pondicherry 37951
221580
3185
35957
148056
28596
176491
140065
59672
20297
156324
187756
48524
667374
15274
5953
8323
11369
122732
166929
161508
2416
79040
8517
202255
166340
261
5980
23177
520
9812
17355
708
140
4945
1028
984
502
11326
107
20
6335
857
9215
46
602
34
134
13155
548
587
8619
301
632
1266
3235
2963
1351
832
4772
3034
351
573
1912
458
18557
299
178
3
100
2104
4882
11269
1010479
1682
3394
225
55
150
3719
60
909
21971
8322
3378
33104
1730
15476
23167
5065
2988
13380
41783
18942
14316
589
1807
200012887
24948
36155
23892
602
5734
2234
15418
9645
570
331
4510
641
1312
1330
531
1689
5456
2285
12043
2641
5065
1331
6983
2018
25289
41088
110
251
6280
2787
5199
18723
3255
202
3138
3985
100
99
213
418
1699
A30
222
8096{(
4632
1606<>
411884
1267t
66611
14509
13828
11256
26965
30680
26649
35779&
4421
1534
466
100
699
44009
25803
14817
25482
5306
84112
140297
2841
1690
47
100
18353
92
411
2533376
50832
356324
1924019
230939
1078228
1163121
455930
141707
1064835
2346017
315195
4665585
158159
70198
73447
77018
772487
1405480
1084094
47339
800099
137572
835768
1339491
18980
60105
1971
17097
217448
8695
50617
95.15
65.71
93.20
76.26
91.88
90.92
96.23
92.18
88.53
95.55
96.47
77.10
90.55
96.54
93.77
72.01
95.45
95.87
93.54
92.60
67.43
94.49
93.81
87.44
88.26
80.32
96.38
86.81
96,09
86.99
85.93
94.36
IN3IA 18534527 2884283 66480 69822 352398 1<»8866 1445297 23502173 91.14

TABLE V - Recurring Expenditure by Item and Type of Institutions
F-Middle/Senior Basic Schools
(Ri4>ees in Thouisands)
State/UTs Salaries Salaries Hos Libraries Sti Ap|: a a Other Total % of Expendi -
Al Iowan* ALlowan- tels pends tus;, I t«!ms CRecu- ture on Sala
ces of ces of Scholar Ch«Hni- ring) ries of Tea
T each i ng Non- ships; & ca(:s S' {Col. ching Staff
and Aca T each i ng other Consu 2 to Total
demic Staff F in. mable to Recurring
staff Concc. stores 8 Expenditure
1 2 8 9 10
Andhra Pradesh 1160196 81430 1;»41626 93.44
Arunachal pradesh 48560 34331 82891 58.58
Assam 432336 35679 468015 92.38
Bihar 2506541 49382 2555923 98.07
Goa 14165 119 14284 99,17
Gujarat 2862269 229398 3091667 92^158
Haryana 274519 25397 2199916 91.53
Himachal Pradesh 223172 17482 J!40654 92.74
Jammu & Kashmir 202741 15921 2118662 92.72
Karanataka 1956835 37897 1994732 98.10
Kerala 821873 61069 {182942 93.08
Madhya Pradesh 761953 41292 £103245 94.86
Maharashtra 5705998 429072 4135070 89.62
Manipur 148996 6387 155383 95.89
Meghalaya 37027 5876 42903 86.30
Mizoram 98955 9753 108708 91.03
Nagaland 113156 4725 117881 95.99
Orissa 544731 55447 600178 90.76
Punjab 268870 32503 301373 89.22
Rajasthan 1292623 67409 1360032 95.04
Sikkim 30190 5627 35817 84.29
Tamil Nadu 1031091 59055 1090146 94.58
Tripura 101988 17005 118993 85.71
Uttar pradesh 977113 134384 1111497 87.91
West Bengal 286529 72774 359303 79.75
A & N Islands 20014 9920 29934 66.86
Chandigarh 5709 2616 8325 68.58
D & N Haveli 10089 984 11073 91.11
Daman & Diu 4002 625 4627 86.49
Delhi 134038 26872 160910 83.30
Lakshadweep 2380 75 2455 96.95
Pondicherry 42252 14625 56877 74.29
INDIA 20120911 ... ... 1585131 21706042 92.70
2 5

TABLE V - Recurring Expenditure by Item and Type of institutions
G-Primary/Junior Basic Schools
(Rupees in Thousands)
State/UTs ■Salaries
Allowan
ces of
reaching
and Aca-
demi c
staff
Salaries
AlIowan*
ces of
Non-
T each i ng
Staff
Hos
tels
L i brcTies Sti
pends
Scholar
ships &
other
Fin.
Conce.
Ap:tara
tUs.,
Chsmi; -
cats &
Co'isu-
macile stores
1 other Total % of Expendi
Items (Recu ture on Sala
ring) ries of Tea
(Col. ching Staff
2 to Total
to Recurring
8 Expenditure
8 9 10
122433 2570874 95.24
30773 96692 68.17
24922 973501 97.44
44028 2434440 98.19
1862 131343 98.58
52871 731722 92.77
32755 483310 93.22
24719 614478 95.98
10678 183978 94.20
4617 941543 99.51
45497 884136 94.85
60139 2035067 97.04
354094 3421812 89.65
14168 199543 92.90
918 72570 98.74
2171 131226 98.35
7773 171581 95.47
32440 1329889 97.56
17933 1607931 98.88
62047 1220337 94.92
3491 81474 95.72
44968 1953485 97.70
39524 260058 84.80
435118 3636864 88.04
103023 1808747 94,30
7020 29976 76.58
3935 16772 76.54
573 5056 88.67
43 8073 99.47
93381 557213 83.24
47 6966 99.33
13568 52871 74.34
Anctfira Pradesh 12448441
Arinachal pradesh 65919
Assewr 948579
B i har 2390412
Goa 129481
Gujarat 678851
Haryana 450555
Himachal Pradesh 589759
Jainm. & Kashmir 173300
Kararataka 936926
Kerala 838639
Madhya Pradesh 1974928
Hahar&shtra 5067718
Manipur 185375
Meghalaya 71652
Mizoram 129055
Nagaland 163808
Orissa 1297449
Punjab 1589998
Rajasthan 1158290
Sikkim 77983
Tamil Nadu 1908517
Tripura 220534
Uttar pradesh 3201746
West Bengal 1705724
A & N Islands 22956
Chandigarh 12837
D & N Haveli 4483
Daman & Diu 8030
Delhi 463832
Lakshadweep 6919
Pondicherry 39303
INDIA 26961999 1691529 28653528 94.10

TABLE )/ • Recurring Expenditure by Item and Type of Institution;j
H-Pre-Primary/Pre-BAsic Schools
(Rupees in Thousands)
State/UTs Salaries Salaries Hcs- Libraries Sti- Appara Other Total % of Expendi
Allowan AlIowan* tels peiids tus. Iteins (Recu ture on Sala
ces of ces of Scholar Chemi ring) ries of Tea
Teaching Kon- ships & cals & (Col. ching Staff
and Aca Tcaching other Consu 2 to Total
demic Staff Fin. mable to Recurring
staff Conce. stores 8 Expendi ture
1 2 5 8 9 10
Andhra Pradesh 777 206 983 79.04
Arunachal pradesh 8127 . . . 805 8932 90.99
Assam 8015 257 8272 96.89
Bihar 171 6 177 96.61
Goa
Gujarat 19157 10958 30115 63.61
Haryana 759 95 854 88.88
Himachal Pradesh 577 • • • 120 697 82.78
Jamnu & Kashmir
Karanataka 33467 33467 100.00
Kerala 2571 • • . 1173 3744 68.67
Madhya Pradesh 6187 993 7180 86.17
Maharashtra 13209 8844 22053 59.90
Manipur 114 14 128 89.06
Meghalaya 941 374 1315 71.56
Mizoram
Nagaland
Orissa • • . • • •
Punjab 259 259 100.00
Rajasthan 3878 618 4496 86.25
Sikkim 5381 • . • 561 5942 90.56
Tamil Nadu 1093 92 1185 92.24
Tripura 18725 12849 31574 59.31
Uttar pradesh 3319 42 3361 98.75
West Bengal 5664 1595 7259 78.03
A & N Islands 335 432 817 41.00
Chandigarh ____
D & N Haveli
Daman & Oiu 4110 • • s 4110 100.00
Delhi 6243 2824 9067 68.85
Lakshadweep 1190 8 1198 99.33
Pondicherry 1724 . . . 249 1973 87.38
INDIA 145993 . . . 43165 189158 77.18
*87
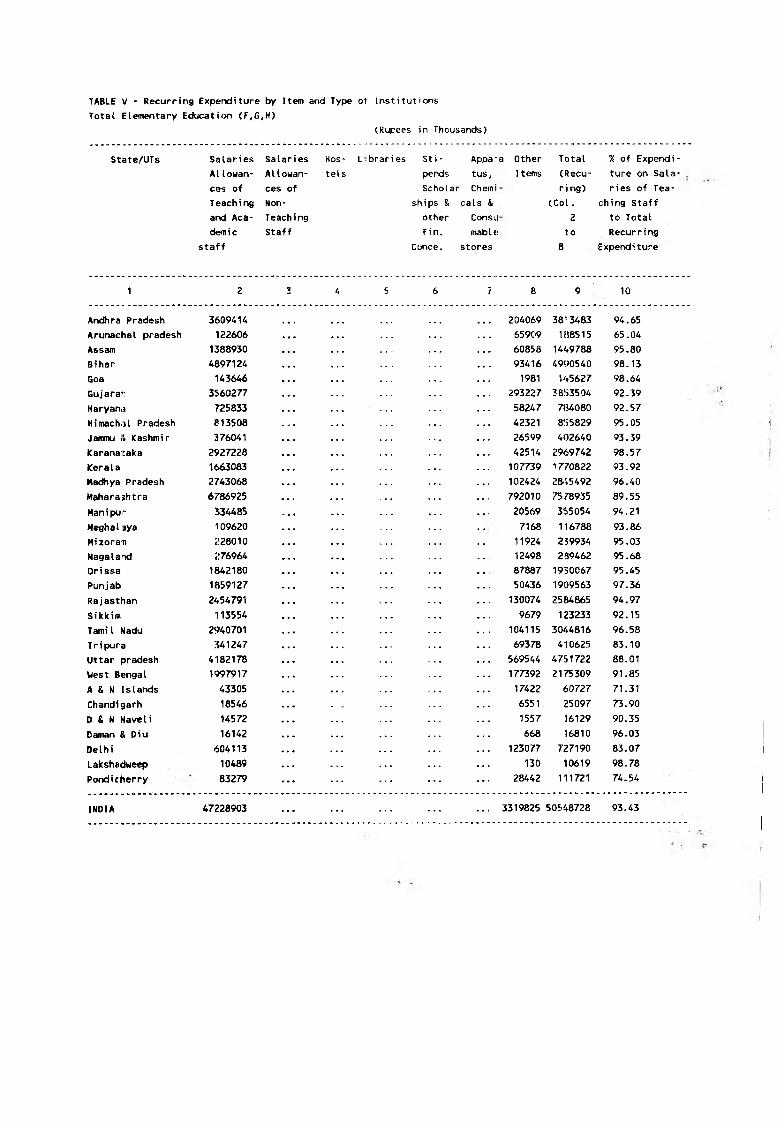
(Rupees in Thousands)
TABLE V - Recurring Expenditure by Item and Type of Institutions
Total Elementary Educati<jn <F,G,H)
State/UTs Salaries Salaries Hos Libraries Sti Appa"a Other Total % of Expendi-
Al lowan- Allowan tels pends tus. 1 terns (Recu- ture on Sala
ces of ces of Scholar Chemi ring) ries of Tea
Teaching Mon- sh i ps & cals & (Col. ching Staff
and Aca Teaching other Consul 2 to Total
demic Staff Fin. mable to Recurring
staff Conce. stores 8 Expenditure
1 2 4 5 6 8 9 ^ 10
Andhra Pradesh 3609414 204069 38^ 3483 94.65
Arunachal pradesh 122606 65909 188515 65.04
Assam 1388930 60858 1449788 95.80
Bihar 4897124 93416 4990540 98.13
Goa 143646 1981 K 5 6 2 7 98.64
Gujara’: 3560277 293227 J8!i3504 92.39
Haryanii 725833 58247 784080 92.57
Himachal Pradesh 813508 42321 8!55829 95.05
Jaimiu lit Kashmir 376041 26599 402640 93.39
Karanataka 2927228 42514 29.59742 98.57
Kerala 1663083 107739 1770822 93.92
Madhya Pradesh 2743068 102424 2&;5492 96.40
Maharashtra 6786925 792010 7578935 89.55
Manipur 334485 20569 355054 94.21
Heghalaya 109620 7168 116788 93.86
Mizoram 228010 11924 239934 95.03
Nagalaxi 276964 12498 2S9462 95.68
Orissa 1842180 87887 1930067 95.45
Punjab 1859127 50436 1909563 97.36
Rajasthan 2454791 130074 2584865 94.97
Sikkim 113554 9679 123233 92.15
Tamil Nadu 2940701 104115 3044816 96.58
Tripura :W1247 69378 410625 83.10
Uttar pradesh 4182178 569544 4751722 88.01
West Bengal 1997917 177392 2175309 91.85
A & N Islands 43305 17422 60727 71.31
Chandigarh 18546 6551 25097 73.90
D & N Haveli 14572 1557 16129 90.35
Daman & Diu 16142 668 16810 96.03
Delhi 604113 123077 727190 83.07
Lakshadweep 10489 130 10619 98.78
Pondicherry 83279 28442 111721 74.54
INDIA 47228903 3319825 50548728 93.43

TAtLE V - Recurring Expenditure b>' Item and Type of Institutions
I-rnstitutions Imparting Instructions in tn'ploma/Certificate
Courses of School Level (Be lew Hatric Level.)
<a) Agriculture & Forestry
(Rupees in Thou!>ands)
State/UTs Salaries
Allowan
ces of
Teaching
and Aca
demic
staff
Salaries
Allowan-
ces of
Ncin-
Teaching
Staff
Hos
tels
Libraries Sti-
pend:;
Scholar
ship.3 &
other*r
Fin.
Concij.
Appara
tus,
Chemi-
cals &
Consu
mable
stores
Other
Items
Total
(Recu
ring)
(Col.
2to
8
% of Expendi
ture on Sala
ries of Tea
ching Staff
to Total
Recurring
Expenditure
1 2: 3 6 8 9 , ^ 10
Andhra Pradesh . . . . . .Arinachal pradesh 391 190 46 145 938 1713 33.92
Assam
Bihar — —Goa . . . • • •Gujarat
Haryana
3526 1324 391 869 1074 7253 66.87
• • •
Pradesh . •.Jartmu & Kashmir . . . . . . . • • •Karanataka 386€ 338 532 1042 657 6429 65.30
Kerala . . . ___Madhya Pradesh —Maharashtra
Manipur
2&)1 10040 1310 527 4454 19247 66.92
Meghalaya . . .Mizoram
Nagaland . . .Or i ssa . . .Punjab — . . .Rajasthan
Sikkim
2U 126 14 364 93.41
Tamil Nadu 10A2 29 332 ___ 104 1507 71.07
Tripura — . . .Uttar pradesh . . .West Bengal . . .A & N Islands . . . 1 ■Chandigarh
D & N Haveli . . .Daman & Diu . . .Delhi • • •
Lakshadweep . . . • • •Pondicherry . . . . . . . . . . . . . . . . . . • • •
INDIA 11874 12047 130 18 2616 2587 7241 36513 65.51
8=1
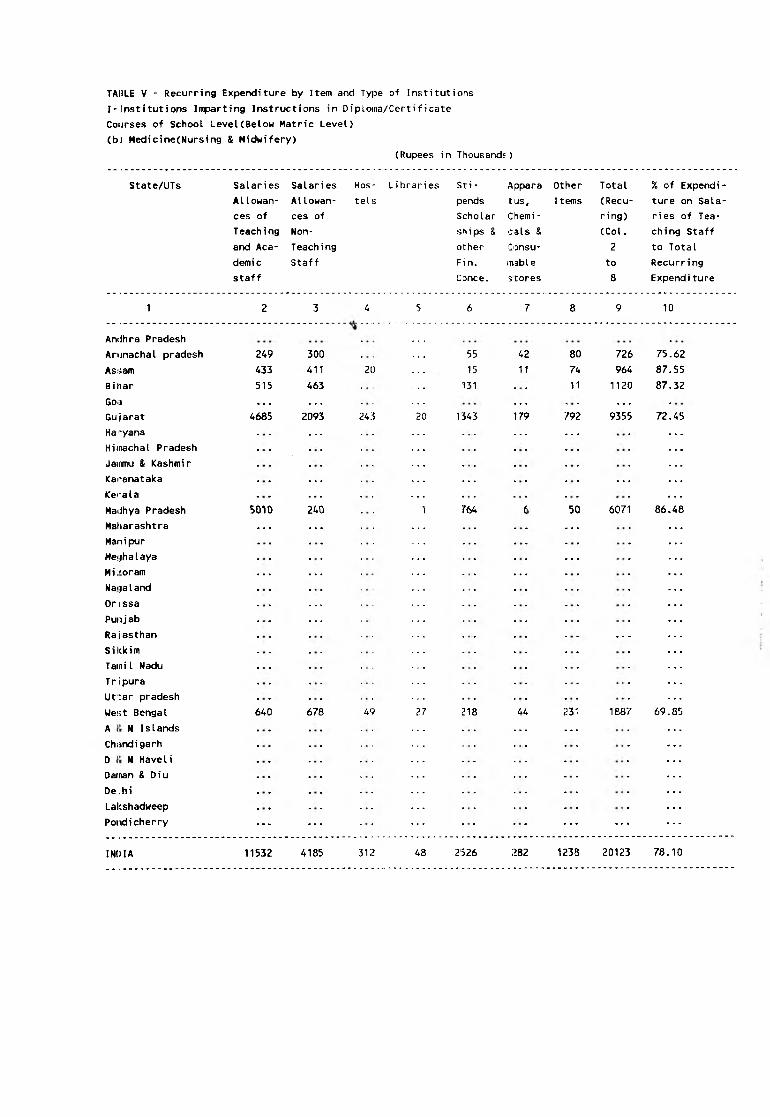
TABLE V - Recurring Expenditure by Item and Type of Institutions
I-Institutions Imparting Instructions in Diplotna/Certificate
Courses of School Level(Below Matric Level)
(b) Medicine(Nursing & Midwifery)
(Rupees in Thousands)
State/UTs Salaries Salaries Hos Libraries Sti Appara Other Total % of Expendi
Al lowan- Allowan- tels pends tus. 1 terns (Recu ture on Sala
ces of ces of Scholar Chemi- ring) ries of Tea
Teaching Non- ships & cals & (Col. ching Staff
and Aca T each i ng other Consu 2 to Total
demic Staff Fin. mable to Recurring
staff Conce. stores 8 Expend? ture
1 2 3 4 5 6 7 8 9 10
Ancihra Pradesh
Arunachal pradesh 249 300 55 42 80 726 75.62
As:sam 433 411 20 15 11 74 964 87.55
Bihar 515 463 131 11 1120 87.32
Goi) — — — —Gujarat 4685 2093 243 1343 179 792 9355 72.45
Haryana — — —Himachal Pradesh
Jammu & Kashmir
Karanataka — — —Kerala __
Macdhya Pradesh 5010 240 764 50 6071 86.48
Maharashtra — — —Manipur
Meghalaya . . .Mii'oram — — —Naijaland
Or issa —Punjab —Ra jasthan . . .Sikkim
Tamil Nadu
Tr ipura
Ut:ar pradesh
West Bengal 640 678 4‘? 218 44 231 1887 69.85
A N Islands — —
Chijndigarh
D N Havel i
Darnan & Diu
De .hi
Lakshadweep
Pondicherry . . . . . . . . . . . .
INDIA 11532 4185 312 48 2526 282 1238 20123 78.10

TAtLE V - Recurring Expenditure by Item aixl Type of Institutions
I-Institutions Imparting Injitruct«ons in Diploma/Certificate
Courses of School Level(BeU»w Matric Leve.)
(c) Teacher Training
(Rupees in Thousands)
State/UTs Salaries Salaries Hos libraries Sti- Appara Other Total % of Expendi
Allowan Allowan tels perxjs tus. Items (Recu- ture on Sala
ces of ces of Scholar Chemi ring) ries of Tea
Teaching Non- sh^ps & cals & (Col. ching Staff
and Aca Teaching other Consu 2 to Total
demic Staff Fin. mable to Recurring
staff ConcB. stores 8 Expenditure
1 i. 3 4 5 6 8 9 10
Andhra Pradesh . . . . . . . . . . . . . . .
Arunachal pradesh
Assam • . »
Bihar • • • • • • • • • - . • • • •
Goa
Gujarat 28753 7443 916 288 2942 634 1706 42682 84.80
Haryana
Hiinachal Pradesh
Jammu & Kashmir
Karanataka 80756 8042 20 • • • 2962 8059 3083 102922 86.28
Kerala • • •
Madhya Pradesh
Maharashtra
Manipur
Meghalaya 19&7 1591 68 27 945 4618 77.48
Mizoram . . .
Nagaland 1644 765 10 10 2435 98.93
Orissa . . . . . .
Punjab
Rajasthan . . . . . . ___ —
Sikkim 313 147 • • • • • • 37 . . . 766 1263 36.42
Tamil Nadu . . .
Tripura 2616 508 238 3362 92-92
Uttar pradesh 61222 10135 58 40 884 Ill 377 72827 97.98
West Bengal
A & N Islands
Chandigarh
D £t N Havel i
Daman & Diu • • • ■ • • • • • . . .
Delhi
Lakshadweep
Pondicherry . . . . . . . . .
INDIA 177291 28631 1068 365 6825 8804 7125 230109 89.49

TABLE V ' Recurring Expenditure by Item and Type of Institutions
I-Institutions Imparting Instructions in Diplonfia/Ct:rtificate
Courses of School LeveKBelow Matric Level)
(d) Industrial/Arts & Crafts
(Rupees in Thousands)
State/UTs Salaries Salaries
AlIowan- Allowan
ces of ces of
Teaching Non-
and Aca- Teaching
demic Staff
staff
Hos
tels
L i b rar i es Sti Appara Other Total % of Expendi-
pends tus, I tems (Recu ture on Sala
Scholar Chemi ring) ries of Tea
ships & cals & (Col. ching Staff
other Consu- 2 to Total
Fin. mab L e to Recurri ng
Conce. stores a Expendi ture
10
Arunachal pradesh 393 88 2 50 87 405 1025 46.93
Assam 1069 355 5 194 65 184 1872 76.07
Bihar 1937 462 116 A 95 'i69 583 3364 71.31
Gca 951 401 5 82 97 1536 88.02Gl jarat 5783 1281 5 2 1824 1544 1074 11513 61.36
Haryana — — —
Himachal Pradesh 2760 510 1<*4 101 29 27 3571 91.57
Jemmu & Kashmi r . . • . . . • • • • • .
Karanataka
Kerala 55172 9905 227 51 3146 2722 4050 75273 86.45
Madhya Pradesh 7621 2466 70 60 581 413 696 11907 84.71
Maharashtra —
Manipur 824 271 345 88 1528 71.66
Meghalaya — —
Mi zoram —
Nagaland
Or i ssa
Punjab 7A16 4691 200 1205 13516 89.58
Rajasthan — ____
Sikkim 376 289 65 430 1160 57.33
Tamil Nadu 35543 15138 1378 37 3398 84.21 5278 69193 73.25
T r i pura —
Uttar pradesh 4637 593 230 103 544 6107 85.64
West Bengal 7656 1151 179 85 115 227 2550 11963 73.62
A & N Islands ____
Chandigarh — —
D & N Haveli —
Daman & Diu
Delhi 347 95 14 130 592 74.66
Lakshadweep — . . .
Pondicherry 56 5 . . . 23 84 72.62
INDIA 132541 37701 2124 253 10356 I3&65 17364 214204 79.48
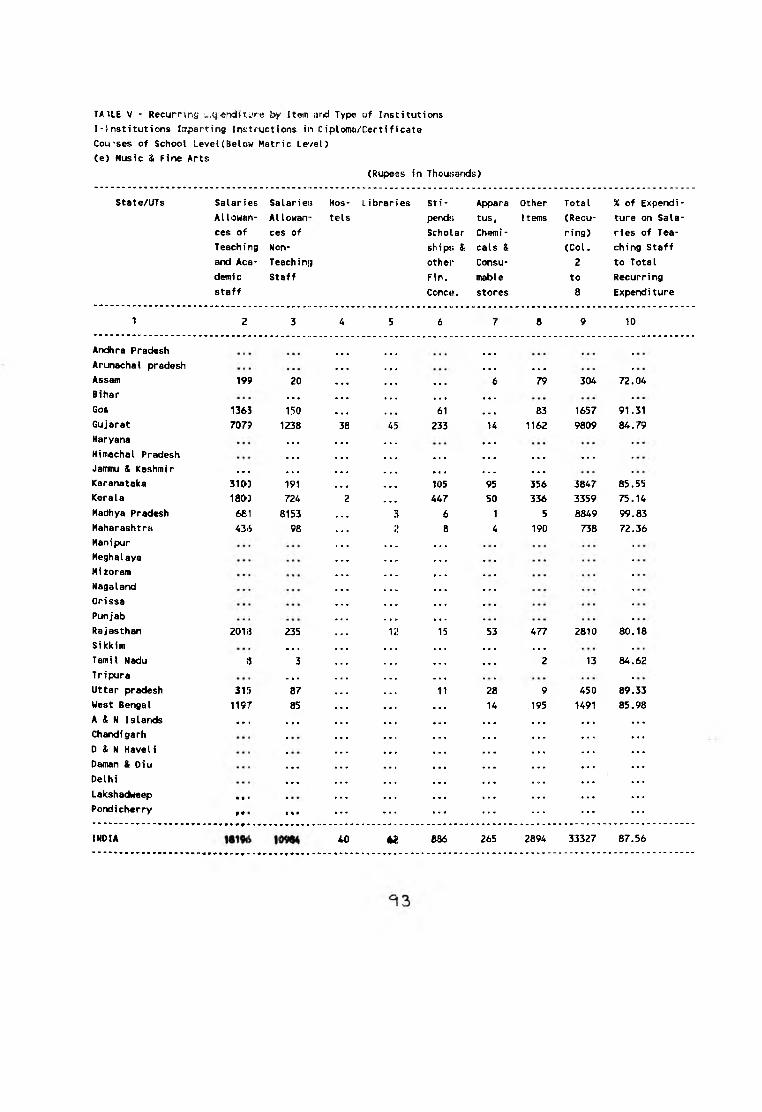
TAILE V * Recurring L..q>endit.ure by Item and Type of Institutions
I-! nstitutions Itr^sarting Ins;tructions in C iploma/Certif icate
Cou'ses of School Level(Below Metric Level)
(e) Music & Fine Arts
(Rupees in Thousands)
State/UTs Salaries. Salarieii Hos Libraries Sti Appara Other Total % of Expendi
Allowan AI Iowan* tels pends; tus, Items (Recu ture on Sala
ces of ces of Scholar Chemi - ring) ries of Tea
T each i ng Non- shipK & cals & (Col. ching Staff
and Aca* T each i nn other Consu 2 to Total
demic Staff Fin. mable to Recurring
staff Conct*. stores 8 Expendi ture
1 2 3 4 5 6 8 9 10
Andhra Pradesh
Arunachal pradesh . . .
Assam 199 20 • • • 79 304 72.04
Bihar « • • . . •
Goa 1365 150 61 83 1657 91.31
Gujarat 7079 1238 233 1162 9809 84.79
Haryana • • •
HiiTiachal Pradesh • • • • • • . . . . . .
Jaimu & Kashmir • • • • . « • • « • • • . . .
Karanataka 3100 191 ■ • • 105 95 356 3847 85.55
Kerala 1800 724 447 50 336 3359 75.14
Madhya Pradesh 681 8153 ■ • a 3 6 1 5 8849 99.83
Maharashtra A36 98 2 8 4 190 738 72.36
Manipur
Meghalaya
Mizoram
Nagaland . . . .
Orissa
Punjab
Rajasthan 201i3 235 53 477 2810 80.18
Sikkim . • • • • • . . .
Tamil Nadu 'A 3 • • • 2 13 84.62
Tripura . . .
Uttar pradesh 31!5 87 28 9 450 89.33
West Bengal 1197 85 • • • « • 14 195 1491 85.98
A & N Islands • • I « « » • # «
Chandigarh • • •■ • • «
D & N Haveli
Daman & Diu . • •
Delhi . . . m m m
Lakshadweep • ♦» • • •
Pondicherry 9 9 t •«• • • • • « •
INDIA 40 62 086 265 2894 33327 87.56
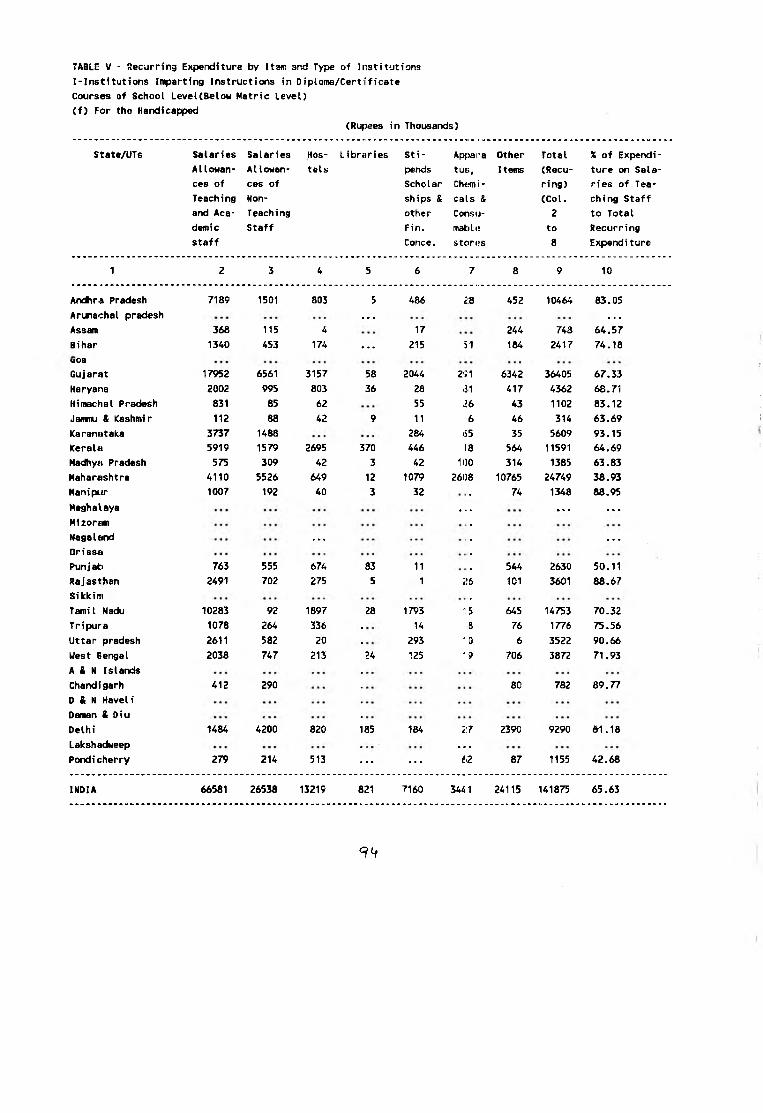
TABLE V - Recurring Expenditure by Item and Type of Institutions
I-Institutions Imparting Instructions in Diploma/Certificate
Courses of School LeveKBelow Metric Level)
(f) For the Handicapped
(Rupees in Thousands)
State/UTs Salaries Salaries Hos Libraries Sti Appara Other Total % of Expendi
Allowan Allowan tels pends tus. Items (Recu ture on Sala
ces of ces of Scholar ChtHni - ring) ries of Tea
Teaching Non- ships & cals & (Col. ching Staff
and Aca Teaching other Consu 2 to Total
demic Staff Fin. mable to Recurring
staff Conce. stores 8 Expenditure
1 2 3 4 5 6 7 8 9 10
Andhra Pradesh 7189 1501 803 5 486 E!8 452 10464 83.05
Arunachal pradesh — ...Assam 368 115 4 17 244 748 64.57
Bihar 1340 453 174 ... 215 31 184 2417 74.18
uoa
Gujarat 17952 6561 3157 58 2044 2'?1 6342 36405 67.33
Haryana 2002 995 803 36 28 .31 417 4362 68.71
Himachal Pradesh 831 85 62 55 ,26 43 1102 83.12
Jamnu & Kashmir 112 88 42 9 11 6 46 314 63.69
Karanataka 3737 1488 284 .55 35 5609 93.15
Kerala 5919 1579 2695 370 446 18 564 11591 64.69
Madhya Pradesh 575 309 42 3 42 100 314 1385 63.83
Maharashtra 4110 5526 649 12 1079 2608 10765 24749 38.93
Manipiir 1007 192 40 3 32 74 1348 88.95
Meghalaya ... ... ...Mizoram
Nagaland ... ...Or i ssa
Punjab 763 555 674 83 11 544 2630 50.11
Rajasthan 2491 702 275 5 1 26 101 3601 88.67
Sikkim
Tamil Nadu 10283 92 1897 28 1793 '!5 645 14753 70.32
Tripura 1078 264 336 14 B 76 1776 75.56
Uttar pradesh 2611 582 20 293 '0 6 3522 90.66
West Bengal 2038 747 213 24 125 '9 706 3872 71,93
A & N Islands
Chandigarh 412 290 80 782 89.77
D & N Havel i
Daman & Diu
Delhi 1484 4200 820 185 184 z;7 2390 9290 61.18
Lakshadweep —Pondicherry 279 214 513 ... ... 62 87 1155 42.68
INDIA 66581 26538 13219 821 7160 34^1 24115 141875 65.63
9 ^

TABLE / - Recurring Expenditure by Item amd Type of Institutions
I-Institutions Imparting Instructions in Diploma/Certificate
Courses of School LeveUBelow Metric Level)
<g) Reforraatory/Certiffed
(Rupees in Thousands)
State/UTs Salaries Salaries Hos- Libraries Sti Appara Other Total % of Expendi
Allowan Allowan te Is pends tus. Items (Recu ture on Sala
ces of ces of Sciiolar Chemi ring) ries of Tea
Teaching Non- ships & cals & (Col. ching Staff
and Aca Teaching other Consu 2 to Total
demic Staff Fin. mable to Recurring
staff Conce. stores 8 Expenditure
1 2 3 4 5 6 8 9 10
AfKlhra Pradesh 3283 1581 559 2 281 5707 85.23
Arunachal pradesh ... _Assam 73 • • • .«. ... • • • .. • •. • 73 100.00
Bihar 390 494 «• • • t • 884 100.00
Goa ;.. — —
Gujarat 1930 1579 938 9 222 86 274 5038 69.65
Haryana —
Himachal Pradesh • • • ... . ..
Janmu & Kashmir —
Karanataka 3896 1665 1368 ... . .. 121 66 7116 78.15
Kerala 709 839 264 1 339 2152 71.93
Madhya Pradesh 444 420 ... • 2 491 1357 63.67
Maharashtra 2727 3986 51 15 50 3621 10450 64.24
Manipur
Meghalaya ...
Mizoram • • •. —
Nagaland
Orissa
Punjab 390 390 100.00
Rajasthan ... ...
Sikkim
Tamil Madu 4760 1443 2090 240 75 8608 72.06
Tripura
Uttar pradesh _West Bengal 33 33 100.00
A & N Islands ... • • ...
Chandigarh ...
D & N Haveli ... • • • •. •
Daman & Oiu ... ..» ...
Delhi 290 300 36 240 139 1019 57.90
Lakshadweep ...
Pondicherry ... ... ... ... ... ...
INDIA 18925 12307 5306 43 7C2 333 5211 42827 72.93
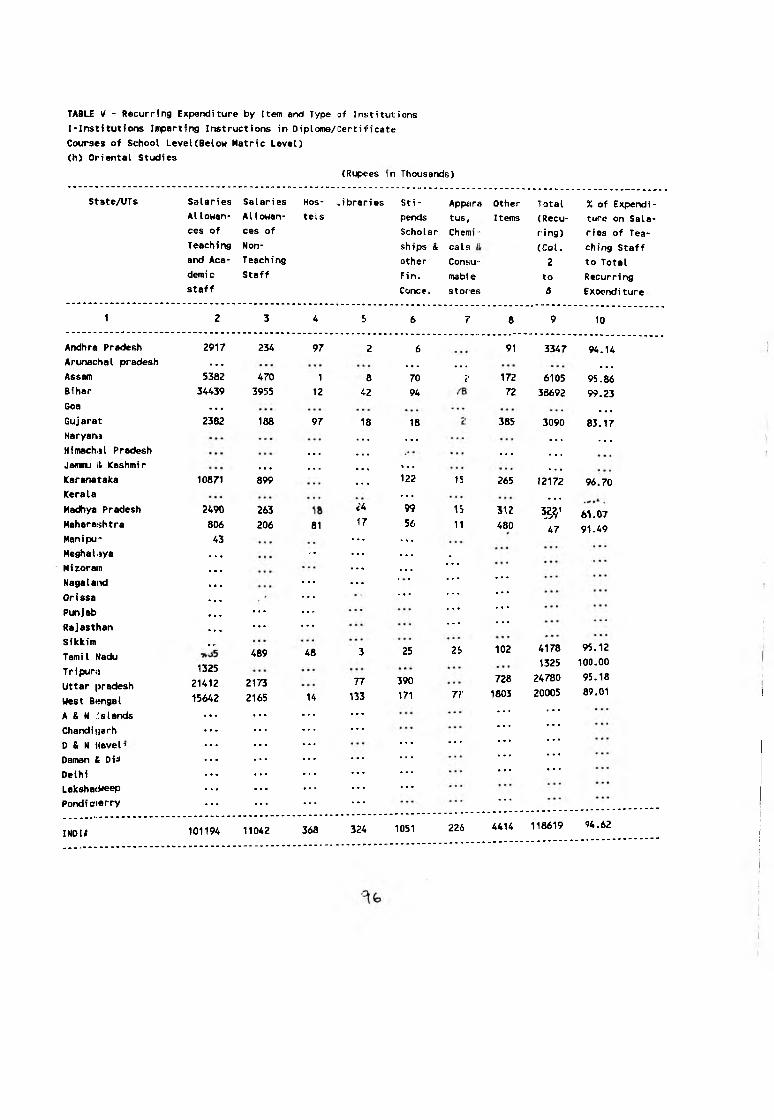
TABLE ^ - Recurring Expenditure by Item and Type of Institutions
I-Institutions Imparting Instructions in Diploma/Certificate
Courses of School LeveKBelow Metric Level)
(h> Oriental Studies
(Rupees in Thousands)
State/UTs Salaries Salaries Hos -ibraries Sti Apparo Other Total % of ExpendiAllowan AIlowan- tels pends tus, Itefns (Recu ture on Salaces of ces of Scholar Chemi ring) ries of Tea
Teaching Non- ships & cals (Col. ching Staff
and Aca T each i ng other Consu- 2 to Totaldemic Staff Fin. mabte to Recurringstaff Conce. stores & Expenditure
1 2 3 4 5 6 7 8 9 10
Andhra Pradesh 2917 234 97 2 6 91 3347 94.14Arunachal pradesh . . . • • • • • • • • •
Assam 5382 470 1 8 70 ? 172 6105 95.86Bihar 34439 3955 12 42 94 72 38692 99.23Goa . . . • • •
Gujarat 2382 188 97 18 18 385 3090 83.17Haryana • • • . . . • • • . . .
Himachal Pradesh • • • • a • • • • • • •
Jaamu & <ashmir . . . • • . • ■ * . . .• • •
Karanataka 10871 899 • • • 122 15 265 12172 96.70Kerala . . .
• • •
Madhya Pradesh 2490 2&3 t'4 99 15 312 w 61.07Maharashtra 806 206 81 17 56 11 480 47 91.49Manipur 43 . . . . . .
Meghalaya -• . . . . . . .
Mizorain . . . . . .. . .
Nagaland . . . . . . ' •• • • . . .
Orissa . . . . . . • • • . . .
Punjab . . . . . .. . • • • •
Rajasthan . . . . . . * • •• • •
Sikkim
Tamil Hadu 489 48 3 25 2.S 102 4178
1325
95.12
100.00Tripura
Uttar pradesh
West Bengal
1325
21412
15642
2173
2165 14
77
133
390
171 71
728
1803
24780
20005
95.18
89.01
A & M Islands . . . . . . . . . . . . • • •. . .
Chandigarh . . . . . . . . . . . . • • •. . .
D & N Havel' . . . . . . . . . . . . — • • • . . .
Daman & Di^ . . . . . . . . . . . . — • • • . . .
Delhi . . . . . . . . . . . . . . . • • •• • •
Lakshat^eep . . . . . . . . . . . . . . .
Pondioierry . . . . . . . . . . . . • • •
INDI/ 101194 11042 368 324 1051 22iS 4414 118619 94.62

TABLE f - Recurring Expenditure by Item and Type of Institutions
[-Institutions Imparting Instructions in Diploina/Certificate
Courses of School LeveKBelow Matric Level)
(i) Social (Adult) Education
(Rupees in Thousands)
State/UTs Salaries Salaries Hos Libraries Sti- Appara Other Total % of Expendi
Allowan Allowan tels peixis tus, Items (Recu ture on Sala
ces of ces of Scholar Chemi- ring) ries of Tea
T each i ng Mon- ships & cals & (Col. ching Staff
and Aca Teaching other Consu 2 to Total
demic Staff Fin. mable to Recurring
staff Conce. stores 8 Expendi ture
1 2 3 5 6 8 9 10
Andhra Pradesh 17981 22396 . . . . . . 32258 72635 55.59
Arunachal pradesh • a 3361 3361
Assam 1788 1000 2792 64.04
Bihar —
Goa 733 1800 161 558 3252 77.89
Gujarat 22483 7920 3027 33430 90.95
Haryana —
Himachal Pradesh 4931 1200 ■ • « 100 6231 98.40
Jamnu & Kashmir . t . % % * *
Karanataica 48149 . . . • .. • « 48149 100.00
Kerala __Madhya Pradesh 2072 497 * « ■ 56 6943 9599 26.76
Maharashtra . . . • • • ■ 1 • 101396 101396
Manipur 4007 >• • • « • • • • ■ 6322 10329 38.79
Meghalaya 2520 . . . 4829 7349 34.29
Mizoram 125 . . . 266 391 31.97
Nagaland 2250 1978 •i ■ • 1631 3529 9388 45.04
Orissa . . . . . .
Punjab 8878 . . - 4421 13299 66.76
Rajasthan . . . 32195 . . . 49971 82166 39.18
Sikkim 1575 . . . • • « • • • 1427 3002 52.47
TamiI Nadu 20773 36372 16381 73526 77.72
Tripura 42878 1647 • • . 3151 47676 93.39
Uttar pradesh 44519 101413 145932 30.51
West Bengal 20214 170 9920 30304 67.27
A & N Islands 382 330 • • . 32 748 95.19
Chandigarh 687 707 • • . 1394 100.00
D & N Haveli 148 • • . . . . 148 100.00
Daman & Diu 166 15 • • • 93 274 60.58
Delhi 3713 1579 » • . 2328 7620 69.45
Lakshadweep 163 81 45 289 84.43
Pondicherry . . . 734 58 66 17 875 83.89
INDIA 206491 154250 . . . . 238 1757 352788 715555 50.41
^ 7
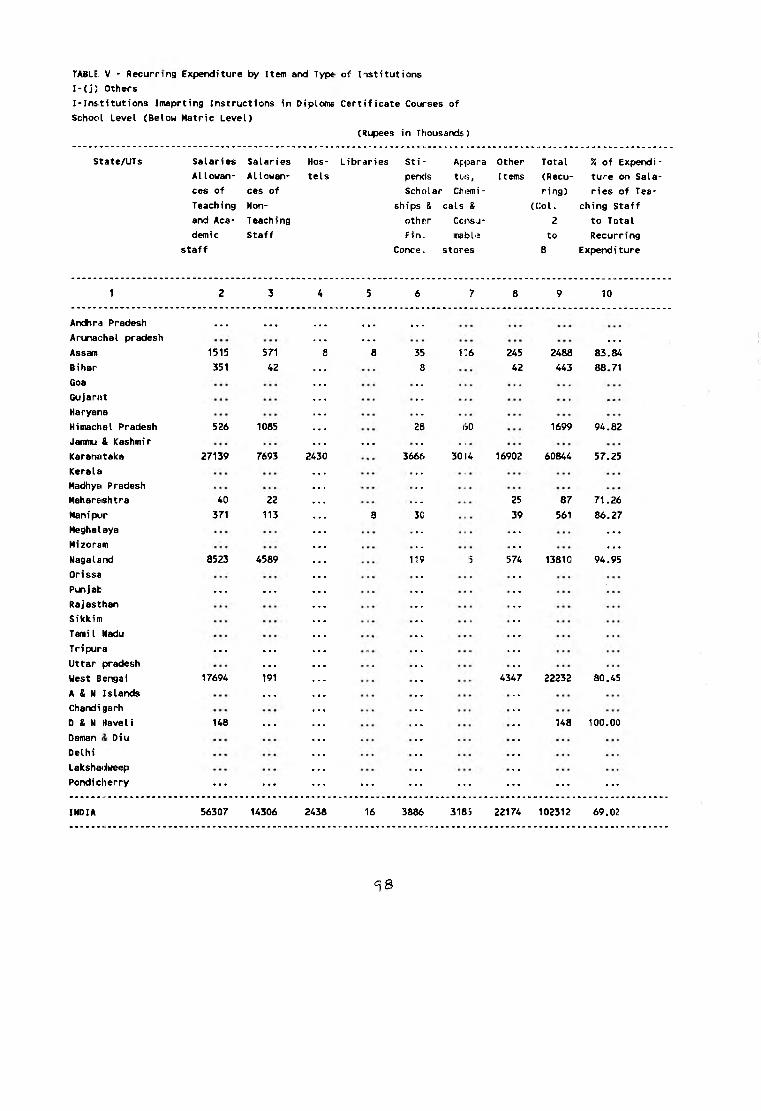
table: V - Recurring Expenditure by Item and Type of Institutions
I-(j) Others
I-Institutions Imaprting Instructions in Diploma Certificate Courses of
School Level (Below Metric Level)
(Rupees in Thousands.)
State/UTs Salaries Salaries Hos Libraries Sti Apijjara Other Total % of Expendi
AIlowan- Allowan tels pends tus, Items (Recu ture on Sala
ces of ces of Scholar Cht^i- ring) ries of Tea
T each i ng Non- ships & cals & (Col. ching Staff
and Aca T each i ng other Ccnsu- 2 to Total
demic Staff Fin. mable to Recurring
staff Conce. stores 8 Expenditure
1 2 3 4 5 6 7 8 9 10
Andhra Pradesh . . . . . . ... . . .
Arunachal pradesh — . . .
Assam 1515 571 8 35 i:>6 245 2488 83.84
Bihar 351 42 8 42 443 88.71
Goa
Gujarat
Haryana
Himachal Pradesh 526 1085 oO 1699 94.82
Janmu & Kashmir —
Karanfitaka 27139 7693 2430 3666 3014 16902 60844 57.25
KeraUi
Madhya Pradesh
Mahar&shtra 40 22 25 87 71.26
Manipur 371 113 8 39 561 86.27
Meghalaya . . .
Mizoram . . .
Nagaland 8523 4589 119 5 574 13810 94.95
Orissa
Punjab . . . . . .
Rajasthan
Sikkim
Tamil Nadu
Tripura . . . . . . * • •
Uttar pradesh . . .
West Bengal 17694 191 4347 22232 80.45
A & N Islands _Chandi garh
D & N Haveli 148 . . . 148 100.00
Daman Oiu
Delhi
LakshatJweep
Pondicherry . . . . . . . . . ... ... . . . . . . ...
INDIA 56307 14306 2438 16 3886 318'5 22174 102312 69.02
^ 8
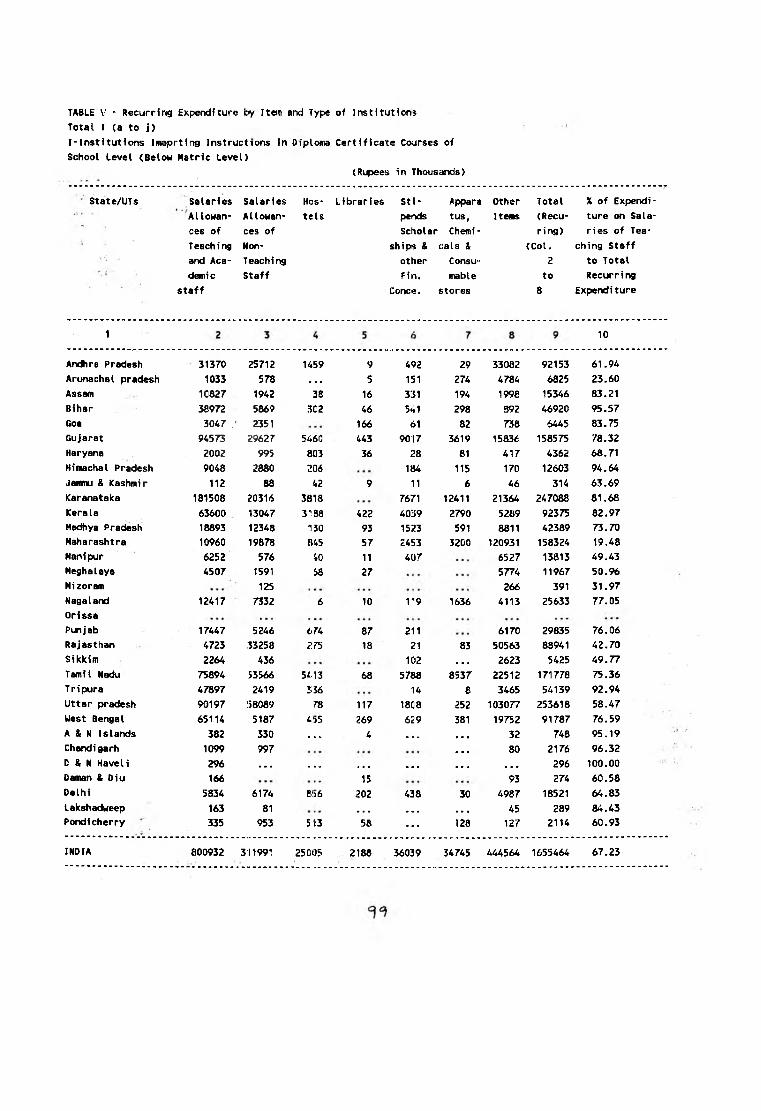
TABLE V - Recurring Expenditure ty Itan an<d Type of Institutions
Total I (a to j)
I-Institutions Imaprting Instructions in Diplona Certificate Courses of
School Level (Below Metric Level)
(Rupees in Thcusiinds)
State/UTs Salaries
Allowan
ces of
Teaching
and Aca
demic
staff
Salaries
Allowan
ces of
Non-
Teaching
Staff
Hos
tels
Libraries St i- Appara
petxls tus,
Scholar Chemi-
ships S cals &
other Consu"
Fin. mable
Conce. stores
Other
Items
Total
(Recu-
X of Expendi
ture on Sala-
ring) ries of Tea*
(Col. ching Staff
2 to Total
to Recurring
8 Expendi ture
1 10
Andhra Pradesh
Arunachal pradesh
Assam
Bihar
Goa
Gujarat
Haryana
Himachal Pradesh
Jarnnu & Kashmir
Karanataka
Kerala
Hacftiya Pradesh
Maharashtra
Hanipur
Meghalaya
Mizoram
Nagaland
Orissa
31370 25712 1459 9 492 29 33082 92153 61.94
1033 578 a . . 5 151 274 4784 6825 23.60
10827 1942 38 16 331 194 1998 15346 83.21
38972 5869 3C2 46 5<»1 298 892 46920 95.57
3047 / 2351 166 61 82 738 6445 83.75
94573 29627 5460 443 9017 3619 15836 158575 78.32
2002 995 803 36 28 81 417 4362 68.71
9048 2880 H06 1B4 115 170 12603 94.64
112 83 ;2 9 11 6 46 314 63.69
181508 20316 3818 7671 12411 21364 247088 81.68
63600 13047 3138 422 4039 2790 5289 92375 82.97
18893 12343 ISO 93 1523 591 8811 42389 73.70
10960 19878 8 « 57 2453 3200 120931 158324 19.48
6252 576 ;o 11 407 6527 13813 49.43
4507 1591 S8 27 5774 11967 50.96
125 266 391 31.97
12417 7332 6 10 1-9 1636 4113 25633 77.05
Punjab 17447 5246 6?-4 87 211 6170 29835 76.06
Rajasthan 4723 33258 2^5 18 21 83 50563 88941 42.70
Sikkim 2264 436 102 . . . 2623 5425 49.77
Tamil Nadu 75894 53566 5413 68 5788 8537 22512 171778 75.36
Tripura 47897 2419 336 14 8 3465 54139 92.94
Uttar pradesh 90197 58089 78 117 1808 252 103077 253618 58.47
Uest Bengal 65114 5187 4I>5 269 629 381 19752 91787 76.59
A & N Islands 382 330 • . «. 4 • • • • • • 32 748 95.19
Chandigarh 1099 997 . . . 80 2176 96.32
D & N Haveli 296 . . . • . • « • ■ • • • • • • • • * 296 100.00
Daman & Diu 166 15 93 274 60.58
Delhi 5834 6174 81)6 202 438 30 4987 18521 64.83
Lakshadweep 163 81 • • • • • • • • • 45 289 84.43
Pondicherry 335 953 513 58 . . . 128 127 2114 60.93
INDIA 800932 31199“! 25005 2188 36039 54745 444564 1655464 67.23
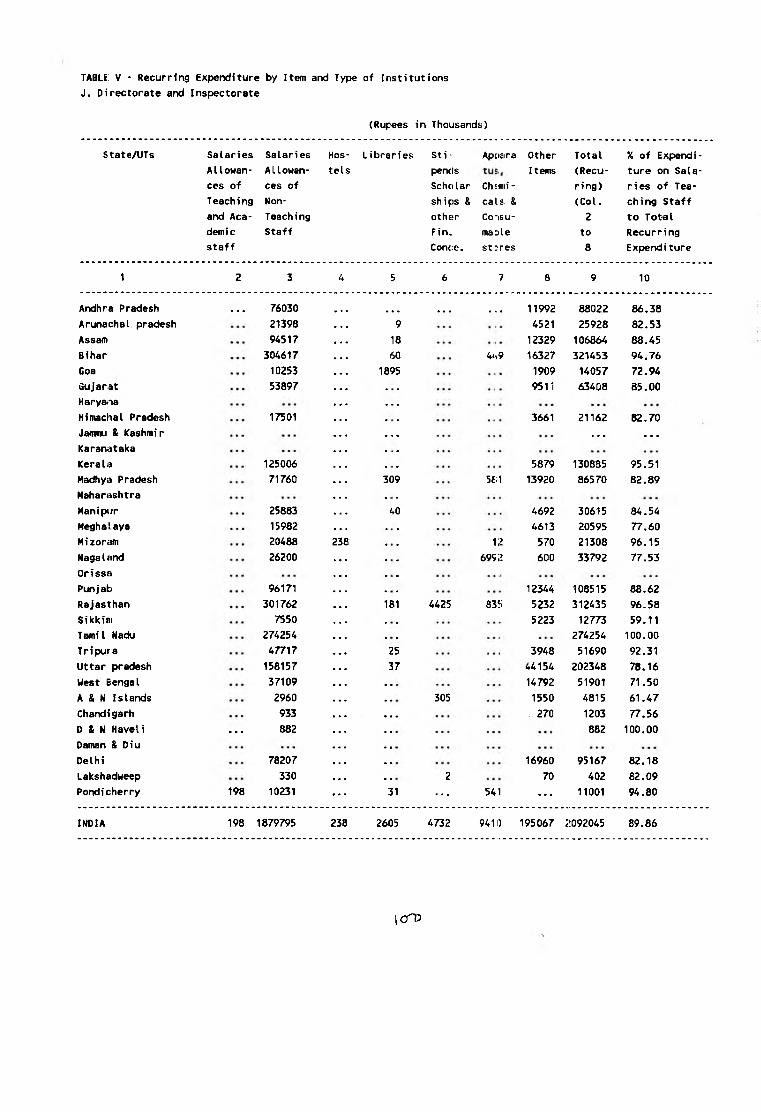
table: V - Recurring Expenditure by Item and Type of Institutions
J. Directorate and Inspectorate
(Rupees in Thousands)
State/UTs Salaries Salaries Hos Libraries St i ■ Appfira Other Total % of Expendi
Allowan- Allowan tels pencis Items (Recu ture on Sala
ces of ces of Scholar ChEHii- ring) ries of Tea
Teaching Non- ships & cals. & (Col. ching Staff
and Aca* Teaching other Corisu- 2 to Total
demic Staff Fin. mable to Recurring
staff Conce. stores 8 Expenditure
1 2 3 4 5 6 7 8 9 10
Andhra Pradesh ... 76030 ... ... ... 11992 88022 86.38
Arunachal pradesh 21398 9 4521 25928 82.53
Assam 94517 18 12329 106864 88.45
Bihar 304617 60 4<v9 16327 321453 94.76
Goa 10253 1895 1909 14057 72.94
Gujarat 53897 9511 63408 85.00
Haryana —Himachal Pradesh 17501 3661 21162 82.70
Jainnu & Kashmir ... ... ...Karanataka
Kerala 125006 5879 130885 95.51
Madhya Pradesh 71760 309 5£;1 13920 86570 82.89
Maharashtra
Hanipiir 25883 40 4692 30615 84.54
Meghalaya 15982 4613 20595 77.60
Mizoram 20488 12 570 21308 96.15
Nagaland 26200 6952 600 33792 77.53
Orissa
Punjab 96171 12344 108515 88.62
Rajasthan 301762 181 4425 83!i 5232 312435 96.58
Sikkim 7550 5223 12773 59.11
Tamil Nadu 274254 274254 100.00
Tripura 47717 25 3948 51690 92.31
Uttar pradesh 158157 37 44154 202348 78.16
West Bengal 37109 14792 51901 71.50
A & N Islands 2960 305 1550 4815 61.47
Chandigarh 933 ... 270 1203 77.56
0 & N Haveli ... 882 882 100,00
Daman & Diu
Delhi 78207 16960 95167 82.18
Lakshadweep 330 2 70 402 82.09
Pondicherry 198 10231 31 ... 541 ... 11001 94.80
INDIA 198 1879795 238 2605 4732 9411) 195067 2092045 89.86
\cTO
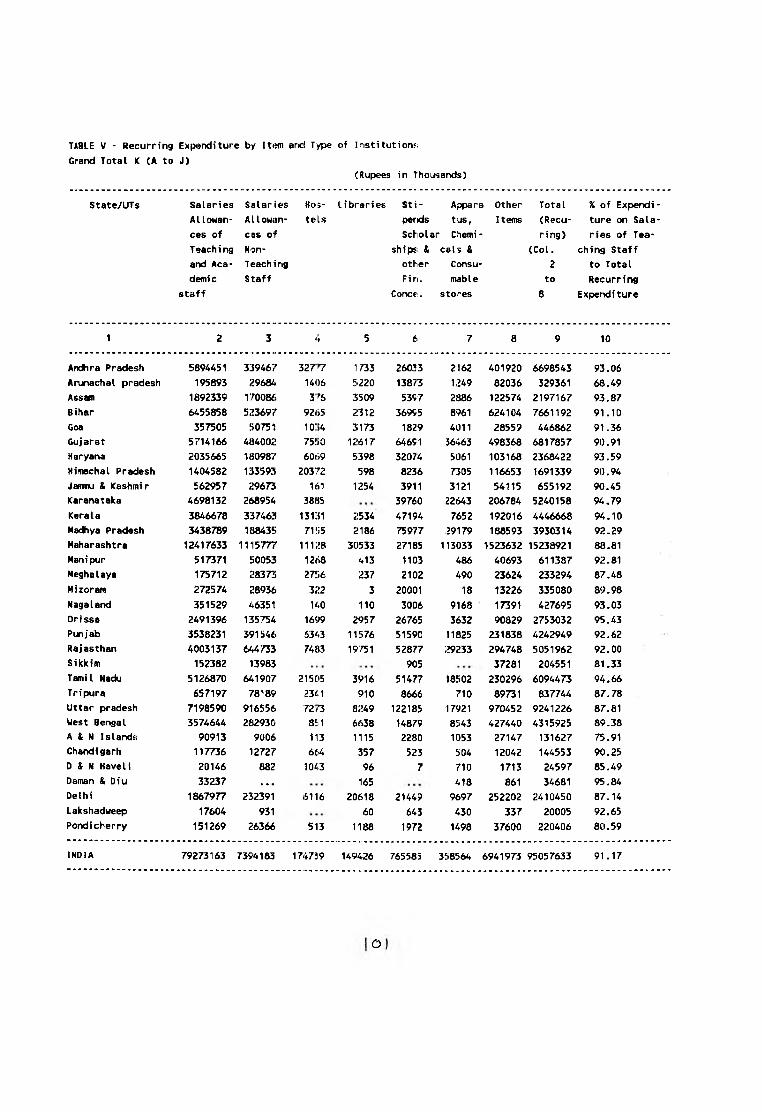
TABLE V - Recurring Expenditure b/ Itian aricl Type of Institutions
Grand Total K (A to J)
(Rupees in Thousands)
State/UTs Salaries
Allowan
ces of
Teaching
and Aca
demic
staff
Salaries
AL lowan-
ces of
Non-
T each i ng
Staff
Hos
tels
Libraries Sti- Appara Other
pends tus, Items
Scholar Chemi-
shlps; & cals &
other Consu-
Fin. mable
Conce. stores
Total
(Recu
ring)
(Col.
2
to
8
% of Expendi
ture on Sala
ries of Tea
ching Staff
to Total
Recurring
Expenditure
1 2 3 4 5 6 7 8 9 10
Andhra Pradesh 5894451 339467 327 V 1733 26033 2162 401920 6698543 93.06
Arunachal pradesh 195893 29684 1406 5i220 13873 1249 82036 329361 68.49
Assam 1892339 170086 3^6 3509 5397 2886 122574 2197167 93.87
Bihar 6455858 523697 9265 5!312 36995 8961 624104 7661192 91.10
Goa 357505 50751 10;54 3173 1829 4011 28559 446862 91.36
Gujarat 5714166 484002 75!)0 12617 64691 56463 498368 6817857 90.91
Haryana 2035665 180987 60(’>9 5398 32074 5061 103168 2368422 93.59
Himachal Pradesh 1404582 133593 20372 598 8236 7305 116653 1691339 90.94
Jamnnu & Kashmir 562957 29673 161 1254 3911 3121 54115 655192 90.45
Karanataka 4698132 268954 3885 39760 22643 206784 5240158 94,79
Kerala 3846678 337463 i3i:5i i!534 47194 7652 192016 4446668 94.10
MaJiya Pradesh 3438789 188435 71!i5 2186 75977 29179 188593 3930314 92.29
Maharashtra 12417633 1115777 11128 30533 27185 113033 1523632 15238921 88.81
Manipur 517371 50053 12<i8 413 1103 486 40693 611387 92.81
Meghalaya 175712 28373 27!i6 237 2102 490 23624 233294 87.48
Mizoram 272574 28936 322 3 20001 18 13226 335080 89.98
Nagaland 351529 46351 140 110 3006 9168 17391 427695 93.03
Orissa 2491396 135754 1699 2957 26765 3632 90829 2753032 95.43
Punjab 3538231 391546 6343 11576 51590 11825 231838 4242949 92.62
Rajasthan 4003137 644733 74«3 19751 52877 29233 294748 5051962 92.00
Sikkim 152382 13983 905 37281 204551 81.33
Tamil Nadu 5126870 641907 21505 3916 51477 18502 230296 6094473 94.66
Tripura 657197 78189 23 . 1 910 8666 710 89731 837744 87.78
Uttar pradesh 7198590 916556 72/3 8249 122185 17921 970452 9241226 87.81
Uest Bengal 3574644 282930 851 6638 14879 8543 427440 4315925 89.38
A & N Islands 90913 9006 113 1115 2280 1053 27147 131627 75.91
Chandigarh 117736 12727 6iA 357 523 504 12042 144553 90.25
D & N Haveli 20146 882 1043 96 7 710 1713 24597 85.49
Daman & Diu 33237 . . . 165 418 861 34681 95.84
Delhi 1867977 232391 6116 20618 21449 9697 252202 2410450 87-14
Lakshadweep 17604 931 60 645 430 337 20005 92.65
Pondicherry 151269 26366 513 1188 1972 1498 37600 220406 80.59
INDIA 79273163 7394183 174739 149426 765585 3f«564 6941973 95057633 91.17
O
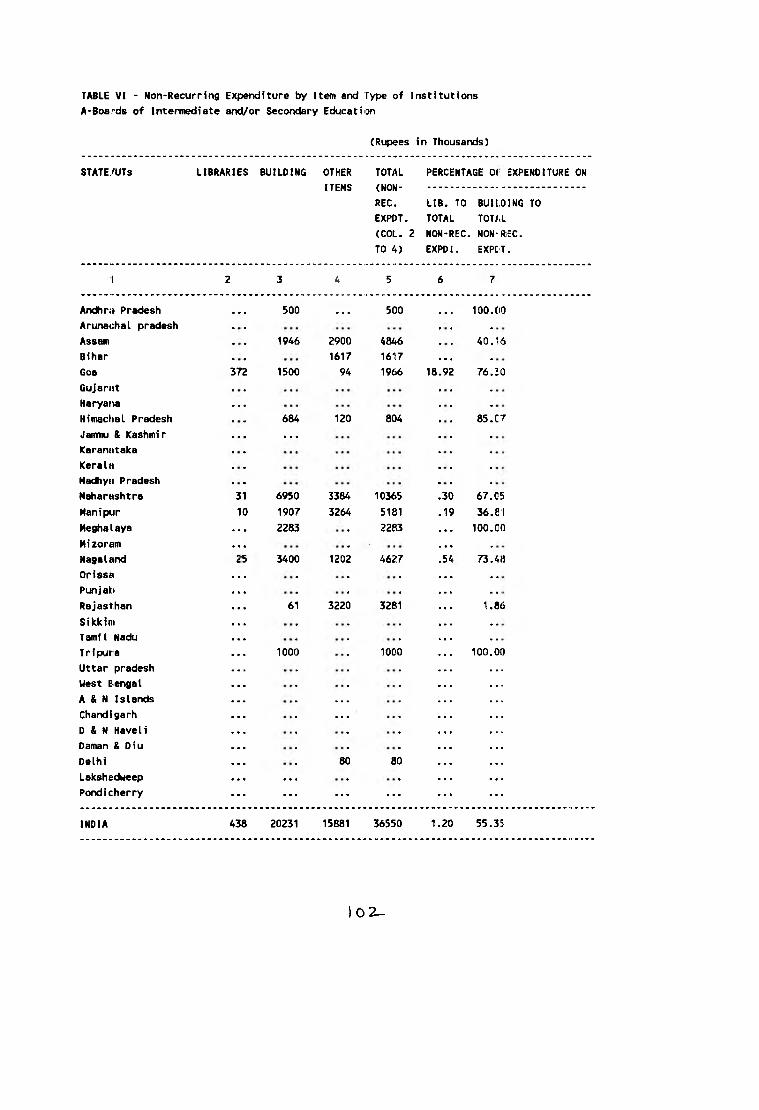
(Rupees in Thousands)
TABLE VI - Non-Recurring Expenditure by Item and Type of Institutions
A-Boards of Intermediate and/or Secondary Education
STATE/UTs LIBRARIES BUILDING OTHER
ITEMS
TOTAL
(NON-
REC.
EXPOT.
(COL. 2
TO 4)
PERCENTAGE Of EXPENDITURE ON
LIB. TO BUILDING TO
TOTAL TOT/.l
NON-REC. NON-REC.
EXPDI. EXPCT.
1 2 3 4 5 6
Andhra Pradesh • • • 500 . . . 500 . . . 100.00
Arunachal pradesh
Assam 1946 2900 4846 40.16
Bihar 1617 1617 ■ ■ •
Goa 372 1500 94 1966 18.92 76.20
Gujarat
Haryarui • • •
Himachal Pradesh 684 120 804 85.C7
Jaimiu & Kashmir . . . . . .
Karanataka
Kerala
Hadhyu Pradesh
Maharashtra 31 6950 3384 10365 .30 67.C5
Hanipiir 10 1907 3264 5181 .19 36.81
Meghalaya 2283 2283 • • ■ 100.CO
Mizoram
Nagaland
• • •
3400 1202 4627
• • •
73.48
Orissa « a •
Punjab ■ • •
Rajasthan 61 3220 3281 ■ • • 1.86
Sikkim • a •
Tamil Nadu • • •
Tripura 1000 1000 100.00
Uttar pradesh
West Bengal • • •
A & N Islands • • • _____
Chandigarh a • • . . .
D & N Haveli ■ • «
Daman & Diu ■ • • • • •
Delhi • • • 80 80 • ■ •
Lakshadweep • • • . . . • • ■ • • •
Pondicherry • ■ • . . . . . . . . . • • •
INDIA 438 20231 15881 36550 1.20 55.31
1 0 2 -
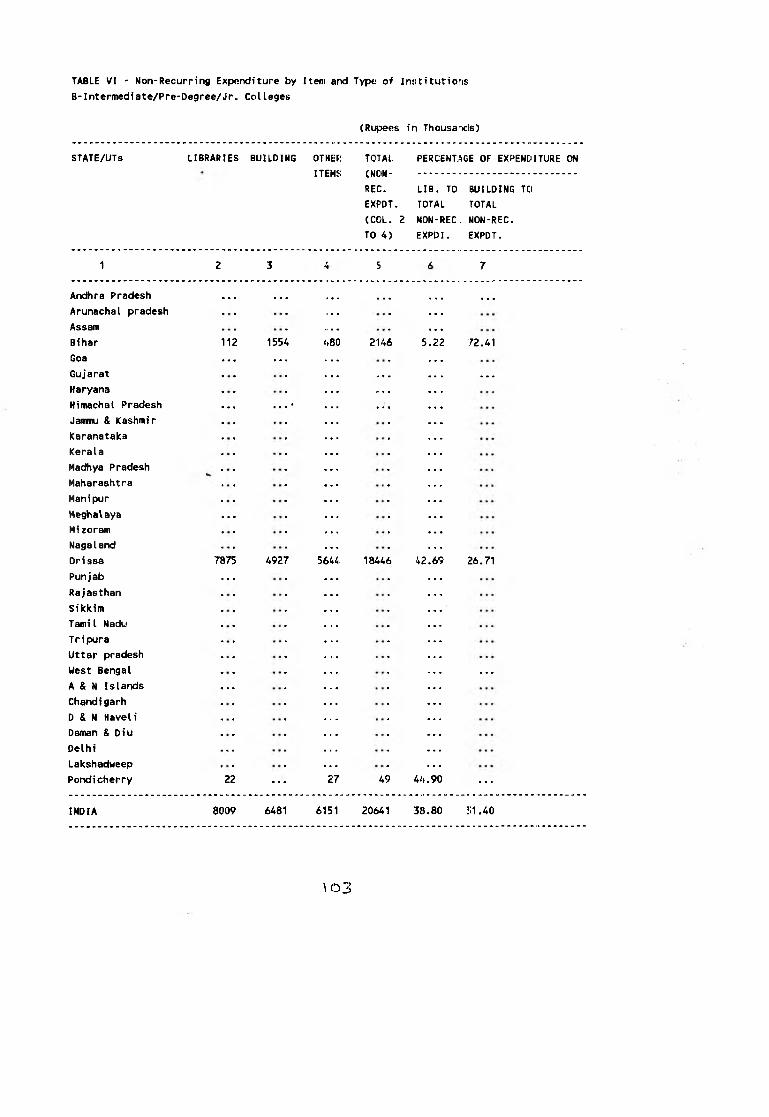
TABLE VI - Non-Recurring Expenditure by Iteni arxi Type of Insititutioris;
B-Intermediate/Pre-Degree/Jr, Col leges
(Rupees in Thousa'icis)
STATE/UTs LIBRARIES BUILDING OTHER
ITEMS
TOTAL
(NOM-
REC.
EXPDT.
(COL. 2
TO 4)
PERCENUGE OF EXPENDITURE ON
LIB. TO BUILDING TO
TOTAL TOTAL
NON-REC, NON-REC.
EXPO I. EXPDT.
1 2 3 f 5 7
Andhra Pradesh • • • >«• ... ...
Arunachal pradesh
Assam
Bihar 112 1554 2146 5.22 72.41
Goa ■ ■ « ...
Gujarat ... —
Haryana ...
Himachal Pradesh « • « ... • ...
Jammu & Kashmir
Karanataka
Kerala
Madhya Pradesh
Maharashtra
Manipur
MeghaVaya • • •
Mizoram
Nagaland
Orissa 7875 4927 5 6 W 18446 42.69 26.71
Punjab « a «
Rajasthan
Sikkim
Tamil Nadu
T r i pura
Uttar pradesh
West Bengal —
A & N Islands • • •
Chandi garh
D & N Haveli
Daman & Diu
Delhi ■ « ■
Lakshadweep
Pondicherry 22 ... 2l7 49 44.90 ...
INDIA 8009 6A81 6151 20641 38.80 211.40
\03
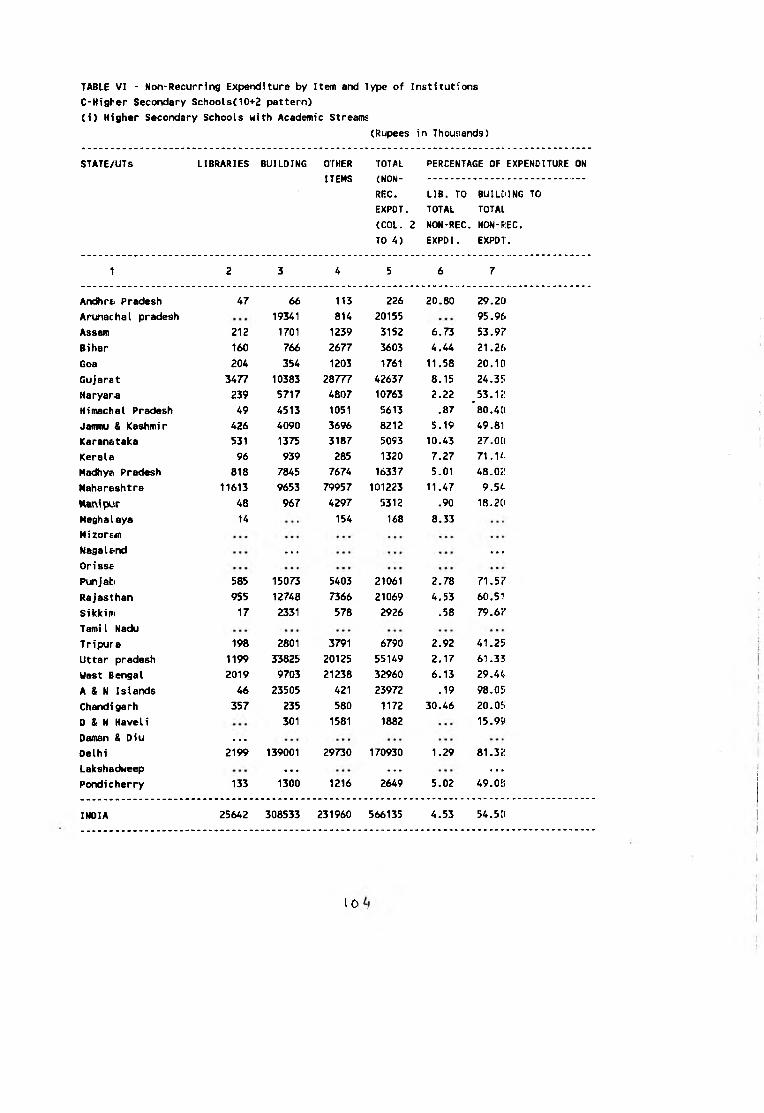
(Rupees in Thousands)
TABLE VI - Non-Recurring Expenditure by Item and Type of Institutions
C-Higher Secondary Schools(10+2 pattern)
(i) Higher Secondary Schools with Academic Streams
STATE/UTs LIBRARIES BUILDING OTHER TOTAL PERCENTAGE OF EXPENDITURE ON
ITEMS (NON-
REC.
EXPDT.
(COL. 2
TO 4)
LIB. TO
TOTAL
NON-REC.
EXPO I.
BUILDING TO
TOTAL
NON-REC.
EXPDT.
1 2 3 4 5 6 7
Andhra Pradesh 47 66 113 226 20.80 29.2CI
Arunachal pradesh 19341 814 20155 95.9f.
Assam 212 1701 1239 3152 6.73 53.97
Bihar 160 766 2677 3603 4.44 21.26
Goa 204 354 1203 1761 11.58 20.10
Gujarat 3477 10383 28777 42637 8.15 24.35
Haryatia 239 5717 4807 10763 2.22 53.12
Himachal Pradesh 49 4513 1051 5613 .87 *80.4CI
Jainnu & Kashmir 426 4090 3696 8212 5.19 49.81
Karanataka 531 1375 3187 5093 10.43 27.0CI
Kerala 96 939 285 1320 7.27 71. K.
Madhya Pradesh 818 7845 7674 16337 5.01 48.o:i
Maharashtra 11613 9653 79957 101223 11.47 9.5^.
Hanipur 48 967 4297 5312 .90 18.2CI
Meghalaya 14 154 168 8.33
MizorEim
Nagaland . . . . . .
Orissa
PtBijab 585 15073 5403 21061 2.78 71.5/’
Rajasthan 955 12748 7366 21069 4.53 60.51
Sikkim 17 2331 578 2926 .58 79.67
Tamil Nadu
Tripura 198 2801 3791 6790 2.92 41.25
Uttar pradesh 1199 33825 20125 55149 2.17 61.35
West Bengal 2019 9703 21238 32960 6.13 29.4«.
A & N Islands 46 23505 421 23972 .19 98.05
Chandigarh 357 235 580 1172 30.46 20.05
0 & N Haveli 301 1581 1882 i5.9;»
Daman & Diu . . .
Delhi 2199 139001 29730 170930 1.29 81.32
Lakshadweep . . . . . . . . .
Pondicherry 133 1300 1216 2649 5.02 49.0B
INDIA 25642 308533 231960 566135 4.53 54.5CI
10
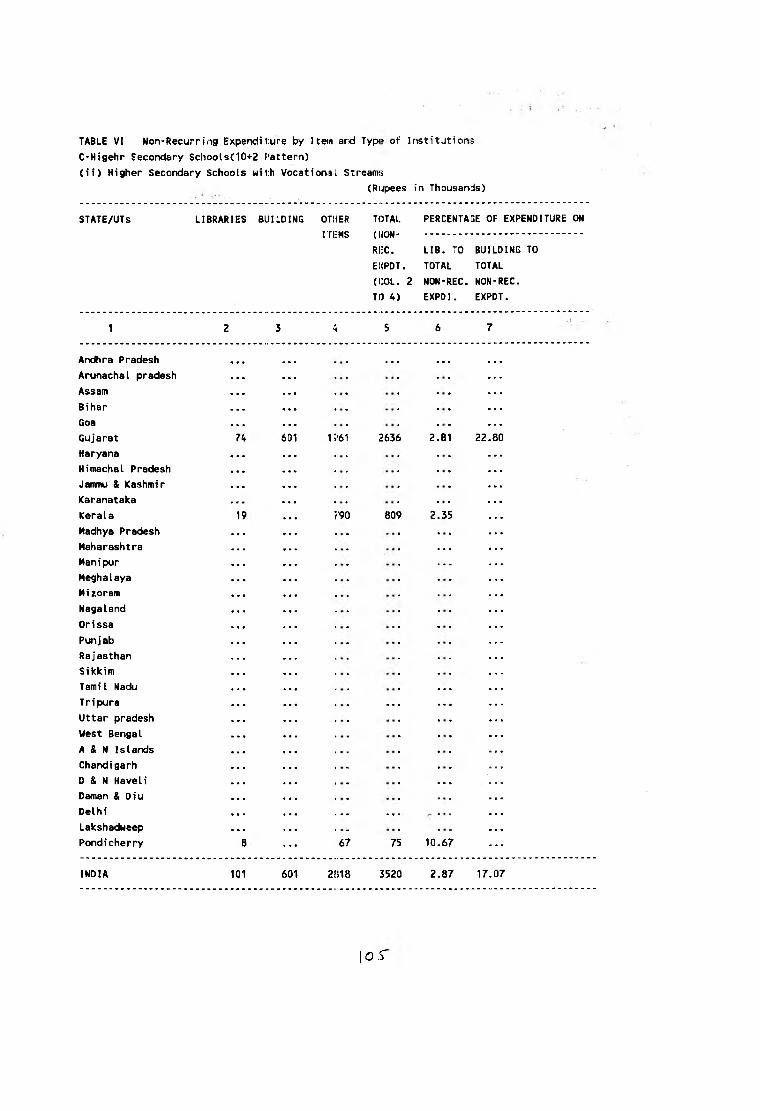
TABLE VI Non-Recurring Expenditure by I tan and Typt» of Institutions
C-Higehr Secondary Schools(10+2 F'attern)
(ii) Higher Secondary Schools uii;h Vocational Streaiiifi
(Rupees in Thousands)
STATE/UTs LIBRARIES BUILDING OTHER TOTAL PERCENTAGE OF EXPENDITURE ON
ITEMS (HON.....................................
RIEC. LIB. TO BUILDING TO
EXPDT. TOTAL TOTAL
(COL. 2 NON-REC. NON-REC.
TO 4) EXPDI. EXPDT.
1 2 3 5 7
Andhra Pradesh • • • ... ...
Arunachal pradesh • • «
Assam • • •
Bihar ■ * • • • •
Goa
Gujarat
• » • • « •
i;'6i 2636 2.81 22.80
Haryana • • • • • •
Himachal Pradesh • • •
Jammu & Kashmir • • •
Karanataka
Kerala ?’90 809 2.35
Madhya Pradesh • • ■
Maharashtra • • • • • ■ ...
Manipur • • • • • • —
Meghalaya • • • • • «
Mizoram • • ■ • • •
Nagaland • • •
Orissa « • •
Punjab • • •
Rajasthan • • •
Sikkim
Tamil Nadu * • • • a •
Tripura • • • — « > •
Uttar pradesh
West Bengal • ■ ■
A & N Islands • • • • • •
Chandigarh • • • • • •
D & N Haveli • • • • ■ •
Daman & Diu • • • • • • • * •
Delhi • • • « • • . .. ... • • •
Lakshadweep ■ • • • ■ ■
Pondicherry 67 75 10.67
INDIA 601 2ai8 3520 2.87 17.07
| o : r

TABLE VI - Non-Recurring Expenditure by Item and Type of Institutions
C-Higehr Secondary Schools(10>2 pattern)
(iii) Higehr Secondary Schools with Vocational amd Academic Streams
(Rupees in Thousands)
STATE/UTs LIBRARIES BUILDING OTHER
ITEMS
TOTAL
(NOH-
REC.
EXPDT.
(COL. 2
TO 4)
PERCEMTAGE Of EXPENDITURE ON
LIB. TO BUILDING TO
TOTAL TOT/,.
NON-REC. NON-t?EC.
EXPD], EXPCT.
■I 2 3 4 5 7
Andhra Pradesh . . . . . . . . . . . . ... •. •Arunachal pradesh — —Assam . . .Bihar —Goa
Gujarsit 721 2984 6819 10524 6.85 28.3!}
Haryana — —Himachal Pradesh ■ ■ « 131 131
Jammu & Kashmir . . .Karamitaka
KeraUi
MacAiyd Pradesh
Maharashtra . . .Manipur •. ■Meghalaya
Mizoreim . ■ ■Nagaland ...Orissa
Punjab 329 4429 1693 6451 5.10 68.66
Rajasthan
Sikkim —Tamil Nadu 9864 25311 17664 52839 18.67 47.9CI
Tripura
Uttar pradesh ...West Bengal
A & N Islands 82 82 _Chandigarh
D & N Haveli —Daman & Diu __Delhi 37 298 517 852 4.34 34.9i
Lakshadweep _ — —Pondicherry 92 2200 586 2878 3.20 76.4.;
INDIA 11043 35222 27492 73757 14.97 47.71)
0 €

TABLE VI- Non-Recurring Expenditure by Item iand by type of
Total C (i to iii) (10+2 pattern;i
Institut
(Rs. in
ions
Thousnds)
STATE/UTs LIBRARIES BUILDING OTHER
ITEMS
TOTAL
(HDN-
REC.
EXPDT.
(COL. 2
TO 4)
PERCEMTA3E OF EXPENDITURE ON
LIB. TO BUILDING TO
TOTAL TOTAL
MON-REC. NON-REC.
EXPDI. EXPDT.
1 2 3 4 5 6 7
Andhra Pradesh 47 66 113 226 20.30 29.20
Arunachal pradesh 19341 814 20155 95.96
Assam 212 1701 1239 3152 6.73 53.97
Bihar 160 766 2677 3603 4.44 21.26
Goa 204 354 1203 1761 11.58 20.10
Gujarat 4272 13968 3TO57 551797 7.66 25.03
Haryana 239 5717 4807 10763 2.22 53.12
Himachal Pradesh 49 4513 1182 5744 .35 78.57
Jamniu & Kashmir 426 4090 3(>96 8212 5.19 49.81
Karanataka 531 1375 3137 5093 10.43 27.00
Kerala 115 939 '1075 2129 5.40 44.11
Madhya Pradesh 818 7845 7674 16337 5.01 48.02
Maharashtra 11613 9653 7 W 5 7 101223 11.47 9.54
Manipur 48 967 4297 5312 .90 18.20
Meghalaya 14 '154 168 8.33
Mizoram — —
Nagaland
Orissa
Punjab 914 19502 70 ?6 2?’512 3.32 70.89
Rajasthan 955 12748 /'!iS6 21069 4.53 60.51
Sikkim 17 2331 5178 2926 .58 79.67
Tamil Nadu 9864 25311 176S4 52839 18.67 47.90
Tripura 198 2801 37’?1 6790 2.92 41.25
Uttar pradesh 1199 33825 201 >5 55149 2.17 61.33
West Bengal 2019 9703 212:38 32:960 6.13 29.44
A & N Islands 46 23505 S>)3 24054 .19 97.72
Chandigarh 357 235 '30 1172 30.46 20.05
D & N Haveli 301 1531 1882 15.99
Daman & Diu
Delhi 2236 139299 302:47 171782 1.30 81.09
Lakshadweep . . .
Pondicherry 233 3500 1Jm)9 5602 4.16 62.48
INDIA 36786 344356 2622^0 643412 5.72 53.52
\ 0 7

TABLE VI - Non-Recurring Expenditure by Item and Type of Institutions
D-Higher Secondary Schools(Old Pattern)
(Rupees in Thousands)
STATE/UTs LIBRARIES BUILDING OTHER TOTAL PERCENTAGE 0I= EXPENDITURE ON
ITEMS (NON-
REC. LIB. TO BUILDING TO
EXPDT. TOTAL TOT/kL
(COL. 2 NON-REC. NONREC.
TO 4) EXPO I. EXPDT.
1 2 3 6 7
Andhra Pradesh « • •
Arunachal pradesh • ■ • ... ...
Assam • • • ... ...
Bihar • • * ... ...
Goa • • • __ ...
Gujarat • • • ...
Haryana ...
Himachal Pradesh ... ...
Janmu & Kashmir • • « ... ...
Karanataka • ■ • ... ...
Kerala • • • ... ...
Madhya Pradesh • • • ... ...
Maharashtra • ■ ■ • • • ... ...
Manipur • • • • • • • •• • ... ...
Meghalaya • • • • • • • • ...
Mizoriim • • • • t ■ ... ...
Nagaland ■ ■ ■ ...
Orissa __ ...
Punjab — __
Rajasthan ...
Sikkim • • ■ ... —
TamiI Nadu « • • ... ....
Tripura • ■ • ...
Uttar pradesh • • • ...
West Bengal • • • ...
A & N Islands « • • ... ....
Chandigarh
D & N Haveli ... ...
Daman & Oiu ... ...
Delhi ... ...
Lakshadweep — —
Pondicherry ...
INDIA ... ...
O g

TABLE VI * Non-Recurring Expenditure by Item and Typje of
E-High/Post Basic Schools
(Rupees
Institutions
i n Thousands)
STATE/UTs LIBRARIES BUILDING OTHER
ITEMS
TOTAL
(NON-
REC.
EXPOT,
(COL.
TO 4)
PERCENTAGE 0= EXPENDITURE ON
LIB. TO BUILDING TO
TOTAL T O L a
2 NON-REC. NON-REC.
EXPDI. EXPI)T.
1 2 3 4 5 6 7
Andhra Pradesh 1916 13845 15465 31226 6.14 44.;S4
Arunachal pradesh 66 21367 587 22020 .30' 97.03
Assam 924 5164 4509 10597 8.72 48.^3
Bihar 844 8469 9806 19119 4.41 44.:50
Goa 579 1372 3346 5297 10.93 25.'JO
Gujarat 3721 15808 58431 57960 6.42 27,;>7
Haryana 98 1082 3010 4190 2.34 25.JJ2
Himachal Pradesh 355 6047 3154 9556 3.71 63.i’8
Jammu & Kashmir 673 3466 8821 12960 5.19 26.-'4
Karanataka 648 1319 5741 7708 8.41 17. 11
Kerala 066 11609 8656 21131 4.10 54.94
Madhya Pradesh 337 767 347 1451 23.23 52.2S6
Maharashtra 9789 16474 119494 U 5 7 5 7 6.72 u.-.w
Manipur 254 6502 1293 8049 3.16 80.78
Meghalaya 195 4449 2342 6936 2.79 63. (>8
M i zoram 4311 2543 6854 62.90
Nagaland 10 3600 1502 5112 .20 70. hZ
Orissa 1772 9050 8782 19604 9.04 46. 16
Punjab 808 24594 6351 31753 2.54 77. h5
Rajasthan 1948 3169 10917 160:J4 12.15 19.76
Sikkim 50 6992 1733 8775 .57 79.<i8
Tamil Nackj 4180 7856 19245 312S1 13.36 25.11
Tripura 124 1635 3040 4799 2.58 34.07
Uttar pradesh 610 7970 6411 149<?1 4.07 53. 17
West Bengal 3931 31235 31545 66761 5.96 46.79
A & N Islands 79 12240 294 12613 .63 97.04
Chandigarh 550 240 1121 1911 28.78 12.!i6
D & N Havieli . . . 75 65 140 53.Ji7
Daman & Diu
Delhi 510 4260 4218 8988 5.67 47.^^0
Lakshadweep 91 806 745 1642 5.54 49.09
Pondicherry 766 10624 911 12301 6.23 86.:;7
INDIA 36744 246397 324425 6075(S6 6.05 40.S5

TABLE VI * Non-Recurring Expenditure by Item and Type of Institutions
F-Mfddle/Senior Basic Schools
(Rupees in ThousarKJs)
STATE/UTs LIBRARIES BUILDING OTHER
ITEMS
NON
RECURRING
EXPOT.
1 2 3 4 5
Andhra Pradesh 2331 2331
Arunachal pradesh 45207 45207
Assam « ■ ■ 28709 28709
Bihar • ■ • 20634 20634
Goa ■ • « 84 84
Gujarat a • • 61427 61427
Haryana • • « 234 234
Himachal Pradesh 4780 4780
Janinu & Kashmir 10856 10856
Karanataka • « • 238035 238035
Kerala • • • 6392 6392
Madhya Pradesh • • • 13745 13745
Maharashtra • • • • • 98649 98649
Manipur • ■ • • • 6306 6306
Meghalaya • • • m • 13049 13049
Mizoram • • • 5422 5422
Nagaland • • • 14950 14950
Orissa • • 8869 8869
Punjab • • 7372 7372
Rajasthan a • 22252 22252
Sikkim f m 7961 7961
Tamil Nadu • • • • m 3544 3544
Tripura • m 4041 4041
Uttar pradesh • • • • • 64152 64152
West Bengal • • • • • 12431 12431
A & N Islands • ■ « • • 13291 13291
Chandigarh • • • • • 2365 2363
D & N Haveli • • • • • 327;i 3273
Daman & Diu • • • • « 47:5 473
Delhi • • « • • 2967 2967
Lakshadweep • • 2857 2857
Pondicherry • • ii 9652 9652
INDIA • • • 736308 736308
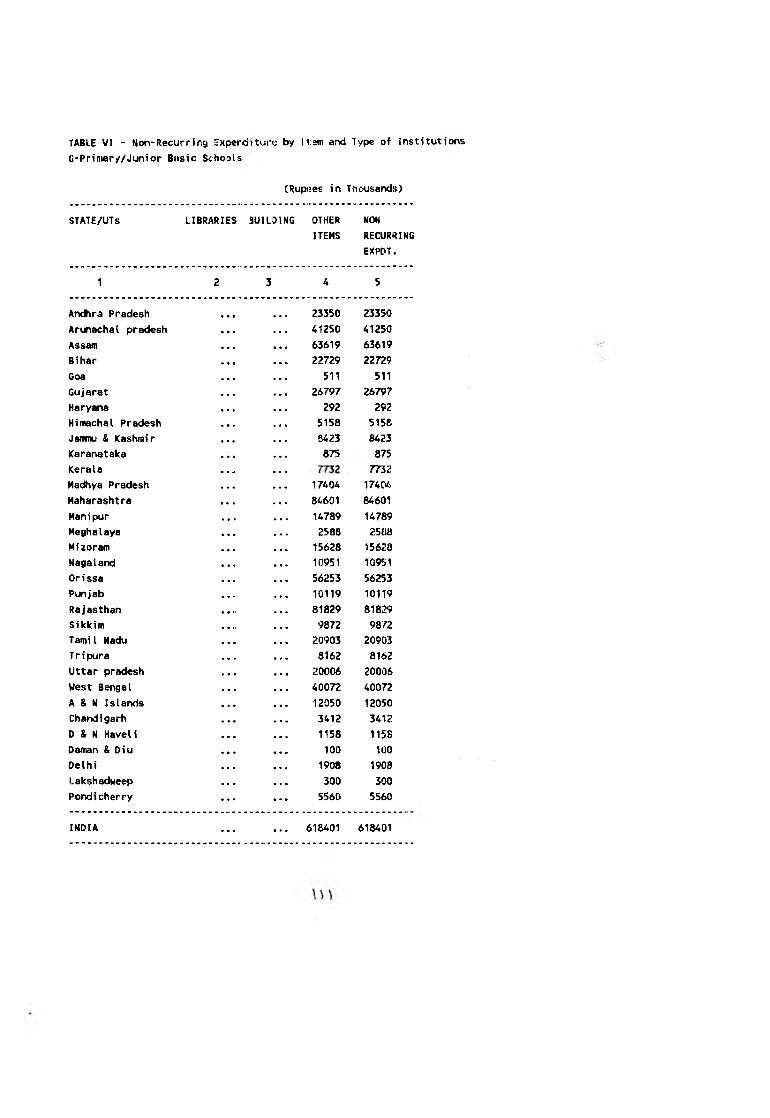
TABLE VI - Hon-Recurring Sxperditure by ]i:siri and Type of InstitutionsG-Primary/Junior Basic Schools
(Ru|>;es in T^iousands)
STATE/UTs LIBRARIES 3UILDING OTHER
ITEMS
NON
RECURRING
EXPDT.
1 2 3 4 5
Andhra Pradesh • • • 23350 23350
Arunachal pradesh • ■ • • • • 41250 41250
Assam w • • • ■ • 63619 63619
Bihar « « • • • • 22729 22729
Goa « • • ■ • • 511 511
Gujarat m m m • • • 26797 26797
Haryana m * • • • 292 292
Himachal Pradesh « • «« • • » 5158 5158
Jammu ft Kashmir • • 0 • • • 8423 8423
Karanataka • • • • • ■ 875 875
Kerala ■ ■ <4 • • « 7732
Madhya Pradesh • • • 17404 17404
Maharashtra • • t 84601 84601
Manipur • • • 14789 14789
Meghalaya • • • 2588 2588
Mizoram • • • • • • 15628 15628
Nagaland • • • 10951 10951
Orissa • • ( • • • 56253 56253
Punjab • • 10119 10119
Rajasthan 81829 81829
Sikkim • • 9872 9872
Tamil Nadu • • • 20903 20903
Tripura • • « 8162 8162
Uttar pradesh • « • 20006 20006
West Bengal ■ • « 40072 40072
A & N Islands • • « 12050 12050
Chandigarh * • • 3412 3412
D & N Havel i 1158 1158
Daman & Diu 100 100
Delhi 1908 1908
Lakshadweep 300 300
Pondicherry • • • 5560 5560
INDIA . . . • ■ • 618401 618401
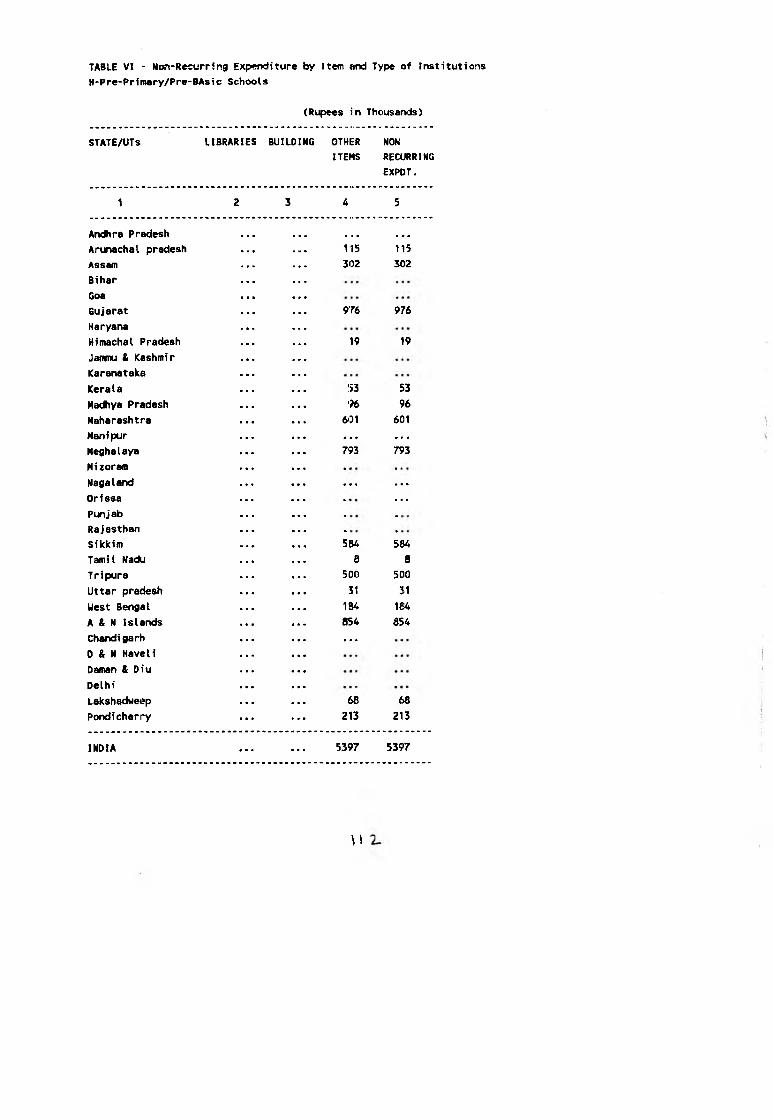
TABLE VI - Non-Recurring Expenditure by Item «nd Type of Institutions
H*Pre-Primary/Pre-BAsic Schools
(Rupees in Thousands)
STATE/UTs LIBRARIES BUILDING OTHER
ITEMS
NON
RECURRING
EXPDT.
1 2 3 4 5
Andhra Pradesh . . . . . .Arunachal pradesh 115 115
Assam 302 302
Bihar
Goa
Gujarat 976 976
Haryana
Himachal Pradesh 19 19
Janinu & Kashmir
Karanataka
Kerala 153 53
Madhya Pradesh 96 96
Maharashtra 601 601
Manipur . . . . . .Meghalaya ?93 793
Mizoram
Nagaland . . . . . .Orissa . . .Punjab
Rajasthan
Silckim 5B4 584
Tamil Nadu 8 8
Tripura 500 500
Uttar pradesh 31 31
West Bengal 1BA 184
A & N Islands 854 854
Chandigarh . . .0 & N Haveli
Daman & Oiu
Delhi
Lakshadweep 68 68
Pondicherry 213 213
INDIA . . . 5397 5397
\l

(Rs. in Thoujnds)
TABLE VI- Non-Recurring Expenditure by Item and by tyiae of Institutions
Total Elementary Education ( F,G,H >
STATE/UTs LIBRARIES BUILDING OTHER
ITEMS
TOTAL
<NOW-
REC.
EXPDT.
(COL. 2
TO 4)
PERCENTAGE Oi: EXPENDITURE: ON
LIB. TO BUILDING TO
TOTAL TOT/iL
NON-REC. NDN-’REC.
EXPDl. EXPIlT.
1 2 3 4 5 6 7
Andhra Pradesh <!5681 25WJ1 ...
Arunachal pradesh 86572 865;’? ...
Assam 92630 92630
Bihar 43363 43J63
Goa 595 595
Gujarat 89200 89200
Haryana 526 526
Himachal Pradesh « • • ■ ■ 9957 9957
Janmu & Kashmir • • • • • 19279 19279
Karanataka • • 238910 238910
Kerala 14177 141/7
Madhya Pradesh 31245 31245
Maharashtra 183851 1338S1
Manipur 21095 21095 —
Meghalaya 16430 16430
Mizoram 21050 21050
Nagaland • • » 25901 25901
Orissa • • ■ 65122 65122
Punjab • a 17491 17491
Rajasthan m • 104081 104081
Sikkim • • 18417 18417
Tamil Nadu 24455 24455
Tripura 12703 12703
Uttar pradesh 84189 8/* 189 —
West Bengal 52687 52687
A & N Islands • • • 26195 26195
Chandigarh • • • 5775 5775
D & N Haveli • • • 4431 4431
Daman & Diu 573 573
Delhi 4875 ^875
Lakshadweep ■ M • • » 3225 3225
Pondi cherry • • 15425 15425 ... ...
INDIA • • • 1360106 156C106 ... ...
113

TABLE VI - Non-Recurring Expenditure by Item arid Typ<‘ of Institutions
I-Institutions Iirparting Instructions in Diploma/Certificate
Courses of School Level(Below Matric Level)
(a) Agriculture & Forestry
' (Rupees in Thousands)
STATE/UTs LIBRARIES BUILDING OTHER
ITEMS
rOTAL
(Hom-
REC.
EXPOT.
(COL. 2
TO 4)
PERCENTAGE OF EXPENDITURE ON
LIB. TO BUllL'JING TO
TOTAL TOTAL
NON-REC. NOH-iEC.
EXPDI. EXPDf.
1 2 3 5 6 7
Andhra Pradesh ■ • • ft ft ft ft • ft ft ft ft o . •
Arinachal pradesh 1022 1070 4.49 »..
Assam • • • • « •
Bihar • a • • • • ...
Goa • « • ' ■ ■ •
Gujarat • • • * <i • 232 232 ...
Haryana • • • ft ■ • ... ....
Himachal Pradesh • • • ft ■ • ...
Jammu & Kashmir .>..
Karanataka
Kerala • • •
Madhya Pradesh • • «
Maharashtra 770 772 .26
Manipur
Meghalaya • « • ... ... ... ...
Mizoram s • ■
Nagaland
Orissa ft ft ft
Punjab
Rajasthan • ■ • ...
Sikkim • • • ft ■ •
Tamil Nadu ft • « • • ft ...
Tripura • • • ft ft ft ... ...
Uttar pradesh « • • . . . . . . ...
West Bengal • ■ ■
A & N Islands • B •
Chandigarh • • • ...
0 & N Haveli • • • ft W •
Daman & Diu • • • • • ftDelhi • • « ft ft ftLakshadweep ft • • . . . . . .
Pondicherry ft ft ft . . . . . . . . .
INDIA 50 . . . 2024 2074 2.41 . . .
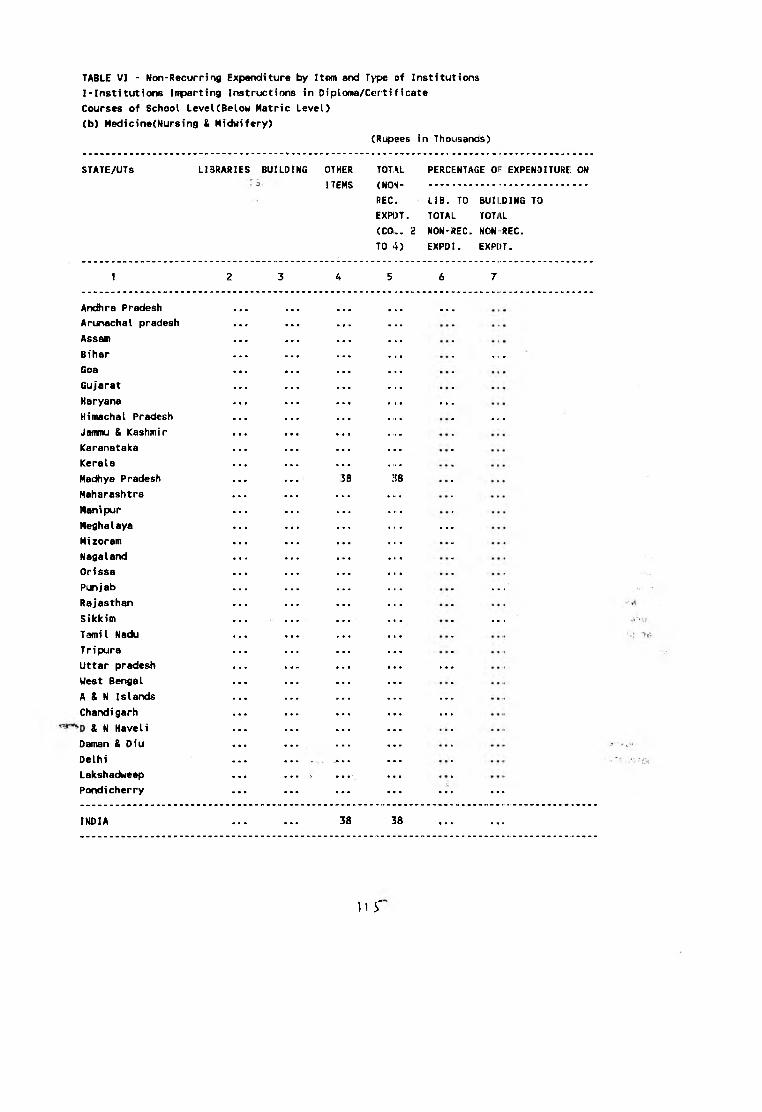
TABLE VI - Non-Recurring Expenditure by Item and Type of Institutions
I-Institutions Imparting Instructions in Diploma/Certificate
Courses of School Level(Below Matric Level)
(b) Hedicine(Nursing & Midwifery)
(Rupees in Thousands)
STATE/UTs LIBRARIES BUILDING OTHER
ITEMS
TOTAL
(NON-
REC.
EXPDT.
(COL. 2
TO 4)
PERCENTAGE 0!- EXPENDITURE; ON
LIB. TO BUILDING TO
TOTAL TOTi^L
NON'REC. NONREC.
EXPDI. EXPOT.
1 2 3 4 5 6 7
Anc^ra Pradesh « • • • • • • « . . .
Arunachal pradesh • • * • • • • •
Assam • • • a • • « • • • •
Bihar • • • m • • • • . . .
Goa • • • • «
Gujarat « • • • ■ • « ■
Haryana • • « « • • . . .
Himachal Pradesh ■ • • • • • • • . . .
Jammu & Kashmir • • • • 9 • • a
Karanataka • ■ • m m
Kerala
MacSiya Pradesh
Maharashtra
Manipur • • • « «
Meghalaya • * • • • . . .
Mizoram • • • • • • • •
Nagaland • • • • • • • • • • •
Orissa • • * ■ ■ « • • • • •
Punjab • M • . . .
Rajasthan • s • a •
Sikkim . . .
Tamil Nadu • • • 1 •
Tripura • • • • ■ w • • * « •
Uttar pradesh • « « • • • • • • . . .
West Bengal • ■ • • • • ■ • •
A & N Islands • • • • • • . . .
Chandigarh • • • . . .
& N Haveli • • • • • • • •
Daman & Diu • • « • ■
Delhi • • • • • • • •
Lakshadweep ■r • • • ' • • •
Pondicherry • • • a • • . . . . . . .
INDIA 38 38 . . . . . .
n r
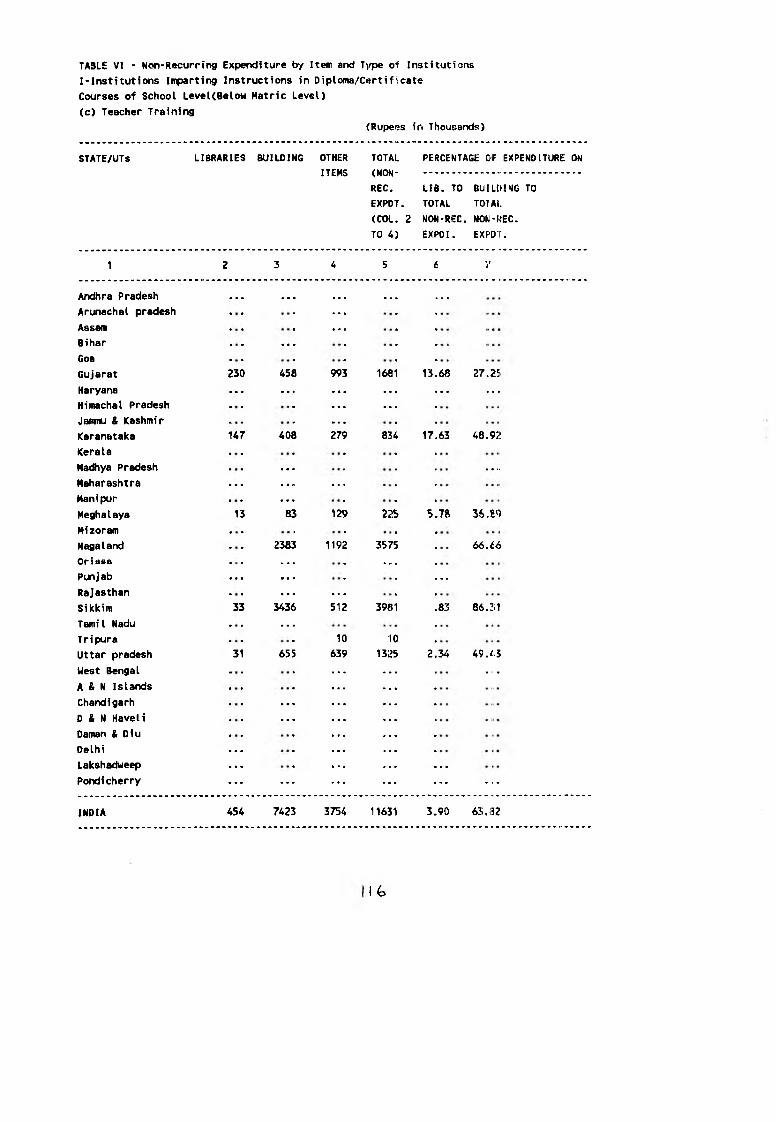
TA3LE VI - Nwi-Recurring Expenditure by Item and Type of Institutions
I-Institutions Imparting Instructions in Diploma/Certificate
Courses of School LeveKBelow Hatric Level)
<c) Teacher Training
{Rupees in Thousands)
STATE/UTs LIBRARIES BUILDING OTHER TOTAL PERCENTAGE OF EXPENDITURE ON
ITEMS (NON-
REG.
EXPDT.
(COL. 2
TO 4)
LIB. TO
TOTAL
NON-REC.
EXPO I.
BUI LIU MG TO
TOTAI.
NOM-«EC.
EXPDT.
1 2 3 4 5 7'
Andhra Pradesh • • • . . . • « • . . . . . .
Arunachal pradesh . . .
Assam . . .
Bihar . . .
Goa
Gujarat 230 458 993 1681 13.68 27.2!
Haryana . . . . . . . . . . . . . . . . . .
Himachal Pradesh . . . . . .
Jammu & Kashmir . . .
Karanataka 147 408 279 834 17.63 48.92
Kerala
MacRiya Pradesh . . . . . . .
Maharashtra . . . . . . . . .
Manipur . . .
Meghalaya 13 83 129 225 5.78 36. E<)
Mizoram
Nagaland 2383 1192 3575 66.66
Orissa — —
Punjab . . . . . . . . .
Rajasthan . . . . . .
Sikkim 33 3436 512 39«1 .83 86.31
Tamil Nadu . . .
Tripura 10 10
Uttar pradesh 31 655 639 1325 2.34 49. a
West Bengal . .
A & N Islands
Chandigarh . . .
D & N Haveli . . .
Daman & Diu
Delhi . . .
Lakshadweep . . . . . .
Pondicherry . . . . . . . . . . . .
INDIA 454 7423 3754 11631 3.90 63.132
1 ^
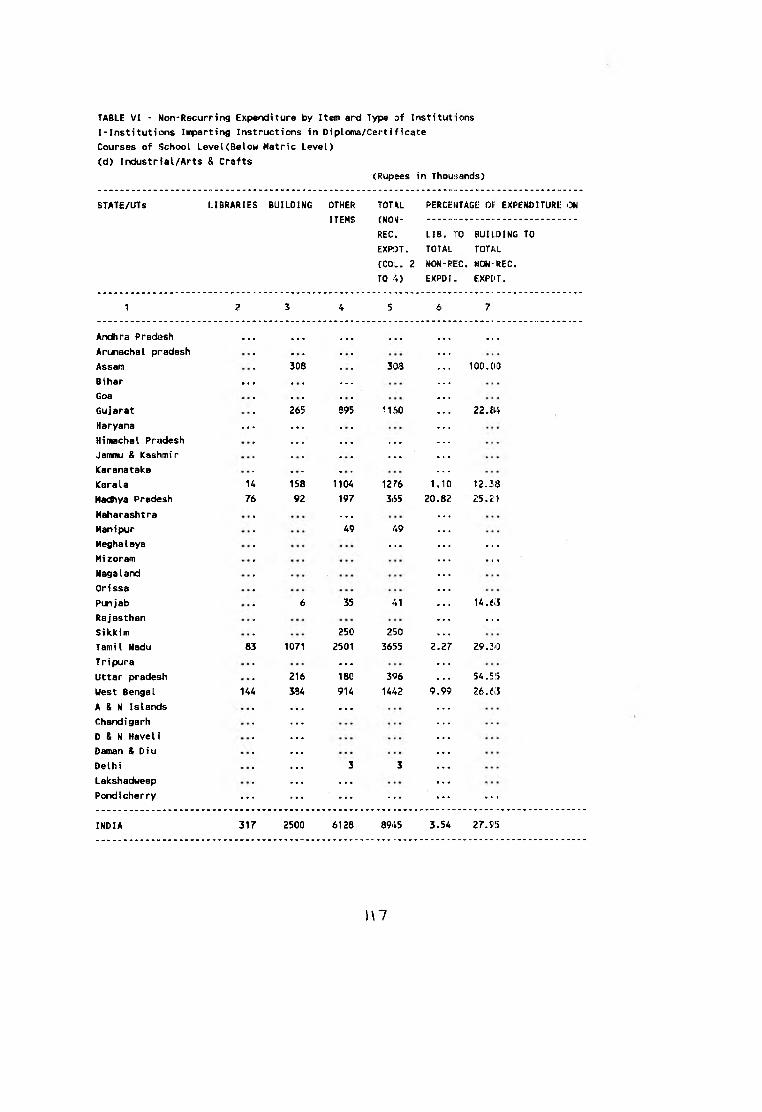
TABLE VI - Non-Recurring Expenditure by Item and Type of Institutions
I-Institutions Imparting Instructions in Diploma/Certificate
Courses of School LeveKBelow Metric Level)
(d) Industrial/Arts & Crafts
(Rupees in Thounsands)
STATE/UTs LIBRARIES BUILDING OTHER
ITEMS
TOTAL
(NOM-
REC.
EXPDT.
COOL. 2
TO 4)
PERCENTAGE 01’ EXPENDITURE ON
LIB. TO BUILOING TO
TOTAL TOTAL
NON-Rf:C. NON-REC.
EXPDI,. EXPDT,
1 2 3 4 5 7
Andhra Pradesh . . . . . . . . . . . . . . .
Arunachal pradesh
Assam 308 308 100.00
Bihar . . . —
Goa
Gujarat 265 895 11(50 22. M
Haryana . . . . . .
Himachal Pradesh . . . . . . ____
Jamnu & Kashmir . . .
ICaranataka
Kerala 14 158 1104 1276 1.10 12.^8
Hadhya Pradesh 76 92 197 3.S5 20.82 25.2!1
Maharashtra . . .
Manipur 49 49
Meghalaya . . . . . .
Mizoram . . .
Nagaland
Orissa
Punjab 6 35 41 14.63
Rajasthan . . .
Sikkim 250 2!50
Tamil Nadu 83 1071 2501 3655 2.27 29.30
Tripura —
Uttar pradesh 216 18G 396 54,515
West Bengal 144 384 914 1442 9.99 26.63
A & N Islands —
Chandigarh
D & N Haveli
Daman & Diu
Delhi 3 3
Lakshadweep . . .
Pondicherry . . . . . . . . . . . .
INDIA 317 2500 6128 8945 3.54 27.S'!5
)\7

TABLE VI - Hon-Recurring Expenditure by Item and Type of Institutions
1‘Institutions Imparting Instructions in Diploma/Certificate
Courses of School Level(Below Matric Level)
(e) Music & Fine Arts
(Rupees in Thousands)
STATE/UTs LIBRARIES BUILDING OTHER
ITEMS
TOTAL
(NON-
REC.
EXPOT.
(COL. 2
TO 4)
PERCENTAGE OF EXPENDITURE ON
LIB. TO BLIRiJING TO
TOTAL TOTAL
NON-REC. NCW'REC.
EXPO I. EXPOI.
1 2 3 5
Andhra Pradesh ... ... ... ... ...Arunachal pradesh
Assam 20 29 68,97
Bihar
Goa 1 9 10 10.00 90.0CI
Gujarat 15 75 176 8.52 42.61
Haryana
Himachal Pradesh —Janinu & Kashmir
Karanataka 5 15 66.67
Kerala 385 385
Madhya Pradesh
Maharashtra 2 2
Manipur ... ... ...Meghalaya ...Mizoram
Nagaland ... ...Orissa ...Punjab
Rajasthan 6 14 57.14
Sikkim
Tamil Nadu 4 8 50.00
Tripura ... ...Uttar pradesh 5 12 58.33
West Bengal 8 8
A & N Islands
Chandigarh ...D & N Haveli
Daman & Diu
Delhi
Lakshadweep
Pondicherry ...INDIA 27 122 510 659 4.10 18.5‘i
/IS

TABLE VI - Non-Recurring Expeoditure by Item and Type of Institutions
I-Institutions Imparting Instructions in Diploma/Certificate
Courses of School Level(Below Metric Level)
(f) For the Handicapped
(Rup<!es in Thousands)
STATE/UTs LIBRARIES BUILDING OTHER TOTAL PERCENTAGE OF EXPENDITURE ON
ITEMS (NON-
REC. LIB. TO BUILDING TO
EXPDT. TOTAL tOTAL
(COL, 2 NON-REC. NON-REC.
TO 4) EXPO I. EXPDT.
1 2 3 4 5 7
Andhra Pradesh 500 198 703 .71 71.12
Arunachal pradesh — —
Assam 46 60 108 1-85 42.59
Bihar
Goa
Gujarat 49 1026 735 1810 2.71 56.69
Haryana 21 12 178 211 9.95 5.69
Himachal Pradesh 117 117
Jamau & Kashmir
Karanataka 13 • ■ ■ 100 113 11.50
Kerala • • • 631 6.51 • « •
Madhya Pradesh % « • ... 6 6
Maharashtra 965 969 .10 .21
Manipur • - • 178 183 2.73
Meghalaya • • •
Mizoram —
Nagaland
Orissa
Punjab 19 114 133 i4.::9
Rajasthan 4 3 9 22.22 44./4
Sikkim • • •
Tamil Nadu 189 39 228 ■ • • 82.89
Trfpura 56 56
Uttar pradejsh 17 100.00
West Bengal • ■ • 239 239
A & N Islands • ■ •
Chandigarh • « « ... ...
D & N Haveli
Daman & Diu
Delhi 14 36 61.11
Lakshadweep ...
Pondicherry 40 40 ...
INDIA 137 1799 3673 56D9 2.44 32.07
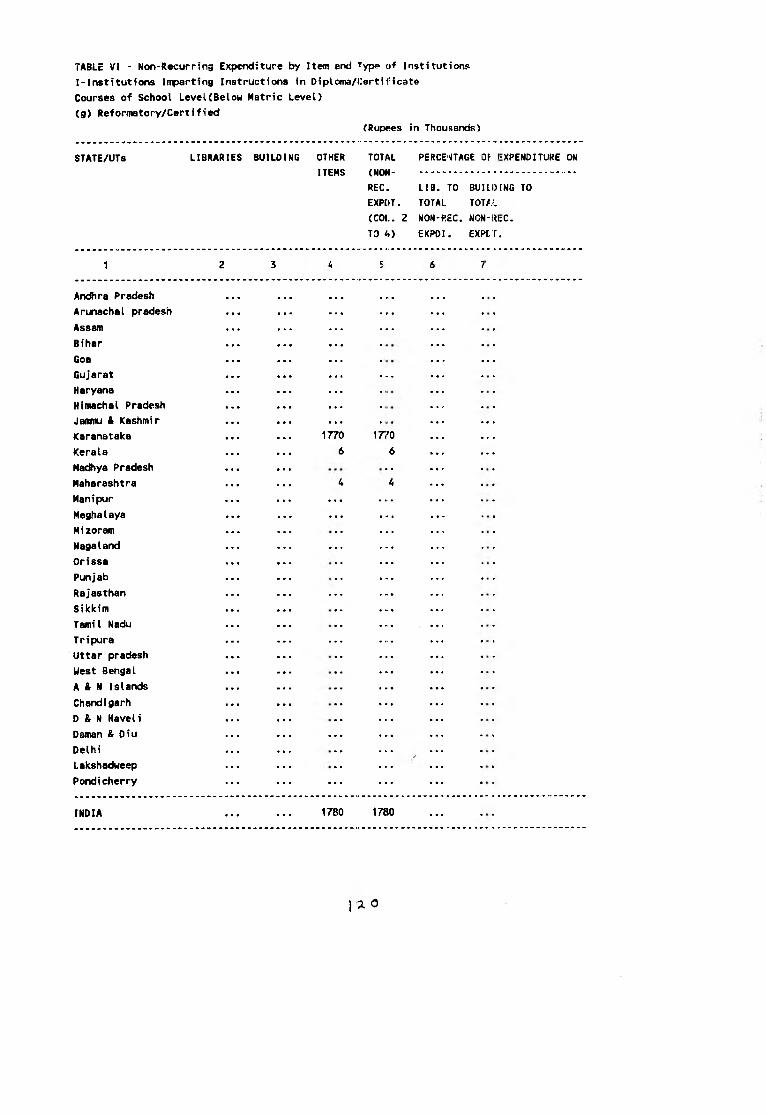
TABLE VI - Non-Recurring Expenditure by Item end fype of Institutions
I-lnstitutions Imparting Instructions in Diploma/Certificate
Courses of School LeveL(Below Matric Level)
(g) Reformatory/Certified
(Rupijes in Thousands)
STATE/UTs LIBRARIES BUILDING OTHER
ITEMS
TOTAL
(MOH-
REC.
EXPtlT.
(COL. 2
TO 4)
PERCEI4TAGE OF t-XPENDITUKE ON
LIB. TO BUIIDING TO
TOTAL T0T;.L
NON-REC. NON-i^:C.
EKPDl. EXPCT.
1 2 3
Ancffira Pradesh .... • ■ •Arunachal pradesh ... ...Assam ... ...Bihar ...Goa ... ...Gujarat ... ...Haryana ...Himachal Pradesh ...Jannu & Kashmir ... ...Karanataka 1770 1770 ... ...Kerala 6 6 ... ...Madhya Pradesh ...Maharashtra 4 ...Manipur ... ...Meghalaya ... ...Mizoram ...Nagaland ... ...Orissa ...Punjab ...Rajasthan ... ...Sikkim ...Tamil Nadu ...Tripura ... ...Uttar pradesh ...West Bengal ...A & N Islands ...Chandigarh ...D & N Haveli ...Daman & Oiu — ...Delhi ...Lakshadweep ...Pondicherry ... ...
INDIA 1780 1780 ...
) 2. 0

TABLE VI - Non-Recurring Expenditure by Item and Type of Institutions
I-Institutions Imparting Instructions in Diploma/Certificate
Courses of School Level(Below Metric Level)
(h) Oriental Studies
(Rupees in Thousands)
STATE/UTs LIBRARIES BUILDING OTHER
ITEMS
TOTAL
(HOM-
REC.
EXPDT.
(COL. 2
TO 4)
PERCENTAGE OF EXPENDITURE ON '
LIB. TO BUILDING TO
TOTAL TOTAL
NON-REG. NON-KEC.
EXPOI. EXPDT.
1 2 3 4 5
Andhra Pradesh . . . • • • • • • > • • • • • > • •Arunachal pradesh . . .Assam 46 57 18 121 38.02 47.11
Bihar 1 98 325 424 .24 23.11
Goa
Gujarat 10 60 92 162 6.17 37.04
Haryana . . . . . .Himachal Pradesh — . . . • • • —Jammu & Kashmir • • •Karanataka 95 131 6.11 21.SP
Kerala . . .Madhya Pradesh • • • 6 6
Maharashtra * • • 8 12 SS. 3 3
Mani pur • • • . . . . . .Meghalaya • • ■ . . . . . .Mizoram • • «Nagaland
Orissa . . .Punj ab . . .Rajasthan —Sikkim
Tamil Nadu 19 100 119 15.97
Tripura . . . . . .Uttar pradesh 180 247 1362 1769 10.06 13.81
West Bengal 59 331 156 546 10.81 60.62
A & N Islands . . .
Chandigarh . . .0 & N Haveli
Daman & Oiu
Delhi
Lakshadweep . . .Pondicherry . . .
INDIA 304 844 2162 3310 9.18 25.50

TABLE VI " Non-Recurring Expenditure by Item and Type of Institutions
!•Institutions Imparting Instructions in Diploma/Certificate
Courses of School LeveKBelow Metric Level)
(i) Social (Adult) Education
(Rupees in Thousands)
STATE/UTs LIBRARIES BUILDING OTHER
ITEMS
TOTAL
(NON-
REC.
EXPDT.
(COL. 2
TO 4)
PERCENTAGE OF EXPENDITURE ON
LIB. TO BUILOINS TO
TOTAL TOTAL
NON-REC. NOW-ilEC.
EXPO I. EXPDT.
1 2 3 4 5
Andhra Pradesh • • • . . . . . . . . . • • « . . .
Arunachal pradesh « ■ • 3700 251 3951 • • » 93.615
Assam • • • 142 265 407 • • • 34.8'J
Bihar • • • ■ • fi
Goa • • • 913 913 • • *
Gujarat • a • . . . • • •
Haryana • • • . . . . . . m m e
Himachal Pradesh • • • • • • • m m —
Jamnu & Kashmir • • • • • * • m m
Karanataka • • • m m -
Kerala • • • • • • • • »
Madhya Pradesh • • « 190 190 • m m
Maharashtra • ■ • • • «
Manipur • • • . . . • • •
Meghalaya • « • . . . . . . • • »
Mizoram ■ ■ a
Nagaland • ■ • . . . 3043 3043
Orissa
Punjab 3725 3725
Rajasthan . . . . . . . . .
Sikicim
Tamil Nadu
Tripura 230 166 396 58. OH
Uttar pradesh
West Bengal
• • •
315 354 8.47 2.5^i
A & N Islands « a • 105 105
Chandigarh 72 100.00
D & N Haveli • • • . . .
Daman & Diu . . .
Delhi • • •■
Lakshadweep 37 37 • • «
Pondicherry . . . . . . • • •• . . .
INDIA 102 4081 9010 13193 .77 30.9:5
0.2--

TABLE VI- Non-Recurring Expenditure by Item arxi by type of Institutions
Institutions Iinparting Instructions in Diploma/Cortificate courses of
School Level (Below Matric Level)
I-(j) Others
<Rs. in Thousncis)
STATE/UTs LIBRARIES BUILDING OTHER
ITEMS
TOTAL
{NON-
REC.
EXPDT.
(COL. 2
TO 4)
PERCENTAGE 0' EiXPENDITURE ON
LIB. TO BUILDING TO
TOTAL TOTAL
NON-REC. NON-REC.
EXPDl. EXPDT.
1 2 3 4 5 7
Andhra Pradesh • • •• • • • . . . ■ • m
Arunachal pradesh . . .
Assam 103 122 i5.:>7
Bihar — —
Goa
Gujarat • ■ • . . .
Haryana • ■ • . . .
Himachal Pradesh a • • . i.
Jammu & Kashmir
ICaranataka 3381 12081 17160 32622 10.36 37.03
Kerala . . .
Madhya Pradesh • • • . . . . . . .
Maharashtra • • « 32 32
Manipur 25 38 34.21
Meghalaya • • V . . . . . . . . . . . . .
Mizoram . . .
Nagaland 861 S61
Orissa
Punjab . . . . . .
Rajasthan
Sikkim
Tamil Nadu . . .
Tripura . . . . . .
Uttar pradesh
West Bengal 227 2<S8 12.31 2.99
A & N Islands . . .
Chandigarh . . .
D & N Havel 1 . . .
Daman & Diu
Delhi —
Lakshadweep
Pondicherry . . . . . . . . .
INDIA 3427 12108 18408 33943 10.10 35.67
)2-3
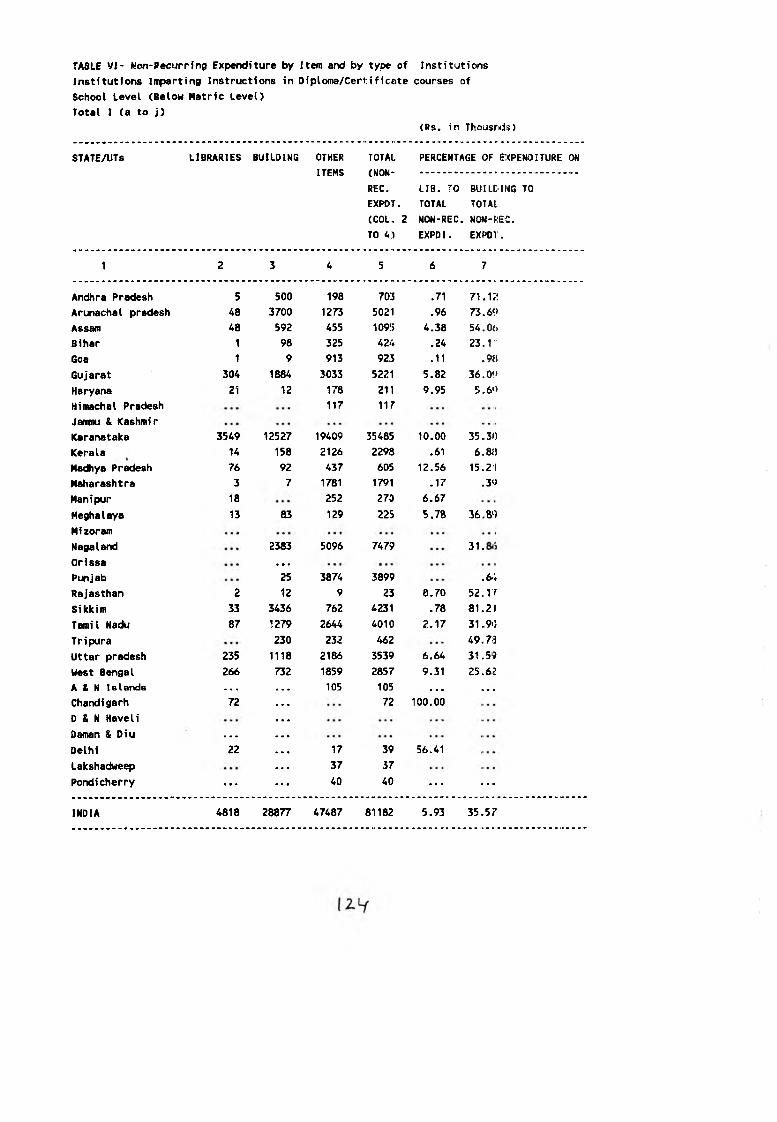
TASLE VI- Hon-Recurring Expenditure by Item and by type of Institutions
Institutions Imparting Instructions in Diploma/CeriMficnte courses of
School Level (Below Metric Level)
Total I (a to j)
(Rs. in Thousrdis)
STATE/UTs LIBRARIES BUILDING OTHER
ITEMS
TOTAL
(NON-
REC.
EXPDT.
(COL, 2
TO 4)
PERCENTAGE OF EXPENDITURE ON
LIB. TO B U ILMWG TO
TOTAL TOTAL
MON-REC. NON-MEC.
EXPDI. EXPDT.
1 2 3 4 5 6 7
Andhra Pradesh 5 500 198 703 .71 71.1J!
Arunachal pradesh 48 3700 1273 5021 .96 73.69
Assam 48 592 455 1095 4.38 54.06
Bihar 1 98 325 424 .24 23.1'!
Goa 1 9 913 923 .11 .9H
Gujarat 304 1884 3033 5221 5.82 36.09
Haryana 2i 12 178 211 9.95 5.60
Himachal Pradesh 117 117
Jatnnu & Kashmir
Karanataka 3549 12527 19409 35485 10.00 35.30
Kerala 14 158 2126 2293 .61 6.8J)
Madhya Pradesh 76 92 437 60S 12.56 15.21
Maharashtra 3 7 1781 1791 .17 .3<?
Manipur 18 252 270 6.67
Meghalaya 13 83 129 225 S.78 56.8')
Mizoram
Nagaland 2383 5096 7479 31.
Orissa ...Punjab 25 3874 3899 .6-i
Rajasthan 2 12 9 23 8.70 52.17
Sikkim 33 3436 762 4231 .78 81.21
Tamil Nadu 87 1279 2644 4010 2.17 31.90
Tripura 230 232 462 49.713
Uttar pradesh 235 1118 2186 3539 6.64 31.5?
West Bengal 266 732 1859 2857 9.31 25.62
A & N lelande _ 105 105 ... ...Chandigarh 72 72 100.00
0 & N Haveli • • •Daman & Diu ... • ■ •Delhi 22 • • • 17 39 56.41
Lakshadweep 37 37
Pondicherry ... 40 40 ... ....
INDIA 4818 28877 47487 81182 5.93 35,57
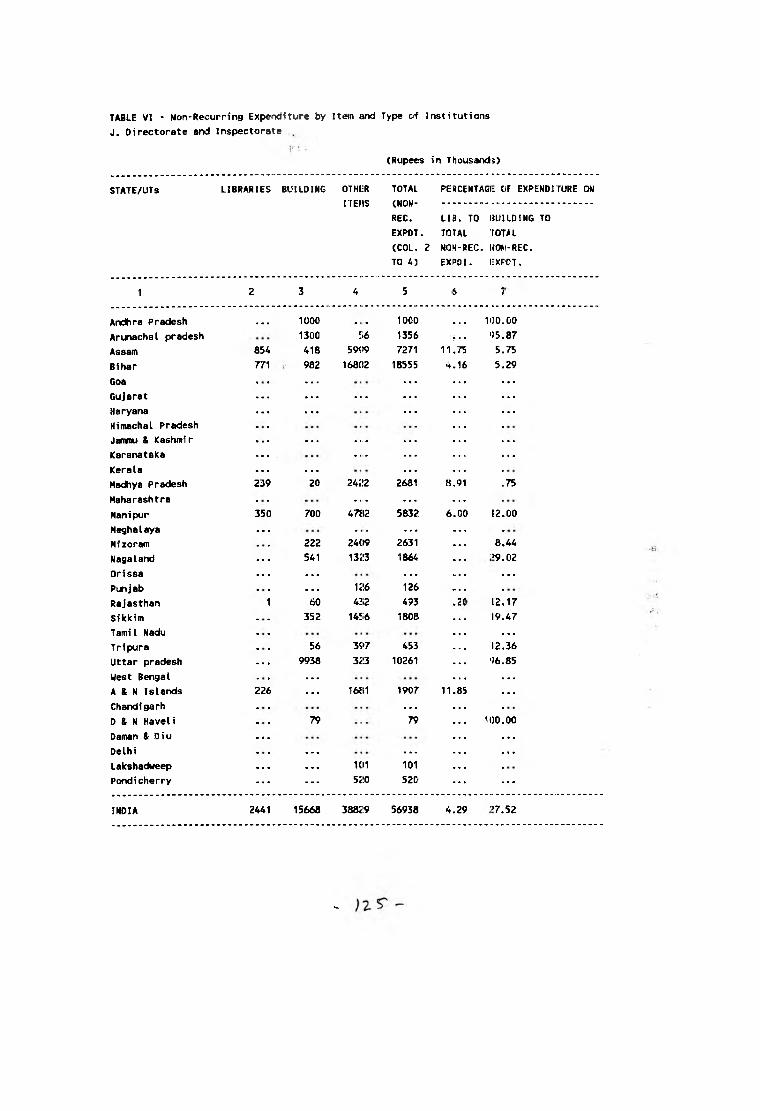
TABLE VI - Non-Recurring Expenditure by Item and Type of Institutions
J. Directorate and Inspectorate .
(Rupees in Thousand:;)
STATE/UTs LIBRARIES BUILDING OTHEiR
ITEMS
TOTAL
(NON-
REC.
EXPOT.
(COL. 2
TO 4)
PERCENTAGl: CF EXPENDITURE ON
LIB. TO I3UILDING TO
TOTAL TOTAL
NOH-BEC. Wai-REC.
EXPO I. lEXFUT.
1 2 3 4 5 6
Andhra Pradesh « • • 1000 • • 1000 m ■ • 100.00
Arunachal pradesh 1300 !.6 1356 W . . 95.87
Assam 854 418 59^)9 7271 11.75 5.75
Bihar 771 982 16802 18555 4.16 5.29
Goa ... ... ...
Gujarat ... ... ... ... ...
Haryana ... ... ... ...
Himachal Pradesh
Jaomi & Kashmir ... ... .... ... ...
iCaranataka ... ... ... ...
Kerala ... ... ...
Madhya Pradesh 239 20 2422 2681 8.91 .75
Maharashtra ... ...
Manipur 350 700 47{»2 5832 6.00 12.00
Meghalaya ... ... ...
Mizoram 222 2409 2631 8.44
Nagaland ... 541 1323 1864 ;>9.02
Orissa ... ... ... ...
Punjab ... 126 126
Rajasthan 60 4212 493 12.17
Sikkim 352 14!i6 1808 19.47
Tamil Nadu ...
Tripura 56 397 453 12.36
Uttar pradesh ... 9938 323 10261 96.85
West Bengal ... ...
A & N Islands 226 — i6tn 1907 11.85 —
Chandigarh ...
D & N Haveli 79 79 100.00
Daman & Diu ... ...
Delhi — — ...
Lakshadweep ... ... 101 101
Pondicherry ... ... 520 520 ...
INDIA 2441 15668 388219 56938 4.29 ;>7.52
-
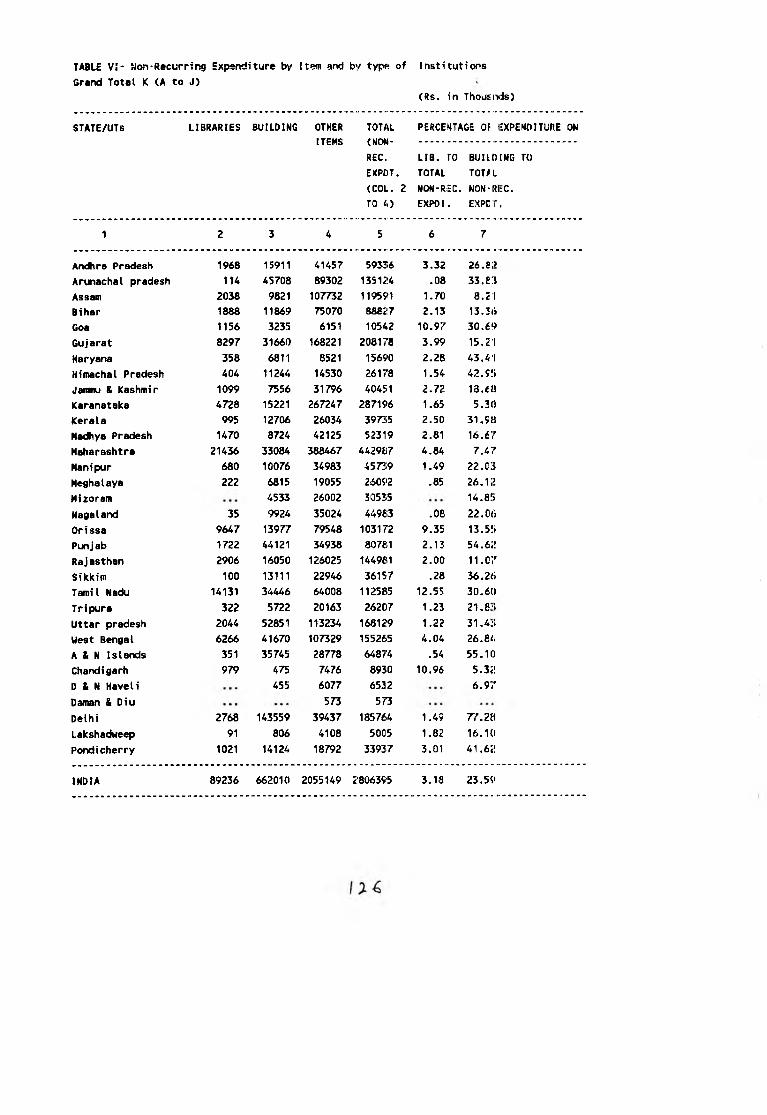
(Rs. in ThousntJs)
TABLE VI- Non'Recurring Expenditure by Item and by type of Institutions
Grand Total K (A to J)
STATE/UTs LIBRARIES BUILDING OTHER
ITEMS
TOTAL
(NON-
REC>
EXPDT.
(COL. 2
TO 4)
PERCEMTAGE OF lEXPEMOITURE ON
LIB. TO BUILDING TO
TOTAL TOT/L
NON-REC. NON-lll:C.
EXPO I. EXPDT.
1 2 3 4 5 6 7
Andhra PradesK 1968 15911 41457 59336 3.32 26.s;>
Arunachal pradesh 114 45708 89302 135124 .08 33.53
Assam 2038 9821 107732 119591 1.70 8.21
Bihar 1888 11869 75070 88827 2.13 13.36
Goa 1156 3235 6151 10542 10.97 30.69
Gujarat 8297 31660 168221 208178 3.99 15.21
Haryana 358 6811 8521 15690 2.28 43.41
Himachal Pradesh 404 11244 14530 26178 1.54 42.55
Jamnu & Kashmir 1099 7556 31796 40451 2.72 13.ea
Karanataka 4728 15221 267247 287196 1.65 5.30
Kerala 995 12706 26034 39735 2.50 31.9«
Madhya Pradesh 1470 8724 42125 52319 2.81 16.67
Maharashtra 21436 33084 388467 442967 4.84 7.47
Manipur 680 10076 34983 45739 1.49 22.03
Meghalaya 222 6815 19055 26092 .85 26.12
Mizoram 4533 26002 30535 14.85
Nagaland 35 9924 35024 44983 .08 22.00
Orissa 9647 13977 79548 103172 9.35 13.55
Punjab 1722 44121 34938 80781 2.13 54.62
Rajasthan 2906 16050 126025 144981 2.00 11.07
Sikkim 100 13111 22946 36157 .28 36.26
Tamil Nadu 14131 34446 64008 112585 12.55 30.60
Tripura 322 5722 20163 26207 1.23 21.8-5
Uttar pradesh 2044 52851 113234 168129 1.22 31.4:;
West Bengal 6266 41670 107329 155265 4.04 26.84
A & N Islands 351 35745 28778 6487’4 .54 55.10
Chandigarh 979 475 7476 8930 10.96 5.32
D & N Haveli 455 6077 6532 6.97
Daman & Diu 573 573
Delhi 2768 143559 39437 185764 1.49 77.2«
Lakshadweep 91 806 4108 50C5 1.82 16.10
Pondicherry 1021 14124 18792 33937 3.01 41.62
INDIA 89236 662010 2055149 2:806395 3.18 23.59

TABLE VII- TOTAL EXPENDITURE (RECURRING & NON-RECURRING) BY TYPti OF INSTITUTIONS
A-Boards of Intermediate and/or Secondary Education
(Rupoes in "hcusands)
STATE/UTs TOTAL EXPENDITURE X OF REC. CO:>T/STUDENT
EXPDT. ON THE BASIS
RECUR NON-RECU GRAND TO TOTAL OF REC. EXPDT.
RING RRING TOTAL EXPDT. (ACTUAL)
1 2 3 4 5
Andhra Pradesh 49951 500 50431 99.01
Arunachal pradesh . . .
Assam 36134 4846 40980 «8.17
Bihar 124778 1617 126395 98.72:
Goa 9159 1966 11125 82.35
Gujarat . . .
Haryana
Himachal Pradesh 64701 804 65!i05 98.77
Jafimu & Kashini r 8936 . . . 8936 100.00
Karanataka 91412 91412 100.00
Kerala 41518 41518 100.00
Madhya Pradesh
Maharashtra 154551 10365 164916 93.71
Manipur 5341 5181 10522 50.76
Meghalaya 7408 2283 9691 76. U
Mizoram
Nagaland 1790 4627 6417 27.89
Orissa
Punj ab 126862 126862 100.00
Rajasthan 79558 3281 82839 96.04
Sikkim
Tamil Nadu 73814 72814 100.00
Tripura 4168 1000 5168 80.65
Uttar pradesh 100864 100864 100.00
West Bengal 45957 — 4!.957 100.00
A & N Islands —
Chandigarh . . .
D & N Haveli
Daman & Diu
Delhi 27994 80 28074 99.72
Lakshadweep . . .
Pondicherry . . . . ••• . . . . . .
INDIA 1054876 36550 1091426 96.65
) i7
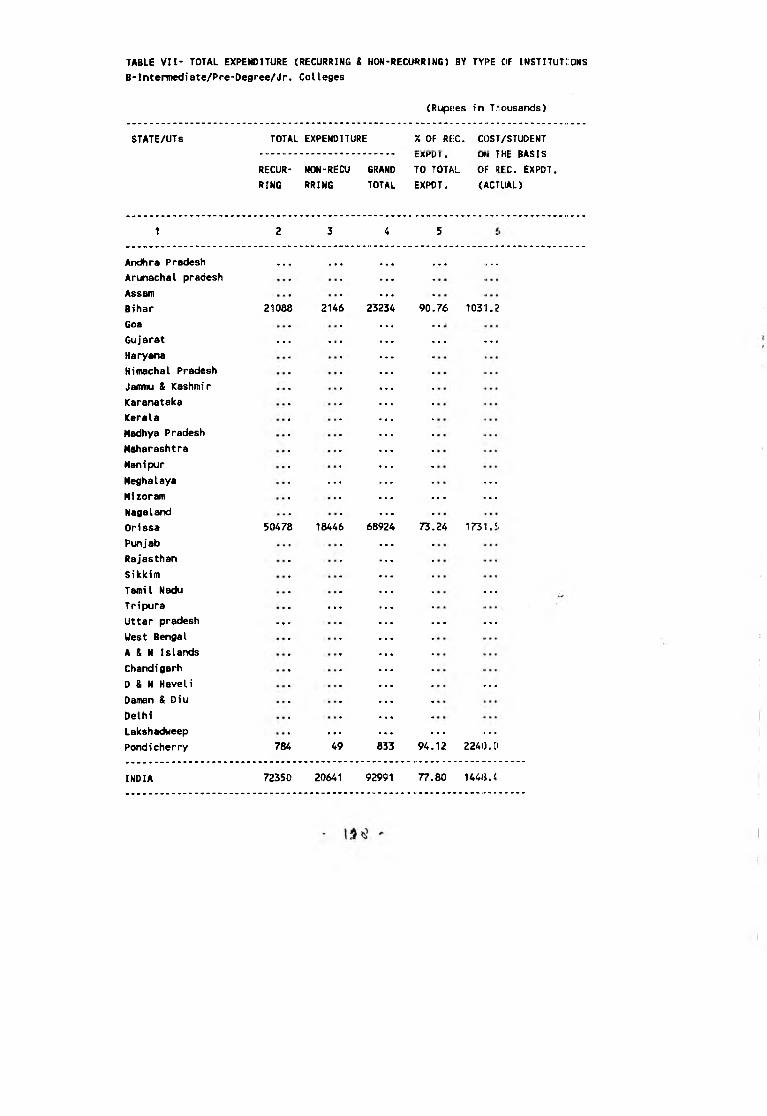
TABLE VII' TOTAL EXPENDITURE (RECURRING S NON-RECURRING) BY TYPE OF INSTITUTiiONS
B-Intermediate/Pre-Degree/Jr. Colleges
(Rupt:es in Thousands)
STATE/UTs TOTAL EXPENDITURE % OF REC . COSI/STUDENT1'LlC DACTCtXPDT• Ufii 1 nc BASIS
RECUR NON-RECU GRAND TO TOTAL OH* SEC. EXPDT.
RING RRING TOTAL EXPDT. < AC I LIAD
1 2 3 5
Andhra Pradesh . . . . . . • « • • • • . . . .
Arunachal pradesh • • •
Assam • • •
Bihar 21088 2146 23234 90.76 1031.E:
Goa . .
Gujarat . . . . . . . . . . . .
Haryana
Himachal Pradesh
Jamnu & Kashmir
Karanataka
Kerala
Madhya Pradesh
Maharashtra
Manipur
Meghalaya . . . . . .
Mizoram . . . . . .
Nagaland
Orissa 50478 18446 68924 73.24 1731.'.
Punjab
Rajasthan
Sikkim
Tamil Nadu . . .
Tripura . . .
Uttar pradesh . . . ■ ■ • . . . . . .
West Bengal • • •
A & N Islands • • •
Chandigarh
D & N Haveli . . .
Daman & Diu • • •
Delhi • • •
Lakshadweep . . . . . . . . .
Pondicherry 784 49 833 94.12 2240.D
INDIA 72350 20641 92991 77.80 1448.4

(Ruptses i n " h 0 usands)i> ;; f : ■ - .
STATE/UTs TOTAL EXPENDITURE % OF REC. COST/STUOENT
......................... ...EXPOT. ON THE BASIS
RECUR- NON-RECU GRAND TO TOTAL OF REC. EXPDT.
RING RRIMG TOTAL EXPDT, (ACTUAL)
1 2 3 4 5 6
An.*ra Pradesh 121578 226 12180A 99.81 1754,4
Arunachal pradesh 57261 20155 77416 73.97 2194.7
Assam 232711 3152 235863 98.66 952 B
Bihar 232394 3603 235997 98.47 1131„1
Goa 40635 1761 42396 95.85 6225.,7
Gujarat 1392929 42637 1435566 97.03 1475„3
Haryana 416859 10763 427622 97.48 1290,. 6
Himachal Pradesh 255864 5613 261477 97.85 1673..0
Jaimiu & Kashmir 101595 8212 109807 92.52 1108.1
Karanataka 867081 5093 872174 99.42 1262.2
Kerala 50713 1320 52033 97.46 1269 ..7
Madhya Pradesh 640668 16337 657005 97.51 526..5
Maharashtra 2681526 101223 2782749 96.36 1294..9
Manipur 48405 5312 53717 90.11 3048.,0
Meghalaya 6338 168 6506 97.42 6189 ..5
Mizoram ... ... ...
Nagaland
Orissa ... ... ... ... .
Punjab 452648 21061 473709 95.55 1042.2
Rajasthan 901062 21069 922131 97.72 1415.4
Sikkim 15781 2926 18707 84.36 1192..3
Tatnil Nadu
Tripura 179550 6790 186340 96.36 1549.5
Uttar pradesh 3096906 55149 3152055 98.25 878,, 1
West Bengal 611480 32960 644440 94.89 458,.1
A & N Islands 44927 23972 68899 65.21 1626,.9
Chandigarh 55972 1172 57144 97.95
D & N Haveli 5319 .1882 7201 73.86 2114..1
Daman & Diu 500 ... 500 100.00 420.5
Delhi 1230698 170930 1401628 87.80 1614.5
Lakshadweep
Pondicherry 20956 2649 23605 88.78 967.3
INDIA 13762356 566135 14328491 96.05 1061.0
TABLE VII- TOTAL EXPENDITURE (RECURRING & MOM-RECURRING) BY TYPE OF INSTITUTIONS
C-Higher Secondary Schools(10+2 pattern]
(i) Higher Secondary Schools with Academic Streams
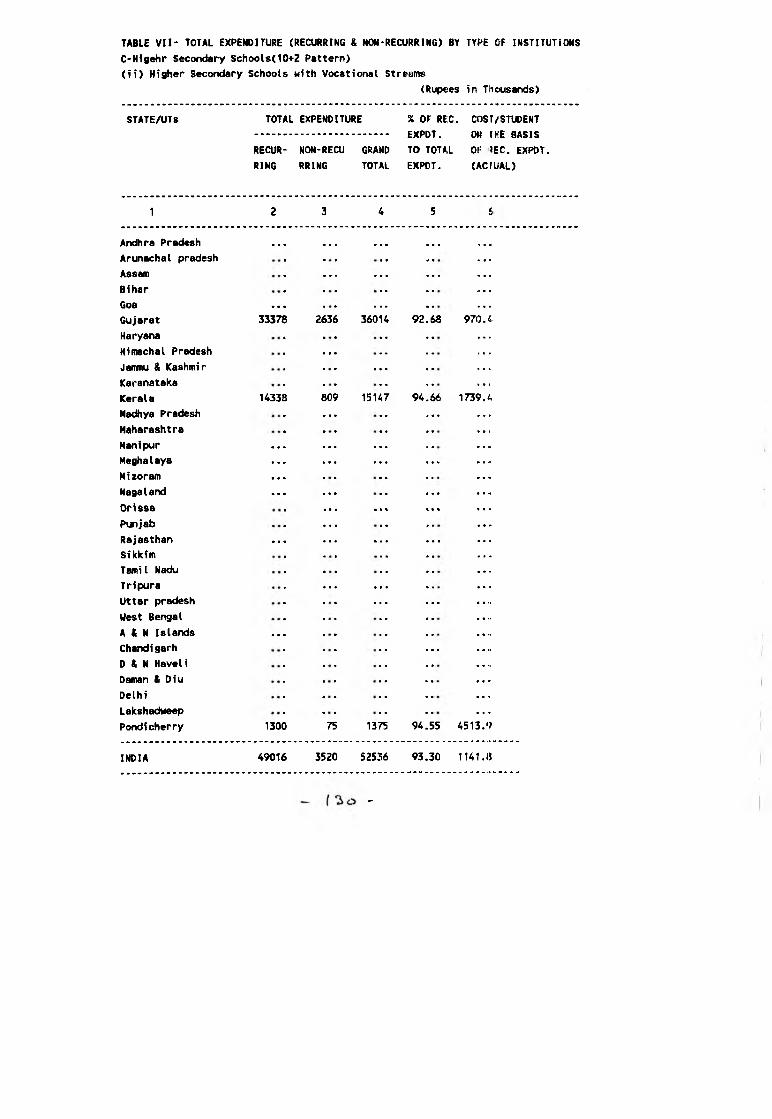
TABLE VII- TOTAL EXPENDITURE (RECURRING & NON-RECURRING) BY TYPE OF INSTITUTIONS
C-H!gehr Secondary Schools(10+2 Pattern)
(ii) Higher Secondary Schools with Vocational Streams
(Rupees in Thousands)
STATE/UTs TOTAL
RECUR
RING
EXPENDITURE
NON-RECU GRAND
RRING TOTAL
% OF REC
EXPDT.
TO TOTAL
EXPDT.
. COSr/STUDENT
ON IKE BASIS
OF ?EC. EXPDT.
(ACrUAL)
1 2
Andhra Pradesh ■ ■ • . • • ... ...Arunachal pradesh
Assam ... ... ...Bihar
Goa ... ...Gujarat 33378 2636 36014 92.68 970. <•
Haryana
Himachal Pradesh ...Janmu & Kashmir ...Karanataka
Kerala 14338 809 15147 94.66 1739.4
Madhya Pradesh ... ...Maharashtra
Manipur ... ... ...Meghalaya ... ... ... ...Mizoram ...Nagaland ... ... ...Orissa ... ... ...Punjab ...Rajasthan ... ... ... ...Sikkim
Tamil Nadu
Tripura ... ...Uttar pradesh ... ...West Bengal
A & N Islands ...Chandigarh ...D & N Haveli
Daman & Oiu
Delhi
Lakshadweep
Pondicherry 1300 75 1375 94.55 4513.9
INDIA 49016 3520 52536 93.30 1141.8
-
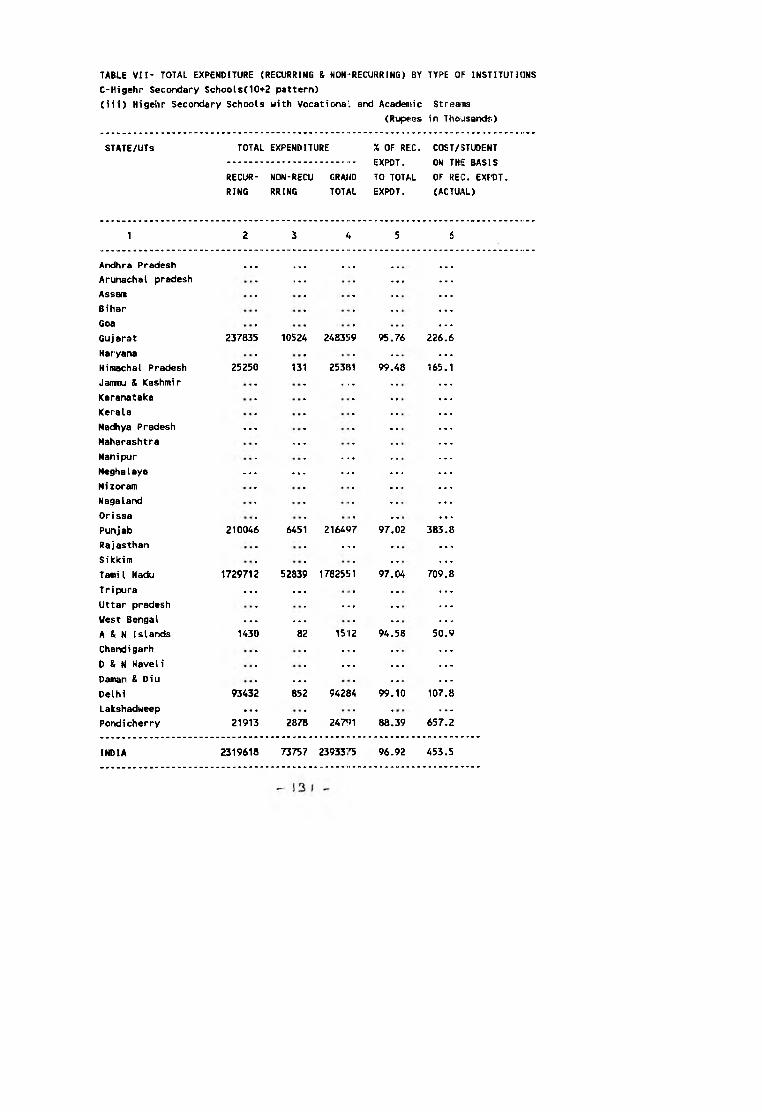
TABLE VII- TOTAL EXPENDITURE (RECURRING & NON-RECURRING) BY TYPE OF INSTITUTIONS
C-Higehr Secondary Schools(10+2 pattern)
(lii) Higehr Secondary Schools with Vocational and Acadentic Streams
(Rupees in Thousands)
STATE/UTs TOTAL
RECUR
RING
EXPENDITURE
NON-RECU GRAND
RRING TOTAL
% OF REG.
EXPDT.
TO TOTAL
EXPDT.
COST/STUDENT
ON THE BASIS
OF REC. EXPDT.
(ACTUAL)
1 2 3 4
Andhra Pradesh . .. ... ...Arunachal pradesh ... ...Assam
Bihar
Goa
Gujarat 237835 10524 248359 95.76 226.6
Haryana • •Himachal Pradesh 25250 131 253IJ1 99.48 165.1
Jamnu & Kashmir —Karanataka
Kerala
Madhya Pradesh —Maharashtra —Manipur ....MeghaIaya ... ... ... ... • • i*Mizoram • • 4Nagaland • • ••Orissa
Punjab 210046 6451 216497 97.02 383.8
Rajasthan ...Sikkira
Tamil Nadu 1729712 52839 1782551 97.04 709.8
Tripura ... ...Uttar pradesh ...West Bengal — —A & N Islands 1430 82 1512 94.58 50.9
Chandigarh ...D & N Haveli — ...Daman & Diu —Delhi 93432 852 94284 99.10 107.8
Lakshadweep ... • • «Poridi cherry 21913 2878 247«.)1 88.39 657.2
INDIA 2319618 73757 23933'^ 96.92 453.5

STATE/UTs TOTAL EXPENDITURE % OF Rs;c. COST/STUDEMT
EXP'Df. ON THE BASIS
RECUR NON-RECU GRAND TO TOTAL OF REC. EXPOT.
RING RRINC. TOTAL EXPDT. (ACTUAL)
1 2 3 4 'i 6
Andhra Pradesh 121578 226 121804 99.J51 1754.4
Arunachal pradesh 57261 20155 77416 73.97 2194.7
Assam 232711 3152 235863 98.<)6 952.8
Bihar 232394 3603 235997 98.^7 1131.1
Goa 40635 1761 42396 95.85
Gujarat 1664U2 55797 1719939 96.76 isas.^Haryana 416859 10763 427622 97.i,e 1290.6
Hirriachal Pradesh 2811U 5744 286853 98.00 1839-1
Jammu & Kashmir 101595 8212 109807 92.52 1108.1
Karanataka 867081 5093 872174 99. .2 1262.2
Kerala 65051 2129 67180 96.83 1350.1
Macfiya Pradesh 640668 16337 657005 97„;.1 526.5
Maharashtra 2681526 101223 27827 ,9 96. J6 1294.9
Manipur 48405 5312 53717 90.11 3048.0
MeghaIaya 6338 168 6506 97.42 6189.5
Mi zoram
Nagaland * • •
Orissa
Punjab 662694 27512 690206 96.Cl
Rajasthan 901062 21069 922131 97,n
Sikkim 15781 2926 18707 84.36
Tami I Nadu 1729712 52839 1782551 97.04 709.8
Tripura 179550 6790 186340 96.36 1549.5
Uttar pradesh 3096906 551^9 3152055 98.25 878.1
West Bengal 611480 32960 644440 94.89 458.1
A & N Islands 46357 24054 70411 65.84 tC¥f^2Chandigarh 55972 1172 57144 97.95
D & N Haveli 5319 1882 7201 73.86 2114.1
Daman & Diu 500 500 100.00 420.5
Delhi 1324130 171782 1495912 88.52 f 5 17 .3Lakshadweep
Pondicherry 44169 5602 49771 88.7i
INDIA 16130990 643412 16774402 96.
- \Z>1
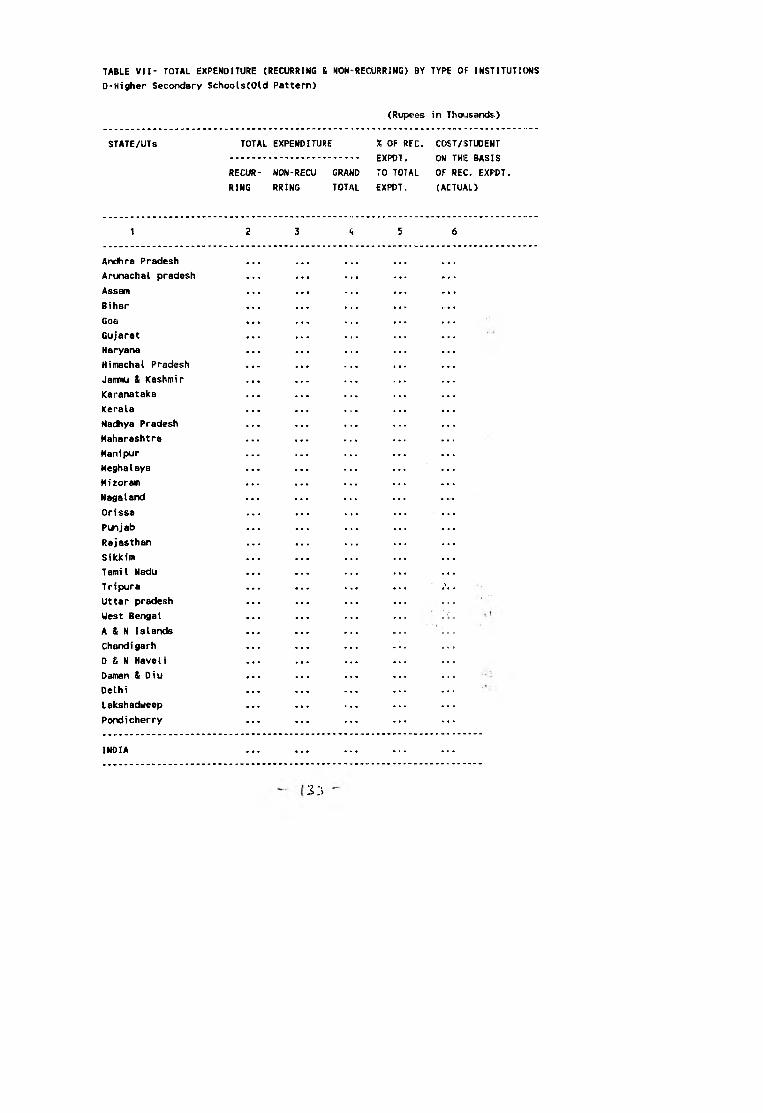
TABLE VII- TOTAL EXPENDITURE (RECURRING i NON-RECURRING) BY TYPE OF INSTITUTHWIS
D-Higher Secondary Schools(Old Pattern)
(Rupees in Thousands:)
STATE/UTs TOTAL EXPENDITURE % OF REC.
EXPDT.
COST/STUDENT
ON THE BASIS
RECUR NON-RECU GRAND TO TOTAL OF HEC. EXPDT.
RING RRING TOTAL EXPDT. (ACTUAL)
1 2 6
Andhra Pradesh
Arunachal pradesh ■ • • • • •
Assam • • • > 1 •
Bihar • • • • • •
Goa
Gujarat
Haryana ■ • ■ » ■ • • > « • • •
Himachal Pradesh • • • ■ » • 1
Jammu & Kashmir • • • ■ • ■ • * •
Karanataka
Kerala
Nadhya Pradesh
Maharashtra
Manipur
Meghalaya • • • • • •
Mizoram • « • • • •
Nagaland • • • • • •
Orissa
Punjab
Rajasthan
Sikkim
Tamil Nadu
Tripura
Uttar pradesh
West Bengal ■ . i- . '
A & N Islancte* V .
Chandigarh
D & N Haveli
Daman & Diu
Delhi
Lakshadweep
Pondicherry
INDIA
33
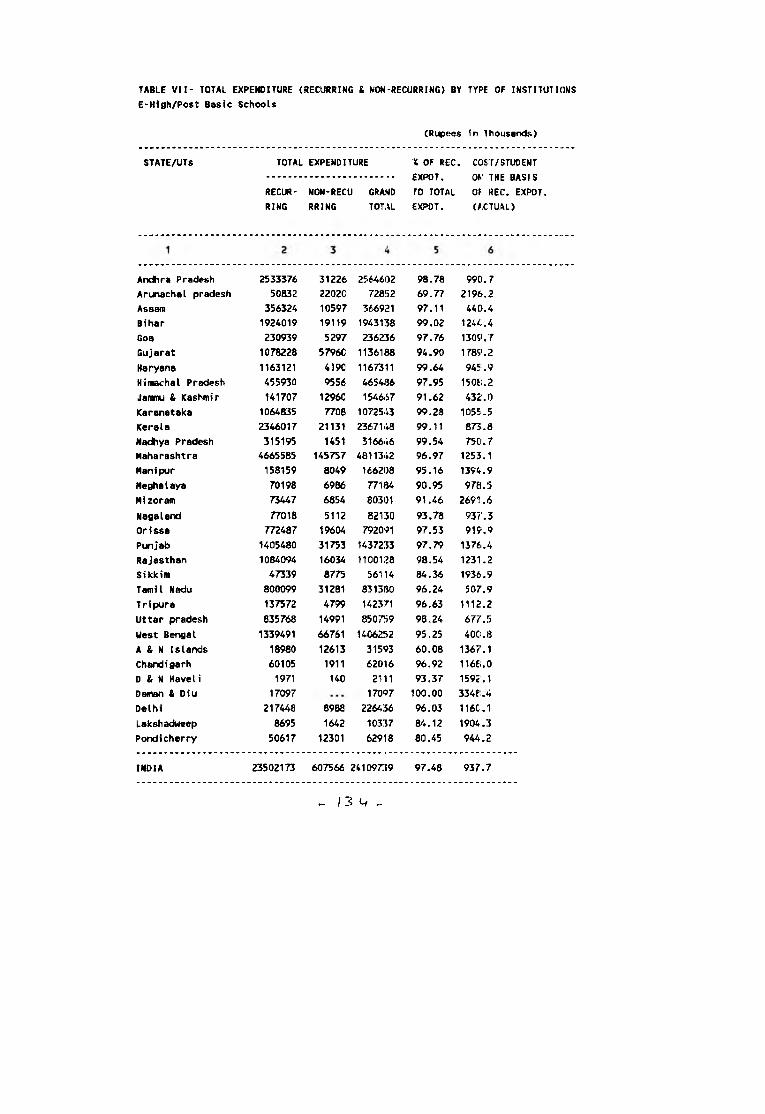
(Rupees in Thousands)
TABLE VII- TOTAL EXPENDITURE (RECURRING & MON-RECURRING) BY TYPE OF INSTITUTIONS
E*High/Post Basic Schools
STATE/UTs TOTAL EXPENDITURE
RECUR
RING
NON-RECU
RRING
GRAND
TOTAL
X OF REC.
EXPOT.
TO TOTAL
EXPOT.
COST/STUDENT
ON THE BASIS
OF REC. EXPDT.
(ACTUAL)
Andhra Pradesh 2533376 31226 2564602 98.78 99CI.7
Arunachal pradesh 50832 22020 72852 69.77 2196.2
Assam 356324 10597 366921 97.11 440.4
Bihar 192A019 19119 1943138 99.02 1244.4
Goa 230939 5297 236236 97.76 1309.7
Gujarat 1078228 5796C 1136188 94.90 1789.2
Haryana 1163121 419C 1167311 99.64 945.9
Himachal Pradesh 455930 9556 465486 97.95 1508.2
Jammu & Kashmir 141707 1296C 1546(57 91.62 432.0
Karanataka 1064835 7708 1072543 99.28 1055.5
Kerala 2346017 21131 2367148 99.11 873.8
Nadhya Pradesh 315195 1451 316646 99.54 750.7
Maharashtra 4665585 145757 4811342 96.97 1253.1
Manipur 158159 8049 166208 95.16 1394.9
Meghalaya 70198 6986 77184 90.95 978.5
Mizoram 73447 6854 80301 91.46 2691.6
Nagaland 77018 5112 82130 93.78 937.3
Orissa 772487 19604 792091 97.53 919.9
Punjab 1405480 31753 1437233 97.79 1376.4
Rajasthan 1084094 16034 1100128 98.54 1231.2
Sikkim 47339 8775 56114 84.36 1936.9
Tamil Nadu 800099 31281 831380 96.24 507.9
Tripura 137572 4799 142371 96.63 1112.2
Uttar pradesh 835768 14991 850759 98.24 677.5
West Bengal 1339491 66761 1406252 95.25 400.8
A & N Islands 18980 12613 31593 60.08 1367.1
Chandigarh 60105 1911 62016 96.92 1166.0
D & N Haveli 1971 H O 2111 93.37 1592.1
Daman & Diu 17097 17097 100.00 334?.. 4
Delhi 217448 8988 226436 96.03 1160.1
Lakshadweep 8695 1642 10337 84.12 1904.3
Pondicherry 50617 12301 62918 80.45 944.2
INDIA 23502173 607566 24109739 97.48 937'. 7
^ 1 3 c, „

TABLE VII- TOTAL EXPENDITURE (RECURRING & NON-RECURRING) BY TYPE OF INSTITUTI(}NS
F-Middle/Senior Basic Schools
STATE/UTs TOTAL EXPENDITURE % OF REC. COST/STUDENT
EXPDT. ON THE BASIS
RECUR- NON-RECU GRAUD TO TOTAL OF REC. EXPDT.
RING. RRING TOTAL EXPDT. (ACTUAL)
1 2 3 4 5 6
Andhra Pradesh 1241626 2331 1243957 99.81 624.9
Arunachal pradesh 82891 45207 128098 64,71 2320.1
Assam 468015 28709 496724 94.22 539.0
Bihar 2555923 20634 2576557 99.20 611.7
Goa 14284 84 14368 99.42 902.6
Gujarat 3091667 61427 3153094 98.05 553,6
Haryana 299916 234 300150 99.92 548.2
Himachal Pradesh 240654 4780 2454y»4 98.05 2246,9
Jammu & Kashmir 218662 10856 229518 95.27 552,6
Karanataka 1994732 238035 2232767 89.34 399.9
Kerala 882942 6392 889334 99.28 537,2
Madhya Pradesh 803245 13745 8169S>0 98.32 308.0
Maharashtra 4135070 98649 42337-9 97.67 724.4
Manipur 155383 6306 161«i9 96.10 2073.7
Meghalaya 42903 13049 55952 76.68 756.2
Mizoram 108708 5422 114130 95,25 2462.9
Nagaland 117881 14950 1328211 88.75 1727.0
Orissa 600178 8869 6090^7 98.54 571.6
Punjab 301373 7372 308745 97.61 1458.9
Rajasthan 1360032 22252 1382284 98.39 617.0
Sikkim 35817 7961 43778 81.82 1571.1
Tamil Nadu 1090146 3544 1093690 99.68 364.8
Tripura 118993 4041 1230J4 96.72 1122.6
Uttar pradesh 1111497 64152 1175649 94.54 404.5
West Bengal 359303 12431 37173.4 96.66 306.9
A & N Islands 29934 13291 45225 69.2S 2048.5
Chandigarh 8325 2363 10668 77.89 721.5
D & N Haveli 11073 3273 14346 77.19 883.2
Daman & Diu 4627 473 5 ICO 90.73 616.?
Delhi 160910 2967 163877 98.19 1245.5
Lakshadweep '2455 2857 5312 46.22 876.2
Pondicherry 56877 9652 66529 85.49 1126,7
INDIA 21706042 736308 22442350 96.72 547.5
-

<Rup«es in Thotjsands)
TABLE VII- TOTAL EXP-NOITURE (RECURRING & NON-REOMKING) BY TYPE OF INSTITUTICMS
G-^rfMsry/Junior - ,ie Sdtools
STATE/UTs TOTAL EXPENDITLIRE
RECUR
RING
NON-RECU
RRING
GRAND
TOTAL
X OF REC.
EXPOT.
TO TOTAL
EXPOT,
CCST/STUDENT
ON TWE BASIS
OF REC. EXPOT.
(ACTUAL)
1
Andhra Pradesh
Arunachal pradesh
Assam
Bihar
Goa
Gujarat
Haryana
Hfmachal Pradesh
JaniHu t Kashmir
Karanataka
Kerala
Madhya Pradesh
Maharashtra
Manipur
Meghalaya
Mizoram
Nagaland
Orissa
Punjab
Rajasthan
Sikkim
Tamil Nadu
Tripura
Uttar pradesh
West Bengal
A & N Islands
Chandigarh
0 & N Havel i
Oaaian & Diu
Delhi
Lakshadweep
Pondicherry
INDIA
2570874 23350 25942i’4 99.10 441.2
96692 41250 137942 70.10 1401.0
973501 63619 1037120 93.87 357.0
243U40 22729 2457169 99.07 420.5
131343 511 131854 99.61 2115.4
731722 26797 758519 96.47 520.9
483310 292 483602 99.94 617.9
614478 5158 6196.(6 99.17 952.6
183978 8423 192401 95.62 423.3
941543 875 942418 99.91 478.B
884136 7732 891868 99.13 554.2
2035067 17404 2052471 99.15 267,4
3421812 84601 3506413 97.59 726.0
199543 14789 214332 93.10 1054.B
72570 2588 75158 96.56 305.5
131226 15628 146854 89.36 1265. t.
171581 10951 182532 94.00 1275.1
1329889 56253 1386142 95.94 355,?
1607931 10119 1618050 99.37 863.B
1220337 81829 1302166 93.72 391. i
81474 9872 89.19 2358,S
1953485 20903 1974388 98.94 351,5
260058 8162 2682I!0 96.96
3636864 20006 3656870 99.45 304.5
1808747 40072 18488*,9 97.83 224. S
29976 12050 42026 71.33 1984.2
16772 3412 20184 83.10 1052.r
5056 1158 6214 81.36 705. J
8073 100 8173 98.7B 807.1
557213 1908 5591Z1 99.66 796.?
OYWJ> 300 7266 95.87 1254.3
52871 5560 5W31 90.48 1030.?-
>8653528 618401 ^?271929 97.89
^ 136

TABLE VII- TOTAL EXPENDITURE (RECURRING & NON-f^ECURRING) BY TYPE OF INSTITUTIONS
H-Pre-Primary/Pre-BAsic Schools
(Rupees in Thousands)
STATE/UTs TOTAL EXPENDITURE % OF REG . COST/STUDENT
EXPDT. ON THE BASIS
RECUR NON-RECU GRAND TO TOTAL OF HEC. EXPDT.
RING RRING TOTAL EXPDT. (ACrUAL)
1 2 3 4 5
Andhra Pradesh 983 • • • 983 100.00 442. i
Arunachal pradesh 8932 115 9047 ^ 98.73 693.3
Assam 8272 302 8574 96.48 365.'5
Bihar 177 177 100.00 379,1]
Goa . . .Gujarat 30115 976 31091 96.86 196.5
Haryana 854 . . . ' 854 100.00 392.1
Himachal Pradesh 697 19 716 97.35 973.!)
Jammu & Kashmir • • • . ..Karanataka 33467 33467 100.00 101 ,;j
ICerala 3744 53 3797 98.60 245.1
Madhya Pradesh 7180 96 7276 98,68 91.3
Maharashtra 22053 601 22654 97.35 251.1
Manipur 128 128 100.00 2415.1
Meghalaya 1315 793 2108 62.38 27.4
Mizoram . . .Nagaland . . . . . . . . .Orissa • • ■Punjab 259 • • • 259 100.00 1947..'4
Rajasthan 4496 • • • 4496 100.00 656. ?
Sikkim 5942 584 6526 91.05 401.?:
Tamil Nadu 1185 8 1193 99.33 212.1
Tripura 31574 500 32074 98.44 272.,?
Uttar pradesh 3361 31 3392 99.09 338. E
West Bengal 7259 184 7443 97.53 239.1
A & N Islands 817 854 ^671 48.89 449.5
Chandigarh . . .D & N Haveli • • •
Daman & Diu 4110 4110 100.00
Delhi 9067 9067 100.00 139.?'
Lakshadweep 1198 68 1266 94.63 1302.-2
Pondicherry 1973 213 2186 90.26 185.6
INDIA 189158 5397 194555 97.23 186.1
1 3 7

TABLE VII- TOTAL EXPENDITURE(RECURRING & NON*i?ECURRlNG> BY TYPE OF INSTITUTIONS
Total Elementary Education < F,G,H )
STATE/UTs TOTAL
RECUR
RING
EXPEND rURE
NON-RECU GRAND
RRING TOTAL
% OF REC
EXPDT.
TO TOTAL
EXPDT.
. COST/STUOEMT
ON THE BASIS
OF «EC. EXPDT.
(ACTUAL)
1 2 3 4 5 (3
Andhra Pradesh 3813483 25681 3J839164 99.33 487.9
Arunachal pradesh 188515 86572 275087 68.53 1602.7
Assam 1449788 92630 '1542418 93.99 400,13
Bihar 4990540 43363 S033903 99.14 500.7
Goa 145627 595 ?46222 99.59 1869.0
Gujarat 3853504 89200 3942704 97.74 539.15
Haryana 784080 526 784606 99,93 588.'?
Himachal Pradesh 855829 9957 865786 98.85 1136.13
Jammu & Kashmir 402640 19279 421919 95.43 484.'?
Karanataka 2969742 238910 3208652 92.55 407.7
Kerala 1770822 14177 1784999 99.21 544.1
Hadhya Pradesh 2845492 31245 2876737 98.91 276. :j
Maharashtra 7578935 183851 1'762766 97.63 721.2
Hanipur 355054 21095 376149 94.39 1344.}
Meghalaya 116788 16430 133218 87.67 341.1
Mizoram 239934 21050 2609&4 91.93 1623.1
Nagaland 289462 25901 315363 91.79 1427.2:
Orissa 1930067 65122 199516.9 96.74 403. J
Punjab ^909563 17491 1927Q54 99.09 923.1
Rajasthan 2584865 104081 2688946 96.13 485.2
Sikkim 123233 18417 141650 87.00 1708.4
Tamil Nadu 3044816 24455 3069271 99.20 356. :•
Tripura 410625 12703 423328 97.00 164.2;
Uttar pradesh 4751722 84189 4835911 98.26 322. S
West Bengal 2175309 52687 2227996 97.64 235.D
A & N Islands 60727 26195 86922 69.86 1925.j
Chandigarh 25097 5775 30872 81.29 913.5
D S N Haveli 16129 4431 20560 78.45 818.<
Daman & Diu 16810 573 17383 96.70 960.5
Delhi 727190 4875 732065 99.33 814.1
Lakshadweep 10619 3225 13844 76.70 1144.?
Pondicherry 111721 15425 127146 87.87 993.9
INDIA 50548728 1360106 51908834 97.38 449.?
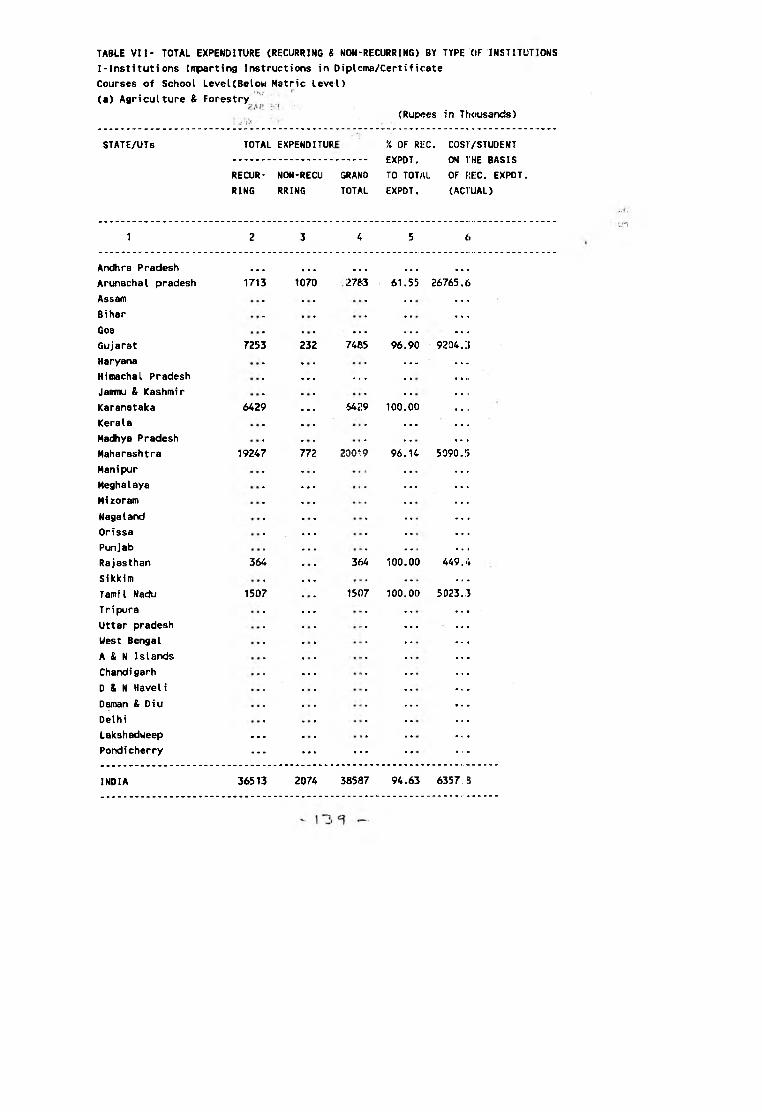
TABLE VII- TOTAL EXPENDITURE (RECURRIMG S NON-RECURRING) BY TYPE OF INSTITUTIONS
I-Institutions Imparting Instructions in Diploma/Certificate
Courses of School LeveUBelow Metric Level)
(a) Agriculture & Forestry
(Rupt^es in Thousands)
STATE/UTs TOTAL
RECUR
RING
EXPENDITURE
NON-RECU
RRING
GRAND
TOTAL
% OF RL'C
EXPDT.
TO TOTAL
EXPDT.
. COST/STUDENT
ON THE BASIS
OF ftEC. EXPDT.
(ACTUAL)
1 2 4 6
Andhra Pradesh . . . . . . . . . . . .
Arunachal pradesh 1713 1070 2763 61.55 26765.6
Assam • « n
Bihar « a ri
Goa . . . . . . • « It
Gujarat 7253 232 7485 96.90 9204.3
Haryana . . . • • X
Himachal Pradesh • « • __ • a II
Jatnnu & Kashmir
Karanataka 6429 ■ « ■ iS429 100,00 ■ • t
Kerala « • ■ • « *
Hadhya Pradesh a • «
Maharashtra 19247 772 20019 96.14 5090. :>
Manipur
Meghalaya . . . . . . • « •
Mizoram • • •
Nagaland • • •
Orissa * * * • • •
Punjab ■ • •
Rajasthan 364 364 100.00 449.4
Sikkim • • •
TamiI Nadu 1507 1507 100.00 5023.3
Tripura . . .
Uttar pradesh . . .
Uest Bengal
A & N Islands
Chandigarh . . .
D & N Haveli
Daman & Diu . . . • i •
Delhi • • •
Lakshadweep . . . • < •
Pondicherry . . . . . . . . . • t •
INDIA 36513 2074 385U7 94.63 6357,B

TABLE VII- TOTAL EXPENDITURE (RECURRING & NON-RECURRING) BY TYPE OF INSTITUTIONS
I'Instftutions Imparting Instructions in Diplcwia/Certificate
Courses of School LeveKBelow Metric Level.)
(b) Nedicine(Nursing & Midwifery)
(Rupees in ThcHjjsands)
STATE/UTs TOTAL
RECUR
RING
EXPENDITURE
NON-RECU GRAMD
RRING TOTAL
% OF REC
EXPDT.
TO TOTAL
EXPDT.
. COST/STUDENT
ON THE BASIS
OF REC. EXPDT.
(ACTUAL)
1 2 4 5
Andhra Pradesh . . . . . . . . . . . .
Arunachal pradesh 726 726 100.00 6258.6
Assam 964 964 100.00 6836.9
Bihar 1120 1120 100.00 9572.6
Goa
Gujarat 9355 9355 100.00 9545.9
Haryana • • •
Himachal Pradesh ■ • •
Jammu & Kashmir ■ • •
Karanataka • » •
Kerala
Madhya Pradesh 6071
• • «
6109 99.38
Maharashtra
Manipur . . .
Meghalaya . . . . . .
Mizoram • • • . . .
Nagaland • • • . . . . . .
Orissa
Punjab . . .
Rajasthan ____
Sikkim
Tamil Nadu . . .
Tripura . . . . . .
Uttar pradesh • • •
West Bengal 1887 • • ■ 18J37 100.00 1906.1
A & N Islands • • •
Chandi garh ■ • •
D & N Haveli . . . . . .
Daman & Diu . . .
Delhi . . . . . .
Lakshadweep . . . . . . . . .
Pondicherry . . . • • » . . . . . . . . .
INDIA 20123 38 20161 99.81 858‘i.9

TABLE VII- TOTAL EXPENDITURE (RECURRING & NON-RECURRING) BY TVPE OF INSTITUTIONS
I-Institutions Imparting Instructions in Diploma/Certificate
Courses of School LeveUBelow Matric Level)
(c) Teacher Training
' ' ' f (Rupees in Thousands)^,'
STATE/UTs TOTAL EXPENDITURE % Of REC. :OST/STUDENT
EXPDT. CN THE BASIS
RECUR NON-RECU GRAND TO TOTAL OF REC. EXPDT.
RING RRING TOTAL EXPDT. FACTUAL)
1 2 3 4 5 6
Andhra Pradesh 2533376 31226 256iV602 98.78
Arunachal pradesh ...Assam
Bihar
Goa
Gujarat 42682 1681 44363 96.21 44£:;2.9
Haryana
Himachal Pradesh ... ■..Jammu & Kashmir ... ... ...Karanataka 102922 834 103756 99.20
Kerala . .. ....Madhya Pradesh
Maharashtra
Manipur
Meghalaya 225 4843 95.35 693T..9
Mizoram
Nagaland 2435 3575 6010 40.52 5939D.2
Orissa ...Punj ab ...Rajasthan
Sikkim 1263 3981 5244 24.08 1619:’.3
Tamil Nadu ...Tripura 3362 10 3572 99.70 ...Uttar pradesh 72827 1325 74152 98.21 1623:\9
West Bengal ■ • « ....A & N Islands • • ■Chandigarh « • •D & N Haveli
Daman & Oiu
Delhi
Lakshadweep —Pondicherry ... ... ... ...
INDIA 2763485 42857 2806342 98.47 186835.6
Ttil -
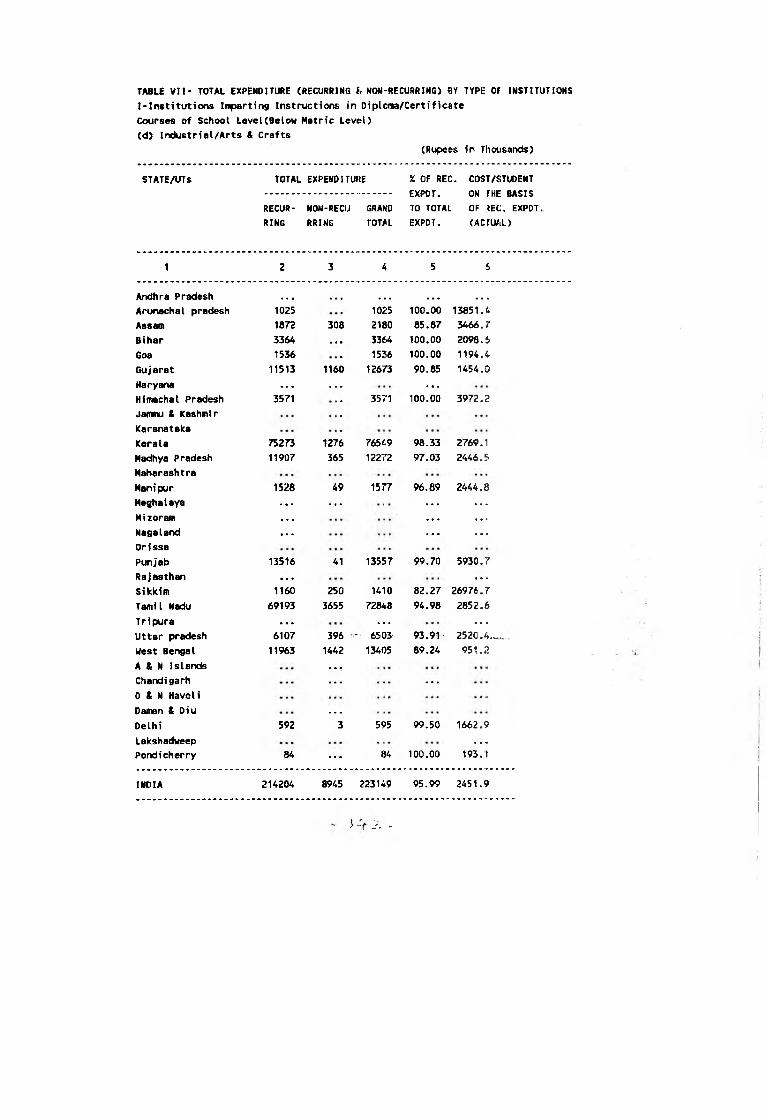
TABLE VII- TOTAL EXPENDITimE (RECURRING i. NON-RECURRING) BY TYPE OF INSTITUTIONS
I-Institutions Imparting Instructions in Diplcraa/Certificate
Courses of School Level(Below Matric Level)
(d) Industrial/Arts & Crafts
(Rupees in Thousands)
STATE/UTs TOTAL EXPENDITURE
RECUR
RING
NON-RECU
RRING
GRAND
TOTAL
% OF REC.
EXPOT.
TO TOTAL
EXPDT-
COST/STUDENT
ON THE BASIS
OF ?EC. EXPOT,
(ACrU/tL)
1 2 3 4 5 i
Andhra Pradesh ... ... ... ... ...Arunachal pradesh 1025 1025 100.00 13851.4.
Assam 1872 308 2180 85.87 3466.7
Bihar 3364 .. • 5364 100.00 2098.6
Goa 1536 1536 100.00 1194.4
Gujarat 11513 1160 12673 90.85 1454.0
Haryana ... ... ...Himachal Pradesh 3571 3571 100.00 3972.2
Janrmu & Kashmir
Karanataka
Kerala 75273 1276 76549 98.33 2769.1
Madhya Pradesh 11907 365 12272 97.03 2446.5
Maharashtra
Manipur 1528 49 1577 96.89 2444.8
Meghalaya ... ... ... ...Mizoram ... ... ...Nagaland ... ... ...Orissa
Pwijab 13516 41 13557 99.70 5930.7
Rajasthan ... ...Sikkim 1160 250 1410 82.27 26976.7
Tamil Nadu 69193 3655 728/f8 94.98 2852.6
Tripura ... ... ...Uttar pradesh 6107 396 - 6503- 93.91' 2520.4___
West Bengal 11963 1442 13405 89.24 951.2
A & N Islands • • •Chandigarh ... ...D & N Haveli
Daman & Diu _Delhi 592 3 595 99.50 1662.9
Lakshadweep ....Pondicherry 84 ... 84 100.00 193.1
INDIA 214204 8945 223149 95.99 2451.9
3 :r. -

TABLE VII- TOTAL EXPENDITURE (RECURRING & NON-RECURRING) BY TYPE OF INSTITUTIONS
I-Institutions Irusarting Instructions in Diplcma/Certificate
Courses of School Level(Below Matric Level)
(e) Music & Fine Arts
(Rupees in Thousands)
STATE/UTs TOTAL EXPENDITURE % OF REC . COST/STUDENT
EXPDT. ON THE BASIS
RECUR NON'RECU GRAND TO TOTAL OF fti:C. EXPDT.
RING RRING TOTAL EXPDT. (ACTUAL)
1 2 3 4 5 6
Andhra Pradesh • • • • « • • • • • • • • • ••
Arunachal pradesh
Assam 304 29 333 91.29 66.2
Bihar . . . . . .
Goa 1657 10 1667 99.40 1511.9
Gujarat 9809 176 9985 98.24 4396.7
Haryana
Himachal Pradesh
Jammu & Kashmir
Karanataka 3847 15 3862 99.61
Kerala 3359 385 3744 89.72 2131.3
Madhya Pradesh 8849 8849 100.00 ;20627.0
Maharashtra 738 2 740 99.73 215.1
Manipur
Meghalaya . . . . . . . . .
Mizoram
Nagaland
Orissa . . .
Punjab . . . • • •
Rajasthan 2810 -<14 2824 99.50 2616.4
Sikkim
Tamil Nadu 13 8 21 61.90 53.1
Tripura
Uttar pradesh 450 12 462 97.40 398.2
West Bengal 1491 8 1499 99.47 297.1
A & N Islands • a •
Chandigarh > ■ ■
D & N Haveli . . .
Daman & Diu • • « ••• VDelhi • • • . . . • • •
Lakshadweep • • • . . . . . . . . . • I •
Pondicherry . . . . . . • • •
INDIA 33327 659 33986 98.06 1600.4

TABLE VII- TOTAL EXPENDITURE {RECURRING & MON-RECURRlNG) BY TYPE OF INSTITUTIONS
I-Institutions Imparting Instructions in Diplcma/Certificate
Courses of School LeveUBelow Metric Levol)
(f) For the Handicapped
(Rupees in Thousands)
STATE/UTs TOTAL EXPENOITUIJE % OF REG, COSI/STUDENT
........................... EXPDT. ON THE: BASIS
RECUR- NON-RECU GRAND TO TOTAL OF ^EC. EXPDT.
RING RRING TOTAL EXPDT. (ACfU/iL)
1 2 3 4 5 f.
Andhra Pradesh 10464 703 11167 93.70 5234.S
Arunachal pradesh
Assam 748 108 856 87.38 1903.5
Bihar 2417 ... 2417 iOO.OO 3629.1
Goa
Gujarat 36405 1810 38215 95.26 6418.«
Haryana 4362 211 « 7 3 95.39 9125.5
Himachal Pradesh 1102 117 1219 90.40 11131.5
Jaiimu & Kashmir 314 ... 314 100.00 3488.9
Karanataka 5609 113 5722 98.03 6985.1
Kerala 11591 631 12222 94.84 5341.5
Madhya Pradesh 1385 6 1391 99.57 1644.9
Maharashtra 24749 969 25718 96.23 12783.6
Manipur 1348 183 1531 88.05 12144.1
Meghalaya
Mizoram
Nagaland
Orissa
Punjab 2630 133 2763 95.19 9598.5
Rajasthan 3601 9 3610 99.75 4731.9
Sikkim
Tamil Nadu 14753 228 14981 98.48 2623.2
Tripura 1776 56 1832 96.94 11607.8
Uttar pradesh 3522 17 3539 99.52 2640.2
West Bengal 3872 239 41*1 94.19 2765.7
A & N Islands
Chandigarh 782 ... 782 100.00 13482.8
D ft N Haveli
Daman & Diu
Delhi 9290 36 9326 99.61 6616.8
Lakshadweep
Pondicherry 1155 40 1195 96.65 3564.8
INDIA 141875 5609 147484 96.20 5335.5
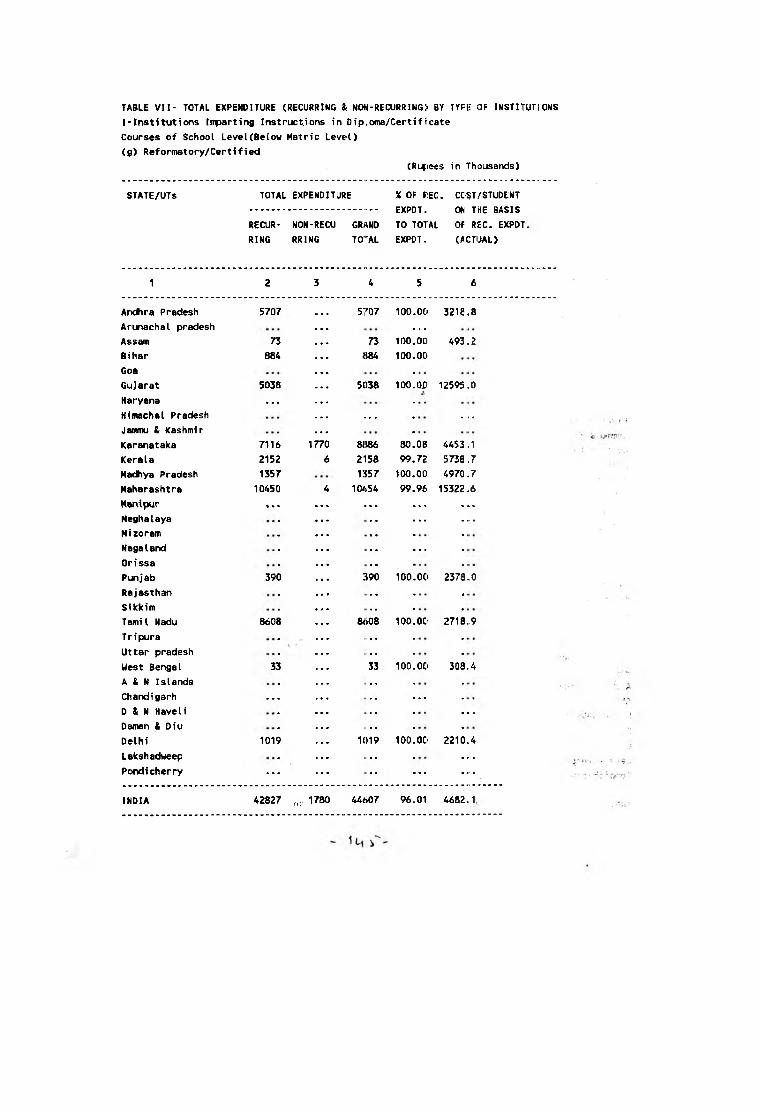
TABLE VII- TOTAL EXPENDITURE (RECURRING & NON-RECURRING) BY TVPH OF INSTITUTIONS
I'Institutions Imparting Instructions in Dip.oma/Certificate
Courses of School LeveKBelow Matric Level)
(g) Reformatory/Certified
(Rufiees in Thousands)
STATE/UTs TOTAL EXPENDITURE
RECUR
RING
NON-RECU
RR1N6
GRAND
TO'AL
X OF REC.
EXPDT.
TO TOTAL
EXPDT.
CC^T/STUDENT
OM THE BASIS
OF RIEC. EXPDT.
(ACTUAL)
1 2 3 4 5 6
Andhra Pradesh 5707 5707 100.00 3218..8
Arunachal pradesh —Assam 73 73 100.00 493.2
Bihar 884 884 100.00
Goa
Gujarat 5038 5038 lOO.Ofi 12595..0
Haryana —Himachal Pradesh — —
Jammu & Kashmir
Karanataka 7116 1770 8886 80.08 4453 ..1
Kerala 2152 6 2158 99.72 5738 ,.7
Hadhya Pradesh 1357 1357 100.00 4970.7
Maharashtra 10450 4 10454 99.96 15322.6
H*r\ipur » % % * « % ... . . . . . .Meghalaya • • • . . . . . .Mizoram
Nagaland • • • ...
Orissa • • •
Punjab 390 • • • 390 100.00 2378.0
Rajasthan • • •
Sikkim • • •
Tamil Nadu 8608 8<>08 100.00 2718..9
Tripura
Uttar pradesh
West Bengal 33
• • •
• • • 100.00 308 „ 4
A & N Islands * • ■Chandigarh . . . . . .D & N Haveli . . .Daman & Diu
Delhi 1019 1019 100.00 2210.4
Lakshadweep . . . . . .Pondicherry . . . . . . . . .
INDIA 42827 o:. 1780 44607 96.01 4682.1

TABLE VII- TOTAL EXPENDITURE (RECURRING & KOM-RECURR|Na> BY TYPE OF INSTITUTIONS
I-Institutions Imparting Instructions in Diploma/Certificate
Courses of School Level(Below Matric Level)
(h) Oriental Studies
(Rupees in Thousands)
STATE/UTs TOTAL EXPENDITURE X OF REC.. COST/STUOENT
EXPOT. ON THE BASIS
RECUR NO»t-RECU GRAND TO TOTAL OF REC. EXPDT.
RING RRING TOTAL EXPDT. (ACTUAL)
2 3 4 5 6
Andhra Pradesh 33A7 ... 3347 100.00 1829.0
Arunachal pradesh —Assam 6105 121 6226 98.06 756.4
Bihar 38692 424 39116 98.92 251.6
Goa
Gujarat 3090 is: 3252 95.02 1195.8
Haryana
Himachal Pradesh
Jammu & Kashmir
Karanataka 12172 151 12303 98.94 412.6
Kerala
Madhya Pradesh 3221 6 3227 99.81 836.6
Maharashtra 1657 12 1669 99.28 361.7
Manipur 47 ... 47 100.00 100.6
Meghalaya
Mizoram
Nagaland
Orissa
Punjab
Rajasthan ...Sikkim
Tamil Nadu 4178 119 4297 97.23 651.6
Tripura 132!) 1325 100.00 343.0
Uttar pradesh 24780 26569 93.27 187.1
West Bengal 20005 20551 97.34 446.1
A & N Islands
Chandigarh ...D & N Haveli
Daman & Diu . . u ...Delhi
Lakshadweep
Pondicherry ... .... ... ... ...
INDIA 118619 3310 121929 97.29 302.4
-
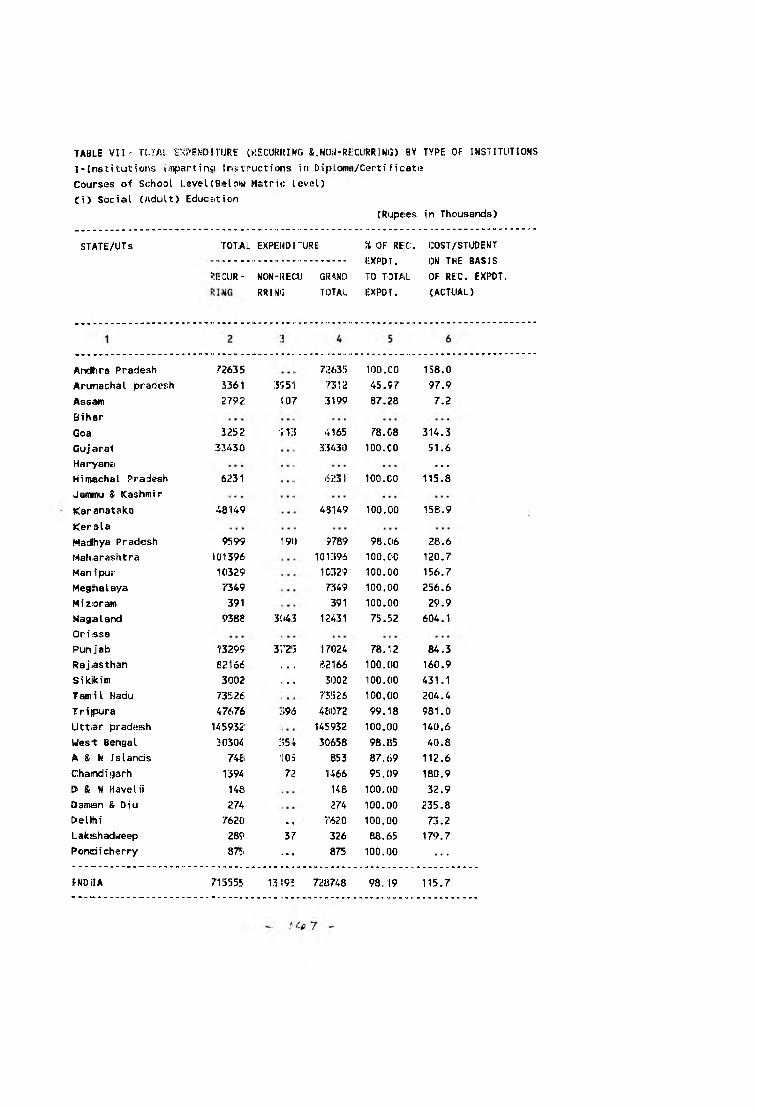
TABLE VII' n;17U- EKPEI^DITIJRi (KECUfmiMO S.HOW-RECLIRRINl3) BY TYPE OF INSTITUTIONS
I - Inst i tut ions t impart inci Instructions in Diplomci/C<5rti f icattj
Courses of School Level(Below Matric Level)
(i) Social (Adult) Educsition
(Rupees in Thousands)
STATE/UTs TOTiAL EXPIEUDITURE
I!!: CUR - NON-l?EC:iJ
RRING
GRANi:)
TOTAL
54 OF re;c .
KXPDT.
TO TOTAL
EXPDT.
COST/STUDENT
ON THE BASIS
OF REC. EXPDT.
(ACTUAL)
Andhra Pradesh r2635 72635 100.00 158.0
Arunachal pradesh 5361 3i51 7312 45.97 97.9
Assam 2792 ■i07 3199 87.28 7.2
Bihar
Goa 52*32 ii:5 4165 78.08 314.3
Gujarat 33430 33430 100.CO 51.6
Haryana —
Himachal Pradesh 6231 6H31 100.00 115.8
Jammu & Kashmir
Karanataka 48149 4i5'l49 100.00 158.9
Kerala
Wadlhya Pradesh 9599 190 9789 98.06 28.6
Maharashtra 101396 101396 100.00 120.7
Man i pur 10329 10329 100.00 156.7
Meghalaya 7349 nu9 100.00 256.6
Mizoram 391 391 100.00 29.9
NagalarKf 938fi 3043 12431 75.52 604.1
Orissa
Punjab 13299 37213 17024 78.12 84.3
Raj ;as than 02166 . . . . 82166 100,00 160.9
Sikikim 3002 . . . 3002 100.00 431.1
Tamil Nadu ?3526 73526 100.00 204.4
Triipura 47676 :i96 48072 99.18 981.0
Uttar pradesh 145932: 145932 100.00 140.6
West Bengal 30304 :;54 30658 98.85 40.8
A & N Islands 748 ■[05 853 87.69 112.6
Chatndigarh 1394 72 1466 95.09 180.9
Di & N Havel ii 14S 148 100.00 32.9
D aman & Diu 274 lit, 100.00 235.8
[Jelihi 762CI . . 7620 100.00 73.2
Lakishadueep 289 37 326 88.65 179.7
Pondicherry 87!. . . . 875 100.00 . . .
fNDlIA 715555 11 i93 728748 98.19 115.7

iiL- : ••i- <'
TABLE VII* TOTAL EXPEKO n’URE(RI:CUKKl W K MO»-ltEajRRIMG) BY TYPE OF IMSTITUTIOMS
Institutions Imparting Irvstpuctionsi ir Diploma/Djnrificjrte
Courses of School
(j) Others
Le'/el (Below Matri c l evel)
STATEA»Ts TOTAL EXPEH)ITURF. 5{ OF IWEC. COST/STUDENT
....... EXPDT. ON THE BASIS
HECWR- NON-R£CU Gft#t.NO TO TOTAL OF REC. EXPOT.
It IMG RRIHC TOTAL IIXPOT. (ACTUAL)
1 2 4 5 6
Andhru Pradesh ... ...
Arupvschal
Assam •!22 2610 95.3:1 47V4.6
Bihar 443 443 100.01) 11657.9
Goa
Gujartit
Haryarta
Himachal Pradesh 1 6 W 1699 100.01) 7138.7
Jannu & Kosimtir ... . ..
Karanataka 6D&44 91166 6S.10
Kerale . .. .»« ...
Mat^iya Pradesh . ..
Maharashtra 87 S2 1 19 73.11 JI44.7
Manipur 561 S3 599 93.6(> {106.0
Meghalaya
Mizoram . ..
Nagalcnd UfllO «S1 1.*671 •H.rj 230166.7
Orissa •.. . ..
Punjab ...
iiiajasthan ... . ..
Sikkim
Tamil Madu ... . .. ...
Tripura
Uttar pradetth
West Beng«l 22232 5!5S 2i?500 98.81
A t N Islands ... . u . .. .
Chandi garh ... • • >D & N Haveli 148 . ., 148 11)0.01)
Daman & Diu ... . .. . . .
Delhi ... . .. .». . . .
Lakshadweep ., .
Pondicherry ... ...
IMOIA 102312 3’i?i43 13(i255 75.0<> 61&19.9

T^BLE VII- TOTAL EXPEMDiTURE(RECURRING & NOM-RECURRING} BY
Institutions Impartinsi Instructions in Diploma/Certificate
Courses of School Levcd (Below Metric Level)
Total I <8 to j>
PE OF INSTITUTIONS
STATE/UTs TOTAL EXPENDITURE
RECUR
RING
NON-RECU
R R l N aGRAND
TOTAL
% OF REC.
EXPCT.
TO TOTAL
EXPCT.
COST/STUDENT
ON THE BASIS
OF REC. EXPDT.
(ACTUAL)
1
Andira Pradesh
Arunachal pradesh
Assam
Bihar
Goa
Gujarat
Haryana
Himachal Pradesh
Jannu & Kashmir
Karanataka
Kerala
Madhya Pradesh
Maharashtra
Manipur
Meghalaya
Mizoram
Nagaland
2625529 3V?29 2657458 98.80 5641.6
6825 5D21 11846 57.61 197.4
15346 11)95 16441 93.34 38.2
46920 424 47344 99.10 300.3
6445 923 7368 87.47 506.4
158575 5221 163796 96.81 234.1
4362 211 4573 95.39 9125.5
12603 117 12720 99.08 228.9
314 ’314 100.00 3488.9
247088 35485 282573 87.44 737.8
92375 2298 94673 97.57 2950.9
42389 S05 42994 98.59 122.6
158324 1791 160115 98.88 185.2
13813 270 14083 98.08 203.7
11967 225 12192 98.15 408.3
391 391 100.00 29.9
25633 7^79 33112 77.41 1638.7
Orissa — . . .
Punjab 298155 3399 33734 88.44 185.8
Rajasthan 88941 23 38964 99.97
Sikkim 5425 4231 9656 56.18 765.8
Tamil Nadu 171778 4010 175788 97.72 429.8
Tripura 54139 ^62 54601 99,15 1028.9
Uttar pradesh 253618 3539 257157 98.62 215.0
West Bengal 91787 2057 94644 96.98 113.6 '
A & N Islands 748 105 853 87.69 112.6
Chandigarh 2176 72 2248 "96.80 280.3
D & N Havel i 296 296 100.00 65.8
Daman & Diu 274 274 100.00 235.8
Delhi 18521 39 18560 99.79 174.3
Lakshadweep 289 37 326 88.65 179.7
Pondicherry 2114 40 2154 98.14 2785.2
INDIA 4188840 112408 4301248 97.39 620.9
- J V -
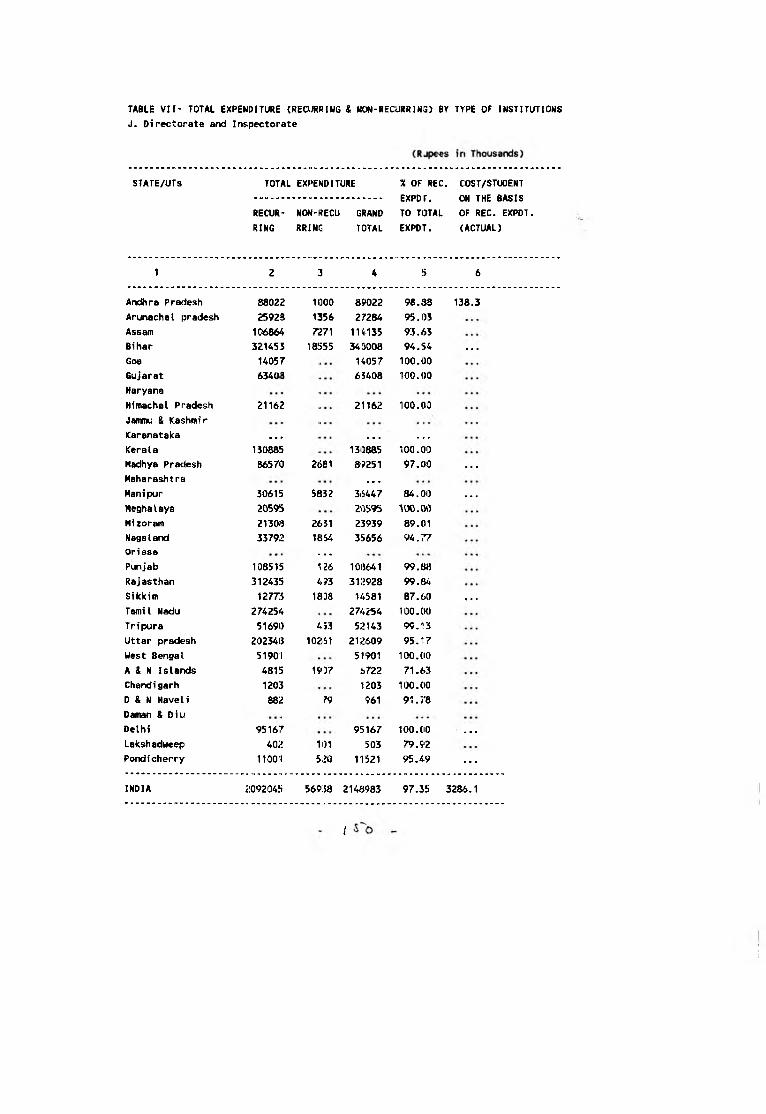
TABLE VII- TOTAL EXPENDITURE {RECIJKRING & NON-RECURRING) BY TYPE OF INSTITUTIONSJ. Directorate and Inspectorate
STATE/UTs TOTAL EXPENDITURE X OF rec. cost/stuoent
EXPDr. ON THE BASIS
RECUR NON-KECU GRAND t o TOTAL OF REC. EXPDT.
RING rri:ng TOTAL e x p d t . (ACTUAL)
1 2 3 4 5 6
Andhra Pradesh 88022 1000 89022 98.38 138.3
Arunachal pradesh 25928 1356 27284 95.1)3
Assam 106864 7271 114135 93.63
Bihar 32 U 5 J 18555 340008 94.54 ...
Goa 14057 14057 100.00
Gujarat 63403 63408 100.013
Haryana
Himachal Pradesh 21162 21162 100.00
Jammu & Kashmir
Karanataka • . • ... ...
ICerala 130885 133885 100.00
Madhya Pradesh 86570 26B1 87251 97.00 ...
Maharashtra ...
Manipur 30615 5832 36447 84.00 __
Meghalaya 20595 20595 100. IM)
Mizoram 21308 2651 23939 89.01
Nagaland 33792 18S4 35656 94,7'7
Orissa ...
Punjab 108515 ^26 108641 99.88
Rajasthan 312435 4?3 312928 99.84
Sikkim 12773 1833 14581 87.60 .. ■Tamil Nadu 274254 274254 100.00
Tripura 51690 453 52143 99.-! 3
Uttar pradesh 202348 10251 212609 95.17
West Bengal 51901 51901 100.00
A & N Islands 4815 1937 (l>722 71.63
Chandigarh 1203 1203 100.00
D & N Haveli 882 79 961 91.'/8
Daman & Diu
Delhi 95167 95167 100.00 ...
Lakshadweep 402 1D1 503 79.92
Pondicherry 11001 5,20 11521 95.49 ...
INDIA i:092045 56938 214JJ983 97.35 3286.1
/
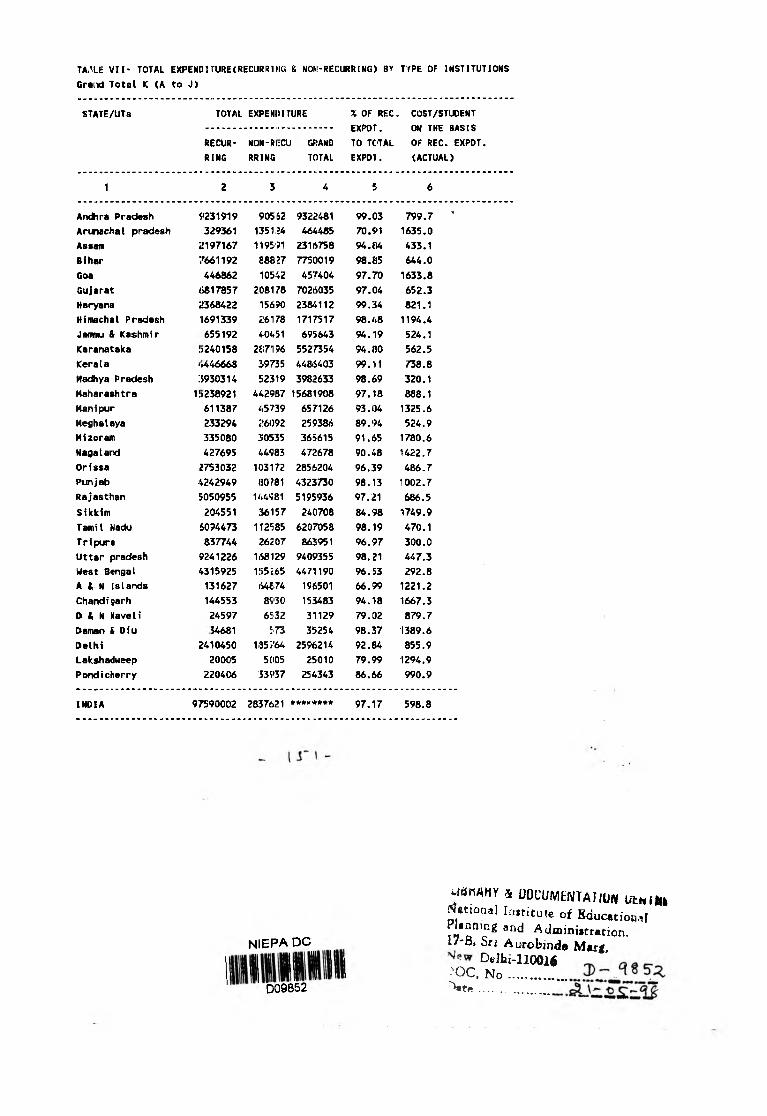
TAv LE VII- TOTAL EXPEHDlrURE(RECURRIHG & MOM-RECURRING) BY TYPE OF IMSTITUTIOMS
Gracxi Total K (A to J)
STATE/UTs TOTAL
RECUR
RING
EXPEMUITURE
NON-RI:CU GRAND
RRING TOTAL
% OF REC
EXPOT.
TO TOTAL
EXPDT.
. COST/STUDENT
ON THE BASIS
OF REC. EXPDT.
(ACTUAL)
1 2 3 4 5 6
Andhra Pradesh 9231919 90562 9322481 99.03 799.7 ’
Arurwchal pradesh 329361 135124 464485 70.91 1635.0
Assam 2197167 1195'JI 2316758 94.84 433.1
Bihar 7661192 88827 7750019 98.85 644.0
Goa 446862 10542 457404 97.70 1633.8
Gujarat 6817857 208178 7026035 97.04 652.3
Haryana 2368422 156?0 238-i112 99.34 821.1
Himachal Pradesh 1691339 26178 1717517 98.48 1194.4
Jannu & Kashmir 655192 40451 695643 94.19 524.1
Karanataka 1)240158 287196 5527354 94.80 562.5
Kerala <f446668 39735 4486403 99.11 738.8
Ha<^ya Pradesh 3930314 52319 3982633 98.69 320.1
Maharashtra 1!)238921 442987 15681908 97.18 888.1
Manipur 611387 45739 657126 93.04 1325.6
Meghalaya 233294 26092 259386 89.94 524.9
Mizoram 335080 30535 365615 91.65 1780.6
Nagaland 427695 44'583 472678 90.48 1422.7
Orissa 2753032 103172 2856204 96.39 486.7
Punjab 4242949 H0781 4323730 98.13 1002.7
Rajasthan 5050955 144S81 5195936 97.21 686.5
Sikkim 204551 36157 240708 84.98 U49.9
Tamil Nadu 6094473 112585 6207058 98.19 470.1
Tripura 837744 26207 863951 96.97 300.0
Uttar pradesh 9241226 1<S8129 9409355 98.21 447.3
West Bengal 4315925 155265 4471190 96.53 292.8
A & N Islands 131627 tS4{;74 196501 66.99 1221.2
Chandigarh 144553 8?'30 153483 94.18 1667.3
D & N Maveli 24597 6532 31129 79.02 879.7
Daman & Diu 54681 573 35254 98.37 1389.6
Delhi 2410450 185764 2596214 92.84 855.9
Lakshadweep 20005 5005 25010 79.99 1294.9
Pondicherry 220406 33937 254343 86.66 990.9
INDIA 97590002 2857621 ******** 97.17 598.8
NIEPA DC
D09852
uaiiAHY & OOCUMtNTAIIUN UtwlHfc '??Rtional Institu te of Educatiooal Plinning and A dm iniitration.17“B, Sri Autobind© M arf,
Delhi-11001^^OC. N o ........■T,t......................