ED 034 215 - ERIC
276
ED 034 215 AUTHOR TITLE INSTTTUTION SPONS AGENCY PUB DATE GRANT NOTE EDRS PRICE DESCRIPTORS ABSTRACT DOCUMENT RESUME CG 004 401 Past, Leon; Jensen, J. Alan Present Student Characteristics. Continuation Education System Development Project. Technical Report 1.1. La Puente Union High School District, Calif. Office of Education (DHEW) , Washington, D.C. Dec 68 ORG-9-8-03513-0022-(056) 276p. EDRS Price MF-$1.25 HC-$13.90 *Academic Performance, *Behavior, Continuation Education, *Continuation Students, Data, *Data Collection, Educational Programs, Instructional Programs, Population Trends, *Student Characteristics Over a four year period, the Continuation Education System Development Project will develop a practical instructional system capable of continuous identification and efficient response to the most critical needs of individual continuation students or those who have been pushed out of, or have dropped out of high school; in La Puente, California. This report is concerned with p'resent student characteristics. Five major sections are included: (1) procedures, (2) critique of procedures, (3) findings, (4) summary, and (5) tables. The data were researched and reported in three separate categories: population characteristics, behavioral probability, and present academic performance capabilities. (See CG 004 283, CG 004 402, and CG 004 409). The research reported herein was funded under Title III of the Elementary and Secondary Education Act. (Author/KJ) I
-
Upload
khangminh22 -
Category
Documents
-
view
1 -
download
0
Transcript of ED 034 215 - ERIC

ED 034 215
AUTHORTITLE
INSTTTUTIONSPONS AGENCYPUB DATEGRANTNOTE
EDRS PRICEDESCRIPTORS
ABSTRACT
DOCUMENT RESUME
CG 004 401
Past, Leon; Jensen, J. AlanPresent Student Characteristics. ContinuationEducation System Development Project. TechnicalReport 1.1.La Puente Union High School District, Calif.Office of Education (DHEW) , Washington, D.C.Dec 68ORG-9-8-03513-0022-(056)276p.
EDRS Price MF-$1.25 HC-$13.90*Academic Performance, *Behavior, ContinuationEducation, *Continuation Students, Data, *DataCollection, Educational Programs, InstructionalPrograms, Population Trends, *Student Characteristics
Over a four year period, the Continuation EducationSystem Development Project will develop a practical instructionalsystem capable of continuous identification and efficient response tothe most critical needs of individual continuation students or thosewho have been pushed out of, or have dropped out of high school; inLa Puente, California. This report is concerned with p'resent studentcharacteristics. Five major sections are included: (1) procedures,(2) critique of procedures, (3) findings, (4) summary, and (5)tables. The data were researched and reported in three separatecategories: population characteristics, behavioral probability, andpresent academic performance capabilities. (See CG 004 283, CG 004402, and CG 004 409). The research reported herein was funded underTitle III of the Elementary and Secondary Education Act. (Author/KJ)
I

I It It i
t It
'FiL4111111114,
111=1"
CONTINUATIONEDUCATION
SYSTEMDEVELOPMENT
PROJECTLEON EASTproject director
TECHNICAL REPORT
PRESENT STUDENT CHARACTERISTICS
LA PUENTE UNIONHIGH SCHOOL DISTRICT
La Puente, California
1968
ac)oi/1/0/ it IL

ram! Continuation Education(J System Development Project
re%Technical Report 1.1 +,
C:)
C:)
LW/
PRESENT STUDENT CHARACTERISTICS
Leon East, Project Director
J. Alan Jensen, Principal Investigator
U.S. DEPARTMENT OF HEALTH, EDUCATION & WELFARE
OFFICE OF EDUCATION
THIS DOCUMENT HAS BEEN REPRODUCED EXACTLY AS RECEIVED FROM THE
PERSON OR ORGANIZATION ORIGINATING IT. POINTS OF VIEW OR OPINIONS
STATED DO NOT NECESSARILY REPRESENT OFFICIAL OFFICE OF EDUCATION
POSITION OR POLICY.
La Puente Union High School DistrictLa Puente, California
1968

Acknowledgements
Principal Staff Associates
Judy Blase, Research Associate ( assistance in developingthe Recorded Historical Information, Faculty Question-naire and California Achievement Test manual revision;statistical analyses of data.)
Frank Frimodig, Assistant Editor (, documenting and editingdata.)
Nora Jacobs, Research Associate (, planning and documentingresearch objectives; assistance in developing theRecorded Historical Information, Faculty Questionnaireand California Achievement Test manual revision; analysesof findings.)
Lewise Langston, Research Associate (... statistical analysesof data; assistance in reporting findings.)
Principal Consultants
Robert Corrigan, Chairman, Department of Instructional SystemTechnology, Chapman College (... evaluation of documentsand procedures.)
William Foist, Senior Systems Engineer, Systems Associates,Incorporated (... assistance in development of proceduresand data processing; construction and implementation ofthe Sociological Questionnaire; assistance with the trans-lation of the Meaning of Words Inventory into Spanish.)
Henry Johnson, Director of Testing, California State Collegeat Long Beach (... consultation services in the construc-tion of the Meanin3 of Words Inventory_ and SociologicalQuestionnaire; direction in the selection of testmaterials.)
Bruce Strem, Educational Psychologist, University of SouthernCalifornia, Los Angeles, Division of Research in MedicalEducation (, consultation services in the constructionof the Meaning of Words Inventory.)
ii

Other Contributors
California State Department of Employment, local andregional staff members, Lillian Avery, Fred Baugh,Ed Gall, Don Stonebraker and Marge Walker(... assistance, suggestions and cooperation inGeneral Aptitude Test Battery testing.)
Marie Earl, School Nurse, La Puente Union High SchoolDistrict (... liason activities with borderingschool districts; guidance in administration ofthe physical Profile.)
Art Franco, Teacher, Whittier Union High School District(... consultation and direction in working with theMexican-American adolescent population.)
La Puente Union High School District Principals andAdministrators, particularly Steve Campbell,Principal, Valley High School and Tom Johnson,Director of Adult School (... tolerance, flexi-bility, cooperation, responsiveness to Projectneeds and requests.)
Sue Lohr, School Nurse, La Puente Union High SchoolDistrict (... investigation of legal aspects of
school nursing; assistance in the development ofthe Physical Profile.)
Guillermo Martinez, Teacher, La Puente Union High SchoolDistrict (... translation of the Meaning of WordsInventory into Spanish.)
Office of the Los Angeles County Superintendent of Schools,Research and Guidance Division personnel, JerryGarlock, James Nivette, Elsie Sinrod and GeorgeSitkie (... guidance and assistance in data collec-tion, processing and analyses procedures.)
Research Assistants, Richard Brockway, Frank DeLuca,Gail Montwill, John Rhodes, Dave Sanchez and LloydShaw ( assistance in data collection and inter-action with Valley students.)
Valley High School Faculty (... for patience beyond thecall of duty. Special thanks to Ken Ditty, ScottFox, and Val Harper for their help in developing theTeacher Evaluation Survey.)
Georgianna Like, School Nurse, La Puente Union High SchoolDistrict ( consultation on school nursingpractices; development of the Physical Profile.)
iii

TABLE OF CONTENTS
PROCEDURES
I. Identification of Data Needed 2
II. Data Sources 7
III. Data Collection Instruments 8
IV. Data Collection Procedures 16
V. Reduction of Data 23
CRITIQUE OF PROCEDURES
I. Research Design 27
II. Test Instruments 28
III. Testing Procedures 31
IV. Data Sources and Instruments 31
V. Concluding Remarks 35
FINDINGS
I. Population Characteristics 40
A. Quantity Descriptors 42
B . Socio-Economic Descriptors 45
C. Physical Descriptors 64
II. Behavior Probability Indicators 82
A. Evaluation and Attitudes of the Students 83
B . Evaluation of Students by "Others" 136
III. Present Performance Capabilities 143
A. The Wide Range Achievement Test (WRAT) 144
B . The California Achievement Test (CAT) 158
C. The General Aptitude Test Battery (GATB) 208
iv

SUMMARY OF FINDINGS
I. Population Characteristics 249
II. Behavior Probability Indicators 252
III. Present Performance Capabilities 259
TABLES
I. Bibliography 270
II. Statistics 273
III. Letter to Schools 279
IV. Initial In-service Training of Valley Staff 281
V. Teacher Information Matrix (TIM) 286
VI. Invitation to Students 293
VII. Sample Key 295
VIII. Testing Administration Manual 297
IX. Letter to California State Employment Services 319
X. "General Aptitude Test Battery" (Reprint) 322
XI. Valley High School Faculty Communication 330
XII. Letter of Thanks 333
XIII. School Nurses 335
XIV. Recorded Historical Information (RHI) 338
XV. Sociological Questionnaire (SOC) 357
XVI. Physical Profile (PP) 381
XVII. Meaning of Words Inventory (MOWI) 412
XVIII. Instructional Preference Scale (IPS) 478
XIX. Teacher Evaluation Survey (TES) 485

......0.0101010441ormemi.,
FOREWORD
The CONTINUATION EDUCATION SYSTEM DEVELOPMENT PROJECT
is operated by the La Puente Union High School District
according to the terms of a grant award authorized by Title
III of the Elementary and Secondary Education Act of 1965
(Public Law 89-10).
Over a four year period, September, 1967 through August,
1971, the PROJECT will develop a practical instructional
system capable of continuous identification and efficient
response to the most critical instructional needs of indi-
vidual continuation high school students in La Puente.
Continuation high school students in La Puente are those
who the traditional system has been unable to accommodate or
who have been unable to accommodate the traditional system.
Their usual label is "pushout" or "dropout."
The first project year (1967-68) has been spent identi-
fying the instructional needs of these students.* During
*Technical(1.1)
Reports in this phase of the study:Present Student Characteristics
(1.2) Student Performance Requirements: Military Situations(1.3) Student Performance Requirements: Other Educational
Situations(1.4) Student Performance Requirements: Employment Situations(1.5) Performance Ade uac for Home and Communit Livin(1.6) Operational Limits(1.7) Instructional Needs

year two, an instructional program will be designed to meet
those needs. Year three will see implementation and tryout
of subsystems. Year four will provide for full system tryout
with transfer of all functions to the permanent school staff.
Throughout the Project, system analysis and other modern
management control and planning techniques will be employed.
It is hoped that this new problem solving technology of the
defense and aero-space industries can be applied as well to
the problems of education.
It is the mission of the PROJECT not only to solve a
particular set of problems in La Puente, but to provide a
problem solving model for other school districts with similar
conditions. Consequently, an effort has been made to describe
procedures in such detail that they can be used as guidelines
by others.
If further information or interpretation can be provided
the PROJECT staff will be pleased to respond to your inquiries.
La Puente, California LEON EASTDecember, 1968 PROJECT DIRECTOR

PROCEDU
I
i
i l'

In January, 1968, the task was assigned of identifying the char-
acteristics of the student population which must be observed in the
design of an °instructional program.
The procedures for completing this task involved identifying the
relevant kinds of information about these students which would be of
use to the system designer. The Project staff had to identify the
most appropriate sources for these data, and to select the best tech-
niques for collecting and measuring them. During the early phases of
this research, experts were consulted for their advice on measurement
techniques and experimental designs. The staff also explored other
studies which concerned continuation education, and which suggested
experimental designs and techniques relevant to this part of the Project's
efforts. In some cases, established techniques and standardized mea-
surements were adapted to Project purposes. In other cases, the staff
had to create its own measurement instruments.
Before testing was initiated, in-service training for the test
administrators was necessary in order to insure proper evaluative
controls in the data gathering activities. During this phase, ques-
tionnaire and interview techniques were piloted. Cooperation between
the Project staff and the other agencies involved was also established.
I. Identification of Data Needed
Basically, this Project is describing the unique and typical
characteristics of the student population at Valley High School. The
2
major objective is to determine whether there are sufficient differ-
ences within the population to affect the modes that an instructional
system can employ as academic stimuli. The basic premise is that
continuation students are an atypical population. By definition the
continuation student is different. The objective is to identify these
differences, as well as the differences within the population distribu-
tion, to program meaningful and acceptable academic stimulation to
the students, including their various sub-groups.
The continuation high school population appears to deviate from
the normal high school population in aspects which determine success
or failure in the normal high school. It is assumed that the student's
presence in continuation high school is dependent upon his attitudes,
his motivation, his behavior, and his general performance in the
academic setting. It is therefore necessary to obtain measures of
his performance in these areas for the development of a curriculum
based on the needs and limitations of the student.
A. Quantity Descriptors
An important step in identifying the data needed began with
drawing up a definition of "quantity descriptor." Quantity descriptor
is defined as a numerical evaluation of the population. Such an
evaluation includes:
1) The total population of Valley High School as of the
beginning of testing
2) The male/female student ratio
3) The attendance patterns of the male and female population
Me.
3

4) The attrition rate of the original population, as well asthe constant influx of new students.
B. Socio-Economic Descriptors
Other elements relevant to an assessment of the population
include:
1) The socio-economic status of the student's family
2) The student's ethnic group membership
3) Data on familial structure, including marriage patternsof parents, mobility of parents and number of siblingsin the student's family
4) The amount of special education the student has received
5) Stated student discipline problems
6) Reason for referral to Valley High School.
C. Physical Descriptors
Physical information is also necessary to assess the student
population. The necessary physical information was defined as the
students' physical ability to sense and respond to instructional
stimuli. It encompasses:
1) General health information (historical and familial)
2) Individual health history including illness, accidents,operations, medical visitation practices, and schoolabsences, their cause and treatment
3) Present general health status encompassing blood pressureand pulse rate, height and weight, apparent nutritionalcondition, speech condition, patterns and re-medication,dental examination, audiological information (includingaudiological examination), visual information includingSnellen Chart screening, sight screener and telebinoculartesting
4

4) Assessment of hand preference
5) Examining nurses recommendations.
D. Behavior Probability Indicators
Factors considered as determinants of the continuation high
school student's predisposition to perceive and respond to
instructional stimuli were also identified. These include pre-
conscious attitudes in seven general areas:
1) Instruction and curriculum
2) Self-concept
3) Authority relationships
4) Goal orientation
5) Peer relationships
6) Moral and social values
7) Family relationships.
E. Academic Performance Capabilities
An identification of academic performance capabilities of
the student population is also required in order to derive the
instructional needs of the student. An academic profile can be
compared to the collected behavior expectations; and, the difference
between the two provides a guideline for the development of the
curriculum for the projected system.
In order to identify the basic academic and performance capabil-
ities of the student population/ scholastic achievement and general
aptitudes must be determined. Scholastic achievement encompasses the
5

language, reading, spelling and computational areas. Student
achievement may be defined as tested ability to: use language,
comprehend selected reading, spell accurately, comprehend numerical
concepts, perform general arithmetical operations and reason
abstractly. General aptitudes are measured in terms of: verbal
aptitude, numerical aptitude, spatial aptitude, form perception,
clerical perception, motor coordination, finger dexterity, manual
dexterity and a general learning aptitude.
F. Social Capabilities
The assessment of the student's capability to perform in
social situations was performed as a part of this Project's
assessment of the expectations of other educational systems.
The procedures used and the findings are reported in another
section of the Project's Final Report for Year I. 1
G. Family and Citizen Capabilities
The assessment of the student's capabilities to perform
successfully in family and community situations was performed as
a part of this Project's assessment of home and community perfor-
mance expectations. The procedures used and the findings are re-
ported in another section of the Project's Final Report for
Year I.
6

II. Data Sources
The testing of the total population of continuation-eligible
students was suggested as a primary research source by Dr. Henry
Johnson, Project Consultant. It was finally agreed that continuation
eligible students often become high school dropouts, if they are
not referred to continuation education. The location and testing
of continuation-eligible students who have already become dropouts
would be a difficult task at best. It was, therefore, decided that
the target population are those students referred to Valley High
School within the La Puente Union High School District.
The Valley High School student body was designated as a
homogeneous population to facilitate the use of a "block design."
The total population (N=276) was divided into three groups designated
Group A, Group B, and Group C. Group A was composed of those students
who are enrolled at Valley High School and who attend classes more
than fifty percent of the time. Group B was composed of enrolled
students who attend less than fifty percent of the time, and Group
C was composed of those students who have been referred to Valley
High School but who are not presently attending. Further sub-
division of each group was done on the basis of sex and point of
origin (refe'rring high school).
The following is a table of the "N's" of each sub-group
within the total population:
7

Male
Total MalTotal GroupTotal Group BTotal Group C
e Population = 202A = 75 50% = 38
Total males to be teste
Females
88 50% = 4439 50% = 20
d =102
Total Female Population = 74Total Group A = 34 50% = 17Total Group B = 31 50% = 16Total Group C = 9 50% = 5
Total females to be tested = 38
Total Testing Male and Female =140
Individuals within each sub-group were selected for testing on a
randomized basis and the 1:3 ratio (females to males) was kept
constant.
III. Data Collection Instruments
Specialists were consulted as to the kinds of data collection
instruments that could be used to gather scholastic information about
the continuation students. The first step was to define basic aca-
demic and performance capabilities, and how the acquired information
would correlate to specific requirements of curriculum designers.
Expert consensus3 was to employ standard measures of scholastic
achievement, general aptitudes, and basic computational skills. The
measures which were selected are as follows: The California Achieve-
ment Test (CAT) which provides measure, evaluation and diagnosis of
school achievement; the Wide Range Achievement Test (WRAT) which provides
8

accurate diagnosis of reading, spelling and arithmetic disabilities
as well as the determination of the instructional levels in school
children; and the General Aptitude Test Battery (GATE) which yields
nine aptitude scores from twelve tests and provides detailed student
vocational aptitudes.
Selection of the CAT was based on the following considerations:
1) Since the CAT is accepted and used in the La Puente UnionHigh School District, it represents an indirect measure ofcurrent classroom curriculum taught in that district.
2) The CAT is easy to administer, to score and to interpret.
3) The CAT is inexpensive and readily data processed.
4) Data processing procedures for the CAT are currently in useand are available through the Los Angeles County Superinten-dent of Schools.
5) The CAT is designed for individual item analysis.
6) This standardized test provides diagnostic information ofstudent academic achievement in word-recognition (vocabulary)and understanding word-groups (reading). The mathematicssection of the CAT will be used as a measure of the contin-uation student's ability to compute problems and reasonarithmetically.
Selection of the WRAT was based on the following considerations:
1) It is an accurate diagnosis of reading, spelling, andarithmetic disabilities.
2) It determines instructional levels of all students.
3) It provides the assignment of students to instructionalgroups progressing at similar rates and their transferto faster or slower groups in keeping with individuallearning rates.
4) It establishes the degrees of literacy and arithmeticproficiency of mentally retarded persons.
9

5) It indicates the ability of the student at variousoccupational levels.
6) It provides a comparison of school achievement and otherabilities in all individuals, especially those who aredisturbed or maladjusted.
7 It provides a relationship between reading mechanicsand comprehension; between computation and number conceptsas measured by other means.
8) It is short, inexpensive and easy to administer and toscore.
9) It has a potential value as a possible screening devicefor future continuation high school students.
10) Standard scores obtained on the WRAT correlate highlywith I.Q. scores derived from the California Test ofMental Maturity, the Weschler Intelligence Scales andthe Stanford Binet.
Selection of the General Aptitude Test Battery (GATB) was based
on the following considerations:
1) It will establish vocational aptitude profiles of theValley High School students.
2) The GATB correlates with the United States EmploymentServices (USES), Dictionary of Occupational Titles (DOT).
3) It is accepted by the "world of work" as an occupationalyardstick.
4) Test materials and equipment needed may be easily obtainedfrom the California State Employment Services (CSES).
5) CSES will provide test administrators and proctors to assistContinuation Education System Development Project in testadministration and procedures at a rate of $2.94 - 3.57 perhour.
6) Data processes will be provided by California State Employ-ment Services at no charge.
7) It provides a measure by use of the "G factor," which correlatesscholastic success with intelligence or general learning
10

ability. The GATE also correlates with specificperformance variables including motor coordination,finger dexterity and manual dexterity.
The use of standardized test measures alone as a primary data
source for academic capability was debated. The alternative was a
selection and construction by the staff of special tests tailored
to continuation students at Valley High School. It was finally
agreed that the primary, standard scholastic test measures should
be utilized. The rationale for this was that without validated
norms with which to compare population scores, the resulting informa-
tion would have little external validity.
The Recorded Historical Information (RHI) (see Table XIV , infra)
was developed to obtain the necessary information from the student's
"Cum" folder. This folder traditionally provides a record of the
student's academic and behavioral performance from the time of
first enrollment in school until the present day. Information
available in the "Cum" folder can be recorded easily on the RHI
in an organized and standardized fashion, after one brief training
session. The format permits data processing. Specific questions
on the RHI correlate highly with items on the SOC and will be
designed to provide other information needed. Teacher's and
administrator's recorded observations of student behavior are
also found in the cumulative records of each student and are included
in the Recorded Historical Information.
The Sociological Questionnaire (SOC) (see Table XV , infra) was
11

based on the Student Data Servide and adapted for the needs of Valley
High School. The SOC has as its primary purpose provision of non-
academic information not readily available from other sources. The
SOC can be easily administered in an individual or group setting.
The language level is suitable for this type of population; it presents
no reading difficulties or built-in cultural biases. Test anxiety can
be held to a minimum as there are no right or wrong answers. The content
is tailor-made and standardized for the Valley High School population,
thus giving needed information about the home environment, socio-economic
variables and educational goals as seen by the student himself. The
SOC can be scored by hand and results can be handled by data processing
procedures.
Factors considered as determinants of the continuation high school
student's predisposition to perceive and respond to instructional stimuli
are further identified by the student's expressed attitudes toward in-
structional stimuli as measured by the Meaning of Words Inventory (MOWI).
(See Table XVII, infra.) The MOWI measures preconscious attitudes toward
seven general areas: a) instruction and curriculum; b) self-concept;
c) authority relationships; d) goal orientation; e) peer relationships;
f) moral and social values; and g) family relationships.
Selection of the MOWI was based on the following considerations:
1) The format appeals to students.
2) There are no right/wrong answers and as a consequence has
minimal test anxiety.

3) It is short and easy to administer individually and ingroups.
4) Minimum reading skills are required.
5) Test is bi-lingual to accomodate the large Mexican-American population of Valley High School.
6) It is ambiguous and, as a consequence, permits expressionof pre-conscious attitudes.
7) It measures motivational areas relative to educationalachievement.
8) It has been used previously and validated in the LosAngeles County School District.
9) Mr. Bruce Strem, Ph.D., who assisted in the developmentand validated the MOWI, is available as a consultant.
Predisposition to perceive and respond to instructional stimuli
are also measurable by the continuation student responses to the
Sentence Completion Test (SCT) and the Instructional Preference Scale
(IPS). (See Table XVIII , infra.) These instruments are designed to
ascertain student attitudes toward a variety of instructional stimuli
items, instructional response items and instructional reinforcement
items.
A list was drawn up of every possible experience a student
could have in an instructional setting that would serve as a learning
factor. These were narrowed to seventy-six including: thirty-two
instructional stimulus items, thirteen instructional response items,
and thirty-three instructional reinforcement items. From these
seventy-six items, thirty-two were chosen on a matched percentage
basis for the Sentence Completion Test.
.--"
13

Selection of the Instructional Preference Scale and Sentence
Completion Test was based on the following:
1) The format appeals to students.
2) There are no right/wrong answers and as a consequence hasminimal test anxiety.
3) The IPS is easily administered to a large group.
4) No reading skills required in either (read aloud bytest administrators).
5) They measure student's predispositions to respond to avariety of instructional stimuli, responses and rein-forcement items.
6) Since the same items are used on both, they serve tocross-validate each other.
Student predispositions are also indicated by teacher's observa-
tion of student behavior in a specified test situation. Two instru-
ments, Faculty Questionnaire and Teacher Evaluation Survey, were
used for this purpose. (See Table XIX , infra.) The former
required short statements by the teacher relevant to the effects
of testing on the student. The latter provides information on
student response patterns and an assessment of these patterns
on individual tests in the battery. Selection of the Faculty
Questionnaire and Teacher Evaluation Survey were based on the
following considerations:
1) These two measures were developed to collect observationaldata of the teachers after they have assisted in administra-tion of the CESDP test battery.
2) These two measures will be given to the teachers immediatelyafter the testing so that assessment will not be retro-spective.
14

3) The Faculty Questionnaire is an open-ended survey.
4) The Teacher Evaluation Survey is a forced-choice measure.
After the instructional needs of the students at Valley High
School are identified, decisions will have to be made regarding which
needs can be feasibly provided for in the curriculum. The physical
limitations of the continuation high school students could influence
these decisions. Developmental retardation, neurological sensory and
communication deficiencies are important determinants of learning abil-
ities. General nutritional inadequacies and poor present health status
cannot help but affect school performance, as do any disabling or chronic
diseases.
Physical data has been obtained from a combination of the Cumu-
lative folders and a Physical Profile. (See Table XVI, infra.) As
stated, data from the "Cum" folder was condensed by means of the RHI.
This facilitates organized and standardized information gathering from
the folders, as well as an item analysis of historical health infor-
mation on both a general and individual basis. Other physical data is
derived from the Physical Profile, which was developed specifically to
meet the needs of Valley High School students. Recommendations sub-
mitted by the examining nurses on the Physical Profile provide an
additional source of physical data. The Physical Profile does the
following:
1) It presents general health information and documents suchinformation.
2) It identifies specific hearing range of each student anddocuments observations.
15

3) It identifies specific visual acuity of each studentand documents observations.
4) It identifies cerebral dominance and laterality anddocuments observation.
5) It summarizes each student's health status.
6) It offers the nurses recommendations.
The Physical Profile was developed specifically for Valley High
School students. It was also constructed in such a way that all infor-
mation obtained could be handled through data processing.
Two school nurses were employed as research associates to explore
legal aspects of school nursing as related to continuation education.
They assisted in the development of an efficient means to measure
health information. Mrs. Sue Lohr researched and reported the legal
aspects. Mrs. Georgina Zike researched methods for gathering health
information, and constructed the first rough draft of the Physical
Profile. She then assisted the staff in revising it into its final
form.
IV. Data Collection Procedures
A. Consultation and Conferences
During the months of November, December and January, the Con-
tinuation Education System Development Project contacted various experts
in the field of data collection to assist and direct the Project in its
overall objectives. Henry Johnson, Ph.D., Director of Testing at Califor-
nia State College at Long Beach, was consulted as an expert in test and
16

measurement procedures. Dr. Johnson is also a known authority and
expert in Mexican-American population characterisitcs. Since the La
Puente Union High School District has a high percentage of Mexican-
Americans, the selection of tests involved consideration of the typical
differences between Mexican-Americans and other ethnic groups at Valley
High School. Mr. Don Goodwin was contacted as the initial systems
analyst consultant in an attempt to develop an overall procedure for
data gathering. Mr. Bill Foist from Systems Associates, Inc., was
also consulted as a systems analyst to finalize the organizational
approach to data gathering. Mr. Art Franco, a resident of La Puente,
and an active participant in civic affairs both at the community level
and as a teacher at Whittier High School, was contacted as a public-
relations expert with knowledge of the Mexican-American adolescent
population. Bruce Strem, Ph.D., USC School of Medical Research, was
consulted as an educational pyschologist to develop psychological mea-
surements appropriate to the La Puente Union High School District
Continuation Education population. Mr. Jim Nivette of the Los Angeles
County Superintendent of Schools Research and Guidance Division assisted
in the preparation of the research design to be utilized by the staff.
Within the framework of the design, he suggested test procedures and
methods of implementation. Dr. George Sitkei, Ed.D. and Mrs. Elsie
Sinrod, also of the Los Angeles County Superintendent of Schools Re-
search and Guidance Division, were consulted regarding basic electronic
data processing techniques and procedures available.
Group conferences were held with the above consultants from
17

November to January. During this period of time, it was determined
that information regarding academic and vocational skills, social and
historical data, psycho-social, attitudinal traZts and physical assess-
ment was necessary. These requirements were subsumed under the term
"Student Population Characteristics."
The determination and identification of data sources in this phase
of the research involved a liaison with California State Employment
Services. This included contact with the local department of employment
as well as the regional office to determine the availability of GATB
materials, test techniques, and data processing measures. Scheduling
of testi4,g and the employment of part-time staff members was coordinated
with Mr. Gall and Mrs. Avery of the regional office, and Mr. Baugh and
Mr. Stonebraker of the West Covina office. This part of the research
design was formed through discussions among Project members, Project
consultants (Dr. Henry Johnson, Long Beach State College and Mr. Bill
Foist, Systems Associates, Inc.) and consultants from the research and
guidance section of the Los Angeles County Superintendent of Schools
(Dr. George Sitkei, and Mr. Jim Nivette). A parallel function involved
acquisition of specific test materials and coordinating efforts with the
Western Psychological Association, the California State Employment
Services, the Hudson School District, the West Covina Unified School
District, and the Covina-Valley Unified School District.
Upon conclusion of all administrative conferences, a specific
data collection plan was synthesized and submitted to Project manage-
ment for approval. During this time brief consultations were held with
18

1]
it
Project members and experts in the field of data collection.
B. Operational Plans
Procedures used in the data collection were as follows:
4
1) Compile a student population list complete with names,addresses and telephone numbers.
2) Assign students to categories of: attendance, sex andethnic group. For identification purposes, studentswill also be assigned to recommending high schoolcategory.
3) Using a table of random numbers, select sample.
4) Devise and obtain test materials.
5) Make arrangements with Valley High School and ValleyVocational Center administrators so that test times,materials and teachers to assist in planning and admin-istration can be allocated.
6) Hold in-service training sessions for teachers andassistants.
7) Determine field interviewing techniques for Group C(non-attenders) based on role-playing, encompassingproblems of interviewing "hard-core," non-attendingcontinuation high school students.
8) Administer test battery (all).
9)
10)
Reduce data.
Document findings.
C. In-service Training
1_0 Coordination of Valley High School staff members and the
research associates was performed by the Project's directing staff
member. This involved the orienting of both research associates
and employed teachers toward the Project's objectives, as well as
19

the preparation and performance of the specific tasks necessary.
In-service training included the "role-playing" of test administra-
tions, attempting to portray characteristic reactions of students;
and, preparation and scheduling of academic tests. Scheduling
and programming of test procedures was an administrative function
performed by the behavioral analyst and Valley High School staff
members. Specific procedural tasks were assigned and distributed
to team members during the key week preceeding tests.
In-service training was held for the Valley High School staff
throughout the data collection phase. This included three, one-
hour sessions at which time the entire program was discussed.
(See Table IV, 2, infra.) These sessions focused upon teacher
involvement and student involvement as related to Continuation Education
System Development Project's objectives and requirements.
Reorientation and in-service training was again provided to
Valley High School staff for the administration of the Wide Range
Achievement Test. This involved coordinating and programming Valley
High School and Valley Vocational administrators as well as in-
service training and more "role playing" with the research associates
prior to actual test encounter with the student body at Valley High
School.
One of the primary objectives of the Project was to utilize
available teacher talent in the local school districts to assist in
the research. This involved contacting principals and other adminis-
trators in the La Puente Union High School District for their recom-
mendations of credentialed people currently employed within the district.
20

At the same time, the Project searched professional ranks for qualified
people who could add their knowledge and experience in dealing with
continuation education populations. Professional talent and materials
were available through local universities and college job placement
centers, local high schools, nearby high school and elementary school
districts, as well as through county and city facilities.
D. Obtain Testing Materials
Specific testing materials were obtained March 7 - 11, from
Western Psychological Association, California State Employment Services,
Hudson School District, West Covina Unified School District, and the
Covina-Valley Unified School District. The materials included:
300 pencils (IBM), 200 CAT Protocals (junior high school level),
200 WRAT and GATB, two reams scratch paper and two stop watches.
E. Schedule and Program Test Procedures
Scheduling and programming of test procedures was an administra-
tive function performed by Project and Valley High School staff members
between March 18 - 20. (See Table VIII, infra.)
The Project's population survey held group measurement (six to
eight, and eight to twenty students) as an objective. Testing was
initiated in the classroom where the students normally report for their
first class. Movement of students was kept to a minimum, and when
possible a teacher was in the room to assist test administration.
Student-teacher ratio was kept between 6:1 and 8:1 for optimal proc-
toring. Test administrations began twenty minutes after school was
21
4

officially in session and lasted three and one-half hours with two
ten-minute breaks, and one twenty-minute break. Actual test time
per day was less than two hours when instruction and material
disbursement is considered. Testing began on Thursday, March 21,
1968, and concluded on Thursday, April 26, 1968.
Test procedures and dates for administering tests to non-
attending continuation students were formulated March 18 - 20.
These included:
1) Letter of introduction
2) Invitation to students to attend further testing sessionsat Continuation Education System Development Project office
3) In-service role-playing training encompassing problems of
interviewing "hard core," non-attending continuation students
4) Mapping, routing and field assignments to assistants
5) Test materials assigned.
Those students who were absent on regularly scheduled test
dates were scheduled for residual testing April 1 - 4.
Test items for those students absent on regularly scheduled
test dates were prepared by research assistants during March 18 - 20.
File cards for each student were developed to expedite data
gathering. After first test administration, student names,
test numbers, and official coding numbers were entered on the
file card. (See Table VII, infra.) The test number plus the
coding number became the permanent identification number of
that student. All tests taken by the student were entered on
22

file cards for that student and all tests were numbered with the
student's permanent identification number.
V. Reduction of Data
Statistical procedures and treatment of IBM "output" data in
accordance with necessary population descriptors per research
design was accomplished by contacting population research experts.
All consultants agreed that output data was best justified by
reporting descriptive information pertinent to the population. Such
descriptors provide data which best identifies the limitations and
constraints which the population at Valley High School will impose
upon system designers. They agreed upon the necessity for regarding
this population as a changing, rather than static, entity. They
confirmed the necessity for handling this population in terms of
three separate groupings: Group A, which attends more than fifty
percent of the assigned time; Group B, which attends less than
fifty percent; and Group C, which has been referred and never
enrolled, or has been enrolled and never attended. Items such
as ethnic group membership and socio-economic status indicate
broad factors such as general language patterns, values relevant
to schooling and sub-cultural norms which influence learning and
behavior patterns. Data on familial structure gives additional
information relative to behavior patterns of the student, length
of stay in a given school as well as in a given area.
23
5

During this data reduction phase, it was also necessary to
determine statistical procedures for treatment of the output data.
The simple difference in statistical percentage between two
variables is not necessarily important in terms of statistical
probability. The analysis of the needs assessment survey results
has incorporated a statistical test of "significance" in order to
assure maximum reliability for the conclusions reached. Throughout
this survey analysis, the Chi-Square test was employed to measure
the chance that a particular result might have happened by accident
of sampling. No aspect of the conclusions has been characterized
in this report as being "significant" unless a Chi-Square test, a
"t" test, or a test based on the pooled critical ratio formula,
showed at least the five percent level of significances. (See
Table II, 1 - 5, infra.)
All data was collected and reduced between June and August.
Data was finally synthesized by August 13.
24

1ti
j
NOTES
1Continuation Education System Development Project,
Student Performance Reuirements, "Other Educational Situations,"La Puente Union High School District, La Puente, California,September, 1968.
2Continuation Education System Development Project,Student Performance Requirements, "Home and Community Situations,"La Puente Union High School District, La Puente, California,September, 1968.
3Dr. Henry Johnson, Director of Testing at Long Beach StateCollege and Bill Foist, of Systems Associates, Inc.
4 Systems Associates, Inc., Los Angeles County Superintendentof Schools Research and Guidance Consultants, individuals in theLa Puente Union High School District familiar with test itemsselected, and the established advisory council utilized by theContinuation Education System Development Project.
5Consulted population research experts were: Jerry Garlock,
Ph.D., Director of Research, Los Angeles County Superintendentof Schools; Jim Harsh, Ph.D., Director of Research, CaliforniaEducation Testing Service; Dr. Mormon, California State Collegeat Los Angeles; George Sitkei, Ph.D.; and Mr. Jim Nivette.
W.: ,11,74,C,
25

Ca1111410
Of
PRO
CSIO
SS
.07

During synthesis and documentation of obtained data, anecdotal
records were kept by staff members to provide a basis for a personal
critical review. This review uses as a baseline how a project of this
kind should proceed under optimal conditions. The following remarks
are offered as an effort at self-evaluation, and also as a possible
guide to those who plan a project of a similar nature. This part of
the Project staff has made many mistakes and discovered much by trial
and error. Some selections, however, were more effective than antici-
pated.
RESEARCH DESIGN
A pilot project, utilizing key students in the Valley High student
body would have been of tremendous help. It might have revealed things
which would have brought about better relations with the student body
at testing time, as well as more valid responses from them. A pilot
project could have also helped in discovering errors in judgment in
the selection of data collection instruments. In addition, there would
have been a better opportunity for ascertaining the best ways of
handling and reducing data, as well as specifying more exactly the uses
to which data could be put. A pilot project would have been a great
help in defining which statistical tests and procedures were appro-
priate prior to the massive data collection which the staff performed.
Furthermore, a pilot project would have indicated earlier the need for
the services and advice of an "in-house" data expert.
Early decisions to base the data analysis on the variables of sex
27

and attendance groupings, resulted in more work than perhaps it was
worth. A curriculum based on sex-differences requires little more
than a common-sense assessment of any high school population in relation
to culture. Secondly, according to the RHI, the chief cause for re-
ferral to Valley High School is "truancy," which implies non-attendance.
One cannot, then, expect other than deviant attendance patterns from
a population such as Valley High which has been referred because of
just such attendance patterns. More relevant variables such as aspira-
tion level, motivation and interest would have been more fruitful.
TEST INSTRUMENTS
California Achievement Test (CAT)
This test was used to measure the academic achievement of the
Valley High population as compared to the "normal" junior high school
population. For Project purposes, the testing sessions were far too
long, exceeding the motivation, interest and attention level of the
students. This was so despite the existence of a reward system for
lest completion.
Meaning of Words Inventory (MOWI)
On the basis of student reaction, it became obvious that the
Spanish translation of the MOWI was unnecessary, and in many instances
detrimental. Many of the Mexican-American students "pretended" that
they could not read the English at all, while both Anglo and Mexican-
American students "made much" of not being able to read the Spanish.
There is some doubt that the demanding seven-choice semantic
28

differential test was appropriate for the test population, in view of
its apparently low motivation and interest level. The seven-choice
scale may also have offered distinctions which were too fine for Valley
High students.
Sociolosical_fpuestionnaire (SOC)
Many relevant questions were included in the original SOC but were
later deleted. Such questions would have given information as to the
parents' income bracket, students' use of narcotics and other areas.
Such questions were deemed "too controversial" for inclusion by the
Project.
There were other kinds of information which might have been sought
in the SOC. Such questions might have been: 1) what help, if any, the
student thought he needed to be able to enter and function in the "adult"
world; 2) when or how the student thought he had started on a pattern
of school failure which ended in referral to Valley High; and 3) whether
the student preferred attending Valley High to returning to his regular
high school, and why.
Recorded Historical Information (RHI)
Much of the information gathered through the use of the RHI was
outdated. This is not the fault of the instrument, however, but of the
Cum records which were available for the Valley High students. Appar-
ently, these are of little importance to the school itself and, as a
consequence, they are not kept up to date. Cum records for some of the
students were not available at all.
Wide Range Achievement Test (WRAT)
The WRAT was most useful, principally because the tests in it are
29

of short span. In addition, the reading test is based on a person-to-
person relationship which was found to be very useful with the students
of Valley High. Scores obtained on the reading section of the WRAT were
much higher than those obtained on the reading sections of the CAT,
which are not administered personally. Part of this may have been due
to the "coaching" effect present in the one-to-one relationship. Some
difference is expectable, however, since each test is based on a slightly
different concept of reading.
The reading scores on the WRAT may be positively biased since they
are measured by vocal responses to printed words. To prevent such a
bias, in-service training emphasized the "auditory conditioning" of each
research associate and assistant. One of the trained assistants was
absent on the first WRAT test day, however, and an untrained Valley High
School teacher substituted.
Dr. Richard Harsh of Educational Testing Service has noted that WRAT
reading scores do not measure "reading proficiency" or level of learning
rate, but instead, threshold experiences acquired through reading or
word exposure. He has also noted that one's reading level in learning
is approximately two years below the WRAT reading score.
Physical Profile (PP)
The format of the PP could have been different in order to facil-
itate easier scoring. The nurses' recommendations could have been
placed closer to the items requiring response. In this way, the nurses'
recommendations would have then been more easily available for scoring
and reporting procedures.

TESTING PROCEDURES
Taking into consideration the deviant attendance patterns as well as
the constantly changing characteristics of the Valley High population,
a more than adequate job of testing was accomplished. Certain changes,
however, might have helped to give more reliable results. For example,
the testing might have been spaced over a longer period of time, thus
eliminating the atmosphere of rush and hurry. Again, if the staff had
had the opportunity to question the students as to what rewards they.
considered worthwhile, the reward system (see Table VIII, 2 and 3, infra)
might then have proved more useful in stimulating student participation
in the testing.
At times during testing, the Project staff's relationships with
the teachers at Valley High were "strained." This resulted in some
lack of cooperation on their part and some intolerance on the staff's.
The students seemed to have sensed this tension, and were willing to
use it to their own "advantage." Perhaps the most important result of
the faculty-Project communications gap was that the teachers spent
little time explaining the reasons for the testing to their students in
preparing them for testing sessions. Future projects of this kind would
be advised to spend more time with cooperating faculty staff in the early
planning of data collection. Continuous efforts should be made to insure
complete communication and cooperation.
DATA SOURCES AND INSTRUMENTS
This Project's purpose is to produce an instructional program which
will prepare continuation students for the performance requirements
31

necessary for success in school and in the community. The task, then,
was to assess the student needs individually and collectively, and to
translate these into acceptable terminal behaviors. It was also part
of the task to produce through the use of an instructional systems
approach, a program designed to adequately develop these specific, ter-
minal behaviors. To develop a suitable instructional program, student
characteristics were first identified through basic evaluations and
measurements of aptitude, interest, achievement, and psychological
stability and socio-economic history. The particular means of assess-
ment were determined by a group of consultants and staff members em-
ployed by Continuation Education System Development Project. They
selected and/or developed:
1) The Semantic Differential (in MOWI)
2) The Sociological Questionnaire (SOC)
3) Instructional Preference Scale (IPS)
4) Sentence Completion Test (SCT)
5) A Physical Profile (PP)
6) California Achievement Test (CAT)
7) Wide Range Achievement Test (WRAT)
8) General Aptitude Test Battery (GATB)
9) Recorded Historical Information (RHI)
These tests are adaptable to both group and individual testing. They
were also easily processed by the electronic data processing facility
available to the La Puente Union High School District.
These instruments exclude direct measures of "motivation" and I.Q.
They also exclude a psychological diagnosis. Motivation is an operational
32

definition of an emotional drive which can be interpreted from observ-
able performance, recorded historical performance, or emotional tone
demonstrated by students' classroom performance or social behavior.
"Drive level" (or motivation) can be inferred from responses to the
selected test battery which the Project administered. Therefore, an
indirect measure of motivation is available and reportable.
The second assessment measurement excluded is that of I.Q. Cur-
rently, I.Q. is a controversial area, often it is rejected by educators,
especially when dealing with a socio-economically depressed population,
as in the case of this research. An indirect measure of I.Q., however,
is derivable by correlating standard scores obtained by the WRAT, and
also the "G Factor" of the GATB.
Thirdly, psychological diagnosis is a clinical term which generally
is of little use to curriculum planners. For the planner, it is the
potential expectancies of student behavior which are most relevant to
this task. Therefore, the staff chose not to provide a psychological
diagnosis of Valley High School students.
Although the selected test battery provided sufficient information
to meet the research objectives, a more comprehensive battery could
have been employed. A team of psychologists, counselors and aides could
have administered comprehensive academic and psychological test measures
on an individual basis. With a test popualtion of 140, two psychologists
and two counselors working only four hours a day with the students could
have completed individual testing in four months. The testing initiated
in February could have been completed well before June, with three months
for analysis and interpretation.
33

Future researches of this kind would be advised to include the
following instruments where possible:
1) Review of Historical and Developmental information in the
"Cum" records.
2) An Intake Interview gathering current information, family
status, etc.
3) A home call with the parents and students to bridge student
information and introduce the Project to the community.
4) Selection of a diagnostic test battery including:
A) Projective Techniques
1) Draw a Person - Goodenough/Harris
2) Draw a Family
3) House-Tree-Person
4) Thematic Appreception Test
5) Rorschach Ink Blot
B) I.Q. Measures
1) Weschler Adult Intelligence Scale (WAIS)
2) Weschler Intelligence Scale for Children (WISC)
C) Vocational Aptitude - General atitude Test Battery. (GATB)
D) Interest
1) Edwards Personal Preference Schedule
2) Edwards Vocational Preference Schedule
E) Scholastic - Wide Range Achievement Test (WRAT)
F) Diagnostics for specific learning disabilities
34

1) Bender-Visual Motor Gestalt
2) Illinois Test of Psycholinguistic Ability (ITPA)
These instruments are psychological measurements necessary for identi-
fying specific learning and personality problems. They are essential
if one wiwhes to identify those students who may require appropriate
referral practices, but who cannot be discovered by the regular screen-
ing battery employed by this staff.
CONCLUDING REMARKS
There are some dangers of which one should be aware in doing re-
search of this kind. An implicit comparison between the test group
and the so-called normal students is often built into such work.
Sometimes the program designer falls into the trap of asserting "normal"
to be desirable, as though it were the ideal. Relative to contin-
uation students, this can be dangerous since the "normal" school system
is in some ways as much to blame for the continuation student's plight
as he himself is.
Secondly, the term "normal" is so vague as to be misleading.
Highly competent researchers in the field of psychology, for instance,
find it nearly impossible to define normal needs, expectations, motiva-
tions, etc. Yet, as the term enters into comparisons of continuation
students with others, it generally asserts that continuation students
are deviant; All of this is unnecessary since by definition continua-
tion students (normal, deviant or not) have their own educational needs.
The system designer should focus clearly on these needs, and develop a
program to meet them in the most effective, efficient way.
35

Two other terms can easily mislead the researcher. One must be
cautious of equating student preferences with student behaviors. Program
designers sometimes naively suppose that students behave as they prefer,
or conversely, that they prefer to behave as they do. The designer than
constructs a program attempting to achieve consistency between pref-
erence and behavior within socially (or institutionally) defined limits
of acceptability. The fact is that continuation students (as well as
most people, according to psychologists) do not always act as they prefer,
nor do they necessarily prefer to act as they do. Their actions are
often impulsive and inappropriate to environmental circumstances. The
system designer, then, is well advised to concentrate on behavioral
needs for performance success, and not to be misled by "preferences"
in so far as these might be based on impulse rather than on reason.
36

FINDINGS

The task of identifying student characteristics which
must be observed in the design of an instructional program
was assigned in January. In order to accomplish this, the
staff had to identify the most appropriate sources for these
data, and to select the best means for collecting and
measuring them. In some cases, established techniques and
standardized measurements were adopted to Project purposes.
In other cases, the staff had to create its own instrumentso.
These findings basically describe the unique and typical
characteristics of the students at Valley High School. A
major objective was to discover significant differences
within the population which could affect the modes of
instructional stimulus that the system can employ. The
data here is organized as shown in the following outline:
I. POPULATION CHARACTERISTICS
A. Quantity Descriptors
B. Socio-Economic Descriptors
C. Physical Descriptors
II. BEHAVIOR PROBABILITY
A. Evaluation and Attitudes of the Students
1. Sociological Questionnaire (SOC)
2. Meaning of Words Inventory (MOWI)
3. MOWI and SOC: Aspirations
38

4. MOWI: Teachers
5. Instructional Preference Scale (IPS)
B. Evaluation of the Students by "Others"
1. Recorded Historical Information (RHI)
2. Teacher Evaluation Survey (TES)
III. PRESENT ACADEMIC PERFORMANCE CAPABILITIES
A. Wide Range Achievement Test (WRAT)
1. Standard Scores and Grade Placement: Percentilesfor Total Valley High School Sample
2. Teacher Evaluation Compared with WRAT Scores
3. Correlaticnal Study: WRAT
B. California Achievement Test (CAT)
1. Mean Raw Scores and Grade Placements: TotalPopulation of Valley High School
2. Analysis: Sex, Ethnic, Attendance Groupings
3. The CAT as a Diagnostic Tool
C. General Aptitude Test Battery (GATB)
1. Aptitudes Measured by GATB
2. Who is Referred for the GATB?
3. Score Distribution of Valley High School Popula-tion as Compared with the Normal Population
4. Distribution of GATB Mean Standard Scores by Sex,Attendance, Ethnic Groupings
5. GATB Correlations
6. GATB Measures as Predictors of College Success
7. Occupational Aptitude Patterns
39

I. POPULATION CHARACTERISTICS
A general description of the Valley High School student
body is a prerequisite to any identification of characteris-
tics, or any assessment of instructional needs. The follow-
ing descriptive data on population characteristics are
divided into three sections.
The first section, quantity descriptors, includes the
following items: the total population of Valley High as of
the beginning of testing; the male/female student ratio;
attendance patterns; attrition rate; and, the rate of new
enrollments.
The second section, socio-economic descriptors, includes
these topics: socio-economic family status; ethnic group
membership; data on family structure; the amount of special
education that students have received; stated discipline
problems; and, reasons for referral to Valley High School.
Physical descriptors, the third section, reports the
following data: general health information (historical and
familial); individual health history; present general health
status; assessment of lateral preference; and, the examining
nurses' recommendations.
There is a wide variety of individual differences in the
population of Valley High School; an assumption of homogeneity
is, therefore, an artificial one. Certain characteristics of
40

the population, however, necessitate such an assumption, and
dictate the type of research design utilized by the Project
in assessing attitudes, abilities, and behavioral and demo-
graphic variables relevant to the continuation student at
Valley High School.
The pattern of student enrollment at Valley High School
is a "dynamic" one, as shown in the example below for the
period of September 16, 19671to April 30, 1968.
Total Enrollment 483
Active Enrollment 297
Dropped by Valley High 186
Dropped, but re-enrolled 33
Such an "incoming-outgoing" pattern presents a problem
in data collection, and prohibits obtaining complete test
batteries for each individual student. As a consequence,
the Project employed a "block" design to expedite data
collection. Such a design defines the population of Valley
High School as an homogeneous one, and, thereby makes possible
accurate measures without the constraints of obtaining complete
test batteries. Within the "block" design, the population
characteristics are measured in terms of the following vari-
ables: total population, sex, ethnic group membership and
attendance.
Collection of demographic data which is concerned with
size, distribution and vital statistics of the Valley High
41

School population required two steps. The first involved a
quantitative evaluation of the student body at Valley High
School. This evaluation included:
1. The total population of Valley High School, asof the beginning of testing. (March 18, 1968.)
2. The male/female ratio of the student body.
3. The mean age of the student body.
4. The attendance patterns of the male and femalepopulation.
5. The ethnic distribution ratio.
6. The referring high school.
The second step was to gather data relevant to a socio-
economic assessment of the student population. This included:
1. The socio-economic status of the student's family.
2. Familial structure.
3. Marriage patterns of parents.
4. Mobility of parents.
5. Educational level of parents.
6. Number of siblings of students, etc.
A. Quantity Descriptors
As of the beginning of testing, the total attending
population of Valley High School was 276. Of this total, 254
students served as testing subjects. Because of the attendance
pattern at Valley High School, only 12% of the sample popula-
tion completed a full test battery. Eighteen percent (18%)
completed all but the WRAT, 20% completed all but the CAT,
42

and over 27% completed all but the GATB. The following charts
show the numerical distribution by sex and the mean ages of
the test population.
Numerical Distribution (by sex)Valley High School
Males 202
Females 74
Male/female ratio 3:1
The majority of students at Valley High School are sixteen
years or older.
Mean Ages of the Total Population and Percentages:
(SOC, N = 176)
'Percentage ofAge Total population
14 years 4 0
15 years 20.5
16 years 42.6
17 years (or older) 32.4
As reported, the attendance pattern at Valley High School
is a non-stable one. Attendance varies from day to day, and
it increases and decreases from month to month. In order
to obtain a sufficient amount of data, the total population
at Valley High School was divided into three separate groups.
4-3

Those students who attended more than 50% of the time were
designated Group A; those who attended less than 50%, Group 13;
and those who had been referred to Valley High but who did
not attend, as Group C. Group A was composed of 109 students;
Group 13, 119 students; Group C, 48 students. Within each
group, the male/female ratio of the total population was
maintained in data collection.
In the total test population, an ethnic distribution is
shown by the data as follows:
Percentage ofEthnic Group Total Population (N=276)
Anglo
Mexican-American
Other (Negro, Oriental)
69.2
30.6
1.8
This ethnic distribution is further broken down as follows:
Percentage ofMales Total Population
Anglo 68.3
Me xi can - American 30.2
Other 1.5

Percentage ofFemales Total Population
Anglo
Mexican-American
Other
71.6
27.0
1.4
The ratio of Anglo to Mexican-American students is roughly
3:1. As can be seen, the "Other" group is stastically insig-
nificant to the population at Valley High School.
B. Socio-Economic Descriptors
The socio-economic status of the students'
was derived from two sources:
families
the RHI and the SOC. (See
Tables XIV, 1 and XV, 1, infra.)
Data derived from the RHI indicate that the father
of the student, or the male with whom the student lives, is
generally employed at the following occupational levels:
Level of EmploymentPercentage(N = 138)
Unskilled, semi-skilled, andskilled
White collar
Professional
workers
workers
82
10.2
7.6
Mothers, or the females with whom the student lives, were
employed at the following levels:
45

Level of EmploymentPercentage(N = 138)
Housewives
Semi-skilled or skilled
Professional workers
73
20.7
6.3
In most instances, the most recent data were obtained
from the SOC which showed the following:
Ar Males Level of Employment Percentage
Laborers 10.2
Trade crafts (mechanic, electrician, etc )., 27.3
Professional Workers 11.9
Unemployed 4.0
None of listed categories 40.9
On the SOC, however, no questions were asked relevant to the
occupation of the mother or female with whom the student
lives.
Data derived from the Physical Profile (PP)(see
Table XVI, 1, infra) indicate that the mean age of the parents
of students now attending Valley High School is 42.1 years,
and that the mean age of the siblings is 11.7 years. (See
Figure 1.) Data from the SOC indicate that 8.4% of the
student population have two siblings, (see Figure 2a, 2b)
16.8% have three siblings, and 67.1% have four or more siblings.
46

Thirty-four and seven-tenths percent (34.7%) of the Valley
High School students are the middle-born child; 23.7%, the
first born, and 22.3%, the last born. (See Figure 3.)
Analysis of the RHI and the SOC in terms of ethnic
groupings indicates that no Anglo student has ten or more
siblings as compared with 7.1% of the Mexican-American
students who have more than ten siblings. Approximately
75% of the Anglo and the Mexican-American students both
have between two and six siblings in the family.
Most Valley High School students live in "matri-
centric" families, that is, mother and father are married and
both living in the home (r.= .856). The majority of Valley
High School students, regardless of ethnic group membership
or sex, live with both father and mother. Findings ....icate
that a greater proportion of the Mexican-American students
(75.5%) live with both parents as compared with the Anglo
students (53.1%). (See Figure 4.) Data from the RHI indicate
that: 82.1% of the students live with their natural mother
and father; 14.9% live with their mother or father only; and,
only 2.9% live with other relatives or guardians.
Data from the Physical Profile and the SOC, which
reflect the most recent and accurate information, indicate
that only 58.8% to 66.8% of the students live with their
natural parents; the remainder live with step-parents, in
foster homes, or with friends or older siblings. (See Figure 5.)
47

Figure 1 MEAN AGE DISTRIBUTION OF FAMILIES-PHYSICAL PROFILE
No. Parents
18
16
14
12
10
8
6
4
2
0Mean Age 20 25 30 35Parents u
15=34.95
1
I
I
I
I
No. Families
I IQ1=38.2
40 I 45
Mean=42.1
Q3=46
50
+15=49.26
I
20- I I I
I I I
I I I
I I I
I I
I
I
I
I
. WIC. .Mean Age 0 2 4 6 8 10 12 14 i 16 18 20Siblings I I 1 1
I15=6.8 Mean 11.7
I+15=17.8
I Q1=9.6 I Q3=15.1 I
15
10
55
I
I
I
I
60
I
65 70
WNW
NNW

Figure 2a TOTAL POPULATION - NUMBER OF SIBLINGS
100 p.
90
80
70
NUMBER OF SIBLINGS(RHI)
38.4
35.5
NoData
1
6.5
2.2
2-3 4-6 7-9 10+
Number of Siblings
100NUMBER OF SIBLINGS(SOC)
90
80 p
70 I, 67.1
Number of Siblings

Figure 2b
NUMBER OF SIBLINGS - ETHNIC COMPARISON(RHI DATA)
40.5
9.5
NoData
90 (SOC DATA)
1 2-3 4-6 7-9
ANGLO:MEX. AMER.:M=111
7.1
0.0
NUMBER OF SIBLINGS- ETHNIC COMPARISON
64.6
10+
62.2
24.4
13.3
7.1
NoData
One Two Three FourOr More

Li
Li
LI
Figure 3 BIRTH ORDER OF V.H.S. STUDENTS
100
90
80
70
60
50
40 ,
30
20
10
0
34.7
23.7 22.3
11
14.0viewmworiww
1.7
First Middle Last Twin OtherBorn Born Born

Figure 4
100
90
80
70
60 We%
50
40
30.
20
10
0
100
90
80
70
60
50
40
30.
20
10
0
17.0%
FAMILY STRUCTURE FROM PHYSICAL PROFILE
ALL(N=153)
15.7%
16.3%
Father
Mother
FatherOr
MotherOnly
11.5%
MIL
MEXICANAMERICAN(N=49)
6.1%
FatherOr
Mother& Step.
100
90,
80
70
60,
100
90,
80
70
z 60I.
0' 50z
wgg40,
a.
30,
20, 16.7%
102.0%
0Other
14.3%
66.7%
ANGLO(N=98)
20.4%
12.2%
OTHER(N=6)
16.7%
Father Father FatherOr Or
Mother Mother MotherOnly & Step.
Other

0s=
60p.0
6" 40
20,
0
58.8
Figure 5 P.P., SOC, RHI COMPARISON -ADULTS STUDENTS LIVE WITH
17.0
PHYSICAL PROFILE(N=153)
15.7
visamorms 8.5
Father
Mother100,
80,
66.8
60,
40p
FatherOr
MotherOnly
FatherOr
MotherStep.
SOC TEST(N=176)
Other
20,
0
100
80,
18.2
4.3 2.1
8.6
Fathera
Mother
82.1
FatherOr
MotherOnly
OtherRelative
RHI TEST(N=138)
FriendsHoneof
These
60,
40, ,....
20 , , 14.9,
0.7 .7 1.5
Father Fathera or
Mother MotherOnly
Older Other GuardianSibling Relative
Adults in Horne

U
Of the parents of students at Valley High School, 79.1%
are presently married; 4.7% are divorced or separated and not
remarried; 5.4% are widowed and not remarried; and 10.9% are
widowed and remarried. (See Figure 6.)
English is the predominant language spoken by Valley
High School students and their families in their homes. (See
Figure 7.) Combined data indicate the following:
Language Spoken at Home
(RHI) N = 138
Language Percentage of Homes
English 69.5
English/Spanish 19.1
English/Other 2.2
Spanish .4
i Other 3.2
Income for family needs is provided as shown in Figure 8.
(SOC) N = 176
Source Percentage of Population
Father as sole source 54.0
Mother 14.2
More than one member of family 15.9
Outside support (i.e., State, County) 7.4
None of these 4.5
Not indicated 4.0
54

100 1,,
90
80
70 ,
60
50 ,
40 ,
30 ,
20
10 0
0
Figure 6
73.9
4.3 5.1
MARITAL STATUSOF ADULTS IN
THE HOME(RHI-N=138)
10.1
6.5
0.0
Married Separat. Widowed Remarried , Never NoOr Mar.
Divorced
Marital Status
Marital Status

100
90
80
70
60
50
40
30
20
10
Figure 7
73.9
.7
SOC. SURVEY(N=176)
13.0
2.2
LANGUAGES SPOKEN IN THE HOME
0.0
No English Spanish English/ English/Data Only Only Other
Spanish Other
Language Spoken
100
90 p.
80
70 ,
60
50
40 o.
30
20 p
10
65.3
RHI(N=138)
25.3
1.1 0.02.1 L0 4.
No English Spanish English/ English/ OtherData Only Only Spanish Other
6.3
Mean % LanguageRHI and Soc Data pop.
English 69.5
English/Spanish 19.1
Spanish .4
English/Other 2.2
Other 3.2
Language Spoken

Figure 8
14.215.9
SOURCE OF FAMILYINCOME
(SOC-N=176)
7.44.5
No Data Father Mother More Than FromOne Out.
Member sideFamily
Source of Family Support
Noneof
These

Only a limited amount of data relative to the educa-a
tional level of the parents of the student at Valley High
School was available. Such data were obtained from the RHI,
and indicated that 46.9% of the fathers and 57.9% of the
mothers had had some high school education. Four and one-half
percent (4.5%) of the males and 3.9% of the females had been
to a trade or technical school; 10.6% of the males and 5.6G
of the females had gone to some college, and 7.3% of the
males and less than 1% of the females had gone to a four-year
college. Thirty and seven-tenths percent (30.7%) of the
fathers and 29.8% of the mothers had completed none of the
above. Figures 9 and 10 identify the education experience of
the total parent population. The following charts report
these data by the sex and ethnic subgroup variables.
(RHI) N = 138
Parents' EducationalLevel Completed
Percentage PercentageMale Female
Elementary School only
Jr. High School
High School
Jr. College
Four-year College
No data
6.5
10.9
23.9
2.9
3.2
54.5
5.8
10.1
32.6
2.9
0.0
48.6
58

100
Figure 9 EDUCATIONAL LEVEL OF PARENTS
190
80
70 ,
60
50
40 ,,
30 p
20 ,
10
0
I
5.7
45.5
EDUCATION OF FATHER (SOC)
4.5
100
90
80
70
60
50
40
29.0 30
20
8.5 106.8 6.3
No HighData School
Tradeor
Tech.
Some CollegeCollege Degree
Educational Level
Noneof
These
0
55.7
EDUCATION OF MOTHER (SOC)
4.0
No HighData School
Tradeor
Tech.
3.4
28.4
2.3
Some CollegeCollege Degree
Educational Level
Noneof
These
_1

1 0 0
80,
5E 60,2
W40,
2
0Actual % 53.8 5.9 7.6 27.5 4.3 1.1
Figure 10 EDUCATIONAL LEVEL OF PARENTS-RHI
0.0
ANGLO
Projected %59.1
16.312.9
9.3
2.4
11 .0.
ll 80,0
tl60,
o40,
.11
20,
b.
8 8
1 I 1...
A (X 8t A Ia ±i i .t c
0 E Eo :to
Z Lia -1 I
0 0.0
14.3
Actual % 54.5 6.5
100
80,
60,
40,
206.
O0.0
Actual % 47.7 7.2 17,4 22.4 0.0 0.0
13.3
MEXICANAMERICAN
Projected %
52.3
34.4
0.0 0.0
100,
St
O 8
III
St
(1) 8t I, 1
C i I(1)udo
IIa 1 t0 E S
Z -1 Ela 2MALES
Projected %
52.4
23.8
6.33.2
80,
60,
40,
206.
00.0
11.3
FEMALES
Projected %
63.4
19.7
5.60.0
10.9 23.9 2.9 1.4 Actual % 48.6 5.8 10.1 32.6 2.9 0.0

Ethnic Distribution:
0...1110
(RHI) N = 138
Parents' EducationalLevel Completed
PercentAnglo
ge PercentageMexican-American
Elementary School only 5.9 7.2
Jr. High School only 7.6 17.9
High School only 27.5 27.4
Jr. College 4.3 0.0
Four-year College 1.3. 0.0
RHI data (see Figure 11a) indicates that the majority
of Valley High School students (60.9%) were born
or the Western portion of the United States. Six
in California
teen and
seven-tenths percent (16.7%) were born in the Midwest, 11.6%
in tha East, 5.1% in the South, and 1.4% in a forei n country.
An attempt was made to ascertain the mobility
of the students' parents, using as an indicator the nu
patterns
mber of
schools attended by the students. (See Figure 11b.), D
from the RHI (N=138) indicate the following:
ata
Percentage of students who have atten1 2 3-4 5-7
School Level School Schools Schools Schools
Elementary 14.5 35.5 28.3 3.6
Jr. High 60.1 20.3 5.1 0.7
ed:I
High School(including VHS) 5.8 71.0 17.4 0.7
63.

Figure lie
100
80
70
60.9
50
40
30
2016.7
10
4.3
0Calif.No Or MidwestData West.
STUDENTBIRTHPLACE
(RHI-N=138)
11.6
5.1
Eastern Southern ForeignMorn
Area of Birth
4

100,
90,
80,
o 70
60,
o 50,-z40,
a.
30
20,
10,
Figure 11b
71.0
5.8
HIGHSCHOOL(RHI)
17.4
0.7
NUMBER OF SCHOOLS ATTENDED% Total VHS Population
No 1 3.4 5.713sts
Number of Schools
HIGHSCHOOL(SOC)
48.3
18.215.3
10 8.55.1
NoData
*Normal for this Population
100,
90, ELEMENTARYSCHOOL(RHI)
80,
70
60,
50,
40,35.5
30 , 28.3
20, 16.114.5
10-3.6
No 1 2 34 5.7Data
100
90
80
70
60,
50,
40,
30 ,
20
10
13.8
1
60.1
2" 3
Number of Schools
20.3
4
JUNIOR HIGHSCHOOL(RHI)
5.10.7
5
No 1 2 34 5.7Data
Number of Schools Number of Schools

On the basis of the above figures, it would seem that
the parents of the students at Valley High School are essen-
tially non-mobile, and once established in a community, they
tend to remain.
C. Physical Descriptors
A student's ability to respond to instructional
stimuli depends upon many things. Among these are the student's
general physical condition. The task was to assess the
physical characteristics of Valley High School students which
might directly affect their educational performance. The
Physical Profile was devised to identify these physical
characteristics. This instrument was administered by six
district nurses in April, 1968, during which time 153 students
were interviewed.
The findings from the Physical Profile are reported
below under the following headings: General Health Informa-
tion; Individual Health History; Present Health Status;
Dominance and Lateral Preference; and Nurses' Recommendations.
Each nurse made recommendations at the conclusion of the
interviews, writing independently in accordance with her
orientation to Project objectives.
GENERAL HEALTH INFORMATION (See Figs. 12a, c, e):
The data show that half of the student population have
not experienced accidents serious enough to require hospital-
ization. Approximately 20% of the students have suffered
64

No
Acc
iden
tsR
equi
ring
Hos
pita
lizat
ion
Fal
ls o
rS
titch
edC
uts
Maj
orF
ract
ure
Or
Bre
ak
Fai
ntin
g or
Pro
long
edU
ncon
scio
us-
ness
Maj
orS
urge
ry
Pro
long
edIll
ness
or
Hos
pita
lizat
ion
Sei
zure
s
PE
RC
EN
T O
F P
OP
ULA
TIO
N
ct0
O0
00
0
arm
Oth
er
Sev
ere
Infa
ntIll
ness
Pre
mat
ure
Sev
ere
Mat
erna
lIll
ness
inP
regn
ancy
R.H
. Pro
blem
0
PE
RC
EN
T O
F P
OP
ULA
TIO
N
1111
1111
1111
1111
18
bit m
ara.
.4
PE
RC
EN
T O
F P
OP
ULA
TIO
N
0cy.
08
CP 0
00
00
00
00
00
0
A0 :4
vb.
m Xo
Jil°5
O'4
4F.
>°O
z0
lial
0-o
E.4
.1C
rn n...
.I 0>
ZZ
--C
l)as
ZZ
II
II1. (P
I4P
ER
CE
NT
OF
PO
PU
LAT
ION
it,P
ER
CE
NT
OF
PO
PU
LAT
ION
PE
RC
EN
T O
F P
OP
ULA
TIO
NC
aba
41)
0'C
IU
"O
P'J
111
0'C
Oa
P'J
111
PC
Da
00
00
00
00
00
00
00
00
PI
9.8 O is
a"f
!
C
O 0
s.

from major fractures; slightly more have required stitches to
close cuts resulting from falls; and only 11% of the students
report any history of fainting or prolonged unconsciousness.
Less than 6% of the students report having had major surgery.
There seems to be a low incidence of severe problems at
birth. Only 8% of the students reported severe illness during
infancy, and only 4% of the students were born prematurely.
Pre-natal care and parental obstetric visitation data were
unavailable.
INDIVIDUAL HEALTH HISTORY (See Figs. 13 - 15):
Illnesses: Of the total population, 83.7% reports no
severe illnesses, and 15.3% of the students have had one
severe illness. Only 2.7% of the students report more than
one severe illness.
Accidents: According to Recorded Historical Information,
more than three-fourths of the population have not experienced
serious accidents requiring medical attention. The RHI
findings are consistent with the data on major health traumas
reported by the Physical Profile.
Operations: Only 5% of the students have experienced
major surgery, and only 6% have been in a hospital for any
prolonged period of time.
Medical Visitation Practices: More than two-thirds of the
student body at Valley High School report visiting doctors
only when necessary. Approximately one-sixth of the students
66

, 1
) ,
11.
11
100
90
80
70
60
50
40
30
20
10
Figure 13
76.8
100
90
80
70
60
50
40
30
20
10
12.3
5.1
TOTAL POPULATION (N=138)
(a) HANDICAPS
0.7 0.74.3
to soc 911c 1
A az > z i I 10
76.1
8.7
A:M111
(b) MAJOR HEALTH TRAUMAS
5.6 5.82.2 0.7 0.7
eo1 le
aso 1 .12 ,,,
mg! ,, O~ 0 ,6 0 S.75 .0 0 la rni 1 5
01. 00 : a, 0
c I i I .N :I 422 c aZ 41. t 3 o. = z co it co) 1i. CP
Data From Recorded Historical Information

Figure 14
ao,z0
Z60,60.2o
40,
5G.
20.
0
100
80.
60.
40,
20.
80.O
60.20
40,,
a.
1117
(a)
FREQUENCY OFVISITS TO DOCTOR
6.0
1.32.7
TOTAL POPULATION (N=153)
80.71.3
16.4
(C)
FREQUENCY OFVISITS TO DOCTOR
7.11.0 0.0
70.4
ANGLOS (N=98)
122
(e)
FREQUENCY OFVISITS TO DOCTOR
10.2
62.0 6.1
0 I MRII g 5
At Least Every Every Every WhenYearly 1.2 Years 2.5 Years 5+ Years Needed
60.
40,
20.
0
80.
60.
40.
20.
I
27.0
(b)
FREQUENCY OFVISITS TO DENTIST
6.0
29.6
1.64.4
IMO
(d)
FREQUENCY OFVISITS TO DENTIST
MEXICAN-AMERICANS (N=49)
69.4
1
80.
60.
40.
20.
0
5.1 4.1 5.1
U
FREQUENCY OFVISITS TO DENTIST
14.3
6.24.1
10.2
51.6
44.9
53.1
At Least Every Every Every WhenYearly 1.2 Years 2.5 Years 5+ Years Needed

I
L.J
Figure 15
60,
40,
20,
0
TOTAL POPULATION (N=153)
11.6
2.0
MEDICAL REASONS FORSCHOOL ABSENCES
1.3 1.3 1.3 1.3
1 .... ;IS g
ee 2 S.2 0 g 3 m
AI UN 1 Eo e 2 e azit(' it8 213
4.6
reCI rE *o
az

will consult a doctor each year, while the remaining one-
sixth vary their attendance from one to five years or more.
Half of the students visit a dentist only when it is
necessary. Slightly less than half of the remaining sample
(one-fourth) go at least once a year.
Between the Anglo and Mexican-American subgroups, there
are no statistically significant differences in their
practices of visiting doctors. More than two-thirds of the
Mexican-Americans and Anglos consult medical practitioners
only when necessary.
As for visiting a dentist, approximately one-half of
both the Anglo and Mexican-American populations report dental
consultations only when necessary.
The difference between the two subgroups in visiting a
dentist once or more a year, however, is statistically
significant at a .05 level of confidence. Of the Mexican-
American sample, approximately one-sixth goes to a dentist
once a year, while one-third of the Anglo population reports
dental consultation of the same frequency. No other subgroup
differences in dental visitation practice are significant.
Reasons for School Absences: Medical reasons are seldom
responsible for school absences among the students of Valley
High School. When absent from school, 78% of the sampled
population were absent for other than medical reasons during
the school year. Colds, the most common reason, were listed
70

as reasons for absences by only 12% of the students. This
suggests that psycho-social factors may keep the students
from normal attendance.
PRESENT GENERAL HEALTH STATUS (See Figs. 16 - 20):
Blood Pressure and Pulse Rate, Height and Wei ht: Nearly
all of the students have normal blood pressure and pulse rate,
as defined in Cole and Hall, (1964). The average student is
physically well proportioned.
students are between five feet,
More than three-fourths of the
and five feet and ten inches
tall. Over one-half weigh between 110 and 150 pounds. The
majority of students are described as thin or athletic body
types.
Nutritional Condition: Few students appear to suffer from
poor nutrition, but less than 10% of the students seem to
enjoy excellent nutrition. Nurses judged the remaining student
body to be in fair to good health.
Dental Examination:
teeth in good condition;
have severe carries.
Of the sample population,
35% have moderate carries,
40% have
and 15%
The remaining students need to have
their teeth cleaned, or require some orthodontic attention.
Audiological Information: According to audiological test-
ing, more than two-thirds of the students have normal hearing'
in the low range of 250 to 1000 cycles per second, while
slightly more have normal hearing in'the high range of 2000 to
4000 cycles per second. In low range testing of right and
71

9
Figure 16
100.
800
Z 60.2
40.
20.
0 0.741Mwm=v
80.
E 60.
60
40.
20.
TOTAL POPULATION (N=153)
Mope(a) BLOOD PRESSURE
60.9
9.2
is:
5.9
ta
(c) HEIGHT (INCHES)
41.2
35.3
3.3
14.4
20.
0
80p
60.
40.
20.
6.52.60 IN=IML._ 0
601
43.1
40.
20.
12.5
(b) PULSE RATE/MINUTE
65.4
20.3
1.3
8 2o
0.7
2
0
(d) WEIGHT (POUNDS)
23.5
13.3
31.426.1
O. oe 210
422 h .4" oS
(0) BODY PROPORTION
41.1
bh.
14.4
0
if 60 61XX 31
60.
40
20.
2.6
(0 NUTRITIONAL STATUS56.9
31.4
9.2
- _

Figure 17 CONDITION OF TEETH
TOTAL POPULATION (N= 153)
1000
90,
80,
70,
600
50,
40,
30
20,
10
40.5
34.6
15.0
6.5
01.3
Good Moderate Severe Need OrthodonticCaries Caries Cleaning Problem

Figure 18
100,
80,O 70.6
60,20
40,
5
20,
0
HEARING
(a)(250.1000c.p.s.)
20.3
TOTAL POPULATION (N=153)
8.5
Normal Possible ReferralDefect Needed
100,
80,1
60,
40,
74.5
(c)
(250.1000 c.p.s.)
20, 17.0
0
Normal
6.5
Possible ReferralDefect Needed
RIGHT EAR 10010
85.6
LEFT EAR
80,z0
60,2
O40,
5
20,,
0
100,
80,
60,
40,
20,
12.4
(b)
(2000.4000 c.p.s.)
Normal ReferralNeeded
87.6
Normal
10.5
ReferralNeeded
(d)
(2000-4000 c.p.s.)

Figure 19 TOTAL POPULATION (N=153)
O
80,1
z
60,
0kr
E 40,
t20,
0
100,
z67.2 (a)1
0rot
. 64.7 (a)2VISION = 60 RIGHT EYE W/OUTa.BOTH EYES W/OUT R GLASSESGLASSES
ze 40W
21.1
20,
7.2
80,
60,
40,
20.9
12.4
0
14A 62g2zP) igi a
64.7
(a)3
LEFT EYE W/OUTGLASSES
24.2
20,9.2
100p,_
80,
60,
40,
20,
0 0
121 II 7$
f7E:
E v' . 4.0 &O &6 0Z0
Z0Z li. Z
(b) 1
BOTH EYESW/GLASSES
2.0
60, 56.9
40,
20,
34.0
(b)2
VISION SUMMARY
7.96.7
0
No
z
eg
m

100
90
80
70
60
50
40
30
20
10
Figure 20 TOTAL POPULATION (N=138)
97.4
0
2.6
E
2 IN6
()SPEECH
100(c)
90 88.0 SPEECH THERAPY
80
70
60 ,
50,
40
30
20
12.010
0
100,
90,
SOS
70 ,
60,
50,
40,
30
20,
0
(b)
QUALITY OF ARTICULATION
70.7
18.0
11.3

11 left ear, 15% of the sample population were recommended for
referral, while 20% of the students require "possible"
referral for sub-normal hearing in the low range. This
finding is meaningful since it is in the low range that the
normal speaking voice occurs.
Visual Information: Two-thirds of the tested students
have normal vision without glasses. Nearly one-third of the
students are far-sighted, that is, their vision is 20/16 or
below. The data shows that nearly all students have normal
vision allowing for the use of corrective lenses.
Speech Pattern, Articulation, and Remediation: Nearly
all students measured were judged to have normal speech patterns,
and over four-fifths of them have good to excellent articula-
tion. It is to be noted, however, that about one-eighth of
the students have had some speech therapy.
LATERAL PREFERENCE (See Figs. 21 - 22)
Only one student in five (21.0%) was found to have a
consistent preference for using one side of his body. The
largest single category, 38.3% is "mixed preference*" 11.8%
show "crossed preference."
NURSES' RECOMMENDATIONS (See Fig. 23)
In more than one-fourth of the cases, nurses' recommended
that students be referred for further examination and treatment
of either hearing and/or vision impairments. Dental care was
77

Mix
edP
refe
renc
e
PE
RC
EN
T O
F P
OP
ULA
TIO
N
s...
n)w
4%ut
Ch
....1
OD
1)0
00
00
00
00
00
.V
VV
co
Inco
mpl
ete
1...
or P
artia
lP
refe
renc
e
Late
ral
Pre
fere
nce
I.0
Cro
ssed
pa paP
refe
renc
e
Uni
late
ral
Pre
fere
nce
Con
vert
edP
refe
renc
e
Oth
er

Figure 22
LATERAL PREFERENCE TERMS
Lateral Preference
Crossed Preference
Incomplete Preference
Impartial Preference
Mixed Preference
Converted Preference
Unilateral Preference
Eye Preference
The preferred use and superiorfunctioning of one side of bodyover the other.
Dominant hand and eye appear onopposite sides of body.
Equal use of both sides in hand,eye, and leg.
Same as incomplete.
Includes both crossed and in-complete preference.
Shift in preference has takenplace.
One sided preference as opposedto crossed.
The selection of the eye habituallyused for sighting.
According to some in the field of readingdisabilities and body dominance, a largenumber of children with some type of readingproblem are found to have a CROSSED PREFERENCE.
79

Den
tal
Ort
hodo
ntal
Hea
ring
Vis
ion
Phy
sica
l Exa
m
Blo
od &
Urin
e
Che
st X
-ray
Neu
rolo
gica
l
E.E
.G.
E.K
.G.
Pne
umo-
ence
phal
ogra
ph
Gyn
ecol
ogic
al
Alle
rgy
Dia
bete
s
Dom
inan
ceT
rain
ing
Spe
ech
Rea
ding
Psy
. Wor
k-up
Fam
ily C
ouns
el
Indi
vidu
alT
hera
pyG
roup
The
rapy
PE
RC
EN
T O
F P
OP
ULA
TIO
N
emb
srIV
W4u
U1
Ot
...4
co%
coo
0o
oo
oo
oo
oo
o
P a 11.
m
1a
142 0 id
ii. a is
suggested for nearly half the students. The nurses indicated
that slightly less than one-third of the students require
nutritional improvement. From brief interviews, the nurses
made recommendations for family counseling for 40.5% of the
students, and other kinds of psychological services were
also advised.
81
1;

II. BEHAVIOR PROBABILITY INDICATORS
A system designer must know those factors which determine
students' predispositions to instruction before he can develop
the most effective modes of instructional stimulus. These
factors, i.e., behavior probability indicators, are the sub-
ject of this section of the findings.
In order to assess the probable behaviors of Valley High
continuation students in the world of further schooling, work,
the military and the community, the Project made use of a
twofold approach. This approach analyzes how the students at
Valley High School view the curriculum and themselves as well;
and, how they have been viewed by past and present teachers
and school systems. Both measures are requisite to any assess-
ment of the limits and constraints of the student population
which will influence program planning for that population.
The Sociological Questionnaire (SOC) (see Table XV, 1,
infra) and the Meaning of Words Inventory (MOWI) (see Table
XVII, 1, infra) provided measures of the students' self-
evaluations and their aspirations. The Instructional
Preference Scale (IPS) (see Table XVIII, infra) was used as
a measure of the students' evaluations of the curriculum at
Valley High School. In order to gather an evaluation of the
students. by others, the staff utilized information from the
82

[11 Cum folders (the RHI), and Teacher Evaluation Surveys (TES).
(See Table XIX, 1, infra.)
A. Evaluation and Attitudes of the Students
1. Sociological Questionnaire
Data obtained from the SOC can be divided into
three sections: the students' personal data; the students'
attitudes towards school; and, the students' work and future
plans. Student answers to those questions on the SOC which
seek personal data give some information as to the way the
students see themselves. (Questions: #4, 13, 15, 16, 17, 18,
39, and 40; also see Figures 24-29; and Table XV, 1, infra.)
Such data indicate that 1.6% of the total male
population at Valley High School and none of the total female
population are married and also attending school. Of the
males, 8.6% indicate that they are engaged, as compared with
19.0% of the females. Fifty percent of the males, and 40.5%
of the females indicate no specific plans as to expected time
of marriage after completion of high school. The following
chart shows the sub-populational breakdowns. (See next page.)
Of the total population at Valley High School,
48.9% indicate that they go out almost every night of the
week during school and on weekends. Of the males, 15.6%, as
compared with 35.7%of the girls at Valley, indicate that they
go out on weekends and one week night only. This difference
was found to be significant at the .01 level. No significant
83

GOING STEADY, MARITAL STATUS AND FUTURE MARITAL PLANS:
Percent
Percent
Percent
Percent
Percent
Percent
Percent
of Total
Males
Females
Anglo
Mexican-
AB
Pop.
American
Married
1.7
1.6
none
1.6
2.2
2.3
1.4
Single
51.7
54.7
40.5
53.1.
51.1
56.3
47.9
Engaged
10.8
8.6
19.0
11.7
8.9
8.0
13.7
Going Steady
21.0
18.0
31.0
20.3
17.8
23.0
16.4
Plan to Marry
in High School:
No Chance
61.9
68.0*
42.9
61.7
64.4
62.1
61.6
Some Chance
15.3
12.5
23.8
14.8
15.6
17.2
12.3
Plan Marriage
After High School:
No Specific
Plans
47.7
50.0
40.5
51.6
40.0
47.1
50.7
In Less Than
Five Years
17.6
18.8
14.3
18.0
15.6
14.9
20.5
* The difference between male and female answers to this question
proved to be
significant at the .01 level.

io
Figure 24A SOCIOLOGICAL QUESTIONNAIRE - PERSONAL DATA
[11 (a)
fa
(b)
100,
80,zO1::
60
O
z 404.4
20,
100,
20-
Os.
PLANS FOR MARRIAGEIN HIGH SCHOOL
15.3 13.6
61.9
51.7
TOTAL POPULATION - N =1'2
21.0
MARITAL STATUSOF STUDENTS
10.8
(c)
100,-
ao,z0
60,
r.O
40,
20,
5.12.8
1.1O 0
IP 0 -ri 12
01 -a a i 'E 0C
I 0 0 0a >v Z z i Z
13.6
0Z
PLANS FOR MARRIAGEAFTER HIGH SCHOOL
11.98.5
17.6
47.7
10,83.4
O
3
ani
IC
)1.
3e>
a
I.
t,0

II
Figure 24B SOCIOLOGICAL QUESTIONNAIRE
PERSONAL DATA - BY ATTENDANCE GROUP*
100MARITAL STATUSOF STUDENTS
90
80
70
60
50
40
30N N
20
a10
Nl ti
0Single Going Engaged Married **None of No
Steady These Data
*These items show responses which differed at orbeyond the .05 level of significance for the twoattendance groups: A, N=07; and S.
0.01 level
**.05 level

*These items show responses which differed at or 20,beyond the .05 level of significance for the twoattendance groups: A, N=17; and II, N=73.
*.01 level
*.05 level
21.6
FREQUENCY OF DATING
Only on Weekends Almost Do not None of NoWeekends + 1 Wk. Nit. Every Go Out These DataNight Much
FREQUENCY OF DATING
Only on "Weekends *Almost Do not None of NoWeekends + 1 Wk. Every Nite Go Out These Data
Nite Much

11
I1
it
III
Figure 26A PERSONAL DATA
TOTAL POPULATION N = 172
SPENDING HABITS(a) 100,
90,
80,
70,
60,
50,
40,
30.
20
10
0
(b) 100,
90,,
80,
70,
60,
500
40o
30.
20
10-
0
13.6
14.8
17.0 18.2
10.8
37.5
2.8
O
if C 3otu .c 5Gti
inaz% 56; 13
C C 45
(1)
0% VI ....
ci a 5 wag z0%
PERSONAL DATA SEX*
35.7
SPENDING HABITS
23.4
36.7
40.5
11.9
4.8
11.7
7.13.9el=
...=AA t=C
u.0 0U I
:e =0 *0w 2C Ua '',
(A X*
4.1
C 31%5 uI%
6,Dit ga U*
N7. a0 0 :V.1 aCr ij (AX1090 1 CCa X i
C0'0 6 toC ca 'Cu) 6 g
a0 Izo
*These items show responses which differ at or beyond the 0.5level of significance for the two groups: MALE, N =128; and FEMALE, N = 42.
*.01 level
*.05 level

Figure 26B SOCIOLOGICAL QUESTIONNAIREPERSONAL DATA ETHNIC*
100.,
90 p
80 p
70 ,
60 ,
50 1,
40 ,
30 p
20 ,17.8
11.710 -
0
19.5
SPENDING HABITS
18.0 17.8
7.8
20.0
40.6
28.9
4.42.3
Contribute Spend on Fix/Run "Buy Records, Spend on No DataTo Family My Clothes Car/'Cycle Magazines, Other
and Stuff Things
*These items show responses which differed at or beyondthe .05 level of significance for the two groups:ANGLO, N=128; and MEXICANAMERICAN, N=45.
**.05 level

Figure 27 SOCIOLOGICAL QUESTIONNAIRE- PERSONAL DATATOTAL POPULATION- N = 172
100
90
80
70
60
50
40
30 -
20
10
0
31.3
19.9
(a)
ARRESTS
10.28.5
23.3
6.8
...ez
;p es
3 to) ta td
beC
.6 aV 1 g ti § Tig i1- ix iS et I=
..... o''
5 = eI a Vt t 2<IL 0
II,..f O0Z
100
90
80
70
60
50
40
30
20
10
38.9
(b)
IN PERSONAL TROUBLE,WHO STUDENT GOES TOFOR HELP
19.918.2
8.5 8.5
3.4
:5VI
CT1on 'CI
A
IbiC
woaa
O e e 0 0.. 0 0 o oa o 'C 0O. ti Ia. Z Z
-

Figure 28A PERSONAL DATA BY SEX*
(a)100,
80,
60,
40,
20,
0
ARRESTS
(b)100,
80,
IN PERSONAL TROUBLE,WHO STUDENT GOES TOFOR HELP
z01=
c460, .4,
a.44 R
inin
0 q as40,z tr:11
li.
Uhif.e
ID N44 OMNI N 5 411.:N al 11 e mS.
R off.e Nni id ri 20- -
PI witPI rt
44 li? del P.: IA l' ,,
wit P Z
V
FZ
Cl
eft '4
b
w2 0c
T)c 4e E io l .e
Z a 0 0....CI 0O . U Y. 8 Z Z 0
*
*These items show responses which differ at or beyond the 0.5level of significance for the two groups: MALE, N =128; and FEMALE, N = 42.
*.01 level
**.05 level
Figure 28B PERSONAL DATA BY ATTENDANCE GROUP*
100,
80,
60
40,
20,
0
if!A
ARRESTS
°Ien so q r`cv4 m istN N N
an qN
IC toC 6 \ A o
6
la : I a% 4C
TZ 6r. 2 0=3:4 6
II 4 1-% 8 =0 0z 6 to6 fi 2a 2§ .e...e tom o nZ .6 : 8 1.- it to o 1- IC la. U Z 0*
*These items show responses which differed at orbeyond the .05 level of significance for the twoattendance groups: A, N=87; and
In
IA
*.01 level
**.05 level

GI
Figure 29
(a)
SOCIOLOGICAL QUESTIONNAIRE PERSONAL DATA
TOTAL POP.N=172
*These items show responses which differ at or beyondthe .05 level of significance for the two groups:
imiblale N=128; and Female, N=42.MINE
+.01 level
*+.05 level
(b) 1001,-
90,
80,,
70,,
60,
50,,
40,
30,
20,
100,
90,
80,
70,
60,
50,
40,
30,
20,
10
0
10.8
WHAT STUDENT DOESAT LIBRARY
21.0
14.812.5
38.1
2.8
Study and Check Out Look Thru Meet and None of No DataRead for Books Magazines Talk to TheseSchool and Books Friends
PERSONAL DATA - SEX*
WHAT STUDENT DOESAT LIBRARY
38.1
14.3 15.614.8 16.7
14.810.2
NE0 IE 7.1
40.6
23.8
Study and *Check Out Look Thru Meet and **None ofRead for Books Magazines Talk to TheseSchool and Books Friends
3.90.0
No Data

differences in "going out" patterns were found between the
two ethnic groupings nor between the attendance groupings.
Only 9.4% of the males at Valley High School
spend their money on clothing for themselves while 35.7% of
the females do. Of the males, 23.4% indicate that they
spend their money to repair and operate cars and motorcycles,
as compared with 4.8% of the females. Twenty percent of
the Mexican-American population indicate that they spend
their money on "records, magazines and stuff," while only
7.8% of the Anglos spend their money in this fashion. This
difference between ethnic groupings is significant at the
0.5 level.
In the total Valley High School population,
52.9% have been arrested; 31.3% have never been, and 6.8%
did not answer. A significant difference was found between
the percentage of males (26.6%) and females (45.2%) who
state they have never been arrested. Data show that Group B
(those who attend 50% of the time or less) have been arrested
significantly more often for disturbing the peace or curfew
violation than either Group A (those who attend 50% of the
time or more), or Group C (those who were referred to Valley
High School, but have not attended at all).
If in personal trouble, 23.4% of the males at
Valley High School indicate that they would go to "no one"
for help; 4.8% of the females answered similarly. In the
total student population, 41.5% indicated that in case of
93

personal trouble they would consult their parents; 19.9%
would consult friends; and, 18.2% would consult no one. A
significantly greater percentage of females stated that
they would seek their parents' help.
Answers to ques:ions #5, 6, 7, 9,, 11, 12, 14,
and 19 on the Sociological Questionnaire were used to measure
the students' attitudes and feelings towards school, and
more particularly, towards Valley High School. (See Figures
30 - 37, and Table XV, 1, infra.)
Of the total population at Valley High School,
the percentage of students who indicate that they plan to
stay at Valley High until they return to regular school is
almost equal to the percentage planning to stay at Valley
until graduation. A significantly greater proportion of the
Mexican-American students as compared to Anglo students have
expressed preference for staying at Valley High until gradu-
ation. Significantly more females than males intend to
remain at Valley High until graduation; and a greater number
of males indicated a preference for staying at Valley High
only until they could return to regular school. According to
attendance groupings, Group A expressed a preference for
remaining at Valley High until graduation, while Group B
expressed a preference for a return to regular school.
Of the total population, 39.8% feel that there
is "no chance" of their dropping out of school before gradua-
tion. Attendance Group B more frequently expressed the
94

1
Figure 30
(a)100
80
60
40
20us"
SOCIOLOGICAL QUESTIONNAIRE
STUDENT ATTITUDES TOWARD SCHOOL
TOTAL POPULATION N = 172
SCHOOL WORKBEFORE V.H.S.
(C)
100
80
60
40
20
0
(b)100
80
60
40
20
GRADE AVERAGETHIS YEAR
O
.1..
.1.. c.) 0 V. a.1..al o tO .1.. .1.. .1.. a0 = = = ri 3 0
1Z Roo e o
1..o o
A0.0 0
.0 C 00 C 00 bg Z 4 4 4 4 0 bC Z
TROUBLE WITHSCHOOL WORK
otrl
CqN
d r O.". A or0O 2
0 C 1.Im ig II. 0 16. a = e0 0 ... 0 ON 200 A LI O U 4, 4. .0 0 S 0 0 Z : 0
E I ... E 1 0 20 h. 2 e 00 g 0 C 0 a Z
0) im al 4 4 8 uc 1- x I- Z Z 0 0 I-o C
(d)100
TIME SPENT ONHOMEWORK PER EVENING**
80
60
40
20qt. Pt
ulq
eac... co* 1... ...
0 MIMI
*See Fig. 35b for ethnic sub group comparison, infra.
**See Fig. 36c for attendance sub group comparison, infra.
220sI-N
to q0is
Zo>

Figure 31 SOCIOLOGICAL QUESTIONNAIRE
STUDENT ATTITUDES TOWARD SCHOOL
TOTAL POPULATION N = 172
(a) (b)100, 100,
WHAT STUDENT LIKESBEST ABOUT V.H.S.*
20,
0
22.7 22.2
15.911.9
25.6
80,z0r--
60,2ibe
40,
20,
42.6
17.6
SUBJECTS OF VALUETO STUDENT**
19.6
12.56.6
1.7 0.6
141
1.1 a a.1g 32 a (n
(C) (d)100, 100,
WHAT WOULD IMPROVEV.H.S.***
80,0
a. 60,20P. 40,
42.0
34.1
80,
60
06- 40,
20, 20,
eC
9.14.5 5.1 5.1
0
gre 0EiNU
lM.
gec.)
aa
25.6
z z
STUDENT ATTITUDETOWARD MORE COUNSELLING****
13.615.9
1.1
seEz it; ust
X c 321 ego202 mew
aSee Fig. 34c for comparison by sex,, Fig. 35c for ethnic subgroup comparison; infra.4 S e Fig. 36d for attendance subgroup comparison, infra.
***See Fig. 35d for ethnic subgroup comparison, infra.
** **Sea Fig. 37a for attendance subgroup comparison, infra.
31.8
11.9
zz 0
00 0

Figure 32 SOCIOLOGICAL QUESTIONNAIRE
STUDENT ATTITUDES TOWARD SCHOOL - 4TOTAL POPULATION-N = 172
100.,DOES V.M.S. HELPTHE STUDENT?*
90
80 ,
70
60 ,
50 ,
40
30
22.2
20 , 19.9
17.015.9
10 -
0Very Quite W/Lots of Not at AllMuch A Lot Chants
15.3
9.7
None Apply NoData
*See Fig. 37b for attendance subgroup comparison, infra.

Figure 33 SOCIOLOGICAL QUESTIONNAIRE
0
06" 40,
5a.
(a)100
80,
60,
20,
31.335.2
STUDENT ATTITUDES TOWARD SCHOOL
TOTAL POP.= 172
PLANS TO STAYAT V.H.S.*
9.76.8
2ro 3
ZEia
SMASce
15.3
1.7
0
z
WHY STUDENT SHOULDFINISH HIGH SCHOOL***
35.8
14.811.4 11.4
0O
5.1
C eg
wy c
3a0
*See Fig. 34a for sex subgroup comparison; Fig. 35a for ethnic subgroupcomparison, infra.
**See Fig. 36a for attendance subgroup comparison, infra.
(b)100,
800
5 60,
0
W 40,
20,11.9
(d)100,
80,
60,
40,
20,
u
44.3
***See Fig. 34b
****See Fig. 36b
CHANCE OF BECOMINGHIGH SCHOOL DROPOUT"
13.1
39.8
18.214.2
2
SCHOOL WORK AT V.H.S.COMPARED TO WORK ATPREVIOUS HIGH SCHOOL****
30.7
9.112.5
2.8
2.8
0O
0.6
8
for sex subgroup comparison, infra.
for attendance subgroup comparison, infra.
elveR00

Figure 34 SOCIOLOGICAL QUESTIONNAIRE
STUDENT ATTITUDES TOWARD SCHOOL SEX*
(a)100,,
80,z0
60,
OZ 40,
20,r
PLANS TO STAYAT V.H.S.
C! gir
qt. 0 wI
0 0.4r1
P40 MEI01 qel
co0 d
5 E....1 i2 a isis c A- t I _ .,0 .
3 ] 3 a I r. E w7. 4., I : a=
e , goo a E : e i g o2 0 2 p. 2 0 Z**
O
(b) (c)100, 100,WHY STUDENT SHOULD
FINISH HIGH SCHOOL
z0
2 60,2a.
N
In
at
80,zO
S' 60,2O
40,
a.
20,
0 0I. C
tlo
1 1 i Z e R wS 2 .V. LT. : 4 m o maz I e o =Y$... 12 e 6 0aII 0To I. o = oZ i A i a O. 2 0 Z I- ZO.206.
* *
*These items show responses which differ at or beyondthe .05 level of significance for the two groups:
Male. N=128; and Female, N=42.
WHAT STUDENT LIKESBEST ABOUT V.H.S.
*.01 level
**.05 level
en
O1
C ico a
C.-on on o .1.1on IN.
N = .2 : Sin u e 0In 6n B M o = ou 3 2N Z I, Z
O

*Sho
p an
dP
ract
ice
Con
trac
tS
yste
m
Cla
ss3.
Zi
Dis
cuss
ion
7 7
PM
ovie
sZ
71-
and
II s
2S
lides
oO? *
7I
O. r
i;
moo
0
7, 3
A 310
lb Zg.
rn..
2/0 F Z
II!
0. O er 0 7 0.
Non
e of
The
se
No
Dat
a
Mor
ning
Cla
sses
Phy
sica
lE
duca
tion
Sm
alle
rC
lass
es
Mor
eC
ouns
ellin
g
Non
e of
The
se
**N
o D
ata
PE
RC
EN
T O
F P
OP
ULA
TIO
N
2.3
0.0
OO
00
18.8 25
.0
18.0
12.5
23.4
PE
RC
EN
T O
F P
OP
ULA
TIO
N
.16
cs0
00
00
0.
.
4.7
4.4 5.5
2.2 6.
3
0.4
9.4
8.9
44.5
35.6
29.7
1111
1111
1 48
9
II 0 C O PI
*Unt
ilG
radu
atio
n
Unt
il R
etur
nT
o R
egul
arS
choo
l
Unt
il 18
Yea
rs O
ld
Unt
il I
Get
a J
ob
Non
e of
The
se
No
Dat
a
Wel
l
Abo
utA
vera
ge
B e
low
Ave
rage
Poo
rly
Do
Not
Kno
w
No
Dat
a
PE
RC
EN
T O
F P
OP
ULA
TIO
N
a.0
00
0
11 4
4 8
39.1
6.3
al -4 5 2
8.9
in-4
9.4
rnC
O/
31.
zC
-I17
.2
corn
PE
RC
EN
T O
F P
OP
ULA
TIO
N
116
06 0C
D 0iS
oo
0.
0.0
OU
) 825
.0.- rn
28.9
'11
C.)
PI
31.1
00 1-
0.8
0.0
34.4
5 I0 Nf
jc2
C m W

Figure 36 SOCIOLOGICAL QUESTIONNAIRE
STUDENT ATTITUDES TOWARD SCHOOL- ATTENDANCE*
(a) (b)100, 100
CHANCE OF BECOMINGHIGH SCHOOL DROPOUT
80,
60
40,
20,
0
so
M "4 M"4r
g-
N
Nen
N
1 0 00g0u 0 0
0s. 411
e u -I u u A Isb c* c
a 0.c o .e 0 .e .e .01 ot..) W.) o I.) Z I.) Z Z
80,
SCHOOL WORK AT V.H.S.COMPARED TO WORK ATPREVIOUS HIGH SCHOOL
20,
0N
Ipin r'a 0
<CO
(C) (d)100, 100,
HOMEWORK PER EVENING
.33
aa
TIME SPENT ON
.1 3
80, 80,
Lel60 or% 60,
0/40, = 40, ig
(4cri
SUBJECTS OF VALUETO STUDENT
r4
r%
gt cp%
0 IMENI=111111M1016.11.1.
O..
VS
q20, 4
0If) in ,4z
r2:
q0
20,
~ NlaO oO ZZ ... 0*
N§
N 0
*These items show responses which differ at or beyondthe .05 level of significance for the two groups:
A , N = 87; and B , N= 73
*.01 level
**.05 level
A
0

Figure 37 SOCIOLOGICAL QUESTIONNAIRE
STUDENT ATTITUDES TOWARD SCHOOL-ATTENDANCE*
(a)
(b)
100
90 j
80 .
70 .
60.
50.
0.
30,. 28.7
20, 20.5 19.2
10 9.2
STUDENT ATTITUDETOWARD MORECOUNSELLING
10.3
20.5
36.8
28.8
13.8
9.6
Le
1.1 1.4
0
EstiO 4 a ..111:41
fi Ma3 f 3.11 41 i!! ze on.a 1 28m 88 z 0
100.
*4)
DOES V.H.S. HELPTHE STUDENT?
90.
80
70,,
60.
50.
40.
31.030
20.523.3
20.15.1 17.21 16.4 17.2
10.313.8
10.3 9.6mmem
0 :g'S fta l.0 4.1 0 C 11l 0= I I
g2 &Z id I z aom4,.
*These items show responses which differed at orbeyond the .05 level of significance for the twoattendance groups: A, N=87; and 8, N=73.

opinion of "very little chance" than did attendance Group A.
The differences between the groups was found to be significant
at the .05 level. No other significant differences were
found.
One-half of the students at Valley High feel
they should finish high school in order to get a job or to
find a better job. While an equal percentage of Anglo and
Mexican-Americans feel they should finish high school to
find a better job, a slightly higher percentage of the
Mexican-American students felt that it was important to
finish in order to find a job. The differences between
male and female attitudes towards finishing high school are
more pronounced. A significantly greater percentage of males
than females feel that finishing school will aid them in find-
ing a better job. A significantly greater percentage of
females indicate that they feel they should finish because
their parents want them to graduate.
Three-fourths of the students feel that they are
doing "much better" or a "little better" in their school work
since they have been at Valley High School. This feeling is
expressed equally by males and females, and by Mexican-
American and Anglo students. Members of Group B, however,
have indicated that there has been "no change" in their work.
Of the total population at Valley, 59.7% felt
that they were doing below average or poor school work before
entering Valley High School. A significant difference in such
feelings was found between the Anglo and Mexican-American
103

group; 34.4% of the Anglos reported poor school work prior
to referral to Valley High, as compared with 17.8% of the
Mexican-Americans.
About 40% of the population expected to earn
a grade of "C" for their work at Valley High during the past
year. Almost 18% expect an "A" or "B," and slightly more
than 15% expect a "D." Three-quarters of the students feel
that they have done passing work during this last year at
Valley High School. No differences were found in grade
expectations between ethnic, sex, or attendance groupings.
Approximately one-half of the tested students
feel that they have some trouble with school work but that
they can do it. More boys than girls feel that they had no
trouble at all and that the work was easy. In the Mexican-
American population, 22.2% expressed the belief that they
would earn a "D" grade, as compared with 13.3% of the Anglo
students who stated that they expected a "D."
Assigned homework is not regularly a part of the
Valley High School procedure and therefore it is not surpris-
ing that 61.4% of the total population indicates that it
spends "no time" doing homework. Attendance Group B, however,
indicated that they study, exclusive of school time, one hour
or less per day.
In their assessment of Valley High School, over
one-half of the students expressed feelings that most or all
of the subjects taught at Valley High were of value to them;
104

22.7% expressed a preference for shop and practice classes.
The Mexican-American students expressed a significantly
greater preference here than did the Anglos. In the male/
female comparison, it was found that shop and practice class
preference expressed by males was expectably greater than
than expressed by the female students.
Valley High School awards one unit for three
contracts of school work. Fifteen contracts are then equal
to five units, which is the usual award for one semester's
work in a specified subject. Of the total test population,
22.2% indicated that they like the contract system better than
other teaching methods they have experienced. A greater
proportion of Anglo students indicated that they liked the
contract system than did the Mexican-American students.
Females prefer this system to all others mentioned.
When asked whether morning classes, physical
education, smaller classes, or more counseling, would improve
Valley High School, 42% of the students chose morning classes.
(At present, Valley High School holds classes from 1.00 P.M.
until 5:00 P.M.) Although no significant differences were
found when these data were analyzed according to the three
sub-groupings (sex, attendance, and ethnic groups), more
Anglos chose the morning classes than did the Mexican-Ameri-
cans--as did more males than females, and more members of
Group B than Group A.
105

Answers to the question, "Do you think continua-
tion school helps students?" indicate that Attendance Group A
feels that they are helped "very much," as compared with
Attendance Group B, who indicated that the school would help
if "it had lots of changes." The predominant Anglo response
was that "it helped quite a lot," as compared with the
Mexican-American response of "if it had lots of changes."
No observable differences were found between male and female
responses to all possible choices.
Answers to questions #21, 22, 24, 27, 31, 32,
33, 36, and 38 on the SOC were used to measure the students'
attitudes toward work and their future plans. (See Figures
38 - 43, and Table XV, 1, infra.)
Analysis of data indicating future schooling
plans reveals that almost one-half of the students at Valley
High School intend to complete high school.
equal number plan further schooling, e.g.,
An approximately
trade school,
junior college, or a four-year college. More females than
males express plans for completing high school, as well as
for attending a four-year college. Within the ethnic distri-
bution, slightly more Mexican-Americans than Anglos plan to
attend trade or technical schools. A slightly larger percent-
age of Anglos indicate plans for four-year college.
The majority of males at Valley High expect
either to be drafted, or to enlist, or to join the reserves.
Slightly more than 16% indicate that they intend to stay out
106

11
Figure 38 SOCIOLOGICAL QUESTIONNAIRE
,..MA
STUDENT PLANS FOR FUTURE WORK AND EDUCATION
TOTAL POPULATION N = 172
(a) (b)100 100,
SCHOOLING STUDENTPLANS TO COMPLETE
80
60
40
20
0
41.5
16.519.3
8.5
80
60
40
20 22.2
29.0
STUDENT PLANS FORMILITARY SERVICE*
25.6
11.99.7 9.14.5
2.3
V '00 2 - w 1 ft I a 1..1 to
w ....
Z C 0 1 6 NO41/ t 0 V0 . w e . Is a u Cyr t, w 4,,0 .0 Z 0 0 6 e
It I- tfi -,..: .1. (..)): 1 Z 1-
COZ
Z oO 6...
COw
laZ , iti .
cf)«.es
Z I-,
e v0 aZ (30 ii1°42
" V '5
(c)100
80,
STUDENT PLANS FORA JOB AFTER HIGHSCHOOL* *
60
4028.4 29.5
20 21.0
11.4
0)% . .10
00 1 6 6 0C . 0_V C 0 I C 0 .1
C 6 a. 1.ID .... 2 CoY 7t. o a, C O. t iI fZ ra g z i ...1
a 0 .6' 0
5.1
O6 0C C0Z
4.5
z
80
60
40
Cl) 3 z
45.5
SUBJECTS STUDENT WANTSTO LEARN MORE ABOUT
10.8
25.0
5.7
See Fig. 41a for sex subgroup comparison; Fig. 43a for attendancesubgroup comparison, infra.
**See Fig. 42 for ethnic subgroup comparison, infra.
OY yVjC0Z

Figure 39 SOCIOLOGICAL QUESTIONNAIRE
(a)100
80,0
66.5
60,20'i 40,
20,
STUDENT PLANS FOR FUTURE WORK AND EDUCATION
TOTAL POPULATION N = 172
IF STUDENT WOWS,HOURS PER WEEK*
(b)100
80,
..14 60,
0440,
20,11.9 12.5 10.8
TYPE OF JOB HELDBY STUDENT**
w 6.3 5.13.4 6.8
6.8 3.40 '0
zintAi
c cc i c ;5,
to
^ 0 e w E E toi il :$ .1 3 g 6....os_a E -I i ! 3 I z2 0
. o -a 2 E 0 d. ce 6IP4 0 2 o, to to o z
(c) (d)100 100,
EXPECTED HOURLYWAGE***
80,
60,
40,
20,
0
26.7 27.8
19.8 21.0
80,
60,
40,
20,
29.5
MN
u s m
54.0
0I1
z A
AREA WHERE STUDENTEXPECTS TO WORK****
52.8
12.5
0O
4.0 2.36.3
2.36.80.6
t 6de IA .th ft to .5 S e4. c 0 C 13i0
'12 0 e mi "'8 8.0t4
8.004
.-A: b.
.11a.4.40 z
O
O0zO
Z s1 t o. a
E gi0 ...
la 4
....O sow e Z ...
c se xe00Z
*See Fig. 41b for sex subgroup comparison, infra. ***See Fig. 41c for sex subgroup comparison, infra.
**See Fig. 43b for attendance subgroup comparison, infra. ****See Fig. 43a for attendance subgroup comparison, infra.

1
it
Figure 40 SOCIOLOGICAL QUESTIONNAIRE
STUDENT PLANS FOR FUTURE WORK AND EDUCATION
TOTAL POP. N = 172
100
90
80
70
60 p
50 0,
40
30
20 1,
10
0
7.4
0.6
STUDENT ESTIMATEOF WAGES REQUIREDTO SUPPORT A FAMILYOF FOUR
37.5 35.2
15.9
$1.00 per $2.00 per 3.00 p.r At Least No IdeaHour Hour Hour $5.00 per
Hour
See Fig. 41d for sex subgroup comparison, infra.
3.4
NoData

11
Figure 41 SOCIOLOGICAL QUESTIONNAIRE
STUDENT PLANS FOR FUTURE WORK AND EDUCATION SEX°
(a) (b)100. 100.
5c,i0
80. 80.zo 0
o 60. 60.E
6. IP
g 40. R = 40.al
. I.5a.
20. 2 20 p 111: we
r4./.
01 woel .... c) in f.
2.4 q NM I"; owww*1101 to 14` v aq IA
0 0° 0 OwimmitcLim=iimilo.ctm (.I '''
STUDENT PLANS FORMILITARY SERVICE
r.
IF STUDENT WORKS,HOURS PER WEEK
IIn F
EXPECTED HOURLYWAGE
N
in0;
N
N
IIMMIIMIN
C cia! eC iss h 2il 0
.E-ii 0 z x a
3 ... o`& 1°.-N agg 51t
t -z0.
(d)100.
80
60
40.
20.
74
0
STUDENT ESTIMATEOF WAGES REQUIREDTO SUPPORT A FAMILYOF FOUR
In
3
14:401.4
N"0m QO
. II & 1 18 8 8 .18 1 aA 0.
St $N3 83 .38..4 c4 pi 4.6 o .4N4.,°
in ocuo Z I 2"Z.D.lz .4 z ,ri a.
*These items show responses which differ at or beyond the 0.5 4%01 levellevel of significance for the two gi oups: MALE, N = 128; and FEMALE, N= 42.
level
o

Figure 42 SOCIOLOGICAL QUESTIONNAIRE
STUDENT PLANS FOR FUTURE WORK AND EDUCATION - ETHNIC*
100
90
80
70
60
50 ,
40
Have notThoughtNo Plans
STUDENT PLANS FORA JOB AFTER HIGHSCHOOL
29.728.9
21.1 22.2
13.3
6.7
2.24.7
3.9 4.4
Like Many Want Par- **Too Early None of NoThings ticular Job to Decide These DataNo Plans
*These items show responses which differed at or beyondthe .05 level of significance for the two groups:ANGLO, N=128; and MEXICANAMERICAN, N=45.
*0.05 level

Diff
eren
tLi
ttle
Jobs
Ser
vice
Sta
tion
or G
arag
eM
echa
nic
Coo
k, W
aitr
ess
Wai
ter,
Bus
Boy
Cle
rk,
Typ
ist,
Rec
eptio
nist
Bus
. Mac
h.
*La
Pue
nte
or In
dust
ry
Pom
ona/
Riv
ersi
de
Eas
t Los
Ang
eles
Dow
ney,
Bel
lflow
er
Non
e of
The
se
No
Dat
a
PE
RC
EN
T O
F P
OP
ULA
TIO
N
11.3
1cr
.co
aO
00
00
17.8
16.4
1111
1111
63 2
1452
PE
RC
EN
T O
F P
OP
ULA
TIO
N
Ai
16cr
.co
50
00
00
0
3.4
lio 1
0.3
1.4 2.3
2.7
9.2
4.1
23.0
37.0
-51
.7 54.8
m >
1:1
rnR
I
W 0 ..e r
n
0 I
XI C X 0 R
t
**B
e D
rafte
d
Enl
ist
Join
Res
erve
s
Sta
y O
ut
Non
e of
The
se
No
Dat
a
PE
RC
EN
T O
F P
OP
ULA
TIO
N
11.3
016cr 0.
0co0
000
16.1
1.1
2.7
9.6
131
.5
29.9
27.4
in 2
7.6
11.5
8.2
20.5

of the military. A comparison of Attendance Group A and B
indicates that a significantly greater proportion of Group B
expects to be drafted. More members of Group A expect to
enlist, although this difference between groups was not
statistically significant. More Mexican-American students
expect to be drafted, and more Anglos indicate a preference
for enlisting.
In response to a question regarding job plans
after schooling has been completed, over one-half of the
student body indicated that they had no particular plans,
or felt that it was too early to decide. Analysis reveals
that significantly more Anglos feel this way than do Mexican-
Americans. Approximately one-quarter of the students indicate
that they want a particular job and are taking steps to get
it.
The majority of the students at Valley High
School stated that they were not working at the time of the
testing. Of those who were working, a significantly higher
percentage of males than females were employed. More of
the employed males than females worked thirty hours or more
per week. More members of Group B than Group A were employed
and were working thirty hours a week or more. The difference
between groups, however, was not significant.
The answers concerning types of jobs held shows
the largest percentage, 12.5%, holding "different little
jobs." Other job categories were "service station, garage,
113

or mechanic," 10.8%; "cook, waiter, waitress, busboy," 6.8%;
and "clerk, typist, receptionist and business machines," 3.4%.
No Mexican-American students held jobs in the last category
as compared with 4.7% of the Anglos who did.
Hourly salary expectations expressed by the
students range from $2.00 per hour to $5.00 per hour, with
one-fifth of the students indicating that they would not know
how much to expect. A significant number of girls as compared
with boys expect to make $2.00 per hour at work they would
like to do. A larger percentage of boys express $5.00 per
hour expectations. There was no pronounced difference in
salary expectations between Anglos and Mexican-Americans,
nor between Attendance Groups A and B.
Three-fourths of the students felt that it would
be necessary to earn between $3.00 per hour ($120.00 per week)
and $5.00 per hour ($200.00 per week) in order to support
a family of four. Comparisons of male and female attitudes
on this question yielded two significant findings: more
girls felt that a family of four would need only an $80.00
per week income ($2.00 per hour); and, more males felt that
a $200.00 per week ($5.00 per hour) was a more accurate
estimate. No significant differences between ethnic or
attendance groups were found.
Within the total population, one-half of the
students felt that they would not be working,in La Puente or
the surrounding area. Of the remaining half, over one-quarter
114

,f4i,
felt that they would be working in La Puente or the City of
Industry, with the remaining fraction working in Pomona,
Riverside, Downey, and Bellflower areas. More Anglos indi-
cated that they thought they would be working in the Downey-
Bellflower areas than did Mexican-Americans. More females
felt they would be working in the La Puente area as compared
to males; and more males thought they would be working in
the East Los Angeles area. Attendance Group B indicated
greater expectations of working in the La Puente area as
compared to Group A. More of Group A, however, felt that
they would be working in the Pomona-Riverside, East Los
Angeles, and Downey-Bellflower areas.
2. MeaningoS Words Inventory (MOWI)
The MOWI was designed to identify preconcious
attitudes of Valley High School students. In order to do
this, the MOWI utilizes the semantic differential process
which taps a generalized measure of attitude, and estimates
the way a person perceives himself in his environment.
The semantic differential process involves no
directly observable right or wrong answers. Responses are
made according to the way a subject feels about a particular
concept. Such an approach helps to eliminate biased response
patterns, and to tap evaluative feelings which exist at the
preconscious level.
115

The MOWI as adapted to Project needs was short
and easy to administer individually and in groups; and mini-
mum reading skills were required of the students. The test
was made bi-lingual to accomodate the Mexican-American popu-
lation at Valley High School. In addition, the MOWI was
used previously and validated in the Los Angeles County
School District. (Strem, 1966, see Table I, infra.)
For ease of reporting, the evaluative statements
made by the students of Valley High School have been grouped
into eight categories: (1) Instruction and Curriculum,
(2) Self-Concept, (3) Authority Relations, (4) Goal Orienta-
tion, (5) Moral and Social, (6) Peer Relations, (7) Family
Relations,. and (8) Adults. (See Figures 44 - 47, and Table
XVII, 1, infra.)
(a) Instruction and Curriculum
In this grouping, the stimulus items pre-
sented were: "regular high school," "teachers," "continua-
tion school," and, "high school counselor." Evaluation of
each item was made five times on the basis of a continuum
ranging from: sour to sweet; fair to unfair; bad to good;
honest to dishonest; and, pleasant to unpleasant. (See
Table XVII, 1, infra.) The most positive score for any
variable, e.g., regular high school, was plus fifteen. Such
a score would indicate a very "sweet," "fair," "good,"
"honest," and "pleasant" attitude toward regular high school
The most negative score was minus fifteen. Zero score was
116

Fig
ure
44
15 14 13 12 11 10 9 8 7 6+
5.3
5 4 3 2+
1.0
1
Mea
nS
core
1 21.
53 4 5 6 7 8 9 10 11 12 13 14 15
Clu
ster
Inst
ruct
ion
and
Sel
f-C
once
ptA
utho
rity
Rel
atio
nsC
urric
ulum
Item
s(1
, 8, 1
5, 2
2)(2
, 9, 1
3, 1
6)23
, 28
MO
W! C
LUS
TE
R A
NA
LYS
IS
TO
TA
L P
OP
ULA
TIO
NN
= 1
73
+6.
9+
6.9
+5.
2
Poi
nt o
f Ind
iffer
ence
+4.
0
+1.
7
Goa
lM
oral
Pee
rF
amily
Adu
ltO
rient
atio
nan
d S
ocia
lR
elat
ions
Rel
atio
nsR
elat
ions
Val
ues
(1, 3
, 8, 1
0, 1
8)(4
. 11,
17,
19,
24)
(6, 1
1 13
17)
(5, 1
2 25
, 28,
29)
(19,
20,
26,
30)
(7, 1
4, 2
1, 2
7)(5
. 8, 1
8, 2
2)

Fig
ure
4515 14 13 12 11
Mea
nS
core
10 8 7 6 5 4 3 2 1 0 1 2 3 4 5 6 7 8 9 10 11 12 13
+7.
3
MO
W! C
LUS
TE
R A
NA
LYS
IS B
Y S
EX
+8.
6
+6.
5
+4.
5
+2.
8
+0.
3
14 15C
lust
erIn
stru
ctio
nan
dC
urric
ulum
Item
s(1
, 8, 1
5, 2
2)
Sel
f-C
once
pt
(2, 9
, 13.
16)
23, 2
8
1.9
Aut
horit
yR
elat
ions
+62
+6.
2
+4.
7
Poi
nt o
f Ind
iffer
ence
Goa
lO
rient
atio
n
(1, 3
, 8, 1
0, 1
8)(4
, 11,
17.
19,
24)
KE
Y
Mal
e N
=12
6
Fem
ale
N=
47
I+
3.2
+7.
8
+6.
5
+3.
6
Mor
alP
eer
Fam
i!rA
dult
and
Soc
ial
Rel
atio
nsR
elat
ions
Rel
atio
nsV
alue
s
(6, 1
1 13
17)
(5, 1
2 25
, 28,
29)
(19,
20,
26.
30)
(7, 1
4, 2
1, 2
7)(5
. 8. 1
8, 2
2)

Fig
ure
46M
OW
! CLU
ST
ER
AN
ALY
SIS
BY
ET
HN
IC G
RO
UP
15 14 13 12 11 10 9
Mea
nS
core
8 7 6 5 4 3 2+
1.5
+5.
7
+ 7
.1
+ 6
.1+
5.4
+4.
3+
4.3
Poi
nt o
f Ind
iffer
ence
+3.
7
+3.
4
1 0 1 2 3 4 5 6 7 8 9 10 11 12 13 14 15
an
0.6
1.0
3.2
KE
Y
Ang
los
N=
125
Mex
ican
- N
=45
Am
eric
ans
+6.
8
+5.
5a
+5.
8
+2.
1
Clu
ster
Inst
ruct
ion
Sel
f-A
utho
rity
Goa
lM
oral
Pee
rF
amily
Adu
ltan
dC
once
ptR
elat
ions
Orie
ntat
ion
and
Soc
ial
Rel
atio
nsR
elat
ions
Rel
atio
nsC
urric
ulum
Val
ues
Item
s(1
, 8, 1
5, 2
2)(2
, 9, 1
3, 1
6)23
, 28
(1, 3
, 8. 1
0, 1
8)(4
, 11,
17.
19,
24)
(6, 1
1 13
17)
(5, 1
2 25
, 28,
29)
(19,
20.
26,
30)
(7, 1
4, 2
1, 2
7)(5
, 8, 1
8, 2
2)

Fig
ure
4715 14 13 12 11 10 9 8 7 6 5 4 3 2 1 0 1
Mea
nS
core
4 5 6 7 8 9 10 11 12 13 14 15C
lust
erIn
stru
ctio
nan
dC
urric
ulum
+3.
2
+1.
5
+0.
1
Item
s(1
, 8, 1
5, 2
2)
MO
W! C
LUS
TE
R A
NA
LYS
IS B
Y A
TT
EN
DA
NC
EG
RO
UP
+5.
2+
5.6
+7.
0+
7.5
MIS
+6.
1+
6.7
UM
WM
EM
+5.
1M
1+
4.3
+5.
1+
5.0
:my:
yr-s
nore
,+
3.8
+3
III
0.0
Poi
ntIn
diffe
renc
eof
-1.1
-2.3
Sel
f-A
utho
rity
Goa
lM
oral
Pee
rC
once
ptR
elat
ions
Orie
ntat
ion
and
Soc
ial
Rel
atio
nsV
alue
s
(2. 9
, 13,
16)
23, 2
8(1
. 3, 8
. 10,
18)
(4. 1
1. 1
7. 1
9. 2
4)
KE
Y
Gro
up A
N=
84
Gro
up B
N=
73
N=
16so
lo ia
s G
roup
C
+6.
9
+6.
5
+24
+2.
1
+1.
2
(6. 1
1 13
17)
(5. 1
2 25
. 28.
29)
(19.
20.
26.
30)
Fam
ilyA
dult
Rel
atio
nsR
elat
ions
(7. 1
4. 2
1. 2
7)(5
. 8, 1
8, 2
2)

designated as the point of indifference or of no evaluation.
Total population means were computed for each variable within
each grouping.
Variables
Regular High SchoolTeachersContinuation SchoolHigh School Counselors
Total Population Mean
Negative 3.0Positive 1.2Positive 3.0Positive 2.6
Indications are that the Valley High
student tends to a slightly positive evaluation of Valley
High, his high school counselors and teachers. He expresses
a slightly negative attitude towards regular high school.
(b) Self-Concept
Stimulus items presented were: "me,"
"school abilities," "trying hard," "how I would like to be,"
"how my class sees me," and, "my best friends."
Variables
MeSchool AbilitiesTrying HardHow Class Sees MeBest FriendsHow I'd Like to Be
Total Population Mean
Positive 4.8Positive 4.2Positive 4.4Positive 3.1Positive 7.2Positive 8.3
Responses to self-concept items show a
fairly positive attitude towards the self on the part of
Valley High School students. The variable "How I'd Like to
Be" indicates, however, a strong desire to change in the
direction of more social acceptability.
121
11

(c) Authority
Variables
AuthorityTeachersRegular High SchoolPunishmentGrownups
Total _population Mean
Negative 0.8Positive 1.2Negative 3.0Negative 5.5Positive 0.5
A negative attitude towards authority and
punishment is apparent. The other variables were included
since there is some correlation between them and authority.
(See Table XVII, 8, infra.) In general, the students at
Valley have negative feelings regarding authority or those
elements which, in their minds, are representative of
authority.
(d) Goal Orientation
Variables
Trying HardQuitting SchoolGraduatingMy FutureCollegeA Job
Total Population Mean
Positive 4.4Negative 5.3Positive 9.8Positive 7.2Positive 4.2Positive 8.1
The data indicated that the students at
Valley High School have positive attitudes towards those items
representing goal orientation.
ting school is "bad."
The students feel that quit-
They also hold positive attitudes
towards trying hard, graduating, the future, college and a
job.
122

11
(e) Moral and Social
Variables
CheatingSmokingDatingGraduatingTrying HardJobQuitting SchoolNeighbors
Total Population Mean
Negative 6.5Positive 3.8Positive 10.3Positive 9.8Positive 4.4Positive 8.1Negative 5.3
Indifference 0.0
Moral and social values can be conceived of
as attitude-value systems which predispose an individual to-
wards certain feelings or behaviors. In a sense, they en-
compass a concept of "right" and "wrong" for the individual.
Students at Valley High feel that cheating is "wrong," as is
quitting school. For them, smoking, dating, graduating,
trying hard and a job are "right." Within the social context,
however, they express "indifference" to neighbors.
(f) Peer Relations
Variables
Best FriendsMost PeopleClassmatesMexican-AmericansAnglos
Total Population Mean
Positive 7.2Positive 2.6Positive 7.2Positive 4.8Positive 2.8
The Valley High student reports "good"
feelings towards his peers, irrespective of ethnic origin. He
feels strongly positive towards his best friends and towards
his classmates.
123

(g) Family Relations
Variables
MotherFatherMy FamilyHome
Total Population Mean
Positive 9.6Positive 5.4Positive 6.7Positive 5.7
Feelings towards family, mother, father
and home were among the most positive expressed by students.
(h) Adults
Variables Total Population Mean
Grownups Positive 0.5Teachers Positive 1.2High School Counselors Positive 2.6Most People Positive 2.6Neighbors Indifference 0.0
While the students do not feel a strong
positive feeling towards adults, they do tend to regard them
more favorably than unfavorably.
3. MOWI and SOC: Aspirations
Six questions on the MOWI and eight questions on
the SOC were designated to measure the students' aspirations.
Those groupings on the MOWI from which the aspirational items
were drawn were compared with appropriate questions from the
SOC. For instance, grouping "B" on the MOWI encompasses
items relative to the students' self-concept, and 'grouping "A"
encompasses items relative to the students' goal orientation.
124

The relevant SOC questions are related to these groupings.
Aspirational information was thereby derived. The following
chart compares the responses to the two tests. (Chart on
next page.)
This data suggests that students at Valley High
School are attempting to fulfill some of the developmental
tasks of adolescence as defined by Havighurst, (1951). (See
Table I, infra.) An estimation of self-concept and identity-
discovery, insofar as school work is concerned, is provided
by those questions which measure "school abilities" and
"grade average this year." Plans for economic independence
are expressed in those items which indicate student interest
in jobs and in learning job skills. Plans for intellectual
growth are expressed in those items which indicate student
plans to continue schooling at least until graduation from
high school and in some cases, through trade school or
college. Marriage and family plans are also expressed, al-
though more frequently by females than males.
In general, students at Valley High are not
unlike students at most "regular" high schools in that they
hold aspirations for further schooling, for jobs and for
marriage. Like most male students at "regular" high schools,
those at Valley High are concerned with future military plans.
Approximately 50% of the female students at Valley High have
plans which include marriage in the next five years or less.
125

ATTITUDEMOWI ITEM
ATTITUDEMOWI
RESPONSE SOC ITEM SOC RESPONSE
#9 -School Abilities
63.6%Positive
#19-Grade aver-age this year?
57.9% GradesA, B, C.
#4 - 68.2% #27-How much 75% high school,College Positive schooling plans
to get?trade school,jr. college,college.
#19 - 67.1% #20-Dxop out 57% little orQuitting School Negative before grad-
uating?no chance.
#17 - 83.2% #34-Why finish 83.6% positiveGraduating Positive high school? reasons.
#11 - 86.1% #21-Plans for 29.5% wantJob Positive job? 21.0% like
many things buthave no partic-ular plans.
particularjob - makingplans.
#24 -My Future
#36-Learn moreabout?
45.5% jobskills
75.1% #20, 21, 341Positive 38, Military?
#18-How longafter highschool expectmarriage?
126
(see above)53.5% drafted,enlist, or joinreserves.
50.0% girlsonly: fiveor less years.

4. MOWI: Teachers
As part of their "in-service training" for the
Project's testing phase, teachers at Valley High were asked
to answer the MOWI (see Figure 48). Results and comparisons
with the students (on all variables) are as follows:
VARIABLES TEACHERS STUDENTS
Regular High School Positive 6.5 .... Negative 3.0Me Positive 8.5 .... Positive 4.8Authority Positive 4.7 .... Negative 0.8College Positive 7.9 .... Positive 4.2Most People Positive 7.1 .... Positive 2.4Cheating Negative 9.6 .... Negative 6.5Home Positive 7.6 .... Positive 5.7Teachers Positive 6.9 .... Positive 1.2My School Ability Positive 6.9 .... Positive 4.2Punishment Negative 3.5 .... Negative 5.5Job Positive 10.1 .... Positive 8.1Classmates Positive 7.7 .... Positive 2.6Trying Hard Positive 7.1 .... Positive 4.4Mother Positive 8.9 .... Positive 9.6Continuation School Positive 6.1 Positive 3.0How I'd Like to Be Positive 11.8 .... Positive 8.3Graduating Positive 11.0 .... Positive 9.8Grownups Positive 6.0 .... Positive 0.5Quitting School Negative 8.5 .... Negative 5.3Dating Positive 8.5 .... Positive 10.3Father Positive 9.8 .... Positive 5.4High School Counselor Positive 5.9 .... Positive 2.6How My Class Sees Me Positive 6.6 .... Positive 3.1My Future Positive 9.3 .... Positive 7.2Mexican-Americans Positive 7.4 .... Positive 4.8Smoking Negative 3.4 .... Positive 3.1My Family Positive 9.1 .... Positive 6.7Best Friends Positive 10.1 .... Positive 7.2Anglos Positive 4.7 .... Positive 2.8Neighbors Positive 7.8 .... Indiff. 0.0
The teachers indicate a more positive attitude
towards regular high school and towards authority than do
127

Fig
ure
48M
OW
! CLU
ST
ER
AN
ALY
SIS
OF
FA
CU
LTY
(N =
15)
Mea
nS
core
15 14 13 12 11 10 9 8 7 6 5 4 3 2 1 0 1 2 3 4 5 6 7 8 9 10 11 12 13 14 15C
lust
erIn
stru
ctio
nan
dC
urric
ulum
+8.
5
+6.
4
+9.
4
+4.
1
Item
s(1
, 8, 1
5, 2
2)
Sel
f-A
utho
rity
Con
cept
Rel
atio
ns
(2. 9
, 13,
16)
23. 2
8(1
, 3, 8
. 10,
18)
+8.
3
Poi
nt o
f Ind
iffer
ence
Goa
lO
rient
atio
n
+8.
9
+7.
4
+6.
5
Mor
alP
eer
Fam
ilyA
dult
and
Soc
ial
Rel
atio
nsR
elat
ions
Rel
atio
nsV
alue
s
(4. 1
1, 1
7. 1
9, 2
4)(6
. 11
13 1
7)(1
9. 2
0, 2
6. 3
0)(5
. 12
25, 2
8, 2
9)(7
, 14.
21.
27)
(5. 8
. 18,
22)

..40400
the students. Conversely, they tend to take a more negative
stand with regard to smoking than do the students. It is
noteworthy that when teacher and student responses are in
the same direction, in most instances the teachers respond
with more extreme scores (both positive and negative) than
do the students.
5. Instructional Preference Scale (IPS)
The Instructional Preference Scale (IPS) was
designed to ascertain what the students at Valley High School
like and dislike about their school experience. Variables
were checked by students on a five point scale: "strongly
like," "like," "indifferent," "dislike," and "strongly dis-
like." Seventy-six items were presented which covered methods
of teaching, types of classes, student role, student behavior,
school activities, and methods of discipline. (See Figure 49.)
Of the seventy-six items presented, seventeen were
chosen by the majority of students as "strongly like" or
"like."
ITEM
INDIFFERENT/DISLIKE/STRONGLY LIKE/ STRONGLY DISLIKE -LIKE - TOTAL TOTAL
Field. Trips 62 28
Films 74 18
Magazines 57 37
Filmstrips 58 34
Tapes and Recordings 52 40
Industrial Arts Class 58 33
129

ir I. I. I.Ill W s. 0 la le si ka W s. N W Ut N a to o 1- N W ui
Textbooks
Counselors
'Hid Trips r
Lettuces
Films
Pvpotback Beek%
CI wil0 students
Magasines
Filmstrips
Palish Classes .ww.
Ceotracts
Programmed Materials ww.
Teachers
Meth CI
Workbooks
CI w/30 students
Newspapers
Teaching Machines,
Libraries
Working By Yourself
Science Classes
Principals
Summer Scheel
Remedial Reading CI
Teaching Games
Tapes and Recordings
History Classes
T.V. Teaching
Claws w/40 Students www.
Industrial Arts Classes ww..
Tests and Quince
Business Classes
Writing Papers
Class Discussions
Speaking Before Class
Listening in Class
Doing Research
Working at Own Speed wwwo
Doing Reports
Homework
Taking Notes wwwwwwwww
Doing Prolects
Redoing Work
Help from Teachers eoespeeerreeessoorieeesre
Hew Rolls
School Sports -- *1
Teacher's Praise,
Advice from Teachers rfierzeittiv.:404.4pawatafoliks
Sr Counselors -
Suspension
Home Calls by Tooch. wwwwel
. .
maw rempeermionWelerierreee
leeeeosooseoesoore...._,.
wowrn,swotreceertet
osiowsneosieweeswerrow 4
9.10,,,,nWfliwiOneeserreirio71111111
OP.1.. : .
Milk.., a -. -- - )
'r .4
siises es*
:
40,4,04,64«..mi
001000001110000001148000000
School Dances
Clubs
Awards
Assemblies
Deed Grad«
Scheel Newspapers wwwwww,
Going into the Military
Teacher's Criticism
Swats
Scheel Plays
Parent Conforonces
School Sandsand Glee ClubsHigh School Diplomas ..w4
Detention
Going I. College
Nepali CLras
Student Govt.
Dressing the way you_want at school
Getting a Jib
Bad Grades
Smoking at Scheel
Going 10 Trade Scheel ww...4
Chewing Gum at School w,
Getting out if Seatw/o Permission
Eating In Class
Students DecidingWhat to Study
rnemsew.tntrimoreerwitoweelo
.41:4444...;.,40414114I.10
NON
I
sierseinseeestoeseeeseana
0.11001111110
ztO

m
ITEMSTRONGLY LIKE/LIKE - TOTAL
INDIFFERENT/DISLIKE/STRONGLY DISLIKE -
TOTAL
Class Discussions 54 39
Working at Own Speed 77 17
School Dances 51 42
Good Grades 72 21
High School Diploma 77 16
Dressing the Way YouWant at School 85 8
Getting a Job 77 15
Smoking at School 72 22
Chewing Gum at School 68 26
Getting Out of SeatWithout Permission 57 37
Eating in Class 56 36
Twelve items were chosen by the majority of
students as "strongly dislike" or Itlislike." These were:
ITEM
Classes with MoreThan 40 Students
INDIFFERENT/DISLIKE/STRONGLY LIKE/ STRONGLY DISLIKE -LIKE - TOTAL TOTAL
55 39
Speaking Beforethe Class 57 35
Tests and Quizzes 57 33
Doing Reports 58 35
Homework 65 28
Taking Notes 68 25
131

INDIFFERENT/DISLIKE/STRONGLY LIKE/ STRONGLY DISLIKE -
ITEM LIKE - TOTAL TOTAL
Home Calls by Teachers 69 25
Swats 78 14
Parent Conferences 67 27
Detention 68 25
Bad Grades 77 16
Summer School 65 29
Of the forty-eight remaining
as follows:
items, responses were distributed
ITEMSTRONGLY
LIKE LIKE INDIFFERENT DISLIKESTRONGLYDISLIKE
Textbooks 3 22 38 19 21
Counselors 5 32 28 11 14
Lectures 9. 16 18 6 9
Paperback Books 9 27 33 13 10
Classes withLess Than 10Students 13 19 32 17 10
English Classes 4 13 29 26 18
Contracts 12 28 20 16 16
ProgramkedMaterials 7 15 40 14 13
Teachers 8 41 28 5 11
132

ll
4,1
STRONGLYITEM LIKE LIKE INDIFFERENT DISLIKE
STRONGLYDISLIKE
Math Class 3 21 19 20 2.8
Workbooks 6 18 29 19 18
Classes With30 Students 5 27 22 15 22
Newspapers 6 38.._
28 12 7
Teaching Machines 4 28 31 14 14
Libraries 9 31 30 12 8
Working By Yourself 15 32 20 15 8
Science Classes 6 20 22 28 16
Principals 4 11 39 19 21
Remedial ReadingClasses 3 8 39 27 16
Teaching Games 3 30 23 21 15
History Classes 3 19 23 28 19
Television Teaching 4 13 33 28 14
Business Classes 5 23 28 19 17
Writing Papers 1 16 29 29 17
Listening in Class 3 28 33 10 16
Doing Research 6 19 24 25 18
Doing Projects 6 25 25 19 18
Help From Teachers 4 40 30 9 9
Honor Rolls 12' 17 32 15 16
School Sports 14 21 29 12 17
Teacher's Praise 0 22 33 21 16
133

ITEMSTRONGLY
LIKE LIKE INDIFFERENT DISLIKESTRONGLYDISLIKE
Advice FromTeachers orCounselors 5 38 22 11 18
Suspension 5 12 23 24 28
Clubs 12 22 30 13 16
Awards 8 23 35 12 13
Assemblies 15 20 26 9 13
School Newspapers 4 35 34 13 7
Going intothe Military 8 23 23 14 25
Teacher's Criticism 2 13 30 22 27
School Plays 5 13 40 16 20
School Bands& Glee Clubs 4 13 36 17 24
Going to College 19 15 29 13 17
Report Cards 9 25 29 12 19
Student Government 8 18 34 18 15
Going to TradeSchool 16 27 36 7 7
Students DecidingWhat to Studyin' Class 24 23 28 10 7
As the above demonstrates, the largest proportion of
answers fall within the "indifferent" category. There are some
items, however, to which students responded somewhat more
positively than negatively; and conversely, some to which
they responded somewhat more negatively than positively.
134

More Positive Responses:
Counselors Help from teachers
Lectures School sports
Paperback books Advice from teachers orcounselors
Classes with less than 10 students Clubs
Contracts Awards
Teachers Assemblies
Newspapers School Newspapers
Libraries Going to trade school
Working by yourself Students deciding whatto study in class
More Negative Responses:
Textbooks History classes
English classes Television teaching
Math classes Business classes
Workbooks Writing papers
Science classes Doing research
Remedial reading classes Teacher's praise
School plays Suspension
School bands & glee clubs Going into the military
Student government Teacher's criticism
Principals
135

B. Evaluation of the Students by "Others"
1. The Recorded Historical Information (RHI)
In an attempt to assess what "others," i.e.,
teachers, counselors and former schools, think of Valley High
School students, the staff used specific information gathered
from the students' cumulative folders. The Recorded Histori-
cal Information (RHI) was designed for this purpose; and
questions #16, 17, 18, 23, 24, 25, and 26 were selected as
those which provide the most meaningful data. (See Figures
50 - 52, and Table XIV, 1, infra.)
Although many expressions of remedial need were
indicated by the former grade school teachers of Valley High
School students, only 25% were referred for special educa-
tion classes. Of this 25% approximately one - half* were
referred for remedial reading, and one-fourth for remedial
speech. (See Figure 50.)
Approximately one-quarter of the students received
their first "F" grade between kindergarten and seventh grade;
most received it between kindeggarten and fifth grade. Of
the remaining students, over one-half received their first
"F" between the eighth to ninth grade. The general trend
at the eighth to ninth grade level, however, was not a single
grade of "F" but rather a cluster of "F's." (See Figure 51.)
This suggests that at this level, past academic deficiencies
become operative, or that adjustment to adolescence proves
overwhelming to some students.
136

Figure 50
(a)
GRADE FIRST REFERREDFOR SPECIAL EDUCATION
100
90
80
100,.
90 ,
80
70,' 70
60
50 ,
40
30
1111.11111
1111112111MIN
60 ,
50 ..
40 p
30 p,
20 p 20 p
10 10 -
(b)
STATED REASONFOR REFERRALTO SPECIAL ED.
Om-
0 0K2 3.5 6.7 6.9 10+ Never Speech Reading Psyc Rehm,. Other
GRADE OF REFERRAL REASON FOR REFERRAL

Figure 51 GRADE STUDENTRECEIVEDFIRST "F"
NoData
Grades "F" Received

Figure 52
(a)
100,
80,
60,
40,
23.7
20,
(b)
SCHOOL ACTION TAKEN loop, STATED REASONFOR REFERRAL
29.324.5
21.1
80,
60,
40,
20,
29.1
35.7
23.6
9.3
1.4 0.0 2.3 2.9
No Discip. Truancy Dress Grades Other NoData Problem Viol. Data
Refer.to
Counsel-Of
100,
80,
60,
40,
20,
7.6
Letter Parent Suspen- OtherHorne Conf. lion
TYPES OF SCHOOL ACTION REASONS FOR REFERRAL
GRADE OF FIRST REPORTEDATTENDANCE OR BEHAVIOR
PROBLEM
16.8
51.3
21.0
13.8
100,
80,
60,
40,
20,
35.0
MOST FREQUENTLYREPORTED SCHOOL
VIOLATIONS
23.6
32.5
3.4 4.2 4.7 5.1
K-2 3.6 74 9.10 11+ No Attend. Academ. Dress Smoking OHO). NoData Failure Problems Data
GRADE OF FIRST PROBLEM REPORTED VIOLATIONS

Further analysis reveals a fairly strong relation-
ship between the grade of first "F" and the first reported
attendance or behavior problem. (The correlation for these
two items was .474 at .01 significance.) One-fourth of the
students experienced their first grade of "F" between kinder-
garten and seventh grade; the same percentage also experienced
their first attendance or behavior problem at that time. One-
half of the students received the first "F" at the seventh to
ninth grade level; and, an equal percentage had their first
attendance and/or behavior problems at the same time.
The most frequently reported school violation was
that of attendance. Discipline problems were also reported
frequently. These two factors account for approximately two-
thirds of the reported violations; the remaining one-third
consists of academic failure (23.6%); dress violations (4.2 %) ,
and smoking (4.7%).
The referring high schools used the following
means to handle these violations: letters home, counselor
referral, parent conferences, and suspension from school. A
significantly greater number of males than females were re-
ferred to counselors when a violation occurred. A greater
number of females than males, however, report parent confer-
ences as the means of handling school violations.
Analysis of the RHI responses indicates no other
significant differences according to ethnic, attendance or
sex groupings.
140

2. Teacher Evaluation Surveys (TES)
During the testing periods, ten of the Valley High
School teachers, the principal, and the social worker at
Valley responded to the TES which was designed to assess the
teachers' evaluations of student behavior during the test
period. (See Table XIX, 1, infra.) The responses and their
frequencies are indicated below.
MEASURE
Cooperation Levelof Student
TOTAL NUMBEROF EACHRESPONSE RESPONSE
1 Good6 Fair5 Poor1 Resentful
Student Reactionto Unusual Routine 1 Enjoyed it
7 Tolerated it1 Indifferent4 Rejected it (left school)
Motivational Value ofReward System 1 High
6 Some3 Little2 None
Student Interest inTesting
Student AttendanceDuring Testing
3 In reasons for testing1 In test results7 No interest in test purpose3 No interest in test results
2 No change5 Decrease of those tested6 Decrease to avoid testing'
Classroom Behavior 8 Increase in behavioraldisturbance
3 Increase in cooperation2 Decrease in cooperation
141
Z,1"..tki les+, x.z.v.roAt , . , r.

In evaluating the above responses, the subjectivity
of the TES should be kept in mind. The instrument measures
the teacher and staff evaluation of students; it is quite
possible, however, that it also reflects individual teacher
and staff feelings towards the total testing situation.
142

III. PRESENT ACADEMIC PERFORMANCE CAPABILITIES
An identification of academic performance capabilities
of the student population is required in order to derive the
instructional needs of the student. An academic profile can
be compared to collected performance requirements; the
difference between the two provides a guideline for the
development of the projected system.
In order to identify the basic academic performance
capabilities of the student population, both scholastic
achievement and general aptitudes had to be determined.
Scholastic achievement encompasses language, reading, spell-
ing and computation. Performance capability is defined as
the tested ability to: use language; comprehend selected
reading; spell accurately; comprehend numerical concepts;
perform general arithmetical operations; and, reason
abstractly. General aptitudes are measured in terms of:
verbal aptitude; numerical aptitude; spatial aptitude; form
perception; clerical perception; motor coordination; finger
dexterity; manual dexterity; and, a general learning aptitude.
The Project has used the Wide Range Achievement Test
(WRAT) and the California Achievement Test (CAT) to determine
academic skills, and the General Aptitude Test Battery (GATB)
to determine the vocational skills of the Valley High School
population.
143

nro, :wpm
A. The Wide Range Achievement Test (WRAT)
The WRAT is a convenient tool for the study of
capabilities in basic school subjects such as reading (word
recognition and pronunciation), written spelling and arithmetic
computation. Three types of interpretation may be used in
reporting WRAT results: grade ratings, which are based on
norms derived from the actual mean grade levels of children
in different age groups; standard scores, which are used to
represent the rate of learning rather than th'ki level of
achievement reached; and, percentiles or rankings. (See
Figures 53 - 56.) The following chart reports ZAAT results
for the Valley High test population in terms of the above
three methods of interpretation.
1. Grade Placement, Standard Scores and Percentilesfor Total Valley High School Sample:
Mean Grade Mean StandardSection Placement Score* Percentile
Reading 7.8 94.1 34
Spelling 6.0 83.6 13
Arithmetic 5.3 80.3 9
*According to the WRAT Manual, a standard score of between80 and 89 is classified as low average, and a score of 90to 109 is classified as average.
.144

El
50
49
48
47
46
45
44
43
42
41
40
39
38
37
36
35
34
33
32
31
30
O 29
5 28
a. 272O 26a.1 25u.r 24
cc 23
a. 22
21
20
19
18
17
16
15
14
13
12
11
10
98
7
6
11.6
7.0
CN
26.1OMB254 .'r 25.0
a
a
16.0
:6
aa
50 60 70
I
r.R:
8 25.0
16.0
KEY
ED Normal Population1.0. Normal Mean 100.00
IMP V.H.S. Sample (N = 96)
Sample Mean 94.1
WRAT READING
7.0
1.50.7alfZim awe
i.
80 90 100 110
STANDARD SCORES
120A
130

5049
4847
4645
4443
4241
4039
3837
3635
3433
3231
3029
2827
2625
2423
2221
2019
1817
1615
1413
1211
109
87
65
43
21 0.5
isI
1111
1111
r7IM
PR
IMIT
27.5
33.3
.11,
2II
16.0
14.5
88
25.0
.4
: :44
4ai
lmi
25.0
. 9.4
KE
Y
[Z]
Nor
mal
Pop
ulat
ion
.1.1
1
1.1.
Nor
mal
Mea
n
100.
00
V.H
.S.
Sam
ple
(N = 96)
Sam
ple
Mea
n
83.6
Fig
ure
54
WR
AT
SP
ELL
ING
16.0
7.0
limm
min
nim
min
0.
1.5
0.5
50 60 70 80 90 100
110
ST
AN
DA
RD
SC
OR
ES
120
130
140
150

0.5
17.5
31.6
7.0
2I I
825.0 ?I 25.0
KEY
Normal PopulationIIN IOW Normal Mean 100.00
V.H.S. Sample (N = 96)
Imo Sample Mean 80.3
Figure 55
WRAT ARITHMETIC
16.0
7.0
1.5
0.5
50 60 70 80 90 100 110 IP" 120
STANDARD SCORES
130 140 150

it
Figure 56 WRAT GRADE PLACEMENT DISTRIBUTIONS
80,z0
60,,
ka.0z 40,
20,
a Reading (N =135)
N N m m 01
C c4 tri vi :2 N 1p ma mood
0 1.=inigailyiblijo.m....11111111.1111110411111hiliiiiiOdiElliummeamewa
100,
80,
60,
40,
20,
0
100,
80,
60,
40,
20,
1 2 3 4 5 6 7 8 9 10 11 12 13 14 15 16
grade placement
b Spelling (N =140)
ID et 1-CI dd N - . f 01
"""%ms...
for.Irm
mcno ogog4cv d cede
11111111411,
1 2 3 4 5 6 7 8 9 10 11 12 13 14 15 16
grade placement
C Arithmetic (N=132)
Che in CV CO
01 ^1m to inon IV)
I-01 01 in
Irm""elmJ
IrrN444~t6i, s ,
q 00 o cto q o oeh d ci oo dd d
2 3 2 5 6 7 8 9 10 11 12 13 14 15 16
grade placement

Comparisons within the Valley High population on the
basis of ethnic, sex and attendance groupings are as follows:
(See Figures 57 - 59.)Mean Mean
Standard GradeSection Grouping Score Placement Percentile
Reading Anglo* 97.1 9.1 42Mexican-American 87.8 7.1 19
Spelling Anglo** 84.7 6.7 16Mexican-American 82.1 5.7 12
Arithmetic Anglo*** 81.7 6.1 12Mexican-American 76.9 5.1 6
Reading Male 94.6 8.5 37Female 92.8 8.2 32
Spelling Male 83.2 6.4 14Female 84.5 6.6 16
Arithmetic Male 80.8 5.9 10Female 78.9 5.5 8
Reading Group A 94.6 8.4 37Group B 83.4 8.5 14
Spelling Group A 83.7 6.3 14Group B 83.4 6.4 13
Arithmetic Group A 80.4 5.8 9Group B 79.8 5.7 9
2X df Significance Level
* 16.10** 10.8*** 13.8
5 .014 .053 .01
149

50
49
48
47
46
45
44
43
42
41
40
39
38
37
36
35
34
33
32
31
30
29
28
27
26
25
24
23
22
21
20
19
18
17
16
15
14
13
12
11
10
98
7
6
5
4
3
2
1 0.50
450
7.69
12.31
9.47
7.00
031403
I I
27.37
I
I
61 I
II
2
26.92 I
24.32 1.8
WET
I
I
I
6
16.00
I
II
I
I
I
I
KEY
Normal Population
- - - - Normal Mean 100.00Anglos (N = 94)Anglo Mean: 97.1Mexican-American (N = 38)Mexican-A. Mean: 87.8
Figure 57
WRAT STANDARD SCORES - READING
25.00
17J9
1615
80 90 100
16.00
10,53
7.00
421**
I1.50
3
3
(
i6 111Ea
. A .040 .7110 120 130 140 150
STANDARD SCORES
7.17.;-7"V;ZZ:7-77,7-..

iGO
25.00
9.18
32.50
25.51
Os
88
12.27
KEY
E3 Normal Population
Normal Mean 100.00Anglos (N = 95)
ems Anglo Mean: 84.7Mexican-Americans
ga moo Mexican-American Mean: 8
Figure 58
WRAT STANDARD SCORESSPELLING
10.20
1402
50 60 70 80 90 100 110
STANDARD SCORES
120 130 140 150

50
49
48
47
46
45
44
43
42
41
40
39
38
37
36
3535.00
34
33 32.63
32
31
30
29
28
2727.54
mmmmmm
26
25
24
23el
22 10N.
21 I I
C20 es019
2
18
17
16
15
14
13
12
11 10.53
10
98
7.07 I-6
5
4
3
2 1.50.
1 0.50
1 43.16
35.00
25.00 25.00
KEY
ED Normal PopulationAM WINO Normal Mean 100.00
Anglos (N = 94)Anglo Mean: 81.7Mexican-American
Mexican-American Mean: 7
Figure 59
WRAT STANDARD SCORESARITHMETIC
16.00 16.00
1138 Jli
. 1l 7.00
1
4 aa
a
Ita,0sa
1
*
a**
I
* 2.50V
INOS _ 2.05 1.50.1 0.50
50 60 70 80 90 100 110 120 130 140 150
STANDARD SCORES
.9

Standard Scores Classification
130 and up Very superior
120-129 Superior
110-119 High Average
90-109 Average
80-89 Low Average
70-79 Inferior
69 and below Defective
Based on this system of classification, 16.84% of the Anglo
students in the test population rated high average or above
in reading while only 10.0% of the Mexican-Americans did
as well. Of the Anglos, 71.58% were rated as low average
or average as compared with 67.99% of the Mexican-Americans.
At the extreme low end of the rating scale, only 12.62% of
the Anglos rated inferior or defective while 20.00% of the
Mexican-Americans exhibited inferior or defective reading
skills.
The same distribution is apparent in the scores
obtained on the spelling section of the WRAT. Of the Anglos,
1.02% scored high average or above while 0.0% of the Mexican-
American students scored in this range. Of the Anglos, 64.29%
scored at low average to average as compared with 42.50% of
the Mexican-Americans; 34.69% of the Anglos scored at the
inferior or defective range as compared with 57.50% of the
Mexican-Americans.
153

In the arithmetic section, scores were as follows: high
average, 1.05% Anglos, and 0.0% Mexican-Americans; low average
to average, 55.75% Anglos, and 37.50% Mexican-Americans;
inferior to defective, 43.16% Anglos, and 63.53% of the
Mexican-Americans.
In summary, a larger proportion of Anglos obtained
higher scores than did Mexican-Americans. And, a larger pro-
portion of Mexican-Americans obtained lower scores than did
Anglos. No Mexican-American scored between 120-150 (superior
to very superior) on any of the three tests.
Distribution of scores for the males was the same as
for the female subgroup; this was also true of attendance
groups A and B. (See Figure 60.) Relative to the male/female
comparison, it is noteworthy that 15.6% of the total tested
male population scored high average, superior, or very superior
in reading, as compared to 10.0% of the total female population
scoring in that range.
2. Teacher Evaluation Compared with WRAT Scores
The Teacher Information Matrix (TIM) (see Table V, 2,
infra) provided data on the Valley High School teachers' evalu-
ations of student performance in reading and arithmetic. These
data were compared with the students' WRAT scores. (See
Table V, 4, infra.) The following chart compares TIM findings
with the relevant data from the WRAT for reading and arithmetic.
154

Figure 60
WRAT- DISTRIBUTION OF STANDARD SCORES
BY SEX
Score 51.60 61-70 71.80 81.90 1 91.100 101.110 111.120 121.130 131.140 141.150
Spelling
Male N-98; Mean .2 0.9 14.3 27.6 34.7 13.3 9.2 1.0 0.0 0.0 0.0
Female - N=40; Mean=78.9 0.0 15.0 25.0 32.5 17.5 10.0 0.0 0.0 0.0 0.0.Arithmetic
.
Male N=.96; Mean=80.8 0.0 12.5 33.3 42.7 10.4 0.0 1.0 0.0 0.0 0.0
Female - N=40; Mean=92.8 0.0 30.0 27.5 37.5 5.0 2.5 0.0 0.0 0.0 0.0
Reading
Male - N=96; Mean=94.6 1.0 6.3 11.5 25.0 26.0 14.6 9.4 4.2 1.0 1.0
Female - N=40; Mean=92.0 0.0 5.0 12.5 27.5 22.5 17.5 10.0 0.0 0.0 0.0
BY ATTENDANCE GROUP
Score 51.60 61.70 71.80 81-90 91-100 101-110 111-120 121-130 131-140 141-150
Spelling
Group A N=87; Mean=83.7 0.0 16.1 26.4 29.9 16.1 10.3 1.1 0.0 0.0 0.0
Group 9 - N=49; Mean=83.4 0.0 12.2 30.6 40.8 10.2 6.1 0.0 0.0 0.0 0.0
tiArithmetic
Group A - N=85; Mean=80.4i
0.0 18.8 28.2 41.2 9.4 1.2 1.2 0.0 0.0 0.0
Group B - N=47; Mean=79.8 0.0 17.0 40.4 36.2 6.4 0.0 0.0 0.0 0.0 0.0
Reading
Group A N=87; Mean=94.6 1.1 8.0 10.3 24.1 25.3 13.8 12.6 2.3 1.1 1.1
1.--- Group B - N=46; Mean=97.6 0.0 2.2 15.2 28.3 28.3 17.4 4.3 4.3 0.0 0.0

Elementary grade level is defined as grades 1 to 4; average
grade level as grades 5 to 9; and, superior grade level as
grade 10 and over.
Teachers' Evaluation and WRAT Scores Comparison
ReadingElementaryGrade Level
AverageGrade Level
SuperiorGrade Level
Teachers Eval.
WRAT Score
38%
12%
48%
63%
15%
25%
throe ti c
Teachers' Eval.
WRAT Score
47%
34%
50%
64%
3%
2%
Par
In most instances, the teachers at Valley High
tended to overestimate poor performance on the part of the
students, and to underestimate average and superior performance.
An accurate teacher estimation of general students' abilities
(as compared with WRAT scores) was demonstrated in only one
instance: that of superior performance in arithmetic.
3. Correlational Study: WRAT
Figure 61 presents correlational findings relative
to the WRAT. As can be seen, neither the sex nor attendance
subgroups showed any significant correlation with other
variables, i.e., spelling, arithmetic and reading. Ethnic
grouping, however, does show some significant correlations
156

Sex Grouping
Attendance Grouping
Ethnic Grouping
Age
Grade Placement
Spelling
Standard Score
Spelling
Grade Placement
Arithmetic
Standard Score
Arithmetic
Grade Placement
Reading
Standard Score
Reading
2
FIGURE 61
WRAT CORRELATIONS
45
67
89
10
2.079
3.122
-.105
4-.134
.104
-.092
5.049
.023
*-.210
+-.255
6.052
.011
*
-.198
.288+
+.998
7-.111
-.006
.233+
-.077
.601+
.591+
8-.102
-.008
.222+
-.103
.597+
.590+
.997+
.063
.011
-.319+
.247+
.753+
.752
.470+
.468+
10
-.064
-.024
+-.302
.290+
.745+
.748+
.457+
.459+
.997+
df = 133
*.05 level of significance,
.167
+.01 level of significance,
.218
r
Derived from t =
in Statistical Methods for the
Behavioral
Sciences, A. L. Edwards, 1964.

with grade placement and standard scores in spelling, arithme-
tic and reading. As standard scores and grade placements
decrease, there is a corresponding increase in the number
representing Mexican-American.
One further correlation seems to be noteworthy.
Age of the student correlates negatively with grade placement
and standard scores on spelling and reading. These correla-
tions were significant at the .01 level. Indications are
that the older the student the poorer his performance in
these two areas.
B. The California Achievement Test (CAT) - Com lete Batter
The CAT is designed to fulfill the educational testing
purposes of measurement, evaluation and diagnosis. The CAT
is composed of six "sub-tests": Reading Vocabulary, Reading
Comprehension, Arithmetic Reasoning, Arithmetic Fundamentals,
Mechanics of English, and Spelling.
The Junior High Level of the CAT was selected as proper
to the achievement range at Valley High School. This selection
was based on information obtain from the Teacher Information
Matrix which estimated a reading level of elementary to average
for 86% of the Valley High students. Junior High School norms
correspond most closely to these levels. Data processing
techniques provided raw scores and grade placement scores, as
well as summary data for the total Valley High School student
population.
158

1. Mean Raw Scores onTotal Valley High
Sub-Test
the CAT and GradeSchool Population
Mean RawScore
Placements for
Mean GradePlacement
Reading Comprehension 37.1 6.8
Reading Vocabulary 33.6 7.5
Total Reading 70.7 7.0
Arithmetic Reasoning 23.8 7.4
Arithmetic Fundamentals 33.5 7.0
Total Arithmetic 57.3 7.0
Mechanics of English 60.9 7.4
Spelling 15.6 7.5
Total Language 76.6 7.4
For a complete distribution of the scores and grade
placements for the Valley High School population, see Figures
62 - 87.
2. CAT Analysis by Sex, Ethnic and Attendance Groupings
Sex Grouping
Total Arithmetic
Male Female Possible
Range of Scores 25-120 15-105 1-135Mean Scores 59.2 53.4
Arithmetic Reasoning
Range of Scores 5-50 0-45 0-55Mean Scores 24.6 22.3
159

0O
to
6.10
11-1
5
16-2
0
21-2
5
26-3
0
31-3
5
36-4
0
41-4
5
46-5
0
51-5
5
56-6
0
61-6
5
66-7
0
71-7
5
76-8
0
81-8
5
86-9
0
91-9
5
96-1
00
101-
105
106-
110
111-
115
116-
120
121-
125
126-
130
131-
135
136-
140
141-
145
146-
150
CO
XI
n O0
ni-
sL
o2:1
306-
10.-
.I.
io . z
o -
11-1
5= on
16-2
0
21-2
5
X)
CO n
cr1-
5
-n6.
10C
4.0
11.7
11-1
5
1620
s21
-25
26-3
0
31-3
5
0
z
26-3
0
31-3
5
3640
41-4
5
46-5
0
51.5
5
56-6
0
61-6
5
66-7
0
71-7
5
76-8
0
81-8
5
86-9
0
91-9
5
96-1
00
101-
105
r
106.
110
111-
115
116-
120
121-
125
126-
130
131-
135
136-
140
141-
145
146-
150
Mea
n-33
.5
s O
3640
41-4
5
46-5
0
51-5
5
56-6
0
61-6
5
66-7
0
71-7
5
76-8
0
81-8
5
86-9
0
91-9
5
96-1
00
101-
105
106-
110
111-
115
116-
120
121-
125
126-
130
131-
135
136.
140
141-
145
146-
150
% o
f Po
pula
tion
0A
0
-1!
IG C 0) N

XI
A .
51 0 N 1-5
6-10
11-1
5
16-2
0
21-2
5
26-3
0
31-3
5
36-4
0
41.4
5
46-5
0
51-5
5
56-6
0
61-6
5
66-7
0
71-7
5
76-8
0
81-8
5
86-9
0
91-9
5
96-1
00
101-
105
106-
110
111-
115
116-
120
121-
125
126-
130
131-
135
136-
140
141-
145
146-
150
O r 0
1
33.6 41
1=1.
1111
1W M
I, III
IIIIN
din
/ .
A
AW
21
PA N 1-5
6-10
11-1
5
16-2
0
21-2
5
26-3
0
31-3
5
36-4
0
41-4
5
46-5
0
51-5
5
56-6
0
61-6
5
66-7
0
71-7
5
76-8
0
81-8
5
86-9
0
91-9
5
96-1
00
101-
105
106-
110
111-
115
116-
120
121-
125
126-
130
131-
135
136-
140
141-
145
146-
150
% o
f Pop
ulat
ion
...0
1 03
4'
W M
IA
.51 O
0( 15 6-
10
11-1
5
16-2
0
21-2
5
26-3
0
31-3
5
36-4
0
41-4
5
46-5
0
51-5
5
56.6
0
61-6
5
66-7
0
71-7
5
76.8
0
81-8
5
86-9
0
91-9
5
96-1
00
101-
105
106-
110
111-
115
116-
120
121-
125
126.
130
131-
135
136-
140
141-
145
146-
150
.. A
m, .
.....
1
7 0.
7_
1 0 c 0 0) co

woj
n*
o
1-5
6-10
11-1
50
16-2
0
21-2
5
26-3
0
31-3
50
36-4
0
41.4
5
4E-5
0
51-5
5
56-6
0
61-6
50
66-7
00
71-7
5
76-8
0
81-8
5
86-9
0
91-9
5
96-1
00
101-
105
106-
110
111-
115
0
116-
120
121-
125
126-
130
131-
135
136-
140
141-
145
146.
150
Ch
c)1.
5
cn6-
10-o
11-1
5ao
16-2
0
21-2
5
26-3
0
31-3
5
36-4
0
41.4
5
46-5
0
51-5
5
56-6
0
61-6
5
66-7
0
71-7
5
76-8
0
81-8
5
86-9
0
91-9
5
96-1
00
101-
105
106-
110
111-
115
116-
120
121-
125
126-
130
131-
135
136-
140
141-
145
146-
150
O
% o
f Pop
ulat
ion
1 OD
Ch
A23
O0
1.5
6.10
11-1
5
16-2
0
21-2
5
26-3
0
31-3
5
36-4
0
41-4
5
4E-5
0
51-5
5
56-6
0
61-6
5
66-7
0
71-7
5
76-8
0
81-8
5
86.9
0
91-9
5
96-1
00
101-
105
106.
110
111-
115
116-
120
121-
125
126-
130
131-
135
136-
140
141-
145
146-
150
I
A
76.6
r6-1
CO
Ch

Fig
ure
65
CA
T D
IST
RIB
UT
ION
OF
OV
ER
ALL
TO
TA
L S
CO
RE
S F
OR
TO
TA
L P
OP
ULA
TIO
N(N
=99
)
c 20
12"
106
7
11
1516
108
55
21
1
3.5-
3.9
4.5-
4.9
5.5-
5.9
6.5-
6.9
7.5-
7.9
8.5-
8.9
9.5-
9.9
10.5
-10.
93.
0-3.
44.
0-4.
45.
0-5.
46.
0-6.
47.
0.7.
48.
0-8.
49.
0-9.
410
.0-1
0.4
11.0
-11.
4
Gra
de P
lace
men
t

20 10
22
3
kMIft
ON
I I
I MO
-NY
imal
ll-
Fig
ure
66C
AT
DIS
TR
IBU
TIO
N O
FS
UM
MA
RY
SC
OR
ES
FO
RT
OT
AL
PO
PU
LAT
ION
- LA
NG
UA
GE
20 10 20 10
2
4
(a)
TO
TA
L LA
NG
UA
GE
(N=
100)
19
(b)
ME
CH
AN
ICS
OF
EN
GLI
SH
N=
101
66
00
3.0-
3.4
4.0-
4.4
3.5-
3.9
4
(c)
SP
ELL
ING
(N=
100)
14
8
45
5.0-
5.4
6.0-
6.4
7.0-
7.4
8.0-
8.4
9.0-
9.4
10
12
010
.0-1
0.4
11.0
-11.
412
.0-1
2.4
4.5-
4.9
5.5-
5.9
6.5-
6.9
7.5-
7.9
8.5-
8.9
9.5-
9.9
10.5
-10.
911
.5-1
1.9
12.5
+G
rade
Pla
cem
ent

20 10
I 20
18 a 10 20 10
Fig
ure
67C
AT
DIS
TR
IBU
TIO
N O
F S
UM
MA
RY
SC
OR
ES
FO
R T
OT
AL
PO
PU
LAT
ION
RE
AD
ING
(a)
TO
TA
L R
EA
DIN
G(N
=10
0)
14
I
23
55
10
44
10
(b)
RE
AD
ING
CO
MP
RE
HE
NS
ION
10p.
p.m
omp,
i
7
(N=
100)
8
(c)
RE
AD
ING
VO
CA
BU
LAR
YN
=10
1
99
77
11
64
4 4
20
k.-5
,:0,,,
,m1
02
0
8
3
A0
03.
0-3.
44.
0-4.
45.
0-5.
46.
0-6.
47.
0-7.
48.
0-8.
49.
0-9.
410
.0-1
0.4
11.0
-11.
412
.0-1
2.4
3.5-
3.9
4.5-
4.9
5.5-
5.9
6.5-
6.9
7.5-
7.9
8.5-
8.9
9.5-
9.9
10.5
-10.
911
.5-1
1.9
12.5
+G
rade
Pla
cem
ent

Fig
ure
68C
AT
DIS
TR
IBU
TIO
N O
F S
UM
MA
RY
SC
OR
ES
FO
R T
OT
AL
PO
PU
LAT
ION
AR
ITH
ME
TIC
(a)
TO
TA
L A
RIT
HM
ET
ICN
=10
1
-411
11.-
-4
2017
17
(b)
AR
ITH
ME
TIC
RE
AS
ON
ING
N=
101
20 10
(0 A
RIT
HM
ET
IC F
UN
DA
ME
NT
ALS
N=
101
23
1313
00
2
4.0-
4.4
5.0-
5.4
6.0-
6.4
7.0-
7.4
8.0.
8.4
9.0-
9.4
10.0
-10.
411
.0-1
1.4
12.0
-12.
43.
5-3.
9A
5.5-
5.9
6.5-
6.9
7.5-
7.9
8.5-
8.9
10.5
-10.
911
.5-1
1.9
12.5
+r

10.0 9.0
8.0
7.0
6.0
a tUi
a.5.
0a
4.0
3.0
2.0
1.0
Fig
ure
69
9.0 as
....
'as.
8.1
8.3
Ato
5901
eeee
eeee
......
......
......
......
......
..Q
3...
......
......
......
.....
....
...7.
6
7.2
7 . 7
.....
.5...
......
..se
....
....
..7
.7.
5...
......
......
......
.....
6.2
Mea
n7.
56.
9a.
....
.....
7.0
....
......
......
...7
.0*
7.4
7.5
7.4
6.7
....
.6.
06.
16.
8...
......
......
6.0
5.9
......
.....
.....
5.9
6.1
Med
ian
6.7
......
......
......
Q1
6.1
661.
. ......
...5.4
.....
5.5
......
so .
0R
eadi
ngR
eadi
ngT
otal
Arit
h.A
rith.
Tot
alE
nglis
hS
pelli
ngT
otal
Tot
alV
ocab
ular
yC
ompr
ehen
sion
Rea
ding
Rea
soni
ngF
unda
men
tals
Arit
h.M
echa
nics
Lang
uage
Tot
al
CA
T-S
UM
MA
RY
DA
TA
FO
R T
OT
AL
V.H
.S.
ST
UD
EN
T P
OP
ULA
TIO
N

to x
iet ow
0QI
1,4
PE
R C
EN
T O
F P
OP
ULA
TIO
N
aO
ID 0 0
1-5
6-10
11-1
5
16-2
0
21-2
5
26-3
0
31-3
5
36-4
0
41-4
5
46-5
0
51-5
5
...
Mea
n =
53.4
56-6
011
11
61-6
5
66-7
0
71-7
5g:
.76
-80
81-8
5bi
t86
-90
91-9
5
96 -
100
101-
105
106-
110
111-
115
116-
120
.112
1-12
5ii
126-
130
131-
135
136-
140
141-
145
146-
150
Mea
n =
54.2
OxZ
o xi2
11
11
11
11
11
11
h)
Le
p cia 4)
h)
V) V)0
91
N
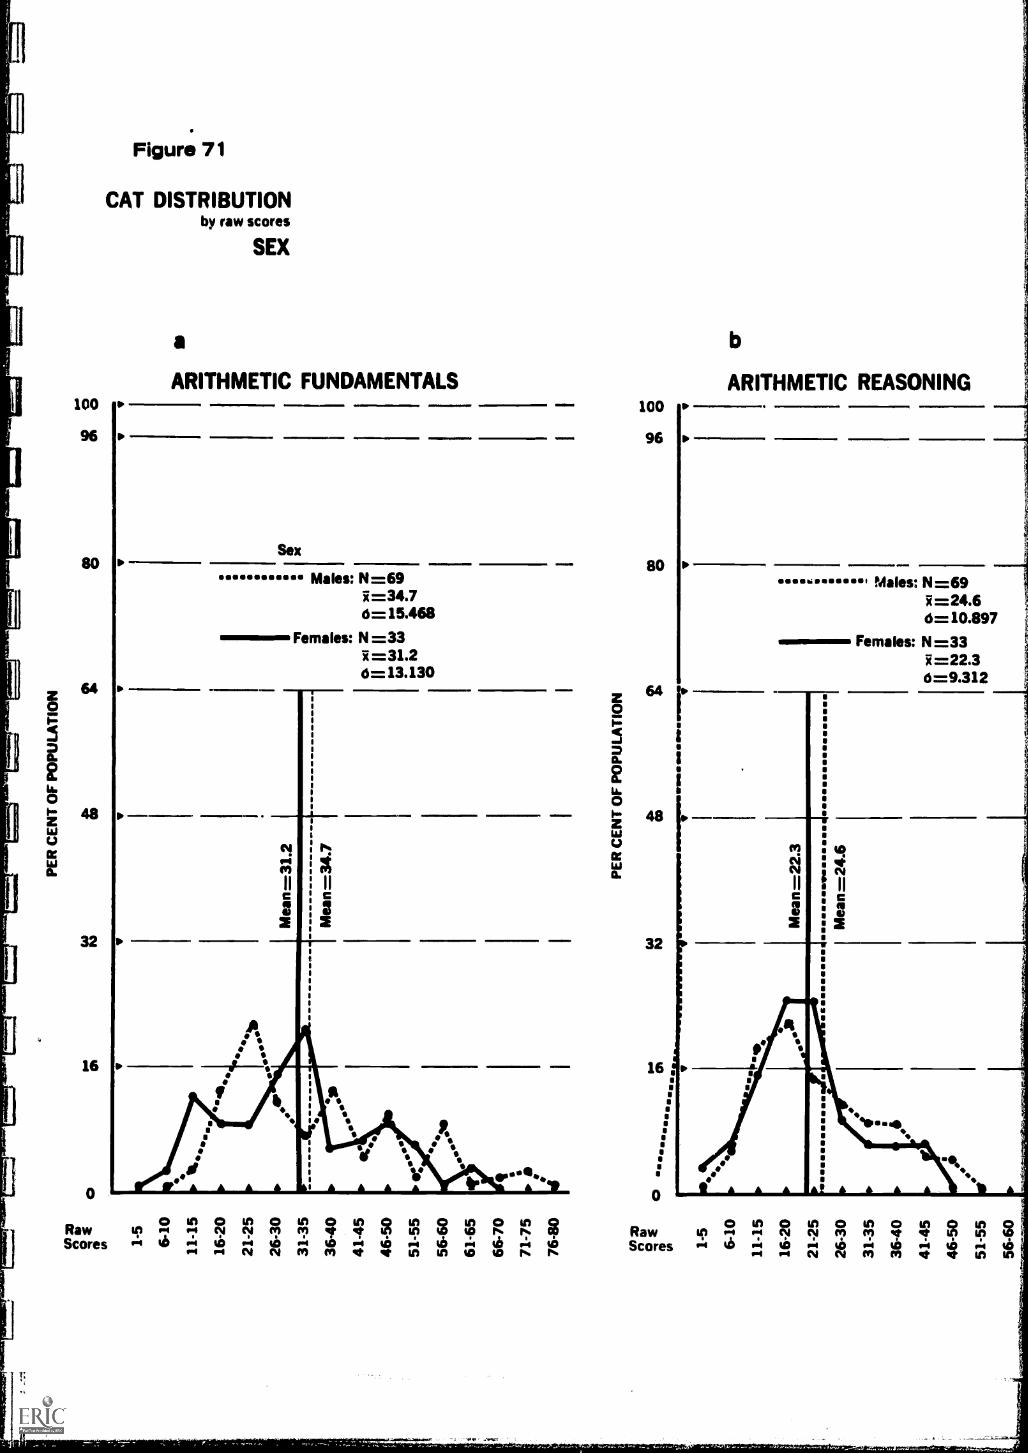
O
PE
R C
EN
T O
F P
OP
ULA
TIO
N
a*
0
1-5
6-10
11-1
5
16-2
0
21-2
5
26-3
0
31-3
5
3640
41-4
5
46.5
0
51-5
5
56.6
0
61-6
5
66-7
0
71-7
5
76-8
0
.,..
......
Mea
n=31
.2on
w
eT
Ox1
Z11
1111
cos
id 1
id14
;9 N
0
ow
Oxi
211
1111
w+
id 0
1yi
i V
et:
Mea
n=34
.7
CA
A)
11 0
)0
*1.
6(.
110
..ch
....
(a...
......
1-5
6-10
11-1
5
16-2
0
21-2
5
26-3
0
31-3
5
36-4
0
41-4
5
46-5
0
51-5
5
56-6
0
N
PE
R C
EN
T O
F P
OP
ULA
TIO
N
IMP
IPIIM
INIP
IIPIP
MU
MP
OI
1111
6111
1111
1.11
101M
PIP
IN
Mea
n=22
.3
ce41
00
at
Mea
n=24
.6
111

1-5
6-10
11-1
5
16-2
0
21-2
5
26-3
0
31-3
5
36-4
0
41-4
5
46-5
0
51-5
5
56-6
0
61-6
5
66-7
0
71-7
5
76-8
0
81-8
5
86-9
0
91-9
5
96-1
00
101-
105
106-
110
111-
115
116-
120
121-
125
126-
130
131-
135
136-
140
141-
145
146-
150
PE
R C
EN
T O
F P
OP
ULA
TIO
N
11. 1! 0
Mea
n=70
.7
Mea
n=70
.7

wz
el e
l g0
111 1-
5
6-10
11-1
5
16-2
0
21-2
5
26-3
0
31-3
5
36-4
0
41-4
5
46-5
0
51-5
5
56-6
0
61-6
5
66-7
0
71-7
5
76-8
0
ER
OFP
AT
IOP
=1
''C
hO
)110
...
0 e
44
Mea
n =
36.1
1-5
6-10
11-1
5
16-2
0
21-2
5
26-3
0
31-3
50.
36-4
0k
41-4
5
46-5
0
51-5
5
56-6
0
Mea
n =
37.5
PE
R C
EN
T O
F P
OP
ULA
TIO
N
1.0
00
et0
Mea
n=33
.1
Mea
n=34
.6
1=31
mie
s

1-5
6-10
11-1
5
16-2
0
21-2
5
26-3
0
31-3
5
36-4
0
41-4
5
46-5
0
51-5
5
56-6
0
61-6
5
66-7
0
71-7
5
76-8
0
81-8
5
86-9
0
91-9
5
96-1
00
101-
105
106-
110
111-
115
116-
120
121-
125
126-
130
131-
135
136-
140
141-
145
146-
150
sol
PE
R C
EN
T O
F P
OP
ULA
TIO
N
0'0
8

01
PE
RC
EN
TO
FP
OP
ULA
TIO
N
1-5
6-10
11.15
16-20
21.25
26-30
31-35
36-40
41-45
46-50
51-55
56-60
61-65
66-70
71-75
76-80
81-85
86-90
91-95
96.100
101-105
WI
ZA
se *0
1-5
6-10
11-15
16-20
21-25
26-30
31-35
eeeeee
1
1
\I
I\
\
\II
11
,T,
ni
Mean=
58.8
Mean=
65.3
IrollE
li
CO
sew
;...co 0
co.so
zii
11ii
1
5a
$0
in
11
1
11
\1
\
\\
H-t
0
41
PE
RC
EN
TO
FP
OP
ULA
TIO
N
Mean=
14.6
6-0o
0C
A0
is a.
Mean
=17.7
eee .....
.......

1-5
6-10
11-1
5
16-2
0
21-2
5
26-3
0
31-3
5
36-4
0
41-4
5
46-5
0
51-5
5
56-6
0
61-6
5
66-7
U
71-7
5
76-8
0
81-8
5
86-9
0
91-9
5
96-1
00
101-
105
106-
110
111-
115
116-
120
121-
125
126-
130
131-
135
136-
140
141-
145
146-
150
OO
;
PE
R C
EN
T O
F P
OP
ULA
TIO
N
co

A ID 1-5
6-10
11-1
5
16-2
0
OW
,
***
21-2
5
26-3
0
31-3
5IIM
ON
36-4
011
10
to41
-45
46-5
0
51-5
5
56-6
0
61-6
5of
66-7
0
71-7
5
76-8
0
A p
i0 0 1-
5
6-10
11-1
5
16-2
0
21-2
5
26-3
0
31-3
5
36-4
0
41-4
5
46-5
0
51-5
5
Oco
PE
R C
EN
T O
F P
OP
ULA
TIO
N
Aco O
*As
* 8
Mea
n=29
.2
IN
Mea
n=35
.4
PE
R C
EN
T O
F P
OP
ULA
TIO
N
Mea
n=21
.1
Mea
n=25
.1

A a
)
CD cit 1-
5
6-10
11-1
5
16-2
0
21-2
5
26-3
0
31-3
5
36-4
0
41-4
5
46-5
0
51-5
5
56-6
0
61-6
5
66-7
0
71-7
5
76-8
0
81-8
5
86-9
0
91-9
5
96-1
00
101-
105
106
-110
111-
115
116-
120
121-
125
126-
130
131-
135
136-
140
141-
145
146-
150
1.)
EM
3E
=1
PE
R C
EN
T O
F P
OP
ULA
TIO
N
CO
ID0
OC
O0
Mea
n=66
.3
Mea
n=72
.9
I

gy
CD
0(/
) 1-5
6-10
11-1
5
16-2
0
21-2
5
26-3
0
31-3
5
36-4
0
41-4
5
46-5
0
51-5
5
56-6
0
61-6
5
66-7
0
71-7
5
76-8
0
81-8
5
Le1
Om
+
01
6e1c
cane
es
PE
R C
EN
T O
F P
OP
ULA
TIO
N
04:
z01
0
1-5
6-10
11-1
5
16-2
0
21-2
5
26-3
0
31-3
5
36-4
0
41-4
5
46-5
0
51-5
5
56-6
0
.ir
: ... .
....
41,
Mea
n =
33.6
Mea
n =
38.
7
PE
R C
EN
T O
F P
OP
ULA
TIO
N
03 0on
+tL
1e
010
Mea
n =
32.
4
Mea
n =
34.
2
V
0 02)
am co>
c r" Z
>0

1-5
6-10
11-1
5
16-2
0
21-2
5
26-3
0
31-3
5
36-4
0
41-4
5
46-5
0
51-5
5
56-6
0
61-6
5
66-7
0
71-7
5
76-8
0
81-8
5
86-9
0
91-9
5
96-1
00
101-
105
106-
110
111-
115
116-
120
121-
125
126-
130
131-
135
136-
140
141-
145
146-
150
0N
PE
R C
EN
T O
F P
OP
ULA
TIO
N
OS
O0
OW
0

1-5
6-10
11-1
5
16-2
0
21-2
5
26-3
0
31-3
5
36-4
0
41-4
5
46-5
0
51-5
5
56-6
0
61-6
5
66-7
0
71-7
5
76-8
0
81-8
5
86-9
0
91-9
5
96-1
00
cnzi gm
ul 1.5
6-10
11-1
5
16-2
0
21-2
5
26-3
0
PE
R C
EN
T O
F P
OP
ULA
TIO
N
co
Mea
n =
60.
3
Mea
n =
61.
2
PE
R C
EN
T O
F P
OP
ULA
TIO
N
a00
440
e oV

1-5
6-10
11-1
5
16-2
0
21-2
5
26-3
0
31-3
5
36-4
0
41-4
5
46-5
0
74-5
5
56-6
0
61-6
5
66-7
0
71-7
5
76-8
0
81-8
5
86-9
0
91-9
5
96-1
00
101-
105
106-
110
111-
115
116-
120
121-
125
126-
130
131-
135
136-
140
141-
145
146-
150
Oad
iw
Ea/
PER
CE
NT
OF
POPU
LA
TIO
N
OD
OD
° O

1-5
6-10
11-1
5
16-2
0
21-2
5
26-3
0
31-3
5
36-4
0
41-4
5
46-5
0
51-5
5
56-6
0
61-6
5
66-7
0
71-7
5
76-8
0
81-8
5
PE
R C
EN
T O
F P
OP
ULA
TIO
N
0
13
1-5
6-10
11-1
5
16-2
0
21-2
5
26-3
0
31-3
5
36-4
0
41-4
5
46-5
0
51-5
5
Mea
n =
32.
8
Mea
n =
34.
0
PE
R C
EN
T O
F P
OP
ULA
TIO
N
A01
-03
OD
s.0
0C
h0
Mea
n =
23.
2
Mea
n =
24.
8
CT

PE
R C
EN
T O
F P
OP
ULA
TIO
NC
O X
i
0at
0CO
co) 1-
5
6-10
11-1
5
16-2
0
21-2
5
26.3
0
31-3
5
36-4
0
41-4
5
46.5
0
51-5
5
56-6
0
61-6
5
66-7
0
71-7
5
76-8
0
81-8
5
86-9
0
91-9
5
96-1
00
101-
105
106-
110
111-
115
116-
120
121-
125
126-
130
131-
135
136-
140
141-
145
146-
150
II
I

1-5
6-10
11-1
5
16-2
0
21-2
5
26-3
0
31-3
5
3640
41-4
5
46-5
0
51-5
5
56-6
0
61-6
5
66-7
0
71-7
5
76-8
0
OO
wl
al
ri=
PE
R C
EN
T O
F P
OP
ULA
TIO
N
OD
a0o
O
aM
ean
= 3
5.3
.
1-5
6-10
11-1
5
16-2
0
21-2
5
26-3
0
31-3
5
3640
41-4
5
46-5
0
51-5
5
56-6
0
Mea
n =
38.
2
PE
R C
EN
T O
F P
OP
ULA
TIO
N
1-6
OD
00
a 0
..... .
...M
ean
= 3
2.4
Mea
n =
34.
4P
g
axi
2a
xi 2
1111
I.."
is1
caw
1111 11
1
4%
1111 O
W
4

PE
R C
EN
T O
F P
OP
ULA
TIO
NW
2)
14.
Iii *
0ba
WA
tco
ID cst
oCI
4'
co1%
.10
1-5
6-10
11-1
5
16-2
0
21-2
5
26-3
0
31-3
5
36-4
0
41-4
5
46-5
0
51-5
5
56-6
0
61-6
5
66-7
0
71-7
5
76-8
0
81-8
5
86-9
0
91-9
5
96-1
00
101-
105
106-
110
111-
115
116-
120
121-
125
126-
130
131-
135
136-
140
141-
145
145-
150
C 0 0

1-5
6-10
11-1
5
16-2
0
21-2
5
26-3
0
31-3
5
36-4
0
41-4
5
46-5
0
51-5
5
56-6
0
61-6
5
66-7
0
71 -
75
76-8
0
81-8
5
86-9
0
91-9
5
96-1
00
101-
105
PE
R C
EN
T O
F P
OP
ULA
TIO
N
9.6
CO
/ Ot0
00
p
Mea
n =
59.
1
Mea
n =
61.
7
PE
R C
EN
T O
F P
OP
ULA
TIO
NC
h
0e-
e1.
1A
AC
ON
1-5
6-10
11-1
5
16-2
0
21-2
5
26-3
0
P)
0, x
i Z O
xi Z
1111
1111
1111
co 9
) 42
coC
hI%
)
4;. V
to
C)
O, x
i zz
0,11
1.1
.11
9,11
61c1
1
1.0
o
cncr
C)
rn
91co
I%)
(.4

Male Female Possible
Arithmetic Fundamentals
Range of Scores 10-75 5-65
Mean Scores 34.7 31.2
Total Reading
Range of Scores 25-135 15-120
Mean Scores 70.7 70.7
Reading Comprehension
Range of Scores 10-80 5-65
Mean Scores 37.5 36.1
Reading Vocabulary
Range of ScoresMean Scores
*Total Language
Range of ScoresMean Scores
Mechanics of English
Range of ScoresMean Scores
Spelling
Range of ScoresMean Scores
0-60 5-5533.1 34.6
20-12573.4
15-9658.8
0-3014.6
5-75
0-150
5-80
0-60
25-120 1-12983.4
10-9665.3
0-3017.7
1-100
0-30
*Chi square analysis revealed a significant difference (.05
level) between males and females on Total Language.
(X2 = 9.28, df ='3.)
ETHNIC GROUPING ANALYSIS
Total Arithmetic
Range of ScoresMean Scores
ANGLO MEXICAN-AMERICAN POSSIBLE
15-12160.5
186
25-11550.3
0-121

Arithmetic Reasoning
ANGLO MEXICAN-AMERICAN POSSIBLE
0-5025.1
10-5021.1
11-66
0-55
1-80
Range of ScoresMean Scores
Arithmetic Fundamentals
Range of Scores 5-76Mean Scores 35.4 29.2
Total Reading
Range of Scores 15-136 26-110 1-146Mean Scores 72.9 66.3
Reading Comprehension
Range of Scores 6-81 15-61 6-81Mean Scores 38.7 33.6
Reading Vocabulary
Range of Scores 0-60 6-56 0-60Mean Scores 34.2 32.4
Total Language
Range of Scores 20-125 35-110 1-129Mean Scores 76.7 76.1
Mechanics of English
Range of Scores 10-96 26-86 1-100Mean Scores 61.2 60.3
Spelling
Range of Scores 0-30 0-30 0-30Mean Scores 15.4 15.9
While no significant differences were found between the
Anglo and Mexican-American populations, in general, the mean
scores obtained by the Anglos were higher than those of the
Mexican-Americans.
187

3. The CAT as a Diagnostic Tool
It is possible to use the CAT as a diagnostic measure
as well as an achievement measure. For Project purposes,
diagnosis begins with an analysis of the subject area
scores and proceeds through analyses of various sub-tests.
The percentage of right responses to items on the CAT
was compared to ninth grade population norms. (See Figure
88.) Comparisons to these norms were made for the Valley
High population. For total population comparisons, see
Figures 89 - 92. From these and other data which present
analyses of learning difficulties in terms of sex (Figures
93 - 96), ethnic (Figures 97 - 100), and attendance groupings
(Figures 101 - 104); it seems clear that the Valley High
School population has the same strengths and weaknesses
as does a normal junior high population, but at a lower
level of proficiency. In effect, the line for the Valley
High population follows the same pattern as that of the
normal junior high population. The lower level of proficiency
indicates greater learning difficulty for the Valley High
student.body. This line can be indicated as follows:
Area Scores
Reading Vocabulary
Reading Comprehension
Arithmetic Fundamentals
Percent CorrectResponses, 9thGrade Norms
189
71
67
73
Percent CorrectResponses, ValleyHigh School
59
42
43

ATTENDANCE GROUPING A GROUP B GROUP POSSIBLE
Total Arithmetic
Range of ScoresMean Scores
Arithmetic Reasoning
Range of ScoresMean Scores
Arithmetic Fundamentals
Range of ScoresMean Scores
Total Reading
Range of ScoresMean Scores
Reading Comprehension
Range of ScoresMean Scores
Reading Vocabulary
Range of ScoresMean Scores
Total Language
Range of ScoresMean Scores
Mechanics of English
Range of ScoresMean Scores
Spelling
Range of ScoresMean Scores
15-12057.2
0-5023.2
10-7634.0
15-13072.7
5-7538.2
5-5534.4
20-12077.0
15-9561.7
0-3015.2
25-11557.6
0-5024.8
6-7632.8
15-13567.7
5-8035.3
0-6032.4
25-12576.0
10-9559.7
0-3016.1
1-135
0-50
6-76
1-150
1-85
0-60
0-130
0-100
0-30
The above data indicate little or no difference between the
scores achieved by the two attendance groupings.
188
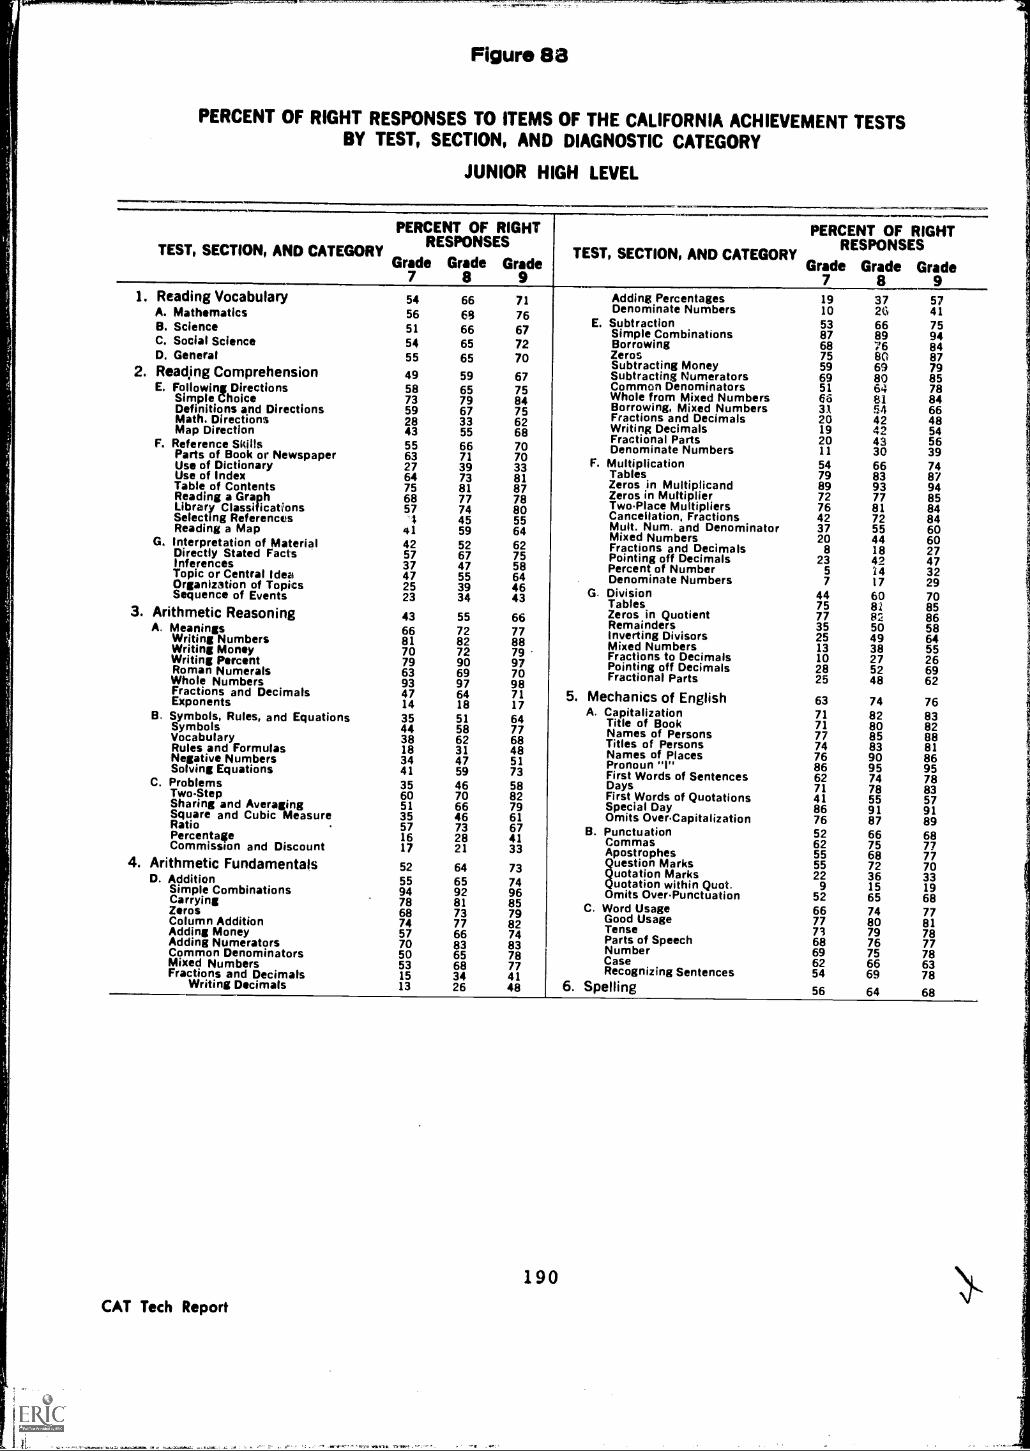
Figure as
PERCENT OF RIGHT RESPONSES TO ITEMS OF THE CALIFORNIA ACHIEVEMENT TESTSBY TEST, SECTION, AND DIAGNOSTIC CATEGORY
JUNIOR HIGH LEVEL
111101.111RMIFIEWM.RIMII
PERCENT OF RIGHT
TEST, SECTION, AND CATEGORYRESPONSES
Gra7 de Grade Gra9 de8
TEST, SECTION, AND CATEGORY
PERCENT OF RIGHTRESPONSES
Grade7
Grade Grade8 9
1. Reading VocabularyA. MathematicsB. ScienceC. Social ScienceD. General
2. Reading ComprehensionE. Following Directions
Simple ChoiceDefinitions and DirectionsMath, DirectionsMap Direction
F. Reference SkillsParts of Book or NewspaperUse of DictionaryUse of IndexTable of ContentsReading a GraphLibrary ClassificationsSelecting ReferencesReading a Map
G. Interpretation of MaterialDirectly Stated FactsInferencesTopic or Central IdeaOrganization of TopicsSequence of Events
3. Arithmetic ReasoningA. Meanings
Writing NumbersWriting MoneyWriting PercentRoman NumeralsWhole NumbersFractions and DecimalsExponents
B. Symbols, Rules, and EquationsSymbolsVocabularyRules and FormulasNegative NumbersSolving Equations
C. ProblemsTwoStepSharing and AveragingSquare and Cubic MeasureRatioPercentageCommission and Discount
4. Arithmetic FundamentalsD. Addition
Simple CombinationsCarryingZerosColumn AdditionAdding MoneyAdding NumeratorsCommon DenominatorsMixed NumbersFractions and Decimals
Writing Decimals
54 6656 6951 6654 65
71766772
55 65 70
49 59 6758 6573 7959 67
4328 33
5555 6663 7127 3964 7375 8168 7757 74
4 4541 5942 5257 6737 4747 5525 3923 34
7584756268707033818778805564627558
4664
43
43 55 6666 7281 8270 7279 9063 6993 9747 6414 1835 5144 5838 6218 3134 4741 59
6035 40 6
751 6635 4657 7316 217 21
8877
799770987117647768485173
8258
79
6761
3341
52 64 7355 6594 9278 8168 7374 7757 6670 8350 6553 6815 3413 26
9674
7985
82748378774148
Adding PercentagesDenominate Numbers
E. SubtractionSimple CombinationsBorrowingZerosSubtracting MoneySubtracting NumeratorsCommon DenominatorsWhole from Mixed NumbersBorrowing, Mixed NumbersFractions and DecimalsWriting DecimalsFractional PartsDenominate Numbers
F. MultiplicationTablesZeros in MultiplicandZeros in MultiplierTwoPlace MultipliersCancellation, FractionsMult. Num. and DenominatorMixed NumbersFractions and DecimalsPointing off DecimalsPercent of NumberDenominate Numbers
G. DivisionTablesZeros in QuotientRemaindersInverting DivisorsMixed NumbersFractions to DecimalsPointing off DecimalsFractional Parts
5. Mechanics of EnglishA. Capitalization
Title of BookNames of PersonsTitles of PersonsNames of PlacesPronoun "I"First Words of SentencesDaysFirst Words of QuotationsSpecial DayOmits OverCapitalization
B. PunctuationCommasApostrophes
uestion Marksuotation Marksuotation within Quot.
Omits OverPunctuationC. Word Usage
Good UsageTenseParts of SpeechNumberCaseRecognizing Sentences
6. Spelling
19 37 5710 26 4153 66 7587 89 9468 76 8475 80 8759 69 7969 80 8551 64 7866 1 843A 5
8466
20 42 4819 42 5420 43 5611 30 3954 66 7479 83 8789 93 9472 77 8576 81 8442 72 8437 55 6020 44 608 1 27
23 42 475 14 327 17 29
44 60 7075 8; 8577 82 8635 50 5825 49 64
1013 38 56 5
27 2628 52
66925 48 2
63 74 7671 82 8371 80 8277 85 8874 83 8176 90 8686 95 9562 74 7871 78 8341 55 5786 91 9176 87 8952 66
75 7768
6255 68 7
77055 7222 36 33
9 15 1952 65 6866 7
8478777 0 1
67379 78
8 76 7769 75 7862 66 6354 69 78
56 64 68
190CAT Tech Report

11
C
3
Per cent correct
g a IS
4//
p
Reading Vocabulary
Mathematics
Science
Social Science
General
Reading Comprehension
Follow Directions
Simple Choice
Definitions and Directions
Math. Directions
Map Direction
Reference Skills
Parts of Book or Newspaper
Use of Dictionary
Use of Index
Table of Contents
Reading a Graph
Library Classifications
Selecting References
Reading a Map
Interpretation ofMaterial
Directly Stated Facts
Inferences
Topic or Central Idea
Organization of Topics
Sequence of Events

Ocn
0urn
-ri
cnrn
rn
C
21,
rn
rU)
Plow Cent of Right Responses
0 0 g 1st t s 0 1§4
Arithmetic Fundamentals
Addition
Simple Combinations(tarrying
Zeros
Column Addition
Adding Money
Adding NumeratorsCommon Denominators
Mixed Numbers
Fractions and Decimals
Writing Decimals
Adding Percentages
Denominate Numbers
Subtraction
Simple Combinations
Borrowing
Zeros
Subtracting Money
Subtracting Numerators
Common Denominators
Whole from Mixed Numbers
Borrowing, Mixed Numbers
Fractions and Decimals
Writing Decimals
Fractional Parts
Denominate Numbers
Laloft ea%
se
Tables
Zeros in Multiplicand
Zeros in Multiplier
TwoPlace Multipliers
Cancellation, Fractions
Mult. Num. and Denominator
Mixed Numbers
Fractions and Decimals
Pointing Off Decimals
Per cent of Number
Denominate Numbers
Division
Tables
Zeros in Quotient
Remainders
Inverting Divisors
Mixed Numbers
Fractions to Decimals
Pointing off Decimals
Fractional Parts

0 0Per Cent Correct8 8tS 0
co
?I' ZO,
Fl io,
v
Itv v
Arithmetic Reasoning
I0C=
Meanings
00
P//t%
X
Sala---..... IIINIme waft
.00
Writing Numbers
Writing Money
Writing Percent
Roman Numerals
Whole Numbers
Fractions and Decimals
Exponents
ZXin 3ill x
-0 rn12 12 "4.o
I 1
000 too ... 001
waft ft.. ...
r ;,"Ix rin
Symbols, Rules & Equations
'ti/iI%
1\)
Symbols
Vocabulary
Rules and Formulas
Negative Numbers
Solving Equations
-a 0 i-.o i-p it Problems
/iSharing
de
7...i
Two-step
and Averaging
Square and CubicMeasure
Ratio
Percentage
Commission and Discount
1

0o 00o 0 o 0 g §ir W 46
V V
Mechanics of English
Capitalization
Title of Book
Names of Persons
Titles of Persons
Names of Places
Pronoun "I"
First Words of Sentences
Days
First Words of Quotations
Special Day
Omits Overcapitalization
Punctuation
Commas
Apostrophes
Question Marks
Quotation Marks
Quotation Within Quote
Omits Over-Punctuation
Word Usage
Good Usage
Tense
Parts of Speech
Number
Case
RecognizingSentences
Spelling

rn
CI
O
cn
CI
cncn
Or-rn
cn >rn z
C)
OTI
C
cn
rn
C)
-Irncn
cn
0 0
2O
3
0
PERCENT OF POPULATION
0 0 CO0
oo
00000000
400
Reading Vocabulary
Mathematics
Science
Social Science
General
Reading Comprehension
Follow Directions
Simple Choice
Definitions and Directions
Math. Directions
Map Direction
Reference Skills
Parts of Book or Newspaper
Use of Dictionary
Use of Index
Table of Contents
Reading a Graph
Library Classifications
NO DATA eo 1( SEX Selecting References
NO DATA BY 'belt Reading a Map
?Interpretation ofMaterial
Directly Stated Facts
Inferences
Topic or Central Idea
Organization of Topics
Sequence of Events

(0
11
0 O($.10
PERCENT OF POPULATION
O O O OcoO O
,-600
, ..... ow°.... goo. : ..... mooIV. V',, NI.
ern1°..'" ao.4. 0
.46ic al,111%,
"11/
II.
c
F.
01,
... a...0000000
dl,
oo 1.1; oo0AA
.-orbar s"
..............
.11."ri...............
.0.111% fir1011%AVM% it
e*** fAA
Arithmetic Fundamentals
Addition
Simple Combinations
Carrying
Zeros
Column Addition
Adding Money
Adding Numerators
Common Denominators
Whole from Mixed Numbers
Fractions and Decimals
Writing Decimals
Adding Percentages
Denominate Numbers
Subtraction
Simple Combinations
Borrowing
Zeros
Subtracting Money
Subtracting Numerators
Common Denominators
Whole from Mixed Numbers
Borrowing, Mixed Numbers
Fractions and Decimals
Writing Decimals
Fractional Parts
Denominate Numbers
Multiplication
Tables
Zeros in Multiplicand
Zeros in Multiplier
TwoPlace Multipliers
Cancellation, Fractions
Mult. Num. and Denominator
Mixed Numbers
Fractions and Decimals
Pointing Off Decimals
Per cent of Number
Denominate Numbers
Division
Tables
Zeros in Quotient
Remainders
Inverting Divisors
Mixed Numbers
Fractions to Decimals
Pointing off Decimals
Fractional Parts

Per Cent Correct04 IN3 4.41 A 4.71 cn 4 CO
0 0 0 0 0 o 0 0
30CO Ca=
Ve tI1 .:4°°°°°°
..,res °°° 00.00"*.°.0*.0;;;;;45.:::
AftIPIA +NorNur gadhs$1114
laaw:INI:Talli ::::816
fole °°
...... :::,fe...... ..10
.. .00"°.
Arithmetic Reasoning
Meanings
Writing Numbers
Writing Money
Writing Percent
Roman Numerals
Whole Numbers
Fractions and Decimals
Exponents
Symbols, Rules & Equations
Symbols
Vocabulary
Rules and Formulas
Negative Numbers
Solving Equations
Problems
Two-step
Sharing and Averaging
Square and CubicMeasure
Ratio
Percentage
Commission and Discount

PERCENT OF POPULATION
O o o o o O O o co to co
rt ..
'1
rnm X
CD
coo
cts
3x zo
m
4
St.
000000
00000
0t
5O
,...° 0°40.
Mechanics of English
Capitalization
Title of Book
Names of Persons
Titles of Persons
Names of Places
Pronoun "1"
First Words of Sentences
Days
First Words of Quotations
Special Day
Omits Overcapitalization
Punctuation
Commas
Apostrophes
Question Marks
Quotation Marks
Quotation Within Quote
Omits Over-Punctuation
Word Usage
Good Usage
Tense
Parts of Speech
Number
Case
RecognizingSentences
Spelling

O
Reading Vocabulary
Mathematics
Science
Social Science
General
Reading Comprehension
Follow Directions
Eca
0. 100*or°
t\i
Simple Choice
Definitions and Directions
Math. Directions
Map Direction
Reference Skills
Parts of Book or Newspaper
Use of Dictionary
76
Use of Index
Table of Contents
Reading a Graph
Library Classifications
Selecting References
Reading a Map
Interpretation ofMaterial
Directly Stated Facts
inferences
Topic or Central Idea
Organization of Topics
Sequence of Events

0
Per Cent of Right Responses
0 0 0
.re
%.10 co0 01-4
0
41
......4.! *ow,
..........
1"..
< 1/.....601 WW1
OaWI.... gill° Wig.
Arithmetic FundamentaliAddition
711 Simple Combinations
Carrying
Zeros
Column Addition
Adding Money
Adding Numerators
Common Denominators
Mixed Numbers
Fractions and Decimals
Writing Decimals
Adding Percentages
Denominate Numbers
Subtraction
sc'.041(/...... ... ....Simple CombinationsBorrowing
Zeros
Subtracting Money
Subtracting Numerators
Common Denominators
Mixed Numbers
Borrowing, Mixed Numbers
Fractions and Decimals
Writing Decimals
Fractional Parts
Denominate Numbers
Multiplication
Tables
Zeros in Multiplicand
Zeros in Multiplier
Two-Place Multipliers
Cancellation, Fractions
Mult. Num. and Denominator
Mixed Numbers
Fractions and Decimals
Pointing Off Decimals
Per cent of Number
Denominate Numbers
Division
."4111..
04:
...............P ..
11011.
11...
froo,gzadisaft.
..................
a. ...0-
......
.0 °I
Tables
Zeros in Quotient
Remainders
Inverting Divisors
Mixed Numbers
Fractions to Decimals
Pointing off Decimals
Fractional Parts
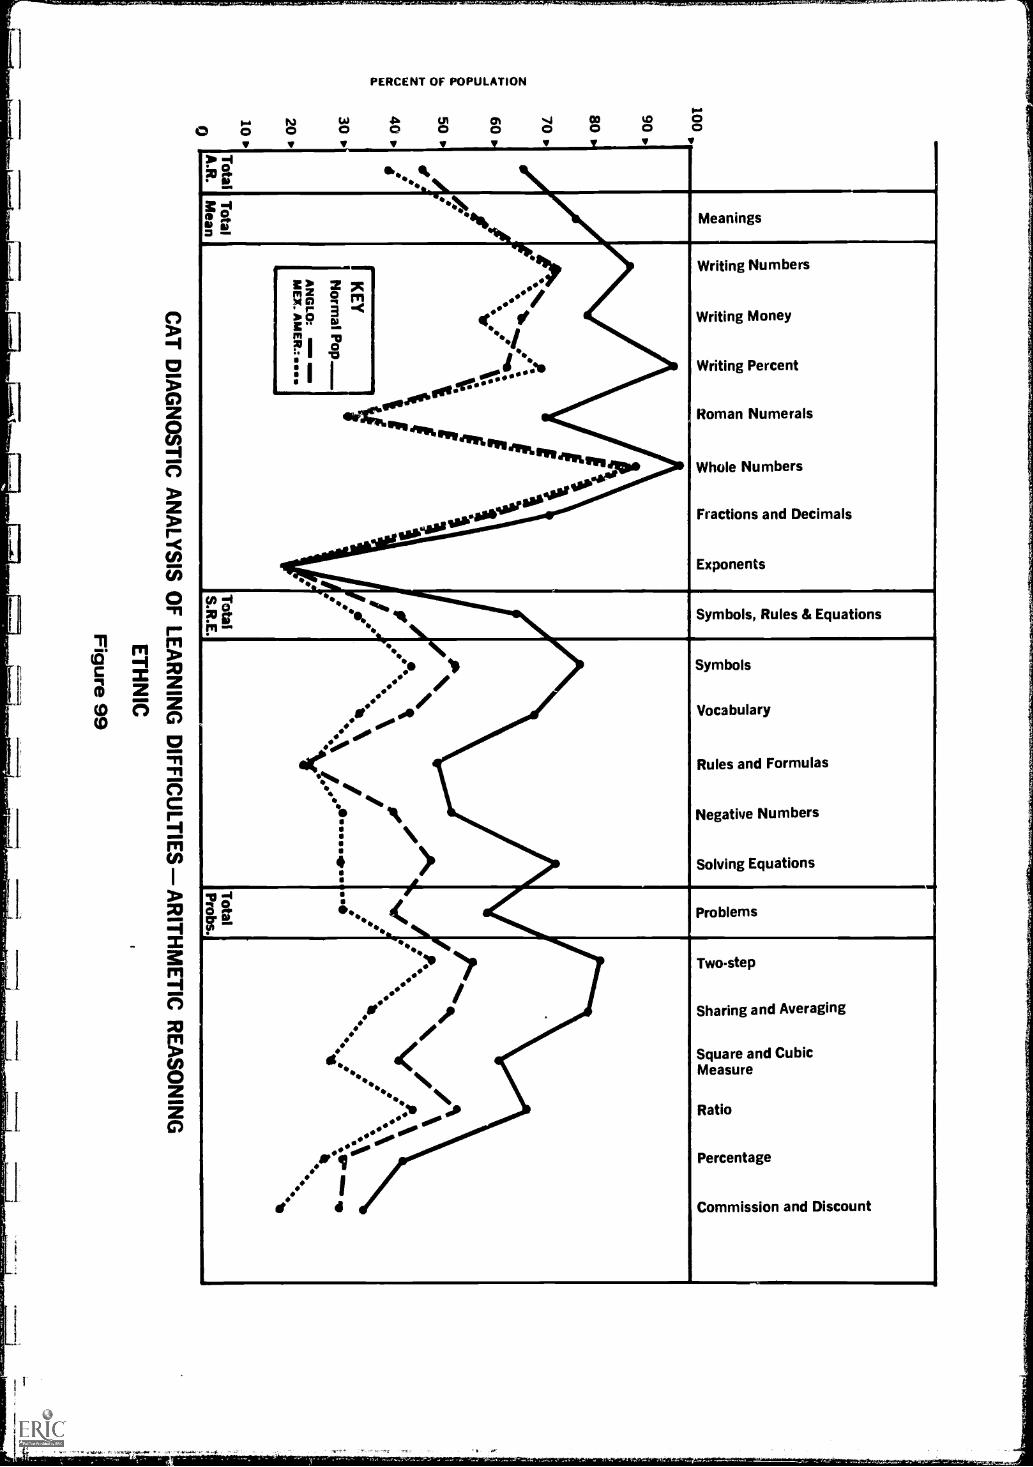
11 riiaCiii Zcoco
5
L.
PERCENT OF POPULATION
0-I 10.4.1 411.0 0 0 oo0 0 0
30 -,m a
64.....
311111.1.11EM1111111 Meanings
i .....40:"":1-..
011`oeova dim._
wvilowin. proIvy Ann
Writing Numbers
Writing Money
Writing Percent
Roman Numerals
Whole Numbers
Fractions and Decimals
Exponents
E 3"pi> 9CniP I
: Ie
zx9. m3 -w-o13
I
:,
.
ill6 rt Symbols, Rules & Equations
... 10
0.0..-
0Se _,,, A/o./
4tic:.. .%
%,,
N\'a
. y
Symbols
Vocabulary
Rules and Formulas
Negative Numbers
Solving Equations
-0 Izia n
0)
a
o Problems
i
/#/
e: A00- 0.0I...r4
Two-step
Sharing and Averaging
Square and CubicMeasure
Ratio
Percentage
Commission and Discount

CI
C7
CI
zre--<
0-n
Li)
-71-n
Cr-FriCA
C
m
m
Per Cent of Right Responses- M W 010 e e 0 0 eEnglishMechanics
c 3i It r)
s) e73 2
Capitalization
">hli
44: t
ita
1
0*...4.
4I 44
a
Title of Book
Names of Persons
Titles of Persons
Names of Places
Pronoun "I"
First Words of Sentences
Days
First Words of Quotations
Special Day
Omits Overcapitalization
.
pc
P11
..
I
E 30m zc, .4r-
11 9
I
I
I
I
z0 rriNiC3
0.1
01v
40efri1%
ofI :0 .00 _.
1 , ILI 000414.41
%o
sou ooIsom% oo
els% o,- ..0.7
le A
4:4( Punctuation
IN1.. ,
.0)'.1.41!...
.01.:so°
430.."°./e: oo r
000000 :?....,,,0000000 ....,
o lab .46
Commas
Apostrophes
Question Marks
Quotation Marks
Quotation Within Quote
Omits Over-Punctuation
w e a .1111 .4 11)
OCI CL -Word Usage
/,14
..//ICY
..t_
TS.P
P.5
5
,
Good Usage
Tense
Parts of Speech
Number
Case
RecognizingSentences
cn
1 a Aco
Spelling

to
0
-0 0 1,710 00 cn v coo a 4r)0s-00
. fy
.=JReading Vocabulary
.0-is 0i
Mathematics
Science
Social Science
GeneralI
0 0 2 x3 a 9, qc c 3
tuCO ND
V8
II
;340 0 Reading Comprehension
-Ii. 9,.
CD 0,
.Follow Directions
_,,,,r-le444
.v_...l;
'. Simple Choice
Definitions and Directions
Math. Directions
Map Direction
Reference Skillsx) -Iiv;«7.. r,cn
17--1
.0..0°or4(401.
4. .6ii.:4
.4,
.
...1.... 4:aloos0 $1.-P
% ItI i
Parts of Book or Newspaper
Use of Dictionary
Use of Index
Table of Contents
Reading a Graph
Library Classifications
Selecting References
Reading a Map
-IIka k Interpretation of
Material
./0. i
\:1 ,
I*
Directly Stated Facts
Inferences
Topic or Central Idea
Organization of Topics
Sequence of Events

Gl
0
-..makaamalftakum.1
0
a.ab
0.2
"e)'F
1.40 0 O
PERCENT OF POPULATION
O O
V191
000too
001.j46°.411. 41.4,
a+O O
aoO
toO
14OO
VOW
0
....0°.1
.0,40\woo)
obetize"'"
.......rU..
Arithmetic Fundamentals
Addition
Simple CombinationsCarrying
Zeros
Column Addition
Adding Money
Adding NumeratorsCommon Denominators
Mixed Numbers
Fractions and Decimals
Writing Decimals
Adding Percentages
Denominate Numbers
Subtraction
Simple Combinations
Borrowing
Zeros
Subtracting Money
Subtracting Numerators
Common Denominators
Whole from Mixed Numbers
Borrowing, Mixed Numbers
Fractions and Decimals
Writing Decimals
Fractional Parts
Denominate Numbers
MultiplicationTables
Zeros in Multiplicand
Zeros in Multiplier
TwoPlace Multipliers
Cancellation, Fractions
Mult. Num. and Denominator
Mixed Numbers
Fractions and Decimals
Pointing Off Decimals
Per cent of Number
Denominate Numbers
Division
Tables
Zeros in Quotient
Remainders
Inverting Divisors
Mixed Numbers
Fractions to Decimals
Pointing off Decimals
Fractional Parts

?' 04P)
a rtmtc Raoig;tft l enns=
.
' rtn ubrI-0xa a s .1 /c c m ,. I rtn oeo 3
6... 01 Wiig Pret-'1..-0ise oa ueas- -;;;...
m. . .-.._.. .. .-tid- --. Woe Nmes-'.-j.- Fatos ad Dcml
xoet%; i
r Smos ue qain
ybl...
oauay.
ocl ue n omls\ Ngtv ubr
Slig Eutoss
171 1
r t 1 rbes,...7,, Tose
il Saig ad Aeaig,/s# 4 Sur n ui
esr. Rto--F.-f r Pretg/
1 Cmiso n icut
PERCENT OF POPULATION
0 ,0 tn0 03 t0
o-I00

0 0 0Per Cent of Right Responses
O41. cr, 0 03 $0
00-10
0 0
c ;I Mechanics11 irof English
012 0'
Capitalization
\ \NO, Title of Book
Names of Persons
Titles of Persons
Names of Places
Pronoun "I"
First Words of Sentences
Days
First Words of Quotations
Special Day
Omits Overcapitalization
c'0co
0 0c'0a
111
1
2 7C=-,gy
li
I
I'el
\ \),
II!
/ 1.00 ,..
00 ,-.0 --
< I"_il
70I,1- -,/ --,--
ail,
11)2 ."?OILM11111410111101
Punctuation
,-/--0-
----
,
...,
ei
Commas
Apostrophes
Question Marks
Quotation Marks
Quotation Within Quote
Omits OverPunctuation
C a --1ta.° a '3
ao L' ,A ,
Word Usage
//#!#
,,/ A; /jftIf.,
Good Usage
Tense
Parts of Speech
Number
Case
RecognizingSentences
- / Icn -1
1 2 11.- ib..Spelling

Area Scores
Arithmetic Reasoning
Language:Mechanics of English
Spelling
Percent CorrectResponses, 9thGrade Norms
66
76
68
Percent CorrectResponses, ValleyHigh School
43
62
52
The following chart compares learning difficulty
by sex, ethnic and attendance test population sub-groups
with the CAT norms established by the junior high school
population:
Area Scores
SEX
PercentCorrectResponses9th GradeNorm
Percent PercentCorrect CorrectResponses- Responses-Males Females
Reading Vocabulary 71 59 61
Reading Comprehension 67 44 43
Arithmetic Reasoning 66 45 39
Arithmetic Fundamentals 73 46 43
Language:Mechanics of English 76 59 68
Spelling 68 49 56
ETHNIC
9th Grade Mexican-Area Scores Norms Anglo American
Reading Vocabulary 71 60 56
Reading Comprehension 67 55 37
Arithmetic Fundamentals 73 43 35
207
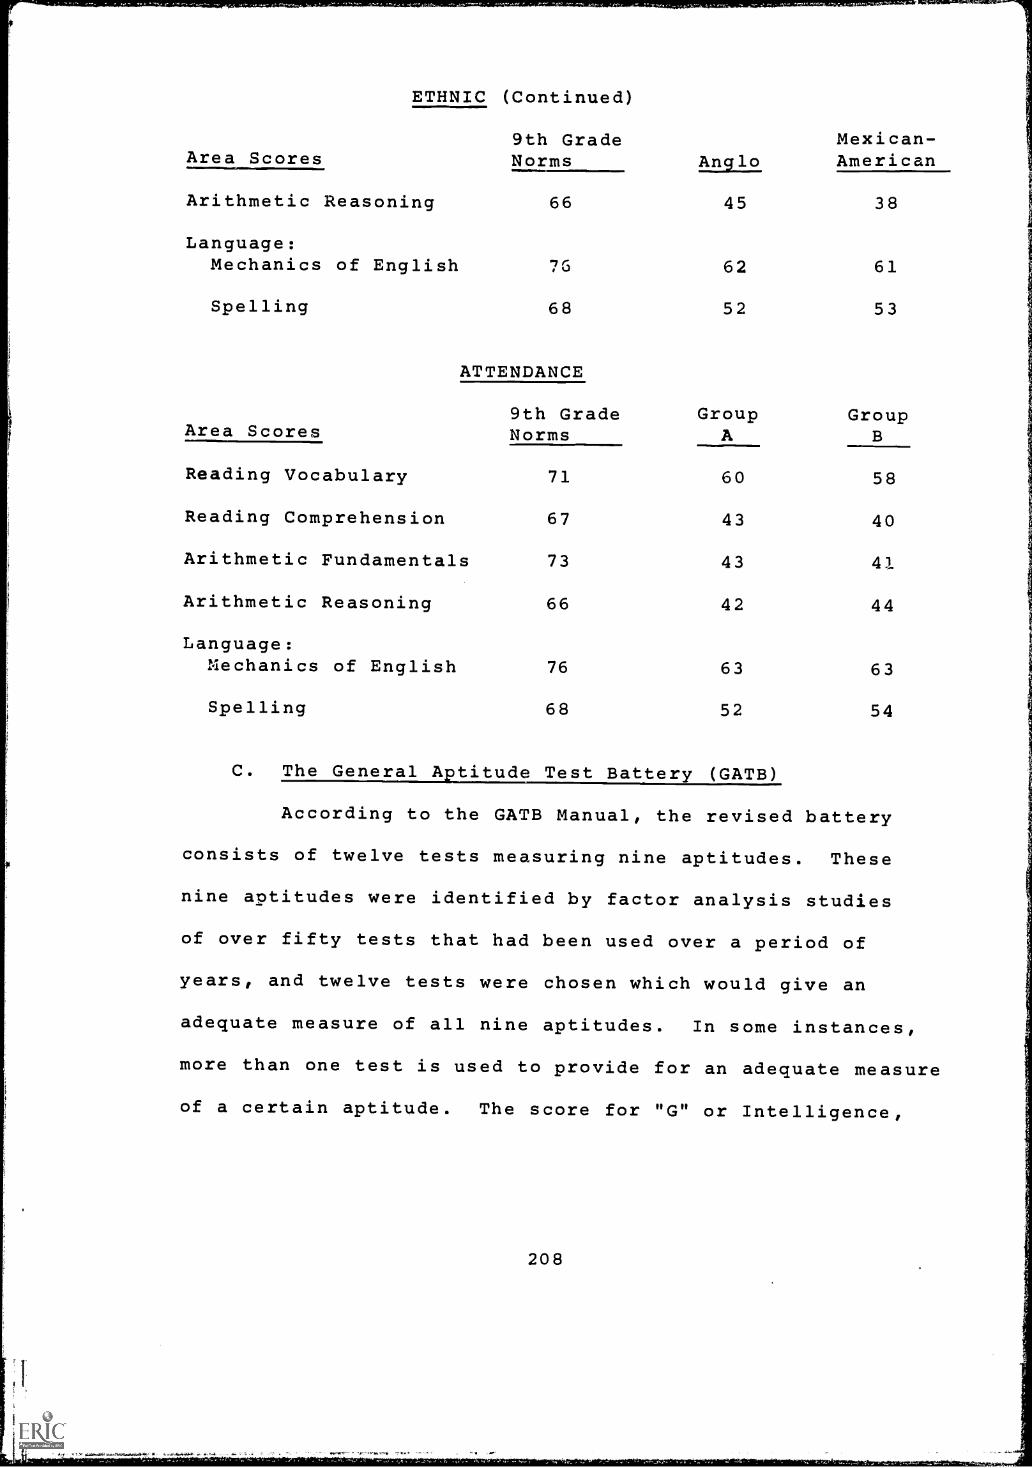
ETHNIC (Continued)
Area Scores9th GradeNorms Anglo
Mexican-American
Arithmetic Reasoning 66 45 38
Language:Mechanics of English 75 62 61
Spelling 68 52 53
ATTENDANCE
9th GradeArea Scores Norms
GroupA
GroupB
Reading Vocabulary 71 60 58
Reading Comprehension 67 43 40
Arithmetic Fundamentals 73 43 41
Arithmetic Reasoning 66 42 44
Language:Mechanics of English 76 63 63
Spelling 68 52 54
C. The General A titude Test Battery (GATB)
According to the GATB Manual, the revised battery
consists of twelve tests measuring nine aptitudes. These
nine aptitudes were identified by factor analysis studies
of over fifty tests that had been used over a period of
years, and twelve tests were chosen which would give an
adequate measure of all nine aptitudes. In some instances,
more than one test is used to provide for an adequate measure
of a certain aptitude. The score for "G" or Intelligence,
208

I I
for example, is obtained from three tests, and the Numerical
Ability or "N" score is obtained from two tests, while the
Verbal Ability or "V" score is obtained from only one test.
Of the twelve tests, eight are paper-and-pencil tests and
four are apparatus tests. The items for the paper-and-
pencil tests were selected and arranged in order of difficulty
after item analysis studies had been conducted to deter-
mine the difficulty level and discriminating power of each
item. All of the paper-and-pencil tests except the Motor
Coordination test are administered with separate answer
sheets which can be scored with an IBM scoring machine.
The nine aptitudes measured by the GATB are G
or Intelligence, V or Verbal Ability, N or Numerical Ability,
S or Spatial Ability, P or Form Perception, Q or. Clerical
Perception, K or Motor Coordination, F or Finger Dexterity,
and M or Manual Dexterity. The reliability coefficients
for these nine aptitudes range from 0.81 to 0.93. These
coefficients were obtained by, the test-retest method. In
other words, the reliability coefficient in each instance
is above 0.80, which may be regarded as an acceptable
reliability coefficient.
1. Aptitudes Measured by the GATB
The nine aptitudes measured by the GATB are listed
below. The letter used as the symbol to identify each
209

aptitude and the part or parts of the GATB measuring
each aptitude are also shown.
LEtitude
G-Intelligence
V-Verbal Aptitude
N-Numerical Aptitude
S-Spatial Aptitude
P-Form Perception
Q-Clerical Perception
K-Motor Coordination
F-Finger Dexterity
Tests
Part 3-Three-Dimensional Space
Part 4-VocabularyPart 6-Arithmetic Reason
Part 4-Vocabulary
Part 2-ComputationPart 6-Arithmetic Reason
Part 3-Three-Dimensional Space
Part 5-Tool MatchingPart 7-Form Matching
Part 1-Name Comparison
Part 8-Mark Making
Part 11-AssemblePart 12-Disassemble
M-Manual Dexterity Part 9-PlacePart 10-Turn
The following are the definitions of the nine aptitudes
measured by the GATB:
G-Intelligence.-General learning ability. The ability to
"catch on" or understand instructions and underlyingprinciples; the ability to reason and make judgments.Closely related to doing well in school. Measured by
Parts 3, 4, and 6.
V-Verbal Aptitude.-The ability to understand meaning ofwords and to use them effectively. The ability tocomprehend language, to understand relationships betweenwords and to understand meanings of whole sentences
and paragraphs. Measured by Part 4.
210

N-Numerical Aptitude.-Ability to perform arithmetic oper-ations quickly and accurately. Measured by Parts 2 and 6.
S-Spatial Aptitude.-Ability to think visually of geometricforms and to comprehend the two-dimensional representationof three-dimensional objects. The ability to recognizethe relationships resulting from the movement of objectsin space. Measured by Part 3.
P-Form Perception.-Ability to perceive pertinent detail inobjects or in pictorial or graphic material. Ability tomake visual comparisons and discriminations and see slightdifferences in shapes and shadings of figures and widthsand lengths of lines. Measured by Parts 5 and 7.
Q-Clerical Perception.-Ability to perceive pertinentdetail in verbal or tabular material. Ability to observedifferences in copy, to proofread words and numbers,and to avoid perceptual errors in arithmetic computation.Measured by Part 1.
K-Motor Coordination.-Ability to coordinate eyes and handsor fingers rapidly and accurately in making precisemovements with speed. Ability to make a movement re-sponse accurately and swiftly. Measured by Part 8.
F-Finger Dexterity.-Ability to move the fingers, and ma-nipulate small objects with the fingers, rapidly oraccurately. Measured by Parts 11 and 12.
M-Manual Dexterity.-Ability to move the hands easily andskillfully. Ability to work with the hands in placingand turning motions. Measured by Parts 9 and 10.
2. Who Is Referred for the GATB?
The GATB is administered to applicants who have
not yet chosen a field of work or who are uncertain as to the
wisdom of their choice. Among the groups usually tested
are (1) high school graduates with no specialized training;
(2) young people who are uncertain as to their abilities;
(3) experienced workers who want to or must change their
211

NINE APTITUDES MEASURED BYTWELVE TESTS IN THE
GENERAL APTITUDE TEST BATTERY 61002

rt
field of work; (4) any applicant who has not discovered
his aptitudes through training or experience; (5) any
applicant suspected of having untapped abilities; and, (6)
those with a number of interests and who have difficulty
in choosing among a number of seemingly suitable fields.
The base population for the GATB general working
population norms study is the employed labor force in
the age range of eighteen to fifty-four, as recorded in
the 1940 census report and adjusted on the basis of the
1950 census report. The mean age for the norming sample
was 30.4 years with a standard deviation of 9.9;
the mean e.ducation was 11.0 years with a standard devi-
ation of 2.6. According to the census data, the median
educational level for the general working population
is 10.2 years for males, and 11.7 years for females.
(U.S. Department of Commerce, Bureau of the Census, 1949.)
The Manual for the General Aptitude Test Battery, Section
III, 1967, states that adult aptitude norms should be
used with high school juniors and seniors and for out-of-
school youth; adult norms should be used with those who are
at least sixteen years.
The mean standard score for all aptitudes measured
by the GATB is 100.00 for the normal population. For the
Valley High population means are as follows:
213

Valley High MeanAptitude (Total Pop.),
Intelligence 84.43
Verbal 85.27
Numerical 78.28
Spatial 100.23*
Form Perception 98.12
Clerical Perception 94.88
Motor Coordination 90.39
Finger Dexterity 90.95
Manual Dexterity 94.65
*This mean may reflect the fact that men tend to scorehigher on spatial aptitude than do women. Since theratio at Valley High School is approximately threemales to one female, the 100.23 mean score may respre-sent the male bias more than a developed spatial apti-tude.
3. Score Distribution of Valley High Population AsCompared With the Normal Population:
The following charts compare the Valley High test
population to the normal in terms of performance on the various
sections in the GATB.
StandardScores
Valley HighStudents
NormalPopulation
Intelligence (G) 50-70 15.1% 6.0%70-90 54.0% 24.0%90-110 26.4% 40.0%110-130 3.6% 24.0%130-150 0.0% 6.0%
Verbal (V) 50-70 5. 3% 6.0%70-90 51.5% 24.0%90-110 31.8% 40.0%110-130 0.0% 24.0%130-150 0.0% 6.0%
214

Standard Valley High NormalScores Students Population
Numerical (N) 50-7070-9090-110
110-130130-150
Spatial (S) 50-7070-9090-110
110-130130-150
Form Perception (P) 50-7070-9090-110
110-130130-150
Clerical Perception (Q) 50-7070-9090-110110-130130-150
Motor Coordination (K) 50-7070-9090-110110-130130-150
Finger Dexterity (F) 50-7070-9090-110
110-130130-150
Manual Dexterity (M) 50-7070-9090-110
110-130130-150
215
33.6%32.0%22.1%3.2%0.0%
2.0%40.2%30.4%23.6%2.9%
4.7%29.2%41.2%21.2%4.7%
1.9%38.4%49.0%9.6%1.0%
10.6%45.0%23,2%13.0%0.0%
20.5%29.1%36.2%14.5%2.4%
11.3%25.0%46.6%17.1%0.0%
6.0%24,0%40.0%24.0%6.0%
6.0%24.0%40.0%24.0%6.0%
6.0%24.0%40.0%24.0%6.0%
6.0%24.0%40.0%,24.0%6.0%
45.0%24,0%40.0%24.0%6.0%
6.0%24.0%40.0%24.0%6.0%
6.0%24.0%40.0%24.0%6.0%

Only in categories F, Q, P and S did the Valley
High students score between 130-150. Scores at the 110-
130 level were approximately equal to that of the normal
population in Spatial, and above the normal population
in Clerical Perception. Scoring in Form Perception was
also slightly above the normal in the 90-110 range. (See
Figures 105 - 113.)
4. Distribution of GATE Mean Standard Scores bySex, Attendance, and Ethnic Groupings
The following charts report GATE data for the
Valley High School test population in terms of the comparative
subgroupings:
Distribution of Scores: Sex(See Figure
Mean Score
114)
Mean ScoreAptitude Males Females
Intelligence 85.5 82.4
Verbal 85.7 82.3
Numerical 79.0 81.8
Spatial 99.6 95.3
Form Perception 94.2 107.0*
Clerical Perception 93.5 96.6
Motor Coordination 87.6 93.8
Finger Dexterity 89.6 96.8
Manual Dexterity 93.4 95.3
*X 2 = 11.68; df = 4; significance at the .05 level.
216

50
49
48
47
46
45
44
43
42
41
40
39
38
37
36
35
34
33
32
31
30
29
28
27
26
25
24
23
22
21
20
19
18
17
16
15
14
13
12
11 10.3IMO
10
9
8
7
65.2.j413I2
2.0
1
4.0
28.6
r-I
25.4 IOM MIN MIMI WWI.
3
2
15.0 I
U
1
80
9.0111111111111111110111111MMIMMI,
50 60 70
20.0 20.0
Pa
KEY
1=1 Normal Population
Normal Mean 100.00
V.N.S. Sample. N=105
Sample Mean 84.43
Figure 105
GATB STANDARD SCORESINTELLIGENCE
15.0
1
II
I
9.04
4.0
140j41 2484014'44441111441414044M1'114.
90 100 110 120 130 140 150
2.0
STANDARD SCORES

El
4
1
50
49
48
47
46
45
44
43
42
41
40
39
38
37
36
35
34
33
32
31
30
O 29
2
28
26
25
C.)24
a 23LaJ
0- 22
21
20
19
18
17
16
15
14
13
12
11
10
98
7
6
5
4
3
2
1
2.0
5.3
4.0
33.9
log ao. we ton
KEY
Normal Population
Normal Mean 100.00
V.H.S. Sample, N=.94
Sample Mean 85.27
Figure 106
GATB STANDARD SCORESVERBAL
15.0
=
9.0
4.0
50 60 70 80 90 100 110 120 130
STANDARD SCORES
2.0
140 150

50
49
48
47
46
45
44
43
42
41
40
39
38
37
36
35
34
33
32
31
30
0 29
J 28
270 26
I-- 25
24
ir 23
0- 22
21
20
19
18
17 16.8 16.8
16
15
14
13
12
11
10
9
8
7
6
5 4.04
32.0
2
1
17.9
24.1
15.0
I
IA ..
50 60 70 80
20.0
10.5
KEY
Normal Population
Normal Mean 100.00
V.H.S. Sample, N=96
Sample Mean 78.28
Figure 107
GATB STANDARD SCORESNUMERICAL
15.0
2.1
9.0
4.0
2.0
A A
90 100 110 120 130 140 150
STANDARD SCORES

II
z0
0
50
49
48
47
46
45
44
43
42
41
40
39
38
37
36
35
34
33
32
31
30
29
28
27
26
25
24
23
22
21
20
19
18
17
16
15
14
13
12
11
10
9
8
7
6
S
4
3
2
1
4.0
I
' A50 60 70 80 90 100 110 120 130 140 150
STANDARD SCORES
20.6
19.6
9.0
I
21.6
20.0 20.0
KEY
Normal Population
Normal Mean 100.00
V.H.S. Sample, N=102
Sample Mean 100.2
Figure 108
GATB STANDARD SCORESSPATIAL PERCEPTION
17.6
15.0 15.0
9.0
4.0I 2.92.0
A

50
49
48
47
46
45
44
43
42
41
40
39
38
37
36
35
34
33
32
31
30
29
28
27
26
25
24
23
22
21
20
19
18
17
16
15
14
13
12
11
10
9
8
7
6
11.5
9.0
17.7
15.0
0000
2I 22.4
20.0 20.0
Ma
I
KEY
Normal Population
Normal Mean 100.00
V.H.S. Sample, N=85
Sample Mean 98.12
Figure 109
GATB STANDARD SCORESFORM PERCEPTION
15.3
45.p
9.0
5;9
5 4.74.0
4
3
2
1
3.5
2.01.2
2.0
50 60 70 80 90 100 110
STANDARD SCORES
120 130 140 150

50
49
48
47
46
45
44
43
42
41
40
39
38
37
36
35
34
33
32
31
30
29
28
27
26
25
24
23
22
21
20
19
18
17
16
15
14
13
12
11
10
9
8
7
6
5
4
3
22.0
9.0
4.0 1
p
31.7 31.7
20.0 20.0
I
I17.3
I
KEY
Normal Population
Normal Mean 100.00
V.H.S. Sample, N=104
um. am, Sample Mean 94.88
Figure 110
GATB STANDARD SCORESCLERICAL PERCEPTION
15.01
15.0
I
I
1
I
t7717
A
II
II
I
9.0
19
4.0
1 A A.......... ,A A
1,0
50 60 70 80 90 100 110 120 130
IV, .1,-.110.041.-
STANDARD SCORES
2.0
140 150

GI
5 4.7
22.5 22.5
9.0
5.9
4.04
3
2
1
15.0
II
I
20.0 20.0
17.8
KEY
Normal Population
Normal Mean 100.00
V.H.S. Sample, N=86
Sample Mean 90.39
Figure 1 1 1
GATB STANDARD SCORES
MOTOR COORDINATION
15.0
0.7I
I
I
I
I
2.0
9.0
23
4.0
' A A
50 60 70 80 90 100 110 120 130 140 150
STANDARD SCORES

I
50
49
48
47
46
45
44
43
42
41
40
39
38
37
36
35
34
33
32
31
30
29
28
27
26
25
24
23
22
21
20
19
18
17
16
15
14
13
12
11
10
9
87.2
7 !FINN..6
5
4
32.0
2
1
18.1
13.3
9.0
.....-r12S3:30111133,31511111PUIPIIk
KEY
i-71 Normal Population
Normal Mean 100.00
NMI V.H.S. Sample, N=83Sample Mean 90.95
Figure 112
GATB STANDARD SCORES
FINGER DEXTERITY
20.520.0
15.715.0
13,3
15.0
I:ILO
204
I
4.0
A JA, A
II
I
IIIII
, At,
1 9.0
'1.2
4.0
2.42.0
50 60 70 80 90 100 110 120 130 140 150
STANDARD SCORES

50
49
48
47
46
45
44
43
42
41
40
39
38
37
36
35
34
33
32
31
30
2 291
28
2a. 270 26I 25Lir 24
et 23Lira. 22
21
20
19
18
17
16
15
14
13
12
11
10
9
8
7
6
5
4 3.43
2.02 ONWPWWW.WI
7.9
11.4
1
9.0
15.0
-13,6
II
25.0 .4
20.0
21.6
20.0
15.0
KEY
Normal Population
Normal Mean 10.0.00
V.H.S. Sample, N=88
Sample Mean 94.65
Figure 1 13
GATB STANDARD SCORES
MANUAL DEXTERITY
9.0
4.0
2.0
..A. A A50 60 70 80 90 100 110 120 130 140 150
STANDARD SCORES

Figure 114
GATB - DISTRIBUTION OF STANDARDSCORES BY SEX
Score
51-60
61-70
71-80
81-90
91-100
101-110
111-120
121-130
131-140
141-150
Intelligence (G)
Male- N=64 Mean=85.5
34.7
12.5
25.0
23.4
18.8
10.9
1.6
3.1
0.0
0.0
Female- N=31 Mean =82.4
6.5
9.7
35.5
16.1
22.6
6.5
3.2
0.0
0.0
0.0
Verbal (V)
Male- N=66 Mean=85.7
0.0
4.5
34.8
28.8
22.7
9.1
0.0
0.0
0.0
0.0
Female- N=32 Mean=87.3
0.0
6.3
15.6
46.9
21.9
9.4
0.0
0.0
0.0
0.0
Numerical (N)
Male- N=65 Mean=79.0
20.0
16.9
20.0
16.9
10.8
12.3
1.5
1.5
0.0
0.0
Female- N=31 Mean -81.8
9.7
16.1
12.9
38.7
12..9
6.5
3.2
0,0
0.0
0.0
Spatial (S)
"Male- N=67 Mean=99.6
1.5
1.5
14.9
17.9
10.4
23.9
17.9
10.4
1,5
0.0
cy."
Female- N=32 Mean=95.3
0.0
0.0
25.0
28.1
6.3
15.6
18.8
0.0
6.3
0.0
Form Perception (P)
Male- N=59 Mean=94.2
6.8
1.7
13.6
22.0
15.3
22.0
11.9
5.1
1.7
0.0
Female- N=28 Mean=107.0
0.0
0.0
7.1
3.6
25.0
21.4
25.0
7.1
10.7
0.0
Clerical Perception (Q)
Male- N=68 Mean=93.5
0.0
3.0
8.8
38.2
23.5
14.7
10.3
0.0
1.5
0.0
Female- N=36 Mean=96.6
0.0
0.0
2.8
22.2
44.4
22.2
2.8
5.6
0.0
0.0
Motor Coordination (K)
Male- N=57 Mean=87.6
5.3
8.8
24.6
21.1
15.8
14.0
8.8
1.8
0.0
0.0
Female- N=29 Mean=93.8
3,4
0.0
17.2
24.1
13.8
24.1
13.8
3.4
0.0
0.0
Finger Dexterity (F)
Male- N=54 Mean=89.6
7.4
16.7
18.5
13.0
20.4
11.1
13.0
0.0
0.0
0.0
Female- N=29 Mean=96.8
6.9
6.9
13.8
3.4
20.7
24.1
13.8
3.4
6.9
0.0
Manual Dexterity (M)
Male- N=58 Mean=93.4
1.7
8.6
12.1
17.2
22.4
24.1
12.1
1.7
0.0
0.0
Female- N=30 Mean=95.3
6.7
6.7
10.0
3.3
23.3
23.3
20.0
3,3
0.0
0.0

Distribution of Scores: Attendance(See Figure 115)
Aptitude
Intelligence
Verbal
Numerical
Spatial
Form Perception
Clerical Perception
Motor Coordination
Finger Dexterity
Manual Dexterity
Group A Group B
84.6 84.4
86.7 85.3
79.8 80.1
97.6 99.3
99.4 96.4
94.6 94.4
91.3 86.8
95.2 86.3
93.5 95.1
No significant differences were found between Group
A and Group B. Group A, however, tended to score slightly
higher in Form Perception, Motor Coordination and Finger
Dexterity than Group B.
Distribution of Scores: Ethnic(Compared with the Normal Population)
(See Figures 116 - 124)
Normal Anglo Mexican-AmericanAptitude Mean Mean Mean
Intelligence 100.0 88.0* 79.6*
Verbal 100.0 87.6 84.4
Numerical 100.0 84.1** 73.7**
Spatial 100.0 100.4 94.6
Form Perception 100.0 100.4 94.7
227

fl
50
49
48
47
46
45
44
43
42
41
40
39
38
37
36
35
34
33
32
'3130
O 29
28
27O 26
25
24
23
22
21
20
19
18
17
16 15.6
15 "111111111
14-13
12:11:10: 9.4
A111111119:8 :7 : 6.7
6-5
4 :3
2'1
4.0
36.7
21.91311111
2.0
9.0
mi
raj
1
02
2
28.1111111141
FF
16.7
15.0
F
FF
21.9I/1111111111
20.0 C 20.0
III
I
I
I
1
I
I
I
I
I
0000
13,3
11111
KEY
I:: 1 Normal PopulationIR ...a Normal Mean 100.00
Anglos (N=60)mil Anglo Mean 88.0
limo MexicanAmericans (N=32owiloOm OP MexicanAmerican Mean 79,
Figure 116
GATB STANDARD SCORES
INTELLIGENCE
(ETHNIC)
15.0
3.3
9.0
334.0
1 2.0
50 '60 70 80 90 100 110 120 130
STANDARD SCORES
140 150

12.5
4.0
34.4
40.6
31.3
2.0
9.0
15.0
00.
25.0 §11111111c
2
21.91=1
20.0 20.0
12.5
34Thissmi
KEY
Ej Normal Populationas Normal Mean 100.00
Anglos (N=64)OOP - MI Anglo Mean 87.56els111 Mexican-Americans (P1=32)--- Mexican-American Mean 84 40
Figure 117
GATB STANDARD SCORES
15.0
VERBAL
(ETHNIC)
9.0
4.0
1 2.0
50 60 70 80 90 100 110 120 130 140 150
STANDARD SCORES

..1-
,IV
CO
A (
.11
01N
I00
b0 0
1-*
gegi
litIII
IIIIII
IIIIII
IIIIII
IIII1
.,-
O co O e-s 0 0 e-s 0 b O 4:
b O
O
O
1811
11.1
0.1.
1110
1111
11.1
0,11
1111
ININ
OM
MIN
IOIN
I1T
rEIR
Gtp
urPO
TIO
N...
-s
0-4
o-.
o-.
1%)
N N
N N
N N
N N
NW
WW
W W
Co
W W
W W
A ..
Fb
.Fb
A .F
b.F
b A
41.
4bt1
1N
CO
A (
.11
Q1
Ni
CO
k0 0
o-s
N W
A (
.11
01 V
CO
%C
O O
- N
W A
t.n
cre
-.4
CO
%C
O 0
o-s
N W
A(.
11Q
1 V
CO
tO 0
1111
1111
1111
1111
11C
01 01
CO
- 1111
1111
1111
1111
1111
1111
1111
1111
1111 as
:
!WI m
mum
mum
erea
n 73
.67
IQI
MM
M A
NIN
IMM
M1.
0.00
,00
.01
. M ,
.11
dm M
INIM
, M. 1
AN
,..
dm.
.. dm
. .r
.
-111
1111
1111
1111
-1
1111
1111
1111
1111
INO
PIA
MIN
I M
OM
111
10.1
1011
1W I
SM in
o A
IMam
:mit
wpm
. 111
115
- m
omb
allI
latm
oalls
0 1
1!11
1 in
n= s-
-* Ipj
M-
Mii1
1111
J fr
11+
O4f
orom
atirr
o.
O
01°
w IMPM
1144
.1.
O
t4o
O 0
1111
1111
1111
1111
1111
1111
1111
1111
1111
111.
Mea
n 84
.13
ca
IIIIIIIIIIIIIIIIIIIIIIIIIIIIIIIIIUIIt.
Mea
n 10
0.00
0
c3
"r!
CD co

25.0J immie
9.0
18.5
ompprprpwrppppppprpmew
15.0
I;1
27.7i
: !. qo°:
I I-c4
i ii
. r424.0 1 20.0 20.0
I I
1i I
1 15.0
'145 I -
it
I'9.4
1riiiiiiM
1 I
I IMES MI
KEY
Normal Population
Normal Mean 100.00Anglos (N=65)Anglo Mean 100.41
mu, Mexican-Americans (N=32)Mexican-American Mean 94
FigUre 119
GATB STANDARD SCORES
SPATIAL PERCEPTION
(ETHNIC)
15.6
50 60 70 80 90 100 110
STANDARD SCORES
9.0
120 130
4.64.0
2.0
140 150

50
49
48
47
46
45
44
43
42
41
40
39
38
37
36
35
34
33
32
31
30
29
28
27
26
25
24
23
22
21
20
19
18
17
16
15
14
13
12
11
10
20.0
19-4
et
00cI`°
I
98
6.97 Lommur;6-: 4.0
*0.9
..o rtmolr
1
I
I
A. I
«
I
I
1+
A
4 No
3 -2.0
111011101113.4
1 if 14, A
50 60 70 80 90 100 110
STANDARD SCORES
KEY
E] Normal Population
Normal Mean 100.00AnglosAnglo Mean 100.41
moss Mexican-AmericansMexican-American Mean 94=ISM IN1111111
Figure 120
GATB STANDARD SCORES
FORM PERCEPTION
17.2555551555.
16.1 NI
ILO
9.0

50
49
48
47
46
45
44
43
42
41
40
39
38
37
36
35
34
33
32
31
30
O 291*t 28
27O 26
)1 25
C.)24
tx 23
22
21
20
19
18
17
16
15
14
13
12
11
10
cf
34.2
26.4
4.713
20.0
II
15.01
20.0
87.9
It
7
.1111111011
6 5.6
54.0
4
3 HUM 2.02 2.0
1.4 1.4
11s A A Aime2L.......momkt.416...A.N406,06WIWOIWILM4.1WWMWOlj
50 60 70 80 90 100 110 120 130 140 150
14.7
KEY
ED Normal PopulationNormal Mean 100.00Anglos (N=67)
MOM Anglo Mean 96.96mule Mexican-Americans (N=36)
Mexican-American Mean 92.
Figure 121
GATB STANDARD SCORESCLERICAL PERCEPTION
15.0
979.0
4.2 4.0
STANDARD SCORES

O
0
50
49
48
47
46
45
44
43
42
41
40
39
38
37
36
35
34
33
32
31
30
29
28
27
26
25
24
23
22
21
20
19
18
17
16
15
14
13
12
11
10
9
8
7
6
5
4 3.611111
3 3.52
1
35.7 i
15.0E
20.0
A
1liglorrefor11711.
9
ihl
10.7 lit
9.0 liL111111111
it
li
KEY
Normal Population
Normal Mean 100.00Anglos (N=57)Anglo Mean 90.21Mexican-Americans (N=27)
----- Mexican-American Mean 90.
Figure 122
GATB STANDARD SCORES
MOTOR COORDINATION
15.0
14.3uporiiiii.
9.0
4.015
2.0
50 60 70 80 90 100 110
STANDARD SCORES
120 130 140 150

50
49
48
47
46
45
44
43
42
41
40
39
38
3
37
35
34
33
32
31
30
0 29II< 28:-.1 27a.
26
II 25
C.)24
CC 23w0- 22
21 20.8
20
19 -18-17- se
16 =
15 14.3
1.4
13 12.5
12
11
10 - : 9.09
8-7 -6
5
4 E
3
2
1rfr
50
2.0
1111.1104.2
40.
00001-1
220.0 20.8
I 200
145.0
10.7I'll''
I
I
10.7
=NNW 41., MIMIMP.
KEY
Normal Population
Normal Mean 100.00Anglos (N=56)Anglo Mean 90.59Mexican-Americans (N=25)Mexican-American Mean 82.
Figure 123
GATB STANDARD SCORES
FINGER DEXTERITY
9.0
4.0
3.6
AL AL
1.0 2.0
a60 70 80 90 100 110 120 130 140 150
STANDARD SCORES
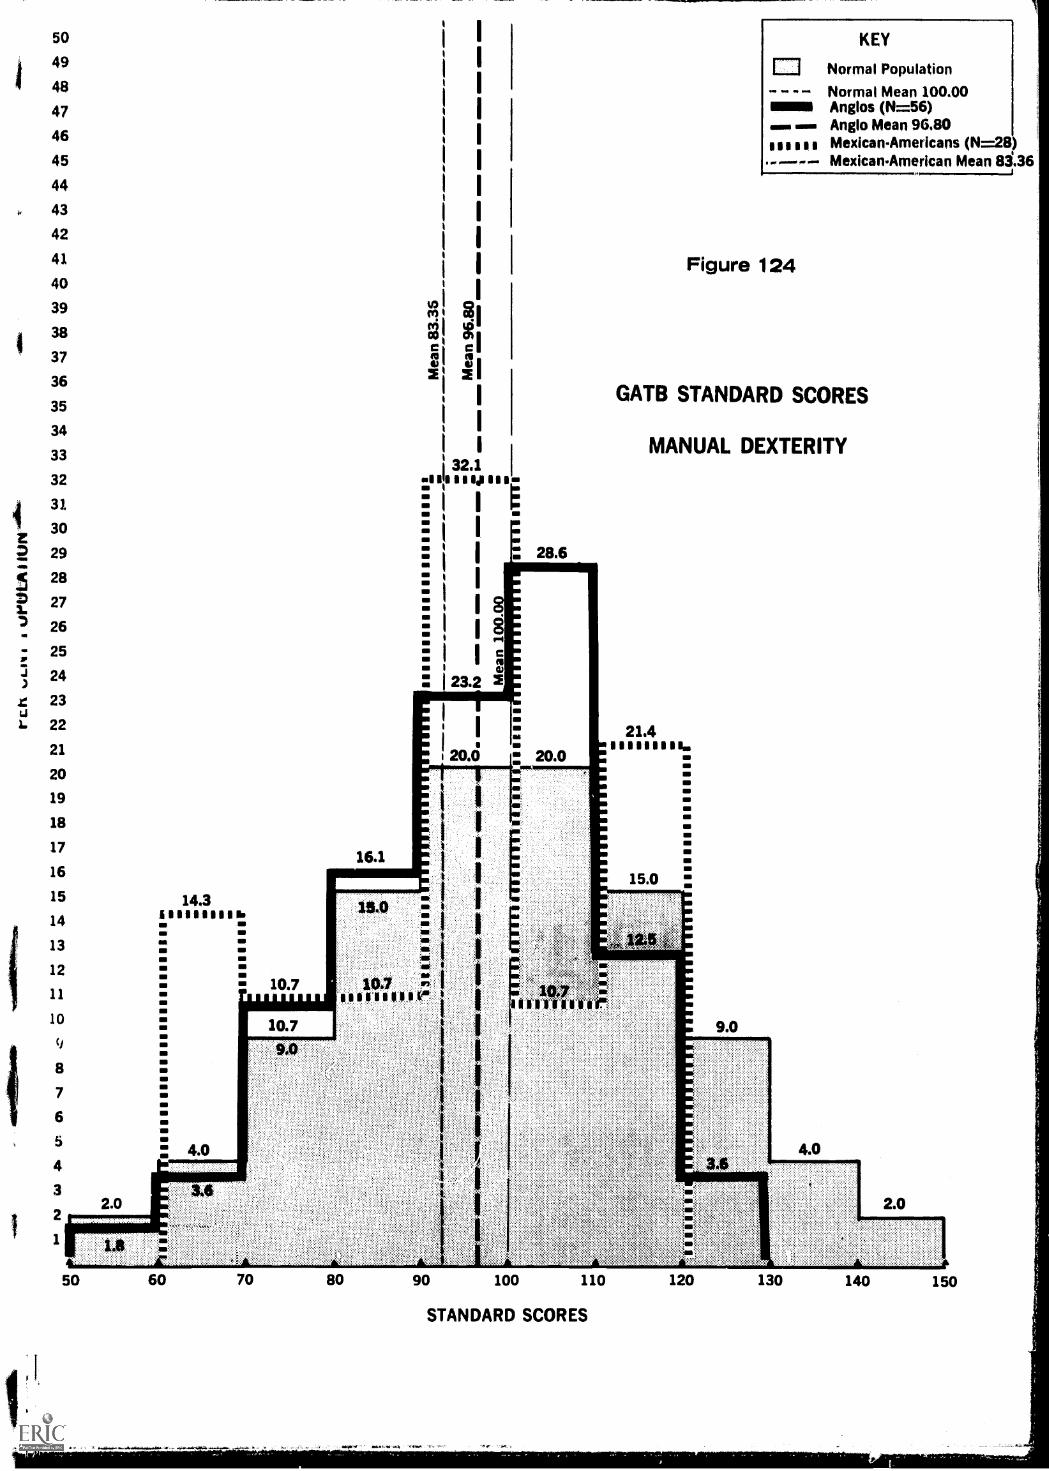
z
p
50
49
48
47
46
45
44
43
42
41
40
39
38
37
36
35
34
33
32
31
30
29
28
27
26
25
24
23
22
21
20
19
18
17
16
15
14
13
12
11
10
9
8
7
6
5
4
3
22.0
uic! a
;
I
i
!
E
I-
ISE I
i es. a): 23.2
28.6
KEY
Normal Population
Normal Mean 100.00Anglos (N=56)
Nam . Anglo Mean 96,80ill III MexicanAmericans (N=28)----- MexicanAmerican Mean 83;36
Figure 124
GATB STANDARD SCORES
MANUAL DEXTERITY
16.1 I
21.4
20.0 20.01 1
I
I 15.0
I
I
1 is
50 60
3.0
II II ITU" roe
A
9.0
4.0
70 80 90 100 110
STANDARD SCORES
120 130 140 150

Distribution of Scores: Ethnic (cont.)
Mexican-AmericanNormal AngloAptitude Mean Mean Mean
Clerical Perception 100.0 97.0 92.5
Motor Coordination 100.0 90.2 90.4
Finger Dexterity 100.0 90.6 82.7
Manual Dexterity 100.0 96.8 93.3
* X 2 = 10.13; df = 4. Difference between Anglo and Mexican-American Means significant at the .05 level.
X2 = 14.24; df = 5. Difference between Anglo and Mexican-
American Means significant at the .05 level.**
With the exception of the category of Motor Coordina-
tion, all Anglo mean scores were above those obtained by the
Mexican-American. The Anglo mean for Spatial, Form Perception
and Clerical Perception were at, or only slightly below, the
normal mean.
5. GATE Correlations (See Figure 125)
Findings indicate a positive correlation at the
.05 level between sex grouping and the following aptitudes:
Form Perception, Motor Coordination, Clerical Perception
and Finger Dexterity. Previous analyses indicated that
females at Valley High perform better in the areas of Form
Perception, Clerical Perception and Finger Dexterity, while
the males perform better in the area of Motor Coordination.
238

Sex Grouping
Attendance
Grouping
Ethnic
Grouping
G V N
N.)
S P Q K F M
12
FIGURE 125
GATB CORRELATIONS
(N = 77)
34 G
-
56
78
910
11
VN
SP
QK
F12
2-.127
3-.031
-.133
4-.114
.049
-.368+
5.003
.039
-.304
.761+
6.048
-.011
-.397+
.843
.
.b59+
7-.171
.107
-.209
.693+
.359+
.411
8.229
*
-.019
-.191
.327+
.309+
.397
.248*
9.137
.004
-.270+
.562+
.549+
.631+
.326
.563+
10
.275
*
-.131
-.216+
.158
.328+
.284
*
-.014
.244*
.346+
11
.258*
-.186
-.091
-.0002
.008
.035
.076
.171
.040
.226*
12
.105
.054
.247+
.353+
.372+
.351+
.178
.279*
.386+
.524+
.364+
df = 75.
*.05 level of significance, r t .224
+.01 level of significance, r

A negative correlation, significant at the .01
level, exists between the ethnic variable and the following
aptitudes: Intelligence, Verbal, Numerical, Clerical
Perception and Manual Dexterity. This indicates, as
have previous findings, that the Mexican-American students
perform less well in these areas than do the Anglo student.
No significant correlation was found between attendance
groupings and any of the measured aptitudes.
6. GATB Measures as Predictors of College Success
Aptitude G (Intelligence) has been found to cor-
relate significantly with criteria of academic success in a
variety of academic fields. Because of the variety of college
training available, colleges were divided into three broad
groupings:
(1) Junior college - those colleges where a certificateor degree is granted after two years of study.
(2) Four-year college - those colleges offering courseswhich usually lead to a bachelor's degree afterfour years of study.
(3) Professional college - those colleges offeringhighly specialized professional courses such asmedicine, dentistry or engineering.
With these distinctions in mind, it is possible to estab-
lish an appropriate cutoff score for the Aptitude G which
can function as a predictor of college success in each
of the three colleges mentioned. Critical scores for the
three types of schooling are:
240

Junior College
2, Four year College
3. Professional College
Critical G Score - 100
Critical G Score - 110
Critical G Score - 120
It is evident, of course, that a critical G score at or
above the cutoff point does not insure college success.
Of the total Valley High School population, 8.5%
scored at a level which would indicate potential junior
college success; 1.8% scored at the four-year college
critical level, and 1.8% at the professional college level.
A comparison by sex grouping indicates that 10.9% of the
males and 6.5% of the females scored at the level indicative
of junior college success; 1.6% of the males and 3.2% of
the females scored at the critical scores for four-year
college success; and 3.1% males and 0.0% females scored at
the professional college critical level.
A comparison of the Anglo and Mexican-American
population in terms of possible college success reveals
that 3.1% of the Mexican-Americans scored at the junior
college level as compared with 13.3% of the Anglos. No
Mexican-American scored at a level indicative of possible
success in either four-year college or professional college.
Of the Anglos, 3.3% scored at the four-year college level,
and 3.3% scored at the professional college level.
241

7. The Occupational Aptitude Patterns
In order to establish Occupational Aptitude Patterns,
occupations have been grouped into a relatively small number
of categories for which aptitudinal requirements were very
nearly the same. Aptitude norms were then established in
terms of the three most significant aptitudes in each category.
Patterns of aptitude scores accomplished on the GATB can
give some indication not only of the relationship between
individual occupations and test scores, but also of the
relationship between occupation groupings and their appro-
priate scores.
According to the GATB Manual, there are thirty-six
Occupational Aptitude Patterns (OAP).* The following chart
presents the Occupational Aptitude Patterns, 1 - 36, as
well as the number of Valley High males, group A and B;
and the number of Valley High females, group A and B,
who qualify in each of the patterns. The next chart
compares th! number of Anglo and Mexican-American students
who qualify in the occupational patterns.**
* For a complete breakdown of all occupations within eachpattern, the reader may refer to the GATB Manual, SectionIII, which presents a more comprehensive picture of thecutting scores for the various aptitudes, as well as thecomplete aptitude patterns.
**According to the GATB Manual, Section III, even if theresults show that a student does not fit into any of theOAP's, one cannot assume that the student's pattern ofabilities is unsuitable for any kind of work.
242

Occupational Aptitude Patterns:Number of Students Qualifying
Ay Sex and Attendance Grouping A and B
1-Engineers, Surgeon,Systems Analyst,
GroupMales Females
TotalsA Group B Group A Group B
Programmers 1 0 0 0 1
2-Accountant, Pharmacist 1 1 0 0 2
3-Social Work, Teacher,Employment Service 1 1 1 0 3
4-Librarian, CityCirculation 1 1 1 0 3
5-Dental Hygienist,Photographer 2 1 2 0 5
6-File Clerk, PsychiatricTechnician 1 1 2 0 4
7-Bookkeeper I, TheatreManager 2 3 2 0 7
8-Lab Tester I, ChemistAssistant 3 2 2 0 7
9-Sales, general,Grocery Checker 5 5 3 1 14
10-Cook, Press Man,selected 5 7 3 1 16
11-Auto Mechanic,Meat Cutter 7 5 3 1 16
12-Proofreader I, Mgr.Retail Food 5 4 3 0 12
13-Clerk, Camp Counselor 6 4 3 0 13
14-Waitress, Bricklayer 4 5 3 1 13
15-Clothes Designer,Structural Steel 8 6 5 1 20
243

GroupMales Females
B TotalsA Group B Group A Group
16-Assembler, selected,Sheet Metal 9 6 6 1 22
17-Coil Assembler, Air-Conditioner Installer 15 10 9 1 35
18-Fork Lift TruckOperator 8 7 6 1 22
19-Tractor-Trailer TruckDriver 14 9 9 3 35
20-Aircraft Electricianand Mechanic 12 10 9 2 33
21-Central Office OperatorCosmetologist 13 7 10 2 32
22-Aircraft Assembly,Mechanic, selected 13 10 11 2 36
23-Comptometer, CalculatingMachine Operator 4 2 2 0 8
24-Radio Repairman,Electrician 5 3 7 2 17
25-Carpenter, Painter,Machinist I 10 7 8 2 27
26-Machine Operators,selected 9 7 11 2 29
27-Watchmaker, Welder,Arc & Combination 11 6 11 2 30
28-Dental Lab Technician,Die Cutter 22 15 13 5 55
29-General Laborer, SoldererProduction Line 11 7 11 4 33
30-Rolling Mills, FoundryJobs 8 8 7 2 25
31-Drill punch, Inspector,Forms 16 10 11 6 43
244

MalesB
FemalesB TotalsGroup A Group Group A Group
32-Fruit Sorter,Sewing Machine 17 9 12 4 42
33-Bundler, Laundry,Napkin Packager 9 6 9 4 28
34-Assembler, selected 9 4 9 2 24
35-Cannery Worker,Candy Packer 10 4 12 3 29
36-Stenographer, Typist,Typesetter 1 0 2 0 3
ALL 1 0 0 0 1
NONE 6 2 1 0 9
Of the total population, only
for all jobs listed in defined OAP.
one person would qualify
Occupational Aptitude Patterns:Number of Students Qualifying
by Ethnic Grouping
Number OAPAngloTotals
Mexican-AmericanTotals
1-Engineers, Surgeon, SystemsAnalyst, Programmers 1 0
2-Accountant, Pharmacist 2 0
3-Social Work, Teacher,Employment Service 3 0
4-Librarian, City Circulation 3 0
5-Dental Hygienist, Photographer 5 0
6-File Clerk, Psychiatric Tech. 4 0
245

Number OAPAngloTotals
Mexican-AmericanTotals
7-Bookkeeper I, Theatre Manager 5 1
8-Lab Tester I, Chemist Assist. 6 1
9-Sales, general, Grocery Checker 12 2
10-Cook, Press Man (selected) 13 3
11-Auto lechanic, Meat Cutter 13 2
12-Proofreader I, Manager,Retail Food 10 3
13-Clerk, Camp Counselor 9 3
14-Waitress, Bricklayer 13 2
15-Clothes Designer, StructuralSteel Designer 16 4
16-Assembler, (selected),Sheet Metal 17 5
17-Coil Assembler, Air-ConditionerInstaller 29 9
18-Fork Lift Truck Operator 17 5
19-Tractor-Trailer Truck Driver 26 9
20-Aircraft Electrician andMechanic 24 9
21-Central Office Operator,Cosmetology 23 8
22-Aircraft Assembly, Mechanic,(selected) 30 7
23-Comptometer, CalculatingMachine Operator 7 1
24-Radio Repairman, Electrician 14 3
25-Carpenter, Painter, Machinist I 22 5
26-Machine Operators (selected) 9 6
246

Number OAPAngloTotals
Mexican-AmericanTotals
27-Watchmaker, Welder (Arc & Comb.) 10 7
28-Dental Lab Technician,Die Cutter 14 12
29-General Laborer, Solderer(production line) 11 7
30-Rolling Mills, Foundry 7 6
31-Drill Punch, Forms Inspector 13 12
32-Fruit Sorter, Sewing MachineOperator 12 10
33-Bundler, Laundry, NapkinPackager 11 5
34-Assembler (selected) 8 7
35-Cannery Worker, Candy Packer 12 7
36-Stenographer, Typist, Typesetter 2 0
ALL 1. 0
NONE 3 6
247

SUMMARY OF FINDINGS

11
SUMMARY OF FINDINGS
The task of identifying the characteristics of the
student population which must be observed in the design
of an instructional program was assigned in January. To
accomplish this, the staff had to identify the most appro-
priate sources for these data, and select the best means
for collecting and measuring them. In some cases, estab-
lished techniques and standardized measurements were
adapted to Project purposes. In other cases, the staff
had to create its own instruments.
The research findings basically describe the unique
and typical characteristics of the students at Valley High
School. A major objective was to discover significant
differences within the population which could affect the
modes of stimulus that the instructional system can employ.
For purposes of analysis, the data were researched and
reported in three separate categories: Population Charac-
teristics, Behavior Probability, and Present Academic
Performance Capabilities.
I. POPULATION CHARACTERISTICS
A general description of the Valley High School student
body is a prerequisite to any identification of characteristics,
249

or any assessment of instructional needs. The following
descriptive data is divided into three areas. The first
area, quantity descriptors, includes the following items:
the total population of Valley High as of the beginning
of testing; the male/female student ratio; attendance
patterns; attrition rate; and, the rate of new enrollments.
The second area, socio-economic descriptors, includes
these topics: socio-economic family status; ethnic group
membership; data on family structure; the amount of special
education that students have received; stated discipline
problems; and, reasons for referral to Valley High School.
Physical descriptors, the third area, reports the
following data: general health information (historical
and familial); individual health history; present general
health status; assessment of lateral preference; and, the
examining nurses' recommendations.
The population at Valley High School can be charac-
terized as a "dynamic" one. It changes from day to day,
week to week, and month to month. Of the students
referred to Valley, 39.5% attend fifty percent of the time
or more; 43.1% attend fifty percent or less; and, 17.4%
of those referred do not attend at all. Three times as
many boys as girls are students of Valley High School.
Within the community of La Puente, the ratio of
Mexican-American families to Anglo families is approximately
250

4
1:3. This same ratio is maintained in the student body
at Valley High School. Only 1.8% of Valley High School
is composed of "others," i.e., Negros or Orientals.
A statistically "average student" is between sixteen
and seventeen years old. He is apt to be the middle-
born child with four to six siblings. The mean age of
his brothers and sisters is 11.7 years, and the mean age
of his parents is 42.1 years.
Tilis "average student" lives with both mother and
father. He was most probably born in California or the
western part of the United States. Generally, he has
attended only two elementary schools, one junior high school,
and two high schools (including Valley High School). He
and his family seem to remain stable members of the community
once he is twelve years old.
At home, this "average student" and his family speak
English; only a smaU percentage (19.1) speak both English
and Spanish. The student's father is, in most instances,
the sole source of financial support for the family. In
17.0% of the population, financial support comes from more
than one member of the family, while in 13.4%, the student's
mother was named as sole support. The student's father is
most likely employed as an unskilled, semi-skilled or skilled
worker. In most cases, he works as a mechanic, electrician,
or in related trade crafts. The student's mother lists her
occupation as housewife.
251

It should be kept in mind, of course, that the concept
of "average student" is an artificial one, and, an extremely
wide range of differences within the total population does
exist.
In general, students at Valley High School are not a
physically atypical high school population. Evidence does
suggest some suboptimal student health practices, such as
dental care, poor eating habits, and a need for eye and ear
check-ups. The health of Valley High School students could
be better, but it is not unusual.
II. BEHAVIOR PROBABILITY INDICATORS
The system designer must know those factors which de-
termine the students' predispositions to instruction before
he can develop the most effective modes of instructional
stimulus. To identify these predispositions the Project
investigated the behavior probabilities of the target pop-
ulation at Valley High. In this assessment, a two-fold
approach was used. Utilizing information derived from the
SOC, the MOWI and the IPS, a description of how the Valley
High School student views himself, his peers, his family,
his future, his aspirations, as well as his present and
past schooling experiences was derived. An attempt was also
made to describe the evaluation of Valley High students by
others. Information for this was derived from the RHI and
the TES.
252

Personal data indicate that only a small fraction of
the Valley High population is married and attending school.
However, 27.6% answered that they were engaged at the time.
Over one-half of the student body indicated "no chance" of
marriage while in high school. A greater proportion of
girls indicated that they go out on weekends and one week
night only, while more of the boys indicated that they went
out every night of the week. Spending habits of the
males and females were those normally expected: males
spend more on cars and motorcycles; and, females spend
more on clothing. One-half of the student body at Valley
indicated that they have been arrested. Of this number,
members of Group B indicated that they have been arrested
for curfew violation or disturbing the peace significantly
more often than did Group A or Group C. More females state
that they have never been arrested. If in personal trouble,
approximately one-half of the students said they would
seek help from their own parents; significantly more females
than males responded with this choice.
Measured attitudes towards school and particularly
towards Valley High indicate that an almost equal percentage
of students plan to stay at Valley until graduation as
plan to return to regular high school. A significantly
high proportion of the Mexican-Americans and females indicated
a preference for remaining at Valley. In an assessment
253

of courses offered at Valley, over one-half of the students
indicated that all or most of the subjects taught were of
value to them. Approximately one-quarter of the student
body expressed preference for shop and practice classes.
One-quarter of the students indicated a liking for the
contract system; and most of the female population seemed
to prefer this teaching method to all others mentioned.
One-half of the students thought that morning classes would
improve Valley High (as opposed to the present afternoon
class schedule).
A comparison of MOWI and SOC attitudinal responses
to "school abilities," "college" and "graduating" indicate
that more than one-half of the students feel positively
towards these items. Over one-half feels negatively
towards quitting school, which would seem to place this
particular population outside that usually classified
as potential dropouts.
The data further indicate that in terms of future
planning, the general attitude of Valley High School
students is positively oriented towards job, further
schooling and marriage. More females than males express
plans for completing high school as well as for attending
a four-year college. More Mexican-Americans than Anglos
plan to attend trade or technical schools. The majority
of males at Valley expect to be drafted, to enlist, or to
254

join the reserves. More Mexican-Americans expect to be
drafted as compared with the Anglos who express a preference
for enlisting.
In response to a question regarding job plans, over
one-half of the student body indicated that they felt it
was too early to decide. This might indicate that they did
not have enough information p.s to available alternatives.
Only one-quarter of the students indicated that they want
a particular job and that they are taking steps to get
it. At the present time, the majority of students are not
employed. Of those who do work, a significantly higher
percentage are males than females. More members of Group
B than Group A work, stating that they are employed thirty
or more hours per week. Salary expectations for the future
range from $2.00 an hour to $5.00 an hour. A significant
number of females indicate an expectation of $2.00 an hour
as compared with the general male expectation of $5.00.
Over one-half of the students tested indicated that
they do not expect to be working in La Puente or the
surrounding areas after graduation. Attendance Group B
has higher expectations of working in the La Puente area
than Group A. More Anglos indicated that they would be
working in the Downey-Bellflower areas than did Mexican-
Americans, and more females than males felt that they
would work in the La Puente area.
255

The MOWI data indicate that the students tend to
have a positive attitude towards Valley High, the high
school counselors and the teachers. Students express
a slightly negative attitude towards regular high school,
but they are positively oriented towards trying hard,
graduating, the future, college, and job. Valley High
students hold negative attitudes towards authority and
punishment, as well as towards those elements which to
their mind represent authority.
In common with most high school students, they tend
to have "good" feelings towards classmates and peers,
(and this is true irrespective of ethnic origin). Attitudes
and feelings towards family, home, mother and father were
among the most positive expressed by the students. Students
at Valley feel that cheating and quitting school are "wrong."
For them, smoking, dating, graduating, trying hard and a
job are "right." Measures of self-concept indicate that
students feel fairly positive towards themselves but that
they have a strong desire to change in the direction
of more social acceptability.
Six questions on the MOWI and eight questions on the
SOC were designed to measure student aspirations. From
these it can be seen that the students at Valley hold
aspirations for further schooling, for a job and for
marriage. No measures suggest desires for "dropping
out" of school.
256

The evaluation of Valley High students by "others"
indicates that there were many expressions of students'
remedial need by various teachers prior to their referral
to Valley High. In most instances, however, the students
were not referred to special education classes. Of the
small proportion who were referred, remediation was in
the speech and reading areas. Indications are that the
students have been given little or no remediation in
mathematics.
There is a clear indication of a relationship between
the school grade level of first reported "F" and the
grade level of first reported behavioral or attendance
problem. One-quarter of the students received their
first "F" between kindergarten and seventh grade; and
within this group, most students received the "F" between
kindergarten and fifth grade. Of the remaining students,
over one-half received their first "F" at the eighth or
ninth grade level. Most of these students show a cluster
of "F's" rather than a single failing grade which suggests
that at the eighth or ninth grade level either past deficien-
cies reveal themselves, or that adjustment to adolescence is
very difficult for these students.
Schools report most frequently "attendance" and "disci-
pline" as problems for students later referred to Valley High.
257

These two factors account for approximately two-thirds
of the reported school violations. The remaining one-third
consists of reports of "academic failure," "dress violation,"
and "smoking." Referring high schools report parent con-
ferences, letters home, counselor referrals and suspension
as means of handling the school violation. Males are
generally referred to counselors, and females to parent
conferences.
Ten teachers, the principal and the social worker
at Valley High School were asked to give their opinions
of the students' behavior during the testing period.
Most felt that the cooperation level of the student was
"fair"; that the student had little interest in the test
sessions; and that student attendance decreased in order
to avoid the testing periods. They also felt tha
testing session was responsible for an increase in disturbing
behavior in the classroom, but that the students "tolerated"
the break in their usual routine. The majority of the staff
felt that the reward system had some effect on student
participation. Some teachers, however, expressed feelings
that the testing should have been mandatory and without
reward. These evaluations might reflect negative attitudes
towards the students; or, they might reflect a reaction to
the staff's possibly inadequate explanation of reasons
for testing; or, they might possibly reflect the Valley High
School staff's resentment of a "break" in their routine.
258

All of the results summarized are for the total popula-
tion at Valley High. Within this population it is possible
to find a variety of individual differences. Consequently,
it is neither possible nor correct to conclude that all
students at Valley High are academic failures or all
behavior problems. Some of the students have indicated
that they chose to come to Valley; some recognize their
own inability to conform to the middle-class regular high
school. Others have been referred because of truancy,
but often the cause for the individual truancy was not known.
One important fact should be kept in mind in an
assessment of the Valley High student body. The effect of
school on any teenager is determined by the entire circum-
stances surrounding his life. Schools take up a large
proportion of the teenager's life. His role as a student
encompasses learning to cope with new people, new knowledges
and new routines. How he succeeds or fails depends to
some extent on himself, and possibly, to an even greater
extent on how the school does its work.
III. PRESENT ACADEMIC PERFORMANCE CAPABILITIES
An identification of academic performance capabilities
of the student population was required in order to derive
the instructional needs of the student. An academic profile
can be compared to the collected behavior expectations;
259

the difference between the two provides a guideline for the
development of the projected system.
In order to identify the basic academic performance
capabilities of the student population, scholastic achievement
and general aptitudes had to be determined. Scholastic
achievement encompasses language, reading, spelling and
computation. ACademic performance, or achievement, can be
.ddefined as tested ability to: use language; comprehend
selected reading; spell accurately; comprehend numerical
concepts; perform general arithmetical operations; and,
reason abstractly. General aptitudes are measured ir, terms
of: verbal aptitude; numerical aptitude; spatial aptitude;
form perception; clerical perception; motor coordination;
finger dexterity; manual dexterity; and a general learning .
aptitude. The Wide Range Achievement Test (WRAT) and the
California Achievement Test (CAT) was used to determine
academic skills, and the General Aptitude Test Battery (GATE)
to determine the vocational aptitudes of the Valley High
School population.
It is possible to interpret WRAT performance in two
ways. First, by using standard scores and standard deviation,
one can estimate rate of learning. Secondly, one can inter-
pret achievement or performance in terms of grade placement.
Mean standard scores for the total Valley High population
range from 80.3 in arithmetic to 83.6 in spelling, and 94.1
in reading. The rate of learning for the total population
260

in the three areas falls between the low average to average
classification. In terms of academic achievement, however,
results on the WRAT picture the Valley High population as
reading at a 7.8 grade level, spelling at a 6.0 grade
level, and as having an arithmetic ability comparable to
that of the 5.3 grade level.
The Anglo/Mexican-American comparison indicE.es that
the rate of learning as well as the achievement level is
significantly lower for the Mexican-American student at
Valley High School. No significant differences were
found between the ale/female or attendance groupings.
A comparison between the WRAT scores and the Teacher
Information Matrix indicated that the teachers at Valley
High School generally tend to underestimate their students
in terms of academic achievement in reading and arithmetic.
It is quite possible that scores and grade placements
obtained on the WRAT are the most accurate measure of
academic achievement and aptitude for a population such
as Valley High. The WRAT tests are of short duration and
demand less in the way of motivation and attention from
the student.
The evaluation of the student body at Valley High
School by the teachers estimated an elementary (grades
1 - 4) reading level far 38% of the students, and an average
level (grades 5 - 9 ) for 48%. On the basis of this
261

information, the junior high school level of the California
Achievement Test was selected as proper to the achievement
range of the students. All findings are reported relative
to the ninth grade norms established by the CAT for this
level.
For the total Valley High population, the mean grade
placement scores are as follows:
Total Reading - 7.0 grade level
Total Arithmetic - 7.0 grade level
Total Language - 7.4 grade level
The mean grade placement of the student body is approximately
two grades below that of the "normal" ninth grade junior
high population.
An analysis of mean scores in terms of sex, ethnic
and attendance variables shows a difference between males
and females on the Total Language section of the CAT to
be significant at the .05 level; the female scores being
superior to those obtained by the males. No significant
differences between Anglos and Mexican-Americans were
found, but the general trend was toward higher scores
for the Anglos. Apparently, more consistent attendance
at Valley High has little effect on the measured academic
achievement of the students; little or no difference was
found between the scores obtained by the two attendance
groupings.
262

EL
The Diagnostic Profile for the CAT was devised to
indicate subject areas in which an individual or a group
is strong, typical, or weak relative to given criteria.
If one defines the percent of correct responses formed
for the ninth grade as 100% in each of the subject areas,
findings indicate that: in the reading vocabulary area,
Valley High students score approximately 20% below the
ninth grade; in reading comprehension, approximately 40%
below; in arithmetic fundamentals, 40% below; in arithmetic
reasoning, 40% below; in mechanics of English, 20% below;
and in spelling, approximately 75% below.
The Diagnostic Profile in terms of the variable of
sex for the Valley High population reveals an approximate
50% difference between the arithmetical reasoning of females
at Valley and the ninth grade criterion. However, in
mechanics of English, Valley High females scored only 10%
less than do normal ninth graders.
The ethnic analysis indicates that the Mexican-
Americans in Valley High School obtained scores in reading
comprehension which are 30% below those obtained by the
Anglos, and 50% below the ninth grade norm. Scoring on
arithmetic fundamentals by the Mexican-Americans was 20%
below that of the Anglos, and 40% below the "normal." On
arithmetic reasoning, Mexican-Americans scored 10% below
the Anglos, and 50% below the "normal."
263

Slight differences in scoring were shown between the
two attendance groupings. In most instances, scores for
both attendance groupings fell 20% to 40% below the ninth
grade norm.
Thus, the academic achievement of students at Valley
High School, as measured by the CAT, is two grade levels
below the mean scores established by the ninth grade
population norm. The student body at Valley exhibits
the same pattern of learning strengths, averages and
weaknesses as the norm population, but at an appreciably
lower level of proficiency. Differences between performance
of males and females in Total Language were significant,
with females scoring higher. A general trend of higher
scores for Anglos than Mexican-Americans was evident
although the differences did not prove to be statistically
significant. It is noteworthy that attendance patterns
at Valley High seem to make little or no difference in
academic performance.
The General Aptitude Test Battery measures the
following nine aptitudes: Intelligence (G), Verbal (V),
Numerical (N) , Spatial (S) , Form Perception (P) , Clerical
Perception (Q), Motor Coordination (K) , Finger Dexterity
(F), and Manual Dexterity (M). Among groups usually
tested by the GATB are high school graduates with no
specialized training and young people who are uncertain
as to their abilities.
264

Findings indicate that the mean scores for the total
Valley High sample were slightly lower than those of the
"normal population." The lowest score made by the Valley
High sample was in Numerical Aptitude (N). There is some
correspondence between this score and the 5.3 grade placement
level made by the same sample on the arithmetic section
of the WRAT, and also the 7.0 grade placement level on the
arithmetic section of the CAT.
The Valley High population scored near the normal
population mean in the Spatial, Form Perception, Clerical
Perception and Manual Dexterity categories. Analysis
of the scoring distribution compared with that of the
normal population indicates that only in Form Perception,
Clerical Perception, Finger Dexterity, and Spatial did
any Valley High students score between 130 - 150. Scorings
at the 110 - 130 level were approximately equal to that
of the normal population in Spatial, and above the normal
in Clerical Perception. Scoring in Form Perception was
also slightly above normal in the 90 - 110 scoring range.
Significant differences were found between male and
female scores on Form Perception and Clerical Perception
with a superiority indicated for the females. No signif-
icant differences were found between Group A and Group B.
In an analysis of ethnic groupings, significant differences
were found between the Mexican-American and the Anglo in the
Intelligence (G) and the Numerical (N) categories. In both
265'

instances, the Anglos scored higher; and, with the exception
of Motor Coordination, all Anglo mean scores were above
those obtained by the Mexican-American.
Analysis confirms that there is a positive correlation
at the .05 level between sex grouping and the following
aptitudes: Form Perception, Motor Coordination, Clerical
Perception and Finger Dexterity. Females performed better
in all of these areas except for Motor Coordination. A
negative correlation was found between the ethnic variable
and Intelligence, Verbal, Numerical, Clerical and Manual
Dexterity. In these areas, the Mexican-American did not
perform as well as the Anglo student.
GATB scores can be used for many purposes. For exam-
Pia, Aptitude G (Intelligence) has been found to correlate
significantly with criteria of academic success in a
variety of academic fields. A critical G score has been
established for junior college (G = 100)1 four-year college
(G = 110) and professional college (G = 120). Of the
total Valley High population, 8.5% scored at the 100 level;
1.8% scored at the 110 level; and, 1.8% scored at the
120 level. Analysis by sex grouping indicates that 10.9%
of the males, and 6.5% of the females scored at a level
indicating possible success in junior college; 1.6% of the
males and 3.2% of the females scored at a level for four-
year college; and, 3.1% of the males scored at the professional
266

college level. No Mexican-Americans made scores indicative
of possible success in either a four-year college or
professional college; 3.3% of the Anglos scored at the four-
year college level and 3.3% scored at the professional
college level.
The GATB Manual, Section III, presents occupational
groupings for which aptitude requirements are substantially
the same. These groupings are called Occupational Aptitude
Patterns. it was not feasible to include all the occupational
patterns in this report. A brief discussion of these
patterns is given, however, with a comparative analysis
in terms of males and females, Groups A and B, and the
Anglo-Mexican-American distribution. One male in the
Valley High population qualified in all patterns, and
eight males and one female performed at a level which
qualified for none.
The GATB Manual indicates that under no conditions
should it be assumed that the student is unsuitable for
any kind of work, even if his score qualifies him in no
occupational patterns. A small proportion of Valley High
students performed at a level which would qualify them
for "professional positions." Most of the students would
qualify for "skilled" occupations such as assembly work,
machine operators and factory workers.
267

The ethnic distribution revealed that no Mexican-
Americans qualifed for so-called "professional" jobs. An
approximately equal number of Anglos and Mexican-Americans
performed at a level which would qualify them in four
occupational aptitude patterns which fall within the
"skilled to unskilled" classification. Six of the Mexican-
Americans, as compared with three Anglos, performed at the
"none" level.
Findings suggest that the students at Valley will
tend to follow in their
vocation is concerned.
fathers' "footsteps" insofar as
The majority of parents of Valley
students are in the skilled/semi-skilled category. Student
scores on the GATB indicate these occupations as both
possible and probable for them.
26.8