Economic Survey of Maharashtra 2020-21
335
-
Upload
khangminh22 -
Category
Documents
-
view
0 -
download
0
Transcript of Economic Survey of Maharashtra 2020-21


Economic Survey of Maharashtra2020-21


PREFACE
The Economic Survey of Maharashtra is a concerted endeavor of Directorate
of Economics and Statistics, Planning Department, which is prepared every year and
the same is presented in the Budget Session before the State Legislature. The present
publication for the year 2020-21 is the 60th issue in the series.
2. The latest available information related to various socio-economic sectors of
the economy along with indicators and trends are provided in this publication. This
publication provides time series data of important statistics for the State and selected
socio-economic indicators of all states in India. In an effort to provide latest available
data, some of the data / estimates are provisional.
3. This Directorate is thankful to the concerned Departments, Offices and
Undertakings of the State and Central Government for providing useful information in
time that enabled us to bring out this publication.
R.R. Shinge Director of Economics and Statistics, Government of Maharashtra Mumbai
Dated : 5th March, 2021


Economic Survey of Maharashtra 2020-21
ECONOMIC SURVEY OF MAHARASHTRA 2020-21
CONTENTS Subject Page No. Overview of the State 1
A. Maharashtra at a Glance 3 B. Maharashtra’s comparison with India 6 1. State Economy 9 2. Population 19 3. State Income 29 4. Prices and Public Distribution System
Prices Public Distribution System
47
5. Public Finance 75 6. Institutional Finance and Capital Market 91 7. Agriculture and Allied Activities
Agriculture Irrigation Horticulture Animal Husbandry Dairy Development Fisheries Forests and Social Forestry
101
8. Industry and Co-operation Industry Co-operation
143
9. Infrastructure Energy Transport and Communication
169
10. Social Sector Education Public Health Women and Child Development Employment and Poverty Housing Water Supply and Sanitation Environment Conservation Social Justice Human development and sustainable development goals
195
Glossary 287 C. Selected Socio-economic indicators of States in India 292

Economic Survey of Maharashtra 2020-21
ANNEXURES
Subject Page No. Annx. 2.1 Population of Maharashtra and india as per censuses 27 Annx. 2.2 Rural and urban population in the State based on censuses 27 Annx. 2.3 Districtwise population indicators as per Census 2011 28 Annx. 3.1 Nominal Gross State value added at basic prices by industry of origin &
Nominal Gross State Domestic Product at market prices (at current prices) 36
Annx. 3.2 Real Gross State value added at basic prices by industry of origin & Real Gross State Domestic Product at market prices (at constant (2011-12) prices)
37
Annx. 3.3 Nominal Net State value added at basic prices by industry of origin & Nominal Net State Domestic Product at market prices (at current prices)
38
Annx. 3.4 Real Net State value added at basic prices by industry of origin & Real Net State Domestic Product at market prices (at constant (2011-12) prices)
39
Annx. 3.5 Nominal Gross value added at basic prices by industry of origin, Nominal Gross domestic product at market prices & gross national income (at current prices)
40
Annx. 3.6 Real Gross value added at basic prices by industry of origin, Real Gross Domestic product at market prices & Gross National Income (at constant (2011-12) prices)
41
Annx. 3.7 Nominal Net value added at basic prices by industry of origin, Nominal Net domestic product at market prices & net national income (at current prices)
42
Annx. 3.8 Real Net value added at basic prices by industry of origin, Real Net domestic product at market prices & net national income (at constant (2011-12) prices)
43
Annx. 3.9 Nominal Gross District Value Added (at current prices) 44 Annx. 3.10 Real Gross District Value Added (at constant (2011-12) prices) 45 Annx. 3.11 Per Capita Nominal Gross District Value Added (at current prices) 46 Annx. 4.1 Groupwise Consumer Price Index numbers for rural Maharashtra 60 Annx. 4.2 Groupwise Consumer Price Index numbers for urban Maharashtra 61 Annx. 4.3 Groupwise Consumer Price Index of Maharashtra compiled by
National Statistical Office, GoI for rural, urban and combined 62
Annx. 4.4 Consumer Price Index numbers for agricultural labourers and rural labourers in Maharashtra and All-India
63
Annx. 4.5 All-India Consumer Price Index numbers for industrial workers 64 Annx. 4.6 Consumer Price Index numbers for industrial workers at selected
centres in Maharashtra 65
Annx. 4.7 Consumer Price Index numbers for industrial workers at selected centres in Maharashtra
66
Annx. 4.8 Inflation rates based on important price indices 67 Annx. 4.9 All-India Wholesale Price Index numbers 68

Economic Survey of Maharashtra 2020-21
Subject Page No. Annx. 4.10 Districtwise number of ration cards (As on 31st December, 2020) 69
Annx. 4.11 Quantity of rice and wheat distributed to authorised ration/fair price shops 70
Annx. 4.12 Allotment by Government of India to the State 70
Annx. 4.13 Districtwise number of godowns available, their capacity and fair price shops
71
Annx. 4.14 Under NFSA, Districtwise allotment, off-take & distribution of foodgrains to fair price shops for antyodaya anna yojana households during 2019-20
72
Annx. 4.15 Under NFSA, Allotment, off-take & distribution of foodgrains to fair price shops for priority households during 2019-20
73
Annx. 5.1 Budget at a glance 86
Annx. 5.2 Budget : Trends in receipts on revenue and capital accounts 87
Annx. 5.3 Budget : Trends in expenditure on revenue and capital accounts 88
Annx. 5.4 Borrowings & other liabilities 89
Annx. 5.5 Final consumption expenditure and expenditure on capital formation of Government
90
Annx. 6.1 Deposits and credit of all scheduled commercial banks 98
Annx. 6.2 Districtwise Annual Credit Plan (2020-21) 99
Annx. 6.3 Districtwise information on Pradhan Mantri Jan Dhan Yojana 100
Annx. 7.1 Total number, area and average size of operational holdings in the State according to Agricultural Censuses
134
Annx. 7.2 Land utilisation statistics of the State 135
Annx. 7.3 Area under principal crops, production and yield per hectare in the State
136
Annx. 7.4 Cropwise index numbers of agricultural production in the State 138
Annx. 7.5 Area under irrigation in the State 139
Annx. 7.6 Irrigation & non-irrigation water charges levied, recovered and outstanding
140
Annx. 7.7 Livestock and poultry in the State 141
Annx. 8.1 Minerals production in the State 163
Annx. 8.2 Important characteristics of industries in the State (Based on Annual Survey of Industries)
164
Annx. 8.3 Index numbers of industrial production in India 166
Annx. 8.4 Details of Co-operative societies in the State 167

Economic Survey of Maharashtra 2020-21
Subject Page No.
Annx. 9.1 Electricity supply & consumption in the State 191
Annx. 9.2 Road Length by type of roads in the State (Maintained by Public Works Department and Zilla Parishads)
192
Annx. 9.3 Classification of district-wise road length according to breadth (Maintained by Public Works Department)
193
Annx. 9.4 Categorywise number of motor vehicles on road in the State 194
Annx. 10.1 Regionwise and Education levelwise institutions, enrolment and number of teachers
271
Annx. 10.2 Number of health science institutions, their intake capacity and students admitted in the first year of the course for the year 2020-21
272
Annx. 10.3 Number of technical institutions, their intake capacity and students admitted in the first year of the course for the year 2020-21
273
Annx. 10.4 Number of institutions for arts, science, commerce, Non A.I.C.T.E courses, law, education, fine arts, their intake capacity and students admitted in first year of the course for the year 2020-21
274
Annx. 10.5 Number of institutions for agriculture, veterinary and fishery science courses, their intake capacity and students admitted in first year of the course for the year 2020-21
275
Annx. 10.6 Medical facilities available in the State (Public, Local Bodies and Trust Hospitals)
276
Annx. 10.7 Birth rates, death rates, infant mortality rates and total fertility rates based on sample registration scheme of the State
277
Annx. 10.8 Economic classification of workers as per Population census 2011 278
Annx. 10.9 Average daily employment in different industries in the State 279
Annx. 10.10 Working factories and factory employment in the State 280
Annx. 10.11 Registrations in the skill development, employment and entrepreneurship guidance centres in the state, the vacancies notified and placements effected
281
Annx. 10.12 Number of persons on the live register of skill development, employment and entrepreneurship guidance centres as on December, 2020
282
Annx. 10.13 Categorywise number of works completed and expenditure incurred thereon under the Mahatma Gandhi National Rural Employment Guarantee Act (MGNREGA) in the State
283
Annx. 10.14 Industrial disputes in the State** 284
Annx. 10.15 Districtwise Human development index 2011 285

OVERVIEW OF THE STATE
Maharashtra occupies the western & central part of India and has 720 km long coastline along the Arabian Sea and is also fortified naturally by Sahyadri and Satpuda mountain ranges. The State is surrounded by Gujarat to the north west, Madhya Pradesh to the north, Chhattisgarh to the east, Telangana to the south east, Karnataka to the south and Goa to the south west. For administrative convenience, the State has been divided into 36 districts and six revenue divisions. With a population of 11.24 crore, as per Population Census 2011 and with geographical area of about 3.08 lakh sq. km, the State ranks 2nd by population and 3rd in terms of geographical area. Maharashtra is one of the highly urbanised states in India.
The State enjoys tropical monsoon climate. The hot scorching summer from March onwards is followed by monsoon in early June. The rich green cover of the monsoon season persists during the mild winter that follows through an unpleasant October transition.
The State capital Mumbai is not only home for leading corporate houses and firms but also has Asia’s oldest Stock Exchange, the Bombay Stock Exchange.
In order to have development in the emerging sectors, thrust sectors viz. Agro & food processing units, Textile machinery manufacturing, Information Technology (IT) & IT Enabled Services (ITeS), Electric vehicles, Industry 4.0 (artificial intelligence (AI), 3D printing, internet of things (IoT) & robotics, nanotechnology), Integrated data centre parks, Electronic systems design & manufacturing and semi-conductor fabrication, etc. have been identified in the State. The State has adopted varied measures for ‘Ease of Doing Business’. MIDC is offering ready-to-move-in factory environment under Plug & Play Infrastructure complete with advanced utilities and affordable pricing structure with sectoral tailoring.
The grand response garnered in ‘Magnetic Maharashtra 2.0 investors summit’ has shown that the State remains the favoured destination for investment owing well developed infrastructure, technological advancement, availability of skilled manpower, connectivity to major areas and ample natural resources.
Maharashtra is not just a geographical expression but an entity built on collective efforts of its people. Varied customs and traditions co-exist peacefully in Maharashtra. The State is well known throughout the country for its rich music and dances. Povadas, Bharuds, Gondhals and Lavnis are the major forms of folk music in the State and represent the best that the Maharashtrian society has contributed in the field of music. Maharashtra celebrates all major religious festivals in a peaceful and harmonious manner. As such the State has played a significant role in the social, economical and political sphere of the nation.
Monuments like Ajanta, Ellora & Elephanta caves, Gateway of India and architectural structures like Viharas and Chaityas attract tourists from all over the world. The State has announced its Agro Tourism Policy and Beach Shack Policy to promote tourism in the State. The State has classified the Hospitality sector as an industry. The State has sizable contribution in sports, arts, literature and social services. The State is also home to ‘Bollywood’, a world famous entertainment industry.
Maharashtra has time and again showed its pragmatic & progressive nature and the State continued to walk on the path of sustainable development.
* * * * *

Economic Survey of Maharashtra 2020-21
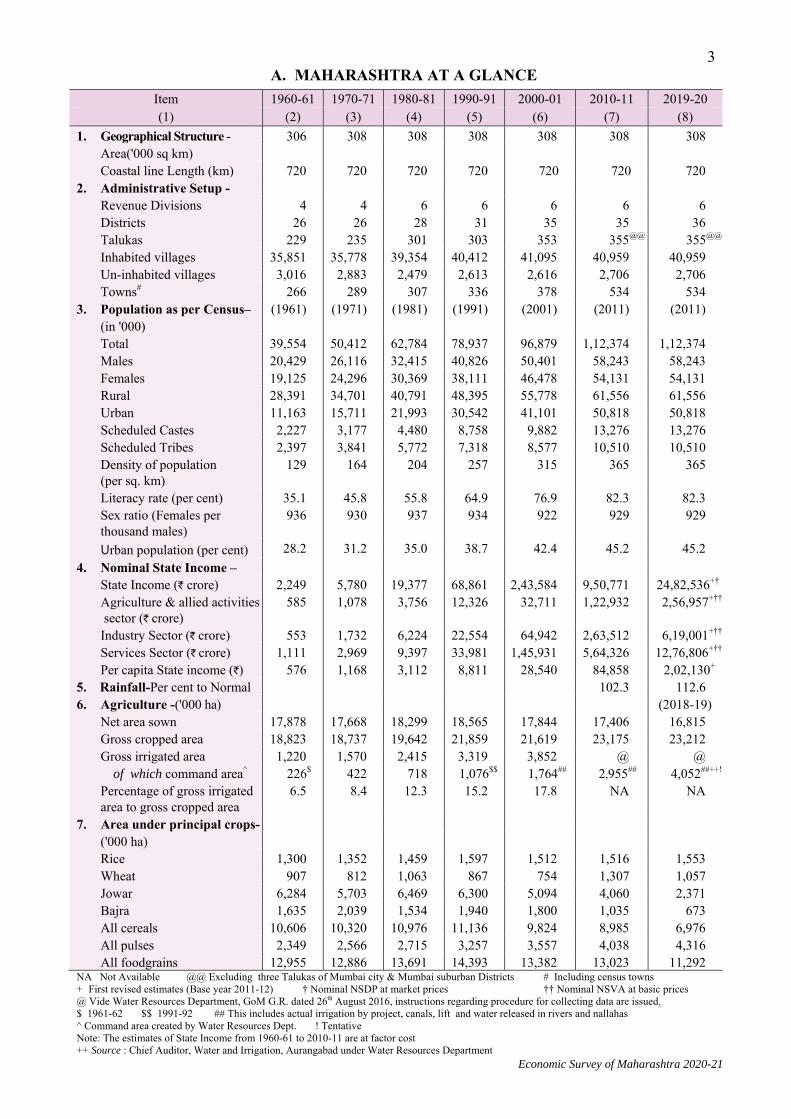
3A. MAHARASHTRA AT A GLANCE
Item 1960-61 1970-71 1980-81 1990-91 2000-01 2010-11 2019-20 (1) (2) (3) (4) (5) (6) (7) (8)
1. Geographical Structure - 306 308 308 308 308 308 308 Area('000 sq km) Coastal line Length (km) 720 720 720 720 720 720 720 2. Administrative Setup - Revenue Divisions 4 4 6 6 6 6 6 Districts 26 26 28 31 35 35 36 Talukas 229 235 301 303 353 355@@ 355@@ Inhabited villages 35,851 35,778 39,354 40,412 41,095 40,959 40,959 Un-inhabited villages 3,016 2,883 2,479 2,613 2,616 2,706 2,706 Towns# 266 289 307 336 378 534 534 3. Population as per Census– (in '000)
(1961) (1971) (1981) (1991) (2001) (2011) (2011)
Total 39,554 50,412 62,784 78,937 96,879 1,12,374 1,12,374 Males 20,429 26,116 32,415 40,826 50,401 58,243 58,243 Females 19,125 24,296 30,369 38,111 46,478 54,131 54,131 Rural 28,391 34,701 40,791 48,395 55,778 61,556 61,556 Urban 11,163 15,711 21,993 30,542 41,101 50,818 50,818 Scheduled Castes 2,227 3,177 4,480 8,758 9,882 13,276 13,276 Scheduled Tribes 2,397 3,841 5,772 7,318 8,577 10,510 10,510 Density of population (per sq. km)
129 164 204 257 315 365 365
Literacy rate (per cent) 35.1 45.8 55.8 64.9 76.9 82.3 82.3 Sex ratio (Females per thousand males)
936 930 937 934 922 929 929
Urban population (per cent) 28.2 31.2 35.0 38.7 42.4 45.2 45.2 4. Nominal State Income – State Income (` crore) 2,249 5,780 19,377 68,861 2,43,584 9,50,771 24,82,536+†
Agriculture & allied activities sector (` crore)
585 1,078 3,756 12,326 32,711 1,22,932 2,56,957+††
Industry Sector (` crore) 553 1,732 6,224 22,554 64,942 2,63,512 6,19,001+†† Services Sector (` crore) 1,111 2,969 9,397 33,981 1,45,931 5,64,326 12,76,806+†† Per capita State income (`) 576 1,168 3,112 8,811 28,540 84,858 2,02,130+ 5. Rainfall-Per cent to Normal 102.3 112.6 6. Agriculture -('000 ha) (2018-19) Net area sown 17,878 17,668 18,299 18,565 17,844 17,406 16,815 Gross cropped area 18,823 18,737 19,642 21,859 21,619 23,175 23,212 Gross irrigated area 1,220 1,570 2,415 3,319 3,852 @ @ of which command area^ 226$ 422 718 1,076$$ 1,764## 2,955## 4,052##++! Percentage of gross irrigated area to gross cropped area
6.5 8.4 12.3 15.2 17.8 NA NA
7. Area under principal crops- ('000 ha)
Rice 1,300 1,352 1,459 1,597 1,512 1,516 1,553 Wheat 907 812 1,063 867 754 1,307 1,057 Jowar 6,284 5,703 6,469 6,300 5,094 4,060 2,371 Bajra 1,635 2,039 1,534 1,940 1,800 1,035 673 All cereals 10,606 10,320 10,976 11,136 9,824 8,985 6,976 All pulses 2,349 2,566 2,715 3,257 3,557 4,038 4,316 All foodgrains 12,955 12,886 13,691 14,393 13,382 13,023 11,292 NA Not Available @@ Excluding three Talukas of Mumbai city & Mumbai suburban Districts # Including census towns + First revised estimates (Base year 2011-12) † Nominal NSDP at market prices †† Nominal NSVA at basic prices @ Vide Water Resources Department, GoM G.R. dated 26th August 2016, instructions regarding procedure for collecting data are issued. $ 1961-62 $$ 1991-92 ## This includes actual irrigation by project, canals, lift and water released in rivers and nallahas ^ Command area created by Water Resources Dept. ! Tentative Note: The estimates of State Income from 1960-61 to 2010-11 are at factor cost ++ Source : Chief Auditor, Water and Irrigation, Aurangabad under Water Resources Department

Economic Survey of Maharashtra 2020-21
4
A. MAHARASHTRA AT A GLANCE Item 1960-61 1970-71 1980-81 1990-91 2000-01 2010-11 2019-20 (1) (2) (3) (4) (5) (6) (7) (8)
Sugarcane area 155 204 319 536 687 1,041 NA Sugarcane harvested area 155 167 258 442 595 965 882 Cotton 2,500 2,750 2,550 2,721 3,077 3,942 4,491 Groundnut 1,083 904 695 864 490 395 291 8. Production of principal
crops-
( '000 tonnes) Rice 1,369 1,662 2,315 2,344 1,930 2,691 2,897 Wheat 401 440 886 909 948 2,301 1,793 Jowar 4,224 1,557 4,409 5,929 3,988 3,452 1,865 Bajra 489 824 697 1,115 1,087 1,123 512 All cereals 6,755 4,737 8,647 10,740 8,497 12,317 9,218 All pulses 989 677 825 1,441 1,637 3,096 3,849 All foodgrains 7,744 5,414 9,472 12,181 10,134 15,413 13,037 Sugarcane 10,404 14,433 23,706 38,154 49,569 85,691 69,313 Cotton (lint)# 1,673 484 1,224 1,875 1,803 7,473 6,639 Groundnut 800 586 451 979 470 470 309 9. Index of agricultural production@
-- -- -- 136.5 127.4 223.8 199.0
10. Agriculture Census - (1970-71) (1980-81) (1990-91) (2000-01) (2010-11) (2015-16) Number of operational holdings ('000)
-- 4,951 6,863 9,470 12,138 13,699 15,285
Area of operational holdings ('000 ha)
-- 21,179 21,362 20,925 20,103 19,767 20,506
Average size of operational holdings (ha)
-- 4.28 3.11 2.21 1.66 1.44 1.34
11. Livestock Census - (1966) (1978) (1987) (1997) (2007) (2012) (2019) Total livestock ('000) 25,449 29,642 34,255 39,638 35,955 32,489 33,080 Total poultry+ ('000) 9,902 18,751 24,830 35,392 64,756@@ 77,795@@ 74,298@@ (2003) (2003) Tractors 1,427 3,274 12,917 34,529 79,893 1,05,611 1,05,611 12. Forest Area (sq km) (2020) 63,544 62,311 64,222 63,798 61,935 61,939 61,952* 13. Industrial Investment - (2020)$$ No. of projects approved -- -- -- -- -- 16,686 20,909 Proposed Investment (` crore) -- -- -- -- -- 8,10,864 14,29,142 14. Electricity – (Million Kwh) Total generation 3,268 7,925 17,864 36,430 61,209 83,017 1,23,314 Total consumption 2,720 7,650 14,034 29,971 47,289 87,396 1,25,464 Industrial consumption 1,853 5,312 8,130 14,706 18,363 34,416 46,507 Agricultural consumption 15 356 1,723 6,604 9,940 16,257 29,118 Domestic consumption 260 732 1,779 5,065 11,172 19,546 29,301
* Provisional # Production of cotton in 170 kg per bale in '000 bales @ Base Triennial Average 1979-82=100
$$ Since August 1991 to October NA Not Available
+ Total poultry includes Turkey, Quail and other birds. @@ Total poultry includes birds in poultry farm.

Economic Survey of Maharashtra 2020-21
5
A. MAHARASHTRA AT A GLANCE Item 1960-61 1970-71 1980-81 1990-91 2000-01 2010-11 2019-20 (1) (2) (3) (4) (5) (6) (7) (8)
15. Banking - (Scheduled Commercial)
(June, 1971) (June, 1981) (June, 1991) (June, 2001) (June, 2010) (31st March, 2020)
Banking offices NA 1,471 3,627 5,591 6,294 8,037 13,114 (March 1991) (March 2001) Banking offices for rural population
NA 450 1,355 2,749 2,294 2,170 3,186
16. Education+ - Primary schools 34,594 44,535 51,045 57,744 65,960 75,695 1,06,491 Enrolment ('000) 4,178 6,539 8,392 10,424 11,857 10,626 15,694 Secondary schools (incl. higher secondary)
2,468 5,313 6,119 10,519 15,389 21,357 28,093
Enrolment ('000) 858 1,985 3,309 6,260 9,267 10,711 6,481 17. Health - (1971) (1981) (1991) (2001) (2011) ( 2019) Hospitals NA 299 530 768 981 1,368 1,402 Dispensaries NA 1,372 1,776 1,896 1629 3,012 3,087 Beds per lakh of population NA 88 114 144 105 103 102 (2018) Birth rate@ 34.7 32.2 28.5 26.2 20.7 16.7 15.6 Death rate@ 13.8 12.3 9.6 8.2 7.5 6.3 5.5 Infant mortality rate@ 86 105 79 60 45 25 19 18. Transport - Railway route length (km) 5,056 5,226 5,233 5,434 5,459 5,984 6,210 Total road length (km)† 39,241 65,364 1,41,131 1,72,965 2,16,968 2,41,712 3,09,342* of which surfaced 24,852 35,853 66,616 1,32,048 1,78,999 2,21,182 2,54,093*
Motor vehicles ('000) 100 312 805 2,641 6,607 16,990 37,762* 19. Co-operation - Primary agricultural credit societies
21,400 20,420 18,577 19,565 20,551 21,451 20,744
Membership (lakh) 22 38 54 79 101 150 147* No. of co-op. societies 31,565 42,597 60,747 1,04,620 1,58,016 2,24,306 2,12,951* Membership (lakh) 42 86 148 269 430 530 556* Working capital of 291 1,489 5,210 24,284 1,34,440 2,48,434 3,97,466* co-op. societies (` Crore) 20. Local Self-Govt. Institutions- (2019-20)$ Zilla Parishads 25 25 25 29 33 33 34 Gram Panchayats 21,636 22,300 24,281 25,827 27,735 27,913 27,832 Panchayat Samitees 295 296 296 298 321 351 351 Municipal Councils 219 221 220 228 228 222 241 Municipal Corporations 3 4 5 11 15 23 27 Nagar Panchayat -- -- -- -- 3 4 128 Cantonment Boards 7 7 7 7 7 7 7
* Provisional @ As per Sample Registration Scheme NA Not Available
† Roads maintained by P.W.D. and Z.P. $ As per State Election Commission (As on 31.12.2019)
+ The source of this information has been changed from year 2011-12. The information is categorised as Primary (std 1 to 8) and Secondary (including higher secondary) (std.9 to 12). Earlier the information was categorised as Primary (std 1 to 7) and Secondary (including higher secondary) (std.8 to 12) and source for this information is Maharashtra Prathamik Shikshan Parishad

Economic Survey of Maharashtra 2020-21
6
B. COMPARISION OF MAHARAHTRA AND INDIA
Item Unit Maharashtra India Comparison with India
(Percentage) (1) (2) (3) (4) (5)
1. Population (2011) 1.1 Total population ('000) 1,12,374 12,10,855 9.3
(a) Males -”- 58,243 6,23,270 9.3 (b) Females -”- 54,131 5,87,585 9.2
1.2 (a) Rural population ('000) 61,556 8,33,749 7.4 (b) Proportion of rural population to total population
Per cent 54.8 68.9 --
1.3 (a) Urban population ('000) 50,818 3,77,106 13.5 (b) Proportion of urban population to total population
Per cent 45.2 31.1 --
1.4 Sex Ratio Females per thousand males
929 943 --
1.5 Decadal growth rate of population (2001-2011)
Per cent 16.0 17.7 --
1.6 Literacy rate -”- 82.3 73.0 -- 1.7 Population of scheduled castes and scheduled tribes
('000) 23,786 3,05,924 7.8
1.8 Total workers -”- 49,428 4,81,889 10.3 1.9 Geographical area Lakh sq. km. 3.08 32.9 9.4 2. Agriculture (2016-17) 2.1 Net area sown ('000 ha) 16,910 1,39,415 12.1 2.2 Gross cropped area -”- 23,224 2,00,203 11.6 2.3 Gross irrigated area -”- NA 98,148 -- 2.4 Percentage of gross irrigated area to gross cropped area
Per cent NA 49.0 --
2.5 Area under principal crops (average for years 2016-17 to 2018-19)
(i) Rice ('000 ha) 1,484 43,975 3.4 (ii) Wheat -”- 1,044 29,918 3.5 (iii) Jowar -”- 2,305 4,914 46.9 (iv) Bajra -”- 745 7,348 10.1 (v) All cereals -”- 6,785 97,706 6.9 (vi) All foodgrains (cereals and pulses) -”- 10,975 1,27,177 8.6 (vii) Sugarcane Area -”- NA 4,745 -- Sugarcane Harvested Area -”- 899 NA -- (viii) Cotton -”- 4,123 12,009 34.3 (ix) Groundnut -”- 297 4,986 6.0
NA Not Available

Economic Survey of Maharashtra 2020-21
7
B. COMPARISION OF MAHARAHTRA AND INDIA (contd.) Item Unit Maharashtra India Comparison
with India (Percentage)
(1) (2) (3) (4) (5)
3. Livestock census
3.1 Total livestock (2019) (000) 33,080 5,36,761 6.2
3.2 Wheel Tractors (2003) -”- 106 2,361 4.5
3.3 Diesel engines & Electric pumps for irrigation (2003)
-”- 1,174 15,684 7.5
4. Forests
4.1 Total forest area (2019) Sq km 61,579 7,67,419 8.0
5. Industry
5.1 Industrial Investment$$
(a) Projects approved Number 20,909 1,16,257 18.0
(b) Proposed investment ` crore 14,29,142 1,33,43,438 10.7
6. Electricity (2019-20)
6.1 Total generation Million kwh 1,23,314 13,83,398 8.9
6.2 Total consumption# -”- 1,25,464 10,50,996 11.9
6.3 (a) Industrial consumption -”- 46,507 3,42,702 13.6
(b) Percentage of industrial consumption to total consumption
Per cent 37.1 32.6 --
7. Banking (Scheduled commercial) (March, 2020)
7.1 Banking offices Number 13,114 1,48,904 8.8
7.2 Rural Banking Offices (March, 2020) -”- 3,186 52,098 6.1
8. State / National Income (2019-20) 8.1 Nominal Gross State Domestic Product (GSDP) /Nominal Gross Domestic Product (GDP)†
` crore
28,18,555+
2,03,51,013+
13.8
8.2 Nominal Income ` crore 24,82,536+ 1,79,94,301+ 13.8
8.3 Per capita income at current prices ` 2,02,130+ 1,34,186+ --
$$ From August, 1991 to October, 2020 + First revised estimates † GSDP / GDP are at market prices # Electrical energy sales to ultimate consumers through distribution licensees


1State Economy


Economic Survey of Maharashtra 2020-21
1. STATE ECONOMY State Income
1.1 As per the advance estimates, the State economy is expected to grow by (-)8.0 per cent during 2020-21, the Indian economy is also expected to grow by (-)8.0 per cent. During 2020-21, the ‘Agriculture & allied activities’, ‘Industry’ and ‘Services’ sectors are expected to grow by 11.7 per cent, (-)11.3 per cent and (-)9.0 per cent respectively. As per the advance estimates, nominal (at current prices) Gross State Domestic Product (GSDP) for 2020-21 is expected to be ` 26,61,629 crore and real (at constant 2011-12 prices) GSDP is expected to be ` 19,62,539 crore.
1.2 As per the first revised estimates, nominal GSDP for 2019-20 is ` 28,18,555 crore as against ` 25,79,628 crore for 2018-19. Real GSDP is ` 21,34,065 crore for 2019-20 as against ` 20,33,314 crore for 2018-19. The Per capita State Income for 2019-20 is ` 2,02,130 as against ` 1,87,118 for 2018-19.
Per capita State Income of selected states during 2019-20 (Base year 2011-12)
Particulars Haryana Telangana Karnataka Tamil Nadu Maharashtra Andhra Pradesh
Madhya Pradesh
Uttar Pradesh
Per capita State Income (`) 2,64,207 2,28,216 2,23,433 2,18,599 2,02,130 1,69,519 99,763 65,704
World Gross Product Growth Rate for 2020
Particulars World Developed Economies
Developing Economies
Least Developed Economies
United States of America
Japan China India$ Maharashtra$
Gross product growth rate (per cent)
(-)4.3 (-)5.6 (-)2.5 (-)1.3 (-)3.9 (-)5.4 2.4 (-)8.0^ (-)8.0^^
$ for 2020-21 ^ Second advance estimates as per National Statistical Office, GoI ^^Advance estimates as per Directorate of Economics and Statistics, GoM
The average share of State’s contribution is highest (14.2 per cent) among all states in All-India nominal GDP
Nominal GSDP is expected to decrease by ` 1,56,925 crore during 2020-21 as compared to 2019-20
Per capita State Income during 2020-21 is expected at ` 1,88,784
Per capita State Income and Nominal GSDP (Base year 2011-12) Particulars 2011-12 2012-13 2013-14 2014-15 2015-16 2016-17 2017-18+++ 2018-19++ 2019-20+ 2020-21$
Per capita State Income (`)
99,597 1,12,092 1,25,261 1,32,836 1,46,815 1,63,726 1,72,663 1,87,118 2,02,130 1,88,784
Nominal GSDP (` Crore)
12,80,369 14,59,629 16,49,647 17,79,138 19,66,225 21,98,185 23,52,782 25,79,628 28,18,555 26,61,629
+++ Third revised estimates ++ Second revised estimates + First revised estimates $ Advance estimates

Economic Survey of Maharashtra 2020-21
10 10
Prices
1.3 During Covid-19 lockdown, difficulties were faced in the collection of prices of essential commodities for the month of April and May, 2020. For non-food group items, prices were unavailable for the same period. Hence the CPI for ‘pan, supari & intoxicant’, ‘clothing, bedding & footwear’, ‘miscellaneous (except medical services for urban)’ and ‘general’ groups could not be compiled for the month of April and May, 2020. Average Consumer Price Index (CPI) (base year 2003) for rural and urban areas in the State from June, 2020 to December, 2020 was 318.5 and 303.2 respectively as against 300.5 and 284.2 respectively from June, 2019 to December, 2019. The year-on-year rate of inflation based on average CPI during June, 2020 to December, 2020 was 6.0 per cent for rural areas and 6.7 per cent for urban areas as against 9.4 per cent and 6.3 per cent respectively from June, 2019 to December, 2019.
1.4 During 2020-21 upto January, Aadhaar seeding of 153.12 lakh ration cards out of total eligible 156.63 lakh ration cards covered under National Food Security Act (NFSA) and 8.96 lakh ration cards out of total eligible 9.09 lakh ration cards covered under Above Poverty Line (APL) farmers from drought prone 14 districts has been completed.
1.5 Point of Sale (PoS) devices have been installed in 52,532 Fair Price Shops (FPS) across the State for distribution of foodgrains upto January, 2021. About 1.43 crore families availed ration with Aadhaar based biometric authentication in January, 2021.
1.6 ‘One Nation, One Ration Card’ is being implemented in India from 1st January, 2020. Under the scheme, beneficiaries can buy subsidised foodgrains from FPS in any part of the country by way of portability using PoS devices. Since inception 4,381 ration card holders of this State and 609 ration card holders of other states have availed facilities under the scheme upto January, 2021.
Measures taken during Covid-19 lockdown
• Price of Shiv Bhojan thali has been reduced to ` five and the same will be provided upto 31st March, 2021. Since inception upto December, 2020, about 2.81 crore Shivbhojan thalis have been distributed through total 906 Shivbhojan centres
• Under Pradhan Mantri Garib Kalyan Anna Yojana, about seven crore Antyodaya Anna Yojana & Priority Households beneficiaries in the State have been provided five kg of foodgrains per person per month and one kg of pulses per family per month free of cost in addition to foodgrains permissible under NFSA
• GoM has distributed five kg foodgrains at subsidised rates (two kg rice at ` 12 per kg and three kg wheat at ` 8 per kg) to all APL saffron cardholders who are not covered under NFSA and APL farmers schemes

Economic Survey of Maharashtra 2020-21
11
Public finance
1.7 The revenue receipts of the State are ` 3,47,457 crore for 2020-21 (BE) as against ` 3,09,881 crore during 2019-20 (RE). The tax and non-tax revenue (including central grants) as per 2020-21 (BE) are ` 2,73,181 crore and ` 74,276 crore respectively. Actual revenue receipts during April to December, 2020 were ` 1,76,450 crore (50.8 per cent of BE).
1.8 The revenue expenditure of the State is ` 3,56,968 crore as per 2020-21 (BE) as against ` 3,41,324 crore during 2019-20 (RE).
1.9 As per 2020-21 (BE), the share of capital receipts in total receipts and capital expenditure in total expenditure are 20.0 per cent and 17.8 per cent respectively.
1.10 Share of development expenditure in revenue expenditure is 68.7 per cent as per 2020-21 (BE)
Institutional finance
1.11 As on 31st March, 2020 aggregate bank deposits and gross credit of scheduled commercial banks in the State were ` 27.55 lakh crore and ` 28.26 lakh crore respectively. Credit-Deposit Ratio was 102.6 per cent as on 31st March, 2020.
1.12 The share of ‘Agriculture & allied activities’ sector is 19.7 per cent and that of ‘MSME (Micro, small, medium enterprises, khadi & village industry)’ sector is 52.4 per cent in the Annual credit plan for priority sector for 2020-21.
1.13 During 2019-20, under Pradhan Mantri MUDRA Yojana total loans of ` 27,398 crore were disbursed to 47.71 lakh beneficiaries in the State, of which 41.33 lakh were under ‘Shishu’, 5.05 lakh under ‘Kishor’ and 1.33 lakh under ‘Tarun’ category.
The percentage of fiscal deficit to GSDP is 2.1 per cent and debt stock to GSDP is 19.6 per cent as per 2020-21 (BE)
As per recommendations of 15th FC, total transfers of financial resources to the State during 2021-22 to 2025-26 will be ` 3,37,252 crore, of which total grants-in-aid will be ` 70,375 crore
Measures taken during Covid-19 lockdown • Approval given only for purchases of
medicines, essential medical equipment and supplies, etc.
• Expenditure on new schemes curtailed • Approval for distributing budgeted funds for
creating assets & job opportunities • During 1st September to 31st December, 2020
Stamp Duty was decreased by three per cent for Mumbai & Mumbai Suburban districts and by two per cent for the rest of the State whereas for the period 1st January to 31st March, 2021, it is decreased by two per cent for Mumbai & Mumbai Suburban districts and by 1.5 per cent for the rest of the State
• Approval given for exemption of 50 per cent in the yearly taxes paid by goods & tourist vehicles, mines, private service vehicles, professional campers vehicles and school students carrying vehicles for 2020-21
The Maharashtra’s share in aggregate deposits and gross credit of scheduled commercial banks as on 31st March, 2020 was 20.0 per cent and 27.0 per cent respectively at All-India level
Annual Credit Plan size for Priority Sector of the State for 2020-21 is ` 4.75 lakh crore

Economic Survey of Maharashtra 2020-21
12 12
Agriculture & allied activities
1.14 The State received 113.4 per cent of the normal rainfall during monsoon 2020. Out of 355 talukas (excluding talukas in Mumbai City & Mumbai suburban districts) in the State, 139 talukas received excess rainfall, 173 received normal and 43 received deficient rainfall.
1.15 Average size of operational holding as per Agriculture Census 2015-16 is 1.34 ha whereas as per Agriculture census 2010-11 it was 1.44 ha. The total area of small & marginal operational holdings (upto 2.0 ha) was 92.20 lakh ha constituting 45 per cent of the total area of operational holdings whereas number of small and marginal operational holdings were 121.55 lakh which were 79.5 per cent of the total number of operational holdings.
1.16 During kharif season of 2020-21, sowing was completed on 156.89 lakh ha area. The production of cereals, pulses, oilseeds, cotton and sugarcane is expected to increase by 60 per cent, 14 per cent, 28 per cent, 33 per cent and 40 per cent respectively over the previous year.
1.17 During Rabi season 2020-21, by the end of December sowing was completed on 53.64 lakh ha. The production of cereals and pulses is expected to increase by one per cent and 12 per cent respectively while production of oilseeds is expected to decrease by 18 per cent over the previous year.
1.18 The area under horticulture crops is 19.20 lakh ha and production is expected to be 278.75 lakh MT during 2019-20.
Rainfall and Crop production in the State Particulars 2011-12 2012-13 2013-14 2014-15 2015-16 2016-17 2017-18 2018-19 2019-20#
Rainfall (percentage to normal)
102.3 90.3 124.6 70.2 59.4 94.9 84.3 73.6 112.6
Crop Production ('000 MT)$
Cereals 10,276 8,667 10,677 9,259 7,210 12,646 10,944 7,947 9,218
Pulses 2,225 2,262 3,114 2,019 1,545 4,584 3,684 2,683 3,849
Total Foodgrains
12,501 10,929 13,791 11,278 8,755 17,230 14,628 10,630 13,067
Oilseeds 4,485 5,087 5,294 2,850 2,436 5,113 4,208 4,885 5,178
Sugarcane 86,733 69,648 76,901 84,699 73,680 54,237 83,138 89,771 69,313
Cotton (Lint)@
7,200 7,655 8,834 7,000 7,500 10,755 6,094 6,593 6,639
Fruits 10,538 9,785 13,458 11,090 9,750 10,630 11,729 10,778 11,544
Vegetables 8,778 8,008 10,162 8,783 9,452 10,520 12,307 11,472 14,394 $ Includes Kharif, Rabi and Summer @ Production of cotton in '000 bales of 170 kg each #Final estimates

Economic Survey of Maharashtra 2020-21
13
1.19 Irrigation potential created as on 30th June, 2019 by major, medium and minor irrigation (State sector) projects was 53.04 lakh ha and actual irrigated area was 40.52 lakh ha (76.4 per cent) during 2019-20. Irrigation potential created as on 30th June 2020, by minor irrigation (local sector) projects was 19.26 lakh ha and potential utilised was 8.63 lakh ha (44.8 per cent) during 2019-20.
1.20 As on 15th October, 2019 live storage in the major, medium & minor irrigation (State sector) reservoirs taken together was 30,579 million cubic metre, which was 69.2 per cent of the storage capacity.
1.21 During 2020-21, the annual target for agriculture & allied activities sector in annual credit plan was ` 93,626 crore. During 2020-21 upto December, crop loans of ` 40,515 crore was disbursed through financial institutions as against ` 28,604 crore during 2019-20. During 2020-21 upto September, agricultural term loans of ` 30,014 crore were disbursed as against ` 34,427 crore during 2019-20. 1.22 During 2019-20, Primary Agricultural Credit Co-operative Societies (PACS) disbursed loans of ` 10,898 crore to farmers. 1.23 Heavy rainfall and flood during June to October, 2020 affected agriculture and horticulture crops in the State. Compensation for maximum two ha plantation, ` 10,000 per hectare for agriculture crops and ` 25,000 per hectare for horticulture crops has been sanctioned in two installments to distressed farmers. Total amount of compensation sanctioned is ` 4,374.43 crore.
1.24 With a view to augment income of small and marginal farmers, GoI has launched ‘Pradhan Mantri Kisan Samman Nidhi (PM-KISAN)’ scheme from 2018-19. Under the Scheme, a direct payment of ` 6,000 per year is transferred in three equal installments of ` 2,000 each, into the Aadhaar linked bank account of eligible farmer family, comprising of husband, wife and minor children. Under the scheme, as on 4th January, 2021 in all 102.54 lakh beneficiary farmers in the State have been benefited and the total amount of ` 9,496.38 crore has been credited to beneficiary
farmers’ bank accounts. 1.25 As per Livestock Census 2019, the State ranks seventh at All-India level with total livestock of about 3.31 crore. The State ranks fifth at All-India level with poultry birds population of about 7.43 crore. 1.26 During 2019-20, the average daily collection of milk by the government and co-operative dairies was 0.96 lakh litre and 39.76 lakh litre respectively whereas the corresponding figures during 2018-19 were 1.79 lakh litre and 49.14 lakh litre respectively.
Since inception of ‘Mahatma Jyotirao Phule Shetkari Karjamukti Yojana 2019’ benefit of ` 19,847 crore has been given to 31.04 lakh beneficiary farmers upto January, 2021.
Measures taken during Covid-19 lockdown
• Licenses made available from concerned departments to transport and sell agricultural inputs and produce
• Distribution of agricultural inputs to 9.42 lakh farmers at their door steps
• Direct sell of about 1.37 lakh MT of fruits and vegetables to urban consumers through 3,790 groups of farmers
Measures taken during Covid-19 lockdown
• Created mass awareness through radio, television and other extension media about safety of consumption of poultry products and nutritional benefits therein
• Provided uninterrupted vaccination, artificial insemination & other veterinary services, fodder availability, transport for maintaining health of livestock and consistent milk production including action against animal cruelty
• Ensured smooth supply of feed and fodder to animal owners and manufacturing units

Economic Survey of Maharashtra 2020-21
1414
1.27 During 2019-20, marine and inland fish production was 4.44 lakh MT and 1.18 lakh MT respectively. During 2018-19, it was 4.67 lakh MT and one lakh MT respectively.
1.28 The forest area of the State at the end of the year 2019-20 was about 20.1 per cent of geographical area of the State, as against the target of 33 per cent set under National Forest Policy, 1988.
Industry and co-operation
1.29 Since liberalisation (August, 1991) upto October, 2020 in all 20,909 industrial projects with an investment of ` 14,29,142 crore were approved in the State. During 2020 upto October, 247 projects with proposed investment of ` 37,887 crore were registered in the State.
1.30 The FDI inflows in the State since April, 2000 to September, 2020 was ` 8,18,522 crore, which was 27.7 per cent of total FDI inflows at All-India level. During 2020-21 upto September the total FDI inflows in the State was ` 27,143 crore.
1.31 The number of MSMEs registered in the State, upto March, 2020 for Udyog Aadhaar were 17.67 lakh, of which 15.60 lakh were micro, 1.99 lakh were small and 0.08 lakh were medium enterprises. The total investment of MSMEs in the State was ` 2,38,543 crore and employment generated was 91.01 lakh.
1.32 Aurangabad Industrial City (AURIC), a well planned and greenfield smart industrial city based on the concept of ‘walk to work’, is being developed across an area of 10,000 acres in the State as a part of Delhi-Mumbai Industrial Corridor (DMIC). In all 62 plots of total area of about 212 acres have been allotted in AURIC to the investors. Total investment in AURIC is more than ` 5,000 crore and employment generated is about 2,811.
1.33 As per the ‘India Tourism Statistics At a Glance - 2020’ report, the State had 14.93 crore domestic tourist visits and 0.55 crore foreign tourists visits during 2019 as against 11.92 crore domestic tourist visits and 0.51 crore foreign tourists visits during 2018.
1.34 As on 31st March, 2020 there were about 2.13 lakh co-operative societies, with about 5.56 crore members therein. Of these, 9.7 per cent were primary agricultural credit societies, 9.8 per cent were non-agricultural credit societies, 52.4 per cent were housing societies, 12.5 per cent were agro processing societies, 5.1 per cent were labour contract societies and 10.5 per cent were engaged in other activities.
During Magnetic Maharashtra 2.0 in June, 2020, the State has attracted investment proposals of ` 1.13 lakh crore with expected employment over 2.50 lakh
There were 7,603 Startups in the State at the end of December, 2020
MIDC is offering ready-to-move-in factory environment under Plug & Play Infrastructure and is allocating over 40,000 acre of land for the same; MIDC will also provide Industrial Shed Spaces on rental basis to enable quick setting up of industries
The State has announced Beach Shack Policy during August, 2020 and Agro Tourism Policy in September 2020 to promote tourism industry
To revive the worst hit Hospitality sector during Covid-19 pandemic, the State has decided to classify it as an industry

Economic Survey of Maharashtra 2020-21
15
Infrastructure Energy
1.35 During 2019-20 total electricity generated was 1,58,302 Million Units (MU) (including electricity received from central sector) and total consumption of electricity during 2019-20 in the State was 1,25,464 MU. 1.36 During 2020-21 upto December, average peak demand for electricity was 17,345 MW and supply was 21,841 MW. During 2019-20 the average peak demand was 19,103 MW and supply was 21,771 MW.
1.37 During 2019-20, transmission losses of MAHATRANSCO, distribution losses and ‘Aggregate Technical & Commercial’ (AT & C) losses of MAHADISCOM were 3.17 per cent, 15.91 per cent and 17.51 per cent respectively.
Transport and Communication
1.38 At the end of March 2019, the total road length maintained by PWD and ZP was about 3.09 lakh km.
1.39 ‘Hindu Hruday Samrat Balasaheb Thackeray Maharashtra Samruddhi Mahamarg’ is a proposed eight lane expressway (701 km long and 120 metre wide) connecting Mumbai and Nagpur with total estimated cost of ` 55,335.32 crore. Of the total land required, 92.3 per cent land is acquired upto December, 2020.
1.40 The total number of vehicles on road in the State as on 1st January, 2021 was 386 lakh (125 vehicles per km road length) as against 378 lakh (122 vehicles per km road length) on 1st January, 2020.
1.41 During 2019-20, Maharashtra State Road Transport Corporation (MSRTC) has effectively operated on an average 15,505 buses per day covering 53.29 lakh km and carrying 60.07 lakh passengers.
1.42 During 2019-20, total cargo traffic handled by major and non-major ports was 1,728.05 lakh MT as against 1,770.80 lakh MT during the previous year.
Installed capacity of generating electricity as on 31st March, 2020 and electricity generated during 2019-20 in the State was highest in the country
State ranks fourth in terms of installed capacity of renewable energy
State ranks second in consumption of major petroleum products during 2019-20
During Covid-19 lockdown, MSRTC started transportation of employees working for essential services
To control adverse effect on freight transportation due to Covid-19 lockdown, GoM permitted to carry essential and other articles by MSRTC passenger vehicles
Mumbai Trans Harbour Link project with estimated cost of ` 17,843 crore is in progress to smoothen traffic flow and accelerate growth of Navi Mumbai
Mumbai Coastal Road project (South) with estimated cost of ` 12,721 crore is in progress and about 20 per cent work was completed at the end of November, 2020
Belapur to Kharkopar route of Belapur-Seawood-Uran (New line) is commissioned
Under Mumbai Metro Rail Project, works of Dahisar - Charkop - Bandra - Mankhurd (` 17,396 crore), Colaba - Bandra - SEEPZ (` 23,136 crore), Wadala - Kasarvadavali - Gaimukh (` 15,498 crore), Thane - Bhiwandi - Kalyan (` 8,417 crore), Swami Samarth Nagar - Vikhroli (` 6,672 crore) and Andheri Dahisar - Mira Bhayandar (` 12,815 crore) are in progress

Economic Survey of Maharashtra 2020-21
16 16
1.43 During 2019-20, domestic and international cargo handled by airports in the State was 3.30 lakh MT and 5.83 lakh MT respectively. The corresponding figures for 2018-19 were 3.45 lakh MT and 6.78 lakh MT respectively. During 2019-20 the passenger traffic from domestic and international airports was 458.49 lakh and 125.21 lakh respectively, whereas the corresponding figures for 2018-19 were 468.14 lakh and 146.33 lakh respectively.
1.44 The internet subscriber base in the State at the end of September, 2020 was 9.7 crore which is highest among all states in the country.
Social sector 1.45 During 2019-20, number of primary schools (class I to VIII) were 1,06,491 with enrolment of 156.9 lakh. During 2019-20, number of secondary & higher secondary schools (class IX to XII) were 28,093 with enrolment of 64.8 lakh. 1.46 As per All-India Survey of Higher Education, number of universities and colleges in the State were 65 and 4,732 respectively in 2019-20.
1.47 Under Integrated Mahatma Jyotirao Phule Jan Arogya Yojana and Pradhanmantri Jan Arogya Yojana, about 4.54 lakh surgeries and therapies were conducted and an expenditure of ` 744.65 crore was incurred during 2020-21 upto December.
1.48 Under Swachh Maharashtra Abhiyan (Urban), 217 cities have been declared as ODF+ and 116 cities as ODF++ upto December, 2020.
Navi Mumbai Metro Rail Project with estimated cost of ` 3,064 crore and Pune Metro with estimated cost of ` 11,420 crore are in progress
Nagpur Metro Rail Project with estimated cost of ` 8,680 crore is in progress. Khapri to Sitabuldi of North-South corridor and Lokmanya Nagar to Sitabuldi of East-West corridor are opened to public
Navi Mumbai International Airport is being developed with estimated cost of ` 14,179 crore
The National Education Policy 2020 (NEP 2020) was declared in July, 2020 for transformational reforms in school and higher education systems in the country
Under Maharashtra State Rural Livelihood Mission, total credit linkage of ` 872.52 crore was disbursed to 63,063 Self Help Groups during 2020-21 upto January
Measures taken during Covid-19 lockdown
• The concept of ‘learning at home’ was adopted and various educational applications such as Diksha of NCERT, Shaikshanik dindarshika of MSCERT etc. were used. The State accounted for 46 per cent share in the use of Diksha app at All-India level
• Under Mid day Meal Scheme rice, gram, moongdal, etc. distributed to eligible students either in schools or at door step. Special instructions issued to deliver food grains at door step of divyang students
• Foodgrains and grocery provided to all beneficiary children of anganwadi and migrant children in age group of 3-6 years
• Village Child Development Centers (VCDC) were converted into home based VCDC and 8,037 children were provided with energy dense nutritious food
• The Khawati Anudan Yojana was revived for one year for economically weaker families of Scheduled Tribe

Economic Survey of Maharashtra 2020-21
17
Covid -19 pandemic 1.49 The first patient of Covid-19 in the world was found in the city of Wuhan in China in December, 2019. In India, the first patient was found in Kerala on 30th January, 2020. The first patient in the State was found on 9th March, 2020 in Pune. 1.50 Covid-19 pandemic situation in the State as on 15th January, 2021 was as follows
• Total cases were 19.84 lakh, of which 18.81 lakh cases were recovered
• Recovery rate was 94.8 per cent • Total deaths were 50,336 • Case fatality rate was 2.5 per cent • Number of cases per million population
were 15,649 • Weekly average growth rate active
cases was 0.16 per cent in January, 2021
• Total 1.37 crore tests were conducted in the State
1.51 ‘My family, My responsibility’ campaign was conducted during 15th September to 25th October, 2020, in which each household was visited twice. In the first phase, out of 2.76 crore families, 2.74 crore families were surveyed and 11.92 crore people were directly contacted. In the second phase, 2.70 crore families were covered under the survey and 10.01 crore people were visited.
• Out of 3.57 lakh ILI/SARI patients identified, 3.22 lakh were tested for Covid-19, of which 51,064 were found Covid -19 positive and were treated subsequently
• In all 23.75 lakh co-morbid patients were identified during the survey and further treatment was arranged for them
1.52 In the State, Covid-19 immunisation programme was commenced on 16th January, 2021. As on 18th February, 2021 total 7,81,800 corona warriors were vaccinated.
1.53 Maharashtra Human Development Programme is being implemented in rural and all ‘C’ class municipal councils areas of 125 most backward talukas. Under the programme, various schemes focusing on improvement in education, health and income are being implemented. During 2020-21, a budget provision of ` 359.20 crore has been made and an expenditure of ` 45.62 crore was incurred upto November, 2020.
* * * * *
Measures taken to tackle Covid-19 pandemic
• As on 15th January, 2021 there were 487 labs functioning for Covid-19 diagnosis
• To trace all contacts of a confirmed positive patient, contact tracing teams were established
• Mahatma Jyotirao Phule Jan Arogya Yojana was made available to non-beneficiaries also
• In private hospitals, 80 per cent beds were taken under State government’s control
• Grievance redressal mechanism was set up for complaints against private hospital bills
Infant Mortality Rate for 2018 was 19
Under Five Mortality Rate, Neo-Natal Mortality Rate and Total Fertility Rate were 22, 13 and 1.7 respectively in 2018
Maternal Mortality Ratio during 2016-18 was 46


2Population


Economic Survey of Maharashtra 2020-21
2. POPULATION 2.1 The population census has been a major source for data pertaining to the population count, it’s composition and other features. The valuable set of indicators relating to the human capital, thrown up by the Census, are the empirical basis to evaluate the past, assess the present and take informed decisions for the future. Census is not merely a head count but a snapshot of the socio-economic, demographic and cultural profile of the country at a particular point of time.
Census 2021 2.2 Due to Covid-19 pandemic, the phase I of Census 2021 and updation of National Population Register (NPR) which was to begin from 1st April, 2020 and other related field activities are postponed by GoI.
Census 2011 2.3 As per the Population Census 2011, population of the State was 11.24 crore, which was 9.3 per cent of All-India population. The State was second largest populous State in India after Uttar Pradesh. The State had a population density of 365 per sq km. Decadal growth rate of population of the State was 16.0 per cent as against 17.7 per cent for All-India. The State stands fifth and sixth in proportion of urban population and literacy respectively at All-India level. Average household size in the State was 4.6 as against 4.9 at All-India level. Important indicators of population of Maharashtra and All-India are given in Table 2.1. Population of Maharashtra and India as per censuses is given in Annexure 2.1, rural and urban population in the State based on censuses is given in Annexure 2.2 and districtwise population indicators as per Census 2011 are given in Annexure 2.3. 2.3.1 As per population projections released by National Commission on Population, Ministry of Health and Family Welfare,GoI projected population of the State as on 1st March, 2021will be 12.44 crore.
Population Growth Rates 2.4 The percentage decadal growth rate of the State population during 2001-2011 has registered sharp decline since independence. It declined from 22.7 per cent in 2001 to 16.0 per cent in 2011, a sharp decrease of 6.7 percentage points.

Economic Survey of Maharashtra 2020-21
20
Table 2.1 Important indicators of population of Maharashtra and All-India
Particulars Maharashtra All- India
2001 2011 2001 2011
Population (crore)
Total Persons 9.69 11.24 102.87 121.09
Male 5.04 5.82 53.22 62.33
Female 4.65 5.41 49.65 58.76
Rural Persons 5.58 6.15 74.25 83.38
Male 2.85 3.15 38.16 42.78
Female 2.73 3.00 36.09 40.60
Urban Persons 4.11 5.08 28.61 37.71
Male 2.19 2.67 15.06 19.55
Female 1.92 2.41 13.56 18.16
Scheduled Castes Persons 0.99 1.33 16.66 20.14
Male 0.51 0.68 8.61 10.35
Female 0.48 0.65 8.05 9.79
Scheduled Tribes Persons 0.86 1.05 8.43 10.45
Male 0.44 0.53 4.26 5.25
Female 0.42 0.52 4.17 5.20
Population (age group 0 to 6 years) Persons 1.37 1.33 16.38 16.45
Male 0.71 0.70 8.50 8.57
Female 0.65 0.63 7.88 7.88
Adolescent population (age group 10 to 19 years)
2.09 2.14 22.51 25.32
Youth population (age group 15 to 24 years)
1.84 2.17 19.00 23.20
Decadal growth rate (per cent) 22.7 16.0 21.5 17.7
Sex ratio 922 929 933 943
Child sex ratio (age group 0 to 6 years) 913 894 927 918
Literacy rate ( age 7 years and above) (per cent)
76.9 82.3 64.8 73.0
Population density (per sq.km.) 315 365 325 382
Urban population (per cent) 42.4 45.2 27.8 31.1 Source : ORGI Note : Figures may not add up due to rounding

Economic Survey of Maharashtra 2020-21
21
Adult Literacy Rate 2.5 As per Census 2011, the adult (age15 years & above) literacy rate at All-India level was 69.3 per cent, it was 78.8 per cent for males and 59.3 per cent for females. As per Census 2011, the adult literacy rate at State level was 80.2 per cent, it was 87.4 per cent for males and 72.6 per cent for females.
Age groupwise population 2.6 Demographic dividend refers to the growth in an economy that is the result of a change in the age structure of the population. The share of working age population (age group 15 to 59 years) in the State had increased from 59.0 per cent in 2001 to 63.1 per cent in 2011, increase of 4.1 percentage points. The working age population (age group 15 to 59 years) was larger than the non-working age population (age 14 years & younger and 60 years & older). Percentage of population in selected age group for Maharashtra and All-India is given in Table 2.2. Table 2.2 Percentage of population in selected age group for Maharashtra and All-India
(per cent) Age Group (Years) Maharashtra All- India
1991 2001 2011 1991 2001 2011 0-4 12.0 9.8 8.3 12.2 10.7 9.3 5-9 12.3 10.6 8.7 13.3 12.5 10.5 10-14 11.3 11.7 9.6 11.8 12.1 11.0 0-14 35.6 32.1 26.6 37.3 35.4 30.8 15-59 57.0 59.0 63.1 55.4 56.9 60.3 60 & above (including age not stated)
7.4 8.9 10.3 7.3 7.7 8.9
Source : ORGI Note : Figures may not add up due to rounding
Economic Survey of Maharashtra 2020-21
22
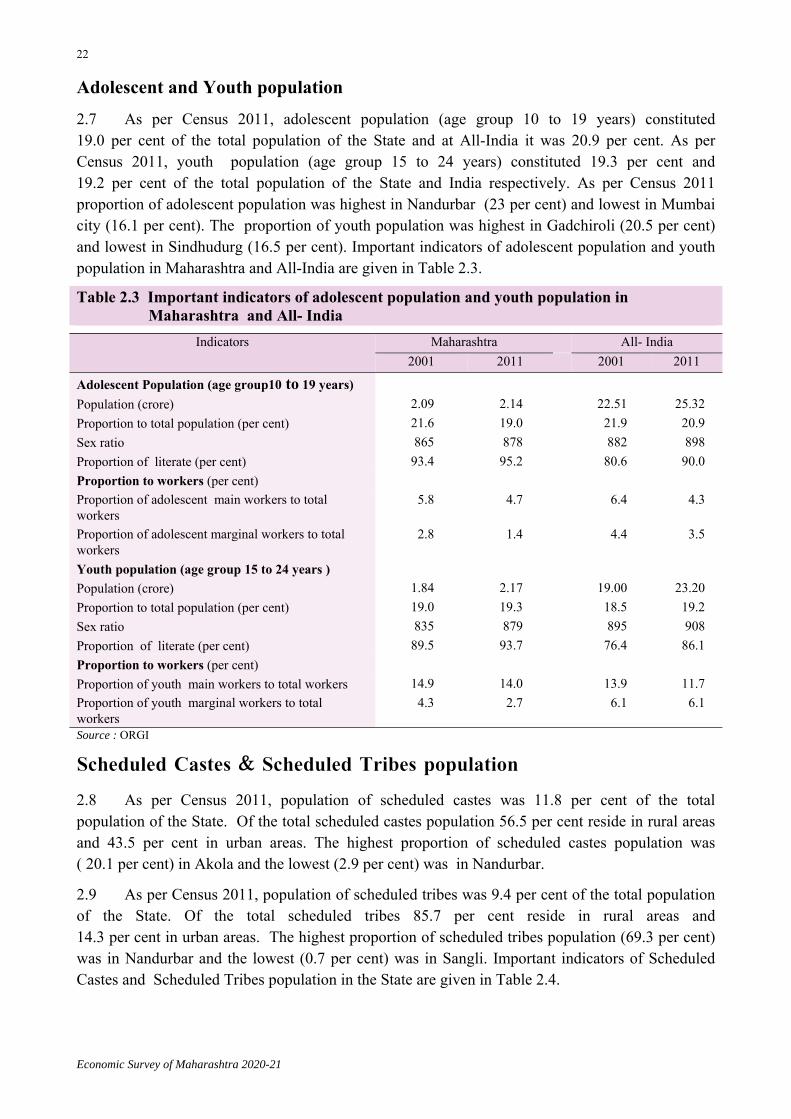
Adolescent and Youth population 2.7 As per Census 2011, adolescent population (age group 10 to 19 years) constituted 19.0 per cent of the total population of the State and at All-India it was 20.9 per cent. As per Census 2011, youth population (age group 15 to 24 years) constituted 19.3 per cent and 19.2 per cent of the total population of the State and India respectively. As per Census 2011 proportion of adolescent population was highest in Nandurbar (23 per cent) and lowest in Mumbai city (16.1 per cent). The proportion of youth population was highest in Gadchiroli (20.5 per cent) and lowest in Sindhudurg (16.5 per cent). Important indicators of adolescent population and youth population in Maharashtra and All-India are given in Table 2.3.
Table 2.3 Important indicators of adolescent population and youth population in Maharashtra and All- India
Indicators Maharashtra All- India 2001 2011 2001 2011
Adolescent Population (age group10 to 19 years) Population (crore) 2.09 2.14 22.51 25.32 Proportion to total population (per cent) 21.6 19.0 21.9 20.9 Sex ratio 865 878 882 898 Proportion of literate (per cent) 93.4 95.2 80.6 90.0 Proportion to workers (per cent) Proportion of adolescent main workers to total workers
5.8 4.7 6.4 4.3
Proportion of adolescent marginal workers to total workers
2.8 1.4 4.4 3.5
Youth population (age group 15 to 24 years ) Population (crore) 1.84 2.17 19.00 23.20 Proportion to total population (per cent) 19.0 19.3 18.5 19.2 Sex ratio 835 879 895 908 Proportion of literate (per cent) 89.5 93.7 76.4 86.1 Proportion to workers (per cent) Proportion of youth main workers to total workers 14.9 14.0 13.9 11.7 Proportion of youth marginal workers to total workers
4.3 2.7 6.1 6.1
Source : ORGI
Scheduled Castes & Scheduled Tribes population 2.8 As per Census 2011, population of scheduled castes was 11.8 per cent of the total population of the State. Of the total scheduled castes population 56.5 per cent reside in rural areas and 43.5 per cent in urban areas. The highest proportion of scheduled castes population was ( 20.1 per cent) in Akola and the lowest (2.9 per cent) was in Nandurbar.
2.9 As per Census 2011, population of scheduled tribes was 9.4 per cent of the total population of the State. Of the total scheduled tribes 85.7 per cent reside in rural areas and 14.3 per cent in urban areas. The highest proportion of scheduled tribes population (69.3 per cent) was in Nandurbar and the lowest (0.7 per cent) was in Sangli. Important indicators of Scheduled Castes and Scheduled Tribes population in the State are given in Table 2.4.
Economic Survey of Maharashtra 2020-21
23
Table 2.4 Important indicators of Scheduled Castes & Scheduled Tribes population in the State
Indicators 2001 2011
Scheduled Castes Scheduled Tribes Scheduled Castes Scheduled Tribes Population ( crore) 0.99 0.86 1.33 1.05 Proportion to total population (per cent) 10.2 8.9 11.8 9.4 Households (lakh) 20.6 17.1 29.0 21.6 Sex ratio 952 973 962 977 Child sex ratio 936 965 926 955 Literacy Rate (per cent) Total 71.9 55.2 79.7 65.7 Male 83.3 67.0 87.2 74.3 Female 60.0 43.1 71.9 57.0 Work participation rate (per cent) 41.9 49.7 43.9 50.6 Percentage to total workers Main workers 81.9 76.9 87.4 82.3 Marginal workers 18.1 23.1 12.6 17.7 Source : ORGI
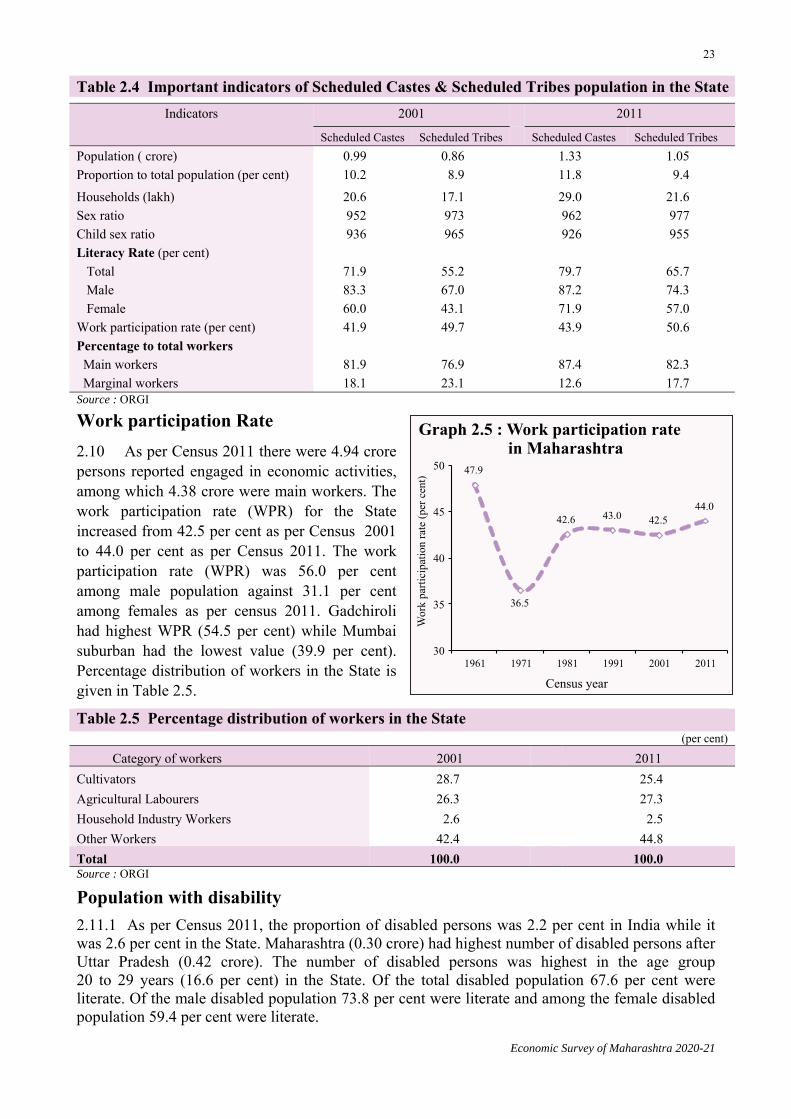
Work participation Rate 2.10 As per Census 2011 there were 4.94 crore persons reported engaged in economic activities, among which 4.38 crore were main workers. The work participation rate (WPR) for the State increased from 42.5 per cent as per Census 2001 to 44.0 per cent as per Census 2011. The work participation rate (WPR) was 56.0 per cent among male population against 31.1 per cent among females as per census 2011. Gadchiroli had highest WPR (54.5 per cent) while Mumbai suburban had the lowest value (39.9 per cent). Percentage distribution of workers in the State is given in Table 2.5.
Table 2.5 Percentage distribution of workers in the State (per cent)
Category of workers 2001 2011 Cultivators 28.7 25.4 Agricultural Labourers 26.3 27.3 Household Industry Workers 2.6 2.5 Other Workers 42.4 44.8 Total 100.0 100.0 Source : ORGI
Population with disability 2.11.1 As per Census 2011, the proportion of disabled persons was 2.2 per cent in India while it was 2.6 per cent in the State. Maharashtra (0.30 crore) had highest number of disabled persons after Uttar Pradesh (0.42 crore). The number of disabled persons was highest in the age group 20 to 29 years (16.6 per cent) in the State. Of the total disabled population 67.6 per cent were literate. Of the male disabled population 73.8 per cent were literate and among the female disabled population 59.4 per cent were literate.

Economic Survey of Maharashtra 2020-21
24
2.11.2 As per Census 2011, among disabled persons highest disability was in seeing (19.4 per cent) followed by disability in movement (18.5 per cent ) in the State. The disabled population in the age group 5 to 19 years accounts for 23.1 per cent of the total disabled population of the State. The proportion of disabled in the age group of 5 to19 years attending educational institution in the State was 70.3 per cent and who never attended educational institution was 17.1 per cent in the State. Percentage distribution of disabled population by type of disability in the State as per Census 2011 is given in Table 2.6. Age groupwise proportion of disabled persons in the State as per Census 2011 is given in Table 2.7. Proportion of disabled in the age group 5 to19 years attending or who never attended educational institution in the State as per Census 2011 is given in Table 2.8.
Table 2.7 Age groupwise proportion of disabled persons in the State as per Census 2011
(per cent) Age Group ( Years)
Type of disability
In seeing
In hearing In speech In movement Mental retardation
Mental illness
Any other
Multiple disability
0-4 22.7 17.4 4.0 8.8 4.1 0.5 37.5 5.0
5-19 19.5 15.4 16.3 11.9 9.9 1.1 18.0 7.9
20-29 17.5 15.1 17.5 18.3 7.0 1.9 17.4 5.2
30-39 16.2 15.0 18.8 20.9 5.0 2.9 17.1 4.0
40-69 19.6 15.9 17.1 22.7 2.8 2.7 15.3 4.0 70 and above (including age not stated)
25.4 20.2 10.2 22.1 1.3 1.3 11.2 8.4
Total 19.4 16.0 16.0 18.5 5.4 2.0 17.2 5.5 Source : ORGI
Table 2.6 Percentage distribution of disabled population by type of disability in the State as per Census 2011
(per cent) Type of disability Persons Male Female
In seeing 19.4 18.4 20.6 In hearing 16.0 15.7 16.4 In speech 16.0 15.4 16.8 In movement 18.5 21.1 15.0 Mental retardation 5.4 5.4 5.5 Mental illness 2.0 1.9 2.0 Any other 17.2 16.5 18.2 Multiple disability 5.5 5.6 5.5 Total 100.0 100.0 100.0 Source : ORGI

Economic Survey of Maharashtra 2020-21
25
Table 2.8 Proportion of disabled in the age group 5 to 19 years attending or who never attended educational institution in the State as per Census 2011
(per cent) Type of disability Proportion of disabled attending
educational institution Proportion of disabled who never
attended educational institution
All Boys Girls All Boys Girls
In seeing 76.2 77.0 75.2 11.7 11.0 12.5
In hearing 74.0 74.6 73.2 13.0 12.5 13.6
In speech 71.9 72.7 70.9 14.5 14.1 15.1
In movement 69.2 70.7 66.6 14.8 13.7 16.8
Mental retardation 55.9 58.4 52.4 33.2 31.5 35.6
Mental illness 48.2 50.3 45.4 32.0 29.9 34.7
Any other 77.9 78.4 77.2 10.7 10.4 11.0
Multiple disability 50.8 52.0 49.1 40.2 39.5 41.2
Total 70.3 71.1 69.3 17.1 16.6 17.8 Source : ORGI
Households and household amenities 2.12 As per Census 2011, there were 2.38 crore households (which excludes institutional households) in the State and 24.67 crore households in India. Household amenities in Maharashtra and All-India as per Census 2011 is given in Table 2.9.
Slum population 2.13 As per Census 2011, Slum population of India was 6.55 crore. Maharashtra had the highest proportion of slum population (18.1 per cent) followed by Andhra Pradesh (15.6 per cent), West Bengal (9.8 per cent), Uttar Pradesh (9.5 per cent), Tamil Nadu (8.9 per cent), Madhya Pradesh (8.7 per cent) and Karnataka (5.0 per cent).
Table 2.9 Household amenities in Maharashtra and All-India as per Census 2011$ (per cent)
Particulars Maharashtra All- India
Households having availability of source of drinking water by location
Within the premises 59.4 46.6
Outside the premises 40.6 53.4
Households having source of lighting
Electricity 83.9 67.3
No lighting 0.9 0.5
Households having latrine facility within the premises 53.1 46.9
Households not having latrine facility within the premises 46.9 53.1
Households having bathing facility within the premises 85.4 58.4
Households availing banking services 68.9 58.7
Source : ORGI $ Excluding institutional households

Economic Survey of Maharashtra 2020-21
26
Slum population in Million-plus cities 2.14 As per Census 2011, there were 53 million-plus cities in India. About 38.3 per cent of the total slum population of country resides in these cities. Municipal Corporation area of Greater Mumbai had the highest slum population which accounts for 7.9 per cent of the total slum population of the country followed by 3.5 per cent for Hyderabad, 2.5 per cent for Delhi, 2.1 per cent for Kolkata, 2.0 per cent for Chennai and 1.3 per cent for Nagpur.
Household amenities in urban and slum areas
2.15 As per Census 2011, there were 1.08 crore urban households in the State and 7.89 crore urban households in India. There were 0.24 crore slum households in the State and 1.37 crore slum households in India. Household amenities in urban and slum areas in Maharashtra and All-India as per Census 2011 is given in Table 2.10.
Migration 2.16 Migration is measured in the census by considering two types of situations i.e. migration by birth place and migration by place of last residence. When a person is enumerated in census at a place, i.e village or town, different from his / her place of birth, he / she is considered as a migrant by place of birth. A person is considered as migrant by place of last residence, if he/she had last resided at a place other than his/her place of enumeration. The census also captures the reasons for migration. The reasons for migration from place of last residence are classified as work/employment, business, education, marriage, moved after birth, moved with households and other. The data on migration by last residence in the State as per census 2011 shows that the total number of migrants was 5.74 crore. Out of total migrants 42.2 per cent were males while 57.8 per cent were females. There are different streams of migration generally relating to the degree of economic and social development in the area of origin as well as area of destination. Out of total migrants in the State 37.4 per cent migrated from rural to rural, 7.5 per cent from urban to rural while migration from rural to urban was 22.6 per cent and urban to urban was 22.2 per cent excluding unclassifiable cases. Migration on account of change in residence for women after marriage constitutes significant proportion of these migrants. Excluding the reason of migration viz. marriage, moved after birth and moved with household, the major reason of migration was work/ employment with 37.1 per cent, education 3.6 per cent, business 1.8 per cent and others 57.5 per cent.
* * * * *
Table 2.10 Household amenities in urban and slum areas in Maharashtra and All-India as per Census 2011$
(per cent) Particulars
Maharashtra All- India
Urban Slum Urban Slum Households having availability of source of drinking water by location
Within the premises 79.3 64.6 71.2 56.7 Outside the premises 20.7 35.4 28.8 43.3 Households having Source of Lighting Electricity 96.2 93.8 92.7 90.5 No lighting 0.4 0.6 0.3 0.5 Households having latrine facility available within the premises 71.3 41.6 81.4 66.0 Households not having latrine facility within the premises 28.7 58.4 18.6 34.0 Households having bathing facility within the premises 95.4 91.4 87.0 81.0 Households availing banking services 76.0 64.4 67.8 53.2 Source : ORGI $ Excluding institutional households

Economic Survey of Maharashtra 2020-21
27ANNEXURE 2.1
POPULATION OF MAHARASHTRA AND INDIA AS PER CENSUSES
Census
Year
Population (crore) Decennial growth rate (per cent) Literacy rate (per cent) ££
Maharashtra India Maharashtra India Maharashtra India
(1) (2) (3) (4) (5) (6) (7)
1961 3.96 43.92 23.6 21.6 35.1 28.3
1971 5.04 54.82 27.5 24.8 45.8 34.5
1981 6.28 68.52@ 24.5 25.0 55.8 43.6§
1991 7.89 84.63£ 25.7 23.9£ 64.9 52.2@@
2001 9.69 102.87 22.7 21.5 76.9 64.8
2011 11.24 121.09 16.0 17.7 82.3 73.0
Source : ORGI
@ Including projected population of Assam £ Including projected population of Jammu & Kashmir. ££ Literacy rates for 1961 and 1971 relate to population age 5 years and above. The literacy rates for the years 1981, 1991, 2001 and 2011 relate to population age 7 years and above. § Literacy rate excludes Assam @@ Literacy rate excludes Jammu & Kashmir.
ANNEXURE 2.2
RURAL AND URBAN POPULATION IN THE STATE BASED ON CENSUSES
Census
Year
Population (crore) Percentage of urban
population to total
population
Sex ratio Population density
(per sq. km) Rural Urban Total Males Females Rural Urban Total
(1) (2) (3) (4) (5) (6) (7) (8) (9) (10) (11)
1961 2.84 1.12 3.96 2.04 1.91 28.2 995 801 936 129
1971 3.47 1.57 5.04 2.61 2.43 31.2 985 820 930 164
1981 4.08 2.20 6.28 3.24 3.04 35.0 987 850 937 204
1991 4.84 3.05 7.89 4.08 3.81 38.7 972 875 934 257
2001 5.58 4.11 9.69 5.04 4.65 42.4 960 873 922 315
2011 6.16 5.08 11.24 5.82 5.41 45.2 952 903 929 365
Source - ORGI Note - Figures may not add up to totals due to rounding.

Economic Survey of Maharashtra 2020-21
28ANNEXURE 2.3
DISTRICTWISE POPULATION INDICATORS AS PER CENSUS 2011
Sr. No. District
Population ('000) Decennial growth rate (per cent)
(2001-2011)
Literacy rate (per cent) Sex ratio
Child sex ratio (age
group 0-6
years) Male Female Total Male Female Total
(1) (2) (3) (4) (5) (6) (7) (8) (9) (10) (11) 1 Mumbai City 1,685 1,401 3,085 (-) 7.6 91.5 86.5 89.2 832 914 2 Mumbai Suburban 5,031 4,326 9,357 8.3 92.9 86.4 89.9 860 913 3 Thane# 5,865 5,195 11,060 36.0 88.7 79.8 84.5 886 924 4 Raigad 1,344 1,290 2,634 19.3 89.1 76.9 83.1 959 935 5 Ratnagiri 761 854 1,615 (-) 4.8 90.9 74.5 82.2 1,122 936 6 Sindhudurg 417 432 850 (-) 2.2 91.6 79.8 85.6 1,036 922
Konkan Division 15,104 13,498 28,601 14.9 90.7 82.0 86.6 894 921 7 Nashik 3,157 2,950 6,107 22.3 88.2 76.1 82.3 934 890 8 Dhule 1,054 997 2,051 20.1 79.5 65.8 72.8 946 898 9 Nandurbar 833 815 1,648 25.7 72.2 56.5 64.4 978 944
10 Jalgaon 2,197 2,033 4,230 14.9 85.4 70.6 78.2 925 842 11 Ahmednagar 2,343 2,200 4,543 12.4 86.8 70.9 79.1 939 852
Nashik Division 9,585 8,995 18,579 18.1 84.9 70.7 78.0 938 876 12 Pune 4,924 4,505 9,429 30.4 90.8 81.1 86.2 915 883 13 Satara 1,511 1,493 3,004 6.9 89.4 76.3 82.9 988 895 14 Sangli 1,436 1,386 2,822 9.2 88.2 74.6 81.5 966 867 15 Solapur 2,228 2,090 4,318 12.2 85.0 68.5 77.0 938 883 16 Kolhapur 1,981 1,895 3,876 10.0 88.6 74.2 81.5 957 863
Pune Division 12,079 11,370 23,449 17.3 88.9 76.2 82.7 941 880 17 Aurangabad 1,924 1,777 3,701 27.8 87.4 70.1 79.0 923 858 18 Jalna 1,011 948 1,959 21.5 81.5 61.0 71.5 937 870 19 Parbhani 943 893 1,836 20.2 82.6 63.6 73.3 947 884 20 Hingoli 606 571 1,177 19.3 86.9 69.0 78.2 942 882 21 Beed 1,349 1,236 2,585 19.6 85.6 67.8 77.0 916 807 22 Nanded 1,730 1,631 3,361 16.9 84.3 66.1 75.5 943 910 23 Osmanabad 862 796 1,658 11.5 85.8 70.5 78.4 924 867 24 Latur 1,273 1,181 2,454 18.0 84.4 69.6 77.3 928 889
Aurangabad Division 9,699 9,033 18,732 19.9 84.9 67.4 76.4 931 870 25 Buldhana 1,338 1,249 2,586 15.8 90.5 75.8 83.4 934 855 26 Akola 932 882 1,814 11.3 92.3 83.5 88.0 946 912 27 Washim 620 577 1,197 17.3 90.5 75.5 83.2 930 863 28 Amravati 1,481 1,408 2,888 10.8 91.5 83.1 87.4 951 935 29 Yavatmal 1,420 1,352 2,772 12.8 89.4 75.9 82.8 952 922
Amravati Division 5,791 5,467 11,258 13.2 90.8 79.0 85.0 944 900 30 Wardha 668 632 1,301 5.2 91.9 81.8 87.0 946 919 31 Nagpur 2,385 2,269 4,654 14.4 92.1 84.5 88.4 951 931 32 Bhandara 606 595 1,200 5.6 90.4 77.1 83.8 982 950 33 Gondia 662 661 1,323 10.1 92.0 77.9 85.0 999 956 34 Chandrapur 1,124 1,080 2,204 6.4 86.8 73.0 80.0 961 953 35 Gadchiroli 541 532 1,073 10.6 82.3 66.3 74.4 982 961
Nagpur Division 5,986 5,769 11,754 10.0 90.0 78.9 84.5 964 941
Maharashtra State 58,243 54,131 1,12,374 16.0 88.4 75.9 82.3 929 894
Source : ORGI # Undivided Thane district
Note - Figures may not add up to totals due to rounding.
3 State Income


Economic Survey of Maharashtra 2020-21
3. STATE INCOME
3.1 Gross Domestic Product (GDP) measures the size of the economy and its growth rate is one of the important indicators of economic development & progress. GDP is useful to the government in framing policies and can be helpful to investors to take better investment decision. Covid-19 pandemic posed formidable economic challenge to the world and most of the countries during 2020-21. 3.2 As per the methodology for the current series 2011-12, sector wise estimates are given as Gross Value Added (GVA) at basic price and GDP at market price. Accordingly, for the State, sector wise estimates are given as Gross State Value Added (GSVA) at basic prices and Gross State Domestic Product (GSDP) at market prices. The estimates at current price are referred as ‘nominal’ and estimates at constant price as ‘real’.
State Economy GSDP Forecast (2020-21)
3.3 As per the advance estimates of 2020-21, the real GSDP is expected to grow at (-)8.0 per cent over 2019-20 and is estimated to be ` 19,62,539 crore. 3.3.1 The nominal GSDP is estimated to be ` 26,61,629 crore with expected growth of (-)5.6 per cent over the previous year. The annual growth rates of real GSVA, real GSDP and per capita real GSDP for 2020-21 as per advance estimates are given in Table 3.1.
3.3.2 Advance estimates of 2020-21 should be read and interpreted keeping in view the extraordinary situation of Covid-19 pandemic. The complete lockdown and then step by step removal of these restrictions has impacted the economic activities and availability of data. Due to the non-availability of the data or wide fluctuations in the available data, the projection techniques were required to be modified accordingly. Implications of the various measures taken to tackle the pandemic situation may lead to sharp revisions in these estimates when the first revised estimates of 2020-21 will be released. 3.3.3 Among the three major sectors of the economy, ‘Agriculture and allied activities’ sector was the only sector contributed positively to GSVA in 2020-21 and was least impacted during Covid-19 pandemic due to timely and proactive measures taken by government. The real GSVA of
Table 3.1 Annual growth rates of real GSVA, real GSDP and per capita real GSDP as per advance estimates of 2020-21
(per cent) Sector Growth Rate
i) Agriculture & allied activities (Agriculture#, Forestry & Fishing) 11.7 ii) Mining & Quarrying (-)12.1 iii) Manufacturing (-)11.8 iv) Electricity, Gas, Water supply & Other Utility Services 3.3 v) Construction (-)14.6 vi) Trade, Repairs, Hotels & Restaurants, Transport, Storage & Communication & Services related to Broadcasting (-)20.4
vii) Financial, Real Estate & Professional Services (-)4.9 viii) Public Administration, Defence & Other Services (-)5.0 GSVA (-)7.8 GSDP (-)8.0 Per capita GSDP (-)8.9
Source : DES, GoM # includes Crops and Livestock

30
Economic Survey of Maharashtra 2020-21
‘Agriculture & allied activities’ sector is expected to grow at 11.7 per cent due to overall good monsoon (113.4 per cent of the normal). Due to overall increase in the estimated agricultural production, the real GSVA of the ‘Crops’ sector is expected to grow by 16.2 per cent. ‘Livestock’, ‘Forestry & Logging’ and ‘Fisheries & Aquaculture’ sectors are expected to grow at 4.4 per cent, 5.7 per cent and 2.6 per cent respectively. The ‘Manufacturing’ and ‘Construction’ sectors were hit hardest and are expected to grow at (-)11.8 per cent and (-)14.6 per cent respectively, due to which ‘Industry’ sector’s growth is expected to be (-)11.3 per cent. Due to the hard impact of pandemic situation mainly on Trade, Repairs, Hotels & Restaurants and Transport sectors, ‘Services’ sector is expected to grow at (-)9.0 per cent.
GSDP (2019-20) 3.4 As per the first revised estimates, real GSDP is estimated to be ` 21,34,065 crore with expected growth of 5.0 per cent over 2018-19. 3.4.1 The nominal GSDP of 2019-20 is estimated at ` 28,18,555 crore, higher by 9.3 per cent than the previous year. Annual growth rates of real GSDP, sectorwise real GSVA and per capita real GSDP are given in Table 3.2.
Table 3.2 Annual growth rates of real GSDP, sectorwise real GSVA and per capita real GSDP (per cent)
Particulars
Growth rate Average growth
rate (2012-13
to 2019-20)
2012-13 2013-14 2014-15 2015-16 2016-17 2017-18+++ 2018-19++ 2019-20+
GSDP 6.1 6.9 6.3 7.2 9.2 6.0 6.2 5.0 6.6 GSVA 6.0 6.8 6.2 6.7 8.9 5.6 5.7 5.2 6.4 Agriculture & allied activities sector
(-)0.4 12.3 (-)10.7 (-)3.7 21.0 (-)0.7 (-)0.9 6.1 2.9
i) Crops (-)1.8 18.6 (-)16.7 (-)7.5 25.0 (-)5.1 (-)5.1 8.4 2.0 ii) Livestock 3.8 1.1 4.0 4.8 11.5 8.5 6.0 4.1 5.5 iii) Forestry & Logging 0.8 (-)3.3 2.8 3.4 18.0 9.3 8.8 (-)0.8 4.9 iv) Fishing & Aquaculture 0.9 2.0 7.0 (-)4.2 21.2 (-)11.5 (-)10.6 7.8 1.6 Industry sector 5.1 3.1 8.0 8.8 5.9 7.2 5.2 0.2 5.4 i) Mining & Quarrying 4.2 (-)25.4 23.6 10.8 3.1 7.1 7.0 2.0 4.1 ii) Manufacturing 8.2 10.0 5.1 10.8 6.8 8.2 5.5 (-)1.0 6.7 iii) Electricity, Gas, Water supply & Other Utility Services
5.1 (-)4.4 14.7 4.8 3.1 10.7 7.9 5.7 6.0
iv) Construction (-)3.8 3.8 7.9 1.9 5.4 2.0 1.6 1.7 2.6 Services sector 8.3 8.1 9.1 7.4 8.7 5.8 7.2 8.3 7.9 i) Trade, Repairs, Hotels & Restaurants, Transport, Storage, Communication & Services related to Broadcasting
9.6 1.3 6.1 5.5 9.5 7.1 7.4 7.1 6.7
ii) Financial, Real Estate & Professional Services
8.3 12.2 10.8 8.1 8.0 4.5 7.3 7.3 8.3
iii) Public Administration, Defence & Other Services
6.3 7.3 8.6 8.2 10.0 7.8 6.8 13.1 8.5
Per capita GSDP 4.9 5.7 5.2 6.0 8.1 4.9 5.2 4.0 5.5 +++ Third revised estimates ++ Second revised estimates + First revised estimates Note : Sectorwise growth rates are based on GSVA whereas the growth rate of the State economy is based on GSDP Source : DES, GoM

31
Economic Survey of Maharashtra 2020-21
3.4.2 The first revised estimates of 2019-20 are compiled using the sector wise available information. As an effect of Covid-19 pandemic situation on data availability for 2019-20, these estimates may be revised significantly during further revision. 3.4.3 The real GSVA of ‘Agriculture & allied activities’ sector is expected to grow by 6.1 per cent in 2019-20. Due to comparatively better rainfall during 2019-20 (112.6 per cent of the normal), production of food grains, oilseeds is expected to increase by 22.9 per cent and 6.0 per cent respectively over the previous year. Production of cotton is expected to be slightly higher whereas sugarcane production is expected to be less by 22.8 per cent. Production of fruits & vegetables is expected to be higher by 12.5 per cent and 42.7 per cent respectively as compared to the previous year. This has resulted in the expected growth of 8.4 per cent in the real GSVA of ‘Crops’ sector. The real GSVA of ‘Livestock’ is estimated to grow by 4.1 per cent mainly due to increase in milk production, eggs & poultry meat production over the previous year. The ‘Forestry & Logging’ sector’s real GSVA is expected to grow by (-)0.8 per cent due to less production of minor forest produce as compared to the previous year. ‘Fishing & Aquaculture’ sector’s real GSVA is expected to grow by 7.8 per cent due to increase in the inland fish production as compared to the previous year. 3.4.4 During 2019-20, real GSVA of ‘Industry’ sector is expected to grow by 0.2 per cent over the previous year. Real GSVA of ‘Manufacturing’ sector is expected to grow by (-)1.0 per cent while real GSVA of ‘Electricity, Gas, Water Supply & Other Utility Services’ and ‘Construction’ is expected to grow at 5.7 per cent and 1.7 per cent respectively. 3.4.5 Real GSVA of ‘Services’ sector is expected to grow by 8.3 per cent over the previous year. ‘Trade, Repairs, Hotels & Restaurants’ sector’s real GSVA is expected to grow by 6.2 per cent and that of ‘Transport, Storage, Communication & Services related to Broadcasting’ is expected to grow at 8.4 per cent. The real GSVA of ‘Financial, Real Estate & Professional Services’, ‘Public Administration & Defence’ and ‘Other Services’ sector are expected to grow at 7.3 per cent, 18.4 per cent and 11.0 per cent respectively.
Sectoral average share and average annual growth in the current series 3.5 The State’s contribution to All-India nominal GDP (base year 2011-12) for 2011-12 to 2019-20 is on an average 14.2 per cent which is highest in the country. In the nominal GSVA of the State, average share of ‘Services’ sector (55.7 per cent) is highest, followed by ‘Industry’ sector (32.6 per cent) and ‘Agriculture & allied activities’ sector (11.7 per cent).

32
Economic Survey of Maharashtra 2020-21
3.6 Average annual growth rate of the real GSVA (base year 2011-12) of ‘Agriculture & allied activities’ sector, ‘Industry’ sector and ‘Services’ sector from 2012-13 to 2019-20 is 2.9 per cent, 5.4 per cent and 7.9 per cent respectively. Sectorwise average annual growth rate is given in Table 3.2.
State Income (2019-20) 3.7 As per the first revised estimates, nominal State Income i.e. Net State Domestic Product (NSDP) at current prices is estimated at ` 24,82,536 crore in 2019-20, as compared to ` 22,76,793 crore in 2018-19 showing an increase of 9.0 per cent. The real State Income i.e. NSDP at constant (2011-12) prices in 2019-20 is estimated at ` 18,73,801 crore, showing an increase of 4.7 per cent over previous year. Details of GSDP & NSDP are given in Annexure 3.1 to Annexure 3.4. 3.7.1 The Per Capita State Income (i.e. Per Capita Nominal NSDP) is estimated at ` 2,02,130 during 2019-20 whereas it was ` 1,87,118 during 2018-19.
Districtwise Gross Value Added 3.8 Revision in the base year (from 2004-05 to 2011-12) resulted in changes in the methodology and nomenclature. Estimates of Gross District Value Added (GDVA) are to be compiled using the ‘Income Originating Approach’ and therefore have inherent limitations. For the commodity producing sectors, district wise data is available but for other sectors, proxy indicators are used to allocate the GSVA estimates to districts. These district level estimates may be used only to have a broad idea of the economy at district level. The estimates of nominal and real GDVA and Per Capita nominal GDVA are given in Annexure 3.9 to Annexure 3.11.
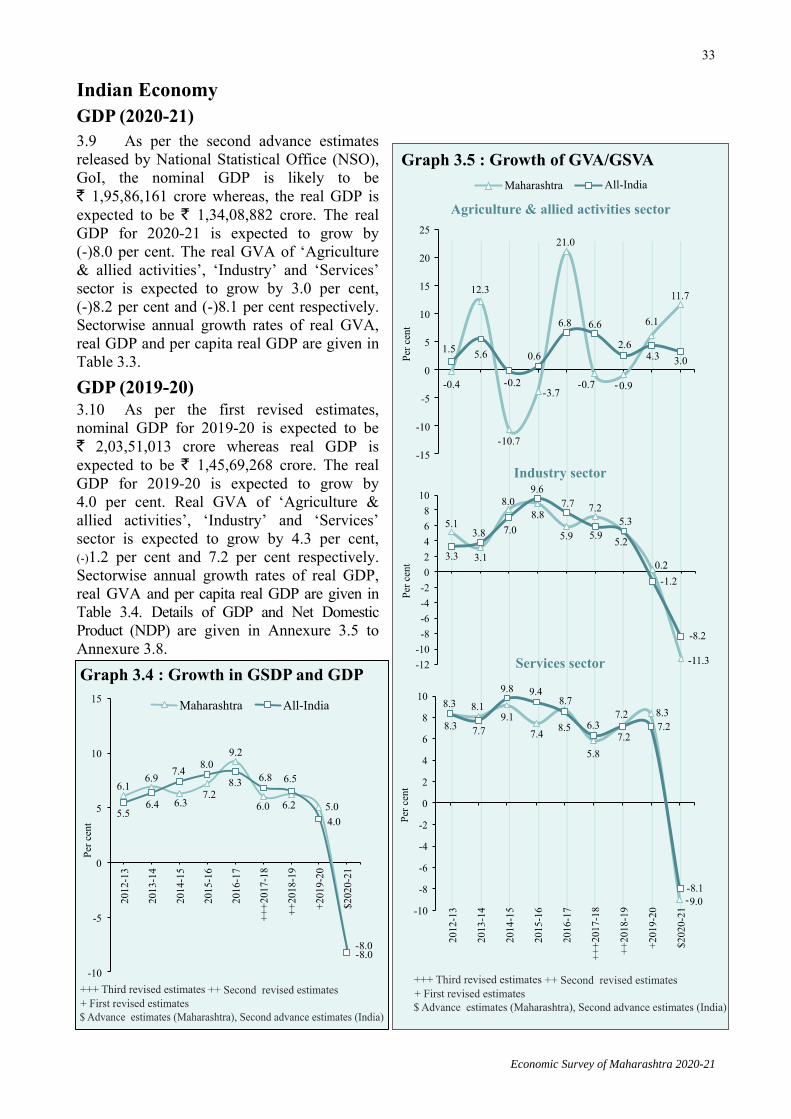
33
Economic Survey of Maharashtra 2020-21
Indian Economy
GDP (2020-21) 3.9 As per the second advance estimates released by National Statistical Office (NSO), GoI, the nominal GDP is likely to be ` 1,95,86,161 crore whereas, the real GDP is expected to be ` 1,34,08,882 crore. The real GDP for 2020-21 is expected to grow by (-)8.0 per cent. The real GVA of ‘Agriculture & allied activities’, ‘Industry’ and ‘Services’ sector is expected to grow by 3.0 per cent, (-)8.2 per cent and (-)8.1 per cent respectively. Sectorwise annual growth rates of real GVA, real GDP and per capita real GDP are given in Table 3.3. GDP (2019-20) 3.10 As per the first revised estimates, nominal GDP for 2019-20 is expected to be ` 2,03,51,013 crore whereas real GDP is expected to be ` 1,45,69,268 crore. The real GDP for 2019-20 is expected to grow by 4.0 per cent. Real GVA of ‘Agriculture & allied activities’, ‘Industry’ and ‘Services’ sector is expected to grow by 4.3 per cent, (-)1.2 per cent and 7.2 per cent respectively. Sectorwise annual growth rates of real GDP, real GVA and per capita real GDP are given in Table 3.4. Details of GDP and Net Domestic Product (NDP) are given in Annexure 3.5 to Annexure 3.8.

34
Economic Survey of Maharashtra 2020-21
Table 3.3 Annual growth rates of real GVA, real GDP and per capita real GDP
Sector Percentage change over previous year’s
provisional estimates 2020-21
i) Agriculture & allied activities (Agriculture#, Forestry & Fishing) 3.0 ii) Mining & Quarrying (-)9.2 iii) Manufacturing (-)8.4 iv) Electricity, Gas, Water supply & Other Utility Services 1.8 v) Construction (-)10.3 vi) Trade, Repairs, Hotels & Restaurants, Transport, Storage & Communication & Services related to Broadcasting (-)18.0
vii) Financial, Real Estate & Professional Services (-)1.4 viii) Public Administration, Defence & Other Services (-)4.1 GVA (-)6.5 GDP (-)8.0 Per capita GDP (-)8.9
Source : Press release note dated 26th February, 2021 of NSO, GoI # includes Crops and Livestock
Table 3.4 Annual growth rates of real GDP, sectorwise real GVA and per capita real GDP (per cent)
Particulars
Growth rate Average growth
rate (2012-13
to 2019-20)
2012-13 2013-14 2014-15 2015-16 2016-17 2017-18+++ 2018-19++ 2019-20+
GDP 5.5 6.4 7.4 8.0 8.3 6.8 6.5 4.0 6.6 GVA 5.4 6.1 7.2 8.0 8.0 6.2 5.9 4.1 6.4 Agriculture & allied activities sector
1.5 5.6 (-)0.2 0.6 6.8 6.6 2.6 4.3 3.5
i) Crops 0.2 5.4 (-)3.7 (-)2.9 5.3 5.4 (-)1.6 4.0 1.5 ii) Livestock 5.2 5.6 7.4 7.5 10.0 7.9 8.5 7.0 7.4 iii) Forestry & Logging 0.2 5.9 1.9 1.7 5.5 5.4 7.9 0.3 3.6 iv) Fishing & Aquaculture 4.9 7.2 7.5 9.7 10.4 15.2 9.0 1.0 8.1 Industry sector 3.3 3.8 7.0 9.6 7.7 5.9 5.3 (-)1.2 5.2 i) Mining & Quarrying 0.6 0.2 9.7 10.1 9.8 (-)5.6 0.3 (-)2.5 2.8 ii) Manufacturing 5.5 5.0 7.9 13.1 7.9 7.5 5.3 (-)2.4 6.2 iii) Electricity, Gas, Water supply & Other Utility Services
2.7 4.2 7.2 4.7 10.0 10.6 8.0 2.1 6.2
iv) Construction 0.3 2.7 4.3 3.6 5.9 5.2 6.3 1.0 3.7 Services sector 8.3 7.7 9.8 9.4 8.5 6.3 7.2 7.2 8.1 i) Trade, Repairs, Hotels & Restaurants, Transport, Storage, Communication & Services related to Broadcasting
9.8 6.5 9.4 10.2 7.7 10.3 7.1 6.4 8.4
ii) Financial, Real Estate & Professional Services
9.7 11.2 11.0 10.7 8.6 1.8 7.2 7.3 8.4
iii) Public Administration, Defence & Other Services
4.3 3.8 8.3 6.1 9.3 8.3 7.4 8.3 7.0
Per capita GDP 4.2 5.0 6.1 6.6 6.9 5.6 5.5 3.0 5.4 Source : NSO, GoI +++ Third revised estimates ++ Second revised estimates + First revised estimates
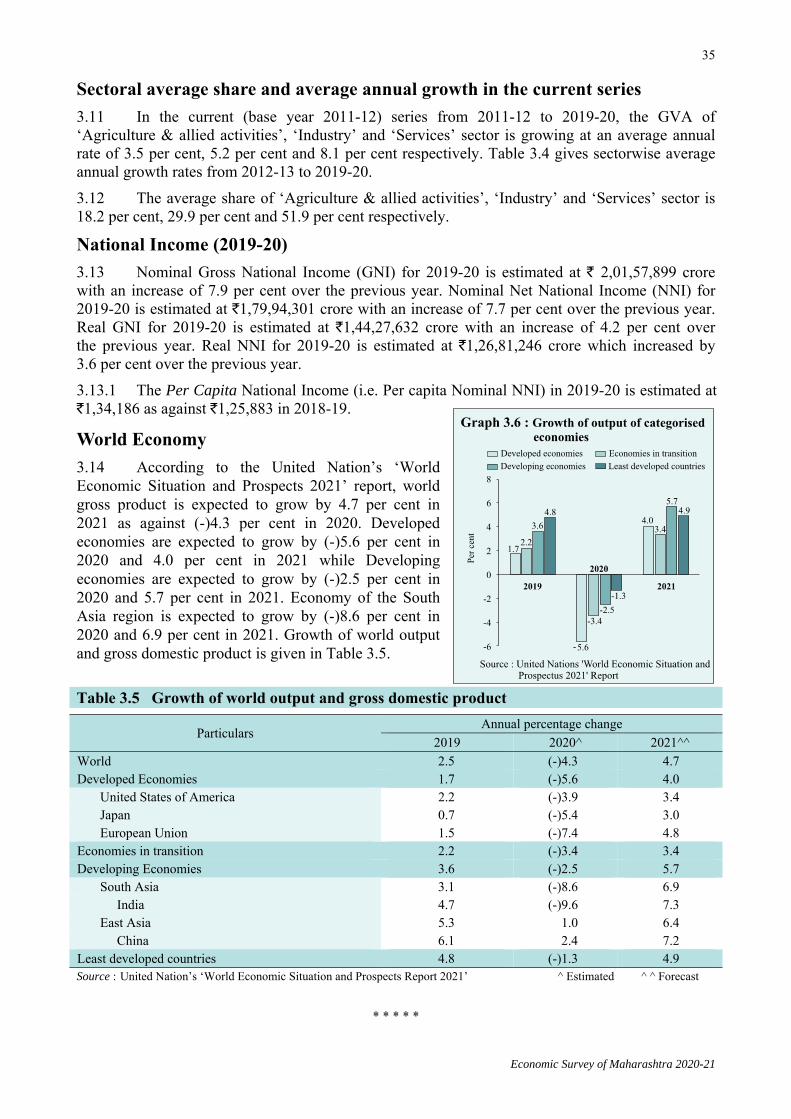
35
Economic Survey of Maharashtra 2020-21
Sectoral average share and average annual growth in the current series 3.11 In the current (base year 2011-12) series from 2011-12 to 2019-20, the GVA of ‘Agriculture & allied activities’, ‘Industry’ and ‘Services’ sector is growing at an average annual rate of 3.5 per cent, 5.2 per cent and 8.1 per cent respectively. Table 3.4 gives sectorwise average annual growth rates from 2012-13 to 2019-20. 3.12 The average share of ‘Agriculture & allied activities’, ‘Industry’ and ‘Services’ sector is 18.2 per cent, 29.9 per cent and 51.9 per cent respectively.
National Income (2019-20) 3.13 Nominal Gross National Income (GNI) for 2019-20 is estimated at ` 2,01,57,899 crore with an increase of 7.9 per cent over the previous year. Nominal Net National Income (NNI) for 2019-20 is estimated at `1,79,94,301 crore with an increase of 7.7 per cent over the previous year. Real GNI for 2019-20 is estimated at `1,44,27,632 crore with an increase of 4.2 per cent over the previous year. Real NNI for 2019-20 is estimated at `1,26,81,246 crore which increased by 3.6 per cent over the previous year. 3.13.1 The Per Capita National Income (i.e. Per capita Nominal NNI) in 2019-20 is estimated at `1,34,186 as against `1,25,883 in 2018-19.
World Economy 3.14 According to the United Nation’s ‘World Economic Situation and Prospects 2021’ report, world gross product is expected to grow by 4.7 per cent in 2021 as against (-)4.3 per cent in 2020. Developed economies are expected to grow by (-)5.6 per cent in 2020 and 4.0 per cent in 2021 while Developing economies are expected to grow by (-)2.5 per cent in 2020 and 5.7 per cent in 2021. Economy of the South Asia region is expected to grow by (-)8.6 per cent in 2020 and 6.9 per cent in 2021. Growth of world output and gross domestic product is given in Table 3.5.
* * * * *
Table 3.5 Growth of world output and gross domestic product
Particulars Annual percentage change
2019 2020^ 2021^^ World 2.5 (-)4.3 4.7 Developed Economies 1.7 (-)5.6 4.0 United States of America 2.2 (-)3.9 3.4 Japan 0.7 (-)5.4 3.0 European Union 1.5 (-)7.4 4.8 Economies in transition 2.2 (-)3.4 3.4 Developing Economies 3.6 (-)2.5 5.7 South Asia 3.1 (-)8.6 6.9 India 4.7 (-)9.6 7.3 East Asia 5.3 1.0 6.4 China 6.1 2.4 7.2 Least developed countries 4.8 (-)1.3 4.9 Source : United Nation’s ‘World Economic Situation and Prospects Report 2021’ ^ Estimated ^ ^ Forecast
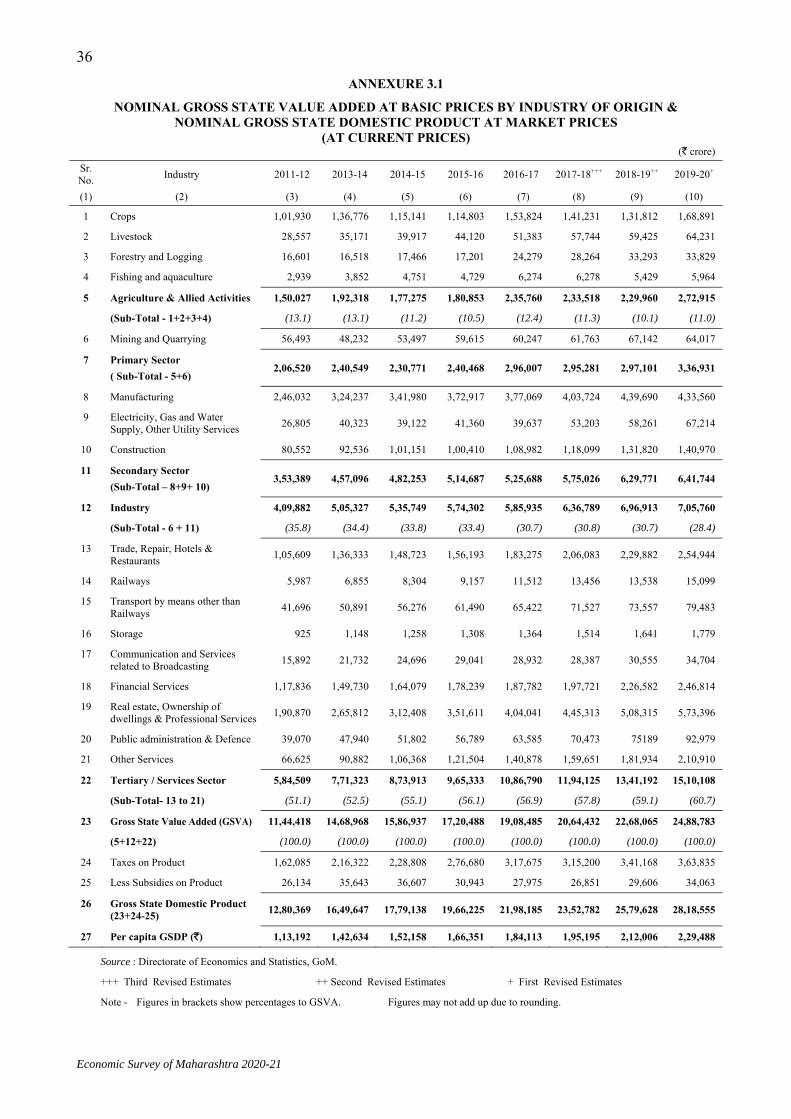
Economic Survey of Maharashtra 2020-21
36ANNEXURE 3.1
NOMINAL GROSS STATE VALUE ADDED AT BASIC PRICES BY INDUSTRY OF ORIGIN & NOMINAL GROSS STATE DOMESTIC PRODUCT AT MARKET PRICES
(AT CURRENT PRICES) (` crore)
Sr. No. Industry 2011-12 2013-14 2014-15 2015-16 2016-17 2017-18+++ 2018-19++ 2019-20+
(1) (2) (3) (4) (5) (6) (7) (8) (9) (10)
1 Crops 1,01,930 1,36,776 1,15,141 1,14,803 1,53,824 1,41,231 1,31,812 1,68,891
2 Livestock 28,557 35,171 39,917 44,120 51,383 57,744 59,425 64,231
3 Forestry and Logging 16,601 16,518 17,466 17,201 24,279 28,264 33,293 33,829
4 Fishing and aquaculture 2,939 3,852 4,751 4,729 6,274 6,278 5,429 5,964
5 Agriculture & Allied Activities 1,50,027 1,92,318 1,77,275 1,80,853 2,35,760 2,33,518 2,29,960 2,72,915
(Sub-Total - 1+2+3+4) (13.1) (13.1) (11.2) (10.5) (12.4) (11.3) (10.1) (11.0)
6 Mining and Quarrying 56,493 48,232 53,497 59,615 60,247 61,763 67,142 64,017
7 Primary Sector ( Sub-Total - 5+6)
2,06,520 2,40,549 2,30,771 2,40,468 2,96,007 2,95,281 2,97,101 3,36,931
8 Manufacturing 2,46,032 3,24,237 3,41,980 3,72,917 3,77,069 4,03,724 4,39,690 4,33,560
9 Electricity, Gas and Water Supply, Other Utility Services 26,805 40,323 39,122 41,360 39,637 53,203 58,261 67,214
10 Construction 80,552 92,536 1,01,151 1,00,410 1,08,982 1,18,099 1,31,820 1,40,970
11 Secondary Sector (Sub-Total – 8+9+ 10)
3,53,389 4,57,096 4,82,253 5,14,687 5,25,688 5,75,026 6,29,771 6,41,744
12 Industry 4,09,882 5,05,327 5,35,749 5,74,302 5,85,935 6,36,789 6,96,913 7,05,760
(Sub-Total - 6 + 11) (35.8) (34.4) (33.8) (33.4) (30.7) (30.8) (30.7) (28.4)
13 Trade, Repair, Hotels & Restaurants 1,05,609 1,36,333 1,48,723 1,56,193 1,83,275 2,06,083 2,29,882 2,54,944
14 Railways 5,987 6,855 8,304 9,157 11,512 13,456 13,538 15,099
15 Transport by means other than Railways 41,696 50,891 56,276 61,490 65,422 71,527 73,557 79,483
16 Storage 925 1,148 1,258 1,308 1,364 1,514 1,641 1,779
17 Communication and Services related to Broadcasting 15,892 21,732 24,696 29,041 28,932 28,387 30,555 34,704
18 Financial Services 1,17,836 1,49,730 1,64,079 1,78,239 1,87,782 1,97,721 2,26,582 2,46,814
19 Real estate, Ownership of dwellings & Professional Services 1,90,870 2,65,812 3,12,408 3,51,611 4,04,041 4,45,313 5,08,315 5,73,396
20 Public administration & Defence 39,070 47,940 51,802 56,789 63,585 70,473 75189 92,979
21 Other Services 66,625 90,882 1,06,368 1,21,504 1,40,878 1,59,651 1,81,934 2,10,910
22 Tertiary / Services Sector 5,84,509 7,71,323 8,73,913 9,65,333 10,86,790 11,94,125 13,41,192 15,10,108
(Sub-Total- 13 to 21) (51.1) (52.5) (55.1) (56.1) (56.9) (57.8) (59.1) (60.7)
23 Gross State Value Added (GSVA) 11,44,418 14,68,968 15,86,937 17,20,488 19,08,485 20,64,432 22,68,065 24,88,783
(5+12+22) (100.0) (100.0) (100.0) (100.0) (100.0) (100.0) (100.0) (100.0)
24 Taxes on Product 1,62,085 2,16,322 2,28,808 2,76,680 3,17,675 3,15,200 3,41,168 3,63,835
25 Less Subsidies on Product 26,134 35,643 36,607 30,943 27,975 26,851 29,606 34,063
26 Gross State Domestic Product (23+24-25) 12,80,369 16,49,647 17,79,138 19,66,225 21,98,185 23,52,782 25,79,628 28,18,555
27 Per capita GSDP (`) 1,13,192 1,42,634 1,52,158 1,66,351 1,84,113 1,95,195 2,12,006 2,29,488
Source : Directorate of Economics and Statistics, GoM.
+++ Third Revised Estimates ++ Second Revised Estimates + First Revised Estimates
Note - Figures in brackets show percentages to GSVA. Figures may not add up due to rounding.

Economic Survey of Maharashtra 2020-21
37ANNEXURE 3.2
REAL GROSS STATE VALUE ADDED AT BASIC PRICES BY INDUSTRY OF ORIGIN & REAL GROSS STATE DOMESTIC PRODUCT AT MARKET PRICES
(AT CONSTANT (2011-12) PRICES) (` crore)
Sr. No. Industry 2011-12 2013-14 2014-15 2015-16 2016-17 2017-18+++ 2018-19++ 2019-20+
(1) (2) (3) (4) (5) (6) (7) (8) (9) (10)
1 Crops 1,01,930 1,18,654 98,833 91,426 1,14,314 1,08,507 1,02,975 1,11,648
2 Livestock 28,557 29,955 31,140 32,642 36,388 39,478 41,830 43,536
3 Forestry and Logging 16,601 16,172 16,623 17,185 20,272 22,165 24,105 23,904
4 Fishing and aquaculture 2,939 3,025 3,238 3,103 3,762 3,330 2,979 3,209
5 Agriculture & Allied Activities 1,50,027 1,67,806 1,49,835 1,44,356 1,74,735 1,73,481 1,71,889 1,82,298
(Sub-Total - 1+2+3+4) (100.0) (111.9) (99.9) (96.2) (116.5) (115.6) (114.6) (121.5)
6 Mining and Quarrying 56,493 43,947 54,334 60,203 62,053 66,446 71,101 72,531
7 Primary Sector ( Sub-Total - 5+6)
2,06,520 2,11,753 2,04,169 2,04,559 2,36,788 2,39,927 2,42,991 2,54,829
8 Manufacturing 2,46,032 2,92,762 3,07,651 3,40,882 3,64,164 3,94,100 4,15,925 4,11,601
9 Electricity, Gas and Water Supply, Other Utility Services 26,805 26,937 30,893 32,362 33,372 36,931 39,842 42,094
10 Construction 80,552 80,467 86,807 88,473 93,261 95,132 96,653 98,250
11 Secondary Sector (Sub-Total – 8+9+10)
3,53,389 4,00,166 4,25,352 4,61,718 4,90,797 5,26,163 5,52,420 5,51,945
12 Industry 4,09,882 4,44,112 4,79,686 5,21,921 5,52,850 5,92,609 6,23,522 6,24,476
(Sub-Total - 6 + 11) (100.0) (108.4) (117.0) (127.3) (134.9) (144.6) (152.1) (152.4)
13 Trade, Repair, Hotels & Restaurants 1,05,609 1,15,132 1,18,873 1,19,406 1,34,099 1,45,047 1,57,145 1,66,932
14 Railways 5,987 6,416 7,250 7,790 8,857 10,144 10,014 10,444
15 Transport by means other than Railways 41,696 47,559 52,481 58,581 63,677 69,149 74,576 80,161
16 Storage 925 999 1,049 1,061 1,063 1,126 1,161 1,218
17 Communication and Services related to Broadcasting 15,892 18,810 20,721 24,591 23,801 22,487 23,326 26,378
18 Financial Services 1,17,836 1,44,377 1,55,606 1,65,110 1,74,211 1,78,979 1,87,449 1,95,236
19 Real estate, Ownership of dwellings & Professional Services.
1,90,870 2,30,612 2,59,882 2,84,000 3,10,624 3,27,673 3,56,331 3,88,136
20 Public administration & Defence 39,070 40,784 41,790 43,918 47,187 50,258 51,987 61,547
21 Other Services 66,625 79,822 89,203 97,750 1,08,714 1,17,751 1,27,436 1,41,405
22 Tertiary / Services Sector 5,84,509 6,84,509 7,46,854 8,02,208 8,72,234 9,22,614 9,89,425 10,71,458
(Sub-Total- 13 to 21) (100.0) (117.1) (127.8) (137.2) (149.2) (157.8) (169.3) (183.3)
23 Gross State Value Added (GSVA) 11,44,418 12,96,428 13,76,374 14,68,485 15,99,819 16,88,703 17,84,836 18,78,232
(5+12+22) (100.0) (113.3) (120.3) (128.3) (139.8) (147.6) (156.0) (164.1)
24 Taxes on Product 1,62,085 1,87,889 1,98,541 2,12,210 2,30,678 2,47,882 2,71,776 2,81,540
25 Less Subsidies on Product 26,134 32,702 31,750 26,411 23,451 21,964 23,298 25,707
26 Gross State Domestic Product (23+24-25) 12,80,369 14,51,615 15,43,165 16,54,284 18,07,046 19,14,621 20,33,314 21,34,065
27 Per capita GSDP (`) 1,13,192 1,25,511 1,31,977 1,39,960 1,51,353 1,58,844 1,67,108 1,73,757
Source : Directorate of Economics and Statistics, GoM.
+++ Third Revised Estimates ++ Second Revised Estimates + First Revised Estimates
Note - Figures in brackets show percentages to Col. (3) Figures may not add up due to rounding.

Economic Survey of Maharashtra 2020-21
38ANNEXURE 3.3
NOMINAL NET STATE VALUE ADDED AT BASIC PRICES BY INDUSTRY OF ORIGIN & NOMINAL NET STATE DOMESTIC PRODUCT AT MARKET PRICES
(AT CURRENT PRICES) (`crore)
Sr. No. Industry 2011-12 2013-14 2014-15 2015-16 2016-17 2017-18+++ 2018-19++ 2019-20+
(1) (2) (3) (4) (5) (6) (7) (8) (9) (10)
1 Crops 96,153 1,29,053 1,06,617 1,05,620 1,43,896 1,30,610 1,20,469 1,54,357
2 Livestock 28,153 34,668 39,373 43,593 50,813 57,124 58,784 63,538
3 Forestry and Logging 16,435 16,333 17,283 17,039 24,054 27,996 32,996 33,527
4 Fishing and aquaculture 2,591 3,443 4,304 4,305 5,757 5,820 5,039 5,536
5 Agriculture & Allied Activities 1,43,331 1,83,497 1,67,576 1,70,557 2,24,520 2,21,550 2,17,288 2,56,957
(Sub-Total - 1+2+3+4) (14.5) (14.5) (12.3) (11.5) (13.5) (12.4) (11.1) (11.9)
6 Mining and Quarrying 49,674 41,552 44,638 56,197 57,719 59,513 64,649 61,639
7 Primary Sector ( Sub-Total - 5+6)
1,93,005 2,25,049 2,12,214 2,26,755 2,82,239 2,81,063 2,81,937 3,18,597
8 Manufacturing 2,06,804 2,79,022 2,93,074 3,23,111 3,29,946 3,52,541 3,83,926 3,78,573
9 Electricity, Gas and Water Supply, Other Utility Services 18,021 26,868 25,881 27,841 26,413 36,945 40,810 47,082
10 Construction 76,841 86,650 95,206 94,446 1,02,317 1,10,598 1,23,159 1,31,708
11 Secondary Sector (Sub-Total – 8+9+ 10)
3,01,666 3,92,540 4,14,161 4,45,398 4,58,676 5,00,083 5,47,895 5,57,362
12 Industry 3,51,340 4,34,092 4,58,799 5,01,595 5,16,394 5,59,596 6,12,544 6,19,001
(Sub-Total - 6 + 11) (35.5) (34.2) (33.7) (33.7) (31.0) (31.2) (31.2) (28.8)
13 Trade, Repair, Hotels & Restaurants 98,061 1,25,776 1,36,727 1,43,462 1,68,866 1,88,046 2,09,096 2,31,885
14 Railways 5,125 5,759 6,957 7,607 9,771 11,455 11,205 12,497
15 Transport by means other than Railways 35,801 42,929 48,015 53,301 56,559 60,685 60,970 65,883
16 Storage 792 971 1,063 1,099 1,146 1,273 1,369 1,483
17 Communication and Services related to Broadcasting 12,883 16,370 18,826 22,473 21,710 19,683 20,187 22,928
18 Financial Services 1,15,976 1,47,225 1,61,059 1,74,574 1,83,740 1,93,424 2,21,455 2,41,230
19 Real estate, Ownership of dwellings & Professional Services. 1,41,087 1,95,429 2,28,172 2,61,486 3,04,943 3,37,094 3,87,322 4,36,911
20 Public administration & Defence 27,844 34,972 38,270 43,040 48,964 55,377 58,832 72,752
21 Other Services 58,403 81,022 95,552 1,10,378 1,28,460 1,44,662 1,64,964 1,91,237
22 Tertiary / Services Sector 4,95,972 6,50,453 7,34,641 8,17,418 9,24,159 10,11,699 11,35,398 12,76,806
(Sub-Total- 13 to 21) (50.1) (51.3) (54.0) (54.9) (55.5) (56.4) (57.8) (59.3)
23 Net State Value Added (NSVA) 9,90,644 12,68,041 13,61,016 14,89,571 16,65,074 17,92,845 19,65,230 21,52,764
(5+12+22) (100.0) (100.0) (100.0) (100.0) (100.0) (100.0) (100.0) (100.0)
24 Taxes on Product 1,62,085 2,16,322 2,28,808 2,76,680 3,17,675 3,15,200 3,41,168 3,63,835
25 Less Subsidies on Product 26,134 35,643 36,607 30,943 27,975 26,851 29,606 34,063
26 Net State Domestic Product (23+24-25) 11,26,595 14,48,720 15,53,217 17,35,308 19,54,774 20,81,195 22,76,793 24,82,536
27 Per capita NSDP (`) 99,597 1,25,261 1,32,836 1,46,815 1,63,726 1,72,663 1,87,118 2,02,130
Source : Directorate of Economics and Statistics, GoM.
+++ Third Revised Estimates ++ Second Revised Estimates + First Revised Estimates
Note - Figures in brackets show percentages to NSVA. Figures may not add up due to rounding.

Economic Survey of Maharashtra 2020-21
39ANNEXURE 3.4
REAL NET STATE VALUE ADDED AT BASIC PRICES BY INDUSTRY OF ORIGIN & REAL NET STATE DOMESTIC PRODUCT AT MARKET PRICES
(AT CONSTANT (2011-12) PRICES) (`crore)
Sr. No. Industry 2011-12 2013-14 2014-15 2015-16 2016-17 2017-18+++ 2018-19++ 2019-20+
(1) (2) (3) (4) (5) (6) (7) (8) (9) (10)
1 Crops 96,153 1,12,053 91,890 84,262 1,06,841 1,00,696 94,865 1,02,855
2 Livestock 28,153 29,509 30,672 32,170 35,888 38,967 41,333 43,019
3 Forestry and Logging 16,435 16,008 16,466 17,042 20,078 21,946 23,877 23,677
4 Fishing and aquaculture 2,591 2,666 2,843 2,733 3,301 2,921 2,639 2,844
5 Agriculture & Allied Activities 1,43,331 1,60,235 1,41,871 1,36,207 1,66,107 1,64,531 1,62,714 1,72,395
(Sub-Total - 1+2+3+4) (100.0) (111.8) (99.0) (95.0) (115.9) (114.8) (113.5) (120.3)
6 Mining and Quarrying 49,674 37,829 46,705 57,343 59,971 64,640 69,164 70,555
7 Primary Sector
( Sub-Total - 5+6) 1,93,005 1,98,065 1,88,577 1,93,550 2,26,079 2,29,171 2,31,877 2,42,949
8 Manufacturing 2,06,804 2,50,479 2,63,691 2,96,268 3,21,906 3,49,245 3,68,741 3,64,907
9 Electricity, Gas and Water Supply, Other Utility Services 18,021 14,316 19,057 20,253 21,524 22,714 25,070 26,487
10 Construction 76,841 74,929 81,293 82,912 86,902 88,010 88,673 90,138
11 Secondary Sector (Sub-Total – 8+9+ 10)
3,01,666 3,39,723 3,64,041 3,99,432 4,30,331 4,59,969 4,82,484 4,81,532
12 Industry 3,51,340 3,77,553 4,10,746 4,56,775 4,90,303 5,24,609 5,51,648 5,52,087
(Sub-Total - 6 + 11) (100.0) (107.5) (116.9) (130.0) (139.6) (149.3) (157.0) (157.1)
13 Trade, Repair, Hotels & Restaurants
98,061 1,05,522 1,08,341 1,08,018 1,21,335 1,29,744 1,40,324 1,49,059
14 Railways 5,125 5,416 6,078 6,441 7,363 8,481 8,156 8,506
15 Transport by means other than Railways
35,801 40,165 44,841 51,022 55,617 59,519 63,616 68,380
16 Storage 792 838 878 875 870 924 946 992
17 Communication and Services related to Broadcasting 12,883 13,571 15,613 19,026 17,636 15,130 14,840 16,781
18 Financial Services 1,15,976 1,41,994 1,52,929 1,61,928 1,70,674 1,75,316 1,83,248 1,90,862
19 Real estate, Ownership of dwellings & Professional Services. 1,41,087 1,67,687 1,88,001 2,07,087 2,27,262 2,40,799 2,64,056 2,87,625
20 Public administration & Defence 27,844 28,689 29,551 31,399 33,905 36,939 38,079 45,082
21 Other Services 58,403 70,694 79,701 87,938 97,821 1,05,068 1,13,734 1,26,200
22 Tertiary / Services Sector 4,95,972 5,74,576 6,25,933 6,73,732 7,32,483 7,71,922 8,26,998 8,93,486
(Sub-Total- 13 to 21) (100.0) (115.8) (126.2) (135.8) (147.7) (155.6) (166.7) (180.1)
23 Net State Value Added (NSVA) 9,90,644 11,12,364 11,78,551 12,66,715 13,88,894 14,61,062 15,41,359 16,17,968
(5+12+22) (100.0) (112.3) (119.0) (127.9) (140.2) (147.5) (155.6) (163.3)
24 Taxes on Product 1,62,085 1,87,889 1,98,541 2,12,210 2,30,678 2,47,882 2,71,776 2,81,540
25 Less Subsidies on Product 26,134 32,702 31,750 26,411 23,451 21,964 23,298 25,707
26 Net State Domestic Product (23+24-25) 11,26,595 12,67,551 13,45,341 14,52,513 15,96,121 16,86,980 17,89,838 18,73,801
27 Per capita NSDP (`) 99,597 1,09,597 1,15,058 1,22,889 1,33,686 1,39,958 1,47,097 1,52,566
Source : Directorate of Economics and Statistics, GoM.
+++ Third Revised Estimates ++ Second Revised Estimates + First Revised Estimates
Note - Figures in brackets show percentages to col. (3) Figures may not add up due to rounding.

Economic Survey of Maharashtra 2020-21
40
ANNEXURE 3.5
NOMINAL GROSS VALUE ADDED AT BASIC PRICES BY INDUSTRY OF ORIGIN, NOMINAL GROSS DOMESTIC PRODUCT AT MARKET PRICES & GROSS NATIONAL INCOME
(AT CURRENT PRICES) (`crore)
Sr. No. Industry 2011-12 2013-14 2014-15 2015-16 2016-17 2017-18+++ 2018-19++ 2019-20+
(1) (2) (3) (4) (5) (6) (7) (8) (9) (10)
1 Crops 9,82,151 12,48,776 12,92,874 13,27,992 14,86,044 16,33,264 16,68,832 19,72,394
2 Livestock 3,27,334 4,22,733 5,10,411 5,82,410 6,72,611 7,85,683 8,80,623 9,62,682
3 Forestry and Logging 1,24,436 1,56,674 1,73,760 1,84,411 2,05,364 2,17,603 2,53,971 2,36,346
4 Fishing and aquaculture 68,027 98,190 1,16,567 1,32,720 1,54,643 1,93,275 2,12,851 2,22,611
5 Agriculture & Allied Activities 15,01,947 19,26,372 20,93,612 22,27,533 25,18,662 28,29,826 30,16,277 33,94,033
(Sub-Total - 1+2+3+4) (18.5) (18.6) (18.2) (17.7) (18.0) (18.3) (17.6) (18.4)
6 Mining & quarrying 2,61,035 2,95,794 3,08,476 2,94,011 3,26,808 3,36,109 3,77,171 3,55,833
7 Primary Sector ( Sub-Total - 5+6)
17,62,983 22,22,166 24,02,088 25,21,544 28,45,470 31,65,935 33,93,447 37,49,866
8 Manufacturing 14,09,986 17,13,452 18,78,369 21,46,189 23,33,721 25,66,623 28,05,330 27,12,269
9 Electricity, Gas ,Water supply & Other Utility Services
1,86,668 2,60,155 2,82,258 3,34,965 3,55,709 4,25,718 4,50,631 4,83,644
10 Construction 7,77,335 9,21,470 9,79,086 9,91,084 10,80,870 12,00,414 13,49,795 13,68,638
11 Secondary Sector (Sub-Total – 8+9+10)
23,73,988 28,95,076 31,39,713 34,72,237 37,70,300 41,92,755 46,05,756 45,64,552
12 Industry 26,35,023 31,90,871 34,48,189 37,66,248 40,97,108 45,28,864 49,82,927 49,20,385
(Sub-Total - 6+11) (32.5) (30.8) (30.0) (30.0) (29.3) (29.2) (29.0) (26.7)
13 Trade, Repair, Hotels & Restaurants
8,83,582 11,84,560 13,20,833 14,33,969 16,09,001 18,81,395 21,34,988 23,23,632
14 Railways 61,150 78,724 92,459 1,00,451 1,06,786 1,16,584 1,23,498 1,36,648
15 Transport by means other than Railways
3,37,347 4,27,352 4,81,455 5,15,790 5,68,118 6,17,201 6,65,379 7,09,440
16 Storage 5,108 6,026 6,407 7,021 7,442 16,194 18,369 19,587
17 Communication and Services related to Broadcasting
1,25,930 1,77,804 2,06,442 2,37,282 2,47,809 2,47,549 2,58,052 2,90,933
18 Financial services 4,80,226 5,99,341 6,61,411 7,26,286 7,50,201 8,46,194 9,55,344 10,52,827
19 Real estate, Ownership of dwelling & Professional Services
10,50,651 14,70,167 17,01,935 18,99,852 21,61,236 22,81,018 25,87,115 28,63,021
20 Public administration & Defence
4,91,155 6,01,912 6,76,818 7,31,578 8,27,438 9,45,082 10,44,718 11,69,949
21 Other Services 5,34,827 7,00,023 8,14,718 9,28,489 10,71,399 11,95,759 13,74,548 15,80,888
22 Tertiary / Services Sector 39,69,975 52,45,910 59,62,479 65,80,718 73,49,430 81,46,975 91,62,009 1,01,46,925
(Sub-Total- 13 to 21) (49.0) (50.6) (51.8) (52.3) (52.6) (52.5) (53.4) (55.0)
23 Gross Value Added (GVA) 81,06,946 1,03,63,153 1,15,04,279 1,25,74,499 1,39,65,200 1,55,05,665 1,71,61,213 1,84,61,343
(5+12+22) (100.0) (100.0) (100.0) (100.0) (100.0) (100.0) (100.0) (100.0)
24 Taxes on products 8,90,060 11,80,444 12,91,662 15,18,496 17,46,288 18,98,896 20,44,722 22,39,222
25 Less subsidies on products 2,60,677 3,10,075 3,27,982 3,21,120 3,19,819 3,14,518 3,18,978 3,49,553
26 Gross Domestic Product (23+24-25)
87,36,329 1,12,33,522 1,24,67,959 1,37,71,874 1,53,91,669 1,70,90,042 1,88,86,957 2,03,51,013
27 Primary income receivable from ROW
(-)76,824 (-)1,39,884 (-)1,47,430 (-)1,59,779 (-)1,76,400 (-)1,84,813 (-)2,02,324 (-)1,93,114
28 Gross National Income (26+27)
86,59,505 1,10,93,638 1,23,20,529 1,36,12,095 1,52,15,268 1,69,05,230 1,86,84,632 2,01,57,899
29 Per Capita Gross National Income (`)
70,980 88,678 97,242 1,06,096 1,17,131 1,28,655 1,40,804 1,50,320
Source : National Statistical Office, GoI + + + Third Revised Estimates ++ Second revised estimates + First revised estimates
Note - Figures in brackets show percentages to GVA Figures may not add up due to rounding.

Economic Survey of Maharashtra 2020-21
41ANNEXURE 3.6
REAL GROSS VALUE ADDED AT BASIC PRICES BY INDUSTRY OF ORIGIN, REAL GROSS DOMESTIC PRODUCT AT MARKET PRICES & GROSS NATIONAL INCOME
(AT CONSTANT (2011-12) PRICES) (`crore)
Sr. No. Industry 2011-12 2013-14 2014-15 2015-16 2016-17 2017-18+++ 2018-19++ 2019-20+
(1) (2) (3) (4) (5) (6) (7) (8) (9) (10)
1 Crops 9,82,151 10,37,060 9,98,425 9,69,344 10,20,258 10,75,111 10,57,785 10,99,586 2 Livestock 3,27,334 3,63,558 3,90,449 4,19,637 4,61,572 4,97,830 5,39,945 5,77,720 3 Forestry and Logging 1,24,436 1,32,093 1,34,609 1,36,960 1,44,547 1,52,351 1,64,330 1,64,894 4 Fishing and aquaculture 68,027 76,487 82,232 90,205 99,627 1,14,730 1,25,084 1,26,370
5 Agriculture & Allied Activities
15,01,947 16,09,198 16,05,715 16,16,146 17,26,004 18,40,023 18,87,145 19,68,571
(Sub-Total - 1+2+3+4) (100.0) (107.1) (106.9) (107.6) (114.9) (122.5) (125.6) (131.1)
6 Mining & quarrying 2,61,035 2,63,107 2,88,685 3,17,974 3,49,248 3,29,612 3,30,521 3,22,116
7 Primary Sector ( Sub-Total - 5+6)
17,62,983 18,72,305 18,94,401 19,34,120 20,75,252 21,69,635 22,17,666 22,90,687
8 Manufacturing 14,09,986 15,60,709 16,83,938 19,03,850 20,54,764 22,09,428 23,26,067 22,69,424 9 Electricity, Gas ,Water
supply & Other Utility Services
1,86,668 1,99,601 2,14,047 2,24,158 2,46,496 2,72,650 2,94,488 3,00,532
10 Construction 7,77,335 8,00,771 8,35,229 8,65,335 9,16,445 9,64,306 10,25,446 10,35,534
11 Secondary Sector (Sub-Total – 8+9+10)
23,73,988 25,61,081 27,33,213 29,93,343 32,17,705 34,46,383 36,46,002 36,05,490
12 Industry 26,35,023 28,24,188 30,21,899 33,11,316 35,66,953 37,75,996 39,76,523 39,27,606 (Sub-Total - 6+11) (100.0) (107.2) (114.7) (125.7) (135.4) (143.3) (150.9) (149.1)
13 Trade, Repair, Hotels & Restaurants
8,83,582 10,34,506 11,35,841 12,61,426 13,89,322 15,68,175 17,06,849 18,27,508
14 Railways 61,150 73,685 80,720 85,452 82,161 87,886 91,350 94,524 15 Transport by means other
than Railways 3,37,347 3,82,630 4,09,551 4,38,458 4,64,899 5,01,039 5,28,369 5,45,255
16 Storage 5,108 5,210 5,529 6,245 6,100 12,976 13,701 14,052 17 Communication and Services
related to Broadcasting 1,25,930 1,56,031 1,76,047 2,01,243 2,03,896 1,98,344 1,97,151 2,18,458
18 Financial services 4,80,226 5,77,914 6,27,255 6,72,788 6,95,983 7,28,670 7,63,153 7,94,744 19 Real estate, Ownership of
dwelling & Professional Services
10,50,651 12,89,493 14,46,460 16,21,999 17,96,983 18,08,521 19,55,632 21,21,765
20 Public administration & Defence
4,91,155 5,10,046 5,43,853 5,65,106 6,14,238 6,76,507 7,22,248 7,74,359
21 Other Services 5,34,827 6,00,748 6,59,262 7,11,691 7,81,744 8,36,035 9,02,084 9,84,628
22 Tertiary / Services Sector 39,69,975 46,30,263 50,84,519 55,64,408 60,35,327 64,18,152 68,80,535 73,75,294 (Sub-Total- 13 to 21) (100.0) (116.6) (128.1) (140.2) (152.0) (161.7) (173.3) (185.8)
23 Gross Value Added (GVA) 81,06,946 90,63,649 97,12,133 1,04,91,870 1,13,28,285 1,20,34,171 1,27,44,203 1,32,71,471 (5+12+22) (100.0) (111.8) (119.8) (129.4) (139.7) (148.4) (157.2) (163.7)
24 Taxes on products 8,90,060 10,08,913 10,92,430 11,45,558 12,39,334 13,54,508 14,95,990 15,49,075 25 Less subsidies on products 2,60,677 2,71,192 2,76,889 2,67,935 2,59,425 2,44,097 2,36,877 2,51,278
26 Gross Domestic Product (23+24-25)
87,36,329 98,01,370 1,05,27,674 1,13,69,493 1,23,08,193 1,31,44,582 1,40,03,316 1,45,69,268
27 Primary income receivable from ROW
(-)76,824 (-)1,22,343 (-)1,24,687 (-)1,34,922 (-)1,44,575 (-)1,45,888 (-)1,52,459 (-)1,41,636
28 Gross National Income (26+27)
86,59,505 96,79,027 1,04,02,987 1,12,34,571 1,21,63,619 1,29,98,695 1,38,50,857 1,44,27,632
29 Per Capita Gross National Income (`)
70,980 77,370 82,107 87,565 93,638 98,925 1,04,377 1,07,589
Source : National Statistical Office, GoI + + + Third Revised Estimates ++ Second revised estimates + First revised estimates Note - Figures in brackets show percentages to Col. (3) Figures may not add up due to rounding.

Economic Survey of Maharashtra 2020-21
42
ANNEXURE 3.7
NOMINAL NET VALUE ADDED AT BASIC PRICES BY INDUSTRY OF ORIGIN, NOMINAL NET DOMESTIC PRODUCT AT MARKET PRICES & NET NATIONAL INCOME
(AT CURRENT PRICES) (` crore)
Sr. No. Industry 2011-12 2013-14 2014-15 2015-16 2016-17 2017-18+++ 2018-19++ 2019-20+
(1) (2) (3) (4) (5) (6) (7) (8) (9) (10)
1 Crops 9,00,975 11,37,605 11,68,060 11,91,902 13,38,083
26,45,905† 28,16,587† 31,75,638† 2 Livestock 3,22,185 4,15,763 5,02,799 5,74,764 6,64,443 3 Forestry and Logging 1,23,070 1,55,045 1,72,049 1,82,678 2,03,476 4 Fishing and aquaculture 60,039 88,220 1,05,592 1,20,793 1,42,038
5 Agriculture & Allied Activities
14,06,268 17,96,633 19,48,500 20,70,140 23,48,040 26,45,905 28,16,587 31,75,638
(Sub-Total - 1+2+3+4) (19.6) (19.6) (19.2) (18.6) (19.0) (19.3) (18.6) (19.5)
6 Mining & quarrying 2,29,186 2,52,785 2,61,787 2,44,585 2,75,183 2,81,018 3,18,073 2,93,321
7 Primary Sector ( Sub-Total - 5+6)
16,35,454 20,49,418 22,10,287 23,14,725 26,23,224 29,26,923 31,34,661 34,68,960
8 Manufacturing 11,46,928 14,11,657 15,54,656 18,02,694 19,68,540 21,74,611 23,79,444 22,56,063 9 Electricity, Gas ,Water
supply & Other Utility Services
1,23,811 1,73,574 1,82,728 2,25,552 2,36,476 2,96,301 3,06,756 3,30,110
10 Construction 7,38,178 8,66,610 9,20,941 9,31,992 10,14,415 11,24,218 12,60,390 12,67,085
11 Secondary Sector (Sub-Total – 8+9+ 10)
20,08,917 24,51,841 26,58,325 29,60,238 32,19,431 35,95,131 39,46,590 38,53,258
12 Industry 22,38,103 27,04,626 29,20,112 32,04,823 34,94,614 38,76,149 42,64,663 41,46,579 (Sub-Total - 6 + 11) (31.1) (29.5) (28.7) (28.8) (28.2) (28.2) (28.1) (25.4)
13 Trade, Repair, Hotels & Restaurants
8,38,114 11,20,451 12,47,371 13,52,232 15,14,613 17,68,275 20,02,609 21,77,709
14 Railways 48,531 61,450 70,457 76,040 79,261
7,99,084† 8,29,851† 8,86,166†
15 Transport by means other than Railways
2,88,061 3,68,454 4,18,654 4,48,351 4,90,555
16 Storage 4,352 5,116 5,370 5,904 6,243 17 Communication and
Services related to Broadcasting
1,02,777 1,33,058 1,57,285 1,82,334 1,86,308
18 Financial services 4,73,399 5,89,132 6,49,295 7,11,622 7,33,707 8,28,182 9,33,759 10,28,326 19 Real estate, Ownership
of dwelling & Professional Services
8,97,897 12,44,046 14,23,577 15,93,181 18,16,045 18,97,837 21,53,890 23,94,270
20 Public administration & Defence
4,05,592 5,03,188 5,71,755 6,23,316 7,13,596 8,22,681 9,12,339 10,28,161
21 Other Services 4,86,677 6,41,025 7,49,614 8,56,854 9,90,884 11,02,739 12,67,526 14,60,896
22 Tertiary / Services Sector
35,45,400 46,65,919 52,93,377 58,49,834 65,31,213 72,18,799 80,99,975 89,75,527
(Sub-Total- 13 to 21) (49.3) (50.9) (52.1) (52.6) (52.8) (52.5) (53.4) (55.1)
23 Net Value Added (NVA)
71,89,771 91,67,178 1,01,61,988 1,11,24,802 1,23,73,868 1,37,40,853 1,51,81,225 1,62,97,745
(5+12+22) (100.0) (100.0) (100.0) (100.0) (100.0) (100.0) (100.0) (100.0)
24 Taxes on products 8,90,060 11,80,444 12,91,662 15,18,496 17,46,288 18,98,896 20,44,722 22,39,222 25 Less subsidies on
products 2,60,677 3,10,075 3,27,982 3,21,120 3,19,819 3,14,518 3,18,978 3,49,553
26 Net Domestic Product (23+24-25)
78,19,154 1,00,37,547 1,11,25,668 1,23,22,177 1,38,00,336 1,53,25,231 1,69,06,970 1,81,87,414
27 Primary income receivable from ROW
(-)76,824 (-)1,39,884 (-)1,47,430 (-)1,59,779 (-)1,76,400 (-)1,84,813 (-)2,02,324 (-)1,93,114
28 Net National Income (26+27)
77,42,330 98,97,663 1,09,78,238 1,21,62,398 1,36,23,936 1,51,40,418 1,67,04,645 1,79,94,301
29 Per Capita Net National Income (`)
63,462 79,118 86,647 94,797 1,04,880 1,15,224 1,25,883 1,34,186
Source : National Statistical Office, GoI † Breakup not available +++ Third Revised Estimates ++ Second revised estimates + First revised estimates Note - Figures in brackets show percentages to NVA Figures may not add up due to rounding.

Economic Survey of Maharashtra 2020-21
43
ANNEXURE 3.8
REAL NET VALUE ADDED AT BASIC PRICES BY INDUSTRY OF ORIGIN, REAL NET DOMESTIC PRODUCT AT MARKET PRICES & NET NATIONAL INCOME
(AT CONSTANT (2011-12) PRICES) (`crore)
Sr. No. Industry 2011-12 2013-14 2014-15 2015-16 2016-17 2017-18+++ 2018-19++ 2019-20+
(1) (2) (3) (4) (5) (6) (7) (8) (9) (10)
1 Crops 9,00,975 9,41,924 8,96,785 8,63,339 9,09,002
17,01,840† 17,41,577† 18,14,544† 2 Livestock 3,22,185 3,57,438 3,83,865 4,12,787 4,54,411 3 Forestry and Logging 1,23,070 1,30,661 1,33,134 1,35,429 1,42,919 4 Fishing and aquaculture 60,039 67,436 72,535 79,783 88,405
5 Agriculture & Allied Activities 14,06,268 14,97,458 14,86,319 14,91,337 15,94,736 17,01,840 17,41,577 18,14,544 (Sub-Total - 1+2+3+4) (100.0) (106.5) (105.7) (106.0) (113.4) (121.0) (123.8) (129.0)
6 Mining & quarrying 2,29,186 2,24,332 2,48,479 2,76,579 3,06,743 2,85,401 2,84,612 2,74,872
7 Primary Sector ( Sub-Total - 5+6)
16,35,454 17,21,790 17,34,798 17,67,916 19,01,479 19,87,241 20,26,189 20,89,417
8 Manufacturing 11,46,928 12,78,832 13,93,158 15,95,406 17,27,321 18,65,797 19,65,551 18,86,946 9 Electricity, Gas ,Water
supply & Other Utility Services
1,23,811 1,18,076 1,25,088 1,25,998 1,39,662 1,59,467 1,72,657 1,70,669
10 Construction 7,38,178 7,47,210 7,81,289 8,09,853 8,53,049 8,92,015 9,42,948 9,40,538
11 Secondary Sector (Sub-Total – 8+9+10)
20,08,917 21,44,118 22,99,534 25,31,257 27,20,032 29,17,280 30,81,156 29,98,153
12 Industry 22,38,103 23,68,450 25,48,013 28,07,836 30,26,775 32,02,681 33,65,768 32,73,025 (Sub-Total - 6+11) (100.0) (105.8) (113.8) (125.5) (135.2) (143.1) (150.4) (146.2)
13 Trade, Repair, Hotels & Restaurants
8,38,114 9,76,637 10,71,289 11,88,026 13,05,709 14,72,163 15,99,655 17,10,408
14 Railways 48,531 57,772 61,570 64,166 58,538
6,29,075† 6,33,012† 6,49,005†
15 Transport by means other than Railways
2,88,061 3,26,018 3,51,635 3,76,072 3,94,405
16 Storage 4,352 4,391 4,629 5,243 5,041 17 Communication and
Services related to Broadcasting
1,02,776 1,12,617 1,33,553 1,54,216 1,51,385
18 Financial services 4,73,399 5,68,348 6,16,582 6,59,910 6,81,553 7,13,306 7,45,447 7,74,697 19 Real estate, Ownership of
dwelling & Professional Services
8,97,897 10,86,282 12,08,961 13,59,743 15,06,813 14,99,438 16,23,013 17,59,515
20 Public administration & Defence
4,05,592 4,18,382 4,48,787 4,66,379 5,10,820 5,68,503 6,09,649 6,55,798
21 Other Services 4,86,677 5,46,683 6,02,151 6,48,053 7,10,984 7,57,244 8,15,605 8,88,092
22 Tertiary / Services Sector 35,45,400 40,97,130 44,99,157 49,21,807 53,25,247 56,39,729 60,26,380 64,37,515 (Sub-Total- 13 to 21) (100.0) (115.6) (126.9) (138.8) (150.2) (159.1) (170.0) (181.6)
23 Net Value Added (NVA) 71,89,771 79,63,039 85,33,489 92,20,980 99,46,758 1,05,44,250 1,11,33,725 1,15,25,085 (5+12+22) (100.0) (110.8) (118.7) (128.3) (138.3) (146.7) (154.9) (160.3)
24 Taxes on products 8,90,060 10,08,913 10,92,430 11,45,558 12,39,334 13,54,508 14,95,990 15,49,075 25 Less subsidies on products 2,60,677 2,71,192 2,76,889 2,67,935 2,59,425 2,44,097 2,36,877 2,51,278
26 Net Domestic Product (23+24-25)
78,19,154 87,00,760 93,49,029 1,00,98,603 1,09,26,667 1,16,54,661 1,23,92,839 1,28,22,882
27 Primary income receivable from ROW
(-)76,824 (-)1,22,343 (-)1,24,687 (-)1,34,922 (-)1,44,575 (-)1,45,888 (-)1,52,459 (-)1,41,636
28 Net National Income (26+27)
77,42,330 85,78,417 92,24,343 99,63,681 1,07,82,092 1,15,08,774 1,22,40,380 1,26,81,246
29 Per Capita Net National Income (`)
63,462 68,572 72,805 77,659 83,003 87,586 92,241 94,566
Source : National Statistical Office, GoI † Breakup not available
+++ Third Revised Estimates ++ Second revised estimates + First revised estimates
Note - Figures in brackets show percentages to Col. (3) Figures may not add up due to rounding.

Economic Survey of Maharashtra 2020-21
44
ANNEXURE 3.9
NOMINAL GROSS DISTRICT VALUE ADDED (AT CURRENT PRICES) (`crore)
Sr.No. District 2011-12 2013-14 2014-15 2015-16 2016-17 2017-18 2018-19 2019-20
(1) (2) (3) (4) (5) (6) (7) (8) (9) (10)
1 Mumbai# 2,20,975 2,83,580 3,13,640 3,42,221 3,72,056 4,07,107 4,52,786 4,92,582
2 Thane$ 1,63,761 2,09,677 2,31,688 2,52,443 2,75,476 3,01,061 3,34,388 3,63,524
3 Raigad 29,576 37,995 42,886 47,028 50,203 54,910 60,778 65,515
4 Ratnagiri 13,842 18,172 22,238 21,795 25,405 27,839 28,786 30,664
5 Sindhudurg 8,033 10,316 11,174 11,987 13,907 16,795 16,759 17,535
KOKAN DIV. 4,36,186 5,59,740 6,21,626 6,75,474 7,37,046 8,07,713 8,93,498 9,69,820
6 Nashik 55,289 77,227 78,428 83,159 89,656 1,02,243 1,08,732 1,23,641
7 Dhule 14,564 18,906 21,068 22,259 24,178 26,978 27,860 31,700
8 Nandurbar 8,010 10,374 10,017 11,045 12,610 13,403 14,690 16,586
9 Jalgaon 29,657 37,387 40,536 42,554 48,238 51,411 55,134 60,239
10 Ahmednagar 37,219 47,007 51,962 56,180 60,584 68,366 73,449 80,181
NASHIK DIV. 1,44,740 1,90,901 2,02,011 2,15,198 2,35,265 2,62,401 2,79,865 3,12,347 11 Pune 1,31,145 1,67,755 1,84,575 2,00,727 2,18,746 2,38,125 2,62,858 2,92,695
12 Satara 25,684 32,415 34,862 38,641 41,469 46,249 50,295 54,845
13 Sangli 26,066 32,462 35,637 37,834 42,545 45,046 50,462 56,252
14 Solapur 39,459 47,474 53,917 57,841 62,633 69,532 74,100 83,072
15 Kolhapur 40,732 51,335 55,967 60,881 66,643 72,713 79,111 85,645
PUNE DIV. 2,63,086 3,31,441 3,64,959 3,95,924 4,32,036 4,71,666 5,16,826 5,72,509 16 Aurangabad 31,519 40,394 42,805 47,389 52,229 56,197 61,420 68,282
17 Jalna 13,178 18,328 15,884 16,539 20,622 20,395 21,765 25,748
18 Parbhani 12,150 15,575 15,933 15,564 19,824 19,943 21,532 23,718
19 Hingoli 5,994 7,540 8,691 8,064 9,639 9,933 10,959 12,769
20 Beed 15,710 19,599 19,485 20,762 25,502 26,507 26,787 31,318
21 Nanded 20,998 27,074 26,793 29,522 34,967 36,507 41,087 45,330
22 Osmanabad 11,733 14,447 12,944 13,384 15,771 16,996 18,492 21,605
23 Latur 16,885 22,856 21,303 22,509 28,278 29,346 32,149 35,429
AURANGABAD DIV. 1,28,167 1,65,813 1,63,837 1,73,733 2,06,831 2,15,825 2,34,190 2,64,198
24 Buldhana 12,924 17,791 16,624 18,093 22,523 21,827 24,273 27,105
25 Akola 13,030 16,951 17,408 19,231 23,068 23,338 26,182 28,223
26 Washim 6,262 7,968 7,028 8,150 9,718 9,471 10,897 11,570
27 Amravati 18,893 25,070 27,011 29,772 35,045 34,946 39,215 41,427
28 Yavatmal 15,682 19,346 20,202 23,484 27,801 27,690 31,134 31,705
AMRAVATI DIV. 66,791 87,126 88,273 98,730 1,18,156 1,17,271 1,31,699 1,40,030 29 Wardha 10,060 12,481 13,518 15,660 17,870 18,624 20,661 22,426
30 Nagpur 56,028 71,731 78,976 87,372 95,953 1,03,242 1,14,258 1,24,226
31 Bhandara 8,061 10,349 11,193 11,899 13,374 13,685 15,630 16,573
32 Gondia 8,539 10,969 11,997 12,793 14,405 14,479 16,342 17,741
33 Chandrapur 16,940 21,468 23,208 25,866 29,042 30,296 35,055 37,856
34 Gadchiroli 5,821 6,949 7,340 7,838 8,506 9,229 10,042 11,057
NAGPUR DIV. 1,05,449 1,33,947 1,46,233 1,61,429 1,79,151 1,89,556 2,11,988 2,29,878
Source : Directorate of Economics and Statistics, GoM. # Includes Mumbai city + Mumbai Suburban $ Includes Palghar
Note – 1) Figures may not add up due to rounding.
2) Figures for 2011-12 to 2019-20 are provisional.
3) The Estimates of Gross District Value Added are not comparable due to revision in methodology and nomenclature of revised base year 2011-12 with the estimates calculated with respective base year 2004-05 series

Economic Survey of Maharashtra 2020-21
45
ANNEXURE 3.10
REAL GROSS DISTRICT VALUE ADDED (AT CONSTANT (2011-12) PRICES) (`crore)
Sr.No. District 2011-12 2013-14 2014-15 2015-16 2016-17 2017-18 2018-19 2019-20
(1) (2) (3) (4) (5) (6) (7) (8) (9) (10)
1 Mumbai# 2,20,975 2,50,630 2,72,621 2,94,038 3,16,483 3,36,370 3,57,987 3,76,515
2 Thane$ 1,63,761 1,85,268 2,01,051 2,16,555 2,33,021 2,47,391 2,63,412 2,76,644
3 Raigad 29,576 33,387 37,007 39,855 42,432 44,923 47,763 49,765
4 Ratnagiri 13,842 15,750 18,411 17,935 19,949 21,357 21,688 22,354
5 Sindhudurg 8,033 8,955 9,282 9,782 10,765 12,213 12,029 12,337
KOKAN DIV. 4,36,186 4,93,990 5,38,372 5,78,164 6,22,650 6,62,253 7,02,878 7,37,615
6 Nashik 55,289 66,051 68,456 72,546 78,630 85,375 88,090 92,288
7 Dhule 14,564 16,598 18,175 18,567 19,931 21,506 21,638 22,986
8 Nandurbar 8,010 9,400 8,864 9,542 10,613 10,995 11,683 12,539
9 Jalgaon 29,657 33,825 35,604 36,017 40,252 41,697 43,223 45,237
10 Ahmednagar 37,219 42,036 44,794 46,129 49,887 54,391 56,774 58,631
NASHIK DIV. 1,44,740 1,67,909 1,75,893 1,82,802 1,99,312 2,13,964 2,21,407 2,31,680 11 Pune 1,31,145 1,48,095 1,60,112 1,71,363 1,84,131 1,95,397 2,07,610 2,20,420
12 Satara 25,684 28,748 30,016 32,661 34,443 37,120 39,117 41,253
13 Sangli 26,066 28,885 30,437 31,857 34,909 35,921 38,499 40,586
14 Solapur 39,459 42,598 48,047 49,946 52,469 56,958 59,332 62,639
15 Kolhapur 40,732 45,279 48,306 51,574 55,610 58,750 61,972 64,835
PUNE DIV. 2,63,086 2,93,605 3,16,918 3,37,402 3,61,562 3,84,146 4,06,530 4,29,734 16 Aurangabad 31,519 35,808 37,227 40,528 43,953 46,045 48,410 51,491
17 Jalna 13,178 16,649 13,477 14,269 16,743 16,661 17,018 19,278
18 Parbhani 12,150 13,748 13,864 13,356 16,613 16,450 17,053 17,908
19 Hingoli 5,994 6,744 7,496 6,780 7,763 8,152 8,629 9,354
20 Beed 15,710 17,385 17,009 17,702 20,803 21,530 20,980 23,243
21 Nanded 20,998 23,746 23,276 25,168 28,718 29,707 32,041 33,876
22 Osmanabad 11,733 12,806 11,308 11,519 12,931 13,818 14,555 15,796
23 Latur 16,885 20,009 18,482 19,240 22,785 23,956 25,188 26,728
AURANGABAD DIV. 1,28,167 1,46,893 1,42,141 1,48,562 1,70,308 1,76,318 1,83,874 1,97,673
24 Buldhana 12,924 15,096 13,986 15,099 17,654 17,442 18,806 20,088
25 Akola 13,030 15,001 15,174 16,309 18,466 18,905 20,569 21,443
26 Washim 6,262 7,191 6,055 6,818 8,323 8,278 9,245 9,492
27 Amravati 18,893 22,071 23,706 25,604 29,059 29,020 31,166 31,802
28 Yavatmal 15,682 16,914 17,619 20,169 22,680 22,199 24,268 24,496
AMRAVATI DIV. 66,791 76,273 76,541 84,000 96,182 95,843 1,04,054 1,07,321 29 Wardha 10,060 11,008 11,803 13,132 14,672 15,221 16,132 16,894
30 Nagpur 56,028 63,281 68,587 74,813 81,083 84,871 89,981 94,719
31 Bhandara 8,061 8,958 9,482 9,990 10,972 11,126 12,042 12,380
32 Gondia 8,539 9,509 10,164 10,839 11,862 12,078 12,767 13,386
33 Chandrapur 16,940 18,945 20,162 22,046 24,180 25,095 27,379 28,526
34 Gadchiroli 5,821 6,057 6,310 6,733 7,035 7,790 7,791 8,304
NAGPUR DIV. 1,05,449 1,17,757 1,26,510 1,37,555 1,49,803 1,56,180 1,66,092 1,74,209
Source : Directorate of Economics and Statistics, GoM. # Includes Mumbai city + Mumbai Suburban $ Includes Palghar
Note – 1) Figures may not add up due to rounding.
2) Figures for 2011-12 to 2019-20 are provisional.
3) The Estimates of Gross District Value Added are not comparable due to revision in methodology and nomenclature of revised base year 2011-12 with the estimates calculated with respective base year 2004-05 series
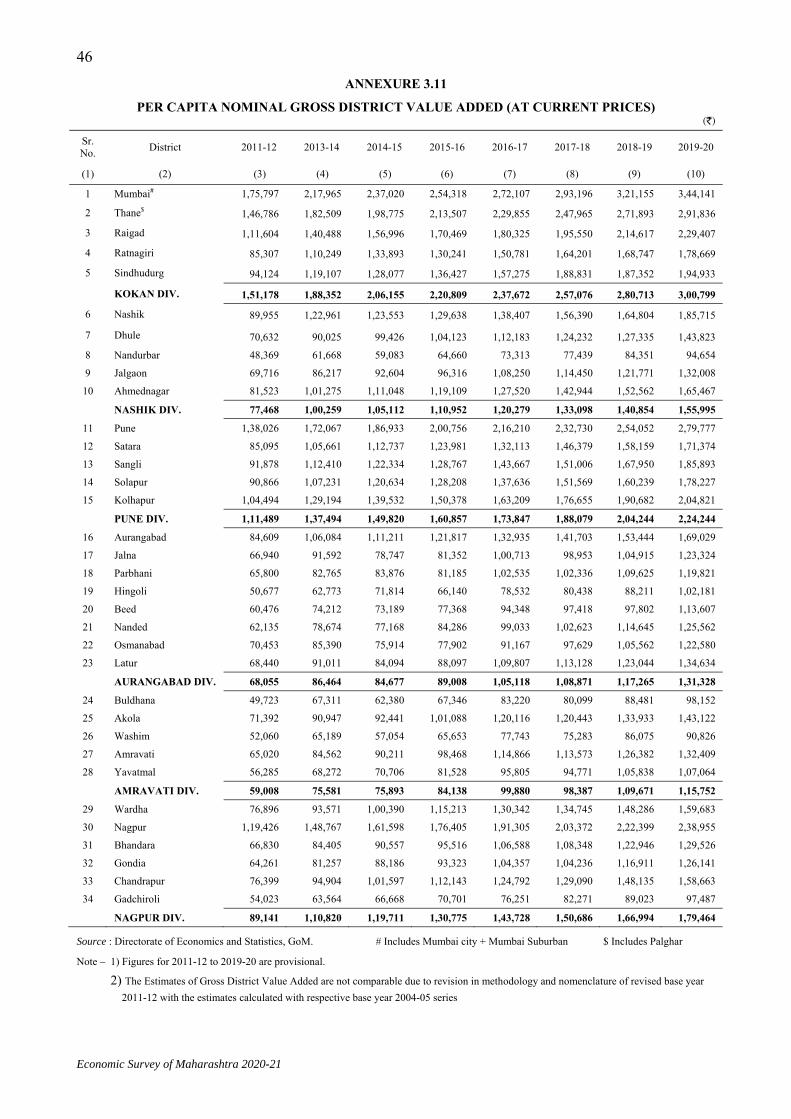
Economic Survey of Maharashtra 2020-21
46ANNEXURE 3.11
PER CAPITA NOMINAL GROSS DISTRICT VALUE ADDED (AT CURRENT PRICES) (`)
Sr. No. District 2011-12 2013-14 2014-15 2015-16 2016-17 2017-18 2018-19 2019-20
(1) (2) (3) (4) (5) (6) (7) (8) (9) (10)
1 Mumbai# 1,75,797 2,17,965 2,37,020 2,54,318 2,72,107 2,93,196 3,21,155 3,44,141
2 Thane$ 1,46,786 1,82,509 1,98,775 2,13,507 2,29,855 2,47,965 2,71,893 2,91,836
3 Raigad 1,11,604 1,40,488 1,56,996 1,70,469 1,80,325 1,95,550 2,14,617 2,29,407
4 Ratnagiri 85,307 1,10,249 1,33,893 1,30,241 1,50,781 1,64,201 1,68,747 1,78,669
5 Sindhudurg 94,124 1,19,107 1,28,077 1,36,427 1,57,275 1,88,831 1,87,352 1,94,933
KOKAN DIV. 1,51,178 1,88,352 2,06,155 2,20,809 2,37,672 2,57,076 2,80,713 3,00,799
6 Nashik 89,955 1,22,961 1,23,553 1,29,638 1,38,407 1,56,390 1,64,804 1,85,715
7 Dhule 70,632 90,025 99,426 1,04,123 1,12,183 1,24,232 1,27,335 1,43,823
8 Nandurbar 48,369 61,668 59,083 64,660 73,313 77,439 84,351 94,654
9 Jalgaon 69,716 86,217 92,604 96,316 1,08,250 1,14,450 1,21,771 1,32,008
10 Ahmednagar 81,523 1,01,275 1,11,048 1,19,109 1,27,520 1,42,944 1,52,562 1,65,467
NASHIK DIV. 77,468 1,00,259 1,05,112 1,10,952 1,20,279 1,33,098 1,40,854 1,55,995
11 Pune 1,38,026 1,72,067 1,86,933 2,00,756 2,16,210 2,32,730 2,54,052 2,79,777
12 Satara 85,095 1,05,661 1,12,737 1,23,981 1,32,113 1,46,379 1,58,159 1,71,374
13 Sangli 91,878 1,12,410 1,22,334 1,28,767 1,43,667 1,51,006 1,67,950 1,85,893
14 Solapur 90,866 1,07,231 1,20,634 1,28,208 1,37,636 1,51,569 1,60,239 1,78,227
15 Kolhapur 1,04,494 1,29,194 1,39,532 1,50,378 1,63,209 1,76,655 1,90,682 2,04,821
PUNE DIV. 1,11,489 1,37,494 1,49,820 1,60,857 1,73,847 1,88,079 2,04,244 2,24,244 16 Aurangabad 84,609 1,06,084 1,11,211 1,21,817 1,32,935 1,41,703 1,53,444 1,69,029
17 Jalna 66,940 91,592 78,747 81,352 1,00,713 98,953 1,04,915 1,23,324
18 Parbhani 65,800 82,765 83,876 81,185 1,02,535 1,02,336 1,09,625 1,19,821
19 Hingoli 50,677 62,773 71,814 66,140 78,532 80,438 88,211 1,02,181
20 Beed 60,476 74,212 73,189 77,368 94,348 97,418 97,802 1,13,607
21 Nanded 62,135 78,674 77,168 84,286 99,033 1,02,623 1,14,645 1,25,562
22 Osmanabad 70,453 85,390 75,914 77,902 91,167 97,629 1,05,562 1,22,580
23 Latur 68,440 91,011 84,094 88,097 1,09,807 1,13,128 1,23,044 1,34,634
AURANGABAD DIV. 68,055 86,464 84,677 89,008 1,05,118 1,08,871 1,17,265 1,31,328
24 Buldhana 49,723 67,311 62,380 67,346 83,220 80,099 88,481 98,152
25 Akola 71,392 90,947 92,441 1,01,088 1,20,116 1,20,443 1,33,933 1,43,122
26 Washim 52,060 65,189 57,054 65,653 77,743 75,283 86,075 90,826
27 Amravati 65,020 84,562 90,211 98,468 1,14,866 1,13,573 1,26,382 1,32,409
28 Yavatmal 56,285 68,272 70,706 81,528 95,805 94,771 1,05,838 1,07,064
AMRAVATI DIV. 59,008 75,581 75,893 84,138 99,880 98,387 1,09,671 1,15,752 29 Wardha 76,896 93,571 1,00,390 1,15,213 1,30,342 1,34,745 1,48,286 1,59,683
30 Nagpur 1,19,426 1,48,767 1,61,598 1,76,405 1,91,305 2,03,372 2,22,399 2,38,955
31 Bhandara 66,830 84,405 90,557 95,516 1,06,588 1,08,348 1,22,946 1,29,526
32 Gondia 64,261 81,257 88,186 93,323 1,04,357 1,04,236 1,16,911 1,26,141
33 Chandrapur 76,399 94,904 1,01,597 1,12,143 1,24,792 1,29,090 1,48,135 1,58,663
34 Gadchiroli 54,023 63,564 66,668 70,701 76,251 82,271 89,023 97,487
NAGPUR DIV. 89,141 1,10,820 1,19,711 1,30,775 1,43,728 1,50,686 1,66,994 1,79,464
Source : Directorate of Economics and Statistics, GoM. # Includes Mumbai city + Mumbai Suburban $ Includes Palghar
Note – 1) Figures for 2011-12 to 2019-20 are provisional.
2) The Estimates of Gross District Value Added are not comparable due to revision in methodology and nomenclature of revised base year 2011-12 with the estimates calculated with respective base year 2004-05 series

4 Prices and Public Distribution
System


Economic Survey of Maharashtra 2020-21
4. PRICES AND PUBLIC DISTRIBUTION SYSTEM
4.1 Prices of prefixed goods and services needs to be collected from the selected markets in order to measure general price level or standard of living of the people. Price level gets affected by changes in demand and supply at large. The outbreak of ‘Covid-19’ pandemic had significant impact not only on public health, but also on standard of living of the people. To contain spread of pandemic, the lockdown was imposed by the government which adversely affected all stages of supply chain and value chain. However, the shortages in the markets were not due to lack of production, but problems faced by the distribution channels. The lockdown resulted in panic buying and people hoarding essential items such as rice, wheat, packaged food, home care products, etc. The government announced packages to ameliorate the hardships faced by the poor and needy due to economic disruptions caused by the ‘Covid-19’ lockdown. Also food grains were provided through the Public Distribution System to all the priority households at free of cost so that the poor and vulnerable beneficiaries do not suffer on account of the non-availability of food grains during the unprecedented time of crisis.
Price Index 4.2 Consumer Price Index (CPI) is an index measuring retail inflation in the economy by collecting retail prices of common goods and services compared to specific period called base period. Wholesale Price Index (WPI) measures the changes in wholesale prices of goods sold.
Consumer Price Index of the State
4.3 Directorate of Economics & Statistics, GoM compiles monthly CPI (Base year 2003) for rural and urban areas of the State. There are 68 rural and 74 urban centres in the State for collection of retail prices of 106 and 127 items respectively.
4.4 During ‘Covid-19’ lockdown difficulties were faced in the collection of prices of essential commodities for the month of April, 2020 and May, 2020. Also for non-food group items prices were unavailable for the same period. Hence, the CPI for ‘pan, supari & intoxicant’, ‘clothing, bedding & footwear’, ‘miscellaneous (except medical services for urban)’ groups and general CPI could not be compiled for the month of April, 2020 and May, 2020. 4.4.1 The average annual CPI percentage change recorded during April, 2019 to March, 2020 over the same period of previous year was 8.7 and 6.2 for rural and urban areas respectively. The CPI increased from 311.2 in June, 2020 to 314.4 in December, 2020 for rural areas and 297.3 in June, 2020 to 300.5 in December, 2020 for urban areas. The year-on-year (y-o-y) rate of inflation for CPI gradually decreased from 5.5 per cent in June, 2020 to 2.9 per cent in December, 2020 for rural areas and for urban areas it decreased from 6.4 per cent to 4.1 per cent for the same period. The ‘food’ group (66 per cent for rural areas and 60 per cent for urban areas) and ‘fuel-power-light’ group (17 per cent for rural areas and 19 per cent for urban areas) have attributed to the increase in the general CPI index for the period June, 2020 to December, 2020. CPI for rural areas and urban areas of Maharashtra are given in Annexure 4.1 and Annexure 4.2 respectively.
4.4.2 For food group CPI, the annual average percentage change recorded during April, 2019 to March, 2020 over the same period of previous year was 13.5 and 10.9 for rural areas and urban areas respectively. The food CPI increased from 319.8 in April, 2020 to 323.8 in December, 2020 in rural areas and from 322.4 in April, 2020 to 325.6 in December, 2020 in urban areas. The y-o-y inflation of food group was 10.3 per cent in April, 2020 which gradually decreased to 1.3 per cent

Economic Survey of Maharashtra 2020-21
48
in December, 2020 in rural areas. Similarly, for urban areas it decreased from 10.9 per cent in April, 2020 to 2.2 per cent in December, 2020. The average inflation rate for food group during the period April, 2020 to December, 2020 was 7.5 per cent for rural areas and 8.4 per cent for urban areas. The sub-groups having major contribution in inflation of food group were ‘eggs, meat & fish’, ‘pulses & products’, ‘edible oil’ and ‘vegetables and fruits’. Sub-groupwise inflation rate based on average CPI for food group is given in Table 4.1.
Table 4.1 Sub-groupwise inflation rate based on average CPI for food group (per cent)
Subgroups of Food Group Rural Urban
April to December, 2019
April to December, 2020 April to
December, 2019 April to
December, 2020 Cereals & products 21.9 9.1 15.2 12.9 Pulses & products 14.9 14.3 17.1 14.0 Milk & milk products 5.7 3.8 3.1 3.8 Edible oil 1.8 8.4 2.9 8.8 Eggs, meat & fish 7.1 16.7 7.9 18.0 Vegetables & fruits 26.9 3.5 27.5 6.0 Condiments & spices 12.3 10.3 18.2 11.1 Other food 2.1 2.3 1.9 3.6 Food group 14.4 7.5 11.3 8.4
Source: Directorate of Economics & Statistics, GoM

Economic Survey of Maharashtra 2020-21
49
4.4.3 The annual percentage change in CPI of ‘fuel, power and light’ group during April, 2019 to March, 2020 was 4.1 for rural areas and 0.9 for urban areas. The CPI for ‘fuel, power and light’ group was 570.0 in April, 2020 & 570.2 in December, 2020 in rural areas and 561.6 in April, 2020 & 547.7 in December, 2020 for urban areas. The y-o-y rate of inflation for fuel, power and light group CPI decreased from 9.4 per cent in April, 2020 to 6.0 per cent in December, 2020 for rural areas and from 11.5 per cent to 7.6 per cent for urban areas for the same period.
Consumer Price Indices compiled by other agencies 4.5 National Statistical Office (NSO), GoI compiles and publishes monthly CPI (Base year 2012) for rural, urban and combined at All-India level, States and UTs. There are selected 1,181 rural and 1,114 urban centres for price collection of 281 and 287 items respectively. Of which, 66 rural and 86 urban centres are from the State. ‘Covid-19’ pandemic resulted in limited transaction of products in the market in the month of April and May, 2020 due to which number of price quotations received were very less, it was not feasible to construct either state level indices or the all India CPI (NSO’s technical note published in July, 2020). For April, 2020 and May, 2020 at all India level, NSO published only ‘food’ group index and ‘fuel and light’ group index. All India CPI increased from 152.7 in June, 2020 to 158.5 in December, 2020 in rural areas and from 150.8 in June, 2020 to 156.0 in December, 2020 for urban areas. The combined CPI increased from 151.8 in June, 2020 to 157.3 in December, 2020. During the same period, the y-o-y inflation based on average CPI for rural, urban and combined was 6.6 per cent each.
4.5.1 NSO also compiles the monthwise CPI for the State. The average CPI during the period June 2020 to December, 2020 for the State was 156.0, 150.2 and 152.2 for rural, urban and combined respectively. The y-o-y inflation was 5.8 per cent for rural, 6.7 per cent for urban and 6.4 per cent for combined for the same period. Groupwise CPI of Maharashtra compiled by NSO for rural, urban and combined are given in annexure at 4.3.
4.6 Labour Bureau, GoI publishes monthly CPI for Agricultural Labourers (CPI-AL) (Base year 1986-87) and CPI for Rural Labourers (CPI-RL) (Base year 1986-87). For this, prices are collected from 600 centres across 20 states, of which 54 centres are from the State. At All-India level, the average CPI-AL and average CPI-RL for April, 2020 to December, 2020 were 1032.7 and 1038.6 respectively, showing y-o-y inflation of 6.6 per cent and 6.4 per cent respectively.
4.6.1 For April, 2020 to December, 2020 the average CPI-AL and average CPI-RL compiled by Labour Bureau, GoI for the State were 1168.8 and 1153.7 showing y-o-y inflation of 8.3 per cent and 7.7 per cent respectively. CPI-AL and CPI-RL in Maharashtra and All-India are given in Annexure 4.4.
4.7 Labour Bureau, GoI compiles and publishes monthly CPI for Industrial Workers (CPI-IW) (Base year 2001). CPI-IW is used for determination of Dearness Allowance (DA) and for fixation & revision of minimum wages in the scheduled employment. CPI-IW is based on retail prices of essential commodities and services in industrially developed 78 selected centres in India, of which five centres are from the State. The average CPI-IW for all-India during April, 2020 to August, 2020 was 333.0 showing y-o-y inflation of 5.3 per cent. The average CPI for Mumbai, Solapur, Nagpur, Pune and Nashik during the period April, 2020 to August, 2020 were 327.2, 352.2, 409.6, 369.0 and 385.2 respectively. All-India CPI-IW and CPI-IW for selected central centres in Maharashtra are given in Annexure 4.5 & Annexure 4.6 respectively. Labour Bureau, GoI launched new series with base year 2016 with effect from September, 2020. The release of index commenced from the month of September, 2020.

Economic Survey of Maharashtra 2020-21
50
4.7.1 The Office of the Commissioner of Labour, GoM compiles and publishes monthwise CPI (Base year 2001) for Industrial Workers (CPI-IW) separately for five centres viz. Akola, Kolhapur, Jalgaon, Nanded and Aurangabad in the State. CPI-IW for selected centres in Maharashtra are given in Annexure 4.7. The inflation rates based on various important price indices at all-India level are given in Annexure 4.8.
Wholesale Price Index at All-India 4.8 The Office of the Economic Adviser, Ministry of Commerce and Industry, GoI compiles and publishes monthly WPI (Base year 2011-12). The various commodities taken into consideration for computing the WPI are categorised into ‘primary articles’, ‘fuel & power’ and ‘manufactured products’.
4.9 WPI for all commodities increased from 119.2 in April, 2020 to 124.5 (provisional) in December, 2020. During the same period, for ‘primary articles’ group, it increased from 137.8 to 146.5 (provisional), increased from 89.8 to 94.2 (provisional) for ‘fuel & power’ group and increased from 118.7 to 123.0 (provisional) for ‘manufactured products’ group. All-India WPI are given in Annexure 4.9.
4.10 The y-o-y inflation based on WPI increased from (-)1.6 per cent in April, 2020 to 1.2 per cent (provisional) in December, 2020. For ‘primary articles’ group, it decreased from (-)1.1 per cent in April, 2020 to (-)1.6 per cent (provisional) in December, 2020. For ‘fuel & power group’, it increased from (-)12.6 per cent in April, 2020 to (-)8.7 per cent (provisional) in December, 2020. For ‘manufactured products’ group, the inflation increased from 0.2 per cent in April, 2020 to 4.2 per cent (provisional) in December, 2020. For ‘food articles’ sub-group under ‘primary articles’ group, it decreased from 3.8 per cent in April, 2020 to (-)1.1 per cent (provisional) in December, 2020.
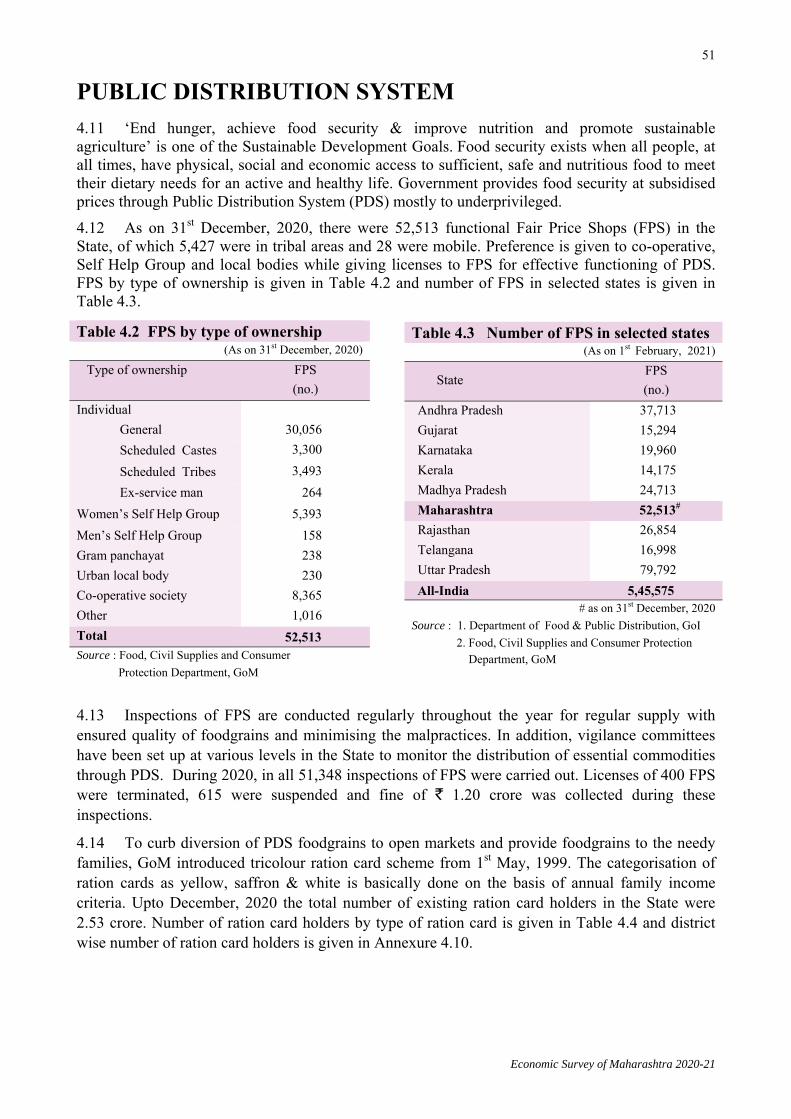
51
Economic Survey of Maharashtra 2020-21
PUBLIC DISTRIBUTION SYSTEM 4.11 ‘End hunger, achieve food security & improve nutrition and promote sustainable agriculture’ is one of the Sustainable Development Goals. Food security exists when all people, at all times, have physical, social and economic access to sufficient, safe and nutritious food to meet their dietary needs for an active and healthy life. Government provides food security at subsidised prices through Public Distribution System (PDS) mostly to underprivileged. 4.12 As on 31st December, 2020, there were 52,513 functional Fair Price Shops (FPS) in the State, of which 5,427 were in tribal areas and 28 were mobile. Preference is given to co-operative, Self Help Group and local bodies while giving licenses to FPS for effective functioning of PDS. FPS by type of ownership is given in Table 4.2 and number of FPS in selected states is given in Table 4.3.
4.13 Inspections of FPS are conducted regularly throughout the year for regular supply with ensured quality of foodgrains and minimising the malpractices. In addition, vigilance committees have been set up at various levels in the State to monitor the distribution of essential commodities through PDS. During 2020, in all 51,348 inspections of FPS were carried out. Licenses of 400 FPS were terminated, 615 were suspended and fine of ` 1.20 crore was collected during these inspections.
4.14 To curb diversion of PDS foodgrains to open markets and provide foodgrains to the needy families, GoM introduced tricolour ration card scheme from 1st May, 1999. The categorisation of ration cards as yellow, saffron & white is basically done on the basis of annual family income criteria. Upto December, 2020 the total number of existing ration card holders in the State were 2.53 crore. Number of ration card holders by type of ration card is given in Table 4.4 and district wise number of ration card holders is given in Annexure 4.10.
Table 4.2 FPS by type of ownership (As on 31st December, 2020)
Type of ownership FPS (no.)
Individual General 30,056 Scheduled Castes 3,300 Scheduled Tribes 3,493 Ex-service man 264 Women’s Self Help Group 5,393 Men’s Self Help Group 158 Gram panchayat 238 Urban local body 230 Co-operative society 8,365 Other 1,016 Total 52,513 Source : Food, Civil Supplies and Consumer Protection Department, GoM
Table 4.3 Number of FPS in selected states (As on 1st February, 2021)
State FPS (no.)
Andhra Pradesh 37,713 Gujarat 15,294 Karnataka 19,960 Kerala 14,175 Madhya Pradesh 24,713 Maharashtra 52,513#
Rajasthan 26,854 Telangana 16,998 Uttar Pradesh 79,792 All-India 5,45,575
# as on 31st December, 2020 Source : 1. Department of Food & Public Distribution, GoI 2. Food, Civil Supplies and Consumer Protection Department, GoM

52
Economic Survey of Maharashtra 2020-21
4.14.1 Annapurna, a centrally sponsored scheme, is being implemented in the State since 1st April, 2001. Under the scheme, 10 kg of foodgrains per month are provided free of cost to destitute people of age 65 years & above who do not get benefit under the Indira Gandhi National Old Age Pension scheme or Shravanbal Seva Rajya Nivruttivetan Yojana. Number of beneficiaries under Annapurna scheme upto December, 2020 were 8,999. Beneficiaries under National Food Security Act, 2013 4.15 The National Food Security Act (NFSA), 2013 is aimed to provide food and nutritional security to the citizens for assured availability of adequate quantity of quality foodgrains at affordable prices to meet their food requirements. It is being implemented in the State since 1st February, 2014. Under this Act, about 62.3 percent population in the State is entitled to receive rice, wheat and coarse grains at ` three, ` two and ` one per kg respectively. Beneficiaries are categorised as Antyodaya Anna Yojana (AAY) and Priority Household (PHH). Below Poverty Line (BPL) households satisfying criteria for AAY scheme are treated as AAY households. BPL households other than AAY and Above Poverty Line (APL) saffron card holders having annual family income upto ` 44,000 in rural areas & upto ` 59,000 in urban areas are termed as PHH. AAY households are eligible for 35 kg of foodgrains per ration card per month and PHH are eligible for five kg of foodgrains per person per month. The details of allotment, off-take and distribution of foodgrains to FPS under NFSA are given in Table 4.5. Under NFSA, districtwise allotment, off-take & distribution of foodgrains to FPS for AAY household is given in Annexure 4.14 and districtwise allotment, off-take & distribution of foodgrains to FPS for PHH is given in Annexure 4.15. Number of persons covered and ration cards under NFSA in selected states are given in Table 4.6.
Table 4.4 Ration card holders by type of ration card (Lakh)
Year Ration card holders (upto December)
Yellow Saffron White Total
2018 64.32 160.90 22.07 247.52 2019 60.87 170.52 22.17 253.70 2020 64.18 166.80 22.18 253.24
Source : Food, Civil Supplies and Consumer Protection Department, GoM
Table 4.5 Allotment, off-take and distribution of foodgrains to FPS under NFSA (Lakh MT)
Beneficiary Year Rice Wheat
Allotment by GoI
Off-take by GoM
Distribution to FPS
Allotment by GoI
Off-take by GoM
Distribution to FPS
AAY Household
2018-19 5.52 5.10 5.02 5.00 4.47 4.40
2019-20 5.26 4.73 4.75 5.24 4.66 4.67
2020-21+ 3.78 3.58 3.53 4.08 3.85 3.82
PHH 2018-19 14.69 12.68 12.51 20.84 17.72 17.57
2019-20 14.84 12.59 12.61 20.47 17.44 17.47
2020-21+ 11.27 10.03 9.88 15.16 13.50 13.50 Source: Food, Civil Supplies and Consumer Protection Department, GoM + upto December

53
Economic Survey of Maharashtra 2020-21
4.16 APL saffron card holder farmers of 14 drought prone districts (all districts of Aurangabad & Amravati regions and Wardha district from Nagpur region) not covered under NFSA are being distributed 5 kg foodgrains per person per month at ` three & ` two per kg for rice & wheat respectively. Allotment, off-take and distribution of foodgrains to FPS for APL saffron card holder farmers are given in Table 4.7.
Pradhan Mantri Garib Kalyan Anna Yojana 4.17 The Covid-19 pandemic has caused the whole country to face an economic crisis and hence putting people even more at risk of food insecurity. In times of crisis, Pradhan Mantri Garib Kalyan Anna Yojana (PMGKAY) was announced by GoI. PMGKAY was implemented from April to November, 2020. All AAY & PHH beneficiaries were provided five kg of foodgrains per person per month and one kg of pulses per family per month free of cost in addition to foodgrains permissible under NFSA.
4.17.1 Under PMGKAY, five kg rice per person per month has been distributed free of cost from April to June, 2020 and five kg foodgrains (rice & wheat) per person per month was distributed from July to November, 2020 to eligible beneficiaries. Allotment, off-take & distribution of the rice is given in Table 4.8 and allotment, off-take & distribution of foodgrains (rice & wheat) is given in Table 4.9.
Table 4.6 Number of persons covered and ration cards under NFSA in selected states (As on 1st February, 2021) (Lakh)
State Number of persons covered Ration cards
Rural Urban Total AAY PHH Total
Andhra Pradesh 200.20 68.03 268.23 9.08 79.04 88.12
Gujarat 258.78 124.06 382.84 8.13 63.14 71.27
Karnataka 285.55 116.38 401.93 10.92 111.11 122.03
Kerala 91.87 62.93 154.80 5.87 32.51 38.38
Madhya Pradesh 420.83 125.59 546.42 14.59 92.70 107.29
Maharashtra 469.72 230.45 700.17 24.74 131.79 156.53
Rajasthan 356.09 90.53 446.62 6.29 100.58 106.87
Telangana 143.08 48.62 191.70 5.64 47.89 53.52
Uttar Pradesh 1,234.10 286.52 1,520.62 40.76 317.34 358.11
All-India 6,249.33 1,885.68 8,135.01 236.09 2,126.19 2,362.29 Source : Food Security Portal, GoI Note : Totals may not add up due to rounding
Table 4.7 Allotment, off-take and distribution of foodgrains to FPS for APL saffron card holder farmers
(Lakh MT)
Year Rice Wheat
Allotment by GoI
Off-take by GoM
Distribution to FPS
Allotment by
GoI Off-take by
GoM Distribution
to FPS 2018-19 1.18 0.98 0.96 2.05 1.78 1.72 2019-20 1.12 0.88 0.86 1.94 1.53 1.46 2020-21+ 0.77 0.64 0.63 1.33 1.07 1.07
Source: Food, Civil Supplies and Consumer Protection Department, GoM + upto December

54
Economic Survey of Maharashtra 2020-21
4.17.2 Under PMGKAY, one kg of Chanadal/Turdal per family per month has been distributed from April to June, 2020. GoI has allocated whole gram for the distribution under PMGKAY from July to November, 2020. Since there is more preference to Chanadal than whole gram in the State, GoM decided to distribute Chanadal obtained after milling of whole gram received from GoI. Accordingly, one kg of Chanadal per family per month was distributed free of cost under PMGKAY from July to November, 2020. Allotment, off-take and distribution of the pulses is given in Table 4.10. Table 4.10 Allotment, off-take and distribution of pulses under PMGKAY
('000 MT) Period Allotment by GoI Off-take by GoM* Distribution to FPS*
April to June, 2020 46.15 44.79 39.88 July to November, 2020 85.69@ 67.63@@ 63.85@@
@ Chana @@ Chanadal obtained from 84.54 Thousand MT Chana * Provisional Source: Food, Civil Supplies and Consumer Protection Department, GoM
Subsidised foodgrains to APL saffron cardholders 4.18 As a part of economic response during Covid-19 pandemic, GoM distributed foodgrains at subsidised rates from May to August, 2020 to all APL saffron cardholders who are not covered under NFSA and APL farmer scheme. Five kg foodgrains (two kg rice at ` 12 per kg and three kg wheat at ` eight per kg) per person per month has been distributed to eligible beneficiaries. Allotment, off-take and distribution of foodgrains for APL saffron cardholders is given in Table 4.11.
Table 4.8 Allotment, off-take and distribution of rice under PMGKAY (Lakh MT)
Month Allotment by GoI Off-take by GoM* Distribution to FPS April, 2020 3.50 3.44 3.15 May, 2020 3.50 3.36 3.17 June, 2020 3.50 3.28 3.20
Total 10.50 10.08 9.52 Source: Food, Civil Supplies and Consumer Protection Department, GoM * Provisional
Table 4.9 Allotment, off-take and distribution of foodgrains (rice & wheat) under PMGKAY (Lakh MT)
Month
Rice Wheat Allotment
by GoI Off-take by
GoM* Distribution
to FPS Allotment
by GoI Off-take by
GoM* Distribution
to FPS July, 2020 1.54 1.35 1.39 1.96 1.87 1.78 August, 2020 1.54 1.47 1.36 1.96 1.88 1.75 September, 2020 1.54 1.40 1.35 1.96 1.82 1.72 October, 2020 1.54 1.35 1.37 1.96 1.76 1.74 November, 2020 1.54 1.14 1.32 1.96 1.69 1.69
Total 7.70 6.71 6.79 9.80 9.02 8.68 Source: Food, Civil Supplies and Consumer Protection Department, GoM * Provisional

55
Economic Survey of Maharashtra 2020-21
Distribution of free foodgrains under Atma Nirbhar Bharat scheme 4.19 To help mitigate the food security requirements of migrants/stranded migrants across the country during Covid-19 pandemic, GoI announced Atma Nirbhar Bharat scheme. This scheme specially covers all such persons who were neither covered under NFSA nor under any other State PDS scheme or were not able to access PDS foodgrains for any reason. Five kg rice per person per month & one kg chana per family per month was distributed from May to June, 2020 to all eligible beneficiaries. Allotment, off-take and distribution of rice & chana under Atma Nirbhar Bharat scheme is given in Table 4.12 & Table 4.13 respectively.
Table 4.12 Allotment, off-take and distribution of rice under Atma Nirbhar Bharat scheme ('000 MT)
Month Allotment by GoI Off-take by GoM* Distribution to FPS*
No. of beneficiaries* (lakh)
May, 2020 17.97 17.43 13.87 27.75
June, 2020 17.97 16.75 3.46 6.93
Total 35.94 34.18 17.33 34.68 Source: Food, Civil Supplies and Consumer Protection Department, GoM * Provisional
Table 4.13 Allotment, off-take and distribution of chana under Atma Nirbhar Bharat scheme
('000 MT)
Month Allotment by GoI Off-take by GoM* Distribution to FPS*
No. of beneficiary families* (lakh)
May, 2020 0.88 0.69 0.56 5.69
June, 2020 0.88 0.56 0.19 1.92
Total 1.76 1.25 0.75 7.61 Source: Food, Civil Supplies and Consumer Protection Department, GoM * Provisional
Distribution of coarse grains 4.20 Along with rice and wheat, coarse grains are also distributed to the NFSA beneficiaries in the State. Allotment, off-take and distribution of coarse grains to FPS for NFSA beneficiaries are given in Table 4.14.
Table 4.11 Allotment, off-take and distribution of foodgrains for APL saffron cardholders ('000 MT)
Month Rice Wheat Allotment by
GoI Off-take by
GoM* Distribution
to FPS*
Allotment by GoI
Off-take by GoM*
Distribution to FPS*
May, 2020 61.68 51.74 27.58 92.53 77.53 44.33
June, 2020 61.68 23.53 7.20 92.53 35.93 11.01
July, 2020 61.68 5.73 7.18 92.53 8.33 10.93
August, 2020 61.68 0.96 1.81 92.53 1.21 1.96
Total 246.72 81.96 43.77 370.12 123.00 68.23 Source: Food, Civil Supplies and Consumer Protection Department, GoM * Provisional

56
Economic Survey of Maharashtra 2020-21
Fortification of Rice & its distribution under PDS 4.21 To initiate the process towards nutritional security and to address anaemia & micro-nutrient deficiency in the country, GoI approved the centrally sponsored pilot scheme on ‘Fortification of Rice & its distribution under PDS’.
4.21.1 Fortified Rice Kernels (FRK) are made from rice flour, water and micro-nutrients such as Iron, Folic Acid & Vitamin B12. In fortification process, these FRK will be mixed into the common rice distributed under the PDS in proportion of 1 FRK: 100 rice grains. This pilot project was implemented for a period of one year with the help of Tata Trust in two blocks viz. Kurkheda and Bhamragad of Gadchiroli district. In these two blocks, total 5.48 thousand MT of fortified rice has been distributed during the year 2018-19.
4.21.2 During 2019-20, GoM decided to implement this scheme in all blocks of Gadchiroli district with the help of Tata Trust and Bharat Petroleum Corporation Limited. Under this project, 34.33 thousand MT of fortified rice have been distributed to the beneficiaries upto December, 2020.
Distribution of foodgrains to establishments holding ration card 4.22 In addition to allocation to FPS for various households in the State, GoI sanctions allocation of foodgrains to Government Aided Welfare Institutions and Hostels, including the Welfare Institutions owned / run by the Government under the Welfare Institutions and Hostels Scheme. Upto September, 2020, the number of establishments holding ration cards are 3,894 with 3.88 lakh inmates. Of which, 214 are Government Institutions with 0.32 lakh inmates and 3,680 are Government Aided Institutions with 3.56 lakh inmates. Allotment, off-take and distribution of foodgrains to establishments holding ration card are given in Table 4.15.
Table 4.14 Allotment, off-take and distribution of coarse grains to FPS ('000 MT)
Year Jowar Maize Allotment by
GoI Off-take by
GoM Distribution
to FPS
Allotment by GoI
Off-take by GoM
Distribution to FPS
2018-19 13.71 13.71 12.76 54.68 54.68 54.05 2019-20 7.17 7.17 7.17 114.90 114.90 114.90
Note : Procurement of coarse grains is in the process for 2020-21 Source: Food, Civil Supplies and Consumer Protection Department, GoM
Table 4.15 Allotment, off-take and distribution of foodgrains to establishments holding ration card
('000 MT) Year Rice Wheat
Allotment by GoI
Off-take by GoM
Distribution
Allotment by
GoI Off-take by
GoM Distribution
2018-19 16.42 13.51 7.91 24.64 19.97 9.56 2019-20 4.51 2.40 4.60 5.00 2.83 5.76 2020-21+ 14.33 4.24 0.24 13.90 4.27 0.29
Source: Food, Civil Supplies and Consumer Protection Department, GoM + upto September

57
Economic Survey of Maharashtra 2020-21
Decentralised procurement 4.23 The Decentralised Procurement Scheme for paddy/coarse grains is being implemented since 2016-17 through Maharashtra State Co-operative Marketing Federation Ltd. and Maharashtra State Co-operative Tribal Development Corporation Ltd. Paddy producing farmers’ registration and procurement process is done online through the National e Markets Limited. During 2020-21, in all 37.41 lakh quintal foodgrains worth ` 709.45 crore was procured upto December.
Procurement of paddy and coarse grains
4.24 GoI declares Minimum Support Price (MSP) of various agricultural produce. Procurement of paddy and coarse grains at MSP is done through Maharashtra State Co-operative Marketing Federation Ltd., Mumbai in non-tribal area and Maharashtra State Co-operative Tribal Development Corporation Ltd., Nashik in tribal area. During 2019-20, MSP of ` 3,458.51 crore has been paid online to 4.05 lakh farmers. Procurement of paddy and coarse grains is given in Table 4.16.
Distribution of Sugar 4.25 As per the guidelines of GoI, since July, 2017 sugar is being distributed only to the AAY card holders. Sugar supplied to such card holder is one kg per family per month at ` 20 per kg. Allotment, off-take and distribution of sugar to FPS is given in Table 4.17.
Distribution of Kerosene
4.26 Under PDS, kerosene is provided to the card holders excluding all those having LPG gas connection. As per the Maharashtra Scheduled Commodities Retail Dealers Licensing Order, 1979 a license is required for stock and trade of kerosene. There are 61,741 kerosene license holders in the State, of which 669 are wholesalers, 1,537 semi wholesalers and 59,535 are retailers. Allotment, off-take and distribution of kerosene to FPS are given in Table 4.18.
Godowns 4.27 The foodgrains to be distributed through PDS are lifted from godowns of Food Corporation of India and are stored in the godowns of the State. By the end of December, 2020, GoM has 1,153 godowns having total capacity of 7.82 lakh MT. Of these, 269 godowns having capacity of 1.20 lakh MT are not fit to store foodgrains, 49 godowns of capacity of 0.41 lakh MT are given on rent and 90 godowns of capacity of 1.11 lakh MT are taken on rent.
Table 4.16 Procurement of paddy and coarse grains
('000 MT) Year Paddy Coarse grains
Jowar Maize 2018-19 865.67 10.96 6.99 2019-20 1,742.59 7.15 114.98 2020-21+ 688.25 17.79 88.28
+ upto January Source: Food, Civil Supplies and Consumer Protection Department, GoM
Table 4.17 Allotment, off-take and distribution of sugar to FPS
(Lakh MT)
Year Allotment by GoI
Off-take by GoM
Distribution to FPS
2018-19 0.38 0.38 0.37 2019-20 0.25 0.25 0.25 2020-21+ 0.34 0.33 0.30
+ upto December Source : Food, Civil Supplies and Consumer Protection Department, GoM
Table 4.18 Allotment, off-take and distribution of kerosene to FPS
(Lakh kilolitres) Year Allotment Off-take Distribution
to FPS 2018-19 2.59 2.42 2.42 2019-20 1.44 0.69 0.69 2020-21+ 0.46 0.20 0.20
+ upto December Source: Food, Civil Supplies and Consumer Protection Department, GoM

58
Economic Survey of Maharashtra 2020-21
4.27.1 To safely store foodgrains and to avoid wastage of foodgrains, GoM has undertaken a programme to construct new godowns with the financial assistance from NABARD. Upto December, 2020, administrative approval is given for construction of 280 godowns of total capacity 4.10 lakh MT. Of which, 200 godowns are completed and construction of 62 godowns is in progress. Districtwise godowns and their capacity is given in Annexure 4.13.
Foodgrain subsidy 4.28 The foodgrain subsidy is the financial assistance provided by GoI under PDS for foodgrain distribution, meeting the expenditure on maintenance of reserve stock for adverse situation and the loss that the State has to bear due to difference in the cost of foodgrain procurement and sale price. As per 2020-21(RE) foodgrain subsidy was ` 2,837.80 crore as against ` 2,641.68 crore during 2019-20.
Shivbhojan Yojana 4.29 To provide meal to the poor and needy people in the State at affordable rates of ` 10 per plate, GoM started Shivbhojan Yojana from 26th January, 2020 at all district headquarters and municipal areas. The scheme has been expanded upto the taluka level from 1st April, 2020.
4.29.1 During Covid-19 pandemic labourers, migrants, homeless as well as outstation students etc. faced issues of non-availability of food. Therefore to facilitate food at affordable rates to these people the price of Shivbhojan thali has been reduced to ` five and the same will be provided upto 31st March, 2021. Under this scheme, provision of ` 6.48 crore and ` 150 crore has been made for the year 2019-20 and 2020-21 respectively. Since inception 2.81 crore Shivbhojan thalis have been distributed through 906 Shivbhojan centres upto December, 2020.
Computerisation of PDS 4.30 As per the guidelines issued by GoI, the State has undertaken end-to-end computerisation of Targated Public Distribution System to eradicate malpractices in the distribution of foodgrains under NFSA and distribute food commodities to eligible beneficiaries in a transparent manner using biometric identity authentication.
4.30.1 GoM is working on Aadhaar seeding into the Ration Card Management System. During 2020-21 out of total eligible 156.63 lakh ration cards covered under NFSA, Aadhaar seeding of 153.12 lakh ration cards has been completed upto January, 2021. Aadhaar seeding of 8.96 lakh ration cards out of total eligible 9.09 lakh ration cards covered under APL farmers from drought prone 14 districts scheme has been completed upto January, 2021. For distribution of foodgrains Point of Sale (PoS) devices have been installed in 52,532 FPS across the State upto January, 2021. During 2019-20, the distribution of foodgrains through PoS devices has resulted in decrease in lifting of foodgrains of about 7.53 thousand MT.
4.30.2 In May, 2018, the State has launched Aadhaar enabled Public Distribution System (AePDS) across all FPS and introduced inter-state & pan-state portability, with objective of availability, access and utilisation of foodgrains to the marginal section of society dependent upon government for its food requirements. In January, 2021 about 1.43 crore families availed ration with Aadhaar based biometric authentication.
4.30.3 'One Nation, One Ration Card' scheme is being implemented in the country from 1st January, 2020. The main objective of the scheme is to introduce nation-wide portability of ration card holders under NFSA to lift their entitled foodgrains from any FPS in the country without need to obtain a new ration card using Point of Sale (PoS) devices. Through this system migratory beneficiaries who frequently change their dwelling place in search of employment or for other

59
Economic Survey of Maharashtra 2020-21
reasons shall be able to access their entitled foodgrains from any FPS in another State/UT. Foodgrains are distributed to the beneficiaries using the 12-digit number on the existing ration cards through Aadhaar authentication. Since inception 4,381 ration card holders of the State have lifted their foodgrains from other states and 609 ration card holders from other states have lifted their foodgrains from the State, upto January, 2021.
State Consumer Dispute Redressal Commission 4.31 The State Consumer Dispute Redressal Commission has been constituted in the State to redress the grievances of the consumer. The head office of the State Commission is in Mumbai with two benches at Aurangabad and Nagpur. Circuit bench of the State Commission are constituted at Kolhapur, Pune, Amravati and Nashik in the State. In the State, District Consumer Dispute Redressal Commissions have been established for each district at the district headquarters and additional District Commissions at Mumbai, Mumbai Suburban, Thane, Pune and Nagpur taking into consideration the heavy filing of the complaints. As per Consumer Protection Act, 2019 the complaints within the pecuniary jurisdiction of ` one crore to ` ten crore are redressed by the State Consumer Dispute Redressal Commission and the complaints within the pecuniary jurisdiction upto ` one crore are redressed by District Consumer Dispute Redressal Commission. To monitor cases at the State Consumer Dispute Redressal Commission and District Consumer Dispute Redressal Commission, Computerisation and Computer Networking of Consumer Commission in India (CONFONET) system has been developed. Since constitution of the State Consumer Dispute Redressal Commission including 40 District Consumer Dispute Redressal Commissions total 3,70,582 complaints were received. Of which 2,60,514 grievances were resolved upto December, 2020.
* * * * *

Economic Survey of Maharashtra 2020-21
60ANNEXURE 4.1
GROUPWISE CONSUMER PRICE INDEX NUMBERS FOR RURAL MAHARASHTRA
(Base Year - 2003)
Year/ Month Food Pan, Supari &
Intoxicants Fuel, Power &
Light
Clothing, Bedding & Footwear
Miscellaneous All
Commodities
Year on Year
Inflation rate
(1) (2) (3) (4) (5) (6) (7) (8)
Weight 52.85 2.15 10.67 8.53 25.80 100.00 --
2010-11 184 174 297 114 150 181 10.9
2011-12 201 205 326 119 162 198 9.1
2012-13 222 243 383 125 172 218 10.5
2013-14 242 264 434 131 192 241 10.2
2014-15 249 293 467 133 200 251 4.2
2015-16 262 325 446 135 205 258 2.8
2016-17 271 352 463 137 209 266 3.2
2017-18 270 410 498 139 208 270 1.7
2018-19 272 444 513 143 213 275 1.7
2019-20 309 450 534 147 219 299 8.7
2020-21@ 331 468# 565 152# 228# 318# 6.0#
April 2020 320 -- 570 -- -- -- --
May 2020 322 -- 571 -- -- -- --
June 2020 326 467 546 152 224 311 5.5
July 2020 332 471 563 152 227 317 7.2
August 2020 335 469 565 151 228 319 6.7
September 2020 335 468 568 151 230 320 6.1
October 2020 342 465 567 151 230 323 7.2
November 2020 343 467 567 152 231 324 6.3
December 2020 324 469 570 152 230 314 2.9
Source - Directorate of Economics & Statistics, GoM, Mumbai. @ Average for 9 months # Average for June to December
Note - Inflation rate = Percentage rise in the index of the current period over that of corresponding period of the previous year.

Economic Survey of Maharashtra 2020-21
61
ANNEXURE 4.2
GROUPWISE CONSUMER PRICE INDEX NUMBERS FOR URBAN MAHARASHTRA
(Base Year - 2003)
Year / Month Food Pan, Supari
& Intoxicants Fuel, Power
& Light
Clothing, Bedding & Footwear
Miscellaneous All
Commodities Year on Year Inflation rate
(1) (2) (3) (4) (5) (6) (7) (8)
Weight 45.80 1.54 10.28 7.51 34.87 100.00 --
2010-11 186 169 278 118 143 175 11.4
2011-12 201 205 297 126 154 189 7.9
2012-13 224 233 349 132 160 208 10.1
2013-14 248 262 396 137 175 230 10.3
2014-15 254 288 429 139 185 240 4.5
2015-16 268 322 408 142 191 247 3.0
2016-17 278 347 426 145 194 255 3.2
2017-18 278 386 462 146 195 260 2.0
2018-19 278 417 503 147 201 267 2.5
2019-20 308 434 507 150 206 283 6.2
2020-21@ 333 453# 543 154# 216# 303# 6.7#
April 2020 322 -- 562 -- -- -- --
May 2020 324 -- 549 -- -- -- --
June 2020 330 447 527 153 211 297 6.4
July 2020 337 450 538 153 214 303 7.1
August 2020 337 452 540 154 215 304 7.4
September 2020 337 455 540 153 216 304 7.2
October 2020 342 454 540 154 217 307 7.7
November 2020 345 457 540 154 218 308 7.2
December 2020 326 458 548 155 219 301 4.1
Source - Directorate of Economics & Statistics, GoM, Mumbai. @ Average for 9 months # Average for June to December
Note - Inflation rate = Percentage rise in the index of the current period over that of corresponding period of the previous year.

Economic Survey of Maharashtra 2020-21
62
ANNEXURE 4.3
GROUPWISE CONSUMER PRICE INDEX OF MAHARASHTRA COMPILED BY NATIONAL STATISTICAL OFFICE, GoI FOR RURAL, URBAN AND COMBINED
(Base Year - 2012)
Group Year
Weights 2014-15 2015-16 2016-17 2017-18 2018-19 2019-20 2020-21#
(1) (2) (3) (4) (5) (6) (7) (8) (9)
Rural
Food & Beverages 54.28 120.8 129.2 136.5 140.6 139.3 145.0@ 158.2
Pan, Tobacco & Intoxicants 2.72 114.6 130.5 140.5 155.0 158.6 158.5@ 167.3
Clothing & Footwear 7.56 119.0 127.3 135.0 145.9 148.7 149.0@ 151.6
Housing -- -- -- -- -- -- -- --
Fuel & light 7.86 116.3 124.7 129.4 141.1 147.5 148.1@ 154.0
Miscellaneous 27.58 113.6 119.0 126.9 136.7 144.4 149.3@ 155.6
General Index 100.00 118.2 126.0 133.3 140.4 142.6 147.3 156.9
Inflation -- 6.1 6.6 5.8 5.3 1.6 3.3 5.7
Urban
Food & Beverages 34.38 123.3 128.4 133.4 135.4 137.8 148.5@ 162.2
Pan, Tobacco & Intoxicants 0.97 118.5 134.1 152.6 162.9 169.2 174.3@ 185.0
Clothing & Footwear 5.14 117.9 122.2 126.7 131.9 138.4 141.9@ 147.2
Housing 24.74 111.7 115.3 119.6 127.0 134.6 139.9@ 146.4
Fuel & light 5.21 112.9 116.0 118.5 122.2 127.3 131.7@ 139.8
Miscellaneous 29.56 112.1 114.2 117.6 121.5 127.4 131.4@ 144.1
General Index 100.00 116.2 120.1 124.4 128.6 133.7 140.5 151.2
Inflation -- 5.2 3.3 3.6 3.4 4.0 5.1 6.7
Combined
Food & Beverages -- 122.2 128.8 134.8 137.7 138.5 147.0@ 160.4
Pan, Tobacco & Intoxicants -- 116.2 132.0 145.5 158.3 163.0 165.1@ 174.6
Clothing & Footwear -- 118.4 124.4 130.2 137.9 142.8 144.9@ 149.1
Housing -- -- -- -- -- -- -- --
Fuel & light -- 114.4 119.7 123.2 130.3 136.0 138.8@ 145.9
Miscellaneous -- 112.6 115.7 120.6 126.3 132.8 137.1@ 147.8
General Index -- 116.9 122.0 127.3 132.5 136.7 142.8 153.1
Inflation -- 5.5 4.4 4.4 4.1 3.1 4.4 6.3 Source: National Statistical Office, GoI @ Average for 11 months # Average for August to December

Economic Survey of Maharashtra 2020-21
63
ANNEXURE 4.4
CONSUMER PRICE INDEX NUMBERS FOR AGRICULTURAL LABOURERS AND RURAL LABOURERS IN MAHARASHTRA AND ALL-INDIA
(Base year - 1986-87)
Year/Month
Consumer Price Index No. for Agricultural Labourers Consumer Price Index No. for Rural Labourers Maharashtra All India Maharashtra All India
Food group
General Index
Food group
General Index
Food group
General Index
Food group
General Index
(1) (2) (3) (4) (5) (6) (7) (8) (9)
2010-11 633 600 572 564 629 595 573 564
2011-12 704 676 602 611 697 668 603 611
2012-13 770 744 658 672 763 737 660 673
2013-14 818 793 737 750 793 786 739 751
2014-15 873 848 778 800 861 841 782 801
2015-16 930 897 807 835 915 887 810 836
2016-17 993 950 841 870 981 943 847 875
2017-18 975 957 846 889 963 951 852 895
2018-19 963 967 850 907 950 963 855 915
2019-20 1131 1094 932 980 1113 1084 937 986
2020-21@ 1228 1169 993 1033 1203 1154 998 1039
April 2020 1205 1150 971 1014 1180 1136 975 1019
May 2020 1217 1159 977 1019 1191 1144 982 1025
June 2020 1223 1162 975 1018 1198 1148 980 1024
July 2020 1223 1163 978 1021 1195 1147 984 1028
August 2020 1228 1166 986 1026 1200 1151 991 1033
September 2020 1230 1170 999 1037 1203 1154 1004 1043
October 2020 1250 1185 1017 1052 1223 1169 1022 1057
November 2020 1252 1187 1025 1060 1228 1172 1031 1065
December 2020 1228 1177 1005 1047 1205 1162 1010 1053
Source - Labour Bureau, Simla, GoI. @ Average for 9 months
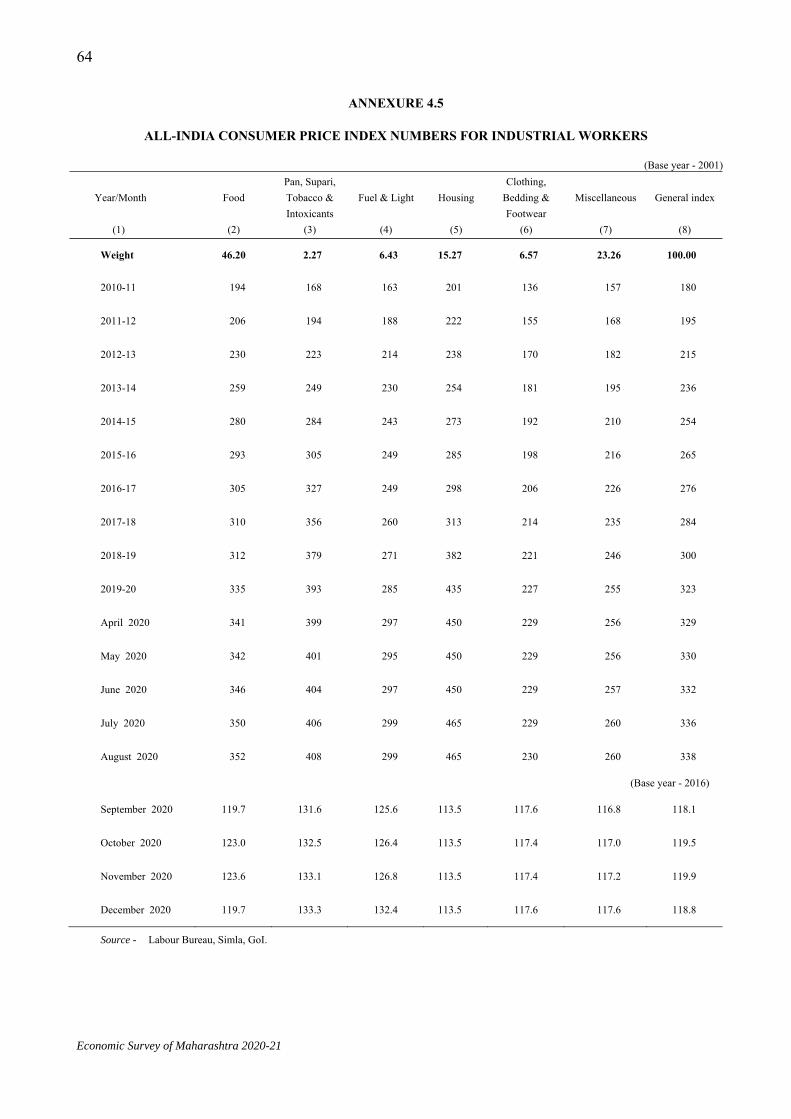
Economic Survey of Maharashtra 2020-21
64
ANNEXURE 4.5
ALL-INDIA CONSUMER PRICE INDEX NUMBERS FOR INDUSTRIAL WORKERS
(Base year - 2001)
Year/Month Food Pan, Supari, Tobacco & Intoxicants
Fuel & Light Housing Clothing,
Bedding & Footwear
Miscellaneous General index
(1) (2) (3) (4) (5) (6) (7) (8)
Weight 46.20 2.27 6.43 15.27 6.57 23.26 100.00
2010-11 194 168 163 201 136 157 180
2011-12 206 194 188 222 155 168 195
2012-13 230 223 214 238 170 182 215
2013-14 259 249 230 254 181 195 236
2014-15 280 284 243 273 192 210 254
2015-16 293 305 249 285 198 216 265
2016-17 305 327 249 298 206 226 276
2017-18 310 356 260 313 214 235 284
2018-19 312 379 271 382 221 246 300
2019-20 335 393 285 435 227 255 323
April 2020 341 399 297 450 229 256 329
May 2020 342 401 295 450 229 256 330
June 2020 346 404 297 450 229 257 332
July 2020 350 406 299 465 229 260 336
August 2020 352 408 299 465 230 260 338
(Base year - 2016)
September 2020 119.7 131.6 125.6 113.5 117.6 116.8 118.1
October 2020 123.0 132.5 126.4 113.5 117.4 117.0 119.5
November 2020 123.6 133.1 126.8 113.5 117.4 117.2 119.9
December 2020 119.7 133.3 132.4 113.5 117.6 117.6 118.8
Source - Labour Bureau, Simla, GoI.

Economic Survey of Maharashtra 2020-21
65
ANNEXURE 4.6
CONSUMER PRICE INDEX NUMBERS FOR INDUSTRIAL WORKERS AT SELECTED CENTRES IN MAHARASHTRA
(Base year - 2001) (CENTRAL CENTERS)
Year/Month
MUMBAI SOLAPUR NAGPUR PUNE NASHIK THANE
Food
group General
index Food
group General
index Food
group General
index Food
group General
index Food
group General
index Food
group General
index (1) (2) (3) (4) (5) (6) (7) (8) (9) (10) (11) (12) (13)
Weight 48.9 100.0 54.7 100.0 43.1 100.0 39.8 100.0 41.4 100.0
2010-11 191 178 189 182 205 207 203 185 202 186
2011-12 208 196 214 204 216 224 226 204 216 208
2012-13 232 218 228 220 244 246 247 221 233 228
2013-14 260 242 260 246 280 268 280 242 258 244
2014-15 284 262 283 265 294 281 299 257 280 261
2015-16 306 280 306 284 317 298 316 269 289 274
2016-17 312 286 316 294 325 308 331 277 303 287
2017-18 314 291 311 295 324 317 323 280 305 297
2018-19 314 297 318 311 323 359 342 316 304 333
2019-20 338 316 345 342 347 401 384 353 334 370
April 2020 340 320 349 349 343 404 403 367 349 381
May 2020 346 324 353 352 348 406 402 367 356 384
June 2020 351 326 355 353 356 410 402 367 358 385
July 2020 352 333 353 353 362 415 400 372 356 387
August 2020 352 333 355 354 359 413 401 372 360 389
(Base year - 2016)
September 2020 119.4 113.5 114.0 114.9 115.5 116.6 119.9 114.7 117.5 113.7 115.5 112.4
October 2020 122.7 114.8 115.3 116.6 120.6 118.4 122.6 115.3 120.1 114.9 119.3 113.3
November 2020 120.7 114.0 115.0 117.0 119.3 118.2 124.1 115.8 122.4 116.1 119.5 113.4
December 2020 116.7 112.9 119.1 119.4 118.7 118.6 121.4 115.4 121.0 115.9 115.6 112.4
Source - Labour Bureau, Simla, GoI.

Economic Survey of Maharashtra 2020-21
66ANNEXURE 4.7
CONSUMER PRICE INDEX NUMBERS FOR INDUSTRIAL WORKERS AT
SELECTED CENTRES IN MAHARASHTRA
(Base year - 2001) (STATE CENTERS)
Year/Month
AKOLA KOLHAPUR JALGAON NANDED AURANGABAD
Food
group
General
index
Food
group
General
index
Food
group
General
index
Food
group
General
index
Food
group
General
index
(1) (2) (3) (4) (5) (6) (7) (8) (9) (10) (11)
Weight 45.88 100.00 48.22 100.00 47.76 100.00 49.05 100.00 40.89 100.00
2010-11 170 175 191 184 195 186 187 200 188 183
2011-12 183 188 217 207 218 206 215 227 212 206
2012-13 210 216 236 226 241 230 232 251 239 234
2013-14 231 238 258 245 262 251 261 275 266 258
2014-15 220 243 262 255 266 261 270 289 276 273
2015-16 250 262 276 270 278 272 304 314 296 292
2016-17 267 282 288 281 286 285 318 331 303 308
2017-18 276 311 284 296 282 303 305 343 293 324
2018-19 277 332 284 310 285 318 305 359 294 337
2019-20 293 358 309 333 309 341 343 395 317 357
2020-21@ 303 371 333 351 333 355 375 415 337 371
April 2020 295 362 320 344 317 348 356 407 324 364
May 2020 299 361 324 343 319 347 356 405 329 363
June 2020 300 363 325 344 324 349 364 409 334 366
July 2020 304 365 330 346 324 350 368 411 337 367
August 2020 307 366 332 348 329 352 370 412 339 368
September 2020 300 375 336 355 338 356 380 417 338 375
October 2020 307 381 344 359 348 363 396 425 343 377
November 2020 310 383 343 359 351 365 397 426 346 378
December 2020 308 382 339 358 345 364 390 423 343 377
Source - Office of the Labour Commissioner, GoM, Mumbai. @ Average for 9 months

Economic Survey of Maharashtra 2020-21
67
ANNEXURE 4.8
INFLATION RATES BASED ON IMPORTANT PRICE INDICES
Year/Month
Inflation Rates
All India consumer price index number for industrial workers
(Base Year-2001)
All India consumer price index number for agricultural labourers
(Base Year-1986-87)
All India consumer price index number for rural
labourers
(Base Year-1986-87) (1) (2) (3) (4)
2010-11 10.4 10.0 10.0
2011-12 8.4 8.2 8.3
2012-13 10.4 10.0 10.2
2013-14 9.7 11.7 11.5
2014-15 7.9 6.6 6.9
2015-16 5.6 4.4 4.6
2016-17 4.1 4.2 4.2
2017-18 3.1 2.2 2.3
2018-19 5.4 2.1 2.2
2019-20 7.5 8.0 7.7
2020-21 -- 6.6 6.4
April 2020 5.4 8.8 8.5
May 2020 5.1 8.4 8.1
June 2020 5.1 7.2 7.0
July 2020 5.3 6.6 6.5
August 2020 5.6 6.3 6.3
September 2020 -- 6.3 6.1
October 2020 -- 6.6 6.4
November 2020 -- 6.0 5.9
December 2020 -- 3.3 3.3
Source - Labour Bureau, Simla, GoI. @ Average for 9 months Note - Inflation rate = Percentage rise in the index of the current period over that of corresponding period of the previous year.

Economic Survey of Maharashtra 2020-21
68ANNEXURE 4.9
ALL-INDIA WHOLESALE PRICE INDEX NUMBERS
(Base year – 2011-12)
Year / Month Primary Articles Fuel & Power Manufactured Products
All commodities Inflation
(1) (2) (3) (4) (5) (6)
Weight 22.62 13.15 64.23 100.00 --
2012-13 111.4 107.1 105.3 106.9 --
2013-14 122.4 114.7 108.5 112.5 5.2
2014-15 125.1 107.7 111.2 113.9 1.3
2015-16 124.6 86.5 109.2 109.7 (-) 3.7
2016-17 128.9 86.3 110.7 111.6 3.6
2017-18 130.6 93.3 113.8 114.9 2.9
2018-19 134.2 104.1 117.9 119.8 4.3
2019-20 143.3 102.2 118.3 121.8 1.7
2020-21@* 145.3 90.0 119.9 121.7 0.0
April 2020 137.8 89.8 118.7 119.2 (- ) 1.6
May 2020 137.3 80.3 118.2 117.5 (- ) 3.4
June 2020 140.9 85.6 118.6 119.3 (- ) 1.8
July 2020 145.1 90.7 118.7 121.0 (- ) 0.2
August 2020 146.7 92.0 119.4 122.0 0.4
September 2020 148.8 91.9 120.1 122.9 1.3
October 2020 151.8 90.9 120.4 123.6 1.3
November 2020 152.8 94.2 121.6 125.1 2.3
December 2020* 146.5 94.2 123.0 124.5 1.2
Source - Office of the Economic Adviser, Ministry of Commerce and Industry, GoI @ Average for 9 months * Provisional

Economic Survey of Maharashtra 2020-21
69
ANNEXURE 4.10
DISTRICTWISE NUMBER OF RATION CARDS (As on 31st December, 2020)
District Yellow Saffron
Annapurna White Total ration cards PHH Saffron PHH
Farmers NPH
Saffron (1) (2) (3) (4) (5) (6) (7) (8)
Mumbai 44,407 19,00,302 0 13,52,912 0 9,16,862 42,14,483
Thane 1,04,876 47,076 0 59,462 0 8,830 2,20,244
Palghar 1,99,858 1,93,276 0 2,68,852 345 40,368 7,02,699
Raigad 1,83,936 2,45,160 0 2,08,983 0 1,12,113 7,50,192
Ratnagiri 1,07,970 1,83,787 0 1,02,836 173 43,305 4,38,071
Sindhudurg 69,202 1,07,250 0 35,832 0 21,244 2,33,528
Nashik 4,84,836 2,97,756 0 4,77,729 0 87,970 13,48,291
Dhule 2,19,830 73,441 0 1,29,859 0 17,477 4,40,607
Nandurbar 2,07,285 46,681 0 83,609 0 8,091 3,45,666
Jalgaon 3,52,391 2,56,377 0 3,21,226 0 74,820 10,04,814
Ahmednagar 3,68,214 2,96,840 0 3,71,752 0 57,622 10,94,428
Pune 2,12,679 7,67,710 0 7,76,022 0 2,11,206 19,67,617
Satara 1,42,598 2,84,582 0 2,46,775 0 57,359 7,31,314
Sangli 96,696 3,05,449 0 2,51,815 444 78,455 7,32,859
Solapur 2,36,342 2,60,211 0 3,23,191 0 74,819 8,94,563
Kolhapur 1,99,011 3,61,830 0 3,27,031 0 95,830 9,83,702
Aurangabad 2,47,524 2,00,664 94,798 2,44,693 2,078 12,274 8,02,031
Jalna 1,56,591 1,46,288 37,020 35,670 1,088 2,530 3,79,187
Parbhani 1,15,876 1,41,523 69,134 83,419 1,527 3,210 4,14,689
Hingoli 88,226 92,919 30,475 35,882 485 2,460 2,50,447
Beed 63,909 52,764 43,785 23,409 498 2,891 1,87,256
Nanded 2,24,921 2,85,733 1,22,401 1,16,746 1,212 12,134 7,63,147
Osmanabad 1,53,088 83,215 81,446 41,612 0 12,263 3,71,624
Latur 1,27,984 2,44,332 66,300 48,470 0 22,184 5,09,270
Buldhana 2,20,664 1,86,545 88,437 89,910 0 22,425 6,07,981
Akola 1,15,712 1,47,040 49,929 1,04,660 0 22,520 4,39,861
Washim 1,08,064 99,616 53,012 33,141 0 14,415 3,08,248
Amravati 2,94,681 1,22,740 1,26,775 1,18,148 0 25,611 6,87,955
Yavatmal 2,77,471 1,40,564 70,948 1,65,056 1,149 22,916 6,78,104
Wardha 92,301 1,72,416 15,853 15,319 0 4,155 3,00,044
Nagpur 2,41,719 5,18,940 0 4,03,468 0 79,606 12,43,733
Bhandara 1,41,450 84,479 0 36,818 0 14,865 2,77,612
Gondia 1,63,530 51,321 0 73,264 0 6,348 2,94,463
Chandrapur 2,30,650 1,70,740 0 55,189 0 21,744 4,78,323
Gadchiroli 1,23,376 67,911 0 29,606 0 6,760 2,27,653
Maharashtra State 64,17,868 86,37,478 9,50,313 70,92,366 8,999 22,17,682 2,53,24,706
Source: Food, Civil Supplies and Consumer Protection Department, GoM.

Economic Survey of Maharashtra 2020-21
70
ANNEXURE 4.11
QUANTITY OF RICE AND WHEAT DISTRIBUTED TO AUTHORISED RATION / FAIR PRICE SHOPS
(Lakh MT)
Year
Rice Wheat Mumbai
rationing area Other districts Total.
(2) + (3) Mumbai
rationing area Other districts Total
(5) + (6) (1) (2) (3) (4) (5) (6) (7)
2001-02 (Total) 0.02 5.16 5.18 0.05 8.48 8.53
Of which, TPDS 0.02 5.00 5.02 0.04 8.27 8.31
2014-15 (Total) 2.13 17.92 20.05 2.93 22.72 25.65
Of which, NFSA, 2013 1.83 16.77 18.60 2.60 21.22 23.82
2015-16 (Total) 2.28 19.15 21.43 2.92 22.17 25.09
Of which, NFSA, 2013 2.28 18.34 20.62 2.92 20.91 23.83
2016-17 (Total) 2.02 18.10 20.12 3.01 23.05 26.06
Of which, NFSA, 2013 2.02 16.92 18.94 3.01 23.05 26.06
2017-18 (Total) 1.99 18.15 20.14 2.98 22.64 25.62
Of which, NFSA,2013 1.99 16.97 18.96 2.98 20.83 23.81
2018-19 (Total) 1.57 16.92 18.49 2.33 21.38 23.71
Of which, NFSA,2013 1.57 15.97 17.54 2.33 19.64 21.97
2019-20 (Total) 2.11 19.11 21.22 3.14 24.50 27.64
Of which, NFSA,2013 1.59 15.78 17.36 2.35 19.78 22.13
2020-21 (Total) + 1.55 14.27 15.82 2.32 18.26 20.57
Of which, NFSA,2013 1.25 12.17 13.42 1.84 15.47 17.32
Source: Food, Civil Supplies and Consumer Protection Department, GoM. + upto December Note - 1. Figures of Antyodaya Anna Yojana are included in Targeted Public Distribution System (TPDS) & NFSA, 2013 2. Since February, 2014 allotment is under NFSA, 2013 for PH and AAY beneficiaries.
ANNEXURE 4.12
ALLOTMENT BY GOVERNMENT OF INDIA TO THE STATE
(Lakh MT) Year Rice Wheat
(1) (2) (3) 2001-02 (Total) 9.23 17.13
Of which, TPDS 6.55 12.16
2014-15 (Total) 21.57 27.47
Of which, NFSA, 2013 19.78 25.28
2015-16 (Total) 21.30 27.37
Of which, NFSA, 2013 20.30 25.88
2016-17 (Total) 21.56 27.98
Of which, NFSA, 2013 20.21 25.85
2017-18 (Total) 21.51 27.98
Of which, NFSA,2013 20.21 25.84
2018-19 (Total) 21.40 27.90
Of which, NFSA,2013 20.21 25.84
2019-20 (Total) 21.22 27.64
Of which, NFSA,2013 20.10 25.70
2020-21 (Total) + 15.82 20.57
Of which, NFSA,2013 15.05 19.24
Source: Food, Civil Supplies and Consumer Protection Department, GoM. + upto December Note - 1. Figures of Antyodaya Anna Yojana are included in Targeted Public Distribution System (TPDS) & NFSA, 2013 2. Since February, 2014 allotment is under NFSA, 2013 for PH and AAY beneficiaries.

Economic Survey of Maharashtra 2020-21
71
ANNEXURE 4.13
DISTRICTWISE NUMBER OF GODOWNS AVAILABLE, THEIR CAPACITY AND FAIR PRICE SHOPS
District Available godowns (upto December, 2020) Number of fair price shops
(upto December, 2020) Number Capacity (MT)
(1) (2) (3) (4)
Mumbai 7 5,481 2,836
Thane 15 7,500 2,035
Palghar 21 8,900 1,082
Raigad 29 18,440 1,371
Ratnagiri 28 16,740 946
Sindhudurg 17 9,660 434
Nashik 28 27,750 2,608
Dhule 23 19,820 980
Nandurbar 22 11,000 1,060
Jalgaon 35 29,060 1,933
Ahmednagar 38 39,060 1,883
Pune 25 27,230 2,573
Satara 35 23,850 1,681
Sangli 30 19,930 1,356
Solapur 38 45,804 1,872
Kolhapur 23 20,550 1,637
Aurangabad 16 19,626 1,802
Jalna 11 16,400 1,280
Parbhani 18 11,180 1,183
Hingoli 10 10,340 797
Beed 35 34,060 1,968
Nanded 44 22,740 1,998
Osmanabad 23 17,700 1,074
Latur 22 20,240 1,350
Buldhana 65 36,861 1,536
Akola 19 13,820 1,061
Washim 17 10,320 776
Amravati 37 20,020 1,913
Yavatmal 36 20,320 2,039
Wardha 14 8,785 855
Nagpur 52 75,363 1,978
Bhandara 17 10,130 888
Gondia 13 12,210 998
Chandrapur 30 20,340 1,534
Gadchiroli 32 20,500 1,196
Maharashtra State 925 7,31,730 52,513
Source: Food, Civil Supplies and Consumer Protection Department, GoM.

Economic Survey of Maharashtra 2020-21
72
ANNEXURE 4.14
UNDER NFSA, DISTRICTWISE ALLOTMENT, OFF-TAKE & DISTRIBUTION OF FOODGRAINS TO FAIR PRICE SHOPS FOR ANTYODAYA ANNA YOJANA HOUSEHOLDS DURING 2019-20
(MT)
District Allocation by State Government Lifting from FCI Lifting by FPS from godowns
Rice Wheat Total Rice Wheat Total Rice Wheat Total (1) (2) (3) (4) (5) (6) (7) (8) (9) (10)
Mumbai 4,702 3,973 8,675 3,448 2,905 6,353 3,447 2,906 6,353
Thane 14,186 6,288 20,474 13,020 6,077 19,097 13,219 6,042 19,261
Palghar 28,205 12,519 40,724 26,254 11,587 37,841 27,052 12,106 39,158
Raigad 24,357 9,741 34,098 24,854 9,741 34,595 23,667 9,741 33,408
Ratnagiri 12,702 5,637 18,339 11,014 4,907 15,921 10,502 4,775 15,277
Sindhudurg 7,213 3,200 10,413 6,569 2,735 9,304 6,521 2,789 9,310
Nashik 23,386 52,705 76,091 20,714 46,887 67,601 20,329 46,065 66,394
Dhule 10,625 21,711 32,336 8,904 19,229 28,133 9,241 18,832 28,073
Nandurbar 25,379 20,602 45,981 22,224 16,747 38,972 20,789 16,048 36,838
Jalgaon 18,560 38,290 56,850 15,711 35,337 51,048 17,050 35,245 52,295
Ahmednagar 12,095 27,265 39,360 10,032 22,170 32,201 10,764 24,162 34,926
Pune Rural 8,251 14,378 22,629 6,472 11,020 17,492 6,792 11,452 18,244
Pune city 1,530 2,669 4,199 1,240 2,064 3,303 1,240 2,064 3,303
Satara 4,829 8,420 13,249 4,171 6,798 10,969 4,453 7,064 11,517
Sangli 4,986 8,705 13,691 4,612 7,797 12,410 5,050 8,515 13,565
Solapur Rural 8,684 15,149 23,833 7,866 12,448 20,314 7,805 13,045 20,850
Solapur City 930 1,626 2,556 866 1,487 2,353 866 1,486 2,353
Kolhapur 8,346 14,561 22,907 8,029 13,641 21,670 8,146 13,883 22,030
Aurangabad 11,379 18,099 29,478 9,609 14,794 24,403 9,555 14,770 24,326
Jalna 7,155 11,395 18,550 6,050 9,500 15,550 6,449 9,543 15,992
Parbhani 7,364 11,714 19,078 5,916 9,402 15,318 5,764 9,112 14,875
Hingoli 5,293 8,412 13,705 3,953 6,071 10,024 4,304 6,531 10,835
Beed 6,775 10,760 17,535 5,567 8,179 13,746 5,508 8,342 13,851
Nanded 13,178 20,978 34,156 11,333 17,877 29,211 11,333 17,877 29,211
Osmanabad 6,412 10,199 16,611 5,467 8,474 13,941 5,540 8,388 13,928
Latur 6,820 10,854 17,674 5,762 9,905 15,667 5,913 9,963 15,877
Amravati 29,281 21,958 51,239 23,644 21,539 45,183 23,229 20,561 43,790
Akola 10,791 8,097 18,888 9,766 7,525 17,291 9,775 7,289 17,064
Washim 11,592 8,700 20,292 10,422 6,992 17,414 10,617 7,795 18,412
Buldhana 15,927 11,946 27,873 13,439 11,966 25,405 12,288 11,174 23,462
Yavatmal 31,151 23,366 54,517 29,100 21,594 50,694 27,650 20,751 48,400
Nagpur Rural 17,721 13,282 31,003 17,289 13,076 30,365 17,724 13,244 30,968
Nagpur City 9,754 7,313 17,067 9,393 7,141 16,534 9,500 7,141 16,641
Wardha 10,866 8,155 19,021 10,110 7,790 17,900 10,680 8,026 18,706
Bhandara 19,632 7,584 27,216 17,416 7,481 24,897 19,061 7,838 26,899
Gondia 23,925 9,243 33,168 23,488 9,033 32,521 23,104 8,949 32,052
Chandrapur 32,562 24,429 56,991 30,630 24,429 55,059 31,407 23,752 55,160
Gadchiroli 29,256 9,744 39,000 28,905 9,747 38,652 28,590 9,674 38,264
Maharashtra State 5,25,800 5,23,667 10,49,467 4.73,259 4,66,092 9,39,352 4,74,924 4,66,940 9,41,864
Source: Food, Civil Supplies and Consumer Protection Department, GoM Note: Totals may not add up due to rounding

Economic Survey of Maharashtra 2020-21
73
ANNEXURE 4.15
UNDER NFSA, ALLOTMENT, OFF-TAKE & DISTRIBUTION OF FOODGRAINS TO FAIR PRICE SHOPS FOR PRIORITY HOUSEHOLDS DURING 2019-20
(MT)
District Allocation by State Government Lifting from FCI Lifting by FPS from godowns
Rice Wheat Total Rice Wheat Total Rice Wheat Total (1) (2) (3) (4) (5) (6) (7) (8) (9) (10)
Mumbai 2,06,561 3,09,830 5,16,391 1,55,252 2,32,271 3,87,524 1,55,255 2,32,351 3,87,606
Thane 18,125 14,855 32,980 14,708 13,129 27,837 15,357 13,333 28,690
Palghar 48,068 39,439 87,507 40,016 32,085 72,101 40,091 33,165 73,256
Raigad 50,496 41,392 91,888 39,339 36,307 75,646 38,553 36,246 74,799
Ratnagiri 34,384 28,172 62,556 31,784 27,016 58,800 28,507 21,861 50,368
Sindhudurg 19,622 16,058 35,680 17,215 14,187 31,402 17,509 14,364 31,873
Nashik 72,526 1,08,794 1,81,320 60,110 89,639 1,49,749 59,821 90,000 1,49,821
Dhule 27,478 41,216 68,694 24,820 35,313 60,133 23,258 34,769 58,027
Nandurbar 26,173 17,448 43,621 22,181 14,442 36,623 21,072 13,970 35,043
Jalgaon 54,049 81,073 1,35,122 45,783 69,603 1,15,385 47,813 71,488 1,19,301
Ahmednagar 67,296 1,00,938 1,68,234 54,709 82,504 1,37,213 60,401 90,564 1,50,964
Pune Rural 61,582 92,384 1,53,966 52,785 79,453 1,32,238 53,759 79,990 1,33,749
Pune city 34,174 51,250 85,424 26,838 40,418 67,255 26,838 40,418 67,256
Satara 39,745 59,606 99,351 36,973 55,204 92,177 36,574 54,551 91,125
Sangli 41,937 62,906 1,04,843 37,164 55,515 92,679 36,331 54,418 90,750
Solapur Rural 40,374 60,554 1,00,928 37,374 52,294 89,668 38,410 57,590 96,000
Solapur City 10,524 15,780 26,304 9,703 14,616 24,319 9,703 14,616 24,319
Kolhapur 55,418 83,127 1,38,545 51,769 77,517 1,29,285 51,894 78,038 1,29,932
Aurangabad 47,793 71,679 1,19,472 40,897 61,334 1,02,231 39,870 59,459 99,330
Jalna 30,404 45,599 76,003 26,280 39,325 65,604 27,909 40,550 68,459
Parbhani 21,868 40,716 62,584 16,279 32,833 49,112 15,910 32,160 48,070
Hingoli 15,849 29,493 45,342 12,811 23,227 36,038 12,799 24,906 37,705
Beed 37,769 56,663 94,432 30,210 45,341 75,551 30,462 45,564 76,026
Nanded 47,505 71,258 1,18,763 38,121 57,962 96,083 38,373 59,192 97,566
Osmanabad 23,162 34,737 57,899 19,419 29,375 48,795 19,429 28,929 48,358
Latur 35,790 53,684 89,474 33,016 48,251 81,268 33,251 49,121 82,372
Amravati 33,639 50,456 84,095 27,060 46,869 73,929 26,978 42,652 69,630
Akola 25,303 37,971 63,274 22,266 34,254 56,520 22,690 33,531 56,221
Washim 17,772 26,664 44,436 16,194 21,367 37,562 16,133 22,849 38,982
Buldhana 36,364 54,541 90,905 31,253 51,482 82,735 27,198 45,192 72,390
Yavatmal 33,694 50,547 84,241 29,273 45,053 74,325 28,256 41,899 70,156
Nagpur Rural 29,471 44,200 73,671 29,427 43,144 72,572 29,556 44,106 73,662
Nagpur City 30,382 45,578 75,960 26,355 40,865 67,220 27,858 41,600 69,458
Wardha 19,283 28,909 48,192 17,832 25,400 43,232 18,950 28,095 47,045
Bhandara 25,628 17,086 42,714 22,599 16,746 39,345 24,258 17,128 41,386
Gondia 24,415 16,284 40,699 23,258 15,727 38,985 22,971 15,296 38,267
Chandrapur 23,223 34,840 58,063 22,354 32,736 55,090 22,339 32,418 54,757
Gadchiroli 16,560 11,040 27,600 15,822 10,856 26,678 15,010 10,557 25,567
Maharashtra State 14,84,406 20,46,767 35,31,173 12,59,249 17,43,660 30,02,909 12,61,346 17,46,939 30,08,285
Source: Food, Civil Supplies and Consumer Protection Department, GoM Note: Totals may not add up due to rounding


5 Public Finance


Economic Survey of Maharashtra 2020-21
5. PUBLIC FINANCE
5.1 The budget is an annual financial statement which includes estimated receipts & expenditure of the government for the coming financial year, actuals for the preceding year and revised estimates for the current year. It is necessary to review government activities, various sources of financing the expenditure, funds management during the financial year to provide better services and facilities to the public. The fiscal indicators viz. revenue deficit, fiscal deficit and debt to GSDP ratio, etc. are useful tools to analyse government operations. 5.1.1 Fiscal policy of the State provides adequate attention towards public investments with priority in infrastructure, agriculture, health, education water supply, sanitation and other aspects of development. Various infrastructure projects viz. Mumbai-Nagpur Hindu Hridaysamrat Balasaheb Thackeray Maharashtra Samriddhi Mahamarg, metro network, trans harbour link to Navi Mumbai are expected to have positive impact on the State’s economy. Economic measures taken by the State to tackle Covid-19 pandemic 5.2 Due to time to time lockdown announced in order to control spread of Covid-19 pandemic in the State, industries and services except essential services were closed, which impacted in slowing down of the State economy. To revive the economy the concessions given in State Excise Duties, Motor Vehicle Tax and Stamp Duty resulted adversely on revenue of the State. To tackle Covid-19 and to revive the State economy measures taken were: Purchase of medical equipments and materials upto ₹ 50 lakhs were allowed under
MLALAD programme Curtail expenditure on new schemes and cancel unnecessary schemes during current
financial year No administrative approval for purchase except for medicines, essential medical equipments
and supplies, etc. No administrative approval to any new construction, tender, work order during current
financial year (excluding capital expenditure on pre-monsoon necessities) No new recruitments by departments (except Public Health Department, Medical education
& Drugs Department, compassion ground and education workers) Surrender unutilised funds to the government No printing work except publications regarding Covid-19 Approval given to departments responsible for creating assets and job opportunities to
distribute 75 per cent of budgeted funds Under district annual scheme (General/SC/ST component scheme) approval given to
distribute 100 per cent funds During 1st September to 31st December, 2020, Stamp Duty chargeable on instrument of
Conveyance or Agreement to sell of immovable property was decreased by three per cent for Mumbai & Mumbai Suburban districts and by two per cent for the rest of the State whereas for the period 1st January to 31st March, 2021, it is decreased by two per cent for Mumbai and Mumbai Suburban districts and by 1.5 per cent for the rest of the State
Extension of six months given to work of contractors, concession given on security deposit amounts (bank guarantee or cash amount)

76
Economic Survey of Maharashtra 2020-21
Approval given for exemption of 50 per cent in the yearly taxes paid by goods and tourist vehicles, mines, private service vehicles, professional campers vehicles and school students carrying vehicles for 2020-21
Budget 2020-21
5.3 The budget 2020-21 was presented with budgetary surplus of ` 103 crore. As per the budget estimates 2020-21, total receipts and total expenditure are expected to increase by 3.6 per cent and 3.5 per cent respectively over the previous year. Important fiscal indicators are given in Table 5.1 and budget at a glance is given in Annexure 5.1. Revenue Receipts
5.4 Revenue receipts consist of tax revenue & non-tax revenue from the State’s own resources and grants-in-aid & share in taxes from GoI. Revenue receipts are expected to be ` 3,47,457 crore in 2020-21 (BE). Revenue receipts are expected to increase by 12.1 per cent over the previous year. Revenue receipts as per cent of GSDP is increasing and is expected to be 13.1 per cent in 2020-21 (BE). Expected revenue for the State through its own resources i.e. Own Tax Revenue (OTR) and non-tax revenue is ` 2,45,577 crore (share of 70.7 per cent). Grants-in-aid and share in taxes from GoI are expected to be ` 1,01,879 crore. Revenue receipts are given in Table 5.2.
Table 5.1 Important fiscal indicators (` Crore)
Particulars 2018-19 (Actual)
2019-20 (RE)
2020-21 (BE)
1. Revenue Receipts 2,78,996 3,09,881 3,47,457 As per cent of total receipts (91.6) (79.4) (85.9) 2.Revenue Expenditure 2,67,022 3,41,324 3,56,968
As per cent of total expenditure (87.9) (87.3) (88.3) 3. Revenue Deficit (2-1) (-)11,975 31,443 9,511
As per cent of GSDP (-)0.5 1.1 0.4 4. Capital Receipts# 25,561 80,514 57,031
As per cent of total receipts (8.4) (20.6) (14.1) 5. Capital Expenditure# 36,594 49,463 47,417
As per cent of total expenditure (12.1) (12.7) (11.7) 6. Total Receipts# (1+4) 3,04,558 3,90,394 4,04,488 7. Total Expenditure# (2+5) 3,03,616 3,90,787 4,04,385 8. Budgetary Deficit (7-6) (-)942 393 (-)103 9. Fiscal Deficit 23,015 78,617 54,618
As per cent of GSDP 0.9 2.8 2.1 10. Primary Deficit (-)11,006 44,444 19,088 As per cent of GSDP (-)0.4 1.6 0.7 11. Interest Payment 34,021 34,173 35,531
As per cent of revenue receipts 12.2 11.0 10.2 RE Revised Estimates BE Budget Estimates # Net of loan repayment Note: Figures may not add up to totals due to rounding Source: Finance Department, GoM
Table 5.2 Revenue receipts (` Crore)
Year Tax revenue Non-tax revenue
Central grants
Total revenue receipts Own Tax
Revenue Share in central taxes
Total
Interest receipts
Other non-tax revenue
Total
2016-17 1,36,616 33,715 1,70,331 3,259 9,450 12,709 21,653 2,04,693 2017-18 1,67,948 37,203 2,05,151 4,163 12,517 16,680 21,823 2,43,654 2018-19 1,87,538 41,953 2,29,491 4,191 11,652 15,844 33,662 2,78,996 2019-20 (RE) 1,99,534 36,220 2,35,754 2,600 14,251 16,851 57,276 3,09,881 2020-21 (BE) 2,25,071 48,109 2,73,181 2,708 17,798 20,506 53,770 3,47,457
Source : Finance Department, GoM Note : Figures may not add up to totals due to rounding

77
Economic Survey of Maharashtra 2020-21
5.4.1 The tax revenue is expected to increase by 15.9 per cent in 2020-21(BE) over the previous year. The major component of tax revenue, i.e. OTR is expected to increase by 12.8 per cent with expected share 82.4 per cent in tax revenue and 64.8 per cent in revenue receipts in 2020-21 (BE). The OTR as per cent of GSDP is expected to be 8.5 per cent in 2020-21(BE). The State Goods & Services Tax (SGST) has substantial contribution in OTR with expected share of 47.6 per cent followed by Sales Tax with expected share of 17.8 per cent and Stamps & Registration Fees with expected share of 13.3 per cent in 2020-21(BE). Revenue from SGST is expected to increase by 23.9 per cent over the previous year. Componentwise OTR of the State is given in Table 5.3. Revenue received from SGST of selected states in 2019-20 (RE) is given in Table 5.4.
5.4.2 The share of taxes devolved by GoI, component of tax revenue is expected to be ` 48,109 crore in 2020-21 (BE) with 32.8 per cent expected increase over the previous year. The share of Corporation Tax in central taxes is expected to be 30.8 per cent followed by Central Goods & Services Tax (CGST) with expected share of 30.3 per cent and Tax on Income other than Corporation Tax with expected share of 28.6 per cent. OTR, revenue receipts and revenue expenditure of selected states in 2019-20 (RE) are given in Table 5.5. 5.4.3 State’s non-tax revenue comprises of interest receipts, fines, royalties, service charges, user charges, dividends & profits. State’s non-tax revenue is expected to increase by 21.7 per cent in 2020-21 (BE) over the previous year with expected share of 5.9 per cent in
Table 5.3 Componentwise OTR of the State
(` Crore) Component 2016-17 2017-18 2018-19 2019-20(RE) 2020-21(BE)
State Goods & Service Tax NA 50,063 82,352 86,470 1,07,146 Sales Tax 81,174 54,894 35,725 38,066 40,000 Stamps & Registration Fees 21,012 26,442 28,545 29,500 30,000 State Excise Duties 12,288 13,450 15,321 17,977 19,225 Taxes & Duties on Electricity 6,670 7,345 10,085 9,820 9,500 Taxes on Vehicles 6,741 8,665 8,613 8,599 9,500 Land Revenue 1,799 2,310 2,088 3,520 4,000 Other Taxes on Income & Expenditure 2,312 2,205 2,583 2,450 2,420 Tax on Goods & Passengers 1,877 984 837 1,750 1,760 Other Taxes & Duties on Commodities & Services
2,743 1,590 1,389 1,381 1,519
Tax on Agricultural Income 0 Neg. Neg. 0 0 All 1,36,616 1,67,948 1,87,538 1,99,534 2,25,071
Note : Figures may not add up to totals due to rounding NA Not applicable Neg. Negligible Source: Finance Department, GoM
Table 5.4 Revenue received from SGST of selected states in 2019-20 (RE)
(` Crore) State SGST
Andhra Pradesh 20,227 Gujarat 48,735 Karnataka 42,748 Kerala 23,790 Madhya Pradesh 19,323 Maharashtra 86,470 Rajasthan 25,605 Tamil Nadu 44,218 Telangana 25,817 Uttar Pradesh 56,110 Source: Reserve Bank of India
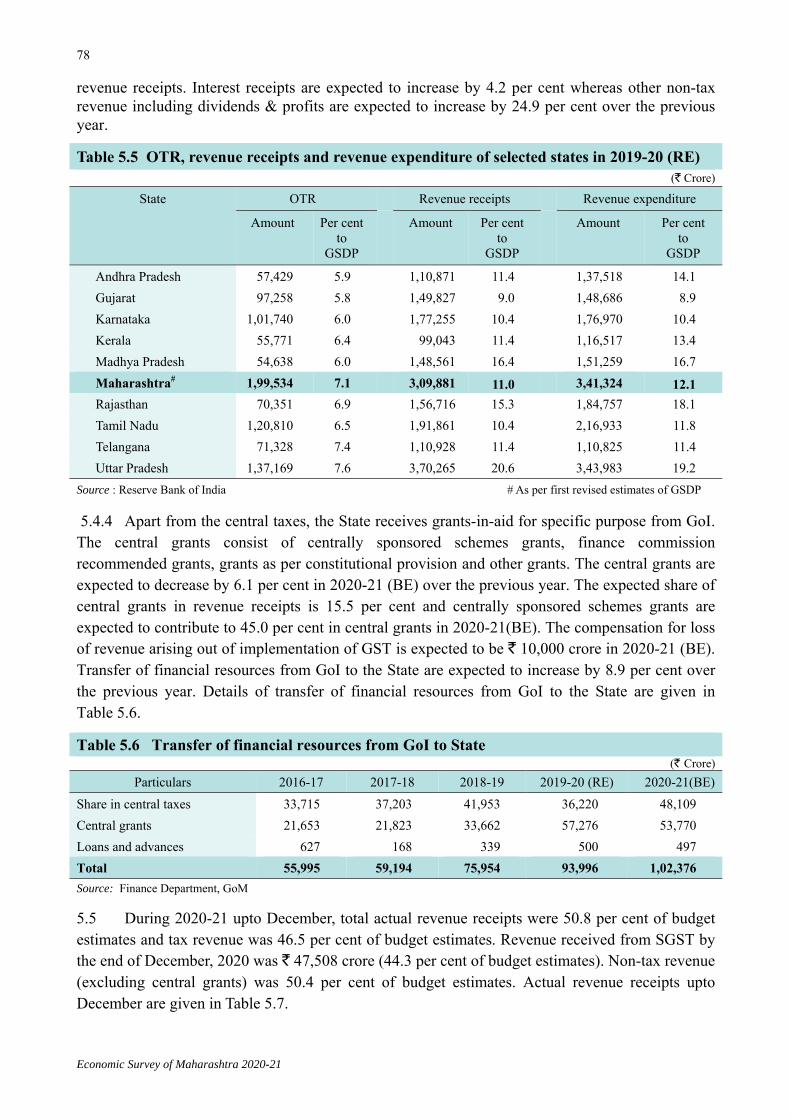
78
Economic Survey of Maharashtra 2020-21
revenue receipts. Interest receipts are expected to increase by 4.2 per cent whereas other non-tax revenue including dividends & profits are expected to increase by 24.9 per cent over the previous year.
5.4.4 Apart from the central taxes, the State receives grants-in-aid for specific purpose from GoI. The central grants consist of centrally sponsored schemes grants, finance commission recommended grants, grants as per constitutional provision and other grants. The central grants are expected to decrease by 6.1 per cent in 2020-21 (BE) over the previous year. The expected share of central grants in revenue receipts is 15.5 per cent and centrally sponsored schemes grants are expected to contribute to 45.0 per cent in central grants in 2020-21(BE). The compensation for loss of revenue arising out of implementation of GST is expected to be ` 10,000 crore in 2020-21 (BE). Transfer of financial resources from GoI to the State are expected to increase by 8.9 per cent over the previous year. Details of transfer of financial resources from GoI to the State are given in Table 5.6.
5.5 During 2020-21 upto December, total actual revenue receipts were 50.8 per cent of budget estimates and tax revenue was 46.5 per cent of budget estimates. Revenue received from SGST by the end of December, 2020 was ` 47,508 crore (44.3 per cent of budget estimates). Non-tax revenue (excluding central grants) was 50.4 per cent of budget estimates. Actual revenue receipts upto December are given in Table 5.7.
Table 5.5 OTR, revenue receipts and revenue expenditure of selected states in 2019-20 (RE) (` Crore)
State OTR Revenue receipts Revenue expenditure Amount Per cent
to GSDP
Amount Per cent to
GSDP
Amount Per cent to
GSDP
Andhra Pradesh 57,429 5.9 1,10,871 11.4 1,37,518 14.1 Gujarat 97,258 5.8 1,49,827 9.0 1,48,686 8.9 Karnataka 1,01,740 6.0 1,77,255 10.4 1,76,970 10.4 Kerala 55,771 6.4 99,043 11.4 1,16,517 13.4 Madhya Pradesh 54,638 6.0 1,48,561 16.4 1,51,259 16.7 Maharashtra# 1,99,534 7.1 3,09,881 11.0 3,41,324 12.1 Rajasthan 70,351 6.9 1,56,716 15.3 1,84,757 18.1 Tamil Nadu 1,20,810 6.5 1,91,861 10.4 2,16,933 11.8 Telangana 71,328 7.4 1,10,928 11.4 1,10,825 11.4 Uttar Pradesh 1,37,169 7.6 3,70,265 20.6 3,43,983 19.2
Source : Reserve Bank of India # As per first revised estimates of GSDP
Table 5.6 Transfer of financial resources from GoI to State (` Crore)
Particulars 2016-17 2017-18 2018-19 2019-20 (RE) 2020-21(BE) Share in central taxes 33,715 37,203 41,953 36,220 48,109 Central grants 21,653 21,823 33,662 57,276 53,770 Loans and advances 627 168 339 500 497 Total 55,995 59,194 75,954 93,996 1,02,376 Source: Finance Department, GoM

79
Economic Survey of Maharashtra 2020-21
Grants-in-aid as per 14th FC recommendations 5.6 As per the recommendations of 14th Finance Commission (FC), 42 per cent proportion of central taxes were devolved to all states. Accordingly, State’s share in devoluble amount (excluding service tax) from central taxes was 5.521 per cent and the share in service tax was 5.674 per cent. 5.6.1 As per the 14th FC recommendations, the State received ` 13,532.11 crore basic grants & ` 294.84 crore performance grants for rural local bodies and ` 9,930.28 crore basic grants & ` 1,037.73 crore performance grants for urban local bodies which were fully utilised. The State also received ` 6,146.25 crore grants-in-aid towards State Disaster Response Fund (SDRF) which were fully utilised. Grants-in-aid as per 15th FC recommendations 5.7 As per the recommendations of 15th FC proportion of central pool of taxes devolved to states is 41 per cent during 2020-21 to 2025-26. Accordingly, State’s share in devoluble amount from central taxes for 2020-21 is 6.135 per cent and 6.317 per cent during 2021-22 to 2025-26. Inter-Se share of selected states in central taxes as per the 15th FC recommendations is given in Table 5.8.
5.7.1 GoI has accepted recommendations of 15th FC for the year 2020-21 regarding grants to rural and urban local bodies. As per the recommendations, the State received basic grants (untied) and tied grants in the ratio 50:50 for rural local bodies. The urban local bodies are classified as Million-Plus Cities and Non Million-Plus Cities based on population. The Million-Plus Cities received grants for ambient air quality and solid waste management & sanitation in the ratio 50:50. The Non Million-Plus Cities received basic grants (untied) and tied grants in the ratio 50:50. 5.7.2 As per 15th FC recommendations for availing grants for local bodies for 2021-22 to 2025-26 requires fulfilling entry level conditions like setting up of State FC and act upon its recommendations, having both provisional and audited accounts online in public domain, fixation of minimum floor for property tax rates, etc. As per the recommendations, states will receive grants
Table 5.7 Actual revenue receipts upto December(` Crore)
Item Actual receipts 2019-20 2020-21
A) Tax Revenue (1 + 2) 1,66,335 1,27,011 1) Own Tax Revenue ( i to xi) 1,39,935 1,04,210 i) Value Added Tax (VAT) 28,658 22,486 ii) SGST 60,473 47,508 iii) Stamps & registration fees 21,703 15,349 iv) State excise duty 11,555 9,691 v) Taxes & duties on electricity 6,945 2,348 vi) Land revenue 1,493 771 vii) Taxes on vehicles 6,269 4,021 viii) Other taxes on income & expenditure
1,751 1,525
ix) Taxes on goods & passengers
468 7
x) Other taxes & duties on commodities & services
620 504
xi) Tax on Agricultural Income 0 Neg. 2) Share in central taxes 26,400 22,801 B) Non-Tax Revenue ( i + ii) 48,041 49,439 i) Non-tax revenue (excluding central grants)
9,278 10,337
ii) Grants-in-aid from GoI 38,763 39,102 Total (A+B) 2,14,376 1,76,450
Neg. Negligible Source : Office of Accountant General, Maharashtra
Table 5.8 Inter-Se share of selected states in central taxes as per 15th FC recommendations
(per cent) State 2020-21 2021-22 to
2025-26 Andhra Pradesh 4.111 4.047 Gujarat 3.398 3.478 Karnataka 3.646 3.647 Kerala 1.943 1.925 Madhya Pradesh 7.886 7.850 Maharashtra 6.135 6.317 Rajasthan 5.979 6.026 Tamil Nadu 4.189 4.079 Telangana 2.133 2.102 Uttar Pradesh 17.931 17.939
Source: 15th FC report for the year 2020-21 and report for 2021-26, GoI

80
Economic Survey of Maharashtra 2020-21
to rural local bodies and urban local bodies in the ratio 67:33 for 2021-22 & 2022-23, in the ratio 66:34 for 2023-24 & 2024-25 and in the ratio 65:35 for 2025-26. The rural local bodies and Non Million Plus Cities in urban local bodies will receive grants with basic grants(untied) and tied grants in the ratio 40:60 whereas Million Plus Cities will receive performance linked grants through Million Plus Cities Challenge Fund (100 per cent). The State is expected to receive about ` 70,375 crore grants as per 15th FC recommendations. 5.7.3 As per guidelines of GoI based on 15th FC recommendations, of the total size of State Disaster Risk Management Fund (SDRMF), the ratio of Centre and State’s contribution to SDRMF is 75:25. 5.7.4 Grants-in-aid received and expenditure incurred under 15th FC during 2020-21 is given in Table 5.9.
Revenue Expenditure 5.8 Revenue expenditure is expected to increase by 4.6 per cent in 2020-21(BE) over the previous year. The development revenue expenditure is major component of revenue expenditure with expected share 68.7 per cent in 2020-21(BE) (average share of 67.7 per cent during last five years). Development expenditure is expected to increase by 2.6 per cent in 2020-21 (BE) over the previous year. Development expenditure comprises of expenditure incurred on social services (expected share 62.5 per cent), economic services (expected share 27.8 per cent) and grants-in-aid and contributions to local bodies & Panchayat Raj Institutions. Revenue expenditure is given in Table 5.10.
5.8.1 The total revenue expenditure of the State during 2020-21 upto December was 55.0 per cent of budget estimates. Development expenditure incurred upto December was 51.2 per cent of 2020-21 (BE). Of the total development expenditure, expenditure incurred on social services was 49.2 per cent and expenditure incurred on economic services was 50.6 per cent of 2020-21 (BE). Actual revenue expenditure upto December is given in Table 5.11.
Table 5.9 Grants-in-aid received and expenditure incurred under 15th FC during 2020-21
(` Crore) Particulars 2020-21+
Received Expenditure 1. Panchayat Raj Institutions 2,913.50 2,913.50
i. Basic grants (untied) 1,456.75 1,456.75 ii. Tied grants 1,456.75 1,456.75
2. Urban local bodies 1,403.00 1,403.00 i. Million Plus Cities 793.00 793.00
of which,
a. Ambient air quality 396.50 396.50
b. Solid waste management & sanitation
396.50 396.50
ii. Non Million Plus Cities 610.00 610.00
of which,
a. Basic grants (untied) 305.00 305.00
b. Tied grants 305.00 305.00
3. State Disaster Risk Management Fund (Central share)
3,222.00 1,000.45
Source: Finance Department, GoM + As on 7th January, 2021
Table 5.10 Revenue expenditure
Year Revenue expenditure (` Crore) Per capita (`) Development Non-
development Total Development
expenditure Revenue
expenditure 2016-17 1,41,619 71,610 2,13,229 11,862 17,859 2017-18 1,63,036 78,535 2,41,571 13,526 20,042 2018-19 1,82,257 84,765 2,67,022 14,979 21,945 2019-20 (RE) 2,38,920 1,02,404 3,41,324 19,453 27,791 2020-21 (BE) 2,45,124 1,11,844 3,56,968 19,774 28,797 Source : Finance Department, GoM

81
Economic Survey of Maharashtra 2020-21
5.8.2 As per 2020-21 (BE), of the total expected development expenditure on social services, share of General Education is expected to be 44.9 per cent, followed by Welfare of Scheduled Caste, Scheduled Tribes, Other Backward Classes & Minorities with 12.1 per cent, Urban Development with 10.9 per cent and Medical services & Public Health with 9.4 per cent. Expected share of expenditure on Agriculture & Allied Activities is highest (35.0 per cent) followed by Rural Development (22.8 per cent) in expenditure on economic services.
5.8.3 The committed expenditure on salary, pension and interest payments is
expected to increase by 7.6 per cent in 2020-21(BE) over the previous year with expected share 53.7 per cent in total revenue expenditure. The share of interest payments in revenue expenditure is expected to be 10.0 per cent in 2020-21 (BE). The interest payment to revenue receipts ratio is decreasing and is expected to be 10.2 per cent in 2020-21(BE). The total amount of subsidies is expected to decrease by 29.2 per cent in 2020-21 (BE) over the previous year. Componentwise revenue expenditure is given in Table 5.12 and its details are given in Annexure 5.3. Major subsidies as per 2020-21 (BE) are given in Table 5.13.
Table 5.11 Actual revenue expenditure upto December
(` Crore) Item Actual expenditure
2019-20 2020-21 1. Development expenditure
a. Social services 87,849 75,398 b. Economic services 31,422 34,536 c. Grants-in-aid and
Contributions to local bodies and Panchyat Raj Institutions
15,489 15,498
Total ( a+b+c) 1,34,760 1,25,432 2. Non-development expenditure
a. General services 49,520 48,491 b. Interest payment and
servicing of debt 20,372 22,482
Total ( a+b) 69,892 70,973 3. Total revenue expenditure (1+2) 2,04,652 1,96,405
Source : Office of Accountant General, Maharashtra

82
Economic Survey of Maharashtra 2020-21
5.9 The classification of expenditure data in the State budget is useful in analysing economic significance of budgetary transactions and measuring changes in government final consumption expenditure, expenditure on capital formation, etc. The expenditure data in the State budget is analysed by classifying into significant economic categories as per guidelines of National Statistical Office (NSO), GoI. Details of government final consumption expenditure and capital formation are given in Annexure 5.5. Capital Receipts and Capital Expenditure 5.10 The capital receipts comprise of (i) public debt viz. Internal debt of the State & loans and advances from central government, (ii) loans & advances by the State(recovery), (iii) net receipts from public account and (iv) other capital receipts such as inter-state settlement, contingency fund & its appropriation. Capital receipts are expected to be ` 86,730 crore in 2020-21 (BE) with expected share of 20.0 per cent in the total receipts. Of the total capital receipts, expected share of internal debt is 92.9 per cent in 2020-21 (BE). 5.11 The share of capital expenditure in the total expenditure is expected to be 17.8 per cent in 2020-21 (BE). Development capital expenditure includes expenditure on capital account and loans & advances given by the State. Expected share of expenditure on capital account in capital expenditure is maximum (58.5 per cent). Out of the total capital expenditure, internal debt expected to be used for repayment is ` 28,521 crore. Capital receipts and capital expenditure are given in Table 5.14.
Table 5.12 Componentwise revenue expenditure (` Crore)
Year Salary & wages
Pension Interest Subsidy Grants-in-aid (non-salary)
Other Total revenue expenditure
2016-17 72,075 (33.8)
21,760 (10.2)
28,532 (13.4)
20,984 (9.8)
43,412 (20.4)
26,466 (12.4)
2,13,229 (100.0)
2017-18 75,088 (31.1)
23,853 (9.9)
33,018 (13.7)
33,894 (14.0)
52,606 (21.8)
23,112 (9.6)
2,41,571 (100.0)
2018-19 80,206 (30.0)
26,545 (9.9)
34,021 (12.7)
27,398 (10.3)
69,861 (26.2)
28,991 (10.9)
2,67,022 (100.0)
2019-20 (RE) 1,07,752 (31.6)
35,947 (10.5)
34,173 (10.0)
44,500 (13.0)
85,085 (24.9)
33,867 (9.9)
3,41,324 (100.0)
2020-21 (BE) 1,17,473 (32.9)
38,467 (10.8)
35,531 (10.0)
31,517 (8.8)
95,639 (26.8)
38,341 (10.7)
3,56,968 (100.0)
Source : Finance Department, GoM Note : Figures in bracket show percentage to total revenue expenditure
Table 5.13 Major subsidies as per 2020-21 (BE) (` Crore)
Particulars Amount
Mahatma Jyotirao Phule Shetkari Karjamukti Yojana 2019 (State Level ) 7,000
Concession In Energy Tariff to Agriculture Pump Consumers (General) 5,020
Incentives under package scheme of incentives to industrial units 3,000
For foodgrain distribution and related schemes like Antyodaya Anna Yojana, Annapurna Scheme, etc. 2,376
Premium subsidy under Pradhanmantri Fasal Bima Yojana (State share) 1,654
Compensation in order to recoup losses of Maharashtra State Road Transport Corporation for providing concessional fares to senior citizens, students, freedom fighters, etc. 1,450
Source: Finance Department, GoM

83
Economic Survey of Maharashtra 2020-21
Deficit Trends
5.12 The State has continued on the path of fiscal consolidation and as a result of which one of the major fiscal indicators i.e. fiscal deficit as per cent of GSDP remained well within the limits (three per cent of GSDP) laid down by the Maharashtra Fiscal Responsibility & Budgetary Management (MFRBM) Rules, 2006. The expected fiscal deficit in 2020-21(BE) is 2.1 per cent of GSDP. The fiscal deficit in selected states is given in Table 5.15. Indicative fiscal deficit and debt path for the State as per 15th FC recommendations is given in Table 5.16.
Debt Position 5.13 The debt stock of the State comprises of accumulated unpaid loans and other liabilities on the State. The debt stock of the State is expected to be ` 5,20,717 crore as per 2020-21 (BE), which is 19.6 per cent of GSDP, well within the limit (25.0 per cent of GSDP) as per Fiscal Policy Strategy Statement 2020-21 for the State. Debt stock and interest payments are given in Table 5.17.
Table 5.14 Capital receipts and capital expenditure (` Crore)
Year Capital receipts Capital expenditure Total Of which
internal debt Total Of which
Capital account
Repayment of public debt
2016-17 52,300 47,710 43,693 25,529 11,887 2017-18 42,458 49,502 45,198 26,842 17,376 2018-19 50,678 25,686 65,239 35,049 28,645 2019-20 (RE) 1,06,647 74,432 75,597 46,317 26,134 2020-21 (BE) 86,730 80,609 77,117 45,124 29,700
Source : Finance Department, GoM
Table 5.15 Fiscal deficit in selected states (2019-20 (RE))
State Fiscal deficit as per cent of GSDP
Andhra Pradesh 4.2 Gujarat 1.6 Karnataka 2.3 Kerala 3.0 Madhya Pradesh 3.6 Maharashtra# 2.8 Rajasthan 3.2 Tamil Nadu 3.0 Telangana 2.3 Uttar Pradesh 2.8 India 3.8
# As per first revised estimates of GSDP Source : Reserve Bank of India
Table 5.16 Indicative fiscal deficit and debt path for the State as per 15th FC recommendations
(per cent) Year Fiscal deficit to
GSDP Debt stock to
GSDP 2020-21 4.5 25.7 2021-22 4.0 26.0 2022-23 3.5 27.5 2023-24 3.0 28.1 2024-25 3.0 28.5 2025-26 3.0 28.5
Source: 15th FC report for 2021-26, GoI
Table 5.17 Debt stock and interest payments (` Crore)
Year Debt stock
Interest payments
2016-17 3,64,819 28,532 2017-18 4,02,402 33,018 2018-19 4,07,152 34,021
2019-20 (RE) 4,64,020 34,173
2020-21 (BE) 5,20,717 35,531
Source: Finance Department, GoM

84
Economic Survey of Maharashtra 2020-21
5.13.1 Internal debt of the State is expected to reach ` 4,30,140 crore (82.6 per cent of debt stock) as per 2020-21 (BE), of which open market borrowings are expected to be ` 3,53,005 crore. In 2020-21(BE) internal debt of ` 80,609 crore are expected to be raised of which expected open market borrowings are ` 70,000 crore (share of 86.8 per cent).
Annual scheme 2020-21
5.14 Total funds proposed for annual scheme 2020-21 are ` 1,15,000 crore as against ` 99,000 crore proposed for annual scheme 2019-20. The share of district schemes in annual scheme 2020-21 is ` 14,455 crore. During 2019-20, of the total expenditure the expected share of Social & Community Services was highest (31.0 per cent) followed by Agriculture & Allied Activities (23.0 per cent) and Transport (15.1 per cent). Sectorwise annual scheme expenditure is given in Table 5.18.
Table 5.18 Sectorwise annual scheme expenditure
(` Crore)
Sector Annual scheme expenditure incurred 2020-21
2017-18 2018-19 2019-20# Proposed funds
Per cent share
Agriculture & Allied Activities 23,002 11,428 30,512 16,334 14.2 Rural Development 2,691 3,795 4,050 5,125 4.5 Special Area Development 61 118 145 160 0.1 Irrigation and Flood Control 8,751 7,889 9,587 11,898 10.4 Energy 12,825 9,714 17,133 9,112 7.9 Industry & Minerals 319 487 754 843 0.7 Transport 7,807 16,775 19,973 16,846 14.7 Science, Technology & Environment
35 137 125 381 0.3
General Economic Services 736 891 865 1,972 1.7 Social & Community Services 22,253 28,218 41,065 42,588 37.0 General Services 2,276 3,334 4,490 7,564 6.6 Other Programmes 3,321 3,184 3,708 2,177 1.9 Total 84,077 85,970 1,32,407 1,15,000 100.0 Source: Finance Department, GoM # Anticipated

85
Economic Survey of Maharashtra 2020-21
Guarantees given by the Government 5.15 Status of outstanding guarantees given by the State at the end of 2018-19 were ` 25,135 crore (9.0 per cent of total revenue receipts). The highest outstanding guarantee of 76.1 per cent was given by the Urban Development Department followed by 15.7 per cent by Co-operation, Marketing & Textile Department and 3.2 per cent by Public Works Department. Guarantees given by the government during 2018-19 are given in Table 5.19.
Fifth State FC
5.16 The Fifth Maharashtra Finance Commission was constituted with main objective to review financial condition of local bodies and accordingly make recommendations regarding remedial measures to improve their financial condition. The Commission submitted its report on 20th August, 2019 for the period 2020-2025. Due to extension given to the commission, implementation period is 16th December, 2020 to March, 2025. The Commission made recommendations regarding evaluation of economy of the local bodies, economic and administrative measures, additional sources to increase income, accounts and audit. Amongst these recommendations, recommendations having financial burden on the State are 62, of which 29 recommendations have been accepted.
* * * * *
Table 5.19 Guarantees given by the government during 2018-19 (` Crore)
Name of the department Outstanding guarantees
at the beginning of the year
Additional guarantees Deletion (other than
invoked) in the year
Invoked and
discharged during
the year
Outstanding at the end of the year During
the year
Due to loan received on revolving
guarantees and amount changed due
to revised interest rate (a) (b) (c) (d) (e) (a)+(b)+
(c)-(d)-(e) Social Justice & Special Assistance 267.75 325.00 5.93 51.97 0.00 546.71
VJNT, OBC & SBC Welfare 142.01 0.00 1.42 40.40 0.00 103.03
Urban development 19,170.27 0.00 0.00 38.57 0.00 19,131.70
Industry, Energy & Labour (Energy) 0.13 0.00 0.00 0.13 0.00 0.00
Public works 1,157.15 0.00 0.00 352.50 0.00 804.65
Tribal development 24.63 0.00 0.88 0.59 0.00 24.92
Co-operation, Marketing & Textile 5,272.57 660.00 30.52 1,847.63 174.00 3,941.46
Water supply & sanitation 504.64 0.00 0.00 13.05 0.00 491.59
Minority development 38.67 0.00 0.00 4.79 0.00 33.88
Planning 79.90 0.00 0.00 22.98 0.00 56.92
Total 26,657.72 985.00 38.75 2,372.61 174.00 25,134.86 Source: Finance Department, GoM

Economic Survey of Maharashtra 2020-21
86
ANNEXURE 5.1
BUDGET AT A GLANCE (` Crore)
Item 2014-15 2015-16 2016-17 2017-18 2018-19 2019-20# 2020-21## (1) (2) (3) (4) (5) (6) (7) (8)
1. Revenue Receipts (a + b) 1,65,415 1,85,036 2,04,693 2,43,654 2,78,996 3,09,881 3,47,457 a) Tax Revenue 1,32,694 1,54,714 1,70,331 2,05,151 2,29,491 2,35,754 2,73,181
b) Non-Tax Revenue 32,722 30,322 34,362 38,503 49,506 74,127 74,276
2. Revenue Expenditure 1,77,553 1,90,374 2,13,229 2,41,571 2,67,022 3,41,324 3,56,968 of which a) Interest Payments 23,965 25,771 28,532 33,018 34,021 34,173 35,531
b) Administrative Services 15,086 16,628 18,544 18,922 20,760 27,877 34,519
c) Pensions & Misc. gen. Services
14,407 15,468 16,999 18,716 20,841 27,631 29,566
3. Revenue Deficit (2 - 1) 12,137 5,338 8,536 (-) 2,082 (-)11,975 31,443 9,511 4. Capital Receipts 45,939 38,233 52,300 42,458 50,678 1,06,647 86,730
4.1) Net Capital receipts 30,758 28,190 40,413 25,082 25,561 80,514 57,031 of which a) Recovery of loans 975 865 1,746 1,778 1,604 2,290 2,309
b) Other capital receipts 10 17 0 0 0 0 0
c) Borrowings & Other Liabilities 29,783 27,308 38,667 23,304 23,957 78,224 54,722
5. Capital Expenditure 40,195 34,913 43,693 45,198 65,239 75,597 77,117 6. Total Receipts (1 + 4) 2,11,355 2,23,268 2,56,993 2,86,111 3,29,674 4,16,528 4,34,187 7. Total Expenditure (2 + 5) 2,17,748 2,25,287 2,56,922 2,86,769 3,32,260 4,16,921 4,34,085 8. Appropriation to Contingency
Fund 4,350 962 0 0 2,528 0 0
9. Budgetary Deficit (7 - 6 - 8) 2,043 1,057 (-) 71 657 (-)942 393 (-)103 10. Fiscal Deficit (9 + 4 C) 31,827 28,364 38,596 23,961 23,015 78,617 54,618 11. Primary Deficit (10-2(a)) 7,862 2,610 10,064 (-) 9,057 (-)11,006 44,444 19,088
As per cent of GSDP (base year 2011-12)
1. Revenue Receipts (a + b) 9.3 9.4 9.3 10.4 10.8 11.0 13.1 a) Tax Revenue 7.5 7.9 7.7 8.7 8.9 8.4 10.3
b) Non - Tax Revenue 1.8 1.5 1.6 1.6 1.9 2.6 2.8
2. Revenue Expenditure 10.0 9.7 9.7 10.3 10.4 12.1 13.4 of which a) Interest Payments 1.3 1.3 1.3 1.4 1.3 1.2 1.3
b) Administrative Services 0.8 0.8 0.8 0.8 0.8 1.0 1.3
c) Pensions & Misc. gen. Services 0.8 0.8 0.8 0.8 0.8 1.0 1.1
3. Revenue Deficit (2 - 1) 0.7 0.3 0.4 (-) 0.1 (-) 0.5 1.1 0.4 4. Capital Receipts 2.6 1.9 2.4 1.8 2.0 3.8 3.3 4.1) Net Capital receipts 1.7 1.4 1.8 1.1 1.0 2.9 2.1
of which a) Recovery of loans 0.1 0.0 0.1 0.1 0.1 0.1 0.1
b) Other capital receipts 0.0 0.0 0.0 0.0 0.0 0.0 0.0
c) Borrowings & Other Liabilities 1.7 1.4 1.8 1.0 0.9 2.8 2.1
5. Capital Expenditure 2.3 1.8 2.0 1.9 2.5 2.7 2.9 6. Total Receipts (1 + 4) 11.9 11.4 11.7 12.2 12.8 14.8 16.3 7. Total Expenditure (2+5) 12.2 11.5 11.7 12.2 12.9 14.8 16.3
8. Appropriation to the contingency fund 0.2 0.0 0.0 0.0 0.1 0.0 0.0
9. Budgetary Deficit (7 - 6 - 8) 0.1 0.1 0.0 0.0 0.0 0.0 0.0 10. Fiscal Deficit (9 + 4 C) 1.8 1.4 1.8 1.0 0.9 2.8 2.1 11. Primary Deficit (10 - 2(a)) 0.4 0.1 0.5 (-) 0.4 (-) 0.4 1.6 0.7 Source - Finance Department, GoM. # Revised Estimates ## Budget Estimates
Note - Figures may not add up to totals due to rounding.

Economic Survey of Maharashtra 2020-21
87
ANNEXURE 5.2
BUDGET: TRENDS IN RECEIPTS ON REVENUE AND CAPITAL ACCOUNTS
(` Crore)
Item 2014-15 2015-16 2016-17 2017-18 2018-19 2019-20# 2020-21##
(1) (2) (3) (4) (5) (6) (7) (8) (A) Total Revenue Receipts (1+2+3+4) 1,65,415 1,85,036 2,04,693 2,43,654 2,78,996 3,09,881 3,47,457 (1) State's own Tax Revenue (1 to 9) 1,15,090 1,26,628 1,36,616 1,67,948 1,87,538 1,99,534 2,25,071 (1) State GST -- -- -- 50,063 82,352 86,470 1,07,146 (2) Sales Tax 67,466 69,661 81,174 54,894 35,725 38,066 40,000 (3) Stamps and Registration Fees 19,959 21,767 21,012 26,442 28,545 29,500 30,000 (4) State Excise Duties 11,397 12,470 12,288 13,450 15,321 17,977 19,225
(5) Taxes and Duties on Electricity
4,350 8,506 6,670 7,345 10,085 9,820 9,500
(6) Taxes on Vehicles 5,405 6,017 6,741 8,665 8,613 8,599 9,500 (7) Land Revenue 1,272 1,748 1,799 2,310 2,088 3,520 4,000
(8) Other Taxes on Income & Expenditure
2,175 2,193 2,312 2,205 2,583 2,450 2,420
(9) Tax on Goods and Passengers 587 1,582 1,877 984 837 1,750 1,760
(10) Other Taxes & Duties on Commodities & Services
2,478 2,684 2,743 1,590 1,389 1,381 1,519
(11) Taxes on Agricultural income 0 Neg. 0 Neg. Neg. 0 0 (2) Non-Tax Revenue (1+2) 12,580 13,423 12,709 16,680 15,844 16,851 20,506 (1) Interest Receipts 3,351 3,079 3,259 4,163 4,191 2,600 2,708 (2) Other non-tax revenue 9,229 10,344 9,450 12,517 11,652 14,251 17,798 (3) Share in Central Taxes (1 to 6) 17,604 28,086 33,715 37,203 41,953 36,220 48,109 (1) Corporation Tax 6,147 8,835 10,790 11,388 14,622 12,230 14,798 (2) Central GST -- -- -- 522 10,378 11,891 14,561
(3) Taxes on Income other than Corporation Tax
4,390 6,145 7,499 9,616 10,768 11,122 13,760
(4) Customs 2,847 4,487 4,642 3,753 2,980 2,554 3,003 (5) Union Excise Duties 1,608 3,730 5,300 3,923 1,981 1,645 1,962 (6) Service Tax 2,596 4,887 5,459 4,247 390 28 26 (7) Taxes on Wealth 17 2 25 Neg. 5 (-)3,251 Neg. (8) Integrated GST -- -- -- 3,754 828 0 0 (4) Grants in Aid from Central
Government 20,141 16,899 21,653 21,823 33,662 57,276 53,770
(B) Total Capital Receipts (1+2+3+4) 45,939 38,233 52,300 42,458 50,678 1,06,647 86,730 (1) Receipts from Public Debts (a+ b) 35,726 37,976 48,336 49,669 26,025 74,932 81,106
(a) Internal Debt of the State Govt.
35,184 37,392 47,710 49,502 25,686 74,432 80,609
(b) Loans & Advances from Central Govt.
542 584 627 168 339 500 497
(2) Loans & Advances by the State Government (Recoveries)
975 865 1,746 1,778 1,604 2,290 2,309
(3) Other Capital Receipts. (net) ‡ 10 17 0 0 0 0 0 (4) Public Account (net) (a+b +c+d ) 9,228 (-) 626 2,218 (-) 8,990 23,049 29,426 3,315
(a) Small Savings, Provident Funds, etc. (net)
1,260 1,209 1,124 547 492 1,559 1,906
(b) Reserve Funds (net) (1+2) (-) 275 (-) 321 102 (-) 194 (-)1,356 3,192 (-)288 (1) Interest Bearing (-) 43 9 302 45 (-)282 3,659 (-)38 (2) Non-interest Bearing (-) 232 (-) 330 (-) 200 (-) 239 (-)1,074 (-)467 (-)250 (c) Civil Deposits (net) (1+2) 4,411 2,773 6,840 3,930 4,323 3,725 5,252 (1) Interest Bearing 3,361 1,251 3,240 4,717 3,631 2,852 3,454 (2) Non-interest Bearing 1,050 1,522 3,600 (-) 787 692 873 1,798 (d) Others 3,832 (-) 4,287 (-) 5,849 (-) 13,272 19,590 20,950 (-)3,554 Total Receipts (A + B) 2,11,354 2,23,268 2,56,993 2,86,111 3,29,674 4,16,528 4,34,187
Source - Finance Department, GoM. # Revised Estimates ## Budget Estimates Neg.- Negligible
‡ It comprises of inter-state settlement (net) appropriations to the contingency fund (net) and contingency fund (net). Note - Figures may not add up to totals due to rounding.

Economic Survey of Maharashtra 2020-21
88
ANNEXURE 5.3
BUDGET: TRENDS IN EXPENDITURE ON REVENUE AND CAPITAL ACCOUNTS (` Crore)
Item 2014-15 2015-16 2016-17 2017-18 2018-19 2019-20# 2020-21##
(1) (2) (3) (4) (5) (6) (7) (8)
(A) Revenue Expenditure (1+2) 1,77,553 1,90,374 2,13,229 2,41,571 2,67,022 3,41,324 3,56,968 (1) Development Expenditure (a+b+c) 1,17,067 1,26,004 1,41,619 1,63,036 1,82,257 2,38,920 2,45,124
(a) Social Services (1 to 8) 76,953 82,317 90,282 93,054 1,09,391 1,42,634 1,53,237 (1) Education, Sport, Art & Culture 39,696 42,867 45,358 48,476 50,922 66,531 72,901 (2) Health & Family Welfare 8,497 9,357 10,121 11,605 11,969 14,956 15,748
(3) Water Supply & Sanitation, Housing and Urban Development
7,429 9,573 14,868 12,214 14,378 21,144 28,619
(4) Information & Broadcasting 122 83 94 72 142 190 311 (5) Welfare of SC, ST & OBC 8,097 8,237 9,187 12,439 14,234 16,051 18,535 (6) Labour and Labour Welfare 895 709 845 834 883 1,235 1,702 (7) Social Welfare and Nutrition 12,112 11,407 9,707 7,291 16,724 22,329 15,152 (8) Others 105 82 102 123 140 198 270 (b) Economic Services (1 to 9) 37,686 38,052 43,843 54,189 52,759 74,756 68,211 (1) Agriculture and Allied activities 8,567 9,660 13,245 26,130 20,020 32,940 23,862 (2) Rural Development 6,172 5,609 7,018 6,589 6,997 12,585 15,562 (3) Special Area Programme 33 1 (-) 1 1 1 1 1 (4) Irrigation and Flood control 2,487 2,758 2,544 2,159 1,898 1,904 2,490 (5) Energy 10,891 9,404 9,611 8,946 11,135 11,656 9,641 (6) Industry and Minerals. 2,894 3,279 3,102 2,439 3,580 4,380 3,891 (7) Transport and Communication 5,556 5,541 6,106 5,461 6,338 7,540 7,479
(8) Science, Technology & Environment
77 97 237 225 297 392 690
(9) General Economic Services 1,009 1,703 1,980 2,241 2,494 3,357 4,595
(c) Grants-in-Aid & contributions to Local Bodies & P.R. Institutions
2,428 5,635 7,495 15,793 20,107 21,530 23,676
(2) Non-Development Expenditure (a+b) 60,486 64,370 71,610 78,535 84,765 1,02,404 1,11,844 (a) General Services (1 to 5) 34,631 36,378 40,478 42,416 46,943 64,231 72,313 (1) Organs of State 2,334 1,859 1,865 1,994 2,272 4,679 4,125 (2) Fiscal Services 2,590 2,424 3,070 2,784 3,070 4,044 4,103 (3) Administrative Services 15,086 16,628 18,544 18,922 20,760 27,877 34,519
(4) Pensions and Miscellaneous General Services
14,407 15,468 16,999 18,726 20,841 27,631 29,566
(5) Transfers to Reserve Funds 214 0 0 0 0 0 0 (b) Interest Payments & Debt Services 25,855 27,991 31,132 36,118 37,821 38,173 39,531
(B) Capital Expenditure (1+2) 40,194 34,913 43,693 45,198 65,239 75,597 77,117 (1) Development Expenditure (a+b) 20,664 23,908 31,806 27,821 36,594 49,463 47,417
(a) Capital Expenditure outside the Revenue Account
19,523 22,793 25,529 26,842 35,049 46,317 45,124
(b) Loans and Advances given by the State Government
1,141 1,115 6,277 979 1,545 3,146 2,293
(2) Non-Development Expenditure (a+b+c) (Repayment of Public debt)
19,530 11,005 11,887 17,376 28,645 26,134 29,700
(a) Internal Debt of the State Government 14,294 9,138 10,917 16,428 24,190 24,902 28,531 (b) Loans & Advances from Central Govt. 886 905 970 949 926 1,233 1,179 (c) Appropriation to the Contingency Fund 4,350 962 0 0 3,528 0 0 Total Expenditure (A + B) 2,17,748 2,25,287 2,56,922 2,86,769 3,32,260 4,16,921 4,34,085
,
Source - Finance Department, GoM. # Revised Estimates ## Budget Estimates Note - Figures may not add up to totals due to rounding.

Economic Survey of Maharashtra 2020-21
89
ANNEXURE 5.4
BORROWINGS & OTHER LIABILITIES (` Crore)
Item 2014-15 2015-16 2016-17 2017-18 2018-19 2019-20# 2020-21## (1) (2) (3) (4) (5) (6) (7) (8)
I Debt Receipts (1+2+3) (bearing interest)
25,124 30,402 41,116 37,602 4,749 56,868 56,728
1) Internal Debt of the State Government (net)
20,890 28,254 36,792 33,074 1,496 49,530 52,088
2) Loans & Advances from Central Government (net)
(-) 344 (-) 321 (-) 343 (-) 781 (-)587 (-)733 (-)682
3) Interest bearing obligations (a + b + c)
4,578 2,469 4,666 5,309 3,841 8,071 5,322
a) Provident Fund (net) 1,260 1,209 1,124 547 492 1,559 1,906
b) Reserve Fund (net) (-) 43 9 302 45 (-)282 3,659 (-)38
c) Civil Deposits (net) 3,361 1,251 3,240 4,717 3,631 2,852 3,454
II Debt Receipts (1+2 )
(Not bearing interest) 4,659 (-) 3,095 (-) 2,448 (-) 14,298 19,208 21,356 (-) 2,007
1) Net receipts on Public Account @
4,649 (-) 3,095 (-) 2,448 (-) 14,298 19,208 21,356 (-) 2,007
2) Other capital receipts (net)$
10 0 0 0 0 0 0
Total Borrowings & other Liabilities (I + II)
29,783 27,308 38,667 23,304 23,957 78,224 54,722
Source - Finance Department, GoM. # Revised Estimates ## Budget Estimates @ Net Receipts on Public Accounts consist of Reserve Funds, Deposits, Suspense & Misc. and Remittances Accounts. $ It comprises of the receipts of Inter-State Settlement (net), Appropriation to the Contingency Fund (net) and Contingency Fund (net)
Note - Figures may not add up to totals due to rounding.

Economic Survey of Maharashtra 2020-21
90
ANNEXURE 5.5
FINAL CONSUMPTION EXPENDITURE AND EXPENDITURE ON CAPITAL FORMATION OF GOVERNMENT
(` Crore)
Particular 2014-15 2015-16 2016-17 2017-18 2018-19 2019-20# 2020-21##
(1) (2) (3) (4) (5) (6) (7) (8)
A. Consumption Expenditure
1. Compensation to Employees (1.1+1.2) 33,954 37,040 40,441 45,656 47,095 64,089 71,467
1.1 Wages & Salaries 20,750 23,142 24,751 26,733 28,175 38,759 44,485
1.2 Pension 13,204 13,898 15,690 18,923 18,920 25,330 26,983
2. Net Purchases of Commodities & Services (2.1+2.2-2.3)
12,870 11,505 15,382 14,353 13,590 17,848 21,117
2.1 Purchases 10,339 9,166 12,387 10,664 12,384 17,519 22,512
2.2 Maintenances 4,785 4,605 5,112 5,896 6,306 8,166 6,866
2.3 Sales 2,034 2,266 2,117 2,207 5,099 7,838 8,261
Total Consumption Expenditure 47,044 48,545 55,824 60,009 60,685 81,936 92,584
B. Expenditure on Capital Formation
1. Buildings 1,978 2,548 1,918 2,043 3,210 5,091 10,331
2. Roads & Bridges 3,654 4,351 4,979 6,113 9,512 14,297 10,521
3. Other Capital Outlay 6,623 7,653 7,975 10,233 10,219 15,631 15,474
4. Transport Equipments 171 197 256 151 96 167 186
5. Machinery & Equipment 457 646 1,105 998 1,171 1,726 1,921
6. Cultivated Assets 0 0 0 4 4 4 5
7. Animal Stock 0 0 0 0 0 0 0
8. Expenditure on New Capital Formation ( 1 to 7 )
12,883 15,395 16,234 19,542 24,213 36,916 38,437
9. Change in Stock 4 3 4 0 0 0 0
10. Gross Capital Formation (8 + 9) 12,887 15,398 16,237 19,542 24,213 36,916 38,437
Source - Directorate of Economics & Statistics, GoM. # Revised Estimates ## Budget Estimates
Note - Figures may not add up to totals due to rounding.

6 Institutional Finance and
Capital Market


Economic Survey of Maharashtra 2020-21
6. INSTITUTIONAL FINANCE AND CAPITAL MARKET
6.1 A well structured and efficient network of financial institutions helps economic growth. These institutions caters to credit needs of all sections of the society as well infrastructure projects. Banking institutions are prime financial institutions in India. Scheduled commercial banks and nationalised banks are actively engaged in providing credit in rural areas. Non-banking financial institutions are financial intermediaries playing an important role in capital formation. These institutions cater to increasing financial needs of the corporate sector.
Banking institutions 6.2 The banking institutions are prime institutions both in deposits and credit. The Scheduled Commercial Banks (SCB) comprises of Public Sector banks, foreign banks, Regional Rural Banks (RRB), private banks, etc. 6.3 As on 31st March, 2020 in all 13,114 banking offices of SCB (about nine per cent of the total banking offices in India) were functioning in the State. Of which, 24.3 per cent were in rural areas, 23.5 per cent were in semi-urban areas and 52.2 per cent in urban areas. The Credit-Deposit (CD) ratio of the SCB in State was 102.6 per cent whereas, that of All-India was 76.0 per cent. Deposits and credit of SCB in the State are given in Table 6.1 and its series is given in Annexure 6.1.
6.4 As on 31st March, 2020 average population served per bank office in the State were 9,402 as against 9,057 at All-India level. The facility of Automated Teller Machines in the State was 24,943 as against 2,10,760 at All-India level as on 31st March, 2020. The per capita deposits and per capita credit of SCB in the State were ` 2,23,436 and ` 2,29,215 respectively as on 31st March, 2020. The corresponding figures at All-India level were ` 1,01,961 and ` 77,485. The share of Public Sector Banks in the aggregate deposits and credit of SCB in the State was 49.2 per cent & 48.8 per cent and that of private banks was 38.8 per cent & 44.1 per cent respectively. Bank groupwise deposits and credit of SCB in the State are given in Table 6.2. Table 6.2 Bank groupwise deposits and credit of SCB in the State (As on 31st March)
Bank group Banking offices (no.)
Deposits (` '000 Crore)
Credit (` '000 Crore)
CD ratio (per cent)
2019 2020 2019 2020 2019 2020 2019 2020 Public Sector Banks 7,954 7,919 1,231.25 1,355.08 1,382.90 1,378.13 112.3 101.7
Foreign banks 91 99 264.83 304.33 181.18 186.11 68.4 61.2 RRBs 739 739 13.62 15.67 8.61 8.45 63.2 54.1 Private banks 3,484 3,833 1,033.13 1,069.05 1,135.85 1,245.70 110.0 116.5 Small Finance banks 233 524 7.12 10.84 6.26 7.83 88.7 72.2
All 12,501 13,114 2,549.94 2,754.97 2,714.80 2,826.22 106.5 102.6 Source : Reserve Bank of India
Table 6.1 Deposits and credit of SCB in the State (As on 31st March)
Particulars Rural Semi-urban Urban Total 2019 2020 2019 2020 2019 2020 2019 2020
Banking offices (no.) 3,135 3,186 2,860 3,078 6,506 6,850 12,501 13,114
Deposits (` '000 Crore) 77.28 91.71 156.90 183.78 2,315.77 2,479.48 2,549.94 2,754.97
Credit (` '000 Crore) 52.24 53.93 92.21 96.46 2,570.36 2,675.83 2,714.81 2,826.22 CD ratio (per cent) 67.6 58.8 58.8 52.5 111.0 107.9 106.5 102.6 Source : Reserve Bank of India

Economic Survey of Maharashtra 2020-21
92
6.5 In rural areas, savings are higher than term deposits, while in urban areas, term deposits are higher than savings. Deposits of SCB in the State by type of account are given in Table 6.3.
Table 6.3 Deposits of SCB in the State by type of account (As on 31st March)
Type of account
Deposits ( ` '000 Crore) Per cent change in total
over previous
year
2019 2020
Rural Semi-urban Urban Total Rural Semi-
urban Urban Total
Current 4.53 17.78 351.70 374.01 4.63 17.36 385.78 407.78 9.0
Savings 39.44 69.71 396.55 505.70 45.71 81.22 448.52 575.45 13.8
Term deposits 33.30 69.42 1,567.52 1,670.23 41.37 85.20 1,645.18 1,771.75 6.1
All 77.28 156.90 2,315.77 2,549.94 91.71 183.78 2,479.48 2,754.97 8.0 Source : Reserve Bank of India
6.6 As on 31st March, 2020 of the total outstanding credit, about 55.7 per cent was from Public Sector Banks, followed by private banks (36.8 per cent). Outstanding credit of SCB in the State is given in Table 6.4.
6.7 As on 31st March, 2020 the maximum (20.5 per cent) outstanding credit of SCB in the State was in Finance occupation group followed by Manufacturing (20.1 per cent) and personal loans (18.7 per cent). Occupation groupwise outstanding credit of SCB in the State is given in Table 6.5. 6.8 Priority sector lending is an important role given by the Reserve Bank of India to SCB for providing a specified portion of the lending to few specific sectors like ‘Agriculture & Allied activities’, ‘micro, small & medium enterprises’, ‘housing for poor, other low income groups & weaker sections’. As on 31st March, 2020 maximum (45.4 per cent) advances were outstanding wise ‘Agriculture & Allied activities’ sector followed by micro, small & medium enterprises (38.2 per cent). Priority sectorwise outstanding advances of SCB in the State is shown in Table 6.6.
Table 6.4 Outstanding credit of SCB in the State
(As on 31st March) Bank group Outstanding credit
( ` '000 Crore) Per cent change
over previous
year 2019 2020
Public Sector Banks 1,398.4 1,397.91 0.0
Foreign banks 183.7 171.55 (-)7.1
RRBs 0.0 8.45 -
Private banks 1,147.3 923.31 (-)24.3
Small Finance Banks 6.2 9.86 59.7
All 2,735.6 2,511.09 (-)8.9 Source : Reserve Bank of India
Table 6.5 Occupation groupwise outstanding credit of SCB in the State
(As on 31st March) Occupation group Outstanding
credit (` '000 Crore)
Per cent change
over previous
year 2019 2020 Agriculture & Allied activities 130.8 96.25 (-)35.8 Mining & Quarrying 23.7 31.20 31.7 Manufacturing 552.5 504.60 (-)9.5 Electricity, Gas & Water Supply 137.8 128.30 (-)7.4 Construction 232.0 220.03 (-)5.5 Transport 90.6 61.82 (-)46.6 Professional & other services 224.3 203.91 (-)10.0 Trade 216.0 214.83 (-)0.6 Personal loans 509.2 470.36 (-)8.2 Finance 514.5 515.20 0.1 Others 104.2 64.59 (-)36.9 All 2,735.6 2,511.09 (-)8.9 Source : Reserve Bank of India
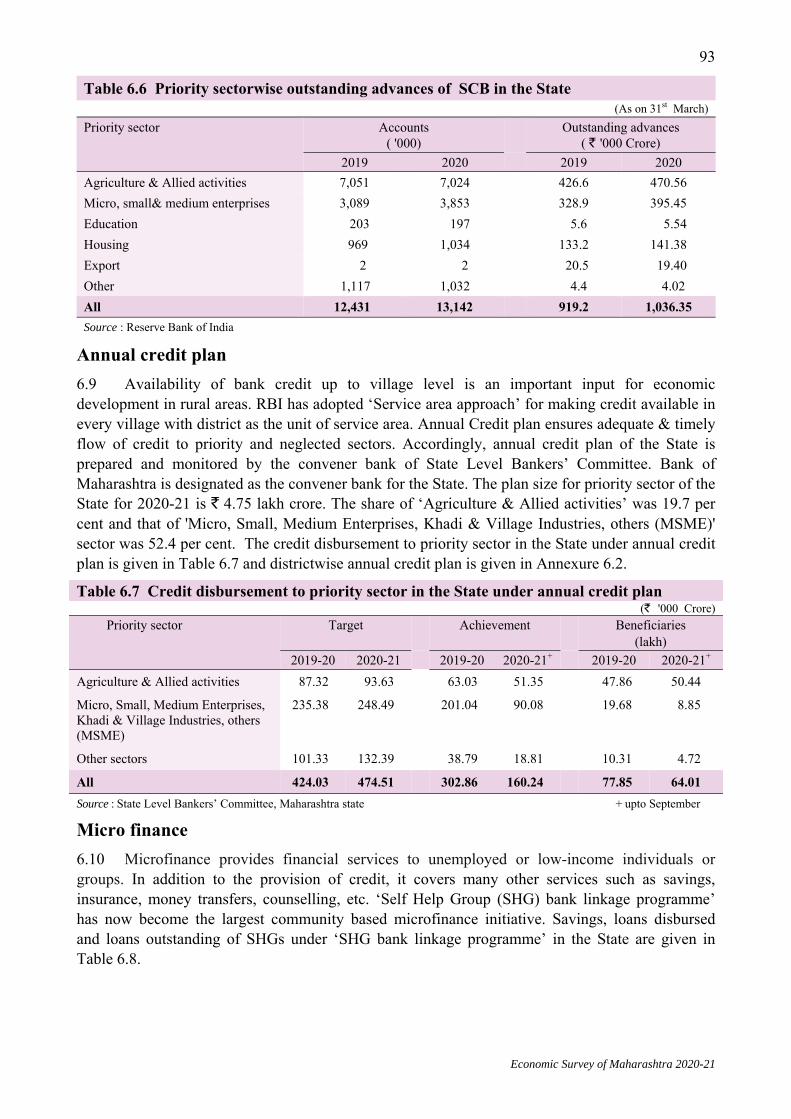
Economic Survey of Maharashtra 2020-21
93
Table 6.6 Priority sectorwise outstanding advances of SCB in the State (As on 31st March)
Priority sector Accounts ( '000)
Outstanding advances ( ` '000 Crore)
2019 2020 2019 2020 Agriculture & Allied activities 7,051 7,024 426.6 470.56 Micro, small& medium enterprises 3,089 3,853 328.9 395.45 Education 203 197 5.6 5.54 Housing 969 1,034 133.2 141.38 Export 2 2 20.5 19.40 Other 1,117 1,032 4.4 4.02 All 12,431 13,142 919.2 1,036.35 Source : Reserve Bank of India
Annual credit plan 6.9 Availability of bank credit up to village level is an important input for economic development in rural areas. RBI has adopted ‘Service area approach’ for making credit available in every village with district as the unit of service area. Annual Credit plan ensures adequate & timely flow of credit to priority and neglected sectors. Accordingly, annual credit plan of the State is prepared and monitored by the convener bank of State Level Bankers’ Committee. Bank of Maharashtra is designated as the convener bank for the State. The plan size for priority sector of the State for 2020-21 is ` 4.75 lakh crore. The share of ‘Agriculture & Allied activities’ was 19.7 per cent and that of 'Micro, Small, Medium Enterprises, Khadi & Village Industries, others (MSME)' sector was 52.4 per cent. The credit disbursement to priority sector in the State under annual credit plan is given in Table 6.7 and districtwise annual credit plan is given in Annexure 6.2.
Table 6.7 Credit disbursement to priority sector in the State under annual credit plan (` '000 Crore)
Priority sector Target Achievement Beneficiaries (lakh)
2019-20 2020-21 2019-20 2020-21+ 2019-20 2020-21+
Agriculture & Allied activities 87.32 93.63 63.03 51.35 47.86 50.44
Micro, Small, Medium Enterprises, Khadi & Village Industries, others (MSME)
235.38 248.49 201.04 90.08 19.68 8.85
Other sectors 101.33 132.39 38.79 18.81 10.31 4.72
All 424.03 474.51 302.86 160.24 77.85 64.01 Source : State Level Bankers’ Committee, Maharashtra state + upto September
Micro finance 6.10 Microfinance provides financial services to unemployed or low-income individuals or groups. In addition to the provision of credit, it covers many other services such as savings, insurance, money transfers, counselling, etc. ‘Self Help Group (SHG) bank linkage programme’ has now become the largest community based microfinance initiative. Savings, loans disbursed and loans outstanding of SHGs under ‘SHG bank linkage programme’ in the State are given in Table 6.8.

Economic Survey of Maharashtra 2020-21
94
Table 6.8 Savings, loans disbursed and loans outstanding of SHGs under SHG bank linkage programme in the State
(As on 31st March, 2020) Type of Bank Particulars Total SHGs SHG under
NRLM/SGSY#
Exclusive women SHGs
No. Amount (` Crore) No. Amount
(` Crore) No. Amount (` Crore)
Co-operative
Savings 4,39,814 482.37 1,21,222 173.66 3,99,613 420.29
Loans disbursed 58,451 427.45 21,915 106.98 48,966 338.32
Loans outstanding
30,829 280.22 11,268 85.27 30,161 275.10
Regional Rural Savings 1,40,752 188.04 1,24,854 147.21 1,24,854 147.21
Loans disbursed 18,262 270.34 17,714 260.03 18,212 269.30
Loans outstanding
32,509 347.98 27,569 305.36 31,550 341.25
Public commercial
Savings 4,17,491 628.47 1,59,109 235.55 3,01,893 445.95
Loans disbursed 40,084 509.90 28,516 372.78 30,112 388.28
Loans outstanding
94,638 1,051.61 60,032 655.41 68,442 793.43
Private commercial
Savings 1,69,099 285.56 1,38,590 93.93 1,64,577 277.69
Loans disbursed 44,689 970.32 26,394 590.72 44,648 969.62
Loans outstanding
76,297 1,008.40 46,441 606.59 75,148 1,000.13
Source: NABARD # NRLM / SGSY National Rural Livelihood Mission / Swarnajayanti Gram Swarozgar Yojana
Financial inclusion 6.11 Effective financial inclusion should be reflected not only in terms of access but in the use of financial services. Financial inclusion is the process of ensuring access to financial services and timely & adequate credit needed by weaker sections & low income groups at an affordable cost. Pradhan Mantri Jan Dhan Yojana (PMJDY) is an ambitious programme of financial inclusion. Under PMJDY, upto 27th January, 2021 in all 2.97 crore accounts were opened in the State, of which 1.66 crore accounts (56 per cent) were from rural / semi-urban areas. The total balance in these accounts was ` 9,515.89 crore. Under the scheme, about 2.07 crore ‘RuPay cards’ were issued. Banking facilities provided under financial inclusion by SCB in the State are given in Table 6.9 and district wise details of PMJDY are given in Annexure 6.3.
Table 6.9 Banking facilities provided under financial inclusion by SCB in the State (As on 31st March)
Particulars 2018 2019 2020 Total number of banking outlets in villages (no.) 39,130 41,115 41,754 No-Frill accounts Number ('000) 37,548 40,208 41,516 Amount ( ` Crore) 7,446.2 8,755.5 11,015.2 Overdraft amount availed in No-Frill Accounts (` Crore) 25.8 26.7 26.6 Kisan Credit Card Number ('000) 3,297 3,694 3,725 Outstanding amount (` Crore) 37,871.0 43,282.6 40,874.1 Source : RBI
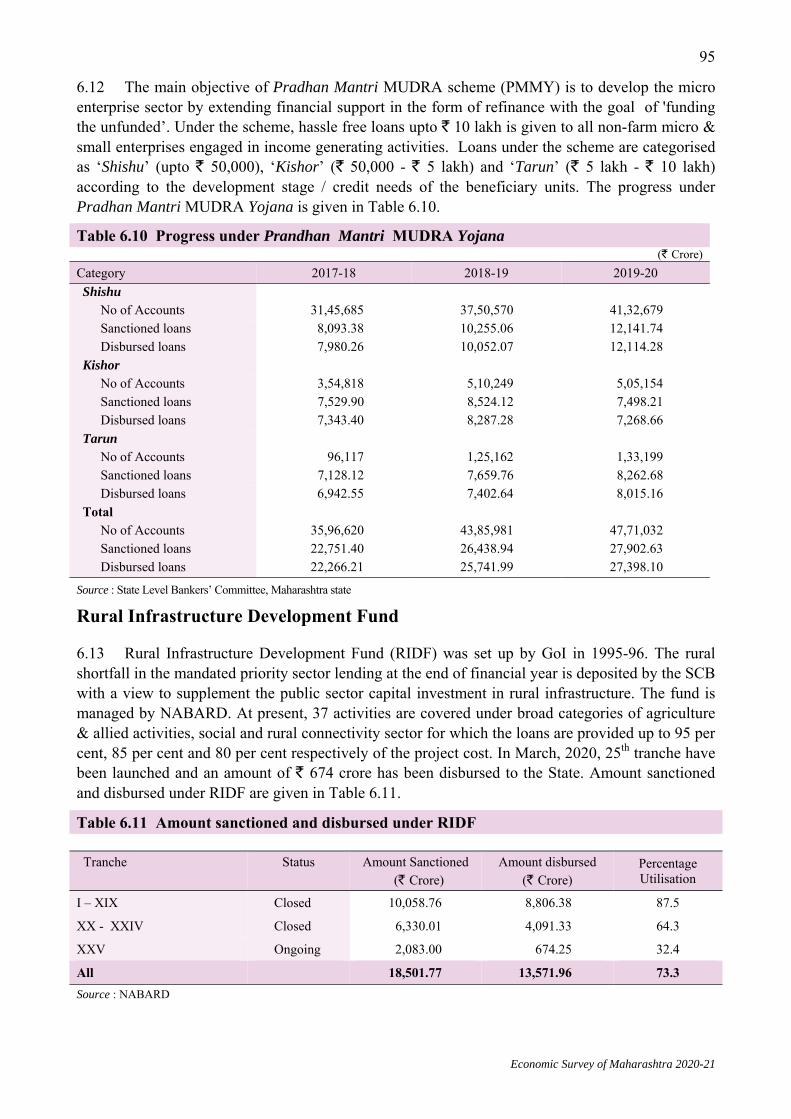
Economic Survey of Maharashtra 2020-21
95
6.12 The main objective of Pradhan Mantri MUDRA scheme (PMMY) is to develop the micro enterprise sector by extending financial support in the form of refinance with the goal of 'funding the unfunded’. Under the scheme, hassle free loans upto ` 10 lakh is given to all non-farm micro & small enterprises engaged in income generating activities. Loans under the scheme are categorised as ‘Shishu’ (upto ` 50,000), ‘Kishor’ (` 50,000 - ` 5 lakh) and ‘Tarun’ (` 5 lakh - ` 10 lakh) according to the development stage / credit needs of the beneficiary units. The progress under Pradhan Mantri MUDRA Yojana is given in Table 6.10.
Table 6.10 Progress under Prandhan Mantri MUDRA Yojana (` Crore)
Category 2017-18 2018-19 2019-20 Shishu No of Accounts 31,45,685 37,50,570 41,32,679 Sanctioned loans 8,093.38 10,255.06 12,141.74 Disbursed loans 7,980.26 10,052.07 12,114.28 Kishor No of Accounts 3,54,818 5,10,249 5,05,154 Sanctioned loans 7,529.90 8,524.12 7,498.21 Disbursed loans 7,343.40 8,287.28 7,268.66 Tarun No of Accounts 96,117 1,25,162 1,33,199 Sanctioned loans 7,128.12 7,659.76 8,262.68 Disbursed loans 6,942.55 7,402.64 8,015.16 Total
No of Accounts 35,96,620 43,85,981 47,71,032 Sanctioned loans 22,751.40 26,438.94 27,902.63 Disbursed loans 22,266.21 25,741.99 27,398.10
Source : State Level Bankers’ Committee, Maharashtra state
Rural Infrastructure Development Fund
6.13 Rural Infrastructure Development Fund (RIDF) was set up by GoI in 1995-96. The rural shortfall in the mandated priority sector lending at the end of financial year is deposited by the SCB with a view to supplement the public sector capital investment in rural infrastructure. The fund is managed by NABARD. At present, 37 activities are covered under broad categories of agriculture & allied activities, social and rural connectivity sector for which the loans are provided up to 95 per cent, 85 per cent and 80 per cent respectively of the project cost. In March, 2020, 25th tranche have been launched and an amount of ` 674 crore has been disbursed to the State. Amount sanctioned and disbursed under RIDF are given in Table 6.11.
Table 6.11 Amount sanctioned and disbursed under RIDF
Tranche Status Amount Sanctioned (` Crore)
Amount disbursed (` Crore)
Percentage Utilisation
I – XIX Closed 10,058.76 8,806.38 87.5
XX - XXIV Closed 6,330.01 4,091.33 64.3
XXV Ongoing 2,083.00 674.25 32.4
All 18,501.77 13,571.96 73.3 Source : NABARD

Economic Survey of Maharashtra 2020-21
96
Joint stock companies 6.14 Joint stock companies promote various ancillary industries, trade and ancillaries to trade and also offer employment at a large scale. As on 31st March, 2020 of the total 12,01,500 joint stock companies in India, about 19.6 per cent were functioning in the State. The share of paid-up capital of these companies in the State in the total paid-up capital of companies in the country was 22.9 per cent. Paid-up capital of joint stock companies is given in Table 6.12.
Table 6.12 Paid-up capital of joint stock companies (As on 31st March)
Item Maharashtra All-India Companies
(no.) Paid-up capital
(` '000 Crore) Companies
(no.) Paid-up capital
(` '000 Crore) 2019 2020 2019 2020 2019 2020 2019 2020
Private 2,08,370 2,21,398 319.24 345.85 10,81,506 11,35,634 1,441.23 1,581.85
Public 13,474 14,002 657.03 687.52 65,793 65,866 2,440.23 2,938.69
All 2,21,844 2,35,400 976.27 1033.37 11,47,299 12,01,500 3,881.46 4,520.53 Source : Ministry of Corporate Affairs, GoI
Mutual funds 6.15.1 Mutual fund is a mediator that brings together a group of people and invests their money in stocks, bonds and other securities. During 2019-20, net amount mobilised by mutual funds in the State was ` 34,140 crore as against ` 87,301 crore in India. During 2020-21 the corresponding figures are ` 1,65,362 crore and ` 2,45,823 crore respectively. The amount mobilised through mutual funds is given in Table 6.13.
Commodity exchange
6.15.2 Multi Commodity Exchange of India Ltd. (MCX) and National Commodity and Derivatives Exchange Ltd. (NCDEX) are the main commodity exchanges functioning in the State to facilitate retail investors. Turnover of MCX and NCDEX are given in Table 6.14.
Table 6.14 Turnover of MCX and NCDEX
Commodity exchange
Commodities included (no.) Turnover ( ` '000 Crore) 2018-19 2019-20 2020-21+ 2018-19 2019-20 2020-21+
MCX 29 30 25 6,772 8,690 5,512 NCDEX 23 23 21 531 482 179 Source : MCX and SEBI + upto November
6.15.3 Insurance is the most effective risk management tool which can protect individuals from financial risks arising out of various contingencies. Apart from protecting against property & casualties risks and providing a financial safety net for individuals & enterprises; insurance sector encourages savings and provides long term funds for development. There are 24 life insurance companies functioning in the State. The share of Life Insurance Corporation of India (LIC) in total new business of life insurance in the State during 2019-20 was 60.6 per cent as against 62.9 per cent in the previous year. New individual life insurance policies underwritten are given in Table 6.15.
Table 6.13 Amount mobilised through mutual funds
(` '000 Crore)
Year New fund offers
Existing mutual funds
2018-19 136.37 24,257.99
2019-20 66.76 18,746.70
2020-21+ 30.21 6,517.19
Source: Association of Mutual Funds in India + upto December
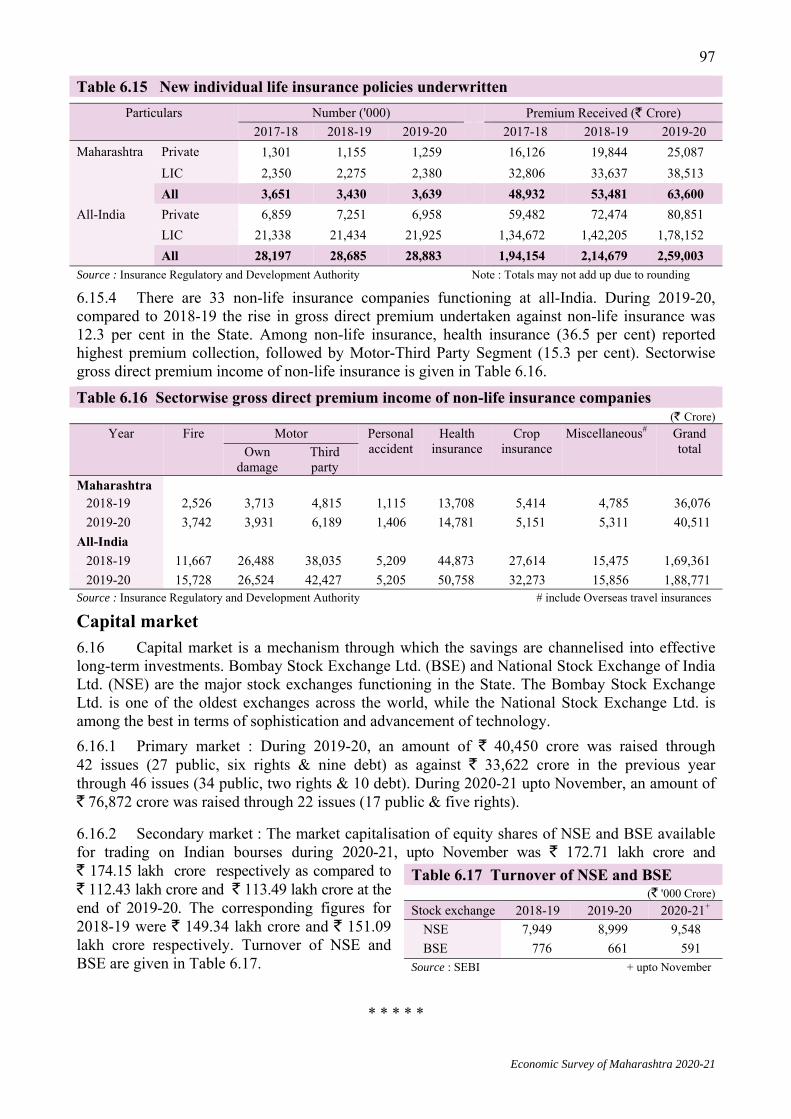
Economic Survey of Maharashtra 2020-21
97
Table 6.15 New individual life insurance policies underwritten
Particulars Number ('000) Premium Received (` Crore) 2017-18 2018-19 2019-20 2017-18 2018-19 2019-20
Maharashtra Private 1,301 1,155 1,259 16,126 19,844 25,087 LIC 2,350 2,275 2,380 32,806 33,637 38,513 All 3,651 3,430 3,639 48,932 53,481 63,600
All-India Private 6,859 7,251 6,958 59,482 72,474 80,851 LIC 21,338 21,434 21,925 1,34,672 1,42,205 1,78,152 All 28,197 28,685 28,883 1,94,154 2,14,679 2,59,003
Source : Insurance Regulatory and Development Authority Note : Totals may not add up due to rounding
6.15.4 There are 33 non-life insurance companies functioning at all-India. During 2019-20, compared to 2018-19 the rise in gross direct premium undertaken against non-life insurance was 12.3 per cent in the State. Among non-life insurance, health insurance (36.5 per cent) reported highest premium collection, followed by Motor-Third Party Segment (15.3 per cent). Sectorwise gross direct premium income of non-life insurance is given in Table 6.16. Table 6.16 Sectorwise gross direct premium income of non-life insurance companies
(` Crore) Year Fire Motor Personal
accident Health
insurance Crop
insurance Miscellaneous#
Grand total Own
damage Third party
Maharashtra 2018-19 2,526 3,713 4,815 1,115 13,708 5,414 4,785 36,076 2019-20 3,742 3,931 6,189 1,406 14,781 5,151 5,311 40,511
All-India 2018-19 11,667 26,488 38,035 5,209 44,873 27,614 15,475 1,69,361 2019-20 15,728 26,524 42,427 5,205 50,758 32,273 15,856 1,88,771
Source : Insurance Regulatory and Development Authority # include Overseas travel insurances
Capital market 6.16 Capital market is a mechanism through which the savings are channelised into effective long-term investments. Bombay Stock Exchange Ltd. (BSE) and National Stock Exchange of India Ltd. (NSE) are the major stock exchanges functioning in the State. The Bombay Stock Exchange Ltd. is one of the oldest exchanges across the world, while the National Stock Exchange Ltd. is among the best in terms of sophistication and advancement of technology. 6.16.1 Primary market : During 2019-20, an amount of ` 40,450 crore was raised through 42 issues (27 public, six rights & nine debt) as against ` 33,622 crore in the previous year through 46 issues (34 public, two rights & 10 debt). During 2020-21 upto November, an amount of ` 76,872 crore was raised through 22 issues (17 public & five rights). 6.16.2 Secondary market : The market capitalisation of equity shares of NSE and BSE available for trading on Indian bourses during 2020-21, upto November was ` 172.71 lakh crore and ` 174.15 lakh crore respectively as compared to ` 112.43 lakh crore and ` 113.49 lakh crore at the end of 2019-20. The corresponding figures for 2018-19 were ` 149.34 lakh crore and ` 151.09 lakh crore respectively. Turnover of NSE and BSE are given in Table 6.17.
* * * * *
Table 6.17 Turnover of NSE and BSE (` '000 Crore)
Stock exchange 2018-19 2019-20 2020-21+ NSE 7,949 8,999 9,548 BSE 776 661 591 Source : SEBI + upto November

Economic Survey of Maharashtra 2020-21
98ANNEXURE 6.1
DEPOSITS AND CREDIT OF ALL SCHEDULED COMMERCIAL BANKS
(` Crore)
Year
Position as on last Friday of June of the year Total
deposits Total credit Rural Semi-Urban Urban/Metropolitan
Deposits Credit Deposits Credit Deposits Credit (1) (2) (3) (4) (5) (6) (7) (8) (9)
1971 NA NA NA NA NA NA 1,460 1,291†
1981 309 226 714 384 6,568 5,321 7,590 5,931
1991 1,701 1,357 2,347 1,354 36,181 26,936 40,230 29,647
2001 6,769 5,029 10,034 4,138 1,59,199 1,34,340 1,76,001 1,43,507
2011 29,231 22,703 49,174 27,604 13,25,550 11,25,780 14,03,955 11,76,087
2012 34,454 26,712 58,586 31,829 15,00,654 13,29,287 15,93,694 13,87,827
2013# 41,119 31,527 70,052 41,135 16,73,872 15,03,827 17,85,043 15,76,490
2014# 48,115 39,009 85,322 51,510 19,19,090 17,22,604 20,52,527 18,13,123
2015# 56,214 44,578 95,688 60,479 19,81,815 18,71,000 21,33,718 19,76,057
2016# 61,824 52,817 1,02,026 67,660 20,13,746 21,14,827 21,77,596 22,35,304
2017# 63,597 46,740 1,28,123 77,920 19,71,935 21,74,919 21,63,654 22,99,580
2018# 70,104 49,384 1,39,312 84,875 19,55,325 21,96,322 22,89,301 24,04,766
2019# 77,276 52,242 1,56,900 92,205 23,15,767 25,70,362 25,49,943 27,14,809
2020# 91,709 53,929 1,83,780 96,459 24,79,479 26,75,833 27,54,968 28,26,220
Year Per Capita deposit
(`)
Per Capita Credit (`)
No. of banking offices Number of banking offices
per lakh population
Rural and Semi- Urban
Urban / Metropolitan
Total
(1) (10) (11) (12) (13) (14) (15)
1971 290 256 NA NA 1,471 2.9
1981 1,204 940 NA NA 3,627 5.8
1991 5,344 3,580 3,353 2,238 5,591 7.4
2001 18,106 14,763 3,380 2,914 6,294 6.5
2011 1,24,048 1,03,911 3,902 4,613 8,515 7.5
2012 1,39,572 1,21,543 4,196 4,857 9,053 7.9
2013# 1,54,286 1,36,260 4,585 5,189 9,774 8.5
2014# 1,75,147 1,54,718 5,162 5,478 10,640 9.1
2015# 1,81,988 1,68,541 5,555 5,729 11,284 9.6
2016# 1,81,383 1,86,190 5,753 6,036 11,789 9.8
2017# 1,78,101 1,89,289 5,822 6,369 12,191 10.0
2018# 1,86,223 1,95,619 5,908 6,409 12,317 10.0
2019# 2,07,425 2,20,836 5,995 6,506 12,501 10.2
2020# 2,23,439 2,29,213 6,264 6,850 13,114 10.6
Source - Reserve Bank of India † Data relate to the second Friday of June 1971 # As on 31st March NA Not Available Note - Details may not add up to due to rounding.

Economic Survey of Maharashtra 2020-21
99ANNEXURE 6.2
DISTRICTWISE ANNUAL CREDIT PLAN (2020-21)
(` Crore)
Sr.
No. District
Priority Sector
NPS Total Plan Agriculture & allied activities
NFS OPS Total Total credit
Of which, crop loan
(1) (2) (3) (4) (5) (6) (7) (8) (9)
1 Mumbai City 117 0 1,92,590 11,966 2,04,673 1,55,495 3,60,168
2 Mumbai Suburban 2,987 0 66,088 1,724 70,798 1,39,340 2,10,138
3 Thane 220 220 9,793 1,287 11,300 19,200 30,500
4 Palghar 480 250 2,350 0 2,830 600 3,430
5 Raigad 580 280 3,236 79 3,896 1,540 5,435
6 Ratnagiri 1,108 563 1,781 0 2,889 251 3,140
7 Sindhudurg 852 403 933 222 2,007 98 2,106
8 Nashik 7,350 4,725 8,169 481 16,000 4,800 20,800
9 Dhule 1,340 1,100 1,126 174 2,640 150 2,790
10 Nandurbar 1,099 770 324 109 1,532 88 1,620
11 Jalgaon 4,619 3,340 2,601 65 7,284 236 7,520
12 Ahmednagar 7,149 5,250 3,654 24 10,827 1,091 11,917
13 Pune 7,350 3,481 32,122 775 40,247 40,000 80,247
14 Satara 4,400 3,150 2,030 1,070 7,500 1,000 8,500
15 Sangli 4,505 2,595 1,745 75 6,325 1,400 7,725
16 Solapur 6,747 4,051 2,612 0 9,358 56 9,414
17 Kolhapur 4,240 2,480 4,351 729 9,320 5,320 14,641
18 Aurangabad 1,896 1,496 4,575 325 6,796 1,410 8,206
19 Jalna 2,000 1,600 861 23 2,884 175 3,059
20 Parbhani 2,811 2,123 1,017 96 3,924 190 4,114
21 Hingoli 1,797 1,444 457 80 2,335 0 2,335
22 Beed 1,746 1,190 1,731 256 3,733 0 3,733
23 Nanded 3,101 2,540 1,613 130 4,843 12,109 16,952
24 Osmanabad 2,640 2,272 436 77 3,153 0 3,153
25 Latur 3,468 2,858 1,932 47 5,447 592 6,039
26 Buldhana 3,556 2,734 730 379 4,665 220 4,885
27 Akola 1,690 1,200 1,220 400 3,310 300 3,610
28 Washim 1,800 1,650 225 55 2,080 20 2,100
29 Amravati 2,880 2,150 1,345 250 4,475 300 4,775
30 Yavatmal 2,890 2,250 905 200 3,995 380 4,375
31 Wardha 1,497 1,029 531 0 2,029 247 2,275
32 Nagpur 1,815 1,190 4,010 275 6,100 4,950 11,050
33 Bhandara 623 455 717 4 1,344 230 1,575
34 Gondia 494 300 438 4 936 168 1,104
35 Chandrapur 1,470 1,120 766 180 2,416 262 2,678
36 Gadchiroli 308 199 310 0 618 70 688
Maharashtra State 93,626 62,459 3,59,323 21,562 4,74,511 3,92,287 8,66,798
Source - SLBC, Bank of Maharashtra NFS - Non-Farm Sector, OPS - Other Priority Sector, NPS - Non-Priority Sector
Note - Details may not add up to due to rounding.

Economic Survey of Maharashtra 2020-21
100
ANNEXURE 6.3
DISTRICTWISE INFORMATION ON PRADHAN MANTRI JAN DHAN YOJANA
(As on 31st March, 2020)
Sr.
No. District
Total Accounts opened
No. of RuPay Cards Issued
No. of Zero Balance Accounts
Total Deposit in Accounts (` Crore)
(1) (2) (3) (4) (5) (6)
1 Mumbai 6,36,693 5,47,785 1,29,741 208
2 Mumbai Suburban 6,51,053 5,54,494 98,147 262
3 Thane / Palghar 16,09,589 11,59,870 2,54,977 511
4 Raigad 4,36,037 3,09,486 96,142 162
5 Ratnagiri 3,24,966 1,87,612 45,988 143
6 Sindhudurg 1,64,180 1,07,520 19,990 84
7 Nashik 17,77,645 10,99,957 2,79,860 630
8 Dhule 6,86,580 4,85,208 1,78,538 125
9 Nandurbar 5,21,497 4,34,328 1,26,475 88
10 Jalgaon 11,99,394 9,07,411 1,54,298 253
11 Ahmednagar 12,56,781 8,90,496 1,59,626 391
12 Pune 14,96,439 9,55,854 2,95,978 698
13 Satara 6,83,449 3,88,674 1,64,949 174
14 Sangli 6,50,375 4,89,212 1,70,597 146
15 Solapur 13,25,251 9,93,193 2,56,703 374
16 Kolhapur 10,26,927 7,41,978 1,90,262 281
17 Aurangabad 10,76,687 6,95,310 2,02,120 233
18 Jalna 6,78,452 4,28,898 1,34,399 103
19 Parbhani 6,13,127 4,37,591 1,61,475 111
20 Hingoli 4,11,694 3,27,940 1,23,435 67
21 Beed 9,99,237 7,41,238 2,36,606 290
22 Nanded 11,52,941 9,01,605 2,72,927 187
23 Osmanabad 5,92,185 4,07,133 1,27,926 207
24 Latur 7,56,851 5,52,919 1,68,288 167
25 Buldhana 7,95,415 6,24,401 87,270 119
26 Akola 4,85,108 3,39,402 64,863 97
27 Washim 3,38,972 2,48,083 39,897 54
28 Amravati 7,11,330 4,70,265 1,05,928 160
29 Yavatmal 9,23,331 7,08,793 1,14,164 141
30 Wardha 2,82,796 2,16,460 33,783 99
31 Nagpur 10,45,539 8,53,824 1,13,939 347
32 Bhandara 4,75,775 3,32,433 48,561 153
33 Gondia 4,35,675 3,56,785 39,955 128
34 Chandrapur 5,31,234 3,77,671 56,065 166
35 Gadchiroli 2,69,857 1,91,382 27,407 105
Maharashtra State 2,70,23,062 1,94,65,211 47,81,279 7,466
Source - Bank of Maharashtra, Convener, State Level Bankers Committee.
7Agriculture and Allied Activities


Economic Survey of Maharashtra 2020-21
7. AGRICULTURE AND ALLIED ACTIVITIES
7.1 Agriculture & allied activities sector has always remained a focal point of economy as well as social system. Over the decades, more than 50 per cent of the State population is dependent on the sector for livelihood.
7.2 Agriculture sector is always vulnerable to challenges posed by climatic changes and degradation of productive land. Erratic rains, high input costs, market uncertainties, changing weather conditions, etc. are the main concerns of the agriculture sector in the State. Various schemes and programmes are being implemented by the Government to enhance agricultural production, to promote export and to encourage agro-processing. Agricultural credit, agricultural marketing and enhancement of agro-processing capabilities have facilitated farmers to enhance their income. Various crop insurance schemes are implemented as a part of risk management and risk mitigation in agriculture. Various strategic initiatives and steps have been taken up by the Government for doubling farmers’ income. During the decade average share of Agriculture & allied activities sector in Gross State Value Added was 11.7 per cent and that of crops sector was 7.6 per cent.
7.3 Government has developed a comprehensive Information & Communication Technology strategy to improve awareness, knowledge and efficiency of farmers under National e-Governance Plan – agriculture. Transfer of benefits and subsidies under 13 schemes of agriculture sector directly into the bank account of beneficiary has been initiated through MahaDBT portal from 2020-21. The State has established e-governance system MAHA-MADAT for assessment of drought situation in the State, to ensure minimum human interference and human errors in the process of valuation.
7.4 Anticipating the effective measures needed, so that the agriculture sector will have bare minimum impact of Covid-19 pandemic lockdown and the sector should boost the State economy by retaining its share in GSVA in the difficult phase of lockdown, the State Government exempted agriculture sector from Covid-19 lockdown. Various measures regarding transport & distribution of agricultural inputs, transport & sale of agricultural produce, online renewal of licenses, co-ordination amongst the state departmenets, use of modern technology, etc. by the State Government benefitted in giving support to agriculture and allied activities sector during the lockdown period.

102
Economic Survey of Maharashtra 2020-21
Monsoon 2020 7.5 Monsoon rains arrived on 11thJune, 2020 in the State. As against the normal rainfall the State received 113.2 per cent in June, 86.9 per cent in July, 123.6 per cent in August, 121.8 per cent in September and 175.4 per cent in October. The total rainfall received in the State upto October, 2020 was 113.4 per cent of the normal. Out of 355 talukas excluding Mumbai city and Mumbai suburban districts in the State, 139 talukas received excess rainfall, 173 talukas received normal rainfall and 43 talukas received deficient rainfall. Classification of talukas according to rainfall received is given in Table 7.1. Regionwise actual rainfall received is given in Table 7.2.
Table 7.1 Classification of talukas according to rainfall received
Rainfall class (percentage to normal)
No. of talukas#
June July August September October
2019 2020 2019 2020 2019 2020 2019 2020 2019 2020
120 & above 33 177 108 113 132 144 232 180 256 220
100 – 120 33 64 74 51 51 58 54 46 20 24
80 – 100 63 50 97 69 65 60 42 58 36 41
60 – 80 98 34 52 58 60 51 21 42 21 35
40 – 60 95 26 20 42 36 39 6 25 17 26
20 – 40 31 4 4 21 10 3 0 4 4 7
0 – 20 2 0 0 1 1 0 0 0 1 2
Source : Commissionerate of Agriculture, GoM # Excluding talukas in Mumbai City & Mumbai Suburban districts

Economic Survey of Maharashtra 2020-21
103
Operational holdings 7.6 As per the first Agriculture Census (1970-71) number of operational holdings & area of operational holdings in the State was 0.50 crore & 2.12 crore ha respectively and average size of operational holding was 4.28 ha.
7.6.1 As per the tenth Agriculture Census (2015-16) number of operational holdings increased from 1.37 crore (Census 2010-11) to 1.53 crore showing an increase of 11.6 per cent and area of operational holdings also increased from 1.98 crore ha (Census 2010-11) to 2.05 crore ha showing an increase of 3.7 per cent. The average size of holding decreased from 1.44 ha (Census 2010-11) to 1.34 ha as per tenth census 2015-16.
7.6.2 As per Census 2015-16, average size of land holding for SC and ST was 1.24 ha and 1.76 ha respectively. The share of female operational holders was 14.1 per cent with 1.22 ha of average size of land holding. The time series data on operational holdings in the State is given in Annexure 7.1. Details of operational holdings and area of operational holdings in the State are given in Table 7.3 and for selected states are given in Table 7.4.
Table 7.2 Regionwise actual rainfall received (mm)
Rainfall during Region
Maharashtra Konkan# Nashik Pune Aurangabad Amravati Nagpur
June 2019
Normal 660.2 127.7 166.0 145.8 154.1 187.5 223.3 Actual 593.9 82.8 148.0 94.0 108.4 93.6 160.1 (71.7)
2020 Normal 662.5 139.7 198.6 134.0 147.6 187.1 207.6 Actual 541.2 210.0 200.9 203.2 183.1 193.3 235.1 (113.2)
July 2019
Normal 1,164.7 235.5 330.6 201.2 261.0 412.3 402.6 Actual 1,480.5 245.7 372.2 151.8 250.2 392.1 406.9 (101.1)
2020 Normal 1,063.8 218.5 327.2 186.2 239.6 362.3 330.9 Actual 886.1 204.7 165.4 209.0 247.6 347.8 287.5 (86.9)
August 2019
Normal 757.1 189.0 216.7 197.3 210.0 352.4 303.3 Actual 925.5 260.5 360.2 141.1 168.7 385.1 328.6 (108.3)
2020 Normal 766.3 197.4 247.5 193.3 231.7 347.8 286.0 Actual 1,222.0 192.4 310.4 151.1 199.5 444.4 353.5 (123.6)
September 2019
Normal 379.0 158.6 158.1 176.9 166.7 209.5 202.1 Actual 897.1 207.1 221.9 220.3 200.3 339.9 304.3 (150.6)
2020 Normal 375.5 151.5 171.7 166.0 130.9 175.3 179.7 Actual 429.9 193.7 189.3 270.3 151.0 139.1 218.8 (121.8)
October 2019
Normal 115.4 50.8 91.6 58.6 46.1 53.5 67.4 Actual 183.6 131.6 217.5 209.8 80.9 48.2 150.3 (222.8)
2020 Normal 108.6 53.1 96.5 71.3 57.5 53.4 71.1 Actual 242.5 71.0 232.7 110.7 59.2 51.5 124.7 (175.4)
June to October
2019 Normal 3,076.4 761.6 963.0 779.8 837.9 1,215.2 1,198.7 Actual 4,080.6 927.7 1,319.7 816.9 808.5 1,258.9 1,349.7 (112.6)
2020 Normal 2,976.7 760.2 1,041.5 750.8 807.3 1,125.9 1,075.3 Actual 3,321.7 871.8 1,098.7 944.3 840.4 1,097.1 1,219.6 (113.4)
# Excluding Mumbai City & Mumbai Suburban districts Note : Figures in bracket indicate percentage of actual rainfall to normal rainfall GoM has revised districtwise,talukawise and monthwise average rainfall in the State from monsoon 2020 on 12th May, 2020 Source : Commissionerate of Agriculture, GoM
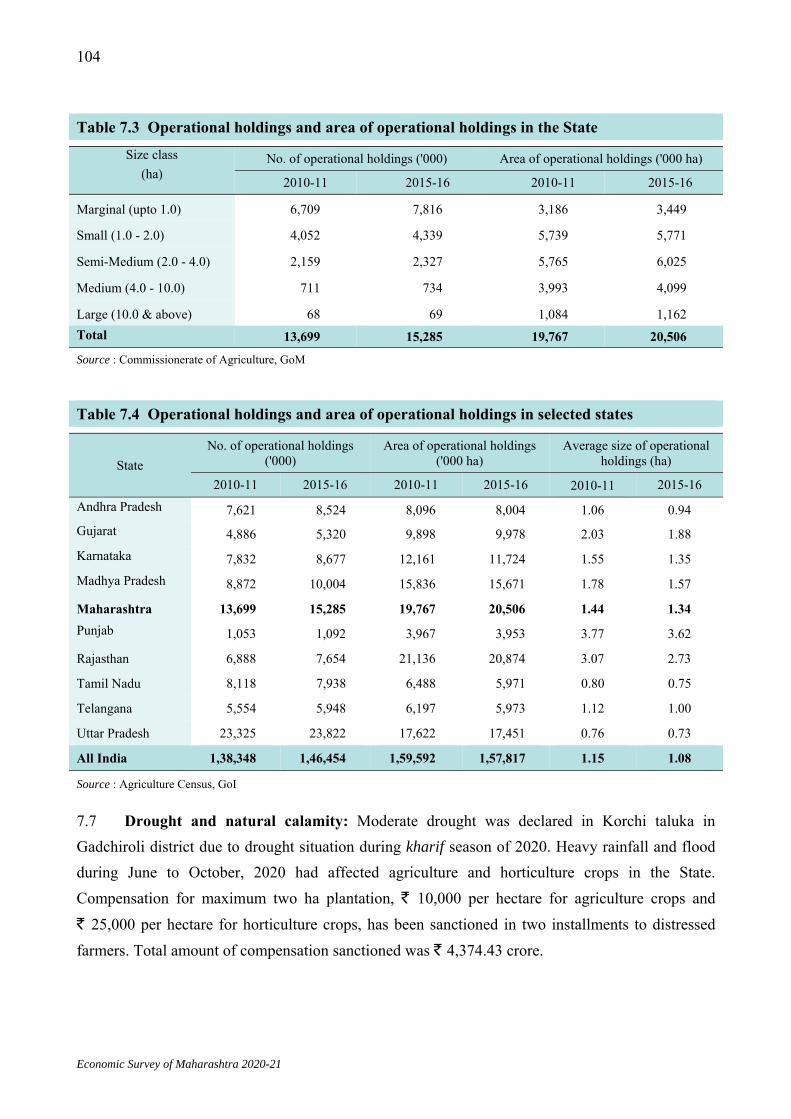
104
Economic Survey of Maharashtra 2020-21
7.7 Drought and natural calamity: Moderate drought was declared in Korchi taluka in Gadchiroli district due to drought situation during kharif season of 2020. Heavy rainfall and flood during June to October, 2020 had affected agriculture and horticulture crops in the State. Compensation for maximum two ha plantation, ` 10,000 per hectare for agriculture crops and ` 25,000 per hectare for horticulture crops, has been sanctioned in two installments to distressed farmers. Total amount of compensation sanctioned was ` 4,374.43 crore.
Table 7.3 Operational holdings and area of operational holdings in the State
Size class (ha)
No. of operational holdings ('000) Area of operational holdings ('000 ha)
2010-11 2015-16 2010-11 2015-16
Marginal (upto 1.0) 6,709 7,816 3,186 3,449
Small (1.0 - 2.0) 4,052 4,339 5,739 5,771
Semi-Medium (2.0 - 4.0) 2,159 2,327 5,765 6,025
Medium (4.0 - 10.0) 711 734 3,993 4,099
Large (10.0 & above) 68 69 1,084 1,162 Total 13,699 15,285 19,767 20,506 Source : Commissionerate of Agriculture, GoM
Table 7.4 Operational holdings and area of operational holdings in selected states
State No. of operational holdings
('000) Area of operational holdings
('000 ha) Average size of operational
holdings (ha)
2010-11 2015-16 2010-11 2015-16 2010-11 2015-16 Andhra Pradesh 7,621 8,524 8,096 8,004 1.06 0.94 Gujarat 4,886 5,320 9,898 9,978 2.03 1.88 Karnataka 7,832 8,677 12,161 11,724 1.55 1.35 Madhya Pradesh 8,872 10,004 15,836 15,671 1.78 1.57
Maharashtra 13,699 15,285 19,767 20,506 1.44 1.34 Punjab 1,053 1,092 3,967 3,953 3.77 3.62
Rajasthan 6,888 7,654 21,136 20,874 3.07 2.73
Tamil Nadu 8,118 7,938 6,488 5,971 0.80 0.75
Telangana 5,554 5,948 6,197 5,973 1.12 1.00
Uttar Pradesh 23,325 23,822 17,622 17,451 0.76 0.73
All India 1,38,348 1,46,454 1,59,592 1,57,817 1.15 1.08
Source : Agriculture Census, GoI
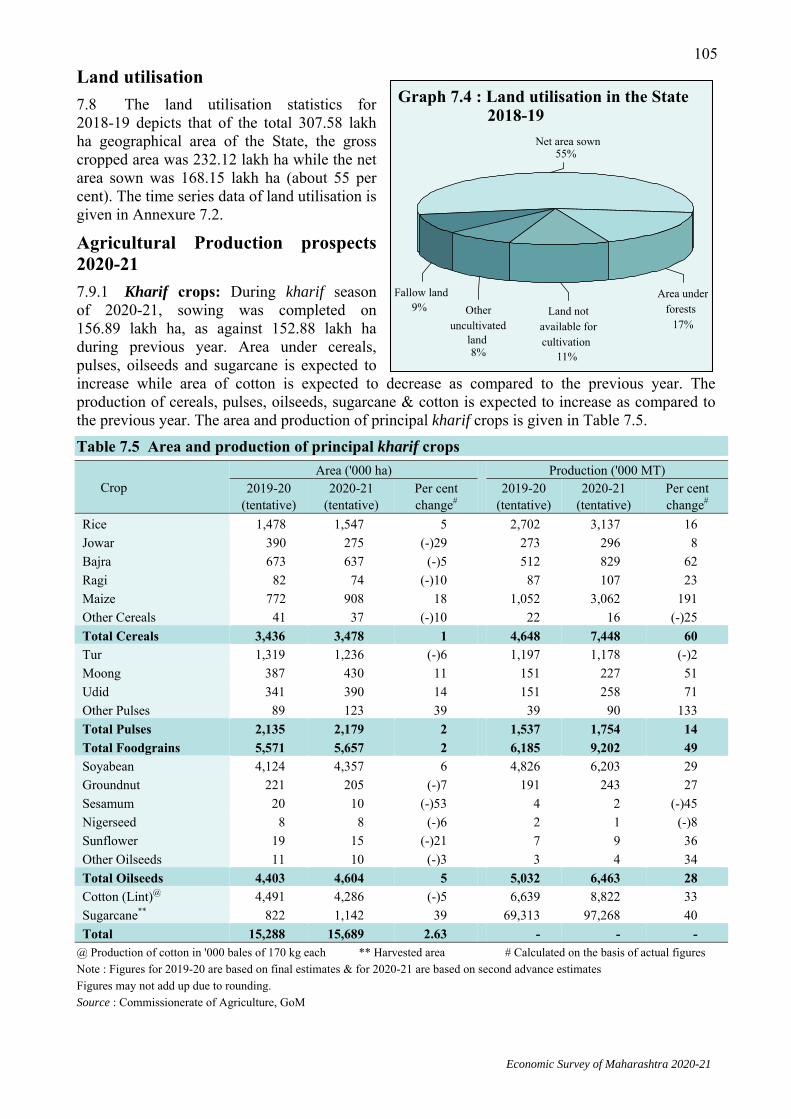
Economic Survey of Maharashtra 2020-21
105 Land utilisation 7.8 The land utilisation statistics for 2018-19 depicts that of the total 307.58 lakh ha geographical area of the State, the gross cropped area was 232.12 lakh ha while the net area sown was 168.15 lakh ha (about 55 per cent). The time series data of land utilisation is given in Annexure 7.2. Agricultural Production prospects 2020-21 7.9.1 Kharif crops: During kharif season of 2020-21, sowing was completed on 156.89 lakh ha, as against 152.88 lakh ha during previous year. Area under cereals, pulses, oilseeds and sugarcane is expected to increase while area of cotton is expected to decrease as compared to the previous year. The production of cereals, pulses, oilseeds, sugarcane & cotton is expected to increase as compared to the previous year. The area and production of principal kharif crops is given in Table 7.5. Table 7.5 Area and production of principal kharif crops
Crop Area ('000 ha) Production ('000 MT)
2019-20 (tentative)
2020-21 (tentative)
Per cent change#
2019-20 (tentative)
2020-21 (tentative)
Per cent change#
Rice 1,478 1,547 5 2,702 3,137 16 Jowar 390 275 (-)29 273 296 8 Bajra 673 637 (-)5 512 829 62 Ragi 82 74 (-)10 87 107 23 Maize 772 908 18 1,052 3,062 191 Other Cereals 41 37 (-)10 22 16 (-)25 Total Cereals 3,436 3,478 1 4,648 7,448 60 Tur 1,319 1,236 (-)6 1,197 1,178 (-)2 Moong 387 430 11 151 227 51 Udid 341 390 14 151 258 71 Other Pulses 89 123 39 39 90 133 Total Pulses 2,135 2,179 2 1,537 1,754 14 Total Foodgrains 5,571 5,657 2 6,185 9,202 49 Soyabean 4,124 4,357 6 4,826 6,203 29 Groundnut 221 205 (-)7 191 243 27 Sesamum 20 10 (-)53 4 2 (-)45 Nigerseed 8 8 (-)6 2 1 (-)8 Sunflower 19 15 (-)21 7 9 36 Other Oilseeds 11 10 (-)3 3 4 34 Total Oilseeds 4,403 4,604 5 5,032 6,463 28 Cotton (Lint)@ 4,491 4,286 (-)5 6,639 8,822 33 Sugarcane** 822 1,142 39 69,313 97,268 40 Total 15,288 15,689 2.63 - - -
@ Production of cotton in '000 bales of 170 kg each ** Harvested area # Calculated on the basis of actual figures Note : Figures for 2019-20 are based on final estimates & for 2020-21 are based on second advance estimates Figures may not add up due to rounding. Source : Commissionerate of Agriculture, GoM

106
Economic Survey of Maharashtra 2020-21
7.9.2 Rabi crops: During rabi season of 2020-21, by the end of December sowing was completed on 53.64 lakh ha which is three per cent less than the corresponding period of previous year. The area of pulses is expected to increase whereas area of cereals and oilseeds is expected to decrease as compared to previous year. The production of cereals and pulses is expected to increase whereas the production of oilseeds is expected to decrease as compared to previous year. The area and production of principal rabi crops is given in Table 7.6.
7.9.3 Summer crops: During summer 2019-20 the sown area of summer crops was 3.35 lakh ha. Sowing target of 2.20 lakh ha has been set for 2020-21. 7.9.4 The time series data on area, production and yield of principal crops is given in Annexure 7.3. Triennial average yield for selected commodities for selected states is given in Table 7.7.
Table 7.6 Area and production of principal rabi crops
Crop
Area ('000 ha)
Production ('000 MT) 2019-20
(tentative) 2020-21
(tentative) Per cent change#
2019-20 (tentative)
2020-21 (tentative)
Per cent change#
Jowar 1,982 1,584 (-)20 1,592 1,611 1 Wheat 1,057 1,003 (-)5 1,793 1,783 (-)1 Maize 298 286 (-)4 795 845 6 Other cereals 11 10 (-)8 4 4 (-)4 Total cereals 3,347 2,883 (-)14 4,184 4,243 1 Gram 2,043 2,294 12 2,240 2,467 10 Other pulses 125 147 18 66 108 64 Total pulses 2,168 2,442 13 2,306 2,576 12 Total foodgrains 5,515 5,325 (-)3 6,490 6,819 5 Sesamum 2 1 (-)30 0.6 0.4 (-)29 Safflower 22 19 (-)12 15 12 (-)22 Sunflower 3 3 (-)21 2 1 (-)37 Linseed 5 6 14 2 2 9 Rapeseed & mustard 11 10 (-)3 3 3 (-)7 Total oilseeds 43 39 (-)8 22 18 (-)18 Total 5,558 5,364 (-)3 - - -
# Calculated on the basis of actual figures Note : Figures for 2019-20 are based on Final estimates and for 2020-21 are based on Second Advance Estimates Figures may not add up due to rounding Source : Commissionerate of Agriculture, GoM
Table 7.7 Triennial average yield for selected commodities in the selected states
State
Triennial average yield (2016-17 to 2018-19) Cereals (kg/ha)
Pulses (kg/ha)
Oilseeds (kg/ha)
Cotton (kg/ha)
Sugarcane (MT/ha)
Andhra Pradesh 3,811 694 833 507 78 Gujarat 2,372 971 1,769 558 61 Karnataka 2,029 587 777 414 81 Haryana 3,831 1,000 1,961 503 81 Madhya Pradesh 2,641 981 1,157 561 52 Maharashtra 1,424 777 1,091 326 84 Punjab 4,591 900 1,456 713 82 Rajasthan 1,877 626 1,470 535 75 Tamil Nadu 3,060 622 2,337 396 97 Telangana 3,288 844 1,670 412 75 Uttar Pradesh 2,848 965 1,003 NA 75 All India 2,645 798 1,250 444 76 NA Not available Source : Directorate of Economics and Statistics, Department of Agriculture, Co-operation and Farmers Welfare, GoI

Economic Survey of Maharashtra 2020-21
107 7.9.5 Index of Agricultural Production: The time series data regarding index number of agricultural production (Base: Triennial 1979-82) for the State is given in Annexure 7.4. 7.10 Horticulture: Horticulture has an average 30 per cent share in Gross State Value Added (GSVA) of crops sector. Estimated area and production of horticulture crops is given in Table 7.8.
Improved seeds
7.11 Maharashtra State Seeds Corporation and National Seeds Corporation are major public sector organisations in production and distribution of quality seeds. Private seed producers are also involved in supply of seeds of various crops. GoI has fixed the seed replacement targets of 35 per cent for self-pollinated crops (paddy, wheat, tur, moong, udid, etc.), 50 per cent for cross pollinated crops (maize, jowar, bajra, sunflower, etc.) and 100 per cent for hybrid crops. The quantity of improved seeds distributed for kharif and rabi seasons is given in Table 7.9.
Fertilisers and pesticides 7.12 Consumption of chemical fertilisers in the State for 2020-21 is anticipated to be 78.10 lakh MT with per hectare consumption of 144.9 kg. The fertiliser consumption for the year 2019-20 was 61.33 lakh MT which was 113 kg per hectare. Use of chemical fertilisers is given in Table 7.10 and use of pesticides is given in Table 7.11. Regionwise use of nitrogenous (N), phosphatic (P) and potassic (K) chemical fertilisers is given in Table 7.12.
Table 7.8 Estimated area and production of horticulture crops
Crop Area ('000 ha) Production ('000 MT)
2018-19
2019-20 (tentative)
Per cent change
2018-19
2019-20 (tentative)
Per cent change
Fruits 755.58 785.13 3.9 10,778 11,544 7.1
Vegetables 649.28 845.00 30.1 11,472 14,394 25.5
Condiments & Spices 46.24 84.13 81.9 391 1,304 233.6
Plantation crops 188.72 194.42 3.0 348 590 69.5
Flowers@ 11.45 11.32 (-)1.1 47 43 (-)8.2 @ includes cut and loose flowers Note : Figures for 2018-19 are based on final estimates and for 2019-20 are based on 3rd advance estimates Source : Horticulture Area Production Information System (HAPIS), GoI
Table 7.9 Quantity of improved seeds distributed for kharif & rabi seasons ('000 quintal)
Distribution Agency Season 2018 2019 2020
Per cent change in 2020 over 2019
Public
Kharif 531 615 307 (-)50.1 Rabi 382 317 342# 7.9 Total 913 932 649 (-)30.4
Private
Kharif 1,077 1,002 1,379 37.6 Rabi 178 790 758# (-)4.1 Total 1,255 1,792 2,137 19.3
Kharif 1,608 1,617 1,686 4.3 Total Rabi 560 1,107 1,100# (-)0.6
Total 2,168 2,724 2,786 2.3 Source : Commissionerate of Agriculture, GoM # Expected availability of seeds

108
Economic Survey of Maharashtra 2020-21
Irrigation 7.13.1 The irrigated area in command area under the jurisdiction of Water Resources Department, GoM is 40.52 lakh ha in 2019-20. Number of irrigation projects, irrigation potential created and utilised are given in Table 7.13. Number of minor irrigation projects (local sector), irrigation potential created and utilised are given in Table 7.14.
Table 7.11 Use of Pesticides (MT)
Year Pesticides
Chemical Bio 2018-19 11,746 1,164 2019-20 12,794 1,082 2020-21# 13,680 2,545 # anticipated Source : Commissionerate of Agriculture, GoM
Table 7.10 Use of chemical fertilisers
Year Total consumption (Lakh MT)
Per hectare consumption
(kg) 2018-19 60.08 126.0 2019-20 61.33 113.0 2020-21# 78.10 144.9 # anticipated Source : Commissionerate of Agriculture, GoM
Table 7.12 Regionwise use of Nitrogenous, Phosphatic and Potassic chemical fertilisers ('00 MT)
Region Chemical fertilisers
2019-20 2020-21#
Nitrogenous (N)
Phosphatic (P)
Potassic (K)
Total Nitrogenous (N)
Phosphatic (P)
Potassic (K)
Total
Konkan 353 77 65 495 386 91 79 556 Nashik 3,873 1,998 1,554 7,425 4,428 2,416 1,948 8,791 Pune 3,447 1,690 1,151 6,288 4,039 2,218 1,834 8,092 Aurangabad 3,631 2,396 1,051 7,077 4,769 3,467 1,843 10,079 Amravati 1,895 1,274 554 3,723 2,117 1,703 766 4,587 Nagpur 1,928 980 305 3,213 2,174 1,172 525 3,870 Maharashtra 15,127 8,415 4,680 28,222 17,913 11,067 6,995 35,975 Source : Commissionerate of Agriculture, GoM # anticipated
Table 7.13 Number of irrigation projects, irrigation potential created and utilised
Particulars Projects of Water Resources Department
Major & Medium Minor Total No. of projects completed & ongoing as on 30th June, 2020 405 3,472$ 3,877
Irrigation potential (lakh ha)
(i)Irrigation potential created upto June, 2019 39.18 13.86 53.04
(ii)Area under irrigation by canal & river during 2019-20* 19.57 7.03 26.60
(iii)Area under irrigation by wells in command area during 2019-20* 11.79 2.13 13.92
(iv)Total irrigation potential utilised during 2019-20 (ii+iii)* 31.36 9.16 40.52
$ Includes lift irrigation schemes implemented through Irrigation Development Corporation of Maharashtra (IDCOM) * Tentative Source : Chief Auditor, Water and Irrigation, Aurangabad under Water Resources Department

Economic Survey of Maharashtra 2020-21
109
7.13.2 Reservoir storage: The total live storage as on 15th October, 2019 in the major, medium and minor irrigation (State sector) reservoirs taken together was 30,579 million cubic meters, which was about 69.2 per cent of the storage capacity as per the project design. Live storage of water, irrigation potential and actual irrigated area are given in Table 7.15.
7.13.3 Reforms in irrigation sector: By the end of November, 2020 in all 10,974 Water Users Associations (WUA) with an area of 49.79 lakh ha have been formed in the State under Water Resource department for management of irrigation system by farmers. Out of these WUA, 1,689 WUA covering 6.76 lakh ha area are registered under Maharashtra Management of Irrigation System by Farmers Act, 2005 and 454 WUA covering 1.73 lakh ha area are constituted under Maharashtra Co-operative Societies Act, 1960. The time series data on water charges is given in Annexure 7.6.
Electrification of agricultural pumps 7.14.1 Number of agricultural pumps in the State are about 43.22 lakh. MAHAVITARAN has energised 96,327 pumps during 2019-20 and 52,870 pumps during 2020-21, upto October. 7.14.2 Atal Saur Krishi Pump Yojana: The main objective of the scheme is day time power availability for agricultural pumps. In its first phase (2015 to 2018), in all 5,662 solar agricultural pumps were commissioned by MAHAVITARAN as against the target of 7,540. In the second phase (2018-19 onwords) upto December, 2019, in all 7,000 solar agricultural pumps were commissioned by Maharashtra Energy Development Agency.
Table 7.14 Number of minor irrigation projects (local sector), irrigation potential created and utilised
Particulars K.T. Weirs
Lift Irrigation schemes
Other important types Total M.I.
Tanks Percolation
tanks Others$
Number of projects as on 30th June, 2020 Completed 13,095 2,899 2,970 24,222 63,083 1,06,269 Ongoing 1,732 86 547 975 4,009 7,349 Irrigation potential (Lakh ha) (i) Created upto June, 2019 3.55 0.42 2.64 6.88 5.47 18.96 (ii) Created upto June, 2020 3.62 0.42 2.67 6.89 5.66 19.26 (iii) Utilised in 2019-20 1.27 0.15 0.93 3.45 2.83 8.63 $ Includes diversion weir, storage bandhara, majimalgujari tank, village tank, cement nalla bunds, etc. Note : Irrigation potential utilised is assumed to be 35 per cent of the irrigation potential created Source : Office of the Chief Engineer, Minor Irrigation (Local), GoM
Table 7.15 Live storage of water, irrigation potential and actual irrigated area
Year Storage capacity as per project
design (MCM)
Live storage as on
15th October (MCM)
Percentage of live storage
Irrigation potential created (as on 30th June)
(Lakh ha)
Actual irrigated area (1st July to
30th June) (Lakh ha)
Percentage of actual irrigated
area to irrigation potential created
2015-16 42,960 17,712 41.2 49.10 24.07 49.0 2016-17 43,241 29,971 69.3 49.65 40.58 81.7 2017-18 43,752 27,607 63.1 50.37 39.42 78.3 2018-19 43,572 23,004 52.8 51.23 35.97 70.2 2019-20 44,183 30,579 69.2 53.04 40.52* 76.4
MCM : Million Cubic Meters *Tentative Source : Chief Auditor, Water and Irrigation, Aurangabad under Water Resources Department

110
Economic Survey of Maharashtra 2020-21
7.14.3 Mukhyamantri Saur Krishi Pump Yojana: GoM has launched this scheme in 2018-19 with the main objectives of day time power availability for agricultural pumps and replacement of diesel pumps to reduce pollution. GoM has targeted deployment of one lakh off-grid solar powered agricultural pumps in next three consecutive years. The scheme is implemented for farmers from remote & tribal non-electrified area or from area which is not electrified by MSEDCL. Farmers who do not have electric agricultural pump and own agriculture land with assured source of water are eligible under the scheme and have to pay maximum 10 per cent of total cost of solar pump as contribution. Since inception of the scheme in all 64,598 solar pumps have been commissioned by MAHAVITARAN upto December, 2020.
Agricultural finance 7.15.1 Financial assistance is provided to farmers by way of short-term loans, credit, etc. by the government through various banks and co-operative agencies. The National Bank for Agriculture and Rural Development (NABARD), the apex bank for agricultural and rural development in India, provides agricultural short term & medium term loans through Maharashtra State Co-operative Bank (MSCB) & District Central Co-operative Banks (DCCB), Regional Rural Banks (RRB) and Commercial Banks (CB). Annual Credit Plan for priority sector of the State for 2020-21 is of ` 4.75 lakh crore. Share of Agricultural and Allied activities sector in Annual Credit Plan is ` 0.94 lakh crore (19.7 per cent). Loans disbursed by Commercial banks, RRB and MSCB/DCCB are given in Table 7.16.
7.15.2 The institutions directly associated with agricultural finance at grass root level in the State are Primary Agricultural Credit Co-operative Societies (PACS) which provide short-term crop loans to their cultivator members. During 2018-19 loans of ` 12,010 crore were advanced to farmers through PACS. During 2019-20 loans of ` 10,898 crore and during 2020-21 upto January, loans of ` 15,496 crore were advanced to farmers through PACS. 7.15.3 Kisan Credit Card Scheme: Maharashtra State Co-operative Bank issued 22.59 lakh new Kisan Credit Cards (KCC) in the State during 2019-20. The amount of loans sanctioned to the new KCC holders during 2019-20 was ` 10,542 crore. KCC linked agriculture loans disbursed to farmers by MSCB are given in Table 7.17.
Table 7.16 Loans disbursed by Commercial banks, RRB and MSCB/DCCB (` crore)
Type of loan Commercial Banks$ RRB MSCB/DCCB Total 2019-20 2020-21 2019-20 2020-21 2019-20 2020-21 2019-20 2020-21+
Crop loan 16,296 22,282 1,409 3,197 10,899 15,036 28,604 40,515 Agriculture term loan
34,248 29,805 169 172 10 37 34,427 30,014
Total 50,544 52,087 1,578 3,369 10,909 15,073 63,031 70,529 $ including nationalised banks + upto December Source : State Level Bankers’ Committee, Maharashtra State
Table 7.17 Agriculture loans to farmers by MSCB linked to KCC
Year Short term loans Long term loans No of beneficiaries
('000) Amount (` Crore)
No of beneficiaries ('000)
Amount (` Crore)
2018-19 2,683 13,138 7.6 35.46 2019-20 2,259 10,538 0.2 3.38 2020-21+ 2,880 15,648 10.01 169.54 Source : Maharashtra State Co-op. Bank Ltd. + upto November

Economic Survey of Maharashtra 2020-21
111 Agricultural marketing
7.16 Department of Agricultural Marketing establishes Agricultural Produce Market Committees (APMC) under Maharashtra Agricultural Produce Marketing (Development & Regulation) Act, 1963 and provides infrastructure for sale of agricultural produce so that farmers get adequate price of their agricultural produce and are protected from exploitation by traders and middlemen by offering low prices. In all 306 APMCs and 623 subyards have been established in the State. Number of direct marketing licenses issued upto 25th November, 2020 was 1,230. Apart from these, 61 private market licenses have been issued. The quantity and value of arrivals in all APMCs are given in Table 7.18.
7.17 Minimum Support Price Scheme: Based on the recommendations of the Commission for Agricultural Costs and Prices, GoI declares Minimum Support Prices (MSP) for selected crops before their sowing seasons in order to give guaranteed price & assured market to the farmers and protect them from the price fluctuations, which is a preventive measure to make agricultural activity economically viable. Under the scheme, procurement in the State is undertaken by Maharashtra State Co-operative Marketing Federation, Maharashtra State Co-operative Tribal Development Corporation, National Agricultural Co-operative Marketing Federation and Maharashtra State Co-operative Cotton Growers Federation and APMCs. The MSP declared for selected crops by GoI are given in Table 7.19. 7.18 Electronic National Agriculture Market (e-NAM): e-NAM, a pan-India electronic trading portal which is a device to connect existing physical APMC mandis which can be accessed online. This provides a single window service for all APMC related information & services and includes information on commodity arrivals & prices, buy & sell trade offers, provision to respond to trade offers. While material flow of agriculture produce continues through mandis, an online market reduces transaction costs and information asymmetry. In all 118 APMCs in the State have been included under e-NAM. Of these 118 APMCs, online gate entry, e-auction have been started in all the APMCs and e-payment has been started in 67 APMCs. Upto November, 2020 in all 13 lakh MT of grains amounting to ` 3,850 crore have been e-auctioned and e-payment of ` 98.56 crore has been done. Assaying labs have been established in 60 APMCs to monitor quality of agriculture produce. Selected agricultural development schemes 7.19 Various centrally sponsored schemes and state schemes for agricultural development are implemented in the State.
Table 7.18 Quantity & value of arrivals in all APMC
Year Quantity (Lakh MT)
Value (` Crore)
2017-18 211.50 56,995 2018-19 213.70 45,886 2019-20 203.90 54,463 Source : Maharashtra State Agricultural Marketing Board
Table 7.19 MSP for selected crops (`/quintal)
Crop MSP 2018-19 2019-20 2020-21
Paddy (FAQ) 1,750 1,815 1,868 Paddy (Grade A) 1,770 1,835 1,888 Jowar (Hybrid) 2,430 2,550 2,620 Jowar (Maldandi) 2,450 2,570 2,640 Wheat 1,840 1,925 1,975 Maize 1,700 1,760 1,850 Bajra 1,950 2,000 2,150 Gram 4,620 4,875 5,100 Tur 5,675 5,800 6,000 Moong 6,975 7,050 7,196 Udid 5,600 5,700 6,000 Sunflower 5,388 5,650 5,885 Soyabean 3,399 3,710 3,880 Groundnut-in-shell 4,890 5,090 5,275 Cotton (Medium Staple) 5,150 5,255 5,515 Cotton (Long Staple) 5,450 5,550 5,825 Safflower 4,945 5,215 5,327 Ragi 2,897 3,150 3,295 FAQ : Fair Average Quality Source : Maharashtra State Agricultural Marketing Board

112
Economic Survey of Maharashtra 2020-21
7.20 Rashtriya Krishi Vikas Yojana: GoI had approved Rashtriya Krishi Vikas Yojana (RKVY) to be continued as Rashtriya Krishi Vikas Yojana – Remunerative approaches for agriculture & allied sector rejuvenation (RKVY-Raftaar) upto 2020-21with an objective of making farming a remunerative economic activity through strengthening farmers’ efforts, risk mitigation and promoting agri-business entrepreneurship. The distribution of funds for the scheme is in such a manner that 70 per cent is reserved for growth in production, infrastructure & assets to states, 20 per cent for special sub-schemes of national priority under RKVY-Raftaar and 10 per cent for innovation and agri-entrepreneurship development projects. During 2019-20, total grants received was ` 409.32 crore, of which ` 345.90 crore was utilised upto December, 2020. For 2020-21 out of ` 140.80 crore received grants ` 56.59 crore grants are spent upto January, 2021. 7.21 National Mission on Agriculture Extension and Technology (NMAET): The aim of NMAET is to restructure & strengthen agricultural extension to enable delivery of appropriate technology and improved agronomic practices to the farmers. The mission consists of four sub-missions viz. Agriculture Extension, Seed and Planting Material, Agricultural Mechanisation and Plant Protection & Quarantine. 7.21.1 Agriculture extension: The major scheme covered under agriculture extension is support to Agriculture Technology Management Agency (ATMA) whose components are farmers’ trainings, demonstrations, farmers’ exposure visits, formation & capacity building of farmers’ groups, farm school, kissan goshtie, agriculture exhibitions, kissan mela, farmers’ friends, etc. Under the scheme during 2020-21 upto December total expenditure of ` 26.96 crore was incurred. 7.21.2 Sub-Mission on Seeds and Planting Material: This sub-mission has two components viz. Seed Village Programme and Seed Processing Plant & Storage Godown. A. Seed Village Programme: The scheme is being implemented in the State from 2014-15 through Maharashtra State Seeds Corporation, with an objective to supply quality/certified seeds to farmers at affordable prices, which helps in increasing agricultural production. Under the scheme, assistance is provided for distribution of certified seeds for one acre area per farmer, 50 per cent for cereal crops and 60 per cent for pulses & oilseed crops. During 2019-20 expenditure of ` 24.23 crore was incurred and during 2020-21 funds of ` 28.76 crore are sanctioned. B. Seed Processing Plant and Storage Godown: Implementation of this 100 per cent centrally sponsored scheme has started from 2019-20 in the State. Under the scheme target of 50 seed processing plants & storage godowns was set for the State by GoI. During 2019-20 in all 12 projects were completed and five projects are in progress and funds of ` 7.66 crore were utilised. During 2020-21, funds of ` 16.94 crore are sanctioned. 7.22 Orchard Plantation Scheme under Mahatma Gandhi National Rural Employment Guarantee Act (MGNREGA): This 100 per cent centrally sponsored scheme is being implemented in 34 districts of the State from 2011-12. Objectives of the scheme are enhancing income of MGNREGA job card holder farmers and employment generation by plantation of horticulture crops in their own productive or fallow land upto two ha. Beneficiaries under the scheme are selected by Gramsabha. It is mandatory for a beneficiary to hire a MGNREGA job card holder as a labour for this work. Necessary training for orchard cultivation is imparted under the scheme. During 2019-20, orchard plantation was done on 17,351 ha area and an expenditure of ` 83 crore was incurred. During 2020-21, upto December orchard plantation was done on 32,622 ha area and an expenditure of ` 104.80 crore was incurred.
7.23 National Food Security Mission (NFSM): The mission was launched in 2007-08 to increase the production of rice, wheat and pulses through area expansion and productivity enhancement, restoring soil fertility & productivity, creating employment opportunities and enhancing farm level economy. From 2014-15, coarse cereals and commercial crops viz. cotton, jute and sugarcane have been included under NFSM. During 2019-20 an expenditure of ` 6.88 crore for rice, ` 3.62 crore for wheat, ` 164.25 crore for pulses, ` 5.90 crore for additional

Economic Survey of Maharashtra 2020-21
113 pulses, ` 2.54 crore for coarse cereals and ` 11.80 crore for nutri-cereals was incurred. During 2020-21 upto December, an expenditure of ` 1.20 crore for rice, ` 0.57 crore for wheat, ` 22.79 crore for pulses, ` 5.41 crore for additional pulses, ` 1.14 crore for coarse cereals and ` 7.21 crore for nutri-cereals is incurred.
7.23.1 National Mission on Oilseed and Oil palm, launched in 2014-15 has been merged with NFSM in 2018-19. NFSM (oilseed crops) and NFSM (Tree Borne Oilseed crops) are the two sub-missions being implemented under the mission in the State. During 2019-20, expenditure of ` 29.12 crore was incurred under the scheme and during 2020-21 upto December, out of ` 46.91 crore sanctioned grants, ` 15.66 crore are released and expenditure of ` 13.78 crore is incurred.
7.23.2 National Food Security Mission Cash Crop (Cotton & Sugarcane) is being implemented in the State from 2014-15. During 2019-20 the expenditure of ` 5.80 crore was incurred under the scheme and during 2020-21, upto December, expenditure of ` 1.68 crore is incurred.
7.24 Mission for Integrated Development of Horticulture: The National Horticulture Mission (NHM) has been launched by GoI in 2005-06, with the main objective of increasing the area and productivity under horticulture and to promote post-harvest management such as controlling ripening, edible coating, temperature management, chemical treatment, etc. 7.24.1 Maharashtra State Horticulture and Medicinal Plants Board (MSHMPB) was established in 2005 to implement schemes of NHM and National Medicinal Plants Board (NMPB). From 2015-16 the Mission for Integrated Development of Horticulture (MIDH) is implemented in the State.
7.24.2 Since inception upto October, 2020 MSHMPB has received total grants of ` 2,072.18 crore under MIDH and total expenditure incurred is ` 2,068.73 crore. Expenditure incurred on major components of MIDH is given in Table 7.20.
7.24.3 Grapes, mango, pomegranate and bananas are the major fruits exported from the State. Area under various fruit crops during 2019-20 was 7.85 lakh ha, of which area under pomegranate was highest (1.64 lakh ha) followed by mango (1.58 lakh ha), mandarin orange (1.14 lakh ha), grapes (1.09 lakh ha), banana (0.77 lakh ha), sweet orange (0.59 lakh ha) and sapota (0.16 lakh ha). The quantity & value of export of various fruits, vegetables & flowers are given in Table 7.21.
Table 7.20 Expenditure on major components of MIDH(` Crore)
Component Expenditure incurred+
Area expansion for high density plantation of mango, guava, oranges, etc. and plantation of grapes, banana, papaya, spices & flower crops, etc.
477.31
Construction of 22,077 community tanks 462.14 Establishment of green house, shed net house, plastic mulching, anti-bird/ anti-hail net, etc. under protected cultivation
350.40
Construction of pack house, ripening chamber, onion storage structure, cold storage, pre-cooling unit, etc. to promote post-harvest management
283.94
Promotion of horticulture mechanisation 77.17 Rejuvenation of old orchards 49.00 Establishment of high-tech nurseries and tissue culture laboratories for production of quality planting material & Seed Production
37.47
Farmers’ training/study tours under human resource development
35.35
Promotion of organic farming 21.20 Promotion of integrated pest/nutrient management 20.73 Establishment of 20 mushroom projects 2.52 Promotion of beekeeping 1.39 Mission Management 77.72 Indo Israel/Indo Dutch projects-6 40.27 Innovative components 18.71 Others 113.41 + since inception upto October, 2020 Source : Maharashtra State Horticulture & Medicinal Plants Board

114
Economic Survey of Maharashtra 2020-21
7.25 Promotion of Kitchen Garden in Tribal Districts: The scheme is being implemented in 14 tribal districts viz. Thane, Pune, Nashik, Dhule, Nandurbar, Jalgaon, Ahmednagar, Nanded, Amravati, Yavatmal, Gadchiroli, Chandrapur, Palghar and Gondia which have been facing the problem of malnutrition. The scheme aims at providing balanced diet, rich in vitamin A & C and other essential minerals like iron & other nutrients, by promoting plantation of fruit trees and vegetables in the backyards of their residence. During 2019-20 grants of ` 14.40 lakh were received and expenditure incurred was ` 14.18 lakh. During 2020-21 grants of ` 7.26 lakh are sanctioned.
7.26.1 Dr. Babasaheb Ambedkar Krishi Swavalamban Yojana: Under the scheme financial assistance is provided in the form of 100 per cent subsidy to SC & Neo-Buddhist farmers holding land upto six ha and having annual income upto ` 1.50 lakh, with an objective to provide sustainable irrigation facility such as new well, old well repairing, plastification of farm pond, inwell boaring, pumpset, electric connection charges, etc. During 2019-20 expenditure of ` 268.60 crore was incurred. During 2020-21 budget provision of ` 276.06 crore is made.
7.26.2 Birsa Munda Krishi Kranti Yojana: Under the scheme financial assistance is provided in the form of 100 per cent subsidy to ST farmers holding land upto six ha and having annual income upto ` 1.50 lakh, with an objective to provide sustainable irrigation facility such as new well, old well repairing, plastification of farm pond, inwell boaring, pumpset, electric connection charges, HDPE/PVC pipe, Micro irrigation set, kitchen garden, etc. During 2019-20 expenditure of ` 103.12 crore was incurred. Under the scheme grants of ` 38.31crore are sanctioned for 2020-21.
Table 7.21 Quantity & value of exports of fruits, vegetables & flowers
Fruits/ flowers
State/ Country
2017-18 2018-19 2019-20 Quantity
(MT) Value
(` Crore)
Quantity (MT)
Value (` Crore)
Quantity (MT)
Value (` Crore)
Mango Maharashtra 35,343 309 29,346 314 29,884 307 India 49,180 382 46,510 406 49,657 400
Grapes Maharashtra 1,75,370 1,871 1,93,709 2,118 1,53,693 2,019 India 1,88,221 1,900 2,46,134 2,335 1,93,690 2,177
Banana Maharashtra 44,559.3 149.4 61,830.56 207.58 1,08,961 429 India 1,01,312 348.8 1,34,502.33 412.07 1,95,746 659
Orange Maharashtra 25.24 0.16 37.43 0.28 25.88 0.1 India 25.29 0.17 407.88 1.18 130.16 0.48
Pomegranate Maharashtra 32,653 412 40,721 491 32,137 408.41 India 47,336 538 67,892 689 80,548 688
Raisins (manuka) Maharashtra 24,425 231 18,183 248 23,721 257 India 25,259 239 18,926 259 24,688 270
Rose flowers Maharashtra 877.01 28.84 863.36 29.81 549.52 22.65 India 2,517.47 57.98 2,134.34 57.47 1,613.62 47.95
Rose saplings Maharashtra 37.78 1.81 38.65 3.17 43.43 3.47 India 45.43 2.19 40.88 3.30 45.76 3.65
Mango pulp Maharashtra 20,659 156 21,068 168 15,195 115 India 1,10,924 674 1,05,872 658 85,726 584
Onion Maharashtra 10,54,618 1,972 13,23,482 1,941 7,29,563 1,350 India 15,88,984 3,089 21,82,826 3,467 11,48,924 2,319
Other vegetables (excluding onion)
Maharashtra 1,71,053 708 1,54,548 694 1,31,023 669 India 7,39,056 1,882 7,35,742 2,070 7,54,007 2,065
Other processed fruits & vegetables (excl. mango pulp)
Maharashtra 1,84,342 1,645 1,71,810 1,755 1,72,780 1,759
India 5,43,837 4,859 5,87,726 5,279 6,13,736 5,847
Source : Commissionerate of Agriculture, GoM

Economic Survey of Maharashtra 2020-21
115 7.27 Crop pest surveillance and advisory project: This is online, realtime Crop Pest Management Advisory Project in the state which is being implemented in collaboration with various national agriculture research institutes and state agriculture universities. The objectives of the project are (i) to create awareness among farmers about pest & disease management and knowledge updating through trainings & field visits, (ii) giving early warning of pest & diseases to adopt appropriate management strategies and (iii) scientific advisory free of cost SMS to farmers. The project covers rice, soyabean, cotton, red gram, maize, sorghum, sugarcane and gram crops. During 2019-20, grants of ` 17.69 crore were utilised for this project. During 2020-21 special emphasis is given on the management of the outbreak of Fall Army Worm on maize, sorghum, sugarcane crops and White Grub on sugarcane crop. During 2020-21 upto December, 248.90 lakh plant protection advisory SMS were sent to farmers for management of pest & diseases. Grants of ` 16.50 crore are sanctioned for the project during 2020-21.
7.28 Watershed development programme: Watershed Development aims to create conditions which help in increasing agricultural productivity while conserving natural resources. Since majority of the area in the State is rainfed, various schemes are being implemented in the State with main objectives (i) increasing productivity of dry agriculture land, (ii) prevention of deterioration of soil & conservation of moisture in soil and (iii) water conservation. Completed and ongoing micro watersheds under various schemes are given in Table 7.22.
7.29 National Mission for Sustainable Agriculture: National Mission for Sustainable Agriculture (NMSA) has been formulated for enhancing agricultural productivity, especially in rainfed areas, focusing on integrated farming, water use efficiency, soil health management and synergizing resource conservation. It includes sub-missions on Soil Health Management & Distribution of Soil Health Cards, Integrated Nutrient Management (INM) & organic farming, Rainfed Area Development (RAD), e-Governance and On Farm Water Management.
Table 7.22 Completed and ongoing micro watersheds
Scheme
Number of watersheds Expenditure incurred on selected watersheds
upto June, 2020 (` Crore)
Selected Completed Under execution
1. Vidarbha Panlot Vikas Mission 1,032 1,032 0 365.36
2. Marathwada Panlot Vikas Mission 285 285 0 137.34
3. River Valley Project 271 226 45 580.80
4. Western Ghat development programme 160 160 0 137.19
5. National watershed development programme 1,028 956 72 290.59
6. Accelerated Watershed Development programme 10,614 5,747 4,867 3,012.18
7. Rural Infrastructure Development Programmed- NABARD assistance 364 364 0 86.87
8. Integrated watershed management programme 14,935 10,273 4,662 3,039.69
9. Jalyukt Shivar Abhiyan 22,586 20,544 2,042 9,731.32
10. Other Schemes (DPAP, Hariyali, Jawahar, Ashwashit, etc.) 5,680 5,680 0 -
Note : Micro watershed from other schemes completed above 50 per cent are included in Jalyukt Shivar Abhiyaan. Source : Commissionerate of Agriculture, GoM

116
Economic Survey of Maharashtra 2020-21
7.29.1 Soil Health Management and Distribution of Soil Health Cards: The sub-mission Soil Health Management (SHM) and Distribution of Soil Health Cards (SHC) is introduced to promote the use of integrated nutrient management for maintaining soil health and improving soil fertility. There are 31 soil testing laboratories established in the State for examining soil and water samples along with five fertiliser sample testing laboratories at Amravati, Aurangabad, Nashik, Pune and Kolhapur. To create awareness about soil health status and suggesting measures for improvement of soil health, SHC are distributed to farmers in phased manner. During 2019-20 two lakh SHCs were distributed to farmers and expenditure of ` 10.68 crore was incurred under the scheme. During 2020-21 under SHM programme, traning and demonstrations are conducted in 3,510 villages (10 villages from each taluka) and an amount of ` 9.49 crore has been sanctioned by GoI. 7.29.2 Rainfed Area Development Programme: Rainfed agriculture is risk prone activity, mainly due to its dependence on climate. A centrally sponsored Rainfed Area Development (RAD) Programme has special objective to minimise risk by providing agriculture based income generating opportunities and sustaining the rainfed agriculture through optimum utilisation of potential of natural resources and resources created through various interventions. During 2019-20 funds of ` 33.01 crore were received from GoI, of which ` 15.75 crore were utilised for 10,394 beneficiaries. During 2020-21 upto December, funds of ` 19.95 crore are received from GoI, of which ` 10.09 crore are utilised. 7.29.3 Paramparagat Krishi Vikas Yojana: Paramparagat Krishi Vikas Yojana (PKVY), a sub-component of Soil Health Management scheme under NMSA is a centrally sponsored scheme. Objectives of PKVY are (i) increasing soil fertility and producing healthy food through organic practices without use of chemicals, (ii) empowering farmers through cluster approach in farm practice management, (iii) quality assurance and (iv) direct marketing of agriculture produce through innovative means. Benefits of the scheme are given to each cluster (maximum 50 farmers in a cluster of 50 acre land) for three consecutive years. During first phase of the scheme (2016-17 to 2018-19), in all 932 clusters of 40,762 beneficiary farmers, covering 20,346 ha land were formed and expenditure of ` 92.60 crore was incurred. During second phase of the scheme (2017-18 to 2019-20), 326 clusters of 11,803 beneficiary farmers, covering 7,160 ha land were formed and expenditure of ` 29.95 crore was incurred. 7.30 Pradhan Mantri Krishi Sinchai Yojana: The major objective of Pradhan Mantri Krishi Sinchai Yojana (PMKSY) is to expand cultivable area under assured irrigation, improve on-farm water use efficiency to reduce wastage of water, enhance the adoption of precision-irrigation and other water saving technologies such as sprinkler and drip irrigation (More Crop Per Drop). The scheme is being implemented in the State from 2015-16. As per the subsidy norms small & marginal farmers can avail 55 per cent subsidy and other farmers can avail 45 per cent subsidy, with a limit of five ha area for both. During 2019-20 in all 1,23,300 ha area is newly brought under micro irrigation and subsidy of ` 402.14 crore has been credited to bank accounts of 1,64,692 eligible farmers upto 28th December, 2020. Sprinkler and drip irrigation sets distributed and expenditure incurred under PMKSY are given in Table 7.23.
Table 7.23 Sprinkler & drip irrigation sets distributed and expenditure incurred
Year Sprinkler irrigation sets Drip irrigation sets Expenditure incurred (` Crore) No. of sets Area (ha) No. of sets Area (ha)
2017-18 1,10,610 72,814 1,53,589 1,36,180 687.84 2018-19 71,161 44,812 1,03,921 85,731 415.95 2019-20 67,531 40,794 97,161 82,505 402.14 2020-21 (Target)
69,979 63,617 1,21,685 1,10,623 667.66#
Source : Commissionerate of Agriculture, GoM # Anticipated

Economic Survey of Maharashtra 2020-21
117 7.31 Pradhan Mantri Fasal Bima Yojana: The scheme is being implemented with an objective to stabilise farmers’ income to ensure their continuous contribution in farming, by providing insurance coverage and financial support to farmers in the event of failure of any of the notified crops as a result of natural calamities, pests & diseases. The scheme is being implemented from kharif season 2016 in the State. Food crops, oilseeds, horticultural and cash crops are covered under the scheme. The erstwhile National Agricultural Insurance Scheme has been integrated with this scheme. Farmers have to pay insurance premium maximum up to five per cent of amount assured, depending on the type of crop. During 2019-20, in all 140.89 lakh farmers participated in the scheme, wherein area insured was 75.15 lakh ha with sum assured of ` 25,229.13 crore and gross premium paid was ` 4,925.57 crore. Compensation claims of ` 5,511.68 crore are proposed for 84.36 lakh beneficiary farmers. During 2020-21, in all 119.41 lakh farmers participated in the scheme, wherein area insured is 64.48 lakh ha with sum assured of ` 24,407.92 crore and gross premium paid is ` 5,774.81 crore. Interim compensation claims of ` 346.07 crore are proposed for 4.66 lakh beneficiary farmers. 7.32 Weather Based Crop Insurance Scheme for Fruit Crops: Weather based fruit crop insurance scheme is being implemented for grapes, mango, pomegranate, banana, orange, sweet orange, guava, sapota, lemon and cashew nut in the State. During 2019-20, in all 4.91 lakh farmers participated in the scheme, wherein area insured was 4.21 lakh ha with sum assured of ` 4,995.38 crore and gross premium paid was ` 1,415.42 crore. During 2019-20 compensation claims of ` 1,125.68 crore (progressive) were settled for 3.22 lakh beneficiary farmers. During 2020-21, in all 3.93 lakh farmers participated in the scheme, wherein area insured is 2.86 lakh ha with sum assured of ` 3,440.28 crore and gross premium paid is ` 643.73 crore. 7.33 Unnat Sheti-Samruddha Shetkari Campaign: GoM has initiated this campaign from kharif 2017-18 with the objective of Doubling Farmers’ Income by the year 2022. For NFSM rice, wheat, pulses, coarse grains and nutria-cereals during 2020-21 upto December, in all 54,589 ha block demonstrations are organised and expenditure of ` 23.42 crore is incurred and training of 1,218 farmers is organised and expenditure of ` 0.77 crore is incurred. For NFSM Oilseed & Oilpalm, during 2020-21 upto December, in all 4,687 ha block demonstrations are organised and expenditure of ` 0.58 crore is incurred. During 2020-21 upto December total expenditure of ` 14.25 crore is incurred on various components.
7.33.1 Agricultural Mechanisation: Agricultural Mechanisation Campaign is being implemented in the State since 2017-18 under Unnat Sheti Samruddha Shetkari Campaign with an objective to tackle challenges posed due to declining size of land holding, decreasing number of bullocks, non-availability of labours, increasing labour wages, short period of kharif season, varied cropping pattern, etc. Components of this campaign are subsidy to farmers for purchase of improved agricultural implements and establishment of agricultural implements banks. Details of beneficiaries and subsidy given under the scheme are given in Table 7.24.
7.34 Bhausaheb Fundkar Falbaug Lagwad Yojana: GoM has launched this 100 per cent subsidy scheme from kharif season of 2018-19 in the State for farmers who cannot avail benefits of
Table 7.24 Beneficiaries and subsidy given under Agricultural Mechanisation Campaign
Year Agricultural Implements Agricultural Implements Banks Total subsidy (` Crore)
Number Subsidy
(` Crore) Number
Subsidy (` Crore)
2017-18 62,254 372.63 50 2.31 374.94
2018-19 60,041 340.39 29 1.33 341.72
2019-20 45,238 249.43 47 2.50 251.93 Source : Commissionerate of Agriculture, GoM

118
Economic Survey of Maharashtra 2020-21
horticulture plantation under Mahatma Gandhi National Rural Employment Guarantee Scheme of GoI, for not being registered under MGNREGA. The main objectives of the scheme are enhancing farmers' income, employment generation for young farmers, changing cropping pattern, creating sustainable source of income, increasing raw material availability for agro-processing industry, conservation of natural resources and minimising effects of climatic changes. The scheme includes plantation of 16 perennial horticulture grafts and seedlings. During 2019-20, grants of ` 46.94 crore were received, of which ` 36.61 crore have been spent on plantation programme. In all 19,700 beneficiaries have undertaken fruit plantations on 17,757 ha area. During 2020-21 upto December, ` 20.02 crore grants have been utilised. 7.35 Chief Minister Agriculture and Food processing scheme: Chief Minister Agriculture and Food Processing Scheme is being implemented in the State since 2017-18 for consecutive five years. The main objectives of the scheme are to encourage modern technology based projects for quality enhancement of agriculture produce, to encourage exports, to create skilled manpower for agro & food processing and employment generation through small and medium agro & food processing units in rural areas. In all 158 projects have been sanctioned under the scheme. During 2019-20, out of ` 24 crore grants received ` 15.60 crore has been utilised. During 2020-21, upto December out of ` 12 crore grants received ` 3.35 crore were utilised. 7.36 Pradhan Mantri Kisan Samman Nidhi (PM-KISAN): With a view to augment income of small and marginal farmers, GoI has launched PM-KISAN scheme from 2018-19. Under the Scheme, a direct payment of ` 6,000 per year is transferred in three equal installments of ` 2,000 each, into the Aadhaar linked bank account of eligible farmer family, comprising of husband, wife and minor children. Under the scheme, as on 4th January, 2021 in all 102.54 lakh beneficiary farmers in the State have been benefited and total amount of ` 9,496.38 crore has been credited to beneficiary farmers’ bank accounts. 7.37 Scheme for promotion and strengthening of Group Farming: GoM has launched a scheme for group farming on pilot basis to achieve the target of doubling of farmers’ income by the year 2022. A group of 20 farmers having minimum 50 acre land in Konkan revenue division or 100 acre land in rest of the revenue divisions is eligible under this programme. Financial assistance for Konkan is ` one lakh per acre and upto ` one crore per group for rest of the regions. Government has sanctioned amount for spill over to complete remaining work of farmers’ groups selected for the year 2017-18 and 2018-19. Budget provision of ` 110 crore is made available for 2020-21 and ` 33 crore grant is released. Progress under the scheme is given in Table 7.25.
7.38 Mahatma Jyotirao Phule Shetkari Karjamukti Yojana 2019: The State has experienced drought like situation continuously during 2015-16 to 2018-19. At the same time farming was affected due to unseasonal rains. Due to these natural calamities, farmers' short term & medium term crop loans became overdue and farmers were deprived of borrowing fresh loans. To relieve
Table 7.25 Scheme for promotion and strengthening of Group Farming
Year Target Grants Released ( ` Crore)
Achievement
Physical (No. of groups)
Financial Assistance ( ` Crore)
Physical (No. of groups)
Financial Assistance ( ` Crore)
2017-18 200 200.00 31.50 196 3.43
2018-19 200 200.00 80.00 232 73.53
2019-20 $ -- -- 70.00 -- 44.11
2020-21 $ -- -- 33.00 -- 15.18 Source : Commissionerate of Agriculture, GoM $ spill over amount

Economic Survey of Maharashtra 2020-21
119 the farmers from this vicious circle, GoM announced this scheme during 2019-20 with the objective to waive off loans borrowed during 1st April, 2015 to 31st March, 2019 from one or more institutions and have become overdue as on 30th September, 2019. Under the scheme, overdue loans upto ` two lakh, including principle & interest are waived off without any limit of size of land holding. The scheme is applicable only to individual farmer borrowers of Nationalised banks, Commercial banks, RRBs, DCCBs and PACS. Since inception of the scheme upto January, 2021 benefit of ` 19,847 crore has been given to 31.04 lakh beneficiary farmers. 7.39 Pradhan Mantri Kisan Maandhan Yojana: Pradhan Mantri Kisan Maandhan Yojana (PM-KMY), a voluntary and contribution based pension scheme has been initiated in the State to provide old age protection and social security to all small and marginal farmers. Under the scheme, a fixed pension of ` 3,000 per month is to be given to all eligible small and marginal farmers. Farmers in the age group 18 to 40 years, as on 1stAugust, 2019 are eligible to enroll into the scheme. Farmers have to contribute an amount between ` 55 to ` 200 per month in the pension fund till they reach age of 60 years. Pension is to be paid to the farmers from a pension fund managed by Life Insurance Corporation of India. GoI contributes an equal amount in the pension fund. As on 19th January, 2021 in all 77,807 beneficiary farmers in the State have been enrolled under PM-KMY. 7.40 Dr. Punjabrao Deshmukh Jaivik Sheti Mission: This mission is being implemented for promotion of organic farming in the State through cluster approach (20 to 30 farmers in a cluster of 50 acre land) from 2019-20. Benefits of the scheme are given to each cluster for three consecutive years. In the first phase distressed districts in the Vidarbha region, viz. Buldhana, Akola, Washim, Amravati, Yavatmal and Wardha are included in the programme. Details of physical and financial achivements under the mission are given in Table 7.26.
New Initiatives for agriculture sector
7.41 ‘Vikel te Pikel’ Abhiyaan: Considering the fact that 81 per cent of the farmers in the State fall in the category of small & marginal farmers and about 83 per cent of the agricultural land is rainfed, GoM has initiated ‘Vikel te Pikel’ Abhiyaan in October, 2020 to assess demands of farmers and consumers, protect farmers from market uncertainties leading to non-profitability and in turn making agriculture activity economically viable. Objectives of the abhiyaan are (i) changing cropping pattern according to demand, (ii) enhancing quality of agricultural production, (iii) making agriculture activity economically viable, (iv) creating brand for sale and marketing of agricultural produce, (v) creating more opportunities of marketing through better value chain markets, (vi) formulate new policies to simplify agriculture activity, (vii) increasing investment in agriculture sector, (viii) sustained agricultural income and increase in productivity and (ix) analyzing market related information, trends & supplying it to producers. Under the abhiyaan agricultural produce will be sold to consumers & traders and infrastructure will be developed for sale of processed agricultural produce. This abhiyaan is going to be implemented by concerned state departments and NABARD. Ongoing Sant Shiromani Shri Savata Mali Shetkari Athavade Baajar Abhiyaan, under which 76 weekly markets are functioning upto September 2020, will be implemented under this abhiyaan.
Table 7.26 Physical and Financial Achievement
Financial Year
Target (No. of groups)
Achivement (No. of groups)
Beneficiaries (No.)
Area (ha)
Funds distributed (` Crore)
Expenditure (` Crore)
2019-20 350 314 7,457 6,800
6.00 0.64 2020-21 2.16+ 1.24+
Source : Commissionerate of Agriculture, GoM + upto January

120
Economic Survey of Maharashtra 2020-21
7.42 Prime Minister Formalisation of Micro Food Processing Enterprises Scheme: Under Aatmanirbhar Bharat abhiyaan, GoI has launched all India centrally sponsored PM Formalisation of Micro food processing Enterprises Scheme (PMFME) in partnership with the state governments, for providing financial, technical and business support for upgradation of existing micro food processing enterprises in the unorganized sector. PMFME is going to be implemented on ‘One District One Product’ basis for a period of five years from 2020-21 to 2024-25. Objectives of the scheme are (i) support for capital investment for upgradation, (ii) Capacity building through skill training, imparting technical knowledge on food safety standards & hygiene and quality improvement, (iii) hand holding support for preparation of DPR, availing bank loan and upgradation and (iv) support to Farmer Producer Organisations (FPOs), Self Help Groups (SHGs), producers’ co-operatives for capital investment, common infrastructure and support branding & marketing.
7.42.1 Under the scheme the State has set a target of empowering 20,119 micro food processing industries in five years. Individual micro food processing units for perishable agricultural commodities, food grains, pulses, oilseeds, spice crops, fisheries, poultry, dairy, forest products, etc. are going to be covered under the scheme and individual micro food processing units would be provided 35 per cent of the project cost as credit-linked capital subsidy with a maximum limit of ` 10 lakh per unit.
7.43 Punyashlok Ahilyadevi Holkar Nursery Scheme: Maharashtra is leading State in production of fruits and vegetables and their export. Farmers in the State are inclined towards production of chemical free export quality vegetables and their export. GoM has launched Punyashlok Ahilyadevi Holkar Nursery Scheme under RKVY from 2020-21 for two years. Objectives of the scheme are (i) provide pest free and chemical free healthy saplings grown in controlled climatic conditions, (ii) availability of agro-based activity to local farmers for income generation, (iii) change in cropping pattern and adoption of new technology and (iv) increasing high quality vegetable production, export and enhancing farmers’s income. Farmers having minimum 0.40 ha land and having permanent source of water for establishment of nursery are eligible under the scheme. Female agriculture graduates & their groups and vegetable producing small & marginal farmers and their groups are given priority of selection under the scheme. Basic infrastructure viz. poly-tunnel, shednet, plastic crates, knapsack sprayers, etc. is provided and technical training of three to five days is imparted under the scheme. The scheme is going to be implemented as per the norms of NHM and financial assistance is given in two installments of 60 per cent and 40 per cent of the project cost. Target of 500 beneficiaries covering an area of 200 ha has been set and financial assistance of ` 11.62 crore is proposed for the State.
7.44 Formation and Promotion of 10,000 Farmer Producer Organisations: Agricultural land holding is dominated by small & marginal farmers with average size of land holding less than one ha. These farmers face challenges in production and post production agricultural activities. Collective efforts of such farmers in the form of Farmer Producer Organisations (FPO) can reduce cost of production, increase productivity, increase better market linkages and in turn enhance their income. GoI has initiated a central sector scheme ‘Formation and Promotion of 10,000 FPOs’ with

Economic Survey of Maharashtra 2020-21
121 the objectives (i) to promote holistic system to facilitate development of sustainable income oriented farming, (ii) to enhance productivity through efficient, cost effective & sustainable resource use, (iii) to provide support to new FPOs for five years in all aspects of management of agricultural activity and (iv) capacity building to develop agriculture enterpreneurship skills to become economically viable & self-sustaining. Duration of the scheme is from 2020-21 to 2023-24. Formation of FPO is based on produce cluster area. FPO with a minimum farmer members size of 300 are eligible under the scheme. Farmer members cohesively located with almost same interest are to be mobilised to form a group of 15-20 members, calling the group as Farmer Interest Group (FIG) or Self Help Group (SHG), Farmers Club (FC), Joint Liability Group (JLG), Rythu Mitra Group. Such 20 or more groups from a produce cluster area or a village/ cluster of neighboring villages based on certain commonalities are to be put together to form FPO.
7.45 Establishment of Village Agricultural Development Committee: The State has made it mandatory to form Village Agricultural Development Committee in every village u/s 49(4), of Village Panchayat Act, 1959 with objectives of overall development of agriculture, maximum use of natural resources, setting priorities of works to be undertaken through various schemes & projects. The committee should have minimum 12 members (not less than 50 per cent should be female members) connected to agriculture & allied activities sector.
7.46 Measures taken during Covid-19 lockdown period:
Establishment of control room to co-ordinate transport of agricultural inputs and agricultural produce
Licenses were made available from concerned departments, to transport and sell agricultural inputs and agricultural produce
Online renewal of licenses
Distribution of agricultural inputs to farmers at their door steps
Distribution of fertilisers and seeds to 9.42 lakh farmers
Distribution of 19,700 MT seeds to farmers
Distribution of 2.79 lakh MT chemical fertilisers to farmers
Distribution of more than six lakh cotton seed packets to farmers
Direct sell of about 1.37 lakh MT of fruits & vegetables to urban consumers through 3,790 groups of farmers.

122
Economic Survey of Maharashtra 2020-21
ANIMAL HUSBANDRY 7.47 Animal Husbandry, dairy and fisheries activity along with agriculture, continue to be an integral part of the rural economy. These activities have contributed to the food basket, draught animal power & employment generation and also helps in maintaining ecological balance. It also provides essential nutrients at low cost to the livestock rearing families. Livestock has become an important source of income for millions of rural families and plays an important role in achieving the goal of doubling farmers’ income. Government is implementing various policies for livestock healthcare, encouraging rural families to take up livestock rearing and for genetic upgradation of livestock for sustainable production. To overcome the challenges posed by the Covid-19 pandemic outbreak in the State, various initiatives were taken by the State Government for the sustainability of Animal Husbandry sector.
Measures taken during Covid-19 pandemic 7.48 During Covid-19 pandemic, poultry industry faced demand crisis from February, 2020 to April, 2020 due to widespread rumours and false information through social media. The State created mass awareness through radio, television and other extension media about safety of consumption of poultry products and nutritional benefits therein. As a result, the demand for poultry products was restored and poultry industry was sustained. During lockdown period, various measures such as providing uninterrupted vaccination, artificial insemination & other veterinary services, fodder availability, transport for maintaining health of livestock and consistent milk production including action against animal cruelty were taken by the State Government.
7.48.1 During Covid-19 lockdown, the inter state and intra state transportation was badly affected resulting in shortage of feed supply, ingredients for feed manufacturing and silage making bags. Collective efforts were taken across the state in order to ensure smooth supply of feed and fodder to animal owners and manufacturing units.
7.48.2 Horse feed was supplied to Raigad, Sindhudurg, Palghar and Ratnagiri districts. Also donkeys owned by labourers stranded in Raigad district were given 10 MT grass and 200 Kg rice bran for dietary needs. In Amravati, Palghar and Kolhapur districts 43 MT fodder was supplied to the cattle with the help of NGO's.
Livestock Census 7.49 As per Livestock Census 2019, the State ranks seventh at national level with total livestock of about 3.31 crore. The State ranks fifth at national level with poultry birds population of about 7.43 crore. Livestock as per Livestock Census 2019 in selected states is given in Table 7.27 and time series data is given in Annexure 7.7.

Economic Survey of Maharashtra 2020-21
123
Veterinary health care infrastructure 7.50 The State has provided facilities for animal health care upto village level through a network of the veterinary institutions. Veterinary health care infrastructure of the State is given in Table 7.28.
Table 7.28 Veterinary health care infrastructure of the State (As on 31st March, 2020)
Veterinary region
Polyclinics
Mini polyclinics
Veterinary dispensaries
Mobile veterinary
clinics
Total District artificial
insemination centres Grade I Grade II
Mumbai 5 20 138 359 12 534 5 Nashik 5 25 365 491 6 892 5 Pune 5 26 458 559 7 1,055 5 Aurangabad 3 20 161 288 2 474 4 Latur 4 20 164 291 3 482 4 Amravati 5 27 192 394 17 635 5 Nagpur 6 30 263 459 18 776 6 State 33 168 1,741 2,841 65 4,848 34
Note: In addition to this, six polyclinics are attached to Veterinary colleges at Mumbai, Parbhani, Nagpur, Shirval (Satara), Udgir (Latur) & Akola Source : Office of the Commissioner of Animal Husbandry, GoM
7.51 The State provides veterinary medical facilities for various diseases and also implements vaccination programmes through 4,848 vetrinary institutions. Cases treated and vaccinated are given in Table 7.29.
Table 7.29 Cases treated and vaccinated ('000)
Particulars 2018-19 2019-20 2020-21+ General treatment 17,153 17,150 8,870 Castration 931 892 338 Major operation 53 60 19 Minor operation 565 521 200 Vaccination (including poultry) 53,543 62,417 39,205 Source : Office of the Commissioner of Animal Husbandry, GoM + upto November
Table 7.27 Livestock in selected states as per Livestock Census 2019 ( '000)
State Livestock Total
poultry birds#
Cattle Buffaloes Sheep and Goats
Other@ Total
Andhra Pradesh 4,601 6,219 23,149 99 34,068 1,07,863 Gujarat 9,634 10,543 6,655 61 26,893 21,773 Karnataka 8,469 2,985 17,220 339 29,013 59,494 Madhya Pradesh 18,751 10,307 11,389 190 40,637 16,660 Maharashtra 13,993 5,604 13,285 198 33,080 74,298 Rajasthan 13,938 13,693 28,744 426 56,801 14,623 Tamil Nadu 9,519 519 14,389 74 24,501 1,20,781 Telangana 4,232 4,226 23,998 185 32,641 79,999 Uttar Pradesh 19,020 33,017 15,465 511 68,013 12,516 All-India 1,93,463 1, 09,852 2,23,146 10,300 5,36,761 8,51,810 @ includes pigs, horses & ponies, mules, camels & donkeys # includes birds in poultry farm Source : Department of Animal Husbandry & Dairying, GoI

124
Economic Survey of Maharashtra 2020-21
Artificial Insemination
7.52 Three frozen semen laboratories are located at Pune, Nagpur and Aurangabad where semen straws are prepared and distributed through 34 district artificial insemination centres to 4,848 veterinary institutions. Information about Artificial Insemination (AI) is given in Table 7.30.
Nationwide Artificial Insemination Programme
7.53 Nationwide Artificial Insemination Programme (NAIP) -I was implemented in 33 districts of the State from September, 2019 to March, 2020 using high genetic merit bull semen with an objective to increase AI coverage to more than 50 per cent. Under NAIP-I, GoI released funds of ` 14.80 crore, of which ` 2.82 crore were utilised for performing 5.85 lakh AI. NAIP-II is being implemented in the State from August, 2020 to May, 2021.
Rashtriya Gokul Mission
7.54 GoI has started Rashtriya Gokul Mission with the following objectives
Development and conservation of indigenous breeds
Enhancing milk production and productivity of bovine population by increasing disease free high genetic merit female population and check on spread of diseases
Distribution of disease free high genetic merit bulls for natural service
To bring all breedable females under organised breeding policy through AI or natural service using germ plasm of high genetic merits
To arrange quality AI services at farmers’ doorstep
To create e-market portal for bovine germ plasm for connecting breeders and farmers
Expenditure incurred under Rashtriya Gokul mission is given in Table 7.31.
Table 7.30 Information about Artificial Insemination ('000)
Particulars 2018-19 2019-20 2020-21+
I) Cow (AI) 1,687 1,668 968 Exotic 280 210 105
Cross breed 1,052 1,034 576
Indigenous 355 424 287
No. of calves born (Cow) 579 576 342 Cross breed 465 450 265
Indigenous 114 126 87
II) Buffalo (AI) 719 713 339 No. of calves born (Buffalo) 243 247 134 Source : Office of the Commissioner of Animal Husbandry, GoM + upto November

Economic Survey of Maharashtra 2020-21
125
7.54.1 Under Rashtriya Gokul Mission, Krishi Kalyan Abhiyaan is implemented in selected villages of four aspirational districts viz. Gadchiroli, Nandurbar, Osmanabad and Washim in the State with the objective of genetic upgradation through high yielding indigenous bovine semen and providing quality artificial insemination services at farmers’ doorstep. During 2018-19, funds of ` 2.61 crore are received from GoI for activities under Krishi Kalyan Abhiyaan.
National Animal Disease Control Programme 7.55 GoI started 100 per cent centrally sponsored National Animal Disease Control Programme on mission basis from 2019-20 to achieve effective control on Foot and Mouth Disease (FMD) and Brucella by 2024-25 and complete eradication by 2029-30. 7.55.1 Out of the proposed 1.76 crore animals, 1.47 crore animals were vaccinated against FMD from 1st September, 2020 to 30th November, 2020. Tagging of all vaccinated animals is done and information is being entered in Information Network for Animal Productivity and Health (INAPH) software for which funds of ` 41.19 crore are proposed. 7.55.2 For Brucella disease control, GoI is going to supply vaccine for 29.07 lakh female cattle & buffalo of four to eight months of age. The vaccination programme will be implemented from December, 2020. Tagging of all vaccinated animals will be carried out and information will be entered in INAPH software.
Special project to increase milk production in Vidarbha & Marathwada region 7.56 GoM in collaboration with National Dairy Development Board and Mother Dairy Fruit & Vegetable Pvt Ltd. has started a special project to increase milk production in 11 districts of Vidarbha and Marathawada. In all 4,263 villages in 11 districts viz. Akola, Amravati, Buldhana, Chandrapur, Jalna, Latur, Nagpur, Nanded, Osmanabad, Wardha & Yavatmal are identified for increase in milk production. This project involves in providing AI service at doorstep, fodder development programme, supply of quality cattle feed, cattle feed supplements (mineral mixture), veterinary services like vaccination, eradication of ticks & flies, infertility and treatment camps, etc. During 2020-21 upto October, 7.22 lakh AI were performed, 4.35 lakh infertility cases were treated, 37.62 lakh animals were treated against various diseases and 129.65 lakh vaccinations were carried out. Expenditure incurred upto October, 2020 was ` 45.72 crore. NDDB collected 253.61 lakh litre of milk from villagers and 210.80 lakh litre from milk collection centres.
Table 7.31 Expenditure incurred under Rashtriya Gokul Mission
Activities undertaken Commencement
year Expenditure incurred
(` Crore) Strengthening of two bull mother farms and procurement of 600 high genetic gaolao cows and pandharpuri buffaloes on each mother farm
2016-17 8.30
Up-gradation of three frozen semen laboratories and existing artificial insemination centres
2016-17 1.49
Establishment of Embryo Transfer (ET) and In-vitro Fertilization (IVF) Laboratory at BAIF Research and Development Centre, Pune
2017-18 5.07
Strengthening of ET/IVF laboratory in the Maharashtra Animal and Fishery Science University, Nagpur
2018-19 1.19
Embryo transfer laboratory at Wadgaon Rasai, Tahsil Shirur, Dist. Pune
2018-19 4.83
Establishment of sex sorted semen laboratory at Frozen semen laboratory, Aurangabad
2018-19 24.84
Source : Office of the Commissioner of Animal Husbandry, GoM

126
Economic Survey of Maharashtra 2020-21
Chief Minister Animal Health Scheme 7.57 Chief Minister Animal Health Scheme aims in establishing mobile veterinary clinics in 349 rural tehsils to provide veterinary services to remote inaccessible, hilly and tribal villages. The Government has approved to establish 81 veterinary squads in 81 tehsils in first stage. Funds of ` 14.77 crore have been released in 2019-20. Establishment of call centre to facilitate the mobile clinics is under development.
National Livestock Mission 7.58 Under the scheme, total funds received from GoI during 2017-18 were ` 11.99 crore and an expenditure of ` 7.63 crore was incurred for establishment of three cattle feed manufacturing units, modernisation of feed testing laboratories, establishment of 224 silage making units and distribution of 1,341 power driven chaff cutters. During 2018-19 and 2019-20, GoI has sanctioned ` 10.53 crore and ` 18.55 crore respectively.
Livestock insurance scheme 7.59 This scheme is being implemented in the State by Maharashtra Livestock Development Board since 2006-07. The main objective of the scheme is to provide protection to the cattle holders against any eventual losses due to death of animal because of natural calamity, accident or disease. Maharashtra Livestock Development Board executed tri-partite agreement with New India Assurance Company Ltd. and Prudent Insurance Broker Pvt Ltd. for the period 9th October, 2018 to 31st January, 2020. Under the scheme total 40,334 animals of 11,969 beneficiaries were insured and expenditure incurred was ` 303.55 lakh as premium subsidy and ` 25.79 lakh as honorarium to veterinarians. In all 3,854 claims were made of which 3,300 claims amounting to ` 9.58 crore were settled.
Fodder Development
7.60 During 2019-20, area brought under cultivation and fodder production is given in Table 7.32.
Raje Yashwantrao Holkar Mahamesh yojana 7.61 This scheme aims at promotion of sheep rearing for Nomadic Tribes-C beneficiaries. Under the scheme, 75 per cent subsidy is given for sheep unit (20+1), distribution of improved male sheep, providing infrastructure for sheep rearing & balanced feed for each sheep unit and 50 per cent subsidy given for purchasing of mini silage baler-cum-wrapper machine & installation of animal feed units. During 2019-20, GoM released ` 39 crore to distribute 1,520 sheep units, infrastructure for sheep rearing to 593 beneficiaries, balanced feed for 458 sheep units, distribution of 25 mini silage baler-cum-wrapper machines and installation of 10 animal feed units.
Table 7.32 Area under cultivation and fodder production
Scheme Expenditure (` Crore)
Seed Distribution (MT)
Sapling distribution (Lakh no.)
Area ( '000 ha)
Expected Production (Lakh MT)
District Plan 8.37 1,268.40 253.60 27.48 16.90
RKVY and NLM 13.58 975.00 409.00 26.20 18.22
Total 21.95 2,243.40 662.60 53.68 35.12 RKVY Rashtriya Krishi Vikas Yojana NLM National Livestock Mission Source : Office of the Commissioner of Animal Husbandry, GoM

Economic Survey of Maharashtra 2020-21
127
7.62 Various schemes are implemented in the State to uplift the rural poor through livestock rearing, create entrepreneurship and generate employment in rural areas. Progress of selected schemes is given in Table 7.33.
Table 7.33 Progress of selected state level schemes
Scheme
2017-18 2018-19 2019-20 Beneficiaries
(no.) Expenditure
incurred (` Lakh)
Beneficiaries (no.)
Expenditure incurred (` Lakh)
Beneficiaries (no.)
Expenditure incurred (` Lakh)
6/4/2 Milch animal group distribution scheme
2,339 1,695
2,736 1,590
2,124 960
Stall-feeded supply of 10 goats & 1 male goat group distribution
2,547 1,233
2,533 1,112
1,848 829
Poultry farming (avocation) by rearing 1,000 broiler birds
947 1,279
890 1,186
674 879
Source: Office of the Commissioner of Animal Husbandry, GoM
Poultry development
7.63 The State has established four central hatcheries in Aurangabad, Kolhapur, Nagpur and Pune with the following objectives:
To produce and supply improved chicks, pullets and hatching eggs to farmers at government approved rate
To make arrangement to distribute improved variety of eggs, day old chicks and cockerels & pullets to beneficiaries under different poultry schemes
To supply improved birds to rural poultry farming To impart poultry farming training to farmers, women self-help groups, educated
unemployed youths, students, etc. To give technical advice and motivate farmers for poultry farming
The poultry birds supplied through central hatcheries during 2019-20 were 8.44 lakh as against 9.60 lakh in 2018-19.
Swayam Prakalp 7.64 The project was implemented from 2017-18 to 2019-20 in scheduled areas of 16 tribal districts to supply eggs in children’s diet in Anganwadi and creation of self-employment. The project aims in creating 104 mother units of poultry to supply 45 chicks of four weeks old to beneficiaries for rearing. The beneficiaries are motivated to raise the flock of 45 birds to 100 birds by hatching eggs domestically so as to have sustainable and significant source of income. The eggs produced under the project are being supplied to children in anganwadis for protein nourishment. The total project cost is ` 22.56 crore. Capacity building of beneficiaries was carried under Maharashtra State Rural Livelihood Mission. During 2019-20, 101 mother units have been established and 8.76 lakh four week old birds have been distributed to 40,142 beneficiaries for self-employment generation.
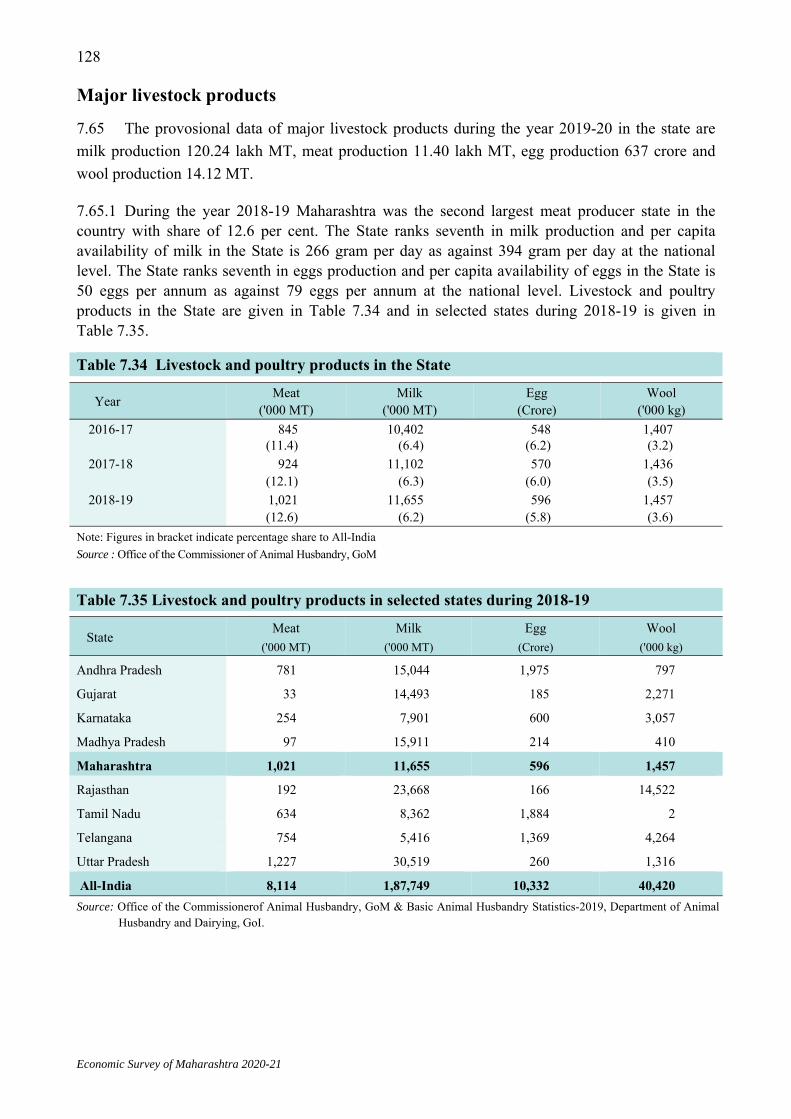
128
Economic Survey of Maharashtra 2020-21
Major livestock products
7.65 The provosional data of major livestock products during the year 2019-20 in the state are milk production 120.24 lakh MT, meat production 11.40 lakh MT, egg production 637 crore and wool production 14.12 MT.
7.65.1 During the year 2018-19 Maharashtra was the second largest meat producer state in the country with share of 12.6 per cent. The State ranks seventh in milk production and per capita availability of milk in the State is 266 gram per day as against 394 gram per day at the national level. The State ranks seventh in eggs production and per capita availability of eggs in the State is 50 eggs per annum as against 79 eggs per annum at the national level. Livestock and poultry products in the State are given in Table 7.34 and in selected states during 2018-19 is given in Table 7.35.
Table 7.34 Livestock and poultry products in the State
Year Meat ('000 MT)
Milk ('000 MT)
Egg (Crore)
Wool ('000 kg)
2016-17 845 (11.4)
10,402 (6.4)
548 (6.2)
1,407 (3.2)
2017-18 924 (12.1)
11,102 (6.3)
570 (6.0)
1,436 (3.5)
2018-19 1,021 (12.6)
11,655 (6.2)
596 (5.8)
1,457 (3.6)
Note: Figures in bracket indicate percentage share to All-India Source : Office of the Commissioner of Animal Husbandry, GoM
Table 7.35 Livestock and poultry products in selected states during 2018-19
State Meat
('000 MT) Milk
('000 MT) Egg
(Crore) Wool
('000 kg)
Andhra Pradesh 781 15,044 1,975 797
Gujarat 33 14,493 185 2,271
Karnataka 254 7,901 600 3,057
Madhya Pradesh 97 15,911 214 410
Maharashtra 1,021 11,655 596 1,457
Rajasthan 192 23,668 166 14,522
Tamil Nadu 634 8,362 1,884 2
Telangana 754 5,416 1,369 4,264
Uttar Pradesh 1,227 30,519 260 1,316
All-India 8,114 1,87,749 10,332 40,420 Source: Office of the Commissionerof Animal Husbandry, GoM & Basic Animal Husbandry Statistics-2019, Department of Animal Husbandry and Dairying, GoI.

Economic Survey of Maharashtra 2020-21
129
Dairy Development 7.66 Dairy is a supplementary activity to agriculture, which has potential for generating additional income & employment opportunities for the rural households besides improving nutrition levels. Milk production and per capita availability are given in Table 7.36 and regionwise milk production is given in Table 7.37.
7.67 During 2019-20, there were 107 milk processing plants, 142 chilling centres and 903 bulk milk coolers with capacity of 94.03 lakh litre and chilling capacity of 44.30 lakh litre per day under government & co-operative sector together. The average daily collection of milk by the government & co-operative dairies was 0.96 lakh litre & 39.76 lakh litre respectively during 2019-20 and 0.53 lakh litre & 40.09 lakh litre respectively during 2020-21 upto October. There were 263 cold storages with capacity of 17,494.40 MT of which, 247 cold storages with capacity of 17,175.65 MT were with private sector in 2019-20.
Table 7.37 Regionwise Milk production (Lakh MT)
Region 2016-17 2017-18 2018-19
Konkan 4.98 5.33 5.52 Nashik 28.07 29.85 33.34 Pune 42.99 46.41 49.57 Aurangabad 16.48 17.70 17.04 Amravati 6.77 6.62 6.10 Nagpur 4.73 5.11 4.97 State 104.02 111.02 116.54
Source:Office of the Commissioner of Animal Husbandry, GoM
Table 7.36 Milk production and per capita availability of Milk
Year Milk production
(Lakh MT)
Per capita availability
(gram per day) State All-India State All-India
2016-17 104.02 1,636.94 243 352
2017-18 111.02 1,763.46 256 375
2018-19 116.54 1,877.49 266 394 Source: Office of the Commissioner of Animal Husbandry, GoM

130
Economic Survey of Maharashtra 2020-21
Fisheries
7.68 The State has a coastline of 720 km with 173 fish landing centers and the area suitable for marine fishing is 1.12 lakh sq km. In addition to this, the area suitable for inland and brackish water fishing in the State is 4.18 lakh ha and 0.10 lakh ha respectively. During 2019-20, there were 16,089 marine fishing boats in operation, of which 12,948 were mechanised. There were 34 fish seed production centers in the State with 2,414 lakh spawn production capacity per year for catering to inland fishing. Fish production and exports are given in Table 7.38. 7.69 Under the National Agricultural Development scheme, since 2011-12, development of 25 jetties worth ` 177 crore have been undertaken. Of which work of 15 jetties has been completed, work of five jetties is in progress, approval of Coastal Regulation Zone is pending for the work of two jetties. 7.70 GoI launched Pradhan Mantri Matsya Sampada Yojana (PMMSY) on 3rd December, 2020 for a period of five years. The PMMSY is designed to address critical gaps in fish production & productivity, quality, technology, post-harvest infrastructure & management, modernisation & strengthening of value chain, establishing a robust fisheries management and fishers' welfare. Under PMMSY ` 153 crore have been sanctioned to the State for 46 beneficiary oriented schemes.
Sericulture 7.71 Sericulture is an agro-based industry which has high potential to generate employment opportunities in rural areas. Mulberry silk development programme is implemented in 24 districts of the State. Information of mulberry plantation and silk production is given in Table 7.39.
7.71.1 Tasar silk development programme is implemented in four districts of the State viz. Bhandara, Chandrapur, Gadchiroli and Gondia. Area under plantation of Ain and Arjun trees (on which Tasar silkworms are grown) in these four districts is 18,866 ha. During 2019-20 production of raw Tasar silk was 19.06 MT, while during 2020-21 upto October, it was 1.42 MT.
Table 7.38 Fish production and exports
Item Unit 2018-19 2019-20 2020-21+
Fish production Lakh MT Marine 4.67 4.44 1.25 Inland 1.00 1.18 0.44 Total 5.67 5.62 1.69 Gross value ` Crore Marine 6,298 6,751 2,000 Inland 1,178 1,474 572 Total 7,476 8,225 2572 Export of fish Quantity Lakh MT 1.61 1.36 NA Value ` Crore 5,121 4,536 NA NA Not available + upto September Source : Office of the Commissioner of Fisheries, GoM
Table 7.39 Mulberry plantation and silk production
Item Unit 2018-19 2019-20 2020-21+ Area under plantation (Old) ha 10,377 12,984 11,279 Area under plantation (New) ha 9,406 4,901 4,426 Total area under plantation ha 19,783 17,885 15,705 Beneficiaries (farmers) no. 18,160 16,744 14,851 Supply of disease free layings Lakh 54.67 42.22 24.71 Cocoon production MT 3,230.27 2,655.76 1,340.61 Production of raw silk MT 496.37 408.50 206.07 Procurement of cocoon MT 0.477 0.093 0.00 Employment generated (mandays) Lakh 54.60 44.93 22.66 Source : Directorate of Sericulture, GoM + upto October

Economic Survey of Maharashtra 2020-21
131
Forest 7.72 The forest area of the State at the end of the year 2019-20 was 61,951.76 sq km constituting about 20.1 per cent of geographical area of the State, as against the target of 33 per cent set under National Forest Policy, 1988. The jurisdiction of the total forest area in the State is divided amongst Forest department (55,858.64 sq km), Forest Development Corporation of Maharashtra (FDCM) (3,462.26 sq km), private forest brought under possession of Forest department (1,190.54 sq km) and Revenue department (1,440.32 sq km). As per India State of Forest Report (ISFR) 2019, the total forest cover in the State is 50,778 sq km showing an increase of 96 sq km over that reported in ISFR 2017, of which the very dense forest constitutes 17.2 per cent, moderately dense forest 40.5 per cent and open forest 42.3 per cent of the total forest cover in the State. As per ISFR 2019, the total mangroves cover of the State is 320 sq km showing an increase of 16 sq km over that reported in ISFR 2017. Forest circlewise distribution of forest area is given in Table 7.40 and forest cover of selected states is given in Table 7.41.
Table 7.40 Forest circlewise distribution of forest area (as on 31st March, 2020) (sq km)
Forest circle Forest area Percentage to total forest area Reserved Protected Unclassed Total
Gadchiroli 11,227.19 1,403.05 267.59 12,897.84 20.8 Nagpur 4,414.17 2,157.10 1,184.63 7,755.90 12.5 Dhule 6,148.12 57.06 222.77 6,427.95 10.4 Thane 4,344.27 1,156.15 333.32 5,835.74 9.4 Nashik 5,065.92 241.02 32.96 5,339.90 8.6 Amravati 5,055.54 15.81 14.06 5,085.41 8.2 Chandrapur 3,835.80 877.71 125.84 4,839.35 7.8 Kolhapur 3,361.79 412.78 754.61 4,529.18 7.3 Yavatmal 3,352.86 6.31 122.35 3,481.53 5.6 Aurangabad 2,818.94 105.86 229.57 3,154.37 5.1 Pune 2,430.53 0.03 174.04 2,604.60 4.2 State 52,055.13 6,432.88 3,563.75 61,951.76 100.0 Source : Office of the Principal Chief Conservator of Forest, GoM
Table 7.41 Forest cover of selected states (sq km)
State Geographical area Total forest cover
Percentage of forest cover to geographical area
Andhra Pradesh 1,62,968 29,137 17.9 Gujarat 1,96,244 14,557 7.6 Karnataka 1,91,791 38,575 20.1 Kerala 38,852 21,144 54.4 Madhya Pradesh 3,08,252 77,482 25.1 Maharashtra 3,07,713 50,778 16.5 Rajasthan 3,42,239 16,630 4.9 Telangana 1,12,077 20,582 18.4 Uttar Pradesh 2,40,928 14,806 6.2 All- India 32,87,469 7,12,249 21.7 Source : India State of Forest Report, 2019

132
Economic Survey of Maharashtra 2020-21
Wild Life, National Parks and Sanctuaries 7.73 There are six national parks, 49 sanctuaries and seven conservation reserves in the State. Tiger census is carried out quadrennially by National Tiger Conservation Authority. According to ‘Status of Tigers in India, 2018’ report, estimated number of tigers in the State were 312 as against 190 in 2014. Area of wildlife projects and expenditure incurred are given in Table 7.42.
Forest Produce
7.74 Forest provides major produce like timber & firewood and minor produce like bamboo, tendu leaves, gum, grass, etc. Production and value of forest produce is given in Table 7.43.
Table 7.42 Area of wildlife projects and expenditure incurred
Project Area (sq km) Expenditure incurred (` Crore) Core Buffer 2018-19 2019-20 2020-21+
Tiger Project Melghat 1,500.49 1,268.03 119.77 23.67 12.85 Tadoba-Andhari 625.82 1,101.77 11.87 15.40 1.94 Pench 257.26 483.96 12.46 14.80 4.66 Sahyadri 600.12 565.45 5.24 8.17 0.23 Navegaon-Nagzira 653.67 1,241.27 12.54 12.94 1.14 Bor 138.12 678.14 7.17 5.70 0.48
Integrated Development of wildlife habitat - - 15.83 8.56 0.21
Elephant Project, Kolhapur Area not specified 0.72 0.43 NA Source : Office of the Principal Chief Conservator of Forest, GoM + upto November
Table 7.43 Production and value of forest produce (` Crore)
Forest produce Unit of production
2018-19 2019-20 2020-21@ Production Value Production Value Production Value
(A) Major forest produce Timber LCM 1.3 356.67 1.11 338.69 1.13 354.81 Firewood LCM 2.32 50.11 1.79 45.2 2.25 62.27 Total (A) LCM 406.78 417.08
(B) Minor forest produce Bamboo LMT 0.22 14.75 0.1 10.5 0.27 22.07 Tendu leaves LSB 2.12 50.69 2.24* 38.48* 1.29 26.76 Grass MT 1,440 0.17 495* 0.11* NA NA Gum Quintal 225 0.15 2,675* 0.16* NA NA Lac Quintal 25 0.06 0 0 NA NA Others (Hirda, Shikekai, etc.)
- NA 0.9 0.51* NA NA
Total (B) 66.72 49.76 48.83 Total (A + B) 473.50 433.65 465.91 LCM Lakh Cubic Metre LMT Lakh Metric Tonne *Provisional @ expected NA Not available LSB Lakh Standard Bags 1Bag is 1,000 bundles of 50 tendu leaves Source : Office of the Principal Chief Conservator of Forest, GoM

Economic Survey of Maharashtra 2020-21
133
Tree Plantation 7.75 Tree plantation programme is mainly implemented through Forest Department, FDCM and Directorate of Social Forestry. An amount of ` 1,000 crore was spent on plantation activity during 2019-20. Area under tree plantation and expenditure incurred is given in Table 7.44.
Table 7.44 Area under tree plantation and expenditure incurred (` Crore)
Year Forest Dept. FDCM Social Forestry
Area (ha)
Expenditure incurred
Area (ha)
Expenditure incurred
Area (ha)
Expenditure incurred
Plants supplied (Crore)
2016-17 36,457 142.95 2,906 9.08 2,787 45.10 1.19
2017-18 26,405 99.46 3,577 13.80 3,985 60.46 0.50
2018-19 51,724 200.88 4,633 22.79 12,620 210.56 15.89
2019-20 1,02,987 388.35 8,987 89.72 21,032 521.94@ 35.14@ Source:Office of the Principal Chief Conservator of Forest, GoM @ includes plantation of 17,858 km along road side
Social Forestry 7.76 During 2019-20, in all 539.12 lakh seedlings were planted on 17,178 ha of community land and 16,267 km along roads/railways/canal side plantation and 17.12 lakh seedlings were supplied to institutions, grampanchayats and individuals for undertaking plantations. During 2020-21 upto November, 18.49 lakh seedlings were planted on 951 ha of community land and 1,385 km along roads/railways/canal side plantation, 754 unit of farm bunds plantation under MGNREGA, 11.49 lakh seedlings were planted under Agro forestry scheme under MGNREGA and 5.74 lakh seedlings were supplied to institutions, grampanchayats and individuals for undertaking plantations. Area of plantations under major schemes is given in Table 7.45. Table 7.45 Area of plantations under major schemes
Particulars Unit 2018-19 2019-20 2020-21+ Seedlings planted on community land
a) Block Plantation b) Road / railway/ canal side Plantation
Lakh seedling ha km
126.00 7,069.00
16,385.00
539.12 18178.00
17,725.20
18.49 951.00
1,385.00
Seedlings supplied to institutions/ individuals and Grampanchyat
Lakh seedling 8.89 17.12 5.74
MGNREGA Scheme a) Farm bund plantation unit
Unit
190.00
102.00
754.00
b) Agroforestry Plantation Lakh seedling - 15.05 11.49 Kanya Vansamruddhi Scheme Lakh seedling - 5.49 0.20 Source : Office of the Principal Chief Conservator of Forest, Social Forestry, GoM + upto November
Sant Tukaram Vangram Yojana 7.77 Sant Tukaram Vangram Yojana is launched with a view to create awareness about the importance of forest & wild life, to protect the forest from illegal tree cutting, encroachments, etc. Under the scheme 12,084 Joint Forest Management Committees (JFMC) were constituted in 15,500 villages. The best performing three committees at district & state level and one committee for Aurangabad region were awarded JFMC award. The JFMC manages 27.04 lakh ha of forest area. The expenditure incurred during 2017-18 was ` 75 lakh.
* * * * *

Economic Survey of Maharashtra 2020-21
134
ANNEXURE 7.1
TOTAL NUMBER, AREA AND AVERAGE SIZE OF OPERATIONAL HOLDINGS IN THE STATE ACCORDING TO AGRICULTURAL CENSUSES
Sr. No.
Size class (ha)
Number of operational holdings ('00)
1970-71 1980-81 1990-91 1995-96 2000-01 2005-06 2010-11 2015-16
(1) (2) (3) (4) (5) (6) (7) (8) (9) (10)
1 Below 0.5 6,834 9,914 16,672 22,409 27,462 31,658 36,457 43,722
2 0.5—1.0 5,585 9,345 16,075 20,252 25,595 29,525 30,633 34,436
3 1.0—2.0 8,783 15,409 27,276 31,755 36,056 41,503 40,523 43,392
4 2.0—3.0 6,266 10,275 13,969 14,745 15,791 17,020 15,463 16,964
5 3.0—4.0 4,606 6,583 7,289 6,774 6,949 7,496 6,128 6,306
6 4.0—5.0 3,576 4,601 4,469 3,874 3,780 4,037 3,142 3,353
7 5.0—10.0 8,715 9,316 7,241 5,558 4,873 5,214 3,964 3,984
8 10.0—20.0 4,180 2,819 1,530 1,029 773 622 590 576
9 20.0 and above 961 363 176 132 97 81 89 121
Total 49,506 68,625 94,697 1,06,528 1,21,376 1,37,156 1,36,989 1,52,854
Sr. No.
Size class (ha)
Area of operational holdings ('00 ha)
1970-71 1980-81 1990-91 1995-96 2000-01 2005-06 2010-11 2015-16
(1) (2) (11) (12) (13) (14) (15) (16) (17) (18)
1 Below 0.5 1,634 2,630 4,119 5,746 7,328 7,740 9,180 10,278
2 0.5—1.0 4,142 7,103 12,057 15,120 19,159 20,274 22,680 24,209
3 1.0—2.0 12,842 23,337 39,833 46,059 51,271 52,476 57,391 57,711
4 2.0—3.0 15,386 25,363 33,689 35,420 37,414 37,542 36,681 38,844
5 3.0—4.0 15,920 22,815 25,108 23,303 23,676 23,756 20,974 21,412
6 4.0—5.0 15,961 20,556 19,864 17,210 16,717 16,717 13,901 14,778
7 5.0—10.0 61,213 63,937 48,700 37,150 32,084 32,135 26,027 26,216
8 10.0—20.0 56,302 37,213 19,749 13,514 9,961 6,776 7,524 7,251
9 20.0 and above 28,394 10,662 6,129 5,274 3,418 2,634 3,314 4,365
Total 2,11,794 2,13,616 2,09,248 1,98,796 2,01,028 2,00,050 1,97,672 2,05,064
Sr. No.
Size class (ha)
Average size of holdings (ha)
1970-71 1980-81 1990-91 1995-96 2000-01 2005-06 2010-11 2015-16
(1) (2) (19) (20) (21) (22) (23) (24) (25) (26)
1 Below 0.5 0.24 0.27 0.25 0.26 0.27 0.24 0.25 0.24
2 0.5—1.0 0.74 0.76 0.75 0.75 0.75 0.69 0.74 0.70
3 1.0—2.0 1.46 1.51 1.46 1.45 1.42 1.26 1.42 1.33
4 2.0—3.0 2.46 2.47 2.41 2.40 2.37 2.21 2.37 2.29
5 3.0—4.0 3.46 3.47 3.44 3.44 3.41 3.17 3.42 3.40
6 4.0—5.0 4.46 4.47 4.44 4.44 4.42 4.14 4.42 4.41
7 5.0—10.0 7.02 6.86 6.73 6.68 6.58 6.16 6.57 6.58
8 10.0—20.0 13.47 13.20 12.91 13.13 12.89 10.89 12.75 12.59
9 20.0 and above 29.55 29.37 34.82 39.95 35.24 32.52 37.24 36.07
Total 4.28 3.11 2.21 1.87 1.66 1.46 1.44 1.34
Source - Commissionerate of Agriculture, GoM
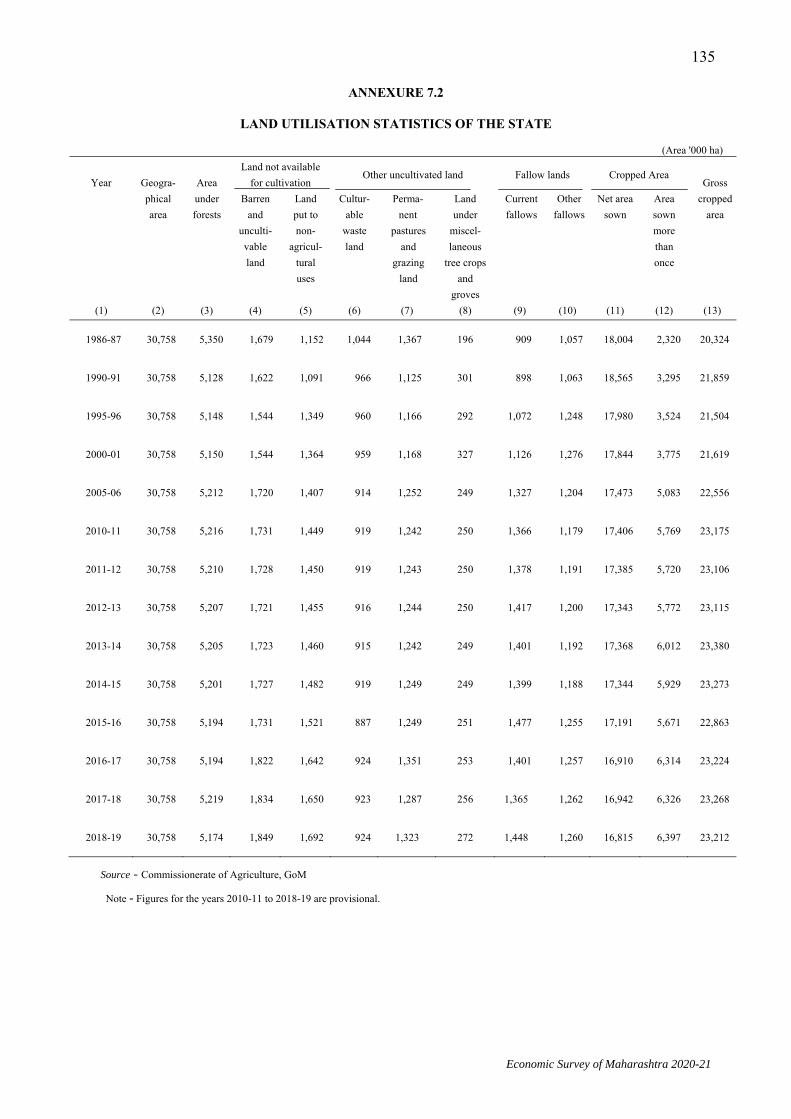
Economic Survey of Maharashtra 2020-21
135
ANNEXURE 7.2
LAND UTILISATION STATISTICS OF THE STATE
(Area '000 ha)
Year
Geogra- phical area
Area under forests
Land not available for cultivation Other uncultivated land Fallow lands Cropped Area
Gross cropped
area Barren
and unculti-vable land
Land put to non-
agricul- tural uses
Cultur- able
waste land
Perma- nent
pastures and
grazing land
Land under
miscel- laneous
tree crops and
groves
Current fallows
Other fallows
Net area sown
Area sown more than once
(1) (2) (3) (4) (5) (6) (7) (8) (9) (10) (11) (12) (13)
1986-87 30,758 5,350 1,679 1,152 1,044 1,367 196 909 1,057 18,004 2,320 20,324
1990-91 30,758 5,128 1,622 1,091 966 1,125 301 898 1,063 18,565 3,295 21,859
1995-96 30,758 5,148 1,544 1,349 960 1,166 292 1,072 1,248 17,980 3,524 21,504
2000-01 30,758 5,150 1,544 1,364 959 1,168 327 1,126 1,276 17,844 3,775 21,619
2005-06 30,758 5,212 1,720 1,407 914 1,252 249 1,327 1,204 17,473 5,083 22,556
2010-11 30,758 5,216 1,731 1,449 919 1,242 250 1,366 1,179 17,406 5,769 23,175
2011-12 30,758 5,210 1,728 1,450 919 1,243 250 1,378 1,191 17,385 5,720 23,106
2012-13 30,758 5,207 1,721 1,455 916 1,244 250 1,417 1,200 17,343 5,772 23,115
2013-14 30,758 5,205 1,723 1,460 915 1,242 249 1,401 1,192 17,368 6,012 23,380
2014-15 30,758 5,201 1,727 1,482 919 1,249 249 1,399 1,188 17,344 5,929 23,273
2015-16 30,758 5,194 1,731 1,521 887 1,249 251 1,477 1,255 17,191 5,671 22,863
2016-17 30,758 5,194 1,822 1,642 924 1,351 253 1,401 1,257 16,910 6,314 23,224
2017-18 30,758 5,219 1,834 1,650 923 1,287 256 1,365 1,262 16,942 6,326 23,268
2018-19 30,758 5,174 1,849 1,692 924 1,323 272 1,448 1,260 16,815 6,397 23,212
Source - Commissionerate of Agriculture, GoM
Note - Figures for the years 2010-11 to 2018-19 are provisional.
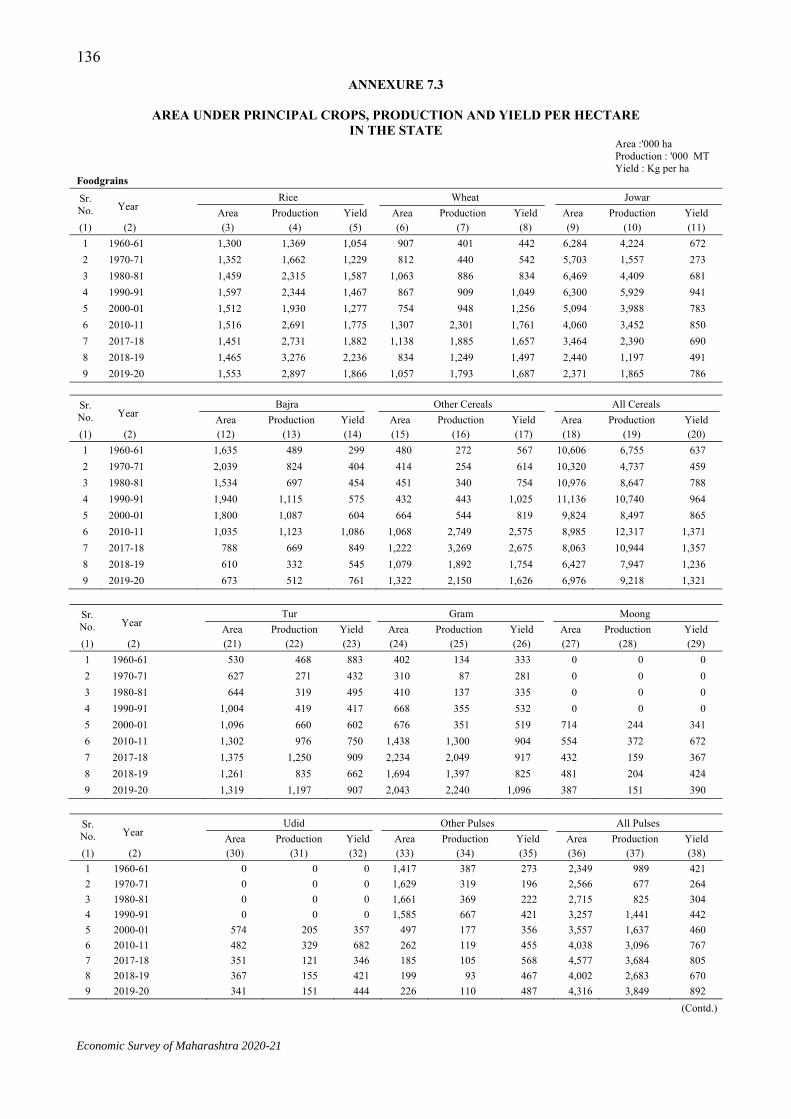
Economic Survey of Maharashtra 2020-21
136
ANNEXURE 7.3
AREA UNDER PRINCIPAL CROPS, PRODUCTION AND YIELD PER HECTARE IN THE STATE
Area :'000 ha Production : '000 MT Yield : Kg per ha Foodgrains Sr. No. Year
Rice Wheat Jowar Area Production Yield Area Production Yield Area Production Yield
(1) (2) (3) (4) (5) (6) (7) (8) (9) (10) (11) 1 1960-61 1,300 1,369 1,054 907 401 442 6,284 4,224 672 2 1970-71 1,352 1,662 1,229 812 440 542 5,703 1,557 273 3 1980-81 1,459 2,315 1,587 1,063 886 834 6,469 4,409 681 4 1990-91 1,597 2,344 1,467 867 909 1,049 6,300 5,929 941 5 2000-01 1,512 1,930 1,277 754 948 1,256 5,094 3,988 783 6 2010-11 1,516 2,691 1,775 1,307 2,301 1,761 4,060 3,452 850 7 2017-18 1,451 2,731 1,882 1,138 1,885 1,657 3,464 2,390 690 8 2018-19 1,465 3,276 2,236 834 1,249 1,497 2,440 1,197 491 9 2019-20 1,553 2,897 1,866 1,057 1,793 1,687 2,371 1,865 786
Sr. No. Year
Bajra Other Cereals All Cereals Area Production Yield Area Production Yield Area Production Yield
(1) (2) (12) (13) (14) (15) (16) (17) (18) (19) (20) 1 1960-61 1,635 489 299 480 272 567 10,606 6,755 637 2 1970-71 2,039 824 404 414 254 614 10,320 4,737 459 3 1980-81 1,534 697 454 451 340 754 10,976 8,647 788 4 1990-91 1,940 1,115 575 432 443 1,025 11,136 10,740 964 5 2000-01 1,800 1,087 604 664 544 819 9,824 8,497 865 6 2010-11 1,035 1,123 1,086 1,068 2,749 2,575 8,985 12,317 1,371 7 2017-18 788 669 849 1,222 3,269 2,675 8,063 10,944 1,357 8 2018-19 610 332 545 1,079 1,892 1,754 6,427 7,947 1,236 9 2019-20 673 512 761 1,322 2,150 1,626 6,976 9,218 1,321
Sr. No. Year
Tur Gram Moong Area Production Yield Area Production Yield Area Production Yield
(1) (2) (21) (22) (23) (24) (25) (26) (27) (28) (29) 1 1960-61 530 468 883 402 134 333 0 0 0 2 1970-71 627 271 432 310 87 281 0 0 0 3 1980-81 644 319 495 410 137 335 0 0 0 4 1990-91 1,004 419 417 668 355 532 0 0 0 5 2000-01 1,096 660 602 676 351 519 714 244 341 6 2010-11 1,302 976 750 1,438 1,300 904 554 372 672 7 2017-18 1,375 1,250 909 2,234 2,049 917 432 159 367 8 2018-19 1,261 835 662 1,694 1,397 825 481 204 424 9 2019-20 1,319 1,197 907 2,043 2,240 1,096 387 151 390
Sr. No. Year
Udid Other Pulses All Pulses Area Production Yield Area Production Yield Area Production Yield
(1) (2) (30) (31) (32) (33) (34) (35) (36) (37) (38) 1 1960-61 0 0 0 1,417 387 273 2,349 989 421 2 1970-71 0 0 0 1,629 319 196 2,566 677 264 3 1980-81 0 0 0 1,661 369 222 2,715 825 304 4 1990-91 0 0 0 1,585 667 421 3,257 1,441 442 5 2000-01 574 205 357 497 177 356 3,557 1,637 460 6 2010-11 482 329 682 262 119 455 4,038 3,096 767 7 2017-18 351 121 346 185 105 568 4,577 3,684 805 8 2018-19 367 155 421 199 93 467 4,002 2,683 670 9 2019-20 341 151 444 226 110 487 4,316 3,849 892
(Contd.)

Economic Survey of Maharashtra 2020-21
137
ANNEXURE 7.3 (Concld.) Area :'000 ha Production : '000 MT Yield : Kg per ha Foodgrains
Sr. No. Year Total Foodgrains Groundnut Soyabean
Area Production Yield Area Production Yield Area Production Yield (1) (2) (39) (40) (41) (42) (43) (44) (45) (46) (47) 1 1960-61 12,955 7,744 598 1,083 800 739 0 0 0
2 1970-71 12,886 5,414 420 904 586 649 0 0 0
3 1980-81 13,691 9,472 692 695 451 648 0 0 0
4 1990-91 14,393 12,181 846 864 979 1,132 201 190 947
5 2000-01 13,382 10,133 757 490 470 958 1,142 1,266 1,109
6 2010-11 13,023 15,413 1,183 395 470 1,290 2,729 4,316 1,581
7 2017-18 12,640 14,628 1,157 291 345 1,184 3,694 3,805 1,030
8 2018-19 10,430 10,630 1,019 244 239 977 4,075 4,611 1,132
9 2019-20 11,292 13,067 1,157 291 309 1,063 4,124 4,826 1,170
Sr. No. Year Safflower Other Oilseeds All Oilseeds
Area Production Yield Area Production Yield Area Production Yield (1) (2) (48) (49) (50) (51) (52) (53) (54) (55) (56) 1 1960-61 331 0 0 454 0 0 1,868 0 0
2 1970-71 406 102 252 408 65 159 1,718 753 438
3 1980-81 480 174 363 605 103 170 1,780 728 426
4 1990-91 634 258 408 1,127 455 404 2,826 1,882 666
5 2000-01 296 122 412 631 241 382 2,559 2,099 820
6 2010-11 173 94 544 331 176 532 3,628 5,056 1,394
7 2017-18 39 21 548 115 39 339 4,133 4,208 1,018
8 2018-19 25 12 475 113 23 312 4,458 4,885 1,096
9 2019-20 22 15 691 90 28 312 4,526 5,178 1,144
Cash crops
Sr. No.
Year
Sugarcane Cotton (lint) Tobacco
Harvested Area
Production Yield (in MT)
Area Production Yield Area Production Yield
(1) (2) (57) (58) (59) (60) (61) (62) (63) (64) (65) 1 1960-61 155 10,404 66.92 2,500 1,673 114 25 12 480
2 1970-71 167 14,433 86.53 2,750 484 30 12 5 448
3 1980-81 258 23,706 91.74 2,550 1,224 82 12 8 648
4 1990-91 442 38,154 86.40 2,721 1,875 117 8 8 1,039
5 2000-01 595 49,569 83.27 3,077 1,803 100 8 9 1,148
6 2010-11 965 85,691 88.85 3,942 7,473 322 1 1 994
7 2017-18 902 83,138 92.00 4,351 6,094 238 0.5 0.7 1,245
8 2018-19 1,163 89,771 77.00 4,219 6,593 266 0.5 0.8 1,745
9 2019-20 822 69,313 84.00 4,491 6,639 251 0.5 0.8 1,815
Source – Commissionerate of Agriculture, GoM
Note – (1) Information for year 2019-20 is based on Final Advance Estimates.
(2) Production of cotton in 170 kg/bale in '000 bales.
(3) Sugarcane Productivity in MT/ha
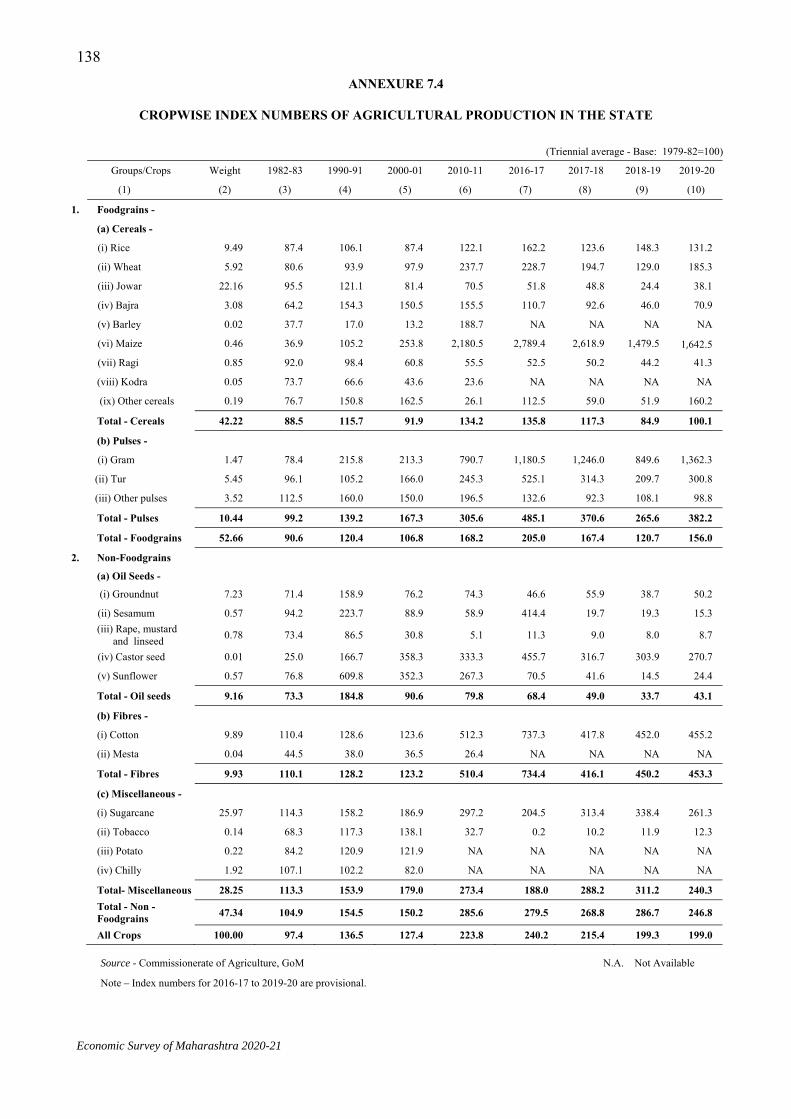
Economic Survey of Maharashtra 2020-21
138ANNEXURE 7.4
CROPWISE INDEX NUMBERS OF AGRICULTURAL PRODUCTION IN THE STATE
(Triennial average - Base: 1979-82=100)
Groups/Crops Weight 1982-83 1990-91 2000-01 2010-11 2016-17 2017-18 2018-19 2019-20
(1) (2) (3) (4) (5) (6) (7) (8) (9) (10)
1. Foodgrains -
(a) Cereals -
(i) Rice 9.49 87.4 106.1 87.4 122.1 162.2 123.6 148.3 131.2
(ii) Wheat 5.92 80.6 93.9 97.9 237.7 228.7 194.7 129.0 185.3
(iii) Jowar 22.16 95.5 121.1 81.4 70.5 51.8 48.8 24.4 38.1
(iv) Bajra 3.08 64.2 154.3 150.5 155.5 110.7 92.6 46.0 70.9
(v) Barley 0.02 37.7 17.0 13.2 188.7 NA NA NA NA
(vi) Maize 0.46 36.9 105.2 253.8 2,180.5 2,789.4 2,618.9 1,479.5 1,642.5
(vii) Ragi 0.85 92.0 98.4 60.8 55.5 52.5 50.2 44.2 41.3
(viii) Kodra 0.05 73.7 66.6 43.6 23.6 NA NA NA NA
(ix) Other cereals 0.19 76.7 150.8 162.5 26.1 112.5 59.0 51.9 160.2
Total - Cereals 42.22 88.5 115.7 91.9 134.2 135.8 117.3 84.9 100.1
(b) Pulses -
(i) Gram 1.47 78.4 215.8 213.3 790.7 1,180.5 1,246.0 849.6 1,362.3
(ii) Tur 5.45 96.1 105.2 166.0 245.3 525.1 314.3 209.7 300.8
(iii) Other pulses 3.52 112.5 160.0 150.0 196.5 132.6 92.3 108.1 98.8
Total - Pulses 10.44 99.2 139.2 167.3 305.6 485.1 370.6 265.6 382.2
Total - Foodgrains 52.66 90.6 120.4 106.8 168.2 205.0 167.4 120.7 156.0
2. Non-Foodgrains
(a) Oil Seeds -
(i) Groundnut 7.23 71.4 158.9 76.2 74.3 46.6 55.9 38.7 50.2
(ii) Sesamum 0.57 94.2 223.7 88.9 58.9 414.4 19.7 19.3 15.3
(iii) Rape, mustard and linseed 0.78 73.4 86.5 30.8 5.1 11.3 9.0 8.0 8.7
(iv) Castor seed 0.01 25.0 166.7 358.3 333.3 455.7 316.7 303.9 270.7
(v) Sunflower 0.57 76.8 609.8 352.3 267.3 70.5 41.6 14.5 24.4
Total - Oil seeds 9.16 73.3 184.8 90.6 79.8 68.4 49.0 33.7 43.1
(b) Fibres -
(i) Cotton 9.89 110.4 128.6 123.6 512.3 737.3 417.8 452.0 455.2
(ii) Mesta 0.04 44.5 38.0 36.5 26.4 NA NA NA NA
Total - Fibres 9.93 110.1 128.2 123.2 510.4 734.4 416.1 450.2 453.3
(c) Miscellaneous -
(i) Sugarcane 25.97 114.3 158.2 186.9 297.2 204.5 313.4 338.4 261.3
(ii) Tobacco 0.14 68.3 117.3 138.1 32.7 0.2 10.2 11.9 12.3
(iii) Potato 0.22 84.2 120.9 121.9 NA NA NA NA NA
(iv) Chilly 1.92 107.1 102.2 82.0 NA NA NA NA NA
Total- Miscellaneous 28.25 113.3 153.9 179.0 273.4 188.0 288.2 311.2 240.3
Total - Non - Foodgrains 47.34 104.9 154.5 150.2 285.6 279.5 268.8 286.7 246.8
All Crops 100.00 97.4 136.5 127.4 223.8 240.2 215.4 199.3 199.0
Source - Commissionerate of Agriculture, GoM N.A. Not Available
Note – Index numbers for 2016-17 to 2019-20 are provisional.

Economic Survey of Maharashtra 2020-21
139
ANNEXURE 7.5
AREA UNDER IRRIGATION IN THE STATE
('000 ha)
Sr. No. Year
Area irrigated Intensity of irrigated cropping
No. of irrigation
Wells ('000)
Net area irrigated per well
(ha)
Gross cropped
area
Percentage of gross irrigated area to gross cropped area
Wells Other sources Net Gross
(1) (2) (3) (4) (5) (6) (7) (8) (9) (10) (11)
1 1960-61 595 477 1,072 1,220 114 542 1.10 18,823 6.5
2 1970-71 768 579 1,347 1,570 117 694 1.11 18,737 8.4
3 1980-81 1,055 780 1,835 2,415 132 826 1.28 19,642 12.3
4 1990-91 1,672 999 2,671 3,319 124 1,017 1.64 21,859 15.2
5 2000-01 2,262 987 3,249 3,852 119 1,318 1.72 21,619 17.8
6 2001-02 2,146 990 3,136 3,727 119 1,322 1.52 20,991 17.8
7 2002-03 2,145 1,071 3,216 3,806 118 1,331 1.61 20,915 18.2
8 2003-04 1,914 1,030 2,944 3,636 123 NA NA 22,190 16.4
9 2004-05 1,942 1,001 2,993 3,665 125 NA NA 22,376 16.4
10 2005-06 2,077 1,070 3,147 3,810 118 NA NA 22,556 16.9
11 2006-07 2,109 1,137 3,246 3,958 122 NA NA 22,557 17.6
12 2007-08 2,151 1,160 3,311 4,037 122 NA NA 22,655 17.8
13 2008-09 2,115 1,140 3,255 3,970 122 NA NA 22,454 17.7
14 2009-10 2,159 1,162 3,321 4,050 122 NA NA 22,612 17.9
15 2010-11 NA NA NA NA NA NA NA 23,175 NA
16 2011-12 NA NA NA NA NA NA NA 23,106 NA
17 2012-13 NA NA NA NA NA NA NA 23,115 NA
18 2013-14 NA NA NA NA NA NA NA 23,380 NA
19 2014-15 NA NA NA NA NA NA NA 23,273 NA
20 2015-16 NA NA NA NA NA NA NA 22,863 NA
21 2016-17 NA NA NA NA NA NA NA 23,224 NA
22 2017-18 NA NA NA NA NA NA NA 23,268 NA
23 2018-19 NA NA NA NA NA NA NA 23,212 NA
Source - Commissionerate of Agriculture, GoM NA Not Available
Note - (1) Details may not add up to the totals due to rounding.
(2) Intensity under Col. No. 7 is worked out by using the formula (Col. No. 6 ÷ Col. No. 5) x 100.
(3) Figures for the years 2003-04 to 2018-19 are provisional.
(4) Vide Water Resources Department, GoM, GR dated 26th August 2016, instructions regarding procedure for collecting data are issued.

Economic Survey of Maharashtra 2020-21
140
ANNEXURE 7.6
IRRIGATION & NON-IRRIGATION WATER CHARGES LEVIED, RECOVERED AND OUTSTANDING
(` Crore)
Year Water charges levied Recovery Outstanding at the end of year
Irrigation Non-
Irrigation
Total Irrigation Non-
Irrigation
Total Irrigation Non-
Irrigation
Total
(1) (2) (3) (4) (5) (6) (7) (8) (9) (10)
2000-01 74.48 362.60 437.08 41.23 153.99 195.22 223.39 571.30 794.69
2001-02 84.72 368.83 453.55 43.57 208.12 251.69 264.54 732.01 996.55
2002-03 83.17 360.68 443.85 42.02 335.50 377.52 303.79 751.99 1,055.78
2003-04 93.03 360.26 453.29 42.89 335.20 378.09 376.63 353.06 729.69
2004-05 78.69 418.44 497.13 45.78 402.57 448.35 415.59 378.59 794.18
2005-06 68.25 350.28 418.53 64.03 349.45 413.48 410.18 282.09 692.27
2006-07 90.70 408.75 499.45 74.72 420.26 494.98 427.01 245.82 672.82
2007-08 110.35 563.89 674.24 70.47 556.54 627.01 473.70 275.20 748.90
2008-09 112.95 695.37 808.32 71.05 602.11 673.16 531.10 466.38 1,004.61
2009-10 95.00 715.11 810.11 69.94 732.69 802.63 561.77 466.38 1,028.15
2010-11 96.24 670.46 766.70 79.03 666.87 745.90 745.90 468.62 1,047.90
2011-12 109.73 541.06 650.79 79.13 541.13 620.26 608.87 461.74 1,070.61
2012-13 82.98 670.12 753.10 63.10 443.05 506.15 618.78 656.52 1275.30
2013-14 70.37 536.67 607.04 57.57 457.20 514.77 631.49 728.24 1,359.73
2014-15 78.15 593.59 671.74 61.97 574.53 636.50 648.29 695.80 1,344.09
2015-16 80.04 660.13 740.16 49.16 523.42 572.59 679.02 835.13 1,514.15
2016-17 73.05 690.47 763.52 59.48 513.43 572.89 693.99 1,010.29 1,704.28
2017-18 93.72 735.06 828.78 74.30 613.84 688.14 714.00 1,135.19 1,849.19
2018-19 105.79 1,030.95 1,136.74 78.27 965.87 1,044.14 749.07 1,198.52 1,947.59
2019-20 114.03 1,195.69 1,309.72 59.97 908.34 968.31 809.40 1,593.71 2,403.11*
Source – Chief Auditor, Water and Irrigation, Aurangabad under Water Resources Department * Provisional

Economic Survey of Maharashtra 2020-21
141ANNEXURE 7.7
LIVESTOCK AND POULTRY IN THE STATE
('000)
Livestock Census Year
Cattle Buffaloes Sheep and goats
Other
live stock+
Total live
stock
Sheep and goats per hundred
hectares of grazing and pasture land
(no.)
Livestock per hundred hectares of
net area cropped
(no.)
Livestock per lakh of population
Total poultry$
(1) (2) (3) (4) (5) (6) (7) (8) (9) (10)
1961 15,328 3,087 7,273 360 26,048 512 144 66 10,578
1966 14,729 3,042 7,326 352 25,449 522 140 57 9,902
1972 14,705 3,301 8,038 317 26,361 491 164 52 12,217
1978 15,218 3,899 10,199 326 29,642 650 162 51 18,751
1982 16,162 3,972 10,376 409 30,919 673 175 48 19,845
1987 16,983 4,755 12,068 449 34,255 950 189 48 24,830
1992 17,441 5,447 13,016 489 36,393 940 202 46 32,187
1997 18,071 6,073 14,802 692 39,638 1,104 223 50 35,392
2003 16,738 6,084 13,624 612 37,058 1,016 213 36 34,596
2007 16,184 6,073 13,301 397 35,955 1,064 206 37 64,756@
2012 15,484 5,595 11,016 394 32,489 885 187 29 77,795@
2019 13,993 5,604 13,285 198 33,080 NA NA NA 74,298
Source - Livestock Census NA Not Available
Note - Details may not add up to totals due to rounding.
+ 'Other livestock' includes pigs, horses & ponies, mules, camels and donkeys.
$ Total poultry includes Turkey, Quail & other birds.
@ Total poultry includes birds in poultry farm.


8Industry and Co-operation


Economic Survey of Maharashtra 2020-21
8. INDUSTRY AND CO-OPERATION
INDUSTRY 8.1 Maharashtra, one of the most industrialised state in India, has established strengths across all sectors of industry. The State has always remained at forefront and formulated various sector specific policies, introduced regulatory initiatives, organised various events, drafted incentives, etc time and again in a bid to boost economic activities. The State is offering a ready-to-move-in factory environment complete with advanced utilities and affordable price. The State is also set to roll out a single permission system for new industrial units. The Covid-19 pandemic has caused severe impact on the State economy. The State has focused to bring on track the sectors which have been adversely affected by the pandemic.
Industrial scenario in the State 8.2 The State is an industrial hub and has been contributing majorly to the growth of the national economy. The economy of Maharashtra is mainly driven by manufacturing, finance, international trade, mass media, technology, petroleum, fashion, apparel, gems & jewellery, IT & ITES and tourism. The State has well developed industrial ecosystem for industries viz. automobile (Pune and Aurangabad region), Electronic Systems Design & Manufacturing (Pune region), Pharmaceuticals & Chemicals (Mumbai-Thane, Aurangabad & Pune region), Engineering (Ahmednagar-Nashik, Pune & Aurangabad region), Textile (Solapur-Pune, Nagpur & Amravati region), Food Processing (Solapur-Pune, Ahmednagar-Nashik, Nagpur & Amravati region), Logistics (Mumbai-Thane and Nagpur & Amravati region), Cement & Steel industry (Vidarbha-Marathwada region) and IT & ITES (Mumbai-Thane, Pune, Nagpur & Amravati region). The State has the largest number of large and mega projects in the country.
8.3 The State has already established single window investor facilitation cell - MAITRI to facilitate clearances through single window to industrial entrepreneurs. The State has one of the best industrial infrastructure in place. MIDC has been the responsible agency for developing and strengthening the industrial infrastructure in various industrial estates spread across the State. Mega events such as ‘Magnetic Maharashtra’ and ‘Make in India’ are organised to attract industrial investment in the State. The State also participates in various national and international road shows.
8.4 In order to have development in the emerging sectors, 14 thrust sectors have been identified in the State Industrial Policy 2019 and priority is being given in land allotment and incentives. The State has planned to augment the infrastructure considering the futuristic Industry 4.0. The State intends to promote setting up of industrial clusters along the special projects such as Hindu Hridaysamrat Balasaheb Thackeray Samruddhi Mahamarg, Delhi Mumbai Industrial Corridor (DMIC), Sagarmala, Bharatmala, etc. It also promotes innovative startups by providing necessary infrastructure and creating facilitating environment involving young entrepreneurs to enable sharing of their ideas and help them by handholding, mentoring and providing them financial assistance. It intends to strengthen and promote the MSME sector which is instrumental in creating local entrepreneurship and employment. To minimise the adverse environmental impact, eligible units would be provided a Green Industrialisation Assistance for undertaking measures to conserve water, energy and environment. The policy continues to give incentives in the form of subsidies on power, interest & State GST paid and exemptions on stamp duty & electricity duty.

Economic Survey of Maharashtra 2020-21
144
Industrial Investment in the State
8.5 Since liberalisation (August, 1991) upto October, 2020 in all 20,909 industrial projects with an investment of ` 14,29,142 crore were approved. During 2020 upto October, 247 projects with proposed investment of ` 37,887 crore were registered.
8.5.1 The State’s share in the total approved industrial projects and total investment therein is 18.0 per cent and 10.7 per cent respectively. Information regarding approved industrial projects in selected states is given in Table 8.1.
Table 8.1 Approved industrial projects@ in selected States (August, 1991 to October, 2020)
Particulars Maharashtra Gujarat Tamil Nadu Andhra Pradesh$
Uttar Pradesh
Karnataka All-India
Projects (no.)
20,909 (18.0)
14,879 (12.8)
9,898 (8.5)
9,336 (8.0)
8,711 (7.5)
6,028 (5.2)
1,16,257 (100.0)
Investment ( ` Crore)
14,29,142 (10.7)
19,88,292 (14.9)
5,69,391 (4.3)
10,78,533 (8.1)
4,06,269 (3.0)
14,99,789 (11.2)
1,33,43,438 (100.0)
@ Includes IEM/LOI/100 per cent EOU proposals $ includes Telangana Note : Figures in brackets are percentage to All-India Source : Directorate of Industries, GoM

Economic Survey of Maharashtra 2020-21
145
8.5.2 Magnetic Maharashtra 2.0 was launched in June, 2020 in the State with an aim to attract investments and generate employment. Both the domestic and global investors have shown fabulous interest for investment in the State. The State has attracted investment proposals of ` 1.13 lakh crore with expected employment over 2.50 lakh. Steel manufacturing (24 per cent), Data Centres (23 per cent), Logistics (20 per cent), IT (9 per cent), Chemicals & Pharmaceuticals (5 per cent) and Automobiles (4 per cent) were the key sectors that attracted investments.
Investment in Mega Projects
8.6 Mega Project Policy has been implemented in the State since 2005. Upto December, 2019 approval has been given to 643 mega projects in the State with an investment of ` 4,79,950 crore and proposed employment of 5.23 lakh. Of these upto November, 2020 eligibility certificates have been issued to 220 projects with an actual investment of ` 1,13,132 crore with proposed employment of about 1.46 lakh.
Investment in Micro, Small and Medium Enterprises
8.7 Since October, 2015, the Micro, Small & Medium enterprises (MSMEs) are being issued online a twelve digit Unique Identification Number as Udyog Aadhaar Number which is provided by the Ministry of Micro, Small and Medium Enterprises, GoI. This hassle free registration makes the enterprise eligible for all government benefits and schemes like low rate interest, easy loan, loan without guarantee, subsidies, etc. Upto March, 2020 number of MSMEs registered for Udyog Aadhaar were 17.67 lakh. The total investment of MSMEs in the State was ` 2,38,543 crore and employment generated was 91.01 lakh. Details regarding typewise Udyog Aadhaar MSMEs is given in Table 8.2 and regionwise Udyog Aadhaar MSMEs is given in Table 8.3.
Foreign Direct Investment
8.8 Foreign Direct Investment (FDI) has brought innovative technologies in the industrial units, raised competitiveness amongst the units and also increased domestic investment in the State. The share of the State is about 28 per cent of total FDI inflow at All-India. FDI inflows in selected states are given in Table 8.4.
Table 8.2 Typewise Udyog Aadhaar MSMEs (October, 2015 to March, 2020)
Type
Udyog Aadhaar MSMEs
(Number)
Employment (Lakh)
Investment (` Crore)
Micro 15,60,481 57.04 65,441 Small 1,98,683 28.17 1,23,113 Medium 8,195 5.80 49,989
Source : Directorate of Industries, GoM
Table 8.3 Regionwise Udyog Aadhaar MSMEs (October, 2015 to March, 2020)
Region
Udyog Aadhaar MSMEs
(Number)
Employment (Lakh)
Investment (` Crore)
Mumbai# 3,66,449 21.55 42,674 Konkan (Excl. Mumbai) 3,86,209
20.24 48,317
Nashik 1,57,515 7.53 25,845 Pune 4,04,078 23.59 69,856 Aurangabad 1,81,355 8.79 25,501 Amravati 67,206 2.54 7,613 Nagpur 2,04,547 6.78 18,737 Total 17,67,359 91.01 2,38,543
Source : Directorate of Industries, GoM # including City and Suburb

Economic Survey of Maharashtra 2020-21
146
Table 8.4 FDI inflows in some selected states (` Crore)
State 2019-20 2020-21+ Cummulative Inflows (April, 2000 - September, 2020) April - September October - March
Telangana 3,582$ 4,865 5,045 1,19,734 (4.0) Gujarat 24,012 18,964 1,19,566 2,79,691 (9.5) Karnataka 32,431 30,746 27,458 3,16,145 (10.7) Maharashtra 25,316# 52,073 27,143 8,18,522 (27.7) Tamil Nadu 9,394 7,230 7,062 1,97,582 (6.7) All India 3,53,558 2,24,613 29,57,058 Note : Figures in bracket indicate percentage to Total All-India inflows Source : DPIIT, GoI $ Including Andhra Pradesh # Including Dadra & Nagar Haveli and Daman & Diu + upto September
Exports from Maharashtra
8.9 The State is well connected through road, rail, air and port. Exports from the State cover a wide range of products such as gems & jewellery, petrochemicals, readymade garments, cotton yarn, metal & metal products, agro-based products, engineering items, drugs & pharmaceuticals and plastic & plastic items. As per the Industrial Policy, 2019, GoM has set up Maharashtra Export Promotion Council for promotion of export in the State. Exports from Maharashtra and All-India are given in Table 8.5.
Special Economic Zones 8.10 To attract foreign direct investment, promote export and generate employment, GoM has announced its Special Economic Zone (SEZ) policy in 2001. In all 253 SEZ proposals have been received upto October, 2020. Of which 37 SEZs were set up on an area of 4,553 ha with total investment of ` 58,531 crore and employment of about 7.80 lakh. Details regarding area, employment and investment of executed SEZs is given in Table 8.6.
IT Parks 8.11 In order to promote balanced growth of Information Technology (IT) industry in the State, GoM came up with its IT & ITES Policy. Maharashtra Industrial Development Corporation (MIDC), City and Industrial Development Corporation of Maharashtra Limited (CIDCO) and
Table 8.5 Exports from Maharashtra and All-India
(` Crore) Year Maharashtra All-India 2018-19 5,08,975 23,07,726 2019-20 4,59,637 22,19,845 2020-21+ 1,72,262 9,39,924 Source : Directorate of Industries, GoM +upto September
Table 8.6 Details regarding area, employment and investment of executed SEZs
(Upto October, 2020)
Division Number Area (ha)
Employment (Lakh)
Investment (` Crore)
Konkan 11 700 3.14 12,549 Pune 20 772 3.25 32,415 Nashik 1 1,007 1.25 1,380 Aurangabad 3 375 0.16 4,487 Amravati 0 0 0 0 Nagpur 2 1,699 0.01 7,700 Maharashtra 37 4,553 7.80 58,531
Source : Directorate of Industries, GoM
Economic Survey of Maharashtra 2020-21
147
Software Technology Parks of India have developed 37 public IT parks which are functioning in the State with an investment of about ` 18,000 crore and about 2.68 lakh employment.
8.11.1 Participation of private sector has been invited for creating world class infrastructure for IT industry. Under this, 546 private IT parks with proposed investment of ` 92,484 crore have been approved. Of which, 199 IT parks are functioning with investment of ` 29,729 crore and about 7.75 lakh employment upto November, 2020. Private IT parks are located in Pune (193), Mumbai city & Mumbai suburban (175), Thane (164), Nagpur (5), Nashik (5), Aurangabad (3) and Wardha (1) districts.
Bio-technology Parks 8.12 As per the Bio-technology (BT) policy of the State, several financial incentives and tax benefits are provided to the companies setting up bio-tech units in the State. Two public sector BT Parks have been developed in the State at MIDC Jalna and MIDC Hinjewadi (Pune). Fifteen BT–SEZs are proposed with investment of about ` 4,968 crore and expected employment generation of about 1.77 lakh. Six private BT parks are proposed with an investment of about ` 305 crore in the State.
8.12.1 Upto March, 2020 there were 67 units registered under MSMEs having investment of ` 264 crore and expected to generate employment of 0.87 lakh. There were 16 units registered under large units having investment of ` 1,120 crore and expected to generate employment of 0.71 lakh.
Delhi-Mumbai Industrial Corridor 8.13 Delhi-Mumbai Industrial Corridor (DMIC), a planned industrial development project between Delhi and Mumbai, aims to develop new industrial cities as ‘Smart Cities’ by converging next generation technologies across infrastructure sectors. This corridor covers two industrial areas viz. Shendra-Bidkin and Dighi port in the State. The Shendra-Bidkin Industrial Area is envisioned as a very large-scale industrial cluster and the Dighi Port Industrial Area is intended to be a port as well as trade and industrial hub that will augment the port of Mumbai. Aurangabad Industrial City (AURIC), a well-planned and Greenfield smart industrial city based on the concept of Walk to Work, is being developed across an area of 10,000 acres in the State as part of DMIC. State-of-the-art smart technology along with infrastructure with focus on clean, reusable and recycling methodologies are being adopted. In all 62 plots of total area of about 212 acres have been allotted in AURIC to the investors. Total investment in AURIC is more than ` 5,000 crore and employment generated is about 2,811.
Industrial Cluster Development Programme 8.14 Government has announced the Industrial Cluster Development Programme for the holistic development of the micro and small enterprises. The cluster strategy offers advantages for this sector in terms of efficiency and effectiveness. Improvement of technology, skills & quality, capacity building, market access, access to capital, create/upgrade infrastructure facilities, set-up common facility centres, etc. are being addressed under the programme. Financial support in terms of grants-in-aid upto 70 to 90 per cent is being given by the Government.
8.14.1 Micro, Small Enterprises - Cluster Development Programme: GoI has approved 30 industrial cluster projects and has released total grants of ` 169.85 crore. Of these, 17 projects have become operational and facilities of the high-end technology based Common Facility Centres (CFCs) therein, are available to the units in these clusters.

Economic Survey of Maharashtra 2020-21
148
8.14.2 Maharashtra State Industrial Cluster Development Programme: Under the programme, 174 cluster projects have been primarily approved by GoM. Of these, 73 cluster projects have been granted approval for establishment of CFCs for which total grants of ` 127.03 crore have been released.
Business Reforms Action Plan 8.15 The State has been consistent in implementation of the reforms identified under Business Reforms Action Plan (BRAP) released by Department for Promotion of Industry and Internal Trade, GoI for ease of doing businesses. The State has implemented almost all reforms prescribed under BRAP 2019.
Maharashtra Industry, Trade and Investment Facilitation Cell 8.16 To attract investment and employment in the State, GoM has launched online one stop shop Maharashtra Industry, Trade and Investment Facilitation Cell (MAITRI). It provides services for existing and prospective investors to get comprehensive information about the investment process. MAITRI has integrated 53 services rendered through 12 departments. Upto December, 2020 MAITRI has catered to 1,935 grievances of which 1,870 grievances have been resolved. The State has initiated Maha Parwana, a mega single permission system, for new industrial units having investment of 50 crore or more.
Co-operative Industrial Estates 8.17 With an objective of decentralisation of industries concentrated in urban areas to rural areas, the State initiated promotion of industrial estates in areas other than MIDC on co-operative basis. As on 30th October, 2020 in all 142 co-operative industrial estates were registered, of which 107 co-operative industrial estates were functioning with 8,037 units and 1.79 lakh employment.
Package Scheme of Incentives 8.18 To encourage setting up of industries to the industrially less developed areas, GoM is implementing a ‘Package Scheme of Incentives’ (PSI) for new or expansion units located in such regions. Since its inception in 1964, the scheme was amended from time to time. Under PSI-2019 eligible units in the private sector, State public sector/joint sector and co-operative sector are considered for providing incentives. Disbursements under Package Scheme of Incentives are given in Table 8.7.
Maharashtra Industrial Development Corporation 8.19 Maharashtra Industrial Development Corporation (MIDC) is the premier industrial infrastructure development agency of GoM. The main objective of MIDC is to set up industrial areas for planned and systematic industrial development and to function as a special planning authority in development of industrial areas. MIDC has one of the largest industrial land banks amongst all the Industrial development corporations in India. MIDC has built industrial areas, SEZs, Silver Zone and specialized parks for IT, BT, Wine (Grape Processing) & Gems. As on 31st December, 2020 it has built 289 Industrial areas of which 253 are major industrial areas, 25 are minor industrial areas and 11 are growth centres.
Table 8.7 Disbursement under Package Scheme of Incentives
(` Crore)
Particulars Disbursement
2018-19 2019-20 2020-21+ Industrial Promotion subsidy Mega Projects 2,304 2,770 203 Large Scale Industries 76 141 14 MSMEs 346 258 473 Other Incentives Large Scale Industries 100 60 6 MSMEs 209 161 54 Total 3,035 3,390 750 Source : Directorate of Industries, GoM + upto November
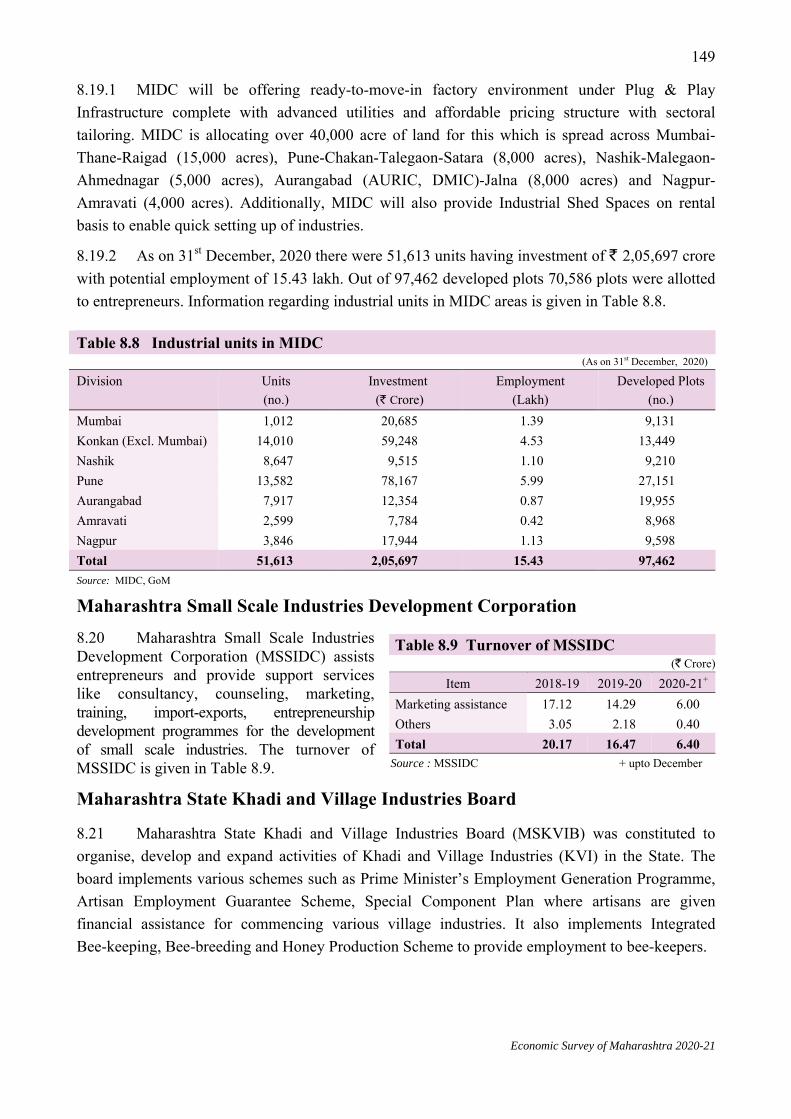
Economic Survey of Maharashtra 2020-21
149
8.19.1 MIDC will be offering ready-to-move-in factory environment under Plug & Play Infrastructure complete with advanced utilities and affordable pricing structure with sectoral tailoring. MIDC is allocating over 40,000 acre of land for this which is spread across Mumbai-Thane-Raigad (15,000 acres), Pune-Chakan-Talegaon-Satara (8,000 acres), Nashik-Malegaon-Ahmednagar (5,000 acres), Aurangabad (AURIC, DMIC)-Jalna (8,000 acres) and Nagpur-Amravati (4,000 acres). Additionally, MIDC will also provide Industrial Shed Spaces on rental basis to enable quick setting up of industries.
8.19.2 As on 31st December, 2020 there were 51,613 units having investment of ` 2,05,697 crore with potential employment of 15.43 lakh. Out of 97,462 developed plots 70,586 plots were allotted to entrepreneurs. Information regarding industrial units in MIDC areas is given in Table 8.8.
Maharashtra Small Scale Industries Development Corporation 8.20 Maharashtra Small Scale Industries Development Corporation (MSSIDC) assists entrepreneurs and provide support services like consultancy, counseling, marketing, training, import-exports, entrepreneurship development programmes for the development of small scale industries. The turnover of MSSIDC is given in Table 8.9.
Maharashtra State Khadi and Village Industries Board
8.21 Maharashtra State Khadi and Village Industries Board (MSKVIB) was constituted to organise, develop and expand activities of Khadi and Village Industries (KVI) in the State. The board implements various schemes such as Prime Minister’s Employment Generation Programme, Artisan Employment Guarantee Scheme, Special Component Plan where artisans are given financial assistance for commencing various village industries. It also implements Integrated Bee-keeping, Bee-breeding and Honey Production Scheme to provide employment to bee-keepers.
Table 8.8 Industrial units in MIDC (As on 31st December, 2020)
Division Units (no.)
Investment (` Crore)
Employment (Lakh)
Developed Plots (no.)
Mumbai 1,012 20,685 1.39 9,131 Konkan (Excl. Mumbai) 14,010 59,248 4.53 13,449 Nashik 8,647 9,515 1.10 9,210 Pune 13,582 78,167 5.99 27,151 Aurangabad 7,917 12,354 0.87 19,955 Amravati 2,599 7,784 0.42 8,968 Nagpur 3,846 17,944 1.13 9,598 Total 51,613 2,05,697 15.43 97,462 Source: MIDC, GoM
Table 8.9 Turnover of MSSIDC (` Crore)
Item 2018-19 2019-20 2020-21+ Marketing assistance 17.12 14.29 6.00 Others 3.05 2.18 0.40 Total 20.17 16.47 6.40
Source : MSSIDC + upto December

Economic Survey of Maharashtra 2020-21
150
8.21.1 Financial assistance of ` 20.02 crore have been disbursed in the form of subsidy to KVI units in 2019-20 and ` 12.53 crore have been disbursed in 2020-21 upto January. Performance of KVI units in the State is given in Table 8.10.
Maharashtra State Innovation Society 8.22 The State has formulated ‘Maharashtra State Start Up Policy, 2018’ which aims to create economic growth and job creation by encouraging entrepreneurs to design novel solutions in new age sectors viz. bio-technology, artificial intelligence, internet of things, clean energy, etc. as well as revamping the traditional sectors. Establishing a network of business incubators, cultivating entrepreneurial mind-sets among students, connecting relevant stakeholders, simplify the regulatory environment and make strategic investments is the holistic approach adopted. Maharashtra State Innovation Society is the nodal agency appointed by GoM to implement the ‘Maharashtra State Start Up Policy, 2018’. The number of startups in the State has increased from 4,323 in September, 2019 to 7,603 in December, 2020. Some of the initiatives of Maharashtra State Innovation Society are as follows:
Maharashtra Startup Week, which helps in bringing innovation in various government department, is the State’s flagship competition for startups. It was organised during June, 2018, January, 2019 and virtually in August, 2020 wherein more than 4,100 startups participated and of these 72 startups were awarded work orders. Beneficiary departments have been identified for 58 startups and 21 startups have completed their project.
16 business incubators have been sanctioned across the State of which 14 incubators have started incubating startups.
With an intention of encouraging entrepreneurship and innovation amongst women in the State, a program called Hirkani Maharashtrachi was launched and in 20 districts more than 5,000 SHGs/entrepreneurs have been benefitted during 2019-20.
Maharashtra Virtual Incubator Centre, a virtual incubator, which would provide startups several common incubation services such as access to labs, software, marketing solutions, etc. at discounted price is being developed.
To combat Covid-19 pandemic, Maharashtra State Innovation Society helped facilitate Corporate Social Responsibility funds and donations for procurement and distribution of essential equipments & food items viz. surgical masks, ventilators, PPE kits, N95 masks, sanitisers, hot meals, biscuit packets, sanitary pads, grocery kits, etc.
Mahakavach, a digital platform for contact tracing and quarantine tracking, was developed. Covid-Madat, a telemedicine helpline, was deployed which helped citizens screen
themselves over the phone for Covid-19 related symptoms.
Mining 8.23 Around 58 thousand sq km (19 per cent of the State’s total geographical area) has been identified as the total potential mineral area in the State. Bhandara, Chandrapur, Gadchiroli, Nagpur, Gondiya & Yavatmal districts in Vidarbha region, Kolhapur in Western Maharashtra and Raigad, Ratnagiri & Sindhudurg districts in Konkan region have deposits of major minerals like coal, limestone, manganese ore, bauxite, iron ore, kyanite, fluorite (graded), chromite, etc. As on
Table 8.10 Performance of KVI units
Year Units assisted (Lakh)
Value of production (` Crore)
Employment (Lakh)
2018-19 1.67 3,660 2.5 2019-20 1.95 1,890 2.8 2020-21+ 0.72 1,569 1.2
Source : MSKVIB + upto November

Economic Survey of Maharashtra 2020-21
151
31st March, 2020 in all 189 major mineral mines, with employment of 41,142 were working in the State. The total value of minerals extracted during 2019-20 was ` 14,905 crore. The total value of minerals extracted during 2020-21 upto September was ` 2,984 crore. The production of coal was highest among all the minerals. During 2019-20, about 768.68 lakh MT coal was extracted worth ` 13,401 crore (89.9 per cent of the total value of minerals extracted). The production of major minerals along with their values is given in Annexure 8.1.
Textile 8.24 Policy : The State produces ample quantity of cotton & silk and fairly good quantity of wool. In addition to that, it also produces large quantity of non-conventional yarn from bamboo, banana, ghaypat, ambadi and coir. The State has set an objective of achieving 100 percent processing of all the cotton grown. The Textile Policy 2011-17 declared in January, 2012 led to investments of ` 20,000 crore in the sector with employment generation of about three lakh. Textile policy 2018-23 focuses on further revival of the textile industry and aims at reducing the gap in the production and processing.
8.24.1 Textile mills : There are 188 spinning & 36 composite textile mills in the State with installed capacity of 48.39 lakh spindles and 43,863 rotors. During 2019-20 estimated production of cotton yarn is 28.80 crore kg and that during 2020-21 upto October, is 14.20 crore kg. Under PowerTex India, a comprehensive scheme for powerloom sector development, 26,291 existing plain looms were upgraded to semi-automatic/shuttleless looms to improve the quality and productivity of the fabric being produced and financial assistance of ` 30.71 crore has been provided by GoI from 2017-18 to 2019-20.
8.24.2 Technology Upgradation Fund Scheme : The Technology Upgradation Fund Scheme (TUFS) was introduced by the GoI in 1999 to facilitate new and appropriate technology for making the textile industry globally competitive and to reduce the capital cost for the textile industry. This scheme has been amended to facilitate augmenting of investment, productivity, quality, employment, exports and import in textile industry and also to indirectly promote investment in textile machinery manufacturing. Under the Textile Policy 2011-17 of the State, 3,026 textile projects have been linked with TUFS for interest subsidy on long term loans. Of these, 1,342 projects have been given interest & capital subsidy of ` 237.81 crore during 2018-19 and 1,881 projects have been given ` 61.24 crore during 2019-20.
8.24.3 Textile Parks : Textile parks provides a platform to many small and medium industries to flourish their businesses. There are 13 Textile Parks in the State at Hinghanghat (Wardha), Basmat (Hingoli), Latur (Latur), Shirpur, Dhule & Degaon (Dhule), Bhivandi (Thane), Baramati (Pune), Islampur (Sangli) and Ichalkaranji (Kolhapur). In all there are 631 units functioning in these 13 textile parks with total employment of 25,576.
Tourism 8.25 Tourism, one of the fastest growing sectors in the State, is generating substantial foreign exchange and is also creating significant employment prospects. The State is one of the most popular tourist destinations in India, offering a diverse range of experiences from beaches, wildlife sanctuaries, hill stations, natural caves, waterfalls, forts, colourful festivals, ancient pilgrimage shrines, museums and historical monuments. The State has always attracted tourists from different states and countries. As per the ‘India Tourism Statistics At a Glance - 2020’ report, the State had 14.93 crore domestic tourist visits and 0.55 crore foreign tourists visits during 2019 as against 11.92 crore domestic tourist visits and 0.51 crore foreign tourists visits during 2018.

Economic Survey of Maharashtra 2020-21
152
8.25.1 Maharashtra Tourism Policy, 2016 aspires to make the State a leading tourist destination by the year 2025 and attract investments to the tune of ` 30,000 crore along with creation of one million additional jobs in this industry. As of December, 2020 there were 1,416 Bed & Breakfast entrepreneurs and 124 Mahabhraman entrepreneurs in the State. During 2019-20, in all 21 proposals with expected investments of ` 1,970.27 crore have been received of which 10 proposals with expected investment of ` 1,638.03 crore have been sanctioned.
8.25.2 The State has announced its Agro Tourism (earlier conceptualised in the Tourism Policy 2016) Policy in September 2020. Rural development through agro-tourism, ensuring market to agricultural produce, encouraging agriculture-related businesses, exhibiting folk art & traditions, providing employment to rural women & youth and providing information & experience of farm related activities to the urbanites are the objectives of the policy. Individual farmers, agriculture cooperative societies, agriculture research centres, agriculture colleges & universities and companies/partnership firms set up by farmers are eligible for setting up agro-tourism centres. These enterprises are eligible for loans and other tax benefits.
8.25.3 The State has announced the Beach Shack Policy during August, 2020, which will allow setting up of temporary eco-friendly and CRZ compliant beach shacks, deck beds, umbrellas and common beach facility centres along the Konkan coast. During the first year two popular beaches from all the four districts viz. Kelwe & Bordi in Palghar, Diveagar & Varsoli in Raigad, Aare Ware & Guhagar in Ratnagiri and Kundkeshwar & Tarkarli in Sindhudurg have been selected for this project.
8.25.4 Hospitality sector was the worst hit sector during Covid-19 pandemic. In an effort to revive this sector, the State has decided to classify the sector as an industry. To start a new business in the hospitality sector about 70 permissions/ approvals/ licenses were required from 12 departments earlier. However after the impact of Covid-19 on this sector and considering tremendous employment potential in this sector, GoM has decided to reduce the number of permissions/ approvals/ licenses to 15 which can be obtained from seven departments.
Annual Survey of Industries 8.26 The Annual Survey of Industries (ASI) is the major source of industrial statistics. It provides estimates of various aggregates like input, fixed & working capital, employment, output, value added, etc. pertaining to registered manufacturing sector. ASI covers all factories registered under the sections 2m(i) and 2m(ii) of the Factories Act, 1948 and Beedi & Cigar units registered under the Beedi & Cigar Workers (Conditions of Employment) Act, 1966.
8.26.1 The State retained its top position in terms of Gross Value Added with share of 17.6 per cent at All-India level as revealed in ASI 2017-18 results. It is at the second position in number of workers and wages to workers with share of 11.6 per cent and 14.7 per cent respectively.

Economic Survey of Maharashtra 2020-21
153
8.26.2 The contribution of the State in the total value of output, working capital and in the Net Value Added in India was 14.9 per cent, 18.2 per cent & 18.2 per cent respectively. Selected characteristics of industries based on ASI are given in Table 8.11.
8.26.3 Major industries in terms of total value of output during 2017-18 were food products & beverages (13.5 per cent), chemicals & chemical products (13.0 per cent), coke & refined petroleum products (11.1 per cent), motor vehicles, trailers (10.2 per cent), basic metals(9.7 per cent) and machinery & equipments, repair & installation of machinery & equipments (8.5 per cent). These industry groups accounted for 66.1 per cent value of output of all industries and 65.9 per cent of fixed capital during 2017-18. Important characteristics of industries in the State according to ASI are given in Annexure 8.2. Important indicators based on ASI are given in Table 8.12.
Table 8.11 Selected characteristics of industries based on ASI (` Crore)
Characteristics 2015-16 2016-17 2017-18 Maharashtra All-India Maharashtra All-India Maharashtra All-India
Industries (no.) 28,210 (12.1)
2,33,116 27,010 (11.5)
2,34,865 26,393 (11.1)
2,37,684
Employment (lakh) 19.70 (13.9)
142.10 19.26 (12.9)
149.10 20.08 (12.9)
156.15
Fixed capital 3,46,175 (12.3)
28,09,647 3,37,982 (10.6)
31,90,386 3,58,441 (10.9)
32,85,889
Working capital 2,32,334 (31.4)
7,40,529 2,02,557 (30.5)
6,63,083 1,17,152 (18.2)
6,44,119
Total output 11,68,017 (17.0)
68,62,354 10,74,970 (14.8)
72,65,514 11,99,718 (14.9)
80,72,173
Total input 9,19,540 (16.5)
55,89,074 8,32,819 (14.1)
58,97,464 9,41,087 (14.2)
66,05,202
Gross value added 2,48,476 (19.5)
12,73,280 2,42,152 (17.7)
13,68,050 2,58,631 (17.6)
14,66,970
Net value added 2,17,259 (20.3)
10,72,485 2,08,800 (18.2)
11,45,919 2,23,724 (18.2)
12,29,674
Profit 1,18,212 (23.0)
5,13,193 1,12,576 (20.9)
5,39,353 1,17,380 (20.4)
5,76,242
Source : National Statistical Office, GoI Figures in brackets indicate percentage to All-India
Table 8.12 Important indicators based on ASI (` lakh)
Indicator 2015-16 2016-17 2017-18
Maharashtra All-India Maharashtra All-India Maharashtra All-India a) Per factory Investment in fixed capital 1,227 1,205 1,251 1,358 1,358 1,382 Value of goods & services
produced 4,140 2,944 3,980 3,093 4,546 3,396
Net value added 770 460 773 488 848 517 Employment (no.) 49 48 51 50 54 51 b) Per worker Net value added 15.8 9.6 15.3 9.8 15.8 10.1 Annual wages 1.8 1.4 1.9 1.5 2.0 1.6 Source : National Statistical Office, GoI

Economic Survey of Maharashtra 2020-21
154
Index of Industrial Production
8.27 Index of Industrial Production (IIP) measures the short-term changes in the volume of production of a basket of industrial products during a given period with respect to that in a chosen base period. It tracks manufacturing activity in various sectors of the economy and hence it is of paramount importance to the Government for framing policies and to various organizations as well. All-India IIP is compiled and published monthly by National Statistics Office, GoI. The average general All-India IIP (Base year 2011-12) during April to December, 2019 has decreased from 128.8 to 111.4 during April to December, 2020. Groupwise and use-based caterorywise All-India IIP is given in Table 8.13. Series of IIP at All-India is given in Annexure 8.3.
Table 8.13 Groupwise and use-based caterorywise All-India IIP (Base Year 2011-12=100)
Item Weight Average IIP (April to December)
2019-20 2020-21 Per cent change Groupwise
General Index 100.00 128.8 111.4 (-)13.5
Mining 14.37 104.0 92.2 (-)11.4
Manufacturing 77.63 130.2 110.5 (-)15.1
Electricity 7.99 160.5 154.8 (-)3.6
Use-based Category Primary goods 34.05 125.0 112.4 (-)10.1
Capital goods 8.22 94.1 68.2 (-)27.6
Intermediate goods 17.22 137.1 116.5 (-)15.0
Infrastructure/ construction goods 12.34 136.6 115.9 (-)15.2
Consumer durables 12.84 122.6 92.3 (-)24.7
Consumer non-durables 15.33 145.5 138.9 (-)4.6 Source : Mospi, GoI

Economic Survey of Maharashtra 2020-21
155
CO-OPERATION 8.28 Co-operation has made significant contribution in socio-economic development and in social integration. The co-operative movement was mainly initially confined to agricultural credit, subsequently it extended to finance, agro processing, marketing, housing, dairy, storage, textile, fisheries and various other industries. 8.29 As on 31st March, 2020 there were about 2.13 lakh co-operative societies in the State. Of which, about 52 per cent were co-operative housing societies. Information about co-operative societies is given in Table 8.14 and details of co-operative societies in the State are given in Annexure 8.4.
Table 8.14 Information about co-operative societies (₹ Crore)
Particulars As on 31st March Per cent change in 2020 over 2019 2018 2019 2020*
Societies (no.) 1,98,252 2,06,414 2,12,951 3.2 Members (lakh) 550 566 556 (-)1.8 Paid-up share capital 21,811 23,583 22,354 (-)5.2 Of which, State Govt. 3,887 3,954 3,931 (-)0.6 Working capital 3,84,506 4,07,481 3,97,466 (-)2.5 Deposits 1,94,667 2,10,923 2,10,404 (-)0.2 Loans advanced 1,44,268 1,57,385 1,58,717 0.8 Societies in profit (no.) 54,210 55,951 57,624 3.0 Amount of profit 4,326 5,569 4,606 (-)17.3 Societies in loss (no.) 34,777 38,961 37,952 (-)2.6 Amount of loss 9,028 10,469 6,621 (-)36.8 Loans outstanding 1,50,869 1,58,316 1,62,900 2.9
Source: Office of the Commissioner for Co-operation & Registrar Co-operative Societies, GoM * Provisional
Apex and District Central Co-operative Banks 8.30 Maharashtra State Co-operative Bank Ltd. is the apex co-operative bank in the State. At district level 31 District Central Co-operative Banks are working. Information of apex and the District Central Co-operative Banks are given in Table 8.15.
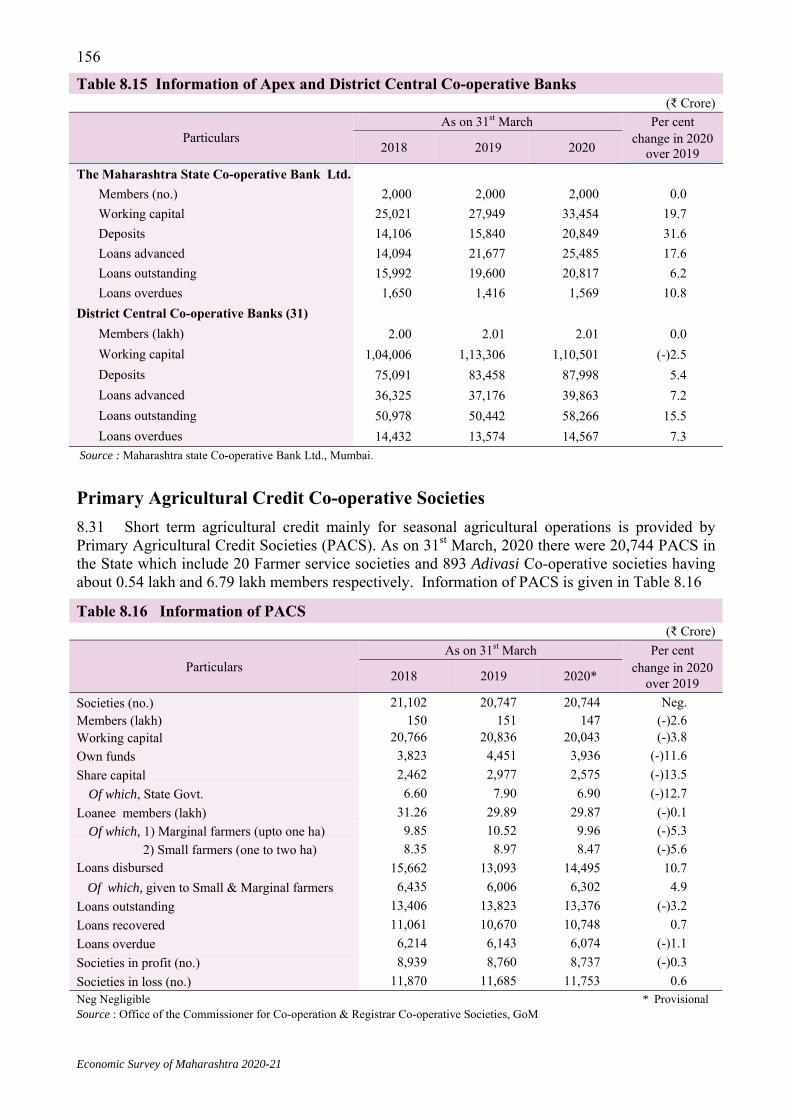
Economic Survey of Maharashtra 2020-21
156
Primary Agricultural Credit Co-operative Societies 8.31 Short term agricultural credit mainly for seasonal agricultural operations is provided by Primary Agricultural Credit Societies (PACS). As on 31st March, 2020 there were 20,744 PACS in the State which include 20 Farmer service societies and 893 Adivasi Co-operative societies having about 0.54 lakh and 6.79 lakh members respectively. Information of PACS is given in Table 8.16
Table 8.15 Information of Apex and District Central Co-operative Banks (₹ Crore)
Particulars As on 31st March Per cent
change in 2020 over 2019 2018 2019 2020
The Maharashtra State Co-operative Bank Ltd. Members (no.) 2,000 2,000 2,000 0.0 Working capital 25,021 27,949 33,454 19.7 Deposits 14,106 15,840 20,849 31.6 Loans advanced 14,094 21,677 25,485 17.6 Loans outstanding 15,992 19,600 20,817 6.2 Loans overdues 1,650 1,416 1,569 10.8 District Central Co-operative Banks (31) Members (lakh) 2.00 2.01 2.01 0.0 Working capital 1,04,006 1,13,306 1,10,501 (-)2.5 Deposits 75,091 83,458 87,998 5.4 Loans advanced 36,325 37,176 39,863 7.2 Loans outstanding 50,978 50,442 58,266 15.5 Loans overdues 14,432 13,574 14,567 7.3 Source : Maharashtra state Co-operative Bank Ltd., Mumbai.
Table 8.16 Information of PACS (₹ Crore)
Particulars As on 31st March Per cent
change in 2020 over 2019 2018 2019 2020*
Societies (no.) 21,102 20,747 20,744 Neg. Members (lakh) 150 151 147 (-)2.6 Working capital 20,766 20,836 20,043 (-)3.8 Own funds 3,823 4,451 3,936 (-)11.6 Share capital 2,462 2,977 2,575 (-)13.5 Of which, State Govt. 6.60 7.90 6.90 (-)12.7 Loanee members (lakh) 31.26 29.89 29.87 (-)0.1 Of which, 1) Marginal farmers (upto one ha) 9.85 10.52 9.96 (-)5.3 2) Small farmers (one to two ha) 8.35 8.97 8.47 (-)5.6 Loans disbursed 15,662 13,093 14,495 10.7 Of which, given to Small & Marginal farmers 6,435 6,006 6,302 4.9 Loans outstanding 13,406 13,823 13,376 (-)3.2 Loans recovered 11,061 10,670 10,748 0.7 Loans overdue 6,214 6,143 6,074 (-)1.1 Societies in profit (no.) 8,939 8,760 8,737 (-)0.3 Societies in loss (no.) 11,870 11,685 11,753 0.6 Neg Negligible * Provisional Source : Office of the Commissioner for Co-operation & Registrar Co-operative Societies, GoM
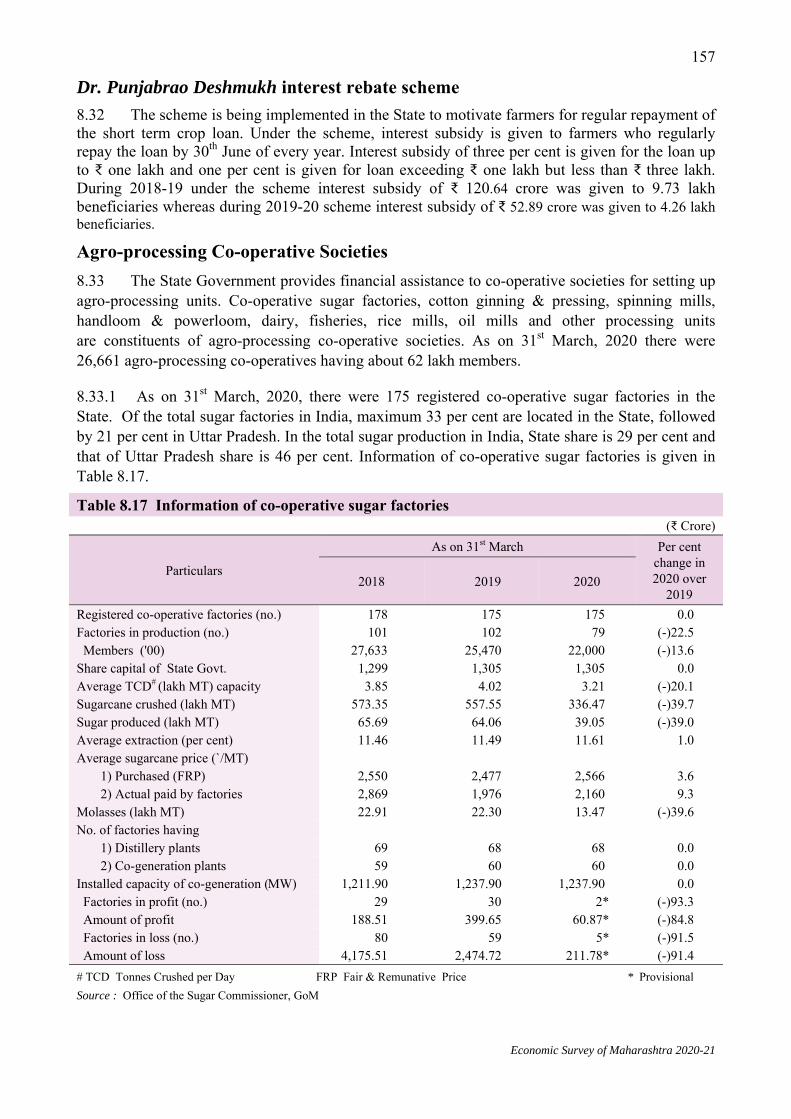
Economic Survey of Maharashtra 2020-21
157
Dr. Punjabrao Deshmukh interest rebate scheme 8.32 The scheme is being implemented in the State to motivate farmers for regular repayment of the short term crop loan. Under the scheme, interest subsidy is given to farmers who regularly repay the loan by 30th June of every year. Interest subsidy of three per cent is given for the loan up to ₹ one lakh and one per cent is given for loan exceeding ₹ one lakh but less than ₹ three lakh. During 2018-19 under the scheme interest subsidy of ₹ 120.64 crore was given to 9.73 lakh beneficiaries whereas during 2019-20 scheme interest subsidy of ₹ 52.89 crore was given to 4.26 lakh beneficiaries.
Agro-processing Co-operative Societies 8.33 The State Government provides financial assistance to co-operative societies for setting up agro-processing units. Co-operative sugar factories, cotton ginning & pressing, spinning mills, handloom & powerloom, dairy, fisheries, rice mills, oil mills and other processing units are constituents of agro-processing co-operative societies. As on 31st March, 2020 there were 26,661 agro-processing co-operatives having about 62 lakh members.
8.33.1 As on 31st March, 2020, there were 175 registered co-operative sugar factories in the State. Of the total sugar factories in India, maximum 33 per cent are located in the State, followed by 21 per cent in Uttar Pradesh. In the total sugar production in India, State share is 29 per cent and that of Uttar Pradesh share is 46 per cent. Information of co-operative sugar factories is given in Table 8.17.
Table 8.17 Information of co-operative sugar factories (₹ Crore)
Particulars
As on 31st March Per cent change in 2020 over
2019 2018 2019 2020
Registered co-operative factories (no.) 178 175 175 0.0 Factories in production (no.) 101 102 79 (-)22.5 Members ('00) 27,633 25,470 22,000 (-)13.6 Share capital of State Govt. 1,299 1,305 1,305 0.0 Average TCD# (lakh MT) capacity 3.85 4.02 3.21 (-)20.1 Sugarcane crushed (lakh MT) 573.35 557.55 336.47 (-)39.7 Sugar produced (lakh MT) 65.69 64.06 39.05 (-)39.0 Average extraction (per cent) 11.46 11.49 11.61 1.0 Average sugarcane price (`/MT) 1) Purchased (FRP) 2,550 2,477 2,566 3.6 2) Actual paid by factories 2,869 1,976 2,160 9.3 Molasses (lakh MT) 22.91 22.30 13.47 (-)39.6 No. of factories having 1) Distillery plants 69 68 68 0.0 2) Co-generation plants 59 60 60 0.0 Installed capacity of co-generation (MW) 1,211.90 1,237.90 1,237.90 0.0 Factories in profit (no.) 29 30 2* (-)93.3 Amount of profit 188.51 399.65 60.87* (-)84.8 Factories in loss (no.) 80 59 5* (-)91.5 Amount of loss 4,175.51 2,474.72 211.78* (-)91.4 # TCD Tonnes Crushed per Day FRP Fair & Remunative Price * Provisional Source : Office of the Sugar Commissioner, GoM

Economic Survey of Maharashtra 2020-21
158
Co-operative Dairy Societies
8.33.2 As on 31st March, 2020, there were 12,781 co-operative dairy societies and 78 co-operative dairy unions in the State. Information of co-operative dairy societies and dairy unions is given in Table 8.18.
8.33.3 As on 31st March, 2020, there were 78 co-operative cotton ginning & pressing societies in the State. Information of co-operative cotton ginning & pressing societies is given in Table 8.19.
8.33.4 As on 31st March, 2020, there were 291 co-operative spinning mills in the State, of which 69 were working. About 20 per cent working spinning mills were in loss. Information of co-operative spinning mills is given in Table 8.20.
Table 8.18 Information of co-operative dairy societies and dairy unions (₹ Crore)
Particulars
As on 31st March Co-operative dairy societies Co-operative dairy unions
2019 2020* Per cent change 2019 2020* Per cent
change Societies (no.) 12,932 12,781 (-)1.2 75 78 4.0 Members (lakh) 11.68 11.92 2.1 1.07 1.32 23.4 Share capital 12.45 12.64 1.5 81.90 82.03 0.2 Working capital 27.51 27.82 1.1 89.64 89.75 0.1 Milk procured (value) 301.25 307.47 2.1 982.30 983.15 0.1 Milk & milk products sold (value) 442.59 453.78 2.5 1,235.63 1,241.01 0.4 Societies in profit (no.) 7,611 7,724 1.5 58 60 3.4 Amount of profit 159.46 163.98 2.8 101.92 110.53 8.4 Societies in loss (no.) 5,319 5,056 (-)4.9 17 18 5.9 Amount of loss 69.83 68.72 (-)1.6 49.37 48.85 (-)1.1 Source : Office of the Commissioner for Dairy Development Department, GoM * Provisional
Table 8.19 Information of co-operative cotton ginning & pressing societies (₹ Crore)
Particulars As on 31st March Per cent change 2019 2020*
Societies (no.) 80 78 (-)2.5 Of which, in production 73 71 (-)2.7 Members (′00) 993 870 (-)12.3 Share capital 7.50 7.32 (-)2.4 Of which, State Govt. 1.89 1.78 (-)5.8
Working capital 66.20 51.79 (-)21.8
Raw cotton ginned (MT) 28.36 32.90 16.0 Societies in loss (no.) 41 38 (-)7.3 Amount of loss 1.78 1.60 (-)10.1 Source : Office of the Commissioner for Co-operation & Registrar Co-operative Societies, GoM * Provisional
Table 8.20 Information of co-operative spinning mills
(₹ Crore)
Particulars As on 31st March Per cent change 2019 2020*
Number of mills 287 291 1.4 Of which, in production 69 69 0.0 Members (′00) 4,996 5,008 0.2 Share capital 2,190.83 2,194.58 0.2 Of which, State Govt. 1,915.45 1,953.15 2.0 Working capital 9,137.66 9,140.04 Neg. No. of spindles (lakh) 15.40 15.60 1.3 Value of Yarn produced 2,875.08 2,441.40 (-)15.1 Mills in profit (no.)s 4 0 (-)100.0 Amount of profit 8.36 0 (-)100.0 Mills in loss (no.) 65 14 (-)78.5 Amount of loss 2,101.14 312.74 (-)85.1 *Provisional Neg. Negligible Source : Office of the Commissioner for Textiles, GoM

Economic Survey of Maharashtra 2020-21
159
8.33.5 As on 31st March, 2020, there were 644 co-operative handloom and 1,606 powerloom co-operative societies in the State. About 66 per cent co-operative handloom societies and 91 per cent co-operative powerloom co-operative societies were in loss. Information of handloom & powerloom co-operative societies is given in Table 8.21.
Fisheries co-operative societies 8.34 As on 31st March, 2020, there were 3,255 primary fisheries co-operative societies, working in the State. In addition, there were 40 fisheries co-operative unions and one federation. Information of fisheries co-operative societies is given in Table 8.22.
Co-operative marketing societies 8.35 Co-operative marketing societies have a three-tier organisational structure. The Maharashtra State Co-operative Marketing Federation Ltd. is the apex body. The District
Table 8.21 Information of co-operative handloom & co-operative powerloom societies (₹ Crore)
Particulars
As on 31st March Handloom Powerloom
2019 2020* Per cent change 2019 2020* Per cent
change Societies (no.) 644 644 0.0 1,604 1606 0.1 Members (′00) 599.78 596.66 (-)0.5 807.41 799.52 (-)1.0 Share capital 8.13 8.13 0.0 199.11 168.79 (-)15.2 Of which, State Govt. 1.72 1.72 0.0 140.59 147.87 5.2 Working capital 8.67 9.07 4.6 1,283.86 1,279.98 (-)0.3 No. of looms (′000) 3.81 3.81 0.0 14.37 14.40 0.2 Production value 36.71 38.26 4.2 87.09 86.99 (-)0.1 Societies in profit (no.) 238 239 0.4 154 150 (-)2.6 Amount of profit 2.19 2.08 (-)5.0 2.69 3.31 23.1 Societies in loss (no.) 406 427 5.2 1,450 1,456 0.4 Amount of loss 6.57 6.95 5.8 17.48 19.11 9.3 Source : Office of the Commissioner for Textiles, GoM * Provisional
Table 8.22 Information of fisheries co-operative societies ( ₹ Crore)
Particulars As on 31st March Per cent
change 2019 2020 Societies (no.) 3,133 3,255 3.9 Members (lakh) 3.23 3.28 1.6 Share capital 69.90 70.13 0.3 Of which, State Govt. 55.67 55.67 0.0 Working capital 251.40 252.32 0.4 Fish & fish products sold 711.39 735.22 3.4 Societies in profit (no.) 2,019 2,052 1.6 Amount of profit 14.89 15.62 4.9 Societies in loss (no.) 992 1,203 21.3 Amount of loss 47.90 58.13 21.4 Source :Office of the Commissioner for Fisheries, GoM

Economic Survey of Maharashtra 2020-21
160
co-operative marketing societies and the Primary co-operative marketing societies are functioning at district and village level respectively. Information of co-operative marketing societies is given in Table 8.23.
Non-Agricultural co-operative credit societies 8.36 As on 31st March, 2020 there were 20,863 non-agricultural co-operative credit societies, of which 13,779 were urban co-operative credit societies, 6,613 were salary earners co-operative credit societies and 471 urban co-operative banks in the State. About 23.5 per cent of non-agricultural co-operative credit societies were in loss. There were 15.7 per cent urban co-operative banks in the State which were under liquidation. Information of non-agricultural co-operative credit societies is given in Table 8.24.
Table 8.23 Information of co-operative marketing societies (₹ Crore)
Particulars As on 31st March Per cent
change 2019 2020* Societies (no.) 1,264 1,345 6.4 Members (lakh) 10.18 10.25 0.7 Share capital 90.00 93.00 3.3
Of which, State Govt. 22.73 24.88 9.5 Working capital 1,590 1,617 1.7 Sales
(a) Agriculture produce 4,556 3,259 (-)28.5 (b) Fertilisers 752 667 (-)11.3 (c) Seeds 81 76 (-)6.2 (d) Consumer goods 372 344 (-)7.5
Societies in profit (no.) 624 709 13.6 Amount of profit 24.44 32.09 31.3 Societies in loss (no.) 563 494 (-)12.3 Amount of loss 99.00 87.00 (-)12.1 Source : Office of the Commissioner for Co-operation & Registrar Co-operative Societies, GoM * Provisional
Table 8.24 Information of non-agricultural co-operative credit societies (₹ Crore)
Particulars As on 31st March Per cent
change 2019 2020* Societies (no.) 20,663 20,863 1.0 Members (lakh) 276.32 266.00 (-)3.7 Deposits 1,09,703 99,473 (-)9.3 Own funds 25,317 23,713 (-)6.3 Share capital 10,567 9,441 (-)10.7 Of which, State Govt. 1.12 1.12 0.0 Working capital 1,93,491 1,80,721 (-)6.6 Loans advanced 81,669 75,715 (-)7.3 Loans outstanding 69,855 66,820 (-)4.3 Loans recovered 60,961 59,051 (-)3.1 Loans overdue 9,635 9,022 (-)6.4 Societies in profit (no.) 15,209 15,304 0.6 Amount of profit 3,212 2,649 (-)17.5 Societies in loss (no.) 4,910 4,910 0.0 Amount of loss 2,391 1,977 (-)17.3 Source : Office of the Commissioner for Co-operation & Registrar Co-operative Societies, GoM *Provisional

Economic Survey of Maharashtra 2020-21
161
Other co-operative societies 8.37 As on 31st March, 2020 there were 1,11,555 co-operative housing societies in the State with about 32 lakh members. There were 10,845 labour contract co-operative societies having about 5.4 lakh members and 270 forest labour co-operative societies with about 71,000 members.
Maharashtra State Co-operative Housing Finance Corporation Ltd. 8.38 Maharashtra State Co-operative Housing Finance Corporation Ltd. is the central housing credit institution functioning in the State. Information of Maharashtra State Co-operative Housing Finance Corporation Ltd. is given in Table 8.25.
Co-operative Consumer Societies
8.39 Maharashtra State Co-operative Consumer Federation is the apex body which controls the functions of the wholesale consumer stores working at district level. These wholesale consumer stores distribute goods to primary consumer stores working at village level. As on 31st March, 2020, there were 127 wholesale consumer stores and 1,601 primary consumer stores working in the State, besides the apex consumer federation. Information of co-operative consumer federation, wholesale and primary co-operative consumer stores is given in Table 8.26.
Table 8.25 Information of Maharashtra State Co-op. Housing Finance Corporation Ltd. (₹ Crore)
Particulars As on 31st March Per cent
change 2019 2020 Members (no.) 10,287 10,251 (-)0.3 Working capital 83.55 87.91 5.2 Gross loans 644 644 0.0 Loans outstanding 47.85 46.48 (-)2.9 Loans recovered 5.07 3.90 (-)23.1 Loans overdue 18.62 18.50 (-)0.6 Source: Maharashtra State Co-op. Housing Finance Corporation Ltd.
Table 8.26 Information of consumer federation, wholesale and primary co-operative consumer stores
( ₹ Crore)
Particulars
As on 31st March Co-operative Consumer
federation Co-operative Wholesale consumer store Co-operative Primary
consumer store 2019 2020* 2019 2020* 2019 2020*
Number 1 1 125 127 1,603 1,601 Members (′00) 6.73 6.85 3,170 3,236 12,119 11,611 Share capital 0.51 0.51 20.31 19.03 76.72 70.72 Of which, State Govt. - - 3.32 3.15 3.85 3.06 Consumer stores in ptofit (no.) 1 1 81 73 953 949 Amount of profit 1.45 6.10 13.88 13.08 40.88 38.96 Consumer stores in loss (no.) 0 0 44 54 641 649 Amount of loss 0 0 2.72 2.79 14.62 12.56 Source :Office of the Commissioner for Co-operation & Registrar Co-operative Societies, GoM and Maharashtra State Co-operative Consumer Federation Ltd, GoM * Provisional
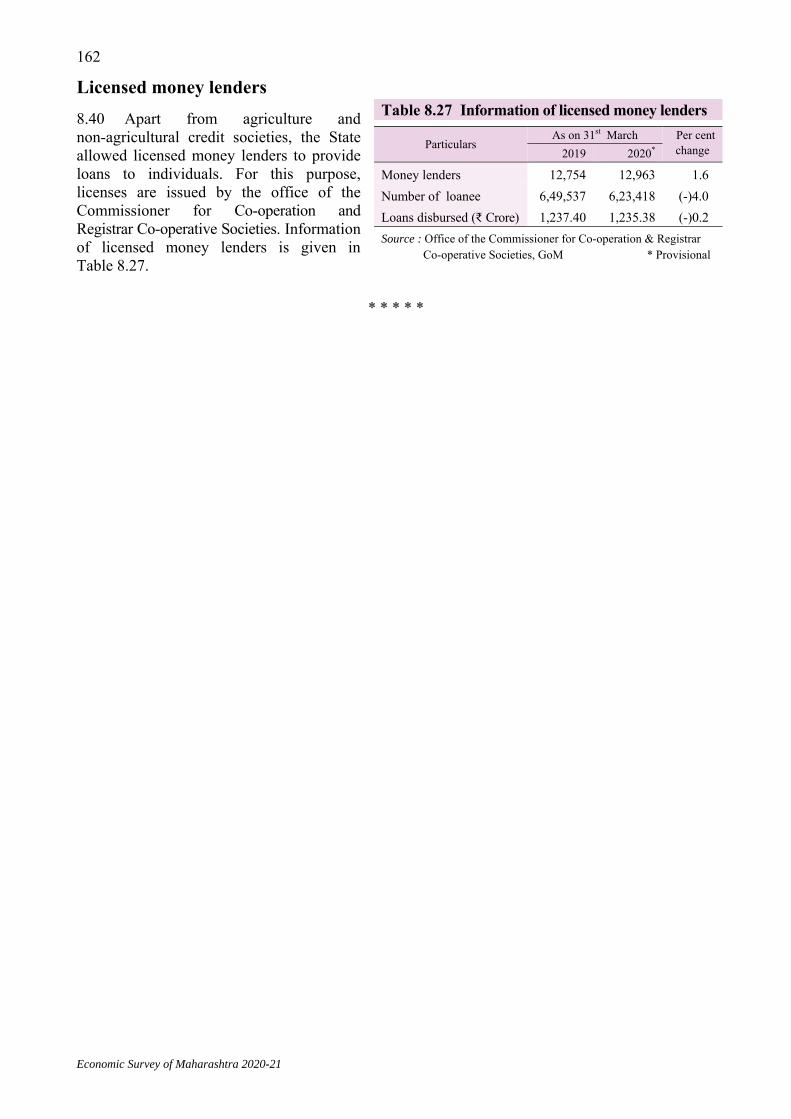
Economic Survey of Maharashtra 2020-21
162
Licensed money lenders
8.40 Apart from agriculture and non-agricultural credit societies, the State allowed licensed money lenders to provide loans to individuals. For this purpose, licenses are issued by the office of the Commissioner for Co-operation and Registrar Co-operative Societies. Information of licensed money lenders is given in Table 8.27.
* * * * *
Table 8.27 Information of licensed money lenders
Particulars As on 31st March Per cent
change 2019 2020*
Money lenders 12,754 12,963 1.6 Number of loanee 6,49,537 6,23,418 (-)4.0 Loans disbursed (₹ Crore) 1,237.40 1,235.38 (-)0.2 Source : Office of the Commissioner for Co-operation & Registrar Co-operative Societies, GoM * Provisional

Economic Survey of Maharashtra 2020-21
163
ANNEXURE 8.1
MINERALS PRODUCTION IN THE STATE
(Quantity: '000 tonne) (Value: ` Lakh)
Sr. No. Minerals Quantity /
Value 1961$ 1971$ 1980-81 1990-91 2000-01 2010-11 2019-20
(1) (2) (3) (4) (5) (6) (7) (8) (9) (10)
1 Salt Quantity 384 472 540 229 148 180 124
2 Coal Quantity 856 2,085 5,770 16,848 28,754 36,932 76,868
Value 186 745 6,681 47,244 2,10,192 5,08,249 13,40,068
3 Chromite Quantity 1 3 2 -- 0.60 -- --
Value 1 5 5 -- 8 -- --
4 Iron Ore Quantity 362 613 1,456 645 22 1,018 1,079
Value 51 69 657 384 31 7,154 16,426
5 Limestone Quantity 55 363 715 5,135 6,066 10,431 14,548
Value 2 33 163 1,968 5,266 15,647 41,495
6 Manganese ore Quantity 179 218 232 276 363 589 717
Value 206 148 553 1,615 6,280 54,109 84,873
7 Kaolin (Natural) Quantity 2 3 5 3 0.20 -- --
Value 0.13 0.16 1 1 0.29 -- --
8 Bauxite Quantity 27 302 365 543 1,027 2,492 690
Value 2 21 137 443 1,705 4,585 6,306
9 Dolomite Quantity 6 5 27 28 65 79 --
Value 0.38 1 8 27 145 71 --
10 Silica sand Quantity 5 27 89 197 168 327 --
Value 0.34 3 3 87 228 982 --
11 Fluorite (Graded) Quantity -- -- -- 3 3 284 1
Value -- -- -- -- 24 12,457 88
12 Laterite Quantity -- -- -- 85 83 49 --
Value -- -- -- 76 107 58 --
13 Kyanite Quantity -- 5 22 15 0.20 3 3
Value -- 11 53 85 1 24 119
14 Others$$ Quantity -- 4 544 912 306 4,034 594
Value -- 0.36 27 196 49 5,258 1,150
Source - (1) Directorate of Geology and Mining, Nagpur.
(2) Assistant Salt Commissioner, GoI, Mumbai (Only for Salt)
$ Figures are for calendar year.
$$ Others include minerals like Sand Stowing and Silimanite.

Economic Survey of Maharashtra 2020-21
164ANNEXURE 8.2
IMPORTANT CHARACTERISTICS OF INDUSTRIES IN THE STATE
(BASED ON ANNUAL SURVEY OF INDUSTRIES) (` Crore)
Activity
(at two digit level
NIC 2008) Year No. of
Ind. Fixed capital
Working capital
Wages to
workers Total output
Material consumed
Total input
Net value
added
(1) (2) (3) (4) (5) (6) (7) (8) (9) (10)
(1) Cotton ginning, cleaning etc. (01) 2016-17 705 1,406 3,010 109 19,219 13,982 17,564 1,511
2017-18 568 1,153 3,261 82 18,070 13,683 17,198 771
(2) Salt production (08) 2016-17 37 1 2 1 3 Neg. 1 2
2017-18 30 1 1 2 5 Neg. 3 2
(3) Food products and beverages
(10,11)
2016-17 2,808 40,801 10,104 2,408 1,26,925 83,826 1,05,980 17,836
2017-18 2,762 49,360 (-)245 2,883 1,61,807 1,10,529 1,37,806 20,607
(4) Tobacco products (12) 2016-17 92 2,244 862 179 4,300 1,387 1,591 2,575
2017-18 81 1,237 665 189 3,350 1,239 1,432 1,793
(5) Textiles (13) 2016-17 1,821 15,398 2,207 1,876 41,043 22,445 32,827 6,684
2017-18 1,792 15,019 1,535 2,007 38,315 20,648 31,065 5,718
(6) Wearing apparel (14) 2016-17 1,038 1,956 1,330 421 7,275 2,563 5,634 1,468
2017-18 1,017 2,129 2,186 657 10,642 5,058 8,135 2,282
(7) Leather and related products (15) 2016-17 123 192 254 66 1,036 560 792 222
2017-18 118 162 218 52 890 469 655 218
(8) Wood and products of wood &
cork (except furniture) (16)
2016-17 228 399 131 37 1,099 709 894 173
2017-18 222 388 301 55 1,683 1,172 1,396 258
(9) Paper and paper products (17)
2016-17 851 8,600 1,405 404 14,934 8,392 12,381 1,983
2017-18 883 8,179 1,162 421 17,593 10,348 13,044 3,928
(10) Printing and reproduction of
recorded media (18)
2016-17 864 4,398 (-)385 390 8,863 3,902 6,231 2,213
2017-18 839 3,511 357 410 9,634 4,180 6,793 2,366
(11) Coke, refined petroleum products
(19)
2016-17 186 17,908 (-)12,634 665 1,24,616 72,763 77,459 45,727
2017-18 162 16,304 3,583 610 1,33,715 78,681 85,061 47,411 (12) Chemicals & chemical products, pharmaceuticals, medicinal chemical and botanical products (20,21)
2016-17 2,622 47,527 23,269 3,215 1,41,204 71,605 1,02,270 34,599
2017-18 2,534 54,626 29,183 3,536 1,56,217 82,818 1,15,804 35,568
(13) Rubber and plastic products (22) 2016-17 1,745 17,746 19,829 1,747 50,651 30,173 39,118 9,942
2017-18 1,762 17,619 15,015 1,472 46,335 27,441 36,011 8,365
(14) Other non-metallic mineral
products (23)
2016-17 915 10,433 1,00,379 685 21,162 7,500 14,628 5,486
2017-18 891 9,347 1,974 513 17,428 7,471 12,921 3,774
(15) Basic metals (24)
2016-17 1,285 47,396 (-)173 1,825 1,08,653 70,267 95,896 9,467
2017-18 1,345 49,577 964 1,936 1,16,191 78,925 1,00,399 12,383
(16) Fabricated metal product, except
machinery and equipment (25)
2016-17 3,450 13,961 4,969 1,822 43,071 24,738 33,112 8,563
2017-18 3,234 15,420 5,728 1,887 53,587 32,398 42,349 9,544
(Contd.)

Economic Survey of Maharashtra 2020-21
165
ANNEXURE 8.2 (Concld.)
Activity
(at two digit level
NIC 2008) Year
No. of Ind.
Fixed capital
Working capital
Wages to
workers
Total output
Material consumed
Total input
Net value
added
(1) (2) (3) (4) (5) (6) (7) (8) (9) (10)
(17) Computer, Electronic and Optical products (26)
2016-17 431 3,209 5,639 488 19,975 11,623 15,428 4,143
2017-18 434 4,475 4,336 530 20,321 12,575 16,247 3,546
(18) Electrical equipments (27) 2016-17 1,432 11,095 8,428 1,294 55,807 32,998 42,756 11,661
2017-18 1,253 10,358 7,598 1,325 48,369 30,686 38,192 9,025
(19) Machinery & equipments n.e.c, Repair & installation of machinery and equipment
(28,33)
2016-17 2,150 25,708 13,147 2,660 73,316 39,385 54,578 15,886
2017-18 2,260 26,210 16,684 3,147 1,02,194 54,731 74,930 24,248
(20) Motor vehicles, trailers and semi trailers (29)
2016-17 1,404 38,371 3,541 3,188 1,17,103 71,229 96,651 15,976
2017-18 1,396 40,290 5,145 3,904 1,22,863 84,893 1,02,462 14,501
(21) Other transport equipments (30)
2016-17 351 8,030 729 860 32,861 20,856 24,371 7,592
2017-18 338 7,965 1,276 968 41,032 27,827 32,464 7,522
(22) Manufacture of furniture and
other manufacturing (31,32)
2016-17 1,251 4,561 15,089 954 37,169 26,234 31,516 5,136
2017-18 1,200 4,511 16,770 1,032 49,151 31,499 43,003 5,657
(23) Others (Waste collection, treatment and disposal activity, material recovery, publishing activity, other industries (38,58, others)
2016-17 1,221 16,642 1,425 540 24,686 4,343 21,140 (-)46
2017-18 1,271 20,602 (-)544 746 30,326 7,428 23,718 4,235
Total 2016-17 27,010 3,37,982 2,02,557 25,835 10,74,970 6,21,480 8,32,819 2,08,800
2017-18 26,393 3,58,441 1,17,152 28,365 11,99,718 7,24,699 9,41,087 2,23,724
Source - Annual Survey of Industries, National Statistical Office, GoI. Neg.- Negligible

Economic Survey of Maharashtra 2020-21
166ANNEXURE 8.3
INDEX NUMBERS OF INDUSTRIAL PRODUCTION IN INDIA
(Base year 2011-12 = 100)
Sr.
No. Item Weight 2015-16 2016-17 2017-18 2018-19 2019-20 2020-21++
(1) (2) (3) (5) (6) (7) (8) (9) I General Index 100.00 114.7 120.0 125.3 130.1 129.0 111.4
II Mining 14.37 97.3 102.5 104.9 107.9 109.6 92.2
III Manufacturing 77.63 115.9 121.0 126.6 131.5 129.6 110.5
Industry groups
1 Food products 5.30 104.7 98.9 108.1 121.3 123.7 113.5
2 Beverages 1.04 109.7 106.3 105.4 109.2 106.4 71.4
3 Tobacco products 0.80 136.3 115.9 95.1 94.2 95.4 76.2
4 Textiles 3.29 119.4 117.4 117.1 118.7 115.7 82.5
5 Wearing apparel 1.32 131.0 151.7 137.5 154.2 154.6 98.3
6 Leather and related products 0.50 123.6 122.3 123.9 125.0 122.7 92.9
7
Wood and products of wood & cork,
except furniture ; manufacture of article
of straw & plating material
0.19 97.5 93.1 92.4 105.1 113.8 82.7
8 Paper and paper products 0.87 116.5 114.0 108.9 104.1 90.8 65.2
9 Printing & reproduction of recorded
media 0.68 103.8 106.0 99.7 97.6 90.7 62.5
10 Coke and refined petroleum products 11.77 113.7 119.1 123.5 126.7 126.7 106.7
11 Chemicals and chemical products 7.87 113.7 116.5 116.1 119.0 118.5 112.6
12 Pharmaceuticals, medicinal, chemical
and botanical products 4.98 132.1 172.3 212.1 215.5 215.2 218.7
13 Rubber and plastic products 2.42 118.3 120.5 110.6 108.0 100.0 91.6
14 Other non-metallic mineral products 4.09 110.4 109.9 113.9 123.6 121.3 97.1
15 Basic metals 12.80 124.3 130.6 138.0 143.3 159.1 140.3
16 Fabricated metal products ,except
machinery and equipment 2.65 103.4 105.5 107.9 106.2 90.6 72.2
17 Computer, electronic and optical
products 1.57 123.6 126.7 148.5 168.7 151.0 116.9
18 Electrical equipment 3.00 128.4 122.6 107.4 110.1 105.2 86.6
19 Machinery and equipment n. e. c 4.77 105.9 114.1 120.5 123.4 107.7 82.8
20 Motor vehicles, trailers &
semi-trailers 4.86 101.1 101.7 114.5 122.7 100.2 71.4
21 Other transport equipment 1.78 112.5 117.5 133.9 145.7 136.6 103.1
22 Furniture 0.13 163.9 176.2 196.6 212.6 197.3 134.3
23 Other Manufacturing 0.94 119.9 125.6 106.2 92.8 81.2 54.3
IV Electricity 7.99 133.8 141.6 149.2 156.9 158.4 154.8
Source – National Statistical Office, GoI ++ Average of April 2020 to December 2020

Economic Survey of Maharashtra 2020-21
167ANNEXURE 8.4
DETAILS OF CO-OPERATIVE SOCIETIES IN THE STATE
Item 1970-71 1980-81 1990-91 2000-01 2010-11 2017-18 2018-19 2019-20* (1) (2) (3) (4) (5) (6) (7) (8) (9)
I. Number of co-operative societies
(1) Apex and central- Agricultural and non- agricultural credit societies
29 31 34 34 34 34 33 33
(2) Primary Agricultural credit societies
20,420$ 18,577 19,565 20,551 21,451 21,102 20,747 20,744
(3) Non-agricultural credit societies
2,964 5,474 11,291 22,014 23,434 20,668 20,663 20,863
(4) Marketing societies 410 423 931 1,115 1,719 1,221 1,264 1,345
(5) Agro-processing enterprises@
6,810 14,327 28,954 39,070 48,848 25,634 25,805 26,661
(6) Social services & other co-op. societies@
11,964 21,915 43,845 75,232 1,28,760 1,29,593 1,37,902 1,43,305
Total 42,597 60,747 1,04,620 1,58,016 2,24,306 1,98,252 2,06,414 2,12,951
II. Number of members ('000)
(1) Apex and central- Agricultural and non- agricultural credit societies $$
70 1,014 1,485 1,371 247 213 213 213
(2) Primary Agricultural credit societies
3,794 5,416 7,942 10,125 15,001 15,010 15,077 14,683
(3) Non-agricultural credit societies
2,438 3,759 9,302 18,467 21,618 26,097 27,632 26,600
(4) Marketing societies 282 471 745 840 1,337 962 1,018 1,025
(5) Agro-processing enterprises
959 2,124 3,974 6,339 8,010 6,244 6,270 6,215
(6) Social services & other co-op. societies
1,038 1,999 3,455 5,880 6,809 6,492 6,412 6,828
Total 8,581 14,783 26,903 43,022 53,022 55,018 56,624 55,564
III. Working capital (` crore)
(1) Apex and central- Agricultural and non- agricultural credit societies
613 1,831 8,806 39,267 89,719 1,31,200 1,41,338 1,44,043
(2) Primary Agricultural credit societies
343 527 1,851 6,988 18,987 20,766 20,836 20,043
(3) Non-agricultural credit societies
168 1,209 7,508 66,887 1,04,814 1,77,533 1,93,491 1,80,721
(4) Marketing societies 39 188 340 1,518 1,300 2,543 1,590 1,617
(5) Agro-processing enterprises
219 1,029 4,588 13,288 28,717 44,632 42,456 42,443
(6) Social services & other co-op. societies
107 426 1,191 6,492 4,897 7,831 7,771 8,599
Total 1,489 5,210 24,284 1,34,440 2,48,434 3,84,506 4,07,481 3,97,466
IV. Gross loan (` crore)
(1) Apex and central- Agricultural and non- agricultural credit societies
751 1,528 9,085 28,709 40,436 51,063 59,497 65,992
(2) Primary Agricultural credit societies
133 250 800 3,734 8,060 15,662 13,093 14,495
(3) Non-agricultural credit societies
204 1,129 5,178 39,268 49,907 75,331 81,669 75,715
(4) Marketing societies 3 3 8 18 11 3 3 2 (5) Agro-processing
enterprises 3 12 17 103 2,052 2,016 2,920 2,315
(6) Social services & other co-op. societies
4 12 60 235 215 194 203 198
Total 1,098 2,934 15,148 72,067 1,00,681 1,44,268 1,57,385 1,58,717 (Contd.)

Economic Survey of Maharashtra 2020-21
168ANNEXURE 8.4 (Concld.)
Item 1970-71 1980-81 1990-91 2000-01 2010-11 2017-18 2018-19 2019-20*
(1) (2) (3) (4) (5) (6) (7) (8) (9)
V. Outstanding loans (` crore)
(1) Apex and central- Agricultural and non-agricultural credit societies
478 1,137 5,889 23,120 42,385 67,020 70,089 79,130
(2) Primary Agricultural credit societies
284 384 1,310 5,308 12,024 13,406 13,823 13,376
(3) Non-agricultural credit societies
105 731 4,594 35,908 47,863 66,890 69,855 66,820
(4) Marketing societies 2 4 9 182 5,032 16 24 19
(5) Agro-processing enterprises
6 30 69 236 3,724 3,072 4,061 3,073
(6) Social services & other Co-op. societies
8 25 191 2,899 834 466 464 482
Total 883 2,311 12,062 67,653 1,11,862 1,50,869 1,58,316 1,62,900
VI. Turnover-Value of produced goods sold (` crore)
(1) Apex and central- Agricultural and non- agricultural credit societies
NA NA NA NA NA NA NA NA
(2) Primary Agricultural credit societies
51 146 239 1,012 593 808 804 829
(3) Non-agricultural credit societies
3 10 -- 38 76 -- -- --
(4) Marketing societies 214 979 2,602 3,205 1,368 6,087 5,762 4,346
(5) Agro-processing enterprises
194 1,031 3,467 7,496 46,112 23,496 23,896 22,726
(6) Social services & other co-op. societies
69 187 330 1,588 4,076 5,562 5,619 6,247
Total 531 2,353 6,638 13,339 52,225 35,953 36,081 34,148
Source - Office of the Commissioner for Co-operation & Registrar Co-operative Societies, GoM. NA Not Applicable
Note - Figures upto 1990-91 are at the end of June.
* Provisional
$ Includes primary agricultural credit societies, primary land development banks and grain banks upto 1970-71. $$ Excluding Nominal Members. @ Lift Irrigation societies are classified in Social Services & Other Co-op. Societies category instead of 'Agro-processing' category since 2000-01.

9Infrastructure


Economic Survey of Maharashtra 2020-21
9. INFRASTRUCTURE
9.1. Availability of better infrastructure helps in economic growth across the sectors. The infrastructure comprises of energy, road & railway transport system, ports, airports and modes of communication viz. posts, telephones, mobile, etc.
ENERGY
9.2 Energy is essential input for economic development as well improving the quality of life. Electricity, Natural Gas, Petroleum are various forms of energy.
Electricity 9.3 Electricity is generated through non-renewable and renewable sources.
Installed capacity 9.3.1 The total installed capacity of generating electricity as on 31st March, 2020 in the State was 36,644 MW of which share of private sector was 58.6 per cent, public sector was 36.0 per cent and public-private partnership (PPP) (Ratnagiri Gas Power Project Ltd.) was 5.4 per cent. The share of renewable energy in the installed capacity of private sector was 44.6 per cent. The installed capacity in the State as on 31st March, 2020 was highest (11.7 per cent) in the country. The sourcewise installed capacity is given in Table 9.1.
Table 9.1 Sourcewise installed capacity (MW)
Source As on 31st March As on 31st
December 2020
Per cent change in 2020 over
2019 2018 2019 2020
In the State 36,317 36,729 36,644 36,874 (-)0.2 Thermal 22,096 22,096 21,176 21,176 (-)4.2 Renewable 8,341 8,753 9,588 9,818 9.5 Hydro 3,061 3,061 3,061 3,061 0.0 Natural gas 2,819 2,819 2,819 2,819 0.0 Central sector allocation 7,420 7,754 7,831 7,919 1.0 Source : MAHAGENCO, MEDA, Central Electricity Authority, Tata Power Co. Ltd., Adani Electricity Mumbai Ltd.

170
Economic Survey of Maharashtra 2020-21
Electricity generated 9.3.2 The total electricity generated in the State was 1,23,314 Million Units (MU) during 2019-20 and electricity received from central sector was 34,988 MU. During 2020-21 upto November, total electricity generated in the State was 69,606 MU, 13.9 per cent less than electricity generated in the previous year for the same period (80,813 MU) due to Covid-19 pandemic impact. The share of private, public and public-private partnership in total electricity generation during 2019-20 was 53.5 per cent, 43.0 per cent and 3.5 per cent respectively. The sourcewise electricity generated is given in Table 9.2.
Electricity purchased 9.3.3 During 2019-20 per unit average cost of electricity purchased by MAHADISCOM was ` 5.06 and that of BEST was ` 5.10. The electricity purchased by MAHADISCOM and BEST is given in Table 9.3.
Table 9.2 Sourcewise electricity generated (MU)
Source 2017-18 2018-19 2019-20 2020-21+ Per cent change
in 2019-20 over 2018-19
In the State 1,20,160 1,27,059 1,23,314 69,606 (-)2.9 Thermal 93,950 98,720 95,460 52,628 (-)3.3 Natural gas 9,062 8,452 7,999 3,801 (-)5.4 Hydro 5,114 5,387 6,104 3,528 13.3 Renewable$ 12,034 14,500 13,751 9,649 (-)5.2 Received from central sector
33,003 34,238 34,988 23,093 2.2
Note : 1 Unit = 1 Kilo Watt Hour $ including captive + upto November Source: MAHAGENCO, MAHADISCOM, Central Electricity Authority, Tata Power Co. Ltd., Adani Electricity Mumbai Ltd.
Table 9.3 Electricity purchased by MAHADISCOM and BEST
Year MAHADISCOM BEST
Electricity purchased (MU)
Total cost (` Crore)
Electricity purchased (MU)
Total cost (` Crore)
2018-19 1,36,253 62,754 4,771 2,315 2019-20 1,32,020 66,775 4,791 2,445
2020-21+ 93,800 45,512 2,950 1,754 Source : MAHADISCOM, BEST + upto December
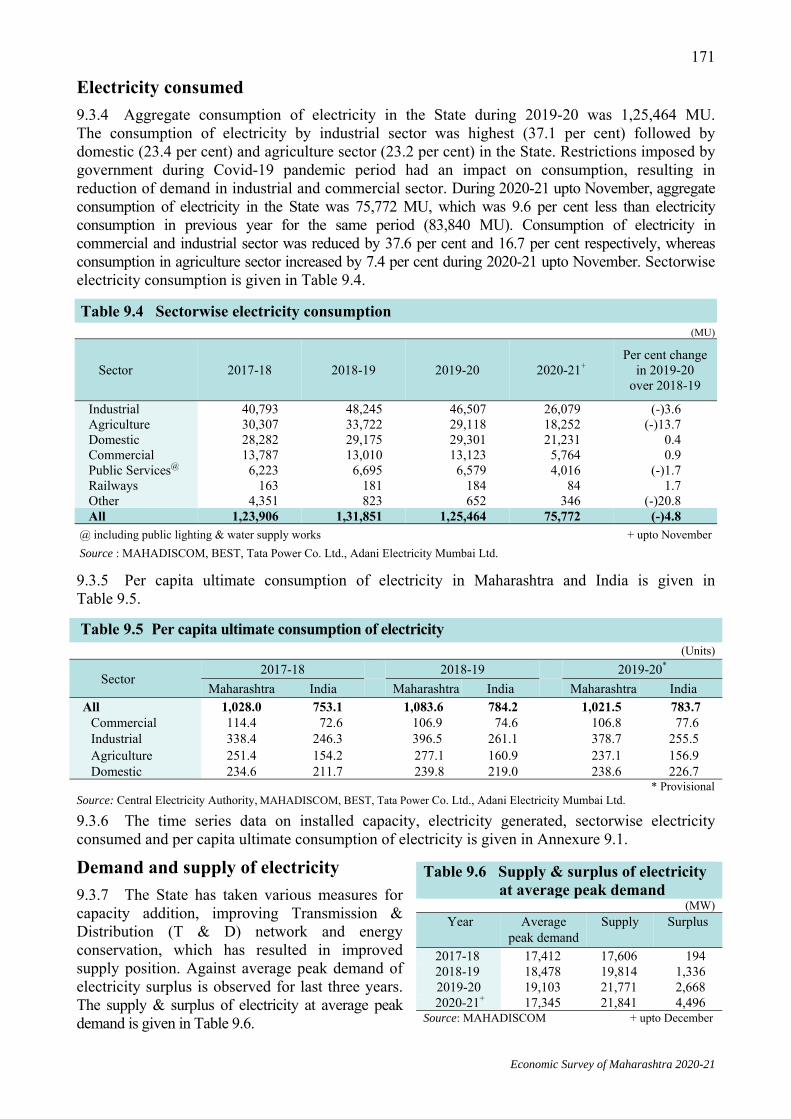
171
Economic Survey of Maharashtra 2020-21
Electricity consumed 9.3.4 Aggregate consumption of electricity in the State during 2019-20 was 1,25,464 MU. The consumption of electricity by industrial sector was highest (37.1 per cent) followed by domestic (23.4 per cent) and agriculture sector (23.2 per cent) in the State. Restrictions imposed by government during Covid-19 pandemic period had an impact on consumption, resulting in reduction of demand in industrial and commercial sector. During 2020-21 upto November, aggregate consumption of electricity in the State was 75,772 MU, which was 9.6 per cent less than electricity consumption in previous year for the same period (83,840 MU). Consumption of electricity in commercial and industrial sector was reduced by 37.6 per cent and 16.7 per cent respectively, whereas consumption in agriculture sector increased by 7.4 per cent during 2020-21 upto November. Sectorwise electricity consumption is given in Table 9.4.
9.3.5 Per capita ultimate consumption of electricity in Maharashtra and India is given in Table 9.5.
Table 9.5 Per capita ultimate consumption of electricity (Units)
Sector 2017-18 2018-19 2019-20* Maharashtra India Maharashtra India Maharashtra India
All 1,028.0 753.1 1,083.6 784.2 1,021.5 783.7 Commercial 114.4 72.6 106.9 74.6 106.8 77.6 Industrial 338.4 246.3 396.5 261.1 378.7 255.5 Agriculture 251.4 154.2 277.1 160.9 237.1 156.9 Domestic 234.6 211.7 239.8 219.0 238.6 226.7
* Provisional Source: Central Electricity Authority, MAHADISCOM, BEST, Tata Power Co. Ltd., Adani Electricity Mumbai Ltd.
9.3.6 The time series data on installed capacity, electricity generated, sectorwise electricity consumed and per capita ultimate consumption of electricity is given in Annexure 9.1.
Demand and supply of electricity 9.3.7 The State has taken various measures for capacity addition, improving Transmission & Distribution (T & D) network and energy conservation, which has resulted in improved supply position. Against average peak demand of electricity surplus is observed for last three years. The supply & surplus of electricity at average peak demand is given in Table 9.6.
Table 9.4 Sectorwise electricity consumption (MU)
Sector 2017-18 2018-19 2019-20 2020-21+ Per cent change
in 2019-20 over 2018-19
Industrial 40,793 48,245 46,507 26,079 (-)3.6 Agriculture 30,307 33,722 29,118 18,252 (-)13.7 Domestic 28,282 29,175 29,301 21,231 0.4 Commercial 13,787 13,010 13,123 5,764 0.9 Public Services@ 6,223 6,695 6,579 4,016 (-)1.7 Railways 163 181 184 84 1.7 Other 4,351 823 652 346 (-)20.8 All 1,23,906 1,31,851 1,25,464 75,772 (-)4.8
@ including public lighting & water supply works + upto November Source : MAHADISCOM, BEST, Tata Power Co. Ltd., Adani Electricity Mumbai Ltd.
Table 9.6 Supply & surplus of electricity at average peak demand
(MW) Year Average
peak demand Supply Surplus
2017-18 17,412 17,606 194 2018-19 18,478 19,814 1,336 2019-20 19,103 21,771 2,668 2020-21+ 17,345 21,841 4,496 Source: MAHADISCOM + upto December

172
Economic Survey of Maharashtra 2020-21
Transmission and Distribution (T & D) network infrastructure 9.3.8 T & D network infrastructure is the backbone of the electricity power system as it facilitates the delivery of electricity from power plants to end consumers. Improvement in T & D network infrastructure is an ongoing process which involves measures such as modernisation of Extra High Voltage (EHV) sub-stations, replacement of faulty meters, load reduction on overloaded high tension (HT) & low tension (LT) circuits by providing additional transformers, erection & commissioning of new sub-stations and anti-theft drive. 9.3.9 The transmission capacity of MAHATRANSCO was about 1,28,990 Mega Volt Ampere (MVA) with the network of 48,321 circuit km transmission lines and 681 sub-stations by the end of 2019-20. Transmission capacity has been enhanced to 1,29,520 MVA with the network line length of 48,805 circuit km with 688 sub-stations during 2020-21 upto December. The transmission losses of MAHATRANSCO for 2018-19 & 2019-20 were 3.11 per cent & 3.17 per cent respectively whereas in 2020-21 upto December it was 2.86 per cent.
9.3.10 The distribution network of MAHADISCOM had 3,865 sub-stations, 10,87,173 circuit km line length with 6,87,916 distribution transformers by the end of 2019-20. During 2020-21 upto November, there were 3,899 sub-stations, 10,98,005 circuit km line length and 7,18,868 distribution transformers.
9.3.11 Distribution network of MAHADISCOM is in all over Maharashtra except Mumbai city. BEST have distribution network in Mumbai city whereas Tata Power and Adani Electricity have distribution network in Mumbai suburban. The contribution of MAHADISCOM to the distribution utilities in the State was 86.0 per cent followed by Adani Electricity 6.7 per cent, Tata Power 3.7 per cent and BEST 3.6 per cent during 2019-20. The distribution losses are given in Table 9.7.
9.3.12 Ujwal Discom Assurance Yojana(UDAY): The GoI has approved the scheme in 2015 for improving the operational and financial efficiency of the State DISCOM. Under the scheme, an amount of ` 4,959.75 crore has been transferred by GoM to MAHADISCOM during 2016-17. Upto March, 2020, feeder metering, electricity access to unconnected households, feeder segregation, rural feeder audit and distribution of LED bulbs has been completed, whereas distribution transformer metering is in progress.
Table 9.7 Distribution losses (per cent)
Licensee 2017-18 2018-19 2019-20 2020-21+ MAHADISCOM 13.90 13.63 15.91 12.72 BEST 5.82 4.18 4.62 3.71 Adani Electricity Mumbai Ltd. 8.16 7.84 7.37 7.55 Tata Power Co. Ltd. 0.90 0.63 1.02 2.05 Source : MAHADISCOM, BEST, Tata Power Co. Ltd., Adani Electricity Mumbai Ltd. + upto September

173
Economic Survey of Maharashtra 2020-21
9.3.13 Capacity addition of thermal power: MAHAGENCO has accorded approval for installation and commissioning of projects at various thermal power stations. Capacity addition in project at Bhusawal 660 MW is in progress, which is expected to be completed by May, 2022. State government and Maharashtra Electricity Regulatory Commission has given in-principal approval for implementation of project with capacity of 1,320 MW at Koradi.
Regulatory measures and electricity tariffs 9.4 Maharashtra Electricity Regulatory Commission (MERC) has been set up for determination of tariff, regulation of power purchase and procurement process of transmission & distribution utilities and promotion of competition and efficiency in the electricity sector. MERC has notified ‘Multi Year Tariff Regulation, 2019’ for the period from April, 2020 to March, 2025 for determining the category wise tariffs for distribution licensee for each year of control period. Average tariffs of electricity in 2020-21 are given in Table 9.8.
Table 9.8 Average Tariffs of electricity during 2020-21 (` per unit)
Category of user MAHADISCOM BEST Adani Electricity Tata Power
LT - Domestic/Residential BPL 3.69 @ @ @ 0-100 Units 6.03 3.54 4.87 2.16 101-300 Units 9.94 6.49 7.29 5.24 301-500 Units 12.84 8.98 8.87 8.78 Above 500 Units 13.54 10.39 10.01 9.81 LT - Commercial/Non-residential
0-20 KW load 10.61 7.89 8.31 6.49 > 20 KW & <= 50 KW load 14.01 8.67 9.30 8.23 Above 50 KW load 16.11 8.73 9.60 8.23 LT - Industry
below 20 KW load 7.24 7.09 7.48 6.17 above 20 KW load 8.90 8.10 8.66 7.61 LT - Agriculture
Un-metered – Pumpsets Metered – Pumpsets Metered – Others
4.48 3.71 7.95
NA @ @
NA
@ @
NA
@ @
LT - Street lights (Public lighting) Grampanchayat and A, B & C class Municipal Councils
6.51 NA NA NA
Municipal Corporation areas 7.96 # # # LT - Public services
Government educational institutions & hospitals
8.09 6.82 7.27 6.77
Others 8.77 6.95 7.65 8.25 HT - Industry 8.50 7.09 7.89 7.15 HT - Railways / Metro / Monorail 8.24 7.25 7.71 7.39 HT - Public services
Government educational institutions & hospitals
9.28 7.14 8.00 8.18
Others 11.12 7.68 8.28 7.92 HT- Agriculture pumps 4.22 NA NA NA @ Average tariff not shown as no or less number of consumers NA Not Applicable # LT Street lights is included in LT Public services others Source: MERC
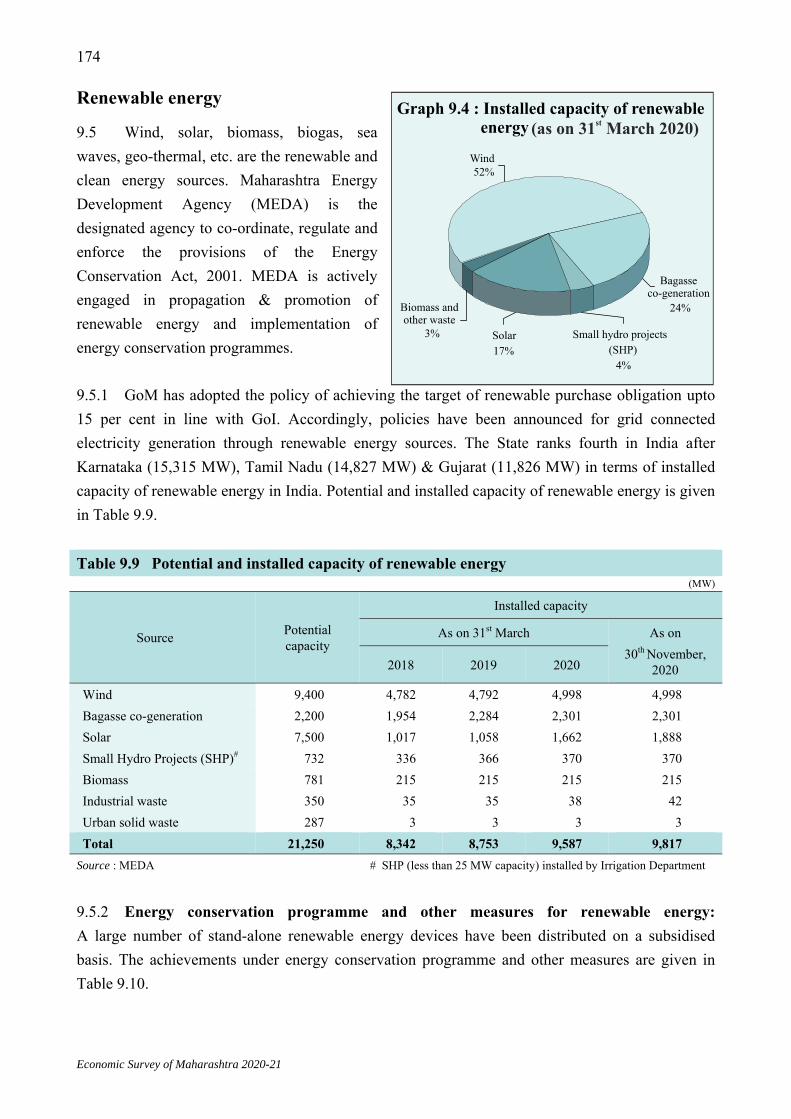
174
Economic Survey of Maharashtra 2020-21
Renewable energy
9.5 Wind, solar, biomass, biogas, sea waves, geo-thermal, etc. are the renewable and clean energy sources. Maharashtra Energy Development Agency (MEDA) is the designated agency to co-ordinate, regulate and enforce the provisions of the Energy Conservation Act, 2001. MEDA is actively engaged in propagation & promotion of renewable energy and implementation of energy conservation programmes.
9.5.1 GoM has adopted the policy of achieving the target of renewable purchase obligation upto 15 per cent in line with GoI. Accordingly, policies have been announced for grid connected electricity generation through renewable energy sources. The State ranks fourth in India after Karnataka (15,315 MW), Tamil Nadu (14,827 MW) & Gujarat (11,826 MW) in terms of installed capacity of renewable energy in India. Potential and installed capacity of renewable energy is given in Table 9.9. Table 9.9 Potential and installed capacity of renewable energy
(MW)
Source Potential capacity
Installed capacity
As on 31st March As on 30th November,
2020 2018 2019 2020
Wind 9,400 4,782 4,792 4,998 4,998 Bagasse co-generation 2,200 1,954 2,284 2,301 2,301 Solar 7,500 1,017 1,058 1,662 1,888 Small Hydro Projects (SHP)# 732 336 366 370 370 Biomass 781 215 215 215 215 Industrial waste 350 35 35 38 42 Urban solid waste 287 3 3 3 3 Total 21,250 8,342 8,753 9,587 9,817 Source : MEDA # SHP (less than 25 MW capacity) installed by Irrigation Department
9.5.2 Energy conservation programme and other measures for renewable energy: A large number of stand-alone renewable energy devices have been distributed on a subsidised basis. The achievements under energy conservation programme and other measures are given in Table 9.10.
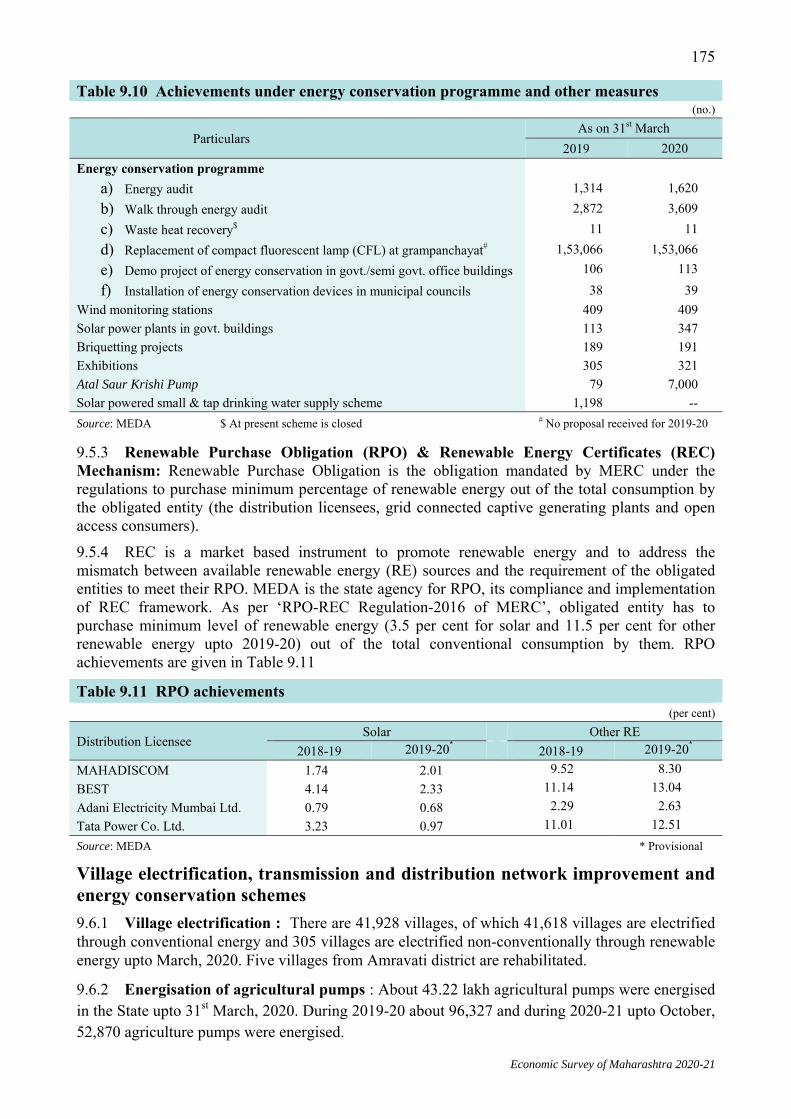
175
Economic Survey of Maharashtra 2020-21
9.5.3 Renewable Purchase Obligation (RPO) & Renewable Energy Certificates (REC) Mechanism: Renewable Purchase Obligation is the obligation mandated by MERC under the regulations to purchase minimum percentage of renewable energy out of the total consumption by the obligated entity (the distribution licensees, grid connected captive generating plants and open access consumers). 9.5.4 REC is a market based instrument to promote renewable energy and to address the mismatch between available renewable energy (RE) sources and the requirement of the obligated entities to meet their RPO. MEDA is the state agency for RPO, its compliance and implementation of REC framework. As per ‘RPO-REC Regulation-2016 of MERC’, obligated entity has to purchase minimum level of renewable energy (3.5 per cent for solar and 11.5 per cent for other renewable energy upto 2019-20) out of the total conventional consumption by them. RPO achievements are given in Table 9.11
Village electrification, transmission and distribution network improvement and energy conservation schemes 9.6.1 Village electrification : There are 41,928 villages, of which 41,618 villages are electrified through conventional energy and 305 villages are electrified non-conventionally through renewable energy upto March, 2020. Five villages from Amravati district are rehabilitated.
9.6.2 Energisation of agricultural pumps : About 43.22 lakh agricultural pumps were energised in the State upto 31st March, 2020. During 2019-20 about 96,327 and during 2020-21 upto October, 52,870 agriculture pumps were energised.
Table 9.10 Achievements under energy conservation programme and other measures (no.)
Particulars As on 31st March 2019 2020
Energy conservation programme a) Energy audit 1,314 1,620 b) Walk through energy audit 2,872 3,609 c) Waste heat recovery$ 11 11 d) Replacement of compact fluorescent lamp (CFL) at grampanchayat# 1,53,066 1,53,066 e) Demo project of energy conservation in govt./semi govt. office buildings 106 113 f) Installation of energy conservation devices in municipal councils 38 39
Wind monitoring stations 409 409 Solar power plants in govt. buildings 113 347 Briquetting projects 189 191 Exhibitions 305 321 Atal Saur Krishi Pump 79 7,000 Solar powered small & tap drinking water supply scheme 1,198 -- Source: MEDA $ At present scheme is closed # No proposal received for 2019-20
Table 9.11 RPO achievements (per cent)
Distribution Licensee Solar Other RE 2018-19 2019-20* 2018-19 2019-20*
MAHADISCOM 1.74 2.01 9.52 8.30 BEST 4.14 2.33 11.14 13.04 Adani Electricity Mumbai Ltd. 0.79 0.68 2.29 2.63 Tata Power Co. Ltd. 3.23 0.97 11.01 12.51 Source: MEDA * Provisional

176
Economic Survey of Maharashtra 2020-21
9.6.3 Atal Saur Krushi Pump Yojana : This scheme aims to provide electricity to farmers during the day for irrigation. In first phase of the scheme (2015 to 2018) total 5,662 solar agriculture pumps were commissioned as against the target of 10,000 pumps in the State. In the second phase (from 2018-19) target of total 7,000 agriculture pumps is achieved upto March, 2020. After implementation of this scheme, total 30.60 MW of energy and 73.41 MU electricity has been saved. 9.6.4 Mukhyamantri Saur Krishi Vahini Yojana : This scheme aims to provide electricity to farmers during day time by installing solar projects on decentralised manner at or nearby to MAHADISCOM’s substation. Under this scheme, agriculture feeders in the Agriculture dominant areas of the State will be electrified through solar energy so that day time power can be supplied to farmers. During 2019-20 capacity commissioned is 169 MW and upto December, 2020 total 292 MW capacity is commissioned. 9.6.5 Pradhan Mantri Kisan Urja Suraksha evam Utthan Maha-abhiyan (PM KUSUM): GoI has launched the scheme for farmers for installation of solar pumps and grid connected solar & other renewable power plants in the country. Under this scheme 3 HP, 5 HP and 7.5 HP solar pumps are being installed with the share of GoI 30 per cent, GoM 60 per cent and beneficiary 10 per cent. The scheme is implemented in the State from 2019-20 for the period of three years. GoI has given sanction to commission 30,000 and 70,000 solar agriculture pumps during year 2019-20 and 2020-21 respectively. 9.6.6 Deen Dayal Upadhyay Gram Jyoti Yojana (DDUGJY): GoI has launched this scheme in 2015, to provide electricity connection to rural household and sanctioned ` 2,164.15 crore for the State. Under the scheme it is targeted to provide electricity connection to 12.48 lakh rural households (including 3.86 lakh BPL households). The progress under DDUGJY in the State upto December, 2020 is given in Table 9.12.
9.6.7 Domestic Efficiency Lighting Programme : Under the scheme, about 2.20 crore LED bulbs, 5.31 lakh LED tube lights and 1.86 lakh five star rating ceiling fans have been distributed in the State upto 15th December, 2020. 9.6.8 Pradhanmantri Sahaj Bijali Har Ghar (Saubhagya) Yojana: GoI is implementing Saubhagya yojana since October, 2017. This scheme aims at electrifying unelectrified households in the remote areas through installed solar home light systems including five years comprehensive maintenance. Under this scheme, installation of solar home light systems in 30,538 households is completed.
Table 9.12 Progress under DDUGJY (since inception upto December, 2020)
Particulars Unit Target Achievement In Progress New stations no. 210 201 9 Augmentation/upgradation of existing transformers no. 149 148 1 New transformers no. 9,266 7,426 287 Feeder separation no. 709 629 32 Feeder separation km 9,755 8,245 292 HT line km 6,467 5,426 190 LT line km 5,539 4,066 137 Sansad Adarsh Gram Yojana Villages no. 79 79 0 Connection to BPL Households no. 3,86,439 3,86,439 0 Source : MAHADISCOM

177
Economic Survey of Maharashtra 2020-21
9.6.9 Save Energy Programme : Energy conservation potential for industrial, agriculture, domestic and commercial sector is about 30 per cent. In order to achieve energy conservation, energy audit is first step. Energy audit involves a systematic study undertaken on major energy consuming sections and equipments with a view to identify the flow of energy and efficient use of energy in each step. Technical and financial assistance is provided to conduct systematic energy audit under the programme. In all, 1,620 such energy audits have been conducted upto March, 2020.
9.6.9.1 Scheme for walk-through energy audit for SMEs : The main objective of this program is to provide financial assistance to eligible organizations for carrying out walk-through energy audit through empaneled consultant of MEDA. MEDA remits ` 3,000 per walk-through energy audit to auditing firm after submission of walk-through energy audit report. About 3,609 small and medium enterprises (SMEs) participated in the scheme upto March, 2020.
Other forms of energy
Petroleum and natural gas
9.7 Consumption of major petroleum products in comparison with previous year indicates rise of 0.14 per cent for India and fall of 1.05 per cent for Maharashtra during 2019-20. Consumption of major petroleum products in India and Maharashtra is given in Table 9.13.
Table 9.13 Consumption of major petroleum products ( '000 MT)
Petroleum products 2018-19 2019-20*
India Maharashtra India Maharashtra Naphtha 11,420 363 11,904 345 Liquified Petroleum Gas (LPG) 24,591 2,990 26,126 3,124 Motor Spirit/Gasolene (MS) 28,284 3,358 29,975 3,462 Superior Kerosene Oil (SKO) 3,459 200 2,397 54 Aviation Turbine Fuel (ATF) 8,041 1,639 7,999 1,399 High Speed Diesel (HSD) 83,435 9,292 82,485 9,529 Light Diesel Oil (LDO) 598 78 628 81 Furnace Oil (FO) 5,583 815 5,137 766 Hot Heavy Stock (HHS)/ Low Sulphur Heavy Stock (LSHS) 369 4 390 6
Lubricants/Grease 1,313 285 1,317 303 Bitumen 5,830 712 5,098 653 Others 17,428 1,281 17,172 1,074 Total 1,90,352 21,017 1,90,627 20,797 Source : Ministry of Petroleum and Natural Gas, GoI * Provisional

178
Economic Survey of Maharashtra 2020-21
9.7.1 LPG domestic consumers, LPG distributors, Superior Kerosene Oil (SKO) / Light Diesel Oil (LDO) dealers and SKO/ LDO retail outlets are given in Table 9.14.
9.7.2 Mahanagar Gas Ltd., Maharashtra Natural Gas Ltd. and Gas Authority of India Ltd. (GAIL) are the operating entities of Piped Natural Gas (PNG) connections and Compressed Natural Gas (CNG) stations in the State. Upto March, 2020 there were 2,208 CNG stations in India of which 370 CNG stations were in the State. There were 61.01 lakh PNG connections in India, of which 17.61 lakh connections were in the State.
9.7.3 Pradhan Mantri Ujjwala Yojana (PMUY): Under the scheme, the target of eight crore LPG connections to BPL families was achieved upto September 2019, of which total 44.38 lakh LPG connections were released in the State. During Covid-19 pandemic, GoI has launched ‘Pradhan Mantri Garib Kalyan Package’ (PMGKP) scheme. Under this scheme, three refills of LPG cylinders were provided free of cost. Upto August 2020, in all 13.06 crore refills have been delivered to PMUY beneficiaries, of which total 73.24 lakh have been delivered in the State.
Energy Efficiency
9.8 The ‘State Energy Efficiency Index 2019’, which tracks the progress of energy efficiency initiatives in all States and UTs has been developed by the Bureau of Energy Efficiency, Ministry of Power, GoI and Alliance for an Energy Efficient Economy based on 97 significant indicators. This Index categorises states as 'Front Runner', 'Achiever', 'Contender' and 'Aspirant' based on their efforts and achievements towards energy efficiency implementation. As per State Energy Efficiency Index 2019, Haryana, Kerala and Karnataka were in the ‘Achiever’ category. No state falls in the category of ‘Front Runner’. Manipur, Jharkhand, Rajasthan and Jammu & Kashmir are least performers and fall in ‘Aspirant’ category. Maharashtra fall in the category of ‘Contender’.
Table 9.14 LPG domestic consumers, distributors, SKO/LDO dealers and retail outlets
Particulars 2017-18 2018-19 2019-20*
India Maharashtra India Maharashtra India Maharashtra
LPG Active Domestic Consumers (lakh) 2,243 241 2,654 269 2,787 276
LPG Distributors (no.) 20,146 1,827 23,737 2,134 24,670 2,184 SKO/LDO Dealers (no.) 6,536 767 6,528 767 6,521 766 SKO/ LDO Retail Outlets (no.) 62,585 5,970 64,627 6,159 69,093 6,458 PDS SKO allocation ('000 MT) 5,022 385 4,433 287 3,121 107 PDS SKO upliftment of allocation ('000 MT) 4,669 378 4,152 242 2,793 53
Source: Ministry of Petroleum and Natural Gas, GoI * Provisional

Economic Survey of Maharashtra 2020-21
179
TRANSPORT AND COMMUNICATION 9.9 A good transport & communication system helps in growth of the economy. The various modes of transport and communication in the State are road, rail, air, water, postal services, telephones, cell phones and internet services. The robust infrastructure leads to better service delivery and wider market accessibility for primary, secondary and tertiary sectors.
Surface transport
Road network 9.10 The road network consists of highways, district roads, village roads and internal city roads. Road development plan 2001-2021 is being implemented in the State with a target to develop 3.37 lakh km roads. The total road length maintained by Public Works Department (PWD) and Zilla Parishad (ZP) (excluding road length maintained by other agencies) at the end of March, 2019 was 3.09 lakh km. During 2020-21, funds of ` 14,085 crore are approved and an expenditure of ₹ 5,401.86 crore is incurred upto December. The road length maintained by PWD and ZP is given in Table 9.15. Road length by type of road in the State is given in Annexure 9.2 and district wise road length according to breadth is given in Annexure 9.3.
Central Road Fund Scheme
9.11 Government of India introduced Central Road Fund (CRF) scheme in 2001-02 for the development and maintenance of national highways, rural roads, state roads (roads of interstate
Table 9.15 Road length maintained by PWD and ZP (As on 31st March)
Year Roads (km)
National highways
Major state highways
State highways
Major district roads
Other district roads
Village roads Total
2016-17 7,682 3,971 30,776 51,627 56,336 1,53,946 3,04,336 2017-18 10,195 3,272 29,151 55,030 53,924 1,52,272 3,03,843 2018-19 10,300 2,967 28,466 60,531 49,206 1,57,127 3,08,597 2019-20* 17,726 2,967 29,030 63,886 47,398 1,48,335 3,09,342 Note: Figures may not add up due to rounding * provisional
Source: Public Works Department, GoM
Table 9.16 Progress of works under CRF scheme in the State
Year Works sanctioned
(no.)
Sanctioned length (km)
Amount sanctioned (₹ Crore)
Works (no.) Physical length completed
(km)
Expenditure incurred (₹ Crore)
In progress
Completed
2001-02 to 2015-16 832 8,298.04 4,806.30 15 812 8,336.54 3,072.14 2016-17 170 1,102.00 3,030.36 59 93 1,095.61 1,516.02 2017-18 1 3.90 11.41 1 0 3.90 928.00 2018-19 52 575.55 2,638.56 51 0 191.80 1,109.12
TOTAL 1,055 9,979.49 10,486.63 126 905 9,627.85 6,625.28 Note : Total 24 works have been deleted Source : Public Works Department, GoM
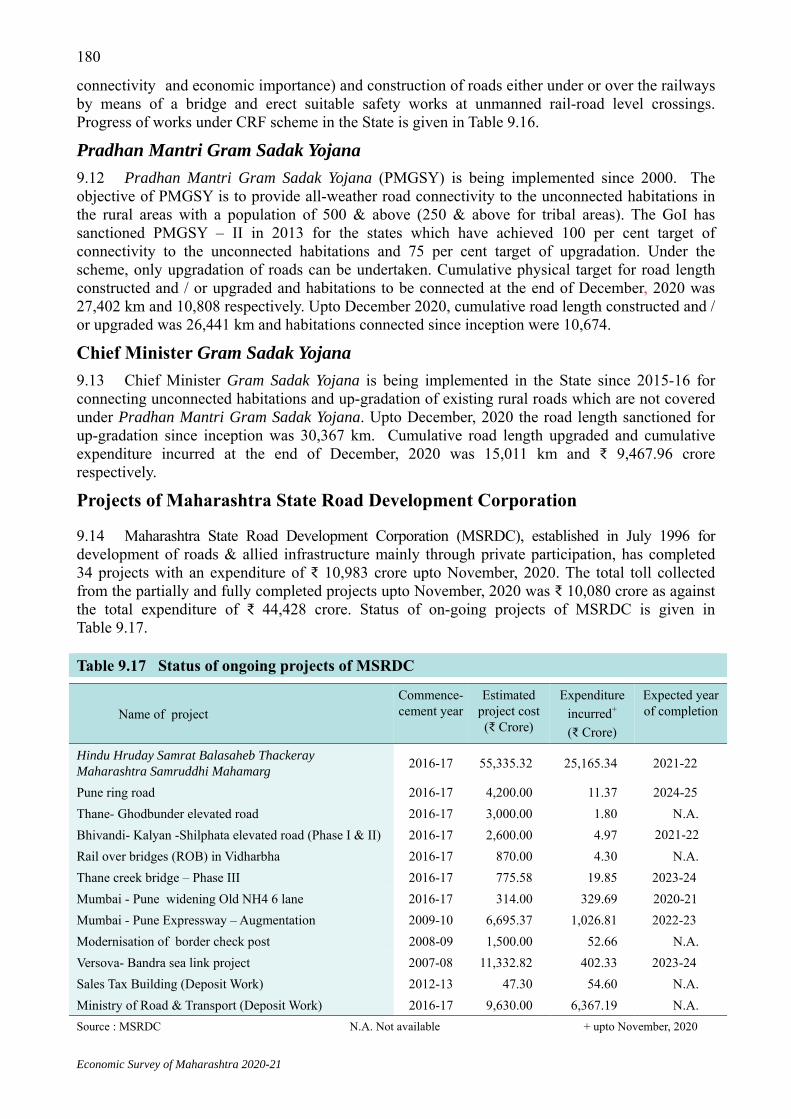
Economic Survey of Maharashtra 2020-21
180
connectivity and economic importance) and construction of roads either under or over the railways by means of a bridge and erect suitable safety works at unmanned rail-road level crossings. Progress of works under CRF scheme in the State is given in Table 9.16.
Pradhan Mantri Gram Sadak Yojana 9.12 Pradhan Mantri Gram Sadak Yojana (PMGSY) is being implemented since 2000. The objective of PMGSY is to provide all-weather road connectivity to the unconnected habitations in the rural areas with a population of 500 & above (250 & above for tribal areas). The GoI has sanctioned PMGSY – II in 2013 for the states which have achieved 100 per cent target of connectivity to the unconnected habitations and 75 per cent target of upgradation. Under the scheme, only upgradation of roads can be undertaken. Cumulative physical target for road length constructed and / or upgraded and habitations to be connected at the end of December, 2020 was 27,402 km and 10,808 respectively. Upto December 2020, cumulative road length constructed and / or upgraded was 26,441 km and habitations connected since inception were 10,674. Chief Minister Gram Sadak Yojana 9.13 Chief Minister Gram Sadak Yojana is being implemented in the State since 2015-16 for connecting unconnected habitations and up-gradation of existing rural roads which are not covered under Pradhan Mantri Gram Sadak Yojana. Upto December, 2020 the road length sanctioned for up-gradation since inception was 30,367 km. Cumulative road length upgraded and cumulative expenditure incurred at the end of December, 2020 was 15,011 km and ₹ 9,467.96 crore respectively.
Projects of Maharashtra State Road Development Corporation
9.14 Maharashtra State Road Development Corporation (MSRDC), established in July 1996 for development of roads & allied infrastructure mainly through private participation, has completed 34 projects with an expenditure of ₹ 10,983 crore upto November, 2020. The total toll collected from the partially and fully completed projects upto November, 2020 was ₹ 10,080 crore as against the total expenditure of ₹ 44,428 crore. Status of on-going projects of MSRDC is given in Table 9.17.
Table 9.17 Status of ongoing projects of MSRDC
Name of project Commence-cement year
Estimated project cost (₹ Crore)
Expenditure incurred+ (₹ Crore)
Expected year of completion
Hindu Hruday Samrat Balasaheb Thackeray Maharashtra Samruddhi Mahamarg 2016-17 55,335.32 25,165.34 2021-22
Pune ring road 2016-17 4,200.00 11.37 2024-25 Thane- Ghodbunder elevated road 2016-17 3,000.00 1.80 N.A. Bhivandi- Kalyan -Shilphata elevated road (Phase I & II) 2016-17 2,600.00 4.97 2021-22 Rail over bridges (ROB) in Vidharbha 2016-17 870.00 4.30 N.A. Thane creek bridge – Phase III 2016-17 775.58 19.85 2023-24 Mumbai - Pune widening Old NH4 6 lane 2016-17 314.00 329.69 2020-21 Mumbai - Pune Expressway – Augmentation 2009-10 6,695.37 1,026.81 2022-23 Modernisation of border check post 2008-09 1,500.00 52.66 N.A. Versova- Bandra sea link project 2007-08 11,332.82 402.33 2023-24
Sales Tax Building (Deposit Work) 2012-13 47.30 54.60 N.A. Ministry of Road & Transport (Deposit Work) 2016-17 9,630.00 6,367.19 N.A. Source : MSRDC N.A. Not available + upto November, 2020

Economic Survey of Maharashtra 2020-21
181
Hindu Hruday Samrat Balasaheb Thackeray Maharashtra Samruddhi Mahamarg 9.15 Hindu Hruday Samrat Balasaheb Thackeray Maharashtra Samruddhi Mahamarg is proposed eight lane expressway connecting Mumbai to Nagpur (701 km long and 120 m wide) and will enable travellers to cover the distance in eight hours. This expressway will pass through 10 districts, 26 tehsils and 392 villages and thereby it will connect 24 districts. At the crossing points of state and national highways an innovative idea of development of 24 Krushi Samruddhi Kendra is proposed. This corridor is proposed to connect industrial places (Butibori, Wardha, Amravati, Jalna, Chikalthana, Shendra, Walunj and Sinnar), tourist & pilgrimage places (Sewagram, Karanja (Lad), Lonar, Sindkhedraja, Ellora and Shirdi). The total land required is 9,599.99 ha, of which 8,861.02 ha land was acquired. The compensation amount paid upto December, 2020 was ₹ 7,424.37 crore.
Projects of Mumbai Metropolitan Region Development Authority 9.16 Mumbai Metropolitan Region (MMR) comprises of whole of the area of Mumbai City, Mumbai Suburban and parts of the Thane, Raigad and Palghar districts. It has total 6,500 sq.km area under nine municipal corporations, nine municipal councils, one nagar panchayat and about 14,769 villages. Mumbai Metropolitan Region Development Authority (MMRDA) has undertaken various infrastructure projects in MMR. Status of on-going transport projects in MMR is given in Table 9.18.
Table 9.18 Status of on-going transport projects in Mumbai Metropolitan Region (₹ Crore)
Name of project Commence- ment year
Cost of project
Expenditure incurred+
Expected year of
completion
Current status
EXTENDED MUIP:
Phase - I, II & III : Roads, Flyovers 2007 6,235.12 4,361.12 2022 Work in progress Mithi river works Phase II deepening, widening, beautification, service roads etc.
2007 570.76 492.58 2017 Almost completed
Multi-modal corridor from Virar to Alibaug: Construction of freeway with eight lanes for the vehicles besides dedicated lanes for buses (126 km)
2010 39,841.93 44.81 - Handed over to MSRDC
Outer Area Road Development Scheme 2014 956.66 417.47 2022 Work in progress Santacruz – Chembur Link Road (SCLR) Kurla to Wakola Phase I
2016 449.00 294.12 2022 Work in progress
Bharat Diamond Bourse to Wakola Junction Phase II (under extension of SCLR)
2017 149.00 43.03 2021 Work in progress
Mumbai Trans – Harbour link : Construction of bridge across the sea from Sewri to Nhava (22 km)
2017 17,843.00 5,899.00 2022 Work in progress
Traffic improvement of Chheda Nagar Junction Ghatkopar (E) on Eastern Express Highway
2018 223.85 74.38 2021 Work in progress
Construction of 6 Lane Tunnel from Tikujiniwadi in Thane City to Sanjay Gandhi National Park, Borivali
2020 11,270.88 - 2026 Work in progress
Other project Grand Memorial of Bharat Ratna Dr. Babasaheb Ambedkar at Indu Mill
2018 1,083.95 154.33 2023 Work in progress
Source: MMRDA + upto November, 2020

Economic Survey of Maharashtra 2020-21
182
Mumbai Coastal Road Project (South) 9.17 The Coastal Road Project of eight lane road including three interchanges of length 10.58 km from Princess Street flyover to Worli end of Bandra Worli Sea Link is undertaken by Municipal Corporation of Greater Mumbai. This project comprises of twin tunnel each 3.45 km long equipped with latest technology. About 70 ha reclaimed area will be for green belt & recreational facilities. The project includes public transport facilities by virtue of dedicated lane for Bus Rapid Transit System (BRTS) with BRTS depot and four underground parking areas with a cumulative capacity of about 1,800 cars. The work is commenced from October, 2018 and planned to be completed by July, 2023. The total estimated cost of the project is ₹ 12,721 crore. The expenditure incurred upto November, 2020 was ₹ 1,439.70 crore. About 20 percent work is completed at the end of November, 2020.
Motor vehicles
9.18 The total number of motor vehicles on road in the State as on 1st January, 2021 is 3.86 crore showing an increase of about 2.3 per cent over the previous year. Of the total registered vehicles in the State, about 10.3 per cent vehicles were in Brihanmumbai. The number of vehicles per km road length (roads maintained by PWD and ZP) in the State was 125. Categorywise number of motor vehicles on road is given in Table 9.19 and it’s series is given in Annexure 9.4.
Table 9.19 Categorywise number of motor vehicles on road ('000)
Category of vehicles
As on 1st January Maharashtra Brihanmumbai
2020 2021* Per cent change
2020 2021* Per cent change
Two wheelers (motorcycles, scooters & mopeds)
27,711.43 28,340.41 2.3 2,290.22 2,361.75 3.1
Auto rickshaws 1,052.23 1,060.62 0.8 221.16 222.36 0.5 LMV (cars, jeeps, station wagons & taxis)
5,607.81 5,761.71 2.7 1,239.07 1,265.98 2.2
Buses (stage carriages, contract carriages, school buses & PSV)
157.42 158.42 0.6 19.12 19.40 1.5
Goods vehicles [articulated/multiaxial vehicles, trucks & lorries, tankers, delivery vans (3 & 4 wheelers) etc.]
1,877.31 1,907.41 1.6 88.10 91.10 3.4
Tractors 827.58 868.75 5.0 0.20 0.20 0.0 Trailers 425.26 432.41 1.7 0.14 0.15 7.1 Ambulances 16.77 17.36 3.5 1.57 1.76 12.1 Others 85.79 89.16 3.9 2.71 2.92 7.7 Total 37,761.59 38,636.25 2.3 3,862.29 3,965.62 2.7
Source : Office of the Transport Commissioner, GoM PSV - Public Service Vehicles LMV - Light Motor Vehicles *Provisional
9.18.1 The driving licenses are being issued online in the form of smart cards through ‘SARATHI’ software and registration certificate is issued in the form of a smart card through ‘VAHAN’ software. The number of valid motor driving licenses in the State at the end of December, 2020 was 364.32 lakh, showing an increase of two per cent over the previous year. The number of learning licenses issued in the State during 2019-20 was 28.65 lakh.

Economic Survey of Maharashtra 2020-21
183
9.18.2 Every year plays and lectures based on theme of road safety are organised in the State. The number of accidents per ten thousand vehicles in the State during 2020 was five. Road accident statistics is given in Table 9.20.
Table 9.20 Road accident statistics (no.)
Year Accidents Persons killed Persons injured State Brihanmumbai State Brihanmumbai State Brihanmumbai
2018 35,717 3,162 13,261 475 31,365 3,292 2019 32,925 2,872 12,788 447 28,628 2,925 2020+ 19,552 1,369 8,747 223 15,529 1,393
Source : Office of the Additional Director General (Traffic), GoM + upto October
Public passenger road transport facility Maharashtra State Road Transport Corporation
9.19 During 2019-20 on an average 60.07 lakh passengers per day availed bus service of Maharashtra State Road Transport Corporation (MSRTC). Percentage of villages covered and population served by MSRTC bus service is given in Table 9.21. The transport statistics of MSRTC is given in Table 9.22.
Table 9.21 Percentage of villages covered and population served by MSRTC bus service
Bus Service
Percentage of Villages Covered Percentage of Population Served
2018-19 2019-20 2018-19 2019-20 Direct 76.42 77.30 91.95 92.08 Up to 3 km 14.67 14.09 5.45 5.30 Between 3 to 5 km 5.57 5.11 1.56 1.56 Beyond 5 km 3.63 3.51 1.04 1.06
Source : MSRTC
9.19.1 Apart from regular operations, MSRTC provides special services for fairs and casual contracts. The transport statistics of fairs and casual contracts is given in Table 9.23.
Table 9.22 Transport statistics of MSRTC
Item 2018-19 2019-20 2020-21+# Total vehicles in possession 18,796 18,272 17,773 Average no. of buses on road per day 16,414 15,505 1,891 Total employees (as on 31st March) 1,01,879 1,00,171 96,441 Average effective km operated per day (lakh) 55.83 53.29 4.43 Average no. of passengers carried per day (lakh) 65.97 60.07 1.54 Vehicle productivity (km) 297.03 291.64 24.94 Crew productivity (km) 218.08 217.15 185.10 Bus Staff ratio (on road vehicles) 6.21 6.54 50.99 Average seating capacity 43.33 43.06 42.92 Percentage load factor (excluding value of concessions) 54.04 51.28 33.61 Percentage load factor (including value of concessions) 69.14 68.38 34.58
Source : MSRTC # During Covid-19 lockdown period, operations of MSRTC restricted + upto August

Economic Survey of Maharashtra 2020-21
184
9.19.2 Various types of concessions in bus fares are provided to students, senior citizens (above 65 years age), cancer patients, freedom fighters, etc. by MSRTC and amount of concession is reimbursed by GoM. During 2019-20, amount of concession given was ₹ 1,706.60 crore.
9.19.3 The toll charges paid by MSRTC during 2018-19 and 2019-20 were ₹ 136.97 crore and ₹ 128.29 crore respectively.
9.19.4 The number of accidents and compensation paid by MSRTC is given in Table 9.24
Measures taken by MSRTC during Covid-19 pandemic period 9.20 During Covid-19 lockdown period as per GoM directives, Maharashtra State Road Transport Corporation (MSRTC) started transportation for employees of essential services. For this purpose, the MSRTC operated one lakh effective kilometre urban transportation through 425 schedules and 2,004 trips per day. To control adverse effect on freight transportation, State government permitted to carry essential and other articles by passenger vehicles. MSRTC made available 1,106 passenger vehicles for freight purpose by changing internal structure of vehicles. During year 2020-21, upto December, MSRTC operated 82.62 lakh km freight transportation carrying 3.96 lakh MT freight through 56,595 trips. MSRTC also carried 4.92 lakh stranded individuals through 22,749 passenger vehicles and covered 1.71 crore km.
City public passenger road transport 9.21 The public passenger road transport is one of the major modes of passenger transport in cities. This facility is available in 22 cities in the State. Of these, MSRTC provides local passenger transport facility in seven cities, Brihanmumbai Electricity Supply & Transport (BEST) in Brihanmumbai, Pune Mahanagar Parivahan Mahamandal Ltd (PMPML) in Pune & Pimpri- Chinchwad Municipal Corporation area and in remaining 12 cities respective Municipal Corporations/ Council provide such facilities. City public passenger road transport statistics is given in Table 9.25.
Table 9.23 Transport statistics of fairs & casual contracts of MSRTC
Particulars Fairs Casual contracts 2018-19 2019-20 2018-19 2019-20
Conces-sional
Non- Conces-sional
All Conces-sional
Non-conces-sional
All
Effective km (lakh) 162.54 169.45 56.44 40.46 96.90 119.46 101.18 220.64 Income earned (₹ crore) 65.75 68.56 16.77 22.26 39.03 35.29 79.77 115.06 Earnings per km (₹) 40.45 40.46 29.71 55.02 40.28 29.54 78.84 52.15 Source : MSRTC
Table 9.24 Number of accidents and compensation paid by MSRTC
Particulars 2018-19 2019-20 Accidents (no.) 3,310 3,337
Persons killed (no.) 441 474
Persons injured (no.) 4,814 4,703
Rate of accidents per lakh km 0.16 0.17
On the spot payment (₹ crore) 0.33 0.29
Final compensation (₹ crore) 79.31 50.52
Source: MSRTC

Economic Survey of Maharashtra 2020-21
185
Table 9.25 City public passenger road transport statistics ( As on 31st March)
Transport service provider
Average no. of vehicles on road per
day
Average no. of passengers
carried per day (Lakh)
Average effective km operated per
day (Lakh)
Net profit (₹ Lakh)
2019 2020 2019 2020 2019 2020 2019 2020 MSRTC (City operations)
331 283 1.47 1.18 0.59 0.44 (-)2,421 (-)2,679
BEST 2,865 2,839 22.10 25.08 4.63 4.41 (-)1,01,285 (-)1,42,481 Pune Mahanagar Parivahan Mahamandal Limited
1,972 1,383 10.35 10.47 2.84 2.89 (-)24,705 (-)31,510
Navi Mumbai municipal transport
391 326 3.00 1.92 0.88 0.80 (-)8,695 (-)8,232
Nagpur municipal transport
301 321 1.56 1.45 0.63 0.66 (-)9,400 (-)9,604
Thane municipal transport
281 274 2.08 2.05 0.56 0.55 (-)7,025 (-)12,537
Vasai-Virar municipal transport
135 130 0.86 1.00 0.28 0.25 - -
Kolhapur municipal transport
96 94 0.71 0.71 0.21 0.21 (-)251 (-)387
Solapur municipal transport
31 28 0.12 0.14 0.08 0.05 (-)1,074 (-)1,067
Kalyan-Dombivli municipal transport
62 65 0.35 0.34 0.11 0.10 (-)2,520 (-)1,810
Mira-Bhayander municipal transport
31 44 0.26 0.35 0.08 0.11 (-)876 (-)1,253
Amravati municipal transport
25 25 0.26 0.27 0.03 0.03 (-)122 (-)127
Akola municipal transport
16 8 0.05 0.02 0.03 0.02 - (-)24
Khopoli municipal transport
10 16 0.04 0.04 0.02 0.02 7 13
Latur municipal transport
9 14 0.24 0.04 Neg. 0.02 44 16
Ahmednagar municipal transport
- 12 - 0.05 - 0.02 - (-)3.83
Note : Ahmednagar Municipal Transport Bus service is started from July 2019. Neg. Negligible Source: MSRTC, BEST, PMPML & Concerned Municipal Corporations/ Council
Railway 9.22 Railway is the major public transport system. Passenger and freight transport are the two major segments of the railways. The railway route length including konkan railway in the State as on 31st March, 2020 was 6,209.98 km, which is 9.1 per cent of the total railway route length (67,955.64 km) of India. The status of on-going railway works in the State is given in Table 9.26.

Economic Survey of Maharashtra 2020-21
186
Table 9.26 Status of on-going railway works (As on 31st December, 2020)
Name of the route Route length (km)
Total project cost (₹ Crore)
Physical progress (per cent)
Pune Miraj londha (doubling) 466 4,670.00 25 Wardha-Nanded via Yavatmal-Pusad (new line) 284 3,168.29 27 Itarsi - Nagpur 3rd line 280 2,449.91 10 Ahmednagar-Narayandoh -Beed-Parli- Vaijnath (new line) 261 4,794.60 62 Daund-Manmad 248 2,081.27 31 Manmad - Jalgaon 3rd line 160 1,035.16 20 Wardha - Ballarshah 3rd line 132 1,283.49 22 Wardha - Nagpur 4th line 76 637.95 36 Wardha - Sewagram-Nagpur 3rd line 76 540.02 36 Kalyan - Kasara 3rd line 68 1,387.52 25 Baramati - Lonand (new line) 64 736.44 40$ Belapur - Seawood-Uran (new line) 54 1,781.98 68$$ Bhusawal - Jalgaon 3rd line 24 325.00 94 Jalgaon - Bhusawal 4th line 24 261.37 40 Teegaon - Chichonda 3rd line 17 175.66 100 Source: Central Railway $ Phaltan to Lonand route commissioned $$ Belapur to Kharkopar route commissioned
Mumbai suburban railway 9.23 Suburban rail network is the major mode of public transport in Mumbai. Two zonal railways, viz. Western railway and Central railway operate Mumbai suburban railway system. The Harbour line and Trans Harbour line are parts of the Central railway. During year 2019-20, fleet of 225 local trains was utilised to run 3,031 train services, daily carrying on an average 85.3 lakh passengers.
9.24 Mumbai Railway Vikas Corporation Ltd. (MRVC) implements rail component of Mumbai Urban Transport Projects (MUTP). The works undertaken in MUTP I are completed. The status of on-going projects of MUTP II, III & 3A is given in Table 9.27.
Table 9.27 Status of on-going projects of MUTP II, III & 3A (As on 31st October, 2020)
Name of project Length of corridor (route
kilometer)
Estimated cost (₹ Crore)
Expenditure incurred
(₹ Crore)
Expected year of completion
MUTP II Thane-Diva (additional 5th & 6th line) 9 502.36 551.05 June, 2021 Mumbai Central - Borivali (additional 6th line) 30 918.53 398.56 March, 2023 CSMT-Kurla (additional 5th & 6th line) 15 1,367.00 196.57 March, 2024 MUTP III New suburban corridor between Panvel- Karjat on CR
28 2,782.00 291.47 March, 2024
New suburban corridor link between Airoli- Kalwa (elevated) on CR
4 476.00 83.35 March, 2023
Quadrupling of Virar-Dahanu road on WR 63 3,578.00 127.36 March, 2024 Trespass Control on Mid-section on CR & WR - 551.00 130.99 March, 2024 MUTP 3 A Kalyan-Badlapur (3rd & 4th line) 14 1,510.00 0.40 March, 2025 Station Improvement - 947.00 1.05 March, 2025 5th & 6th line between Borivali-Virar 26 2,184.00 0.20 March, 2025 CR - Central Railway WR - Western Railway CSMT Chhatrapati Shivaji MaharajTerminus Source : Mumbai Railway Vikas Corporation
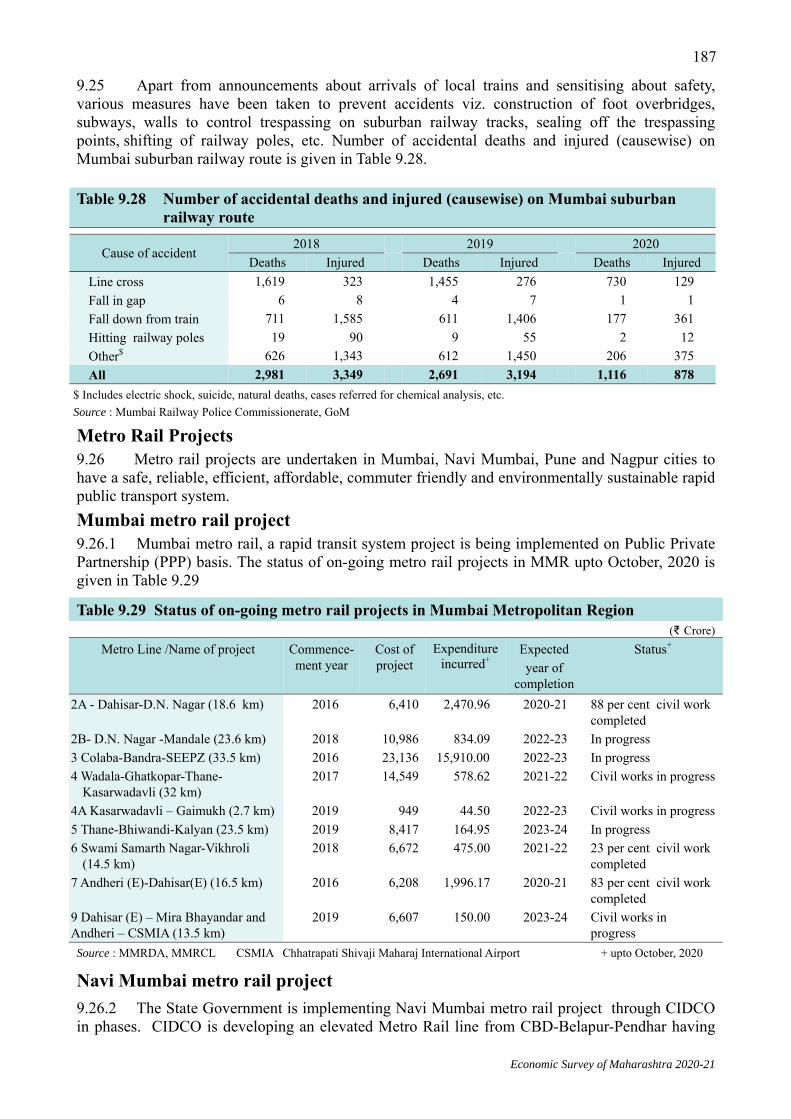
Economic Survey of Maharashtra 2020-21
187
9.25 Apart from announcements about arrivals of local trains and sensitising about safety, various measures have been taken to prevent accidents viz. construction of foot overbridges, subways, walls to control trespassing on suburban railway tracks, sealing off the trespassing points, shifting of railway poles, etc. Number of accidental deaths and injured (causewise) on Mumbai suburban railway route is given in Table 9.28.
Metro Rail Projects 9.26 Metro rail projects are undertaken in Mumbai, Navi Mumbai, Pune and Nagpur cities to have a safe, reliable, efficient, affordable, commuter friendly and environmentally sustainable rapid public transport system. Mumbai metro rail project 9.26.1 Mumbai metro rail, a rapid transit system project is being implemented on Public Private Partnership (PPP) basis. The status of on-going metro rail projects in MMR upto October, 2020 is given in Table 9.29
Navi Mumbai metro rail project 9.26.2 The State Government is implementing Navi Mumbai metro rail project through CIDCO in phases. CIDCO is developing an elevated Metro Rail line from CBD-Belapur-Pendhar having
Table 9.28 Number of accidental deaths and injured (causewise) on Mumbai suburban railway route
Cause of accident 2018 2019 2020
Deaths Injured Deaths Injured Deaths Injured Line cross 1,619 323 1,455 276 730 129 Fall in gap 6 8 4 7 1 1 Fall down from train 711 1,585 611 1,406 177 361 Hitting railway poles 19 90 9 55 2 12 Other$ 626 1,343 612 1,450 206 375 All 2,981 3,349 2,691 3,194 1,116 878
$ Includes electric shock, suicide, natural deaths, cases referred for chemical analysis, etc. Source : Mumbai Railway Police Commissionerate, GoM
Table 9.29 Status of on-going metro rail projects in Mumbai Metropolitan Region (₹ Crore)
Metro Line /Name of project Commence- ment year
Cost of project
Expenditure incurred+
Expected year of
completion
Status+
2A - Dahisar-D.N. Nagar (18.6 km) 2016 6,410 2,470.96 2020-21 88 per cent civil work completed
2B- D.N. Nagar -Mandale (23.6 km) 2018 10,986 834.09 2022-23 In progress 3 Colaba-Bandra-SEEPZ (33.5 km) 2016 23,136 15,910.00 2022-23 In progress 4 Wadala-Ghatkopar-Thane- Kasarwadavli (32 km)
2017 14,549 578.62 2021-22 Civil works in progress
4A Kasarwadavli – Gaimukh (2.7 km) 2019 949 44.50 2022-23 Civil works in progress 5 Thane-Bhiwandi-Kalyan (23.5 km) 2019 8,417 164.95 2023-24 In progress 6 Swami Samarth Nagar-Vikhroli (14.5 km)
2018 6,672 475.00 2021-22 23 per cent civil work completed
7 Andheri (E)-Dahisar(E) (16.5 km) 2016 6,208 1,996.17 2020-21 83 per cent civil work completed
9 Dahisar (E) – Mira Bhayandar and Andheri – CSMIA (13.5 km)
2019 6,607 150.00 2023-24 Civil works in progress
Source : MMRDA, MMRCL CSMIA Chhatrapati Shivaji Maharaj International Airport + upto October, 2020

Economic Survey of Maharashtra 2020-21
188
elevated length of 11.10 km with 11 elevated metro stations in first phase with estimated project cost of ₹ 3,063.63 crore. The expenditure incurred upto December, 2020 is ₹ 2,040 crore.
Nagpur metro rail project 9.26.3 Nagpur Metro rail project consists 38 stations covering length of 38.22 km. The entire stretch of this project is divided into two corridors viz. North-South corridor (19.81 km length with 18 stations) and East-West corridor (18.41 km length with 20 stations). The estimated cost of project is ₹ 8,680 crore. The expenditure incurred upto December, 2020 was ₹ 7,488.19 crore. Khapri to Sitabuldi of North-South corridor (13.5 km) and Lokmanya nagar to Sitabuldi of East-West corridor (10.82 km) were opened to public. Pune metro rail project 9.26.4 Pune metro rail project consists of two corridors with total length of 33.28 km. Pimpri-Chinchwad to Swargate corridor (Purple line) is of 17.53 km length (11.45 km elevated stretch and 6.08 km underground stretch) with 9 elevated and 5 underground stations. Vanaz to Ramwadi corridor (Aqua line) with length 15.75 km is totally elevated with 16 elevated stations. The total estimated cost of the project is ₹ 11,420 crore. The total land required for the project is 45.86 ha, of which 40.15 ha land has been acquired. At the end of January, 2021 about 50 per cent work was completed and expenditure incurred therein was ₹ 5,385.93 crore. The project is expected to be completed by December, 2022. Water transport 9.27 Water transport is cheaper and environment friendly as compared to other transport facilities. The State is implementing ‘Maharashtra Maritime Port Development Policy-2016’ to boost the maritime by developing infrastructural facilities and thereby achieving industrial development. The policy covers areas viz. greenfield ports & connectivity, jetties, coastal shipping & inland waterways, shipyards, coastal economic zones & facilitation of maritime projects, etc. Concessions are also given on electricity duty, non-agriculture cess, stamp duty, port charges and discount on royalty for port projects.
Major ports 9.27.1 The State has two major ports viz. Mumbai Port and Jawaharlal Nehru Port. During 2019-20, Mumbai Port and Jawaharlal Nehru Port handled 606.95 lakh MT and 684.49 lakh MT cargo traffic respectively. Transport statistics of major ports is given in Table 9.30.
Table 9.30 Transport statistics of major ports
Item Mumbai Port Jawaharlal Nehru Port 2018-19 2019-20 Per cent
change 2018-19 2019-20 Per cent
Change Total cargo capacity (lakh MT) 784.00 778.50 (-)0.70 1,188.30 1,188.30 0.00 Cargo traffic handled (lakh MT) 605.88 606.95 0.18 707.06 684.49 (-)3.19 Of which a) Import 422.73 418.63 (-)0.97 393.61 408.51 3.79 b) Export 183.15 188.32 2.82 313.45 275.98 (-)11.95 Passenger traffic handled (‘000) 48.90 175.10 258.08 Nil Nil - Vessels handled (no.) 5,849 6,162 5.35 2,582 2,498 (-)3.25 Source : MbPT & JNPT
Non-major ports 9.27.2 There are number of captive and multi-purpose jetties set-up within the limits of 48 non-major ports in the state which also undertake cargo handling. The transport statistics of non-major ports is given in Table 9.31.

Economic Survey of Maharashtra 2020-21
189
Table 9.31 Transport statistics of non-major ports
Particulars 2018-19 2019-20 2020-21+ Cargo traffic handled (lakh MT) 457.86 436.61 225.26 Of which a) Import 362.44 369.04 191.79 b) Export 95.42 67.57 33.47 Passenger traffic handled (lakh) 192.91 159.07 32.58 Of which a) By mechanised vehicles 190.03 157.30 32.26 b) By non-mechanised vehicles 2.88 1.77 0.32 Source : Maharashtra Maritime Board +upto November
Sagarmala programme 9.27.3 This programme aims to promote port-led development. Under this programme, GoI has sanctioned 22 projects with estimated cost of ₹ 336.26 crore to develop infrastructure facilities at ports.
Marina 9.27.4 Marina would help decongest water areas by eliminating un-authorised/ un-organised anchorages. In the first phase infrastructure will be developed at Belapur in Navi Mumbai to facilitate anchoring of 30 boats. The yachts and speedboats anchored at Gateway of India can be parked safely at the marina.
Roll on- Roll off services 9.27.5 Roll on – Roll off (ro-ro) services have been started at New Bhaucha Dhakka (Mumbai) - Mandwa (Raigad) and Agardanda - Dighi in Raigad district. The construction work of jetty and passenger terminal is completed at Karanja and is underway at Revas in Raigad district. The works of ro-ro jetties are in progress to start ro-ro services on Gorai-Borivali, Marve-Manori, Bhayander-Vasai and Naringi (Virar) - Kharvadeshri waterways.
Air transport 9.28 There are 13 airports functioning in the State. Transport statistics for selected airports is given in Table 9.32.
Table 9.32 Transport statistics for Selected airports (As on 31st March)
Airport Passenger traffic (Lakh) Cargo traffic (MT) 2019 2020 2019 2020
A) Domestic 468.14 458.49 3,44,788 3,30,170 Mumbai 343.93 335.18 2,86,488 2,82,506 Pune 88.19 79.27 47,278 37,645 Nagpur 26.96 29.46 8,450 8,669 Aurangabad 3.47 3.46 2,007 981 Juhu (Mumbai) 1.48 1.58 340 362 Jalgaon 0.02 0.15 0 0 Kolhapur 0.18 1.31 0 0 Nanded 1.18 1.37 0 0 Shirdi 2.29 5.69 0 0 Ojhar Nashik (HAL) 0.44 1.02 225 7 B) International 146.33 125.21 6,78,064 5,82,534 Mumbai 142.76 122.49 6,76,972 5,81,276 Pune 2.50 1.55 114 341 Nagpur 1.06 1.15 966 917 Aurangabad 0.01 0.02 - 0 Ojhar Nashik (HAL) - - 12 0
Total ( A + B) 614.47 583.70 10,22,852 9,12,704 Source : Airports Authority of India HAL Hindustan Aeronautics Limited

Economic Survey of Maharashtra 2020-21
190
9.28.1 To reduce air-traffic congestion at Chhatrapati Shivaji Maharaj International Airport, an additional international airport has been proposed at Navi Mumbai through Public Private Partnership in four phases with estimated basic cost of ₹ 14,179 crore for Phase I. It is one of the largest greenfield airports planned to handle minimum six crore passengers and 15 lakh MT cargo per annum.
Communication 9.29 Posts, telephones, voice-video and data telecommunication are major components of the communication system. The operational statistics of postal services in the State is given in Table 9.33. 9.30 The internet subscriber base in the State at the end of September, 2020 was 9.7 crore which is highest among all the states.
9.31 The total number of landline connections at the end of November, 2020 in the State was 43.61 lakh. The landline and cell phone connections per lakh population were 3,518 and 1,03,700 respectively. Data of landline and cell phone connections is given in Table 9.34.
* * * * *
Table 9.33 Operational statistics of postal services in the State
(no.) Particulars Area 2018-19 2019-20
Post offices Rural 11,507 11,499 Urban 1,237 1,246 Total 12,744 12,745
Letter boxes Rural 35,842 31,656 Urban 7,934 6,449 Total 43,776 38,105
Delivery postmen (including dak sevak)
Rural 4,500 7,095 Urban 4,950 4,062 Total 9,450 11,157
Source : General Post Office, Mumbai
Table 9.34 Landline and cell phone connections ( Lakh)
Operator 2018-19 2019-20 2020-21+ Landlines Cell phones Landlines Cell phones Landlines Cell phones
MTNL 17.62 12.40 16.98 11.78 16.38 11.53 BSNL 10.84 72.04 8.78 70.51 8.49 69.00 Bharati 4.65 241.84 5.12 260.21$ 5.16 270.60 $ Tata 8.38 19.70 7.97 - 7.33 - Vodafone Idea 0.76 610.97 1.16 508.39 1.23 437.39 Reliance/Jio - 353.37 2.51 455.33 4.05 496.95 Reliance com. 2.20 0.06 1.74 0.03 0.97 0.02 Total 44.45 1,310.38 44.26 1,306.27 43.61 1,285.49 India total 216.96 11,618.12 202.18 11,577.48 200.69 11,551.95
$ Bharati & Tata Teleservices combined + upto November Source : Telecom Regulatory Authority of India
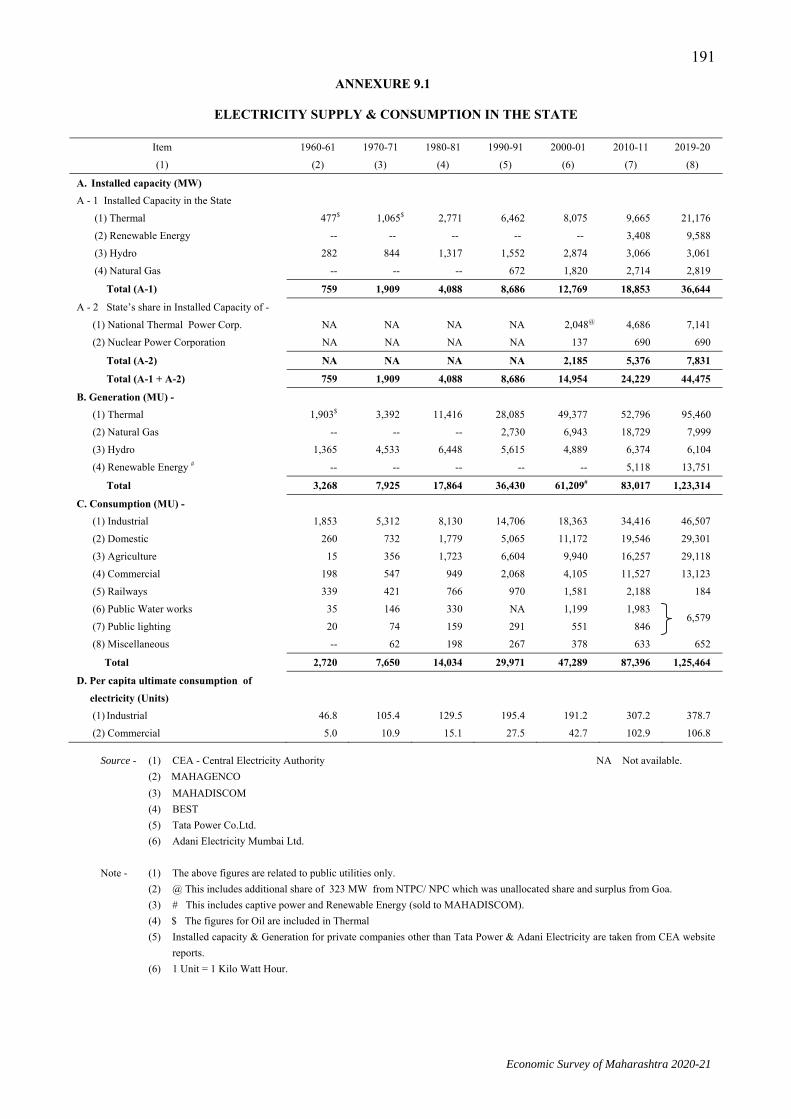
Economic Survey of Maharashtra 2020-21
191ANNEXURE 9.1
ELECTRICITY SUPPLY & CONSUMPTION IN THE STATE
Item 1960-61 1970-71 1980-81 1990-91 2000-01 2010-11 2019-20 (1) (2) (3) (4) (5) (6) (7) (8)
A. Installed capacity (MW) A - 1 Installed Capacity in the State (1) Thermal 477$ 1,065$ 2,771 6,462 8,075 9,665 21,176 (2) Renewable Energy -- -- -- -- -- 3,408 9,588 (3) Hydro 282 844 1,317 1,552 2,874 3,066 3,061 (4) Natural Gas -- -- -- 672 1,820 2,714 2,819
Total (A-1) 759 1,909 4,088 8,686 12,769 18,853 36,644 A - 2 State’s share in Installed Capacity of -
(1) National Thermal Power Corp. NA NA NA NA 2,048@ 4,686 7,141 (2) Nuclear Power Corporation NA NA NA NA 137 690 690
Total (A-2) NA NA NA NA 2,185 5,376 7,831 Total (A-1 + A-2) 759 1,909 4,088 8,686 14,954 24,229 44,475
B. Generation (MU) - (1) Thermal 1,903$ 3,392 11,416 28,085 49,377 52,796 95,460 (2) Natural Gas -- -- -- 2,730 6,943 18,729 7,999 (3) Hydro 1,365 4,533 6,448 5,615 4,889 6,374 6,104 (4) Renewable Energy # -- -- -- -- -- 5,118 13,751
Total 3,268 7,925 17,864 36,430 61,209# 83,017 1,23,314 C. Consumption (MU) -
(1) Industrial 1,853 5,312 8,130 14,706 18,363 34,416 46,507 (2) Domestic 260 732 1,779 5,065 11,172 19,546 29,301 (3) Agriculture 15 356 1,723 6,604 9,940 16,257 29,118 (4) Commercial 198 547 949 2,068 4,105 11,527 13,123 (5) Railways 339 421 766 970 1,581 2,188 184 (6) Public Water works 35 146 330 NA 1,199 1,983
6,579 (7) Public lighting 20 74 159 291 551 846 (8) Miscellaneous -- 62 198 267 378 633 652
Total 2,720 7,650 14,034 29,971 47,289 87,396 1,25,464 D. Per capita ultimate consumption of electricity (Units)
(1) Industrial 46.8 105.4 129.5 195.4 191.2 307.2 378.7 (2) Commercial 5.0 10.9 15.1 27.5 42.7 102.9 106.8
Source - (1) CEA - Central Electricity Authority NA Not available. (2) MAHAGENCO (3) MAHADISCOM
(4) BEST (5) Tata Power Co.Ltd.
(6) Adani Electricity Mumbai Ltd. Note - (1) The above figures are related to public utilities only. (2) @ This includes additional share of 323 MW from NTPC/ NPC which was unallocated share and surplus from Goa. (3) # This includes captive power and Renewable Energy (sold to MAHADISCOM). (4) $ The figures for Oil are included in Thermal (5) Installed capacity & Generation for private companies other than Tata Power & Adani Electricity are taken from CEA website
reports. (6) 1 Unit = 1 Kilo Watt Hour.

Economic Survey of Maharashtra 2020-21
192ANNEXURE 9.2
ROAD LENGTH BY TYPE OF ROADS IN THE STATE
(MAINTAINED BY PUBLIC WORKS DEPARTMENT AND ZILLA PARISHADS)
(km)
Serial No. Year National
highways Major State highways
State highways
Major district roads
Other district roads
Village roads All roads
(1) (2) (3) (4) (5) (6) (7) (8) (9)
1 1965-66 2,364 -- 10,528 12,628 8,744 17,524 51,788
2 1970-71 2,445 -- 14,203 17,684 11,012 20,020 65,364
3 1980-81 2,945 -- 18,949 25,233 25,404 68,600 1,41,131
4 1990-91 2,959 -- 30,975 38,936 38,573 61,522 1,72,965
5 2000-01 3,688 -- 33,212 46,751 43,696 89,599 2,16,946
6 2005-06 4,367 -- 33,571 48,987 45,226 99,279 2,31,430
7 2006-07 4,367 -- 33,675 49,147 45,674 1,00,801 2,33,664
8 2007-08 4,367 -- 33,800 49,393 45,886 1,02,149 2,35,595
9 2008-09 4,367 -- 33,933 49,621 46,143 1,03,604 2,37,668
10 2009-10 4,376 -- 34,102 49,901 46,817 1,04,844 2,40,040
11 2010-11 4,376 -- 34,103 49,936 46,897 1,06,400 2,41,712
12 2011-12 4,376 -- 34,157 50,256 47,529 1,06,601 2,42,919
13 2012-13 4,376 6,694 27,528 50,256 47,573 1,06,745 2,43,172
14 2013-14 5,858 6,337 33,963 50,232 52,761 1,14,557 2,63,708
15 2014-15 4,766 6,163 33,860 50,585 58,115 1,45,879 2,99,368
16 2015-16 4,901 5,249 33,695 52,275 56,564 1,53,435 3,05,119
17 2016-17 7,682 3,971 30,776 51,627 56,336 1,53,946 3,04,336
18 2017-18 10,195 3,272 29,151 55,030 53,924 1,52,272 3,03,843
19 2018-19 10,300 2,967 28,466 60,531 49,206 1,57,127 3,08,597
20 2019-20* 17,726 2,967 29,030 63,886 47,398 1,48,335 3,09,342
Source - Public Works Department, GoM * Provisional Note - (1) The classification of road length upto 1987 was according to ‘Road Development Plan (RDP), 1961-81’ and 1987-88 onwards it is according to ‘RDP 1981-2001’.
(2) State highways include major State highways for 1965-66 to 2011-12. (3) The classification of road length from 2012-13 is according to ‘RDP 2001-21’.

Economic Survey of Maharashtra 2020-21
193ANNEXURE 9.3
CLASSIFICATION OF DISTRICT-WISE ROAD LENGTH ACCORDING TO BREADTH
(MAINTAINED BY PUBLIC WORKS DEPARTMENT) (km)
Sr. No.
District Achievement in Length 2018-19 Achievement in Length 2019-20*
Breadth (mt.) 7.0 5.5 3.75 Other Total 7.0 5.5 3.75 Other Total
(1) (2) (3) (4) (5) (6) (7) (8) (9) (10) (11) (12)
1 Brihan Mumbai 49 0 0 0 49 49 0 0 0 49
2 Thane 195 243 872 2,038 3,347 398 253 1,221 2,466 4,338
3 Palghar 3,605 439 1,917 937 6,898 550 492 1,655 4,350 7,046
4 Raigad 1,087 795 1,060 2,312 5,253 862 1,592 905 2,470 5,829
5 Ratnagiri 465 859 8,345 227 9,896 533 859 8,360 227 9,979
6 Sindhudurg 117 946 6,919 0 7,982 197 961 3,475 3,433 8,066
Konkan Division 5,518 3,282 19,113 5,513 33,426 2,588 4,157 15,615 12,947 35,307
7 Ahmednagar 531 1,470 11,149 6,914 20,064 1,600 1,392 9,279 3,379 15,650
8 Nashik 331 1,825 10,404 5,896 18,456 1,525 1,748 9,728 6,682 19,683
9 Dhule 277 538 4,138 1,198 6,151 947 519 4,221 77 5,765
10 Nandurbar 180 505 3,945 1,971 6,601 366 514 4,497 78 5,455
11 Jalgaon 330 1,072 5,230 5,683 12,316 941 1,283 4,968 2,760 9,953
Nashik Division 1,649 5,409 34,866 21,663 63,588 5,379 5,457 32,694 12,976 56,506
12 Pune 801 1,264 16,379 201 18,646 1,929 1,245 16,367 130 19,670
13 Satara 383 943 7,953 3,161 12,439 990 1,096 8,668 3,314 14,069
14 Sangli 685 1,065 4,411 6,188 12,349 865 1,070 4,253 6,138 12,326
15 Kolhapur 571 1,017 3,869 3,154 8,611 864 1,044 3,853 3,146 8,907
16 Solapur 928 888 4,862 10,079 16,757 1,613 989 10,225 4,964 17,790
Pune Division 3,368 5,177 37,475 22,782 68,802 6,262 5,443 43,366 17,691 72,762
17 Aurangabad 671 695 6,789 1,971 10,126 858 833 6,721 1,888 10,300
18 Jalna 393 452 4,819 1,732 7,396 702 394 4,824 1,579 7,499
19 Parbhani 193 317 3,981 935 5,426 438 184 3,898 898 5,418
20 Hingoli 134 286 3,424 17 3,861 172 220 3,398 69 3,859
21 Nanded 321 1,297 8,261 1,531 11,410 1,088 667 7,805 2,137 11,697
22 Beed 660 629 8,395 2,643 12,327 1,089 435 8,252 2,589 12,365
23 Osmanabad 379 1,033 4,868 1,211 7,491 515 908 4,584 1,447 7,454
24 Latur 285 1,002 5,403 982 7,672 694 767 5,358 997 7,816
Aurangabad Division 3,036 5,711 45,940 11,022 65,709 5,555 4,408 44,840 11,604 66,407
25 Buldhana 302 813 2,859 1,470 5,443 430 713 2,851 1,470 5,465
26 Akola 191 547 1,429 1,079 3,246 626 510 1,378 1,101 3,615
27 Washim 225 441 1,138 1,165 2,970 354 403 1,141 1,162 3,060
28 Amravati 491 920 1,864 4,684 7,959 649 927 1,856 4,682 8,114
29 Yavatmal 388 926 3,539 3,494 8,347 727 928 3,539 3,494 8,688
Amravati Division 1,597 3,647 10,829 11,892 27,964 2,786 3,481 10,765 11,909 28,942
30 Wardha 323 657 1,803 2,534 5,316 444 518 1,803 2,534 5,299
31 Nagpur 635 1,043 6,002 6,693 14,372 1,082 645 6,354 6,584 14,666
32 Bhandara 134 414 2,829 2,798 6,175 348 246 2,859 2,769 6,221
33 Gondia 168 439 3,562 3,234 7,403 218 317 3,675 3,227 7,438
34 Chandrapur 397 602 5,948 2,618 9,565 312 612 5,942 2,618 9,484
35 Gadchiroli 296 723 4,677 582 6,278 422 746 4,622 520 6,310
Nagpur Division 1,953 3,875 24,821 18,459 49,109 2,826 3,084 25,255 18,253 49,418
Maharashtra State 17,120 27,102 1,73,044 91,332 3,08,597 25,396 26,030 1,72,536 85,379 3,09,342
Source - Public Works Department, GoM * Provisional
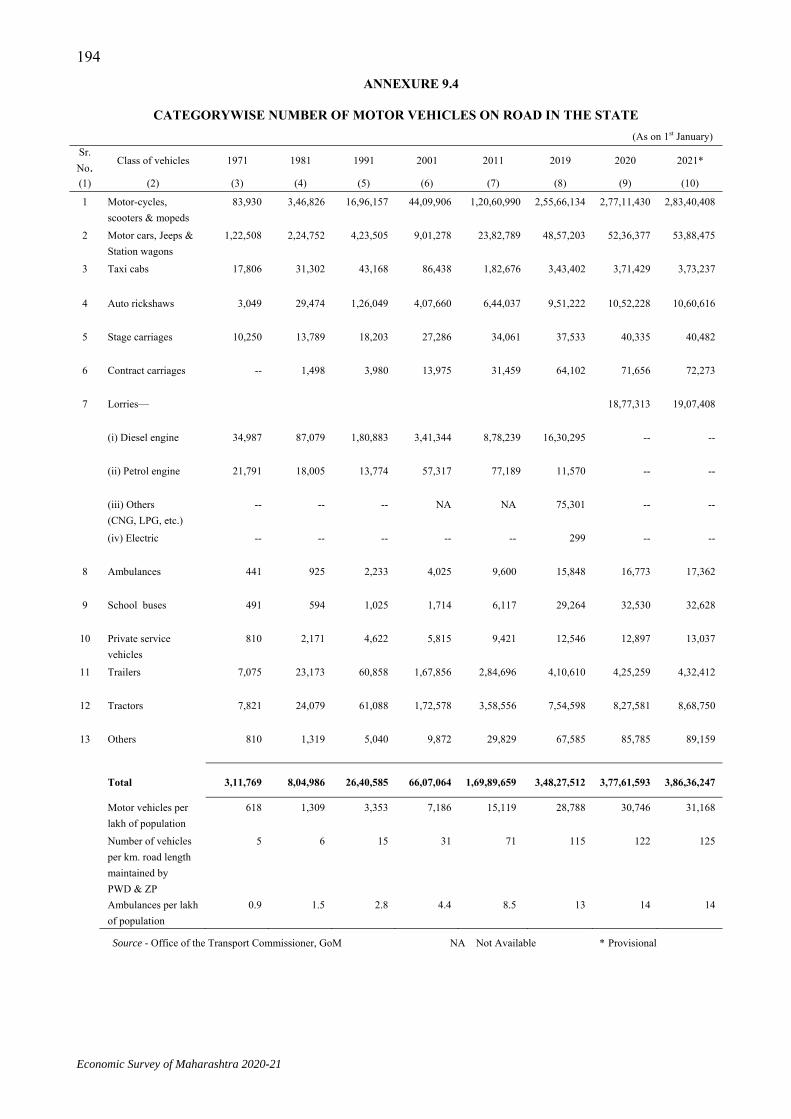
Economic Survey of Maharashtra 2020-21
194ANNEXURE 9.4
CATEGORYWISE NUMBER OF MOTOR VEHICLES ON ROAD IN THE STATE
(As on 1st January) Sr. No. Class of vehicles 1971 1981 1991 2001 2011 2019 2020 2021*
(1) (2) (3) (4) (5) (6) (7) (8) (9) (10)
1 Motor-cycles, scooters & mopeds
83,930 3,46,826 16,96,157 44,09,906 1,20,60,990 2,55,66,134 2,77,11,430 2,83,40,408
2 Motor cars, Jeeps & Station wagons
1,22,508 2,24,752 4,23,505 9,01,278 23,82,789 48,57,203 52,36,377 53,88,475
3 Taxi cabs 17,806 31,302 43,168 86,438 1,82,676 3,43,402 3,71,429 3,73,237
4 Auto rickshaws 3,049 29,474 1,26,049 4,07,660 6,44,037 9,51,222 10,52,228 10,60,616
5 Stage carriages 10,250 13,789 18,203 27,286 34,061 37,533 40,335 40,482
6 Contract carriages -- 1,498 3,980 13,975 31,459 64,102 71,656 72,273
7 Lorries— 18,77,313 19,07,408
(i) Diesel engine 34,987 87,079 1,80,883 3,41,344 8,78,239 16,30,295 -- --
(ii) Petrol engine 21,791 18,005 13,774 57,317 77,189 11,570 -- --
(iii) Others (CNG, LPG, etc.)
-- -- -- NA NA 75,301 -- --
(iv) Electric -- -- -- -- -- 299 -- --
8 Ambulances 441 925 2,233 4,025 9,600 15,848 16,773 17,362
9 School buses 491 594 1,025 1,714 6,117 29,264 32,530 32,628
10 Private service vehicles
810 2,171 4,622 5,815 9,421 12,546 12,897 13,037
11 Trailers 7,075 23,173 60,858 1,67,856 2,84,696 4,10,610 4,25,259 4,32,412
12 Tractors 7,821 24,079 61,088 1,72,578 3,58,556 7,54,598 8,27,581 8,68,750
13 Others 810 1,319 5,040 9,872 29,829 67,585 85,785 89,159
Total 3,11,769 8,04,986 26,40,585 66,07,064 1,69,89,659 3,48,27,512 3,77,61,593 3,86,36,247
Motor vehicles per lakh of population
618 1,309 3,353 7,186 15,119 28,788 30,746 31,168
Number of vehicles per km. road length maintained by PWD & ZP
5 6 15 31 71 115 122 125
Ambulances per lakh of population
0.9 1.5 2.8 4.4 8.5 13 14 14
Source - Office of the Transport Commissioner, GoM NA Not Available * Provisional
10 Social Sector


Economic Survey of Maharashtra 2020-21
10. SOCIAL SECTOR
10.1 A healthy, educated and skilled work force can contribute to economic development more effectively and hence planned development emphasizes social sector development. The main objective of planned development is to ensure the improvement in the quality of life of the people, particularly poor and vulnerable sections of the civil society. Government provides services to social sectors such as education, public health, women & child development, employment, housing, water supply & sanitation, social justice, etc. with special focus on the disadvantaged groups of the society.
EDUCATION 10.2 Education is universally acknowledged as one of the key inputs contributing to the process of national and individual development. Sustainable development can be achieved by providing universal access to quality education. Government has taken various measures to improve quality of education and its accessibility with the help of modern technologies.
National Education Policy 2020 10.3 The GoI approved the National Education Policy 2020 (NEP 2020) on 29th July, 2020. The policy aims to pave way for transformational reforms in school and higher education systems in the country to achieve the targets stated in Sustainable Development Goal 4. The salient features of the NEP 2020
I. School education Universalisation of education from preschool to secondary level with 100 per cent Gross
Enrolment Ratio (GER) in school education by 2030 To bring out of school children into the mainstream through an open schooling system The current 10+2 system to be replaced by new 5+3+3+4 curricular structure corresponding
to age 3 to 8 years (foundational), 8 to 11 years (preparatory), 11 to 14 years (middle) and 14 to 18 years (secondary) respectively. The new system brings the uncovered age of 3-6 years under school curriculum with 12 years of schooling
Class X and XII examinations to be made easier Introduction of accredition frame work and an independent authority to regulate public as
well as private schools Emphasis on foundational literacy and numeracy Impart vocational education from class VI onwards with internship A new and comprehensive National Curriculum Framework for Teacher Education 2021 to
be formulated II. Higher education GER in higher education to be raised to 50 per cent by 2035 (current All India GER is
26.3 per cent) Holistic undergraduate education with flexible curriculum can be of three or four years
having multiple entry and exit options Academic bank of credits to be established to facilitate transfer of credits Multidisciplinary Education and Research Universities of global standards to be set up in
the country The National Research Foundation to be created as an apex body for fostering a strong
research culture Higher Education Commission of India to be set up as a single umbrella body for the entire
higher education, excluding medical and legal education

Economic Survey of Maharashtra 2020-21
196
III. Other changes An autonomous body named National Educational Technology Forum to be created to
provide a platform for free exchange of ideas on the use of technology to enhance learning, assessment, planning and administration
National Assessment Centre ‘PARAKH’ has been created to assess the students Encourage foreign universities to set up campuses in India The new policy emphasizes setting up of Gender Inclusion Fund and Special Education
Zones for disadvantaged regions and groups
Primary education Measures taken during Covid-19 pandemic 10.4 Due to Covid-19 pandemic all the schools were closed due to the lockdown imposed in the State from March 2020. The government effectively used information and communication technology to maintain the continuity in education of students during the lockdown period. The concept of ‘learning at home’ was adopted and education was given through various websites, portals, platforms and educational applications. In this process parents were involved. The following activities were carried out. Abhyasmala (Education through ‘DIKSHA’ App): The National Council for Educational
Research and Training developed a portal based on information technology viz. ‘DIKSHA Digital Infrastructure for School Education’. Daily more than two lakh students, teachers and parents used ‘DIKSHA App’. Of the total average use of ‘DIKSHA App’ in the country, the average in Maharashtra is 46 per cent
Shaikshanik dindarshika: Maharashtra State Council for Educational Research and Training (MSCERT) prepared an educational calendar for students and teachers in the areas where internet facilities are not available. The educational calendar from June, 2020 to November, 2020 was distributed to the students, teachers and parents through smart PDFs as well as various WhatsApp groups
Distribution of textbooks: The government distributed Textbooks to all students so that they could learn at home
Education through Geo TV and Geo Sawan: Education was imparted to the students of class III to XII through 12 educational channels of Geo TV. Telecast of the lectures of expert teachers in the subject was carried out through these channels
Programmes on Doordarshan: Education through educational programmes on Doordarshan such as Gali Gali Sim Sim, Tilly Milli, Vividh Gyanganga, etc. is implemented
Google Classroom Online Training: In order to keep interaction between students and teachers, MSCERT arranged online training programmes of Google Classroom for the teachers in the State
Saturday Stories: In order to develop reading skills in the students, an online programme 'Saturday Stories' was launched to read ethical and cognitive stories with the help of UNICEF and Pratham foundation
Maitri karuya Vidnyan va Ganitashi: Experiments and activity based innovative online workshops on science and mathematics were conducted under the joint venture of MSCERT and Indian Institute of Science Education and Research, Pune
Mid day Meal Scheme : During lockdown, instead of cooked food government distributed food grains viz. rice, gram, moongdal, etc. to the eligible students either in schools or at door step. Special instructions were issued to deliver food grains at door step of all divyang students

Economic Survey of Maharashtra 2020-21
197
10.5 Educational programmes, especially for primary education, are executed through the State Government and local bodies. During 2019-20, expenditure incurred on primary education by the State Government was ` 28,100 crore. Some important indicators of primary (Std I to V) and upper primary (Std VI to VIII) education are given in Table 10.1 and regionwise details are given in Annexure 10.1.
Table 10.1 Some important indicators of primary and upper Primary education (As on 30th September)
Indicator 2017-18 2018-19 2019-20 No. of schools imparting primary education reported under U-DISE 1,06,546 1,06,237 1,06,491 Percentage of schools in rural areas 77.6 77.2 77.2 Density of schools/ divisions per 10 sq km (a) Primary 3.2 3.2 3.2
(b) Upper primary 1.7 1.8 1.7 Primary schools/ divisions per thousand children population (6 to 11 years age) 9.9 10.0 10.1
Upper primary schools/ divisions per thousand children population (11 to 14 years age) 9.0 9.4 9.3
Percentage share of private self-financed schools to total schools 21.1 21.5 21.6 Enrolment in schools (lakh) 159.1 157.4 156.9 Percentage of girls enrolment 46.8 46.9 47.0 Gross Enrolment Ratio (a) Primary 100.1 99.2 98.5 (b) Upper primary 59.0 58.3 58.7 Average Student - Class room ratio (all schools) 31 30 29 No. of teachers (lakh) 5.4 5.2 5.3 Pupil-teacher ratio 29:1 30:1 29:1 Percentage of schools having facilities of
Drinking water 98.8 98.8 99.3 Functional girls toilet 98.8 95.9 92.9 Boundary wall 83.4 82.6 83.7 Computers 68.2 58.9 63.3 Ramp 87.1 89.5 90.0 Playground 87.6 85.1 85.1 Library 95.0 81.2 83.9 Electricity connection 94.7 94.3 93.5
Dropout rate (a) Primary 0.21 1.09 0.04 (b) Upper primary 1.56 2.15 1.17 Gender Parity Index (a) Primary 0.87 0.89 0.89 (b) Upper primary 0.88 0.88 0.88 Source : 1) Directorate of Primary Education, GoM 2) Maharashtra Prathamik Shikshan Parishad
The Right of Children to Free and Compulsory Education (RTE) Act, 2009 10.6 The Right of Children to Free and Compulsory Education (RTE) Act, 2009 is being implemented in the State from April, 2010. RTE Act provides the right of children to free and compulsory education till completion of elementary education in a neighbourhood school. The act ensures that no child is liable to pay any kind of fee or charges or expenses which may prevent him or her from pursuing and completing elementary education. Under this act 25 per cent of intake capacity is reserved in self-financed private schools (excluding minority schools) and admission as well as free education is provided to children of economically backward and deprived class from preprimary to VIII standard. During 2020-21, total 86,962 students received admission under RTE. In all 4,78,334 students received admission upto 2020-21 under RTE since inception of the Act. 10.6.1 Under RTE, efforts are being made to bring every out of school child between age group 6 to 14 years in educational stream. During 2019-20, efforts were made to bring 33,888 out of school children in the mainstream. Of this, special training was imparted to 20,921 students. During 2020-21, efforts were made to bring 26,453 out of school children in the mainstream. Of this, special training was imparted to 13,784 students.
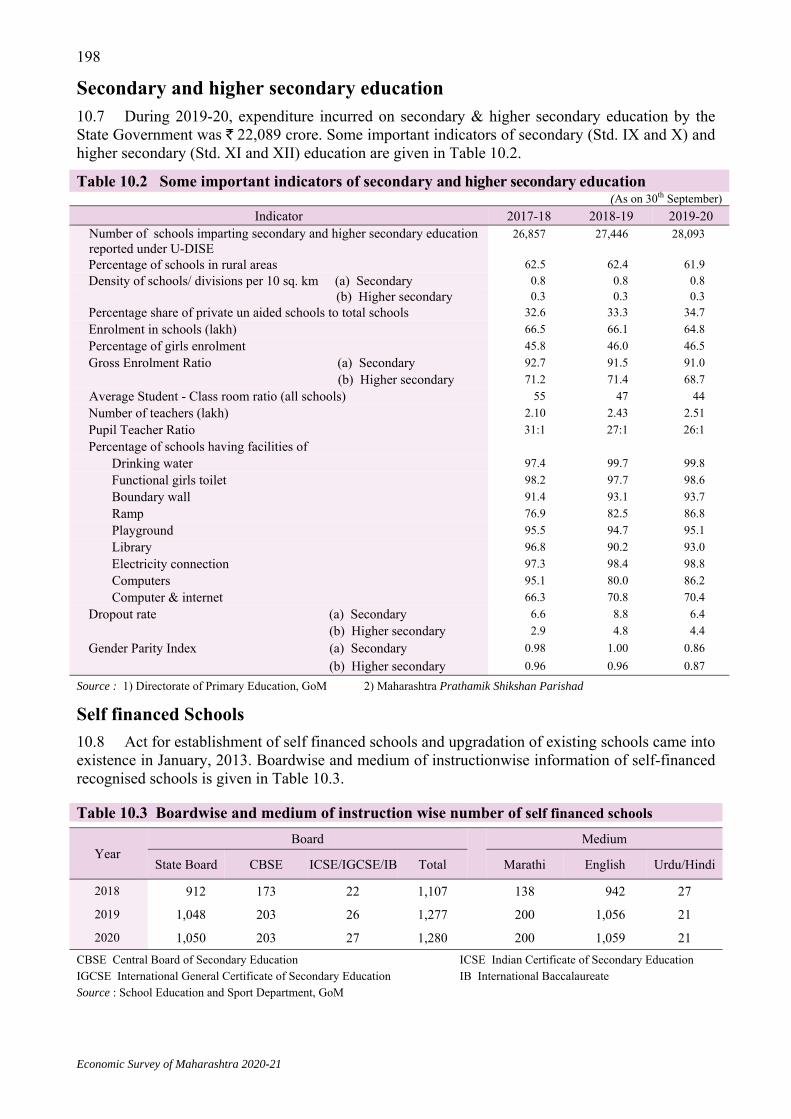
Economic Survey of Maharashtra 2020-21
198
Secondary and higher secondary education 10.7 During 2019-20, expenditure incurred on secondary & higher secondary education by the State Government was ` 22,089 crore. Some important indicators of secondary (Std. IX and X) and higher secondary (Std. XI and XII) education are given in Table 10.2.
Table 10.2 Some important indicators of secondary and higher secondary education (As on 30th September)
Indicator 2017-18 2018-19 2019-20 Number of schools imparting secondary and higher secondary education reported under U-DISE
26,857 27,446 28,093
Percentage of schools in rural areas 62.5 62.4 61.9 Density of schools/ divisions per 10 sq. km (a) Secondary 0.8 0.8 0.8
(b) Higher secondary 0.3 0.3 0.3 Percentage share of private un aided schools to total schools 32.6 33.3 34.7 Enrolment in schools (lakh) 66.5 66.1 64.8 Percentage of girls enrolment 45.8 46.0 46.5 Gross Enrolment Ratio (a) Secondary 92.7 91.5 91.0 (b) Higher secondary 71.2 71.4 68.7 Average Student - Class room ratio (all schools) 55 47 44 Number of teachers (lakh) 2.10 2.43 2.51 Pupil Teacher Ratio 31:1 27:1 26:1 Percentage of schools having facilities of Drinking water 97.4 99.7 99.8 Functional girls toilet 98.2 97.7 98.6 Boundary wall 91.4 93.1 93.7 Ramp 76.9 82.5 86.8 Playground 95.5 94.7 95.1 Library 96.8 90.2 93.0 Electricity connection 97.3 98.4 98.8 Computers 95.1 80.0 86.2 Computer & internet 66.3 70.8 70.4 Dropout rate (a) Secondary 6.6 8.8 6.4
(b) Higher secondary 2.9 4.8 4.4 Gender Parity Index (a) Secondary 0.98 1.00 0.86
(b) Higher secondary 0.96 0.96 0.87 Source : 1) Directorate of Primary Education, GoM 2) Maharashtra Prathamik Shikshan Parishad
Self financed Schools 10.8 Act for establishment of self financed schools and upgradation of existing schools came into existence in January, 2013. Boardwise and medium of instructionwise information of self-financed recognised schools is given in Table 10.3.
Table 10.3 Boardwise and medium of instruction wise number of self financed schools
Year Board Medium
State Board CBSE ICSE/IGCSE/IB Total Marathi English Urdu/Hindi
2018 912 173 22 1,107 138 942 27
2019 1,048 203 26 1,277 200 1,056 21
2020 1,050 203 27 1,280 200 1,059 21 CBSE Central Board of Secondary Education ICSE Indian Certificate of Secondary Education IGCSE International General Certificate of Secondary Education IB International Baccalaureate Source : School Education and Sport Department, GoM

Economic Survey of Maharashtra 2020-21
199
Samagra Shiksha
10.9 Samagra Shiksha is being implemented in the State since 2018-19. Under this programme three schemes, viz. Sarva Shiksha Abhiyan (SSA), Rashtriya Madhyamik Shiksha Abhiyan (RMSA) and Teacher Education (TE) are subsumed to ensure inclusive and equitable quality education from pre-school to senior secondary stage as envisaged in one of the Sustainable Development Goals. The programme ensures to attain minimum standards in schooling provisions. It also aims to bridge Social and Gender Gaps in School Education. It encourages Vocationalisation of education and resulting in enhancement of learning outcomes of students. Details of grants sanctioned and expenditure incurred under Samagra Shiksha is given in Table 10.4.
Inclusive Education for Divyang 10.10 ‘Inclusive Education for Divyang’ programme is being implemented in the State to ensure quality education to Children With Special Needs (CWSN) in a normal set up with a normal peer group for their emotional progress and their social integration. The programme includes identification and medical assessment of CWSN, providing rehabilitation and educational support services such as Braille books, spectacles, hearing aids & appliances, speech trainer, etc. The progress of Inclusive Education of Divyang Programme is given in Table 10.5.
Table 10.5 Progress of Inclusive Education for Divyang programme
Level of education 2018-19 2019-20 2020-21+ Beneficiaries
(Lakh) Expenditure
incurred (` Crore)
Beneficiaries (Lakh)
Expenditure incurred (` Crore)
Beneficiaries (Lakh)
Expenditure incurred+ (` Crore)
Primary (I to VIII) 2.52 87.32 2.52 31.65 2.51 22.96 Secondary (IX to XII) 0.55 4.49 0.55 1.97 0.56 0.00 Source : Maharashtra Prathamik Shikshan Parishad + upto November
Mid Day Meal Scheme 10.11 With a view to enhance enrolment & attendance and simultaneously improving nutritional levels among children studying in primary schools, GoI launched the ‘Mid Day Meal Scheme’, under which cooked meal is provided to the children. Progress of Mid Day Meal Scheme is given in Table 10.6.
Table 10.6 Progress of Mid Day Meal Scheme
Class 2018-19 2019-20 2020-21+
Beneficiaries (Lakh)
Expenditure incurred (` Crore)
Beneficiaries (Lakh)
Expenditure incurred (` Crore)
Beneficiaries (Lakh)
Expenditure incurred (` Crore)
I to V 56.99 938 51.47 808 60.70 151 VI to VIII 36.34 628 32.56 661 39.24 124 Source : Directorate of Primary Education, GoM + upto November
Table 10.4 Grants sanctioned and expenditure incurred under Samagra Shiksha
(` Crore)
Year Amount sanctioned
Expenditure incurred
2018-19 1,854.54 1,354.06
2019-20 2,825.47 1,404.53
2020-21+ 1,807.49 322.96 + upto December
Source : Maharashtra Prathamik Shikshan Parishad

Economic Survey of Maharashtra 2020-21
200
Schemes to encourage education 10.12 To encourage children for education and to ease the financial burden of parents, the GoM is providing concessions through various schemes to the students. Progress of selected schemes to encourage education is given in Table 10.7.
Schemes to encourage Girls education 10.13 Government is implementing various schemes to encourage girls education viz. Attendance allowance scheme, Ahilyabai Holkar scheme (free transportation in State Transport Bus), Free education to girls studying in XI & XII, Thirty per cent reservation and free education for girls in D.Ed and B.Ed colleges, Kasturba Gandhi Balika Vidyalaya, etc. Progress of selected schemes is given in Table 10.8.
Table 10.8 Progress of selected schemes to encourage girls education
Scheme
2018-19 2019-20 2020-21+
Beneficiaries (Lakh)
Expenditure incurred (` Crore)
Beneficiaries (Lakh)
Expenditure incurred
(` Crore)
Target Beneficiaries
(Lakh)
Anticipated Expenditure
(` Crore)
Attendance allowance scheme
1.47 3.24 1.47 1.78 - -
Ahilyabai Holkar scheme
19.61 96.81 24.76 141.59 9.28 44.07
Free education to girls studying in XI & XII
2.44 1.83 2.98 1.24 0.51 2.00
Kasturba Gandhi Balika Vidyalaya
0.04 18.70 0.04 20.07 0.04 5.28
Source :1) Directorate of Primary Education, GoM 2) Maharashtra Prathamik Shikshan Parishad + upto November
Sainiki schools 10.14 To encourage the youths to join armed forces, Government has established Sainiki schools in the State. The main objective is to culture qualities such as discipline, self-confidence, bravery, leadership, patriotism, etc. among the students. There are 42 Sainiki schools in the State, of which four schools are exclusively for girls, four are for co-education and 34 schools are exclusively for boys. Out of these, 38 Sainiki schools are aided, in which 18,685 students are enrolled during 2020-21.
Table 10.7 Progress of selected schemes to encourage education
Scheme
2018-19 2019-20 2020-21+ Beneficiaries
(Lakh) Expenditure
incurred (` Crore)
Beneficiaries (Lakh)
Expenditure incurred (` Crore)
Target Beneficiaries
(Lakh)
Anticipated Expenditure (` Crore)
Providing free uniform and writing material to poor children of Standard I to IV
1.10 0.88 2.57 2.12 3.35 2.30
Fee concession to students of Standard I to X studying in government aided and unaided schools
26.34 3.72 15.71 2.38 15.71 4.00
Free education to economically backward students (Boys) of Standard XI & XII
1.36 1.28 0.11 0.54 0.62 1.50
Stipend to tribal students 0.01 0.03 0.01 0.02 0.01 0.05 Source : Directorate of Primary Education, GoM + upto November

Economic Survey of Maharashtra 2020-21
201
Sports education
10.15 The State Government has established ‘Shiv Chhatrapati Kridapeeth’ in Pune with the motive of promoting sports and develop excellence by upgrading the skills of sports persons. The State level accredited players or players participating in authorised national sports competitions are given admission through direct entry. For selected players participating at State level, admission is given through skill tests. Eight to 10 years training is provided in 14 sports to the selected players. There are nine sports academies under the purview of the Kridapeeth. So far, 30 students from these academies were awarded Shiv Chhatrapati Sports Award of State and 81 players had represented the nation in international competitions. On an average ` 9,000 per trainee per month is spent by the government. Due to Covid-19 pandemic the selection procedure was not carried out in the year 2020-21. Medals received by students of sports academies are given in Table 10.9.
Table 10.9 Medals received by students of sports academies
Year No. of trainees
International level medals National level medals State level medals Gold Silver Bronze Total Gold Silver Bronze Total Gold Silver Bronze Total
2017-18 561 2 2 1 5 33 33 31 97 142 109 63 314 2018-19 545 1 3 3 7 38 38 32 108 148 103 82 333 2019-20 545 2 1 1 4 22 25 33 80 152 83 69 304 2020-21 408 - - - - - - - - - - - - Note : Due to covid-19 pandemic State and National level competitions were not organised Source : Directorate of Sports and Youth Services, GoM
Higher & Technical education 10.16 Due to Covid-19 pandemic all the universities, colleges, technical institutes and ITIs in the State were closed from March, 2020. The following measures were carried out to maintain the continuity in education of students during the lockdown. During academic year 2019-20, the final examinations were conducted online. All
universities and colleges worked online during academic year 2020-21. Only Ph.D. and research students were allowed to attend the college for practical work
Online training classes were conducted by all the ITIs using various modes viz. VCs, Microsoft team VC, Whats app, YouTube, zoom VC, etc. Online training programmes on various topics were conducted for the instructors in ITIs
Diploma in engineering, Hotel management and surface coating technology (after X): The timetable of admission process for the academic year 2020-21 was informed through SMS to the aspiring students. The concept of e-scrutiny of the documents was introduced along with regular scrutiny method. The Government imparted training to the scrutiny officers in facility centres through VC. Special training programmes were arranged about e-scrutiny for the nodal officers and the students through Google meet. Out of total 2,35,309 candidates, the number of candidates’ availed e-scrutiny facility was 1,24,646
The entrance examinations viz. MHT_CET-2020, BHMCT-2020, MHHCT-2020, M.Arch-2020 and MCA-2020 were postponed and were conducted in October, 2020. Upto January, 2021 the admission procedure is completed
10.17 As per the report of All-India Survey of Higher Education 2018-19, there were 62 universities in the State, of which 34 were State universities (22 public, 11 private and one open), 21 were deemed universities (12 private, seven government and two government aided), six were institute of national importance and one central university. Higher education statistics based on All-India Survey on Higher Education (AISHE) in the State is given in Table 10.10. Details of
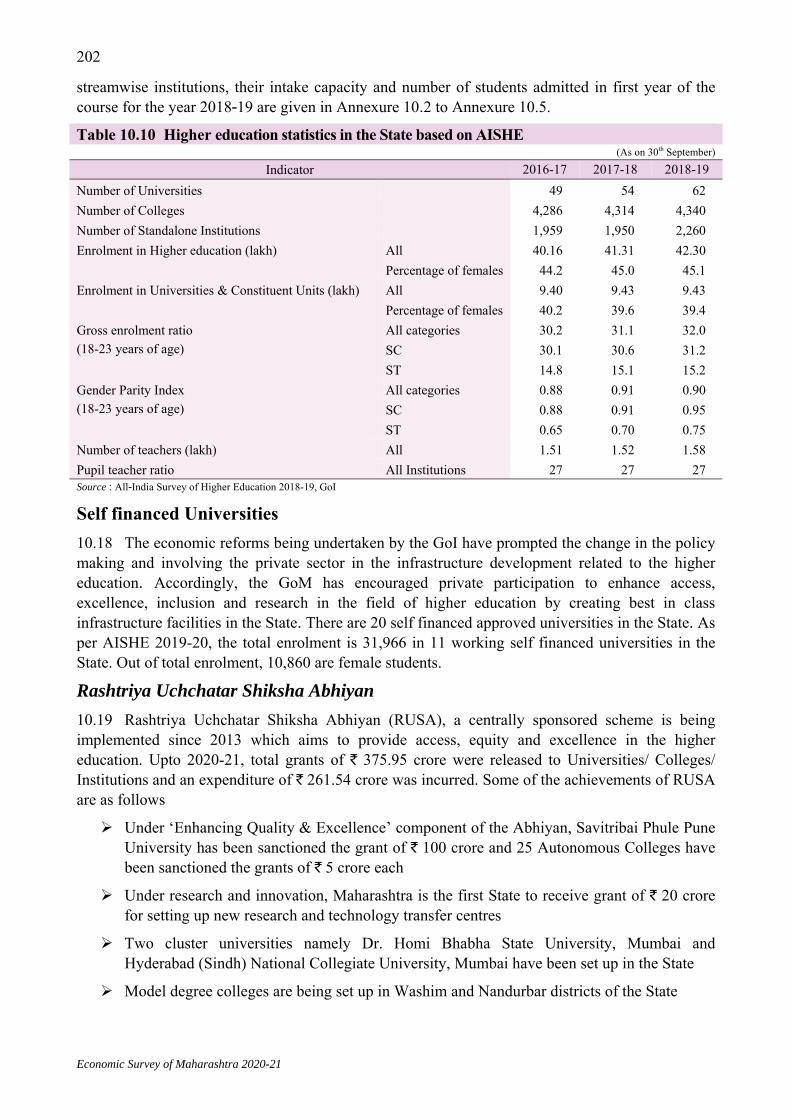
Economic Survey of Maharashtra 2020-21
202
streamwise institutions, their intake capacity and number of students admitted in first year of the course for the year 2018-19 are given in Annexure 10.2 to Annexure 10.5.
Table 10.10 Higher education statistics in the State based on AISHE (As on 30th September)
Indicator 2016-17 2017-18 2018-19 Number of Universities 49 54 62 Number of Colleges 4,286 4,314 4,340 Number of Standalone Institutions 1,959 1,950 2,260 Enrolment in Higher education (lakh) All 40.16 41.31 42.30
Percentage of females 44.2 45.0 45.1 Enrolment in Universities & Constituent Units (lakh) All 9.40 9.43 9.43
Percentage of females 40.2 39.6 39.4 Gross enrolment ratio (18-23 years of age)
All categories 30.2 31.1 32.0 SC 30.1 30.6 31.2 ST 14.8 15.1 15.2
Gender Parity Index (18-23 years of age)
All categories 0.88 0.91 0.90 SC 0.88 0.91 0.95 ST 0.65 0.70 0.75
Number of teachers (lakh) All 1.51 1.52 1.58 Pupil teacher ratio All Institutions 27 27 27 Source : All-India Survey of Higher Education 2018-19, GoI
Self financed Universities 10.18 The economic reforms being undertaken by the GoI have prompted the change in the policy making and involving the private sector in the infrastructure development related to the higher education. Accordingly, the GoM has encouraged private participation to enhance access, excellence, inclusion and research in the field of higher education by creating best in class infrastructure facilities in the State. There are 20 self financed approved universities in the State. As per AISHE 2019-20, the total enrolment is 31,966 in 11 working self financed universities in the State. Out of total enrolment, 10,860 are female students.
Rashtriya Uchchatar Shiksha Abhiyan 10.19 Rashtriya Uchchatar Shiksha Abhiyan (RUSA), a centrally sponsored scheme is being implemented since 2013 which aims to provide access, equity and excellence in the higher education. Upto 2020-21, total grants of ` 375.95 crore were released to Universities/ Colleges/ Institutions and an expenditure of ` 261.54 crore was incurred. Some of the achievements of RUSA are as follows
Under ‘Enhancing Quality & Excellence’ component of the Abhiyan, Savitribai Phule Pune University has been sanctioned the grant of ` 100 crore and 25 Autonomous Colleges have been sanctioned the grants of ` 5 crore each
Under research and innovation, Maharashtra is the first State to receive grant of ` 20 crore for setting up new research and technology transfer centres
Two cluster universities namely Dr. Homi Bhabha State University, Mumbai and Hyderabad (Sindh) National Collegiate University, Mumbai have been set up in the State
Model degree colleges are being set up in Washim and Nandurbar districts of the State

Economic Survey of Maharashtra 2020-21
203
Technical Education Quality Improvement Programme 10.20 Technical Education Quality Improvement Programme (TEQIP) was envisaged in 2003 as a long term programme for transformation of Technical Education System. The main objective of TEQIP is to scale up and improve quality of technical education and enhance existing capacities of the institutions. TEQIP is being implemented as a World Bank assisted project. The details of TEQIP are given in Table 10.11.
Rajarshi Chhatrapati Shahu Maharaj tuition fee scholarship scheme 10.21 Rajarshi Chhatrapati Shahu Maharaj tuition fee scholarship scheme is being implemented in the State to provide scholarship to students (having annual family income upto ` 8 lakh) belonging to economically backward class category. The scheme includes 605 professional & non-professional courses being offered by various universities and colleges in the State. The progress of the scheme is given in Table 10.12.
Table 10.11 Details of TEQIP
Particulars TEQIP-I TEQIP-II TEQIP-III Duration 2003-2009 2011-2017 2017-2021 Total number of institutes participated 17 17 12 Government / Government aided 12 18# 12 Private 5 4 0 Total funds disbursed (` Crore) 161.94 229.78 101.80 Source : Directorate of Technical Education, GoM # includes five centres of excellence
Table 10.12 Progress of Rajarshi Chhatrapati Shahu Maharaj tuition fees scholarship scheme
Stream Year Number of Beneficiaries
Expenditure incurred (` Crore)
Higher Education 2018-19 1,63,406 80.08
2019-20 1,74,496 69.28
2020-21 97,481 28.06
Technical Education 2018-19 1,78,440 579.39
2019-20 1,81,327 620.22
2020-21 1,99,509@ 600.00#
Medical Education & Research 2018-19 8,455 49.07
2019-20 6,356 50.65
2020-21$ - -
Agriculture 2018-19 10,112 24.86
2019-20 11,303 14.97
2020-21$ - -
Animal Husbandry, Dairy Development & Fisheries 2018-19 305 0.39
2019-20 454 0.79
2020-21 528 1.26 @ targeted # grant sanctioned $ due to Covid-19 pandemic procedure is not completed Source :1) Directorate of Higher Education, GoM 2) Higher & Technical Education Department, GoM 3) Directorate of Medical Education & Research, GoM 4) Maharashtra Council of Agricultural Education & Research 5) Maharashtra Animal & Fishery Science University

Economic Survey of Maharashtra 2020-21
204
PUBLIC HEALTH 10.22 Government has been implementing various healthcare schemes and programmes to prevent diseases, promote healthy and prolonged life of people. Preventive healthcare, affordable healthcare, medical infrastructure and mission mode healthcare interventions are the main pillars of healthcare in the country. The State has been at the forefront of healthcare development and basic to tertiary health care services are being provided by public & private sectors and voluntary organisations in the State. The integrated management of healthcare services has helped in handling the critical phase of Covid -19 pandemic.
Covid -19 pandemic 10.23 The first patient of Covid-19 disease in the world was found in the city of Wuhan in China in December, 2019. In India, the first patient was found in Kerala on 30th January, 2020. By the end of February, 2020, the infection of this disease spread to over 54 countries, infected more than 85,403 persons and resulted around 3,000 deaths across the world. In the State, the passengers coming from high-risk countries were screened at the airport. The first patient was found on 9th March, 2020 in Pune. On 13th March, 2020 GoM declared the outbreak as an epidemic in four cities viz. Mumbai, Navi Mumbai, Pune and Nagpur and invoked provisions of Epidemic Diseases Act, 1897 which enabled to forcibly hospitalise anyone with suspected symptoms. To control the spread of disease as a precaution commercial establishments such as cinema halls/theatres, malls, swimming pools, gyms and hotels & restaurants were shut. All public gatherings and functions were also banned to control the spread of the virus. In order to implement physical distancing & crowd management, all shops and commercial establishments except grocery stores and pharmacies were closed. Public transport and all workplaces excluding essential services were closed. People were urged not to step out of the house without the necessity of doing so. Lockdown was announced from 23rd March, 2020 midnight all over India. The borders of all the districts in the state were sealed, section 144 was imposed and a strict curfew was implemented state wide.
10.24 Information of Covid-19 cases as on 15th January, 2021 is given in Table 10.13 and information of Covid- 19 cases in some of the most affected countries is given in Table 10.14. USA is the most affected country followed by India and Brazil.
Table 10.13 Information of Covid-19 cases (no.) (As on 15th January, 2021)
Particulars Maharashtra All-India World Total cases 19,84,768 1,05,28,062 9,35,33,917 Cases recovered 18,81,088 1,01,62,738 6,68,35,146 Recovery rate (per cent) 94.8 96.5 71.5 Total deaths 50,336 1,51,918 20,02,411 Case fatality rate (CFR) (per cent) 2.5 1.4 2.1 Number of cases per million population 15,649 8,712 12,000 Doubling time (days) 420.1 427.1 NA Source: Directorate of Health Services, GoM NA Not available
Table 10.14 Information of Covid-19 cases in some of the most affected countries (no.) (As on 15th January, 2021)
Country Total
population (in lakh)
Total cases (in lakh)
Number of cases per million population
Total deaths (in lakh)
CFR (per cent)
Percentage of active cases out
of total cases USA 3,320.5 238.5 71,821 3.98 1.7 39.2 India 13,873.1 105.3 7,590 1.52 1.4 2.0 Brazil 2,133.7 83.3 39,021 2.07 2.5 9.4 Russia 1,459.7 34.9 23,951 0.64 1.8 15.7 UK 680.8 32.6 47,886 0.86 2.6 54.2 Italy 604.1 23.4 38,667 0.81 3.5 24.0 Source: www.worldometer.info/coronavirus
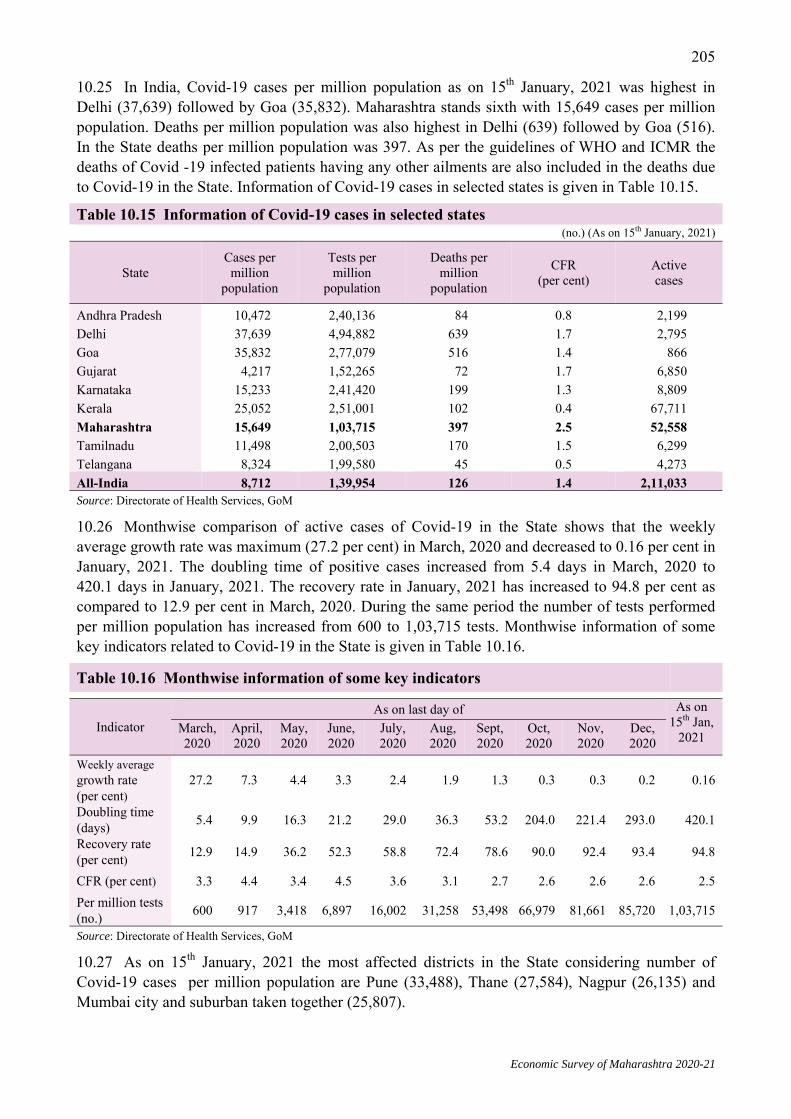
Economic Survey of Maharashtra 2020-21
205
10.25 In India, Covid-19 cases per million population as on 15th January, 2021 was highest in Delhi (37,639) followed by Goa (35,832). Maharashtra stands sixth with 15,649 cases per million population. Deaths per million population was also highest in Delhi (639) followed by Goa (516). In the State deaths per million population was 397. As per the guidelines of WHO and ICMR the deaths of Covid -19 infected patients having any other ailments are also included in the deaths due to Covid-19 in the State. Information of Covid-19 cases in selected states is given in Table 10.15.
Table 10.15 Information of Covid-19 cases in selected states (no.) (As on 15th January, 2021)
State Cases per million
population
Tests per million
population
Deaths per million
population
CFR (per cent)
Active cases
Andhra Pradesh 10,472 2,40,136 84 0.8 2,199 Delhi 37,639 4,94,882 639 1.7 2,795 Goa 35,832 2,77,079 516 1.4 866 Gujarat 4,217 1,52,265 72 1.7 6,850 Karnataka 15,233 2,41,420 199 1.3 8,809 Kerala 25,052 2,51,001 102 0.4 67,711 Maharashtra 15,649 1,03,715 397 2.5 52,558 Tamilnadu 11,498 2,00,503 170 1.5 6,299 Telangana 8,324 1,99,580 45 0.5 4,273 All-India 8,712 1,39,954 126 1.4 2,11,033 Source: Directorate of Health Services, GoM
10.26 Monthwise comparison of active cases of Covid-19 in the State shows that the weekly average growth rate was maximum (27.2 per cent) in March, 2020 and decreased to 0.16 per cent in January, 2021. The doubling time of positive cases increased from 5.4 days in March, 2020 to 420.1 days in January, 2021. The recovery rate in January, 2021 has increased to 94.8 per cent as compared to 12.9 per cent in March, 2020. During the same period the number of tests performed per million population has increased from 600 to 1,03,715 tests. Monthwise information of some key indicators related to Covid-19 in the State is given in Table 10.16.
Table 10.16 Monthwise information of some key indicators
Indicator As on last day of As on
15th Jan, 2021
March, 2020
April, 2020
May, 2020
June, 2020
July, 2020
Aug, 2020
Sept, 2020
Oct, 2020
Nov, 2020
Dec, 2020
Weekly average growth rate (per cent)
27.2 7.3 4.4 3.3 2.4 1.9 1.3 0.3 0.3 0.2 0.16
Doubling time (days) 5.4 9.9 16.3 21.2 29.0 36.3 53.2 204.0 221.4 293.0 420.1
Recovery rate (per cent) 12.9 14.9 36.2 52.3 58.8 72.4 78.6 90.0 92.4 93.4 94.8
CFR (per cent) 3.3 4.4 3.4 4.5 3.6 3.1 2.7 2.6 2.6 2.6 2.5 Per million tests (no.) 600 917 3,418 6,897 16,002 31,258 53,498 66,979 81,661 85,720 1,03,715
Source: Directorate of Health Services, GoM
10.27 As on 15th January, 2021 the most affected districts in the State considering number of Covid-19 cases per million population are Pune (33,488), Thane (27,584), Nagpur (26,135) and Mumbai city and suburban taken together (25,807).
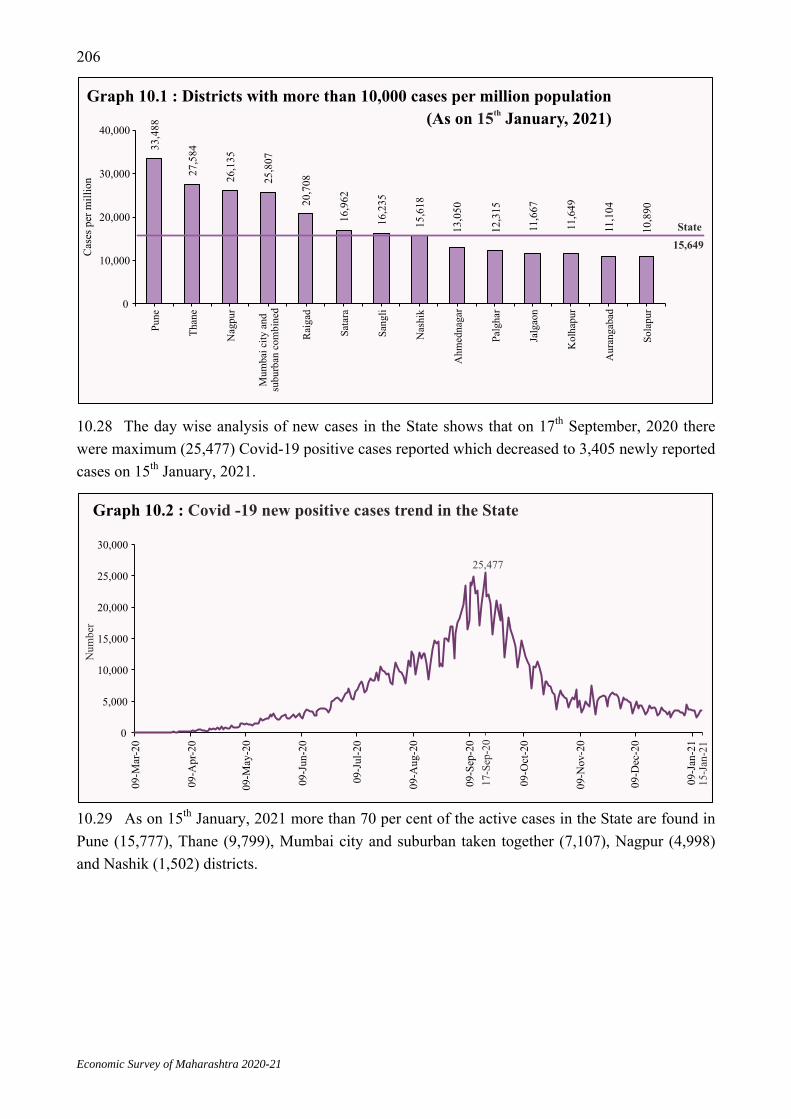
Economic Survey of Maharashtra 2020-21
206
10.28 The day wise analysis of new cases in the State shows that on 17th September, 2020 there were maximum (25,477) Covid-19 positive cases reported which decreased to 3,405 newly reported cases on 15th January, 2021.
10.29 As on 15th January, 2021 more than 70 per cent of the active cases in the State are found in Pune (15,777), Thane (9,799), Mumbai city and suburban taken together (7,107), Nagpur (4,998) and Nashik (1,502) districts.

Economic Survey of Maharashtra 2020-21
207
10.30 As on 15th January, 2021 out of 52,558 active cases, 35,984 patients were hospitalised. There were 5,637 patients on oxygen support beds. Total 2,984 patients were in ICU of which 694 patients were on ventilator. Details of Covid-19 positive patients admitted in different hospitals as on 15th January, 2021 are given in Table 10.17.
Measures taken for Covid-19 prevention and control in the State 10.31 GoM has taken following measures to control the spread of Covid-19.
1. Initially, passengers coming from high-risk countries were screened at the airport and passenger ports and measures were taken accordingly. 2. Laboratory diagnosis
In the beginning, only one diagnostic laboratory was available. As on 15th January, 2021 there are 487 labs (of which 363 are government and 124 are private labs) functioning for Covid-19 diagnosis. Medical colleges and district hospitals have been provided with RT-PCR testing capacity.
Table 10.17 Details of Covid-19 positive patients admitted in different hospitals (no.)
Type of hospital
Cumulative positive admitted patients
As on 15th January, 2021
Positive admitted patients
In ICU Outside ICU on oxygen
support On
ventilator On oxygen
support GoI 3,961 47 0 0 14 PHD 6,13,972 10,665 99 303 406 Medical colleges 47,779 891 80 212 177 Corporation 7,98,916 11,849 86 357 839 Railway 2,765 36 3 0 6 Defence 11,059 144 1 17 19 Port Trust Hospital 1,486 27 0 1 3 Private MJPJAY 44,011 983 63 239 169 Private 4,40,229 11,342 362 1,161 1,714 Total 19,64,178 35,984 694 2,290 3,347 PHD Public health department MJPJAY Mahatma Jyotirao Phule Jan Arogya Yojana Source: Directorate of Health Services, GoM

Economic Survey of Maharashtra 2020-21
208
As per the rates decided by the central government, private labs charged over ` 4,000 for a test. GoM has reduced RT-PCR rates in the range ` 980 to ` 1,800.
Due to increase in number of diagnostic labs, the turnaround time of tests results has been reduced to less than 48 hours.
Upto 15th January, 2021 total 1.37 crore tests have been conducted in the State. Tests per million population in the State is 1,03,715 as against the national average of 1,39,954 tests.
From June, 2020 Rapid Antigen Testing facility (kits) were made available by the State government. The funds were made available to the districts for purchasing the testing kits at the district level.
3. Surveillance To trace all contacts of a confirmed positive patient, contract tracing teams were
established on the field. Contact tracing of 95.2 per cent patients have been done. On an average 15.7 manual
and 17.6 portal contacts per confirmed cases have been traced. Containment zones were demarcated and as on 15th January, 2021 there were 7,600
active containment zones in the State. Regular surveillance of patients with Influenza Like Illness (ILI) and Severe Active
Respiratory Syndrome (SARI) is being done. In all 94,942 teams surveyed population of 34.95 lakh upto 15th January, 2021.
4. Three-tier treatment system As per the guidelines of the central government, a three-tier treatment and care system was established. This augmented the number of beds and ventilators available. In March, 2020 in all 7,722 beds, 3,091 ICU beds and 1,143 ventilators were available in 211 facilities. The health facilities available for Covid-19 treatment in the State as on 15th January, 2021 are given in Table 10.18.
Table 10.18 Health facilities available for Covid-19 patients (no.) (As on 15th January, 2021)
Category Number
of facilities
Total isolation
beds (excl. ICU beds)
Isolation beds for Covid confirmed
cases
Isolation beds for
suspected cases
Oxygen supported
beds
Total ICU beds
Number of ventilators
Dedicated Covid hospitals (DCH) 601 46,672 34,959 11,712 29,945 11,710 6,034
Dedicated Covid health centre (DCHC)
1,053 50,923 38,511 12,421 29,323 6,096 1,965
Dedicated Covid centre 1,898 2,46,371 1,28,592 1,17,612 0 0 0
Total 3,552 3,43,966 2,02,062 1,41,745 59,268 17,806 7,999 Source: Directorate of Health Services, GoM
5. Oxygen management system Oxygen management system is a key requirement for Covid-19 treatment. For this, 14,884 jumbo cylinders, 13,749 B-type cylinders and 424 Dura cylinders have been made available. Oxygen pipelines have been fitted at DCHs and DCHCs. Oxygen tanks have been operationalised in 20 districts in the State. Protocols and guidelines have been disseminated. Webinars and training sessions have been organised for oxygen treatment. As on 15th January 2021, oxygen storage capacity in the State is 921 MT and it is being augmented by 358 MT in the near future.

Economic Survey of Maharashtra 2020-21
209
6. Various protocols Protocols in the context of Covid-19 for various measures such as surveillance, lab testing, treatment, care of pregnant women & children, measures in the neonatal care units for neonatal care etc. have been formed and disseminated to the concerned. The State had prepared treatment protocols with the help of experts even before the protocol was sent by the GoI.
7. Quarantine facilities In the beginning of the pandemic, 16,192 beds were available in 353 quarantine facilities across the State. As on 15th January 2021, there are 1,13,799 beds available in 816 quarantine facilities.
8. Experimental therapy usage for Covid-19 treatment As per the guidelines by ICMR, treatments such as plasma therapy, Remdesivir, Tocilizumab, Itolizumab have been tried under expert guidance.
9. Establishment of the State task force A task force of the various experts in different fields at the State and the district levels was created. The experts in the task force have been guiding the doctors at the district level. Large-scale webinars were organised for technical guidance on Covid-19.
10. Establishment of death audit committees Death audit committees have been established at the district, municipal corporation and State level to analyse every death due to Covid-19 and identify causes of each death. Instructions have been given to form similar committees at the level of each Covid hospital. The avoidable reasons of deaths are identified on priority and the specific recommendations of the experts in these committees are provided to the concerned.
11. Adequate storage of essential equipment Essential equipments & personal protective equipment (PPE) kits, medicines, Covid
testing kits, oxygen cylinders and other necessary equipments were received from central government and also purchased from state disaster response fund, district annual plan fund and MLALAD fund. Upto December, 2020 total 4,384 ventilators were received from central government. From district annual plan fund and MLALAD fund total 533 ventilators, 84,866 infra-red thermometer/ oxymeter, 16.60 lakh PPE kits, 137.25 lakh N95/ triple layer masks, 20.53 lakh covid testing kits, 23,149 oxygen cylinder kits and other necessary equipments and medicines have been purchased upto December, 2020.
All the essential equipment to be made available, the procurement process was decentralised and made transparent.
Daily stock of the essential PPE kits is taken and is being updated on the national Covid-19 portal every day.
12. Other important decisions Mahatma Jyotirao Phule Jan Arogya Yojana was made available to non-beneficiaries also. In private hospitals, 80 per cent beds were taken under State government’s control. In private hospitals registered under Charitable Commissioner, 10 per cent beds were made completely free for BPL and additional 10 per cent beds were made available at concessional rates for economically poor sections of the society. Audit of private hospital bills was done by government auditors.
Economic Survey of Maharashtra 2020-21
210
Grievance redressal mechanism was set up for complaints against private hospital bills. RT-PCR test rates were reviewed periodically and the rates have been reduced. Price control over multiple requirements for Covid-19 diagnosis and treatment to avoid additional financial burden on people.
13. Training and capacity building of State and district level functionaries
On 6th March, 2020, training of trainers regarding Covid-19 was conducted at the national level and the same at State level on 12th and 13th March, 2020. In the State, total 205 functionaries were trained in these sessions. At municipal corporation and district level total 2,462 functionaries were trained in 81 training sessions. In all 89,887 health personnel were trained. Apart from this, at the regional level ventilator management training for specialists was conducted and with the help of the Critical Care Medicine Department of Bharati Vidyapeeth, all the district-level doctors in the State were trained on respiratory management for Covid -19.
14. Health education
Health education material was prepared by the Public Health Department for general public, medical professionals and for travellers coming from affected areas and was disseminated. Large awareness drive through multiple media channels was started from 12th March, 2020. ‘A’ grade newspapers, broadcast of 30-second TV spots on 11 private news channels and DD, airing of 60-second-long audio jingle through 55 private FM channels and All India Radio, hoardings, banners and social media were the key mediums used to create awareness. For general public, a handbook was prepared and disseminated containing overall information about the disease, symptoms, preventive measures, Do’s and Don’ts etc. Social media platforms viz. Facebook, WhatsApp, Twitter, Instagram were used effectively. District mental health programme teams across the State carried out psychiatric counselling, diagnosis and treatment of psychiatric illness among migrant labourers, Covid positive patients admitted in Covid Care Centres, DCH, DCHC and other Covid units. Training of trainers and webinars were conducted using online platform by eminent psychiatrists. Upto January, 2021 total 69,948 counselling sessions were conducted in which 5.23 lakh patients were benefited.
15. Usage of ICT Multiple preventive and control measures were deployed by using the latest technology and mobile applications. RT-PCR App and Covid-19 portal was used for real-time collection of Covid-19 data with the help of the central government. Covid Yoddha App was used for involving volunteers at the district level for Covid-19 control interventions. Mahakavach App was used for contact tracing and monitoring patients in quarantine. e-Sanjivani platform has been used for providing online medical consultations to the people.

Economic Survey of Maharashtra 2020-21
211
16. Additional human resource Additional human resources were hired for Covid hospitals and centres on contractual basis. The recruitment rights are given to circle and district administrations. Approval has been given to hire specialists with an honorarium upto ` two lakh. Government asked private doctors to report to hospitals for treating Covid-19 patients at least for 15 days.
17. State helpline A toll-free number 104 is made available for any guidance on Covid-19. All key guidelines on Covid are made available on the department website and are disseminated to all the concerned.
18. Corona War Room A Corona war room was established from 19th March, 2020 at the State level for coordination with all the municipal and district administrations to collate different types of information and daily reports. District and municipal corporation wise information on Covid-19 cases and deaths is being disseminated daily.
19. Community-based sero-survey A community-based sero-survey was conducted in six districts of the State. The details of the sero-survey are given in Table 10.19. A similar survey has been conducted in municipal corporation areas of Mumbai, Pune and Aurangabad.
Table 10.19 Details of the sero-survey
District
First Round (May-June, 2020) Second round (Aug-Sept, 2020) Total
samples collected
Samples tested
positive
Positivity (per cent)
Total samples collected
Samples tested
positive
Positivity (per cent)
Beed 396 4 1.0 443 33 7.4 Parbhani 396 6 1.5 480 73 15.2 Nanded 393 5 1.3 439 43 9.8 Sangli 400 5 1.3 467 55 11.7 Ahmednagar 404 5 1.2 447 39 8.7 Jalgaon 396 2 0.5 405 105 25.9 Total 2,385 27 1.1 2,681 348 13.0 Source: Directorate of Health Services, GoM
20. Preparedness according to projection of cases (Predictive model) Mathematical models are used to predict the possible number of cases that might be diagnosed at the district level 15 days ahead. This helped in predicting the possibility of infrastructure deficit so that the districts can work on augmenting capacities ahead of time.
21. My family, My responsibility campaign This campaign was conducted during 15th September to 25th October, 2020, in which each household was visited twice.
Objectives of the campaign Surveillance and treatment of suspected patients of Covid-19 in the State through
home visits. Surveillance, treatment, counselling and prevention guidance to high-risk people. Surveillance, Covid-19 testing and treatment of all those with ILI and SARI. Health education on Covid-19.
Economic Survey of Maharashtra 2020-21
212
Coverage of the campaign In the first phase, out of 2.76 crore families, 2.74 crore families were surveyed. Total 11.92 crore people out of 12.43 crore population were directly contacted. In the second phase, 2.70 crore families were covered under the survey and 10.01 crore people were visited. Trained teams screened every visited person for fever, oxygen saturation and were provided with health education guidance. Total 59,679 teams screened the population. Each team included an ASHA worker, health worker and a local volunteer.
Outcome of the campaign Out of the 3.57 lakh ILI/SARI patients identified, 3.22 lakh were tested for Covid-19. Of which 51,064 were Covid -19 positive and were subsequently treated. In all 8.69 lakh patients were diabetic, about 1.31 crore were having hypertensive, 73,055 were having heart diseases, 17,843 were having cancer and 1.07 lakh were having other illnesses. A total of 23.75 lakh co-morbid patients were identified during the survey and further treatment was arranged for them. Total 2.40 lakh patients who had Covid-19 were screened for post Covid symptoms and were given further advice.
‘No mask No entry’ campaign This campaign has been implemented across the State. Wearing mask made compulsory in public places as well as in public and private transport. Effective public awareness campaigns have been made to tell people that wearing masks, practising social distance and washing hands is necessary for prevention and control of Covid-19.
22. Covid-19 Vaccine The world’s largest Covid-19 immunisation programme in India was commenced on 16th January, 2021 through two vaccines viz. COVISHIELD and COVAXIN. In the State, about eight lakh corona warriors including doctors, police, nurses, ward boys, ASHA workers etc. and other frontline workers have been offered the vaccine in the first round. As on 8th February, 2021 total 5,09,746 corona warriors were vaccinated.
Funds available from various sources 10.32 All districts have been provided with adequate funds from the National Health Mission for Covid-19 prevention and control. The central government has provided funds of ` 716.50 crore under Covid -19 emergency preparedness plan. Apart from this, the State has approved ` 634 crore of supplementary demand. Procurement rights from state disaster response funds, district annual plan funds as well as the MLALAD funds have been given by the State government. Expenditure incurred from National Health Mission was ` 361.79 crore, from state disaster response funds was ` 860.92 crore and from district annual plan & MLALAD funds was ` 690.82 crore upto December, 2020.
Health infrastructure 10.33 The State has three-tier health infrastructure to provide comprehensive health services. The primary tier comprises of Sub-centres, Primary Health Centres (PHC) and Community Health Centres (CHC). The sub-district hospitals and district hospitals constitute secondary tier whereas, well equipped hospitals attached to medical colleges and super-speciality hospitals are at tertiary level. The health infrastructure of the State Government is given in Table 10.20 and its series is given in Annexure 10.6.

Economic Survey of Maharashtra 2020-21
213
10.34 Sub-centres provide health services with counselling for maternal & child health care, family welfare, nutrition, immunisation, control of diarrhoea and communicable diseases. Facilities available at PHC are outdoor patients department (OPD), six beds indoor ward, emergency services, operative & laboratory facilities and medicines. Treatment to patients referred by sub-centres and family planning services are also provided. Community health centres, sub-district hospitals and district hospitals provide round the clock emergency health services. 10.35 As per government norms, a sub-centre is to be set up for a population of 3,000 in tribal areas & for a population of 5,000 in non-tribal rural areas and a PHC is to be set up for a population of 20,000 in tribal areas & for a population of 30,000 in non-tribal rural areas. Similarly, a CHC is to be set up as referral centre for every four to five PHC covering a population of 80,000 to 1.20 lakh. There are 2,162 Sub-centres, 341 PHCs and 67 CHCs operating in tribal areas of the State. 10.36 GoI had launched a flagship scheme Ayushman Bharat on 23rd September, 2018 to achieve the vision of Universal Health Coverage as envisaged in Sustainable Development Goals. Ayushman Bharat is an attempt to move from sectoral and segmented approach of health service delivery to a comprehensive need based health care service. This scheme aims to move towards a provision of universal healthcare system covering prevention, promotion and ambulatory care at the primary, secondary and tertiary level. It has two components viz. Health and Wellness Centres (HWCs) and Pradhan Mantri Jan Arogya Yojana (PMJAY). 10.36.1 HWCs are being created by transforming the existing sub-centres and PHCs. These centres are to deliver Comprehensive Primary Health Care bringing healthcare closer to the homes of people. The following health care services are provided by HWC through outreach services, Mobile Medical Units, health camps, home visits and community-based interaction. Care in pregnancy and child-birth Neo-natal and infant health care services Childhood and adolescent health care services Family planning, contraceptive services and other reproductive health care services Management of communicable diseases General out-patient care for simple illnesses and minor ailments Screening, prevention, control and management of chronic, non-communicable and
communicable diseases including tuberculosis (TB) & leprosy Care for common ophthalmic and ear, nose, throat problems Basic oral health care Elderly and palliative health care services Emergency medical services including burns and trauma Screening and basic management of mental health ailments
10.36.2 Ayurveda / Unani / BSC Nursing graduates are being appointed as Community Health Officers in HWCs. The HWCs are headed by a Community Health Officer with a primary health care team including Health Workers (ANMs), Multipurpose Health Workers (MPWs) and Accredited Social Health Activist (ASHA) workers.
Table 10.20 Health infrastructure of the State Government
(As on 31st December, 2020)
Type of Institution No. Sub-centre (incl. HWC) 10,668 Primary Health Centre (incl. HWC) 1,830 Community Health Centre 364 Primary Health Unit 108 Mobile Medical Unit 58 Sub-district Hospital 91 District Hospital 23 Hospitals attached to Medical College 19 General Hospital 8 Women Hospital 13 Mental Hospital 4 Leprosy Hospital 4 TB Hospital 4 Other Hospital (Orthopedic) 1 Regional Referral Hospital 2 HWC : Health and Wellness Centre Source: Directorate of Health Services, GoM

Economic Survey of Maharashtra 2020-21
214
10.36.3 In the State 4,234 sub-centres (SCs), 1,813 PHCs and 442 urban PHCs (UPHCs) are operationalised as HWCs upto December, 2020. Of these, 420 SC-HWC and 126 PHC-HWC are in tribal areas. The State is committed to transform all SCs, PHCs & UPHCs in to HWCs in phased manner by 2022.
10.36.4 Under this programme all the population above the age of 30 years, is being screened & free of cost treatment is provided for hypertension, diabetes and common cancers.
Doctor-population ratio 10.37 After getting the degree, the allopathy medical practitioners in the State have to register to Maharashtra Medical Council, Mumbai and renew their licence every five years. Upto December, 2020 in all 1,61,379 (of which 72,539 are post graduate) allopathy doctors were registered. In last five years 31,991 allopathy doctors have newly registered and 72,358 doctors have renewed their licences. Based on the data of last five years, estimated doctor-population ratio in the State is 1:1188.
National Health Mission 10.38 The National Health Mission (NHM), which encompasses National Rural Health Mission (NRHM) and National Urban Health Mission (NUHM), aims to provide universal access to health care by strengthening health systems, institutions and human resource capabilities. The main components of the mission include health system strengthening in rural & urban areas, control of communicable & non-communicable diseases and implementation of reproductive, maternal, newborn, child & adolescent health programmes. NHM attempts to make effective integrations of health determinants like sanitation & hygiene, nutrition and safe drinking water.
National Rural Health Mission 10.38.1 The National Rural Health Mission (NRHM) was launched in April, 2005 to provide accessible, affordable and quality health care to the rural population, especially poor and vulnerable sections. NRHM further aims to provide overarching umbrella to the existing programmes of health and family welfare including reproductive, maternal, newborn, child and adolescent health programme, malaria, blindness, iodine deficiency, filaria, tuberculosis, leprosy and integrated disease surveillance. 10.38.1.1 Under NRHM, 40 Mobile Medical Units are operating to provide health care services for population living in remote and inaccessible areas of the State. These Mobile Medical Units are being run by NGO/ Rugna Kalyan Samiti to provide medical services on day to day basis. Every Mobile Medical Unit consists of a doctor, nurse, radiologist, lab attendant, pharmacist, helper and driver. Telemedicine facility is available at 23 district hospitals, 39 sub district hospitals/CHC and six medical colleges. Under NRHM, total 13,660 (6,956 regular cadre and 6,704 contractual) medical officers including specialists are providing health services to 43,943 villages covering 1.45 crore population. Under the scheme, 60,887 ASHA workers are appointed upto December, 2020. Sickle Cell Disease Control Programme is implemented in 21 districts where Sickle Cell Disease is more prevalent.
10.38.1.2 Under NRHM during 2019-20, an expenditure of ` 2,148.78 crore was incurred and during 2020-21 upto December, expenditure incurred was ` 1,362.46 crore. Physical achievements under NRHM are given in Table 10.21.

Economic Survey of Maharashtra 2020-21
215
Reproductive, maternal, newborn, child and adolescent health programme 10.38.2 Reproductive, maternal, newborn, child and adolescent health programme is being implemented to enhance child health status and population stabilisation thereby reducing Maternal Mortality Ratio (MMR), Infant Mortality Rate (IMR) and Total Fertility Rate (TFR). Under the programme, during 2019-20 an expenditure of ` 345.01 crore and during 2020-21 upto December, an expenditure of ` 184.03 crore was incurred. Selected health indicators are given in Table 10.22 and its series is given in Annexure 10.7.
Table 10.21 Physical achievements under NRHM (no.)
Component Particulars 2018-19 2019-20 2020-21+ AYUSH Patients treated
Out Patient Department (OPD) 42,51,428 51,12,102 15,14,442 In Patient Department 89,298 1,09,262 72,937
Mobile Medical Unit (MMU)
Patients treated 16,01,984 16,93,019 10,46,452 RCH (ANC & PNC) 2,21,016 2,23,020 1,52,925 Lab test 7,92,643 9,03,780 5,71,223 Villages visited 22,501 20,578 16,402
Telemedicine Patient referred and opinion received 28,211 31,286 8,353 Sickle cell disease control programme
Total test performed 7,48,097 10,50,225 2,54,110 Sufferers 744 1,517 377 Carriers 7,741 10,413 3,956
Palliative Care Patients treated 7,096 9,776 3,966 Referral transport Pregnant women Institutional deliveries 5,58,633 5,19,562 5,67,364 Home to institute 4,38,522 4,63,112 3,74,468 Institute to institute 1,75,278 1,86,244 1,43,521 Institute to home 4,93,283 5,03,520 3,83,238 Sick Neonates Sick Neonates 86,089 88,839 52,999 Home to institute 40,118 55,061 52,748 Institute to institute 20,165 25,883 22,995 Institute to home 51,479 70,633 59,519 Public - Private Partnership (PPP) a) Health Advice Call Centre Total calls 4,20,666 3,47,418 3,64,434 b) Epilepsy programme
Camps organized 11 9 0 Patients treated 3,055 2,108 0 EEG in camps 379 318 0 OT/PT/Speech therapy provided 783 574 0
c) Medical & Dental camp Camps organised 48 48 0 Patients treated 62,961 59,277 0 Surgeries performed 4,223 2,589 0
d) Maher Ghar Mother beneficiary 2,649 2,525 2,209 RCH Reproductive and Child Health ANC Antenatal Care PNC Post Natal Care PT Physiotherapy OT Occupational Therapy EEG Electro Encephalo Gram + upto December Source: Directorate of Health Services, GoM
Table 10.22 Selected health indicators
Indicator 2016 2017 2018 Crude Birth Rate (CBR) 15.9 15.7 15.6 Crude Death Rate (CDR) 5.9 5.7 5.5 Infant Mortality Rate (IMR) 19 19 19 Neo-natal Mortality Rate (NMR) 13 13 13 Under-Five Mortality Rate (U5MR) 21 21 22 Total Fertility Rate (TFR) 1.8 1.7 1.7 (2014-16) (2015-17) (2016-18) Maternal Mortality Ratio (MMR) 61 55 46 Source: Sample Registration System, ORGI

Economic Survey of Maharashtra 2020-21
216
Janani Suraksha Yojana
10.38.3 Janani Suraksha Yojana is being implemented to promote institutional deliveries in rural and urban areas to reduce infant and maternal mortality in BPL, SC and ST families. The scheme aims at lowering MMR by ensuring that all deliveries are conducted by skilled birth attendants (SBA). Under the scheme, an amount of ` 700 in rural areas and ` 600 in urban areas is given to beneficiary within seven days after delivery in the institutions. For delivery at home by SBA, ` 500 is given to the beneficiary in rural as well as urban areas. For the delivery by caesarean, upto ` 1,500 is given to the beneficiary as reimbursement of the expenditure incurred. Progress of Janani Suraksha Yojana is given in Table 10.23.
Pradhan Mantri Surakshit Matritva Abhiyaan 10.38.4 GoI has launched Pradhan Mantri Surakshit Matritva Abhiyaan to provide assured and quality antenatal care to pregnant women on a fixed day of every month. Laboratory tests, sonographic examination, physical & abdominal examination by obstetrician, timely diagnosis of high risk pregnancies, prompt referral services are important components of the Abhiyaan. The services are provided at the health facility centre free of cost to the beneficiaries on 9th day of every month. If the 9th day of the month is a Sunday or a public holiday, then the services are provided on the next working day. These services are provided in addition to the routine antenatal care. Performance of Pradhan Mantri Surakshit Matritva Abhiyaan is given in Table 10.24.
Pradhan Mantri Matru Vandana Yojana 10.38.5 In India, majority of pregnant women continue to work right up to last days of their pregnancy due to poor economic condition. Furthermore, they resume to their work soon after child birth even though they are physically incapable for working. As a result, health of children born to such undernourished pregnant women & lactating mothers is severely affected. To improve maternal & child health by promoting importance of nutritional diet ‘Pradhan Mantri Matru Vandana Yojana’ is being implemented in the State from 1st January, 2017. Under the scheme, amount of ` 5,000 is given in three instalments in the form of direct benefit transfer to pregnant women registered in Government institutions for first living child only. Women availing paid maternity leave are not eligible for this benefit. The progress of Pradhan Mantri Matru Vandana Yojana is given in Table 10.25.
Table 10.23 Progress of Janani Suraksha Yojana
Year Expenditure
incurred (` Crore)
Number of beneficiaries
(lakh) 2018-19 45.35 2.36 2019-20 47.55 2.71 2020-21+ 30.46 1.44
Source: State Family Welfare Bureau, GoM + upto December
Table 10.24 Performance of Pradhan Mantri Surakshit Matritva Abhiyaan
Year Expenditure
incurred (` lakh)
Number of pregnant women received ANC
(lakh)
Number of pregnant women received ANC in 2nd and 3rd trimester for 1st time (lakh)
Number of high risk pregnancies identified (lakh)
2018-19 50.02 7.03 3.48 0.24 2019-20 22.74 3.01 1.47 0.32 2020-21+ 6.32 0.49 0.21 0.07
Source: State Family Welfare Bureau, GoM + upto December
Table 10.25 Progress of Pradhan Mantri Matru Vandana Yojana
Year Expenditure
incurred (` Crore)
Number of Beneficiaries
(lakh)
2018-19 219.98 5.98 2019-20 381.88 7.19 2020-21+ 176.25 3.32 Source : State Family Welfare Bureau, GoM + upto December

Economic Survey of Maharashtra 2020-21
217
Navsanjivani Yojana 10.38.6 Navsanjivani Yojana (NSY) is being implemented to reduce MMR and IMR in tribal areas of 16 districts covering 8,419 villages. Under NSY, 281 Mobile Medical Squads are formed each having one medical officer with para medical staff and a vehicle. These squads visit every village and hamlet to identify malnourished & sick children for providing health services at their homes. As and when required children are shifted to the nearest health centres. Various schemes viz. Matrutva Anudan Yojana, Dai meetings, pre monsoon preventive measures, provision of food to severely & moderately acute malnourished children and compensation for loss of wages to parents, etc. are being implemented under NSY.
Matrutva Anudan Yojana 10.38.6.1 Matrutva Anudan Yojana is being implemented under NSY to provide health services like antenatal care registration, regular health check-up and required medicines to pregnant women in tribal areas. Under the scheme, an amount of ` 400 is given in cash for visiting health centre for antenatal check-up and medicines worth ` 400 are provided free of cost. Progress of Matrutva Anudan Yojana is given in Table 10.26.
Universal Immunisation Programme 10.38.7 Universal Immunisation Programme of GoI is being implemented in the State with the aim to provide immunisation services to pregnant women, infants and children in various age groups in order to prevent mortality, morbidity and disability from diseases such as tuberculosis, diphtheria, whooping cough, tetanus, polio, haemophilus influenza type B, hepatitis B, measles, etc. Number of beneficiaries of Universal Immunisation Programme is given in Table 10.27.
Table 10.27 Number of beneficiaries of Universal Immunisation Programme (in lakh)
Vaccine 2018-19 2019-20 2020-21+
Target Achievement Target Achievement Target Achievement BCG 19.46 19.42 19.32 20.08 19.32 14.89 Oral Polio Vaccine (OPV) – III 19.46 18.92 19.32 19.19 19.32 13.55 Hepatitis B-0 9.67 10.77 19.32 10.33 19.32 8.57 Measles and rubella 19.46 18.44 19.32 19.33 19.32 13.86 Diphtheria, Pertussis and Tetanus (DPT) booster
19.08 17.19 19.32 18.34 19.32 12.67
OPV (booster) 19.08 17.30 19.32 18.44 19.32 12.65 DPT (5 years) 19.08 13.78 18.96 14.90 18.96 9.40 Tetanus (Td-10 years) 25.98 16.44 26.08 17.20 26.08 7.60 Tetanus (Td-16 years) 23.50 16.59 23.59 16.59 23.59 7.20 Tetanus (Td-Pregnant women) 21.40 19.38 21.36 19.37 21.26 14.09 Pentavalent 3 19.46 18.95 19.32 19.23 19.32 13.59 Rota virus 3 NA NA 19.32 8.62 19.32 13.11 Japanese Encephalitis 3.40 2.35 2.99 2.77 2.99 1.96 Expenditure incurred (` crore) 55.77 57.50 31.83 Source: State Family Welfare Bureau, GoM NA Not Applicable + upto December
Table 10.26 Progress of Matrutva Anudan Yojana
Year Expenditure
incurred (` Crore) Number of
beneficiaries 2018-19
4.92 66,851 2019-20
2.48 46,393 2020-21+
0.60 14,883
Source: State Family Welfare Bureau, GoM + upto December

Economic Survey of Maharashtra 2020-21
218
Pulse Polio Programme 10.38.8 Children below five years of age irrespective of earlier receipt of number of doses of Oral Polio Vaccine are immunised on National Immunisation Day. The Government has succeeded in controlling the spread of polio virus, as no polio case was reported. Progress of Pulse Polio Programme is given in Table 10.28.
Rashtriya Baal Swasthya Karyakram 10.38.9 Rashtriya Baal Swasthya Karyakram aims for early detection and management of defects at birth, diseases in children, deficiency condition and development delays including disabilities. Biannual regular health screening of pre school children up to six years of age using anganwadi as a platform is an essential component. Moreover, children in the age group six to 18 years studying in government and government aided schools also receive regular health check ups. Children diagnosed for illness receive follow up referral support and treatment including surgical interventions free of cost. Progress of Rashtriya Baal Swasthya Karyakram is given in Table 10.29.
National Vector Borne Disease Control Programme 10.38.10 National Vector Borne Disease Control Programme is being implemented in the State to reduce mortality and control morbidity due to vector borne diseases. Number of cases & deaths reported due to vector borne diseases are given in Table 10.30.
Table 10.28 Progress of Pulse Polio Programme
Year No. of children
immunised (lakh)
Expenditure incurred (` Crore)
2018-19 170.94 13.93 2019-20 169.28 17.41 2020-21+ 43.32 2.24
Source : State Family Welfare Bureau, GoM + upto December
Table 10.29 Progress of Rashtriya Baal Swasthya Karyakram (no.)
Year Schools / anganwadis
Students (lakh) Operations performed Health screened Treated Referred Heart related Other
2018-19 84,437 121.24 10.47 1.76
2,614 17,638 1,01,647# 63.55 5.07 0.45 1,03,777## 64.71 5.05 0.73
2019-20 85,386 113.96 10.32 3.60
2,340 23,832 1,03,216# 69.88 4.99 1.01 1,03,303## 71.08 6.41 1.82
2020-21+ @ 98 264
# anganwadi phase 1 ## anganwadi phase 2 @ Since April, 2020, due to Covid-19 pandemic school and anganwadi were closed Source: State Family Welfare Bureau, GoM + upto December
Table 10.30 Number of cases & deaths reported due to vector borne diseases (no.)
Vector borne disease 2018-19 2019-20 2020-21+
Cases Deaths reported
Cases Deaths reported
Cases Deaths reported
Malaria 10,231 14 9,491 6 11,163 11 Swine flu 2,594 462 2,287 246 121 3 Lymphatic Filariasis 1,474 0 1,187 0 394 0 Dengue 11,249 70 15,363 49 2,429 4 Japanese Encephalitis 6 1 35 10 2 1 Chikungunya 1,061 0 1,780 0 532 0 AES/Chandipura 54 1 114 11 12 0 Expenditure incurred (` crore) 7.51 15.18 2.71
Source: Directorate of Health Services, GoM AES : Acute Encephalitis Syndrome + upto December

Economic Survey of Maharashtra 2020-21
219
Ayurveda, Yoga & Naturopathy, Unani, Siddha and Homoeopathy 10.38.11 Ayurveda, Yoga & Naturopathy, Unani, Siddha and Homoeopathy (AYUSH) systems are based on definite medical philosophies and represent a way of healthy living with established concepts on prevention of diseases and promotion of health. Yoga has now become the icon of global health and many countries have started integrating it in their health care system. There is great curiosity to understand the principles and practice of AYUSH especially due to growing challenges in medicine in non communicable diseases, life style disorders, chronic diseases, etc. To enhance the existing medical facilities, government is bringing AYUSH into the mainstream health care services. Under NRHM, AYUSH facilities are being made available in all PHCs & CHCs and qualified AYUSH physicians are being appointed. As on 31st December, 2020 there were 76 ayurvedic hospitals, 469 ayurvedic dispensaries, seven unani hospitals, 25 unani dispensaries and 55 homeopathic hospitals in the State. There were 88,166 ayurveda doctors (of which 4,061 were post graduate) and 7,833 unani doctors (of which 110 were post graduate) registered with Maharashtra Council of Indian Medicine and 74,000 homeopathy doctors (of which 2,517 were post graduate) were registered with Maharashtra Council of Homeopathy upto December, 2020.
National Urban Health Mission 10.38.12 The National Urban Health Mission (NUHM) is being implemented in the State since 2013 to meet health care needs of the urban population. The mission primarily focuses on slum dwellers and other marginalised groups of all cities/towns with a population above 50,000. Poor environmental condition in the slums along with high population density makes the people living in slums, vulnerable to lung diseases like asthma, tuberculosis, etc. Slums also have a high-incidence of vector borne diseases. Under NUHM, 95 cities from the State are covered. About 2.01 crore slum population is covered under NUHM in the State.
10.38.13 Under NUHM, upto December, 2020 total 651 UPHCs are functional, 10 Mobile Medical Units are operating and 7,137 ASHA workers are appointed. To provide health care facilities to people living in slums having population around 10,000 and not having UPHC, 100 ‘Aapala davakhana’ clinics have been approved in 10 municipal corporations. These clinics will function as a sub-centre of UPHC. For 2019-20, project implementation plan of ` 220.23 crore was approved by GoI and an expenditure of ` 135.22 crore was incurred. For 2020-21, project implementation plan of ` 272.79 crore is approved and an expenditure incurred upto December was ` 123.42 crore.
Maharashtra Emergency Medical Services 10.38.14 Maharashtra Emergency Medical Services provide pre-hospital health services to patients through life support ambulance while transporting them to nearby hospital for further treatment. This 24×7 emergency service can be availed by dialing a toll free number 108. In all there are 937 ambulances, of which 233 are having advanced life support system and 704 are equipped with basic life support system. Number of patients served in emergency are given in Table 10.31.

Economic Survey of Maharashtra 2020-21
220
Revised National TB Control Programme 10.38.15 The programme aims to achieve ‘TB free India’ as Tuberculosis (TB) is an infectious disease. The Directly Observed Treatment Short Course (DOTS) strategy ensures that infectious TB patients are diagnosed and treated effectively till cure, by ensuring availability of the full course of drugs and a system for monitoring patient compliance to the treatment. During 2019, number of suspected TB patients per lakh population was 893 and cure rate was 88 per cent and during 2020, number of suspected TB patients per lakh population was 803 and cure rate was 83 per cent. During 2019-20, an expenditure of ` 135.07 crore was incurred and during 2020-21 upto December, an expenditure of ` 61.80 crore was incurred.
National Programme for Control of Blindness 10.38.16 National programme for Control of Blindness is being implemented mainly for cataract surgeries & screening of school children with provision of spectacles to the students having refractive errors. During 2019-20, as against the target of 7.50 lakh cataract surgeries, 7.04 lakh surgeries were performed and an expenditure of ` 7.22 crore was incurred, while during 2020-21 upto December, against the same target 1.01 lakh surgeries were performed and an expenditure of ` 0.95 crore was incurred.
National Leprosy Eradication Programme 10.38.17 The objective of National Leprosy Eradication Programme is to eliminate leprosy (prevalence of less than one case per 10,000 population in all districts), strengthen disability prevention & medical rehabilitation of persons affected by leprosy and reduction in the level of stigma associated with leprosy. During 2019-20, number of newly reported and active leprosy cases were 16,531 & 10,203 respectively and the prevalence rate per 10,000 population was 0.81. During 2020-21 upto December, number of newly reported and active leprosy cases were 9,793 and 9,849 respectively.
Family Welfare Programme 10.38.18 The main objective of the Family Welfare Programme is to stabilise population. Sterilisation and spacing between the births of two children are important aspects of the programme. More emphasis is given on propagation of spacing methods like Oral Pills, Copper-T (IUD), PPIUCD, conventional contraceptives along with some new contraceptive methods like Injectable MPA, Weekly Centchroman Pills etc. The progress of Family welfare sterilisation programme is given in Table 10.32.
Table 10.31 Number of patients served in emergency (no.)
Emergency situation 2018-19 2019-20 2020-21+ Child birth 6,501 3,847 1,246 Pregnancy 2,31,374 1,75,124 77,887 Medical 8,86,674 5,95,856 3,55,923 Accident (vehicle) 73,431 51,983 24,711 Assault 11,911 8,804 4,171 Burns 3,606 2,068 762 Cardiac 1,777 1,095 324 Fall 27,314 21,994 6,440 Intoxication / poisoning 32,331 25,899 11,165 Mass casualty 4,586 2,107 918 Poly trauma 1,233 469 98 Others 64,923 52,053 2,39,441@ Total 13,45,661 9,41,299 7,23,086 Source : Directorate of Health Services, GoM @ includes Covid-19 patients + upto December
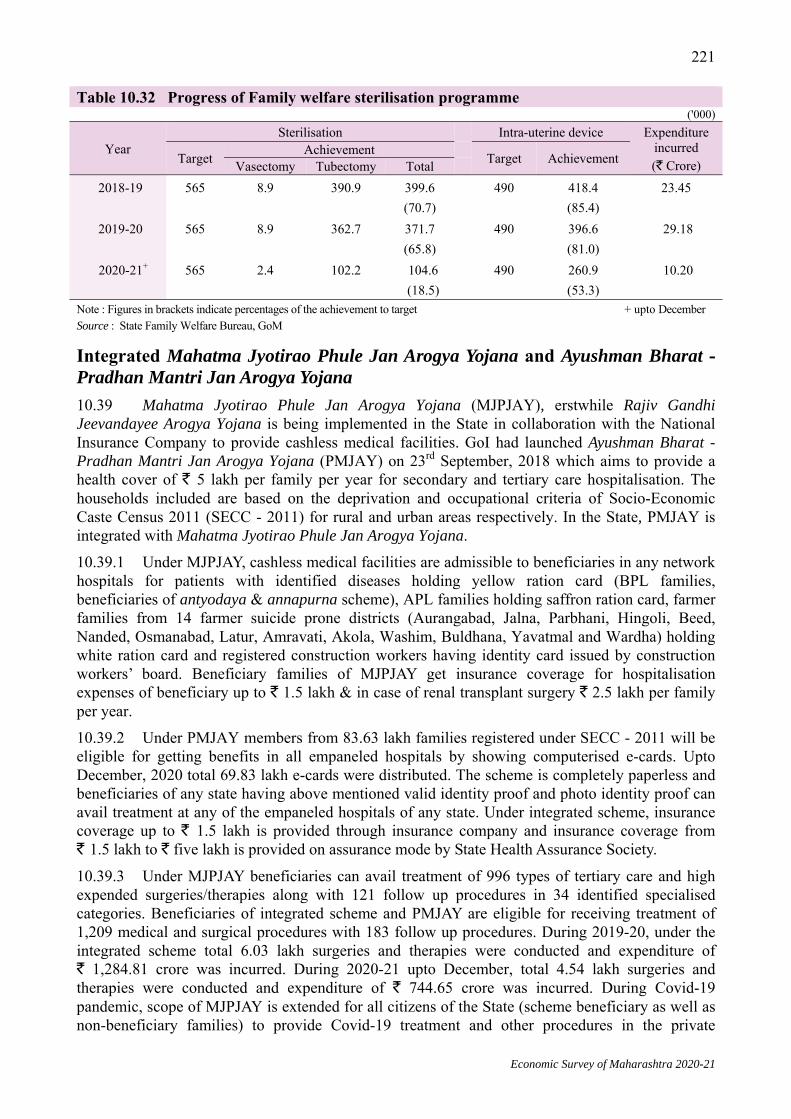
Economic Survey of Maharashtra 2020-21
221
Integrated Mahatma Jyotirao Phule Jan Arogya Yojana and Ayushman Bharat -Pradhan Mantri Jan Arogya Yojana 10.39 Mahatma Jyotirao Phule Jan Arogya Yojana (MJPJAY), erstwhile Rajiv Gandhi Jeevandayee Arogya Yojana is being implemented in the State in collaboration with the National Insurance Company to provide cashless medical facilities. GoI had launched Ayushman Bharat - Pradhan Mantri Jan Arogya Yojana (PMJAY) on 23rd September, 2018 which aims to provide a health cover of ` 5 lakh per family per year for secondary and tertiary care hospitalisation. The households included are based on the deprivation and occupational criteria of Socio-Economic Caste Census 2011 (SECC - 2011) for rural and urban areas respectively. In the State, PMJAY is integrated with Mahatma Jyotirao Phule Jan Arogya Yojana. 10.39.1 Under MJPJAY, cashless medical facilities are admissible to beneficiaries in any network hospitals for patients with identified diseases holding yellow ration card (BPL families, beneficiaries of antyodaya & annapurna scheme), APL families holding saffron ration card, farmer families from 14 farmer suicide prone districts (Aurangabad, Jalna, Parbhani, Hingoli, Beed, Nanded, Osmanabad, Latur, Amravati, Akola, Washim, Buldhana, Yavatmal and Wardha) holding white ration card and registered construction workers having identity card issued by construction workers’ board. Beneficiary families of MJPJAY get insurance coverage for hospitalisation expenses of beneficiary up to ` 1.5 lakh & in case of renal transplant surgery ` 2.5 lakh per family per year. 10.39.2 Under PMJAY members from 83.63 lakh families registered under SECC - 2011 will be eligible for getting benefits in all empaneled hospitals by showing computerised e-cards. Upto December, 2020 total 69.83 lakh e-cards were distributed. The scheme is completely paperless and beneficiaries of any state having above mentioned valid identity proof and photo identity proof can avail treatment at any of the empaneled hospitals of any state. Under integrated scheme, insurance coverage up to ` 1.5 lakh is provided through insurance company and insurance coverage from ` 1.5 lakh to ` five lakh is provided on assurance mode by State Health Assurance Society. 10.39.3 Under MJPJAY beneficiaries can avail treatment of 996 types of tertiary care and high expended surgeries/therapies along with 121 follow up procedures in 34 identified specialised categories. Beneficiaries of integrated scheme and PMJAY are eligible for receiving treatment of 1,209 medical and surgical procedures with 183 follow up procedures. During 2019-20, under the integrated scheme total 6.03 lakh surgeries and therapies were conducted and expenditure of ` 1,284.81 crore was incurred. During 2020-21 upto December, total 4.54 lakh surgeries and therapies were conducted and expenditure of ` 744.65 crore was incurred. During Covid-19 pandemic, scope of MJPJAY is extended for all citizens of the State (scheme beneficiary as well as non-beneficiary families) to provide Covid-19 treatment and other procedures in the private
Table 10.32 Progress of Family welfare sterilisation programme ('000)
Year Sterilisation Intra-uterine device Expenditure
incurred (` Crore) Target Achievement Target Achievement Vasectomy Tubectomy Total
2018-19 565 8.9 390.9 399.6 (70.7)
490 418.4 (85.4)
23.45
2019-20 565 8.9 362.7 371.7 (65.8)
490 396.6 (81.0)
29.18
2020-21+ 565 2.4 102.2 104.6 (18.5)
490 260.9 (53.3)
10.20
Note : Figures in brackets indicate percentages of the achievement to target + upto December Source : State Family Welfare Bureau, GoM

Economic Survey of Maharashtra 2020-21
222
network hospitals. Cashless treatment has been provided to 93,884 beneficiaries in all network hospitals and expenditure of ` 41.92 crore was incurred upto December, 2020. Number of major surgeries and therapies performed under Integrated Mahatma Jyotirao Phule Jan Arogya Yojana and Ayushman Bharat - Pradhan Mantri Jan Arogya Yojana is given in Table 10.33.
National AIDS Control Programme 10.40 Maharashtra State AIDS Control Society is established to implement National AIDS Control Programme (NACP) effectively in the State. The focus of NACP is on creating awareness and education & surveillance of specific groups of population. Surveillance is undertaken through screening of blood samples of patients from the clinics of sexually transmitted diseases and women seeking antenatal care. During 2019-20, an expenditure of ` 109.28 crore was incurred and during 2020-21 upto December, an expenditure of ` 75.61 crore was incurred. Information of HIV/AIDS cases is given in Table 10.34.
State Blood Transfusion Council 10.41 The prime objective of State Blood Transfusion Council is to provide adequate & safe blood and its components at reasonable rates. Since 2000, free blood is being provided to Sickle Cell children as well as Thalassemia and Hemophilia patients. Information about blood collection is given in Table 10.35.
Table 10.33 Number of major surgeries and therapies under Integrated Mahatma Jyotirao Phule Jan Arogya Yojana and Ayushman Bharat - Pradhan Mantri Jan Arogya Yojana
Speciality
2018-19 2019-20 2020-21+
No. of surgeries/ therapies
Claims paid
(` Crore)
No. of surgeries/ therapies
Claims paid
(` Crore)
No. of surgeries/ therapies
Claims paid
(` Crore) Medical oncology 1,44,232 72.03 1,59,769 84.75 1,13,865 59.22 Nephrology 84,808 71.62 93,588 86.74 61,732 65.64 Cardiology 66,104 244.95 79,368 315.87 44,964 164.09 Pulmonology 5,090 10.36 5,306 11.95 44,662 32.67 Gynecology and obstetrics 4,710 7.62 4,339 8.40 28,296 10.47 Poly trauma 35,007 47.01 40,164 61.24 24,456 44.90 Genitourinary system 45,581 83.13 46,198 92.68 23,535 43.20 Radiation oncology 22,890 106.89 23,997 119.34 16,340 78.34 Pediatrics medical management
20,013 40.12 23,488 47.90 15,896 35.48
Surgical oncology 16,706 43.93 17,640 52.46 11,723 14.51 Total 4,45,141 727.66 4,93,857 881.33 3,85,469 548.52 Source : State Health Assurance Society, GoM + upto December
Table 10.34 HIV/AIDS cases ('000)
Particulars 2018 2019 2020
Persons screened from risk groups 5,806 7,004 5,166
HIV positive by three tests methods 26 23 13
HIV positivity rate (per cent)@ 0.5 0.3 0.3
AIDS cases 16.13 11.50 8.20
Deaths due to AIDS 3.72 3.52 2.20
@ with respect to persons screened from risk groups Source : Maharashtra State AIDS Control Society

Economic Survey of Maharashtra 2020-21
223
Epidemic Control Programme
10.42 Epidemic control programme deals with monitoring of outbreaks as well as sporadic cases of water borne diseases like cholera, gastro, acute diarrhoea/dysentery, infective hepatitis, typhoid, etc. To control occurrences and deaths due to these diseases, containment measures are taken. The number of affected persons & deaths due to water borne diseases are given in Table 10.36.
Transplantation of Human Organs 10.43 GoI has enacted the Transplantation of Human Organs (THO) Act, 1994 to regulate removal, storage and transplantation of human organs for therapeutic purposes and for prevention of commercial dealings in human organs. As on 31st December, 2020 there are 211 centres registered in the State, of which 111 centres are registered for single organ transplantation and 100 centres for multiple organ transplantation. In addition to this there are 263 centres for eye retrieval, eye bank & cornea transplant. Also 67 hospitals are registered as non transplant organ retrieval centres. Number of transplantations performed are given in Table 10.37.
Table 10.35 Information about blood collection
Year Blood banks (no.)
Total collection
(lakh units)
Of which, voluntarily donated
(lakh units)
No. of cards issued to patients of
Sickle Cell Thalassemia Hemophilia
2018 334 16.56 16.37 611 631 111
2019 341 17.23 17.07 1,169 682 321
2020 345 15.28 15.13 597 465 99
Source : State Blood Transfusion Council, GoM
Table 10.36 Number of affected persons & deaths due to water borne diseases (no.)
Disease 2018 2019 2020 Affected Deaths Affected Deaths Affected Deaths
Cholera 356 2 245 3 7 0 Gastro 61,003 5 55,097 0 23,236 0 Diarrhoea 6,55,347 3 7,38,480 0 4,42,295 0 Infective hepatitis 4,463 1 4,280 0 1,309 0 Typhoid 72,453 0 72,876 0 25,548 0 Leptospirosis 309 13 684 15 502 16 Total 7,93,931 24 8,71,662 18 4,92,961 16
Source : Directorate of Health Services, GoM
Table 10.37 Number of transplantations performed (no.)
Transplantation 2018 2019 2020
Live
a) Kidney 646 593 79
b) Liver 119 123 74
Cadaver
a) Kidney 206 242 19
b) Liver 138 142 24
c) Heart 37 39 4
d) Lungs 6 8 0
e) Cornea 3,813 2,295 242 Source : Directorate of Health Services, GoM

Economic Survey of Maharashtra 2020-21
224
Swargiya Balasaheb Thackeray Road Accident Insurance Scheme 10.44 Swargiya Balasaheb Thackeray Road Accident Insurance Scheme is being implemented in the State from 14th October, 2020 to provide prompt medical services (in golden hour) to road accident victims. Under the scheme, the medical services required to stabilise the condition of a patient in a road accident will be provided for the first 72 hours through 74 treatment packages in the nearest empaneled hospital. Treatment cost up to ` 30,000 per patient per accident will be paid by insurance company to empaneled hospital as per the approved package rates. The scheme will be implemented in insurance mode by State Health Assurance Society.
National Family Health Survey
10.45 National Family Health Survey (NFHS-5) was conducted during 2019-20. Selected indicators for the State as per NFHS-4 and NFHS-5 is given in Table 10.38.
Table 10.38 Selected indicators as per NFHS-4 and NFHS-5 (per cent)
Indicator NFHS-4 (2015-16)
NFHS-5 (2019-20)
Registered pregnancies for which the mother received a Mother and Child Protection card
90.9 95.5
Institutional delivery 90.3 94.7 Birth attained by skilled health personnel 91.1 93.8 Mothers who received postnatal care within 2 days of delivery from a doctor/nurse/other health personnel
78.5 85.4
Registered births of children (< 5 years) 95.1 96.3 Average out-of-pocket expenditure per delivery in a public health facility (₹) 3,578 2,966 All women of age 15-49 years who are anemic 48.0 54.2 Children under 5 years who are stunted (height-for-age)$ 34.4 35.2 Children under 5 years who are wasted (weight-for-height)$ 25.6 25.6 Children under 5 years who are underweight (weight-for-age)$ 36.0 36.1 Blood sugar level - high or very high (>140 mg/dl) or taking medicine to control blood sugar level#
Women NA 12.4 Men NA 13.6 Elevated blood pressure (Systolic ≥ 140 mm of Hg and/or Diastolic ≥ 90 mm of Hg) or taking medicine to control blood pressure
Women NA 23.1 Men NA 24.4 $ Below -2 standard deviations, based on the WHO standard # Random blood sugar level measurement NA Not available Source: International Institute of Population Science
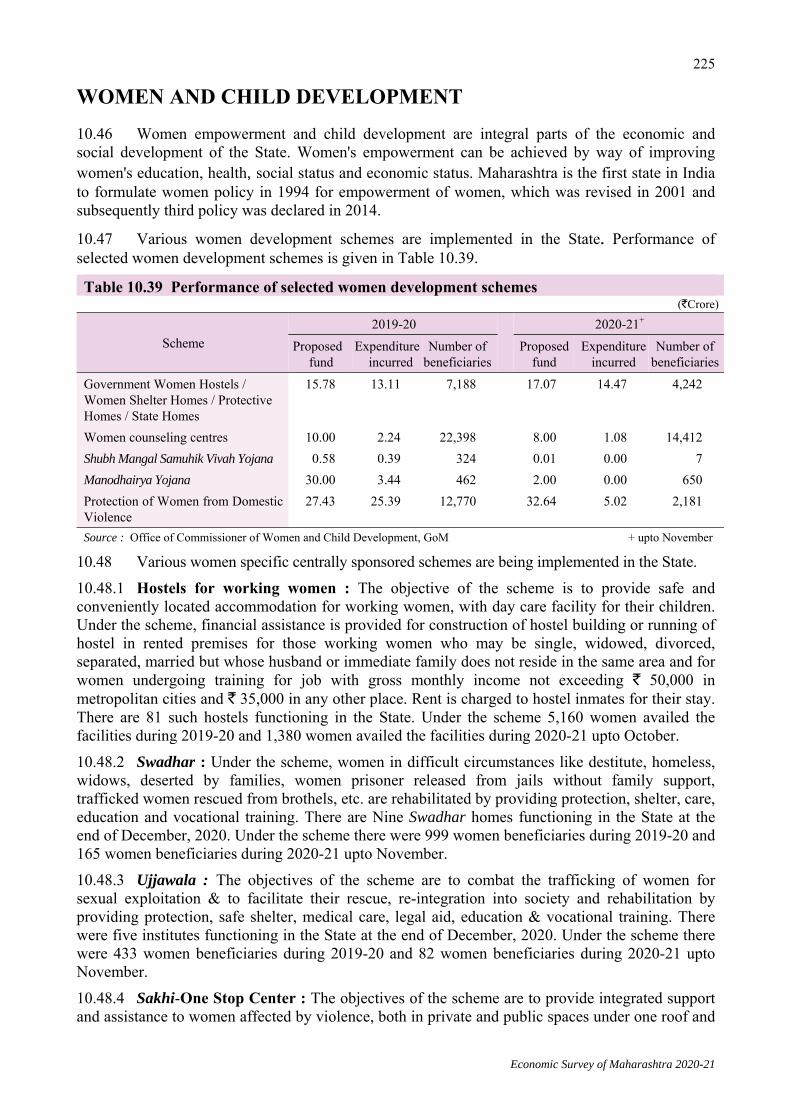
225
Economic Survey of Maharashtra 2020-21
WOMEN AND CHILD DEVELOPMENT 10.46 Women empowerment and child development are integral parts of the economic and social development of the State. Women's empowerment can be achieved by way of improving women's education, health, social status and economic status. Maharashtra is the first state in India to formulate women policy in 1994 for empowerment of women, which was revised in 2001 and subsequently third policy was declared in 2014.
10.47 Various women development schemes are implemented in the State. Performance of selected women development schemes is given in Table 10.39.
Table 10.39 Performance of selected women development schemes (`Crore)
Scheme 2019-20
2020-21+ Proposed
fund Expenditure
incurred Number of
beneficiaries Proposed
fund Expenditure
incurred Number of
beneficiaries Government Women Hostels / Women Shelter Homes / Protective Homes / State Homes
15.78 13.11 7,188 17.07 14.47 4,242
Women counseling centres 10.00 2.24 22,398 8.00 1.08 14,412 Shubh Mangal Samuhik Vivah Yojana 0.58 0.39 324 0.01 0.00 7 Manodhairya Yojana 30.00 3.44 462 2.00 0.00 650 Protection of Women from Domestic Violence
27.43 25.39 12,770 32.64 5.02 2,181
Source : Office of Commissioner of Women and Child Development, GoM + upto November
10.48 Various women specific centrally sponsored schemes are being implemented in the State. 10.48.1 Hostels for working women : The objective of the scheme is to provide safe and conveniently located accommodation for working women, with day care facility for their children. Under the scheme, financial assistance is provided for construction of hostel building or running of hostel in rented premises for those working women who may be single, widowed, divorced, separated, married but whose husband or immediate family does not reside in the same area and for women undergoing training for job with gross monthly income not exceeding ` 50,000 in metropolitan cities and ` 35,000 in any other place. Rent is charged to hostel inmates for their stay. There are 81 such hostels functioning in the State. Under the scheme 5,160 women availed the facilities during 2019-20 and 1,380 women availed the facilities during 2020-21 upto October. 10.48.2 Swadhar : Under the scheme, women in difficult circumstances like destitute, homeless, widows, deserted by families, women prisoner released from jails without family support, trafficked women rescued from brothels, etc. are rehabilitated by providing protection, shelter, care, education and vocational training. There are Nine Swadhar homes functioning in the State at the end of December, 2020. Under the scheme there were 999 women beneficiaries during 2019-20 and 165 women beneficiaries during 2020-21 upto November. 10.48.3 Ujjawala : The objectives of the scheme are to combat the trafficking of women for sexual exploitation & to facilitate their rescue, re-integration into society and rehabilitation by providing protection, safe shelter, medical care, legal aid, education & vocational training. There were five institutes functioning in the State at the end of December, 2020. Under the scheme there were 433 women beneficiaries during 2019-20 and 82 women beneficiaries during 2020-21 upto November. 10.48.4 Sakhi-One Stop Center : The objectives of the scheme are to provide integrated support and assistance to women affected by violence, both in private and public spaces under one roof and
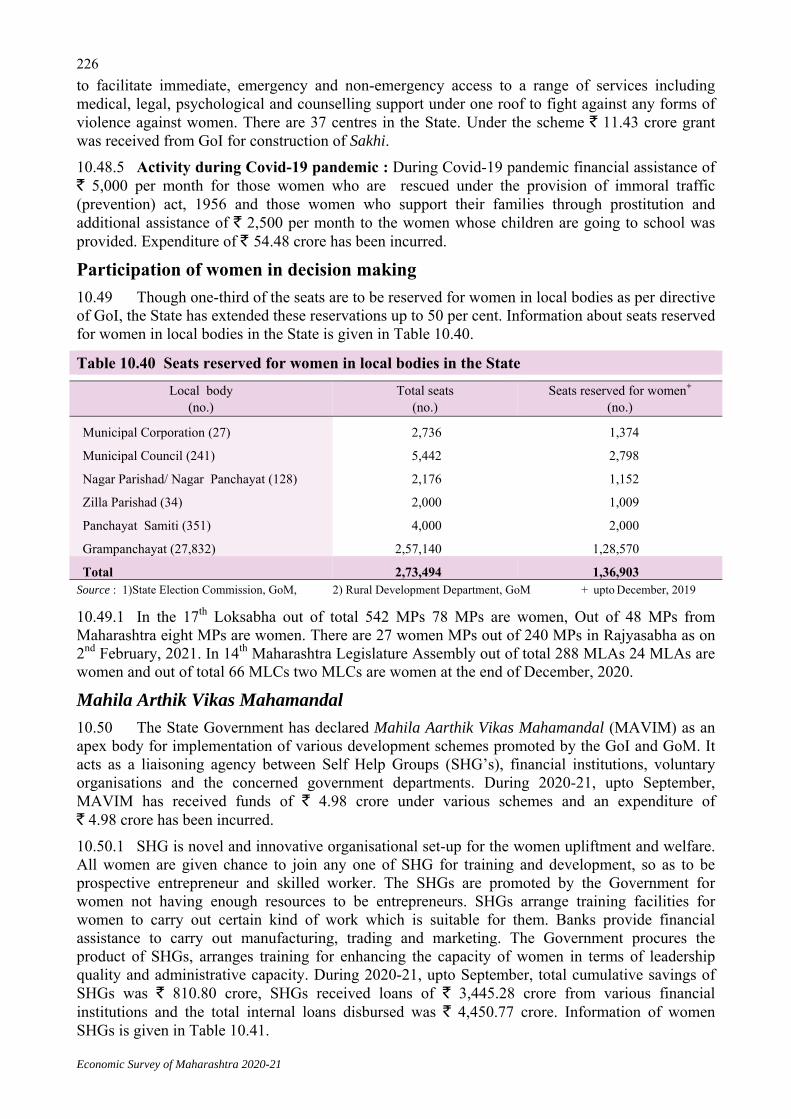
226
Economic Survey of Maharashtra 2020-21
to facilitate immediate, emergency and non-emergency access to a range of services including medical, legal, psychological and counselling support under one roof to fight against any forms of violence against women. There are 37 centres in the State. Under the scheme ` 11.43 crore grant was received from GoI for construction of Sakhi. 10.48.5 Activity during Covid-19 pandemic : During Covid-19 pandemic financial assistance of ` 5,000 per month for those women who are rescued under the provision of immoral traffic (prevention) act, 1956 and those women who support their families through prostitution and additional assistance of ` 2,500 per month to the women whose children are going to school was provided. Expenditure of ` 54.48 crore has been incurred. Participation of women in decision making 10.49 Though one-third of the seats are to be reserved for women in local bodies as per directive of GoI, the State has extended these reservations up to 50 per cent. Information about seats reserved for women in local bodies in the State is given in Table 10.40. Table 10.40 Seats reserved for women in local bodies in the State
Local body (no.)
Total seats (no.)
Seats reserved for women+ (no.)
Municipal Corporation (27) 2,736 1,374
Municipal Council (241) 5,442 2,798
Nagar Parishad/ Nagar Panchayat (128) 2,176 1,152
Zilla Parishad (34) 2,000 1,009
Panchayat Samiti (351) 4,000 2,000
Grampanchayat (27,832) 2,57,140 1,28,570
Total 2,73,494 1,36,903 Source : 1)State Election Commission, GoM, 2) Rural Development Department, GoM + upto December, 2019
10.49.1 In the 17th Loksabha out of total 542 MPs 78 MPs are women, Out of 48 MPs from Maharashtra eight MPs are women. There are 27 women MPs out of 240 MPs in Rajyasabha as on 2nd February, 2021. In 14th Maharashtra Legislature Assembly out of total 288 MLAs 24 MLAs are women and out of total 66 MLCs two MLCs are women at the end of December, 2020. Mahila Arthik Vikas Mahamandal 10.50 The State Government has declared Mahila Aarthik Vikas Mahamandal (MAVIM) as an apex body for implementation of various development schemes promoted by the GoI and GoM. It acts as a liaisoning agency between Self Help Groups (SHG’s), financial institutions, voluntary organisations and the concerned government departments. During 2020-21, upto September, MAVIM has received funds of ` 4.98 crore under various schemes and an expenditure of ` 4.98 crore has been incurred. 10.50.1 SHG is novel and innovative organisational set-up for the women upliftment and welfare. All women are given chance to join any one of SHG for training and development, so as to be prospective entrepreneur and skilled worker. The SHGs are promoted by the Government for women not having enough resources to be entrepreneurs. SHGs arrange training facilities for women to carry out certain kind of work which is suitable for them. Banks provide financial assistance to carry out manufacturing, trading and marketing. The Government procures the product of SHGs, arranges training for enhancing the capacity of women in terms of leadership quality and administrative capacity. During 2020-21, upto September, total cumulative savings of SHGs was ` 810.80 crore, SHGs received loans of ` 3,445.28 crore from various financial institutions and the total internal loans disbursed was ` 4,450.77 crore. Information of women SHGs is given in Table 10.41.

227
Economic Survey of Maharashtra 2020-21
Table 10.41 Information of women SHGs (no.)
Division Sector Villages/ Cities
2018-19 2019-20 2020-21+ SHGs Members SHGs Members SHGs Members
Konkan Rural 968 10,751 1,31,392 10,755 1,31,547 10,848 1,32,529 Urban 36 5,151 56,468 5,822 63,398 6,900 64,360 Total 1,004 15,902 1,87,860 16,577 1,94,945 17,748 1,96,889 Nashik Rural 1,600 9,241 1,09,465 9,346 1,09,730 9,530 1,11,618 Urban 43 5,570 57,404 6,539 67,303 7,919 75,098 Total 1,643 14,811 1,66,869 15,885 1,77,033 17,449 1,86,716 Pune Rural 1,039 14,325 1,85,823 14,929 1,92,729 15,667 2,01,415 Urban 48 5,454 66,051 6,290 76,796 7,666 91,244 Total 1,087 19,779 2,51,874 21,219 2,69,525 23,333 2,92,659 Aurangabad Rural 2,510 14,626 1,75,926 14,794 1,77,834 15,086 1,81,240 Urban 57 6,841 76,142 8,041 88,537 9,477 96,964 Total 2,567 21,467 2,52,068 22,835 2,66,371 24,563 2,78,204 Amravati Rural 1,942 16,915 1,87,020 16,996 1,87,862 17,083 1,88,892 Urban 42 4,202 41,971 4,744 47,371 5,944 61,585 Total 1,984 21,117 2,28,991 21,740 2,35,233 23,027 2,50,477 Nagpur Rural 2,436 15,889 1,99,751 16,004 2,00,786 16,239 2,03,135 Urban 33 3,822 40,284 4,243 44,694 5,038 46,220 Total 2,469 19,711 2,40,035 20,247 2,45,480 21,277 2,49,355 Regional NGOs
Rural - 13,621 1,69,781 13,621 1,69,781 13,621 1,69,781 Rural 10,495 95,368 11,59,158 96,445 11,70,269 98,074 11,88,610 Urban 259 31,040 3,38,320 35,679 3,88,099 42,944 4,35,471 Total 10,754 1,26,408 14,97,478 1,32,124 15,58,368 1,41,018 16,24,081 Source : MAVIM, GoM + upto September
10.50.2 Community Managed Resource Centre : The Community Managed Resource Centre (CMRC) registered under Society Act, 1860 is a group of 150 to 200 SHGs formed in a cluster of around 20 villages within the radius of 25 km. The role of the CMRC is to provide primary services to SHGs such as skill development training for livelihood, bank linkages, provide market to produced goods for empowerment of women. There are 361 CMRCs functioning in the State upto November, 2020. 10.50.3 Tejashree Financial Service Scheme : Tejashree financial service scheme is a loan redemption scheme being implemented through SHGs since 2018-19 for ultra-poor debt ridden women. Under this scheme one lakh women will get individual loan upto ` 10,000, ten thousand debt ridden women will get financial assistance of ` 20,000 for repayment of loan and working capital upto ` two lakh will be made available to 300 women social enterprises. This scheme has timeline of five years. Total loan of ` 13.19 crore is distributed under the scheme. About 3,000 women started new enterprises or expanded their enterprises.

228
Economic Survey of Maharashtra 2020-21
Maharashtra State Commission for Women 10.51 The Maharashtra State Commission for women is a statutory body which regularly holds hearings / public hearings on complaints filed by women victims, provides free legal services and counselling. An innovative initiative called ‘Women Commission at your doorstep’ was implemented extensively by organising divisionwise and districtwise public hearing, with primary objective to give victim women a platform to resolve their issues and interact unhesitantly. It also organises workshops, training programmes and seminars on women related issues viz. self defence programmes, awareness about gender equality, legal literacy, cyber crime, implementation of Prevention of Domestic Violence Act, 2005, Sexual harassment of Women at Workplace (Prevention, prohibition & redressal) Act, 2013, rehabilitation of acid attack victims, preparation of guidelines for crèche, etc. During 2019-20, an expenditure of ₹ 5.94 crore was incurred and during 2020-21 upto November, an expenditure of ` 2.59 crore is incurred on these activities. Crimes against women 10.52 ‘Crime against Women’ is direct or indirect physical or mental cruelty to women. Crimes reported in which women are victims are given in Table 10.42. Child Development 10.53 The State Child Policy for the children’s rights, children care & protection and development was announced in 2014. The main objectives of the child policy are to take appropriate, constructive and reformative measures to remove inequality, discrimination, injustice occurring on children due to social status, to give rights to every child for love & care, protection, co-operation and child rearing in a family or family like environment. Various children development schemes are implemented in the State. 10.53.1 Integrated Child Protection Scheme: Programmes such as shelter homes, special adoption resource agencies, child welfare committees, juvenile justice boards, district child protection society, State child protection society, Government / NGO children homes, observation homes, after care homes, etc. are included under an umbrella scheme Integrated Child Protection Scheme (ICPS). Component wise expenditure incurred and beneficiaries under ICPS are given in the Table 10.43.
Table 10.43 Component wise expenditure incurred on beneficiaries under Integrated Child Protection Scheme
(` Lakh) Component
No. of Units
2019-20 2020-21+ Expenditure
incurred No. of
beneficiaries Expenditure
incurred No. of
beneficiaries Shelter homes 3 18.94 121 0.00 107 Adoption agencies 17 82.26 190 13.21 149 Government children homes 19 1,316.04 873 763.64 322 Government observation homes 15 566.70 198 328.84 78 Government after care homes 6 789.87 183 150.78 120 NGO observation homes 40 722.76 1,398 866.35 786 NGO Children homes 411 3,476.12 17,440 2,474.13 10,428 Total 511 6,972.69 20,403 4,596.95 11,990 Source : Commissionerate of Women and Child Development, GoM + upto November
Table 10.42 Crimes reported in which women are victims
(no.) Type of offence 2018 2019 2020+
Rape 4,974 5,416 3,970 Kidnapping & abduction 6,825 6,906 5,327 Dowry deaths 200 196 192 Cruelty by husband & relatives 6,862 8,430 4,886 Molestation 14,070 13,632 10,561 Sexual harassment 1,127 1,074 829 Immoral Trafficking 200 152 108 Other 1,243 1,306 713 Total 35,501 37,112 26,586 Source : Crime Investigation Department, GoM + upto October

229
Economic Survey of Maharashtra 2020-21
10.53.2 Observation homes: Children in conflict with law and detained by police for judicial inquiry are admitted in these homes as per orders of Juvenile Justice Boards. Residential, medical, educational, counselling, vocational guidance, etc. facilities are provided to the inmates. There are 15 Government observation homes in 12 districts with intake capacity of 550 children upto December, 2020. In addition, there are 40 NGO observation homes (16 for girls and 24 for boys) with intake capacity of 2,049 children. The Government provides grants-in-aid of ` 2,000 per month per inmate. 10.53.3 Children homes: Children upto 18 years of age who need care & protection such as orphan, abandoned, missing, HIV / AIDS affected in need of special care, endangered & oppressed are admitted in these homes. They are rehabilitated by providing facilities like food, clothes, shelter, medical help, counselling, education, training and recreation. There are 19 Government children homes with intake capacity of 975 children. In addition, there are 411 NGO aided children homes with total intake capacity of 21,525 and 63 NGO un-aided children homes with intake capacity of 3,840 children. The Government provides ` 2,000 per month per inmate to these homes as grant-in-aid. Under the scheme, during 2019-20 an expenditure of ` 34.76 crore was incurred on 17,440 inmates and during 2020-21 upto November, an expenditure of ` 24.74 crore is incurred on 10,428 inmates. 10.53.4 After care homes: Children have to leave children homes after completing 18 years of age. However, some of them are not fully rehabilitated due to incomplete training or education and are in need of food, clothes and shelter. Such children are rehabilitated in after care homes. Facilities such as residence, food, clothes, education, medical treatment, counselling, vocational guidance, etc. are provided to the inmates till completion of education or getting employment. There are six Government and three NGO after care homes in the State with total intake capacity of 600 and 110 respectively. The Government provides grant-in-aid of ` 2,000 per month per inmate to these homes. 10.53.5 Foster care scheme (Bal Sangopan Yojana): The scheme is being implemented in the State through NGOs to provide family life to orphan, destitute, needy and homeless children. There are 111 NGOs in the State upto November, 2020. Under the scheme, foster care was given to 12,961 children during 2019-20 and the expenditure incurred was ` 2.88 crore. During 2020-21, foster care is given to 12,961 children and expenditure incurred is ` 5.76 crore upto November. 10.53.6 Chacha Nehru Bal Mahostav: Chacha Nehru Bal Mahotsav is organised every year in the second week of November in each district and region to bring forth hidden qualities of all children admitted in Government / NGO care homes and develop feeling of brotherhood and team spirit among them. Competitions like sports, games, elocution, etc. are organised and winners are awarded. Every year the grants of ` five lakh for each district and ` 5.82 lakh for each region are sanctioned. Under the scheme, during 2019-20, an expenditure of ` 1.27 crore was incurred. Integrated Child Development Services 10.54 The objective of the Integrated Child Development Services (ICDS) programme is to provide integrated services for proper growth & development of pre-school children in rural, tribal and slum areas. This programme is implemented through 97,475 anganwadis, 13,011 mini anganwadis and 553 Child Development Projects. Nutrition programme 10.54.1 The ‘Supplementary Nutrition Programme’ (SNP) is implemented under ICDS to meet the minimum nutritional requirements of children, pregnant women & lactating mothers and to provide health care to them. The SNP aims to provide nutritious diet to the children below six years of age

230
Economic Survey of Maharashtra 2020-21
and improve the health of pregnant women & lactating mothers belonging to the deprived sections of the society. It aims to minimise infant mortality by controlling malnourishment in remote and sensitive area. During 2019-20 an expenditure of ` 1,511.11 crore was incurred on 66.93 lakh beneficiaries and during 2020-21 upto November, an expenditure of ₹ 947.46 crore is incurred on 72.86 lakh beneficiaries. During Covid-19 lockdown instead of cooked food, foodgrains and grocery were provided to all the beneficiaries in the age group of 3-6 years. Apart from these, migrant children of age 3-6 years were also benefited under the scheme. As per the World Health Organisation standards, percentage of children of age 0-5 years in the state according to nutrition grades is given in Table 10.44. Table 10.44 Percentage of children of age 0-5 years in the State according to nutrition grades
Year Area Children
weighed (no.)
Percentage of children
Normal Moderately Under weight
Severely Under weight
2018-19 Rural 38,64,180 92.8 6.2 1.0 Tribal 8,47,962 81.5 15.3 3.2 Urban 10,60,815 85.5 13.7 0.8 Total 57,72,957 89.8 8.9 1.3
2019-20 Rural 38,96,250 91.6 7.1 1.3 Tribal 8,50,963 79.0 16.8 4.2 Urban 10,24,442 83.1 14.6 2.3 Total 57,71,655 88.2 9.9 1.9
2020-21+
Rural 37,92,195 91.6 7.1 1.3 Tribal 8,81,367 77.5 17.6 4.9 Urban 6,51,314 84.7 13.0 2.3 Total 53,24,876 88.4 9.6 2.0
Source : Commissionerate of ICDS, GoM + upto July 10.54.2 Poshan Abhiyan - The National Nutrition Mission is being implemented in all the districts under the Integrated Child Development Services Scheme. This Abhiyan includes reducing malnutrition by six per cent (about two per cent per year), reducing anaemia by nine per cent (about three per cent per year) in infants, adolescent girls & women and by reducing the proportion of low birth weight babies by six per cent (about two per cent per year). During 2019-20 an expenditure of ₹ 256 crore was incurred, in 2020-21 upto November, an expenditure of ₹ 20.40 crore is incurred. 10.54.3 Baby Care Kit – Baby care Kit bag upto ₹ 2,000 for newborns are provided to mother who have registered and delivered at PHC/Government hospital at first delivery. During 2019-20, an expenditure of ₹ 44.75 crore was incurred on 2.64 lakh baby care kits and during 2020-21 upto November, an expenditure of ₹ 35.25 crore was incurred on 1.36 lakh baby care kits. 10.55 Various State and Central level schemes for child development are being implemented in the State. 10.55.1 Scheme for adolescent girls : The scheme for adolescent girls is being implemented across 553 ICDS projects in the state from February, 2019 with an aim to encourage to rejoin for school drop out girls aged 11 to 14 years. The main objective of the scheme is to facilitate, educate and empower adolescent girls to become self-reliant and aware citizens. All adolescent girls are also given micronutrient food, take home ration, Iron & Folic Acid supplementation, de-worming tablets, regular health check-ups and referral services in anganwadis. Under the Scheme, during 2019-20, an expenditure of ` 10.84 crore was incurred on 55,125 beneficiaries. During 2020-21 upto December, an expenditure of ` 0.15 crore is incurred on 50,000 beneficiaries.
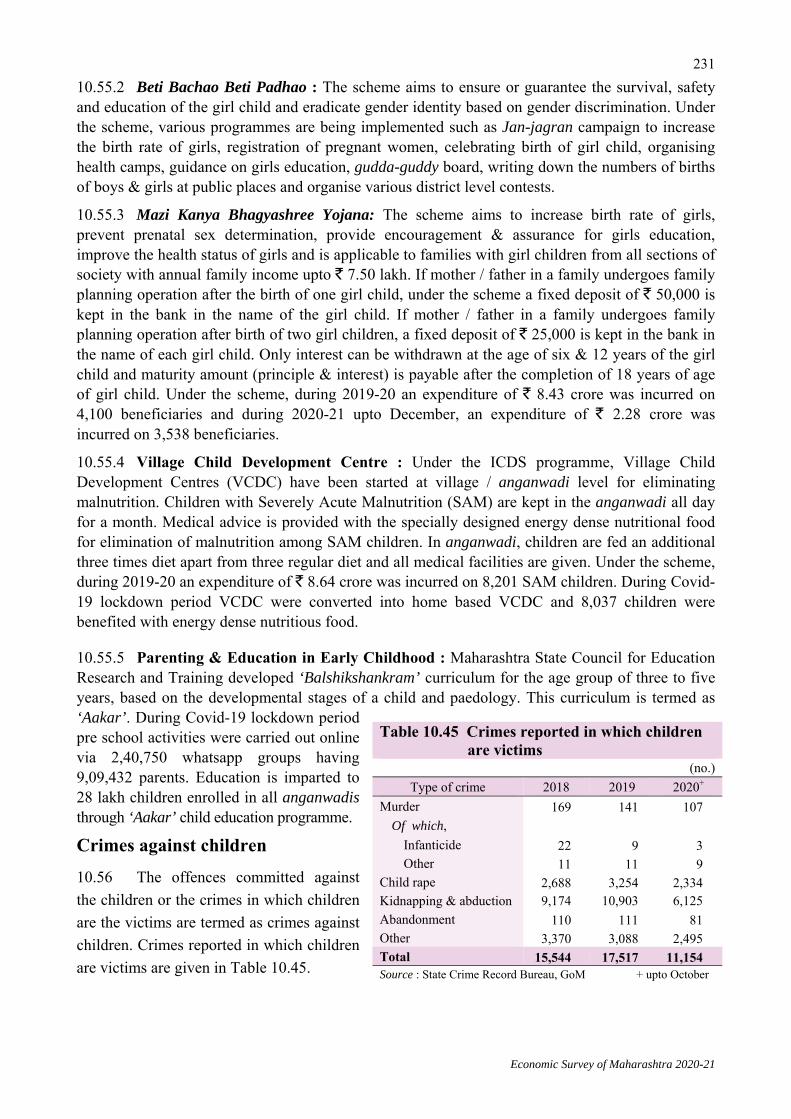
231
Economic Survey of Maharashtra 2020-21
10.55.2 Beti Bachao Beti Padhao : The scheme aims to ensure or guarantee the survival, safety and education of the girl child and eradicate gender identity based on gender discrimination. Under the scheme, various programmes are being implemented such as Jan-jagran campaign to increase the birth rate of girls, registration of pregnant women, celebrating birth of girl child, organising health camps, guidance on girls education, gudda-guddy board, writing down the numbers of births of boys & girls at public places and organise various district level contests. 10.55.3 Mazi Kanya Bhagyashree Yojana: The scheme aims to increase birth rate of girls, prevent prenatal sex determination, provide encouragement & assurance for girls education, improve the health status of girls and is applicable to families with girl children from all sections of society with annual family income upto ` 7.50 lakh. If mother / father in a family undergoes family planning operation after the birth of one girl child, under the scheme a fixed deposit of ` 50,000 is kept in the bank in the name of the girl child. If mother / father in a family undergoes family planning operation after birth of two girl children, a fixed deposit of ` 25,000 is kept in the bank in the name of each girl child. Only interest can be withdrawn at the age of six & 12 years of the girl child and maturity amount (principle & interest) is payable after the completion of 18 years of age of girl child. Under the scheme, during 2019-20 an expenditure of ` 8.43 crore was incurred on 4,100 beneficiaries and during 2020-21 upto December, an expenditure of ` 2.28 crore was incurred on 3,538 beneficiaries. 10.55.4 Village Child Development Centre : Under the ICDS programme, Village Child Development Centres (VCDC) have been started at village / anganwadi level for eliminating malnutrition. Children with Severely Acute Malnutrition (SAM) are kept in the anganwadi all day for a month. Medical advice is provided with the specially designed energy dense nutritional food for elimination of malnutrition among SAM children. In anganwadi, children are fed an additional three times diet apart from three regular diet and all medical facilities are given. Under the scheme, during 2019-20 an expenditure of ` 8.64 crore was incurred on 8,201 SAM children. During Covid-19 lockdown period VCDC were converted into home based VCDC and 8,037 children were benefited with energy dense nutritious food.
10.55.5 Parenting & Education in Early Childhood : Maharashtra State Council for Education Research and Training developed ‘Balshikshankram’ curriculum for the age group of three to five years, based on the developmental stages of a child and paedology. This curriculum is termed as ‘Aakar’. During Covid-19 lockdown period pre school activities were carried out online via 2,40,750 whatsapp groups having 9,09,432 parents. Education is imparted to 28 lakh children enrolled in all anganwadis through ‘Aakar’ child education programme. Crimes against children 10.56 The offences committed against the children or the crimes in which children are the victims are termed as crimes against children. Crimes reported in which children are victims are given in Table 10.45.
Table 10.45 Crimes reported in which children are victims
(no.) Type of crime 2018 2019 2020+
Murder 169 141 107 Of which, Infanticide 22 9 3 Other 11 11 9 Child rape 2,688 3,254 2,334 Kidnapping & abduction 9,174 10,903 6,125 Abandonment 110 111 81 Other 3,370 3,088 2,495 Total 15,544 17,517 11,154 Source : State Crime Record Bureau, GoM + upto October

Economic Survey of Maharashtra 2020-21
232
EMPLOYMENT AND POVERTY 10.57 Eradicating poverty is one of the greatest challenge and unemployment is one of the main reason for poverty. ‘Promote sustained, inclusive and sustainable economic growth, full and productive employment and decent work for all’ is one of the Sustainable Development Goals.
EMPLOYMENT 10.58 The main sources for data on employment status are Population Census, Economic Census, Periodic Labour Force Survey (PLFS) and National Sample Survey. The data on employment in the factories (registered under Factory Act, 1948) is available through statutory returns. Besides this, data on employment from public and private sector establishments is collected under Employment Market Information Programme. Employment as per Population Census 10.59 As per Population Census 2011, there were 4.94 crore workers in the State, of which 34 per cent were females. As per Census 2011, the percentage of main workers working in agriculture and allied activities sector was 52.1 per cent. As per Census 2011, the percentage of female main workers was 31.5 per cent and that of female marginal workers was 53.6 per cent. The percentage distribution of workers by industrial category is given in Table 10.46 and the percentage distribution of workers by occupation is given in Table 10.47. Economic classification of workers as per Population Census 2011 is given in Annexure 10.8.
Table 10.46 Percentage distribution of workers in the State by industrial category
Industrial category Census 2011 Census 2001 Main Marginal Main Marginal
Agriculture and allied activities 52.1 62.8 53.5 77.2 Mining and Quarrying 0.3 0.2 0.4 0.2 Manufacturing 11.8 7.6 13.1 8.6 Electricity, Gas and Water Supply 0.4 0.1 0.5 0.1 Construction 4.6 5.3 4.1 3.7 Trade, Repairs, Transportation & Storage, Communication 13.7 6.1 14.8 5.2 Financial and Real Estate Services 1.9 0.6 3.8 1.5 Public Administration and Defence 5.3 1.8 9.8* 3.5* Others 9.9 15.5 Total Workers (in crore) 4.38 0.57 3.46 0.64 Source : ORGI * bifurcated data not available
Table 10.47 Percentage distribution of workers in the State by type of occupation (per cent)
Type of Occupation Census 2011 Census 2001 Male Female Total Male Female Total
Legislators, Senior officials and Managers 9.0 4.2 8.0 4.3 1.7 3.8 Professionals 6.0 7.3 6.3 5.1 6.3 5.3 Technicians and Associate professionals 6.6 13.4 8.1 6.0 12.1 7.1 Clerks 6.4 6.8 6.5 5.9 6.5 6.0 Service workers and Shop & market sales workers 13.4 8.3 12.3 20.2 12.2 18.8 Skilled agricultural and fishery workers 1.5 1.6 1.5 2.7 5.9 3.3 Craft and related trades workers 17.5 10.7 16.0 22.3 18.9 21.7 Plant, machine operators and assemblers 12.1 2.7 10.0 13.7 3.0 11.8 Elementary occupations 17.8 18.8 18.1 16.3 24.0 17.7 Workers not classified by occupations 9.6 26.1 13.2 3.4 9.4 4.5
Source : ORGI

Economic Survey of Maharashtra 2020-21
233
Employment as per Economic Census 10.60 The Sixth Economic Census (2013) covered all establishments excluding establishments engaged in crop & plantation, public administration, defence, compulsory social security services, activities of household as employers of domestic personnel, activities of extra territorial organisation & bodies and illegal activities. Number of establishments and employment by type of establishments in the State as per fifth and sixth economic census is given in Table 10.48 The field work for seventh economic census is in progress.
Employment as per Periodic Labour Force Survey 10.61 The labour force data always remains crucial for planning and policy formulation. National Statistical Office of GoI launched Periodic Labour Force Survey (PLFS) in April, 2017. The PLFS is designed with two major objectives for measurement of employment and unemployment. The first is to measure the dynamics in labour force participation and employment status in a short time interval of three months for urban areas only in the Current Weekly Status (CWS). Second one is to measure the labour force estimates for both rural and urban areas. Thus, in every quarter, PLFS brings out the key labour force indicators viz., Worker Population Ratio (WPR), Labour Force Participation Rate (LFPR), Unemployment Rate (UR). 10.61.1 The age-group wise Worker Population Ratio (WPR) for 2019-20 according to current weekly status for urban areas in the State is given in Table 10.49.
Table 10.49 Worker population ratio (WPR) for 2019-20 according to CWS for urban areas (per cent)
Period Male Female Total
15 to 29 yrs
15 yrs & above
15 to 29 yrs
15 yrs & above
15 to 29 yrs
15 yrs & above
April-June, 2019 49.7 68.2 15.0 19.0 32.9 44.1 July-September, 2019 50.6 69.3 18.0 21.8 34.9 45.9 October-December, 2019 50.3 69.9 17.7 22.1 34.7 46.4 January-March, 2020 47.5 68.7 17.2 22.7 33.7 46.0 Source : National Statistical Office, GoI
10.61.2 The sectorwise percentage distribution of persons working according to current weekly status for age-group 15 yrs & above, for urban areas is given in Table 10.50.
Table 10.48 Number of establishments and employment therein as per fifth and sixth Economic Census in the State
( Lakh)
Particulars Fifth Economic@
Census - 2005 Sixth Economic Census - 2013
Total establishments 41.53 61.37 Agricultural establishments 6.04 15.92 Non-agricultural establishments 35.49 45.46 Persons employed in total establishments 105.27 145.12 Persons employed in agricultural establishments 10.51 26.39 Persons employed in Non-agricultural establishments 94.76 118.73 @ For meaningful comparison of Fifth and Sixth Economic Censuses public administration, defence & compulsory social security service activities reported in Fifth economic census are not considered Source : DES, GoM

Economic Survey of Maharashtra 2020-21
234
Table 10.50 Percentage distribution of working persons according to CWS for age group 15 yrs & above for urban areas
(per cent)
Sector
2018-19 2019-20
Maharashtra India
Maharashtra India Apr-Jun
2019
Jul-Sep
2019
Oct-Dec 2019
Jan-Mar 2020
Apr- Jun
2019
Jul-Sep
2019
Oct-Dec 2019
Jan-Mar 2020
Agriculture & allied activity
3.4 5.1 3.1 2.9 2.7 3.0 4.9 5.2 5.1 5.1
Industry 30.2 33.5 30.1 30.1 30.9 29.8 33.2 32.8 33.2 32.5
Services 66.4 61.4 66.7 67.1 66.4 67.2 62.0 62.0 61.7 62.4 Source : National Statistical Office, GoI
10.61.3 The age group wise quarterly unemployment rate during 2019-20 according to current weekly status for urban areas in the State is given in Table 10.51.
Table 10.51 Quarterly unemployment rate for 2019-20 according to CWS for urban areas (per cent)
Period Male Female Total
15 to 29 yrs
15 yrs & above
15 to 29
yrs 15 yrs &
above
15 to 29 yrs
15 yrs & above
April-June, 2019 15.1 6.5 23.3 11.4 17.1 7.6 July-September, 2019 13.5 5.7 15.3 6.4 13.9 5.8 October-December, 2019 12.4 5.2 14.5 6.6 12.9 5.5 January-March, 2020 12.5 5.6 17.7 8.0 13.8 6.2 Source : National Statistical Office, GoI
10.61.4 The unemployment rates for 2017-18 and 2018-19 according to current weekly status of the selected states is given in Table 10.52.
Table 10.52 The unemployment rates according to CWS in selected states (per cent)
State 2017-18 2018-19
Rural Urban Rural Urban Andhra Pradesh 8.3 8.7 9.4 9.4 Gujarat 5.6 4.6 3.6 3.6 Karnataka 5.5 7.3 5.2 6.0 Madhya Pradesh 7.6 10.6 8.2 10.5 Maharashtra 6.8 9.1 9.2 9.2 Rajasthan 9.4 9.3 8.3 11.6 Tamil Nadu 12.6 9.4 10.5 9.2 Telangana 7.2 10.9 9.3 12.2 Uttar Pradesh 9.4 12.1 7.9 12.7 All-India 8.5 9.6 8.4 9.5 Source : National Statistical Office, GoI

Economic Survey of Maharashtra 2020-21
235
Factory employment 10.62 During 2020, the average daily employment in 30,928 working factories registered under Factory Act, 1948 was about 28.07 lakh. Of the total working factories, 33 per cent had 50 or more workers. Industry wise percentage distribution of average daily employment in the State is given in Table 10.53. The average daily employment in different industries in the State is given in Annexure 10.9. Details of working factories & factory employment therein is given in Annexure 10.10.
Employment Market Information Programme 10.63 The main objective of Employment Market Information (EMI) Programme is to provide information about the structure of employment in public and private sectors for monitoring the changes in the level of employment. The number of establishments in public and private sectors and employment therein is collected quarterly under EMI Programme. It covers establishments employing 25 or more employees in Greater Mumbai area and 10 or more employees in other areas of the State. The total employment in the State for the year 2020 upto September, was 73.87 lakh, of which 27.6 per cent were females. Of the total employment 31 per cent were in public sector. The employment in public and private sector under EMI Programme is given in Table 10.54. Table 10.54 Employment as per Employment Market Information Programme
('000)
Year Public Sector Private Sector Total Male Female Total Male Female Total Male Female Total
2018 1,667 616 2,283 3,644 1,423 5,067 5,311 2,039 7,350 2019 1,647 591 2,238 3,635 1,423 5,058 5,283 2,014 7,296 2020+ 1,660 623 2,283 3,688 1,415 5,103 5,349 2,038 7,387
Source : Commissionerate of Skill development, Employment & Entrepreneurship, GoM +upto September
Employment as per ‘Employees Provident Fund Organization’ 10.64 Since April, 2018 Ministry of Statistics & Programme Implementation (MoSPI), GoI has been bringing out the employment related statistics using information on the number of subscriber under Employees’ Provident Fund (EPF) Scheme. EPF is applicable to the establishments having more than 20 workers. The total employees registered newly for EPF in the State for 2018-19 and 2019-20 were 15.76 lakh and 17.44 lakh respectively, whereas in 2020-21 upto September new employees registered were 2.5 lakh.
Employment in the State Government services 10.65 As on 1st July, 2020 total sanctioned posts in group A to D in the State Government services was 7.19 lakh, of which 31.2 per cent posts were vacant. Groupwise employees in the State Government Services is given in Table 10.55.
Table 10.53 Percentage distribution of average daily employment
Type of Industry Year
2018 2019 2020
Consumer goods 25.0 24.5 24.2 Reconstruction goods 20.3 18.8 18.9 Capital goods 11.2 11.2 10.7 Others 43.4 45.5 46.2 All 100.0 100.0 100.0 Source : Directorate of Industrial Safety and Health, GoM
Table 10.55 Groupwise employees in the State Government services
(As on 1st July, 2020) (Lakh)
Group Posts* Sanctioned Filled in Vacant
A 0.41 0.26 0.15 B 0.73 0.44 0.29 C 4.77 3.51 1.26 D 1.28 0.74 0.54 A to D 7.19 4.95 2.24 E# 2.33 2.33 -- Total 9.95 7.27 2.68
# Employees on daily wages, honorarium, aunshkalin and pay scale not applicable * Provisional Note : Figures may not add up to totals due to rounding Source : DES, GoM

Economic Survey of Maharashtra 2020-21
236
Skill development, employment and entrepreneurship guidance centres 10.66 Skill development, employment and entrepreneurship guidance centres have been established in the State to counsel, guide & help the jobseekers regarding employment & self-employment. In all, 50 such centres are functioning in the State, of which 36 are at district level, six in universities, eight for tribal candidates. This includes one special centre for differently abled persons. 10.66.1 The number of persons on the live register of these centres upto December, 2020 was 53.66 lakh. During 2020 upto December, number of persons registered with these centres was 5.75 lakh and about 1.99 lakh persons were placed against 8.01 lakh notified vacancies. The details of notified vacancies, placement and persons on the live register according to educational qualification are given in Annexure 10.11 and Annexure 10.12 respectively.
Employment generation and Skill development programmes 10.67 Various employment generation and skill development programmes are being implemented by GoI as well as GoM. Promotion of employment programmes 10.67.1 The State Government is implementing following programmes for promotion of employment in the State. Employment promotion programme: On-the-Job training or other practical training to
educated unemployed persons. Apprenticeship training programme: Supply of skilled manpower to industries through
apprenticeship training. Entrepreneurial development training programme: Motivate and train the educated
unemployed youths for self-employment. Beneficiaries and expenditure incurred under Employment Promotion Programmes is given in Table 10.56.
Table 10.56 Beneficiaries and expenditure under employment promotion programmes
Programme Beneficiaries (number) Expenditure incurred (` Lakh)
2018-19 2019-20 2020-21+ 2018-19 2019-20 2020-21+ Employment promotion 27,049 27,860 13,683 258.75 195.13 0 Apprenticeship training 27,466 36,660 34,103 1,321.93 1,625.77 1,623.25 Entrepreneurial development training
34,963 34,562 $ 1,262.18 1,288.58 $
$ Stay given due to Covid-19 pandemic + upto December Source : Commissionerate of Skill development, Employment & Entrepreneurship, GoM
Directorate of Vocational Education and Training, GoM Directorate of Industries, GoM
10.67.2 The State is organising job fairs in all districts since 2009-10 to provide employment opportunities to skilled job seekers and also making available skilled manpower to industries. Job fairs organised and employment provided is given in Table 10.57.
Table 10.57 Job fairs organised and employment provided (no.)
Particulars 2018-19 2019-20 2020-21+ Job fairs 171 148 160 Entrepreneurs participated 2,190 1,647 1,647 Youths attended job fairs 1,67,641 84,635 94,112 Employment provided 47,421 22,877 1,807 Source : Commissionerate of Skill development, Employment & Entrepreneurship, GoM + upto December

Economic Survey of Maharashtra 2020-21
237
10.67.3 Maharashtra State Skill Development Society (MSSDS) is the nodal agency for skill development programs in the State. Pradhan Mantri Kaushalya Vikas Yojana centrally sponsored programme implemented through MSSDS to enable the youths to take up industry relevant skill training for helping them in securing a better livelihood and Pramod Mahajan Kaushalya va Udyojkta Vikas Abhiyan was implemented to achieve the goal of ‘Skilled Maharashtra, Employable Maharashtra’ through skill development training to the youths in the age group of 15 to 45 years. The status of various skill development training schemes implemented through MSSDS during 2020-21 is given in Table 10.58.
Mahatma Gandhi National Rural Employment Guarantee Act 10.68 National Rural Employment Guarantee Act is being implemented in all the districts. Under this act, Mahatma Gandhi National Rural Employment Guarantee Scheme and State Funded Scheme are being implemented.
10.68.1 Mahatma Gandhi National Rural Employment Guarantee Scheme-Maharashtra: Under this scheme, employment of 100 days per household in a year to families whose adult member volunteers to do unskilled manual work is guaranteed by GoI. Additional expenditure on wages beyond 100 days per household is borne by GoM. The performance of MGNREGA in the State is given in Table 10.59. Categorywise number of works and expenditure incurred is given in Annexure 10.13.
Table 10.58 Skill development training schemes implemented through MSSDS during 2020-21
Scheme Enrolled Candidates
Trained Candidates
Candidates Employed
/Self-employed
Percentage of candidates employed
/ Self-employed Centrally Sponsored Scheme Pradhan Mantri Kaushlya Vikas Yojana
i) Industry relevant skill training 61,408 18,150 4,709 25.9 ii) Agri.Project – Mass Skilling 3,34,039 2,60,045 NA NA iii) Agri. Project – Individual Skilling 3,720 783 0 0
Deendayal Antyodaya Yojana – National Urban Livelihood Campaign 2,52,741 1,85,921 1,12,801 60.7
State Sponsored Scheme Pramod Mahajan Kaushalya va Udyojkta Vikas Abhiyan 1,74,704 1,33,210 85,460 64.2
Kiman Kaushalya Vikas Karykram 44,199 22,099 11,502 52.1 Source : Maharashtra State Skill Development Society, GoM NA Not Applicable upto November
Table 10.59 Performance of MGNREGA in the State
Particulars 2018-19 2019-20 2020-21+ No. of households provided employment (Lakh) 17.93 15.37 13.91 Person days generated (Crore) 8.46 6.30 5.03 Average employment per household (days) 47 41 36 Share in employment of (per cent) Scheduled Castes 10.5 10.9 8.8 Scheduled Tribes 20.0 20.9 27.3 Women 44.9 43.4 42.2 Number of works completed 3,22,504 3,31,744 2,16,758 Total expenditure incurred (` Crore) 2,381.56 1,821.20 1,427.54 Cost of generating one day of employment (`) 282 289 284 Source: Planning Department (EGS), GoM + upto January

Economic Survey of Maharashtra 2020-21
238
10.68.2 State Funded Scheme – Farm pond on demand and 11,000 Sinchan Vihir yojana for Nagpur region are being implemented with State Fund. The performance of State Funded Schemes is given in Table 10.60. National Rural Livelihood Mission
10.69 The State Government is implementing Maharashtra State Rural Livelihood Mission (MSRLM-UMED) since 2011 under Nationa Rural Livelihood Mission (NRLM). Building strong institutions for the underlying poor, earning employment opportunities for the self-employed and skilled wages to the poor families and thereby reducing poverty, resulting in significant improvement in their livelihood on a sustainable basis is the objective of this mission. During 2020-21 upto June, total credit linkage of ` 871.52 crore was disbursed to 63,063 Self Help Groups. The performance of this mission is given in Table 10.61.
Deendayal Antyodaya Yojana - National Urban Livelihood Mission 10.70 Deendayal Antyodaya Yojana - National Urban Livelihood Mission (DAY NULM) : The aim of mission is to reduce poverty and vulnerability of the urban poor households by enabling them to access self-employment and skilled wage employment opportunities. From May, 2017 the mission is being implemented in 259 urban local bodies. Under the mission ‘Employment through Skill Training and Placement’ is implemented through MSSDS. The performance of the mission is given in Table 10.62.
Table 10.60 Performance of State funded schemes
Particulars 2020-21^ Farm pond on demand
No. of works completed 1,49,590 No. of works under progress 384 Subsidy disbursed (` Crore) 639.41
11,000 Sinchan Vihir yojan in Nagpur region No. of wells completed 11,411 No. of wells under progress 115 Subsidy disbursed (` Crore) 286.62
Source: Planning Department (EGS), GoM upto November, 2020
Table 10.61 Performance of MSRLM-UMED
Particulars 2018-19 2019-20 2020-21+ SHGs formed (no.) 1,15,395 1,43,715 43,563 Members of SHGs 12,69,345 15,80,865 4,79,193 Grants received (` Crore) 403.43 551.15 256.87 Expenditure incurred (` Crore) 489.97 469.55 196.25 SHGs given loans (no.) 1,01,232 1,14,083 63,063 Credit Linkage (` Crore) 1,527.41 1,800.96 871.52
Source: Rural Development Department, GoM + upto January
Table 10.62 Performance of DAY NULM in the State
Particulars 2018-19 2019-20 2020-21+ Fund Released
GoI (` Crore) 0.00 0.00 50.96 State (` Crore) 0.23 0.35 32.30
Number of SHGs Formed 17,956 14,636 7,282 Revolving Fund for SHG
Number of SHG 15,498 15,513 1,588 Expenditure incurred (` Crore) 15.50 15.51 1.58
Employment through Skill Training & Placement Training Beneficiaries 95,991 63,039 1,180 Placement Beneficiaries 27,189 34,224 1,315 Expenditure incurred (` Crore) 143.41 88.91 11.00
Self-Employment Programme Individual enterprises
Beneficiaries 6,667 4,442 1,382 Expenditure incurred (` Crore) 0.89 2.31 1.00
Group enterprises Beneficiaries 485 315 160 Expenditure incurred (` Crore) 0.12 0.30 0.11
Bank linkage programme Beneficiaries 8,220 11,216 5,693 Expenditure incurred (` Crore) 0.44 6.57 3.15
Source: Directorate of Municipal Administration, GoM + upto January

Economic Survey of Maharashtra 2020-21
239
Prime Minister employment generation programme
10.71 The Prime Minister employment generation programme is a centrally sponsored programme being implemented in the State since 2008-09. The main objective of this programme is to generate employment opportunities through setting up of new self-employment ventures of traditional artisans or unemployed youths to reduce migration to urban areas and increase employment opportunities by increasing wage earning capacity of artisans. The scheme is being implemented by Khadi & Village Industries Commission, Khadi & Village Industries Board and District Industry Centre. During 2019-20 total margin money of ` 108.64 crore was disbursed to 4,303 projects, thereby generating employment of 34,424. During 2020-21 upto November, total margin money of ` 32.75 crore was disbursed to 1,227 projects, thereby generating employment of 16,976.
Seed money scheme
10.72 The scheme is being implemented by GoM to encourage unemployed youth to take up self-employment ventures through industry, service and business by providing soft loans from institutional finance to meet part of the margin money. Local unemployed person or a group of persons of age 18 to 45 years who have passed standard VII are eligible under the scheme. During 2019-20 seed money of ` 11.89 crore was disbursed to 1,084 projects, whereas during 2020-21due to Covid-19 pandemics the stay has given to this scheme.
Industrial Relations
10.73 During 2020, number of work stoppages (strikes and lockouts) were 23, which affected 6,434 employees against 31 work stoppages affecting 9,572 employees in the previous year. The number of person-days lost due to work stoppages during 2020 was 16.21 lakh as against 21.84 lakh during 2019. The details of industrial disputes in the State are given in Annexure 10.14.
Maharashtra Building and Other Construction Workers Welfare Board
10.74 The GoI enacted ‘The Building & Other Construction Workers (Regulation of employment & condition of service) Act, 1996’ with the objective to regulate the employment & condition of service and to provide safety, health & welfare measures for the building & other construction workers. ‘Maharashtra Building and Other Construction Workers welfare Board’ is established to implement this act.
10.74.1 During 2019-20 the number of registered and working construction workers were 7,55,972 whereas in 2020-21 upto February 99,978 construction workers were registered. The number of beneficiaries under various schemes during the period 2014-15 to 2020-21 upto January, 2021 were 48,94,361 and an amount disbersed to these beneficiaries for the same period was ` 2,224.67 crore. In Covid-19 pandemic lockdown, the Board has given financial assistance of ` 5,000 in two installments through DBT to 9,72,234 registered construction workers for their livelihood.

Economic Survey of Maharashtra 2020-21
240
Maharashtra Kamgar Kalyan Mandal 10.75 ‘Maharashtra Kamgar Kalyan Mandal’ is implementing welfare schemes for workers and their families outside the work place. The number of establishments and workers registered and number of beneficiaries of welfare schemes by Mandal are given in Table 10.63. Table 10.63 Establishments and workers registered and beneficiaries of welfare schemes
(in lakh) Year Registered on Mandal Beneficiaries of Welfare Schemes implemented by Mandal
Establishments Workers Workers Family Member Others 2017-18 1.26 44.56 1.86 1.55 0.50 2018-19 1.31 48.56 2.45 1.62 0.51 2019-20 1.36 49.71 2.61 1.60 0.47
POVERTY 10.76 The erstwhile Planning Commission periodically estimated poverty lines and poverty ratios on the basis of large sample surveys on ‘Household Consumer Expenditure’ conducted quinquennially by the NSSO, GoI. Based on NSS 68th round data of ‘Household Consumer Expenditure’ survey, poverty estimates for the year 2011-12 have been estimated as per recommendations of Tendulkar Committee.
10.76.1 For 2011-12, the national poverty line was estimated at ` 816 per capita per month for rural areas and ` 1,000 per capita per month in urban areas. For the State, poverty line was estimated at ` 967 per capita per month in rural areas and ` 1,126 per capita per month for urban areas. Proportion of population below poverty line is 24.2 per cent for rural areas and 9.1 per cent for urban areas. The poverty line and percentage of population below poverty line of selected states for 2011-12 are given in Table 10.64.
Table 10.64 Poverty line and headcount ratio of selected states for 2011-12
State Poverty line
( ` per capita per month) Percentage of population below poverty line
Rural Urban Rural Urban All Andhra Pradesh 860 1,009 11.0 5.8 9.2 Bihar 778 923 34.1 31.2 33.7 Gujarat 932 1,152 21.5 10.1 16.7 Karnataka 902 1,089 24.5 15.3 20.9 Kerala 1,018 987 9.1 5.0 7.1 Madhya Pradesh 771 897 35.7 21.0 31.7 Maharashtra 967 1,126 24.2 9.1 17.4 Punjab 1,054 1,155 7.7 9.2 8.3 Rajasthan 905 1,002 16.1 10.7 14.7 Tamil Nadu 880 937 15.8 6.5 11.3 Uttar Pradesh 768 941 30.4 26.1 29.4 West Bengal 783 981 22.5 14.7 20.0 All- India 816 1,000 25.7 13.7 21.9
Source : Erstwhile Planning Commission, GoI # As per recommendations of Tendulkar Committee

Economic Survey of Maharashtra 2020-21
241
HOUSING
10.77 Population growth leads to growing demand of houses. Affordable housing to all is one of the target under Sustainable Development Goals. Government is implementing various schemes to cater the housing needs of different sections of the society.
Due to the Covid-19 pandemic, GoM has taken initiative to support housing sector by reducing stamp duty by three per cent in Mumbai & Mumbai suburban district and by two per cent in the rest of the State for the period September, 2020 to December, 2020. For the period January, 2021 to March, 2021 it is reduced by two per cent in Mumbai & Mumbai suburban district and by 1.5 per cent in the rest of the State.
Urban Housing 10.78.1 For effective implementation of housing schemes in the urban areas, the State has established Maharashtra Housing and Area Development Authority (MHADA), City and Industrial Development Corporation Limited (CIDCO), Slum Rehabilitation Authority (SRA), Maharashtra Real Estate Regulatory Authority (MahaRERA) and other authorities. Pradhan Mantri Awaas Yojana 10.78.2 ‘Pradhan Mantri Awaas Yojana – Housing For All (PMAY- HFA)’, is a flagship scheme of GoI under which the houses are to be made available to all by the year 2022. The scheme includes Economically Weaker Section (EWS), Low Income Group (LIG) and Middle Income Group (MIG) in urban areas. Under the scheme, the State has set a target of building 19.40 lakh houses in 391 cities. The State government has established Maharashtra Housing Development Corporation (MahaHousing) to speed up housing projects under PMAY. Under PMAY, housing projects are being given 2.5 carpet area for residential zone and one carpet area for green or no development zone. Under the scheme, upto December, 2020 total 1,008 projects consisting of 14.43 lakh dwelling units have been approved of which construction of 6.68 lakh dwelling units is in progress.
Maharashtra Housing and Area Development Authority 10.78.3 GoM has established MHADA in the year 1977 for providing houses at affordable price in Mumbai and some parts of the State. Since inception upto November, 2020 MHADA has constructed (including redevelopment) 4,80,880 dwelling units. Dwelling units constructed by MHADA are given in Table 10.65.
Table 10.65 Dwelling units constructed by MHADA (no.)
Year EWS LIG MIG HIG Tenements Total Transit camps
Expenditure incurred (` Crore)
2018-19 1,931 2,402 553 212 18 5,116 3,295 1,250.57
2019-20 742 813 0 0 519 2,074 284 651.43
2020-21+ 1,110 0 0 0 53 1,163 278 389.32
EWS Monthly Income < ` 25,000 LIG Monthly Income ` 25,001 to ` 50,000 + upto November MIG Monthly Income ` 50,001 to ` 75,000 HIG Monthly Income > ` 75,001 Source : MHADA

Economic Survey of Maharashtra 2020-21
242
10.78.4 Dwelling units constructed by various boards of MHADA during 2020-21 upto November are given in Table 10.66.
Table 10.66 Dwelling units constructed by various boards of MHADA during 2020-21 (upto November) (no.)
MHADA Board
EWS LIG MIG HIG Tenements Total Transit camps
Expenditure Incurred (` Crore)
Mumbai 0 0 0 0 0 0 278 59.18
Konkan 1,014 0 0 0 0 1,014 0 160.77
Nashik 0 0 0 0 0 0 0 13.68
Pune 0 0 0 0 53 53 0 48.94
Aurangabad 96 0 0 0 0 96 0 31.47
Amravati 0 0 0 0 0 0 0 26.54
Nagpur 0 0 0 0 0 0 0 48.74 Total 1,110 0 0 0 53 1,163 278 389.32 Source : MHADA
City and Industrial Development Corporation Ltd. (CIDCO) 10.78.5 CIDCO is implementing housing development programme in a planned manner. Since inception (1970) upto March, 2019 CIDCO has constructed 1,83,110 tenements. Number of tenements constructed by CIDCO is given in Table 10.67.
Table 10.67 Tenements constructed by CIDCO (since inception) ( upto March, 2019) (no.)
City EWS/LIG MIG HIG Total Expenditure
incurred (` Crore)
Navi Mumbai 64,641 35,245 28,736 1,28,622 2,476
Aurangabad 19,501 2,127 432 22,060 56
Nashik 21,343 2,619 582 24,544 42
Nanded 7,758 126 0 7,884 9
Total 1,13,243 40,117 29,750 1,83,110 2,583 Source : CIDCO
10.78.6 Under PMAY- HFA (Urban), CIDCO has taken up construction work of 15,432 tenements mainly for EWS and LIG from March, 2017. Under the scheme, construction work has been taken up at different locations such as Taloja, Kharghar, Kalamboli, Ghansoli and Dronagiri in Navi Mumbai. Under the extended phase of PMAY scheme, construction work of 7,905 tenements has been taken up at Taloja, Navi Mumbai.
Slum Rehabilitation Scheme 10.78.7 Under the Slum Rehabilitation Scheme, tenements are being provided to families residing in slums. Since inception (1995) upto November, 2020 total 1,993 projects are completed and 2,16,016 families residing in slums have been rehabilitated. The progress of the scheme is given in Table 10.68.
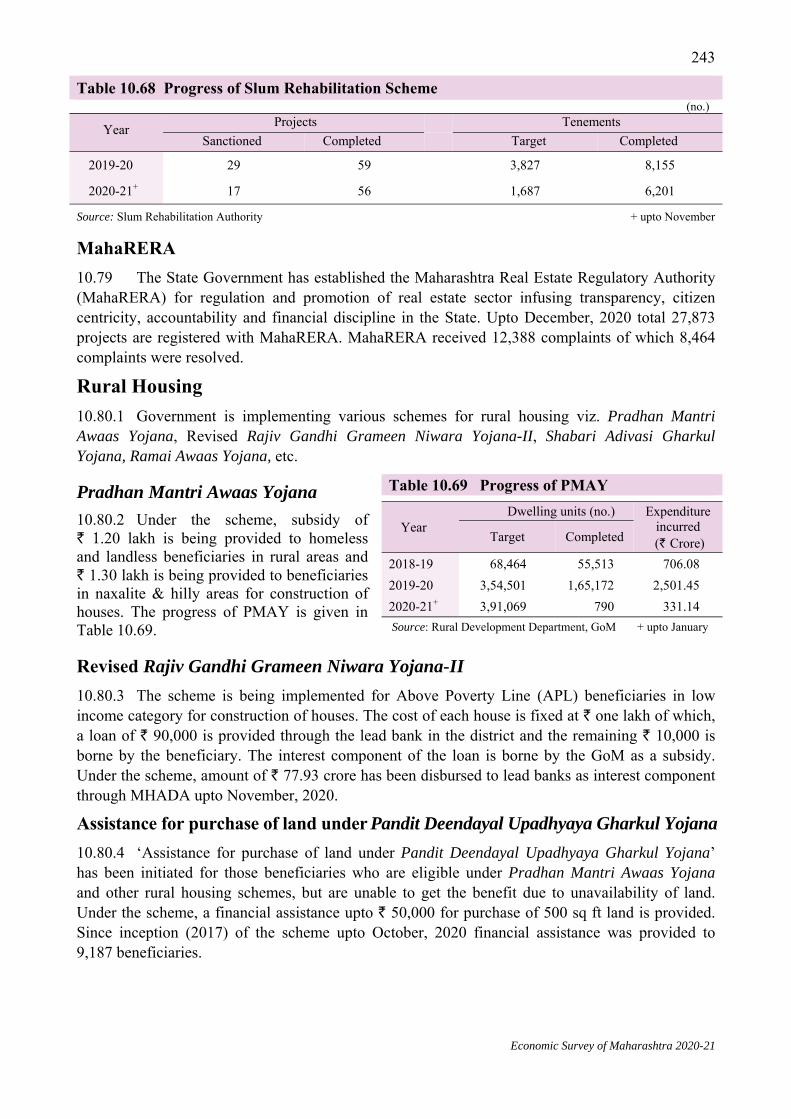
Economic Survey of Maharashtra 2020-21
243
Table 10.68 Progress of Slum Rehabilitation Scheme (no.)
Year Projects Tenements Sanctioned Completed Target Completed
2019-20 29 59 3,827 8,155
2020-21+ 17 56 1,687 6,201
Source: Slum Rehabilitation Authority + upto November
MahaRERA 10.79 The State Government has established the Maharashtra Real Estate Regulatory Authority (MahaRERA) for regulation and promotion of real estate sector infusing transparency, citizen centricity, accountability and financial discipline in the State. Upto December, 2020 total 27,873 projects are registered with MahaRERA. MahaRERA received 12,388 complaints of which 8,464 complaints were resolved.
Rural Housing 10.80.1 Government is implementing various schemes for rural housing viz. Pradhan Mantri Awaas Yojana, Revised Rajiv Gandhi Grameen Niwara Yojana-II, Shabari Adivasi Gharkul Yojana, Ramai Awaas Yojana, etc.
Pradhan Mantri Awaas Yojana 10.80.2 Under the scheme, subsidy of ` 1.20 lakh is being provided to homeless and landless beneficiaries in rural areas and ` 1.30 lakh is being provided to beneficiaries in naxalite & hilly areas for construction of houses. The progress of PMAY is given in Table 10.69.
Revised Rajiv Gandhi Grameen Niwara Yojana-II 10.80.3 The scheme is being implemented for Above Poverty Line (APL) beneficiaries in low income category for construction of houses. The cost of each house is fixed at ` one lakh of which, a loan of ` 90,000 is provided through the lead bank in the district and the remaining ` 10,000 is borne by the beneficiary. The interest component of the loan is borne by the GoM as a subsidy. Under the scheme, amount of ` 77.93 crore has been disbursed to lead banks as interest component through MHADA upto November, 2020. Assistance for purchase of land under Pandit Deendayal Upadhyaya Gharkul Yojana 10.80.4 ‘Assistance for purchase of land under Pandit Deendayal Upadhyaya Gharkul Yojana’ has been initiated for those beneficiaries who are eligible under Pradhan Mantri Awaas Yojana and other rural housing schemes, but are unable to get the benefit due to unavailability of land. Under the scheme, a financial assistance upto ` 50,000 for purchase of 500 sq ft land is provided. Since inception (2017) of the scheme upto October, 2020 financial assistance was provided to 9,187 beneficiaries.
Table 10.69 Progress of PMAY
Year Dwelling units (no.) Expenditure
incurred (` Crore) Target Completed
2018-19 68,464 55,513 706.08 2019-20 3,54,501 1,65,172 2,501.45 2020-21+ 3,91,069 790 331.14 Source: Rural Development Department, GoM + upto January

Economic Survey of Maharashtra 2020-21
244
Shabari Adivasi Gharkul Yojana 10.81 Shabari Adivasi Gharkul Yojana, a State scheme is being implemented for the people belonging to ST community who are homeless or having kutcha house. Under the scheme, preference is given to people belonging to Aadim and Paradhi Jamati. Under the scheme, subsidy of ` 1.32 lakh in general area and ` 1.42 lakh in naxalite & hilly areas is being provided to beneficiary who is not included in the generated priority list of Socio Economic Caste Census 2011 and having annual income less than ` 1.20 lakh for construction of dwelling units of area 269 sq ft in rural areas. Under the scheme, subsidy of ` 2.50 lakh is being provided to beneficiary who is not included in the generated priority list of Socio Economic Caste Census 2011 and having annual income less than ` three lakh for construction of dwelling units of area 269 sq ft in urban areas. For 2019-20, total 33,538 dwelling units were sanctioned of which 9,732 dwelling units were constructed upto January, 2021.
Ramai Awaas Yojana 10.82 Ramai Awaas Yojana, a State scheme, is being implemented for the people belonging to SC and Neo-Buddhist community in order to build the houses either on their own vacant land or on the land of kutcha house. The families those are not included in the generated priority list of Socio Economic Caste Census 2011 and having annual income less than ` 1.20 lakh in rural area & less than ` three lakh in urban area are covered under the scheme. Under the scheme, subsidy of ` 1.32 lakh in general area and ` 1.42 lakh in naxalite & hilly areas is being provided for construction of dwelling units of area 269 sq ft in rural area. Under the scheme, subsidy of ` 2.50 lakh is being provided for construction of dwelling units of area 323 sq ft in urban area. The share of beneficiaries is 7.5 per cent and 10 per cent in the Municipal Council & Municipal Corporation areas respectively. The progress of the scheme is given in the Table 10.70.
Table 10.70 Progress of Ramai Awaas Yojana (no.)
Dwelling units Rural Urban
2018-19 2019-20 2020-21 2018-19 2019-20 2020-21
Target 98,336 91,517 0 10,838 18,185 0
Sanctioned 92,881 53,755 0 4,028 1,423 0
Completed 52,186 0 0 1,039 0 0
Under construction
40,695 53,755 0 2,989 1,423 0
Expenditure Incurred (` Crore) 400.00 300.00 400.00 160.00 60.00 20.00
Source : Social Justice and Special Assistance Department, GoM

Economic Survey of Maharashtra 2020-21
245
Water Supply and Sanitation
Water Supply 10.83 Clean, affordable & adequate drinking water and provision of basic sanitation facilities are essential for a healthy human life. The government is implementing various schemes to provide such facilities with the help of local bodies.
National Rural Drinking Water Programme
10.84 The National Rural Drinking Water Programme (NRDWP), a flagship programme of GoI, is being implemented in the State since 2009. This programme aims at providing safe and adequate drinking water in rural areas. Since inception upto March, 2020, out of 99,606 target villages/ wadis 73,693 villages/ wadis were tackled under the programme. Progress of NRDWP is given in Table 10.71.
10.84.1 NRDWP had set a strategic vision for the State to achieve at least 50 per cent of rural population have access to pipe water supply of 40 litre per capita per day and 35 per cent household to have tap connectivity by 2017. The State has achieved 90.2 per cent access of water supply to rural population and 38 per cent rural households were provided tap connectivity upto March, 2020.
Jal Jeevan Mission 10.85 GoI has converted centrally sponsored National Rural Drinking Water Programme, into Jal Jeevan Mission from September, 2020 with aim ‘Har Ghar Nal Se Jal’ (FHTC- Functional Household Tap Connection) by 2024. As per the mission, government is committed to provide clean, adequate, sustainable water supply to all households at all times and in all convenient places in rural areas. The main objective of Jal Jeevan Mission is to supply minimum 55 litres quality water per person per day in every household of rural areas of the State through individual household tap connection.
Dual Pump Piped Water Supply Scheme 10.86 Solar energy based dual pump piped water supply scheme, a component of NRDWP, is being implemented in the State since 2009. The small villages/ habitations, which are either not electrified or where electrification is not affordable or where the electric supply is not sustainable, generally depend on hand pumps for water supply. For such villages solar energy based dual pump piped water supply scheme is being implemented through Groundwater Surveys and Development Agency (GSDA). Under the scheme, upto March, 2020 in all 5,110 solar energy based and 2,915 electrical energy based dual pump schemes were implemented with an expenditure of ` 253.78 crore. The scheme is being implemented under Jal Jeevan Mission since March, 2020. During 2020-21, upto October out of 202 solar energy based dual pump schemes, 104 schemes have been completed and an expenditure of ` 10.59 crore is incurred.
Table 10.71 Progress of NRDWP
Year No. of villages/ wadis Expenditure
incurred (` Crore) Target Achievement
2016-17 1,891 1,270 854.00
2017-18 978 638 474.47
2018-19 748 635 654.26
2019-20 1,206 432 736.18 Source: Water Supply & Sanitation Department, GoM

Economic Survey of Maharashtra 2020-21
246
Mukhyamantri Rural Drinking Water Programme
10.87 In order to improve water supply and to provide clean & sufficient drinking water in the rural areas Mukhyamantri Rural Drinking Water Programme (MRDWP) was being implemented in the State since 2016-17 to 2019-20 which has been extended for two years (upto 2021-22) to complete ongoing water supply schemes. Upto October, 2020 in all 743 water supply schemes worth ` 602.06 crore have been approved of which 394 schemes have been completed. Under the scheme, rejuvenation works worth ` 124.78 crore, for 33 non-functional regional water supply schemes have been approved, of which 16 schemes have been completed. Details of disbursement of funds under MRDWP is given in Table 10.72.
Drinking Water Sustainability Programme 10.88 Drinking water sustainability programme, a component of NRDWP, is being implemented with an objective of conservation of water by conventional and non-conventional measures. Under the programme, various measures for strengthening of drinking water sources such as rooftop rainwater harvesting, construction of tanks in hilly areas for storage of rainwater, recharge shaft and trench, cement nala band, well deepening etc. are undertaken. Information about works completed under drinking water sustainability programme are given in Table 10.73.
Water Scarcity Mitigation Programme 10.89 Water scarcity mitigation programme is implemented every year from October - June in villages & wadis facing water scarcity. During 2019-20 under the programme, an amount of ` 742.61 crore was disbursed & ` 294.73 crore is disbursed during 2020-21, upto October. The region wise amount disbursed under water scarcity mitigation programme is given in Table 10.74.
Table 10.72 Details of disbursement of funds under MRDWP (` Crore)
Year New water supply scheme
Rejuvenation of non-functional regional water
Maintenance & repairs of regional rural water supply
2017-18 227.13 0.87 12.00 2018-19 123.89 11.31 8.00 2019-20 151.12 19.32 0.00
2020-21+ 39.52 9.00 0.00 Source: Water Supply & Sanitation Department, GoM + upto October
Table 10.74 Region wise amount disbursed under water scarcity mitigation programme
(` Crore) Region 2019-20 2020-21+ Konkan 16.05 9.80 Nashik 134.00 53.00 Pune 93.25 33.94 Aurangabad 315.47 196.07 Amravati 94.94 0.92 Nagpur 66.67 1.00 Total 742.61@ 294.73@
@ Including Maharashtra Jeevan Pradhikaran + upto October Source: Water Supply & Sanitation Department, GoM
Table 10.73 Works completed under drinking water sustainability programme
Year Villages/
Habitation (no.)
Works completed
(no.)
Expenditure incurred (` Crore)
2016-17 802 4,396 8.91
2017-18 448 1,480 6.65
2018-19 524 1,902 2.71
2019-20 125 514 1.36 Source: Water Supply & Sanitation Department, GoM

Economic Survey of Maharashtra 2020-21
247
10.89.1 To tackle scarcity situation in affected villages and wadis, the State has undertaken various measures such as temporary piped water supply schemes, rejuvenation of bore wells & other water sources, water supply by tankers, etc. Number of villages and wadis covered under water scarcity mitigation programme is given in Table 10.75.
Jalswarajya – II Programme 10.90 Maharashtra is the first State in India to implement the World Bank funded Jalswarajya-II programme and the programme was implemented during January, 2014 to September, 2020. The components of the schemes are: (i) aquifier mapping and community based groundwater management, (ii) mitigation to address water quality issues in water quality affected areas along with service improvements, (iii) water supply measures in water scarce habitations having population less than 500, (iv) establishing ground water level monitoring network in the villages, (v) strengthening of Hydro Meteorological Stations (HMS), (vi) strengthening of six regional ground water quality testing laboratories, and (vii) real time ground water level data monitoring. Jalswarajya-II programme was implemented in two districts of each region viz., Amravati, Buldhana, Nanded, Aurangabad, Raigad, Ratnagiri, Nagpur, Chandrapur, Jalgaon, Ahmednagar, Pune and Satara. Under Jalswarajya-II programme, 63 piped water supply schemes are being implemented in peri-urban areas, of which 44 schemes are commissioned and remaining schemes are in progress. In all 79 community storage tanks and 63 water purification units have been installed for ensuring safe and secured water supply to water stressed habitations & water quality affected areas. Total cost of the programme was ` 1,284 crore and the share of World Bank and the State was 70:30. The financial progress of Jalswarajya-II programme is given in Table 10.76.
Atal Bhujal Yojana (Atal Jal) 10.91 Atal Jal is a World Bank aided central sector scheme to be implemented in the State during 2020-21 to 2024-25 with an objective to facilitate sustainable ground water management. In all 1,443 villages under 1,339 grampanchayats from 38 talukas of 13 districts (Pune, Satara, Sangli, Solapur, Nashik, Ahmednagar, Jalgaon, Jalna, Latur, Osmanabad, Amravati, Buldhana and Nagpur) in the State have been selected under the scheme, on the basis of criterion of most exploited,
Table 10.75 Villages and wadis covered under water scarcity mitigation programme (no.)
Nature of Works Villages Wadis 2018-19@ 2019-20$ 2018-19@ 2019-20$
New bore wells 3,629 1,960 1,377 642
Temporary piped water supply- special repairs 2,173 1,531 379 246
Special repairs of bore wells 1,293 1,227 691 447
Temporary supplementary pipe connection 466 324 51 64
Water supply by tankers/ bullock carts 5,607 1,281 11,875 2,352 Requisition of private wells 6,831 2,616 1,412 268
Deepening/mud cleaning of wells 833 250 116 120
Source: Water Supply & Sanitation Department, GoM @ October, 2018 to September, 2019 $ October, 2019 to September, 2020
Table 10.76 Financial Progress of Jalswarajya -II (` Crore)
Year Disbursed
Loans from World Bank
Amount disbursed by
GoM
Expenditure incurred
2014-15 to 2016-17 77.15 170.30 170.30
2017-18 127.43 160.00 160.00
2018-19 0 144.00 144.00
2019-20 208.90 108.00 108.00
2020-21+ 82.00 54.00 38.70
Total 495.48 636.30 621.00 Source: Water Supply & Sanitation Department, GoM + upto September
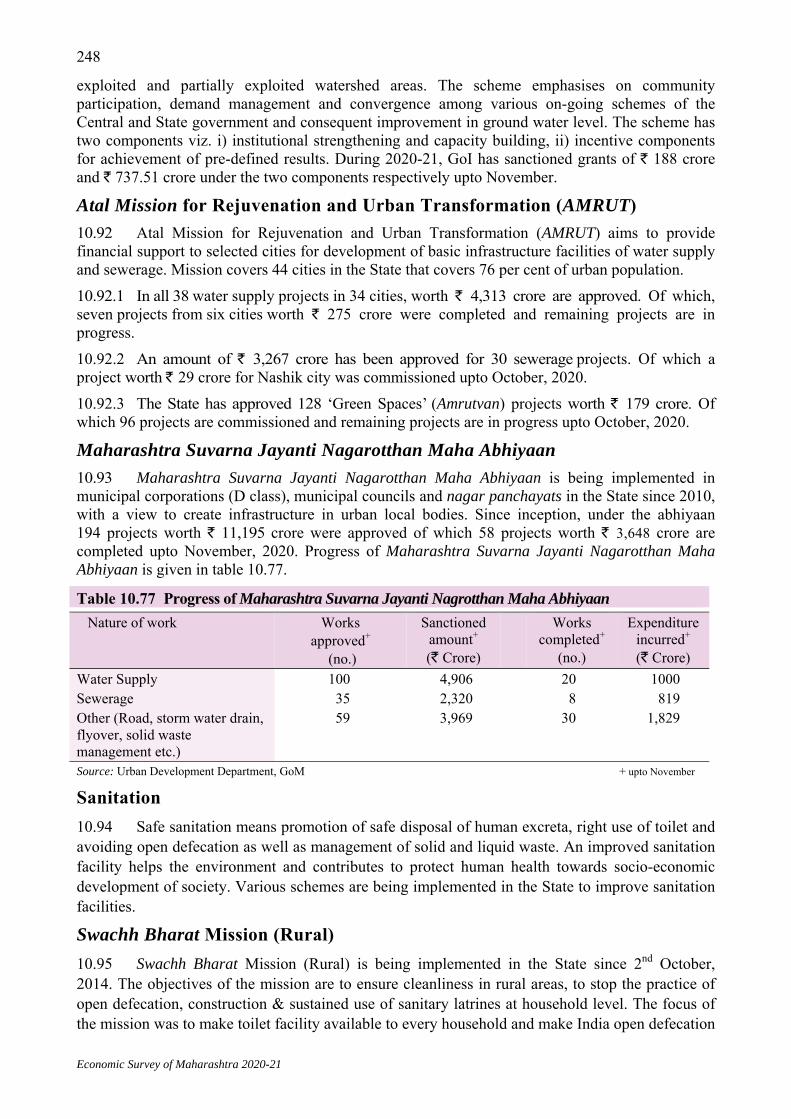
Economic Survey of Maharashtra 2020-21
248
exploited and partially exploited watershed areas. The scheme emphasises on community participation, demand management and convergence among various on-going schemes of the Central and State government and consequent improvement in ground water level. The scheme has two components viz. i) institutional strengthening and capacity building, ii) incentive components for achievement of pre-defined results. During 2020-21, GoI has sanctioned grants of ` 188 crore and ` 737.51 crore under the two components respectively upto November.
Atal Mission for Rejuvenation and Urban Transformation (AMRUT) 10.92 Atal Mission for Rejuvenation and Urban Transformation (AMRUT) aims to provide financial support to selected cities for development of basic infrastructure facilities of water supply and sewerage. Mission covers 44 cities in the State that covers 76 per cent of urban population. 10.92.1 In all 38 water supply projects in 34 cities, worth ` 4,313 crore are approved. Of which, seven projects from six cities worth ` 275 crore were completed and remaining projects are in progress. 10.92.2 An amount of ` 3,267 crore has been approved for 30 sewerage projects. Of which a project worth ` 29 crore for Nashik city was commissioned upto October, 2020. 10.92.3 The State has approved 128 ‘Green Spaces’ (Amrutvan) projects worth ` 179 crore. Of which 96 projects are commissioned and remaining projects are in progress upto October, 2020.
Maharashtra Suvarna Jayanti Nagarotthan Maha Abhiyaan 10.93 Maharashtra Suvarna Jayanti Nagarotthan Maha Abhiyaan is being implemented in municipal corporations (D class), municipal councils and nagar panchayats in the State since 2010, with a view to create infrastructure in urban local bodies. Since inception, under the abhiyaan 194 projects worth ` 11,195 crore were approved of which 58 projects worth ` 3,648 crore are completed upto November, 2020. Progress of Maharashtra Suvarna Jayanti Nagarotthan Maha Abhiyaan is given in table 10.77.
Table 10.77 Progress of Maharashtra Suvarna Jayanti Nagrotthan Maha Abhiyaan
Nature of work
Works approved+
(no.)
Sanctioned amount+ (` Crore)
Works completed+
(no.)
Expenditure incurred+ (` Crore)
Water Supply 100 4,906 20 1000 Sewerage 35 2,320 8 819 Other (Road, storm water drain, flyover, solid waste management etc.)
59 3,969 30 1,829
Source: Urban Development Department, GoM + upto November
Sanitation 10.94 Safe sanitation means promotion of safe disposal of human excreta, right use of toilet and avoiding open defecation as well as management of solid and liquid waste. An improved sanitation facility helps the environment and contributes to protect human health towards socio-economic development of society. Various schemes are being implemented in the State to improve sanitation facilities.
Swachh Bharat Mission (Rural) 10.95 Swachh Bharat Mission (Rural) is being implemented in the State since 2nd October, 2014. The objectives of the mission are to ensure cleanliness in rural areas, to stop the practice of open defecation, construction & sustained use of sanitary latrines at household level. The focus of the mission was to make toilet facility available to every household and make India open defecation

Economic Survey of Maharashtra 2020-21
249
free (ODF), garbage free and adopt efficient solid waste management practices. Under the mission, the grants were given to grampanchayats with regard to the criteria of population for mainly solid and liquid waste management. 10.95.1 Since inception of Swachh Bharat Mission (Rural) upto 11th November, 2019, in all 59.35 lakh families were provided with personal toilet facilities and 1.07 lakh families were provided with community/ public toilet facility. The State has achieved 100 per cent sanitation coverage in all 34 districts, 351 panchayat samitis and 27,668 grampanchayats and the State has been declared as open defecation free on 18th April, 2018. About 10.5 lakh eligible families were found not to be covered under baseline survey and covered in baseline survey but not having Individual Household Latrine (IHHL) facility, out of which construction of IHHL have been completed for 10.4 lakh families. During 2019-20, an expenditure incurred under scheme was ` 709.26 crore. In addition, the State government has received performance based incentive grants from Central government with the assistance of the World Bank since 2018-19 and has been used mainly to provide incentive funds to the beneficiaries of IHHL, under which ` 412.92 crore funds has been spent upto 15th January, 2021.
Swachh Bharat Mission (Rural)-II 10.96 GoI has released guidelines regarding implementation of second phase of Swachh Bharat Mission (Rural)-II to be implemented during 2020-21 to 2024-25. Under the mission during 2020-21 upto November, an expenditure of ` 200.18 crore was incurred. Solid and liquid waste management in rural areas is being planned under the second phase of Swachh Bharat Mission (Rural) to maintain overall rural sanitation and hygine.
Swachh Bharat Mission (Urban) 10.97 As per Census 2011, in all 8,99,741 urban households were without toilet facility within their premises. Under the Swachh Bharat Mission in urban areas 7.10 lakh individual household toilets were constructed upto November, 2020 and an expenditure of ` 852 crore was incurred. The GoI declared 384 cities from the State as ODF on 1st October, 2017. Of which 226 cities are ODF+ and 117 cities are ODF++ upto December, 2020.
Swachh Maharashtra Mission (Urban) 10.98 On the basis of Swachh Bharat Mission, GoM launched Swachh Maharashtra Mission (Urban) on 15th May, 2015. The objective of mission to make cities Open Defecation Free (ODF) and to ensure scientific management of solid waste and sewerage including ensured behavioral changes regarding healthy sanitation practices by 2nd October, 2019. Under the mission about 7.09 lakh individual household latrines were constructed. In the State, 46 cities are ODF, 217 cities are ODF+ and 116 cities are ODF++ upto December, 2020. Maharashtra is one of the leading State in implementing state level policy for treatment of fecal sludge. The Government has sanctioned fecal sludge treatment plants (FSTP) for 311 urban local bodies, of which, 148 cities have initiated operations and remaining FSTPs are under construction.
Swachh Survekshan (Urban)-2020 10.99 In all 4,242 cities were participated in Swachh Survekshan (Urban)-2020 conducted at national level and 384 participant cities were from the State. The State is declared as one of the best performing states for third consecutive year and 14 cities from the State have received national award. Out of top 100 AMRUT rank holder cities in India 31 cities were from the State. Out of top 100 non AMRUT rank holder cities, 60 cities were from the State.
Gandagi Mukt Bharat Campaign 10.100 GoI organised a week long behavior change campaign called Gandagi Mukt Bharat campaign from 08th August to 15th August, 2020. The State got third prize in the campaign.

Economic Survey of Maharashtra 2020-21
250
Samudayik Shauchalaya Abhiyaan -2020 10.101 During Covid-19 pandemic due to large-scale migration of labourers back to their native places throughout the State, it was essential for the migrant population to have sanitation facilities. As construction of Community Managed Sanitary Complexes (CMSC) in villages is one of the key components of the Swachh Bharat Mission (Rural), GoI launched three month campaign, viz. Samudayik Shauchalaya Abhiyaan from 15th June, to 15th September, 2020 to mobilise districts and villages to construct and maintain community toilets. Under the abhiyaan, grampanchayats from Bhandara and Yavatmal districts received second and third award respectively amongst all grampanchayats, Jalgaon district got third award amongst all districts & State received second award at national level.
Solid Waste Management (Urban) 10.102 The campaign of ‘Kachra Lakh Molacha’ is being implemented in the State from 1st May, 2017 to segregate 100 per cent of the waste in the wet and dry form, at source of production in the cities. On an average every day 22,081 MT waste is generated in the State. Of which 96 per cent is collected from door to door. About 88 per cent of the waste collected is segregated in the wet and dry form and about 75 per cent of collected waste is processed. The process of segregation has been initiated in all 396 cities in the State. 10.102.1 Compost fertilisers are produced by scientifically processing the segregated wet waste. The State has registered ‘Harit Mahacity compost’ brand for its sale and marketing. The permission has been given to 95 cities in the State to use the ‘Harit Mahacity compost’ brand for sale. The GoM has sanctioned ` 3,138 crore for Solid Waste Management.
Maharashtra Sujal and Nirmal Abhiyaan 10.103 The objective of Maharashtra Sujal and Nirmal abhiyaan is to achieve adequate and qualitative services at affordable rates to implement technological, financial and managerial reforms in the sector of urban water supply, sewerage, toilet construction and solid waste management. Since inception (2008-09) upto October, 2020 administrative approvals have been given to 258 water supply and sanitation works worth ` 1,202.88 crore and an amount of ` 916.15 crore has been disbursed. During 2019-20, an expenditure of ` 27.89 crore was incurred and during 2020-21, upto November ` 5.53 crore is incurred.
National Sample Survey Results 10.104 Some important indicators for the State based on central sample data of National Sample Survey on Drinking water, Sanitation, Hygiene and housing condition in India during July-December, 2012 (69th round) & July-December, 2018 (76th round) are given in Table 10.78.
Table 10.78 Important indicators of National Sample survey 69th round (July-December,2012) & 76th round (July-December, 2018) regarding drinking water and sanitation
(per cent) Indicator Rural Urban Rural+Urban
2012 2018 2012 2018 2012 2018 Drinking Water Households having drinking water facilities within the household premises
46.8 67.1 87.4 93.6 64.4 79.0
Percentage of households with improved principal sources of drinking water
85.5 93.4 98.7 99.7 NA 96.2
Access to latrine Households having access to latrine 46.0 78.0 93.1 98.6 66.5 87.2 Households having exclusive access to latrine
32.2 72.7 58.0 75.0 43.4 73.7
Source: National Sample Survey Report, GoI NA Not Available

Economic Survey of Maharashtra 2020-21
251
ENVIRONMENT CONSERVATION
10.105 Clean and healthy sustainable environment is recognised globally and nationally as a basic entitlement of the people. Increase in population leads to increase in construction, industrialisation, air & water pollution, increase in sewage, etc. This causes changes in the environment such as deforestation, climate change, degradation of air & water quality, etc. United Nations (UN) has considered environment as one of the important dimensions while formulating Sustainable Development Goals. The State has taken effective measures for environmental conservation and to tackle problems arising due to climate change. Maharashtra Pollution Control Board (MPCB) is the regulatory body for effective implementation of environmental laws and conducting mitigating measures for controlling pollution levels in the State.
Air pollution 10.106 Air pollution is the biggest risk to human health and environment. As per Global Ambient Air Quality Database (2018) about 70 lakh individuals die every year in the world due to air pollution. Air pollution leads to health issues such as heart & lung diseases and pulmonary & respiratory infections. Air pollution has been a matter of serious concern in all urban cities. Air (Prevention & Control of Pollution) Act, 1981 has been enacted in the State for prevention, control and abatement of air pollution. MPCB assesses the present and anticipated air pollution through continuous air quality monitoring systems at 102 stations spread across 27 cities in the State under National Air quality Monitoring Programme (NAMP). Ambient air quality reported at selected monitoring stations during 2020 is given in Table 10.79.
Table 10.79 Ambient air quality reported at selected monitoring stations during 2020
Monitoring Station
Concentration of air pollutants
Sulphur Dioxide (SO2)
Nitrogen Oxides
(NOx)
Respirable Suspended Particulate Matter
(RSPM) Limit 50 µg/m3 Limit 40 µg/m3 Limit 60 µg/m3 Min Max Min Max Min Max
Mumbai - Sion 4 33 19 158 75 349
Navi Mumbai - Mahape 4 105 9 290 10 289
Pune - Swargate 6 31 10 121 40 275
Pune - Bhosari 7 42 9 162 13 218
Nashik - NMC Building 4 14 9 44 16 92
Nashik - MIDC Satpur 4 12 8 37 16 64
Aurangabad - CADA Office 3 37 5 79 16 172
Aurangabad - MIDC Waluj 4 39 4 97 12 187
Amravati - Govt. College of Engineering 5 15 6 17 26 92
Amravati - MIDC Amravati 5 19 7 20 18 101
Nagpur - Civil Lines 4 22 6 53 14 145
Nagpur – Hingana Road 4 24 9 58 44 192 Source : MPCB µg/m3 microgram per cubic meter

Economic Survey of Maharashtra 2020-21
252
10.107 The majority of carbon dioxide emission arises from combustion of fossil fuels such as diesel, petrol and natural gas. Use of low sulphur content diesel, lead free petrol, LPG/ CNG as an alternative fuel, making Pollution Under Control (PUC) certificate mandatory, banning 15 years old vehicles and converting eight years old vehicles to LPG/ CNG are some of the important measures being taken to restrict air pollution. As on 31st December, 2019 of the total 371.22 lakh registered vehicles, 2.7 per cent were on LPG/ CNG & 0.07 per cent were on electricity. The number of registered vehicles on LPG/ CNG and Electricity in the State is given in Table 10.80.
Impact of Covid-19 lockdown on Air Quality 10.108 As a result of the strict restrictions on travelling & closure of non-essential activities including various industries during Covid-19 lockdown period (21st March, 2020 to 1st June, 2020) air quality improvement has been anticipated in most towns & cities across the State. Air Quality Index (AQI) is a tool to disseminate information on air quality in qualitative terms. Air Quality Index (AQI) is calculated on air quality data collected from air quality monitoring stations. Average Air Quality Index for pre lockdown and lockdown period is given in Table 10.81.
Table 10.80 Number of registered vehicles on LPG/ CNG and Electricity in the State
(no.)
Year Total Of which
On LPG/ CNG
On electricity
2017-18 26,98,688 1,39,005 1,418
2018-19 25,38,833 1,35,988 4,958
2019-20 23,69,426 1,16,651 7,396
2020-21+ 7,77,226 36,764 3,666 + upto November
Source : Office of Transport Commissioner, GoM
Table 10.81 Average Air Quality Index for pre lockdown and lockdown period
Monitoring Station
Pre - lockdown Lockdown 01-03-2020
to 20-03-2020
21-03-2020 to
01-06-2020 Khadakpada, Kalyan 174.76 81.07 Sion, Mumbai 164.25 70.16 Kurla, Mumbai 161.95 79.91 Chhatrapati Shivaji Maharaj International Airport (T2), Mumbai 153.05 54.41 Mahape, Navi Mumbai 148.95 74.84 Nerul, Navi Mumbai 148.39 97.35 Vasai West, Mumbai 121.68 45.18 Solapur, Solapur 110.30 63.28 Worli, Mumbai 108.95 61.17 Vile Parle West, Mumbai 107.05 58.96 Colaba, Mumbai 104.24 56.00 Bandra, Mumbai 101.67 68.96 Karve Road, Pune 98.75 60.97 Powai, Mumbai 98.58 59.03 Gangapur Road, Nashik 96.80 57.88 Pimpleshwar Mandir, Thane 90.55 60.15 Airoli, Navi Mumbai 87.85 89.45 More Chowk, Waluj 85.29 52.01 MIDC Khutala, Chandrapur 81.82 77.36 Borivali East, Mumbai 79.56 62.88 Chandrapur, Chandrapur 78.06 71.81 Opp GPO, Civil Lines, Nagpur 77.73 59.98 Note: AQI category - Good (0-50), Satisfactory (51-100), Moderate (101-200), Poor (201-300), Very Poor (301-400), Severe (401-500) Source: MPCB

Economic Survey of Maharashtra 2020-21
253
Water pollution 10.109 Contamination of water bodies making it harmful for consumption or use is water pollution. It is mainly caused due to discharge of harmful chemical waste by industries directly into the water bodies. Improper sanitation, spraying insecticides and pesticides on crops, bathing and washing clothes near rivers or ponds also cause water pollution. This is harmful to environment and human health. Water (Prevention & Control of Pollution) Act, 1974 has been enacted in the State for the prevention & control of water pollution and maintaining or restoring the water quality. MPCB regularly monitors the water quality across 250 water quality monitoring stations for both surface (155 on rivers, 34 on sea/ creeks, 10 on drains, one on dam) and ground water (24 bore wells, 24 dug wells, one hand pump, one tube well) under National Water Monitoring Programme (NWMP). Surface water samples are monitored every month for nine core parameters and 19 general parameters whereas the ground water samples are monitored every six months to trace metals and pesticides. Water quality at 39 locations of Godavari, Krishna, Panchganga and Bheema rivers in the State during 2019-20 is given in Table 10.82. Water quality at monitoring stations on selected rivers for surface water in the State during January to September, 2020 is given in Table 10.83.
Table 10.83 Water quality at monitoring stations on selected rivers during January to September, 2020
Station Name pH Dissolved Oxygen (mg/l)
B.O.D (mg/l)
C.O.D. (mg/l)
Nitrate (mg/l)
Fecal Coliform (mg/l)
Krishna River at Rajapur Weir 7.80 6.40 1.90 16.00 0.59 10.10 Godavari river at Jaikwadi Dam, Paithan
7.70 6.80 3.00 9.78 0.53 2.45
Mula-Mutha River at Mundhwa Bridge
7.40 5.20 9.56 27.00 3.70 546.00
Kanhan River at downstream of M/s Vidharbha Paper Mills
8.29 6.97 5.37 27.56 2.32 35.33
Purna River at Dhupeshwar at upstream of Malkapur Water works
8.22 6.38 4.84 25.60 2.66 34.80
Darna River at Aswali (Darna Dam) 7.76 6.12 3.19 13.33 0.49 14.00 Savitri River at Muthavali village 7.60 6.70 2.10 50.00 0.78 11.00 Mithi River at near bridge 7.37 2.70 21.22 66.67 2.09 48,824.44
Source : MPCB B.O.D. Biochemical Oxygen Demand C.O.D. Chemical Oxygen Demand
Table 10.82 Water quality at 39 locations of Godavari, Krishna, Panchganga and Bheema rivers in the State during 2019-20
Parameters
pH value
Bio-chemical Oxygen Demand Dissolved Oxygen Fecal Coliform
6.0 to 9.0# Less than 3 mg/l# More than 4 mg/l# MPN/ 100 ml#
Range No. of Locations Range No. of
Locations Range No. of Locations Range No. of
Locations 5.5 - 6.4 0 Below 2.5 8 Below 3 0 0 - 100 30 6.5 - 7.4 2 2.5 - 5.4 22 3 – 4.9 2 100 - 200 6 7.5 - 8.4 37 5.5 - 8.4 7 5 – 6.9 34 200 - 300 0 8.5 - 9.5 0 8.5 - 11.4 0 7 – 8.9 3 300 & above 3
11.5 & above 2 9 & above 0
Source: MPCB mg/l milligram/litre # CPCB’s Water quality criteria, Class C MPN Most Probable Number

Economic Survey of Maharashtra 2020-21
254
Sewage Treatment 10.110 The estimated sewage generated in the area of 27 Municipal Corporations in the State during 2019-20 was 6,710 million litres per day (MLD) of which about 4,067 MLD (60.6 per cent) sewage was treated. The sewage generated & treated in the area of urban local bodies of the State during 2019-20 is given in Table 10.84.
Solid Waste Management 10.111 Solid waste consists of household solid waste, construction & demolition debris, industrial solid waste, drainage residue and waste generated from residential & commercial complexes. Solid waste generated in the State is being treated in 56 common treatment facilities centers provided either by Municipal Corporation or Municipal Councils and 7 Cantonment Boards. Of the total solid waste generated, 69.9 per cent solid waste is treated per day. Solid waste generated and treated in the State during 2019 is given in Table 10.85.
Table 10.84 Sewage generated & treated in the area of urban local bodies of the State during 2019-20
Local body Reporting
local bodies
Sewage
Generated (MLD)
Treated (MLD)
Percentage of treated to generated
Municipal Corporation 27 6,710 4,067 60.6 Municipal Council
A Class 17 280 56 20.0 B Class 73 401 41 10.2 C Class 143 334 22 6.6
Nagar panchayat 126 154 3 2.0 Cantonment board 7 39 7 18.0 Total 393 7,918 4,196 52.9
Source : MPCB
Table 10.85 Solid waste generated and treated in the State during 2019
MPCB Region Solid Waste
Generated (MT/day)
Treated (MT/day)
Percentage of treated to generated
Mumbai 6,661.00 5,500.00 82.6 Navi Mumbai 761.00 626.50 82.3 Raigad 562.82 443.82 78.9 Thane 2,172.02 1,563.82 72.0 Kalyan 1,683.32 309.00 18.4 Pune 3,875.48 3,355.89 86.6 Nashik 1,946.89 1,420.89 73.0 Aurangabad 1,744.06 1,185.85 68.0 Nagpur 1,389.94 455.86 32.8 Amravati 910.07 319.60 35.1 Kolhapur 791.89 551.92 69.7 Chandrapur 446.76 304.11 68.1 Total 22,945.25 16,037.26 69.9
Source : MPCB

Economic Survey of Maharashtra 2020-21
255
Noise pollution
10.112 In order to assess the impact of noise pollution, Ambient Noise Level Monitoring Programme is conducted for two days by MPCB in major cities. The noise levels are measured at the same locations on both the days at the same time. Day-night noise levels in residential area in selected cities during Diwali in 2019 and 2020 are given in Table 10.86. As per Noise Pollution (Regulation & Control) Rules - 2000, the standards of noise level limits for Residential zone are 55 decibel during day time & 45 decibel during night time.
Pollution due to industries
10.113 During 2020-21 industries under the purview of MPCB were 1,01,948 upto December. Under Common Effluent Treatment Plant (CETP) scheme, financial assistance is provided to install pollution control equipment for treatment and disposal of hazardous solid waste generated from small scale industrial units. CETPs are commissioned in 26 industrial areas covering 7,851 industries. During 2019-20 effluent quantity treated on an average was about 179.50 million litres/day. Classification of industries based on the pollution index during 2019-20 is given in Table 10.87.
Table 10.86 Day-night noise levels in residential areas in selected cities during diwali in 2019 & 2020
(decibel)
Location 14th Nov, 2020 27th Oct, 2019 16th Nov, 2020 29th Oct, 2019
Day Night Day Night Day Night Day Night
Mumbai (Shivaji Park-Dadar) 73.8 60.2 71.6 62.1 71.6 59.4 68.5 62.4
Mumbai (Chembur) 70.3 60.1 68.7 59.1 75.4 62.2 71.2 58.3
Thane (Gokhale Road) 72.6 67.2 62.3 59.0 77.7 67.6 66.0 57.9
Thane (Wagle Estate) 69.3 62.9 70.2 59.1 73.0 62.8 66.2 57.9
Pune (Swargate) 80.6 69.0 85.3 77.6 75.4 62.5 79.9 65.8
Pune (Laxmi Road) 79.7 73.0 82.8 74.6 73.8 60.4 78.8 63.8
Nashik (Central Bus Stand) 70.0 72.4 70.6 71.5 65.6 60.8 70.6 65.7
Nashik (Bytco Point) 69.7 65.9 70.6 66.6 65.5 61.7 67.8 65.6
Aurangabad (City Chowk) 66.2 61.1 66.4 61.0 65.3 57.9 64.5 57.1
Nanded-Waghala (Ganesh Nagar) 61.5 54.6 62.2 51.5 63.2 50.4 61.4 48.6
Nagpur (Sadar) 72.4 66.2 74.2 68.6 69.1 51.7 69.5 57.6
Chandrapur (Jatpura Gate) 72.9 60.6 76.2 66.5 76.1 63.3 73.1 65.2
Amravati (Rajkamal Chowk) 78.7 69.8 77.7 70.2 75.4 55.4 76.2 66.6
Akola (District Collector Office) 75.0 64.5 73.4 56.8 72.7 59.7 72.1 57.7
Source : MPCB
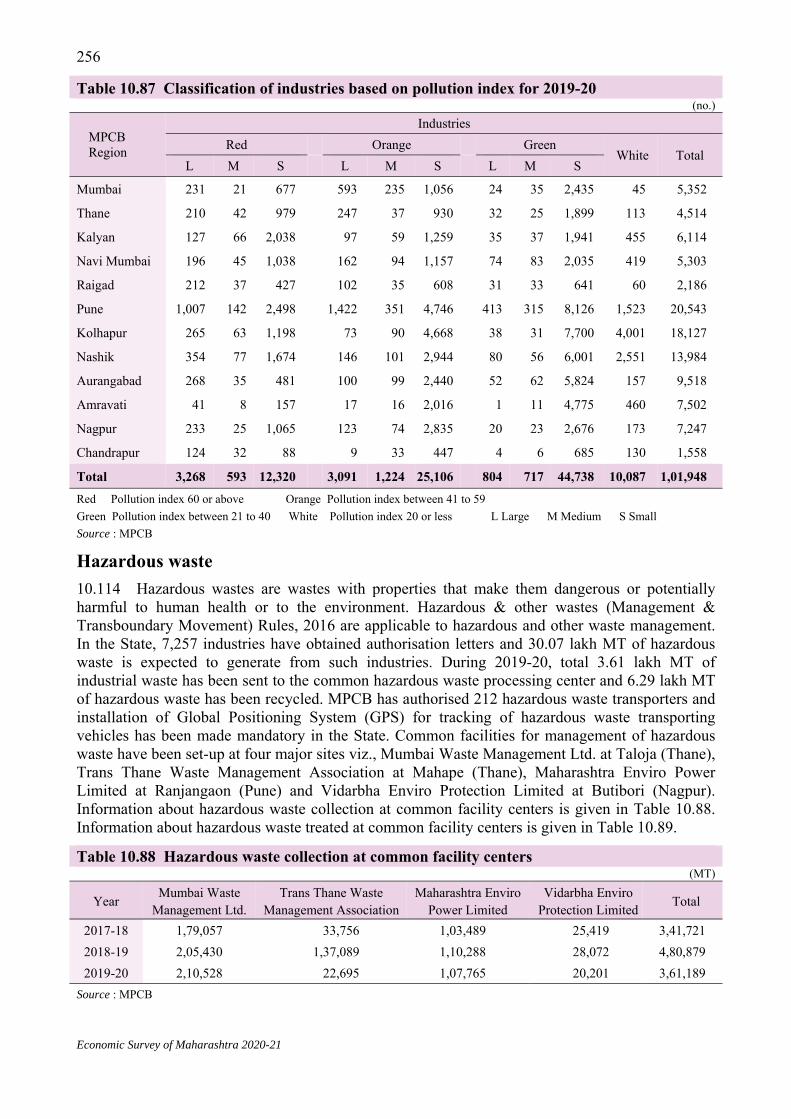
Economic Survey of Maharashtra 2020-21
256
Table 10.87 Classification of industries based on pollution index for 2019-20 (no.)
MPCB Region
Industries Red Orange Green
White Total L M S L M S L M S
Mumbai 231 21 677 593 235 1,056 24 35 2,435 45 5,352
Thane 210 42 979 247 37 930 32 25 1,899 113 4,514
Kalyan 127 66 2,038 97 59 1,259 35 37 1,941 455 6,114
Navi Mumbai 196 45 1,038 162 94 1,157 74 83 2,035 419 5,303
Raigad 212 37 427 102 35 608 31 33 641 60 2,186
Pune 1,007 142 2,498 1,422 351 4,746 413 315 8,126 1,523 20,543
Kolhapur 265 63 1,198 73 90 4,668 38 31 7,700 4,001 18,127
Nashik 354 77 1,674 146 101 2,944 80 56 6,001 2,551 13,984
Aurangabad 268 35 481 100 99 2,440 52 62 5,824 157 9,518
Amravati 41 8 157 17 16 2,016 1 11 4,775 460 7,502
Nagpur 233 25 1,065 123 74 2,835 20 23 2,676 173 7,247
Chandrapur 124 32 88 9 33 447 4 6 685 130 1,558
Total 3,268 593 12,320 3,091 1,224 25,106 804 717 44,738 10,087 1,01,948 Red Pollution index 60 or above Orange Pollution index between 41 to 59 Green Pollution index between 21 to 40 White Pollution index 20 or less L Large M Medium S Small Source : MPCB
Hazardous waste 10.114 Hazardous wastes are wastes with properties that make them dangerous or potentially harmful to human health or to the environment. Hazardous & other wastes (Management & Transboundary Movement) Rules, 2016 are applicable to hazardous and other waste management. In the State, 7,257 industries have obtained authorisation letters and 30.07 lakh MT of hazardous waste is expected to generate from such industries. During 2019-20, total 3.61 lakh MT of industrial waste has been sent to the common hazardous waste processing center and 6.29 lakh MT of hazardous waste has been recycled. MPCB has authorised 212 hazardous waste transporters and installation of Global Positioning System (GPS) for tracking of hazardous waste transporting vehicles has been made mandatory in the State. Common facilities for management of hazardous waste have been set-up at four major sites viz., Mumbai Waste Management Ltd. at Taloja (Thane), Trans Thane Waste Management Association at Mahape (Thane), Maharashtra Enviro Power Limited at Ranjangaon (Pune) and Vidarbha Enviro Protection Limited at Butibori (Nagpur). Information about hazardous waste collection at common facility centers is given in Table 10.88. Information about hazardous waste treated at common facility centers is given in Table 10.89.
Table 10.88 Hazardous waste collection at common facility centers (MT)
Year Mumbai Waste Management Ltd.
Trans Thane Waste Management Association
Maharashtra Enviro Power Limited
Vidarbha Enviro Protection Limited Total
2017-18 1,79,057 33,756 1,03,489 25,419 3,41,721 2018-19 2,05,430 1,37,089 1,10,288 28,072 4,80,879 2019-20 2,10,528 22,695 1,07,765 20,201 3,61,189
Source : MPCB
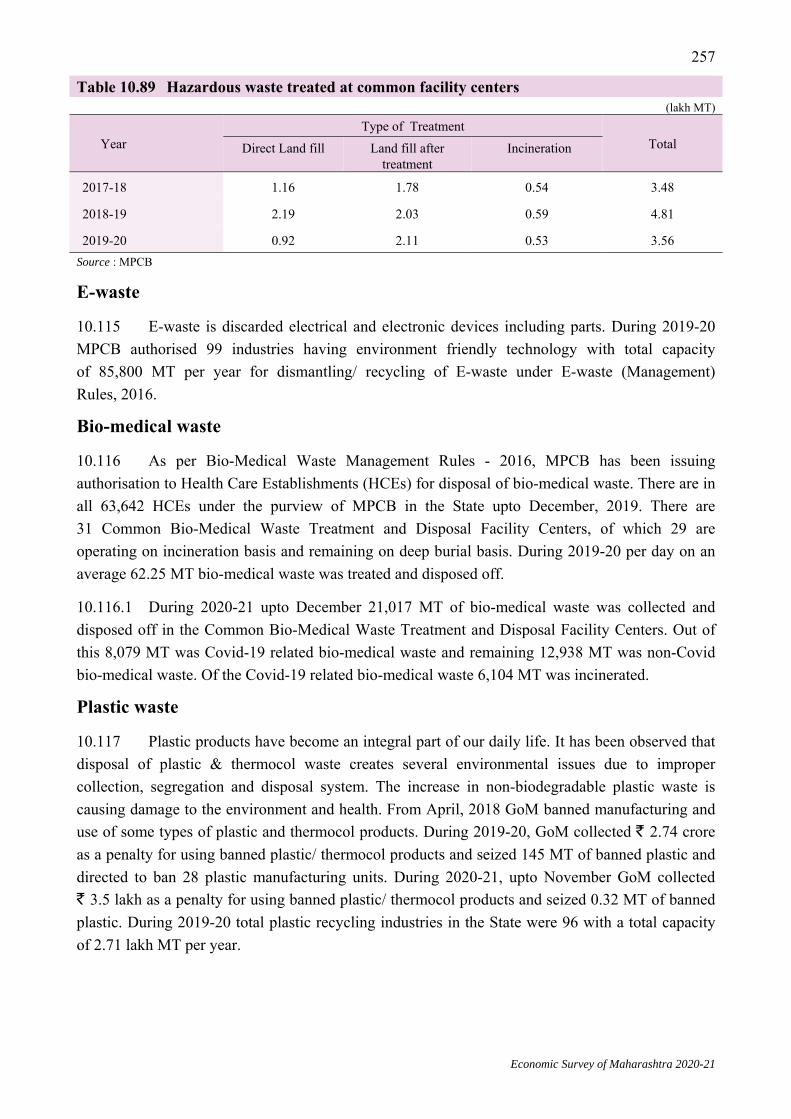
Economic Survey of Maharashtra 2020-21
257
Table 10.89 Hazardous waste treated at common facility centers (lakh MT)
Year Type of Treatment
Total Direct Land fill Land fill after treatment
Incineration
2017-18 1.16 1.78 0.54 3.48
2018-19 2.19 2.03 0.59 4.81
2019-20 0.92 2.11 0.53 3.56 Source : MPCB
E-waste
10.115 E-waste is discarded electrical and electronic devices including parts. During 2019-20 MPCB authorised 99 industries having environment friendly technology with total capacity of 85,800 MT per year for dismantling/ recycling of E-waste under E-waste (Management) Rules, 2016.
Bio-medical waste
10.116 As per Bio-Medical Waste Management Rules - 2016, MPCB has been issuing authorisation to Health Care Establishments (HCEs) for disposal of bio-medical waste. There are in all 63,642 HCEs under the purview of MPCB in the State upto December, 2019. There are 31 Common Bio-Medical Waste Treatment and Disposal Facility Centers, of which 29 are operating on incineration basis and remaining on deep burial basis. During 2019-20 per day on an average 62.25 MT bio-medical waste was treated and disposed off.
10.116.1 During 2020-21 upto December 21,017 MT of bio-medical waste was collected and disposed off in the Common Bio-Medical Waste Treatment and Disposal Facility Centers. Out of this 8,079 MT was Covid-19 related bio-medical waste and remaining 12,938 MT was non-Covid bio-medical waste. Of the Covid-19 related bio-medical waste 6,104 MT was incinerated.
Plastic waste
10.117 Plastic products have become an integral part of our daily life. It has been observed that disposal of plastic & thermocol waste creates several environmental issues due to improper collection, segregation and disposal system. The increase in non-biodegradable plastic waste is causing damage to the environment and health. From April, 2018 GoM banned manufacturing and use of some types of plastic and thermocol products. During 2019-20, GoM collected ` 2.74 crore as a penalty for using banned plastic/ thermocol products and seized 145 MT of banned plastic and directed to ban 28 plastic manufacturing units. During 2020-21, upto November GoM collected ` 3.5 lakh as a penalty for using banned plastic/ thermocol products and seized 0.32 MT of banned plastic. During 2019-20 total plastic recycling industries in the State were 96 with a total capacity of 2.71 lakh MT per year.

Economic Survey of Maharashtra 2020-21
258
Environmental clearance
10.118 Under the Environment (Protection) Act, 1986, the Central Government constituted Maharashtra Coastal Zone Management Authority (1998), State Level Environment Impact Assessment Authority (2008) and State Level Expert Appraisal Committee (SEAC) in the State for Coastal Regulation Zone (CRZ) recommendations and environment clearances. From January, 2016 environment clearances are granted through online services. The State has granted environment clearances to 3,335 applications upto January, 2021 through online process. Maharashtra Coastal Zone Management Authority issued CRZ recommendations to 81 projects from January to December, 2020.
State Lake conservation plan
10.119 To prevent degradation of lakes, the State has included 80 lakes under ‘National lake conservation for degraded lakes’ scheme since 2007. The GoM sanctioned ` 15 crore of funds for conservation of these lakes in 2019-20 & an expenditure of ` 8.58 crore was incurred.
Mangroves conservation
10.120 Maharashtra has a long coastline of about 720 km. As per India State of Forest Report - 2019, about 320 sq km area is under mangroves cover in the State. The State is implementing ‘Mangroves conservation and livelihood generation’ scheme with the participation of local communities for the entire coastal stretch of Maharashtra covering over 120 villages from Palghar, Thane, Raigad, Ratnagiri and Sindhudurg districts.
10.120.1 During 2020-21, the State has allocated funds of ` 15.46 crore for upscaling the various livelihood activities such as Mud Crab Farming, Fish Cage Culture, Oyster & Mussel Farming, Ornamental Fish Culture, Eco-tourism and mangrove plantation under this scheme. These activities can be taken up as group activity or as an individual beneficiary. The group activity is entitled with 90 per cent subsidy, while individual beneficiary (land owners with more than one acre of mangroves) is entitled to get 75 per cent subsidy. During 2019-20 profit of ` 20.55 lakh was earned by villagers/ beneficiaries under the scheme. Regarding the mangrove plantation activity, 655 hectares of mangrove plantation was undertaken in 2019-20 and about 120 hectares is planned for the year 2020-21.
10.120.2 A compensation scheme for the fishermen is being implemented by the Mangrove Cell along with the State Fisheries Department from 2018. In this scheme, the fishermen are encouraged to cut their fishing nets to release marine protected animals [under the Wildlife (Protection) Act, 1972] such as Whale, Shark, Dolphin, Sea Turtle, etc. which get entangled in the fishing nets. Upon successful release of these animals back to the sea and submission of evidence, financial compensation (maximum up to ` 25,000 per case) is given to the fishermen. During 2019-20, total compensation of ` 8.27 lakh was given to 41 fishermen. During 2020-21, upto November total compensation of ` 10.98 lakh is given to 66 fishermen.
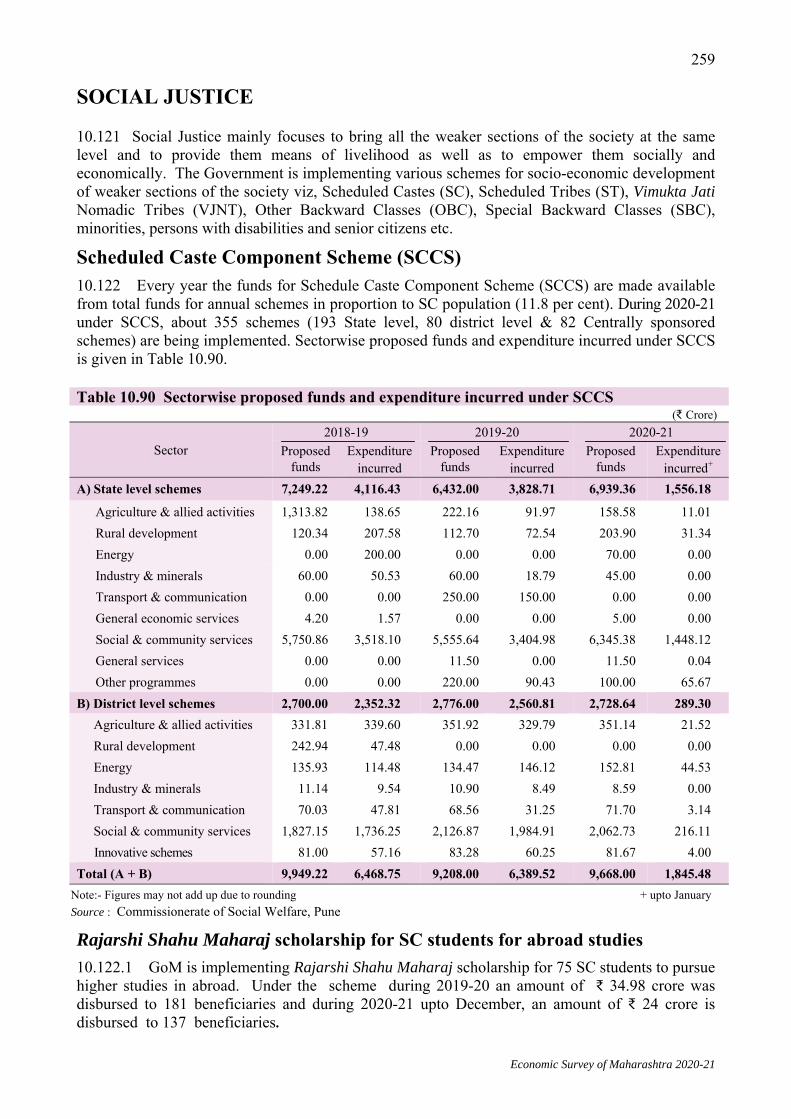
Economic Survey of Maharashtra 2020-21
259
SOCIAL JUSTICE
10.121 Social Justice mainly focuses to bring all the weaker sections of the society at the same level and to provide them means of livelihood as well as to empower them socially and economically. The Government is implementing various schemes for socio-economic development of weaker sections of the society viz, Scheduled Castes (SC), Scheduled Tribes (ST), Vimukta Jati Nomadic Tribes (VJNT), Other Backward Classes (OBC), Special Backward Classes (SBC), minorities, persons with disabilities and senior citizens etc.
Scheduled Caste Component Scheme (SCCS) 10.122 Every year the funds for Schedule Caste Component Scheme (SCCS) are made available from total funds for annual schemes in proportion to SC population (11.8 per cent). During 2020-21 under SCCS, about 355 schemes (193 State level, 80 district level & 82 Centrally sponsored schemes) are being implemented. Sectorwise proposed funds and expenditure incurred under SCCS is given in Table 10.90.
Rajarshi Shahu Maharaj scholarship for SC students for abroad studies 10.122.1 GoM is implementing Rajarshi Shahu Maharaj scholarship for 75 SC students to pursue higher studies in abroad. Under the scheme during 2019-20 an amount of ₹ 34.98 crore was disbursed to 181 beneficiaries and during 2020-21 upto December, an amount of ₹ 24 crore is disbursed to 137 beneficiaries.
Table 10.90 Sectorwise proposed funds and expenditure incurred under SCCS (₹ Crore)
Sector 2018-19 2019-20 2020-21
Proposed funds
Expenditure incurred
Proposed funds
Expenditure incurred
Proposed funds
Expenditure incurred+
A) State level schemes 7,249.22 4,116.43 6,432.00 3,828.71 6,939.36 1,556.18 Agriculture & allied activities 1,313.82 138.65 222.16 91.97 158.58 11.01 Rural development 120.34 207.58 112.70 72.54 203.90 31.34 Energy 0.00 200.00 0.00 0.00 70.00 0.00 Industry & minerals 60.00 50.53 60.00 18.79 45.00 0.00 Transport & communication 0.00 0.00 250.00 150.00 0.00 0.00 General economic services 4.20 1.57 0.00 0.00 5.00 0.00 Social & community services 5,750.86 3,518.10 5,555.64 3,404.98 6,345.38 1,448.12 General services 0.00 0.00 11.50 0.00 11.50 0.04 Other programmes 0.00 0.00 220.00 90.43 100.00 65.67
B) District level schemes 2,700.00 2,352.32 2,776.00 2,560.81 2,728.64 289.30 Agriculture & allied activities 331.81 339.60 351.92 329.79 351.14 21.52 Rural development 242.94 47.48 0.00 0.00 0.00 0.00 Energy 135.93 114.48 134.47 146.12 152.81 44.53 Industry & minerals 11.14 9.54 10.90 8.49 8.59 0.00 Transport & communication 70.03 47.81 68.56 31.25 71.70 3.14 Social & community services 1,827.15 1,736.25 2,126.87 1,984.91 2,062.73 216.11 Innovative schemes 81.00 57.16 83.28 60.25 81.67 4.00 Total (A + B) 9,949.22 6,468.75 9,208.00 6,389.52 9,668.00 1,845.48
Note:- Figures may not add up due to rounding + upto January Source : Commissionerate of Social Welfare, Pune
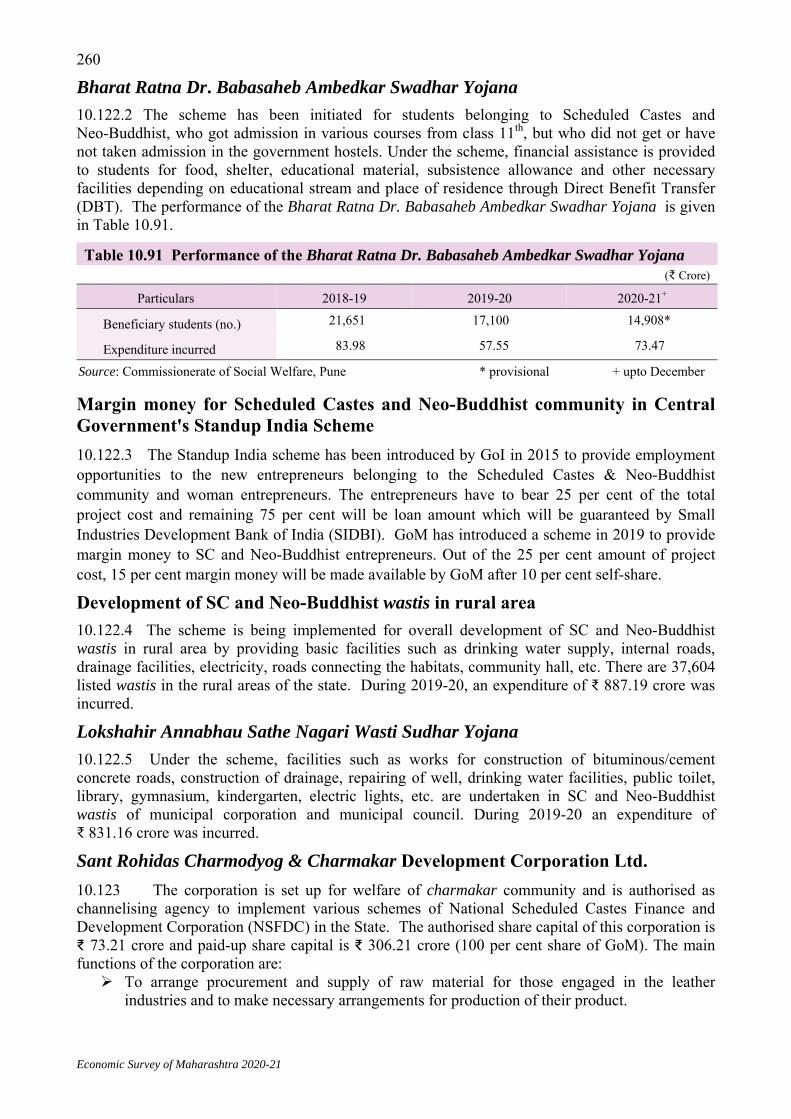
Economic Survey of Maharashtra 2020-21
260
Bharat Ratna Dr. Babasaheb Ambedkar Swadhar Yojana 10.122.2 The scheme has been initiated for students belonging to Scheduled Castes and Neo-Buddhist, who got admission in various courses from class 11th, but who did not get or have not taken admission in the government hostels. Under the scheme, financial assistance is provided to students for food, shelter, educational material, subsistence allowance and other necessary facilities depending on educational stream and place of residence through Direct Benefit Transfer (DBT). The performance of the Bharat Ratna Dr. Babasaheb Ambedkar Swadhar Yojana is given in Table 10.91.
Margin money for Scheduled Castes and Neo-Buddhist community in Central Government's Standup India Scheme 10.122.3 The Standup India scheme has been introduced by GoI in 2015 to provide employment opportunities to the new entrepreneurs belonging to the Scheduled Castes & Neo-Buddhist community and woman entrepreneurs. The entrepreneurs have to bear 25 per cent of the total project cost and remaining 75 per cent will be loan amount which will be guaranteed by Small Industries Development Bank of India (SIDBI). GoM has introduced a scheme in 2019 to provide margin money to SC and Neo-Buddhist entrepreneurs. Out of the 25 per cent amount of project cost, 15 per cent margin money will be made available by GoM after 10 per cent self-share.
Development of SC and Neo-Buddhist wastis in rural area 10.122.4 The scheme is being implemented for overall development of SC and Neo-Buddhist wastis in rural area by providing basic facilities such as drinking water supply, internal roads, drainage facilities, electricity, roads connecting the habitats, community hall, etc. There are 37,604 listed wastis in the rural areas of the state. During 2019-20, an expenditure of ₹ 887.19 crore was incurred.
Lokshahir Annabhau Sathe Nagari Wasti Sudhar Yojana 10.122.5 Under the scheme, facilities such as works for construction of bituminous/cement concrete roads, construction of drainage, repairing of well, drinking water facilities, public toilet, library, gymnasium, kindergarten, electric lights, etc. are undertaken in SC and Neo-Buddhist wastis of municipal corporation and municipal council. During 2019-20 an expenditure of ₹ 831.16 crore was incurred.
Sant Rohidas Charmodyog & Charmakar Development Corporation Ltd. 10.123 The corporation is set up for welfare of charmakar community and is authorised as channelising agency to implement various schemes of National Scheduled Castes Finance and Development Corporation (NSFDC) in the State. The authorised share capital of this corporation is ₹ 73.21 crore and paid-up share capital is ₹ 306.21 crore (100 per cent share of GoM). The main functions of the corporation are: To arrange procurement and supply of raw material for those engaged in the leather
industries and to make necessary arrangements for production of their product.
Table 10.91 Performance of the Bharat Ratna Dr. Babasaheb Ambedkar Swadhar Yojana (₹ Crore)
Particulars 2018-19 2019-20 2020-21+
Beneficiary students (no.) 21,651 17,100 14,908*
Expenditure incurred 83.98 57.55 73.47
Source: Commissionerate of Social Welfare, Pune * provisional + upto December

Economic Survey of Maharashtra 2020-21
261 To render necessary assistance and act as an agent for sale of finished product in domestic
as well as international markets. To provide training facilities regarding production and marketing.
The performance of Sant Rohidas Charmodyog and Charmakar Development Corporation Ltd. is given in Table 10.92.
Sahityaratna Lokshahir Annabhau Sathe Development Corporation Ltd. 10.124 GoM has established Sahityaratna Lokshahir Annabhau Sathe Development Corporation Ltd. (SLASDC) for economic, educational and social development of Matang community and 12 sub castes. The share capital of SLASDC is ₹ 300 crore, of which 51 per cent share is of GoM & 49 per cent is of GoI. SLASDC works as channelising agency of NSFDC in the State. The performance of Lokshahir Annabhau Sathe Development Corporation Ltd. is given in 10.93.
Mahatma Phule Backward Class Development Corporation Ltd. 10.125 Mahatma Phule Backward Class Development Corporation Ltd. (MPBCDC) is set up for economic development of SC and Neo-Buddhist communities. The authorised share capital of this corporation is ₹ 632.64 crore, of which 51 per cent share is of GoM and 49 per cent share is of GoI. The corporation works as channelising agency of NSFDC in the State and National Safai Karmachari Finance and Development Corporation (NSKFDC). The performance of Mahatma Phule Backward Class Development Corporation Ltd. is given in Table 10.94.
Tribal Component Scheme 10.126 The funds for Tribal Component Scheme (TCS) are made available from total funds for annual schemes in proportion to ST population (9.4 per cent). During 2020-21 under TCS, about
Table 10.92 Performance of Sant Rohidas Charmodyog & Charmakar Development Corporation Ltd.
(₹ Lakh)
Particulars 2018-19 2019-20 2020-21+
Beneficiaries (no.) 317 192 89
Amount disbursed 35.30 21.22 8.40 Source: Sant Rohidas Charmodyog & Charmakar Development Corporation Ltd. + upto December
Table 10.93 Performance of Lokshahir Annabhau Sathe Development Corporation Ltd. (₹ Lakh)
Particulars 2018-19 2019-20 2020-21+
Beneficiaries (no.) 2,066 1,232 387
Amount disbursed 460.46 280.01 133.45 Source : Lokshahir Annabhau Sathe Development Corporation Ltd. + upto December
Table 10.94 Performance of Mahatma Phule Backward Class Development Corporation Ltd. (₹ Lakh)
Particulars 2018-19 2019-20 2020-21+
Beneficiaries (no.) 5,185 11,607 792
Amount disbursed 2,086.08 3,612.05 896.19 Source: Mahatma Phule Backward Class Development Corporation Ltd. + upto December

Economic Survey of Maharashtra 2020-21
262
368 schemes (156 State level, 148 district level & 64 Centrally sponsored schemes) are being implemented. Sectorwise proposed funds and expenditure incurred under TCS is given in Table 10.95.
Government Ashram schools 10.126.1 There are 500 Government residential ashram schools for tribal students in hilly and remote areas of the State. Tribal students are provided meal, residence, educational material, and other facilities at free of cost. Since 2017-18, the cost of educational materials and equipments are being deposited directly in the bank accounts of students. The performance of Government ashram school is given in Table 10.96.
Table 10.95 Sectorwise proposed funds and expenditure incurred under TCS (₹ Crore)
Sector 2018-19 2019-20 2020-21 Proposed
funds Expenditure
incurred Proposed
funds Expenditure
incurred Proposed
funds Expenditure
incurred+ A) State level schemes 5,074.06 4,135.09 6,329.89 4,716.93 7,559.03 2,293.52
Agriculture & allied activities
706.77 90.37 118.64 42.09 150.99 27.72
Rural development 239.30 230.55 324.89 199.99 782.41 226.28
Irrigation & flood control 50.00 50.00 50.00 51.85 25.00 0.00
Energy 433.17 259.79 310.00 132.00 237.80 50.00
Industry & minerals 8.00 7.00 10.00 0.00 9.00 0.00
Transport & communication 553.20 541.86 326.02 196.56 456.32 5.00
Social & community services
3,083.61 2,955.52 5,190.34 4,094.44 5,897.51 1,984.53
B) District level schemes 3,208.00 3,156.82 2,201.11 2,104.59 1,925.91 111.90 Agriculture & allied activities
271.84 271.00 284.32 251.47 231.50 3.48
Rural development 481.18 463.53 350.96 321.13 145.25 6.68
Irrigation & flood control 0.09 0.00 0.00 0.00 0.00 0.00
Energy 0.00 0.00 124.96 122.04 114.85 0.22
Industry & minerals 129.02 115.55 4.70 1.22 1.30 0.00
Transport & communication 203.35 199.10 254.39 252.93 240.36 2.32
Social & community services
2,122.56 2,107.64 1,181.79 1,155.79 1,192.65 99.21
Total (A + B) 8,282.10 7,291.90 8,531.00 6,821.52 9,484.94 2,405.42 Note : Figures may not add up due to rounding + upto December Source : Tribal Development Department, GoM
Table 10.96 Performance of Government Ashram School (₹ Crore)
Particulars 2018-19 2019-20 2020-21+
Beneficiary students (no.) 2,06,163 1,83,546 1,91,713
Budget Provision 937.86 1,465.40 1,392.06
Expenditure incurred 1,035.00 1,199.35 527.01 Source: Tribal Development Department, GoM + upto December

Economic Survey of Maharashtra 2020-21
263
Aided Ashram schools 10.126.2 In aided ashram schools, tribal students are provided accommodation, food, uniforms, educational materials and other facilities at free of cost. There are 556 aided ashram schools in the State. The performance of aided ashram schools is given in Table 10.97.
Government hostels for tribal students 10.126.3 Government hostel facility is provided to tribal students at talukas, districts and division level for pursuing higher studies. In these hostels accommodation, food, uniforms, educational materials and other facilities are provided at free of cost to the students. There are 495 government hostels in the State for tribal students. The cost of bedding material, books, educational material, etc. are being deposited directly into the student’s bank accounts since 2017-18. The performance of Government hostels for tribal students is given in Table 10.98.
Education in English medium schools 10.126.4 A scheme has been started in order to encourage the tribal students to pursue studies in renowned residential English medium schools at free of cost. In these schools, education and residential facilities are provided to the students. The performance of English medium schools is given in Table 10.99.
Pandit Deendayal Upadhyay Swayam Scheme 10.126.5 Under the scheme, financial assistance is provided to the students who have taken admission (for higher educational courses after XIIth standard) but who do not get admission in Government hostels. Financial assistance is provided for facilities such as meal, residence
Table 10.97 Performance of Aided Ashram Schools (₹ Crore)
Particulars 2018-19 2019-20 2020-21+
Beneficiary students (no.) 2,42,546 2,33,485 2,41,468
Budget Provision 1,000.10 1,165.00 1,230.00
Expenditure incurred 967.10 1,088.98 751.30 Source : Tribal Development Department, GoM +upto December
Table 10.98 Performance of Government hostels for tribal students (₹ Crore)
Particulars 2018-19 2019-20 2020-21+ Beneficiary students (no.) 48,658 54,150 4,122 Budget Provision 408.40 500.30 521.61 Expenditure incurred 346.82 353.24 74.71
Source : Tribal Development Department, GoM +upto December
Table 10.99 Performance of English medium schools (₹ Crore)
Particulars 2018-19 2019-20 2020-21+
Beneficiary students (no.) 49,354 53,627 53,627
Budget Provision 378.00 345.00 360.00
Expenditure incurred 297.34 241.41 76.14 Source: Tribal Development Department, GoM +upto December

Economic Survey of Maharashtra 2020-21
264educational material and subsistence allowance etc. The performance of Pandit Deendayal Upadyay swayam scheme is given in Table 10.100.
Direct funding to PESA Gram panchayats 10.126.6 Under the PESA (Panchayat Extension to Scheduled Areas) Act five per cent of the total Tribal Component Scheme budget is allotted to the gram panchayats in the scheduled areas for developmental works. Gram sabha can undertake works related to basic infrastructure, forest and implementation of PESA Act, health, sanitation, education, wild life conservation, water conservation, forestry, wild life tourism and forest produce through this fund. Under PESA Act, direct funding provided to 3,050 gram panchayats. During 2019-20, an expenditure of ₹ 160.73 crore was incurred. A budget provision of ₹ 267.89 crore is made during 2020-21 and upto December, an expenditure of ₹ 66.97 crore has been incurred.
Dr. A. P. J. Abdul Kalam Amrut Aahar Yojana 10.126.7 This scheme is implemented in 16 tribal districts of the scheduled areas. Under the scheme, ‘one full meal’ is provided to ST pregnant women & lactating mothers and children of age seven months to six years are given eggs or bananas four times per week. The performance of Dr. A. P. J. Abdul Kalam Amrut Aahar Yojana is given in Table 10.101.
Thakkar Bappa Adivasi Wasti Sudharna Ekatmik Karyakram 10.126.8 Under the scheme, permanent community development facilities are created in tribal habitats. During 2019-20, an expenditure of ₹ 167.15 crore was incurred. A budget provision of ₹ 175.02 crore is made during 2020-21 and upto December, an expenditure of ₹ 30.55 crore has been incurred.
Khawti Anudan Yojana 10.126.9 Khawti Anudan Yojna was introduced to provide assistance to the economically weaker ST families. Under the scheme assistance was provided in kind (50 per cent) and cash (50 per cent) (including 70 per cent loan and 30 per cent grant). Khawti Anudan Yojna, which was closed since 2013-14, was revived to tackle economic situation arised due to Covid-19 pandemic. The scheme is being implemented in form of 100 per cent grant.
Table 10.100 Performance of Pandit Deendayal Upadhyay Swayam Scheme (₹ Crore)
Particulars 2018-19 2019-20 2020-21+
Beneficiary students (no.) 3,750 9,219 #
Budget Provision 45.00 60.00 60.00
Expenditure incurred 33.00 25.76 0.00 # For the year 2020-21 the number of students is not given as the online portal has not been launched +upto December Source: Tribal Development Department, GoM
Table 10.101 Performance of Dr. A. P. J. Abdul Kalam Amrut Aahar Yojana (₹ Crore)
Particulars 2018-19 2019-20 2020-21+
Beneficiary (no.) 9,90,097 7,72,000 7,97,465
Budget Provision 128.93 144.65 204.27
Expenditure incurred 144.18 175.69 67.86 Source: Tribal Development Department, GoM +upto December
Economic Survey of Maharashtra 2020-21
265
Foreign scholarship for ST students for abroad studies 10.126.10 GoM has started this scholarship for ST students to pursue higher studies in abroad. Under the scheme during 2019-20, an amount of ₹ 1.04 crore was disbursed to five beneficiaries and during 2020-21, an amount of ₹ 82.60 lakh has been distributed to five beneficiaries upto December. Two new beneficiaries have been selected for the year 2020-21 under this scheme.
Welfare of Other Backward Bahujan 10.127 GoM has established separate department for welfare of the people belonging to Other Backward Bahujan. Various development programmes are being implemented for upliftment of the weaker sections of these communities. During 2019-20, an expenditure of ₹ 2,974.03 crore was incurred. A budget provision of ₹ 3,533.01 crore is made during 2020-21 and upto January, an expenditure of ₹ 1,681.77 crore has been incurred. Tanda/Wasti Sudhar Yojana 10.127.1 The scheme is implemented for overall development of VJNT and SBC habitats by providing basic facilities such as electrification, drinking water supply, internal roads, drainage, toilets, community hall/library, etc. During 2019-20, an expenditure of ₹ 33.35 crore was incurred under the scheme.
Foreign scholarship for VJNT, OBC and SBC students for abroad studies 10.127.2 GoM has started this scholarship for VJNT, OBC and SBC students to pursue higher studies in abroad. Under the scheme during 2019-20 an amount of ₹ 3.94 crore was disbursed to 10 beneficiaries.
Maharashtra State Other Backward Class Finance and Development Corporation Ltd. 10.128 Maharashtra State Other Backward Class Finance and Development Corporation Ltd. has been established for the welfare of OBCs in the State. The authorised share capital of this corporation is ₹ 250 crore and acquired share capital is ₹ 161.54 crore (100 percent share of GoM). This corporation also works as State’s channelising agency of National Backward Class Finance and Development Corporation Ltd. (NBCFDC). The Corporation implements schemes such as seed money, direct loan scheme, individual interest reimbursement, group loan interest reimbursement etc. The performance of the Maharashtra State Other Backward Class Finance and Development Corporation Ltd. is given in Table 10.102.
Minority Development 10.129 Various schemes for the development of minority community are being implemented in the State. During 2019-20, an expenditure of ₹ 160.05 crore was incurred. During 2020-21, the budgetary provision of ₹ 624.50 crore is made and upto January, an expenditure of ₹ 55.54 crore has been incurred.
Table 10.102 Performance of Maharashtra State Other Backward Class Finance and Development Corporation Ltd.
(₹ lakh) Particulars 2018-19 2019-20 2020-21+
Beneficiaries (no.) 159 78 130
Amount disbursed 56.09 28.76 123.50 Source: Maharashtra State Other Backward Class Finance and Development Corporation Ltd. + upto December

Economic Survey of Maharashtra 2020-21
266
Maulana Azad Alpasankhyak Arthik Vikas Mahamandal Ltd. 10.130 Maulana Azad Alpasankhyak Arthik Vikas Mahamandal Ltd. has been set up for the welfare of minority community in the State. The authorised share capital of this Corporation is ₹ 500 crore and paid-up capital is ₹ 475.69 crore (100 per cent share of GoM). This Corporation works as State channelising agency for National Minorities Development & Finance Corporation. During 2019-20 education loan worth ₹ 2,339.37 lakh was given to 3,009 students. During 2020-21, upto January, education loan worth ₹ 1,177.89 lakh was given to 1,416 students.
Wasti /Area development schemes for minorities 10.131 Schemes for wasti/ area development for minorities are being implemented in the State. The proposed funds and expenditure of major schemes of wasti/area development for minorities are given in Table 10.103.
Welfare of persons with disability 10.132 Various schemes for persons with disabilities are being implemented by GoM to identify their potentials, develop their skills, give them equal opportunities and protect their rights so as to empower & involve them in the main stream of the society. During 2019-20, an expenditure of
₹ 546.34 crore was incurred. During 2020-21 budget provision of ₹ 874.13 crore is made and upto December, an expenditure of ₹ 328.38 crore has been incurred.
Maharashtra State Handicapped Finance and Development Corporation Ltd. 10.133 Maharashtra State Handicapped Finance and Development Corporation Ltd. is established for the welfare of disabled persons. This corporation works as State channelising agency for National Handicapped Finance and Development Corporation in the State. The authorised share capital of this Corporation is ₹ 50 crore and paid up capital is ₹ 47.52 crore (100 per cent share of GoM). The performance of Maharashtra State Handicapped Finance and Development Corporation Ltd.is given in Table 10.104.
Table 10.103 Proposed funds and expenditure of major schemes of wasti/area development for minorities
(₹ Crore)
Scheme 2018-19 2019-20 2020-21
Proposed funds
Expenditure incurred
Proposed funds
Expenditure incurred
Proposed funds
Expenditure incurred+
Area development in minority concentrated urban areas
26.40 17.18 41.89 25.13 44.63 4.18
Area development in minority concentrated rural areas
38.00 22.49 51.00 22.16 57.33 6.97
Source Minority Development Department, GoM + upto January
Table 10.104 Performance of Maharashtra State Handicapped Finance and Development Corporation Ltd.
(₹ Lakh)
Scheme 2018-19 2019-20 2020-21+
No. of beneficiaries
Amount disbursed
No. of beneficiaries
Amount disbursed
No. of beneficiaries
Amount disbursed+
Direct loan -- -- 83 16.60 -- --
Term loan 234 334.97 6 7.93 2 2.70
Source : MSHFDC + upto January

Economic Survey of Maharashtra 2020-21
267
Annasaheb Patil Aarthik Magas Vikas Mahamandal Ltd. 10.134 Annasaheb Patil Aarthik Magas Vikas Mahamandal Ltd. is established by the State to provide employment and self-employment opportunities to economically backward educated unemployed youth. The performance of the Annasaheb Patil Aarthik Magas Vikas Mahamandal Ltd. is given in Table 10.105.
Table 10.105 Performance of Annasaheb Patil Aarthik Magas Vikas Mahamandal Ltd. (₹ Lakh)
2018-19 2019-20 2020-21+ Beneficiary count/Group
count
Amount Disbursed
Beneficiary count/Group
count
Amount Disbursed
Beneficiary count/Group
count
Amount Disbursed
Individual Interest Reimbursement
1,325 260.82 7,584 3,246.83 5,041 2,972.02
Group Loan Interest Reimbursement
- - 4 3.33 8 9.06
Group Project Loan 5 50.00 14 140.00 6 60.00 Source : Annasaheb Patil Arthik Magas Vikas Mahamandal Ltd. + upto December
Important Schemes for Social Security 10.135 The State implements various schemes for social security. During Covid-19 lockdown period financial assistance under various social security schemes has been provided to beneficiaries through Direct Benefit Transfer (DBT) in advance for the period of April to June 2020 in the month of April 2020. No of beneficiaries and expenditure incurred on important social security schemes are given in Table 10.106.
Table 10.106 Beneficiaries and expenditure incurred on important social security schemes
Scheme
2018-19 2019-20 2020-21+ No. of
beneficiaries (lakh)
Expenditure incurred (₹ Crore)
No. of beneficiaries
(lakh)
Expenditure incurred (₹ Crore)
No. of beneficiaries
(lakh)
Expenditure incurred (₹ Crore)
Sanjay Gandhi Niradhar Anudan
8.97 865.65 10.82 1,161.50 12.31 1,016.31
Shravanbal Seva Rajya Nivruttivetan
19.62 1,396.47 21.74 1,896.91 24.74 2,062.06
Indira Gandhi National Old Age Pension
10.84 302.28 11.61 299.83 12.08 329.20
Indira Gandhi National Widow Pension
0.57 16.71 0.67 22.93 0.76 25.64
Indira Gandhi National Disability Pension
0.07 2.02 0.08 3.81 0.09 3.20
National Family Benefit 0.08 28.36 0.11 27.45 0.05 12.67 Source: Social Justice and Special Assistance Department, GoM +upto January

Economic Survey of Maharashtra 2020-21
268
HUMAN DEVELOPMENT AND SUSTAINABLE DEVELOPMENT GOALS
10.136 Human development is about creating and environment that enables people to develop their potential, lead productive & creative lives in accordance with their needs & interests. Human Development Index (HDI) is composite index for assessing long term progress measuring three basic dimensions of human development viz. a healthy long life, access to knowledge and a decent standard of living. As per Human Development Report, 2020 published by United Nations Development Programme (UNDP), Norway ranks first with HDI 0.957, whereas India with HDI 0.645 is at 131st rank as against 129th rank with HDI 0.647 as per HDI report 2019.
10.137 According to UNDP Subnational Human Development Index Report (4.0), HDI of India for 2018 was 0.647 and for 2017 was 0.643. Highest HDI is of Kerala 0.779 for 2018 and 0.774 for 2017. HDI of Maharashtra for 2018 was 0.696 and for 2017 was 0.692.
10.138 As per Maharashtra Human Development Report, 2012 the HDI of the State was 0.752. Mumbai (Mumbai City and Mumbai Suburban) ranked first with HDI 0.841, followed by Pune (0.814). Nandurbar (0.604) had the lowest rank. District wise HDI as per Maharashtra Human Development Report, 2012 is given in Annexure 10.15.
Maharashtra Human Development Programme
10.139 Maharashtra Human Development Programme is being implemented in rural and all ‘C’ class municipal councils areas of 125 most backward talukas. Under the programme, various schemes focusing on improvement in education, health and income are being implemented. Considering socio-economic, geographical conditions and local needs of the talukas, taluka specific schemes are formulated. An amount of 20 per cent of the total funds allocated to the taluka is reserved for this purpose. During 2020-21 a budget provision of ` 359.20 crore has been made and an expenditure of ` 45.62 crore was incurred upto November, 2020. The physical progress of various schemes implemented under Maharashtra Human Development Programme is given in Table 10.107.

Economic Survey of Maharashtra 2020-21
269
Table 10.107 Physical progress of various schemes implemented under Maharashtra Human Development Programme
Scheme Type of beneficiaries Number of beneficiaries
2018-19 2019-20 2020-21+ Education a) Abhyasika in secondary & higher
secondary schools (2,889 Abhyasika) Students 92,186 68,219 @
b) Free school bus service for girl students in rural areas (871 buses)
Girls 1,00,595 99,978 @
c) ‘Bal Bhavan’ science centres (124 centres)
Students visited 2,35,796 1,84,933 @
d) Extending scope of Kasturba Gandhi Balika Vidyalaya Yojana upto Xth Std. (39 schools)
Girls 2,029 1,900 1,525
e) Distribution of bicycles to the needy girls studying in class VIIIth to XIIth
and living within five km from school.
Girls 31,252 43,606 @
f) Construction of Anganwadis$ 630 667 668 Health a) Health camps for pregnant women,
lactating mothers and infants (0-6 months)
Pregnant & lactating women & infants
9,74,899 9,48,666 1,69,142
b) Lapsed wages to SC, ST, BPL pregnant women
Pregnant women 1,25,885 1,19,836 28,693
c) Construction of Health sub centres$ 27 37 37 Income Generation a) Mobile soil testing laboratories Soil samples tested 49,500 36,922 4,919 b) Seed capital to Gramsabhas for
collection of minor forest produce, fishery
Gramsabha proposals 3 0 0
$ since inception of scheme + upto November @ Due to Covid-19 lockdown the schemes could not be implemented Source: Commissionerate, Maharashtra Human Development Programme
Sustainable Development Goals 10.140 Participating countries of United Nations Organisation (UNO) have adopted 17 Sustainable Development Goals (SDGs) comprising 169 targets to be achieved by 2030. SDGs are based on four interdependent pillar namely social, economic, environmental and peace. These SDGs are comprehensive, universal and integrated with each other. The main theme of SDGs is ‘leave no one behind’. 10.140.1 All the state level and district level schemes & programmes are mapped to SDGs and targets therein. All the administrative departments have been instructed to enter schemewise SDGs and targets in the Maharashtra Plan Schemes Information Management System (MP-SIMS) portal which is used to prepare State Annual Plan and District Annual Plan. GoM has setup ‘Sustainable Development Goals - Implementation & Co-Ordination Center (SDG-ICC)’ under Directorate of Economics & Statistics, Planning Department. GoM has taken special initiative to provide financial support to the ultra poor women in rural areas under the ‘Tejashree Financial Services’ scheme for women empowerment. Village Social Transformation Foundation (VSTF) has been set up to promote Public Private Partnership (PPP) between GoM and corporate sectors & philanthropic organisations to plug into development gaps in one thousand villages with focus on SDGs.

Economic Survey of Maharashtra 2020-21
270
Sustainable Development Goals Index
10.141 As per the SDG Index Report 2018, Maharashtra ranked 4th among 29 states of India, with a score of 64 as against 57 of India.
10.142 As per SDG India Index Report 2019, India’s score was 60. Kerala ranked at the top with score 70 followed by Himachal Pradesh (69). Maharashtra ranked 6th with a score of 64, along with Gujarat and Uttarakhand. The performance of the State across SDGs is given in Table 10.108.
Table 10.108 Performance of the State across the SDGs
Performance Achiever
(100) Front Runner (65-99) Performer (50-64) Aspirant (0-49)
--
Goal 3 Good Health and Well- Being (76)
Goal 9 Industry, Innovation and Infrastructure (59)
Goal 1 No Poverty (47)
Goal 4 Quality Education (65) Goal 13 Climate Action (50) Goal 2 Zero Hunger (34)
Goal 6 Clean Water & Sanitation (93)
Goal 5 Gender Equality (41)
Goal 7 Affordable and Clean Energy (82)
Goal 11 Sustainable Cities and Communities (45)
Goal 8 Decent Work and Economic Growth (70)
Goal 10 Reduced Inequality (70)
Goal 12 Sustainable Consumption & Production (71)
Goal 15 Life on Land (85)
Goal 16 Peace, Justice and Strong Institutions (72)
Source : SDG India Index, 2019 Report (2.0) Note : Figures in bracket indicates composite score
* * * * *

Economic Survey of Maharashtra 2020-21
271ANNEXURE 10.1
REGIONWISE AND EDUCATION LEVELWISE INSTITUTIONS,
ENROLMENT AND NUMBER OF TEACHERS
Item Year Region
Total Konkan Pune Nashik Aurangabad Amravati Nagpur
(1) (2) (3) (4) (5) (6) (7) (8) (9)
Primary (I to VIII)
No. of Schools 2017-18 20,721 22,163 17,998 21,267 11,592 12,805 1,06,546
2018-19 20,541 22,100 17,985 21,258 11,565 12,788 1,06,237
2019-20 20,515 22,162 18,054 21,393 11,574 12,793 1,06,491
2020-21 NA NA NA NA NA NA NA
Total enrolment ('000)
2017-18 3,863.6 3,211.5 2,821.1 3,016.7 1,524.3 1,474.9 15,912.1
2018-19 3,795.5 3,213.8 2,804.7 2,986.4 1,496.1 1,451.6 15,748.1
2019-20 3,785.6 3,226.0 2,795.6 2,844.2 1,477.9 1,423.8 15,693.5
2020-21 NA NA NA NA NA NA NA
Girls enrolment ('000)
2017-18 1,829.4 1,486.9 1,304.1 1,401.4 720.4 709.2 7,451.4
2018-19 1,798.7 1,491.5 1,299.4 1,389.3 707.4 697.8 7,384.1
2019-20 1,796.4 1,499.1 1,300.9 1,390.6 700.0 683.9 7,371.1
2020-21 NA NA NA NA NA NA NA
No. of teachers ('000)
2017-18 119.2 112.2 86.5 107.3 56.3 60.6 542.0
2018-19 111.8 107.1 83.4 105.9 54.2 58.2 520.6
2019-20 114.4 110.9 85.4 107.5 54.6 59.5 532.5
2020-21 NA NA NA NA NA NA NA
Pupil Teacher Ratio (PTR)
2017-18 32.4 28.6 32.6 28.1 27.1 24.3 29.4
2018-19 33.9 30.0 33.6 28.2 27.6 24.9 30.3
2019-20 33.0 29.0 32.7 27.7 27.0 23.8 29.4
2020-21 NA NA NA NA NA NA NA
Secondary & Higher secondary (IX to XII)
No. of Schools 2017-18 5,521 5,572 4,229 5,263 3,041 3,231 26,857
2018-19 5,209 5,255 3,948 4,756 2,756 2,948 24,872
2019-20 5,761 5,792 4,386 5,655 3,138 3,361 28,093
2020-21 NA NA NA NA NA NA NA
Total enrolment ('000)
2017-18 1,570.8 1,375.1 1,091.5 1,214.7 676.4 719.7 6,648.3
2018-19 1,563.9 1,363.7 1,089.6 1,224.8 666.9 698.9 6,608.0
2019-20 1,535.6 1,347.0 1,078.2 1,195.4 648.9 675.4 6,481.0
2020-21 NA NA NA NA NA NA NA
Girls enrolment ('000)
2017-18 741.0 619.3 484.0 535.2 314.9 348.1 3,042.6
2018-19 738.2 621.3 486.4 545.4 311.5 339.8 3,042.6
2019-20 731.7 622.8 487.3 539.0 304.9 329.9 3,015.8
2020-21 NA NA NA NA NA NA NA
No. of teachers ('000)
2017-18 48.7 47.6 34.0 38.7 20.8 26.2 215.8
2018-19 58.1 52.7 40.0 41.8 22.3 28.3 243.7
2019-20 61.1 54.4 41.4 42.7 22.9 28.5 251.2
2020-21 NA NA NA NA NA NA NA
Pupil Teacher Ratio (PTR)
2017-18 32.3 28.9 32.1 31.4 32.5 27.5 30.8
2018-19 12.72 11.78 12.17 13.04 13.62 12.02 12.48
2019-20 25.1 24.7 26.0 27.9 28.3 23.6 25.7
2020-21 NA NA NA NA NA NA NA Source: Maharashtra Prathmik Shikshan Parishad NA Not Available

Economic Survey of Maharashtra 2020-21
272
ANNEXURE 10.2
NUMBER OF HEALTH SCIENCE INSTITUTIONS, THEIR INTAKE CAPACITY AND STUDENTS
ADMITTED IN THE FIRST YEAR OF THE COURSE FOR THE YEAR 2020-21
Faculty
Government Government aided Unaided Total
Insti-tutions
Intake capacity
Admitted students
Insti-
tutions Intake
capacity Admitted students
Insti-
tutions Intake
capacity Admitted students
Insti-
tutions Intake capacity
Admitted students
(1) (2) (3) (4) (5) (6) (7) (8) (9) (10) (11) (12) (13)
Allopathy
Graduate 24 4,230 4,230 1 100 100 18 2,270 2,270 43 6,600 6,600
Post-Graduate 22 2,284 2,038 1 78 64 19 685 624 42 3,047 2,726
Ayurvedic
Graduate 5 563 449 16 1,149 933 45 3,030 2,558 66 4,742 3,940
Post-Graduate 4 205 171 10 170 157 19 720 553 33 1,095 881
Homeopathy
Graduate -- -- -- -- -- -- 34 2,855 2,224 34 2,855 2,224
Post-Graduate -- -- -- -- -- -- 14 235 218 14 235 218
Unani
Graduate -- -- -- 2 120 102 2 120 111 4 240 213
Post-Graduate -- -- -- 1 17 5 -- -- -- 1 17 5
Dental
Graduate 4 326 302 -- -- -- 25 2,400 2,298 29 2,726 2,600
Post-Graduate 4 89 89 -- -- -- 21 431 406 25 520 495
Physiotherapy
Graduate 4 90 88 -- -- -- 53 2,570 1,930 57 2,660 2,018
Post-Graduate 5 47 47 -- -- -- 17 213 213 22 260 260
Occupational Therapy
Graduate 4 90 88 -- -- -- -- -- -- 4 90 88
Post-Graduate 5 31 31 -- -- -- -- -- -- 5 31 31 Audiology & Speech Language Pathology
Graduate 2 25 25 -- -- -- -- -- -- 2 25 25
Post-Graduate 2 16 16 -- -- -- -- -- -- 2 16 16 Prosthetics & Orthotics
Graduate 1 15 15 -- -- -- -- -- -- 1 15 15
Post-Graduate 1 2 2 -- -- -- -- -- -- 1 2 2
Nursing
Graduate 4 200 197 -- -- -- 117 5,260 5,420 121 5,460 5,617
Post-Graduate@ 3 42 NA -- -- -- 22 352 NA 25 394 NA
B.P.M.T
Graduate 12 979 696 -- -- -- 4 255 179 16 1,234 875
Source - 1) Maharashtra University of Health Sciences, Nashik 2) State CET cell, Maharashtra State, Mumbai Note: @ Since the admission process is incomplete due to Covid-19 pandemic, the information is not available
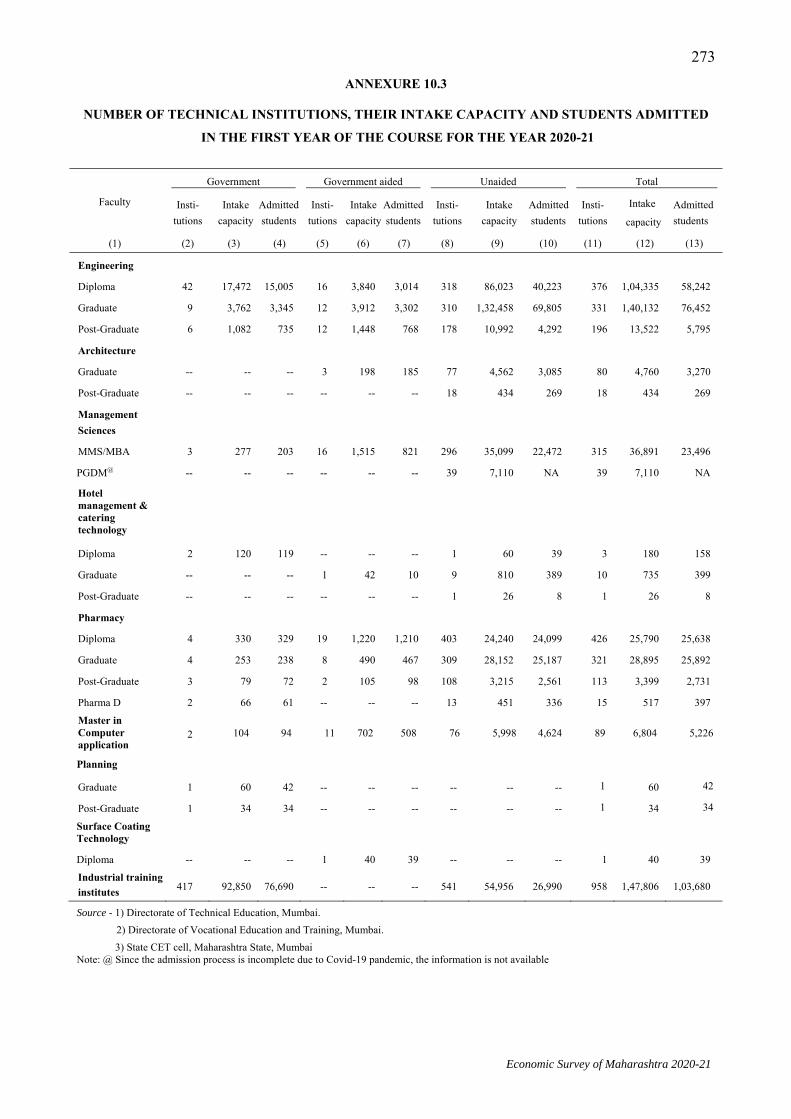
Economic Survey of Maharashtra 2020-21
273ANNEXURE 10.3
NUMBER OF TECHNICAL INSTITUTIONS, THEIR INTAKE CAPACITY AND STUDENTS ADMITTED
IN THE FIRST YEAR OF THE COURSE FOR THE YEAR 2020-21
Faculty
Government Government aided Unaided Total
Insti-tutions
Intake capacity
Admitted students
Insti-tutions
Intake capacity
Admitted students
Insti-tutions
Intake capacity
Admitted students
Insti-tutions
Intake
capacity Admitted students
(1) (2) (3) (4) (5) (6) (7) (8) (9) (10) (11) (12) (13)
Engineering
Diploma 42 17,472 15,005 16 3,840 3,014 318 86,023 40,223 376 1,04,335 58,242
Graduate 9 3,762 3,345 12 3,912 3,302 310 1,32,458 69,805 331 1,40,132 76,452
Post-Graduate 6 1,082 735 12 1,448 768 178 10,992 4,292 196 13,522 5,795
Architecture
Graduate -- -- -- 3 198 185 77 4,562 3,085 80 4,760 3,270
Post-Graduate -- -- -- -- -- -- 18 434 269 18 434 269
Management Sciences
MMS/MBA 3 277 203 16 1,515 821 296 35,099 22,472 315 36,891 23,496
PGDM@ -- -- -- -- -- -- 39 7,110 NA 39 7,110 NA
Hotel management & catering technology
Diploma 2 120 119 -- -- -- 1 60 39 3 180 158
Graduate -- -- -- 1 42 10 9 810 389 10 735 399
Post-Graduate -- -- -- -- -- -- 1 26 8 1 26 8
Pharmacy
Diploma 4 330 329 19 1,220 1,210 403 24,240 24,099 426 25,790 25,638
Graduate 4 253 238 8 490 467 309 28,152 25,187 321 28,895 25,892
Post-Graduate 3 79 72 2 105 98 108 3,215 2,561 113 3,399 2,731
Pharma D 2 66 61 -- -- -- 13 451 336 15 517 397 Master in Computer application
2 104 94 11 702 508 76 5,998 4,624 89 6,804 5,226
Planning
Graduate 1 60 42 -- -- -- -- -- -- 1 60 42
Post-Graduate 1 34 34 -- -- -- -- -- -- 1 34 34
Surface Coating Technology
Diploma -- -- -- 1 40 39 -- -- -- 1 40 39 Industrial training institutes 417 92,850 76,690 -- -- -- 541 54,956 26,990 958 1,47,806 1,03,680
Source - 1) Directorate of Technical Education, Mumbai. 2) Directorate of Vocational Education and Training, Mumbai. 3) State CET cell, Maharashtra State, Mumbai Note: @ Since the admission process is incomplete due to Covid-19 pandemic, the information is not available

Economic Survey of Maharashtra 2020-21
274
ANNEXURE 10.4
NUMBER OF INSTITUTIONS FOR ARTS, SCIENCE, COMMERCE, NON A.I.C.T.E COURSES, LAW,
EDUCATION, FINE ARTS, THEIR INTAKE CAPACITY AND STUDENTS ADMITTED IN FIRST YEAR OF THE COURSE FOR THE YEAR 2020-21(Provisional upto dated 31/01/2021)
Faculty
Government Government aided Unaided Total
Insti-
tutions
Intake capacity
Admitted students
Insti- tutions
Intake capacity
Admitted students
Insti- tutions
Intake capacity
Admitted students
Insti- tutions
Intake capacity
Admitted students
(1) (2) (3) (4) (5) (6) (7) (8) (9) (10) (11) (12) (13)
Arts
Graduate -- -- 2,17,894 1,36,373 75,699 31,831 2,93,593 1,68,204
Post-Graduate 180 143 59,538 17,847 4,119 1,342 63,837 19,332
Science
Graduate 1,240 1,162 1,87,684 1,36,397 81,030 40,807 2,69,954 1,78,366
Post-Graduate 450 421 26,820 20,818 4,464 3,128 31,734 24,367
Commerce 15 1,088 1,369 2,472
Graduate -- -- 2,47,095 1,82,279 1,35,113 76,403 3,82,208 2,58,682
Post-Graduate -- -- 26,869 18,262 4,403 2,242 31,272 20,504
Non- A.I.C.T.E
Courses
Graduate -- -- 18,028 12,969 27,134 16,121 45,162 29,090
Post-Graduate -- -- 1,141 212 60 -- 1,201 212
Law
Graduate 1 -- -- 41
10,366 6,386 98
4,388 2,319 140
14,754 8,705
Post-Graduate -- -- -- 1,214 854 410 264 1,624 1,118
Education
D. Ed 16 849 476 97 4,545 2,686 538 30,520 11,252 651 35,914 14,414
B. Ed 12
835 489 38
1,800 964 471
18,712 12,376 521
21,347 13,829
M. Ed 120 26 365 98 1,890 562 2,375 686
Visual Art
Diploma 3 145 104 31 1,930 1,697 178 11,600 1,919 212 13,675 3,720
Graduate 4 300 269 -- -- -- -- -- -- 4 300 269
Post-Graduate 3 95 41 -- -- -- -- -- -- 3 95 41
Source - 1) Directorate of Higher Education, GoM 2) Directorate of Art, GoM 3) Maharashtra Academic Authority, Pune

Economic Survey of Maharashtra 2020-21
275
ANNEXURE 10.5
NUMBER OF INSTITUTIONS FOR AGRICULTURE, VETERINARY AND FISHERY SCIENCE COURSES,
THEIR INTAKE CAPACITY AND STUDENTS ADMITTED IN FIRST YEAR OF THE COURSE FOR THE YEAR 2020-21
Faculty Government Government aided Unaided Total
Insti- tutions
Intake capacity
Admitted students
Insti- tutions
Intake capacity
Admitted students
Insti- tutions
Intake capacity
Admitted students
Insti- tutions
Intake capacity
Admitted students
(1) (2) (3) (4) (5) (6) (7) (8) (9) (10) (11) (12) (13) Agriculture Graduate 18 1,828 950 2 244 116 74 7,890 2,095 94 9,962 3,161 Post-Graduate 11 882 769 -- -- -- -- -- -- 11 882 769 Ph.D. 5 168 106 -- -- -- -- -- -- 5 168 106 Horticulture Graduate 5 200 120 -- -- -- 10 560 139 15 760 259 Post-Graduate 10 134 118 -- -- -- -- -- -- 10 134 118 Forestry Graduate 2 64 26 -- -- -- -- -- -- 2 64 26 Post-Graduate 2 21 20 -- -- -- -- -- -- 2 21 20 Fishery Science Graduate 3 116 24 -- -- -- -- -- -- 3 116 24 Post-Graduate 1 28 20 -- -- -- -- -- -- 1 28 20 Ph.D. 1 11 2 -- -- -- -- -- -- 1 11 2 Food Technology Graduate 2 104 35 -- -- -- 25 1,520 217 27 1,624 252 Post-Graduate 1 15 13 -- -- -- -- -- -- 1 15 13 Ph.D. 1 5 3 -- -- -- -- -- -- 1 5 3 Bio-Technology Graduate 2 80 31 -- -- -- 15 920 144 17 1,000 175 Post-Graduate 1 8 8 -- -- -- 3 24 21 4 32 29 Ph.D. 1 3 1 -- -- -- -- -- -- 1 3 1 Agriculture Engineering
Graduate 4 247 71 -- -- -- 15 880 154 19 1,127 225 Post-Graduate 4 86 74 -- -- -- -- -- -- 4 86 74 Ph.D. 4 34 5 -- -- -- -- -- -- 4 34 5 Home /Community Science
Graduate 1 40 6 -- -- -- -- -- -- 1 40 6 Post-Graduate 1 12 7 -- -- -- -- -- -- 1 12 7 Ph.D. 1 2 2 -- -- -- -- -- -- 1 2 2 Agriculture Business Management
Graduate 1 40 6 -- -- -- 12 600 108 13 640 114 Post-Graduate 1 35 35 -- -- -- 2 60 60 3 95 95 Post Harvest Management
Post-Graduate 1 30 13 -- -- -- -- -- -- 1 30 13 Veterinary Graduate 5 405 -- -- -- -- -- -- -- 5 405 -- Post-Graduate 6 260 -- -- -- -- -- -- -- 6 260 -- Ph.D. 6 101 -- -- -- -- -- -- -- 6 101 -- Dairy Technology Graduate 2 76 -- -- -- -- -- -- -- 2 76 -- Post-Graduate 1 8 -- -- -- -- -- -- -- 1 8 --
Source - 1) Maharashtra Council of Agriculture Education and Research, Pune. 2) Maharashtra Animal and Fishery Sciences University, Nagpur Note: Since the admission process is incomplete due to Covid-19 Pandemic, the information is not available for Veterinary and Dairy Technology.
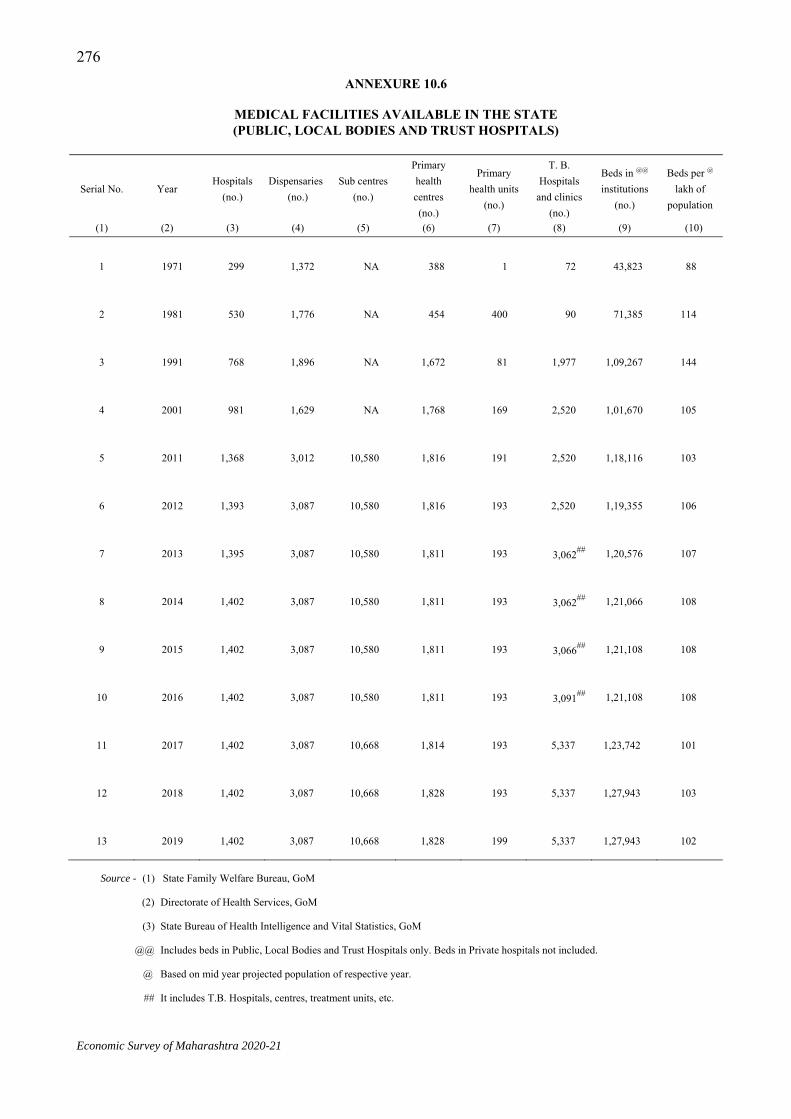
Economic Survey of Maharashtra 2020-21
276ANNEXURE 10.6
MEDICAL FACILITIES AVAILABLE IN THE STATE (PUBLIC, LOCAL BODIES AND TRUST HOSPITALS)
Serial No. Year Hospitals
(no.) Dispensaries
(no.) Sub centres
(no.)
Primary health centres (no.)
Primary health units
(no.)
T. B. Hospitals
and clinics (no.)
Beds in @@
institutions (no.)
Beds per @
lakh of population
(1) (2) (3) (4) (5) (6) (7) (8) (9) (10)
1 1971 299 1,372 NA 388 1 72 43,823 88
2 1981 530 1,776 NA 454 400 90 71,385 114
3 1991 768 1,896 NA 1,672 81 1,977 1,09,267 144
4 2001 981 1,629 NA 1,768 169 2,520 1,01,670 105
5 2011 1,368 3,012 10,580 1,816 191 2,520 1,18,116 103
6 2012 1,393 3,087 10,580 1,816 193 2,520 1,19,355 106
7 2013 1,395 3,087 10,580 1,811 193 3,062## 1,20,576 107
8 2014 1,402 3,087 10,580 1,811 193 3,062## 1,21,066 108
9 2015 1,402 3,087 10,580 1,811 193 3,066## 1,21,108 108
10 2016 1,402 3,087 10,580 1,811 193 3,091## 1,21,108 108
11 2017 1,402 3,087 10,668 1,814 193 5,337 1,23,742 101
12 2018 1,402 3,087 10,668 1,828 193 5,337 1,27,943 103
13 2019 1,402 3,087 10,668 1,828 199 5,337 1,27,943 102
Source - (1) State Family Welfare Bureau, GoM
(2) Directorate of Health Services, GoM
(3) State Bureau of Health Intelligence and Vital Statistics, GoM
@@ Includes beds in Public, Local Bodies and Trust Hospitals only. Beds in Private hospitals not included.
@ Based on mid year projected population of respective year.
## It includes T.B. Hospitals, centres, treatment units, etc.

Economic Survey of Maharashtra 2020-21
277
ANNEXURE 10.7
BIRTH RATES, DEATH RATES, INFANT MORTALITY RATES AND TOTAL FERTILITY RATES BASED ON SAMPLE REGISTRATION SCHEME OF THE STATE
Year Birth rate Death rate Infant mortality rate Total fertility rate
Rural Urban Total Rural Urban Total Rural Urban Total Rural Urban Total (1) (2) (3) (4) (5) (6) (7) (8) (9) (10) (11) (12) (13)
1971 33.7 29.0 32.2 13.5 9.7 12.3 111 88 105 4.9 3.9 4.6
(38.9) (30.1) (36.9) (16.4) (9.7) (14.9) (138) (82) (129) (5.4) (4.1) (5.2)
1981 30.4 24.5 28.5 10.6 7.4 9.6 90 49 79 4.0 3.0 3.7
(35.6) (27.0) (33.9) (13.7) (7.8) (12.5) (119) (62) (110) (4.8) (3.3) (4.5)
1991* 28.0 22.9 26.2 9.3 6.2 8.2 69 38 60 3.4 2.5 3.0
(30.9) (24.3) (29.5) (10.6) (7.1) (9.8) (87) (53) (80) (3.9) (2.7) (3.6)
2001 21.1 20.2 20.7 8.5 5.9 7.5 55 28 45 2.6 2.2 2.4
(27.1) (20.3) (25.4) (9.1) (6.3) (8.4) (72) (42) (66) (3.4) (2.3) (3.1)
2008 18.4 17.2 17.9 7.4 5.6 6.6 40 23 33 2.1 1.7 2.0
(24.4) (18.5) (22.8) (8.0) (5.9) (7.4) (58) (36) (53) (2.9) (2.0) (2.6)
2009 18.1 16.9 17.6 7.6 5.5 6.7 37 22 31 2.1 1.7 1.9
(24.1) (18.3) (22.5) (7.8) (5.8) (7.3) (55) (34) (50) (2.9) (2.0) (2.6)
2010 17.6 16.4 17.1 7.5 5.3 6.5 34 20 28 2.0 1.7 1.9
(23.7) (18.0) (22.1) (7.7) (5.8) (7.2) (51) (31) (47) (2.8) (1.9) (2.5)
2011 17.3 15.8 16.7 7.3 5.1 6.3 30 17 25 1.9 1.6 1.8
(23.3) (17.6) (21.8) (7.6) (5.7) (7.1) (48) (29) (44) (2.7) (1.9) (2.4)
2012 17.4 15.5 16.6 7.3 5.0 6.3 30 17 25 2.0 1.6 1.8
(23.1) (17.4) (21.6) (7.6) (5.6) (7.0) (46) (28) (42) (2.6) (1.8) (2.4)
2013 17.2 15.4 16.5 7.1 5.0 6.2 29 16 24 1.9 1.6 1.8
(22.9) (17.3) (21.4) (7.5) (5.6) (7.0) (44) (27) (40) (2.5) (1.8) (2.3)
2014 16.8 16.0 16.5 6.8 4.8 6.0 27 14 22 1.9 1.7 1.8
(22.7) (17.4) (21.0) (7.3) (5.5) (6.7) (43) (26) (39) (2.5) (1.8) (2.3)
2015 16.6 15.9 16.3 6.6 4.7 5.8 26 14 21 2.0 1.6 1.8
(22.4) (17.3) (20.8) (7.1) (5.4) (6.5) (41) (25) (37) (2.5) (1.8) (2.3)
2016 16.3 15.5 15.9 6.9 4.6 5.9 24 13 19 1.9 1.6 1.8
(22.1) (17.0) (20.4) (6.9) (5.4) (6.4) (38) (23) (34) (2.5) (1.8) (2.3)
2017 16.0 15.4 15.7 6.6 4.6 5.7 23 14 19 1.8 1.5 1.7
(21.8) (16.8) (20.2) (6.9) (5.3) (6.3) (37) (23) (33) (2.4) (1.7) (2.2)
2018 15.9 15.2 15.6 6.3 4.5 5.5 24 14 19 1.8 1.5 1.7
(21.6) (16.7) (20.0) (6.7) (5.1) (6.2) (36) (23) (32) (2.4) (1.7) (2.2)
Source - Sample Registration Scheme Bulletin, Registrar General of India, New Delhi Note - (1) Bracketed figures are for India. (2) * Excludes Jammu & Kashmir. (3) Birth rates and Death rates are per thousand populations. (4) Infant mortality rates are per thousand live births.

Economic Survey of Maharashtra 2020-21
278ANNEXURE 10.8
ECONOMIC CLASSIFICATION OF WORKERS AS PER POPULATION CENSUS 2011
('000)
Class of workers Main /
Marginal / Total
Maharashtra India# Males Females Total Males Females Total
(1) (2) (3) (4) (5) (6) (7) (8)
(A) Workers
1. Cultivators Main 7,181 4,297 11,478 73,018 22,823 95,841
Marginal 411 680 1,091 9,689 13,163 22,851
Total 7,592 4,977 12,569 82,707 35,986 1,18,692
2. Agricultural labourers Main 5,847 5,222 11,069 55,255 30,912 86,167
Marginal 928 1,489 2,417 27,485 30,678 58,163
Total 6,775 6,711 13,486 82,740 61,590 1,44,330
3. In Household Industries Main 607 385 991 7,540 4,791 12,331
Marginal 84 150 234 2,236 3,769 6,005
Total 691 535 1,225 9,776 8,560 18,336
4. Other Main 16,355 3,870 20,225 1,37,336 30,771 1,68,107
Marginal 1,204 718 1,922 19,307 12,971 32,278
Total 17,559 4,588 22,147 1,56,643 43,742 2,00,385
Total (A) Main 29,989 13,774 43,763 2,73,149 89,297 3,62,446
Marginal 2,628 3,037 5,665 58,717 60,580 1,19,297
Total 32,617 16,811 49,428 3,31,866 1,49,877 4,81,743
(B) Non-Workers Total 25,626 37,320 62,946 2,91,256 4,37,570 7,28,826
Total (A+B) 58,243 54,131 1,12,374 6,23,122 5,87,447 12,10,569
Source - Registrar General and Census Commissioner, GoI
# Excludes Mao-Maram, Paomata and Purul sub-divisions of Senapati district of Manipur state
Note - Figures may not add up to totals due to rounding

Economic Survey of Maharashtra 2020-21
279
ANNEXURE 10.9
AVERAGE DAILY EMPLOYMENT IN DIFFERENT INDUSTRIES IN THE STATE ('00)
Sr. No
Industry Group Average daily employment
1971 1981 1991 2001 2011 2017 2018 2019 2020 (1) (2) (3) (4) (5) (6) (7) (8) (9) (10) (11)
(A) Consumer Goods Industries 5,020 5,168 4,535 4,533 5,164 6,314 6,707 7,065 6,790
1 Food products, beverages and
tobacco products
921 965 1,330 1,662 1,991 2,804 3,064 3,442 3,255
2 Textiles (including wearing
apparels) 3,516 3,554 2,527 2,167 2,182 2,554 2,662 2,705 2,649
3 Wood and wood products 75 75 152 154 217 284 308 301 286
4 Paper, paper products, printing
and publishing, etc. 494 549 491 525 736 588 583 526 504
5 Tanning and dressing of
leather & leather products
14 25 35 25 38 86 91 90 95
(B) Reconstruction goods
Industries
2,435 3,193 3,421 3,462 6,648 5,242 5,461 5,431 5,299
6 Chemicals and chemical
products 760 1,059 1,215 1,299 1,802 1,883 1,932 1,963 1,970
7 Petroleum, rubber, plastic
products 349 421 482 535 1,087 1,170 1,250 1,293 1,238
8 Non-metallic mineral products 402 403 423 317 465 526 560 486 477
9 Basic metals, metal products 924 1,310 1,301 1,311 3,294 1,663 1,719 1,689 1,614
(C) Capital goods Industries 2,110 2,898 2,712 3,140 5,033 3,035 3,018 3,251 3,017
10 Machinery and equipments
(other than transport equipments)
1,322 1,786 1,614 1,720 2,407 1,354 1,367 1,573 1,367
11 Transport equipments 608 903 867 1,025 1,785 389 357 385 342
12 Other manufacturing industries 180 209 231 395 841 1,292 1,294 1,293 1,308
(D) Others 412 663 1,016 870 1,301 10,957 11,664 13,127 12,963
Total 9,977 11,922 11,684 12,005 18,146 25,548 26,851 28,874 28,068
Source - Directorate of Industrial Safety and Health, GoM Note - (1) Details may not add up to totals due to rounding (2) Bidi factories are covered under separate Act from 1974

Economic Survey of Maharashtra 2020-21
280
ANNEXURE 10.10
WORKING FACTORIES AND FACTORY EMPLOYMENT IN THE STATE
Employment ('000)
Year Item * *
Section 2m (i) Section 2m (ii) & Section 85 All Factories
Employing less than
50 workers
Employing 50 or more
workers
Total Employing less than
50 workers
Employing 50 or more
workers
Total
Employing less than 50 workers
Employing 50 or more
workers
Total all
factories (1) (2) (3) (4) (5) (6) (7) (8) (9) (10) (11)
1971 Factories 6,341 2,701 9,042 856 343 1,199 7,197 3,044 10,241
Employment 123 824 947 15 36 51 138 860 998
1981 Factories 10,238 3,132 13,370 3,154 70 3,224 13,392 3,202 16,594
Employment 183 983 1,166 20 6 26 203 989 1,192
1991 Factories 13,139 3,199 16,338 7,743 38 7,781 20,882 3,237 24,119
Employment 215 910 1,124 40 4 44 254 914 1,169
2001 Factories 15,977 3,929 19,906 8,393 25 8,418 24,370 3,954 28,324
Employment 266 891 1,157 42 2 44 308 893 1,201
2009 Factories 18,668 6,112 24,780 9,263 17 9,280 27,931 6,129 34,060
Employment 345 1,103 1,448 50 2 52 395 1,105 1,500
2010 Factories 19,173 6,517 25,690 9,183 15 9,198 28,356 6,532 34,888
Employment 363 1,231 1,594 52 1 53 415 1,233 1,647
2011 Factories 19,410 7,373 26,783 9,067 26 9,093 28,477 7,399 35,876
Employment 367 1,394 1,761 51 3 54 418 1,397 1,815
2015 Factories 17,917 7,908 25,825 10,377 87 10,464 28,294 7,995 36,289
Employment 404 1,584 1,989 60 10 70 464 1,595 2,059
2016 Factories 20,823 9,317 30,140 5,159 48 5,207 25,982 9,365 35,347
Employment 449 1,910 2,359 40 4 44 489 1,914 2,403
2017 Factories 16,893 9,108 26,001 8,698 70 8,768 25,591 9,178 34,769
Employment 466 2,014 2,480 68 8 76 533 2,022 2,555
2018 Factories 18,655 9,431 28,086 7,824 45 7,869 26,479 9,476 35,955
Employment 466 2,153 2,618 62 5 67 528 2,157 2,685
2019 Factories 18,451 9,252 27,703 7,826 51 7,877 26,277 9,303 35,580
Employment 537 2,275 2,813 70 5 75 607 2,280 2,887
2020 Factories 20,721 10,202 30,923 4,746 53 4,799 20,726 10,202 30,928
Employment 489 2,263 2,752 50 5 55 539 2,268 2,807
Source – Directorate of Industrial Safety and Health, GoM
Note - (1) Employment includes estimated average daily employment of factories not submitting returns (2) Figures pertain to the factories registered under the Factories Act, 1948 (3) Details may not add up to totals due to rounding in respect of employment
* * Factories – Number of working factories Employment – Average Daily Employment Bidi factories are deregistered and covered under separate Act from 1974

Economic Survey of Maharashtra 2020-21
281
ANNEXURE 10.11
REGISTRATIONS IN THE SKILL DEVELOPMENT, EMPLOYMENT AND ENTREPRENEURSHIP GUIDANCE CENTRES IN THE STATE, THE VACANCIES NOTIFIED AND PLACEMENTS EFFECTED
(‘000)
Year Number of Registrations during reference Year
Number of vacancies notified
Number of placements during reference year
Number of persons on live register at the end of the
year (1) (2) (3) (4) (5)
1991 591.8 64.8 30.3 3,159.8
1992 596.6 55.9 29.1 3,320.5
1993 599.7 55.4 24.1 3,349.6
1994 635.8 52.1 24.7 3,439.2
1995 720.1 49.7 18.7 3,634.3
1996 688.7 53.7 22.6 3,787.2
1997 692.8 47.4 22.9 3,933.1
1998 729.3 37.9 16.8 4,109.6
1999 861.1 50.9 16.2 4,183.8
2000 750.8 43.9 18.1 4,348.8
2001 623.2 32.3 12.5 4,419.7
2002 622.7 30.9 9.5 4,203.3
2003 819.1 59.6 16.4 4,044.1
2004 880.3 43.4 15.1 4,105.7
2005 645.2 44.2 13.9 4,000.3
2006 608.1 68.3 14.8 3,608.5
2007 616.7 97.5 9.2 3,213.8
2008 721.5 99.2 11.8 3,007.2
2009 698.3 176.6 17.2 2,875.9
2010 892.9 378.8 353.9 2,682.4
2011 747.5 346.2 191.0 2,596.2
2012 612.3 259.2 134.2 2,404.0
2013 630.3 118.9 114.6 3,034.8
2014 536.4 841.1 84.7 3,571.5
2015 461.9 571.4 70.4 3,401.5
2016 460.0 576.8 144.0 3,356.7
2017 539.3 413.1 222.6 3,819.6
2018 726.9 785.3 197.9 4,403.4
2019 786.6 467.6 200.0 4,990.0
2020 575.1 801.8 199.4 5,365.6
Source - Commissionarate of Skill Development, Employment and Entrepreneurship, GoM

Economic Survey of Maharashtra 2020-21
282ANNEXURE 10.12
NUMBER OF PERSONS ON THE LIVE REGISTER OF SKILL DEVELOPMENT, EMPLOYMENT AND
ENTREPRENEURSHIP GUIDANCE CENTRES AS ON DECEMBER, 2020
Sr. No. Educational Qualification Total Persons
Of which, females
Percentage of females
Percentage of persons to grand
total (1) (2) (3) (4) (5) (6)
1. Below S.S.C. (including illiterates) 12,77,565 1,63,945 12.83 23.81
2. S.S.C. Passed 12,66,727 2,97,307 23.47 23.61
3. H.S.C. Passed 12,98,538 3,31,721 25.54 24.20
4. I.T.I. trained and Apprentices 2,49,064 25,878 10.39 4.64
5. Diploma holder
5.1 Engineering/Technology 1,03,429 22,229 21.49 1.93
5.2 Medicine, DMLT and Pharmacy 20,892 7,878 37.70 0.38
5.3 Others 1,43,829 1,17,777 81.88 2.68
Total (5.1 to 5.3) 2,68,150 1,47,884 55.14 5.0
6. Graduate
6.1 Engineering/Technology 1,37,368 31,154 22.67 2.56
6.2 Medicine 3,027 2,441 80.64 0.05
6.3 Others 7,14,643 2,39,410 33.50 13.31
Total (6.1 to 6.3) 8,55,038 2,73,005 31.92 15.93
7. Post-Graduate
7.1 Engineering/Technology 6,450 2,321 35.98 0.12
7.2 Medicine 297 283 95.28 0.005
7.3 Others 1,43,825 46,689 32.46 2.68
Total (7.1 to 7.3) 1,50,572 49,293 32.73 2.81
Grand Total 53,65,654 12,89,033 24.02 100
Source - Commissionarate of Skill Development, Employment and Entrepreneurship, GoM
Note - In above, job seeker’s having more than one qualification are counted in each respective qualification.
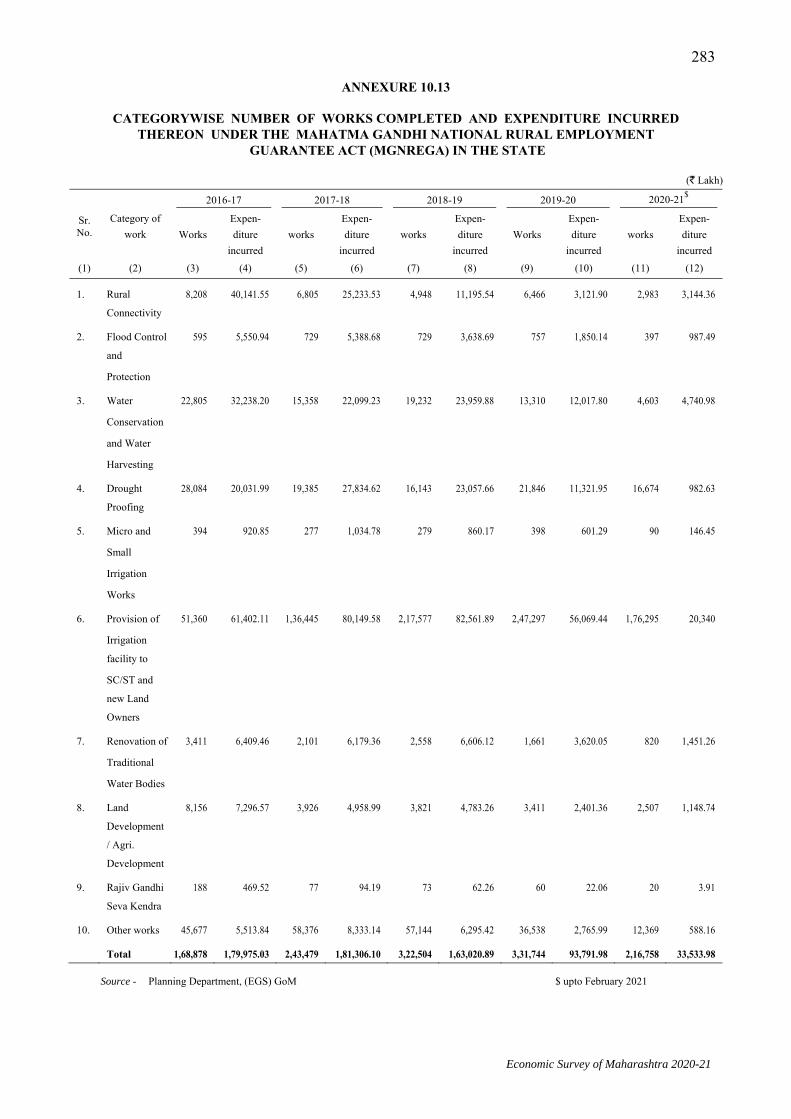
Economic Survey of Maharashtra 2020-21
283
ANNEXURE 10.13
CATEGORYWISE NUMBER OF WORKS COMPLETED AND EXPENDITURE INCURRED THEREON UNDER THE MAHATMA GANDHI NATIONAL RURAL EMPLOYMENT
GUARANTEE ACT (MGNREGA) IN THE STATE
(` Lakh)
Sr. No.
Category of work
2016-17 2017-18 2018-19 2019-20 2020-21$
Works Expen-diture
incurred works
Expen-diture
incurred works
Expen-diture
incurred Works
Expen-diture
incurred works
Expen-diture
incurred (1) (2) (3) (4) (5) (6) (7) (8) (9) (10) (11) (12)
1. Rural
Connectivity
8,208 40,141.55 6,805 25,233.53 4,948 11,195.54 6,466 3,121.90 2,983 3,144.36
2. Flood Control
and
Protection
595 5,550.94 729 5,388.68 729 3,638.69 757 1,850.14 397 987.49
3. Water
Conservation
and Water
Harvesting
22,805 32,238.20 15,358 22,099.23 19,232 23,959.88 13,310 12,017.80 4,603 4,740.98
4. Drought
Proofing
28,084 20,031.99 19,385 27,834.62 16,143 23,057.66 21,846 11,321.95 16,674 982.63
5. Micro and
Small
Irrigation
Works
394 920.85 277 1,034.78 279 860.17 398 601.29 90 146.45
6. Provision of
Irrigation
facility to
SC/ST and
new Land
Owners
51,360 61,402.11 1,36,445 80,149.58 2,17,577 82,561.89 2,47,297 56,069.44 1,76,295 20,340
7. Renovation of
Traditional
Water Bodies
3,411 6,409.46 2,101 6,179.36 2,558 6,606.12 1,661 3,620.05 820 1,451.26
8. Land
Development
/ Agri.
Development
8,156 7,296.57 3,926 4,958.99 3,821 4,783.26 3,411 2,401.36 2,507 1,148.74
9. Rajiv Gandhi
Seva Kendra
188 469.52 77 94.19 73 62.26 60 22.06 20 3.91
10. Other works 45,677 5,513.84 58,376 8,333.14 57,144 6,295.42 36,538 2,765.99 12,369 588.16
Total 1,68,878 1,79,975.03 2,43,479 1,81,306.10 3,22,504 1,63,020.89 3,31,744 93,791.98 2,16,758 33,533.98
Source - Planning Department, (EGS) GoM $ upto February 2021

Economic Survey of Maharashtra 2020-21
284ANNEXURE 10.14
INDUSTRIAL DISPUTES IN THE STATE**
(Workers participated in '00 and person days lost in lakh)
Item 1981 1991 2001 2011 2016 2017 2018 2019 2020$
(1) (2) (3) (4) (5) (6) (7) (8) (9) (10)
1. Textile mills —
(a) No. of strikes and lockouts 66 10 12 7 18 13 4 6 3
(b) Workers participated 564 61 86 26 70 16 16 57 35
(c) Person days lost 47.36 2.37 4.53 1.73 1.80 0.41 0.85 11.40 9.11
2. Engineering factories —
(a) No. of strikes and lockouts 119 59 28 8 60 48 11 14 11
(b) Workers participated 412 110 65 71 147 138 58 19 12
(c) Person days lost 16.21 14.46 25.79 12.90 3.81 3.65 3.59 3.30 2.99
3. Miscellaneous —
(a) No. of strikes and lockouts
451 148 19 18 66 57 10 11 9
(b) Workers participated 1,031 423 85 38 508 507 48 19 17
(c) Person days lost 31.49 29.66 15.90 7.80 15.67 12.98 13.80 7.14 4.10
4. Total —
(a) No. of strikes and lockouts 636 217 59 33 144 118 25 31 23
(b) Workers participated 2,007 594 237 135 725 660 122 96 64
(c) Person days lost. 95.05 46.49 52.31 22.43 21.29 17.04 18.60 21.84 16.21
Source - Commissioner of Labour, GoM
Note - (1) Figures against item No. 4 (b) and 4 (c) may not tally against actual totals due to rounding (2) ** Under State Industrial Relations Machinery
(3) Information January to December
(4) $ Upto October

Economic Survey of Maharashtra 2020-21
285
ANNEXURE 10.15
DISTRICTWISE HUMAN DEVELOPMENT INDEX 2011
District Total
Literacy Rate (2011)
Gross Enrolment Ratio
(2011-12)
Infant Mortality Rate
(2007-08)
PCDDP constant (1999-2000)
price (`)
Human Development
Index (HDI) 2011
HDI Status
(1) (2) (3) (4) (5) (6) (7)
Nandurbar 63.0 67.7 75 19,156 0.604 Low
Gadchiroli 70.6 80.7 63 14,913 0.608
Washim 81.7 88.0 46 14,885 0.646
Hingoli 76.0 78.7 50 18,286 0.648
Osmanabad 76.3 81.9 50 17,847 0.649
Nanded 76.9 80.3 30 18,155 0.657
Jalna 73.6 83.7 48 20,565 0.663
Latur 79.0 91.1 53 17,674 0.663
Dhule 74.6 83.7 44 21,442 0.671
Beed 73.5 90.4 33 21,013 0.678 Medium
Parbhani 75.2 86.3 51 23,146 0.683
Buldhana 82.1 87.6 34 19,487 0.684
Yavatmal 80.7 84.9 47 24,118 0.700
Gondia 85.4 87.2 67 23,091 0.701
Amravati 88.2 86.0 59 21,804 0.701
Bhandara 85.1 89.3 60 25,735 0.718
Chandrapur 81.4 88.9 74 28,730 0.718
Ahmednagar 80.2 87.9 41 27,392 0.720 High
Akola 87.6 85.6 28 24,055 0.722
Wardha 87.2 87.9 62 26,130 0.723
Jalgaon 79.7 88.2 48 28,939 0.723
Aurangabad 80.4 82.2 44 30,690 0.727
Solapur 77.7 89.5 23 28,828 0.728
Ratnagiri 82.4 89.0 25 27,685 0.732
Satara 84.2 85.7 27 29,916 0.742
Sangli 82.6 87.9 33 33,713 0.742 Very High
Nashik 81.0 82.2 46 35,545 0.746
Sindhudurg 86.5 87.5 35 31,563 0.753
Raigad 83.9 88.9 35 34,377 0.759
Kolhapur 82.9 88.4 13 36,178 0.770
Nagpur 89.5 92.6 40 37,995 0.786
Thane$ 86.2 78.5 34 50,408 0.800
Pune 87.2 88.2 28 50,158 0.814
Mumbai@ 90.3 85.5 18 58,818 0.841
Maharashtra State 82.9 85.4 44 35,033 0.752 Source - Maharashtra Human Development Report 2012 PCDDP – Per capita District Domestic Product Note - @ Mumbai city & Mumbai Suburban districts together $ including Palghar


Economic Survey of Maharashtra 2020-21
GLOSSARY Demography Child Sex Ratio (0-6 Years) : Child Sex Ratio (0-6 Years) has been defined as the number of females in age-group 0-6 years per 1,000 males in the same age-group in the population.
Child Sex Ratio (0-6 Years) = Number of Female Children (0-6 Years)
X 1000 Number of Male Children (0-6 Years)
Institutional Households : A group of unrelated persons who live in an institution and take their meals from a common kitchen are considered as an Institutional Household. Boarding houses, Messes, Hostels, Hotels, Rescue Homes, Observation Homes, Beggars’ Homes, Jails, Ashrams, Old Age Homes, Children Homes, Orphanages, etc. all are covered in this type of household.
Head of the Household : The head of household for census purposes is a person who is recognized as such by the household. She or he is generally the person who bears the chief responsibility for managing the affairs of the household and takes decision on behalf of the household. The ‘Head of Household’ need not necessarily be the oldest male member or an earning member, but may be a female or a younger member of either sex.
Main Workers : Workers who worked for more than six months (180 days) in the reference period are termed as main workers.
Marginal Workers : Workers who worked for less than six months (180 days) in the reference period are termed as marginal workers.
Seeking or available for work (unemployed) : Persons, who owing to lack of work, had not worked but either sought work through employment exchanges, intermediaries, friends or relatives or by making applications to prospective employers or expressed their willingness or availability for work under the prevailing condition of work and remuneration are considered as those who are seeking or available for work (or unemployed).
Labour Force : Persons who were either ‘working’ (or employed) or ‘seeking or available for work’ (or unemployed) constituted the labour force.
Workforce (Employed) : Persons engaged in any economic activity constitute the work force.
Work Participation Rate (WPR) : Work participation rate( as per population census 2011) is defined as the percentage of total workers (main and marginal) to total population
Work Participation Rate =
Total workers(Main + Marginal) X 100 Total population
Labour Force Participation Rate (LFPR)$ : LFPR is defined as the percentage of persons in the labour force (i.e. working or seeking or available for work) in the population.
Worker Population Ratio (WPR)$: Worker Population Ratio (WPR) is defined as the percentage of employed persons in the population.
Worker Population Ratio (WPR) = No. of employed persons
X 100 Total population
Unemployment Rate (UR)$ : UR is defined as the percentage of persons unemployed among the persons in the labour force.
(As per terminology used in Annual report of Periodic Labour Force Survey,(July, 2017-June, 2018)
Labour Force Participation Rate (LFPR) =
(No. of employed persons + No. of unemployed persons ) X 100 Total population
Unemployment Rate (UR) =
No. of unemployed persons X 100 No. of employed persons + No. of unemployed persons
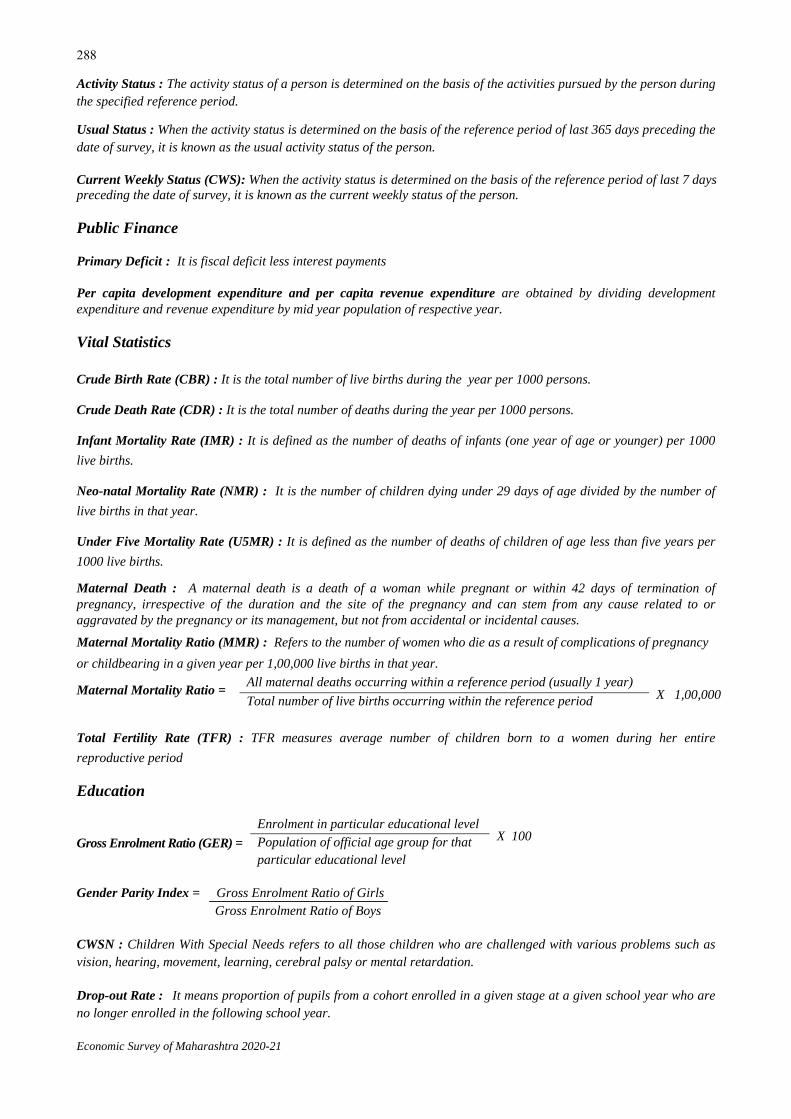
Economic Survey of Maharashtra 2020-21
288
Activity Status : The activity status of a person is determined on the basis of the activities pursued by the person during the specified reference period.
Usual Status : When the activity status is determined on the basis of the reference period of last 365 days preceding the date of survey, it is known as the usual activity status of the person. Current Weekly Status (CWS): When the activity status is determined on the basis of the reference period of last 7 days preceding the date of survey, it is known as the current weekly status of the person.
Public Finance
Primary Deficit : It is fiscal deficit less interest payments
Per capita development expenditure and per capita revenue expenditure are obtained by dividing development expenditure and revenue expenditure by mid year population of respective year.
Vital Statistics
Crude Birth Rate (CBR) : It is the total number of live births during the year per 1000 persons.
Crude Death Rate (CDR) : It is the total number of deaths during the year per 1000 persons.
Infant Mortality Rate (IMR) : It is defined as the number of deaths of infants (one year of age or younger) per 1000 live births.
Neo-natal Mortality Rate (NMR) : It is the number of children dying under 29 days of age divided by the number of live births in that year.
Under Five Mortality Rate (U5MR) : It is defined as the number of deaths of children of age less than five years per 1000 live births.
Maternal Death : A maternal death is a death of a woman while pregnant or within 42 days of termination of pregnancy, irrespective of the duration and the site of the pregnancy and can stem from any cause related to or aggravated by the pregnancy or its management, but not from accidental or incidental causes.
Maternal Mortality Ratio (MMR) : Refers to the number of women who die as a result of complications of pregnancy or childbearing in a given year per 1,00,000 live births in that year.
Total Fertility Rate (TFR) : TFR measures average number of children born to a women during her entire reproductive period
Education
Gender Parity Index = Gross Enrolment Ratio of Girls Gross Enrolment Ratio of Boys
CWSN : Children With Special Needs refers to all those children who are challenged with various problems such as vision, hearing, movement, learning, cerebral palsy or mental retardation.
Drop-out Rate : It means proportion of pupils from a cohort enrolled in a given stage at a given school year who are no longer enrolled in the following school year.
Maternal Mortality Ratio = All maternal deaths occurring within a reference period (usually 1 year)
X 1,00,000 Total number of live births occurring within the reference period
Gross Enrolment Ratio (GER) = Enrolment in particular educational level
X 100 Population of official age group for that particular educational level

Economic Survey of Maharashtra 2020-21
289
Economic
Gross Domestic Product (GDP) at market prices: It is a measure in monetary terms of all the goods & services produced (without duplication) within the boundaries of any geographical area during a given period of time (generally, one year). Usually, geographical area is Nation. It is termed as Gross State Domestic Product (GSDP) if the geographical boundary is State and termed as Gross District Domestic Product (GDDP) if the geographical boundary is District.
Gross Domestic Product (GDP) at market prices : Sum of GVA at basic prices for each industry + Taxes on products including import duties less Subsidies on Products
All Net Products such as Net Domestic Product, Net State Domestic Product & Net District Domestic Product are obtained by subtracting Consumption of Fixed Capital (CFC) from respective Gross Domestic Products.
GVA at basic prices (Income Approach) : Compensation of Employees + Operating surplus / Mixed Income + Consumption of Fixed Capital + Production taxes less production subsidies
GVA at basic prices (Production Approach) : Gross value of output - Inputs
Gross National Income (GNI ): It is an addition of Net Income from abroad & Gross Domestic Product of a Nation.
Net National Income (NNI) : It is obtained by subtracting Consumption of Fixed Capital (CFC) from Gross National Income. It is also called as National Income (NI).
Per Capita Income : Per capita National Income, Per capita State Income & Per Capita District Income is obtained by dividing Net Products of respective geographical area by mid- year population of respective year.
Advance estimate : Estimates based on available suitable/proxy indicators.
Consumer goods : Items purchased by consumers for personal and household use.
Intermediate goods : Goods used as inputs in the production of other goods.
Capital goods : Goods such as machinery, used in production of commodities.
Gross output : Gross output is defined to include the ex-factory value, (i.e., exclusive of taxes, duties, etc. on sale and inclusive of subsidies etc., if any) of products and by-products manufactured during the accounting year, and the net value of the semi-finished goods, value of own construction and also the receipts for industrial and non-industrial services rendered to others, rent received for plant & machinery and other fixed assets, net balance of goods sold in the same condition as purchased and value of electricity generated and sold.
Net value added (NVA) : This is obtained by deducting the value of total input and depreciation from gross output.
General
Per capita Ultimate Consumption of Electricity = Ultimate Consumption of Electricity/Mid-year population
Ultimate Consumption of Electricity refers to the electricity actually consumed by the consumers (or the electricity sold to consumers).
Energy - Units
1 MW = 1 Megawatt = 1,000 kW = 10, 00,000 Watts
1 Unit = 1 kilo-watt-hour = 1 kWh
1 MU =1 Million Units = 10,00,000 Units =10, 00,000 kWh
1 MVA = 1 Million Volt Ampere

Economic Survey of Maharashtra 2020-21
290
Methodology for Construction of State and District HDI (SHDR-2012) :
The dimension indices for Health, Education and Income are calculated using following formula. Actual value-Minimum value Ix= Dimension Index of 'X' =
Maximum value-Minimum value
Education index has been calculated by allocating two -third weight to literacy and one -third weight to GER.
An aggregate HDI for a given district has been calculated as a simple arithmetic mean.
The goal posts used to estimate the district wise HDI are as follows:
Component Maximum Minimum Infant Survival Rate (ISR) 1,000 0 Literacy rate 100 0 GER 100 0 Per capita net domestic product (Rupees at current prices)
1,50,000 10,000
Note : ISR is obtained as (1,000 – IMR), Log transformation is used for the estimates of DDP
Cropping Intensity : Ratio of total cropped area to net area sown.
Teledensity : Teledensity is the number of telephone connections for every hundred individuals living within an area.
Mean age at effective marriage of female : It is the estimated mean age of the marriages happening to the females in a given year.
Water Supply and Sanitation
ODF village : A village can be notified/ declared as ODF village if, no visible faeces found in the environment/ village and every household as well as public/ community insitutions using safe technology option for disposal of faeces.
ODF city : A city/ ward can be notified / declared as ODF city if, at any point of the day, not a single person is found defecating in the open.
ODF+ city : A city/ ward can be notified / declared as ODF+ city/ ODF+ ward if, at any point of the day, not a single person is found defecating and/ or urinating in the open, and all community & public toilets are functional and well maintained. ODF++ city : A city / ward / work circle can be notified/ declared as ODF++ city/ ODF++ ward/ ODF++ work circle if, at any point of the day, not a single person is found defecating and/ or urinating in the open, all community and public toilets are functional and well maintained, and faecal sludge/septage and sewage is safely managed and treated, with no discharging and/or dumping of untreated faecal sludge/septage and sewage in drains, water bodies or open areas.
* * * * *
Vehicle productivity =
Average effective km operated per day (in lakh) X 100000 Average vehicle held
Crew productivity =
Total effective km operated (in lakh) X 100000 Total driver on line days
Percentage Load Factor =
Actual passenger earning X 100 Expected passenger earning

Selected Socio-economic indicators of States in India

Economic Survey of Maharashtra 2020-21
292C. SELECTED SOCIO-ECONOMIC INDICATORS OF STATES IN INDIA
$ Includes Union Territories ^ Included in Andhra Pradesh unless specifically mentioned
State Geographical
area (lakh sq.km)
Population (lakh)
Density of population (per sq.km)
Percentage of urban
population to total
population
Percentage of State
population to all India population
Decennial growth rate
of population (per cent)
Sex ratio
Child sex ratio
(Age group 0-6 years)
Total Households (lakh)
Reference Year /
Date (2011) (2011) (2011) (2011) (2011) (2001-11) (2011) (2011) (2011)
(1) (2) (3) (4) (5) (6) (7) (8) (9) (10)
Andhra Pradesh 2.75 845.81 308 33.36 7.00 10.98 993 939 210.23
Telangana^ - - - - - - - - -
Arunachal Pradesh 0.84 13.84 17 22.94 0.11 26.03 938 972 2.71
Assam 0.78 312.06 398 14.10 2.58 17.07 958 962 64.06
Bihar 0.94 1,040.99 1,106 11.29 8.60 25.42 918 935 189.14
Jharkhand 0.80 329.88 414 24.05 2.72 22.42 949 948 62.55
Delhi 0.01 167.88 11,320 97.50 1.39 21.21 868 871 34.36
Goa 0.04 14.59 394 62.17 0.12 8.23 973 942 3.44
Gujarat 1.96 604.40 308 42.60 4.99 19.28 919 890 122.48
Haryana 0.44 253.51 573 34.88 2.09 19.90 879 834 48.58
Himachal Pradesh 0.56 68.65 123 10.03 0.57 12.94 972 909 14.83
Jammu & Kashmir 2.22 125.41 124 27.38 1.04 23.64 889 862 21.20
Karnataka 1.92 610.95 319 38.67 5.05 15.60 973 948 133.57
Kerala 0.39 334.06 860 47.70 2.76 4.91 1,084 964 78.54
Madhya Pradesh 3.08 726.27 236 27.63 6.00 20.35 931 918 150.93
Chhattisgarh 1.35 255.45 189 23.24 2.11 22.61 991 969 56.51
Maharashtra 3.08 1,123.74 365 45.22 9.28 16.00 929 894 244.22
Manipur 0.22 28.56 128 29.21 0.24 24.50 985 930 5.58
Meghalaya 0.22 29.67 132 20.07 0.25 27.95 989 970 5.48
Mizoram 0.21 10.97 52 52.11 0.09 23.48 976 970 2.23
Nagaland 0.17 19.79 119 28.86 0.16 -0.58 931 943 3.96
Odisha 1.56 419.74 270 16.69 3.47 14.05 979 941 96.38
Punjab 0.50 277.43 551 37.48 2.29 13.89 895 846 55.13
Rajasthan 3.42 685.48 200 24.87 5.66 21.31 928 888 127.11
Sikkim 0.07 6.11 86 25.15 0.05 12.89 890 957 1.29
Tamil Nadu 1.30 721.47 555 48.40 5.96 15.61 996 943 185.25
Tripura 0.10 36.74 350 26.17 0.30 14.84 960 957 8.56
Uttar Pradesh 2.41 1,998.12 829 22.27 16.50 20.23 912 902 334.48
Uttarakhand 0.53 100.86 189 30.23 0.83 18.81 963 890 20.57
West Bengal 0.89 912.76 1,028 31.87 7.54 13.84 950 956 203.80
India$ 32.87 12,108.55 382 31.14 100.00 17.70 943 918 2,495.02

Economic Survey of Maharashtra 2020-21
293 SELECTED SOCIO-ECONOMIC INDICATORS OF STATES IN INDIA
N. A. Not Applicable
Female headed households
(lakh)
Number of cultivators
( lakh)
Per cent of households
having access to safe drinking
water
Percentage of scheduled caste and scheduled
tribe population to total
population
Percentage of disabled
population to total population
Percentage of slum population (All towns) to
urban population
Percentage of main workers
to total population
Percentage of agricultural workers to
total workers
Female workers participation rate
(2011) (2011) (2011) (2011) (2011) (2011) (2011) (2011) (2011)
(11) (12) (13) (14) (15) (16) (17) (18) (19)
31.27 64.92 90.5 23.41 2.68 36.10 39.06 59.51 36.16
- - - - - - - - -
0.35 3.03 78.6 68.79 1.93 4.90 34.60 57.67 35.44
8.53 40.62 69.9 19.60 1.54 4.48 27.84 49.35 22.46
19.75 71.96 94.0 17.20 2.24 10.53 20.52 73.55 19.07
6.82 38.15 60.1 38.29 2.33 4.70 20.67 62.99 29.10
3.95 0.33 95.0 16.75 1.40 10.91 31.61 1.30 10.58
0.80 0.31 85.7 11.98 2.26 2.89 32.64 10.07 21.92
12.35 54.48 90.3 21.50 1.81 6.53 33.70 49.61 23.38
5.66 24.81 93.8 20.17 2.16 18.80 27.67 44.96 17.79
3.05 20.62 93.7 30.90 2.26 8.90 30.05 62.85 44.82
2.04 12.45 76.8 19.28 2.88 19.28 21.08 41.48 19.11
22.69 65.81 87.5 24.10 2.17 13.93 38.30 49.28 31.87
19.83 6.70 33.5 10.55 2.28 1.27 27.93 17.15 18.23
15.04 98.44 78.0 36.71 2.14 28.35 31.26 69.79 32.64
7.35 40.05 86.3 43.44 2.45 31.98 32.26 74.68 39.70
31.36 125.69 83.4 21.17 2.64 23.32 38.94 52.71 31.06
0.83 5.74 45.4 44.29 1.89 N. A. 33.26 52.81 39.88
1.27 4.95 44.7 86.73 1.49 9.64 31.06 58.45 32.67
0.37 2.30 60.4 94.54 1.38 13.74 37.83 55.76 36.16
0.53 5.38 53.8 86.48 1.50 14.42 37.46 61.66 44.74
12.02 41.04 75.3 39.98 2.96 22.28 25.51 61.82 27.16
7.96 19.35 97.6 31.94 2.36 14.04 30.46 35.59 13.91
11.77 136.19 78.1 31.31 2.28 12.13 30.72 62.10 35.12
0.17 1.17 85.3 38.43 2.98 20.43 37.73 46.53 39.57
29.65 42.48 92.5 21.11 1.64 16.61 38.73 42.13 31.80
1.21 2.96 67.5 49.59 1.75 14.54 29.32 44.20 23.57
40.07 190.58 95.1 21.27 2.08 14.02 22.34 59.25 16.75
3.93 15.80 92.2 21.66 1.84 16.00 28.46 51.23 26.68
26.15 51.17 92.2 29.32 2.21 22.06 28.14 44.04 18.08
327.83 1,188.09 85.5 25.27 2.21 17.37 29.94 54.61 25.51

Economic Survey of Maharashtra 2020-21
294SELECTED SOCIO-ECONOMIC INDICATORS OF STATES IN INDIA
State
Basic Indicators of Human Development
Human Development
Index
Literacy percentage †† Life expectancy at birth
(years) Birth rate
Death rate
Infant mortality
rate @
Per capita income
at current prices*
(`)
Male Female Total Male Female
Reference Year / Date (2011) (2011) (2011) (2014-18) (2014-18) (2018) (2018) (2018) (2019-20) (2011)
(1) (20) (21) (22) (23) (24) (25) (26) (27) (28) (29)
Andhra Pradesh 74.88 59.15 67.02 68.7 71.4 16.0 6.7 29 1,69,519 0.473
Telangana ^ - - - 68.6 70.8 16.9 6.3 27 2,28,126 -
Arunachal Pradesh 72.55 57.70 65.38 N A N A 17.9 6.0 37 N A N A
Assam 77.85 66.27 72.19 66.1 67.9 21.1 6.4 41 90,758 0.444
Bihar 71.20 51.50 61.80 69.4 68.7 26.2 5.8 32 46,664 0.367
Jharkhand 76.84 55.42 66.41 69.9 68.5 22.6 5.4 30 79,873 0.376
Delhi 90.94 80.76 86.21 73.8 77.0 14.7 3.3 13 3,89,143 0.750
Goa 92.65 84.66 88.70 N A N A 12.4 5.9 7 5,20,031 0.617
Gujarat 85.75 69.68 78.03 67.8 72.3 19.7 5.9 28 N A 0.527
Haryana 84.06 65.94 75.55 67.7 72.3 20.3 5.9 30 2,64,207 0.552
Himachal Pradesh 89.53 75.93 82.80 69.6 76.8 15.7 6.9 19 1,95,255 0.652
Jammu & Kashmir 76.75 56.43 67.16 72.2 76.2 15.4 4.9 22 N A 0.529
Karnataka 82.47 68.08 75.36 67.9 70.9 17.2 6.3 23 2,31,246 0.519
Kerala 96.11 92.07 94.00 72.5 77.9 13.9 6.9 7 22,904 0.790
Madhya Pradesh 78.73 59.24 69.32 64.8 68.5 24.6 6.7 48 99,763 0.375
Chhattisgarh 80.27 60.24 70.28 63.7 66.6 22.5 8.0 41 98,281 0.358
Maharashtra 88.38 75.87 82.34 71.3 73.8 15.6 5.5 19 2,02,130 0.572
Manipur 82.27 72.37 79.21 N A N A 14.3 4.5 11 85,307 N A
Meghalaya 75.95 72.89 74.43 N A N A 22.1 5.8 33 92,174 N A
Mizoram 93.35 89.27 91.33 N A N A 14.8 4.1 5 2,04,018 N A
Nagaland 82.75 76.11 79.55 N A N A 12.9 3.5 4 1,44,138 N A
Odisha 81.59 64.01 72.87 68.0 70.8 18.2 7.3 40 1,04,566 0.362
Punjab 80.44 70.73 75.84 71.0 74.8 14.8 6.6 20 1,66,830 0.605
Rajasthan 79.19 52.12 66.11 66.5 71.6 24.0 5.9 37 1,18,159 0.434
Sikkim 86.55 75.61 81.42 N A N A 16.3 4.5 7 4,25,656 N A
Tamil Nadu 86.77 73.44 80.09 70.2 74.2 14.7 6.5 15 2,18,599 0.570
Tripura 91.53 82.73 87.22 N A N A 13.0 5.5 27 1,23,630 N A
Uttar Pradesh 77.28 57.18 67.68 64.8 65.8 25.6 6.6 43 68,333 0.380
Uttarakhand 87.40 70.01 78.82 67.9 74.3 16.7 6.2 31 2,02,895 0.490
West Bengal 81.69 70.54 76.26 70.7 72.6 15.0 5.6 22 1,15,748 0.492
India$ 80.88 64.63 72.98 68.2 70.7 20.0 6.2 32 1,34,186 0.467
$ Includes Union Territories ^ Included in Andhra Pradesh unless specifically mentioned * Provisional N A Not Available †† The literacy rates related to the population aged seven years and above @ Infant mortality rates for smaller States and Union Territories are based on three years period 2016-18

Economic Survey of Maharashtra 2020-21
295 SELECTED SOCIO-ECONOMIC INDICATORS OF STATES IN INDIA
Financial Indicators
Per capita revenue
receipts of the State (`)
Share of State’s own Tax Revenue
in Total revenue
receipts (per cent)
Per capita share in
central taxes (`)
Per capita grants from
centre (`)
Share of development
expenditure in total expenditure
(per cent)
Percentage of
revenue deficit(+)/ surplus (-) to
GSDP
Percentage of
fiscal deficit(+)/ surplus(-) to
GSDP
Percentage of
outstanding liabilities to
GSDP
(2019-20) (2019-20) (2019-20) (2019-20) (2019-20) (2019-20) (2019-20) (31-3-2020)
(30) (31) (32) (33) (34) (35) (36) (37)
21,164 51.8 5,391 4,176 68.0 2.7 4.2 31.8
29,703 64.3 4,281 3,036 70.2 Neg. 2.3 22.6
1,09,637 7.6 59,481 36,154 68.8 -12.8 3.1 42.1
26,955 23.5 9,960 7,705 68.0 -0.2 6.1 21.5
12,553 22.5 5,259 4,066 71.9 3.0 9.5 31.5
19,318 28.7 6,578 4,075 71.0 -2.0 2.4 28.2
25,736 76.7 N. A. 5,596 71.3 -1.1 -0.1 0.3
87,482 39.0 19,796 12,529 68.0 -0.3 5.0 28.1
21,880 64.9 2,957 2,299 66.0 -0.1 1.6 19.6
26,837 61.7 2,460 4,321 63.2 1.8 2.8 25.2
44,124 24.8 6,384 23,578 60.2 2.4 6.4 36.0
49,521 19.7 9,017 27,456 60.7 -4.4 7.1 51.3
26,815 57.4 4,677 5,611 67.4 Neg. 2.3 19.2
28,112 56.3 5,365 3,158 41.7 2.0 3.0 30.5
17,921 36.8 5,973 4,079 68.8 0.3 3.6 25.3
26,149 33.3 6,980 7,306 76.5 2.9 6.4 26.3
25,231 64.4 2,949 4,663 63.7 1.1 2.7 16.6
44,557 9.0 12,970 27,069 60.2 -0.9 8.5 37.5
44,562 14.5 16,736 19,522 69.2 -2.0 3.6 32.8
81,892 5.8 25,190 48,079 66.4 2.8 10.4 39.5
55,722 7.8 15,118 34,540 55.7 1.9 8.0 38.7
24,729 30.0 6,737 7,362 71.0 -1.2 3.4 22.3
24,659 45.6 3,449 7,310 46.9 2.2 3.0 40.0
20,130 44.9 4,630 3,946 68.6 2.7 3.2 33.7
1,05,563 14.0 36,097 43,682 61.4 -0.2 3.7 23.7
25,277 63.0 3,477 4,014 55.1 1.4 3.0 24.5
34,213 16.2 10,419 17,557 60.4 3.8 6.5 31.3
16,332 37.0 5,830 3,067 55.5 -1.5 2.8 33.9
31,651 35.1 6,705 9,442 50.9 Neg. 2.5 24.7
16,785 40.3 6,093 3,514 61.7 0.5 2.7 35.7
21,896 45.6 N .A. N .A. 63.3 0.7 3.2 26.3
N. A. Not Applicable Neg. Negligible
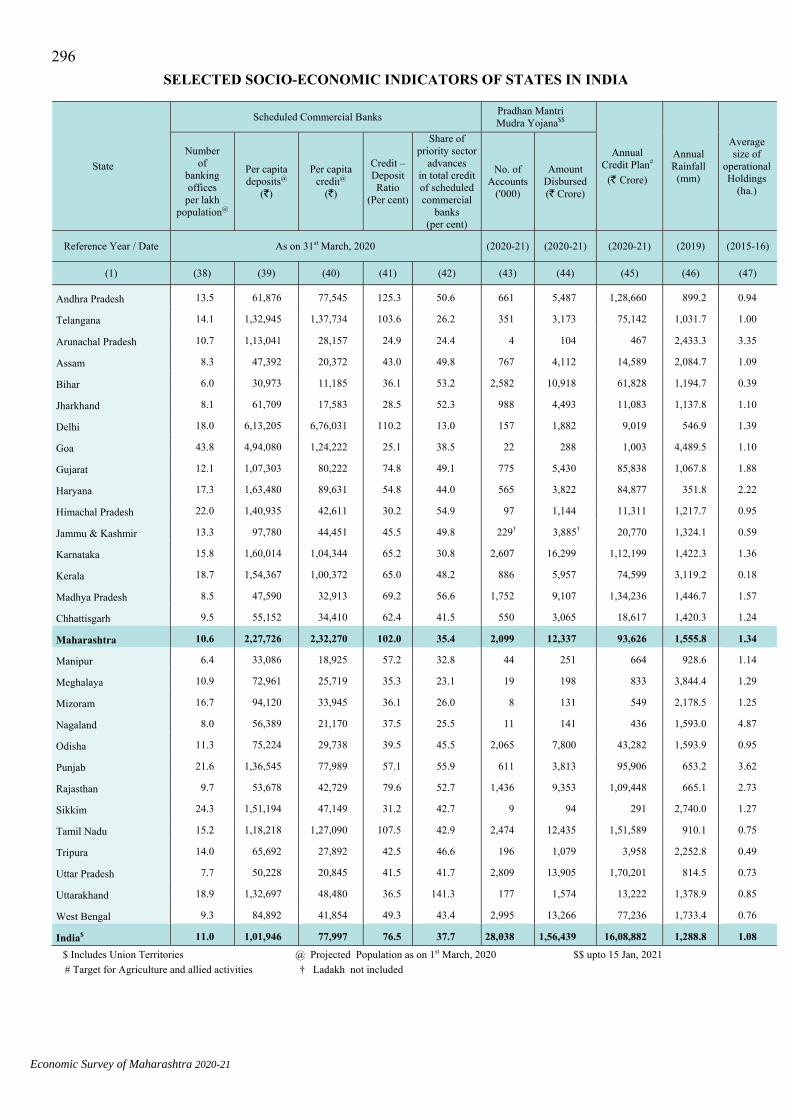
Economic Survey of Maharashtra 2020-21
296SELECTED SOCIO-ECONOMIC INDICATORS OF STATES IN INDIA
State
Scheduled Commercial Banks Pradhan Mantri Mudra Yojana$$
Annual Credit Plan#
(` Crore)
Annual Rainfall
(mm)
Average size of
operational Holdings
(ha.)
Number
of banking offices
per lakh population@
Per capita deposits@
(`)
Per capita credit@
(`)
Credit –Deposit Ratio
(Per cent)
Share of priority sector
advances in total credit of scheduled commercial
banks (per cent)
No. of Accounts
('000)
Amount Disbursed (` Crore)
Reference Year / Date As on 31st March, 2020 (2020-21) (2020-21) (2020-21) (2019) (2015-16)
(1) (38) (39) (40) (41) (42) (43) (44) (45) (46) (47)
Andhra Pradesh 13.5 61,876 77,545 125.3 50.6 661 5,487 1,28,660 899.2 0.94
Telangana 14.1 1,32,945 1,37,734 103.6 26.2 351 3,173 75,142 1,031.7 1.00
Arunachal Pradesh 10.7 1,13,041 28,157 24.9 24.4 4 104 467 2,433.3 3.35
Assam 8.3 47,392 20,372 43.0 49.8 767 4,112 14,589 2,084.7 1.09
Bihar 6.0 30,973 11,185 36.1 53.2 2,582 10,918 61,828 1,194.7 0.39
Jharkhand 8.1 61,709 17,583 28.5 52.3 988 4,493 11,083 1,137.8 1.10
Delhi 18.0 6,13,205 6,76,031 110.2 13.0 157 1,882 9,019 546.9 1.39
Goa 43.8 4,94,080 1,24,222 25.1 38.5 22 288 1,003 4,489.5 1.10
Gujarat 12.1 1,07,303 80,222 74.8 49.1 775 5,430 85,838 1,067.8 1.88
Haryana 17.3 1,63,480 89,631 54.8 44.0 565 3,822 84,877 351.8 2.22
Himachal Pradesh 22.0 1,40,935 42,611 30.2 54.9 97 1,144 11,311 1,217.7 0.95
Jammu & Kashmir 13.3 97,780 44,451 45.5 49.8 229† 3,885† 20,770 1,324.1 0.59
Karnataka 15.8 1,60,014 1,04,344 65.2 30.8 2,607 16,299 1,12,199 1,422.3 1.36
Kerala 18.7 1,54,367 1,00,372 65.0 48.2 886 5,957 74,599 3,119.2 0.18
Madhya Pradesh 8.5 47,590 32,913 69.2 56.6 1,752 9,107 1,34,236 1,446.7 1.57
Chhattisgarh 9.5 55,152 34,410 62.4 41.5 550 3,065 18,617 1,420.3 1.24
Maharashtra 10.6 2,27,726 2,32,270 102.0 35.4 2,099 12,337 93,626 1,555.8 1.34
Manipur 6.4 33,086 18,925 57.2 32.8 44 251 664 928.6 1.14
Meghalaya 10.9 72,961 25,719 35.3 23.1 19 198 833 3,844.4 1.29
Mizoram 16.7 94,120 33,945 36.1 26.0 8 131 549 2,178.5 1.25
Nagaland 8.0 56,389 21,170 37.5 25.5 11 141 436 1,593.0 4.87
Odisha 11.3 75,224 29,738 39.5 45.5 2,065 7,800 43,282 1,593.9 0.95
Punjab 21.6 1,36,545 77,989 57.1 55.9 611 3,813 95,906 653.2 3.62
Rajasthan 9.7 53,678 42,729 79.6 52.7 1,436 9,353 1,09,448 665.1 2.73
Sikkim 24.3 1,51,194 47,149 31.2 42.7 9 94 291 2,740.0 1.27
Tamil Nadu 15.2 1,18,218 1,27,090 107.5 42.9 2,474 12,435 1,51,589 910.1 0.75
Tripura 14.0 65,692 27,892 42.5 46.6 196 1,079 3,958 2,252.8 0.49
Uttar Pradesh 7.7 50,228 20,845 41.5 41.7 2,809 13,905 1,70,201 814.5 0.73
Uttarakhand 18.9 1,32,697 48,480 36.5 141.3 177 1,574 13,222 1,378.9 0.85
West Bengal 9.3 84,892 41,854 49.3 43.4 2,995 13,266 77,236 1,733.4 0.76
India$ 11.0 1,01,946 77,997 76.5 37.7 28,038 1,56,439 16,08,882 1,288.8 1.08 $ Includes Union Territories @ Projected Population as on 1st March, 2020 $$ upto 15 Jan, 2021 # Target for Agriculture and allied activities † Ladakh not included

Economic Survey of Maharashtra 2020-21
297 SELECTED SOCIO-ECONOMIC INDICATORS OF STATES IN INDIA
N A Not Available Neg. Negligible # Number of cultivators is based on Census 2011
Yield per hectare (kg)
Per capita foodgrains Production
(kg)
Consumption of fertilizer per hectare
cropped area (kg)
Percentage
of gross irrigated area to gross
cropped area
Net area sown per cultivator
(ha)#
Percentage of net area sown to total geographical area
All cereals
All pulses
All foodgrains
All oilseeds
Cotton (lint)
Sugarcane (Tonne)
Triennial average (2016-17 to 2018-19) (2018-19) (2016-17) (2016-17) (2016-17) (2016-17)
(48) (49) (50) (51) (52) (53) (54) (55) (56) (57) (58)
3,811 694 2,746 833 507 78 208.0 227.4 48.3 1.7 37.3
3,288 844 2,838 1,670 412 75 250.1 229.8 50.4 -- 42.6
1,665 977 1,624 1,040 -- 21 244.1 0.0 17.9 0.8 2.8
2,085 746 2,009 641 -- 37 160.1 56.5 11.4 0.7 35.4
2,609 945 2,487 1,204 -- 68 131.3 197.1 69.8 0.7 56.2
2,098 1,016 1,812 709 -- 46 118.3 72.8 15.2 0.4 18.2
3,597 2,040 3,596 1,257 -- 0 5.4 138.9 65.1 0.7 14.8
2,721 964 2,489 2,318 -- 37 68.5 29.5 23.9 4.2 35.2
2,372 971 2,046 1,769 558 61 100.7 133.8 49.3 1.9 52.5
3,831 1,000 3,783 1,960 503 81 636.6 208.1 90.4 1.4 79.1
2,122 1,992 2,117 556 -- 17 206.2 58.9 23.6 0.3 9.8
1,908 541 1,879 790 -- 0 140.7 99.1 42.2 0.6 3.4
2,029 587 1,432 777 414 81 166.0 138.2 30.1 1.5 51.4
2,739 979 2,719 574 -- 107 16.6 69.8 19.2 3.0 51.9
2,641 981 1,960 1,157 561 52 394.0 81.8 44.1 1.5 49.4
1,721 759 1,561 531 -- 44 264.6 118.7 32.5 1.2 34.5
1,424 777 1,174 1,091 326 84 84.7 120.8 N A 1.3 55.0
2,044 963 1,931 861 -- 58 160.3 26.8 16.0 0.8 21.0
2,125 1,427 2,082 1,056 -- 3 81.3 0.0 46.2 0.5 11.3
1,665 1,490 1,651 1,149 -- 30 64.8 15.7 16.1 0.6 6.9
1,706 1,180 1,645 1,050 -- 44 260.9 5.1 23.1 0.7 23.2
1,949 559 1,718 656 483 63 185.4 101.2 26.8 1.0 26.3
4,591 900 4,573 1,456 713 82 1059.6 233.0 98.8 2.1 82.0
1,877 626 1,399 1,470 535 75 277.0 52.0 41.2 1.3 53.1
1,720 959 1,650 922 -- 0 139.4 0.0 10.9 0.7 10.9
3,060 622 2,469 2,337 396 97 137.5 177.1 55.5 1.0 33.4
2,857 798 2,689 804 -- 54 210.5 53.2 24.0 0.9 24.4
2,848 965 2,624 1,003 -- 75 244.2 158.1 80.3 0.9 68.7
2,308 888 2,206 928 -- 70 169.2 186.8 50.1 0.4 12.9
2,973 911 2,838 1,200 -- 78 193.4 156.2 65.7 1.0 59.1
2,645 798 2,217 1,250 444 76 214.7 129.6 49.0 1.2 42.4

Economic Survey of Maharashtra 2020-21
298SELECTED SOCIO-ECONOMIC INDICATORS OF STATES IN INDIA
State Cropping intensity
Percentage of forest cover +
to total geographical
area
Percentage of tree cover ++
to total geographical
area
Annual Survey of Industries Percentage of employed persons#
Unemployment
Rate#
Factories (no.) Workers ('000)
Gross output Per worker
('000)
Net value added Per
worker ('000)
Rural Urban Rural Urban
Reference Year
/Date (2016-17) (2019) (2019) (2017-18) (2018-19)
(1) (59) (60) (61) (62) (63) (64) (65) (66) (67) (68) (69)
Andhra Pradesh 122.1 17.9 2.4 16,296 487 6,392 726 46.2 36.6 4.5 7.3
Telangana ^ 125.0 18.4 2.2 15,263 669 3,323 590 44.1 34.6 6.8 11.2
Arunachal Pradesh 135.0 79.6 1.0 117 3 3,744 457 32.3 28.1 7.3 11.1
Assam 147.4 36.1 1.8 4,538 180 3,730 756 32.6 31.0 6.3 10.7
Bihar 144.6 7.8 2.1 3,461 104 5,769 615 24.0 24.7 10.2 10.5
Jharkhand 140.9 29.6 3.3 2,866 153 9,249 1,530 31.4 28.0 4.5 8.7
Delhi 259.5 13.2 8.7 3,432 69 6,783 810 26.6 34.0 0.5 10.8
Goa 118.9 60.4 7.3 715 51 9,819 2,748 33.7 38.4 8.0 9.1
Gujarat 116.4 7.6 3.5 26,586 1403 9,692 1,304 39.2 37.1 3.3 3.2
Haryana 184.4 3.6 3.5 8,891 674 7,464 891 29.8 34.0 9.5 8.7
Himachal Pradesh 175.2 27.7 1.5 2,671 147 7,701 2,022 51.4 39.0 4.8 8.8
Jammu & Kashmir 155.5 10.6 3.6 1,019 58 5,669 1,105 42.7 33.2 3.9 10.1
Karnataka 119.5 20.1 3.3 13,518 829 6,383 1,052 40.0 36.0 2.7 5.2
Kerala 128.2 54.4 7.6 7,649 242 6,765 781 36.4 35.4 8.4 9.7
Madhya Pradesh 159.0 25.1 2.7 4,533 281 9,152 1,420 40.3 32.9 2.4 7.4
Chhattisgarh 121.6 41.1 3.1 3,352 147 8,527 984 46.4 37.5 1.8 5.5
Maharashtra 137.3 16.5 3.5 26,393 1415 8,481 1,582 43.1 35.2 4.2 6.4
Manipur 100.0 75.5 0.8 191 7 574 114 32.9 32.7 9.8 9.2
Meghalaya 122.3 76.3 3.2 133 11 5,288 1,138 42.6 32.6 2.0 7.5
Mizoram 128.8 85.4 2.1 N A N A N A N A 39.0 34.2 5.2 9.1
Nagaland 135.5 75.3 2.2 186 5 1,035 252 29.8 25.3 16.2 21.1
Odisha 119.2 33.2 3.0 3,066 229 10,041 1,178 36.2 32.5 6.1 12.7
Punjab 189.0 3.7 3.2 12,726 569 3,726 471 33.8 35.9 7.7 7.0
Rajasthan 143.3 4.9 2.4 9,212 432 6,879 982 37.3 31.2 4.6 9.5
Sikkim 189.2 47.1 0.5 82 15 12,184 7,062 50.7 45.9 2.5 4.9
Tamil Nadu 118.0 20.3 3.7 37,787 2095 4,123 654 44.1 37.9 6.4 6.7
Tripura 192.0 73.7 2.2 607 23 667 130 34.6 32.3 9.3 13.5
Uttar Pradesh 162.7 6.2 3.1 15,830 839 6,133 868 29.2 27.3 4.3 10.6
Uttarakhand 156.7 45.4 1.6 2,998 340 6,953 1,309 31.8 29.7 7.2 13.4
West Bengal 183.4 19.0 2.3 9,534 517 6,176 719 38.6 38.7 3.5 4.9
India$ 143.6 21.7 2.9 2,37,684 12,224 6,603 1,006 35.8 34.1 5.0 7.7 $ Includes Union Territories N A Not Available + All Lands, more than one ha. in area, with a tree canopy density of more than 10 per cent irrespective of ownership and legal status, it also includes orchards, bamboo and palm. ++ It comprises of tree patches outside the recorded forest area exclusive of forest cover and less than the minimum mappable area (one ha) # Data based on Annual Report- Periodic Labour Force Survey, (July, 2018-June, 2019)

Economic Survey of Maharashtra 2020-21
299 SELECTED SOCIO-ECONOMIC INDICATORS OF STATES IN INDIA
Labour force participation Rate#
Economic Census Installed
capacity of electricity per lakh
population* (MW)
Per capita generation of electricity*
(kwh.)
Transmission and Distribution Losses
(Per cent)*
No. of establish- ments per lakh
population
Employment in
establish- ment per lakh
population
CAGR (Per cent)
Rural Urban Establishment Employment
(2018-19) 6th Economic Census (5th Economic Census - 6th Economic Census ) (31-03-2020) (2019-20) (2019-20)
(70) (71) (72) (73) (74) (75) (76) (77) (78)
48.3 39.4 7,484 16,703 6.11 3.52 42.17 1,262.99 17.62
47.3 39.0 - - - - 34.48 1,120.07 14.85
34.8 31.6 2,632 7,873 3.67 3.54 9.05 1.48 50.83
34.8 34.7 6,505 12,669 9.59 8.31 1.46 43.72 23.98
26.7 27.6 1,640 3,116 4.39 5.26 0.28 2.69 32.51
32.9 30.7 1,936 4,406 3.56 4.10 6.43 356.79 18.37
26.7 38.1 5,214 17,988 1.87 -1.47 12.84 469.22 12.56
36.7 42.3 6,622 19,792 3.63 3.96 3.44 0.76 16.23
40.6 38.3 6,573 15,897 6.57 6.53 45.98 1,481.18 20.30
32.9 37.2 4,595 12,767 4.44 5.52 19.20 742.50 22.78
54.0 42.7 6,005 14,235 6.05 6.98 46.82 1,708.59 14.29
44.4 37.0 4,002 8,735 5.90 6.71 11.84 456.16 42.19
41.1 38.0 4,715 11,696 1.76 2.29 39.22 888.22 16.01
39.7 39.2 10,043 20,711 2.37 2.98 7.29 176.57 16.39
41.3 35.5 2,964 6,262 3.04 2.73 21.95 831.09 27.65
47.2 39.7 3,029 7,286 2.74 3.51 58.45 2,470.47 25.14
45.0 37.6 5,462 12,914 5.00 4.09 29.84@ 1,004.03$ 19.46
36.5 36.1 8,942 15,936 10.42 8.61 1.49 1.35 35.61
43.5 35.3 3,558 9,755 3.32 4.71 11.37 333.65 43.12
41.2 37.6 5,239 11,140 2.68 4.88 3.17 41.74 25.21
35.6 32.1 3,080 8,179 7.52 3.91 1.47 35.11 20.67
38.6 37.3 4,977 10,287 1.84 2.79 17.95 565.06 34.94
36.6 38.6 5,454 13,145 4.53 4.67 32.05 1,266.71 14.73
39.1 34.4 4,223 9,136 5.25 5.74 26.51 843.00 24.80
52.0 48.2 6,096 14,950 9.06 7.14 121.62 5,522.10 32.72
47.1 40.6 6,971 16,210 1.83 2.57 32.68 802.45 19.12
38.1 37.4 6,445 10,997 3.10 2.48 4.73 176.95 26.70
30.5 30.5 3,345 7,066 6.65 7.62 7.37 307.63 21.21
34.2 34.3 3,908 10,416 2.68 5.73 28.46 1,107.89 22.23
40.0 40.7 6,470 13,041 4.42 2.73 9.20 379.58 18.33
37.7 36.9 4,832 10,846 4.46 4.12 27.55 1,028.69 20.66 # Data based on Annual Report-Periodic Labour Force Survey, (July, 2018-June, 2019) * provisional
@ MAHAGENCO, Tata power Co. Ltd, Adani Electricity Mumbai Ltd., MEDA, Central Electricity Authority
$ MAHAGENCO, MAHADISCOM, Tata power Co. Ltd, Adani Electricity Mumbai Ltd, Central Electricity Authority

Economic Survey of Maharashtra 2020-21
300SELECTED SOCIO-ECONOMIC INDICATORS OF STATES IN INDIA
State
Annual per capita ultimate consumption of electricity* (kwh)
Motor vehicles per lakh
population* (no.)
Total road length per hundred sq km
of area* (km)
Railway route length per hundred sq km
of area* (km)
Total
Domestic
Industrial
Agriculture
Reference Year / Date (2019-20) (31-3-2019) (31-3-2018) (31-3-2020)
(1) (79) (80) (81) (82) (83) (84) (85)
Andhra Pradesh 1,090.33 302.37 291.96 292.78 23,017 134 2.43
Telangana^ 1,589.37 331.53 366.92 557.38 32,697 114 3.60
Arunachal Pradesh 239.21 95.63 69.75 0.02 15,385 60 0.01
Assam 203.00 101.31 47.83 1.36 11,532 438 3.21
Bihar 182.91 100.90 27.51 6.37 7,201 309 4.03
Jharkhand 583.00 158.02 351.75 5.14 9,105 99 3.26
Delhi 1,505.23 816.77 169.33 1.86 57,955 1,187 12.38
Goa 2,657.23 781.96 1,422.13 17.66 91,279 503 1.87
Gujarat 1,357.90 233.26 850.14 169.51 37,307 103 2.70
Haryana 1,444.00 338.02 498.87 341.22 30,171 113 3.85
Himachal Pradesh 1,328.18 305.64 783.71 9.25 22,456 111 0.56
Jammu & Kashmir 739.85 308.24 142.69 26.80 13,779 49 0.13
Karnataka 943.24 205.66 208.39 332.64 32,130 185 1.85
Kerala 657.01 339.66 121.91 10.23 38,047 662 2.69
Madhya Pradesh 704.42 180.52 138.56 277.71 18,710 118 1.67
Chhattisgarh 787.38 193.65 314.04 175.57 22,319 76 0.85
Maharashtra 1,021.50 238.60 378.70 237.10 29,087 204 1.89
Manipur 229.22 151.70 9.82 0.70 11,722 131 0.06
Meghalaya 359.88 144.17 141.12 0.04 11,403 195 0.04
Mizoram 327.75 189.85 12.13 0.00 19,694 63 0.01
Nagaland 280.25 179.14 19.81 0.00 22,893 221 0.07
Odisha 470.74 171.54 169.27 13.21 18,459 198 1.70
Punjab 1638.17 453.78 609.74 385.99 35,483 283 4.50
Rajasthan 785.52 162.62 183.80 329.66 23,047 92 1.75
Sikkim 616.72 161.83 342.56 0.00 8,198 190 0.00
Tamil Nadu 1263.64 383.92 472.94 182.19 39,942 208 1.41
Tripura 227.87 132.37 10.00 8.57 12,481 412 2.53
Uttar Pradesh 421.57 186.36 69.26 80.28 14,620 181 3.66
Uttarakhand 1044.45 255.48 574.07 40.73 24,826 99 0.65
West Bengal 511.24 165.64 202.65 16.05 7,703 371 4.75
India$ 783.65 226.69 255.53 156.92 22,269 162 2.07 $ Includes Union Territories ^ Included in Andhra Pradesh unless specifically mentioned *provisional
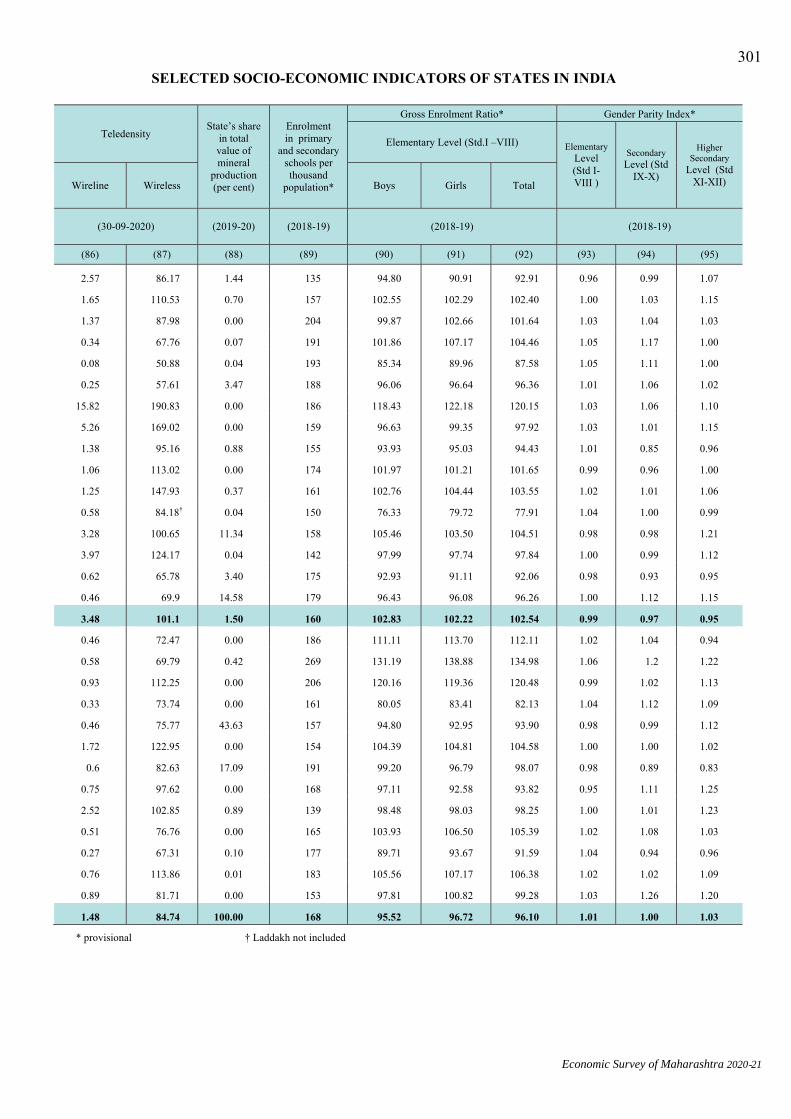
Economic Survey of Maharashtra 2020-21
301 SELECTED SOCIO-ECONOMIC INDICATORS OF STATES IN INDIA
Teledensity State’s share
in total value of mineral
production (per cent)
Enrolment in primary
and secondary schools per thousand
population*
Gross Enrolment Ratio* Gender Parity Index*
Elementary Level (Std.I –VIII) Elementary Level (Std I-VIII )
Secondary Level (Std
IX-X)
Higher Secondary
Level (Std XI-XII)
Wireline Wireless Boys Girls Total
(30-09-2020) (2019-20) (2018-19) (2018-19) (2018-19)
(86) (87) (88) (89) (90) (91) (92) (93) (94) (95)
2.57 86.17 1.44 135 94.80 90.91 92.91 0.96 0.99 1.07
1.65 110.53 0.70 157 102.55 102.29 102.40 1.00 1.03 1.15
1.37 87.98 0.00 204 99.87 102.66 101.64 1.03 1.04 1.03
0.34 67.76 0.07 191 101.86 107.17 104.46 1.05 1.17 1.00
0.08 50.88 0.04 193 85.34 89.96 87.58 1.05 1.11 1.00
0.25 57.61 3.47 188 96.06 96.64 96.36 1.01 1.06 1.02
15.82 190.83 0.00 186 118.43 122.18 120.15 1.03 1.06 1.10
5.26 169.02 0.00 159 96.63 99.35 97.92 1.03 1.01 1.15
1.38 95.16 0.88 155 93.93 95.03 94.43 1.01 0.85 0.96
1.06 113.02 0.00 174 101.97 101.21 101.65 0.99 0.96 1.00
1.25 147.93 0.37 161 102.76 104.44 103.55 1.02 1.01 1.06
0.58 84.18† 0.04 150 76.33 79.72 77.91 1.04 1.00 0.99
3.28 100.65 11.34 158 105.46 103.50 104.51 0.98 0.98 1.21
3.97 124.17 0.04 142 97.99 97.74 97.84 1.00 0.99 1.12
0.62 65.78 3.40 175 92.93 91.11 92.06 0.98 0.93 0.95
0.46 69.9 14.58 179 96.43 96.08 96.26 1.00 1.12 1.15
3.48 101.1 1.50 160 102.83 102.22 102.54 0.99 0.97 0.95
0.46 72.47 0.00 186 111.11 113.70 112.11 1.02 1.04 0.94
0.58 69.79 0.42 269 131.19 138.88 134.98 1.06 1.2 1.22
0.93 112.25 0.00 206 120.16 119.36 120.48 0.99 1.02 1.13
0.33 73.74 0.00 161 80.05 83.41 82.13 1.04 1.12 1.09
0.46 75.77 43.63 157 94.80 92.95 93.90 0.98 0.99 1.12
1.72 122.95 0.00 154 104.39 104.81 104.58 1.00 1.00 1.02
0.6 82.63 17.09 191 99.20 96.79 98.07 0.98 0.89 0.83
0.75 97.62 0.00 168 97.11 92.58 93.82 0.95 1.11 1.25
2.52 102.85 0.89 139 98.48 98.03 98.25 1.00 1.01 1.23
0.51 76.76 0.00 165 103.93 106.50 105.39 1.02 1.08 1.03
0.27 67.31 0.10 177 89.71 93.67 91.59 1.04 0.94 0.96
0.76 113.86 0.01 183 105.56 107.17 106.38 1.02 1.02 1.09
0.89 81.71 0.00 153 97.81 100.82 99.28 1.03 1.26 1.20
1.48 84.74 100.00 168 95.52 96.72 96.10 1.01 1.00 1.03
* provisional † Laddakh not included

Economic Survey of Maharashtra 2020-21
302
SELECTED SOCIO-ECONOMIC INDICATORS OF STATES IN INDIA
State
Pupil -Teacher Ratio@@* Drop- Out Rates@@*
Primary Level (Std I-V)
Upper Primary
level (Std
VI-VIII)
Secondary Level (Std
IX-X)
Higher secondary
Level (Std
XI-XII)
Primary Level
(Std I-V)
Upper Primary Level
(Std VI-VIII) Secondary Level
(Std IX-X)
Boys Girls Boys Girls Boys Girls
Reference Year /
Date (2019-20)
(1) (96) (97) (98) (99) (100) (101) (102) (103) (104) (105)
Andhra Pradesh 26 17 16 34 -- -- 1.25 0.87 17.48 15.19
Telangana ^ 25 15 11 48 1.79 2.07 3.01 2.70 15.26 11.61
Arunachal Pradesh 14 10 14 18 14.46 13.09 6.34 6.96 36.93 35.03
Assam 22 14 11 17 3.51 2.63 3.14 0.70 30.77 32.11
Bihar 64 20 58 62 8.66 6.82 12.74 12.14 27.44 29.46
Jharkhand 35 23 51 70 6.17 4.61 10.69 9.73 22.09 22.42
Delhi 33 30 29 18 -- -- 1.27 0.83 16.06 13.69
Goa 28 19 11 18 1.63 1.42 0.73 1.18 12.26 6.19
Gujarat 30 26 33 27 2.57 1.90 5.90 9.14 25.79 21.15
Haryana 25 19 15 13 -- -- 1.67 2.27 15.68 13.67
Himachal Pradesh 16 10 9 10 0.15 0.49 0.24 0.27 8.85 6.65
Jammu & Kashmir 17 8 12 24 6.54 6.92 5.69 6.99 17.90 17.70
Karnataka 33 21 15 25 -- -- 0.00 0.45 26.36 20.24
Kerala 28 22 16 23 0.34 0.00 0.12 0.00 11.32 6.83
Madhya Pradesh 32 18 36 41 3.46 3.03 5.17 6.78 25.55 24.01
Chhattisgarh 20 18 18 14 3.28 3.50 7.75 6.28 22.71 14.05
Maharashtra 28 28 22 41 1.11 1.06 1.80 2.55 13.67 12.84
Manipur 14 11 10 16 7.04 5.11 3.97 2.76 12.90 13.17
Meghalaya 20 14 12 21 18.43 15.29 10.94 8.16 20.85 18.28
Mizoram 17 8 10 14 7.96 7.05 3.83 2.30 11.17 10.13
Nagaland 13 8 11 20 11.58 11.23 6.36 2.77 25.65 22.49
Odisha 17 17 22 96 2.87 3.89 4.91 5.02 11.75 7.23
Punjab 24 21 13 19 1.37 1.33 2.92 2.93 13.01 9.63
Rajasthan 27 13 12 15 5.50 4.84 3.28 4.43 12.63 12.76
Sikkim 7 10 13 13 6.12 4.59 1.67 0.56 26.30 21.29
Tamil Nadu 21 15 18 33 0.75 1.60 0.23 0.88 17.72 8.10
Tripura 15 18 18 10 3.58 2.52 5.00 3.62 29.40 29.69
Uttar Pradesh 33 27 34 48 9.51 9.92 3.18 8.39 15.47 15.57
Uttarakhand 19 19 15 20 3.81 3.51 4.02 3.37 12.30 9.46
West Bengal 23 26 36 49 4.06 2.89 3.60 0.00 19.36 19.61
India$ 28 20 21 30 4.60 4.30 4.26 5.14 18.64 17.01
$ Includes Union Territories ^ Included in Andhra Pradesh unless specifically mentioned @@ Based on Educational stage * provisional (“-”) Negative drop-out rates have not been reported

Economic Survey of Maharashtra 2020-21
303
SELECTED SOCIO-ECONOMIC INDICATORS OF STATES IN INDIA
Average number
of Teachers per school*
Percentage of
female Teachers*
Per cent of children fully immunised
Mean age at effective marriage (females)
Total Fertility
Rate
Maternal Mortality
Ratio
Crimes against women
(no.)
Crimes against children
(no.)
Number of fair price /
ration shops per lakh
population
Percentage of
population Below Poverty
Line
(2018-19) (2018-19) (2017-18) (2018) (2018) (2016-18) (2019) (2019) (31-01-2021) (2011-12)
(106) (107) (108) (109) (110) (111) (112) (113) (114) (115)
4.9 49.06 73.6 22.1 1.6 65 17,746 2,524 72 9.20
6.1 55.79 70.1 21.9 1.6 63 18,394 4,212 45 -
6.2 45.85 41.3 NA NA NA 317 153 129 34.67
5.7 38.92 46.1 22.1 2.2 215 30,025 6,608 107 31.98
6.5 39.52 48.1 21.7 3.2 149 18,587 9,320 38 33.74
4.7 38.73 58.4 23.4 2.5 71 8,760 1,674 64 36.96
27.3 74.25 47.8 23.7 1.5 NA 13,395 7,783 10 9.91
9.2 79.50 59.7 NA NA NA 329 167 31 5.09
7.4 53.41 59.6 22.6 2.1 75 8,799 4,685 22 16.63
10.3 61.03 72.1 22.4 2.2 91 14,683 5,119 35 11.16
5.6 50.75 72 23.6 1.6 NA 1,636 748 68 8.06
5.9 46.80 64.5 25.6 1.6 NA 3,069 470 51 10.35
6.0 54.79 61.7 22.6 1.7 92 13,828 6,305 30 20.91
15.4 77.87 72.8 23.2 1.7 43 11,462 4,754 40 7.05
3.8 44.12 62.8 21.4 2.7 173 27,560 19,028 29 31.65
4.8 47.46 65.2 22 2.4 159 7,689 5,665 43 39.93
7.0 46.51 58.6 22.6 1.7 46 37,144 19,592 43 17.35
9.4 53.71 75.1 NA NA NA 266 148 124 36.89
3.8 56.77 52 NA NA NA 558 379 145 11.87
6.0 44.43 73.4 NA NA NA 170 125 103 20.40
11.6 53.01 12.8 NA NA NA 43 59 75 18.88
5.0 45.43 66.8 21.9 1.9 150 23,183 7,012 27 32.59
9.5 75.42 61.8 23.8 1.6 129 5,886 2,625 57 8.26
7.1 39.47 57.3 21.7 2.5 164 41,550 7,385 34 14.71
11.1 58.14 65.1 NA NA NA 125 163 196 8.19
9.5 75.27 57.5 23.2 1.6 60 5,934 4,139 46 11.28
9.5 31.73 39.6 NA NA NA 1,070 311 45 14.05
4.8 44.26 54.6 22.3 2.9 197 59,853 18,943 35 29.43
5.1 53.88 70.5 22.3 1.8 99 2,541 1,214 81 11.26
6.3 43.55 66.2 20.9 1.5 98 30,394 6,286 21 19.98
6.1 49.99 59.2 22.3 2.2 113 4,05,861 1,48,185 40 21.92 NA Not Available * provisional