Economic Restructuring and Labour Market Developments in the New EU Member States
74
wiiw Research Reports | 312 Forschungsberichte Michael Landesmann, Hermine Vidovic and Terry Ward Economic Restructuring and Labour Market Developments in the New EU Member States December 2004
Transcript of Economic Restructuring and Labour Market Developments in the New EU Member States

wiiw Research Reports | 312
Forschungsberichte
Michael Landesmann, Hermine Vidovic and Terry Ward
Economic Restructuring and Labour Market Developments in the New EU Member States
December 2004

Michael Landesmann is Research Director of wiiw and Professor of Economics at Johannes Kepler University, Linz, Austria. Hermine Vidovic is Research Economist at wiiw. Terry Ward is Managing Director of Alphametrics Ltd., UK and Director of Research of Applica sprl, Brussels.
Research for this paper was conducted in the context of the project ‘Industrial Restructuring and Implications for Labour Markets in the New EU Member States’, commissioned by EU DG Employment, Social Affairs and Equal Opportunities, Contract No. VC/2003/0367.
Michael Landesmann,
Hermine Vidovic and
Terry Ward
Economic Restructuring
and Labour Market
Developments in the
New EU Member States

Contents
Executive Summary ................................................................................................................i
1 Introduction ........................................................................................................................ 1
2 Aggregate developments in the labour markets of the NMs ............................................ 1
2.1 Employment rates below EU-average....................................................................... 2
2.2 Part-time employment in the NMs ............................................................................. 8
2.3 Unemployment rate twice as high as in the EU-15 ................................................. 10
2.4 Population out of the labour force less diverse than in the EU-15 .......................... 11
3 Converging employment patterns in the NMs................................................................. 12
3.1 Sectoral developments between 1995 and 2003.................................................... 12
3.2 Sectoral developments between 1998 and 2003.................................................... 16
4 Educational attainment and employment patterns ......................................................... 21
4.1 The structure of the labour force in the NMs, CC and the EU-15 by educational attainment level................................................................................ 21
4.2 Changes in the labour force by educational characteristics, 1999-2003, employment, activity and unemployment rates ....................................................... 23
4.3 Differences in employment structure by sector ....................................................... 24
4.4 Changes in employment structure, 1999-2003 ....................................................... 26
4.5 Differences in the educational level of the work force across sectors .................... 28
4.6 Changes in labour demand by education level and by sector, 1999-2003............. 31
4.7 The structure of occupations in the NMs, the EU-15 and EU South....................... 36
Conclusions .......................................................................................................................... 40
References ........................................................................................................................... 42
Appendix A: Educational levels in the NMS and the EU-15................................................ 43
Appendix B: Employment in business services ................................................................... 50
Appendix C: Classification of NACE groups........................................................................ 57

List of Tables, Figures and Boxes
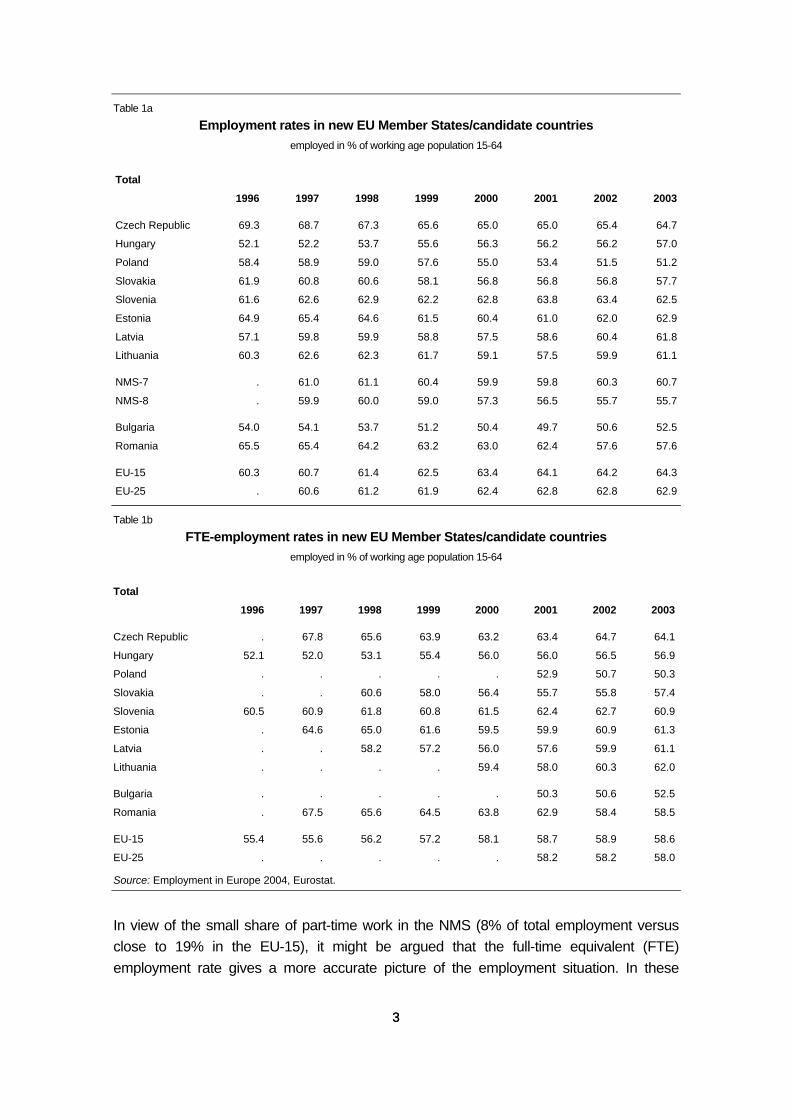
Table 1a Employment rates in new EU Member States/candidate countries, employed in % of working age population 15-64 ...............................................................3
Table 1b FTE-employment rates in new EU Member States/candidate countries, employed in % of working age population 15-64 ...............................................................3
Table 2 Employment rates in new EU Member States/candidate countries by gender.........4
Table 3 Employment by activities in new EU Member States/candidate countries, changes 1995-2003, annual averages....................................................................13
Table 4 Employment by activities in new EU Member States/candidate countries, structure 2003, in % (annual averages) ..................................................................14
Table 5 Employment by activities in new EU Member States/candidate countries, changes 1998-2003, in % (2nd quarter)..................................................................17
Table 6 Employment by activities in new EU Member States/candidate countries, structure 2003, in % (2nd quarter) ..........................................................................18
Table 7a Shares of NACE groups in total employment, 2003 ...............................................25
Table 7b Shares of NACE groups in total employment, 2003, difference from EU-15 ..........25
Table A1 New entrants and total numbers enrolled in tertiary education, 1998 to 2001........48
Table B1 Employment in real estate and business services in the NMs and selected EU-15 countries, 2001 ..............................................................................56
Table C1 Classification of NACE groups – description – 2-digit level ....................................58
Figure 1 Youth employment rates in the NMs/CC ............................................................................6
Figure 2 Employment rates of older workers in the NMs/CC...........................................................7
Figure 3a Part-time employment in the NMs and EU-15, working less than 30 hours a week, % of total employed..............................................................................................................9
Figure 3b Part-time employed in the NMs and EU-15, working less than 30 hours a week, % of total employed..............................................................................................................9
Figure 4 Long-term unemployment in the NMs/CC (% of total unemployed) ...............................11
Figure 5 Employment changes 1995-2003, LFS, in thousands.....................................................15
Figure 6 Educational structure of working-age population, 15-64, 2003.......................................22
Figure 7 Employment rates, 15-64, 1999, 2003..............................................................................23
Figure 8 Unemployment rates, 15-64, 1999, 2003 .........................................................................23
Figure 9 Growth of labour force by educational category, 15-64, 1999-2003, in % .....................24
Figure 10 Change in employment by educational category, 1999-2003, in % ...............................24
Figure 11 Growth in employment by NACE groups, 1999-2003, in %............................................27
Figure 12 Educational composition of the workforce within sectors in 2003 (difference from composition in the economy as a whole) ..............................................29
Figure 13a Source of employment growth/decline by sector, 1999-2003 (highly educated) ...........33
Figure 13b Source of employment growth or decline by sector, 1999-2003 (medium-educated)...34
Figure 13c Source of employment growth or decline by sector, 1999-2003 (low-educated)...........35
Figure 14 Shares of ISCO occupations in NACE groups, 2003, in %.............................................37
Figure A1 Employment rates of those aged 25-64 by education level, 2003..................................47
Box B1 Comparison of SBS data on employment in business services with LFS data .............51

i
Executive summary
Aggregate developments in the labour markets of the NMS
• In contrast to the old EU where employment rates increased steadily over the past decade, these show a declining trend in most of the new Member States. Only Hungary starting from a very low level shows a modest recovery from the mid-1990s, the Baltic States from 2000 onwards. By 2003 only the Czech Republic recorded a higher employment rate than the EU-15, Slovenia and Estonia resembled the EU-25 pattern, while there was a remarkable gap in Bulgaria and Poland.
• However, measured in full-time equivalents the gaps in employment rates between the new and old Member States are much smaller due to the low share of part time employment in the NMS.
• Disparities exist also between the NMS and the EU-15 with regard to employment rates for different age and gender groups. Female employment rates remained above the EU average in a number of countries, exceptions being Hungary, Poland and Slovakia. The latter two show, together with the Czech Republic, the most pronounced reduction between 1996 and 2003. However, over the past few years we observed upward developments in Hungary, Bulgaria and the three Baltic States. The full-time equivalent (FTE) employment rates for women exceeded the EU-15 level in all NMS but Poland.
• By contrast, all NMS but the Czech Republic reported lower male employment rates than the EU-15. Suffering from declines in the second half of the 1990s male employment rates started to grow again in most NMS from 2000 onwards. Measured by FTE male employment rates are in all countries except the Czech Republic significantly lower than in the EU-15.
• As regards young people, employment rates have been on the decline from the late 1990s and were in 2002 by 16 percentage points lower than in the EU-15. A substantial part of the drop was caused by extended education. E.g. in the 16-18 age group in 2003 90% of the total was in education in the NMS, while only 68% in the EU-14 (excluding Germany). These gaps are narrowing from age group to age group. As for the employment rate of the 20 to 24 year old people we found a similar value for the NMS-4 as for the EU South. The worse record for NMS-8 is almost entirely accounted for by Poland.
• Also employment rates of older workers are well below the EU-15 average, which might be partly explained by the lower statutory retirement age in the NMS than in the old EU, but also by early retirement programmes implemented in the 1990s and the increased use of disability pensions in order to combat unemployment.

ii
• In contrast to the old EU where part time work plays an important role this form of employment is almost negligible in the NMS. Relatively higher shares of part time work are to be found in countries with a large agricultural sector, particularly Romania, Poland, Lithuania and Latvia. Overall, the NMS are resembling the pattern observed in the EU-South (Greece, Portugal, Spain) where part time employment plays a subordinate role too. One of the reasons behind these developments is the underdeveloped services sector in the NMS.
• Unemployment levels in the NMS are almost double those in the old EU. The incidence of unemployment varies from country to country. Roughly speaking the NMS/CC can be divided into three groups according to their unemployment record: In the first group consisting of Hungary; Slovenia, Romania and the Czech Republic the unemployment rate (6-8%) is well below the EU-15 average, while the second group comprises the high unemployment countries Poland and Slovakia; the third group including the Baltic States and Bulgaria ranges in between.
• Regarding the features of unemployment, long-term unemployment has become a serious problem all over the region. Levels are much higher than in the EU-15, but seemingly the further increase came to a halt in most countries. Hungary is an outlier with a share of less than 40% long-term unemployed in the total number of jobless, while all other countries report shares between 50% in the Czech Republic and 65%! in Slovakia. In the long run we might expect an exit from the labour market for many of those registered as long-term unemployed.
• Youth unemployment in the NMS is more than twice as high as both the national average of the respective countries and the EU-15 average. However, calculating the youth unemployment rate based on the age group between 20-24, the picture changes substantially with the unemployment of 17.5% in the NMS-7 ranging between the EU-15 and EU-South levels.
• Inactivity is still on the increase in most of the NMS. Between 1998 and 2003 activity rates fell in all countries, exceptions being Hungary and Slovakia. Activity rates fell most among young people, shrinking between 2003 and 1998 by 9 and 7 percentage points for those aged between 15 and 19 years and 20-24 years respectively.
Sectoral employment patterns
• Over recent years job creation in the NMS was mainly concentrated in the tertiary sector, whereas employment in agriculture and industry fell in all countries. From a comparative perspective the NMS exhibit still a much lower portion of services sector employment than the EU-15, but are close to EU-South patterns. The differences are less pronounced in the community services segment than in market services.

iii
• However, we found also some signs of recovery in manufacturing employment, particularly in Hungary, and to a lesser extent in Slovakia and some of the Baltic States. This does not apply to Poland. These favourable developments seem to be driven by the strong inflow of FDI in the manufacturing sector.
• In four countries – Hungary, Slovakia, Slovenia and Latvia – job creation in the services and/or manufacturing sectors could offset job creation in other sectors over the past years.
• In general, the NMS still have a relatively large industrial sector, particularly in the Czech Republic, Slovakia and Slovenia. On the other hand there is still a high portion of agricultural employment in Poland and Lithuania (about 19% each), in Bulgaria (25%) and in Romania where it was 36% in 2003. In these countries agriculture has had an important function as a buffer against unemployment, absorbing workers laid off from other sectors.
• Employment gains in the services sector were mainly concentrated in the market services segment in all countries. Though market services activities are concentrated in low-skill segments – trade, tourism and transport – employment gains were – apart from trade – mainly reported in the high-skill segments, where there is still a wide gap between the NMS and the EU-15 average.
• Between 1998 and 2003 increases in market services were reported for all countries, but the Czech Republic and Romania. Within market services job creation in the business services sub-segment, particularly ‘other business services’ (legal, architectural and engineering services, advertising) contributed most to the overall job growth over that period. By contrast, we observe employment reductions in R&D, which were in absolute terms most pronounced in the Czech Republic and in Slovakia, whereas jobs in that category rose significantly in Hungary.
• Jobs in tourism (hotels and restaurants) grew most in Hungary and Slovakia, but fell in Slovenia and the Czech Republic between 1998 and 2003. Overall, tourism absorbs a lower portion in the NMS than both in the EU-15 and in the southern EU countries (traditional tourist destinations). Only Bulgaria exhibits a higher share of employed in tourism than the EU-15.
• Employment in financial intermediation stagnated over the past years characterized by job destruction in the banking sector (except Slovenia and Latvia) and job creation in the insurance, pension funding and auxiliary activities. In 2003 employment in financial intermediation accounted for 1.8% in the NMS versus 3.3% in the EU-15. Considering the still limited supply of financial instruments in the NMS, a convergence towards EU-15 levels seems to be feasible both in the banking and insurance sectors.

iv
• Transport and telecom is the only declining employment segment within market services in the whole region, with job losses occurring in all sub-segments. The drop was felt in all transport sub-categories, except auxiliary transport activities and activities of travel agencies. However, the bulk of job losses was reported in postal services and telecom, excepting Slovenia and Latvia. Transport and telecom is the only segment employing a higher proportion in all NMS (but Romania) than in the EU-15. Notable differences exist in the employment share in land transport, which in several NMS (Czech Republic, Hungary, Slovakia, Estonia and Latvia) is twice as high as in the EU-15.
• Community services sector employment grew in all NMS except Hungary, Bulgaria and Romania caused by increases in almost all sub-segments, most pronouncedly in health/social work and public administration. By contrast, employment in education fell in a number of countries. Overall, the proportion employed in the NMS community services sector is smaller than in the EU-15, but higher than in the EU-South – employment levels in that segment are highest in Hungary and Estonia and lowest in Slovenia. Public administration employs a similar portion as EU-South in the NMS as a whole; Bulgaria, Hungary and Slovakia already resemble the EU-15 pattern. The proportion employed in education is higher in the NMS than both the EU-15 and EU-South. Health and social work employment is above the EU South but significantly lower than in the EU-15.
Educational attainment and employment
• The educational composition of the NMS labour force is biased in favour of medium-educated (i.e. those with completed secondary schooling); relative to the EU-15 the NMS show smaller shares of both people with completed tertiary education (the ‘highly educated’) and those who did not complete a secondary degree (the ‘low-educated’). Within the group of ‘medium-educated’ there is a higher proportion of vocationally trained as compared to those with completed general secondary training compared to the EU-15.
• As regards employment rates, there are similar employment rates of the high- educated in the NMS and the EU-15, also similar rates for the medium-educated in the more advanced NMS-4 and somewhat lower rates in the NMS-8, but very low employment rates (and, conversely, high unemployment rates) for the low-educated (exceptions are Slovenia and Romania).
• There are a number of structural features accounting for these differences in employment rates: The primary sector (largely agriculture) accounts for a high proportion of the employment of the low-educated and this sector has lost jobs on a massive scale in most NMS; furthermore there is an ‘under-representation’ of the low-educated in the NMS both in the industrial and in the market services sectors compared to the EU-15. The medium-educated, on the other hand, are particularly

v
strongly represented in the labour forces of the industrial sector which in turn specializes (in comparison to the EU-15) in medium-skill segments. This provides job opportunities for the medium-educated, however, strong productivity catching-up in the industrial sector affects these employment opportunities negatively. Finally, the highly educated are particularly strongly in demand in the high-skill segment of the market services sector (financial intermediation and business services) which has expanded strongly both in the NMS and the EU-15 and in publicly provided services (in fact, there is a comparatively very strong allocation of the highly educated in public services and very low allocation to the industrial sector).
• Overall, the very bad job situation of the low-educated in the NMS seems to be a function of three factors: a high proportion of these are employed in agriculture and this sector is shrinking; a relatively weak representation of low-educated particularly in the labour-intensive lower-skill segments of the industrial and market services sectors; and, linked to the above, a tendency to substitute medium-educated for low-educated in a situation in which medium-educated are rather plentifully available and the general labour market situation provides sufficient slack.
• An analysis of occupational structures in the NMS supports this picture: there is, in comparison to the EU-15, a smaller share of blue-collar low-skilled jobs in agriculture, industry and market services i.e. the type of jobs which could provide job opportunities for the low-educated. Also in public services, there is a relative under-representation low-skilled white collar jobs compared to the situation in the EU-15. This supports the picture of a substitution of low-educated by medium-educated.
• Finally, an analysis of changes in the structure of the labour force over the more recent period (1998-2003) and of the younger age cohorts shows significant adjustments in the educational characteristics of the labour force in the direction of an ‘up-grading’ in educational attainment; however, the speed of change on the demand side is such that the labour market position of the low-educated still further deteriorates. Furthermore, we found in an age cohort analysis that in a number of respects educational attainment structures are adjusting less in the NMS than in the EU-15.
Keywords: economic restructuring, labour markets, EU enlargement, skill structures, new EU Member States JEL classification: J21, J22, J24, J31, L16, O41


1 1
Michael Landesmann, Hermine Vidovic and Terry Ward*
Economic restructuring and labour market developments in the new EU Member States
1 Introduction
Labour markets have gone through turbulent phases in the new Member States (NMS) over the past 15 years or so. Macroeconomic fluctuations and major structural change have given rise to serious problems as regards employment, activity and unemployment rates. Particular groups within the labour force have been especially hard hit (women in a number of countries, the young and older workers in most). The concern here is to present an overview of these developments, to emphasise differences between the NMS and the EU-15 countries with respect to structural characteristics and trends and to point to the heterogeneity among the NMS themselves (chapters 2 and 3). A major focus is on the composition of the labour force in the NMS in terms of educational attainment and the effect of structural change on different skill groups in the labour market (chapter 4).
Within the enlarged EU, the new Member States account for about 16% of population, 9% of overall GDP measured in purchasing power standards and 15% of employment. There have been opposing developments in employment in the EU-15 and the NMS over recent years. Whereas employment in the EU-15 has risen since the mid-1990s, increasing even in times of relatively low GDP growth, in the NMS it fell continuously after a temporary increase in the mid-1990s, despite marked growth of GDP. Closer examination reveals that these tendencies are apparent in most countries and in most sectors, except for market services, especially high -skill sectors). 2 Aggregate developments in the labour markets of the NMS
Between 1995 and 2003, employment in the NMS fell on average by 4%. However, if the new Member States are divided into two groups, Poland being one group and the other countries (the NMS-7) – the Czech Republic, Hungary, Slovakia, Slovenia and the three Baltic States – the other group, distinct differences emerge. In the NMS-7, employment remained unchanged between 1995 and 2003, while in Poland, it shrunk by 8%. Employment also fell in the two candidate countries (CC), Bulgaria and Romania, by 8% and 17%, respectively. Hungary was the only country with steady job increases from 1998
* The authors wish to express their gratitude for the excellent statistical research assistance by Sebastian Leitner (wiiw)
and Nirina Rabemiafara (Applica).

2 2
onwards, though in the Baltic States, there were rises from 2001. While Poland was successful in creating jobs in the mid-1990s, it has suffered painful employment cuts since 1999. The main reasons are modest GDP growth up to 2002, accompanied by massive layoffs in industry and falling employment in agriculture. In the following, the structural features of employment are examined by gender, age group and the pattern of working time (part–time as against full-time) and differences between the NMS and the EU-15 highlighted. 2.1 Employment rates below the EU average
As a consequence of the above developments, there are significant differences in employment rates (employment as a proportion of the working-age population, taken as those aged 15-64) between the EU-15 countries and the NMS. In contrast to the EU-15, where employment rates have shown a steady increase over recent years – at least up until 2002 – rates have tended to decline in most NMS (Table 1a). Employment rates have fallen steadily in Poland, Romania and Bulgaria since 1996 (the last showed a rise in 2003 for the first time) – while there has been a modest recovery in Hungary throughout the period and in the Baltic States from 2001 onwards.1 After declining in the second half of the 1990s, employment rates in the Czech Republic and Slovakia remained almost unchanged from 2000 onwards. The rate in Slovenia fluctuated over the period, though together with Hungary, this was the only country with a higher employment rate in 2003 than in 1996, and in Hungary, they had fallen to a much lower level at the beginning of the period. By 2003, the employment rate was below the EU-15 average (64%) in all NMS except the Czech Republic. In Estonia and Slovenia, the rate was similar to the EU-25 average (62.9%) and in Latvia and Lithuania, only slightly below this. By contrast, the rate was well below the EU average in Poland and Bulgaria, in the former, lower than in any of the other EU-25 Member States. Over time, the average employment rate in the NMS-7 has remained constant at about 61% and has declined in NMS-8 taken together, i.e. including Poland. Aside from the fact that in the EU-15, progress towards the Lisbon target of a 70% overall employment rate in 2010 has at present come to a standstill, it seems clear – given the weak job creation in the NMS – that the recent enlargement will further contribute to the EU missing the intermediate employment rate target of 67% in 2005 as set by the Stockholm European Council (see European Commission, 2004a).
1 Hungary and Bulgaria experienced the most dramatic employment rate reductions up to 1996 (between 22 and 23
percentage points).
3 3
Table 1a
Employment rates in new EU Member States/candidate countries employed in % of working age population 15-64
Total
1996 1997 1998 1999 2000 2001 2002 2003
Czech Republic 69.3 68.7 67.3 65.6 65.0 65.0 65.4 64.7
Hungary 52.1 52.2 53.7 55.6 56.3 56.2 56.2 57.0
Poland 58.4 58.9 59.0 57.6 55.0 53.4 51.5 51.2
Slovakia 61.9 60.8 60.6 58.1 56.8 56.8 56.8 57.7
Slovenia 61.6 62.6 62.9 62.2 62.8 63.8 63.4 62.5
Estonia 64.9 65.4 64.6 61.5 60.4 61.0 62.0 62.9
Latvia 57.1 59.8 59.9 58.8 57.5 58.6 60.4 61.8
Lithuania 60.3 62.6 62.3 61.7 59.1 57.5 59.9 61.1
NMS-7 . 61.0 61.1 60.4 59.9 59.8 60.3 60.7
NMS-8 . 59.9 60.0 59.0 57.3 56.5 55.7 55.7
Bulgaria 54.0 54.1 53.7 51.2 50.4 49.7 50.6 52.5
Romania 65.5 65.4 64.2 63.2 63.0 62.4 57.6 57.6
EU-15 60.3 60.7 61.4 62.5 63.4 64.1 64.2 64.3
EU-25 . 60.6 61.2 61.9 62.4 62.8 62.8 62.9
Table 1b
FTE-employment rates in new EU Member States/candidate countries employed in % of working age population 15-64
Total
1996 1997 1998 1999 2000 2001 2002 2003
Czech Republic . 67.8 65.6 63.9 63.2 63.4 64.7 64.1
Hungary 52.1 52.0 53.1 55.4 56.0 56.0 56.5 56.9
Poland . . . . . 52.9 50.7 50.3
Slovakia . . 60.6 58.0 56.4 55.7 55.8 57.4
Slovenia 60.5 60.9 61.8 60.8 61.5 62.4 62.7 60.9
Estonia . 64.6 65.0 61.6 59.5 59.9 60.9 61.3
Latvia . . 58.2 57.2 56.0 57.6 59.9 61.1
Lithuania . . . . 59.4 58.0 60.3 62.0
Bulgaria . . . . . 50.3 50.6 52.5
Romania . 67.5 65.6 64.5 63.8 62.9 58.4 58.5
EU-15 55.4 55.6 56.2 57.2 58.1 58.7 58.9 58.6
EU-25 . . . . . 58.2 58.2 58.0
Source: Employment in Europe 2004, Eurostat.
In view of the small share of part-time work in the NMS (8% of total employment versus close to 19% in the EU-15), it might be argued that the full-time equivalent (FTE) employment rate gives a more accurate picture of the employment situation. In these

4 4
terms, the difference between the two employment rates is much smaller in 2003. Indeed, the FTE employment rate was lower than the EU-15 average in only four countries – Hungary, Poland, Slovakia and Bulgaria – while the rate in Romania was similar. By contrast, in the Baltic States, the rate was well above the EU-15 average (Table 1b). Table 2
Employment rates in new EU Member States/candidate countries by gender
Male FTE
1996 1997 1998 1999 2000 2001 2002 2003 2003
Czech Republic 78.1 77.4 76.0 74.0 73.2 73.2 73.9 73.1 73.2
Hungary 59.5 59.7 60.5 62.4 63.1 62.9 62.9 63.5 64.0
Poland 65.2 66.8 66.5 64.2 61.2 59.2 56.9 56.5 56.1
Slovakia 69.2 67.7 67.8 64.3 62.2 62.0 62.4 63.3 63.6
Slovenia 66.0 67.0 67.2 66.5 67.2 68.6 68.2 67.4 66.1
Estonia 69.8 70.7 69.6 65.8 64.3 65.0 66.5 67.2 66.0
Latvia 62.3 64.9 65.1 64.1 61.5 67.9 64.3 66.1 66.3
Lithuania . 68.4 66.2 64.3 60.5 58.9 62.7 64.0 65.8
Bulgaria 57.7 58.0 57.5 55.1 54.7 52.7 53.7 56.0 56.3
Romania 72.6 71.9 70.4 69.0 68.6 67.8 63.6 63.8 65.2
NMS-7 . 68.3 67.9 66.9 66.0 66.2 66.7 67.0 66.5
NMS-8 . 67.5 67.2 65.5 63.5 62.5 61.5 61.5 66.3
EU(15) 70.4 70.7 71.2 72.0 72.8 73.1 72.8 72.5 70.6
EU(25) . 70.2 70.6 70.9 71.3 71.3 71.0 70.8 69.7
Female 1996 1997 1998 1999 2000 2001 2002 2003 2003
Czech Republic 60.6 59.9 58.7 57.4 56.9 57.0 56.3 56.3 55.1
Hungary 45.2 45.4 47.2 49.0 49.7 49.8 49.8 50.9 50.0
Poland 51.8 51.3 51.7 51.2 48.9 47.7 46.2 46.0 44.7
Slovakia 54.6 54.0 53.5 52.1 51.5 51.8 51.4 52.2 51.3
Slovenia 57.1 58.0 58.6 57.7 58.4 58.8 58.6 57.6 55.5
Estonia 60.2 60.4 60.3 57.8 56.9 57.4 57.9 59.0 57.0
Latvia 52.4 55.0 55.1 53.9 53.8 55.7 56.8 57.9 56.7
Lithuania . 57.2 58.6 59.4 57.7 56.2 57.2 58.4 58.4
Bulgaria 50.4 50.3 49.9 47.5 46.3 46.8 47.5 49.0 48.8
Romania 58.4 59.1 58.2 57.5 57.5 57.1 51.8 51.5 51.8
NMS-7 . 54.1 54.5 54.2 54.0 54.1 54.0 54.6 52.9
NMS-8 . 52.6 53.0 52.6 51.3 50.7 49.9 50.1 54.1
EU-15 50.2 50.8 51.6 52.9 54.1 55.0 55.6 56.0 46.9
EU-25 . 51.1 51.8 52.9 53.6 54.3 54.7 55.0 47.1
Source: Employment in Europe 2004, wiiw.

5 5
Noticeable differences also exist between the NMS and the EU-15 with regard to employment rates for men and women (see Table 2) and for different age groups. Starting from levels which were much higher than the EU-15 average, female employment rates remained above the average in a number of countries, the exceptions being Hungary, Poland, Slovakia and the two candidate countries Bulgaria and Romania. Among the NMS, therefore, female employment rates in 2003 ranged from 59% in Estonia to 46% in Poland. The Lisbon target for female employment is set at 60% in 2010 and the intermediate target rate at 57% in 2005, which seems to be feasible for at least some of the new Member States; for instance, female employment rates in the Baltic States are already higher than the intermediate target and are continuing to increase. It is also probable that Slovenia will reach the target by 2010. Employment rates of women were higher in 2003 than in 1996 in Latvia, Hungary and Lithuania and almost the same in Slovenia. The most pronounced decline was in the Czech Republic, followed by Poland and Slovakia. In 2003, except for Poland, the full-time equivalent employment rate for women was higher (for the most part significantly) in all NMS and CC than the EU-15 average. In contrast to female employment rates, male employment rates in the NMS were well below the EU-15 average in the mid 1990s in all countries bar the Czech Republic and Romania. With the exception of Hungary, Slovenia and Latvia, employment rates of men were lower in 2003 than in 1996. The most marked declines over this period were in Poland, Romania and Slovakia, where rates were down by 6-9 percentage points. The Czech Republic, though experiencing a reduction too, was the only country in 2003 where the male employment rate was above the EU-25 average. This was also the case in full-time equivalent terms, since the incidence of part-time working is relatively low for men in both the NMS and the EU-15. For the NMS as a whole, the youth employment rate (that of those aged 15-24) has been declining since the late 1990s and in 2003 was only around 28% compared with 40% in the EU-15 (Figure 1). Over the period 1998-2003, falls were recorded in all countries, though to varying extents. The decline was largest in Lithuania and the Czech Republic (about 15.5 percentage points) and was less severe in Latvia and Estonia. In the remaining countries, youth employment rates fell by 7-8 percentage points With the exception of Slovenia and Estonia, employment rates of women aged 15-24 fell by less than for men of the same age. While part of the decline in rates is attributable to an extension in education, it was probably due to a greater extent to the difficult transition from school to work because of mismatches between the skills acquired and those demanded by the labour market (ETF,

6 6
Figure 1
Youth employment rates in the NMS/CC % of population aged 15-24
10.0
20.0
30.0
40.0
50.0
60.0
70.0
80.0
90.0
CZ HU PL SK SI EE LV LT NMS-7 NMS-8 BG * RO EU(15) EU(25)
1998
2003
% of population aged 20-24
10.0
20.0
30.0
40.0
50.0
60.0
70.0
80.0
90.0
CZ HU PL SK SI EE LV LT NMS-7 NMS-8 BG * RO EU(15) EU(25)
1998
2003
% of population aged 25-29
10.0
20.0
30.0
40.0
50.0
60.0
70.0
80.0
90.0
CZ HU PL SK SI EE LV LT NMS-7 NMS-8 BG * RO EU(15) EU(25)
1998
2003
Note: * BG: first column 2000.
Source: Eurostat.

7 7
Figure 2
Employment rates of older workers in the NMS/CC % of population aged 50-54
20
30
40
50
60
70
80
90
CZ HU PL SK SI EE LV LT NMS-7 NMS-8 BG * RO EU-15 EU-25
1998
2003
% of population aged 55-59
20
30
40
50
60
70
80
90
CZ HU PL SK SI EE LV LT NMS-7 NMS-8 BG * RO EU-15 EU-25 *
1998
2003
Note: *) EU-25, BG: first column 2000. - +) NMS-7: without PL.
Source: Eurostat. 2003 and Fortuny et al., 2003). The difference in rates between the NMS and the EU-15 is, therefore, most marked for the 20-24 age group, while employment rates for those aged 25-29 are similar in the two groups of countries (in Slovenia and Lithuania, the employment rates for this age group even exceeded the EU-15 average). The picture is similar for older workers (those aged 55-64). Again the EU-15 average is significantly higher than in a number of NMS, which might be partly explained by the lower statutory retirement age in the latter, but also by the early retirement programmes implemented in the 1990s in order to combat open unemployment.

8 8
In 2003, the employment rate for this age group in the EU-15 averaged 41.7% (EU-25, 40.2%) and varied between 52.3% in Estonia and 23.5% in Slovenia (Figure 2). Apart from Estonia, the rate was also above the EU-15 average in Lithuania, Latvia and the Czech Republic, while in Slovenia, Slovakia, Poland and Hungary, rates were below this level. The employment rate of older workers has, however, increased in all NMS, with the exception of Poland and Romania, since the late 1990s, most markedly in Hungary (by 11.6 percentage points) and Latvia (7.8 percentage points). Among those in the older age group, the ‘early retirement effect’ becomes evident if the employment rates of those aged 55-59 are compared with those aged 50-54 (before retirement). For 50-54 year-olds, employment rates in the NMS-7 are similar to those in the EU-15. (In the NMS-8, the reverse is the case because of the low rate in Poland). By contrast, the employment rates for the 55-59 age group in the NMS, apart from the three Baltic States and the Czech Republic, were well below the EU-15 average. 2.2 Part-time employment in the NMS
In contrast to the EU-15, where part time jobs2 account for around 16% of total employment, part-time working is not common in the NMS, where full-time employment is a legacy of the communist past. In 2003, the share of part time jobs in total employment ranged from only 2% in Slovakia to 11% in Poland. Only in Lithuania and Latvia was the proportion working part-time close to that in Poland and in other NMS, it was significantly less. The relatively large share of part time employment in Lithuania, Latvia and Poland is mainly attributable to the large agricultural sector in these countries and the comparatively large numbers working under 30 hours a week in the sector. Over recent years the share of part time employment has increased slightly in Lithuania and Slovakia (from a very low level); it has remained much the same in the Czech Republic and Hungary and has fallen in Estonia, Latvia, Slovenia, Bulgaria and Romania. As in the EU-15, part time working in the NMS is mainly a female phenomenon, but the difference between the proportions of men and women working part-time is considerably less. In 2003, while the relative number of men in employment working part-time was similar in the two groups of country, the share of women varied from 16% in Poland to 3% in Slovakia, well below the EU-15 average (30%). In contrast to the EU-15, where it has risen continuously since the mid-1990s, the share of part time employment of men fell slightly in the Czech Republic, Latvia, Slovenia, Slovakia and Romania between 1998 and 2003. The share increased only in Hungary, Estonia and Lithuania, while it remained virtually unchanged at a low level in Estonia. Part time
2 Part-time jobs are defined here as those in which people usually work for less than 30 hours a week

9 9
employment of women rose in Lithuania and Latvia, remained constant in the Czech Republic, Slovenia and Slovakia and fell in Estonia and Hungary. (Figure 3a). The relative differences are similar in services (the sector with the largest proportion of part-time workers) to those in the economy as a whole. Figure 3a
Part-time employment in the NMS and EU-15 working less than 30 hours a week % of total employed
0.0
5.0
10.0
15.0
20.0
25.0
30.0
35.0
NMS-7 NMS-8 EU-15 NMS-7 NMS-8 EU-15 NMS-7 NMS-8 EU-15
Total Male Female
1998
2001
2003
Total economy
Figure 3b
Part-time employed in the NMS and EU-15 working less than 30 hours a week % of total employed
0.0
5.0
10.0
15.0
20.0
25.0
30.0
35.0
NMS-7 NMS-8 EU-15 NMS-7 NMS-8 EU-15 NMS-7 NMS-8 EU-15
Total Male Female
1998
2001
2003
Services
Source: Eurostat.
Average hours worked by those in employment also tend to be longer in the NMS than in the EU-15, whether they work part-time or full-time. Full-time employees on average work on average 1.4 hours longer per week in the NMS and CC than in the EU-15

10 10
(EIRO, 2004). Lithuania is the only country in which this is not the case, though the UK has longer usual working hours than any of the NMS and CC except Latvia. 2.3 Unemployment rate twice as high as in the EU-15
The dramatic job losses that occurred during the transition process either gave rise to a decline in activity (and employment) rates, as people quit the labour market, or to increasing unemployment. Expectations that the labour market situation would improve once GDP began to grow again did not materialise. Instead, unemployment remained stubbornly high or even increased further. Unemployment rates in the NMS in 2003 were almost double those in the EU-15 (8%). However the incidence of unemployment varies from country to country. The NMS and CC can be divided into three groups in this respect. In the first group, consisting of Hungary, Slovenia, Romania and the Czech Republic, the unemployment rate (6-7.7%) is well below the EU-15 average; in the second group, comprising Poland and Slovakia, the rate (18-20%) is well above the EU average. The Baltic States (10-13%) and Bulgaria (14%), with falling unemployment, comprise a third group somewhere in between the other two. The main reasons for high unemployment in Poland and Slovakia include, apart from low GDP growth in Poland, restructuring and demographic factors (large numbers of young people entering the labour market). In Slovakia very high unemployment among the Roma population, also contributes to the high overall rate.3 Long-term unemployment has become a serious problem in all NMS. It has reached much higher levels than in the EU-15, though it seems to have stopped rising in most countries in the recent past. According to LFS figures for 2003, Hungary seems to be an outlier with the share of long-term unemployed among total job seekers having fallen below 40%. In the other countries, the share ranged from 65% in Slovakia to 50% in the Czech Republic (compared to the EU-15 average of 38%). This suggests that the unemployed tend not to move quickly from one job to another (Huber et al., 2003). Youth unemployment in the NMS and CC is around twice as high as both the overall national average rate of the respective countries and the EU-15 average (16% in 2003). It ranges from 14% in Hungary to as much as 44% in Poland.
3 In 1999, Roma accounted for around a quarter of total registered unemployment in Slovakia In the eastern parts of the
country with a traditionally large Roma population the share was much larger. Most of the unemployed Roma had been out of work for more than a year (World Bank, 2002)

11 11
Figure 4
Long-term unemployment in the NMS/CC % of total unemployed
0
10
20
30
40
50
60
70
CZ HU PL SK SI BG RO EE LV 1) LT 1)
EU-15 EU-South
2)
1996
2003
Notes: 1) More than 11 months. LV year 1997; LT year 1998. - 2) EU-South: Greece, Portugal, Spain. Source: Eurostat.
2.4 Population out of the labour force less diverse than in the EU-15
Declining employment over the transition period in the NMS has been accompanied by high unemployment and increasing economic inactivity, associated with early retirement, increasing numbers on disability benefits, an expansion of the informal economy and a growing discouraged worker effect. In 2003, the share of population of 15 and over who were economically inactive was smaller in the Czech Republic, Estonia, Latvia, Lithuania and Slovakia than in the EU-15 and similar in Slovenia. The proportion of men who were inactive varied from 45% in Bulgaria to 32% in the Czech Republic and was above the EU-15 average (34%) in Latvia, Poland, and Bulgaria. The share of women who were inactive ranged from 55% in Bulgaria to 49% in the Czech republic and Latvia and exceeded the EU-15 average (52%) in three countries: Hungary, Poland and Bulgaria. In the EU-15 countries, the difference was significantly wider, the proportion varying from 63% in Italy to 40% in Denmark. Inactivity is still on the increase in most of the NMS as well as in Bulgaria and Romania. Between 1998 and 2003, activity rates fell in all countries apart from Hungary and Slovakia. The decline was most pronounced among young people under 25: in 2003 activity rates of those aged 15-19 were 9 percentage points lower in the NMS-7 than in 1998, while rates of those aged 20-24 were down by almost 7 percentage points. Reductions occurred in all countries bar Poland, where activity rates of both age groups increased. By contrast, the participation rate of older workers (age groups 55-59 and

12 12
60-64) increased in the NMS-7 over this period, most markedly in Hungary, Latvia and Lithuania, though it fell significantly in Poland as well as Slovenia. 3 Converging employment patterns in the NMS
The structure of employment has changed dramatically in all NMS within a relatively short space of time. In particular, employment in industry and agriculture has declined while that in the underdeveloped service sector has increased. The following analysis of changing employment patterns is based on two data sets both derived from the Labour Force Survey. The first provides details of annual average employment at the NACE-1 digit level for the period 1995 to 2003. The second gives details of employment in the second quarter of each year at the NACE-2 digit level for the period 1998 to 2003. 3.1 Sectoral developments between 1995 and 2003
Between 1995 and 2003, job creation was mainly concentrated in the tertiary sector, whereas employment in agriculture and industry fell in all countries (Tables 3 and 4). There are also, however, signs of some recovery in industrial employment, particularly in Hungary. In the other NMS, though employment in industry fell overall, at a more disaggregated level, there was some increase in manufacturing in the last few years of the period, the only exception being Poland. Large inflows of FDI into manufacturing may well have played an important role in creating new jobs. In four countries (Hungary, Slovakia, Slovenia and Latvia), job creation both in services and manufacturing offset job destruction in other sectors, while in other countries the creation of new jobs was not sufficient to compensate for continuing job losses in agriculture and industry. Overall, the NMS still had a relatively large share of employment in industry in 2003, particularly the Czech Republic, Slovakia and Slovenia, while the share of employment in agriculture was large in Poland and Lithuania (around 19% in each case) as well as in Romania (36%). In services, employment gains were primarily due to job creation in the market sector in all countries. Employment expanded in distribution throughout the whole region, while there were smaller increases in tourism (hotels and restaurants) and real estate and business activities, the only exception being Romania. Only three countries – Latvia, Lithuania and Slovenia – recorded new job creation in transport and communications, while job losses in this sector were most pronounced in Romania and Bulgaria. Though market services activities are still concentrated in low-skill activities, such as distribution, tourism and

13 13
Table 3
Employment by activities in new EU Member States/candidate countries, changes 1995-2003 annual averages
NACE CZ HU PL SK SI EE LV 2) LT 3) BG 1) RO NMS-4 4) NMS-7 5) NMS-8 6) BG, RO label
A-Q Employment, total -4.6 6.6 -7.9 0.8 1.7 -6.2 1.6 -2.0 -8.1 -17.3 0.4 -0.1 -4.0 -15.2
A-B Agriculture, forestry, fishing -34.6 -27.1 -25.1 -36.5 -18.5 -43.1 -9.3 -9.8 -5.2 -26.8 -30.9 -24.3 -24.8 -23.5
C-F Industry total -10.3 9.0 -17.6 -0.7 -11.5 -11.0 -7.5 -8.4 -21.8 -20.3 -3.4 -4.4 -10.5 -20.7
C-E Industry -12.1 2.6 -19.3 -2.5 -15.4 -17.7 -14.4 -12.2 -21.4 -22.1 -6.6 -7.9 -13.3 -21.9
F Construction -3.7 37.8 -10.5 5.8 17.2 24.3 24.5 3.4 -24.2 -9.0 9.3 9.9 0.7 -13.0
G-O Services 3.8 9.9 7.6 8.5 17.1 3.6 10.5 4.8 0.7 -0.7 7.6 7.4 7.5 -0.3
G-K Market services 3.2 20.3 14.1 13.4 16.2 3.7 14.5 5.3 7.2 1.4 11.4 10.6 12.2 3.3
G Wholesale, retail trade, repair motor vehicles 1.5 20.3 8.2 21.5 6.9 0.9 19.4 0.2 19.8 20.1 11.2 9.9 9.1 20.0
H Hotels and restaurants 10.9 19.6 18.0 33.4 12.1 1.2 29.7 25.2 10.6 -13.6 17.5 17.9 17.9 -5.0
I Transport, storage, communications -6.0 -5.1 -3.7 -10.6 15.9 -11.8 1.3 1.4 -15.6 -17.1 -5.3 -4.6 -4.2 -16.6
J Financial intermediation 5.2 -11.4 -4.7 46.3 1.2 10.1 3.2 24.7 -20.7 -4.8 4.2 5.5 0.0 -10.1
K Real estate, renting & business activities 16.1 103.5 105.6 13.8 59.8 42.3 26.6 21.5 33.3 -2.3 41.2 39.0 62.6 11.9
L-O Communal services 4.7 -0.9 0.5 3.4 18.3 3.5 6.2 4.3 -7.6 -2.9 3.1 3.5 2.1 -4.3
L Public admin., defence, compuls.social security 9.8 -7.1 24.5 16.3 34.0 0.0 8.5 12.1 51.9 -5.8 5.3 5.9 13.6 0.8
M Education -6.9 -1.9 8.0 -6.6 13.7 5.8 3.0 5.7 -23.6 -6.9 -3.7 -1.6 2.9 -13.1
N Health and social work 8.4 15.5 -14.3 8.0 3.2 2.0 0.7 4.3 -25.5 1.5 10.3 8.7 -3.3 -8.0
O Other community, social & personal services 8.6 -8.7 -17.0 -13.3 30.4 5.2 16.2 -14.7 21.8 6.3 -1.1 -1.0 -8.4 11.5
Notes: 1) BG: 1996-2003, registration data. 2) LV: 1995-2002. 3) LT: 1997-2003, estimated figures for 2003 due to structural break in 2000. 4) NMS-4: Czech Republic, Hungary, Slovak Republic, Slovenia. 5) NMS-7: NMS-4, Estonia, Latvia, Lithuania. 6) NMS-8: NMS-7, Poland.
Source: wiiw Database.

14 14
Table 4
Employment by activities in new EU Member States/candidate countries, structure 2003 in % (annual averages)
NACE CZ HU PL SK SI EE LV 2) LT BG 1) RO NMS-4 3) NMS-7 4) NMS-8 5) BG, RO EU-15 6)
label
A-Q Employment, total 100.0 100.0 100.0 100.0 100.0 100.0 100.0 100.0 100.0 100.0 100.0 100.0 100.0 100.0 100.0
A-B Agriculture, forestry, fishing 4.5 5.5 18.4 5.8 8.4 6.2 15.1 17.9 25.8 35.7 5.4 7.5 12.7 33.1 4.0
C-F Industry total 39.4 33.3 28.6 38.3 37.5 32.5 25.4 28.1 27.8 29.8 37.0 35.0 31.9 29.3 27.5
C-E Industry 30.1 25.7 22.7 29.3 31.6 25.2 18.3 20.7 23.8 25.2 28.6 26.9 24.9 24.8 19.6
F Construction 9.3 7.6 5.9 9.0 5.9 7.2 7.1 7.4 4.1 4.6 8.4 8.1 7.0 4.5 7.9
G-O Services 56.1 61.2 53.0 55.8 53.4 61.4 59.3 53.5 46.3 34.5 57.6 57.4 55.3 37.6 66.8
G-K Market services 32.5 34.0 29.3 30.1 31.4 34.7 32.7 28.3 28.3 18.2 32.5 32.1 30.8 20.6 37.6
G Wholesale, retail trade, repair motor vehicles 13.3 14.1 14.4 12.5 12.5 13.6 16.6 14.9 12.5 9.3 13.3 13.7 14.0 10.2 14.6
H Hotels and restaurants 3.6 3.6 1.7 3.7 3.9 2.9 2.3 2.0 2.8 1.3 3.6 3.4 2.6 1.7 4.1
I Transport, storage, communications 7.6 7.7 6.1 6.9 6.7 9.5 8.1 6.4 7.3 5.0 7.4 7.5 6.8 5.5 6.1
J Financial intermediation 2.0 1.9 2.1 2.0 2.4 1.3 1.5 1.2 1.1 0.9 2.0 1.8 1.9 1.0 3.3
K Real estate, renting & business activities 6.0 6.8 5.1 5.0 5.9 7.5 4.3 3.7 4.5 1.6 6.1 5.8 5.4 2.3 9.4
L-O Communal services 23.6 27.2 23.7 25.8 22.0 26.6 26.5 25.3 18.0 16.3 25.1 25.3 24.5 17.0 29.2
L Public admin., defence, compuls.soc. security 7.0 7.5 6.3 7.4 5.8 5.8 7.1 5.2 3.3 5.7 7.2 6.9 6.6 5.2 7.6
M Education 6.1 8.4 7.9 7.3 6.7 9.6 9.1 9.4 6.7 4.4 7.1 7.6 7.7 4.9 6.9
N Health and social work 6.5 6.8 6.1 7.1 5.4 6.1 5.2 6.9 5.0 3.8 6.6 6.6 6.4 4.0 10.0
O Other community, social & personal services 3.9 4.5 3.3 3.6 4.1 5.1 5.1 3.8 3.0 2.4 4.0 4.1 3.7 2.8 4.7
Notes: 1) BG: registration data. - 2) LV: 2002. - 3) NMS-4: Czech Republic, Hungary, Slovak Republic, Slovenia. - 4) NMS-7: NMS-4, Estonia, Latvia, Lithuania. - 5) NMS-8: NMS-7, Poland. - 6) 2nd quarter 2003.
Source: wiiw Database.

15 15
transport, employment gains – apart from in distribution – have mainly occurred in the high-skill activities, especially in particular business services, where the gap in employment vis-à-vis the EU-15 average is still very wide (see Appendix B2 for a more detailed analysis of business services). Overall, job creation in high-skill services was larger (in absolute numbers) than in the low-skill sectors.4 Almost all countries reported an increase of communal service employment in the 1995-2003 period, the exceptions being Hungary, Bulgaria and Romania. Developments within and across countries and individual sub-sectors varied considerably. The decline in Hungary and Romania was mainly the result of a reduction of jobs in public administration, in Bulgaria, of job losses in the education and health sectors. Apart from Bulgaria, Poland experienced most job losses in health and social services. In half the countries, the Czech Republic, Hungary, Slovakia and Bulgaria and Romania, employment fell in education:; employment in other community and personal services declined in Hungary, Poland, Slovakia and Lithuania. Romania is the only country, where employment in services declined over the 1995-2003 period as a result of a fall in employment in communal services.5 Figure 5
Employment changes 1995-2003 LFS, in thousand
-2500 -2000 -1500 -1000 -500 0 500
Employment total
Communal services
Fin. & business act.
Transport & telecom
Trade
Market services
Services
Industry total
Agriculture & forestry
NM-4 PL BG, RO
4 Low-skill service sectors comprise (NACE-Rev.1): Wholesale and retail trade (G) Hotels and restaurants (H) and
transport, storage and communications (H), while high-skill service sectors comprise financial intermediation (J) and real estate, renting and business activities (K).
5 LFS results for Romania from 2002 onwards lack comparability with previous years due to methodological changes.

16 16
3.2 Sectoral patterns between 1998 and 2003
More detailed data (for NACE-2 digit sectors) on employment changes are available for the period 1998-2003 (Tables 5 and 6).6 It should be noted at the outset, however, that because of the relatively small sample size, the data are of uncertain reliability for sectors which employ relatively few people. Between 1998 and 2003, there was a modest increase in employment of just under 1% in the NMS-7, primarily due to increases in Hungary and more modest rises in Latvia. In all other countries, employment fell over the period, only slightly in most cases but by almost 16% in Romania. Agricultural employment declined by almost 20% in the NMS-7, most especially in Estonia and Slovenia (by over 30% in each case) and Slovakia (by 27%). In Lithuania, the fall was only around 5%. At the same time industrial employment increased only in Hungary and continued to fall in all other NMS. Changing patterns in the service sector
In contrast to the job losses in agriculture and industry, employment in services rose in all new Member States between 1998 and 2003 as well as in Bulgaria (Figure 5). In Romania, by contrast, service employment declined. Over the 5-year period, there was a net creation of 550 thousand service jobs in the NMS-7, and the share of services in total employment increased from 53.8% to 57.2% (Figure 5). The share of employment in services in the new Member States, however, is still far below that in the EU-15 (67% in 2003), but already close to the share in the EU-South (59%). In general, the share of employment in services differs less from the EU-15 in communal services than in market services. There are, however, major differences across countries. The proportion employed in services in 2003 ranged from 61-62% in Hungary and Estonia to 53-54% in Poland, Lithuania and Slovenia and only 33% in Romania.
6 Data refer to the second quarter of the year and are available for the Czech Republic, Hungary, Slovakia, Slovenia,
Estonia, Latvia, Lithuania and Romania.

17 17
Table 5 Employment by activities in new EU Member States/candidate countries, changes 1998-2003 in % (2nd quarter)
NACE CZ HU PL 4) SK SI EE LV LT BG 4) RO NMS-4 1) NMS-7 2) EU-15 EU-South 3)
label
A-X Employment, total -2.7 7.8 -5.9 -1.5 -0.9 -3.2 1.8 -0.6 0.1 -15.6 1.0 0.7 7.2 14.7
A-B Agriculture, forestry, fishing -20.9 -21.0 -8.3 -27.4 -30.9 -34.9 -22.0 -4.9 -15.1 -24.2 -23.7 -19.9 -8.0 -6.9 C-F Industry total -6.5 3.5 -13.5 -4.9 -7.1 -8.2 1.0 -6.9 -1.6 -14.5 -3.4 -3.7 -0.4 12.9 C-E Industry -5.9 -3.3 -8.7 -5.1 -8.7 -6.8 -9.1 -10.6 -0.2 -16.1 -5.2 -5.9 -4.1 2.2 F Construction -8.6 34.9 -29.0 -4.3 2.2 -13.1 40.5 5.5 -8.0 -4.5 3.1 4.4 10.1 35.9
G-O Services 2.1 14.2 -0.4 4.4 11.3 4.8 9.7 4.0 5.6 -4.0 7.2 7.0 11.4 19.9 G-K Market services -0.4 18.4 -0.5 6.6 9.4 6.2 15.5 7.9 4.4 -11.9 7.6 8.0 11.9 19.6 G Wholesale, retail trade, repair motor veh. -1.5 18.5 -2.5 3.5 7.1 -9.4 2.8 5.8 5.9 -11.8 6.4 5.3 5.9 12.8 50 Sale and repair of motor vehicles; automotive fuel 11.8 71.9 . -0.8 1.1 3.4 -4.7 22.8 70.6 -6.6 27.0 23.4 4.1 9.1 51 Wholesale trade, except of motor vehicles -2.2 25.9 . -25.7 -17.0 -26.2 17.9 37.2 31.9 0.6 -3.6 -0.5 0.3 12.0 52 Retail trade, except of motor vehicles; repair of household goods -4.2 8.4 . 18.9 20.6 -6.2 1.1 -5.1 -7.7 -14.2 6.0 3.7 8.5 14.0 H Hotels and restaurants -5.1 17.7 -4.6 29.9 -5.4 19.9 44.6 34.9 -5.5 -21.1 7.3 10.7 11.9 19.9 I Transport, storage, telecommunications -6.2 1.4 -8.0 -14.2 16.4 4.8 21.7 -6.1 4.1 -12.7 -4.0 -2.0 10.2 19.1 60 Land transport; transport via pipelines -5.5 1.0 . -8.0 9.3 5.7 18.7 6.0 4.4 -11.7 -3.0 -0.6 5.1 18.0 61 Water transport -4.7 -31.5 . -21.4 -57.9 -15.8 -9.8 40.5 36.5 15.1 -22.4 -12.2 -8.6 7.1 62 Air transport -11.3 -7.2 . -58.8 -40.3 -100.0 -71.4 -25.7 -47.5 3.0 -22.1 -26.8 9.4 35.0 63 Auxiliary transport activities; activities of travel agencies 5.1 43.0 . -7.3 39.8 95.4 57.1 27.1 -19.2 29.9 16.8 29.5 24.0 6.1 64 Post and telecommunications -11.1 -3.7 . -27.6 46.1 -30.5 27.5 -49.5 18.6 -27.0 -9.5 -12.4 9.6 31.8 J Financial intermediation 1.4 -13.0 -21.1 15.4 22.5 28.9 13.1 -19.9 -13.1 -3.2 0.2 0.1 5.1 13.1 65 Financial intermediation, except insurance and pension funding -15.0 -19.5 . -3.2 18.3 -9.3 28.9 -37.4 -17.7 -14.5 -11.8 -11.8 6.0 12.5 66 Insurance and pension funding, except compulsory social security 32.8 -3.0 . 130.0 37.0 36.6 -49.2 112.8 -7.7 133.8 28.3 27.6 -3.9 1.9 67 Activities auxiliary to financial intermediation 36.2 10.1 . -47.5 12.8 1529.0 107.2 -34.8 32.0 -9.5 11.9 18.0 16.6 113.4 K Real estate, renting & business activities 13.8 65.9 38.2 43.4 14.4 35.6 40.5 49.0 20.0 -5.9 33.7 35.1 27.4 41.4 70 Real estate activities 0.1 40.4 . 12.1 8.8 58.1 3.5 209.6 -0.8 83.3 13.3 28.1 13.1 83.3 71 Renting of machinery without operator and of household goods -7.7 -19.1 . 6.9 390.3 152.1 -100.0 15.0 49.5 115.0 -3.7 -3.1 18.4 39.4 72 Computer and related activities 27.2 146.5 . 56.8 27.3 22.2 119.2 10.2 9.8 -21.6 60.4 58.5 59.9 59.2 73 Research and development -17.6 39.1 . -25.7 -14.1 -27.8 -28.9 2.5 -26.9 -29.6 -10.3 -10.8 13.3 13.9 74 Other business activities 18.1 61.2 . 65.1 13.7 35.5 83.3 39.6 36.4 3.2 37.8 39.3 25.3 37.9 L-O Communal services 5.9 9.2 -0.3 1.8 14.2 2.9 3.2 0.0 7.2 6.6 6.8 5.6 10.7 20.4 L Public admin., defence, compuls.soc.sec. 8.7 14.1 12.9 5.3 21.4 3.6 -3.7 -3.8 17.3 20.8 10.6 8.1 7.9 19.3 M Education -1.8 5.4 7.9 -3.4 3.6 -0.3 -15.2 -0.1 1.9 -9.4 1.0 -0.5 9.7 11.3 N Health and social work 12.5 13.1 -13.4 1.8 13.1 0.8 22.1 4.3 -4.9 10.5 10.5 10.2 13.4 29.1 O Oth. community, social & personal serv. 4.3 3.2 -11.8 5.8 27.1 10.9 26.9 -1.6 20.6 8.8 5.6 6.8 11.2 25.3 90 Sewage and refuse disposal, sanitation and similar activities 3.4 20.4 . 49.6 -2.3 36.0 -31.2 69.7 61.3 -6.9 16.1 17.1 19.8 37.3 91 Activities of membership organizations n.e.c. -25.1 66.1 . 62.9 215.7 -75.2 14.0 19.6 3.0 97.9 35.3 25.0 3.7 16.2 92 Recreational, cultural and sporting activities 9.0 26.1 . -6.7 21.2 32.0 14.3 -10.7 16.5 -5.2 13.0 12.0 14.0 19.3 93 Other service activities 4.5 -27.5 . -8.7 18.0 -32.2 79.2 -27.1 6.4 -2.9 -11.9 -7.4 10.3 34.0
P-X Other activites 50.0 -56.0 . 281.4 34.0 -33.7 361.6 203.1 -68.5 -55.1 53.5 86.9 37.2 13.1
Notes: 1) NMS-4: Czech Republic, Hungary, Slovak Republic, Slovenia. 2) NMS-7: NMS-4, Estonia, Latvia, Lithuania. 3) EU-South: Greece, Portugal, Spain. 4) Poland, Bulgaria: changes 2000-2003.
Source: Eurostat.

18 18
Table 6 Employment by activities in new EU Member States/candidate countries, structure 2003 in % (2nd quarter)
NACE CZ HU PL SK SI EE LV LT BG RO NMS-4 1) NMS-7 2) EU-15 EU-South 3)
label
A-X Employment, total 100.0 100.0 100.0 100.0 100.0 100.0 100.0 100.0 100.0 100.0 100.0 100.0 100.0 100.0
A-B Agriculture, forestry, fishing 4.5 5.4 18.2 6.0 8.4 6.3 14.6 18.7 11.1 37.7 5.4 7.4 4.0 8.7 C-F Industry total 39.9 33.4 28.5 38.1 36.9 31.3 26.8 27.2 32.1 29.1 37.1 35.2 27.5 29.8 C-E Industry 30.5 25.6 22.9 29.1 31.1 24.6 19.2 20.0 26.7 24.6 28.7 27.0 19.6 18.5 F Construction 9.4 7.8 5.6 9.0 5.8 6.6 7.6 7.2 5.4 4.5 8.5 8.2 7.9 11.4
G-O Services 55.5 61.2 53.2 55.4 54.0 62.4 58.0 53.6 56.6 33.1 57.3 57.2 66.8 58.9 G-K Market services 32.5 34.2 29.6 30.1 32.2 35.8 32.5 28.6 32.0 17.5 32.6 32.3 37.6 37.0 G Wholesale, retail trade, repair motor veh. 13.4 14.2 14.5 12.7 13.2 13.1 14.6 15.0 14.8 8.8 13.5 13.7 14.6 15.8 50 Sale and repair of motor vehicles; automotive fuel 2.0 2.5 . 1.4 1.9 2.1 1.5 2.7 2.0 0.9 2.0 2.1 2.2 2.4 51 Wholesale trade, except of motor vehicles 3.7 2.1 . 2.7 2.9 2.4 2.3 3.1 3.3 1.1 2.9 2.9 3.3 3.3 52 Retail trade, except of motor vehicles; repair of household goods 7.7 9.6 . 8.6 8.5 8.5 10.9 9.3 9.6 6.8 8.5 8.8 9.2 10.0 H Hotels and restaurants 3.5 3.7 1.7 3.6 4.0 3.0 2.7 2.1 4.7 1.3 3.6 3.4 4.1 6.2 I Transport, storage, telecommunications 7.4 7.7 6.1 6.9 6.6 10.0 9.4 6.4 7.7 4.9 7.4 7.5 6.1 5.7 60 Land transport; transport via pipelines 4.8 5.0 . 4.8 3.8 5.2 5.1 4.1 4.4 3.4 4.8 4.8 2.5 3.1 61 Water transport 0.1 0.1 . 0.1 0.1 1.3 0.7 0.3 0.5 0.2 0.1 0.2 0.1 0.2 62 Air transport 0.1 0.2 . 0.1 0.1 0.0 0.1 0.2 0.1 0.1 0.1 0.1 0.2 0.2 63 Auxiliary transport activities; activities of travel agencies 0.6 0.6 . 0.4 1.0 2.2 2.0 0.9 0.8 0.2 0.6 0.8 1.5 0.9 64 Post and telecommunications 1.8 1.8 . 1.5 1.5 1.4 1.6 0.9 1.9 0.9 1.7 1.6 1.7 1.3 J Financial intermediation 2.1 1.8 2.1 2.0 2.4 1.5 1.3 0.9 1.0 0.9 2.0 1.8 3.3 2.3 65 Financial intermediation, except insurance and pension funding 1.2 1.1 . 1.2 1.7 0.8 1.0 0.6 0.7 0.7 1.2 1.1 2.1 1.6 66 Insurance and pension funding, except compulsory social security 0.7 0.6 . 0.7 0.6 0.4 0.1 0.3 0.2 0.2 0.6 0.6 0.7 0.6 67 Activities auxiliary to financial intermediation 0.3 0.1 . 0.1 0.1 0.3 0.1 0.1 0.1 0.0 0.2 0.2 0.5 0.2 K Real estate, renting & business activities 6.1 6.8 5.1 4.9 5.9 8.2 4.6 4.1 3.8 1.7 6.1 5.9 9.4 7.0 70 Real estate activities 0.6 0.5 . 0.5 0.2 2.7 1.3 1.0 0.2 0.1 0.5 0.7 0.9 0.5 71 Renting of machinery without operator and of household goods 0.1 0.1 . 0.0 0.1 0.1 0.0 0.1 0.0 0.0 0.1 0.1 0.2 0.2 72 Computer and related activities 1.0 1.1 . 0.7 0.8 0.5 0.5 0.3 0.4 0.2 1.0 0.9 1.4 0.6 73 Research and development 0.4 0.2 . 0.3 0.3 0.4 0.2 0.5 0.4 0.3 0.3 0.3 0.4 0.1 74 Other business activities 4.0 4.9 . 3.3 4.5 4.4 2.5 2.3 2.8 1.0 4.2 3.9 6.5 5.6 L-O Communal services 23.0 27.0 23.6 25.3 21.9 26.6 25.5 25.1 24.5 15.6 24.7 24.8 29.2 21.8 L Public admin., defence, compuls.soc.sec. 6.6 7.4 6.4 7.6 5.5 6.1 6.3 4.9 7.9 4.9 6.9 6.7 7.6 6.6 M Education 6.2 8.2 7.9 7.4 6.9 9.3 7.2 9.5 7.5 4.3 7.2 7.5 6.9 5.8 N Health and social work 6.3 6.9 5.9 6.7 5.2 5.8 6.3 6.7 5.5 4.0 6.5 6.5 10.0 5.6 O Oth. community, social & personal serv. 3.9 4.5 3.4 3.6 4.2 5.4 5.6 3.9 3.7 2.4 4.1 4.2 4.7 3.8 90 Sewage and refuse disposal, sanitation and similar activities 0.7 0.6 0.9 0.7 0.4 0.5 0.9 0.8 0.3 0.7 0.7 0.4 0.4 91 Activities of membership organizations n.e.c. 0.2 0.4 0.2 0.6 0.1 0.3 0.5 0.3 0.6 0.3 0.3 0.9 0.4 92 Recreational, cultural and sporting activities 1.8 2.1 1.4 2.0 4.2 2.3 1.6 1.8 0.9 1.8 1.9 1.9 1.7 93 Other service activities 1.3 1.4 1.0 0.9 0.7 2.5 0.9 0.6 0.7 1.2 1.3 1.5 1.3
P-X Other activites 0.1 0.1 0.1 0.5 0.7 0.1 0.6 0.4 0.2 0.1 0.2 0.3 1.8 2.6
Notes: 1) NMS-4: Czech Republic, Hungary, Slovak Republic, Slovenia. 2) NMS-7: NMS-4, Estonia, Latvia, Lithuania. 3) EU-South: Greece, Portugal, Spain.
Source: Eurostat.

19 19
Within the sector as a whole, employment increased by 8% in market services over the period 1998-2003 and by 5.6% in communal service, giving an overall rise of 7%. Increases in employment in market services occurred in all countries, except the Czech Republic (which was in recession) and Romania; with the largest rises in Latvia and Hungary (16-18%). Within market services, employment rose markedly in business services in all countries, increasing by 35% in the NMS-7 taken together and contributing significantly to net job creation in the economy as a whole. The bulk of this increase occurred in the ‘other business activities’ sector (legal, architectural and engineering services, advertising, and so on), though there was also growth in computer and related activities and real estate. By contrast, the number of jobs in research and development fell by around 11% in the NMS-7, the decline varying between 14% in Slovenia and 29% in Latvia7, though there was a significant increase in Hungary, if from a low level (only 0.2% of total employment, half the NMS-7 average share). Between 1998 and 2003, jobs in tourism (hotels and restaurants, NACE H) expanded by 11% in the NMS-7, with growth occurring in all countries, except the Czech Republic and Slovenia, and most especially in Hungary and Slovakia. Overall, however, this sector accounts for a smaller share of employment than in the EU-15 and a much smaller share than in the southern EU countries. Only in Bulgaria, was the proportion employed in tourism larger than the EU-15 average, though it was similar to the average in Slovenia. The proportion is particularly small in Poland and Romania, the two countries in which the need for jobs outside of agriculture in rural areas is most pressing. In Romania, moreover, the share of employment in tourism was much the same in 2003 as in 1998, the only country apart from the Czech Republic and Slovenia where the share failed to rise over this period. Employment in financial intermediation remained unchanged between 1998 and 2003 in the NMS-7, reductions in employment in banking caused by restructuring being generally offset by increases in insurance and auxiliary financial activities. Again there were differences across countries, with Hungary and (to a lesser extent) Lithuania contributing most to the weak overall performance. In the other 5 countries, employment increased in the sector, most notably in Slovakia and Slovenia, with job losses in banking (except in Slovenia and Latvia) being more than compensated by job increases in the underdeveloped insurance sector, especially in the Czech Republic and Slovakia. In 2003, employment in financial intermediation accounted for 1.8% of total employment in the NMS-7, well below the EU-15 average of 3.3% and lower than in the EU-South (2.3%).
7 By contrast, administrative data for Slovenia indicate an increase in employment in R&D by about 7% over the period.

20 20
Given this and the limited range of financial instruments available in the NMS, convergence towards the EU-15 employment share is possible in future years. Transport and communications is the only sector within market services where employment declined in the NMS-7 over the period 1998-2003. A reduction occurred in all sub-sectors of transport (land, water and air) except travel agencies and auxiliary transport activities, and there were substantial job losses in post and telecommunications. Job losses were especially large in the Czech Republic and Slovakia, particularly in land transport, as well as in Lithuania, in this case mostly in communications. Employment in air and water transport fell in all countries, while in all except Slovakia, jobs increased in travel agencies. Job growth in post and telecommunications occurred only in Slovenia and Latvia. Transport and communications is the only broad service sector in which the share of employment in the NMS-7 is larger than both the EU-15 and EU-South averages. This is particularly true for land transport (in the Czech Republic, Hungary, Slovakia, Estonia and Latvia, the relative number employed is twice the EU-15 average), while the share of employment in auxiliary transport services is smaller than in both EU groupings. A breakdown by NM indicates that the share in the sector as a whole is above the EU-15 average in all countries except Poland (where it is close to the average) and Romania. The reductions which have occurred in recent years, therefore, represent a convergence towards the EU-15 employment share. Between 1998 and 2003, job creation in communal services in the NMS (5.6% overall) was associated with employment increases in all sub-sectors except education and was most pronounced in health and public administration, though there were also significant increases in recreational, cultural and sporting activities. Above average increases occurred in the Czech Republic, Hungary and Slovenia as well as in Romania. Developments in sub-sectors varied significantly across countries. Employment in public administration increased in all except Latvia and Lithuania, while it fell in education in all bar Hungary and Slovenia. Employment in health expanded in all countries and in other community services, in all except Lithuania. Overall, the proportion employed in communal services in the NMS-7 (25% in 2003) is smaller than in the EU-15 (29%) but larger than in the EU-South (22%). The largest shares were recorded in Hungary and Estonia (around 27% in each), the smallest in Slovenia (22%). In public administration. the share of employment in Bulgaria, Hungary and Slovakia is close to the EU-15 average, while in the Czech Republic and Poland, it is much the same as in the EU-South, and in the other countries, below this level. In 2003, the share employed in health and social work in the NMS-7 (6.5%) as well as in Poland (5.9%)

21 21
exceeded the EU-South average (5.6%), but was well below the EU-15 average (10%). By contrast, the proportion employed in education is larger in both Poland (8%) and the NMS-7 (7.5%) than in the EU-15 (7%) or EU-South (6%). In Romania (4.3%), it is significantly lower. Between 1998 and 2003, total employment growth in the EU-15 and even more in the EU-South was much higher than in the NMS and CC. This was also the case in services – the main potential source of new job creation in the NMS. The gap in both the overall employment rate and the level of employment in services, including in most sub-sectors, therefore, widened rather than narrowed over this period. 4 Educational attainment and employment patterns
The concern in this chapter is to examine the educational attainment of the work force and in particular:
• the division of the labour force in the NMS, CC and EU-15 and employment rates by educational attainment level;
• the changes which occurred over the period 1999 (the first year for which broadly comparable data are available) to 2003 in employment, activity and unemployment rates by education level;
• differences in the structure of employment by education level between sectors, types of activity (defined in terms of skill intensity) and occupations and changes in these between 1999 and 2003;
• changes in the demand for workers with different education levels across sectors of activity over the years 1999-2003.
For analytical purposes, we again divide the NMS into three: the NMS-4 (the Czech Republic, Hungary, Slovakia and Slovenia), the NMS-7 (the NMS-4 plus the Baltic States) and Poland. The CC are Bulgaria and Romania. 4.1 The structure of the labour force in the NMS, CC and the EU-15 by educational
attainment level
The analysis here is based on data from the LFS, which enables population, the labour force and employment to be broken down by educational attainment level (defined in terms of ISCED 97) and employment to be sub-divided by occupational (ISCO-88) category as well as (NACE Rev 2) sector of activity. Educational attainment is divided into ‘low’ – those with lower secondary education or below (ISCED 0-2), ‘medium’ – those who have

22 22
completed upper secondary education or training (ISCED 3 or 4) and ‘high’ – those who have completed tertiary education (ISCED 5 or 6).8 Examination of the structure of the labour force by education level shows that the NMS and CC have a smaller proportion of their labour force with low education (i.e. with at most basic schooling) than the EU-15 (12% for the NMS as against 29% for the EU-15) – and an even smaller proportion than the EU-South (53%) (Figure 6). On the other hand, they have a very much larger proportion with medium education (72% against 47%) and a relatively small proportion with high education (16% against 24%). The employment rates of the highly educated (the proportion of the total with high education in employment) are relatively high in both the NMS and EU-15 and are very similar in the two groups of countries, in spite of the lower employment rate overall in the NMS (Figure 7). On the other hand, employment rates are low for those with low education in both the NMS and the EU-15 but much lower in the former than the latter, despite their comparatively small numbers in the NMS. The inverse applies to rates of unemployment (Figure 8). Except in Slovenia, unemployment rates of the least educated are much higher in the NMS than in the EU-15, while rates among the most educated are similarly low, despite much higher overall levels of unemployment. Figure 6
Educational structure of working-age population, 15-64, 2003
0.0
10.0
20.0
30.0
40.0
50.0
60.0
70.0
80.0
90.0
EU-15 EU-S NMS-4 NMS-7 NMS-8 CZ HU PL SI SK EE LV LT RO
1. Low
2. Medium
3. High
8 The division into only three groups is determined by the available data. In particular for the ‘medium’ category, a more
detailed classification between those with vocational qualifications and those with more general educational qualifications would have been more informative, but the data for a number of countries are not sufficiently consistent over time to enable such a split to be made. A more detailed analysis for 2003, where the data seem to be reasonably comparable for most countries is included in Appendix A to this paper.

23 23
Figure 7
Employment rates, 15-64, 1999, 2003
Highly educated
0
20
40
60
80
100
EU-15 EU-S NM-7 NM-8
1999 2003Medium educated
0
20
40
60
80
100
EU-15 EU-S NM-7 NM-8
1999 2003Low educated
0
20
40
60
80
100
EU-15 EU-S NM-7 NM-8
1999 2003
Figure 8
Unemployment rates, 15-64, 1999, 2003
Highly educated
0
5
10
15
20
25
EU-15 EU-S NM-7 NM-8
1999 2003
Medium educated
0
5
10
15
20
25
EU-15 EU-S NM-7 NM-8
1999 2003
Low educated
0
5
10
15
20
25
EU-15 EU-S NM-7 NM-8
1999 2003
4.2 Changes in the labour force by educational characteristics, 1999-2003,
employment, activity and unemployment rates
Over the period 1999-2003, significant changes are evident on both the demand and supply side, with demand shifting in favour of the most highly educated and away from the least educated. The movements in demand relative to supply underlie the changes in unemployment (see Figure 8). In general, while there were marked shifts in the structure of labour supply (in favour of the more highly educated), the shifts on the demand side were even greater, leading to rising unemployment among the low-educated and reductions (or smaller increases) in unemployment among the more highly educated. In the NMS-7, therefore, the unemployment rate of the highly educated declined slightly from 2.5% to 2.4% and that of the medium-educated from 9.0% to 8.4%, while the rate for the least educated rose from 19.1% to 20.3%.

24 24
Figure 9
Growth of labour force by educational category, 15-64, 1999-2003, in %
Highly educated
0
5
10
15
20
25
EU-15 EU-S NM-4 NM-7 NM-8
Medium educated
0
3
6
9
12
15
EU-15 EU-S NM-4 NM-7 NM-8
Low educated
-15
-12
-9
-6
-3
0
EU-15 EU-S NM-4 NM-7 NM-8
Figure 10
Change in employment by educational category, 1999-2003, in %
Highly educated
0
5
10
15
20
25
30
EU-15 EU-S NM-4 NM-7 NM-8
Medium educated
0
5
10
15
20
25
EU-15 EU-S NM-4 NM-7 NM-8
Low educated
-15
-12
-9
-6
-3
0
3
EU-15 EU-S NM-4 NM-7 NM-8
4.3 Differences in employment structure by sector
In the following, (NACE 1- and 2-digit) sectors are divided into the following groups according to the educational levels of their work force:
– primary
– secondary (industry): – high-skill – medium-skill – low-skill
– market services – high-skill – low-skill
– communal services – public administration – education – health Details of the NACE 2-digit sectors included in each of these groups are presented in Appendix C at the end of this paper.

25 25
Table 7a
Shares of NACE groups in total employment, 2003
EU-15 EU-S NMS-4 NMS-7 CZ HU SI SK PL EE LV LT BG RO 100.0 100.0 100.0 100.0 100.0 100.0 100.0 100.0 100.0 100.0 100.0 100.0 100.0 100.0
1 Primary sector 4.0 8.7 5.4 7.4 4.5 5.4 8.4 6.0 18.2 6.3 14.6 18.7 11.1 37.7 2 Secondary sector 27.5 29.9 37.1 35.2 39.9 33.4 36.9 38.1 26.6 31.3 26.8 27.2 32.1 29.1
2a high-skill sectors 9.2 6.0 11.2 10.0 11.3 11.2 11.1 10.9 6.27 5.06 5.5 8.4 9.1 2b medium-skill sectors 14.1 17.2 18.1 17.0 20.5 15.7 16.2 18.1 13.6 12.8 11.9 13.2 10.1 2c low-skill sectors 4.1 6.6 7.8 8.3 8.0 6.5 9.5 9.1 11.4 9.0 9.8 10.5 10.0 3 Market services 37.6 37.0 32.6 32.3 32.5 34.2 32.2 30.1 29.6 35.8 32.5 28.7 32.1 17.5
3a high-skill sectors (J,K) 12.7 9.3 8.1 7.7 8.19 8.7 8.4 6.9 7.3 9.7 5.8 5.1 4.8 2.6 3b low-skill sectors (G-I) 24.9 27.7 24.5 24.6 24.3 25.5 23.9 23.2 22.3 26.1 26.7 23.5 27.2 14.9 4 Community services 30.4 24.4 24.8 25.0 23.1 27.0 21.9 25.7 23.7 26.7 26.1 25.5 24.6 15.7
4a Public administration 7.6 6.6 6.9 6.7 6.6 7.4 5.5 7.6 6.4 6.1 6.3 5.0 7.9 4.9 4b Education 6.9 5.8 7.2 7.5 6.2 8.2 6.9 7.4 7.9 9.3 7.3 9.5 7.5 4.3 4c Health and social work 10.0 5.6 6.5 6.5 6.3 6.9 5.2 6.7 5.9 5.8 6.3 6.7 5.5 4.0
Table 7b
Shares of NACE groups in total employment, 2003 – difference from EU-15
EU-15 EU-S NMS-4 NMS-7 CZ HU SI SK PL EE LV LT BG RO 100.0 100.0 100.0 100.0 100.0 100.0 100.0 100.0 100.0 100.0 100.0 100.0 100.0 100.0
1 Primary sector 4.0 4.7 1.4 3.4 0.5 1.4 4.4 2.0 14.2 2.3 10.6 14.7 7.2 33.7 2 Secondary sector 27.5 2.4 9.7 7.7 12.4 5.9 9.4 10.6 -0.9 3.8 -0.7 -0.2 4.6 1.7
2a high-skill sectors 9.2 -3.2 2.0 0.8 2.1 1.9 1.9 1.7 -3.0 -4.2 -3.7 -0.8 -0.2 2b medium-skill sectors 14.1 3.1 4.0 2.8 6.4 1.6 2.1 3.9 -0.5 -1.4 -2.3 -0.9 -4.0 2c low-skill sectors 4.1 2.5 3.7 4.1 3.9 2.4 5.4 5.0 7.3 4.9 5.7 6.4 5.8 3 Market services 37.6 -0.5 -5.0 -5.2 -5.1 -3.4 -5.8 -7.4 -8.0 -1.8 -5.0 -9.0 -5.5 -20.1
3a high-skill sectors (J,K) 12.7 -3.4 -4.6 -5.0 -4.5 -4.0 -4.4 -5.8 -5.4 -3.1 -6.9 -7.7 -7.9 -10.2 3b low-skill sectors (G-I) 24.9 2.8 -0.4 -0.3 -0.5 0.7 -1.0 -1.6 -2.5 1.3 1.8 -1.4 2.4 -9.9 4 Community services 30.4 -6.0 -5.6 -5.3 -7.3 -3.3 -8.5 -4.69 -6.7 -3.7 -4.3 -4.9 -5.7 -14.7
4a Public administration 7.6 -1.0 -0.7 -1.0 -1.1 -0.3 -2.1 -0.1 -1.2 -1.5 -1.3 -2.7 0.3 -2.7 4b Education 6.9 -1.1 0.3 0.6 -0.7 1.3 0.0 0.5 1.0 2.4 0.4 2.6 0.6 -2.6 4c Health and social work 10.0 -4.3 -3.5 -3.5 -3.7 -3.1 -4.8 -3.2 -4.0 -4.2 -3.7 -3.3 -4.5 -5.9

26 26
In what follows, differences in the division of employment between these groups across the NMS and between these and the EU-15 and EU-South are, first, reviewed. Secondly, the pattern of change over the period 1999-2003 is examined since such changes affect the overall demand for different educational groups in the labour market, though this is also affected by changes in the demand for workers with different education levels within sectors. Table 7a shows the shares of total employment in the different sectors in the NMS and Table 7b the differences in these shares from those in the EU-15. The features to emerge are:
• as noted earlier, the NMS have an over-representation of the primary sector as compared with the EU-15, though there are large differences in this respect between the countries, with the share of employment in the primary sector in the NMS-4 being only 2-5% percentage points above the EU-15 average but the share in Poland, the Baltic States, except Estonia, and Romania exceeding the average by much more (15-33 percentage points);
• at the same time, there is also an over-representation, relative to the EU-15, of the secondary sector, or industry, by a large margin in the NMS-4 (about 10 percentage points) and either not at all or by much less in Poland, Latvia, Lithuania and Romania.
• within industry, the high-skill sectors are less represented relative to medium- and low-skill sectors in the NMS compared to the EU-15;
• the under-representation of market services is almost entirely due to a small share of employment in the high-skill sectors, i.e. financial and business services;
• in non-market services, the under-representation is largely confined to health, though the share of employment in public administration is also relatively small.
4.4 Changes in employment structure, 1999-2003
As noted above (in chapter 2), over the period 1999-2003, there was a dramatic fall in employment in the primary sector in the NMS and a marked rise in market services, especially in high-skill sectors (financial and business services) (Figure 11). In non-market services, there was generally a rise in employment in public administration and health, with much less of a rise, or even a decline, in education. This pattern of change reflects a process of convergence towards the structure of employment in the EU-15.

27 27
Figure 11
Growth in employment by NACE groups, 1999-2003, in %
Total Employment
-10.00
-5.00
0.00
5.00
10.00
15.00
EU-15 EU-S NMS-4 NMS-7 PL*
Total Employed
Primary sector
-20.00
-15.00
-10.00
-5.00
0.00
EU-15 EU-S NMS-4 NMS-7 PL*
Primary sector
Secondary sector
-20.00
-15.00
-10.00
-5.00
0.00
5.00
10.00
15.00
20.00
EU-15 EU-S NMS-4 NMS-7 PL*
Secondary sector
high skill sectors
medium skill sectors
low skill sectors
Market services
-10.00
-5.00
0.00
5.00
10.00
15.00
20.00
25.00
EU-15 EU-S NMS-4 NMS-7 PL*
Market services
high skill sectors (J,K)
low skill sectors (G-I)
Community services
-20.00
-15.00
-10.00
-5.00
0.00
5.00
10.00
15.00
20.00
25.00
EU-15 EU-S NMS-4 NMS-7 PL*
Community services
Public administration
Education
Health and social work
*) Poland 2000-2003.

28 28
4.5 Differences in the educational level of the work force across sectors
Sectors differ markedly as regards their demand for labour with different educational attainment levels. This is shown in Figure 12 which indicate the difference in the composition of the labour force by education level in each sector from that in the economy as a whole. It is evident that:
• the primary sector has a much larger representation of the low-educated than the economy as a whole, and a much smaller representation of the high and – to a lesser degree – the medium-educated;
• the secondary sector in the NMS has a particularly large representation of the medium-educated relative to the EU-15 or EU-South, reflecting the large number of workers with vocational training at upper secondary level (see Appendix A2); the counterpart of this is low representation of the low-educated. In the three skill sectors, the picture is as expected, with a larger share of the low-educated in low-skill industries and a less marked under-representation of the highly educated in high-skill industries. However, whereas in the EU-15 and the EU-South, the highly educated are more strongly represented in high-skill industries than in the economy as a whole, in the NMS-4, they are less strongly represented. This in part reflects the relatively small proportion of people with high education levels in the NMS, though it also reflects the relative concentration of such people in sectors other than industry;
• in market services, the difference in the educational demands of the high-skill sectors as compared with the low-skill ones is very evident: the high-skill market services (financial and business activities) absorb a relatively large share of the highly educated and the opposite is true of the low-skill services (distribution, etc.). As regards, the medium and low-educated, an interesting difference emerges between the NMS and the EU-15. It would be expected that the low-educated would be less strongly represented in high-skill market services and more strongly represented in low-skill market services than in the economy as a whole and this is indeed the case in the EU-15 and EU-South. In the NMS, however, there is a smaller representation of the low-educated in both types of market service, while the medium-educated are strongly represented in the low-skill sectors and much less strongly represented in the high-skill ones. This suggests an under-absorption of the low-educated in low-skill market services in the NMS and a substitution of the low-educated by medium-educated in these traditionally labour-intensive sectors. This is one of the most striking differences in the NMS in relation to the EU-15 and is an important factor underlying the very low employment rates (and high unemployment rates) of the low-educated in these countries.

29 29
Figure 12
Educational composition of the work force within sectors in 2003 difference from composition in the economy as a whole
Primary sector
Highly educated
-25
-20
-15
-10
-5
0
EU-15 EU-S NM-7 PL
Medium educated
-15
-10
-5
0
EU-15 EU-S NM-7 PL
Low educated
05
10152025303540
EU-15 EU-S NM-7 PL
Industry
Highly educated
-20.0
-15.0
-10.0
-5.0
0.0
5.0
10.0
EU-15 EU-S NMS-7 PL
Secondary sector
high skill sectors
medium skill sectors
low skill sectors
Medium educated
-8.0 -6.0 -4.0 -2.0 0.0 2.0 4.0 6.0 8.0 10.0 12.0
EU-15 EU-S NMS-7 PL
Secondary sector high skill sectors medium skill sectors low skill sectors
Low educated
-15.0
-10.0
-5.0
0.0
5.0
10.0
15.0
20.0
25.0
EU-15 EU-S NMS-7 PL
Secondary sector
high skill sectors
medium skill sectors
low skill sectors

30 30
Market services
Highly educated
-15.0
-10.0
-5.0
0.0
5.0
10.0
15.0
20.0
25.0
EU-15 EU-S NMS-7 PL
Market services
high skill sectors (J,K)
low skill sectors (G-I)
Medium educated
-15.0
-10.0
-5.0
0.0
5.0
10.0
15.0
EU-15 EU-S NMS-7 PL
Market services
high skill sectors (J,K)
low skill sectors (G-I)
Low educated
-30.0
-25.0
-20.0
-15.0
-10.0
-5.0
0.0
5.0
10.0
EU-15 EU-S NMS-7 PL
Market services
high skill sectors (J,K)
low skill sectors (G-I)
Communal services
Highly educated
0.0
10.0
20.0
30.0
40.0
50.0
60.0
EU-15 EU-S NMS-7 PL
Community services
Public administration
Education
Health and social w ork
Medium educated
-40.0
-30.0
-20.0
-10.0
0.0
10.0
20.0
EU-15 EU-S NMS-7 PL
Community services
Public administration
Education
Health and social w ork
Low educated
-45.0
-40.0
-35.0
-30.0
-25.0
-20.0
-15.0
-10.0
-5.0
0.0
EU-15 EU-S NMS-7 PL
Community services
Public administration
Education
Health and social work

31 31
• In communal services, in both the EU-15 and the NMS the demand for highly educated is greater than in the economy as a whole (particularly in education) and there is below average demand for the least educated. Comparing the NMS with the EU-15, there is slightly less demand for the highly educated in the health sector in the NMS than in the EU-15 (and EU-South) and there might be an adjustment in this respect in the future. In addition, there is less demand for the medium-educated in communal services as a whole in the NMS than in the EU-15 and less under-representation of the low-educated. Accordingly, this suggests less of a substitution of medium- for low-educated in communal services in the NMS than in industry or market services. Communal services, therefore, seem to have performed more of a role in providing jobs for the low-educated in the NMS than in the EU-15, but – as we shall see in the next section – they were less able to do so over the most recent period.
4.6 Changes in labour demand by education level and by sector, 1999-2003
Over the period 1999-2003, the demand for labour with different education levels changed in different ways with some sectors contributing more to the change than others. This is evident in Figure 13 which shows how the overall change in the demand for workers with different education level (first column in each graph) can be attributed to each sector (the other columns in the graphs) which together sum to the overall change. The main features to emerge are:
• the growth in overall demand for the highly educated in the NMS-4 was similar to that in the EU-15 (about 13%) over the period 1999-2003 (in the EU-South it was much larger still). The distribution of the increased demand between sectors differed in the two groups of countries. In both the EU-15 and the NMS-4/NMS-7, the increased demand was heavily concentrated in services, but in the EU-15, there was also increased demand in industry and more of an increase in market than non-market services. In the NMS-4, the opposite was the case on both counts. These differences were even more pronounced in relation to the EU-South;
• there were also differences within services. In the NMS-4, the increased demand for the highly educated within market services was even more heavily concentrated in ‘high-skill’ activities (financial and business services) than in the EU-15 and within non-market services, there was a bias in favour of public administration and relatively low increased demand for the highly educated in the health sector in the NMS-4 as compared with the EU-15;
• the overall growth of demand for medium-educated was much more modest in the NMS-4 than in the EU-15 and even more so than in the EU-South. The sectoral pattern of growth was also quite distinct in the NMS-4, where the primary sector was responsible for a large reduction in jobs over this period and employment growth was concentrated in market services (and there predominantly in the high-skill sectors) and

32 32
in non-market services. This contrasts with the EU-South where job growth for the medium-educated also occurred in industry. In the NMS-4, on the other hand, there was little job growth in industry overall but relatively high growth in the medium-skill sectors compensating for job losses in the other sectors, which suggests some specialisation in the NMS in medium-skill industries within manufacturing. There was also increased demand for the medium-educated in public administration and health services. The overall picture for the medium-educated in the NMS-4 is, therefore, one of a substantial shift away from agriculture (in which the educational mix seems to have changed as a result of sharply falling employment) and predominantly towards market services, in particular towards high-skill activities;
• around half of the sharp decline in jobs for the low-educated in the NMS-4 (which amounted to 11% over the period 1999-2003) was accounted for by the primary sector, around 30% by industry (almost 22% by the low-skill sectors alone and 12% by the medium-skill sectors, while there was some increase in employment in the high-skill sectors). Market services accounted for 6% of the overall fall in demand for the low-educated (concentrated in the low-skill sectors, with a strong rise in the high-skill sectors), while communal services accounted for 16% (education alone accounting for 9%). This contrasts markedly with developments in the EU-15 where the overwhelming factor in the decline in overall demand the low-educated was the loss of jobs in industry, while in both market and non-market services, demand rose.
In services, there was an increase in demand for the low-educated in high-skill activities in both the EU-15 and the NMS-4 and a reduction in other market services. Given the high employment growth in market services as a whole, the reduction in the capacity to employ the low-educated, particularly in low-skill activities within the sector (NACE G-I), is a significant, and disturbing, feature of current developments in the NMS which distinguishes them from the EU-15 countries. In the EU-South, the loss of jobs for the low-educated in the primary sector over the period 1999-2003 was compensated by a growth of jobs for them in other sectors of the economy (in industry and services). However, the job loss in the primary sector in these countries (6%) was much smaller than in the NMS-4 (where it was more than 30%), so the job creation required in other sectors was correspondingly much less than needed in the NMS.
The most striking points to emerge from the above analysis are as follows:
• the growth of demand for the highly educated was high in both the NMS-4 and the EU-15. However, while in the EU-15, the increase in market services was higher than in non-market services, the opposite was the case in the NMS. Moreover, the increase in the NMS was more concentrated in financial and business services than in the EU-15;

33 33
Figure 13a
Source of employment growth/decline by sector*, 1999-2003
Highly educated
Poland*
0.00
5.00
10.00
15.00
20.00
25.00
Total 1 2 2a 2b 2c 3 3a 3b 4 4a 4b 4c
EU-15
0.00
2.00
4.00
6.00
8.00
10.00
12.00
14.00
Total 1 2 2a 2b 2c 3 3a 3b 4 4a 4b 4c
EU-South
0.00
5.00
10.00
15.00
20.00
25.00
30.00
Total 1 2 2a 2b 2c 3 3a 3b 4 4a 4b 4c
Note: *Calculated as: (change of employment in sector i, 1999-2003) / (employment level in the economy as a whole in 1999). ** Poland: 2000-2003. 1 primary, 2 secondary (industry), 2a high-skill, 2b medium-skill, 2c low-skill, 3 market services, 3a high-skill, 3b low-skill, 4 communal services, 4a public administration, 4b education, 4c health.
NMS-4
-2.00
0.00
2.00
4.00
6.00
8.00
10.00
12.00
14.00
Total 1 2 2a 2b 2c 3 3a 3b 4 4a 4b 4c
NMS-4
Poland**

34 34
Figure 13b
Source of employment growth or decline by sector*, 1999-2003
Medium-educated
NMS-4
-1.00
-0.50
0.00
0.50
1.00
1.50
Total 1 2 2a 2b 2c 3 3a 3b 4 4a 4b 4c
Poland*
-10.00
-8.00
-6.00
-4.00
-2.00
0.00
2.00
Total 1 2 2a 2b 2c 3 3a 3b 4 4a 4b 4c
EU-15
-1.00
0.00
1.00
2.00
3.00
4.00
5.00
6.00
Total 1 2 2a 2b 2c 3 3a 3b 4 4a 4b 4c
EU-South
-5.00
0.00
5.00
10.00
15.00
20.00
25.00
Total 1 2 2a 2b 2c 3 3a 3b 4 4a 4b 4c
Note: *Calculated as: (change of employment in sector i, 1999-2003) / (employment level in the economy as a whole in 1999). ** Poland: 2000-2003. 1 primary, 2 secondary (industry), 2a high-skill, 2b medium-skill, 2c low-skill, 3 market services, 3a high-skill, 3b low-skill, 4 communal services, 4a public administration, 4b education, 4c health.
NMS-4
Poland**

35 35
Figure 13c
Source of employment growth or decline by sector*, 1999-2003
Low-educated
NMS-4
-12.00
-10.00
-8.00
-6.00
-4.00
-2.00
0.00
2.00
Total 1 2 2a 2b 2c 3 3a 3b 4 4a 4b 4c
Poland *
-25.00
-20.00
-15.00
-10.00
-5.00
0.00
5.00
Total 1 2 2a 2b 2c 3 3a 3b 4 4a 4b 4c
EU-15
-2.50
-2.00
-1.50
-1.00
-0.50
0.00
0.50
1.00
1.50
Total 1 2 2a 2b 2c 3 3a 3b 4 4a 4b 4c
EU-South
-1.50
-1.00
-0.50
0.00
0.50
1.00
1.50
2.00
2.50
Total 1 2 2a 2b 2c 3 3a 3b 4 4a 4b 4c
Note: *Calculated as: (change of employment in sector i, 1999-2003) / (employment level in the economy as a whole in 1999). ** Poland: 2000-2003. 1 primary, 2 secondary (industry), 2a high-skill, 2b medium-skill, 2c low-skill, 3 market services, 3a high-skill, 3b low-skill, 4 communal services, 4a public administration, 4b education, 4c health.
NMS-4
Poland**

36 36
• the growth of demand for the medium-educated in the NMS-4 was also concentrated in services. In industry, there was strong job growth in the medium-skill sector but little growth in the sector as a whole (in contrast to the EU-South), which reflects the low employment elasticity in this sector due to productivity catching-up;
• the demand for the low-educated fell sharply, primarily because of job losses in the primary and secondary sectors. There was also a fall in services, especially in non-market activities. In the EU-15, by contrast, job ,losses were concentrated in industry and there was a growth of jobs in both market and non-market services.
4.7 The structure of occupations in the NMS, the EU-15 and EU-South
In the following analysis, employment is divided into 5 occupational groups, based on the ISCO-88 classification (see also Figure 14):
• non-manual high-skill (includes managers, professionals and technicians)
• non-manual medium-skill (includes clerks and office workers)
• non-manual low-skill (includes service and shop workers)
• manual high-skill (includes craft workers and plant and machine operators)
• manual low-skill (includes agricultural workers and elementary occupations) In contrast to the marked difference between the NMS and the EU-15 for educational groupings, where those with medium education were much more numerous in the NMS than the EU-15, differences in the structure of occupations are much less marked. With the exception of the primary sector and some parts of non-market services (in particular health services and public administration), the occupational structure within sectors is quite similar in the NMS and the EU-15 (and more similar than between the NMS and the EU-South). This implies that similar occupations are performed by people with different education levels in the NMS than in the EU-15. In particular, since the NMS have a much stronger representation of the medium-educated, many of the jobs undertaken in the EU-15 by workers with low or high education are performed in the NMS by people with medium education. One of the concerns here is to identify the sectors in which this is the case. Examination of the data reveals the following:
• the dominant occupations in agriculture are low-skill manual ones and in the EU-15 a larger proportion of the low-educated are employed in these jobs than in the economy as a whole. In the NMS-4, the opposite is the case. In Poland and the Baltic States, the situation is more similar to that in the EU-15;

37 37
Figure 14
Shares of ISCO occupations in NACE groups, 2003, in %
Total Economy
0%
20%
40%
60%
80%
100%
EU-15 EU-S NMS-4 Poland NMS-7 NMS-8 NMS-10
White-high
White-medium
White-low
Blue-high
Blue-low
NACE-GROUP 1 (A-B)
0%
20%
40%
60%
80%
100%
EU-15 EU-S NMS-4 Poland NMS-7 NMS-8 NMS-10
White-high
White-medium
White-lowBlue-high
Blue-low
NACE-GROUP 2 (CDEF)
0%
20%
40%
60%
80%
100%
EU-15 EU-S NMS-4 Poland NMS-7 NMS-8 NMS-10
White-high
White-medium
White-low
Blue-high
Blue-low
NACE-GROUP 2a (CDEF - high skill sectors)
0%
20%
40%
60%
80%
100%
EU-15 EU-S NMS-4 Poland NMS-7 NMS-8 NMS-10
White-high
White-medium
White-low
Blue-high
Blue-low
NACE-GROUP 2b (CDEF - medium skill sectors)
0%
20%
40%
60%
80%
100%
EU-15 EU-S NMS-4 Poland NMS-7 NMS-8 NMS-10
White-high
White-medium
White-low
Blue-high
Blue-low
NACE-GROUP 2c (CDEF - low skill sectors)
0%
20%
40%
60%
80%
100%
EU-15 EU-S NMS-4 Poland NMS-7 NMS-8 NMS-10
White-high
White-medium
White-low
Blue-high
Blue-low

38 38
Figure 14 (contd.)
Shares of ISCO occupations in NACE groups, 2003
NACE-GROUP 3a (J,K - high skill sectors)
0%
20%
40%
60%
80%
100%
EU-15 EU-S NMS-4 Poland NMS-7 NMS-8 NMS-10
White-high
White-medium
White-lowBlue-high
Blue-low
NACE-GROUP 3b (G-I - low skill sectors)
0%
20%
40%
60%
80%
100%
EU-15 EU-S NMS-4 Poland NMS-7 NMS-8 NMS-10
White-high
White-medium
White-low
Blue-high
Blue-low
NACE-GROUP 4 (L-Q)
0%
20%
40%
60%
80%
100%
EU-15 EU-S NMS-4 Poland NMS-7 NMS-8 NMS-10
White-high
White-medium
White-low
Blue-high
Blue-low
NACE-GROUP 4a (L - Public administration)
0%
20%
40%
60%
80%
100%
EU-15 EU-S NMS-4 Poland NMS-7 NMS-8 NMS-10
White-high
White-medium
White-low
Blue-high
Blue-low
NACE-GROUP 4b (M - Education)
0%
20%
40%
60%
80%
100%
EU-15 EU-S NMS-4 Poland NMS-7 NMS-8 NMS-10
White-high
White-medium
White-low
Blue-highBlue-low
NACE-GROUP 4c (N - Health and social work)
0%
20%
40%
60%
80%
100%
EU-15 EU-S NMS-4 Poland NMS-7 NMS-8 NMS-10
White-highWhite-medium
White-low
Blue-high
Blue-low

39 39
• the medium-educated are more strongly represented – and those with low education strongly underrepresented – in low-skill manual jobs in agriculture in the NMS than in the economy as a whole and – particularly importantly – in low-skill non-manual and high-skill manual jobs in labour-intensive services (distribution, hotels and restaurants), which are the main types of job in these sectors;
• on the other hand, there is stronger representation of the low-educated in the NMS-4 in low-skill non-manual and manual jobs in communal services than in other parts of the economy, which again is not the case in the EU-15.
The above points reinforce the picture of a substitution of medium-educated for low-educated in the NMS-4 in agriculture and labour-intensive market services.
The other difference between the NMS and the EU-15 lies in the relative division of the highly-educated (those with tertiary qualifications) between occupations in different sectors. In both the NMS and the EU-15, the proportion of highly educated in high-skill non-manual jobs in agriculture, industry and low-skill market services is smaller than in high-skill market services and non-market services, but the extent of the difference is much wider in the NMS than in the EU-15, where relatively few people with this level of qualification are employed in industry to perform these jobs.
This reinforces the conclusion which emerged earlier of a disproportionate number of the highly-educated being employed in high-skill market services in the NMS compared to the EU-15 and a smaller proportion in industry.
Other differences in occupational structure between the EU-15 and the NMS within sectors are as follows:
• there is a considerably larger share of high-skill non-manual and skilled manual jobs in agriculture in the NMS (except for Poland and Slovenia, the economies in which the sector is characterised by small holdings). This difference might be a vestige of the semi-industrial way agriculture was organised in the communist period, i.e. within large-scale collectivised holdings;
• within industry, there are proportionately fewer low-skill manual jobs in the NMS-4 than in the EU-15 and even fewer than in the EU-South, but more skilled manual jobs;
• the same difference is evident in market services, where in both high- and low-skill sectors the share of low-skill manual jobs is smaller in the NMS-4 than in the EU-15. In high-skill sectors, there is an additional difference in that there are proportionately more high-skill non-manual jobs and fewer medium-skill non-manual ones;

40 40
• a similar difference is evident in public administration and even more so in health and social services. In the latter, there is also a much smaller share of low-skill non-manual jobs in the NMS than the EU-15.
Overall, these differences in occupational structure are consistent with a lack of jobs (low- and medium-skill non-manual jobs and low-skill manual jobs) in the NMS for those with low education, a feature noted earlier in terms of their very low employment rates (and high unemployment rates). The relatively large proportion of high-skill non-manual jobs in a number of services in the NMS (high-skill market services, public administration and health services) is also consistent with the relatively high demand for the highly educated and their high employment rates. Conclusions
• Job creation in the NMS and CC remains low despite high GDP growth in most countries. However, there are significant differences in developments between countries, most recently between the NMS-7 and Poland.
• Labour markets in the NMS/CC differ significantly from those in the EU-15 in terms of employment and unemployment rates and the pattern of employment. Long-term unemployment is persistently high and youth unemployment twice the EU-15 rate.
• Services (in particular market services) have become the main source of employment, but in some countries, growth of employment in manufacturing has recently resumed. Job creation (in employment generating services and manufacturing) has compensated for job destruction (in other activities) in some of the NMS at least.
• The tertiary sector is dominated by low-skill activities, while most high-skill activities are still underdeveloped; these, however, show the most dynamic growth both in relative and absolute terms.
• Future employment opportunities will arise primarily in market services – particularly in high-skill sectors, while jobs in transport and communications are likely to decline further. There is also scope for new job creation in communal services, especially in health and social services, though this may be limited by budgetary constraints.
• Stimulating the creation of part-time jobs – the share in total employment of the NMS is almost negligible compared with the EU-15 – would be conducive to increasing employment, particularly of women.
• The educational composition of labour force in the NMS is biased in favour of the medium-educated (i.e. those who have completed upper secondary schooling); relative to the EU-15, the NMS have smaller proportions of people who have completed tertiary education and smaller proportions with only basic schooling. Within

41 41
the medium-educated, there is a larger proportion who have undertaken vocational training rather than general education compared to the EU-15.
• The employment rates of the highly educated in the NMS are relatively high and similar to those in the EU-15, but employment rates are very low (and, conversely, unemployment rates very high) for the low-educated (except in Slovenia and Romania).
• There are a number of structural features accounting for these differences in employment rates: The primary sector (largely agriculture) accounts for a large proportion of the employment of the low-educated and this sector has lost jobs on a massive scale in most NMS. There is also under-representation of the low-educated in the NMS in both industry and market services compared with the EU-15. The medium-educated, on the other hand, are particularly strongly represented in industry which in turn specialises (in comparison to the EU-15) in medium-skill sectors. This provides job opportunities for the medium-educated, but strong productivity catching-up in industry is tending to reduce these opportunities. The highly educated are in particularly strong demand in high-skill activities in market services (financial and business services) which have expanded markedly in both the NMS and the EU-15 as well as in non-market services (indeed, relative to the EU-15, the highly educated are disproportionately employed in the public sector and comparatively little in industry).
• Overall, the poor employment situation of the low-educated in the NMS seems to be a function of three factors: a high proportion being employed in agriculture, a sector which is shrinking; relatively weak representation in the labour-intensive lower-skill activities in industry and market services; and, linked to this, a tendency to be displaced by the medium-educated in a situation in which these are relatively plentiful and there is slack in the labour market.
• Analysis of occupational structures in the NMS supports this picture: there is, in comparison with the EU-15, a smaller share of low-skill manual jobs in agriculture, industry and market services, i.e. the type of jobs which could provide job opportunities for the low-educated. In non-market services, there is also relative under-representation of low-skill non-manual jobs compared with the EU-15.
• Analysis of changes in the structure of the labour force over the period 1998-2003 and of the younger age cohorts shows a significant up-grading of educational attainment; however, the speed of change on the demand side means that the labour market position of the low-educated has deteriorated still further. Moreover, in a number of respects, educational attainment levels seem to be adjusting less rapidly in the NMS than in the EU-15.

42 42
References
Alphametrics (2004), Needs of Objective 1 regions in the accession countries and in existing EU15 Member States in areas eligible for Structural Funds; Final Report to DG Regio, European Commission, Brussels.
EIRO (2004), European Industrial Relations Observatory – online, Working time developments 2003, http://www.eiro.eurofound.eu.int/2004/03/update/tn0403104u.html
European Commission (2004a), Draft Joint Employment Report 2003/2004, Report of the Commission to the Council, Brussels, January.
European Commission (2004b), A new partnership for cohesion: convergence, competitiveness, cooperation, Third Cohesion Report, Brussels, February
European Commission (2003a), Employment in Europe 2003. Recent Trends and Prospects, Directorate-General for Employment and Social Affairs, Unit A.1, Brussels.
European Commission (2003b), Progress in implementing the Joint Assessment Papers on employment policies in acceding countries, Communication from the Commission to the Council, the European Parliament, the European Economic and Social Committee and the Committee of the Regions, Brussels, November.
European Foundation for the Improvement of Living and Working Conditions (2003), Part-time work in Europe, Dublin, http://www.eurofound.eu.int/publications/files/EF0441EN.pdf
European Training Foundation – ETF (2003), ‘Skills Development and Employment Reform’, Discussion Note.
Fortuny, M., A. Nesporova and N. Popova (2003), ‘Employment promotion policies for older workers in the EU accession countries, the Russian Federation and Ukraine’, Employment Paper 2003/50, ILO, Geneva.
Huber, P. et al. (2003), ‘Regional and Labour Market Development in Candidate Countries. A Literature Survey’, AccessLab, Workpackage No. 1.
Römisch, R. (2003), ‘Regional GDP and Regional Unemployment’ in M. Landesmann (ed.), wiiw Structural Report 2003 on Central and Eastern Europe, Vol. 2, The Vienna Institute for International Economic Studies (wiiw), Vienna, October.
Stehrer, R. (2004), ‘Enterprise size and the structure of employment in the new Member States’, paper prepared for the project ‘Industrial Restructuring in the Accession Countries’, commissioned by EU DG Employment, Social Affairs and Equal Opportunities, Contract No. VC/2003/0367.
World Bank (2002), ‘Poverty and Welfare of Roma in the Slovak Republic’, Foundation S.P.A.C.E., INEKO, The Open Society Institute, Bratislava, April.
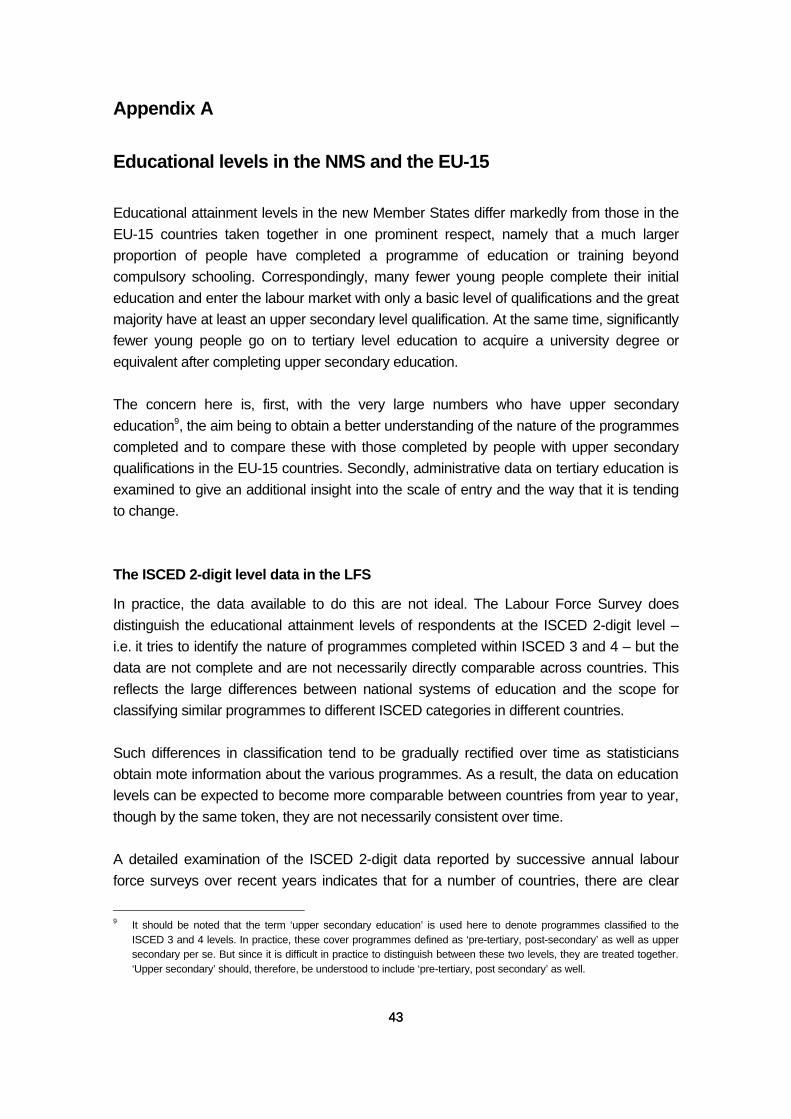
43 43
Appendix A
Educational levels in the NMS and the EU-15
Educational attainment levels in the new Member States differ markedly from those in the EU-15 countries taken together in one prominent respect, namely that a much larger proportion of people have completed a programme of education or training beyond compulsory schooling. Correspondingly, many fewer young people complete their initial education and enter the labour market with only a basic level of qualifications and the great majority have at least an upper secondary level qualification. At the same time, significantly fewer young people go on to tertiary level education to acquire a university degree or equivalent after completing upper secondary education. The concern here is, first, with the very large numbers who have upper secondary education9, the aim being to obtain a better understanding of the nature of the programmes completed and to compare these with those completed by people with upper secondary qualifications in the EU-15 countries. Secondly, administrative data on tertiary education is examined to give an additional insight into the scale of entry and the way that it is tending to change. The ISCED 2-digit level data in the LFS
In practice, the data available to do this are not ideal. The Labour Force Survey does distinguish the educational attainment levels of respondents at the ISCED 2-digit level – i.e. it tries to identify the nature of programmes completed within ISCED 3 and 4 – but the data are not complete and are not necessarily directly comparable across countries. This reflects the large differences between national systems of education and the scope for classifying similar programmes to different ISCED categories in different countries. Such differences in classification tend to be gradually rectified over time as statisticians obtain mote information about the various programmes. As a result, the data on education levels can be expected to become more comparable between countries from year to year, though by the same token, they are not necessarily consistent over time. A detailed examination of the ISCED 2-digit data reported by successive annual labour force surveys over recent years indicates that for a number of countries, there are clear
9 It should be noted that the term ‘upper secondary education’ is used here to denote programmes classified to the
ISCED 3 and 4 levels. In practice, these cover programmes defined as ‘pre-tertiary, post-secondary’ as well as upper secondary per se. But since it is difficult in practice to distinguish between these two levels, they are treated together. ‘Upper secondary’ should, therefore, be understood to include ‘pre-tertiary, post secondary’ as well.

44 44
signs of shifts in the classification of programmes of this kind. Accordingly, while the data for broad education levels – ie low, medium and high, aggregating the ISCED 1 and 2, 3 and 4, and 5 and 6 categories, respectively – seem reasonably consistent, this is less the case for more detailed education levels. In the analysis described below, therefore, the ISCED 2-digit data are examined and compared across countries for 2003 alone. As is noted, even for this year, there seem to be some problems of comparability across countries. Moreover, for a few countries, including Germany, the data at this level of detail are not reported at all and for a few others, not completely. Nevertheless, the data available give an added insight into educational attainment levels across Member States and, in particular, between the EU-15 and new Member States. Upper secondary level sub-groups
The ISCED data reported by the LFS enable upper secondary education to be split into three groups:
(i) ISCED 3c programmes, which are not designed to lead to tertiary education, of less than three years duration,
(ii) ISCED 3c and 4c programmes again not designed to lead to tertiary education but lasting three years or more,
(iii) ISCED 3 or 4a and b programmes designed to lead on to tertiary education.10 The programmes included under the first two categories above are different in kind from those included under the third, in that they are essentially vocational in character and designed to train people for a particular occupation rather than to prepare them for university education. The general educational content of programmes might, therefore, be small, though it is likely to vary across countries in terms of its relative weight, and the occupations concerned might be more or less narrowly defined. Programmes included in the first two categories also differ in terms not only of duration but also perhaps of content, in that those of less than three years may be short courses designed to provide basic training for a particular occupation. Differences across the EU in the nature of upper secondary level qualifications
Dividing those with upper secondary level education into these three sub-groups shows significant differences between EU countries. In the 8 new Member States taken together, some 21% of those aged 25 to 64 were recorded as having upper secondary education in
10 Although it is possible in principle also to divide the data between ISCED 3 and 4 levels, in practice, it is neither easy
nor particularly useful to do.

45 45
2003 because they had completed ISCED 3c programmes of less than three years, or almost a third of those in this age group with upper secondary education. In addition, the highest level of educational attainment for a further 13% of the age group consisted of ISCED 3c programmes of three years or more. Altogether, therefore, half of the people recorded as having upper secondary education had completed vocational programmes. Accordingly, only half of those with upper secondary education had followed programmes potentially leading on to tertiary education and the remaining half had uncertain levels of general education beyond compulsory schooling. This raises a question over the extent to which they have been suitably prepared for adaptation to changing labour market requirements and for lifelong learning. Although the same question can also be asked of those following general education streams, these might perhaps be expected to have a better basis for adaptation. This question is pursued below by comparing the employment rates of those with different qualifications. The figures for the new Member States in this regard are, as usual, affected considerably by the results for Poland, which in this case differ from those for the other countries. In Poland, therefore, half of those aged 25-64 with upper secondary education – 34% of the total in the age group – had completed ISCED 3c programmes lasting under three years. A further 5% had completed ISCED 3c programmes of three years or more. Some 55% of those with upper secondary education had, therefore, undertaken vocationally-oriented programmes not designed to lead on to tertiary education. In the new Member States apart from Poland, a much smaller proportion of 25-64 year-olds with upper secondary education (only 10%) had completed ISCED 3c programmes of less than three years but a larger proportion (35%) had completed programmes of three years or more. Altogether, therefore, some 45% of those with upper secondary education had followed vocational streams. These figures are similar to those for EU-15 countries for which data are available (which means ten countries excluding Germany, Austria, Portugal and Sweden, as well as the Netherlands for which there are no educational attainment data for 2003), though the EU-15 figures are affected significantly by the UK, where as noted above, a relatively large proportion of those recorded as having upper secondary education have attained this by completing vocational programmes lasting under three years. Excluding the UK, very few of those with upper secondary education in the EU-15 have completed programmes of short duration, though 40% of them have ISCED 3c qualifications. In all the new Member States taken individually, except the three Baltic States, around half or more of those with upper secondary education had completed ISCED 3c programmes, though only in Slovakia was the proportion completing programmes of under three years

46 46
significant. In the EU-15 countries, the same was true of France, the UK, Denmark and Luxembourg (in Denmark, the proportion reaching over 90% and in France, over 70%). The position in this respect is similar in Romania to that in most of the new Member States. Some 10% of those aged 25 to 64 with upper secondary education had completed ISCED 3c programmes of under three years, while another 42% had completed programmes of three years or more. For Bulgaria, detailed data is lacking on upper secondary education. Upper secondary level qualifications by sex
A major difference between the new Member States and the EU-15 countries concerns the relative number of men and women who have attained an upper secondary level qualification by completing an ISCED 3c programme. In all the new Member States, many more men than women fall into this category, whereas in the EU-15 countries, there is little difference between the two. In the new Member States taken together, therefore, some 58% of men aged 25 to 64 with upper secondary education in 2003 had completed ISCED 3c programmes, as compared with 42% of women. In the EU-15 countries for which data are available, some 42% of men fell into this category as against 47% of women. Employment rates of those with upper secondary education
For most men and women with upper secondary education in the new Member States taken together, employment rates are only slightly lower than in the EU-15 countries – at just under 80% for men and just under 65% for women. The main exception is for those with ISCED 3c qualifications who have completed programmes in under three years. In the NMS-8, only 60% of men and women aged 25-64 with this qualification were in employment, some 10 percentage points lower than for those completing either longer vocational programmes or more general ones (Figure A1). Excluding Poland, the difference is less but still around 6 percentage points. In the EU-15, by contrast, there is little difference in employment rates between those with ‘vocational’ upper secondary education and those with ‘general’ upper secondary education.11 The differences in employment rates between those with differing qualifications within upper secondary education are particularly marked for older people, most especially in Poland. For people aged 50-54 in the NMS-8, therefore, the employment rate of those completing ISCED 3c programmes of under three years was almost 20 percentage points
11 Although for the EU-15, the employment rate for those completing ISCED 3c programmes of under three years is
higher than for those completing other upper secondary programmes, this reflects the high overall rate for the UK, where these programmes are most important. In the UK, employment rates are lower for those completing ISCED 3c programmes of under three years than for others with upper secondary education.

47 47
lower than for those with general rather than vocational upper secondary qualifications, largely because of the large difference in Poland. Nevertheless, in the NMS-7, it was still almost 10 percentage points. Figure A1
Employment rates of those aged 25-64 by education level, 2003
0.0
10.0
20.0
30.0
40.0
50.0
60.0
70.0
80.0
90.0
EU10 NM7 NM8
LowMedium (3c <3yrs)*Medium (3+4 c)*Medium (3+4 a,b)*HighTotal
Note: The three ‘medium’ education categories are: ISCED 3c programmes of under 3 years duration, ISCED 3c or 4c of 3 years or more, and ISCED 3a and b or 4a and b.
Participation in tertiary education
The evidence from the Labour Force Survey shows that the proportion of people successfully completing tertiary education has tended to increase over time in the new Member States as well as EU-15 countries. The data, therefore, indicate that younger age groups, once they reach the age at which they are likely to have completed their initial education and training (ie in most countries around the mid-20s), have a larger proportion with university degrees or the equivalent than older age groups. The difference in the proportion with such qualifications between successive 5-year age cohorts is much the same in the NMS-8 as in the EU-15 countries., implying a similar increase over time in young people completing tertiary education. For example, in the EU-15, some 28½% of 25-29 year-olds had tertiary education in 2003 as opposed to 24½% of 35-39 year-olds, while in the NMS-8, the figures were 20% and 15½%, respectively. These figures, however, were greatly affected by the large difference (and apparent rise) in Poland: 23% of 25-29 year-olds, 15½% of 35-39 year-olds; in the NMS-7, the difference was much less, 17% and 15½% respectively. The implications of the LFS data can be examined further on the basis of administrative data on the number of people enrolled in university and similar programmes and the

48 48
number of new entrants each year. These data (from the UN-OECD-Eurostat, or UOE, collection) are available for the academic years 1998 to 2001. They show a similar pattern to the LFS data, in the sense that both new entrants and total enrolments tended to increase over this period in most countries. Account needs to be taken, however, of changes in the population of young people in order to interpret the data meaningfully. To do this, the total number of those aged 19 and 20 in each of the years for which UOE data exist has been used to scale the data for new entrants, since in most countries young people tend to begin tertiary education at around this age, and the total number aged 19 to 24 has been used to scale the data on enrolments. In most countries, the large majority of those enrolled on tertiary programmes are within this age group, though in some cases (in Germany or the Nordic countries, for example), a substantial number are enrolled who are older than this. Table A1
New entrants and total numbers enrolled in tertiary education, 1998 to 2001
BE DK DE EL ES FR IE IT NL AT PT FI SE UK EU15Entrants as % 19-20 year-olds
1998 36.1 21.2 16.5 30.2 28.7 27.0 22.9 28.0 19.4 43.4 35.1 40.2 27.91999 40.5 21.1 19.1 28.8 28.1 27.0 21.7 28.7 20.6 34.3 37.2 38.7 27.52000 38.9 21.4 21.7 32.0 28.0 28.0 22.2 27.9 21.5 36.2 39.4 38.7 28.12001 34.2 40.3 23.1 27.2 34.2 28.8 28.7 23.6 28.9 22.1 35.7 40.6 38.5 29.4
Enrolments as % 19-24 year-olds1998 43.4 39.0 37.2 43.3 35.3 9.4 135.3 40.0 39.7 59.4 43.3 43.8 45.21999 46.5 38.1 39.6 45.0 37.6 24.7 136.5 40.4 40.8 54.4 50.4 46.3 46.62000 48.2 36.7 42.3 45.1 39.7 39.4 137.8 41.9 41.5 38.3 63.8 52.8 45.2 46.92001 39.0 50.2 36.5 47.0 46.5 41.7 41.9 144.1 42.9 41.3 65.9 54.7 46.2 48.1
BG CZ EE HU LT LV PL RO SI SK NM10 NM8 NM7 EU25Entrants as % 19-20 year-olds
1998 21.6 17.3 33.1 21.7 28.4 30.5 28.2 13.3 33.5 17.4 22.3 25.2 21.7 26.31999 23.3 19.0 36.1 25.4 31.1 37.1 29.8 17.8 22.2 18.5 24.7 27.1 23.7 26.72000 22.6 17.8 32.8 29.2 34.8 52.1 32.1 17.5 25.9 19.8 26.4 29.5 26.3 27.62001 19.2 20.2 36.2 31.6 37.6 48.7 32.9 26.3 36.4 21.3 29.3 31.1 28.8 29.4
Enrolments as % 19-24 year-olds1998 33.9 17.7 36.9 24.6 32.9 35.7 32.4 15.2 38.1 18.9 25.8 28.4 23.9 39.31999 35.9 22.5 41.7 27.7 36.9 41.6 36.0 17.4 43.6 20.5 29.1 32.2 27.8 41.22000 37.7 24.0 45.2 31.7 42.1 46.3 40.4 19.7 46.3 22.9 32.4 36.0 30.9 42.52001 36.0 25.5 48.0 35.3 46.4 51.6 45.1 25.5 51.1 24.3 36.7 40.0 33.9 44.8
Source: UN, OECD, Eurostat data collection.
The results of this scaling indicate that in the EU-15 countries taken together, the number of new entrants in tertiary education in 2001 amounted to just over 29% of total 19 and 20 year-olds. This was virtually identical to the proportion in the NMS-8 together with Bulgaria and Romania. Across the countries concerned, the figure varied from 49% in Latvia – where new entrants decreased considerably in 2000 and 2001– and 36-38% in the other two Baltic States and Slovenia, to only 20-21% in the Czech Republic and Slovakia and just under this in Bulgaria. This is less than in any of the EU-15 countries (Austria has the lowest figure at 22%), while the figure for Latvia is much higher than in any of the countries (Denmark and Sweden have the highest figures at just over 40%).

49 49
More significantly perhaps, the figures for new entrants scaled in this way show a higher rate of increase in the new Member States between 1998 and 2001 than in EU-15 countries (an average increase of 7 percentage points over the four years as opposed to a rise of under 2 percentage points in the EU-15 – or at least in the 11 countries for which data are available). (It should be noted that data are not available for Belgium, Luxembourg and Portugal for all or most years and for Finland do not seem consistent between these years. It should also be noted that data for France, Sweden and Poland are incomplete and are estimated for 1998.) These data at least seem to suggest a relatively fast rise in participation in tertiary education in the new Member States, though the extent of the increase varied markedly from Hungary, Romania, Lithuania and Latvia, where it was around 10 percentage points or more – figures matched in the EU-15 only by Greece – to the Czech Republic, Estonia and Slovenia, where it was only around 3 percentage points, and Bulgaria, where there was an apparent decline. More new entrants, however, does not necessarily imply more people successfully completing tertiary programmes. This is demonstrated by the data on enrolment which for some countries seem to imply a much larger proportion of university graduates than indicated by the LFS data on educational attainment. This is particularly the case in Italy, a country with one of the smallest proportions of people with university qualifications, where relating the total number enrolled in tertiary education to those aged 19 to 24 produces a figure of over 140%, implying that a substantial proportion of those in their 20s and probably early 30s are enrolled in tertiary programmes but only a small proportion of these succeed in acquiring university degrees. (High figures for enrolments, it should be noted, can also reflect a relatively long duration of tertiary programmes.) The enrolment figures, partly reflecting the smaller number of new entrants in earlier years, were much lower on average in the new Member States in 2001 than in the EU-15 and higher than the EU-15 average only in Latvia and Slovenia, In the Czech Republic, Slovakia and Romania, they were much lower than in any EU-15 country.

50 50
Appendix B
Employment in business services
The LFS provides a means of examining employment in business services and the way this is changing over time in more detail than is possible from the national accounts, which for services at least breaks down employment only to the NACE 1-digit level. The LFS, therefore, gives an insight into the division of employment within the NACE K section (Real estate, renting and business activities), but for most Member States, this division only provides a break-down to NACE 2-digit level. This means that while it is possible to distinguish employment in real estate and renting from computing, R&D and other business services, it is not possible to distinguish employment in the services activities which make up the other business service category. Since these activities vary widely in terms of the jobs involved and education or skill level required to do them, this is a major limitation of the LFS data12. The Structural Business Statistics
Data collected by the Structural Business Statistics (SBS) provide a means of examining the composition of business services in more detail. These data are broken down to a NACE 3-digit level for services (and to a 4-digit level for parts of industry) which makes it possible to identify the numbers employed in activities within ‘other business services’ and to examine how these vary across countries. It should be emphasised at the outset, however, that the SBS data for employment differ from those collected by the LFS in the sense that they come from enterprises rather than from a survey of households. They also relate to the average numbers employed over a particular year (in this case, 2001, which is the latest for which data are available) rather than during a particular week of the year. Both of these differences imply that the SBS might give a more reliable view than the LFS of the number employed in particular activities. Enterprises (in the form of the person completing the return) ought, therefore, to know more accurately which sector of activity they are engaged in, while an average figure for the year is likely to be more representative of the total working in a sector than the figure at one point in time. Irrespective of which is the more reliable, these two differences in the method of collecting data mean that the results are also liable to be different.
12 It is a limitation, it should be noted, that is in the process of being addressed since Member States are now asked when
they undertake the LFS to provide data at a NACE 3-digit level if possible. There is a question mark, however, over how far the data so collected will be reliable, given the relatively small sample size of the LFS in most countries.

51 51
A further source of difference is that while the LFS classifies those employed to sectors according to the main activity of the local unit, the SBS does so in terms of the main activity of the enterprise. In the case of multi-branch, or multi-unit, enterprises, this may mean all of the local units being classified to one activity even if they are producing different goods and services. A comparison of the SBS data with those from the LFS is presented below. However, there are no SBS data for Greece (or Bulgaria), which restricts comparisons of employment in the new Member States with that in the EU-15 countries. It is also the case, more importantly, that the SBS data for Slovakia exclude employment in many small enterprises and for Slovenia, the employment data exclude the self-employed (see Stehrer, 2004). This obviously affects the totals reported for both countries, since the importance of small firms and the self-employed is likely to vary between activities.
Box B1
Comparison of SBS data on employment in business services with LFS data
The SBS shows significantly more people employed in NACE section K than the LFS, which is the source of much of the analysis in this report. In 2001, the SBS reported total employment in these activities in the EU-15 of some 28% higher than the LFS. In the new Member States, the difference was even larger, the SBS total being around 40% higher.
The SBS total is also higher than the LFS figure in most EU-15 countries. The only exceptions are Ireland, where the SBS figure is slightly lower, and Finland, where it is 27% lower. In the other countries, except Austria and Sweden, where the figures are similar, the SBS total is much higher. In the new Member States, Slovakia is the only country in which the SBS total is less than the LFS, reflecting the exclusion of many small enterprises from the former. The SBS total is over 50% higher than reported by the LFS in both the Czech Republic and Hungary. In Slovenia, on the other hand, where the SBS total is reduced by the exclusion of non-employees, the SBS figure is only 15% higher than the LFS, though the difference is the same in Estonia and smaller than in Lithuania.
The reason for this difference is uncertain. It might be a result of average employment over the year being higher than that during the LFS reference week, usually in the second quarter of the year. Or it might arise from the different way in which the two sources classify those employed to sectors of activity, which would imply a larger number of enterprises than local unit producing business services as their main activity. Or it may be that fewer respondents to the LFS believe that the main activity of their local unit has to do with business services than is actually the case in practice.
Given this uncertainty, it is difficult to know which source gives the more accurate estimate of employment in business services. Nevertheless, whichever series is used, the conclusion remains the same: the number employed in relation to working-age population is significantly higher in the EU-15 countries than in the new Member States.

52 52
The results
The total employed in business services
Since the SBS covers only enterprises, it is not possible to relate the numbers reported to be employed in business services to the total employed in the economy as a whole. This is a minor complication. In 2001, the number employed in Real estate, renting and business activities amounted to 23½% of the total employed in market services (here defined, because of the coverage of the SBS, as NACE G, H, I and K and, therefore, excluding financial services and community and personal services as well as public administration, education and health care) in the NMS-8 (Table B1). This was much lower than the average in the EU-15 countries (32%). The difference between the new and old Member States is even wider if the number employed is expressed in relation to working-age population (15-64) because of the higher employment rate in the EU-15 countries. In the NMS-8, the business service employment rate was 4% as against 7½% in the EU-15. This perhaps gives a better indication of the gap between the two, and a better indication also of the possible scope for job growth in future years in this sector. Unlike in the case of the EU-15 countries, there is not a substantial difference in the share of service employment in NACE K between most of the new Member States. The exceptions are Lithuania and Latvia, where it was significantly lower than elsewhere (only 14% in the latter, which was slightly below the level in Romania), and Hungary (28%) where it was higher. Employment in relation to working-age population, however, gives a slightly different perspective. In these terms, employment in the Czech Republic was higher than in Hungary and these two countries stand apart from the other new Member States, though in Slovenia, employment in NACE K is probably similar to that in the Czech Republic once allowance is made for the exclusion of the self-employed (the LFS data are much the same). Nevertheless, even in these countries, employment in NACE K relative to working-age population was below that in most EU-15 Member States and significantly higher only than in Portugal. In Romania, employment in this sector was even further below the level in the EU-15, amounting to only 1½% of working-age population. The division of employment within business services
There are further large differences between the new Member States and the EU-15 countries in terms of the division of employment within business services. In the NMS-8, real estate and renting accounted for almost 18% of the total employed in NACE K in 2003, and over 30% in each of the three Baltic States, as compared with 13% in the EU-15 countries (the figure being below 16% in all cases). In both the Czech Republic and Hungary, the share was more similar to that in the EU-15 and in Slovenia, substantially

53 53
lower. Despite the relative importance of real estate and renting activities for employment in most of the NMS-8, it was still the case that a smaller proportion of working-age population was employed in these activities than in the EU-15. The only exceptions were Estonia and Latvia. Perhaps surprisingly, the share of employment in R&D in the new Member States was also above that in the EU-15 countries – and markedly above in Poland, Slovenia and Slovakia – even if it was relatively small in both cases. Here, the difference might reflect R&D being integrated into other activities in the EU-15 to a greater extent. The share of employment in computing in all the new Member States, except Slovakia, was lower than the EU-15 average (9% on average as against 12%) and substantially below the level in Sweden (and Finland – over 20%). It was particularly low in Poland (just over 7%), though it was still just above the level in Portugal. In the Czech Republic, Hungary and Slovenia, the share was on a par with that in Germany and the Netherlands, while in Slovakia, it was higher than in these or in France. Nevertheless, in relation to working-age population, the number employed in computing was lower in all of the new Member States than in EU-15 countries, with the exception of Spain and Portugal. Only in the Czech Republic and Hungary was the number employed on a par with that in Spain, still substantially below the number in the top EU-15 Member States (Sweden and the UK). Apart from real estate and tenting, legal, accountancy and other business consultancy represents the largest sector in NACE K in the NMS-8 (16% of the total) as in the EU-15 (19%). The share was much smaller in Poland, Lithuania, Latvia and Slovakia than elsewhere and even in the Czech Republic and Hungary, where the share was highest in the new Member States, employment was still below the EU15-average in relation to working-age population. On the other hand, Latvia apart, the relative number employed in architectural, engineering and other technical consultancy was larger in the new Member States than in the EU 15 (15% of NACE K employment as opposed to 10%). The number employed, however, was still slightly below the EU-15 average in all the countries except the Czech Republic and Slovenia. The proportion of those employed in business services working in advertising was much the same in the new Member States as in the EU-15 (around 4% in each). The numbers involved were small relative to working-age population in both cases (around 2-3 people per 1,000), though still lower in the former than in the EU-15.

54 54
There is a major difference between the new Member States and the EU-15 countries in the relative importance of the labour recruitment and contracting sector (i.e. agencies involved in helping employers find staff either on a permanent or temporary basis – note that staff sub-contracted by an agency are counted as being employed in this sector rather than in the sector in which they actually work). In the EU-15, this sector accounted on average for 14% of total business service employment in 2001, in the new Member States, for just 2%, the figure ranging from almost 5% in Estonia and under 4% in Hungary to 1% in Lithuania, Slovenia and Slovakia. Relative to working-age population, the number employed by employment agencies in the new Member States was around 1 percentage point below the EU-15 average, 2 percentage points below the level in the UK and some 3 percentage points below that in the Netherlands. In sharp contrast, security services were much more important in the NMS-8 than in the EU-15, accounting for just almost 13% of NACE K employment as against under 4%. The share was particularly high in Poland and Slovakia, though in all the countries it was well above the share in the EU-15, apart from in Portugal (8%, similar to the share in Lithuania, the lowest in the NMS-8). This reflects the greater reliance in the new Member States on private security firms as opposed to the police (who are classified as part of public administration in the NACE system). In relation to working-age population, the number employed in the Czech Republic, Hungary and Poland was some 3-4 per 1,000 people of working-age higher than in most EU-15 countries (the two main exceptions are Portugal and the UK). On the other hand, relatively few people are employed in Industrial cleaning in the NMS-8 (under 8% of NACE K) as compared with the EU-15 (13%). As in the case of R&D, however, this gap does not necessarily imply that less cleaning is done, only that less cleaning is contracted out to specialist companies. Finally, the Miscellaneous business service sector, which includes secretarial and translation services, is of similar importance in the new Member States as in the EU-15 countries, accounting for around ½ % of working-age population in both cases, though closer to 1% in Hungary. In overall terms, there is some tendency for the division of employment within NACE K to be concentrated more in the less skilled activities in the new Member States than in the EU-15 countries – more in security services, in particular – though the difference is not great given the larger share of employment in the EU-15 in industrial cleaning. Relative to working-age population, however, Industrial cleaning apart, the difference in the numbers employed in the two groups of countries is pronounced in the activities requiring high levels of education – Computing and professional consultancy services, in particular,

55 55
though also employment agencies to the extent that these provide specialist personnel. These are the areas in which the potential for job growth in the new Member States seems most significant, though for this to occur requires both changes and growth in the rest of the economy to generate expansion in demand among businesses for these services and to stimulate in turn the increase in specialisation in the delivery of these services which is key to the growth of jobs. In this regard, the growth of business services stems not simply from activities shifting from other sectors to specialist enterprises but from the increase in capacity and capabilities and the correspondingly increased contribution to value-added in the economy as a whole which accompany this shift.

56 56
Table B1
Employment in real estate and business services in the NMS and selected EU-15 countries, 2001
% of total NACE K CZ EE HU LT LV PL SI SK NM8 NM7 RO EU15 DE ES FR IT NL PT SE UK Real estate renting 12.5 30.6 15.5 35.8 43.5 18.4 5.7 20.3 17.7 17.2 10.4 13.0 11.8 14.6 14.2 11.6 7.6 12.5 14.7 13.0 R&D 1.6 0.4 1.7 1.1 5.7 6.4 7.0 6.5 4.1 2.4 14.3 1.2 1.8 0.8 1.1 1.0 2.8 0.1 2.4 2.2 Computing 10.6 6.7 11.4 8.2 8.7 7.4 10.3 12.9 9.2 10.7 9.4 12.2 10.2 8.6 12.0 15.7 10.0 6.9 20.4 13.5 Legal, accountancy, consultancy 19.6 16.1 21.9 8.1 8.6 12.4 23.5 8.7 16.1 18.5 9.1 19.4 20.3 17.7 15.9 22.0 21.3 17.5 19.0 19.8 Architecture, enginerring, technical 17.0 12.9 11.5 22.7 9.5 14.1 24.2 16.4 14.6 15.1 16.3 10.8 13.3 10.1 8.5 13.8 8.8 7.4 13.3 8.8 Advertising 5.3 4.5 2.6 6.5 5.2 3.4 3.1 5.2 3.9 4.2 4.1 4.0 5.9 5.7 3.8 2.3 3.8 3.7 5.7 2.4 Labour recruiting, contracting 1.7 4.6 3.6 1.1 1.3 2.1 1.2 1.2 2.2 2.4 2.2 14.2 7.4 11.2 23.5 5.3 26.5 15.3 0.7 17.7 Security services 10.9 11.9 10.7 7.8 9.6 15.0 8.5 14.4 12.6 10.9 19.0 3.6 3.5 4.7 4.7 2.6 1.9 7.9 2.8 3.7 Industrial cleaning 9.6 7.1 6.7 4.1 3.5 7.4 10.9 5.7 7.5 7.7 2.9 13.3 18.1 17.5 9.6 16.1 12.3 15.8 6.7 9.4 Miscellaneous business services* 11.3 5.2 14.5 4.7 4.4 13.4 5.7 8.6 12.0 11.0 12.5 8.3 7.8 9.1 6.8 9.5 5.0 12.9 18.7 9.5 NACE K as % market services 24.7 22.5 28.1 14.2 18.5 23.1 22.2 23.2 23.5 24.2 14.7 32.0 34.1 28.4 33.9 29.0 37.2 21.1 38.5 33.8 % population 15-64 NACE K , total 5.7 4.6 5.4 2.2 3.3 3.3 3.7 2.4 3.9 4.4 1.4 7.4 6.8 7.0 7.4 5.6 11.8 4.5 10.4 11.1 Real estate renting 0.7 1.4 0.8 0.8 1.4 0.6 0.2 0.5 0.7 0.8 0.1 1.0 0.8 1.0 1.1 0.7 0.9 0.6 1.5 1.4 R&D 0.1 0.0 0.1 0.0 0.2 0.2 0.3 0.2 0.2 0.1 0.2 0.1 0.1 0.1 0.1 0.1 0.3 0.0 0.2 0.2 Computing 0.6 0.3 0.6 0.2 0.3 0.2 0.4 0.3 0.4 0.5 0.1 0.9 0.7 0.6 0.9 0.9 1.2 0.3 2.1 1.5 Legal, accountancy, consultancy 1.1 0.7 1.2 0.2 0.3 0.4 0.9 0.2 0.6 0.8 0.1 1.4 1.4 1.2 1.2 1.2 2.5 0.8 2.0 2.2 Architecture, enginerring, technical 1.0 0.6 0.6 0.5 0.3 0.5 0.9 0.4 0.6 0.7 0.2 0.8 0.9 0.7 0.6 0.8 1.0 0.3 1.4 1.0 Advertising 0.3 0.2 0.1 0.1 0.2 0.1 0.1 0.1 0.2 0.2 0.1 0.3 0.4 0.4 0.3 0.1 0.5 0.2 0.6 0.3 Labour recruiting, contracting 0.1 0.2 0.2 0.0 0.0 0.1 0.0 0.0 0.1 0.1 0.0 1.1 0.5 0.8 1.7 0.3 3.1 0.7 0.1 2.0 Security services 0.6 0.5 0.6 0.2 0.3 0.5 0.3 0.3 0.5 0.5 0.3 0.3 0.2 0.3 0.3 0.1 0.2 0.4 0.3 0.4 Industrial cleaning 0.5 0.3 0.4 0.1 0.1 0.2 0.4 0.1 0.3 0.3 0.0 1.0 1.2 1.2 0.7 0.9 1.5 0.7 0.7 1.0 Miscellaneous business services* 0.6 0.2 0.8 0.1 0.1 0.4 0.2 0.2 0.5 0.5 0.2 0.6 0.5 0.6 0.5 0.5 0.6 0.6 1.9 1.0
Note: No data for BG or GR; data for SK excludes some small enterprises and for SI covers only employees.
Source: Eurostat, Structural Business Statistics.

57 57
Appendix C
Classification of NACE groups

58 58
Table C1 Classification of NACE groups – description – 2-digit level
NACE-group NACE 1-digit NACE 2-digit Description
1 Primary sector A-B A Agriculture, hunting and forestry A 01 Agriculture, hunting and related service activities A 02 Forestry, logging and related service activities B 05 Fishing
2 Secondary sector C-F C 10-14 Mining and quarrying D 15-37 Manufacturing E 40-41 Electricity, gas and water supply F 45 Construction
2a Secondary high-skill sectors C 11 Extraction of crude petroleum and natural gas;
service activities incidental to oil and gas extraction, excluding surveying
D 30 Manufacture of office machinery and computers D 23 Manufacture of coke, refined petroleum products
and nuclear fuel D 32 Manufacture of radio, television and
communication equipment and apparatus D 24 Manufacture of chemicals and chemical products C 13 Mining of metal ores E 40 Electricity, gas, steam and hot water supply D 33 Manufacture of medical, precision and optical
instruments, watches and clocks E 41 Collection, purification and distribution of water D 35 Manufacture of other transport equipment D 22 Publishing, printing and reproduction of recorded
media D 31 Manufacture of electrical machinery and
apparatus n.e.c. D 29 Manufacture of machinery and equipment n.e.c. D 16 Manufacture of tobacco products D 34 Manufacture of motor vehicles, trailers and semi-
trailers
2b Secondary medium-skill sectors
C 10 Mining of coal and lignite; extraction of peat D 27 Manufacture of basic metals D 21 Manufacture of pulp, paper and paper products D 25 Manufacture of rubber and plastic products D 15 Manufacture of food products and beverages F 45 Construction D 28 Manufacture of fabricated metal products, except
machinery and equipment
2c Secondary low-skill sectors C 14 Other mining and quarrying D 26 Manufacture of other non-metallic mineral
products D 36 Manufacture of furniture; manufacturing n.e.c. D 37 Recycling D 20 Manufacture of wood and of products of wood
and cork, except furniture; manufacture of articles of straw and plaiting materials
D 17 Manufacture of textiles D 18 Manufacture of wearing apparel; dressing and
dyeing of fur D 19 Tanning and dressing of leather; manufacture of
luggage, handbags, saddlery, harness and footwear
C 12 Mining of uranium and thorium ores
(Table C1 contd.)

59 59
Table C1 (contd.)
3 Market services G-K
3b Low-skill sectors in market services
G-I
G Wholesale and retail trade; repair of motor vehicles, motorcycles and personal and household goods
G 50 Sale, maintenance and repair of motor vehicles and motorcycles; retail sale of automotive fuel
G 51 Wholesale trade and commission trade, except of motor vehicles and motorcycles
G 52 Retail trade, except of motor vehicles and motorcycles; repair of personal and household goods
H Hotels and restaurants H 55 Hotels and restaurants I Transport, storage and communication I 60 Land transport; transport via pipelines I 61 Water transport I 62 Air transport I 63 Supporting and auxiliary transport activities;
activities of travel agencies I 64 Post and telecommunications
3a High-skill sectors in market services
J-K
J Financial intermediation J 65 Financial intermediation, except insurance and
pension funding J 66 Insurance and pension funding, except
compulsory social security J 67 Activities auxiliary to financial intermediation K Real estate, renting and business activities K 70 Real estate activities K 71 Renting of machinery and equipment without
operator and of personal and household goods K 72 Computer and related activities K 73 Research and development K 74 Other business activities
4 Communal services L-Q
4a Public administration L 75 Public administration and defence; compulsory social security
4b Education M 80 Education
4c Health N 85 Health and social work O Other community, social and personal service
activities O 90 Sewage and refuse disposal, sanitation and
similar activities O 91 Activities of membership organizations n.e.c. O 92 Recreational, cultural and sporting activities O 93 Other service activities P Activities of households P 95 Activities of households as employers of domestic
staff P 96 Undifferentiated goods producing activities of
private households for own use P 97 Undifferentiated services producing activities of
private households for own use Q Extra-territorial organizations and bodies Q 99 Extra-territorial organizations and bodies

Short list of the most recent wiiw publications (as of December 2004)
For current updates and summaries see also wiiw's website at www.wiiw.ac.at
Economic Restructuring and Labour Market Developments in the New EU Member States by Michael Landesmann, Hermine Vidovic and Terry Ward wiiw Research Reports, No. 312, December 2004 59 pages including 10 Tables and 15 Figures hardcopy available at printing costs: EUR 8.00 (PDF: free download from wiiw’s website)
Macroeconomics versus ‘Common Sense’ by Kazimierz Laski wiiw Working Papers, No. 33, December 2004 11 pages hardcopy: EUR 8.00 (PDF: free download from wiiw’s website)
The Vienna Institute Monthly Report 12/04 edited by Leon Podkaminer • Russian Federation: GDP growth slows down • Albania: integrating into the Balkans • Bosnia and Herzegovina: shrinking donations, more foreign investment • Selected monthly data on the economic situation in ten transition countries, 2003-2004 • Guide to wiiw statistical services on Central and Eastern Europe, Russia and Ukraine wiiw, December 2004 21 pages including 13 Tables (exclusively for subscribers to the wiiw Service Package)
Determinants of Industrial Location Patterns in CEECs by Antje Hildebrandt and Julia Wörz wiiw Working Papers, No. 32, November 2004 21 pages including 6 Tables and 2 Figures hardcopy: EUR 8.00 (PDF: free download from wiiw’s website)
Manufacturing FDI in New EU Member States – Foreign Penetration and Location Shifts between 1998 and 2002 by Gábor Hunya wiiw Research Reports, No. 311, November 2004 44 pages including 13 Tables hardcopy: EUR 22.00 (PDF: EUR 20.00)
The Vienna Institute Monthly Report 11/04 edited by Leon Podkaminer • Updated wiiw forecasts for 2004 and 2005 • Bulgaria: economy keeps growing fuelled by credit expansion • Romania: booming, but cumbersome years ahead until EU accession • Croatia: growth losing momentum • Serbia and Montenegro: growth recovers • Macedonia: stagnation returns • Ukraine: a good grain harvest and booming exports • Selected monthly data on the economic situation in ten transition countries, 2003-2004 • Guide to wiiw statistical services on Central and Eastern Europe, Russia and Ukraine wiiw, November 2004 31 pages including 17 Tables (exclusively for subscribers to the wiiw Service Package)

Countries in Transition 2004: wiiw Handbook of Statistics covers twelve transition countries (Bulgaria, Croatia, Czech Republic, Hungary, Poland, Macedonia, Romania, Russia, Serbia and Montenegro, Slovakia, Slovenia, Ukraine), 1990 to August 2004 wiiw, Vienna, November 2004 (ISBN 3-85209-009-1) 555 pages including 415 Tables and Figures EUR 90.00
The Vienna Institute Monthly Report 10/04 edited by Leon Podkaminer • Czech Republic: economy in full swing at last • Hungary: new government facing old problems • Poland: strong profits and weak investment • Slovakia: robust economic growth amidst increasing regional disparities • Slovenia: running smoothly • Estonia: fast growth, on track to the euro • Latvia: highest EU-wide growth, deteriorating current account balance • Lithuania: loans fuel boom without inflation • Selected monthly data on the economic situation in ten transition countries, 2003 to 2004 • Guide to wiiw statistical services on Central and Eastern Europe, Russia and Ukraine wiiw, October 2004 41 pages including 18 Tables and 2 Figures (exclusively for subscribers to the wiiw Service Package)
Foreign Direct Investment and the Catching-up Process in New EU Member States: Is There a Flying Geese Pattern? by Jože P. Damijan and Matija Rojec wiiw Research Reports, No. 310, October 2004 48 pages including 17 Tables and 10 Figures hardcopy: EUR 22.00 (PDF: EUR 20.00)
Income Distribution, Technical Change and the Dynamics of International Economic Integration by Michael Landesmann and Robert Stehrer wiiw Working Papers, No. 31, September 2004 23 pages including 2 Tables and 2 Figures hardcopy: EUR 8.00 (PDF: free download from wiiw’s website)
Tax Rates and Corruption: Labour-market and Fiscal Effects. Empirical cross-country comparisons on OECD and transition countries by Mária Lackó wiiw Research Reports, No. 309, September 2004 80 pages including 27 Tables and 16 Figures hardcopy: EUR 22.00 (PDF: EUR 20.00)
The Vienna Institute Monthly Report 8-9/04 edited by Leon Podkaminer • Does FDI follow comparative advantage? • A note on Modigliani-Miller and the balance of payments • Do profit tax cuts stimulate private investment? • Selected monthly data on the economic situation in ten transition countries, 2003 to 2004 • Guide to wiiw statistical services on Central and Eastern Europe, Russia and Ukraine wiiw, August/September 2004 33 pages including 13 Tables and 9 Figures (exclusively for subscribers to the wiiw Service Package)

wiiw-WIFO Database: Foreign Direct Investment in Central and Eastern Europe with Special Attention to Austrian FDI Activities in this Region by Gábor Hunya and Jan Stankovsky wiiw and WIFO, Vienna, 17th edition, July 2004 64 pages including 48 Tables hardcopy: EUR 47.00 (PDF: EUR 47.00) As East You Go, the More They Grow: Transition Economies in a New Setting by Vladimir Gligorov, Josef Pöschl, Sándor Richter et al. wiiw Research Reports, No. 308, July 2004 112 pages including 38 Tables and 11 Figures hardcopy: EUR 70.00 (PDF: EUR 65.00)
The Vienna Institute Monthly Report 7/04 edited by Leon Podkaminer • Belarus: sustainable growth without structural reforms? • A note on dissatisfaction with integration • Quality gains in exports of the Czech Republic, Hungary, Poland, Slovakia and Slovenia • Selected monthly data on the economic situation in ten transition countries, 2003 to 2004 • Guide to wiiw statistical services on Central and Eastern Europe, Russia and Ukraine wiiw, July 2004 29 pages including 15 Tables and 1 Figure (exclusively for subscribers to the wiiw Service Package)
FDI in Small Countries: the Baltic States by Gábor Hunya wiiw Research Reports, No. 307, June 2004 (reprinted from EIB Papers, Vol. 9, No. 2, 2004, pp. 92-115) 23 pages including 3 Tables and 8 Figures hardcopy: EUR 8.00 (PDF: free download from wiiw’s website)
The Vienna Institute Monthly Report 6/04 edited by Leon Podkaminer • Domestic absorption, real exchange rates and trade balances in the Czech Republic, Hungary,
Poland, Slovakia and Slovenia • Foreign direct investment in the Central European new EU members • Is rapid, long-term economic growth in Poland likely? • Selected monthly data on the economic situation in ten transition countries, 2003 to 2004 • Guide to wiiw statistical services on Central and Eastern Europe, Russia and Ukraine wiiw, June 2004 29 pages including 12 Tables and 1 Figure (exclusively for subscribers to the wiiw Service Package)
Can Trade Explain the Sector Bias of Skill-biased Technical Change? by Robert Stehrer wiiw Working Papers, No. 30, May 2004 28 pages including 13 Tables hardcopy: EUR 8.00 (PDF: free download from wiiw’s website)
Wirtschaftsentwicklung in den MOEL durch deutliche Konvergenz geprägt by Vasily Astrov wiiw Research Papers in German language, May 2005 (reprinted from: WIFO-Monatsberichte, Vol. 77, No. 5, May 2004) 19 pages including 10 Tables and 8 Figures hardcopy: EUR 8.00 (PDF: free download from wiiw's website)

wiiw Service Package The Vienna Institute offers to firms and institutions interested in unbiased and up-to-date information on Central, East and Southeast European markets a package of exclusive services and preferential access to its publications and research findings, on the basis of a subscription at an annual fee of EUR 2,000.
This subscription fee entitles to the following package of Special Services:
– A free invitation to the Vienna Institute's Spring Seminar, a whole-day event at the end of March, devoted to compelling topics in the economic transformation of the Central and East European region (for subscribers to the wiiw Service Package only).
– Copies of, or online access to, The Vienna Institute Monthly Report, a periodical consisting of timely articles summarizing and interpreting the latest economic developments in Central and Eastern Europe and the former Soviet Union. The statistical annex to each Monthly Report contains tables of the latest monthly country data. This periodical is not for sale, it can only be obtained in the framework of the wiiw Service Package.
– Free copies of the Institute's Research Reports (including Reprints), Analytical Forecasts and Current Analyses and Country Profiles
– A free copy of the wiiw Handbook of Statistics, Countries in Transition (published in October/November each year and containing more than 400 tables and figures on the economies of Bulgaria, Croatia, the Czech Republic, Hungary, Macedonia, Poland, Romania, Russia, Serbia and Montenegro, Slovakia, Slovenia and Ukraine)
– Free online access to the wiiw Monthly Database, containing more than 1200 leading indicators monitoring the latest key economic developments in ten Central and East European countries.
– Consulting. The Vienna Institute is pleased to advise subscribers on questions concerning the East European economies or East-West economic relations if the required background research has already been undertaken by the Institute. We regret we have to charge extra for ad hoc research.
– Free access to the Institute's specialized economics library and documentation facilities.
Subscribers who wish to purchase wiiw data sets on CD-ROM or special publications not included in the wiiw Service Package are granted considerable price reductions.
For detailed information about the wiiw Service Package please visit wiiw's website at www.wiiw.ac.at

To The Vienna Institute for International Economic Studies Oppolzergasse 6 A-1010 Vienna ¡ Please forward more detailed information about the Vienna Institute's Service Package ¡ Please forward a complete list of the Vienna Institute's publications to the following address
Please enter me for
¡ 1 yearly subscription of Research Reports (including Reprints) at a price of EUR 225.00 (within Austria), EUR 250.00 (Europe) and EUR 265.00 (overseas) respectively
Please forward
¡ the following issue of Research Reports ...........................................................................................
¡ the following issue of Analytical Forecasts ........................................................................................
¡ the following issue of Current Analyses and Country Profiles ...........................................................
¡ the following issue of Working Papers ...............................................................................................
¡ the following issue of Research Papers in German language ...........................................................
¡ the following issue of China Reports .................................................................................................
¡ the following issue of Industry Studies ..............................................................................................
¡ the following issue of Structural Reports ...........................................................................................
¡ the following issue of wiiw-wifo Data on Foreign Direct Investment ..................................................
¡ the following issue of COUNTRIES IN TRANSITION: wiiw Handbook of Statistics ..........................
...................................................................................................................................................................................................
Name
...................................................................................................................................................................................................
Address
...................................................................................................................................................................................................
Telephone Fax E-mail
.......................................................... ........................................................
Date Signature
Herausgeber, Verleger, Eigentümer und Hersteller:
Verein „Wiener Institut für Internationale Wirtschaftsvergleiche“ (wiiw), Wien 1, Oppolzergasse 6
Postanschrift: A-1010 Wien, Oppolzergasse 6, Tel: [+431] 533 66 10, Telefax: [+431] 533 66 10 50
Internet Homepage: www.wiiw.ac.at
Nachdruck nur auszugsweise und mit genauer Quellenangabe gestattet.
P.b.b. Verlagspostamt 1010 Wien