ECOLOGY OF THE KANGAROO ISLAND WALLABY ...
298
ECOLOGY OF THE KANGAROO TSLAND WAILABY, Maeropus eugenii (Desmarest), IN FI.TNDERS CHASE NATTONAL PARK' KANGAROO ISLAND. by ROBERT W. TN}TS B.Sc. (H-ons. ) (Adelaide) Department of ZooIogY Uníversity of Adelaide. A thesis submitted to the University of Adelaide in fulfítment of the requirements for the <legree of Doctor of Philosophy. March 1980 A wrri-¡lry' l+i'" j""'.,r" i -titlr
-
Upload
khangminh22 -
Category
Documents
-
view
1 -
download
0
Transcript of ECOLOGY OF THE KANGAROO ISLAND WALLABY ...

ECOLOGY OF THE KANGAROO TSLAND
WAILABY, Maeropus eugenii (Desmarest),
IN FI.TNDERS CHASE NATTONAL PARK'
KANGAROO ISLAND.
by
ROBERT W. TN}TS
B.Sc. (H-ons. ) (Adelaide)
Department of ZooIogY
Uníversity of Adelaide.
A thesis submitted to the University of Adelaide infulfítment of the requirements for the <legree of
Doctor of Philosophy.
March 1980A wrri-¡lry' l+i'" j""'.,r" i -titlr

CONTENTS
Summary
DeclarationAcknowledgements
2.0
v
a
l_v
1011L2
t616
L7
L7L7181B19
20
202T24242425
2627272728
I 0 Introduction1.1 General IntroductionI.2 The Present Stucly1.3 The Study Area
II
10
.1 Location
.2 Climate
.3 VegetationGeneral Methods2.I Capture of V{allabies in the Field2.2 Examínation of Animals in the Field2.3 Tooth Eruption Studies of Known Age Animals
2.3.I Animal Husbandry2.3.2 Age Determination
2.4 Telemetry2.4.I Equipment2.4.2 Location of Animals in the Field
2.5 Water Metabolísm2.5.r Estimation of Total Body Water and
Water TurnoverMeasurement of Body Fluid CompartmentsCollection of Urine and FaecesHaernatocritPlasma Protei-nPlasma Concentration
1.31.31.3
2.5.22.5 .32.5 .42.5.52.5.6
3 .0 Age Determj-nation3.1 Introduction3.2 Methods and Terminology
3.3 Results3.3.1
3.2 .I3.2.23.2.33.2.4
Age Determination of Pouch YoungTooth EruptionMolar IndexIvleasurements of the Size of the Skul1and Teeth
Estimation of Age of Pouch Young inthe FieldCranial- Features and Denti-r-ionTooth Bruption Pat'ternMolar Index
2828
3.3.23.3.33.3.4
28303337
3.4 Discussion 37

4,0 Aspects of Reproduction4.I Introduction4.2 Materials and Methods
4.3 Results
5.2.I
5.2.2
4444
2222
.1 Coll-ection of Samples
.2 Histology
.3 Testosterone Assay
.4 N-Acetylglucosamine Assay fromProstate Tissue
42
44444545
47474748484848485252
53
57585858626263
69
7T
7I7L
80B181
82
90
9092939396
4.3.r4.3.2
Sexual Maturity of MalesSeasonal ChangesAnalysis of ResultsTes'tis and EpididymisAccessory Reprocluctive Organs(a) Prostate Gland(b) Cowper's GlandsTestos terone Concentration
Activity and Movement PatternsWinter MovementsSurmner MovementsI,lovements Out of the Study AreaMeasurement of Home-range
5
4.4 Díscussion
0 Home-range and Movement Patterns5.1 Introduction5.2 Results
6.0 Population Dynamics6.1 Introduction6.2 The Mark-Recapture Method
6
6.2. L Assumptions Underlying Use of thisMethodTesting for Equal CatchabilityThe Jol1y-Seber Stochastic Model forMark-Recapture AnalysisResultsCapture DataPopulation Estimates from the Jol1y-Seber Stochastic Mode1
6.2.4
3 Estimation of the Minimum Number of AnimalsKnown to be Aliver âs a Measrire of PopulationSi ze
6.3"1 The Assumptions and CalculationsNecessary to Obtaj-n PopuJ-ati<-rn Estimatesby this Method
6.3.2 Results4 Reproductive Characteristics of the Population
6 .4. L Season of Births6.4"2 Fecundity and Pouch-Young Mortality
6.2.26.2.3
6

Sex RatiosPresence of More Than One Young inthe Pouch
6.5 Survival Rates and Life TablesEstimation of Survival RatesLife-TabIes 'Ages orÍ Death Estimated from SkullsCollected on the Study Area andLongevity Records
7.0 Some Aspects of the Physiology of the KangarooIstand VüaIIaby under Fie1d Conditions7.I Introduction7 .2 Results
Water TurnoverUrine and Faecal Water LossPlasma Osmotic and ElectrolYteConcentrationBody Fluid CompartmentsHaematocrit and Plasma ProteinConcentrationBody Weight
6.4 .36.4.4
6. s.16.5.26.5.3
7 .2.I7.2.27 .2.37 .2.47.2.s
L02
r05r06106111
It5
I19L20120L23
L23130
133134
L37
150
L77
8.0
9.0
10 .0
7 .2.6General Discussion
Appendices
Bibliography

I give consent to this copy of my the-sis' when deposited in theUnlversity Libnar"y, being avaitaLte for io"tt and photocopying'
pate , ¡.21.+IV.U. ..Sisned :
I

SUMMARY
The Kangaroo Island Wallaby (Macz'opus eugenii ) was
once quite coïrmon on the mainland of SouLh Australia but due
to habitat <lestruction and the introdttction of aliencompetitors and predators it is now abundant only on Kangaroo
Is1and, where it is cotlsidered to be a pastoral pest.Ihe presence of a large undisturbed popr-rlation in
Flinders Chase National Park, provided an ideal situation fora study of the population ecology of th-i-s species. Further-moïe, such a study would al-so provi-de the basic biologicaldata on which a management plan could be based.
In order to gain some understanding of the factorsinfluencj-ng the si-ze of a natural population of wallabies,sLudies were made on their home-range and movement- patterns,population size and structure, \n¡ater metabolism and some
as¡lects of reproduct-ion.
The foraging area of a single population was deter-
mined by night-time observations and with the aid of radj-o-
transmitÈers. The radj-o=trackingr information showed that the
wallabies in this population had well defined home-ranges
which overlapped with each other. The síze of the population
fluctuated seasonally and annual.ly. At around October
Novernber each year there was an increase in the size of the
population d.ue to young animals leaving the pouch. This was
followed by a decline in numbêrs over the late summer and
early winter. A much higher mortality occurred in 7978 than
in the previous years. A similar die-off has been reported
for the winter of 1968. In both years the heawy rnortalitywas preceded by a Iong, dry sumrrìer.

iiTo ascertain whÍch agesÇroups suffered the heaviest
mortality it was necessary to establish the age of each
animal captured. Tooth eruption in a number of animals ofknown age was studied in the laboratory and a standard curve
relating age to stage of molar eruption was established..Animals in the field could then be accurately aged by refer-ence to this graph. Young animals just out of the pouch
suffered the highest mortality, partitularl.y over summer,
while the o1d animals also had a high mortality. However, inL978 all age-groups were affected equa11y.
Both the radio-tracking data and the recapture
records indicated that immigration and emigration were not
significantly affecting'the size of the population. Thus
the number of animals was determined by the combined
influences of natality and mortality,The Kangaroo Is1and Wallaby has a seasonal breeding
pattern with most young being born in late January and earlyFebruary. The breeding pattern of females is controlled by
seasonal changes in photoperiod. The presence of females inbreeding condition appears to induce the increase in size ofthe accessory reproductive organs and rise in plasma
testosterone levels observed in the males. This may actthrough pheromones. Fecundity was high in all years whilemortality of pouch young was significant only in I978.
During the surnmer months the grass on the main
feeding area dried off and the wallabies were moving over
greater distances than in winter, probably searching forbetter quality food. It was at this time, and in earlywinter, that the greatest mortality occurred while those

.I l- l-
animals which did survive were ofÈen in poor condition.Studies on their water metabolism in the field showed thatalthough they rdere conserving water over summerr âs indicatedby low water turnovers and urine volumes, they were notsuffering from dehydration. Although the causes of mortalitywould be quite complex a major factor seems to be a shortage
of good quality food in late sufirmer and early winter. This
means that at the beginning of wínter when there are increased
metabolic demands due to the 1ow temperatures and wet
conditions the animals are in poor condition. Furthermore,
heavy infestations of gastro-intestinal parasj-tes at this timewould also decrease thej-r chance of surviving. The weather
obviously has a major irifluence via the food supply and
physical conditions in early winter.

lv
DECLARATION
This thesis contains no material previously
submitted by me for the award of any other degree or diploma
in any University. To the best of my knowledge it contains
no material previously published or written by another
person except where due reference is made in the text of the
thesis.

v
ACKNOVILEDGEMENTS
I wish to thank my supervisor, Dr. Shelley Barker'
for his support and encouragement throughouL this study and
for his helpful criticisms of the manuscrípt. I would also
like to thank Prof. W.D. Williams for providing the depart-
mental facilities and Lor supervision during 1977 whileDr. Barker was on study leave.
I am indebted to the various people who assisted me
with the field-work but in particular T would like to thank
Jane Wright, Stephen McKillup and Ray Bickle. The assistance
and hospitality of Mr. Graham Warncken, Park Keeper atf'linclers Chase, is gratefully acknowledged and I also thank
the Senior Ranger, Mr. G. Lonzar, for his j-nterest in thisproject. M-r. Leon HaIl of rGreenslopesr, Kangaroo Island'made the reproductive study possible by helpinq to obtain
speci-mens on his property. I thank the National Parks and
Wildlife Service for permission to capture wal-labies inFlinders Chase National Park and to take animals from nearl:y
properties for the reproductive study.
Many people assisted me with various aspects of the
laboratory work. I would like to thank Dr. Beth Howard forcounting the tritiated water samples, Ms. M. Ralph and
Mr, M. Gaughwin for analysing plasma testosterone concentr-
ations, Dr. J. Rodger for assaying N-acetylglucosamine inprostate gland tissue, Mr. N. West for help in cannulatinqtaj,l=yeins of wallabies, Dr. J. Rice for help in analysing
the mark-recapture data and Dr. R. Gj-esecke for perfo::ming
post-mortems on sick animals obtainecl from Flinders Chase.
Mr. P.G. Kempster kindly reproduced the photographs

Vifor this thesis and the figures \irere drawn by Ms. R. Altmann.
Finallyr ily sincere thanks go to Ms. Jane Wright,Dr. R.I. Somrnerville and Mr. .S.C. McKíIlup for theirencouragement and support during the course of this study.
I am grateful to the Co¡mnonwealth Department ofEducation and Science, the National Parks and. Wild1ifeService and. the M.A. Ingham Trust for their financialassistance.

1.0 INTRODUCTION

I.1 GENERAL INTR.ODUCTTON
The environmental changes brought about by euro-
pean settlement, togettrer r,¡ith the introduction of aliencompetitors and. predators, has had drastic effects on the
native fauna of Australia.Vlhile the mar¡ma1s seem to have been among those
most adversely affected by the environmental changes, itappears that some species may actually have increased innunù¡er. For example population numbers of the euro
(Macropus robustus) increased in the Pilbara district ofWestern Australia because overgrazing by domestic stock
allowed their natural food plant (IYíodia spp.) to spread
(Brown and. Main, 1967i fialey, L967a). Increased avail-ability of water from man-made stock watering points has
also allowed an extension of their range. Similarly, the
red kangaroo (MegaLeia rufa) has increased in abundance insome parts of its ranqe (Frith, 1964; Newsome, I965a). Inthe Upper Richmond and Clarence Rivers district of New South
Wales, Calaby (1966) found that a varied and abundant nat-rve
mammal fauna existed. even though the area had a long historyof european settlement. The main factor responsible forthis richness appeared to be the considerable habitat diver-sity, due to the topograph.y and cli.mate, and the existence
of state forests. Some alterations to the habitat through
partial clearing for beef-cattle grazing has improved the
quality of the available food plants for several species ofmacropods. However, in areas where complete clearing fordairying purposes has occurred there has been a dec::ease inthe numbers of a1l spec-ies.

2
Despite these examples most species of nativemammals have either declined in numbers or become extinct(Marlow, 1958; Ride, 1970). Within the Macropodidae the
most seriously affected \,rere the smaller species (Calaby,
1971) . For example, in western New South Wales a coml¡in-
atíon of overgrazing by domestic stockr ârI increase in the
number of rabbits and a severe drought caused extinction ofspecies of BettongLa, Lagorchestes and )rrychogaLea (Cal-aby, 197I) .
The Kangaroo Island Wallaby, or Tammar, Macropus
eugerrLi,, is another of the smaller members of the Macropod-
idae whose range has been considerably reduced in recent
times. The first description and observations of an Aust-ralian marsupial were made on this speci-es by the Dutch
navigator, Francisco Pelsaert, after his ship the Batavia
was wrecked on Houtman's Abrolhos in 1629. However, the
species was not actually scientifically described until the
early nineteenth century when a French expedition under
Nicolas Baudj-n collected walJ-abies from LrIle Eugene (now
known as St. Peter Island) in Nuyts' Archipelago, South
Australia. The type specimen was given the name Kangaz'us
eugenü (Desmarest, 1817). This species was once quitecommon on the South Australian main1and, particularly incoastal scrub and parts of the Mt. Lofty Ranges (Finlayson,
L927). With european settlement much of their habitat was
destroyed, and predators such as the fox (VuLpes tuLpes ) were
introduced, so that they were thought to have become
extinct on the mainland of South Austra.lia by 1930. Then inJ-.969 a female carrying a pouch young was captured in mallee
scrub near Cleve on Eyre Pen-i-nsula (aitken , 1970) and in ]-970

3
a young male v\¡as caught in the sälne area (p.f'. Aitken, pers.
comm. ) . Thus hopes \^/ere strengthened that a viable popula-
tion still exists on the mainland. The population on St.Peter Island is now extinct rnifu a colony on FlindersIsland, in the Investigator Group, has been severely reduced
in numbers since about 1964 (Calaby I I97I) and. it is doubt-
ful that it has survived (P,F. .Z\itken, pers. comm.). Some
animal-s sti11 lj-ve on Greenly Tsland although these were
introduced there from Kangaroo Tsland (Mitchell and Behrndt,
1949). In Western Australia the tammar is stil1 found on
the mainland in the south-west of the state and on several
of fshore islands, namely Midd.le and North T\¡¡in Peaks in the
Recherche Archipelago, Qarden, East and West Wallabi Islaridsin Houtman's Abrolhos (Ca1aby, I97l-). The one remaining area
where this species is still abunclant is on Kangaroo Island,South Australj-a, where it is considered to be a pastoral pest.
To minimize any further effects of clearing and
grazíng on the distribution and abundance of macropods,
management plans must be formulated. Before this can be
achieved field studies on habitat selection, general ecology,
social organization and. physiology are needed. However, dL
the present time litt1e is known about the basic biology ofmost. species.
The only species of macropods that har¡e been studied
in any detail in the field are the red kangaroo, the euro and
the quokka (SetowLæ bracltytts"us) . Studíes on the red kangaroo
and the euro \,rere initiated because of their economic import-ance (Ealey, 1967ai Fri'Lh and Cal-aby, 1969) but they have
a.1so provided data which is of interest to the populatj-on

4
biologist. On the other hand, research on the quokka was
aimed at elucidating the factors control-ling population síze
after a large die-off of quokkas on Rottnest Island was
observed in the summer of 1954 (Waring I iI956). other
studies which have been more limited in extent, but which
have nevertheless provided useful information, are those on
the Eastern Grey Kangaroo (Maø'opus giganteus) , the WhiptailWallaby (M. parvyi) and the trarma Wallaby (tt. parnm) , (Caughley,
1964; Kirkpatrickr I965a,L966, 1967; Kaufmann, I974; Maynes,
1974, 1977) .
Both the red kangaroo and the euro are welladapted to living in the arid zone but have developed differ-ent physiological and behavioural mechanisms to cope withthis environment. Research into their abundance and the
factors influencing population size have indicated these
differing patterns of adaptation.Densities of red kangaroos have been measured by
Frith (L964) in the Riverina district and in north-western
New South Wales, by Newsome (1965a) in central Australia, and
by Bailey (1971) in far western New South Wales. These
workers aII observed great changes in the density of anj-mals
in their study areas over relatively short time periods.
They believed these chatrges could be attributed to the
effects of either a drought, movements, or professionalshooters. Frith (L964) concluded. that shooting was probably
tl:e main factor for .Ehe decline that he observed as neithernatural mortality nor movements could account for it.Newsome (1965b) found that red kangaroos were quite mobile
resul-ting in conqLegations of anímals in areas where gleen

5
food persisted. However, after raj-n these animals dispersed
widely. Thus, Newsome (1965a) thought that the nr.lrnbers ofred kangaroos on his study area depended on the avail-abilityof green herbage and shelter. eaitey (1'g7I) showed that a
variety of movementpatterns could occur. Some animals \^/ere
essentialty sedentary, while others exhibited a marked
mobility. Among the mobile animals neither sex nor any age
group predominated. The decline in densi-ty that Baitey (1971)
observed appeared to be due to a combination of the three
factors; natural mortatity due to drought' movement ofanimals out of the area and an increased harvesting prograÍtme
by professional shooters.
In contrast to the red kangaroo the euro is sedent-
ary and occupies a permanent home range that contains shelter'food and occasionally, water (Ealey | 1-967b) . However, durj-ng
a long drought it has been observed that as the proteincontent of their food declines: there is a fall in body weight
and haemogtobin levels (Ealey and Main , L967') . Because they
do not disperse to obtain better quality food many clie ofstarvation.
Studies on the euro have indicated that they do
have a low nitrogen requirement (Brown and Main, 1967¡ Brown,
1969). Work on the red kangaroo seems to indicate that they
reguire a better quality dietn although some conflictingresul-ts have been obtained. Foot and Romberg (1965) found
that juvenile red kangaroos were better adapted to make use
of poor guatity forage than sheep. Mclntosh (1966) and
Forbes and Tribe (L970), using mature animals, showed the red
kangaroo was inferior to sheep .in retainj-ng nitrogen and

6
utilizing poor quality roughage when placed on a low nj-trogen
diet. However, d-ifferences in the diets could account forthe discrepancy in results. The poor quality diet given by
McÏntosh (1966) was lower in crude fibre and higher ínsoluble carbohydrate than that of Foot ancl Romberg (1965).
Forbes and Tribe (1970) concluded that the red kang,aroo may
either have a higher nitrogen requirement than the euror or
their results may have been due to an inadequate energy in-take while on the poor quality diet. In an experiment where
euïos, sheep and red kangaroos hrere compared, Hume (I974)
found that the red kangaroo was less efficient than the euro
and sheep in retaining nitrogen and sulphur, and in digestingfibre, when fed poor quality roughage. Hence, red kangaroos
compensate for this by beingr highly selective in their feed-
ing (Newsome, I965b¡ Griffiths andBarker, L966) while the
euro is able to survive on plants low in nitrogen, except
during extended droughts (Ea1ey and Main, 1967) .
Field studies on reproduction in these macropods
indícates that many females enter anoestrus during drought
and that many pouch young die (Ea1ey, 7-963¡ Newsome, I964a,b) .
Frith and Sharman (1964) and Newsome (1965c) showed that a
reduced food supply resulted. in a high mortality of pouch
young and young at foot in red kangaroos probably caused by
a failure of lactation..On Rottnest Island, Western Australia the quokka
has been studied in two areas which differ mainly in the
availability of water. Tn the Lakes area water is present
a.Il year rouncl while on the West End there is no free water
available during summer. The population on the West End

7
appears to be isol-ated from the rest of the island as they
do not migrate from there at any tirne of the year (Dunnet,
19621. Holsworth (1964) studied the population on the West
End and suggested that changàs in their pattern of reproduc-
tion tended to stabiLi-ze the population in a density-depend-
ent manne:c. Following a population decline around 908 offemales would breed, but when the population was increasingt]:e birth-rate decreased untíl less than 50% of the females
\^rere reproducing. However, the harsh conditions over
summer also exerted an effect as a high mortality occurred
each year around the end of the dry summer period. Thus,
much of the research on this species has attempted todetermine the physiological changes that take place duringsurnmer and the factors whictr cause them.
Quokkas show a pronounced seasonal cycle inphysical condition. They are in peak condition at the end
of spring but then there is a steady decline in weight over
the sununer. If the summer is prolonged a large proportionof the population dies. Shie1d (1959) found that there was
a pronounced anaemia associated with the clecline in condition.He also found a difference between the lrlest End and Lakes
area populations. Those on the West End appeared in bettercondition in spring but had lower body rveights and a more
pronounced anaemia at the end of suilrmer. From the work ofBarker (1961a,b) it appeared that copper deficiency may be
associated with the seasonal anaemia but it is not. the main
factor responsible. In a later study, Shield (1971) found
that a decrease in blood. volume in autumn was due to a
decrease in red cell volume. Barker, Glover, Jacobsen

B
and Kakulas (I974) subsequently showed that reduction in red
cell diameter, haemoglobin levels and haematocrit occurred
from spring to autt:rtn.
Storr (11964) examined the diet of the quokka and
found that nitrogen levels in their food declined over
summer. However, not enough information was available on the
nitrogen requirements of the quokka to say whether plantnitrogen was inadequate during sunmer. Barker, Glover,
Jacobsen and Kakulas (L974) attempted to reproduce the
anaemia suffered by field animals by placing two groups ofcaptive quokkas on a low nitrogen diet, one group having
water ad Lib. and the other group on a restricted water intake.Although a partial anaemia developed, the experiment did not
continue long enough because adverse weather conditj-ons kitl-ed the experimental animals. However, from their data they
theorized that animals living in the vicinity of the Lakes
area suffered from an absolute nitrogen shortage while those
on the West Enit suffered from an inadequate water intake and
a shortage of niuågen.It is apparent from these studies that the size of
macropod populations is regulatecl by environmental condit.ions
which control the abundance and quality of food plants. The
behavioural and physiological characteristics of the individ-ual species show the extent to which they have adapted totheir environment.
I.2 THE PRESENT STUDY
fn l-975 when the present. study began some inform-ation was available on the physiology of captive l(angaroo

9
Is1and Wallabies. This included work on nitrogen metabolism
(Barker, l-968¡ Lintern and Barker, 1969; Barker, Linte-rn and
Murphy, L970¡ Lintern-Moore, I973a,b), thermoregulation(Dawson, Denny and Flulbert, 1969), and thyroid function(Setchell, I974). In addition, a considerable amount was
known about the reproductive physiology of female wallabies 'reviewed by \nda1e-Biscoe, Hearn and Renfree (L974) . The
only work done in the field has been an assessment of the
nit,::ogen status of the wallaby at different times of the year
(Barker, 797l-). A progranme of ear-tagging was carried outin conjunction with this study in Flinders Chase National
Park, Kangaroo Island, and resulted in a large pool ofindividually marked animals (Andrewartha and Barker, 1969).
The data obtained from this marking progranìme has been used
in the present study to estimate population numbers from
L966 to 1969.
The large undistu::bed populaLion of wallabies atFlinders Chase Nat.ional Park provides an ideal situation fora study of the field biotogy of the Kangaroo Island Wal1aby.
I chose to work on the population dynamics of this animal
for a number of reasons. Firstly, the wallaby was access-
ible, abundant ancl relatively easy to catch. Moreover'
specimens could be obtained from nearby farms, for the
reproductive study, without disturbing the protected popula-
tj-on. Secondly, there was a laclç of detailed'information on
the populat.ion biology of macropods as a group. Thirdly'the species was regarrled as a pastoral pest and informationon thej-r biology was required before effective managenent
plans coul-d be formulated.

t0
The core of my study of the Kangaroo fsland
Wallaby has been the estimatj-on of population size using the
mark/recapture method. This required ear-tagging a largenumber of animals in orr. p.t"icular part of Flinders Chase
National Park during I7 catching trips made at approximately
two-monthly interval-s. In addition, at the time of capture,
animals were examined for their stage of tooth eruption.This data was then compared with that obtained from captiveanimals of known a9ê, such that the age structure and survivalrates of the field population could be calculated.
Migration is another factor which is important indetermining population síze. To take this into account,
information on the movelnents and home-ranges of several
wallabies has been obtained at different times of the year
using radio-transmitters. Other aspects of the biology ofthe Kangaroo Island Vûa11aby which were investigated in thisstudy include water metabolism in the fie1d, onset of sexual
rnaturity and seasonal changes in the male reproductive tract.
1.3 THE STUDY AREA
1.3.1 LocationKangaroo Isl-and is situated approximately 130 Km
south-west of Adelaide, across the mouth of Gulf St. Vj-ncent.
The island is I45 I(m long, east to west, and 55 Km wide atthe widest point, and the total land area ís approximately
)3890 Km-.
l'he western two-thirds of l{angaroo Island iscovered by a high plain or plateau capped by an ironstone or
lateritic crust while the southern and western coa.sts are

1I
backed by calcareous aeolinite dune-systems. The plateau
has been, cut by rivers and streams al-ong its northern and
southern margins. The eastern end of the island is ]ow
lying and more fertile. For this reason it has proved more
suitable for intensive agriculture and much of it is now
cleared. The first official settlement took place at thisend of the island in 1836, âfthough before thi.s time the
island was frequented by whalers and sealers -
Flinders Chase Nati_onal Park occupies most of the
western end of the island with an area of 570 Km2. The
sLudy area was located in the vicinity of the original- Rocky
River llomestead and the present Park Rangerrs Headquarters
in Flínders Chase (rigure 1.1).L.3.2 Climate
The climate of Kangaroo Island is typicallyMediterranean with mesothermal- temperatures and a pronounced
concentration of rainfalt in the winter months (Bauer' 1959).
RainfalI and temperature data were obtained from the Adelaide
Bureau of MeteorologY.The mean annual rainfal-l recorded at the Rocky
River station in Flinders Chase for the years 1965 1978 was
806 mm. Mean monthly total rainfalls over these years isshown in Figure 1.2 while monthly rainfalls for the period of
study are pïesented in Table 1.1. The total rainfall over
the sunmer months (December - March) are shown in Tab1e L'2'The ef fect of rairif al-I, temperature and evaporation
on promotion of plant growth shows that rainfall is effectivefor about 6.5 months over most of the island (Burrows, 1979)
So that the growing season beginsr oD average, in the second

T2
\^reek of April and ends around the third week of October.
The mean maximum and minimum temperatures for each
month of the year (from 1965 1978) at Parndana are shown in
Figure l-.3 and the extreme *å*imu* temperatures for Lg75
1978 are presented in Table 1.3. Parndana is situated in
the centre of the island approxj-mately 50 Km from Flinders
Chase.
1.3.3 VegetationThevegetationiscomprisedofathicksc]ero-
phyllous cover 2 - 10 m in height and dominated by EueaLypts,
many of which exLribit the mallee form, with Acacias, MeLaleucas
and Barú<sias forming much of the shrub layer 'on ttre study area the d.ominant trees are EucaLyptus
&Luet,sífoLia anð. E. obliqm while the shrub layer consists of
AcacLa retirndes, A. az,nø.ta, MeLaLeuca Lanceolata, Hakea rostrata,
Bcnksia mat'girnta and B. ornT.-ua with occasional Xqnthot'z'hoea
tateanû. The ground cover within the scrub contained such
plants as rsopogon cez,atophyLLus, Epacris intp?essa, Leptosperm'tn
jrurLperLnwn, LasiopetaLwn schulzeníi and' Hibbez'ti'a- sev"Leea.
on the cleared area surrouncling the Rocl<y River
homestead the southern corner \^IaS covered by Bracken Fern'
Pteridiwn eseuLentwn, while the rest of the area consisted of a
rnixLure of introduced and natíve grasses ' small annuals and
krryophytes. The plants on the cleared area are subject to
heavy grazLng pressure from Grey Kangaroos(Macropus fuLígírnsus
fuLigírnstn) and Cape Barren Geese (Ceneopsi's rnuaehoLLandíae)
as welf as the wallabies. The height of this ground cover is
kept to around 2 - 3 cm throughout the year by the continuous
grazíng.

13
The affect of the seasonal distribution of rainfallon the plant cover of the cleared area is shown in Figures
1.4 and. 1.5. The photographs \,vere taken in suÍlmer (Figure
1.4) and in winter (Figure f.Sl. During sunmer the
vegetation diies out, the annuals disappear and patches ofbare ground appear. In winter the pasture appears quite 1ush.
A list of the plants identified on the study area ispresented in Append.ix I.


Figure 1.2
Mean Total MonthlY RainfallRiver from 1965 to
for Rocky1978E
E
(E
.E(!É.
.c,co=(5
Êc,(goE
160
120
80
40
JFM AMJJASOND
Figure 1.3
Daily Maximum & Minimum Temperatures
Parndana for each Month of the Year
from 1965 to 1978
Meanfor
25 o/'
20
15
10
aa
Maxa
()o
0)
(E
oeEP
¡¿O
a
'\Mean Min.a
G
5
----n ¡/'
JFMA MJJASOND

TABLE 1.1
RAINFALL (MM) AT ROCKY RIVER, FLTNDERS CHASE
M A M J J A SYear
1.975
t976
]-977
r978
J
34
35
44
F
4
49
13
8
6B
3
40
31
4L
38
L4165
106
62
t37
75
82
T7T
92
227
]-52
78
72
188
79
100
54
75
o
66 l-26 35
64 84 37
76 14 97
]-29 35 24
93
119
42
6
22
13
I4
TotaI
789
746
690
810
TABLE I.2RAINFALL DURING SUMMER MONTHS (DECEMBER . MARCH)
December a975 - March 1976
December L976 - March 1977
December L977 - March 1978
HÈ

TABLE 1.3
EXTREME MAXIMUM TEMPERATURES (PENNOEXA)
(oc)
M A M J J AYear
1975
l-976
l-977
l-97 I
J
36 .3
39.2
40.8
38. B
F
39.8
34.2
40.9
34.6
31. 3
33.9
34 .6
36.2
29 .9
28.9
25.2
30 .3
25.2
20 .4
22.8
24.5
L6.9
L7 .2
16.2
16.7
22.2
17 .2
L8.7
77.7
I7.218 .0
22.2
19.4
S
18.7
19.7
24. r19 .6
o
25.3
24.0
32 .4
26.9
N
29 .9
30 .9
35.2
33.0
D
40.4
4I.336 .9
35. 3
H(¡


2"0 GBNERAL MXTHODS

16
2.I CAPTURE OF WATLABIES IN THE FTELD
Fence-traps (Andrewartha and Barker, ]-969) were
built in a number of locations using 1 m high wire-nettingand star droppers. The design of these traps is shown inFigure 2.I. From October 1976 onwards the wings of the two
traps on the main study area \^¡ere extended during each
catching trip with nylon nets (3 cm mesh, 20 rn x 2 m) . The
nets were supported by wooden stal<es driven into the ground.
After dark wallabies emerged from the scrub tofeed on the main stud.y area. They had access to this area
through smal1 holes in the fence and these were blocked offbefore catching commenced" The operators then attempted to
drive the animal-s slowly along the fence line and into one
of the traps. Once they were within the main yard of the
trap, the gate was closed" The animals \^/ere then caught withhand nets and placed individually into sacks"
At least two people were needed for catching opera-
tions. Head torches provj-ded sufficient light while leavingboth hands free for handling wallabies.
After three to four drives, when no more wallabiescould be caughtn those animals which had been captured were
transported back to the field st.ation.
2.2 EXAMTNATION OF ANTMALS IN THE FIELD
After capture, all animals were ear-tagged withind.ivÍdually nu¡llcered monel metal ear tags (Fingerling tags
No. F3, Sa-It Lake Stamp Co., SaIt Lake City, Utah).
Initially, all animals \,vere tagged in the right ear but laterthey \^rere tagged in both ears to obtain an estimate of tag

ne,woy gotes
Smoll yordfor netlingwollobies
Fence surround mgcleored oreo
Gateof tropN$on net-+
lo extend thelength of the trop
Figure 2.L Design of the fence-trap used -in one cornerof the Main Study Area for capturing wallabies.

t¡
I7
loss.A number of observations were recorded from each
animal exarn-ined, these being: sex; body weight; pes length;stage of tooth er,uption; condition of pouch; presence ofpouch young; sex of pouch young; pes, hind leg and head
length of pouch young; the teat to which the pouch young was
attached; and the general condition of the animal-.
2.3 TOOTFI ERUPTTON STUDIES OF KNOWN AGE ANT}IALS
2.3.L Animal Husbandry
Animals were housed in large concrete-floored yards,
either partly or who1ly roofed with corrugated iron. Cages
measured 9.5 m x 6.7 m and housed 10 15 wallabies of mixed
sex and ages. The floors were covered wíth straw.Kangaroo pellets (Wil1iam Charlick Lt.d.) and water
\¡rere always arrailable. Lucerne hay was given every other day
and fresh cabbageS and carrots trvice a week.
2. 3.2 Age DeterminationAge was determined by examining the sequence of
eruption of premolars and molars ofknownage animals.Nine adult females, with pouch youtlg, were obtained
from Kangaroo Island in August 1975. The pouch young were
measured to obtai-n their date of birth and the first examin-
ation of the:L¡r teeth took place in December.
Animals v/ere placed j-n sacks with their heads justemerging from the opening while the hin<l }egs were firmly heldby one pe-rson. The other person both controlled the fore-lirnbs and. examined the teeth using an auroscope handle with a
bent arm whilè the ja\.{s were held open will.h a mouth gag.

1B
2.4 TELEMETRY
2.4.L Equipment
Three types of radio-transmitter were used during
the study:(a) The first transmitter was designed and made by lt4r. N.
Weste of the Electrical Engineering Department, University ofAde1aide.
Transmitter: I47.5 WIz, 1 w, crystal controlled, FM modulat-
ed with 1 RHz tone for 30 secs. every 5 mins..
Antenna - "rubber d.uck" he1ix.
Receiver: Superheterodyne with 10 eJ-ement yagi antenna.
This transmitter was used only once in December 1976 because
of its size and- weight. - It was attached as a back-pack to a
large male (Male 1). The movements of ùhis animal were
followed for three days and then the transnitter was removed.
(b) Eight transmitters \^rere subsequently borrowed from the
Division of Wildlife Research, C.S nT.R.O. , Canberra. They
were initially designed for use on dingos and were reduced insize to fit the wallabies.Transmitter: operated in the U.H.F. band, 403.I 1üIz with
channels spaced 10 KHz apart with differentpulse rates to identify individual animals.
Power supply was 7 Mallory RM 640 cell-s inseries. Transmitters were wrapped in parafilmand fibre-g1ass tape, coated with araldite and
attached to small dog collars. Total weight oftransmitter was L2O grn. Aerial was a helicalmonopole,
Receiver: a doubl-e conversion superheterodyne with a

L9
sensitivity of 135 dbM. The antenna was a
4 element yagi with two directors and measured
39 x 39 cm. For locating animals in the fieldthe antenna was hand held.
(c) The third type of transmj-tter used was obtained. from
the AVM Instrument CompâDy, Champaign, Illinois, U.S.A. The
equipment consisted of SB 2-îv crystal-controlled transmitters,a twelve channel model LA 12 portable receiver and a 4 element
yagi antenna. Each transmitter was powered by one mercury
battery (1.35 v) and the frequency range v¡as from 150.710 to
150.993 IvGlz with different pulse rates for each transmitter.Transmitters weighed 40 gm and were attached to collars which
also contained the antenna. The receiving antenna u/as mounted
on a 4 m aluminium po1e.
2.4"2 LocaLion of animals i-n the Fie1d
Location of animals was achieved by taking compass
bearings along the direcion of maximum signal strength. By
taking bearings from two or more points the position of each
animal could be pÌotted on a map by triangulation. A number
of fixed stations were used at various points around thestudy area.
A problem with this method of locating animal-s js
thal: readings cannot be made at the different stationssj-multaneously. This would not affect the resul-ts signifi-cantly as the stations were only 300 900 m apart.
Init.ially measurements were taken at irregularinLervals during the day while a normal collecting trip was
in progress. Later, to obtain more accurate measurements ofthe wallabies home-range size, âs well as their daily ancl

20
seasonal movements, I took readings at approximately 4 hourlyintervals over a period of 3 days, repeating this at differ-ent times of the year.
2.5 VIATER METABOLISM
2.5.L Estimation of Total Body Water and Water Turnover
Prior to field-work a Iaboratory experiment was
performed on 5 captive wal-labies (2 M, 3 F) to determine
equil-ibration time for tritium (rable 2.I) . The animals were
injected intramuscularly with 0.5 ml of tritiated saline ata concentration of 100 ltCi/mJ-. Blood. samples of 2 mI vüere
taken from the lateral tail vein at i-ntervals of 2 hours
over a period of l-2 hours. EquilibraLion was achieved within4 hours and the concentration of tritium in the blood remain-
ed relatively constant up to 10 hours.TABLE 2.I
CONCENTRATTON OF TOH (þCí/Ð AT VARTOUS
TIMES AFTER INJECTION
Animal No. 2
Time After Injection468
(hrs. )
10 I2
I2
3
4
5
M
M
F
F
F
12.9
11. IL4.7
L6 .7
14 .1
t2.I11.4
13. 9
16. t13.6
12 .0
11.3
13. I16 .1
13.6
11. 9
lI.213 .4
16. 0
L2.7
1I. 9
11. 4
13.8
16 .0
l-3.2
12.0
10. 7
13. 4
16 .0
13. 1
In the field the following procedure was used.
Wallabies v¡ere weighed 'to the nearest 100 g and given an

2L
intramuscular injection of tritiated saline r âs described
above. After allowing B - t hours for equilibration (over-
night) a 2 mI blood sample was taken from either the tailvein or by cardiac puncture. The animals were therr released
in the scrub near the point of capture. Upon recapture,during the same trip, they were re-weighed and another blood
sample collected. All blood samples were stored frozen.Stored blood samples were sublimed to dryness
(Vaughan and Boì-ing, 1961) and 0.5 ml of the separated water
hras added to t0 mI of scintillation f1uid. The scintillationfluid consisted of B0 g napthalene, 5 g PPO (2,5 diphenyl--
oxazolyl), 375 mI dioxane, 37 5 ml toluene and 250 mI ethylalcohol. Samples were counted for three periods of 10
minutes in a Packard Tricarb Scintillation Spectrometer
(lrttodel 3002), with a suitably diluted standard and a water
blank.The total- body water (TBW) was determined for each
animal from the inj-tial sample, after equilibration.activity TOH injected (uCi)
TBw (m1)activity TOH initial- sample (uCilm1)
Water turnover rates were estimated by fitting an exponential
curve to the data, plotting sample counts against time indays. The slope of the line was calculated from U fo/t,where Co is the activity at time O, Ct is the activity attirne L, and t is the time in days between samples. This
fractional change per day was multiplied by the TBW (mI) togive Lhe water turnover in ml/day"
2.5.2 Measurement of Body Fluid Compartments
Plasma \¡ol'¿me (PV) was determ-ined by the dilution

22
of the dye T1824 (Evan's blue) . This dye binds to albumin
and circulates with it. to al1ow estimation of the albumin
space.
The extracellular vofume (ECV) was determined using
sodium thiocyanate.Before collecting data from field animals an
experiment was conducted to see whether a single sample
technique could be used for estimating plasma and extracellularvolr:mes.
Four wallabies (2 M, 2 F) were cannul-ated in the
lateral tail vein using Terumo Surflo-st l{inged Infusion Sets
(2L c). The watlabies were anaesthetized with Ketalar(Xetamine hydrochlorj-de)_ at )-5 mg/kg. An initial blood sample
of 5 mI was taken from each wallaby to obtain the plasma blanl<.
At time zeÍo 1.0 m1 of sodium thiocyanate solution (70 mgrlml)
was injected into a marginal ear: vein. Fifteen minutes later0.5 mI of Evan's blue solution (4 mg/mI) was also injectedinto an ear vein. Blood samples were taken at 20, 30, 45, 60
and 75 minutes after injection of the thiocyanate. Blood
samples were placed in heparinized centrifuge tubes and spun
for 20 minutes at 3000 rpm to obtain plasma.
Plasma volurne could be estimated by measuring the
optical density of plasma samples directly against the pre-
injection blank in an Eel Spectrophotometer at 620 ryl- A
dye disappearance cuïve was fitted by eye to readings obtained
from al-l samples, except the first, and extrapolated to time
of, injection. Plasma volume was determined by comparison
with a standard curve made by dilution of the Evan's bl-ue
soluLion. A small correctic¡n was made for the plasma obtained

23
from the initial pre-injection sample.
The error involved in estimating plasma volume
from a single sample tal<en at 5 minutes after injection ofEvan's blue was 1.91.9? .
To obtain measuremenLs of extracellular volume the
plasma samples vrere first treated. with trichloroacetj-c acid
to remove plasma proteins. Tr¿o ml of plasma was mixed with5.5 m1 of water and then 2.5 m1 of 20eø trichloroacetic acidwas added relatively s1ow1y. After thorough mixj-ng they were
allowed to stand for 10 minutes before being filtered. EquaÌ
volumes of the filtrate and a colour reagent were mixed and
the opLical density read immediately aL 46Omp against the
blank sample prepared in the same way, The colour reagent
consists of B0 g ferric nltrate in 250 ml of 2N nitric acidmade up to 500 mI with distilled water and then filtered.
Extracellular vol-ume was determined by comparison
with a standard curve in the same v/ay as plasma volume.
For the ECV the error involved in using a singlesample at 20 minutes after injection of the sodíum thiocyanatewas 4 .6!2,42 .
Thus for measurements of plasma volume and extra-cell-ular volume in field animals it was decided that the
single sample technique gave reliable result.s. An initialblood. sample was collected by cardiac puncture for the pre-injection b1ank" Then 1.0 ml of thiocyanate was injectedinto an ear vein followed 15 minutes later by 0.5 m1 of Bvan's
b1ue. At 20 rninutes after the first injection another blood
sample was obtai-ned by cardiac puncture. Tlhis sample was
used to calculate the plasma and extracell-ular fluicl spaces.

24
2.5.3 Collecti-on of Urine and l-aeces
From January 1977 to May I97B urine and faecalsamples \^rere col-lected from wallabies held for L2 hours inmetabolj-sm cages.
The metabolism cages \^/ere constructed from 2 cm
square gal-vanized wire mesh and measured 60 "nl3. Cages
v¡ere U-ned with hessian to p::event the wallabies from
panicking and damaging themselves. Each cag.e was suspended
over a fibre-glass collecting shute and urine/faeces separator,
similar to that descríbed by Mclntosh (1966).
Urine drained into polythene jars containing a
small quantity of toluene and faeces were collected intoplastic baEs
' The volume of urine and wet weight of faeces
excretecl over the 12 hours was recorded. Samples were thenf.rozen for transport back to the laboratory.
Moisture content of the faeces was deterntined afterdrying samples for 24 hours at 105oc.
Osmolality of urine samples was measured with a
Knauer Osmometer. Sodium and potassium concentrations were
determined by flame-photometry with an Ee1 Flame Photometer
MK. TI"
2.5.4 Haematocrit
The total haematocrj-t value (red cells plus whitecelIs and platelet layer) was determined from blood collectedinto heparj-nized micro--haematocrit tubes after pricking an
ear vein. Sa-mples \,vere centrifuged f.or 20 minutes at 3000 rpm.
2.5"5 Plasma ProteinPlasma protein concentration was deLermined by

25
refractive index on an Atago Refractometer using the plasma
cotlected during measurements of haematocrit.2.5.6 Plasma Concentration
Blood samples \^rere collected by cardiac puncture
and placed ínto heparinized (lithium heparin) centrifugetubes. Plasma \,vas collected af ter centrifugation at 3000 rpm
for 20 minutes.
Osmolality and electrolyte concentrations \^Iere
determined as for the urine samples.

3. O AGE DBTERMTI{ATIO}]

26
3.1 TNTRODUCTTON
The ability to determine the age of individuals isan essential part of any study of the population dynamics ofa species. This information can then be used to constructlife-tables for estimating survival rates.
Many different techniques have been used in age
determination of mammal-s. These incl-ude the degree ofepiphyseal fusion (Washburn, 1,946), weight of eyelens(Oudzinski and MykyLowycz, 196I), tooth eruption and wear
(Severinghaus, 1949; Robinette, Jones, Rogers and Gashwiler,1957), and annual growth rings in horns (Caughley, 1965¡
Geist, 1966) and teeth (Scheffer, 1950; Laws, 1952¡ Kingsmill,7962; Low and Cowan, 1963; Pekelharing I 1970) .
. In the macropod marsupials age determination of thepouch young has been estimated from body measurements (Shie1d
ancl l{oolley, 196I; Sadleir, 1963; Sharman, Frith and Calaby,
1964; Murphy and Smith, 1970; Maynes, 7972) . In olderanimals either the sequential eruption of the molars (Sharman,
Frith and Calaby, 1964; Ealey, L967c; Shield, 1968; Maynes,
1972) or the forward progression of the molar row a.long thejaw has been used (Kirkpatrick, 1964, 1965Þ; Sharman, Frithand Calaby, 7964; Dudzinski, Newsome, Merchant and Bolton,Le77) .
In this chapter the growth curves obtained by
Murphy and Smith (1970) for pouch young of captive Kangaroo
fsland lrlallab-ì-es are compared with growth rates in fieldanimals. The patt-ern of tootir erup't.ion in anj-mals olderthan one year is descril¡ed an<l its usefulness for aging
wallabies in the fiel-d is assessed..

27
3.2 METHODS AND TERI{INOLOGY
3.2.I Age Deternr-ination of Pouch Young
In order to assess.the reliability of using the
g.r:owth curves obtained by Murphy and Smith (1970) in deter-mining the ages of pouch young in the field 19 young \,vere
measured at different times during the year in 1977 and 1978.
The aqes \^/ere det-ermined from head, Pes and leg lengths as
described by Murphy and Snrith (1970) . The eTTor |nvolved
\^ras taken to be the difference between the actual number ofdays between trvo successive measurements and the estimated
nurnber of days.
3,2.2 Tooth EruptíonThe tooth eruption sequence was observed in 23
animals (f¿ F, 9 M) of known age that \^¡ere born in captivity'and a further 5 females that r,ilere of unknown age when firstbrought from Kangaroo Island. The teeth of the upper jaw
only were examined at intervals of 2 - 6 months-
The notation used in recording the stage of eruption
of molar teeth followed that of Sharman, Frith and Calaby
(1964). Each stage is scored subjectively, three stages
being recognized in live animals.
Position ofPosterior LophNotation Position of
Anterior Loph
Just emergedthrough gum
Below the gum
.3 PartIY er:uPted Just emergedttrrough gum
.4 FuJ,1y eruPted PartlY eruPted
A fully erupted molar tooth was represertted by an
M foll-orn'ed by a capital- Roman numeral. For a partly erupted
2

2B
molar this was represented by the nr:¡lber of the fu11y erupted
tooth in front followed by the appropriate decimal notationfor the'stage of eruption of the partly emerged tooth.
3.2.3 Molar Index
The molar indices of the skulls of 19 animals (7 t,12 M) were measured using the method established by Kirk-patrick (1964). The notation used followed that of Newsome,
Merchant, Bolton and Dudzinski (1977), Ten stages in the
progression of any molar past the anterior border of the
orbits was recognized and given decimal notations accumul-ating
in tenths.3.2.4 Measurements of the Size of the Skull and Teeth
A series of measurements of both skulls and teethwere made on 69 crania (2I I', 48 M) from animal-s shot in the
field as part of the reproductive study. The skull measure-
ments vrere based on those described by Thomas (1888) and are
defined in Appendix II. Measurements were made with a dialcaliper reading to 0.05 mm and Ì^/ere recorded to the nearest0.1 mm. The right side of the skull was used for unilateralmeasurements, and for measuring teeth, except where thisside had been damaged.
3.3 RESULTS
3.3.1 Estimation of Age of Pouch Young in the FieldThe error j.nvolved in using the growth curves of
Murphy and Smith (1970) to age pouch young in the field are
shown in Table 3.1. fn 1977 only 2 animals had an errorgreater than 5 days rvhile in I97B all errors were under-
estimatj-ons and orrly one animal had an error that was less

TABLE 3.1 ERROR TNVOLVED TN ESTTMATTNG THE AGE OT'POUCH YOUNG
TN THE FÏELD FROM DATA ON CAPTIVE ANTMALS
Year
l-977
]-978
-sex ofPouch Young
First AgeEstimation
(days)
4777347577646B7275
6062695597639466
5111
Second AgeEs:timation
(days)
]-'20153118156161L37l.42159l_55
100139l_5 0143152136L4793
1s4]-62
Estimated Numberof clays between
measurements
73768481B4
,73748780
4077818B55735327
l-4951
Actual Numberof days between
measurements
78798277B284858975
44104109106
62101
6042
16560
Error( days )
Mean Error:s.o t 3.6
4272B18
728
715T6
9
Mean Error:i-5.9 ! g .z
53242
1111
25
MMMMFFFIF
MMMMMFFFFF
-\&
lv\o

30
than 5 days. The differences between the two years suggests
that nutrition of the mother is imporLant to the growth ofthe pouch young
3.3.2 Cranial Features and DentitionThe skull of Maeropus eugerrLí is strongly buílt with
short nasals, which are expanded in width at their posteriorends, a square inter-orbital region wh-iIe the inter-temporalconstrj-ction is scarcely observable (thomas, IBBB; Wood Jones,
1924). They also possess a well developed external zygomatic
shelf (Ride I 1957), (rigure 3.1).A marked sexual dimorphism hras observed in cranial
measurements, except for nasal wid.th in young animals (p3Cp4
still present) and inter-orbital width in adults (pA preserrt) .
Ma1es were always larger than females (Tables 3.2 and 3.3).The adult dental formula is:
.. 3 ., o-1 't Á'
1 o PMi Mä
Molars are hypsodont and the cusps are joined by transverse
rÍdges or lophs. A vestigial canine tooth is sometimes found
in the upper jaw.
In juvenile animal-s two deciduous prentolar teethare present, a sectorial tooth (p3) and a molariforrn toot-h
¿,[¿p*). These are later replaced by a permanent, sectorial¿.premolar (p'). Because of the resembiance between p3 and
4 - ^4p=, and dp= and MI, identif.icatj-on of these teeth is not
always easy.
Tooth measurements show that there is no significantdiffererrce in anterior or posterior widLhs between p3 u.rrd p4
in females but p4 is longer than p3. ÈIorvever, in males, p3
is significantly wider than p4, u..rd p4 is longer than p3

Figure 3.1
Ventral view of skuIl oWallaby showing the welzygomaLic shelf (zs).
Kangaroo Isl-andeveloped external
fa1d
A.
c.
B Dorsal view of sku1l showing the(n) and the square inter-orbitalshort nasalsregion (io) .
Teeth of a juvenile wallaby3p- = deciduous sectorial premolar
_4dp - = deciduous molariform toothMI and MIf = firs't and second permanent molar
teeth.
D
E
The permanent premolar (p ) has just eruptedon one side and has pushed out the deciduousmolariform tooth (apa¡ .
The permanent premolar (pa) is fully eruptedand has replaced both the deciduous molar-iform tootñ.(dp4) and the deciduous sectorialpremolar (pt).

BA
2cm zs
- ED
3p4p
M
/?l
!
)
\lJ
I
I
--;rl
- a-tÇa-
ë
¡J\bq
ñF

TABLE 3.2 SKULL I"IEASUREMENTS
"¿.FOR tu\IMALS OF DENTITION p" dp- MI..o - MIII .0
(E¡T, MEASUREMENTS TN MILLIMETRES)
Measurements
Basal Length
Nasal Length
NasaI l{idth
Inter-Orbital Width
Palate Length
Di-as tema
*
7Ì*
N.S
Females
Mean S.D. Range
8s. s0
34 .32
16.31
L6.66
53.88
L9.26
79 .0-9 3.0
30 .6-40 .0
13.7-18.115 .1-17 . I49.8-58.818.0-20 . 9
' 91.00
37 .70
17.70
l_7.83
s7 .85
20.95
8r.7-98 .7
32 - 4-4I.315.6-20.316. s-19 . s
5I.4-63.418.4-23.1
Studentst-test( 2Odf)
2. lrl*2.429*
N.S.
2.702*
2.238*
3.330**
N
Males
I4ean S . D Range
5.s5
3.23
r.721. 05
3.61
.99
9
9
9
9
9
9
6.6I3. 18
r.72.92
4.70
1. 39
N
13
13
13
13
13
13
Significant at 58 leve1
Significant at 13 levelNot significant
(¡)H

TABLE 3.3 SKULL MEASUREMENTS
FOR ANTMALS OF DENTTTTON p4 urtr Ïv(AT,L MEASUREMENTS TN MILLI¡'MTN¡S)
FemalesMeasurements
Basal- Length
Nasal Length
Nasal Width
Inter-Orbi+-al Width
Palate Length
Diastema
N. S.
tç
*:l
***
Mean S.D. Range
Males
N Mean S.D Range N
93.27
39 .L9
18.33
16. 33
60.42
22.I3
2.39
r.72r.44
oo
1. 59
2.65
99.69
42.55
19.91
l-6.87
64.49
25.TL
4.00
2.62
I.67L.27
2.78
1. 89
89 .8-96.236.7-4I.615.9-20.213.8-17.6
58 " 2-62.7
19 .r-29.3
T2
\2T2
12
L2
12
91.9-106.3
36 .5-47 .5
r7 .2-22 .9
l-4.6-19. I59 .0-70 . s
2A . e-28.0
Studentst-test( 4 5df)
6.646***5.050***3.r44**1.511 N.S.
6. 19 6** *
3.595***
35
3s
35
35
35
35
Not signì ficantSignifi cant at 5? levelSignificant. at 1? levelSignificant at 0.IZ level
(^)N)

33
(tables 3.4, 3.5 and 3.6), These teeth can also be
distinguished on morphological features. *iaf, p3 the main
cutting ridgre is in f.ine with the outer cusps on the lophs ofÁ,.3dp" and the molar row while the inner cusps of p- are in line
with the inner cusps of ¿p4 and the molars. In the permanentLpremolar (p=) the central- ridge is not in line with either
the outer or inner cusps of the molars (Figure 3.1).Although the tooth dp4 is veïy similar morphologically to
MI it is i;ignificantly smaller in size (tables 3.3 and 3.5).The anterior cingulum is more clearly separated in MI than
LÃdp=. In dp= it is extended upwarcls towards the labial surface
almost to the paracone.
There was Iittle sexual dimorphism in tooth sizeapart from dp4 and lIfI which were longer in juvenile males,
and MIVwhich was longer in adult males (Tables 3.4 and 3.5).3,3.3 Tooth Eruption Pattern
By the time the young have permatrently left the
pouch at 245 270 days (t"lurphy and Smith, 1970) two of the
three pairs of upper incisors have fuIly erupted while the
third has just broken Lhrough the gum. eoth p3 and dp4
emerge before the third incisor and before the young has leftthe pouch while MI is fully empted just after the young
Ieaves the pouch. The permanent premolar (pa) erupts at a
mean age of -1049 days with a ïange of 901 to 1196 days (N = 9).The sequence of erupt.ion of the molar teeth is
shown in Figure 3.2, The lir-re of best fit is átttrl through
the mean ages at which each stage was first observed. Data
for males and females is combined. This information was
supplementecl with examinat-ion of five captive females of

t
TABLE 3.4 TOOTH ¡4EASUREMENTS
FOR .AIÍIMALS OF DENTITIoN p3 dp 4 Mr-r11
9
9
9
3p
Measurements
anterior v¡idthposterior widthlength
4 anterior wid.thposterior widthIenEth
anteríor wid'thposterior wì dthlength
f anterior v,'id.thposterior wi dthIength
FemalesS.D. Range
Males.T:T Mean S.D. Range
Students ,t:test(20 df)Mrean
2 .663.234.63
4.024.084.70
4-664.695 .46
4 -974.826.r75. 305 .156 .90
2 .4-2.93.0-3.54.5-4.83.8-4. s3. B-4 .54.6-5.04. 5-5.1¿, L-tr, 2
5.1-5"64 .7-5 .54.6-5.45.8-6"65.0-5.64.8-5.66 -5-7 .L
2.623.234.71
4.004.r84.87
4.784.765.60
5.104.956 .53
5 .365. 097.15
.77
.15
.09
.2I
.23
.15
.18
.27
.76
.25
.29
.24
.24
.34
.28
.09
.15
.31
.16
.20
.19
.23
.2r))
.18
.16
.19
.2I
.24
.29
2 .5-2 .83.0-3.54.1-s.r3.7-4.23.8-4.54.5-5 .1
4. 3-5 .l_4 .3-5.05. 1-5 .9
4.7-5.44.8-5.36.3-6.85.r-5 .74.7-5.46"8-7.6
.646 N.SO N.S
.878 N.S
.24I N.S.1.057 N.S.2.342 *
r-37.65
r.7 2
1.339 N.I.222 N.3.758 **
S.S.
.42
.31L.44
(10 df)
N
13
13
13
13
dp
I'fT
lvi.I
MI IÏ
N"S*
I
9
4
0 lt.s.3 N.S.8 N.S.
5 rr.s.6 N.S.1 N.S.
anterior widthposterior widthlength
Not significantSignificant at 5% levelSignificant at 13 level (,:k*

T.ABLE 3.5 TOOTH MEASUREMENTS
FOR ANII4ALS OF DENTITÏON P4 IÏI-IVM
4p
Measurements
anterior widthposterior widttrIengthanterior widthposterior widthIengthanterior widthposterior widthlengthanterior widthposterior wid.thlengtlrante:rior widthposterior widthlength
FernalesMean S.D. Range
MaIesN Mean S.D. Range
Stud.ents t-test(45 df)
.49r N.S.O N.S.
.249 N. S .
N
35
Nr
M
Ivi
II
ÏIT
2.563. 105.09
4.965.A45"52
5 .445.276.20
5 .645. 396.99
5.454.756.9I
.18
.15
.25
.2I
.19,2L
.24
.2L
.40,o
.33
.40
.33
.JJ-32
2.3-3.02.9-3.54.8-5 .7
4.6-5. 34.7-5 .35 .2-5 .8
5.0-5.74.8-5.65.5-6.95 .2-6.25.0-6.06.4-7.55.0-6.14.1-5 .36.4-7.3
2.533.105 -07
4.975.035.44
5 .475.206.22
s .795.406.99
5.424.757 .2L
I2
I2
I2
12
11
.19
.i4
.2)-
.22t^
.31
.27-24.32
.27)tr,
.34
.33)1
.31
2.2-3.02.9-3.44.8-5.64.6-5 .74.6-6 "04 .9-6 .2
s. 0-6. 04.8-5 .95.4-6 - B
5.2-6.44.9-6.05.8-7.54. 8-6 .24.I-5 .26 .5-7 .B
35
35
35
33
.T4T N. S.
.I47 N"S.
.999 N.S.
.361 N.S
.137 N.S
.157 N.S
.261 N. (42 df)I
N.S.N.S.N.S.
r.57 4.096
0
sS
Mv
N.S
N.**02.7l-3
Not significantSignificant at 1å leve1 (,
(n
**

36
TABLE 3.6
STUDENTS t TESTS ON TOOTH MBASUREMENTS
3 4p AND p
Females Males
anterior widthposterior width
length
= 1.300 N.S
: 1.967 N.S
= -!.882 ***
tt_9
ttgttg
ttt
46
46
46
2.2rI *
2.7r4 *'*_3. 971 ***
4 Idp AND }1
Females Males
anterior widthposterior width
length
= 6.94]- ***
= 5.161 tt**
= 10.397 *x*
L
"16¿tr-6L
"r6
!t24!t24Lt24
10.039 ***
7 .2I4 ***
9.057 )r*x
I{"S,*
*)t
*ts*
Not signj-ficantSignificant at 5? leve1
Significant at. I% levelSignificant at 0.1% leve1

37
unknown age which were examined at the same time. These
animals had tooth eruption stages of MII.2 to MIII.2 when
first examinecl and were used .to extend the graph up to when
the fourth molar was fully erupted. T'he eruption sequence
for each of these animal-s was plotted on graph paper and then
adjusted to the curve constructed from known age animals to
give the best fit.This method was also used to plot the er:uption
sequence of 10 females and 10 males that wele caughL several
times in the field (Figure 3.3).3.3.4 Molar Index
The plot of molar index against age for nineteen
animals is shown in Figure 3.4.
The regression equation obtained j-s:
Log Age (days) = 2'0939 + '4067 Mo1ar rndex
(Correlation Coefficient, T = .9837)
3.4 DTSCUSSION
When estimating ages of pouch young in the fietd.using data from captive animals it is necessary to assume
either that the growth rates are the same or to actuallymeasuïe growth rates of field anirrials. Sharman, Frith and
Calaby Q964) suggested that gro',vt-h of red kangaroos in the
pouch approximated an all..or-none phenomenou. Shield and
Woolley (1961) considered that as the growth proportions were
similar in cap'L.ive and wild caught guoJ<kas it was probablethat their growth Iates were simi-lar- Sadleir (l'963) also
found this to be true for euros and concluded that nutritionv/as never poor enough to retard the growth of pouch young.

iV.o Captive Animalso.4
o.3
-lt'o5.4
0.3
o-27
23
1
Figure 3.2
Eruption of P4
3AGE (years )
o
o5
10
13
ul(5
*< m.o
19
21
.4
.3
o.2
zIt-o-
E,¡tJ
É.
JoE
't8
2
l.o4
654o
Molar eruption sequence of captive Kangaroo Island Wallabies.Vertical lines represent mean age and horizontal lines the range.Numbers above horizontal lines represent the sample size.Symbols are for 5 females that were of unknown age when first caught.

tv,
lll
oo
oo
o Maleso Females
Field Animalso-4
o.3
o-2
al¡Jot-ct)
zIl-ÈÊclu
EJo=
o
o
l.o
o.4
0.3
o.2
¡t.o0.4
0.3
4.2
7a)D)tD)D
OO
oo
4
oo
Io 1 3
AGE (years)
Figure 3.3 Molar eruption sequence of 10 females and 10 males re-captured atvarious intervals in the field. Curved line is the line of best-fitobtained from captive animals.
6542

4.O
3.5
Log (Age in days) : 2-0939 + -4067 (Motar tndex)
c(r = .9837)p<.01
ooO o
o Maleso Females3.O
2.5
o
O
1 23 4 5 678910 15(Age,Yrs)
2.5 3.5
Figure 3.4 The molar index of 19 animals plotted againstIog. age in days.
o o
3.O
LOG AGE ( daYs )
ooo
.5
xt¡lo=a
É,
JoE
2.O
1
1.O
.5
o 4.0

3B
However, Ealey(1967c) clemonstrated that euro pouch young in ì
the field can have a sl-ower growth rate than captive animafs
under conditions of severe drought. The information gained
from the present study on the Kangaroo Island Wallaby al-so
indi-cates that in some years growth of pouch young may be
retarded. This occurïed in )-978 which began with a 1ong,
dry summer. However j-n normal years it seems that estímating
the age of pouch young in the field is quite accurate.
For anj_mals older than one year body measuremen.bs
are no longer useful for aging purposes. By using the mol-ar
eruption sequence it is possible to establ-ish the age ofKangaroo Istand Wallabies in the field up to the erupti-on of
the fourth molar which occurs between 5 and 6 years of age"
An animal- that is caught after the eruption of the fourthmolar cannot be aged with this technique. Althouqh there isvariation in the age at which each eruption stage is firstokrserved it is nevertheless possibte to place animals withinyear-classes in the following ways. If a number of observa-
tions have been made on different occassions the "best fit"can be reliably determined" When only one observation isavailable the time of year when it was made can aid in placing
the animal in the approprj-ate age-group. This is because the
Kangaroo Is1and Wallaby has a strict seasonal breeding pattern
so that age-classes are quite clistinct (Andrewartha and Bar:ker'
1e6e) .
When applying tooLh eruptj-on clata f::om captíve
animals to the field situation Sharman, Frith and Calaby
(1964) observe<f what they consiclered was an excess ofanimals in tire Ml-.1 and MTI.J. stages. Tl'rey assumed that these

39
stages vrere of longer duration in field animals than the data
on captive ani-mals indicated. Variations in the timing oftooth eruption stages has al-so been observed in mule deer,
)dpeoiLøus hemíornLs, (nobinette, Jones, Rogers and Gashwiler,
L95.7) and Himalayan thar, Hanitragus iemLahians, (Caughley, 1965).
Despite this, Sharman, Frith and Calaby (1964) , Ealey (1961ç)
and Shield (l-968) concluded that the sequence of molar
eruption provides a useful means of determining the aç¡es ofmacropods in the field. This would also appear to be the case
for the l(angaroo Island Wallaby
Sharman, Frith and Calaby (1964) measured the
forward progression of molars relative to the zygomatic
process in red kangaroos but found there was some variablityin the position of the process in animals of the same age.
Ealey (1967c) showed that in euros the movement of the molar
rov¡ was directly related to the eruption of the molars buthe did not relate molar progression directly to age beyond
full tooth eruption. Ilowever he dj-d. relate rnolar progression
to a dental wedr pattern which was used to separate out age
groups- Kirkpatrick (7964, a965ij) found that it was possibleto measure the forward progression of the molars relative to
the anterior border of the eye orbits, using either skullsor radiographs of living animal-s. Dudzinski, Newsome,
Merchant and Bolton (.1,977 ) in a study on agile wallabies,Møcz,opus agilìs concluded that molar progression is more
accurate than molar eruption for determining age because itis objective and has narrower confidence limits. However
this method entails using skulls o:r obtaining radiographs ofliving animals. !-or a f iel-d study of a population of live

4A
animals, unless access to an X-ray apparatus is readilyavailable, molar eruption remains the only methocl. Mo1ar
progression is useful- in aging a series of skulls from
animals that have died in the field or in constructing life-tables from animals obtained by shooting. Wilson (1975) used
this method to construct. life-tabl-es for red kangaroos, grey
kangaroos and wallaroos that hrere obtai-ned by professional-
shooters. Molar progression in the Kangaroo Ts1and Wallaby
vras Ij-nearly related to 1og age and could be used to age
animals up to about 15 years, Flowever, due to the smal-l number
of observations and the var-iation in ages of animals with the
same mol-ar index these resul1-s are provisional on1y.
The technique 'of using histological sections ofincisors to count annual increments to dentine or cementum
does not seem to have been investigated in macropod.s. It has
been found useful in aging several species of ungulates, such
as moose , ALces aLces, (Sergeant and Piml-ott, 1959) , barren
ground caribou, Rangífer tarandus, (McEwan, 1963) , and deer ofthe genus )daeoiLeus (Low and Cowan, 7963; Gilbert' 1966¡
Lockard, a972) . Kingsrnill (1962) found that sections of the
incisors of brush-tailed possums ( Tt'Lchasruus uuþecul'a) did
not Show regular annual rings although several age-classes
could be recognized. Pekelharing (1970) showed that the age
of possums could be determined by counting cementum layers inground sections of molars. A single molar from a red-necked
wallaby, Macropus rufogrisea, groUnd in the same way also showed
layers in the cementum.
It was of interes'l- to determine whether annual
growth rings also occurred in the teeth of the Kangaroo

4IIsland Wallaby. The fj-rst incisors and first molars of eightanimals (5 M, 3 F) ranging in age from 1 - 14 years were
examined using the sectioning technique of Lockard (L972) forincisors and the methods of Pekelharing (1970) for grinding,etching and staining molars.
For animals up to 4 years the number of layers could
be correlated with the age of the animals using either method.
In ground molars from older animals the layers v\¡ere hard todistinguish while in the sections of incisors there were
always fewer rings than the anj.malts age in years. This was
because the outer rings were cl-ose together and could not be
clearly resolved.Thus it would'seem that molar progression sti1l
remains the best method of aging macropods beyond the stage
of full tooth eruption.

4.0 ASPECTS OF REPRODUCTION

42
4.T INTRODUCTTON
A knowledge of the reproductive characteristics ofan animal plays an important.part in understanding the
population dynamics of that species.A considerable amount of information i-s no\.r avail-
able on the reproductive physiology of female macropod
marsupials (reviewed by Tyndale-Bj-scoe, Hearn and Renfree,
I974). This incl-udes the reproductive pattern of the female
Kangaroo Island Wallaby which can be summarized as follows:There is a well defined breeding,season with most
young being born in late January and early February (Andrew-
artha and Barker, L969) . There is a post-partum oestrus, and
if conception occurs thei embryo will develop only to the
stage of a unilaminar blastocyst (Berger, 1966) and the corpus
Iuteum also will become quiescent. If the pouch young islostr or removed, between January and June the quiescent
corpus luteum and blastocyst resume development and another
young is born 26 27 d.ays later (Renfree and Tyndale-Bjscoe,
L973). Loss of the pouch young afte:r June has no effect on
the corpus luteum and blastocyst. Usually the first pouclt
young is reared successfully and remains in the pouch forI - 9 months (Murphy and Smith, 1970). During this time the
mother is in lactational anoestrus (Berger and Sharmalr, l-969)
which merges with the seasonal anoestrus from around June to
December. The quiescent corpus l-uteum and blastocyst resume
development a few days after the sufilmer sol-stice in IateDeceml:er (Berger and Sharmanf 1969; Renfree and T\zndale-
Biscoe, 1973) . Thus the cycle is completed by the birth ofanother pouch young about a month later. The slight. decrease

43
in daylength after the sulrlmer solstice is thought to be
responsjble for reactivating the blastocyst as Berger (1970)
has shown that transferring wallabies to the northern hemi-
sphere reversed their breed'ing cycle -
Investigations into the hormonal mechanisms control-
ling embryonic diapause in the Kangaroo Island Wal-Iaby have
shown that the pítuitary is inhibiting the corpus luteum
(Hearn, 1973, Ig74). This inhibition is initiated and main-
tained by the suckling stimulus. Tyndale-Biscoe and Hawkins
(1977) showed that prolactin appear:s to be the pituitary
factor that is responsible for suppression of the corpus luteum
during emÌ:ryonic diaPause.
Despite our knòwledge of the female marsupial
reproductive system ther:e have been few studies on the male.
The onty male marsupials that have been studied in ally detail
are the dasyurid Antechinus stuav'tü (Woo1ley, 1966) and the
brush-tailed possum (Gilmore, 1969) . Tn the seasonally breed-
ing brush-tailed possu¡n Gj-lmore (1969) found that the testis
anit epididymis d.id not show any weight changes durinq the
breeding Season but the size of the prostate gland increased
considerably.For l-he macropods, field studies on sexual maturity
in red. kangaroos were made by Frith and Sharrnan (l-964) and
Newsome (1965c). Sadleir (1965) studied the euro and the red
kangaroo in the arid Pi.lbara region of Western Australia but
did not find any seasonal changes .in testis r,r'eight, density
of spernt and total n'umber of sperm in the ejaculate. He
assumed that. males were fertile atl the year round whích
correlated with the continuous b:;eeding pattern of the femaÌes.

44
Hearn (1975) found no difference in testis' epidid.ymis,
prostate or Cowper's glands weights between the breeding and
non-breed.ing season in male Kangaroo Island Wal-labies incaptivity. Although plasma gonadotrophin levels did notchange during the year, after hypophysectomy they were
undetectable and this was followed by shrinkage of the semini-
ferous tubules and a decline in wei-ght of the accessory sex
organs. Thus it seemed tl.at the pituitary was necessary formaj-ntenance of the testís but there was no seasonal- cycle
in the reproductive tract.Because of the large seasonal changes observed in
the accessory reproductive system of the brush-tailed possum
by Gilmore (1969) úre present study was designed to establishwhether male Kangaroo Island Wallabies in their natural-
environment showed any seasonal reproductive cyctrè, and to
deterrnine the ages at which rnales and females reached sexual
maturity.
4.2 ¡4ATERTALS AI.JD METHODS
4 , 2 .), ôo1lecti on of Samples
Animals were collected at 2-monthly interval-s from
May l-975 to April a977, They l¡¡ere shoL at night after they
had emerged from scrub to feed on farmland.
Immediatel-y after the animals had l¡een shot blood
samples were coll-ected by cardiac puncture and kept on ice inheparinized centr.ifuge tubes unt.i.l 1ater, when they were
centrifuged for collection of plasma. Plasma samples were
stored f.rozen.
The right testis and epidiclymis, the prostate gland

45
and the three pairs of Cowper'S glands \dere dissected out
and fixed j-n for:mo1-acetic-80å al-cohol (1: 1: IB v/v) and
later stored in B0? alcohol.Body weights were measured and. the teeth examined
for age determination.Testis :biopsies and measurements of the right testis
diameter within the scrota.l sac were performed on live animals
caught in Flinders Chase National Park.
4.2.2 HistologyThe testis and epididymis, prostate gländ and paired
Cowper's glands were weighèd and sma1l pieces dissected out
for histologj-caI exam:'.nation.
Tissue for histology was dehydrated via graded
alcohols, cleared in benzene and. embedded in paraffin wax.
Sections were cut at 7 lrm and routinely stained wj-th Ehrlich'sHaematoxylin and Eosin.
The Periodic acid-schiffs reaction, following the
me'Lhod of Drury and Wallington (1967) , was used to detect the
presence of mucopolysaccharides in prostate and Cowperrs gland
tis sue.
Measurements of testis tubul-e diameters were made
with a calibrated. rnicrometer eyepiece.
4.2.3 Testosterone AssaY
Plasma testosterone was assayed by a radio-immuno-
assay procedure using polyethylene glycol 6000 for precipita-tj-on of the bound steroj.d. Samples of waltaby plasma (50
100 ¡r1) were extracLed with ether: ethyl acetate (1:1) and
the amount of testosterone in the extract measured when
compared to standarcls extracted from an eqrral quantity of

46
hormone-free wallaby plasma. The antiserum \4las raised insheep to testosterone-3- (o-carboxymethyl) oxine conjugated
to bovine serum albumin. The dilution of the antiserum was
I:20r000. The antiserum was obtained from Dr. R.I. Cox
Division of Animal Physiology, C.S"I.R.O. The antiserum
cross-reactivity to oùher steroids is shown in Tab1e 4. I.
TABLE 4.I
TESTOSTERONE ANTISERA SPECIFÏCITY
Steroid
? Cross-reactivity
Sheep 605017.6.76
Tes tos terone (178-hydroxy- 4-andros ten- 3-one)Epi tes tos terone ( 17a-hydro>q¡-4- androsten- 3-one )
Etiochol-anolone ( 5B- andros tan- 3a-oI-17 -one)Andros terone ( 5a-androstan- 3a-ol- 17-one)Androstenedione ( 4-androsten-3, 17-díone)Dehydroepiandrosterone ( 5-androsten- 38-o1-
17-one)5a-dihydrotes tos terone ( 5a-androstan- I7B-
o1- 3-one )
4- andros ten- L7 B, 79-dioI - 3-one4-andros ten- 38, 178-dio1Proges terone ( 4-pregnene- 3 | 20 -dione)17 a-hydro>q/proges terone ( 4-pregnene-174-o 1-
3,20-dione)Pregnenolone [5-pregnen-38-o1-20-one)17 a-hydroxypregnenolone (5-pregnen-38, 77 a-
diol- 2 0-one )
Cortisol (4-pregnene-1lB,,I7a, 2l-Lríol-3, 20-dione)Oes trone (1, 3 , 5 (-10 ) oes tratrien-. 38 -o-1-17-one )
oestr:adioI-I7B [1, 3, 5 ( 10 ) oestratrien -38' I7B -dioI)Oestrj.ol [1, 3, 5 (10) oestratrien-38,16a,1'7B-tríol)
1000 .110.100.021.3
(0.01
313.5
30
0.004
<0.0030 .004
<0.003<0.003<0.003
0 .10<0.003

47
4.2.4 N-Acetylglucosamine Assay from Prostate Tissue
The concentration of N-acetylglucosamine in prostategland tissue and secretion was assayed by the following method.
Frozen glands \trere partially thawed and divided
into two by a dorsi-ventral cut along the length of the
urethra. Frozen fluid secretion was recovered from the
urethral lumen when possible and extracted. A cross-
sectional slice of the central prostatic segment was then
taken, exluding the outer urethral muscle coat. Both
secretion and tissue were weighed and then homogenized follow-ing the method of Rodger and White (1974) except that the
tissue was homogenized in ice cold 2N Perchloric acid at an
approximate dilution of '1 girn/30 mI. The deproteinized homo-
genates were l-eft standing at iced water temperature for atteast 30 minutes, centrifuged and the supernatant neutralizedby the addition of solid potassium bicarbonate. The
neutralized, extracts were stored frozen and then assayed by
the Modified Morgan-Elson method for N-acetylglucosamine(neisÈig, Strominger ancl Leloir, I955) .
4.3 RESULTS
4.3.I Sexual Maturity of Males
Male Kangaroo Island Wallabies reached sexual
maturity at around 18 20 months of age when rapid growth
of the testes occurred (nigure 4.I) .
Testis weight increasecl wíth bodl' weight and age
(nigure 4.2) although after 3 years of age the testis weight
remained faii:Iy constant.Spermatogenesis began at arouncl 18 months of age

3.O
2'O
1.O
oo
Figure 4.I
o
Ëo
Ë
o2t-atult-E
o o o8o :oEog gg08
8
iug
Io
oo 8 3:';
of E" -3"
n" o
¡g
23AGE (Yrs.)
$+
Measurements of right testis diameter withinthe scrotal sac of live animals.Open cj-rcIes represent open tubules with spermpresent.Half-open circles represent partly open tubuleswhere spermatogenesis has begun.Closed circles represent closed tubules withno sperm.
41

30
20
10
o
30
20
10
o123 4567BODY wT. (Kg.)
I I 10
o
oo
ooooo o
Ect)
Ë
=2t-Øl¡Jt-
oooo
ooo
ooooo
ooo
o
o
ooooo
€o
%
ooo
o
ooo
OO OO
0
1 23AG E (Yrs.)
Relationship between testis weight and bodyweight (t-op figure) , and age (bottom figure) .SymboJ-s as for Fj-gure 4.1.
4o 5+
Figure 4.2
48
when the seminiferous tubules i-ncreased in diameter and
developed a lumen (Figure 4.3) . By 2 years of age the
seminiferous tubules\^rere fully open and contained spermatozoa.
The diameter of the tubules showed vj-rtualIy no furtherincrease after 2 years of age.
4.3.2 Seasonal Changes
Analysis of Resul.ts
To test for significant seasonal changes in the
reproductive organs and, testosterone assay, each set of data
was analysed by means of a one-way anáJ-ysis of Vari-ance.
The results of these tests are summarized in Table 4.2-
Testis and EpididymisThere \^/ere no 'seasonal changes in testis weight,
testis tubule diameter or epididymis wei.ght (P > 0 . 05) (rigure
4.4'). Spermatogenesis occurred. throughout the year and sperm
were always present in the testis tubulesand epididyrnis-
Accessory Reproductive Orqans
The only accessory sex glands are the prostate and
three pairs of Cowper's glands. The anatomy' hi-stology and
histochemistry of the accessory reproductive glands ofseveral species of male marsupials has been descríbed by
Rodger andHughes (1973) .
(a) Prostate Gland
The prostate gland. (Figure 4.51 of the Kangaroo
Istand Wallaby is carrot-shaped and. l.ocated at the posteriorend of the body cavity withirr the pelvic region. The gland
consists of glandular tissue sur:rounded by the smooth muscle
coat of the membranous urethra. The vasa deferentia enter at
the anterior end of the gland just below vrhere the bladder

300
200
100
o
300
200
100
oo
o
5
oË{É,urFl¡.1
=3au¡J=o:fF
2t-(Dl¡lt-
ooBoo
?t"?
to 15 20
. TESTIS wt. (gm.)25 30o
c
9O33oo
þoo
oo I 2
AGE
3
( Yrs.)
4 5+
Figure 4.3 Relationship between testis tubule diameterand testis weight (top figrire), and age(bottom figure) .Symbols as for Figure 4.I.

30
20
10
300
200
1212
10
I1011
79 12 10
ËCD
É
=2UIt¡J
-I-I
,tt12 11
I I--I
o JFMA1977
JFMA1977
JFMA1977
MJJASOND JFMAMJJASOND1975 1976
12 1299
T
ELÉ
õ¡¡l
f@:f
2atl¡,
I7f
FI^1110129T
-I--I-t-I
Å
Ir10
Ito 11
r-I
100
MJJASOND1975
12
o
1211
JFMAMJJASOND1976
10
12 11
12
Êgl
ÈìU'
=ôo;l¡J
5
4
3
2
1
o
10
JFMAMJJASOND1976
10
I7I
I
MJJASOND1975
Mean values (dots) and standard deviations aboutthe means (vertical lines) for testis weight,testis tubule dj-ameter and epididymis weight ofsexually mature wallabies.Numbers above vertj-cal lines represent the samplesize.
Figure 4.4

Figure 4.5 Prostate glands taken from maleKangaroo Island Wal-Iabies, in thebreeding season (left) and thenon-breeding season (right).

t'

TABLE 4.2
Testis Wt. (gm)
Testis Tubule Diam.
Epid.idymis Wt. ($n)
Prostate Gland I¡It.
Co',vper's Glands Vlt.
Testostercne Conc.
A}TAIYSTS OF VARIANCE FOR SEASONAI CHANGES
TN MALE REPRODUCTTVE ORGANS A}üD PLASMA TESTOSTERONE LEVELS
*1975 - 1976 1976 L977
î (l ,lz)F (l ,rz)F (l ,72)E (7 ,lz)E (s,+4)F (4,+r)
0.400 F1o,ee)
F(0,øe)
F(o,og)
F(e,og)
F(o.eo)
'rc,qg)
= I.69 4
= 2.024
= 1. 010
= 16.528
= 6.46I= 6.366
a'N.s. N.S
N.S
N.S
P<0
P<0
P<0
. 001
.001
. 001
(¡:m)
(gm)
( sm)
(nglml)
= 7.238 N.S.
= L.273 N.S.
:28.797 P<0.001
= 8.026 P<0.001
= I7.555 P<0.0C1
* Fcr Testis lrÏeight, Testis Tubule Diameter, Epididymis lVeight and Prostate Gland Weight the
analysis of results fcr the twoyears r^ras from May 1975 to May tr'976, and May 1976 to April 7977-
For Cowper's Glands Weight analysis was from September l-975 to May 1976 and May 1976 to
April L977.
For Testosterone Concentration analysis was from october L975 to May ]-976 and May L976 to
ApríI 1977. È+ N.S. = Not significant at 5% Ievel.

50
and the ureters join the urethra..
The gland can be divided into three segments, refer-red to as anterior, central and posterior segments. These
seg,ments can be discerned macroscopically and they differ intheir histology and histochemistry. In each segment the
glandular tissue consísts of numerous simple branched tubules
supported by connective tissue. The tubules radj,ate out from
the centrat urethral lumen to which they are joined by shortcollecting ducts. 'Ihe tubules are lined by a síngIe layer ofepithelial cel1s which vary in size and histochemistry between
the dif ferent segrments.
The size of the prostate gland showed a significant(P< 0.001) seasonal change, with two peaks (Figure 4.6). The
first peak occurred at the end of October and the other was
in the breeding season in late January.
To determine whether all three segments increased
by the same proportion each segment was dissected out from
prostate glancls in the breeding and non-breeding seasons.
The anterior segment, whj-ch is the sma11est, doubl.ed in size
in the breeding season while both the central and posterj.orsegments showed a five-fotd increase in size (Table 4.3) .
The size and appearance of the tubules in each
segment also changed between the breeding and non-breeding
season. In the non-breeding season the tubules appeared to
be smaller in diameter and the height of the epitheliumlining the tubules \,vas reduced (Figure 4.7) . However the
PAS reactíon showed that mucopolysaccharicles were present
throughout the year.The major free sugar procluced by the prostate 91and

120
100
20
I
11
\
12
12
EC')
.8()Þ
=oz
d60u¡t-<l-q,o40EÀ
't2
l1
7
JJASOND1975
10
10
I
11
JFMAMJJASOND1976
10
J FMA1977
9
oM
Figure 4.6 Seasonal changes in the size of the prostategland of sexually mature wal1abies.Symbols as for Figure 4.4.

51
TABLE 4.3
SEASONAL CHANGES IN THE WEIGHT
oF PRoSTATE GLAND SEGMENTS (gm).
Time of YearGland Segrment July L976 January 1977
Anterior
Central
Pos terior
(N = 11)1.3s t 0.32(0.78 - 1.ee)
s.06 1 2.46(s.30 l-4.34)
2 .13LI.72)
(N = 11)3.06 t 0.91( 1.e6 - 4.e3)
41.11 J 8.37(27.04 - s3.01)
.L288-4
-l-6.04:(4.02
29.0(15.s
.383.44)
Va1ues are means t standard deviation.Ranges are presented in parentheses.
TABLE 4.4
N.ACETYLGLUCOSAMTNE CONCENTRATTON fN PROSTATE
GLAND TTSSUE AND SECRETIOI{ (mgllOO9m)
Time of Year ¡ltean j Standard Deviation Range N
January 1976
May 1976
September J-976
c.P.S
c.P.S
c.P .S
60r.4506.5
383.6642.0
545 .4444 .0
245 .0239.0
99 .4200.8
L82.51.26.5
309204
253327
38933s
9L7732
522840
843574
ttItJt
5
4
5
5
5
4
c P. = [ cross-sectional slice of central prostatic segment,excluding outer urethral muscle coat.: Fluid secreti-on recovered from the urethral- l-umen-
(2,12) = 1' 85e' ;::=i:i:'ii:3ïå, i' t* rever (centrar
(2,10) = L'227' å::,:ii:ií:cant
at 5'u leve1 (Fluid
SF
F
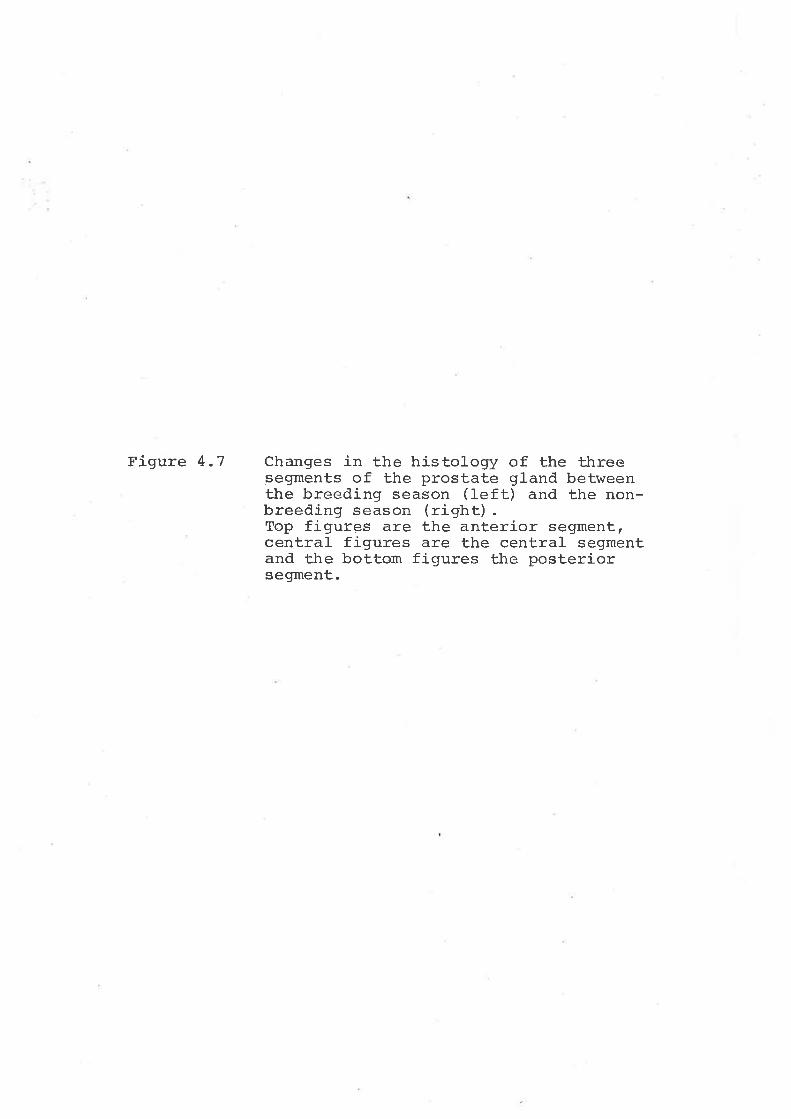
Figure 4.7 Changes in the histology of the threesegments of the prostate gland betweenthe breed.ing season (teft) and the non-breeding season (right) .Top figures are the anterior segment,central figures are the central segmentand the bottom figures the posteriorsegment.

,ú, :
'-l
.Da
Ï

52
of macropods is N-acetylglucosamine, occurring nrainly in thecentral segment. The analysis of central prostate segment
tissue and secretion for N-acetylglucosamine did not show
any significant seasonal changes -i-n concentration (P>0.05)
(table 4.4). However, because of the seasonal change insize, the total amount of secretion produced would j-ncrease
during the breeding season.(b) Cowper's G1ands
The three pairs of Cowper's glands in the wallabyare located posterior to and on either side of the prostategland. The glands are bulbous structures and are joined tothe base of the urethra by ducts. The glands consist ofnumerous tubules, lined with columnar epithelium, and
surrounded by a striated muscle coat.The Cowperrs glands were not' separatedbutweighed
as one structure. There was a significant seasonal change inweight (P<.001) (Figure 4.8) similar to that shown by theprostate g1and. There hras some difference between 1975 and
1976 however. In 1976, although the weight of the glands
increased in October there was no decline in weight inDecember, as was shown in 1975.
Only the largest of the Cowper's glands was exam-
ined histologically. ft showed simil-ar changes to theprostate gland in that the tubules were larger in cross-section in the breeding season. Mucopolysaccharj-des were
present throughout the year.
Tes tos terone Concen tratíonDespite -large variaticn between animals the mean
concentration of testosterone was elevated in the breeding

6
118
7
6
5
10I
Ëoì
Ë
=q,oz(5
IÊ,IJJÀ
=oo
1110
1010
6 98 9
4
3
2
1
oM JJASOND
1975
JFMAMJJASOND1976
JFMA1977
Figure 4.8 Seasonal changes in the weight of theCowper's Glands of sexually rnature wallabies.Symbols as for Figure 4.4.

53
season (figure 4.9). However a double peak in concentrationwas not as evident for testosterone as was shown by prostategland weight
There was a significant correlation between
prostate gland weight (in the breeding season) and testoster-one concentration (Figure 4.10).
4.4 DTSCUSSfON
The results show that male Kangaroo Island Wallabies
in the wild have a seasonal cycle in their accessory reproduct-ive organs and in plasma testosterone concentration. The sizeof the testís and epididymis do not change seasonally and
spermatozoa were produced in the testis throughout the year.
Catt (1977) has shown that a símilar increase in prostategland size in the breeding season occurs in Bennett's Wallaby
(Macropus rufogr"isea frutica) .
Testis function is controll-ed by a system involvingthe hypothalamic secretion of luteinizíng hormone releasinghormone (LH-RH) and the anterior pítuitary hormones, folliclestimulating ho¡rmone (¡'SH) and luteini zing hormone (LH) .
Although there was no seasonal change in testis weight, Hearn
(l.975) showed that in captive Kangaroo IsIand Wallabies normal
testicular function was disrupted following hypophysectomy.
This suggested that normally FSH is maintaining spermatogenesis
throughout the year. Receptors for FSH have been demonstrated
within the seminiferous epithelium of the ralu (Means and
Vaitukaitis I 1972) and it is likely that the Sertoli cell istlie site of actj-on of this hormone (Castro, Alonso and
Mancini, I972.i Means and Huckins, 1974).

I1l
I
9
6
Eo'c
ozoC)
l¡JzoÊt¡lÞc,ol-U'l¡lt-
10
I
o
4
2
o
129
MJJASOND1975
JFMAMJJASONDJF1976
10
l'/12
MA1977
Figure 4 9 Seasonal changes in the concentration oftestosterone j-n the peripheral plasma ofsexually mature wallabies.Symbols as for Figure 4.4.

oo^12E
trodz8oo
a
o
30 40 so òoPROSTATE
o
a
¡O
aa
70 80 90 100 110
GLAND WT. (sm.)
a
a
a
ooa
6
4
2
o
l¡¡zoÊl¡¡t-U'oÞg,u¡F 120
Fisure 4 ' 10 ;iåiå'?î;n'c"o;::äT"i':3::":f :lå Ë::i:3t:,.".concentration.
Testosterone Conc . (ng/mL) =0 .09I Prostate Gland lVt (gm) -L.284('r = .562, si9. at 1? Ievel , N = 20)

54
The seasonal cycle in the accessory glands and
testosterone concentratj-on indicated that LH levels may also
fluctuate seasonally. Receptors for LH exist on the inter-stitial cells of the rat testis (de Kretser, Catt and Paulsen,
I97I) and can be stimulated by LH from a number of mammalian
species resulting in testosterone secretion ín uitro (Catt,
Tsuruhara, Mendelson, Kietelslegers and Dufau, L974) . Lj-ncoln
(1978) showed that injection of LH-RH induced a rapid and
substantial increase in the leve1 of testosterone in fivespecies of macropod marsupial, including the Kangaroo IslandWatlaby. Thus release of l,H during the breeding season would
cause the interstitial cells of the testis to secrete
testosterone which j-n turn would act on the accessory
reproductive system. Recent work by Catling and Sutherland(in press) has confirmed that males in contact with sexuallymature females in the breeding season showed a significantincrease in plasma LH and. testosteronerwhereas males isolatedfrom females did not show this increase. Leve1s of FSH didnot change in either group in the breeding season.
Cook, IvlcDonald and Gibson (1978) suggested that inthe brush-tailed possum the complex of arteries and veins
surrounding the urethra and radiating into the body of the
prostate gland might be capable of transferring androgens
carried from the epididymis to the urethra into the prostatictissue. Anderson and Liao (1968) suggested that in rats the
nuclear chromatin of prostate cel1s contains an androgen
receptor which can selectively retain dihydrotestosterone.Another of tb-e interesting aspects of the seasonal
changes in accessory reproductive organs was the double peak

55
in activity, one at the end of October and the other j-n
January during the normal breeding season. This indicatedthat some sexuar activity was occurrinq around. october -November before the main breeding season had begun. At thistime of the year young anirirals are just- leaving the pouch and
thus it was possible that the young females could be enter-ing oestrus. Tlznd.ale-Biscoe and Hawkins (I977) have
observed young females entering oestrus in october and
reported that of a sample of nine juvenires colrected on
Kangaroo rsrand in December, seven had ovulated and had a
quiescent corpus luteum and four had a blastocyst. This was
confirmed by the present study when the reproductj-ve systems
of eight juvenl-re females were cotlected in early December
1977. All the femares had a corpus luteum present in one
ovaLy and from six anima]s a btastocyst was recovered fromthe uterus.
Hence it appears that young females that have justleft the pouch in October - November enLer oestrus immediately,mater and the blastocyst resulting from this mating remainsdormant until just after the sunìmer sol-stice, vrhen theblasLocysts in older animal_s start to develop.
It is probable that it is the presence of oestrousfemales that stimulates sexual activity in the mal.es and thatthis may be due to a pheromome. The lack of any changes j-n
the reproductive system of male ltangaroo rsland wallabiesobserved by Hearn (l975) may have been due to keeping mares
separate from females.Tn sunmary, the male Kangaroo Island Wallaby does
have a seasonal reproductj-ve cycle which appears to be

influenced by the presence of oestrous females.
LH-RH from the hypothalamus, due to the actionwould stimulate release of LH from the anteriorThis in turn acts on the interstitial cells ofs,ecrete testosterone which causes the increase
activity of the accessory reproductive organs.
56
Release ofof a pheromone,
pituitary.the testis toin size and

5.0 HOI4E_RANGE AND MOVEMENT PATTERNS

57
5.1 TNTRODUCTION
Initial observations on the movements of wallabiesonto the cleared area surrounding the Park Rangerr s Head-
quarters suggested that there were four main groupsr orpopulations (Figure 5.1). Each of these groups utilized a
different part of the cleared area as a feeding site. These
divisions were particularly obvious when trying to capture
wallabies at night. Individuals from the different groups
could not be forced beyond a certain distance from theirpoint of entry to the feeding area. For the populationstudy the only capture records analysecl were of Èhe animals
using the Main Study Area (Figure 5.2) .
It was important to ensure that these animals didbelong to a single population because any widespread dispersal,either temporarily or peïmanently, once they had re-enteredthe scn:b Would affect the estimates of population sl-ze. Itwas therefore necessary to cletermine the extent of both the
daily and seasonal movements of individuals. This would show
whettrer or not these wallabies occupíed a distinct home-range,
and if so, their size and the amount of overlap with otherhome-ranges.
Burt (1943) defined home-range as "that area
traversed by the individual in its normal actirrities of food
gathering, mating and caring for young,". The concept ofhome-range is thus distinguished from a territory which isregarded as a defended area or object (Howard, J-920) . Areas
of hearry and regular use within a home-range or territory may
be called core-areas (Kaufmann, 1962).Radio-tracking has become w-irlely used in recent years

oao
.--\\
III
I¡
o
AN
aI I-l
1Km
Figirre 5.1 The main movement patternsentering the cleared areasurrounding scrub.
of wall-abiesfrom the

Rocky R iver
Dense Vegetation
AN 1Km
O toc¡rror,¡ oF TRAPs
SY'A M P
I HOUSE
The Study Area in Flinders ChasePark showing distribution of theand the l-ocation of trap-sites.
---É
Nationalvegetation
Figure 5.2

5B
for studying the movements of animals. It is particularlyuseful for tÍmíd species or those inhabiting areas of dense
vegetaLion, This was the case in the present study as the
wariness of the wallables wÍthin the thick scrub made visualobservations particularly difficult. Hence to obtain the
information on home-ranges and movement patterns radi-o-
transmÍtters vrere used.
5.2 RESULTS
5.2.I Activity and Movement Pat.terns
Sixteen individuals (g M, B F) vrere raclio-trackedfor varying periods of time from December 1976 to July 1978.
A summary of the time periods over which each wa11.aby
carried a radio-transmitter, and the number of radio-l-ocationsmade, are shown in Tables 5,1 and 5.2. A more complete
history for each animal is presented in Appendix IIf"Although radio-locations were only taken about every
four hours over a period of three days some indication of the
actJ-vity and movement patterns of the wallabies at differenttimes of the y,ear was obtained. The winter measurements were
made from May to Novernber while the summer measurements were
from December to March, although in 1978 early Apr-i-l was
included in the sufitmer group because of the dry conditions.Maps showing tLre daily movement pattern of each wallaby during
the periods of radio-tracking are shown in Appendix IV.Win'Ler Movements
In v¡inter the movement patterns for the differentindividuals were similar, During the clay Lhere was littleactivity until the late afternoon when the lval.labies began to

Animal
l
U.A. JC.S.I.R.O.=A.V.M. :
TABLE 5.1
TransmitterType
. R.O
.M.
c.s.r.R.o.A.V.M.
A.V.M
A. V.M.
A.V.M
A.V.M
Dates For l{hichTransmitter Was
Carri ed
Nurnber DaysTransmitterI{as Carried
32I0
2l-32L3
209
approx, 263
Number OfHours Over Which
ObservationsWere Made
5B394236
25427I
479
299
l.44
83
l-44
]-64
Number OfMeasurementsOf Position
254553
1869
54
73
38
17
38
4I
TTME PERIODS O\ÆR WHICH R.ADIO.TRANSMTTTERS
II]ERE CARRIED AND THE NUMBER OF MEASUREMENTS
OF POSITION FOR MALE VüALLABIES
Aff 7 /r2/7613/ 4/773a/ I/78
e /r2/76B/rI/77c. s. r. R.o.A. V.M.
1
C.S.TA.V2
3
4
5
6
7
I
7/ 4/77L2/L2/77
e/ 4/77
12/J-2/77
12/12/77
12/L2/77
2s/ r/787/ 2/78
s /1,r/7 7t2/ 7/78
3/rr/77
Sept.t78 +
Transmitter was recovered from dead animal September 7978.Transmitter made by Mr. N. Weste, Electrical Engineering Dept., University of Adelaide.Transmitters made by Mr. K. Newgrain, Division of Wildl-ife Research, C.S.I.R.O.Transrnitters purchased from A.V.M. Instrument Company, Champaign, Illinois, U.S.A.
(Jl\0

TABLE 5.2
TransmitterType
c.s.r.R.o.
c.s.f.R.o.A .V" M.
c.s.r.R.o.A.V.M.
A.V.M.
A.V.M.
A. V. M.
Dates For WhíchTransrnitter Was
Carried
Numbei DaysTransmitterWas Carri-ed
130
2r0168
]-20212
2t0
Number OfHours Over Which
ObservationsWere Made
466
446]-44
42227I
224
227
227
163
44
Number OfIvleasurementsOf Posítion
52
TTME PERIODS OVER ViHICH RADIO-TRANSMTTTERS
VüERE CARRIED AND THE NUMBER OF MEASUREMENTS
OF POSITTON FOR FEMALE WALLABÏES
Animal
1
2
6/ 4/77
7/ 4/7725/ r/787/ 4/77
12/),2/77
7/ 4/77
12/t2/7713/12/77
r/ 2/78
8/ 5/78
13/ 8/77
2/Lr/77rr/ 7/78
4/ B/77Ð/ 7 /78
to/ 7/78
3938
c.s.r.R.o.A. V.M.
J 4269
4
5
6
7
B
+ 11
56
56
4I12
+ Transmitter recovered from scrub, September, 1978.oro

61
move towards the edge of the scrub surrounding the Main Study
Area. Just after dark they emerged from the scrub to feed.
The time spent out on the feeding area varied a great deal
between individuals although the early evening seerned to be
the time of greatest activity.To assess the activity pattern of wal-labies feeding
on the Main Study Area spot-light counts were made every hour
over two consecutive nights for May and July. Although
individual animals could not be followed the results do
j-ndicate the general- pattern of feeding activity (rigure 5.3).No wallabies were seen out during the day but just after dark
Iarge numbers emerged from the scrub. The maximum number was
observed from around 2000 hrs to 2400 hrs. From 0100 hrs to
0200 hrs the activity began to decline so that by dawn a1I
the anímals had returned to the scrub. Packer (1965) recorded
the movement of quokkas through gates in a fence-line surround-
ing an area of food and water. There was a bimodal activitycycle with the greatest amount of movement just after sunset
and just before dawn.
The effect of windy weather conditions on activityv/as observed on the second night of observation in Jrily.Throughout the day there was a strong south-westerly wind
which eventually stopped at aror:nd 2200 hrs. Few v¡allabies
emerged from the scrub until after the wind had dropped.
More wallabies \,vere observed out feeding in the early morning
than on any other night probably because the weather condi-tions had prevented them from feeding any earlier.
Although no quantitative data wa^s obtained on the
effect of other climatj-c corrditíons orl activity it was

4
MAY 1976 JULY 1976
Night 1 Night 1
1200 1800 2400 0600 1200 1200 1800 24c0 0600 1200
ìrtight 2 Night 2
Windy Conditions
I
1200 1800 24AO 0600 1200 1200 f800 2400 0600 1200
TIME ( hrs)
+
20
10
o
50
40
30
2A
10
o
ozãl,¡JUJII
|t)t¡JEJ
BILoEt¡lmËz
Figure 5-3 Pattern of feeding activity of wallabies on the Main Study Area.

62
observed that while light rain did not alter the pattern offeeding activity heavy rain did deter them. During wet, windy
conditíons walla-bies were often observed sheltering under
bushes along the edge of the cleared area.
Summer Movements
Activity on the feeding area was not recorded
during summer but j-t was noticed that fewer wallabies !{ere
present, and this was confirmed by the movements of animals
with transmitters" Many of these animals did not emerge from
the scrub at all during the three days of rad.i-o-trackingobservations. However, within the scrub there \^/as more
activity during the day than in winter and they moved overlonger: distances. An example of this was shown by MaIe 1
which was located several times in the vicinity of the Rocky
River" This is approximately 1400 m from the centre of theanirnal' s winter home-range.
Movements out of the Study Area
None of the animals that \,rere radio-tracked were
ever observed to move completely away from the Main Study
Area or to permanently change the location of their home-range.
However, one animal, Female 2, did show a shift in its main
acti-vity pattern in surÌrmer. This animal was from the 1973
cohort and was first captured on the Main Study Area inNovember 1975. In May L977, when first radio-tracked, alllocatÌons were on the norLhern sj-de of the main road leadinginto the study area. In the following srurmer the major partof its actívity was on the southern si<1e of the road.
Another animalo Male 3, was first caught in the Goose Padclock
.in May 1976 when it was about 16 months of age. T\^Io days

63
later it was caught on the Main Study Area and rvas subsequent.-
ly only caught there, It was first radio-tracked in April1977 during its second year out of the pouch and ít remained
within a well defined home-range for the rest of the study.All other young animals which were radio-tracked in eithertheir first or second year out of the pouch did not change
the location of their horne-range in any way.
5.2,2 Measurement of Home-range
AIl radio-locations for each animal were divid.edinto sunmer and winter observatíons and p1o'bted onto a base
map of the study area. The results show that the wallabiesin this population do have a well defined home-range whj-ch
overlaps lvith the home-ranges of other wallabies of the same
or opposite sex. Because wider movements took place duringthe summer the home-range area was larger at thj-s time. Home-
ranges for each individual for summer and winter are shown inFigures 5.4 to 5.9.
Home-rangfe area was calculated using three methods.
The simplest method was to measure the minimum area containJ-ng
all the location points with an OTT Compensating Po1ar Plani-meter. However this method is biased by the number of measure-
ments and by individual judgement of the location of theboundary 1ine. A similar method involved drawing the smallestconvex polygon which contalns all of the location points(Southwood, L966¡ Jennrich and Turner, 7969) . The third method
\^ras to calculate the area using the ellipsoid method ofJen¡rrj.ch and Turner (L969 ) who defined home-range âs r "thearea of the srnallest region which accounts for 952 of arì
anima-l's utilizatíon of its hal:itat.". The area of the home-

64
ranges calculated by these methods are shown in Tables 5.3'
5 .4 and 5.5 .
The mínimum area .ld convex polygon methods gave
similar results but differed quite considerably from the
ellipsoid method. The convex polygon method is known to have
a sample size bias while the ellipsoid method has been
recofltmended because of íts high degree of statistical stabilityand lack of dependence on sample size (Jennrj-cn "lU Turner,
Lg6g). Furthermore, this method assumes that animals may be
active outside the poi.nts of tocation, whereas the other two
methods do not. Despite this T believe that the minimum
area method does give a more accurate indication of the size
of the home-range of wal'l-abies as it does not assume thathome-ranges are ellipsoid. Because the wal-l.abies use run-
vfays or trails through the scrub to move to and from the
feeding site much of the area calculaterl by the ellipsoidmethod would be unused. Hence I have used the results of
the minimum area method for discussions of home-range size.
There was no significant difference in the mean
size of the home-range between mal-es and females in eithersunmer or winter (Sunmer t t10 = 0 . 380 , P>0 . 05; Winter: t, :
I.L43, P>0.05). For both males and females the summer home-
range was significantly larger than the winter home-range
(Males, tlo = 3.004, P(0.05; Females: tn = 3.113, P(0.05) "
It, appears that the wallabies using the Mai-n study
Area do belong to a single populatj.on and that within this
they have oVerlapping home-ranges. The 1ìean size of the
summer home-range for all- animals was 42.4!I7.6 ha while in
winter it was 15.9J8.1. ha. The total- area over which obsert'-

TABLE 5.3 HOME-RANGE AREA FOR ¡4ALES (Hectares)*
AnimaI Time OfYear
SummerWinterSummerV{inter
Vüinter
SummerV'linter
Surnrner
Summer
Summer
Number OfObservations
6T58
5630
54
4416
38
L7
37
2516
Area Of Home-range As Measured BY:Minimum Convex PoIYgon ElliPsoid
Area Method Method Method
179 .322.7
34.711. 3
33.5
31. 46.5
43.7
34.7
56.0
28.62L.4
91. 523-7
47 .015 .0
37 .0
29.76.6
42 .3
35.5
56.8
26.319 -5
t20.631.0
60 .430 .2
56.6
39 .5L7.3
49.8
99 .5
70. I51. 350 .6
2
3
4
5
6
7
S urnrnerVlinter
2r' 1 Hectare .= .01 Km or 2.47 Acres
I
o\(¡

TABLE 5.4 HOME-RANGE AREA FOR FEMALES (HecIaTes)
Animal Time OfYear
WinterSummerWinterSummerWinterVüinter
Sunrner
Summer
SummerV,Iinter
ïIinter
Number OfObservations
51
3838
5649
10
52
55
2516
T2
Area Of Home-range As Measured By:Minimum Convex Polygon Ellipsoid.
Area Method. Method Method
77 .6 19 .71
2
26.2
91. 022 .4
47 .24r.6I2'.8
96.4
93.6
32.345.3
36 .2
3
4
5
6
7
I
, 4.9
56.477.5
29.I]-6.6
40.3
59.4
14.8],L.2
11. 6
54.715. I28.625.3
3.5
44.2
69 .0
16. 313. I10. I
orol

67
TABLE 5.5
MEAN HOME-RANGE AREA (HectaTes) 1 STANDARD DEVIATÏoN
MALES
l4ethod. Surmner(N=7) Winter
(N=5)
Mi-nimum Area
Convex Polygon
Ellipsoid
44.r ! 18.r47.0 t 22.2
70.3 ! 2s.s
I19.r:f20.4:-L37.1 -:.
10 .6
11. 3
16. 1
FEMALES
Method Summer(N=5) Winter
(N=6)
Minimum Area
Convex Polygon
Ellipsoid
4o.o j 18.7I42.6 '
-l-72.r :
Jr3.2 j 5 0
20 .8
30. 1
L4.l-I 7.4+ L2.430
IB

68
ations of the movements of wallabies were made was approxi-
mately 230 ha.
Holsworth (1967) reported that quokka populations
also arranged themselves into mutually exc]-usive group
territories within which the individuals had overlapping home-
ranges of 4 - 24 acres (1.6 9.7 ha). Kitchener (1972)
confirmed the existence of this type of social structurealthough both he and Nicholls (1971) found that there was more
movement between groups than recorded by Holsworth (I967).
Nicholls (1971) found that individual home-ranges were 2.5
31 ac.res (1 - I2.5 ha) in July to October and 5 42 acres
(2 17 ha) in February to April. The changes in size, and
sometimes location , of t'he areas occupied by quokkas and
their movement patterns could be explained by the distr:ibutionof the vegetation which provided shelter and food.
SÍmilarly, the increase in size of the home-range
during suÍtmer for the KangaToo fsland Wallabry was probably
due to changes in the abundance and/ot quality of food on
the study area.

a
a
a
a
a ta
aa aa
a
a
aaaa
a
Oa
taa
r oo
.O aoa
a
a
oa a
a oa
o
.ta
a
aao
z> 2>
z> z>
q P- q É r-
J o (¡
x 3
= t- m ch c 3 = m Ð
3 Þ m N
^st
3c 3 m j Þ î m f\) =z -{ m ¡
È
FI E
d0r
ooã 5(
D I
P, F
J
opr
rFÞ (4
FJO
om õ r-l t
-hoo (n
Ho Þ
Ecl
' ct
MH (D
o Þts
IDpr
FlÞ
Êro
,o P
.EoÊ
rIH ts(D
o ON
)pr
.rt ts
- o Ð
x :
= Þ m É 2 { m 7
x 3o3
o .
ao
ao
a a
aO a
aa
a aa
.. 3r a a

a
ao
oa
o
o
a
ao.:.
a
AN
^N lKm
MALE 4 SUMMER
lKm
MA LE 4 WINTER
1KmAN
At{ lKm
MALE 8 SUMMER MALE 8 WINTER
'arao ca
a
æc
ao
.. *'ooa
O.oa
aa aa
a
a
a aoa
Figure 5. 5 Home-ranges for IrIaIe 4 and Male I

aaa
o
a a. !¡'d'
oa
o
t.l
a a
oa
a
I
a
o
AN
AN 1Km
MALE 3 W¡NTER MALE 5 SUMMER
lKmA
NA
N
MALE 6 SUMMER MALE 7 SUMMER
oaa
.:5.|
aoa
a
a a
o'
a
ao
OOoo
ao
a
a
aaaao
Figure 5.6 Home-ranges for MaIe 3 | MaIe 5 , Male 6 and Male 7

o'o
o.aa
aaa
a
aa
a
lo
AN lKm
AN
FEMALE 2 SUMMER
lKm
FEMALE 2 WINTER
O
a
o¡l I
a oaaaa
a
aaa
AN lKm
FEMALE 3 SUMMEB FEMALE 3 WINTEB
AN
Figure 5.7 Home-ranges for tsema1e 2 and Femal-e 3

o a
o
a '.1{': 'o a
o
oa- t
AN
AN lKm 1Km
FEMALE 7 WINTERFEMALE 7 SUMMER
lKm lKm
FE MALE 4 WINTERFEMALE 1 WINTER
AN
AN
o
a
oOa
o
Figure 5. B llome-rang:es f or Female 7 , Fema1e 1 and Female 4

a
a
o
aa
oa
a
a
o
aa
.gaao
aoa
oa
o ooa a
a
a a
AN
AN lKm lKm
FEMALE 5 SUMMER FEMALE 6 SUMMER
1Km
FEMALE 8 WINTEB
AN
oa
o
t. t3a
Figure 5.9 Flome-ranges for Female 5 ' Femal-e 6 and I'emale B

6.0 POPULATION DYNAM]CS

69
6.1 INTRODUCTÏON
The size of a population can be measured as an
absolute numberr âs a density. measurement or by the use ofindices which give some measure of abundance. The choice ofmethod depends upon the species being studied, the type of
habitat and the information the investigator wishes to obtain
from the population.Aerial suïveys have been used quite extensively to
estimate the popul-ation size or density of man)¡ species of
animals, particularty in Africa (l,amprey, 1964¡ Talbot and
Stewart, 1964; Goddard, 1967¡ Eltringham, I973; Caughley,
1974). Such Surveys, ês well as being e>rpensive to carry out,
can only be used in relatively open country and for large,
conspicuous animals. fn Australj-a thís method has been used
to estimate numbers of red kangaroos which inhabit the J-ightly
timbered.areas of the inland (Frith, 1964¡ Newsome, I965a¡
Bailey , I|TI; Caughley, Sinclair and Scott-Kemmis, 1976) .
Because the Kangaroo Island Wallaby inhab-i-ts dense vegetation
during the day aerial survey was impractical.Ground surveys can be used to obtain density
measurements by traversing the study area along transects'
either on foot or by vel"ricl-e, attd counting the number ofanimals seen, Eberhardt. (1968) and Seber (I973) have
reviewed the problems involved. in making density measurements
using this method and have suggested ways of designing the
experiment and analysing the results. Ealey (1967a) used the
transect method Lo estimate the ciensity of euro populat'ions
in north-western Australia. By making coì.rnts at dawn and dusk
he hrel-ieved that r:el.iable measurements \^/ere made. However'

70
Kirkpatrick (I974) rejected this technique for monitoringkangaroo populations because of the lack of documentation on
the precision and accuracy of the metlrod of analysis.Although this method was a possibility for use on Kangaroo
Island Vüallabies the density of vegetation over the study
area made observatj-ons extremely difficult. The otherfactor influencing my decision not to use this method was the
limited amount of information that could be obtained.Although a measure of the density of the population was
possible nothing would be known about the sex ratio, age
structure or reproductive potential. Such information isessential in understanding the dynamics of a population.Nevertheless this method. could be of use on farms where
wallabies enter pasture at night to feed. Such counts could
be used to indicate the level of control needed. Johnson
(1977) found that the line Èransect spotlight count was the
most efficient method for censusing Bennettts wallabies,pademelons ( IhULogaLe bíLLardr,erÐ and brush-tailed possums inTasmania, in areas where visibility was adequate.
For this study I decided that the best method forobtaining data on both population size and structure was the
mark-recapture method. In this method a sample of animals
from the population is captured, marked and released. An
estimate of the size of the population can be made from the
relatÍve numbers of marked and unmarked animals insubsequent samples. Although this technique required a largeamount of work in capturing wallabies I felt that the
information that could be obtainecl on the biology of the
animal made it worthwhi.le.

7L
6.2 THE MARK-RNCAPTURE METHOD
6.2.I Asstrmptions underlying use of this method
Since the pioneering work of Lincoln (1930) ' Leslie,Chitty and Chitty (1953), Beverton and Hol-t (L957) , orj-ans
and Leslie (1958) and Ricker (1958) the methods of analysing
mark-recapture data have been considerably improved (see
Cormack, 1968¡ Seber I 1973). However, aII of the mathematical-
models used for analys-i-s are based on a number of assumptions.
The main assumptions are that:(1) the marked animals are not affected by being marked. and
the marks are not lost,(2) upon release, the marked animals become completely mixed
in the population before the next sample is taken,
(3) being captured once or more does not affect the chance
of an animal- being subsequently captured,(4) the population is sampled randomly. This means that
all individuals must be equally available for capture and
that individuals of different age groups and sex are
sampled in the proportion in which they occur in the
population.This last assumption that sampling is completely random isprobably the most important but is difficult to verify (Coll-y'
1965). For many animals differences in the probability ofcapture are associated with dj-fferent age g'roups or sex. For
this reason the data for these groups should be analysed
separate iy .
6.2.2 Testing for Equal CatchabilityThe assunption of equal catchability of all anj-maIs
in the population will be satisfiecl if there is random mixing

72
of marked and unmarked animals, and all sampling is random.
fn a statistical- appendix to a paper by Orians (1958), Lesliehas suggested a test for equal .catcirability with respect to themarked population. This test uses the recapture history of a
group of animals which are known to be al-ive by being in the
i th sample and the Ø + s) th sample over a recapture period.s. If the animals are equally catchable the frequencies oftheir recaptures wilÌ form a binomial distribution. The
observed and expected variances of the distribution are then
compared by means of a Chi-square test. Leslie suggested
that the number of recapture periods should not be less than
3 and the number of animal-s that are known to be alive should
be more than 20.' In the present study Leslíers test was first
appli-ed to the recapure data of a group of Kangaroo Tsland
Wallabies marke<l by Dr. S. Barker, Zoology Department,
UniversÍty of Adelaide, over the period August L966 to May
1969. As these animals lvere caught in the area in which my
study was being conducted I thought that it would give a
useful indication of whether the mark-recapture technique was
feasibtre. Because of the minimum requirements for the number
of animals known to be alive over the recapture period itwas only possible to apply this test to females. From August
1966 to May 1967 92 females \^/ere marked with ear-tags and
out of these a group of 24 were known stilI to be alive afterJu1y.1968. Table 6.1A' shows the number of females recapturedin each tri-p from November-December L967 to July 1968 and
Table 6.18 shows the frequency of recaptures.Because the assurnption, of equal catchability was

73
TABLE 6.1A
NUMBER OF FEMALES CAPTURED IN EACH TRIP
FROM NOVEMBER/DECEMBER 1967 TO JULY 1968
I,Ionth of Capture Numbe:: of Recaptures
November,/December 19 67
February 1968
May 1968
July 1968
5
4
7
5
TABLE 6.18
DATA FOR LESLIE' S TEST OF EQUAL CATCHABTT,ITY
FOR FEMALES CAPTURED UP TO NOVEMBER/DECEMBER
T967 AND STTLL ALTVE AFTER JULY 1968
Times Recaptured Nu¡nber of Animals
9
10
4
I0
0
1
2
3
4
223 24.619, P> 0.05x
Therefore, the nu1I hypothesis of equal catchability isaccepted.

74
accepted for these animals, a mark-recapture proqram was
considered suj-table for this population study.
A stochastj-c model .for analysing mark-recapture
data was derived independently by Jolly (1965) and Seber
(1965). This model is less complicated and gives more validresults than the corresponding deterministic models (Cormack,
1968). For this reason it was decided to analyse the data
obtained in thj.s study using this method. As Jol1y (1965)
reviewed the deveÌopment of the model and provided a detailed
description of its use, his methods and notation are used here.
Before proceecling with the analysis of the recapture
data the assumption of equal catchability was tested, again
using the method outlined in Orians and Leslie (1958). The
results for males and femal-es were treated separately.
Because the number of animals known to be alive over the
entire study (JuIy 1975 to November l-978) was small I divided
it into two time periods. r'or females these were May 1976
to January-February 1977 (tables 6.24 and 6.28) and April1977 to December l977'January ]-978 (tables 6.34 and 6.38) -
For males the first period was from July 1976 to January-
February 1977 (Tables 6.44 and 6.48) and the second was the
same as for the females (Tables 6.54 and 6.58) .
For:the recapture data obtained in the present
study the assumption of equal catchability for both males and
females could be accepted for 1976 but was rejected for 1977.
According to Cormack (1966) and Eberhardt (1969) a failure of
this test may be due to three causes:
(1) a behavioural- properLy, inherent to the individual, when
encor:ntering a traP n

75
TABLE 6.2A
NUMBER OF FEMALES CAPTURED IN EACH TRIP FROM
MAY 1976 TO JANUARY/FEBRUARY 1977
Month of Capture Number of Recaptures
May l-976
July J976
October/November J-976
December ]-976
January/Eebruary 1977
10
IO
L7
9
9
TÀBLE 6.28
DATA FOR LESLIE'S TEST OF EQUAL CATCHABILITY
FOR FEMALES CAPTURED UP TO MAY 1976 AND
STII,L AITVE AFTER JANUARY/FEBRUARY 1977
Times Recaptured Number of Animals
0
1
2
3
4
5
10
13
11
4
2
0
"3,51.002, P>0. 05
Therefore,accepted.
the nulI hypothesis of equal ca'b.chability is

76
TABLE 6.3A
NUMBER OF FEMALESJ CAPTURED ÏN EACH TRIP
FROM ApRrL L977 TO DECEMBER Iq77/JÆJUARY L978
Month of Capture Number of Recaptures
April 1977
June/Ju1y 1977
November f977
December, a97 7 / J anuary 797 I
I8
L2
t711
TABLE 6.38
DATA FOR LESLIEIS TEST OF EQUAL CATCHABILTTY
FOR FEMALES CAPTURED UP TO APRIL 1977 AND
sTrLL ALIVE A_FTER DECEMBER 1977/ JANUARY L978
Times Recaptured Nunber of Animals
I6
B
8
3
0
I2
3
4
232x 58.924, P<0.01
Therefore, the null hypothes-ì-s of equal catchability ì-s
rejected.

77
TABLE 6.4A
NUMBER OF MAI,ES CAPTURED IN EACH TRTP FROM
JULY 1976 TO JANUARY/FEBRUARY 1977
Month of Capture Number of Recaptur:esI
JuIy J-976
October/November 1976
December L976
January/February I977
IT4
13
11
TABLE 6.48
DATA FOR LESL]EIS TEST OF EQUAL CATCHABILTTY
FOR }{ALES CAPTURED UP TO JULY 1976 AND
STILL AIT\æ AFTER JANUARY/FEBRUARY ]-977
Times Recaptured Nurnber of Animals
5
B
9
4
2
0
1
2
3
4
)*il = 38 '696 , P>o ' 05
Therefore, the null hypothesis of equal catchabj-lity isaccepted.

78
TABLE 6.54
NU1VIBER OF MALES CAPTURED IN EACH TRIP FROM
ApRrL 1977 TO DECEMBER L977/J?0IUARY I978
Month of Capture Number of Recaptures
April 1-977
June/July 1977
November L977
December 1977 / January J-97 I
T4
9
10
5
TABLE 6.58
DATA FOR LESLIE'S TEST OF EQUAL CATCHABTLÏTY
FOR MALES CAPTURED UP TO APRIL 1977 AND
sTrLL ALIVE ASTER DECEMBER 1977IJANUARY I978
Times Recaptured Number of Animals
5
5
7
5
1
0
].
2
3
4
222x 34 ,9 85, P<0. o5
Therefore, the null hypothesis of equal catchal:ility isrejected.

79
(2) the previous capture history of an individual'(3) lack of opportunity for the capure of an individual. For
example, íf some animals. in the population do not always
feed on the cleared area they will have a differentprobability of capture to those who forage nightly.
The first cause would be difficult to detect but it. is unlikely
to be important in this population due to the method of capture.
If the second factor was operating it might be expected that the
number of animals recaptured zero times would be high' due to
avoidance of the traps through learning. However, this v¿as not
apparent during the times that the test for equal catchabilíty
failed. The third reason seems the most likely as the radio-tracking results [see Chapter 5.0) indicated that there h/ere
differences between the sunmer and winter feeding behaviour of
individuals and also between individuals over summer. The very
dry 1977-L978 srunmer may have been responsible for these
changes in behaviour. This would. lead to the unequal catch-
ability over the period April 1977 to December l977-January
7978.
Because of the possible bias introduced into the
rJolly-Seber modet by unequal catchability an independent
estimate of population size was made using a different method.
Thi s was done by calculating the Minimum Number of Animals
Known to be Alive. However, as the trappíng data was available
it was also decÍded to proceed with an analysis using the
Jolly-Seber model. This would provide a useful basis fox
comparison with tiie Minimun Number of Animals Known to be
Alive especialiy for the period v¡hen equal catchability could
be assumed. I have chosen to present the results of the

80
JoÌIy-Seber model first as it facilitates explanation ofthe data.
6.2.3 The Jolly-Seber Stochastic Model for Mark-
Recapture AnalysisThe following is a brief summary of the formulae
used in this model following the notaÈion of JoIIy (1965).
A number of samples of the population are taken on L
occasions each animal being marked so that its recapture
history is known. Thus at time i an estimate of the population
size can be found from:
N,. =Mí (i = 2,3¡.r. L--Ðu- u¿
where N,. = estimated number of animals in the population when1,_the zl th sample is captured.
M. = estimated numlcer of marked animals in the population't
at time ¿,
a.-. = the proportion of marked animals in the i Lh sample,L
= m,/n¿, \n/here m. is the number of marked animals inthe i t.h sample and n. is the number caught in the
í, th sample. s. z.The estimate M. is calculated from # n ^¿ (í = 2,3, ... L-Ð
1,
where SU = number released from the zl th sample after marking.
z. = the number marked before time i whích are not caught,L
in the i th sample but are caught subsequently.
R. '= the number of animals released from the i Lh sample¿'
that are caught subsequentlY.
Thus, the Populat-ton Es.timate
S. Z. n.'7. '.t a.+n.4N1, R. m.LL
(i = 2,3, L_I)

B1
The probability that an animal alive at the time of release
of Line i th sample will survive to the time of capture of the
(i + 1) th sample can be estimated from the capture histories
of the marked portion of the population.
MSurvival Rate @ ) it-14M¿ - m. * S¿
(í, = 2,3, L-2)
In this estimatio¡ emigration ancl death are combj-ned.
The number of new animals which join the population in the
interval between L]ne í and (¿ + 1) th samples and are st-i]Ialive at time (i + 1) is a combination of the birth rate
(or animals leaving the pouch in the case of wallabies) and
any ímmigration.Birth Rate (Bl = N¿*I ^ ØO(tt. ni +.sí)(i = 2,3,...L-2)
Variances of the popul-ation estimate (Ni), the survival- rate
Wì and birth rate ßil can be calculated from the formulae
given by Jolly (1965)
6.2.4 Results
CaPture Data
se-venteen catching trips were made to the study area
from May Lg75 to November 1978. The total number of ani-mals
ear-tagged from the three capture sites was 479 (2I0 Ft 269 I\4).
The total number ear-tagged i.n each area are shown in Table 6"6-
The number of animals caught during each trip for the presetrt
study, ancl the data for 1966 J969 are presented in Appendix
V.
OnIy the recapture data obtained from animals caught
on the Main Study Area \^/ere used for estimations of population
síze as these \^Iere believed to form a single population (see
Chaptei: 5.0). To obtain a population estimate each animal

B2
TABLE 6.6
TOTAL NUMBER OF WALLABIES EAR-TAGGED AT EACH CAPTURE SITE
CaptureSite
' Total Number Ear-taggedFemales lt/iales Tota1
Main Study Area
Goose Paddock
Bottom Paddock
could only be 'effectively' caught once during a trip. The
results for the number !effectj-vely' caught on each trip on
the Main Study Area and the results of captures in 1966
1969 are shown in Tab.les 6 ,7 and 6 ' 8.
Population nstimates from the Jolly-SeberStochastic Model
The mark-recapbure data for males and females were
analysed separately but the different age groups were not, due
Èo the small numbers involved in each group. The values offr., R. and z, (see section 6.2.3) for 1975 l-978 and 1966 -'t,' '1, 1'
1969 are shown in Appendix VI. The population estimates from
these d.ata are pïesented ín Tables 6 .9 to 6 .L2 together with
estj-mates of survival (and/or emigration) and birth (and/or
immigration) rates.These populatíon estimates show that for females in
the period L975 1978 there was an increase in population
size around January of both L976 and 1977 but not for 1978.
The two peaks vüere followed by a rapid decline by March-April
while over the rest of lie year there was lj.ttl-e fluctuationin size of the population. The males did not show peaks inpopulation size at the same Lime as the femal-es as the
I7].28
11
202
62
5
373
90
16

TABLE 6.7
Date ofField. Trip
July 1975Ociober-November L975
Januarlr I976March 1976May L976
July l..976
October-November L976December L976
January-February J-977
April J-977
June-Ju1y L977November 7977
December J-977-January J-'97 8
May 1978JuIy 1978
November 197B
THE IEFFECTT\Æ' NUMBER OF ANTMALS CAUGHT
DURING EACH TRIP ON THE MAIN STUDY AREA
Number CaughtFemales Males Total
Number RecapturedFemales MaIes Tota1
I RecapturesFemales I¡iaIes Total
24
4219
312519
432830
483240
202722
22
1B
23I725
27
203831253630
372I242325
42
65
36
56
5239
8159
55B4
62
7741s145
47
7
5
17
17
T4
311819
4L2835152520
9
9
7
202924
5339
39
7047
5229
40
38
23
L6.726 .354.868.07 3.772.I64.363.385.487. s87 .575.092.690.940.9
8.711. It2.044.4s0.057.967 .7B0 .080.663.345.966 .762.57 8.356 .0
13. IL9 .435.755.861. 5
65.466.I70.983. 3
75 .867 .570.778.484.448.9
2
2
3
L210
222T2C
2919T7
I41518
I4
@UJ

TABLE 6.8
Date ofField Trip
August 1966November-December 19 66
May 1-967
Noven'Jcer-De cember 19 67
February L9€'8
May 1968July 1968
December 1968March l-969May J967
Number CaughtFemales Males Tota1
Number RecaPturedFemales MaIes Total
E RecaPturesFemales Mal-es Total
THE IEFFECTI\rEI NUMBER OF ANIMALS CAUGHT
BY DR. S. BARKER, ZOOLOGY DEPARTMENT'
UNT\ÆRSITY OF ADELAIDE FROM AUGUST 1966 TO MAY T969
3B
38
44
3833
444440
3444
2II730
32233923262819
59
5574
70
56
83
676
6263
,41313
8
2I231B
2326
2
I3
5
1710
3
9
8
6
I416
1338332T
3234
r0.529.534.224.247 .752.345.067.6s9 .1
10 .918 .922.923.245.849 .331. B
s1.654.0
11. I3.39".4
2L.743.643.511. s32.142. r
Animals that were ear-tagged before AugusE Ig66 and were recaptured during the period August l-966
- May Lg6g were recorded as having been newly caught, for the purposes of the population estimates'
Thus , for this period a total of 450 anj-mals h/ere recorded as being ear-tagged.@È

TABLE 6.9
Date of Fj-eld TriP
October-November L975January L976March 1976May J-976
JuIy 1976October-November I976
December ]-976January-FebruarY 1977
April 1977June-JulY J977Novernber 1977
December 1977 -January I978May L97B
JuIy I97BNovember l-978
POPULATION ESTIMA1ES FOR FEMALES OVER THE PERÏOD
oCToBER-NOVEMBER 1975 TO NOVEMBER 1978' DERTVED
FROM THE JOLLY-SEBER STOCHASTTC MODEL
Proportionof
Recaptures(a¿)
0.)"670 .2630.s480.6800.7370.72L0.6430.6330.8540.8750"8750 .7500.9260 .9090.409
Number OfMarked
Animals(rvi¿ )
2r.7s3.956.482.663.268.974.098.079 .481.37 4.054 .561. I64. 0
PopulationSíze (Ni )t standardDeviation
SurvivalRate @i)t standardDeviation
BirthRate (8".)
t standaídDeviation
t!tttttttIIttt
L54.793.093.084 .6
130 .0204.7I02.7L2L.5
85 .79s.6
11s.1
72.666.870 .4
0.8301.1750.6971.01r0.914
.158
.I27
.184
.115
.100
.101
.180
.111
.130
.r49
.140
.262
.547
78.6-67 .2
0.8
8.927 .720 .4
-19 .85.4
r32.379.630. 7
L7 .9L3.718.928.720 .48.26.89.3
10. 4
5.3
0.98548.884.720.026.0
tItJttttttttt
1.0
jItJjfttttt+
1
15 .113. I20.531. I12.4l-5.415.416. 3
t7 .4
1.1660.7290.941
8670
0.69I1. 0s7
0031
4.OL4.39.03.4
39.2 @(rl

TABLE 6.10
Date of Fiel-d TriP
October- November 1975January 1976March l-976May L976
July 1916October-November 1976
December 1976January-FebruarY 1977
April L977June-July 1977November l-977
December 1977-January l-97 8
May L978JuIy I97B
ìdovember 19 78
POPULATION ESTTMATES FOR }{ALES OVER THE PERTOD
oCToBER-NOVEMBER 1975 TO NOVEMtsER 1978' DERTVED
FROM THE JOLLY.SEBER STOCHASTIC MODEL
Proportionof
Recaptures(a¿)
0.0870 .1180.1200 .4440.5000.5790.6770.8000.8060.6330.4590.6670.6250.7830.560
Nurnber OfMarked
Animals(Mi)
PopulationSize (N"- )t standaídDeviation
Survival, Rate @¿)f StandardDeviation
+
31.6131. I
. -115.413. I3.18.01.1
26 .44r.8
10 .428.5
BirthRate (ø¿)Standard
Deviation
20 .4TT.228.047 .85 0.05r.249.968.459 .056.549.095.051. 4
317.0
23,4 .694.8
233.3I07.4100 .0
88.5
85. 5
73.289.2
106.5
30.s28.217.972.517.I]-3.72I.626.250.622.7
1.163
.TI2
.202
.187
.165
.l-46
.091
.172
.j.47
.17s
.150
.444
.I79
33. I25.I17. 315 .5
8.912.620.848.719.276.7
ItItIttttttttt
.5
.3
.1
2
8274
0.269205 -865.9 l-57 .4
L72.31.071
0. 8540.74r
0
0
!ttttttttIt1t
tttttttIt1tt1
r07 .2
73.6
0.95531330. 810
803869
0.725r.3780.5045 .335
4.5
4.3
5.277405 400.3
@Or

TABLE 6.11
Date Of Fielil Trip
November-December 19 66
May 7967
November-De cember 19 67
February 1968
May 1968
July 1968
December 1968
March ]-969
May 1969
POPULATION ESTIMATES FOR FEMALES O\TER THE
PERIOD NO\ÆMBER-DECE¡{BER 1966 TO ¡{AY 1969,
DERIVED FROM THE JOLLY.SEBER STOCHASTTC MODEL
Proportionof
Recaptures(a¿)
0.105
0.295
0.342
a.242
0.477
0.523
0.450
0.676
0 .591
Number OfMarked
Animals(Mi)
61.0
5r.777 .6
97 .3
r44.2138.1
I23.587 .2
Population, Size (w¿ )! StandardDeviation
+
a0.544 :49 .8 0.e38 t
0.e48 tl-L.I79:
0.826 !
SurvivalRare (ø¿)Standard
Deviation
BirÈhRate (B; )t standaídDeviation
-l-579.5 -I175.1 l-L226.8 :
401.3
302.rI264.r !t
274 -3 :-
I128.9 :
82.7
76.r90.5
42.9
313.3
64.8
.133
.183
.2I3
.309
.252
.264
.22L
-L40.462.6
T86.2
-171.114-6
89 .3
63.4
62.9
46.0
t1
J
t+
243.2
]-42.2
174.L145.01
JI0.776 :I0.600 l J-35-6 -i-
I69.3 !
@\¡

TABLE 6.L2
Date of Field Trip
May 1967
November-December 19 6 7
February 1968
May 1968
JuIy 1968
December 1968
March 1969
May 1969
POPULATION ESTIMATES FOR MALES O\ÆR THE
PERIOD MAY L967 TO MAY 1969, DERTVED FROM
THE JOLLY-SEBER STOCHASTIC MODEL
Proportionof
Recaptures(a¿)
0.033
0.094
0.2L7
0 .436
0.435
0.115
0 .32J.
0 -42r
Number OfMarked
Animals(wr¿ )
30. 0
34 .0
85.5
59.2
57.3
89.7
37 .0
PopulationSize (u¿)
t standard.Deviation
SurvivalRate (Ø¿)
t Stand.ardDeviation
BirthRare (e¿)j standardDeviation
f
-I64.3 '
-L-10s.5 :-L89.2:
3s.4 1 4s .L
606.7 ! s53.0
-140.1 I 257 .7
900.0
362.7
393.3
135. 9
131. 7
777.r115. 1
!: 2r7 -r-!: s2.BfI 72.2T: 633.9-tj 74-o
IL.379 :I0.572 :J-0.7r4 tr
f1- 314 l
f0.328 :
.216
.560
.257
.37 6
.933
.239
-!¿I 961.4 0.586 : 778.9
398.5
L27.L
+ 224.7
Information from November-December 1966 was deleted from the analysis because no animals ear-tagged
in this trip were subsequently recaptured. @

89
highest estimates occurred in October-November 1975, March
Lg76, December 1977 January l-978 and JuIy l-978. The high
population estimate for Octob.er-November 1975 was due to the
Iow proportion of recaptures while for July J-978 it was due
to the fact that only one of Lhe animals released at this time
was subsequently recaptured. This meant that the estimate
of the number of marked anímals in the population (Mi), and
hence the estimate of population size, \^7as large. Because
young animals leave the pouch around October-November each
year I expected an increase in the population síze ät this
time. This would only be estimated if a large number of these
young animals \^Iere caught at this time. However, the captures
of this age-c1ass tended to be spread over several trips so
that no sudden increase in population estimates \^¡as observed
in October-November. Over the tirne period that the assumption
of equal catchability was vatid the population estimates for
femares varj-ed from 86 t rs in July Lg76 to 155 t 32 in
January-February Ig77. For males the lowest value was 74 1 13
in Decemb er :-]976 and. the highest was 1OO t 28 in July 1976.
over the ),966 :-969 period the population estimates
f,or both males and females tended to fluctuate from month to
month. The hÍgh values appeared to be the result of a low
proportion of recaptures at that. time but whether this was due
to new animals enLering the population or marked animals
avoiding beíng caught could not be determined- I suspect that
despite the acceptance of equal catchability for females from
November - December 1967 to July 1968 the populaLion estimates
are biased by changes in the behaviour of animals at different
times of the year which affected their chance of being caught'

90
6.3 ESTTMATION OF THE MINIMUM NUMBER OF ANIMALS KNOWN TO BE
ALTVE AS A MBASURE OF POPULATTON STZE
6.3.1 The Assumptions and Calculations Necessary toObtain Population Estimates by this Method
Krebs (1966) abandoned the mark-recapture method ofestimating population size due to trap bias. He attempted tocensus a population of the Californj-a vole (Micz,otus caLifonrLcrc)
by calculating the minimum number of anímals alive at each
capture period. This was obtained. from (1) the actual number
caught at tíme t, and (2) the number of previously marke<l
individuals caught after time tt but not at that tj-me.
A similar method was used in this study which
utilized the data obtained for the mark-recapture method.
However, a further two calculations were needed to obtain the
population estimate. One of these calculations involved the
number of anímals noL caught at time t but which belonged toa cohort that left the pouch before time f and were caught
subsequently. The other calculation estÍmated the number ofpouch young which enter the population at around October-
t{ovember each year. To do this the number of females 1- 2
years old and older than 2 years, that \dere known to be alivein October-November, \^/ere first calculated. By multiplyingthese numbers by the proportion of females carryíng a pouch
young during the appropriate year, the total number of young
leaving the pouch could be estimated. The number of males
and females was then calculated by usi-ng the mean sex ratioobtained for pouch young during the stud.y.
To obtain a population estimate by this method an
intensive trapping program was required and it wa"s assumed

91
that immigration and emigration were negligible. Howard
(1960) d.efined dispersal as "tf:le movement the animal makes
from its point of origin to the place where it reproduces
or would have reproduced if it had survived and found a mate.".
Animals may disperse for several reasons, such as to escape
from harsh environmental conditions or high populationdensities (Howard, 1960; Lidicker, 1962; Joule and Cameron,
1975) , lnovement of animals as they approach sexual maturitydue to aggressive interactions with territoríal residents(Blair , 1953¡ Healey , L967) , or movement into ne\^/ or previouslydepopulated habitats [Joule and Carneron, I975) . Among
macropods, dispersal does not occur in quokka populations(Dunnet, a962; Holsworth, 1967; Kitchener, L970) but Kaufmann
(I974) concluded that for male sub-adult whip-tail wallabiessome dispersal occurred as they approached sexual maturity.
For the Kangaroo Isl-and Wallaby the informationobtained from the recapture of animals and the limited amount
of data from radio-tracking (Chapter 5.0) suggests that littledispersal occurs. Of all the animal-s recaptured only the
following Ínstances of an anímal being caught in a differentarea from that in which it was first caught \^rere recorded. A
female was fi¡rst captured on 28/10/75 in the Main Study Area
after it had recently left its mother's pouch. It was nextcaptur:ed on 2515/76 in the Goose Paddock but was not sub-
sequent1y recaptured. A male that was first caught in theGoose Paddock (Male 3 from radio-tracking results) on 27/5/76
when 15-16 months old was recaptured two days later on the
Main Study Area. Al1 subsequent recaptures of this animal
vrere made only on Lhe Main Study Area. Another male that was

92
first captured j-n the Goose Paddock on 27/7/76 when 17-18
months oId was next caught on 9/4/77 on the Main Study Area.
No tagged. animals from the Main Study Area \^¡ere caught in the
Bottom Paddock nor were any from this area caught in eitherthe Goose Padd.ock or Main Study Area. Four animals (3 F' I M)
that were first tagged in tfrre Goose Padd.ock were caught close
by ln the Bottom Paddock but three of these \,vere laterrecaptured in the Goose Paddock again.
For this study I have assumed that dispersal is nota major factor influencing the number of anj-maIs on the Main
Study Area and that the population size can be estimated by
calculati-ng the minimum number of aninals known to be alive.This estimate is for the'population which uses approximately
one guarter of the cleared area as a feeding site (see Chapter
5,0) and is the same area where wallabies v/ere caught in1966-19 69 .
6.3.2 Results
The results obtained in estimating the population
size as the Minimum Number of Animals Known to be Alive(l4.lJ.A") on the Main Study Area are shown separately for males
and females for 1975-7978 in Figure 6.1 and for 1966-1969 inFigure 6.2, The proportion of the populatj-on belonging toeach cohort is also shown in these figures.
There is an annual fluctuation in numbers with a
peak occurring around October-November of each year when young
animals leave the pouch. Over the following srunmer there was
an initial sharp drop in population size followed by a slightlylower decline over the winter. Population size was similar in1975 and 1976 but was lower towards the end of L977 and early

150
100
50
100
197s
1974
1975
197s
1977
1977
1978
1978
974
>1872
197s
FEMALES
1976
MAI.ES
1976
7291
uJNU'
zot-JDo-oo-
1
5
Poputation size for wall-abies using the MainStudy Area from 1975 1978.Top thick l--ine represents total population,shacled areas represent the number of animalsfrom a particular cohort.
Figure 6.1

utN(¡,
zoEJÐo-oo,
200FEMALES
150
1965
1001964
50 > 1963
1966
MALES
1965
1964
>1963
1966
200
150
1967
1967
1968
1968
100
50
Population size of rvallabies, obtained. from thedata collected by Dr. S. Barker , Zoology Depart-ment, UniverÉity of Adelaide.These animals were caught in the same area asfor the present study.
Figure 6.2

93
L978. Confirmation of a population decline in 1978 was
obtained frorn observations of many dead animals on the study
area over the wi-nter. Similar observations r/¡ere made by
Murphy (1970) over the 1968 winter and the population es:timates
at thi-s time also show that a decline in population size
occurred.A comparison with the results obtained from the
Jolly-Seber method for 1975-1978 j-s shown in Table 6.13. Ivlany
of the estimates obtained by the two methods are quite similaralthough there are some vrhich do show a considerable differ-ence. For fernales, the times when values for the M.N.A. were
beyond one standard deviation of the Jol1y-Seber estimate
hrere January 1976, October-November J-976 and January-February
1977 while for males ít was in October-November l976 and
December I977 January L978. The differences in October-
November 1976 would be due to the calculation of the number ofpouch young entering the population by using the M.N.A. method.
The other differences occured in summer when it is likely thatchanges in the feeding behaviour of animals affects the chance
of an animal being captured and hence the population estimate
made by the Jolly-Seber method.
6.4 REPRODUCT]VE CHARACTERISTTCS OF THE POPULATTON
6.4.L Season of Birthsfn the Kangaroo Island Wallaby there is a distinct
breeding season with most young being born in late January and
early February (Andrewa-rtha and Barker, 1969; Berger, 7970) .
This was confirmed in th.e presen'L study as shown by the resultsfor 1975-1977 (Figure 6.3) . When the results from these years
\,vere combined [Figure 6.4) it shows that I4Z of young were

TABLE 6.13
Date Of Field Trip
October-November l'975January 1976March l976May 1976
July 1976October-November 1976January-February L977
ApríI 1-977
June-July I977November L977
December L97 7-January J-97 8
May I97B
COiVIPARISON OF POPULATION ESTTMATES OBTATNED BY
THE MTNIMUM NUMBER KNO!fN TO BE ALIVE (M.N.A.) AND
THE JOLLY-SEBER METHOD
FEMALES
M. N.A.Estimate
I32110105100
91]-23101
90
7789
6457
Jo1lv-Sebernstimáte + s.D.
? Difference10 0 (M. N.A . -JS) ,/JS
I30.0204.7I02.7I2I.5
84.6
66.8
48.884.720.026 .0ls.113. I31. I12.415.415 .416. 3
17 .4
8s.79s.6
I54.79 3.093.0
72.6
J!Itttttt1t+
+ 1.5-46.3+ 2.2-L7 .7+ 6.2+28.7-34.7
3.2-I7.2+ 5.2-11. I-14.7
Contf d. on pg. 95
\0È

TASLE 6.13 CONTI D.COMPARISON OF POPULATTON ESTTMATES OBTAINED BY
THE MTNIMUM NUMBER KNOWN TO BE ALTVE (M.N.A.) AND
THE JOLLY-SEBER METHOD
MALES
Date of Field Tri-p
October-Dtovember 19 7 5
January 1976March 1976May 1976
July 1976October-November 1976January-February J-977
April L977June-Ju1y J-977
November L977December l977-January 1978
May L978
M. N.A.Estimate
14III4110103
93126100
9176
907359
Jo1ly-SeberEstimate + S.D.
% Difference100 (M.N.A.-JS) /JS
-39.9+20 .3-52.9- 4.L
7.0+42 .4+I7 .0+24.3-14.8-15.s-4 8.8-28.3
234.694.8
233 .3l.07 .4100 .0
88.58s .5
30 .528.2L7 .917. 1l-3.72\.626.250.622.7
IJ!1ttttIttI
205 -86 5.9
133. 3
7 3.289.2
106 .5I42.5
82.3
\o(tl

96
born in the period January 15th - 2IsL, 2IZ from January 22nð'
28th, and. 28e" from January 29LL' - February 4th. The mean
date of bj-rth was estimated as February 6th with a standard
deviation of 17.8 days. The data for I97B was not included
because it was possible that errors may have occurred inestimating the age of pouch young from body measurements
(see Chapter 3.0). For the purposes of this study I have
taken the breeding season to be from the beginning ofJanuary to the end of March.
6.4.2 Fecundity and Pouch-young MortalityThe fecundity of an animal can be defined as the
number of offspring produced over an interval of time. For
this study fecundity was measured as the proportion of females
of reproductive age in any one year having either a young inthe pouch, oT t a lactating teat if examined. in october-
November
It was shown earlier that female Kangaroo Island
Vlattabies become sexually mature at 9 months of â9ê, just
after leaving the pouch (Chapter 4.0) ' However, they do
not give birth until the January - March breeding season.
To assess fecundity the animals were divided into Juveniles
(1 - 2 years) and Adults (older than 2 years). Except fora trip in late March L976 only animals caught after the end
of the breeding Season were scored for the presence or
absence of pouch Young,
The results r,or these animal-s for the years 7975 -L97B and 1966 ]-'969 are shown in Tables 6-I4 and 6.15"
There was a high fecundity for adults in all years while the
fecundity of juveniles fluctuated from year to year. All

20 @10
lflLol
tffil
DEC JAN FEB
N =46
N=40
N=52
MAR APR MAY JUN
o
?, zoÞÉ,õ
äroÉl¡¡o
=oz
10
o
Dates of birth of Pouch Younqperiods starting JanuarY lst)L975, l-.97 6 and 1977.
(in one weekfor the yearsFigure 6.3

30
20
10
ØTt-É,ol¡.oEuJo=fz
40
o
Figure 6.4
N=138
DEC JAN FEB MAR APR MAY JUN
Dates of birth of all pouch young examinedover the period J-975 1977 -

97
TABLE 6.I4
PROPORTION OF FEMALES CARRYING A POUCH YOUNG
IN EACH YEAR FROM 1975.1978 (MATN STUDY AREA)
JUVENTLES (1 - 2 YEARS OLD)
Year NumberExamined
Number WithA Pouch Young OrLactating Teat.
Proportion OfFemales CarryingA Pouch Young
]-975
1976
l977
].97 8
10
19
l-5
I
10
L4
6
0
1. 00
.74
.40
0
ADULTS (OLDER THAN 2 YEARS)
Year NumberExamined
Nurnl¡er WithA Pouch Young OrLactating Teat
Proportion OfFemales CarryingA Pouch Young
L97 5
]-'97 6
7977
L97 I
40
60
53
51
38
51
49
43
.95
.85
.93
.84

98
TABLE 6.15
PROPORTTON OF FEMALES CARRYING A POUCH
YOUNG rN EACH YEAR, FROM 1966-1969
JUVENTLES (1 - 2 YEARS OLD)
Year NumberExamined
Nr¡nbef WithA Pouch Young OrLactating Teat
Proportion OfFemales CarryingA Pouch Young
1966
1967
1968
L969
I213
22
10
11
10
16
9
.92
.77
.73
.90
ADULTS (OLDER THAN 2 YEARS)
Year NunberExamined
Number WithA Pouch Young OrLactating Teat
Proportion OfFemales CarryingA Pouch Young
l.966
1967
.L96I
L969
45
44
87
56
43
4I76
52
.96
.93
.87
.93

99
the juveniles examined in 1975 had pouch young while for 1976,
742 had pouch young and in J-977 it had fallen to 40e". InI97B none of the juveniles examined had a pouch young.
However, the number of animals examined in each year was smaIl.For the 1966 - 1969 period the fecundity of juveniles was
high in J966 and in 1969 but was lower for 1967 and 1968 (77e"
and '13e" respectively) .
This method of assessing fecundity does not take
into account any pouch young mortality that may occur d.uring
the year. To estimate the amount of this mortality the
nr¡riber of animal-s with a pouch young that were caught in each
trip were recorded. The percentage of adult females withpouch young that rirere captured in each trip are shown inFigure 6.5, If there was no loss of pouch young during theyear it would be expected that the proportion with young
early in the year would be the same as later in the year.Tables 6.16 and 6 ,)-7 show the number with pouch young thatwere caught ìn each trip and. the expected number for the
sr:bsequent trip, íf no pouch young mortalj-ty occurred.
Pouch young mortality among adult females vüas
negligible in 7975, 1976 and 1977 I'¡ut was apparently high in1978. From JuIy to November I97B the proportion of females
with a pouch you¡g feIl from 952 to 46e". None of thejuveniles sampled in 1978 had a pouch young,while for otheryears the number examined rvas too small to determine whether
young wer:e being lost from the pouch or whether fecunditywas lower for this group. In the 1966 7969 period pouch
mortal-ity h/as only apparent in 1968 when the numb-er of adultscarrying a pouch young fell from 97e" ln May to 76% j-n

100
80
60
40
20
100
80
(5z:fo
()Ðoo-
E
=CI'l.LlJ
tulJ-
5ÐoIIoèq
1975 1976 1977 1978
a
1966 1967 1968 1969o
Figure 6.5 PercenÈage of Adult Females with a Pouch Young or f,actating.
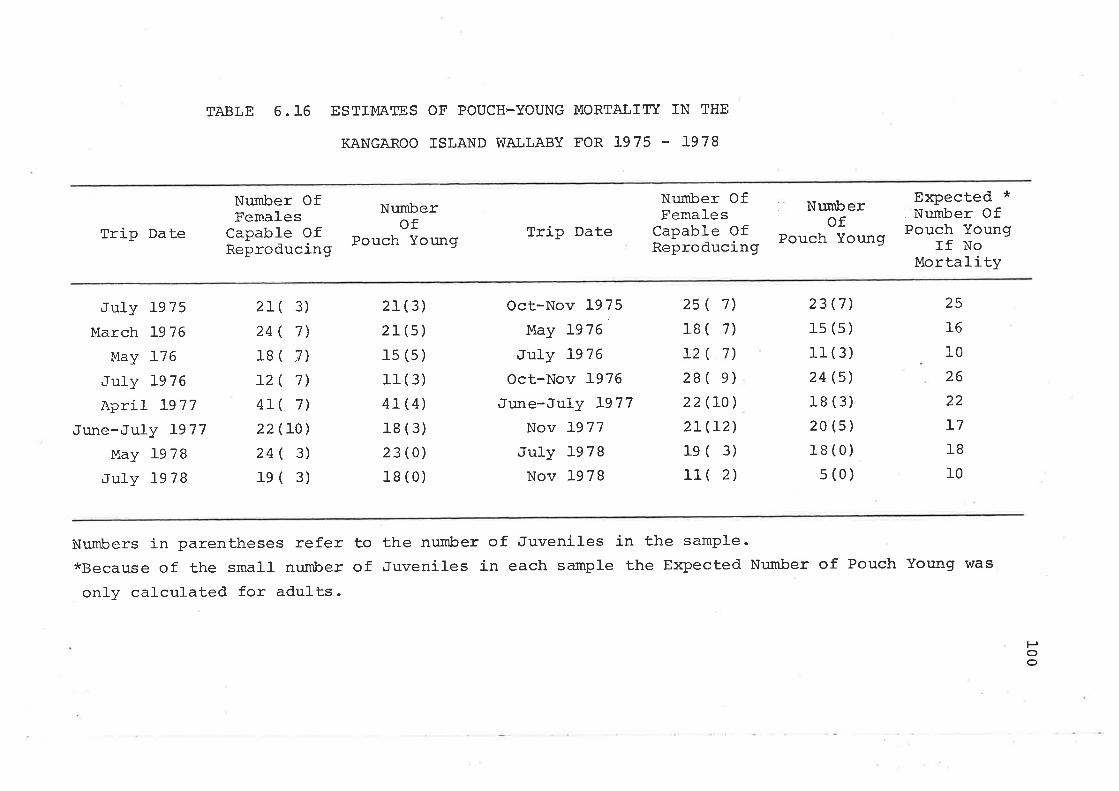
TABLE 6.16 ESTIMATES OF POUCH-YOUNG MORTA],IflT IN THE
KANGAROO TSLAND WAILABY FOR 1975 1978
Tr.ip Date
July J-975
Ivlarch ]-976May 176
JuIy 1976April J-977
June-July 1977May I97B
JuIy 1978
Number OfFemales
Capable OfReproducing
Numberof
Pouch Young Trip Date
Oct-Nov 1975May L976
July 1976Oct-Nov 1976
June-July 1977Nov 1977
July I97BNov 1978
Number OfFemales
Capable OfReproducing
Numberof
Pouch Young
Expected *Number Of
Pouch YoungIf No
Mortality
25
16
10
2622L71810
2r( 3)
24( 7)18( 7)12( 7)4L( 7)22 (r0)24( 3)le( 3)
21(3)2r(5)15 (s)11(3)47(4)18 (3)23(0)1B(0)
2s( 7)
18( 7)
12( 7)28( e)22 (L0)2L(L2)le( 3)11( 2)
23 (7)1s (s)11(3)24 (s)18 (3)2o(s)1B (0)5(0)
Numbers in parentheses refer to the number of Juveniles in the sample.*Because of the srnall number of Juveniles in each sample the Expected Number of Pouch Young was
only calculated for adults.
Poo

TABLE 6.L7
Nr:mber OfFemales
Capable OfReproducing
Nunberof
Pouch Young
Nurnber OfFemales
Capable OfReprod.ucing
Nr:mberof
Pouch Young
Expected'Number Of
Pouch Youngff No
MortalityTrip Date
AugusL 1966
May J..967
May 1968
July 1968
March 1969
Trip Date
Nov-Dec 19ç6
Nov-Dec ]-967
JuIy 1968
Dec 1968
May 1969
ESTTMATES OF POUCH-YOUNG MORTALINT IN THE
KÄNGAROO TSLAND VIAILABY FOR 1966 T969
2e ( e)
34 (10 )
36( 8)
34 (10)
30( 4)
2e (8)
33(e)
3s (6)
30(e)
2e (4)
25( 3)
25( 8)
34 (10)
25( 7)
32 (r2)
23( 3)
23( 5)
30( e)
1e( 4)
28(10)
25
24
33
22
31
Hots

L02
December.
6.4.3 Sex RatiosA survey of the sex ratio of pouch young of
marsupials by Caughley and Kean (1964) showed that in onlyone species, a macropod, was there a significant d.ifference
in the numbers of males and females (Table 6.18) . The
results for the Kangaroo Island Wallaby from both the present
study and from the period 1966 L969 showed that although
there were slightly nore males than females this was not
significantly different from a 1 : I ratj-o (Table 6.19) .
Newsome (1977) found that in red kangaroos incentral Australi-a the sex ratio at birth was not differentfrom J- : 1 and this contìnued to be so up to 3 years of age.
After that age females started to outnumber the males fo:r
each age group examined. From about 3 years of age the males
become sexually mature and the difference in size between the
sexes is more apparent. Newsome concluded that there was
probably selective predation by man on the larger mal-es which
resulted in the biased sex ratio. Any differences in naturalmortality between the.sexes would have been masked by the
human predation. In the present study the wallaby population
was protected from human interference so that any changes inthe sex ratio of the different age groups would reflectdiffer:ences in their survival.
The total number of animals in each age class that\dere caught in each year for the period L975 I97B are shown
in Table 6.20. There was no sìgnificant difference in the
number of males and. females in each age grouP up to fiveyears. However, for animals older than five years there were

TABLE 6.18
Species
DideLphidaeDideLphis uinginiana
PhaLang eri daeTyíchosuTus uuLpecula
PerameLídaePerameLes nasuta
MaeropodidaeSetoniæ braehyurusMacropus robustusM. nufusM. cq,nguruM. eugenii
(This study and r,rnpr:blishedresults of Dr. S. Barker)
A SURVEY OF THE SEX RATTO OF POUCH YOUNG
FOR SE\¡ERAL SPECIES OF MARSUPIALS, FROM
CAUGHLEY AND KEAN (L964) AND THE PR-ESENT STUDY
Number OfFemales
606
425
55
322315208]-78]-96
Number OfIvIales
632
483
57
27928r202242233
P f
.49
.47
.49
.54
.53
.51
.42
.46
* X2
.546 N.S
3.70s N. S.
.036 N.S
1
3.0771.940
.0889.7s23. 191
N. S.N. S.N. S.
.00l<P<.05N.S.
l-ol¡,
* P, is the proportion of females

r04
TABLE 6.I9SEX RATIO OF POUCH YOTING TN THE KANGAROO
ISLAND WALLABY FOR THE PERIODS T966-7969
AND 1975-1978
Year Number OfFemales
Number OfMales Pf
2Ix
],966
]967
1968
-l-9 6 9
18
18
39
31
18
23
50
34
.50
.44
.44
.48
0
. 610
1.360
.139
N. S.
N.S.
N. S.
N.S.
Total 106 ]-'25 .46 1.563 N.S
a97s
]..976
7977
797 8
23
29
22
1,6
30
30
28
20
.43
.49
.44
.44
.925
. 016
.720
.444
t{. s.N.S
N.S.
N.S
Total 90 108 .45 1.636 N.S

105
significantly more females, suggesting that females are
surviving better than males in the older age groups.
TABLE 6.20
TOTAL NUMBER OF MALES AND FEM¿.LES OF EACH
AGE.CLASS THAT WERE CAUGHT IN EACH YEAR
FOR THE T975-I978 PERTOD.
DATA FOR EACH YBAR WAS ADDED TOGETHER
Age C1ass(Years )
PouchYoung 7-2 2-3 3-4 4-5 Older Than
5
Males
Females
Sex Ratio (Pr)
*"
108
90
.45
1.636
N.S.
75
61'.45
T.44IN.S.
47
50
.52
0.093
N. S.
3B
44
.54
0 .439
N.S.
29
2B
,49
0 .018
N.S.
69
96
.58
4.4l-8
.025<P <. 0 5
6,4.4 Presence of More Than One Young in the Pouch
I\¡ro females out of the 262 caught with pouch young
were carrying two young. The ages of one pair differed by
31 days, which is only slightly longer than the length ofgestation (Calaby and Poole, L971). It is probable thatafter the first young \Á/as boi:n, and the normal post-partum
fertilization occurred, the mechanj-sm initiating embryonic
diapause failed. Hence normal embryonic development took
place rather than being delayed at the blastocyst stage.
The second pair of young were true twj-ns as they were the
same age.

106
6.5 SURVIVAL RATES AND LIFE TABLES
6.5.1 Estimation of Survival RaLes.
Survival curves fol the various cohorts of both
males and females over the period 1975 L978 are shown inFigures 6.6 and 6.7. These curves were constructed from the
data used to estimate the Minimum Nr:¡nlcer of Animals Known to
be Alive. This assumes that if an animal disappears from the
population it has died rather than emigrated. This assumption
is supported by the lack of evidence for any significantdispersal of animals.
By dividing the population into 3 age-classes itwas possible to see which age group had the highest mortality.The age-classes used rt/ere, Juveniles (from 0 - I years afteremerging from the pouch), Young Adults (1 - 3 years afterleaving the pouch) and. OId Adults (more than 3 years since
leaving the pouch).
Survival was different between agfe groups, between
years for a particular age group, and. in some seasons between
the sexes. Juveniles just out of the pouch suffered a high
mortality over their first summer, Tab1es 6.21 and 6.22
present the survival data for males and fenales over theirfirst year after leaving the pouch. From the time they leave
the pouch in October - Novernber to the end of the summer
period in March - April there was a 35% mortality of males
and females of the 1975 cohort, while for the \976 cohort over
the same period mortality was 35å for females and 442 formales. The number of juveniles surviving one year afterleaving the pouch was, for the l-975 cohort, 58% fot females
and 50? for ma1es. For the 1976 cohort survival was 56qø for
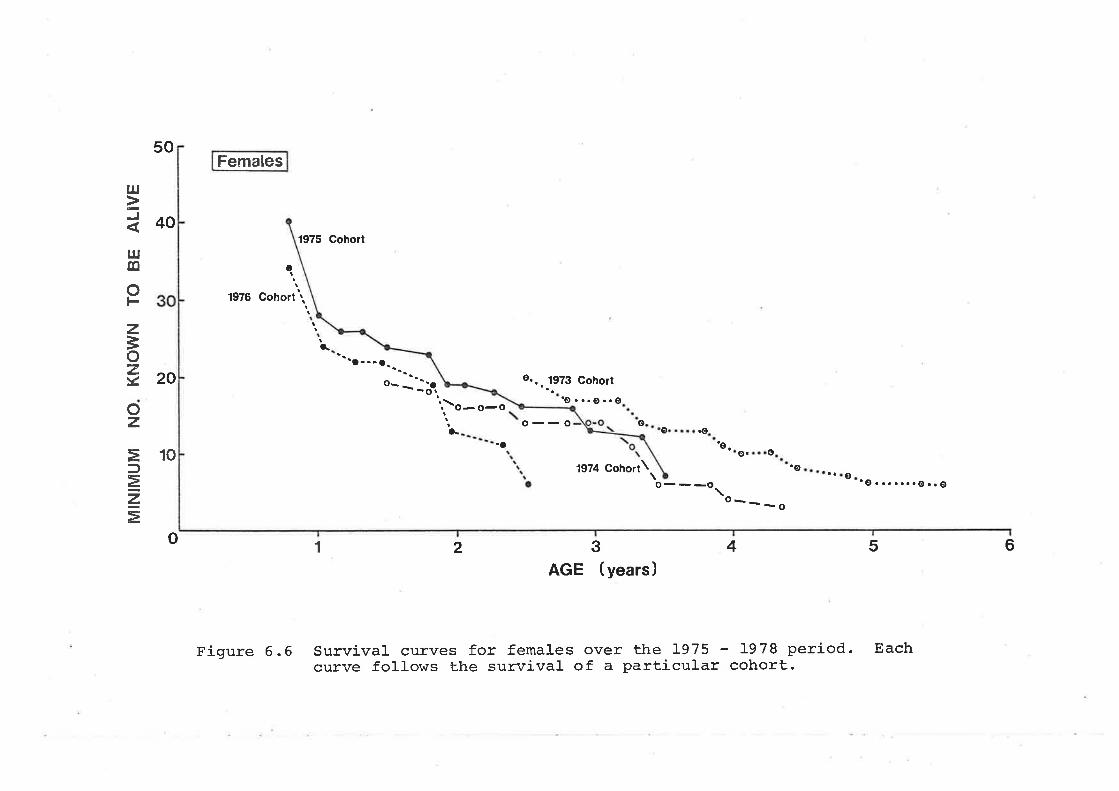
50
40
l¡lJ
l¡Jg¡
oFzEozv
Females
c¡I
1976 Cohort\
1975 Gohort
I
20 .--jÈo
o.. 1973 Cohort
þ . ..9..9
1974 Cohort\
oro1
810fEzE
oo- o.o
641
'o
o- _ _oao
'o. o
o 2 3 5AGE ( years )
Survival curves for females over the L975 1978 period. Eachcurve follows the survival of a particular cohort.
Figure 6.6

50
ot\t
IJJ
J40
ulc0
ol-30
z=ozY20oa1z,
Ë10=E
Io
1976 Cohort
\1974 Coho?t
o\
Males
\O---O_
1975 Cohort
ttItIIa
o\orrr'q
þ'o
621o
o
o :.ì?--"-o-.o
a€'d"o""...o..o.
1973 Gohort 'o
53 4
AGE ( years)
Survival curves for males over the L975 to 1978 period'Each curve follows the survival of a particular cohort'Figure 6.7

107
TABLE 6.2ISURVTVAI OF JUVENILE MALES
L975 ]-976 1977
Maximum potenti,al Numberof young leaving the pouchin Oct-Nov each year.Actual number of youngIeaving the pouch in Oct-Nov.
Number of juveniles alivein the following January.
Number of juveniles alivein March-AprilNumber of juveniles alivein June - July.Number of juveniles aliveone year after leavingthe pouch
50
48
48
20
T4
2B
19
15*
36
39
31
32 25
22
25
24
*Denotes number alive in Ma1z.

108
TABLE 6.22
SURVTVAL OF JWENTLE FEMALES
L975 \976 l-977
Maximum potential Numberof young leaving the Pouch1tr gst-hlov each year.Actual number of youngleaving the pouch in Oct-Nov.
Number of juveniles alivein the following JanuarY.
Nr¡mber of juvenj-Ies alivein March-Aprilr .
Number of juveniles alir¡ein June-July.Number of juveniles aliveone year after leavingthe pouch.
42
40
28
26
24
23
4L 30
23
15
13*
24
34
22
22
19
*Denotes number al-ive in May.

109
females and 362 for ma1es.
The annual survival rate for all adults (Young
adults plus Old adult.s) \,vas calculated from the number present
in October - November of one year to the number sti1l alive inOctober ' November of the followÍng year (rable 6.23). For
males it was 69Z for L975 1976 and 55? f.or 1976 1977. For
fernales it was 72e" for L975 1-976 and 53% for 1976 L977.
The percentage mortality for each age-class over
suÍtrner and winter for L975 I97B is shown in Table 6.24.
The young adult animals.hadthe lowest Sufltrner mortality rate.In both sexes mortality was hígher during the 1977 sunìJner than
in 1976. For the old adults the mortality rate was higher
than the young adults but not as high as in juveniles. There
was litt1e difference between the sexes but once again
mortality was higher in 7977 than 1976. In the winter period
the juvenile females had the lowest mortality, which was I2Z
in L976 and l-4? in 1977. .Juvenile males and oId males had the
highest mortality in the 1976 winter (232 and 222 respectively)while in 1977 botln they, and the old females, had a 362
mortality, 'i-he winter mortality of the young adults was
higher than over the sulnmer and was 18% for both males and
fernales ín 1976, and 25eo and,242 for males and females in\977 ,
In .1978 a large number of dead wallabies h/ere found
on the Study area and nany animals \^/ere seen to be in poor
condition (see Chapter 7.0) . The highest mortality occurred
from late summer to the end of winter as jud.ged by the
number of dead animals found. Bstimates of mortality are only
available from November L977 up to May 7978 and so are not

I10
TABLE 6.23
SURVTVAI OF ADULTS (YOUNG ADULTS AND OLD ADULTS)
MALES
l975 ]-976 L977
Number of Adu1ts presentin Oct-Nov.
Number of Adults aliveín the following January.
Number of Adults alivein March-Apri1.Number of Adults alivein June-Ju1y.
Nuniber of Adults aliveafter one year.
91
82
79
68
63
69
54
4U,
87 62
75
56
48
FEMALES
]-975 ]-976 L977
Number of Adults presentin Oct-Nov.
Number of Adults alivein the following JanuarY.
Number of Adu1ts alivein March-April.Number of Adults alívein June-July.Number of Adults aliveafter one year,
92
82 77
79 68
67 55
89 66
49
44*
*Denotes number alive in MaY.
66 47

TABLE 6.24
Time Period
OctlNov 1975-Mar L976
Mar I976-OcL/Nov 1976
octlNov 1976-April 1977
Apri1 1977-Nov L977
Nov 1977-May 1978
PERCENTAGE MORTAIITY FOR THREE AGE-CLASSES
ovER SUMMER AND WTNTER, FROM I975-I978
? MortalityJuveni Ie s
Males FemalesYoung Ad.ults
Ma1es FemalesOId Animals
Males Females
35.4
22.6
43.6
36 .4
46 .4
35.0
11. 5
35 .3
13. 6
43,5
9.5
L8.4
16.3
25.0
4L.4
5.7
r8.22I.624 .).
34.3
16 .3
22.0
25.0
36.4
39 .5
19.3
l5.225.0
3s .9
32.3
HHP

1r1
strictly cornparable to the estimates from the previous. years.
However they do suggest that a large decline in the popula-
tion occurred over L978. From November 1977 to May 1978 the
total population size decreased by 352, compared with a
decrease of 252 for the l-975 1976 period- Juvenile
mortality for the 1977 1978 period was 432 for females and
462 for males. Although these rates are hj.gher than inprevious years, particularly for females, it was the adult
animals that showed a greater increase in mortality.6.5.2 Lífe-TabIes
A life-table is a convenient form for summarizing
the age-specific mortality pattern of a population-
Life-tables may be constructed in two ways. The
survival of a cohort of animals ís followed until all have
died (an age-specific life-table) or the fate of an innagin-
ary cohort is found by determining the age struct.ure of a
sample of individuals from the population at some point intime (a time-specific life-table). For the first type of
life-table the population may be stationary oI fluctuatingbut for the second the sample is assumed to have come from
a population with a sta'Lj-onary age-distribution and zero
intrinsic rate of increase.' For the Kangaroo Is1and Wallaby an age-specifj-c
Ij-fe-table was constructed by obtainj-ng data from an 'average'
survival curve. This curve summarizes the number of animals
stiIl alive in each of the cohorts (¡'igures 6.6 and 6.7) by
clrawing a line of best fit througtr a1I the points- The
first age .interval was 3 months as survival was estimated
from the time the young left the pouch (at I - 9 months) to
LL2
one year of age. All subsequent point.s were at yearly
intervals. The survival curve \^¡aS extended beyond 5 years
by incorporating the number of ol-der animals that were stillalive and caught during the study. This curve, although itaverages out the variations that occur in recruitment and
mortality from year to year, does present a usefu1 Summary ofthe mortality pattern of the populat-ion for comparison with
other species. The figures obtaj-ned in the present study
were transformed into the percentage of anj-mals surviving ineach age group (rigure 6. B) .
From the frequency distribution of the numbers
surviving in each age-class a composite Iife-table was
constructed for both mafes and females from a cohort of 1000
young animals leaving the pouch (Tables 6.25 and 6.26). Age-
specific mortality is also presented in graphical form inFigure 6.9 . Although juvenile mortality was initially high
for both males and females in their first few months afterleaving the pouch, it did not show the subsequent rapiddecline as reported by Caughley (1966) for several species ofmammals. Nevertheless the general shape of the curves issimilar. For males the mortality rate stayed relaLivelyconstant at about 30% for each age class up to 9 - 10 years'
before it sharply increased, so that all had. died by 12 years
of age. The mortality rate of the females declined slowly
after the first year reaching a minimum of 11 I2e" in the
7 - 9 year age-class before increasing again. No females
survived. beyond the 14 15 year age-c1ass. Thus, females
have a similar mortality rate to males in their first year
after leaving the pouch but their surviva.l in later years is

100
80
60
4
(52E0cfU'
èR
MalesFe-mãesl
._..__:--_.
o 234 67AGE ( years )
891011121314
Figure 6.8 Percentage survival of male and female wallabies afterleaving the pouch at 8 - 9 months of age-

113
TABLE 6.25
LIFE TABLE FOR FEMALE KANGAROO ISLAND VüALLABIES
Age Class (yrs) xekdxKI x ko-x
*0I2
3
4
5
6
7
I9
10
111213
10 006504383252501801s0]-20105
9380
635028
350212113
75
70
30
30
15L213L7132228
.350
.326
.2s8
.23L
.280
. l-67
.200
.]-25
.114
.140
.2I3
.206
.4401.000
3.033.403. 80
3.943.9I4.334.093.9 9
3.432.882.26r.7 4
1.060.50
*ãq. Class 0 - 1 represents the number of young leaving the
pouch at I - 9 months of age (October -November) .
The other age classes are at one year intervals from birth(January February).kI__ = survival, at begining of each age class, outx
of an initial cohort of 1000 animals leavingthe pouch.
kd-- = number dying in age interval.xk9* = age-specific mortalitY'e-- = expectation of life.x

114
TABLE 6.26
LÏFE TABLE FOR MALE KANGAROO ISLAND WATLABTES
Age C1ass (yrs) k1x kdx kcr'x ex
0
]-
2
3
4
5
6
7
I9
10
11
1000
646
438
313
208
146
104
73
52
36
25
16
354
208
L25
105
,6242
31
2L
16
11
9
16
.354
.322
.285
,335
.298
.288
.298
.288
.308
.306
.360
1.000
2.56
2 .68
2.72
2.6L
2.67
2.60
2.44
2 .27
1.98
L.64
r.. 14
0.50

1.OO ?IatIaIa,lIIaa,
atII,
.80
a
xET
.60
.40
.20
t-JÉEoã()lrõulo-ØI
t¡Jo
MalesIIa,Ifaa,
a,,I,taaaIIt
o ..o---¡--...-o---..a.""' r "" "-
a-
Females
1234567891011121314AGE ( years )
o
Figure 6.9 Age<specific mortality for male and female wallabíes

1]s
higher.6.5.3 Ages of Death Estimated from Skulls Collected on
the Study Area and Longevity R.ecords.
All skull-s that v/ere collected during each year
from 1976 to 1978 were aged either by the stage of tootheruption or by the molar index method (see Chapter 3.0).The results are shown in Table 6.27. Few skulls were
collected in I976 and 1977 but the number collected in L978
shows that the highest mortality was in the 3 - 4 year olds
and o1der. It is possible that the number in the youngest
age group was under-represented due either to the skuIlsdisappearing quickly because of their fragile nature or to
animals dying in the scru-b where they could not be found
easily. Most of the adult skulls collected were from
animals found eíther on or near the c1earing. Not aII ofthe sku1ls would have come from the Main Study Area popula-
tion. However it does indicate that a high mortality was
widespread at this time, and shows the age groups most
affected.Of the skulls that were collected in ]-978 12
animals were older than 9 years, 2 of which were in the 14
15 year age group. A number of animals (I7 F, 7 M) that had
been ear-tagged by Dr. S. Barker between 1965 and 1972 were
recaptured during the present study. The dates when fírstand last caught and their estimated age rvhen last caught are
shown in Tables 6.28 and 6.29. It is apparent that females
are living longer than males as only 2 of the males caught
were older than 9 years compared with 11 females. Many ofthe older females weTe sti1l carrying pouch young, t-he oldestto do so being 13 L4 years.

116
TABLE 6.27
AGES OF SKULLS COLLECTED
Age-CIass(Years )
Number of Sku1ls CollectedL976 L977 1978
1- 2
2- 3
3- 4
45566- 7
7- I8- 9
91010 11
11-].212 13
13 t4
L4 15
2
0
I2
I
II0
I7
0
0
1
I1
0
0
0
1
9
3
22
L2
9
5
4
11
4
2
2
1
1
2
Total t4 6 87

TABLE 6.28 FEMALES TAGGED BEFORE L975 AND STILL AIIVE
DURING PRESENT STUDY
Number
F 88664F 88684F 88725F 88927F 889 30F 89051F 89 111F 88541F 88926F 89115F 88522F 88536F 88710F 89067F 89L24F 89130F 89132
Date WhenFirst Caught
Date WhenLast Caught
26/ro/757 /rr/7520/ 7/75
26 /r0 /7 s26/r0 /7 530/ro/7526 /r0 /7 5
23/ 5/762L/ r/76t7/ 3/766/ 4/77
27/ 6/773/ 7/773/ 7/777/ r/778/ 4/77
n/ 7/78
Age lihenLast Caught
10 1110 1112 1310 118- 99-107- I
11-L2L2
5- 6
13-]-412 1311-129-10
67- I7- I
Presence OfPouch Young
26 / Lr/ 666/L2/66
2L/ rL/ 67ß/ 5/ 68tB/ 5/6826/ 7/6828/ s/6e22/ 8/6613/ s/688/ 3/72
28/ s/65re/ 8/6623/ 5/67
e / 12/68rc/ 3/72L4/ 3/728/ 7/72
++++++
:
+
+
+++++
HH\¡

TABLE 6.29 }4AIES TAGGED BEFORE 1975 AIID STTLL AIIVE
DURING PRESENT STUDY
Number Date When First. Caught Date When Last Caught Age When Last Caught
M 89006M 89032M 89040M 89043
M 89047
M 89034
M 88797
8/ 3/6e8/ 3/72
r0/ 3/72t3/ 3/72
13/ 3/72
e/ 3/72
13/ 5/68
il"/L0/75L7l 7/75te / 7/,7528/L0/7s
" 29/ 5/76
16/ 4/77
2s/ 1/78
7845
8+
8+
9+
6 7
11
HHco

7.0 SOME ASPECTS OF THE PHYSIOLOGY OF THE KANGAROO
ISLAND WAILABY I]NDER FTELD COI{DITTONS

t19
7.I INTRODUCTION
The availability of food, water and shelter are
important factors influencing the distribution and popula-
tion size of many animals.The nitrogen status of macropods can be Índicated
by the ratio of urea nitrogen to total nitrogen excreted inthe urine (Lintern and Barker, l-969; Kinnear and Main, 1975) .
An animal on a low nitrogen diet retaíns urea in the kidney
(l,intern and Barker, 1969) thus lowering the amount of urea
excreted in the urine. The urea retained by the kidney is
recycléd baek to the fore-stomach via parotid saliva and
across the stomach wa1] from the blood supply (Brown and
Main, l;967). Recyc1ed. rr.. is converted into living microbial
protein in the stomach and subsequently utilized as the main
protein source of the host. By exarnining the ratio of urea
nitrogen to total nitrogen in the urine, Barker (1971) con-
cluded that the diet of Kangaroo Island Wallabies in the
field was not nitrogen d.eficient at any time -
Measurements of total bod.y water and water turnover
can provide useful indications of the energy and water
reselves of an animal in t.he field (Macfarlane and Howard,
1972). When an animal has more fat there is less water per
unit weight while in lean anlmals or those suffering from
starvation or disease an excess of body water is present.
There is a dry summer period on l(angaroo Island when the
pasture dries off and rnany of the rivers cease flowing (Bauer,
Ig5g) although in Flinders Chase Natj-onal Park artificíalsouïces of water would still be available to the wallabies.
Barker (I97I) found that in field animals there was a

L20
reduction in excretion of water in urine and faeces insurnmer which was sirnilar to the pattern of water excretion inlaboratory animals on a resti:icted water intake (Barker,
Lintern and Murphy, 1970). Hence a more detailed knowledge
of the pattern of water usage of these animals could provide
a better understand.ing of their physiology and behavj-our j-n
relation to survival over the summer months. This kind ofinvestigation has never been done in a field population ofttre Kangaroo Island Wallaby.
In this study water turnover, urine and faecal water
loss, urine and plasma concentrations and measurement of body
fluid compartments were used to investigate the water
metabolism of a population of free-livíng Kangaroo Is1and
Vüallabies. At the same time measurements of bod.y weíght,
haematocrit and plasma protein concentration provided an
indication of the physical condition of the animals.
7.2 RESULTS
7.2.I Water Turnover
In Kangaroo Island Wallabies in the field there
were no significant changes in total body water (pígure 7.1)
at any time of the year (F1f0 ,252) : 0.67, P).05).The tritiated water turnover values of free-living
wallabies in Flinders Chase are shown in Table 7.I and Figure
7.2. As no difference \^¡as found in any month between males
and. females (P>.05) the data vllas pool-ed. Despite the small
number of animals recaptured during the summer months the
results do show that water turnover was reduced. The mean
water turnover (ml/kg/day) for the summer of 1976 (January

371726
273
102
105
6
É,ur 80
3?50 39ß
1976 1977 1978
Measurements of Total Body l,rÏater of Kangaroo Island lfallabies atd.ífferent'times of the year.Dots repïesent mean values and vertical lines the sÈandarddeviations.Nunibers above vertical lines represent the sample size.
6or0
!to.Ct
7A
àq 60JÉot-
Figure 7.L

TABLE 7.I WATER TURNOVER OF KANGAROO ISLAND VTALLABIES
IN FLTNDERS CHASE NATIONAL PARK
? Total BodyWaterr/day
.82mL/kg/d,ay mL/ks /daymlldayDate
January L976March ]-976May 1-976
iuly L976December 1976January 1977April l-977July 1977
August 1977Novenber L977January I978March I97BMay I97B
7.56.6
18. 310.7o)
12.I10 .724.223 .310-45.58.4
15.0
2.042 .462.625.402.587.5 B2 .425.064.192 .46
-52.55
8.44
242858503245369LBO4I2I2643
7010918928l-1552I7138343208100107194252
54.50.
137.98.69.88.79.
TB2.17L.74.40.62.
109.
15.t7.20.66.20.57.18.38.31.r7.
a
6.
70.68.
L76.L32.90.
118 .104.242.225.100.54.79.
138.
86.26.72.24.56.36.23.7.4.
N
65
102
103
2010L2I0
32I
95I3I17392I23
16.24.25.
75.59.
s+0-61o+:il=51:i5rti?TJ-
51,+L-îil-_J;
2i?+8:^+Z=2!-ei0'
1iri:;Õi3iC!:+;t0-3+7'
8-t2+
;Ï'rc'jl3t0+oi4'
4835I11573544
Values are means t standard deviationsAnalysis of Variance
F (9,86) 27.54 14.29 28.51 29.00**:k *** )k rt zt ***
*** = Significant at 0.1å level.Values for July 1976 and January i-977 were omitted from analysis of variance due tosinall sample sizes.Values for January Ig78 and Ivlarch 1978 were pooted to give a larger sample size forfor the suminer period of 1978.
HNH

WA
TER
TU
RN
OI/E
R(m
l/ kg
/daY
) (.r| o
o
.l\)
aa
o
-a (¡
'
N
MO
NTH
LY R
AIN
FALL
(mm
)C
tl o.J
J o(Jl
N oo
N o oo
l-d P.
r.Q ç t-j o : l\)
o) (,|
t ¡ t , a , a t a a
..--.¡
-.s
(o o) (oË
ì (o { @
aqt
N o
o
a
(o C', (o \¡ \¡
Þ.fF
Jrjz
Ov)
Fl 5
oJ o
pJ
Fro
OO
F'rd
rt P
rÞ
Þ
P
.xo
{ *,
r¡O
0, O
^ßJ
g P
-þ Þ
Þol
rfHA
or
lq PJ
O o
l-É
P
Þ
l-rt
l-1
H
Ffcf
O
OFd
OO
oo<
Þo5
P,O
O !o
l-1
Pr
þFji'7
fHÞ
Fd
O.
tr¡!q
P'f0
rt{
PO
Þ Þ
5ro
0,
u¡
O c
FO
Þct
o,
P.
. or
c5
Þl-h
cf l
D
ãÊ
N
J€tO
OJO
ts
PJ
H<
O
tsrt
Þ
P,
0rO
o Fd
úl
Þ''
Ffoo
o H
.H
Þ
Orf
O F
.PJ
Ø É
ÞO
F'
l-jg,
P
'Þrl
o Þ
oi'^
P'
<o
o u!
hC
Oo
rl ts
l-lR
F-F1
¡,'
0r P
-t--
Þ ^
|--o,
b"
o,Þ
''Þ
Ë
(D
0H
ct
Fl rf
(n H
'P.
O c
tcf
50
OÉ
o5
c)ä
Èv
59J
Þh
OP
-5
O\rq
PrÉ
H g
t t
t
1\)
a a a a a ,
co(o @
% W
ATE
R C
ON
TEN
TO
F G
RA
SS
ON
MA
INS
TUD
Y A
RE
Ao o
À oo

L22
and March) vüas 52.5 t 15.8, for 1977 (December ]-976 and
January J:g77) it was 73.9 t 30.3, and for the 1978 sufllmer
(January and March) was 49.2 I 12.8. The higher water turn-over obtaj-ned for the Lg77 ",i*.t period was due to one
animal with a turnover of 151 ml/kg/day.During the winter months higher values for water
turnover were obtained, except for JuIy L976 when only two
animals were recaptured. The values obtained were J-45 and
51 mlrlkg/day. In the other winter months the mean turnovers
ranged from 109.3 t 59.4 mL/kg/d,ay in May J:g78 to 182.5 t
38.5 in July 1977.
The lowest mean water tuïnover vras 40.3 t 3.5 mL/kg/
day in January 1978. This is comparabl-e to that found infree-ranging red kangaroos and euros during Sunmer in north-
western New South wales, 39.5 1 1.4I and 39.4 I 2.2g m1/kg/
day respectively (Dawson, Denny, Russell and El]is, 1975) -
However, these authors pointed out that envíronmental condit-ions at this time were more mild than in the preceding summer.
Kaethner and Good (1975) found that in captive Kangaroo Island
Wallabies water turnover was highest in December (104.2 ml-/kg/
day), coinciding with the onset of hot weather. However these
animals had water availabl-e at all times (¡'t. Kaethner' pers.
comm. ) and \dere thus turning over more water due to increased
use for thermoregulation. The field situation appears to be
different as wallabies are conserving water during the summer.
The intake of water with their feed j-s much higher in winter
than in summer so that although wallabies in sunìmer may imbib,e
more free water their total water intake is 1ess. A comparison
of water turnovers of other species of macropods under various

L23
conditions is shown in Table 7.2.7.2.2 Urine and Faecal Water Loss
Results are presented separately for males and
females in Tables 7.3 - 7.6.There was a significant reduction in urinary water
loss during the summeT months while osmotic and electrolyteconcentrat.ions increased for both males and females. The
maximum uiine osmolality (1650 rn-osmolesr/kg) hras obtaj-ned
from a female caught in January 1977. The mean values obtain-ed are similar to those found in quokkas on Rottnest Island(Bentley, 1955) but are lower than for red kangaroos and euros
(Dawson and Denny, 1969). Electrolyte concentrations v/ere
considerably lower Èhan-for red kangaroos and euros.
The water content of the faeces declined during the
SuÍtmer months. However, more water was actuaJ-ly lost via the
faeces during the sufiimer. This is because the more indigest-ible diet over summer causes the excretion of a greater amount
of faecal matter.7.2.3 Plasma Osmotic and Electrolyte Concentration
. Ther:e were sígnificant changes in the osrnotic
concentratÍon of tlle plasma of males but not females from April).977 to November 1978 (Table 7.71 .
For males the data showed a trend of increasing
osmotic concentration over Summer to early winter followed by
a decrease later in the year. Although there was no signifi-cant seasonal difference in the values for females there was a
similar trend in that the maximum value occurred. in January
L97 B,
There were no significant changes in the sodium or

TABLE 7.2 TRTTIATED V{ATER TURNOVER OF SOME MACROPODS
UNDER VARTOUS ENVIRONMENTAL CONDTTTONS
Species
PetrogaLe inornaLa(Rock Wallaby)
Macropus agiLis(AgiJ-e Wallaby)
MegaLeia rufa(Red Kangaroo)
Macropus robustus(euro)
Maeropus eugenL1,(Kangaroo Island
Vüa11aby)
Macropus eugen'I'1'
Conditions
Free livingCaptive , water ad Lib.
no water
Captive r Do water
Free living
Free living
Captive , rñaiuer ad Lib.
Free living
Vfater Turnover(mI/kg/day)
80.7LI2
80.8
60
39 .5
39.4
66.5 (rvrin)L04.2 (Iaax)
40. 3 (Min)L82.5 (Max)
Reference
Kennedy andHeinsohn (I974)
Dawson, Denny,Russell andEllis (1975)
Kaethner andGood (1975)
This Study
tsl\)È

TABLE 7.3 URINE EXCRETION TN MALES
Jan L977 April Lg77 Jun/Jult77' Nov 1977 Jan 1978 March 1978 May 1978 FsTrip
mL/I2 }:rsmL/ks'" / r, hrs
Osmolality(mi11i-osmole s/kg)
INa,
(mEqv/I)
K+
Sample Size
-l-7298: 25r(1625)
a115. 7:9r.7
(27 8 .3)I
1s1. 0:89 . 7(2e7 .4)
10
:+28 - L:l3. 7
I592:
(8e0)
s3.2!27.0(e s. 7)
4s.s!17 -B(80.8)
I8
I32 -8:l-6.6
f604:184(ee0)
-l-62 .8-24 .9
(10 8. 7)I
60 .7!32.4(14r.0)
16
I70 .9:54.0
-l-19 .6-13.6
I695: 263(lIs0)
l-7L-7:47.4
(150.0)J.
60 -6:44 .8(r28.2)
ga. gtsr. e 7.L4***23.r!r0.2 g.28***
5o7J 106 22.L7***(68s)
¡g.ot¡0. ø 4.38***(130.4)
¡e.oJrg.s L2.61*,t*(8s.e)
13
zq.alzg.e rr4.7!6r.6 t25.altg.z 120. 41s1.8 zt.zltz.tf6.7! 4-526 .2! 8.79.oJ s.2
205205-l-
6 891(1180)
J-10731 237
( 1340 )
gr.¿tss.o 106. slsz.a(1e5.7) (173.e)
77 .7!4L.8 143. Bts1.2( ls3. 8) Q2A.s)
15 12 7
Values are means I standard deviationsVa1ues in parentheses are maximum values for urine osmolalityFs = Variance Ration.s. = not significant* 3 significant at 5% level** = significant at 1? Ievel*:k* = significant at .1% level
HNul

TABLE 7.4 URINE EXCRETION IN FEMALES
Jan 1977 April Ig77 Jun/JuL'77 Nov L977 Jan 1978 March L978 May 1978 Fs
gl .olz+.1 10.55***5 7s .2!43. g
Trip
mL/L2 hrsmt/ks'"/r, hrs
OsmoIal j-ty(rnilliosmoles/kg)
l-Na'
(mEqv/I)
K+
Sample S j- ze
48.9
12.8I
1039- 340(16s0)
ILO7 .6r54. 5
(173.e)I
8s.1-19 . I(123.1)
12
5 161. 6Ii.55 I113.0r43.8
I30.ËL2.8I655r r82
(114s)
42.4!3s .7
:.2.2!ro.sss6! 395(1600)
t+
3L.7 121.s160
8.4 zs.s! s. oI32.8:r3.7f
582,: 206( 11s0 )
-!63 .7-2I.0
( 8e .1)I
48 .6-15 .4(e4.e)
l-'16
I44.8:1L.2I524: 115
( 76s)-L54. 3r15 .9
(7r.7)I38.0-11.9
(6s.4)
11
I22 .9!12.9
I654: 235(1060)
-l-70 -2:59.4
( 1es .7)f
6I .4-42 .6(ls4.4)
11
l-3991 50(440)
I46 -0!3L.7
(er.3)a
31. 3:13.9(52.6)
7
L2.01***9 . 87* tc*
3. 22* *
6.58***
88.2t38.3 roz.elaz.z(213.0) (187.0)
82.6!5r.2 r3g.altoz.+(230.8) (307.7)
14 T4
+Sample síze for urine volume measurenents was l-3.
HNo'r

TABLE 7.5 FAECAI EXCRETTON TN MALES
Trip April Lg77 June/July 1977 Nov. J-977 Jan. 1978 March 1978 May L978
Faecal Moisturegm/L2 hrs
gm/kg't'/r, hrs?
Dry Faeces
gm/I2 lnrs
gn/kg'75 ¡tznttSample Size
Fs=ñ c :
*:** =*** :VaIues
5.
4o. rJrB.923.s114.0 2L.7t 16.s 18.2!t2.s 2r.3!t2.4 32-s!24.7
e .s! 2.4s. st l.eI3.0: L.4
It-
20.r! s.s32.7f5.6:
3 3
6
I?lI53r
0
5
3104.0-LB-4:J-5.5: 2.23. et 2.3I5.9: 3.9t58: 6
Fs
3.53*
6.75**tc
3.53*
g .7 4***17.05***
J-52! I57: 9 slt s 4s! s
-4 11.91 s.8 19.81 s.2 L7.4 34.611s.114 .4! II4.4:- 2
16
I30.6:¿9.1r5
2.9
18 1s 13 13
Variance RatioNot SignificantSignificant at 5? leve1Significant at 1å levelSignificant at .IZ levelare means I standard deviations. PN{

ÎABLE 7.6 FAECAL EXCRETION IN FEMALES
Tríp April Ig77 June/July 1977 Nov. J-977 Jan. I97B March L978 May L978
Faecal it{oisturegm/12 hrs
gm/kg'" / t, hrs
z
Dry Faeces
gm/I2 hrs1E
gm/kg' !'/12 hrsSample Si-ze
27 .slrs.0 rs. sJr¿ . ¡ ls.st 8.0
11
1.8
16 10 10
zq.g!tt.g tt.zltz.z-L9.4: 3.2l-7.2:I5.8: 2.8I4.1: 2.25
I3. 9a
a7.6! 3.56
I
47:f
47:
6
f56:
17 .7! 7.9
I48L
I60:I58:
B.6t 3.8l-2.9! r.4
7
7 5
4.16
Fs
3. 28*
3.65**8.21***
L2.52.'c**
14.50***
6
-L6 .2! 2.L
5.210B.st 6.020 .2! 8.1 0+ 18.Bt 6.6 zt.oltt.q 34.0t s.6
6.Bt 2.g 11.31 1.6I2 -7!
74 11
l¿N@

c
TABLE 7 .7 PLASMA OSMOTIC AND ELECTROLYTE CONCENTRATTONS
VaLues rr. *".rr= t standard deviations.MALES
Date OfCollectionApril J-977
November 1977January L978March l-978May 1978
Ncver¡ber I97IF (5,31)
Date OfCollectionApril 1977
November 1977January L978March 1978
Malz 1978November 1978
F (5,39 )
SampleSize
SampleSi ze
f3.0 ï .63.3 i .73.8 : 1.0r3.3 I .6I3-2 : -7I3.0 ' .3
I1 i 8.75 i 8.5e + 6.68 + 2.64 ! 3-2l7 6.0
9.37.6
11. 02I.813.5
7-6
^+J^+(t=¿.!1+¿' -L
9,i
65
10475
Osmolality(m-osmol es/kg)
282830313I28
6. 33 ***
FEMALES
Osmolali ty(m-osmolesr/kg)
282930292929
1.48 N.S.
Sodium Conc.(m-Eqv,/1)
139.133.138.133.L32.134 .
1.41 N.S.
Sodium Conc.(m-Eqv/1)
133.131.134.138.r32.130.
1.35 N. S .
Potassium Conc.(m-Eqv/1)
I.23 N.S.
Potassium Cone.(m-nqvr/t¡
I.79 N. S .
I2 _ 6.01 -' 5.46' 6.5
f6 :9.9I2 ' 4-8I0 ' 6.2
I9 I 23.9f2: 7.5I4 ' 1-2-7I0 ' 9-3I4 ', 2r.4f1 ' 6.3
76
13B
74
223323
435557
+T++Ti
7I3092
HN)\0

130
potassium ion concentrations for males or females at any time
of the year.It is possible that the changes observed in the
osmolality of the plasma of males reflects changes in urea
concentrations. Barker (1971) found that in field animals
plasma urea leve1s fluctuated during the year although they
did not seen to be correlated wìth any environmental condit-ions. However, wallabies on a restricted water intake
excreted less urea than control animals and maintained higher
plasma urea concentrations (Barker, Lintern and Murphy, L970) .
7.2,4 Body Fluid ComPartments
Measurement of bo-dy fluid compartnents was achieved
át the end of summer (March 1978) and in winter (May 1978).
An attempt to repeat these observations in November 1978
resulted in only 4 animals being measured due to technicalproblems. The results for March and May are presented inTable 7.8 while those for November are shown separately
CTahle 7 .9) . There \^rere no significant changes in total body
waterr plasma volume, blood volume, interstitial fluid volurne,
and intra-ceIIu1ar fluid volume between March and May-
Blood volume v¡as calculated from plasma volume/
plaSmatocrit, where plasmatocrit = 1.0 .91 haematocrit.
The value .gI is the ratio of the mean circulatory haematocrit
to the true haematocrit obtained by Shield (1971) in quokkas
and was the only value available for macropods.
InterstitÍal fluid volr:¡re = extra-ceIlular volume - plasmavolurne
Intra-cellular fluid volume = total body water - extra-cellu1ar volume
ceII and gut v¡ater

TABLE 7.8
Body lrleight (kg)
Total Bod.y l{aterPlasma Volume
Blood VolumeInterstitial Fluid
VolumeIntracell-ular Fluid
VolumeExtracell-ular Fluid
VoIume
BODY FLUID COMPARTMENTS TN SUMMER AND WTNTER
March May
nI./kg m1.m1
I3496 :
4.82 t 1.11l-5.05 :
667
49.0
71. B
600
.93
709.6
49 .3
7s.5
L67 .7
492.6
2r7 -0
223.9
359.3
728.2
2â44 ! 5s7
J-952.I..:
I732 -4 :
46.6 t 4.2I74.5 : 7
-l-3581 rf
248 -9 !I
380.3 rJ-
832 -I :.L2500 l
I: 2-4f: 3.7
mJ-. /kgt-test
}T.S.
N.S.
N.S.
N.S.
N.S.
N.S.
N.S
+
ttj
774
52 .3
94.8
23.7
23.0178.5
38.7
5
15.0
36.218s.1
33.1
36.3
151. 4
529 .4
t+
ttt2I5.1 199.s t 22.6 1091.o t 200.7
Sample Size : 7 in each group.
Values are fneans t standard cleviations.N.S. : not significant at 5Z leveI.
H(,H

TABLE 7.9
Body Weight (kg)
Total Bod.y Water
Plasma Volume
Blood Vo1ume
Interstitial FluidVolume
Intracellular FluidVolurne
Extracellular F1uidVolume
BODY FLUID COMPARTMENTS OF FOUR ANII4ALS
CAUGHT TN NOVEMBER 1978
MaIe 89753 Male 8979I Female 892L7 Female 89683
m1 ÍtJ-/kg m1 ml/kg mI mI/kg mI mJ-/kg
3805
26I.0463.6
706.),
2838
967.r
5.3
718.0
49 .2
87.5
r33.2
535.5
l82.5
39 85
272.7
46r.4
652.4
3060
925.L
7
69,9.L
47 .8
80 .9
114.5
536. 8
162.3
4089
274.1
482.6
9
693. 1
46 .5
81. I
30 70
237.3
384.0
729.8
2I03
967.r
7L4.0
55.2
89 .3
L69.7
489.1
224.9
5 5 4.3
Hu)N)

133
The 1ack of any difference in body fluid compartments between
sunmer and winter would aÌso suggest that the wallabies are
not suffering from water stress.It is known that extra-celIular f-luid volume rises
in animals wj-thout adequate food (Macfarlane, Morris, Howard
and Budtz-Olsen' 1959; Morris, Howard and Macfarlane, 1962)
while a reduction in the concentration of ci-rcul-atory haemo-
globin, number of red blood cel1s and total serum protej-ns ischaracteristic of starving animals, and gives rise to aneamia
(Bethard, Wissler, Thompson, Schroeder and Robson' 1958;
Shield, 1959¡ Ealey and MaÌn, 1967¡ Casperson, 1968; Nasser
and PIatL, 1968). Although absolute plasma volume and blood
volume were not significantly different in March and May there
could be a change in blood volume in November, However, the
number of animals measured is too sma1l to test this stati:sticalIy. Shield (1971) found a 16Z reduction in blood
volume of quokkas between October and May on F.ottnest Is1and.
He suggested that semi-starvation during late summer and
autumn was responsible although'the situation is probably
mrrch more complex than this (Barker , I97 4') .
7.2.5 Haematocrit and Plasma Protein Concentration
Both males and females showed a significant seasonal
decline in haematocrit (rigure 7.3) . Low haematocrj-ts were
observed in late Sufitmer to early winter when animals appeared
to be in poor condition. The lowest haematocrits were
observed j-n I978 after aparticularly dry summer.
From October - November 1976 to November l-977 there
\,vas no significant change in the plasma protein concentration
of male wallabies, but for females there was a significant

134
drop in January 1'977 o Over the period November L977 toNovember 1978 there was a significant reduction in the plasma
protein concentrat,ión over th. late sunìmer to early winterfor both males and females (Figure 7.4).
7 .2.6 Body V'Ieight
The animals used for analysis of seasonal changes
ín body weight were all ad.ult animals with the third molar
fully erupted (3 years of age or older).Male wallabies h¡ere heavier than females at a1l
times of the year and showed a pronounced annual cycle in body
weight. Maximum body weights occurred in spring to earlysunmer (October - December) and then declined over the summer
and autumn to reach their lowest values in mid-winter (June -
^Iu1y) (Figure 7.5). A si-miIar cycle was shown in the
deposition of fat around the kidneys (Appendix VTI) and.
suggests that fat is being laid down in late winter and spring.
Female wallabies dìd not show the same seasonal
variation in body weights although maximum weights did occur
in spring and mínimum weights in autumn to early winter. Itis possible that the mating activities of the males over the
sunmer period may use up more energy reserves than in females
resulting in the decline in condition. However from November
L977 to the winter of 1978 there was a considerable loss inweight for both males and females. The mean weight loss formales was 2Le" and for females was L6Z (fab1e 7.10).
Growth rates of young wallabies, once they have leftthe pouch, showed that over the late suInmer' and winter there
was little growth with animals just maintaining weight while
in spring there was a rap-id rise in weight. This indicates

T.qBLE 7 .IO
Time Interval
October-November ).975 to July I976December 1976 to June-JulY 4977
November 1977 to JulY L978
Time IntervalOctober-November 1975 to July 1976
October-November 1976 to April 1977November A977 to Ivlay 1978
Males:
Females:
SEASONAL CHANGES TN BODY WEIGHT OF I"IALE AND
FEMALE KANGAROO TSLAND VüALLABTES
T4ALES
JuIy l-975 to October-November L976October-November 1976 to November 1977
Nor¡ember 1977 to November L978
B Weight Loss
16.818. 12r.3
% V{eight Loss
,= 3.50 *,= 7.96 *rt*
=9.26 ***
u(6,rr4) = r.82 N.s.
FEMALES
612
7661
ANALYSIS OF VARTANCE OF SEASONAL CHANGES IN BODY WEIGHT
Jul-y a975 to December 1976 E 0,gZ)December 1976 to November 1977 F (A,ZS)Novernber L977 to November L978 F (S,lZ)
F
F(s,111)( 5, 81)
= 1.97 N.S.= 4.89 ***
PUJ(Jl

136
that the requirements for growth of young animals are not
being met over the summer to early winter period (Figure 7.6) .

HA
EM
ATO
CR
IT('t o
Þ o
o¡ o o'
N (¡)
À)
( % P
Cv)
o) of\) o
-\(,lC
')ôo
o
¿J N
l\) 1\)
N Þ
lù @
N o¡
f/)
N oN G
't
Þ oÌ\)
o) o(o (¡
, oÊ
¡ õ- u,
à o) Þ'Ît o I o U
I
hd P. a É Fl o : (,
3 pr H o o
hd o ä p, P o UI
(o o, (o \¡ {
c{q
ÉÉ
,)È
)rD
3(D
EtÞ
lpr
cr
t'l
c{
FjÉ
oÊo
P5F
5 tsH
ts\o
H\o
\o
\¡ \O
-J
{ot{o
t\¡
\¡rt
ctrtO
rtOoo
ÞÞ
zijz
rcO
t-JO
FJID
HO
tsll
llúP
úts
o\or
D\o
l-l
\¡ FJ
{
{{H
ts\o
\o
{{ @@
rþ * * UI
Fr. a 5 P.
l-h ts. o Ê
r rt 0r cf <) P o\o ts o o H
N G'
(o o)t\) o G
)(r
) ]\)
(/) F
d O
u)
<0r5
(Dä
I-J o
,FJ
ttrf
aO
. Fh
OH
oÞ
Þ
o ãP
¡Þ
P
JHP
JPJH
H m
(D
c)
Ø r
+r {
Pr
|-. o
Þ
Þ('I
H
ts
(qH
OO
F4
0r
o|-n
l--tt
úl
P-
ts-
9r F
1 C
nFJ
Orf
ts.
P- it
pr \
¡ Þ
OH O
H
FÐ
5ID
.
HO
JP
-oH
H È)=
P, 0
JQ
r|l-l
oût
o FfO
l-'
it rt
pr mo
oFh
¿H 4- PJ
9JrtH P
.oo Þ p) P
N
(o \¡ {
(¡t o
Ed
l-dhd
rd
(o { @
(o { @
or
ol
or
ottì H
HH
ts(/)
æ
N
) \¡
\f N
) N
) (J
l
G)
ilülll
lH
HN
)(¡
HÈ
æts
(-rlN
)\0ou
tÞul
1.*r
F)F
)FtÈ
r+*
**tl-
*
Ut

20I2423
1328
30
1642
2430 23
7.O
5.o
4.o
8.O
7.O
6.o
5.O
Ect¡
z_tuFoÉ,o-
EÎtJÈ
197
I o.o!t
Males
1976
Females
1976
Figure 7.4 Seasonal changeconcentration oFlinders ChaseSymbols as for
1978
2l30
23
1978
n the plasma Proteinangaroo Isl-and Wallabies inional Park.ure 7.L.
1977
1977
12
s22A
l1
4.o
sifKI.IatFig
Analysis of Variance
Male s
Females
Oct.-Nov. 1976 to November ]-977
November l.977 to November 1978
Oct.-Nov. ]976 to November 1977
November 1977 to November 1978
F G ,l,za)F(s,too)
Fla,tsz)F(s,toz)
=I.87 N . S.
=9.51 ***
=5 .59 * **
=5.99 ìtJr*
N.s*** Not signífj-cant at 5e IeveI.Significant at 0. I% Ievel.

1615
4
15
13
21
16
^gElI-gF-
= 7
ào6o
El.Y
t-=ooo
1ô t9I 't0 15 9
157 I
Males
1975 1976 1977 1978
720
-6 19 26 10 18 1515
4Females
1976 1977 1978
Figure 7.5 Seasonal changes in body weight of adultKangaroo Ts1and Wallabies in Flinders ChaseNational- Park.Symbols as for Figure 7.I.
5
12
5I I142429 I l720
31975

t17
þ
5
4
3
Males
Females
11
AGE
a
O-1>t<-1-,
n2cD.v-1F.Lgo¡rJ
=6
3
2
1
l-'-aa6 o
Iff
424o5o@
4
3_4-
8
{-fr
5t1
12 --fiI
$
o
Figure 7 .6
AGE-2---+-k 3-4-
Growtkr pattern of young Kangaroo Island-Wallabies in Flinders Chase National Park-Horizontal bars ïepresent mean values obtainedover the whole study period (JuIy 1975November I97B), vertical lines represent therange and the open rectangle represents thestandard deviation.Numbers above vertical lines represent thesample size.

8.0 GENBRAL DTSCUSSTON
\
I
I

r37
Attempts have been made by ecologists to determine
a single theory which could explain population regulation inall species of animals. This has resulted in three quite
different theories.Nicholson (1933, 1954) , Nicholson and Bailey (1935)
and Smith (1935) put foward a model based on evidence thatcontrolling factors will act more severely against an individ-ual when the density of animals is high. This has become
known as desity-dependent population regulation. It was
suggested that the controlling factors are food, predators'
parasites and pathogens. These factors act by increasing the
mortality rate and/or reducing the reproductive rate as the
population increases.' Andrewartha and Birch (1954) criticized the density-
dependent model because they believed that no special import-
ance should be given to either density-dependent or density-
independent regulating mechanisms. They suggested that the
numbers of. animals in a natural population may be limited by
shortage or inaccessibitity of material resources, or a
shortage of time during whj-ch conditions are favourable foran increase in the population. They proposed that the
cOmponents of the environment, weather, food, other animals
and organisms causing di-sease, and. a place in which to liveall ínfluence an animalts chance to survive and multipIy.Such factors will operate regardless of the density of the
population.Since then other workers have developed a theory
wh-i-ch regards íntrinsic factors, such as social behaviour and
genetic polymorphismr âs being the important factors regulat-

138
ing population size. These could increase mortality, reduce
fertility or change the dispersal rate such that the popula-
tion is kept at a level below which resources would. become
limiting. The intrinsic factors may be in part physiological'such as the rstress-syndrome' caused by exhaustion of the
adreno-pituitary system (christian, 1950, 196I¡ christian,Lloyd and Davis, 1965) or could act through spacing mechan-
isms such as territoriality (Wynne-Edwards, 1962¡ Watson and
Ivloss, 1970) or by dispersal of ind,ividuals (Lidicker' 1962¡
Krebs, Keller and Tamarin, 1969). Genetic changes which
influence an animals 'fitness' may also be important although
there is little information availabte on this aspect (Chitty'
1960; Krebs, 1972¡ Krebs and Myers, 1974) 'It is apparent that these ttreories of population
regulation are not mutually exclusive. When differentpopulations are examined the evidence points to multiplecauses rather than a single cause. Thus Kikkar^¿a (1977) and
Lidicker (J'978) have expressed the víew that a general theory
of population regulation is unattainable. Instead they
suggest the use of a multi-factoriaf model. In this model
there is a network of extrinsi-c and intrinsic factors inter-acting with the subject population and with each other. This
approach seems to be the most useful as it takes into account
all of the ideas put forward in the previous models. It has
therefore been used in interpreting the results of the
present stud.y. In this study the size, â9e structure and
annual- fluctuations of a natural population of the Kangaroo
Island Wallaby has been established and their reproductive
pattern, movements and water metabolism studied and related

139
to the environmental conditions. In this way I hoped to
gain some insight into the factors influencing the size of the
population. Each factor can.on1y operate by influencing one
or nO're of the birttr rate, the death rate or dispersal. Tn
this sLudy there was no evidence that dispersal was a signifi-cant factor at any time. Hence, in this sectj-on I willdiscuss how natality and mortality combine to cause the
observed regular annual fluctuation in population size.Natality
The Macropodidae are monovular and polyoestrous, and
also extribit the phenomenon known as embryoníc diapause
(\zndate-Biscoe, Hearn and Renfree, 1974). In the Kangaroo
Island Wallaby there is a post-partum oestrous and mating
that results in the formation of a unilaminar blastocyst which
remafns quiescent for the duration of pouch life. Among
polyoestrous nammals the birth rate may be influenced by
several components, such aS age at sexual maturity, littersize, plegnancy rate, length of the breeding season and the
sex ratio (Krebs and Myers, 1974) . Sadleir (1969) has also
giVen numerous examples of how climatic, nutritive and
social factors may change the reproductive performance of many
specíes of manrnals.
The female Kangaroo Island Wallaby reaches sexual
maturity and first mates Just after leaving the pouch inOctober-Novemberr at around 9 months of age (see Chapter 4.0).
However, they do not give birth until the usual breeding
season ìn late January and February. Hence, because of the
sLrict seasonal breeding pattern, and Lhe fact that the young
remain in the pouch for B - 9 months, each female is effect-

140
ively U-mited to producing only one young each year.
The birth rate was calculated from the proportion
of females that were carrying a pouch young when examined as
soon as possible after the breeding season had finished.
In this study the nr¡nrber of adult females with pouch young
was 10OU in July 1975, 88ã in i{arch L976, 100% in April L977
and 96% in May 1978. This high fecundity r^/as also shown in
the records of animals caught during the years 1966 to L969.
It was 100ã in August 1966 and 973 in May L967, May 1968 and
March 1969. Although the number of juveniles examined was
sma1l it appeared that the birth rate for this group was also
high except in 1977 and 1978. In L978 none of the juveniles
examined at any time during the year showed signs of having
given birth.The practical problem ín relating the birth rate
to changes in the population sÌze is to determine how many
ínctividuals survive after birth to actively enter the
population. The marsupials are born in a very immature state
but remain within the motherrs pouch for a considerable tim.e-
By examining the proportion of females with pouch young
later in the year and comparing this to the proportion with
young just after the breeding season the extent of any
significant loss of young could be determined. In this study
it was found that the only tirne when there was a significant
loss of pouch young in adult females I^Ias in the latter half
of ag7}. The proportion of females with a pouch young had
fallen from 962 in May to 46% by the time the young \^/ere
ready to leave the pouch j,n Ì,lovember. tr{hen the records for
the years 1966 Ig69 were examined further evidence that

141
mortality among Pouch young occurs occasionally was obtained.
In 1968 the propprtion of adult females with pouch young had
fallen f.rom 97? in May to 762. in December.
A high mortality of pouch young has been observed
in other macropods during periods of lowered rainfall and
poor nutrition. Ealey (1963) ancl Sadleir (1965) reported
losses of the larger pouch younq of euros in the north-west
of Western Australia during an extended dry season. After
a succession of dry seasons female fecundity dropped to 472
(Sadleir, !965) . In a study of the red kangaroo in inland
New South Wales, Frith and. Sharman (1964) found that signifi-
cant mortality of pouch younq only occurred in drought areas
at about Èhe time they \^/ere leaving the pouch. fn these dry
areas 83% failed to reach maturity compared to 153 in the
rnore favourable areas. Similarly, Nern/some (1965c I 3.966)
working on red kangaroos in central Australia found that poor
nutrition was the likely cause of a reduction of both the
proportion of mature females in breeding condition and the
rate of development and survival of pouch young. A drought
period in southern Queensland also resulted in the death of
all the pouch young of the eastern grey kangaroo born in this
periocl (Kirkpatrick ancl McEvoy, 1966) .
Thus for some species of macropods it is apparent
that recruitment is determined. by the waY in which climatic
factors and the food supply influence female fecundity and
survival of pouch young. For animals living in the arid zone
the population size and structure depend.s very much on the
occurrence of a few good years. Newsome (1977) found an
inverted age struciure in a population of red kangaToos in

L42
central Australia and estirnated that periods of two or more
good years every 15 20 years was necessary to prevent the
population declining to extinction. For species such as the
grey kangaroos and the Kangaroo Island Wallaby, which live in
seasonal and more favourable environments, the birth rate and
survival of pouch young is high in most years but may be
reduced during an extended dry pèriod
Mortalityr.ollowing the influx of juvenile animals into the
population in October'- November there is a continual decline
in population size over the following year.
Mortality rates varied from year to year and also
with the season in ariY one Year.Juvenite animals tended to have the highest mortal-
ity rate, particularly over Su¡nmer, while young adults had
the lowest. Over winter the juvenite females had a low
mortaliLy rate while juvenile males and old adult males had
the highest.A high mortality of juvenile animals also occurs in
other macropod populations. Frith and Calaby (1969) reported
that for female red. kangaroos the average mortality over the
first year was 38.5? while 46so failed to reach two years of
age and 90? died before 10 years. During periods of extended
drought, not only is there a high mortality of pouch young
and yoirng-at-foot, but many adults also succtunb. Thus
population 'crashes' are known to occur in both red kangaroos
(Newsome, Stephens and ShipwaYr Ig67) and euros (Ea1ey, 1.967a) '
In South Australia the summer of 1979 was longer and
drier than in previous years. over the period. November ]977

143
to May ]-g78 there was a high mortality in a1l age grouPs.
The total population size $/as reduced by 352 ' compared to
25e. for October-November 1975 to May \976. For juvenile
animals the mortality rate \^las 462 for males and 44? for
females, The young adults showed a higher mortality than
previous years as it was Aleo for males and 342 for females
while for the o1d aclults it was 402 for males and 322 for
females. Although it. was not possible to measure mortality
over the winter it was evident that it was very high as many
dead animals were obseryed in the study area. By collecting
the skulls of the dead animals it was found that mainly old
animals were affected.A high mortalÌty was also observed in 1968. From
November - December L967 to May 1968 the total population
declined by 33? whereas from November-Decembet l.966 to May
1967 it had declined by only 183. lrlurphy (1970) reported
a die-off of wallabies in Flinders Chase during JuIy 1968
when high rainfall in early winter followed a hot, dry
suÍrmer.
It is apparent that the abundance and quality of
food, anõl access to water' are the major factors regulating
the size of populations of the red kangaroo (Frith and.
Sharman, A964¡ Newsome, I965a, 1966; Bailey, a9'7I¡ Bailey,
l{at|enz and Barker, agTI), the euro (Ealey, I967b¡ Ealey and
Main, 1967) and the quokka (Barker, 1974) . Such factors aIe
also known to be liniting in many other mammal populations'
Sinclair (\974) has shown that for the African
buffalo ( sgncerus eaffer) the availability of plant nitrogen
was the most important component of the envir:onment limiting

L44
their abundance. The influence of weather on the abundance
of food anð./or shortage of plant nitrogen have also been
implicated in the regulation.of populations of rabbitç,
lryctnLagus cunicuLus , (tvtyers and Poo|e, 1963; Stoddart and
Myers , 1966) , squirrels, TænLaseLurus hudsoníeus, Seiuz't'ts eav'oLensis
and ,S. nigez', (Kemp and Keith, 1970¡ Nixon, McCIain and
Donohoe , L975) and elephants , Loæodonta afr"Læna, (Hanks and
McIntoch, 1963; Phillipson, I975) . Undernutrition is also
known to be a major cause of mortality in many species of
ungulates (Rosen and Bischoff, 1952¡ Taber and Dasman, L954¡
Klein and Olscn, 1960; Hirst, 1969) -
FortheKangaroolslandWallabythere\^lasno'evidence that nitrogen was a limiting factor aÈ any time of
ttre year (Barker, ]-97l-) as it is for the same species on East
Wa1labi Island in the Abrolhos archipeldgo, Vlestern Australia(Kinnear and Main, 1975) . The Kangaroo Island Wallaby may
obtain nitrogen from the seeds of Acacia z'etínades during the
suÍìmer as it was observed by Andrewartha andBarker (1969)
that the wallabies were foraging beneath these trees. The
radio-tracking data indicates that during the summer the
wallabies are moving around more and have expanded the size
of their home-ranges. This is probably due to animals
searching for better quality food as the grass on the cleared
area dri.es off over sunìmer. Their diet seems to be much more
indigestible during summer as there is more faecal clry
matter excreted at this time. ft is possible that they are
suffering from an inadequate energy intake over the late
suÍtmer and early winter. Íhre greater movements that take
place at this time may place an extra burden on animals'

I45
Vtith regard to their water metabolism, although the wallabies
are conserving water during the sunìmerr âs indicated by the
low water turnovers and low urine volumes of high concentr-
ation, they were not suffering from dehydration.
The other factors which could contribute to mortal-
ity are predation, d.isease or social stress.Predation is unlikely to be a major factor as the
only large predator is the Wedge-tailed Ea91e (AquLLa audøn).
one adult male was apparently killed. by a pair of eagles
during the study. However Èhis animal was obviously out in
the open on the cleared-area when attacked. It was not known
whether the eagles directly kilted the wallaby or if it was
panicked and stunned itself trying to get through the fence-
line. A similar instance \^las reported by êrrdrewartha and
Barker (1969) where eagles kiIled a young wallaby that had.
entered a fence-trap during daylight. ËIot,rever, these are
unusual occurrences as wallabies normally spend the day in
dense scrub where it would be extremely difficult for them
to be captured by eagles. It is probable that eagles are
opportunistic predators and hence have no great affect on the
population. Feral cats (FeLis catus) could prey upon young
animals just out of the pouch but as cats are not abundant
in this area it ís doubtful that they cause many deaths.
The influence of social fa.ctors in determining
abundance is unknown except that the radio-tracking data has
shown that the wallab j-es have over-l-apping honte-ranges.
Some stress could occur during the breeding season when males
are competing for oestrous females or if the population reach-
ed a high density. Neither natality nor mortalíty could be

146
shown to be density-dependent although the time period of the
study was too short to determine whether this may occur in
the long term. Tt is possible that if the population did
build up to a high density this would have drastic affects
on their food supply. Although the abundance of food was not
measured it was not obvious that the size of the population
observed in the present study was having an adverse affect
on the abundance of food'Thus, the most Iikely influences on mortality are
through food quality over suÍlmer and possibly parasites and/
or pathogens in winter. The amount of rainfall obviously
influences pasture growth. According to Burrows (J-979) tne
growing season on Kangaroo Island beginsr orl average, in the
second week of Aprit and ends in the third week of October'
However, in Some years- the growing Season may end earl-ier and
start later. I suggest that it is in these years, such as
1968 and 1978, that the hÍghest mortality will occur.
Mortality over the following winter could also be influenced
by the drier summer. Being stressed by the energy shortage
oyer SuÍtmer the animals cannot cope with the cold, hlet
conditions of winter. There may be further problems due to
hearry parasite loads and. the the possibitity of disease.
Unclernutrition is known to impair the immune response and
affects the endocrine system, which in turn allows existing
diseases to become pathogenic (Scrimshaw, Taylor and Gordon,
1e68).
The total worm burdens of the gastro-intestinal
tract of Kangaroo IsIand Wallabies fluctuates seasonally and
from year to year (smales and Mawson, 1978) with a tendency

L47
for low levets of infestation in suflrmer and hi-ghest in winter.This is typical of strongyle infections in sheep where there
is a pronounced winter rainfall (A-nderson, 1972; Gord.on' 1958;
ParneII, 1963) . These results are al-so consistent with those
reported by Arundel, Barker and Beveridge (L977) suggesting
that juvenile eastern grey kangaroos begin to pick up
nematodes in autumn at about 14 16 months of â9ê, about 4
montb.s after leaving the pouch.
Although there j-s little information available on
the pathogenicity of helnr-inths in natural populations a
winter mortality in the eastern grey kangaroo has been
associated with the blood-sucking nematod.e GLoboeephaLoid.es
txif,idospi,cuLay'ts (Arundel r' Barker and Beveridge, I977) .
Mortality with associated anaemiá occurred each year in July
and August when animals had low haematocrits, haemoglobin and
plasma protein concentrations, Afthough all animals were
heavily infected with gastro-intestinal parasites, GLoboeepha-
Loides appeared to be the only serious pathogen. This parasite
is also found in the Kangaroo Island Wallaby (Smales and
Mawson, 1978) although it does not appear to be abundant.
Despite the fact that low haematocrits and plasrna proteinconcentrations were observed in the Kangaroo Island Wallaby
oyer winter, and particularly in 1978, it was not possible torelate thÍs to the presence of any particular parasites oT
disease state,During May and July l-978 when many dead wallabj-es
were obserVe<l on the study area 3 males and 1female, whj-ch
were in Very poor condition, were collected from Flínders
Chase and autopsied at the InstiÈute of Medical and Veterin-

148
ary Science, Adelaide. AII of these animals had large
numbers of nematodes in the gastro-intestinal tract which
lrrere often associated wÍth granuloma formations on the gastric
mucosa. These very heawy parasite loads could have contrib-uted to the poor state of health of these animals. There was
histotogical evidence that these wallabies were also sufferingfrom sporo zoarr j-nfections, both IoæopLasma and Coccidia were
detected (R. Giesecke, pers. coÍlm.) and it is like]y thatthis was the cause of death.
It seems likely that poor quality forage over
summer, combined with heavy parasite loads and cold, wet
conditions in early winter stress the animals severely so
that the weaker individuals die. The delicate balance ofthis survival pattern is indicated by the fact that a much
higher mortality in the population often follows a long dry
s ummer .
Control Measures on Farms
The Kangaroo Is1and Wallaby is regarded as a
pastoral pest by many farmers as it competes wittr domestic
animals for the introduced pasture species. This has led to
the illegal use of the poison 1080 to control wallabies,particularly on the eastern end of the island. Indescrimin-
ate use of this poison has undoubtedly affected numbers of¡nany native vertebrates. This pest problem is enhanced by
the large areas of pasture which adjoin tracts of uncleared
bcrub. The scrub acts as an excellent daytime refuge forthe wallaby.
The aim of a management programme is to reduce the
animal population to a level which causes l-east damage to the

l.49
farmtand without completely exterminating it-Before control measures can be properly instigated
it is necessary to determine.the abundance of wallabies.The most appropriate method for estimating denËity in thissituation is the line-transect spotlight count. This method
has the advantage that it iS not time consuming and gives a
reliable density measurement. Johnson (L977) found thismethod suitable for Bennetts wallaby, pademelon and the brush-
tailed possum in Tasmania. He has outlinecl the use of the
method and the calculation of densities.Tto estimate the proportion of animals to be removed
from a pest population it is first necessary to establish an
acceptable level for the population density. Then, if a
census reveals that the population size is above this levela number of animals must be removed. To maintain the
population at this l-evel will require that an annual census
be made to determine the rate of increase. If the rate ofincrease is positive then more animal-s wil-I have to be culled
from the population. Because environmental conditions
fluctuate from year to year so will the fecundity and survival
rates, âs seen in the p::esent study, and thus I'he rate ofincrease and the number to be culled will vary.
The time of year when the census is made must be
taken into consideration as high populations will be encount-
ered when young l-eave the pouch and. lower numbers wilt be seen
over suÍtmer and winter, following natural mortality. The
best time of year to census the population and to remove thatpïoportion which will keep the rate of increase at zeTo
would be just after young animals leave the pouch, around
November.

9.0 APPENDICES

150
APPENDIX T
PLANTS OCCURRING ON THE STUDY AREA
Identifications from Black, {.M. (1943 - l,957) 'Flora of
South Australia' 2nd. Edn. Vo]s. I IV Govt. Printer'
Adelaide, and Eichler, H. (1965),'supplement to J.M. Blackrs
Flora of South Australia (2nd. Ed. r 1943 1957) | Govt.
printer, Adelaide. Identification of Bryophytes by L.D.
lrfi1liams, Ecological Survey Section, Dept. of the Environment.
A. Vlithin the Scrub
LlLTACEAE
thysarntus cl:Lehotomus (Labil1 - ) R. Br .
Xanfhorrhoea tateana. F .v.M.
CASUARINACEAE
Ca"suotirn strLata Macklin
PNOTEACEAE
Isopogon ceratoPhYLLus R.Br
Adernnthos sez"í'eea var. breaifoLia Benth.
Hakea rostYata F.v.M. ex Meisn-
Bønksùa narginata Cav.
B, ornata F.v.M. ex Meisn.
DRQSERACEAE
Dt'osera aurtcuLata Backh. ex Planch.
MIT^OSACEAE
AcøsLa arrnta R.Br. ex Ait-A, retírndes Schtdl.
IABACEAE
PuLtenaea døPhnoides Wendl .

15I
RUTACEAE
Boz,onLa fiLifoLia F . v. M.
Correa puLcheLLa Mackay ex Sweet
RHAMNACEAE
Spyz,idí-un phy Li coídes Rei ss .
STERCULIACEAE
LasiopetaLwn sehuLzenLi (F . v.M. ) Benth.
DTLLENTACEAE
Hibbev,tia serLeea (R.Br. ex DC. ) Benth.
ÌlflRTACEAE
LeptosperTnwn itwLperLnwn Sm.
MeLaLeuca Lanceolata Otto
EucøLyptus obLíqtn L I Herit.E. diuersif,oLia Bonp1.
EPACRTDACEAE
Epaeris ímpressa Labi11 .
B. On the Cleared Area
MASCT
BarbuLa pseudopiLif,era C. Muell .
WtquetneLLa papiLLata (Hook. f .
Brywn bíLLardLev"i Schwaegr.
PTEEIMPHYTA
PterLdiwn escuLenLum (Forst. f . )LTLIACEAE
AnthnopoclLun s tríctun R. Br .
GNAUTNEAE
Agnos f,Ls atsenacea Gmel .
hnthorñq pí'Losa R, Br.* TuLpía Tu¡uîos (L. ) GmeI ,
& Hampe
c Wi1s.) Broth.
Nakai

l-52
*V. byoroides $.) S.F. Gray
CARYOPHYLLACEAE
* Cerastium glomeratttn Thuil1.F¿EACEAE
* IrLfoLiun dubiun Sibth.* TrLgoneLLa ormithopodLoides (L. ) Dc
(* Represents introduced plants.)

153
APPENDIX IISKULL MEASUREMENTS (FROM THOMAS 1888)
Basa1 Length : From the basionr oI lower front edge of
the foramen magnum, to the gnathion, or
most anterior point of the premaxill-a'
Nasal Length : Greatest length.
Nasal Width : Greatest breadth of the two nasals
tggether.
fnter-orbital Width : Least breadth between the two orbito-temPoral fossae.
Palate Length : From the back of the bony palate to the
gnathion.
Diastema : FÌom the back of the alveolus of the
last incisor to the front of that of the
most anterior of the cheek-teeth'

154
APPENDIX III
HISTORY OF TRANSMITTER ANIMALS
MALE 1
First captured 29/5/76 Born J-972
Last captured. 6/7/78
Tot.al number of times caught - 7
Transmitter (u.4.) placed on anímal 7/I2/76. Position of
animal recorded at intervals of 2'4 hours from 1400 hrs.
7/12/76 to 2400 hrs. 9/12/76. Transmitter was removed. A
second transrnitter (C.S.I.R.O.) placed on animal l-3/4/77 -
Position of animal noted at irregular intervals during AprilIg77 (14/4/77 17/4/771; at 3 - 5 hour intervals in May L977
(22/5/77 - 25/5/77) ; at-irregular time intervals in June -JuIy Ig77 (28/6/77 s/7/77) and in Ausust ]-977 (3/8/77 -5/8/77). The transmitter signal was getti-ng weaker in August
L977 and could not be picked up in September L977. Trans-
mitter was removed 8/lI/77.A third transmitter (A.V.M.) placed on anj-mal 30/L/78.
Position of animal recorded at 4-hourly intervals in January -February L978 (3I/1/78 - 3/2/78) , March - April 1978 (30/3/78
2/4/78) and May I978 (9/5/78 II/5/78) . Four measurements
at irregular Èime intervals were made in July 1978 (13/7/78
f4/7/7ü. Transmitter signal was getting weak at this time.
The transmiLter was not recovered.
MALE 2
First captured 22/I/76 Boxn J-974
Last captured L2/7/78
Total number of times caught - 4
Transmitter (C. S.I.R.O. ) placed on anirnal 7 /4/77 . Positj-on

-
1s5
of animal recorded at irregular intervals during Äçrit 1977
(IO/4/77 I7/A/77)¡ at intervats of 3 - 5 hours in May ].977
(22/5/77 - 24/5/77) and at irregular intervals in August L977
(3/8/77 - 4/8/77) . Transmitter signal could' not be heard in
September Ig77 and was removed 5/1I/77 'A secoird transmitter (A.V.M.) was placed on animal I2/L2/77 'position of animal was recorded at 4 - hourly intervals in
December Ig77 (I4/I2/77 ' I7/I2/77) , January ' February 1978
(3r/I/78 - 3/2/ 78) ¡ March - Arpil ]:s78 (30/3/78 - 2/4/78) and
May 11978 (9/5/78 - LI/5/78) . Transmitter was removed L2/7/78
when signal was getting weak.
MALE 3
First captured 27/ 5/76 Born 1975
Last captured e/LI/77Total number of times caught - ITransmitter (c.s-I.R.o-) placed on animal 9/4/77' Measure-
ments of the animalts position htere recorded at irregular
intervals in April 7977 (IO/4/77 - \7/a/77) ¡ at regular
intervals of 3 - 5 hours in May Ig77 (22/5/77 - 25/5/77) and
at. irregular intervals in June JuIy 1977 (28/6/77 - 5/7/77)
and Augusl l-977 (3/8/77 5/B/77) - Transmitter apparently
not working in september Ig77 anC was removed 3/II/77 -
MALE 4
First captured 6/Lf/77 Born 1977
Last captured LI/L2/77
Total nu¡nber of times caught - 2
Transmitter (A.V.ivl.) placed on animal l2/I2/77 ' Position of
animal recorded at reqular intervats of 4 hours in December
Ig77 QA/I2/'77 17/),2/77) , January - February l:}TB (3L/L/78 -

156
3/2/78) , March - April 1978 (30/3/78 - 2/4/781 and Mav 1978
(g/5/78 J.I/s/78). Four measurements of position were taken
at irregular time intervats in July L978 (L3/7/78 - 14/7/78) .
Transmitter signal was getting weaker in July 1978.
Transmitter not recovered-
MALE 5
First captured L6/3/76 Born 1975
Last captured 6/7/78
Total number of times caught B
Found dead SePtember I978
Transmj-tter (A.V.M.) placed on animal I2/I2/77 ' Position of
animal followed at regular intervals of '4 hours in January
February ]:g78 (3I/I/78 - 3/2/78) and t4arch - April 1978
(30/3/78 2/4/78). Weak signal heard from main feeding area
in May Ig78 but position of animal in scrub could not be
found
Transmitter recovered from dead anj-maI September 1978'
I4ALE 6
First captured 24/ I/76 Born 1973
Last captured LI/I2/77Tota1 nr¡nlcer of times caught - 5
Transmitter (A.V.M.) placed on animal 12/L2/77 ' Position of
animal recorded at 4=hourly intervals in December I977
(L4/r2/77 - 17 /L2/77) .
Transmitter signal not heard again and. transmitter not
recovered.

].57
IIALE 7
First captured 3/II/77 Born 1976
Last captured 30/ I/78Totat number of times caught - 2
Transmitter (A.V.M. ) placed on animal 25/L/78. Position of
animat measuïed at 4-hourly intervals January - February 1978
(3I/L/78 - 3/2/781 and March - April- 1978 ß0/3/78 - 2/4/78).
Transmitter signal weak in May 1978, Posítion of aníma1 not
recorded.Transrnitter was not recovered.
MALE 8
First captured 16/3/76 orn L974
Last captured e/7/78
Total nurnber of times caught - 4
Transmitter (A.V.M. ) placed on animal )./2/78. Position of
animal recorded at regular intervals of 4 hours in February
Ig78 Q/2/78 - 3/2/7Ð, March - April 1978 (30/3/78 - 2/4/781
and May Ig78 (9/5/78 II/5/78). Four measurements were taken
at irregular time intervals in July 1978 (13/7/78 - 14/7/78) .
FEMALE 1
First captured 6/II/76 Born 1973
Last captured 1-3/ 7/78
Tota1 number of times caught - 8
Carried a female pouch young in 1977 and had female pouch
young in 1978 which was present in May 1978 but had been lost
by 13/7/78.Transmitter (c:s. T.R.O. ) placed on animal 6/4/77 ' Positi'on
of animal recorded at irregular intervals in April I977
(Il/4/77 L7/4/77); at regular spaced intervals of 3 - 5

hours in May 1977 (22/5/77 - 25/5/77) ¡
in June - July Ig77 (28/6/77 ' 5/7/77)
(3/8/77 - s/8/77).Transmitter was removed 13/8/77.
ls8
at irregular intervalsand August 1977
FEMALE 2
First captured 7/IL/75 Born 1973
Last captured l3/7/78Total nr-rmber of times caught - 10
Carried pouch young (sex unknown) in 1976, female pouch young
in )-977 and a male pouch young in L978,
Transmitter (C.S.I.R.O.) placed on animal 7/4/77' Position of
animal recorded at irregular time intervals in April L977
(IO/4/77 17/4/77); at regular intervals of 3 5 hours in
I{ay L977 Q2/5/77 25/5/77) and at irregular intervals in
June - Jul1z J:g77 (28/6/77 - 5/7/77) and August 1977 (4/8/77 -
5/8/77) . Transmitter s,ignaI was getting weaker in August and
could not be heard in September L977.
Transmitter was removecl 2/LI/77 -
A second transmitter (A.V.M.) placed on animal 25/I/78'
Position of animal recorded at reqular intervals January-
February L}TB (3I/I/78 3/2/78) and March - Aprit 1978
(.30/3/78 - 2/4/78).Transmitter was not heard in May 1978 and was removed on
Lr/7 /7 8.
FEMALE 3
FÍrst captureð' 3L/aO'/75 Born 1975
Last captured B/ 7/78
Total number of times caught 12
Carríed a male poucFr young in ),976, a female pouch yo.rng i-''

159
Lg77 which was lost by 28/6/77, a male pouch young in 1978.
Transmitter (c.s.I.R.o.) placed on animal 7/4/77 ' Position
of animal recorded at irregular intervals in April 1977
(LO/4/77 I7/a/77) ¡ at regular time intervals of 3 - 5
hours in May Ig77 (22/5/77 25/5/77) and at irregular
inrervals in June July Ig77 (28/6/77 - 5/7/77).
Transmitter found to have flat batteries in August 7977 and
removed 4/8/77.Second transmitter (A-v.M.) placed on animal I2/I2/77 'position of animal recorded at regular time intervals of 4
hours in December Lg77 G4/L2/77 I7/L2/77) ' January -
February 1977 ßI/I/78 ' 3/2/78), March - April L978 (30/3/78
2/4/78) and May ]:g78 (-9/5/78 - IL/5/78) . TransmiÈter was
not working in July Ig78 and was removed II/7/78.
FEMALE 4
First captureð' 6/a/77 Born l-973
Last captured 4/B/77
Total nr:¡riber of times caught - 3
Carried a female pouch you¡Ig in l-977 '
Transmitter (C.S.I-R.O.) placed on animal 7/4/77 ' Position
of animal recorded at irregular intervals in April L977
(ro/4/77 - 17/4/77) and May Is77 (22/s/77 - 24/5/77) .
Transmitter signal could not be heard in June 1977 and
transmitter was removed 4/8/77 '
PEMALE 5
First caPtured 5/LI/76 Born l-976
Last caPtured 6/LI/77Total nr¡niber of times caught 3
Did not appeaï to have carried a pouch young in L977 '

160
Transmitter (Â.V.M. ) placed on animal L2/)'2/77 . Position of
animal recorded at 4 - hourly intervals in December 1977
(I4/L2/77 r 17/12/77) | January - February l-978 (3I/I/78 -3/2/78) and March - April 1978 (30/3/78 - 2/4/78). rrans-
mitter could noÈ be heard in May 1-978 and was not recovered.
FEMAT,E 6
First captured 3n-I/75 Born 1-.973
Last capturecl L/L2/78
Total number of times caught - 6
Had been lactating when caught Ln L975 and L976, carried a
male pouch younginAprÌ1 a977, which was kil1ed during capture,
and subsequently produced and reared a female pouch young.
Carried a female pouch young in 1978.
TransmÍtter (A.V.M.) placed on animal I3/I2/77. Position of
animal recorded at regular intervals of 4 hours in December
Ig77 (I4/I2/77 ' L7/L2/77), January - February ]978 (3I/I/78 -3/2/78) and in March - Aptil L978 (30/3/78 - 2/4/78).
Transmitter was weak in May J-978 and was removed I0/7/78.FE}4ALE 7
First captured 24/I/76 Born 1975
Last captured 6/7/78
Total number of times caught ICarried a male pouch young in 1976, a male pouch young ín 1-977
and a female pouch young in 1978.
Transmitter (A.v.M. ) placed on aníma1 I/2/78 . Position of
animal recorded at regular 4 - hourly Íntervals in February
Lg78 (2/2/78 - 3/2/78) | March = April l.978 (30/3/78 - 2/4/78\
and May 1978 (9/5/78 - LI/5/78) , Four measurements at
irregular time intervals hiere taken in July 1918.
Transmitter was not recovered.
16r
FEMALE 8
First captured l2/I2/77 Born 1977
Last captured 8/ 5/78
Tota1 number of times caught - 3
Did not carry a pouch Young in L978.
Transmitter (,[,V.M. ) placed on animal 8/5/78. Position ofanimal recorded at regular 4-hourly intervals ín May 1978
(9/5/78 - LL/5/78). Signal could not be heard in July 1978
and the transmitter was not recovered.

L62
APPENDIX TV
The daily movement patterns of each wallaby at
different times of the year are presented in the following
maps, togeÈher with the dates on which the observations
were made and the times when each measurement was taken.

I&8
6
4
o
16
AN
AN . lKm
MaIe 1 December L976
Time (hrs) Reference Date
8/12/76
e/r2/76
Reference Date
7 /r2/76
8/12/7 6
l_234567I9
1011I2
140 01 830210 0220000300 23004300700083010 30L2301430
1,3L4L516T71819202T22232425
Time (hrs )
16 301B 3020302l-3002300730120 014001600r800200022002400

6
73
AN
AN 'l Km
lKm
lKm
AN
Male 1
Reference
I234567I9
1011I213I41516L71B1920
May L977
Date
22/5/77
23/ 5/77
24/5 /77
Time(hrs)110 0Is00180 022000 1000700110 01500180 0220002000600I10 01500180 02200110015 00180 02200
16o
2s/s/77

6
5
o
11
7 12
I
o
AN
AN
lKm
Iv1ale 1
Reference
I23456789
101tI2I3t41516T718
Jan. /Eeb .
Date
3r/L/78
L/2/78
2/ 2/78
l-978Time(hrs )
L2001600200024000800120016002000240004000 80012 001600200024000 4000 80012 00
AN
17
16
3
4
a18
3/2/7 8

o
t3
1t12
o
AN
AN lKm
lKm
1Km
Male 1 }4arch/April L978
Reference
1234567I9
1011L213I41s16L71819
Date
30/ 3/7 8
3r/ 3/78
L/ 4/7 B
Time(hrs )
120016002000240004000 800120 016002000240004000800120 0160 0200 0240004000800120 0A
N
14I
16
2/ 4/7 8

2
4
8oI
AN
AN
MaIe I MaY L97'8
Reference Date Time (hrs)
1234567I9
101112
e/5/78
),0 /5/7I
rL/5/78
12001600200 0240004000800120016 00200 0240004000800

7
10
62
4
o11
12
87
15 1914 13
AN
AN 1Km
MaIe 2 December 1977
Time (hrs) Reference
l Km
Date
L6/12/77
17 /L2/77
Reference Date
14/12/77
t5/12/77
L6/t2/77
123456789
10
1200170 02400120 0160020002300040008001200
1IL2I3L41516L71819
Time (hrs)
16 0020002 3000 4000 8001200160020002 300

4 76
o1r
9
12
13
AN
AN lKm
1Km
Male 2
Reference
13141516171819
Jan. /Eeb.Date
3r/ v7 e
r/2/78
2/2/7 8
r97 ITime(hrs )
l-2001600200024000400080012001600200 024000 40008001200160 020002400040008001200
I234567I9
1011I2
AN
15
14
3/ 2/7 8

o5
4
3
1'l
8
AN
AN l Km 1Km
Male 2
Reference
I234567I9
1011L213L4I5t6t_7I819
NLardn/Apri1
Date
30/3/78
3r/ 3/7 8
L/ 4/78
L97 ITime(hrs )
12001600200024000400080012 00160020002400040008001200160 0200024000 4000 8001200A
N
o15 14
17 18
1Km
2/ 4/7 B

o4 27
o
10I
2
AN
AN lKm lKm
Ilale 2 May 1978
Reference Date Time (hrs)
e/s/78I234567I9
1011I2
t0/5/78
tr/s/78
12 00160 02 000240004000 800120016002000240004000 800

7
26
o4
o11
2
AN
AN lKm
AN
1Km
Male 3
Reference
1234567I9
1011L213I41516I7181920
May 1977
Date
22/s/77
23/5/77
24/s/77
Time(hrs)110 0150 018002200010 00600110 0ls001800220002000600110 015 00180 022000600110 0150 01800
17 't419
26
lKm
25/s/77

o
5
102
13
11
2
AN
AN lKm
Male 4 December L977
Time (hrs) Reference
1Km
Date
16/ I2/7 7
r7 /r2/77
Reference Date
14/12/77
Ls/ 12/ 77
16/a2/77
I234567I9
10
120017002400r200160 020002 30004000800L200
11I213L4I516I71819
Time (hrs )
160020002 30004000800L20016002 0002300

o5 7
6
4 3
13
AN
AN lKm
1Km
MaIe 4
Reference
11L2I3L41516I71819
Jan./reb.Date
3L/ L/7 8
t/2/78
2/ 2/7 e
I234567I9
10
r97 8
Tirne(hrs )
L200160020002400040 0080012001600200 024000400080012001600200 02400040008001200A
N
17 1514
18
3/2/7 8

o36 I I
2
AN
AN 1Km . lKm
Male 4 March/ApríI 1978
Rererence Date iii!,t234567I9
1011t213L415I6I71B19
30/3/78
3r/ 3/7 8
L/ 4/7 8
12001600200024000 4000 8001200160 020 00240004000 800120016 002000240004000 8001200A
N
7 19
18
1Km
2/ 4/7 8

27
1r
I12
AN
AN fKm
Date
e/5/78
Male 4 May 1978
Time (hrs) Reference
1Km
Date
ro/5/7 8
tr/5/7 B
Reference Time (hrs)
16002000240004000 800
I234567
ro /5/7 8
1200160 020 002400040008001200
I9
1011I2

o27
4 6
o 13
12
I
^N
AN 1Km lKm
Male 5 Jan./Eeb.Reference Date
L978Time(hrs )
AN
I234567I9
1011L2I3141516T71819
3r/r/7 8
L/2/78
2/ 2/7 8
3/2/7 8
L200160020 002400040008001200160 0200024000400080012 0016 002000240004000 800120 0
o 8
5
6

o5
7
3
o8
I
åN
AN 1Km
Male 5 lt[arch /epriLReference Date
30/ 3/7 8I234567I9
1011T213141516I718t9
3L/ 3/7 8
r/ 4/7 B
]-97 8
Tirne(hrs )
120016002000240004000800120016002000240004000800I200160020002400040008001200A
N
o
lKm
2/ 4/7 B

Io7
13
16
1
9
11 10
7
o
AN
AN lKm
Male 6 December l-977
Time (hrs) Reference
lKm
Date
L6/L2/77
L7 /L2/7 7
Reference Date
14/12/77
15/ L2/ 77
16/L2/77
I234567I
120017 0012001600200023000400I200
9101II2I3L41516I7
Time (hrs)
16002000230004 000 800120 01600200 02300

o 7
52
4
10
13o 11
I
AN
AN lKm lKm
Male 7
Reference
11L213L41s16I71819
Jan./Feb .
Date
3r/r/7 B
r/2/7 B
2/2/7 8
I97 B
Time(hrs)120016 00200 0240004000800120 016 002000240004000 800120 0160020002400040008001200
I234567I9
10
AN
o16 17
14
1Km
3/2/7 8

o5
7
6
4
12 13
o
AN
AN lKm lKm
30/3/7e
3r/3/ 7 B
MaIe 7 March/ApríI 1978
Reference Date iåT!,I234567I9
10r/4/78
12001600200024000400080012 001600200024000 40008001200160 02000240004000800120 0A
N
111213l41516T71819
o15
6
lKm
2/4/78

2
o 5
6
3
AN lKm
Male I February L978
Reference Date Time (hrs)
I23456
2/2/7 8
3/ 2/7 8
16 00200024000 400080012 00

o 3
5 62
oÂ1.
ry10
12
I
AN
AN 1Km lKm
MaIe I March/APri-I
Reference Date
1 30/3/78234s 3L/3/7867I9
1011 L/4/78l213L4151617 /4/781819A
N
L978Time(hrs )
120 016002000240004 000 80012001600200 0240004000800120016002000240004000 8001200
15 '18
17
419

o4
3 2
o11
12
8
AN
AN
Reference
1Km
Date
e/5/78
ro /5/7 8
lKm
Date
Lo/s/78
1r/5/7 I
Time (hrs)
16 00200024000 4000800
Male 8 May 1978
Time (hrs) Reference
1234567
12001600200 0240004000 80012 00
89
1011L2


o4
5
o10
I
AN
AN lKm lKm
AN lKm
Female 2
Reference
t234567I9
1011L213L41516L71819
Jan. /Eeb.Date
3r/r/7 8
L/2/7 I
2/ 2/7 B
I97 B
Time(hrs)r20016 002000240004000800120016002000240004000800120 016002000240004000 800120 0
o15
16
19
3/2/7 B

46
o
9o
11
I
AN
AN lKm 1Km
AN
Female 2
Reference
123,4
567I9
1011I213T41516T71819
tr{archlApri1 L978Tirp.eDare (hrs)
30/3/7 I 12oo160020002400
3L/3/7 8 04oo0800120 0160020002400
r/4/78 04000 80012 00160020002400
2/4/78 o4oo0800L200
16
o15
17
lKm

o4
7 o11
Io
AN
AN lKmlKm
Female 3
Reference
I234567I9
10111213141516t71819
May 7977
Date
22/5/77
23/ 5/7 7
24/5/77
AN
Time(hrs )
r10 01500I8002200010 006001I0 01500180 02200020006001100ls00180 022000 200110 0180 0
o16
15
7
I
1Km
25/s/77

5
o14 12
13
11
16
15
AN
AN
Reference Date
14/12/77
rs/12/77
16/L2/77
1Km
Date
L6/L2/77
17 / 12/77
Time (hrs)
160020002 30004 000 80012 0016 0020 002300
- lKm
Female 3 December ]-977
Time (hrs) Reference
123456789
10
l-20017 002400I20016002000230004000800120 0
11L213141516I718I9

2, 13
I
AN
AN lKm lKm
I234567I9
101II213L41516L718L9A
N
Female 3
Reference
Jan. /Eeb.Date
3L/ r/7 B
L/2/7 B
2/ 2/7 I
L97 8
Time(hrs )
120 016002000240004000800120 016002000240004000 800120 01600200024000 4000 8001200
18
o16 19
1417
lKm
3/2/7 8

o5
2
7
o10
I
AN
AN 1Km 'l Km
AN
Female 3
Reference
t234567I9
1011T213141516T7T819
March/AprilDate
30/ 3/78
3r/ 3/7I
r/ 4/7 I
1978Time(hrs )
12001600200 0240004000 800l-200160020 00240004000800120 01600200024000 4000800120 0
1918
17
lKm
2/ 4/7 I

5 67o
11 128
AN
Reference Date
e /5/7 B
ro/s/78
Female 3
Tirne (hrs)
I20016002000240004000 8001200
May 1978
Reference
I9
10l1I2
1Km
Date
L0/5/78
tr/5/7 I
Time (hrs)
16002000240004000800
- lKmA
N
I234567

o 47
9
AN
AN lKm
Female 5 Decernber ]..977
Time (hrs) ReferenceReference Date
14/12/77
15/12/77
L6/12/77
Date
L6 / 12/ 77
L7 /r2/77
Time (hrs)
160020002 3000400080012 00160020002 300
123456789
1200170 02400120 0200 0230004000 800120 0
10I1L2I3I41516T71B

54
3
6 7 119
12 13
^N
1Km
AN lKm
AN
Female 5
Reference
1234567I9
1011L2I3l41516L71B19
Jan./Feb.Date
3r/r/7 8
r/2/78
2/ 2/7 8
I978Time(hrs)12001600200 0240004000800120 01600200 0240004000800120016002000240004000800r200
a
15
14
I18
3/ 2/7 8

o3
o11
AN
AN 1Km
Female 5
Reference
I23:4567I9
1011L2I3I4I516T718,I9
March-Apri1
Date
30/ 3/7 e
3L/ 3/7 B
r/4/78
L97 ITime(hrs )
120 016002000240004000 800120 01600200 024000 4000800120 0160 020002400040008001200A
N lKm
o15
9B
2/ 4/7I

2o3
7
5
10
't7
o13
18
AN - lKm
AN lKm
Fema1e 6 Decenber 1977
Time (hrs) Reference Date Time (hrs)Reference Date
L4/L2/77
rs/12/77
16/12/77
1234567I9
10
120017002400120 016 002000230004000800120 0
t6/12/7717 / r2/7 7
I1L213L41516L718
1600230004000800I200160020002300

o
2
o
AN 1Km
AN lKm
AN
Female 6
Reference
1234567I9
1011T2I3T41516I7IBL9
Jan. /Eeb.Date
3L/t/7 8
r/2/78
2/ 2/7 8
l-97 ITime(hrs )
120 0160 02000240004000800]-20016002000240004000800120 016002000240004000 8001200
1618
7 19
14
o
lKm
3/ 2/7 8

1
o 6
34
o 13o
't1
I
I
AN 1Km
AN lKm
Female ¡6
Reference
I234567I9
1011L213I41516L71819
March/April 1978
Date iii3,30/3/78
3L/3/7 I
t/ 4/7 I
12001600200024000 4000800]-200160 02 00024000 4000800120016002000240004000 8001200A
N
o16
7
18
145
lKm
2/ 4/7 I

o 6
2
AN lKm
3/2/78
Fema1e 7 February 1978
Reference Date Time (hrs)
2/2/7 8123456
1600200 024000 400080012 00

o4
5
o12
AN 1Km
AN lKm
AN
Female 7
Reference
I234567B9
1011L213L41516T71819
March/April 1978TimeDaËe (hrs)
30/3/7 I 1200160020002400
3L/3/7 8 04oo080012 00160 020002400
t/4/78 04000800120 0t6 0020002400
2/4/78 04000 8001200
1Km
16
o15
1418
19

5 76
911 12
AN
AN - lKm
Female 7 MaY L978
Time (hrs) Reference Date
ro/5/78
rr/5/7 8
Reference Date
e /s/78
L0/s/7 8
I234567
1200160020 00240004000800I200
I9
101112
Time (hrs)
1600200024000 4000800

o5
2
4
oI
11
10
12
AN
Date
e/5/7e
Female I MaY 1978
Time (hrs) Reference Date
Lo /s/78
Lr/s /7 8
AN
Reference Time (hrs )
1600200 024000 4000800
1234567
ro/5/78
I20A1600200 024000 40008001200
I9
1011t2

163
APPENDIX V
The number of animals caught during each trip for
the present study, and the number ear-tagged in each trip from
November 1963 to JulY 1972.

The total number of wallabies caught in eachtrip for the Main Study Area from July L975
to November 1978.
Field Trip Date
JuIy L975October-
I'lovember 1975January L976March I976May J-976
July 1976October-
November l.976December 1976January 1977April 1977
June-Jul1z 1977November ]-977
December 1977-January L978May 1978July L978
November 1978
Tota1 Number Caught
F M T
25 18 43
Mean No.
Caught/Ni9ht
7.2
7.37.2
10.09.7
10 .3
18.0II.710 .512.39.6
IL.7
3.97.87.78.0
Range
Caught/Ni9ht
5-11
T-L24-LI8-148-146-16
IT-24t-176-166-204-L62-29
1-93- 14
1-152-15
Deaths During CaPture
F M T
50
2440
282I
563334
784I58
2L302728
23
19
30
30
20
52
3729
4536
47
26322736
7343
70
5B
4I
10870
63).23
77105
4762
5464
1
2
0
0
I0
0
1
0
I0
I
I1
0
0
I
0
0
0
I0
0
1
0
T
0
0
0
1
0
0
0
2
0
0
0
0
0
0
0
0
0
1
10
0
0
HOì¡Þ

165
The number of wallabies. caught in the Goose
Paddock and Bottom Paddock traPs.
Goose Paddock
Field Trip DateTotal Number Caught
F M T
May J-975
July 1975October-November ).9 7 5
January J-976*March 1976
May L976,Iuly 1976
December L976
154
0
2
I11
6
0
42I2
2
6
9
L2I
57L2
2
4
7
2018
1
Bottom Paddock
Field Trip DateTotal Number Caught
F M T
JuIy 1975October-November ]-975
March L976
6
t11
5
5
1
I6
0
)c 1 Male d.ied during capture, March 1976.

166
The number of wallabies ear-tagged for each
trip from November 1963 to July L972'
Data from Dr. S. Barker, Zoology Department,
UniversitY of Adelaide.
Field Trip DateNumber of Animals Ear-Tagged
Females Males Total
November 1963February-March L964
October-November ]-964May 1965
JanuarY 1966August 1966
November-December 19 66
May L967November-December 19 67
FebruarY 1968May 1968
July 1968December 1968March ]-969May 1969
March L972JuIy 1972
3
I7
7
4
3034
28252322
2T2l11I719
2
4
L4
9
5
IL7
1526
28t72L112319
1123
1
7
22
16
T2
T2
4749
54
53404332
44
30
2842
3

167.
n
S
1,
't,
APPENDTX VI
TABLES FOR THE ANA],YSTS OF THE I4ARK-RECAPTURE
DATA FOR 1975 1978 AND 1966'- L969 USTNG THE
JOLLY'SEBER STOCHASTIC MODEL
= nunber caught in the zl th samPle.
= nuniber released from L]nei th sample after marking.
= number of animals. released from the / th sample
' ttrat are caught subsequentlY.
= nr¡nlcer of animals marked before tíme i which are
not caught in Llne ith sample but are caught
subsequentlY.
R.1'
z ,1,
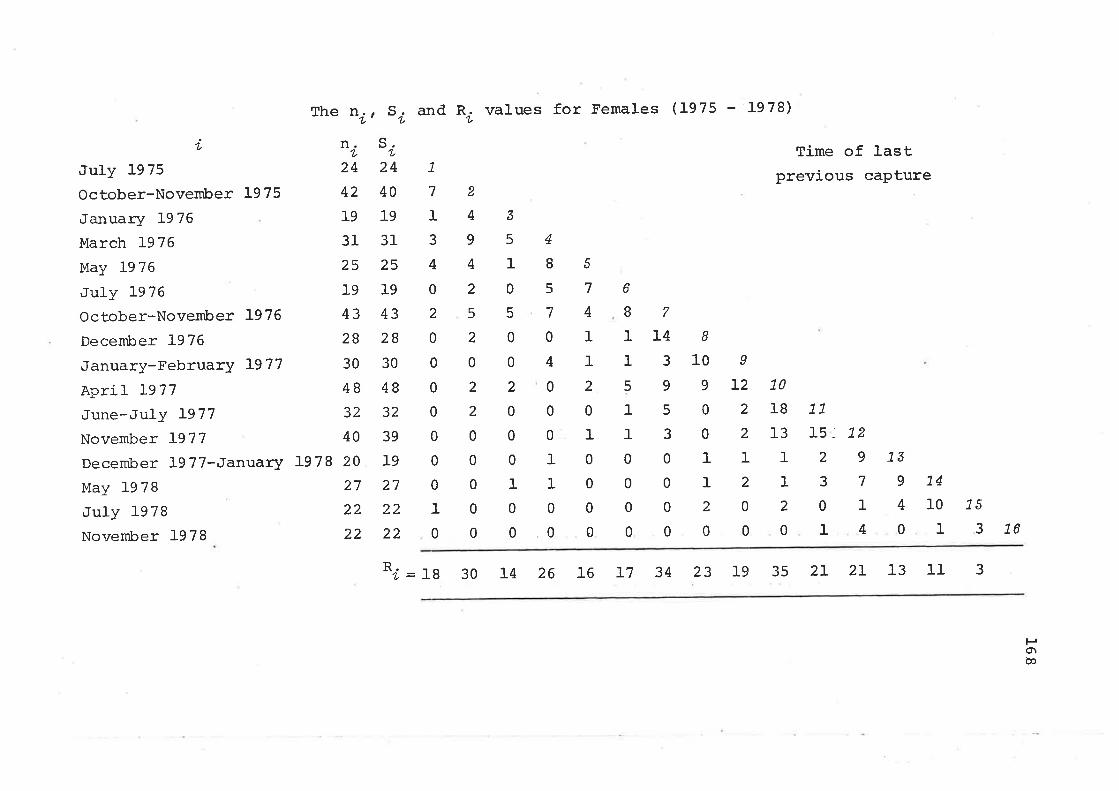
The ni, Sí, and RO values for Females (1975 1979)
n1- S.424
'1,
JuIy 1975 24
October-November L975 42
January L976 19
March L976 31
May l-976 25
JuIy l-976 19
October-November 1976 43
December L976 28
January-FebruarY 1977 30
April L977 48
June-Ju1y 1977 32
November L977 40
December l977-Januarlf J-978 20
May I97e 27
July 1978 22
Nor¡ember 1978 22
7
7214339544418
5
7
0
4
0
0
0
1
0
5
0
0
2
0
0
0
Time of lastprevious capture
4019
3125
19
432830
4832
39
t9272222
0
2
0
0
0
0
0
0
2
5
2
0
2
2
0
0
6
I115
110
0
0
0
5
7
4
II2
0
10
0
0
7
I43
9
5
3
0
0
0
0
B
109
0
0
112
0
o
12 10
2182]-3112L0200
1115- L229370114
739744 10 15
013
0011100000000 L6
Ri=rB 30 14 26 l-6 17 34 29 rg 35 21 2L 13 11 3
Holco

The Z values for Females (1975 - 1978)1.
L
721
J
4
0
2
0
0
0
0
0
0
0
I0
5
T2
8'2
7
2
0
2
2
0
0
0
1
0
3
L7
9
2
122
0
4
2
0
0
1
10
4
L77
192
4
4
2
0
12
10
5
L4
23
3
5
6
2
1
I2
1
0
I19
298
5
2
3
3
0
o
4I10
7
3
5
3
0
70
2820
4
6
5
0
1L
35
6
9
5
1
L21516
6
5
732510
5
15
ztq
L5
o
31 7
41869
11 20
382511221100 976
1z.1, +
42zs
4
36
z311zz
33z
44 30 46 50 28 35 2L
ze zl zg 29 z:ro z:-t ztz27
zl.z
L420
6
6
z 15
POr\o

The n s and. R values for Males (L975 1978)n'l a .t,
¿níJuly 1975 18
October-November L975 23
January L976 17
March 1976 25
tvray 1976 27
July 1976 20
October-November A976 38
December 1976 31January-February 1977 25
April J-977 36
June-Ju1y 1977 30
November 1977 37
December 1.977-January I978 2L
May 1978 24
July J978 23
November L978 25
s.1723L725
2620
38
30
25
3530
372I232325
1Time of Last
previous capture
1130034
22
00
55
6
2
0
I0
3
4
110
2
0
0
0
10
17
00010
2
0
1
0
10
3
2
2
2
0
0
1
o
'10 7
0131412220201010001
0000000
Il272
1
0
0
0
0
1
II2
2
1
0
1
0
0
70
114
3
0
2
1
1110
2
3
0
1
127
7
3
5
0
000
0
0
0
0
0
7337449L50310001 76
R¿-- 6 5 13 t7 16 14 26 26 16 21 16 22 7 12 I
P{o

2
2
0
4
0
1
0
7
2
I0
2
0
0
0
12000000000000
The Z values for MaLes (1975 - 1978),L
4
125310612683312110011000011
6
22I4
3
3
0
1
0
0
1
7
2TI5
5
2
2
1
0
2
o
29I3
2
2
0
3
L019
7
5
2
2
4
71t7.7
5
2
5
I20T7
6
2
2
1
0
3
3
3
7
2
3
2
2
0
10
0
0
0
0
12T4
T2
5
10
L3I5
9
10
1418
1315L4 7600
z i+1 717z z
31 18zg zto
27 19
z:-s zta25
zg20
z743
4
z222
zs28
z6
20
ztt19ztz
13zts
\¡H

The
¿
August 1966
November-Decembe r 19 66
May 1967
November-De cember L9 67
February 1968
May 1968
July 1968
December 1968
March 1969
May 1969
ni' sin.
1,
38
38
44
38
33
44
44
40
34
44
anil
S.4
38
38
44
38
33
44
44
40
34
44
R. values for Fernales (1966 1969)u
Time of last
7 Previous caPture
4294361640125531755631734s70304425801113647e02221244970
R.1,
25L425201715131]-9
F{N

The Z values for Females (1966 L969)'t,
L
4
9
6
0
3
3
0
0
0
2
13
7
I4
4
3
1
2
3
4
I
I411
3
2
4
13
3
11 16
34 46
z z
5
2T
18
11
6
7
6
23
13
t2
9
7
18
16
13
I23
17
I7
3
6
29
z8765432
26 70
z¿+1 2I 22z z
42 34
z z
L7z
9
H\¡(,

The nU, S¿ and R, values for Males (1966 1969)
InformaÈion from November-December L966 was deletedfrom the analysis because no animals from this trip r^lere
subsequently recaptured.
i
August 1966
May 1967
November-De cembe r L9 67
February 1968
May 1968
July 1968
December 1968
March ]-969
May 1969
n,1,
2T
30
32
23
39
23
26
28
19
s.
2I29
31
23
38
2L
26
28
L9
7
Time of lastprevious capture
R.L
121231044346452L1066100101701202318000110249
981369'434
H{È

values for l"lales (1966 1969)
3
5
13
4
1
3
0
z
The Z't
III
7
9
4
6
3
I2
5
2
5
2
10
4
L7
z102Iz 543
9
6
Izz
4
2
3
I
2
3
1
7
3
II0
L
1
1
I3
2
I0
0
410
7
13z
z¿+1zz
8
H{(¡
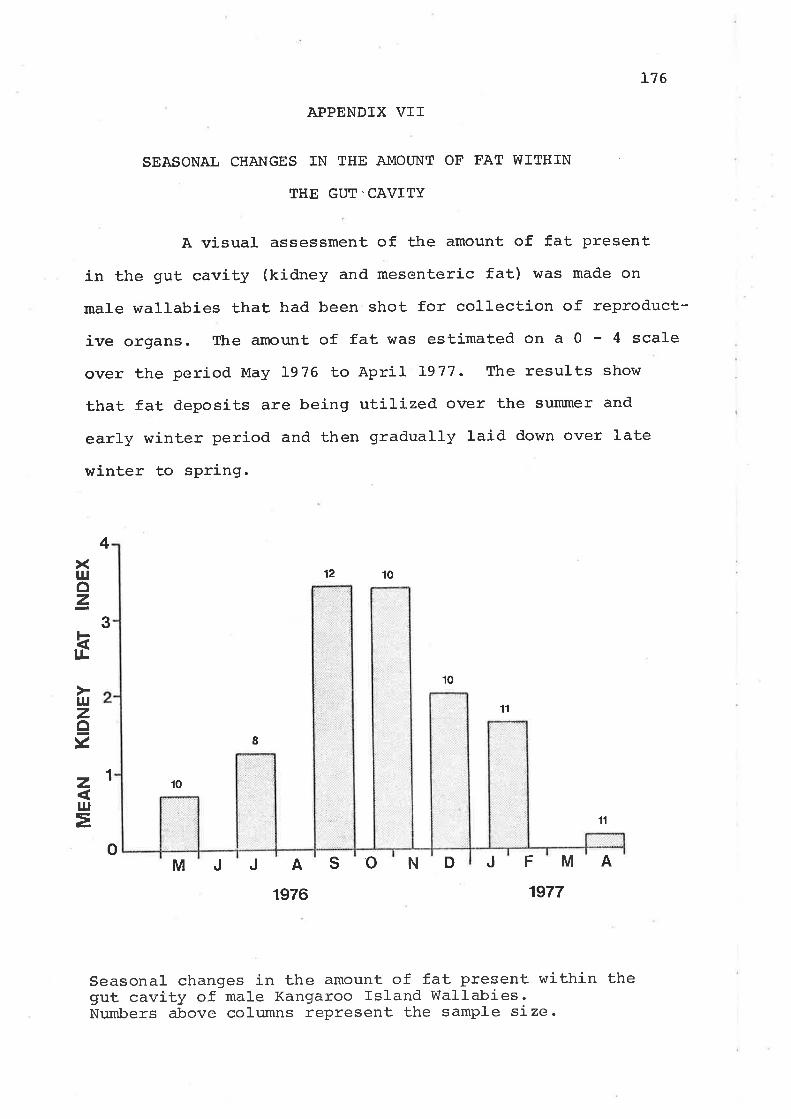
J.76
APPENDIX VTT
SEASONAL CHANGES IN THE AMOUNT OF FAT WITHÏN
THE GUT.CAVÏTY
A visual assessment of the amount of fat present
in the gut cavity (kidney and mesenteric fat) rltras mad.e on
male wallabies thaL had been shot for collection of reproduct-
ive organs. The amount of fat was estimated on a 0 4 scale
over the period May L976 to April L977. The results show
that fat deposits are being utilized over the summer and
early winter period and then gradually laid d.own over latewinter to spring.
12 10
110
4
11
11
10
I
3
xl¡¡oz
È<
¡¡Jzevzu¡E
oM J J S o N D J F M AA
1976 1977
Seasonal changes in the amount of fat present. within thegut cavity of male Kangaroo Island Vüallabies -
Nr¡nbers above columns represent the sample síze -

10.O BTBLIOGRAPHY

L77
Aitken, P.F., l-970. Mammals. In, South AustraLian Iear Book,Commonwealth Bureau of Census and Statistics: Adelaide.
Anderson, K.M. and Liao, S., 1968. Selective retention ofdihydrotestosterone by prostatic nuclei . Nattu'e, Lond. 2I9 |277-279.
Anderson, N. / a972. Trichostrongylid infections of sheep ina vrinter rainfall region. 1. Epizootiological studies in thewestern district of Victoria 1966-67. Aust. J. Agr"Le. Res. 23,1113-1129.
.Andrewartha, H . G. and Barker, S . , 19 69 . Introduction to astudy of the ecology of the Kangaroo Island Wa11aby,Protenmod.on eugenr)í (Desmarest) I within Flinders Chase, KangarooIsland, South Australia. Lþans. RoA. Soc. S. Aust. 93, L27-I32.
Andrewartha, H.G. and Birch , L.C., L954. The DLstribution and.Abundance of AnirnaLs. University of Chicago Press' Chicago.
ArundelrJ.H., Barker, I.K. and Beveridge, I., L977. Diseasesof marsupials. In The BioLogA of MarsupíaLs. Eds. B. Stonehouseand D. Gilmore. pp 141-154. Macmillan, London.
Bailey, P.I,, I97I. Thê red kangaroo, lulegaLeia rufa (Desmarest),in north-western New South Wales I. Movements. C.5.I.R.0. f,/¿LdL.Res. 16 , I).-28.Bailey, P.T., Martensz, P.N. and Barker, R., J-97t... The redkangaroo, MegaLeia zwfa (Desmarest) , in north-western New SouthWales II. Food . C.S.I.R.O. WiLdL. Res. 16 , 29-39.
Barker, 5., 196Ia. Copper, molybdenum and inorgani-c sulphateIevel-s in Rottnest plants. J. Roy. Soc. West. Atnt. 44, 49-52-
Barker, S., 1961b. Studies on marsupial nutrition III. Thecopper-molybdenum-inorganic sulphate interaction in theRottnest quokka, Setoniæ bz'aehywws (Quoy and Gaimard) . Aust.J. b.ioL. Sci. 14, 646-658.
Barker, S., 1968. Nitrogen balance and water intake in theKangaroo Island Wallaby , ProtennLodon eugenii (Desmarest) . Aust.J. erp. BioL. ned. SsL. 46, 17-32.
Barker, 5., 1971. Nitrogen and water excretíon of wallables:Differences between f ield and laboratory find.ings. ConP.Biochem. PhysioL. 38, 359-367 .
Barker, S., 1974. Studies on seasonal anaemia in the RottnestIsland quokka , SetorrLæ brachytrtus (Quoy and Gaimard)(Iularsupialia; Macropodidae) . Trans. Roy. Soe. S.Aust. 98, 43-48.
Barker, 5., Glover, R., Jacobsen, P. and Kakulas, B-4. , 1974-Seasonal anaemia in the Rottnest quokka , SetonLæ brachytu'us(Quoy and Gaimard) (Marsupialia; Macropodiriae). ConP. Biochem.Physiol. 49 , I47-I57.

I 178
Barker, S., Lintern, S.M. and Murphy, C.R. , ]-970. The effectof waÈer restriction on urea retention and nitrogen excretionin the Kangaroo Island Wallaby , Protenrtodon eugenii (Desmarest) .
Conrp. Biochem. PltysíoL: 34, 883-893.
Bauer, F.H., l-959. The regiånal geography of Kangaroo Island,South Australia. Ph. D. thesis. Australian National Uni-versity.Bentley, P.J.,1955. Some aspects of the water metabolism ofan Australian marsupial Setonyæ braehyut'us. J. PhysíoL., Lond.r2'1 , 1-10.
Berger, P.J., a966. Eleven-month 'embryonic diapauser in amarsupial. Nature, Lond. zIL, 435-436.
Berger I P.J. , 1970. The reproductive biology of the tammarwal1aby, Maeropus eugenii, Desmarest. Ph. D. thesis, TulaneUniversity.Berger, P.J. and Sharman, G.B. ¡ 1969. Embryonic diapauseinitiated without the suckling stimulus in the wallaby,lrla.cyopus eugenii , J. Mønnw.L. 5 0 , 6 30- 632 .
Bethard, W.F., lrlissIer, R.W., Thompson, J.S., Schroeder, M-4.and Robson, M.J., 1958. The effect of acute protein depriv-ation upon erythropoiesis in rats. BLood 13, 216-225.
Beverton, R.J.H. and Ho1t, S.J. , L957. On the dynamics ofexploited fish populations . Min. Ag. Fish and Food, Fishev'iesInuestLgattons, Ser,. 2, 19, 1-533.
Blair, W.F. r 1953. Population dynamics of rodents and othersmall mammals. Adu. Genetics 2, 1-41.
Brown, G.D. I 1969. Studies on marsupial nutrition VI. Theutilization of dietary urea by the euro or hj-ll kangaroo,Macropus robustus (Gould) . Aust. J. ZooL. 17, I87-I94.Brown, G.D. and Main, A.R. , 1967. Studies on marsupialnutrition V. The uitrogen requirements of the euro , Maeropusyobustus. Aust. J. ZooL. L5, 7-27.
Burrows, K., 1979. C1imate. Chapter 4 in, Natuz'aL Hístory ofKangaroo fsLand. Edt. by M.J. Tyler, C.R. Twidale and J.K. Ling-Royal Society of South Aust.; Adelaide.
Burt, W.H,, \943. Territoriality and homerange concepts asapplied to mammals. J. MønnaL. 24, 346-352.
Calaby, J.H., 1966. Mammals of the Upper Richmond andClarence Rivers, Ne'w South Intrales. Tech. Pap. OLu. l^liLdL. Res.C.5.1.R.0. No. l-0 , 1-55 .
Calaby, J.H. I I97L. The current status of AustralianMacropodidae. Aust. ZpoL.16 (Ð , 17-29.

]-79
Calaby, J.H. and Poole, W.8., )-97I. Keeping kangaroos incaptivity. fnt. Zoo Ib. 11, 5-72,
Casperson, K., 1968. Influence of envirorunent upon somephysiological parameters of the rabbíL)ryctoLagus etmicuLus (L.),in natural populations. Pt'oc.'EcoL. Soe. Aust. 3, 113-118.
Castro, 4.E., Alonso, A. and Mancini, R.E. , 1972. Localizationof follicle-stimulatíng and luteini zing hormones in the rattestis using immunohistological tests. J. Endpcr. 52, 129-136.
Catling, P.C. and Sutherland, R.L., in press. Effect ofgonadectoily, season, and the presence of females on plasmatestosterone, luteini-zing hormone, and follic1e-stimulatinghormone levels in male tammar wallabies (Macropus eugenLi).J. Endoey,
Catt, D.C. , L977. The breeding biology of Bennettrs wallaby]Laez,optn rufogz"tserc fz,uticusJ in South Canterbury, New Zealand.Nea ZeaL, J, ZooL.' !,' 401- 4I1'.
Catt, K.J., Tsuruhara, T., Mendelson, C., Kietelslegers, J-M.and Dufau, M.L. , I974. Gonadotropin binding and activationof the interstitial ce1ls of the testis. In Horrnone BindLng andIarget CeLL Acttoation in the Testis. Eds. M.L. Dufau, and A.R.Means pp l--30 Plenum Press, New York.
Caugh1ey, G.J., 1964. Density and dispersion ofof kangaroo in relation to habitat. Aust. J. ZooL.
Caughley, G., 1965. Horn rings and tooth eruptionof age in the Himalayan thar, HemLtragus iemLahicus.Sat, 8r 333-351.
two species12, 238-249.
as criteriaNeu ZeaL. J.
and Kean, R.I., 1964. Sex ratios in marsupialNatuz'e, Lond. 204 ' 49I.
., 1961. Phenomena associated with populationNatL. Acad. Sci.. U.S,A. 4'1 , 428'449.
Caugh1ey, G., 1966. Mortality patterns in mammals. Ecology9 06-9 18.
4'1 ,
Caughley, G.9 21=9 33 .
),97 4. Bias in aerial survey . J. l'liLdL. Mgnt 38'
Caughleyr G.pouch young.
Caughtey, G., Sinclair, R. and Scott-Kemmis' D.' 1976-Experiments in aerial survey. ./. hliLdL. Mgmt,40, 290-300-
Chitty, D., 1960. Population processes in the vol-e and theirrelevance to general theory. Can. J. boL.39, 99-113.
Christian, J.J., 1950. The adreno-pituitary system andpopulation cycles in mammals. J. tr4anrnaL. 31' 247-259 -
Christian, J.Jdensity. Pv,oc.
Christianof endocrRee. Prog.
J.J., L1es in thIin
oyd, J.A. and Davis, D.E. , 1965. The rolee self-regulation of mamm.alian populations.2I, 501-578.Horm. Res

Cook, 8., McDonald, I.R. and Gibson,function in the brush-tailed possum,J. Reprod. Fert. lp, 369-375.
180
W.R. , L978. ProstaticTv"i chosut us uuLp e cuLa.
Cormack , R. M. ,22,330-342.
1966. A test for equal catchability. Biometrics
Cormack, R.M., 1968. The statistics of capture recapturemethods . )eeanogz'. Mar', BioL. Arm. Reo. 6 , 455-506.
Dawson, T.J. and Denny' M.J.S., 1969. Seasonal variation inthe plasma,and urine electrolyte concentration of the aridzone kangaroos MegaLeia rwfa and Macropus z'obusttn. Aust. J. ZooL.
't , 777-7 84 .
Dawson , T.J . , Denny, M. J. S. and Hulbert, A.J. , 1969 . Thermalbalance of the macropodid marsupial- Macropus eugewLi Desmarest.Cor¡rp. Biochem, PhysioL. 3I, 645-653.
Dawson, T.J., Denny, M.J.S., Russell, E.M. and E1Iis, 8., 1975.Water usage and diet preferences of free ranging kangaroos,sheep and feral goats in the Australian arid zor,e duringsummer. J. ZooL., Lond. ).77, L'23.de Kretser, D.M., Catt, K.J. and Paulsen, C.4., L97I. Studieson tt,e in Vitto testj-cular binding of iodínated Luteinizínghormone in rats . Endoen. 88, 332-337.
and Vlallington, E.A. , l-967 . CarLetonts Histol.ogiealEd. Oxford University Press, Lonclon.
Drury, RTechnique.
A. B.4rh
Dudzinski, M.L. and Mykyfowycz, R. r 1961. The eyeindicator of age in the wj-ld rabbit in Australía.WiLdL. Res.6, 156-159.
lens as anc. s .r.R,o.
Dudzinskj-, M.L., Newsome, 4.8., Merchant, J.C. and Bolton'B,L. , 1-977. Comparing the two usual methods for agingMacropodidae on tooth-classes in the Agile Wallaby. Aust.WiLdL. Res. 4, 219-221.
Dunnet, G.M., )-962. A population study of the quokka, Setoniæbrachyurus (Quoy and Gaimard) (Marsupialia) . II. Habitat'movements, breeding and growth. C,5.I.R.0. WiLdL. Res, '1 , l-3-32.
Ea1ey, E.H.M., 1963. The ecological significance of delayedimplantation in a population of the hill kangaroo (Macz'opttsyobustus) . T,n, DeLayed InrpLantation Ed. by A. C. Enders. UniversityPress , Chicagio.
Ea1ey, B.H.M., \967a. Ecology of the euro, Macz'opus robustus(Gould), in north-western Austral-ia I. The environment andchanges in euro and sheep populations. C,S,I.ß.0. l^liLdL. Res,12, g-25.
Ea1ey, E,H.M. , 7967b. Ecology of the euro, Maa'opus t'obustus(Gould), in north-western Australia II. Behaviour, movements,ancl drinking patterns. C.S.I.R.O. VíLíL. Res. L2, 27-5I.

181
Ea1ey, E.H.M., I967c, Ecology of the euro, Maeropus nobustus(Gould), in north-western Australia IV. Age and growth.C.5.I.R.0. WiLdL. Res. 12, 67-80.
Ealey, E.H.M. and Main, A.R. ' 1967. Ecology of the euro,Inlaeropus robusttts (Gould), in north-western Australia III.Seasonal changes in nutrition. C.S.I.R,O. WiLdL. Res, 12, 53-65.
Eberhardt, L.L., 1968. A preliminary appraisal of linetransects. J. WiLdL. l4gnt. 32, 82-88.
Eberhardt, L.L. , 1969. Population estimates from recapturefrequencies. J. l,l¿LdL, lúgmt. 33, 28-39.
Eltringham, S.K., l-973. An assessment of variability inrepeated ground counts of large Afrj-can manunals. J. App.EæL. 10, 409'4I5 .
Finlayson, H.H. , 1927. Observations on the South Australíanmembers of the subgenus , t'WaLLabia". Trans. RoA. Soc. S.At'tst. 5:.-'363-377 .
Foot, J.Z. and RombêTg, 8., 1965. The utilization of roughageby sheep and the red kangaroo, Macz'opt'ts rafus (Desmarest) .Aus,t. J. agz,ic. Res. IL, 429-435.
Forbes, D.K. and Tribe, D.8., L970. The utilization of rough-ages by sheep and kangaroos. Aust. J. ZooL. 18, 247-256.
Frith, H.J., 1964. Mobility of the red kangaroo, MegaLeiarufa.C,5.1.R.0. WiLdL. Res. 9t 1-19.
Frith, H.J. and Calaby, J.H. , 1969. Kangaroas. F.W. CheshirePublishing Pty. Ltd., Melbourne.
Frith, H.J. and Sharman, G.8., 1964. Breedi.ng in wildpoputations of the red. kangaroo, MegaLeia nufa. C.5.I.R.0. l^liLdL.Res. 9t 86-114.
Geist, Y., 1966. Validity of hc¡rn seqment counts in agingbighorn sheep. ./. WiLdL. I,hgmt. J0, 634-646.
Gilbert, F.E. , 1966. Aging white-tailed deer by annuli in thecementum of the first incisor. J. WiLdL. Mgmt. 30, 200-202-
Gilmore, D.P., 1969. Seasonal reproductive periodicity in themale Australj-an Brush-taited possum (TricVtosut't'æ ouLpeculd -
J. ZooL., Lond. I57 ' 75-98.
Goddard, J., 1967. The validity of censusing black rhinocerospopulations from the air. East Afr. l'/¿LdL. J. 5, tB-23.
Go::don, H.McL., 1958. The epidemiology of hel-minthosis insheep in winter rainfall regions of Australia.2. WesternAustralia. Aust. Ile'b. J. 34, 5-19.
Griffiths, M. and. Barker, R. , 1966, The plants eaten by sheepand by kangaroos grazing together in a paddock in south-western Queensland. C.5.f .R.0. hliLdL. Res. 11, 145-167.

]-82
Hanks , J. and McIntoch, J. E ..A' r I97 3. Population d.ynamics oftlre African elephant (Loæodenta af,r'iearn). J. ZooL,, Lond, 169 '29-38.
Healey, M.C., 1967. Aggression and self-regulatj-on ofpopulatÍon sj-ze in deermice., EcoLogy 48, 377-392.
Hearn, J.P., I973. Pituitary inhibition of pregnancy. Nattæe,Lond. 24I, 207-208.
Hearnt J.P.,7974. The pituitary gland and implantation inthe wallaby, Macropus eugeniö, J, Reprod. lev't, 39, 235-24I.
Hearn, J.P., 1975. The role of the pituítary in the reproduc-tion of the male Tammar wal1aby, Maez,opus eugenii. J. Reprod, Fert.9, 399- 402 .
Hirst, S.M. , 1969. Predation as a regulating factor of wildungulate populations in a Transvaal l-ow-veld nature reserve.ZooL. Afr. 4, I99-23I.Holsworth, W.N. , )-964. Marsupial behaviour with specialreference to population homeostasís in the quokkas on theWest End of Rottnest Island. Ph. D. thesis. The Universityof Western AustraliaHolsworth, W.N. , 1967. Population dynamics of the quokka,SetonLæ bz,achytu.us, on the west end of Rottnest Isl-and, WesternAustralia. 1. Habitat and distribution of the quokka. Aust.J. ZooL. 15, 29-46.
Howard, H.E L920. Iezry"Ltory in Bird Life John Murray, London.f
Howard, W.8., 1960. fnnate and environmental dispersal ofindividual vertebrates. Amer'. MLíL. Nat. 63, 152-l-6I.
Hume, I.D., 1974. Nitrogen and sulphur retention and fibredigestion by euros, red kangaroos and sheep. Ausl;. J. ZnoL.22, 13-23.
Jennrich, R.I. and Turner, F.8., 1969. Measurement of non-circular home range. ./. Íheoret, BioL. 22, 227-237.
Johnson, K.4., 1977. Methods for the census of wallaby andpossum in Tasmania. WiLdL. Dtu. Techn. Report 77/2. NatiornL Paz'ksøtd WiLdLife Sez,uice, Tasmania.
Jolly, G.M., l-965. Explicit estimates from capture-recapturedata with both death and immigratj-on - stochastic model.Biometz"Lka 52, 225-247 -
Joule, J. and Cameron, G.N., 1975. Spe,cies removal studies.I. Dispersal strategies of sympatric Sigmodon hispidtls andReithrodontomgs fuluescens populations. J, Ma¡nnLl. 56, 378-396.
Kaethner, M.M. and Good, 8.F., 1975.in the Tammar Wal-1aby , Ma.cropus eugenií23, 363-369 .
Seasonal thyroid activity(DesmaresL). Aust. J. ZooL.

183
Kaufmann, J.H. I L962. Ecology and social behaviour of thecoati, Nasua nan'íeq on Barro Colorado Island, Panama. Uniu.CaLíf. PubLs. zooL. 69, 95-222-
Kaufmann, J.H. , 1974. Social ethology of thè whiptail wallaby,Macz,opus parryi, in northeastern New South Wales. Anim. Behau. 22,2Br-369.
Kemp, G.A, and Keith, L.B. I 1970. Dynamics and regulation ofred squirrel (Tanriasa|urus hudsonicus) populations . EeoLogy 5I,763-779.
Kennedy, P.M. and Heinsohn ' G.8., J-974. Water metabolism oftwo marsupials the brush-taÍled possum, TrLchosum,Ls uuLpeculaand the rock-wallaby , Pel;r,ogaLe inornata in the wild. Contp.Biochen, PhystoL, 41, 829-834.
Kikkawa, J. t 1977. Ecological paradoxes. Aust. J. EcoL. 2,]-2L-I36 .
Kingsmill, 8., 1962. An investigation of criteria forestimating age in the marsupials IrLchosum.¿s ouLpecuLa Kerr andPerameLes na.suta Geoffrey . Aust. J. ZooL. 10, 597-616.
Kinnear, J.E. and Main, A.R. , 1975. The recycling of ureanitrogen by the wild ta¡rrnar wallaby (ILacxopus eugenLí) - A"ruminant-fike" marsupial. Comp. Biochem. Physiol. 51, 793-810.
Kirkpatrick¡ T.H.¡ A964. Molar progression and macropod age.QLd. J. Agz"tc. Anim. Sai. 2L, 163-165.
Kirkpatrick, T.H., 1965a. Studies of Macropoclidae in Queens-land. 1. Food preferences of the grey kangaroo (Macropus maiorShaw). ?Ld. J. Agric. Aním. Sci. 22, B9-93.
Kirkpatrick, T.H., 1965b. Studies of Macropodidae in Queens-Iand. 2. Age estimation in the Grey Kangaroo, the RedKangaroo, the Eastern Wallaroo and the Red-necked Wa11aby,with notes on dental abnormafities. QLd. J. AgrLc. Artin. Sci.22 , 30l_- 3L7 .
Kirkpatrick, T.H., 1966. Studies of Macropodidae in Queens-land. 4. Social organization of the grey kanqaroo (Macropusg'tganteus).]Ld. J. Agz"Lc. AwLm. Sci.23, 317-322.
Kirkpatrick, T.H., l-967. Grey kangaroo in Queensland. QLd.Agz"Lc. J, 93, 550-552.
Kirkpatrick,QLd. AgrLe. J.
T.H., I974. Kangaroo harvesting and survival.100 , 36 B- 376.
Kirkpatrick, T.H. and llcEvoy, J.S., 1966. Studies ofMacropodidae in Queensland. 5. Effects of drought on repro-duction .in the grey kangaroo 0,Iaeropus giganteus). ]Ld.. J. Agr"Lc.AnLn. Scí. 23 , 439- 442 .
Kitchener, D.J. I Ig7O. Aspects of the Response of the Quokkato Envj-romental Stress. Ph.D. thesis, University of WesternAus tralia .

184
Kitchener, D.J. , 1972. The importancequokk a, SetowLæ bracLryutws (Marsupialia) ,Aust. J. ZpoL. 20, 28I'299.
of shelter to theon Rottnest Island,.
Klein, D.R. and Olson, S.T., 1960. Natural mortality patternsof deer in southeast Alaska . J. Wí'LíL. Mgmt. 24, 80-88.
Krebs, C.J., 1966. Demographic changes in fluctuatingpopulations of Microtus caLifornicus. EcoL. Monogr. 36, 239-273-
Krebs , C.J., 1972. EcoLogy. Harper and Row, New York.
Krebs , C.J., Keller, B.L. and Tamarin, R.H., 1969. I|icrotuspopulation biology:demographic changes in fluctuatingpopulations of M. ochnogaster and M. pennsyLuanicus in southernIndiana. Ecologg 50, 577-607.
Krebs, C.J. and Myers, J.H. t 1974. Population cycles insma1l ntammals . Adu. EcoL, Res, 8, 267- 399.
Lamprey, H.F., 1964, Estimation of large mammal densities,biomass and energy exchange in the Tarangir:e Game Reserve andthe Masai Steppe in Tanganyika. East Afr'. WiLdL. J. 2, I-46.Laws, R.M. , 1952. A new'method of age determination formammals. Nature, Lond. 169, 972-973.
Les1ie, P.H., Chitty, o. and Chitty, H., 1953. The estimationof population parameters from data obtained by means of thecapture - recapture method. III. An example of the practicalapplications of the method. Biometu'íka. 40, 137-169.
Lidicker, Vl.Z.t Jr., 1962. Emigration as a possible mechanismpermitting the regulation of population densj-ty below carryingcapacity. Amer, Nat.96 ' 29-33.
Lidicker, W.2., Jr., 1978. Regulation of numbers in smallmammal populations historical reflections and a synthesis.In PopuLations of SmaLL ManxnaLs urtder NaturaL CondLtiorrc. Ed. D.P-Snyder. pp I22-1-4I. Vot. 5 Special Publ. Ser. Pymatuning Lab.Eco1., Univ. Pittsburgh.Lincoln, F.C., 1930. Calculating waterfowl abundance on thebasis of banding returns. Cir. U.S. Dept. Agz'tc. No. 118.
Lincoln, G.4., L978. Plasma testosterone profiles in malemacropodid marsupials. J, Endpcr. 77, 347-351.
Lintern, S.M. and Barker, S., L969. Renal retention of ureain the Kangaroo Tsland Wal1aby, Pz'oterrntodon eugerrLi (Desmarest) .Az,tst. J. Eæp. BioL, Med. SeL. 47, 243-250.
Lintern-Moore, S., 1973a. Incorporation of dietary nitrogeninto microbial- nitrogen in the forestomach of the KangarooIsland Wallaby. Pz,otenmod.on eugeníi (Desmarest) . Conp, Bíochem.Physiol; 44, 75-82.

I85
Lintern-Moore, S., 19'73b. Utilization of d'ietary urea bythe Kangaroo Island Vüa11aby Pz,otenmodpn eugeníi (Desmarest) .Contp. Biochem. Phgsíol. 46, 345-351.
Lockard, G.R. , \972, Further studies of dental annuli foraging White-tailed. Deer. /. WiLdL. tu|gmt. 36, 46-55.
Lor^¡, W.A. and Cowan, I.McT., 1963. Age determination of deerby annular structure of dental cementum. ./. W¿LíL. It4gmt.27,466- 47r.
Macfarlane, W.V. and Howard, 8., 1972. Comparative water andenergy economy of wi-ld and domestic mammals. SAmp. boL- Soc.Lond. 3 , 261-296.
I"lacfarlane, Vü.V. , Morris, R. J. H. , Howard, B. and Budtz-Olsen,O,8., 1959. Extra-ce1lular fluid distribution in tropicalMerj-no sheep. Aust. J. Agric. Res. 10, 269-286.
Marlow, 8.J., 1958. A survey of the Marsupials of New SouthWales . C.S.f ,R.0. WiLdL. Res . 3, 7l-I1-4 .
Maynes, G.M. | 1972. Age estimation in theMacz,optts panna. Waterhouse. Aust. J, ZooL. 20 'Maynes, G.M., L974. Occurrence and fieldMaæopus pannd. Aust. ZooL, 18 (2) | 72-87.
Parma Wallaby,t07- 118.
recognition of
IvÍaynes, G.M. , 1977. Distribution andof the Parma Vüa11ùy, l4acropus panna.tAust. J. I^liLdL. Res . 4 , 10 9 - L25 .
aspects of the biologYin New South Wa1es.
McEwan, 8.H., 1963. Seasonal annuliteeth of barren ground caribou. Cút,
in the cementum of theJ. ZooL. 4I, 111-113.
McIntosh, D.L., L966. The digestibility of two roughaqes andthe rates of passage of their residues by the red kangaroo,MegaLeia rufa (Desmarest) , and the merino sheep. C.5.I.R.0.W¿LúL. Res. 11, 125-135.
Means, A,R. and Huckins, C., 1974. Coupled events in theearly biochemical actions of FSH on the Sertoli celIs of thetestis. În Hormone BindLng and ?arget CeLL Actiuation in the Testis.Eds. M.L. Dufau and A.R. Means, PP 145-165. Plenum Press,New York.
Means, A.R. and vaitukaitis, J. \972. Peptid.e hormone"receptors":Specific binding of rH-rSH to testis. Endoct'.90, 39-46.
Mitchell, F.J, and Behrndt, A.c. I 1949. Fauna and flora ofthe Greenly Tslands, Part 1, introductory narrative andvertebrate fauna. Rec, S, Aust. Mtts. 9, 167-179.
Morris, R,J.H., Howard, B. and Macfarlane, W-V., 1962-Interaction of nutrition and temperature with water metabolismof Merino wethers shorn in winter. Aust. J- AgTic- Res. 13,320-334.

Murphy, C.R. , L970. Haematological studies onIs1and WaIlaby , Protenmodon eugerñi (oesmarest) .University of Adelaide.
186
the KangarooM.Sc. thesis,
Murphy, C.R. and Smith, J.R,,young and juvenile KangarooS. Aust. 94, 15-20.
Nicholson, A. J. ,populatÍons. Aust.
Age determination ofWalla-bies . TYøts. Roy.
1970.Is1and
pouchSoc.
Myers, K. and Poole, W.8., 1963. A study of the biology ofthe wild rabbit in confined populatíons. V' Populationdynamics. C.5.I.R.0. W¿LíL. Res.8n 166-203.
Nasser, S.S. and Platt, 8.S., 1968. Development of anaemiain prote j-n-calorie defic j-ency. Pt'oc. Nutr', Soc. 2'1 , 564.
Newsome, 4.E., L964a. Anoestrus in the red kangaroo, MegaLeíarafa (Desmarest) , Aust. J. ZooL. ]-2, 9-I7.Newsome, A.E., I964b, Oestrus in lactating red kangaroosMegaLeia rufa (Desmarest) in central Australia. Aust. J. ZooL.12,315-32r.
Newsoroe, 4.8., 1965b. The distribution of red kangaroos,MegaLeía rufa (Desmarest) about sources of persistent food andwater in central Australia. Aust. J. boL, l-.3, 289-299.
Newsome, A.8., 1965c. Reproduction in natural populations ofthe red kangaroo , MegaLeia z'ufa (Desmarest) , j-n centralAustralia. Aust. J. ZooL. 13' 735-759.
Newsome, .A.8., 1966. The influence of food on breeding inthe red kangaroo in central Australia. C.5.I.R.0. WiLdL. Res.11, 187-196.
Newsome, 4.E., 1977. Imbalance in the sex-ratio and age-structure of the red kangaroo in central- Australia. InThe BioLoW of Maz'stqiaLs. Eds. B. Stonehouse and D. Gilmore.pp 22L-233. Macmi1.Ian, London.
Newsome, 4.E., Merchant, J.C., Bolton, B.L. and Dudzinskj-,l{.L. , 1977. Sexual dímorphism in molar progLession anderuption in the Agile Wallaby. Aust. l^/¿LdL. Res. 4, 1-5.
Newsome, 4.E., 1965a. The abundance of redzwfa (Desmarest) , in central Australia. Aust.287 .
Newsome, A.E. , Stephens, D.R. and Shipway I A.K. ,Effect of a long drought on the abundance of redcentral Austral-ia. C.5.f.R.0, WiLdL. Res. 12, 1-8.
Nicho11s, D.G. , J97I. Daily and seasonal movementsquokka, Setoniæ brachyurws (Marsupialia), oD RottnestArct. J. ZooL. 1-9, 215-226.
kangaroos, MegaLeiaJ. Zool. 13, 269-
1967 .kangaroos in
Nichol-son, A.J. , J-933. The balance of animal populations.J. Awim. EcoL. 2, I32-I78.
of theIs 1and.
L954. An outline of the dynamics of animalJ. ZaoL. 2, 9-65.

Nicholson, A.J. and BaileY, V.4.,populations. Part I. Pvoe. ZooL. Soe
r87
1935. The balance of animal. Lond. Pt.3, 551-598.
Nixon, C.M., McClain, M.W. and Donohoe, R.W. , 1975. Effectsof hunting and mast crops on. a squirrel population. J. WiLdL.Mgnt. 39 , f.=25.
Orians, G.H. and Leslie, P.H. ' 1958. A capture - recaptureanalysis of a shearwater population. J, AnLm. EcoL,27, 71-86.
Packer, W.C. , 1965. Environmental j-nfluences on daily and.seasonal activity ín Setoniæbrachyutus (Quoy and Gaimard)(Marsupialia) . AnLm. Behats. 13 ' 270-283.
Parnel1, I.W., 1963. Helminthosis in sheep in WesternAustralia. Aust, Vet. J. 39, 220-226.
Pekelharing, C.J., 1970. Cementum deposition as an ageindicator in the Brush-tailed Possum, TrLchosutus uuLpecuLa Kerr(Marsupialia) . Aust. J. ZooL. 18, 7I-76.
Phillipson, J., I975. Rainfal-l, prj-mary production and'carrying capacity' of Tsavo National Park (East), Kenya.E; Aft,. l,lildL. J, l.3t 77I-?0I,Reissig, J.L., StomingêT, J.L' and Leloir, L.F., 1955. Amodified colorimetric method for the estimation ofN-acetylamino sugars . J, BioL. Chem. 2I7, 959-966.
Renfree, M.B. and Tyndale-Biscoe, C.H., I973. Intra-uterinedevelopment af ter diapause in the marsupial Maez'opus eugenii.DeÐ, BioL. 32, 28-40.
Ricker, Vil.E. , 1958. Hand book of computations for biologicalstatistics of fish populations. Fish. Res. Bd. Canadn BuLL.No.. '119, 1-300 .
Ride, W.D.L. I 1957. Pnoternnodon parma (Waterhouse) and theclassification of related wal-labies (Pz,otenrnodon, ThyLogaLe, andSetovn d . Pzpc. ZooL. Soc. Lond. I28, 327-346 .
Ride, w.D.L. I 1970. A gaLde to the natiue mamnaLs of AustraLia.Oxford University Press, Melbourne.
Robinette, W.L., Jones, D.4., Rogers, G. and Gashwiler, J-S.,1957. Nobes on tooth development and wear for Rocky Mountainmule äeer. J. WiLdL. Mgmt.2I, 134-153.
Rodger, J,C. and Hughes, R.L., I973. Studies of the accessoryglands of male marsupials. Aust. J. ZooL.2L, 303-320.
Rodger, J.C. and Vlhite, I.G., L974. Carbohydrates of thepro3tate of two Austral-i-an marsupials, Trichosuru,s uuLpecula and"MegaLeia rufa. J. Reprod. F'ez't. 39, 267-275.
Rosen, M.N. and Bischoff , A.I., 1952. The relaLion ofhaematology to condition in California deer. Trarrc. N. Am.hliLdl, Conf . 17, 482-496.

188
Sadteir, R.M.F.S., 1963. Age estimation by measurement ofjoeys of the euro Maeropus robustus Gould in Western Australia.Aust. J. ZooL. 11, 24I"249.
Sadleir, R.M.F.S., l-965. Reproduction in two species ofkangaroo Macropus robustus anð, MegaLeia z'ufa in the arid Pilbararegion of üIestern AustraLia. Ptoc. ZooL. Soc, Loytã.. I15, 239-26I.
Sadlej-r, R.M.F.S. , l-969. The ecoLog7 of reptodt',tction in uild anddomestie mawraLs . Methuen, London.
Scheffer, V.8., 1950. Growth layers on the teeth of Pinnipediaas an indication of age. Science. 1J-2t 309-311.
Scrimshaw, N.S., Taylor, C.E. and Gordon, J -E-, 1968. fnter-q.ctions of nutrition and infection W.H.O. No. 57, Geneva.
Seber, G.A.F., 1965. A note on the multiple-recapture census.BionetrLka. 52, 249-259 .
Seber, G.A.F. , 1973. Íhe estimation of animaL abundance and reLatedparametez,s. Charl es Grif f in , London .
Sergeant, D. E. and Piml-ott, D. H. , 1959. Age determination inmoose from sectioned incisor teeth. J. WiLdL. Mgmt.23' 315-32l-.
Setche]l, P.J., I974. The development of thermoregulationand thyroid function in the marsupial Macropus eugertii(Desmarest) . Conrp. Biochem. PhysioL. 47, 1115-1121.
Severinghaus, C.W. I J-949. Tooth development and wear ascriteria of age in white-tailed deer. J. l^liLdL. Mgmt. L3,195-2L6.
Sharman, G.8., Frith, H.J. and Calaby, J.H., 1964. Growththe pouch young, tooth eruption and age dete::mination inred kangaroo , MegaLeia rufa. C.5.I.R.0. WiLdL. Res, 9, 20-49.
Shield, J.Iü., 1959. Rottnest field studies concerned withthe Quokka. J. Roy. Soc. West. Aust. 42, 76'78.
ofthe
Shietd, J,!V. ,brachyuz,tn, ín
1968. Reproduction of the quokkacaptivi ly . J. ZooL., Lond. fl9 , 4
Shield , J,, I97I. A seasonal change in blood ceIl volume ofthe Rottnest Island Quokka, Setoniæ bz'acLryut'us. J. ZooL., Lond.165, 343-354.
Shield, J.W. and Woolley, P.,1961. Age estimation by measure-ment of pouch young of the quokka (Setoniæ brac\ryum,ts). Aust. J.ZpoL, 9, 14-23.
Sinclair, A.R.E., I974. The natural regulation of buffalopopulations in East Africa IV. The food supply as a requlatingfactor, and competition. E. Afr'. W¿LíL. J. L2, 29I-3l-I.
Seto44.427-
7TLû
Smal-es , L. R.the KangarooSeasonal and
02, 9-L6.
and Mawson, P.M. , 1978. Nematode parasites ofIsIand WaÌlaby , Macropus eugenii (Desmarest) - ,1.geographical distribution. Tnqns. RoA, Soc. S. Atnt.

189
SÍLith, H.S., 1935. The role of biotic factors in thedetermination of population densities, J. Econ. Ent. 28, 873-898.
1966. Ecologieal Methods. Methuen and Co.,Soutlrwood, T.R.ELtd., London.
Stoddart, E. and Myers, K. I L966. the effect of differentfoods on confined populations of wild rabbits, Orgcblaguscwn)cuLus (L. ) . C.5.r,R,0. l,liLdL. Res. 11, 111-I24-
Storr, G.M. , 1964. Studies on marsupial nutrition IV-of the quokka, Setoniæ bz'acLrywus (Quoy and. Gaimard), onRottnest Island, Western Australia. Aust. J. BioL. Sci,- 48l-.
Diet17, 469
Taber, R.D. and Dasmann, R.F., 1954. A sex difference inmortality ín young Colr:mbian Black-tailed deer. ./. WiLdL. Xlgmt.18, 309-315.
Talbot, L.M. and Stewart, P.R.M. , l.964. First wildlife censusof the entire Serengeti-Mara region, East Africa. ./. l^liLdL.Mgmt. 28, 815-827.
Thomas , O., 1888. Catalogue of the MarsupiaLia and Monott'emata in thecoLLectLon of the Bri,tísh Musuem (NatwaL History). British Museum(Nat, Hist.), London.
Tyndale-Biscoe, C.H. and Hawkins, J., J-977. The corpora luteaof marsupials:Aspects of function and control. In Reproductionand EuoLution. Proc. 4th Symposium Comp. Biol-. Reprod., Ed.J.H. Calaby and C.H. Tyndale-Biscoe, PP 245-252. AustralianAcademy of Science. .,Tyndale-Biscoe, C.H. , Hearn, J.P. and Renfree, M.8., 1974.Control of reproduction in Macropodid marsupials. J. Endacr.63, 589-614.
Vaughan, B.E. and Boling, 8.4., 1961. Rapid assay proceduresfor tri-tium-labelled water in body fluids. ./. Lqb. CLin. Med.57 , 159-164.
Waring, H. , 1956. Marsupial studies in Western Australía-Aust. J. Set'. 19r 66-73.
Washburn, S.L. I 1946. The sequence of epiphyseal fusion inthe opossum. Arr¿t, Rec.95, 353-363.
Watson, A. and Moss, R,, 1970. Dominance, spacing behaviou¡cand aggression j-n relation to population l-imitation invertel¡rates. In AnimaL PopuLal;ions ín ReLation to theír FoodResouz,ces, Symp. Brit. Ecol. Soc. 10 , 167-220 .
Vfilson, G.R., L975, Age structures of populaLions of Kanagroos(Macropodidae) taken by professional shooters in New SouthWales. Aust. WiLdL, Res, 2, L-9.Wood Jones, 8., 1924. Ihe MamnaLs of South AustraLia. Pt. il- IheBanùLcool;s and the Herbiuorouß \ulatsupíaLs. Govt. Pri-nter, Adelai-de.

190
WooIIey , P. , 1966. Reproduction in Anteehint*s spp. and otherdasyurid marsupials. In Cornpanatiue BioLogA of ReprodueÞion inMamnnLs. Ed. I.w. Rowlands. SAnp, ZpoL. Soc. Lond.'15, 28L-294.
Wynne-Edwards, V.C. , 1962. ArcinaL Dispersion in ReLatíon to SoeiaLBehatiow. Oliver and Boyd, Edínburqh.