
Eco-Ist'12 - Društvo mladih istraživača Bor
667
-
Upload
khangminh22 -
Category
Documents
-
view
0 -
download
0
Transcript of Eco-Ist'12 - Društvo mladih istraživača Bor


Eco-Ist’12, Ecological Truth, 30 May - 2 June 2012. Hotel “Srbija TIS”, Zajecar, Serbia
3
between the group means should be lower than the variance of the samples, following
central limit theorem. A higher ratio therefore implies that the samples were drawn from
different populations [10].
In order to perform one-way ANOVA, there are three basic assumptions to be
fulfilled: each sample is randomly selected and independent, each population from which
a sample is taken is assumed to be normal, and the populations are assumed to have
equal standard deviations (or variances). Independence of cases is a requirement of the
design. Kolmogorov-Smirnov and Shapiro-Wilk tests can be use to test normality and
Levene's test can be used for homogeneity of variances.
Post hoc tests in one-way ANOVA are designed for situations in which the
researcher has already obtained a significant omnibus F-test with a factor that consists of
three or more means and additional exploration of the differences among means is
needed to provide specific information on which means are significantly different from
each other.
Consider comparing 3 groups and testing 3 true null hypothesis. In using p=0.05
for each test, the probability of making a correct retention is 0.95. The probability of
making three consecutive correct retentions is 0.95×0.95×0.95=0.86. Therefore, the
probability of making at least one incorrect decision is 1-0.86=0.14. This is the family-
wise type I error rate and it increases as the number of post hoc comparisons increases.
The level of significance for a family of tests thus far exceeds that of each individual
test. Many tests are developed to keep the family-wise error rates in check, such as:
Least square difference (LSD), Duncan, Dunnett, Tukey’s honest square difference
(HSD), Bonferroni, Scheffe and others. For post-hoc tests, the validity of the results is
questionable if the population variances differ regardless of whether the sample sizes are
equal or unequal. It is recommended to choose Dunnett’s C procedure in instances where
the variances are unequal, and Tukey-Kramer modification of Tukey test in cases where
the sample sizes are unequal.
OBJECTIVE
The aim of this paper is to investigate relations between the amount of
precipitation and daily hospital admissions for cardiovascular diseases in the urban area
of the City of Niš during the 2001 to 2010 period using both, the regression and one-way
ANOVA statistical methods.
MATERIALS AND METHODS
The data on daily hospital admissions in the urban area of the City of Niš during
the 2001 to 2010 period are taken from Public health institute of Niš Informatics and
medicine biostatistics centre electronic database. Daily values for amount and
precipitation types are taken from the Republic hydrometeorological institute.
The influence of precipitation on hospital admissions for cardiovascular
diseases is tested up to single lag day 6. Polynomial exposure-response curves were
estimated to visually assess the shape of the relations between counts of daily hospital

Eco-Ist’12, Ecological Truth, 30 May - 2 June 2012. Hotel “Srbija TIS”, Zajecar, Serbia
4
admissions and amount of rainfall and snowfall. AIC was used for curve fitting and up to
6th polynomial degrees were tested.
To compare numbers of hospital admissions for cardiovascular diseases
between the days with different precipitation levels, one-way ANOVA with Tukey-
Kramer post hoc test was used. Analyses were performed using R: A language and
environment for statistical computing, version 2.12.0 (R Foundation for Statistical
Computing, Vienna, Austria).
RESULTS
According to the 2002 census, there were 250000 residents in the City of Niš,
171000 of them within the 32 km2 urban area.
There were 48507 patients hospitalized for cardiovascular disease during the
2001 to 2010 period with daily average of 13.287.81 hospitalized persons (table 1).
There were 1199 (32,8%) days with rain and 364 (10,0%) with snow. Average daily
amount of rain was 1.654.47 mm and 0.783.00 cm for snow.
Table 1. Number of cardiovascular disease related hospital admissions and amount of
precipitation during the 2001 to 2010 period
Statistical parameter Hospital
admissions
Rainfall
(mm)
Snowfall
(cm)
Average 13.28 1.65 0.78
Standard deviation 7.81 4.47 3.00
Minimum / / /
Maximum 52 52.60 32.00
Quartiles I 7 / /
Median 12 / /
III 18 0.20 /
The shape of the relations between daily hospital admissions for cardiovascular
diseases and both rainfall and snowfall appears graphically as a 'S' shape (fig. 1). The
lowest AIC values suggest that both rainfall and snowfall two days before hospital
admissions (Lag 2) have the strongest relationship with hospital admissions for
cardiovascular diseases, and those relationships are best approximated with polynomial
curves of the fourth degree. The number of hospital admissions was the largest in days
without rain and in days with the amount of rainfall between 30 and 35 mm. On the
contrary, the number of hospital admissions was the smallest in days without snowfall.

Eco-Ist’12, Ecological Truth, 30 May - 2 June 2012. Hotel “Srbija TIS”, Zajecar, Serbia
5
`
Figure 1. Shape of the relations between number of daily hospital admissions for
cardiovascular diseases and amount of rainfall and snowfall
The number of admissions for hospital care was the largest when there was no
rainfall one, two and five days before, and when the amount of rainfall was over 15 mm
on the day of admission and 3 and 4 days before (table 2).
All differences in the number of hospital admissions caused by cardiovascular
diseases in relation to rainfall amount were not statistically significant.
Table 2. Comparison of hospital admissions in relation to rainfall amount
Lag period
(days)
Number of hospital admissions (Mean±SD)
in relation to rainfall amount
ANOVA I
0 mm
(n=2453)
II
0.1 to 5 mm
(n=814)
III
5.1 to 15 mm
(n=279)
IV
15.1 to 53 mm
(n=106)
0 12.45±6.27 12.47±6.20 12.42±6.23 12.80±6.72 F=0.05; p=0.99
1 12.59±6.26 12.31±6.42 11.65±5.70 12.09±6.48 F=0.98; p=0.40
2 12.72±6.38 12.10±6.04 11.28±5.27 11.04±6.42 F=1.35; p=0.25
3 12.47±6.23 12.44±6.43 12.29±5.71 12.74±7.27 F=0.06; p=0.98
4 12.45±6.17 12.25±6.38 12.38±6.28 13.82±7.11 F=0.61; p=0.60
5 12.62±6.33 12.29±5.93 11.72±6.65 11.15±5.55 F=1.61; p=0.18
6 12.52±6.33 12.63±6.17 11.30±5.76 12.57±5.94 F=1.53; p=0.21
The number of cardiovascular disease related hospital admissions was the
greatest when the amount of snowfall was over 10 cm on the day of admission to
hospital care, and also on the 4 preceding days (table 3). Hospital admissions were
statistically significantly more frequent when the amount of precipitation two days
before them (Lag 2) was greater than 10 cm, than when there was no snowfall (p=0.02)
or when the amount of precipitation was up to 5 cm (p=0.04). Although F-test indicated
possible significant differences in hospital admissions in relation to snowfall amount one
day before admission to hospital care (Lag 1), Tukey-Kramer test did not confirm
significant differences in relation to days with different amounts of precipitation.
Observably, the frequency of hospital admissions is abruptly dropping when the
amount of snowfall 5 and 6 days before admission to hospital care surpasses 10 cm.

Eco-Ist’12, Ecological Truth, 30 May - 2 June 2012. Hotel “Srbija TIS”, Zajecar, Serbia
6
Table 3. Comparison of hospital admissions in relation to snowfall amount
Lag period
(days)
Number of hospital admissions (Mean±SD)
in relation to snowfall amount ANOVA and
Tukey-Kramer
post hoc test I
0 cm
(n=3288)
II
0.1 to 5 cm
(n=276)
III
5.1 to 10 cm
(n=51)
IV
10.1 to 38 cm
(n=37)
0 12.37±6.26 13.26±5.97 12.32±7.60 14.45±5.90 F=1.60; p=0.19
1 12.34±6.25 13.19±5.98 13.21±7.34 15.60±6.79 F=2.68; p=0.04
Post hoc test: n.s.*
2 12.38±6.26 12.56±5.84 13.93±7.23 16.50±6.68
F=3.41; p=0.02
Post hoc test:
I vs. IV: p=0.02
II vs. IV: p=0.04
3 12.39±6.25 12.68±6.39 13.75±5.86 14.80±6.14 F=1.46; p=0.22
4 12.44±6.29 12.33±5.74 13.39±6.30 14.35±7.36 F=0.84; p=0.47
5 12.40±6.21 12.76±6.84 14.00±6.72 11.85±4.68 F=1.77; p=0.15
6 12.42±6.21 12.92±6.93 12.82±5.13 11.90±6.27 F=0.39; p=0.76 NOTE: n.s. - non significant.
DISCUSSION AND CONCLUSION
A semi-parametric Poisson regression is a widely used approach to assess the
relations between daily adverse health events and weather variables, but it is often
difficult to interpret the results in cases where independent variables of interest are not
fitted by straight lines. Such is the case with investigations focused on relation between
amount of precipitation and daily hospital admissions.
In the first step, the model extending Poisson regression to estimate the
appropriate lag periods with the strongest relationship between hospital admissions for
cardiovascular diseases and amount of precipitation was applied. The model fitting was
based on AIC. To construct the models, the appropriate lag period for rainfall and
snowfall that gave the smallest AIC value were used. Individual lags from day 0 to day 6
were all examined. In the same way the degrees for polynomial functions of precipitation
influence approximation were selected.
In the second step graphical analysis based on regression results was used to
visually assess the shape of the relations, and to estimate the appropriate cut-off points of
rainfall and snowfall. Subsequently, one-way ANOVA was performed to compare
hospital admission counts between days with different precipitation values. Kolmogorov-
Smirnov test and Levene's test were used to test normality and homogeneity of
variances. The number of days in four compared groups was unequal, so Tukey-Kramer
modification of Tukey post hoc test was performed.
Study results show that there were variations in the number of cardiovascular
disease related hospital admissions in relation to the amount of rainfall, but they were not
statistically important.
Hospital admissions were the most frequent when the amount of snowfall in the
period up to 4 days before admission to hospital care was greater than 10 cm.
Statistically significant differences were confirmed for Lag 2 in relation to the days with

Eco-Ist’12, Ecological Truth, 30 May - 2 June 2012. Hotel “Srbija TIS”, Zajecar, Serbia
7
no snowfall and to the days when the amount of snowfall was up to 5 cm. This confirms
the thesis that snow has physiological influence on cardiovascular diseases, probably
because it causes increased physical effort. However, the abrupt drop in the number of
hospital admissions 5 and 6 days after snowfall has stopped indicates a possibility of
existing ‘harvesting effect’. The term means a short-term forward admissions
displacement with compensatory decrease in the number of hospital admissions during
the subsequent days after a snowfall [11].
This research shows that precipitation, especially snowfall, can have an acute
influence on people’s health. To further inspect the effect, additional analysis of
numerous confound factors is necessary, for example air pollutant concentrations, other
meteorological factors and cyclic morbidity oscillations caused mostly by infectious
disease epidemics.
Finally, it should be noted that while the paper is specifically devoted to
precipitation-hospital admissions relationship, using both the regression and one-way
ANOVA could be a useful statistical method to assess the relations between other daily
adverse health events and weather variables in cases when independent variables of
interests in regression models are not fitted by straight lines.
Acknowledgements
Presented results are the part of the project 44007 financed by Ministry of
Science and Technological Development, Republic of Serbia.
REFERENCES
1. McMichael AJ. Global environmental change and human population health: a
conceptual and scientific challenge for epidemiology. Int J Epidemiol. 1993;
22:1-8.
2. Michelozzi P, Kirchmayer U, Katsouyanni K, Biggeri A, McGregor G, Menne
B, Kassomenos P, Anderson HR, Baccini M, Accetta G, Analytis A and
Kosatsky T. Assessment and prevention of acute health effects of weather
conditions in Europe, the PHEWE project: background, objectives, design.
Environmental Health. 2007; 6:12.
3. Kovats RS, Hajat S, Wilkinson P. Contrasting patterns of mortality and hospital
admissions during hot weather and heat waves in Greater London, UK. Occup
Environ Med. 2004; 61:893-8.
4. Schwartz J, Samet JM, Patz JA. Hospital admissions for heart disease: the
effects of temperature and humidity. Epidemiology. 2004; 15:755-61.
5. Faiche G, Rose R. Blizzard Morbidity and Mortality: Rhode Island. Am J Pub
Health. 1999; 69:1050-2.
6. Kalkstein LS, Valimont KM. An evaluation of summer discomfort in the United
States using a relative climatological index. Bull Am Meteor Soc. 1986; 7:842-
8.

Eco-Ist’12, Ecological Truth, 30 May - 2 June 2012. Hotel “Srbija TIS”, Zajecar, Serbia
8
7. Dominici F, McDermott A, Zeger SL, Samet JM. On the Use of Generalized
Additive Models in Time-Series Studies of Air Pollution. Am J Epidemiol.
2002; 156:193-203.
8. Pattenden S, Nikiforov B, Armstrong BG. Mortality and temperature in Sofia
and London. J Epidemiol Community Health. 2003; 57:628–33.
9. Kendrovski T. The impact of ambient temperature on mortality among the
urban population in Skopje, Macedonia during the period 1996–2000. BMC
Public Health. 2006; 6:44.
10. Cochran WG, Cox GM. Experimental Designs. John Wiley & Sons, London
1957.
11. Schwartz J. Is there harvesting in the association of airborne particles with daily
deaths and hospital admissions? Epidemiology. 2001; 12:55-61.

9
XX International Scientific and Professional Meeting
"ECOLOGICAL TRUTH" ECO-IST'12
30 May - 2 June 2012, Hotel “Srbija TIS“, Zajecar, SERBIA
ECOLOGY AND SUSTAINABILITY IN 21st CENTURY:
MYTHS AND REALITY
Florian Kongoli1*
, E. Z. O’Brien2, S. Llubani
1, I. McBow
2
1Flogen Technologies Inc. Montreal, Qc, CANADA
2 Flogen Technologies Inc., Wilmington, DE, 19808, USA
ABSTRACT
Ecology and sustainability are two terms that have recently become very popular in any field of life.
Both terms are now used intermittently and sometimes they are starting to substitute each other. Although generally there should be no problem when two different terms are used to describe the same subject a problem
arises however when different subjects that the two terms refer to get confused and loose individual meaning.
In fact ecology and sustainability are two different concepts with distinguished meanings. Ecology is the relations that living organisms have with respect to each other and their natural environment while
sustainability is a way of development that meets the needs of the present without compromising the ability of
future generations to meet their own needs. In other words ecology is mainly the protection of environment
while sustainability has three important dimensions: environmental, economic and social. In order to achieve
a sustainable future an optimum golden cut needs to be found between ecology and the three aspects of
sustainability. This is because ecology and sustainability today have started to be a prerequisite for any development in any field of sciences from economy, environment, engineering, natural, social, political, health,
legal, cultural, etc. However, because of different and extremely wide and sometimes abusive definitions of
ecology and sustainability many solutions offered as sustainable are in fact unsustainable. One of the reasons for that is because they deal with a narrow field of a particular science, do not make the relationship with other
sciences and do not properly define their applicability within the big picture. There might be very good ideas,
projects and achievements in any particular field of sciences. However in order to make them sustainable they have to be applicable in practice and in long term. Hence a close link and better coordination is needed between
all fields of sciences and engineering because the latter is able to apply in practice the achievement of sciences
such as natural, environment, agricultural, medicine, health etc. but also to push new development in sciences such as economical, legal, social and political ones, by giving them new grounds and new horizons. The
purpose of this plenary paper is to make the case of this necessary link between various sciences and
engineering and to stress the prime role of the new technologies in sustainable developments.
Key words: ecology, sustainability, environment, economy, society, definitions, abuses, sciences,
engineering, technologies, coordination

10
XX International Scientific and Professional Meeting
"ECOLOGICAL TRUTH" ECO-IST'12
30 May - 2 June 2012, Hotel “Srbija TIS“, Zajecar, SERBIA
HYDROGRAPHY OF NATIONAL PARK DURMITOR
Stevan M. Stankovic
University of Belgrade, Geographic faculty, SERBIA
ABSTRACT
Protection of the hydrography bodies of the National park Durmitor (Montenegro) is a complex and
responsible task, particularly because the lakes are situated within a national park which is a part of the world heritage of natural beauties. As lakes are evolutive water bodies they have to be studied in detail if preservation
and evaluation actions are to meet the purpose. Problems are numerous and varying: the majority of the lakes
are small and some of them are difficult to reach, some lie on limestone bedrock, some are attached by hydrophilic vegetation, information on water balance and heat regime is lacking.
Key words: Durmitor, national park, hydrography bodies, protection, evaluation
INTRODUCTION
The fundamentals for exploring the lakes on Mount Durmitor were set by
geographer Jovan Cvijić (1865-1927) in 1899. His studying of the traces of Pleistocene
glaciers enriched the world scientific throught by new data on glaciology and limnology.
His papers that were published in the editions of the Serbian Academy of Sciences and
exchanged with many institutions in the world, attracted the attention of numerous
foreign explorers. This is why the list of scientists who studied Mount Durmitor contains
a large number of foreigners [1].
Among the mountain in Montenegro Durmitor is distinguished by a number of
natural features. That is why it has been attracting the attention of nature lovers,
mountaineers, and scientists of different specializations. Vast expanses on Mount
Durmitor were proclaimed a national park after a decision of Assembly of the People's
Republic of Montenegro in 1952. Some time later (1962) the teritory of Durmitor
National Park came under the jurisdiction of the Forest Administration of Ţabljak.
In 1978, Durmitor National Park acquired its present appearance, area and
boundaries by the Act on National Parks in Montenegro. The Community of Durmitor
National Park was instituted and seated in Ţabljak, its responsibility being to protect this
unique mountain in their care. Durmitor national Park covers an area of 39,000 hectars
and extends over the territories of five municipalities: Ţabljak, Pljevlja, Pluţine, Šavnik
and Mojkovac. The largest areas in the National Park are the canyon of the Tara River
(15,804 ha) and the central part of Mount Durmitor (8,710 ha).

Eco-Ist’12, Ecological Truth, 30 May - 2 June 2012. Hotel “Srbija TIS”, Zajecar, Serbia
11
By its organization the Park resembles the natural preserves in America. This
means that it is open to tourists all yaer round. The development of tourism is not
detrimental to the main task of the national park, which is to preserve and promote
natural and anthropogenic values. Some localities have the characteristics of strictly
controlled preserves where no works that may change the landscape and disturb the
environmental balance are allowed. This must be observed because the Tara River, as an
integral component of Durmitor National Park was classified as an ecological preserve of
our planet biosphere by the 1977 UNESCO Man and Biosphere programme. Also, at the
session of the International Committee for World Cultural and Natural Heritage, held in
Paris, 1980, Durmitor National Park was placed on the list of world cultural and natural
heritage under the auspices of the United Nations. Among numerous tributes we proudly
mention the award for preserving the Tara River environment that was presented to
Durmitor National Park by the International Association of Tourist and travel Agencies
on the 27 th Congress in Lisbon in 1987.
With regard to morphology, Mount Durmitor consists of three wholes, each of
them with its own hydrographic phenomena, processes and bodies. The central part is
mountain massif that rises to an altitude of 2,523 m. As such, it receives maximun
rainfall, but due to its limestone structure and specific morphology of the terrain there
are no major water bodies except for several small glacial lakes, swamps, and springs of
small discharge.The eastern section of Mount Durmitor is represented by Jezerska
Plateau at an altitude of 1,400 – 1,500 m. Besides lakes, it is also known for a number of
swamps and periodical water sourses mostly disappearing in sinkhols and ponors. The
waterless Pivska Plateau extends in the west [2].
National Park Durmitor and Mount Durmitor and the town of Ţabljak as a
unique hub of Montenegro, the first ecological state in the world, must also base their
identity on the lakes in which they see their reflections multiplied as in crystal mirrors.
The more thoroughly we learn about the lakes and evaluate them in a proper way, the
more dazzling they appear to be. Endeavours to preserve the authenticity of the
landscape and high quality of lake waters must be based on detailed investigations of all
the lakes together and each one in turn. It appears that a modern department for
observations in hydrology, meteorology, and ecology should be soon set up in order to
monitor closely the pulsations of the lakes and nature on National Park Durmitor, as this
is an area of complex correlations, direct and reciprocal. The lakes are not all that
numerous. They will not be there for ever. They are evolutionary water bodies of low
self purification potential.
HYDROGRAPHY OF MOUNT DURMITOR
Hydrogrphic bodies on National Park Durmitor are numerous and (Peac
Bobotov kuk altitude 2,523 m) diverse. On Mount Durmitor and in its vicinity there are:
Permanent river courses (Piva, Tara, Bistrica, Komarnica, Mlinski potok); Periodical
river courses (Sušica, Ţabljačka River, Motički potok, Veliki potok, Bijeli potok, Suvi
potok, Smrdaljica, Virski potok, Suvi do, Strijeţevica); Surface river courses (Piva, Tara,
Bistrica, Komarnica, Draga); Subterranean water courses (Ţabljačka River from the
ponor to Bijeli bukovi, a stream to Malo Crno jezero to Dubrovska vrela, stream from

Eco-Ist’12, Ecological Truth, 30 May - 2 June 2012. Hotel “Srbija TIS”, Zajecar, Serbia
12
Škrke towards Skakala, some section of the Sušica River discharged from the Jezerska
površ to Ljutica).
Natural hydrographic bodies (Barno jezero, Zeleni vir, Ljutica, Piva, Tara, Bare
Marića, Ravnjak, Sušica, Čelina, Mlinski potok, Valovito jezero, Crno jezero,
Pošćensko jezero, Modro jezero, Riblje jezero, Škrčka jezera, Zmijinje jezero, Zminičko
jezero, Zabojsko jezero); Anthropogenic hydrographic bodies (Lake Mratinje on the Piva
River); Transit river courses (Tara, Piva, Komarnica with Pridvorica); Domicile
hydrographic bodies (Crno jezero, Vraţje jezero, Pošćensko jezero, Riblje jezero, Modro
jezero, Škrčka jezera, Ţabljačka rijeka, Toplik, Čelina, Ljutica, Barno jezero, Jablan
bara, Ševarita lokva, Skakala, Mlinski potok, Zeleni vir, Bukovica, Ţugića bare, Ljutica);
Pre-Pleistocene hydrographic bodies (Piva, Tara, Komarnica, Bukovica, Bistrica,
Draga); Post-Pleistocene hydrographic bodies (Crno jezerо, Zmijinje jezerо, Vraţje
jezerо, Riblje jezero, Pošćensko jezero, Malo jezero, Modro jezero, Škrčka jezera,
Skakala, Zeleni vir, Ševarita lokva); Periodical limnologic bodies (Sušičko jezero);
Standing limnologic bodies (Lakes: Riblje, Crno, Vraţje, Škrčka, Valovito, Zmijinje,
Malo, Zabojsko, Pošćensko, Modro, Zminičko, Zabojsko); Standing swamps and karst
fens (Barno, Govedje, Gostaja, Okrugljica, Zeleni vir, Lokvica, Begova bara, Crepulj
poljana, Miloševa lokva, Surutka); Periodical marshes and puddles (Bare Ţugića,
Ševarita lokva, Marića bare, Macanove bare, Boban, Bućan bare, Krstajića bara, Virske
bare); Permanent springs (Ljutica, Bukovica, Ravnjak, Bjelovac, Mušovi bukovi, Bijeli
bukovi, Sige,Turska glava, Oko, Jezerac, Sokolac, KaluĎerovača); Periodical springs
(Studenac, Pištelina, Varezina voda, Kamenica, Marića voda, Šarban, Čelina, Toplik,
Pašinac);
Eutrophic hydrographic bodies – rich in organic matter (Barno jezero, Govedja
lokva, Ševarita lokva, Pošćensko jezero); Oligotrophic hydrographic bodies – poor in
organic matter (Crno jezero, Tara, Piva, Mratinje storage reservoir- artificial lake,
Komarnica, Bistrica, (Škrčka jezera, Zeleni vir, Modro jezero); Oligosaprobic
hydrographic bodies oxygen rich pure waters (Crno jezero, Modro jezero, Piva, Tara,
Komarnica, Čelina. Ljutica, Oko); Mezzosaprobic hydrographic bodies - less
contaminated waters with reduced oxygen content (Barno jezero, Zmijinje jezero,
Pošćensko jezero, Valovito jezero, Ševarita lokva).
Polyvalent and polyphase hydrographic bodies (Tara, Piva, Komarnica, Sušica,
Ţabljačka reka, Crno jezero, Barno jezero); Monovalent and monophase hydrographic
bodies (Valovito jezero, Modro jezero, Riblje jezero, Čelina, Ljutica, Savin izvor);
Anthropogenic modified - dammed or caught hydrographic bodies (Piva, Glava
bukovice, Oko, Pašinac, Šaransko oko, Pištet); Former hydrographic bodies (Vrelo
Pive); Newly created hydrographic bodies (Mratinje, Glava Bukovice, water mains for
Ţabljak);
Among the hydrographic bodies on Mount Durmitor are the rivers of Tara and
Piva and Black Lake that are important, easy to recognize, and attractive to tourists.
They are of specific water regime and balance and rich in power potential. They should
be evaluation and protected before any other actions are undertaken [3].

Eco-Ist’12, Ecological Truth, 30 May - 2 June 2012. Hotel “Srbija TIS”, Zajecar, Serbia
13
The lakes of the National Park Durmitor Name of lake A B C D E F
Crno 1422 1150 810 516200 4395 49,1
|Zmijinje 1520 230 123 16740 560 7,7
Malo 1791 255 105 17470 730 8,5
Veliko Škrčko 1686 580 165 56800 1720 17,2
Malo Škrčko 1711 136 94 10800 440 15,2
Pošćensko 1487 215 155 15300 700 3,6
Modro 1609 230 75 7300 630 3,3
Valovito 1695 225 84 11600 710 3,5
Vraţje 1411 635 295 118310 1440 10,6
Riblje 1409 340 220 42400 840 5,5
A = altitude in m, B = length in m, C = width in m, D = area in m2 , E = length of the shore in m,
F = maximum depth in m.
PROTECTION AND EVALUATION
Most of National Park Durmitor and the area which is by geological and
morphological features similar to it are formed of Mesozoic and Tertiary limestone and
dolomite, Upper cretaceous flysh, clastic sediments of the Paleozoic and Middle triassic
ages, diabase hornstone formations, igneous rock and verfen sandstone. Rock masses
differ in water-bearing properties and correlations, so that even on a short stretch of land
one may come across extremely contrasted water bodies and peculiar hydrographic
systems on the surface and in underground sectors which, beside the lack of
superimposed orographic and hydrographic drainage basins, cause the unique bifurcation
of Crno jezero (Black Lake) waters [6].
The lakes that originated in different parts of the Mount Durmitor, with their
picturesque scenery and unique environment, represent its singular feature. The Durmitor
lakes are an element of identification for naturalist and tourists, a basis for investigations
into a series of phenomena and processes, a key to solving numerous problems in science
and practice. They were first mentioned in the descriptive, scientific and other papers on
the nature of Mount Durmitor and of Montenegro one hundred years ago. These two
have always been considered inseparable in their impressiveness, tranquility and silence
that they introduce into the space dominated by rocky cliffs, sky jutting peaks, defiles
and canyons, meadows and pastures, forest complexes and small settlements.
Seven land complexes of unique values and specific ecosystems have been
singled out in the Durmitor National Park. A special regime of protection applies to
forest of juniper and trees in the Mlinski Potok (creek) drainage basin, to black pine
forest on the Crna Poda site, to Crno jezero (Black Lake) with the surrounding forest, to
the Škrke glacier cirque with Škrčka jezera (Škrke Lakes) and a section of the Sušica
River basin, to Barno jezero (Barno Lake) and its immediate vicinity, to Zabojsko jezero
(ZabojskoLake) and vicinity, and to the canyon section of the Tara River basin.
Taken as a whole the lakes on National Parks Durmitor have been well
preserved till the present. Almost all of them have remarkably pure water and are far
from pollutants from town and village settlements and industrial facilities. However,

Eco-Ist’12, Ecological Truth, 30 May - 2 June 2012. Hotel “Srbija TIS”, Zajecar, Serbia
14
the karst processes are doing their bit. At the bottom and in the shore area of some lakes,
ponors are widening and new ones appearing. Unknown and uncontrollable quantities of
water are lost. Quantities of eroded materials drift into some of the lakes filling their
basins and decreasing space for water accumulation. Due to small depth, heat regime is
changed, hydrophilic vegetation growth is accelerated, and the fauna undergoes changes.
The overgrowth of hydrophilic plants and decreasing of the lake water volume increase
organic matter decay and carbon dioxide content, the negative indicators of water purity.
Natural processes and Man's impact upon the environment on Mount Durmitor
and its lakes lie at the root of the changes of the original properties of these water bodies
and unique ecosystems. Natural changes are partly consequences of global changes in
the climate and development of erosive and accumulative processes in the relief and, as a
rule, they are long lasting.
In contrast to these, the anthropogeneous changes and other action in nature
provoke such disturbances that cannot be fully comprehended in a short time. "The
processes prompting mountain lakes vanishing have different rates, but compared with
the anthropogeneous influences they are very slow. This gives a chance to evolutionary
biocenosis of these ecosystems to follow and adjust themselves to changes or experience
the fate of the lake and vanich themselves." [4].
The lakes on National Park Durmitor are a specific natural feature and value for
tourism trade on the mountain. As such, they require specific treatment for the sake of
their protection. Both actions must be based on detailed scientific investigations.
Investigations and implementation must be comprehensive and permanent as all the
lakes are not equally endangered, nor equally accessible and interesting for tourists. For
better knowledge of the lakes on National Park Durmitor and in order to develop tourist
trade and carry out preservation of unique ecosystems, it is necessary to conduct
systematic and detailed ichtiologic investigations regardless of the generally known fact
of poverty in fish in highland lakes. Black Lake, as mentioned before, was spawned in
1901 with brown trout (Salmo trutta) from the Bukovica River. The young of Phoximus
phoximus were brought to it in 1936 and of brook trout (Salvelinus alpinus) in 1959.
Some time later Salmo gairdneri was spawned. It was intended for sports fishing, but this
spawning action proved to be unjustified. In the eighties the lakes on Durmitor were
spawned with Salmonidae that mostly came from the Blagaj nursery [5].
Though, at first sight, the lakes on National Park Durmitor may seem small in
size, heavily accessible, of minor economic importance, and uninteresting for science
and practice, they are coming into light as significant, continuously changing
components of the highland area which they endow with a number of unique features. As
the lakes are highly interesting from the aspects of genesis, hydrography, biology and
tourism, they are frequently taken as research subjects. Particularly interesting in this
respect is Crno jezero (Black Lake) which, in the course of the last several years, have
been the subject of many research studies of hydrographic character that have proved
more useful than any of the preceding ones [7].
Complex problems of environment and the evaluation of Crno jezero (Black
Lake) should be considered in light of the positive statements that were reported at the
symposium devoted to this water body. As an attractive tourist sight Crno jezero (Black
Lake) will continue to be most frequented in summer. An organized tourist trade with

Eco-Ist’12, Ecological Truth, 30 May - 2 June 2012. Hotel “Srbija TIS”, Zajecar, Serbia
15
appropriate information services and tourist guiding predetermine the proper valuation of
the lake and near lake country. As plenty of data have been collected in the meantime,
possible approaches to further investigations and eventually practical actions are clearer.
Priority tasks are to make the water balance as uniform as possible and preserve spring
water during summer months. It will also be necessary to determine all the peculiarities
of the runoff and of the surface inflow, amount of precipitation, time and way in which
the openings at the bottom of Malo jezero (Small Lake) function, the filling of the basin
with material from Mlinski potok ( creec) drainage area, the hydrophilic vegetation, the
Čelina spring behaviour, the evaporation column, and other elements.
Only a few mountains in Montehegro and in the vat expanses of the Balkan
Peninsula attract the attention of explores the way Mount Durmitor does. Generations of
scientists have come and gone. The written material on National Park Durmitor is
growing into a library. From general to specific, from relief to vegetation, from climate
to hydrography and limnology, the pieces are fitted into a unique mosaic.
National Park Durmitor and the town of Ţabljak as a unique hub of
Montenegro, the first ecological state in the Europe and the world, must also base their
identity on the lakes in which they see their reflections multiplied as in crystal mirrors.
The more thoroughly we learn about the hydrographic bodies and evaluate them in a
proper way, the more dazzling they appear to be. The hydrographic bodies (lakes, rivers,
creeks, swamps, springs , karst fens, marshes) are not all that numerous. They will not be
there for ever. They are evolutionary water bodies of low self purification potential.
By applying the concept of active environmental protection, which means
prevention and preservation and not healing and rehabilitation of damages, satisfactory
results are possible. Some errors from the past (stocking, non-functional water intake,
uncontrolled cattle grazing, roads) should be overcome. Concrete actions and permanent
control of the activities that bear risks for the hydrographic bodies and the environment
in general can now give appropriate results. Large funds are needed for some actions and
they will have to be provided since from the viewpoint of the present and future
generations even the smallest endangering of the nature on National Park Durmitor is
inforgivable. Once impaired, the natural balance can hardly be reinstated. It is known
that only the original and well preserves environment is a true tourists and general value
for the society and that it is a national property that must be rationally managed [8].
REFERENCES
1. Cvijić J. (1899): Glacijalne i morfološke studije o planinama Bosne,
Hercegovine i Crne Gore. Glas Srpske kraljevske akademije, knj.57, Beograd.
2. Stanković M. S. (1999): Planinska jezera Crne Gore, limnološka monografija.
Srpsko geografsko društvo, drugo izdanje, Beograd.
3. Stanković M. S. (2005): The lakes on Mount Durmitor, a monograph on
limnology. Intersistem kartography, Belgrade.
4. Dţukić G. (1991): Vodozemci i gmizavci., gradja za faunu vodozemaca
i gmizavaca Durmitora. Fauna Durmitora, knj. 4, Crnogorska akademija
nauka i umjetnosti, Titograd.

Eco-Ist’12, Ecological Truth, 30 May - 2 June 2012. Hotel “Srbija TIS”, Zajecar, Serbia
16
5. Kaţić M. D.(1988): Endohelminti riba nekih durmitorskih jezera. Glasnik
Republičkog zavoda za zaštitu prirodeCrne Gore i Prirodnjačkog muzeja, knj.
21, Titograd.
6. Bešić Z. (1969): Geologija Crne Gore, knj. II, Karst Crne Gore. Zavod za
geološka istraţivanja Crne Gore, Titograd.
7. Stanković M. S. (2007): Protection of the lakes on Mount Durmitor. Bulletin of
the Serbian Geographical Society, tome LXXXVII, No. 2, Belgrade.
8. Stanković M. S. (1995): Vodoprivredni problemi Nacionalnog parka Durmitor.
Zbornik radova Geografskog fakulteta Univerziteta u Beogradu, sveska XLV,
Beograd.

17
XX International Scientific and Professional Meeting
"ECOLOGICAL TRUTH" ECO-IST'12
30 May - 2 June 2012, Hotel “Srbija TIS“, Zajecar, SERBIA
NEW SPECIES OF FLORA AND FAUNA IN SNR ZASAVICA
BETWEEN 1997.TH - OF 2011.
Mihajlo Stankovic
Special Nature Reserve Zasavica, SERBIA
ABSTRACT
From a total of 34 new species of seven species or 20.5% are new findings for the Balkan Peninsula,
a 27 species or 79, 4% for the new Serbia. In the Reserve algoflorae three new species of the partition
Charophytha of which two types of Serbia, a new one for the Balkans region. Other discovered species are invertebrates. Among the 25 species of invertebrates are new to Serbia and the other six species are new to the
Balkan Peninsula. Since the new invertebrate species were noted in the following groups Oligochaeta,
Ostracoda, Rotatoria, Hydroacarina, Aranida i Insecta (Coleoptera-fam. Curculionidae, Hydrophyllidae i Carabidae), Hymenoptera (fam.Fornicidae) i Lepidoptera (fam.Noctuidae)). The greatest number of species
discovered in Serbia is among the invertebrates insects from the fam. Curculionidae seven species, followed by
Rotatoria six species, Aranida five species, other groups have had one new species for Serbia.
Key words: new species, flora, fauna, reserve Zasavica
INTRODUCTION
The first data on the diversity of North Macve, and therefore the area of today's
reserve lists F.V.Taube (1777), followed Panĉić, J.(1860) and Dombrowski (1895). Then
follows a period of over half a century of intermittent research by small groups and
individual researchers. To be launched in 1995 conservation initiatives. The following
year, the Institute for Nature Research and started bringing the Regulation on the
preceding Protection (Official Gazette of the Republic of Serbia br.51/95). After a year
of preliminary research on the proposal of the Institute for Nature Protection of the
Government of the Republic of Serbia proclaimed 1997 as Zasavica Special Nature
Reserve and categories with an area of 1851 ha, of which 671 ha in the second mode of
protection (Official Gazette of the Republic of Serbia no. 19/97).
After placing the stream Zasavica with the protection of the environment started
with the intensive inventory of flora and fauna, especially in the period 1997-1998.
years. a synthesis of previous results is presented in the Proceedings of Scientific
meeting, held 2001. years. Then realized that this is a very valuable biological area Next
years of research have been continued or expanded in some areas. To 2007. he held
different scientific expert Meeting with international participation, where research results

Eco-Ist’12, Ecological Truth, 30 May - 2 June 2012. Hotel “Srbija TIS”, Zajecar, Serbia
18
are summarized in the last ten years. This extensive research and made the discovery of
new species of flora and fauna of Serbia and the Balkan Peninsula. This paper aims to
show so far discovered a new species of flora and fauna of Serbia and the Balkan
Peninsula in the Reserve Zasavica.
MATERIALS AND METHODS
Research conducted in the reserve through group and individual research
through one-day and weekend courts, maintenance of summer research camps, and
through a formal employee of an associate-researcher in the research reserve. During the
organized day and night tours. Set the various traps in accordance with the group being
researched. Part of the research is conducted across the reserve on their diplom's,
master's and doctoral thesis work.
RESULTS AND DISCUSSION
According to data as of 2011.th year in a reserve Zasavica was discovered 34
new species of flora and fauna of Serbia and theBalkan Peninsula. Overall view of newly
discovered species is given in Table 1.
Table 1. Summary of newly discovered species of flora and fauna in the reserve
Zasavica for Serbia and the Balkan Peninsula
Species
new species
for
Serbia
for Balkan
Peninsula
A l
g
e
Charophytha Tolypella prolifera (Ziz ex A.Braun)Leonhardi,1863 +
Charophytha Tolypella intricata (Trenter. ex Rothleonh)Leon.,1863 +
Charophytha Nitella confervacea (Breb) A Braun x Leonh.,1863 +
Oligochaeta Rynchelmis limosella * +
C r
u
s t
a
c e
a
Ostracoda Candona aff.candida (O.F.Müller,1776) +
Rotatoria Mytilina acanthophora Haver,1938 +
Rotatoria Lepadella apsida Harring,1916 +
Rotatoria Lepadella (Heterolepadella) ehrenbergi (Perty,1850) +
Rotatoria Lepadella imbricata Harring,1914 +
Rotatoria Lepadella triptera rhomboidulata (Bryce,1800) +
Rotatoria Lecane elongata Harring et. Myers, 1926 +
Rotatoria Monommata appendiculata Stenroos,1898 +
Rotatoria Ptygura furcillata +
Rotatoria Testudinella caeca (Parsons,1892) +
Rotatoria Collotheca ornata cornata (Dobie,1849) +

Eco-Ist’12, Ecological Truth, 30 May - 2 June 2012. Hotel “Srbija TIS”, Zajecar, Serbia
19
Rotatoria Stephanoceros fimbriatus (Goldfuss,1829) +
Hydroacarina Hydrachna geographica Müller,1776 +
Hydroacarina Hydrachna crassipalpis Piersig,1897 +
Aranidae Cyclosa oculata (Walckenaer,1802) +
Aranidae Mendoza canestrinii (Ninni,1868) +
Aranidae Philodromus albidus Kulczynski,1911 +
Aranidae Sibianor aurocinctus (Ohlert,1865) +
Aranidae Herineus graminicola (Doleschall,1852) +
H
e x
a
p o
d
a
Curculionidae Hylobius (Callirus) transversovittatus (Goeze,1777) +
Curculionidae Bagous puncticollis Boheman,1845 +
Curculionidae Stenopelmus rufinasus Gyll, +
Curculionidae Dryophthorus corticalis Payk, +
Curculionidae Pelenomus quadricorniger (Colonnelli,1986) +
Curculionidae Rhinoncus bruchoides Hbst, +
Curculionidae Ceutorhynchus picitarsis Gyll, +
Hydrophillidae Acilius canaliculatus +
Carabidae Pterostichus (Bothriopterus) quadrifoveolatus Letzner +
Formicidae Bothriomyrmex communistus Santschi,1919 +
Noctuidae Orbona fragariae (Vieweg,1790) +
(* Note: A new species of SR.Jugoslavia)
The reserve has recorded around 400 species of micro and macro-algae.
Distribute Charophytha in reserve Zasavica is represented with a total of nine species
from three genera (Chara 3, Nittela 4, Tolypella 2). Newly discovered harofe the
reservation belonging to the genus Nittela and Tolypella. Rod Nittela has the highest
recorded four species harofita, a kind of Nittela confervacea is new to Serbia, while the
genus Tolypella is represented by two species of which T.intricata new species in Serbia
and West Balkans and T. proliferation of new Serbia. (Vesic,et.al., 2011)
For the previous period it was discovered over 550 species of arthropods filum,
of which 31 species are new species for Serbia or the Balkan Peninsula.
Hydrobiological studies have shown that the water stream river and surrounding
ephemeral waters live some of the newly discovered species. In the area of Banovo
Polje, the named place Trebljevine the benthos Zasavica where the Drina sources
1998.th years., the gravelly surface where the substrate does not exceed 15-18 º C, was
found oligoheta Rynchelmis limosella which was then the first time in SR.Jugoslavia,
and subsequent research has reaffirmed, so that the continuity of these lines determined
oligohete. (Miljanović,et.al.,2001) Among 197 zooplanctons species, six species of
Rotatoria are new species for Serbia, and five are new to the Balkan Peninsula. These
rotatories inhabit the cold spring waters in Banovo Polje to the hot summer of eutrophic
water Zasavica very much of the species inhabits shallow and ephemeral spring waters,

Eco-Ist’12, Ecological Truth, 30 May - 2 June 2012. Hotel “Srbija TIS”, Zajecar, Serbia
20
such as Lecane elongata living in submerged mosses. Type Mytilina acanthophora is a
rare species in Europe. (Bobic,2001) In Obedska pond Zivkovic (1973) finds only genus
Ptygura without the kind of determination, so that the species is determined Ptygura
furcillata new for Serbia. Index saprobic species ranges from 1.0 for the type of Lecana
elongata to 2.12 (β) for Stephanoceros fimbriatus and 2.3 (α-β) for the type Collotheca
cornata ornata. This range of values of saprobic index indicates that water quality varies
from oligo-saprobic the α-β-mezosaprobic water ie. in the range of I to II-III Class.
(Grginĉević & Pujin,1998) The ephemeral waters, together with rare endemic
branhiopodes crabs Chirocephalus brevipalpis (Orhgidan, 1953), which is the
westernmost finding Zasavica and only south of the Sava and the Danube, was found
ostracodes Candona aff. candida, which is a new species for Serbia. (Petrov,et.al, 2007)
The hydrobiologic studies were performed and water mites (Hydrachnidia) of which is a
type Hydrachna geographica registered for the first time for the fauna of Serbia, a
species of H. crassipalpis registered for the first time for the fauna of the Balkan
Peninsula. (Pesic,et.al., 2007)
During the entomological survey it was found several new species for Serbia.
Fauna Aranida Reserve has 104 species, of which five species are new for Serbia.
(Grbic.et.al, 2011) According to Valerian, F. (2000) Cyclos oculata species is
categorized as a rare species on the Red List of Europe. Newly discovered species of
spiders in Serbia are present in the region. So paleoarctics salticidnes types of spiders
Mendoza canestrinii and Sibianor aurocinctus are present in Macedonia for which data
M.canestrinii dating from 1921. (Doflein) for S.aurocinctus in 1929. (Stojiĉević).
(Kamnenov,2005) While the kinds Herineus graminicola and Cyclos oculata are present
in Romania. (Ingmar & Petrisor, 1999) Familia Curculionidae Zasavica total of 86
species. According to data from the European database (Fauna Europaea) was recorded
in Zasavica seven new species for Serbia. (Pesic, 2011)
The 2007th-year published a paper Pesic&Stankovic (2007) where leaf weevil
Zasavica made of 43 species, which are allocated for two new types of Serbia Hylobius
transversovittatus and Bagous puncticollis. Further investigation and processing of
materials list is expanded to 86 species when added five new species in Serbia. Of these
seven newly discovered species has an interesting ecology of species Dryophthorus
cortical and Bagous puncticollis. Type Dryophthorus cortical lives very often near the
nest, but for now does not know whether there is a connection between them and the
ants. Looking at the map of a species D.corticalis in Europe, we see that there is in
Central Europe, Scandinavia and much of Britain, Italy, France and some states of the
former USSR. In our environment was observed in Hungary and Bulgaria. (Pesic, 2011)
While Bagous puncticollis species is related to the floating aquatic macrophyte
vegetation ie. for plants from the following genera: Elodea, Stratiotes Hydrocharis and
(Hydrochariaceae) whose leaves are larvae feed. In an environment B.puncticollis
species was found in the USA, Hungary and Romania. (Pesic, 2007) Mirmecofauns
reserves, has 31 species, which is the fifth known ant fauna of Serbia, a species observed
Bothriomyrmex communistus is new for Serbia. (Karaman, M.,Karaman. G.,2007) The
processing of materials Hydrophyllidae fauna was found a new species in Serbia. It is a
type of Acilius canaliculatus whose genus inhabited Europe, North Africa, Asia Minor,
and Siberia. He lives in small ponds, is a good swimmer, and in the evening and at night

Eco-Ist’12, Ecological Truth, 30 May - 2 June 2012. Hotel “Srbija TIS”, Zajecar, Serbia
21
leave the water and seek new habitats, overwinter in the water. (Hari & Borm,1981)
Fauna Carabidae reserve has a total of 72 species, among which was identified species of
Pterostichus (Bothriopterus) quadrifoveolatus like new for Serbia. (Curcic & Stankovic,
2011) The ground beetles inhabiting the eastern Palearctic grassy habitats and forest
habitats where the it hides under stones, rotten logs, stumps, etc. The processing of
materials lepidopterological moths was found Orbona fragariae species as new for
Serbia. (Stojanovic & Curcic, 2011) The species is found at the site of Turkey meadow
on the edge of the forest community middle age Genisto elate-quercetum Horv.1939
well built with undergrowth of Fragaria vesca, which she hosted. (Erdeš & Janjatović,
2001)
Previous investigations have shown that space is important to reserve a place
for national and international conservation of species and ecosystem diversity, and
therefore Zasavica 2000th The area was declared for the IBA in 2001 and became a
member of the Federation EUROPARK. That scientific and professional community
recognizes the importance of international reserves Zasavica was nominated for the 2005
and 2008 IPA area declared a Ramsar site (Stojnić, et.al., 2008).
CONCLUSION
From a total of 34 new species of seven species or 20.5% are new findings for
the Balkan Peninsula, a 27 or 79,4% species for the new Serbia. . In the Reserve algo-
flor's three new species of the partition Charophytha of which two types of Serbia, a new
one for the Balkans region. Other discovered species are invertebrates. Among the 25
species of invertebrates are new to Serbia and the other six species are new to the Balkan
Peninsula. Since the new invertebrate species were noted in the following groups:
Oligochaeta, Ostracoda, Rotatoria, Hydroacarina,Aranida and Insecta
(fam.Coleoptera,Curculionidae,Carabidae and Hydrophyllidae), Hymenoptera
(fam.Fornicidae) and Lepidoptera (fam.Noctuidae)). The greatest number of species
discovered in Serbia is among the invertebrates insects from the fam. Curculionidae
seven species, followed by Rotatorias six species Aranidas five species, other groups
have had one new species for Serbia
REFERENCES
1. Bobić,M.(2001):Novi i retki taksoni Rotatoria i Cladocera za faunu Jugoslavije
konstatovanih u Specijalnom rezervatu prirode Zasavica (Srbija,Jugoslavija),
Zbornik radova Nauĉnog skupa Zasavica 2001, Sr.Mitrovica, str.20-27
2. Ćurĉić,S.,Stanković.M.,(2011):The ground beetles (Coleoptera:Carabidae) of
the Zasavica Special Nature Reserve (Serbia), Acta entomologica Serbica,
No.16 (½), Beograd, str.13
3. Dombrovski,E.(1895):Osnovi ornitologije sjeverozapadne Srbije, Glasnik
Zemaljskog muzeja, Sarajevo,
4. Erdeši&Janjatović,(2001):Šumski ekosistemi rezervata Zasavica,Zbornik
radova Nauĉnog skupa Zasavica 2001, Sr.Mitrovica, str.57-64
5. Grbić,G.,Gajić,I.,Stanković,M.,(2011):Preliminary notes on the spider fauna

Eco-Ist’12, Ecological Truth, 30 May - 2 June 2012. Hotel “Srbija TIS”, Zajecar, Serbia
22
(Arachnidae, Araneae) of the Special Nature Reserve, Acta entomologica
Serbica,Beograd, str.127-138
6. Grginĉević,M.,Pujin,V.,(1998): Hidrologija Priruĉnik za studente i
poslediplomce, Ekološki pokret grada Novog Sada, str.182-195
7. Hari.G.,Borm,L.,(1981):Fauna Evrope-priruĉnik za raspoznavanje ţivotinjskih
vrsta, Mladinska knjiga, Ljubljana,str.378
8. Ingmar,W.,Petrisor,A.,(1999): List of the spiders (Arachnidae, Araneae) from
Romania, Museul Natural de istorie atorala “Grigore Antipa”, Vol.XLI,
Romania, str.79-107
9. Karaman,M.,Karaman.G., (2007): Contribution of the knowlegde of the ants
(Hymenoptera, Formicidae) from Special Nature Reserve Zasavica, Serbia,
Nauĉno-struĉni skup Zasavica 2007, Sr.Mitrovica, str.67-75
10. Komnenov,M.(2005): New data on jumping spiders in the Republic of
Macedonia with a complete cheecklist (Araneae:Salticidae)
Europaea,Arachnology,Acta zoologica Bulgarica, No.1, str.301-314
11. Miljanović,B.,Divljak,V.,Đukić,N.,Maletin,S.,Teodorović,I.,Ţivić,N.,Ivanc,A.,(
2001): Zajednica Oligochaeta kao pokazatelj kvaliteta vode u Specijalnom
rezervatu prirode Zasavica, Zbornik radova Nauĉnog skupa Zasavica 2001,
Sr.Mitrovica, str.14-19
12. Panĉić, J. (1860): GraĊa za faunu Kneţevine Srbije,Glasnik Srpskog uĉenog
društva, Beograd.
13. Pešić,S.,Stanković,M. (2007): Surlaši (Curculionidea)Specijalnog rezervata
prirode Zasavica, Nauĉno-struĉni skup Zasavica 2007, Sr.Mitrovica, str.159-170
14. Pešić,S.(2007):Bagous puncticollis Boheman,1845-New weeoil species
(Coleoptera, Curculionidae) for the Fauna of Serbia, Journale Sciantis of
Kragujevac No.29, Kragujevac, str. 149-154
15. Pešić,S.(2011):First record of Dryophthorus corticalis (Coleoptera,
Curculionidae, Dryophthoridae) in Serbia, Journale Sciantis of Kragujevac
No.33, Kragujevac, str.83-86
16. Pešić,V.,Šundić,M.,Stanković,M.(2007):Vodene grinje roda Hydrachna Müller
(Acari, Hydrachnidia) Specijalnog rezervata prirode Zasavica (Srbija),Nauĉno-
struĉni skup Zasavica 2007, Sr.Mitrovica, str.129-131
17. Pešić.S.,(2011): Nove vrste za faunu surlaša (Coleoptera,Curculionidae) u
Specijalnom rezervatu prirode Zasavica, Simpozijum entomologa Srbije, Donji
Milanovac, str.32
18. Petrov,B.,Miliĉić,D.,Ţnidaršiĉ,Z.T.,(2007):Branchipodni i ostrakodni rakovi
Specijalnog rezervata prirode Zasavica (Crustacea:Branchipoda,Ostracoda)
Nauĉno-struĉni skup Zasavica 2007, Sr.Mitrovica, str.153-157
19. Sluţbeni glasnik R.Srbije br.19/97:Rešenje o zaštiti prirodnog dobra Zasavica
20. Sluţbeni glasnik R.Srbije br.51/95:Rešenje o prethodnoj zaštiti prirodnog dobra
Zasavica
21. Stojnić,N.,Puzović,S.,Dobretić,V.,Panjković,B.,Habjan-
Mikeš,V.,Stojšić,V.,Mijović,D.,Sekulić,N.,Kovaĉev,N.,Pil.N.,Branković,D.,Bid
akov,Lj.,Simić,S.,Stanković,M.,Ĉalakić,S.,(2008): Nominacija podruĉja
“Zasavica” za Ramsarsko podruĉje.

Eco-Ist’12, Ecological Truth, 30 May - 2 June 2012. Hotel “Srbija TIS”, Zajecar, Serbia
23
22. Stojanović.V.D.,Ćurĉić,B.S.,(2011): The Diversity of Noctuid Moths
(Lepidoptera: Noctuidae) in Serbia, Acta zoologica Bulgarica,No.63(I),str.47-60
23. Taube,W.F,(1776): Historische und geografische Beschreibung des
königreiches Slavonien und das Herzogthumes Syrmien,Leipzig
24. Vesić,A.,Blaţenĉić,J.,Stanković,M.,(2011):Charophytes (Charophyta) in the
Zasavica Special Nature Reserve, Arhiv Bioloških nauka, Beograd,No.63 (3),
Str.883-888
25. Vilerian,F.,(2000):Spider (Araneae) on the Red List of European countrines,
Ecologia, Vol. 19, Supplement 4, Bratislava, str.23-28
26. Ţivković.A.,(1973):Sastav i dinamika zooplanktona i mikrofaune Obedske
bare,Zbornik Matice Srpske za prirodne nauke,sv.45,Novi sad,str.135-154

24
XX International Scientific and Professional Meeting
"ECOLOGICAL TRUTH" ECO-IST'12
30 May - 2 June 2012, Hotel “Srbija TIS“, Zajecar, SERBIA
IMPORTANCE OF IMPLEMENTATION OF ADAPTIVE FOREST
MANAGEMENT IN SERBIA
Ljiljana Brasanac-Bosanac*, T. Cirkovic-Mitrovic, V. Popovic
Institute of Forestry, Kneza Viseslava No. 3, Belgrade, SERBIA
ABSTRACT
Based on the analysis of the air temperature trend in Serbia over the period 1950-2008, it can be
concluded that the trend of increase of mean air temperature (by about 1.2 °C in the twentieth century) is
present in the greatest part of the territory, except in southeast Serbia, where the trend of the decrease of mean air temperature was reported. It is expected that these trends of climate change in Serbia will continue in the
future, which will significantly alter the structure and function of forest ecosystems, thereby imposing the need
for the change of the previous forest management. In order to predict new changes and adaptability of the forest ecosystems, it is necessary to initiate scientific researches, modernize forest policies, and apply more
adaptive forest management practices in Serbia. This paper analyzes problems and challenges in forestry in
Serbia caused by climate change and the negative impacts of the climate change on the forests and forest
management. The greatest challenge to the management of the forests and other natural resources is posed by
the development of the adaptive measures in forest management, as well as by their increasing vulnerability
under various climate change scenarios.
Key words: adaptive forest management, the impact of climate change, forest ecosystems, Serbia
INTRODUCTION
Global warming and the potential changes of temperature and humidity, point
out to a very wide range of the effects, both on the forest system in general and on the
individual trees [1-3]. Since the effects of global warming can be so intense in some
regions that they can cause the changes in the forest productivity in composition of the
plant and animal species in them, the forest cover would become unsustainable. Some
effects of climate change are already noticeable and there is a need and opportunity to be
better prepared for future change. Individuals, societies and institutions should be aware
of the impacts that climate change is likely to have and should have strategies to adapt to
them. Forest, and the goods and services they provide, are essential for human well-
being. An assessment of the likely impacts of climate change on forests and forest-
dependent people, therefore, is important for effective climate change adaptation. Such
an assessment can also assist the development of options for avoiding the harmful effects
of climate change and to take advantage of the opportunities provided by it. The previous
activities aimed at reforestation, tending and regeneration of forest ecosystems were

Eco-Ist’12, Ecological Truth, 30 May - 2 June 2012. Hotel “Srbija TIS”, Zajecar, Serbia
25
based on the climate parameters from the previous multi-annual period and did not take
into account the recent climate change which was reported in Serbia as well. This paper
is aimed at pointing out to the possible conditions of the forest ecosystems in Serbia due
to global warming and the type of actions which can be taken, based on the study of the
trend of the changes of air temperatures in Serbia.
MATERIALS AND METHODS
The paper is not based on the experimental methods, but on the methods of
analysis and synthesis, with the elements of generalization and specialization,
comparative analysis and inductive-deductive methods, modelled on the current
theoretical-methodological knowledge.
The assessment of the change of climate characteristics in Serbia is presented
by the results of the climate modelling under the most commonly used scenarios of IPCC
(Scenario SRES A1B and Scenario SRES A2) [4]. The scenario A1B of the model of the
increase of the mean annual temperature in Europe in the late of the 21st century (from
2071 to 2100) in comparison with the climate normal values (from 1961 to 1990)
belongs to the group of the moderate scenarios, which anticipates that CO2
concentration will be about 700 ppm by the end of the century. The SRES A2-scenario is
a “medium-high” scenario and specifies a tripling of atmospheric greenhouse gas
concentrations by the end of the 21st century.
The analytical method, which implied the use of the results of the previous
researches on the climate parameters, their change and effects on the condition of forest
ecosystems in Serbia, was applied. The data provided by the Republic
Hydrometeorological Service of Serbia, Public Enterprise “Srbijasume”, The Ministry of
Agriculture, Forestry and Water Management – Forest Directorate, Republic Agency for
Spatial Planning, Spatial Development Strategy of Serbia from 2009 to 2020, Spatial
Plan of the Republic of Serbia until 2020, as well as the suitable scientific papers,
studies, projects and monographs dealing with this problem, were analyzed and
processed.
The proposed measures are based on the previous works and experiences that
have proved effective.
RESULTS AND DISCUSSION
It is known that the occurrence and survival of vegetation in certain area, its
distribution and altitudinal differentiation, along with the other ecological conditions, to
a great extent also depends on the climate characteristics of the area. The numerous
researches point out to this fact: Kolic [5], Jovanovic and Kolic [6], Krstic [7], Krstic et
al. [8], Smailagic et al. [9], Krstic and Cirkovic [10].
The possibility and rationality of using some forest functions, as well as the rate
of achieving the goals related to the forest management, depend on the pre-existing
conditions, particularly in regard to the functional optimum determined for some primary
purposes. The condition of forests in Serbia is unsatisfactory in several regards. There
are the following disturbing factors of planning and permanent use of forest ecosystems:

Eco-Ist’12, Ecological Truth, 30 May - 2 June 2012. Hotel “Srbija TIS”, Zajecar, Serbia
26
forest desiccation, wildfires, strong winds and storms, climate change, polluted air, as
well as the process of soil acidification. Several examples can be used to prove the
previous statement.
The damage by defoliation in Serbia in 2003 on conifers accounts for 39.6%, and on
broadleaves it accounts for 21.4%. The annual forest area in Serbia damaged by wildfires
over the period 1990–2004 covers an area of 2,324 ha. The forests covering an area of
13,018 ha were destroyed in the wildfires in Serbia in 2000 only. The following quantity
of gases was emitted by the wildfires over the period 1990-2004: 148,420 t CO2, 380 t
CH4, 3,500 t CO and 60 t NOx [11].
The occurrence of desiccation to a great extent depends on the high
temperatures and amount of precipitation. Along with the amount of precipitation and
their distribution in the growing season, the lack of moisture in the soil has a great
impact on the process of forest of desiccation. Fighting against the heavy drought, forest
trees decelerate transpiration, which implies absorption of lower quantities of nutrients
from the soil and deceleration of all other physiological processes. Under such
conditions, if the period of drought is extended, the trees physiologically weaken and
become less tolerant to the other anthropogenic, abiotic and biotic causes of forest
desiccation.
Serbian forests are characterized by the relatively high potential carbon-dioxide
absorption from the atmosphere and thereby they significantly contribute to the
alleviation of the adverse effects of the climate change. Based on the preliminary
calculation, there are around 120,237,000 tonnes of carbon-dioxide in the Serbian
forests, and around 5,000,000 tonnes of CO2 is absorbed annually (NFI) [11].
The scenario of partial application of measures aimed at decrease of emission of
greenhouse gases (Scenario A1B, SRES/IPCC) implies that the mean air temperature in
Serbia would increase by 3-4°C compared to the reference period 1961-1990, and the
amount of precipitation would decrease by about 12% per a year, compared to the
reference period, i.e. by about 24% in summer. However, if no measures are taken
(Scenario A2, SRES/IPCC), considerably higher increase of air temperature is
anticipated, particularly in summer (by 4-5°C), as well as the greater decrease of
precipitation, which would be equal to 30%, particularly in spring.
Based on the Spatial Development Strategy of Serbia 2009-2013-2020 [12],
scenario A1B and A2, SRES/IPCC, during this century point out to the fact that in the
next decades more adverse effects on the water supplement and biological diversity in
Serbia can be anticipated, which would be, among other, reflected in changes of vertical
and horizontal zonal distribution of vegetation; increase of soil degradation and
intensification of desertification process due to the increased erosion, soil salinisation,
decrease of nutrients in the soil; decrease of arable land due to erosion; increase of risk
from diseases and pests; increased risk from disappearance of numerous species due to
synergistic effects of climate change and site fragmentation; redistribution and migration
or disappearance of some forest species due to high temperatures and decrease of ground
waters; increase of the risk from wildfires, etc.
Environmental pollution leads to numerous ecological problems, climate changes
and global warming, creating negative impact on forest ecosystems: rapid deforestation and
forest degradation, biodiversity loss, occupation of habitats by allochthonous species,

Eco-Ist’12, Ecological Truth, 30 May - 2 June 2012. Hotel “Srbija TIS”, Zajecar, Serbia
27
change in pollination system, change in plant dispersion and regeneration, change in forest
growth and ecosystem biomass, change in relation between species/habitat, change in
ecosystem nitrogen cycle, increased mortality due to climatic stress and reduced forest
ecosystem vitality and health due to cumulative impact of different stresses [13].
ADAPTIVE FOREST MANAGEMENT – ADAPTIVE MEASURES
According to Lim and Spanger-Siegfried [14], the need for adaptation within
forest management varies across ecosystems and tenure types and is related to the
vulnerability of forests to climate change as well as to the vulnerability of forest-dependent
people to changes in the provision of ecosystem goods and services. The United Nations
Development Programme – Global Environment Facility has developed an Adaptation
Policy Framework (APF) that provides an approach that permits users to clarify their own
priority issues and to implement adaptation strategies, policies and measures.
The APF has four basic principles:
Adaptation to short-term climate variability and extreme events is included as a
basis for reducing vulnerability to longer-term climate change.
Adaptation policy and measures are assessed in the context of development.
Adaptation occurs at different levels in society, including the local level.
Both the strategy and the process by which adaptation is implemented are
equally important [14].
Roberts et al. [15] provide survey of current forest management trends which
are promoting forest and forestry adaptation to new climate changes. The proposed
management measures are mainly oriented to creation of stable, resistant to negative
climate changes, forests. The management model which aims at preserving forests in
their most natural form, avoiding mono-cultures and creating mixed forests, both in the
structure of species and age, is supported. Furthermore, it aims at maintaining natural or
nature appropriate regeneration, as methods of maintaining genetic diversity, and
consequently, forest ecosystems sensitivity reduction.
There is a large number of potential methods, related to resolving issues that have
arisen in forestry owing to global climate change and forest adaptation to new
environmental conditions [14-17]. A survey of potential strategic and operational methods
of adaptation, which can be implemented as adaptive measures of forest management are:
strictly comply with legal provisions concerning prevention of unlimited and
unrestrained wood felling;
protect climate refugia by different measures;
minimise habitat fragmentation and maintain connectivity;
protect high forests;
strategically increase the size and number of protected areas, particularly in
exceptionally valuable habitats;
protect most endangered ex-situ species;
create artificial forest reservations or arboreta for the purpose of rare species
preservation;
Eco-Ist’12, Ecological Truth, 30 May - 2 June 2012. Hotel “Srbija TIS”, Zajecar, Serbia
28
improve regional co-operation concerning species management and protection;
support changes in distribution of endangered and sensitive species by means of
their introduction to new areas;
in artificially planted woods and mixed cultures, encourage natural genetic
diversity, imitate the structure of neighbouring forests and avoid direct
substitute of natural ecosystem;
maintain seed sources (seed banks and seed facilities);
allow forest regeneration through natural succession after large disturbances
wherever possible;
plant and sow genotypes resistant to draught and other climate extremes, insects
and diseases;
increase genetic diversity of trees used in setting up plantations;
reduce stress factors not linked to climate conditions, in particular air pollution,
in order to increase ecosystem ability to respond to climate change;
re-cultivate degraded area in order to preserve genetic diversity and improve
ecosystem health;
carry out monitoring of all forests by means of establishing and improving
national, regional and operational network for monitoring forest health
condition, and subsequently, diagnostic – forecast services, as well as services
for invasive species distribution monitoring;
actively implement control measures against pests and diseases;
improve plantation stability by means of increasing species and structure diversity;
increase use of commercial thinning in draught areas in order to increase tolerance
of remaining trees and to introduce species tolerant of draught, where possible;
increase people‟s awareness in regard to potential impact of climate changes on
fire regime and promote proactive actions in regard to fuel management and
community protection.
include climate parameters in forest growth and production models;
apply thinning or selective removal of suppressed, damaged trees of poor quality;
adapt the time of annual wood felling in such a way that forest processes remain
in a state of most possible balance.
It is certain that implementation of number of measures aiming at adapting
forests to climatic changes conveys a degree of uncertainty. According to Inness et al.
[13], essentially, adaptive forest management can be understood as a systematic process
aiming at constant improving of management policy and practice itself by monitoring,
and later, learning by means of analyses of operative programmes results.
CONCLUSION
Given the possible irreversible processes in the climate system with the
immeasurable consequences to the living world, it is necessary to take the preventive
measures aimed at alleviation of the effects of the climate change and adaptation to the
altered climate conditions. The suitable anticipations of the climate change and update of

Eco-Ist’12, Ecological Truth, 30 May - 2 June 2012. Hotel “Srbija TIS”, Zajecar, Serbia
29
the database will point out to the needs and application of the sector strategies and action
plans for the adaptation and measures aimed at alleviation.
The fact that the climate change occurs much more rapidly than it was
anticipated has pointed out to the need to incorporate the problems regarding the adverse
climate change on the natural resources in the priorities of the National Strategy of
Scientific and Technological Development of Serbia. It is needed to conduct the
continuous researches and monitor the influence of the climate change on the vertical
and horizontal zoning of vegetation, alternations in the current forest ecosystems and
effects of this change during the establishment of new forests.
A key strategy applicable to all forests, regardless of which scenario is used, is
adaptive management. While much research has been undertaken, there are large gaps in
our knowledge of the impacts of climate change and the most appropriate adaptation
strategies. For individual managers, the most appropriate management approach in many
cases (but not all) given such uncertainty is adaptive management. Policies and regulations
must be sufficiently flexible to allow adaptive management to take place, and there needs
to be a recognition that mistakes will be made. It is important that lessons are taken from
such mistakes, and that they are rectified as quickly as possible. Commitments at several
different levels are required – not just between scientists and managers but also amongst
policymakers and the public. Effective mechanisms are required to ensure that existing and
novel adaptation approaches can be readily „translated‟ into policy and practice.
The concept of the spatial development of the Republic, aimed at the alleviation
of the effects of global warming and climate change on the forest ecosystems in Serbia,
should include the determination of the effects of climate change on the availability of
the natural resources, above all forest ecosystems and biodiversity aimed at planning
sustainable development and ecologically acceptable activities in the domains
susceptible to the climate change. It implies the adoption and application of new,
adaptive measures aimed at preservation and protection of forest land in accord with
international conventions, national plans and sector strategies.
REFERENCES
1. Andrasko, K.: Global warming and forests: An overview of current knowledge.
Unasylva - No. 163 – Forestry and environment, Vol. 41 – 1990/4, 3-11, 1990.
2. Botkin, D.B., Nisbet, R.A., Simpson, L.G.: Forests and Global Climate Change.
In: S.K. Majumdar, L.S. Kalkstein, B.M. Yarnal, E.W. Miller, and L.M.
Rosenfeld (eds.), Global Climate Change: Implications, Challenges and
Mitigation Measures, Chapter 19, 274- 290, Pennsylvania Academy of
Sciences, Philadelphia, 1992.
3. Biringer, J.: Forest ecosystems threatened by climate change: promoting long-
term forest resilience. In: Hansen, L.J., Biringer, J., Hoffman, J.R. (eds.),
Buying time: A user‟s manual for building resistance and resilience to climate
change in natural systems. 43-71, World Wide Fund for Nature, 2003.
4. IPCC: Land Use, Land-Use Change and Forestry. Watson, R.T., Noble, I.R.,
Bolin, B., Ravindranath, N.H., Verardo, D.J. and Dokken, D.J. (eds.)., p. 375,
Cambridge University Press, UK., 2000.

Eco-Ist’12, Ecological Truth, 30 May - 2 June 2012. Hotel “Srbija TIS”, Zajecar, Serbia
30
5. Kolic, B.: Forest ecoclimatology, Class book, 1-397, Faculty of Forestry,
Scientific Book, Belgrade, 1988.
6. Jovanovic, B, Kolic, B.: Climate-vegetation (oroclimatogenic) regionalization
of Suva mountain, Bulletin of the Faculty of Forestry, No. 54, 19-62, University
of Belgrade, Belgrade, 1980.
7. Krstic, M.: Climatic characteristics of the sessile forest belt (Quercetum
montanum serbicum Cer et Jov.) on Stara mountain, Jubilee Scientific
Conference: 70 Anniversary of the Forest Research Institute of the Bulgarian
Academy of Sciences, Proceedings, Sofia, 76-79, 1998.
8. Krstic, M., Smailagic, J., Nikolic, J.: Climatic characteristics of the Sessile oak
forests (Quercetum montanum serbicum Cer et Jov.) belt in Serbia. 3rd
Balcan
Scientific Conference „Study, conservation and utilisation of the forest
resources“, Proceedings, Sofia, 200-209, 2001.
9. Smailagic, J., Krstic, M., Cvjeticanin, R.: Climate and vegetation characteristics
of the mountain Deli Jovan in East Serbia. 18th
International Conference on
Carpation Meteorology, Proceedings (printed as CD version), Belgrade, 2002.
10. Krstic, M., Cirkovic, T.: Climate-vegetation characteristics of Cemernik region,
Conference „8th
Symposium on Flora of Southeast Serbia and Neighbouring
Regions”, Proceedings, 195-200, Nis, 2005.
11. Kadovic, R., Medarevic, M., Knezevic, M., Bajic, V., Glavonjic, B., Belanovic,
S., Petrovic N.: Reserves and Dynamics of Carbon in Forest Ecosystems in
Serbia, Proceedings Forests and Climate change, 179-193, Ministry of
Agriculture, Forestry and Water Management – Department for Forestry,
University of Belgrade – Faculty of Forestry, 2007.
12. Spatial Plan Strategy of Serbia 2009-2013-2020, The Ministry of the Environment
and Spatial Planning, Republic Agency for Spatial Planning, Belgrade, 2009.
13. Innes, J., Joyce, L.A., Kellomaki, S., Louman, B., Ogden, A., Parrotta, J. and
Thompson, I.: Management for Adaptation. In: Risto Seppälä, Alexander Buck and
Pia Katila. (eds.). Adaptation of Forests and People to Climate Change - A Global
Assessment Report. IUFRO World Series Volume 22. 153-185, Helsinki, 2009.
14. Lim, B. & Spanger-Siegfried, E. (eds.).: Adaptation Policy Frameworks for
Climate Change: Developing Strategies, Policies and Measures. United Nations
Development Programme. p. 258, Cambridge University Press, New York, 2005.
15. Roberts, G., Parrotta, J. and Wreford, A.: Current Adaptation Measures and
Policies. In: Risto Seppälä, Alexander Buck and Pia Katila. (eds.). Adaptation
of Forests and People to Climate Change - A Global Assessment Report, 123-
133, IUFRO World Series Volume 22, Helsinki, 2009.
16. Spittlehouse, D.L. and Stewart, R.B.: Adaptation to climate change in forest
management. BC Journal of Ecosystems and Management, Volume 4, Number
1, 1-11, 2003.
17. Ogden, A.E.:Forest management in a changing climate: building the
environmental information base for southwest Yukon. Forestry Chronicle
Volume 83, Number 6, 806-809, 2007.

31
XX International Scientific and Professional Meeting
"ECOLOGICAL TRUTH" ECO-IST'12
30 May - 2 June 2012, Hotel “Srbija TIS“, Zajecar, SERBIA
STAND STRUCTURE AND CARBON STOCK IN AN UNMANAGED
BEECH STAND ON FRUŠKA GORA
Martin Bobinac1, S. Andrasev
2
1University of Belgrade, Faculty of Forestry,
Kneza Višeslava 1, 11000 Belgrade, SERBIA 2University of Novi Sad, Institute of Lowland Forestry and Environment,
Antona Cehova, 13, 21000 Novi Sad, SERBIA
ABSTRACT
The structure of beech trees, oven dry above-ground biomass and carbon stock were researched on a permanent sample plot in an unmanaged mixed beech stand on Fruška Gora. The analysis was based on two
periodic measurements, the first at the stand age of 97 years, and the second at the age of 105 years. In both
measurements, dominant beech trees accounted for 94% of the number of trees and 98% of volume. The increased phytosociological weakening of trees resulted from the stand spontaneous development, which had
an adverse effect on the structure of stand basal area and volume increment, as well as on oven dry above-
ground biomass and carbon stock.
Key words: beech, tree structure, above-ground biomass, carbon stock, Fruška Gora
INTRODUCTION
The research of unmanaged forests that are excluded from direct human impact
facilitates important implications for forest management, especially for the silvicultural
concepts which employ the stand selfregulation mechanisms in the achievement of
management goals [1, 2, 3]. In that respect, the most suitable forests are protected forests
in which management measures have been excluded over a long period, and old-growth
forests whose adaptation mechanisms to environmental conditions present the foundation
for the definition of sustainable forest management. The retrospective and the conceptual
basis of such ideas are reported by Brang [4]. During the spontaneous development, the
selfregulation mechanisms in old-growth forests and unmanaged forests establish the
close-to-nature structure, but the adequate responses to their relationship and
significance for silvicultural concepts are still lacking. The comparative researches in
beech stands point to numerous unfavourable consequences in unmanaged stands on the
tree structure and increment potential [5, 6, 7, 8, 9], and thus also to reduced carbon
stock in their biomass [10].

Eco-Ist’12, Ecological Truth, 30 May - 2 June 2012. Hotel “Srbija TIS”, Zajecar, Serbia
32
Because of the special ecological, historical and social significance, Fruška
Gora forests are today under different protection regimes within the National Park and
they make possible various comparisons with intensively managed forests. Beech forests
on Fruška Gora are an isolated and ecologically specific part of the beech forest range in
Serbia. The most mesophilous forests on Fruška Gora are submontane beech forests, and
forests of beech and sessile oak occupy the transitory positions, which are also the
spatially most widely distributed forests in the National Park forest area [11].
The aim of the study is to define the stand structure, oven dry above-ground
biomass and carbon stock in an unmanaged maturing beech stand. Carbon stock
estimation in woody biomass is significant in the global policy of climate change
mitigation, and the study results should be used in the objectivisation of the production
and ecological roles of unmanaged beech stands.
MATERIAL AND METHOD
The study area is Mt. Fruška Gora, characterised by temperate continental
climate with distinct seasonal alterations. According to [12], mean annual air
temperature is 11.2°C and 17.9°C during the vegetation period. Mean annual
precipitation is 663 mm, of which about 55% falls during the vegetation period. The
study area is a beech stand in the Management Unit “Ravne“, Compartment 18 e, on the
northern and north-eastern slopes, at the altitude of 360-380 m. Based on the forest
management plan data [13], the stand is classified as the forest of beech and sessile oak
(Querco-Fagetum typicum - on brown forest soil to lessive brown forest soil, and eutric
brown to lessive brown soil). The composition of beech forest is mixed: beech is
dominant in the tree storey, and the following species are individually admixed:
Quercus petraea, Quercus cerris, Tilia platyphyllos, Tilia tomentosa, Tilia cordata and
Carpinus betulus. Beech accounts for 75% of the number of trees and for 82% of the
volume. The stand is in the protection zone of the first degree (Nature Reserve) and there
have been no silvicultural measures over a period of several decades. To preserve the
originality and genetic diversity of beech in the area of NP “Fruška Gora“, since 1996 a
part of the stand has been used also as a seed stand. By the end of 2003, a permanent
sample plot (1 ha) was established in the most homogeneous part of the stand and all
trees with diameter at breast height (d1,30) above 10 cm were numerated, marked with
paint, and measured [14]. According to the Management Plan data [13], the stand age
during the first measurement in 2003 was 97 years, and during the second measurement
in 2011, it was 105 years.
On the permanent sample plot, the numerated trees were measured: two cross
section diameters to the nearest 1 mm, and height with altimeter Vertex III. The trees
were classified by crown class (BP), stem quality (KD) and freedom of crown position
(OK), by three-step classification:
- Crown class (BP): dominant (1); codominant (2); suppressed (3);
- Stem quality (KD): good (1); medium (2); poor (3);
- Crown shape (OK): freely formed crowns, without neighbouring tree crown
touching, or touching less than 25% of the crown perimeter (1); one-side crown
reduction - neighbouring tree crown touching 25-50% of the crown perimeter

Eco-Ist’12, Ecological Truth, 30 May - 2 June 2012. Hotel “Srbija TIS”, Zajecar, Serbia
33
(2); multiple-side crown reduction - touching neighbouring tree crowns more
than 50% of the crown perimeter (3).
Volume was calculated using volume tables for beech in high stands in Serbia.
Current (average periodical) volume increment was calculated by the control method and
it referred to the same group of trees. Total oven dry above-ground biomass of beech
trees was calculated by equation [15], and carbon content in the biomass was calculated
by equation [16].
RESULTS AND DISCUSSION
Tables 1 and 2 present growth elements of beech trees in the stand, estimated
oven dry above-ground biomass and carbon stock in the biomass at the ages of 97 and
105 years. In both inventories, dominant beech trees accounted for 94% of the number of
trees and for 97% of volume, 81% of trees had good and medium stem quality and they
accounted for about 85% of volume. The proportion of tree categories (crown class and
stem quality) in oven dry biomass and carbon content was adequate to the proportion of
tree categories in volume. Between two inventories, significant changes were recorded in
crown shape. At the age of 97, trees with freely formed crowns accounted for 22% of the
number of trees and 32% of volume, and the trees with multiply reduced crowns
accounted for 26% of the number of trees and 16% of volume (Table 1).
Table 1. Growth elements, oven dry above-ground biomass, and carbon stock of beech
trees at the age of 97
Structure elements Total
Crown class Crown shape Stem quality
1 2 3 1 2 3 1 2 3
N [trees∙ha-1] 153 144 7 2 33 80 40 36 88 29
G [m2∙ha-1] 25.47 24.75 0.63 0.09 7.59 13.19 4.68 7.11 14.12 4.24
V [m3∙ha-1] 382.44 372.88 8.45 1.12 123.31 196.33 62.80 112.14 212.66 57.64
m [kg∙ha-1] 247533 241258 5542 733 78324 127344 41864 71681 137211 38641
C [kg∙ha-1] 122261 119201 2706 354 38837 62857 20568 35466 67724 19071
N [%] 100.0 94.1 4.6 1.3 21.6 52.3 26.1 23.5 57.5 19.0
G [%] 100.0 97.2 2.5 0.4 29.8 51.8 18.4 27.9 55.4 16.6
V [%] 100.0 97.5 2.2 0.3 32.2 51.3 16.4 29.3 55.6 15.1
m [%] 100.0 97.5 2.2 0.3 31.6 51.4 16.9 29.0 55.4 15.6
C [%] 100.0 97.5 2.2 0.3 31.8 51.4 16.8 29.0 55.4 15.6
N=number of trees; G=basal area; V=volume; m=oven dry biomass; C=carbon content
At the age of 105 years, beech crown structure was characterised by even more
unfavourable state compared to the state at the age of 97. The trees with freely formed
crowns accounted for 9% of the number of trees and for 14% of volume, and the trees
with multiple-side reduced crown accounted for 50% of the number of trees and for 35
% of volume (Table 2).

Eco-Ist’12, Ecological Truth, 30 May - 2 June 2012. Hotel “Srbija TIS”, Zajecar, Serbia
34
Table 2. Growth elements, oven dry above-ground biomass, and carbon stock of beech
trees at the age of 105
Structure
elements Total
Crown class Crown shape Stem quality
1 2 3 1 2 3 1 2 3
N [trees∙ha-1] 153 144 7 2 13 63 77 36 88 29
G [m2∙ha-1] 29.26 28.47 0.69 0.10 3.82 14.55 10.89 8.36 16.14 4.76
V [m3∙ha-1] 471.89 460.78 9.85 1.26 67.41 240.59 163.89 141.45 260.69 69.74
m [kg∙ha-1] 298699 291552 6337 811 41863 151736 105100 88510 164548 45641
C [kg∙ha-1] 147766 144278 3097 392 20819 75233 51714 43879 81337 22551
N [%] 100.0 94.1 4.6 1.3 8.5 41.2 50.3 23.5 57.5 19.0
G [%] 100.0 97.3 2.4 0.3 13.1 49.7 37.2 28.6 55.2 16.3
V [%] 100.0 97.6 2.1 0.3 14.3 51.0 34.7 30.0 55.2 14.8
m [%] 100.0 97.6 2,1 0.3 14.0 50.8 35.2 29.6 55.1 15.3
C [%] 100.0 97.6 2.1 0.3 14.1 50.9 35.0 29.7 55.0 15.3
Table 3 presents current increment of basal area, volume, above-ground
biomass, and carbon stock of all beech trees, trees of different crown class, crown shape
and stem quality per hectare, between the ages of 98 and 105 years.
In the total structure of the increment of basal area, volume, oven dry above-
ground biomass, and carbon stock, dominant trees accounted for more than 98%, trees
with freely formed crowns - 16%, and trees with good stem quality - 33%. Trees with
multiple-side reduced crown (50% of trees) accounted for about 29% of increment, and
trees with poor stem quality (19% of trees) accounted for about 14% of increment. Trees
with one-side reduced crown and trees with medium stem quality accounted for more
than 50% of increment.
Table 3. Current increment of basal area, volume, oven dry above-ground biomass, and
carbon stock of beech trees between the ages of 98 and 105 years
Elements of increment
Total Crown class Crown shape Stem quality
1 2 3 1 2 3 1 2 3
iG [m2∙ha-1∙yr-1] 0.4743 0.4658 0.0077 0.0008 0.0758 0.2622 0.1363 0.1556 0.2528 0.0659
iV [m3∙ha-1∙yr-1] 11.18 10.99 0.18 0.02 1.83 6.12 3.23 3.66 6.00 1.51
im [kg∙ha-1∙yr-1] 6395.8 6286.7 99.4 9.7 1049.2 3521.3 1825.3 2103.7 3417.2 874.9
iC [kg∙ha-1∙yr-1] 3188.1 3134.6 48.8 4.7 526.2 1758.9 903.1 1051.6 1701.7 434.9
iG [%] 100.0 98.2 1.6 0.2 16.0 55.3 28.7 32.8 53.3 13.9
iV [%] 100.0 98.3 1.6 0.2 16.4 54.7 28.9 32.8 53.7 13.5
im [%] 100.0 98.3 1.6 0.2 16.4 55.1 28.5 32.9 53.4 13.7
iC [%] 100.0 98.3 1.5 0.1 16.5 55.2 28.3 33.0 53.4 13.6
Compared to the stand average, higher average annual increase in basal area,
volume, above-ground oven dry biomass, and carbon stock was shown by dominant

Eco-Ist’12, Ecological Truth, 30 May - 2 June 2012. Hotel “Srbija TIS”, Zajecar, Serbia
35
beech trees by 4%, trees with freely formed crown by 88-94%, and trees with good stem
quality by 39-40%. The annual increase in the above elements of the codominant and
suppressed trees with multiple-side reduced crowns and trees with poor stem quality was
on average from one to two thirds of the stand average (Table 4).
Table 4. Current increment of basal area, volume, oven dry above-ground biomass, and
carbon stock of different categories of beech trees, and the coefficient of increase
compared to the stand average between the ages of 97 and 105 years
Category
Value Coefficient
iG iV im iC iG iV im iC
[m2∙ha-1∙yr-1] [m3∙ha-1∙yr-1] [kg∙ha-1∙yr-1] [kg∙ha-1∙yr-1]
All trees 0.0031 0.0731 41.8026 20.8375 1.00 1.00 1.00 1.00
Crown class
1 0.0032 0.0763 43.6578 21.7681 1.04 1.04 1.04 1.04
2 0.0011 0.0252 14.2006 6.9771 0.36 0.34 0.34 0.33
3 0.0004 0.0087 4.8404 2.3468 0.13 0.12 0.12 0.11
Crown shape
1 0.0058 0.1410 80.7079 40.4748 1.88 1.93 1.93 1.94
2 0.0042 0.0971 55.8939 27.9185 1.34 1.33 1.34 1.34
3 0.0018 0.0419 23.7050 11.7285 0.57 0.57 0.57 0.56
Stem quality
1 0.0043 0.1018 58.4348 29.2103 1.39 1.39 1.40 1.40
2 0.0029 0.0682 38.8321 19.3371 0.93 0.93 0.93 0.93
3 0.0023 0.0522 30.1698 14.9966 0.73 0.71 0.72 0.72
The study results on the increment potentials of the particular categories of
beech trees indicate that the stand spontaneous development was the responsible factor
for the phytosociological weakening of trees. Based on the current increment of the study
elements averagely attained by dominant beech trees, and also considering the beech
tolerance of lateral shade over long time periods, it can be assumed that in the study
stand in near future there will be no biological re-layering and tree devastation.
However, in future, this can be expected under the established regime of stand protection
in the changed site conditions, consistent with the supposed climate changes and the
advanced process of phytosociological weakening of trees. Based on the monitoring of a
permanent sample plot in unmanaged beech stand (17), the authors concluded that during
the study ten-year period it was the trees from the lower layers that were predominantly
declined, and based on the reduced crown vigour the authors pointed out the process of
devitalisation of beech trees whose natural dying and removal from the stand can be
expected in future.
CONCLUSIONS
In the study beech stand, which was excluded from management processes and
developed spontaneously over a several-decade-long period, at the age of 97 years beech
accounted for 75% of tree number and for 82% of volume. 94% of the trees were
dominant and they accounted for 98% of volume, 22% of the trees had freely formed

Eco-Ist’12, Ecological Truth, 30 May - 2 June 2012. Hotel “Srbija TIS”, Zajecar, Serbia
36
crowns and they accounted for 32% of volume, and 24% of trees had good stem quality
and they accounted for about 30% of volume.
At the stand age of 105 years, it was recorded that the percentages of trees per
crown classes and stem quality remained the same, and that crown structure was more
unfavourable compared to the state at the age of 97 years. The measurement at the age of
105 years showed that the trees with freely formed crowns accounted for about 9% of
tree number and about 14% of volume.
In the total structure of the increment of basal area, volume, above-ground oven
dry biomass, and carbon stock, between the ages of 98 and 105 years, dominant beech
trees accounted for more than 98%, trees with good stem quality - about 33%, and trees
with freely formed crowns - about 16%. About 84% of the above increments was
realised by the trees with one-side to multiple-side reduced crowns.
Compared to the stand average, which is the usual measure representing the
stand growth, higher average annual increase in basal area, volume, above-ground oven
dry biomass, and carbon stock was achieved by dominant beech trees by 4%, trees with
freely formed crowns by 88-94%, and trees with good stem quality by 39-40%. The
annual increase in the above elements of the codominant and suppressed trees with
multiple-side reduced crowns amounted to on average from one third to two thirds of the
stand average, which confirms their secondary ecological significance in the stand
structure.
Acknowledgement
This paper was realized as a part of the project Establishment of Wood
Plantations Intended for Afforestation of Serbia (31041) financed by the Ministry of
Education and Science of the Republic of Serbia within the framework Technological
development for the period 2011-2014.
REFERENCES
1. Otto H.-J.: Zielorientierter Waldbau und Schutz sukzessionaler Prozesse. Forst
Holz 50, 203–209, 1995.
2. Schütz J.-P.: Neue Waldbehandlungskonzepte in Zeiten der Mittelknappheit:
Prinzipien einer biologisch rationellen und kostenbewussten Waldpflege.
Schweiz. Z. Forstwes. 150, 451–459, 1999.
3. Schütz J.-P.: Opportunistic methods of controlling vegetation, inspired by
natural plant succession dynamics with special reference to natural outmixing
tendencies in a gap regeneration. Ann. For. Sci. 61, 149–156, 2004.
4. Brang P.: Virgin forests as a knowledge source for central European
silviculture: reality or myth? For. Snow Landsc. Res. 79, 1/2: 19–32, 2005.
5. Bobinac, M.: Biološko diferenciranje stabala u sastojinama bukve i njegov
značaj za izvođenje mera nege. Glasnik Šumarskog fakulteta 88, 27-40, Šumarski
fakultet Univerziteta u Beogradu, 2003.

Eco-Ist’12, Ecological Truth, 30 May - 2 June 2012. Hotel “Srbija TIS”, Zajecar, Serbia
37
6. Bobinac, M.: Efekti selektivne prorede na prirast stabala i sastojina bukve na
Južnom kučaju. Glasnik Šumarskog fakulteta 90, 53-66, Šumarski fakultet
Univerziteta u Beogradu, 2004.
7. Bobinac M.: Učinak proreda na prirast stabala različitih bioloških položaja u
srednjedobnoj sastojini bukve. Šumarski list br. 5-6, 183-191, Zagreb, 2006.
8. Bobinac M.: Effect of different silvicultural treatment on the development and
increment of middle-aged beech stands on Južni Kučaj. International Scientific
Conference: Sustainable Use of Forest Ecosystems: “The Challenge of the 21st
Century”, 172-176, Proceedings, Donji Milanovac, 2006.
9. Vučković M., Stajić B.: Ocena stanja sastojina bukve na bazi osnovnih
elemenata rasta. Glasnik Šumarskog fakulteta 87, 95-102, Beograd, 2003.
10. Paladinić E., Marjanović H., Ostrogović M., Balenović I., Krajter S., Vuletić
D.: Simulation of carbon sequestration in aboveground biomass of managed and
unmanaged mixed stands of European beech. FAGUS "Is there Future for
Beech – Changes, Impacts and Answers", Seletković, Z. (ur.), Varaždin, 2010.
11. Opšta osnova za gazdovanje šumama za Nacionalni park „Fruška Gora” 2002-
2011, Beograd 2002.
12. Milosavljević M., Stanojević S., Katić P., Todorović N.: Klimatske prilike
Fruške Gore, Monografija Fruške Gore, Matica Srpska, Novi Sad, 1973.
13. Posebna Šumsko privredna osnova za GJ Ravne 1997-2006. Beograd 1997.
14. Bobinac M., Dinić A.: Predlog mera za uređenje semenske sastojine bukve na
Fruškoj Gori sa posebnim osvrtom na kontrolu zakorovljenosti kupinom. Acta
herbologica, 2, Vol. 14, 75-88, Beograd, 2005.
15. Wutzler T., Wirth C., Schumacher J.: Generic biomass functions for common
beech (Fagus sylvatica) in Central Europe: predictions and components of
uncertainty. Can. J. For. Res., Volume: 38 Issue: 6, 1661-1675, 2008.
16. Joosten R. Schumacher J. Wirth C. Schulte A.: Evaluating tree carbon
predictions for beech (Fagus sylvatica L.) in Western Germany. Fore. Ecol.
Manag., Volume: 189, Issue: 1-3, 87-96, 2004.
17. Novotny V., Balenović I., Dubravac T. Vuletić D. Dekanić S.: First results of
monitoring of stand structure changes in unmanaged beech stands in NP
Plitvice Lakes. South-east European Forestry, Preliminary communication, 2,
91-98, 2010

38
XX International Scientific and Professional Meeting
"ECOLOGICAL TRUTH" ECO-IST'12
30 May - 2 June 2012, Hotel “Srbija TIS“, Zajecar, SERBIA
FOREST WILDFIRES IN VRSAC MOUNTAINS
Orhideja Strbac
JP “Varos” Dvorska 10a,Vrsac, SERBIA
ABSTRACT
Forest fires are becoming more common occurrences throughout the world. By reducing the number
of forest fires are kept natural resources, which enable their improvement. Vojvodina is a region with least forests throughout Europe, with only 6,4 % area under forest, which makes the problem of maintenance and improvement of forests more important. Uncontrolled or misused fires can cause tremendous adverse impacts on the environment and human society. Besides destroying valuable habitat, wildfires pose a severe risk to people living in or near affected areas. Prevention from forest wildfires demands better education about importance of nature preservation and consequences and costs of unplanned burning. It is particular important for the protected Area of outstanding features “Vršac Mountains”. Key words: Forest fires, education, Vršac Mountains
INTRODUCTION
The area of outstanding features “Vršac Mountains” is located in the south-eastern part of the Pannonian Plain in west-east direction. The length of the mountain massif is 20 km of which most is in Serbia and the smaller one in Romania. The total area of the protected area Vršac Mountains is 4408 ha of which 190 ha under the first degree, under a 2936 ha and 1282 ha under the third level of protection.
Subject protect of Vršac Mountains are plant and animal species important for biodiversity conservation, areas of specific geological and geomorphological phenomena, important forest and meadow ecosystems, habitats of plant and animal species, fauna and hunting deer. Because of its natural values Vršac Mountains are 1982nd was placed under the protection of the Regional Nature Park to 2005th given the status of a region of outstanding feature of the IUCN categories IV classification with the prescribed regime of care I, II and III level.1
Only in 2007, there were 34 interventions of Vršac Fire department, with 23 interventions in July.2 There are two main types of forest wildfires accidentally caused by humans in this area:
(1) a butt of cigarette thrown from a car and (2) burning grass in fields.

Eco-Ist’12, Ecological Truth, 30 May - 2 June 2012. Hotel “Srbija TIS”, Zajecar, Serbia
39
MATERIAL AND METHODS
The Fire Department of Vršac Municipality collected data about all interventions from 2000 to 2009. The data were filtered related to the area of Vršac Mountains. There was also prepared a questionnaire with ten questions, and people from villages near Vršac Mountains were asked several questions about the most often causes of wildfires. There were 401 samples within the population, mostly children.
RESULTS AND DISCUSSION
Preliminary analysis has showed that in most cases, almost 100%, forest fires
were human-induced. Totally, there were 108 wildfires near Vršac Mountains in the last ten years. In the largest wildfire, 10 hectares of the forests have burned out. 2
0
5
10
15
20
25
30
35
40
Figure 1. Distribution of wildfires in Vršac Mountains during the observed period (Štrbac O.2009)
Most wildfires begin near picnic places, during, or just after holidays, when a
lot of people visit Vršac Mountains. The possible cause is preparation of barbecues, and the fact that, after leaving the picnic place, tourists do not extinguish their fireplaces completely.
Another common cause of wildfires is burning fields after harvest by farmers. This type of wildfires is very dangerous, if the burning field is located near a forest, because it comprises a large area. In the case of certain whether conditions, the wildfire

Eco-Ist’12, Ecological Truth, 30 May - 2 June 2012. Hotel “Srbija TIS”, Zajecar, Serbia
40
can spread along the forest border very fast. This is, especially, a case if a field is located South-East of the forest, due to a wind rose in Vršac region. The third most possible cause of a forest wildfire is a cigarette butt that one hits outside from a car window. Several fires started just because of that reason. Analysing the hourly distribution of the wildfires, one can see that most fires begin in the afternoon, with the peak at 6 PM. From the survey can be seen that the farmers burn their fields during the day, leave the fields and the fire starts to spread after that.2

Eco-Ist’12, Ecological Truth, 30 May - 2 June 2012. Hotel “Srbija TIS”, Zajecar, Serbia
41
Figure 4. Forest wildfire near cottages in Vršac Mountains (Vučanović M. 2012)
CONCLUSION
The main aim of this research is to make a contribution to the general objective of sustainable development through the encouragement and education of local communities in importance of biodiversity and role of prevention of forest wildfires. It can be concluded that the need to devote additional attention in the future education of the population on issues related to the behaviour of fire. Continued lecturing is necessary because the fact that the principal cause of wildfires is accidents or carelessness. Prevention from forest wildfires demands better education about importance of nature preservation and consequences and costs of unplanned burning.
REFERENCES
1. Kovačević B., Habijan-Mikeš V. Studija zaštite: Predeo izuzetnih odlika Vršačke planine, Zavod za zaštitu prirode, Novi Sad, 2005.
2. Ogrizović V. et Štrbac O. Project of cross-border co-operation Hungary - Serbia 06SER02/02/08/001 „Save Our Mountains from Forest Wildfires“ Municipality of Vršac, 2009.

42
XX International Scientific and Professional Meeting
"ECOLOGICAL TRUTH" ECO-IST'12
30 May - 2 June 2012, Hotel “Srbija TIS“, Zajecar, SERBIA
INFLUENCE OF CHANGED CLIMATE CONDITIONS ON ADAPTABILITY
AND VITALITY OF Ficus carica L. SPECIES ON GREEN SPACES IN BELGRADE
Djurdja Stojicic*, M. Ocokoljic, D. Obratov-Petkovic, N. Stojanovic
University of Belgrade, Faculty of Forestry,
Kneza Viseslava 1, Belgrade, SERBIA
ABSTRACT
In this paper we present results of adaptability and vitality analysis of Mediterranean floral element species (Ficus carica L.) in urban conditions of Belgrade. Floristic material includes 221 specimens of fig tree which were grown on public and private green spaces at Banovo Brdo. Different parameters were analyzed including absolute height, vitality, decorative value and fructification in different periods of age. The research determined that analyzed specimens are characterized by good phenotypic and biological features, which is confirmed by their general appearance, resistance to climate change, functionality and visually-esthetic value. Repeated monitoring confirmed that all of the specimens are fructifying due to which the species can have greater use in fruit growing but also in the practices of Landscaping and Horticulture in changed conditions of temperate continental climate.
Key words: fig tree, allochthonous dendroflora, cultivation, genetic potential INTRODUCTION Introduction of woody plants in Serbia is believed to have happened in the
distant past, but research in regards to these plants is of a newer date and majorly focuses on comparison between introduced plants and autochthonous plants regarding the speed of growth and longevity. Nevertheless, current research of allochthonous dendroflora must be more detailed in order to familiarize with their breeding and aesthetic characteristics. This would provide us with the possibility of making more informed decisions when using these plants in changed climate conditions. Taking into account mentioned facts the paper demonstrates results of adaptability and vitality analysis of Mediterranean floral element species (Ficus carica L.) in urban conditions in Belgrade. In local and foreign literature it is known that Ficus carica L. (Fam. Moraceae Link.) is dioecious or monoecious deciduous species with widely branched treetop originating from Western Asia. Its cultivation begun around 4,000 years BC in Near East, and it is grown for ages in Mediterranean (South Europe and North Africa) where it expands spontaneously. Even though it is a species of

Eco-Ist’12, Ecological Truth, 30 May - 2 June 2012. Hotel “Srbija TIS”, Zajecar, Serbia
43
Mediterranean floral element, it can be submitted to frost and it is recorded in high numbers in regions with continental climate and temperate continental climate. It bears fruit two times per year. First fruits (spring yield) which form on old branches generally decay due to frost, while main yield on young branches matures in (summer) autumn (Jonhson et al., 2011; Stover et al., 2007; Zohary et al., 1975). Other than the use in fruit growing, fig tree is often grown as decorative species, mainly because of its interesting habit, light-gray and smooth bark and unusual polymorph leafs.
MATERIAL AND METHOD
Floristic material includes grown specimens of fig tree at Banovo Brdo in South West Belgrade. Average elevation of researched area is 159 m. Soil type is degraded chernozem, eutric cambisol, and alluvial deposit which are under influence of anthropogenic factors in great degree changed and degraded. Banovo Brdo is located in Moesian phytogeographical province, Pontic-Central Asian and Sub-Mediterranean floral elements are predominant (Jovanović, 1951; Sarić et al.1997, Obratov-Petković et al., 2000). Climate is temperate continental with worm summers and cold winters. Analysis of meteorological data is based on climate information (from Republic Hydro-meteorological Service of Serbia) for thirty-year period from year 1960 until 1990 and from year 1970 until 2000. Based on data for average monthly air temperatures during two thirty-year periods rise in average temperatures is noted. Average yearly air temperature for period from year 1970 until year 2000 is 12.0 ˚С, which is an increase of 0.1 ˚С in comparison to previous period. The coldest month in Belgrade is January with 1.2 ˚С which also indicates a rise because of the fact that for the previous thirty year period this parameter was 0.4 ˚С. Winter temperatures in the Mediterranean areas range between 5 and 12 ˚С, which is between 4 and 11 ˚С higher than Belgrade temperatures. July is usually the hottest month in Belgrade with 22 ˚С on the average - which is 3 ̊ С lower than in the Mediterranean. The average maximum monthly temperature for January (the coldest month) in Belgrade was 11 ˚С higher for the period between years 1970 and 2000 than for the previous period. The month with the highest average maximum monthly temperature is July with 34.9 ˚С, which is 7.6 ˚С more than when compared with the previous period. The average minimum monthly temperatures are below zero for November, December, January, February and March. Month of January has the lowest average minimum temperature: -8.9 ˚С and -2.3 ˚С. During the last thirty-year period Belgrade had, on the average, 2051.1 sun hours every year, 30.5 hours more than in the previous period. The yearly average (1970-2000) for the precipitation was 692.1 mm, compared to 683.4 mm during the previous period. These quantities resemble the ones which characterize Mediterranean climate: 500-700 mm per year. The end of spring and the beginning of summer bring most precipitation, while in the Mediterranean most precipitation happens during fall and winter. The most common form of precipitation in Belgrade is rain, while snow is less common and it usually does not stay for long on the ground. During the colder part of the year the falling snow can be very wet, and there are instances of icy rain. In the Mediterranean, snow is a very rare occurrence. The average yearly relative humidity was 69% for both thirty-year periods in

Eco-Ist’12, Ecological Truth, 30 May - 2 June 2012. Hotel “Srbija TIS”, Zajecar, Serbia
44
Belgrade, which is 9% more than in the Mediterranean. According to the average monthly wind speeds and their frequency, the prevailing wind at the beginning of the vegetation period blows from the South East, and during the second half of the vegetation period - from the North West. In the Mediterranean region, the most common winds are sirocco, bora and mistral.
The field research covered: identifying Ficus carica L. species on green spaces at Banovo Brdo, and measuring height with a tape, while decorative value, vitality and yield were rated visually on a scale ranging from 1 to 5, where 1 is a specimen without esthetic value, with low vitality and minimal yield, and 5 is a specimen with exceptional esthetic qualities, excellent vitality and maximal yield.
RESULTS AND DISCUSSION During the research of green spaces at Banovo Brdo in Belgrade 221 Ficus carica L. specimens were recorded which grow as a tree or as a bush. There were 59.7% of bushy specimens, while there were 40.3% of the ones that grow as a tree. At number 66, Nikolaja Gogolja Street we recorded the use of fig tree as a vertical greening in combination with vines (Figure 1). Highest number of analyzed specimens of fig tree were grown on private green spaces (88,1 %), while smaller number of specimens were recorded on public green spaces (11,9 %).
Figure 1. Fig tree used as vertical greening

Eco-Ist’12, Ecological Truth, 30 May - 2 June 2012. Hotel “Srbija TIS”, Zajecar, Serbia
45
According to changeability of absolute height, and grades for vitality, decorative value and yield we recorded variability of parameters between specimens. Values of statistical parameters as indicators of variability for analyzed features are presented in Table 1.
Table 1. Analyzed parameters for 221 specimens of fig trees at Banovo Brdo in Belgrade
Parameter
Specimen
Tot
al N
umbe
r
x a
bsol
ute
heig
ht
(m)
x
vita
lity
(1-5
)
x
dec
orat
ive
valu
e (1
-5)
x
yie
ld
(1-5
)
Tree 89 3.1 4.1 3.9 3.8 Bush 132 2.9 4.1 3.7 3.9
Ficus carica L. in the researched area had average height of 3.0 m. Lowest
height was 1 m, and highest was 8 m. Recorded heights show us that fig tree is in fact reaching the heights which are mentioned in the literature (Ocokoljić et al., 2003) for the Mediterranean region (10 m). Belgrade is not an exception, because fig trees can be found in large numbers on green spaces in Great Britain as well. The biggest fig tree garden is located in Tarring, Sussex which is the sunniest part of Britain. In this garden there are 70 specimens with average height ranging from 3.5 to 4.5 m. Wild fig trees can grow on junkyards and on abandoned land (Dickson et al., 1996), which is an occurrence on public green spaces and abandoned yards of Banovo Brdo. Fig tree cannot colonize new regions which is true for London as well as is for Belgrade. Fig trees in Britain reproduce mainly by vegetative propagation. Nevertheless, if a specimen appears by generative reproduction its origin is usually from an introduced fruits (Dickson et al., 1996).
Average grades of vitality and decorative value are 4.1 and 3.8 respectively; while minimal and maximal grades are 1 and 5. These very good average grades show us that fig tree has adapted to temperate continental clime conditions of Belgrade. Fig trees with more vitality were the ones recorded in private yards. Average grades for vitality were the same for both bushes and trees (4.1). But, average grade for vitality of specimens on private green spaces (4.1) is greater than vitality of specimens on public green spaces (4.0), which demonstrates the importance of tending. Average grade for decorative value of bushes is 3.7; while for trees it is 3.9 due to ornamental, smooth and gray bark, and unique treetop architecture. Average grade of decorative value of specimens which grow in private gardens is significantly higher than average grade of specimens which are grown on public green spaces (3.9 to 3.5 respectively).
Yield and quality (size and weight) of fig tree fruits depend upon the light, temperature, air humidity and pollination. Nevertheless, good fig fruiting can lower the vegetative growth of the plant during the next season (Gaaliche et al., 2011, Trad et al., 2012). Fig tree yield in the researched area was very good and the average grade was 3.8;

Eco-Ist’12, Ecological Truth, 30 May - 2 June 2012. Hotel “Srbija TIS”, Zajecar, Serbia
46
fruiting was good in both bushy and woody specimens (3.9 and 3.8 respectively). Specimens on public green spaces have had lower average yield grade (3.5), due to recording of some specimens without a yield, even though great number of analyzed specimens were awarded with the maximal grade of 5. Average grade of yield abundance was significantly higher in specimens which were grown on private green spaces (4.1).
The research has confirmed the views underlined by Dickson et al., (1996), which were that species Ficus carica L. is exceptionally adjustable and that it has wide range of propagation and adaptability to different environments.
CONCLUSION Through analysis of green spaces at Banovo Brdo 221 specimens of Ficus
carica L. were recorded. Highest number of these specimens (88.1 %) is grown on private green spaces, and only 11.9 % is grown on public green spaces.
On the basis of reached heights of fig trees on green spaces at Banovo Brdo it was determined that fig trees in Belgrade reach maximal height which the species reaches in Mediterranean region. Through comparative grade analysis of vitality of all the specimens we determined very high average grade of 4.1 which demonstrates good adaptability of fig tree in environmental conditions of researched area. Relative analysis of decorative values’ grades of all the specimens it was determined somewhat lower average grade in comparison to vitality grades (3.8). Average grade of yield is 3.8. Specimens which were grown on private green spaces had higher grades for yield, vitality and decorative value than specimens on public green spaces; and especially in comparison with specimens which have been recorded on unregulated space.
Research of growth and development of fig tree specimens in Belgrade confirmed their phenotypic and biological characteristics, which is seen through general appearance, resistance to diseases and pests, functionality and esthetic value.
Repeated monitoring showed that very high number of specimens abundantly fructifies, which demonstrates successful acclimatization and adaptability in changed temperate continental climate conditions.
Acknowledgement This paper was realized as a part of the project "Studying climate change and
its influence on the environment: impacts, adaptation and mitigation" (43007) financed by the Ministry of Education and Science of the Republic of Serbia within the framework of integrated and interdisciplinary research for the period 2011-2014.
REFERENCES
1. Jonhson, H.: Trees: A lifetime's journey through forests, woods and gardens. Octopus Publishing Group. London. 2011.
2. Stover, E.W., Aradhya, M.K., Crisosto, C., Ferguson, L.: The fig: overview of an ancient fruit. HortScience 42: pp. 1083-1087. 2007.
Eco-Ist’12, Ecological Truth, 30 May - 2 June 2012. Hotel “Srbija TIS”, Zajecar, Serbia
47
3. Zohary, D. & Spiegel-Roy, P.: Beginnings of fruit growing in the Old World. Science 187: pp. 319-327. 1975.
4. Jovanović, B., Dunjić, R.: Prilog poznavanju fitocenoza hrastovih šuma Jasenice i okoline Beograda. Zbor. radova SAN br. 11. Inst. za ekol. i biogeograf. br. 2. Beograd. 1951.
5. Sarić, M. et al.: Vegetacija Srbije II. Šumske zajednice 1. SANU. Beograd. 1997.
6. Obratov-Petković, D. & Đukić, M.: Mala flora Avale. Agena. Beograd. 2000. 7. Ocokoljić, M., Ninić-Todorović, J.: Priručnik iz dekorativne dendrologije.
Šumarski fakultet. Beograd. 2003. 8. Dickson, J. H. & Dickson C.: Ancient and modern occurrences of common fig
(Ficus carica L.) in the British isles. Quaternary Science Reviews 15: pp. 623-633. 1996.
9. Gaaliche, B., Trad, M., Mars, M.: Effect of pollination intensity, frequency and pollen source on fig (Ficus carica L.) productivity and fruit quality. Scientia Horticulturae 130: pp. 737-742. 2011.
10. Trad, M., Ginies, C., Gaaliche, B., Renard, C. M.G.C., Mars, M.: Does pollination affect aroma development in ripened fig (Ficus carica L.) fruit. Scientia Horticulturae 134: pp. 93–99. 2012.

48
XX International Scientific and Professional Meeting
"ECOLOGICAL TRUTH" ECO-IST'12
30 May - 2 June 2012, Hotel “Srbija TIS“, Zajecar, SERBIA
EFFECT OF AGE AND SITE ON THE YIELD AND VIABILITY
OF EMPRESS TREE SEEDS Djurdja Stojicic*, M. Ocokoljic, D. Obratov-Petkovic, D. Skocajic
University of Belgrade, Faculty of Forestry,
Kneza Viseslava 1, Belgrade, SERBIA
[email protected] ABSTRACT Taking into account that the generatively produced seedlings are characterised by higher resistance,
longevity and better-formed root systems, this paper presents the analysis of the yield and quantitative and qualitative characteristics of the seeds of 14 Empress Trees, aged from 10 to 50 years, cultivated at four different sites in Belgrade.
The comparative analysis of all parameters shows that the superior trees were selected from the same site (Zemun), which supports the thesis that, in addition to genotype effect, the effect of site conditions was also significant for Empress Tree seed yield and viability, while the effect of tree age on reduced seed yield was not recorded.
Key words: Paulownia tomentosa (Thunb.) Steud., selection, genotype, photoblastism, germination INTRODUCTION Green space functionality, in addition to other conditions, is determined by the
correct selection of woody species, i.e. by their traits, such as adaptation, viability and ornamentalness (Ocokoljić, 2006). Consequently, in the selection of mother trees to be used for seed collection, it is necessary to choose the individuals whose multiannual cultivation shows their adaptability to environmental conditions (Stojičić, et al., 2010). Generative production of planting stock from the selected mother trees will be more economic, and the seedlings will be of better quality if the selected individuals are previously tested and show the best seed germination.
Namely, the seedlings of generative origin are more resistant, more vigorous, and long-living, and have better-formed root systems. Also, the progeny obtained by this type of reproduction is characterised by genotype and phenotype variability which enables better species adaptability (Stilinović, 1985, 1987).
The fructification and germination of the species Paulownia tomentosa (Thunb.) Steud. were studied in the function of determining the best trees for future seedling production and tree breeding.

Eco-Ist’12, Ecological Truth, 30 May - 2 June 2012. Hotel “Srbija TIS”, Zajecar, Serbia
49
MATERIAL AND METHOD Seed germination of 14 trees of different ages (10 - 50 year-old) of the species
Paulownia tomentosa (Thunb.) Steud. grown at four localities in Belgrade: Banovo Brdo, Dorćol, Novi Beograd and Zemun (out of 25 trees at 5 study localities), was analysed in laboratory conditions.
The abundance of seed yield (for 25 individuals) was assessed in the field. The evaluation of the abundance of seed yield was performed by the method of quantification of phenological traits using points from 0 to 5, in which the trees with no seed yield obtained 0 points, and the trees with rich seed yield obtained 5 points. The trees with no seed yield (0 points) were not included in this analysis. The fruits were collected in the autumn (10 fruit groups from each of 14 individuals).
The morphometric analysis of fruit groups was performed in laboratory conditions (length and width of fruit groups were determined by millimetre paper measurements, and the number of capsules per fruit group was determined by counting). After that, the seeds were extracted and stored in glass jars, in a dry and dark place till the establishment of the experiment.
The light induced germination of Paulownia tomentosa (Thunb.) Steud. seeds was observed under exposure to fluorescent white light bulb (Philips 100w), and the chamber temperature was 21 ̊C. 400 seeds (4 x100) were placed on wet filter paper in each of 14 petri dishes. Filter paper was moistened with distilled water with Previcur energy 3ml/1l, to prevent the infestation of pathogenic species of the genus Fusarium. The dishes with seeds were imbibed in the chamber at the temperature of 21˚C. Seed germination started after 7 days, four days later than that reported by reference data. The analysis of empress tree seed germination lasted for 21 days, according to the standard procedure (Stilinović, 1985; Grbić, 2003).
The statistical analysis included: abundance of seed yield, mean value of fruit group length, fruit group width, number of capsules, number of seeds per fruit group, and the values of germination indicators. The data were processed using STATGRAPHICS Plus Programme and presented in Table 1. The results of seed germination were calculated using the formulas of germination indicators, after which the values were statistically processed.
RESULTS AND DISCUSSION
The species Paulownia tomentosa (Thunb.) Steud. was analysed at five sites in Belgrade: Banovo Brdo, Dorćol, Tašmajdan, Novi Beograd and Zemun. All the analysed trees at Banovo Brdo produced a very abundant seed yield which was scored with maximal points (5). At Dorćol, the trees were scored 1 and 5, so their mean seed yield score was 3. Five individuals in the Tašmajdan Park did not have yield. The seed yield of the trees at Novi Beograd was poor 1.75. In Zemun, seed yield of empress trees differed, so their mean score was 3.4. The seed yield of the following seven trees was maximal: 1, 2, 3, 4, 5, 8 and 21. The results of analyses of fruit characteristics and parameters of seed germination are presented in Table 1.

Eco-Ist’12, Ecological Truth, 30 May - 2 June 2012. Hotel “Srbija TIS”, Zajecar, Serbia
50
Based on the multiple scale analysis of fruit group length mean values, individual trees were classified into nine homogeneous groups. The highest value of fruit group length (46.65 %) is assigned to tree number 22, which belongs to homogeneous group a. Tree number 23 (45.45 %) belongs to the second homogeneous group ab (single overlapping). Tree 25 is in the third homogeneous group abv with two-fold overlapping (39.25 %). Tree no. 6 (38.35 %) is in the fourth homogeneous group bv with one-fold overlapping. Tree no. 24 is in the fifth homogeneous group abvgd (four-fold overlapping), mean value 37.75 %. The sixth homogeneous group vg with single-fold overlapping comprises tree no. 21 (34.6 %), and the seventh group gdđ with two-fold overlapping consists of trees no. 1, 8 and 17 (28.6-29.2 %). The eighth homogeneous group dđ with single-fold overlapping comprises the trees 2, 3, 4 and 5 (24.36-25.5 %). Tree no. 19 belongs to the ninth homogeneous group đ and its mean value is 17.67 %.
Tree number 19 has much lower value of fruit group length compared to other trees, and the best one was tree number 22. Table 1. Mean values of fruit characteristic and germination parameters
Tree number
Fruit group length
(%)
Fruit group width (%)
Number of capsules
(%)
Number of seeds per
fruit group (%)
Kt (%)
Ek (%)
SVTK (%)
Ik (%)
1 28,95 gdđ
16,1 gd
19,5 vgd
52 820,6 vg
94,25 ab
15,25 ab
12,62 ab
1191,75 ab
2 24,65 dđ
16,15 gd
18,6 vgdđ
34 183,6 gd
81,25 d
14,25 db
12,32 b
1000 đ
3 24,75 dđ
14,94 gd
11,37 dđ
29 883,8 gd
90,5 abv
10,75 bvgd
12,3 b
1114,5 bvg
4 24,36 dđ
16,21 vgd
15,14 gdđ
43 614,9 vgd
93,5 ab
16 а
12,77 а
1194,5 аb
5 25,5 dđ
15,71 gd
29,43 bv
49 404,1 vg
86,75 vgd
7 gd
11,92 v
1034,75 gdđ
6 38,35 bv
23,35 а
23,9 vg
53 918,7 vg
83,75 gd
8 vgd
12,3 b
1030,75 dđ
8 28,6 gdđ
18,3 bvg
21,0 vgd
48 454,4 vg
94,25 ab
12,75 аbv
12,32 b
1164 аbv
17 29,2 gdđ
17,1 vgd
20,4 vgd
47 627,0 vg
96 а
7,75 gd
12,37 b
1189 аb
19 17,67 đ
10,83 d
2,67 đ
4 060,33 d
95,5 а
11,25 аbvg
12,5 аb
1195,75 а
21 34,6 vg
21,55 аbv
49,4 а
111 641,0 а
92,25 аbv
10,75 bvgd
12,57 ab
1159,5 аbv
22 46,65 а
22,2 аb
20,9 vgd
39 048,2 gd
87 vgd
6 d
11,57 v
1008,5 đ
23 45,45 аb
24,7 а
37,2 b
94 127,7 аb
90 аbv
14 аb
12,62 аb
1134,5 аbv
24 37,75 аbvgd
22,0 аbvg
10,5 vgdđ
23 059,0 gd
89 bvg
13 аb
12,42 аb
1106,25 vgd
25 39,25 аbv
24,05 а
26,8 bvg
69 657,8 bv
95,5 а
10,5 bvgd
12,55 аb
1198 а
Kt - germination capacity, Ek - germination energy, SVTK - mean germination time, and Ik - germination intensity. The symbols a, b, v, g, d, đ represent the classification to homogeneous groups.
Eco-Ist’12, Ecological Truth, 30 May - 2 June 2012. Hotel “Srbija TIS”, Zajecar, Serbia
51
Based on the multiple scale analysis of fruit group width mean values, individual trees were classified into eight homogeneous groups. The highest value of fruit group width (24.7 %) is attained by tree number 23, belonging to homogeneous group a which also includes trees 6 (23.35 %) and 25 (24.05 %). The second homogeneous group (one-fold overlapping) ab comprises the tree 22 (22.2 %). Tree no. 24 belongs to the third homogeneous group abvg with three-fold overlapping (22.0 %). The fourth homogeneous group abv with two-fold overlapping includes only tree no. 21 (21.55 %). Tree no. 8 is in the fifth homogeneous group bvg (two-fold overlapping), mean value 18.3 %. The sixth homogeneous group vgd with two-fold overlapping consists of trees no. 4 and 17 (16.21-17.1 %), and the seventh group gd with single-fold overlapping includes trees no. 1, 2, 3 and 5 (14.94-16.1 %). The eighth homogeneous group d includes tree no. 19 (10.83 %).
Tree number 19 attained a much lower value of fruit group width, compared to other trees. The best tree is number 23 whose homogeneous group also comprises trees no. 6 and 25, which also attained high values.
Based on multiple scale analysis of mean values of capsule numbers per fruit groups, individual trees are classified in ten homogeneous groups. The highest value of the number of capsules per fruit group (49.4 %) was attained by tree number 21 belonging to homogeneous group a. The second homogeneous group b includes tree no. 23 (37.2 %). Tree no. 5 is in the third homogeneous group bv with single-fold overlapping (29.43 %). The fourth homogeneous group bvg with two-fold overlapping consists of tree no. 25 (26.8 %). Tree no. 6 is in the fifth homogeneous group vg (one-fold overlapping), mean value 23.9 %. The sixth homogeneous group vgd with two-fold overlapping consists of trees no. 1, 8, 17 and 22 (19.5-21.0 %), and the seventh group vgdđ with three-fold overlapping includes trees no. 2 (18.6 %) and 24 (10.5 %). The eighth homogeneous group gdđ with two-fold overlapping includes tree no. 4 (15.14 %). Tree no. 3 belongs to the ninth homogeneous group dđ with single-fold overlapping, mean value 11.37 %. The tenth homogeneous group đ includes tree no. 19 with the lowest mean value 2.67 %.
Tree number 19 has a very low value of the number of capsules per fruit group compared to other trees, and tree number 21was the best with the highest number of capsules per fruit group.
Based on the multiple scale analysis of the mean value of the number of seeds per fruit group, individual trees were classified into seven homogeneous groups. The highest value of the number of seeds per fruit group (111,641.0 %) was reached by tree number 21 and it belongs to homogeneous group a. The second homogeneous group ab includes tree no. 23 with single-fold overlapping (94,127.7 %). Tree no. 25 is in the third homogeneous group bv with single-fold overlapping (69,657.8 %). The fourth homogeneous group with single-fold overlapping vg consists of trees no. 1, 5, 6, 8 and 17 (47,627.0 – 53,918.7 %). Tree no. 4 is in the fifth homogeneous group vgd (two-fold overlapping), mean value 43,614.9 %. The sixth homogeneous group gd with single-fold overlapping consists of trees no. 2, 3, 22 and 24 (23,059.0 – 39,048.2 %), and seventh group d includes tree no. 19 (4,060.33 %).
Tree number 19 again has the lowest value compared to other trees, and the best tree is tree no. 21, with the highest number of seeds per fruit group.

Eco-Ist’12, Ecological Truth, 30 May - 2 June 2012. Hotel “Srbija TIS”, Zajecar, Serbia
52
After fruit collection and capsule cleaning, the germination of seeds of each individual was tested in laboratory conditions. The study parameters of seed germination were: germination capacity (Kt), germination energy (Ek), mean germination time (SVTK) and germination intensity (Ik). The classification was determined based on multiple scale analysis. The result of germination testing was that 90 % of seeds germinated in 21 days.
Based on the multiple scale analysis of the germination capacity mean value, individual trees were classified into seven homogeneous groups. The highest value of germination capacity (96 %) was reached by tree number 17 and also trees 25 and 19 showed no significant statistical difference (95.5 %) – so these three mean values are classified in the homogeneous group a. The second homogeneous group (one-fold overlapping) ab comprises the trees 1, 4 and 8 (93.5-94.25 %). Trees no. 3, 21 and 23 are in the third homogeneous group abv with two-fold overlapping (90-92.5 %). The fourth homogeneous group with two-fold overlapping bvg consists of tree no. 24 (89 %). Trees no. 5 and 22 are in the fifth homogeneous group vgd (two-fold overlapping), mean values from 86.75 to 87 %. The sixth homogeneous group gd consists of tree no. 6 (83.75 %), and the seventh group d is tree no. 2 (81.25 %).
Tree number 2 attained a far lower value compared to other trees. The study results show that tree number 17 had the best germination capacity.
Based on the multiple scale analysis of the mean value of germination energy, individual trees were classified into eight homogeneous groups. The highest value of germination energy (16 %) was attained by tree number 4 and it belongs to the first homogeneous group a. The second homogeneous group with single-fold overlapping ab comprises the trees 1, 2, 23 and 24 (13 - 15.25 %). Tree no. 8 belongs to the third homogeneous group abv with two-fold overlapping (12.75 %). The fourth homogeneous group with three-fold overlapping abvg includes only tree no. 19 (11.25 %). Trees no. 3, 21 and 25 are in the fifth homogeneous group bvgd (three-fold overlapping), mean value from 10.5 to 10.75 %. The sixth homogeneous group vgd includes tree no. 6 (8 %), the seventh group gd consists of trees no. 5 and 17 (7 – 7.75 %) and the eighth group d includes tree no. 22 (6%).
Tree number 22 has the lowest value compared to other trees. The study results show that tree number 4 has the best germination energy.
The seeds started germinating seven days after imbibition, although, according to references, germination starts 72 hours after swelling. Based on the calculation of the parameter Ek, it can be observed that almost the entire quantity of seeds capable of germination germinated within the period of ten days.
Based on the multiple scale analysis of the mean value of mean germination time, individual trees were classified into four homogeneous groups. The highest value of mean germination time (12.77 %) was reached by tree number 4 in the homogeneous group a. The second homogeneous group with single-fold overlapping ab comprises the trees 1, 19, 21, 23, 24 and 25 (12.42 -12.62 %). Trees no. 2, 3, 6, 8 and 17 are in the third homogeneous group b (12.3 -12.37 %). The fourth homogeneous group v consists of trees no. 5 and 22 (11.57 – 11.92 %). As the parameter of mean germination time SVTK is calculated by the same formula as SMK, except that the last day of germination analysis is denoted by zero, and not the day of the establishment of seed germination

Eco-Ist’12, Ecological Truth, 30 May - 2 June 2012. Hotel “Srbija TIS”, Zajecar, Serbia
53
test, the seeds with faster germination will also have a higher SVTK value. It is this difference that will be the reason of the opposite classification of mean SVTK values into homogeneous groups compared to SMK. Tree number 4 has the longest mean germination time, and tree no. 22 has the shortest mean germination time.
Based on the multiple scale analysis of the mean value of germination intensity, individual trees were classified into eight homogeneous groups. The highest value of germination intensity (1198 %) was reached by tree number 25, which together with tree no. 19 (1195.75%) makes the homogeneous group a. The second homogeneous group ab with single-fold overlapping comprises the trees 1, 4 and 17 (1189 -1194.5 %). Trees 8, 21 and 23 are in the third homogeneous group abv with two-fold overlapping (1134.5 - 1164 %). The fourth homogeneous group bvg with two-fold overlapping includes only tree no. 3 (1114.5 %). Tree no. 24 is in the fifth homogeneous group vgd (two-fold overlapping), mean value 1106.25 %. The sixth homogeneous group gdđ includes tree no. 5 (1034.75%), the seventh group dđ is tree no. 6 (1030.75%) and the eighth group đ consists of trees no. 2 and 22 (1000 – 1008.5 %).
Trees number 2 and 22 of the same homogeneous group, have the lowest values of germination intensity, and trees no. 19 and 25 have the highest germination intensity values.
CONCLUSION In the analysis of seed germination of 14 trees of the species Paulownia
tomentosa (Thunb.) Steud. at 4 localities in Belgrade, based on the analysis of seed yield abundance, empress trees cultivated at Banovo Brdo were identified as plus trees, but their values of other parameters for fruits and seed germination were at the average level.
Based on the comparative analysis of fruit group parameters, the trees cultivated in Zemun were singled out as elite trees, and tree no. 19 at Novi Beograd was the tree with the lowest viability. At the individual level, the following Empress Trees were singled out: 22 (with the highest fruit group length), 23 (with the highest fruit group width) and 21 (with the highest number of capsules and seeds per fruit group). Based on the results of quantitative and qualitative parameters representing the germination dynamics of 14 trees at four localities, it can be concluded that the seeds of the species Paulownia tomentosa (Thunb.) Steud. are positively photoblastic. Namely, light stimulates seed germination which is proved by high seed sensitivity to the effect of white light. A good germination percentage resulted seven days after imbibition under white light, which is a significant deviation from the reference data by which empress tree seeds germinate 72 hours after imbibition and exposure to light (Bonner, 1990). The following Empress Trees were singled out based on the comparative analysis of the analysed germination parameters: tree number 17 (the best germination capacity), tree number 4 (the highest germination energy), tree number 22 (the shortest mean germination time) and tree number 25 (the highest germination intensity).
Based on the study analyses at four localities in Belgrade, six trees were identified as plus trees: 21, 22, 23, 25, 4 and 17, therefore they are recommended as the best trees for future production of seedlings and tree breeding.

Eco-Ist’12, Ecological Truth, 30 May - 2 June 2012. Hotel “Srbija TIS”, Zajecar, Serbia
54
Acknowledgement
This paper was realized as a part of the project "Studying climate change and its influence on the environment: impacts, adaptation and mitigation" (43007) financed by the Ministry of Education and Science of the Republic of Serbia within the framework of integrated and interdisciplinary research for the period 2011-2014.
REFERENCES
1. Ocokoljić, M.: Najstarija stabla na zelenim površinama Beograda kao polazni materijal u proizvodnji sadnica ukrasnog drveća. PhD thesis. Šumarski fakultet. Beograd. 2006.
2. Stojičić, Đ., Ocokoljić, M., Obratov-Petković, D.: Adaptivnost Paulownia tomentosa (Thumb.) Sieb. et Zucc. na zelenim površinama u Beogradu. Glasnik Šumarskog fakulteta 101: pp. 151-162. 2010.
3. Stilinović, S.: Semenarstvo šumskog i ukrasnog drveća i žbunja. Univerzitet u Beogradu. Beograd. 1985.
4. Stilinović, S.: Proizvodnja sadnog materijala šumskog i ukrasnog drveća i žbunja. Univerzitet u Beogradu. Beograd. 1987.
5. Grbić, M.: Dormantnost i klijanje semena - mehanizam klasifikacije i postupci. Glasnik Šumarskog fakulteta 87: pp. 25-49. 2003.
6. Bonner, F. T.: Paulownia tomentosa (Thunb.) Sieb. & Zucc.--royal paulownia. http://www.na.fs.fed.us/pubs/silvics_manual/volume_2/paulownia/tomentosa.htm. 1990.

55
XX International Scientific and Professional Meeting
"ECOLOGICAL TRUTH" ECO-IST'12
30 May - 2 June 2012, Hotel “Srbija TIS“, Zajecar, SERBIA
VITALITY ANALYSIS OF NORWAY MAPLE (Acer platanoides L.)
IN PARKWAYS OF BELGRADE
Isidora Simovic1*, M. Ocokoljic2, D. Obratov-Petkovic2, D. Vilotić
2
1
Nemanjina 22-24, 11000 Belgrade, SERBIA Ministry of Education and Science scholar, Republic Of Serbia
2
Kneza Viseslava 1, 11030 Belgrade, SERBIA University of Belgrade, Faculty of Forestry,
ABSTRACT
Norway maple is an adaptive species suitable for urban areas. In Belgrade city center majority of parkway trees has been graded 4 for their vitality and decorative value, although in each street there is at least one tree with phytopathological and entomological injuries. The trees are up to 100 years old with height up to 18 m, and diameter at breast height up to 53 cm. Crowns shape are mostly oval. Results show that Norway maple is very suitable for parkways in urban coenoses. Superior trees could be used as material for vegetative propagation, as well as for their seeds.
Key words: Norway maple, trees in alleys, phenotype, adaptability, variability
INTRODUCTION Ecological importance and function of urban parkway trees is firstly to connect
variety of urban and suburban green spaces in unique system which greatly enlarges their influence on city's microclimate. Trees in alleys make an average air temperature lower, has hygienic role, increase relative air humidity, decrease mechanical wind power and noise and has aesthetic function (Anastasijević, 1979). Unfavorable environmental conditions require careful selection of species for the formation of linear populations in urban areas. Limitations are primarily increased levels of air pollutants, increased average air temperature (Yow, 2007), reduced relative air humidity (Changnon, 2003), increased cloudiness (Romanov, 1999). Trees in urban areas have also limited space for root growth, changed balance of air and water in soil and less nutrients (Anastasijević, 1979).
Acer platanoides L. (Norway maple) is famous for its attractive form, small number of entomological and phytopathological pests, adaptability to poor soil and resistance towards polluters (Nowak et el., 1990). Norway maple produces abundant fruit, has large photosynthetic potential, big leaves, is shade tolerant and has rapid growth (Kloeppel et al., 1995, Sanford et al., 2003). Among species: Alnus incana L.,

Eco-Ist’12, Ecological Truth, 30 May - 2 June 2012. Hotel “Srbija TIS”, Zajecar, Serbia
56
Salix caprea L., Prunus padus L., Pinus sylvestris L., Rhamnus frangula L., Picea abies Karst., Betula pendula Roth., Populus tremula L., Sorbus aucuparia L. and Acer platanoides L., unfavorable conditions showed the least influence on growth and development of Norway maple (Lehvavirta et al., 2002). Furthermore, if nutrition level decreases, leaves size do not change nor biomass reduces (Black-Samuelsson et al., 2003). These characteristic makes Norway maple very convenient species for urban parkways.
MATERIAL AND METHODS Objects of research are Norway maple trees in 23 streets in Belgrade city center.
Area is confined with streets: Cara Dušana, Džordža Vašingtona, 27. Marta, Ruzveltova, Bulevar Kralja Aleksandra, Beogradska, Nemanjina, Karađorđeva, Pariska and Tadeuša Košćuška.
During object recogniction, trees of Norway maple in alleys were noted and maped and were classified in phenotypes according to crown shape (round, oval, layered and vase). Age of Norway maple trees was determend according to information from literature and its assesement in the field.
Trees height is determined by ocular method - sighting. Diameter at breast height is determined by measuring trunk diameter at the height of 1,30 m. Vitality is evaluated based on the presence of witch`s broom, bark cancers, cracks on the bark, the symptoms of disease, wood-rotting fungi; and evaluation of decorative value according to shape of crown, height of branching etc. on scale 0 to 5. Zero representing tree of low vitality without aesthetic values and 5 represents tree of good vitality of extraordinary aesthetic values.
Descriptive statistics was used for the quantitive processing of biometric data.
RESULTS AND DISCUSSION In Belgrade city center the most common species of parkway trees is Norway
maple which form lines of trees in 23 streets. There are 1384 Norway maple trees in alleys which mostly build green lines made exclusively from one species except in Hilandarska, Lomina, Kraljice Natalije, Svetozara Markovića and Desanke Maksimović Street where apart from Norway maple, Tilia grandifolia Ehrh., Tilia argentea DC., Tilia parvifolia Erh., Fraxinus excelsior L., Acer pseudoplatanus L. and Aesculus hipposactanum L. are found. Trees form lines on both sides of the streets, one on each side of alley, except in Gospodar Jevremova, Cetinjska, Hilandarska, Topličin venac, Carice Milice, Kraljice Natalije, Lomina i Admirala Geprata where trees form line only on one side of the street.
Norway maple trees in alleys according to data from 1979. were 10 to 70 years old. Research showed that only several trees were replaced with young seedlings suggesting that nowdays trees age from 40 to 100 years. Taking this into account, it can be concluded that the avrage age of street trees is 65,5 years, hence around 30% of trees are at the age between 60 and 70 years. There are 3% of trees at the age of 100 years and 70% of trees are over 60 years old.

Eco-Ist’12, Ecological Truth, 30 May - 2 June 2012. Hotel “Srbija TIS”, Zajecar, Serbia
57
Height of Norway maple trees ranges from 2 m to 18 m. There are 74 trees 2 m high and only 10 are 18 m high. Majority of trees (162) are 10 m high which is at the same time the average height of Norway maple trees in alleys in Belgrade city center. Some injured trees are replaced with young seedlings so that in lines of trees 18 m high, trees of 2 m or 3 m can be found.
Diameter at breast height of Norway maple parkway trees in Belgrade city center ranges from 1 cm to 53 cm. There are 20 trees whose trunks has diameter of 1 cm and 1 tree with a diameter of 53 cm. Majority of trunks (97) has diameter 12 cm, and average value of trunk diameter is 14 cm, although only 27 trees has trunk of this diameter. Average values of trunk diameter at breast height ranges from 7 cm in Admirala Geprata Street where young trees build line of trees, to 23 cm in Skadarska and Lomina Street where trees are old and of poor vitality.
The vitality grades of the Norway maple trees in the researched area range from 1 to 5. There are 9 trees with graded 1 and 98 trees have grade 5. The majority of trees (635) have the vitality grade 4 and there are 509 trees with the average grade which is 3 so, in conclusion, the overall vitality of the Norway maple in Belgrade City center is good. The trees with the lowest average vitality grade (2) are in Skadarska and Lomina Street while trees in the majority of streets in the researched area have the highest average grade 4. However, a great number of old trees are damaged with a low chance of regenerating, mainly because of improper pruning, while phytopatological and entomological injuries are present on the trees in all the streets in the researched area. In some streets these injuries are found on only one tree (Studentski trg, Hilandarska) while they are very frequent in Skadarska and Lomina Street. Young trees are of good vitality and have a high grade of decorative value which influences the average grade of these two parameters.
The mark of decorative value of the Norway maple in the researched area ranges from 1 to 5. Grade 4 being the average. There are 11 trees with the grade 1, 146 with grade 5 and 577 trees with the grade 4. Average grade of decorative value is the lowest (2) for the trees in Skadarska and Lomina Street where the irregular shape of their crowns and numerous diseases and defects have nearly completely diminished their aesthetic value; the highest average grade 5 is in the Hilandarska Street where most of the trees have no defects, their crowns are roundish, branching is regular and their vitality is extraordinary. According to crown shape, i.e. the ratio of width and height of the crown, four phenotypes are distinguished. The research shows there are 423 trees with round shaped crowns, 797 with oval crowns, 107 with layered and 57 vase shaped crown. The roundish shape is typical of Norway Maple (Vukićević, 1996) and it implies the same width and height of the crown while other shapes differ from this habitat. Trees with roundish shaped crowns make for 31%. Crowns of oval shape are narrower than the typical habit and vase-shaped are, apart from lower width, characterized by less circumference at the bottom and greater circumference at the top of the crown. Layered crowns have the width typical for its species but their height is smaller than the height of the roundish shaped ones. Due to lack of space and light needed for formation of roundish shaped crowns, irregular crown shapes are formed. Hence, it is in narrow streets (such as one way streets) with high buildings where the oval shaped crowns are

Eco-Ist’12, Ecological Truth, 30 May - 2 June 2012. Hotel “Srbija TIS”, Zajecar, Serbia
58
formed due to the trees innate tendency to grow towards sunlight. There are 58% of trees of this type. In the streets where trees are densely planted, both the height and the width of the crowns are deformed. As a result of inability of trees to grow in width, vase shape is formed. This shape has the width of the crown greater at the top where enough space is provided for the side branches to be formed. This type of crowns represents 3%. Layered type crowns develop as a consequence of a damaged leading branch, i.e. its growth arrest, while the side branches continue to grow normally leaving the tree crown greater in width than in height. These represent 8%.
SUMMARY
The paper presents the general characteristics of the population of Norway maple parkway trees in Belgrade city center. Population genetic diversity has selective and technological advantages, reflecting at the same time their specific genetic potential. The level of variability and the existence of genotypes with significant production of certain features were determined by studying several morphological characteristics of Norway maple trees. Among evaluated parkway trees uniformity of ecological factors is assumed, and therefore proven individual variability can be attributed to genetic constitutions of test trees. The obtained results can be further used for the selection of genotype whose application is of great importance in landscape architecture, horticulture and forestry. Furthermore, they are a basis for fixating potential variability into free variability of Norway maple. Among Norway maple in parkways, there are certain superior trees distinguished by their good grades of vitality and decorative value. These can be used as a seed source and as material for vegetative propagation. Given the state of Norway maple trees in streets, this species has proved to be a good choice for alleys, and with other forms of urban green spaces, Norway maple in streets form stable and functional system of urban open spaces in Belgrade.
Acknowledgement
This paper was realized as a part of the project Establishment of Wood Plantations Intended for Afforestation of Serbia (31041) financed by the Ministry of Education and Science of the Republic of Serbia within the framework Technological development for the period 2011-2014.
REFERENCES
1. Anastasijević, N.: Starost stabala drvoreda duž ulica srednjeg dela Beograda, Magistarski rad, Šumarski fakultet, Beograd, 1979.
2. Yow, D.: Urban Heat Islands: Observations, Impacts and Adaptation. Geography Compass 1/6 (2007): 1227–1251, Blackwell Publishing Ltd, 2007.
3. Changnon, S. A. Jr.: Metromex. Meteorological Monographs 40, p. 181, 1981.

Eco-Ist’12, Ecological Truth, 30 May - 2 June 2012. Hotel “Srbija TIS”, Zajecar, Serbia
59
4. Romanov, P.: Urban influence on cloud cover estimated from satellite data. Atmospheric Environment 33, pp. 4163–4172, 1999.
5. Nowak, D., Rowntree, R.: History and range of Norway maple. J. Arboriculture 16: 296, 1990.
6. Kloeppel, B., Abrams, М.: Ecophysiological attributes of the native Acer saccharum and the exotic Acer platanoides in urban oak forests in Pennsylvania. USA. Tree Physiol. 15: 739 746, 1995.
7. Sanford, N., Harrington, R., Fownes, J.: Survival and growth of native and alien woody seedlings in open and understory environments. For. Ecol. Manag. 183: 377-385, 2003.
8. Lehvavirta, S., Hannu, R.: Natural Regeneration of Trees in Urban Woodlands. Journal of Vegetation Science, Vol. 13, No. 1, pp. 57-66, 2002.
9. Black-Samuelsson, S., Andersson, S.: The Effect of Nutrient Stress on Developmental Instability in Leaves of Acer platanoides(Aceraceae) and Betula pendula (Betulaceae). American Journal of Botany, Vol. 90, No. 8, pp. 1107-1112, 2003.
10. Vukićević, Е.: Dekorativna dendrologija, Šumarski fakultet, Beograd, 1996.

60
XX International Scientific and Professional Meeting
"ECOLOGICAL TRUTH" ECO-IST'12
30 May - 2 June 2012, Hotel “Srbija TIS“, Zajecar, SERBIA
DISTRIBUTION OF Acer L. GENUS IN VEGETATION OF SERBIA
Isidora Simovic1*, M. Ocokoljic2, D. Obratov-Petkovic2, D. Vilotic
2
1
Nemanjina 22-24, 11000 Belgrade, SERBIA Ministry of Education and Science scholar, Republic Of Serbia
2
Kneza Višeslava 1, 11030 Belgrade, SERBIA University of Belgrade, Faculty of Forestry,
ABSTRACT
Different environmental characteristics of Serbia are represented by vegetations of Subotica, Belgrade and Niš. It is found that species of Acer L. genus have high degree of presence in vegetation of these cities, but are not dominant. Species Аcer campestre L. is the most common in vegetation of Belgrade and Niš, and the next most common is Acer tataricum L. In Belgrade area, Acer platanoides L. is noted as the second most common species. Species of Acer L. genus are not present in potential vegetation of Subotica, and therefore hypothesis that environmental characteristics influence structure of natural vegetation is proven.
Key words: autochthonous dendroflora, Field maple, Tatarian maple, Norway maple, variability INTRODUCTION The vegetation of certain region consists of plant community (phytocoenosis)
that occur as a result of а long process оf mutual competition and adaptation as well as adaptation to habitat conditions (Tomić, 2004). Vegetation structure and characteristics of phytoceonosis depends on environmental factors and anthropogenic impacts. Natural potential vegetation develops in areas which are not modified by anthropogenic factors directly or indirectly, and is formed exclusively depending on climate, pedology and other environmental condition.
Basic principles of distribution of vegetation and flora in Serbia are determined by changes of climate and geomorfological characteristics moving from north to south and (to a lesser extent) moving from east to west. In the first case, relief and climate change significantly from continental and even pallid climate on the north to different types of mountain climate on the south and to those types with the growing influence of the south and submediterranean. In addition, the north is characterized by depression with the valleys of large lowland rivers, and the south is characterized by montane areas with low
There are many species of the genus Acer L. in Serbia: Acer platanoides L., Acer monspessulanumL., Acer obtusatum Wladst. et Kit., Acer campestre L., Acer
mountains massif ending with high mountains (Janković, 1984).

Eco-Ist’12, Ecological Truth, 30 May - 2 June 2012. Hotel “Srbija TIS”, Zajecar, Serbia
61
marsicum Gussone, Acer pseudoplatanus L., Acer tataricum L., as well as endemics of Balkan peninsula Acer intermedium Panč. and Acer heldreichii Orph. (Vukićević, 1996).
Bearing this in mind, this paper presents the results of analysis of presence of Acer L. species in potential vegetation of Serbia, because these type of exploration are prerequisite for determining biological, and later breeding and decorative characteristics of autochthonous trees in order to continue with their growing in cultures, plantations and green areas of cities.
MATERIAL AND METHODS Floristic material includes regions and coenosis in Serbia in which
autochthonous species of Acer L. genus are found. Exploration of potential vegetation were conducted according to Braun-Blanquet floristic-ecological principles, which suggests existence of 5 basic biomes and 4 elementary biogeografical provinces (Gajić, 1961). To determine the distribution of species, quantitive and qualitive analysis of many stands were conducted (storey, periodicity, vitality, phenotypes, abundance, dominance, sociability and frequency), and obtained data were synthesized.
Abundance, dominance and sociability are presented in tables (Arabic numbers from 5 to 1 or sign + are written with species name when making phytocoenological shot). The species gets number 5 regardless of the number of the individuals if it covers 75-100% of the area, and sign + gets the species which occurs with small number of the individuals or its dominance is negligible (<1%). Sociability is also graded with Arabic numbers. Number 5 gets the species which grows in large groups and number 1 if it grows individually (Tomić, 2004).
Phytocoenological shots were taken on areas of 200m2 to 1200m2, and most commonly on areas of a couple of acres. Mandatory elements of phytocoenological shot are: ordinal number, date, phytocoenosis provisional designation, the size of the surface in m2
, locality, basic environmental conditions (orographic and edaphic), observations on preservation, age and origin of the stand, data about structure of each story, list of species for each story and for each species combined grade of abundance, dominance and sociability. After taking at least 10 shots, phytocoenological table is made. Degree of presence is determined by synthesizing data from tables. Degree of presence is presented according to scale: V - species present 80-100% and I - species present 1-20% (Tomić, 2004).
RESULTS AND DISCUSSION Cities Subotica, Belgrade and Niš are chosen as representatives of different
climate and geomorphological characteristics, hence the presence of species of the genus Acer L. were noted and analysed in their potential vegetations.
Phytocoenosis of Subotica are: : Crataego nigrae - Populetum albae Par. 1972, Populetum albae Jovanović et al. 1985, Salicetum albae - fragilis Soo (1933) 1958 and Salicetum cinereae B. Jov. 1953., which are typical for conditions of high soil humidity unfavorable for species of Acer L. genus (Janković et al., 1984). Therefore, species of Acer L. genus are not registrated in potential vegetation of Subotica.

Eco-Ist’12, Ecological Truth, 30 May - 2 June 2012. Hotel “Srbija TIS”, Zajecar, Serbia
62
There are no plant communities with edificators from the genus Acer L. in Belgrade area, but there are phytocoenosis in which these species occur with oaks and beeches. Аcer campestre L., Acer tataricum L. and Acer marsicum Gussone occur in phytocoenosis Quercetum frainetto-cerris Rudski (1940) 1949 s. l. (Jovanović, 1997). In phytocoenosis Robori-Quercetum frаinetto-cerris (Slav. 1952) Jov. et Tom. 1978. besides English oak and Turkey oak, Acer campestre L. dominates. Field maple occurs in phytocoenosis Rusco aculeati - Quercetum frainetto-cerris (Rud. 1940) B. Jov. (1951) 1979. (which is widespread on Avala and in Košutnjak). Acer platanoides L. occurs in plant communities Tilio - Fagetum submontanum (Jank. et Miš. 1960) Mišić 1972. and Festuco drymeiae - Fagetum submontanum (Jank. et Miš. 1960) Mišić 1972. (Jovanović et al., 1997), but in these phytocoenosis is not dominant species (Table 1.). Table 1.
Presence of species of the genus Acer L. in the potential phytocoenosis of Belgrade
Phytocoenosis Parameter
Species Abundance and
sociability Dominance Degree of
presence Quercetum frainetto-cerris Rudski
Аcer campestre L. Acer tataricum L. Acer masricum Gussone.
+ + +
1 1 1
V IV I
Robori-Quercetum frаinetto-cerris (Slav. 1952) Jov. et Tom. 1978
Acer campestre L. + 2 III
Rusco aculeati - Quercetum frainetto-cerris (Rud. 1940) B. Jov. (1951) 1979
Acer campestre L. 1 2 III
Tilio - Fagetum submontanum (Jank. et Miš. 1960) Mišić 1972
Acer platanoides L. + 1 V
Festuco drymeiae - Fagetum submontanum (Jank. et Miš. 1960) Mišić 1972
Acer platanoides L. 1 2 III
Species from the genus Acer L. do not occur in phytocoenosis Quercion
petraeae-cerris Lakš. et Jov. 1980, Quercetum frainetto - cerris - virgilianae Jov. et Vuk. 1977, Salicetum albo-amygdalinae Slav. 1952, Salicetum triandrae Malc. 1929, Salicetum albae - fragilis Soo (1933) 1958, Populetum nigro-albae Slav. 1952, Populetum nigrae Jov. et Tom. 1979, Crataego nigrae - Populetum albae Par. 1972 and Populeto - Salicetum Rajev. 1949 which are also natural potential vegetation of Belgrade (Kojić et al., 1998).
Although they occur in great number of phytocoenological shots (relevés) (which indicates grade of degree of presence), the combined grade of abundance and sociability as well as grade of dominance show that species of maple genus are not dominant.
In plant communities in Niš area, the most common of all species from Acer L. genus is Acer campestre L.. It can be found in phytocoenosis Quercetum frainetto-cerris Rudski (1940) 1949 s. l., Carpino orientalis - Quercetum frainetto - cerris (Knapp 1944) B. Jov. 1953., Fraxino-Quercetum roboris Rud. (1940) 1949 s.l., as well as in Populeto - Salicetum Rjev. 1950 s.l. (Jovanović et al., 1997), in which Acer tataricum L. can also

Eco-Ist’12, Ecological Truth, 30 May - 2 June 2012. Hotel “Srbija TIS”, Zajecar, Serbia
63
be found (Table 2.). Both species are found in great number of phytocoenological shots but do not have high grades of dominance, abundance and sociability. Table 2. Presence of species of the genus Acer L. in the potential phytocoenosis of Ni
š
Phytocoenosis Parameter
Species Abundance
and sociability
Dominance Degree of presence
Quercetum frainetto-cerris Rudski (1940) 1949 s. l.
Acer campestre L. + 1 IV
Carpino orientalis - Quercetum frainetto - cerris (Knapp 1944) B. Jov. 1953
Acer campestre L. + 1 I
Fraxino-Quercetum roboris Rud. (1940) 1949 s.l.
Acer campestre L. 1 3 V
Populeto - Salicetum Rjev. 1950 s.l.
Acer campestre L. Acer tataricum L.
1 +
2 1
II I
Species of the genus Acer L. do not occur in phytocoenosis Quercion petraeae-
cerris Lakš. et Jov. 1980, Quercetum frainetto - cerris - virgilianae Jov. et Vuk. 1977, Quercetum frainetto - cerris physospermetosum (typicum Horv. 1946), Quercion frainetto Ht. 1954, Hyperico androsaemi - Fagetum submontanum Vukić. (1966) 1970 and Salicetum cinereae B. Jov. 1953. which are also natural potential vegetation of Niš (Kojić, 1998).
SUMMARY By comparative analysis of potential vegetation in Serbian cities: Subotica,
Belgrade, Niš it is determined that species of the genus Acer L. have high degree of presence in Belgrade and Niš but they are not dominant species; and these species were not found in phytocoenosis of Subotica.
The wide ecological amplitude of Аcer campestre L. is confirmed and this is the most common maple species in potential vegetation of Belgrade and Niš.
It is also confirmed that species Acer tataricum L. occurs in area of Belgrade and Niš but is frequent in phytocoenosis of potential vegetation in Belgrade area, while in Niš area occurs with a low degree of presence. This type of distribution of Acer tataricum L. is expected given the lower ecological range than the range of Field maple and similarities and diversities of ecological conditions in Belgrade and Niš area.
Acer platanoides L. is noted as the second most important accompanying species in Belgrade phytocoenoses where it has high degree of presence. Norway maple occurs in specific edaphic and climate conditions characteristic only for this area and therefore is not noted in plant communities of Subotica and Niš.
Acknowledgement
This paper was realized as a part of the project Establishment of Wood Plantations Intended for Afforestation of Serbia (31041) financed by the Ministry of Education and Science of the Republic of Serbia within the framework Technological development for the period 2011-2014.

Eco-Ist’12, Ecological Truth, 30 May - 2 June 2012. Hotel “Srbija TIS”, Zajecar, Serbia
64
REFERENCES
1. Tomić, Z.: Šumarska fitocenologija, Šumarski fakultet, Beograd, 2004. 2. Јanković, М.: Vegetacija SR Srbije Opšti deo, Srpska akademija nauka i
umetnosti, Beograd, 1984. 3. Vukićević, Е.: Dekorativna dendrologija, Šumarski fakultet, Beograd,1996. 4. Gajić, М.: Fitocenoze i staništa planine Rudnik i njihove degradacione faze:
doktorska disertacija, Glasnik šumarskog fakulteta br. 23, Beograd, 1961. 5. Janković, М., Pantić, N., Mišić, V., Diklić, N., Gajić, М.: Vegetacija SR Srbije
I, Srpska akademija nauka i umetnosti, Beograd, 1984. 6. Jovanović, B.: Vegetacija Srbije II, Srpska akademija nauka i umetnosti,
Beograd, 1997. 7. Jovanović, B., Mišić, V., Diklić, N., Vukićević, Е.: Vegetacija Srbije II, Srpska
akademija nauka i umetnosti, Beograd, 1997. 8. Којић, М., Popović, R., Karadžić, B.: Sintaksonomski pregled vegetacije
Srbije, Institut za biološka istraživanja "Siniša Stanković", Beograd, 1998. 9. Коjić, М.: Sintaksonomski pregled vegetacije Srbije, Institut za biološka
istraživanja "Siniša Stanković", Beograd, 1998.

65
XX International Scientific and Professional Meeting
"ECOLOGICAL TRUTH" ECO-IST'12
30 May - 2 June 2012, Hotel “Srbija TIS“, Zajecar, SERBIA
STATE OF QUERCUS ROBUR FORESTS IN NATURAL
MONUMENT “ROGOT”
Vladan Popovic1, I. Bjelanovic2, T. Cirkovic-Mitrovic1
Lj. Brasanac-Bosanac,
1*, A. Lucic1, D. Jokanovic
2
1Institute of Forestry, Kneza Viseslava No. 3, Belgrade, SERBIA 2
University of Belgrade, Faculty of Forestry, Kneza Viseslava No. 3, Belgrade, SERBIA
*
ABSTRACT
Quercus robur forest inside natural monument “Rogot” is one of the greatest areas of this forest type in Serbia southern from the rivers Sava and Danube. This natural monument is located in Batocina area and there is a group of Alno-Quercion roboris forest. There are analyzed ecological conditions and parameters of development and production at Fraxino-Quercetum roboris typicum forest. This forest is 76 years old, with 213 trees per ha, cross-section surface of 28.8 square meters per ha, volume of 432.505 m3 per ha and volume growth of 7.7 m3 per ha. As typical and rare forest in area of Sumadija, it is protected, which gave a possibility of biodiversity conserving and determining a real strategy for its developing.
Key words: natural monument Rogot, Quercus robur, forest structure
INTRODUCTION
Natural monument Rogot was firstly protected in 11.11.1971- that was suggestion of Institute for Nature Conservation of Serbia. On the base of law about protection natural environment, this area belongs to the third grade of protection, which means limited using of natural raw materials and strictly controlled activities in this space.
Batocina Parliament made a decision about protection this natural monument, so this Quercus robur forest is protected as a significant natural fortune.
The aim of this work is to explain why it is so important to protect it, to indicate producing potential of this forest and to emphasize the importance of biodiversity conserving. Some other authors tried to solve the same problems, [1], [2], [3], [4], [5], and they deduced almost the same.
MATERIALS AND METHODS
Natural monument Rogot is located in Central Serbia, Great Pomoravlje area, 15 km far away from Kragujevac – north-eastern direction – and just 3 km far away from

Eco-Ist’12, Ecological Truth, 30 May - 2 June 2012. Hotel “Srbija TIS”, Zajecar, Serbia
66
Batocina, close to the railway Lapovo-Kragujevac and highway Belgrade-Nis. It’s about 1 km far away from highway Belgrade-Nis, and about 4 km from the river Big Morava. This complex is located between 44 07’50’’ and 44 09’00’’ of northern geographic width and between 18 44’50’’ and 18 46’50’’ of eastern geographic length from Paris. Positions of a central place are X=48 08 500, 48 08 900 and Y = 75 30 750, 75 31 175.
The whole surface is a bit flat, with an average height from 105 till 116 meters. This area is characterized with continental climate, with an average air temperature on annual basis 10.9 C, average rainfalls quantity on annual basis 633 mm, and there is so often windy.
Collecting of all necessary dates was performed in spring 2009. There were seven fields on the whole ground, dimensions 50*50 meters [6]. All trees were measured, diameter on 1.3 meters height was determined with accuracy of 1mm, heights were determined with accuracy of 0.1 meter by device for height measurements Vertex III, and all dates were done with computer program Statgraph 6.0.
RESULTS AND DISCUSSION
This type of forest is located on non-carbonate ground, in the lowest and wettest part of this complex. Greater part of this area is covered with Fraxino-Quercetum robori typicum forest, with height between 105 and 108 meters. The ground is mainly flat with some surfaces whose wettest parts keep the water when there is a big rainfalls quantity.
This forest is in the mid-period of its development. Quercus robur dominates here and builds forests with a high grade of stability. As for its dimensions, diameter on 1.3 meters height, and its heights, we can deduce that it’s completely well adapted to this type of habitat. These forests are characterized with lots of undergrowth plants.
As for the highest level of it, there is Quercus robur at the first place, and then come some other species such as: Fraxinus angustifolia, Populus alba, Ulmus effusa, Ulmus minor. Among undergrowths it is important to mention following species: Crataegus oxyacantha, Crataegus monogyna, Cornus mas, Cornus sanguinea, Viburnum opulus, Lysimachia nummularia, Lysimachia vulgaris, Carex remota, Agrostis alba, Agrimonia eupatoria. Table 1. Taxation value of fixed elements number T
god N kom/ha
dg (cm)
hg (cm)
G (m2
V /ha) (m3
Iv /ha) (m3
Dg /ha) (cm)
Hg (cm)
1. 65 184 43.1 26.3 26.8 387.769 7.1 52.5 27.4 2. 78 192 42.6 27.4 27.4 417.514 6.7 49.2 27.8 3. 78 192 42.9 27.4 27.8 423.141 6.8 49.5 27.9 4. 78 184 41.6 27.3 25.0 383.190 6.2 50.8 28.0 5. 78 188 44.1 27.8 28.7 437.611 7.0 50.8 28.0 6. 76 276 38.9 25.8 32.8 493.227 10.9 42.1 26.0 7. 76 276 39.0 25.4 32.9 485.086 9.3 43.5 26.8 X 76 213 41.7 26.8 28.8 432.505 7.7 48.3 27.4
T – forest age N – number of trees dg- diameter of a mid-tree hg – height of a mid-tree G – cross section surface per ha
V – volume per ha Iv – current volume growth per ha Dg – diameter of a mid-tree from 20 % the largest trees Hg – height of a mid-tree from 20 % the largest trees X – average values

Eco-Ist’12, Ecological Truth, 30 May - 2 June 2012. Hotel “Srbija TIS”, Zajecar, Serbia
67
On the base of these values we can deduce that these forests have a big potential, which is related to a big producing potential of the soil where they are located. This type of forest is characterized with smaller number of trees per ha, but these representatives have bigger dimensions at the same time, not only of diameter on 1.3 meters height, but also of heights. They also have a big current volume growth of about 7.7 m3 per ha, which gives an average volume of 430 m3 per ha. If we compare these values with average values for Quercus robur in Serbian [7] forests measured research – volume 312,3 m3/ha and volume growth 5,5 m3/ha -, and with values for Quercus robur forests in Srem - volume 500 m3/ha and volume growth about 9,0 m3
/ha [8], we can deduce about their great producing potential. Apart from this, these forests are in a good health condition, there is no presence of some harmful insects, which is a big difference from this type of forest in Srem where we have process of drying its [9].
Figure 1. Diameter structure
Real structure of this forest makes distribution of heights and diameters. It is close to Gauss distribution form, which characterizes the same age forests [9], [10]. However, it’s hard to find forests like these, so those distribution forms are just similar to Gauss. This complex is located at habitat of a big producing potential and there is one expressed maximum at 37.5 cm diameter grade[13], [14], [15].
0 5
10 15 20 25 30 35 40
22.5 27.5 32.5 37.5 42.5 47.5 52.5 57.5 62.5 67.5 d ( cm )
N ( % )

Eco-Ist’12, Ecological Truth, 30 May - 2 June 2012. Hotel “Srbija TIS”, Zajecar, Serbia
68
Figure 2. Height structure
Mid-heights of this forest are well-balanced with a producing potential of this
habitat [16]. There is a one height-maximum at the grade of 25.5 meters.
CONCLUSIONS
On the base of everything that’s already said, we can deduce: - Protection of this complex contributed keeping it in a good condition, then
building its stability and increasing its producing potential - Managing of it should be a good example how to balance sustainable
development with different protection grades - High producing values and a big stability of this ecosystem suggest coming
back Quercus robur forests to this are - Conducting of protection measurements should be balanced with Quercus robur
needs, which could prepare it gradually for process of natural reproduction - Inside form of these forests introduces a mixture of different factors - Less intensive working activities in this area affect very positive animal world - Because of increased presence of visitors, it’s necessary to organize some kind
of education and give them enough information in order not to endanger natural processes there.
0 10 20 30 40 50 60 70 80
16.5 19.5 22.5 25.5 28.5 31.5 h ( m )
N ( % )

Eco-Ist’12, Ecological Truth, 30 May - 2 June 2012. Hotel “Srbija TIS”, Zajecar, Serbia
69
REFERENCES
1. Bobonac, M.: Characteristics of structure and seed reproduction of Quercus robur in the nature reserve „Vraticna“, Nature conservation No. 50; 335-340, 1998.
2. Bobinac, M.,: Stand strukture and natural regeneration of common oak in the nature reserves „Vratična“ and „Smogva“ near Morović. Glasnik za šumske pokuse, Vol. 37, Zagreb 295-309, 2000.
3. Bobinac, M., Dabić, S.: Stand strukture in the oldest protected remains of Quercus robur in the nature reserves „Vraticna“ and „Smogva“, for forestry sciences. „Zasavica 2001“, Sremska Mitrovica 145-151, 2001.
4. Vukelić, J., Španjol, Ž.: Protected Quercus robur forests in Croatia – Monography “Quercus robur in Croatia”, Vinkovci-Zagreb 307-331, 1995.
5. Medarević, M.: Forests functions and providing within time of management , PHD, Faculty of Forestry, Belgrade University, 1991.
6. Banković, S.: Methods and techniques of scientific research, Faculty of Forestry, Belgrade University, 2003.
7. Banković, S., Medarević, M., Pantić, D., Sofrenić, V.: Characteristics of development and producing of Platanus forests at Quercus robur and Fraxinus angustifolia habitats, Bulletin of Faculty of Forestry, No. 84, 7–15, 2001.
8. Jović, D., Banković, S., Medarević, M.: Serbian forests - state, importance, possibilities – “Past, present time and future of Serbian forestry as a factor of Serbian development, DIT Srbije, 9–16, Belgrade, 1991.
9. Grbić, P., Jović, D., Medarević, M.: Drying of Quercus robur forests at Bosutski basen area, Bulletin of Faculty of Forest, No. 73, 1991.
10. Mirković, D., Banković, S.: Dendrometry, Faculty of Forestry, Belgrade University, 1993.
11. Stameković, V., Vučković, M.: Growth and production of trees and forest ecosystems, Faculty of Forestry, Belgrade Univeristy, 1988.
12. Jovanović, B., Domazet, Č.: Contribution to knowing of CARPINETO–QUERCETUM ROBORIS SERBICUM, Bulletin of Nature museum, book 34, 1979.
13. Medarević, M.: Planning of forests management, a book, Faculty of Forestry, Belgrade University, 2006.
14. Medarević, M., Banković, S., Pantić, D.: Characteristics of ecology and producing of different forests types, monography - “Hard metals in Serbian forests ecosystems”, Faculty of Forestry, Belgrade University, 2002.
15. Milojković, D., Jović, N., Jović, D.: Soil impact on Quercus robur production in Gornji Srem area, Academy of science and art in Bosnia and Herzegovina, special publications XXIII, department of scientific and mathematical sciences, book 5, Sarajevo, 1975.
70
XX International Scientific and Professional Meeting
"ECOLOGICAL TRUTH" ECO-IST'12
30 May - 2 June 2012, Hotel “Srbija TIS“, Zajecar, SERBIA
MAIN CHARACTERISTICS OF Chamaecyparis lawsoniana (MURR.) PARL.
AND ITS USAGE IN PLANTATIONS ON MONTANE BEECH FOREST SITES
Ivan Bjelanovic1, M. Perovic1, V. Popovic
2
1Faculty of Forestry, Kneza Viseslava No. 3, Belgrade, SERBIA 2
Institute of Forestry, Kneza Viseslava No. 3, Belgrade, SERBIA
ABSTRACT
Main biological characteristics of Port-Orford cedar (Chamaecyparis lawsoniana (Murr.) Parl.) are presented in the paper, as well as the results of the research of Port-Orford cedar plantation, established on site of the montane beech forest (Fagetum moesiacae montanum B. Jov. 1953). Port-Orford cedar is non- native conifer species in Serbia, which is used in reforestation on a couple of localities only, and on very small area. The knowledge about bioecological characteristics of this species in its native sites, as well as research of its stand state and realized production effects, are necessary for introspective of effects achieved by usage of Port-Orford cedar in plantations on suitable sites. The research of environment conditions and Port-Orford cedar stands state was done by setting of permanent sample plots in its plantation on Mt. Jelova Gora in western Serbia.
Key words: Chamaecyparis lawsoniana (Murr.) Parl., bioecological characteristics, stand state INTRODUCTION Reclamation of degraded forests can be carried out in accordance with different
methods based on direct and indirect conversion and their combinations. Radical measures of reconstruction used to be the most commonly applied methods in the past, which implied substitution of degraded and coppice forests with artificially established conifer stands.
The area of artificially established conifer stands in Serbia amounts to 124.800 ha or 5.54% of total forest cover [1], the most commonly were used Austrian pine, Norway spruce, Scots pine, silver fir, Macedonian pine and Serbian spruce, among native species, and Douglas fir, eastern white pine, European larch and Atlas cedar, among introduced species. Port-Orford cedar is non-native conifer species in Serbia, which is used in reforestation on a couple of localities only, and on very small area, and the data about its development and structural characteristics and productivity of this species in Serbia very sparse. For that reason the plantation on Jelova Gora Mt. represents very significant research object. The knowledge about bioecological characteristics of this species in its native sites, as well as research of its stand state and

Eco-Ist’12, Ecological Truth, 30 May - 2 June 2012. Hotel “Srbija TIS”, Zajecar, Serbia
71
realized production effects, are necessary for introspective of effects achieved by usage of Port-Orford cedar in plantations on suitable sites.
Conifer monocultures were mostly established on the sites of broadleaved species which affected the flora composition and diversity and caused soil degradation (acidification), which is the reason that, despite very good production effects, silvicultural goal in such situations is conversion of conifer plantations to indigenous broadleaved forests. The change of floristic composition, i.e. degradation is recorded in conifer plantations, which, in shade tolerant species causes pauperization- facies nudum [2].
MATERIAL AND METHODS Researh was conducted in Port-Orford cedar plantations in western Serbia, in
Jelova Gora Mt., which is management by forest enterprise „Užice“. Geologic bedrock is composed of schists and sandstones, and soil is acidic cambic with following characteristics: texture is loam to loam-sand, with good porosity, and good water-air characteristics, reaction is acidic to strongly acidic, saturation of bases is poor to medium, and humus supply is medium to strong. In Coenologically researched stand is on the site of montane beech forests (Fagetum moesiacae montanum B. Jov. 1953), with flora characteristic of siliceous bedrock and acidic soils: Luzula luzuloides (Lam.)Dandy et Wilmott, Rubus hirtus W. et K, Poa nemoralis L, Asperula odorata L, Mycelis muralis (L.)Rchr., Vaccinium myrtilus L, Viola silvestris Lam, Fragaria vesca L. etc. Establishment of Port-Orford plantation caused change and pauperization of floristic composition, resulting in lacking of many plant species characteristic of beech forests (facies nudum).
The analysis of meteorological data was done on the basis of ten years of stationary measurments (1993-2002) in polygon station on Jelova gora Mt, located at 833 m.a.s.l. [3]. Average temperature in named interval was 9.5˚C. Average air temperature during vegetation period (April -September) is 15.5˚C. The warmest months are July and August, with average air temperature from 19.2˚C to 19.3˚C, and the coldest months are December and January, with average air temperature 0.4˚C and -0.1˚C. Average yearly precipitation is 786 mm. Total precipitation in vegetation period is 471 mm or 59.8%, which is very significant for the development of forest vegetation. Based on Thorntweite climate classification, the climate of researched area belongs to moderately-humide climate (type B2).
Stand state was analyzed by placing permanent sample plots at the plantation on the Jelova gora Mt. Research of stand state at the sample plot was based on the data that included measurement of basic elements of forest inventory to determine stand condition, collecting ecological characteristics necessary to define the site conditions and typology. Diameters of all trees over 7.5 cm D.B.H. were measured, its heights are measured also, and cores are taken from a certain number of trees in each diameter class 5 cm wide. Elements of stand conditions were calculated using Prodan's functions for the design of height curve, Schumacher-Hall’s function to calculate the volume, and diameter increment method to calculate the current volume increment. Also, mean diameters of the basal area of stands (dg) and the dominant tree (Dg) were calculated, and diameter structure elements are shown by the following statistical indicator:

Eco-Ist’12, Ecological Truth, 30 May - 2 June 2012. Hotel “Srbija TIS”, Zajecar, Serbia
72
arithmetic mean (da), standard deviation (sd), coefficient of variation (cv), variation width (vš), asymmetry coefficient (α3) and the coefficient of kurtosis (α4) [4]
.
RESULTS AND DISCUSSION BIOECOLOGICAL CHARACTERISTICS OF PORT-ORFORD CEDAR (Chamaecyparis lawsoniana (Murr.) Parl.) Port-Orford cedar is ditributed in western part of the USA, in soutwest Oregon
and northwest California, near Pacific coast. Elevations are between 0 and 1500 m.a.s.l., on isloated stands even to 1950 m [5]. Port-Orford cedar has best development in areas with lot of moisture in atmosphere and with wet soils, and it is usually confined to bottomlands or hills (below 500 m.a.s.l) [6, 7]. It grows most frequently on slopes, benches and gullies [8]. The climate characteristics on native sites are influenced by the vicinity of the Pacific ocean. Average yearly temperatures are between 10°C and 13°C. Winters are wet and moderately cold, and summers are warm and dry. Average yearly precipitation level is moderate to high and makes 1000 to 2200 mm. Only 5% of this amount falls in June, July and August, so the summers are characteristically dry. Snow cover doesn’t forms in sites near the coast, but mountain sites have regular snow cover of 1-2 m. The lowest recorded temperature in native Port-Orford cedar sites is -15°C, but soils are rarely frozen, minimal recorded temperature is -0,5°C. It is important to mention that almost all natural stands grow on sites which remain wet during dry summertime [5, 8].
Port-Orford cedar gros on various sites: sand dunes, moors, margins of intemittent streams, and drier sites on ultramafic rocks; and on productive soils on sedimentary rocks and diorite. It grows on soils in the orders Spodosols, Ultisols and Inceptisols. Soils vary from well developed, deep, productive to skeletal. Average depht to the surface of the C horizon ranges from 32 cm to 73 cm. Surface soils vary from sandy loam to clay in texture and often contain much gravel, cobble and stone. Their pH values range from 4,2 and 7,0 [8].
Port-Orford cedar rarely forms pure stands, it usually occurs in mixed stands with other conifers, where it can comprise up to 25% of the growing stock [9]. Most frequent associates are duglas-fir (Pseudotsuga menziesii (Mirb)Franco), sitka spruce (Picea sitchensis (Bong.)Carr), western hemlock (Tsuga heterophylla (Raf.)Sarg) and western redcedar (Thuja plicata Donn ex D. Don). These forests usually occur on colder aspects, norhern, norteastern and eastern [8].
Port-Orford cedar is winterhardy species, it can whitstand temperatures as low as -22°C. According to USDA frostresistent classification, it belongs to zone 7 [10], which coers lowland areas of Serbia also. It is shade tolerant species. It is not demanding in regards to soils, it thrives well on podzols, even on saline soils; provided enough moisture, it can grow well on calk soils also. Howerver, it develops best on deep, fresh soils rich in clay, especially if they are in wet climate. Its root system is strong, which makes it windfirm. It is sensitive to air and soil drought. It copes well with moderately

Eco-Ist’12, Ecological Truth, 30 May - 2 June 2012. Hotel “Srbija TIS”, Zajecar, Serbia
73
poluted air and traffic emisions, but grows poorly in heavily poluted areas [7, 8, 11]. It can partially withstand stagnant water [12].
Native deceases and insects rarely attack Port-Orford cedar and inflict only minor damage. Detrimental abiotic factors are drought and frost, to a smaller part cold, drying winds, as well as air polution. Young trees are sensitive to fire [5]. It can cuffer from windfalls [6]. However, it is hit by exotic fungus Phytophtora lateralis on its native sites. Since, the rejuvenation is disabled on many sites, this species is categorized as vulnerable species in IUCN red list of endangered species for the year 2010 [13].
Seed production starts when the tree is between 5. and 20. years old, years of good seed crops occur every 3 to 5 years, with anual medium to smal level of seed crops. Seedling are shade tolerant, they survive for the long time in the understory, and thay start to grow vigorously after reducing the canopy. However, if the canopy is very dense, the seedling are of low vitality and soon die out, and in young even-aged forests it doesn't form at all. Port-Orford cedar reproduces agressively from seed. It reproduces fast on burntover areas with equal aggressivity. On clearcuts it reproduces up to distances of 80 to 110 meters from seed source. It almost always reproduces generatively, vegetative reproduction occurs very rarely in natural conditions. However, Port-Orford cedar cuttings root with relative ease [5, 8].
It grows as a high tree, and reaches maximal heights 45 to 55 m (maximally 73 m with diameter of 4,9 m). It lives between 300 and 500 years [6], and the oldest trees reach up to 600 years [14]. Growth in youth is slow, than moderate [6, 11]. It takes between 14 and 31 year for rejuvenation to reach 1.3 m height, on clearcuts between 5 and 11 years [8]. The best heights are attained on soils rich in mineral maters. It reach 12 to 30 m of height in 100 godina. In Oregon 60 years old stands reach 23 m height, and 30 cm diameter. They produce about 900 m³ of wood per hectare and have annual increment 5-12 m³/ha in age between 36 to 44 years, i.e. 14-17 m³/ha in age 57 to 65 years. There are experimental Port-Orford cedar forest areas in many countries of temperate climate. It achieves good heights, but the overall yield is not higher than by main native tree species: Great Britain (50 years) height 18 to 27 m visine, annual increment 12-24 m³/ha; Belgium, Danemark (28-46 years) 5-13 m³/ha; New Zealand (38-78 years) 0,2-20 m³/ha [5].
Port-Orford cedar is very important as an ornamental species [11], and it is one of the most frequently grown ornamental species in North America and Europe [6]. First introduction to Europe was in 1854. [15], and there are now in Europe over 200 cultivars of this species [14].
There is some interest for growing of Port-Orford cedar in European forestry. In middle Europe, the productivity of Port-Orford cedar is lower than that of duglas-fir. It is suited to be planted on wet soils in which spruce suffers from wood rotting [12]. Maximal heights in Europe are half oh those in native sites. In England, a tree of 38 m height is measured. Average height increment is 35 to 40 cm, and young trees can grow up to 80 cm yearly [16]. In the territory of former Yugoslavia, near Nova Gorica, Slovenia, Port-Orford cedar in the age of 40 years had volume 437 m³/ha, height 13.2 m and annual increment 23,47 ha/m³, while average increment is 17,46 ha/m³ [9, 17]. It is frequent in parks of former Yugoslavia and Serbia, and it is vital, while it rarely occurs

Eco-Ist’12, Ecological Truth, 30 May - 2 June 2012. Hotel “Srbija TIS”, Zajecar, Serbia
74
in forest plantations. It is suitable for growth on stands of mesophilous forests in lower elevations [18].
STAND STATE OF Chamaecyparis lawsoniana (MURR.) PARL. PLANTATION ON JELOVA GORA Analysis of stand conditions was carried out on experimental fields located at an
altitude of 975 m, while its slope is around 5° and south-east exposure. The stand is aged 52 years. Canopy closure is dense. Based on the study of site conditions, climatic factors, soil and phytocoenological characteristics, the stand is typologically defined as artificially established stand of pačempres on the site of montane beech forest (Fagetum moesiacae montanum B. Jov. 1953 fac. nudum) on deep acid brown soil on schists
Basic information on stand state (table 1) indicate a total number of trees is 1650 per ha. All trees are distributed in diameter classes from 10 to 35 cm. Distribution maximum is in diameter class of 25 cm, with participation of 39.4%. Mean stand diameter is 25.3 cm with the average height of 21.1 m.
.
Table 1. Basic data on the stand state
Age (year) 52 dg 25.3 (cm) hg 21.1 (m) Dg 32.3 (cm) Hg 22.5 (m) No tree∙ha 1650 -1 basal area (m2∙ha-1 82.8 ) volume (m3∙ha-1 741.4 ) mean annual diameter increment 2.66 (mm) mean annual volume increment (m3∙ha-1 15.2 ) percentage of annual increment 2.05 (%) sd 5.5 (cm) cv 22.15 (%) Vš 24.1 (12.2-36.3) (cm) α -0.23 3 α 3.07 4
Diameter structure of analyzed stand has parameters that characterize typical
even-aged structure that is characteristic of monocultures (diagram 1). Wood volume amounts of 741.4 m3∙ha-1, mean annual volume increment 15.2 m3∙ha-1 and percentage of annual increment 2.05%. Distribution of volume per diameter classes coresponds to the distribution of trees, with maximum in diameter class of 30 cm with participation of 39,1%. High values of volume are the results of bioecological characteristics and production potential, as well as leaving out of tending measures, and are consistent with other results obtained with similar site conditions [17]. The results shows that the ability of Chamaecyparis, as introduced on montane beech forest site, shows very good production effects. Comparison of pačempres with other introduced conifers (Douglas

Eco-Ist’12, Ecological Truth, 30 May - 2 June 2012. Hotel “Srbija TIS”, Zajecar, Serbia
75
fir, Weymouth pine, Norway spruce, Serbian spruce, Austrian pine) in the same site conditions shows that there are significant differences compared to indigenous species, and that the results approximate to other introduced species.
0
10
20
30
40
50
10 15 20 25 30 35 40 45
diameter (cm)
N (%
)
N
V
Figure 1. Distribution of trees and volume per diameter classes
CONCLUSIONS The importance of this research, which refers to bioecological characteristics,
environment conditions and stand state in the artificially established stands of Chamaecyparis lawsoniana, would be reflected in selection of suitable tree species for the reconstruction and silvicultural measurements, which would have to be adapted to stand state and site conditions with the aim of improving the present state of the sites and better use of their production capacities. Also, these results represent first data about development and structural-productional characteristics of Port-Orford cedar plantations in Serbia and they are significant for the retrospective of effects, which are achieved bu using of Port-Orford cedar in plantation on montane beech site, as well as for the comparation with the other species on the same site. Generally, it could be concluded that under given beech site conditions, the production potential of Port-Orford cedar is more or less equal to other introduced species and significantly higher when compared with domestic conifers.
Acknowledgments This paper was realized as a part of the project TR31041
financed by the Ministry of Education and Science of the Republic of Serbia.

Eco-Ist’12, Ecological Truth, 30 May - 2 June 2012. Hotel “Srbija TIS”, Zajecar, Serbia
76
REFERENCES
1. Banković, S., Medarević, M., Pantić, D., Petrović, N.: Nacinalna inventura šuma Republike Srbije. UŠITS, Beograd, Šumarstvo br. 3: 1-16, 2008.
2. Cvjetićanin, R., Bjelanović, I.: Promene florističkog sastava u veštački podignutim sastojinama četinara na staništu planinske šume bukve na području Bukova. 9. Simpozijum o flori jugoistočne Srbije i susednih područja, Apstrakti. Niš, 1-3. septembar 2007, str. 69, 2007.
3. Stojanović, LJ., Krstić, M., Bjelanović, I., Vukin, M.: Uzgojne mere u kulturama crnog bora podignutim na staništu planinske bukve u zapadnoj Srbiji. UŠITS, Beograd, Šumarstvo br. 1-2: 57-72, 2009.
4. Stamenković, V., Vučković, M.: Prirast i proizvodnost stabala i šumskih sastojina. Šumarski fakultet, Beograd, 1988.
5. Zobel, D.: Chamaecyparis lawsoniana (A. Murr.) Parl. In: Schütt, Weisgerber, Schuck, Lang, Stimm, Rloff (eds.). Lexikon der Nadelbäume. Nikol Verlag. Hamburg; 117-123, 2008.
6. Harlow, W., Harrar, E., Hardin, J., White, F.: Textbook of dendrology. McGraw-Hill, Inc. 1996.
7. Jovanović, B.: Dendrologija. Šumarski fakultet Univerziteta u Beogradu. Str. 1-536. 2007.
8. Zobel, D.: Chamaecyparis lawsoniana (A. Murr.) Parl. Port-Orford-Cedar. In: Burn, R, Honkala, B. (eds.). Silvics of North America, Volume 1, Conifers. Agriculture handbook 654. United states department of agriculture; 88-96. 1990.
9. Vidaković, M.: Četinjače. Jugoslavenska akademija znanosti i umjetnosti, Zagreb i Sveučilišna naklada Liber, Zagreb, 1982.
10. www.conifers.org. The Gymnosperm Database. 11. Vukićević, E.: Dekorativna dendrologija. Šumarski fakultet, Univerzitet u
Beogradu. Str. 1-582. 1996. 12. Mayer, H.: Waldbau. Gustav Fischer Verlag. Stuttgart-New York. 1984. 13. www.iucnredlist.org. The IUCN red list of threatened species 2010. 14. Schütt, P, Schuck, H, Stimm, B. (eds.): Lexikon der Baum- und Straucharten.
Nikol Verlag. Hamburg. 2002. 15. Godet, J. D.: Bäume und Sträucher. Thalacker Medien. Braunschweig. 1999. 16. Mitchell, A.: Die Wald- und Parkbäume Europas. Paul Parey. Hamburg-Berlin.
1979. 17. Mikuletić, V.: Lavsonov pačempres (Chamaecyparis lawsoniana P.) pogodna
vrsta za očetinjavanje i plantažiranje. Šumarstvo 5-6; 271-280. 1962. 18. Jovanović, B.: Rod Chamaecyparis Spach. In: Sarić, M. (Ed.). Flora Srbije I.
Srpska akademija nauka i umetnosti, Odeljenje prirodno-matematičkih nauka; 224-227. 1992.

77
XX International Scientific and Professional Meeting
"ECOLOGICAL TRUTH" ECO-IST'12
30 May - 2 June 2012, Hotel “Srbija TIS“, Zajecar, SERBIA
BIOTECHNOLOGY IN BRYOPHYTE PROTECTION
Bojan D. Petrovic*
, N. Petrovic, M. Vujicic, A. Sabovljevic, M. Sabovljevic
University of Belgrade, Faculty of Biology, Institute of Botany and Botanical Garden ``Jevremovac``, Takovska 43, 11000 Belgrade, SERBIA
ABSTRACT Bryophytes are the second largest group amongst terrestrial plants, which counts approximately
25.000 species. Playing an important role in ecosystems they could be used in pharmacology, medicine and agriculture. Serbia has 167 threatened species, that is important to protect; particularly nowadays, when the environment is severely misbalanced. Herein, we present current advances in use of ex situ protection, predominantly methods facilitated by biotechnology application in plant material manipulation. Although not recognized, potential of this approach is respectable. It is important to emphasize each achievement in compiling knowledge of bryophyte biology and biotechnology, especially when it serves to protect genetic diversity.
Key words: biodiversity, bryophytes, biotechnology, ex situ conservation, in vitro propagation,
cryopreservation
INTRODUCTION Bryophytes (Bryophyta) are an evolutionary old division of plants, which
includes three main groups: hornworts (Anthocerotopsida), liverworts (Marchantiopsida), mosses (Bryopsida). They manifest a large promiscuity in their ecological niches – covering a wide spectrum of habitats, except in the marine ecosystems (sea).
The bryophytes are generally gametophyte-oriented; that is, the normal plant is the haploid gametophyte, with the only diploid structure being the sporangium in season. The bryophyte sporophyte remains attached to the gametophyte, and does not become a free-living plant, as in other land plants. As a result, bryophyte sexuality is very different from that of other plants. Bryophytes undergo two distinct stages of their life cycle: the haploid and diploid generations. When a spore is released, it germinates, forming the protonema, which is a photosynthetic filament of cells. As the protonema matures, it forms leafy buds, which form the leafy gametophores that produce the gametangia (antheridia or archegonia). These form at the apex of the stems and produce gametes. The male plants or plant parts produce antheridia, which produce thousands of sperm. Water is required for the sperm to be ejected. Stems that produce archegonia are

Eco-Ist’12, Ecological Truth, 30 May - 2 June 2012. Hotel “Srbija TIS”, Zajecar, Serbia
78
identified by the pointed apices of the leaves, which enclose the archegonia, containing an egg. The sperm produced by the antheridia must swim to the archegonia and down the neck canal in order to fertilize the egg. The start of the diploid (sporophyte) generation is marked by the formation of the zygote, which then develops into an embryo. The embryo grows a shoot apex, directly out of the archegonial neck, which grows to enclose the developing sporophyte, forming the calyptra. A capsule, called the sporangium, develops at the apex of the sporophyte. The sporangia contain sporogenous cells, which undergo meiosis, producing meiospores. This marks the beginning of the haploid gametophyte generation.
Bryophytes play a major role in terrestrial ecosystems. Even though they are rather small in size, their relative number compensates the net impact in total biomass. This makes them an important factor for preventing erosion in woods and swamps. Moss turfs could also be viewed as mini-ecosystems, providing microenvironment for small invertebrates and prokaryotes. Furthermore, bryophytes are very important as one of pioneer organisms inhabiting biologically empty space in the process of primary successions. They are also important in nutrient, water and carbon cycling on a large scale. Finally, due to their unique anatomy, some bryophyte species serve as good bioindicators, showing levels of pollution in observed area(s) of distribution.
It is suggested that mosses are the closest living relatives of the vascular plants (Goffient&Buck 2004). There are various estimates about the number of bryophyte living species, with the estimated number varying from 13.370 (Paton et al. 2008) through 15.000 (Schofield 2000), 16.236 (IUCN 2009) to over 20.000 and up to 28.000 (Sabovljevic&Sabovljevic 2008).
In Serbia bryoflora counts somewhat less than 500 species, of which: 78 liverworts and 419 mosses (Sabovljevic 2000, Sabovljevic&Stevanovic 1999). According to the Serbian and Montenegrin regional red list (Sabovljevic et al. 2004), 167 species are threatened, including one moss species that is reported to be extinct - Encalypta serbica. Besides that, Serbia has 36.92% of bryophytes threatened: 13 critically endangered, 21 endangered, 76 vulnerable, 53 low risk species, while for 23 taxa data is deficient.
As regards the use and application of bryophytes – it is not yet developed as it could be. Even though, there are and could be significant uses of bryoflora. Bryophytes are used in pharmaceutical products, in horticulture, for household purposes (Saxena&Hadinder 2004). Peat is a very promising substitute for conventional fuels, with a novel beneficial property – it is a clean-burning fuel (Glime 2007), while some peat mosses can be used for novel bioremediation strategies in eliminating acid and toxic heavy metal discharge, detergents, and dyes from the soil (Sabovljevic&Sabovljevic 2010). Mosses are often used to condition the soil; coarse textured mosses increase water-storage capacity, whereas fine-textured mosses provide air spaces (Ishikawa 1974). Compounds present in bryophytes have been investigated for antioxidative, anti-inflammatory, antimicrobial, antivenomous, anti-tumor and other biologically important activities (Dey and Jitendra 2012). Some bryophytes are found to hyperaccumulate metals (Dey and Jitendra 2012), while some can be used for monitoring the thickness of ozone layer (Glime 2007).

Eco-Ist’12, Ecological Truth, 30 May - 2 June 2012. Hotel “Srbija TIS”, Zajecar, Serbia
79
MATERIALS AND METHODS There is multiple importance of in vitro techniques for this type of applied
research. Depending on the goal of our research, we are able to optimize our experiment to favour the desired effects of in vitro manipulation on our specimens.
Generally, after collection of sample material, the sporophytes must be separated from the gametophytes and mildly sterilized. Then, samples must be subjected to cultivation. Different media compositions and combinations of nutrients are reported to be successful for usage (Sabovljevic et al. 2003, Duckett et al. 2004, Thelander et al. 2005, Sabovljevic et al. 2012). There should be special attention pointed to chemical properties of the medium (above all its pH). The cultures should be grown at optimal temperature, illumination and day/night regime. Effects of physical factors, especially light intensity and temperature and response on variable external conditions are species specific (Awasthi&Nath 2010).
Several possible factors that participate in dormancy in bryophyte’s spores have been already described (Sabovljevic et al. 2003, Silva et al. 2010) and therefore must be taken into consideration when designing experimental setup. In general, bryophytes prefer temperatures between 15 and 25 °C. Irradiance in laboratory conditions is often far below the intercepted by the majority of bryophytes in nature, but that level is sufficient for their optimal growth. (Duckett et al. 2004).
Plant growth regulators are important supplements of growth medium, because they can induce specific developmental stages. Auxins and cytokinins are commonly used in this type of procedure (Schumaker&Dietrich 1998, Cove et al. 2006). Gibberellic acid has shown positive effect on bryophyte morphogenesis in few examined species. (Sabovljevic et al. 2010).
Newly formed culture serves as a reliable donor of explants. These explants can be inoculated and further cultured in growth medium multiple times, and this process is called micropropagation (Benson 1999). Medium with all nutrients necessary can serve as plant storage for a determined period, which has been used as in vitro mid-term storage technique for ex situ preservation of endangered and rare species.
To avoid the genetic alterations that may occur in long tissue cultures storage, experimental protocols have been developed for the storage of germplasm at very low temperatures known as cryopreservation. (Benson 1999, Paunescu 2009). Multiple protocols are optimized and reported to be applicable for various experimental models (Pence 2008), some of which rely on the ability of abscisic acid as a growth regulator.
These protocols comprise several component parts, many of which interface with in vitro manipulations. Cryoprotection is the key step, together with the application of pre-treatment strategies, enabling the usage of cryopreservation for long-term storage in ex situ preservation. Reduction of moist is also significant stage in preparing plant material for cryopreservation. Bryophytes are easy to use because they survive loss of water more easily than other fragile plants. Both gametophyte and sporophyte are suitable for cryostorage, particularly gametophyte as highly regenerative tissue. Cryopreserving of bryophyte's spore still remains to be inquired (Pence 2008).

Eco-Ist’12, Ecological Truth, 30 May - 2 June 2012. Hotel “Srbija TIS”, Zajecar, Serbia
80
RESULTS AND DISCUSSION Many obstructing factors may interfere with our results. There (potentially) are
some problems we shall encounter when trying to gain a satisfactory result. The initial material must be sterile. For that purpose, better option is to use
sporophyte generation of plants. Complete sterilization of surface and later opening of capsule can provide sterile spores. Type and concentration of sterilizing agent can be crucial for final amount of viable initial material (Duckett et al. 2004, Sabovljevic et al. 2012).
After various manipulations and sterilization, the explant which is finally placed on the medium will inevitably contain stressed, damaged and dying cells (applicable for any kind of plant material). Dying of tissue may be prevented by the adding glutamine (Bergmann et al. 1997) or activated charcoal (Kikkert et al. 1996) to the culture medium. When the explants are placed at a low population density, the concentration of essential substances in the cells and in the medium shall also make culture development unfavoured, via activation of programmed cell death (McCabe et al. 1997). The population density is most often empirically adjusted.
Protocols for culturing are well established and they can be easily modified in order to satisfy specific requirements of cultured species. Ratio between auxin and cytokinin will determine the type of culture established. However, usage of plant growth regulators can provoke changes in genetic property of cultured sample. Therefore, it is necessary to limit addition of these regulators if the purpose of culturing is preservation of cultured species (Rowntree et al. 2011). Indirect pathway (via callus) should be avoided due to increased risk of somaclonal variation occurrence (Panescu 2009).
Cryoprotective pre-treatments are usually applied to germplasm before cryoprotection; they enhance survival when used in combination with other cryoprotective strategies, particularly those that have a purpose to avoid ice crystals formation. Improvements in cryopreserveative protocols enable appearance of many different methods of safely storaging plant material for long term. Complete procedures and description of these methods have been published (Engelmann 2004). However, there are bryophyte species vulnerable to desiccation. Future efforts should be dedicated to solve the problem of low surviving induced by stressful stage of preparing material for preservation (Duckett et al. 2004).
Bryophyte spores are likely adaptable to cryostorage, so spore cryopreservation should prove to be an efficient and stable method for storing a large amount of moss and liverwort genetic diversity with lowered costs (Pence 2008).
After the complete development of the plant in vitro, it is important to fulfil a process called acclimatization. This procedure helps plants to survive contrast between optimal conditions in the laboratory and severe conditions in natural environment, which is enormously important for reintroduction (Lynch 1999).
CONCLUSIONS The potential use of applied science for bryophyte protection and its
implications for agriculture and human health are still not explored as it could be.

Eco-Ist’12, Ecological Truth, 30 May - 2 June 2012. Hotel “Srbija TIS”, Zajecar, Serbia
81
Potential utilization of bryophytes for human use is not appreciated enough. Nevertheless, it may be immensely useful to try and make gene banks, in vitro cryopreservated and/or living collections, or spore collections of as many bryophyte species as possible, due to their massive importance for a number of processes in the ecosystems.
In vitro techniques were predominantly developed to manipulate with vascular plants, but later were successfully applied in bryology. Differences between possible techniques in these two groups come from specificities in anatomy and life cycle. In vitro cultures are strongly applicable for ex situ protection of bryophytes. Further work with protocols for cryopreserving spores and highly regenerative tissues are still explored and expected to continue improvement of the efficiency and expand the applicability with these procedures.
Even though, organised bryophyte conservation seems to be absent in Balkan countries, and general lack of awareness on this issue is apparent. Perhaps the most serious threat to bryophytes, and to the natural world as a whole, is the attitude many governments, businesses, and other groups with influential roles have towards environmental conservation, placing their economic development before any environmental concerns.
When we give something to the environment, the nature duly delivers back, as well as when we take something out of it. The technological progress made by the mankind have brought us into the position of seriously considering possible negative consequences of men activities on Earth and now we must realize the importance of sustainability, as one and only concept that is applicable to save the future. In the light of knowledge that we posses today – it is essential to redirect at least a part of our technological aspirations towards a more sustainable society, that makes it both in its development and protecting (or to say it more accurately: avoid endangering) exceptional values woven into biological diversity. Protecting rare biological species en general by use of biotechnology is and will continue to be a good example of the kind of behaviour future society must rely on in order to get any closer to sustainability.
Acknowledgement
This paper was supported by the Ministry of Education and Science of the Republic of Serbia, Project No. 173030.
REFERENCES
1. Goffinet B. and Buck W.R. (2004). Systematics of the Bryophyta (Mosses): From molecules to a revised classification. Monographs in Systematic Botany. Molecular Systematics of Bryophytes (Missouri Botanical Garden Press). ISBN 1-930723-38-5. 98: 205–239.
2. Paton A.J., Brummitt N.A., Govaerts R., Harman K., Hinchcliffe S., Allkin R., Nic Lughadha E.M. (2008). A working list of all known plant species – progress and prospects towards Target 1 of the Global Strategy for Plant Conservation. Taxon. 57: 1–10.

Eco-Ist’12, Ecological Truth, 30 May - 2 June 2012. Hotel “Srbija TIS”, Zajecar, Serbia
82
3. Schofield W.B. (2000). Classification and Number of Bryophyte Species. In: Hallingbäck T. and Hodgetts N. (eds). Status Survey and Conservation Action Plan for Bryophytes; Mosses, Liverworts, and Hornworts. IUCN, Gland, Switzerland. ISBN: 2-8317-0466-9. pp. 2-5.
4. International Union for Conservation of Nature. (2009). Numbers of threatened species by major groups of organisms (1996–2009). Available at URL: http://www.iucnredlist.org/documents/summarystatistics/2009RL_Stats_Table_1.pdf
5. Sabovljevic A. and Sabovljevic M. (2008). Bryophytes, a source of bioactive and new compounds. In: Govil J.N. and Singh V.K. (Eds.) Phytopharmacology and Therapeutic Values IV, the Series "Recent Progress in Medicinal Plants". Studium Press, Houston, Texas, USA. pp. 9-25.
6. Sabovljević M. (2000). Checklist of hepatics of the Federal Republic of Yugoslavia. Lindbergia. 25(2): 37–42.
7. Sabovljević M. and Stevanović V. (1999). Moss Conspectus of the Federal Republic of Yugoslavia. Flora Mediterranea. 9: 65–95.
8. Sabovljevic M, Cvetic T, Stevanovic V. (2004). Bryophyte Red List of Serbia and Montenegro. Biodiversity and Conservation. 13: 1781-1790.
9. Saxena D.K. and Harinder. (2004). Uses of Bryophytes. Resonance. 9(6): 56-65. 10. Glime J.M. (2007). Economic and Ethnic uses of Bryophytes. In: Flora of North
America Editorial Committee (Eds). Flora of North America: North of Mexico. 27(1): pp. 14-41. Oxford University Press, New York, ISBN-13: 9780195318234.
11. Sabovljevic M. and Sabovljevic A. (2010). Potentials of bryophytes for biotechnological use. In: Govil J.N. (Ed). Comprehensive bioactive natural products V.1 - Potential & Challenges. Studium Press, LLC, USA. pp. 211-233. ISBN: 1933699515.
12. Ishikawa I. (1974). Bryophyta in Japanese gardens (2). Hikobia. 7: 65-78. 13. Dey A. and Jitendra Nath D. (2012). Antioxidative Potential of Bryophytes:
Stress Tolerance and Commercial Perspectives: A Review. Pharmacologia. 3: 151-159. doi: 10.5567/pharmacologia.2012.151.159.
14. Sabovljevic M, Bijelovic A, Dragicevic I. (2003). In vitro Culture of Mosses: Aloina aloides (K.F.Schultz) Kindb., Brachythecium velutinum (Hedw.) B.S. & G., Ceratodon purpureus (Hedw.) Brid., Eurhynchium praelongum (Hedw.) B.S. & G. and Grimmia pulvinata (Hedw.) Sm. Turc. J. Bot. 23: 441-446.
15. Duckett J.G, Burch J, Fletcher P.W, Matcham H.W, Read D.J, Russell A.J, Pressel S. (2004). In vitro cultivation of bryophytes: a review of practicalities, problems, progress and promise. Journal of Bryology. 26: 3-20.
16. Thelander M, Olsson T, Ronne H. (2005). Effect of the energy supply on filamentous growth and development in Physcomitrella patens. Journal of Experimental Botany. 56(412): 653–662.
17. Sabovljevic A, Vujicic M, Skoric M, Bajic-Ljubicic J, Sabovljevic M. (2012). Axenically culturing the bryophytes: Establishment and propagation of the pleurocarpous moss Thamnobryum alopecurum Nieuwland ex Gangulee (Bryophyta , Neckeraceae) in in vitro condition. Pak. J. Bot. 44(1): 339-344.

Eco-Ist’12, Ecological Truth, 30 May - 2 June 2012. Hotel “Srbija TIS”, Zajecar, Serbia
83
18. Awasthi V. and Nath V. (2010). Effect of Some Physical Factors on Reproductive Behaviour of Selected Bryophytes. The International Journal of Plant Reproductive Biology. 2(2): 141-145.
19. Silva A.S.M, Pôrto K.C, Simabukuro E.A. (2010). Effects of Light and Nutrients on Different Germination Phases of the Cosmopolitan Moss Bryum argenteum Hedw.(Bryaceae). Braz. Arch. Biol. Technol. 53(4): 763-769.
20. Schumaker K.S. and Dietrich M.A. (1998). Hormone-induced signaling during moss development. Annual Review of Plant Physiology and Plant Molecular Biology. 49: 501-523.
21. Cove D, Bezanilla M, Harries P, Quatrano R. (2006). Mosses as model systems for the study of metabolism and development. Annu Rev Plant Biol. 57: 497–520.
22. Sabovljevic A, Sabovljevic M, Grubisic D. (2010). Gibberellin influence on the morphogenesis of the moss Bryum argenteum Hedw. in in vitro conditions. Arch. Biol. Sci. 62(2): 373-380.
23. Benson E.E. (1999). Cryopreservation. In: Benson E.E. (Ed). Plant Conservation Biotechnology. Taylor & Francis Ltd. London, UK. pp. 83-96.
24. Panescu A. (2009). Biotechnology for Endangered Plant Conservation: A Critical Overview. Romanian Biotechnological Letters. 14(1): 4095-4103.
25. Pence V.C. (2008). Cryopreservation of Bryophytes and Ferns. In: Reed B.M. (Ed). Plant Cryopreservation: A Practical Guide. Springer Science+Business Media LLC, Corvallis, OR, USA. Section II, pp. 117-140.
26. Bergmann B.A, Sun Y.H, Stomp A.M. (1997). Harvest time and nitrogen source influence in vitro growth of apical buds from Fraser fir seedlings. HortScience. 32: 125–128.
27. Kikkert J.R, Hubertsoule D, Wallace P.G, Striem M.J, Reisch B.I. (1996). Transgenic plantlets of chancellor grapevine (Vitis sp.) from biolistic transformation of embryogenic-cell suspensions. Plant Cell Reports. 15: 311–316.
28. McCabe P.P, Levine A, Meijer P-J, Tapon N.A, Pennell R.I. (1997). A programmed cell death pathway activated in carrot cells cultured at low density. The Plant Journal. 12: 267–280.
29. Rowntree J.K, Pressel S, Ramsay M.M, Sabovljevic A, Sabovljevic M. (2011). In vitro conservation of European bryophytes. In Vitro Cell.Dev.Biol.—Plant. 45: 55-64.
30. Engelmann F. (2004). Plant cryopreservation: progress and prospects. In Vitro Cell.Dev.Biol.—Plant. 40: 427–433.
31. Lynch P.T. (1999). Tissue Culture Techniques in In Vitro Plant Conservation. In: Benson E.E. (Ed). Plant Conservation Biotechnology. Taylor & Francis Ltd. London, UK. pp. 41-62.
84
XX International Scientific and Professional Meeting
"ECOLOGICAL TRUTH" ECO-IST'12
30 May - 2 June 2012, Hotel “Srbija TIS“, Zajecar, SERBIA
THE BOULDER VEGETATION OF MILJKOVACKA GORGE VALLEY
Milica Miljkovic*
, V. Randjelovic, N. Randjelovic
The Faculty of Science, Departman for Biology,
Visegradska 33, 18000 Nis, SERBIA *
ABSTRACT In this paper, the boulder vegetation of Miljkovacka Gorge is presented which consists of two
associations in the clints: ass. Micromerio-Parietarietum serbicae, ass. Nova, and at the rocks: ass. Ceterachi-Ramondietum serbicae R. Jovanović 1952.
Key words: the boulder vegetation, Miljkovacka Gorge INTRODUCTION
Miljkovacka Gorge, which flora and vegetation we explored from 2010. to
2011., is situated in Eastern Serbia, near Nis. It is bordered by Svrljiške Mountains – Kalafat (837 m high) and Kamenički vis (813 m high) from south and hillsides of Devica (1187 m high) from north and northeast, which belong to Carpathian-Balkan group of mountains. According to classification of N. Ranđelović and his associates (2009.) the Valley of Miljkovačka River belongs to area of Balkan Serbia.
Bela River that wells near mountain Devica and Kopaljkošarska River that wells near Kalafat meats each other near Popsica making Popšička River, which gets name Kravljanska River because it runs through Kravlje, and it changes name to Miljkovacka River when it’s running through the village Miljkovac, and near the village Mezgraja it ejects to Južna Morava as Toponicka River (171 m above the level of sea).
The geological basis of Miljkovacka Gorge and its banks consists of Mesozoic limestone, arisen in period of Palaeozoic and Mesozoic, like the other boulders on the mountains of East and Balkan Serbia. Besides them, the gneiss, phyllit, amphibolite, slate, sediment boulders (the tufa is the most representative near the springs and the metamorphic boulders like quartzite and marble also) can be found there. In the geomorphologic way, the Valley of Miljkovacka river is very rugged with numerous gorge-like and canyon-like types of relief, many caves, sub caves, the boulders with different condition, age and origin.
During the degradation of geologic basis by anthropogenic factor and ecological succession of floristic and vegetation processes, there are the pedogenetic processes also in the Valley of Miljkovacka River. According that, the soils of Valley of Miljkovacka

Eco-Ist’12, Ecological Truth, 30 May - 2 June 2012. Hotel “Srbija TIS”, Zajecar, Serbia
85
River can be classified at two categories: zoned and inter-zoned, which degradation goes with the vegetation degradation, so in this region the degraded cambisols and degraded grey forest soils can be found, where the vegetation of boulders and pastures can be developed.
In view of the fact that at this area, yearly, there are two extremely wet and cold periods (from January to May and from September to December) and one arid period during the summer, the flora distribution is justified, and the duration of vegetation period, the consistency and percent of some life forms also.
The area of Miljkovacka Gorge is not explored enough, and it was the object of interest by many explorers, like Spas Sotirov, who found at 1977. the new emplacement of endemic-relic plant Ramonda serbica in the Valley of Kravljanska River, that contributed to bigger concernment for new explorations by geomorphologist Ž. Martinović and botanist N. Ranđelović who visited this area at 1984. and next year, they published short paper about some botanic news.
THE SYSTEMATIC REVIEW OF LIMESTONE BOULDERS ASSOCIATIONS
The associations at clints and limestone boulders: Class Asplienetea rupestria Br.-Bl. 1934. Genus Potentilletalia caulescentis Br.-Bl. 1926. Nexus Micromerion cristatae N. et V. Ranđ. 2010. 1. Ass. Micromerio-Parietarietum serbicae , N.Ranđ.,V.Ranđ. et M.Milj.2011. Nexus Ramondion nathaliae Horvat 1935. 2. Ass. Ceteracho-Ramondietum serbicae R.Jovanović 1952.
THE DESCRIPTION OF ASSOCIATIONS
1.Ass. Micromerio-Pariterietum serbicae, ass. nova- zajednica bresine i srpske vijošnice
Nearby Kravlje, there are big limestone boulders on the right side of riverbank near the pastures, where the vegetation is developing at clints of rocks.
The vegetation like this we have found earlier in Jelasnicka Gorge where the similar boulders can be found, with similar vegetation at the clints and on the ledges.
We think that this is vegetation which was not described before, characterized by the species Micromeria cristata, that builds the limestone boulders association mentioned before with the species Parietria lusitanica f. serbica.
Besides them, there are next species: Alyssum saxatile, Sedum hispanicum, Dianthus petraeus, Silene flavescens, Asperula purpurea, Sedum dasyphyllum, Allium saxatile, Sesleria rigida, Linaria concolor, Artemisia alba, Melica ciliata, Sempervivum marmoreum, Draba aizoides, and some bushy species Cotinus coggygria, Rhamnus saxatilis, Syringa vulgaris, Coronilla emerus that present the elements of bushy vegetation in further progressive ecological succession at these habitats.
The association belongs to the class Asplienetea rupestria, the genus Potentilletalia caulescentis and new nexus Micromerion cristatae.

Eco-Ist’12, Ecological Truth, 30 May - 2 June 2012. Hotel “Srbija TIS”, Zajecar, Serbia
86
Table 1. Phytocoenotic table Ass.Micromerio-Parietarietum serbicae, ass.nova 1 2 3 4 5 6 7 8 9 10 11 Characteristic species of association: Kravlje Topilo Life
form Flora element
Micromeria cristata (Hampe) Griseb. 2 2 2 3 3 3 1 . . 1 1 H Bal-Anat Parietaria serbica Pancic 2 1 1 1 . 1 1 1 + . . H Med-As Micromerion cristata: Sedum dasyphyllum L. 1 2 2 1 1 1 + + + + + H subMed Alyssum saxatile L. 2 2 1 1 1 3 3 1 3 1 2 T Carp-Bal Silene flavescens Waldst. & Kit. 2 1 1 . 2 2 3 1 1 1 1 H Carp-Bal Asperula purpurea (L.) Ehrend. 1 2 . 2 2 2 3 . 1 + 2 H subMed Alyssum murale Waldst. & Kit. . . 1 1 1 1 1 . 1 1 2 H Euro-subMed Seseli rigidum Waldst. & Kit. 2 1 . . . + 1 3 . 3 . H subMed Dianthus petraeus Waldst. & Kit. 2 2 1 . . 3 + 1 . . . H Bal-Dac Linaria concolor Gris. . . + + + + . 1 . . . H Bal Allium saxatile Bieb. . . . . . . 1 1 . . . G Med-As Cephalaria flava (Sibth. & Sm.) Szabó . . . . . . 1 . . . . H Bal-End Draba aizoides L. . . . . . . 1 . . + . H Alp-Carp Asperula longiflora Waldst. & Kit. . . . . . . . . + 1 . H subMed Potentilletalia caulescentis Asplenietea rupestria:
Asplenium ceterach L. . . . . 1 + 1 . + + 1 Ch subMed Sedum acre L. 1 1 . 1 2 1 1 . . + 1 H Euro-Med Sedum ochroleucum Chaix + . . + . . . . + 1 1 H subMed Sedum hispanicum L. . + . 1 1 . 1 + . . + T Euro-Med Melica ciliata L. . . . + . . 1 1 1 . + H Euro-subMed Asplenium ruta-muraria L. . . . . + . . . + + + Ch Boreal Asplenium trichomanes L. . 1 . . . . . . . . . Ch Kos Festuco - Brometeae Petrorhagia saxifraga (L.) Link 3 2 2 2 2 2 1 3 . 1 + H subMed Allium flavum L. 1 . 1 . . + . . + + 1 G Med Centaurea micranthos + . . r + . . 1 + . + H subMed Satureja kitaibelii Wierzb. . . . . . 1 1 . . 1 + H Bal-End Acinos hungaricus (Simonkai) Šilic . . . . 1 . . . . . + H Pont-Med Stipa capillata L. . . . . . . . . . + + H Pont-Med Potentilla argentea L. + + . . . . . . . . . H SPont Festuca vallesiaca Schleich . . . + . . . . . . . H Euro-As Scabiosa columbaria L. + . . . . . . . . . . H Ilir-Ap Scabiosa ochroleuca L. . + . . . . . . . . . H Euro-Sib Sideritis montana L. . . . . + . . . . . . T subMed Artemisia alba L. . . . . . . 2 . . . . Ch subMed Festuco - Seslerietea Sesleria rigida Heuffel ex Reichenb. 3 . 2 . . . . . 3 . 2 H Carp-Bal Paronychia kapela . . . . . + . . . . . H subMed Carpinetum orientalis Syringa vulgaris L. . + . . . 1 1 1 1 . + P Carp-Bal Coronilla emerus L. 1 + 1 . . . . 1 . 1 1 Ch subMed Rhamnus saxatilis Jacq. . . . . . . + + . . + Ch Euro-Med Crataegus monogyna W. K. . . . r . . + . . . . Ch subBoreal Acer monspessulanum L. . . . . . . . . . + + P subMed Fraxinus ornus L. . . . . . . . . . + + P subMed Cotoneaster niger (Thunb.) Fries + . . . . . . . . . . Ch Euro-As Cotinus coggygria Scop. . . . . . . . . . . + Ch Med-As

Eco-Ist’12, Ecological Truth, 30 May - 2 June 2012. Hotel “Srbija TIS”, Zajecar, Serbia
87
Quercus pubescens Willd. . . . . . . . . . . + P Euro-subMed Prunus mahaleb L. . . . . . . . . . . 1 P Euro-Med Euonymus europaeus L. . . . . . . . . . . + Ch Euro-As Accompaniers: Sempervivum marmoreum Griseb. . . . . . + 2 . 1 + . H subMed Galium album Miller . . . . . . . 1 + + + H Euro-As Teucrium montanum L. . . . . + + . . 1 + . H subMed Euphorbia cyparissias L. . . . . + . . . . + + T Eur Coronilla varia L. . . . . . . . . . + + H Euro-Med Hypericum rumelicum Boiss. . . . . . . . . + + . H Bal Arenaria leptoclados (Reichenb.) Guss. . . + . . . . . . . . T Euro-As Xeranthemum annuum L. . . . . . + . . . . . T subMed Linaria vulgaris Miller . . . + . . . . . . . H Euro-Sib Carum carvi L. . . . . . . . 1 . . . T Euro-As Chelidonium majus L. . . . . . . . + . . . H Euro-As
Graph 1. The presence of flora elements of association Ass.
Micromerio-Parietarietum serbicae, ass.nova
The analysis of flora elements: In this association, and flora analysis shows that, we meet three groups of flora
elements. The first group is consisted of flora elements with Mediterranean designations: Mediterranean 2%, Sub-Mediterranean 30%, Euro-Mediterranean 9%, Euro-sub-Mediterranean 5%, Pont-Mediterranean 4%, South-Pont 2% and Mediterranean-Asian 5%, and the total is 57%. At first look, the presence of this group of flora elements is great, but this is normal because they grow in hilly regions, on limestone boulders at rocky basis that heats easily and more easily colds, so the temperature of the basis, i.e. of these plants habitats, extremely warm or extremely cold. If you look the habitat of this association, you see the degraded habitat of Mediterranean type, with small amount of soil covering, in the clints and ledges.
The second group is made by the flora elements of local area, Balkan flora elements: Carpathian-Balkan with 7%, Balkan (exact meaning of word) with 4%,

Eco-Ist’12, Ecological Truth, 30 May - 2 June 2012. Hotel “Srbija TIS”, Zajecar, Serbia
88
followed by: Balkan endemic species with 4%, Balkan-Dacia plant species with 2%, Balkan-Anatolian with 2%, Illyrian-Apennines with 2% and Alps-Carpathian with 2%.
The third group is made by the plants of colder northern areas that come to this habitat from north: European 2%, Eurasian 12%, Euro-Siberian 4%, Sub-Boreal 2% and Boreal 2%, and Cosmopolite with 2%.
Graph 2. The presence of flora elements groups in vegetation of association
Ass.Micromerio Parietarietum serbicae, ass.nova On the base of this analysis, we can conclude that the association belongs to
sub-Mediterranean phytocoenosises developed on extremely degraded limestone basis that is characteristic for warmer areas of East Serbia situated in the development zone of sub-mediterranean nexus Syringo-Carpinion orientalis, and it belongs to nexus Micromerion cristatae and to new association Micromerio-Parietarietum serbicae, which is developing on limestone boulders of lower hilly region of Balkan Serbia mountains, with characteristic species: Silene flavescens, Sedum dasyphyllum, Alyssum saxatile, A. muralis, Allium saxatilis, Cephalaria flava, Seseli rigidum, Draba aizoides, Asperula purpurea, Micromeria cristata and Parietaria lusitanica f. serbica.
Graph 3. The life forms presence at association Micromerio-Parietarietum
serbicae, ass.nova
As it’s shown on graph 3., hemicryptophytes dominate (H) and this shows that the described association is situated in zone of moderate-continental climate, and large presence of chamaephytes (Ch) points to the progressive successive processes to permanent stadium Carpinetum orientalis serbicum. The plants of this association live in condition of increased temperature and lower humidity for one part of vegetation season, the June, the July and the August, the summer period, and it is shown by percent of therophytes (T). The small number of phanerophytes (P) is effect of high level of basis degradation by anthropogenic-zoogenic factors, because the habitat of this phytocoenosis

Eco-Ist’12, Ecological Truth, 30 May - 2 June 2012. Hotel “Srbija TIS”, Zajecar, Serbia
89
is situated nearby pastures and the village Kravlje. The small percent of geophytes (G) is effected by the character of the ground itself, because it is made of boulder clints where is the small part of pedologic covers, which inhibits the development of sub-terrain vegetative organs, except the individuals adapting to these extreme conditions of life (for example, Allium saxatile). According that, the association Micromerio-Parietarietum serbicae is chamaephyte-hemicryptophytes.
2.
Ass. Ceterachi-Ramondietum serbicae R. Jovanović 1952
On the left side of the riverbank down to the village Kravlje, at the beautiful canyon, on the vertical limestone boulder, there is one of two tropic relict plants from the genus Ramonda-R serbica.
The endemic-relict species R. serbica is discovered firstly by the greatest Serbian botanist (1878)., and at Miljkovacka Gorge, as we mentioned before, it is noticed by S.Sotirov. And here, like at the others localities, which is described by (1952), it builds mentioned association with the species Ceterach officinarum.
In association, there are the next species also: Alyssum saxatile, Galium album, Asplenium ruta-muraria, Draba aizoides, Seseli rigidum, Sesleria rigida, Dianthus petraeus, Sedum ochroleucum, Cerastium banaticum etc.
The association belongs to the class Asplenietea rupestria, to the genus Potentilletalia caulescentis and the nexus Ramondion nathaliae.
CONCLUSION
1. Ass. Micromerio-Parietarietum serbicae is new association which belongs to new nexus Micromerion cristatae, to genus Potentilletalia caulescentis and to class Asplenietea rupestria, and the association Ceterachi-Ramondietum serbicae, belongs to nexus Ramondion nathaliae, and to the same genus and class.
2. The new association of East Serbia boulders is studied in detail, and the well known association with the species Ramonda serbica is just notified in Miljkovacka Gorge.
3. Until the ass. Micromerio-Parietarietum serbicae grows at clints of rocks, the ass. Ceterachi-Ramondietum serbicae, grows on the ledges of rocks at the canyons of East Serbia, higher than first association.
4. The both associations belong to hasmophyte vegetation of limestone boulders of Carpathian-Balkan mountain system, that is not explored well at area of Carpathian and Balkan Serbia. REFERENCES
1. Martinović, Ž., Sotirov., S., Ranđelović, N., 1985: Biljno-geografske karakteristike Miljkovačke klisure. Simpozijum Stogodišnjica flore okoline Niša. Niš, str.51-56.

Eco-Ist’12, Ecological Truth, 30 May - 2 June 2012. Hotel “Srbija TIS”, Zajecar, Serbia
90
2. Sotirov, S., 2011: Topilo i Provalija-bajka na domaku Niša. Manuscript. NIš Asov, B., Dimitrov, D. (ed).,Vasilev, R., Petrova, A., 2002: Konspekt na višata flora v Balgaria. Sofija.
3. Miljković M., 2011: Flora i vegetacija doline Miljkovačke reke 4. Sarić, M(ed)., 1986: Flora SR Srbije X. SANU Beograd. 5. Sarić, M.(ed)., 1992: Flora Srbije I (2.izd.) SANU Beograd 6. Josifović, M. (ed)., 1970-1977: Flora SR SRbije I-IX. SANU. Beograd. 7. Diklić, N., 1989: Životne forme biljnih vrsta I biološki aspect flore SR Srbije. In
Sarić, M., (ed). Vegetacija SR Srbije I. SANU. Posebna izdanja. Beograd. 8. Horvat, I., Glavač, V., Ellemberg, H., 1974: Vegetation Sudosteuropa. Gustav
Fischer Verlag. Stuttgart. 9. Mišić, V., 1981: Šumska vegetacija klisura i kanjona istočne Srbije. IBI Siniša
Stanković. Beograd. 10. Đorđević, V.,Ranđelović, N., Avramović, D., Lilić, A., 2006: Prilog vegetaciji
Leskovika. Ekološka istina 2006. Sokobanja. .

91
XX International Scientific and Professional Meeting
"ECOLOGICAL TRUTH" ECO-IST'12
30 May - 2 June 2012, Hotel “Srbija TIS“, Zajecar, SERBIA
THE WATERFALLS OF STARA PLANINA MOUNTAIN
AND THEIR PROTECTION
Miodrag Velojic
Zajecar, SERBIA
ABSTRACT
The waterfalls of Stara planina mountain are not as high and impressive as Victoria or Niagara falls, but in this area, there are more waterfalls than we have assumed. Unfortunately, we have not even heard for many of those waterfalls, and some of them have been discovered in the last few years. Waterfalls lovers claim that those waterfalls show their most beautiful side during spring and summer when there is a lot of water flowing through them. Some of those waterfalls are about 10-20 meters high, but there are several waterfalls that reach the height over 60 meters. Considering the fact that all of those waterfalls are inside the protected area “Nature Park Stara Planina” their ecological protection should be considered during the forthcoming tourist visits to Stara planina mountain.
Key words: Stara planina mountain, waterfalls, protection The Stara planina mountain is an exceptionally interesting natural and cultural
area in the border zone of Serbia and Bulgaria. Also known as the Balkan mountain (from which the Balkan peninsula got its name), the Stara planina mountain begins at the town of Zajecar and stretches across the municipalities of Knjazevac, Pirot and Dimitrovgrad and across the Republic of Bulgaria, all the way to the Black sea on the east. Its total length is around 530 kilometers. The highest peak in Serbia is Midzor (2169 m), while in Bulgaria the highest peak is Botev (2.376 m). As a complex morphological body, on the west side, it is bordered by the rivers Beli Timok, Trgoviski Timok and Visocica river, while the entire mountain range is intercut with many rivers and streams [1]. Because of the vast hydrographical net, this area has recently started to attract visitors due to its natural beauties located on rivers and streams. As those streams run through transversal valleys and contain a lot of water, they form many natural beauties, whose names are present in scientific literature as well as in the language of the native population (river, creek, stream, waterfall, whirlpool, cascade, waterfall…) Those natural beauties have primarily been described by the famous Serbian geographer Jovan Cvijic in the 19th century. He wrote that “in Eastern Serbia, waterfalls and cascades are located on small rivers and streams that run through karst terrains, where the main river produces much more erosion than smaller creeks and that leads to the

Eco-Ist’12, Ecological Truth, 30 May - 2 June 2012. Hotel “Srbija TIS”, Zajecar, Serbia
92
imbalance between the heights of river valleys” [2]. All the occurrences of falling water from river valleys, Jovan Cvijic has divided into two categories- those waterfalls where water crosses only one ledge during its fall (he calls those waterfalls skok, buk or ripaljka) and those waterfalls where crosses several descending ledges and forming cascades (which he calls slap). Both of those categories contain the following parts: ledge or several ledges (where the flowing water falls), bucnica ( the cauldron-shaped depression under the final ledge) and pljusak ( foaming water torrent which dissolves to drops after falling). The height of the waterfalls is usually around 5-15 meters, but there are some linked waterfalls which together form heights of over 60 meters.
There is not much scientific information about the waterfalls on Stara planina mountain. The existing data are often about the waterfalls which are in the proximity of roads or cultural monuments, while the information about the hidden interesting waterfalls can currently be found only on the internet [3]. The scientific literature doesn’t provide systematic and insightful information about their names, locations, characteristics and there are no suggestions for their protection. As all of these waterfalls and cascades are located in the basins of greater rivers, in this publication, the waterfalls are going to be classified according to the basins which contain them.
The basin of Beli Timok river contains the waterfall in Vlaski dol, the Saska River waterfall and the Suvodol Cascade. The waterfall in Vlaski dol is located less than 6 kilometers from the city of Zajecar in the southeastern direction. It is located in the northern part of Stara planina mountain, below the peak of Vrska cuka (692 m) and near the settlement of Prlita, in the karst valley of the Prlita stream, about 160 meters above the sea level. The waterfalls has 4 ledges with a total height of about 10 meters. The biggest and the most beautiful section is about 2 meters high. The Saska River waterfall is located about 14 kilometers from the city of Zajecar and it is near the settlement of Vratarnica, but it hasn’t been described in the scientific literature. It is located on the eponymous river, which flows down from the Stara Planina Mountain from the Bulgarian direction into the river of Beli Timok. Before the part of Saska river which is called Zli dol (evil valley), there is a vertical section about 5 meters high where the relatively beautiful waterfall appears during the periods of greater water level. Located deep inside the river valley, in the areas which people have deserted since the middle ages, this waterfall can be accessed only with the help of local guide. The largest and the most beautiful cascade in this area formed by the deposition of travertine in river bed is located in the upper part of Selacka reka (a tributary river to Beli Timok). Considering the fact that it is located near the monastery of Suvodol, it was named after that (The Suvodol Cascade). The source of the Suvodol river is located 42 meters upstream from the travertine accumulation and the monastery of Suvodol is located on one of the travertine terraces nearby. From the source of the river to the travertine accumulation water is transported through underground tunnels to the pond, from where it falls through cascades from the height of 38 meters. The travertine accumulation is about 70 meters wide and its diameter is approximately the same size as the diameter of the travertine terrace. The main section of the waterfall is separated by dense moss into several smaller torrents. The various forms of travertine deposits and the water flowing over the limestone contain a specific esthetic value, not only for the cascade, but for the whole travertine accumulation [4]. The genetic and esthetic characteristics of this

Eco-Ist’12, Ecological Truth, 30 May - 2 June 2012. Hotel “Srbija TIS”, Zajecar, Serbia
93
waterfall have made this waterfall become one of the protected geomorphologic creations in the Geo-heritage of Serbia [5].
The basin of Trgoviski Timok river contains the Buk waterfall and the Bigar cascade. The Buk waterfall has been described by Jovan Cvijic as the most typical erosive waterfall of its kind on Stara planina mountain. It is located on the Crni Vrh river (the tributary river to Trgoviski Timok river) which flows over amphibolite schists and whose river bed contains many rapids and smaller waterfalls in the part from the settlement of Crni Vrh to the settlement of Balta Berilovac. The Buk waterfall is 4 meters high and its water flow is divided into two parts- the larger amount of water falls into a deep pit covered with sand, while the other part of water pours down a less steep path at the right side of the main waterfall. One of the most recognizable and (according to Jovan Cvijic) one of the most beautiful waterfalls of Stara planina mountain is the Bigar cascade on the eponymous river in the territory of Stanjinac village. The streams appears below St.Onufrije monastery and it flows through the valley which is 1000 meters long and about 500-600 meters wide and it flows into the Stanjinac river (a tributary river to Trgoviski Timok river). The source of the river is located underneath the limestone section called Pajeski kamen “which separates from the limestone mountains of Orlja and Pajes”. (Cvijic, 1896) From the source to the mouth of the river, the valley is filled with travertine deposits which is over the limestone base in the upper part and over the sandstone base in the lower part of the river. The shallow sinuous river bed is located in the central part of the wide valley filled with travertine depostis and it is covered with abundant vert, so it hard to spot the river flow. At the place where this valley reaches the bigger valley of Stanjinac river, the water (divided into several cascades) falls from the height of 35 meters and creates a very beautiful cascade waterfall. The basin of Topli dol river (and Temstica river) contains the waterfalls Prskalo, Piljski skok, Cunguljski skok and Kurtulski skok. The road that leads from St.Djordje monastery (and the settlement of Temska) up the Temstica river goes through a beautiful canyon, which people sometimes call “The small Colorado” because of the impressive red rocks that form the canyon. Near the entrance to the canyon, on the right side of the road towards Bukovicki dol, there is a canyon-like section with a relatively small, but scenic waterfall. The waterfall is called Prskalo and its water falls from the height of about 10 meters and at the half of that height it hits a smooth rock and spatters intensely. Thus the waterfall justifies its name (prskati-spatter), but it also makes the surrounding rocks very slippery, so it is recommended to observe this waterfall from a distance. One of the biggest waterfalls of Stara planina mountain are located on the tributary rivers to Topli dol river. The most interesting of those waterfalls are Piljski skok, Cunguljski skok and Kurtulski skok. Piljski skok is the second highest waterfall in Serbia with its height of 64 meters. It is located about 8km east of the settlement Topli Do, on the river called Lisevsli dol, below the peak of Pilj (1467 m). It consists of two ledges- Upper and Lower Piljski skok. Due to its remoteness, it was discovered in 2002, before that, only indigenous population was aware of its existence. Cunguljski skok is located below the peak of Cungulj (1692 m), it is 42 meters high and it can only be accessed through mountain roads and paths from the settlement of Topli do (about 18 km). It has been discovered by a group of explorers in 1996. Kurtulski skok is located

Eco-Ist’12, Ecological Truth, 30 May - 2 June 2012. Hotel “Srbija TIS”, Zajecar, Serbia
94
in Krmoljski dol below the peaks of Ostra cuka (1318 m) and Cungulj (1692 m). It is 27 meters high and it is 12km away from the nearest settlement (Topli do). In the vicinity of these waterfalls, there are also waterfalls called Ciselski skok, Jerisorski skok and Vurnja. The basin of Visocica river contains the waterfalls Tupavica, Dragan waterfall, Bigar, Belsko Vrelo cascade, Crveni Breg waterfall, Kraijna waterfall, Tri kladenca waterfall, Orlov kamen waterfall, Kopren waterfall and Vodenicka reka waterfall near the settlement of Senokos in the municipality of Dimitrovgrad. Tupavica waterfall is not very high, but due to its esthetic values, it can be classified as one of the most beautiful waterfalls in Serbia. It is located on the small river called Lisevski dol (the tributary river to Dojkinci river) near the protected area of Arbinje. The waterfall is consisted of about ten ledges and it is 15 meters high. Although it is located only hundreds of meters from the road it is hard to find without the help of a guide. In the area of Arbinje (in the upper part of Dojkinci river) there are more smaller waterfalls and potholes in river bed (which are called kotlovi by the indigenous population). The most famous waterfall in that part of the river is located in the place called Draganov vir and it is called Dragan waterfall after the owner of that piece of land. The waterfall is about 6-7 meters high and it is located at the right side of the road which leads through Arbinje. Near the settlement of Paklestica, there is another waterfall called Bigar. It is currently not a well-known waterfall, but it certainly possesses distinctive esthetical values. It can be accessed by an old caravan road, which leads next to the ruins of an ancient city. The inhabitants of that city used to transport the water from the waterfall by large pipes and use it for drinking and other purposes. The height of the waterfall is around 10m and it is about half-hour walk away from the settlement of Paklestica, thus only adventurers and explorers visit this waterfall. The Belsko Vrelo cascade is located at the entrance of the settlement of Bela, only few meters below the eponymous karst spring. The legend says that the entire settlement got its name for the whiteness of the waterfall (belo-white). On the 12 kilometre from the town of Pirot to Stara planina mountain (and the settlements of Rsovci and Visocka Rzana) and 4 kilometres from “Stara” motel in the territory of the village of Krajinci, there is a beautiful waterfall trapped between huge rocks, called Kraijna waterfall. On the left side of the same road, but (farther up the road) between the villages of Rsovci and Visocka Rzana, in the periods of heavy rains and snow meltdown, Crveni Breg waterfall appears. Unfortunately, the water runs through this waterfall only at certain times of year and at that period it runs through the hole in red sandstones (after which it was named crveni breg - red hill) and pours down into the river of Visocica. The Tri kladenca waterfall was unknown to wider population all until 2010. It is located on the Dojkinci river (at the altitude of 1645 m) below the eponymous spring (Tri kladenca). On the right tributary river to Dojkinci river (in the area of Lisevski dol) there is another waterfall called Orlov kamen waterfall. It got its name because it is under the rocks where eagles nest (orlov kamen- eagle’s stone), it is about 20 meters high, and it has several ledges (the biggest vertical section is 8 meters high) and it is difficult to find because it is surrounded by dense spruce forest. The waterfall that is located the farthest from civilization is in the territory of the village of Senokos (the municipality of Dimitrovgrad) on the Vodenicka reka river (below the road to Srebrna glava) and above teh Ivkov vir spring. It is about 6 meters high and it is called

Eco-Ist’12, Ecological Truth, 30 May - 2 June 2012. Hotel “Srbija TIS”, Zajecar, Serbia
95
after the river (Vodenicka reka waterfall) or after the spring (Ivkov vir waterfall). The waterfall at the greatest altitude in Serbia is located in the basin of Jelovica river (on Dabidza stream) below the eponymous peak (Kopren, 1963 m) after which it is named Kopren waterfall. According to the measurements done by dr Sasa Milenkovic from the Karst Hidrogeology Center at The Faculty of Mining and Geology in Belgrade, this waterfall (which is located at the altitude of 1820 meters) can get the title of the largest waterfall in Serbia, because its total height (from the top to the bottom) is 103.5 meters, with several ledges and an average fall of 56.4 degrees. Below this waterfall, there is another one (not yet named) whose height hasn’t yet been measured, but according to visual estimation of the same scientist “ it is not less than 50-60 meters high”. All the mentioned waterfalls, because of their great sizes and esthetical values, are becoming a key destination for many mountain climbers and nature lovers in the past several years. An increasing number of tourist agencies and mountaineering associations already incorporate the visits to Stara planina mountain waterfalls in their routes and thus the number of visitors of these attractive natural destinations is getting larger.
The Stara planina mountain was proclaimed a Nature park in 1997 and in the area of the Park special sectors and protection categories were defined (Sl.glasnik RS, 115/08, Prostorni plan podrucja Stare planine i turisticke regije Stara planina, 2007). The first category of protection includes the parts of Visocica river, Topli dol river and Trgoviski Timok river basins and the second category of protection includes the parts of Temstica river and Beli Timok river basins. With the regime of protection in the Stara Planina nature park, the amount and different kinds af tourist exploitaions, infrastructural urbanism and other scenery changes have been defined. But, the intensive tourist activity in this area includes certain ecological risks (the water basins pollution and the change of landscape esthetics), and the incoming tourist exploitation will not sustain only on winter sports and recreational tourism, it is surely going to embrace using other natural values inside the defined preotected areas. A large number of tourist visits toward the attractive values of Stara planina mountain (like the mentioned waterfalls) and the construction of traffic and tourist infrastructure, is surely going to lead to the deterioration of the appearance and the authenticity of natural landscapes. The solutions to the negative effects of tourism can be formed in the mutual cooperation between national, regional and local community and also scientists, tourist operators and tourists, as with mutual partnership which builds the collective responsibility toward the sustainability of natural values and cultural inheritance of the specific tourist destination [6].

Eco-Ist’12, Ecological Truth, 30 May - 2 June 2012. Hotel “Srbija TIS”, Zajecar, Serbia
96
THE WATERFALLS OF STARA PLANINA MOUNTAIN
The Kopren waterfall The Bigar waterfall
The Suvodol cascade The Piljski skok waterfall
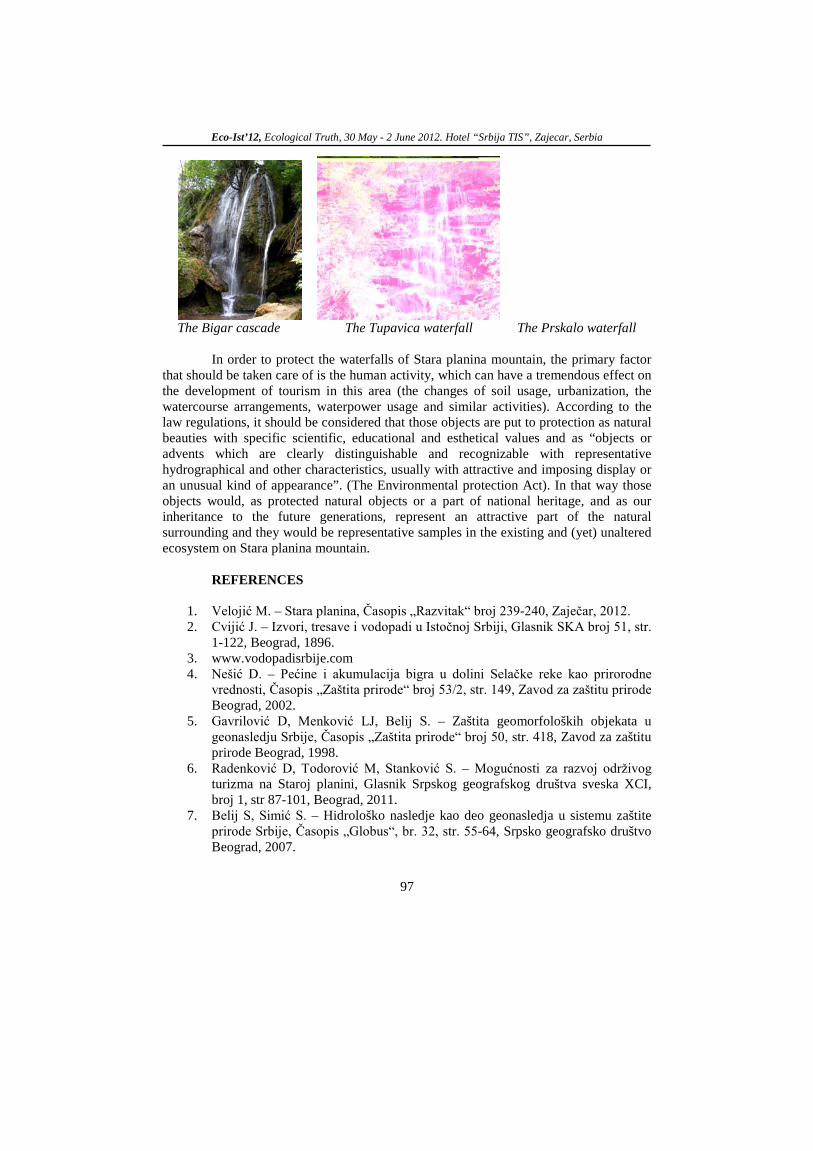
Eco-Ist’12, Ecological Truth, 30 May - 2 June 2012. Hotel “Srbija TIS”, Zajecar, Serbia
97
The Bigar cascade The Tupavica waterfall The Prskalo waterfall
In order to protect the waterfalls of Stara planina mountain, the primary factor
that should be taken care of is the human activity, which can have a tremendous effect on the development of tourism in this area (the changes of soil usage, urbanization, the watercourse arrangements, waterpower usage and similar activities). According to the law regulations, it should be considered that those objects are put to protection as natural beauties with specific scientific, educational and esthetical values and as “objects or advents which are clearly distinguishable and recognizable with representative hydrographical and other characteristics, usually with attractive and imposing display or an unusual kind of appearance”. (The Environmental protection Act). In that way those objects would, as protected natural objects or a part of national heritage, and as our inheritance to the future generations, represent an attractive part of the natural surrounding and they would be representative samples in the existing and (yet) unaltered ecosystem on Stara planina mountain.
REFERENCES
1. Velojić M. – Stara planina, Časopis „Razvitak“ broj 239-240, Zaječar, 2012. 2. Cvijić J. – Izvori, tresave i vodopadi u Istočnoj Srbiji, Glasnik SKA broj 51, str.
1-122, Beograd, 1896. 3. www.vodopadisrbije.com 4. Nešić D. – Pećine i akumulacija bigra u dolini Selačke reke kao prirorodne
vrednosti, Časopis „Zaštita prirode“ broj 53/2, str. 149, Zavod za zaštitu prirode Beograd, 2002.
5. Gavrilović D, Menković LJ, Belij S. – Zaštita geomorfoloških objekata u geonasledju Srbije, Časopis „Zaštita prirode“ broj 50, str. 418, Zavod za zaštitu prirode Beograd, 1998.
6. Radenković D, Todorović M, Stanković S. – Mogućnosti za razvoj održivog turizma na Staroj planini, Glasnik Srpskog geografskog društva sveska XCI, broj 1, str 87-101, Beograd, 2011.
7. Belij S, Simić S. – Hidrološko nasledje kao deo geonasledja u sistemu zaštite prirode Srbije, Časopis „Globus“, br. 32, str. 55-64, Srpsko geografsko društvo Beograd, 2007.

98
XX International Scientific and Professional Meeting
"ECOLOGICAL TRUTH" ECO-IST'12
30 May - 2 June 2012, Hotel “Srbija TIS“, Zajecar, SERBIA
TREE-SIZE DIVERSITY AND TREE SPECIES DOMINANCE AS THE
ELEMENTS OF MIXED BEACH SPATIAL STANDS STRUCTURE
Branko Stajic1*, M.Vuckovic1, M. Koprivica2, S. Andrasev3, B. Matovic3, G.Vucetic
4
1University of Belgrade, Faculty of Forestry, Belgrade, SERBIA 2Institute of Forestry, Belgrade, SERBIA
3Institute of Lowland Forestry and Environment, Novi Sad, SERBIA 4
Public Company ''Vojvodinasume'', Forest holding ''Banat'' Pancevo, SERBIA
*
ABSTRACT
A dataset of fifteen sample plots of mixed beech and valuable broadleaved forests in the northeast of Serbia was used in order to examine tree-size diversity and tree species dominance. For this purpose, structural index U (Hui et al. 1998) was applied. The results show that in this case the dominance of beech over valuable broadleaves is not so clearly expressed, as these relationships were analyzed through measures which are commonly used in forestry. It can be concluded that the applied index is very suitable for the evaluation of stand structure, tree-size diversity and the level of competition between trees.
Key words: beech and valuable broadleaved species, tree-size diversity, stand structure, dominance
index INTRODUCTION Speaking about the necessity of applying new parameters for the
characterization and description of the actual state and structure of the stands in forest management, Gadow (1993) underlines the importance of determining the degree of inequality – diversity of tree sizes in a stand. It is well known that tree size diversity within stands affects economical values in terms of relative profit of different management regimes and that large tree size diversity may ensure a wide range of habitats and a continuous supply of large dead trees, providing a high level of biodiversity in a forest ecosystem (Lexerød, Eid 2006). In these analyses, determination of tree diameter diversity is particularly emphasized because it is easy to define and it can be used for different purposes (Stajić, Vučković, 2006, Stajić 2011).
The basic information about the differences between the trees with regard to their diameter size can be obtained in different ways: by applying the diameter structure curves and statistical parameters that characterize these distributions, through so called degree of homogeneity (Kramer, Akça 1995, Banković, Medarević, 2003) or through the index of homogeneity (De Camino 1976). All these methodological approaches have one

Eco-Ist’12, Ecological Truth, 30 May - 2 June 2012. Hotel “Srbija TIS”, Zajecar, Serbia
99
thing in common – their application does not provide detailed information about the ''spatial'' differences in the dimensions of trees and their nearest neighbours, which should be an important part of the database on spatial structure and diversity of forest stands.
The aim of this study is to analyze and quantify the tree size diversity and the tree species dominance in the mixed stands of beech and valuable broadleaved tree species and to review information on some characteristics of structure and biodiversity that are important for the nature-based management of these forests.
. MATERIAL AND METHODS
The research of the stand structure and the tree size diversity in the mixed stands of beech and valuable broadleaved tree species was carried out in four series of sample plots (15 experimental plots in total) in the northeastern part of the Republic of Serbia, in the National Park ’’Djerdap’’(44°26'36'' N, 22°09'45''). These four series represent four ecological units: A (SP1-SP4), B (SP5-SP8), C (SP9-SP12) and D (SP13-SP15). The average annual precipitation is 784 mm. The study stands, sized 0,25-0,45 ha (about 5 ha in total), are in the forest of beech and valuable broadleaves (Turkish hazel, Norway maple, wild cherry, sycamore, wild service tree, elm, lime, hornbeam and flowering ash). The average number of trees per ha is: 621 (A), 401 (B), 309 (C) and 570 (D) and the average volume per ha (m3) is: 453 (A), 431 (B), 494 (C) and 298
The diversity of the tree size (diameter differentiation) and the tree species dominance were calculated by the measure of neighbourhood dimensions or dominance index, i.e. structural index after Hui, et al. (1998):
(D). The average quadratic mean diameter and the average quadratic mean diameter of dominant trees (cm) of two most represented tree species per ecological unit are: beech – 29,1 and 50,9, Turkish hazel – 26,9 and 36,9 (ecological unit A), beech – 38,4 and 56,2, Turkish hazel – 34,9 and 51,6 (ecological unit B), beech – 42,2 and 61,0, Norway maple – 29,7 and 43,2 (ecological unit C) and beech – 23,7 and 37,3, Turkish hazel – 29,4 and 45,2.
∑=
=n
ii k
nU
1
1,
with: к
is a binary value (0 = neighbour is smaller then the reference tree i, 1 = otherwise)
The measure of the neighbourhood dimensions was based on the differentiation of the diameters of the reference tree and its three nearest neighbours. In general, this structural index quantifies the number of neighbouring trees that are larger than the reference tree and clearly illustrates the differences between the sizes of neighboring trees.
The average value of this index for all tree species together (stand level) and for two main tree species respectively was calculated as a mean value of all iU values:
∑=
=n
iiU
nU
1
1

Eco-Ist’12, Ecological Truth, 30 May - 2 June 2012. Hotel “Srbija TIS”, Zajecar, Serbia
100
RESULTS AND DISCUSSION
Table 1 presents the average values of the dominance index per diameter at stand level ( dsU tan ), then per diameter of beech ( beechU ), Turkish hazel ( hazeltU . )
and Norway maple ( maplenU . ) trees. The values of dominance index dsU tan in all sample plots (except SP6) and averagely at the level of the ecological units are approximately the same and range from 0,44 to 0,49 (Table 1). The values of dsU tan
index are quite different from the values of hazeltU . and maplenU . indices. The values
of beechU , particularly within the stands of ecological unit A, are the closest to the average values of dsU tan index. This is due to the fact that beech trees outnumber other species in these stands. Therefore, the values of the beech tree dominance index have the greatest impact on the values of these indices at stand level. A special importance of U index lies in the fact that its application provides results that can be used to determine the level of relative dominance of individual woody species in the stands. For this purpose, the average index of dominance was determined for two dominant tree species in each stand respectively. The average values of the index of dominance of beech (), Turkish hazel and Norway maple trees are also presented in Table 1.
Table 1. Values of U index-stand level, beech trees, Turkish hazel trees and Norway maple trees dsU tan beechU haseltU . maplenU .
A
SP 1 0,47 0,47 0,48 - SP 2 0,49 0,50 0,18 - SP 3 0,45 0,46 0,52 - SP 4 0,48 0,50 0,42 - Average 0,47 0,48 0,40 -
B
SP 5 0,49 0,45 0,61 - SP 6 0,33 0,28 0,30 - SP 7 0,46 0,39 0,38 - SP 8 0,47 0,34 0,33 - Average 0,44 0,37 0,41
C
SP 9 0,48 0,48 - 0,52 SP 10 0,46 0,35 - 0,69 SP 11 0,44 0,40 - 0,51 SP 12 0,46 0,46 - 0,78 Average 0,46 0,42 0,63
D
SP 13 0,47 0,54 0,23 - SP 14 0,47 0,48 0,33 - SP 15 0,49 0,55 0,39 - Average 0,48 0,52 0,32

Eco-Ist’12, Ecological Truth, 30 May - 2 June 2012. Hotel “Srbija TIS”, Zajecar, Serbia
101
The results show that in the stands with beech and Turkish hazel as the most frequent species (stands of ecological units A, B and D), we cannot establish a uniform ''pattern'' of relative dominance of one species over another. In other words, in ecological units A and B, beech exhibits the greatest relative diameter dominance (SP1, SP3, SP5 and SP6) in one half of the stands, while Turkish hazel dominates in the other half of the stands (SP2, SP4, SP7 and SP8). On the other hand, all the stands of ecological unit D are characterized by a clear relative dominance of Turkish hazel over beech. There are two most frequent species in ecological unit C - beech and Norway maple. By comparing the obtained results it can be concluded that beech (0,35≤ beechU ≤0,48, averagely 0,42) has a significant relative dominance over Norway maple (0,51≤ maplenU . ≤0,78, averagely 0,63).
Even if the mean values are the same, data structure can be characterized by a quite different variability. Therefore, in order to make the picture of the actual stand structure and tree size diversity as clear as possible, the determined values of Ui
The same species of trees with the same or approximately the same values of
index are classified according to the guidelines of Hui et al. (1998): ''class 0'' (all three nearest neighbouring trees have smaller diameters than the reference tree), ''class 0.33'' (two trees have smaller diameters than the reference tree), ''class 0.67'' (one tree has a smaller diameter than the reference tree) and ''class 1'' (none of the neighbouring trees have a smaller diameter than the reference tree).
U index can have quite different distributions of individual values of Ui index, which means that they have different structural form as well (Graph 1). It can be clearly seen if we analyze for example distributions of individual Ui
With approximately the same values of the average
values for Turkish hazel trees in ecological unit A (Figure 1).
U index (0,48 and 0,52), classes ''0'' and ''1'' are the most frequent classes in SP1 and ''0.67'' in SP3. This value of Ui index (''0.67'') is determined in about 10% of Turkish hazel trees in SP1, while the same value applies to 60% of the trees in SP3. It practically means that in SP1 only about 10% of Turkish hazel trees have 2 nearest neighbouring trees whose diameters are larger than the diameter of the observed tree, while in SP3, almost 60% of Turkish hazel trees are surrounded by two out of three neighbours with superior dimensions. Ui index of beech trees in this ecological unit has a more regular distribution of values in comparison to the distribution of the same index of Turkish hazel trees. The same can be said for the distribution of beech Ui index and Turkish hazel Ui index in ecological unit C. Anyway, in 14 out of 15 sample plots in total, Ui
indices of individual beech trees are recorded in all four studied classes, which indicate a considerable regularity in the distribution of these values in all ecological units.

Eco-Ist’12, Ecological Truth, 30 May - 2 June 2012. Hotel “Srbija TIS”, Zajecar, Serbia
102
Ubeech=0,47,Ut.hasel=0,48
010203040
0 0,33 0,67 1
U Values
%
beech t.hasel
Ubeech=0,50 Ut.hasel=0,18
0
20
40
60
0 0,33 0,67 1
UValues
%
beech t.hasel
Ubeech=0,46 Ut.hasel=0,52
0
20
40
60
0 0,33 0,67 1
UValues
%
beech t.hasel Ubeech=0,50 Ut.hasel=0,42
020406080
0 0,33 0,67 1
Uvalues
%
beech t.hasel
Ubeech=0,45 Ut.hasel=0,61
0
20
40
0 0,33 0,67 1
UValues
%
beech t.hasel
Ubeech=0,28 Ut.hasel=0,30
0
20
40
60
0 0,33 0,67 1
UValues
%
beech t.hasel
Ubeech=0,39 Ut.hasel=0,38
0
20
40
0 0,33 0,67 1
UValues
%
beech t.hasel
Ubeech=0,34 Ut.hasel=0,33
0
20
40
60
0 0,33 0,67 1
U values
%
beech t.hasel
Ubeech=0,48 Un.maple=0,52
0
20
40
60
0 0,33 0,67 1
Uvalues
%
beech n.maple
Ubeech=0,35 Un.maple=0,69
0
20
40
60
0 0,33 0,67 1
UValues
%
beech n.maple
Ubeech=0,40 Un.maple=0,51
0
20
40
60
0 0,33 0,67 1
U Values
%
beech n.maple
Ubeech=0,46 Un.maple=0,78
020
4060
0 0,33 0,67 1
UValues
%
beech n.maple Ubeech=0,54 Ut.hasel=0,23
0
20
40
60
0 0,33 0,67 1
UValues
%
beech t.hasel
Ubeech=0,48 Ut.hasel=0,33
0
20
40
60
0 0,33 0,67 1
UValues
%
beech t.hasel
Ubeech=0,55 Ut.hasel=0,39
0
20
40
60
0 0,33 0,67 1
UValues
%
beech t.hasel Figure 1. Values of U index- stand level, beech trees, turkish hasel trees and Norway
maple trees according to classes (SP1-SP15)

Eco-Ist’12, Ecological Truth, 30 May - 2 June 2012. Hotel “Srbija TIS”, Zajecar, Serbia
103
The index of dominance is readily applicable in the assessment of the tree-size diversity and dominance, which can be proved by comparing the results obtained by applying U index with the results obtained by applying the parameters that are used to qualify diameter structure. Based on the values of quadratic mean diameter and average quadratic mean diameter of dominant trees, it is evident that the beech trees in ecological units A and B are characterized by larger diameters in comparison to the trees of Turkish hazel and this element of growth makes beech dominant over Turkish hazel. The results of the application of U index give a clearer picture of the actual dimensional relations between the trees of each individual species and their nearest neighbours. The smaller average value of the index determined for Turkish hazel in comparison to beech in ecological unit A shows that Turkish hazel has a relative dominance over beech in this ecological unit. Out of three analyzed dominant tree species, the smallest relative dominance is asserted by Norway maple, whose trees are usually surrounded by two rivals with larger and one with smaller dimension.
These results can be used to obtain basic information about the degree of tree competition in the stands. The basic assumption is that if the trees, which are in the immediate surroundings of the observed reference tree, have superior dimensions, they in most cases have better developed crowns and greater potential for competition in comparison to the reference tree.
With the beech trees, there is a kind of randomness in the distribution of the rivals with larger and smaller dimensions, which practically means that beech trees are partly surrounded by one rival with superior dimension and partly by two rivals with larger dimensions. The trees of Turkish hazel are in most cases trees with greater dimensions in comparison to the neighbouring trees, so their immediate neighbours are rivals whose diameters are about 40% smaller. The dimensions of Norway spruce trees are in most cases less superior in comparison to the neighbouring trees. Therefore, they are often under strong or extremely strong competition from the neighbouring trees.
CONCLUSIONS
Dimensional differences among the trees can be estimated by the curve which
represents the number of trees per individual diameter degrees or by applying statistical parameters of diameter structure (for example, coefficient of variation). However, the stands of identical diameter structure and with the same values of coefficient of variation can differ considerably because the trees of different diameters can be spatially more or less mingled. In ecological unit A, relative dominance is exerted by beech in two stands and by Turkish hazel in the other two. On the average, it can be concluded that Turkish hazel has a greater relative dominance than beech in this ecological unit. The same applies to ecological unit B – two stands are dominated by beech and two by Turkish hazel. However, on average beech has a relative dominance over Turkish hazel at the level of this ecological unit. In ecological unit D, Turkish hazel can be described as a species with a greater relative dominance in comparison to beech. In ecological unit C, beech has considerably more dominant dimensions than Norway maple in relation to their nearest neighbours. On the average, each Norway maple tree is surrounded by two out of three nearest neighbours with larger diameters than the reference Norway maple tree.

Eco-Ist’12, Ecological Truth, 30 May - 2 June 2012. Hotel “Srbija TIS”, Zajecar, Serbia
104
At the end, we can say that in the commercial forests, as well as in the conserved ecosystems, the characteristics of structure and biodiversity are the key elements for the assessment of forest function, stability and hazards. For this reason, forest management and administration by the principles of sustainable development require permanent monitoring of different aspects of structure and diversity. In that context, spatial distribution of tree dimensions and tree species dominance are important parameters for the characterisation of the spatial stand structure and diversity.
Acknowledgement
This paper was realized as a part of the project "Studying climate change and its influence on the environment: impacts, adaptation and mitigation" (43007) financed by the Ministry of Education and Science of the Republic of Serbia within the framework of integrated and interdisciplinary research for the period 2011-2014.
REFERENCES
1. Gadow, V. K. Zur Bestandesbeschreibung in der Forsteinrichtung. Forst und Holz 48, S.602-606, 1993
2. Lexerød, N. L., Eid, T. An evaluation of different diameter diversity indices based on criteria related to forest management planning. Forest Ecology and Management 222, p.17-28, 2006
3. Stajić, B., Vučković, M. Diversity of trees in the stands of beech and valuable broadleaves in the area of N.P. "Djerdap". International Scientific Conference "Sustainable Use of Forest Ecosystems – The Challenge of the 21st Century, Donji Milanovac, Serbia, p. 199-206, 2006
4. Stajić B. Characteristics of the stand structure and the tree growth in the mixed stands of beech and valuable broadleaved tree species in the National park ''Djerdap''. Doctoral dissertation, Faculty of Forestry, Belgrade, 2011 (in Serbian)
5. Kramer, H., Akca, A. Leitfaden zur Waldmeßlehre. J.D.Sauerländer’s, Frankfurt am Main, 266 S, 1995
6. Banković, S., Medarević, M. Metod rada pri sastojinskoj (uređajnoj) inventuri šuma-Tehnička upustva. Šumarski fakultet u Beogradu, 90 s, 2003
7. De Camino, R. Zur Bestimmung der Bestandeshomogenität. Allgemeine Forst- und Jagdzeitung 147 Jahrgang, Heft 2/3, S. 54-58, 1976
8. Huy, Y, G., Albert, M., Gadow, K. V. Das Umgebungsmaß als Parameter zur Nachbildung von Bestandesstrukturen. Forstwissenschaftliches Centralblatt 117, S. 258-266, 1998

105
XX International Scientific and Professional Meeting
"ECOLOGICAL TRUTH" ECO-IST'12
30 May - 2 June 2012, Hotel “Srbija TIS“, Zajecar, SERBIA
DIAMETER GROWTH AND INCREMENT OF ARTIFICIALLY
ESTABLISHED BLACK LOCUST IN S. N. R. DELIBLATO SANDS
Branko Stajic1, M. Vuckovic1, G .Vucetic2, S. Andrasev
3
1University of Belgrade, Faculty of Forestry, Belgrade, SERBIA 2Public Company ''Vojvodina sume'', Forest holding ''Banat'' Pancevo, SERBIA
3
Institute of Lowland Forestry and Environment, Novi Sad, SERBIA
ABSTRACT
The paper presents the results of studying diameter growth and increment of artificially established black locust in the Special Natural Reserve `Deliblato Sands`. To reconstruct the diameter growth and increment, 30 dominant trees from the stands on Rhamneto – Quercetum virgilianae forest type (better and poorer site classes) were felled. At the age of 25, black locust reached the diameter of 20 cm (better site classes) and 16.5 (poorer site classes) in this area. The lines of growth and current and average diameter increment show that black locust is a species with intensive growth in youth, early growth peak and intensive subsequent increment decline.
Key words: Deliblato sands, black locust, diameter growth and increment
INTRODUCTION
One important aspect of forest management and forestry in general is to achieve
maximal production of high quality wood. Under such a management system, a range of management measures have to be in compliance with the biological patterns of tree growth as well as with the aim of achieving primary production of commercial timber. Apart from its commercial importance, the growth of forest trees is of tremendous ecological significance. Biometric description of the course of growth (growth models) is a reliable parameter for assessing the ability of different woody species to withstand the impact of various factors (climate changes and extremes, air pollution, changes in the level of groundwater, changes in certain site conditions etc). Early detection of possible devitalization is extremely important from the aspect of discovering its causes and taking control measures to minimize the damage of both commercial and ecological character (Vučković, Stajić 2001). In this context, observing the responses of individual tree species to the changes of the main environmental conditions is the most important task in the process of forest preservation and enhancement because when we talk about some phenomena, we should have proven quantitative indicators to support our assumptions (Vučković, et al. 2005).

Eco-Ist’12, Ecological Truth, 30 May - 2 June 2012. Hotel “Srbija TIS”, Zajecar, Serbia
106
In the light of the above stated problems of forest management and with the aim of their minimizing or solving, the economic and ecological importance of investigating the tree diameter growth is particularly emphasized. An area of great national importance, whose successful governing and managing requires a range of high quality information about diameter growth of different tree species, is the Special Natural Reserve ''Deliblato sands''. According to Medarević, et al., (2005) the greatest area of Deliblato sands is covered by black locust forests (35.9% of the total volume and 45.5% of the total volume increment). The greatest part of the black locust forests belong to the protected forests of category III, which have not only the ecological, but also the production function, which makes them suitable for economic use.
MATERIAL AND METHODS
The study was carried out in the region of ''high sand'' (at the altitude above
150 m) of The Deliblato Sands in the Management unit ''The Deliblato sands''. This management unit extends between 44048' and 45001' of north latitude and between 20056' and 210
The research comprises stands of generative origin on two different soil types. For each soil type, a group (or a series) of five experimental plots was singled out (10 experimental plots in total):
19' of east longitude. January is the coldest month of the year (-1,4˚C) and July is the hottest (+21,8̊C). The pluviometric regime of The Deliblato sands has all the features of the continental middle European pluviometric type of regime which prevails in much of the continental part of our country. According to mean monthly values of relative air humidity, the wettest months are December and January, the driest April, July, August and September.
• Series A – artifically established locust stands on Rhamneto – Quercetum virgilianae forest type, on medium deep leached chernozem,
• Series B - artifically established locust stands on Rhamneto – Quercetum virgilianae forest type, on the shallower variant of medium deep leached chernozem with a two-layered humus-accumulative horizon,
Table 1. Basic growth elements of the studied plots
Plot N/ha V (m3
h) (m)
L H (m)
dg (cm)
Dg (cm)
A
1 832 211 18,2 20,0 19,0 27,6 2 1104 231 17,9 20,8 17,3 26,2 3 1120 247 18,6 20,3 17,3 23,8 4 944 187 18,1 20,2 16,9 24,0 5 832 224 18,8 21,0 19,1 25,9
B
1 1891 178 14,1 16,3 12,1 18,7 2 1478 146 14,4 15,9 13,2 19,2 3 2121 184 14,8 17,0 12,0 17,2 4 1872 181 14,7 15,9 14,7 21,0 5 1503 129 13,6 15,8 11,3 14,7

Eco-Ist’12, Ecological Truth, 30 May - 2 June 2012. Hotel “Srbija TIS”, Zajecar, Serbia
107
The stands are 25 (BG) and 29 (AG) years of age The size of the plots was from 250 m2 to 625 m2
In order to reconstruct the growth and increment of diameter, a set of 30 trees (15 trees in each series) was felled and their cross-sections were taken at successive distances of 1 m along the stem from the bottom to the top (0.0 m, 0.3 m, 1.3 m etc.).
, depending on the stand density, in order to achieve a minimum of 50 trees per plot. The basic growth elements of studied experimental plots are presented in Table 1.
Chapman-Richards function was used for the purpose of presenting the diameter growth of black locust dominant trees. It is one of the most commonly used functions in this kind of research (Zeide 1993, Pretzsch 2001, Gadow 2002, Коtar 2005, Stajić 2003, 2011):
( )cTbeay ⋅−−⋅= 1
Based on the obtained growth function, the current (it) and the mean increment (ip
) functions were derived:
( 1)1
cbt bt
t bt
abc e ei
e
− − =−
TTF
T
dTTf
Td
i
T
tp
)()(
0 ===∫
In order to determine the significance of the observed differences in the growth of trees analyzed in the same series at different ages, the analysis of variance method was applied. Testing the significance of differences in the diameters of black locust trees at certain ages (5, 10, 15, 20 and 25 years of age) between the series was done on the basis of t-statistics.
RESULTS AND DISCUSSION
The most accurate and reliable information about the growth of forests and forest stands can be obtained through continuous measurements of forest estimation elements in permanent sample plots. When such data are not available, high-quality information can be obtained by using a large number of temporary sample plots of different age (and in different stages of development) and by reconstructing the increment of the trees of the first biological position, provided that they had free and undisturbed growth (Vučković 1989, Stajić 2011). The effect of age on the change in the diameter of dominant black locust trees was analyzed because of the fact that under the same site conditions which determine the site class, tree age is the main factor that regulates the process of growth (Vučković, et al., 2000).
Diameter growth
The course of the diameter growth of the studied dominant trees are presented
in Figure 1 both per sample plots and per series

Eco-Ist’12, Ecological Truth, 30 May - 2 June 2012. Hotel “Srbija TIS”, Zajecar, Serbia
108
0
5
10
15
20
25
0 2 4 6 8 10 12 14 16 18 20 22 24 26Age
Diam
eter
(cm
)
A1 A2 A3 A4 A5
024
68
1012
141618
0 2 4 6 8 10 12 14 16 18 20 22 24 26Age
Dia
met
er (c
m)
B1 B2 B3 B4 B5
Figure 1. Diameter growth of dominant trees per sample plots and series.
Although the graph (Figure 1) suggests that there is almost no deviation between the tree diameters within the same series throughout the whole study period, the significance of differences in the height of trees was tested using the analysis of variance at a 95% confidence level within each series at the age of 5, 10, 15, 20 and 25. The results of the conducted test and F-statistics confirmed that there was no statistically significant difference in the diameters of the dominant trees within the same series of different sample plots at all ages (5, 10, 15, 20 and 25 years of age).
This means that the null hypothesis about the identical growth of tree diameter within the same series can be fully accepted. Therefore, the models of diameter growth were separately defined for each series of black locust trees. Figure 2 and Table 2 show the lines of diameter growth according to the determined models and presents the model parameters for each series. The first differences in the growth of black locust diameter between the series can be observed in the early years. The observed differences are retained until the age of 25. Based on the defined growth models, the anticipated values of diameter at the age of 25 are 19.8 cm (series А) and 16.5 cm (series В).
0
5
10
15
20
25
0 2 4 6 8 10 1214 16 18 20 22 24 26Age
Dia
met
er (c
m)
A B
Figure 2. Diameter growth of dominant trees pe rseries

Eco-Ist’12, Ecological Truth, 30 May - 2 June 2012. Hotel “Srbija TIS”, Zajecar, Serbia
109
Table 2. Parameters of Chapman-Richards’ function and index of curvilinear correlation
Series Model: ( )cTbeay ⋅−−⋅= 1
Parameters Index а b c ρ
A 23,59977 0,084311 1,367395 0,97333 B 19,36382 0,108640 2,353830 0,96899
Current and mean diameter increment
The lines of current (it) and average tree increment (ip) in both series are
presented in Figure 3. The current diameter increment of all analyzed dominant trees in both series peaked between the age of 4 and 9 (Table 3). In series A, this increment peaked between the age of 4 and 5 and it amounted to 1.17-1.31 cm/year, while in series B it happened between the age of 7 and 9 and the increment ranged from 0.92 to 1.06 cm/year. According to the determined models of tree diameter growth per series this increment reached its highest value at the age of 4 in series A (Itmax = 1.23 cm) and at the age of 8 in series B (Itmax
The average diameter increment of all trees (in both series) peaked between the age of 6 and 15 (Table 3). In series A, this increment peaked between the age of 6 and 9 and amounted to 1.09-1.16 cm/year, while in series B it peaked between the age of 12 and 15 with an amount of 0.74 to 0.81 cm/year. Based on the determined models of tree diameter growth per series, the peak of the average increment was reached at the age of 7 in series A (Ip
=0.99 cm).
max = 1.12 cm) and at the age of 14 in series B (Ipmax
=0.77 cm).
0,00
0,20
0,40
0,60
0,80
1,00
1,20
1,40
0 2 4 6 8 10 12 14 16 18 20 22 24 26Age
Incr
emen
t (cm
)
A-it B-it A-ip B-ip
Figure 3. Current and mean diameter increment of dominant trees per series

Eco-Ist’12, Ecological Truth, 30 May - 2 June 2012. Hotel “Srbija TIS”, Zajecar, Serbia
110
Table 3. Age culmination and maximum values of increment per sample plots and series
Sample Plots
Current increment Mean increment Age of culmination
(year) It(cm)
max Age of culmination (year)
Ip(cm)
max
A1 5 1,31 9 1,13 А2 4 1,17 6 1,09 А3 4 1,18 6 1,11 А4 5 1,25 8 1,11 A5 4 1,26 6 1,16
Model 4 1,23 7 1,12 B1 9 0,98 15 0,74 B2 8 0,92 13 0,77 B3 7 0,99 12 0,79 B4 9 1,06 14 0,78 B5 8 1,03 14 0,81
Model 8 0,99 14 0,77
It can be noticed that the better the site conditions, the sooner the peak time of the black locust diameter increment is reached. Furthermore, the values of the increment at the peak time are lower if the site class is lower.
The determined peak time of the black locust diameter increment coincide with the time stated in other literature sources. Rédei (2002) states that the black locust current increment peaks in the first decade. Ristić (1978) found that in Sombor the current diameter increment peaked between the age of 5 and 7 and the average increment at the age of 9.
CONCLUSION The lines of growth, as well as of current and average diameter increment have
a shape which shows that black locust is a tree species with intensive growth in youth that leads to early growth peak and intensive subsequent increment decline. Its early attainment of usable size makes black locust a very interesting species from the aspect of forest operations (Vučetić 2009). Therefore, the defined models of diameter growth provide a range of useful information about the size of diameter that black locust can reach in these two characteristic sites in Deliblato sands and about the time needed to attain these dimensions. They further contribute to proper planning of the optimal rotation age that is market-oriented and aimed at achieving the maximum revenue or economic yield. Its intensive growth and high increment of dendromass in the early youth, high total production of biomass, extraordinary coppice vigour and high wood density are the characteristics that make it suitable for the establishment of fast-growing energy plantations and for biomass production.

Eco-Ist’12, Ecological Truth, 30 May - 2 June 2012. Hotel “Srbija TIS”, Zajecar, Serbia
111
Having all these facts in mind, we can conclude that studying the growth and increment of this economically and ecologically significant species is of great importance for the forestry of the areas such as Deliblato Sands, which is, according to Vučković et al. (2005), so impressively `between the ecology and the economy` that it cannot be compared to any other place.
Acknowledgement
This paper was realized as a part of the project Establishment of Wood
Plantations Intended for Afforestation of Serbia (31041
) financed by the Ministry of Education and Science of the Republic of Serbia within the framework Technological development for the period 2011-2014.
REFERENCES
1. Medarević, M., Bajić, V., Tomović, Z. (2005): The state and management of forest ecosystems of The Deliblato sands. ’’The Deliblato sands’’ Proceedings VII, Pančevo, Serbia, p. 15-30 (in Serbian)
2. Redei, K. (2002): Management of black locust (Robinia pseudoacacia L) stands in Hungary. Journal of Foretsry Reserach 13 (4), p. 260-264.
3. Ristić, M. (1978): Comparative research productivity and development of black locust (R. pseudoacacia) of generative and vegetative origin in Region of MU’’ Dobroslovačka šuma”. Sombor, Faculty of Forestry, Belgrade (in Serbian)
4. Stajić B. (2011): Characteristics of the stand structure and the tree growth in the mixed stands of beech and valuable broadleaved tree species in the National park ''Djerdap''. Doctoral dissertation, Faculty of Forestry, Belgrade (in Serbian).
5. Vucetić G. (2009): Developmental and productive characteristics of black locust (Robinia pseudoacacia L.) in the area “High sand” SNR “The Deliblato Sands”. M.Sc. Thesis, Faculty of Forestry, Belgrade (in Serbian)
6. Vučković M., Stajić B. (2001): Research of timber volume increment as part of ecological monitoring. International conference "Environmental protection of urban and suburban settlements", Novi Sad, Serbia, P.351-355 (in Serbian).
7. Vučković, M., Stajić, B., Vučetić, G. (2005): Succession of tree species and the charactersitics of their growth in Scots pine stands in the area of ’’Low sand’’. Proceedings VII - ’’The Deliblato sands’’, Pančevo, Serbia, p. 123-130 (in Serbian)
8. Vučković, M., Stajić, B., Radaković, N. (2005): The significance of dimeter increment monitoring from the aspect of bioindication of tree and stand vitality. Forestry 1-2, p. 1-10, Belgrade, Serbia (in Serbian)

112
XX International Scientific and Professional Meeting
"ECOLOGICAL TRUTH" ECO-IST'12
30 May - 2 June 2012, Hotel “Srbija TIS“, Zajecar, SERBIA
RESTORATION INTERVENTIONS IN THE FIRE AFFLICTED FORESTS OF MOUNTAIN ATTAVIROS, A PROTECTED AREA ON THE ISLAND OF
RHODES – GREECE
Gerassimos Arapis1*, E. Evergetis2, D. Mavrogiorgos2, F. A. Pavlidis
1
1Laboratory of Ecology & Environmental Sciences of the Agricultural University of Athens, Iera Odos 75, Athens 11855, GREECE
2
Tripodon 28, Athens 10558, GREECE ELLINIKI ETAIRIA Society for the Environment & Cultural Heritage,
EXTENDED ABSTRACT
Fires in the Mediterranean region are nothing but a rear phenomenon. Nowadays with climate
change impacts becoming increasingly prominent, forest fires in Greece occur more often and result mostly to national disasters. Because of this increased frequency, post-fire management and fires impact research are becoming rather popular within the scientific and environmental conservation community. Major effects detected are the decrease of the soil’s hydraulic volume and organic matter, erosion and high seed mortality due to CO intoxication. Up to date post fire management includes mainly types of large-scale interventions, namely, log barriers, fencing, logging and plantations, which however only address the latter two of the aforementioned effects. The more severe effects which relate to soil’s fertility, affect two of the major element cycles, namely carbon and water, and despite their significance, an appropriate intervention has not yet been identified. The significance of these effects grows exponentially when referred to a NATURA 2000 site, where special care is required towards the achievement of an environmentally sound management.
Such a case is the NATURA 2000 site of Mountain Attaviros on the island of Rhodes, in the Dodecanese region of Greece, which was devastated by the fire in the summer of 2008. The importance of the implementation area and the rationale behind the method of choice in the experimentation is based on the numerous species of flora and fauna, which inhabit this protected area. These include: endemic plants such as the Paeonia clusii Stern ssp.Rhodia, the endemic and endangered freshwater fish Ladigesocypris ghigii as well as the Dama dama deer, characteristic of the islands fauna and the typical Mediterranean habitats Juniperus matorral, Cypress forests (Acero-Cupression) with endemic pine forests.
On this specific background the LIFE08 NAT/GR/000533 project, entitled “Fire RestorAtion Methodology for MEditerranean Forests – environmental safety & sustainability of 4 interventions in the Rhodes NATURA 2000 site FRAMME”, was developed, with the ambition of covering the knowledge gap in contemporary science regarding management and restoration of fire afflicted Mediterranean forests. This will be achieved through the combinatorial study of 4 different restoration interventions, 2 commonly used and 2 innovative incorporating the reuse of treated wastewater and sludge, standalone and in combinations with each other, in an area of 1 ha each, that will be realized in 4 geographically targeted repetitions, covering a total area of 64 ha. Subjects of the interventions evaluation are environmental soundness, restoration effectiveness and economic efficiency, concluding to a Restoration Guide for Mediterranean fire afflicted forests in the form of a policy decision tool readily applicable to the greater area of the Mediterranean basin, which will be presented here for the first time.
Key words: Forest fires, Mediterranean, ecosystems, restoration, Natura 2000, FRAMME

Eco-Ist’12, Ecological Truth, 30 May - 2 June 2012. Hotel “Srbija TIS”, Zajecar, Serbia
113
INTRODUCTION
Forest fires on the Island of Rhodes, before the exponential development of tourism, were mainly humanly induced and caused by practices which are no longer carried out today; such as the periodical fires set off by stock farmers aiming to regenerate the vegetation used to feed their stock. The result of this practice was the creation of brushwood ecotypes.
Currently, the islands economy depends exclusively on tourism. As a result traditional occupations, which involved the utilization of forests, have been relinquished thus reducing the maintenance of any basic routes of approach to such areas making their access harder. In addition, the eradication of controlled periodical forest fires led to the accumulation of highly flammable organic matter on the forest floor resulting in forest fires, which grow much larger in area and more catastrophic.
The impacts of forests fires, which have been identified and assessed best, are addressed mostly to soil properties. Those can be further divided into many categories. A most critical impact regards the hydrology of the burned area and consequently the erosion phenomenon. In relation to the water retention capacity of soil, fire is proven to increase runoff by almost 77% (Gonzalez-Pelayo et al., 2006), thus leading to the post-fire hillslope erosion by direct rain-drop impact and overland flow (Smith & Dragovich, 2008, Gonzalez-Pelayo et al., 2010). Though runoff and erosion is proven to depend upon the post-fire type of vegetative cover (Glenn & Finley, 2010), it also presents an additive effect that leads to considerably greater runoff and sediment yield, over a period of seven years (Mayor et al., 2007). In total the above impacts involve hydraulic changes as well as geomorphological changes. These changes may be caused directly by weathering bedrock surfaces as well as changes in soil properties and structure, or indirectly due to the effect of the changes to the soil and vegetation on the hydrological and geomorphological processes. In addition, forest fires may alter the rates at which hydrological and geomorphological processes operate, during the period after the fire until the environmental conditions return to levels similar to those before it. Changes that can affect hydrological and geomorphological processes include alterations to aggregate stability, porosity, organic matter and water repellence characteristics. (Shakesby & Doerr, 2006). Variations in climate, vegetation, soil, topography and fire severity cause differences in Mediterranean post-wildfire erosion, first-year post-wildfire soil losses are similar to or even lower than those reported for fire-affected land elsewhere or other disturbed in the Mediterranean, while removal of organic matter and nutrients in the commonly thin, degraded soils is arguably just as if not more important than the total soil loss (Shakesby, 2011). This nutritional and trace elements runoff is also a suspected risk for disruption impacts on water supply from forest catchments (Smith et al., 2011).
Beside a considerable risk for human health those element leaks are also a serious threat for soil’s fertility. Humic substances and water extractable organic matter represent an important part of soil organic matter, and forest fires inarguably cause both quantitative and qualitative changes on those deposits (Vergnoux et al., 2011a). The extent of those alterations depends on the frequency and intensity of the fire. Polycyclic aromatic hydrocarbons concentration in burned soils are more than 20 times higher than in the control soils and still remain important years after the last fire event (Vergnoux et

Eco-Ist’12, Ecological Truth, 30 May - 2 June 2012. Hotel “Srbija TIS”, Zajecar, Serbia
114
al., 2011b). Fire may burn part or all of a standing plant in its pacing as well as the organic matter in the upper layers of soil. The nutrients found in the organic matter are either made more available or volatilised and lost. Ash on the other hand is an important nutrient source for ecosystem recovery, affecting pH, electrical conductivity and trace elements concentration improving soil fertility, especially in acidic soils (Pereira et al. 2011). If plants do not absorb ash soluble nutrients right away, then it is highly likely for them to be lost due to leaching in the groundwater or erosion. (Guerrero et al., 2000)
Plant regeneration after a forest fire involves either the growth of new plants from seed or by re-sprouting. A lot of attention has been given to the first; however the re-sprouting mechanism allows the survival of many perennial shrubs. Sprouting plants begin growing almost immediately after the fire, this way the population turnover of plants is reduced and the impacts of the fire are minimised. Seed germination depends mostly on the intensity of the fire since temperatures above 500 o
Re-sprouting is the other main regeneration mechanism, which takes place in Mediterranean-type ecosystems; examples of shrubs which apply this mechanism include: Arbutus unedo, Pistakia lentiscus and Olea europaea (Figure 1). When the top part of a plant has been destroyed re-sprouting occurs from underground buds. The rate with which plats re-sprout, depends largely on the condition of the plant before the fire, i.e. its height, as well as on fire intensity and the environmental conditions after the fire. In order for these shoots to survive, sufficient reserves of carbon and nitrogen must be available. (Konstantinidis et al, 2005).
C effectively kill most species (Emery et al., 2011), while low intension fires may cause CO intoxication and a decreased germination rate of the seeds (Gomez-Gonzalez et al., 2008). Mediterranean pine forests present uniqueness among burnt forests described by the phenomenon of autosuccession (direct regeneration), which has been found to be often combined with an increase of species richness during the first years after fire due to the high abundance of short-lived herbaceous plants facilitated by plentiful nutrients and light (Buhk et al., 2006). Though Mediterranean plant adaptation to fire is a prevailing theory current trends appear to be more sceptic, treating this approach as a pervading concept accepted by most environmental managers, that can lead to a deliberate increase of fire frequencies and a consequent ecosystem degradation and plant extinctions (Bradshaw et al., 2011).
Figure 1: Arbutus unedo re-sprouting

Eco-Ist’12, Ecological Truth, 30 May - 2 June 2012. Hotel “Srbija TIS”, Zajecar, Serbia
115
Impacts on faunal biodiversity due to forest fires is less developed. Even though, for many conservation agencies protection of biodiversity stands as of their major goals, information on the effects of fire on fauna in these biomes is fragmentary. Only a few studies have examined the effects of fire on amphibians or reptiles, and work on invertebrates is likewise sparse. The majority of studies that have been published are observational reports, and few experimental studies have been undertaken using an experimental fire regime, or over appropriately long period intervals (Parr & Chown, 2003). The recovery of vertebrates seems to depend on topographic refugee, thus, connectivity-reducing management activities, may not affect the early stages of population recovery in remaining strands of burnt forest. Rather, ongoing recovery is likely to be limited by demographic rates and resource availability (Banks et al. 2011). Reptile recovery has been studied for Testudo graeca, an endangered terrestrial tortoise, which was found to cope with a regular fire frequency of 20 years, but the effects of more recurrent fires may severely threaten the species (Sanz-Aguillar et al. 2011). Although forest fire impacts on invertebrates is less studied and sporadic there are clear indications that forest fires seem to favor ground insects (Moretti et al., 2004), and cause significant extinction rates for butterflies (Hirowatari & Makihara, 2007).
As it becomes clear, forest fires are causing multi-layered impacts that cover every aspect of biodiversity. Nowadays a compromise for forest management is often suggested, which considers the risk of damage by fire to people and goods, while avoiding the risk of damage to biodiversity by imitating the effects of sporadic fires and providing a mosaic forest with open gaps of different successional stages. Conservation planning is the process of locating, configuring, implementing and maintaining areas that are managed to promote the persistence of biodiversity and other natural values. Conservation planning is inherently spatial. The science behind it has solved important spatial problems and increasingly influenced practice. To be effective, however, conservation planning must deal better with two types of change. First, biodiversity is not static in time or space but generated and maintained by natural processes. Second, humans are altering the planet in diverse ways at ever-faster rates.
The manipulation of forests in the Mediterranean goes back to the ancient times and it is due to this as well as the abrasive and unpredictable climate and difficult socio-economical conditions that make it crucial for a scientifically sound conservation strategy and a sustainable management plan to be implemented. The risks that may be met if land is managed without a clear perception of structure and functionality are well known by ecologists. Therefore, the large gaps in the understanding of the function of Mediterranean ecosystems prevent us from applying a conservation strategy, which would be safe for the environment. (Scarascia-Mugnozza et al., 2000, Driscoll et al., 2010).
Based on these considerations and along with the devastation and impacts caused by the fires of 2008 in the forested areas of the Natura 2000 site in Rhodes it is evident that new European research policy, should be targeted to studies and experiments for scientifically sound conservation strategies and a locally-tailored sustainable management of the regional forest and landscape resources. For this purpose, rather than simply recommending adaptive management, we propose a research agenda to maximize the rate of learning in this difficult field. This includes measuring responses at a species

Eco-Ist’12, Ecological Truth, 30 May - 2 June 2012. Hotel “Srbija TIS”, Zajecar, Serbia
116
level, building capacity to implement natural experiments, and judicious application of experimental approaches. Developing ecologically sustainable post-fire management practices requires sustained research efforts and a sophisticated research agenda based on carefully targeting appropriate methods to address the critical management questions discussed herein
METHODOLOGY
Mediterranean forests are both aesthetically attractive and fragile making it vital
that they are managed with care. A characteristic of the Mediterranean region is the vast variation in the environmental conditions from country to country. In some cases forest growth is limited due to these conditions but in others, sometimes more often than expected, it allows the growth of lush mesic forests comparable to those of central Europe. Mediterranean forests are also known for their large diversity in plant and animal species caused by the survival of various broadleaf and conifer species during the glacial periods. (Scarascia-Mugnozza et al., 2000)
The GR4210005 site covers a total area of 27.696,22 ha and is situated at the south-west part of Rhodos island and includes the mountainous region of Attavyros (1217 m) and Akramytis, the area of Sianitis river, streams of Gadouras and Kontaris and the coastal area from Papagiorgis bay, to cape Armenistis and southwards to Apolakkias bay. The marine part covers 7% of the site. It is a region without many tourists, in contrast to other regions of the island. The more characteristic terrestrial habitats are the two types of coniferous wood along with matorrals Juniperus spp. (92/43/EEC code 5210). The first consists of Pinus brutia (9540) which creates mixed forests with Cupressus sempervirens v. Horizontalis (9290), which are predominantly found in the FRAMME project implementation area. These mixed forests are found in very few areas in Greece (Dodecanese and Crete) and the Rhodes case is one of their best and most representative expressions. The site also includes a broad area with maquis and phrygana. There are areas with garrigues of Quercus coccifera; the garrigues are grazed and low (YPEHODE, 1995).
The wild forest fire that took place in Rhodes during the summer of 2008 destroyed more than 10.000 ha of forestland affecting major producing facilities and downgrading the island’s vital resources. Part of the fire reached the NATURA 2000 area of interest GR4210005 burning 11,1% (3.063 ha) of its area (WWF, 2008). This area was decided to become the field of the projects implementation, but since insufficient data were available for both the biodiversity and the abiotic elements of the environment a series of literature studies and surveys was performed for the area of interest. The biodiversity study (Chorianopoulos, 2010) outlined the presence of 66 fauna taxa and 503 herbal taxa the most important of which are presented in tables 1 and 2 respectively. The Geological survey on the other hand revealed the vulnerability of the site to erosion. More specifically the soils of the area may suffer from incised erosion, along the major streams, slope instability, with landslides and soil creep and erosion of the upper organic soil, and ultimately desertification. The steep slopes in the area accompanied by excessive rainfall, also play an important role to the extent of erosion. All the above-mentioned factors suggest that the area needs immediate antierosion

Eco-Ist’12, Ecological Truth, 30 May - 2 June 2012. Hotel “Srbija TIS”, Zajecar, Serbia
117
measures, in order to avoid desertification from taking place (Kontari, 2010). The drainage network of the area of interest is made up of 4 main and several secondary streams, which drain the area and create a basin. The various levels of permeability of the geological formations are influenced directly by the compactness of the rocks and the coherence of the sediments. From a hydro geological point of view the area is characterized by the presence of low and non-permanent outflow springs whose water quality is expected to be acceptable given there are no potential pollution sources up stream. However, the karstic aquifer of the area of interest appears to have a remarkable recharge and discharge rate (Dikarou, 2010). From the analysis of the climatic and bioclimatic data of the island of Rhodes, it was concluded that high priority for anti-erosive works must be given to the sloping regions with westerly- north-westerly orientation as well as to the burnt areas from the fire of 2008 (Bastounopoulou, 2010a). Finally, an increase in the number of days with high risk of fire initiation is expected due to both the increases in the number of days with maximum air temperature above 35o
All of the above mentioned facts, in regard with the implementation site, along with the major fire impacts previously discussed, were the crude guidelines for the development of the project’s interventions. Scopes of the project were determined to be the cross evaluation of both the effectiveness of the applied restoration interventions and their economic viability. As outlined previously most post-fire management practices are addressing problems in regard with erosion and tree capital loss, while the most serious impacts on soil fertility and disturbance of the hydrological cycle are left untreated. Therefore also a discreet target of the project was the holistic approach of the restoration efforts, aiming to propose solutions for the disturbance of the water and soil nutrient elements cycles. Thus well-established restoration techniques should be coupled with innovative ones and measurable results should be produced in order to cross evaluate their effectiveness.
and the number of hot nights per year, as well as the decrease in the expected precipitation due to climate change (Bastounopoulou, 2010b).
All of the well established techniques, namely logging, log barriers and planting, were surveyed in order to have a preliminary proof of their effectiveness and viability. Logging was the only one excluded, as it requires extensive human labor and presents also crucial counter active to restoration effects. Bird species in severely burned conifer forests depend heavily on the abundant standing snags for perch sites, nest sites, and food resources (Hutto, 2006), moreover, salvage logging has been found to reduce bird species abundance by 50% and richness by 40%, approximately (Castro et al., 2010). Beside those adverse effects on bird biodiversity, harvesting and slash logging results also in significantly higher seedling mortality (Vega et al., 2008), and has been found the least effective among forestry operations (Barberis et al., 2003). Planting interventions, though have not a proven functionality (Beghin et al., 2010, Gonzalez-Ochoa et al., 2004), were adapted mostly because of the natural presence of Cupressus semperivirens which, in contrast with Pinus brutia, does not regenerate easily and if such an intervention was not included an alteration of the original forest’s character should be expected. Log barrier interventions were dictated because of the preliminary study results, which outlined erosion as the major threat in the implementation area, but also by

Eco-Ist’12, Ecological Truth, 30 May - 2 June 2012. Hotel “Srbija TIS”, Zajecar, Serbia
118
their proven functionality (Shakesby, 2011), though this functionality is much depended upon the twofold difference in the soil water-holding capacity (Wolgermuth et al., 2001)
Decisions on the innovative interventions could not be based on extencive experimental data. Drivers for those decisions became the environmental needs as recorded through post-fire impacts identification and the available to the greater implementation area resources. The first input to this decision making proccess suggested the implementation of fertilization, in order to overcomme the decrease in both soil’s organic matter and macro nutritional elements, and irrigation to overcomme the inreased water runoff and the decreased soil’s water holding capacity. Locally available resources, on the other hand are the ones that limit down the possibilities, with water availability being the crucial parameter. Under this perspective the reuse of the products from municipal sewage plant of the city of Rhodes was promoted as the most influencial and easily adoptable within the Mediterranean region, if proven safe and effective. Though there are scarce records for use of sewage sludge in post-fire management (Larchevêque et al., 2010), the sideeffects of this application to other environmental parameters, beside plant growth, has not yet been investigated. The same goes with wastewater which has been extensively investigated as an alternative source for agricultural irrigation purposes (Botti et al., 2009, Ham et al., 2007, Westrell et al., 2004) but never again in post-fire forest restoration. RESULTS
The aforementioned procedure generated an experimentation scheme consisting
of 4 interventions, cross-complied, following the scheme presented in Figure 4, thus forming a 4X4 experiment within which the following interventions are included: Anti-erosion Interventions. The anti-erosion method of choice is to create log land-barriers. (Figure 2) Soil Improvement Interventions. This will utilize sewage sludge from the waste treatment facilities of the city of Rhodes (Figure 3) in order to enrich the damaged soil, with organic matter. Planting Interventions. In order to enrich the local floral potential, planting will be implemented by the use of Pinus brutia, Cupressus sempervirens and Juniperus sp. propagated by local seeds and in density of almost 3.000 plants per ha. Irrigation Interventions. This new and innovative method will apply almost 2 tons of wastewater per ha, provided by the waste treatment facilities of the city of Rhodes, through a surface application system in order to avoid environmental impacts during its removal.

Eco-Ist’12, Ecological Truth, 30 May - 2 June 2012. Hotel “Srbija TIS”, Zajecar, Serbia
119
Figure 2: Log barrier Figure 3: Rhodes Waste Water
Treatment plant Four repetitions have been included, which are distributed within the burned
Natura 2000 site, in three locations. The distribution of the 16 intervention parcels within each repeat is presented in detail through figures 5, 6 and 7. Each parcel covers an area of 1 ha, resulting this way to a repeat of 16 ha and total covered area of 64 ha. Though efforts were made to retain a tetragonal scheme for each parcel this was not achieved because of a single case in the “Ag. Isidoros” repeat, upon which the null hypothesis will be applied in order to minimize the experimental variation among the parcels.
The effectiveness of the applied interventions will be assessed based on two main categories of criteria. The first category of criteria will assess the cost of each intervention. Previous studies have assessed the cost of forest restoration (Espelta et al., 2003), however they did not include the specific intervention, which will be implemented in this project.
The second category of criteria for the assessment of the interventions will involve their ecological effects. Their efficiency will be evaluated by the use of certain indicators such as the population, density and height of new plants (Espelta et al., 2003), in the case of natural regeneration with the use of simulation models, Geographical Information Systems and satellite data. In addition to those modules, special concern has been given to biodiversity restoration impact, which will be monitored through the total number of taxa growing in each parcel, with direct focus on the ones of Table 2.
The comparative assessment of the interventions will be incorporated through multivariate analysis to deduce conclusions regarding the environmental safety, the economic sustainability and restoration effectiveness, of each intervention alone, but also of every possible among them, combination. Monitoring of the project’s outcomes will be also approached through the use of a GIS tool of remote sensing, which will allow the remote assessment of the interventions effectiveness. Coupling those results with the field acquired data will allow for the verification and the typification of the satellite spatial data.
The added value of this project lays in the fact that it aims towards a complete and combinatory study of the best practice options for the restoration of burnt natural areas, with the main result, a Best Practice Guide for the Restoration of Burned Mediterranean Forests, which will clarify issues regarding safety, cost and efficiency of

Eco-Ist’12, Ecological Truth, 30 May - 2 June 2012. Hotel “Srbija TIS”, Zajecar, Serbia
120
practices applicable to the whole of Southern Europe and especially insular forest ecosystems. In addition, the aim of this project is to research on the safety and efficiency of new innovative practices for forest restoration, such as irrigation and fertilization, with the use of wastewater and sludge from a sewage treatment plant. Given that the water quality from the waste treatment plant remains consistent and safe, then at a later stage, a new more permanent irrigation network could be used as a fire prevention method. Table 1: Special interest faunal taxa in the area of implementation
Family Genus, Species Leuciscinae Ladigesocypris ghigii, Gianferrari Ranidae Pelophylax cerigensis, Beerli, Hotz, Tunner, Heppich & Uzzell Hylidae Hyla arborea (kretensis), Ahl Lacertidae Lacerta trilineata diplochondrodes, Wettstein
Lacerta oertzeni pelasgiana, Mertens Accipitridae Buteo rufinus, Cretzschmar
Hieraaetus fasciatus, Vieillot Falconidae Falco biarmicus, Temminck Cervidae Dama dama, L. Vespertilionidae Eptesicus bottae, Peters
Table 2: Special interest herbal taxa in the area of implementation
Family Genus, Species Cruciferae Aethonema arabicum, (L.) E. O. Schulz
A. pogonocarpum, A. Carlstrom Erophila verna, (L.) Chevall. sensu lato
Caryophyllaceae Arenaria rhodia, Boiss. Gypsophilla confertifolia, Hub.-Mor. Silene salamandra, Pamp. S. discolor, Sm.
Leguminosae Colutea insularis, Browicz. Medicago heyniana, Greuter
Crassulaceae Rosularia serrata, (L.) Berger Hamamelidaceae Liquidambar orientalis, Miller Compositae Anthemis rhodensis. Boiss.
Carlina tragacanthifolia, Klatt Scorzonera elata, Boiss.
Campanulaceae Campanula hagielia, Boiss. C. rhodensis, A. DC.
Primulaceae Cyclamen rhodium, Gorer sensu lato Boraginaceae Lithodora hispidula, (Sm.) Griseb. Labiatae Stachys cretica, L. ssp. smyrnaea Rech. fill. Thymelaeaceae Thymelaea tartonraira, (L.) All. Rubiaceae Galium canum, DC. ssp. ovatum Ehrend. Liliaceae Allium junceum, Sm. ssp. junceum
Fritillaria rhodia, Hansen Muscari weisii, Freyn Colchicum balansae, Planchon C. variegatum, L.

Eco-Ist’12, Ecological Truth, 30 May - 2 June 2012. Hotel “Srbija TIS”, Zajecar, Serbia
121
I I+F I+P I+LB F F+P F+LB I+F+P P P+LB I+F+LB I+P+LB
LB F+P+LB I+F+P+LB null I=Irrigation, F=Fertilization, P=Planting, LB=Log Barriers
Figure 4 : Interventions distribution among each experimental repeat
Figure 5: Agios Isidoros plots

Eco-Ist’12, Ecological Truth, 30 May - 2 June 2012. Hotel “Srbija TIS”, Zajecar, Serbia
122
Figure 6: Laerma plots
Figure 7: South Rhodes plots

Eco-Ist’12, Ecological Truth, 30 May - 2 June 2012. Hotel “Srbija TIS”, Zajecar, Serbia
123
Aknowledgements
The current paper and the work presented herein was funded by the European Commission Initiative LIFE+ as well as by the Greek Green Fund “Prasino Tameio” as of February 2012.
REFERENCES
1. Banks S.C, Dujardin M., McBurney L., Blair D., Barker M. and Lindenmayer D.B. (2011), Starting points for small mammal population recovery after wildfire: recolonisation or residual populations?, Oikos, 120, 26–37.
2. Barberis A., Dettori S. and Filigheddu M.R. (2003), Management problems in Mediterranean cork oak forests: post-fire recovery, Journal of Arid Environments, 54, 565-569
3. Bastounopoulou M. (2010a), Climatic survey of the burned Natura 2000 GR4210005 site - LIFE08 NAT/GR/000533, URL: http://www.ellet.gr/framme/ (In Greek).
4. Bastounopoulou M. (2010b), Risk assessment on the burned Natura 2000 GR4210005 site - LIFE08 NAT/GR/000533, URL: http://www.ellet.gr/framme/ (In Greek).
5. Beghin R., Lingua E., Garbarino M., Lonati M., Bovio G., Motta R., and Marzano R. (2010), Pinus sylvestris forest regeneration under different post-fire restoration practices in the northwestern Italian Alps, Ecological Engineering, 36, 1365-1372.
6. Botti P., Virdis A., Solinas G., Buscarinu P., Ferralis M., Marras G., Spanu P. and Vacca S. (2009), Reclamation and agricultural reuse of wastewater: the experience of the Cagliari sewage treatment plant (Sardinia, Italy). Water Science Technology, 59, 65-72.
7. Bradshaw S.D., Dixon K.W., Hopper S.D., Lambers H. and Turner S.R. (2011), Little evidence for fire-adapted plant traits in Mediterranean climate regions, Trends in Plant Science, 16, 69-76.
8. Buhk C., Götzenberger L., Wesche K., Sánchez Gómez P. and Hensen I. (2006), Post-fire regeneration in a Mediterranean pine forest with historically low fire frequency, Acta Oecologica, 30, 288-298.
9. Castro J., Moreno-Rueda G. and Hodar J.A. (2010), Experimental Test of Postfire Management in Pine Forests: Impact of Salvage Logging versus Partial Cutting and Nonintervention on Bird–Species Assemblages, Conservation Biology, 24, 810-819.
10. Chorianopoulos N. (2010), Biodiversity literature review of the burned Natura 2000 GR4210005 site - LIFE08 NAT/GR/000533, URL: http://www.ellet.gr/framme/ (In Greek).
11. Dikarou E. (2010), Hydrological survey of the burned Natura 2000 GR4210005 site, - LIFE08 NAT/GR/000533, URL: http://www.ellet.gr/framme/ (In Greek).
12. Driscoll D.A., Lindenmayer D.B., Bennett A.F., Bode M., Bradstock R.A., Cary G.J., Clarke M.F., Dexter N., Fensham R., Friend G., Gill M., James S., Kay G.,

Eco-Ist’12, Ecological Truth, 30 May - 2 June 2012. Hotel “Srbija TIS”, Zajecar, Serbia
124
Keith D.A., MacGregor C., Russell-Smith J., Salt D., Watson J.E.M., Williams R.J. and York A. (2010), Fire management for biodiversity conservation: Key research questions and our capacity to answer them, Biological Conservation, 143, 1928-1939.
13. Espelta J. M., Retana J,. Habrouk A. (2003), An economic and ecological multi-criteria evaluation of reforestation methods to recover burned Pinus nigra forests in NE Spain, Forest Ecology and Management, 180, 185-198.
14. Glenn N.F., and Finley C.D., (2010), Fire and vegetation type effects on soil hydrophobicity and infiltration in the sagebrush-steppe: I. Field analysis, Journal of Arid Environments, 74, 653-659.
15. Gomez-Gonzalez S., Sierra-Almeida A., Cavieres L.A. (2008), Does plant-derived smoke affect seed germination in dominant woody species of the Mediterranean matorral of central Chile?, Forest Ecology and Management, 255,1510-1515.
16. González-Ochoa A.I, López-Serrano F.R. and de las Heras J. (2004), Does post-fire forest management increase tree growth and cone production in Pinus halepensis?, Forest Ecology and Management, 188, 235-247.
17. González-Pelayo O., Andreu V., Campo J., Gimeno-García E. and Rubio J.L. (2006), Hydrological properties of a Mediterranean soil burned with different fire intensities, CATENA, V68, 186-193.
18. González-Pelayo O., Andreu V., Gimeno-García E. Campo J., and Rubio J.L. (2010), Rainfall influence on plot-scale runoff and soil loss from repeated burning in a Mediterranean-shrub ecosystem, Valencia, Spain, Geomorphology, 118, 444-452.
19. Guerrero C., Gomez I., Mora R., Mataix-Solera J., Mataix-Beneyto J. & Hernandez T. (2001), Reclamation of a burned forest soil with municipal waste compost: macronutrient dynamic and improved vegetation dynamic cover recovery, Bioresource Technology, 76, 221-227.
20. Ham J.H., Yoon C.G., Jeon J.H. and Kim H.C. (2007), Feasibility of a constructed wetland and wastewater stabilisation pond system as a sewage reclamation system for agricultural reuse in a decentralised rural area, Water Science Technology, 55, 503-11.
21. Hirowatari T. and Makihara H., (2007), Effects of fires on butterfly assemblages in lowland dipterocarp forest in East Kalimantan, Entomological Science, 10, 113–127.
22. Hutto R.L. (2006), Toward Meaningful Snag-Management Guidelines for Postfire Salvage Logging in North American Conifer Forests, Conservation Biology, 20, 984–993.
23. Kontari A. (2010), Geological survey of the burned Natura 2000 GR4210005 site - LIFE08 NAT/GR/000533, URL: http://www.ellet.gr/framme/ (In Greek).
24. Larchevêque M., Ballini C., Baldy V., Korboulewsky N., Ormeño E. and Montès N. (2010), Restoration of a Mediterranean Postfire Shrubland: Plant Functional Responses to Organic Soil Amendment, Restoration Ecology, 18, 729–741.

Eco-Ist’12, Ecological Truth, 30 May - 2 June 2012. Hotel “Srbija TIS”, Zajecar, Serbia
125
25. Mayor A.G., Bautista S., Llovet J. and Bellot J. (2007), Post-fire hydrological and erosional responses of a Mediterranean landscpe: Seven years of catchment-scale dynamics, CATENA, 71, 68-75.
26. Ministry of Environment, Spatial Planning and Public Works - YPEHODE (1995), Standardized Data Forms for the (SCI) GR4210005. URL: http://www.minenv.gr/1/12/121/12103/g1210300/00/DeltiaNatura/GR4210005.pdf.
27. Moretti M., Obrist M.K., and Duelli P. (2004), Arthropod biodiversity after forest fires: winners and losers in the winter fire regime of the Southern Alps, Ecography, 27, 173–186.
28. Parr C.L. and Chown S.L. (2003), Burning issues for conservation: A critique of faunal fire research in Southern Africa, Austral Ecology, 28, 384–395.
29. Pereira P., Úbeda X., Martin D., Mataix-Solera J. and Guerrero C. (2011), Effects of a low severity prescribed fire on water-soluble elements in ash from a cork oak (Quercus suber) forest located in the northeast of the Iberian Peninsula, Environmental Research, 111, 237-247.
30. Sanz-Aguilar A., Anadón J.D., Giménez A., Ballestar R., Graciá E. and Oro D. (2011), Coexisting with fire: The case of the terrestrial tortoise Testudo graeca in mediterranean shrublands, Biological Conservation, 144, 1040-1049.
31. Sarah M. Emery S.M., Uwimbabazi J.and Flory S.L. (2011), Fire intensity effects on seed germination of native and invasive Eastern deciduous forest understory plants, Forest Ecology and Management, 261,1401-1408.
32. Scarascia-Mugnozza G., Oswald H., Piussi P. & Radoglou K. (2000). Forest of the Mediterranean region: gaps in knowledge and research needs, Forest Ecology & Management, 132, 97-109.
33. Shakesby R.A. (2011), Post-wildfire soil erosion in the Mediterranean: Review and future research directions, Earth Science Reviews, 105, 71-100.
34. Shekesby R. A. & Doerr S. H. (2006), Wildfire as a hydrological and geomorphological agent, Earth Science Reviews, 74, 269-307.
35. Smith H.G. and Dragovich D. (2008), Post-fire hillslope erosion response in a sub-alpine environment, south-eastern Australia, CATENA, 73, 274-285.
36. Smith H.G., Sheridan G.J., Lane P.N.J., Nyman P. and Haydon S. (2011), Wildfire effects on water quality in forest catchments: A review with implications for water supply, Journal of Hydrology, 396, 170-192.
37. Vega J.A., Fernandez C., Perez-Gorostiag P. and Fonturbel T. (2008), The influence of fire severity, serotiny, and post-fire management on Pinus pinaster Ait. recruitment in three burnt areas in Galicia (NW Spain), Forest Ecology and Management, 256, 1596-1603.
38. Vergnoux A., Di Rocco R., Domeizel M., Guiliano M., Doumenq P. and Théraulaz F. (2011a), Effects of forest fires on water extractable organic matter and humic substances from Mediterranean soils: UV–vis and fluorescence spectroscopy approaches, Geoderma, 160, 434-443.
39. Vergnoux A., Malleret L., Asia L., Doumenq P. and Théraulaz F. (2011b), Impact of forest fires on PAH level and distribution in soils, Environmental Research, 111, 193-198.

Eco-Ist’12, Ecological Truth, 30 May - 2 June 2012. Hotel “Srbija TIS”, Zajecar, Serbia
126
40. Westrell T., Schönning C., Stenström T.A. and Ashbolt N.J. (2004), QMRA (quantitative microbial risk assessment) and HACCP (hazard analysis and critical control points) for management of pathogens in wastewater and sewage sludge treatment and reuse, Water Science Technology, 50, 23-30.
41. Wohlgemuth P.M., Hubbert K.R. and Robichaud P.R., (2001), The effects of log erosion barriers on post-fire hydrological response and sediment yield in small forested watersheds, southern California. Hydrological Processes, 15, 3053-3066.
42. WWF Greece (2008), Ecological Assessment of the July 2008 forest fire in Rhodes, WWF Greece, Athens: September 2008 (In Greek).

127
XX International Scientific and Professional Meeting
"ECOLOGICAL TRUTH" ECO-IST'12
30 May - 2 June 2012, Hotel “Srbija TIS“, Zajecar, SERBIA
VALORISATION OF BRZANSKO MORAVISTE
FROM THE ASPECT OF ORNITHOFAUNA
Goran Sekulic1, J. Petrovic
2
1Institute for Nature Conservation of Serbia, Belgrade, SERBIA 2
University of Belgrade, Faculty of Forestry, Belgrade, SERBIA
ABSTRACT
Brzansko Moravište is a wet, swampy habitat located along the Velika Morava river, near the
villages of Brzan and Miloševo. It is a significant area for birds and their conservation. In the area of Brzansko Moravište there are 25 representatives of the bird fauna strictly protected by the Rule book on the proclamation and conservation of strictly protected and protected wild species of plants, animals and fungi ("Official Gazette of RS", no.05/10 and 47/11). This research revealed an obvious need for the conservation and improvement of this area and all its natural resources.
Key words: ornithofauna, nature conservation, Brzansko Moravište
INTRODUCTION
The aim of this research is to complete the data and knowledge about the bird fauna of this area and consider the protection of individual sites. Brzansko Moravište is a site that attracted the attention of ornithologists in the first half of the 20th century. In his unpublished data on the research carried out in the period 1930-1940 in the area between Bagrdan and Velika Plana, Matvejev argued that the following significant bird species breeded in this area: the Squacco Heron (Ardeola ralloides), the Night Heron (Nycticorax nycticorax), the Little Bittern (Ixobrichus minutus), the Purple Heron (Ardea purpurea), the White Stork (Ciconia ciconia), the Garganey (Anas querquedula), the Spotted Crake (Porzana Porzana) and many others. Even then, Matvejev [1] pointed out the richness of the ornithofauna of "Brzan mud". From these days until modern research, practically nothing was known about the birds of the area around the Morava. There were only fragmentary data, which did not provide a clear picture of the region.
RESEARCH METHOD The research of the bird fauna of the valley of the Velika Morava river was carried out during 2005 and 2006. In the period from 2006-2011 this research was

Eco-Ist’12, Ecological Truth, 30 May - 2 June 2012. Hotel “Srbija TIS”, Zajecar, Serbia
128
focused on Brzansko Moravište as one of the last preserved wetlands in the area around the Morava river. RESULTS AND DISCUSSION 3.1.General features of the bird fauna
Brzansko Moravište is a wet, swampy habitat and therefore a large number of bird species common for this type of habitats are present. Forty-two species i.e. 37% of the total of 114 recorded species belong to these bird species [2]. The most common families of the category of wading birds are herons (Ardeidae) with 6 representatives, ducks (Anatidae) with 7 representatives and snipes (Scolopacidae) with nine representatives. It is also important to mention the representatives of singing birds of the genuses Acrocephalus and Locustella as characteristic wetland species. Typical breeding birds of the open water surfaces and reed of Brzansko Moravište are the following species: the Little Grebe (Tachybaptus ruficollis), the Crested Grebe (Podiceps cristatus), the Little Bittern (Ixobrychus minutus), the Wild Duck (Anas platyrhynchos), the Marsh Harrier (Circus aeruginosus), the Coot (Fulica atra), the Little Ringed Plover (Charadrius dubius), the Northern Lapwing (Vanellus vanellus), the Marsh Warbler (Acrocephalus palustris), the Sedge Warbler (A. Schoenbaenus), the Great Reed Warbler (A. Arundinace) and the Savi’s Warbler (Locustella luscinioides). According to the typology of ornithofauna after Matvejev [1], this bird fauna matches the type of bird fauna of swamps, marshes and wetlands (Figure 1).
Figure 1. Brzansko Moravište is an important site both for breeding
and migration of birds. Floodplain and riparian forests along the Morava were mostly destroyed and
degraded so that only small enclaves and narrow belts along the river remained. The situation is similar in Brzansko Moravište, where only small groups of willow and poplar trees remained, together with small groups of willow trees close to the water surface in certain parts. It is difficult to determine the characteristic ornithofauna in this
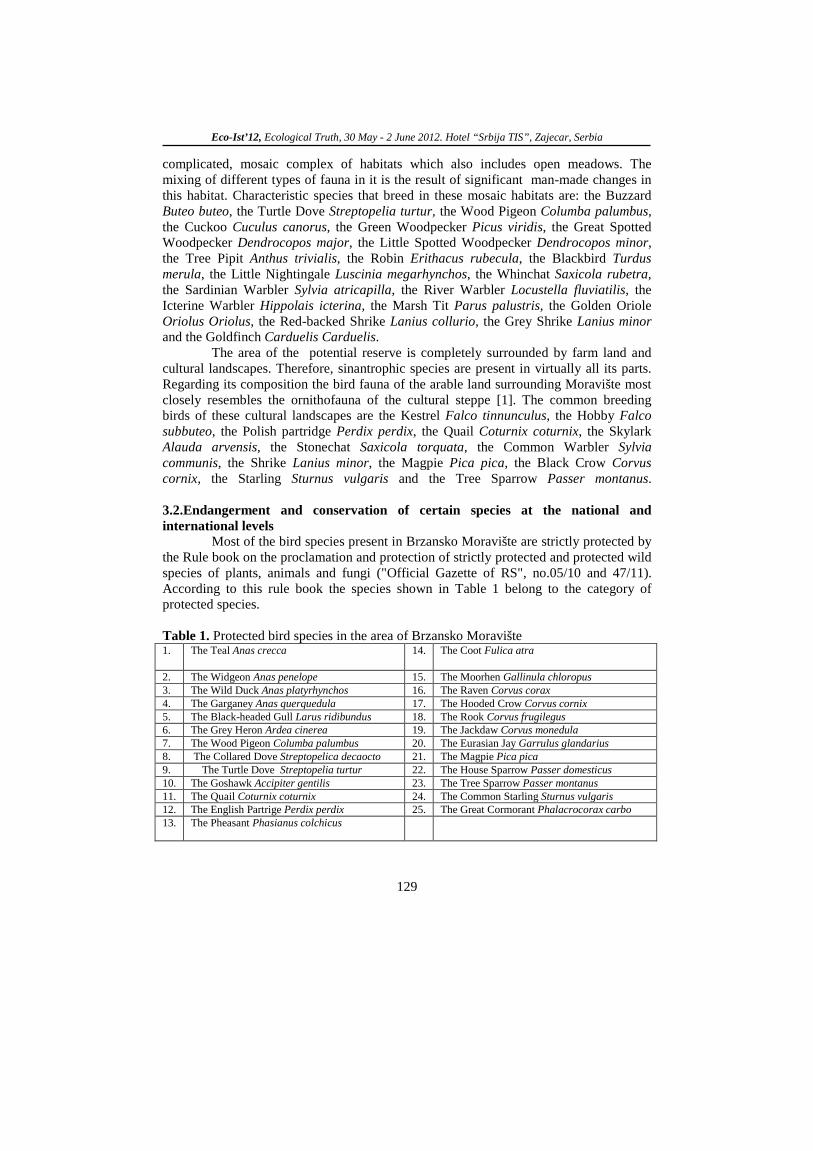
Eco-Ist’12, Ecological Truth, 30 May - 2 June 2012. Hotel “Srbija TIS”, Zajecar, Serbia
129
complicated, mosaic complex of habitats which also includes open meadows. The mixing of different types of fauna in it is the result of significant man-made changes in this habitat. Characteristic species that breed in these mosaic habitats are: the Buzzard Buteo buteo, the Turtle Dove Streptopelia turtur, the Wood Pigeon Columba palumbus, the Cuckoo Cuculus canorus, the Green Woodpecker Picus viridis, the Great Spotted Woodpecker Dendrocopos major, the Little Spotted Woodpecker Dendrocopos minor, the Tree Pipit Anthus trivialis, the Robin Erithacus rubecula, the Blackbird Turdus merula, the Little Nightingale Luscinia megarhynchos, the Whinchat Saxicola rubetra, the Sardinian Warbler Sylvia atricapilla, the River Warbler Locustella fluviatilis, the Icterine Warbler Hippolais icterina, the Marsh Tit Parus palustris, the Golden Oriole Oriolus Oriolus, the Red-backed Shrike Lanius collurio, the Grey Shrike Lanius minor and the Goldfinch Carduelis Carduelis.
The area of the potential reserve is completely surrounded by farm land and cultural landscapes. Therefore, sinantrophic species are present in virtually all its parts. Regarding its composition the bird fauna of the arable land surrounding Moravište most closely resembles the ornithofauna of the cultural steppe [1]. The common breeding birds of these cultural landscapes are the Kestrel Falco tinnunculus, the Hobby Falco subbuteo, the Polish partridge Perdix perdix, the Quail Coturnix coturnix, the Skylark Alauda arvensis, the Stonechat Saxicola torquata, the Common Warbler Sylvia communis, the Shrike Lanius minor, the Magpie Pica pica, the Black Crow Corvus cornix, the Starling Sturnus vulgaris and the Tree Sparrow Passer montanus. 3.2.Endangerment and conservation of certain species at the national and international levels
Most of the bird species present in Brzansko Moravište are strictly protected by the Rule book on the proclamation and protection of strictly protected and protected wild species of plants, animals and fungi ("Official Gazette of RS", no.05/10 and 47/11). According to this rule book the species shown in Table 1 belong to the category of protected species. Table 1. Protected bird species in the area of Brzansko Moravište 1. The Teal Anas crecca 14. The Coot Fulica atra
2. The Widgeon Anas penelope 15. The Moorhen Gallinula chloropus 3. The Wild Duck Anas platyrhynchos 16. The Raven Corvus corax 4. The Garganey Anas querquedula 17. The Hooded Crow Corvus cornix 5. The Black-headed Gull Larus ridibundus 18. The Rook Corvus frugilegus 6. The Grey Heron Ardea cinerea 19. The Jackdaw Corvus monedula 7. The Wood Pigeon Columba palumbus 20. The Eurasian Jay Garrulus glandarius 8. The Collared Dove Streptopelica decaocto 21. The Magpie Pica pica 9. The Turtle Dove Streptopelia turtur 22. The House Sparrow Passer domesticus 10. The Goshawk Accipiter gentilis 23. The Tree Sparrow Passer montanus 11. The Quail Coturnix coturnix 24. The Common Starling Sturnus vulgaris 12. The English Partrige Perdix perdix 25. The Great Cormorant Phalacrocorax carbo 13. The Pheasant Phasianus colchicus
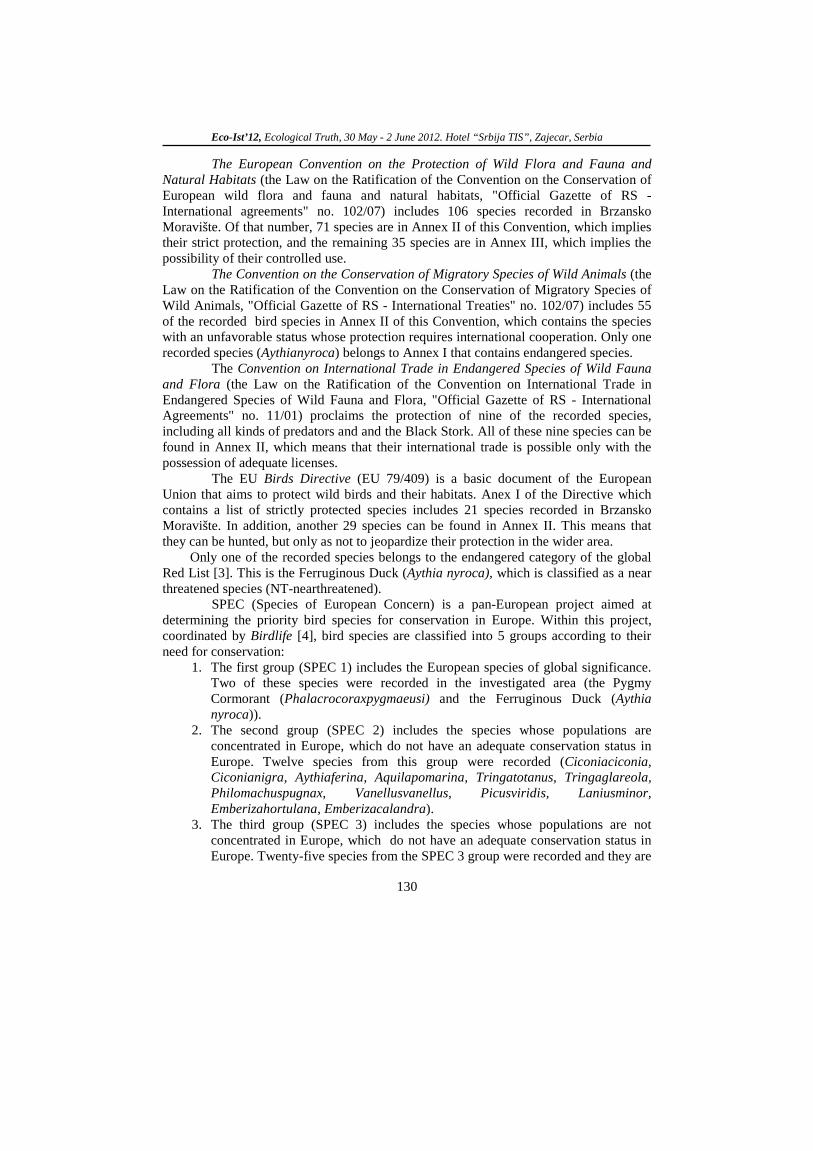
Eco-Ist’12, Ecological Truth, 30 May - 2 June 2012. Hotel “Srbija TIS”, Zajecar, Serbia
130
The European Convention on the Protection of Wild Flora and Fauna and Natural Habitats (the Law on the Ratification of the Convention on the Conservation of European wild flora and fauna and natural habitats, "Official Gazette of RS - International agreements" no. 102/07) includes 106 species recorded in Brzansko Moravište. Of that number, 71 species are in Annex II of this Convention, which implies their strict protection, and the remaining 35 species are in Annex III, which implies the possibility of their controlled use.
The Convention on the Conservation of Migratory Species of Wild Animals (the Law on the Ratification of the Convention on the Conservation of Migratory Species of Wild Animals, "Official Gazette of RS - International Treaties" no. 102/07) includes 55 of the recorded bird species in Annex II of this Convention, which contains the species with an unfavorable status whose protection requires international cooperation. Only one recorded species (Aythianyroca) belongs to Annex I that contains endangered species.
The Convention on International Trade in Endangered Species of Wild Fauna and Flora (the Law on the Ratification of the Convention on International Trade in Endangered Species of Wild Fauna and Flora, "Official Gazette of RS - International Agreements" no. 11/01) proclaims the protection of nine of the recorded species, including all kinds of predators and and the Black Stork. All of these nine species can be found in Annex II, which means that their international trade is possible only with the possession of adequate licenses.
The EU Birds Directive (EU 79/409) is a basic document of the European Union that aims to protect wild birds and their habitats. Anex I of the Directive which contains a list of strictly protected species includes 21 species recorded in Brzansko Moravište. In addition, another 29 species can be found in Annex II. This means that they can be hunted, but only as not to jeopardize their protection in the wider area. Only one of the recorded species belongs to the endangered category of the global Red List [3]. This is the Ferruginous Duck (Aythia nyroca), which is classified as a near threatened species (NT-nearthreatened). SPEC (Species of European Concern) is a pan-European project aimed at determining the priority bird species for conservation in Europe. Within this project, coordinated by Birdlife [4], bird species are classified into 5 groups according to their need for conservation:
1. The first group (SPEC 1) includes the European species of global significance. Two of these species were recorded in the investigated area (the Pygmy Cormorant (Phalacrocoraxpygmaeusi) and the Ferruginous Duck (Aythia nyroca)).
2. The second group (SPEC 2) includes the species whose populations are concentrated in Europe, which do not have an adequate conservation status in Europe. Twelve species from this group were recorded (Ciconiaciconia, Ciconianigra, Aythiaferina, Aquilapomarina, Tringatotanus, Tringaglareola, Philomachuspugnax, Vanellusvanellus, Picusviridis, Laniusminor, Emberizahortulana, Emberizacalandra).
3. The third group (SPEC 3) includes the species whose populations are not concentrated in Europe, which do not have an adequate conservation status in Europe. Twenty-five species from the SPEC 3 group were recorded and they are

Eco-Ist’12, Ecological Truth, 30 May - 2 June 2012. Hotel “Srbija TIS”, Zajecar, Serbia
131
the following: Ixobrychus minutus, Nycticorax nycticorax, Ardea purpurea, Anas strepera, Anas querquedula, Falco tinnunculus, Gallinago gallinago, Actitis hypoleucos, Chlidonias hybrida, Streptopelia turtur, Alcedo athis, Upupa epops, Merops apiaster , Jynx torquilla, Alauda arvensis, Galerida cristata, Riparia riparia, Hirundo rustica, Muscicapa striata, Parus palustris, collurio Lanius, Lanius excubitor, Strunus vulgaris, Passer domesticus and Passer montanus.
4. All other species present belong to the group whose populations are concentrated in Europe and have a favourable conservation status (NON-SPECe
) or the group whose populations are not concentrated in Europe and have a favorable conservation status (NON-SPEC).
European Threat Status (ETS) is the estimation of certain endangered bird species in Europe, according to the IUCN [5] criteria and some other additional criteria [6]. Four species (Aythia nyroca, Perdix perdix, Vanellus vanellus, Merops apiaster) that belong to the category VU (Vulnerable species) were recorded in the study area, as well as 18 species from category D (declining species), one species (Ciconianigra) from category R (rare species ), 17 species from category H (sentient species) and the remaining species belong to the category S (safe species). 3.3.Species of special interest for conservation 1. The Pygmy Cormorant Phalacrocoraxpygmaeus. This species has a special need for conservation at the European level. It does not breed in Brzansko Moravište, but can be observed in this area during migration and wintering in numbers of 10-50 individuals. The largest wintering populations of this species in this part of Europe are located at the confluence of the Sava and the Danube rivers in Belgrade and Skadar Lake, and it can be assumed that the area around the Morava is an important migration corridor for this species. 2. The Little Bittern Ixobrychusminutus. The abundance of this protected species in Serbia is estimated at 2200-3000 breeding pairs [7]. Most of its population is located in Vojvodina, while it was estimated that there are only about 200 pairs in central Serbia. The Little Bittern breeds in the area of Brzansko Moravište in numbers of 5-10 pairs. 3. The Night Heron Nycticorax nycticorax is a protected species which is a common breeding bird of Vojvodina. Only recently has a Night Heron colony been discovered in Central Serbia near the town of Velika Plana [8]. It does not breed in Brzansko Moravište, but it can regularly be encountered, especially in late summer, in a flock of up to 50 individuals. It is most likely that one part of the colony near Velika Plana uses Brzansko Moravište to find food and sleep over. The distance between these two sites is about 25 kilometers by the most direct root. 4. The Grey Heron Ardeacinerea can be encountered in Brzansko Moravište in relatively large numbers during the summer and autumn months. The highest recorded number is about 100 individuals, which is a large number if we consider the fact that the abundance of this species in the central part ranges from 350 to 500 breeding pairs. With adequate safeguards and rehabilitation of the vegetation of willows and poplars, it is possible for

Eco-Ist’12, Ecological Truth, 30 May - 2 June 2012. Hotel “Srbija TIS”, Zajecar, Serbia
132
this species to become a breeding bird of Brzansko Moravište. 5. The Little Egret Egrettagarzetta is a rare breeding bird in central Serbia. It can be ecountered in the area of Brzansko Moravište only during migration and in relatively large numbers (50 individuals). 6.The White Stork Ciconiaciconia is a common breeding bird in the area around the Morava. Wetlands such as Brzansko Moravište are very important as the feeding area of this species. Groups of up to 10 individuals of this species can regularly be seen in the area of Moravište. 7. The Black Stork Ciconianigra is a protected species that is extremely rare in the area of central Serbia. One breeding pair of this species is probably currently breeding near Brzan (the Morava area near Lapovo). One or two of its individuals can occassionally be seen in the area of Moravište. The protection of wetland habitats such as Moravište is essential for the conservation of this species. 8. The Ferruginous Duck Aythia nyroca. This duck species is globally endangered and it is on the world's global list (NT category). It can be seen in Brzansko Moravište during migration, but it is also possible that 1-2 couples breed in this area. 9. The
10. The Shorebirds Charadrii. Ten species from this group were recorded in the area of Moravište. Two of these species breed in this area in small numbers, and these are the Northern Lapwing Vanellusvanellus and the Little Winged Plover Charadriusdubius. The rest of the species can be encountered only during migration. 11.The Terns Sterninae. No terns breed in the area of Moravište, but some individuals of the Common Tern Sterna hirundo can be seen during the reproductive period. The nearest colony of this species is located on the Morava River, in the vicinity of the village of Čepure near Paraćin (Puzović et al., 2006). Another species, the Whiskered Tern, can be encountered only during migration. However, it must be noted that Moravište is a potential breeding area for this species and that with appropriate active conservation measures this species could begin to breed in this area.
Lesser Spotted Eagle Aquilapomarina. This extremely rare and endangered predator species does not breed in the vicinity of Brzan any longer. It used to be found here very often in the past (Matvejev, 1950). The breeding areas suitable for this species are nearby (Rogot forest near Batočina), and habitats such as as Brzansko Moravište are an adequate feeding area for it.
12. The Lesser Grey Shrike Laniusminor. There are only about 500 breeding pairs of this species in Serbia (Puzović et al., 2003). In the area of Moravište and its immediate surroundings there are 3-5 pairs that regularly breed. Open and semi-open habitats are important for the conservation of this endangered species (meadows with small enclaves of trees and shrubs). It can also be found in agricultural areas of suitable conditions (the existence of marginal vegetation) and low use of chemicals in agricultural production. 13. The Warblers Acrocephalus sp. and Locustella sp.. Generally speaking these species are widespread in Serbia, but they are significant as indicators of preserved wetlands and wetlands with reeds. The presence of 5 species of this group suggests that Brzansko Moravište has typical features of a wetland ecosystem.

Eco-Ist’12, Ecological Truth, 30 May - 2 June 2012. Hotel “Srbija TIS”, Zajecar, Serbia
133
3.4.The most important disturbing factors to the birds and the conservation measures The most prominent and influential threatening factor is the destruction of the habitat of the birds that they use in some of their life cycles.Wet and marshy habitats, used by many species for feeding and breeding, are crucial for the bird fauna of Brzansko Moravište. Destruction, draining and successive overgrowth of such habitats brings about the lack of basic conditions for the survival of these bird species. Another important risk factor for the birds in Brzansko Moravište is the destruction of its vegetation, and especially the marginal one. This vegetation is not only a breeding site of many species, but it also provides protection against excessive noise and disturbance to the inner part of the pond (wetland areas). The removal of this vegetation opens an access to the inner parts, which indirectly increases the disturbance of birds in this area. The level of direct disturbance to the birds is not very high in Moravište, although this site is occassionaly visited by hunters and anglers. The roads around Moravište are not highly frequent. The number of people present is slightly higher only during the field work season. Temporary field roads that intersect Moravište in several places, are opened during dry months. Besides directly threatening some habitats, these roads significantly increase the disturbance of the birds of this area. Pesticides and fertilizers are extensively used in the agricultural areas surrounding Moravište which is a significant factor of bird endangerment. Many birds feed on the surrounding agricultural land and thus come into contact with poisonous substances. Those substances also get washed down by atmospheric precipitation and reach the water of Moravište through underground water. Besides the general measures for the conservation of wetland habitats in Brzansko Moravište, adequate protection of its ornithofauna requires the implementation of the following specific measures:
• The application of technical measures for the improvement of breeding conditions for waders (installation of platforms and rafts for breeding, enrichment and maintenance of woody and shrub vegetation in some parts);
• The ban on hunting in the whole area of Moravište and its immediate surroundings (the zone of protection);
• The protection of certain sites that are important for breeding with appropriate marginal vegetation in order to minimize disturbance;
• The education of the local people (farmers) on the reduction of the use of pesticides and other chemical substances to a rational level.
CONCLUSION
Brzansko Moravište located along the Velika Morava river, near the villages of Brzan and Miloševo is a significant area for birds and their conservation. This area is an oxbow lake formed when a meander of the river was cut off. Today, it represents one of the few preserved wetlands that remained in the Morava area. Most of the habitats of this

Eco-Ist’12, Ecological Truth, 30 May - 2 June 2012. Hotel “Srbija TIS”, Zajecar, Serbia
134
type that used to be dominant in this region of Serbia are now drained and converted into arable land. The importance of this area and its conservation is highlighted by the fact that there are no other protected natural areas in the whole area around the Morava located along the river and composed of wet and marshy habitats. Since the Velika Morava river is one of the key ecological corridors of Serbia, there is an obvious need to preserve and improve its surrounding area together with all its natural resources.
REFERENCES
1. Matvejev, S.D.: Rasprostranjenje i život ptica u Srbiji. SANU, posebno izdanje, knjiga CLXI. Beograd, 1950.
2. Predlog za zaštitu prirodnog dobra '' Brzansko moravište'' kao specijalnog rezervata prirode, Zavod za zaštitu prirode Srbije, Beograd, 2008.
3. IUCN: IUCN Redlist of Threatened Species. www.redlist.org., 2004. 4. Birdlife International: Birds in European Union, a status assessment.
Wageningen. The Netherlands: Birdlife, 2004. 5. IUCN: IUCN Red List Categories and Criteria: Version 3.1. IUUCN Species
Survival Commission. Gland, Switzerland and Cambridge, UK:IUCN, 2001. 6. Tucker, G., Heath, M., Tomialojc, L., Grimmett, R.: Birds in Europe: Their
Conservation Status. Birdlife Conservation, Series No 3, 1994. 7. Puzović, S., Simić, D., Saveljić, D., Gergelj, J., Tucakov, M., Stojnić, N., Hulo,
I., Ham, I., Vizi, O., Šćiban, M., Ružić, M., Bučanović, M., Jovanović, T.: Ptice Srbije i Crne Gore –veličine gnezdilišnih populacija i trendovi : 1990-2002.Ciconia 12, 35-120, Novi Sad, 2003.
8. Puzović, S., Sekulić, G., Stojnić, N., Tucakov,M.: Kolonije gaka Nycticorax nycticorax i obične čigre Sterna hirundo na Velikoj Moravi. Ciconia 15, 83-89. Novi Sad, 2006.

135
XX International Scientific and Professional Meeting
"ECOLOGICAL TRUTH" ECO-IST'12
30 May - 2 June 2012, Hotel “Srbija TIS“, Zajecar, SERBIA
ACTIVITY LEVELS OF 137Cs, 40K, 226Ra AND 232
Th IN MOSSES FROM THE TERITORRY SOKOBANJA AND BANJA JOSANICA
Ana A. Cuculovic1*, R. Cuculovic2, D. Veselinovic
3
1University of Belgrade, Institute for the Application of Nuclear Energy – INEP, Banatska 31b, 11080 Zemun, SERBIA
2Higher Business School of Leskovac, Vlade Jovanovica 8, 16000 Leskovac, SERBIA 3University of Belgrade, Faculty for Physical Chemistry,
11001 Belgrade, SERBIA P.O. Box 137,
ABSTRACT Activity levels of the 137Cs radionuclide artificially produced by Chernobyl and natural
radionuclides 40K, 226Ra and 232Th, in mosses and their substrates are shown in this work. Samples were collected in July 2010. Average activity levels of 137Cs in moss was from 15.3 to 105 Bq/kg, 40K from 180 to 218 Bq/kg, 226Ra from 6.67 to 20 Bq/kg and 232Th from 8.87 to 21 Bq/kg. Average activity levels in moss substrates were for 137Cs from 21 to 28 Bq/kg, 40K from 181 to 193 Bq/kg, 226Ra from 16.0 to 29 Bq/kg and for 232
Th from 11.8 to 32 Bq/kg.
Key words: moss, 137Cs, 40K, 226Ra, 232
Th, Sokobanja, Banja Jošanica
INTRODUCTION
Sokobanja is located in central Eastern Serbia 43° 38' 29" north latitude and 21° 53' 37" east longitude at the altitude of about 400 m, between the Rtanj and Ozren mountains. The climate is moderately continental (mild), mild summers and winters. Sokobanju is rich in forests in the surrounding mountains and mineral water springs. The Lepteria vacation area is close to Sokobanja along the bank of the Sokobanjska Moravica River. Banja Jošanica is located in the northwestern part of the Sokobanja valley on the slope of the Bukovik Mountain. Its distance from Sokobanja is 16 km. It is characterized by a low altitude climate (200-500 m) with cold and sharp winters and warm summers. This spa is known for its thermal springs [1].
Radionuclides enter soil and water by migration and collection processes, and through them to plant and animal produce and contribute to the total radiation of a certain territory. Accidents in nuclear power plants or nuclear testing release large amounts of polluting radioactive material into the atmosphere. The Chernobyl accident released a large amount of polluting radionuclides into the environment – 1018 Bq of which 3.7x10¹⁶ Bq 137Cs2,3. The physical half-life of 137Cs is 30.2 years. In an organism it

Eco-Ist’12, Ecological Truth, 30 May - 2 June 2012. Hotel “Srbija TIS”, Zajecar, Serbia
136
behaves similarly to potassium. The time 137Cs remains in an organism determine the physical damage in the organism polluted with this radionuclide. Investigation of radionuclides of natural origin is also significant for this research: 40K, 226Ra and 232Th. 40K is an essential natural radionuclide and in nature is present in a mixture with stable potassium isotopes 39K and 41K. The physical half-life of 40K is 1.25x10⁹ years, while its biological half-life is 58 days. It is part of the human organism and is under homeostatic control. 226Ra forms by radioactive decay of 238U. In an organism it behaves similarly to calcium. By resorption from soil it easily enters plants and then through plant and animal produce to humans. 226Ra has high chemical activity. Its physical half-life is 1600 years. The biological significance of this radionuclide is based on its long biological half-life that can be up to 45 years. 232Th has a long physical half-life of 1.6x10¹⁰
In evolutionary sense mosses are the most primitive land plant species. Mosses may be considered as the most commonly applied organisms for biomonitoring studies of radioactive contamination [7,8]. The structure of mosses make them adequately suited for monitoring aerial metal burden: mosses have a slow growth rate and relatively large surface area to biomass ratio: the lack of the wahy cuticle and associated stomata means that many contaminants can be absorbed over the whole external surface; they do not hove a rooting system; obtain nutrients from dry and wet precipitation by absorption through their leaves which usually lack a cuticle. Moss utilization is high, both in industry, medicine, pharmacy, and also for human and animal consumption and there is a danger of radiation load of organisms consuming it [9].
years and is not significantly present in the biosphere [4-6].
Purpose: Establishing the presence of artificial (137Cs) and natural (40K, 226Ra and 232
Th) radionuclides in mosses and their substrates sampled from the territory of Sokobanja and Banja Jošanica.
MATERIAL AND METHODS Moss samples were collected randomly on the territory of Sokobanja and Banja
Jošanica in July 2010 on localities: Ozren (hospital, canal, park), Lepterija (restaurant, Vodomar spring) and Banja Jošanica (canal, park). The samples were homogenized, soaked in paraffin in Marinelli vessels (1 L), and left for 40 days to reach the radioactive equilibrium. Gamaspectrometric measurements were performed on an HPGe detector with 8192 channels, resolution 1.65 keV and relative efficiency of 34 to 1.33 MeV for 60Co. The average counting time was 60 000s. The standard error of the method was 10 %. Spectral analysis was performed with the Gamma Vision 32 software package. The activity of 40K was determined at the 1461 keV line. The activity of 232Th was determined by the 228Ac lines at 338.4 keV, 911.1 keV and 968.9 keV. The activity of 226Ra was determined at 295 keV, 352 keV and 609 keV, and the activity of 137
Cs at 661.6 keV.
RESULTS AND DISCUSSION
Activity levels of the artifical radionuclide 137Cs, and natural radionuclides 40K, 226Ra and 232Th (in Bq/kg) in mosses (20 samples from Ozren, 5 samples from Lepterija
Eco-Ist’12, Ecological Truth, 30 May - 2 June 2012. Hotel “Srbija TIS”, Zajecar, Serbia
137
and 6 from Banja Jošanica) and their substrates (7 samples from Ozren and 2 samples from Lepterija) are shown in Table 1. The presented results show that all analyzed radionuclides were present in the samples.
The data given in Table 1 was used to determine the ratio between maximal and minimal activity levels (Amax and Amin
In investigated samples from Ozren the A
) for the observed isotopes both in mosses and their substrates. Obtained results are given in Table 2.
max/Amin ratio for 137Cs in moss was 41, while in substrates it was 55. This large ratio is the consequence of different concentrations of 137Cs, moss age, desorption of 137Cs from the substrate or moss by water or snow. The Amax/Amin
In mosses from Sokobanja and Banja Jošanica the A
ratio was significantly lower on Lepterija and Banja Jošanica localities (11.4 i.e. 2.06).
max/Amin ratio for 40K was from 1.62 to 2.27 and in substrates it was from 1.27 to 3.57. The Amax/Amin ratio for 226Ra in mosses was from 4.88 to 6.69 and in substrates it was from 1.73 to 6.20, while for 232
A comparison of activity levels obtained for natural radionuclides Th in mosses it was from 2.50 to 12.9 and in substrates from 2.11 to 9.02.
40K, 226Ra and 232Th in moss and substrate samples collected in 2002 and 2008 with the results presented in Table 1 leads to the conclusion that activity levels of natural radionuclides remained the same [5,6]. Activity levels of 137
Using values of the activity levels presented in our previous work and the values given in Table 1 and using the equation for radioactive decay
Cs in mosses and their substrates are in decline indicating no new contaminations, i.e. accidents on this territory [7].
A=A0e-λt
(1)
where: At is the sample activity after time t = 10 years, A0 is the sample activity for t = 0, λ is the radioactive decay constant = ln2/T1/2=0.023 year-1
, t is the time of 10 years
The conclusion can be made that in the period between 2001 and 2010 (i.e. for 10 years), the average activity level of 137Cs has reduced in mosses due to the radioactive decay on the Ozren locality of 21% and the Lepterija locality of 20% [7,8,10]. The real reduction of 137Cs activity on the Ozren locality is 80.6%, while on the Lepterija locality it is 79.1%. This shows that reduction of the 137
It can be concluded that an ecological system, such as Sokobanja and its surroundings represents a closed biogeocenosis in which radioactive contamination levels are maintained relatively stable over a long time period.
Cs content originates from its washout from moss by atmospheric water and its transfer into the environment.

Eco-Ist’12, Ecological Truth, 30 May - 2 June 2012. Hotel “Srbija TIS”, Zajecar, Serbia
138
Table 1. Activity levels (Bq/kg) of artificial (137Cs) and natural radionuclides (40K, 226Ra and 232
No.
Th) in samples of moss and its substrate from Sokobanja and Banja Jošanica collected in July 2010
Locality 137Cs 40K 226Ra 232Th
(Bq/kg) 1 Ozren, hospital 14.8 305 18 24 2 Ozren, hospital 20 240 7.03 9.94 3 Ozren, hospital 27 179 3.84 4.55 4 Ozren, hospital 19.5 184 9.60 3.78
4A substrate 36 318 8.42 10.7 5 Ozren, hospital 28 188 5.95 6.68 6 Ozren, hospital 20 227 12.4 10.0 7 Ozren, hospital 13.1 232 17 10.9 8 Ozren, hospital 8.26 230 8.70 6.09 9 Ozren, hospital 16 209 9.81 9.26
9A substrate 29 195 18 16 10 Ozren, hospital 14.7 212 11.1 9.49 11 Ozren, canal 7.21 211 8.76 6.82 12 Ozren, canal 5.51 272 20 19
12A substrate 4.70 236 19 17 13 Ozren, park 0.87 255 9.40 12.8
13A substrate 1.10 89 14.6 8.06 17 Ozren, park 1.65 150 11.1 12.7
17A substrate 1.45 90 14.1 8.22 18 Ozren, park 34 141 2.99 1.76
18A substrate 60 157 27 11.8 19 Ozren, park 23 153 8.06 11.5 20 Ozren, park 6.84 178 4.27 3.98
20A substrate 12.4 181 10.7 10.8 21 Lepterija, restaurant 4.72 323 44 61
21A substrate 2.85 216 50 57 22 Lepterija, restaurant 8.45 251 24 26 23 Lepterija, restaurant 25 142 8.43 4.81 24 Lepterija, Vodomar spring 54 187 9.17 7.98 25 Lepterija, Vodomar spring 39 186 12.2 5.25
25A substrate 54 170 8.07 6.32 26 Banja Jošanica, park 107 172 9.37 12.1 27 Banja Jošanica, canal 72 208 2.40 6.42 28 Banja Jošanica, canal 79 222 6.68 6.42 29 Banja Jošanica, park 103 137 3.82 7.26 30 Banja Jošanica, park 123 141 6.07 5.99 31 Banja Jošanica, park 148 201 11.7 15.0

Eco-Ist’12, Ecological Truth, 30 May - 2 June 2012. Hotel “Srbija TIS”, Zajecar, Serbia
139
Table 2. Ratio between maximal (Amax) and minimal (Amin) isotope activity and average activity levels of 137Cs, 40K, 226Ra, 232
Isotope
Th (Bq/kg), in moss and substrate samples stated in Table 1.
Moss Substrate
A Amax A
min max/A Average activity levels
mi
n A Amax Amin max/A
Average activity levels
min
137O*
Cs 34 0.83 41 15.3 60 1.10 55 21
L* 54 4.72 11. 4 26 54 2.85 18.9 28 BJ* 148 72 2.06 105 --- --- --- ---
40O
K 305 141 2.16 210 318 89 3.57 181
L 323 142 2.27 218 216 170 1.27 193 BJ 222 137 1.62 180 --- --- --- ---
226O
Ra 20 2.99 6.69 9.88 14.6 8.42 1.73 16.0
L 44 8.43 5.22 20 50 8.07 6.20 29 BJ 11.7 2.40 4.88 6.67 --- --- --- ---
232O
Th 19 3.78 5.03 9.60 17 8.06 2.11 11.8
L 61 4.81 12.9 21 57 6.32 9.02 32 BJ 15.0 5.99 2.50 8.87 --- --- --- ---
* O-Ozren, L-Lepterija, BJ-Banja Jošanica
CONCLUSION 137Cs, 40K, 226Ra and 232
Average activity levels in mosses from Ozren were
Th were present in all moss and substrate samples from the territory of Sokobanja and Banja Jošanica.
137Cs 15.3 Bq/kg, for 40K 210 Bq/kg, 226Ra 9.88 Bq/kg and for 232Th 9.60 Bq/kg. In moss substrates the average activity levels were 137Cs 21 Bq/kg, 40K 181 Bq/kg, 226Ra 16.0 Bq/kg and 232
Average activity levels in mosses from Lepterija were
Th 11.8 Bq/kg.
137Cs 26 Bq/kg, 40K 218 Bq/kg, 226Ra 20 Bq/kg and 232Th 21 Bq/kg. In moss substrates the average activity levels were 137Cs 28 Bq/kg, 40K 193 Bq/kg, 226Ra 29 Bq/kg and 232
In mosses from Banja Jošanica average activity levels of Th 32 Bq/kg.
137Cs were 105 Bq/kg, for 40K they were 180 Bq/kg, 226Ra 6.67 Bq/kg and for 232
Average activity levels of Th they were 8.87 Bq/kg.
137
Activity levels for natural radioactivity on the territory of Sokobanja and its surroundings have not changed. Activity levels of
Cs in mosses from Banja Jošanica were 6.9 times higher than in mosses from Ozren and 4 times higher than in mosses from Lepterija.
137
Cs in mosses and their substrates are in decline that indicates no new contaminations or accidents on this territory.
Acknowledgment
This work was supported by the Ministry of Education and Science of the Republic of Serbia, Project code III 43009

Eco-Ist’12, Ecological Truth, 30 May - 2 June 2012. Hotel “Srbija TIS”, Zajecar, Serbia
140
REFERENCES
1. Vesenjak P., Ravnikar D., Leskovar D., Jauševec R., Petrović D., Antonović K., Kuzmič T., Pilih T., Sokobanja master plan turističke destinacije, Ministarstvo trgovine, turizma i usluga (Ministarstvo ekonomije i regiomalnog razvoja – sektor turizma), Beograd, 2007.
2. Aakrog A., Global radiological impact of nuclear activities in the former Soviet Union, Proceedings of a symposium: Environmental Impact of Radioactive Releases, 13-32, Vienna, 1995.
3. Savezni komitet za rad, zdravstvo i socijalnu zaštitu, Nivo radioaktivne kontaminacije čovekove sredine i ozračenost stanovništva Jugoslavije 1986. godine usled havarije nuklearne elektrane u Černobilju, Beograd, 1987.
4. Veselinović D., Gržetić I., Đarmati Š., Marković D., Stanja i procesi u životnoj sredini, Fizičkohemijski osnovi zaštite životne sredine, knjiga I, Udžbenici Fizičke hemije, Fakultet za fizičku hemiju, Univerzitet u Beogradu, Beograd, 1995.
5. Gržetić I.A., Jelenković R.J., Prirodni radioaktivni elementi, geološko poreklo i oblici pojavljivanja i migracije, monografija: Jonizujuća zračenja iz prirode, Jugoslovensko društvo za zaštitu od zračenja, INN Vinča, 3-41, Beograd, 1995.
6. Dangić A., Geohemijski procesi u prirodi i radionuklidi, monografija: Jonizujuća zračenja iz prirode, Jugoslovensko društvo za zaštitu od zračenja, INN Vinča, 41-56, Beograd, 1995.
7. Čučulović A., Veselinović D., Radioaktivnost nekih bioindikatora sakupljenih na teritoriji Sokobanje i njene okoline, Ekologica, 87-91, 15, 2008.
8. Čučulović A., Čučulović R., Marković D., Veselinović D., Mahovine Sokobanje i Banje Jošanice – biomonitori zagađenja životne sredine radionuklidima, Ekologica, 135-139, 17, 2010.
9. Richardson D.H.S., The Biology of Mosses, Blackwell Scientific Publications, Oxford, 1981.
10. Čučulović A., Stanković S., Dragović S., Pantelić G., Radioaktivna kontaminacija bioindikatora Karpatsko-Balkanske Srbije, Zbornik radova Ekološka istina, X Naučno-stručni skup o prirodnim vrednostima i zaštiti životne sredine, Donji Milanovac, 53-56, 2002.
141
XX International Scientific and Professional Meeting
"ECOLOGICAL TRUTH" ECO-IST'12
30 May - 2 June 2012, Hotel “Srbija TIS“, Zajecar, SERBIA
APPLICATION OF WASTE GLASS AND MG-SLAG FOR PRODUCTION
OF GLASS MATRIX COMPOSITE
Vladimir D. Zivanovic1, M. B.Tosic1*, S. R.Grujic2, J. D. Nikolic1
S. D. Matijasevic,
1, S. N. Zildzovic1, S. V. Zdrale
2
1
86 Franchet d’ Esperey St., 11000 Belgrade, SERBIA Institute for Technology of Nuclear and Оther Mineral Raw Materials,
2
4 Karnegijeva St., 11000 Belgrade, SERBIA University of Belgrade, Faculty of Technology and Metallurgy,
*
ABSTRACT
The possibility to utilize the waste glass and Mg-slag for production of new valuable materials was investigated. The waste glass matrix composites containing 10-50 mass % of Mg-slag were prepared. The cold pressed pellets were sintered at T= 600-7500C for t = 1-3h. The highest relative density ρ r = 86 % was reached for the sample containing 10 mass % of Mg-slag sintered at T = 6500
C for t=2h. It was determined that the content of Mg-slag in glass matrix strongly affects on the viscous flow sintering process. The presence of crystalline particles in the slag hinders the sintering process and causes a poor densification of the samples.
Key words: waste glass, Mg-slag, glass matrix composite
INTRODUCTION
Utilization of different waste for fabrication of glass or glass-ceramics materials is very important for environmental protection as well as industrial application. The numerous studies have been shown that because of appropriate chemical and mineralogical composition the slag of the metallurgical processes could be used in such purpose. In the past these waste materials were mainly used as ingredient for cements production but recently special attention has been paid in obtaining of glass – ceramics with various chemical, mechanical, electrical, thermal and other useful technological properties. These slags can be used as a major ingredient or in the mixture with other waste industrial by-products (waste glass, coal fly ash, incinerator ash, mineral flotation tailings etc.). To prepare such glass-ceramics the waste is vitrified by standard melt-quenching technique and then the glass is crystallized. One or two step heat treatment of bulk glass or the sinter – crystallization of the glass powder is employed for obtaining the glass-ceramics [1-4]. As reported in different studies the powder technology route can be used also for fabrication of glass matrix composites prepared from waste materials. In such a way the time consuming and expensive classical procedure for glass-

Eco-Ist’12, Ecological Truth, 30 May - 2 June 2012. Hotel “Srbija TIS”, Zajecar, Serbia
142
ceramics preparation can be avoided and new useful engineering materials with wide potential application can be made [5-8].
The Magnetherm silicothermic reduction process [9] generates a large quantity of slag as a solid waste material which is stacked or buried directly nearby the plant area. The release of slag components into soil and water resources can be harmful for environment and therefore the recycling of this waste is necessary. The slag is rich in CaO and other main oxides present are SiO2, Al2O3
In this study the sintering of the glass matrix composite prepared from waste glass cullet and the slag from Mg-production was investigated. The slag sample was collected from the dump of the magnesium plant ˝Bela Stena
and MgO. The content of these oxides may vary and also its phase composition can be different. Unfortunately, only small quantity of this slag is recycled by using in cement, glass and ceramics production, and as a building material.
˝
- Baljevac na Ibru, Republic of Serbia.. The bottle and windows glass cullet was taken from municipal waste glass collecting site. The powder technology route was employed for preparation of glass matrix composite. The mixture of powdered Mg-slag and waste glass was compacted by cold pressing and the pellets obtained were sintered at different temperatures for the fixed time and then analyzed.
MATERIAL AND METHODS
The bulk Mg-slag sample collected from the plant dump was previously crushed in an agate mortar and then pulverized in a laboratory vibrating mill with rings Humbolt Wedag KHD 953/3. This mill was employed also for glass powder preparation. Previously, the waste glass cullet was washed and dried and then crushed in a jaw crusher Retsch 300. The chemical compositions of starting raw materials were determined using gravimetric and spectroscopic methods (AAS Analyst 300). The densities of as-received materials were determined by using the pycnometer. X-ray diffractometry (XRD) was used for examination of the phase compositions of the slag. The XRD patterns were obtained on a Philips PW-1710 automated diffractometer using a Cu tube operated at 40 kV and 30 mA. The instrument was equipped with a diffracted beam curved graphite monochromator and a Xe-filled proportional counter. The diffraction data were collected in the 2θ Bragg angle range from 5 to 70°, counting for 0.50. The differential thermal analysis (DTA) of slag was performed on a Netsch STA 409 EP apparatus by heating a constant sample mass of 100mg at a rate of ν = 10ºCmin -1
The samples for the sintering experiments (pellets Ø 35 mm, h=10mm) were prepared by cold uniaxial pressing (20 MPa) of the powdered glass and slag /glass mixtures containing 10, 15, 20, 30, 40 and 50 wt % of the slag. A hydraulic press Manfredini C95 was employed. To analyze the sinterability of glass matrix composite the pellets were heated in an electric furnace, Carbolite CWF1300 at a rate of 10ºCmin
in the temperature range T = 25-1100ºC.
-1 up to temperatures 600,650,700 and 7500
The bulk density of the as-sintered samples was determined by Archimedes’ method. The relative densities ρ
C for t = 1-3 h and then were cooled in the furnace to room temperature.
r is calculated as the ratio measured and theoretical

Eco-Ist’12, Ecological Truth, 30 May - 2 June 2012. Hotel “Srbija TIS”, Zajecar, Serbia
143
density. The densities of glass matrix composite were calculated from their compositions and from the density of the constituents, following the rule of mixtures.
RESULTS AND DISCUSSION The chemical compositions of Mg- slag and waste glass are presented in Table 1.
Table 1. The chemical compositions of Mg- slag and waste glass Sample Oxide [wt %]
SiO Al2 2O CaO 3 MgO K2 NaO 2 FeO 2O TiO3 L.o.i 2
Mg - slag Waste glass
22.10 68.22
9.19
1.86
45.31 9.97
6. 66 3.65
0.005 0.63
0.01 13.57
1.20 1.57
0.44 0.17
15.08 0.33
In Fig.1, DTA and TG curves of Mg- slag are shown.
0 200 400 600 800 1000
-18
-16
-14
-12
-10
-8
-6
-4
-2
0
2
T [ oC]
TG [%
]
-14
-12
-10
-8
-6
-4
-2
0
DTA
TG
endo
940 oC
787 oC
337 oC
204 oC
DTA [µV]
Figure 1. DTA and TG curves of Mg- slag sample recorded at a heating rate
ν = 10ºCmin-1
(m = 100 mg ; grain size – 74µm)
As seen in Fig.1, DTA and TG curves revealed a several endothermic peaks and high mass loss up to 8000C which indicates the reactions of dehydration during heating of the sample. Two main crystalline phases were determined by XRD analyze of Mg-slag: wollastonite CaSiO3 (JCPDS-76-0186 ) and larnite Ca2SiO4
The densities of as-received waste glass ρ ( JCPDS-33-0302 ), Fig.2.
G = 2.56 cm-3 and the Mg- slag ρS= 3.11g cm3 were determined. The sintering experiment of waste glass samples in the temperature range T = 600- 750 0C for t = 1-3 h showed that the highest relative density ρr = 93% was reached at T = 6500C for t = 2h. The sintering at T > 6500C leads the relative densities to be decreased significantly. It was observed that at these temperatures

Eco-Ist’12, Ecological Truth, 30 May - 2 June 2012. Hotel “Srbija TIS”, Zajecar, Serbia
144
a degassing process exist and a porous glass body is formed. The appearance of waste glass pellets sintered at T = 600-7500C is shown in Fig.3. In Fig.4, a high porous structure of the sample sintered at T= 7500C is presented. Therefore, for the sintering of glass matrix composites T=6500
10 20 30 40 50 600
5
10
15
20
25
30
35
40
W
W-wollastonite CaSiO3, L-larnite Ca2SiO4,
LL L
L
WWW
W
Inten
sity (
a.u)
2θ (o)
C was chosen.
Figure 2. XRD pattern of Mg- slag sample
Figure 3. Waste glass pellets sintered at a) 6000
b) 650C for t=2h
0C for t = 1h c) 6500
C for t=2h

Eco-Ist’12, Ecological Truth, 30 May - 2 June 2012. Hotel “Srbija TIS”, Zajecar, Serbia
145
Figure 4. Waste glass pellet sintered at T =750 0
C for t=1h (fractured surface)
The sintering of the glass matrix composites containing 10-50 mass % of Mg-slag showed a lower sintering ability regarding to the as-received waste glass samples. As shown in Fig.5, the relative densities ρ r
0 10 20 30 40 5074
76
78
80
82
84
86
88
90
92
94
ρ r [ %
]
Mg-slag content (wt %)
decreased with increasing the content of Mg-slag.
Figure 5. Dependence of the relative density of the sintered glass matrix
composites on Mg-slag content ( T = 6500
C, t =2h)
It is obvious from Fig.5 that the relative densities of the sintered glass matrix composite decreased with increasing the Mg-slag content. As established earlier the densification of glass particles occurs by viscous flow sintering process and the sintering mechanism is controlled by glass composition, impurities, surface area, packing efficiency, and crystallization behavior. The viscous flow is the kinetic path through which the surface area is minimized while the surface energy of glass particles is the driving for the process. It was determined experimentally that the crystallization of glass particles during heating inhibited densification. In the case of glass matrix composite the presence of the crystalline particles or any rigid inclusions revealed the same effect on the densification rate.
The as-received waste glass does not crystallize at sintering temperature, and consequently a decrease of the relative densities of the sintered glass matrix composite

Eco-Ist’12, Ecological Truth, 30 May - 2 June 2012. Hotel “Srbija TIS”, Zajecar, Serbia
146
can be attributed to the particles of Mg-slag containing crystallites of wollastonite and larnite. The increase of a volume fraction of these particles in a glass matrix decreases gradually the effective viscosity of the system. In such a way a viscous flow sintering is hindered and poor densification of glass matrix composite bodies was reached.
CONCLUSIONS
The sintered glass matrix composite material was prepared by using the waste glass and Mg-slag. At T=6500
C for t=2h, a highest densification of cold compacted powder samples was reached. It was determined that the content of Mg-slag in glass matrix has a strong influence on viscous flow sintering process. Increase in Mg-slag content causes a decrease of the effective viscosity of the system and consequently a low dense glass matrix body is formed. It was shown that these waste materials can be utilized for fabrication of a new kind of sintered glass matrix composite.
Acknowledgement
The authors are grateful to the Ministry of Science and Technological development – Republic of the Serbia for the financial support given through the projects N0
34001 and 172004.
REFERENCES
1. Hongyu, L., Hongxia, L., Deliang., C., Hailong, W., Hongliang, X., Rui, Z., Preparation and properties of glass–ceramics derived from blast-furnace slag by a ceramic-sintering process., Ceramics International .,35 (2009) 3181.
2. Yan, Z., Dengfu, C., Yanyan, B., Mujun, L., Preparation of low cost glass–ceramics from molten blast furnace slag., Ceramics International 38 (2012) 2495.
3. Gomes,V., De Borba, C.,Riella, J., Production and characterization of glass ceramics from steelwork slag., J.Mat.Sci., 37 (2002) 2581.
4. Khater, G., The use of Saudi slag for the production of glass-ceramic materials, Ceramics International., 28 (2002) 59.
5. Rawlings, D., Glass-ceramic matrix composites, Composites 25 (1994) 372. 6. Boccaccini, A., Bucker,Bossert. J., Marszalek, K., Glass matrix composites
from coal flyash and waste glass., Waste management, 17 (1997) 39. 7. Boccaccini, A., On the viscosity of glass composites containing rigid
inclusions., Materials Letters., 34 (1998) 285. 8. Bernardo,E., Scarinci, G., Sintering behaviour and mechanical properties of
Al2O3
9. Minić, D., Manasijević, D., Đokić, J., Živković, D., Živković, Ž., SILICOTHERMIC REDUCTION PROCESS IN MAGNESIUM PRODUCTION - Thermal analysis and characterization of the slag., Journal of Thermal Analysis and Calorimetr.,, 93 (2008) 411.
platelet-reinforced glass matrix composites obtained by powder technology., Ceramics International 30 (2004) 785.

147
XX International Scientific and Professional Meeting
"ECOLOGICAL TRUTH" ECO-IST'12
30 May - 2 June 2012, Hotel “Srbija TIS“, Zajecar, SERBIA
TECHNOLOGIES, WASTE RECYCLING AND THE ENVIRONMENT
TURNING WASTE INTO WEALTH
Emmanuel Ayuk Tataw
LEND A HAND CAMEROON (LAHCAM) Bp 6013 Douala, CAMEROON
ABSTRACT An official report states that about 1.5million tons of waste is produced yearly in Cameroon.
Yaoundé and Douala and other towns which accounts for close to ¾ of this amount and if appropriate measures are not taken to provide a sustainable waste management programme, there is the justified fear that Cameroonians will be overwhelmed if not consumed by waste.
The Saving Our Environment project is a proposal designed as an urban renewal project fit at empowering residents of rural, sub-urban and urban areas suffering from poverty, hunger and unemployment with skills necessary to survive in today’s fast growing global economy. It is a multifaceted project geared towards promoting a proper waste disposal system through recycling and public awareness.
In a pilot study carried out with the goal of determining its feasibility and profitable, in Buea, South West province of Cameroon, a total of 29 participants consisting of youths aging from 17 to 28 years were involved in this project. After a series of training workshops, the participants acquired practical knowledge on proper disposal and collection of waste, not forgetting recycling of biodegradable waste into compost manure, paper waste into tissue paper, scrap metals used for the fabrication of farm tools and pots, and a lot more.
Besides saving our environment and promoting a sustainable habitat for us, this project also creates job opportunities and small scale enterprises through the provision of affordable goods and services to local inhabitant above all it focuses on the youth, the future as the are key to any sustainable development, thereby contributing to attaining developmental plans such as the millennium development goals and the commonwealth plan for youth empowerment 2000-2015.
Key words (Waste, Transformation, Technology, Development, Environment)
INTRODUCTION Our products which we believe meet the needs of the poor were selected based
on the following criteria: 1. Availability of raw material 2. Consumption of finished products (marketability) and 3. Technology required for recycling of waste
Some of the products include but not limited to; compost manure, exercise
books, tissue paper, farm tools, toys and kitchen gas products that can all be derived from waste products.

Eco-Ist’12, Ecological Truth, 30 May - 2 June 2012. Hotel “Srbija TIS”, Zajecar, Serbia
148
PRODUCTS
Compost manure and kitchen gas: Over 65% of the population in developing nations is located in rural areas. 80%
of this population is involved in agricultural activities. Mindful of the high cost of purchasing chemical fertilizers coupled with its known detrimental effect on natural soil nutrients, SOE provides a perfect substitute: compost manure. This will be produced via standard methods strictly from biodegradable waste (perishables), with cow dung and fowl droppings included to enrich its content. Published research has proven beyond the iota of reasonable doubt that compost manure is effective in the farming of maize, tubers, tomatoes and other food crops.
The preparation process of compost manure requires piling waste in a pit under pressure. During this process, gas is released which if properly channeled into homes could serve as cooking gas for low income earners.
Farm tools and other utensils: Taking into consideration the above facts, SOE will produce simple farm tools
such as hoes and cutlasses from scrap metals and tins. Other items such as packers, pots and baking pans will also be produced. To guarantee low cost of production, SOE will enter into partnership with already existing blacksmiths and metal workers before subsequently establishing SOE’s own factories.
Tissue paper and exercise books: As stated in the Millennium Development Goals (MDGs), education for all
has risen top on international agenda (besides global warming) but accessibility to basic pedagogic material stands as an obstacle to this goal in many developing countries. SOE aims to tackle this issue by recycling paper waste into exercise books and tissue papers. We can achieve this by establishing recycling plants in various locations and/or partnership with existing companies.
Toys: Having identified the ever present need for children to play and distract
themselves from idle and dangerous activities, SOE will produce simple toys such as cars, Lorries, trains and so on from simple tin cans that have been disposed. Attractive packaging and branding will guarantee our products quality.
JUSTIFICATION Today more than ever before, there is the growing need to involve in
environmentally sustainable activities, especially as we begin to grasp the imminent danger of global warming. Recent studies have shown beyond reasonable doubt that there exists a potential market ready to consume recycled products due to their affordability. To crown it all, SOE also aims at not just providing goods and services that meet the needs of the poor but also providing them with the necessary purchasing power by involving them in the production process which doubles as means of creating employment and reducing production cost.

Eco-Ist’12, Ecological Truth, 30 May - 2 June 2012. Hotel “Srbija TIS”, Zajecar, Serbia
149
MARKETABILITY AND COMPETITION By adopting simple principles of demand and supply, when prices are low
demand will be high. In our case where we have a potential market of over 1.5million people, we believe that through our enticing prices, which have been greatly reduced to meet this aim, our products will readily be consumed.
To ensure product standard and quality, we will design attractive SOE packages and introduce branding of our products, attractive SOE logos as our trade mark.
Our marketing strategy will consist of cooperation agreements with local NGOs, governments and farmers union or cooperatives in our selected communities. Prospective customers will be able to easily access our business website as well as our offices for more information. Advertisements in newspaper and environmental magazines will ensure easy access to us and further minimize any additional search cost incurred by potential clients. Aggressive publicity and marketing will be incorporated in our communities via flyers, stickers advert on local radios and television network.
HUMAN RESOURCES NEEDED Essentially, consultants in the relevant recycling fields will assist in setting up the
various factories and provide necessary skills to the locals. Also a group vibrant youth selected from the Area will be involved in the execution of this project. We will also enter into partnership with relevant institutions such as HYSACAM, the Ministry of Health, government parastatals, NGOs and individuals that can assist in facilitating this project.
SUSTAINABILITY AND DOCUMENTATION
Since there is the need to establish business programmes that will survive in the short run as well as the long run, SOE targets the youth, as they are key to any sustainable development. They will constitute a major part of our workforce. Through our partnership with other institutions and the creation of a SOE network we can further guarantee the continuity of this program. From our 2nd
Documentation for this business will be provided through the media (print and electronic). Furthermore, there will be video coverage activities and testimonials from participants. Annual reports and bulletin will also be produced to monitor progress.
year of business, we will set aside 5% of our profits to the SAVING OUR ENVIRONMENT FUND which will be used to sensitize the populace on the need for proper refuse disposal system, and encourage eco-friendly practices. It will also reward businesses that have shown outstanding commitment to embrace proper refuse disposal as a means of social corporate responsibility and business ethics.
WHAT YOUR ORGANIZATION STANDS TO GAIN
The organization stands a chance of pioneering a noble cause that touches the heart of the indigenes in Cameroon ,AFRICA and BEYOND.
The organization stands to benefit from our mass publicity campaign from within and outside Cameroon.

Eco-Ist’12, Ecological Truth, 30 May - 2 June 2012. Hotel “Srbija TIS”, Zajecar, Serbia
150
The organization would have an opportunity to network with local communities as part of your cooperate social responsibility.
The organization stands a chance to increase its activities within local communities, coming into direct contact with people at the grassroots.
The organization’s logo will be included in our annual report and presentation during international events .
The T-Shirts (with your logo) will serve as mass publicity for your involvement in the project.
Above all, you will gain the unique opportunity of leading the global green revolution FINANCE
In a company of this nature, whose finance is highly dependent on external
sources, we will secure loans from financial institutions as well as engage local businessmen in investing in the project. And like most businesses, the bulk of the cost will be on the capital investment during the first year, as subsequent years will experience a constant decrease in cost of production. Below is a financial detail of the project. While thanking you for the possible opport
COSTS OF RECYCLING RAW MATERIALS Year 1 2 3 4 5 6
Operation Cost $23 285,71 $23 285,71 $23 285,71 $23 285,71 $23 285,71 $23 285,71 Recycling space Set up costs $14 285,71 $14 285,71 $14 285,71 $14 285,71 $14 285,71 14 285,71 Monthly operation cost $3 000,00 $3 000,00 $3 000,00 $3 000,00 $3 000,00 3 000,00 Working personnel Director $1 500,00 $1 500,00 $1 500,00 $1 500,00 $1 500,00 1 500,00 Administrative department $2 000,00 $2 000,00 $2 000,00 $2 000,00 $2 000,00 $2 000,00 Recolectors $2 500,00 $2 500,00 $2 500,00 $2 500,00 $2 500,00 2 500,00
Materials Cost Raw materials Plastic 10000 10500 11025 11576 12155 12763 total price $250 000,00 $262 500,00 $275 625,00 $289 406,25 $303 876,56 $319 070,39 Wood 10000 10500 11025 11576 12155 12763 total price $320 000,00 $336 000,00 $352 800,00 $370 440,00 $388 962,00 $408 410,10 processing cost per ton Plastic $5 000,00 $5 250,00 $5 512,50 $5 788,13 $6 077,53 $6 381,41 Wood $10 000,00 $10 500,00 $11 025,00 $11 576,25 $12 155,06 $12 762,82 final product price plastic 10000 ton $266 642,86 $279 392,86 $292 780,36 $306 837,23 $321 596,95 $337 094,66 plastic per ton $26,66 $26,61 $26,56 $26,51 $26,46 $26,41 wood 10000 ton $341 642,86 $358 142,86 $375 467,86 $393 659,11 $412 759,92 $432 815,77 wood per ton $34,16 $34,11 $34,06 $34,01 $33,96 $33,91 Recycling space based in the cost of 4 acres 100.000 usd / 7 years Working personnel 1 director, 3 administrative, 10 recollections based in Colombian salaries Raw materials based in prices given by industries that work with those materials 25 ton 10.000 ton yearly with a 5 % yearly growth 32 ton 10.000 ton yearly with a 5 % yearly growth Processing cost ???????????????????????????????????????????????

151
XX International Scientific and Professional Meeting
"ECOLOGICAL TRUTH" ECO-IST'12
30 May - 2 June 2012, Hotel “Srbija TIS“, Zajecar, SERBIA
SYSTEMATIZATION AND SUGGESTION OF TREATMENT OF
ELECTROPLATING PROCESSES POLLUTERS
Ivan Krstic1*, M. Stanisavljevic2, V. Lazarevic
3
1University of Niš, Faculty of Occupational Safety, Niš, SERBIA 2High Technical School of Professional Studies, Požarevac, SERBIA
3
Institute for Preventive and Medical Protection, Niš, SERBIA
*
ABSTRACT
In technological process of galvanization, the objects need to be successively immersed into solution, where chemical and electrochemical processes are carried out. Due to its geometric shape and adhesion phenomena, when being taken out from the solution, the objects take the amount of fluid which needs to be washed before the next stage of processing. This creates waste water which may contain metal ions (e.g. copper, nickel, chromium, zinc, cadmium, lead, iron, aluminum, etc.), cyanides, acids, alkalis, fats, oils, organic solvents, surfactants, phosphates and a lot of other pollutants. The paper provides the systematization of these pollutants, their treatment and transformation into new beneficial eco-smart products and introduction of new non-conventional treatment systems, with the aim to support clean technologies.
Key words: electroplating, polluting materials, treatment INTRODUCTION Surface of the object should be prepared in the following manner: it should
include mechanical preparation, grease removing and corrosion of metal oxides. Mechanical treatment of metals means treatment on different engines, with
appearance of friction between surface of tool and surface of treated object, with heat release. If we use soapsuds with 2% potassium hydroxide (KOH) solution as cooler, they are not present potential waste materials. But, if the cooler is cutting oil, consisting oily acids, ester, amine and other organic compounds, because of their presence, these compounds must be treated before their release into recipient. Also, great problem are landfills with metal leftovers.
Process of grease removing can be done with alkali solution with work temperature of 70oC to boiling temperature. On this temperature, water steam appears which contains alkalis that form aggressive alkali fog. To prevent that, surface-active materials are added to enable the same grease removing on considerable lower temperatures. Molecules of surface-active materials are relatively big, without distinct active groups, so even if they flow into working atmosphere, they will not cause harmful

Eco-Ist’12, Ecological Truth, 30 May - 2 June 2012. Hotel “Srbija TIS”, Zajecar, Serbia
152
effects. Also, inflammable organically solutions can be used. In chemical terms, they are chloral hydrocarbons, but the difference is in level of evaporation and toxicity. From environmental and occupational safety point of view, criteria for selection of solutions are: steam tension for evaporation, Maximum Allowed Concentration (MAC) for toxicity and chemical stability for appearance of easily flammable and very toxic substances. Perchlorethylene is in most frequent use, because it meets mentioned requirements, but for use in closed systems only. To get the best effect, removing grease from the object must be done. Electrolyte used is usually dissolved alkali (NaOH, KOH, Na2CO3,) with cyanide added (KCN). During electrical grease removing, work place gets extremely polluted with alkali and cyanide vapors. Removing of oxide coating is done by sinking object in strong acid or alkali solutions. To increase efficiency of this operation, acid solutions get warm to 30 to 120oC. So, aggressive vapors and gases are formed: vapours of H2SO4, HNO3, H3PO4, NaOH and gases HCl, NO2, and others, so it is necessary to obtain appropriate ventilation. Used solutions of strong acids and waste waters from rinsed objects after corrosion consist of big quantities of metal salts and surplus of acids, which must not get into recipients. Adding alkali substances can neutralize surplus of acids. Thus solution becomes alkali and most of metals settle like hydroxide. If settling is conducted by use of Ca(OH)2
, mud with gypsum content is produced, and that gypsum prevents reuse of metals. In deposited sludge, under water and oxygen influence, water insoluble metal compounds are transforming in soluble, which pollute the ground, ground and underground waters.
Figure 1. Waste materials of electroplating processes

Eco-Ist’12, Ecological Truth, 30 May - 2 June 2012. Hotel “Srbija TIS”, Zajecar, Serbia
153
It is better to neutralize used acids with amoniumhydroxide and get clear sediments of hydroxide of some metals which become useful as a row materials for other products (pigments for color production, soluble salts (NH4)2SO4
Galvanic metal coating can be conducted through the following operations: electrolytic metal coating, rinse in running or stagnant water, lightning up (sing in solutions) and under-developing (symbol in chromium acid). Electrolytes used are divided into acid and alkali - cyanide. Hydrated salt of coating metal is a base of sour electrolytes, and for electrolytes conductivity increase. Sulfuric acid is used for copper and chrome, boron acid is used for nickel and cadmium. Structure of these electrolytes also consists of surface-active materials, which improve quality of products. Those are organic materials as tiocarbamid, disulfonaphtaline acid, N-propilinhloride, etc. As base of alkali - cyanide electrolytes we use metal cyanide salt, sodium cyanide are sodium hydroxide. They are very dangerous in contact with the skin, and they build very toxic HCN in the mixture with acids.
as an artificial fertilizer, etc).
SYSTEMATIZATION OF ELECTROPLATING PROCESSES POLLUTERS
Since electroplating process needs a big quantity of water for rinsing and
correction or complete change of electrolytes, the consequence of such process is wastewater with big number of toxic materials. These toxic materials can be systematized in four groups, as:
1. Toxic metals are waste materials appearing in this stage of technological process. They are biologically non-degradable, so they get accumulated in ground water plants and animals, get into food chain and thus pollute the environment;
2. Pollutants appearing as unions. The most frequent unions are very toxic cyanides and BO3
3-
3. Pollutants that change pH value. Use of acids and bases makes wastewaters, highly acid and base, which calls for neutralization. After that, pH must be in natural water pH values level (pH=6.8-8.5). If neutralization is not done, release of these wastewaters in environment will endanger flora and fauna.
, phosphates that provoke eutrophication of waters, sulfates, carbonates, and others. In the unions, there are also metal complex of cyanide which are very toxic, so they disassembles; therefore, detoxication is necessary;
4. Pollutants which are changing COD value are organic materials and metal salts. Their elimination is conducted by special regulations, by limitation of COD values.
Wastewaters, according to a danger they can provoke and technological
demands for their elimination, can be divided into: alkali - cyanide, acid, and chrome.

Eco-Ist’12, Ecological Truth, 30 May - 2 June 2012. Hotel “Srbija TIS”, Zajecar, Serbia
154
Figure 2. Untreated electroplating waste waters
Mixing of alkali-cyanide and acid wastewaters forms cyan hydrogen gas, which is very toxic. Therefore, wastewaters are transported by separate canals to sewerage pools and then into decontamination devices. Their treatment is possible to accomplish with different chemical methods of decontamination: neutralization, precipitation, coagulation, flocculation, oxidation and reduction, etc. All these methods are in cases where the treatment of electroplating wastewaters is performed with conventional chemical treatment methods (e.g. cyanide oxidation, reduction Cr6+ into Cr3+
The consequences of these processes and operations, in the second phase of the treatment usually after the reaction with calcium hydroxide, are precipitation of toxic metals (at pH=9,5) and secondary pollution in the form of galvanic sludge (Me(OH)
and depositing of other metals in alkaline media).
x
), which can be presented with the following non-stochiometric reaction:
Me2(SO4)3 ili MeSO4 + Ca(OH)2 → Me(OH)x↓ + CaSO4
Where: Me=Cr, Cu, Zn, Cd, Ni, Pb, Al, Ni, Si itd.
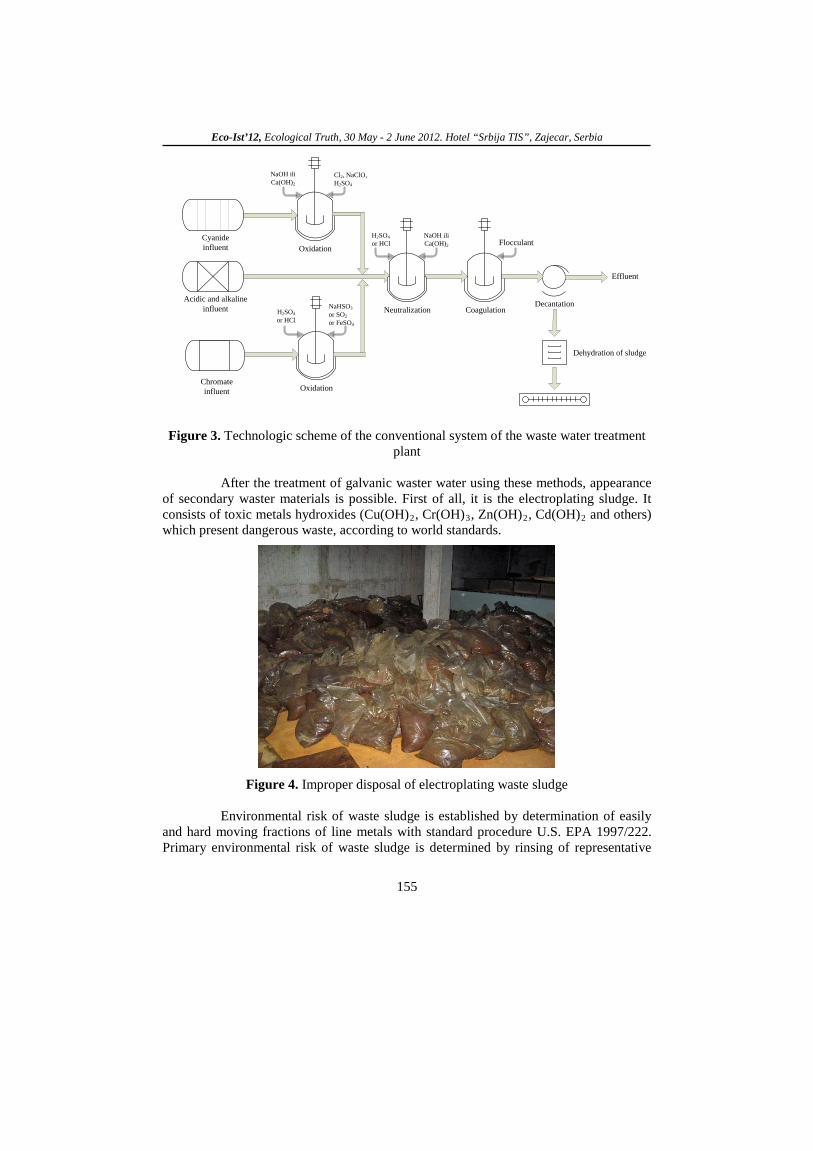
Eco-Ist’12, Ecological Truth, 30 May - 2 June 2012. Hotel “Srbija TIS”, Zajecar, Serbia
155
Cyanideinfluent
Acidic and alkaline influent
Oxidation
NaOH iliCa(OH)2
Cl2, NaClO, H2SO4
Chromateinfluent Oxidation
NaHSO3 or SO2or FeSO4
H2SO4or HCl
Neutralization Coagulation
Flocculant
Decantation
Effluent
Dehydration of sludge
H2SO4or HCl
NaOH iliCa(OH)2
Figure 3. Technologic scheme of the conventional system of the waste water treatment plant
After the treatment of galvanic waster water using these methods, appearance
of secondary waster materials is possible. First of all, it is the electroplating sludge. It consists of toxic metals hydroxides (Cu(OH)2, Cr(OH)3, Zn(OH)2, Cd(OH)2
and others) which present dangerous waste, according to world standards.
Figure 4. Improper disposal of electroplating waste sludge Environmental risk of waste sludge is established by determination of easily
and hard moving fractions of line metals with standard procedure U.S. EPA 1997/222. Primary environmental risk of waste sludge is determined by rinsing of representative

Eco-Ist’12, Ecological Truth, 30 May - 2 June 2012. Hotel “Srbija TIS”, Zajecar, Serbia
156
samples with distilled water and analyses of metals. For this moving fraction, in result, adopted term is water eluate. For better insight in pollution potential, bearing in mind chemical properties of waste sludge, less moving fraction which is stronger tightened was also determined, and therefore acts as a reservoir of pollutants. Harder moving fraction of metals is also isolated by standard procedure of rinsing by alleviated nitrogen acid. This fraction is marked as HNO3
Criteria for comparing metal concentration in water, after rinsing representative samples of waste sludge, have been taken from Holland list 8935/1998, accepted by European Community. These results are shown in table 1.
-eluate.
Table 1. Comparison of concentration of easy moving (H2O-eluate) and heavily moving (HNO3
Pollutant
-eluate) metal fraction in representative samples of waste sludge H2(mg/dm
O-eluate 3
HNO)
3(mg/dm
-eluate 3
A ) (mg/dm3
B ) (mg/dm3
Unfulfilment of criteria )
Cu 0,137 106,1 0,015 0,050 A, B Zn 0,269 1222 0,150 0,200 A, B Ci 9,56 977 0,001 0,050 A, B Ni 1,935 1210 0,015 0,050 A, B Cd 2,839 1203 0,005 0,050 A, B Pb 0,000 9,585 0,005 0,050 A, B
A - referent value for standard underground water; B - concentration for recommended detailed examinations and measures of caution (EEC rule).
Integral environmental protection demands stabilization of these waste
materials before final storage, with the purpose to prevent environmental pollution. One of the easiest ways to achieve this is to dry galvanic sludge in low
temperature driers. Galvanic sludge from filter presses is placed in a trolley with a perforated bottom, through which dry air flows (40-45 °C). The air passes through the mud and it moistures until it becomes saturated. After passing through the sludge, the air enters the zone where pure water gets condensed and flows from the device. Recycled dried air is heated again and it enters the container. The procedure is completely closed and there is no emission of pollutants (Figure 5).
Figure 5. Sludge dehydration system

Eco-Ist’12, Ecological Truth, 30 May - 2 June 2012. Hotel “Srbija TIS”, Zajecar, Serbia
157
Such a procedure, and pressing which follows it, reduce the volume of galvanic sludge, but they do not inactivate it. If exposed to the influence of the precipitation, very toxic and chemically active metal ions get moved.
One of the possibilities to do that is the incorporation of toxic metals in glass-ceramic products in hard solution shape, by adding of glass trash and aluminum dross. In this way, chemical active materials (Cu2+, Cr3+, Cd2+, Ni2+, Pb2+ and Zn2+
The use of non-conventional systems (electrochemical oxidation and reduction, ion exchange, as well as membrane processes, reverse osmosis, ultrafiltration and electrodialysis) avoids the secondary pollution of the environment and allows recovery of useful materials and recycling of waste water to be used again as the mud water in the metalworking processes.
) can be transformed by phase and chemical transformation in very stable structure where pollutants cannot be moved, even under critical conditions as high temperature, influence of acids etc.
These methods imply cyanide detoxification, regeneration of heavy metals and their return to the technological process of production, as well as recirculation of water which is then reused for rinsing metal parts in galvanization. It is extremely important to emphasize that there is no galvanic sludge after the use of these methods, knowing that the efficiency of treatment system is 99,9 %. The systems such as HSA (High Surface Area) and ESE (Extended Surface Electrolysis) are non-conventional systems that are very efficient in removing toxic pollutants beyond the limits of analytical detection methods. They are based on the multiplication of the electrodes, in the form of network with a large adsorption surface. Although they are very efficient, they can pose a potential problem of air pollution which is generated by gases on the electrodes, such as hydrogen and chlorine. However, chlorine can be used as the oxidant and / or flotation agent in galvanic wastewater treatment. CONCLUSION
Systematization of the pollutants has been done on the toxic metals, anions, pollutants that bring to pH change and pollutants that change COD value, on the basis of the galvanic technological process analysis. Secondary waste galvanic sludge has been analyzed. Ecological risk with its deposition by standard procedures according to U.S. EPA 1997/222 has been noticed by defining easy and heavy flowing fractions of metals. One of the proposals for waste sludge treatment is its incorporation into the useful product glass-ceramic. The methods of galvanizing waste water treatment have been defined, and they practically do not lead to the formation of secondary waste. Also, the use of unconventional systems enables regeneration of toxic metals with the aim to obtain an effluent that can be recycled into the technological process.

Eco-Ist’12, Ecological Truth, 30 May - 2 June 2012. Hotel “Srbija TIS”, Zajecar, Serbia
158
REFERENCES
1. G. Vallès, Heavy metal-rich wastes sequester in mineral phases through a glass–ceramic process, Chemosphere 68, 2007.
2. Romagnoli, F. Andreola, L. Barbieri, D. Boccaccini, M. Cannio, I. Lancceotti, V. Piccagliani, Recycling of galvanic sludge in traditional ceramic material, Eleventh International Waste Management and Landfill Symposium, S.Margherita di Pula - Cagliari, Sardinia, Italy, 2007.
3. Vieira, C.M.F.; Monteiro, S.N., Incorporation of solid wastes in red ceramics - an updated review, Matéria (Rio J.) vol.14 no.3, Rio de Janeiro, 2009.
4. Stanisaljević M., Technologies for waste water and industrial hazardous waste treatment, p.p. 531-538, High Technical School of Professional Studies, Požarevac, 2010.
5. Stanisavljevic M., Krstic I., Zec S., Eco-technological process of glass-ceramic production from galvanic sludge and aluminium slag, Science of sintering, International Institute for the Science of Sintering (IISS), ITN SANU, 2010.
159
XX International Scientific and Professional Meeting
"ECOLOGICAL TRUTH" ECO-IST'12
30 May - 2 June 2012, Hotel “Srbija TIS“, Zajecar, SERBIA
COLLECTION AND RECYCLING OF ELECTRONIC
AND ELECTRICAL WASTE IN SERBIA
Snezana Urosevic1*, R. Nikolic1, A. Fedajev1, B. Pejcic
2
1University of Belgrade, Technical Faculty in Bor, Bor, SERBIA 2
City of Nis, City Administration, Local Economic Development Office, SERBIA
*
ABSTRACT Electronic and electrical waste (EE waste) encompasses technical household appliances which we
want to eliminate from our homes. Waste is being collected only in bigger regional centers, and only a few percents of electronic waste are being recycled annually. EE waste is harmful to the environment and people, to some extent, because this type of waste is being generated faster and faster and in larger quantities, both in households and business premises, and it contains numerous toxic substances, therefore, adequate collection and recycling is required in order to prevent the hazardous substances to get into the earth. In 2010 the first factory for electronic waste recycling, Jugo-impex EER, was opened in Nis in cooperation with cluster Recycling South, which recognized contemporary tendencies and electronic waste requirements.
Key words: environmental protection, recycling, electronic waste
INTRODUCTION
Waste recycling in our country is not satisfactory because only one tenth of the collected waste is being recycled. That is one of the problems we need to solve very soon if we are to enter the European Union. Recycling is the most desirable way for the waste treatment in order to preserve the energy and resources. Positive influence of the recycling on the environment is envisaged in the reduction of the waste quantities and in saving up raw materials. Apart from this, recycling, from the economic point of view, represents a chance, for our stagnant economy, for establishing an industrial branch which will provide new jobs, increase profits and the general wellbeing.
We are not going to catch up with other wealthy countries with high standards for quite a while, because they recycle from 60 to 90% and everything that might be reused is being returned in the production process. This task encompasses: keeping records of quantities and locations of the recycled materials, investigating if the waste can be collected, sorted, transported, treated and disposed of on the regional level, and defining how to treat the waste in the least harmful way for the people and the environment. Special attention is paid to the research of the recycling technologies, because the characteristics of the material are being changed during the recycling

Eco-Ist’12, Ecological Truth, 30 May - 2 June 2012. Hotel “Srbija TIS”, Zajecar, Serbia
160
process. These technologies are related to the reduction of the waste capacities, simplifying the waste handling and treatment process in specific production processes [1].
Recycling of secondary resources worldwide is of utmost importance. It is estimated that the annual turnover of secondary resources amounts up to 160 billion US dollars. There is more than 1,5 million people working in the sector, who make it possible to recycle and provide annually more than 600 million tons of the waste paper, colored metals, plastic, textile, glass, electronic waste, etc. Numerous analyses point out the economic justification of waste recycling, mostly in relation to the reduction of the operative costs, but also in saving energy and other inputs [2].
Today, electronic waste recycling is very important, although a new type of waste and the majority of its users are not familiar with the proper way of its disposal and recycling. Recycling of waste, also of electronic waste (computers, monitors, printers, mobile phones, house appliances, etc.) is important because of the environmental protection and some materials used for electronic equipment being harmful to human health. It is considered that there are nine dangerous materials built in computers such as arsenic, antimony, cobalt, cadmium, etc. By recycling electronic waste, apart from the obvious ecological advantages, it is also possible to get a lot of economic advantages, such as saving up money and energy. By saving up energy, one in decreasing the air pollution and the carbon-dioxide emission, thus reducing global warming.
The problem of electronic waste recycling in Europe is an imperative, therefore, there is 6 million tons of electronic waste collected annually and for its recycling 1,5 billion dollars is being spent.
COLLECTION AND RECYCLING OF ELECTRONIC AND ELECTRICAL WASTE
Electronic and electrical equipment waste (WEEE) or E-waste is a type of waste
with the fastest growing rate in the world. It is usually 1%, on average, of the total solid waste in the developed countries. The 2% increase is envisaged by 2010. It is 1%-3% in the USA of the total solid waste generated in municipalities. WEE is growing by 16%-28% every 5 years in the EU, which is 3 times faster generated waste than the average amount of waste generated in municipalities over a year. A resent study showed that the total amount of generated WEEE in EU amounts up to 5-7 million tons per year or 14kg to 25 kg per capita, and it is expected to rise by 3%-5% per year. In the developing countries, it is 0.01% - 1% of the total generated waste in municipalities. Although, in some countries less that 1kg per capita is generated per year, the waste is growing exponentially. The increase of the market expansion rate of the developing countries, of the related services in the developed countries and the high rate of the E-waste becoming out of date, contribute to the fact that this type of waste is the fastest growing one. It contains more than 1000 different substances categorized as “hazardous waste” and “not hazardous”. Namely, it contains metal which consists of, but need not, iron, metals, plastic, glass, wood and wood chips, printed circuit boards, concrete and ceramics, rubber, etc. Iron and steel make around 50% of WEEE, then plastic (21%), metals which

Eco-Ist’12, Ecological Truth, 30 May - 2 June 2012. Hotel “Srbija TIS”, Zajecar, Serbia
161
contain iron (13%), etc. Metals which do not contain iron, contain copper, aluminium and precious metals such as silver, gold, platinum, palladium... The presence of lead, mercury, arsenic, cadmium, selenium and hexavalent chromium and flame retardants
One of the short term objectives (2010-2014) of the Waste Management Strategy is the establishment of the special waste treatment management system (old tires, batteries and accumulators, oils, cars, electronic and electrical waste [4, p.43]).
characterized as WEEE, which are exceeding regular quantities, are characterized as hazardous waste. WEEE disintegration or burning is considered toxic [3].
Products which need electricity or electromagnetic field, as well as the equipment for producing, transmitting and measuring the electricity or the electromagnetic field strength, are considered electronic and electrical equipment and appliances. Electronic and electrical equipment waste encompasses equipment and appliances that the owner wants to get rid of, also devices and spare parts which are produced in industry [4 p. 29].
There are no accurate data about the electronic waste quantities per year but there are estimates that there are 30.000 tons per year accumulated, while there are 85.600 t of new equipment imported each year. Although, the import of the second hand technical goods is banned, it is allowed if for personal use or if of certain age. Waste is being collected only in bigger regional centers, and only a few percents of the electronic waste are being recycled.
The quantity of electronic and electrical waste in the EU is increasing very fast, and the hazardous materials in electronic and electrical equipment represent the main concern related to the E-waste management and its recycling, which is not being exercised as much as it should be. Therefore, electronic and electrical waste is identified as a priority area for applying special measures in European countries, but also in Serbia.
STRATEGIC AND LEGAL FRAMEWORK FOR
E-WASTE MANAGEMENT
EU adopted two directives in relation to the electronic and electrical waste in 2003.
1. Waste of Electrical and Electronic Equipment (WEEE), and 2. RoHS (Restriction of the use of hazardous substances).
These two directives became effective as EU laws in 2006 and since then, each
product which was not in line with these directives could not be sold in the EU countries. WEEE directive aims at improving the electronic waste management and at urging the producers to produce products prone to recycling. The essence of this Directive instructs producers to pay for the collection, recycling and treatment of the electronic waste through paying tax.
The priority of this Directive is the prevention of producing electronic waste, reusing it, and recycling it in order to reduce its disposal to landfills. Also, it aims at improving ecological performance of those who are active in the product’s life cycle (producers, distributors, consumers and others who are directly involved in the WEEE treatment). From 2006, each product which is not in line with WEEE directive cannot be

Eco-Ist’12, Ecological Truth, 30 May - 2 June 2012. Hotel “Srbija TIS”, Zajecar, Serbia
162
sold on the EU market. WEEE directive aims at improving the electronic waste management performance through:
1. Selective collection of electronic waste through certain systems which preserve the integrity of products and their potential for reuse,
2. Collection rate which has to be at least 4 kg of electronic waste per capita annually,
3. Individual responsibility of the producers; reuse and recycling rates are from 50% to 80% depending on the product’s category, which should be secured by the producers of the electronic and electrical equipment, and
4. Providing information to the end users whose involvement is essential for the high collection and recycling rates, through labeling packaging and providing information about treatment plants (also labeling the contents and the structure of the electronic product). RoHS directive is fulfilling the WEEE directive by specifying the quantities of
potentially hazardous materials in products, namely electronic appliances and electrical devices. Numerous cases showed that special measures of collection, treatment, recycling and disposal of electronic waste are required in order to decrease the problems of heavy metals waste management. Despite these measures, a huge quantity of electronic waste is going to end up in the current communal waste. Even if the electronic waste was collected in a proper manner and was recycled it still contains hazardous materials such as mercury, cadmium, lead, PCB, which are still a threat to the environment and the human health. Taking into consideration technical and economic opportunities, the most efficient way for reducing the risk to the environment and human health, in relation to these substances, is by replacing them with harmless or less hazardous materials. RoHS directive restricts the use of certain substances in electronic and electrical equipment, namely it defines what percentage of heavy metals and controlled substances, in comparison to the mass, each component may contain. The maximum concentration of 0,1% per mass in homogenous materials is defined [1].
The Republic of Serbia Government adopted the Ordinance on products which become special waste after use, the form of daily records of the produced and imported products’ quantity and type, and of the annual report, ways and deadlines of delivering the annual report, parties who have to pay the tax, criteria for calculating the tax, amount and the way of calculating and paying («Official Gazette», No. 89/09 and 8/2010 [5]). Products which are considered as special waste are vehicle tires, products containing asbestos, batteries or accumulators, mineral and synthetic oils and electronic waste.
The legal document which regulates the proper waste disposal and management in the Republic of Serbia is the Law on Managing Hazardous Materials. Electronic and electrical waste management is regulated by Article 50:
• Electronic and electrical waste cannot be mixed with other types of waste, • It shall be prohibited to dispose of electronic and electrical waste without
having them pre-treated, • Waste liquids from electronic and electrical products shall be separated and
treated in appropriate manner,

Eco-Ist’12, Ecological Truth, 30 May - 2 June 2012. Hotel “Srbija TIS”, Zajecar, Serbia
163
• Components of electronic and electrical waste containing PCB shall be separated and their appropriate disposal shall be provided for,
• Manufacturer or importer of electronic and electrical products shall identify recyclable components of those products,
• Entities that take waste of electronic and electrical products over upon use thereof shall issue and keep confirmations on taking over, as well as confirmations on their delivery for treatment and disposal,
• The entity that collects, treats or disposes of waste of electronic and electrical products shall hold appropriate permit, maintain records on quantities and types of electric or electronic products taken over, and shall submit such data to the Agency [6].
In order to make the waste collection more efficient and systematic, thus EE
waste, thorough planning and involvement of all parties is required, educations, information campaigns about the waste collection and advantages for the community, establishing recycling systems and alarming and penalizing inappropriate waste disposal, in line with legal procedures in our country and worldwide. EE waste is being gathered through certain activities and through the collection network of operators in charge for recycling but that is still insufficient because a large amount, more than 90% is still ending up at landfills.
The recycling process of electronic waste (home appliances) is similar but also different according to types of components and materials onto which it decomposes. Therefore, it is vital to collect the electronic waste and separate components onto those which are reusable and those which should be disposed of for good. For the collection, treatment or disposal of electronic and electrical products a permit is being issued, and the operator has to keep records of the quantity and type of the electronic and electrical products taken over and should submit such data to the Agency.
It is essential to introduce the tax for producers and importers of electronic and electrical products, which are considered waste after use. This tax would be used for the waste collection and treatment 1
According to the Environmental Protection Law a legal entity will be penalized with a fine from 500.000 to 3.000.000 RSD (inadequate waste management and endangering the environment), an entrepreneur with a fine from 250.000 to 500.000 RSD, a physical entity from 5.000 to 50.000 RSD or with a 30 day imprisonment, a responsible employee in the government, local self-government, public enterprise with a fine from 25.000 to 50.000 RSD.
. Producers and importers of electronic and electrical products are obliged to manage the waste from the electronic and electrical products in line with the Law on Waste Management until 31/12/2012 [7].
1 Republic of Serbia Waste Management Strategy 2010-2019, (Official Gazette No. 29/10), April 2010, p. 53.
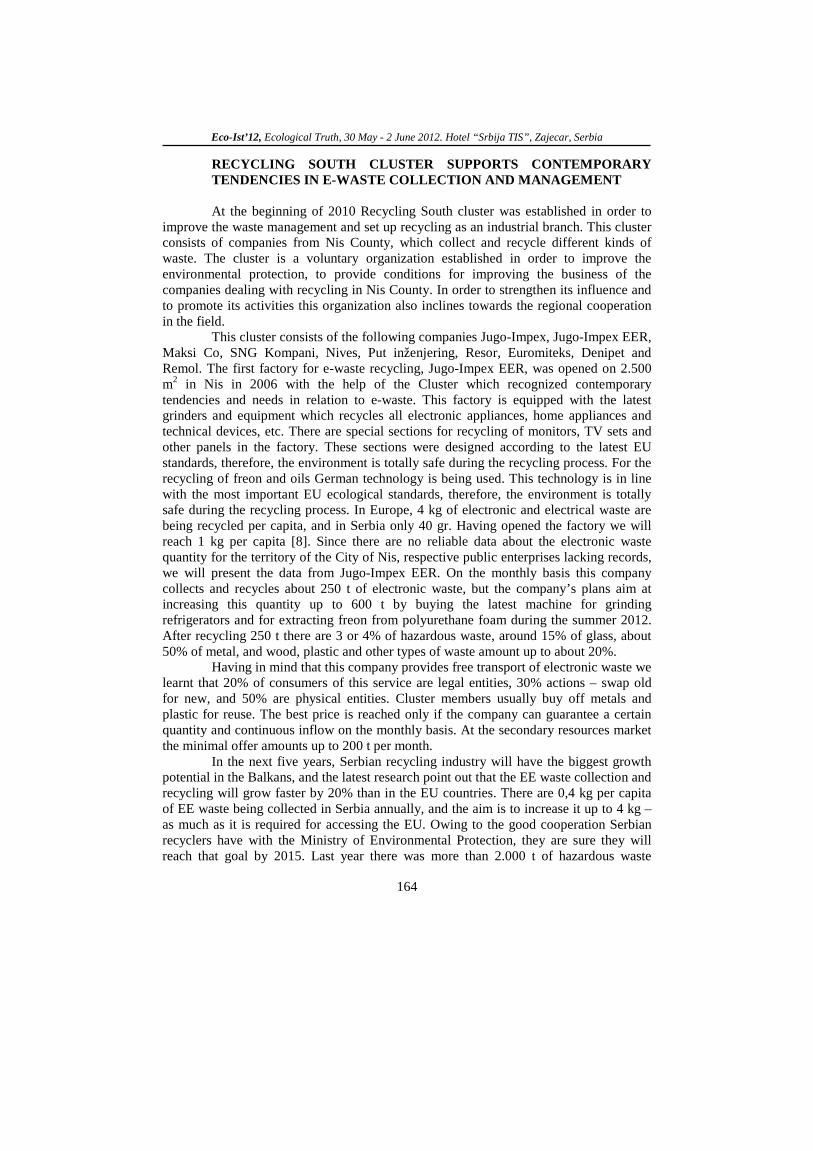
Eco-Ist’12, Ecological Truth, 30 May - 2 June 2012. Hotel “Srbija TIS”, Zajecar, Serbia
164
RECYCLING SOUTH CLUSTER SUPPORTS CONTEMPORARY TENDENCIES IN E-WASTE COLLECTION AND MANAGEMENT
At the beginning of 2010 Recycling South cluster was established in order to
improve the waste management and set up recycling as an industrial branch. This cluster consists of companies from Nis County, which collect and recycle different kinds of waste. The cluster is a voluntary organization established in order to improve the environmental protection, to provide conditions for improving the business of the companies dealing with recycling in Nis County. In order to strengthen its influence and to promote its activities this organization also inclines towards the regional cooperation in the field.
This cluster consists of the following companies Jugo-Impex, Jugo-Impex EER, Maksi Co, SNG Kompani, Nives, Put inženjering, Resor, Euromiteks, Denipet and Remol. The first factory for e-waste recycling, Jugo-Impex EER, was opened on 2.500 m2
Having in mind that this company provides free transport of electronic waste we learnt that 20% of consumers of this service are legal entities, 30% actions – swap old for new, and 50% are physical entities. Cluster members usually buy off metals and plastic for reuse. The best price is reached only if the company can guarantee a certain quantity and continuous inflow on the monthly basis. At the secondary resources market the minimal offer amounts up to 200 t per month.
in Nis in 2006 with the help of the Cluster which recognized contemporary tendencies and needs in relation to e-waste. This factory is equipped with the latest grinders and equipment which recycles all electronic appliances, home appliances and technical devices, etc. There are special sections for recycling of monitors, TV sets and other panels in the factory. These sections were designed according to the latest EU standards, therefore, the environment is totally safe during the recycling process. For the recycling of freon and oils German technology is being used. This technology is in line with the most important EU ecological standards, therefore, the environment is totally safe during the recycling process. In Europe, 4 kg of electronic and electrical waste are being recycled per capita, and in Serbia only 40 gr. Having opened the factory we will reach 1 kg per capita [8]. Since there are no reliable data about the electronic waste quantity for the territory of the City of Nis, respective public enterprises lacking records, we will present the data from Jugo-Impex EER. On the monthly basis this company collects and recycles about 250 t of electronic waste, but the company’s plans aim at increasing this quantity up to 600 t by buying the latest machine for grinding refrigerators and for extracting freon from polyurethane foam during the summer 2012. After recycling 250 t there are 3 or 4% of hazardous waste, around 15% of glass, about 50% of metal, and wood, plastic and other types of waste amount up to about 20%.
In the next five years, Serbian recycling industry will have the biggest growth potential in the Balkans, and the latest research point out that the EE waste collection and recycling will grow faster by 20% than in the EU countries. There are 0,4 kg per capita of EE waste being collected in Serbia annually, and the aim is to increase it up to 4 kg – as much as it is required for accessing the EU. Owing to the good cooperation Serbian recyclers have with the Ministry of Environmental Protection, they are sure they will reach that goal by 2015. Last year there was more than 2.000 t of hazardous waste

Eco-Ist’12, Ecological Truth, 30 May - 2 June 2012. Hotel “Srbija TIS”, Zajecar, Serbia
165
collected in Serbia, and if the cooperation in the field of creating favorable business environment persists according to the recently adopted plans, Serbia will gain the best export industry in the region. The funds made of the ecological tax, Serbian recyclers invested in the action Dispose of Waste, in which they provided free transport of EE waste to public companies and government and private companies
[9].
CONCLUSION
Within the Sustainable Development Strategy, one of the globally acknowledged principles is the sustainable production and consumption, which encompasses environmental protection, preserving of materials and energy efficiency at each phase of production, starting from the preparation, production, primal and secondary use, recycling and disposal. Recycling of any type of waste, including the e-waste (computers, monitors, printers, mobile phones, house appliances, etc) is important for the environmental protection, because some of the materials used for making electronic equipment are very dangerous for human health. The second reason for recycling is saving up money and energy, and by saving energy the air pollution and the carbon-dioxide emission is decreasing, which influences the main reason for global warming. If we want to join the EU, we will have to support and promote recycling and the public awareness about recycling and its inevitability.
REFERENCES
1. Urošević S. Zorboski M., „Recikliranje mobilnih telefona-put ka očuvanju životne sredine“ IV Simpozijum Reciklažne tehnologije i održivi razvoj, Tehnički fakultet u Boru, 3-6.11.2009., Kladovo, Zbornik radova, str. 300-309,
2. Urošević S., Nikolić R., Fedajev A., “Importance of recycling in view of the fulfillment of ecological and economic criteria”, Ecological Truth, Eco-Ist 11 XIX International Scientific and Professional Meeting 01-04.06.2011. Bor, Srbija, str.162-168.
3. Upravljanje e-otpadom u Srbiji, Balkan e-Waste Management Advocacy Netweork, 2010, http://bewman.eu
4. Strategija upravljanja otpadom Republike Srbije za period 2010-2019. godine,
5. Lokalni plan upravljanja otpadom na teritoriji Grada Niša za period od 2011. do 2021. godine, str. 101.
(Sl.gl.RS, br.29/10), april 2010. godine
6. Zakon o upravljanju otpadom, ("Sl. glasnik RS", br. 36/2009 i 88/2010), Član 50.
7. Zakon o upravljanju otpadom, ("Sl. glasnik RS", br. 36/2009 i 88/2010), Preuzeto iz elektronske pravne baze Paragraf Lex, www.paragraf.rs Član 99. str. 86.
8. www.ni.rs 9. http://www.klaster-reciklazajug.com/pocetna.htm

166
XX International Scientific and Professional Meeting
"ECOLOGICAL TRUTH" ECO-IST'12
30 May - 2 June 2012, Hotel “Srbija TIS“, Zajecar, SERBIA
OPTIONS FOR RECLAMATION OF DEGRADED AREAS
AT THE PIT MINE
Samir Nuric1*, A. Nuric1, M. Jukan2, J. Jamakovic
2
1
BOSNIA AND HERZEGOVINA University of Tuzla, Faculty of mining, geology and civil engineering,
2
Black coal mine Banovici, Banovici, BOSNIA AND HERZEGOVINA
*
ABSTRACT
Mining operations inevitably cause changes in the surrounding environment, the extent of which depends upon the nature of the ore, mining methods and the size, geometry and location of the deposit. The closure process deals with the cessation of technical operations, also includes site rehabilitation, which involves both landscape restoration and prevention or mitigation of any potential environmental and safety risks. Crater of pit mine Cubric should be considered as a potential water reservoir (lake) or slag dump of the future thermal power plant Banovici or can be considered as a potential external dump
for pit mine Turija.
Key words: pit mine, closure, rehabilitation, environmental, landscape
INTRODUCTION
Huge land areas are degraded by mining activities. Degraded land areas are excavated area and area for delaying of overburden. Land is one of the most important resources and condition for life existence not only present but future generations and because of that it is prior task take exceptionally care about its protection. Because of that it is necessary to determine of area by plane and depth for technical and biological rehabilitation after closure of Cubric pit mine at brown coal mine Banovici, Bosnia and Herzegovina.
AN OVERVIEW OF MINING ACTIVITIES AT PIT MINE CUBRIC
Cubric pit mine is part of Banovici coal basin. It starts with work in 1977. by exploitation of coal seam thickness from 7 to 19 metres. The pit mine is 2.7 km south-west far from Banovici site.

Eco-Ist’12, Ecological Truth, 30 May - 2 June 2012. Hotel “Srbija TIS”, Zajecar, Serbia
167
Figure 1. Pit mine ''Cubric''
It is bounded with faulting zone on south side, on west side by final slope of
Podgorje pit mine, on north side with final slope of Dolovi pit mine and east side by final slope of Ravne pit mine. All three pit mines are finished with production works.
Mining activity refers to the extraction and enrichment of coal. The mining life-cycle can be divided into three stages: exploration, production and reclamation. The duration of mining operations depends on the size and grade of the deposits and methods used, as well as market prices. When all economically acceptable coal has been mined, preparations for mine closure come to stage. The closure process deals with the shutdown of technical operations, also includes location reclamation and re-vegetation, and prevention or of any potential environmental and safety risks.
ENVIRONMENTAL IMPACTS OF MINING ACTIVITY
Mining operations inevitably cause changes in the surrounding environment, which depends upon the nature of the ore, mining methods and the size, geometry and location of the deposit. The most significant effect on the environment relates to mining production phase. Implementation of a rehabilitation process after mining is intended to ensure safety and to minimize any negative environmental influences of the closed mine.
Open pit mining and related processes can distinctively change the countryside at the site and have impact on local ecosystems. One of the most noticeable effects on the landscape is the removal of overburden in an open pit. The mine environment is influenced by the construction of mine infrastructure and also if it is necessary to reroute surface waters in adjacency to the mine.
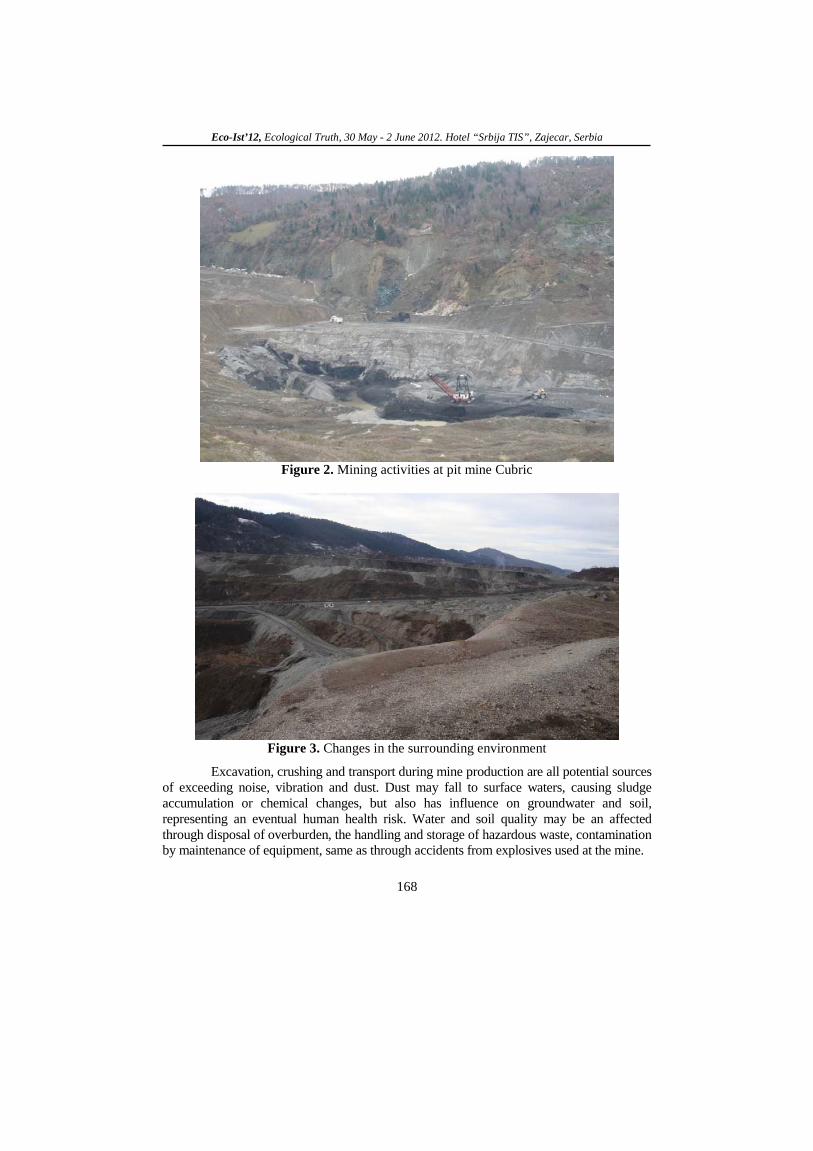
Eco-Ist’12, Ecological Truth, 30 May - 2 June 2012. Hotel “Srbija TIS”, Zajecar, Serbia
168
Figure 2. Mining activities at pit mine Cubric
Figure 3. Changes in the surrounding environment
Excavation, crushing and transport during mine production are all potential sources of exceeding noise, vibration and dust. Dust may fall to surface waters, causing sludge accumulation or chemical changes, but also has influence on groundwater and soil, representing an eventual human health risk. Water and soil quality may be an affected through disposal of overburden, the handling and storage of hazardous waste, contamination by maintenance of equipment, same as through accidents from explosives used at the mine.

Eco-Ist’12, Ecological Truth, 30 May - 2 June 2012. Hotel “Srbija TIS”, Zajecar, Serbia
169
TECHNICAL SOLUTIONS ASSIGNMENT OF THE PIT MINE CRATER AND WASTE AREA
Contours of land area for reclamation
New areas, with changed morphology, geology, pedology and other
characteristics, are formed by planned technology of excavation and exploitation of coal at Cubric pit mine until its closure. After exploitation of coal, it will be form areas at waste dumps and excavated area i.e. crater of the pit mine. Crater of pit and waste dumps are parts of Cubric pit mine with total plane area approximately 326 ha.
Figure 4. Parts of the pit mine intended for reclamation
One of possible allocation of available space
(surface of plateau and slopes of the landfill) is technical and biological reclamation. Orientation structure of areas which are partly reclaimed during production phase and those which are going to be reclaimed after closure Cubric pit mine are presented in table 1.
Table 1. Structure of area for reclamation Part of the pit mine Area for reclamation (m2 Time of reclamation ) Excavated area 787 365 After closure mine East part-Ravne 379 007 From beginning of exploitation West part-internal waste dump 1 574 255 From beginning of exploitation North part 517 795 From beginning of exploitation
Total 3 256 422
Area of Cubric pit mine as potential water reservoir
Crater of pit mine should be considered as a potential water reservoir (lake) or slag dump of the future thermal power plant Banovici. Volume of available free space open pit craters Cubric to elevation 408 m (elevation undermine) calculated by the method of parallel transverse profile of the distance of between 50 m and is 20773462 m3
.

Eco-Ist’12, Ecological Truth, 30 May - 2 June 2012. Hotel “Srbija TIS”, Zajecar, Serbia
170
Figure 5. Pit mine Cubric and position of parallel cross profiles
Table 2. Volume of available free space open pit craters Cubric for water reservoir
Area of Cubric pit mine as waste dump of Turija pit mine
Available space Cubric pit mine can be considered as a potential external dump for pit mine Turija. It was designed approximate (''rough'') construction of potential external disposal Turija pit mine in this area. Potential external landfill at the site of the

Eco-Ist’12, Ecological Truth, 30 May - 2 June 2012. Hotel “Srbija TIS”, Zajecar, Serbia
171
former Cubric pit mine includes the eastern area, the northern area, a crater of pit, bigger part of the western landfill open pit Cubric. Calculation of the potential volume of landfill space was performed using the method of transverse profiles. Based on the performed frame structure of the potential landfill was obtained the available volume in the amount of 116 210 m3.
Considering that this is not a thorough-performing construction landfill, elaborated by delay stages depending on the applied methods, technologies and mechanization of transport and disposal, as well as future solutions formed by reclamation landfill opinion is that possible deviations from the obtained volume of available space
.
Table 3. Volume of available free space as a potential external dump for pit mine

Eco-Ist’12, Ecological Truth, 30 May - 2 June 2012. Hotel “Srbija TIS”, Zajecar, Serbia
172
COVERING OVERBURDEN AT THE WASTE DUMP
Objectives and requirements for covering of the waste dump need to be determined based on characteristics of the waste rock materials and the cover material, hydrological and soil parameters, future land use requirements, and any technical difficulties through mine life cycle. Depending on the above objectives of the covering program may be to:
• prevent wind ablation of waste dumps of pollutants into the surrounding environment,
• prevent or minimize the formation of acid mine drainage, • promote the establishment of a sustainable ecosystem.
The properties of the material to be covered must be well determined. It is also
important to respect that excavation and transport of that kind of material may have an emphatic impact on the surrounding landscape and should be incorporated into the decision-making process.
PROCESS OF RE-VEGETATION IN LANDSCAPE RESTORATION
Process of re-vegetation provide aesthetic enhancement of former mining sites. Vegetation cover also effectively isolates potentially hazardous materials from contact with humans, animals and surface waters and prevents potential dust hazards, and disrupting the effect of wind at ground level. Careful regeneration of vegetation also provides the opportunity for restore to a balanced and viable ecosystem. The choice of appropriate plant species for regeneration requires consideration of soil attributes and climatic factors, as well as evaluation of future options for land use.
CONCLUSION
For example Cubric open pit, which is in phase of closing, are given two variants of the closure: using crater of the pit for water accumulation and/or slag dump or options to create external waste dump for open pit Turija, which is active and in the exploitation phase. Reclamation is one of the final process in the surface mining of mineral raw materials from which depends the future state of the closed mine and its impact on the environment. Both versions of closure require appropriate measures of protection and reclamation, which should lead into a state of balance considered location and surrounding terrain as well as creating opportunities for sustainable development of ecosystems.
REFERENCES
1. Delić M., Nurić A., Nurić S., Radulović V., 2009.: Specifyng the influence of landfill coal mine „Dubrave“ on the surrounding terrain, Proceedings 41th IOC on Mining and Metallurgy – IOCMM, Kladovo, pg. 293-298, Mining and Metallurgy Institute Bor and University of Belgrade Technical faculty Bor, Bor

Eco-Ist’12, Ecological Truth, 30 May - 2 June 2012. Hotel “Srbija TIS”, Zajecar, Serbia
173
2. Delić M., Nurić A., Nurić S., Radulović V., 2010.: Determination of final slope stability at the pit mine Dubrave, Proceedings 42th
3. Girard J.M. McHugh E.L., Miller S. M.: Computer modelling of catches benches to mitigate rockfall hazards in open pit mines, Geological Engineering Program, University of Idaho, Moscow, Idaho, NIOSH Spokane Research Laboratory, Spokane, Washington
IOC on mining and metallurgy, Technical faculty at Bor University of Belgrade, Copper Institute Bor, Kladovo
4. Hustrulid, W.; Kuchta, M., 2006.: Open pit mine, planning & design 2nd
5. Heikkinen P. M. (ed.), Noras P. (ed.), Salminen R. (ed.), Mroueh U.M., Vahanne P., Wahlström M.M., Kaartinen T., Juvankoski M., Vestola E., Mäkelä E., Leino T., Outokumpu Oyj, Kosonen M., Maa ja Vesi Oy, Hatakka T., Jarva J., Kauppila T., Leveinen J., Lintinen P., Suomela P., Pöyry H., Outokumpu Mining Oy, Vallius P., Nevalainen J., Salvor Oy, Tolla P., Tieliikelaitos, Komppa V., 2008.: Mine closure Handbook Environmental Techniques for the Extractive Industries, Espoo, Vammalan Kirjapaino Oy
edition, A.A.Balkema, Rotterdam
6. Knežiček, T., 2004.: Računarski podržano projektovanje površinskih kopova, JU Univerzitet u Tuzli, Tuzla
7. Kennedy B.A., 1990.: Surface Mining, Society for Mining, Metallurgy, and Exploration, Inc., Littleton, Colorado
8. McHugh E.L., D. G. Long, Ch. Sabine: Applications of groun-based radar to mine slope monitoring, Spokane Research Laboratory, NIOSH
9. McHugh E.L.: Video motion detection for real-time hazard warnings in surface mines, Spokane Research Laboratory, National Institute for Occupational Safety and Health, Spokane, Washington, USA
10. McHugh E.L. and Girard J.M.: Evaluating techniques for monitoring rock falls and slope stability, Spokane Research Laboratory, National Institute for Occupational Safety and Health, Spokane, WA
11. Nurić, S., 2009.: Kamionski transport u površinskoj eksploataciji, Tuzla 12. Nurić A., Nurić S., Avdić M., 2005.: Proračun stabilnosti kosina pomoću
računara na PK 'Mošćanica' RMU Zenica, Rudarski radovi 1/2005, str. 44-49, Komitet za podzemnu eksploataciju mineralnih sirovina Resavica, RTB Bor Institut za bakar Bor
13. Nurić A., Nurić S., Haračić E., 2007.: Vizualizacija vanjskog odlagališta 'Zapad' na PK Dubrave korištenjem kompjuterske tehnike, str. 183-187, Zbornik radova RGGF-a XXXIII, Tuzla
14. Nurić A., Nurić S., Lapandić Š., Haračić E., 2007.: The methods of monitoring slope stability to provide security performance of works on the open pit mine, Proceedings 39th
15. Nurić A., Nurić S., Hercegovac E., Lapandić Š., Delić M., 2010.: Methodologies of calculation mass for construction plateau on the site ''Strelište'' Velika Ribnica – Banovići, Proceedings 42
IOC on Mining and Metallurgy, Sokobanja, pg. 58-63, Technical faculty Bor, University of Belgrade and Copper Institute Bor, Bor
th IOC on mining and metallurgy, pg. 364-367, Technical faculty at Bor University of Belgrade, Copper Institute Bor, Bor

174
XX International Scientific and Professional Meeting
"ECOLOGICAL TRUTH" ECO-IST'12
30 May - 2 June 2012, Hotel “Srbija TIS“, Zajecar, SERBIA
STABILITY ASSESSMENT FOR EMBANKMENTS
AT PIT MINE CUBRIC
Adila Nuric, S. Nuric
*
University of Tuzla, Faculty of mining, geology and civil engineering, Tuzla, BOSNIA AND HERZEGOVINA
*
ABSTRACT
Planning and implementation of disposal of waste rocks both need to evaluate and anticipate long-term behaviour of the material and any safety risks associated with the disposal. Monitoring of the stability of embankments and other earthworks is necessary to ensure that there is no risk of failure earthen structures. The relationship between shear strength and maximum shear stress is known as the factor of safety. Stability assessment is in practice performed by computer programs, which ideally include a variety of separate algorithms capable of simulating safety factors based on different criteria.
Key words: pit mine, waste dump, waste rock, environment, factor of safety, stabilization
INTRODUCTION
Mining inevitably generates waste rock, which must be removed to exploit the ore. If waste rock cannot be used during mining, it may have a significant impact on the surrounding landscape. Waste rock can commonly be used for the building industry, in road construction or other earthworks during active mining operations or as material for landfill or in embankments designed for mitigating traffic noise, etc. Planning and implementation of disposal of waste rocks both need to evaluate and anticipate long-term behaviour of the material and any safety risks associated with the disposal.
STABILITY ASSESSMENT FOR EMBANKMENTS IN FUNCTION OF FINAL SLOPE OF THE PIT MINE
Factor of safety
Investigations usually utilize failure surface analysis, in which failure is assumed to occur along a shear plane (Figure 1). In stability calculations the shear strength of a given material is compared with the maximum shear stress that can be sustained along real or theoretical planes subject to shear failure. The relationship between these two values is known as the factor of safety (Fs). Under these circumstances monitoring is

Eco-Ist’12, Ecological Truth, 30 May - 2 June 2012. Hotel “Srbija TIS”, Zajecar, Serbia
175
advisable, especially if the structure consists of various materials having significantly different yield strength characteristics. During mine closure the most relevant strength parameters are determined using the c-φ (cohesion–angle of internal friction) relation, according to which shear strength is calculated as a function of effective stresses. Slope stability investigations require basic knowledge of soil characteristics, the design and geometry of structures, pore water levels and distribution, and strength parameters for waste rock, underlying substrate and any other material used in construction. Additional information required the distribution of different types of materials within structures, and their unit weight, density, hydraulic conductivity or any other properties.
Figure 1. View at final slope instability and the waste dump at pit mine Čubrić
The most significant material properties are presented in Table 1.
Table 1. Characteristics of material at site of investigation Material Internal angle of
friction φ (°) Cohesion c (kN/m2
Density γ ) (kN/m3
Pore pressure pw )
Base material 30 60 20 0,2 Waste material 30 30 19 0,3/0,4
METHODS AND SOFTWARE FOR CALCULATING SLOPE STABILITY
It is possible to use any of the available and approved geotechnical techniques
for calculating slope stability, such as straight failure surface, circular failure surface, multiple segmented failure surface, free-formed failure surface methods or some numerical techniques. Stability assessment is in practice performed by computer

Eco-Ist’12, Ecological Truth, 30 May - 2 June 2012. Hotel “Srbija TIS”, Zajecar, Serbia
176
programs, which can include a versatility of parted algorithms efficient to simulating safety factors based on different criteria and shapes of failure surfaces.
Figure 2a. Parts of software for calculation the factor of safety
Figure 2b. Parts of software for calculation the factor of safety
The results of estimations with minimal factor of safety for selected four
profiles are presented on next figures. Calculation was made by Bishop’s and Janbu’s method.

Eco-Ist’12, Ecological Truth, 30 May - 2 June 2012. Hotel “Srbija TIS”, Zajecar, Serbia
177
0 50 100 150 200 250 300 350
-40
-20
0
20
40
60
80
100
120
140
160
180
200
w ww
w ww w w
c pw[°] [kN/m²] [kN/m³] [-] Designation
30.00 30.00 19.00 0.40 odl.mase30.00 60.00 20.00 0.20 podloga
Soil c pw[°] [kN/m²] [kN/m³] [-] Designation
30.00 30.00 19.00 0.40 odl.mase30.00 60.00 20.00 0.20 podloga
1.711.22
0.970.98
2.153.01
3.694.47
1.801.27
0.970.97
2.292.84
3.524.44
1.88
1.32
0.98
0.97
3.09
2.66
3.52
4.13
1.90
1.39
0.99
0.94
3.08
2.53
3.54
4.06
1.93
1.47
1.00
0.93
2.89
2.46
3.47
3.84
1.94
1.58
1.02
0.91
2.72
2.46
3.55
3.73
1.96
1.72
1.05
0.90
2.63
2.54
3.48
3.89
1.99
1.87
1.10
0.87
2.66
2.78
3.01
3.87
c pw[°] [kN/m²] [kN/m³] [-] Designation
30.00 30.00 19.00 0.40 odl.mase30.00 60.00 20.00 0.20 podloga
Soil c pw[°] [kN/m²] [kN/m³] [-] Designation
30.00 30.00 19.00 0.40 odl.mase30.00 60.00 20.00 0.20 podloga
Basic calculation datamin = 0.87xm = 136.14 mym = 122.74 mR = 47.18 m
Figure 3. Factor of safety Fs=0,87 for profile I-I obtained Bishop's method with pw=0,4
0 50 100 150 200 250 300
-20
0
20
40
60
80
100
120
140
160
180
200
w
w
ww w w w w
c pw[°] [kN/m²] [kN/m³] [-] Designation
30.00 30.00 19.00 0.40 odl.mase30.00 60.00 20.00 0.20 podloga
Soil c pw[°] [kN/m²] [kN/m³] [-] Designation
30.00 30.00 19.00 0.40 odl.mase30.00 60.00 20.00 0.20 podloga
1.75
1.41
1.21
1.24
2.73
19.43
1.85
1.46
1.22
1.21
2.45
1.62
1.98
1.52
1.23
1.16
2.23
36.82
2.13
1.61
1.26
1.12
2.06
64.21
2.33
1.71
1.30
1.10
1.81
71.48
2.59
1.86
1.37
1.09
c pw[°] [kN/m²] [kN/m³] [-] Designation
30.00 30.00 19.00 0.40 odl.mase30.00 60.00 20.00 0.20 podloga
Soil c pw[°] [kN/m²] [kN/m³] [-] Designation
30.00 30.00 19.00 0.40 odl.mase30.00 60.00 20.00 0.20 podloga
Basic calculation datamin = 1.09xm = 273.96 mym = 116.23 mR = 63.11 m
Figure 4. Factor of safety Fs=1,09 for profile II-II obtained Bishop's method
with pw=0,4

Eco-Ist’12, Ecological Truth, 30 May - 2 June 2012. Hotel “Srbija TIS”, Zajecar, Serbia
178
0 100 200 300 400 500
-100
-50
0
50
100
150
200
250
w
w w w w w w w
c pw[°] [kN/m²] [kN/m³] [-] Designation
30.00 30.00 19.00 0.40 odl.mase30.00 60.00 20.00 0.20 podloga
Soil c pw[°] [kN/m²] [kN/m³] [-] Designation
30.00 30.00 19.00 0.40 odl.mase30.00 60.00 20.00 0.20 podloga
Basic calculation dataslip bodies 5: = 0.79
Figure 5. Factor of safety Fs=0,79 for profile III-III obtained Janbu's method
with pw=0,4
0 50 100 150 200 250 300 350 400
0
50
100
150
200
250
w ww
w ww
c pw[°] [kN/m²] [kN/m³] [-] Designation
30.00 30.00 19.00 0.40 odl.mase30.00 60.00 20.00 0.20 podloga
Soil c pw[°] [kN/m²] [kN/m³] [-] Designation
30.00 30.00 19.00 0.40 odl.mase30.00 60.00 20.00 0.20 podloga
1.18
0.98
1.17
1.54
2.36
2.90
1.26
0.98
1.10
1.48
2.21
2.76
1.37
1.02
1.04
1.44
2.10
2.76
1.52
1.07
0.99
1.39
2.04
2.81
1.76
1.14
0.96
1.36
2.01
2.79
2.17
1.24
1.01
1.32
2.08
2.85
c pw[°] [kN/m²] [kN/m³] [-] Designation
30.00 30.00 19.00 0.40 odl.mase30.00 60.00 20.00 0.20 podloga
Soil c pw[°] [kN/m²] [kN/m³] [-] Designation
30.00 30.00 19.00 0.40 odl.mase30.00 60.00 20.00 0.20 podloga
Basic calculation datamin = 0.96xm = 130.98 mym = 183.28 mR = 88.28 m
Figure 6. Factor of safety Fs=0,95 for profile IV-IV obtained Bishop's method
with pw=0,4

Eco-Ist’12, Ecological Truth, 30 May - 2 June 2012. Hotel “Srbija TIS”, Zajecar, Serbia
179
Table 2. Value of minimal factor of safety for all models of calculation
Method Factor of safety Fs(min) I-I II-II III-III IV-IV
Bis
hop'
s m
etho
d no pore pressure 0,99 1,21 0,91 1,12 pw=0,3 LLP 0,99 1,21 0,91 1,12 pw=0,4 NNV 0,87 1,12 0,80 0,95 pw=0,3 HLP 0,99 1,24 0,92 1,12 pw=0,4 HLP 0,87 1,09 0,80 0,95
Janb
u's
met
hod
no pore pressure 1,12 1,12 0,92 1,23 pw=0,3 LLP 1,12 1,51 0,92 1,23 pw=0,4 LLP 0,99 1,36 0,79 1,07 pw=0,3 HLP 1,12 1,33 1,02 1,23 pw=0,4 HLP 0,99 1,36 0,89 1,07
RESULTS OF ESTIMATION From the graphical and tabular views of the calculated safety factors Fs final
slopes can be concluded that for all considered profiles observed a certain degree of instability of slopes. Different variants of pore pressure in deposited masses analyzed, and note that the instability of slopes is greater degree because of influence pore pressure of deposited masses than the level of pore pressure. It is evident that minor or no changes in safety factor with a change of pore pressure levels (LLP - low level of pore pressure; HLP - a higher level of pore pressure), while the value of the PW alone (pore pressure) significantly affects the value of safety factor, i.e. the increasing the value of PW reduces the safety factor Fs, and decreases the stability of slopes.
For profile II-II the lowest safety factor Fs=1.09 obtained by Bishop's method, and Fs=1.12 by Janbu's method. For profile I-I minimal safety factor Fs=0.87 obtained by Bishop’s method, and Fs=0.99 by Janbu’s method. For the profile III-III the lowest safety factor Fs=0.79 obtained by Janbu’s method, and Fs=0.8 by Bishop’s method. For the profile IV-IV the lowest safety factor Fs=0.95 obtained by Bishop’s method, and Fs=1.07 by Janbu’s method. All of these methods include higher value of pore pressure pw=0.4.
For the first observed characteristic profile marked with II-II obtained factor of safety on limit prescribed for the stable final individual slopes. Regardless on the obvious and calculation proven instability of slopes in the remaining discussed profiles and because of entirely undetermined future purpose or reuse of spoil, landfill and other free space is recommended not to perform additional work on the stabilization of slopes, but to leave the slopes that during the time they come in natural balance. This condition will not endanger the environment (because the masses slide into crater pit), human security, nor will it endanger the safety of equipment, because it will be relocated through the process of closing the open pit.

Eco-Ist’12, Ecological Truth, 30 May - 2 June 2012. Hotel “Srbija TIS”, Zajecar, Serbia
180
ENHANCEMENT OF STRUCTURAL STABILITY DURING MINE CLOSURE
In considering the various types of earthworks constructed during and after
mining the most obvious and effective measure for enhancing stability is to reduce the angle of slope. Other options for enhancing slope stability include pumping to reduce pore water levels and pressures. Properly designed drainage systems, as well as systematic planting with appropriate vegetation, i.e. "Grassing-over" the slope, will both assist in long-term stabilization of earthen structures, in terms of minimizing risk of slope failure, as well as erosion.
Figure 7. Loading the toe as
measurement of stabilization of slope Figure 8. Regrading the slope (cut-fill)
Figure 9. Stabilization of slope reduction the height
Figure 10. Stabilization with anchor
Figure11. Stabilization of slope with sheet piling
Figure 12. Stabilization of slope wit retaining structures

Eco-Ist’12, Ecological Truth, 30 May - 2 June 2012. Hotel “Srbija TIS”, Zajecar, Serbia
181
Figure 13. Stabilization of slopes wit geotextiles
CONCLUSION
Closure of the mine is the last phase of mining activities on a mine. The
effective closure of the mine must ensure, among other things, and the stability of the final pit slope and formed the landfill that will achieve long-term safety of the people and the existing ecosystem and the overall balance of the environment. Through the example of closing the mine Čubrić given calculation methodology of the final slope stability by two methods (Bishop and Janbu) with different levels and pore pressure values, which are covered by different states and possible variants of water table at closed mine. Calculations have shown that there is limit stability for west final slope and the other ones to indicate instability and depending on further use should take appropriate measures to stabilize and bringing in natural steady state
.
REFERENCES
1. Delić M., Nurić A., Nurić S., Radulović V., 2010.: Determination of final slope stability at the pit mine Dubrave, Proceedings 42th
2. Hustrulid, W.; Kuchta, M., 2006.: Open pit mine, planning & design 2
IOC on mining and metallurgy, Technical faculty at Bor University of Belgrade, Copper Institute Bor, Kladovo
nd
3. Heikkinen P. M. (ed.), Noras P. (ed.), Salminen R. (ed.), Mroueh U.M., Vahanne P., Wahlström M.M., Kaartinen T., Juvankoski M., Vestola E., Mäkelä E., Leino T., Outokumpu Oyj, Kosonen M., Maa ja Vesi Oy, Hatakka T., Jarva J., Kauppila T., Leveinen J., Lintinen P., Suomela P., Pöyry H., Outokumpu Mining Oy, Vallius P., Nevalainen J., Salvor Oy, Tolla P., Tieliikelaitos, Komppa V., 2008.: Mine closure Handbook Environmental Techniques for the Extractive Industries, Espoo, Vammalan Kirjapaino Oy
edition, A.A.Balkema, Rotterdam
4. Knežiček, T., 2004.: Računarski podržano projektovanje površinskih kopova, JU Univerzitet u Tuzli, Tuzla
5. McHugh E.L., D. G. L., Ch. S.: Applications of groun-based radar to mine slope monitoring, Spokane Research Laboratory, NIOSH

Eco-Ist’12, Ecological Truth, 30 May - 2 June 2012. Hotel “Srbija TIS”, Zajecar, Serbia
182
6. McHugh E.L.: Video motion detection for real-time hazard warnings in surface mines, Spokane Research Laboratory, National Institute for Occupational Safety and Health, Spokane, Washington, USA
7. McHugh E.L. and Girard J.M.: Evaluating techniques for monitoring rock falls and slope stability, Spokane Research Laboratory, National Institute for Occupational Safety and Health, Spokane, WA
8. Nurić, S., 2009.: Kamionski transport u površinskoj eksploataciji, Tuzla 9. Nurić A., Nurić S., Avdić M., 2005.: Proračun stabilnosti kosina pomoću
računara na PK 'Mošćanica' RMU Zenica, Rudarski radovi 1/2005, str. 44-49, Komitet za podzemnu eksploataciju mineralnih sirovina Resavica, RTB Bor Institut za bakar Bor
10. Nurić A., Nurić S., Haračić E., 2007.: Vizualizacija vanjskog odlagališta 'Zapad' na PK Dubrave korištenjem kompjuterske tehnike, str. 183-187, Zbornik radova RGGF-a XXXIII, Tuzla
11. Nurić A., Nurić S., Lapandić Š., Haračić E., 2007.: The methods of monitoring slope stability to provide security performance of works on the open pit mine, Proceedings 39th
IOC on Mining and Metallurgy, Sokobanja, pg. 58-63, Technical faculty Bor, University of Belgrade and Copper Institute Bor, Bor

183
XX International Scientific and Professional Meeting
"ECOLOGICAL TRUTH" ECO-IST'12
30 May - 2 June 2012, Hotel “Srbija TIS“, Zajecar, SERBIA
INVESTIGATION OF DISSOLUTION OF LIMESTONE BRIQUETTES
FROM DOBRILOVIĆI DEPOSIT IN WATER
Vladimir Jovanovic*
, Z. Sekulic, S. Mihajlovic, B. Ivosevic, M. Petrov, D. Radulovic
Institute for Technology of Nuclear and Other Mineral Raw Materials, 86 Franchet d’Esperey St.Belgrade, SERBIA
*
ABSTRACT
This paper presents preliminary results of investigation of dissolution of briquettes obtained from limestone dust from ‘’Dobrilovića Brdo’’ deposit in water. Briquettes were obtained in laboratorial roller briquetting press. Bentonite in various mass fractions to limestone (1-10%) was used as the binding agent, while pressure between press rolls was altered, and it was 2, 10 and 20kN, while other parameters were constant for all the samples. The results presented imply that time needed for complete briquette dissolution in water is shortest for the briquettes with 2.5% of binding agent at briquetting press working pressure of 2kN, while the longest dissolution time was recorded for samples with 1.0% binding agent at the press working pressure of 10kN and 2kN, which leads to conclusion that from the perspective of manipulation, transportation and application, as well as production cost-effectiveness, the briquettes with 1.0% binding agent obtained at 2kN press working pressure proved to be the best.
Key words: limestone, briquetting, roller press, soil pH, dissolution of briquettes in water
INTRODUCTION
Over 60% of cultivable soil in the world can be classified as acidic[1]. That is a consequence of industrial development, as well as the irresponsible attitude towards environment.
Over 50% of soil in Serbia is acidic. Such soil is one of the important causes of low accumulative herbal production [2]. This is the reason why the desired results are often not achieved inspite of increased investments into standard agrotechnical measures because of the decreased fertility caused by lack of calcium.
Adding limestone to the soil induces reaction of calcium with carbon dioxide and water from soil, thus creating calcium and magnesium carbonates. Reaction with acid colloidal complexes also occurs, wherein calcium and magnesium replace hydrogen and aluminum. These reactions produce carbon dioxide and cause raising of the soil pH value to the sufficient level. Alkaline soils with pH over 7 can also benefit from adding limestone since nitrate fertilizers, which induce acid reaction with soil, are better utilized when combined with limestone [3].

Eco-Ist’12, Ecological Truth, 30 May - 2 June 2012. Hotel “Srbija TIS”, Zajecar, Serbia
184
Application of limestone is very wide to all ’’acid’’ soils in agriculture, fruit growing, viticulture, horticulture and silviculture for increasing yield and product quality.
The aim is to achieve an optimal soil pH value (pH in normal KCl solution from 5 to 5.5) [4].
Since limestone powder from various filter plants is used for this purpose, too, the biggest problem occurring in its application are losses in transport and manipulation. That dust is also carried away from soil by wind. On the other hand, limestone particles should be small enough in order to be dissolved under the influence of weathering and evenly distributed in soil. [1]
In order to satisfy these two demands, agglomeration of small limestone classes is used. Most often it is performed by pelletizing or briquetting. [3] These processes provide material of appropriate size, suitable for transportation, manipulation and application to soil, and at the same time small enough so as to be dissolved under the influence of weathering and soil moisture, and thus evenly distributed in soil.
Preliminary investigations were carried out in order to investigate resistance to dissolution, or, in other words disintegration, of limestone briquettes in water. The results of those investigations are presented in this paper.
MATERIALS AND METHODS
The material used in these investigations was limestone from ’’ Dobrilovići“ deposits as dust removing product, the size of which was 100% -100µm, while the binding agent was bentonite, the size of which was also reduced to 100% -100µm. Tables 1 and 2 present chemical compositions of limestone and bentonite starting sample. Table 1. Chemical composition of limestone starting sample Component CaO SiO Al2 2O MgO 3 Na2 KO 2 FeO 2O MnO 3 P2O W.L. 5 Content, % 52,55 3,87 0,50 0,41 0,204 0,104 0,461 0,07 0,032 41,81 Table 2. Chemical composition of bentonite Component CaO SiO Al2 2O MgO 3 Na2 KO 2 FeO 2O TiO3 W.L. 2 Content, % 2,63 50,73 21,76 1,72 0,0027 0,265 5,76 0,675 16,40
Briquettes were produced in a laboratorial roller briquetting press ‘’Komarek B050’’. The pressure, i.e. the force necessary to move press rolls away from each other, was 30 o/minute , spin speed of the rolls was 30 rpm, spin speed of the screw feeder was 70 rpm and the gap between rolls was 0.9 mm. These values were constant for all samples, while content of the binding agent was altered (0.1; 2.5; 5.0 and 10.0%). After coming out of the press, '’fresh’’ briquettes were left in the air for 24 hours, after which time their mechanical properties were tested [5]. This paper presents mechanical properties in relation with dissolution, i.e. disintegration of briquettes in water, while the paper [5] presented results of investigation of mechanical properties of specific briquettes.

Eco-Ist’12, Ecological Truth, 30 May - 2 June 2012. Hotel “Srbija TIS”, Zajecar, Serbia
185
RESULTS OF DISINTEGRATION OF BRIQUETTES IN WATER INVESTIGATION
Disintegration of briquettes in water investigations were carried out by taking
three briquettes from each group according to the content of the binding agent and immersing them into the water at room temperature, and measuring the time needed form complete disintegration of briquettes.
Results of investigations of briquettes’ disintegration times are presented in Tables 3-5. Table 3. Briquettes’ disintegration in water time depending on binding agent ciontent, 2 kN
Briquette 1 2 3 Binding agent content, %
Briquette disintegration in water time, minutes
1,0 11 >24h >24h 2,5 11 10 12 5,0 61 63 60 10,0 46 33 26
Table 4. Briquettes’ disintegration in water time depending on binding agent content, 10kN
Briquette 1 2 3 Binding agent content, %
Briquette disintegration in water time, min
1,0 >24h >24h >24h 2,5 20 13 22 5,0 22 35 55 10,0 50 41 60
Table 5. Briquettes’ disintegration in water time depending on binding agent content,20kN
Briquette 1 2 3 Binding agent content, %
Briquette disintegration in water time, min
1,0 39 Stop at 40 Stop at 40 2,5 21 40 27 5,0 95 100 95 10,0 14 20 23
CONCLUSION
The results presented in this paper show that the time required for complete
briquette disintegration in water is the shortest for the briquettes with 2.5% of the binding agent, at briquette press working pressure of 2 kN (11.5 minutes in the average), while the longest disintegration time was recorded for samples with 1.0% of the binding agent at the press working pressure of 10 kN and 2 kN (over 24 hours). This leads to conclusion that from the perspective of manipulation, transportation and application, as

Eco-Ist’12, Ecological Truth, 30 May - 2 June 2012. Hotel “Srbija TIS”, Zajecar, Serbia
186
well as production cost-effectiveness, the briquettes with 1.0% of binding agent content obtatined at 2 kN press working pressure proved to be the best.
Acknowledgement This paper is a result of project of Technological development no. TR-34013
financed by the Ministry of Science of Republic of Serbia.
REFERENCES
1. Jovanović V. at all. „The possibility of getting pelets from the fine grained Southern Korea Ca-carbonate sample“, VIII Balkan Conference, 1999.
2. Canić M., Stojanović D., Simović I., Đokić S.: „Istraživanje uslova za proizvodnju peleta od mlevenog krečnjaka za primenu u kalcifikaciji zemljišta“, Izveštaj, 4-26, Rudarski Institut i Xilia, Beograd, 2002.
3. Albert K.B., Langford D.: Pelletizing limestone fines“, p. 12-29, Mars Mineral, Pennsylvania, 1998.
4. Nyle B. C.: The Nature and Properties of Soils“, tenth edition, p. 232-235, Macmillan Publisher, 1998.
5. Jovanović V., Sekulić Ž., Radulović D., Mihajlović S., Ivošević B.: „Investigation of mechanical properties of limestone briquettes for agricultural purposes“, The XIV Balkan Mineral Processing Congress, p. 415-420, Vol. II, Faculty of mining, geology and civil engineering-Tuzla; 2011.

187
XX International Scientific and Professional Meeting
"ECOLOGICAL TRUTH" ECO-IST'12
30 May - 2 June 2012, Hotel “Srbija TIS“, Zajecar, SERBIA
THE CHOICE OF FLOCCULANTS FOR SEDIMENTATION OF SLUDGE
FROM ’’BOKSIT MILIĆI’’ SEPARATION
Zivko Sekulic1*, S. Mihajlovic1, B. Ivosevic1, V. Jovanovic1, M. Djokanovic
2
1Institute for Technology of Nuclear and Оther Mineral Raw Materials (ITNMS), Belgrade, SERBIA
2
Boksit Milici, technical manager of BU "Qaurtz sands", Milici, BiH
*
ABSTRACT
This paper presents results obtained by investigating the influence of various flocculants on sedimentation of size class –0,05+0 mm separated by sieving from sludge of quartz sand separation ''Boksit- Milići''. In the experimental work presented here the following flocculants were used: anionic polyelectrolyte polyacrylamide- Magnafloc 1011; anionic flocculant polyaluminum chloride- Bopac; coagulant aluminum sulfate- I-S SFA; as well as cationic flocculant -C420 CYTC. The water used for investigations was from water supplies and technical water used in the separation. The shortest time of 2 minutes in which clear solution was obtained was achieved by application of Magnafloc 1011 flocculant when added in the quantity of 3.5ml, i.e. 55.55 g/t of the settled material.
Key words: quartz sand, separation, pulp, thickening, flocculant
INTRODUCTION
Different processes of mineral raw materials preparations are performed in water with a certain content of liquid phase. Content of the liquid phase is limited in final products. Apart from that, demands regarding preservation of enviroment require dewatering up to a certain moisture content. Depending on the properties of the product that is being dewatered and the requirement regarding moisture content in the product after dewatering, this process includes several different operations- seeping, thickening, filtering and drying.
Thickening is a process of separating liquid from solid phase based on sedimentation granular material. Speeding up of sedimentation process is achived by aggregation. Aggregation is the process of grouping small mineral raw particles under the influence of Van der Waal's forces. Aggregation of particles for the purpose of accelerating sedimentation time is achieved in three ways, by coagulation in electrolytes, flocculation with hydrophobing reagents and by flocculation with high-molecular-weight polymers, most often polyacrylamides. [1-4]

Eco-Ist’12, Ecological Truth, 30 May - 2 June 2012. Hotel “Srbija TIS”, Zajecar, Serbia
188
This paper presents results of desposition of granular material, wherein aggregation of particles is accomplished by use of high-molecular-weight polymers as flocculants.
EXPERIMENTAL
Materials and methods For the experimental work quartz sand samples from ''Boksit- Milići'' separation
was used, out of which class -0,05+0mm was separated. Pulp sample was obtained by mixing the afforementioned size class and water. The water that was used in these investigations was from water supplies and technical water used in the separation. The following flocculants were used when thickening was observed: anionic polyelectrolyte polyacrilamide Magnafloc 1011- Ciba Specialtz Chemicals Ltd Basel Switzerland; anionic flocculant polyaluminum chloride Bopac - Unichem Kft; coagulant aluminum sulfate I-S SFA; as well as cationic flocculants C420 CYTC. Neutral flocculants are not recomended for this type of ore. Wet sieving was performed acording to internal instructions of the Institute for Technology of Nuclear and Оther Mineral Raw Materials from Belgrade. ''Tyler'' series sieves were used, the samples were dried in ''Heraus'' drier and measured by ''Kern'' 440-45 digital precision balance. Thickening tests were performed acording to the standard laboratorial method in 1 liter gauge glasses 340 mm high.
INVESTIGATION RESULTS AND DISCUSSION Thickening test without flocculants
Thickening test was first performed on the sample of slurry taken from river water intake. After that, pulp thickening test was performed by mixing water from water supplies and water from river water intake at 6.3 g/l solid phase density. The results of this test are presented in Table 1.
Table 1. Thickening test without flocculants TEST 1: Sedimentation of slurry from river water intake without flocculants Time Height, mm Volume, ml Solid phase content Thinning Water column appearance min clear residues clear residues g/l % m3/t
0 0 340 0 1000 - - - *** 1 0 340 0 1000 - - - *** 180 0 340 0 1000 - - - *** TEST : Sedimentation at 6,3 g/l density without flocculant, with water from water supplies Time Height, mm Volume, ml Solid phase content Thinning Water column appearance min celar residues clear residues g/l % m3/t
0 0 340 0 1000 - - - *** 1 0 340 0 1000 - - - *** 180 0 340 0 1000 - - - *** TEST : Sedimentation at 6,3 g/l density without flocculant with water from river water intake Time Height, mm Volume, ml Solid phase content Thinning Water column appearance min clear residues clear residues g/l % m3/t
0 0 340 0 1000 - - - *** 1 0 340 0 1000 - - - *** 180 0 340 0 1000 - - - *** *** very cloudy, ** cloudy, * slightly cloudy, B - clear
Eco-Ist’12, Ecological Truth, 30 May - 2 June 2012. Hotel “Srbija TIS”, Zajecar, Serbia
189
Results in Table 1 demonstrate that clearing of water column did not appear after 3 hours of sedimentation, which indicates a necessity for aplication of flocculating agents, i.e. flocculants.
Thickening tests with various flocculants • Anionic flocculant MAGNAFLOC 1011 Flocculation conditions: solution pH was 7.2; solid phase quantity was 6.3 g/l; flocculant quantity used was 50 ml ( 0,001g), which was total 793.5 g/t (0.8kg/t). In 90 seconds complete sedimentation of solid phase occured, and water column
became clear. • Anionic flocculant IS -SFA
Flocculation conditions: solution pH was 7.2; solid phase quantity was 6.3 g/l; flocculant quantity used was 50 ml ( 0.001g), which was total 793.5 g/t (0.8kg/t). Test showed that the flocculant is hard to dissolve, so there is no sedimentation of solid phase. • Cationic flocculant C436
Flocculation conditions: solution pH was 7.2; solid phase quantity was 6.3 g/l; flocculant quantity udsed was 50 ml ( 0.001g), which was total 793.5 g/t (0.8kg/t) Test showed that flocculant was not dissolved, so there was no solid phase deposition.
• Anionic flocculant BOPAC Flocculation conditions: solution pH was 7.2; solid phase quantity was 6.3 g/l; flocculant quantity was 10 ml solution made of 1 ml of flocculant of unknown concentration and 150 ml of water. Test showed that flocculant was not dissolved, so there was no solid phase deposition. BOPAC solution was made of 1ml of flocculant of unknown concentration in 150 ml of water. In thickening test, 10 ml of flocculant was added. Complete sedimentation occured in 90 seconds, and water column became clear. After separate testing of flocculants, the best results were obtained when MAGNAFLOC 1011 and BOPAC flocculants were used. Flocculant MAGNAFLOC 1011 was given an advantage for practical reasons, since it is in dry form, so its storage is more convenient relative to BOPAC, which is a liquid. Further experimental work was performed in order to find the smallest MAGNAFLOC 1011 flocculant quantity needed for obtaining completely clear solution.
Thickening test with various quantities of MAGNAFLOC 1011 flocculant
In order to investigate the smallest MAGNAFLOC 1011 flocculant quantity needed for obtaining completely clear solution, thickening was accomplished with the following flocculant quantities: 2 ml (31.74g/t); 3.5ml (55.55g/t); 5ml (79.36g/t) i 20ml (317.4g/t). Other thickening conditions in all four tests were the same: flocculant solution in distilled water was 0.01%; solution pH was 7.2, and solid phase quantity was 6.3 g/l. The results obtained are presented in Tables 2, 3, and 4, and sedimentation curves in Figures 1, 2 and 3

Eco-Ist’12, Ecological Truth, 30 May - 2 June 2012. Hotel “Srbija TIS”, Zajecar, Serbia
190
Table 2. Thickenin with 2 ml of flocculant Time, Volume, ml Water column appearance min clear residues
0 0 1000 *** 1 100 900 *** 1.5 250 750 *** 2 900 100 *** 3 950 50 ** 4 950 50 ** 15 B *** very cloudy, ** cloudy, * slightly cloudy, B - clear
Figure 1. Sedimentation curve with 2ml of flocculant
The results presented show that clear water column with 2 ml of flocculant
was obtained after 15 minutes of thickening.

Eco-Ist’12, Ecological Truth, 30 May - 2 June 2012. Hotel “Srbija TIS”, Zajecar, Serbia
191
Table 3. Thickening with 3,5 ml of flocculant Time Volume, ml Solid phase content Water column appearance s ckear residues g/l %
0 0 1000 6.3 0.63 *** 10 0 900 6.3 0.70 *** 20 0 800 6.3 0.78 *** 30 400 600 6.3 1.04 *** 45 650 350 6.3 1.78 ** 60 900 100 6.3 6.08 ** 70 930 70 6.3 8.56 ** 80 940 60 6.3 9.91 * 90 945 55 6.3 10.76 * 100 945 55 6.3 10.76 * 110 947 52 6.3 11.34 * 120 950 50 6.3 11.76 B
Figure 2. Sedimentation curve with 3.5 ml of flocculant
The results presented show that clear water column with 3.5 ml of flocculant
was obtained after 2 minutes of thickening. Critical sedimentation time, tk
, on sedimentation curve was 1 minute and 3 seconds at 11.8% solid phase content.

Eco-Ist’12, Ecological Truth, 30 May - 2 June 2012. Hotel “Srbija TIS”, Zajecar, Serbia
192
Table 4. Sedimentation with 5 ml of flocculant Time Volume, ml
Water column appearance sec clear residues 0 0 1000 *** 10 50 950 *** 20 750 900 *** 50 500 500 *** 60 900 100 ** 240 950 50 ** 600 B
Figure 3. Sedimentation curve with 5ml of flocculant
The results presented show that clear water column with 5 ml of flocculant was
obtained after 10 minutes of thickening. Sedimentation of the material was completed in 1.5 minutes in thickening with 20
ml of flocculant, but foam appeared at the surface, and in 30 minutes water column became cloudy, which was the consequence of the big quantity of flocculant added.
CONCLUSION
For the investigations presented in this paper, quartz sand samples from ''Boksit- Milići'' separation was used, out of which class -0,05+0mm was separated. Condensation tests were performed in order to select the flocculant and to determine optimal flocculant

Eco-Ist’12, Ecological Truth, 30 May - 2 June 2012. Hotel “Srbija TIS”, Zajecar, Serbia
193
use. MAGNAFLOC 1011 flocculant was found to be the best. Namely, the shortest time of 2 minutes in which clear solution was obtained was achieved when this flocculant was used in the quantity of 3.5 ml, i.e. 55.55 g/t of the settled material.
Acknowledgements
This paper is a result of project financed by the Ministry of Science of the Republic of Serbia no. 034013 since 2011 to 2014.
REFERENCES
1. Ćalić N. „Teorijski osnovi priprema mineralnih sirovina“, Rudarsko – geološki fakultet, Beograd, 459-479, 1990.
2. Ilišić G., Maksimović M., Vojinović Đ., Koagulacija i flokulacija u procesu pripreme vode za piće na pilot postrojenju, Hemijska industrija 59 (9-10), 279-284, 2005.
3. Barany S., Meszaros R., Kozakova I., Skvarla I., Kinetics and Mechanism of Bentonite and Kaolin Suspensions with Polyectrolytes and Strength of Floces, Colloid Journal 71 (3), 285-293, 2009.
4. Rulyov N., Maes A., Korolyov V., Optimization of hydrodynamic treatement regime in the processes of sorption – flocullation water purification from organic contaminants, Colloids and Surfaces A : Physicochemical and Engineering Aspectc 185 371-381, 2000.

194
XX International Scientific and Professional Meeting
"ECOLOGICAL TRUTH" ECO-IST'12
30 May - 2 June 2012, Hotel “Srbija TIS“, Zajecar, SERBIA
NON-CYANIDE ELECTROLYTES FOR GOLD PLATING – A REVIEW
OF RECENT DEVELOPMENTS
Silvana Dimitrijevic1*, M. Rajcic-Vujasinovic2, R. Jancic-Hajneman3
D, Trifunovic,
3, J. Bajat3, V. Trujic1, S. Alagic
2
1Mining and Metallurgy Institute Bor, Zeleni bulevar 35, 19210 Bor, SERBIA 2University of Belgrade , Technical faculty Bor, VJ 12, 19210 Bor, SERBIA
3
University of Belgrade, TMF Belgrade, Karnegijeva 4, 11000 Belgrade, SERBIA
*
ABSTRACT
Nowadays, the cyanide and ferrous cyanide solutions are used in practice for gold plating. Those compounds are very toxic, and formation and maintenance of cyanide baths is expensive and risky for technical personnel. Due to this reason, and specially in modern time, there is a trend of using the electrolyties without content of cyanides. These electrolytes mainly based on some organic compounds. These article is an overview of the non-cyanide electrolytes for gold plating.
INTRODUCTION
Electrodeposition of gold is not a new process, but has been widely used in the
automotive industries, biomedical processes and electronics industries such as in computers, telecommunications, aerospace applications, etc. The combination of excellent electrical conductivity with high corrosion resistance has led to the widespread adoption of gold as a standard material for interconnects such as contacts, bonds, and high reliability performance conductor applications [1].
Electroplated gold can be classified as either soft gold or hard gold. Hard gold is used as a contact material for electrical connectors and printed circuit boards (PCBs), relays and switches, which should be resistant to mechanical wear whilst having a low electrical contact resistance. Soft gold, on the other hand, is used for electronic packaging, such as fabrication of interconnects in integrated circuits (ICs), or forming connections to external devices, using tape automated bumping (TAB) or chip-on-glass (COG) and chip-on-flex (COF) techniques [1,2].

Eco-Ist’12, Ecological Truth, 30 May - 2 June 2012. Hotel “Srbija TIS”, Zajecar, Serbia
195
CLASIFICATION OF GOLD PLATING BATHS
Gold plating baths can be classified into various categories depending on the gold salt used, the reaction mechanism, bath pH, and properties of the deposit obtained. The diagram shown in Fig.1 illustrates this classification.
Figure 1. Classification of gold plating [3]
The electrolytic cyanide-type baths include those operated at acidic, neutral, or
alkaline pH’s, and they can deposit either hard gold or soft gold. Non-cyanide type baths can be operated only at neutral or alkaline pH’s by either an electrolytic or electroless mechanism, but the baths presently available can deposit soft gold only [3].
This paper reviews currently available non-cyanide electrolytes for gold plating: 1. Sulfite bath 2. Thiosulfate bath 3. Mixed sulfite-thiosulfate bath 4. Thiourea bath 5. Ascorbic Acid Bath 6. Baths Containing No Aditional Reducing Agent 7. Electrolyte based on mercaptotriasole
Sulfite Baths The use of a gold sulfite complex for gold plating has been known since 1842
[4] and it is still the gold complex most commonly used to prepare non-cyanide baths. Gold sulfite baths traditionally attracted attention because of their ability to produce smooth, bright, and ductile pure gold deposits with good microthrowing power. In the sulfite baths, gold exists in the form [Au(SO3)2]3-. The stability constant of this complex is approximately equal to 1010 , which is orders of magnitude smaller than that of the cyanide complex, [Au(CN)2]-, i.e. 1039 [5-6]. Bath composition and operating conditions for sulfite bath are shown in Table 1.

Eco-Ist’12, Ecological Truth, 30 May - 2 June 2012. Hotel “Srbija TIS”, Zajecar, Serbia
196
Table 1. Bath composition and operating conditions [6] Bath constituent (NH4)3{Au(SO3)2 [Au+]=10 g/l } pH 9.5 Temperature 400C Current density 0.15-0.5 A/dm² Agitation Magnetic stirring
Thiosulfate bath The electroplating of gold from Au(I) thiosulfate complex has been known
since as early as 1913. [3,7], but it has never been used for making a practical bath. In view of the fact that the stability constant of [Au(S2O3)2]3- is equal to 1026
, which is orders of magnitude greater than that of the sulfite complex, the thiosulfate complex might be expected to be a viable alternative to the sulfite complex. The reason why the thiosulfate complex has not been used successfully for making a practical bath seems to be the instability of thiosulfate ion itself with respect to its disproportionation reaction.
Mixed sulfite-thiosulfate bath Osaka and coworkers [8] investigated the possibility of electroplating soft gold
from a thiosulfate-sulfite mixed ligand bath, specifically for application to the formation of microbumps on silicon wafers. Optimized bath compositions and operating conditions are listed in Table 2 together with the hardness values of the gold deposits obtained. This bath is operated at a slightly acidic pH of 6.0 and at a mildly elevated temperature of 60°C. It is highly stable, and there is no need to add any stabilizer to suppress spontaneous decomposition. Table 2. Mixed sulfite-thiosulfate bath [8]
Bath constituent Osaka Newcastle NaAuCl 0,06 M 4 - HAuCl - 4 0,05 M Na2SO 0,42 M 3 0,42 M Na2S2O 0,42 M 3 0,42 M Na2HPO 0,30 M 4 - TlSO 5-30 ppm 4 -
Thiourea bath The thiourea bath was developed and subsequently improved by a group of
investigators at Hitachi, Ltd. [9]. Basic and improved versions of the bath composition and operating conditions are shown in Table 3. In this system thiourea has been shown to undergo complex chemical reactions through the formation of a radical intermediate, (NH)(NH2)CS, to form final products including urea, a major product, and dicyandiamide. This radical intermediate is believed to react with dissolved oxygen in the bath to form formamidine sulfinic acid, (NH2)2CSO2
, which appears to be responsible for bath instability.

Eco-Ist’12, Ecological Truth, 30 May - 2 June 2012. Hotel “Srbija TIS”, Zajecar, Serbia
197
Table 3. Basic and improved thiourea baths [3,9] Bath constituent Basic bath Improved bath NaAuCl4·2H2O (mol/dm3 0,0125 ) 0,0125 Na2S2O3·5H2O (mol/dm3 0,1 ) 0,1 Na2SO3 (mol/dm3 0,4 ) 0,4 Na2B4O7·10H2O (mol/dm3 0,13 ) 0,13 Thiourea (mol/dm3 0,033 ) 0,033 Hydrohinone (mol/dm3 - ) 0,002 pH 9,0 8,0 Temperature (0 80 C) 70 Bath life with load (h) 12 50 Bath life without load 60 [h] > 1 month Plating rate (µm/h) 0,8 1,2
Ascorbic Acid Bath The Rihter and collaborators [3] developed a thiosulfate-sulfite mixed ligand
bath with ascorbic acid as the reducing agent. The compositions of the basic bath and an improved bath are shown in Table 4. The possibility of developing these baths was initially investigated based on the well-known mixed potential theory combined with partial polarization curves measured at a gold electrode. This investigation showed that the thiosulfate-sulfite mixed ligand system gives a practical deposition rate and a high stability compared with the baths containing thiosulfate alone or sulfite alone, and that, amongst the many reducing agents tested, only ascorbic acid, hydrazine and thiourea can serve as the practical reducing agent for the autocatalytic deposition of gold. Table.4. Basic and improved ascorbic acid baths [3]
Bath constituent Standard bath Improved bath NaAuCl4·2H2O (mol/dm3 0,0125 ) - Na3Au(SO3)2 (mol/dm3 - ) 0,1 Na2SO3 (mol/dm3 0,1 ) 0,4 NH4Cl (mol/dm3 0,05 ) - K2HPO4 (mol/dm3 - ) 0,1 Sodium L-askorbate (mol/dm3 0,2 ) 0,1 Additive - trace pH 6,0 7,2 Temperature (0 60 C) 60 Bath life <8 [h] 6 month Plating rate (µm/h) 1,2-1,5 0,8-1,1
Baths Containing No Aditional Reducing Agent Krulik and Mandich [10] reported that the Au(I) thiosulfate-sulfite mixed ligand
system functions as an autocatalytic bath in the absence of any conventional reducing agent. They believed that the thiosulfate-sulfite mixture itself is a reducing agent system, and that sulfite functions as the main reducing agent in this bath. The bath composition and operating conditions used in this investigation are listed in Table 5.

Eco-Ist’12, Ecological Truth, 30 May - 2 June 2012. Hotel “Srbija TIS”, Zajecar, Serbia
198
Table 5. Bath composition and operating conditions of no additional reducing agent bath [10] Bath constituent NaAuCl4·2H2O (mol/dm3 0,01 ) Na2SO3 (mol/dm3 0,32 ) Na2S2O3·5H2O (mol/dm3 0,08 ) Na2HPO4 (mol/dm3 0,05 ) K2HPO4 (mol/dm3 0,32 ) pH 9,0 Temperature (0 60 C) Agitation Mechanical Stirrer
Electrolyte based on mercaptotriasole The organic gold complex based on mercaptotriasole was investigated in
Mining and Metallurgy Institute. Electrolyte was stable for six months without visible signs of degradation and precipitation of elementary gold. The detail investigations were carried our in the aim of finding out the optimum conditions for obtaining the quality decorative gold plating from this electrolyte and to compare it with a quality of gold plating obtained from classic electrolyte. Based on experimental investigations, it could be concluded that the quality of decorative gold plating, obtained from organic complex of gold based on mercaptotriasole satisfies the all requirements of decorative gold plating, where current density effect on view and thickness of coating is much more less than in classic cyanide bath. The most important advantage of this electrolyte is ecologic, where gold could be regenerated by simple settling with hydrogen peroxide where sulphur is separated [11,12]. The future work is expected to focus on investigation the influence of current density, pH and additives on decorative gold coatings, obtained from electrolyte, based on mercaptotriasole, to compare them with the obtained coatings from classical cyanide electrolyte. Bath composition and operating conditions of electrolyte based on mercaptotriasole are shown in Table 6. Table 6. Bath composition and operating conditions of electrolyte based on mercaptotriasole [11,12]
Bath constituent Au-mercaptotriasole Gold concentration (g/dm3 2.5 ) pH 9 Temperature (°C) 22 Time (s) 105 Cathode current density (A/dm2 1 ) Current intesity (A) 0.12 Voltage (V) 3.5
CONCLUSION
This article provides an overview of the electrolytes used for soft gold electro deposition in the micro and opto-electronics industry. The development of non-cyanide electrolytes has been compared with the traditional ones. The most important advantage of this electrolytes is ecological.

Eco-Ist’12, Ecological Truth, 30 May - 2 June 2012. Hotel “Srbija TIS”, Zajecar, Serbia
199
Acknowledgment
This work has resulted from the project funded by the Ministry of Education and Science of the Republic of Serbia, No. 34024 " Development of technologies for recycling of precious, rare and associated metals from solid waste in Serbia to high purity products" on which the authors of this occasion want to thank.
REFERENCES
1. M.J.Liew, S.Roy and K.Scoot, Development of a non-toxic electrolyte for soft gold electrodeposition: an overview of work at University of Newcastle upon Tyne, Green Chemistry, 2003., 5, 376-381
2. S. Roy, Electrochemical Gold Deposition from Non-Toxic Electrolytes, ECS Transactions, 16 (36), (2009), 67-72
3. M. Kato, Y. Okinaka, Some Recent Developments in Non-Cyanide Gold Plating for Electronics Applications, Gold Bulletin, 37 (1-2), 2004. , 37-44
4. Todd A. Green, Gold Electrodeposition for Microelectronic, Optoelectronic and Microsystem Applications, Gold Bulletin 2007 • 40/2, 105-114
5. W.S. Rapson and T. Groenewald, “Gold Usage”, Academic Press, Inc., New York, 1978.,
6. Kuhl, Werner, Zilske, Wolfgang, Cyanide-free electroplating bath for the deposition of gold and gold alloys, Patent 6165342 Issued on December 26, 2000.,
7. T. Green, and S. Roy, Speciation Analysis of Au(I) Electroplating Baths Containing Sulfite and Thiosulfate, J. Electrochem. Soc., Volume 153, Issue 3, (2006), pp. C157-C163
8. T. Osaka, A. Kodera, T. Misato, T. Homma and Y. Okinaka, Electrodeposition of Soft Gold from a Thiosulfate-Sulfite Bath for Electronics Applications, J. Electrochem. Soc., 1997, 144(10), 3462.
9. L. Chalumeau, M. Wery, H.F. Ayedi, M.M. Chabouni, C. Leclere, Development of a new electroplating solution for electrodeposition of Au–Co alloys, Surface & Coatings Technology
10. M. Kato, J. Sato, H. Otani, T. Homma, Y. Okinaka, T. Osaka and O. Yoshioka, J. Electrochem. Soc., 2002, 149, C164
11. Silvana B. Dimitrijević Vlastimir K. Trujić, Mirjana M. Rajčić-Vujasinović, Development of new non-cyanide technology in gold plating, 14th
www.tmt2010.ba
International Research TMT 2010., Proceedings, 11.-18.09.2010., Mediterian Cruise,
, ISSN 1840-4944, 669-671 12. Silvana B. Dimitrijević Vlastimir K. Trujić, Mirjana M. Rajčić-Vujasinović,
Gold platin from a new electrolyte, 42th
International October Conference on Mining and Metallurgy, Proceedings, October 2010, Kladovo ISSN 978-86-80987-79-9, 294-297

200
XX International Scientific and Professional Meeting
"ECOLOGICAL TRUTH" ECO-IST'12
30 May - 2 June 2012, Hotel “Srbija TIS“, Zajecar, SERBIA
THE COMPOSITION OF SHEET-FED OFFSET PRINTING INKS
Jelena Kiurski*
, I. Oros, S. Adamovic, L. Comic
University of Novi Sad, Faculty of Technical Sciences, Trg Dositeja Obradovica 6, Novi Sad, SERBIA
*
ABSTRACT
In this paper, the possible changes of the chemical composition of the fresh and used sheet-fed offset printing inks (cyan, magenta, yellow, and black – CMYK) after 20,000 printed sheets were observed. Chemical composition of inks was determined by the infrared spectroscopy with Furier transformation method. The differences of IR maxima intensity of analyzed inks were observed due to the aging process of inks. This method confirmed the presence of the main components of printing ink.
Key words: CMYK inks, chemical composition, FT-IR, sheet-fed offset printing
INTRODUCTION
Sheet-fed offset printing inks have a complex composition with a paste-like consistency. The ink is a mixture of dyes (5 - 30%), oils (20 - 30%), resins (5-50%) and additives (10%) [1, 2]. The coloration carrier could be in the form of dyes, pigments, or it is a combination of both [3]. The most common carriers of color are dyes, while oils, resins and additives affect on the consistency of ink. The dye for black ink is carbon; for red and magenta are typically acid or alkaline salts of iron, barium, calcium and copper; for blue, green and cyan are mainly polycyclic structures with condensed benzene rings and additions of copper, iron, cobalt, zinc or aluminum ions [4].
During the printing process the ink changes chemical composition due to the interaction with different surfaces and materials that serve to improve the press (printing plate, paper, wetting agent, etc.). Contaminated ink becomes unusable and requires special treatment provided for the disposal of hazardous waste since it contains toxic substances, heavy metals [1].
The objective of this research is to determine the changes of the ink composition during the printing production, using infrared spectroscopy with Fourier transform (FT-IR).

Eco-Ist’12, Ecological Truth, 30 May - 2 June 2012. Hotel “Srbija TIS”, Zajecar, Serbia
201
MATERIAL AND METHODS
Samples. In order to determine the composition of sheet-fed offset printing inks, four fresh (manufacturer Toyo Ink MFG CO. LTD., Japan) and used CMYK inks were taken. The used inks were sampled from the ink unit on offset printing machine after 20,000 printed sheets. The general composition of CMYK inks specified by ink’s producer are presented in Table 1.
The highest proportion of inks makes resins, vegetable and mineral oil, while the components with the smallest share of ink are additives. The role of additives is crucial in defining the quality properties of the final color of print. Table 1. General chemical composition of CMYK inks according to the specification of producer [5]
Component (%) Dye 10 - 30 Modified phenolic resin 20 - 40 Vegetable oil 20 - 30 Petroleum oil 20 - 30 Additives 10 > Naphthenic acids, cobalt salts 0 - 1 Carbon black 0 - 20
Method. Non-destructive FT-IR method was conducted to determine the inks composition, using the Nexus 670, Thermo Nicolet, USA spectrometer. Scanning conditions were: range of 500 to 4000 cm-1, resolution 4 cm-1
and 32 scans. Samples for FT-IR analysis were prepared by mixing inks (1-2%) with potassium bromide.
RESULTS AND DISCUSSION
The analysis of the FT-IR spectra was performed using a reference table (Table 2) in order to determine the presence of functional groups (C–H, C=O, =C–H, C–O-C, C=C, N–H, C=N) which are characteristic for aromatic compounds, unsaturated aliphatic compounds and aliphatic amines. Detection of functional groups allows the identification of the major ink components. Table 2. IR regions of the characteristics functional groups [6]
Region (cm-1 Group ) Possible Compounds Present 3700 – 3100 –OH Alcohol, aldehyde, carboxylic acids 3100 – 3000 =C–H Aromatic compounds 3000 – 2800 –CH, –CH2–, –CH Aliphatic groups 3
1870 – 1650 C=O Acid halides, aldehydes, amides, amino acids, anhydrides, carboxylic acids, esters, ketones
1650 – 1550 C=C, C=N, N–H Unsaturated aliphatics, aromatics, unsaturated heterocycles, amides, amines, amino acids
1550 – 1300 NOCH
2
3 and CHNitro compound
2 Alkanes, alkenes, etc 1300 – 1000 C–O–C and C–OH Ethers, alcohols
1000 – 650 =C–H –NH
Alkenes and aromatic compounds Aliphatic amines
800 – 400 C–halogen Aromatic rings
Halogen compounds Aromatic compounds

Eco-Ist’12, Ecological Truth, 30 May - 2 June 2012. Hotel “Srbija TIS”, Zajecar, Serbia
202
To determine the composition of inks, i.e. interpretation of the position of maximum absorption on the FT-IR spectra, reference values of the most important components of pure ink were used in accordance to the literature data, Table 3 [7]. Table 3. Characteristic absorption maxima of pure inks components (cm-1
Alkyd resin ) [7]
Linseed oil CuPc Lithol Rubine B * Yellow 12 3006 3008 1607 1625 1655 2925 2924 1505 1475 1595 2854 2853 1460 1450 1485 1739 1745 1419 1410 1450 1462 1462 1375 1325 1360 1385 1376 1334 1260 1310 1233 1236 1288 1210 1180 1163 1162 1166 1180 1060 1096 1099 1120 1155 1050 727 914 1091 1090 870 871 998 1025 750 721 900 950 786 900 778 820 726 720 *
Copper phtalocyanine
Analysis of FT-IR spectra. FT-IR spectra of fresh and used sheet-fed offset printing inks are presented in Figs. 1-4. The spectra of fresh inks were used as a reference for qualitative monitoring of chemical changes in the samples of used inks after 20,000 printed sheets. Comparing the values of IR spectral peak intensity of the investigated inks (Figs. 1-4) with reference values (Tables 2 and 3) confirm the presence of the main components in ink (vegetable and mineral oil, alkyd resins and dyes) represented with the highest share.
Binder. IR absorption maxima of fresh and used inks corresponded to the values from the literature data (Table 3), which also confirms the presence of alkyd resin and linseed oil as a binder component in all the samples. It is also confirmed the occurrence of IR absorption maxima of specific functional groups in the areas of wavenumbers shown in Table 2.

Eco-Ist’12, Ecological Truth, 30 May - 2 June 2012. Hotel “Srbija TIS”, Zajecar, Serbia
203
Figure 1. FT-IR spectra of fresh and used cyan printing inks
Figure 2. FT-IR spectra of fresh and used magenta printing inks
Figure 3. FT-IR spectra of fresh and used yellow printing inks

Eco-Ist’12, Ecological Truth, 30 May - 2 June 2012. Hotel “Srbija TIS”, Zajecar, Serbia
204
Figure 4. FT-IR spectra of fresh and used black printing inks
Dyes. Based on the values of the characteristic IR maxima of dyes (Table 3) and
detected values of the recorded spectra of CMY inks, it was confirmed the presence of copper-phatalocyanine (CuPc), Lithol Rubin B and Yellow 12 dyes [7]. Copper-phtalocyanine (CuPc). The observed absorption maxima of cyan ink on the FT-IR spectra (Fig. 1) at wavenumbers from 1650 to 1550 cm-1, 1550 to 1300 cm-1, 800 to 400 cm-1 and 1000 to 650 cm-1
Lithol Rubin B. FT-IR spectra of magenta ink (Fig. 2) in the region from 1650 to 1550 cm
corresponded to the presence of primary amines (N-H), aromatic rings (C = C) and aliphatic amines (C = N), respectively.
-1 confirms the presence of primary amines (functional group N-H), while the region of spectra from 1550 to 1300 and 1300 to 1000 cm-1, corresponded to aromatic amines (functional group C = N). Primary and secondary amines, and alkenes, were identified in the region from 1000 to 650 cm-1
Yellow 12. In the FT-IR spectra of yellow ink (Fig.3), the functional groups of alkenes, primary, aromatic and aliphatic amines and aromatic rings were identified in the wavenumber ranges of 1655 cm
.
-1, 1595 cm-1, 1310 cm-1 and from 1180 to 1050 cm-1
The same positions of the IR absorption maxima were observed in all samples of used and fresh inks (Figs. 1-4). The changes in the intensity of the absorption IR bands were observed in all samples of used ink and cover the following regions: from 3100 do 2850 cm
, respectively.
-1 (functional groups of aromatic compounds and alkanes with the alkyd resin and linseed oil) in the samples of used cyan and yellow inks; from 1730 to 1750 cm-1 (ester functional groups) in the sample of used cyan ink (Fig. 1) and from 1380 to 900 cm-1
(functional group aliphatic and aromatic amines, and alkenes) in the samples of used cyan, magenta and yellow inks (Figs. 1-3). Black used ink has the smallest changes in the intensity of the absorption IR bands (Fig. 4). The listed changes in absorption intensity of IR bands were caused by the possible presence of impurities which polluted the ink during the printing process as consequence of the interaction with the printing plate, fountain solution and paper.

Eco-Ist’12, Ecological Truth, 30 May - 2 June 2012. Hotel “Srbija TIS”, Zajecar, Serbia
205
CONCLUSION
Considering that the most components of printing sheet-fed offset ink are organic origin, the characterization has been performed by using non-destructive method, Fourier transform infrared spectroscopy (FT-IR). The analysis of FT-IR spectra confirmed the presence of the main components, alkyd resins, linseed oil and characteristic dyes in inks. Comparative values of wavenumbers recorded from the FT-IR spectra of fresh and used CMYK inks after 20,000 printed sheets enabled the monitoring of the IR absorption intensity changes during the printing production. The changes in the IR absorption intensity were caused by the presence of impurities in inks. Also, the changes in the IR absorption intensity may be influenced by the aging of ink and its direct exposure to the contaminated ambient air in the printing plant. Therefore, FT-IR spectroscopic analysis of fresh and used CMYK sheet-fed offset inks could be an indicator of inks aging during the press.
Acknowledgement The authors acknowledge the financial support of the Ministry of Education and
Science of the Republic of Serbia within the Project No. 34014.
REFERENCES
1. Kiurski J., Radin Oros I., Krstić J., Adamović S., Vojinović Miloradov M., Mihailović A., Grujić S., The spectrochemical analysis of waste printing inks, XVIII International Scientific and Professional Meeting „ECOLOGICAL TRUTH“ ECO-IST ’10, Proceedings, Apatin, Serbia, 126-132, 2010.
2. Kiurski J., Krstić J., Oros I., Adamović S., Vojinović Miloradov M., Waste printing inks as a pollutant of graphic environment, 5th
3. Thanasoulias N.C, Parisis N.A, Evmiridis N.P, Multivariate chemometrics for the forensic discrimination of blue ball-point pen inks based on their Vis spectra, Forensic Science International, 138, 75–84, 2003.
International Symposium on Graphic Engineering and Design (GRID ’10), Proceedings, Novi Sad, Serbia, 207-210, 2010.
4. Christie R. M., Colour chemistry, strane RSC Paperbacks, Heriot-Watt University, Scottish Borders Campus, Galashiels, UK, 2001.
5. M Material Safety Data Sheet, No A107, ToyoInk MFG.CO.,LTD. OFFSET DIVISION, Tokyo, Japan, 2004.
6. Yuen C.W.M., Ku S.K.A., Choi P.S.R., Kan C.W., Tsang S.Y., Determining Functional Groups of Commercially Available Ink-Jet Printing Reactive Dyes Using Infrared Spectroscopy, Research Journal of Textile and Apparel,Vol. 9, No. 2, 26-38, 2005.
7. Hummel D.O., Scholl F.K, Infrared analysis of polymers, resins and additives: an atlas[by] Hummel-Scholl, Technology & Engineering, Wiley-Interscience, 1971.

206
XX International Scientific and Professional Meeting
"ECOLOGICAL TRUTH" ECO-IST'12
30 May - 2 June 2012, Hotel “Srbija TIS“, Zajecar, SERBIA
SULFUR DIOXIDE EMISSIONS FROM MAJOR STATIONARY SOURCES IN
THE COPPER SMELTER BOR
Tatjana Apostolovski-Trujic*
, J. Petrovic
Mining and Metallurgy Institute Bor, SERBIA
*
ABSTRACT
Determination the annual emissions of sulfur dioxide in operational work conditions of the Copper Smelter in Bor are presented in this paper. The main causes of release the large amounts of sulfur dioxide to the atmosphere are: insufficient capacity Sulfuric acid plant to process the overall gas from the converting process and the downtime Sulfuric acid plant. The downtime Sulfuric acid plant is induced by the instabilities in smelter work. In that case, non-treated gases from roasting process and gases from converting process are released to the atmosphere and further the sulphur dioxide emissions are increased.
Key words: emissions, sulfur dioxide, copper production
INTRODUCTION
The main environmental issues for the primary copper production are the potential emission to air of dust and metals/metal compounds and of sulfur dioxide from roasting and smelting sulfide concentrates and matte converting or using sulfur-containing fuels or other materials. The pyrometallurgical processes are potential sources of dust and metals from furnaces, reactors and the transfer of molten metal [1]. The roasting of sulfide concentrates is an important process step in the production of copper in the Smelter Copper in Bor. After cleaning and cooling, the sulfur dioxide generated in the process of roasting and converting is further processed to sulfuric acid in Sulfuric acid plant (single contact).
The most important reasons for unsatisfactory levels of sulfur transformation from raw materials to sulfuric acid are as follows [2]:
• Gasses from the reverb furnace, which contain about 1-1.5% of SO2
• Capacity of the sulfuric acid plant is not consistent with the total amount of emissions from smelters (including reactor and converters). Therefore, the excess gasses are discharged from the converter line to the atmosphere;
, are not suitable for processing in the existing sulfuric acid plant. As a result, these gases are released into the atmosphere;

Eco-Ist’12, Ecological Truth, 30 May - 2 June 2012. Hotel “Srbija TIS”, Zajecar, Serbia
207
• Instabilities in smelter work further increase sulfur dioxide emissions into the atmosphere. After the unplanned downtime and start of the smelter work, time will be needed while the sulfuric acid plants reaches “technological readiness” to accept the gas. During this time the entire off-gas from the smelter is emitted to the atmosphere;
• Applied technology in sulfuric acid plant; single contact- single absorption (even in optimum conditions) emits SO2 and SO3
waste gas in concentrations that are higher than the maximum permitted by regulations.
During the roasting process, higher sulfides are dissociatеd to the lower sulfides, sulfur vapors are oxidized to sulfur dioxide and lower sulfides are partially oxidized to oxides. The roasting process is described by following basic chemical reactions:
(1)
(2)
(3)
(4)
Reactions of oxidation (1, 2, 3) are happened completly. Reaction (4) is
happened until to content of ferro sulfide is sufficient for copper matte defining composition.
MEASUREMENTS OF GAS FLOW PARAMETERS IN THE COPPER SMELTER IN BOR
In 2006, measurements of gas flow parameters were carried out on the line of
roasting, smelting and converting, after purification gases in electrostatic filters. In the Sulfuric acid plant, measurements of SO2 and moisture content in the inlet gas, measurements of the conversion SO2 in the contact boiler and measurements emission of SO2 and SO3
Measurements of gas flow parameters were carried out under conditions when the smelter was operated with reduced capacity (one FS batch reactor, one reverb furnace, two standard PS converters) and the sulfur utilization from 34.32 %. On the line of roasting, 156 measurements of gas flow parameters were carried out after purification gases in the electrostatic filters ESP1 and ESP2, at the same time. On the line of smelting, 44 measurements of gas flow parameters were carried out after purification gas in the electrostatic filter. On the line of converting, 38 measurements of gas flow parameters were carried out after purification gas in the electrostatic filter [3].
were carried out.
Based on the measurements, the annual averages gas parameters from the line of roasting, smelting and converting are shown in Tables 1, 2 and 3.

Eco-Ist’12, Ecological Truth, 30 May - 2 June 2012. Hotel “Srbija TIS”, Zajecar, Serbia
208
Table 1. Characteristic of fluid bed roaster gas in the year 2006 (annual averages)
Fluid bed roaster 1
Gas Quality (v/v %) Static pressure
(Pa) Temp. of gas (o
Velocity of gas streams C) (m/s)
Volume flow rate of gas streams
(Nm3/h) SO O2 2
Electrostatic precipitator 1 7.52 8.73 -681 286 8.90 16914
Electrostatic precipitator 2 7.78 8.11 -754 309 10.70 19503
Table 2. Characteristic of reverberatory furnace gas in the year 2006 (annual averages)
Reverberatory furnace
Gas quality (v/v %) Static
pressure (Pa)
Temp. of gas (o
Velocity of gas streams C) (m/s)
Volume flow rate of gas streams
(Nm3/h) SO CO2 O2 2
Electrostatic precipitator 0.60 6.05 13.2 -2467 205 11.46 55953
Table 3. Characteristic of converter gas in the year 2006 (annual averages)
Converters
Gas Quality (v/v %) Static
pressure (Pa)
Temp. of gas (o
Velocity of gas streams
C) (m/s)
Volume flow rate of gas
streams (Nm3/h) SO O2 2
Electrostatic precipitator 3.89 15.34 -1698 245 9.96 90756
Table 1 shows that the total volume of gas from the line of roasting is 36417
Nm3
Table 2 shows that the total volume of gas from the line of smelting is 55953 Nm
containing 7.66 percent by volume of sulfur dioxide. The total volume of gas from the line of roasting is processed into Sulfuric acid plant.
3
Table 3 shows that the total volume of gas from the line of converting is 90756 Nm
containing 0.60 percent by volume of sulfur dioxide. This gas is not suitable for processing in the existing Sulphuric acid plants and the total volume of gas from the line of smelting is released to the atmosphere.
3
Table 4 shows that the projected capacity of Sulfuric acid plant is 102000 Nm
containing 3.89 percent by volume of sulfur dioxide. During the converting process, large amount of gas with a significant content of sulfur dioxide is produced. Together with the reactor gas, the part of converter gas is processed into Sulfuric acid plant.
3 wet gas containing 5.5 percent by volume of sulfur dioxide. Also, this table shows that the actual capacity of sulfuric acid plant is 63284 Nm3 of wet gas. This means that the capacity of the Sulfuric acid plant is not consistent with the total amount of produced gas (including reactor and converters). Therefore, the excess gasses are discharged from the converter line to the atmosphere (36716.1 t SO2). Downtime of the Sulfuric acid plant is induced by the instabilities in smelter work. In that case, the total amount of produced gases (including reactor and converters) are emitted to the atmosphere (13673.7 t SO2 from the line of roasting and 17315.4 t SO2 from the line of converting).

Eco-Ist’12, Ecological Truth, 30 May - 2 June 2012. Hotel “Srbija TIS”, Zajecar, Serbia
209
Table 4. Total SO2 emissions during the downtime Sulfuric Acid Plant in the year 2006 Sulfuric Acid Plant
Technical Characteristic Achieved capacity (Nm3
Emission of SO/h)
wet gas (v/v %) 2
Downtime (h/a)
Time utilization (%)
Capacity (Nm3
Inlet concentration of SO
/h) wet gas 2 (v/v%) 102 000 5.5 63284 0.123 3589.30 59.02
Fluid bed roaster 1 Converters
Downtime (h/a)
Time utilization (%)
Emission of SO2
(t/a)
from ESP 1
Emission of SO
from ESP 2 2
(t/a)
Total emission
(t/a)
Total emission of SO2
(t/a)
from ESP
1871.50 78.7 6235.6 7438.1 13673.7 17315.4 The total emissions of SO2 36716.1 during the operational work Sulfuric Acid Plant,
in the year 2006
Table 5 shows that the total emission is 67705.2 t SO2 from the roasting process and converting and 6599.2 t SO2 from the melting process. Applied technology in sulfuric acid plant - single contact - single absorption (even in optimum conditions) emits SO2 and SO3 waste gas in concentrations that are higher than the maximum permitted by regulations. In this case, it is 0.123 percent of SO2 by volume or 3514 mg/Nm3 and total emission is 1149.9 t SO2
.
Table 5. Total SO2 emissions from the Copper Smelter and Sulfuric Acid Plant (TIR Bor),in the year 2006
Copper Smelter Sulfuric Acid Plant
(t/a) Emission of SO2 Emission of SO from the
roasting and converting process (t/a)
2 from the smelting process (t/a)
67705.2 6599.2 1149.9
Figure 1 shows that total emission of SO2 during the downtime of Sulfuric acid plant is 45.77 % with respect to the total emission of SO2 from Copper Smelter, in the year.

Eco-Ist’12, Ecological Truth, 30 May - 2 June 2012. Hotel “Srbija TIS”, Zajecar, Serbia
210
Figure 1. Total proportion SO2
Figure 2 shows that the total sulfur dioxide amount of 75454.3 tons was emitted to the atmosphere as follows: 8.8 % with the furnace off-gas through the 100-meter smelter stack, 1.5 % through the sulfuric acid plant stack and 89.7% through the 150-meter smelter stack.
emissions during the downtime and the operational work
Sulfuric Acid Plant to total emissions from Copper Smelter, in the year 2006
Figure 2. Total proportion SO2
emissions from the Copper Smelter and Sulfuric Acid Plant to total emissions, in the year 2006
CONCLUSION
Obviously, little can be done to reduce emission of SO2 from the existing technology of production the copper anode. It is not possible to achieve compliance of environmental standards for emissions, in these conditions. Certainly, this conclusion is nothing new.
Already, much has been done on the introduction of new technology of copper production in Bor, such as the development of Environmental Impact Assessment Study - New Smelter and Sulfuric Acid Plant Project, the start building a new Sulfuric acid plant, a new furnace for melting and reconstruction the existing line of converting. The aim of this paper is to show qualitative and quantitative participation of individual factors in the process for the creating total sulfur dioxide emissions in the existing conditions.
REFERENCES
1. T.Apostolovski-Trujic, V.Gardic, S.Ivanovic, Pollution and Control Techniques in the Copper Industry, Journal of Metallurgy, 13 (1) 2009, p.35
2. EIA Study - New Smelter and Sulphuric Acid Plant Project, Faculty of Tecnology and Metallurgy, University in Belgrade, Volume 1 - Main Report, 2010, Section 4, p.6
3. T.Apostolovski-Trujic, Control of gas flow parameters in the Copper Smelter Bor, Annual Report, Mining and Metallurgy Institute Bor, 2007

211
XX International Scientific and Professional Meeting
"ECOLOGICAL TRUTH" ECO-IST'12
30 May - 2 June 2012, Hotel “Srbija TIS“, Zajecar, SERBIA
COPPER AND COPPER ALLOYS IN CATALYSIS OF REACTIONS
ELIMINATING GREENHOUSE GASES
Mirjana Rajcic-Vujasinovic*
, D. Vujasinovic, V. Grekulovic
University of Belgrade, Technical faculty in Bor, V.J. 12, 19210 Bor, SERBIA
*
ABSTRACT One obvious human impact on the environment is an increasing atmospheric carbon dioxide (CO2)
content. However, no material is known to catalyze the electroreduction of CO2 to fuels both efficiently and selectively. Only copper and its alloys have been shown to be capable of producing significant quantities of hydrocarbons from CO2
. The paper is a review of recent investigations dealing with the employ of copper and copper alloys in catalysis of electroreduction of carbon dioxide into hydrocarbon fuels. Nanoparticles made of these materials are found to be the most efficient electrocatalysts.
Key words: Copper, Nanoparticles, Carbon-dioxide, Greenhouse gases, Anthropocene
INTRODUCTION
Human activities have a significant global impact on the environment. Italian geologist Antonio Stoppani acknowledged as long ago as 1873 the increasing impact of humanity on the Earth's systems and referred to the “anthropozoic era” [1]. Many scientists are now using the term Anthropocene (from Greek: anthropo - "human" and cene - "new") to mark mankind`s growing influence on the Earth's ecosystems. It seems appropriate to assign the term ‘Anthropocene’ to the present, in many ways human-dominated, geological epoch, supplementing the Holocene - the warm period of the past 10–12 millennia. The Anthropocene could be said to have started in the latter part of the eighteenth century, when analyses of air trapped in polar ice showed the beginning of growing global concentrations of carbon dioxide and methane. This date also happens to coincide with James Watt’s design of the steam engine in 1784 and the industrial revolution. Some scientists link it to earlier events, such as the rise of agriculture. Evidence of relative human impact such as the growing human influence on land use, ecosystems, biodiversity and species extinction is controversial, some scientists believe the human impact has significantly changed (or halted) the growth of biodiversity. The Anthropocene may have begun as early as 14 000 to 15 000 years before present, based on lithospheric evidence; this has led other scientists to suggest that the onset of the Anthropocene should be extended back many thousand years [2].

Eco-Ist’12, Ecological Truth, 30 May - 2 June 2012. Hotel “Srbija TIS”, Zajecar, Serbia
212
One obvious geological signal of human activity is increasing atmospheric carbon dioxide (CO2) content. During the glacial–interglacial cycles of the past million years, natural processes have varied CO2 by approximately 100 ppm (from 180 ppm to 280 ppm). As of 2011, anthropogenic net emissions of CO2
have increased its atmospheric concentration by a comparable amount from 280 ppm (Holocene or pre-industrial "equilibrium") to about 390 ppm [3]. The Global Monitoring Division of NOAA/Earth System Research Laboratory has measured carbon dioxide and other greenhouse gases for several decades at a globally distributed network of air sampling sites. A global average is constructed by first fitting a smoothed curve as a function of time to each site, and then the smoothed value for each site is plotted as a function of latitude for 48 equal time steps per year. A global average is calculated from the latitude plot at each time step. Recent monthly mean carbon dioxide globally averaged over marine surface sites is shown in Figure 1.
Figure 1. Monthly mean carbon dioxide globally averaged over marine surface sites
The dashed red line
This signal in the Earth's climate system is especially significant because it is occurring much faster, and to an enormously greater extent, than previous, similar changes. Most of this increase is due to the
with diamond symbols represents the monthly mean values, centered on the middle of each month. The black line with the square symbols represents the same, after correction for the average seasonal cycle. [3]
combustion of fossil fuels such as coal, oil and gas, although smaller fractions are the result of cement production and land-use changes (e.g. deforestation). Anthropogenic emissions of carbon dioxide, may cause significant depart in global climate from natural behavior for many millennia to come.

Eco-Ist’12, Ecological Truth, 30 May - 2 June 2012. Hotel “Srbija TIS”, Zajecar, Serbia
213
RESULTS If an efficient electrochemical process could be developed to produce
hydrocarbons from CO2, this could allow processes (known as ‘‘artificial photosynthesis’’ or ‘‘solar fuels’’) to directly produce useful fuels from CO2 and renewable energy sources. Copper has been found to be unique among the metals in its ability to produce a high quantity of hydrocarbon fuels CH4 and C2H4 from the electroreduction of CO2 [4]. The storage of energy in chemical bonds, as fuels, is attractive for a number of reasons, and a (photo-) electrochemical route to reduce CO2 to hydrocarbon fuels would provide an ideal storage medium for intermittent renewable energy sources, resulting in carbon-neutral fuels. However, only copper and its alloys have been shown to be capable of producing significant quantities of hydrocarbons from CO2, but they do so inefficiently with a large overpotential requirement [5]. Numerous researchers have studied the electrochemical reduction of CO2
Recycling carbon dioxide emissions in power plants means that instead of being released into the atmosphere, carbon dioxide would be circulated through a copper catalyst and turned into methane - which could then power the rest of the plant. Such a self-energizing system could vastly reduce greenhouse gas emissions from coal-fired and natural-gas-powered plants. But copper can be easily oxidized which can significantly slow its reaction with carbon dioxide and produce unwanted byproducts such as carbon monoxide and formic acid. Now researchers at MIT have come up with a solution that may further reduce the energy needed for copper to convert carbon dioxide, while also making the metal much more stable [8]. The group has engineered tiny nanoparticles of copper mixed with gold, which is resistant to corrosion and oxidation. The researchers observed that just a touch of gold makes copper much more stable. In experiments, they coated electrodes with the hybrid nanoparticles and found that much less energy was needed for these engineered nanoparticles to react with carbon dioxide, compared to nanoparticles of pure copper. An electron microscopy image of hybrid gold/copper nanoparticles is given in Figure 2.
at metal electrodes, and two excellent reviews have appeared in the recent literature [6, 7]. Peterson et al. have used a computational hydrogen electrode (CHE) model to show how copper is able to catalyze this reaction, and outlined requirements for more efficient catalysts to enable artificial photosynthesis [5]. Their results suggest that the key enabling step in the formation of hydrocarbons from CO2 is the protonation of adsorbed CO to form adsorbed CHO. If adsorbed CHO can be stabilized relative to adsorbed CO, the necessary overpotential can be significantly reduced, which will translate directly into a more efficient process. However, since CO binds only weakly to copper surfaces, materials that bind CO more weakly will lead to large amounts of gas-phase CO production. Therefore, materials that bind CHO more strongly, while binding CO with similar tenacity, may offer the best hope for future catalyst materials.

Eco-Ist’12, Ecological Truth, 30 May - 2 June 2012. Hotel “Srbija TIS”, Zajecar, Serbia
214
Figure 2. Electron microscopy image of hybrid gold/copper nanoparticles
The researchers have combined gold nanoparticles with copper nanoparticles to form hybrid nanoparticles, which they turned into powder to catalyze carbon dioxide reduction. They say the findings point to a potentially energy-efficient means of reducing carbon dioxide emissions from powerplants [8].
CONCLUSION
Various researches around the world study copper's potential as an energy-efficient means of recycling carbon dioxide emissions in powerplants with a goal to reduce greenhouse gas emissions from coal-fired and natural-gas-powered plants. Investigations including nanoparticles of copper alloys with noble metals are the most promising. Acknowledgment This work was supported by Ministry of Education and Science of Republic of Serbia, Project No. OI 172 060.
REFERENCES
1. Crutzen, P. J. (2002). "Geology of mankind"2.
. Nature 415 (6867): 23 Doughty, C. E.; Wolf, A.; Field, C. B. (2010). "Biophysical feedbacks between the Pleistocene megafauna extinction and climate: The first human-induced global warming?"
3. . Geophysical Research Letters 37 (L15703): 1
http://www.esrl.noaa.gov/gmd/ccgg/trends/global.html

Eco-Ist’12, Ecological Truth, 30 May - 2 June 2012. Hotel “Srbija TIS”, Zajecar, Serbia
215
4. Hori Y., Kikuchi K., Murata A., Suzuki S., Production of methane and ethylene in electrochemical reduction of carbon dioxide at copper electrode in aqueous hydrogen carbonate solution, Chem. Lett., 1986, 15, 897.
5. Peterson A. A., Abild-Pedersen F., Studt F., Rossmeisl J., Nørskov J. K.,
6. Hori Y.. Electrochemical CO
How copper catalyzes the electroreduction of carbon dioxide into hydrocarbon fuels, Energy Environ. Sci., 2010, 3, 1311–1315
2
7. Gattrell M., Gupta N., Co A., A review of the aqueous electrochemical reduction of CO
reduction on metal electrodes, in Modern Aspects of Electrochemistry, Vol. 42, chapter 3, pp. 89–189, Springer, New York, 2008.
28.
to hydrocarbons at copper, J. Electroanal. Chem., 2006, 594, 1. http://web.mit.edu/newsoffice/2012/hybrid-copper-gold-nanoparticles-convert-CO2.html

216
XX International Scientific and Professional Meeting
"ECOLOGICAL TRUTH" ECO-IST'12
30 May - 2 June 2012, Hotel “Srbija TIS“, Zajecar, SERBIA
REHABILITATION OF THE LANDFILL OPEN "DUBRAVE" PIT MINE
Mirad Delic1, A. Nuric2, S. Nuric2*, V. Radulovic1
1Coal mine "DubraveC-"KREKA", Tuzla, B&H
2Universiti of Tuzla, Faculty of mine, geology and civil engineering, Tuzla, B&H
ABSTRACT
Reclamation is complex series of works aimed to establish previously value of damaged land at pit
mines, and to improve environmental conditions. Methods and procedures for reclamation of land vary depending on the character of degraded land, local geographical, hydrological, climatic and economic conditions. This paper presents the re-cultivation measures and ways of ensuring stability and security for the specific location of the landfill surface on Dubrave surface mine.
Key words: landfill, pit mine, overburden, influence, environment, rehabilitation
INTRODUCTION
The subject of paper is remediation and closure of waste dump at which deposited tailings from the ‘Dubrave’pit mine. The landfill is located between Spreca river, stream Ljesnica, railroad Ljubace-Tuzla and highway Tuzla-Sarajevo (Figure 1). The relief of the terrain is lowland type with an average elevation 215 m a.s.l. of arable and meadow land. The total area of earth masses for disposal is 3.12 km2. The landfill began operations with 1987.

Eco-Ist’12, Ecological Truth, 30 May - 2 June 2012. Hotel “Srbija TIS”, Zajecar, Serbia
217
Figure 1. Location of outside ‘Zapad’ landfill of ‘Dubrave’ pit mine
REASON PLANNED REHABILITATION OF LANDFILL
The external waste dump ‘Zapad’ is disposed of overburden from ‘Dubrave’open pit mine. After completion of the waste rock at the landfill, it will not meet the criteria prescribed by law. Waste dump during nowadays has negative impact on the local area. Therefore, it is necessary to prepare a study on impact of landfill on local area according to the current legislative. The study should offer all the planned projects and possible alternatives in terms of acceptable impact on the immediate living and working environment.
DESCRIPTION OF EXISTING WASTE DUMP
The waste dump is no water supply, sewage and telephone infrastructure. Deferred masses are not consolidated and they are subject to seepage of rainwater. Considering that, on waste dump is not built watertight and the overburden disposed on the natural surface soil, rainwater end up in the basic soil and in underground water. It is not carried out monitoring the surrounding environment or to perform investigations relating to the state of the environment.

Eco-Ist’12, Ecological Truth, 30 May - 2 June 2012. Hotel “Srbija TIS”, Zajecar, Serbia
218
Figure 2. Appearance of external ‘Zapad’ waste dump
DESCRIPTION OF PROPOSED MEASURES FOR REHABILITATION
Predicted amount of waste rock that is necessary to accommodate on external
dump is 120 million m3, or 180.000.000 t of waste rock (Table 1.). The estimated volume of waste material is obtained on basis of density of tailings from 1.8 t/m3, which is present on waste dump. Table 1. Volume of waste dump Waste dump Area (km²) Waste material (t)
Volume of waste dump (m³)
External waste dump ″West″
3.12 180.000.000 120.000.000
The most acceptable variant of rehabilitation of existing landfill is derived from
the assessment of several influencing factors of which the most important are existing impacts on the immediate environment and the specificity of location the existing landfill. The main objective of the closure and rehabilitation of landfill is to prevent any possible negative impacts of disposed overburden in accordance with the regulations and technical standards.
Technically acceptable solution to represents a levelling of deposited mass on a regulated landfill by incorporating upper surface of the waterproof layer, reducing the final disposal site slope on the project given the size and construction efficient network of drainage canals that need to accept rainwater and direct it trough the drains into the nearest natural water.

Eco-Ist’12, Ecological Truth, 30 May - 2 June 2012. Hotel “Srbija TIS”, Zajecar, Serbia
219
Figure 3. Construction of drainage canals
The waste dump should be shifted a certain amount of topsoil removed from the
base soil. These masses of humus would be plateau at the final restored area landfill. The total estimated amount of topsoil for ‘covering’ of the landfill resulting from the total quantity of topsoil removed and deposited in the process of construction a landfill and is 975.000 m3.
REVIEW OF POSSIBLE IMPACTS AFTER REHABILITATION OF LANDFILL
Amount of wind-borne tiny particles of dust in the air will be reduced to a
minimum. May occur dust due to reclamation and manipulation of the final layer of topsoil in order to detention the landfill area for crop. After completion of remediation at the landfill will be occur rainwater and given that this is clear water do not need to be processed before being discharged into the surrounding terrain. In case of rainwater contamination with dust particles is necessary to process water settling trough tank system so that it freed and cleared of impurities.
In this sanitized landfill will not be any negative impacts on the environment. The general conditions of the surrounding areas will be significantly enhanced and improved. The visual impact of landfill on the environment is significant because it represents a new form of relief. As these agricultural areas of this effect will be substantially reduced with respect to the surface of the waste dump is brought to agricultural crops. Slopes of the landfill in order to prevent occurrence of slip bands of material will be sown with native plant species, which further aid in the visual fitting landfill of the surrounding area.

Eco-Ist’12, Ecological Truth, 30 May - 2 June 2012. Hotel “Srbija TIS”, Zajecar, Serbia
220
CONCLUSION
Requirement continuation of exploitation is determining of the landfill space. Open pit mine Dubrave does not have this question resolved for a long time term. For this reason it is necessary to delay the overburden as much as possible large amounts to the existing landfill space. To achieve this, with no negative impact on surrounding areas, should be taken care about slope stability on the waste dump, prevention of air pollution with dust from the landfill, as well as preventing contamination of surface and underground water with pollution that infiltrate from deposited mass. In order to accomplish the goals of environmentally acceptable impact on the environment is necessary to implement measures of technical and biological recultivation through methods presented in the paper but leave the possibility of use a geosynthetic as a way of achieving stabilization and security constructed of landfill.
REFERENCES
1. Delić M., Nurić A., Nurić S., Radulović V., 2010.: Determination of final slope stability at the pit mine Dubrave, Proceedings 42th IOC on mining and metallurgy, Technical faculty at Bor University of Belgrade, Copper Institute Bor, Kladovo
2. Hustrulid, W.; Kuchta, M., 2006.: Open pit mine, planning & design 2nd edition, A.A.Balkema, Rotterdam
3. Heikkinen P. M. (ed.), Noras P. (ed.), Salminen R. (ed.), Mroueh U.M., Vahanne P., Wahlström M.M., Kaartinen T., Juvankoski M., Vestola E., Mäkelä E., Leino T., Outokumpu Oyj, Kosonen M., Maa ja Vesi Oy, Hatakka T., Jarva J., Kauppila T., Leveinen J., Lintinen P., Suomela P., Pöyry H., Outokumpu Mining Oy, Vallius P., Nevalainen J., Salvor Oy, Tolla P., Tieliikelaitos, Komppa V., 2008.: Mine closure Handbook Environmental Techniques for the Extractive Industries, Espoo, Vammalan Kirjapaino Oy
4. Knežiček, T., 2004.: Računarski podržano projektovanje površinskih kopova, JU Univerzitet u Tuzli, Tuzla
5. McHugh E.L. and Girard J.M.: Evaluating techniques for monitoring rock falls and slope stability, Spokane Research Laboratory, National Institute for Occupational Safety and Health, Spokane, WA
6. Nurić, S., 2009.: Kamionski transport u površinskoj eksploataciji, Tuzla 7. Nurić A., Nurić S., Avdić M., 2005.: Proračun stabilnosti kosina pomoću
računara na PK 'Mošćanica' RMU Zenica, Rudarski radovi 1/2005, str. 44-49, Komitet za podzemnu eksploataciju mineralnih sirovina Resavica, RTB Bor Institut za bakar Bor
8. Nurić A., Nurić S., Haračić E., 2007.: Vizualizacija vanjskog odlagališta 'Zapad' na PK Dubrave korištenjem kompjuterske tehnike, str. 183-187, Zbornik radova RGGF-a XXXIII, Tuzla
9. Nurić A., Nurić S., Lapandić Š., Haračić E., 2007.: The methods of monitoring slope stability to provide security performance of works on the open pit mine, Proceedings 39th IOC on Mining and Metallurgy, Sokobanja, pg. 58-63, Technical faculty Bor, University of Belgrade and Copper Institute Bor, Bor

221
XX International Scientific and Professional Meeting
"ECOLOGICAL TRUTH" ECO-IST'12
30 May - 2 June 2012, Hotel “Srbija TIS“, Zajecar, SERBIA
BIODEGRADABLE PACKAGING FROM POLYETHYLENE
AND LIFE-CYCLE ASSESSMENT
Darko Ljubic1, M. Stamenovic2, J. Petrovic3, J. N. Shera1, O. Jovanovic2, M. Nujkic
4
1Pittsburg State University, Kansas Polymer Research Center, Pittsburg, Kansas, USA
2College of vocational studies, Belgrade Polytechnic, Belgrade, SERBIA 3University of Belgrade, Faculty of Technology and Metallurgy, Belgrade, SERBIA
4
University of Belgrade, Tehnical faculty in Bor, Bor, SERBIA
ABSTRACT
Rising crude oil prices have resulted in increased costs for industries that rely on traditional petrochemical-based technologies. Concurrently, materials science researchers have been intensively looking for alternatives to traditional petrochemical-based materials with an emphasis on environmentally-friendly polymers. One such viable alternative is the use of biodegradable polymers. Biodegradable polymers may be produced from a) renewable resources or b) from conventional petrochemical-based materials with additives that enhance degradation. Methods of biodegradation include oxo- or hydro-biodegradation. This study aims to represent the significance of polymer materials in modern world from an environmentally-responsible viewpoint. It includes an overview of the most frequently utilized industrial biodegradable polymers and demonstrates life-cycle assessment as it applies to biodegradable polyethylene bags.
Key words: biodegradable plastics, oxo-biodegradable plastics, polyethylene, degradation time,
life-cycle assessment
INTRODUCTION
Plastic materials are commonly used in household and industrial applications such as food packaging. The low cost, light weight, high strength, transparency, printing capabilities and superior barrier properties to gas and water are very important properties of plastics used in packaging materials. High strength and durability, which makes them useful and cost effective materials in packaging applications, can become a key problem after use when disposing of these plastics in landfills Materials science researchers have been investigating solutions to this problem in the form of biopolymers and biodegradable polymers production. Agriculturally-based natural raw materials can be grown in the annual planning cycle, making them rapidly renewable and their production and disposal environmentally benign. However, development of new types of fuels, including hydrogen-based fuels, may sustain industrial use of petrochemical-based technologies for a longer period of time.
.

Eco-Ist’12, Ecological Truth, 30 May - 2 June 2012. Hotel “Srbija TIS”, Zajecar, Serbia
222
Therefore, recycling will become an important option in addressing environmental concerns [1]. Worldwide, research efforts have produced biodegradable polymers as a viable option for waste management. Chemists, materials scientists, engineers and manufacturers have collaborated in attempts to preserve resources for future generations and to develop biodegradable polymers [2]. This study aims to demonstrate the growing importance of biodegradable polymers, with an emphasis on oxo-biodegradable polymers, as well as the presence of biodegradable plastic bags in the international marketplace.
BIODEGRADABLE POLYMERS
Degradation is an essential characteristic of plastic materials and polymers in general. It is based on the fact that many plastics are organic compounds which can undergo oxidation by heat or other radiation and chemical degradation largely by hydrolysis, resulting in deterioration of physical and mechanical properties. In the case of materials and products that have a limited lifetime in which to fulfill their role, oxidation and hydrolysis must play a large role in biological degradation and mineralization. The decomposition process can proceed in an abiotic or biotic fashion, but usually a combination of these two degradation modes occurs. Polymers which degrade in such a fashion are often referred as environmentally degradable polymers and plastic materials (EDP’s) [3
]. Today there are three generations of biodegradable polymeric materials. The
first generation is based on cornstarch: poly(lactic acid) or PLA. The second generation is the oxo-biodegradable conventional plastics including (polyethylene, polypropylene, polystyrene, etc., and third generation most commonly used in the United States are micro-biodegradable conventional The chemistry of key degradation processes is defined in Equations 1 and 2, where C
plastics.
POLYMER
is a polymer or a part of polymer during the degradation process. It is assumed for simplification purposes that the polymer is composed of only carbon, hydrogen and oxygen. Other elements may also be present in the polymer. They are displayed in the oxidized or reduced form after biodegradation which is dependent on weather conditions and the mode of biodegradation (aerobic or anaerobic) [2].
Aerobic biodegradation:
CPOLYMER + O2 → CO2 + H2O + CRESIDUE + CBIOMASS Anaerobic biodegradation:
+ salts (1)
CPOLYMER → CO2 + CH4 + H2O + CRESIDUE + CBIOMASS
+ salts (2)
Biodegradation is complete when no residual polymer remain, and complete mineralization has occurred when CPOLYMER is transformed into gaseous products and salts. Mineralization is an extremely slow process under natural conditions. It can be
Eco-Ist’12, Ecological Truth, 30 May - 2 June 2012. Hotel “Srbija TIS”, Zajecar, Serbia
223
reasonable expected that the polymers undergo biodegradation and direct conversion into biomass. Thus, complete biodegradation without mineralization was what the measurement goal when assessing the dissolution of the polymeric materials in the environment [2].
Degradable plastic materials are divided into two categories: compostable and biodegradable plastics. Biodegradable plastics are decomposed under the influence of naturally generated microorganisms such as bacteria, fungi and algae (ASTM D 6400-99). Compostable plastics are those that decompose under the influence of biological processes which produce CO2, H2O, inorganic compounds and biomass during the composting process. (ASTM D 6400-99).Biodegradable plastics can be divided two categories, also: hydro-biodegradable plastics and oxo-biodegradable plastics which can be further categorized into photo-degradable and thermal-degradable plastic materials. Hydro-biodegradable plastics consist entirely or partly from renewable raw materials that are biodegradable in the presence of high concentrations of environmental microorganisms that effect degradation by hydrolysis during the composting process. Oxo-biodegradable plastics are made from traditional petrochemical raw materials, which are decomposed by oxidation in the environment aided by oxo-biodegradation additives that promote a reduction in molecular weight and material structure by allowing naturally present microorganisms access to the material in order for biodegradation to occur (ASTM 6954 and CEN TC249/WG). Photo-degradable plastic materials are those that react to ultraviolet radiation. Although oxo-biodegradable, photo-degradable plastics will not disintegrate in the soil, sewage or any other environment in which no light is present. Thermal-degradable plastic materials are those in which the oxidation process begins under the influence of radiation in the form of heat, a mechanism of decomposition similar to photo-biodegradable plastics.
It is important to distinguish between different types of biodegradable plastics because of the differences in their costs and appropriate applications. In the case of both oxo-biodegradable and hydro-biodegradable processes, degradation begins with an abiotic processes (either oxidation or hydrolysis), followed by biodegradation. In both cases, CO2 is generated, but the hydro-biodegradation process also generates CH4. Both the oxo-biodegradable and hydro-biodegradable plastics are compostable, but only oxo-biodegradable can be recycled economically. It should be noted that the hydro-biodegradable materials are more expensive compared to oxo-biodegradable materials.
Another important group of biodegradable plastic materials are biopolymers. These polymers are classified as follows: 1) polyalkylene esters or aliphatic polyesters; 2) PLA and its copolymers; 3) polyamide esters; 4) polyvinyl esters; 5) polyvinyl alcohol (PVA); and 6) polyanhydrides. According to the origin and methods of production, biopolymers, in general, are further categorized into two groups of polymers. The first includes polymers produced by classical chemical synthesis of monomers derived from renewable raw materials. An example is PLA, a biopolyester synthesized from lactic acid. The second group includes polymers synthesized by microorganisms or genetically modified bacteria. This group consists mainly of poly (hydroxy butyrate), poly(hydroxy valerate), PVA, and their copolymers. The degree of degradation of biopolymers depends primarily on their molecular structure and environmental conditions under which degradation occurs [1,4].

Eco-Ist’12, Ecological Truth, 30 May - 2 June 2012. Hotel “Srbija TIS”, Zajecar, Serbia
224
OXO-BIODEGRADATION OF COMMERCIAL PRODUCTS
Many standard plastics contain additives that facilitate processing and improve their physical and mechanical properties. Also, commercially-available biodegradable plastics include common additives such as plasticizers, antioxidants, pigments and stabilizers in their formulations. Biodegradable polymers can be processed by conventional techniques such as extrusion, thermoforming, injection molding and blow molding. A polymer is usually considered as biodegradable if its entire mass decomposes in soil or water within six months. In many cases, the degradation products are simply CO2 and H2O. All other products of decomposition and remnants present after biodegradation must be subjected to testing for environmental reasons.
Currently, technologies are used that produce plastics for applications including shopping bags, garbage bags, food-storage films and packaging. Due to the short service life of these plastic materials, their disposal and degradation at the end of their service life can be enhanced during production. Oxo-biodegradation technology can produce plastics that can be degraded after their service life through an oxidative process caused by formulation with an additive which causes degradation. Additives for oxo-biodegradation are incorporated in a plastic material during the manufacturing process. Degradation begins when the pre-set service life controlled by stabilizers in the degradation additive is complete at the time when the product is no longer in use. The time required for degradation of oxo-biodegradable products can be pre-set during production to be short (just a few months) or to be long-term (several years).
Unlike PVC, the oxo-biodegradable plastic polymers do not contain chlorine. Also, these materials do not contain polychlorinated biphenyl, nor do they emit methane or and oxides of nitrogen, even under anaerobic conditions. Oxo-biodegradable plastics decompose in the environment to become a source of nutrients for plants. Also, oxo-biodegradable materials decompose in the upper soil layers, but are completely inert deeper in the earth in the absence of oxygen. Typically, oxo-biodegradable materials are made from byproducts of oil refining. Because these byproducts are normally considered waste, additional oil imports for use as raw materials may not be needed.
The term “oxo-biodegradation” is used to denote the two-step degradation process of polyolefin. The first step of the degradation process is characterized by reaction of molecular oxygen from the air with the polymer which can be accelerated by UV and heat. This phase determines the speed of the entire process. Carbons in the polymer chain oxidize, resulting in the formation of smaller molecules. This is called the fragmentation process. The introduction of oxygen in the polymer chain results in functional groups such as carboxylic acid, esters, aldehydes, and alcohols. The hydrocarbon polymer chains undergo a change from hydrophobicity to hydrophilicity, which allows the fragmented polymer to absorb water [5]. The second step is biodegradation by microorganisms (bacteria, fungi, algae) that eat away parts of oxidized chain to produce oxidation products: CO2, H2O and biomass. To achieve significant microbial degradation at the optimum rate, the average relative molecular weight of the oxidized polyolefin must be under 5000 Da.

Eco-Ist’12, Ecological Truth, 30 May - 2 June 2012. Hotel “Srbija TIS”, Zajecar, Serbia
225
The most commonly used plastic material for oxo-biodegradation is polyethylene. Any reduction in the accumulation of waste PE has a large impact on overall reduction of plastic waste in the environment [6]. Degradation products of oxo-biodegradable polyethylene samples are in accordance with the standard Standard Guide for Exposing and Testing Plastics that Degrade in the Environment by a Combination of Oxidation and Biodegradation (ASTM D6954-04). Biodegradable bags are produced from oxo-biodegradable polyethylene. Oxo-biodegradable polyethylene film is produced by the usual technique of blown film extrusion that is normally employed with conventional low- and high-density polyethylene (LDPE and HDPE, respectively). After achieving the required level of inflation, the balloon cools, collapses, and is then pulled over a roller. Subsequently, the film is shaped into the desired form (shopping bags). The procedure is no different from the normal production of plastic film and bags made of LDPE and HDPE without additives for biodegradation. What distinguishes biodegradable bags from ordinary bags is the composition of the basic raw material used in blown film extrusion. Oxo-biodegradable disposable bags are HDPE with antioxidant and auto-oxidant additives in the formulation that function as accelerators of degradation. Oxo-biodegradable plastics do not contain heavy metals. Any metal compounds used in these materials those permitted for use in the European Directive 67/548/EC. The key advantage of oxo-biodegradable plastic is the reduction of the bulk of waste disposed of in landfills. That is, the oxo-biodegradable plastic waste degrades unlike conventional plastic waste that remains in the environment where it accumulates over time.
Polymer biodegradation mostly depends on two factors: the types of polymers and the environment in which it occurs. While studies often focus on biodegradability testing of materials, environmental effects cannot be neglected when measuring biodegradability. Microbial activity and, thus biodegradation, is influenced by the presence of microorganisms, the availability of oxygen, available water, biodegradation temperature, and chemical composition (pH, electrolytes, etc.) of the environment. In order to simplify measurement, the biodegradation environment can be designated either aerobic and anaerobic. Aerobic and anaerobic environments can be present in both the aquatic environment and terrestrial environments. The terrestrial environment is the most suitable for measuring the biodegradation of polymeric materials because they best represent conditions present in the biological treatment of municipal solid waste, such as composting or anaerobic digestion by bio-gasification.
Numerous methods for experimental evaluation of biodegradable polymers are described in the scientific literature. Four commonly available approaches for study of the biodegradation process are: 1) monitoring of microbial growth, 2) monitoring the consumption of substrate, 3) monitoring the reaction products, and 4) monitoring changes in substrate properties. Biodegradable polymer test methods are usually based on the approaches which are specified above. Combinations of biodegradable polymer test methods are also possible. Test methods most often depend on what information is desired upon measurement or testing There are many standards in the field of testing of biodegradation. The main difference between international standards is the percentage of biodegradation that is levied. Mainly, the standards provide guidance on assessing the biodegradability,
.

Eco-Ist’12, Ecological Truth, 30 May - 2 June 2012. Hotel “Srbija TIS”, Zajecar, Serbia
226
compostability, and the determination of possible harmful starting materials and degradation products from the decomposed packing material. For example, it is obligatory to examine all packaging materials labeled as "biodegradable" according to EN 13432 to ensure compliance with EU Directive 94/62/EC for packaging in packaging waste.
THE LIFETIME OF BIODEGRADABLE POLYMERS
The most common biodegradable polymer products are oxo-biodegradable
polyethylene bags made for single- or multi-use in almost all major European supermarkets. They are designed to break down after 2-4 years if they are exposed to oxygen, light and heat. Life-Cycle Assessement (LCA) is a useful way to quantify and assess the environmental impacts of products, processes and application from their inception until the end of their service life, including disposal and degradation. From an LCA perspective, the determination of the service life of oxo-biodegradable bags after use upon storage in different conditions is a key step in their life cycle and has the greatest impact on the entire life cycle [7,8].
The International Standard Organization (ISO) 14040 standard provides high quality guidelines for LCA. The standard includes a detailed description of the general framework of LCA, principles and requirements for conducting LCA and LCA report writing. ISO 14040 dictates that LCA consist of four phases: 1) definition of objectives and areas, 2) inventory analysis, 3) impact assessment and 4) presentation of results. For detailed LCA procedure descriptions, it is necessary to consult ISO standards 14041, 14042 and 14043. Biodegradable plastic materials that usually undergo LCA analysis are HDPE, LDPE and polypropylene (PP). Paper bags and woven bags were considered as non-biodegradable controls compared to
oxo-biodegradable polyethylene bags.
Indicators of the LCA impact by biodegradable bags on the environment are classified into six groups: 1) Consumption of material – amount of material consumed during bag manufacturing; 2) Global warming – impacts on climate change arising from the release of CO
Non-biodegradable HDPE, LDPE and PP were considered as non-biodegradable controls. The main objective of the study is to understand the life cycle of biodegradable bags and the impact on the environment compared with non-biodegradable bags. LCA studies of plastic bags includes production of raw materials, manufacturing of bags, transport of bags to retailers and shops, and storage bags at the end of service life.
2 and CH4
All indicators lead to several conclusions for the bags from biodegradable polymers compared to conventional plastics [9,10]. Generally, if we can recycle all plastic materials, the environmental impact is reduced over the total life cycle of the
or that have an impact on the effect of greenhouse gases in the atmosphere; 3) Energy consumption – the total consumed energy, including fossil fuels, renewable energy, electricity and raw materials, during bag manufacturing; 4) Water consumption – the total amount of water consumed in bag production from raw materials to the final product; 5) Retention of marine biodiversity – the time it takes for garbage in the marine environment to degrade and potential interference with marine species; 6) Appearance –the visible impact of garbage before degradation. [9]

Eco-Ist’12, Ecological Truth, 30 May - 2 June 2012. Hotel “Srbija TIS”, Zajecar, Serbia
227
material. Polymers for reusable bags have a lower environmental impact compared to polymers for disposable bags. Degradable polymer bags have a similar impact on the greenhouse gases (GG’s) emitted over time, compared to non-degradable HDPE bags. If the biodegradable polymer bags are not disposed of in a landfill but composted instead, the effect on GG’s is reduced but not eliminated. Generally, polyolefin packaging production energy costs are more than 50% less than that of paper packaging production. Composted material derived in part from biodegradable plastics reduces soil contamination by chemicals, suppresses plant diseases and increases organic matter, water and nutrients present in the soil. Biodegradable bags disposed of in landfills can increase the speed of organic waste decomposition in landfills. On the other hand, the presence of biodegradable bags can reduce the usable landfill space and increase the amount of landfill CH4
if composted. The use of a biodegradable film cover for the landfill can extend landfill lifespan. Biodegradable plastics also provide important environmental benefits in many cases including the use of renewable energy resources and reduction of the release of harmful GG’.
CONCLUSIONS
Combining ecology requirements and materials from renewable resources is a viable solution in general biodegradable polymers production, and therefore, the production of biodegradable bags and other plastic products. Biodegradable plastics can be produced from renewable raw materials and from common plastics with the incorporation of additives that promote degradation. Biodegradation may occur through be oxo-, hydro-, thermal-and photo- biodegradation pathways, as well as by composting. When a biodegradable plastic product is taken to market, the ability to predict service lifespan or rate of deterioration is a major advantage. Plastic materials should be tested in real time in an environment that is similar to that which the product will be exposed during its service life. However, this is not always possible. Accurate prediction of a biodegradable plastic product’s service life depends on testing method, plastic material types and form and processing history of the plastic material. It is also important to examine the effect of compounds obtained from decomposition and biodegradation of plastic materials. Assurances of environmental harmlessness should be interpreted with caution. Rigorously future testing is still required to evaluate the absolute environmental impact of biodegradable polymers during decomposition
.
REFERENCES
1. Ljubić D., Termogravimetrijsko određivanje vremena razgradnje okso-biorazgradivih kesa od polietilena na kraju životnog ciklusa, Master rad, Tehnološki fakultet Univerziteta u Novom Sadu, Novi Sad, 2010.
2. Zee M., Biodegradation of polymeric materials - an overview of available testing methods, Chapter 4., Biorelated polymers - sustainable polymer science and technology, Kluwer Academic/Plenum Publishers, New York, 2001.

Eco-Ist’12, Ecological Truth, 30 May - 2 June 2012. Hotel “Srbija TIS”, Zajecar, Serbia
228
3. Krzan A., Hemjinda S., Miertus S., Corti A., Chiellini E., Standardization and certification in the area of environmentally degradable plastics, Polym. Deg. Stab., 91 (2066) 2819-2833.
4. Shah A.A., Hasan F., Hameed A., Ahmed S., Biological degradation of plastics: a comprehensive review, Biotechnology Advances, 26 (2008) 246–265.
5. Ammala A., Bateman S., Dean K., Petinakis E., Sangwan P., Wong S., Yuan Q., Yu L., Patric C., Leong K.H., An overview of degradable and biodegradable polyolefins, Prog. Polym. Sci., Article in press, 2011.
6. Sivan A., New perspectives in plastic biodegradation, Environmental biotechnology, Article in Press, 2011.
7. Radusin T., Pilić B., Matić J., Novaković A., Bera O., The life cycle assessement (LCA) of polypropylene as food packaging material, II Međunarodni kongres „Inženjerstvo, ekologija i materijali u procesnoj industriji“, Univerzitet u Istočnom Sarajevu, Tehnološki fakultet Zvornik, Zbornik radova na CD-u, Republika Srpska, Jahorina 9-11. mart 2011.
8. Azapagic A., Emsley A., Hamerton I., Polymers, the environment and sustainable development, Wiley J: West Sussex, (2003) 126-152.
9. http://www.europeanplasticfilms.eu/docs/Jamesandgrant1.pdf 10. Dilli R., Comparison of existing life cycle analysis of shopping bag alternatives,
Final report, Hyder Consulting Pty Ltd, Melbourne, Australia, 2007.

229
XX International Scientific and Professional Meeting
"ECOLOGICAL TRUTH" ECO-IST'12
30 May - 2 June 2012, Hotel “Srbija TIS“, Zajecar, SERBIA
INFLUENCE OF THE PROCESSING OF POLYMER COMPOSITE
MATERIALS
ON THE ENVIRONMENT AND SOCIETY
Dominik Brkic1, J. Petrovic2, I. Dimic2, M. Stamenovic1*, S. Putic
2
1
Brankova 17, 11000 Belgrade, SERBIA College of vocational studies, Belgrade Polytechnic,
2University of Belgrade, Karnegijeva 4, 11000 Belgrade, SERBIA
Faculty of Technology and Metallurgy,
*
ABSTRACT
Thanks to its characteristics reinforced plastics provides an increasing use in construction and transport industry due to low weight, easy installation, corrosion resistance, low maintenance and the tailor made properties. Various options of production process for the entire integrated process of realization of the final composite product can affect the environment and health and safety at work. The primary materials used in the production of composite materials have a strong influence on the environment. In this work was analyzed influence of double-curved panels composite material on the environment
.
Key words: composite material, environment
INTRОDUCTION
Composites are a combination of two or more distinctly identifiable materials. Composite materials consist of matrix (polymer, metal or ceramic) and a filler[1]. Evaluating the effects of polymer composite materials, processes and products on the environment and society may seem unrealistic compared to hard times for starting and running any kind of business. But a rising tide of regulations and directives suggests otherwise. It is no longer enough to repeat the composites help to protect the environment by allowing ground, sea and air vehicles to use fuel more efficiently, helping the utilization of air and other renewable energy sources and increasing the durability (longevity) of various products to be replaced less frequently. The facts that the composite compounds are based on carbon, that are derivatives petroleum, whose production and processing of large amount of energy with industrial emissions of volatile substances and waste materials which are usually difficult to recycle only necessary point to their rational use.
In this work we tried to assess the influences of composite materials and methods for obtaining and processing on the environment ranging from 1 (poor) to 5 (good) using certain assumptions and simplifications. The diversity of products has been

Eco-Ist’12, Ecological Truth, 30 May - 2 June 2012. Hotel “Srbija TIS”, Zajecar, Serbia
230
reduced to one of the most representative form of composite materials: a double-curvature monolithic laminate.[2]
Generally were studied effects on the environment, while the social effects being limited to safety and health at work. The base methodology used was composites life cycle assessment from the materials primary production to the formation of composite products in the factory.[3,4]
Effect occurred during the working life and in post-life disposal, although very important, are not studied. The observed effects are related to the issue of climate change fossil fuel depletion, ozone depletion, toxicity to humans of materials carried in air and water, eco-toxicity, waste disposal, water extraction, acid rain, eutro-phication (over-enrichment of watercourses), smog, minerals extraction and, socially, the exposure of workers
and others to health risks.
EFFECT OF COMPOSITE MATERIALS
ON THE ENVIRONMENT
Composite material is a material that consist of two or more distinct consistuent materials which are bound together to form an integral unit. Composite materials consist of a bulk material called matrix and a filler of some types such as fibers, whiskers or particles. Composites are conventionally classified into three categories-polymer matrix, metal matrix and ceramic matrix, depending on the matrix employed. Effect of composite materials on the environment and health and safety at work are highly dependent of used primary material.[5]
Reinforced plastic are increasingly being used in construction due to their light weight, ease of installation, low maintenance, tailor made properties and corrosion resistance. In the case of glass/polyester item laid up by hand (a combination that still dominates composites usage throughout the world), combination that dominated in the use of composites, polyester has the greatest influence, as 66% of the total influence. Only 6% is the result of fibrous chopped strand mat (CSM). The rest represents gel-coat, cleaning mold based on acetone and effects resulting from open mixing polyester and open roller consolidation. Hand lay-up production worsens the situation because it leads to greater use of resin per volume of fiber. In addition it occurs in the open, allowing the emission.
Subject to required mechanical properties may also be used mineral fillers, to reduce amount of resin required. It was found that calcium carbonate (chalk) has lowered environmental effect compared to alumina trihydrate (ATH). Different matrix systems, such as for example epoxy thermoset or polypropylene thermoplastic, have significantly reduced environmental influence. Lowest effect have a polypropylene and polyester matrix filled with 50% chalk, while highest effect have the epoxy resins and unfilled polyester. Besides adding fillers, the amount of fibers in composites can be increased. Thus increasing the strength of the matrix and reduces the proportion of resin. This may require more advanced process such as resin transfer moulding (RTM). Of the four examined fibers (glass, carbon, hemp and polypropylene), the highest influence have a carbon fiber because of the amount of energy needed for their manufacture. Natural hemp fibers has the smallest influence, but it takes more material to meet actual structural requirements. Polypropylene has a significant effect if we ignore possibility of its recycling. [2,6]

Eco-Ist’12, Ecological Truth, 30 May - 2 June 2012. Hotel “Srbija TIS”, Zajecar, Serbia
231
Another possibility is to use preimpregnated materials, such as sheet moulding compound (SMC), glass mat thermoplastic, long fibre reinforced thermoplastic, a co-mingled glass/PP or a glass or carbon/epoxy prepreg. These materials have a better environmental properties than traditional composites and processes, due to a previous implementation of resin under controlled factory conditions. It is necessary to mention the importance of prepreg production methods, the influence of solvent-impregnated prepregs is by 12% increased compared to that obtained by the hot melt method.
Another useful measure is to reduce the use of resin-rich polyester gel-coat. Besides, application of gel-coat with a brush instead of spraying reduces emissions in the atmosphere up to 60%. These emissions come mainly from styrene, substance that is qualified as a hazardous atmospheric pollutant. This indicates that it is best to adopt closed systems for mixing and molding resins in order to reduce harmful emissions of styrene and other hazardous atmospheric pollutants. In the open mixing effects on the environment can be minimized by using a polyester with low styrene content and adding up to 50% filler. In case of spray-up 1 m2 double-curvature panel, using of controlled spraying, can reduced by 6% emissions into the atmosphere, using a resin with a decrease quantity of styrene for 6% and 31% using 50% calcium carbonate filler. Controlled spraying of gel-coat can help to improve the environment for 1% and 3% if is applied with a brush. Very important is the careful mixing of resins, using the exact quantity of substances in order to reduce health risks. If necessary, eyes, skin and respiratory system should be protected. [7]
Consolidation pre-cure composites also generated emissions. Environmentally most desirable in the consolidation vacuum bags which eliminate atmospheric contamination with minimal energy. The release of agents used in the preparation of the mold is less than 1% of the overall influence. It is best to choose agent that works best and results in minimal waste, with use of personal protection equipment. Cleaning agents of tools and molds (such as acetone) have an effect less than 2%.
In vacuum bagging of wet matrix and fiber, improvements can be achieved by making a similar choice of resin and filling as above. However, the vacuum bag materials and supplies have a negative influence for the about 7% of total influence. Fact can be drastically improved by vacuum bagging prepregs or co-mingled materials rather than the base case: wet polyester matrix and glass fibers. For example, for the double-curvature panel can be provided improvements by 2%, 33% and 52% adoption of carbon/epoxy prepreg, glass/epoxy prepreg or co-mingled glass/polypropylene respectively. If instead of curved panel review sandwich panel, the use of carbon/epoxy has a 56% improvement over the base case glass/polyester
In Table 1 is a summary assessment for the 1 m. 2 the double-curvature panel as
well as individual assessment for the above-mentioned issues of the environment and social (climate change, ozone depletion, human toxicity, water extraction, waste disposal, etc) ranging from 1 to 5. In column social indicators, the risk is balanced by renumeration. From the first row in Table 1 can be seen that the hand lay-up of polyester/ chopped strand mat (CSM) is generally bad from an environmental standpoint. The main risks are the addition of summer smog, human
and eco toxicity. Less important are the risks of fossil fuel depletion and waste disposal.[2]

Eco-Ist’12, Ecological Truth, 30 May - 2 June 2012. Hotel “Srbija TIS”, Zajecar, Serbia
232
Table 1. Assesment table for a 1m2
double-curvature panel, Hand lay-up process
Material choice
Enviromental indicators Social indicators
Sum
mar
y E
nvir
onm
enta
l A
sses
men
t C
limat
e C
hang
e
Foss
il Fu
el D
eple
tion
Ozo
ne
Hum
an T
oxic
ity
Was
te D
ispo
sal
Wat
er E
xtra
ctio
n
Aci
d D
epos
ition
Eco
toxi
city
Eut
roph
icat
ion
Sum
mer
Sm
og
Min
eral
s Ext
ract
ion
Ris
k
Rem
uner
atio
n
CSM/polyester 1 4 3 5 2 3 5 5 2 5 1 4 2 1 Woven glass/ polyester 2 4 4 5 2 3 5 5 3 5 2 3 3 1 Hemp/polyester 2 4 4 5 1 5 5 5 3 5 2 5 3 1 CSM/polyester + 50% CaCO
3filler 4 5 5 5 3 3 5 5 4 5 2 2 2 1
CSM/polyester + 50% ATH filler 3 4 4 5 3 2 5 4 1 5 2 1 2 1 CSM/low styrene polyester 2 4 3 5 1 3 5 5 2 5 3 4 2 1 CSM/low styrene polyester +50% CaCO
3 4 filler 5 5 5 3 3 5 5 4 5 3 2 2 1
CSM/low styrene polyester +50% ATH filler 3 4 4 5 3 2 5 4 1 5 3 1 2 1
CSM/epoxy 3 3 5 5 4 3 1 3 1 3 5 3 2 1 Hemp/low styrene polyester +50% CaCO
3 filler 4 5 5 5 3 5 5 5 4 5 2 4 2 1
Table 2. Assesment table for a 1m2
double-curvature panel, Spray-up process
Material choice
Enviromental indicators Social indicators
Sum
mar
y E
nvir
onm
enta
l A
sses
men
t
Clim
ate
Cha
nge
Foss
il Fu
el D
eple
tion
Ozo
ne
Hum
an T
oxic
ity
Was
te D
ispo
sal
Wat
er E
xtra
ctio
n
Aci
d D
epos
ition
Eco
toxi
city
Eut
roph
icat
ion
Sum
mer
Sm
og
Min
eral
s Ext
ract
ion
Ris
k
Rem
uner
atio
n
CSM/polyester 1 4 3 5 2 3 5 5 2 5 1 4 2 1 Woven glass/ polyester 2 4 4 5 2 3 5 5 3 5 2 3 3 1 Hemp/polyester 2 4 4 5 1 5 5 5 3 5 2 5 3 1 CSM/polyester + 50% CaCO
3filler 4 5 5 5 3 3 5 5 4 5 2 2 2 1
CSM/polyester + 50% ATH filler 3 4 4 5 3 2 5 4 1 5 2 1 2 1 CSM/low styrene polyester 2 4 3 5 1 3 5 5 2 5 3 4 2 1 CSM/low styrene polyester +50% CaCO
3 4 filler 5 5 5 3 3 5 5 4 5 3 2 2 1
CSM/low styrene polyester +50% ATH filler 3 4 4 5 3 2 5 4 1 5 3 1 2 1
CSM/epoxy 3 3 5 5 4 3 1 3 1 3 5 3 2 1 Hemp/low styrene polyester +50% CaCO
3 filler 4 5 5 5 3 5 5 5 4 5 2 4 2 1

Eco-Ist’12, Ecological Truth, 30 May - 2 June 2012. Hotel “Srbija TIS”, Zajecar, Serbia
233
CONCLUSION
This work enables insight options for the use of different materials and processes which are environmentally and social optimal. The life cycle of the composite, since the production of primary materials to the formation of the composite item has assessed. The effect of post-life disposal has not been investigated. The conclusion that imposes is that the resins are environmental unfavorable while fibers are less unfavorable. To obtain a 1 m2 double-curvature panel with spray-up or hand lay-up, resin has the greatest effect on the environment. The reason is that the resins are produced from organic precursors with high energy consumption which causes depletion fossil fuels and further global warming. Accordingly, everything that reduces the resin content, such as the use of fillers or increasing the amount of fibers inside the product, tends to be environmentally acceptable. Treatment of resins is also energy intensive and reduction of these activities is considered positive. Production and processing of fibers has a lower overall negative effect. It should be avoided open mixing, application and curing and use a closed mixing and moulding
instead.
REFERENCES
1. Consise Encyclopedia of Composite Materials, second edition, Elsevier, 2007 2. Marsh G., Reinforced Plastics, 18-26, Elsevier, 2004. 3. Ćosić I., Lazarević M., Šooš Lj., Onderova I., Križan P., Proizvod na kraju
životnog veka-demontaža i reciklaža, Fakultet tehničkih nauka, 2009. 4. Halliwell S., End of Life Options for Composite Waste, best practice guide
(Available online from: http://www.netcomposites.com) 5. Chawla K., Composite materials, Science and Engineering, 2001. 6. Conroy A., Halliwell S., Reynolds T., Composite recycling in the construction
industry, Composites Part A: Applied Science and Manufacturing, 2006. 7. Blackman C.W.jr, Basic Hazardous Waste Management, Lewis Publishers,
2001.

234
XX International Scientific and Professional Meeting
"ECOLOGICAL TRUTH" ECO-IST'12
30 May - 2 June 2012, Hotel “Srbija TIS“, Zajecar, SERBIA
POSSIBILITIES OF USAGE MECHANICAL PROPERTIES OF POLYMER COMPOSITE MATERIALS USING DIFFERENT
RECYCLING METHODS
Ivana Dimic1, J. Petrovic1, M. Stamenovic2*, M. Rakin1, S. Putic
1
1
Karnegijeva 4, 11000 Belgrade, SERBIA University of Belgrade, Faculty of Technology and Metallurgy,
2
Brankova 17, 11000 Belgrade, SERBIA College of vocational studies, Belgrade Polytechnic,
*
ABSTRACT
Composite materials for construction, engineering, and other similar applications are formed by combining two or more materials in such a way that the constituents of the composite materials are still distinguishable, and not fully blended. Because of their inherent nature of heterogeneity, composite materials have not been properly recycled. The current and future waste management and environmental legislations require all engineering materials to be accurately recovered and recycled. Various technologies have been developed: mechanical recycling, thermal recycling, and chemical recycling.
The aim of this paper is to summarize recycling technologies for thermoplastic and thermoset composite materials.
Key word: recycling technologies, thermoplastic composites, thermoset composites
INTRODUCTION
High performance composite materials have few properties that give them an edge over traditional materials: longer life cycles due to high fatigue strength, increased corrosion resistance, improved fire resistance, easier design because of functional integration, possibility of complex shapes and lower weight. Because of that, composite materials are used in a wide range of applications in industries such as automotive, aerospace and construction. They come in a variety of forms. At the cheaper end, polyester resins are combined with short glass fibres and low cost fillers to produce moulding compounds for applications where high mechanical properties are not required. For more demanding uses, continuous carbon fibres and epoxy resins are used for critical applications in the aerospace industry [1]. Although there are many successful uses for composite materials, disposal and recycling at the end of the life cycle is more difficult issue. One such issue concerns end-of-life aircraft structures that contain carbon fiber composites coated with hexavalent chromium primer. These composites that are coated with hexavalent chromium can be classified as hazardous waste and thus may not

Eco-Ist’12, Ecological Truth, 30 May - 2 June 2012. Hotel “Srbija TIS”, Zajecar, Serbia
235
be disposed on land due to possible leaching of the chrome into the ground. Also, weapon systems need to be disposed of in a cost effective, safe and environmentally responsible way. Due to the materials used in these systems, disposal can be very costly [2].
Generally speaking, three types of composite materials are developed and widely used in numerous kinds of engineering applications: polymer–matrix composites (PMC), metal–matrix composites (MMC), and ceramic–matrix composites (CMC). According to the reinforcement types, composite materials can be classified into fibre-reinforced composites, particulate composites, and structural composites. Two types of classifications are illustrated in Fig. 1.[3].
Composite materials, as a special category of engineering materials have not yet been properly recycled (both for the matrix and for the reinforcement materials). This is mainly due to their inherent heterogeneous nature of the matrix and the reinforcement, leading to poor materials recyclability, in particular the thermoset based composites. The current and future waste management and environmental legislations require all engineering materials to be properly recovered and recycled.
a)
b)
Figure 1. Classification of composite materials: (a) Based on matrix materials and (b) based on reinforced materials

Eco-Ist’12, Ecological Truth, 30 May - 2 June 2012. Hotel “Srbija TIS”, Zajecar, Serbia
236
GENERAL RECYCLING SYSTEM
As a general rule for recycling of any engineering materials, each recycling process involves a chain of operations which depends on one another. A failure in any step of this recycling chain implies that the recycling process cannot be completed [3].
Chain operations are: (1) The availability of the composite scrap: this is the source of composites for
recycling, which can originate from EOL postconsumer products – “old scrap”, or can be the production waste during manufacturing process – “new scrap” or “prompt scrap”.
(2) Collection and transport: proper and efficient collection system for “old” and “new scrap”. Collection and transport of EOL consumer products are essential steps in the whole recyclingsystem. Nowadays, the collection of end-of-life vehicles (ELVs) and EOL aircrafts is very well organised. Transportation of these EOL products to the processing facilities may differ depending on the size of the product. ELVs are much more easily transported to the dismantling firms and then further to the shredding plant. However, EOL aircrafts due to their huge size need to be dismantled and cut into smaller sizes for ease of transportation.
(3) Reprocessing – recycling: these can be the application of physical (mechanical), thermal, or chemical technology, depending on the type of the composite materials. This step is the “core” of the chain operation of the recycling system.
(4) Market of the recycled products – recyclates. Market requirements and demand on the quality and price competitiveness compared to the virgin composites are crucial factors, which dictate the whole recycling process.
RECYCLING TECHNOLOGIES
There are essentially four classes of recycling technique which apply to
composite waste in general [4]: Primary recycling – conversion of waste into material having properties
equivalent to those of the original material Secondary recycling - conversion of waste into material having properties
inferior to those of the original material Tertiary recycling - conversion of waste into chemicals and fuel Quaternary recycling - conversion of waste into energy.
RECYCLING OF THERMOPLASTIC MATRIX COMPOSITES
Because of their fundamental ability to be re-shaped upon heating, thermoplastic matrix composites can be recycled directly by re-melting and re-moulding high value materials. Mechanical breakdown into granules for use in the original processing stream is the most obvious technique for recycling fibre reinforced thermoplastics [2]. However, studies have shown that repeated recycling processes often induce degradation of polymeric materials in the form of chain scission (shortening) and

Eco-Ist’12, Ecological Truth, 30 May - 2 June 2012. Hotel “Srbija TIS”, Zajecar, Serbia
237
narrowing of molecular weight distribution. This affects viscosity and mechanical properties. This is mainly due to mechanical shear and grinding, although it seems that incorrect processing parameters (e.g. high temperature) cause more damage than repeated processing at suitable temperatures. These studies show that in a lot of cases recycling is possible without having to accept significant loss in properties [4].
The main technical difficulty for the thermoplastic–matrix composites is its high viscosity of their melts (500–1000 times), which needs high pressure for the impregnation of reinforcement fibres. This leads to expensive product tooling and significant energy input in heating and cooling the tooling. In many application areas the disadvantages have outweighed their advantages and become the obstacles for further market development. However, there are new developments in thermoplastic–matrix composites by using new generation of thermoplastics which can be processed in a water-like low viscous state. Thus much lower pressure and less expensive tooling and lower energy are required [5].
Otheguy et al. [6] have demonstrated the recyclability of thermoplastic-based composites. In particular they have shown that the hull of a rigid inflatable boat, composed of glass/polypropylene laminate along with balsa core material and paint, can be recycled by melt processing into injection mouldable granules which have acceptable properties when processed. Although both balsa and paint have a deleterious effect on moulded strength and elongation-to-break the properties achievable in the compounded granules are well-within the region of commercial interest for reinforced polypropylene moulding materials.
RECYCLING THERMOSET MATRIX COMPOSITES
Most composites use thermosetting resin matrices, which are not easily recycled because they are cross linked and cannot be re-moulded, in contrast to thermoplastics which can be re-melted [2].All 3 types of recycling methods (mechanical, thermal, and chemical recycling methods) have been widely investigated for thermoset matrix composites, and summarised below.
Mechanical recycling
Mechanical recycling process starts with the size reduction of the composite scrap by low speed cutting or crushing (to 50–100 mm). The size is then further reduced down to 10 mm to 50 µm through a hammer mill or other high speed mills for fine grinding. Afterwards the fine particles of the waste composites are classified with cyclones and sieves to fibre-rich (coarser)and matrix-rich (finer) fractions [2]. Palmer et al. [7,8] have investigated of the potential use of recycled glass fibre composite materials as a replacement for virgin reinforcing materials in new thermoset composites. Specifically the closed-loop mechanical recycling of composites used heavily in the automotive sector known as dough and sheet moulding composites were studied. The mechanical recycling process and the collection of useful fibrous grades of recycled materials, recyclate, by a novel air separation technique were developed. The properties of these recyclatefibres were characterised and compared directly with the properties of

Eco-Ist’12, Ecological Truth, 30 May - 2 June 2012. Hotel “Srbija TIS”, Zajecar, Serbia
238
virgin glass fibres. Single fibre tensile tests were employed to compare the strengths of the fibres and single fibre pull-out tests were used to investigate the strength of the interface between the fibres and a polyester matrix. These tests showed the recyclatefibres to be weaker and have a poorer interface with the polyester matrix than the virgin glass fibres. Virgin glass fibres have successfully been replaced by recyclate materials without disrupting standard production techniques and with minimal reduction of the mechanical properties of the resulting composites.
Thermal recycling
Thermal recycling of composites involves the processing at high temperatures. Thermal processing of the composite waste can include 3 types of operations [3]: (1) Incineration or combustion for energy recovery only. (2) Combustion for fibre and filler recycling with energy recovery. (3) Pyrolysis with both fibre and fuel recovery.
Since incineration and combustion for energy recovery do not involve materials recovery, it is not classified as a recycling technology although the inorganic residues after combustion could be potentially used in the cement industry. However, Municipal Solid Waste Incinerators with a certain thermal efficiency are classified as ‘recovery’ installations. This distinction between ‘recycling’ and ‘recovery’ is also made in some of the European recycling directives. Thus there are only two types of thermal recycling methods, where the fluidised-bed recycling process has been mostly studied for both combustion and pyrolysis with promising perspectives.
Fluidised-bed combustion recycling process
Fluidised-bed technology was investigated to recover the glass or carbon fibres, and the organic resins are used as energy source and the combustion heat is recovered through waste-heat recovery system [2,9]. The composite scrap is firstly broken to 25 mm size before feeding into the fluidised-bed reactor operated with a sand-bed and preheated air. The reactor is operated at 450 0C for polyester resin composites and up to 550 0C for epoxy resin composites. The recovered fibres are clean and have a mean length of 6–10 mm. It was found that the recovered glass fibres suffer from 50% tensile strength reduction at 450 0C, while the carbon fibre has less degradation after the thermal treatment at 5500
C (with 20% loss in stiffness).
Pyrolysis recycling process
Pyrolysis is a thermal decomposition of polymers or depolymerisation at high temperatures of 300–800 0C in the absence of oxygen, allowing for the recovery of long, high modulus fibres. A higher temperature of 1000 0C can be applied but the resulting fibre products will be more seriously degraded. It can be used for the treatment of polymers and polymer matrix composites. In the case of polymer–matrix composites, both the reinforcement fibre and the matrix materials (in the form of smaller molecules
Eco-Ist’12, Ecological Truth, 30 May - 2 June 2012. Hotel “Srbija TIS”, Zajecar, Serbia
239
as oil, gas or solid char) are recovered in the pyrolysis process. Control of temperature and residence time in the pyrolysis reactor is important for the complete depolymerisation and cleanness of the recovered fibres [2,10]. Compared to the combustion process where the polymer resins are oxidised to CO2
In practice, the pyrolysis is combined with a combustion process in order to obtain clean fibres. This is in fact a kind of combination of pyrolysis and gasification. However, the high temperature and the oxidation may cause the degradation of the fibre strength. A pyrolysis–gasification process –ReFibre – is developed in Denmark to recycle the glass fibre and recover the thermal energy from end-of-life wind turbine blades.
and water vapour with energy release, the pyrolysis process will break down networked resins into lower molecular weight organic compounds in the form of liquid, gas and solid carbon char product. It generates the products with potential use as feedstock for further chemical processing [2]. This brings advantages over the combustion process with true materials recycling for the matrix polymers. Both glass and carbon fibre reinforced composites can be recycled through pyrolysis. Because of the much higher market value of carbon fibres, pyrolysis recycling of carbon fibre reinforced composites is more economically feasible, which is also the case for other types of recycling processes. The pyrolysis process can be arranged in different types of reactors such as a fixed bed reactor, screw pyrolyser, rotary kiln or fluidised-bed reactor.
Chemical recycling
Chemical recycling involves the process for chemical depolymerisation or
removal of the matrix by using chemical dissolution reagents for liberation of fibres. The chemical recycling process can re-generate both the clean fibres and fillers as well as depolymerised matrix in the form of monomers or petrochemical feedstock. The dissolution process is often called solvolysis, and depending on the solvent can be further classified as: hydrolysis (using water), glycolysis (glycols), and acid digestion (using acid).
When using alcohol or water, high temperature and high pressure are normally used under either sub- or supercritical conditions to gain a faster dissolution and a higher efficiency. For using acid digestion, atmospheric conditions are normally applied but the reaction rate could be very slow. The solvolytic processes such as glycolysis can decompose the epoxy resin into its original monomers to produce a potential chemical feedstock. Supercritical fluids (SCFs), and especially supercritical water (SCW) and supercritical alcohols are also potential media for the recycling of fibres and resin [11]. Using water or alcohol is environmentally relatively clean, and both could be separated from the dissolved solution by using evaporation (for water) and distillation (for alcohol). The process could be used for different types of reinforcement materials (carbon and glass fibres). The re-generated fibre retains most of its mechanical properties. For reaching a higher dissolution efficiency and a faster dissolution rate, an alkaline base is normally used as catalyst (e.g. NaOH and KOH).

Eco-Ist’12, Ecological Truth, 30 May - 2 June 2012. Hotel “Srbija TIS”, Zajecar, Serbia
240
CONCLUSION
Although it may be conceptually less straight forward to recycle thermoset composites than thermoplastics, the common misconception that thermoset composites cannot be recycled, due to the presence of crosslinks, is a myth.
Recently,scientistshave developeda lot ofrecyclingtechnologies, for thermoplastic, and thermoset composite. There is still potential for improved processes and research is ongoing. Appropriate standards for waste categorisation will need to be developed to facilitate the development of supply chains for product containing composite recyclate, as the reliability of supply is critical to product development.
REFERENCES
1. Giulvezan G., Carberry B., Composite Recycling and Disposal An Environmental R&D Issue, Boeing Environmental Technotes, vol. 8, number 4, 2003(Available online from: http://www.boeing.com/companyoffices/doingbiz/environmental/TechNotes.html)
2. Pickering S.J., Recycling technologies for thermoset composite materials-current status, Composites:part A 37 (2006) 1206-1215
3. Yang Y., Boom R., Irion B., Recycling of composite materials, Chemical engineering and processing 51 (2012) 53-6
4. Halliwell S., End of Life Options for Composite Waste, best practice guide (Available online from: http://www.netcomposites.com)
5. Thermoplastic composites explained (Available online from: http://www.eirecomposites.com)
6. Otheguy M.E., Gibson A.G., Robinson M., Recycling of end-of-life thermoplastic composite boats, Plastics, Rubber and Composites 9/10 (38) (2009) 406–411
7. Palmer J., Mechanical recycling of automotive composites for use as reinforcement in thermoset composites. Ph.D. Thesis, University of Exeter, UK (2009)
8. Palmer J., Ghita O.R., Savage L., Evans K.E., Successful closed-loop recycling of thermoset composites, Composites Part A: Applied Science and Manufacturing 40 (4) (2009) 490–498.
9. Yip H.L.H., Pickering S.J., Rudd C.D., Characterisation of carbon fibres recycled from scrap composites using fluidised bed process, Plastics, Rubber and Composites 6 (31) (2002) 278–282
10. Torres A., Marco I., Caballero B.M., Recycling by pyrolysis of thermoset composites: characteristics of the liquid and gaseous fuels obtained, Fuel 79 (2000) 897–902
11. Pinero-Hernanz R., Garsia-Serna J., Dodds C., Chemical recycling of carbon fibrecomposites using alcohols under subcritical and supercritical conditions, Journal of Supercritical Fluids 46 (2008) 83–92

241
XX International Scientific and Professional Meeting
"ECOLOGICAL TRUTH" ECO-IST'12
30 May - 2 June 2012, Hotel “Srbija TIS“, Zajecar, SERBIA
WASTE MANAGEMENT IN THE MUNICIPALITY
OF SREMSKA MITROVICA
Jelena Petrovic1, M. Stamenovic2*, D. Ljubic3, O Jovanovic2, I. Dimic1, D. Brkic
2
1University of Belgrade, Karnegijeva 4, 11000 Belgrade, SERBIA
Faculty of Technology and Metallurgy,
2
Brankova 17, 11000 Belgrade, SERBIA College of vocational studies, Belgrade Polytechnic,
3
Pittsburg State University, Kansas Polymer Research Center, Pittsburg, Kansas, USA
*
ABSTRACT
The situation in respect of waste management in Serbia cannot be described as satisfactory. For this and many other reasons, primarily the health, and the need for improving quality of life, local government municipalities in the regions of Srem and Mačva have launched activities for the organization of waste management in their territory in a modern, sanitary and technically correct manner , in compliance with all environmental requirements and regulations that relate to that. The aim of this paper is to present solutions and defining concrete steps that will lead to the establishment of an integrated waste management system, which involves the selective system of collecting, sorting, recycling and processing of biodegradable waste, and waste treatment system that remains after selection. All this contributes to sustainable development of municipalities in the territory of Srem and Mača, through the development of integrated waste management system that will reduce waste generation and its impact on the environment, ensure sustainable use of resources, ensure the proper final disposal, stimulate investment and exploit the economic potential of waste.
Key words: waste management, municipal waste,
landfill
INTRODUCTION
The problem of waste disposal is still very strong. Bearing in mind that by definition a landfill facility that includes a number of specific requirements, both technical and sanitary, and requirements relating to environment protection, and that the existing waste disposal sites do not have any rough and ancillary facilities and safeguards, it can be concluded that the landfill can be characterized as ordinary dumpsites. Collected waste is without any previous treatment disposed to landfill, and the main problem is the absence of any separation process, and responsible waste management procedures. In addition to municipal waste is disposed of and other wastes such as industrial, hazardous, construction, medical, etc.[1,2]
Eco-Ist’12, Ecological Truth, 30 May - 2 June 2012. Hotel “Srbija TIS”, Zajecar, Serbia
242
Problems in the area of waste treatment arising at his disposal are the following: 1) most of the landfill does not correspond to official regulations that are intended for disposal, 2) existing landfills generally have no zoning, building and occupancy permits, most of them are fullfilled and for closing (age of the landfill is greater than 20 years), 3) for most of the landfill the project documentation was not made or rehabilitation program as well as for successive closing. If there is a program carried on slowly, 4) the landfill does not have the appropriate machinery, 5) in the landfills is not implemented the appropriate technology of disposing, 6) at the landfills is carried waste dispodal which according to national rules and regulations of the EU is not allowed, 7) in landfills do not exists degassing devices and devices for wastewater treatment, 8) the separation of biodegradable waste is not carried out; 9) waste disposing is done without any previous treatment, 10) the existence of closed dumpsites that are not recultivated, 11) separation is not organized for the purpose of evaluation of secondary raw materials; 12) no environmental monitoring.[3] To address the current situation, it is necessary to undertake the following activities at the local level: 1) adopt an action plan for waste management in accordance with the National Strategy and the regulations of the Republic of Serbia, 2) make a program at the local level and waste management companies and establish the mandatory separate collection of waste which can be recycled, 3) establish a system for the disposal of waste from the place of origin to point of disposal, 4) to build a transfer station and the station for the collection of recyclable waste, 5) build a regional landfill, and 6) close and re-cultivated
dumpsites that do not meet environmental standards.
WASTE DISPOSAL IN THE TERRITORY OF SREMSKA MITROVICA City of Sremska Mitrovica is located in northwestern Serbia at contact with three different morphological units: Srem plains, Mačva plains and hills of mountain Fručka Gora. The area of Sremska Mitrovica is 76.153 ha of which 74.1% include agricultural land. The municipality has a population of 85.000 inhabitants or 113 inhabitant/km2
. Total area is located on the 26 settlements associated with 263 km of roads.
Waste collection may in some cases be a very complex problem due to fluctuation in the amount of waste generated over time, easier or more difficult access to locations for waste collection and other features of local character. Population covered by waste collection system by the utility of the small enterprises Sremska Mitrovica was relatively high. The total amount of municipal waste that is collected with utility vehicles in the city of Sremska Mitrovica and surrounding villages during the year is about 56.500 m ³, or about 27.150 t. For this amount should be added the estimated amount of waste that is collected by daily work in the sectors of "Gradsko zalenilo" and "Javna higijena" which range between 5.000-7.000 m ³, or about 3.000 t. The amount of municipal waste from the village in the total amount of collected municipal waste, currently is around 2.400 m ³ or 1.200 t and gradually increases due to the constant inclusion of new beneficiaries. Coverage of the households in the city is 100%, while in rural areas that number is around 15% and
The City landfill is located 8 km south-east of the town of Sremska Mitrovica, the main road from Sremska Mitrovica-Jarak-Šabac. West and south sites of the landfill
is constantly increasing.

Eco-Ist’12, Ecological Truth, 30 May - 2 June 2012. Hotel “Srbija TIS”, Zajecar, Serbia
243
are local roads, while the northern areas are left fallow. The site is located on low ground near the Sava river (1.5 km). Landfill site is characterized by a small hight, i.e. high level of undeground water.
JKP "Komunalije" Sremska Mitrovica is a user of the landfill. Department of City Planning, residential, commercial and public utilities of Sremska Mitrovica is responsible for the landfill and recently issued the permit for the landfill (now it is the responsibility of the province). This landfill received a use permit 2000th year, but only for the period 2000-2001. It works without a license since 2001, but the lack of available alternative landfill, it is still in use.
The landfill is in fact uncontrolled dumpsite without any basic facilities for environmental protection. The current landfill has the following characteristics: 1) presence of the environmental problems in terms of fire, leachate and odor, 2) there is no measuring equipment to control air and water pollution, 3) there is no fence, except at the entrance area of the landfill 4) there is an access road 5) the landfill has no connection to water, electricity and telecomunication services, 6) at the landfill there is no system for collecting leachate, 7) collected waste is not measured (no scales), volume capacity of waste is determined on the basis of capacity of trucks, 8) only equipment at the landfill is working machine, 9) there is security guard service from 7:00 to 15:00 h, 10) in an existing facility at the landfill is scheduled for demolition.
One of the major problems when it comes from waste disposal in the municipality of Sremska Mitrovica is the large number of small illegal dumps that are absolutely inadequate in places and represent a significant risk in terms of environmental protection. In most cases in these landfills, waste represents a heterogeneous mixture of household waste, animal waste and construction waste is mixed with earth.
Great effort of the municipal authorities and the utility company, illegal dumps are located, and each is marked. Individually landfills are measured as well as area, depth and volume of waste. A total of 29 illegal dump sites in the municipality of Sremska Mitrovica are registered. Most of these landfills is re-cultivated, covered with inert material (soil) in a layer 0.3 to 0.5 m. The warning labels on the prohibition of waste disposal and daily guard service are seted on the other landfills that are not yet
The dangers of environmental pollution are from all existing waste disposal in an inadequate manner. Landfill Sremska Mitrovica is located in the floodplains, which are located less than 1km from the river Sava. The Sava river flows from the direction of Sremska Mitrovica to the direction of the village Jarak-Belgrade-Sabac. At the eastern edge of the city's landfill is Mančelov channel, which flows from east to south and empties into the Sava river. This channel is mainly a channel for draining rainwater from the hilly areas in the north. During the spring and fall, the level of discharged water is high, then the highest level of rainfall. The landfill is used at full capacity. Recently, the waste began to be deposited in the fourth cell, because the previous three are maximally filled. The fourth cell is near the Mančelov channel where leachate from the waste directly come to Mančelov channel and then into the Sava River.
covered.
A range of information related to the hydro-geological status of the landfill site exist. Geotechnical analysis of site was made by "Hidrozavod DTD" from Novi Sad in the period April-May 2005.

Eco-Ist’12, Ecological Truth, 30 May - 2 June 2012. Hotel “Srbija TIS”, Zajecar, Serbia
244
Based on these data, the field consists of six different soil types: 1) Mud is located around Mančel channels, as well as in the old pool. The height of this layer is about 0.1-1 m. Physico-chemical properties of this layer are of poor quality, 2) Bar clay is in the old pool. The height of this layer is about 0.3-1 m. Physico-chemical properties of this layer are also of poor quality, 3) Artificial materials are in the area of access road and ancillary facilities. The height of this layer is around 0.2-2 m. In this layer there is a lot of demolition waste and does not meet quality standards, 4) Clay-humus is the area where there is no artificial material. Height is 0.4 to 0.9 m of humus. Clay is a medium hardness, 5) Leskovit clay beneath the humus layer and has a height of 0.7 to 1.4 m. This clay has a low to high elasticity and high hardness, and 6) High plasticity clay is the main part of the entire field. The height of this layer is large, over 20 m in some areas and its located below Leskovit clay and somewhere below the marsh clay. The clay is medium to high elasticity
Groundwater level is very high, close to the surface, throughout the year. During the research period, it amounted to 79.32 m and 76.84 m at least. Since the elevation of the landfill is 78-82 m, groundwater is very high and located on the ground. This high level of groundwater leads to direct contact with the waste at the landfill and groundwater pollution. 12 km downstream of the river Sava is a well for drinking water intervention, for the purposes of Ruma, and there was a well with drinking water to about 6-10 km downstream of the village Jarak.
.
So far, no established system for monitoring water quality in Mančelov channel, and therefore there is no data for the river Sava. The only available data concerning the analysis of water quality (bacteriological and physico-chemical analysis) of sanitary sewage in the urban zone of Sremska Mitrovica, as well as data on water quality of the river Sava, also in the city zone.
Contamination of surface water i.e. the river Sava, it is possible directly and indirectly. The indirect pollution comes from the underground water due to water flowing into the river Sava and by poluttion of Mančelov channel that is connected with the Sava River. At the time of high water inundation occurs river Sava to the landfill, leading to direct pollution, in this way there is no defense, because that part does not have built the dam.
Due to anaerobic conditions in a landfill, results in the formation of landfill gas. The gas goes to the upper layers and is released into the atmosphere. Since contains about 55% methane and 45% carbon dioxide, so that is organic. Because methane has distinct characteristics of greenhouse gas emissions, on its presence contributes to creating the greenhouse effect. On the landfill, because of the landfill gas, there are occasional fires. Concrete pipes were laid for the removal of separated gas, but their number is not sufficient. The presence of unpleasant odors especially during the summer period, and then the appearance of dust in the dry season adversely affect air quality.
Contamination of surrounding soil is closely related to the pollution of groundwater, which are the major cause of polluted soil. There is a protective layer between the landfill and waste land, as well as uncontrolled hazardous waste (oil spills and hazardous chemical substances) worsens the condition of the land.
Based on the above mentioned, and especially because of the water supply system and high groundwater levels, this is a very sensitive location to accommodate the

Eco-Ist’12, Ecological Truth, 30 May - 2 June 2012. Hotel “Srbija TIS”, Zajecar, Serbia
245
landfill, and also not suitable either in terms of environmental protection. Do come to this conclusion in a study and "Vojvodina", prepared by the Department of City Planning of Vojvodina. However, the landfill is already in use, a 1990 this location was chosen as the city dump.[4,5]
SANITARY LANDFILLS AS THE ONLY ACCEPTABLE SOLUTION IN TERMS OF ENVIRONMENT PROTECTION
According to the Waste Management Strategy in the Republic of Serbia
adopted 2003 as the best solution for waste disposal is proposed the formation of regional sanitary landfills including several municipalities.
Municipality of Sabac and Sremska Mitrovica the signing of mutual agreements created Region Waste Management, which has more than 200.000 inhabitants, and thus meet the first and basic condition for the formation of such a region for waste management. This agreement represents a major step toward improving the quality of life of citizens in these regions. The project has two main features: 1) the design of sanitary landfill according to all criteria of national legislation and EU standards, and 2) provides for the technology of recycling center that is accepted as such in the developed countries of Europe and the world, comprising art equipment, quality organization and automatic operation.
Integrated waste management system is based on the analysis, revision and defining the methods and procedures for solid waste treatment, starting from the possibilities for its reduction, by selecting optimal routes for solid waste treatment from the place of its origin to the final for the environment and health of living organisms, harmless disposal.
Regional landfill of municipal waste for the region of Srem and Macva includes two municipalities, Sremska Mitrovica and Sabac. [5,6]The regional landfill is planned at the site of the current landfill Sremska Mitrovica, in the village Jarak. The proposed regional landfill site is located on the 5 km far away from the southeast of the residential part of town and 7 km from the downtown of Sremska Mitrovica. Landfill site is located on the main road Sremska Mitrovica-Jarak-Sabac. From the road to a landfill there is access road for trucks, about 1 km in length. North of the landfill is arable land, while to the east of the landfill is Mančelov channel.
During the geotechnical site analysis, experts from the “Hydrological Institute
From the standpoint of environmental protection, the plan envisages diverting Mančelov channels and raising of dikes. This will remove the potential risks of contamination of channels and thus increasing pollution of the river Sava. Also, in this way eliminates the risk of flooding. Embankments need to protect the landfill from flooding during high water Mančelov channel or the river Sava. Height of fill will be at +81 m, a width of 4 m embankment top (upper surface of the embankment is envisaged to transport vehicles). Dams are designed also in between cells, with a height of 1.4 m
DTD” proposed to completely remove the surface layer of 70-80 cm (mud, marsh clay, synthetic material, and humus). This layer will be filled with quality and cheap sand from the Sava river. Where the groundwater level is too high, it is proposed the first layer of gravel to sand the overhang above.

Eco-Ist’12, Ecological Truth, 30 May - 2 June 2012. Hotel “Srbija TIS”, Zajecar, Serbia
246
and top width of 4m. Mančelov diversion channels increases the surface for extraction and filling.
Purpose of the planned complex is sanitary removal of solid waste by disposal, with the previous application of recycling (separation of recyclables and trash the rest of the bale before disposal to landfill). On the landfill will be disposed only municipal (household) waste. The total area occupied by the future sanitary landfill complex was estimated to be 2.000.000 m², i.e. 20 ha. In the general land use, the landfill complex will be clearly demarcated two areas: 1) work-zone area, which includes all the basic purpose of the operation of sanitary waste disposal, 2) protection zone-which is a protective green belt around the complex and the Sava river embankments.
On the surface of the planned work areas need to place four separate units with individual functions, and four areas with different purpose. These are areas for waste disposal, surface-manipulative plateau with a programming facility for wastewater treatment, surface communications and infrastructure (road surface) and recycling
Dynamic of works will be conducted in two phases. The first phase consists of: a) Mančelov channel relocation and construction of two landfill cells and b) the construction of three additional cells, removing waste from the dumpsite cells currently in use and its disposal in a sanitary cell, construction of transfer stations in Sabac, building a system for landfill and construction of gas supply lines, and separation. The second phase involves the construction of the remaining five cells and dumpsite closing in Sabac.
plateau.
Modern sanitary landfills is a engineering facility where is the final disposal and transformation of waste by it burial or disposal on the surface, in such manner and under such conditions, to the greatest extent possible to eliminate all adverse impacts of waste on the environment in terms of air pollution, water resources and land. Planning, design and operation of landfills involves the application of a large number of scientific, engineering and economic principles.[5,7]
CONCLUSION
A large number of plants built so far in the world and plan point out that the new procedure for removing the waste, after abstracting of quality materials, acceptable from the environmental and economic standpoint, and that would have to be taken into consideration in our cities. The need for efficient development of Serbia, which includes participation in global economic, professional, scientific and environmental flows, requires efficient management of waste. For this purpose it is necessary to involve successful company with many years of experience and excellent expert knowledge in the field of waste treatment. In this way they will get a large mass of useful raw materials. Breast of the total weight of many types of waste have utility value as secondary raw materials. In our country, however, in terms of lack of information producers and outdated technology it is logical that there is no market for other types of waste, everything else is subject to individual cases. By opening markets and customizing the world and other profitable lines will find their place. The economy will

Eco-Ist’12, Ecological Truth, 30 May - 2 June 2012. Hotel “Srbija TIS”, Zajecar, Serbia
247
get a very large momentum, and the environment will be much less vulnerable and better protected. As the above data from this study can be concluded as a result of real insight and analysis carried out for various purposes in order to solve waste management problems, the project of a regional landfill and recycling center for the region of Srem and Macva has all the qualities necessary for successful work, and from the aspect of environmental immeasurable potential. To the end of the projected plans were successfully carried out, it is necessary to follow a responsible advertising and education campaign whose aim must be to increase the level of awareness and involvement of citizens in a system of organized waste collection and recycling.
REFERENCES
1. Tchobanoglous G., Theisen H., Vigil S.A., Integrated Solid Waste Management – Engineering Principles and Management Issues, McGraw-Hill, Inc., New York, 1993.
2. Tchobanoglous G., Kreith F., Handbook of Solid Waste Management, McGraw-Hill, Inc., New York, 2002.
3. Jovanović O., Monitoring i ublažavanje posledica zagađenosti životne sredine (autorizovana predavanja), Viša politehnička škola, Beograd, 2006.
4. Bluewaters, Koncept upravljanja otpadom za Južnu Bačku i Srem, Project Development&Enviromental Engineering, Wien, 2005.
5. Regionalni plan upravljanja otpadom, FTN-EnE Centar, Beograd, 2007. 6. Cvetković S., Regionalna sanitarna deponija i reciklažni centar za region Srema
i Mačve, Integral Cvetković, Beograd, 2004. 7. www.komunalije.co.rs, 2010

248
XX International Scientific and Professional Meeting
"ECOLOGICAL TRUTH" ECO-IST'12
30 May - 2 June 2012, Hotel “Srbija TIS“, Zajecar, SERBIA
INFLUENCE OF ADDITION OF RECYCLED RUBBER TO CONCRETE
ON ITS PHYSICAL-MECHANICAL PROPERTIES
Zoran Grdic1*, G. Toplicic-Curcic1, N. Ristic1, I. Despotovic2
1University of Nis, The Faculty of Civil Engineering and Architecture,
Aleksandra Medvedeva 14 street, 18000 Nis, SERBIA 2University College of Applied Studies in Civil Engineering and Geodesy,
11000 Belgrade, SERBIA
*[email protected] ABSTRACT There is a tendency in contemporary societies to recycle the waste materials to the greatest possible
extent and reuse them. Addition of recycled rubber in production of concrete is important for two facts: direct usage of waste material is important for the environmental aspect while enhancement of physico-mechanical properties of concrete is important for the structural reasons. This paper presents the results of testing the physico-mechanical properties of concrete made with the addition of recycled rubber. Four batches of concrete were produced: a batch of „benchmark“ samples with no rubber added, a batch with the 10% addition of recycled rubber (in respect to the total volume), a batch of samples with the 20% addition of recycled rubber and a batch of samples with the 30% addition of recycled rubber.
Key words: recycled rubber, concrete, mix design, physico-mechanical properties INTRODUCTION Sustainable development is one of the strategic goals of contemporary
economical development. In essence, the concept of sustainable development is based on the effort to harmonize economic development and usage of natural resources and preserve the healthy environment [1]. An important factor in natural conservation is reduction of waste dumps, that is, an effort to reuse the waste material. The primary goal of recycling is protection and conservation of available primary resources, the unrenewable ones, from their further exhaustion.
Waste tires are a specific type of waste generated by all vehicles. Worn off tires are often disposed of in the large piles in the environment. The environment is exposed to long term impacts on its appearance and to the uncontrolled fire risks. Waste tires can be easily collected, processed and recycled. Tires can be an important alternative material in production of certain rubber products, and in generation of power [2]. Large numbers of waste materials or industrial by-products, respectively have been in use in recent concrete technology for many years past. They can be use as

Eco-Ist’12, Ecological Truth, 30 May - 2 June 2012. Hotel “Srbija TIS”, Zajecar, Serbia
249
mineral admixtures or as filler – aggregates, which replace natural stone aggregate partially or on the whole. Waste car tires have become a world-wide environmental problem. Recycling processes make shredded, chipped, granulated, or crumb rubber which has been evaluated for possible replacement of a part of the aggregate in concrete. The concrete prepared with crumb rubber has shown better resistance to cracking, noise reduction, low heat conductivity and flexibility during thermal expansion and contraction due to its ductile behavior. This has been reportedly useful for different applications [3-7].
EXPERIMENTAL RESEARCH
The benchmark concrete was produced with the Portland cement CEM I 42.5 R, whose properties are presented in the table 1. Table 1. Physico-mechanical properties of cement
Property of cement Value
Stetting time, min Start 135 end 160
Mill fineness– sieve residue 0.09 mm 3.2 % Density 3.0 g/cm3 Loose material bulk density 925 kg/m3 Compacted material bulk density 1521 kg/m3 Bending strength after 2 days 5.99 N/mm2 Bending strength after 28 days 7.21 N/mm2 Compressive strength after 2 days 33.67 N/mm2 Compressive strength after 28 days 54.21 N/mm2
For preparation of concrete, the aggregate obtained by mixing three fractions 0/4, 4/8 and 8/16 mm from the river aggregate of the Southern Morava River was used. Granulometric composition of the aggregate is presented in the figure 1.
Figure 1. Granulometric composition of the aggregate

Eco-Ist’12, Ecological Truth, 30 May - 2 June 2012. Hotel “Srbija TIS”, Zajecar, Serbia
250
The recycled rubber used was a fraction 1-4 mm by the „Tigar“ Pirot manufacturer. Particle density and bulk density of rubber aggregate in the loose state were determined according to SRPS B.B8.031:1982 [8] and SRPS B.B8.030:1982 [9] and amounted to 1150 kg/m3 and 480 kg/m3, respectively. Also used was water reducer SIKA 3070. Four mixtures for testing fresh and hardened concrete properties were made. The benchmark mixture was made by the river aggregate, cement, water and water reducer, marked with E. Three mixtures are made, substituting river aggregate for recycled rubber granulate. The aggregate substitution was performed by volume. The mixture marked G10 was made with 10% of rubber substitute, G20 with 20% of rubber substitute and G30 with 30% of rubber substitute instead of the river aggregate. The mixtures were made with the same water /cement ratio ωc = 0.42 and with approximately same consistency of concrete (slump 9-11 cm) which was achieved using Sika 3070 plasticizer. The compositions of the concrete mixtures are given in the table 2. Table 2. Composition of concrete mixtures used in the experiment
Series of specimens
Aggregate Rubber Cement Water Sika 3070 0/4 mm 4/8 mm 8/16 mm 1/4 mm
% kg/m3 % kg/m3 % kg/m3 kg/m3 kg/m3 kg/m3 kg E 45 810 25 450 30 540 - 400 168 3,20
G10 45 638 25 456 30 547 64 405 170 3,65
G20 45 465 25 450 30 540 126 400 168 4,00
G30 45 290 25 456 30 547 189 405 168 4,40 The consistency was measured on the fresh concrete by the slump test
according to SRPS ISO 4109:1997 [10] and the bulk density according to SRPS ISO 6276:1997 [11]. The compressive strength and bulk density of hardened concrete were tested on the cubes with 150 mm sides according to SRPS ISO 4012:2000 [12], and the flexural strength on the prisms with dimensions 100 x 100 x 400 mm according to SRPS ISO 4013:2000 [13]. The tests of determining the rebound number using rebound hammer according to SRPS U.M1.041:1998 [14] and the ultrasonic pulse velocity according to SRPS U.M1.042:1998 [15] were performed on the cubes having 150 mm sides.
RESULTS OF EXPERIMENTAL RESEARCH
The tests results of fresh and hardened concrete are presented in the tables 3, 4, 5 and figures 2, 3 and 4. Table 3. Characteristics of concrete in fresh state
Series of specimen Density [kg/m3] Slump class Air content
[%] E 2375 S3 (11,0 cm) 3,1
G10 2285 S3 (10,0 cm) 3,5 G20 2155 S2 (9,0 cm) 5,2 G30 2060 S3 (10 cm) 7,2

Eco-Ist’12, Ecological Truth, 30 May - 2 June 2012. Hotel “Srbija TIS”, Zajecar, Serbia
251
Table 4. Characteristics of concrete in hardened state
Series of specimen
Age of specimens
Density. [kg/m3]
Compressive strength [MPa]
Flexural strength [MPa]
Rebound number
Ultrasonic pulse
velocity [m/s]
E 2 days 2370 31,45 4,05 - - 7 days 2372 52,23 5,85 - - 28 days 2370 62,89 6,48 48,23 4733
G10 2 days 2264 23,45 3,62 - - 7 days 2271 33,11 4,92 - - 28 days 2260 40,22 5,18 44,47 4479
G20 2 days 2136 14,45 2,92 - - 7 days 2140 19,78 3,87 - - 28 days 2145 25,22 4,25 38,31 4073
G30 2 days 2055 9,34 1,75 - - 7 days 2060 15,11 2,58 - - 28 days 2057 18,56 2,90 34,72 3726
Figure 2. Compressive strength in the function of concrete age

Eco-Ist’12, Ecological Truth, 30 May - 2 June 2012. Hotel “Srbija TIS”, Zajecar, Serbia
252
Figure 3. Flexural strength in the function of concrete age
Figure 4. Ultrasonic pulse velocity in m/s (left) and rebound number obtained
by using rebound hammer (right)
DISCUSSION OF RESULTS AND CONCLUSION
Based on the test results presented in the previous chapter, it can be concluded that substitution of river aggregate for the recycled rubber granulate in concrete brings about significant changes of its performances in fresh and hardened state. It can be observed in fresh concretes that with the increase of content of recycled rubber, the density decreases, in the range 90 do 315 kg/m3. Also, with the increase of the content of rubber aggregate, the content of entrained air in concrete also increases, and it was necessary to add plasticizer in order to maintain the consistency in the range 9-11 cm.

Eco-Ist’12, Ecological Truth, 30 May - 2 June 2012. Hotel “Srbija TIS”, Zajecar, Serbia
253
The observed decrease of density of hardened concrete with the increase of rubber granulate content, on the same order of magnitude as in the fresh concrete was logical. Compressive and flexural strengths decrease to a great extent as the quantity of rubber granulate increases, at various age of concrete samples, figures 2 and 3. The compressive strength decrease of 28 days old samples made with 10% of recycled rubber in comparison to the benchmark concrete is 36%, while in those samples made with 20% and 30% of recycled rubber, the decrease of compressive strength is 60% and 70%. The tensile strength decrease tested by bending of 28 days old samples made with 10%, 20% and 30% of recycled rubber in comparison to the benchmark concrete is 20%, 34% and 55% respectively. As for the tests of ultrasonic wave propagation through the concrete, on the basis of obtained results it could be observed that wave velocity in concrete decreases with the increase amount of recycled rubber granulate in concrete, figure 4 left. Therefore, reduction of wave velocity through concrete comprising 10% of rubber aggregate in comparison to the benchmark concrete is 5,37%, while for concretes comprising 20% and 30% of rubber aggregate this reduction is 13,94% i.e. 21,28%. This demonstrates that rubber granules in concrete are weak spots in its structure, and in this way they do not contribute to increase of mechanical characteristics of concrete, as it was directly demonstrated by the compressive strength and tensile strength testing results.
Surface hardness test by the rebounding hammer testes exhibited similar results as the previously mentioned tests, figure 4 right. The value of rebound is reduced with the increase of the content of rubber aggregate in concrete, whereby it must be taken into account that rubber in the hardened concrete, to a certain extent dampens the blows of the hammer, and reduces its rebound. In figure 5 is displayed the crack surface exposed when concrete samples with various contents of recycled rubber aggregate are tested to bending until failure.
Figure 5. Concrete samples crack surface at bending a) benchmark concrete,
b) concrete with 10% , c) 20% and d) 30% of rubber granulate
Acknowledgements
The work reported in this paper is a part of the investigation within the research project TR 36017 "Utilization of by-products and recycled waste materials in concrete composites in the scope of sustainable construction development in Serbia: investigation and environmental assessment of possible applications", supported by the Ministry for Science and Technology, Republic of Serbia. This support is gratefully acknowledged.

Eco-Ist’12, Ecological Truth, 30 May - 2 June 2012. Hotel “Srbija TIS”, Zajecar, Serbia
254
REFERENCES
1. Parris T. M., Kates R. W.: Characterizing and Measuring Sustainable Development, Annual Reviews of Environment and Resources 28 (2003): 559–86.
2. Stanojevic D., Rajkovic M., Toškovic D.: Management of used tyres, accomplishments in the world, and situation in Serbia, Chemical Industry 65 (6) 727–738 (2011)
3. Eldin, N.N., Senouci, A.B.: Rubber-Tire Particles as Concrete aggregate, Journal of Materials in Civil Engineering, Vol.5, 1993, pp. 478-496. (1993).
4. Jevtić D., Zakić D., Savić A.: Investigation of cement based composites made with recycled rubber aggregate, Chemical Industry , 2012 OnLine-First (00):10-10
5. Lee, H.S., Lee, H., Moon, J.S., Jung, H.W. Development of Tire –Added Latex Concrete. ACI Materials Journal, Vol.95, 1998, no.4, pp. 356–364. (1998).
6. Siddique R., Waste Materials and By-Products in Concrete, Scrap Tires, Chapter 4, Springer; 1st. ed., 2007, pp. 121-145.
7. Šušteršič J., Zajc A., Ercegovič R.: Achievement of special properties of concrete with waste materials, International Conference “Waste Management, Environmental Geotechnology and Global Sustainable Development (ICWMEGGSD'07 - GzO'07)” Ljubljana, Slovenia, August 28. - 30., 2007
8. SRPS B.B8.031:1982 “Crushed aggregate - Determination of particle density and water absorption”
9. SRPS B.B8.030:1982 “Mineral aggregate - Determination of unit weight” 10. SRPS ISO 4109:1997 “Fresh concrete - Determination of the consistency -
Slump test” 11. SRPS ISO 6276:1997 „Concrete, compacted fresh - Determination of density“ 12. SRPS ISO 4012:2000 “Concrete - Determination of compressive strength of test
specimens” 13. SRPS ISO 4013:2000 “Concrete - Determination of flexural strength of test
specimens” 14. SRPS U.M1.041:1998 “Concrete, hardned - Determination of rebound number
using rebound hammer” 15. SRPS U.M1.042:1998 “Concrete, hardened - Determination of ultrasonic pulse
velocity”

255
XX International Scientific and Professional Meeting
"ECOLOGICAL TRUTH" ECO-IST'12
30 May - 2 June 2012, Hotel “Srbija TIS“, Zajecar, SERBIA
PUBLIC PARTICIPATION IN THE PROJECT OF RECONSTRUCTION AND BUILDING A NEW SMELTER AND SULFURIC ACID PLANT IN RTB BOR
Dragana Randjelovic1, I. Pacic2, D. Randjelovic3, T. Marjanovic
3
1University of Belgrade, Faculty of Mining and Geology, Belgrade, SERBIA 2RTB Bor, Bor, SERBIA
3Association of young researchers, Bor, SERBIA
ABSTRACT
This paper analyzes the structure, form, effects and importance of public participation process in
the reconstruction project of building a new smelter and sulfuric acid plant RTB Bor, which is conducted under the propositions of international investors. Public consultation and participation processes include environmental, economic and social aspects, and therefore this paper propose specific measures and recommendations for their improvement during project execution.
Key words: public participation, reconstruction project of building a new smelter and sulfuric acid plant RTB Bor, stakeholder analysis
INTRODUCTION The most important international document that allows public to participate in
drafting of plans, programs and policies relating to the environment is the Aarhus Convention [1]. The Convention obliges the countries that have ratified it ( Serbia did it in 2009.) to make available information relevant to environment, to enable the general public to participate in decision making and to provide adequate legal protection to citizens in case of violation of these rights.
I
Public participation in Environmental Impact Assessment of various projects is regulated by law in Serbia [2] and refers to the environmental aspects of the project, without taking into account the social and economic impact of the project.
n practice, only a few investors in Serbia take actions beyond legally required for make the public familiar with the details of the planned or implemented projects and to find out public opinion. As a fact of not considering the public opinion in environmental impact studies as a priority, the institutions responsible for the preparation of studies rarely obtain time and financial resources necessary to inform the domestic public adequately.

Eco-Ist’12, Ecological Truth, 30 May - 2 June 2012. Hotel “Srbija TIS”, Zajecar, Serbia
256
Consultation and public participation process does not happen for the first time in Bor since the public already had the opportunity to be involved in creating the vision of community and environmental priorities within the process of creating and adopting the Local Environmental Action Plan (LEAP) [3]. This process has began in 2001. and resulted in the adoption of this plan in the Assembly in 2003. During that time, an extensive media campaign aimed at informing the public about the need and the creation of environmental action plan in the local community has been organized. Suggestions and priorities expressed through appropriate survey that accompanied the process of preparing the plan, were provided from 2% of adult residents of Bor. Interested citizens had the opportunity to participate and exhibit conferences, events and public debates that accompanied this process. Meaningful public participation in the LEAP in Bor is noted as an example of good practice of involving the public in the National Profile for Implementation of the Aarhus Convention, prepared by Department of Environmental Protection at the Ministry of Environmental in 2005.
In between 2003 and 2010 a series of thematic seminars were held in the municipality of Bor related to the program and method of application of the Aarhus Convention and public participation through plans, programs and policies relating to the environment (the organization of local environmental NGO "Association of young researchers of Bor"). Round table was organized on which stakeholders discussed and the public gave their views, suggestions and amendments
to the first National Report on Implementation of the Aarhus Convention in Serbia (the NGO Eco-Forum and the OSCE mission in Serbia).
PUBLIC PARTICIPATION PROCESS ON THE
OF BOR COPPER SMELTER RECONSTRUCTION AND CONSTRUCTION OF NEW SULPHURIC ACID PLANT PROJECT
Project of the copper smelter reconstruction and the construction of the new sulfuric acid plant has a great ecological and socio-economic impact on the environment of RTB Bor, and hence it was necessary to establish and implement effective public consultation plan.
Public participation in Environmental Impact Assessment of the Project [5] is conducted according to the recommendations of the World Bank [9] and the Canadian Export Development Fund for EDC that is the creditor of the project. Public consultation in this Assessment consider not only environmental, but also social and economic impacts of the project, which actually covers key aspects of sustainable development in the community that is mostly influenced by this project. Additionally, public consultation process is foreseen in all project phases through various forms.
Primary consultative process objectives are defined as: introduction of environmental, economical and social aspects of Project to the interested public; and ensuring public involvement in decision making, gather public opinion, review, view on the current phase of the project and expectations for the future.
Secondary objectives of the consultative process are defined as: improving project planning in order to avoid conflict and prevent delays in implementation; summarizing of public attitudes about the project or project components; obtaining

Eco-Ist’12, Ecological Truth, 30 May - 2 June 2012. Hotel “Srbija TIS”, Zajecar, Serbia
257
information on needs and priorities of the public; facilitation of transparency in all activities; providing structured schedule of activities, dates and location for various activities related to public participation; and develop a stakeholder engagement program, which defines the form of stakeholder participation during the entire project.
In order to achieve defined objectives, identification of stakeholders and interested parties in the project was made in early stage of the project in the way required by the World Bank (Figure 1). Communication methods for each group were also additionally developed.
Basic public informing methods on this project are defined as: written and electronic media, press conferences, and so-called Open House Day (a day in the week when interested public is enabled to receive information of certain facilities or impacts of the project from relevant persons in the Company).
To ensure the public influence to the content of Environmental Impact Assessment of the Project, but also on the Project phases, a mechanism for public complaints and appeals has been developed, including: regular phone line or number where people can submit oral questions, suggestions and complaints, as well as the electronic form for submitting complaints for the project team. The way of forwarding complaints and the time within which to consider the objections has been defined.
The fact that socio-economic aspects are included in consultation process has enabled allocation of additional stakeholders with an expressed interest for project monitoring (this is the case with Technical secondary school in Bor, where training for handling the new technologies derived within project is planned). In the case of only environmental aspect consideration (as required by national law), this group of stakeholders would probably have less interest to be actively involved in the whole process.
Figure 1. Stakeholder groups defined by World Bank criteria
Checking up of the established stakeholder groups and updating the list of stakeholders was scheduled during the entire project duration. Experiences with

Eco-Ist’12, Ecological Truth, 30 May - 2 June 2012. Hotel “Srbija TIS”, Zajecar, Serbia
258
international projects of similar type have showed that three types of potential interest to the public can be identified during this process [7]:
- interested public that has already been identified as a stakeholder - interested public who will be identified during project
- interested public who will be identified after the project completion
First two groups can be identified by comparison of existing list of identified stakeholders, the list of participants at public consultations, the list of visitors during the Open House Days, complainant register and applicants in oral, written or electronic form. So far, during the Open House Day, public consultation process has included new non-governmental organizations, local communities and others.
Specific stakeholders can also be classified as a more or less interested and more or less active (participating in discussions, make suggestions and complains) or passive, which makes it possible to perform correction of communication method for those groups. For example, during the consultative meeting with stakeholder representatives absence of primary schools as primary educational institutions was noted, which inevitably indicates the need to develop stronger communications with these institutions.
Consultation activities related to the Bor copper smelter reconstruction and construction of new sulphuric acid plant project and it`s Assessment study have started in May 2010. For this purpose 6 groups of stakeholders have been allocated and six consultative meetings with stakeholders were held so far. The final meeting of the consultative process was held in October 2010. The representatives of all interested parties and representatives of the Canadian EDC fund as creditors were presented. The meeting was attended by 52 registered participants from majority of the identified groups.
Conclusion of this meeting was that the public consultation process was successful and that the stakeholders reached consensus in terms of supporting this project, which they perceive as the possibility of reviving production, employment growth and living standard in the community, and as providing the better environmental quality with positive effect on the local population`s health. Evaluation of creditors was that the investor, RTB Bor, achieved transparency of its operations with public consultation process during this project phase.
Further plan is to organize at least 5 public consultation during the project cycle that are related to the main phase of the project (demolition of old facilities, planning new construction process) over the next three years and to use previously created plans and mechanisms of the public involvement process that began in the preparatory phase of the Project (Figure 2). During the project realization, public involvement will be determined by stakeholder engagement program, which is developed within the RTB Bor company. Mechanism for addressing different public suggestions or complaints during project duration is also defined with a procedure and a dedicated form.

Eco-Ist’12, Ecological Truth, 30 May - 2 June 2012. Hotel “Srbija TIS”, Zajecar, Serbia
259
Figure 2. Consultation activities during main project phases
The effect of public participation in this project will be evaluated by combined quantitative-qualitative methods, such as: range of included stakeholders, number of raised questions, number of submitted proposals for the improvement, number of appeals, number of accepted suggestions, proposals and complaints, level of expressed support to the project in the local community, number of published articles in local, regional and national publications on this topic. In order to be defined more precisely, the effect of public involvement degree should be compared with similar projects and examples of good practice for public participation defined in operating manuals of the World Bank.

Eco-Ist’12, Ecological Truth, 30 May - 2 June 2012. Hotel “Srbija TIS”, Zajecar, Serbia
260
PREVIOUS EXPERIENCES WITH OPEN HOUSE DAY
Pursuant to the public consultation plan [7], which was conceived by RTB Bor and became a part of business practices of the company, the first Open House Day was held at the beginning of the project in the end of year 2010. This direct method of informing the public about the project progress was continued on the monthly bases at the premises of the Smelter and Refinery plant. The average number of participants at each Open House meeting was 11 and the number of oral questions was 5. So far, consultative meetings have showed that the general public was concerned with the activities within the running Project – either as the ones directly affected by the activities at a current stage of the project or as a group that would be indirectly involved in the future.
During consultative process, the original structure of the stakeholders underwent some changes - including new interest groups or the previously identified stakeholders that have been activated or passivated. The leading interest is so far expressed by the civil-sector associations that actively operate in the city of Bor and are basically dealing with environmental issues. In addition to previously identified stakeholders from civil sector, the interest for the project activities and their outcomes is showed by non-governmental organizations like the association of beekeepers "Albina", "Ecological Movement of Bor" and others. Civil organizations contributed to take into account the view of the local population, promoted community participation and introduced more innovative approaches, so the investor (RTB Bor) is being encouraged to pay special attention to these groups in the future [9]. Unlike previous meetings, Open House Day enabled a significant participation of trade unions, especially the Trade Union "Independence", either through active participation in the consultation process or through attachment of written comments and suggestions. The presence of urban and rural local community’s inhabitants who were not previously included in the existing list of stakeholders was observed. Together with the former workers and environmental protection activists, this group frequently visits the meetings as the project progresses. As the project processes and information are being presented, public interest for socio-economic effects increases, especially among active job seekers, who see their opportunity for employment during construction phases or after project completion, in reconstructed facilities. Expressed interest of public during the consultation process can be observed through different
aspects. Specifically, each of the aspects - environmental, economic and social has been recognized within different groups of stakeholders (Table 1).

Eco-Ist’12, Ecological Truth, 30 May - 2 June 2012. Hotel “Srbija TIS”, Zajecar, Serbia
261
Table 1. Main stakeholders and their interests during planning project phase Aspect of project
influence
Environmental
Economical
Social
Main
stakeholder groups
• Environmental societies active in Bor
• Local community of the village
• Association of Entrepreneurs
• Citizens groups • Active job seekers • NGO representatives
Project`s areas of interests
and raised questions
- negative environmental impact of future smelter plant - methods for estimation of airpollution and expanding of existing air quality monitoring sistem in the city - Accidental responding plan, noise protection plan, etc. -analyses of soil, groundwater and food heavy metal content in surrounding villages before starting the New smelter plant; evaluation of `zero state`of the environment
- layot, capacity and location of sewage sludge landfill, modes of tr ansport of sewage sludge to the treatment plant
- exploitation of existing flotation tailings within the period of project duration - compliance with EU regulations on labor and environmental protection, completion date for project documentation delivery - model for biodiversity monitoring in Bor region
-participation of local companies as contractors on building the new facilities -rural and agricultural development in Bor surrounding -economic aspect of new copper gaining technology, sulfuric acid future market
-education and training of employees who will operate with new technologies -hiring new employees, staff reception plan -opinion that RTB Bor should ask that special educational program, open for public comments, from SNC Lavalin should become integral part of mutual contract between these two companies -staff recruiting for 2011. and training plan for mastering the new technologies - current staff structure, training programs and interships abroad
NGO representatives stressed out that the monthly overview of the activities through the "Open House Day" is of great importance and that possibility for giving comments and suggestions and receiving objective and prompt answers is effective way of approaching the project to the public.
Eco-Ist’12, Ecological Truth, 30 May - 2 June 2012. Hotel “Srbija TIS”, Zajecar, Serbia
262
CONCLUSION
Public consultations within impact of reconstruction of smelter and sulfuric acid plant Project are carried out in accordance with domestic laws, international directives and investor`s (World Bank and Canadian EDC bank) regulations, including the environmental, social and economic aspects of project impact on the community. It is the first project to be carried out by these principles in RTB Bor company, who so far hasn`t had the practice of public participation beyond the prescribed national framework. Organization of broad public consultation process has contributed to the democratization of public life in Bor municipality, as it has enabled inclusion of large number of stakeholders (especially NGOs and surrounding local communities) through their involvement in decision-making process.
Project implementation, with it`s highly distinctive environmental component, has provided the conditions for solving Bor`s largest environmental problems, which has, alltogether with continoual media support, contributed to a raising environmental awernes of people in Bor. Knowledge about unbreakable connection between environmental, economic and social aspects is also increasing. This should, in turn, facilitate a creation of strategic documents on Bor development ( Spatial plans of Bor and Majdanpek mining basins, improvement of LEAP document etc.), sanitation of environmental consequences derived from century-long mining in this area, acceleration of the planned projects implementation and ensuring their continued funding with development of new organizational forms that are necessary for their implementation.
Review and analysis of previous public consultation content and dynamic have showed that the initial public focus on environmental issues is gradually moving towards economic and social aspects, both through changes in stakeholders structure and issues raised on Open House Days. For these reasons, the following measures and recommendations for public consultation and participation proces during Project implementation are proposed [7]:
1. Concerning the fact that public participation process includes also social and
economic aspects, it is necessary to encourage and involve more institutions and NGOs dealing with social and economic issues in Bor municipality;
2. Since it is anticipated that public consultation process takes place through all project phases, it is necessary to timely plan and inplement additional consultative meetings in following project stages, taking into account new stakeholders and new facilities of public interest, to persistently continue to organize Open House Days, and to eventually introduce new forms of public information and consultation (such as ICT technologies);
3. In public participation analyses it is necessary to take into account degree of materials dissemination to interested parties (non-technical summary of the project impact studies, a brief and simplified presentation of project and new technologies within it, with the implications on environment, health and socio-economic issues) and to use appropriate methodologies and experiences from similar project around the world for analyzing the public impact on modifications in project, or particular segment in a project;

Eco-Ist’12, Ecological Truth, 30 May - 2 June 2012. Hotel “Srbija TIS”, Zajecar, Serbia
263
4. Due to the fact that RTB Bor represents largest industrial complex in Bor region and that all of it`s activities have economic, social and environmental consequences on the immediate surroundings, experiences of public participation process in reconstruction of smelter and sulfuric acid plant Project should be constantly improved and used in the implementation of future projects that are of community interest, in a way that includes covering of all aspects of sustainable development within a project realization process. REFERENCES
1. Convention on Access to Information, Public Participation in Decision-Making and Access to Justice in Environmental Matters, UN ECE, Fourth Ministerial Conference ''Environment for Europe'', Aarhus, Denmark, 23-25 June 1998
2. Zakon o proceni uticaja na životnu sredinu, Službeni glasnik RS, 135/04 3. Marjanović, T.,Trumić, M., Marković, Lj. (urednik), The Local Environmental
Action Programme for Bor, 2003, Građanski forum, Bor 4. Marjanović, T., Ranđelović, D., Projektne osnove učešća javnosti u donošenju
lokalnih ekoloških akcionih planova, Društvo mladih istraživača – Ekološki klub, Bor, 2002., http://www.mibor.rs/st/ekobor1_6.html#01
5. Environmental impact assessment New Smelter and Sulphuric Acid Plant, Volume 1-Main Report, http://www.rtb.rs/media/dokumenti/nt/EIA_Volume_1.pdf , april 2012.
6. Plan for EIA publik consultation – key stakeholders&general public, http://www.rtb.rs/media/dokumenti/nt/Plan_Public%20Consultation%20final.pdf , 2012.
7. Ranđelović, D.: Dnevnik stručne prakse Master studija (Modul Upravljanje projektima), Fakultet organizacionih nauka Univerziteta u Beogradu, Rudarsko-topioničarski basen Bor, 2010.
8. Public Consultation and Disclosure Report 9. Operational Manual OP 4.01 Environmental Assessment
10. Stakeholder Engagement: A Good Practice Handbook for Companies Doing Business in Emerging Markets

264
XX International Scientific and Professional Meeting
"ECOLOGICAL TRUTH" ECO-IST'12
30 May - 2 June 2012, Hotel “Srbija TIS“, Zajecar, SERBIA
MODELING OF POLLUTANTS AT THE LANDFILL WASTE
Sonja Stefanov1, R. Biocanin
2
1University of Novi Sad, Faculty of Technical Sciences, SERBIA 2
University of Novi Pazar, SERBIA
ABSTRACT
Paper presents modelling of pollutants at the landfill waste. Uncontrolled fire on landfill where are tyre produce a lot of smoke and air pollutants, including benzene and polycyclic aromatic hydrocarbons (PAH). Great heat leads to the generation of pyrolytic oil which, when mixed with the fire extinguishing agent, contaminates the surrounding soil, surface water and underground water. Paper analyzes and presents in particular the emission factors of incomplete burning of waste car tyres. Metal dust emissions have been presented, volatile organic compund (VOC) emissions, slightly volatile organic compound (SVOC) emissions and emissions of polycyclic aromatic hydrocarbons (PAH). Evaluation of the effect on the air quality has been graphically presented by modelling of uncotrolled tyre burning by using EPA "SCREEN 3 MODEL".
Key words: waste, modeling, pollutants, landfill, air, tyre, emissions
INTRODUCTION
Tires are a mixture consisting of vulcanized or cross-linked polymers, carbon black, dispersed oil, sulphur, synthetic fibres, pigments, chemical additives and steel or fibreglass. Tire manufacturers use various formulation recipes for the production (Table 1). Table 1. Typical composition of tires for the motor vehicles
Material Content, % Styrene butadiene 46.78
Carbon black 45.49 Aromatic oil 1.74 Zinc oxide 1.40 Stearic acid 0.94
Antioxidant 6C 1.40 Wax 0.23
Sulphur 1.17 Accelerator CZ 0.75
Tire is a very flammable material. Even when densely packed, there could be
sufficient oxygen to make burning possible. Tire fires are most frequently started as deliberate, malicious acts, and they produce a great amount of heat, due to which it is

Eco-Ist’12, Ecological Truth, 30 May - 2 June 2012. Hotel “Srbija TIS”, Zajecar, Serbia
265
very difficult to access the fire and extinguish it. The released heat energy from tire burning is extremely high 37600 kJ kg-1 compared to coal, which is 27200 kJ kg-1.
There are examples of some tire fires that lasted for months, even in the developed countries that have the means and equipment to put them out. For instance, the Rhinehart car tire fire in Winchester, Virginia, lasted almost nine months and the smoke plume was 100 m high and spread 80 km, causing pollution in three states (www.basel.int/meetings/oeng6/docs/oewg6_into6.pdf) . This uncontrolled tire fire produced a lot of smoke and toxic air pollutants, including benzene and polycyclic aromatic hydrocarbons (PAH).
Figure 1. Pojar the landfill of waste tires
MATERIALS AND METHODS
In our country, there had been no thorough researches that deal with this
extremely important environmental issue of incomplete waste combustion, due to which we had to refer to foreign literature. In this manner, we are also drawing attention to the necessity of an urgent introduction of waste treatment without burning, and particularly to the catastrophic environmental consequences that uncontrolled and frequent waste burning at illegal and other dumping places may have. In literature documents, (E.Holzbecher et al. 2007) and (R. Brady Williamson et al. 1994), have published two papers about emission factors for incomplete combustion of waste that includes waste tires as well.The basis for the determination of the stated emission factors is the paper used by U.S.EPA, 1989(EPA-600/2-89-054). Data from the stated literature are presented in a more detailed way in the following tables (Table 2. Metal dust emission during car tire burning): Table 2. Metal dust emission during car tire burning
Pollutant mg kg-1 of tire Pollutant mg kg-1 of tire Aluminium 3.07 Iron 11.8 Antimony 2.94 Lead 0.34 Arsenic 0.05 Magnesium 1.04 Barium 1.46 Nickel 2.37 Calcium 7.15 Selenium 0.06 Chrome 1.97 Silicon 41.0 Copper 0.31 Sodium 7.68 TOTAL 81.24

Eco-Ist’12, Ecological Truth, 30 May - 2 June 2012. Hotel “Srbija TIS”, Zajecar, Serbia
266
Additional researches have been conducted and published in book (Lemieux PM,1993), from which we are presenting the following emission factors of a certain toxic matter separately in mg per kg of burnt tire (Table 3.) Emissions of VOC and SVOC, during uncontrolled car tire burning are shown in Table 4. Polycyclic aromatic hydrocarbon (PAH) emissions during uncontrolled car tire burning). Table 3. Emissions of VOC and SVOC during uncontrolled car tire burning
Class Compound Emission (mg kg-1) Compound Emission
(mg kg-1) VOCs
SVOCs Benzaldehyde 314.4 Ethynylbenzene 160.75 Benzen 2180.5 Ethynyl,methylbenzene 394.65 Benzodiazine 15.55 Isocyanobenzene 318.55 Benzofuran 12.55 Limonene 460.0 Benzothiophene 20.5 Toluene 1367.7 Butadiene 234.6 Methylindene 228.25 Dihydroindene 41.7 Methylthiophene 9.05 Xylenes 928.95 Methyl,ethenylbenzene 66.15 Dimethylhexadiene 59.6 Methyl,methylethenylbenzene 390.75 Dimethyl,methylpropyl benzene 7.45 Methyl,methylethylbenzene 197.45
Dimethyldihydroindene 19.85 Methyl,propylbenzene 20.8 Ethenylbenzene 776.6 Ethyleneindene 41.45 Ethenylcyclohexene 66.90 Methylethylbenzene 152.15 Ethenyl,dimethylbenzene 15.45 Propylbenzene 78.3 Ethenyl,methylbenzene 16.8 Styrene 652.7 Ethenyldimethylcyclohexene 175.2 Tetramethylbenzene 127.85
Ethenylmethylbenzene 131.25 Thiophene 41.25 Ethylbenzene 377.95 Trimethylbenzene 60.90 Ethyl,methylbenzene 405.15 TOTAL 10569.7
Compound Emission (mg kg-1) Compound Emission
(mg kg-1) 1-Methylnaphthalene 279.15 Ethyl,dimethylbenzene 136.2 1,10-Biphenyl,methyl 5.55 Hexahydroazepinone 411.8 2-Methylnaphthalene 389.95 Indene 421.3 Benzisothiazole 86.95 Isocyanonaphthalene 4.7 Benzo[b ]thiophene 22.1 Methylbenzaldehyde 43.3 Biphenyl 269.8 Phenol 533.05 Cyanobenzene 370.25 Propenylnaphthalene 11.75 Dimethylbenzene 620.05 Propenyl,methylbenzene 261.8 Dimethylnaphthalene 109.6 Trimethylnaphthalene 157.9 TOTAL 4135.2

Eco-Ist’12, Ecological Truth, 30 May - 2 June 2012. Hotel “Srbija TIS”, Zajecar, Serbia
267
Table 4. Polycyclic aromatic hydrocarbon (PAH) emissions during uncontrolled car tire burning
As it can be seen in the tables above, emitted quantities of toxic matter depend
on the quantity of burnt tire. Based on the existing experience, we believe that a burning tire heap is practically impossible to put out. Emission analysis of the products of waste or recycled tire burning, if they are in one heap, would show environmentally unacceptable results.
That is why additional protection measures have to be taken, that the tires are disposed in smaller heaps, which are sufficiently distanced from one another, but also with a limited height, so that transfer of fire from one heap to another would not occur. The following table (Table 5. Minimum distance between tire heaps disposed in a safe manner) presents the example of minimum distance between the heaps disposed in a safe manner, not permitting fire transfer.
Table 5. Minimum distance between tire heaps disposed in a safe manner
Length of opposite sides (m)
Height of disposed tires (m) 2.4 3 3.7 4.3 4.9 5.5 5.5
7.6 17.1 18.9 20.4 22.3 23.5 25 25.9 15.2 22.9 25.6 28.3 30.5 32.6 34.4 36 30.5 30.5 35.4 39 41.8 44.5 47.2 50 45.7 30.5 35.4 39 41.8 44.5 47.2 50 61 30.5 35.4 39 41.8 44.5 47.2 50 76.5 30.5 35.4 39 41.8 44.5 47.2 50
These minimum distances depend on the height and dimensions of the heap (R.
Brady Williamson, R. Allen Schroeder 1994). Considering the vicinity of the neighbouring factories and settlements, we
believe that the most favourable distance between the disposed tire heaps is 17.1 m, the maximum disposed tire heap height 2.4 m, and the maximum length of the opposite sides of the dumping area 7.6 m. In that case, about 10 t of tire could be burnt in one heap (7.6m x 10m), leading to emissions stated in the table below (Table 6. Pollutant emissions in case of tire burning).
Class Compound Emission (mg kg-1) Compound Emission
(mg kg-1) PAHs Naphthalene 650.95 Benz[a ]anthracene 92.3
Acenaphthylene 711.55 Chrysene 81.2 Acenaphthene 1368 Benzo[b ]fluoranthene 78.9 Fluorene 223.65 Benzo[k ]fluoranthene 86.85 Phenanthrene 245 Benzo[a ]pyrene 99.35 Anthracene 52.95 Dibenz[a,h ]anthracene 0.55 Fluoranthene 398.35 Benzo[g, h,i ]perylene 112.7 Pyrene 92.75 Indeno[1 ,2,3-cd]pyrene 68.55 TOTAL 4363.6

Eco-Ist’12, Ecological Truth, 30 May - 2 June 2012. Hotel “Srbija TIS”, Zajecar, Serbia
268
Table 6. Pollutant emissions in case of tire burning
Group of emitted matter Emission
factor (g kg-1 )
Emission (kg)
Emission (g s-1)
Emission (g s-1m-2)
For PM – particle matter (mostly metals and soot) 119 1190 330 4.342
Carbon monoxide CO 122.8 1228 341 4.487 Volatile organic compounds (VOC) 10.569 105 29 0.382
Semi-volatile organic compounds (SVOC) 4.1352 41 11 0.145
Polycyclic aromatic hydrocarbons (PAH) 4.3636 44 12 0.158
It has been estimated that the burning of a 10 ton tire heap would last about 24
h, based on which emission in g s-1 has been calculated, which is a necessary input for the calculation of matter dispersion through air. For the calculation of dispersion of suspended matter with the most unfavourable conditions and vertical stability 6 (G) and wind velocity of about 1 m s-1, EPA “SCREEN3 MODEL” Scenario 1.2. referring to surface emissions (Table 7. SCREEN3 model (inputs data))
Table 7. SCREEN3 model (inputs data)
Simple terrain inputs PAH Source type Area
Emission rate (g s-1 m-2) 0.157895 Source heighe (m) 2.000
Length of larger side (m) 8.7178 Length of smaller sider (m) 8.7178
Receptor height (m) 2.000 Urban/Rural option Rural
(http://www.epa.gov/scram001/aqmindex.htm), has been used. Legend for SCREEN3: Dist - distance from centre of the area source; Conc - maximum ground level concentration; Stab - atmospheric stability class (1-A, 2-B, 3-C, 4-D, 5-G, 6-F); U10M - wind speed at the 10 m level; USTK - wind speed at stack height; Mix Ht - mixing height; Plume Ht - plume centreline height; Max dir - wind direction relative to long axis for maximum concentration (Table 8. Summary of SCREEN3 Model Results for PAH ). Table 8. Summary of SCREEN3 Model Results for PAH
Dist (m) Conc (mg m-3) Stab Mix Ht (m) Plume Ht (m) Max dir(deg)
10 2315.0 6 10000 2.0 45 100 209.50 6 10000 2.0 45 200 92.980 6 10000 2.0 45 300 52.370 6 10000 2.0 31 400 33.760 6 10000 2.0 35
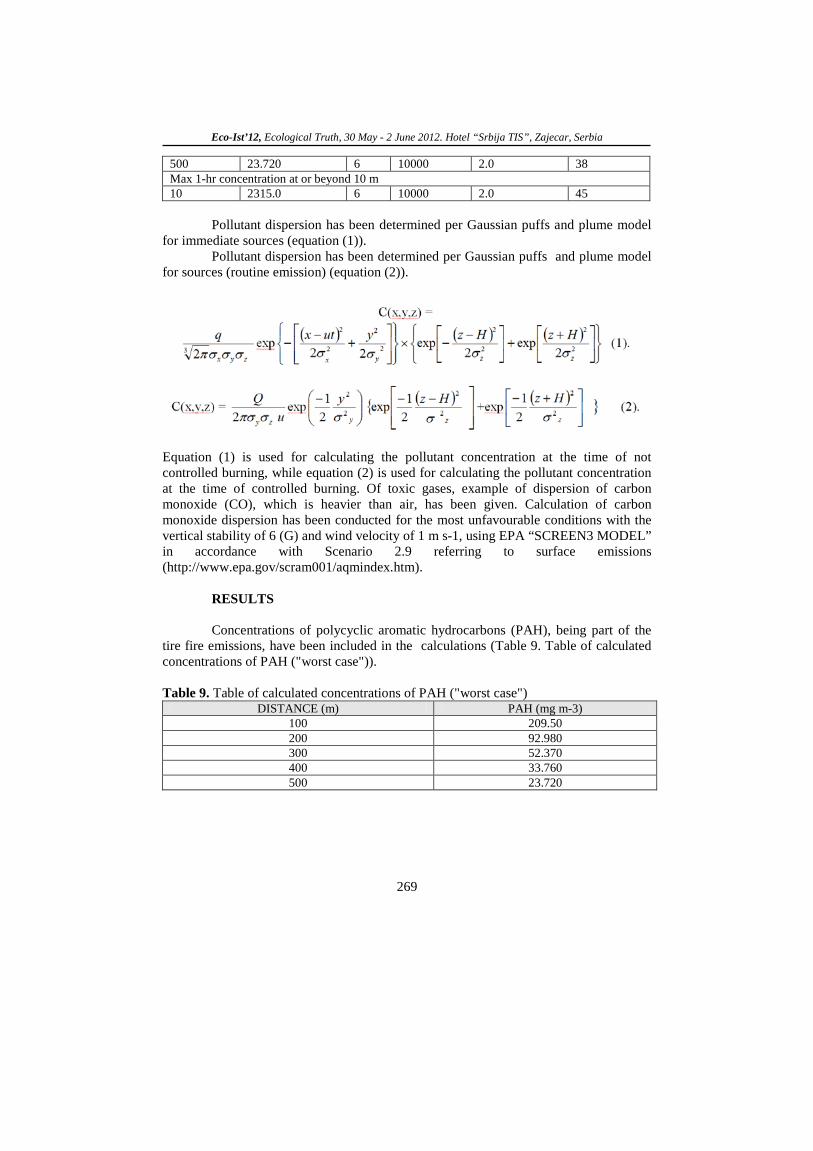
Eco-Ist’12, Ecological Truth, 30 May - 2 June 2012. Hotel “Srbija TIS”, Zajecar, Serbia
269
500 23.720 6 10000 2.0 38 Max 1-hr concentration at or beyond 10 m 10 2315.0 6 10000 2.0 45
Pollutant dispersion has been determined per Gaussian puffs and plume model
for immediate sources (equation (1)). Pollutant dispersion has been determined per Gaussian puffs and plume model
for sources (routine emission) (equation (2)).
Equation (1) is used for calculating the pollutant concentration at the time of not controlled burning, while equation (2) is used for calculating the pollutant concentration at the time of controlled burning. Of toxic gases, example of dispersion of carbon monoxide (CO), which is heavier than air, has been given. Calculation of carbon monoxide dispersion has been conducted for the most unfavourable conditions with the vertical stability of 6 (G) and wind velocity of 1 m s-1, using EPA “SCREEN3 MODEL” in accordance with Scenario 2.9 referring to surface emissions (http://www.epa.gov/scram001/aqmindex.htm).
RESULTS
Concentrations of polycyclic aromatic hydrocarbons (PAH), being part of the
tire fire emissions, have been included in the calculations (Table 9. Table of calculated concentrations of PAH ("worst case")). Table 9. Table of calculated concentrations of PAH ("worst case")
DISTANCE (m) PAH (mg m-3) 100 209.50 200 92.980 300 52.370 400 33.760 500 23.720

Eco-Ist’12, Ecological Truth, 30 May - 2 June 2012. Hotel “Srbija TIS”, Zajecar, Serbia
270
DISCUSSION
This methodology presents the application of epa "screen3 model" for the dispersion of toxic pollutants that are generated during the uncontrolled burning of automobile tires that can occur due to improper tire storage. These results provide the evaluation of time and concentration of pollutant dispersion in the local atmosphere. Results for the dispersion of pollutants pah for „worst case“ are shown in the table 9. „worst case“ deals with the most unfavourable conditions that produce the highest concentrations of pollutants in observed areas. Also, possibilities under different weather conditions are shown in the table 10. Table of calculated concentrations of pah (alternative case).
Table 10. Table of calculated concentrations of PAH (alternative case)
Stability 6 6 6 5 5 5 3 3 3 3 wind velocity
(m s-1) 1 3 4 1 3 4 1 3 4 6
x (m) (mg m-3) 10 2315.0 771.50 578.60 1559.0 519.80 389.80 817.00 272.30 204.30 136.20 100 209.50 69.820 52.360 124.50 41.490 31.120 37.680 12.560 9.420 6.2800 200 92.980 30.990 23.240 46.670 15.560 11.670 11.240 3.746 2.810 1.8730 300 52.370 17.460 13.090 24.410 8.1380 6.104 5.538 1.853 1.390 0.9264 400 33.760 11.250 8.4390 15.420 5.1410 3.856 3.713 1.238 0.9282 0.6188 500 23.720 7.9070 5.9300 10.730 3.5760 2.682 2.924 0.9747 0.7310 0.4874
The table presents the alterations of concentrations at certain distances, having different stabilities and wind velocities. Having seen the results, we concluded that the most unfavourable case is at the vertical stability of 6 and the wind velocity of 1 m s-1. Produced concentrations for PAH is 2315.0 mg m-3. Programmes for the dispersion of pollutants in the air deal with the worst possible case, the so-called „worst case“. From the tables we infer that the highest concentrations are produced at higher categories of instability and lower velocities. There is a substantial influence of input data and it is evident that the greatest influence on the results has the category of stability (higher category of stability and higher concentration) and the velocity of wind (lower velocity, higher concentration of pollutants). Other input results are strictly defined by the SCREEN3 programme that is a part of TSCREEN programme. Required input data are shown in the Table 7. Data for TSCREEN MODEL and Table 8. SCREEN3 MODEL (input data). The input data for the area of pollutant emissions influence the concentration to a small extent. Emission rate is literature data and it cannot be altered 5. Conclusions
Based on the presented calculated values of polycyclic aromatic hydrocarbons (pah) in the range from 23.79 (mg m-3) to 216.10 (mg m-3), it can be concluded that it is
necessary to take very comprehensive and stringent measures that guarantee that burning of tires will not occur, and in case it does happen, fire has to be localized and
extinguished as soon as possible, since otherwise, it may have catastrophic consequences on the life and health of the factory workers, the population, as well as the environment.

Eco-Ist’12, Ecological Truth, 30 May - 2 June 2012. Hotel “Srbija TIS”, Zajecar, Serbia
271
References [1] US EPA, Compilation of Air Pollution Emission Factors (1992) AP 42, Fifth Edition, Volume I, Chapter 2: Solid Waste Disposal [2] EMISSION FACTOR DOCUMENTATION FOR AP-42 SECTION 2.5, OPEN BURNING U.S. EPA, Characterization of Emissions from the Simulated Open Burning of Scrap Tires (1989), Acurex Corporation, Research Triangle Park, EPA- 600/2-89- 054 [3] US EPA, Compilation of Air Pollution Emission Factors, (1992) AP 42, Fifth Edition, Volume I Chapter 2: Solid Waste Disposal, 2.5 Open Burning [4] E.Holzbecher (2007) 2D and 3D Transport Solutions (Gaussian Puffs and Plumes) Environmental Modeling Using MATLAB®, Springer, 293-306 [5] Lemieux PM, Ryan JV (1993) Characterization of air pollutants emitted from a simulated scrap tire fire. Air Waste Mgmt Assoc J; 43(8):1106–15. [6] R. Brady Williamson, R. Allen Schroeder, (1994) Separation distances are based on the "Fire Safety Assessment of the Scrap Tire Storage Methods" [7]Ryan JV (1989) Characterization of emissions from the simulated open burning of scrap tires; EPA- 600/2-89- 054, NTIS PB90-126004. [8]. Biocanin R., Kalinić Z., Radović A. Management of new technologies with economik and ecological aspects of production International conference „RaDMI-2011“, 15-18. September 2011, Sokobanja, Serbia. [9]. Biočanin R. Energy (in) efficiency in conditions globalization sustainable development, Međunarodni naučni skup „OBNOVLJIVI IZVORI ENERGIJE I ODRŽIVI RAZVOJ“, 02-03. Jun 2001. Banja Luka.

272
XX International Scientific and Professional Meeting
"ECOLOGICAL TRUTH" ECO-IST'12
30 May - 2 June 2012, Hotel “Srbija TIS“, Zajecar, SERBIA
REMOVAL OF COPPER IONS FROM ACID MINE DRAINAGE USING
ANTHRACITE COAL
Dejan V. Antic*
, G. D. Bogdanovic, M. M. Antonijevic, V. Stankovic
University of Belgrade, Technical Faculty in Bor, V. J. 12, 19210 Bor, SERBIA
ABSTRACT Industrial and mining related wastes are the main sources of soil and groundwater contamination
with heavy metals. The generation of acid mine drainages (AMD) and uncontrolled release of dissolved heavy metals is the greatest concern in mining industry due to the restrictions established by law regulations for the wastewaters discharge into natural recipients. The efficiency of anthracite coal, for copper ions removal from synthetic aqueous solutions was evaluated through the series of laboratory batch experiments.
Data obtained from the adsorption experiments are interpreted in terms of different kinetic models. The copper ion uptake is correlated with pseudo-second order adsorption kinetics model.
Finally, adsorption data at equilibrium are interpreted in the terms theoretical isotherm models. The results shoved satisfactory well agreement between experimental data and both Langmuir and Freundlich isotherms models.
Key words: adsorption; copper ions; anthracite coal; acid mine drainages
INTRODUCTION
Mining operations from active and abundant sulfide ore deposits generate acid mine drainages (AMDs) which affect human health and to the environment. The type and concentration of metal ions present in AMDs directly relate to the origin of the ore deposit but common feature is an increased acidity, as a result of uncontrolled oxidation of pyrite and other sulfide minerals under the influence of environmental factors. AMDs contain various heavy metals such as copper, zinc, nickel, iron, manganese or lead which are not degradable and tend to BE accumulated in living organisms.
In Mining Basin Bor, Serbia, as a result of mining operations, there are a few acid mine drainages like waters from underground mines, drainage waters collected at the bottom of open pits in Bor, Veliki Krivelj and Cerovo, or overflows from flotation tailing disposals in Bor and Veliki Krivelj. The amount and type of dissolved metal ions varies but acidity is significantly increased. The concentration of copper ions in these waters, according to the chemical analysis, is up to 1 g/l [1].
Heavy metal ions can be removed from wastewaters by various methods, where the adsorption is one of them. The adsorption as a technique is relatively well described

Eco-Ist’12, Ecological Truth, 30 May - 2 June 2012. Hotel “Srbija TIS”, Zajecar, Serbia
273
in the literature and the focus of research has shifted to examining the efficiency of different types of natural adsorbents such as zeolite [2, 3], bentonite, clay [4] or various types of natural or activated carbonaceous materials [5-7] (low-quality coal, waste of various types of deciduous and coniferous trees, etc.).
Removal of heavy metals from effluents can be achieved using treated low-rank coals or sorbents obtained from coals as well as by oxidized or otherwise modified anthracites which previously has been reported [8, 9].
The objective of the study presented in this paper is to determine characteristics of natural anthracite coal and its efficiency as adsorbent in aqueous solutions containing copper ions at laboratory scale.
EXPERIMENTAL
Materials and methods Samples of natural anthracite coal from Serbia (Coal Mine „Vrška Čuka“) were
chosen as adsorbent material for copper ions removal from synthetic aqueous solutions. Initial sample was sieved and five fractions have been extracted to be used in the experiments (grain size from 0.4 mm to 1.18 mm).
Analytical grade copper sulfate salt (CuSO4⋅5H2O) was used in the preparation of Cu2+
The amounts of copper ions adsorbed in the experiments and initial copper concentrations were determined by UV/VIS spectrophotometry and atomic absorption spectrophotometry (AAS).
solutions with strictly chosen concentrations. Initial pH of solutions was adjusted by sulfuric acid and controlled with pH-meter.
The laboratory scale adsorption experiments were performed in a series of beaker equipped with magnetic stirrers. Mixtures were formed by adding 1 g of anthracite sample in 50 cm3
The adsorption degree (AD%) of metal ions could be calculated using equation:
of previously prepared solution with selected initial concentration. The mixture was stirred at 300 rpm for chosen period of time between 1 and 240 minutes. After the experiment, the mixture was filtered, final pH and the amount of copper in the remaining solution was determined. All experiments were carried out at room temperature.
0
0 0
(%) 100 1 100e eC C CADC C
−= ⋅ = − ⋅
(1)
where C0 and Ce are the concentrations of metal ions in initial and final solutions, (mgl-1
The amount of metal ions adsorbed from solution could be expressed by the following equation:
).
0( )t tVq C Cm
= − ⋅ (2)

Eco-Ist’12, Ecological Truth, 30 May - 2 June 2012. Hotel “Srbija TIS”, Zajecar, Serbia
274
where qt is the amount of metal ions adsorbed at time t, (mg⋅g-1); C0 is the initial concentration of metal ions, (mg⋅l-1
Adsorption characteristics of anthracite coal were examined varying the parameters, such as: grain size of the adsorbent, initial pH of the solution and the initial concentration of copper ions in the solutions through the experiments.
); V is the volume of the solution from which adsorption occurs, (l) and m is adsorbent mass, (g).
RESULTS AND DISCUSSION
The effect of particle size
Relation between particle size of the adsorbent and adsorption degree was
established in series of experiments using five fractions of anthracite coal: +1.18 mm; (-1.18+0.8) mm; (-0.8+0.63) mm; (-0.63+0.4) mm and (-0.4+0.0) mm. Mixtures containing 1 g of anthracite coal and 50 cm3 of Cu2+ aqueous solutions (200 mg⋅l-1
1,18 -1,18+0,8 -0,8+0,63 -0,63+0,4 -0,4+0,00
10
20
30
40
50
60
70
80
90
100
AD, %
size, mm
) were agitated at 300 rpm for 2 hours at room temperature. The pH of aqueous phase was adjusted to 3.5 adding small drops of sulfuric acid. Experimental data are plotted in Figure 1.
Figure 1. Effect of particle size of the adsorbent on adsorption degree
Degree of adsorption significantly varies as a function of particle size. The
maximum adsorption degree for copper ions is achieved for midsize fractions and decreases for coarse fractions for almost 21 %. This occurs because the specific surface area of anthracite particles increases as their size decreases. The particle size of anthracite coal should be kept within the range of (-0.8+0.4) mm. Anthracite coal, fraction size (-0.63+0.4) mm, is adopted for further experiments based on previous results and the lowest ash content (27 %).

Eco-Ist’12, Ecological Truth, 30 May - 2 June 2012. Hotel “Srbija TIS”, Zajecar, Serbia
275
The effect of solution pH on adsorption
Influence of aqueous phase pH on adsorption capacity of anthracite coal was examined through the series of experiments. The adjustment of pH was done by sulfuric acid modifying initial Cu2+ solutions (200 mg⋅l-1
0,0 0,5 1,0 1,5 2,0 2,5 3,0 3,5 4,0 4,5 5,0 5,5 6,0 6,5 7,00
1
2
3
4
5
6
7
8
9
10
q, m
g g-1
pH
) from pH 2 to 4.5 in steps of 0.5 The particle size of adsorbent used in the experiment was (-0.63+0.4) mm. All other experimental parameters were kept constant. Results obtained from experiments are presented in Figure 2 in which adsorption capacity is plotted against initial pH of aqueous phase.
Figure 2. The effect of pH on adsorption capacity of Cu2+
ions
It is obvious that adsorption capacity of anthracite coal is strongly affected by initial pH of aqueous phase from which copper ions should be removed. The adsorption capacity of anthracite coal rises from 1 mg⋅g-1 to almost 7 mg⋅g-1
by increasing pH from 2 to 3.5 which coincide with results reported in literature [8]. The maximum adsorption capacity occurs in pH range between 3.0 and 3.5. The influence of aqueous phase pH on copper ions adsorption can be explained by surface characteristics of the adsorbent. As the acidity of solution rises (pH<2.5) the hydrogen ions are predominantly adsorbed by anthracite coal. Decreasing of aqueous phase acidity lowers the concentration of hydrogen ions which favors the adsorption of copper ions.
Adsorption kinetic
The contact time required for reaching equilibrium between aqueous phase and solid adsorbent was evaluated. The initial pH (3.5) of the solution was monitor during the experiments but no buffer solutions were added. The metal uptake against time is presented in Figure 3 (left) and adsorption kinetic of copper ions on anthracite assumed as pseudo-second order reaction on Figure 3. (right).

Eco-Ist’12, Ecological Truth, 30 May - 2 June 2012. Hotel “Srbija TIS”, Zajecar, Serbia
276
0 25 50 75 100 125 150 175 200 225 250 2750
1
2
3
4
5
6
7
8
9
10
q, m
g g-1
t, min 0 25 50 75 100 125 150 175 200 225 250 275
0,02,55,07,5
10,012,515,017,520,022,525,027,530,0
anthracite t/q=1,14951+0,11947*t
R2=0,99325
t/q, m
in g
mg-1
t, min
Figure 3. Adsorption capacity vs. contact time: particle size (-0.63+0.4) mm; n=300 rpm; initial pH 3.5; C0=200 mg⋅l-1 Cu2+
ions
Experimental data obtained from kinetic experiments were modeled by using pseudo-second order reaction model in linear form:
2
1( ) a e e
t tq t K q q
= +⋅
(3)
where Ka is the equilibrium rate constant, (g⋅mg-1⋅min-1
).
The plots on the Figure 3 indicates that copper adsorption follows two phases: a linear one in first 20 minutes after the contact between solution and solid phase is established and slower phase in which adsorption capacity changes slowly. After 120 min of contact, a quasi-stationary state is observed, so for practical considerations that time is going to represent an equilibrium time.
Adsorption isotherms
Distribution of copper ions at equilibrium between aqueous phase and solid adsorbent is quantified by adsorption isotherm. To determine adsorption isotherm, a fixed amount of anthracite coal (1g) was mixed for 2 hours with a constant volume of solution (50 cm3) containing different amount of copper ions dissolved. All other parameters were kept constant as described above. The plot on Figure 4 put in relation adsorption capacity and the equilibrium copper concentration.

Eco-Ist’12, Ecological Truth, 30 May - 2 June 2012. Hotel “Srbija TIS”, Zajecar, Serbia
277
0 50 100 150 200 250 300 350 400 4500
1
2
3
4
5
6
7
8
9
10
q e, m
gg-1
Ce, mgl-1 Figure 4. Adsorption isotherm of copper ions on anthracite coal
The best model to describe adsorption can be determined using linear regression
to analyze equilibrium data obtained from the experiment. The Langmuir and Freundlich adsorption model are the most used in literature and could be, after mathematical transformations, presented in linear form.
The linear form of the Langmuir isotherm can be expressed as:
1 1ee
e L m m
C Cq K q q
= + ⋅⋅
(4)
where KL is the Langmuir`s equilibrium constant; Ce is the solution concentration of metal ions at equilibrium, (mg⋅g-1), qe is the amount of metal ions adsorbed per unit mass of the adsorbent (mg⋅g-1), qm is the maximum adsorption capacity, (mg⋅g-1
The linear form of the Freundlich isotherm is: ).
1log log loge F eq K Cn
= + ⋅ (5)
where KF
Data obtained in a series of experiments showing dependence between adsorption capacity and copper ion concentration at equilibrium according the equations (4) and (5) is graphically presented on Figure 5.
and n are the Freundlich isotherm constant. Parameter K is related to the temperature and n is characteristic constant for the adsorption system under study. A value of n between 2 and 10 shows good adsorption [2].

Eco-Ist’12, Ecological Truth, 30 May - 2 June 2012. Hotel “Srbija TIS”, Zajecar, Serbia
278
0 50 100 150 200 250 300 350 400 4500
10
20
30
40
50
60
70
anthracitey=30.61225+0.08205*x
R2=0,96729
C e/qe,
mgl
-1
Ce, mgl-1 0,00 0,25 0,50 0,75 1,00 1,25 1,50 1,75 2,00 2,25 2,50 2,75 3,00
0,00
0,10
0,20
0,30
0,40
0,50
0,60
0,70
0,80
0,90
1,00
anthracitey=-1.094+0.7372x
R2=0.98456
log
q e, m
gg-1
log Ce, mgl-1 a) b)
Figure 5. Adsorption isotherms in linear form by a) Langmuir and b) Freundlich
Adsorption data in linearized form gave a satisfactory correlation coefficient, R2=0.967 for Langmuir and R2=0.985 for Freundlich model for covered concentration range. Comparison of the linear correlation coefficients indicated that Freundlich adsorption model better fits the experimental data. The Freundlich isotherm constants KF
The fit of experimental data to Langmuir isotherm does not constitute evidence that adsorption satisfies criteria of the adsorption model but allows the calculation of the maximum adsorption capacity q
and n were 0.085 and 1.36 respectively. The numerical value of 1/n<1 indicates that adsorption capacity is only slightly suppressed at lower equilibrium concentrations [2].
m of adsorbent [10]. Maximum adsorption capacity qm of 12.20 mg⋅g-1
was determined from Langmuir plot.
CONCLUSION
The results of preliminary treatment showed that anthracite coal has potential to effectively remove copper ions from relatively diluted aqueous solutions such as acid mine drainages.
Particle size of anthracite coal strongly affects the adsorption degree of copper ions and should be kept within the range of (-0.8+0.4) mm which coincide with midsize fractions.
The adsorption capacity is highly dependant by initial pH of aqueous phase. Adsorption capacity significantly decreases at lower pH (<2.5) due to favorable adsorption of hydrogen ions.
Kinetic studies showed that adsorption is rapid in first 20 minutes after contact between solution and solid adsorbent is established. The best fit is established between experimental data and linear form of pseudo-second order kinetic model.
The experimental data obtained from batch studies gave satisfactory fit with both, Langmuir and Freundlich, isotherm models. Maximum adsorption capacity of 12.20 mg⋅g-1
for copper ions on anthracite coal under given experimental condition was determined.

Eco-Ist’12, Ecological Truth, 30 May - 2 June 2012. Hotel “Srbija TIS”, Zajecar, Serbia
279
Acknowledgement
This research is supported by the Ministry of Education and Science, Republic of Serbia within the framework of the Projects TR 37001 and OI 172 031. The authors are gratefully acknowledged.
REFERENCES
1. G. Bogdanović, M. Antonijević, Z. Milanović, S. Šerbula, S. Milić Otpadne vode iz Rudnika Bakra Bor. Zbornik radova Ekološka istina „EkoIst`07“, Hotel „Zdravljak“, Soko Banja, Srbija, 27-30.05.2007; Tehnički fakultet u Boru, Univerzitet u Beogradu 2007; pp. 398-402.
2. Erdem, E.; Karapinar, N.; Donat, R. The Removal of Heavy Cations by Natural Zeolites. Journal of Colloid and Interface Science 2004, 280, 309-314.
3. Motsi, T.; Rowson, N.A.; Simmons, M.J.H. Adsorption of Heavy Metals from Acid Mine Drainage by Natural Zeolite. International Journal of Mineral Processing 2009, 92, 42-48.
4. Bailey, S.E.; Olin, T.J.; Bricka, R.M.; Adrian, D.D. A Review of Potentially Low-cost Sorbents for Heavy Metals. Water Research 1999, 33(11), 2469-2479.
5. Sole, М.; Casas, J.M.; Lao, C. Removal of Zn from Aqueous solutions by Low-rank Coal. Water, Air and Soil Pollution 2003, 144, 57-65.
6. Razvigorova, M.; Budinova, T.; Petrov, N.; Minkova, V. Purification of Water by Activated Carbons from Appricot Stones, Lignites and Anthracite. Water Research 1998, 32(7), 2135-2139.
7. Božić, D.; Stanković, V.; Gorgievski, M.; Bogdanović, G.; Kovačević, R. Adsorption of Heavy Metal Ions by Sawdust of Deciduous Trees. Journal of Hazardous Materials 2009, 171(1-3), 684-692.
8. Petrov, N.; Budinova, T.; Khavesov, I. Adsorption of the Ions of Zinc, Copper and Lead on Oxidized Anthracite. Carbon 1992, 30(2), 135-139.
9. Tikhonova, L.P.; Lyubchik, S.B.; Tarasenko, Y.A.; Goncharik, V.P.; Galushko, O.L.; Fonseca, I. Modified Anthracites as Selective Sorbents for Platinum Metals. Russian Journal of Applied Chemistry 2006, 79(5), 727-732.
10. Stumm. W.; Morgan, J.J. Aquatic Chemistry: Chemical Equillibria and Rates in Natural Waters, 3rd Ed. Environmental Science Technology. New York: John Wiley & Sons; 1992.

280
XX International Scientific and Professional Meeting
"ECOLOGICAL TRUTH" ECO-IST'12
30 May - 2 June 2012, Hotel “Srbija TIS“, Zajecar, SERBIA
SEDIMENTATION OF SUSPENDED PARTICLES FROM THE OILY
INDUSTRIAL WASTE WATER
Grozdanka D. Bogdanovic1,*, Z. S. Markovic1, M. Z. Trumic1
D. V. Antic,
1, M. S. Trumic1, B. Milivojevic
2
1University of Belgrade, Technical Faculty in Bor, VJ 12, Bor, SERBIA 2Copper Mines Bor, Bor, SERBIA
*
ABSTRACT
Industrial wastewaters are generated in various technological processes and in energetic plans. Waste water from the manufacturing process include: processing, refrigeration, sanitary and waste water from cleaning equipment. Sedimentation characteristics of suspended particles from oily wastewaters are investigated in the paper. Samples of wastewater from washing of electrical machines are used for the laboratory studies. Wastewaters contain solid phase like silt, fine dust particles from industrial plants, and liquid organic phase like grease and various kind of oil. Based on sedimentation curves, the settling rates of suspended particles from oily wastewaters and flocculated particles from suspensions are obtained. Alumina sulfate and lime are used for coagulation of suspended particles.
Key words: Oily wastewater; Emulsion; Sedimentation; Coagulation; Aluminum (III) sulfate; Lime
INTRODUCTION
The development of civilization has caused the increasing use of water
resources and their growing pollution through discharges of untreated or insufficiently treated industrial and municipal wastewaters. After use, industrial facilities discharge waters that are often aggressive, loaded with mud and toxic substances. This water can contain organic or inorganic compounds, or of both. Wastewaters containing oil and fat are from various industries and technological processes. Main source of oily industrial wastewaters are refineries, manufacturing, metal processing and food production. In wastewaters, oil can be found as: free oil, dispersed oil in the form of mechanical or chemical stabilized emulsions, dissolved oil and adsorbed on the solid material that is present in the effluent [1]. Wastewater emulsions containing oil and grease, organic compounds like non-degradable hydrocarbons, secondary oil, corrosion protective substances, metal ions, etc. [2]. Due to its composition, waste water emulsions are dangerous pollutants, and must be safely collected and treated before discharge into drains or recipients.

Eco-Ist’12, Ecological Truth, 30 May - 2 June 2012. Hotel “Srbija TIS”, Zajecar, Serbia
281
Purification of oily wastewaters and emulsions could be achieved through various physical, physical-chemical, chemical or biological methods. Separation of suspended insoluble particles like sand, oxides or sludge and floating substances like oil could be archived by various types of physical processes. Gravity separators are the commonly used equipment for this way of treatment [1, 3]. Emulsions can be disintegrated by chemical, electrical or physical methods. Chemical methods are usually applied in the treatment of oily wastewater. Disintegration of wastewater emulsions by chemical method is based on the destabilization of emulsions by addition of chemical agents (coagulation) and the creation of agglomerates that continue to grow to a size from which can easily be removed from the suspension (flocculation) [4].
Flotation is a process used for grease and oil removal from wastewaters. This process is opposite from sedimentation considering that air introduction causes the lighter particles to be collected at the water surface. Flotation could be combined with other processes like coagulation or precipitation [5].
Nowadays, the mineral oils and greases are used for machinery in various industries as well as in transportation. Repair facilities are doing exchange of spent oil and grease including washing and cleaning the machines. Wastewaters generated in these facilities are overburden with highly concentrated oily emulsions.
Different kinds of wastewaters are produced in mining and metallurgical plants in Bor. A special type of wastewaters are oily waters and emulsions generated by cleaning and washing various types of electrical machines like low and high voltage electro-motors, DC motors, generator groups, transformers, etc.. „Elektroremont“ in Bor performs all types of operations like receiving, disassembling, repairing, assembling and testing of electrical machinery from mining and metallurgical plants. During the washing phase, various types of impurities from mining and metallurgical plants and lubricant like lithium greases of different hardness, different viscosity hypoid oil, transformer oil, etc., are removed from components of electrical machines.
Since the oily waters are serious ecological problem, the settling rate of suspended particles and settling rate of flocculated particles obtained by addition of alumina sulfate and hydrated lime, are investigated in this research.
MATERIALS AND METHODS
Samples of oily wastewaters generated in the washing phase of electrical
machines are used for the laboratory studies. Solid phase like silt containing fine particles from industrial plants as well as liquid organic phase like grease and various types of oil and detergents is present in these wastewaters.
Chemical composition of wastewater (composite sample) is presented in Table 1.

Eco-Ist’12, Ecological Truth, 30 May - 2 June 2012. Hotel “Srbija TIS”, Zajecar, Serbia
282
Table 1. Chemical composition of wastewaters Type of hazard Amount, mg/dm3 Grease and oil 2.617 Detergents 1.975 Cyanides 0.000 Iron 0.172 Copper 0.034 Led 0.031 Cadmium 0.000 Mercury 0.000 Nickel 0.010 Zinc 0.012 Volatile phenols 0.050 Aluminum ions 1.530 Sulfates 0.000
* Sample of wastewater has been analyzed on mineral oil content after mechanical removal of surface oily layer. Analysis of data from Table 1 and comparison with the limits defined by low regulation [6] indicates that the concentration of grease and oils is greater than permitted. For the laboratory studies of suspended particles removal three different samples of wastewater as well as a composite sample obtained by mixing them were used.
Sample I represent wastewater sample generated through washing phase of electrical components of “Marion” type of excavator and part of the engine from “Dart” vehicle from open pit in Veliki Krivelj. The presence of various sizes suspended particles and the presence of grease and oil in the water are observed.
Sample II is wastewater sample obtained by washing the cover of the engine of dumper vehicles. It is observed in the wastewater sample a minor amount of solid particles and greater amount of grease, which mainly serves as lubricant of bearings in the engine.
Sample III is wastewater sample obtained by washing the transformer oil vessel. The greater amount of oil and minor amount of solids was observed in this sample of wastewater. Sample IV is composed by mixing of previously described samples.
The pH and percent of solids of each sample were measured. After intensive agitation solid and liquid phases are separated by sedimentation in measuring cylinder. Sedimentation curves were plotted based on solid phase precipitation results and kinetics of separation process is determined. Settling rate of flocculated suspended particles are investigated after addition of alumina sulfate and hydrated lime. Extraction of oil on the surface of the suspension is also examined. The results are shown on the sedimentation curves.

Eco-Ist’12, Ecological Truth, 30 May - 2 June 2012. Hotel “Srbija TIS”, Zajecar, Serbia
283
RESULTS AND DISCUSSION
The sedimentation of suspended particles is highly dependent of density, coarseness and shape of the particles, solid ratio, oil content and the presence of reagents like coagulants and flocculates. The results of sedimentation are presented on Figures 1 and 2.
0 25 50 75 100 125 150 175 200 225 250 2750
255075
100125150175200225250275300325350375
H, m
m
t, min
sample I, pH=7.36 sample II, pH=7.20 sample III, 7.11
Figure 1. Sedimentation curves of oily wastewaters samples
0 25 50 75 100 125 150 175 200 225 250 275 3000
255075
100125150175200225250275300325350375
H, m
m
t, min
sample IV (composite), pH=6.69 sample IV Al2SO4x18H2O added, pH=7.21 sample IV lime added, pH=8.50
Figure 2. Sedimentation curves of composite sample
The settling rates of suspended particles are the highest at the beginning of the
process, in first 10 minutes, as could be seen form Figure 1. As a result, the most of the suspended particles are deposited. As the time increases the depositing rate reduces and

Eco-Ist’12, Ecological Truth, 30 May - 2 June 2012. Hotel “Srbija TIS”, Zajecar, Serbia
284
after 90 minutes shows very small variations over the time. The oil layer, thickness of about 1 mm, formed at the beginning of sedimentation. This result coincides with kinetic studies previously confirmed in the researches in the case of very dilute suspensions [7]. The percent of solids in the sample I was 2.32 %; the density of solid phase 1870.38 kg/m3; the maximum diameter of particles dmax = 51.061 µm and the average diameter of Dsr= 4.77 µm. Based on Stockes` law [1] calculated settling rate of suspended particles was 6.02 ⋅10-6
As could be seen from Figure 1, the sedimentation characteristic of samples 2 and 3 are very simmilar and significantly varies from the sample 1. The percent of solids in the samples was 0.232 % and is characterized with increased content of oil and grease which was separated on the surface (thickness about 2 mm) at the beginning of sedimentation. Samples 2 and 3 are waste water emulsions which are insoluble or poorly soluble in each other which stratify with very small rate. Decomposition of waste water emulsions can be made through their destabilization, or by addition of chemical agents (coagulation) as well as by creation of agglomerates that continue to grow to a size where can easily be removed from the suspension (flocculation).
m/s.
Sedimentation characteristics of composite sample, with or without chemical agents added for coagulation, are presented on Figure 2. For coagulation of fine particles alumina sulfate and lime are used. It could be seen from sedimentation characteristics of the samples that settling rate is highest for oily waters without coagulant added. Less settling rate is obtained in the presence of aluminum sulfate while the addition of lime has led to increasing pH values and decreases the settling rate. Further sedimentation analyses at constant pH value are necessary for better comparison of the results and establishing the true impact of coagulation on the settling process. The solid phase characterization was performed after sedimentation of composite sample determining the density and average diameter of particles. Calculated percent of solids in the composite sample was p=0.68 %; solid phase density 1511.23 kg/m3; maximal particle diameter dmax=148.653 µm and average diameter Dsr= 11.52µm. The settling rate of suspended particles is 2.06⋅ 10-5
Treatment of oily wastewater results in the formation of sludge, which should be adequately treated considering requirements for the protection of the environment. Procedures to treat the sludge are thickening, stabilization, conditioning, dewatering, drying and disposal.
m/s. Examination of size of the oil drops and their distribution is more complexes. Based on Stockes` law, in gravity separation, incoming velocities of spherical oil droplets can be calculated and based on that calculations equipment for water purification can be chosen which is subject for further studies.
CONCLUSION
Based on experimental data the following can be concluded:
1. Separation rate of solid and liquid phase as well as liquid –liquid separation from oily waste waters depends on contents of solid phase and presence of free oil. It is observed that period of freely settling is rapid, approximately 10 to 20

Eco-Ist’12, Ecological Truth, 30 May - 2 June 2012. Hotel “Srbija TIS”, Zajecar, Serbia
285
minutes, with rate which is dependable of suspended particles concentration and presence of coagulant agents.
2. It was noted that small amount of free oil is extracted on the surface of samples during the sedimentation process. Since there is a wide range of oil droplets in the suspension it is necessary to determine their size to be able to calculate the corresponding classifier or gravity separator for water purification.
3. Sludge obtained from separation process may negatively affect the environment and therefore must be treated before final disposal. REFERENCES
1. S. King, Small Quantity Generator Oily Wastewater Management Study, Final
Report Seatlle WA : Local Hazardous Waste Management Program in King County, 1999.
2. V. N. Rajaković, D.Ljubisavljević,_Physical methods for waste water treatment - The use of freeze/thaw method with the assistance of microwave radiation for oily water treatment, Vodoprivreda 0350-0519, 37 (2005) 71-81.
3. L. Zhang, H. Xiao, H. Zhang, L. Xu, D. Zhang, Optimal design of a novel oil–water separator for raw oil produced from ASP flooding, Journal of Petroleum Science and Engineering 59 (2007) 213–218.
4. K. Bensadok et al., Treatment of cutting oil/water emulsion by coupling coagulation and dissolved air flotation, Desalination 206 (2007) 440-448.
5. J. J. Rosa, J. Rubio, The FF (flocculation–flotation) process, Minerals Engineering 18 (2005) 701–707.
6. Uredba o graničnim vrednostima emisije zagađujućih materija u vodi i rokovima za njihovo dostizanje. “Službeni glasnik RS”, broj 67/11.
7. V.B.Lazarević, I.M.Krstić, Lj.M.Takić, M.L.Lazić, V.B.Veljković, Clarification and filtration of the flocculated particle suspension from a chemical treatment of waste oil-in-water emulsions from a non-ferrous metalworking plant, Hem. ind. 65 (1) (2011) 53–60.

286
XX International Scientific and Professional Meeting
"ECOLOGICAL TRUTH" ECO-IST'12
30 May - 2 June 2012, Hotel “Srbija TIS“, Zajecar, SERBIA
SOME ENVIRONMENTAL PROBLEMS BY USING XANTHATES
IN FLOTATION
Zoran Markovic, G. Bogdanovic, D. Antic, Z. Stirbanovic, B. Sokolovic
University of Belgrade - Technical faculty in Bor, V.J 12, 19210 Bor, SERBIA
ABSTRACT
This paper presents some investigation results about potassium ethyl xanthate (PEX) stability in water solution at higher pH and in presence of mineral chalcopyrite. It is well known that ions of nonferrous metals have a catalytic effect on PEX decomposition forming the simple compounds as: related alcohol, related alkali and carbon disulphide. These investigation were focused on PEX decomposition in presence of mineral chalcopyrite at higher pH, above 10. The concentrations of Xanthate ion and CS2
were determined by UV Vis spectroscopy. Some results from extended investigation were given in this paper.
Key words: Potassium ethylxanthate, carbon disulphide, chalcopyrite, environmental problems
INTRODUCTION Dithiocarbonates are widely applied in practice in the flotation process of sulphide minerals of non-ferrous metals in previous years. Now, they are largely replaced by other substances on the basis of phosphorus chemistry and ethoxy compounds . But their application is still present in some plants for flotation concentration of sulphide minerals in Serbia and abroad . The reason for their application lies mainly in the low cost and satisfactory efficiency in the given process . Dithiocarbonates or well known as xanthates are very unstable in acidic media below pH 4 and also in higher basic conditions in the presence of non-ferrous metal ions they decompose to their simple compounds as: related alcohol, related alkali and carbon disulphide. Here, non-ferrous metal ions play a catalytic role on xanthate decomposition process [1]. Xanthates as surface active substances detrimental to human health so it needs to take special safety measures when handling with them. Addition of carbon disulfide in xanthate decomposition process is even more toxic effects on the working environment in relation to the xanthates itself. NICANAS (National Industrial Chemicals Notification and Assessment Scheme) from Australia was pointed out in detail the dangers of using xanthate [2]. Carbon disulphide affects the central nervous system, cardiovascular system, eyes, kidneys, liver, and skin. It may be absorbed through the skin as a vapor or liquid,

Eco-Ist’12, Ecological Truth, 30 May - 2 June 2012. Hotel “Srbija TIS”, Zajecar, Serbia
287
inhaled or ingested. The probable oral lethal dose for a human is between 0.5 and 5 g/kg for a 70 kg person. In chronic exposures, the central nervous system is damaged and results in the disturbance of vision and sensory changes as the most common early symptoms. Lowest lethal dose for humans has been reported at 14 mg/kg or 0.98 grams for a 70 kg person. Alcoholics and those suffering from neuropsychic trouble are at special risk. [3]. Some physical properties of carbon disulphide are (3): Boiling point at 46 °C(lit.), density 1.266 g/mL at 25 °C, vapor density is 2.67 (vs air), vapor pressure is 5.83 psi ( 20 °C) (40.21 kPa). The process of flotation of copper minerals in the alkali media and especially in the refining cycle of flotation concentrate where the pH rises to 11.8, there is an intensive decomposition of xanthate with carbon disulfide is released as a highly toxic component. There are a number of published papers on the stability of the xanthate in aqueous solutions depending on pH and with and without the presence of foreign ions in solution. It also found that non-ferrous metal ions have a catalytic effect on decomposition of xanthate in alkaline aqueous solutions [2]. The works [4,5] have shown that the presence of copper sulphide minerals affects the decomposition of xanthates in high alkali conditions at pH above the 11. This paper presents some research results concerning the identification of decomposition of potassium ethyl xanthate in the presence of mineral chalcopyrite. Any changes in the solution were monitored by UV Vis spectrophotometer, which has registered the presence of xanthate and carbon disulfide solutions of the appropriate characteristics. In Figure 1, is shown the UV Vis spectra for: ethyl xanthate (ETX-), carbon disulfide CS2, monothio carbonate MTC, xanthogenic acid HEtX and dixanthogenate DXt.
.
Figure 1. UV Vis spectra of xanthogenic compounds

Eco-Ist’12, Ecological Truth, 30 May - 2 June 2012. Hotel “Srbija TIS”, Zajecar, Serbia
288
EXPERIMENTS AND RESULTS
Reagents and materials - Potassium ethyl xanthate of technical grade underwent to double purification by
dissolving in acethone and recrystallization in petrol ether under vacuum. - regulator was calcium hydroxide p.a. grade. - Chalcopyrite sample from Bor copper mine, fraction (-74 + 38) µm.
UV Analyses
Analysis of aqueous solutions of potassium ethyl xanthate after contact with chalcopyrite at the certain conditions, was determined by UV Vis spectrometer 9200 type UV Rayleigh
.
UV measurements In these experiments the variables were: pH, concentration and contact time of KEX solution with chalcopyrite. The concentration of carbon disulfide in the resulting solution was monitored by the wavelength of 206 nm at a concentration of ethyl xanthate over the wavelength of 301nm. Table 1 shows the changes in these concentrations as a function of contact time and pH value of solution at the initial KEX concentration of 1 × 10⁻⁵ mol / l
.
Table 1. Absorbance of degradation KEX products (carbon disulphide - 206 nm and ethylxanthate ion-301 nm) in a solution concentration of 1 × 10⁻⁵ mol/dm-3
at pH = (10, 11 and 12), Time
a function of time
min pH 10 pH 11 pH 12
206.5 nm 301 nm 206.5 nm 301 nm 206.5 nm 301 nm 20 0.14284 0.03938 0.14181 0.05121 0.19804 0.06151 40 0.12368 0.03667 0.14681 0.04865 0.19306 0.06213 60 0.11914 0.02511 0.14361 0.04787 0.17773 0.05566
1440 0.12221 0.02076 0.13698 0.04276 0.16515 0.03887 In Figure 2, is given the graphical representation of the concentration of CS2 in solution as a function of pH and contact time with the mineral chalcopyrite. A in Figure 3, presents the changes in concentrations of KEX function of pH and contact time with chalcopyrite.
Figure 2. The graphical representation of the concentration of CS2 in solution as a
function of pH and contact time with the mineral chalcopyrite

Eco-Ist’12, Ecological Truth, 30 May - 2 June 2012. Hotel “Srbija TIS”, Zajecar, Serbia
289
Figure 3. The changes in concentrations of KEX in function of pH and contact
time with chalcopyrite
.
Based on previous research the decomposition reaction of KEX at higher pH in the presence of minerals
chalcopyrite, the chemical equation was suggested as:
C2H5OCSSK + H2O C2H5OH + KOH + CS
2
The reaction products are ethyl alcochol, potassium hydroxide and carbon disulphide.
CONCLUSION
According to above presented, there is no doubt that Potassium ethylxanthate has a great negativе impact on working area in the closed flotation plants. There are two main negative effects by using the xanthates in copper minerals flotation process. One is related to working environment due the faster decomposition of KEX on pH 11.8 and releasing the carbon dioxide, very toxic gas in the working area. Second is the great losses of reagent xanthates in the flotation cleaning prosess which occurs at the pH of 11.8. Loosing the xanthates it effects on technological results in copper mineral flotation.
Acknowledgements
The authors are greatly acknoledged to the Ministry of Education and Science of the Republic of Serbia that suported these investigation by grants through projects TR-33023 and 33007.
REFERENCES
1. J. Leja, Surface chemistry of froth flotation. Plenum Press, New York, 1983. 2. National Industrial Chemicals Notification and Assessment Scheme (Australia),
Sodium ethyl xanthate : full public report. 1995, Canberra: Australian Govt. Pub. Service. viii, 66.;
3. CAS registry nomber: CAS No. 75-15-0 4. M. Antonijevic et al. Carbon disulphide as a harmful product by PEX
decomposition in basic media with presence of chalcopyrite. IV Naucno strucni skup "Nasa ekoloska istina", Kladovo, 1996.
5. B. Sokolovic. Master of Science Thessis, University of Belgrade-Technical faculty Bor, 2011.

290
XX International Scientific and Professional Meeting
"ECOLOGICAL TRUTH" ECO-IST'12
30 May - 2 June 2012, Hotel “Srbija TIS“, Zajecar, SERBIA
BIOLOGICAL REINFORCEMENTS AS A FACTOR OF SUSTAINABLE
SLOPE STABILITY - CASE STUDY OF THE ZVEZDARA PARK FOREST IN BELGRADE
Maja Todorovic Izquierdo¹*, Tiosav Todorovic²,3
¹Megatrend University, Faculty of Arts and Design,
Bulevar umetnosti 29, Belgrade, SERBIA ²University of Belgrade, Faculty for Forestry, Kneza Višelava 1, Belgrade, SERBIA
3TILEX. d.o.o., Milutina Milankovica 25, Novi Beograd, SERBIA
ABSTRACT The aim of this paper is to show the way how landscape architecture can influence on fortification
of slope and landslide stability. The activation or forming of appearances and processes of erosion and landslides, made up of silty-sandy clays and loess soil, especially in water saturated conditions has been investigated within the multidisciplinary approach.
The obtained results during the investigations indicate the possibility of implementing a biological “reinforcing” as possibility for provision and sustainable slope stability and at the same time represents manner of environmental protection and conservation, also with satisfactory landscape design characterized place with higher esthetical value.
Key words: biological “reinforcing”, landscape architecture, sustainable slope stability, soil drainage, erosion, environmental protection and conservation
INTRODUCTION Landscape architecture as a factor of maintainable slope stability, as well as of
the protection of the environment of ambient areas, can be viewed before all through the reinforcing of soil using root systems as well as natural water drainage, at the same time with adequate landscape design on these areas we can obtain a more esthetical image of the treated area. These cause an overall rise in the firmness or the soil, as well as its resistance to soil erosion, sliding and flowing. The mentioned biotechnical measures have a significant impact on shallow landslides, 2-3 metres deep, and the full effect is achieved with the preventive remediation of “conditionally stable slopes” with a small safety factor, Fs > 1.0 - 1.1. Taking such biotechnical measures, preventive as well as definitive remediation of slopes with a shallow sliding surface, are of special value, as shallow landslides can have a devastating effect on the stability of infrastructural structures, as well as the stability of high-rise buildings.

Eco-Ist’12, Ecological Truth, 30 May - 2 June 2012. Hotel “Srbija TIS”, Zajecar, Serbia
291
INVESTIGATION METHODOLOGY Landscape architecture, beside its basic role in the creation and refining of
ambient areas through planning, introducing and shaping, can have a significant economic effect in view of field development and securing maintainable geodynamic slope stability through its interaction with geoengineering. Their mutual cooperation and conditionality can already be viewed in the phase of spatial planning and defining surface designation. Beside numerous elements surface designation depends on the geoengineering terrain characteristics, the geoengineering model and field zoning according to the degree of stability of geodynamic processes and appearances. The application of landscape architectural methods through biotechnical solutions for protection from erosion, that is to say, preventive and definitive remediation, primarily through biological soil reinforcement using the root systems of ornamental and plants and forests, can secure maintainable slope stability.
The effects of biologically reinforcing loess soil, recorded on the base of numerous investigations by the authors of this work in view of shearing resistance are presented in Figures 1 and 2.
Figure 1. Diagram of comparative analysis
of correlation φr = f(w) i φB= f(w) both reference and biological "reinforced"
macroporous loess soil
Figure 2. Diagram of comparative analysis of the correlation with с = f(w) i с = f(w)
The internal erodibility of silty-sandy soil, defined according to the method of
Prof. Tiosav Todorović (MTT) for determining the coefficient of internal erosive stability Kue, as a limiting granulometric conditioning.
Where Kue = T/g, where T = d85/d15 and G = d50/d25
For values for Kue =1.0 (all grains are of the same size) – there is no internal erosion, only slipping and the shearing of the mass on the slope due to filtration forces are possible, that is to say, the exceeding of the Kue limit (appearance of surfacing and landslides etc.) For values =2.0+5.0 – minor internal erosion is possible, larger

Eco-Ist’12, Ecological Truth, 30 May - 2 June 2012. Hotel “Srbija TIS”, Zajecar, Serbia
292
movement possible only in zones of higher exit gradients on slopes with a fast transition to plastic flows of Kue for values 5.0> <10 (transitory zone) Kue for values 10.0> <200 greater movement is possible, as is particle regrouping and change of grain composition. The suffusion process is long, even with a considerably lower gradient than in the previous case. Flowing is not abrupt, but the movement of (local) masses can cause erosive landslides and larger landslips.
Figure 3. Determining Kue according to the MTT method
The limit condition for the erosive stability of intergranulary porous sandy-
gravelly soil, and loess silty-sandy soil of different grain composition, defined by experimental investigations and through functionally connecting the hydraulic gradient and the coefficient of grain composition, or rather the erosive stability coefficient Kue – as a limit granulometric condition according to (MTT), is given in Figure 3.
For defining the geodynamic characteristics and erodibility of soil, it is recommended that both a clay dispersion test and a liquefaction test are performed.
AERO-GEODYNAMIC RESISTIVITY OF INCOHERENT SILTY-SANDY SOIL TO AEOLIAN EROSION The initial and limit condition for the appearance of initial wind erosion, that is
to say moving, regrouping, lifting and transporting of the soil particles, is conditioned by the total resistivity of silty-sandy soil and the intensity and regime of wind action, and

Eco-Ist’12, Ecological Truth, 30 May - 2 June 2012. Hotel “Srbija TIS”, Zajecar, Serbia
293
upon exceeding the limit conditions. The term “total resistivity” of soil particles refers to their shape, bulk weight and specific gravity, initial moisture and “apparent” cohesion, as well as other relevant parameters and factors that heighten soil resistivity and lower wind strength. Larger particles, rock fragments and pieces, can in conditions of turbulent wind be moved down a slope, just as avalanches are the flow of deposition, or movement and “dry flows” of sand which cause erosion landslides due to the impact of wind, etc. Aeolian erosion (wind erosion) causes a deflation of the surface layer as an aero-mechanic external erosion and natural occurrence, but can be caused using technological procedures and in conditions of anthropogenic influence. Internal erosion and the transport of particles due to wind action can be manifested as a natural occurrence in underground, closed spaces such as caves, tunnels, underground mining shafts and similar structures. Internal erosion of an anthropogenic character is achieved through technological procedures of transporting ash, silty-sandy and organic particles and blowing air into closed pipes and systems. It is known in practice that moderate and mild wetting and dispersion, or “dewing” can subdue the effects of wind blowing in the form of raising the silt from dry silty-sandy soil. The effect of moistening as a measure of protection from Aeolian erosion has been studied through various scientific and experimental investigations by author Prof. Tiosav Todorović. These investigations encompass changes in the resistivity of slity-sandy soil to Aeolian erosion in conditions of changing moisture, or rather changing angle of internal friction φ and cohesion (c kN/m2) in a functional dependence with the degree of saturation, or soil moisture (W%)
Figure 6. Functional connection of the change in parameters of resistivity to shearing
and humidity of the incoherent silty’sandy soil φ=f(W) i c=f(W), according to T.Todorović (MTT)
Through an analysis of the results obtained through experiments and presented in figure 6, it can be concluded that dry silty-sandy soil W = 0-1% has a cohesion of c = 0 kN/m2, while as the moisture rises W = 6%, the “apparent” cohesion rises as a consequence of the electrochemical bonds of silty and silty-sandy soils, while the angle of internal friction of water saturated soil drops to residual values, which enters the domain of considering structural destruction, suffusion and liquefaction of the soil in

Eco-Ist’12, Ecological Truth, 30 May - 2 June 2012. Hotel “Srbija TIS”, Zajecar, Serbia
294
conditions of pore pressure action, hydrostatic and hydrodynamic and chemical action in static and dynamic load conditions, which was subject to analyses in the previous presentation. From the aspect of Aeolian erosion and the possibilities for protection against it, influences have been studied, or rather initial and limit conditions of the originating of Aeolian erosion , or rather the movement, lifting and carrying of particles of a certain grain diameter (def), depending on wind speed at different levels of soil humidity, that is to say, the impact of “apparent” cohesion according to T. Todorović (2009), Figure 7.
Figure 7. The critical wind speed Vkr at which the lifting and carrying of grains of
diameter def and of different humiditz and “apparent” cohesion begins according to MTT
The aero-geodynamic resistivity of silty-sandy soil carried by wind changes its properties during its transport due to the mutual collision of particles and disintegration. The reactivation of the Aeolian process causes particle disintegration and the creation of “fine” sands and silts. The deposition of Aeolian material, especially in aquatic conditions, creates conditions necessary for sedimentation; electrochemical influences on the interconnecting of silt particles, the rise in cohesion and degree of consolidation, that is to say, it leads to digenetic changes and a circular process of creating sedimentary rocks during geological history. Protection measures against Aeolian erosion should be systematic and within the system of protection and defence. Temporary measures of moistening and “dewing” can only be taken on smaller areas in the aim of protection from silt and the like. Systematic measures encompass significant and larger industrial areas, or are taken as measures of environmental and human health protection. A significant effect of the use of geotechnical melioration can be achieved through aero-dispersion along with a manual finishing of cementing and penetrating the bentonite suspension with an addition of grass and bush seeds, of ambient areas suffering from Aeolian erosion. Agricultural silty-erodible soils should be protected with the adequate agro measures and rows of forest perpendicular to the action of the wind, along with the previously performed geoengineering investigations in the aim of defining optimal solutions for terrain and soil melioration.

Eco-Ist’12, Ecological Truth, 30 May - 2 June 2012. Hotel “Srbija TIS”, Zajecar, Serbia
295
STABILITY ANALYSIS AND APPLICATION OF BIO-TECHNICAL SOLUTIONS IN PROVIDING SUSTAINABLE STABILITY OF SLOPES
The budget of the factor of stability, ie the lack of resistance compensated with
adequate technical and biotechnological solution to the required factor of safety according to MTT
URBAN PLANNING AND TERRAIN ZONING
The geoengineering and biotechnical investigations on the area of the plan for detailed regulation of Zvezdara forest Park were performed in the aim of defining terrain zoning according to the degree of geodynamic appearance and process activation (erosion, sliding and soil flows), and in the aim of defining the suitability and terrain designation for the building of certain urban structures along with the application of technical and biotechnical measures of protection and the security of slope stability. The technical measures for the remediation of deep landslides and soil flows are reinforced-concrete diaphragms and pile curtains, while for shallow landslides and soil flows, they are biotechnical – landscape architectural measures of biological soil reinforcing and shaping of stable hill slopes. The protection and conservation of the environment has been viewed in the function of maintainable stability along with an adequate monitoring of the effects of the proposed solutions.
The calculations for the safety factor, namely the deficit of resistivity that needs to be compensated for with the adequate technical, or rather biotechnical solution until the necessary safety factor is achieved.

Eco-Ist’12, Ecological Truth, 30 May - 2 June 2012. Hotel “Srbija TIS”, Zajecar, Serbia
296
Figure 9. Geoengineering map with terrain zoning according to the degree of erosive-
geodynamic processes and appearances and their impact on the protection and conservation of the environment of Zvezdara Park Forest – Belgrade

Eco-Ist’12, Ecological Truth, 30 May - 2 June 2012. Hotel “Srbija TIS”, Zajecar, Serbia
297
DESIGNING AND CHOOSING THE PLANTING MATERIAL
Figure 10. Applied solutions of landscape architecture in providing sustainable stability
Biotechnical measures could be successfully applied for the rehabilitation of
landslides, especially "conditionally" stable slopes as a preventive rehabilitation measure. After defining the bio-geotechnical model of the terrain for the rehabilitation of the unstable phenomenon, it is necessary to make a selection of plant species, both those with spindle-shaped wire systems, required for deeper landslides and their effects, and those with more advanced core systems and significant characteristics in terms of evaporate transpiration power and features of the natural drainage of the terrain. The landscape planning and design should take into account the purpose of urban and other areas as well as their environment. For the geodynamic model of the terrain shown in Fig.8 the safety factor of the landslide was examined according to the MTT method which confirmed that the key factor of the safety of the slope or slopes without vegetation is Fs = 1.01, while with the application of biological treatment we can expect an increase in the factor of slope stability over time and upto Fs = 1.5. Plants for maintainable slope stability
• Trees: Fraxinus latifolia, Pseudotsuga menziesii, Carpinis betulus, Populus tremula, Robinia pseudoacacia, Albizia sp., Cedrus deodara, Celtis australis
• Shrubs: Tamarix sp., Cottinus coggygria, Corylus avelana, Pyracantha coccinea • Grass and perreneal plants: Imperata cylindrica, Elymus sp., Carex sp.,
Chrysopogon zizanioide
Zvezdara Park Forest
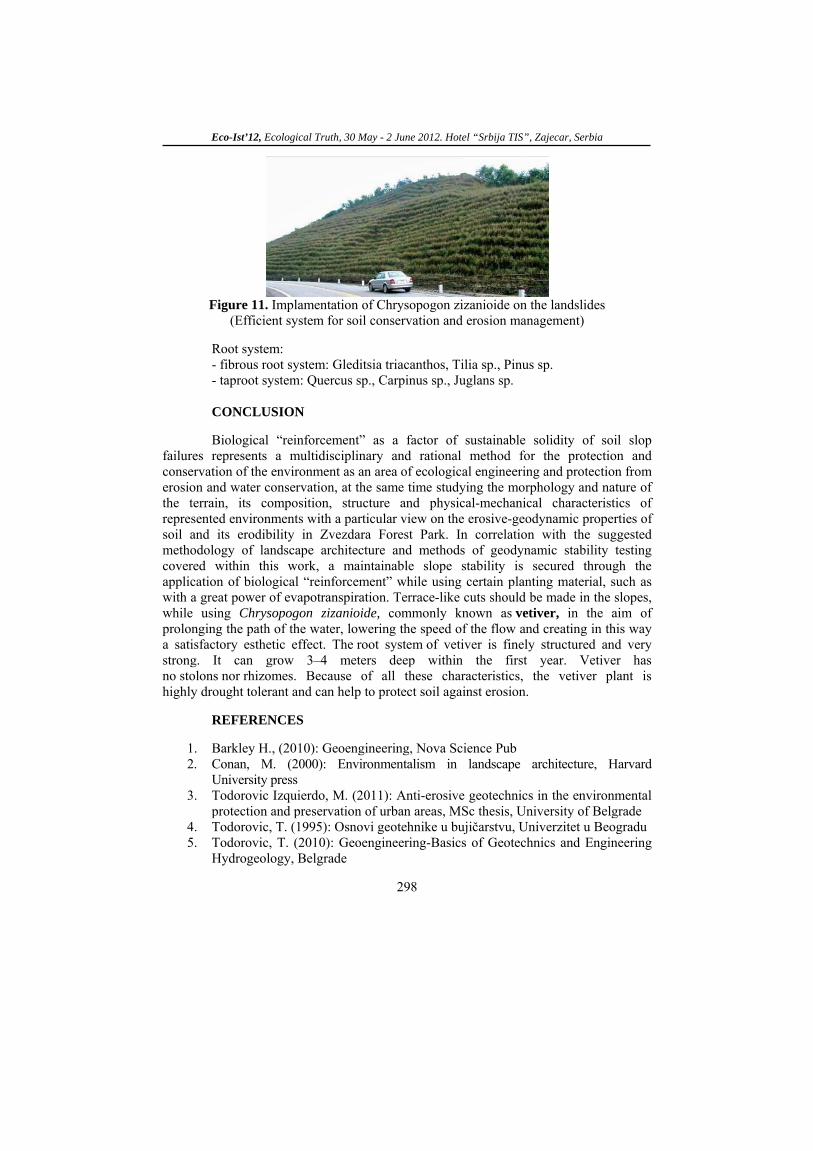
Eco-Ist’12, Ecological Truth, 30 May - 2 June 2012. Hotel “Srbija TIS”, Zajecar, Serbia
298
Figure 11. Implamentation of Chrysopogon zizanioide on the landslides
(Efficient system for soil conservation and erosion management)
Root system: - fibrous root system: Gleditsia triacanthos, Tilia sp., Pinus sp. - taproot system: Quercus sp., Carpinus sp., Juglans sp. CONCLUSION Biological “reinforcement” as a factor of sustainable solidity of soil slop
failures represents a multidisciplinary and rational method for the protection and conservation of the environment as an area of ecological engineering and protection from erosion and water conservation, at the same time studying the morphology and nature of the terrain, its composition, structure and physical-mechanical characteristics of represented environments with a particular view on the erosive-geodynamic properties of soil and its erodibility in Zvezdara Forest Park. In correlation with the suggested methodology of landscape architecture and methods of geodynamic stability testing covered within this work, a maintainable slope stability is secured through the application of biological “reinforcement” while using certain planting material, such as with a great power of evapotranspiration. Terrace-like cuts should be made in the slopes, while using Chrysopogon zizanioide, commonly known as vetiver, in the aim of prolonging the path of the water, lowering the speed of the flow and creating in this way a satisfactory esthetic effect. The root system of vetiver is finely structured and very strong. It can grow 3–4 meters deep within the first year. Vetiver has no stolons nor rhizomes. Because of all these characteristics, the vetiver plant is highly drought tolerant and can help to protect soil against erosion.
REFERENCES
1. Barkley H., (2010): Geoengineering, Nova Science Pub 2. Conan, M. (2000): Environmentalism in landscape architecture, Harvard
University press 3. Todorovic Izquierdo, M. (2011): Anti-erosive geotechnics in the environmental
protection and preservation of urban areas, MSc thesis, University of Belgrade 4. Todorovic, T. (1995): Osnovi geotehnike u bujičarstvu, Univerzitet u Beogradu 5. Todorovic, T. (2010): Geoengineering-Basics of Geotechnics and Engineering
Hydrogeology, Belgrade

299
XX International Scientific and Professional Meeting
"ECOLOGICAL TRUTH" ECO-IST'12
30 May - 2 June 2012, Hotel “Srbija TIS“, Zajecar, SERBIA
PHYTOREMEDIATION OF SOILS CONTAMINATED
WITH HEAVY METALS
Tea Spasojevic-Santic1*, G. Drazic2, Z. Radojevic
1
1IMS Institute, Bulevar vojvode Mišica 43, Belgrade, SERBIA 2
Faculty of Applied Ecology-Futura, Lazarevacki drum 13, Belgrade, SERBIA
ABSTRACT
Heavy metals are among the most widespread pollutants of soil and wider environment. Attention is directed to their toxicity, behavior in the soil and entering the food chain through plants. Phytoremediation is the use of biotechnology, which includes plants for the extraction, sequestration and/or detoxification of pollutants that are present in the soil. Plant species and genotypes are significantly differ in the ability distribution of heavy metals. Therefore, in this paper points is on the different options of phytoremediation, with special emphasis on plant species that are the basis of previous studies have shown good results. Still finding species and genotypes and/or creating them using biotechnological processes can significantly improve the application of plants in the remediation of contaminated soil with heavy metals.
Key words: phytoremediation, heavy metals, hyperaccumulators
, biomass
INTRODUCTION
Due to improper disposal of industrial waste land in industrial areas often contain increased concentrations of cadmium, lead, chromium and arsenic, which significantly affects the vital functions of the ecosystem of industrial zones and reduced self-purification ability of the environment [1].
Heavy metals because of its toxicity and lower concentrations disturb the balance in the system of micro-organisms-plants, causing a reduction in the number and diversity of microorganisms and biochemical activities. Since they are not biodegradable, they can accumulate in biological systems and in different forms circulate in the ecosystem, present a potential threat to all components of the ecosystem.
Phytoremediation is biotechnology, which involves the use of plants for the extraction, sequestration and / or detoxification of pollutants that are present in the soil. This method is considered the cheapest and easiest way to clean the land. Plants that are used in the remediation of land can be divided into two main groups. The first group includes plants hyperaccumulators which maximize the concentration of pollutants in their tissues, and in the second group are plants that produce large amounts of biomass with low concentrations of the adopted elements, and they are very suitable for further

Eco-Ist’12, Ecological Truth, 30 May - 2 June 2012. Hotel “Srbija TIS”, Zajecar, Serbia
300
use for energy purposes in the form of environmentally friendly renewable energy sources [2].
So far has been detected over 400 plant species from around 45 families defined as hyperaccumulators one or more heavy metals. The largest number of plants accumulating nickel (Ni), about 30 plants absorb cobalt (Co) or copper (Cu) and / or zinc (Zn), a small number of plants accumulate manganese (Mn) and cadmium (Cd). A metallophyte store huge amounts of heavy metals (0.5 g / kg, up to 25 g / kg dry weight of plants), about the quantities in which adopted the basic macroelements, which is 1,000 times more than the required amount of micronutrients [3]
On the basis of action of plants to pollutants current science distinguishes several different systems phytoremediation of soil and water, which according to [4] can be classified as follows:
.
• Phytoextraction - using plants that are able to adopt contaminants
• Phytostabilization - involves the use of plants that contain, or immobilize contaminants in soil through: absorption and accumulation by the root system, adsorption on the surface of the root, the precipitation in the root zone.
through the root system and translocated and / or accumulate them to the shoots (stem and leaves).
• Rhizospheric biodegradation / stimulation of microorganisms - decomposition of pollutants in the soil due to the interaction of microbes / root / soil.
• Phytodegradation / phytotransformation - includes the decomposition of pollutants through: the metabolic processes (internally) and the release of enzymes in soil.
• Phytovolatilization - transpiration and absorption of pollutants into the atmosphere by plants.
MANAGING THE PROCESS OF PHYTOREMEDIATION
To be able to fully understand the process of the movement and fate of
contaminants in soil, it it is necessary to characterize the soil, including geological, hydrological and physico-chemical analysis, where the constants are determined sorption, distribution and migration of pollutants [5].
The behavior of contaminants in the soil depends mainly on its density, solubility and viscosity, as well as the type of soil, its porosity, particle size, moisture content and organic matter. In addition to the above mentioned factors, climatic conditions such as temperature and precipitation play an important
Phytoremediation procedure takes place in several stages: soil preparation, planting, planting in full vegetation, drying, incineration, disposal or extraction of metals. Soil is being prepared for planting as usual crops. Given the specificity of contaminated soil adjusted to pH and other characteristics. Plants that were planted during the growing season adopt or carry out detoxification of pollution [6]. After a full growing seasons, the plants are removed, dried and burned. Depending on the concentration and type of approved metal, ash is disposed of or if it is economically feasible, metal is removed from fly ash and sales after purification (Fig.1).
role.
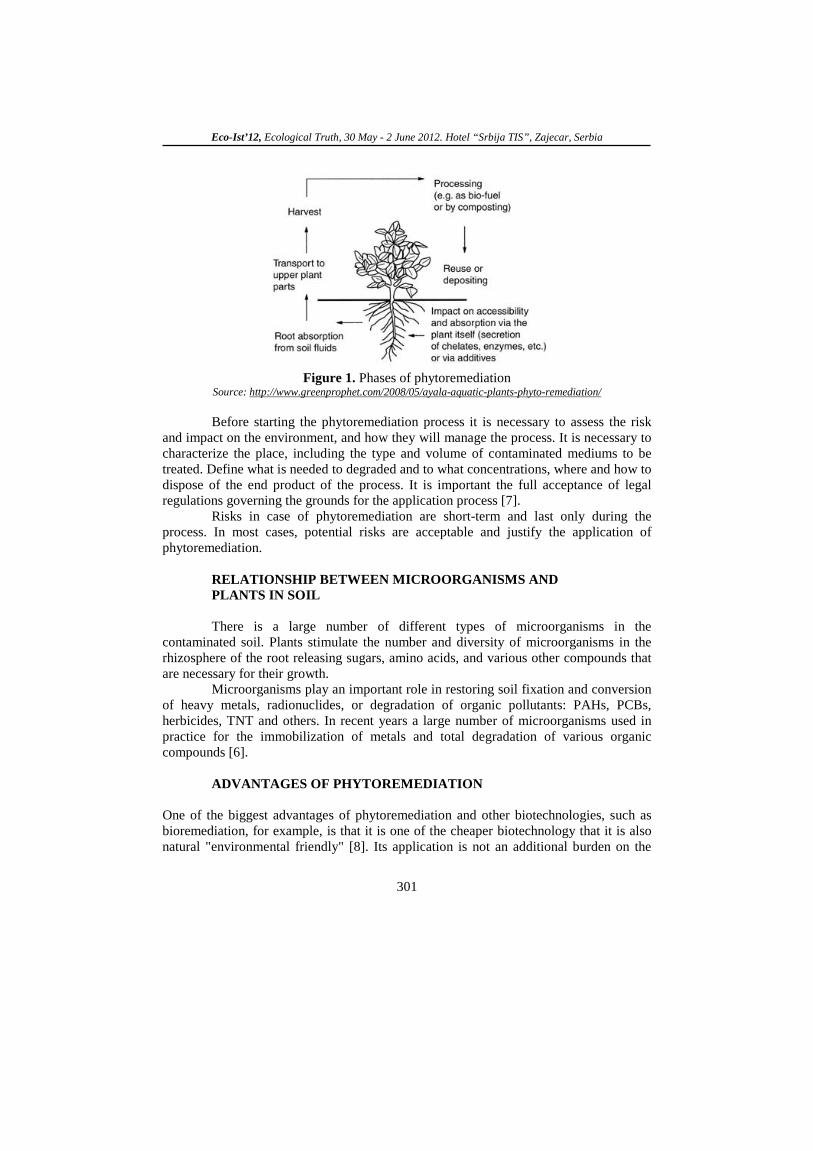
Eco-Ist’12, Ecological Truth, 30 May - 2 June 2012. Hotel “Srbija TIS”, Zajecar, Serbia
301
Figure 1. Phases of phytoremediation
Source: http://www.greenprophet.com/2008/05/ayala-aquatic-plants-phyto-remediation/
Before starting the phytoremediation process it is necessary to assess the risk and impact on the environment, and how they will manage the process. It is necessary to characterize the place, including the type and volume of contaminated mediums to be treated. Define what is needed to degraded and to what concentrations, where and how to dispose of the end product of the process. It is important the full acceptance of legal regulations governing the grounds for the application process [7].
Risks in case of phytoremediation are short-term and last only during the process. In most cases, potential risks are acceptable and justify the application of phytoremediation.
RELATIONSHIP BETWEEN MICROORGANISMS AND PLANTS IN SOIL
There is a large number of different types of microorganisms in the
contaminated soil. Plants stimulate the number and diversity of microorganisms in the rhizosphere of the root releasing sugars, amino acids, and various other compounds that are necessary for their growth.
Microorganisms play an important role in restoring soil fixation and conversion of heavy metals, radionuclides, or degradation of organic pollutants: PAHs, PCBs, herbicides, TNT and others. In recent years a large number of microorganisms used in practice for the immobilization of metals and total degradation of various organic compounds [6].
ADVANTAGES OF PHYTOREMEDIATION
One of the biggest advantages of phytoremediation and other biotechnologies, such as bioremediation, for example, is that it is one of the cheaper biotechnology that it is also natural "environmental friendly" [8]. Its application is not an additional burden on the

Eco-Ist’12, Ecological Truth, 30 May - 2 June 2012. Hotel “Srbija TIS”, Zajecar, Serbia
302
environment because are used only natural objects as cleaning agents, those species that normally can grow or grow at a given contaminated area.
As an advantage to states is that provide energy for this biotechnology takes place in a natural way because the plants use solar energy to the extent that they need for growth, development and conduct of all physiological processes, and mechanisms for phytoremediation [4].
Application of phytoremediation process can be achieved and some side effects whose importance changes depending on which plant species or species used for phytoremediation. Planting of some tree species are created also the protective strips which can effectively reduce noise in the region and provide protection from the wind, reduce emissions of carbon dioxide in the atmosphere, create new habitats for the development of the fauna or represent the source of biomass for the felling of trees at the end of treatment if it should be removed from the location.
DISADVANTAGES
OF PHYTOREMEDIATION
On the other hand, there are limitations in terms of type of pollution that is present in nature as well as on its concentration, because if the concentration exceeds the capacity of species for tolerance to the toxic substance, it will act on it and perhaps suppressing lethal.
One of the very important factors when it comes to the applicability and effectiveness of phytoremediation is the availability of pollutants to the plant and its rhizosphere. The roots of plants will be the best and easiest way to acquire those molecules, ions and atoms that are dissolved in soil solution. Selection of species that will be applied for phytoremediation is a critical step that determines the success of phytoremediation [9].
BIOMASS STORAGE
In the process of phytoremediation is created biomass with a certain concentration of metal that is removed. Contaminated plant waste can be stored in landfills, reduced by microorganisms, physical or chemical methods or incinerated. Mainly is burned and the ashes are stabilise (asphalt, cement and glass). Some metals (Ni, Zn, Cu) can be recycled from the waste and re-use, and partially offset the cost of phytoremediation [6].
It is important to note that by burning process metal oxides are formed. Metals are classified as volatile (Hg and Cd) and nonvolatile (Ni, Cr and Cu) and the intermediate group, which consists of Zn and Pb. Metal oxides are toxic and carcinogenic and therefore must take care of their emissions during incineration.
The ash obtained by burning biomass can contain up to 30% metal. This concentration is several times exceed the concentration of metals in ores. Thus, bio-ash and bio-minerals provides a rich source of metals and depending on the profitability of the process and the value metals can be extracting.

Eco-Ist’12, Ecological Truth, 30 May - 2 June 2012. Hotel “Srbija TIS”, Zajecar, Serbia
303
GENOTYPES HYPERACCUMULATORS OF
HEAVY METALS IN SOIL
Hyperaccumulation is genetic and physiological ability of plants to accumulate and transform heavy metals in the aboveground shoot at a concentration much higher than in soil or roots [10]. Hyperaccumulators are defined as those species that are able to accumulate more than 1 g metal / g dry weight of plants for Co, Cr, Cu, Pb, Ni, or 10 g metal / g dry weight for Mn and Zn.
Probably the most famous hyperaccumulator of heavy metal is a type of Thlaspi caerulescens. While the largest number of plants showing symptoms of zinc toxicity at concentrations of 100 ppm, this plant accumulates Zn concentration of 26,000 ppm without any damage [3].
Many plants, including T. caerulescens have shown the ability of settlement (colonization) of land that are enriched with lead (Pb), zinc (Zn) and cadmium (Cd) [3]. This species, together with the type of Brassica juncea is a model for the study of physiology and biochemistry of the adoption of heavy metals.
In Table 1 according to [10] shows typical plants used in phytoremediation process in relation to the type of pollutant.
Table 1. The classification method of phytoremediation in relation to the type of pollutants
Method
Pollutants
Typical plants
Phytotransformation nitrates, ammonia, phosphates
- Salix family trees: poplar and willow - Grasses - Legumes
Phytostabilization Pb, Cd, Zn, As, Cu, Cr, Se, U - Salix family trees - Grass with root vessels
Phytoextraction Pb, Cd, Zn, Ni, Cu - Indian mustard - Sunflower - Hyperaccumulators
Phytovolatilization Se, As, Ag - Indian mustard - Aquatic plants - Salix family trees
Landfill blanket metals, ammonia, nitrate - Grasses - Poplar and willow
USE OF PLANT IN THE INDICATION OF SOIL POLLUTED WITH HEAVY METALS
The ability of plants to develop resistance to heavy metals in soil are genetically
determined, and in special situations in nature, can be adaptively stimulated. Generally, plants adapted to soil rich in various metals have been identified as metallophyte and are suitable for planting and revitalization of the area around the mines and industrial plants or in places where the soil is contaminated with heavy metals [3].
Eco-Ist’12, Ecological Truth, 30 May - 2 June 2012. Hotel “Srbija TIS”, Zajecar, Serbia
304
The biomonitoring of heavy metals are usually analyzed leaves and bark of trees, but it is also recommended use of roots and rhizomes in the assessment of pollution. Accumulation of heavy metals in plants at higher concentrations indicates the relative increase in the spread of contamination at the site. The best known species that is able to accumulate lead and translocated it from the roots to the outgrowth is (Indian mustard) Brassica juncea. There are numerous examples of test B. Juncea and her ability to accumulate lead in the above ground stem. During accumulation she achieved the accumulation of lead concentration in the leaves that is greater than 1.8% of its dry weight. Viola arsenica is species that is an indicator of soil that are rich in arsenic [11].
One of the most interesting and controversial plants for biological indication of soil pollution in urban ecosystems is Ailanthus altissima - sour tree (tree of heaven) [12]. Nowdays, Ailanthus altissima is one of the best deciduous species adapte into the complex conditions of polluted urban biotopes.
CONCLUSION
The different types of phytoremediation can be successfully applied only if they fully meet all the criteria required for their successful implementation. It is therefore very important to understand the physical-chemical processes that occur between pollutants and soil particles, migration through the soil layers and the interaction with groundwater. In regard to the complexity of the problem and the nature of the contaminants, it is necessary to consider all factors that affect the efficiency of phytoremediation processes (solubility and availability of pollutants, temperature, pH, etc.).Certainly the basic and crucial criterion is the correct selection of the species. Further selection of found species hyperaccumulators is required and improve the adoption of metals using genetically modified plants. It is necessary to create multidisciplinary teams and integralist approach to the process of phytoremediation of soil contaminated with heavy metals in order to be successful.
REFERENCES
1. Spasojević-Šantić T., The importance of bioremediation of industrial landfills, Thesis, University Singidunum, Faculty of Applied Ecology-FUTURA, Belgrade, Serbia, 2011.
2. Spasojević-Šantić T., Dražić G., Petrović B., Analysis of the situation of industrial waste management in the Republic of Serbia in terms of bioremediation landfill, The Third Regional scientific-technical conference on the management of industrial waste in the area of sustainable development, IWM 3, Proceedings (ISBN 978-86-85013-09-6), Kopaonik, Serbia, 65-71, 2011.
3. Stevanović, B., Janković, M. M., Ecology of plants with the basics of plant physiological ecology. - NNK, Belgrade, Serbia, 2001.
4. Pilipović, A., Klašnja, B., Orlović, S., The role of poplars in phytoremediation of soil and groundwater, Topola, Serbia, 169/170: 57-66, 2002.

Eco-Ist’12, Ecological Truth, 30 May - 2 June 2012. Hotel “Srbija TIS”, Zajecar, Serbia
305
5. Beškoski V., Gojgić-Cvijović G., Milić J., Ilić M., Miletić S., Jovančićević B., Vrvić M., Bioremediation of soil contaminated with petroleum and derivatives: microorganisms, decomposition paths, technology, Department of Chemistry, Institute of Chemistry, Technology and Metallurgy, University of Belgrade, Belgrade, Serbia, 2011.
6. Dražić, G., Ecoremediation, University Singidunum, Faculty of Applied Ecology Futura, Belgrade, Serbia, 2010.
7. Vrvić, M., Beškoski, V., Remediation no alternative- Bioremediation technique selection, Obrenovac, Serbia, 2008.
8. Lasat, M. M., Phytoextraction of Toxic Metals: A Review of Biological Mechanisms, Journal of Environmental Quality, 31: 109-120, 2002.
9. Anderson, A. T., Development of a Phytoremediation Handbook: Considerations for Enhancing Microbial Degradation in the Rhizosphere, Institute of Environmental and Human Health, Texas Tech University, Texas, 2002.
10. Rončević, S., Remediation of sediments contaminated with metals, CECRA, Novi Sad, Serbia, 2008.
11. Stevanović, V., Stevanović, B., The main climatic, geological and pedological factors biodiversity of terrestrial ecosystems Yugoslavia. In: Stevanovic, V. and V. Vasic (ed.): Biodiversity of Yugoslavia with the examination-species of international importance, Faculty of Biology, University of Belgrade, Belgrade, 1995.
12. Jovanović, S., Filipović, V., Mačukanović, M., Dražić, G., Stevanović, B., Distribution and ecology of species Ailantus altissima (Mill.) Swingle in the City Belgrade - Gazette of the Institute of Botany and Botanical Garden, University of Belgrade, 31: 9-21, 1997/1998.

306
XX International Scientific and Professional Meeting
"ECOLOGICAL TRUTH" ECO-IST'12
30 May - 2 June 2012, Hotel “Srbija TIS“, Zajecar, SERBIA
REPORT ON THE USE OF ENZYMATIC BACTERIAL PRODUCTS FOR
THE BIOREMEDIATION OF SOILS POLLUTED BY ORGANIC SUBSTANCES
Branislav Jerinkic*, B. Starcevic
Eurovix Srl, ITALY
ABSTRACT The report is about the addition of enzymatic bacterial products and nutrients to enhance the process
of degradation of organic substances in polluted soils.
Key words :Enzymes, bacteria, bioremediation, pollution, organic substances, promoter
INTRODUCTION Among the several techniques that are applied to remediate polluted soils, the
microbiological method can be considered the most practical and economical. Even if with the microbiological method several biodegradable substances can be removed, the experiences that we have done up to now are with decontamination of soils polluted by hydrocarbons coming from oil pipelines, buried holding tanks, and the remediation of soils polluted by organic matter coming from spilling of dumpsites of urban garbage. The aim of microbiological treatments is to turn the organic biodegradable pollutants into bacterial biomass and non toxic compounds deriving from bacterial metabolism as carbon dioxide, methane, water etc.
DESCRIPTION OF THE METHOD
The application of enzymatic bacterial products can be done in three way :
- IN SITU : when the soil remains in the same place and the treatment is done
putting the product into the soil. This is done when the pollution is not very deep ( max 1m ) and the product is diluted in water and put into the ground with pneumatic system.
- ON SITU : when the soil is removed and put in a pile and the products are added to the pile. After the treatment and the effect of the products the soil is placed in it’s original site.

Eco-Ist’12, Ecological Truth, 30 May - 2 June 2012. Hotel “Srbija TIS”, Zajecar, Serbia
307
- OFF SITU : when the soil is removed and carried to special areas for the treatment. This is done when the polluted area has to be used urgently.
It is important to keep a good aeration and humidity, a balanced ratio among the
nutrients and organic substances in order to prevent extreme conditions of pH and temperature.
ADVANTAGES
The advantages of microbiological method for soil remediation are :
- The costs of this treatment are inferior to other methods. This is due to the low
energy costs, in particular when the treatment is done in site and there is no need to remove the polluted soil.
- In microbiological methods the pollutants are removed because they are metabolized by bacteria and they are not simply carried from one place to another as far other methods of soil remediation. In fact with non biological methods the pollutants are turned into a liquid, gaseous or solid substance that has to be further treated or stored. The bacteria contained in our products are not genetically modified, they don’t require any protection of surrounding environment, water systems or of the operators. Our philosophy is based on the application of natural methods and on the “ amplification “ of natural process that are already occurring.
- With microbiological methods the soil is biologically active and therefore living.
The microbiological method exploits the capacity of the bacterial biomass to
metabolise the pollutant, it is important that the pollutant is biodegradable. The substances that are used as nutrients from the bacteria are carbon substances and therefore organic.
LABORATORY TESTS FOR THE DEGRADATION OF PCB IN SEDIMENT AND SOIL
Applied products :
1. Enzymatic bacterial biological promoter, specific for remediation of soils
polluted by bioaccumulative organic molecules. It optimize and fasten biodegradation processes that are usually carried out by autochthonous microflora in the soil and by the selected microorganisms contained in the promoter.
2. Nutrient – synergizer, specific for the remediation of soils polluted by bioaccumulative organic molecules.

Eco-Ist’12, Ecological Truth, 30 May - 2 June 2012. Hotel “Srbija TIS”, Zajecar, Serbia
308
DESCRIPTION OF THE TEST
The test was carried out putting the samples in the external and acted in the following way : Pre – treatment of samples : We took two samples each of both soil and sediment that were representative of the polluted areas, we weighed them and filtered at 2 mm and put them in an external area. Preparation of sample and application
We added to 15 kg of soil and sediment and added the Promoter made up of highly selected enzymes and bacteria and Nutrient – synergizer in order to supply ready to use carbon and nutrients.
Every week the containers were mixed and the following parameters were checked :
- Humidity - Total count - Yeast and moulds - Temperature
RESULTS OF THE TEST
After about 30 days we analyzed all the treated samples and got the following
results :
Table 1. Analysis of PCB Duration of the test Soil T1 Soil T2 Sedim. S1 Sedim. S2
Beginning ( mg/kg ) 17,20 17,20 90,30 90,30 After 30 days ( mg/kg ) 1,40 0,30 10,10 7,60 After 45 days ( mg/kg ) 0,70 0,30 27,30 14,10 Degradation in % 91,8 98,2 69,7 84,4
Figure1. Abatement of PCB in the sediment

Eco-Ist’12, Ecological Truth, 30 May - 2 June 2012. Hotel “Srbija TIS”, Zajecar, Serbia
309
Figure 2. Abatement of PCB in the soil
OPTIMIZATION OF LAND FARMING PROCESSES WITH THE USE OF SELECTED ENZYMATIC BACTERIAL PRODUCTS
Results of the treatment Applied products :
1. Complex biological activator made up of enzymes, bacteria and nutrients,
recommended in order to active and improve the biodegradation of hydrocarbons. It optimizes and fastens biodegradation processes that are usually carried out by autochthonous microflora in the soil and by the selected microorganisms contained in the product.
2. Nutrient – synergizer, specific for the remediation of soils polluted by bioaccumulative organic molecules.
DESCRIPTION OF THE TREATMENT
The treatment was carried out on an area where previously was refinery of
petrol. The large project of restoration of the whole area included different technologies. We applied our products for enhancing the land farming techniques on 150.000 cubic meters of soil. Land farming is technique that can be applied to soils polluted by hydrocarbons that are in a specifically prepared area, we applied Nutrient – synergizer and the Activator on the soil at dosage suitable for the level of pollution. Samples of soil were taken from different rows of soil and analyzed at different times.

Eco-Ist’12, Ecological Truth, 30 May - 2 June 2012. Hotel “Srbija TIS”, Zajecar, Serbia
310
RESULTS OF THE TREATMENT
The analysis of total hydrocarbons gave the following results : Table .2.
ROWS 1 2 3 4 5 6
Before the treatment (average ) mg/kg 1.801 1.408 1.002 1.306 786 412 After 1 month (mg/kg) 354 260 202 299 383 205 After 2 months (mg/kg) 14 26 <10 <10 <10 <10 Reduction in % 99 98 100 100 100 100
Figure 3. Reduction of total hydrocarbons
CONCLUSION
The results of the tests described in this paper are very promising and justifies
further research in this area. In this due our team still working on better solutions for selected enzymes and
bacteria for more successful remediation.

311
XX International Scientific and Professional Meeting
"ECOLOGICAL TRUTH" ECO-IST'12
30 May - 2 June 2012, Hotel “Srbija TIS“, Zajecar, SERBIA
THE QUALITY IMPROVEMENT OF WATER USED FOR IRRIGATION
PURPOSES THANKS TO THE APPLICATION OF ENZYMATIC BACTERIAL PROMOTERS
Branislav Jerinkic*
, B. Starcevic, P. Brignoli, S. Ansfferi
Eurovix Srl, ITALY
ABSTRACT This paper describes one aspect of our research on the possibilities of application selected
enzymatic bacterial products for the quality improvement of polluted water for irrigation purposes.
Key words : irrigation water, promoters, eutrophication, pollutants, transparency
INTRODUCTION The water collected in open basins is subject of serious pollution due to the
leachate of residues from chemical fertilizers, organic and faecal pollution, eutrophication etc.
In natural aquatic ecosystems, pollutants are removed by combination of chemical, physical and biological processes. The most important are sedimentation, precipitation, absorption, uptake from the trees and microbial activity. Nitrogen and phosphorous, that are typical indicators of eutrophication, can be quite rapidly removed when self depurating processes are efficient. Nitrates are assimilated by macrophytes or turned into gaseous nitrogen by the microorganisms through biochemical processes of denitrification.
Phosphorous may be adsorbed by plants, or may become insoluble as mineral phosphates of calcium, iron and aluminum or may create organic complexes, more or less stable, that eventually mineralize through chemical or biological processes.
Microorganisms i.e. bacteria and enzymes that are able to degrade pollutants can grant a fundamental help to the quality of water in an aquatic ecosystem. The level of pollution in surface water ( rivers, lakes, lagoons etc. ) is anyway much higher than the biological self depuration capacity. The use of enzymatic bacterial promoters with a large range of selected microorganisms and enzymes is aimed at helping natural processes to carry out this important task. Several our studies have monitored the quality of water after the application of enzymatic bacterial promoters, especially gram –
Eco-Ist’12, Ecological Truth, 30 May - 2 June 2012. Hotel “Srbija TIS”, Zajecar, Serbia
312
positive Bacillus spp., that are usually more efficient than gram – negative in converting organic substances into CO2.
MATERIALS
This study describes the experience, made in Summer 2011. in an accumulation basin of water used for irrigation of gardens and trees. The dimensions of the basin are : surface 3.700 m2 ; depth 2,5 m ; volume 9.250 m3. The water has been treated every week for the first month ( starting date : July the 8th
The enzymatic bacterial promoter was pre – dissolved in lukewarm water before the application. Features of the biological promoter : carefully selected non pathogenic and useful microorganisms from very controlled fermentation belonging to class 1, mainly of Bacillus spp.; pool of enzymes with prevalence of amylase, lipase, protease, cellulose, beta – gluconase, pectinase nutrients and supports.
) and every two weeks for the following months, at a dosage of 1 g of enzymatic bacterial promoter every cubic meter of water.
METHODS
Methods of analysis :
- for the concentration of phytoplankton we used absorbance at 340 nm with spectrometer UV / VIS 190 – 900 nm,
- for chemical parameters the methods used were APAT CNR IRSA 4030B – 4020 man 29 – 2003 and 2001,
- for the microbiological parameters we applied APAT CNR IRSA 7030F man 29 – 2003 and 2001, and
- for transparency the Secchi disk.
RESULTS AND DISCUSSION
The concentration of suspended phytoplankton was indirectly measured using a “ spectrophotometric field measurement “ at the wave length of 340 nm ( peak at major absorbance detected in the sample collected before the treatment ). The progressive reduction of the absorbance value to 340 nm in the samples collected shows the magnitude of the reduction of concentration of phytoplanktonic material ( Table 1. Absorbance ). We noticed a direct correlation between the reduction of absorbance and the increase of transparency, measured with Secchi disk ( Table 1. ). Table 1. Values of absorbance and transparency of water
Date July 7 17th 27th Aug 7th 18th 28th Sep7th 19th th Absorbance ( 340 nm ) 0.140 0.122 0.076 0.070 0.065 0.060 0.059 0.057 Transparency ( cm ) 20 25 70 75 85 85 90 95

Eco-Ist’12, Ecological Truth, 30 May - 2 June 2012. Hotel “Srbija TIS”, Zajecar, Serbia
313
In the Table 2. is reported the evaluation of chemical parameters in time, showing a progressive reduction of BOD5, of total phosphorous and ammonia nitrogen starting from the situation before the treatment ( July 7th ). Table 3. reports microbiological parameters showing a fast reduction both of total coliforms and feacal streptococci that in one month ( July 7th – August 7th
) are reduced respectively by 98% and 80% and almost totally eliminated in the following months.
Table 2. Evaluation of chemical parameters in time Date July7 17th 27th Aug 7th 18th 28th Sep 7th 19th th PH 7.6 7.4 7.5 7.5 7.7 7.7 7.5 7.4
Conductivity (μS/cm) 721 710 725 630 615 600 509 512 BOD5 (mg / l) 22 20 21 10 5 <5 <5 <5
Total phosphorous (mg / l) 1.3 1 <1 <1 <1 <1 <1 <1
NH4 (mg / l) 3.1 3 3.4 1.1 0.8 <0.2 <0.2 <0.2 Table 3. Evaluation of microbiological parameters in time
Date July 7 17th 27th Aug 7th 18th 28th Sep7th 19th th Total coliform CFU / 100ml ) 12000 3500 3000 200 500 0 0 0
Faecal streptococci ( CFU / 100ml ) 151 85 90 30 0 0 0 0
The improvement, shown by the analysis of control could be clearly noticed
also from the improvement of the appearance of water and the reduction of fouling that deposits inside pipelines. The blockage of sprinklers, that previously were frequent and caused economical damages, have been almost completely eliminated.
CONCLUSION
The use of enzymatic bacterial promoters can bring important advantages to the
quality of water stored in basins and then used in irrigation plants, thus allowing reduction of ordinary maintenance costs ( cleaning operations of pipelines and sprinklers ) and further reduction of investments on mechanical filtration systems that could be used to filter only non sedimentary organic particles.
Also very interesting is the reduction of pathogenic bacterial charge, which is important especially when the water is used for irrigation of edible crops or when a storage basin is located in public area.
REFERENCES
1. Boyd, C.E. and Gross, A. 1998. Use of probiotics for improving soil and water quality in aquaculture ponds. In T.W. Flegel ( ed. ), Advances in shrimp biotechnology. National Center gor Genetic Engineering and Biotechnology, Bankok, Thailand. p. 101-106

Eco-Ist’12, Ecological Truth, 30 May - 2 June 2012. Hotel “Srbija TIS”, Zajecar, Serbia
314
2. Brix, H. 1993. Wastewater treatment in constructed wetlands : system design, removal process and treatment performance. In Moshiri, G.A. ( ed. ), Constructed Wetlands for Water Quality Improvement. CRC Press, Boca Raton, Florida.p. 9-22.
3. Kadlec, R.H. and Knight, R.L. 1996. treatment wetlands, Lewis Publishers, Boca Raton, Florida. p. 893.
4. Mitsch, J.W. and Gosselnik, J.G. 1986. Wetlands. Van Nostrand Reinhold Comp., New York. p. 536.
5. Preisendorfer, R.W. 1986. “Secchi disk science : Visual optics of natural waters “, limnol Oceanorg. 31, 909-926
6. Stainer, R.Y., Doudoroff, M. and Adelberg, E.A. 1963. The microbal world. 2nd
7. Williams, M.1990. Understanding wetlands. In : Williams, M. ( ed. ) wetlands : A Threatened Landscape. Basil Blacjwell, Oxford. p. 1-41.
edn. Prentice Hall, Englewood Cliffs. p. 528

315
XX International Scientific and Professional Meeting
"ECOLOGICAL TRUTH" ECO-IST'12
30 May - 2 June 2012, Hotel “Srbija TIS“, Zajecar, SERBIA
BIOREMEDIATION AND INDOOR AIR QUALITY
Dubravka Perovic1*, T. Spasojevic-Santic
2
1Clinical Center of Serbia, Pasterova 2, Belgrade, SERBIA 2
IMS Institute, Bulevar vojvode Mišića 43, Belgrade, SERBIA
ABSTRACT
A large number of analyses of the quality of indoor air indicated that it is very polluted, even dozens of times from the air in the environment, so it appears so-called "sick building syndrome". Bioremediation is biotechnological method to purify the air and to reduce the pollution of indoor air. The aim of study is to highlight the importance of bioremediation of indoor air, with green walls application and a mixture of microorganisms, in order to improve health and enhance the quality of both residential and working environments.
Key words: bioremediation, microorganisms, green wall, air quality
INTRODUCTION
In modern society, human spends more time on the premises, whether it's residential or office. According to research many people up to 90% of their time spent indoors. The concentrations of certain contaminants in the indoor air space can be between 2 and 5, which is average, and sometimes even up to 100 times greater than their concentration outside [1].
Therefore, Environmental Protection Agency
All the facts show how important is this issue and that is necessary to pay special attention when designing new buildings to air quality in reference to quality and effective ventilation. As one of the alternative solutions is green walls application based on the principle of bioremediation and phytoremediation perform indoor air purification.
(EPA) declared the indoor air quality as one of the five main problems related to public health. According to research conducted in the U.S. every year medical accounts are the result of poor indoor air quality and amounts about $ 1 billion, and losses due to lost productivity and absence from work are up to $ billion 60 [2].

Eco-Ist’12, Ecological Truth, 30 May - 2 June 2012. Hotel “Srbija TIS”, Zajecar, Serbia
316
SICK BUILDING SYNDROME
1984th The Committee of the World Health Organization (WHO) has filed a report that estimates that as many as 30% of new and renovated buildings throughout the world does not meet the indoor air quality.
By (WHO) definition "Sick Building Syndrome" is a condition characterized by irritated mucous membranes, vegetative disorders such as headache and fatigue, as well as disruption of mental health and depression [3]. Sick Building Syndrome is directly related to the internal indoor air quality (IAQ - indoor air quality). Indicators that a building has SBS are: tenants and occupants complain of symptoms associated with the current discomfort (headaches, eye irritation and respiratory tract, dry cough, dry or itchy skin, dizziness, inability to concentrate, etc..). Most symptoms disappear shortly after leaving the building [3].
The most common indoor air pollutants are: asbestos, biological contaminants (mold, pollen, and viruses), carbon monoxide (CO), lead (Pb), nitrogen dioxide (NO), radon (Rn) 222, volatile organic compounds (VOC), etc [4].
Figure 1. Sources of indoor pollutants Source: http://onesourcegroup.blogspot.com/2011/07/indoor-air-quality-and-its-health.html
APPLICATION OF BIO GREEN WALLS
The green walls are a modern solution, sustainable system for growing plants
on vertical surfaces. These ecosystems are designed so that plants grown on a separate structural system that can be freestanding and adjacent or attached to the wall. Systems are maintained without the use of chemicals (pesticides, herbicides) and can be placed in areas with natural or artificial light. Placed in the work environment, they enrich it with oxygen, filter the air of particulates and improve the microclimate [5].

Eco-Ist’12, Ecological Truth, 30 May - 2 June 2012. Hotel “Srbija TIS”, Zajecar, Serbia
317
These botanical biofilters are used as an alternative or supplement to the ventilation system. Instead of taking the air from the environment, to replace the air in the room, biofilters refresh and purify the same air that is in the room so that it can be recirculated and constantly re-used.
In this case, incoming air is not necessary to adjust in terms of temperature and therefore it comes to saving energy. The functioning principle of biofilters is very simple: the aspirator draws air from the room through the front of the biofilter, which consists of perforated partition that serves as a carrier for the plant, moss and soil, and a series of dripping water that collects in the bottom part under another layer of plants and land, and then using the pump, again recirculated to the upper part of the biofilter [6].
The contaminated air flow over the front of this constructed biofilters and that leads to the adsorption, absorption and / or degradation of contaminants using plants and microorganisms in the soil (Figure 2). The first type of biofilter was constructed in Canada 1994th , and it was designed by Dr. Alan Darlington. Today, such systems are in use in major commercial buildings and premises in which residing a large number of people [6].
Figure 2. Filtering mechanism Source: http://www.ubc.ca/academic/
During testing of air quality in a spacecraft NASA has revealed the presence of
more than 300 different volatile organic compounds. In this context, NASA has conducted a number of studies, and one of them was based on the use of indoor plants to improve the indoor air quality. The results showed that indoor plants are able to remove VOCs from the air with great success [6].
On this occasion was designed isolated homes with plants and systems for the purification of air that used a soil planted with plants as filters. The results were positive, people who lived in these isolated areas (simulating the conditions of isolation on spacecraft) no longer had symptoms of "sick building syndrome".
Examination of certain plant species, which was based on the isolation of individual representatives of species in a plexiglass chamber and subsequent exposure to certain contaminants were found species that are most effective in air purification.

Eco-Ist’12, Ecological Truth, 30 May - 2 June 2012. Hotel “Srbija TIS”, Zajecar, Serbia
318
Philodendron Erubescens, Chlorophytum comosum and Epipremnum aureum were identified as most effective in removing formaldehyde, and Gerbera jamesonii and Chrysantheium morifolium were best in treatment of benzene [6]. In addition to these, we found the following species were characterized as indoor air cleaner: Chamaedorea Seifritzii, Aglaonema Modestum, Hedera Helix, Dracaena Marginata, Dracaena Massangeana, Sansevieria Laurentii, Spathiphullum „Mauna Loa“, Ficus robusta, Ficus macleilandii, Ficus benjamina and Brassaia actinophylla.
Given the high efficacy of these plants to remove contaminants from the air, NASA decided to integrate them into systems to maintain the living conditions of future missions in the long stay in space.
RHIZOSPHERIC BIODEGRADATION / STIMULATION OF MICROORGANISMS
Rhizospheric biodegradation takes place in a soil that is in the vicinity of root
systems of plants. This is the microbial decomposition of organic pollutants, which is supported by root systems of higher plants, because roots of their own systems secrete and provide enzymes and organic substances (polysaccharides, amino acids, organic and fatty acids, growth factors) that stimulate the growth of micro organisms and allow them to their activities to degrade pollutants. In this process are used microorganisms and microbial consortium, in accordance with the type of pollutants [6].
Figure 3. Rhizospheric biodegradation Source: http://www.greenecowalls.com/

Eco-Ist’12, Ecological Truth, 30 May - 2 June 2012. Hotel “Srbija TIS”, Zajecar, Serbia
319
CASE STUDY- University of Technology Sydney (UTS)
Following the pioneering work of Wolverton and associates in the United States, UTS studies have shown that pot plants can reliably eliminate a very large, a daily dose of VOC (Volatile Organic Compound). When the plants are stimulated by exposure to a single dose, achieved high rates removal of VOC [7].
Figure 4. Purification of VOCs in indoor air Source: http://www.ubc.ca/academic/
Experiments have shown that plant watering with mixture of microorganisms is a major factor for VOC removal. Watering plants with this mixture of microorganisms, stimulates the root zone to maintain the microbial community, which is the normal task decomposition of humus and nutrient release. It has been shown that by using this process reduces VOC contamination to a negligible level (<100 ppb). This experiment, UTS performed in 60 offices, three of them were air-conditioned building while one had natural ventilation [7].
It was also found that pot plants reduce CO2
levels by 10-20% and CO remains about 90%, thus increasing contrentration and alertness of employees.
Figure 5. Reduction of CO2 Source: http://www.ubc.ca/academic/

Eco-Ist’12, Ecological Truth, 30 May - 2 June 2012. Hotel “Srbija TIS”, Zajecar, Serbia
320
It is important to highlight that required a minimum number of plants in order to effectively reduce TVOC, CO and CO2. Effects of planted plants are seen in performance on health and well being of people and therefore the reduction of sick leave. This method satisfies the three grounds namely economic, social and environmental, and plants should become a vital element of any building.
The following priorities for remediation of indoor air [7,8]:
• further exploration of plants that effectively reduce TVOC, CO2 and CO, andinclude other types
• ;
expand the types of plants that have an influence on other pollutants•
; planting and specialise in different types of buildings
• ;
construct a new pot mixture to spread activity in the root zone•
; monitor the differences in the activities of the different pot mixtures
• ;
potting mixtures for enhanced removal of VOC
's.
CONCLUSION
Considering the fact that the air in modern homes and offices becomes more toxic increasing use of green walls by reason based on numerous studies demonstrated that plants clean the air by absorbing pollutants through the pores of the leaves and the metabolism of microorganisms living in soil.
In the UTS study conducted in an office environment, the results showed that the inner pot plants are effective for reducing volatile organic compounds because they regulating them, and indoor air becomes pure as well applied bioremediation methods is economically acceptable. This method of purifying indoor air can be used for any type of building and thus promote environmental safety and improve working and living environment.
REFERENCES
1. EPA (2011): Indoor Air Facts No. 4 (revised) Sick Building Syndrome, Office of Air and Radiation, Office of Research and Development, Office of Radiation and Indoor Air (6609J); http://www.epa.gov/iaq/pubs/sbs.html
2. EPA (2011): A Guide to Indoor Air Quality, http://www.epa.gov/iaq/pubs/insidestory.html
3. http://www.who.int/en/ 4. EPA (2011): Indoor Air Facts Sick Building Syndrome,
http://www.epa.gov/iaq/pdfs/sick_building_factsheet.pdf 5. http://www.wolvertonenvironmental.com/ 6. http://ntrs.nasa.gov/archive/nasa/casi.ntrs.nasa.gov/19930072988_1993072988.pdf 7. Burchett, M., Tarran, J., Torpy, F., Interior Plants for Sustainable Facility
Ecology and Workplace Productivity, University of Technology Sydney, 2008. 8. Stutte G., Phytoremediation of Indoor Air: NASA, Bill Wolverton, and the
Development of an Industry, 2012.

321
XX International Scientific and Professional Meeting
"ECOLOGICAL TRUTH" ECO-IST'12
30 May - 2 June 2012, Hotel “Srbija TIS“, Zajecar, SERBIA
STADY OF RAIN EROSIVITY IN BELGRADE REGION
Sonja Braunovic*, M. Ratknic
The Institute of Forestry, Kneza Višeslava 3, Belgrade, SERBIA
ABSTRACT
The calculation of rainfall erosivity (R) for the region of Belgrade was based on rainfall data
recorded by a pluviometer during a series of 25 years (quantity, duration, mean intensity and maximum 30-minute intensity for 616 recorded rain events). Different varieties of kinetic energy calculation were applied depending on the necessary units, but also depending on whether it was necessary to take rainfall segments of equal intensities (5-10 mm), or mean rainfall intensity. The results show that factor (R) can be calculated by a simpler method, with rainfall intensity as an input parameter, and then the obtained value is corrected by the obtained correlation equations.
Key words: erosivity, rainfall erosivity factor (R), kinetic energy (E)
INTRODUCTION
Rainfall erosivity (with soil erodibility) is the most important physical factor
affecting the intensity of soil erosion. It is partly the consequence of direct raindrop impact, and partly the effect of run-off caused by rainfall. It is also largely determined by their intensity. The quantification of rainfall erosivity is most adequate by the calculation of rain erosivity factor (R), i.e., mean annual rainfall erosivity in the region (Universal Soil Loss Equation - USLE). Factor R=EI30 consists of kinetic energy (E) and intensity (I30) - defining the combined effect of raindrops on soil structure break down and particle movement (Lal, 1988).
METHOD
Rainfall erosivity factor R, R0, R1 and R2 (Table 1) was calculated based on the following equations, depending on the units in which it is expressed:
100
IER 30⋅= MJ cm ha-1 h-1 (1)
E = (206 + 87 log Is) Hs J m-2

Eco-Ist’12, Ecological Truth, 30 May - 2 June 2012. Hotel “Srbija TIS”, Zajecar, Serbia
322
The above equation is most often used in Czech and Slovakia (Kostadinov, 1989). The analysis of pluviometer tapes is not necessary, as kinetic energy is calculated by means of mean intensity of rainfall event. To calculate mean intensity, it is sufficient to know the beginning and the end of rainfall (duration) and its depth, whereas the maximum I30 is read from the tape for each event. Rainfall erosivity calculation is thus made much simpler, but its preciseness is questionable.
The equations (2) (Wischmeier and Smith, 1978), (3), and (4) have the following common characteristics: Kinetic energy is calculated by dividing the rain into segments of equal intensities (most often 5-10 minutes) and by calculating kinetic energy separately for each one. The obtained value is multiplied by rain depth (mm, cm) of the segment, by which total kinetic energy of the segment is obtained. Total energy of rainfall is the sum of all the total kinetic energies of individual segments.
Ro = E I30 MJ mm ha-1 h-1 (2)
E1 = 210.3 + 89 log I tm ha-1 cm-1
Based on Laws and Parson′s work (1943), Wischmeier and Smith obtained the following equation:
R KE maxI173.61
30= kgm mm m-2 h-1 (3)
KE = 1.213 + 0.89 log I kgm m-2 mm
R EI1002
30= MJ cm ha-1 h-1 (4)
Es = 206 + 87 log I J m-2
The values of R2 were also calculated by equation (1). The difference is that in
the calculation of R, rainfall events were divided into segments. By adding the values of R for individual rains occurring during a month, monthly values were obtained and by adding monthly values, annual values of R were obtained. The value of average annual factor R, for a series of 25 years, was obtained by the arithmetic mean.
RESULTS AND DISCUSSION
From the Diagram of annual values of R it can be observed that, in the analyzed period, there is an almost complete equality of the values of rain erosivity factor obtained by the applied equations, and the deviation of R0 results from the difference in units (MJ mm ha-1 h-1 ) (Braunović, 1996).

Eco-Ist’12, Ecological Truth, 30 May - 2 June 2012. Hotel “Srbija TIS”, Zajecar, Serbia
323
The adopted values are those obtained by equation (4). This method of calculation was adopted as the most precise one, as it is based on the analysis of pluviometer tapes and the research of rainfall per segments of equal intensity (high accuracy of input data). Another reason is that the values of R2 are expressed in SI system, so that they simplify the calculation of soil loss (A), i.e. they enable that soil loss is expressed in t h-1 without correction factors for the conversion of units (Braunovic, 1997). Mean value of rain erosivity factor for the region of Belgrade is R = 85.69 MJ cm ha-1 h-1
Table 1. Annual values of the factor of rain erosivity for rainfall > 5 mm Observatory in Belgrade
Year Rainfall > 5 mm
Values R R0 R1 R2
1968 246.60 44.32 517.49 30.41 51.66 1969 242.80 57.14 625.37 36.73 62.43 1970 386.30 67.41 782.58 45.95 78.15 1971 313.20 110.60 1257.49 73.83 125.55 1972 429.80 119.46 1437.48 84.41 143.52 1973 284.60 75.94 889.91 52.25 88.83 1974 347.60 104.82 1142.79 67.09 114.10 1975 433.40 146.91 1735.33 101.89 173.25 1976 273.80 46.90 565.52 33.22 56.47 1977 282.80 60.29 628.58 36.89 62.78 1978 274.70 61.25 660.42 38.79 65.95 1979 296.00 53.91 572.25 33.33 56.67 1980 426.50 84.12 1009.34 59.26 100.79 1981 293.90 61.91 704.70 41.39 70.37 1982 349.90 92.84 1175.19 69.01 117.33 1983 267.70 47.75 556.97 32.69 55.62 1984 223.70 57.65 667.09 39.17 66.63 1985 262.30 61.23 681.96 40.04 68.09 1986 296.10 102.74 1158.29 68.01 115.67 1987 329.60 94.34 1082.08 63.54 108.01 1988 198.40 26.90 286.31 16.81 28.59 1989 360.50 70.42 808.29 47.44 80.72 1990 203.70 28.22 328.00 19.27 32.77 1991 264.20 47.06 542.14 31.84 54.15 1992 301.40 136.44 1643.65 96.51 164.08 Average 303.58 74.42 858.37 50.39 85.69
Based on the obtained values of rain erosivity factor for rainfall > 5mm (R, R0, R1 and R2) and based on the fact that between them there is an almost fundamental relation, the relation between the values of rain erosivity factor R, Ro, R1 and R2 was represented by a linear function of the general form Y = a + bX.

Eco-Ist’12, Ecological Truth, 30 May - 2 June 2012. Hotel “Srbija TIS”, Zajecar, Serbia
324
Correlation equations were made for the values of rain erosivity factor obtained for rain events >5 mm and for annual values in the period from 1968 to 1992. Equation parameters have been shown in Tables 2 and 3. Table 2. Parameters of correlation equations for the calculation of the value of factor R
Factor R0 R R1 R2 a b a b a b a b
R0 - - 0.38 11.42 0.11 17.02 0.00 10.02 R 0.10 0.08 - - 0.11 1.42 0.1000 0.84 R1 -0.0046 0.05 0.02 0.67 - - -0.0046 0.59 R2 0.000048 0.10 0.04 1.14 0.01 1.70 - -
*for all the rains > 5 mm Table 3. Parameters of correlation equations for the calculation of factor R annual values
Factor R0 R R1 R2 a b a b a b a b
R0 - - 37.72 12.04 - - -37.72 12.04 R 3.81 0.08 - - 3.81 0.08 - - R1 -0.02 0.06 -2.24 0.71 -0.02 0.06 -2.24 0.71 R2 -0.03 0.10 -3.79 1.20 -0.03 0.10 -3.79 1.20
1970 1975 1980 1985 1990200
400
600
800
1000
1200
1400
1600
1800 R0
R
YEAR

Eco-Ist’12, Ecological Truth, 30 May - 2 June 2012. Hotel “Srbija TIS”, Zajecar, Serbia
325
1970 1975 1980 1985 19900
20
40
60
80
100
120
140
160
180
200 R R1 R2
R
YEAR
Figure 1. Annual values of ″R″ for rainfall > 5 mm Diagrams 2, 3, 4, 5, 6 and 7 illustrate the correlation of R2 with the values of R, R0 and R1, as further calculations are based on R2, i.e. on the method by which it was calculated (equation 4).
R0
R2
0 100 200 300 400 500 600
r = 0.999 R2 = -0.000048 + 0.10
60
50
40
30
20
10
Diagram 2: Correlation between R2 and R0 (rain >5mm)
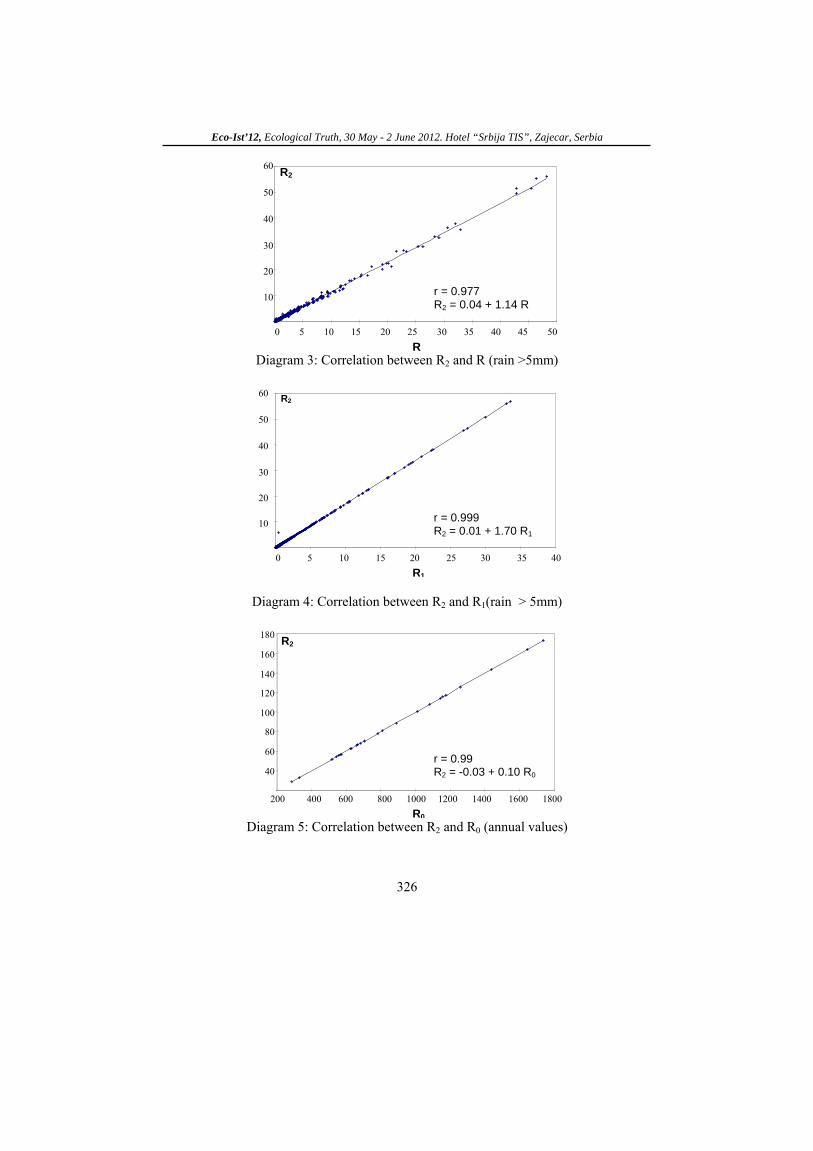
Eco-Ist’12, Ecological Truth, 30 May - 2 June 2012. Hotel “Srbija TIS”, Zajecar, Serbia
326
r = 0.977 R2 = 0.04 + 1.14 R
0 5 10 15 20 25 30 35 40 45 50R
R2 60
50
40
30
20
10
Diagram 3: Correlation between R2 and R (rain >5mm)
r = 0.999 R2 = 0.01 + 1.70 R1
0 5 10 15 20 25 30 35 40
R1
R2 60
50
40
30
20
10
Diagram 4: Correlation between R2 and R1(rain > 5mm)
r = 0.99 R2 = -0.03 + 0.10 R0
200 400 600 800 1000 1200 1400 1600 1800R0
R2 180
160
140
120
100
80
60
40
Diagram 5: Correlation between R2 and R0 (annual values)
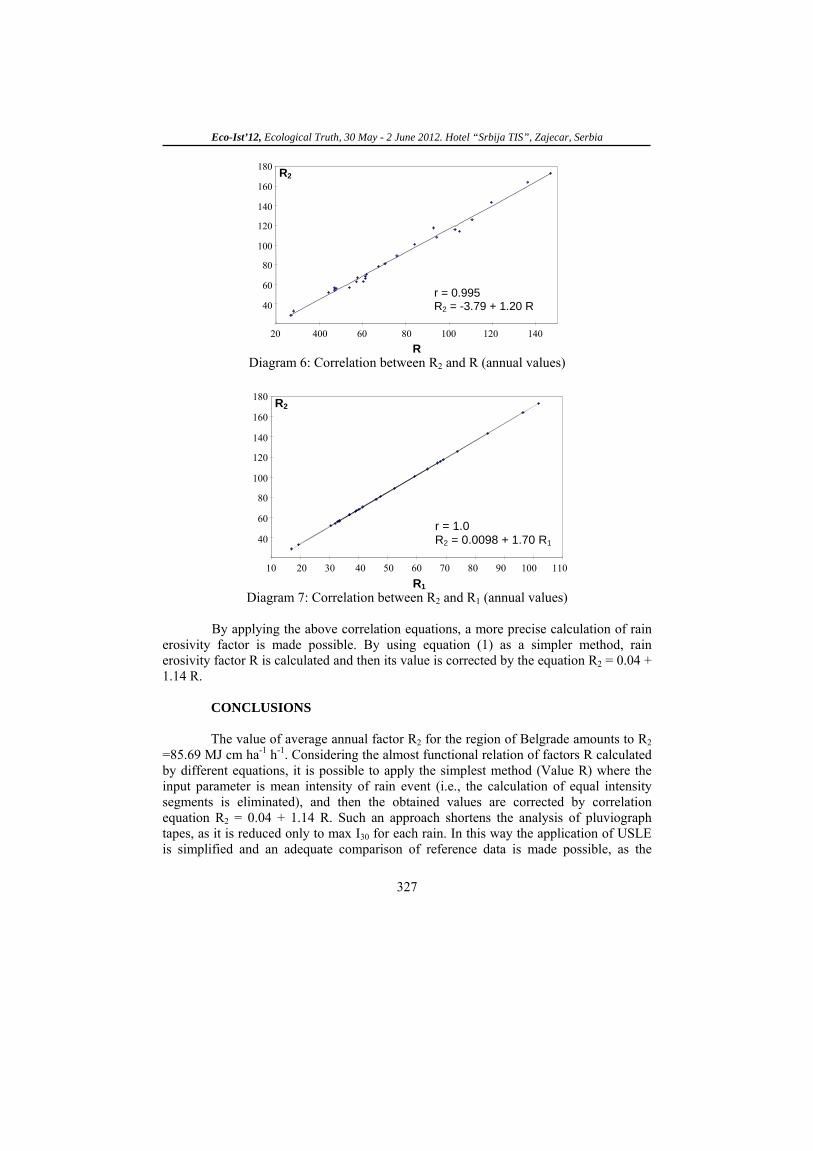
Eco-Ist’12, Ecological Truth, 30 May - 2 June 2012. Hotel “Srbija TIS”, Zajecar, Serbia
327
r = 0.995 R2 = -3.79 + 1.20 R
20 400 60 80 100 120 140
R
R2 180
160
140
120
100
80
60
40
Diagram 6: Correlation between R2 and R (annual values)
r = 1.0 R2 = 0.0098 + 1.70 R1
10 20 30 40 50 60 70 80 90 100 110
R1
R2 180
160
140
120
100
80
60
40
Diagram 7: Correlation between R2 and R1 (annual values)
By applying the above correlation equations, a more precise calculation of rain
erosivity factor is made possible. By using equation (1) as a simpler method, rain erosivity factor R is calculated and then its value is corrected by the equation R2 = 0.04 + 1.14 R.
CONCLUSIONS
The value of average annual factor R2 for the region of Belgrade amounts to R2 =85.69 MJ cm ha-1 h-1. Considering the almost functional relation of factors R calculated by different equations, it is possible to apply the simplest method (Value R) where the input parameter is mean intensity of rain event (i.e., the calculation of equal intensity segments is eliminated), and then the obtained values are corrected by correlation equation R2 = 0.04 + 1.14 R. Such an approach shortens the analysis of pluviograph tapes, as it is reduced only to max I30 for each rain. In this way the application of USLE is simplified and an adequate comparison of reference data is made possible, as the

Eco-Ist’12, Ecological Truth, 30 May - 2 June 2012. Hotel “Srbija TIS”, Zajecar, Serbia
328
values of rain erosivity factor are often given in different units, so that it is possible to miscalculate.
Acknowledgement
This paper was realized as a part of the project "The development of
technological procedures in forestry with a view to an optimum forest cover realisation" (31070) and project "Studying climate change and its influence on the environment: impacts, adaptation and mitigation"(43007), financed by the Ministry of Education and Science of the Republic of Serbia within the framework of integrated and interdisciplinary research for the period 2011-2014.
REFERENCES
1. Lal, R.: Soil erosion research methods. Soil and Water Conservation Society, Ankeny, Iowa, USA, 1988.
2. Kostadinov, S.: Bujični tokovi i erozija. Zbirka rešenih zadataka. Šumarski fakultet, Beograd, 1986.
3. Wischmeier, W. H., Smith, D.D.: Predicting rainfall erosion losses - A guide to conservation planning. Agriculture handbook no.537, US Department of Agriculture, Washington, DC, 1978.
4. Braunović, S.: Proučavanje erozione snage kiše i otpornosti zemljišta na eroziju na području Beograda. Magistarski rad. Šumarski fakultet, Beograd, 1996.
5. Braunovic, S.: Determination of rainfall factor for the region of Belgrade at the application of USLE method in our conditions, pp.176-183, Proceedings The 3rd international conference on the development of forestry and Wood science / technology, Belgrade, (1997).

329
XX International Scientific and Professional Meeting
"ECOLOGICAL TRUTH" ECO-IST'12
30 May - 2 June 2012, Hotel “Srbija TIS“, Zajecar, SERBIA
PROBLEMS OF SOIL EROSION
Ljiljana Trumbulovic-Bujic1*, Z. Acimovic-Pavlovic2, Lj. Andric
3
1High Business and Technical School, Trg Sveti Sava 34, 31000 Uzice, SERBIA
2
4 Karnegijeva Street, 11000 Belgrade, SERBIA University of Belgrade, Faculty of Technology and Metallurgy,
3
86, Franchet d`Esperey street, 11000 Belgrade, SERBIA Institute for Technology of Nuclear and Other Minerals Raw Materials
ABSTRACT
Soil erosion is washing and removal of the finest and most fertile particles from the loose surface. The causes of erosion can be different: deforestation and destruction of vegetation, uncontrolled grazing and the use of plant cover, improper treatment of the soil, wind, rain. Land without vegetation cover, under the influence of wind is subjected to erosion. These procedures often lead to accelerated erosion, which is very serious and sometimes irretrievable process.
Key words: soil, erosion, phytogenous erosion, pluvial erosion, fluvial erosion
INTRODUCTION A certain balance between man and nature has been existing for centuries but for many decades much more has been taken from nature than it has been given back at a speed which the environment cannot tolerate. In the last years, it started to warn us about that. The first reactions came from the countries with the highest level of economic development, which is generally proportional to the volume of negative influence on the environmental influence. Many decades passed in the struggle for education of the population and many legal regulations have been brought, prescribing legal penalties. It may be said that a certain balance has been achieved and that destruction of nature became slower. The number of legal regulations is increasing day by day and organizations must pay it a greater attention. Concern for preservation of the environment reached such proportions that it can be taken as an international trend dominating in the programmes of many countries, that is, their governments. Effects of natural and anthropogenic factors endanger nature even more. The temperature increases globally, the ozone layer is thinning, waters are increasingly

Eco-Ist’12, Ecological Truth, 30 May - 2 June 2012. Hotel “Srbija TIS”, Zajecar, Serbia
330
polluting, and natural resources are rapidly exhausting, while many victims are fallen to chemical and nuclear accidents. One of the major sources of pollution are industrial processes which can produce radiation and noise pollution. In industrial processes the primary SO2
Soil is important for the development and survival of man. Nowadays, it is occupied by a variety of industrial facilities, highways, roads, railways, gas stations, sanitary facilities; it is polluted by communal waste and industrial materials, depositions of air pollutants through pollution of water in agricultural production, pesticides, fertilizers and radionuclides.
emissions come from burning fossil fuels, and first among them are power plants. They are followed by processing of sulphide ore, lead, zinc and copper, production of sulphuric acid and paper, oil refinery.
TYPES OF EROSION The emergence and development of land is determined by environmental factors and depends on: climate, geological substrate, living organisms, relief and weather conditions. The process of erosion has become a problem of everyday life and frequent tremors, sudden changes in temperature, floods, deforestation are intensifying it. Erosion causes losing of humus1
- Mass movement erosion – which occurs during a large spill of rain or during the earthquakes and then the landsliding may occur.
from the surface, and in the place where the soil is collected after being transferred by erosion, choking with mud occurs together with accumulation of organic matters and eutrophication of such places. The most common forms of erosion that occur here are:
Figure 1. Soil erosion at Pribojska Spa
1 Humus is dead organic matter in the soil as a result of incomplete decomposition of plants, animal residues and microorganisms.
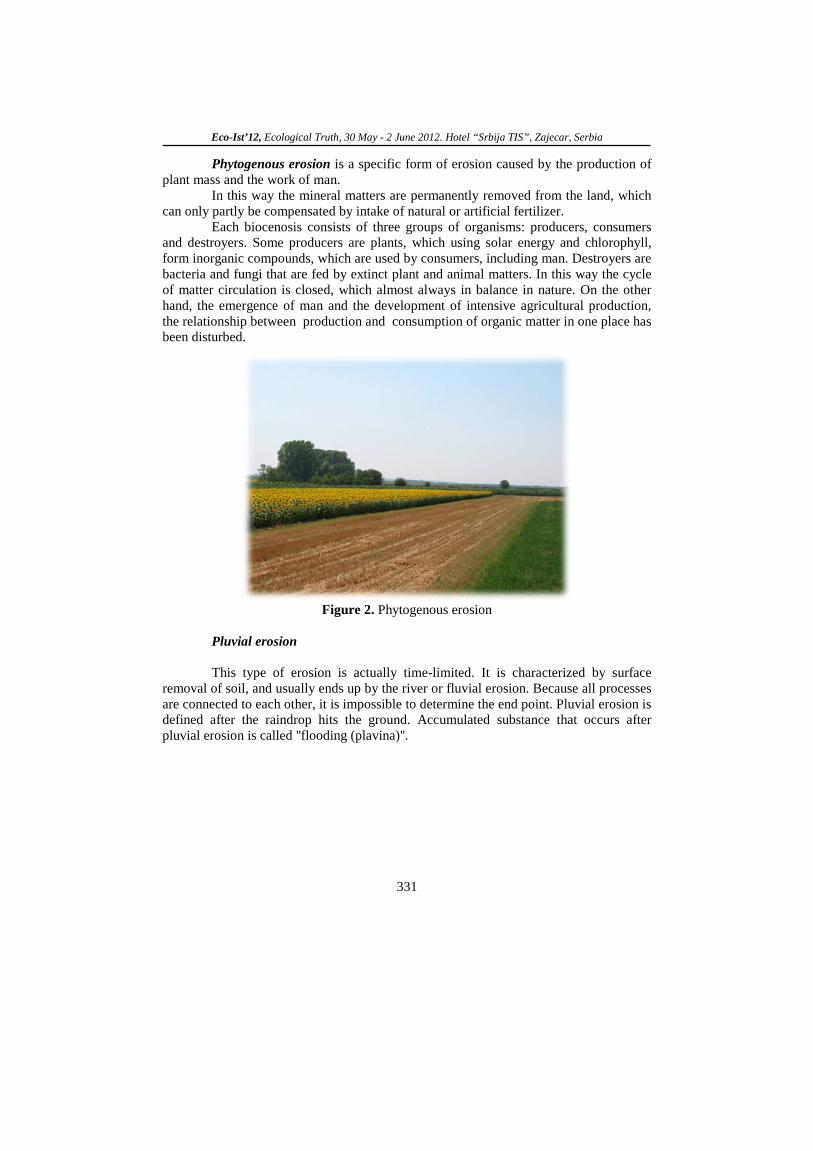
Eco-Ist’12, Ecological Truth, 30 May - 2 June 2012. Hotel “Srbija TIS”, Zajecar, Serbia
331
Phytogenous erosion is a specific form of erosion caused by the production of plant mass and the work of man. In this way the mineral matters are permanently removed from the land, which can only partly be compensated by intake of natural or artificial fertilizer. Each biocenosis consists of three groups of organisms: producers, consumers and destroyers. Some producers are plants, which using solar energy and chlorophyll, form inorganic compounds, which are used by consumers, including man. Destroyers are bacteria and fungi that are fed by extinct plant and animal matters. In this way the cycle of matter circulation is closed, which almost always in balance in nature. On the other hand, the emergence of man and the development of intensive agricultural production, the relationship between production and consumption of organic matter in one place has been disturbed.
Figure 2. Phytogenous erosion
Pluvial erosion
This type of erosion is actually time-limited. It is characterized by surface removal of soil, and usually ends up by the river or fluvial erosion. Because all processes are connected to each other, it is impossible to determine the end point. Pluvial erosion is defined after the raindrop hits the ground. Accumulated substance that occurs after pluvial erosion is called ''flooding (plavina)''.

Eco-Ist’12, Ecological Truth, 30 May - 2 June 2012. Hotel “Srbija TIS”, Zajecar, Serbia
332
Figure. 3. Pluvial erosion
Fluvial erosion Fluvial processes comprise the motion of sediment and erosion or deposition (geology) on the river bed. Erosion by moving water can happen in two ways. Firstly, the movement of water across the bed exerts a shear stress directly onto the bed. If the cohesive strength of the substrate is lower than the shear exerted, or the bed is composed of loose sediment which can be mobilized by such stresses, then the bed will be lowered purely by clear water flow. However, if the river carries significant quantities of sediment, this material can act as tools to enhance wear of the bed (abrasion). At the same time the fragments themselves are ground down, becoming smaller and more rounded (attrition). Sediment in rivers is transported as either bed load (the coarser fragments which move close to the bed) or suspended load (finer fragments carried in the water). There is also a component carried as dissolved material. For each grain size there is a specific velocity at which the grains start to move, called entrainment velocity. However the grains will continue to be transported even if the velocity falls below the entrainment velocity due to the reduced (or removed) friction between the grains and the river bed. Eventually the velocity will fall low enough for the grains to be deposited. This is shown by the Hjulstrøm curve. A river is continually picking up and dropping solid particles of rock and soil from its bed throughout its length. Where the river flow is fast, more particles are picked up than dropped. Where the river flow is slow, more particles are dropped than picked up. Areas where more particles are dropped are called alluvial or flood plains, and the dropped particles are called alluvium. Even small streams make alluvial deposits, but it is in the flood plains and deltas of large rivers that large, geologically-significant alluvial deposits are found. The amount of matter carried by a large river is enormous. The names of many rivers derive from the color that the transported matter gives the water. For example, the Huang He in China is literally translated "Yellow River", and the Mississippi River in the United States is also called "the Big Muddy." It has been estimated that the

Eco-Ist’12, Ecological Truth, 30 May - 2 June 2012. Hotel “Srbija TIS”, Zajecar, Serbia
333
Mississippi River annually carries 406 million tons of sediment to the sea, the Huang He 796 million tons, and the Po River in Italy 67 million tons.
Figure 4. Fluvial erosion
CONCLUSION
Erosion is a phenomenon that affects the entire Earth’s surface and can be viewed at different levels: at the global level, at the level of state, province, municipality, to the level of plot. Erosion areas can be determined on each of the mentioned territorial units. These are not only the areas affected by strong and visible erosion processes, but also the areas where changes in the land use may cause the appearance or intensification of erosion processes. Therefore, the erosion area is defined as the land surface affected by visible erosion processes, but also the surface without visible erosion processes and the visible erosion processes may also emerge due to changes in land uses. Numerous methods have been developed for rehabilitation of erosion processes. The rehabilitation of erosion processes is achieved using the combination of works for erosion rehabilitation on the land surface, by use of different biological and biotechnical works and works for rehabilitation of the riverbed of torrential flows through combination of technical and biotechnical works. These works are investment works and therefore they are implemented only in those places where there is no other choice. A special group of anti-erosion measures is a group of administrative measures which are prescribed as obligation to land users about the anti-erosion land management. The law should oblige the land users to implement anti-erosion measures or allow execution of required works on the seriously eroded land. Execution of anti-erosion works requires a detailed analysis of the condition of soil erosion and identification of erosion areas.

Eco-Ist’12, Ecological Truth, 30 May - 2 June 2012. Hotel “Srbija TIS”, Zajecar, Serbia
334
REFERENCES
1. D. Petrović, P. Maksimović: Geomorphology, University of Belgrade, Faculty of Geography, Belgrade, 2003.
2. Lj. Trumbulović Bujić: ''Sources of pollution of working environment'', Association of Serbian
3. M. Pantelić, B. Jordović, G. Braun: ''Engineers, Belgrade, 2011.
Ecology and Environment'',
4. D. Nikolić: ''
University of Kragujevac, Faculty of Technic, Čačak, 2009.
Environmental protection'',
5. M. Đukanović: ''
Faculty of Mining and Geology, Kosovska Mitrovica, 2002.
Environment and Sustainable Development'',
Elit, Belgrade, 1996.

335
XX International Scientific and Professional Meeting
"ECOLOGICAL TRUTH" ECO-IST'12
30 May - 2 June 2012, Hotel “Srbija TIS“, Zajecar, SERBIA
VELIKI BACKI KANAL PROJECT
Vladimir Pavicevic1, M. Stamenovic2, I. Stankovic
3
1University of Belgrade, Faculty of Technology and Metallurgy, Belgrade, SERBIA 2College of Polytechniques, Belgrade, SERBIA
3
University of Nis, Faculty of Technology Leskovac, SERBIA
ABSTRACT Veliki Bački Kanal (VBK) is one of the most polluted water streams in Europe, so it is considered
as one of the major environmental problems in Serbia. It has been a direct health hazard for an estimated 100,000 people living in its vicinity. The overall objective is to protect and improve the water quality of the VBK and to improve sanitary and health conditions in the municipalities of Vrbas and Kula. The project consists of three components: complete sanitary sewerage collection system in whole area, construction of the Central waste water treatment plant in Vrbas and remediation of VBK.
Key words: sewerage, waste water treatment, remediation
INTRODUCTION Veliki Bački Kanal (VBK) was built at the end of 18th century, partly for
transport and water supply, but also with the purpose of draining the wet and fertile soils of the Bačka district in Vojvodina. The canal did the job and paved the way for development of large scale agriculture, and the entire area between Crvenka and Vrbas was heavily industrialized in the 20th
A victim of its own success, however, the canal today has become a worst environmental hot spot, one of the most polluted water streams in Europe, so it is considered as one of the major environmental problems in Serbia. Heavily polluted by unprocessed industrial and communal wastewaters, the canal today is a lifeless stream of pollutants including heavy metals, petroleum hydrocarbons, nitrogen and phosphorus compounds (nutrients), mineral oils and fecal microorganisms, which only serves to transport pollutants into Tisa and Danube rivers. The canal is no longer able to "deal" with the amount of waste produced by sugar beet processing factories, pig farms, slaughterhouses, edible-oil factories, metal processing factories, and other polluters such as smaller industrial facilities and untreated sewage from the towns on its banks. In its worst stretch around the town of Vrbas the canal is practically filled with sludge, with
century, with small towns springing up along its banks.
Eco-Ist’12, Ecological Truth, 30 May - 2 June 2012. Hotel “Srbija TIS”, Zajecar, Serbia
336
the depth of only 30 cm of water easing over it. It has been a direct health hazard for an estimated 100,000 people living in its vicinity.
In other words, the canal is as “hot” as environmental hot spot can be, which is also part of the reason for its remediation being referred by experts as a potential example project for other hot spots anywhere. The project owes this qualification to the fact that it brings together more than a ten partners from all levels of national, provincial and local government, and from various sectors: public, private, civil society, as well as international organizations which support the project. In appreciation of the call for coordinated action, all the stakeholders involved are gathered in the Task Force for Project VBK: Ministry of Environment, Mining and Spatial Planning, Environmental Protection Fund of Serbia (Ecofund), Capital Investment Fund of AP Vojvodina, Public Company “Vojvodina vode”, Municipality of Vrbas, Municipality of Kula, Municipality Infrastructure Support Programme (MISP) and main consultant Institute “Jaroslav Černi”, Belgrade. Project Implementation Unit (PIU) is Public Company “Directorate for Construction Vrbas” [1].
Before the clean-up can start, the imperative is to stop further pollution so as to ensure the sustainability of the entire project. The completion of the entire project will remove an immediate threat to public health especially for the residents of Vrbas, whose houses are located on the banks of the canal, and turn the canal into a valuable development resource for the future by providing both irrigation and drainage to the plains of Bačka, as well as an invaluable navigation route for both commerce and tourism.
POLLUTION MONITORING
The two canals connecting the Danube and Tisa rivers are commonly known as the VBK. These are: “Vrbas-Bezdan” (up to the Triangle in Vrbas) and “Bečej-Bogojevo” (from the Triangle to Bečej). The worst situation is in the part between the Triangle (0 km) and the Vrbas Lock (6 km). Parallel to the “Vrbas-Bezdan” canal, there are two smaller lateral canals I-64 (with KCIII) and I-61. Both laterals flow into VBK in Vrbas (6 km), downstream of the Vrbas Lock. Cadastre of polluters registers 22 polluters. The biggest polluters are: meat industry “Carnex” with its “Farmacoop” pig farm in Vrbas, sugar refineries in Vrbas and Crvenka, communal waste water from Vrbas and Kula, edible-oil factory “Vital” in Vrbas, metal and leather processing factories in Kula and others.
Norwegian Institute for Water Research (NIVA) performed monitoring of communal and industrial waste waters (2003-2005). Czech company Deconta within the frame of Czech Development Assistance monitored the VBK sludge sediment quality along the 6 km between the Triangle and the Vrbas Lock in 2004 (estimated volume of contaminated sludge is approx. 403,000 m3
UNDP Western Balkans Environmental Programme within Hot Spot Environmental Monitoring (Dutch funded) in 2008 provided these objectives: continuity of hot spot environmental monitoring for the needs of the Ministry of Environment and
; sludge sediment was highly contaminated with coliform bacteria, heavy metals (Cr, As, Cd, Ni) and petroleum hydrocarbons in the upper part of the canal) [2].

Eco-Ist’12, Ecological Truth, 30 May - 2 June 2012. Hotel “Srbija TIS”, Zajecar, Serbia
337
Spatial Planning (MoE&SP) and other institutions, guidance data regarding the quality of water for the Central Waste Water Treatment Plant (CWWTP) design, data on the canal sediments’ quality in the early phase of developing technical documentation for the remediation of the VBK in Vrbas and public information on the quality of surface waters and sediment. Sampling, analyses and assessments were performed by the Institute of Public Health Belgrade [3]. Monitoring of water and sediment quality was undertaken during one hydrological season October – December 2008 (working season for collection and refining of sugar beat). Performed analyses were: physical–chemical analysis in surface water (38 parameters), microbiological analysis (7 parameters), physical–chemical analysis in sediments (25 parameters) and biological analysis (4 parameters). Sediments had high heavy metals content (especially Zn, Cu and Cr in deeper layers of sediment), mineral oils and nutrients and anaerobic conditions for decomposition of organic matters caused high content of sulphides. The MoE&SP and the Ecofund financed continuation of the water and sediment quality monitoring performed in 2009 and 2010. Most of the results were very similar to those above.
PROJECT OBJECTIVES
The pollution of the VBK, which drains into the Tisa river and ultimately the Danube river, is considered as one of the major environmental problems in Serbia. The Municipality of Vrbas is active in investing in their sewerage system to mitigate the negative effects of the pollution of the VBK. The pollution is considerable due to discharge of untreated industrial and communal waste water. The overall objective is to protect and improve the water quality of the VBK and to improve sanitary and health conditions in the municipalities of Vrbas and Kula. Specific objectives of this project (priority investment) are:
• to provide waste water treatment and disposal for 64,000 residents in Vrbas and Kula
• to collect, transfer, treat and dispose pre-treated industrial effluents for identified major industries in Vrbas, currently discharging into and polluting the Veliki Bački Kanal
• to extend the sewage collection system to 20,000 residents, institutions and small industries and businesses living in the villages of the Vrbas municipality
• to significantly improve the quality of life with many indirect impacts, improved sanitation and reduced risks to public health
• to radically improve the water quality in a heavily eutrophicated Danube tributary – VBK (the priority objective in the Danube Strategy)
• to provide compliance with short-term policy objectives in accordance with the National Environmental Protection Programme (NEPP)
• to ensure implementation of a priority project in accordance with the National Environmental Action Plan (NEAP)
• to trigger pre-treatment activities of the major polluting industries • to make a major step towards complying with the EU Urban Waste Water
Treatment Directive

Eco-Ist’12, Ecological Truth, 30 May - 2 June 2012. Hotel “Srbija TIS”, Zajecar, Serbia
338
• to provide relief in economic restraint on the industry development, due to water pollution.
PROJECT DESCRIPTION
The project consists of three components:
1. Complete sanitary sewerage collection system in whole area (Crvenka, Kula, Vrbas and 5 villages in Municipality of Vrbas)
• Extension of the sanitary sewerage collection system Additional sanitary sewerage system are constructed in: Kucura, Zmajevo, Bačko Dobro Polje, Ravno Selo and Savino Selo, including 83,2 km of collection network, 30 km of transmission main and 22 small pumping stations. Through the project the urban area of Vrbas and 5 villages are to be fully covered, including a connection to the Central Waste Water Treatment Plant (CWWTP).
• Main sewer collector connecting Kula to CWWTP in Vrbas Also, it is planned to connect the sanitary sewerage system of Kula town to the CWWTP by constructing the main sewer line between Kula and Vrbas, and corresponding sewage pumping stations. Sections I to IV of the main sewerage line between Kula and Vrbas have already been completed, whereas section V will be finished in September 2011.
2. Construction of the Central Waste Water Treatment Plant in Vrbas • Phase I Waste Water Treatment Facility for 120,000 population equivalent
(organic load 7,500 kg BOD5/day, hydraulic load 23,730 m3
• Phase II (not included in current investment project) potential extension of the capacity by 60.000 population equivalent (to total capacity of 180.000) – subject to demand.
/day) in period 2011-2013
The CWWTP would treat sewage discharges from Vrbas and Kula towns, villages of Vrbas Municipality and pre-treated industrial wastewater for identified industries.
3. Remediation of VBK (removal and treatment of polluted sludge sediments in Vrbas on the part between the Triangle and the Vrbas Lock, 6 km long, in period 2013-2015)

Eco-Ist’12, Ecological Truth, 30 May - 2 June 2012. Hotel “Srbija TIS”, Zajecar, Serbia
339
PROJECT FINANCING
Component/Phase App. value M€
Financing source
1. Main sewer Phase III 2005-2006
2.0 € 1,25 M Norwegian government donation € 0.75 M Municipality of Vrbas
1. Main sewer Phase IV and V 2008-2011
3.1 € 1,9 M Ecofund € 1,2 M Dutch government donation (UNDP)
1. Sewerage system in 5 villages 2010-2012
11.1 € 1.4 M Municipality of Vrbas € 3.7 M the Capital Investment Fund of Vojvodina € 4.0 M National co-financing under EU IPA2008 budget through the Ministry of NIP
2. Central Waste Water Treatment Plant (CWWTP) 2011-2013
13.0 € 9.6 M Water line EU IPA2008
Total priority investment 2005-2013
29.2
3. Remediation of VBK 2013-2015
20.8 Funding not identified
Total priority investment 2005-2015
50.0
REMEDIATION OF VBK
Czech company Dekonta submitted in 2004 the report of site investigation
implemented in the framework of the Czech Development Assistance entitled “Clean up and Revitalization of Veliki Bački Canal in the City of Vrbas, Serbia and Montenegro”. The subject is environmental and human health risk assessment of the VBK’s contamination in the area of Vrbas district. Due to significant fecal contamination the canal surface water is considered to be infectious. Based on existing regulation, due to significant biological contamination, water of canal cannot be used for irrigation and for industry supply, i.e. can be used only after special treatment. Based on human health risk assessment it is concluded that canal sediment should not be used in agriculture. Environmental and human health hazard existing in Vrbas is not acceptable and demands urgent action,.
Dekonta submitted in 2006 the final report within same framework entitled “Pilot Evaluation Study for the Treatment of Contaminated Sludge Sediment of Veliki Bački Kanal, Serbia”. The intention of this project is to find a solution for cleaning up and revitalization of the heavily polluted VBK. The pilot treatment technologies suitable for contaminated sediment treatment have been demonstrated and subsequently, a comprehensive technical solution has been identified and proposed. This project has been closely coordinated with the project implemented by Norwegian Institute for Water Research (NIVA), which has been focusing on the waste water pollution prevention. The prevention of the further VBK pollution is one of the necessary pre-conditions for start of the VBK clean up.
The undertaken laboratory and pilot-scale tests confirmed that, with regard to the amount and large variability of sludge sediment properties, the following solution will be competent in this case:

Eco-Ist’12, Ecological Truth, 30 May - 2 June 2012. Hotel “Srbija TIS”, Zajecar, Serbia
340
• total amount of sludge sediment situated in the VBK part between 0 − 6 km is approximately 403,000 m3
• sludge sediments are contaminated by spectrum of organic and inorganic contaminants; most dominant pollutants are petroleum hydrocarbons and heavy metals
(data from 2004)
• sludge sediments for the whole canal length are contaminated microbiologically (high content of thermotolerant coliform bacteria). From the contamination character point of view, the sediments situated in this
part of the VBK can be divided into three categories: A. Sediments contaminated only microbiologically, content of the other
contaminants ranges on the level of safe disposal on the land surface; sediments situated primary within the canal part of 0 − 3 km are concerned.
B. Sediments contaminated with petroleum substances and microbiologically, content of the other contaminants (heavy metals) ranges on the level of safe disposal on the land surface; sediments situated primary within the canal part of 5 − 6 km are concerned.
C. Sediments contaminated with heavy metals, petroleum substances and microbiologically; sediments situated within the canal part of 3 − 5 km are concerned. Set of recommended remediation technologies and approaches is evident from
the stated waste categorisation: A. In the category of sludge sediments contaminated only microbiologically, the
approaches which are less difficult and less costly can be applied. Especially, chemical hygienisation which belongs to the group of wasteless technologies is most cost-effective solution. The treated sludge sediments can be consequently used in agriculture by which the valuable organic and inorganic mineral substances return back into natural cycle. Alternatively it is possible to dispose the treated sludge sediments on the land surface within the frame of recultivation works.
B. In the category of sludge sediments contaminated with petroleum substances, the biotechnological methods (bioremediation) can be with advantage applied in combination with a consequent sludge sediment hygienisation. It is like a wasteless technology, which is based on the subsequent use of treated sludge sediments in agriculture, eventually within the frame of recultivation works.
C. Disposal of sludge sediments contaminated with heavy metals (and eventually with other pollutants like PCB) will demand application of stabilisation/solidification method, which leads to immobilisation of heavy metals up to limit values required for disposal at landfill of the relevant category. Concerning the expenses of final sludge disposal it is recommended to use the stabilisation prescriptions leading up to sludge stabilisation sufficient for its disposal on the non-hazardous waste landfill. As the sludge is contaminated

Eco-Ist’12, Ecological Truth, 30 May - 2 June 2012. Hotel “Srbija TIS”, Zajecar, Serbia
341
microbiologically, stabilization of the sludge sediments must be assured also from the hygienic point of view. There are three potential locations for the sludge sediments treatment facility:
Ciglana, near Triangl and near canal KC III (technical documentation will define the optimal location). Excavation and treatment of sludge sediment, as an essential measure in terms of VBK clean up and revitalization, can be carried out only after having completed the conditions related to full control of polluted waste water discharge into VBK. Otherwise it will be relatively rapidly filled with new sediments.
These Dekonta reports are good fundament for the team of Project Preparation Facility 4 (PPF4) in the framework of the Municipal Infrastructure Support Programme (MISP), financed by EU IPA2010, which task is the preparation of the preliminary design, the feasibility study with CBA according EU requirements and the environmental impact assessment (EIA) for the project Remediation of VBK in next 18 months (2011-2013). In optimistic case, the implementation of this project should start in 2013.
CONCLUSION
As the VBK, especially the part of canal in Vrbas between the Triangle and the Vrbas Lock (6 km long), is the example for the worst environmental hot spot, one of the most polluted water streams in Europe, the direct environmental benefit of its remediation is so obvious. The more important is the fact that the VBK represents a serious health risk for the local people having also significant negative social as well as economic impacts on further development of the region. Health benefit do not include only population of Vrbas, but population of neighboring municipalities: Crvenka, Kula, Srbobran and Bečej (total population more than 150,000). The project is in compliance with priority objectives in the Danube Strategy, the National Environmental Protection Programme (NEPP), and mentioned by name as a key priority in the National Environmental Action Plan (NEAP) and the Local Environmental Action Plan (LEAP).
Close cooperation of national, provincial and local government, as well as international organizations, made all the stakeholders involved and gathered in the Task Force for Project VBK. The results are very impressive − successful project development, financing and construction in the two components of project (total priority investment for period 2005-2013 app. 29,2 M€). One of the reasons for this is that the ownership and responsibilities for project implementation have been clearly defined. Also institutional capacity of project owner has been proven. During last ten years the Municipality of Vrbas has financed this project with significant amount from its budget, so it has demonstrated the great commitment to this project. Public Company “Directorate for Construction Vrbas” as PIU is well organized and managed, with a lot of experience and very devoted to project.
Dekonta reports and the preparation of technical documentation (PPF4) will certainly insure advanced and integrated technologies for all proposed sludge sediments treatments. Remediation of VBK is the last, third component of long-term big project which overall objective is to protect and improve the water quality of the VBK and to improve environmental, sanitary and health conditions in the municipalities of Vrbas and Kula.

Eco-Ist’12, Ecological Truth, 30 May - 2 June 2012. Hotel “Srbija TIS”, Zajecar, Serbia
342
Concerning all above, it is more than obvious that implementation of project Remediation of VBK can be strongly recommended for financing to international financial institutions and organizations.
REFERENCES
1. T. Đivuljskij, Presentation „Revitalization of Veliki Bački Kanal”, Environmental Infrastructure Support Programme, 2011
2. „Pilot Evaluation Study for the Treatment of Contaminated Sludge Sediment of Veliki Bački Kanal”, Dekonta, 2006
3. „Report about Water and Sediment Quality Monitoring in the Veliki Bački Kanal for the Period X – XII 2008”, Institute of Public Health Belgrade, 2009

343
XX International Scientific and Professional Meeting
"ECOLOGICAL TRUTH" ECO-IST'12
30 May - 2 June 2012, Hotel “Srbija TIS“, Zajecar, SERBIA
SUGGESTION OF SOLUTION FOR REMEDIATION
OF THE LANDFILL IN KUCEVO
Marina Stamenovic1*, D. Brkic1, O. Jovanovic1, J. Petrovic2, V. Pavicevic
2
1
Brankova 17, 11000 Belgrade, SERBIA College of vocational studies, Belgrade Polytechnic,
2
Karnegijeva 4, 11000 Belgrade, SERBIA University of Belgrade, Faculty of Technology and Metallurgy,
*
ABSTRACT
Increase in population social standards and industrial development of a country leads to increasing of waste amounts and the occurrence of problems of his final disposal. Numerous illegal dumps cover the whole area of the Republic of Serbia. Inadequate waste management represents one of the biggest environmental prolem in Serbia. Collected waste is usually disposed in landfill which is located in the municipalities
. Such a case is landfill in municipality Kučevo which represent a risk to environment and public health. Project provides rehabilitation, closure and recultivation of this landfill to minimize environmental danger. Meanwhile, chosen municipal dump location and transfer stations are in Cerovica.
Key words: pollution, waste disposal, remediation, recultivation
INTRODUCTION
One of the biggest environmental problems of our time is the uncontrolled waste disposal at dampsites which represent constant sources of environmental pollution and causing environment degradation. In most cities of Serbia there are uncontrolled dumps, usually located outside the settlement, but expansion of cities has resulted that some of them became an integral part of the city. This dumps pollute all environment elements.
Due to a negative effects on the environment it is necessary to close and isolate illegal, as well as design and build new ecological landfills in accordance with the basic principles of modern design and construction. Planning and building of sanitary landfills is only a part of a complex process of waste management, which includes treatment of waste since its formation, through amount minimization, selection, recycling, collection, transportation, disposal to landfill and recultivation. [1]
In this work are presented necessary activities of rehabilitation and re-cultivation of Kučevo dampsite in order to clasify it as a proper sanitary landfill which does not degrade the environment. These activities are anticipated by the contract

Eco-Ist’12, Ecological Truth, 30 May - 2 June 2012. Hotel “Srbija TIS”, Zajecar, Serbia
344
Kučevo Municipal Assembly and the Agency for consulting and management in ecology "ENVI tech." The Agency has also done a site selection study of a regional landfill for the municipalities of Petrovac, Kučevo, Žagubica, Malo Crniće and
Žabari
WASTE DISPOSAL
Waste generation is result of each family and individual. Communal waste origin, depends on the living standards, lifestyle, social surroundings, consumption and other parameters typical for broader community. According to the place of origin, solid waste materials are divided into: communal, industrial and agricultural. Quality and quantity of communal waste depend on many factors such as location and source of its origin, population density, nutrition and standard of population, type of business activity, economic conditions, time of year, collection technology, type of vehicles and waste transport.
Planning and construction of sanitary landfill is part of the waste management process. Overview of planning, design and operation of waste sanitary landfill includes activities in several phases which involve: appearance and design of landfill, operation and management, the reactions that take place in the landfills body, dumping gas handling, handling of leachate, environmental monitoring, landfills closure and follow-up after closing.
Waste generated in Kučevo is collected by local communal company and puts it in a landfill at the location “Јаruga” about 1 km away from the city. Area of the plateau is about 2ha. Space is unsuitable and the estimated quantity of waste deposited is about 20.000 m3. Dump site is located in the central part of the valley Zvižd, next to the river Pek. The site is not fenced, so uncontrolled access and uncontrolled waste disposed by the citizens is possible.
Landfill directly influences the environment and river Pek water quality, because the waste is disposed in a pebble areas that has a high coefficient of filtration. Source is located downstream of the landfill on the left side of the river Pek . O
During the years of disposal the terrain is completely degraded. Landfill was established in abandoned gravel excavation, and does not satisfy the minimum criteria and standards specified by law and can be considered as absolutely irregular and disordered.
ver the landfill body passes high-voltage electrical cable. At the existing landfill garbage is dissipates unplanned. Besides communal waste, in landfill are disposed other kinds of disposal, including biohazard (from a slaughter house). In this state landfill is unsustainable and represents a real “ecological bomb” and potential latent source of infection for Kučevo city. Thanks to the efforts of local government significant progress has been made. Kučevo municipal Assembly and “tech ENVI” Agency for consulting and management in ecology. Agency “tech ENVI” took over the obligation to make investment and technical documentation in order to access the rehabilitation and re-cultivation activities of degraded area and facilitating conditions for sanitary correct waste disposal until the construction of regional waste management system.
Figure 1 and 2 shows the morphological composition of waste. It is noticeable that the percentage of materials substantially changed since 1998. to 2007.
year.

Eco-Ist’12, Ecological Truth, 30 May - 2 June 2012. Hotel “Srbija TIS”, Zajecar, Serbia
345
Figure 1. Morphological composition of waste for Kučevo municipality
1998.
Figure 2. Morphological composition of waste for Kučevo municipality
2007
Kučevo has a moderate continental climate which is characterized by warm summers and cold winters. The average value of air temperature is +11.3 ° C and the average monthly values ranging from -3.9 ° C in January to +28.8 ° C in July. The average annual amount of precipitation is 764 mm. The average relative humidity is 77.1%. The predominant winds are northeast-southwest direction.
In relation to field configuration and lithological structure, engineering-geological properties of the terrain where junkyard is formed can be defined as follows: stability ground is favorable, good carrying capacity of ground, earthworks depend on physical and mechanical parameters. There is no possibility of using natural materials for covering landfills from this area; clay material must be taken from the further sources. As a coating layer (inert material) can be used pebble from the old separation as well as material from the quarry. There is a risk of spring "Mlaka" pollution which is used for Kučevo water supply.

Eco-Ist’12, Ecological Truth, 30 May - 2 June 2012. Hotel “Srbija TIS”, Zajecar, Serbia
346
Calculation of leachate from the landfill body was made by using rational method. The accepted value of rain intensity is 160 l / s / ha. Two peripheral channels are planned: East and West. Total dump area is 0.88 ha. To determine dimensions of the cross-sectional perimeter channels, hydraulic calculation was made. Leachate have a high concentrations of suspended matter and should not be discharged into natural waterways without treatment. Construction of sedimentation tanks for leachate with two chambers of volume 120 m3 and 80 m3 is predicted on the landfill location. It is planned that the chamber with sedimented solids is cleaned once every two months
. Chambers contents with clarified wastewater should be discharged daily during heavy rainfall.
USING OF LANDFILL UNTIL ITS
CLOSURE
According to Regulations on the criteria for determine location and arrangement of landfill waste ("Sl. glasnik RS", No. 54/92), the location landfill must fulfill following requirements
1. :
Distance between compact type settlements must be at least 1.5 km or less than 400 m if there is an artificial shelter or shelter from the geomorphological formations. This condition is not fulfilled, because existing landfill is located at a distance of 1.5 km from Kucevo center
2. O.
utside settlements dumps can not be located at a distance shorter than 0.5 km from individual houses. This condition is not fulfilled, factory ŠIK Kučevo is located at the distance of 350 m
3. .
Landfill can not be located on land in the narrow zone of water sources sanitary protection for drinking water. This condition is not fulfilled. Landfill is located 1.0 km upstream from source "Mlaka" and represents a direct potential danger
4. Landfill .
can not be located at a distance shorter than 0.5 km from the river, lakes, reservoirs and in their alluvium. This condition is not fulfilled, because the landfill is located close to the river Pek, on the right side, near the
5. Landfill riverbed.
can not be located at a distance shorter than 1.5 km from cultural monuments or protected natural resource. This condition
6. is fulfilled.
Landfill can not be located at a distance shorter than 0.5 km from railway and bus stations, stocks of flammable materials and the military facility. The requirement is
7. fully met.
Landfill can not be located at a distance shorter than 2 km from a health facility for stationary treatment, natural healing, food industry. The condition is fulfilled
8. .
Landfill can not be located within a radius of 3.2 km from the airport reference point (ARP) and 13 km along the jet runway and in the radius of 1.2 km for the other planes. This condition is also
9. fulfilled.
Landfill can not be located on land which highest seasonal level of groundwater is 2 m from the bottom of landfill and in grounds with greater permeability than 1x10⁻⁷ cm/s. This condition is not fulfilled
10. .
Landfill can not be located above built-in installation for artificial irrigation, and other underground infrastructure, above the tunnel, underpass, shelters and similar. The condition is fulfilled.

Eco-Ist’12, Ecological Truth, 30 May - 2 June 2012. Hotel “Srbija TIS”, Zajecar, Serbia
347
11. Landfill can not be located at a distance shorter than 0.1 km from gas pipelines, oil pipelines, power transmission line. This condition is not fulfilled, power line passes the central part of landfill
12. .
Other objects in terms of fencing, lighting, related facilities, systems for accepting rainfall water, water from the dump body and used process waters, then in terms of prescribed waste disposal technologies, recultivation, environmental protection and monitoring of environmental impact, doesn't exists
.
RECOVERY OF DUMP
In order to repair the existing landfill, we should first collect waste and form landfill body with 1:3 external inclinations slope. In the dumps body should be installed four biothorn to allow the gases removal generated in the dump body. Over the dump body formed from garbage geomembranes are installed (HDPE film thickness d=2 mm) and below the geomembrane is located inert material underlay thickness of 20 cm. The role of geomembrane is to prevent leakage of water through the landfill body. Over geomembranes is installed a layer of inert material thickness of 0.50 m and above it a layer of humus thickness 0.20 m. Around the dump body are formed circumferential grooves of trapezoidal cross-section, bottom width of 0.3 m and slope 1:1.5 slope, a depth of 0.30 m. The role of these channels is to collect leachate from the dump body and take them in waterproof collection pool. Overall channel length is about 370 m. Around the body landfill construction of fences and gates is planned to prevent access to the landfill by unauthorized persons. As a measure of greening is only provided greening for the planned crown and slopes of the landfill.
Recovery of landfill must be carried out as planned, while adhering to following rules: disposal begins at the lowest elevation; the cells are formed so that the daily working area is as small as possible; the cell is immediately filled up to final height; the cell is covered with inert material at the end of the day; all wastes which it is brought to the dump must be spread evenly and compacted to the required density; never leaves a bald cells for tomorrow; the slope of the working area is 1:3; adherence to the plan of filling the landfill is strictly; equipment is used according to manufacturer's instructions within the possibilities; equipment to locate in the zone of activity; ensure machinery to move only with the working head
.
WASTE DISPOSAL
Waste disposal is done by "surface" cell type mode delay. Slopes leveling is done before a new waste disposal to communal waste dump, so their decline be 1:3. Then should waste disposal begin. Dimensions of cells work zone are determined depending on the volume of unloaded waste, topography, number and type of vehicles that operate on the landfill. In this case, one vehicle and single machine is used so the cell size depends exclusively on the amount of drive in waste. Thickness of drive waste which is spread evenly should not be thicker than 0.2 to 0.4 m. The projected height of the cell that satisfies the landfill capacity should not exceed a height of 2.0 m. Depending on the the flow of waste to the location, dimensions of the cells will be formed by the

Eco-Ist’12, Ecological Truth, 30 May - 2 June 2012. Hotel “Srbija TIS”, Zajecar, Serbia
348
authorized person who will operate the dump. Cell dimensions are formed in parallel rows to the dump working forehead, in accordance with the filling plan for cassettes. The cassette will be closed after one year of dump operation. At the dump location is necessary to predict the location where will be placed three-month reserve of inert material for daily waste cover
Only permitted disposal on the dump is waste with no qualitative and quantitative properties that would endanger the environment and human health. At the dump may be deposited: communal waste, inert industrial waste, waste from public areas, waste from non-industrial company and administrative structures (institutions, schools), ash, agricultural and construction waste. At the dump should not be disposed: the remains of dead animals, industrial waste that is not biologically and chemically neutral, industrial waste that can be used as secondary materials, machine and motor oils, waste from health facilities, radioactive, biochemical and chemical waste, batteries and classical batteries, tires, flammable substances and explosive materials, fecal matter.
.
After bringing waste in the working area, waste is spreads by bulldozer and flattened to layers from 0.2 to 0.4 m, and compacted using a multiple bulldozer moving over spreaded waste. On formed waste layer is applied a new layer and spreading and compaction operations are repeated during the day. For waste flattening and compaction at Kucevo waste dump crawler tractor with a bulldozer and ripper device, and a truck with a trailer load 5-10 t is enough. The total amount of waste spread and compressed into a single cell is covered with the inert material for the final cell formation. A set of cells is in a horizontal line forming layer. Waste deposal is anticipated to a height of 3.30 m. These completed works ending by covering with an inert material
, are conducted by dump remediation during exploitation. Inert material used for covering cells or final dump cover must have certain characteristics.
FACILITIES AT THE LANDFILL
In the admission and dispatch area are located entrance gates, reception desk, wheel washing ramp and facility for storing secondary materials. Admission and dispatch area is arranged in compacted poured materials (gravel, stone debris).
System for evacuation and treatment of leachate consists of drainage pipes, concrete reinforced dual chamber precipitator and tanks for receiving precipitator water.
System for evacuation of atmospheric waters are circumferential grooves that are built to protect against penetration of atmospheric waters into the dump body and receiving waters which are flowing from the dump.
System for drainage of landfill gas makes biothorn system projected to controlled removal of dump gas in order to prevent damage to crops, property and people injuring due to possible gas explosion
. In the case of Kučevo municipal dumps is planned installation of the four wells which caused evacuation of gases from the dump body.
MEASURES FOR DUMP
RECULTIVATION
After completed exploitation begins the work on the landfill re-cultivation, which consisting from phases of technical and biological re-cultivation. Technical re-

Eco-Ist’12, Ecological Truth, 30 May - 2 June 2012. Hotel “Srbija TIS”, Zajecar, Serbia
349
cultivation being immediate after landfills closure. Phase of biological re-cultivation represents selection of plant species. In the process of dump closing and re-cultivation standards must be respected. Dump re-cultivation includes applying of a new soil layer on the deposited material. Re-cultivation process includes two activities: environmental revegetation and revitalization. Revegetation is an activity which involves plants seeding and planting on a dump surface, slopes and rim. Environmental revitalization is an activity that includes revegetation as well as restoring natural characteristics of devastated area
.
CONCLUSION
The importance of controlled and organized communal waste disposal, collection, transportation and final disposition of waste has not been a taken care of for a long time. Contrary to the rules, landfills are formed in places that have been close to the settlements and in areas where did not perform any technological measures for waste disposal [4].
Since our country has a large number of landfills which are not formed by the technical and hygiene regulations, we are facing a very difficult task in rehabilitation, re-cultivation and expansion of already existing, until they build a new regional type sanitary landfill of communal solid waste.
Performing all works provided by this project, including all necessary measures and environmental protection requirements, the existing Kučevo landfill will be classified in proper sanitary dump that does not undermine the quality and does not degrade the environment. Municipality Kučevo plans to make communal landfill and transfer station in the place Cerovica
.
REFERENCES
1. Ilić M., Miletić S., ''Osnovi upravljanja čvrstim otpadom'', Beograd, 1998. 2. Ilić M., Stevanović H., Mladenović A., ''Plan upravljanja komunalnim
otpadom'', Beograd, 2003. 3. Zakon o zaštiti životne sredine ("Službeni glasnik Republike Srbije", broj
47/2003 sa dopunama) 4. Pravilnik o kriterijumima za određivanje lokacije i uređenje deponija otpadnih
materija ('' Službeni glasnik Republike Srbije '', broj 54/92) 5. Tchobanoglous G., Theisen H., Vigil S.A., Integrated Solid Waste Management
– Engineering Principles and Management Issues, McGraw-Hill, Inc., New York, 1993.
6. Tchobanoglous G., Kreith F., Handbook of Solid Waste Management, McGraw-Hill, Inc., New York, 2002.

350
XX International Scientific and Professional Meeting
"ECOLOGICAL TRUTH" ECO-IST'12
30 May - 2 June 2012, Hotel “Srbija TIS“, Zajecar, SERBIA
LONG-TERM CHANGES IN TEN WATER QUALITY PARAMETERS
OF THE DANUBE IN SERBIA
Ivana Mladenovic-Ranisavljevic1*, Lj. Takic1, N. Zivkovic2, M. Vukovic3, Z. Damnjanovic3
1Faculty of Technology Leskovac, Bulevar oslobođenja 140, 16000 Leskovac, SERBIA
2Faculty of Occupational Safety, Carnojevica 10a, 18000 Nis, SERBIA 3 University of Belgrade, Technical faculty Bor, VJ 12, 19210 Bor, SERBIA
ABSTRACT
This paper investigates the changes in ten selected quality parameters which show physical,
chemical and microbiological characteristics of the water and they altogether give a summary of the Danube water quality. Monitoring of the surface water quality is performed by the Republic Hydrometeorological Service of Serbia (RHSS) and for the purposes of this study, data found in the period from 2005-2009 are used. The presented results show trends of the parameters changes in a form of surface 3D-graphs with continuous curves, as a function of time and depending on the area along the Danube river. The analysis shows discernible differences in the water quality between the entry and exit points, as well as steady improvement of the parameters in space and time indicating acceptable trends in the eco-chemical status of the Danube in Serbia.
Key words: the Danube, water quality parameters, long-term changes
INTRODUCTION The Danube is the most important non-oceanic body of water in Europe. It is
2857 km long, the second largest river in Europe, with a drainage area of almost 801,500 square kilometers. It originates in the Black Forest Mountain in Germany and passes through ten different countries (Germany, Austria, Slovakia, Hungary, Croatia, Serbia, Romania, Bulgaria, Moldova and Ukraine). This is probably one of the reasons why the European Commission considers it to be the “future central axis for the European Union”. About 588 km of total Danube’s length flows through Serbia. Its largest tributaries on the territory of Serbia are the Tisa, the Tamiš and the Danube-Tisa-Danube canal on the left, and the Drava, the Sava and the Velika Morava on the right side [1].
Since the Danube River is one of the most valuable natural water resources in Serbia, a special attention must be paid to its water quality evaluation, along with its pollution and protection problems. The Republic Hydrometeorological Service of Serbia (RHSS) [2] undertakes systematic monitoring of quantitative and qualitative characteristics of the surface and ground water in order to determine, analyze and

Eco-Ist’12, Ecological Truth, 30 May - 2 June 2012. Hotel “Srbija TIS”, Zajecar, Serbia
351
supervise the water régime on the territory of Serbia under the Waters Act and in compliance with the Regulation of the Systematic Waters Quality Testing passed by the Government of the Republic of Serbia. The objective of this research is the Danube water quality analysis in terms of ten water quality parameters, on its course through Serbia using available data of the RHSS [2] for the period of time from 2005 to 2009. Long-term changes in selected parameters indicate changes in water quality of the Danube and are directly related to the eco-chemical status of the Danube in Serbia [3].
METHODOLOGY The scope, type and frequency of the waterways quality control in the Republic
of Serbia are stipulated by the Program of Water Quality Testing. According to the accepted methodology, the basic physic-chemical parameters are tested once a month. The additional physic-chemical parameters are determined at least four times a year, while metals and other harmful and dangerous substances are checked three to twelve times a year, depending on the economic importance of the given waterway. Total radioactivity is measured two to seven times a year at more significant profiles. The results of the established monitoring of the water quantity and quality are reflected in a significant number of data collected in the Hydrological Information System [2] and they are used in this investigation.
The investigation includes five hydrological measuring stations at distances given from the river mouth: Bezdan -1425.59 km; Novi Sad – 1254.98 km; Pančevo – 1154.6 km; Smederevo – 1116.0 km and Radujevac – 852 km. At the sampling point the water temperature, as well as pH value, were determined according to SRPS H.Z1.111 method, biochemical oxygen consumption (BOD-5) was determined by EPA 360.2 method, suspended solids according to 13.060.30 SRPS H.Z1.160 method, phosphates according to standard analytical method APHAS AWWA WEF 4500, total nitrogen oxides according to SRPS ISO 5664 method, while the estimated number of coliform bacteria (E. coli) per liter was determined 48 hours after incubation at 37oC [2].
For the purposes of the investigation, ten water quality parameters were selected: oxygen saturation, E.coli, BOD-5, pH value, total nitrogen oxides, orthophosphates, suspended matter, ammonium, temperature and conductivity. These parameters show physical, chemical and microbiological characteristics of the water [4] and they are used in WQI (Water Quality Index) methodology [5] in determining overall water quality of the surface water. Based on the use of standard parameters for water characterization, the WQI sets the criteria for classification of surface water quality [6,7,8,9,10].
RESULTS AND DISCUSSION Based on the results of monthly samplings analyses, the average value of the
corresponding parameters was calculated for every measuring station annually for the year 2009. Table 1 represents these results at five selected measuring stations along the River Danube for the year 2009.

Eco-Ist’12, Ecological Truth, 30 May - 2 June 2012. Hotel “Srbija TIS”, Zajecar, Serbia
352
Table 1. Values of the ten parameters at five selected measuring stations in 2009
B
ezda
n
N
ovi S
ad
Pančevo
Smed
erev
o
Rad
ujev
ac
Temperature (°C) 13.2 13.7 14.6 14.9 15.5 pH 8.3 8.3 8.2 7.8 7.7 Conductivity (µS/cm) 411.8 398.5 398.3 381.6 372.6 Oxygen saturation (%) 97.7 96.0 95.7 96.7 93.2 BOD-5 (mg/l) 2.2 2.5 2.3 2.6 1.9 Suspended matter (mg/l) 32.4 23.3 31.6 17.3 9.8 Total Nitrogen oxides (mg/l) 1.891 1.574 1.332 0.748 0.983 Orthophosphates (mg/l) 0.044 0.047 0.047 0.061 0.200 Ammonium (mg/l) 0.08 0.06 0.09 0.13 0.12 E. coli (u 100ml) 11498 1727 18525 2400 636
The Danube is a subject of numerous investigations of various aspects. Our results are reflective of other results reported in literature. For instance, Milanović et al. [11] point out that there is a significant problem concerning the required water quality and it is one of the major obstacles in economic development of Serbia along the Danube banks. Also, the analysis of the long-term changes in selected water quality parameters reveals improvement of the parameters and acceptable trends in the eco-chemical status of the Danube, as well as obvious differences in the water quality between the entry and exit points of the Danube in Serbia [12, 13]. The regularity of the changes in the Danube water quality is obtained by the analysis of the given parameter values in Table 2 for the period from 2005-2009. Table 2. Values of the ten parameters for the period 2005-2009
Parameter (Unit) 2005 2006 2007 2008 2009 Temperature (°C) 13.4 13.5 14.4 14 14.2 pH 8.1 8.0 7.9 8.0 8.1 Conductivity (µS/cm) 392.8 439.7 395.4 401.0 394.1 Oxygen saturation (%) 92.1 97.2 93.9 92.8 95.8 BOD-5 (mg/l) 2.6 2.8 2.5 2.6 2.3 Suspended matter (mg/l) 34.7 25.9 24.5 28.9 23.1 Total Nitrogen oxides (mg/l) 1.569 1.662 1.384 1.391 1.326 Orthophosphates (mg/l) 0.054 0.093 0.089 0.066 0.080 Ammonium (mg/l) 0.17 0.17 0.10 0.11 0.10 E. coli (per 100 ml) 6888 9918 5972 4629 6957
Figure 1. graphically represents changes in parameter values from two aspects, space and time, i.e. at characteristical measuring points in investigated time period. Surface 3D-graphs with continuous curves show changes of average yearly values of the selected parameters (vertical axis) as a function of time and depending on the area along the Danube from the entry to the exit point in Serbia (horizontal axis). The presented results show trends of the parameters changes in space and time clearly and swiftly [12, 13].

Eco-Ist’12, Ecological Truth, 30 May - 2 June 2012. Hotel “Srbija TIS”, Zajecar, Serbia
353
Figure 1. Trends of the measured SWQI parameters in time and space: a) Temperature,
b) pH, c) Conductivity, d) Oxygen saturation, e) BOD-5, f) Suspended matter, g) Total Nitrogen oxides, h) Orthophosphates, i) Ammonium, j) E. coli.
Eco-Ist’12, Ecological Truth, 30 May - 2 June 2012. Hotel “Srbija TIS”, Zajecar, Serbia
354
There was no significant temperature differences between the entry and exit point along the river because the temperature of water was in range from 12.0 °C (at measuring station Novi Sad in 2005) to 15.5 °C (at Radujevac in 2009) in the observed period. In time, trend of changes in median yearly pH values is not evident, while in space, there is a noticeable descending trend of ph value, from Bezdan to Radujevac (Figure1b). Similar descending trend in space was also noticed in conductivity parameter values, as well as in temporal trend, from 2005 to 2009 (Figure 1c). No evident trend for the oxygen saturation could be determined neither in time nor in space (Figure 1d). According to the analysis, BOD-5 (Figure 1e) values were in range from 2.3 to 2.6 in the Serbian part of the Danube, which is probably because of the invariant content of organic pollutants
in water. Decreasing tendency of the amount of suspended matter from Bezdan toward Radujevac was evident (Figure 1f), but there was no clear decreasing or increasing tendency in the observed time period. Graphically, changes of toatal nitrogen oxides in time and in space show an evident peak (the highest average value of 1.662 mg/l) in 2006 at measuring station Bezdan. However, there was a significant descending trend for Total nitrogen oxides observed in time (from 2005 to 2009) as well as in space (from Bezdan toward Radujevac). It is also important to emphasize that although the Orthophosphates and Ammonium ion values show no statistically significant trends, Figure 1h shows an evident peak (the highest average value of 0.259 mg/l) in 2006 at measuring station Radujevac and an evident peak (the highest average value of 0.32 mg/l) in 2005 (Figure 1i) at measuring station Pančevo, respectively. The highest average value of E.coli (13900 n/1l) in 2005 at measuring station Pančevo was observed, as well as in 2006 (24000 n/1l) at measuring station Novi Sad. Long-term changes in presented parameters are important for monitoring the overall water quality of the Danube. The Danube water quality, determined by a median of an arranged series of average parameter values, at measuring points in Serbia over a five-year period showed a quality growth.
CONCLUSIONS Water resources are considered to be the most important segment of the environment, so protection of the natural ambient cannot be imagined without the adequate protection of water, which implies monitoring of selected parameters and establishing water quality. This analysis shows improvement of the parameters through the years in the observed five-year period, as well as in space-from the entry to the exit point on the flow through Serbia. Finally, the water quality based on these ten parameters indicates acceptable trends in the eco-chemical status of the Danube in Serbia.
Acknowledgements
This work has been funded by the Serbian Ministry for Science under the projects No. III-43014 and TP 33034. .

Eco-Ist’12, Ecological Truth, 30 May - 2 June 2012. Hotel “Srbija TIS”, Zajecar, Serbia
355
REFERENCES
1. http://www.icpdr.org/icpdr-pages/river_basin.htm 2. Republic Hydrometeorological Service of Serbia (RHSS), Report – 3. Water
quality 2005-2009, Belgrade 3. Takić,Lj., Mladenović-Ranisavljević I., Vuković M., Mladenović I., Evaluation
of the ecochemical status of the Danube in Serbia in terms of water quality parameters, The Scientific World Journal, 2012, Article ID 930737, doi:10.1100/2012/930737.
4. Water Research Center, B.F. Environmental Consultants Inc. (http://www.water-research.net/waterqualindex/index.htm).
5. Scottish Development Department, Development of a Water Quality Index, Engineering Division, Edinburgh, 1976.
6. Sanchez E., Colmenarejo M., Vicente J., Rubio A., Garcia M., Travieso L., Borja R., Use of the water quality index and dissolved oxygen deficit as simple indicators of watersheds pollution, Ecological Indicators 7 (2) (2007), 315-328.
7. Qadir A., Malik R.N., Husain S.Z., Spatio-temporal variations in water quality of Nullah Aik-tributary of the river Chenab, Pakistan, Environmental Monitoring and Assessment , 140 (1-3) (2008), 43-59.
8. Kannel P.R., Lee S., Lee Y.S., Kanel S.R., Khan S.P., Application of water quality indices and dissolved oxygen as indicators for river water classification and urban impact assessment, Environmental Monitoring and Assessment, 132 (1-3) (2007), 93-110.
9. Banerjee, T., Srivastava, R.K., Application of water quality index for assessment of surface water quality surrounding integrated industrial estate-Pantnagar, Water Science and Tehnology, 60 (8) (2009), 2041-2053.
10. Reza R., Singh G., Heavy metal contamination and its indexing approach for river water, International Journal of Environment Science and Technology, 7(4) (2010), 785-792.
11. Milanović A., Kovačević-Majkić J., Milivojević M., Water quality analysis of Danube River in Serbia - pollution an protection problems, Bulletin of the Serbian Geographical Society, TOME XC-N02, (2010), 47-57.
12. Živadinovic I., Ilijević K., Gržetić I., Popović A., Long-term changes in the eco-chemical status of the Danube River in the region of Serbia, Journal of the Serbian Chemical Society, 75 (8) (2010), 1125-1148.
13. Ilijević K., Gržetić I., Živadinović I., Popović A., Long-term seasonal changes of the Danube River eco-chemical status in the region of Serbia, Environmental Monitoring and Assessment, (2011), doi: 10.1007/s106610112153

356
XX International Scientific and Professional Meeting
"ECOLOGICAL TRUTH" ECO-IST'12
30 May - 2 June 2012, Hotel “Srbija TIS“, Zajecar, SERBIA
PROJECT FOR ECOLOGICAL MODERNISATION OF THERMOENERGETIC
BLOCKS AND FACILITIES
Radoje Cvejić1*, R. Cvejić2, M. Stević
3
1ALFA University, FSOM, Belgrade, , SERBIA 2 PD TE-KO TE „Kostolac”, Kostolac, SERBIA
3
Megatrend University, FPS, Požarevac, SERBIA
*radoje.cvejic
@fsom.edu.rs
ABSTRACT By addopting a set of laws that define the area of environmental protection the process of synchronisation of local laws with the EU legislative has been greatly intesified. One of the most important segments of this process is lowering down the emmision of toxic matter at the very soruce of the polution. Taking care about the nature and the environment in its proximity thermal power plants „Kostolac“ have started and/or completed a number of projects for protecting the environment following the regulative in this area. In this paper we are publishing and analizing projects concerning the reconstruction of electro filters , facility for desulfurising of chimney exosted gasses and modernisation of the system for transportaion of ashes from the plants.
Key words: Envirnonmental protection, modernisation, electrofilters, desulfurisation, ash transportaion
INTRODUCTION
As the emmittter of poluting and hamrfull gassess , that are the result of the technological process of producing electrical energy from coal , thermal energitical facilities have the greatest negative impact on the environment. Thus this sector is mandated to take complex and full actions to protect the environment. Thermal energy facilities in Kostolac are consisted from Thermal plant „Kostolac A“ (100+ 210MW) and „Kostolac B“ (2x348,5 MW) that produce electrical energy using coal that is exploited in the surface mine „Drmno“. Besides the production of the elctrical energy these power plants produce a great amount of heat energy that is used for heating the cities of Požarevac, Kostolac and sorounding vilages. By taking care of nature and the environment , following the proclaimed EU norms , especially the regulative that defines the protection of the environment, a number of priority actions have been completed or started that bring great advancements in the protection of the environment. Of all the measures that were taken for reducing the nagative impact of thermal power plants on the environment we should point out the following projects : modernisation of

Eco-Ist’12, Ecological Truth, 30 May - 2 June 2012. Hotel “Srbija TIS”, Zajecar, Serbia
357
all electro filters in all existing facilities, project for the facilitiy for desulfurisation of exhausted gasses, modernisation of ash transportation and displosal systems, continued monitoring of the emission of poluting matter . By finishing the reconstruction of the electrofilter in plant TE „Kostolac A“, which is located in the very city grounds, the emmision of powdered matters has been reduced by 54%. This has completely brought the polution levels to Europen standards of 50 mg/m3
. Maintenace works on the electro filter in plant TE „Kostolac B“ will start later this year in order to bring its operation to EU regulation standards for the emmision of powdery matter. Bringing the concentration of the emmited sulfuric oxyde to the levels of 400 mg/m3, which is in terms with the 2001/80/EC directive, implementation of facility for desulfurisation is planned to be finished by 2015. in TE „Kostolac B“. Modernisation and implementaion of new technology of transport and ash disposal system that is finished in TE „Kostolac B“ and which is starting in TE „Kostolac A“, will besides reducing the eol erosion of ash , enable also the reduction of pultion of underground waters.
MODERNISATION AND SYNCHRONISATION OF THE WORK OF THE ELECTRO-FILTERS WITH LAW AND REGULATION.
In the process of burning coal a considerable amount of gass is being released
that represents a compound of different gasses (sulfurdioxide, Nitrogen oxyde, carbon monoxide, fluroide and chloride) whose contentrations depend from the characteristics of the fuel itself. Besides the gass components , solid matters are also present that are the product of incomplete combustion and presence of mineral components in the fuel (ash). Purification of exhaust gasses and bringing the concentration of poluting matters to permitted levels is being done in electrofilters..
By analising the condition of electrofilter facilities that are present in TE „Kostolac”, and are in use for over 20 and more years, it is clear that their performanse is greatly worsened compared to projected original values. In order to protect the environment thermal plants as one of the biggest poluters are investing large amounts of resources for the development of new facilities in service of lowering the emmision of powdery matter..Gass purification and bringing the concentration of poluted matter to acceptable levels is being done in electrofilters (figure 1). In goal of reducing the emmision of particles to the levels below 50 mg/m3, reconstruction of existing electrofilter facilities has been done in plant TE „Kostolac” on blocks A1 and A2 in the period from 2005. to 2007. On block B2 reconstruction and modernisation of electrofilter facilities is planned.

Eco-Ist’12, Ecological Truth, 30 May - 2 June 2012. Hotel “Srbija TIS”, Zajecar, Serbia
358
(1) - carring construction, (2) - electrofilter deposits, (3) - electrofilter case, (4) - ash funnels, (5) – suspension of depositionall electrodes high voltage case, (6) - depositional electrodes, (7) - emmisional electrode, (8) - emmisional electrode suspension, (9) - emmisional electrode supensional frame, (10) - emmisional electrode shakers, (11) - depositional electrode shakers, (12)- depositional electrodes drive, (13) - emmisional electrodes drive, (14) - stairway, (15) – guidance elements, (16) - difuser, (17) - konfuser, (18) – carring construction set form high voltage converter,
(19) – high voltage converter, (20) – high voltage case, (21) – suspension isolator, (22) - regulator of revisional hatch, (23)- revisional; hatch (24)- thermal isolation
Figure 1: Electrofilter facility implmented on blocks A1 i A2
Adjustment of electrofilter operation with valid legal norms about border emission values , was required to achive the prescribed emmision levels for coal heat sources with power over 300MW. It is prescribed that border level emmisions for powdery matter has to be 50mg/m³, dry gass, 0ºC, 1013mbar and 6% O2
(Sl. Glasnik RS 30/97 and directive 2001/80/EC), so recontruction and modesrnisation of facilities was required. By completing the modernisation of electrofilter facilities poulution in TE „Kostolac A“ is greatly reduced. Emmision of powdery matter is reduced by 54%, and polution completely brought to the european standards and acceptable levels of 50 mg/Nm3. In TE „Kostolac B“ poludtion reduction process will be completed during the revitalisation and modernisation of electrofilter facility in block B2 that is due to start this year.
MODERNISATION OF ASH TRANSPORTATION AND DISPOSAL SYSTEM
The biggest ecological problem in thermal power plant on coal operation is how
to properly dispose big amounts of ash that are created during the process of producing electrical energy by burning coal. Considering that the installed power of thermal energy facilities in Kostolac is close to 1000 MW almost 9 million tons of coal is being used power production. In Table 1 we can see the characteristics of the coal that is used from surface mine Drmno, which is used for burning in Kostolac power plants. Table 2 shows the creating of ash from plant TE „Kostolac A“.

Eco-Ist’12, Ecological Truth, 30 May - 2 June 2012. Hotel “Srbija TIS”, Zajecar, Serbia
359
Table 1. Characteristics of lignite coal from surface mine Drmno Coal charactreristics Moisture (%) 38,50 Ash (%) 27,50 Total sulfur (%) 1,10 Carbon 21,50 Hydrogen 2,10 Vaporable material (%) 13,40 Burnable matter (%) 34,00 Lowest heat value kJ /kg 7 600
Yearly production of ash from all blocks in TE Kostolac is around 2 million tons, for which enough space for disposal is required. This is why adequate technology needs to be used for ash transportation and disposal. Table 2. Ash production values in TE Kostolac A
Coal consum-ption Ash in coal Ash creation
Ash production
Slag production
t/h % t/h t/h t/h
TE Kostolac A1 156,39 27,50 43,00 40,85 2,15
TE Kostolac A2 278,00 27,50 76,40 68,80 7,60
The old system for collection, preparation and hydraulic transport of ash and slag in TE „Kostolac A“ consisted from two almost the same systems for each block separately. With old technology the heated slag was being gravitationaly pulled and was falling into the de-slagger with water where it was being cooled down. From de-slagger it is mechanicaly pulled out by rake transporter and flushed with water to canals coated with bazalt, that further transport the slag using gravity to the pool of excavator pumps. De-ashing process was done so that from from the canals of gasses, trough electrofilters ash is being separated and collected in funnels beneath electrofilters. There ash is being mixed with water and hydromixture is made with 10:1 relation.Then using bazalt cannals it is being transported into the pool of excavator pumps, wherefrom pumps push it trough transport pipes to the disposal site for ash and slag. Planned modernisation of this system will start during this year and assumes the creation of the new system of transport for the ash and slag using the method of thick hydromixture (in relation water-ash 1:1).
The old ash and slag transport and disposal system in TE „Kostolac B“ was constructed using the combined pneumo-hydraulic de-ashing with rare hydromixture (mass concentration 7-10% solid), without water re-circulation from ash and slag disposal site. Technological system is such that the ash beneath the electrofilter is being collected using the system of pneumatic beds, after which it is flushed with hydraulic ejectors and pushed to the pool of rare hydromixture. Slag from the de-slagger is mechanicaly pulled by tape transporters, it is fragmented using smashers, flushed by nozles and taken into pools of hydromixture. From the excavator station hydromixture of

Eco-Ist’12, Ecological Truth, 30 May - 2 June 2012. Hotel “Srbija TIS”, Zajecar, Serbia
360
ash and slag is being transported by the excavator pumps to the the ash and slag disposal site. The new ahs and slag disposal system that was made during 2011. in TE “Kostolac B” is made from four basic components: the inner ash and slag system, complex of silos, outer ransportation system and disposal site for ash and slag.Dry ash that is extracted during the operation of plants power blocks is being collected and transported to ash silos by appropriate pneumatic transport system(the inner ash system). The old system for extracting slag was reconstructed and improved so that the slag transport si done using hydraulics to the flushing facility localted on the slag silo, from where the wet slag is gravitationaly sent to the pool i excavator station. Silos (figure 2) for slag with capacity 2x500m3 are in the same complex with the ash silos with capacity 2x3000m3
(inner slag system).
Figure 2. Ash and slag Silos complex
Ash and slah transportation from the silo complex to the disposal site is done
with hydraulics, using thick hydromixture of ash and slag with mass concentration of 42 – 48% solid, which enables a more racional consumption of water (outer transport system). Transport system constists of 5 lanes trough which the disposal of ash and slag is being done to the new disposal site surface mine “Ćirikovac”. On th edisposal site a system of pipelines exists and the water which is on the site being extracted from the hydromixture is returned by a system of pumps in the technological process of the creation of hydromixture, thus greatly reducing the water consumption levels.
GASS DESULFURISATION FACILITY
At the time of construction of the thermal energy plant facilities in Kostolac, there was no laws and regulation for the reduction of emmision of sulfur oxydes. That is why existing emmisions of sulfur dioxide in exhaust gassess greatly exceed maximum alowed values defined in domestic and European regulatives.Measured values of sulfur dioxide emmisions are in range of 5000-7000 mg/m3, with specific emmisions from 30 kg/MWh. In goal of finding the possible solutions for desulfurisation of exhaust gasses i thermal plants a study was made that proposed technical solutions for the reduction of Sox emmisions from the existing power plants. Also a preliminary suggestion of

Eco-Ist’12, Ecological Truth, 30 May - 2 June 2012. Hotel “Srbija TIS”, Zajecar, Serbia
361
implementation order was made as well as the dynamics of realisation and the needed investment funds. Based on the exam , as optimal a wet procedure for desulfurisation was selected, with the usage of limestone for SO2
absorbtion, after which gypsum is received as a final nusproduct of commercial quality. At the same time using the criterium of minimum investment compared to level of reduction of sulfur emmisions that can be achived TE „Kostolac B” was chosen as the first thermal power plant that is planned for the construction of this facility.
Desulfurisation facility consists from following basic technological phases: • Transport and storage of limestone • Preparation and transport of suspension limestone • Desulfurisation of gasses • Thickening gypsum suspension • Gypsum suspension or dry gypsum transport to storage sites • Diagram on figure 3 show the desulfurisation proccess flow
Figure 3. desulfurisation proccess flow diagram
After passing trough electro filter (whose border values are 50 mg/m3), gass and buster fans, current of gass from each of the powerplant blocks enters into the absorber just above the level of liquid phase in the reaction pool.After it enters the pool, current of gass moves in the direction upwards to the top of the absorber when it comes into contact with fine drops of recirculated suspension which absorbs SO2
from the gass. Purified gass then passess trough two step drop eliminator that removes the drops of suspension and water and afterwards it is pointed trough the gass cannall on the top of the absorber directed into the newly build chimney and released into the atmosphere.

Eco-Ist’12, Ecological Truth, 30 May - 2 June 2012. Hotel “Srbija TIS”, Zajecar, Serbia
362
The goal of gass desulfurisation system is the reduction of SO2 emmsions for over 94%, reaching the exit concentrations of SO2 lower than 400 mg/m3
(6% O2, dry gass) with full power block operation and load and when burning worst quality coal. Characteristics of exhaust gassess on input and on exit from the facility are show on figure 4.
0100020003000400050006000700080009000
Emisija SO2iz TE-KO B
Temperaturadimnog gasa
Koncentracijačestica u
dimnom gasu
KoncentracijaSO2 u
dimnom gasu
KoncentracijaHCl
Pre ODGPosle ODG
Picture 4. Grafički Characteristics of exhaust gassess on input and on
exit from the facility
Basic goal of making a facility for wet gass desulfurisation is to controll and drasticaly reduce to amount of SO2
that is being released and emmited into the atmosphere. The basic contribution of the project to the air quality will undoubtedly be positive and the result will be lower concentration of sulfur oxides in the air which will have awhole range of positive effects on the environment, such as lowered posibility for creation of acid atmospheric precipitates. Wet desulfutisation process will also have a positive offect trgough the reduction of emmsion of solid particles and acid gass components(HCl i HF). In goal of showing the positive effects of the facilities operation we can see the values in Table 3that show the compared concentrations of polutable matter in gass on its way out of the absorber.
Table 3. Compared assesment of reduced amounts of polutable matter from gasses when the facility becomes operational
SO2 NOx Suspended particles
HCl i HF CO2 CO
Reduction of 94,03%
No change Reduction of 70%
Reduction of 90% do 96%
Increase of 1,6% do 1,7%
No change
Negative impact on the quality of ambient air will be in terms of increased
emmision of suspended particles due to difused sources from the transport system, cargo system, storage and manipulation of created limestone. In case that the buyer for the gypsum mass with 10% moisture cannot be found , gypsum disposal will be made in the form of suspension with 50|% moisture. Gypsum will be transported to surface mine disposal site (surface mine „Drmno“) sby a system of pipelines. Due to certain properties of gypsum, after shorter period supension hardens and forms a crust on the surface so no significant emmision of suspended particles from the disposal site is expected.

Eco-Ist’12, Ecological Truth, 30 May - 2 June 2012. Hotel “Srbija TIS”, Zajecar, Serbia
363
CONCLUSION
Largest problems in the environmental protection are caused by air polution, water polution, loosing water resources and inappropriate practice in waste disposal. Air quality is established by SO2
By taking care of nature and the environment, following procalimed norms of the EU , especially environmental protection regulative a number of priority projects has been completed or started that greatly improve environmental protection. With the reconstruction of electrofilters in TE „Kostolac A“, which is located in the very town, emmision of powdery matter has been reduces by 54%, that has made the polution completely to the level of europen standards of 50 mg/m
, NOx, CO powdery matter emmsions, that originate from thermal power plants (lignite coal usage and bad ash disposal). Because of that the largest number of projects realised in the protection of environment is directed to controll and air polution reduction.
3. Adjusting the work of electrofilter in TE „Kostolac B“ with the demands of EU regulative for the reduction in powdery matter emmisions will start during this year. In order to bring the concentraion levels of emmited sulfuric oxides to the level of 400 mg/m3
, in terms with the directive 2001/80/EC, in TE „Kostolac B“ it is planned that by 2015. A facility is constructed for desulfurisation of gassess.. Modernisations and implementations of new technologies for transport and disposal of ash that is finished inTE „Kostolac B“ and that si starting to be implmented in TE „Kostolac A“, will besides the reduction of eol errosion by ash, provide the reduction of the polution of underground watters. In goal of reducing the impact on closes environment and reducing the polution of underground water and air in procimity of the disposal sites the most moder and most usefull ways to solve the problem are being implmented using the existing dugged out space of surface mine Ćirikovac for these needs of ash disposal.
REFERENCES
1. ***, Directive 2001/80/EC on the limitation of emissions of certain pollutants into the air from Large Combustion Plants, October 2001
2. Pravilnik o graničnim vrednostima emisije, načinu i rokovima merenja i evidentiranja podataka („Sl. glasnik RS“,br. 30/97).
3. European Comission - Reference document on Best Available Techniques for Large Combustion Plants, jul 2006
4. ***, Izveštaj o ispitivanju stepena otprašivanja elektrofiltera i emisije štetnih materija u TE „Kostolac”u 2004. godini, Rudarski institut, Zavod za termotehniku, ventilaciju i zaštitu sredine, Beograd, 2005.
5. ***, Pravci optimalnog smanjenja emisije sumpornih oksida iz termoelektrana Elektroprivrede Srbije, Energoprojekt-ENTEL, Beograd, 2006.
6. Cvejic.R., “ Ekološki menadžment „ VŠSP Beograd 2010, god. 7. ***, Idejni projekt odsumporavanja dimnih gasova TE „Kostolac B”,
Energoprojekt-ENTEL,Beograd,2007. 8. www.eps.co.yu/ekologija

364
XX International Scientific and Professional Meeting
"ECOLOGICAL TRUTH" ECO-IST'12
30 May - 2 June 2012, Hotel “Srbija TIS“, Zajecar, SERBIA
DIETARY INTAKE OF PROTEINS AND RISK FOR GASTRIC CANCER
Konstansa Lazarevic1*, D. Stojanovic1,2, M. Ilic
1
1Public Health Institute Nis, SERBIA 2
University of Nis, School of Medicine, SERBIA
*
ABSTRACT The aim of this hospital based study, conducted in Niš (Serbia) in period 2005-2006 was to
investigate association between dietary proteins and gastric cancer. A total of 102 cases of gastric cancer and 204 controls were included in this study.
Using unconditional logistic regression models, (including terms for age, sex, education, physical activity, smoking, history of cancer in the first degree and total energy intake), risk for gastric cancer was inversely associated with intake of plants proteins OR= 0.12; 95%CI (0.04-0.36), but not in animals proteins. Our study suggest that a diet high in plants proteins has favorable effect to risk of gastric cancer.
Key words: diet, proteins, gastric cancer
INTRODUCTION
Worldwide, and also in Nišava District, gastric cancer is the fifth most common cancer [1,2]. Many studies have clearly demonstrated that diet, genetic susceptibility and Helicobacter infection are import risk factors in development of gastric cancer [3].
Proteins are important part of diet because they supply energy and they are also necessary for growth and development. Many proteins are vital to metabolism (as enzymes), and others have structural or mechanical functions (proteins in the cytoskeleton). They are also important in cell signaling, immune responses, cell adhesion, and the cell cycle.
Dietary sources of animals proteins include meats, milk and cheese, and plants proteins include pulses (legumes), nuts, and cereals (grains) and products made from them.
Experimental study indicated that long-term administration of a high-protein diet suppresses corpus atrophic gastritis in H. pylori-infected Mongolian gerbils, and prevents gastric cancer development [4].
The purpose of this study was to assess the relation between dietary proteins intake and the risk of gastric cancer in Nis, Serbia.

Eco-Ist’12, Ecological Truth, 30 May - 2 June 2012. Hotel “Srbija TIS”, Zajecar, Serbia
365
MATERIAL AND METHOD A hospital based case control study was conducted in University Hospital in Nis between January 2005 and December 2006. A total of 102 patients with histologically confirmed gastric cancer were compared with 204 controls. All interviews were conducted by a physician in a hospital setting. All cases and controls were recruited on a voluntary basis. A food-frequency questionnaire (FFQ) was used to assess subjects’ habitual diet, including information on weekly frequency of consumption of specific foods (98 items) in course of 1 year prior to cancer diagnosis or hospital admission (for controls). Nutrient values in food were obtained from USA Department of Agriculture sources [5].
Odds ratio (OR) and the corresponding 95% confidence intervals (CI) were computed by tertile of daily intake of proteins using unconditional logistic regression models, including terms for age, sex, education, physical activity, smoking, history of cancer in the first degree and total energy intake. Analyses were carried out by the SPSS version 10.1 software.
RESULTS AND DISCUSSION
Table 1 shows the distribution of 102 cases of gastric cancer and 204 controls according energy intake (kcal).
Table 1. Daily energy intake (kcal)
Cases Controls P* X± SD Me X ±SD Me
Energy intake 1677.6 ±338,1 1593.0 1720.2 ±373,6 1598.2 p>0.05 *t test
Significant differences between energy intake among gastric cancer cases and controls were not observed (table 1). Daily intake of total proteins was similar among gastric cancer patents compared to the controls (p>0.05), animal protein significantly higher among cases (p< 0.001) and plants proteins significantly higher among controls (p< 0.001) (table 2). Table 2. Daily intake of proteins (g)
NUTRIENTS Cases Controls p* X ±SD Me X ±SD Me 65.6± 18.5 Total proteins 64.7 65.5 ±18.9 64.3 p>0.05
Animals proteins 43.2 ±6.6 38.7 40.5 ±6.5 38.0 p< 0.001 Plants proteins 22.4 ±5.4 23.3 25.0 ±6.6 25.7 p< 0.001
*t test Odss ratios of gastric cancer according to various origins of proteins are shown in table 3.
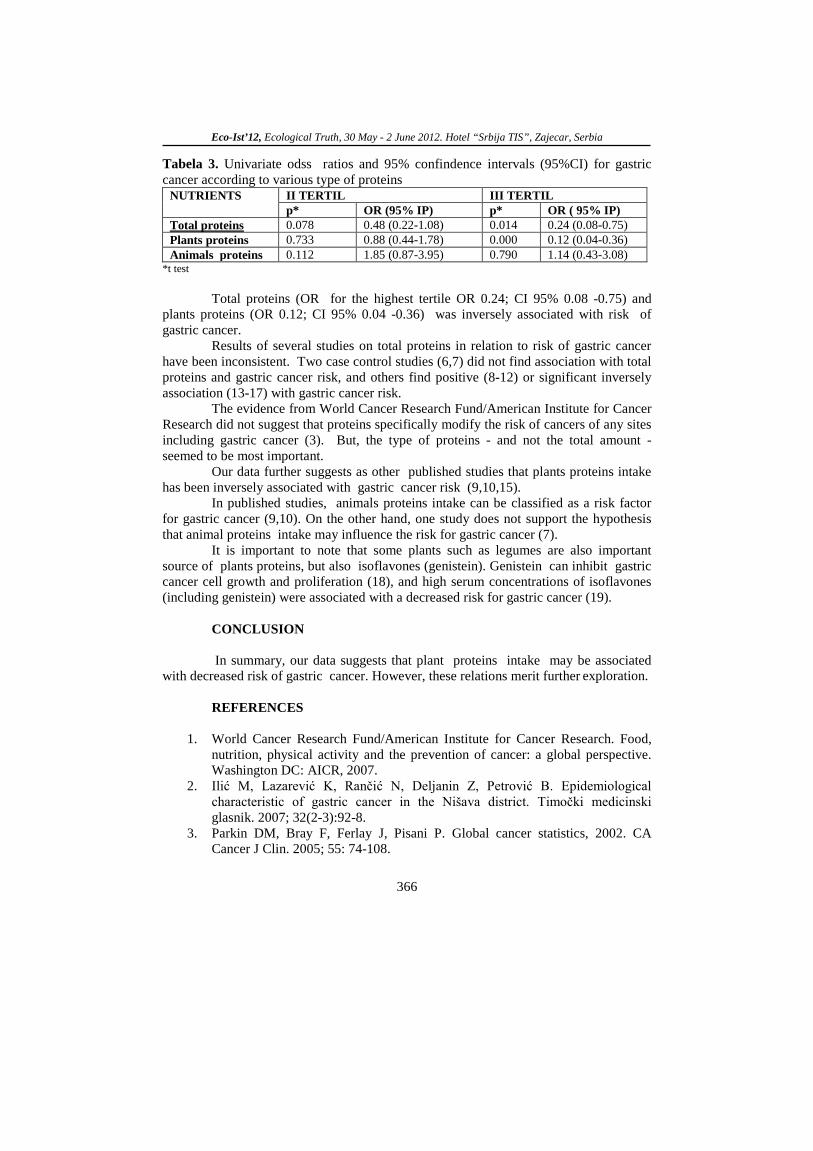
Eco-Ist’12, Ecological Truth, 30 May - 2 June 2012. Hotel “Srbija TIS”, Zajecar, Serbia
366
Tabela 3. Univariate odss ratios and 95% confindence intervals (95%CI) for gastric cancer according to various type of proteins
NUTRIENTS II TERTIL III TERTIL p* OR (95% IP) p* OR ( 95% IP) 0.078 Total proteins 0.48 (0.22-1.08) 0.014 0.24 (0.08-0.75)
Plants proteins 0.733 0.88 (0.44-1.78) 0.000 0.12 (0.04-0.36) Animals proteins 0.112 1.85 (0.87-3.95) 0.790 1.14 (0.43-3.08)
*t test
Total proteins (OR for the highest tertile OR 0.24; CI 95% 0.08 -0.75) and plants proteins (OR 0.12; CI 95% 0.04 -0.36) was inversely associated with risk of gastric cancer.
Results of several studies on total proteins in relation to risk of gastric cancer have been inconsistent. Two case control studies (6,7) did not find association with total proteins and gastric cancer risk, and others find positive (8-12) or significant inversely association (13-17) with gastric cancer risk.
The evidence from World Cancer Research Fund/American Institute for Cancer Research did not suggest that proteins specifically modify the risk of cancers of any sites including gastric cancer (3). But, the type of proteins - and not the total amount - seemed to be most important.
Our data further suggests as other published studies that plants proteins intake has been inversely associated with gastric cancer risk (9,10,15).
In published studies, animals proteins intake can be classified as a risk factor for gastric cancer (9,10). On the other hand, one study does not support the hypothesis that animal proteins intake may influence the risk for gastric cancer (7).
It is important to note that some plants such as legumes are also important source of plants proteins, but also isoflavones (genistein). Genistein can inhibit gastric cancer cell growth and proliferation (18), and high serum concentrations of isoflavones (including genistein) were associated with a decreased risk for gastric cancer (19)
.
CONCLUSION
In summary, our data suggests that plant proteins intake may be associated with decreased risk of gastric cancer. However, these relations merit further
exploration.
REFERENCES
1. World Cancer Research Fund/American Institute for Cancer Research. Food, nutrition, physical activity and the prevention of cancer: a global perspective. Washington DC: AICR, 2007.
2. Ilić M, Lazarević K, Rančić N, Deljanin Z, Petrović B. Epidemiological characteristic of gastric cancer in the Nišava district. Timočki medicinski glasnik. 2007; 32(2-3):92-8.
3. Parkin DM, Bray F, Ferlay J, Pisani P. Global cancer statistics, 2002. CA Cancer J Clin. 2005; 55: 74-108.

Eco-Ist’12, Ecological Truth, 30 May - 2 June 2012. Hotel “Srbija TIS”, Zajecar, Serbia
367
4. Shinozaki K, Kamada T, Sugiu K, Kusunoki H, Manabe N, Shiotani A, et al. High-protein diet suppresses corpus atrophic gastritis in Helicobacter pylori infected Mongolian gerbils. Nutr Cancer. 2010; 62(8):1067-73.
5. USDA (U.S. Deparment of Agriculture Research Service). USDA National Nutrient Database for Standard Reference, Release 17. 2004. accessed 1 December 2007. Available:
6. Harrison LE, Zhang ZF, Karpeh MS, Sun M, Kurtz RC. The role of dietary factors in the intestinal and diffuse histologic subtypes of gastric adenocarcinoma: a case-control study in the U.S. Cancer. 1997; 80:1021-8.
http://www.nal.usda. gov/fnic/foodcomp/Data/SR17/sr17.htm
7. Lucenteforte E, Bosetti C, Gallus S, Bertuccio P, Pelucchi C, Tavani A, et al.. Macronutrients, fatty acids and cholesterol intake and stomach cancer risk. Ann Oncol
8. Lopez-Carrillo L, Lopez-Cervantes M, Ward MH, Bravo-Alvarado J, Ramirez-Espitia A. Nutrient intake and gastric cancer in Mexico. Int J Cancer. 1999;83:601-5.
. 2009;20(8):1434-8.
9. Mayne ST, Risch HA, Dubrow R, Chow WH, Gammon MD, Vaughan TL, et al. Nutrient intake and risk of subtypes of esophageal and gastric cancer. Cancer Epidemiol Biomarkers Prev. 2001;100:1055-62.
10. Palli D, Russo A, Decarli A. Dietary patterns, nutrient intake and gastric cancer in a high-risk area of Italy. Cancer Causes Control. 2001;12:163-72.
11. Qiu JL, Chen K, Zheng JN, Wang JY, Zhang LJ, Sui LM. Nutritional factors and gastric cancer in Zhoushan Islands, China. World J Gastroenterol. 2005;11(28):4311-6.
12. Jedrychowski W, Popiela T, Steindorf K, Tobiasz-Adamczyk B, Kulig J, Penar A, et al. Nutrient intake patterns in gastric and colorectal cancers. Int J Occup Med Environ Health
13. Ji BT, Chow WH, Yang G, McLaughlin JK, Zheng W, Shu XO et al. Dietary habits and stomach cancer in Shanghai, China. Int J Cancer. 1998;76:659-64.
. 2001;14(4):391-5.
14. Kaaks R, Tuyns AJ, Haelterman M, Riboli E. Nutrient intake patterns and gastric cancer risk: a case-control study in Belgium. Int J Cancer. 1998;78:415-20.
15. Kim HJ, Kim MK, Chang WK, Choi HS, Choi BY, Lee SS., et al. Effect of nutrient intake and Helicobacter pylori infection on gastric cancer in Korea: a case-control study. Nutr Cancer. 2005;52:138-46.
16. Muñoz N, Plummer M, Vivas J, Moreno V, De Sanjosé S, Lopez G, et al. A case-control study of gastric cancer in Venezuela. Int J Cancer. 2001;93:417-23.
17. Chen H, Tucker KL, Graubard BI, Heineman EF, Markin RS, Potischman NA, et al. Nutrient intakes and adenocarcinoma of the esophagus and distal stomach. Nutr Cancer. 2002;42(1):33-40.
18. Zhou HB, Chen JJ, Wang WX, Cai JT, Du Q
19. Ko KP, Park SK, Park B, Yang JJ, Cho LY, Kang C, et al. Isoflavones from phytoestrogens and gastric cancer risk: a nested case-control study within the Korean Multicenter Cancer Cohort. Cancer Epidemiol Biomarkers Prev. 2010;19(5):1292-300.
. Apoptosis of human primary gastric carcinoma cells induced by genistein. World J Gastroenterol. 2004; 10: 1822–5.

368
XX International Scientific and Professional Meeting
"ECOLOGICAL TRUTH" ECO-IST'12
30 May - 2 June 2012, Hotel “Srbija TIS“, Zajecar, SERBIA
EFFICIENCY OF ZEOLITE ENRICHED NATURAL PHOSPHATE
FERTILIZER – A VEGETATION TRIAL WITH MAIZE
Marija Mihajlovic*
J. Milojkovic, M. Petrovic , M.Grubisic, M. Stojanovic, Z. Lopicic,
Institute for Technology of Nuclearand Other Minerals Raw Materals,
86 Franchet d` Esperey street, 11000 Belgrade,
SERBIA
ABSTRACT The results of the vegetation experiment in semi-controlled conditions, with maize, indicates that the addition of zeolite to the rock phosphate favors the growth of the culture and its yield. In relation to a natural phosphate fertilization, treatment with the rock phosphate in which was added natural zeolite and NH4
+-zeolite promotes the yield of maize for 85% and 95%, respectively. The increase of P contents in the maize samples are in correlation with the increase in maize yield. Correlation coefficients for Ca2+
and P indicates a direct relationship between their content in the growing medium, with the level of adoption by the plant.
Key words: nature mineral fertilizers, zeolite, rock phosphate, maize INTRODUCTION Phosphorus, from rock phosphate (RP) has a significant impact on increasing
crop yields and the content of physiologically active form of phosphorus, as well as plant nutrient [1,2]. In case of very acidic soils (pH below 4.5), effects of raw phosphate are identical with the used water-soluble phosphorus fertilizers [3]. The dissolution of the RP in acid soils depend on the availability of H+, humidity, Ca2+ and P removal from the solution. Cation exchange capacity of acidic soils are low, the concentration of Ca2+ in the soil solution around the particles increases rapidly, delaying RP dissolution [4]. Porous minerals, like zeolites, with its high cation-exchange capacity, can help control the release of P in agricultural systems [5]. When saturated with monovalent nutrient cations, such as NH4
+ and K+, zeolites additionally enhance increase dissolution of RP [6]. The mechanism proposed for solubilisation of RP is exchange-induced dissolution in wich plant uptake of NH4+ or K+ liberates exchange sites which are occupied by Ca2+, lowering the soil solution Ca2+
In this paper will be presented the results of vegetation experiment aimed to study the efficiency of zeolite as a component of a fertilizer system on maize yields. Also, will be tested the correlations of P and Ca
concentration and inducing further dissolution of RP [2].
2+ accumulated in maize shoots, with the
Eco-Ist’12, Ecological Truth, 30 May - 2 June 2012. Hotel “Srbija TIS”, Zajecar, Serbia
369
previously published concentration of the same elements in the experimental solutions of used fertilizer systems [7]
MATERIAL AND METHODS The fertilizer, concentrate of RP, used in these experiments was made by flotation method of apatite, from ore deposit „Lisina“ Bosilegrad, containing 32-35% P2O5. RP was grounded to about 80μm size particles. The used zeolites was of Romanian origin from deposit Baia Mare. With a wet milling and wet classification process was excluded fraction of < 37 μm, which were used in the experiments. Modification of zeolite with NH4
+ was performed by treating the natural zeolite with 1M NH4
Cl. The total silicate analysis of the used zeolite is presented in Table 1. Loss of ignition at 1000 ° C was 9.81%
Table 1. Composition of used zeolite
Vegetation experiment in semi-controlled conditions was set up with a hybrid ZP
434 on soil type distric cambisol. The characteristics of this type of soil are given in Table 2. The total N content in the soil was 0.08%, while the available forms of K20 (14.9 mg/100 g of soil) and P2O5
(12.5 mg/100 g of soil) were at the average level of supply.
Table 2. Chemical properties of experimental soil
Horizon Depth (cm)
pH EC (μS)
Humus (%)
CEC (meq/100g) H2 KCl O
Ah 0-30 5.55 4.50 71.12 2.12 16.2 Three different growing media placed in the 3 different pots: (RP)/soil, (RP+zeolite)/soil and (RP+NH4-zeolite)/soil, were tested. In each experimental variants were entered 20g of fertilizer per 100 kg of soil. Based on the literature data it was decided that the fertilizer contains initial ratio the zeolite and the RP of 5:1 [2]. In each of 1dm3 pot, after the germination, was grown per 3 plants. Plants were collected when they were one month old, with three to five leaves and dried. Maize yield was determined via total increase of dry matter content (m) and its heights (h). A quantitative chemical analysis of samples has been carried out at the atomic adsorption spectrophotometer Perkin Elmer AAS "703", following acid decomposition of dried plants. The amounts of P after sample preparation were mesaured by analysis of the supernantant by colorimetry. Concentrations of Ca 2+and K+
in all three solutions were determined using AAS.
Oxide SiO Al2 2 FeO3 2O CaO 3 MgO TiO Na2 2 KO 2O mass % 63.60 11.81 1.74 7.35 0.688 0.40 4.40 0.169

Eco-Ist’12, Ecological Truth, 30 May - 2 June 2012. Hotel “Srbija TIS”, Zajecar, Serbia
370
RESULTS AND DISCUSSION
The results of the experiment setup with maize, as test culture, indicate that the addition of natural zeolite to RP favors the growth of the culture and its yield (Table 3). Treatment of maize with the RP in which was added natural zeolite (RP + Z), promotes the growth of maize for 43%, in relation to maize which was fertilized only with RP. Likewise, treatment of maize with the RP in wich was added modified NH4
+ - zeolit (RP+ NH4
+- Z), favors the growth of maize for 53%. The yield in the mass of maize was increased for an additional 85%, in the treatment with (RP+Z) fertilizer and for 95% in the treatment with (RP+ NH4
+-Z) The obtained values of K
, in comparison with the RP treatment. + content in all three samples of maize showed higher
amounts of this nutrient in plants treated with zeolite enriched fertilizer. The highest Ca+2 content of 1.66 % was found in sample with (RP + Z) treatment. The expected decrease in content of Ca+2
Surely the most significant parameter of the applied fertilizer treatments was P content in the prepared plant samples. At the treatment with the addition zeolite to the RP, content of P was increased from 0,181% to 0.198%. As what was expected, the highest P content of 0.263%, was detected in the sample of maize treated with the (RP + NH
was observed in the sample treated with fertilizer which has the least of this element (0.73%).
4+-Z) fertilizer. This increase in P content is in correlation with the increase in maize
yield when using NH4
-zeolites as a supplement to the RP.
Table 3. The results of vegetation experiment with maize
a The percentage of increase in heigh of the maize, compared to the RP treatment b
The percentage of increase of maize yield, compared to the RP treatment
To examine the effects of zeolite addition to natural fertilizer on the crops yield and the level of nutrient adoption, we compared the content of Ca2+ and P which was previously determined in the solutions [7], with those found in maize, Figure 1. Pearson's correlations coefficients obtained for Ca2+
and P were r = 0.99 and r = 0.96, respectively. A high values of correlation coefficients indicate that the addition of zeolites to the RP facilitate the release of phosphorus, and therefore its better adoption from the fertilized soil by maize.
Treatment h (%) m (%)a K (%) b Ca (%) P (%) RP 100 100 1,62 0,77 0,181 RP+Z 143 185 2,08 1,66 0,198 RP+ NH4
+ 153 - Z 195 2,37 0,73 0,263

Eco-Ist’12, Ecological Truth, 30 May - 2 June 2012. Hotel “Srbija TIS”, Zajecar, Serbia
371
Figure 1. The relationship between the Ca2+and P released from the different fertilizer
systems in the solution [7] and the same elements adopted by maize. Pearson's correlations coefficient for Ca2+
is r = 0.99 (1a) and for is r = 0.96 (1b).
CONCLUSION
The results of vegetation experiment in semi-controlled conditions, with maize as test culture, showed that functional fertilizer based on the synergistic conjunction of zeolites and RP, contributing the yield of maize. The obtained values of K+ and P content in all three samples were higher in plants treated with zeolite enriched fertilizer. Furthermore, presence of NH4
+-zeolite in RP additionally facilitates release of P in soil which affects the increase in maize yield. Decrease in content of Ca2+ observed in the sample treated with fertilizer with at least of this element, was also expected. The contents of Ca2+
and P expressed through Pearson's coefficients in the solution [7] and in maize, indicate a direct connection between their content in the soil and the level of adoption by the plant.
Acknowledgement This study is a part of the project TR31003 supported by the Ministry of Education and Science of the Republic of Serbia. REFERENCES
1. Hinsinger P., Gilkes R., Dissolution of phosphate rock in the rhizosphere of five plant species grown in an acid P-fixing mineral substrate, Geoderma 75 pp: 231-249,1997.
2. Pickering W., Menzies N., Hunter M., Zeolite/rock phosphate - a novel slow release phosphorus fertiliser for potted plant production, Scientia Horticulturae 94 pp: 333–343, 2002.
3. Stojanović M., Milojković J., Grubišić M., Ileš D., Primena alumosilikatnih mineralnih sirovina za remedijaciju zemljišta kontaminiranih uranom. I

Eco-Ist’12, Ecological Truth, 30 May - 2 June 2012. Hotel “Srbija TIS”, Zajecar, Serbia
372
međunarodni kongres „Inženjerstvo, materijali i menadžment u procesnoj industriji, Jahorina, Republika Srpska, pp: 523-526, 2009.
4. Lai T. and Eberl D., Controlled and renewable release of phosphorus in soils from mixtures of phosphate rock and NH4
5. Vaughan D., Properties of natural zeolites. In: Sand, L., Mumpton, F. (Eds.), Natural Zeolites: Occurrence, Properties, Use. Pergamon Press, New York, pp: 353–372, 1978
exchanged clinoptilolite, Zeolites 6, pp: 129–132, 1986.
6. Allen E., Hossner L., Ming D., Solubility and cation exchange in phosphate rock and saturated clinoptilolite mixtures Soil Science Society of America Journal 57, pp:1368–1374, 1993
7. Mihajlović M., Stojanović M., Lopičić, Z., Milojković J., Petrović M., Grubišić M.,
A step toward the novel environmental friendly fertilizer, Innovative strategies and technologies in environmental protection, Belgrade, pp: 121-122, 2012.

373
XX International Scientific and Professional Meeting
"ECOLOGICAL TRUTH" ECO-IST'12
30 May - 2 June 2012, Hotel “Srbija TIS“, Zajecar, SERBIA
EFFICIENCY OF ZEOLITE AND APATITE FOR THE REMEDIATE
OF RADIONUCLIDES AND TOXIC METALS FROM THE SOIL
Mirko Grubisic1*, Lj. Boskovic-Rakocevic2, M. Mihajlovic1, M. Stojanovic1
Z. Lopicic,
1, J. Milojkovic
1
1
86 Franchet d` Esperey street, 11000 Belgrade, SERBIA Institute the Technology of Nuclear and Other Mineral Raw Materials,
2
University of Belgrade, Faculty of Agronomy, Department of soils and machinery, Cacak, SERBIA
ABSTRACT
Soil contamination with heavy metals and radionuclides is a global problem and requires the development of new technologies in order to prevent their entrance in the food chain. Toxic metals like Pb, Zn, Cd and U are the most frequent group of pollutants present in soil and water. Subject of this research was to determine the efficiency of apatite and zeolite on the heavy metal immobilization by setting the vegetation experiment in two types of soil with the mustard, Sinapsis Alba. The results indicate that application of apatite and zeolite decrease the soil bioavailability of tested metals which supports their use as sequestering agents for remediation of polluted mediums.
Key words: zeolite, apatite, soil, remediation, toxic element, radionuclides
INTRODUCTION
The use of mineral resources in the technology of immobilization of toxic metals and radionuclides is an important technology in the remediation processes of waste water, sediments and soils and agricultural soils [1, 2]. A great emission of pollutants such as Pb, Cd, Zn, Cu etc., comes from the manufacturing process pirometallurgy [3]. Heavy metals are very harmful to living organisms because of its stability, toxicity and accumulation tendencies in nature. The analyzes performed in the U.S. indicate that the remediation of mining area, of agricultural soil and industrial sites need about a hundred billion dollars with the constant trend of increase in new areas.
Unlike biodegradable organic pollutants, heavy metals and radionuclides are not broken down by natural processes, but rather accumulate in living organisms through the media. In this way, soil and sediment pollution are becoming a potential source for plants, animals and humans. Total remediation of contaminated soil surfaces is not possible. Therefore, the alternative is to stabilize „in-situ” in order to prevent the migration of toxic metals and radionuclides ie going into ground water or the ecosystem.

Eco-Ist’12, Ecological Truth, 30 May - 2 June 2012. Hotel “Srbija TIS”, Zajecar, Serbia
374
Blum [4] according to the seriousness of the problem of sustainable development and measures to control contamination of soil as the main goal of future agricultural production. Reduction of available forms of elements harmful to plants is essential for optimizing agricultural production, especially the disadvantaged, urban and industrial regions. Organic-inorganic materials used for remediation must be effective, cheap and available in tons and applicable in different areas-media. The materials most frequently investigated were: iron oxides, zeolites, apatite, MgO, carbonates, compost, peat, cotton seed , and lime.
Application of mineral adsorbents in remediation technology does not require special machines, and can be applied at different positions (plains, slopes), create a permeable reactive barrier (PRB), or mixed with contaminated soil or waste on the surface. Apart from that it can be successfully used in combination with other materials.
Adsorption, ion exchange and deposition mechanisms of translation are each potentially movable and soluble forms of toxic metals in geochemical stable phase, reducing the adoption and reducing toxic metals by plants. For these processes in the soil can be successfully used lime materials, phosphates, zeolites, bentonites, clays, and Fe oxide and organic matter [5, 6]. Metal stabilization technologies using apatite precipitation is a new phase apropos. creating new stable phase or modification of calcium and calcium apatite making you suffer. In this way, we can stabilize many metals and radionuclides: Pb, Zn, Cu, Cd, Ni, U, Ba, Cs, Sr, Pt, Th and other actinides and lanthanides [7].
The aim of this study was to investigate the effectiveness of apatite and zeolite, through precipitacion and adsorption mechanisms on reduction bioavailability of pollutants and obtaining the ecologically, economically viable materials for remediation of contamination media.
MATERIAL AND METHOD Vegetation experiment was performed with the test culture mustard "Sinapsis
Alba" domestic, germination> 90%, the seed of the Institute of Medicinal Plant Research "Josif Pancic" in Belgrade on two soil types pseudoclay (I), sandy chernozem (II). Soil samples were contaminated with salts of Cd, Pb, Zn and U in the following doses of Cd = 10 mg / kg, Pb = 500 mg / kg, Zn = 300 mg / kg of U = 300 mg / kg. Salt forms of Cd, Pb of Zn were acetate, while in was in the form of uranyl nitrate (238U).
The effectiveness of mineral raw materials based on zeolite of apatite followed by the addition of a dose of 20 g / kg soil. The experiment was conducted in plastic pots where the quantity of non contaminated and contaminated soil was 3 kg. Number of replicates per culture was 3 for a total of 27 pots for each variant (control, contaminant). Number of plants planted was 15 and after germination the number reduced to 10 per pot. During the monitoring of vegetation reflected the constant humidity was maintained around the FWC, and the necessary protection of plants.
In experiment was used zeolite and apatite domestic origin prepared at the Institute for Technology of Nuclear and the Other Mineral Raw Materials, Belgrade.

Eco-Ist’12, Ecological Truth, 30 May - 2 June 2012. Hotel “Srbija TIS”, Zajecar, Serbia
375
RESULTS AND DISCUSSION Before placing the vegetation experiment in semi controlled conditions were
carried out detailed tests of physical and chemical properties of soil. Sandy chernozem soil type is characterized by a neutral soil reaction ( pH in H2O 7.05 and pH in 1N KCl 6.41), and low in organic matter (% humus 2.36). Pseudoclay soil type is characterized by high acid soil reaction ( pH in H2
During execution, and monitoring parameters of the first (germination, emergence and plant growth), which indicated the depressive effect of metals and radionuclides were visible and important during the test. Each of these elements (Pb, Zn, Cd and U) had effect on the typical morphological features of plants. The most typical signs of toxicity effects of contaminants on plants are visible for elements that have entered into a slightly larger boundaries (U and Zn) in relation to natural resources. Effect of zinc-excess (Table 1) caused a more or less specific morphological and physiological changes, as reflected in lower growth, reduce root system and the education of tiny leaves with necrosis phenomena. Zinc content indicate that the change of pH value of the soil, a little higher in sandy chernozem, had less negative impact on growth and development of mustard and therefore the same element content in leaves and root system (Figure 2).
O 5.55 and pH in 1N KCl 4.50) and low in organic matter (% humus 2.12). In these soil samples was found very low and the approximate content of easily accessible and followed by the total content of toxic metals (Pb, Cd, Zn) and radionuclides (U).
Uranium had a stimulating effect on germination percentage of mustard, especially in acid soil reaction pseudoglej land, which is in complete correlation with literature data. Uranium in that concentration in the soil, stimulating, influenced the development of above-ground mass of leaves, trees grow again in the acidic environment and the impact on the root system is negligible.
Table 1. Effect of toxic metals and radionuclides in the morphological properties of Indian mustard
No. Treatment Plant height (cm)
Shoot weight (g) The mass of roots (g)
% of germinated
plants Blom Leaf+Bole SUM (4+5)
I II I II I II I II I II I II 1 Control 53 60 3.00 4.58 4.78 7.37 7.78 11.95 0.50 1.30 89 72 2 + Zeolite 54 62 3.04 4.43 4.66 7.17 7.70 11.69 0.45 1.13 89 83 3 + Apatite 59 63 4.05 4.31 4.58 8.97 8.63 13.28 0.58 1.21 89 78 4 + Pb 51 59 3.98 5.03 4.25 4.80 8.23 9.83 0.39 0.42 78 94 5 + Pb + Zeolite 50 65 4.12 4.98 4.42 6.47 8.54 11.45 0.38 0.53 89 89 6 + Pb + Apatite 54 59 6.02 4.90 5.00 4.70 11.01 9.60 0.53 0.47 78 83 7 + Cd 55 49 7.98 7.86 5.78 5.89 13.76 13.75 0.60 0.66 78 67 8 + Cd + Zeolite 58 52 8.13 7.79 6.44 8.18 14.57 15.97 0.56 0.79 78 78 9 + Cd + Apatite 56 63 8.08 7.88 6.12 7.89 14.20 15.77 0.53 0.77 78 89
10 + Zn 43 45 3.17 7.02 4.60 6.07 7.77 13.09 0.28 0.86 83 100 11 + Zn + Zeolite 47 49 6.73 8.32 4.61 5.82 11.34 14.14 0.51 0.88 72 67 12 + Zn + Apatite 45 51 5.88 7.66 4.53 6.56 10.41 14.22 0.54 0.96 72 89 13 + U 51 54 5.64 4.92 3.63 4.10 9.27 9.02 0.51 0.73 94 89 14 + U + Zeolite 51 46 6.92 5.59 4.58 3.56 11.50 9.15 0.47 0.60 89 94 15 + U + Apatite 52 43 9.68 6.02 5.37 4.25 15.05 10.27 0.78 0.78 94 89
*pseudoclay (I), Sandy chernozem (II)

Eco-Ist’12, Ecological Truth, 30 May - 2 June 2012. Hotel “Srbija TIS”, Zajecar, Serbia
376
Table 2 shows the average content of toxic elements in the root mass and above-ground mustard varieties grown in the zeolite, and apatite in pseudoclay and sandy chernozem soil type. The results indicate that the selected test cultures mustard its root system has a strong affinity for certain toxic elements that are found in trace amounts in zeolite and apatite.
Table 2 . Effect of toxic metals and radionuclides in the morphological properties of mustard
Figure 1 shows the contents of Pb and Cd in root and aboveground mustard
before and after treatment with 500 mg/kg Pb and 10 mg/kg Cd. The total content of Pb in non-contaminated soils are highly variable, even during the year but "normal" content ranges from 10 to 200 mg/kg.
It was found that zeolites have good adsorption of apatite-deposited Pb but to depend on the pH value of the land. One of the famous and often-used method to reduce the availability of plant Pb was that liming. increase in soil pH values in the case of chernozem. However, liming is very limiting in acid soils and liming process can not be done in some regions of which there are adequate supplies of materials and calcification of the complete validity of the above minerals.
Figure 1. The contents of Pb and Cd in the root and leaf mustard grown
on pseudoclay and sandy chernozem
No. Tretman
The total content of toxic elements (mg/kg)
Root Herb
Pb Cd Zn Mn Pb Cd Zn Mn Cu
1
Pseudocley
Control 21.8 3.5 65.33 92.33 2.5 0.1 184 24 5
2 + Zeolite 17.60 4.7 66.90 75.12 2.5 0.1 118 21 3
3 + Apatite 12.3 4.1 75.16 41.67 2.5 0.1 87 11 1
4 Sandy
chernozem
Control 9.04 2.5 30.39 63.31 2.5 0.1 69 19 2
5 + Zeolite 9.29 2.60 37.15 76.92 2.3 0.1 56 17 2
6 + Apatite 11.7 2.3 29.4 51.32 2.0 0.1 212 22 3
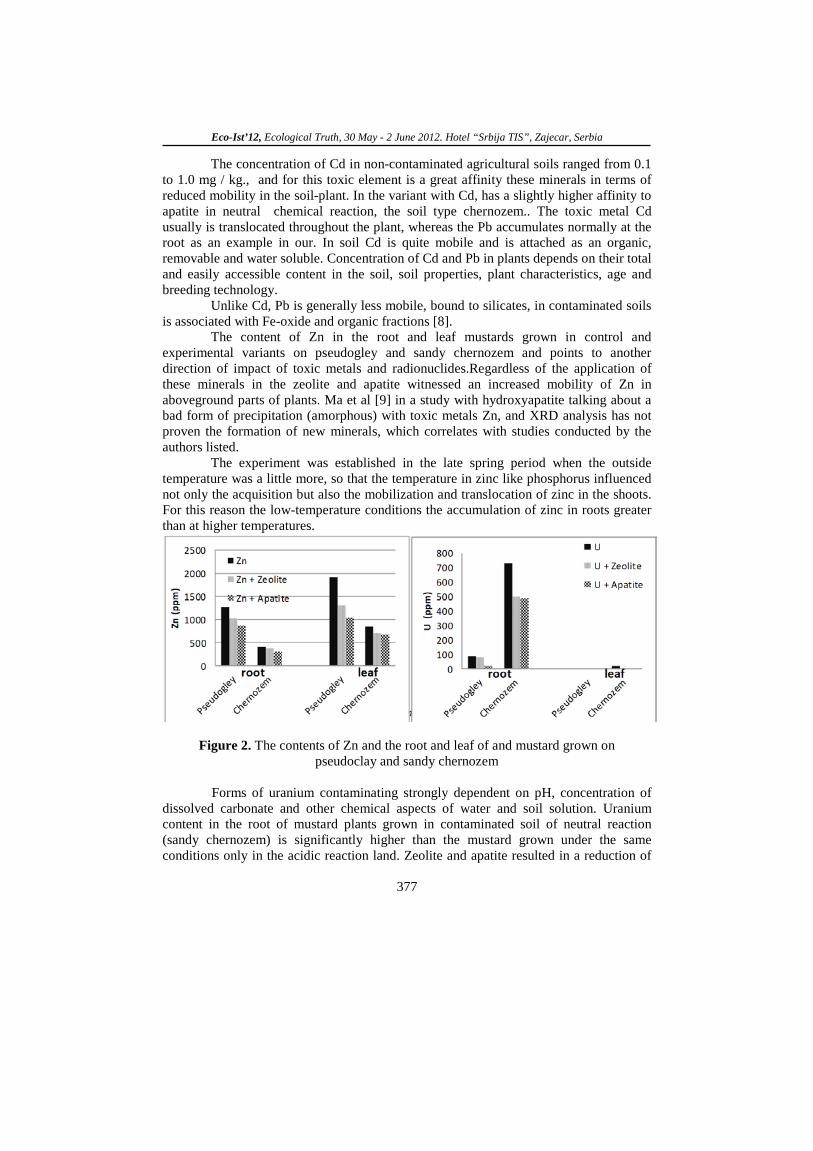
Eco-Ist’12, Ecological Truth, 30 May - 2 June 2012. Hotel “Srbija TIS”, Zajecar, Serbia
377
The concentration of Cd in non-contaminated agricultural soils ranged from 0.1 to 1.0 mg / kg., and for this toxic element is a great affinity these minerals in terms of reduced mobility in the soil-plant. In the variant with Cd, has a slightly higher affinity to apatite in neutral chemical reaction, the soil type chernozem.. The toxic metal Cd usually is translocated throughout the plant, whereas the Pb accumulates normally at the root as an example in our. In soil Cd is quite mobile and is attached as an organic, removable and water soluble. Concentration of Cd and Pb in plants depends on their total and easily accessible content in the soil, soil properties, plant characteristics, age and breeding technology.
Unlike Cd, Pb is generally less mobile, bound to silicates, in contaminated soils is associated with Fe-oxide and organic fractions [8].
The content of Zn in the root and leaf mustards grown in control and experimental variants on pseudogley and sandy chernozem and points to another direction of impact of toxic metals and radionuclides.Regardless of the application of these minerals in the zeolite and apatite witnessed an increased mobility of Zn in aboveground parts of plants. Ma et al [9] in a study with hydroxyapatite talking about a bad form of precipitation (amorphous) with toxic metals Zn, and XRD analysis has not proven the formation of new minerals, which correlates with studies conducted by the authors listed.
The experiment was established in the late spring period when the outside temperature was a little more, so that the temperature in zinc like phosphorus influenced not only the acquisition but also the mobilization and translocation of zinc in the shoots. For this reason the low-temperature conditions the accumulation of zinc in roots greater than at higher temperatures.
Figure 2. The contents of Zn and the root and leaf of and mustard grown on pseudoclay and sandy chernozem
Forms of uranium contaminating strongly dependent on pH, concentration of
dissolved carbonate and other chemical aspects of water and soil solution. Uranium content in the root of mustard plants grown in contaminated soil of neutral reaction (sandy chernozem) is significantly higher than the mustard grown under the same conditions only in the acidic reaction land. Zeolite and apatite resulted in a reduction of

Eco-Ist’12, Ecological Truth, 30 May - 2 June 2012. Hotel “Srbija TIS”, Zajecar, Serbia
378
uranium in the root and leaf mustard, regardless of the reaction of the soil solution, the pH value.
Apatites are a very effective material for removal of soluble uranium in the liquid phase. Tests were conducted using a column where he established the formation of uranyl phosphate ie. minerals Autun (Ca(UO2)2(PO4)2) [10].
For practical use of adsorbents and precipitaora need to phase in each contaminated site individually check the efficiency. This of course dictates the proper observance of economic parameters, and to the efficiency with low cost price, which is sometimes crucial for the application of these materials for remediation. First, check the efficiency under laboratory conditions, vegetation experiments it is necessary to seek the optimum ratio (soil / mineral supplement) for practical use. This is followed by a second phase to the biological assessment, where the vegetation field trials prove remediacionih effects of these materials. During this phase it is necessary to describe the effects of the plant (weight, height, morphology, etc.). Then determine what are the plants that are resistant to conditions that date. hyperaccumulative plant, how it affects soil organisms and microorganisms. The third stage is certainly monitoring the physical and chemical changes on the contaminated soil area in a defined period.
CONCLUSION
Generally, the zeolite adsorbent-and apatite-precipitator had a positive impact
on the test culture of mustard, which was grown on contaminated soil. In the mustard, in all experimental variants with zeolite and apatite, were established the lower contents of toxic metals and radionuclides in the roots and in above-ground mustard mass, regardless of the growing soil conditions. On the contrary, there were found a significant differences on the mobility of toxic elements in relation to the soil physico-chemical conditions (mechanical composition, pH, CEC, humus, etc..).
Acknowledgements
The authors are grateful to Serbian Ministry of Education and Science which support this research through its Project No
TR 31003.
REFERENCES
1. Conca, J. L. (1997): Phosphate-Induced Metal Stabilization (PIMS). Final Report to the U. S. Environmental Protection Agency #68D60023, Res. Triangle Park, NC.
2. Knox, A. S., Seaman, J. C., Mench, M. J., Vergronsveld, J. (2000a): Remediation of Metal- and Radionuclides- Contaminated Soils by In Situ Stabilization Techniques. p. 21-60. In I.K. Iskandar (Ed.), Environmental Restoration of Metals-Contaminated Soils, CRC press, Boca Raton, FL.
3. Boisson J., Ruttens A., Mencha M., Vangronsveld J. (1999): Evaluation of hydroxyapatite as a metal immobilizing soil additive for the remediation of polluted soils. Part 1. In¯uence of hydroxyapatite on metal exchangeability in

Eco-Ist’12, Ecological Truth, 30 May - 2 June 2012. Hotel “Srbija TIS”, Zajecar, Serbia
379
soil, plant growth and plant metal accumulation, Environmental Pollution 104, 225-233
4. Blum W. E. (2002): Environmental protection through sustainable soil management, a holistic approach. In sustainable land management - environmental protection, a soil physical approach. M. Pagliai and R. Jones (eds.). Advan. Geoecol. 35: 1-8.
5. Kuo, S. and McNeal, B. L. (1984): 'Effects of pH and Phosphate on Cadmium Sorption by a Hydrous Ferric Oxide', Soil Sci. Soc. Am. J. 48, 1040-1044.
6. Thomson B. M., Smith C. L., Busch R. D., Siegel M. D., Baldwin C. (2003): Removal of Metal and Radionuclides Using Apatitet and Other Natural Sorbents, J. Envir. Ngrg., Vol. 129, Issue 6, PP 492-499.
7. Ma Q. L., Traina S. J., Logan T. J. and Ryan J. A. (1993): In situ Pb immobilization by apatite. Environ. Sci. Technol. 27: 1803-1810.
8. Chlopecka, A., Bacon J. R., Wilson M. J., and Kay J. (1996): Forms of cadmium, lead, and zinc in contaminated soils from Southwest Poland. J. Environ. Qual. 25:69-79.
9. Ma, Q. Y., Traina, S. J., Logan, T. J., Ryan, J. A. (1994): Effects of aqueous Al, Cd, Cu, Fe(II), Ni, and Zn on Pb immobilization by hydroxyapatite. Environ. Sci. Technol. 28, 1219-1228.
10. Grubišić M., Boškovič Rakočević Lj. , Stojanović M., Mihajlović M., Milojković J., Hojka Z.(2011): Polupropustljive barijere na bazi zeolita i apatita za sprečavanje kontaminacije zemljišta i podzemnih voda, III Savetovanje Stanje i perspektive deponija pepela, šljake i jalovine u termoelektranama i rudnicima, 226-235, Palić 20-23.09.

380
XX International Scientific and Professional Meeting
"ECOLOGICAL TRUTH" ECO-IST'12
30 May - 2 June 2012, Hotel “Srbija TIS“, Zajecar, SERBIA
THE INFLUENCE OF THE LOW-FREQUENT ELECTROMAGNETIC
RADIATION ON HUMANS HEALTH
Biljana Maluckov1*, V. Tasić2, Č. Maluckov
1
1
Vojske Jugoslavije 12, 19210 Bor, SERBIA University of Belgrade, Technical Faculty in Bor,
2
Mining and Metallurgy Institute Bor, Zeleni bulevar 35, 19210 Bor, SERBIA
ABSTRACT The influence of the electromagnetic radiation of frequency 50 Hz on human beings is considered.
Stress is on the electromagnetic radiation from the electric appliances in the household. It is shown that some of these devices radiate very strong electromagnetic field, so that people should stay far from them. The measured data are compared with the corresponding ones in literature, as well as with the critical values suggested by the Ministery o
f Enviroment, Mining and Spatial Planing.
Key words: electromagnetic radiation, influence on human health
INTRODUCTION The humans are continuously exposed to the electromagnetic (ELM) radiation from natural sources: cosmic rays, geomagnetic radiation, solar radiation, and from the electrical appliaces. Significant growth of the ELM radiation level has been noted in recent fifty years as a consequence of the tehnological development. The last is followed by the increasing use of the household devices, telecomunication devices etc. The increased level of the ELM radiation, specially the high intensity ELM radiation,
In Figure 1 the ELM spectrum is shown. Regarding the effect of the radiation to the environment the ELM radiation can be ionized and non-ionized. Here we are interested in the second one, which is characterized by the extremely low frequency in the interval: 0-300 Hz. The non-ionized radiation in this frequency region is characteristical for the electric appliances supplied by the public electrical
inevitably increases the risk to human health.
network.

Eco-Ist’12, Ecological Truth, 30 May - 2 June 2012. Hotel “Srbija TIS”, Zajecar, Serbia
381
Figure 1. The electromagnetic radiation spectrum
The magnetic flux B (T) is one of the physical quantities which determines the time interval during which the humans can be safely exposed to the ELM field. Accoridng to the safety rules possed by the the Ministery of Enviroment, Mining and Spatial Planing [1], the referent limit level of the magnetic induction for the ELM field frequency, f, from 25 Hz to 800 Hz is 2/f. The referent limit level can be defined as the critical radiation level above which the environment conditions are unsafe for humans. Thus the referent limit level for f = 50 Hz is 0.04. μT. The Ministery of Enviroment, Mining and Spatial Planing
In reference [4] the effect of the magnetic field with parameters f =50 Hz, and B = 1 mT, on the neural homeostases is investigated. It is shown that the cell tolerance to the oxide atacks is lowered causing the neurodegenerative problems. In paper [5] the correlation between the increasing number of children safering from the leukemia and long exposure to the ELM field with B = 0.3 μT is suggested. It is shown that the risk can increase for smaller fields too. However, the strong correlation is not proven due to the simultaneous effects of many external conditions.
brought the low on the non-ionized radiation protection [2], which determines the risk conditions and protection measures in the critical situations. According to the international commission for the non-ionized radiation [3] the referent limit level value for people is 5/f, while the same for the employee within the risk working conditions is 25/f, respectively. In this paper the protection measures are advised, as well as the daily control of people exposed to the ELM radiation.
In the review paper [6] the list of deseases caused by the exposure to the ELM low-frequency radiation is presented. It is shown that it can produce the reproductive disfunction in the human population. The problem was specially visible among the employees in the power plants. In this group the chromosom anomaly have been found. In addition, the increased number of children sufering from the brain and spinal cord tumors is found in their families. The correlation between the children leukamia and breast cancer among women was observed in many investigations. The ELM radiation can also affect central nervous system increasing the risk to the amyotrophic lateral sclerosis, Alzheimer’s disease, insomnia, headaches, sexual dysfunction, chronic fatigue, learning and memory problems, and many neuropsychiatric problems. In reference [7] is shown that the low-frequency ELM radiation can break out the DNA structure and chromosoms causing many diseases.

Eco-Ist’12, Ecological Truth, 30 May - 2 June 2012. Hotel “Srbija TIS”, Zajecar, Serbia
382
In this paper, the results of the measurement of the magnetic induction generated by the electrical devices in the household are presented. They are used to point out the potential danger from the low-frequency ELM radiation in the household.
EXPERIMENT Measurements of the magnetic inducation are done with the measuring device EMF 828, Figure 2. It can measure the magnetic induction in the range from 0.01 μT to 2 mT and in the frequency range from 30 to 300 Hz. The EMF 828 posesses three measurement extents: 20 μT, 200 μT and 2000 μT. The measurement precision depends on the measurement extent and is of the order 0.01 μT for the mesurement extent of 20 μT, 0.1 μT for 200 μT and 1 μT for 2000 μT, respectively. The measurement device EMF 828 can measure all three components of the magnetic induction x, y and z.
The total intensity of the magnetic induction is determined by the expression:
222zyx BBBB ++= (2)
Figure 2. Photograph of the measuring device EMF 828
RESULTS AND DISCUSSION The results of measurements of magnetic induction in the households are presented in this paper (Figures 3 and 4). The safety limit value of mganetic induction, B = 0.2 μT (based on literature datas)
is indicated of these figures. This value is very close to 0.3 μT, which is correlated with the increasing number of children suffering from leukemia.

Eco-Ist’12, Ecological Truth, 30 May - 2 June 2012. Hotel “Srbija TIS”, Zajecar, Serbia
383
Figure 3. The measured values of the magnetic induction from TV receiver with the CRT (Cathode Ray Tube), PC monitor with the CRT and TV receiver with the LCD
(Liquid Crystal Display). The safety limit value is B = 0.2 μT
In Figure 3 the values of the magnetic induction of the most frequently used equipments in the household are selected. These are the TV receivers and PC monitors. Let note that in the last few decades children spend a lot of time in the front of them. The values of B at the equipment place, as well as on the distances of 3 cm and 30 cm are presented. The measurement positions are in the front of devices, behaind and near them. The value 30 cm is the minimum distance between the monitor and human head. Figures show that the safety limit value is significantly exceeded in the case of monitors and TVs with the CRT. Comparatively at the distance 30 cm the PC monitor is more safe than the TV with CRT. The special attention should be given for radiation behaid and near the device. On the other hand, the LCD monitor is the most safe exceeding the safety limit only at the short distances.
In Figure 3 the measured values of the magnetic induction from the household electric devices are shown. To make plot clear the referent value of the magnetic induction, B = 2 μT, is writen. It is seen that the highest magnetic induction is produced by the micowave oven, boiler, vacuum cleaner, neon tube (tube inductor), and burner. Therefore it is significant to take care about the distance from the mentioned devices.
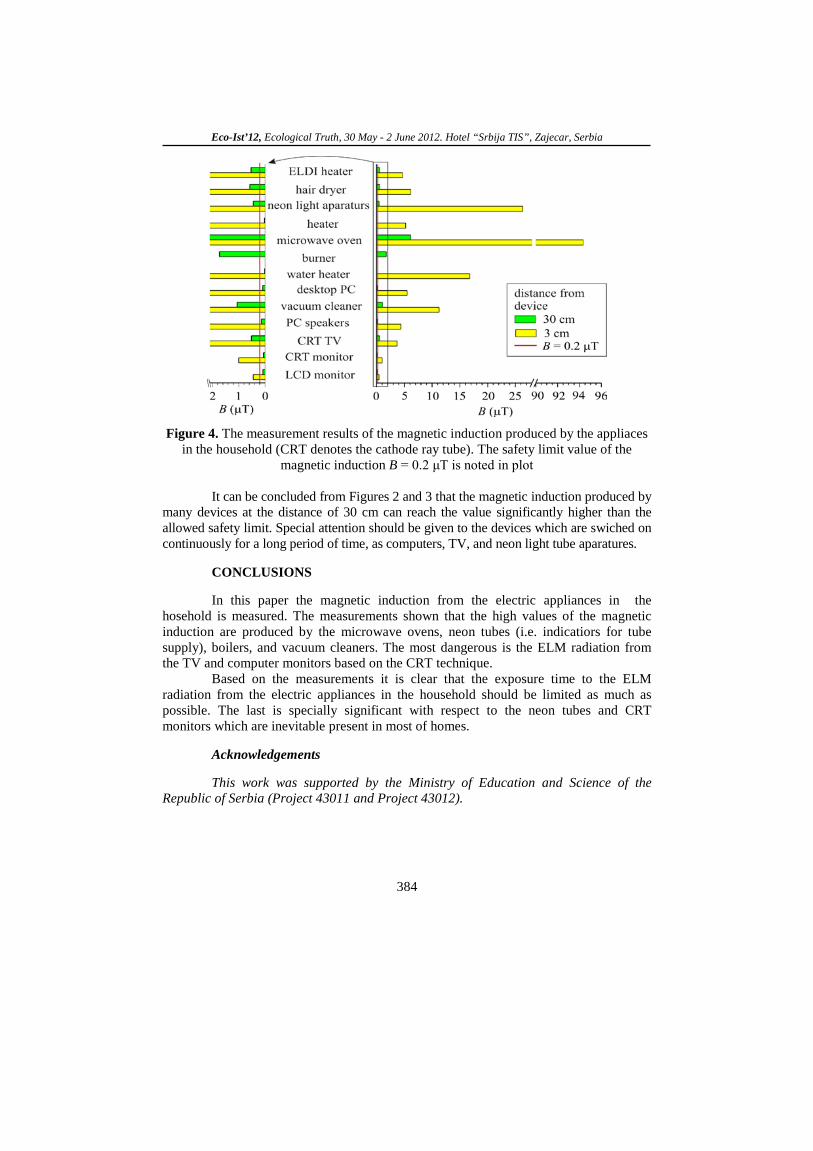
Eco-Ist’12, Ecological Truth, 30 May - 2 June 2012. Hotel “Srbija TIS”, Zajecar, Serbia
384
Figure 4. The measurement results of the magnetic induction produced by the appliaces in the household (CRT denotes the cathode ray tube). The safety limit value of the
magnetic induction B = 0.2 μT is noted in plot
It can be concluded from Figures 2 and 3 that the magnetic induction produced by many devices at the distance of 30 cm can reach the value significantly higher than the allowed safety limit. Special attention should be given to the devices which are swiched on continuously for a long period of time, as computers, TV, and neon light tube aparatures.
CONCLUSIONS
In this paper the magnetic induction from the electric appliances in the
hosehold is measured. The measurements shown that the high values of the magnetic induction are produced by the microwave ovens, neon tubes (i.e. indicatiors for tube supply), boilers, and vacuum cleaners. The most dangerous is the ELM radiation from the TV and computer monitors based on the CRT technique.
Based on the measurements it is clear that the exposure time to the ELM radiation from the electric appliances in the household should be limited as much as possible. The last is specially significant with respect to the neon tubes and CRT monitors which are inevitable present in most of homes.
Acknowledgements This work was supported by the Ministry of Education and Science of the
Republic of Serbia (Project 43011 and Project 43012).

Eco-Ist’12, Ecological Truth, 30 May - 2 June 2012. Hotel “Srbija TIS”, Zajecar, Serbia
385
REFERENCES
1. Pravilnik o granicama izlaganja nejonizujucim zracenjima, Sluzbeni glasnik Republike Srbije 36/09, http://www.ekoplan.gov.rs/src/2-2-Pravilnici-283-document.htm
2. Zakon o zastiti od nejonizujuceg zracenja, http://www.ekoplan.gov.rs/src/2-Zakon-o-zastiti-od-nejonizujucih-zracenja-281-document.htm
3. International commision on non-ionizing radiation protection, ICNIRP GUIDELINES for limiting exposure to time-varying electric, magnetic and electromagnetic fields (up to 300 GHz), Health Physics 74, (4), 494-522, (1998).
4. Falone S., Grossi M.R., Cinque B., D’Angelo B., Tettamanti E., Cimini A., Di Ilio C., Amicarelli F., “Fifty hertz extremely low-frequency electromagnetic field causes changes in redox and differentiative status in neuroblastoma cells”, The International Journal of Biochemistry & Cell Biology 39, 2093–2106, (2007).
5. Calvente I., Fernandez M.F., Villalba J., Olea N., Nuñez M.I., „Exposure to electromagnetic fields (non-ionizing radiation) and its relationship with childhood leukemia: A systematic review”, Science of the Total Environment 408, 3062–3069, (2010).
6. Genuis, S.J., “Fielding a current idea: exploring the public health impact of electromagnetic radiation”, Public Health 122, 113–124, (2008).
7. Phillips J.L., Singh N.P., Laib H., “Electromagnetic fields and DNA damage“, Pathophysiology 16, 79–88, (2009).
386
XX International Scientific and Professional Meeting
"ECOLOGICAL TRUTH" ECO-IST'12
30 May - 2 June 2012, Hotel “Srbija TIS“, Zajecar, SERBIA
FIELD COMPARISON OF CONTINUOUS PARTICULATE MATTER
MONITORS FOR MEASUREMENT OF AMBIENT AEROSOLS
Visa Tasic1, B. Maluckov2, R. Kovacevic1, M. Jovasevic-Stojanovic3, M. Zivkovic
3
1Mining and Metallurgy Institute Bor, Zeleni bulevar 35, 19210 Bor, SERBIA 2University of Belgade, Technical faculty in Bor, V.J. 12, 19210 Bor, SERBIA
3
University of Belgade, Vinca Institute of Nuclear Sciences, P.O.Box 522, 11001 Belgrade, SERBIA
ABSTRACT
The main goal of this study was to investigate the mass concentration (PM10 and PM2.5) comparability between two light scattering based monitoring instruments, OSIRIS Particle Monitor (Model 2315) and GRIMM EDM180 in ambient air. The measurements were done during the period from October 2009 to November 2011 in the town of Bor, Serbia. The 1-hour mean PM10 and PM2.5 levels obtained by OSIRIS monitor were well correlated with the GRIMM EDM180 levels, and did not show statistically significant bias. The results suggest that the OSIRIS monitor underestimates PM10 concentrations by approximately 10%, relative to GRIMM EDM180 monitor. Also, it is found that the OSIRIS monitor underestimates PM2.5
concentrations by approximately 30%, relative to GRIMM EDM180 monitor.
Key words: comparison, real-time, air quality, particulate matter, monitoring
INTRODUCTION
The Municipality of Bor is located in the southeastern part of Serbia, and has a total population of 50,000. It has been the major centre for mining and processing of copper and other precious metals for almost a century. Air pollution is perceived as the main environmental problem in the Bor region because the emissions from the copper smelters are principally particulate matter and sulfur oxides [1]. Airborne particulate matter (PM) is one of the most important ambient air pollutants that adversely affect human health. Prolonged exposure to particulate matter (PM10, PM2.5
Automatic monitoring of particulate matter pollution is carried out in the town of Bor since 2003. These measurements were done at several measuring points (see Figure 1) in the town area with the Turnkey OSIRIS (Model 2315) portable device which is intended for indicative measurements of dust pollution [4]. The Serbian Environmental Agency (SEPA) has started measuring of the air pollution with the automatic monitors in 2006. Nowadays, SEPA monitors particulate matter (PM
) often cause respiratory and cardiovascular diseases and increase mortality [2-3].
10, PM2.5 and PM1) at 13

Eco-Ist’12, Ecological Truth, 30 May - 2 June 2012. Hotel “Srbija TIS”, Zajecar, Serbia
387
automatic monitoring stations which are located in Belgrade (5) and in towns of Smederevo (2), Bor (1), Niš (1), Novi Sad (1), Beočin (1), Obrenovac (1) and Kosjeric (1). During the May of 2009, SEPA set a new continuous real-time dust monitor - GRMM EDM180 [5] in Bor. This paper describes the results of comparison of hourly mean concentrations of PM10 and PM2.5
particles measured by the OSIRIS monitor with the results obtained by GRMM EDM180 monitor.
MATERIALS AND METHODS Gravimetric methods are the basis of the European and US reference methods
for PM10 and PM2.5 for outdoor monitoring purposes. Besides the established reference methods, other monitoring techniques which can provide equivalent results to the reference method may be used [6]. The GRIMM EDM180 and its measurement method are approved for equivalence of PM10 in accordance to the European Standards EN12341 and PM2.5
The GRIMM EDM180 dust monitoring system was designed for simultaneous real time measurement of PM (PM
in accordance to the EN14907. In comparison with automatic monitors, gravimetric monitoring methods require pre/post-conditioning and manual weighing of filters, and therefore not ideally suited for routine compliance measurements. In addition, due to the time-consuming gravimetric procedure, results are available several days after sampling, while automatic on-line monitors, which are already in operation in many European monitoring networks, provide real-time PM measurements [6].
10, PM2.5 and PM1). It uses a light scattering (90°) technique to determine the concentration of airborne dust in the particle size range from about 0.25 µm to about 32 µm. Detection limit (2σ) for technique is less than 0.1 µg/m3 within particle size range (diameter) between 0.25 to 32 µm. The GRIMM EDM180 is the only worldwide approved PM monitor providing PM10 and PM2.5
The Turnkey OSIRIS air particulate monitor gives a continuous and simultaneous indication of TSP, PM
simultaneously in real-time.
10, PM2.5 and PM1
mass fractions. It use a light scattering (diffraction) technique to determine the concentration of airborne dust in the particle size range from about 0.4 µm to about 20 µm.

Eco-Ist’12, Ecological Truth, 30 May - 2 June 2012. Hotel “Srbija TIS”, Zajecar, Serbia
388
Figure 1. Map of Bor Municipality area with the designated measuring location Park and the wind rose diagram for the period 2009-2011
The real-time GRIMM EDM180 dust monitoring system was collocated
outdoors, with Turnkey OSIRIS air particulate monitor to assess the comparability of sampling methods. The measurements were performed within October 2009 to November 2011 at the measuring location Park (shown in Fig. 1).
Four campaigns of sampling were conducted. The first one took place in the period from October to December 2009. Furthermore, the second one took place in the period from January to February 2010. The third campaign of sampling took place in the period from November to December 2010. At the end, the forth one took place in the period from January to February 2011. Each campaign lasted a minimum of two weeks. There have been collected more than 1450 of comparative hourly mean values of concentrations for each of the observed fraction of suspended particles.
RESULTS AND DISCUSION The 1-hour mean PM10 levels from the EDM180 monitor were ranged from 5.4
to 121.2 µg/m3 with the mean and standard deviation 40.1 and 22.1 µg/m3, respectively. The 1-hour mean PM10 levels from the OSIRIS monitor were ranged from 4.4 to 114.7 µg/m3 with the mean and standard deviations 38.6 and 23.5 µg/m3, respectively. Regression intercept significantly different from zero was considered to indicate additive bias of PM10 levels between instruments. Regression slope significantly different from one was considered to indicate multiplicative bias of PM10 levels between instruments. The coefficient of determination (R2) was used to describe the correlation of measured

Eco-Ist’12, Ecological Truth, 30 May - 2 June 2012. Hotel “Srbija TIS”, Zajecar, Serbia
389
levels between instruments and the standard deviation was used to describe how widely values are dispersed from the average value.
Figure 2. 1–hour mean PM10
mass concentrations measured with light scattering instruments, OSIRIS vs. EDM180
Fig. 2 shows the box plot of 1–hour mean outdoor PM10 mass concentrations, OSIRIS vs. EDM180. The 1-hour mean PM10 levels from the OSIRIS monitor are high correlated with EDM180 levels (R2
= 0.755) and do not show statistically significant multiplicative bias. The regression equation is presented as:
27.2*92.0 += xy (1)
where y expresses PM10 levels from the OSIRIS and x expresses PM10 levels from the EDM180 monitor. Fig. 3 shows the correlation between 1–hour mean PM10
mass concentrations obtained by the OSIRIS monitor and EDM180 monitor.
Figure 3. Scatter plot of 1-hour mean PM10 mass concentrations, OSIRIS vs. EDM180

Eco-Ist’12, Ecological Truth, 30 May - 2 June 2012. Hotel “Srbija TIS”, Zajecar, Serbia
390
Figure 4. 1–hour mean PM2.5
mass concentrations measured with light scattering instruments, OSIRIS vs. EDM 180
The 1-hour mean PM2.5 levels from the EDM180 monitor were ranged from 4.0 to 88.8 µg/m3 with the mean and standard deviation 31.2 and 17.8 µg/m3, respectively. The 1-hour mean PM2.5 levels from the OSIRIS monitor were ranged from 1.1 to 79.9 µg/m3 with the mean and standard deviations 23.9 and 20.1 µg/m3, respectively. Fig. 4 shows the box plot of 1–hour mean outdoor PM2.5 mass concentrations, EDM180 vs. OSIRIS. The 1-hour mean PM2.5 levels from the OSIRIS monitor are moderate correlated with EDM180 levels (R2
= 0.558) and do not show statistically significant multiplicative bias. The regression equation is presented as:
12.2*71.0 −= xy (2)
where y expresses PM2.5 levels from the OSIRIS and x expresses PM2.5 levels from the GRIMM EDM180 monitor. Fig. 5 shows the correlation between 1–hour mean PM2.5
mass concentrations obtained by the OSIRIS monitor and the EDM180 monitor.
Figure 5. Scatter plot of 1-hour mean PM2.5 mass concentrations, OSIRIS vs. EDM 180

Eco-Ist’12, Ecological Truth, 30 May - 2 June 2012. Hotel “Srbija TIS”, Zajecar, Serbia
391
CONCLUSION The results presented here suggest that the OSIRIS Particle Monitor (Model
2315) measurements of PM10 concentrations are in good agreement with the measurements of the GRIMM EDM180, which is approved equivalent method monitor compared to reference gravimetric method. The results of comparison indicates that the OSIRIS monitor provides 1-hour mean PM10 measurements of acceptable accuracy (R2 = 0.775) compared to EDM180 monitor. The OSIRIS monitor underestimates the ambient PM10 concentrations, about 10% compared to the GRIMM EDM180 monitor. Also, the results indicates that the OSIRIS monitor provides 1-hour mean PM2.5 measurements of moderate accuracy (R2 = 0.557) compared to GRIMM EDM180 monitor. The OSIRIS monitor underestimates the ambient PM2.5 concentrations, about 30% compared to the GRIMM EDM180 monitor. This could lead to exposure misclassification in health effects studies relying on PM2.5
Overall, the OSIRIS instrument used in this study was proved to be a reliable monitor for assessing outdoor PM
measurements collected with this instrument in outdoor environments.
10 concentrations and for providing temporal variability profiles for PM2.5
.
Acknowledgements This work is supported by a Grant from the Ministry of Education and Science
of the Republic of Serbia, as a part of Project III42008: “Evaluation of Energy Performances and Indoor Environment Quality of Educational Buildings in Serbia with Impact to Health”, within the framework of the Technological Development Program.
REFERENCES
1. Tasić V., Milošević N., Kovačević R., Petrović N., Analysis of air pollution caused
by particle matter emission from the copper smelter complex Bor (Serbia), Chemical Industry & Chemical Engineering Quarterly, Vol. 16, No. 3, pp. 219-228, 2010
2. Pope C.A., Rodermund D.L., Gee M.M., Mortality Effects of a Copper Smelter Strike and Reduced Ambient Sulfate Particulate Matter Air Pollution, Environ. Health Perspect. Vol. 115, No. 5, pp. 679-683, 2007
3. Pope C.A., Dockery D.W., Health Effects of Fine Particulate Air Pollution: Line that Connect, J. Air & Waste Manage. Assoc. Vol. 56, pp. 709-732, 2006
4. Turnkey Instruments, Airborne Particle Monitors. Turnkey Instruments Ltd, 2006 5. http://www.dustmonitor.eu/downloads/datasheets/en/GrimmAerosolTechnik_Envi
ro_EDM180.pdf (Accessed 2 August 2011) 6. Tasić V., Jovašević-Stojanović M., Vardoulakis S., Milošević N., Kovačević R.,
Petrović J., Comparative assessment of a real-time particle monitor against the reference gravimetric method for PM10 and PM2.5
in indoor air, Atmos. Environ. Vol. 54, pp. 358-364, 2012

392
XX International Scientific and Professional Meeting
"ECOLOGICAL TRUTH" ECO-IST'12
30 May - 2 June 2012, Hotel “Srbija TIS“, Zajecar, SERBIA
PLAN AND PROGRAM DEVELOPMENT OF MANAGING URBAN
GREEAN SPACES
Nadezda Stojanovic*
, M. Mesicek, M.Ocokoljic, Dj. Stojicic, S. Matic
University of Belgrade, Faculty of Forestry, Belgrade, SERBIA
ABSTRACT
Plants are the most important elements of urban parks and gardens, and their growth and nurture are the most important operations in the maintenance of an urban landscape. This paper presents a chronological overview of a planned work and time necessary for urban green areas nurture, in order to improve their functioning, efficient ogranization of work as well, and to estimate maintenance cost.
Key words: calendar of nurture, maintenance, urban green areas
INTRODUCTION Plants are living organisms, having all the features that characterize every living
being, since they grow, increase their size, change the environment and ecological relations that govern it – in other words, plants have an active relation to the environment in terms of space (visual), time and biology(1). For these reasons, the process of developing an urban green area does not end, as we all know, in a time, which is common in the construction industry. Unlike building materials, plant material – plants permanently change their volume, and they have the tendency to occupy more and more space, so their functionality has been constantly increasing, especially among trees, during the last decades. It is necessary to engineeringly regulate plants’ life processes, to protect them from diseases and pollution, to provide them with additional amounts of nutrients, to remove damaged parts of the trees, and to provide them with enough space and light, so that they can complete their functions. Therefore, plants have to be cultivated, and it can be said, that the process of creating a green landscape does not end with its growth, but it is an on – going process. The most important rule in maintaining an urban landscape is to propely arrange nurture measures of urban green areas, and to be familiar with important facts connected to species and their needs, depending on a time of the year. The paper presents a chronological overview of the scheduled work and time necessary for urban green areas nurture, in order to improve their functioning, efficient organization of work as well, and to estimate maintenance cost.

Eco-Ist’12, Ecological Truth, 30 May - 2 June 2012. Hotel “Srbija TIS”, Zajecar, Serbia
393
NURTURE OF URBAN PARKS AND GARDENS
From the viewpoint of urban green areas, all measures of nurture can be divided in two groups (Table 1.): nurturing of land and nurturing of plants. Land nurture consists of the following operations: water adding – irrigation, mechanical tillage – hoeing, mulching, adding nutrients – fertilizing and feeding. Nurturing of plants consists of the following operations: spraying, protection of trees and roots, pruning, protection from pests and diseases, protection from adverse human impact and removing weeds.
In the process of maintaining urban green areas, there are three main factors, controlled by a man, in the process of nurturing plants, and they are: the amount of water, the level of added nutrients and pruning. Sufficient amount of water is mostly needed immediately after planting, so that the plant can adapt. Immediately after the adjustment, nutrient elements are needed, so that the plant can build up its own tissues, in order to grow and thrive. Pruning is the most essential following factor, and if it is carried out correctly, it greately helps in keeping plants healthy and strong. A well designed work schedule of urban green areas nurture can reduce overall maintenance costs, and the plants can keep the full extent of their functions in relation to their age and type. Table1. Nurture of urban green areas
Land nurture Plants nurture water adding - irrigation spraying mechanical tillage - hoeing protection of trees and roots mulching pruning adding nutrients - fertilizing protection from pests and diseases
feeding protection from adverse human impacts removing weeds - weeding
PLAN NURTURE OF URBAN GREEN AREAS
A well designed nurturing plan is important for an engineer of landscape
architecture for the following reasons: to be able to provide needed maintenance of green areas, especially when it is the most important for plants; to be able to efficiently use the equipment at his / her disposal; to order necessary supplies in accordance with the time when it will be used; and to make emploees be efficient. One of the biggest advantages of planning, preparing and monitoring maintenance of green areas is being able to economize available funds, so that the city’s landscape can be beautiful, permanent and functional.
Process of maintenance planning begins by grouping different categories of green areas, according to the maintenance level and maintenance needs. Different categories of green area are differently nurtured, and that depends on their importance, place and funds, annually allocated for their maintenance.
The most important maintained city areas contain a carefully designed and maintained different types of high trees, shrubs, ground cover, flowes and first - class lawns. This kind of areas can be found in the center of the city, or next to public buildings and state institutions, or next to resedences, commercial buildings, some

Eco-Ist’12, Ecological Truth, 30 May - 2 June 2012. Hotel “Srbija TIS”, Zajecar, Serbia
394
industrial locations, universities and etc. Secondary important areas of a city are: green areas of most industrial locations, green areas along the highway, green areas of schools and kindergardens and etc. In secondary important areas, trees and shrubs are moderately maintained, in other words, the maintenance consists of tree pruning and pests control, while the use of one – year flowers and ground cover is limited or completely excluded and the lawns are rarely cleaned of weeds and etc. Maintenance in areas of low intensity consists of mowing rarely, while maintenance of trees and shrubs is reduced to a minimum except when it is necessary to remove dead, damaged or rotten plants. This category includes green areas of city blocks, or green areas along the shores and beaches, forest parks, resorts and the like.
Since there is a green area categorization by the level of city maintenance, there are parts of green landscape that are maintained by different intensity as well. As a result of that, the green areas, being the subject of maintenance, have parts which are diffrerently maintained. This is usually the case in large parks, as in Torčidar Park, where the central part of the park (place where is „Milošev konak“) is intensively maintained, while the part of the park along the „Topčidar“ river is extensively maintained. When the maintenance category is determined and when the area itself is divided by the maintenance needs, next step is to develop a bioecological basis for the nurture of plants. The bioecological basis provides the following: a detailed description of the green areas, a map of the current situation, functionality of plant species, and an individual record connected to the condition (vitality and decoration) of each plant on the ground as well. Based on the bioecological basis, a list of necessary measures is nurtured for some groups of plants. In this way, the number of trees that nedd pruning, the area that will be nurtured and the area required for irrigation can be determined.
In order to facilitate the working schedule and nurture of green areas, and after doing some bioecological bases of the green areas, it is necessary to categorize plants depending on the time when they flower and come into leaf. According to the phenological stages, trees can be divided into six categories (Table 2.). According to the character of the leaves and flowering phenology shrubs can be divided into five categories (Table 3.). According to the needs of nurture, other groups of plants can be divided into five groups (Table 4.). Specific measures of nurture will be implemented for every plant of each category or group and at the specific time, depending on the time of the year when they flower or come into leaf. Table 2. Division of trees into groups according to the phenological phases and in accordance with the calendar of nurture
Groups of trees Time of flowering Group I: High deciduous trees – the phenophase of flowering is in the spring Group II: High deciduous trees – the phenophase of flowering is in the second part of the
vegetation period and during the autumn Group III: Low deciduous trees – the phenophase of flowering is in the spring Goup IV: Low deciduous trees - the phenophase of flowering is in the second part of the
vegetation period and during the autumn Group V: Pinophyta – tall trees Group VI: Pinophyta – low trees

Eco-Ist’12, Ecological Truth, 30 May - 2 June 2012. Hotel “Srbija TIS”, Zajecar, Serbia
395
Table 3. Division of woody trees that grow as shrubs in according to flowering phenophase, and leaves’ character in accordance with the calendar of nurture
Group of shrubs
Flowering phenophase and leaves’ character
Group I: Deciduous – without ornamental phenophase of flowering Group II: Deciduous – flowering phenophase is during the spring Group III: Deciduous – the phenophase of flowering is in the second part of the
vegetation period and during the autumn Group IV: Broadleaf evergreen shrubs Group V: Pinophyta shrubs
Table 4. Division of other groups of plants for the purpose of nurture
Gorup of plants Other group of plants Group I: Plants that cover the soil Gorup II: Creeper Group III: Roses Group IV: Perennial, biennium and annual plants Group V: Grassland
The next stage in the planning of nurture of the green areas, is making a
calendar of nurture, in other words, scheduling work for certain groups of plants, that require nurture during the year (Table 5.). For each month of the year and for each week of the month, a list. of required and planned work of maintenance is made. In this way, a landscape architect has the ability to predict the type and sequence of work, so that she / he has enough time to reconcile the plants’ needs for a particular nurture operating
When the calendar of nurture is made, and during the performance of certain operations connected to green areas nurture, it is advisable to keep records of time and resources that are spent, the costs and requirements for certain measures, so that, at the end of year, there will be an insight of maintaining green areas annually. Monitoring and recording of this work, gives us a good base for making plans connected to maintenance of green areas for the following year.
at the proper time, and he / she is able to predict when the materials, equipment and skilled personnel for perfoming certain operations are needed as well. All this will result in the efficient management of the maintenance of the green areas.

Eco-Ist’12, Ecological Truth, 30 May - 2 June 2012. Hotel “Srbija TIS”, Zajecar, Serbia
396
Table 5. Schedule of work required for nurturing an urban green area MONTH/ WEEK SCHEDULE OF WORK REQUIRED FOR NURTURING AN URBAN GREEN AREA
JANUARY AND
FEBRUARY
I Prepare the equipment for the following season. Incorporate the snow and ice if needed. Protect the plants from snow, by connecting them. Avoid excessive use of industrial salt. Prune trees from the Group I, when the temperature is above 5°C. Prune the shrubs from the Groups I, II, III, IV and V, when the temperature is above 5°C. Add humus to the soil if it is needed ,so that the required depth can be returned. Start prunning the trees in the group before the beginning of the vegetation period.
II III
IV
MARCH
I Grass – Do lawn aeration and additional planting in areas where the grass in thin. Use the same mixture of grass as it was used in the original specification and turf the empty lawn areas. Trees and shrubs – Pesticide non – sensitive plants, and that should be done before the opening of a leaf or flower buds, when the temperature is above 7°C. Before the vegetation starts, soil should be mechanically treated, all shrubs should be mulched and fertilized with NKP ferilizer. Finish the prunning of trees and shrubs with flowering phenophase in another part of the vegetation period, and during the autumn, and this should be done with all evergreen plants – but only if vegetation has not started yet.
II
III Grass – If the weed is a problem, use the recommended preventive weedkiller during the last week of March. Fertilize the grass with high – nitrate fertilizer, and the ratio should be 3:1:2. If the season has progressed, mow at this time. Trees and shrubs – Continue and finish the work described for the last two weeks. IV
APRIL
I Grass – Use the weedkiller that prevends broadleaf weeds, in order to form a quality grass surface. Mow the grass when it is needed, the grass should not be mowed if it is shorter than 5cm, and in the areas where the high quality mulching is not necessary (areas where the festuca is planted), the hight of mowing should be from 8 to 10cm. It is desirable to collect cuttings. If the grass is infected, the recommended fungicide should be used.Trees and shrubs – Inspect trees ans shrubs because of the winter hazards.
II
III Plants, trees and shrubs, flowers –Continue and finish the work for the last two weeks. Prepare the gardens for annual flowers. Add 5–8cm of peat or the burned manure. Use the equipment for mixing, and mix it until the peat or manure is completely mixed with the soil.
IV
MAY
I Grass – It will be necessary to mow at least two times a week during the rainy period, or in areas where the artificial irrigation was used. If larvas are the problem, use the appropriate pesticide, that is efficient for the ground insects, but not after the first week of May. Trees and shrubs – Shrubs: Group II and Trees: Group II. Inspect trees and shrubs against the insects and contagious diseases. Remove the weed from the gardens and chech the mulch.
II
III Grass – Continue to mow, when it is necessary. The use of artificial irrigation is not necessary unless the spring is too much warm. For the second time during this period add the fertilizer. The most economical fertilizer is urea. Inspect the grass against the disease, but add fungicide only if it necessary. Trees, shrubs and flowers – Plant annual flowers as required, and water them a lot especially in the stage of adaptation. Remove the weeds from the shrubs and inspect weedy plants for the pests.
IV
JUNE
I Grass – Mow two times a week, if it necassary in representative grassland areas. During this period, attention should be paid on soil moisture in its aeation. The grass will grow actively in the spring, when the moisture is adequate, but on the other hand, if July is too much warm, the grass will be very sensitive at that time. Irrigate areas with fine grass, as required. Trees and shrubs - Inspect evergreen plants for the lic,e and if is necessary use proper pesticide. Inspect trees for the insects. Remove weeds from the gardens, as it was required. Shrubs and trees should be watered, if the season is too hot.
II III
IV

Eco-Ist’12, Ecological Truth, 30 May - 2 June 2012. Hotel “Srbija TIS”, Zajecar, Serbia
397
Table 5. Schedule of work required for nurturing an urban green area
MONTH/ WEEK SCHEDULE OF WORK REQUIRED FOR NURTURING AN URBAN GREEN AREA
JULY
I Grass – Mowing is necessary. Special attention should be paid on to the amount of water, in order to keep the grass green through the summer. Irrigated when it is necessary. Trees and shrubs – Plants should be inspected for the lices or insects, and use pesticide, when it is necessary. Water for newly planted tree should be provided. If the season is too hot, older plants should be watered. Mechanical tillage and mulching should be applied, as well as weeding when it is needed.
II III
IV
AUGUST
I Grass – Mow as needed. Irrigate whenever there is insufficient rainfall. Do not let the grass become dominant, because there is a lack of water. Fertilize by mid – August and aerate. Inspect the lawn for diseases and treat only if necessary. Trees and shrubs – Maintain adequate moisture for newly planted trees and shrubs. Water all plants if it is needed. Continue to inspect plants for pests. Remove weeds form the garden and correctly prun the trees.
II III
IV
SEPTEMBER
I Grass – Use the weedkiller that affects the leaves of weeds. Add plants to the rarely planted areas using the required mix, or turf the empty areas. Continue to water if it is necessary. Mowing should be continued at the prescribed height of 5cm. Trees and shrubs – Chech plants for pests and spray if it is necessary. Remove weeds from the gardens.
II
III Grass – Fertilize as in May. Continue mowing as required. Shrubs and trees – Start to collect early fallen leaves. Water only trees and shrubs, planted in the autumn. If a small weed is a problem in flowers with shrubs and plants that cover the soil, use weedkillers produced for the suppression of small weeds or weed it.
IV
OKTOBER
I - IV
Grass – Mow if it is needed. Water only if the autumn is dry. Trees and shrubs – Water if it is needed. This should be carried out if the autumn is dry in order to improve chances for plants to survive during the winter. Removal of leaves should be done through the whole month. Continue to keep flowers without weeds.
NOVEMBER
I - IV
Prepate the equipment for storage over the winter. Grass – Make the last mowing of the year during the first week of October. Trees and shrubs – Complete the work required for October.
DECEMBER
I – IV
Grass – Complete the removal of leaves (late fallen walnut leaves should not be left to form a heavy stelju across the grass in the winter). Trees and shrubs – Remove and/or repair all damaged branches from snow of ice. Prune evergreen plants and trees, as well as, the shrubs from the Groups I, III, IV and V. Calculate the required reserves for the next season and order it now.
At the end of the year, if there is a need, and based on the experience of the
previous year, a calendar of nurture can be modified, in order to get a realistic schedule of work for the next year's maintenace of green areas.
For the successful maintenance of green areas, and in addition to the well planned green areas nurture, it should be kept in mind, that it is necessary to use the proper equipment and qualified personnel. Only qualified and trained staff can properly nurture plants on the green area (this is particularly true for trees pruning). Appropriate and professional tool is the second thing that is very important.

Eco-Ist’12, Ecological Truth, 30 May - 2 June 2012. Hotel “Srbija TIS”, Zajecar, Serbia
398
CONCLUSION
Planning of maintenance of urban greenery consists of three phases: Making nurturing calendar according to the real situation of green space will
give a realistic cost of a green space maintaining. The maintenance program of a green space can be made for the existing green
space and for future green space, too. Not rarely, the maintaining price of a green space and opportunities to investors to finance will impact on the reduction or rationalization of some project solutions. Regarding good green space functionality, it is important to coordinate maintenance requirements with funding opportunities. Sometimes it is better to give up some demanding project solutions, if it is already known that to maintain these green spaces, there is no adequate budget. Only green spaces that are regularly maintained and nurtured can give its maximum in both aestetic and functional terms
.
REFERENCES:
1. Anastasijevic N. (2007): Podizanje i negovanje zelenih povrsina, Sumarski fakultet, Beograd
2. Anastasijevic N., Vratuša V., Ojdanic M. (1996): Autochthonous trees of Belgrade green areas – the significant indicator of high dendrologic diversity in urban regions, Proceedings of the Balkan Scientific Conference “National parks and their Role in biodiversity Protection of Balkan Peninsula” Ohrid, Macedonia, 1996, 283-288
3. Anastasijevic N., Vuckovic M., Vratuša V. (1997): Funkcionalnost sumskog i ukrasnog drveca u gradskim zelenim povrsinama, Eko-konferencija, Ekoloski pokret grada Novog Sada, Novi Sad 1997, str. 223-227
4. Brown H. G., Kirkham T. (2007): The Pruning of trees, shrubs and conifers, Timber Press, Inc., Second edition, Cambrige.
5. Harris R, Clark J., Matheny N. (2004): Arboriculture: Integrated managemant of Landscape Trees, Shrubs and Vines, Pearson Education Inc., Upper sadle River, New Jersy.
6. N. Stojanovic, M. Mešicek V. Anastasijevic (2010): Native Vegetation As A Basic For Successful Landscaped Roads, Ekoistina 2010, XVIII Naucno-strucni skup o prirodnim vrednostima i zastiti zivotne sredine, Apatin 2010, 133-139.
399
XX International Scientific and Professional Meeting
"ECOLOGICAL TRUTH" ECO-IST'12
30 May - 2 June 2012, Hotel “Srbija TIS“, Zajecar, SERBIA
TREE FUNCTIONALITY Quercus rubra L.USED IN GREENING OF PRIMARY SCHOOL “MILOS CRNJANSKI” IN BELGRADE
Nadezda Stojanovic*
, M. Mesicek, N. Anastasijevic, V. Anastasijevic, S. Matic
University of Belgrade, Faculty of Forestry, Belgrade, SERBIA
nadezda.stojanovic@ sfb.bg.ac.rs
ABSTRACT
The investigation of invasive and potentially invasive plants on green areas in cities is of the great importance, because of their further curbing and spreading into urban ecosystems. This paper presents the functionality of potentially invasive specimen Quercus rubra L. used in greening a schoolyard of the primary school “Milos Crnjanski” in Belgrade.
Key words: Northern red oak, invasive plants, functionality
INTRODUCTION
When we talk about invasive plants we think of specimens whose introduction or spreading out of their native range threatens biodiversity. One of the reason the allochthonouns species become invasive is they are out of reach of their natural enemies, herbivores and pathogen species that maintain the density of that population in their natural habitant. The invasive plant species have the ability of using changed habitants, and to inhabit and spread, since they can penetrate and inhabit shaken habitants more easily than at stabile systems, resistant to the inhabiting of new species. If a new environment is similar to the natural environment of the introduced species, that species can survive and reproduce [1]. However, to name it invasive species it has to push successfully domestic species, autochthonous species, to spread out on new areas, to increase the density of the population and to do harm to ecosystem it is introduced to.
The invasive allochthonouns species are characterized by rapid growth and reproduction, a great power of dispersion, phenotypic plasticity and ability of surviving next to different available food and different environmental conditions. The invasive species can lead to the homogeneous regional flora, i.e. to the jeopardizing of biodiversity, can change structure and functioning of the ecosystem, but also cause socioeconomic and health consequences to a man [2]. Destruction of a habitant and the presence of the invasive species are especially emphasized in cities, urban and suburban areas. Cities are real focal centers of invasive species spread, mostly because the areas are ruined, so the invasive plants inhabit them rapidly and easily. It is also stressed that a

Eco-Ist’12, Ecological Truth, 30 May - 2 June 2012. Hotel “Srbija TIS”, Zajecar, Serbia
400
great number of invasive plants belong to the horticultural group of plants [2], which are introduced into the urban ecosystem by planting on urban public areas, private gardens, botanical gardens and other green areas. The spread of invasive plants, particularly in cities, is greatly contributed by the introduction foreign, allochthonouns species during the greening of green areas, and some of them are invasive or potentially invasive [3].
Investigation and assessment of functionality of existed invasive and potentially invasive plants, especially those from the tree groups, on the green areas of cities is of the great importance because of their efficient curbing. This paper presents functionality species Quecus rubra L. used in greening of the schoolyard of the primary school “Milos Crnjanski” in Belgrade.
MATERIAL AND METHOD At urban part of Belgrade on the green area of schoolyard of primary school
“Milos Crnjanski”, a total of 20 trees of Quercus rubra L. were registered, analyzed and assessed with the objective of getting a total functionality of this potentially invasive species. The trunk functionality of Quercus rubra L. is based on their total grade of vitality and their decorative grade by the method of constructing bioecological base (Anastasijevic, 1999). Table 1. Grades (ranks) of vitality of a tree
Grade (rank) The parameters of vitality in assessing an individual tree species
1 Death tree or a trunk close to death. A bent or sick tree. A tree on the brink of decaying. Broken or mechanical damaged tree. A tree with no recovery chances.
2 Still vital tree, but with mechanical or health damages. The tree with crowns partially missing. Seriously damaged tree that can still recover.
3 Trees with damages which can be revitalized by the nurturing measures. A tree top with a clearly outlined crown. The trees of a medium intensity of phytopathological diseases and mechanical damages.
4 A vital tree with a low intensity of phytopathological diseases or entomological damages. The tree with some weaknesses that can be recovered by adequate measures of nurturing
5 A completely healthy tree without damages. The tree of an exquisite vitality, well adapted to the environment conditions.

Eco-Ist’12, Ecological Truth, 30 May - 2 June 2012. Hotel “Srbija TIS”, Zajecar, Serbia
401
Table 2. Grades (ranks) of aesthetic trees Grade (rank)
Aesthetic parameters for assessing individual plants
1 Visually unbalanced tree with no symmetry. The tree that mars an impression of the whole view. Without expressive colors, changes, dynamic, with no clearly defined mass, surface
2 A tree with disharmonious silhouette and disproportion with not enough clear outlined habitus. A poor colors proportion. A poor proportion of mass and surface
3 A tree top presented in a silhouette with clearly outlined crown. Dull, monotonous in coloration. Trees do not fit in that space, out of proportion.
4 A tree in visually balanced form, with minor visual weaknesses. A clear proportion of colors, surface and mass.
5 Visually imposing and aesthetically very valuable tree. The tree that clearly outline proportion and symmetry in accordance with species characteristic. Accentuated tree in coloration. The trees which stand out in positive manner in a space by their line, figure, shape.
The vitality grade of trees is a total grade of the ratio of the measured trunk
height and front diameter of a trunk, then the individual changes noticed on the trees like: the intensity of dry branches in a tree top, the intensity of broken branches in a tree top, die-back back issue and drying of lower branches, the intensity of drying of leaves and needles etc. The vitality grade is also influenced by a whole individual health condition.
The individuals on which a certain phytopathological disease indentified or entomological damages decrease their grade of vitality. Mechanical damages of the bark and trunk can turn by the time into serious damages of the bark and trunk, so they are separately registered when assessing a tree. Depending on the intensity of these latter manifestations, the trees are marked by stars: * - low intensity, just damages of the bark and trunk, not so severe; ** - medium intensity, damages of the bark and trunk of greater intensity, which led to the tearing of the bark, but the tissue under the bark is still undamaged; ** - strong intensity, with severe bark damages, with mechanical tree damages as well. A total vitality of trees on the spot is identified by the grade (ranks) from 1-5 (Table 1). The grade of aesthetic value of decorative trees, as well as vitality, on the spot is assessed by the grades (ranks) from 1-5 (Table 2). The aesthetic value assessment of plants is mainly based on the subjective assessment of an investigator based on certain criteria and parameters which define certain aesthetic characteristics of plants like a line, surface, mass, symmetry, move, color characteristics, weather changes etc.The result of these two grades, the grade of vitality and the grade of aesthetic aspect of a tree provide a total functionality of a species.
RESULTS AND DICUSSION
DENDROLOGICAL CHARACTERISTICS AND ECOLGY OF SPECIES Querus rubra L. The northern red oak (Querus rubra L. syn. Quercus borealis Michx.) belongs
to the family of Fagaceae Dum.. The northern red oak is a deciduous tree which grows

Eco-Ist’12, Ecological Truth, 30 May - 2 June 2012. Hotel “Srbija TIS”, Zajecar, Serbia
402
naturally from 30-45 cm in height with trunk diameter up to 2 m. The crown of the northern red oak is widely rounded (Jovanovic, 1969). The leaf is 12-20 cm long and 10-12 cm wide, elongated to oval with 7-11 sharp slices and deep cuts. The acorn of the northern red oak is 15-25 mm long, 10-23 mm wide, in a cupule up to 1/3 long.
Figure 1. Dendrology characteristics of the Querus rubra L.species: a) leaf; b) flower;
c) bark; d)small branch; e) fruit-acorn: The northern red oak naturally grows in the valleys and on the hills of the
eastern parts of the USA, along to the north up to Canada. In spring it breaks out in leaves late. It flowers in May. It is easily adapted to different climatic and field conditions. It bears well law temperatures. It grows well on forests habitants: Illyrian oak-hornbeam forests; valley beeches and
Hungarian Oak (Jovanovic, 1969). On poor soils it grows faster, and it also grows on very poor soils, which can be acidic, but not too wetted; it avoids limestone. It works best on sandy clay, especially when the clay is fresh. It cannot bear stagnating water and floods. It hardly grows on dry soil as well. It bears shade better than domestic oaks. It has good tiller strength, but shorter lifespan and a slightly weaker tree than our, domestic oaks. The northern red oak is a potentially invasive species in our region and it has a law invasive potential (Grbic et al., 2010).
TOTAL FUNCTIONALITY OF TREES Querus rubra L. By assessing 20 trees of Querus rubra L.on the green area of the schoolyard of
the primary school “Milos Crnjanski” in Belgrade the data of a total functionality of this potentially invasive woody species were acquired (Table 3).
By measuring on the spot it was conclude that the average height of 20 trees of Querus rubra L.is 6,74 m and the average 1.30 m high diameter 19,10, so it can be said that the trees are vital according to growth of them, and the proportional ratio of the trunk height and diameter. From a total 20 trees, 11 of them have the height of the crown bigger than 6 m, and 12 trees have the diameter of 1.3 m height of the trunk bigger than 19. An average crown width is 6,7m. From a total number of 20 trees, 9 of them have the crown width bigger than 7m. Some of the trees are of the imposing dimensions, while there are also young individuals that still develop (Figure 1).

Eco-Ist’12, Ecological Truth, 30 May - 2 June 2012. Hotel “Srbija TIS”, Zajecar, Serbia
403
Figure 2. A presentation of a tree vitality of Querus rubra L.:
a) Alleyc) d) and e) The damages due to irregular pruning
planting of the northern red oak; b) straight and bent trunks;
A total grade for the vitality of 20 trees of the northern red oaks on the green
areas of the schoolyard of the primary school “Milos Crnjanski” in Belgrade is 4.0. The low total grade for vitality of the northern red oak is mainly affected by the mechanical and phytopathological damages and diseases. The vitality of the tree is mostly affected by injures on the spots of pruning and breaking of the branches. The spots where the brunches had been pruned were mostly damaged (Figure 2). The trunks are straight, vital and mostly healthy, which is the reason for the high grade of vitality. Besides the damaged trunks, on a couple of the individuals the damages of the boughs were indentified as well. Mechanical damages also weaken a total vitality of the northern red oak tree. On the spot two young trees of the northern red oaks were identified. Besides the damages due to improper pruning and mechanical injures on the trees were identified and pruned the intensity of the dry branches in the crown, as improper pruning consequence.
Figure 3. A presentation of injures on the trees. a) A sever damage of the tree
b) Healed injures of pruning. c) The tree with a lot of injures; d) An injury on the spot of branching; e) Injures in the ring of branches

Eco-Ist’12, Ecological Truth, 30 May - 2 June 2012. Hotel “Srbija TIS”, Zajecar, Serbia
404
Table 3. Existing state of trees Quercus rubra L. used for greening the sports center "Kosutnjak"
№ Species name
Hei
ght o
f the
tru
nk (m
)
Trun
k he
ight
cl
ear o
f
Dia
met
er a
t B
reas
t Hei
ght
(DB
H)
bran
ches
Cro
wn
wid
th
(m)
Damages and diseases
Vitality Grade /Aesthetic Grade
1 Quercus rubra L. 6.0 1.3 20.0 4.5 Properly developed, a tree without visible damages 5/5 .
2 Quercus rubra L. 7.0 2.5 23.0 6.0 Properly developed, a tree without visible damages, healthy 5/5 crown
3 Quercus rubra L. 3.0 1.8 8.0 2.5 Peeled trunk bark, rotten branches as a result of improper pruning, healthy branches in the crown
3/4 .
4 Quercus rubra L. 6.0 2.1 18.0 4.2 Evident consequences of improper pruning 2/3 boughs
5 Quercus rubra L. 4.5 1.2 12.0 5.5 Rot in the fork of branches as a result of improper 4/4 pruning
6 Quercus rubra L. 5.5 2.0 20.0 6.2 Peeled bark, branches 4/4 rot
7 Quercus rubra L. 7.5 1.2 18.0 7.0 A tree without significant damages, a proper 5/5 crown
8 Quercus rubra L. 8.0 2.3 22.0 6.7 Rot branches as a result of improper 4/5 pruning
9 Quercus rubra L. 8.0 2.1 30.0 9.0 Rot branches as a result of improper 4/4 pruning
10. Quercus rubra L. 7.0 1.8 22.0 8.5 Trunk rot as a result of improper pruning, a greater number of dry and broken branches
3/4 in the crown
11 Quercus rubra L. 9.0 2.2 25.0 10.5
Trunk rot as a result of improper pruning, a greater number of broken branches
4/4 in the crown
12 Quercus rubra L. 7.5 2.8 16.0 9.5 A large number of dry branches in the crown. Trunk without visible 5/5 damage.
13 Quercus rubra L. 3.5 2.7 5.0 1.0 A young undeveloped plant. Crown not developed. There are lichens on the
4/3 trunk
14 Quercus rubra L. 9.0 2.6 23.0 8.5 Rot branches as a result of improper pruning. There are dry and broken branches in the crown
4/5 .
15 Quercus rubra L. 9.5 2.7 25.0 7.8 Three branch wounds were noted, as a result of bad pruning. Improperly formed
4/5 crown
16 Quercus rubra L. 6.5 2.0 14.0 6.5 Exceptionally upright trunk with no visible 4/5 damage
17 Quercus rubra L. 6.8 2.0 18.0 7.8 Rot branches as a result of improper pruning 4/5 .
18 Quercus rubra L. 9.0 1.9 28.0 10.5
Rot branches as a result of improper pruning 4/5 .
19 Quercus rubra L. 8.5 1.3 32.0 11.0
Rot trunk as a result of improper pruning 4/4 .
20 Quercus rubra L. 3.0 0.5 4.0 0.5 A young tree just 4/3 planted Total 6.74 : 1.95 19.1 6.7 4/4.45

Eco-Ist’12, Ecological Truth, 30 May - 2 June 2012. Hotel “Srbija TIS”, Zajecar, Serbia
405
A total aesthetic evaluation of the 20 red oak trees on the green area of the schoolyard of the Primary School "Milos Crnjanski , is 4.45, as compared to the vitality, that is a high grade. A higher aesthetic evaluation mostly depends on the widely well-formed crowns and the height of trees (Figure 3). As the red oaks are planted linearly, its massive formed in space, gives the impression of high decorativeness. The soft leaves texture and its bright green color, which has a red oak, also increases the total aesthetic experience in the area. The decorativeness impression is mostly reduced by diseases and trunk damages as well as by the presence of dry branches in the crown
.
Figure 4. Showing red oak trees decorativeness: a) and b) high red oak decorativeness
expressed by massive c.) Aesthetically valuable tree evaluated by
5;
CONCLUSION
The evaluation of 20 red oak trees planted for the schoolyard’s greening of the PS "Milos Crnjanski" led to the following conclusions: The overall vitality of Quercus rubra L. is 4.0 and the overall decorativeness is about 4.45, the overall functionality is 4.23, so it can be said that for this green area the red oak is good choice in terms of its functionality. A much better impression of red oak is in terms of its decorativeness. The low vitality evaluation mostly depends on a large presence of defects and diseases, especially diseases that are caused by improper pruning and mechanical injuries. Now, red oak trees are relatively young and this damage can occur as a vitaly reducing factor of the trees in the future. Group line red oak planting has given a strong aesthetic experience in this space, which is particularly reflected in the color changes trough different seasons
.
Acknowledgement This paper was realized as a part of the project "Studying climate change and
its influence on the environment: impacts, adaptation and mitigation" (43007) financed by the Ministry of Education and Science of the Republic of Serbia within the framework of integrated and interdisciplinary research for the period 2011-2014.
REFERENCES
1. Stojanović, N., Mešiček M., N. Galecić (2011): Functionality Assesment of Sophora japonica L. Trees used For Urban Land Planting SC „Kosutnjak“, XIV International Eco-conference, Environmental protection of urban and suburban settlments, Novi Sad, 2010, str. 379-388.
2. Grbić M. i dr. (2010): Ekologija, monitoring i tehnoloski postupci za kontrolu invazivnih biljaka u biotopima Beograda, Sumarski fakultet Beograd, Studija, 2010.
3. Jovanović B. (1969): Dendrologija sa osnovima fitocenologije, Naucna knjiga, Beograd

406
XX International Scientific and Professional Meeting
"ECOLOGICAL TRUTH" ECO-IST'12
30 May - 2 June 2012, Hotel “Srbija TIS“, Zajecar, SERBIA
CONSTRUCTION AND CONSTRUCTIVE ELEMENTS
OF A PATH IN LANDSCAPE
DESIGN
Nevenka Galecic*
, D. Skocajic, D. Vujičic, A. Tutundzic, N. Stojanovic, S. Matic
University of Belgrade, Faculty of Forestry, Belgrade, SERBIA
*
ABSTRACT The paths are one of the most important structural landscape-architectural elements within green
areas. Regardless that the paths are the areas intended for the movement of pedestrians, and that they
differ in materials of which they are built of, as well as in respect of their technical characteristics (strength, resistance to atmospheric agents, abrasion resistance), they are constructed of four constructive elements: capping layer, base course, surface course and curbs.
This paper presents a historical review of development of different types of paths and roads constructions and construction elements, as well as the use of different building technologies and materials, which have greatly contributed to its present appearance in the modern landscape design
.
Key words: paths, construction,
constructive elements
INTRODUCTION
The path network is the basic and meritorious element of the space usability for visitors, which seems to be the skeleton of the green space [1].
The basic elements of the path construction and materials used, mainly depends on the path purpose and its frequency of use. The technology development and construction materials production offer a wide range of possibilities of using different materials for the paths and roads design and construction in the landscape areas.
All contemporary paths and roads designs are an upgrade of the former long set of construction principles in solving problems of tracing and setting up communications.
This paper presents a historical, chronological overview of the development of different roads and paths constructions, different layout of constructive elements and construction technologies, from the first roads and paths up to now
.
CONSTRUCTION OF OLD ROADS AND PATHS When a man had abandoned the nomadic way of life and began to create
settlements the first roads and paths appeared. The roads and paths construction became

Eco-Ist’12, Ecological Truth, 30 May - 2 June 2012. Hotel “Srbija TIS”, Zajecar, Serbia
407
more intense with the states formation as well as the ties strengthening between the tribes and nations. The roads for pedestrian and vehicular traffic had existed in ancient China, India, Persia, Egypt, Ancient Greece and Italy even in the Ancient Times. It is known that even the Phoenicians had developed the technique for the construction of cut slope, embankment, galleries and short tunnels in order to achieve the milder ascent
In the construction technique and the network of roads the Romans surpassed all nations of the Ancient Times. They were very well aware that it was possible to maintain a great empire, if the provinces were linked with good roads to Rome, the center of the empire. The Romans were excellent in trace route planning and they made the roads with the shortest possible routes and on the mildest possible slopes. It could be said that the Romans were the first in the history who created the distinctive road construction, more than 76 000 km of roads were built on that basis, so called Roman road [2].
s.
In static terms the construction is so durable and permanent that some roads have preserved up to date, and many modern roads were built on the foundations of Roman roads. The Romans designed road construction with four constructive elements: base course, capping layer, surface course and curbs. These constructive elements
In terms of the construction, the
would be present through the whole history development of the roads and paths constructions.
base course for the paths and roads, in Roman times, was consisted of two rows of large stones, with a binder material - lime mortar (Figure 1). The capping layer, in the construction of a Roman road, was made of walnut-sized stone with lime mortar. The surface course was made of a mixture of gravel, sand and lime mortar. All the constructive elements of the Roman were made of stone materials of different granulation with binding material. The thickness of the Roman road construction was from 100-125 cm and the road width about 12 m. The road was divided into three belts (zones) by the curbs, made of flat stone bonded with lime mortar. The middle belt was used to move infantry and was about 5 meters wide, and two side zones were used for moving of chariots and cavalry, and were about 3.5 m wide (Figure 1).
Figure 1: Construction and constructive elements of the Roman road
(2)

Eco-Ist’12, Ecological Truth, 30 May - 2 June 2012. Hotel “Srbija TIS”, Zajecar, Serbia
408
In the Middle Ages, new roads were not built, and during this period even the old Roman roads decayed. Power and strength of a state or empire in history, can be measured by its relation to roads. The first state after the Roman Empire, which left a significant mark in the history of the world construction, was France. In the 16th century the French began to repair the old and build new roads, modeled after the Roman roads. The French road also had four constructive elements: base course, capping layer, surface course and curbs (Figure 2). The base course modeled after a Roman road was built in two rows of flat stone, but unlike the Roman road with no binding material. The thickness of the base course was about 30 cm. The capping layer was made of river stone mixed with the ground. Along the road sides there were curbs made of stone cubes. The surface course was made of a fine ground layer. The total thickness of the French road construction was about 50 cm. The particularity of the French road construction was that the binder material was not used in the construction of roads. Also, in their road construction they had not solved the surface drainage, so the puddles of muddy water were on the road surface after rain. After passing of carts, the cart ruts remained on the road surface, so that the French roads rapidly decayed
.
Figure 2: Construction and constructive elements of the French road [
2]
In 1775 in France a new type of road was created with surface course made of broken angular stones - Trésaguet, then Telford in England, and later McAdam, named after an engineers who created its construction and built such roads for the first time in history
.
Figure 3. Construction and constructive elements of the Tresaguet road and Telford road [
2]
The Tresaguet and Telford road construction consisted of the well prepared and rolled ground subgrade, over which was spread a layer of the 20 cm thick crushed stone

Eco-Ist’12, Ecological Truth, 30 May - 2 June 2012. Hotel “Srbija TIS”, Zajecar, Serbia
409
(Fig. 3). The voids between the large stones were filled by using crushed stone of finer granulation. Over the stone base course, a well-rolled 3 cm thick layer, made of fine sand or stone chippings (crushed aggregate), was set in order the voids would be better closed. The surface course was consisted of two layers 10 cm thick, each made of well-rolled crushed stone. During the final rolling of the upper layer of the surface course, a 2-3 cm thick binding material layer was being added. The curb was an extended layer of surface course in relation to the roadbed
.
Figure 4. Construction and constructive elements of the Gravel surfacing -McAdam
(2)
In 1834, an engineer Polonceau used for the first time the roller on an animal drawn cart to roll surface course. In 1858 Blake invented the crusher, and in 1859 Lemoine steam roller. It all contributed to the improvement of the road construction, then the engineer Mc Adam in England for the first time in the road construction applied the rolling road surfacing technique in multiple layers with the water pouring and adding crushed aggregate.
The McAdam road construction consisted of the same constructive elements as the other constructions: capping layer, base course, surface course and curbs. The capping layer was well-rolled and prepared ground. The base course consisted of two layers of compacted broken stones; the first layer was 10-15 cm thick and made of stone whose grain diameter is 5-8 cm and the second 10-15 cm thick layer but made of stone whose grain diameter was 3-5 cm. The McAdam surface course consisted of the sand or stone chippings with a little bit of loam that all make well-compacted connected material in a 3 cm thick layer which was applied on the second base course layer. The characteristic of the McAdam road construction introduced a new constructive element in the road construction – the drain for the precipitation (Figure 4)
The .
Turkish Empire (Ottoman Empire) developed its own construction of roads and paths. The most famous road construction of the Turkish Empire was Turkish cobblestone (Figure 5). The stones used for making the Turkish cobbles by its dimensions in any direction were not smaller than 15cm and bigger than 22cm
In the Turkish cobblestone construction for the first time in the road construction, capping layer, as a constructive element,
.
appeared under the base course - bearing layer. This constructive elements disposition of the roads and paths would remain up to date. One more unique Turkish cobblestone characteristic was that for the first time in history there was a separate space for the pedestrians - there were sidewalks. The spaces within Turkish cobblestone for more effective traffic and the space for

Eco-Ist’12, Ecological Truth, 30 May - 2 June 2012. Hotel “Srbija TIS”, Zajecar, Serbia
410
pedestrians were separated not only visually but also by the construction strength of the particular road parts. The separation of a road construction on parts depending on the traffic type (vehicular and pedestrian), in the history before the Turks, had been done only by the Romans. The curb was clearly distinguished as a constructive element of the path within the Turkish cobblestone. The Turkish cobble in its construction had a surface drainage; in fact, the entire road construction profile was carried out in the transverse slope of 4-6 %, in order to drain water swelling from the carriageway. The Turkish cobblestone construction was consisted of an 8-20 cm thick capping layer that was formed of a mixture of gravel and sand, than along the road edge was a row of crushed stone with the function of curbs. On the gravel capping layer, the bearing layer was set in a form of one row made of stone cubes. The cubes are deeply contested in the capping layer, and the empty spaces on the surface were filled with small stones. The surface course was made of fine stone sand scattered over the base course surface and well rolled
.
Figure 5. Construction and constructive elements of the Turkish cobblestone
[2]
It is considered that from 1860 the modern road construction began. City streets were made of compacted asphalt, and since 1887 on roads a small stone cube began to apply as a surface course. In the early 20th century, the machinery was intensively used in the road construction. In addition to the introduction of mechanization in the roads construction, new materials were being introduced as well, because the old water-bound surface courses of crushed stone and gravel couldn’t resist the load, speed and dimensions of motor vehicles. In 1901 within the surface courses construction, for the first time, tar (coal tar for roads) for dust suppression was applied. New materials, which were used for the surface courses, reduce construction costs, maintenance costs and increase the durability of the roads and paths
.
CONTEMPORARY CONSTRUCTION OF PATHS WITHIN GREEN
AREAS
The paths, built nowadays on green areas, consist also of four basic constructive elements (Figure 6) [3]: capping layer, base course, surface course and curbs. The

Eco-Ist’12, Ecological Truth, 30 May - 2 June 2012. Hotel “Srbija TIS”, Zajecar, Serbia
411
capping layer is the constructive element whose primary function is to break the capillary water climbing from deeper layers through the base course to the inert surface course, and to carry out as soon as possible the surface water, which by gravity goes down into the deeper layers, that would not stay for long in the surface course zone. The thickness of the capping layer depends on hydrological conditions; the standard capping layer thickness in our climatic conditions is 5-10 cm. The capping layer can be constructed of large or fine gravel, crushed stone or sand (Figure 6). After applying the capping layer material, the capping layer is compacted by rollers or compactors, often with a certain number of wetting, in order to provide balanced subsidence and increase construction stability.
During the capping layer formation, the same slope as the slope predicted for the path should be provided. The path slope depends on the terrain type. On flat terrain the longitudinal path slope ranges from 1-2.5%. When the path is used for pedestrian traffic, the permitted maximum for longitudinal slope is 10
%.
Figure 6. Construction and constructive elements of paths within green areas
[3]
The base course, as a major constructive element, receives and carries the load of the upper layers, as well as the traffic load. The thickness of this layer depends on the traffic type (heavier loads require a larger layer thickness). The base course may be

Eco-Ist’12, Ecological Truth, 30 May - 2 June 2012. Hotel “Srbija TIS”, Zajecar, Serbia
412
constructed of gravel, small crushed stone, concrete or sand. After the base course setting, it is aligned or compacted, depending on the path type.
The curbs construction begins during the process of the capping layer formation, when the foundation for future curbs is set up. The base for curbs is generally made of concrete that is poured after placing wooden paneling. The curbs may be constructed of concrete, stone, bricks or finished castings. It is important that the curbs are durable and well fixed to the base course. The curb is bound with base course by cement mortar, if the foundation is built before placing curbs or the curbs are directly immersed into the concrete foundation during its formation.
After the curb construction or in parallel with the curbs construction, the setting of surface drainage system should be done. The drainage systems of open or closed water latticed drains are generally used for park paths. In order to provide a surface water flow towards intended drainage system, it is necessary, during the final surface course processing, to make the cross fall of the path towards drains from 1-2.5 %. Depending on the path width, the cross fall will be made on one or two path sides.
To build a surface course, the different construction materials could be used: sand, mineral aggregate, cast asphalt, cast concrete, stamped concrete, different types of elements (stone cubes, hand-cut flagstones, mechanically processed flagstones, bricks and ceramic tiles, concrete elements and slabs, wood panels), synthetic materials, as well as the
combinations of these materials.
CONCLUSION
Although the choice of building materials, now used as a surface course and are visible part of the path construction, the disposition of the constructive elements of the path is always the same.
Each path within the green area is consisted of four constructive elements: capping layer, base course, surface course and curbs.
The construction technology and the constructive elements disposition in the contemporary path construction are the result of the historical development of modern roads and paths: from the Ancient Times and Roman road, through the construction of roads in France in the 16th century, McAdam road in England, cobblestone in Turkey and building technology innovations of the 19th and 20th centuries as well as the first roads in which construction oil derivatives were used.
It is considered that, regardless of the further course of technology development and production of new materials, the disposition of constructive elements will remain as the basis for new and more sophisticated roads
.
REFERENCES
1. Anastasijević N.: Podizanje i negovanje zelenih površina, Šumarski fakultet, Beograd, 2007.
2. Kutlesa M.: Putovi, Svetlost, Sarajevo, 1959. 3. Landphair C. H., Klatt, F.: Landscape Architecture Construction, Elsevier, New
York - Amsterdam – Oxford, 1988.

413
XX International Scientific and Professional Meeting
"ECOLOGICAL TRUTH" ECO-IST'12
30 May - 2 June 2012, Hotel “Srbija TIS“, Zajecar, SERBIA
TECHNICAL POSSIBILITIES OF APPLYING WOODY PLANTS
IN DESIGNING ROOF GARDENS
Nevenka Galecic*
, A. Tutundzic, D. Vujicic, D. Skocajic, N. Stojanovic, S. Matic
University of Belgrade, Faculty of Forestry, Belgrade, SERBIA
*
ABSTRACT
The main issue of many cities is the quality of life in urban areas. Citizens are increasingly exposed to a different kind of pollution, therefore as one of the measures of alleviating negative influences is greening of almost all available areas to increase urban life quality.
The new opportunities of installing green areas have been opened both by the contemporary architecture and technologies, and by using flat roofs on large constructing buildings there is an opportunity of designing a very specific area refined by plants.
Unlike the other green area projects, roof gardens or green roof systems are very specific and demand adoption of a constructing process, as well as basic measures of nurturing roof plants. A current issue led to construction of the first standards of possibilities and the rules of applying woody species, which is the focus of this paper, as well as the construction and maintenance of roof gardens.
Key words: roof garden,
construction, woody plants
INTRODUCTION
Unlike other constructions, green roofs are a product of natural forms and materials and by imitating of nature represent vivid dynamic systems. Plants, as their integral part, are living organisms, with all features of the living species: they grow, enlarge their dimensions, change an environment, as well as the ecological relations within – in one word, they have an active relation with the environment in terms of space (visually), time and biology. There are a lot of advantages of the roof gardens when comparing them with regular roofs, since they are a thermal insulation, which decrease the expenses of heating and cooling buildings by 20%, which is of great importance in the time of acute issue on climate changes. The other significant importance in constructing microclimate of better quality is the decrease of noise through the natural plant system of sound filtration. These areas, besides sparing energy and their influence on decrease of harmful gases, as well as noise, could be green oases, the places of relaxation and break. The best examples could be seen in Germany, a renowned world leader in “roof horticulture”, then in Copenhagen, where in 2010. the roof gardens were regulated by the law, and the renowned green roof at Nanyang University in Singapore etc.

Eco-Ist’12, Ecological Truth, 30 May - 2 June 2012. Hotel “Srbija TIS”, Zajecar, Serbia
414
Construction buildings suffer gradual changes under the influence of atmospheric conditions and tearing of certain joint elements, they are on the same place during their existence, and on the whole their functionality decrease. However, the basic elements of green areas, the plants on them permanently change in volume, taking gradually bigger space, and their functionality, by the time, increases [2]. This fact vitally influences the way of designing, constructing and maintaining of roof gardens in an urban area. Therefore range technical demands will be presented in the paper about applying woody plants, as a base of most intensive roof gardens in the expected specific conditions of the urban area.
TECHNICAL SOLUTIONS OF APPLYING WOODY PLANTS IN DESIGNING ROOF GARDENS
A roof can be covered with more or less plants, depending on the type of a
garden. Intensive roof gardens, which are the main focus of this paper, demand deep substrates which should support the ideas of design for spaces which are used and with the functions similar to the green areas. On such designed gardens a range of plants are normally planted, from a lawn, a soil cover, perennis, annuals to bushes and trees.
It is not an easy task to recommend plants that could be used in greening roofs, because each of them has its needs towards microclimate conditions, irrigation, drainage, maintenance, loading capacity etc. It is for these specifications, and their increasing significance in a city that led to careful plant material selection, for example American Society for the Testing of Materials (ASTM) adopted a Standard for selection, installation and maintenance of plants for green roof systems, in which they recommended the selection of plant material depending on a garden objective, aesthetic demands, climate etc. [1].
When plants are selected for a roof garden general rules could be to pay attention to the plants predicted to be resistant to the specific condition of the environment. So the selected species should be resistant to air pollution, the conditions of dry air and soil, temperature changes, modest conditions when it comes to reinforcing nutrition etc. The advantage should be certainly given to lower plants, since in the conditions of shallow soil and the increased energy of wind can lead to blow down and threatened safety of a user. The species of a strong root system, which penetrate into deep, can damage hydro-insulation and other construction elements, so for that reason they should be avoided. The plants that develop a wide ramified surface root system are also not recommended, because they stand in the way to the growing of surrounding plants.
Some species of trees and bushes are characteristic for their invasive growth of a root (poplar, willow, alder etc.), which rapidly fill in the planted space on a roof, and it can penetrate through hydro-insulation as well, especially if it is built of organic materials by which the root feeds with. This problem can be partially avoided by putting various bars to the root. Since the invasive growth of root also jeopardizes the surrounded plants, when it comes to cramped spaces of roof gardens it is recommended to avoid planting these plants.

Eco-Ist’12, Ecological Truth, 30 May - 2 June 2012. Hotel “Srbija TIS”, Zajecar, Serbia
415
The ratio of trunk height to root depth is a significant characteristic for the tree stability, which is very important in designing roof gardens, and the ratio should be 10:1 [3]. The most ideal shape of a root, for the static stability of a tree, is to be broad and ramified, but in the limited space, like a roof garden, it is not possible to realize it. For that reason as a precaution of blowing down it is necessary to predict by the project an extra underground reinforcing of the trunk (Figure 1).
Figure 1: a) Underground reinforcements of the trunk prevent blow down; b) Above ground fastening or reinforcing of the trunk to the wall or girder [3]
High trees should be also avoided in installation of roof gardens. The maximum
height for a trunk should be up to 6m, on the assumption that the trunks of this height fit in environment. The weight of the planted tree is evenly spread on the space on which the root spreads out. This weight must not be over the weight that the roof can stand.
Falling of leaves and fruits is important because of the location and amount of fallen. Especially it is important to pay attention to the species like: plum, crab apple, sweet cherry, cherry, ginkgo biloba, Australian laurel, and other fruitful species, which should not be predicted by the paved areas, furniture or water elements. The species that throw away leaves faster should be also predicted so the intensity of maintenance would decrease in that time of the year.
The roof garden’s depth of the soil predicted for the growth of plants is at minimum dimension. An average depth of the soil is 15-20 cm, and at the certain points (the points where the construction of a roof allows it) can install elevated beds in which the depth of substrate can be 150-180cm (Figure 2).
angled wooden structure (60x180x300cm)
girder
cleat (5-5x15x25cm)
anchors in concrete
DRAIN BASE
a.) b.)
plan

Eco-Ist’12, Ecological Truth, 30 May - 2 June 2012. Hotel “Srbija TIS”, Zajecar, Serbia
416
Figure 2. Denivelation of a roof at planted spots [3]
The other method for increasing the depth of soil is by throwing and elevating of soil at the place where high trees are planted. An excess space is filled with the boards of styrofoam, because of the overall decreased roof garden weight (Figure 3).
Figure 3. The deposit of soil around the tree in order to increase the depth, by putting in the blocks of styrofoam [3]
The blocks of styrofoam are perfect material for filling in, by which various
depths of substrates can be formed for planting plants (Figure 4).
blocks of styrofoam
curb
light soil mixture
roofing slate bearing pillar
planting base
drain base curb
drainage
filter-fiber

Eco-Ist’12, Ecological Truth, 30 May - 2 June 2012. Hotel “Srbija TIS”, Zajecar, Serbia
417
Figure 4. The blocks of styrofoam under the planting base [3]
Trees, as well as the other plants on roofs can be planted in lowered planted beds or in elevated planted beds depending on how it is predicted by the project of a roof garden and the static of a building. The best example of using elevated and lowered planted beds is the example of the roof garden of Grosse Schanze Park in Switzerland. The appearance of the roof garden in Grosse schanze park (Figure 5) looks as if it is the garden on the ground not on the roof [3].
Figure 5. High poplar trees planted in the lowed planting beds laid over steel supported columns of the building (left), and a cross-section of details of the garden
in Grosse schanze park (right)
Planting of the bigger plants on a roof should be predicted in the project just by the curb, fence or terrace. For that purpose a special a reinforced-concrete beds up to 1.5 m in depth and up to 2 m wide, and they should be a part of roof construction as well [2], and according to the static project of a building, on the basis of the main project of the roof garden. Besides the hydro-insulation of a roof, each concrete bed has to have its
planting base insulation filter-fiber drainage protective board hydro-insulation roofing slate
blocks of styrofoam
planting base
drain base filter net
roofing slate
Eco-Ist’12, Ecological Truth, 30 May - 2 June 2012. Hotel “Srbija TIS”, Zajecar, Serbia
418
own hydro-insulation. The bottom of the bed, as well as its walls is isolated by hydro-insulation. Over the hydro-insulation a cement screed is laid as a protection of hydro-insulation. A layer of sand is laid on the cement screed, over which is a drain pipe that will drain excess water from the beds. The fall of the bottom of the concrete bed and drain pipe is minimum 2%, because of the easier drain of the excess water. Over the drain pipe a filter of gravel layer or some of lighter drain material, and then a layer of planting substrate is laid. The depth of the planting substrate depends on plants species that would be planted in the bed and they range from 15-20 cm, for herbaceous plants, over 60-70 cm for bushes, flowers and perennis. For lower trees planting 100 cm of the substrate should be supplied [5]. Over the layer of substrate, a layer of mulch is laid. The mulch prevents excessive water drain from soil and making of a crust, and often it has a decorative function as well. After planting tree trunks are permanently fixed by cables for the plugs tighten to a concrete wall of a bed, because of the blow down.
The roofs of strict load limits, so bigger green areas cannot be predicted on them, like elevated concrete beds, so laying containers for planting like bigger jardinieres and flowerpots are the best solution. Regardless the load limit of a roof, these containers can be used for planting plants.
The demands of plants in the containers are the same as the demands of the plants planted in elevated beds. They should be well drained, but deep enough to maintain necessary soil humidity. A mulch layer of minimum 1.5 cm is necessary to prevent drying up. Planting of the other plant species (bushes, lians, and flowers) is identical to planting in normal conditions.
REALIZATION OF ROOF GARDENS AND MAINTAINCE OF GREEN ON A ROOF
Even though a significant part of the installing roof gardens operations are similar
to those on the ground, a specific space demands a range of special requirements during the implementation of a project. From the technical point of view, besides laying hydro-insulation and installations for draining and irrigation, the most difficult part of installing roof gardens is planting trees. The trees are lifted on the roofs by cranes, packed in appropriate containers, intended for transportation and lifting trees on big heights. Because of the load limits, vehicles on a roof which transport planting material mainly move along the bearing columns which make the installment of a roof garden more difficult. Conditions characteristic for the roof gardens require specific measures of maintenance. Because of increased insolation on a roof, evaporation is increased as well, so watering is a basic and important measure in nurturing of roof gardens. The amount of water required for this measure of nurturing plants, in particularly for watering trees, is 1/3 bigger than the amount of water used for watering those plants in the condition of natural soil [2].
Reinforced nutrition of plants is the next significant measure of nurturing roof plants. Because of the limited area, the amount of substrate in concrete beds on a roof is usually barely sufficient minimum of a plant’s required reinforced nutrition. Besides, a frequent irrigation affects an intensive washing out of nutritive substances from the substrates, so the reinforced nutrition is a necessary measure of nurturing so the plants on a roof would regularly and abundantly produce leaves, flowers and fruits. The best way

Eco-Ist’12, Ecological Truth, 30 May - 2 June 2012. Hotel “Srbija TIS”, Zajecar, Serbia
419
of plants’ reinforcing nutrition on a roof is continually putting fertilizer into the irrigational system. In that way the plants are provided by required water along with the nutritive required elements so they grow and develop.
Trimming is another required measure of nurturing. The maintenance of plants in dimensions predicted by a project is a basic task of trimming roof plants, because of the cramped space on a roof. Besides, by trimming plants are kept in good shape, dry branches and leaves are eliminated, and in this way it affects always significant aesthetic aspect of roof gardens.
CONCLUSION
A proper selection of species and taxons of plants is crucial for long life of roof green areas. When selecting plant species in the projects of roof gardens the heliophyte species should be used since roof are regularly exposed to stronger insolation. Due to very difficult conditions where plants grow on a roof the quality planting material is required and exclusively applying turf planting, even with smaller plants as well.
Unlike the other projects of green areas, the projects of roof gardens have their own specific requirements to which the process of installation, as well as the basic measurements of nurturing roof plants should be adopted.
Besides indisputable ecological contributions, there is also an economic aspect of installing roof gardens, in the first place decreasing the cost of heating and/or cooling. That’s way these systems are not attractive exceptions in the developed countries, where through the development of the industry green roof components, significantly decreases the cost of their installation and maintenance and at the same time denying one of the widespread prejudice against these areas [7]. The increasing interest in roof gardens follows the adoption of standards for designing, installation and maintenance of roof gardens, with detailed developed possibilities of applying woody plants, but unfortunately our country is still falling behind. REFERENCES
1. American Society for the Testing of Materials, E 2400-06 Standard Guide for Selection, Installation, and Maintenance of Plants for Green Roof Systems, http://www.astm.org/ Standards/E2400.htm (06.04.2012)
2. Anastasijevi N.: Podizanje i negovanje zelenih površina, Šumarski fakultet, Beograd, 2007. 3. Osmundson, T. H.: Roof Gardens: History, Design and Construction,
W.W.Norton & Company, Singapure, 1999. 4. Landphair C. H., Klatt, F.: Landscape Architecture Construction, Elsevier, New
York - Amsterdam – Oxford, 1998. 5. Harris Ch. W., Dines N. T.: Time - Saver Standards for Landscape Architecture,
McGraw-Hill Book Company, USA, 1988. 6. Vujković Lj.: Pejzažna arhitektura – planiranje i projektovanje, Šumarski
fakultet, Beograd, 1995. 7. Wark, C., Wark W.: Green Roof Specifications and Standards, The
Construction Specifier, Vol. 56, No.8, 2003.

420
XX International Scientific and Professional Meeting
"ECOLOGICAL TRUTH" ECO-IST'12
30 May - 2 June 2012, Hotel “Srbija TIS“, Zajecar, SERBIA
DENDROFLORA IN CENTRAL BELGRADE AREA,
AS A KEY ROLE TO ITS SUSTAINABILITY
Dragana Cavlovic*
, M. Celic, D. Obratov-Petkovic
University of Belgrade, Faculty of Forestry, Kneza Višeslava 1, 11030 Belgrade, SERBIA
ABSTRACT Green areas are crucial factor to sustainability of urban areas, especially their central parts. Belgrade
Zoo, as significant part of central Belgrade area contributes to its sustainability, microclimate improvement (wind blocking, lowing the temperature, raising the humidity…) and after all urban landscape embellishment. Dendroflora of Belgrade Zoo counts 670 individuals from 88 taxa and has well to high vitality and ornamental values. There are 10 woody taxa with excellent vitality and exceptional ornamental values, and only four of them which have low vitality and low ornamental values. It should be pointed out that there are no taxa with the lowest grade for vitality and ornamental values. Dendroflora of the Belgrade Zoo is very vital, have very good ornamental values and therefore is an essential element of the urban landscape which should not be excluded from it.
Key words: dendroflora, urban area, sustainability, Belgrade
INTRODUCTION One of the crucial problems in urban areas nowadays are adverse climatic
conditions, involving temperature extremes, precipitation disorders and strong winds. In remediation of adverse climatic factors, when it comes to Belgrade, the green
areas, new and existing, should specifically help in: protection from the negative effects of the Sun during the summer and refreshment from the summer heat ("islands" of greenery, “green corridors” of alleys can help lowing the temperature and rising the humidity), protection from wind (especially green buffer zones around residential and business units which will function as a windbreak belts) (Anastasijević and Vratuša, 2000).
Considering that, large green areas are very important to us, especially parks in urban areas such as Belgrade. Kalemegdan is one of the greatest parks in central part of Belgrade. Significant part of park area is Belgrade Zoo and its dendroflora contributes to whole park greenery, and also a sustainability of central Belgrade area.
Since the opening of the first scientific zoo in London in 1828, plants have been grown and displayed as part of the formal presentation of the site. Zoological gardens and can be used to formulate a strategic plan outlining the role of the plant resource in

Eco-Ist’12, Ecological Truth, 30 May - 2 June 2012. Hotel “Srbija TIS”, Zajecar, Serbia
421
terms of addressing mission headings. These include the careful selection and use of plants that can help naturalize the design of the exhibits. A further use of plants that has potential for improving welfare is in the modification of the environmental pollution through utilizing the noise- and wind-reduction properties of shelterbelts to modify the environment within an exhibit or the whole surrounding area, to modifying extremes in temperature, moisture and sound (Frediani, 2009)
MATERIAL AND METHOD Belgrade Zoo was established in 1936 by mayor of Belgrade, Mr. Vlada Ilić,
industry man. It used to spread around 14 hectares, and nowadays its area is only 7 hectares. Zoo is situated in one part of Belgrade fortress, at Kalemegdan, the biggest and
most beautiful one of Belgrade parks. It’s unique by its location, and was always interesting because of animal species physical boundaries and architecture. Belgrade Zoo design from 1936 represents unique urban and architectural unit. It was designed by eng. Aleksandar Krstić, who also created numerous buildings and parks from that era. He also was the first who carried duties of a director of the Belgrade Zoo. Ambitious plans for developing and enlargement of the zoo were interrupted by Second World War, when it was bombed twice; first by German fascist in 1941, and then by Allies in 1945, and was almost razed to the ground. After the war, only one part of the zoo was restored, while the rest of it fell into oblivion, until current director Vuk Bojović came in 1986, and whole zoo went flourish. The zoo is being develop ever since, introducing new species of animals, new techniques in breeding etc. Nowadays Belgrade zoo has about 2000 specimens from over 270 animal species, and their number keeps growing. Along with many other international institutions, Belgrade zoo is involved with protection and reintroduction of endangered species. Some very rare and threatened animal species, some like Goffin's Cockatoo (Cacatua goffini Finsch, 1863), Hawaiian Goose (Branta sandvicensis Vigors, 1833), Saker Falcon (Falco cherrug Gray, 1834), Griffon Vulture (Gyps fulvus Hablizl, 1783), Hippopotamus (Hippopotamus amphibius Linnaeus, 1758), Leopard tortoise (Stigmochelys pardalis Bell, 1828), tiger (Panthera tigris Linnaeus, 1758), cougar (Felis concolor Linnaeus, 1771), Boa constrictor (Boa constrictor Linnaeus, 1758), Ussuri black bear (Ursus thibetanus ussuricus Heude, 1901) are nurtured and taking care of in the zoo. In order to establish international cooperation in controlling and limiting trafficking of rare and threatened plant and animal species, Convention on Internacional Trade in Endangered Species of Wild Flora and Fauna (CITES) is declared in 1973. Serbia is contracting party of CITES since 2001. (Bojović et al, 2005).
This research has the goal to identify and map trees, shrubs and climbers on the territory of Belgrade Zoo. Field research is taken and all existing dendroflora. Species were indentified using standard floral method, and available literature was consulted- Iconographia florae Hungaricae, Javorka S, Csapody V. (1975); Ornamental trees and shrubs, Šilić, Č. (1990), Atlas of trees and shrubs, Šilić Č. (1990) an internet database of Europe Flora, http://rbg- web2.rbge.org.uk/FE/fe.html, http://plants.usda.gov.
Associated grades for vitality and ornamental values were on a scale from 1 to 5. Grade 1 has the specimen with low vitality and without ornamental values, and grade 5 has the specimen with excellent vitality and exceptional ornamental values.

Eco-Ist’12, Ecological Truth, 30 May - 2 June 2012. Hotel “Srbija TIS”, Zajecar, Serbia
422
RESULTS AND DISCUSSION
It has been recorded 670 individuals of 88 taxa at the research site, which covers the area of 7 hectares, and these results are shown in Table1.
The results of this research show that overall woody taxa have average vitality and ornamental values graded with 3.7, this may indicate that this is a good quality habitat and the greenery, which was planted over 30 years ago is well adapted to the conditions of the urban environment.
There are 290 individuals from 35 autochthonous woody taxa. Their average vitality and ornamental values are 3.8. On the other hand there are 380 individuals from 37 allochthonous woody taxa, and their values are graded with 3.7. 166 individuals from 22 taxa, belong to Pinophyta subdivision and their average vitality and ornamental values are 3.5. 504 individuals from 66 taxa, belong to Magnoliophyta subdivision with average vitality and ornamental values graded as 3.8. The most abundant taxon is Rosa sp. with its 66 individuals. Second most abundant taxon is Acer pseudoplatanus L., it has 50 individuals and all are very vital and ornamental. On the other side we recorded 23 taxa with only one representative, some of those are: Liriodendron tulipifera L., Ilex aquifolium L., Hedera helix L., Salix caprea L., Cornus alba L.,Eleagnus angustifolia L.etc.. The highest graded are 10 woody taxa (Cedrus atlantica (Endl.) Carrière, Corylus avellana L., Gleditsia triacanthos L., Hedera helix L., Ilex aquifolium L., Juglans nigra L., Liriodendron tulipifera L., Quercus cerris L., Sequoiadendron giganteum (Lindl.)Buchh. and Tilia grandifolia Ehrh.), they all have excellent vitality and exceptional ornamental values. The lowest value is 2.0, and there are four woody taxa that have the lowest grade (Ficus carica L., Juniperus virginiana L., Magnolia x soulangiana Soul. – Bod., Pseudotsuga menziesii (Mirb.) Franco). The fact that stands out is that all of these taxa are allochtonous (and one hybrid).

Eco-Ist’12, Ecological Truth, 30 May - 2 June 2012. Hotel “Srbija TIS”, Zajecar, Serbia
423
Table 1. List of recorded wooded taxa at Belgrade Zoo
No. Binominal name
No.
of I
ndiv
idua
ls
aver
age
vita
lity
and
orna
men
tal v
alue
s
No. Binominal name
No.
of I
ndiv
idua
ls
aver
age
vita
lity/
or
nam
enta
l val
ues
1 Abies concolor (Gord. & Glend.) Lindl. ex Hildebr. 1 3.0 45 Magnolia x soulangiana Soul. – Bod. 1 2.0 2 Acer negundo L. 5 4.2 46 Mahonia aquifolium (Pursh) Nutt. 2 3.5 3 Acer platanoides L. 27 3.9 47 Malus sylvestris (L.) Mill. 2 3.0 4 Acer pseudoplatanus L. 50 3.8 48 Mespilus germanica L. 4 4.0 5 Aesculus hippocastanum L. 23 4.6 49 Morus alba L. 7 3.9 6 Ailanthus altissima (Mill.) Swingle 1 4.0 50 Morus nigra L. 7 3.6 7 Berberis thumbergii D.C. 'Atropurpureum' 6 3.2 51 Paulownia tometosa (Thunb.) Steud. 37 3.9 8 Berberis vulgaris L. 1 4.0 52 Philadelphus coronarius L. 8 3.9 9 Betula pendula Roth. 16 4.1 53 Picea abies Karst. 29 3.5
10 Betula pendula Roth. 'Tristis' 7 4.6 54 Picea omorika (Panč.) Purkyně 5 4.0 11 Betula pendula Roth. 'Purpurea' 1 3.0 55 Picea pungens Engelm. 5 2.8 12 Broussonetia papyrifera (L.) L'Hér. ex Vent. 19 3.5 56 Pinus nigra Arn. 28 3.5 13 Buxus sempervirens L. 7 3.1 57 Pinus wallichiana A.B. Jacks. 2 4.0 14 Catalpa bignonioides Walter 2 3.5 58 Pyrus pyraster Burgsd. 2 4.0 15 Cedrus atlantica (Endl.) Carrière 2 5.0 59 Platanus x acerifolia (Ait.) Willd. 35 4.5 16 Cedrus libani A.Rich. 5 3.6 60 Populus alba L. 2 3.0 17 Celtis australis L. 10 3.4 61 Populus nigra L. 3 3.0 18 Cercis siliquastrum L. 3 4.0 62 Prunus avium L. 5 4.6
19 Chamaecyparis lawsoniana (A. Murray bis) Parl. 'Glauca' 1 4.0 63 Prunus cerasifera Ehrh. 2 3.0
20 Chamaecyparis pisifera Siebold & Zucc. 'Squarosa' 3 3.3 64 Prunus laurocerasus L. 6 4.4 21 Cornus alba L. 1 4.0 65 Prunus cerasifera Ehrh. ‘Atropurpurea’ 4 4.3 22 Corylus avellana L. 1 5.0 66 Pseudotsuga menziesii (Mirb.) Franco 1 2.0 23 Cotoneaster damerii C.K. Schneid. 3 4.5 67 Pyracantha coccinea M. Roem. 23 3.5 24 Cotoneaster horizontalis Decne. 3 4.5 68 Quercus cerris L. 1 5.0 25 Cupressus sempervirens L. 4 2.8 69 Quercus robur L. 5 4.0 26 Eleagnus angustifolia L. 1 3.0 70 Robinia pseudoacacia L. 10 3.6 27 Euonymus japonicus Thunb. 'Variegata' 1 3.0 71 Rosa canina L. 7 3.1 28 Ficus carica L. 1 2.0 72 Rosa sp. 66 3.5 29 Fontanesia fortunei Carr. 2 4.0 73 Salix alba L. 'Vitellina pendula' 1 3.0 30 Forsythia x intermedia Zabel 4 4.5 74 Salix caprea L. 1 3.0 31 Fraxinus angustifolia Vahl. 9 3.7 75 Salix matsudana Koidz. 'Tortuosa' 1 3.0 32 Fraxinus excelsior L. 3 3.7 76 Sambucus nigra L. 13 4.1 33 Fraxinus ornus L. 2 3.0 77 Sequoiadendron giganteum (Lindl.)Buchh. 1 5.0 34 Ginkgo biloba L. 7 4.0 78 Sorbus scandica Fries. 2 3.0 35 Gleditsia triacanthos L. 1 5.0 79 Spiraea x vanhouttei (Briot.) Zbl. 1 4.0 36 Hedera helix L. 2 5.0 80 Taxus baccata L. 4 3.5 37 Hibiscus syriacus L. 12 2.9 81 Thuja occidentalis L. 2 2.5 38 Ilex aquifolium L. 1 5.0 82 Thuja occidentalis L. 'Columna' 22 3.9 39 Juglans nigra L. 1 5.0 83 Thuja occidentalis L. 'Globosa' 21 4.7 40 Juglans regia L. 2 3.5 84 Thuja occidentalis L. 'Rheingold' 9 4.6 41 Juniperus horizontalis Moench 3 3.0 85 Thuja orientalis L. 10 3.0 42 Juniperus virginiana L. 1 2.0 86 Tilia argentea DC. 2 3.5 43 Ligustrum ovalifolium Hassk. 8 4.1 87 Tilia cordata Mill. 5 3.8 44 Liriodendron tulipifera L. 1 5.0 88 Tilia grandifolia Ehrh. 2 5.0

Eco-Ist’12, Ecological Truth, 30 May - 2 June 2012. Hotel “Srbija TIS”, Zajecar, Serbia
424
CONCLUSION
Green areas are crucial factor to sustainability of urban areas, especially their central parts. Belgrade Zoo, as significant part of central Belgrade area contributes to its sustainability, microclimate improvement (wind blocking, lowing the temperature, raising the humidity…) and after all urban landscape embellishment. Dendroflora of Belgrade Zoo counts 670 individuals from 88 taxa and has well to high vitality and ornamental values. 43.4% out of total, are autochthonous woody taxa and 56,7% are allochthonous. There is considerably larger number of taxa- 75% that belong to Magnoliophyta subdivision (deciduous and evergreen trees, shrubs and climbers), and lower amount of woody taxa that belong to Pinophyta subdivision (coniferous and gymnosperm trees and shrubs). Not only that taxa from Magnoliophyta subdivision are more numerous, they are better adapted to urban conditions. We can tell that looking at the grades for vitality and ornamental values of those taxa which are 3.8 for Magnoliophyta and 3.5 for Pinophyta. The most abundant taxon is Rosa sp. with 66 individuals, this point to not only environmental, but ornamental utility of the greenery at the Zoo as well. There are 23 woody taxa that have only one representative, and the number of their individuals should be enlarged in order to achieve their sustainability. There are 10 woody taxa with excellent vitality and exceptional ornamental values, and only 4 that have low vitality and low ornamental values. It should be pointed out that there are no taxa with the lowest grade for vitality and ornamental values (1.0).
Considering everything from above, we may conclude that the dendroflora of the Belgrade Zoo is very vital, have very good ornamental values and therefore is an essential element of the urban landscape which should not be excluded from it. In order to further more investigate the role of dendroflora in central Belgrade area, it is recommended to continue the researches on this subject.
Acknowledgement
This paper was realized as a part of the project "Studying climate change and its influence on the environment: impacts, adaptation and mitigation" (43007) financed by the Ministry of Education and Science of the Republic of Serbia within the framework of integrated and interdisciplinary research for the period 2011-2014.

Eco-Ist’12, Ecological Truth, 30 May - 2 June 2012. Hotel “Srbija TIS”, Zajecar, Serbia
425
REFERENCES
1. Anastasijević N., Vratuša V. (2000): O najvažnijim pravcima razvijanja funkcionalnog sistema gradskih zelenih površina. Zbornik radova, 6. Simpozijum o flori jugoistočne Srbije i susednih područja. Sokobanja. 285-296.
2. Frediani K. (2009): The ethical use of plants in zoos: informing, selection choices, uses and management strategies. International Zoo Yearbook, 43, 29-52.
3. Bojović V., Stevanović B., Latinović D., Rajić Z. (2005): Kroz Beogradski zoološki vrt. Zlatni presek, Beograd.
4. Jávorka S., Csapody V. (1975): Iconographie der Flora des Südostlichen Mitteleuropa, Akademiai Kiado, Budapest
5. Šilić Č. (1990): Ukrasno drveće i grmlje. „Svjetlost“, Zavod za udžbenike i nastavna sredstva Sarajevo, Zavod za udžbenike i nastavna sredstva, Beograd.
6. Šilić, Č. (1990): Atlas drveća i grmlja, „Svjetlost“, Zavod za udžbenike i nastavna sredstva Sarajevo, Zavod za udžbenike i nastavna sredstva, Beograd.
7. Internet Database for Europe Flora. Royal Botanic Garden, Edinburgh http://rbg- web2.rbge.org.uk/FE/fe.html. Date of visit 17.3.2012.
8. USDA Plants Database. Natural Resources Conservation Service http://plants.usda.gov. Date of visit 17.3.2012.

426
XX International Scientific and Professional Meeting
"ECOLOGICAL TRUTH" ECO-IST'12
30 May - 2 June 2012, Hotel “Srbija TIS“, Zajecar, SERBIA
PLANT MATERIAL IN HORTICULTURE THERAPY
Ana Gacic1*, M. Glavendekic2, I. Blagojevic1, J. Cukanovic1, E. Mladenovic
1
1University of Novi Sad, Faculty of Agriculture, SERBIA 2
University of Belgrade, Faculty of Forestry, SERBIA
*
ABSTRACT
This paper investigates the importance of greenery in horticultural therapy, design principles of green parts of therapeutic gardens, as well as the characteristics and classification of plant materials used for therapeutic purposes. The obtained results showed that different plants can be used to stimulate the senses and for creation a new experience in garden activities. It was concluded that there is a wide range of possibilities of plant material applications in horticultural therapy. The plants must be carefully selected in order to be available for all users. For persons in wheelchairs, it should be provided elevated garden area, so that they can take care of the plants from wheelchairs; for the visually impaired people, it is necessary to arrange the garden in order that they can enjoy with the senses of touch, hearing, smell, taste. Dealing with plants in horticultural therapy treatments can help to improve the quality of life for all
people.
Key words: horticultural therapy
, plants, senses, accessibility
INTRODUCTION
Plants can offer some of the most useful and most pleasant experiences, and experiences that persons are feeling about. Horticultural therapy was developed on such idea. American Horticultural Therapy Association (AHTA) defined horticultural therapy as an engagement of a person in gardening activities, facilitated by a trained therapist, to achieve specific therapeutic treatment goals [1]. Lots of researches indicate that plants are connected with our physical, mental, social, and emotional wellness [2, 3]. Gardens have influence to all senses. Most of doctors and therapists recommend that patients should listen, hear, touch, smell and even taste of the fruits in it. Working in the garden is an activity that can be adapted to different needs: people in wheelchairs, blind and visually impaired, senior citizens, people who have experienced stressful and traumatic situations. American Horticultural Therapy Association believes that horticultural therapy is an active process which occurs in the context of an established treatment plan [1]. It is an effective and beneficial treatment for people of all ages, backgrounds, and abilities [1]. Friendly environment, arranged with respect for differences among people, enables everyone, especially disabled persons, to have active, pleasant and quality participation in arranged environment and also its' better use [4]. The objectives of this

Eco-Ist’12, Ecological Truth, 30 May - 2 June 2012. Hotel “Srbija TIS”, Zajecar, Serbia
427
study were: to determine the influence and importance of greenery on a psycho-physical health of people with horticultural therapy, and systematization of the design principles of therapeutic gardens by using plant materials. Greenery is determined by parameters that designers will lead to arrangement of therapeutic gardens in accordance with
ecological principles.
MATERIAL AND METHOD
In this paper, several methods have been applied depending of tasks of the research. In the first phase, data were collected by analyzing and studying the available resources (professional international and national literature). By synthesis and comparison of various written sources, the basic concepts were defined for this study. Previous results of the work have been analyzed and obtained information was applied to planning and landscape designing of space for horticultural therapy purpose. In the next phase of the work, possibilities of the application of plant materials in therapeutic gardens were emphasized, as well as the impact of plants on human health.
In the last phase, conclusions were given through the synthesis of the results.
RESULTS AND DISSCATION
General design principles
Spaces intended for the application of horticultural therapy should be designed to promote the inclusion and the principles of Universal Design. This would ensure the possibility of better, more pleasant and active participation in the present environment, as well as its functional usage, regardless of physical, communicational, intellectual, sexual and age differences of total users [5]. When designing the garden, the area should be accessible, educational, relaxing and inviting [6]. Gardens should be arranged for people of all ages and abilities, so all can enjoy its attractions, with opportunities for recreation, relaxation and a variety of sensory experiences. Garden should invites users to research its beauty with senses of sight, hearing, smell, touch, taste. It can be offered various elements that enhance the experience and adventure - a system for finding directions, raised garden beds (contrasting colors, designed to provide a close connection with visitors), paths with different tactile markings and audio information that lead visitors to different areas, area of combination of hard materials slopes and retaining walls, and soft texture of leaves and flowers that people can touch and smell [7].
Natural elements that are used in therapeutic gardens are primarily plants. Different types of plants can be used - edible, intense colors, smells, textures, medicinal and aromatic plants, the ones that attract insects, birds and small animals, plant for vertical greening etc. Recommended types of plants are: vegetables, fruits, annuals, perennials, vines, herbs, ornamental grasses, bulbs, trees, shrubs. There is a wide range of applicative possibilities and design of plants. What is important to note, poisonous plants should be always avoided, also plants that could cause allergies (e.g. Juniperus spp., strongly pollinating plants) and those one which may lead to injury (e. g. species with very spiky fruits and leaves, plants with sharp thorns). Various programs and

Eco-Ist’12, Ecological Truth, 30 May - 2 June 2012. Hotel “Srbija TIS”, Zajecar, Serbia
428
activities are recommended in the garden: planting, watering, pruning, digging, making bouquets etc.
(Figure 1).
Figure 1. Activities with plants in horticulture therapy
Plants to stimulate
the senses
Design that stimulates the senses can be used as a tool for exploring the space. Materials, equipment and vegetation should be selected to encourage senses in the best possible way. Different elements should be placed in the area in order to aim activating the senses of hearing, smell and touch. To stimulate senses of the horticultural therapy, programs can be extremely valuable, especially for people with visual impairments. Blind and visually impaired people experience the world through the senses of touch, hearing, smell, taste, and vision (partially sighted), so plants of different colors, textures, smells, tastes can help with that.
Related to sight, seeing structures and shapes can give very different feelings (e. g. if the horizontal design of the garden may seem calm, also if the vertical, it may seem otherwise). People also react differently to colors. Everyone has different physiological, emotional and physical responses to color, but there is alkaline principle that can help in mixing colors for effects we want to get in the garden: red - stimulating, warm, romantic, attracts attention, stimulates blood circulation and increases the body temperature; green - a quiet, subtle, relaxing, balancing, harmonizing, restful; associated with nature, trust, acceptance, compassion, caring, and sharing; helps relax muscles, nerves, and thoughts; it cleanses and balances our energy, to give a feeling of renewal, peace and harmony; yellow - the color of the sun, it stimulates our intellect and logical mind, it is related to control, will, and ego; gives us clarity of thought, increases awareness, and stimulates interest and curiosity; orange - warm and rich, color of joy, fun, movement; it is a great antidepressant and it encourages creativity, excitement,

Eco-Ist’12, Ecological Truth, 30 May - 2 June 2012. Hotel “Srbija TIS”, Zajecar, Serbia
429
vibrancy, and humor; it connects us to our senses, helps to remove inhibitions, and makes us independent and social; blue - restful, truthful, peaceful, mentally relaxing; the color of honesty, devotion, and aspiration; eases stress, tension, and pain; has a pacifying effect on the nervous system [8].
Considering the hearing, herbs in the garden can “produced” sound - the sound of wind while running through the branches, leaves and grass rustling in the breeze, fallen leaves crackling underfoot, the sound of the insects that are attracted by the scent of flowers - all of this can have a positive psychological effect. Such an environment contributes in creating a pleasant and soothing effect on the user. Placing the installations that produce vibrations and sounds, it can stimulate the sense of hearing. The calming sound of the garden can be used for the rest of the town crowd and daily stress, so it is recommended to design a garden that will include trees and grass to create subtle sounds. The whole composition may be supplemented by example - musical instruments made from parts of plants such as bamboo, shell and coconut wood, etc. Plants to listen to: Avena sterilis, Platycodon grandiflorus, Bamboo, Physalis alkekengi, Lunaria annua, Cortaderia selloana, Briza maxima [9]. Plants which attract insects for pollination stimulate hearing senses and produce less amount of pollen. They are recommended to be planted on sites with intensive traffic, to lower risks of pollen induced allergies [10]. In addition to smell, the environment in the garden with distinct and rich flavors can be a powerful cure for depression. The sense of smell can be stimulated by using aromatic plants in therapy. In the garden therapy it could be explained how the chemical substances could be used for spices, perfumes, incense, medical components, useful for everyday life. The following plants that are recommended are: rose, jasmine, magnolia, lemon, etc. Also a planting of the following medicinal plants: Matricaria chamomilla, Majorana hortensis, Calendula officinalis, Hypericum perforatum, Salvia officinalis, Mentha piperita, Tarxacum officinale, Thymus serpyllum, Achillea millefolium. Users can explore the captivating scent of flowers and leaves of spice plants: Ocimum basilicum, Eugenia caryophyllata, Pimenta racemosa, Anethum graveolens, Coriandrum sativum, Carum carvi, Sinapis alba, Petroselinum Hortense, Thymus vulgaris, Rosmarinus officinalis.
Related to touch, plants with their variations and textures can produce different stimuli. Touch is very important for people who are interested in horticultural therapy, because they cannot always use all their senses to enjoy the garden. Different plant parts can be used, such as different textures and structures of petals, leaves, bark or fruit. The surface can be glossy, smooth, rough or pubescent. Users can identify plants by comparing the size and structure. Plants that are recommended for touching are: Gardenia jasminoides, Celosia cristata, Stipa pennata, Liatris spicata,Gomphrena globosa, Lagurus ovatus, Stachys byzantina, Lilium sp., Amaranthus caudatus, Verbascum sp., Physostegia virginiana, Papaver nudicaule, Salix discolor, Hibiscus coccineus, Hordeum jubatum, Limonium latifolium, Thymus praecox, Artemisia sp. [9]. Also, garden can be divided into several sections, e. g. section of soft herbs, raw herbs section, section of slightly prickly plants, section of sticky plants. Under the section of soft plants, it can be found fine, silky and fluffy structure, finely ground leaves and others with lots of hair and velvet structure (e. g. Caprifolium lonicera, Magnolia kobus var. Stellata, Salvia rutilans, Verbascum densiflorum). Under the section of rough plants,

Eco-Ist’12, Ecological Truth, 30 May - 2 June 2012. Hotel “Srbija TIS”, Zajecar, Serbia
430
it can be used species with coarser leaves structure (e. g. Picea pungens, which carries a fine, abrasive structure). Species in section of prickly plants should be chosen to avoid injury, but still allow users to enjoy their spiny structure. Users need to be addressed in order to touch the plants, making it very carefully. Sticky plants section may contain the following species: Rosa glutinosa, Abies concolor, etc. One such garden was established in the Botanical garden in Montreal, in the section called "The Courtyard of the Senses" ( Figure 2).
Figure 2. The Courtyard of the Senses (Montreal Botanical Garden)
At the end considering a taste, planting of fruit and vegetables in the therapeutic
garden in addition to offering an aesthetic experience of the appearance of flower in the spring, gives us the pleasure of eating their fruit. Stepped fruit is very attractive, and also very convenient for users of horticultural therapy (apples, pears, plums, peaches, apricots). From the standpoint of horticultural therapy, orchard and vegetable garden is the stimulating green environment that radiates hope and optimism
.
Raised garden
beds
Specific elements that designers often use in designing gardens for horticultural therapy are raised garden beds (Figure 3). Raised bed gardening is a form of gardening in which the soil is formed in 1.0–1.2m wide beds, which can be of any length or shape. The soil is raised above the surrounding soil, sometimes enclosed by a frame generally made of wood, rock, or concrete blocks, and may be enriched with compost. They produce a variety of benefits: they extend the planting season, they can reduce weeds if designed and planted properly, reduce the need to use poor native soil, and the roots have an easier time growing. Plants are arranged in geometric patterns, which give us better conditions for planting and care. This method of growing plants has many advantages: the longer season of planting, reduced usage of poor quality land, and reduced weeds, the soil is not compacted and root plants are easier to develop. Quality raised garden bed is faster, better and more economical access to the plants. They can be used effectively to control erosion and recycle and conserve water and nutrients by building them along contour lines on slopes. This also makes more space available for intensive crop production [11]. Also, plants can be marked on their dashboards that provide a brief description and information about the plants that are mostly kept in pots, baskets or

Eco-Ist’12, Ecological Truth, 30 May - 2 June 2012. Hotel “Srbija TIS”, Zajecar, Serbia
431
special containers. Plants can be identified in several languages (Latin, local and in Braille
for the visually impaired).
Figure 3. Raised garden beds in the Enabling Garden at the Chicago Botanic Garden
How to make a raised bed garden? The first step is to choose the place. It is necessary to select a site that gets at least eight hours of sun per day. A flat, level area is important, one should be sure that the area has easy access to water sources [12]. The second step is to determine the size and shape of the garden. The site must be accessible to all users. When talking about size, it would be good to keep the garden to around four feet wide, because this way we can access the middle of the bed from either side. If the bed is placed against a wall or fence, it should be no more than three feet wide. In terms of depth, ten to twelve inches would be ideal [12]. The next step is to construct the bed and build frames. The most common material used for the frame is wood, but can be used and other materials. The next step is to fill beds with a good mixture of quality topsoil, compost, and rotted manure [12]. Related to maintenance, these areas require very little of it
: each spring or fall, it is necessary to add fresh compost and manure; mulching the top of the soil will help retain moisture and keep weeds down; moisture retention is important, because raised beds tend to drain faster than conventional beds [12].
Plants for vertical greening In the gardens of horticultural therapy, the plants are often used for vertical
greening (Figure 4). The vertical structures are walls, fences, arbors, trellises, vertical wall gardens. Plants that are recommended are the following: Campsis radicans, Clematis x jackmanii, Lonicera sp., Partenocissus quinquefolia, Vitis vinifera, Aktinidia deliciosa,
Momordica charantia.

Eco-Ist’12, Ecological Truth, 30 May - 2 June 2012. Hotel “Srbija TIS”, Zajecar, Serbia
432
Figure 4. Vertical
greening
Maintenance
of plants
It is necessary to maintain plants in the garden in an appropriate manner. Trees placed along pedestrian communication should be pruned at min. 2.5m from the surface [13]. Lawns must be kept constantly cutting, especially along the trails, not to exceed the plant in an area designated for the movement (this can create barriers to movement)
.
CONCLUSION
Horticultural therapy uses physical and psychological benefits offered by working in the garden to help the large number of users (the elderly, people with disabilities, unemployed, victims of violence, chronic ill) in the treatment and rehabilitation. Orchard, flowers, vegetable and other plants, are stimulating green environment that radiates hope and optimism, the pleasure of the senses, teaches patience, relieving stress, tension, aggression and negative emotions, and exercise strengthens muscles, improves the physical condition which prevents the development of or worsening of many diseases. It was concluded that there is a wide range of possible applications of plant material for horticultural therapy, but that they must be carefully selected, available for all users – e. g. for persons in wheelchairs, it should be provided elevated garden area, so they can take care of the plants from wheelchairs; for the visually impaired people, it is necessary to arrange the garden so they can enjoy with the senses of touch, hearing, smell, taste. Dealing with plants in horticultural therapy treatments can help to improve the quality of life for all
people.

Eco-Ist’12, Ecological Truth, 30 May - 2 June 2012. Hotel “Srbija TIS”, Zajecar, Serbia
433
Acnowledgement The research is result of the Project 43002 supported by Ministry of Education
and Science Republic of Serbia
REFERENCES
1. http://www.ahta.org/content.cfm?id=faq 2. Acquaah, G., Horticulture: Principles and practices, Upper Saddle River, NJ:
Prentice Hall., 2004. 3. Haller, R. L., Kramer, C. L., Horticultural therapy methods: Making
connections in health care, human service, and community programs, Binghampton, NY: The Haworth Press, Inc., 2006.
4. Gačić A., Open spaces barriers that influence on reduced mobility of users, str. 373, XIX International Scientific and Professional Meeting "ECOLOGICAL TRUTH" ECO-IST'11, Bor, Serbia, 2011.
5. Gačić A., Blagojević I., Application of the universal design principles in the landscape architecture, I International Conference „ECOLOGY OF URBAN AREAS“, Zrenjanin, 2011.
6. http://www.recreationtherapy.com/articles/horttherapyslideshow.pdf 7. Gačić A., Dizajn otvorenih prostora prilagođen osobama sa invaliditetom na
primeru škole za učenike oštećenog vida Veljko Ramadanović u Zemunu, Master rad odbranjen na Šumarskom fakultetu, Univerziteta u Beogradu, 2009.
8. http://www.homeofmodernart.com/page.php?pid=42 9. http://www.gardenforever.com/pages/artsenses.htm 10. Glavendekić M., Alergeni insekti i klimatske promene – novi rizik za zdravlje
ljudi i životinja, Seminar Pejzažna hortikultura 2012 – zbornik radova, str. 50-56, 2012.
11. http://en.wikipedia.org/wiki/Raised_bed_gardening 12. http://organicgardening.about.com/od/startinganorganicgarden/a/raisedbed.htm 13. Pravilnik o uslovima za planiranje i projektovanje objekata u vezi sa
nesmetanim kretanjem dece, starih, hendikepiranih i invalidnih lica, Beograd, („Sl. Glasnik RS“, br. 18/97), 1997.

434
XX International Scientific and Professional Meeting
"ECOLOGICAL TRUTH" ECO-IST'12
30 May - 2 June 2012, Hotel “Srbija TIS“, Zajecar, SERBIA
APPLICATION OF HORTICULTURE THERAPY IN BOTANICAL GARDENS
Ana Gacic1*, M. Glavendekic2, I. Blagojevic1, E. Mladenovic1, J. Cukanovic
1
1University of Novi Sad, Faculty of Agriculture, Novi Sad,SERBIA 2
University of Belgrade, Faculty of Forestry, Belgrade, SERBIA
*
ABSTRACT
The obectives in this research are to explore the way and methods of Horticulture therapy application in botanical gardens as well as principles of their design. Analysis of three gardens are presented - Chicago Botanic Garden, Denver Botanic Garden and North Carolina Botanical Garden. Comparation with therapeutical gardens built in Serbia has been made and references for design such gardens and applying horticulture therapy in our enviroment were sugessted. It was concluded that therapeutic gardens provide multiple benefits for users and that it is of great importance to enlarge their number in Serbia. To achieve this, it is necessary to educate all relevant participants as well as to promote this concept to wider comunity.
Key words: botanical garden, barrier-free garden, healing landscapes, universal design
INTRODUCTION
Horticulture therapy is special way of therapy which is based on natural surrounding as well as working with plants. Terapeutical power of calming gardens is known to humans since the classical period. In the 19th century, dr Benjamin Rush, a signer of the Declaration of Independence and considered to be the "Father of American Psychiatry," reported that garden settings held curative effects for people with mental illness [1]. During 1940’s and 1950’s of the past century, horticulutre therapy practice started to spread significantly [1]. The main resons for this were results that application of horticulture therapy gave in rehabilitations centers of World War II veterans. Today, is not used only for people with psychiatric diseases but is also used widely as part of diferent therapeutic and wellness programs. Horticulture therapy is used worldwide, in deferent cultures and in diferent fields. This form of therapy is conducted in so called „therapeutical or healing gardens“.
Miyake [2] believes that healing landscapes should not just exist in medical facilities or institutions for people with disabilities, but should also be an important consideration for public spaces as well. Spaces where therapeutic and healing gardens are offten formed (where horticulture therapy can be applied) are numerous – eg. community gardens, schools, prisons, institutions that provide care for old people. This paper deals with an examination of application of horticulture therapy in botanical

Eco-Ist’12, Ecological Truth, 30 May - 2 June 2012. Hotel “Srbija TIS”, Zajecar, Serbia
435
gardens - a way of arranging and designing space, as well as using different programs and activities in the course of therapy
.
MATERIAL AND METHOD
Three objects of horticulture therapy use have been analyzed in this paper: Chicago Botanic Garden, Denver Botanic Garden and North Carolina Botanical Garden. In the first phase of work, all relevant world and domestic literature has been gathered and analyzed. In the second phase, the results were systematized and every object analyzed regarding to the space desing and arrangement. Analysis of therapeutical gardens in Serbia was performed, and comparations with world therapeutical gardens were made. Recomendations for application of horticulture therapy were also given in this phase of research. In the last phase, the results were systematized and conclusions were made.
RESULTS AND DISSCATION
Chicago Botanic Garden Chicago Botanic Garden (Figure 1), managed by the Chicago Horticultural
Society, is one of the most visited in USA. There are 2.5 million plants, 24 display gardens, and four natural areas [3].
Figure 1. Chicago Botanic Garden
Some of the gardens are (Figure 2): Water Garden - aquatic and semiaquatic
plants that range from native grasses to sedges [4], Bulb Garden - new cultivars of narcissus, tulips, ornamental onions, fritillaries, and lilies are planted to ensure a constant color show from early spring well into fall [5], Circle Garden - features a central dancing fountain with two intimate secret gardens [6], Greenhouses - display beautiful and fragrant flowering plants, rare plants, edible plants, utilitarian plants, seasonal plants, and houseplants from around the world [7], Fruit and Vegetable Garden - Aromatic herbs, shiny peppers, juicy grapes, and crisp apples are just a few of the 400 different edible plants grown here, in beautifully landscaped beds [8], Sensory Garden - feast for the senses, inviting visitors to experience its beauty through feel, smell, sound, and sight [9].

Eco-Ist’12, Ecological Truth, 30 May - 2 June 2012. Hotel “Srbija TIS”, Zajecar, Serbia
436
Circle Garden
Japanese Garden Bulb Garden
Heritage Garden Dwarf Conifer Garden
The Krasberg Rose Garden
Figure 2. Theme gardens Part where horticulture therapy is preformed is Buehler Enabling Garden
(Figure 3). The guiding philosophy throughout the planning process was the universal design principles [10]. Since its beginning, the Garden’s Horticultural Therapy Services

Eco-Ist’12, Ecological Truth, 30 May - 2 June 2012. Hotel “Srbija TIS”, Zajecar, Serbia
437
has contracted with more than 200 health and human service agencies - hospitals, schools, Association of Retarded Citizens, Association for the Blind etc. [11]. The program of horticulture therapy serves as a primary regional, national, and international resource for information while offering a full range of professional training opportunities. Also available are consulting services in barrier-free greenhouse and enabling garden design, sensory landscaping, and horticultural therapy program planning [12]. The mission of the Enabling Garden is to be a preeminent exhibit of enabling garden design, tools, techniques, and plant materials and to encourage anyone of any ability to enjoy a lifetime of safe, comfortable gardening [10]. Barrier-free garden design elements are demonstrated throughout the garden trough a collection of containers, raised beds, and vertical gardening techniques that position the soil and plants at comfortable working heights [10]. It is composed of accessible elements so that users have easy access, with minimal bending and consequences. Selected plants in this garden include more than 1.200 varieties that have resulted in one of the more beautiful display gardens on the grounds [10]. There are different therapeutic activities. Depending on the weather and functional levels of the participants, there is variety of carefully planned activities (vegetable, herb, and flower gardening, indoor plant maintenance and care, fresh or dried flower arranging, creating holiday decorations, herbal crafts, and forcing flowering bulbs).
Figure 3. Buehler Enabling Garden
Denver Botanic Garden The living collections at Denver Botanic Gardens are very diverse with seven
major collections identified: alpine, amenity, aquatic, cactus and succulents, native, steppe and tropical [13]. There are 43 individual gardens, some of them are (Figure 4): Gates Montane Garden -
the garden features trees and shrubs from Colorado’s montane life zone including Quercus gambelii and Populus tremuloides [14]; Green Roof - this area which showcases over 100 species of native and drought tolerant plants [15]; Japanese Garden – with Pinus ponderosa from Roosevelt National Forest [16]; Ornamental Grasses Garden - over 50 varieties of ornamental grasses are growing in this garden [17]; Romantic Garden – a collection of four gardens is a delightful adventure for the senses [18]; South African Plaza - plants and flowers of South Africa including calla, lilies, Agapanthus, Delosperma, red hot pokers, asparagus fern and geraniums [19].

Eco-Ist’12, Ecological Truth, 30 May - 2 June 2012. Hotel “Srbija TIS”, Zajecar, Serbia
438
Gates Montane Garden Green Roof Japanese gardens
Ornamental Grasses Garden Romantic Garden South African Plaza
Figure 4. Theme gardens (Denver Botanic Gardens)
The Morrison Horticultural Demonstration Center at Denver Botanic Garden was built in 1983 to be used for horticultural therapy. It includes office space, a classroom, greenhouse, and the Sensory Garden [20]. Safe, restful location of Sensory garden (Figure 5) demonstrate accessible spaces - raised garden beds, plants that appeal to all five senses, wide pathways for wheelchair users, furthermore, garden is used as a learning environment for people with special needs. Participants in garden activities can be people in special education programs, rehabilitative centers, children with visual impairments, adolescents in foster care, adults with developmental disabilities, seniors wit dementia, and all other people with special needs. The landscape architect focuses on structure of plants, rare specimens, and the total design, while the educator leans toward adaptations of plants, the interaction of flowers and pollinators, and human uses of plants [20]. There are lot of activities during the therapy: Flower Arranging - Hand-eye coordination, fine motor skills and creative expression are accomplished during this activity; Making a Topiary - Make a topiary frame, transplant an ivy plant and train the plant to the frame; Plant Propagation - Working with soil and plant materials develops hand-eye coordination and fine motor skills in a highly social setting; Container Herb Gardens - Participants involve their sense of touch, sight and smell while they choose from a variety of herbs to transplant and create a mini herb garden [21].

Eco-Ist’12, Ecological Truth, 30 May - 2 June 2012. Hotel “Srbija TIS”, Zajecar, Serbia
439
Figure 5. The Sensory Garden
North Carolina Botanical Garden The North Carolina Botanical Garden is a part of the same University. This
garden consists of great number of individual separated theme gardens (eg. Native Water Gardens, Carnivorous Plant Collection, Garden of Flowering Plant Families, Coastal Plain and Sandhills Habitat Gardens, etc.). In this botanic garden, horticulture therapy program is used in several areas. Horticultural Therapy Demonstration Garden is designed for persons with limited mobility and reach - users of wheelchairs, users who have difficulty standing for long periods of time or who must stand upright [22]. The Mercer Reeves Hubbard Herb Garden "Garden of Plant and People" - this garden gives visitors possibility of passive and active interaction. Also, have separate parts for rest and relaxation in peacefull intimate surrounding or parts of social interaction, regarding visitor wishes to rest or to use horticulture therapy. It is safe for visitors and in the same time gives space for sitting in shade, parts for physical activities as well as parts with water surface and animals. This therapeutic garden has raised beds that are made to provide possibility for disabled persons to work with plants. The Growing Classroom is horticultural therapy room equipped for plant propagation, potting, and plant crafts, with accessible sinks; multiple working surfaces and storage areas for pullout bins of soil, pots, etc.; multiple storage cabinets and closets for craft materials and tool storage; and painted concrete floors [
Example of activity during horticulture therapy is “Tussie-Mussies”(bouquet with meaning)
22].
These bouquets are something one can make from anything in garden (Figure 6). In this treatement one can participate alone or in group. All persons over 5 years that are interested to work with medical or aromatic herbs can participate. This treatement stimulates sens of colour, smell and texture in participants, gives possibility for socialise and making new friendships, improve motor skills, stimulates mental activities and decisions making process, provides active work with little physical action, gives new insights [23].

Eco-Ist’12, Ecological Truth, 30 May - 2 June 2012. Hotel “Srbija TIS”, Zajecar, Serbia
440
1 2 3 Figure 6. Example of activity during horticulture therapy -“Tussie-Mussies”
Application of Horticultural Therapy in Serbia
Horticulutre therapy in Serbia is not officialy mode of treatement, more precise there is not yet institution where this kind of recovery can be practiced. But, one garden for children with difficulties in developement has been made in Belgrade, in Ada Ciganlija. The garden is used for day care of children with diffculties in development and therapy is conducted to improve their physical and mental health. Also, horticulture treatement can be used by school children, preschool children and all the rest visitors of Ada. Besides therapy, in this garden, users can have manifestations and preformances to provide their better inclusion in society. Garden is accessable for people with dissabilities and all other users, so all can feel equal. Park space is surrounded, which gives security and undisturbed conduction of horticulture therapy for persons with diferent pathology, but not in the way which would separate them from the rest of Ada Ciganlija and isolate these people during their staying and work. Elements of this garden are: trees, grass, paths made of sawdust, gravel, coll, hedge, water surfaces, garden objects, benches. General aim of project is improvement physical and mental sate of users and quality of life as well as raising awarnes in society for problems and capacity of disabled individuals.
Givnig positive results that horticulture provides, it would be of great importance that this form of therapy applies in Serbia. Posibilities are numerous - from hospitals, rehabilitatin centers, special schools, hursing homes, parks, botanical gardens - to prisons and juvenile delinquents institutions. In this way, large specturm of people would be envolved in positive efects of this treatement, and new possibilities would rise. Horticulture can provides buisness possibilities for disabled people, because green industry needs people with basic horticulture skills such as watering, digging, planting, etc.
CONCLUSION
Horticulture therapy is simple treatement with good results. Stimulates memory, social activity, provides sensory stimulation and exercise, lowers stress and tension, reducts anger and agresivness, can be used in improvement of behiveor, prepares disabled people for horticulture work. It can be concluded that the therapeutic botanical gardens provide multiple benefits for users, so it is very important to develope ones in Serbia. Botanical gardens as open green spaces give great opportunity to large spectrum

Eco-Ist’12, Ecological Truth, 30 May - 2 June 2012. Hotel “Srbija TIS”, Zajecar, Serbia
441
of people which could be envolved in positive efects of this treatement. To achieve that, education of participants is mandatory as well as promotion of this concept in public.
Acnowledgement:
The research is result of the Project 43002 supported by Ministry of Education and Science Republic of Serbia
REFERENCES
1. http://www.ahta.org/content.cfm?id=history 2. Miyake F.A., Linking People with Nature by Universal design, Interaction by
Design, Bringing People and Plants Together for Health and Well-Being, An International Symposium, 2002.
3. http://www.chicagobotanic.org/index_redirect 4. http://www.chicagobotanic.org/explore/watergardens.php 5. http://www.chicagobotanic.org/explore/bulb.php 6. http://www.chicagobotanic.org/explore/circle.php 7. http://www.chicagobotanic.org/explore/greenhouses.php 8. http://www.chicagobotanic.org/explore/fruitandveg.php 9. http://www.chicagobotanic.org/explore/sensory.php 10. Rotherth G., From Vision to Reality: The Chicago Botanic Garden's Buehler
Enabling Garden, Interaction by Design, Bringing People and Plants Together for Health and Well-Being, An International Symposium, 2002.
11. http://www.chicagobotanic.org/therapy/buehler_garden.php 12. http://www.chicagobotanic.org/therapy/about_the_program.php 13. http://www.botanicgardens.org/our-gardens/york-street/plant-collections 14. 14.http://www.botanicgardens.org/our-gardens/york-street/individual-
gardens/gates-montane-garden 15. http://www.botanicgardens.org/our-gardens/york-street/individual-
gardens/green-roof 16. 16.http://www.botanicgardens.org/our-gardens/york-street/individual-
gardens/japanese-garden 17. http://www.botanicgardens.org/our-gardens/york-street/individual-
gardens/ornamental-grasses-garden 18. 18.http://www.botanicgardens.org/our-gardens/york-street/individual-
gardens/romantic-gardens 19. http://www.botanicgardens.org/our-gardens/york-street/individual
gardens/south-african-plaza 20. Laminack J., Sensory Garden Tours at Denver Botanic Gardens, Interaction by
Design, Bringing People and Plants Together for Health and Well-Being, An International Symposium, 2002.
21. http://www.botanicgardens.org/programs-classes/summer-sensory-program 22. http://ncbg.unc.edu/horticultural-therapy/#gardens_and_facilities 23. http://ncbg.unc.edu/uploads/files/SampleHTactivity.pdf

442
XX International Scientific and Professional Meeting
"ECOLOGICAL TRUTH" ECO-IST'12
30 May - 2 June 2012, Hotel “Srbija TIS“, Zajecar, SERBIA
THE ANALYSIS OF NEGATIVE TRAFFIC INFLUENCE ON THE
ENVIRONMENT AND SOCIETY IN BELGRADE
Jelena Petrovic1, M. Stamenovic2*, O. Jovanovic2, D. Brkic2, D. Radosavljevic
1
1
Karnegijeva 4, 11000 Belgrade, SERBIA University of Belgrade, Faculty of Technology and Metallurgy,
2
Brankova 17, 11000 Belgrade, SERBIA College of vocational studies, Belgrade Polytechnic,
*
ABSTRACT
We need this planet. We depend on it because we developed from it, became it part forever and we only sustain thanks to its ability to self-preserve. The planet Earth is unique not only in our Solar system but in the entire, known to us universe. The traffic has a negative influence on environment as well as the quality of men's environment. That is especially seen in the pollution of the air, ground and water, increase of noise, turning natural into technical environment (different forms of degradation of the environment), increase of dirt and other. All this contributes to destruction of ecological balance which makes it hard to sustain the dinamic balance of complex system. Because of that, it is very important to constantly work on decrease of bad influence of traffic and measures that will improve the environment.
Key words: traffic, air pollution
INTRODUCTION
Standard natural conditions have made man's life comfortable for milleniums,
and biosphere was powerful enough to neutralize negative cosequences of all men's activities. Since its beginnings the humanity has polluted nature and was faced with the problem of pollution that was constantly increased and become more complex with the growth of world population and development of human society. Since the world population will continue to grow increasingly and in a hundred years there will be between 12 and 15 billion people, along with considerations of world resources of energy, food and water, an important problem is a constant increase of polluting materials in the environment [1]. The consequences of human activities are the loss of untouched environment that is changed by more or less changed environement.
The traffic is organized movement of transport units on the net of traffic crossroads. The traffic has a negativ influence on environment as well as the quality of man's environment. That can be seen through: pollution of air, ground and water, increase of noise, turning natural into technical environment (different forms of

Eco-Ist’12, Ecological Truth, 30 May - 2 June 2012. Hotel “Srbija TIS”, Zajecar, Serbia
443
degradation of the environement), increase of dirt and others. All of this contributes the loss of ecological balance which makes it hard to sustain the dinamic balance of complex system. The pollution of air by emission of dangerous materials by vehicles, dust and soot by combustion and friction of tires and increased noise make conditions of life hard and have negative influence of the health of people [2]. The pollution of the environment by traffic is not locally connected as pollution by industry because the motor vehicles are mobile (the source of energy is moving), so there is a great interest for greater cooperation on the international plan as well. The producers of vehicles have already intervened and by certain constructive and other solutions contributed to decrease the bad influence (unleaded petrol etc.)
In this work we consider the problem of traffic and motors with inner combustion as great polluters of the environment, analyzes the pollution of the environment because of the traffic in Belgrade and gives measures to decrease the pollution.
TRAFFIC AS A SOURCE OF POLLUTION
Traffic is one of the leading polluters of the environment and represents the
source of polluting materials for people as well as for natural surrounding. As for materials which are released from the engines with inner combustion, the more often are: carbon (II)-oxide, benzene, nitrogene (IV)-oxide, formaldehyde, toxic metals (etc. lead), polycyclic aromatic hydrocarbon (for example, benzen pyren-are made by incomplete combustion of diesel engine), sulphure (IV)-oxide and hard particles. It is estimated that in atmosphere in city zones there is 91% of carbon (II)-oxide, 56% of nitric oxide, 50% of carbonhydroxide and 10% of other particles produced by combustion of fossil fuel. Beside that, in the air in traces we can find mercury and other heavy metals. [3,4].
Polluted air of vehicles we breathe while we are driving in the traffic jams or while we are walking along roads, while we are standing next to cars, buses, trucks, while we are spending time near the crossroads but also in the house, school, at work or in the park which are near them.
The traffic on the roads has the leading role in transport of passengers (80% of world transport of passengers), and goods on short and medium distances. It contributes to many problems in the environment, because it is dependable from unrenewable fossil fuels, especially petrol. It causes noise and air pollution, pollution of ground and water, as well as the influences because of the usage of land, which can act locally on elements of the environment (for example on health of population because of smog), regionally (emission of exhaust gas influence on acidity), and even globally (gases which influence warming of atmosphere and change of climate). With the emission of vehicles, hundreds of dangerous compounds are emitted. These compounds can be in the form of liquid or hard particles, volatile organic compounds. From the vehicles the compounds are emitted that can stay in the environment for many years too (heavy metals-lead, cadmium, polyaromatic carbohydrates and organochlorine) [5].
Materials in the form of small hard or liquid particles, especially of small diameter, are connected with diseases of the lungs (diesel engines are the most important source of carbon (II)-oxide), carbon (IV)-oxide is a gas which heats the atmosphere,

Eco-Ist’12, Ecological Truth, 30 May - 2 June 2012. Hotel “Srbija TIS”, Zajecar, Serbia
444
nitric oxides are causing respiratory problems and contribute to creation of acid rain and draining of the land. Some volatile organic compounds are cancerous and neurotoxic (for example, death by cancer is connected by exposure to benzole and polyaromatic carbohydrates).
The researches show that 50% of air pollution in the cities comes from traffic. There is a whole set of international charts, from European directive about the protection of air pollution and following its quality in urban environments, recommendation of World health organization, to domestic Regulative about limit values of emission, measure methods etc, which regulate the field of air pollution.
POLLUTION IN BELGRADE BECAUSE OF TRAFFIC Results of the research [6], talk that the level of noise in Belgrade is over the
allowed level, and that 30% of all disease was caused by polluted environment. Based on long-time measurement of the number of vehicles in Belgrade we can see two types of crossroads: The first type of crossroads 'London', 'Nusiceva', 'Skupstina', with about 92% of
passenger and average 4000 to 6000 vehicles by the hour in traffic jams. The second type of crossroads 'Cvijiceva' and 'Zeleznicka stanica' with 70% of
passenger and 30% of heavy and bus traffic, which can be seen from the results. 'Zeleni venac' is not a typical crossroad with 88% of light traffic and great number of buses (diesel engines).
Upper level value of carbon(II)-oxide is 3 mg/ m3 (picture 1) which means that
in almost all city zones except Autokomanda and New Belgrade the upper limit was exceeded (the crossroad London, Zeleni venac and Zemun the concentration was more than double).
Figure 1. Concentration of carbon (II)-oxide in city zones

Eco-Ist’12, Ecological Truth, 30 May - 2 June 2012. Hotel “Srbija TIS”, Zajecar, Serbia
445
Upper limit value of nitric (IV)-oxide is 60 сg/m3 (Figure 2) which is a value that was exceeded in almost all city zones (the highest concentration was measured in Zemun, and it was higher than 100 сg/m3).
Figure 2. Concentration of nitric (IV)-oxide in city zones
Concentration of lead (limit value 1,1 µ/m3
) in city zones is above the acceptable level, except New Belgrade and Karaburma. The reason for high concentration of lead is the usage of leaded petrol where tetraethillead is used as anti-detonator in the engines and for the more equal combustion of petrol. The reason for excess of almost all polluting materials are: small permeable power of streets, bad quality of petrol, age of cars (over 20 years), passing of heavy traffic through city core etc.
Figure 3. Concentration of lead in city zones
The decrease of pollution in Belgrade will be contributed by purchase of buses
with EURO 4 norms. With the usage of these new 100 buses and ceasing to use 49 buses with engines of older generation of EURO 0, EURO 1 in 2008. the structure of vehicle

Eco-Ist’12, Ecological Truth, 30 May - 2 June 2012. Hotel “Srbija TIS”, Zajecar, Serbia
446
was importantly improved in the work of Public transport company 'Belgrade', which emit less emission of dangerous gases.
Before 2008. the most of buses was with EURO 2 engines, almost 57%, with EURO 3 engines 30% and with EURO 1 engines 13% of buses.
After 2008. there are 14% of buses with EURO 4 engines, and the number of engines with EURO 1 engine was decreased importantly from 13% to 5%.
If we analyze ecological effects of exploatation of buses with standard EURO 4 and the fact that vehicles were changed in Public Transportation 'Belgrade' in the sense of different EURO norms, on figure 4, there are compared values of emission of pollution from the side of the bus in 2007. and 2008, that is before and after introduction of vehicles with EURO 4 norms.
From the figure 4 we can see that in 2008, after the introduction in exploatation of new series of buses IK-P2N and IK-218N, there was the decrease of emission of dangerous gases on corridors where the buses function, carbon (II)-oxide for 9%, carbon-hydrogen for about 6,7%, nitric-oxide for about 6,3% and particles for about 20,2%.
Figure 4. Values of emission of pollution by buses in 2007. and 2008.
The most polluted streets in Belgrade are: 1) Kneza Milosa, 2) Boulevard of
Kralj Aleksandar, 3) Savska (Zeleznika stanica), 4) Boulevard of despot Stefan, 5) Nusiceva.
According to previously stated data about pollution of environment in Belgrade there was a set of measures for the decrease of pollution. Measures are these:
1. Setting the heavy traffic from the city core by making 'ring detours'; 2. Decrease of traffic through the city, by planning and law; 3. Decrease of traffic by planning of certain signalization and traffic capacity of
crossroads in the city; 4. In the narrower city core allowing the passage only to the vehicles of public
transportation; 5. Setting the pedestrian zone in the most dangerous places in town;

Eco-Ist’12, Ecological Truth, 30 May - 2 June 2012. Hotel “Srbija TIS”, Zajecar, Serbia
447
6. Building pedestrian and cycling paths where ever it is possible; 7. Organizing extra measures on crossroads Slavija and London in the time of
pedestrian zone; 8. Improving communal hygiene (washing the streets, cleaning regularly); 9. At least twice a year do the count of vehicles with measurement of air pollution
by specific polluting materials that come from the traffic; 10. Exploration of 'tunnel effect' on the crossroad Nusiceva and in the part of same
street to Makedonska street; 11. Norming concentration of carbon (IV)-oxide: for an hour 30 mg/m3 and for
eight hours 10 mg/m3
12. Higher usage of unleaded petrol; ;
13. Usage of alternative petrols (bio-diesel, gas, alcohol); 14. Giving higher authority to ecological inspection so they can take out of traffic
the vehicles with bad combustion; 15. Putting an accent on health tests, since the measurements of pollution materials
that come from mobile sources are done as way to protect health of the population. In that sense we should follow health effects of the influence of lead and carbonmonoxide on the population that is mostly exposed to the action of these dangerous materials (traffic police, people working in newsagent's, citizens who live nearby crossroads in central city zone);
16. Increase the number of tram lines and trams in the city; 17. Considering the possibility of building of underground; 18. Stricktly following transportation of dangerous and flammable materials (that
they can under no conditions be transported through the town); 19. Education of people about the way they can decrease pollution of air by mobile
sources.
CONCLUSION
Efficiant and adjustable traffic system is a base of economy and better life of a country. However, traffic influences environment in a great deal and the health of people – 'too much traffic kills the traffic' and becomes higher and higher user of energents and 'producer' of greenhouse effect. In order to understand problems of urban air pollution, it is necessary to see sources of pollution, influence and strategy of controle of polluters. The primary determinant which influence the quality of the air are: emission of polluting materials in the atmosphere (natural and anthropogenic sources), natural factors (climate and topography). These determinats are specially seen in urban environment where the sources of emission of polluting materials are concentrated and where the numerous population live who are exposed to influece of bad quality of the iar. The incomplete combustion is one of the most important sources of pollution for stationary and mobile emitters.
Based on all stated, we can say that pollution of environment, especially air and water, that occurs because of the traffic is of big concern. The existing set of international regulations are not applicable completely in the Republic of Serbia because of total social and economical situation in the country. Although eight times more money

Eco-Ist’12, Ecological Truth, 30 May - 2 June 2012. Hotel “Srbija TIS”, Zajecar, Serbia
448
is set for the protection of the environment, the pollution of air and water is constantly increasing. So it is very important to constantly work on decrease of dangerous influence of traffic and setting measures to improve environement, in the city of Belgrade, and also in the Republic of Serbia.
REFERENCES
1. Đarmati Š., Zagađenje i zaštita vazduha, Visoka škola strukovnih studija Beogradska politehnika, Beograd, 2007.
2. Jovanović O., Monitoring zagađenosti životne sredine, Visoka škola strukovnih studija Beogradska politehnika, Beograd, 2009.
3. Ril I., National Geographic oktobar 2007. 4. Ril I., National Geographic septembar 2009. 5. Sudarević D., Dozić A., Uticaj alternativnih goriva u motorima sa unutrašnjim
sagorevanjem na zaštitu životne sredine, Beograd, 2009. 6. Trivan G., Pavlović J., Kvalitet životne sredine grada Beograda, Beograd,
2008.

449
XX International Scientific and Professional Meeting
"ECOLOGICAL TRUTH" ECO-IST'12
30 May - 2 June 2012, Hotel “Srbija TIS“, Zajecar, SERBIA
THE STRUCTURE OF POPLAR TREES IN URBAN
GREEN AREAS OF NOVI SAD
Sinisa Andrasev1, M. Bobinac2, S. Roncevic1, M. Vuckovic2, B. Stajic
2
1
Antona Cehova 13d, Novi Sad, SERBIA University of Novi Sad, Institute of Lowland Forestry and Environment,
2
University of Belgrade, Faculty of Forestry, Kneza Viseslava 1, Belgrade, SERBIA
ABSTRACT
Researches were conducted in the urban area of Novi Sad, in parts of city where poplar trees are found. Each poplar tree was measured the breast height diameter, total height and was assessed damage in the crown and lower part of the trunk. In addition each tree was determined age category. Elements of growth show that poplar trees showing good size, which confirms that they are on their habitat and to have favorable conditions for growth in urban conditions. Age structure of trees shows that the poplar used in the establishment of public green areas in different long period which is mostly coincides with the urbanization of certain areas of the city.
Key words: poplar trees, structure of trees, urban green spaces, Novi Sad.
INTRODUCTION
Novi Sad is located on the alluvial plain of the Danube, whose zone of influence in the formation alluvial soils and soil water regimes in the city is very pronounced. This is the reason that in this area poplar and willow, as a native species, used in the greening of the city. Since the formation of the city in the end of the seventeenth century, the green areas were being formed, which are by the purpose and style vary depending on the period in which they occur. The use of poplar and willow in greening the city center had not a wider character, due to the poplar in the greening of urban settlements and the raising of parks on the outskirts were on periphery of the interests of horticultural experts because of their modest decorative features, short-liveness, brittleness of wood and an increased incidence of windbreak, and in the present classification of pollen trees and seed allergens [1]. Also, the greening of cities were frequent failures due to insufficient knowledge of poplar planting technology.

Eco-Ist’12, Ecological Truth, 30 May - 2 June 2012. Hotel “Srbija TIS”, Zajecar, Serbia
450
Intensive urbanization in the wider area of Novi Sad after the World War II meant considerable changes in habitats and soil characteristics: because of the unequal terrain and low elevation, it was necessary to raise the terrain in order to prevent negative impact of the Danube on life of inhabitans, especially groundwater. The raise of the terrain on the "safe" elevation was done with sand from the bed of the Danube, in the thickness of 3-5 m, which is an unfavorable due to the technique of filling sand, where organic matter and clay particles is washed, and especially the inability to keep atmospheric water.
As a result of the development of poplar production the technique so called. "deep planting" was defined where seedlings without root (pole) was planted to a depth of groundwater [2]. Deep planting technique was first applied 1969th
Poplar trees were planted in the alleys (line plantings), alone or in small or large groups in urban foreheads: streets, residential blocks, parks, factory circles, in addition to schools, kindergartens and so on. The basic purpose of poplar plantations was the humanization of urban areas and priority role of greenery was to meet more demands in a short time, above all to achieve its sanitary-hygienic role (the elimination of air pollution, improve the microclimate, noise reduction), and then reached aesthetic and visual effect.
years in setting up greenery in Novi Sad, establishing the complex of university park [3]. The results were excellent in technological and economic terms. As advantages of this method are: the minimum preparation of terrain, relatively inexpensive procedure of establishing (only 25% of the cost of establishing greenery in conventional manner) and maintenance of greenery, very great percent of plant survival and rapid growth of trees. Based on these advantages this method is applied to the establishment of greenery in the area of the whole city and, depending on soil characteristics, combined with the conventional method of establishment.
In economically significant poplar plantations age of 30 years is considered to be so called "upper" age after which the cutting of trees and raising young plants is done. In urban conditions, poplar trees have much more space for growth, often trees have so called "solitary" growth, while the production function is not emphasized. Upper age is linked to the state of trees and the satisfaction of sanitary-hygienic and ornamental-aesthetic functions [4].
The aim of this study was to determine the structure and assess the state of poplar trees in urban green areas of Novi Sad, which will allow assessment of their sustainability and functionality. Special emphasis is put on the age structure of poplar trees, the elements of growth and degree of damage (health status).
OBJECT OF RESEARCH AND WORK METHOD
Researches were conducted in the urban area of Novi Sad in two phases during
2011th year. In the first phase the spatial presence of poplar trees was recorded. In a second phase the collection of data were acceded which had the character of inventory: a presence of some poplar species, size and degree of damage (health status) were determined. At the inventory the principle of random and systematic sampling is applied. A systematic principle consisted in it that the location in the city with the poplar trees

Eco-Ist’12, Ecological Truth, 30 May - 2 June 2012. Hotel “Srbija TIS”, Zajecar, Serbia
451
were chosen (as in some parts of city poplar trees are not represented). After the spatial location of trees and tree groups applied the principle of random selection of locations from which to collect data. Then at each location trees were selected by systematic principle: to represent different categories of trees in terms of type, age, size and damage, while selected trees realistically displayed their participation in each location. In this respect the data were collected within 41 groups of trees in the city of Novi Sad (Figure 1).
Each tree was measured the breast height diameter by two cross measurements with an accuracy of 1 mm, and total height with the Vertex altimeter, with an accuracy of 0.1 m. Each tree was assessed damage in the form of the following evaluations: (1) the presence of individual dry branches in the crown (up to 10% of the crown) , (2) the presence of dry branches in the tree crown over 10%, (3) the presence of holes of xylophagy insects in the root swelling of trees, (4) the presence of decay in the root swelling of trees, and (5) the presence of mechanical injuries in the lower part of trees, which are caused by man.
In a number of trees wood samples were taken by Presler’s borer at the breast height in order to determine the age category of trees. After drying the samples annual growth rings were counted in the laboratory.
In total there is measured, assessed and drilled 129 trees, within 66 trees were Lombardy poplar (Populus nigra var. Italica) and 63 trees were Hybrid poplar (Populus × euramericana Dode Guinier).
To define the significance of differences in the elements of growth (height and diameter at breast height), and the difference in age of trees, between Lombardy poplar (LP) and Hybrid poplar (HP), the t-test was used.
RESULTS AND DISCUSSION
Studies have shown that the poplar trees located on the wider area of Novi Sad,
from the riparian zone to the peripheral zone of the city, the furthest from the Danube River (Figure 1).
Figure 1. Location of assessed poplar trees in Novi Sad (Source: Google Earth).

Eco-Ist’12, Ecological Truth, 30 May - 2 June 2012. Hotel “Srbija TIS”, Zajecar, Serbia
452
Based on the inventory of poplar trees it was found that diameters of trees are in the range 21-97 cm for Lombardy poplar trees, and 17-97 cm for Hybrid poplar trees. Mean breast height diameter amount of 54.9 cm for Lombardy poplar and 57.7 cm for Hybrid poplar, which is not significantly different by t-test. Lombardy poplar trees had less variation in breast height diameter (22.4%) compared to the Hybrid poplar trees (31.8%) . (Table 1).
Lombardy poplar trees had a height of 15.1 to 35.6 m, and Hybrid poplar trees 10.5 to 36 m. Mean height of Lombardy poplar trees of 28.5 m was significantly higher (p <0.001) than the mean height of Hybrid poplar trees (25 m) by t-test (Table 1).
Diameter structure is unimodal in both species with the highest number of trees around the mean. In Lombardy poplar trees larger number are with diameters 45-65 cm, compared to Hybrid poplar trees, which are more numerous with diameters 75-90 cm (Figure 1a). Table 1. The elements of growth and age of assessed poplar trees in Novi Sad.
d [cm] h [m] Age [year] average cv% min max average cv% min max average cv% min max
LP 54,9 * 22,4 21,0 97,2 28,5 14,8 15,1 35,6 42 15,9 25 52 HP 57,7 31,8 17,5 96,8 25,0 19,1 10,5 36,0 32 38,1 10 47
t-test -1,03 ns 4,35 *** 6,08 *** p-value 0,3068 2,7·10 -5 0
*
LP – Lombardy poplar; HP – Hybrid poplar.
As with the diameter structure, height structure is unimodal with the largest number of trees that are located near the arithmetic mean. In the height degree of 25-30 m is an equal number of trees as Lombardy poplar and Hybrid poplar. In the height degree of 20-25 m number of Lombardy poplar trees is twice smaller than the Hybrid poplar, and in the height degree of 30-35 m was twice as high (Figure 1b).
Comparing the achieved breast height diameters and heights of poplar trees in the conditions of city of Novi Sad with the diameters and heights achieved in production plantations at the best habitats [5, 6] can be seen that they are in range, even higher than those in production plantations, while the heights are less. In urban conditions trees have much more space for growth, and growth can often be characterized as a "solitary", which caused more intensive diameter increment in relation to height [7].

Eco-Ist’12, Ecological Truth, 30 May - 2 June 2012. Hotel “Srbija TIS”, Zajecar, Serbia
453
Figure 1. Diameter and height structure These diameters and heights of poplar trees, as Lombardy poplar and Hybrid poplar,
indicating that they are on their habitat and to have favorable conditions for growth in the urban conditions of Novi Sad.
Figure 2. Damage to trees
In both species, Lombardy poplar and Hybrid poplar trees, it was equally distributed (4%) trees with dry branches exceeding 10% of the crown, a single dry branches of the crown are found in 41% of the Hybrid poplar and over 70% of the Lombardy poplar trees. The presence of dry branches in the crown is the result of fungal

Eco-Ist’12, Ecological Truth, 30 May - 2 June 2012. Hotel “Srbija TIS”, Zajecar, Serbia
454
attack Dothichiza populea Sacc. et Br., and the lack of light needed for normal development of the foliage.
In the root swelling of the tree are determined the presence of holes of xylophagy insects with only 6% of the Lombardy poplar trees and in every fourth Hybrid poplar trees. The presence of decay in the root swelling was found in 18.2% of Lombardy poplar and in 11.1% of Hybrid poplar trees. The presence of mechanical injuries in the lower part of trees were found in 27.3% of Lombardy poplar and in 17.5% of Hybrid poplar trees (Figure 2).
Lombardy poplar trees had the age of 25 to 52 years, and Hybrid poplar tree from 10 to 47 years. The average age of Lombardy poplar trees was 42 years which is significantly higher (p<0.001) than the average age of Hybrid poplar trees of 32 years (Table 1). The coefficient of variation of age of Lombardy poplar trees is half of the Hybrid poplar trees. The majority, about 50% of all trees, is in the age group of 41-50 years. In this 2/3 of Lombardy poplar trees is aged 41-50 years, unlike the Hybrid poplar trees that are more evenly represented in the age categories from 11 to 50 years (Figure 3).
These data indicate that tree of Lombardy poplar significantly planted during the 1960's, while the trees of Hybrid poplar evenly planted in the last 50 years.
Figure 3. The age structure
Based on the analysis of participation of trees per age category and degree of
damage can be concluded that the individual dry branches in the crown (up to 10% of the crown) present in trees older than 20 years, with the unclear influence of tree age on their participation. The trees of Hybrid poplar that are younger than 20 years do not have dry parts of the canopy (Table 2).

Eco-Ist’12, Ecological Truth, 30 May - 2 June 2012. Hotel “Srbija TIS”, Zajecar, Serbia
455
The presence of damage caused by xylophagous insect was found in Lombardy poplar in the age category of 41-50 years to about 10% of the trees. In the trees of Hybrid poplar the presence of damage caused by xylophagous insects is almost in all ages categories, and the share of damaged trees increases with age.
Decay of root swelling in the trunk of Lombardy poplar was found in the age category of 41-50 years, where every fourth tree had clear signs of damage. In trees of Hybrid poplar such damage occurs in the trees aged 21-50 years.
Table 2. Participation of the trees by age category and degree of damage.
Age cate-gory
[year]
Number of tree d h 1,3
Dry branches up to 10% of the crown
Dry branches over 10%
of the crown
Holes of xylophagy
insects
Decay in the root swelling
Mechanical injuries
[%] [cm] [m] [%] [%] [%] [%] [%] LP HP * LP HP LP HP LP HP LP HP LP HP LP HP LP HP
1-10 3,2 20,8 11,40 11-20 17,5 43,7 23,83 18,2 21-30 10,6 28,6 47,9 55,3 24,84 24,78 71,4 61,1 8,6 1,1 22,2 11,1 14,3 22,2 31-40 19,7 17,5 54,5 72,0 24,94 24,48 53,9 27,3 5,0 4,5 27,3 9,1 18,2 41-50 65,2 33,3 55,2 63,1 30,25 27,46 79,1 57,1 3,4 8,1 9,3 38,1 27,9 19,1 39,5 23,8 51-60 4,5 68,0 26,90 66,7
*
LP – Lombardy poplar; HP – Hybrid poplar
Mechanical injuries were detected in both studied species, mainly in trees over 20 years old.
With advanced age the trees have a larger diameter and height, but observed the anomalies that the oldest tree of Hybrid poplar have less breast height diameters than the trees aged 31-40 years, which can be associated with different microhabitat conditions, tree devitalization in particular age periods and their further slower growth due to the impact of these unfavorable factors.
CONCLUSIONS
- The spatial representation of poplar trees in the wider area of Novi Sad, extends from the riparian zone to the the most distant peripheral zone of the Danube River.
- Age structure of trees shows that the poplar used in the establishment of public green areas in different long period which is mostly coincides with the urbanization of certain areas of the city, but there are exceptions, that the poplar trees from the previous period incorporated in the urban area and subsequently was entered.
- The average age of Lombardy poplar trees was 42 years, and of Hybrid poplar trees was 32 years, with 2/3 of Lombardy poplar trees aged 41-50 years, in contrast to Hybrid poplar of trees that are more evenly represented in the age categories from 11 to 50 years. This indicates that the Lombardy poplar trees,

Eco-Ist’12, Ecological Truth, 30 May - 2 June 2012. Hotel “Srbija TIS”, Zajecar, Serbia
456
planted significantly during the 1960s, while the trees of Hybrid poplar planted evenly in the last 50 years.
- Elements of growth show that poplar trees showing good size, which confirms that they are on their habitat and to have favorable conditions for growth in urban conditions.
- Health status and elements of growth by age categories shows that the older trees are of poor health, and can be correlated with age and longer exposure to urban conditions, which are manifested by mechanical injury (the man), dry branches in the crown, decay in root swelling (the disease), holes of the xylophagy insect in the root swelling of trees (the insects), and air pollution from traffic and industry.
REFERENCES
1. Anastasijević N. (2007): Podizanje i negovanje zelenih površina. Univerzitet u Beogradu-Šumarski fakultet, Beograd
2. May, S., (1960): Jedan originalan način gajenja topole na peskovitim dinama u oblasti delte reke Po u Italiji. Topola, br. 13-14. Beograd. (2-10).
3. Milutinović, D., (1979): Topole i vrbe u ozelenjavanju Novog Sada. Savetovanje o stanju i mogućnostima razvoja topolarstva u Jugoslaviji. Institut za topolarstvo, Novi Sad, 8-9. septembra.
4. Anastasijević, N., Vučković, M., Vratuša, V., (1997): Funkcionalnost šumskog i ukrasnog drveća u gradskim zelenim površinama. Zbornik radova „EKO – Konferencija ’97“, Ekološki pokret grada Novog Sada. 223-228.
5. Andrašev, S., Rončević, S., Vučković, M., Bobinac, M., Danilović, M., Janjatović, G. (2010): Elementi strukture i proizvodnost zasada klona I-214 (Populus × euramericana (Dode) Guinier) na aluvijumu reke Save. Glasnik Šumarskog fakulteta 101: 7-24. Beograd.
6. Marković, J., Rončević, S., Pudar, Z., (1997): Izbor razmaka sadnje pri osnivanju zasada topola. Topola, 159-160: 7-26. Beograd.
7. Stamenković, V., Vučković, M., (1988): Prirast i proizvodnost stabala i šumskih sastojina. Šumarski fakultet, Beograd. p. 368.

457
XX International Scientific and Professional Meeting
"ECOLOGICAL TRUTH" ECO-IST'12
30 May - 2 June 2012, Hotel “Srbija TIS“, Zajecar, SERBIA
RELATIONSHIP TO THE CITIZENS TREBINJA
ENVIRONMENTAL PROTECTION
Aleksandar Vukanovic
Elementary school “Vuk Karadzic“ Trebinje, Republic of Srpska, B&H
[email protected] ABSTRACT The ratio of Trebinje give more attention to social issues (e.g. employment, standard of living), while environmental issues are not given such importance. In addition, many members of the public expressed their confidence in the authorities in Trebinje. That is why the citizens’ participation in decision-making processes concerning the solving of public problems is very high. This fact may in the final outcome affect the change of the status of the protected natural resources, and it may lead to strategic and responsible solving of public issues. A local community, a region or a state that manages to achieve a high degree of public participation in the decision-making process and that passes decisions based on consultation with its citizens, acts more rational when adopting solutions that are applicable and acceptable to the public in terms of economic sustainability and in terms of a healthy environment.
Key words: the public, environment
INTRODUCTION
Participation of the public in a process of establishing decisions in area of environment in the Republic of Srpska as well in Bosnia and Herzegovina is of the key importance for preserving basic principles of development and preventing irresponsible behaviour of the authorities, individuals and companies towards natural environment we live in. Providing an important role of the public in establishing resolutions in this area is of a particular importance considering specific feature of the Republic of Srpska and its natural resources which present important developing potential. Regulations and practice in developed countries as well as in the countries which tend to regional, economical and political integrations, enable and encourage citizens initiative through the concept of „participation of the public in establishing decisions“. The convention of availability of information, participation of the public in establishing decisions and availability of justice administration regarding to the question wich deal with environment is of the particular importance in this area. The basic rules of this international contract have become the regulations in the European Union.
• The decree of the Council 97/11/EC about evaluation of the impact of some public and private projects on environment,

Eco-Ist’12, Ecological Truth, 30 May - 2 June 2012. Hotel “Srbija TIS”, Zajecar, Serbia
458
• The decree of the European Parliament and the Council 2003/35/EC which enable the participation of the public in making schemes of particular plans and programmes which refer to environment and by that one the decrees of the Council 85/337/EEC and 96/61/EC change with regard to participation of the public and righ to legal protection.
Аlthough todays legal formulatious explicitly do not forbid citizeus to express
initiative with regard to bringing all decisions, including those for environment. On the other hand, this situation is not affirmative for direct participation of citizens. There are minimal numbel of legal possibilities of citizens direct participation (referendum, citizens meetings) and their importance in the process of deciding is questionable. Formally, this mechanism presents an important „tool“ in citizens hands but in reality they face with problems of disfunctionality and low efficiency. Primarily it depends of inertia of the citizens. Referendum is an explicit „tool“ but for years we didn’t have any practical example of it in establishing municipal decisions and more likely it won’t be used in future for long. Citizens’ meeting mean an important presence of the citizens of local communities. They are faced with social problems and simply do not have time neither for their egsistential problems not for environment. Local community is the most common form of citizens’ participation but it usually doesn’t function. There are problems with politics, finances, communication and those issues almost stop the work of community. Solutions regarding to environment may be found simply in the enthusiasm of individuals and starting of the initiatives on the local community level with a purpose of protection the local residents’ health. Immobile relation of majonity local authorities towards the issues of citizens’ participation make the notion of disconnection and useless efforts. That is a negative trend, bad for development of partnership between citizens – authorities – economy. That is similar trend in all areas, especially environment. METHODS Analysis of particular concepts connected to public relatious is used in this work. Regarding its topic, major part of the research is based on empiritic methods of gathering information: observation, questioning (interviews, inquiries) 300 people are interviewed in this research, adults (18 – 65 years old), 81 with University degree, 219 with lower education. Aport the classical process of dealing with information, it is also used coeficient of correlation to express the measure of connection between two variables in the units that are independent on concrete units of measurement in which the values of variables are shown. There are a lot coeficient of correlation that are used. The most used is Pearson’s coeficient of correlation (product moment coeficient correlation)

Eco-Ist’12, Ecological Truth, 30 May - 2 June 2012. Hotel “Srbija TIS”, Zajecar, Serbia
459
RESULTS OF THE RESEARCH Chart 1. Citizens’ attitudes to ecology
claims N % For developing of industry, opening new factories, regardless if it
pollutes environment
84
28 % To slow down developing of industry, opening new factories, to have
lower standard of living in order to live in healthier environment
114
38 % indecisive / don’t know 102 34 %
All 300 100 %
Graphics 1. Citizens’ attitudes to ecology
Each participant answered answered the question: What is more important: to have jobs no matter of possible pollution or to slow down the development of industry in order to preserve environment. The majority (38) answered that that they would prefer preserve environment even with lower standard of living 28 give priority for opening factories regardless to pollution and 34 are indecisive. The result tells us that no matter of the level of education participants decide in accordance to individualistic points about quality of life. Analysis of situation gives whole and importial image as well as the image in whish it work and also information that the situation regards for. It includes detailed analysis of internal and external factor that help us to come to information needed for evaluation of strong and weak points of municipality and recognising the possibilities and threats in external environment. Empirical research shows a few interesting points. Chart 2. Do the citizens care for environment?
claim N % don’t know 15 5 %
Care about environment 72 24 % Behave indifferently 102 34 %
don’t care 111 37 % All 300 100 %

Eco-Ist’12, Ecological Truth, 30 May - 2 June 2012. Hotel “Srbija TIS”, Zajecar, Serbia
460
Graphics 2. Attitudes to environment
Correlation between two charts (Do the citizens care for environment? And Chart – Level of education) – 0,219710674. Coeficient of correlation expresses the measure of connection between two variables in the units independent on concrete units in which the values of variables are stated. In practice, Pearson’s coeficient of correlation is the most used. In this case Pearson’s coeficient is r= - 0,219. The connection is negative (one is raising, the other is falling and vice verse). Coeficient of correlation in its absolute value is close to 0. So, connection between citizens’ care about environment and the level of education is in „very low dependency“. It tells us that citizens from Trebinje do not care about their environment. Chart 3. Relation of ecological conscience and activism
None/low medium enormous don’t know Interest for ecological issues 84 28 % 93 31% 114 38% 9 3%
Knowledge about ecological issues, problems 108 36% 114 38% 69 23% 9 3%
Engagement in ecological actions 213 71% 48 16% 30 10% 9 3%
Graphics 3. Relation of ecological
conscience and activism Graphics 4. Coeficient of correlation between real relatious of ecological
couscieuce and activism

Eco-Ist’12, Ecological Truth, 30 May - 2 June 2012. Hotel “Srbija TIS”, Zajecar, Serbia
461
Coeficient of correlation between real relations of ecological conscience and activism in lines a chart (Level of education):
- Interest for ecological issues with level of education. Coeficient of correlation is r = 0,16. That value is very close to 0 and no matter that it has a positive value it shows that between these two appearances „there is practically no correlation dependency“, that meause that the level of education is not important for interest of people for ecology.
- Knowledge of ecological topics with level of education. Negative value should show that the counection is inverse. However, value is close to 0 it tells us that between knowledge of ecological topics and level of education „there is practically no correlation dependency“. Knowledge of ecological topics is not councted to level of education.
- Engagement in ecological activities with level of education. Coeficient of correlation is r = -0,23. Coeficient has a negative value, counection is inverse (one is raising, the other is falling). These two are in „weak dependence“. Level of education has a small impact on the decision of people to join in ecological activities.
Chart 4. Priorities of the citizeus
claim N % ecology 9 3%
Economical development 3 1% Standard of living 108 36%
politicians 24 8% Irresponsible citizeus 9 3%
unemployment 93 31% Crime and corruption 54 18%
All 300 100%
Graphics 5. Citizeus’ priorities

Eco-Ist’12, Ecological Truth, 30 May - 2 June 2012. Hotel “Srbija TIS”, Zajecar, Serbia
462
Coeficient of correlation between the chart with level of education and chart which tells us how the citizeus see motives of municipality regarding ecology is r = 0,08. Coeficient of correlation is close to 0 and it is not statistically relevant, because the correlation connection practically does not exist. Simply, citizeus belive to municipal authorities, and that indicates the absence of critical attitude towards authorities but also lethargy and citizens’ passive attitude.
Coeficient of correlation between the chart (Do citizens care for environment?) and chart 4 (Citizens’ priorities9 is r= -0,03. Practically, there isn’t any correlation dependence. It leads us to conclude that our citizens watch indifferenty their environment and they do not wish to change anything, and their priorities are standard, employment, salary regardless to ecological situation in their surrounding.
Coeficient of correlation between the chart ( Do citizens care for environment?) and chart 3 (Relation of ecological conscience and activism).
a) Coeficient of correlation between citizens’ care about environment and knowledge of ecological topics and issues is r= -0,73. Coeficient of correlation has a negative value, connection is inverse and there is „very strong dependency“. It tells us that citizens recognise ecological topics, but don’t do anything and don’t care about solving the problems.
b) Coeficient of correlation between citizens’ care about environment and engagement in ecological activies is r= -0,97. Coeficient of correlation has a negative value, connection is inverse. There is functional connection (almost perfect correlation), actually it is functional dependency and it means that citizens’ bad relation to environment contributes to fall of their interest and engagement in ecological actions. Although, there are some actious of students that indicate that at least young people show interest in ecological activities. Coeficient of correlation between (Relation of ecological conscience and activism) and chart 4 (Citizens’ priorities)
a) Coeficient of correlation between citizens’ priorities and interest for ecological issues is r= 0,85. It has a positive value, correlation is direct. There is „very strong dependency“.
b) Coeficient of correlation between citizens’ priorities and knowledge of ecological topics and issues is r=0,69. It has a positive value. Counection is direct and there is „medium dependency“. If we cousider the fact that improving of the standard brings some possible risks for health the need of citizens for better introduction of ecological situation is quite normal.
c) Coeficient of correlation between citizens’ priorities and engagement in ecological actious is r= -0,11. Coeficient of correlation has a negative value, it is close to 0, so there is practically no correlation. This coeficient shows that previous two are not so indicative for public opinious in Trebinje. Although there is interest of the public for ecological issues and citizens cousider that they know something about those issues, priorities and different. Emphoywent and security are priorities no matter of the clamages to environment. Citizens of Trebinje have huge social problems and they do not want that ecological activists drive away any possible employers.

Eco-Ist’12, Ecological Truth, 30 May - 2 June 2012. Hotel “Srbija TIS”, Zajecar, Serbia
463
CONCLUSION All the mentioned information indicate that the public in Trebinje, regardless to education (we used most often this variable) don’t care about ecological problems, even though the town is burdened with them.
Althoug one part of participants, especially those with University degree, are aware of ecological problems and identify main pollutants and also show an interest for solving ecological problems, priorities are put in other direction. The public is more interested in social and economical issues (employment, standard). Considering that, it is shown that citizens (or majority of them) belive in municipal authorities regarding to solving of ecological problems. The consequence of that attitude is inert and passive public that give up engagement and demand for clean and healthy environment.
Passive attitudeof the public can be easily seen in information that they do not influence on the processes of establishing decisions or giving environmental licences to pollutants. It is clear that all given hypotheses are correct but there is a need for one more deeper multidisciplinary research of the situation in which one part of the public is completely aware of the problem but they behave like that problem does not affect them.
REFERENCES
1. http://www.scribd.com/doc/22750398/ARHUSKA-KONVENCIJA-TEKST 2. 2.http://www.arh.bg.ac.rs/upload/0708/Osnovne_akademske_studije/semestar_
06/Sociologija_1/14%20Arhuska%20konvencija.pdf 3. Đorđević, S., Katić, M. (2004) „Vodič kroz praktičnu primenu Arhuske
Konvencije i mali ekološki rečnik“, Beograd 4. Botan, H. Carl, Hazleton, V. (1989): Public Relations Theory, New Jersey,
CEA. 5. Breton, Filip (2000): “Izmanipulisana reč”, Beograd, Clio. 6. Dewey, John (1999): Javnost in njeni problemi, Ljubljana: Založba FDV. 7. Drucker, Peter (1994) : The New Realities, New York 8. Grunig, J.E., &Hunt, T. (1984): Managing Public Relations, New York:
Routledge

464
XX International Scientific and Professional Meeting
"ECOLOGICAL TRUTH" ECO-IST'12
30 May - 2 June 2012, Hotel “Srbija TIS“, Zajecar, SERBIA
MONITORING OF PHOTOCHEMICAL SMOG IN NIS
BETWEEN 2001-2010
Ljiljana Stosic1, Lj. Blagojevic2, S. Milutinovic1, K. Lazarevic
1
1Public Health Institute Nis, 50 Dr Zorana Djindjica Avenue 18000 Nis, SERBIA 2
University of Nis, Faculty of occupational safety of Nis, SERBIA
ABSTRACT
The aims of this paper were: to establish ozone concentrations in Nis between 2001-2010, as well as concentrations of ozone precursors (nitrogen oxides and formaldehyde) in the same period, and to monitor their trend. In this investigation it has been found concentrations of ozone, nitrogen oxides and formaldehyde which were below of the guideline values. The mean values of ozone concentrations were between 3.07 µg/m3 and 10.03µg/m3, the mean values of nitrogen oxides concentrations were between 17.36µg/m3 and 45.97µg/m3, and formaldehyde concentrations were between 1.93µg/m3 and 9.85µg/m3
. Ozone, formaldehyde and nitrogen oxides were showed decreasing trend in the period examination.
Key words: ozone, formaldehyde, nitrogen oxides INTRODUCTION
Photochemical smog appears in clear, sunny days with low humidity of the air, in the presence of high concentrations of pollutant.
One of the most important pollutant, which is produced in the atmosphere by photochemical reactions, is ozone. Ozone has important detrimental health effects on humans. Acute O3 exposures cause pulmonary function decrements, school absenteeism in children, injury and inflammation, cardiovascular events, and disease exacerbation, while chronic exposures to O3 have been associated with increased incidence of asthma, diminished lifespan, and increased mortality due to cardiovascular and pulmonary disease, as well as reproductive effects (1).
AIM
The aims of this paper were: - to establish ozone concentrations in Nis between 2001-2010 - to establish concentrations of ozone precursors (nitrogen oxides and
formaldehyde) in the same period, - to monitor trend of ozone, nitrogen oxides and formaldehyde.

Eco-Ist’12, Ecological Truth, 30 May - 2 June 2012. Hotel “Srbija TIS”, Zajecar, Serbia
465
METHOD
Institute for Public Health Nis started monitoring of photochemical smog in 1992. on the one place in the town. Laboratory examination was done according to the Regulation of Guideline Values of Imission.
Results of examination are given in μg/m3. In this paper are given some of the statistical parameters: mean values, percentiles (C50 i C98) in the period examination.
RESULTS AND DISCUSSION
In the period examination, the mean values of ozone concentrations (Table-1) were between 3.07 μg/m3 (2007) and 10.03μg/m3 (2003). The noticed values are below of the values which are given in the Regulation of Guidelines Values of Imission (85μg/m3) in that period. Table 1. Ozone concentrations in Nis between 2001-2010 (µg/m3
Year )
X Min C C50 Max 98 2001 6.86 0.10 6.40 17.60 35.20 2002 8.47 0.10 10.20 26.30 60.50 2003 10.03 0.40 7.50 20.90 30.70 2004 8.26 0.10 6.70 22.60 46.20 2005 9.07 0.10 7.60 26.60 36.70 2006 8.40 0.10 7.50 21.20 38.40 2007 3.07 0.40 2.20 12.38 41.00 2008 4.04 0.40 2.80 14.10 20.30 2009 8.54 0.80 7.70 21.50 36.70 2010 8.90 0.10 7.00 21.20 28.10 Nitrogen oxides concentratios are mainly below guideline values (Table -2).
The mean values were between 17.36µg/m3 (2004.) and 45.97µg/m3 (2001.) while the percentile C98 values were between 20.40 µg/m3 and 148.10µg/m3
.
Table 2. Concentrations of Nitrogen oxides in Nis between 2001-2010 (µg/m3
Year )
X Min C C50 Max 98 2001 45.97 0.10 20.10 148.10 180.70 2002 24.19 0.10 16.30 106.20 138.30 2003 20.85 6.50 19.80 42.70 58.80 2004 17.36 2.10 17.00 38.00 50.60 2005 22.57 0.80 20.40 20.40 40.80 2006 24.01 3.20 22.00 50.20 125.70 2007 17.98 0.50 17.50 90.8 102.80 2008 25.31 1.60 22.90 44.00 229.70 2009 23.42 1.10 22.40 76.00 77.80 2010 30.20 0.90 31.10 46.70 53.60

Eco-Ist’12, Ecological Truth, 30 May - 2 June 2012. Hotel “Srbija TIS”, Zajecar, Serbia
466
With regard to formaldehyde, we can say that situation is similar. Formaldehyde concentrations are also below guideline values. Registrated concentrations are given in the Table 3.
Table 3. Concentrations of formaldehyde in Nis between 2001-2010 (µg/m3
Year )
X Min C C50 Max 98 2001 5.82 0.10 4.00 22.30 63.00 2002 5.09 0.10 3.40 22.70 45.80 2003 4.04 3.03 3.00 17.90 32.40 2004 2.73 1.10 2.00 11.60 15.40 2005 4.71 0.10 3.20 20.10 25.30 2006 3.30 1.20 3.20 5.40 8.10 2007 1.93 0.90 1.50 4.40 4.90 2008 2.14 0.60 1.30 23.00 25.80 2009 9.85 2.00 9.70 19.30 26.80 2010 6.40 1.20 4.60 16.20 28.10
Trends of parameters are represented on the figures 1, 2 and 3. Ozone,
formaldehyde and nitrogen oxides were showed decreasing trend in the period examination.
Trend of ozone concentrations in Nis between 2001- 2010
02468
1012
2001 2002 2003 2004 2005 2006 2007 2008 2009 2010
year
ozon
e
Figure1. Trend of ozone concentrations in Nis between 2001- 2010
Trend of NOx concentrations in Nis between
2001- 2010
0
10
20
30
40
50
2001 2002 2003 2004 2005 2006 2007 2008 2009 2010
year
NOx
Figure 2. Trend of NOx concentrations in Nis between 2001- 2010

Eco-Ist’12, Ecological Truth, 30 May - 2 June 2012. Hotel “Srbija TIS”, Zajecar, Serbia
467
Trend of NOx concentrations in Nis between 2001- 2010
0
10
20
30
40
50
2001 2002 2003 2004 2005 2006 2007 2008 2009 2010
year
NOx
Figure 3. Trend of HCHO concentrations in Nis between 2001- 2010
CONCLUSION
In this investigation it hasn,
Concentrations of ozone are below of the values, which are given in the Regulation of Guidelines Values of Imission.
t been found concentrations of ozone, nitrogen oxides and formaldehyde which can have more important influence on the health of the people.
Concentrations of ozone precursors also haven,
Period examination partially has coincidence with the period deficiency of motors fuel. Because of that, parameters which we have measured as many other air pollutants have showed lower concentrations.
t been over the guidelines values.
In the ten years examination ozone, formaldehyde and nitrogen oxides were showed decreasing trend.
In consideration of toxicological importance of these parameters, we should continue their monitoring.
REFERENCES
1. National Institute of Environmental Health Sciences. Ozone induced Pulmonary Injury and Inflammation.
2. Annual reports on air quality. Public Health Institute Nis
Available at: www.niehs.nih.gov/research/atniehs/labs/lrb/envirogen/studies/pulmonary/index.cfm

468
XX International Scientific and Professional Meeting
"ECOLOGICAL TRUTH" ECO-IST'12
30 May - 2 June 2012, Hotel “Srbija TIS“, Zajecar, SERBIA
STATE AND RECOMMENDATIONS FOR IMPROVING THE GRASS
PITCHES OF RED STAR BELGRADE FC AND PARTIZAN FC
Dragana Rakovic1 J. Petrovic1
, N. Stavretovic1,2, O. Kosanin
1
1University of Belgrade, Faculty of Forestry, Belgrade, SERBIA 2
Institute for Nature Conservation of Serbia, Belgrade, SERBIA
ABSTRACT
This paper presents the results of a research that included major pitches of the two football stadiums of Partizan and Red Star Belgrade football clubs. The research was carried out in order to collect data on the measures and activities that are conducted annually in the major pitches, in order to define the state of the grass pitches and make recommendations for their improvement. The research revealed that these clubs have relatively high-quality main pitches. However, some modifications of the activities that are currently carried out on the grass pitches of the football clubs were proposed. The aim of these modifications is the improvement of the game and player achievement. Besides modifications of certain activities the recommendations also include additional activities that have not yet been carried out on these pitches.
Key words: lawns, grass pitches, football stadiums, urban ecology, sports fields
INTRODUCTION
Sudden popularization of sports activities leads to striking changes in the development of recreational areas that include meeting of ever more demanding criteria every year. The origins of football stem from the ancient Chinese ball game [1], which underwent exact and great changes throughout history. Besides the game itself, facilities of the sports fields have changed dramatically. Nowadays, football pitches are zones of massive and periodic integration of people. The lawns of football pitches are specific types of plant cover, which is created, tended and maintained by man, in order to serve its purpose fully and adequately [2]. Due to its complexity and dynamics, the construction of football pitches requires a full range and system of highly-skilled professionals, whose main task is to build this complex up properly and in line with the more general requirements [3]. The value of the investments is high, and therefore the pitches have to be precisely and professionally maintained. If a sports lawn is properly established, its functionality can only be disturbed by improper management. Besides proper tending, management of sports lawns includes the proper use of the pitches. The order of tending measures and their schedule often

Eco-Ist’12, Ecological Truth, 30 May - 2 June 2012. Hotel “Srbija TIS”, Zajecar, Serbia
469
depend on the schedules of training sessions, games, the weather, equipment and machinery and funding along with other factors. [4]. In our country a lot of money is invested in sports complexes, but little attention is paid to the maintenance of their elements. This paper presents the results of a research that included the major football pitches of two stadiums (the Partizan stadium and the Red Star stadium). The research was carried out in order to collect data on the measures and activities conducted in the major pitches annually, in order to define the state of the grass pitches and make recommendations for their improvement. In addition to the data on the implementation of adequate tending measures, this research provided information on the timely implementation of these tending measures and pitch exploitation.
MATERIALS AND METHODS
The field study of the Partizan and Red Star football stadiums was carried out during 2011. It included a floristic survey, data collection regarding the Calendar of Activities and the existing machinery using surveys and interviews on the staff who work on the maintenance and the club managers. The identification of plant species was performed using the available floristic literature: Flora SR Srbije ( The Flora of FR Serbia) IX [5] [6] and Stavretović, N. [7]. In this way, it was possible to determine the current state of the grass pitches, the existing and potential problems and the opportunities to overcome them. The research results provided the basis for the preparation of recommendations/suggestions for the proper tending and maintenance, i.e. the improvement of the grass football pitches. Only a combination of coordination and cooperation among the pitch users, grass pitch managers, workers who maintain the pitches and the managers of the sports facilities [4] will provide a real improvement of the studied grass pitches on the basis of these recommendations.
RESULTS AND DISCUSSION
3.1. The current status and the Calendar of Activities of the grass football pitch of Red Star Belgrade football club
The main football pitch of Red Star Belgrade football club was reconstructed in the autumn of 2007. On the basis of the plan of changes, the drainage system of the main pitch was improved, and the systems of irrigation and heating that, according to the stadium staff, have not been used yet, were introduced. The floristic survey revealed high occurrence of annual meadow grass (Poa annua), which is an aggressive weed in the lawns of sports fields (Figure 1). In Red Star football club the implemented tending and maintenance measures include the following: raking, fertilizing, mowing, irrigation, aeration, undersowing and weed control. The calendar of activities includes the following activities:
• At the initiative of the players the grass pitch is mowed to a height of 2 - 2.5cm and kept at that level throughout the year. This height is desirable during the spring and autumn period because it encourages plant tillering. However, the summer mowing of the grass to this height leads to a decrease in soil moisture

Eco-Ist’12, Ecological Truth, 30 May - 2 June 2012. Hotel “Srbija TIS”, Zajecar, Serbia
470
conservation and decreased development of the root system and foliage of the grass.
• Aeration is performed twice a year (in April and June). Through aeration the compacted soil, which often occurs as a result of frequent training sessions and games, becomes loose, the air penetrates deeper into the rhizosphere layers, the root gets more space for development and expansion, and the intensity of growth and the development of the grass on the main pitch are enhanced. However, in the penalty zone, where there are sparse areas, it would be a good idea to perform aeration for the third time. Also, since the aeration is performed in the spring and summer periods, one more aeration in the zone of sparse areas should preferably be performed in autumn.
• The lawn is fertilized every month either with phosphorus or nitrogen fertilizers. Frequent introduction of mineral fertilizers causes the grass to become softer and less resistant to trampling, reduces the root system and encourages the emergence of annual meadow grass (Poa annua), which was identified as a major problem of this pitch.
• Organic fertilizers have not been added to this pitch for many years, which should be changed in order to improve the characteristics of the subturf layer and primarily enrich the soil with humus. The addittion of organic fertilizers should be performed every three years.
• Undersowing is applied as needed. However, the research revealed that this measure is not applied often enough. The effects of that can be seen in the goal and penalty zones, where the aesthetic quality of the lawn is significantly reduced.
• The parts of the lawns ripped out during games do not recover on time, larger holes are not filled with a mixture of sand and earth, and they are not undersown (Figure 2). These pitches with bare or thinned areas contain plant material of weaker condition, and as such represent an ideal substrate for the emergence and spread of annual meadow grass (Poa annua). Also, unrepaired damage after a game can lead to a disease in the area of the surrounding plants.
Figure 1. Presence of the species by Poa
annua on the main pitch Figure 2. Parts of the pitch damaged
players' boots

Eco-Ist’12, Ecological Truth, 30 May - 2 June 2012. Hotel “Srbija TIS”, Zajecar, Serbia
471
3.2. The current Status and the Calendar of Activities of the grass football pitch of Partizan football club
The conducted research has shown that Partizan Football Club has both very high- quality equipment and maintenance technique used for the grass pitch throughout the year. There is evident consistency and compliance in all activities intended by the Calendar of activities. The field research confirmed that the main pitch has satisfactory functionality i.e. most of the functional criteria are met. However, the presence of two highly aggressive weeds, annual meadow grass (Poa annua) and Bermuda grass (Cynodon dactylon), was recorded in the pitch. The species Cynodon dactylon is classified in the group of invasive plant species on sports fields [8], which means that if monitoring and control measures are not implemented, the quality of both the environment [9] and the grass pitch itself may be compromised. Tending and maintenance measures performed in the main pitch include the following: fertilization, mowing, irrigation, aeration, verticulation, undersowing, and the control of pests, diseases and weeds.
• The research conducted showed that the quality of the measure of mowing is adequate and that grass height is the same in all parts of the pitch. The grass is mowed to a 2 - 2.4 cm height throughout the year.
• In order to solve problems related to the high occurrence of the two weed species in the pitch (annual meadow grass Poa annua, and Bermuda grass Cynodon dactylon) the staff conducts verticulation five times a year, in an attempt to primarily suppress Bermuda grass. At the same time dead organic matter is removed from the pitch. Verticulation is performed in May, June, August, September and October, and so the Bermuda grass (Cynodon dactylon) is lifted, mowed and collected after verticulation (Figure 3). However, the impact of verticulation on the reduction of these weeds is questionable, because each cutting-through causes the tearing of stolons, which intensifies the development of weeds.
• Aeration is done twice a year, in April and June/ July, which is considered sufficient, because the lawn has a very high density, high cover, and solid roots. In case of a minor cover of the goal zone, further implementation of aeration in this area in September or October is proposed, because this is the ideal period for it. Also, the sand filled after the aeration is not shell-free and therefore it must be refined.
• The density of the pitch is very good because it has regularly been undersown. It should be noted that the penalty zone of the lawn had a full cover, as a result of professional maintenance and compliance with the proper order and timeline of activities.
• When mineral fertilizers are concerned, the pitch is fertilized, with a properly chosen type of fertilizer every month, although in smaller amounts.
• Herbicides are preventively used in the grass pitch against broadleaf weeds (in April according to the Calendar of Activities), and in case of a congregation earthworms are immediately suppressed.

Eco-Ist’12, Ecological Truth, 30 May - 2 June 2012. Hotel “Srbija TIS”, Zajecar, Serbia
472
• One of the regular tending and maintenance measures in the football pitch is the reparation of damages after games. Tapping by bringing a new turf from the spare part of the pitch is often performed. It is important to make sure that the spare lawn contains the same grass mixture as the lawn of the football pitch being repaired.
Figure 4. Staines that remained after verticulation
as a consequence of Cynodon dactylon Figure 5. The area along the out
line is a potential weed area 3.3. Recommendations for improving the grass pitches of the football clubs On the basis of the results obtained by this research, recommendations that provide a complete improvement of the Partizan and Red Star stadiums were defined. These recommendations enable the overall improvement of the Red Star and Partizan stadiums by increasing the quality of the main grass pitches and creating better conditions for their exploitation by players.
1) Recommendations for Red Star Belgrade football club
• In summer, mow the grass to the height of 3 - 3.5 cm. • One more aeration should be performed in autumn (September or October). • The use of mineral fertilizers should be applied every two months. • Organic fertilization is proposed once in three years. The recommended organic
fertilizers are compost, peat (40%: 60% mixture with sand) or well rotted farmyard manure. Fertilizers should be dispersed from April to December in a thin layer (30m3/pitch), and the manure is to be dispersed in winter, after the competing season.
• It is proposed to use Top dressing once a year, preferably in autumn, when there are no games on the pitch. This operation is carried out in order to improve the soil properties.

Eco-Ist’12, Ecological Truth, 30 May - 2 June 2012. Hotel “Srbija TIS”, Zajecar, Serbia
473
• More frequent undersowing of the goal and penalty zones is necessary, as well as turf reparation after games.
• It is recommended to purchase different sprayers that are used separately, one for the foliar application of herbicides, and the other one for fungicides only. It is necessary to regularly clean the machinery before and after use.
• The number and cover of Poa annua L. should be monitored in the subsequent period. This species is very frequent in the pitch, but its occurrence still does not require a complete reconstruction of the pith.
• There is no harrowing among the operations performed throughout the year. Harrowing is a regular measure, which should be conducted at least annually, in spring or summer to remove all debris (from construction or plants) from the pitch. In this way, better conditions are created for aeration, mineral nutrition and undisturbed growth and development of the grass.
• Verticulation should be introduced as one more tending and maintenance measure. This measure removes dead plant material. It should be conducted in spring or autumn, prior to the operation of aeration.
• Weed control should be introduced. The main football pitch of the Red Star stadium does not have many problems with broadleaf weeds. However, the research recorded the presence of dandelion (Taraxacum officinalle), which necessarily has to be manually/ mechanically removed (unless there is an emergence of new weed species or an increase in the number of the existing ones).
2) Recommendations for Partizan football club
• In order to suppress weeds, it is recommended to perform a total reconstruction
of the football pitch and apply herbicides (for example, products based on the active ingredient GLYPHOSATE, ATRAZINE, GLUFOSINATE-AMMONIUM, SIMAZINE, etc.).
• In summer, mow the grass to the height of 3 - 3.5 cm. • It is necessary to reduce the number verticulations. Verticulation should be
performed once a year, prior to the operation of aeration. • The use of mineral fertilizers should be implemented every two months in the
standard amounts for certain types of fertilizers. • It is recommended that the second aeration takes place in September or October. • A more frequent undersowing of the zone of referee movement is necessary
because that area is the most thinned part of the pitch. Otherwise, these areas will be the potential zones for the spread of weeds in spring.
• Organic fertilization is proposed once in three years, as well as the application of Top dressing once a year, preferably in September. The range of elements that should constitute the Top dressing, depends on the soil properties.
• In order to reduce the number and cover of Bermuda grass (Cynodon dactylon), it is necessary to often rake the lawn, (tear Bermuda grass by hard raking), and then execute undersowing in that area followed by generous watering. In this

Eco-Ist’12, Ecological Truth, 30 May - 2 June 2012. Hotel “Srbija TIS”, Zajecar, Serbia
474
way, the expansion of Bermuda grass will be controlled in the following few years, until the total reconstruction of the pitch.
• It is necessary to repair the damaged turfs after games. • Preventative spraying against White clover (Trifolium repens) is necessary in
spring or autumn. • Agrochemical analysis of the soil is recommended every three years, because
every two months is too often. • It is recommended to purchase various sprayers that are used separately, one for
foliar fertilization, one for the application of herbicides, and the third one for fungicides only. It is necessary to regularly clean the machinery before and after use.
• There is no harrowing among the operations performed throughout the year. Harrowing is a regular measure which should be conducted at least annually, in spring or summer, to remove all debris (from construction or plants) from the pitch. In this way, better conditions are created for aeration and mineral nutrition, as well as for the undisturbed growth and development of the grass.
CONCLUSION
High-quality sports lawns require good grass surfaces and high quality base, substrate and drainage layers, and they should also have decorative properties. This feature is important because of the active players, observers in the stands, and the audience who watch sports events through the media. [10] On the basis of a study and detailed analysis of the current state of the main pitches of Red Star and Partizan football clubs, it can be concluded that these clubs have relatively high-quality main pitches. The results of this research provide the basis for the preparation of recommendations/suggestions for proper tending and maintenance, i.e. improvement of the grass football pitches. Certain modifications of activities within the Calendar of Activities were proposed, compared to those currently implemented at the grass pitches of the football clubs, in order to promote the very success of the game and players. Besides the modifications of certain activities, these recommendations included additional operations (such as harrowing and verticulation) that had not been performed on the above pitches. The many-years-long presence of aggressive and invasive weeds (Poa annua, and Cynodon dactylon) on the main pitches of both clubs can be eliminated through proper and timely application of the proposed tending measures. Today, the success of a club is not only reflected in a good game of its footballers, but also in the condition of its assets, i.e. the quality of the lawns of the pitches at the club. The cumulative result of these two facts can be the formation of a remarkable facility displaying true quality in every respect. Football pitches are one of the most significant elements for game events and they significantly affect the course of games. One of the tasks of the clubs is to use their expertise to create high-quality facilities that are worthy, presentable and becoming of the league to which the club belongs.

Eco-Ist’12, Ecological Truth, 30 May - 2 June 2012. Hotel “Srbija TIS”, Zajecar, Serbia
475
Only the coordination and cooperation among the users of the pitches, lawn managers, maintenance workers and the managers of the sports facilities [4] will make the recommendations truly bring about an improvement of the studied lawns.
Acknowledgements
This paper was realized as a part of the project "Studying climate change and its influence on the environment: impacts, adaptation and mitigation"(43007) financed by the Ministry of Education and Science of the Republic of Serbia within the framework of integrated and interdisciplinary research for the period2011-2014.
REFERENCES
1. Šiljak, V.: Istorija sporta. Fakultet za menadžment u sportu Univerziteta Braća Karić, Beograd, 2007.
2. Maksimović, S., Kojić, M., Janjić, V., Mrfat-Vukelić, S.: Sportski i ukrasni travnjaci. Unija biloških naučnih društava Jugoslavije, Beograd, 2005.
3. Raković, D.: Analiza mera nege i održavanja glavnih terena fudbalskih klubova. Diplomski rad, Šumarski fakultet Univerzitet u Beogradu, 2011.
4. Stavretović, N.: Menadžment travnatih sportskih terena. Zbornik radova I Internacionalne konferencije Menadžment u sportu, 292-296, Fakultet za menadžment u sportu, Univerzitet Braća Karić, 2005.
5. 1970-1977): Flora SR Srbije I-IX, ur. Josifović M., SANU, Beograd 6. (1986): Flora SR Srbije X, ur. Sarić M., Diklić N., SANU, Beograd 7. Stavetović, N.: Kvalitetne vrste i korovi u travnjacima urbanog područja.
Monografija, Unija bioloških naučnih društava Srbije, Beograd, 2008. 8. Petrović, J., Stavretović, N.: Distribution of invasive plant species in the
Belgrade green areas.
9. Petrović, J., Stavretović, N.: Značaj praćenja i kontrole invazivnih biljnih vrsta na urbanim rekreativnim površinama. Zbornik radova Četvrtog medjunarodnog kongresa "Ekologija, zdravlje, rad, sport", 281-285, Banja Luka, Republika Srpska, 2011.
Proceedings of IX International Eco-conference: Environmental protection of urban and suburban settlements, 397-404, Novi Sad, Srbija, 2011.
10. Stavretović, N.: Izgradnja sportskog travnjaka kao osnov za njegovo kvalitetno upravljanje. Zbornik radova I Internacionalne konferencije Menadžment u sportu, 288-292, Fakultet za menadžment u sportu, Univerzitet Braća Karić, 2005.

476
XX International Scientific and Professional Meeting
"ECOLOGICAL TRUTH" ECO-IST'12
30 May - 2 June 2012, Hotel “Srbija TIS“, Zajecar, SERBIA
BRIEF HISTORY AND SIGNIFICANCE OF THE PRODUCTION
OF GRASS CARPETS
Nenad Stavretovic1,2, J. Petrovic
1
1University of Belgrade, Faculty of Forestry, Belgrade, SERBIA 2
Institute for Nature Conservation of Serbia, Belgrade, SERBIA
ABSTRACT
Production of grass carpets involves the process of their establishment, basic conservation, tending and maintenance up to their installation, and finally their utilization. The utilization implies cutting of a grass carpet for the purpose of lawn formation. Production of grass carpets is nowadays a lucrative business both locally and worldwide. Production of grass carpets is an industrial branch with a significant role in both the construction and maintenance of sports and recreational facilities, and the improvement of the spaces for living. Therefore, this paper briefly reviews the history of the production of grass carpets, and through an overview of its advantages and needs for this kind of production, highlights its ever growing importance and relevance.
Key words: grass carpet, grass turf, landscape architecture, horticulture, urban ecology
INTRODUCTION A grass carpet is a part of the lawn that is cut and separated from the substrate [1]. An increasing number of lawns used for different purposes, including sports fields, garden lawns, lawns of office facilities and larger complexes including parks, little markets, squares, circles around the factories and the like, have been established by laying grass carpets. Due to these needs, there is an increasing interest in the growing i.e. production of grass carpets, which is drawing the attention of a growing number of investors and business people. Production of a grass carpet involves the process of its establishment, basic conservation, tending and maintenance, up to its installation, and finally its utilization. The utilization implies cutting of a grass carpet for the purpose of lawn formation [2]. Some entrepreneurs specialize only in the production of grass carpets, while they leave their installation to others. Of course, there are entrepreneurs who produce grass carpets and carry out their installation, tending and maintenance. The concepts of ground covers and grass carpets should be distinguished. Ground covers are planted at a certain distance and over time (through vegetative growth) they cover the ground surface [3], while a grass carpet covers the entire surface on which it is placed immediately after installation.

Eco-Ist’12, Ecological Truth, 30 May - 2 June 2012. Hotel “Srbija TIS”, Zajecar, Serbia
477
Ground that is well-covered and thoroughly penetrated with the root system of mature grass blades whose growth is stimulated by intense agrotechnical measures, is a grass carpet. Departed with a minimal portion of the ground, this carpet can be transplanted elsewhere as a final product - a lawn. Production of grass carpets is an industrial branch, which has a major role in the construction and maintenance of sports and recreational facilities, and the process of improvement of the spaces for living [2]. As the need for grass carpets in the market of our country has grown in recent years, this paper will highlight both the importance of grass carpet production and its history.
BRIEF HISTORY OF THE PRODUCTION OF GRASS CARPETS Grassy surfaces have always been considered the most suitable surfaces for sports activities and this is still true today [4]. During the reign of Elizabeth Tudor (the English dynasty that ruled from 1485 to l603), a low-mowed "English" lawn was created, and it became the symbol of the nobility. At the beginning of the eighteenth century, garden fashion went through important changes. William Kent improved "English" style lawns around large houses that could be seen across the whole of England and Ireland. These lawns looked like gardens that continued into the surrounding landscape. According to some data, the method of grass carpets or pieces of lawns is several centuries old, i.e. as old as the idea of lawns in England. Rapid development of the production and application of ready-made lawns occurred in the United States in the early fifties of the twentieth century, when the machine for cutting grass carpets was designed. At the same time, the Canadian farmer William Ruthven started the first production of grass carpets. Trial production of grass carpets began in West Germany in 1959, on a 3 ha area. In 1975, this production area was increased to 90 ha. The need for large quantities of high-quality grass carpets caused their production in our country in the eighties of the last century. The species originally used as the material for the production of grass carpets was Poa pratensis. Along with the development of this field the planting mixtures for the establishment of quality grass carpets were determined. During the work on the production of grass carpets market demands increasingly moved in the direction of product quality, which improved the measures aimed at their tending and maintenance. Further development of this production contributed to the improvement of the production of pesticides, fertilizers and mechanization in horticulture and landscape architecture. Generally, the availability of the machines for the cutting of grass carpets enabled an increase in their production. Along with economic growth and higher income, the demand for grass carpets in all types of construction increased. In the end, this led to the development of herbicides against broadleaf weeds. The interest in the production of grass carpets is present throughout the world. In the last twenty years, the interest in the formation of such lawns has been intensively growing in our country.

Eco-Ist’12, Ecological Truth, 30 May - 2 June 2012. Hotel “Srbija TIS”, Zajecar, Serbia
478
The first enterprises of grass carpet formation arose from a need to quickly cover the surface of a soil, i.e. to quickly establish a lawn. Natural grass surfaces were used for this purpose. These were stripped parts of mowed meadows or pastures. A grass carpet transplanted in this way was first used to cover small areas. The development of sports played on grass surfaces, together with the growing needs of the population for the landscaped gardens with green spaces, led to an increased interest in the production of grass carpets. Hence, the need for grass carpets increased, and the spaces whose grass cover was stripped remained unprotected. The forming of a new lawn on an area where the lawn had been removed was rarely performed. The surfaces were left bare, without a grass cover, and the cultivation of such land and additional seeding were not performed, which exposed the soil to the process of erosion. Over time the customers were becoming increasingly demanding. They wanted a quality grass carpet, with unvarying color and uniform growth and density. Natural lawns whose “carpet” was removed were no longer sufficient to meet market demands. Hence, we can say that the need for quality grass carpets initiated their production, from cultivation and sowing to their placing on the market. Grass carpets for sports fields in our country were stripped off the meadows and pastures that were previously subjected to the process of weak reclamation [5]. However, high- quality and proper production of grass carpets is still not being widely used in our country.
ADVANTAGES OF GRASS CARPETS When a new lawn is established, one way of forming it is through the sowing of grass seed, but the establishment of a lawn by laying grass carpets is often a better way to form a lawn and its advantages over sowing are numerous (Figure 1). For example, a lawn established by laying a grass carpet requires regular watering for a much shorter time than the lawn established by sowing. When establishing a lawn by sowing, the regular watering need takes approximately 30 days, during seed germination and thereafter during the period of formation of the full grass cover. Regular watering of the lawns established by grass carpet laying is needed only up to their rooting in the ground, for approximately 15 days. On the lawn established by grass carpet laying, it is not necessary to apply herbicides for weed control in the following year or two, because there are no bare places on it to serve as the substrate for weeds. As long as the cover of the lawn is high, seeds or underground parts of the weeds in the soil do not have favourable conditions for germination and growth. Such a lawn will quickly protect the soil from the process of erosion, which can be caused by water or wind. Formed in this way, the lawn can be maintained better than the one established by sowing. A lawn formed by sowing can deteriorate very quickly due to the presence of pathogens, drought, frost, early utilization through trampling and similar events that can easily damage its young grass. By grass carpet laying, a lawn can be formed over a longer period of the year, in contrast to the lawns formed by sowing, whose formation can occur primarily in spring and autumn.

Eco-Ist’12, Ecological Truth, 30 May - 2 June 2012. Hotel “Srbija TIS”, Zajecar, Serbia
479
Figure 1. Possibility of quick installation of the lawns of different quality (grass carpets with different leaf texture and quality).
Grass carpets have a number of other advantages, e.g. they strongly reduce high temperatures through the process of transpiration, absorb pollutants and carbon dioxide from the air. They are better at retaining dust and they prevent soil mudding and the accumulation of organic matter by wind or otherwise. Through photosynthesis a large amount of oxygen is released from these lawns into the atmosphere. The areas without a grass cover are inhabited by weeds and ruderal plants whose pollen has allergy causing effects [6]. The laying of such lawns has a positive effect on the control of weed pollen, which causes allergic reactions of people. Lawn is the best area for playing games and it provides a sophisticated and organized appearance of a landscape. The forming of a grass carpet on and around recreational areas increases their sanitary value [7]. The population of apartment blocks, and above all children are exposed to the allergic reactions caused by pollen. Invasive species, which are present in residential areas [8], are a source of pollen material that contributes to the occurrence of allergies. Through the establishment of new grass carpets by the method of grass carpet laying the space where these plants may appear, develop and spread is quickly occupied. Grass carpets are the material used for the most efficient type of biological reclamation of degraded areas. The disadvantage of this method is its high cost, which is the main reason for its rare application [9]. The establishment of lawns by the method of grass carpet laying is, according to some authors, a contribution to nature conservation, and an activity which reduces the use of pesticides and the emergence of allergenic and invasive species [8] [10] [11].
NEEDS FOR GRASS CARPETS The need for the establishment of new green spaces, and thus for the production of grass carpets is present worldwide, including our country. It is primarily caused by economic growth, rapid urbanization and the construction of a large number of new buildings. Fast construction of buildings creates the need for a quick establishment of green areas. Planting of adult seedlings is enabled by the existence of "educated" seedlings in nurseries, while meeting of the needs for lawns formed in a short period can be enabled only through lawn transplanting. It can therefore be said that the need for the production of grass carpets can be recognized in a wide area of our country. Grass carpets are primarily used for grassing over representative green areas [12], sports fields [13], football pitches, golf courses [14] and ski slopes [15] [16]. The use of grass carpets is common in the formation of the lawns of residential areas, parks, eroded terrains [17]

Eco-Ist’12, Ecological Truth, 30 May - 2 June 2012. Hotel “Srbija TIS”, Zajecar, Serbia
480
and military facilities for a necessary disguise of certain areas [I8]. Grass carpets are also very effective in the prevention of the emergence of invasive species in the lawns of representative facilities [8], school buildings, kindergartens [19] and recreational areas. [11]. The use of grass carpets is also useful in road design. Roads are corridors of the spread of invasive plant species. The use of grass carpets along roads means a fast establishment of lawns that prevent the colonization of invasive species at these sites [20]. Production of grass carpets involves a series of operations that are conducted throughout the year, while their installation is possible throughout the growing season. The installation of grass carpets in winter and hot months involves an increased risk that can cause their destruction. Although customers often want to have grass carpets installed in the period of unfavourable conditions, during summer and winter, those who lay (produce) grass carpets must inform the customer on the many risks involved which may or may not be taken by the potential buyer.
CONCLUSION Through the laying of grass carpets the number of lawns of various purposes is increasing. The first ventures into grass carpet formation arose from a need to quickly cover the surface of the soil, i.e. to quickly form a lawn. The needs for the use of grass carpets for different purposes are numerous including the following: contribution to sanitary-hygiene, control of the appearance of weed pollen, biological remediation, contribution to nature conservation, reduction in the use of pesticides, prevention of the emergence of allergenic and invasive species, improvement of the visual characteristics of spaces and quicker formation of green areas. In line with these needs is the rising interest in the growing i.e. the production of grass carpets as an area that attracts the attention of a growing number of investors and business people. This interest creates a possibility for the formation of a new industrial branch in our country aimed at the improvement of environmental quality.
Acknowledgements This paper was realized as a part of the project "Studying climate change
and its influence on the environment impacts, adaptation and mitigation"(4 3007) financed by the Ministry of Education and Science of the Republic of Serbia within the framework of integrated and interdisciplinary research for the period 2011-20M.
REFERENCES
1. Stavretovic, N Standardi pejzazne arlutekture - defmicije termma u problematici podizanje l uege travnjaka, Naucno-strucni skup o prirodmm vrednostima l zastiti zivotne sredme- Ekoloska istina. Sokobanja, 2000
2. Stavretovic, R. Stevanovic, J Odredivanje pogodne lokacije za proizvodnju travnog tepiha, VII MedjunsrodnakDnferencija "Menadzment u sportu", Beograd, 2011

Eco-Ist’12, Ecological Truth, 30 May - 2 June 2012. Hotel “Srbija TIS”, Zajecar, Serbia
481
3. Williamson, J. F.: Lawns and ground covers, - A sunset book, Lane books, Menlo park, Kalifomia, USA, 1964,
4. Sutton, A. F. M.; Lawn and Sports Grounds. - Seventeenth edition, Sutton arid Sons LTD reading, England, 1962.
5. Boskovic, P, Boskovic, B Fudbalski stachom i lgralista, Tehmcla propisi kntenji i propisi FSJ. UEFEi FIFE pro]ektovanje, izgradnjai bezbednost evropska igrahsta i odrzavanje Gradsko zelenilo Novi Sad. FK Vojvodina. Tola stampa. 2001
6. Stavretovic, N . Janjic. V , Paunovic, E PnsutnDst biljne vrste Ambrosia artenusiifoha L u zelennn pDvrsinama Beograda, S4 Naucno-strucm skup d prirodnim vrednostima i zastiti zivotne sredine- Ekoloska istina, 325-329. Soko Eanja, Srbija. 200d
7. Stevanovic, J. Stavretovic N Urban recreational areas, First Serbian Forestry Congress "Future with Forests", Congress Proceedings, 1201-1209, Faculty of Forestry. Belgrade, 2010
8. Stavretovic, N, Stevanovic, J , Ivhjovic, A Invasive plant species in lawns of Belgrade residential areas. Acta biolcgica nsgoslavica - senja G Acta herbologica, Vol 19. No 1. 39-47, Umja bioloskih naucmh drustava Jugoslavije, 2010
9. Stavretovic, N Savremena lskustva bioloske rekultivacije degradiramh povrsina, II Simpozijum" P-eciklazne tehnologijei odrzivi razvoj", 34-4S, Sokobanja. Srbija, 2007
10. Franklin, S Building a healthy lawn a safe and natural approach A Garden Way Publishing Book Storey Communications, Inc "American Garden Publisher" Schoolhouse Road Pownal, Vermont 052o'l, IdS, 19SS
11. Petrovic, J , Stavretovic, N Znacaj pracenja i kontrole invazivnih biljmh vrsta na urbanism rekreativmm povrsinama, Zbormk radova Cetvrtog medjunarodnog kongresa "Ekologija, zdravlje, rad, sport", 2S1-2S5, Banja Luka. Republika Srpska, 2011
12. Stavretovic, N.: Lawn around the some hotel in Belgrade. Book of abstracts, Simpozijum on the flora Southeastern Serbia and Neighbouring Regions, 116, Mis, 2005b.
13. Stavretovic, N.: "Menadzment travnatih spotskih terena", Zbornik sazetaka I Medunarodna konferencija "Menadzment u sportu", Fakuitet za menadzment u sportu, Univerzitet "Braca Karic", 148, Olimpijski komitetSCG, Beograd, 2005a.
14. Vuckovic, 3 Travnjaci Monografija, Poljopnvredm falcultet, Univerzitet u Beogradu, GND Produkt. l-50d, 2004
15. Pa she. R . Radio, B Idejm projekat ureclenja prostora inn ad ski staza „Konjarmk 1 i 2", Sumarski fakuitet, Beograd. 2011

482
XX International Scientific and Professional Meeting
"ECOLOGICAL TRUTH" ECO-IST'12
30 May - 2 June 2012, Hotel “Srbija TIS“, Zajecar, SERBIA
ACROSS BORDERS ENVIRONMENTAL IMPACT ASSESSMENT
Tatjana Lukic, B. Tubic, M. Pisaric
University of Novi Sad , Faculty of Law, Novi Sad, SERBIA
ABSTRACT Environmental threats do not respect national borders. Governments have realized that to avert this
danger they must notify and consult each other on all major projects under consideration that might have adverse environmental impact across borders. In that sense the 1991 Espoo Convention (entered into force in 1997) is a key step to bringing together all stakeholders to prevent environmental damage before it occurs. The objective of this Convention is to promote environmentally sound and sustainable economic development, through the application of environmental impact assessment as well as through strategic environmental assessment as preventive measures against transboundary environmental degradation.
Key words: environmental impact assessment, transboundary, strategic environmental assessment
ESPOO CONVENTION AND SEA PROTOCOL
UN ECE Convention on Environmental Impact Assessment in Transboundary
Context was adopted in Espoo, Finland, on 25 February 1991, entered into force on 10 September 1997 and by March 2012 there were 45 Parties to the Espoo Convention1
1 Full text of the Convention:
. The Convention is intended to help make development sustainable by promoting international cooperation in assessing the likely impact of a proposed activity on the environment. It applies, in particular, to activities that could damage the environment in other countries. Ultimately, the Espoo Convention is aimed at preventing, mitigating and monitoring such environmental damage. Regarding that the Convention stipulates the obligation of Parties to assess the environmental impacts of certain activities at an early stage of planning. It also lays down the general obligation of States to notify and consult each other on all major projects under consideration that are likely to have significant adverse transboundary environmental impacts. Parties to the Convention are under an obligation to take policy, legal and administrative measures to control adverse transboundary impacts arising from proposed activities. The Convention also provides conditions for research activities among the Parties, for the purpose of improving methods of EIA, and promoting sustainable economic activity. A dispute settlement
http://www.unece.org/env/eia

Eco-Ist’12, Ecological Truth, 30 May - 2 June 2012. Hotel “Srbija TIS”, Zajecar, Serbia
483
process is also contained within the Convention. First amendment to the Convention was adopted in 2001. Once in force, it will open the Convention to accession upon approval by UN Member States that are not members of the UNECE. Second amendment to the Convention was adopted in 2004. Once in force, it will allow, as appropriate, affected Parties to participate in scoping; require reviews of compliance revise the Appendix I (list of activities) and make other minor changes.
Environmental Impact Assessment (EIA) is a systematic process to identify, predict and evaluate the environmental effects of proposed actions and projects. According to the Espoo Convention, EIA is "a national procedure for evaluating the likely impact of a proposed activity on the environment" (Article 1(vi)). Transboundary EIA is the same as EIA, but there is an explicit consideration of potential transboundary effects, including consultation and public participation in the affected Party (i.e. the country that may be affected by a project in the 'Party of origin' or, more formally, the Contracting Party or Parties to the Convention likely to be affected by the transboundary impact of a proposed activity).
Strategic Environmental Assessment may be defined as “analytical, anticipatory and participatory process that aims to integrate environmental considerations into plans, programmes and other strategic actions and identifies interlinkages with economic & social considerations”2. The need for SEA may be recognized especially in transboundary context. That is the reason why the Espoo convention has been supplemented by a Protocol on Strategic Environmental Assessment3
2 Applying Strategic Environmental Assessment to Development Cooperation, OECD, 2006.
(SEA Protocol) adopted on 21 May 2003 in Kiev. The Protocol entered into force on 11 July 2010; by March 2012 it had 23 Parties. The essence of Strategic Environmental Assessment may be seen as formalised, systematic and comprehensive process of evaluating the environmental impacts of a policy, plan or programme and its alternatives, including the preparation of a written report on the findings of that evaluation, and using the findings in publicly accountable decision-making. In terms of the Protocol SEA is recognized as evaluation of the likely environmental, including health, effects, which comprises the determination of the scope of an environmental report and its preparation, and the carrying-out of public participation and consultations, the taking into account of the environmental report and the results of the public participation and consultations in a plan or programme (article 2.6). The SEA Protocol augments the Espoo Convention by ensuring that individual Parties integrate environmental assessment into their plans and programmes at the earliest stages – so helping to lay the groundwork for sustainable development. The Protocol also provides for extensive public participation in the governmental decision-making process. The SEA Protocol, once in force, requires its Parties to evaluate the environmental consequences of their official draft plans and programmes. The Protocol also addresses policies and legislation, though the application of SEA to these is not mandatory. SEA is undertaken much earlier in the decision making process than EIA, and it is therefore seen as a key tool for sustainable development.
3 http://www.unece.org/env/eia/sea_protocol.html.
Eco-Ist’12, Ecological Truth, 30 May - 2 June 2012. Hotel “Srbija TIS”, Zajecar, Serbia
484
When speaking of relationship between EIA and SEA, the latter relates to plans and programmes (and perhaps policies & legislation), whereas EIA relates to projects. However, the distinction between the two is not always clear. Also, while EIA Convention is all about transboundary impacts of projects, SEA Protocol mainly regards SEA of plans and programmes within a state, with consideration of transboundary effects being secondary. However, the clear connection may be found in provisions of SEA which stipulates the obligation of notification and consultation under certain circumstances: a) notification if Party of origin determines that plan or programme is likely to have significant transboundary effects, or if Party likely to be significantly affected so requests (no recourse available to an inquiry commission, only to the dispute settlement procedures – Article 20)and notification of affected Party by Party of origin when affected Party indicates whether it wishes to be consulted; b) consultation (paragraph 4): where such consultations take place, the Parties concerned shall agree on detailed arrangements to ensure that the public concerned and the authorities referred to in article 9 paragraph 1, in the affected Party are informed and given an opportunity to forward their opinion on the draft plan or programme and the environmental report within reasonable time frames. However, together EIA and SEA EIA has two main potential benefits:
- It may help the project proponent to identify project alternatives (alternative locations or technology, for example) and mitigation and compensatory measures that reduce the environmental impact of the project. Suggestions may come from the public, the EIA experts, the consultees and the developer.
- It may provide for public involvement in the project design, promoting understanding between the community and developer. It may also promote good governance in the longer term: for example, public hearings as part of an EIA process "provide important indirect benefits that can contribute to the capacity for democratic governance and an active civil society". SOME POSITIVE EXPERIENCES IN TRANSBOUNDARY
ENVIRONMENTAL IMPACT ASSESSMENT PROCEDURE
If analyzing experiences of different Convention’s parties4
, several core conclusions may be made:
1. Most parties of the Convention described their national and transboundary environmental impact assessment (EIA) procedures and authorities. Almost all of them described or summarized the EIA procedure in their country and indicated which steps of the EIA procedure included public participation. Besides the mandatory opportunity for commenting on the EIA documentation, a public hearing, as appropriate, and public information on many stages, countries indicated other opportunities for public participation: 4 Base upon Review of Implementation of Espoo Convention (2006-2009) (November 2011) available on http://www.unece.org/environmental-policy/treaties/environmental-impact-assessment/enveiapublications.html.

Eco-Ist’12, Ecological Truth, 30 May - 2 June 2012. Hotel “Srbija TIS”, Zajecar, Serbia
485
- In screening, by the seeking of public opinions in the screening5
- By considering public opinions when deciding whether to participate as an affected Party (Czech Republic, Hungary, Republic of Moldova, Slovakia);
decision (Hungary, Montenegro, Slovakia and, optionally, Spain) or by possibly reconsidering the screening decision in the light of representations by the public (Lithuania, Romania);
- An additional public hearing on the notice of the proposed activity (Armenia); - In scoping6
- By commenting on both draft and final EIA documentation (Kazakhstan, Latvia);
(Belgium, Czech Republic, Denmark, Estonia, Finland, Lithuania, Montenegro, Netherlands, Norway, Portugal, Serbia, Slovakia, Spain, Sweden), though this was not provided for in all cases in some Parties (Austria, Canada), or might be limited to non-governmental organizations (NGOs) (Spain). In Latvia, the public might demand a public hearing at the scoping stage;
- By commenting on the expert review7
- Republic, Serbia); 6 of the EIA documentation (Czech
- An additional public hearing on the expert review of the EIA documentation (Armenia);
- Through access to justice on the final decision (Germany, Montenegro, Netherlands, among others).
2. In a matter of different steps of the transboundary EIA procedure set out in the Convention fit into your country’s national EIA procedure, most countries described how the different steps of the transboundary EIA procedure set out in the Convention fit into their country’s national EIA procedure and legal provisions, or made reference to the legal provisions. Of particular interest were the replies by: Croatia, where the assessment according to national legislation was supplemented by an assessment under the Convention when an activity was likely to cause transboundary impact; Lithuania, where the national EIA law indicated that the Convention prevailed if provisions in the national law differed; The Republic of Moldova and Ukraine, where a transboundary EIA procedure had not been developed nationally and direct reference was made to the Convention. 3. Countries identified the authority responsible for notification, frequently the ministry of environment, or a central environmental or planning department, committee or agency, and sometimes in cooperation with the ministry of foreign affairs. In many instances, the competent authority, often at a regional level but with support from the centre, was responsible for subsequent steps of the transboundary EIA procedure. In
5 “Screening” is the case-by-case determination of whether a proposed activity is subject to EIA or to notification. 6 “Scoping” is the case-by-case determination of the scope of the assessment. 7 “Expert review” by the competent authority of the EIA documentation and other information; sometimes “environmental impact expertise” or “opinion”.

Eco-Ist’12, Ecological Truth, 30 May - 2 June 2012. Hotel “Srbija TIS”, Zajecar, Serbia
486
Austria, Belgium, Germany and Switzerland authorities at the level of the region (or Land or canton) often led the procedure from the start. 4. Very few Parties had special provisions for joint cross-border projects, the exceptions being Canada, which described a procedure; the Czech Republic, which referred to its legislation; Estonia and Finland, which referred to their bilateral agreement; Estonia, which also referred to its agreement with Latvia; and Kazakhstan, which referred to provisions with Azerbaijan and a guide for Central Asian countries. Switzerland had guidance on cross-border projects. Other countries referred to ad hoc procedures (Bulgaria, France, Germany, Greece, Netherlands, Romania, Sweden), with Romania having used the same ad hoc procedure for two separate cases with Bulgaria. Italy and Poland suggested that provisions would be included in bilateral or multilateral agreements. 5. The legislation of a clear majority of Parties already covered, or went beyond, the revised appendix I in the second amendment, whereas others had legislation based on the current appendix I (Canada, Liechtenstein, Republic of Moldova), which Armenia and Azerbaijan were planning to implement. Some countries reported slight differences, for example with respect to wind farms (Finland, Hungary). Portugal and landlocked Kyrgyzstan, the Republic of Moldova, Slovakia and Switzerland all excluded offshore hydrocarbon production from their lists of activities. The deforestation of large areas was not covered by Belarus, or by Kyrgyzstan and the Republic of Moldova, where such an activity was not permitted. Belarus and Kyrgyzstan also excluded trading ports and also inland waterways and ports for inland-waterway traffic; the Republic of Moldova excluded installations for the enrichment of nuclear fuels, and the mining of metal ores and coal, as such activities were not found there. Ukraine made direct reference to the Convention, rather than include appendix I in national legislation. 6. Many Parties, including EU member States, but also Belarus, Kyrgyzstan, Montenegro, Norway, the Republic of Moldova and Switzerland, had numerical thresholds in their list of activities requiring EIA, thus providing an interpretation of terms such as “large” and “major” used in appendix I. 7. Countries indicated how their countries conducted transboundary EIA cooperation. In a clear majority of Parties, such cooperation was through, or mainly through, the points of contact (or focal points, the two terms often being confused). Some countries also referred to joint bodies (Estonia, Finland, Germany, Portugal, Spain) and bilateral agreements (Estonia, Finland, Germany, Liechtenstein, Lithuania, Netherlands, Poland, Portugal, Slovakia, Spain, Ukraine). Armenia had notified via the secretariat. 8. Countries provided information on the average duration of whole transboundary EIA procedures, ranging from six months to three-and-a-half years. However, procedures usually lasted somewhat less than a year in some Parties (Austria, Bulgaria, Croatia, Czech Republic, Estonia, Hungary, Kyrgyzstan, Republic of Moldova,

Eco-Ist’12, Ecological Truth, 30 May - 2 June 2012. Hotel “Srbija TIS”, Zajecar, Serbia
487
Romania), whereas Latvia, Slovenia and Sweden reported averages of over two years. The duration was dependent on, among other factors, the nature of the proposed activity, the number of Parties involved and the quality of the EIA documentation. 9. Many countries also provided information on the duration of the individual steps, though comparison between these durations was difficult as the definitions of steps differed substantially, for example: one month for screening; between one and three months for scoping, depending on whether there was public participation; between one and four months for notification and response; between 3 and 12 months for preparation of the EIA documentation; three weeks for translation of the EIA documentation by the affected Party; between one and three months for distribution of the EIA documentation and the collection of comments in the affected Party, and a further one to three months for any public hearing; between one and two months for consultations; between two and six months for the final decision. 10. Nevertheless, many countries were unwilling to name examples of good practice cases, or had none. Others named examples: the Netherlands and Slovakia wrote of nuclear power plants in their countries, Belgium about one in neighbouring France. Sweden referred to the Skanled gas pipeline, Denmark, Finland and Sweden referred to the Nord Stream pipeline. As Parties of origin, Switzerland noted a transport infrastructure project and Belgium referred to a wind farm. Montenegro, as affected Party, noted a hydroelectric power plant in Croatia. Portugal referred to the hydroelectric use of the Bemposta River 11. When speking of ways of overcome difficulties arising from different legal systems in neighbouring countries, countries indicated how their country had overcome difficulties arising from different legal systems in neighbouring countries, with some referring to general approaches, others referring to specific experiences. Denmark noted that much time and patience had been needed to understand and overcome differences between legal and administrative systems and cultures. Austria, Estonia, Germany, Italy, Lithuania, Portugal and Spain noted the importance of bilateral and multilateral agreements, whereas Germany and Switzerland highlighted the process of the elaboration of such agreements and Kyrgyzstan referred to subregional guidance on transboundary EIA. France was flexible in its application of the Convention. The Netherlands generally followed the Party of origin’s legislation. Romania noted the compatibility of national systems implementing EU legislation. Austria and Estonia referred to the importance of bilateral meetings and consultations. Switzerland also noted that shared practical experience for joint projects had helped overcome difficulties. Germany noted, with respect to the Nord Stream gas pipeline, the agreement among States to use the longest time frame legislated in the various States concerned and to provide for public participation in the scoping phase. Norway reported that for the Skanled gas pipeline the concerned Parties had produced a table summarizing the different legal systems, time frames and key steps; this had helped in reaching a compromise approach.

Eco-Ist’12, Ecological Truth, 30 May - 2 June 2012. Hotel “Srbija TIS”, Zajecar, Serbia
488
CONCLUSION
On the basis of practical experience of Parties, the implementation of the Convention had supported the prevention, reduction or control of possible significant transboundary environmental impacts. In that manner general benefits that could be cited, includes: closer cooperation, with a higher level of mutual information and understanding and an opportunity to express concerns; better EIA, with a broader examination of environmental threats; better consideration of environmental issues and understanding of impacts; better EIA documentation overall and opportunities for and improved public participation; improved proposed activities, with a higher level of environmental safety; better and broader environmental protection and mitigation measures; the introduction of monitoring and an early warning system; specific conditions on the development consent or permit and proper implementation of the activity; better environment, with a reduced environmental impact.
However, most difficulties arose because of countries' divergent EIA procedures. This is the case especially in criteria for screening, determining significance, philosophy of EIA, tradition of public participation as well as the role of developer and authorities. Informing other parties of the national procedure was seen as important, but an ideal way to prevent problems would be through bilateral agreements. Often the Transboundary EIA procedures appear bureaucratic and time consuming. Set rules on responsibilities and time limits were suggested as means to make the procedure flow more smoothly and both official and unofficial contacts were seen as necessary on federal, regional as well as on local levels.
Acknowlegement This paperwork is a result of a research on the Project "Biosensing technology
and global system for continuous research and integrated management of ecosystems”, the number 43002. Funds for realization of this Project are provided by the Ministry of Education and Science of Republic of Serbia.
REFERENCES
1. Applying Strategic Environmental Assessment to Development Cooperation,
OECD, 2006; 2. Cherp, A., Environmental assessment in countries in transition: Evolution in a
changing context Journal of Environmental Management . , Volume 62, Issue 4, August 2001, Pages 357–374;
3. Dalal-Clayton, B., Sadler, B., Strategic Environmental Assessment, A source book and reference guide to International Experience, 2005;
4. De Boer, J., Bilateral agreements for the application of the UNECE convention on EIA in a transboundary context, Environmental Impact Assessment Review, Volume 19, Issue 1, January 1999, Pages 85-98;
5. Hildén, M., Furman, E.,Assessment across borders: Stumbling blocks and options in the practical implementation of the Espoo Convention
6. Review of Implementation of Espoo Convention (2006-2009), 2011.
, Environmental Impact Assessment Review, Volume 21, Issue 6, December 2001, Pages 537-551,

489
XX International Scientific and Professional Meeting
"ECOLOGICAL TRUTH" ECO-IST'12
30 May - 2 June 2012, Hotel “Srbija TIS“, Zajecar, SERBIA
EVOLUTION OF THE ANALYSIS OF
INPUT/OUTPUT IN PHYSICAL UNITS
Pasqua L’Abbate
University Lum Jean Monnet, ITALY
ABSTRACT
The lifestyle of the industrialized modern civilization, every day requires the transformation of a huge amount of material. Natural resources are transformed in industrial goods and services, but at the end of the cycle returns to the environment after use in an altered form, as waste and emissions. The society degradation and the physical resource scarcity, have made the society aware of the complexity of natural resources and of social systems, and the circular interdependencies that exist between the systems. The economic system seen as a subset of the environmental system, is studied by applying the balance of matter, by calculating the physical flows of matter and energy. For the calculation of these flows were born a number of tools. This study considered the innovative instrument : the Physical Input - Output Tables (PIOTs). The following work will expose the concepts PIOTs basis of, their history, the differences between MIOTs (monetary Input - Output table) and PIOTs, and make examples of application. Finally we report the strengths and limitations, and perspectives needed to make the PIOT interesting and convenient tool for evaluating environmental and economic policies.
Key words: input-output, PIOTs, material flow, environmental accounting
INTRODUCTION
The industrial society in the last two centuries has produced goods and services by taking an enormous amount of material. The northern countries of the world have adopted a high lifestyle consumption , considering the continuous growth of world population, the economic model used by them will not work for long, does not appear to be sustainable [5]. The idea decrease the quantity of material and energy used to produce and consume begins to grow , and also the fact to unbind the economic growth from the physical growth [3]. International organizations begin to speak about "dematerializing" the economy, such as the European Commission (2003) and OECD1 (2004). To monitor and calculate the demand for natural resources by industrial activity the conventional national accounts are not enough, it is necessary to build the accounts considering the physical flow of materials from industrial use. 1 OECD: Organization for Economic Cooperation and Development was founded in 1961 to promote development and economic growth of member countries.
The flows of matter and energy input and

Eco-Ist’12, Ecological Truth, 30 May - 2 June 2012. Hotel “Srbija TIS”, Zajecar, Serbia
490
output processes of transformation of natural resources must not only be measured in monetary units but also in physical units. Over the past 20 years a number of alternative approaches to accountability in monetary units have developed, for quantifying the use of natural resources by modern societies in terms of biophysical [4]. Instrument is still being studied are the Physical Input-Output table from now on PIOTs. This paper describes the methods developed on PIOTs, it shows a complete list of PIOTs existing published for the national accounts of some countries and differences in construction between them.
Finally we discuss issues related to the differentiation of existing methodologies and perspectives needed to make PIOT a wider application tool for environmental assessment and economic policies.
MATERIAL AND METHODS: MONITORING OF PHYSICAL FLOWS To monitor physical flows is necessary to provide a physical accounting information for managing natural resources and environmental pressures caused by anthropogenic processes [15]. Have developed a number of alternative approaches to monetary accounts, which allow the quantification of natural resources by the industrialized societies. In this work we analyze the PIOTs. These matrices describing the total material flow into and out of a process anthropic, thermodynamic principles are applied, and the flows of matter calculated by means of mass balances, in this way the economic system is incorporated in a broader environmental system . Manufacturing sectors are separated by the final demand, and changes in physical inventories are recorded for each field [13]. Capital and labor are conceived as the funds that turn the flow of natural resources in a flow of products, and the addition of input and output components represent a flow that starts and ends with the resources with waste[6]. The PIOTs are constructed from the known MIOTs (Monetary Input-Output table) differently. A PIOT is not a conversion unit of MIOT, a PIOT not be obtained by multiplying the MIOT with a vector prices / tons of feed material for each cell. The financial statements used for the construction of the tables I / O in monetary units and in physical units are different, the balance used for the construction of a MIOT is as follows: TOTAL OUTPUT = TOTAL INPUT OF GOODS AND SERVICES + ADDED VALUE The identity that applies to the PIOT is: TOTAL OUTPUT = INPUT OF RAW MATERIAL + TOTAL INPUT OF GOODS AND SERVICES - WASTE AND EMISSIONS
In MIOT logic only environmental products that have cost can be represented and monetary value. The extension of the PIOT respect to MIOT is the inclusion of the 'environment as a source of raw material on the input side and residues on the output side (for residues is meant: solid waste, liquid waste and emissions into the air)[25].

Eco-Ist’12, Ecological Truth, 30 May - 2 June 2012. Hotel “Srbija TIS”, Zajecar, Serbia
491
DEVELOPMENT APPLICATION OF PIOTs
In 1940 Leontief developed the analytical accounting schemes, which later became the elements of modern input-output analysis in monetary units as a result of the first studies of flows of matter were conducted by Ayres and Kneese [1] who applied the mass balance in Tables I / O. Since the nineties the first studies on the flows of matter have been made in Europe by the Institute of Interdisciplinary Studies of Austrian University for Austria and the Wuppertal Institute in Germany[15][29].
I. The first leads to the conceptualization of the system (Duchin 1992, 2009);
Since 1990, we can see four parallel lines of research[29]:
II. The second studies the development of the methodology (Konijn et al.1997; Nakamura and Kondo 2002, Hoekstra 2003, Suh 2004; Giljum and Hubacek 2004; Dietzenbacher 2005; Dietzenbacher et al 2009, Weisz and Duchin 2005);
III. The third considers various applications of PIOTs, developing a water accounting (Gascòet to 2004), waste and development of energy bills (Duchin 1990; Duchin and Lange 1994; Duchin and Lange 1998; Hubacek and Giljum 2003, Kagawa et al
IV. The fourth series of studies has focused on the compilation of tables of national accounts in physical units.
, 2004).
From 1990 to today have been developed a series of tables for the various nations. The first table PIOTs for the national accounts has been calculated for Austria for the year 1983 (and Kratterl Kratena 1990; Kratena et al 1992) for Austria there is currently a highly aggregated PIOTs (Weisz 2000). For Germany, for the year 1990, a full PIOT was published by the General Office of Statistics, with the matrix which contains 58 activities of the conventional accounts, plus an additional area for external environmental protection services (Stahmer at 1997, 1978) and for 1995 (Statistisches Bundesamt 2001) and then were further elaborated in Tables I / O (Bringezu et al 2003; Stahmer et al 2003). For Denmark was published PIOT for the year 1990 (Gravcard) and for 1999 (Pedersen). For Italy a PIOT aggregate was made by Nebbia for 1995 and for 2000 (Nebbia 2003). For Finland a PIOT has been submitted for the year 1995 (Mäenpää 2002). For the Netherlands a table I / O was published in 2003 (Hoekstra). For Japan in 2003 (Ariyoshi and Moriguchi) a PIOT has been built and currently there are others under construction at regional level.
For the United Kingdom a PIOT of 76 sectors is undergoing preparation(Wiedmann).
DIFFERENCE BETWEEN PIOTs The differences between PIOTs built for national accountability of different countries are exposed and analyzed. The 'aggregation of sectors is different between the various existing PIOT. In PIOT of Germany [26] and Denmark [14] Primary and secondary inputs are summed to an aggregate. In the Austrian PIOT the difference of the sectors and the complete economy is very explicit in the balance sheets [32] . From the point of view of the materials considered in the tables there are more differences. Can be constructed a series of sub-tables, separately, describe the flows of

Eco-Ist’12, Ecological Truth, 30 May - 2 June 2012. Hotel “Srbija TIS”, Zajecar, Serbia
492
specific groups of products, of different materials or residues [14][25], for example the German PIOT contains separate tables of supply and uses for 3 major groups of materials: water, energy and other materials. Each of these tables is further broken down into 9 categories of material, from the input side: land cover, energy, mineral excavations, other solids, water from nature, oxygen, CO2, other gases. Outputs from the side there are 17 separate categories in the various flows of solid waste, waste water and emissions. These sub-tables are constructed with a bottom-up and are necessary to understand the stages of a process of transformation of matter such as fossil energy in CO2 emissions during the combustion process. PIOT advertised in Denmark are presented separate tables for 9 sub-groups of materials: animal and crop production, stones, building materials, energy, paper, metals, chemicals and fertilizers, packaging and materials containing nitrogen. The breakdown in the sub-piots is of crucial importance since it allows for separate input-output accounts for groups of materials related to specific environmental problems[8].
The following table 1 shows the differences between the PIOT built for 5 countries: Netherlands, Germany, Denmark, Italy, Finland. All countries have used a model of PIOT basic structure similar to the traditional MIOT except the 'Netherlands which refers to a more extended PIOT model . Each country has a different combination of industry sectors, there are 58 sectors in Germany in 1990 and 60 for 1995, for Denmark there are 27 sectors, 12 sectors for Italy, 30 sectors for Finland. With the extended PIOT Holland has divided the I / O table in several parts, distinguished the use of materials for processing, use of materials to final consumption. For example, in the first case we find that the physical inputs are converted into other products, such as petroleum refining or processing of iron ore in the second there is the oil that is used in transport and cars built by ferrous materials (end-use ). The breakdown of the secondary material the extended PIOT is superior to the classification of industrial activities [18]. Regarding the specified materials there are more differences as shown in table 1.
Table 1. Comparison between different PIOTs structures constructed for accounts of some countries in 1990 and in 1995[9].
NNEETTHHEERRLLAANNDDSS GGEERRMMAANNYY DDEENNMMAARRKK IITTAALLYY FFIINNLLAANNDD YYEEAARR 1990 1990
1995 1990 1995 1995
MMOODDEELL PPIIOOTT
extended PIOT
basic PIOT
basic PIOT
basic PIOT
basic PIOT
NN.. SSEECCTTOORR
… 58 ( 1990) 60 (1995)
27 12 30
MMAATTEERRIIAALL TRASFORMATION FINAL USE cement, plastics, nonferrous metal, paper, steel, energy, steel and zing.
Total mass; energy; water; other materials.
Total mass; animals and plants; Stones and excavated material; energy;metal;machinary; transport;fertilizers; plastics;paper; packaging; products with nitrogen.
Total mass;
Total mass;
RRIIFFEERREENNCCEE Konijn et al. (1995e 1997)
Stahmer et al. (1997)
Gravgard-Pedersen (1999) Nebbia (2000)
Maenpaa et al. (2001 002)

Eco-Ist’12, Ecological Truth, 30 May - 2 June 2012. Hotel “Srbija TIS”, Zajecar, Serbia
493
An extended PIOT certainly gives more information, but can still improve to become complete, and this is done by inserting between the sectors and materials, recycling, packaging, landfill waste, incineration, emissions, changes in stocks.
RESULTS AND DISCUSSION
One of the limitations of PIOTs is the difference between existing methodologies with which they were developed PIOT in different countries. The levels of aggregation are different, by number and fields. Germany: 58 and 60 sectors, Finland: 30 sectors, Denmark: 27 sectors, UK: 76 sectors, Italy: 12 sectors. Regarding the breakdown of materials and product groups: the Danish table shows a table with 9 sub-groups of materials, the German shows only one difference between the groups of primary inputs: domestic material extracted, energy, minerals, stones, water and air. In the UK I / O table accounts of 96 economical sectors have originally been built. Afterwards these sectors have been joined to correspond to e UK NAMEA. These data have allowed to connect the PIOTs with 20 different polluting factors for each sector. Turning to the merits, one of the advantages of PIOTs is to be able to integrate into one framework the various sources of data obtained from: energy accounts, accounts of waste, production statistics, statistics for recycling and emissions and Statistics of International Trade [9]. If data are not readily available or are missing, the table I / O can also be used to fill some data gaps, which is seen as a structured framework of accounts and balance sheets of material can be used to identify data errors and fill voids. The information given in Tables I / O allows the connection between raw materials, energy inputs, production of goods and waste and emissions in each sector of the economy. An analysis of these data helps to identify priority areas to carry out strategies for managing natural resources, and compatibility between PIOT and MIOT yields a direct relationship between indicators derived from physical flows and economic indicators.
The resulting indicators are useful for monitoring the processes of splitting of the use of natural resources from economic growth and move towards a more sustainable use of them.
CONCLUSIONS The “dematerialization” of the economy and the decoupling of economic growth from environmental degradation are messages sent by various international organizations. The objective of reducing the use of natural resources is a necessary but not sufficient to ensure sustainability[32], the question remains as to understand what exactly to reduce. It is therefore important to develop a complete set of accounts to realize a sustainable development strategy. The PIOT allows the connection between micro and macro-level descriptions of material flows, the representation of the cycles, the identification of mechanisms and indicators of materialization. Its conceptual simplicity and includes the operational relationships of quantities and prices, factors and the technology of production, income distribution, capital investments and international trade work . The problem is to compare the existing tables, because the sectors are aggregated in different ways, and dissimilar materials are included and excluded. In

Eco-Ist’12, Ecological Truth, 30 May - 2 June 2012. Hotel “Srbija TIS”, Zajecar, Serbia
494
order to ensure comparability of tables I / O of distinct economies, it is of fundamental importance that international harmonization . This is aimed at creating a system for integrating environmental and economic accounts focused on a standardization of the methodological procedure to set the physical accounts nationally and
supra. Resolving the issue will be a precondition for further development and more widespread applications of the future PIOT
REFERENCES
1. Ayres R.U., Kneese A.V.,1969, "Production, consumption and externalities", American Economic Review, 59, (3), 282-297.
2. Ayres, R., Ayres, L., 1997, Use of material balances to estimate aggregate waste generation in the United States.In P.C, Schulze (Ed.), Measures of environmental performance and ecosystem condition (pp.96-156). Washington, DC: National Academy Press.
3. Alier J. M. 2010, Seminario tenuto presso la Facoltà di Economia di Pisa, Dipartimento di Scienze Economiche.
4. Bailey, R.,U., & Allen, J.K. ,2004, Appling ecological input-output flow analysis to material flows in industry al systems: Part II: Flow metrics, Journal of industrial economics 8 (1-2), 69.91.
5. Brown, L. R. , 2009, Piano B 3.0, Mobilitarsi per salvare la civiltà, Edizioni Ambiente, Milano.
6. Daly, H., 1968, On economics of Political Economy, Journal of Political Economy, 76 (3) 392-406.
7. De Marco O., Lagioia G., Amicarelli V., Sgaramella A., 2009, Constructing Physical Input-Output Tables with Material Flow Analysis (MFA) Data: Bottom-Up Case Studies” Handbook of Input-Output Economics in IndustriaI EcoIogy Edited by Sangwon Suh University of Minnesota, Departmento f Bioproductsa nd BiosysternsE ngineering, Saint Paul, U.S.A. Springer.
8. Hoekstra, R. 2003, Structural change of the physical economy.Decomposition analysis of phy.ical and hybrid-unit input-output tables. Amsterdam: Tinbergen Institute.
9. Hoekstra, R., Van Den Bergh, C.J.M., 2007, Constructing physical input-output tables for environmental modelling and accounting: framework and illustrations, Ecological Economics 59, 375-393.
10. Hubacek, K., Giljum, S., 2003, Applying physical input–output analysis to estimate land appropriation (ecological footprints) of international trade activities. Ecological Economics 44, 137–151
11. Giljum, S., Hubacek, K., 2004, Approaches of physical input–output analysis to estimate primary material inputs of production and consumption. Economic Systems Research 16 (3), 301–310.
12. Giljum, S., Hubacek, K., Sun, L., 2004, Beyond the simple material balance: a reply to Sangwon Suh's note on physical input– output analysis. Ecological Economics 48, 19–22.

Eco-Ist’12, Ecological Truth, 30 May - 2 June 2012. Hotel “Srbija TIS”, Zajecar, Serbia
495
13. Giljum, S., Hubacek, K., 2009, Conceptual Foundations and Applicationsof Physical Input-output Tables, Handbook of Input-Output Economics in IndustriaI EcoIogy Edited by Sangwon Suh University of Minnesota, Departmento f Bioproductsa nd BiosysternsE ngineering, Saint Paul, U.S.A. , Springer.
14. Gravgård-Pedersen O., 1999, Physical Input–Output Tables for Denmark. Products and Materials 1990, Air Emissions 1990–92. Statistics Denmark, Kopenhagen, ISBN 87-501-1076-4.
15. ISTAT, 2009, Costantino C., Femia A.,Tudini A., ,” Contabilità ambientale e pressioni sull’ambiente naturale: dagli schemi alle realizzazioni”, Annali di statistica, Anno 138 Serie XI - vol. 2
16. Kytzia, S., Faist, M., & Baccini, P.,2004, Economically extended-MFA: A material flow approach far a better understanding of food production chain. Journal of cleaner Production, J 2 (8-10), 877-889.
17. Kneese, A. V. Ayres, R.U. & d’Arge, R. C. , 1970, Economics and the environment: A material balance approach. Baltimore, MD/London: John Hopkins.
18. Konijn, P.J.A., de Boer, S., van Dalen, J., 1995. Material Flows and Input–Output Analysis: Methodological Description and Empirical Results. Notanr: 006-95-EIN.PNR/int BPA-nr: 698-95-EIN. PNR/int. Sector National Accounts, Statistics Netherlands, The Netherlands.
19. Konijn, P.J.A., de Boer, S., van Dalen, J., 1997. Input–output analysis of material flows with application to iron, steel and zinc. Structural Change and Economic Dynamics 8, 129–153.
20. Kratena, K., Chovanec, A., Konechy, R., 1992, Eine okologische volkswirtschaftliche gesamtrechnung fur osterreich. Die umwelt input output tabelle 1983. Wien: Institut fur sozial wirtschafts und umweltpolitische forschung.
21. Kratterl, A., Kratena, K., 1990. Reale Input–Output Tabelle und ökologischer Kreislauf. Physica-Verlag, Heidelberg.
22. Mäenpää, I., 2002. Physical input–output tables of Finland 1995 — solutions to some basic methodological problems. 14th International conference on input–output techniques, Montreal, Canada
23. Moll, S., & Acosta, J., 2003, Physical input-output analyses: some experiences from angoing research.Paper presented at the Con Account Workshop, Wuppertal.
24. Nebbia, G., 1990, "Sul valore energetico delle merci", Politica ed Economia, (III), 21, (7/8), 49-50.
25. Stahmer, C., Kuhn, M., Braun, N., 1997. Physical Input–Output Tables for Germany, 1990. Working Paper No. 2/1998/B/ 1German Federal Statistical office.
26. Statistische Bundesambt, 2001. Endbericht zum Projekt A Physical 27. Input–Output Table for Germany, 1995. Vertragsnummer 98/
559/3040/B4/MM, Wiesbaden.

Eco-Ist’12, Ecological Truth, 30 May - 2 June 2012. Hotel “Srbija TIS”, Zajecar, Serbia
496
28. Suh, S., 2004a. A note on the calculus for physical input–output analysis and its application to lan d appropriation of international trade activities. Ecological Economics 48 (1), 9–17.
29. Suh, S., and Kagawa S., 2009, Industrial Ecology and Input-Output Economics: A Brief History, Handbook of Input-Output Economics in IndustriaI EcoIogy Edited by Sangwon Suh University of Minnesota, Departmento f Bioproductsa nd BiosysternsE ngineering, Saint Paul, U.S.A. , Springer.
30. Strassert, G., (2000), physical input-output accounting and analysis: new perspectives, 13th International Conference on Input-Output Techniques, Macerata, Italy
31. Weisz, H., Duchin, F., 2005, Physical and monetary input– output analysis: What makes the difference? Ecological Economics 57 (3), 534-541.
32. WRI (World Resources Institute), 2000. Weight of Nations: Material Outflows from Industrial Economies. World Resources Institute, Washington DC.

497
XX International Scientific and Professional Meeting
"ECOLOGICAL TRUTH" ECO-IST'12
30 May - 2 June 2012, Hotel “Srbija TIS“, Zajecar, SERBIA
ECOLOGY AND PRICE POLITICS
Radmilo Nikolic*
, A. Fedajev, S. Urosevic, I. Svrkota
University of Belgrade, Technical Faculty in Bor, V.J 12, 19210 Bor, SERBIA
*
ABSTRACT
For a long period of time ecology didn’t occur as a specific problem in economy development. All of the activities were mainly focused to business economy, economic improvements and enlargement of profit.
However, serious ecological issues occurred in the second half of last century and changed the relations between ecology and economy. Ecology becomes important factor of economical development.
Significant changes are visible in the economy of business entities, too. Ecological issues are truly respected, both in ecological costs and income benefits. It is especially explicit in the area of politics of products and services prices.
Key words: ecology, economy, ecological costs, prices
INTRODUCTION
In the past, economic development and business economy were a constant threat to environment. Everything was subordinated to profit. Natural resources had been carelessly destroyed or used improperly. The environment was polluted and human health endangered.
In time, conflict between economy and ecology becomes actual more and more. Ozone holes, Greenhouse effect, increasing pollution of water and soil and rain forests are some of the environmental problems which caused concernments in entire world. Everybody realized that this situation is unsustainable.
Providing a sustainable economic development now includes overcoming the antagonisms in this field. It means that environment protection has to become an important factor in industrial development and a binding aspect in the economy of business entities. [1]
In business economy, ecological component may have a double role, i.e. it may represent a cost, but it could also contribute to the increase of income. This role could especially be reflected through prices of products and services, which is the topic of this paper.

Eco-Ist’12, Ecological Truth, 30 May - 2 June 2012. Hotel “Srbija TIS”, Zajecar, Serbia
498
ECOLOGICAL COMPONENT AS AN ELEMENT OF COSTS AND SELLING PRICE
In a period when ecology has not been considered as a factor in business
economy, ecological costs were not included in calculations of costs and business results. The logic was that natural resources are available for free, while damages occurred in the process should be repaired by society or government. That is the reason why natural resources were used recklessly and environment suffered global damages. On the other hand, business entities which used natural resources had an economic freedom in this aspect, since significant share of costs had no influence on their business results.
After introducing ecology as a complementary field, significant changes happened in business economy. Environmental damages caused by business entities were treated as business costs and were named ecological costs. This way they became an element of cost price, as well as selling price and thus a part of business entities’ expenses.
If we divide costs according to their share in cost price, cost price has following structure [2]:
CP = Cdir + Cind
,where:
CP is cost price, Cdir C
are direct costs and ind
are indirect costs.
Direct costs are all the costs made during creation of use values. Direct costs can be monitored, analyzed and directed, i.e. they can be managed, such as material costs, facilities costs, labor costs, production service costs and non – material costs. These costs are directly included in calculation of cost price.
Second group of costs are general or common costs. They are also originated during the operations of business entities, but they are related to more products. By their origin, they are divided into general operational costs and general management and sale costs. Before they are included in calculation of cost price, they have to be distributed to elements by certain mechanisms (keys). These costs can also be divided as previous group.
Ecological costs (Ce) make the third group of costs included in calculation of cost price. Basically, they have a character of common costs since they are also related to more products. Ecological costs are expressed through pollution of air, soil, water and negative influence to environment generally. In literature, they are often named as external costs. Including these costs into product price enables so-called “interning of external effects”. The principle of external environmental costs interning is based on adding these costs to individual (private) costs of the pollutant. Interning enables converting of external negative effects made by pollutant into internal effects, by including external costs into price calculations and other means of financial obligations. Thus, external costs are included into internal calculations of costs and incomes and also into internal calculations of company budget. [3]
So, cost price is a sum of direct, indirect and ecological costs:
CP = Cdir + Cind + Ce

Eco-Ist’12, Ecological Truth, 30 May - 2 June 2012. Hotel “Srbija TIS”, Zajecar, Serbia
499
If a product price would be made only by internal costs (direct and indirect), marketing balance would occur at point A, with balance quantity Qb and balance price Pb
When ecological (external) costs are included, price rises and offer (O) decreases, hence offer curve moves from O to O
(Fig.1).
1
and new marketing balance occurs at point B (Fig.1.).
Figure 1. Marketing balance with and without ecological costs
Besides, in case of use of non – renewable natural resources, there is one more
element of price cost, so-called user cost (Cu
). This is a consequence of limitations of such resources. The user of non – renewable resources diminishes the possibility of their use in future. Hence, it is treated as additional cost in price cost:
CP = Cdir + Cind + Ce + C
u
Addition of user costs causes new marketing balance (Fig.2):
Figure 2. Marketing balance with internal costs, ecological costs and user costs

Eco-Ist’12, Ecological Truth, 30 May - 2 June 2012. Hotel “Srbija TIS”, Zajecar, Serbia
500
When product sale price includes only internal costs, marketing balance is achieved in point A. When the price is increased by ecological (external costs), curve O becomes curve O1, with balance in point B. Finally, after adding user costs, the price is highest while offer is lowest, which is represented by curve O2. In this case, balance is achieved in point C, with quantity Qb2 and price Pb2
Such situation should motivate business entities to use natural resources rationally. Ecological and user costs make the product more expensive, so business entities with lower additional costs (C
.
e and Cu
Product sale price is also dependent on different taxes. In our country, we have ecology tax and a compensation for products which become special waste after use. Ecology taxes are determined by Local Governments (Municipalities and Cities) in order to solve environmental problems in their territories. For business entities, these taxes have a character of costs and they are included in calculations of business results. Compensation for handling special waste is intended to producers and importers of products which become special waste after use. This way, costs of handling special waste are covered. These are following products: all sorts of tires, products containing asbestos, batteries, mineral and synthetic oils and lubricants, electric and electronic products, products used for production, distribution and measuring of electric energy and electro-magnetic fields. These taxes and compensations are calculated in product price, i.e. they increase product’s retail price.
) will be more competitive at the market and will have better positioning.
ENVIRONMENT AND PRODUCT PRICES
Many natural goods are not the subject of market exchange; hence they don’t
have market value and they are called non-market goods. However, these goods are often related with commercial goods and they may have the influence to their value, both positive and negative. In literature, there are many methods of environment evaluation. These methods can be direct and indirect. First group of methods is based on simulated markets, while second group relies on market prices of products and services which are strongly related to natural goods considered in evaluation, i.e. non-market goods. [4]
For instance, in some city, level of air pollution varies. City area is divided into several zones. Air pollution is highest in downtown, and it decreases towards periphery. Level of air pollution is directly related to real estate prices (Fig.3).

Eco-Ist’12, Ecological Truth, 30 May - 2 June 2012. Hotel “Srbija TIS”, Zajecar, Serbia
501
Figure 3. Zones of air pollution and real estate prices
In downtown, with highest level of air pollution, demands on real estate are lowest, as well as prices. As level of air pollution decreases, real estate prices grow, hence they are highest in city periphery, in Zone III. Of course, this is the case only if no other factor which affects real estate prices is taken in consideration. In this case, differences in real estate prices may be treated as a value of clean air (“hedonist price”).
Also, in this example, average real estate value is 900 EUR/m2
Also, environment may have a significant influence on labor price level, i.e. wages. In market economy, labor is considered as goods, and hence it is a subject of offer and demand on the market. Level of wages depends on labor market.
. In downtown, prices are below average due to air pollution, while in the zones with clean air, prices are above average. There are many similar examples. For instance, prices of products and services in touristic destinations are usually higher than in other areas. Values of non-market goods, such as clean air, healthy environment, become valorized through products and services they are related to. Their values increase the values of products and services realized on touristic market.
So, if all other elements of price of labor are identical, employees in polluted areas will have higher wages, because there will be less interest of employees in such areas. In order to provide quantity and quality of workforce they need, employers have to offer higher wages.
Figure 4. Influence of environment to level of wages

Eco-Ist’12, Ecological Truth, 30 May - 2 June 2012. Hotel “Srbija TIS”, Zajecar, Serbia
502
Situation is opposite in healthy environment. Offer of labor is higher, hence the need for employees is lower and their wages are lower.
Difference of wages in two areas should compensate environment issues (method of hedonist wages).
CONCLUSION
Ecology is relevant and obligate factor in modern economy, with a strong influence to growth and development in macro-economy, and as an important element of business economy of business entities at micro-economical level. Complementarity of economy and ecology is our reality.
Ecological costs are an obligate element of cost price and selling price. This is the way to provide funds for rehabilitation of environmental damages. Also, ecological costs, as a part of product price, may have a significant influence to product positioning on the market. This way, business entities are forced to minimize environmental damages in order to minimize ecological costs.
At the end, many elements of environment, treated as non-market goods, may have a huge influence (positive or negative) on prices of products and services related to them. Realization of market goods provides valorization of non-market goods.
REFERENCES
1. R.Nikolic, Ekonomija prirodnih resursa, Kompjuter centar, Bor, 2010. 2. R.Nikolic, Troskovi u poslovnoj ekonomiji, Don Vas, Belgrade, 2012. 3. B.Milenovic, Ekoloska ekonomija, Faculty of Protection at Work, Nis, 2000. 4. Group of authors, Ekonomija privrednog kapitala, IDN, Belgrade, 1998. 5. G.Rikalovic, Ekonomika prirodnih resursa, “Djordje Natosevic” Library,
Indjija, 1999. 6. Pearce, D.W., R.K.Turner, Economics of natural resources and the
environment, New York, 1990. 7. R.Pesic, Ekonomija prirodnih resursa i zivotne sredine, Faculty of Agriculture,
Belgrade, 2002. 8. S.Milenkovic, Resursi u ekonomiji, Faculty of Economy, Kragujevac, 2000. 9. Serbian Government Regulations, “Sl.glasnik RS” , No 54/10.

503
XX International Scientific and Professional Meeting
"ECOLOGICAL TRUTH" ECO-IST'12
30 May - 2 June 2012, Hotel “Srbija TIS“, Zajecar, SERBIA
COST-BENEFIT ANALYSIS, EFFECTIVE TOOL SUPPORT OF
SUSTAINABLE PROGRESS
Marius-Nicolae Miculescu*, C. Miculescu, A. Bratu
The Christhian University „DimitrieCantemir” The Faculty of Tourism and Commercial Management Timisoara, ROMANIA
ABSTRACT
Sustainable progress is, at present, a major concern of major governmental international
organizations to ensure that is balanced with environmental protection, with favorable consequences in the future. Thus, in the current economic context, aimsrealization of socio-ecological processes characterized by human need, maintaining quality of environment an unlimited period of time. For this purpose it developed many project financed by international sources or from internal sources, projects whose feasibility study is conducted through an intermediary assessment methods, namely cost-benefit analysis. Therefore, in this paper we aimed to highlight the importance of this method in social decisions and decisions to ensure effective facilitating the distribution of society's resources.
Key word: cost, benefit, efficiency, sustainable development
INTRODUCTION
European Union Treaty of Amsterdam in 1997, stated in art. 6 that: "The requirements to protect the environment must be integrated into the definition and implementation of Community policies and activities (...) especially taking into account sustainable development". Subsequently, the European Union Sustainable Development Strategy (SDS) in 2001 draws its main objectives are economic growth, greater social cohesion and a better environment, priority being: climate change, public health, poverty and social exclusion, aging, mobility and transport, natural resource management.
Therefore, in recent years, there are concerns more widespread in the international working forums in the convergence process to achieve sustainable progress of society, characterized by several trends:
▪ adopting a new mechanism to address and implement public policies and empowering the harmonizing policies in the economic, social and environmental;
▪ realization of the external/international dimension; ▪ addressing environmental dimension;

Eco-Ist’12, Ecological Truth, 30 May - 2 June 2012. Hotel “Srbija TIS”, Zajecar, Serbia
504
▪ gradual change consumption and production, quality of life, sustainable communities, innovation potential use on the environment and social economy. Thus, it can observe the tendency to support the idea that environmental
protection should constitute an integral part of any development process and cannot be considered in isolation from them.
To achieve these objectives is necessary, however, implementation of a series of projects that provides a synergy of resources, organizations and individuals, projects whose effectiveness is measured or estimated using the methods by which the quantification of resources and the effects will result from adoption of these projects. One of these methods is the cost-benefit analysis.
COST-BENEFIT ANALYSIS - CHARACTERISTICS AND STAGES
Cost-benefit analysis (CBA) is a standard method for assessing project
feasibility studies for projects financed by international sources or internal sources, which is made assessing the costs and benefits, in this case, projects that involveenvironment.
The main purpose of cost-benefit analysis (CBA) is to help social decisions. More specifically, the objective of CBA is to facilitate more efficient allocation of society's resources, which helps support sustainable progress.
Within each project requires a cost-benefit analysis. If you study the regulations for implementation of projects we see that there are provisions in this regard. For example: the ISPA1
The main types of cost-benefit analysis are
Regulation No. 1267/1999, Annex 1 states that require a cost-benefit analysis, including direct and indirect effects on employment.
2
- ex-ante CBA, which is standard CBA, the usual sense of the term. Is performed during a project or policy is still under study, before implementation or start it. Ex-ante CBA will be made when deciding whether scarce resources should be allocated by the government for a specific project or policy, so its contribution to decision making is direct, immediate and specific.
:
- ex-post CBA- is carried out at the end of the project. At this point all resources have been used in the project. The CBA ex - post is more comprehensive, but less direct, since it provides information not only about an intervention, but about the cataloging of such interventions. They contribute to learning by managers if certain categories of projects are appropriate or not.
- CBA in medias res - takes place throughout the project life;
1ISPA - Instrument for Structural Policies for Pre-Accession - is the second financial instrument grant designed
to support candidate countries in EU accession process. ISPA provides financial support for investment in environmental protection and transport, to accelerate the harmonization of legislation with European candidate countries in these two sectors.
2Boardman, A.E., Greenberg, D., Vining, A., Weimer, L., (2004), Cost-benefit analysis, concepts and practice, Ed ARC, Chisinau, p.3

Eco-Ist’12, Ecological Truth, 30 May - 2 June 2012. Hotel “Srbija TIS”, Zajecar, Serbia
505
- comparative CBA - an analysis comparing CBA ex-ante to ex post CBA for a single project. This analysis is most useful for decision makers in policy, to discover the effectiveness of CBA as a tool for evaluation and decision making.
To achieve a cost-benefit analysis requires accurate through the various steps, which are prerequisites, but necessary for cost-benefit analysis.
Table 1. Cost-benefit analysis steps
No. crt.
Stages performing CAB Description
1. Specifying the set of alternatives
pass through this stage if the CBA is done at the pre-feasibility study in order to choose an optimal choice both technically and economically, for investment considered.
for a project in the feasibility study phase of this stage is replaced by the definition of investment objectives (general and specific) and establish working hypotheses (time horizon, so currency exchange rate, discount rate).
2. Identify subjects who will receive benefits and those who will bear the costs
This stage involves defining the target group and beneficiaries of the investment. Depending on the impact of investment is in terms of target group size and number of beneficiaries "affected", the extent CBA can extend from local to regional or even national.
3. Cataloging and selection of indicators measuring impacts (units) (the numbers behind financial results)
investment costs for production; operating costs of the investment period (utilities,
salaries, repairs current repairs, administrative materials, etc.)
operating income from the investment period (from the sale of goods, of services, from the collection of user charges, etc..)
residual value of the investment. 4. Quantitative
estimation of impacts over the life of the project (the numbers behind the results of economic - social)
quantifiable monetary costs (opportunity costs, environmental costs, etc.)
quantifiable monetary benefits (benefits in lives saved, benefits of time saved, benefits of near misses, benefits of institutionalization avoided, benefits from increased tourist attraction, etc..)
5. Monetary assessment of impacts
regarding the socio - economic, in addition to quantifiable monetary benefits and costs (valued) should also be taken into consideration costs and benefits cannot be measured, but whose expression may be positively or negatively affect the subjects covered by investment;
examples of such costs and benefits are: facilitating access to health services and education, creating a comfort on the go, creating favorable conditions for leisure and relaxation, aesthetic benefits, pollution by emissions, noise, etc. .

Eco-Ist’12, Ecological Truth, 30 May - 2 June 2012. Hotel “Srbija TIS”, Zajecar, Serbia
506
6. Update the value of benefits and costs for obtaining the current value
need to update results from the fact that most people prefer to consume now rather than later and, therefore give up eating more in the future. This difference has nothing to do with inflation;
procedure by which a future value is "made" today; cost or a benefit is obtained in "t" is transformed into
present value by dividing the (1+s)t, where is the discount rate.
7. Calculation of net present value for each alternative in some horse
economic rate of return on investment (or the EIRR RREI);
calculating the net present economic value of the investment;
calculationthe economic report cost/benefit(ER c/b). 8. Sensitivity analysis sensitivity analysis appeared from the need to test the
assumptions used in financial analysis and the socio - economic;
results of this analysis can be more meaningful and important for the decision to invest only the results of financial analysis or socio - economic.
9. Risk analysis risk analysis completed risk analysis and sensitivity analysis strengthens the conclusions;
There is a twofold approach in risk analysis: - qualitative (probability and impact) - quantitative (statistical evaluation methods, eg.
Monte Carlo) to automate quantitative risk analysis developed
specialized software: @ Risk, Enablon RM, RiskDecision, and others.
10. Drawing Conclusions
conclusions must be made clear and consistent with the objectives pursued in the analysis;
to formulate reliable conclusions to be followed at all stages of analysis. It is recommended that the completion of each stage to make some conclusions related to those considered at that stage;
it is also preferable to make such conclusions as recommendations
analysts make recommendations and decisions do not take.
Source: made by author and processed by Anthony Boardman3
TYPES OF COST-BENEFIT ANALYSIS USED IN PROJECT SWITH ENVIRONMENTAL CONSEQUENCES
Costsand benefits ofinvestment projectsrespectsustainabledevelopmentcanbe dividedinto threequantifiableandqualitativefourthcomponents
a) :
3Work cited, p.8
directcosts andbenefits

Eco-Ist’12, Ecological Truth, 30 May - 2 June 2012. Hotel “Srbija TIS”, Zajecar, Serbia
507
b) costsandbenefits of environmental externalities determined as result of the
c) costs and benefits of environmental externalitiesevaluationsbasedonmarket prices;
4 determined as a result of the evaluation based on “ghost prices” (
d) shadow prices)
costsandbenefitsdueas a result of qualitativeexternalities.
a) Direct Costs and benefits .This refers to the economic value of resources used and results obtained value. In case of direct cost components - for example land - should be included in the CBA as a basic part of project. The costs are considered / treated to prevent environmental degradation - so the cost of prevention can avoid the cost of reconstruction / rehabilitation. The direct benefits of a project are the value of results. Income from sale goods and services of the project, for which there is the market, can be considered as part of direct benefits.
b) Externalities and evaluation. If direct pricing don’t make problems in evaluation activities, foreign prices are more complicated. There is no the emphasis on quality in evaluating these benefits but they must be identified to be included in the CBA.
It should be highlighted two main problems of externalities in the CBA: - Identify externalities before project implementation; - Quantifying the value of externalities for inclusion in the CBA.
The first problem / issue are important to have a complete picture of the environmental impact of the project, the second involves measuring the externality in monetary terms, but there are some externalities which doesn’t have a market assessment.Externalities typically occur during production, distribution and consumption and thus can have positive effects on the environment and living standards of population. Where environmental values are no important, they can be determined by consulting/questioning people through so-called probable evaluation method (PEM).
b.1. Externalities valuation based on market prices. The most convenient method and commonly used approximate evaluation of externalities are by appreciations the market value of goods and services destroyed or in demand as a result of externalities (positive or negative). Methods evaluation positive and negative externalities refer to:
• Approximate change in productivity- this approximation can be measured to evolving environmental conditions that influence productivity in forestry, agriculture, fisheries etc. Analysis can be extended to some other domains such as tourism.For example: by air and water pollution must be abandoned a
4Externalities = representing the social costs necessary to restoring degraded environment, including human health. Environmental externalities, which occur when private costs differ significantly from those social phenomena are more common, but are beyond the market system, thereby facilitating the deformation mechanism of optimal allocation of resources and complaining, while intervention public power. Externalities occur when production and consumption give rise to unintended costs or benefits for others, the effect of economic behavior, no quantifiable in money, unfound in willing market transactions.

Eco-Ist’12, Ecological Truth, 30 May - 2 June 2012. Hotel “Srbija TIS”, Zajecar, Serbia
508
particular culture and farmers must turn to other less valuable and therefore utilization with the difference in net benefits. The situation can be reversed - by a project implemented; farmers can turn to other culture as a result of positive externalities that obtain a benefit as a result to environmental improvement. So it is very important to identify the effects on productivity in the presence or absence of environmental effects.
• Analysis of loss or gain of income - change in the productivity of a geographic area as a result of the project is felt by the human factor. Air and water pollution has an impact on public health by reducing workdays, medical costs, specific diseases as diarrhea, stomach problems etc. All these aspects lead to so-called cost - loss. Reverse, improving environmental conditions, people can enjoy better health, a shorter working day or week. So public health related benefits are very important, which should be included in the CBA.
• Prevention analysis of expenses - evaluating the damage caused by environmental degradation and expenses to be support by the population to prevent it to a certain level is done by the competent authorities - local, regional, national.These costs shall be support to maintain the productivity of economic activities within the income value necessary to obtain living, state of the environment (landscape aesthetics) etc.. Entrepreneurs and individual persons will support/allocate funds to prevent/avoid negative environmental impact (flood/drought etc.) while the damage will be less than or equal to the cost of actual damage. If the damage value are decreases compared to productivity then the amount of expenses leads to benefit results.
• Analysis of relocation/repair expenses - the cost of relocation/repair is the cost of relocation the villages, communication means, economic, agricultural land by implementing a project such consequences in territory. Recovery air and water quality, by specific actions is also through the cost/benefit.
• Analysis of reorientation of the expenses workforce - the workforce reorientation has many causes but the environmental conditions they may result from degradation and guidance to other preoccupations or implement a project that requires moving people and providing alternative professional in addition to the removal.
b.2. Externalities valuation based on price ghost (shadow price). Shadow prices
are the prices externalities that measuring the indirect externality effect on living standards. This can be done using other goods and services that is closely related to externality in order to evaluate when there is no shadow prices for final goods through direct questionnaires of opinion on the value that people attach to changes in environmental conditions using a hypothetical market.These methods are the quite new and difficult to apply, especially in developing countries or in the in transition as and Romania, with the probable exception of the valuation method (PEM), but involving data and time, approved person, but useful in evaluating the future environmental goods and services.

Eco-Ist’12, Ecological Truth, 30 May - 2 June 2012. Hotel “Srbija TIS”, Zajecar, Serbia
509
c) Probable evaluation method (PEM).In some situations externalities caused by a project cannot be measured directly or indirectly, because there is not a current market or shadow market for goods and services proposed.PEM is the process which involved questioning people that is willing to pay and how much to get some profit.
This method takes into consideration personal/individual evaluation, increases
or decreases on the environmental quality of goods and services probable in relation to a hypothetical market. This method has the advantage that can be used in many situations and practice in evaluation of environmental effects. The examples are numerous: construction of an airport, a highway, an industrial objective, some supermarkets, recreational facilities etc.
PEM's important requirement is that the probable evaluation - that is hypothetical market as close as possible to the real market. The PEM's uses appear, however, several sources of influence that can change the value to be paid as follows:
• Strategic influences - understatement/overstatement of the sum to be paid for an advantage to the environmental or the amount that is claimed to renounce the advantage. People/entrepreneurs want to underestimate the amount of environmental improvement and therefore cheaper or overestimation to take an advantage in the hope that it will not paying in the future;
• Hypothetical influence - resulting from hypothetical answers to hypothetical questions, PEM - is based on hypothetical evaluation building on the fact that people can appreciate the project discussed.
• Consentinfluences - desire/kindness of the person questioned to satisfy the objective under opinion, tend to believe that any environmental improvement is welcome and so are an overestimation because the project costs is not available.
• Design influences - presentation of the project; sum of starting project; level information to the public on project details.
CONCLUSIONS
CBA can be understood as an analysis provides a framework for measuring
efficiency5
Following the conclusions presented can identify some cost-benefit analysis for use in evaluating projects aimed at sustainable economic development:
. It reflects a situation where resources such as land, labor and capital are combined in the most valuable, creating goods and services. In the analysis that is intended exclusively to efficiency, CBA provides a method to make direct comparisons between different types of project. Even in cases where also pursued objectives other than achieving efficiency, CBA provide a benchmark that can provide information about the relative effectiveness of policy choices.
5meaning that we give the term efficiency is the efficiency of allocation; a comprehensive approach is to maximize social welfare of special functions, underlying resource allocation hierarchy variants.
Eco-Ist’12, Ecological Truth, 30 May - 2 June 2012. Hotel “Srbija TIS”, Zajecar, Serbia
510
CBA's purpose is to show that the project benefits society; it must be taken into account all costs and benefits even if some goods and
services are provided free by the authority or other interest groups; prevention costs are considered common-direct expenses; identifying direct costs and prevention of further environmental degradation
provides a good understanding of cost / benefit; requires the introduction/promotion of high technology, clean to prevent further
environmental degradation and environmental benefits; most important benefits of a project to increase environmental quality to be
included in the CBA, are externalities based on market prices; addition to direct benefits, there are environmental benefits, health and
productivity of complementary, avoiding the costs of prevention;; benefits, which are based on shadow prices may apply provided that no question
of money and time (extremely rare); CAB site is under development with future prospects and therefore need not be
superficial, but thoughtful; when these methods are well-informed people learned, are easily applied and
accepted by the population.
For an analyst it is important to realize, however, and the limits of a CBA. Two types of situations are of net benefit criterion inadequate rule of decision making in sustainable development projects. First, the narrow confines of technical device may make it impossible to quantify and measure in monetary terms relevant effects - costs, benefits. Secondly, the project may propose another main objective, not efficiency, such as social equity and opportunity. In any case, even when the net benefit is not an appropriate criterion as a rule of decision, CBA provides a standard measure for comparing policy choices, in terms of efficiency projects
REFERENCES
1. Boardman, A.E., Greenberg, D., Vining, A., Weimer, L., (2004), Cost-benefit
analysis, concepts and practice, Ed ARC, Chisinau 2. GârboanRaluca,(2006), Methods used in program evaluation: social impact
analysis conclusions, Ed Accent, Cluj-Napoca 3. Harribey Jean Marie, (1998), Sustainable Development, Economic, Paris 4. Pearce D., Warford J., (1994), World Without End. Economics, Environment and
Sustainable Development, Oxford University Press 5. Bretschger Lucas, (1999), Growth Theory and Sustainable Development,
Bookcraft (Bath) Ltd. 6. *** - European Commission, Guide to Cost-Benefit Analysis of investment
projects, final report, 16.06.2008 7. *** - www.theiiba.org - Business Analysis Body of Knowledge – International
Institute of Business Analysis

511
XX International Scientific and Professional Meeting
"ECOLOGICAL TRUTH" ECO-IST'12
30 May - 2 June 2012, Hotel “Srbija TIS“, Zajecar, SERBIA
OVERVIEW OF CURRENT TRENDS AND CHALENGES IN THE MODERN
WORLD OF INTERNET, WEB APPLICATIONS AND SERVICES. ADVANTAGES AND CHALENGES OF BUSINESS AND COMMUNICATION .
Milos Stevic1, R.Cvejic
2
1Megatrend University, Belgrade, Srbija, FPS Pozarevac, SERBIA 2
ALFA University, FSOM, Belgrade, SERBIA
ABSTRACT
This document represents the review of the current and some future internet trends that are affecting the way we do business today. It alao presents some new emerged methods of how we communicate and exchange thougts, ideas , opinions and status.Document also explains the sudden rise of use of web applications in business contrary to standard offline applications. In the end the document will be mentioning and reviewing some chalanges and threats that exist in the present constantly online and everywhere accessible world.
Key Words: Internet, Web applications, Cloud computing, Web 2.0, I.T. Security
INTRODUCTION
Internet , a key advantage of modern life and age. Internet is the medium that makes almost every aspect of modern communication and business possible. It has infiltrated all media and telecomunication industries and also every imaginable field of business and industry . The effect of impact is so great that its often being said it is industry-changing. The internet has caused a significant shift of major player roles in some industries. There where days when you could not imagine a company that doesn`t have a telephone , or doing business without those tools . Today try picturing a company without a website or without internet communication . You would hardly think of such a company as productive , serious or competitive. Today internet is not only in our homes and offices ,it has spread amazingly and infiltrated all sorts of markets and devices. It is in our mobile phones, our tv`s, our refridgerators and kitchens, our cars, boats, airplanes, our laptops, simply put it is everywhere. Why you ask? Because it is needed everywhere! Internet simplifies our tasks ,and makes our current and future devices even more advanced thus enabling us to do more in less time and do things that we weren`t able to do before. This widespread adoption of internet infrastructure and it`s services model is the main reason for most companies to start basing their work around them. This previous extract explains why more and more companies are bringing their work to the web.

Eco-Ist’12, Ecological Truth, 30 May - 2 June 2012. Hotel “Srbija TIS”, Zajecar, Serbia
512
TRENDS
The rise of Web applications
The web , short from world wide web is not the internet ! The internet represents a network that is using the same protocol and standards in order to transport information to any device where ever it may be in the world and it provides means for such information “packet” to be routed and to find it`s way to final destination.
Web is the internet`s most used and popular service that 90% of us use. It is based around a software program called a web browser that allows us to acces variuous content and data interactively. The web is a set of services which are accessed trough a web browser using the same transport mechanism`s like HTTP.
But what are web applications? Web applications represent and use the same technologies as internet websites
but are usually more advanced then regular presentation web sites and are deployed to enhance business logic.
In history companies used applications that where located on their local computers , then as network technologies and their bandwirdth troughput evolved, applications started moving to centralized server computers for clients to access them. Finaly when internet bacame vastly widespread , companies started porting their business applications and logic to the internet and web. By putting their application to the web companies are able to cut costs of application maintenance and provide access to their employees and any third parties where ever they might be located in the world. There are no more software installations no more configurations for different computers. Simply put all a person needs in order to access and use application is a computer with internet access and a web browser, the user can be located anywhere in the world. These are one of the main reasons why companies have adopted these technologies globaly at such a fast pace and are actively using them.
Web technologies and standards support full multithreading , concurent usage and portability.Software can work in an internal network as well as over the internet or on a public internet server without any special demands or programming tweaks.Productivity of work is also amplified from the clients side with simpliest requirements possible.The client only needs a standard web browser.There are no client side software installations and no client side data storage that could compromise the overall security and stability of the cients system as well as increase the maintenance costs in case of client equipment failure.The client only needs conectivity with the server through its internal network or over the internet
Web 2.0
When we talk about development of web applications we have to notice that their design and interactivity has evolved step by step with the internet as a whole. This has led to a situation that web application development almost by default always

Eco-Ist’12, Ecological Truth, 30 May - 2 June 2012. Hotel “Srbija TIS”, Zajecar, Serbia
513
involves a whole spectrum of various technologies and programming languages that are being used in their production.
Currently popular trend across the net in web development is the so called WEB 2.0 development process which actualy decribes the building of more interactive web pages and applications using those technologies that have very similiar feel ,behaviour , and interactivness as standard offline desktop based applications that where used trough the last decade. This evolutive step in web application design has removed the last obstacle for most companies not wanting to move their existing applications to the web, the user interface “interactivness”.
Social Networks
The next big trend in web communications that has exponentialy evolved most
unexpectedly are social networks. Soocial networks became gathering sites for thousands and millions of people where they are able to communicate, have fun and exchange thoughts and ideas. They first started of as places of gathering for leaisure time or fun , but they attracted so much traffic and attention that a whole new industry or industries have evoolved around them. Social networks have now been reckognized by business proffesionals as a very powerfull medium and as a a whole new market for promoting, providing services and products as well as communication with other people, customers , business people and potential partners thus enabling the spread of business effectively across the borders and making it global . Social networks became a phenomenom of their own and have became ebraced by business proffesionals across the globe.
Staying in Sync
Once upon a time, most of us had only one computer. We stored all of our work on its hard drive. If we wanted to share our data with someone else, we copied it to a floppy disk and physically carried it to the other system. The world was much simpler then. Today, many of us have multiple computers: one at work, one or more desktops at home, a full-fledged laptop for heavy-duty work on the road, a netbook for lighter tasks, and a smart phone that's really just a hand-held computer. Our data files may be stored on any of these devices, or on one or more servers somewhere on a network. We often collaborate with others across the hall or across the world in creating and editing those files.
With such a wide spread and proliferation of web and internet technologies and with posibilities of access to our data and content from various devices “staying in sync” or keeping all of our devices synchronised started to become more and more of an issue.
Cloud Computing
The next trend that is currently being implemented and propagated, this time by the big companies, is so called CLOUD Computing . Cloud computing is a term that describes how we access and use our applications and data. It`s name tell`s us figuratively that our data and applications are somewhere “out there” on the internet or in the “CLOUD” meaning we no longer need to know where is our data physicaly stored

Eco-Ist’12, Ecological Truth, 30 May - 2 June 2012. Hotel “Srbija TIS”, Zajecar, Serbia
514
and on which computer it is located , we just access it , use it and save our work in the cloud ,paying only for usage and access . Devices which we use to access our data will become so called thin clients or devices with little or no hardware storage and only with various communication options by which we connect to the cloud. In this scenario ,which is currently being heavily promoted and even implemented by more and more large and influential IT companies , all the server and infrastracture costs and scalability become the problem of the cloud services provider and users don’t need to ever worry about runnig out of resources, they only pay access or cpu usage fees.
CHALENGES
Old data never dies and It's everywhere
Today, our data is not confined to our computers' hard drives and the removable drives attached to it, or even to our own networks. Many of us have multiple devices, including laptops and smart phones on which data is stored, and even worse, much of the information we create and save resides not on any device that's physically under our control but somewhere "out there" in the cloud.
Researchers at Cambridge University revealed that most of the major social networks like Facebook don't erase your data from their servers when you delete it from your pages
The troubling thing is that not only are the deleted items still sitting there on the server where Facebook's administrators could access them, but they're even still accessible across the Internet to a Facebook user who has the direct links they were originally assigned.
Now you could argue that anybody should know that information uploaded to a social networking site loses any illusion of privacy. Let's say you post a comment in a friend's status update thread that you decide, after a moment's reflection, might not be appropriate or gives away information you'd prefer not to share with the world. Even if you delete it as soon as it appears, it also appeared on the pages of all those who have access to that particular thread of discussion - and all of those who actually participated in the thread or even just clicked the "Like" button will get an email notification that includes the content of your comment if they have their settings configured to receive such notifications. There's no way to take those back
It's not just social networking sites that save information long after everyone thought it was gone, though. There are millions of old, orphaned web pages out there whose creators can't access them to change them or take them down, Google caches pages so that web searches can still see them even after they have been removed from the web server, and backups of ancient data still languish on the shelves of numerous server rooms.
Many users don't realize that it's not just computers and the miniature handheld computers we call phones that store information for years. Many devices that were once considered peripherals and many standalone electronic devices have computers inside them and are capable of storing information. For example, GPS navigation devices can store the routes you've taken and thus a record of your travels.
.

Eco-Ist’12, Ecological Truth, 30 May - 2 June 2012. Hotel “Srbija TIS”, Zajecar, Serbia
515
Who Controls the Technology that Controls Your Life? ISP
As we have reviewed some properties of current modern business and user
communication trends we can see a great level of importance of consistent connectivity. This scenario which has become very common gives a great deal of control over your business to the provider of such connectivity service , or your internet service provider. If our business is based around internet services then we have become completely depandable on connectivity.
Also we're all becoming more and more dependent on technology, whether we want to or not,. Most of the time, it all works and we reap wondrous benefits from the gadgets and technological infrastructure that have become such an important part of our lives. Other times, something goes wrong and we experience the problems that arise.
But even those of us who depend on the Internet don't really consider it completely dependable. We're all aware that connectivity could be lost at any time; most of us have had that experience more than once. A power outage, a hardware failure, a server overload such problems happen. But what about when our technology is deliberately disabled, when someone makes a conscious decision to cause the machines on which we depend to stop working?
Whomever controls the Internet has a lot of power over others who depend on it for their work. That includes the various ISPs that provide service to one end and on the other end, to those with whom we need to communicate. It includes those who maintain the domain name system on which we depend to translate friendly addresses to IP addresses and get our communications through. It also includes the government that increasingly regulates cyberspace. In USA a Senate bill revealed last spring gives the White House the authority to disconnect private sector computers from the Internet under the auspices of a "cyber emergency."
Security
There are of course some downsides to using I.T. tools in modern business and communication. One of the things that companies nowdays must dedicate a lot of their time and resources is I.T. security. If everything is being placed on the web and is accessible from anywhere in the world and our everyday business depends on our applications and services working properly around the clock , then I.T. security is of great importance to any company. Whole industry has evolved based on IT security and with more and more services , people and devices being more and more connected and cooperabile , security concerns are constantly increasing.
Will Anti-piracy Efforts be the Death of the Internet?
Piracy - the unauthorized distribution or use of copyrighted music, movies, software, books and other intellectual property - is undeniably a problem. Those who create a work or purchase the work outright from its creator should be able to profit from

Eco-Ist’12, Ecological Truth, 30 May - 2 June 2012. Hotel “Srbija TIS”, Zajecar, Serbia
516
that work. Computer technology and broadband Internet connectivity have made it incredibly easy to share the electronic versions of such works, and the vast amount of free information flowing across the Internet has created a culture where many people expect to get everything for nothing.
It's not surprising that those with a vested interest in intellectual property continue to look for ways to stop people from using their property without permission. But some methods are more effective than others. And some seem to have the opposite effect to what's intended. Anti-piracy measures fall into two categories: technological measures used by copyright holders to protect their intellectual properties and legal measures enacted by governmental bodies for the same ostensible purpose.
Some worry that efforts to curb piracy of intellectual property will end up putting a stranglehold on the Internet itself and that this issue will be used as a pretext for more and more government control and less and less online privacy. And the question remains: will all these laws really do anything to solve the problem? The record companies complain that they are losing money because of piracy, but a good argument can be made that they're also losing money because of their heavy-handed anti-piracy tactics. Many users once bought a lot of music but now refuse to give their money to RIAA members because of the "guilty until proven innocent" attitude and the well publicized cases of lawsuits against young children, as well as elderly people who had no idea their computers had been used for illegal file sharing activities.
When the government is involved, there is always the potential for abuse of power, and many are worried that the push by powerful lobbies for the music companies, movie studios and software vendors for more laws will create a climate in which innocent people will end up being cheated out of the electronic works that they legitimately purchased, or worse - being prosecuted for violations they didn't commit.
Both Recording Industry Association of America (RIAA) and the Motion Picture Association of America (MPAA) support U.S. adoption of the Anti-Counterfeit Trade Agreement (ACTA), a treaty that has been negotiated in secret but, according to a leaked document, would include a provision to force ISPs to provide information about suspected copyright infringers without a warrant to make it easier for the record industry to go after file sharers and torrent web sites.
But are all these efforts capable of stopping a practice that is so ubiquitous, especially among young people? We have a generation that's grown up downloading "free" music, movies and TV shows. Is it too late to change that culture now, even with draconian laws? Or will the increasing heavy-handedness just confirm those kids' belief that the law is unreasonable and unfair and inspire them to find ways around it .
Information - how can we trust what we read online
Internet has and in the future certainly will consume all current electronic media
and communication and bring it to average user. But with this comes an abundance of content which is unregulated.If anyone can post and put anything on the internet then how can we trust what we read online.

Eco-Ist’12, Ecological Truth, 30 May - 2 June 2012. Hotel “Srbija TIS”, Zajecar, Serbia
517
Anyone with an Internet-connected computer can put up any kind of page and disseminate any kind of information - or misinformation. With today's user-friendly HTML editing tools, any special talent or technical skill to do it is not needed.
In the olden days publications carefully vetted their reporters and employed fact-checkers to verify information before it went into print, and (most) journalists prided themselves on adhering to a code of ethics.
Today, much of the information on the Internet is published anonymously, or collaboratively (as with wikis) where the original author's material may be edited and changed many times by other people. Wikipedia is a good case in point; it's the place where many casual Internet users turn first to look up an overview of a subject, but it's also dismissed in many circles as unreliable and full of inaccuracies. Wiki technology is useful for creating collaborative projects, but since anyone can contribute an article - or edit or delete the articles written by others - those with a political or personal agenda can use the wiki's openness to purposely or unintentional propagate falsehoods.
CONCLUSION
When we combine all these trends, popular applications ,communication options and scenarios one thing is certain Web Browser is becoming “de facto” the most used and important software application on any operating system. One day in not so distant future web browser might even replace the operating system as we know it today and we will all be keeping our data somewhere in the “CLOUD”.
REFERENCES
1. http://www. www.wxpnews.com (22. 09. 2009.)

518
XX International Scientific and Professional Meeting
"ECOLOGICAL TRUTH" ECO-IST'12
30 May - 2 June 2012, Hotel “Srbija TIS“, Zajecar, SERBIA
POSSIBILITY OF ACCIDENT OCCURRENCE AND ENDANGER
OF ENVIRONMENT
Miodrag Miljkovic*
, R. Stanojlovic, J. Sokolovic
University of Belgrade, Technical Faculty in Bor, V.J. 12, 19210 Bor, SERBIA
*
ABSTRACT
In this article is pointed out on possible application of probability theory theorems for evaluation of danger probability from accidents in production systems under different potential dangers which can lead to ecologic catastrophe in the area of potentially dangerous industrial object.
Key words: Probability theory, natural catastrophe, environment endangering
INTRODUCTION
To estimate the risk probability of accidents’ occurrence in production systems and risk of environment endangering, in addition to mathematical statistics and correlation with events in existing similar facilities, can be successfully applied theorems form the probability theory and reliability of industrial production systems when working in conditions of natural disasters (earthquakes, floods, fires and explosions, wars) and sensitivity of ecosystems.
Dangerous situation in production system which can endanger people and the environment, or cause ecologic catastrophe, resulting from simultaneous occurrence of a serious condition in the vicinity of the production facility, which can lead to the damage in the production system or sudden failure in the production system, failure of protective systems and the presence of vulnerable members of ecosystem in the area of production system, jeopardized by the accident. The likelihood of accidents in dangerous production systems and endangering of ecosystem is complex. It can be, for an area (and hazardous industrial facility in it), determined by applying the fundamental theorems of probability, if they are known, each, partial probability of danger to ecosystem which originates from:
1. Natural disasters which often endanger environment area and thereby can lead to damage in production system of dangerous industrial facility (thereat could come from earthquakes, floods, winds, fires and explosions, wars, etc.)
2. Failures due to unreliability of the devices in production system which contain hazardous substances whose entering in the environment may cause ecological

Eco-Ist’12, Ecological Truth, 30 May - 2 June 2012. Hotel “Srbija TIS”, Zajecar, Serbia
519
disaster. For protection of ecosystem, next to dangerous devices are built safety devices, to prevent environmental endangering at failure occurrence. However in accidental situation even then may cancel. Therefore, probability of environmental damages due to accidents in industrial production facility is complex and it consists of the occurrence probability of accidents and failures of “protective screen”.
3. Presence of sensitive members of eco-system in the area of hazardous industrial facility, in which could be expected damage and endangering the environment, and ecologic disaster. Probability of sensitivity of eco-system on endangering from industrial facility can be determined in relation to the accidental situations and working conditions of the industrial facility which also may have an impact on the ecological factors of the environment or some individuals in the eco-system area. Under ecological disaster is implied occurrence of drastic changes in the eco-
system of a certain area, due to the effects of natural sources of danger (earthquakes, floods draughts, volcano explosions, fires and explosions) or human-made sources of danger ( bomb explosions, breakdowns in atomic power stations, dam failures or other breakdowns in factories) due to them in living environment can reach toxic substances in a solid, liquid and gaseous state, and cause death of plants, animals and people, or destruction of eco-system in the scope of contaminating area. Borders of treats depend of direction and scope of contamination spread and for each hazard can be estimated a zone and scope of environmental endangering, therefore, the probabilities of endangering of some areas are larger or smaller.
Risk probability of the emergence (accident) for any spot (place) from any source of danger is the most objective characteristics of ecological disaster. It is complex and can be determined based on statistical data analysis of accidents emerging from that source of danger in the previous period, by determination of distribution and frequency of occurrence in a specific time interval (probability “aposteriori”) or as probability “apriori” based on estimation of possible occurrence of danger during life time of the facility.
PROBABILITY OF ENVIRONMENTAL NATURAL DISASTERS Natural phenomena that can independently affect on living environment and eco
system or cause damage to hazardous production facilities form which hazardous substances can cause a catastrophe can be: earthquakes, floods, strong winds, lightning strikes, volcanoes, wars. There is a little populated areas on Earth where are not performed researches of frequency and possible intensity of a certain disaster occurrence. Methods of research of these phenomena are constantly upgraded in order to determine their possible global changes, effects caused by cosmic or anthropogenic forces and forecasting of their frequency, intensity and timing in future and in relation to this determination of necessary technical measures of safety (responses) to accidents on the objects in the living environment.
Data for determining of frequency and intensity of occurrence of a natural disaster (earthquakes, heavy rains, strong winds, lightning strikes, wars) can be found in

Eco-Ist’12, Ecological Truth, 30 May - 2 June 2012. Hotel “Srbija TIS”, Zajecar, Serbia
520
a particular literature of seismology, meteorology and history. Among the important technical sizes used and by knowing their distribution in time in the area (in living environment) there are:
1. Frequency of occurrence for given time period (λ)∆t 2. Return intensity of natural phenomena for given time period ∆ t of the existence
of object, with forecast, expected probability of maximum intensity on which must be answered by protective screen design
3. Average return period T4. Risk (probability of treats) on object, living environment and eco system P
O e (mj)
is equal to occurrence probability of natural potential danger. The research results show that for most natural phenomena mutual relationship of the incidence of risk of appropriate intensity is logarithmic function and can be expressed in the shape of relation:
)mj()M( Tln β−α=∆λ where:
λ - Total number of occurrences of natural hazard in a given period of time ∆T= n (year) with maximum intensity greater or equal (mj)
α, β - Relationship constants (their numerical values depend of regime of occurrence of natural disaster in the area).
If there is a stochastic process F (x; t) where x is varying intensity of phenomena of the engineering importance, which each year reaches the highest yi (max), value yi is also variable, and called extreme value making a regular process, which is built into original process F (x; t), where t is interval of time. If yi
are largest annual amplitudes (Mj), for n successive years ∆T, can be put that occurrence frequency probability of certain intensity (Mj) is:
)Mj()Mj(p eP β−= ;
β−α−= ePp where:
PP (Mj)
- Frequency probability of natural phenomena of intensity less than (Mj) by Gambel
α, β - Constant whose amplitudes depend on the expression of natural phenomena in the facility area
∆ T - Period of n years (which are analyzed)
Risk (probability of danger) that in time period of ∆ T years once occur natural potential danger of greater intensity than (Mj) can be obtained from relation:
)Mj(
e1Pe
β−α−−=
By risk probability analysis from occurrence of natural dangers for objects of anthropogenic origin or for living environment in periods of time ∆ T = 10, 20, 50 or 100 years of a certain intensity (Mj), can be obtained data for forecasting of intensity of

Eco-Ist’12, Ecological Truth, 30 May - 2 June 2012. Hotel “Srbija TIS”, Zajecar, Serbia
521
natural phenomena with certain probability for object life time period ∆T < ∆To , where is ∆To
Intensity of natural phenomena in period of object’s life time ∆ T - return intensity period of certain natural hazard.
O
for many natural phenomena could be determined by relation:
(Mj) = M1 - b log Fwhere:
V(To) M1, M2
- Maximum intensity of natural phenomena in time of statistical analysis ∆ To , at the beginning and end of period ∆ T
1
b - Coefficient of proportionality b = (M1 - M2)/(log v2 - log v1
) v2 , v1 Probability of occurrence of intensity M -
1 , M
2
FV (To) Probability for the return period of time F -
V (To) = ∆T1/TO;Fv(To)
< 1, and therefore with the length of return period decreases probability of the phenomena or increases possible intensity of the phenomena
∆ T - Return period
In order for industrial objects to be resistant to potential natural hazards, and at occurrence of some of them failures in industrial facilities do not happen, they are built on such way to withstand their action without being damaged, or they did not come to failures.
PROBABILITY OF FAILURE OF PRODUCTION SYSTEM AND FAILURE OF THE PROTECTIVE SCREEN Failure in production system, especially cancelation of protective screen in
production system with occurrence of potential natural danger or without its action, also can lead to endangering of living environment and people in production process and ecosystem. Probability of failure of production system is opposite to probability of reliability, or correct work. Probability of reliability of production system work in time period ∆ T (hour, day, month, year) can be determined based on statistical data on failures. Frequency of failures in production system which question safety of work in production system is obtained from the expression:
λ = N / ∆ T
where:
λ -
Frequency of failures (breakdowns) in production system that can lead to disaster
N Number of dangerous failures of devices or protective screen in time ∆ T
_
∆T - Period of observation of the system work (selects as the same as in the analysis of occurrences of natural hazards)

Eco-Ist’12, Ecological Truth, 30 May - 2 June 2012. Hotel “Srbija TIS”, Zajecar, Serbia
522
If the frequency of dangerous failures in production systems is continual, than we can determine the average time of system work without risk of failure TK
:
TK = 1 / λ
(AT)
When a fault occurs on the system (on a machine) that leads to the interruption of the unit or the whole system, so it is necessary to perform emergency replacement of the components, The average time of replacement (repair) of unit in production system TR in observed duration of repair ∆T, can be calculated from the statistical data on the duration of repairs tzi
. It is:
TR
= Σ tzi / N
where: tzi
- Times of replacing of defective components and qualification of
productive system N - Number of dangerous failures in observed period of time ∆ T
Coefficient of availability or accuracy of production system for safe operation
KR
in observed period of time ∆ T can be obtained from equation:
KR = TK / (TK + TR
)
This coefficient represents coefficient of sensibility of the production system to malfunction. Probability of system work without failure (probability of safety) in period of time ∆ T, which is considered in analysis, is determined from the expression:
dteePT
0
)t()T()T(s ∫ ∆λ−∆λ−
∆ ==
where: λ -
Frequency of failures in period of time ∆t smaller than observed time ∆ T of the existence of object
∆ t - Time for which is determined frequency of failures PS Probability of safe, proper, work of system, in period of time ∆ T -
Probability of at least one risk of system failure, at observed time interval ∆ T is opposite to the probability of reliability (safety) of the production system work and represent the partial probability of the risk of failure (failure of the protective screen or the system as a whole. It is determined by the formulae:
POS = 1 - PS∆T = 1 - e
-λ(∆T)
These are the simplest relationships for determining the probability of safety and danger of failure of the production system or device. In the case of very complex production system consisting of a large number of subsystems or devices connected in

Eco-Ist’12, Ecological Truth, 30 May - 2 June 2012. Hotel “Srbija TIS”, Zajecar, Serbia
523
series or parallel (the hot reserve) determining the reliability is much more complex. The theory of reliability of production systems, or protective screens in them (whose purpose is that at failure in system prevent the formation of disaster due to leakage of poison, fire and explosions, etc) is done in the appropriate literature on system safety and reliability. Probability of reliability (safety of) the production system may be a function both of the constituent elements and their probability of reliability and time of use. Therefore it must be very carefully and meticulously determined.
For the safety of the production system and protection of people and living environment is related to the reliability of the protective devices and equipment which is intended to prevent the formation of disaster. Their probability of reliable operation is determined in the same way as the probability of reliability of production system. Overall system probability of reliability of the emergence of a disaster is determined by additional theorem
PSK = PS + PZE - PS ⋅ P
where: ZE
PS
- Probability of reliability of the production system (work unit)
PZE Probability of reliability of protective devices - PSK Total probability (reliability) of safety work and living environment -
A protective device increases security (protection) of production system from
the appearance of catastrophe. Probability of risk of catastrophe is opposite of the probability of security:
QK= 1 - PSK
.
PROBABILITY OF THREATS ON ECOSYSTEM AREA AT BREAKDOWNS The size of the damage to the eco system (ecological factors of the
environment)in the vicinity of an industrial facility where there has been a disaster due to effects of natural hazards or failures, wherein there has been the failure of protective equipment (protective screen, depends on the amount of the harmful substances that can be poured into the environment, their harmfulness by members of the eco system ) or environmental factors such as earth, water, air), direction and scope of the dispersion and presence of members of the eco system in the zone of danger. Probability that some members of the eco system will be endangered at breakdowns in the industrial facility is complex and id determined based on detailed analysis of conditions of possible occurrence of dangerous concentrations of hazards in the surrounding of the building and their probability of occurrence in a particular area (spot) of the environment. When flooding of liquid toxins from damaged facility will be in danger zone downstream of the facility and their surfaces may be accurately determined based on the width and range of pollution. By emission of harmful gases into the atmosphere, size of the area damaging the environment depends of the emitted quantity of harmfulness, direction and wind speed and other characteristics of the harmfulness.

Eco-Ist’12, Ecological Truth, 30 May - 2 June 2012. Hotel “Srbija TIS”, Zajecar, Serbia
524
Possible frequency of threats in a zone (area) within the possible range of dangerous concentrations of harmful substances from the damaged facility (probability of danger) can be determined for a year or given period of time ∆ T, by formula:
λ’ = ∆t1where:
/ ∆ T ∆ t1
- Number of days in period ∆ T (year or n years) wind blowing in
the direction of the observed zone ∆ T - Observed time period for which intends to be determined a
probability of danger
Probability of danger of zone (certain area) around the industrial facility located within the range of danger is determined based on the ratio of affected area and the total area that can be periodically threatened (overall sanitary zone a = Pu/Po ; Pu - endangered area , Po
- area of sanitary zone around the building) and is determined by the formula:
)T(z
'ea1P ∆λ−⋅−=
Determining the range of dangerous concentrations above MPC for certain type of wildlife in the emitter’s environment is specially treated in literature, so that methodology can be used in determining the probability of danger of certain zone around industrial facility.
That humans or other members of eco system (insects, plants, animals) have been threatened or suffered an accident at a certain area should be parallel with disaster and threatening the area to find on it. If an individual is considered to be violated, it must be determined the probability of being on the place of the appearance of dangerous concentrations. The frequency of individuals staying in the observed zone (on the observed area) is determined by the formula:
λ,, = ∆t2where:
/ ∆ T ∆ t2
- Duration of staying of individual, time (hours, days, years) in
observed period ∆ t1
∆ T- Observed time period in which is determined the probability of
danger
Probability of presence of individuals in eco system on the endangered area is determined by the formula:
)T(j
''e1P ∆λ−−=
The total probability that the individual will experience the accident on the endangered area is:
PU = PP ⋅ Pj

Eco-Ist’12, Ecological Truth, 30 May - 2 June 2012. Hotel “Srbija TIS”, Zajecar, Serbia
525
Probability of individual security is opposite to probability of danger and is
obtained by the formula:
QSU = 1 - P
U
General probability of eco system security on a surface resides more individuals ni
each represented species in the eco system, depends on number of individuals. It is nit desirable their concentration on narrow surface and for each type it can be expressed:
inSUJOSJ )Q(Q =
Probability of security for the whole eco-system developed at the observed surface is obtained by multiplication probability theorem by formula:
j
k
2
2
1
1
nsuj
nsuj
nsuj
k
1josjep )Q()Q()Q(QQ ⋅⋅⋅⋅==∏
=
The total probability that one type of species from eco-system will experience disaster in time ∆ T (at occurrence of disaster in the industrial facility), based on its occupancy at the surface around the object and in zone that will be endangered at failure, is determined by formula:
PK = 1 - Q
ep
THE OVERALL PROBABILITY OF DISASTER OCCURRENCE AND THREATS TO AREA OF ECO-SYSTEM The overall probability of accidents occurrence on natural or by human
activities created objects in the environment is complex. Will it get to the contaminating of eco-system area, depends on taken protective measures and sensitivity of the system units. All events probabilities are mutually independent, so it is possible to define the probability of safety and danger to system for possible damage on natural or by human activities created objects in the environment or the possible damages in dangerous facilities due to malfunction and failures of protective systems in them.
If with Pei is designated the probabilities of occurrence of dangers to damage the production system due to effects of some elementary natural disaster, with Qk probability of failure in the production system and the simultaneous failure of the protection system (protective screen) and with PK probability of risk that one type of eco-system affected area will experience a disaster in the observed period of time ∆ T which tends to express, overall probability of accident hazards PU
can be obtained by multiplication theorem for calculation of total probability of danger:
∏=
⋅⋅==3
1ikkeiu PQPPP
In order to realize a disaster in the environment while affecting of certain natural potential hazards it is necessary to implement (to happen) that natural hazard

Eco-Ist’12, Ecological Truth, 30 May - 2 June 2012. Hotel “Srbija TIS”, Zajecar, Serbia
526
(earthquake of determined intensity, a strong hurricane), the probability of expression intensity greater than Pe, then to occur in industrial facility the accidents due to that effect and at that comes to failures of protective devices, due to which, hazardous substances penetrate into the environment and vulnerable elements found in the impacted area. When like this is analyzed of the risk of endangering of the ecosystem due to failures in possible dangerous manufacturing systems, it can be concluded that risk probability of endangering the environment due to natural disasters is small, because no matter on the size of probability of their appearance, it is necessary to be realized the failure of protective systems in the facility. Protection from natural disasters industrial buildings are built with high certainty, a small probability of failure in the action of natural (for example, built into anti-seismic protection, the facility is built above the maximum height of flood wave, etc.).
Higher the probability risk of ecological disaster may be due to the manifestation of natural hazards or defects in the production system, with simultaneous failure of protective devices against the penetration of hazardous substances
into the environment, because the probability of risk of some members of eco system and accidents in ecosystem is also determined by additional and multiplication theorem to calculate the total probability of risk:
[ ] [ ]{ } [ ]ep)T(skZEostkkeou Q1P1P)P1(PP)QP(P −⋅−=−=+= Λ
where: POS, PZE, PK
- probability of risk of the emergence of natural danger in the
production system in the period of time ∆ T; reliability of protection devices and the probability of danger that one type of ecological system from the endangering zone experienced the accident (
disaster).
With the same probability of failure in the production system and failure of protective systems, the probability of danger for the environment may be greater than the probability of risk tot he environment from accidents in the production system due to the effects of natural of danger.
CONCLUSION A detailed analysis of the statistical the probability of manifestation of
certain natural danger (separately) and danger (sensitivity) of production systems for that manifestation, especially their protective systems, as well as sensitivity (presence) of certain species (members) in ecosystem in the endangered zone of the environment, can be determined the probability of danger of dangerous objects for the environment and the people in it.
The existence of probability risk of catastrophe in the ecosystem can occur points to take protective measures for its reduction, evaluation of how many times thereby increases the the safety n is obtained by the formula:
)P/P(n 1uo2uo= where: Puo2 - decreased (new) probability of danger

Eco-Ist’12, Ecological Truth, 30 May - 2 June 2012. Hotel “Srbija TIS”, Zajecar, Serbia
527
Puo1 - previous the probability Acknowledgements
of danger
This paper is part of the research projects No. TR 33007 and TR 33038, which
are financed by the Ministry of Education and Science of Republic of Serbia.
REFERENCES
1. Miloradov, Basic Settings of the modern approach to environmental management, Proceedings “Rizik 97”, University of Nis, Faculty of Occupational Safety,
2. Časlav Đaja, Higher mathematics, Part I, Scientific books, Belgrade, Serbia. 1997.

528
XX International Scientific and Professional Meeting
"ECOLOGICAL TRUTH" ECO-IST'12
30 May - 2 June 2012, Hotel “Srbija TIS“, Zajecar, SERBIA
EDUCATION FOR SUSTAINABLE DEVELOPMENT
OR ECOLOGICAL EDUCATION
Milica Andevski1*, M. Vidakovic2, L. Murserovic
3
1Faculty of Philosophy, Novi Sad, SERBIA 2Faculty of Management, Novi Sad, SERBIA
3
High School of Economics, Brcko, B&H
*
ABSTRACT
From the beginning of 2005, we are in the decade of „Education for sustainable development“, initiated by UN – globally established educational institution that takes into account ecologically political and developmentally political action plan for the 21st
century, Agenda 21, adopted in Rio de Janeiro. The term „sustainable development“ appears for the first time in the report of Brundtland Commission and it was generated from the terms „ecological sustainability“ and „economic development“. In the aspect of content and theoretically, the idea of sustainable development links the goals of economic and social development with borders of economic sustainability. With global and intergenerational fairness in the background, sustainable development, basically, depends on the availability of natural bases of life. Hence, the idea of sustainable development is primarily ecologically based and economic-political, as well as developmentally political, measures are evaluated on the basis of the ecological sustainability principle.
Key words: ecological education, education for sustainable development, learning culture
INTRODUCTION
From the beginning of 2005, we are in the decade of „Education for sustainable development“, initiated by UN – globally established educational institution that takes into account ecologically political and developmentally political action plan for the 21st
The term „sustainable development“ appears for the first time in the report of Brundtland Commission (1987) and it was generated from the terms „ecological sustainability“ and „economic development“. In the aspect of content and theoretically, the idea of sustainable development links the goals of economic and social development with borders of economic sustainability. With global and intergenerational fairness in the background, sustainable development, basically, depends on the availability of natural bases of life. Hence, the idea of sustainable development is primarily ecologically based
century, Agenda 21, adopted in Rio de Janeiro 1992. The idea lies in the principle of „sustainable development“.

Eco-Ist’12, Ecological Truth, 30 May - 2 June 2012. Hotel “Srbija TIS”, Zajecar, Serbia
529
and economic-political, as well as developmentally political, measures are evaluated on the basis of the ecological sustainability principle [7].
Similarly, education for sustainable development, without basic ecological education and professionally based facing with the problem of ecology, does not lead up to the goal, just as the new definition is not a guarantee for acceptance in the field of education. Finally, the term „sustainable development“ still needs to be explained in the public, and many teachers are not familiar with the Agenda 21 itself [1].
Education is primarily based on contents, and the term „ecological education“ unmistakably indicates the field on which sustainable development is focused, albeit without previously often practiced and improper limitation of the term to natural environment. Precisely during the 70’s, ecological education is defined as „... facing with natural, social and developed environment with the aim to develop willingness and competence for acting according to ecological laws“[5]. This primary ecological orientation is not re-discovered only for specific replacement of education for sustainable development. In the context of PISA, the experts for education agree in the opinion that more ecology in schedules would increase the quality of teaching, because thinking in complex relations would (also) be required in this way [12].
CURRENT SITUATION Ecological education, which as an interdisciplinary principle of teaching should
be an integral part of contemporary general education, and the idea of sustainable development, which is in Agenda 21 (1992) related to the explicit task of education, for a long time now do not have the role that was assigned to them by various educational-political programmes, but they are still sporadically thematized. All in all, education system has difficulties to integrate new content and knowledge, which cannot be classified into some traditional scientific discipline, i.e. some existing school subject, into educational canon. Here, the world is still explained in a reductionist’s way: „... by the classification into subjects and treatment as if there were separate physical, biological and chemical worlds. Instead of putting the network of life into the centre, unique phenomena are divided into smaller fields“[9].
Ecological education, in the sense of progressive general education and sustainable development, thematizes the contents that require stronger knowledge networking and asks many questions to which we still do not have the answers. In this case, the significant change of traditional principles of teaching and organization is necessary, not only in the aspect of content, but also in the aspect of methods. The teaching oriented on traditional scientific disciplines and compact transfer of knowledge in 45-minute tact is very little adapted to ecological projects, learning based on the problem and development of competences that are also necessary for the future [2].
Our education system has so far successfully defended itself against these (and other) reforms. If the task of education related to the idea of sustainable development is taken seriously, then „... sustainable development could be an advantage that could make a new system out of the old-fashioned system of education“[9].

Eco-Ist’12, Ecological Truth, 30 May - 2 June 2012. Hotel “Srbija TIS”, Zajecar, Serbia
530
ECOLOGICAL EDUCATION IN PISA CONTEXT
International comparative studies of education TIMS and PISA confirm that the efficiency of educational system of many countries, including our country, is far beyond international average. Significant causes of determined deficits of our students are primarily seen in qualitative formation of the process teaching-learning. It was observed that the students should optimize and qualitatively improve the processes of teaching and learning on the basis of current knowledge from pedagogy and didactics (e.g. constructivist environments for learning and scientific literacy), that a concept of education is necessary, which allows the adoption of current orientation knowledge on one hand, and provides learning in contexts with meaning, on the other hand [3].
Principles of teaching and learning at school are necessary, such as systemically structured processes of learning for the formation of conceptual knowledge, which allows vertical transfer within the domain of knowledge (professional competence), situated processes of learning in specific fields of application, which develop lateral transfer between disciplines and domains (networked thinking) and cumulative processes of learning in which we can apply networked and in different situations tested knowledge. Facing with real phenomena and current problems in concrete life reality in the sense of sustainable development requires networked thinking in ecological relations. This is per se based on conceptual knowledge from various disciplines and domains, it needs to be applied in a particular situation and integrated into the solution of the problem for the sake of developing real phenomena.
Ecological education in the sense of sustainable development is predestined to generate everyday relevant contents, whose development strictly requires vertical and horizontal networking of knowledge from various disciplines. That was also observed by PISA experts: In one, the education experts agree: More ecology in the schedule would increase the quality of education. The themes related to ecological development enjoy more attention than the shock that was created by PISA and that has completely exposed deficits of students in calculating and problem-solving. „Environment and sustainability should play a greater role in teaching. That develops the thinking in complex relations – and that is precisely what is tested by PISA“[10]. This requirements is greatly accepted by students and, according to one representative survey „Emnida“, published by Greenpeace Magazine, 61% of the young want more ecological themes in school teaching.
POTENTIALS AND CHANCES OF ECOLOGICAL EDUCATION
No other field of education was as strongly functionalized from the beginning
as ecological education, which was supposed to encourage the development of ecological awareness, and also the ecologically conscientious behaviour. If the measure of direct effect on the behaviour is applied to other education measures, then the schools would actually have to be closed. Ecological education is a beginning, regardless of the relevance for our everyday action, an essential part of the general contemporary education, because familiarity with ecology and awareness of ecological relations are

Eco-Ist’12, Ecological Truth, 30 May - 2 June 2012. Hotel “Srbija TIS”, Zajecar, Serbia
531
„...,for one enlightened man, also a part of education as familiarity with the theory of evolution, genetics or history “[4].
Knowledge and awareness of the environment can be helpful for personal behaviour, and specific knowledge can quite positively be reflected on our actions, if ecologically conscientious behaviour is associated with personal advantages. Finally, ecological education cannot primarily be determined according to the effect of individual behaviour. More significant is the fact that the public is sensitive to the themes of sustainability; it can prepare the road for ecological modernization of economy and society [4]. Unlike other requirements of education, ecological education transfers current knowledge that is greatly significant both for contemporary and the future life and sustainable processes of development. In addition, we should also deal with the question why does the knowledge of environmental threats have so small effect?
The assumptions, which have been cultivated in ecological education for a long time, as well as in other education fields, that the transfer of the appropriate knowledge will be directly effective, have proven to be false. It appears that the knowledge influences the behaviour indirectly, through the attitudes, expectations, developed competences [6], where this „knowledge“ needs to be qualitatively differentiated. Martens [10] distinguish three types of knowledge in the generation of some act: knowledge about the system, knowledge about the actions and knowledge about the implementation. Knowledge about the system is a precondition for risk evaluation and creation of motives for actions. Knowledge about the actions primarily refers to the intention to act and it „... answers the question whether there is an appropriate action that can substantially contribute to solving the problem [...]. In the intention phase, the intention to perform particular action is developed. For the realistic implementation, it is necessary to have the knowledge about the implementation“[10]. Knowledge about the system can be positive only if there is appropriate knowledge about actions and implementation.
Similarly, Frick [4] distinguishes three forms of knowledge: knowledge about the system as „knowledge about the relations in ecosystems“, knowledge about the actions as the „knowledge about possible options of activity“ and knowledge of effectiveness/impact as the „knowledge about relative ecological efficiency of different ways of behaviour“. According to their studies, knowledge about the system represents a basis for the knowledge about the actions and impact, but it does not perform any visible direct impact on specific ecological behaviour.
If ecological education should support the process of the creation of sustainable development and it affects behaviour, then more attention should be paid to knowledge about actions and implementation, i.e. the impact. Knowledge about the system and the facts is not sufficient unless it is applied in „meaningful contexts“. Facing with specific phenomena, problems and risks in nature, in actual life reality, must not be restricted to the explanations of structures and causes. In ecological education, possible solutions need to be reflected more, and effective behaviour strategies must be developed and tested.
Thus, sustainable ecological education offers an enormous potential for reforming to the entire education system. In the aspect of content, ecological education can contribute to the process of sustainable development on the basis of professional,

Eco-Ist’12, Ecological Truth, 30 May - 2 June 2012. Hotel “Srbija TIS”, Zajecar, Serbia
532
effective and creative competences; and in the aspect of methods, it enables the change of teaching-learning process, which is not required only in the context of TIMS and PISA. Because, sustainable ecological development is, by its subject, per se focused on integrating the knowledge from various disciplines and to monitor interdisciplinary, i.e. transdisciplinary problems. Analogous to the model of „sustainability science“[8], which requires close cooperation among scientific disciplines, fields of technology, economic and social fields development, the model „sustainability education“ can be imagined. It requires the connection between systematically structured processes of learning with situated and cumulative learning processes, which are necessary for the transfer of professional competences in the issue of ecology (knowledge about the system), construction of networked thinking and development of individual competences of actions (knowledge about the actions) and opening concrete perspectives for effective implementation (knowledge about the implementation).
SUSTAINABLE ECOLOGICAL DEVELOPMENT
Ecological development in the context of the idea of sustainable development needs to determine current global concept of the „education for sustainable development“. The central goal of learning „Competences of the creation for sustainable development“ – functions through the principles of teaching and organization of „interdisciplinary knowledge“, „participatory learning“ and „innovative structure“ – but in the relation to the desirable and ecologically appropriate change of behaviour it has insufficient range.
As different studies of the relationship between knowledge and behaviour show [6] [10], ecological knowledge about the fact, i.e. system has no direct impact on behaviour, but it is an important precondition for the evaluation of ecological risk and development of appropriate motives for actions, attitudes or intentions. Analogous to this, the concept of „Sustainable ecological education“ assigns an important role to solid ecological basic education, which systematically integrates disciplinary and transdisciplinary professional knowledge in the sense of conceptual knowledge about the ecology. It represents the basis for the development of professionally appropriate competences of actions and creation in the process of ecologically stable development, which is labelled as sustainable.
PERSPECTIVES FOR PRACTICE
For sustainable ecological environment at school, the themes that deal with
elementary natural resources, such as water, air and land, have appeared to be particularly productive. They can be poli-perspectively processed, in a spiral-curricular way from kindergarten to secondary school, and based on multiple threats in the environment, they own great social and ecological importance and play a central role in the ecology. In addition, they are predestined for logical, oriented to concrete problems, linking of systematic, situated and cumulative learning processes, and they encourage the individual construction of knowledge about the system, actions and implementation in the context of the issue of ecology. Different starting points for the process of ecological

Eco-Ist’12, Ecological Truth, 30 May - 2 June 2012. Hotel “Srbija TIS”, Zajecar, Serbia
533
education in the sense of sustainable development offer rarely practiced encountering with our „Mother Earth“, because group of themes about the Earth (land) is particularly important. As living space for people, animals and plants, the Earth can be „... in many ways observed as a basis of human actions and social organization. Since practically each human activity requires the land, each man is in a way „actor on the land“, and from the aspect of an individual, the main functions belong to the Earth. It is a necessary basis for nourishment, basis for creating the place for living, working and leisure time, basis for the needs, control of space and possessions, the land is 30% of Earth’s surface and it is extremely jeopardized.
Every day, great surfaces disappear due to erosion or construction, or they are permanently damaged because of the treatment with harmful substances. Approximately, more than 25% of land and 900 million of people on Earth are currently more or less affected by globally progressive creation of deserts and its consequences [13] „Today, many countries are no longer able to provide food for their population by their own agricultural production. [...] The consequences are the risk of neglect and hunger, acceleration of land degradation and international migration with appropriate pressure on industrial countries“[13].
Based on this, particular ecologically-pedagogical importance of the theme „Earth“, as necessary basis for life and as an jeopardized resource, cannot be denied. Facing with this exceptionally current group of themes at school is not successful primarily because of low-expressed awareness of the issue of land, and also because of the complexity of content and lack of appropriate teaching aids. In order to constructively face with these deficits, it is necessary to, for example, develop one open internet portal about this theme, primarily as a support to teachers in preparing the classes, which should provide different dimensions of knowledge, knowledge about the system, actions and implementation in the long run. It should also contain informative and teaching aids poli-perspectively constructed and adapted to the development of interdisciplinary projects in teaching and transdisciplinary teaching aids. All of this requires appropriate communication between teachers and it does not solve them – aware of – their responsibility for the process of teaching-learning, which is always specific for the situation and those who learn.
CONCLUSION If the available knowledge about education is consequently re-structured under
the categories: ecology, sustainability and sustainable development, new contents and competences profiles that will be necessary in the future could cause the reforms in traditional system of education. Since we are in the second year of the decade that was declared the decade of „Education for sustainable development“ by UN, there is (still) hope that this possibility of sustainable reform of education will fall on fertile land and that it will be sustainably used.
Eco-Ist’12, Ecological Truth, 30 May - 2 June 2012. Hotel “Srbija TIS”, Zajecar, Serbia
534
REFERENCES
1. Andevski, M., (2007a) Responsibility towards the future in the paradigm of sustained development, 6 th International Conference of PHD Students, University of Miskolc, Hungary, 12 – 18 august, 07, Humanities, p.1- 6;
2. Andevski, M., (2007b) Etička utemeljenost održivog razvoja, Teme – časopis za društvene nauke, Br. 3, Niš, str. 411-426;
3. Andevski, M., (2008) Mogućnosti i granice učenja za održivi razvoj, Zbornik radova sa Međunarodnog skupa „Cjeloživotno učenje za održivi razvoj“(„Lifelong learning for sustainable development“) Svezak 1, Sveučilište u Rijeci, Rijeka, str.249-254;
4. Diekman, A., (2005) Denn sie wissen was sie tun.U:Politische Ökologie 95, S.32-34.
5. Eulefeld, G., (1988) Praxis der Umwelterziehung in der Bundesrepublik Deutschland. IPN-Arbeitsberichte 115. Kiel.
6. Frick,J.,(2004)Umweltbezogenes Wissen: Struktur, Einstellungsrelevanz und Verhaltenswirksam keit. Dissertation, Universität Zürich.
7. Hellberg-Rode, G., (2001) Nachhaltige Entwicklung als Leitidee der Agenda 21. U: Gärtner, H.Hellberg-Rode (Hrsg.) Umweltbildung & Nach haltige Entwicklung, Band 1: Theoretische Grundlagen. Schneider Verlag. Hohengehren, Baltmannsweiler. S.1-5.
8. Kruse, L., (2005) Sustainable Science. Eine neue Dimension in der Forschung. U: Politische Ökologie 93, S.28-30.
9. Lüpke, G., (2002) Schule muss zur Nachhaltigkeit-Von der Natur lernen. U Natur&Kosmos 2. S. 24-31.
10. Martens,T., (2005) Das Wissen maβschneidern.U: Politische Ökologie 95, S.35-37.
11. Mittelstraβ, J., (1992) Auf dem Wege zu Transdisziplinarität. U: Gaia 5. s.250. 12. Uken, M., (2005) Umweltbildung: Welche Rolle Ökologie in Kindergarten,
Schule und an der Uni spielt. U: Greenpeace Magazin 6/05. S.25-35. 13. WBGU Wissenschaftlicher Beirat der Bundesregierung Globale
Umweltveränderungen (1994) Weli im Wandel: Die Gefährdung der Böden. Jahresgutachten 1994. Economica.Bonn.

535
XX International Scientific and Professional Meeting
"ECOLOGICAL TRUTH" ECO-IST'12
30 May - 2 June 2012, Hotel “Srbija TIS“, Zajecar, SERBIA
THE ROLE OF THE PERMANENT EDUCATION IN THE PROTECTION
OF THE ENVIRONMENT
Darko Radosavljevic1, I. Stojkovic2, V. Pavicevic
1
1University in Belgrade, Faculty of technology and metallurgy, Belgrade, SERBIA 2
University in Nis, The Faculty of technology, Leskovac, SERBIA
ABSTRACT
The level of public awareness about the protection of the environment and sustainable development is very low in Serbia. The consequences are increased ruining of the environment, irrational usage of natural values, endangering protected natural goods, irresponsible disposal of all kinds of waste etc. Because of that, one of the general goals of policy of protection of the environment in National programme of protection of the environment in Serbia is the improvement of formal, informal and non-formal education about protection of the environment. The third of five key national priorities of National strategy of sustainable development of Serbia is the development and education of people, increase of employment and social participation (attracting experts, improving quality and adjustability of working force, higher investments in human resources through stopping the flow of experts by creation of better working conditions, improvement of adjustability of workers, investments in knowledge and skills of people through the education that is of good quality, efficient and practical and constant improvement of participants of all social groups based on the regulation of equal possibilities).
Key words: education, sustainable development, environment
INTRODUCTION
Formal school system is not capable any more to solve the problem of obsolete
knowledge and technologies as well as the increase of the level of ecological conscience of the employees. Formal education is just the bases for update of educational activities through whole working and living time. It has a goal to adjust existing knowledge and skills with new and higher demands of the working world. ‘Management is realizing more and more that constant education and improvement of the employees is one of the most efficient ways to fulfill competitive advantages, thorough assumption for the entrance into the market game and competition game for the trust of the consumers. That becomes sine qua non, not only for the further development but also the existence of the companies.’

Eco-Ist’12, Ecological Truth, 30 May - 2 June 2012. Hotel “Srbija TIS”, Zajecar, Serbia
536
THE MEANING OF PERMANENT EDUCATION At the time of fast technological changes and ways in which we gather
knowledge, more and more there is a trend of permanent and professional education. Employees, but also those seeking for an employment, more and more face with the needs to qualify more during their lives. Today, there is not a single profession that employee can do all his working time without permanent professional education. New scientific developments, development of science and technology, constantly set new challenges before the employees and to do a job, one needs a constant improvement.
Since competence of unemployed, as well as newly employed on the market do not satisfy the needs of working places, it is necessary to connect more the system of education with the market of work, as well as create the conditions for system of learning all life. Because of constant and fast economical, social and technical and technological changes, there are constant demands to adjust to changes and new approaches to education and learning. New technologies ask for extra training and professional development and more and more influence education, working places, professions and types of jobs. Today, when the levels of knowledge are spreading all the time, if we do not except the concept of learning all life, it can lead to marginalization in social stratification. For those reasons, the term learning all life is mentioned all the time, in developed countries and also in the countries which go through the transition.
Education as a basic human right is a precondition for having sustainable development and basic mean for good management, making reasonable decisions on the basis of reliable, good information and conducting democratic regulations. Also, it is very important for the strengthening of all capacities of the individuals, groups, organizations, communities and states in thinking, realizing and deciding about the protection of the environment and sustainable development of the whole society. Today, in most of the countries there is a realization that knowledge, education and human resources (human capital) are top priority of national strategies and policy of social, economical, technological and cultural development. These elements cannot be changed by any other development facts.
The biggest problem of educational system of Serbia today are lack of efficiency and effectiveness, low educational level of population, very bad educational structure and obsolete system of education. The educational policy in Serbia is not clearly enough focused on creation of human resources and it does not reflect the goals of Lisbon strategy set in 2010. in education and training: increased quality and efficiency, being available to all, and being open for wider world. Extremely important (and probably the most important) cause of the stated is that education is not in financially supported by the state enough. The money that is set away for the needs of education in last few years was 3,0-4,5 % of BDP, while in developed countries it is 6-8 %, which is almost less by the half (in absolute amounts we had better not mention the differences considering the sizes of BDP).

Eco-Ist’12, Ecological Truth, 30 May - 2 June 2012. Hotel “Srbija TIS”, Zajecar, Serbia
537
NATIONAL PROGRAMME FOR THE PROTECTION OF THE ENVIRONMENT OF SERBIA National programme of protection of the environment of Serbia as one of the
most important general causes of problems in the environment, states the low level of conscience and lack of knowledge about the environment, so because of that we proclaim the improvement of formal and informal education about the protection of the environment and sustainable development as one of the general policies [2]. As short-term measures (for the first five years), these are suggested:
- Making a national strategy of education for the protection of the environment and sustainable development
- More important representation of education for the protection of the environment and sustainable development in school system and other forms of formal education
- Starting a net of centers for improvement of education for the protection of the environment and sustainable development
- Improvement of professional education about the protection of the environment and sustainable development by implementation of the system of government of protection of the environment
- More participation in public and better approach to data about environment - Systematical improvement of non-formal education for the protection of the
environment and sustainable development through programmes of professional institutions and non-governmental organizations with media support
- Creation of basis of data, registers of institutions and organizations in the field of education for the protection of the environment and sustainable development.
Reform of education and development of public conscience in the mid-term period (next 10 years) should be focused on: higher representation in the field of protection of environment and sustainable development in curriculum, training of teachers and further development of teaching methods, improvement of education according to Decade of education for the protection of the environment, intensive work to raise the conscience and development of ecological culture of all categories of population, especially of primary selection of communal disposal and tourism.
NATIONAL STRATEGY OF THE SUSTAINABLE DEVELOPMENT OF SERBIA National strategy of sustainable development of Serbia is done according to
Strategy of sustainable development of EU (accepted in 2001. and amended in 2006.), by Lisbon strategy of EU and Millennium goals of development of EU [3]. It is almost completely based on the principles and goals accepted in national strategic documents, most of all, National strategy of business development of the Republic of Serbia 2006-2012. and The draft of National programme of the protection of the environment. The key national priorities for the fulfillment of sustainable development till 2017. are: membership in EU, development of competitive market business and balanced economic growth, development and education of people, improvement of employment and social

Eco-Ist’12, Ecological Truth, 30 May - 2 June 2012. Hotel “Srbija TIS”, Zajecar, Serbia
538
involvement (attracting experts, improvement of quality and adjustment of working force, higher investments in human resources through prevention of outflow of experts through creation of better working conditions, improvement of adjustability of workers, investment in knowledge and skills of people through education which is of better quality, more efficient and practically applicable education and constant improvement of members of all social groups based on the rule of equal possibilities, affirmative measures for the encouragement of employment of the young, women and those from marginalized groups, investments in public health, especially in primary health protection with accent to the measures of prevention), development of infrastructure and equal regional development and protection and improvement of environment and rational usage of natural resources.
Primary goals of education for sustainable development are: providing good general conditions for the reform of education for sustainable development, work on the concept and practice of sustainable development and system of sustainable education through formal and non-formal forms of learning, proper training about sustainable development for teachers of all levels of education, systematic work on the development of research in the field of education for sustainable development and constant improvement of co-operation in the reform of education on national, regional and international plan.
Constant education is defined as the activity of learning all life, with the aim to improve knowledge, skills and capabilities. The concept of constant education is made by the need to adjust to new knowledge and technological achievements. The quality of new knowledge is greater every day, and existing knowledge is more obsolete. Because of that constant education is based on learning all the time and education with a mean to get new and revise already learnt knowledge and skills, necessary for participation in life and work.
THE ROLE OF COMPANIES IN PERMANENT EDUCATION
Constant education means formal education as well as different forms of non-formal education after school, on courses, additional trainings and professional trainings. Constant upgrade and improvement of knowledge gathered by formal school system is done by non-formal education with the goal to improve existing capabilities and competitions.
Today, it is expected from the companies to create knowledge and constantly develop human potentials in order to achieve set goals more easily and fast. The companies invest in training more and more and professional development of their employees. Education becomes in such a way one of the most important investment in future and development, and company is the focus of constant learning and development.
Riderstral talks about the role of company in education and permanent improvement. ‘Technology enables revolution in educational system. Classical education
institutions like universities and business schools have not done anything but rich men have overtaken. Soon all big corporations will actively get involved in education…Although knowledge is something that implies and which is hard to transfer, the education cannot be limited to classrooms only anymore. We learn at work too. Working place must be petrol station for our brain, not only a racing track. We are educated and improved not only by reading books, going on lectures but also improvement of process shape in which we work and by getting to know people around us. Focusing means mentoring, training and directing young forces. The differences

Eco-Ist’12, Ecological Truth, 30 May - 2 June 2012. Hotel “Srbija TIS”, Zajecar, Serbia
539
between studying, working and life do not exist anymore – now it all comes together.’ In the same book there is a datum that programmes of training in companies do not develop 100% faster than academic, but 100 times faster, that is 10000% faster [4].
One of the key forms of modern society is the development of new technologies in developed countries, but also opening of that process in the countries in development, even in Serbia, new production programmes and with it, the changes in social structure of employees and society as a whole. Today, all experts, scientists and politicians agree that the greatest force of technological and economical development represent human resources. The importance and role of education in modern society is also visible, which is confirmed by the fact that today the most developed are those societies which invest the most in the development of human resources. Serbia is a technologically undeveloped country, and one of the obstacles for a faster technological and economical development is a unsatisfactory level of education and lack of adjustment of the structure of working force to the needs of new technologies and production programmes.
CONCLUSION
One of the business branches where permanent education is the most necessary is almost certainly, industry, most of all, because of the common introduction of technological innovations and new standards. In Serbian industry, unfortunately, the field of permanent education of the employees, is not developed. The basic reason is that money set away for permanent education in industry is minimal or even does not exist. The authorities from the state have almost no insight in education and training of employees in industry.
The reason is because most of companies are privatized and their managements lead their own business policy, so because of ‘the business secrets of the company’ it is hard to get an insight in the education and improvement of the employees. The exceptions which confirm the rule are good examples of a few of our leading companies that invest a lot in education of their employees, first of all the training of management, engineers and other highly educated workers. The trainings are of intern and extern type, and they are most commonly connected to introduction of new technologies and standards. Those are by the rule, the companies where good privatization was done and where the majority package is owned by important, trusted foreign companies.
REFERENCES
1. Radosavljević D., PhD work ‘The influence of the development on the changes of professional structure and education of engineers in Serbia’, The Faculty of Philosophy, University in Nis, 2011.
2. National strategy of sustainable development of the Republic of Serbia, the Government of the Republic of Serbia, Belgrade, 2008.
3. The draft of National programme for the protection of the environment of the Republic of Serbia, the Department for the protection of the environment of the Republic of Serbia, Belgrade, 2006.
4. Riderstral, J, ‘Funky business’, Belgrade, Plato, page 226-227

540
XX International Scientific and Professional Meeting
"ECOLOGICAL TRUTH" ECO-IST'12
30 May - 2 June 2012, Hotel “Srbija TIS“, Zajecar, SERBIA
BEGINNINGS OF ACADEMIC TEACHING OF ECOLOGY
IN SERBIA
Tibor Halasi1*, D. Lalosevic2, S. Kalamkovic3, R. Halasi4, M. Miklos
4
1University of Novi Sad, Faculty of Science, Department of Chemistry, Biochemistry and Environmental Protection, Trg Dositeja Obradovica 3, 21000 Novi Sad, SERBIA
2 University of Novi Sad, Medical Faculty, Novi Sad, SERBIA 3Primary School ”Prva vojvodjanska brigada”, Seljackih buna 51a, 21000 Novi Sad, SERBIA
4
DPNUNS, Novi Sad, SERBIA
*
ABSTRACT
Ideas on environmental studies and ecology classes first appear in Serbia by Professor Josif Pančić (1814-1888). The official teaching of ecology at the University of Belgrade begins with courses ”General Biology” at Faculty of Medicine, after World War II. More than half a century past since the first idea of introducing the teaching of ecology until publication the first textbook dealing with Ecology. This textbook was ”General Biology”, published in Zagreb, a translation of the group of Soviet textbook authors. Even the Soviet textbook was partly taken from the U.S. author F. A. Shell. Finally, an association of students of the Medical Faculty in Belgrade, translated and rewrote Soviet general biology textbooks, whose 15th chapter was entitled ”Ecology”. This was a beginner course and mostly dealt with adaptive characteristics of animals and plants. As the most notable persons who participated in the pioneering work of the Belgrade University and Faculty of Medicine, and contributed directly or indirectly to introducing Ecology course were: Josif Pančić, Siniša Stanković, Milan Jovanović-Batut, Djordje Jovanović and Marko Anaf. The development rate of Ecology has had great influence on the opening of the modern Institute of Biology in 1946. Then conditions were created for high quality scientific work and academic study of ecology, with the full support of the Belgrade University
.
Key words: Ecological Education, History, Department of Biology, University of Belgrade, Faculty of Medicine
INTRODUCTION
Josif Pančić is considered the forerunner of our ecology and the science of nature conservation. It is believed that the modern history of environmental studies in our country began in 1846. That year Josif Pančić moved to Serbia. He spent his whole life studying the nature of Serbia, and especially biodiversity. Another well-known scientist in Serbia, who can be considered a pioneer of environmentalism, is Siniša Stanković.

Eco-Ist’12, Ecological Truth, 30 May - 2 June 2012. Hotel “Srbija TIS”, Zajecar, Serbia
541
Ecology, as a new branch of biological science, was rather late to be thought in universities in many countries, which is also true for Serbia. University education in Serbia has gone through several transformations, which had an adverse impact on academic studies. The first university in Serbia was founded in Belgrade, where the biological science, as well as other sciences, were first studied the Faculty of Phylosophy, later in the Faculty of Science. From the very beginning biological sciences started at the Medical School, and immediately after World War II, this faculty was at the forefront of biology in the formation of the Institute of Biology. This was confirmed by the first post-war textbook of biology, which was published by the students of the Belgrade School of Medicine. This textbook testifies to the early days of university teaching of ecology of Serbia, entitled General biology, and issued by the Association of Medical Students in Belgrade in 1946.
THE ESTABLISHMENT OF MEDICAL FACULTIES
IN BELGRADE
This School was established in 1920, when the first lecture was held by the anatomy professor Niko Miljanić. Dr. Niko Miljanić (Нико Миљанић, 1892-1957), a Serbian anatomist and surgeon, was one of the founders of the Belgrade Medical School, which is today a part of the University of Belgrade, and has held the first lecture at the newly formed school on December 12, 1920. He had been a full professor of anatomy during the period 1920-1934, then held lectures on surgery propaedeutics from 1935 until 1947. He was relieved from the faculty in 1954. Professor Miljanić was the author of the first textbooks of anatomy in Serbian, a monograph on asepsis, as well as a lot of scientific articles on anatomy and surgery in different journals in Yugoslavia and abroad. As a French student he was elected president of the French ex-students Association and the founder of the bilingual Serbian-French journal Anali medicine i hirurgije (Annals of Medicine and Surgery), published 1927-1934. In 1930, he unveiled the Monument of Gratitude to France in Belgrade's Kalemegdan Park, together with King Alexander I of Yugoslavia. He fought in both Balkan Wars and both World Wars. Miljanić was a member of the French Academy of Surgeons and was decorated with the order of the Légion d'honneur. Since then, over 30,000 students graduated from this institution, including circa 850 international students. The studies last 12 semesters and are organized within the integral curriculum (no departments and study groups). The training is conducted at the faculty’s institutes (basic subjects) and teaching bases of the faculty (clinical subjects).[3] Medical Faculty in Belgrade is a member of the University of Belgrade. It was opened on December 12th, 1920 with the speech of professor Milan Jovanović-Batut (Милан Јовановић Батут, Sremska Mitrovica, October 10, 1847-Belgrade, September 11, 1940) in the hall of the University. After that, the lecture by Dr. Niko Miljanić, anatomy professor, marked the start of classes at the Faculty. Since 1970, this date is celebrated as the Day of the School. Pančić was a supporter of the establishment of the First Serbian universities of former Great School and School of Medicine. Josif Pančić (Јосиф Панчић, April 17, 1814 - February 25, 1888)[1] was a Serbian botanist of Croatian descent, a doctor, a famous lecturer at the Great School in Belgrade and the first president of the Serbian Royal Academy (Fig. 1). Pančić is credited for discovering the new species of conifer – the Serbian Spruce. He was born as

Eco-Ist’12, Ecological Truth, 30 May - 2 June 2012. Hotel “Srbija TIS”, Zajecar, Serbia
542
Josip Pančić in Ugrini, near Crikvenica, Croatia (then Austrian Empire), as the fourth son of Pavel and Margarita Pančić. After finishing elementary school in Gospić, he went on to the lyceum in Rijeka and graduated medicinein 1842 in Budapest. In addition to other courses, Pančić attended botany courses, taught by the then famous botanist Sadler.
physicianPančić worked as a in rural Serbia and documented its flora during his frequent visits of the principality. He fell in love with the Kopaonik which he visited 16 times between 1851 and 1886. He was credited with having classified many species of plants which were unknown to the botanic community at that time. His most significant discovery was the Serbian Spruce, which he named Pinus omorika (omorika being the Serbian name for a spruce), later being reclassified as Picea omorika (Pančić) Purkyne. Pančić was elected the first president of the Serbian Royal Academy formed on April 5, 1887. He founded the Botanical Garden ”Jevremovac” in Belgrade. We also announce his message to the Serbian youth: ”Only with a thorough understanding and analysis of the nature of our country will they show how much they love and honour their homeland”. It is possible that Josif Pančić laid the foundations of ecology as the branch of biology in the nineteenth century, but ecology wasn’t officially recognized since the early twentieth century. Pančić was a real multi-disciplinary research in biology and in natural sciences, although it was a doctor by profession
.
Figure 1. Professor Josif Pančić (1814-1888)
Another well-known professor and populizator ecological ideas, perhaps the first modern Serbian biologist was Siniša Stanković (Fig. 2). He was born in Zaječar 26th March 1892, and died in Belgrade on 24th February 1974. His most important popular works from the Environment: ”The framework of life”[4]. published in Belgrade and in Skopje, and ”Ecology of Man”(1974) also published in Belgrade [3}
.

Eco-Ist’12, Ecological Truth, 30 May - 2 June 2012. Hotel “Srbija TIS”, Zajecar, Serbia
543
Figure 2. Professor Siniša Stanković
(1892-1974) Figure 3. Professor Milan Jovanović
Batut (1847-1940) The most ardent supporter of the establishment of the Faculty of Medicine in
Belgrade was Dr. Milan Jovanović Batut (Fig. 3). Milan Jovanović-Batut was born in Sremska Mitrovica on 10th October 1847. He graduated from the Medical University of Vienna in 1878 and worked in Sombor, Novi Sad and Cetina. In 1883 he specialized in hygiene and microbiology in Germany, France and England. At the High School in Belgrade, he was elected professor of forensic medicine and hygiene in 1887. He was engaged in preventive and social medicine. He had published papers in the country and abroad. He was editor of the Serbian archives, papers of the Serbian Medical Society, president of the Serbian Medical Society and an honorary Doctor of the University of Zagreb, Belgrade, Prague and Vienna Medical School. Together with Vojislav Subotić (1859-1923) was the initiator of the establishment of the Medical Faculty in Belgrade. He died on 11 September 1940. Vojislav Subotić was born in Novi Sad on 6 January 1859, as the son of a famous writer Jovan Subotić (Dobrinci, 30th Januar/11th February - Zemun, 16th/28th January 1886). He graduated from the Medical University of Vienna in 1881 and eas engaged with surgery and pathological anatomy. Upon his return to Serbia, he founded the surgical department of a hospital in Zemun and General State Hospital in Palilula, Belgrade, in 1889. He has published many papers in Serbia, Prague, Budapest, Paris, Zagreb and Brussels. Since 1910 he was president of the Serbian Medical Society and he participated in the First congress of Serbian physicians and naturalists in Beograd 1904 as a lecturer. He organized the first meeting of the Yugoslav operational medicine in 1911, many years before the country was founded. He was one of the first professors and the first dean of the Faculty of Medicine. He died on 4th December 1923 in Belgrade. From the standpoint of ecology, an important person was also prof. Dr. Paul Trtinac, who was a famous professor of chemistry at the Medical school. Born in 1905 in Novi Sad, he graduated from the Medical Faculty in Belgrade in 1934. The same year he was elected an assistant in Chemistry at the Institute of Chemistry, Faculty of Medicine. He studied in Paris. In 1939 he became an assistant

Eco-Ist’12, Ecological Truth, 30 May - 2 June 2012. Hotel “Srbija TIS”, Zajecar, Serbia
544
professor and associate professor in 1959, and the same year, Professor of Medical Chemistry. He led teaching of biochemistry at the Faculty of Pharmacy and the Medical Faculty of Dentistry. He died in 1991 in Belgrade.
The first dean and one of the founders of the Medical Faculty was an eminent pathologist Djordje Joanović (Ђорђе Јоановић) (Fig. 4). He was born in Vienna on 16th June 1871 and died under mysterious circumstances in Belgrade, on January 28th, 1932. He was a dean of the Medical Faculty in Belgrade for three terms, a member of the Serbian Academy of Sciences, a honorary member of ”Matica Srpska” in Novi Sad, and a president of Serbian and Yugoslavian Medical Society
.
Figure 4. Professor Djordje Joanovic, first Dean of the Medical Faculty in Belgrade
ESTABLISHMENT OF THE INSTITUTE OF BIOLOGY
IN BELGRADE
Institute of Biology in Belgrade within the Faculty of Medicine was founded in 1946. The first Professor of General Biology, Dr. Borivoje Ž. Milojević (1885-1967) came from the Faculty of Philosophy (Fig. 5)
.
Figure 5. Professor Borivoje Ž. Milojević (1885-1967)

Eco-Ist’12, Ecological Truth, 30 May - 2 June 2012. Hotel “Srbija TIS”, Zajecar, Serbia
545
Practical classes in Institute of Biology started after World War II, upon the arrival of an assistant Dr. Marko Anaf, at the initiative of prof. Dr. Nedeljko Divac (Prijepolje, 1883-Belgrade, 1964), a famous professor of biology and a politician (Fig. 6). Professor Divac is one of the founders of the Social Democratic Party of Yugoslavia and a member of Parliament in a period 1920-1923. He worked as a professor at the Pedagogical Academy in Belgrade and as a part-time professor of biology at the Medical Faculty in Belgrade. He was dealing with genetics. He translated parts of the Charles Darwin’s Theory, and was the author of numerous articles on social philosophy and journalism.[5]
.
Figure 6. Professor Nedeljko Divac (1883-1964)
Figure 7. Marko Anaf (1909-2010)
The first professor at the Institute of Biology, Faculty of Medicine in Belgrade after World War II, employed with a permanent workplace was Marko Anaf (Fig. 7). He was born on December 24, 1909 in Požarevac where he graduated from high school. He graduated from the Faculty of Medicine in 1936. After graduating he volunteered at the Chair of Internal medicine. During World War II he was a member of the Resistance and in 1945-1946 was a military doctor. Immediately after the founding of the Chair of Biology at the Faculty of Medicine in Belgrade in 1946, he was elected the first assistant, where he introduced the Practical course of Biology. He was elected assistant professor of Biology in 1954, and associate professor in 1965. He simultaneously studied biology at the University of Belgrade, Department of Biology. He was engaged in genetics and cell physiology, immunobiology and neuroendocrinology. He was one of the first professors to deal with the problems of ecology and modernization in general biology and natural sciences. He died in 102nd year of age in 2010 in Belgrade. Marko Anaf also remembered as a prominent member of the Jewish community in Belgrade
.
ESTABLISHMENT OF THE INSTITUTE
OF CHEMISTRY
Institute of Chemistry at the Medical faculty in Belgrade was founded in 1923. Initially, the Institute had only one part-time assistant, a graduate chemist, Bisenija

Eco-Ist’12, Ecological Truth, 30 May - 2 June 2012. Hotel “Srbija TIS”, Zajecar, Serbia
546
Mihajlović Hristić. Later, it developed into an important scientific, educational and research institute
.
Establishment of other
Institute
Institute of Physics was established in 1927 under the name ”Institute of Radiology”. The Institute had its own library, which had 7 foreign journals, over 600 books and 27 scientific books. Institute of Anatomy was opened in 1920. Institute of Histology was established in 1921, when Dr. Aleksandar Dj. Kostić (Александар Ђ. Костић, Mart 19, 1893 - January 19, 1983) was elected professor of Histology and Embryology (Fig. 8).
Figure 8. Aleksandar Dj. Kostić (1893-1983)
”Physiological Institute of the Medical Faculty of Belgrade University” was
founded in 1921, Institute of Biochemistry in 1959, Institute of General Pathology and Pathological Anatomy in
1922.
THE FIRST UNIVERSITY TEXTBOOKS WITH CHAPTERS ON
ECOLOGY
The first modern textbook of Biology, in Yugoslavia after World War II was the ”General Biology”, a translation of the group of Russian authors: V. A. Dorfman, A. A. Paramonov and I. E. Eskin. In was published in 1946, in the Croatian language, in edition of ”Nakladni zavod Hrvatske”. It was translated by Ivan Erlich, the editor of ”Periodicum Biologicum” (An Interdisciplinary International Journal of the Societas Scientiarum Naturalium Croatica, established in 1885)
The American Textbook by F. Shell was previously adjusted to the Soviet criteria of teaching Zoobiology and Phytobiology. Authors who had supplemented the Soviet edition are: V. A. Dorfman, A. J. Bljahermov, N. A. Borbinski, B. N. Višnjevski, S. E. Emeljanov, S. J. Kaplanski, N. P. Kroenke, M. L. Ljevin, B. S. Matvejev, B. D. Morozov, A. A. Paramanov and D. P. Filatov. In the second book of "General Biology", 15. chapter is entitled "Ecology". In this chapter, the contents and the problem of ecology, particularly the stress factors which exert influence and create conditions for the
.

Eco-Ist’12, Ecological Truth, 30 May - 2 June 2012. Hotel “Srbija TIS”, Zajecar, Serbia
547
existence of organisms, are explained. The term environment was defined as the unity of abiotic and biotic conditions, which directly or indirectly affected organisms. In terms of abiotic stress, role of physico-chemical phenomena protection, was explained which was considered the state that surrounded an organism in its development, growing and moving in space.
It was believed that the environment could be compact (earth, stone, and wood), liquid (water, blood for parasites) and the gas, i.e. air. Biotic conditions were considered those conditions that created activity and life functions of organisms. The first part emphasized the role of man and animals in adaptation to the environment. Based on this definition and the study of ecological phenomena, the goal of studying ecology was postulated. It is important that the authors pointed out that the modern approach was based on the evolutionary ecology of learning. According to this definition, ecology examines the interdependence of organisms from the environment to start and change. The authors considered adjustment (adaptation) a historical phenomenon. In the second part of the chapter they gave an overview of how organisms adapt to different environments. This section emphasized the adaptability of animals to aquatic environment, gas exchange, terrestrial and subterranean lifestyle. The role of running, jumping, crawling, and flight planning was explained on the examples of flying squirrel (Pteromys petaurista), flying maki (Galeopithecus volans) and reptile-dragon (Draco volans
On 390th page of "General Biology", there is a beautiful etching (by an unknown author) of Periophtalmus, one of the amphibians. The book describes the plankton (Sargasso) algae, and explains the gas exchange. It is emphasized that the gaseous environment is required for physiological adaptation. It also examines the problem of air and oxygen, as well as its dependence on the salinity of water, based on which aquatic organisms are divided into freshwater and marine animals. In particular, it explores animals, especially those who live underground: European mole (Thalpa Europea), Australian marsupial mole (Notoryctes Typhlops) and African golden mole (Chrysochloris Aurea). Section F deals with how organisms adapt to physical characteristics of the country. It is a study of animals and organisms that live in rocky areas. At the time of publication of the book, ecology was studying problems of adjustment. The chapter ”The adaptability of organisms” deals with conditions of low temperature and states that animals have a number of qualities that enable them to adapt. There are many warm-blooded animals. The book describes the mechanisms of accumulation of heat, especially in some Bilak, flowers, and as Guaphalium Leontopodium - typical alpine and polar plant. It explains the problems of adaptation to high temperatures expelling excess heat and keeping moisture within the body. This is the case in plants, especially in Calluna Vulopris. Also cave organisms are described, i.e. organisms that live in the dark, as a special form of adaptation. A way of life of algae, some blue or red is also described. At the end of the book there is the question: Is it possible that the body has unsuitable properties? In domestic animals, often are observed properties of potentially inadaptive character (traits that are detrimental to natural conditions). Adaptivity is an important concept in the selection - natural or artificial.
).

Eco-Ist’12, Ecological Truth, 30 May - 2 June 2012. Hotel “Srbija TIS”, Zajecar, Serbia
548
CONCLUSION
Ecology, as a biological science and as the academic study appears relatively late, in mid-twentieth century. The largest contribution to the introduction of ecology studies, was given by Institute for Medical Biology, University of Belgrade. The first findings were obtained through general biology, which came to Yugoslavia from the Soviet Union, and were first translated in Zagreb and Belgrade. The most prominent figures introducing ecology were Josif Pančić and Sinisa Stankovic in the nineteenth and early twentieth century, who were biologists, and Milan Jovanović-Batut, who specialized in hygiene and was a founding member of the Medical Faculty in Belgrade. Among the first teachers who were involved in the practical work in biology was Marko Anaf, who since 1946 worked at the Institute of Biology, Faculty of Medicine in Belgrade.
Acknowedgements
The authors wish to thank to Ministry of Education and Sciences of the Republic of Serbeia to financial support this work with Project: ”European Perspectives on the Quality of Education in Serbia”, project No 179010.
REFERENCES
1. Maksimović, J., 2008, Doprinos lekara iz Vojvodine u uspostavljanju zdravstvene službe u Srbiji i osnivanju i radu Srpskog lekarskog društva, Medicinski pregled, Istorija medicine, Hystory of Medicine, LXI (3-4): 191-203, Novi Sad: mart-april,
2. (?) 1946, Opšta biologija, pomoćna knjiga za studente medicine Univerziteta u Beogradu, druga knjiga, Beograd: Izdanje Udruženja studenata medicine, str. 284-428.,
3. Stanković, S.. 1974, Ekologija čoveka, Beograd: Naučna knjiga, 4. Stanković, S. 1954. (republished 1977), Okvir života, Skopje: Kultura, i
Beograd: Naučna knjiga, 5.
Stefanović et all, 1970, Institut za biologiju, in 50 Godina Medicinskog fakulteta Univerziteta u Beogradu, Galenika, Farmaceutska hemijska industrija, Zemun, p. 35-39.

549
XX International Scientific and Professional Meeting
"ECOLOGICAL TRUTH" ECO-IST'12
30 May - 2 June 2012, Hotel “Srbija TIS“, Zajecar, SERBIA
ENVIRONMENTAL MANAGEMENT IN THE FUNCTION
OF SUSTAINABLE TOURISM DEVELOPMENT
Dragica Stojanovic, B. Ilic, D. Mihajlovic
Megatrend University, Faculty of management Zajecar, Zajecar, SERBIA
ABSTRACT Tourism is integral part of modern society. It is the bearer of social functions, but also of results
shown in various forms. The man of 21st
century is not allowed to neglect ecological issues. While planning the strategy of development of tourism, we should take into consideration not only all challenges but also threats coming together with development. As a priority of sustainability, it is imposed the need for building-up of ecologic component in a tourist product, aimed to provide development and profitability. The Paper emphasizes well-managing eco-systems as a condition for realization of sustainable development with ecological sustainability.
Key words: tourism, modern society, eco-management, tourist product, sustainable development
INTRODUCTION
In the last few years, there have been more and more proofs pointing to the fact that doing tourism means being highly concerned with sustainability of natural resources. Such statement can be explained by the fact that these resources represent true basis for development of tourism. Moreover, it is undoubtedly tourism to be thanked to for comprehension of general need for sustainable development. On the other hand, the term of sustainable development comes from the term of general development. Sustainable development means the development of tourism which satisfies the needs of modern tourists, tourist destinations and all participants in tourism, involving also preservation and increase of potentials for using up tourist resources in future, without endangering possibilities of future generations to satisfy their needs. Sustainable tourism, as multidimensional phenomenon, has, primarily, an extraordinary economic significance; it represents an important driving force of economic development. Sustainable development, on one side, makes possibilities for including numerous subjects of world economy, while, on the other side, it becomes a factor of development on a national, regional and local level. Since the progress of tourist industry is closely connected to natural resources, the need for a good-quality ecologic management becomes primary activity of ecologic management. Starting from the point that sustainability is a global problem, the main task of ecologic management is to manage the environment.

Eco-Ist’12, Ecological Truth, 30 May - 2 June 2012. Hotel “Srbija TIS”, Zajecar, Serbia
550
Preserving the environment involves application of world standards, active participation in relevant ecologic actions, and making partnerships with other participants in realization of the aims.
ECOLOGY COMPONENT OF A TOURIST PRODUCT
During the 1970s, ecology became the problem for most branches of industry and subject of economics theory and practice. People became seriously worried over rapid exhaustion of non-renewable natural resources, and, at the same time, increasingly greater pollution of the environment [1]. Increasingly greater pollution of the environment and neglect of its natural beauties, make ecology, as a science and movement, become a current issue. The word „ecology“ is most frequently used word on the planet, our only common home, which we have to treat with consideration of a good and responsible host, so that we would not lose it. As far as half a century ago, sistematically, however, much earlier, pioneeringly, it was, by wise and responsible people, recorded the need for knowledge on ecology to become an integral part of the ,matrix of general knowledge. Thus, through ecologic education and making people conscious, critical mass of subjects, both individuals and organizations, can be generated on behalf of and in function of ecologic behavior. Sometimes, this term is used as a synonym for the idea of the environment protection, which is not correct, since the environment protection is only one of fields ecology deals with. The most general and widest possible definition of ecology is the following: ecology is the science researching mutual relations between organisms and their environment.
The influence of tourism on the environment can be positive (maintaining welfare of population and social progress, creation of new work places, consumption of natural and cultural values, etc.), but also a negative one (pollution of the nature, consumption of natural wealth, construction of structures, loss of biodiversity, violation of local customs and public structures). Integral approach to tourism planning, based on good quality, would contribute to high level of coordination between tourism and the environment protection. Modern structuring of tourist economy or offer, should be directed to strengthening ecologic properties of a tourist product. We should have in mind that on the demand market there are dynamic changes in needs, desires and demands of tourism consumers, with tendency to become deeper and be transformed, aiming to increase the quality. On the market of tourist demand, to which special attention is paid, there are occurring rapid changes referring to the following:
1. intensifying specific, selected demands of tourists for more efficient protection, by increasing ecologic quality and health functionality of receptive areas;
2. widening the structure and content of tourist stay based on more direct usage of natural resources, and
3. permanent increase of ecologic and technical level of services [2].
Starting from the specific influence of tourism on the environment, and taking into consideration the area, there is a series of instruments important for successful control of the influence of tourism on the environment. Firstly, it is required an integral approach to tourist planning. Tourism is an open system, so that it is necessary to
Eco-Ist’12, Ecological Truth, 30 May - 2 June 2012. Hotel “Srbija TIS”, Zajecar, Serbia
551
integrate tourism into context of general economic and socio-cultural development of a certain region, its specific features and material resources. In that way, the possibilities for conflicts among a greater number of subjects pretending to the same resources in a definite area, are decreasing. Secondly, the standards in tourism management, which we should cling to, with the aim that its development does not exceed the capacity of the natural and socio-cultural surroundings have two components:
1. Standards of the environment protection (standards of the air quality, standards of quality of drinking and bathing water, standards of allowed level of noise) made by legal enactments on the national or international level.
2. Standards of the area per a user of space and standards of density and appearance of built structures that should be determined by spatially-legal instruments on regional or local level.
If we commit ourselves to preserve the nature and wealth of its resources, we,
actually, choose a very complex and long-term process in which the whole population from a certain area should act as one. The basic principle of tourism in future involves protection of a man as an economic creature as well as ecologic balance of the nature.
CONCEPT OF SUSTAINABLE DEVELOPMENT OF TOURISM
There is no uniquely accepted definition of sustainable tourism including not only involvement of the principle of sustainable development but also ethic changes of all participants in tourism. Sustainable tourism in its original sense means a branch of economy which, minimally, influences the environment and local culture, at the same time, contributing to making profit, new work places and protection of local eco-systems. Actually, it is a responsible tourism which has an amicable approach to the natural and cultural wealth. The simplest definition is that sustainable tourism means each aspect of tourism contributing to the environment protection, social and economic integrity and improvement of the natural, created and cultural values on long-lasting basis [3]. Accordingly, sustainable development of tourism means the right to tourism and freedom of tourist moves, satisfaction of economic, social and esthetic needs, with maintaining characteristics of natural and social surroundings, and cultural and historical inheritance. Therefore, sustainable tourism should:
1. make optimum the use of the environment resources which make up the key element of tourism development, reflexing essential ecologic processes and helping natural inheritance and biodiversity be preserved;
2. respect socio-cultural authenticity of tourist destinations, protect their built-up and modern cultural inheritance and traditional values, and contribute to understanding and tolerance among cultures;
3. provide sustainable long-term business making socio-economic benefits that are distributed fairly to all stakeholders, including stable employment, possibilities for making income and welfare for the host’s community, as well as contributing to reduction of poverty [4].

Eco-Ist’12, Ecological Truth, 30 May - 2 June 2012. Hotel “Srbija TIS”, Zajecar, Serbia
552
To operationalize the aims of sustainable tourism and enable its implementation widely, it is necessary to respect the basic principles representing the frame and instructions for acting in practice. A great number of researchers point out four main principles based on four mainstays of sustainability: economic, ecologic, cultural and social sustainability.
1. Economic sustainability – providing profitability directly and for a long-term period, means:
• developing inter-sector partnerships in the wholesome chain of offer, from local micro enterprises to multinational companies;
• using international directions for training and certification; • creating products with a span of tourist activities; • directing a part of earned income to aid for training; • ethical marketing and development of a product; • providing financial initiation for enterprises for adopting the principle of
sustainability.
2. Ecologic sustainability – the development compatible to maintaining basic ecological processes, biologic diversity and biologic resources, requiring the following:
• to make and respect the Code of Behavior on all levels; • to establish directions for business operations in tourism, to assess and follow
cumulative influences; • to form the national, regional and local policy in tourism and development
strategies which are in accordance with the wholesome aims of sustainable development;
• to organize researching assessment of influence on the environment; • to urge for designing, planning, development and practical activities, involving
principles of sustainability; • to measure and conduct research on real effects of tourism; • to identify acceptable behavior among tourists; • to promote responsible behavior of tourists.
3. Cultural sustainability – the development which is compatible to cultural and
traditional value of local communities and which affect on strengthening of their cultural identity which involves the following:
• to initiate developing programmes in tourism with widest participation of a local community;
• to establish programmes of education and training for improving and managing cultural heritage and cultural resources;
• to preserve cultural diversity; • to respect the right to the teritory and property of the local population; • to strenghten, cherish and encourage possibilities of the domestic community in
preserving and making use of traditional skills;

Eco-Ist’12, Ecological Truth, 30 May - 2 June 2012. Hotel “Srbija TIS”, Zajecar, Serbia
553
• to cooperate actively with local leaders and minorities with the aim to provide acceptable behaviour;
• to train the bearers of tourist industry how to behave and do what is permitted.
4. Social sustainability – directed to goodness of the local community and making and keeping income and other benefits in those communities:
• the community should control the development of tourism; • tourism should provide good quality employment of the people living in the
community; • enterprises should be encouraged to reduce negative effects on the local
communities; • fair distribution of the financial benefit in the wholesome chain of values should
be provided; • it should be provided financial impulses for local firms to do tourism; • capacities of the local human resources should be improved [5].
As a sub-component within sustainable tourism, we point to the eco-tourism
which, primarily, represents sustainable version of tourism based on the nature, and involving also both rural and cultural elements of tourism. Ecotourism tends to achieve the results of sustainable development in all forms. However, it is important to clear out that all tourist activities, whether they are closely connected to holidays, business, conferences, congresses or fairs, health, adventure or eco-tourism, should have sustainability as an aim. It means that planning and developing tourist infrastructure, its further business operations and its marketing should be focused on social, cultural and economic criteria of sustainability.
TASKS OF ECOLOGIC MANAGEMENT OF A TOURIST DESTINATION
Function of a technogenous system is a strong factor of influence on existing
relations between alive and material world. The changes, occurring mostly at the expense of the world inhabiting that location and a wider area around it, can be identified, measured and reduced by taking over definite steps. Preservation and protection of a tourist destination environment are in interest of all participants, which requires coordination of actions, with taking into consideration global processes. The environment protection management is based on the change of norms of the ISO 14000, as a starting point of introduction of the wholesome system of the environment management and supervision of the environment, known as the EMS (Environmental Management System) and the EMAS (Eco Management and Audit Scheme). The areas of acting on destination ecologic management are shown in the Table 1 [6].

Eco-Ist’12, Ecological Truth, 30 May - 2 June 2012. Hotel “Srbija TIS”, Zajecar, Serbia
554
Table 1. The influence of the chain of services on the environment [7] Before At once After
information /rese- rvation
coming on
inform. at once
cate-ring
accommodat ion
tran-sport
activity/ anima-tion
entertainment
return after-care services on
material energy air noise ground
mate-rial
waste groud waste energy
energy niose mater. ground
?
energy energy air nosie ground
_
Ecological projects involve different and complex fields, such as: ecologic surroundings, power savings, clean and waste waters, waste management, air and climate. To realize those projects, we need good ideas, a responsible approach to evade risks, adequate financial support, and time. Accordingly, the tourist destination management in realization of this concept has the task of active involvement in relevant ecologic actions relating to protection and saving drinking water, waste water management, protection of air, reducing and separating waste, introduction of clean technologies, substitution of pollutants, etc. Listed and other activities are at the same time the sets of mutual initiatives of the management team and other participants in the tourist offer of a tourist destination in solving open issues of improving and protection of the environment. To solve those problems, it is emphasized the mission, vision and aims of the ecologic development of a tourist destination, in which particularly significant role is played by public sector (local administration and self-administration units) which have to provide conditions and enable realization of adopted projects. It is necessary to make conditions for each participant in the tourist offer on the level of a tourist destination to find his own interest within common activities [8]. Within common development aims of the destination, each participant should also invest certain resources, and take part in the decision-making process. CONCLUSION Sustainable tourism is a complex concept that is manifested through several elemenats relating to the environment protection, from one side, and social responsibility, from the other. Referring to it, sustainable tourism is based on maximizing satisfaction of tourists with simultaneous arising of consciousness on protection and preservation of the natural resources. The fact that the principle of ecology sustainability is one of the basic principles of sustainable development, well-implemented management of ecology systems is a condition to achieve sustainable development. The tasks of the ecology management of a tourist destination are directed to preserving the life ambient of that area, meaning application of world standards, active participation in relevant ecology actions and creation of partnerships with other

Eco-Ist’12, Ecological Truth, 30 May - 2 June 2012. Hotel “Srbija TIS”, Zajecar, Serbia
555
participants aimed to the aims realization. The development of tourism is best if it is planned and based on modern demands of sustainable development which emphasizes the arrangement of the area for needs of tourism that does not violate basic ecology principles. As a result of positive effects, sustainable development of tourism can be regarded as a means for elimination of poverty and increase of the life standard of citizens. Planning which preceeds sustainable tourism is positive in contrast to negative sanation of consequences. REFERENCES
1. Magdalinović N., Magdalinović-Kalinović M., Upravljanje prirodnim resursima, Bor, 2007. 2. Marić R., Ekološke komponente turističkog proizvoda Srbije, Novi Sad, 1997. 3. http://www.ekoplan.gov.rs 4. Svetska turistička organizacija, World Tourism Organization (WTO),
www.world- tourism.org 5. www.iclei.org/europe/tourism 6. Peršić M., Partnerstvo i eko-bilanca turističke destinacije
saţetak,www.bib.irb.hr/datoteka/ 353880.ECO_BILANCA_I_PARTNERSTVO_KNJIGA.pdf
7. Müller H., Turizam i ekologija, Masmedia, ISBN 953-157-456-1 Zagreb, Hrvatska, 2004.
8. http://www.cqm.rs/

556
XX International Scientific and Professional Meeting
"ECOLOGICAL TRUTH" ECO-IST'12
30 May - 2 June 2012, Hotel “Srbija TIS“, Zajecar, SERBIA
OPPORTUNITIES FOR TOURISM DEVELOPMENT AND ENVIRONMENTAL
PROTECTION OF RADAN
MOUNTAIN
Danijela Vukoicic1, J. Dragojlovic1, M. Nikolic1, F. Bacevic2, N. Bacevic
1
1Faculty of Science, Department of Geography, Kosovska Mitrovica,SERBIA 2
Turisticki center, Zemun doo, SERBIA
ABSTRACT
This paper presents the basic geographical features of Radan mountain and systematic review of all natural and anthropogenic resources of the mountains which form the basis for tourism development. Sustainable development is based on conservation and use of all values in the development of tourism in the present, but also the possibility of using them in the future. Protection of natural and anthropogenic values provides an opportunity for future generations to deal with tourism. Radan mountain with all its tourist values enables the development of many types of tourism: excursions, trips, transit, events, hunting, spa, tourism in the countryside and mountains
.
Key words: tourism development, environmental protection, types
of tourism
INTRODUCTION
Radan mountain lies in the central part of southern Serbia. The physical and geographical sense includes the upper parts of Toplica river, Pusta Reka and Jablanica. This mountainous massif also includes a series of smaller ranges (Sokolovica, Arbanaška mountains, Sokolov top, Prolomske mountains, Majdan mountain and Ravna mountain). The highest peak of this mountain range is Sopot (1408 m) on the Radan mountain. Spatially this mountain range covers parts of the municipalities Kuršumlija, Prokuplje (Toplica), Bojnik, Lebane and Medvedja (Jablanica) and extends north-east direction. Radan and its surroundings are intersected faults, and the increased complexity of the terrain is volcanic activity. The space of Radan mountain is characterized by a moderately developed hydrography. The waters are of very good quality in the upper reaches, and belong to the first category, a class IIa quality downstream. The amount of water in streams is uneven during the year, in spring flows lapse of 50-60% of the total water balance, which occurs after a period of little water in the river. Large surface topographic slope and impermeability of crystalline schists and volcanic rocks allow the occurrence of torrential flows. As a result of the volcanic Radan mountain reported numerous thermo-mineral and mineral springs. Favourable temperate-continental climate

Eco-Ist’12, Ecological Truth, 30 May - 2 June 2012. Hotel “Srbija TIS”, Zajecar, Serbia
557
with mild shift in the sub-mountainous phenomenon has enabled grass and forest formations in the lower and forest areas in upper
mountains.
NATURAL AND ANTHROPOGENIC OPPORTUNITIES
FOR TOURISM DEVELOPMENT
Radan mountain is characterized by diversity, variety, beauty and attractiveness of the beautiful landscape elements with characteristic natural and anthropogenic features, which stand out mostly wooded and uninhabited mountain plateau and peaks Radan and Sokolovic. The space is composed of gorged river valleys, deeply dragged with steep sides, covered with woods, pastures with small locally small areas of arable land, and groups in rural households. In Radan mountain is expressed excessive soil erosion, with erosion forms. The best known and most prominent erosion at the site of the Devil's Town. In this area mineral resources are well known with specific physico-chemical properties. Bifurcation of the river Delivode, Zigic spring below Sokolov top and Lake Prolomsko stand out as a special natural values of the Radan mountains. Brestovačko catchments of lakes and mineral springs spa Prolom have the highest value for the natural development of tourism in the Radan mountain. The space is characterized by Radan considerable degree of species and ecosystem diversity. Wild flora and fauna are 960 taxons of higher plants are grouped into 370 genera and 100 families, of moss and lichen fungi have been identified so far with a total of 190 species, 28 plant species of herbaceous and woody vegetation on the meadow pasture, forest and rocky habitats, 100 species of birds of which 94 are breeding species and 57 breeding species - resident, 29 species of mammals, incompletely explored fauna without bats, which has at least 12 species, 17 species of representative herpetofauna (8 species of reptiles and 9 species of amphibians), 12 species of fish and numerous fauna insects which have been identified 295
species. In the area of Radan mountain resorts are similar to other mountainous areas.
This space is allocated three types of settlements (400-700 m above the sea level.), Low mountains (700-1000 m above the sea level), a part of the territory and Major Lebane can be observed and valley type (200-400 m above the sea level). The most common type is a mountain village. The villages are compact type spaces in the valley areas and hills, often divided in a delighted hamlets and broken type villages in mountainous areas, with large gardens, often divided in villages. In both types of settlements are retained objects of material culture (houses, commercial buildings, water-mills, tombs, churches and hillforts), reflecting the spirit of folk architecture and part of his cultural heritage. During building the construction of local materials was used and almost on the whole of this area houses could be found. Houses generally belong to the Moravian type. In addition to individual examples of rural architecture, there are well-preserved group of houses that are gorgeous ambient entirety. The archaeological site of Empress town is of great importance for tourism development
.

Eco-Ist’12, Ecological Truth, 30 May - 2 June 2012. Hotel “Srbija TIS”, Zajecar, Serbia
558
THE PROTECTIVE STATUS OF NATURAL AND ANTHROPOGENIC VALUES
Status of protected natural resources, protected areas and protected species of wild flora and fauna, or the status of areas and species of international importance for nature conservation in the Radan mountain
are:
The protected area is: Nature Monument Devil's Town, which was established in 1995th The Government Decree on the surface of 67 hectares, belongs to the municipality of Kuršumlija in the village Djake, as a protected natural area of great importance which means the first category. Devil's Town is a group composed of spindle poles with stone caps on the top, which is commonly referred to as earth pyramids or towers. Devil's Town is a representative example of the process of soil erosion and as such is unique geomorphological phenomenon in Serbia, rare in the world
.
Protected species are: Species of wild flora and fauna of the declaration set forth in regulations and protection of strictly protected and protected wild species of plants, animals and fungi. From a strictly protected wildlife, the Radan Mountains area is located approximately 20 species of plants and about 95 species of animals, mostly birds (50 species), followed by mammals (about 20 species, including bats), fish (2 species), reptiles and amphibians of 8 species and 15 species of insects around. From protected wildlife species, the observed area is located about 80 species of protected plant species and over 100 species of protected animals, mostly birds, insects and
mammals.
The areas of the national ecological
network are: Radan has been identified as one of the most ecologically significant areas of the
Republic of Serbia which is in the process of Areas with international protection status are: Radan area or its parts are included in the following list of international importance for the protection of nature, or are candidates for this list:
protection.
• list of selected areas of daily butterflies - PBA areas (Prime Butterfly Areas) program by Butterfly Conservation Europe; • EMERALD leaf area, and identified preliminarily established as part of a network area (Emerald Network of Areas of Special Conservation Interest - ASCI) significant from the point of application of the Convention on the Conservation of European wild flora and fauna and natural habitats (Bern Convention) in Serbia; • List of World Heritage properties - a natural monument "Devil's Town" made a motion for entry of goods into the list of World Heritage (World Heritage Convention), for which the Convention Committee requested amendment concerning the cadastral data and display the correct size, or the fulfillment of certain conditions. While these conditions are not met and the proposal does not happen again, "Devil's Town" will be on the preliminary list (Tentative List) goods which will propose the Republic of Serbia in the period for entry into the same global list;

Eco-Ist’12, Ecological Truth, 30 May - 2 June 2012. Hotel “Srbija TIS”, Zajecar, Serbia
559
• list of areas of the European NATURA 2000 network in Serbia and areas of application of the Habitats Directive (Council Directive 92/43/EEC of 21 May 1992 on the conservation of natural habitats and of wild fauna and flora) - for the purposes of identifying and protecting the so-called . Special Areas of Conservation (SACS) and the Birds Directive (Council Directive 79/409/EEC of 2 April 1979 on the conservation of wild birds) - the basis for identifying and protecting the so-called. Special Protection Areas (SPAs). Types of international protection status are: • CITES species - Representatives of wild flora and fauna included in the International Convention on Trade in Endangered plant and animal species, of which the conditions of transport, trade, and entering the amount prescribed in the Regulations on closer cross-border movement and trade in protected species ("Official Gazette of RS", No. 99 / 09), and the space Radan which has about 55; • migratory species of wild animals and wild European flora and fauna - plants and animals covered by the Convention on the Conservation of Migratory Species of Wild Animals (Bonn Convention) and Convention on the Conservation of European wild flora and fauna and natural habitats (Bern Convention), which has the space Radan 120 (mostly birds - over 90, then amphibians, reptiles and mammals); • the type of world and European Red List of threatened plants and animals, including: global Red List - 3 types of plants, 3 species of insects and one species of bird, the European Red List - 3 types of plants and 6 species of insects and birds in terms of status applied SPEC is 1-3 categories, such as SPEC-1 (globally threatened species) - 1 species; SPEC-2 (species with unfavorable conservation status, whose main populations are located in Europe) - 12 species and SPEC-3 (species with unfavorable status security in Europe which is the main population are not in Europe) - 22 species. Protecting the value of anthropogenic
Categorized cultural assets in the Radan mountains represented by only one immovable cultural property of great importance - Archaeological site "Empress City", and immovable cultural property of great importance there.
Archaeological site "Empress Town" protected in 1949. , and categorized 1979th year. It is located in the municipality Lebane in cadastral municipality Štulac, 6 km northwest of the municipal center. The site "Empress Town" has not yet been fully explored even in the urban core, especially in the suburbs and neighboring area, and what has not been investigated adequately protected. Field site is overgrown, with no orderly approach, together with inactivated object "Theodore", a presentation of the city is organized.
Heritage enjoying prior protection of the Radan mountains are archaeological sites, potential monuments, sights and sites of construction. The most vulnerable are all archaeological sites. Significant places are generally not affected, while the sacred objects partially affected. National Construction sites are the most neglected part of the cultural heritage of the area Radan, though there are still preserved extremely valuable residential and commercial buildings and their environmental components, which so far no attention has been paid to the protection.

Eco-Ist’12, Ecological Truth, 30 May - 2 June 2012. Hotel “Srbija TIS”, Zajecar, Serbia
560
TYPES OF TOURISM ON THE MOUNTAIN
RADAN
Among the types of tourism in localities of Radan mountain an important role could have a picnic and excursion tourism, Event tourism, hunting tourism, spa tourism, village tourism, mountain tourism. Excursion and picnic tourism. Natural beauty, suitability for walking, hiking and practicing various kinds of sports in the Radan mountains. Favorable climate, forest areas and environmental protection are attractive to Radan mountain for excursion and picnic tourism The natural values of this mountain complete and anthropogenic tourist values. Most tourists to this area attract Devil's Town, a unique geomorphological phenomenon in our country and rare in the world. Cultural values, ethnic heritage, costumes and customs of rural households and can be attractive motives for tourists and excursionists. Close to the center of Kopaonik mountain and spa surrounded by a favorable influence on the development of this tourism of the the Radan mountain. Event tourism. Original ethnic contents, which are the costumes, customs, way of life and work demonstrate the attractiveness and individual values can become a motive for tourist developments. This type of tourism is evident in certain time periods often in just one day but with a large number of visitors. Often this type of tourism expressed in the celebrations and other gatherings, and a number of motifs that make up the ethnic heritage. Hunting. The diversity and rich collection of game features the Radan mountain. He expressed a higher representation of small and medium game and small game representation characteristic of the high mountains. Radan mountain belongs to the high mountains, which indicates that in this region hunting is developing, and therefore more attractive certain types of tourism. Hunting activities in this area are the basis for the motivation of tourist arrivals. With a small investment in rural households a good accommodation facilities would be got, and with better organization of hunting in the field and specialized training guides which have created the conditions for the full development of this type of tourism. Spa tourism. Radan mountain is rich in thermal mineral springs that have a health resort and recreational skills. On the slopes of this mountain spa resorts have been developed Prolom and Sijerinska spas. In addition to these sources on which they occurred were recorded spa resorts and other thermo-mineral and mineral springs, which have not been explored, but the quality of mineral springs and many can offer a far more significant spa tourism. This is the spring Gajtan which is necessary to carry out fundamental research and determine the way I used water sources
. Tourism in the countryside. This is the oldest and most traditional way of
holiday visitors from urban areas. Villages in the Radan mountains (Zebice, Djake, Kupinovo, Ivan Kula, Dobri Do), have all the values for rural tourism. As the tourists stay longer in the country than other types of tourism, it gives them the opportunity to learn about the natural and social environment of the area and to look at all the advantages that can not be achieved in the crowded centers of mass tourism. By enabling this type of tourism, to contribute in this region move faster development processes Mountain tourism. This type of tourism in Serbia is gaining more popularity. How Devil's Town is an integral part of Radan mountain, this mountain is its wealth of

Eco-Ist’12, Ecological Truth, 30 May - 2 June 2012. Hotel “Srbija TIS”, Zajecar, Serbia
561
natural resources can become popular for locals and foreign visitors. A complete evaluation of this area would impact on the development of tourism and its contents. Close to Kopaonik mountain significantly influences the development of this type of tourism, having a significant advantage over Radan, but complex and specific offer this space can be utilized for the development of mountain tourism. In the observed area, requires further research of population and employment, settlement, and their level of readiness, economic activity and their structural relationships, social base and operations
.
CONCLUSION
The favorable geographic position and tourism and well-preserved nature, which in a special way to enrich rural communities and other immovable cultural property, provide opportunities for developing tourism in the Radan mountain. The best way for tourism development is a modern way to the demands of sustainable development, where it emphasizes that the spatial needs of tourism without disturbing the basic environmental laws. Tourist offer of Radan mountainwill be based on: an attractive natural resources, the most valuable parts of the tourist complex on the site and Radan mountains (especially above 1000 m above the sea level) and thermo-mineral waters Prolom spas, cultural and historical sites, particularly archaeological site "Empress Town" and the tourist amenities of the rural zone Radan mountain. These resources are destined for use in this area: hiking and excursion tourism Event tourism, hunting tourism, spa tourism, village tourism, mountain tourism and other forms of tourism is primarily part of the regional and national levels
.
REFERENCES
1. Vukoičić D. Spa tourism in the Development of Municipal Kuršumlija. Serbian Geographical Society, Belgrade, 2008.
2. Topographic map of the Republic of Serbia in the scale 1:100.000, sheet Kuršumlija and Nis.
3. Vujanovic V. and M Teofilović. Spas and mineral water in Serbia. Scientific Adviser, p. 33-36, Belgrade, 1983.
4. Dimitrijevic, M. and Drakulic, N. Crystalline schists Jablanica. Proceedings of Mining and Geology, VI, 1-32, Belgrade, 1958.
5. Gagarin, G. Dacitske-andesite rocks Radana. Journal of Geol. Institute of the Kingdom of Yugoslavia, V, 219-252, Belgrade, 1937.
6. Milojevic, S. Geomorphological observations in the Valley Spa. Journal of Geographical Society, 15, Belgrade, 1929.
7. Srećković Batoćanin-D., D Vukoičić., O Papović., Milanovic D., Kićović D. and T Đekić. Devil's Town - the story of the formation potential. Geoecology twenty-first century - in theory and application tasks, International Symposium (Proceedings) Budva-Podgorica, 2010.
8. Regulation of the ecological network. The Regulation was published in "Official Gazette of RS", no. 102/2010 of 30.12.2010. year.

Eco-Ist’12, Ecological Truth, 30 May - 2 June 2012. Hotel “Srbija TIS”, Zajecar, Serbia
562
9. Regulations on the declaration and protection of strictly protected wild species of plants, animals and fungi. Official Gazette of RS, no. 5/10. Appendix I and II.
10. Rules on the criteria for issuance of habitat, the habitat types, sensitive, vulnerable, rare, and for the protection of priority habitats and types of protective measures for their conservation ("Off. Gazette RS", no. 35/2010)
11. Jovanovic V., Randjelovic V. and N Randjelovic. Overview of herbaceous vegetation Radana, Sokolovic and valleys Kosanica. Proceedings of "VI Symposium on Flora of Southeastern Serbia and neighboring areas", p. 87-94. Sokobanja, 4-7 July 2000.
12. Ministry of Science and Environmental Protection of Serbia - Directorate for Environmental Protection. National Environmental Protection Programme of the Republic of Serbia. Belgrade, 2005.
13. National Sustainable Development Strategy. Official Gazette of RS, no. 55/05, 71/05-correction and 101/07
14. Spatial plan of Republic of Serbia 2010th-2020. Belgrade, 2010. 15. Stevanovic, V. (Ed.). Red Book of Flora of Serbia, and this. Ministry of Environment of the Republic of Serbia, Faculty of Biology, University of Belgrade, Institute for Nature Protection of Serbia, Belgrade, 1999.
16. Stankovic S. Tourism in Serbia. Serbian Geographical Society, p. 475-483, Belgrade, 2002.
17. Stankovic S. Roads of Yugoslavia. Institute for Textbooks and Teaching Aids, p. 205-206, Belgrade, 2001.
18. Vukoičić D., Punišić M. and Nicholas M. M. Opportunities to create sustainable rural tourism in the Upper Toplica. Problems and challenges of modern geographical science and teaching - Scientific conference with international participation, University of Belgrade-Faculty of Geography, Kopaonik (Brzeće), 8-10. decembar 2011.

563
XX International Scientific and Professional Meeting
"ECOLOGICAL TRUTH" ECO-IST'12
30 May - 2 June 2012, Hotel “Srbija TIS“, Zajecar, SERBIA
ENDURO- TOURISM, CYCLO-TOURISM AND THEIR EFFECTS
ON THE ENVIRONMENT
Cipriana Sava
Faculty of Tourism and Commercial Management Timişoara Christian University”D.Cantemir” Bucureşti, ROMANIA
ABSTRACT
The need to spend free time as far away as possible from polluted urban areas, the need for sports
and to keep fit is, at present, constantly increasing. Tourism has evolved and thus, sports tourism appeared, with its variants.
Enduro-tourism is well-known, due to the sensations of power and freedom. Moreover, many people also practice cyclo-tourism.
In the “fight” to attract tourists, new destinations are proposed, even inside protected areas. The preoccupation for keeping the environment intact, for developing ecotourism should be put on the first place.
Key words: eco-tourism, endure-tourism, cyclo-tourism, touristic itineraries, protected area, pollution
INTRODUCTION
The development of durable tourism is a necessity, as we can maintain
unaltered touristic resources for future generations. According to OMT, durable tourism presents the following aspects:
- quality; - continuity; - balance.
The development of durable tourism offers tourists the opportunity to have a
valuable experience, and the quality of life rises. Also, local cultural identity is kept, unemployment and poverty are reduced, an optimal long-time exploitation of touristic resources is ensured. Thus, a balance between tourists’ needs and the host community related to the environment is also ensured.
Durable tourism is based on a series of principals: - the environment has a main role in touristic activity, thus, it should be preserved; - local communities and visitors are the beneficiaries of the environment; - there should be a mutual relationship between tourism and environment; - maintaining local characteristics;

Eco-Ist’12, Ecological Truth, 30 May - 2 June 2012. Hotel “Srbija TIS”, Zajecar, Serbia
564
- balancing tourists’ needs with hosts’ needs; - authorities’, tourism employees’ and tourists’ implication and responsibility to
respect durable development principles.
Taking into account the information presented, the development of durable tourism is easier to implement and develop in natural protected areas.
Ecotourism belongs to durable tourism which has as a target the protection of the environment, respecting the environment, respecting the landscape, biodiversity and proposing holidays offers for nature lovers.
MATERIALS AND METHODS Inside natural protected areas, various leisure activities may take place:
- studying the nature, flora and fauna; - photographing, painting; - trips in the mountains; - alpinism; - speleology; - diving; - walking; skiing; - cycling and canoeing; - visits to cultural historical and ethnographic objectives; - knowing and learning traditional skills; - visiting eco-museums inside protected areas; - watching movies, documentaries, about protected areas.1
Respecting principles of durability and norms related to protected areas, in which case we can speak about sports tourism. Eco tourism includes numerous sports activities.
Tourists who practice this type of tourism are sportspeople: - active amateurs; - spectators.
These categories combine resting periods with active recreational periods, with
leisure tourism and cultural tourism. Sports tourism also has an extreme side, when tourists practice extreme sports
such as rafting, bungee jumping, alpinism, paragliding, canyoning, enduro-tourism. Enduro is the motorcycle sport that combines the pilot technique in off-road
conditions with speed and other characteristic elements for competitions on circuit.
1 Istrate L, Florina Bran, Anca Gabriela Rosu, Economia turismului si mediul înconjurator, Editura Economica Bucuresti, 1996, pag. 228.

Eco-Ist’12, Ecological Truth, 30 May - 2 June 2012. Hotel “Srbija TIS”, Zajecar, Serbia
565
By practicing enduro-tourism, the tourist has the following objectives: - to adapt to a new environment; - to eliminate the stress of urban life and the stress of the unknown; - to make group decisions to solve problems without generating conflicts.
In order to be able to practice this form of tourism, special equipment and a
very good physical and psychical training. Enduro motorcycles are manufactured by the following makers: Yamaha, Ktm,
Kawasaki, Beta, Honda, Suzuki, Cagiva, Husqvarna. They can have 2 or 4 cylinders, engine displacements (100 cc–650 cc), and are easily recognized due to their high figure, high ground clearance, a bigger front-wheel and tires with studs.
Figure 1. Enduro motorcycle model
The auxiliary equipment includes off-road helmet, off-road glasses, armor, suit
and boots. Internationally, more and more people are interested in enduro-turismului. Cycle-tourism is another leisure activity. It implies visiting tourist monuments
on 2 wheels, that is, by bicycle. We can state that cycle-tourism combines sports with leisure and information. For mountain trips, some companies have released on the market specific
models of bikes, which have the following characteristics: generally, they have a small and thick frame, 26 inch rims, tires with studs for a better traction and shock absorption. Mountain bikes also have a wider handlebar, more speeds and brakes than the usual ones.
Their weight varies between 7 and 20 kg.

Eco-Ist’12, Ecological Truth, 30 May - 2 June 2012. Hotel “Srbija TIS”, Zajecar, Serbia
566
Figure 2. Mountain bike model
The accessories include: helmet, gloves, glasses, knee pads, elbow pads, shorts
or jackets, comfortable shoes, GPS, various specific tools. If we compare this auxiliary equipment with the one necessary for enduro –
tourism we can find a series of common elements. Mountain biking has numerous fans around the world who try to free themselves
from the daily stress, to be closer to nature, to be able to relax.
RESULTS AND DISCUSSIONS Any activity that takes place in nature may have negative effects upon the
environment, and tourism is no exception. Enduro-tourism and cycle tourism raise the problem of relief alteration along
with the soil, the climate, the waters, the vegetation and the fauna. Pollution means contaminating the environment with various materials that
affect people’s health, the quality of life or the natural function of ecosystems, often due to human activities.
It is well known that enduro-tourism uses engines, thus there is the possibility of pollution. This takes place due to:
- mechanical destruction; - gases from motorcycles; - vibrations and engine noises; - resonances by reflections - possible fuel and lubricant losses.
Cycle tourism in the mountains can also be polluting although bikes do not have
engines. Pollution takes place due to: - mechanical destruction; - noise produced by brakes.
Limiting pollution and environmental degradation can be done by passing laws
that restrict access into forests and protected areas on motorcycles, or other engine cars.

Eco-Ist’12, Ecological Truth, 30 May - 2 June 2012. Hotel “Srbija TIS”, Zajecar, Serbia
567
In Romania, in Codul Silvic (Forest Norms), there are two paragraphs that do not specifically limit access into forests on motorized means of transport. “Public access into forests is allowed only in special areas and on itineraries marked for this purpose. Public access into forests in automobiles, on motorcycles, ATVs or mopeds is forbidden, with the exception of sports activities, leisure and tourism activities, that can be practiced only with the owner’s or administrator’s permission.”2
Unfortunately, if durable development is to happen, this study offers the possibility to diminish pollution and protect forests.
International Mountain Bicycling Association (IMBA) has tried to impose some rules to all mountain bikers, for example:
- access is allowed only on known paths; - no obvious tracks should be left; - to be able to control your bike; - help the others in need; - wild animals should not be disturbed; - the trip is always carefully planned.
In all protected areas around the world there is a minimum set of rules to help
protect them and avoid natural disasters. These rules forbid: leaving marked paths, noise and writing on trees or rocks, lighting fires in unmarked places, leaving trash behind, camping in unmarked areas, picking flowers or other protected plants, taking fossils or minerals, destruction of signs and posts.
Ţarcu Mountains are situated in the North- West area of Meridionali mountains in the Caraş-Severin County, Vest Development Region, Romania. The maximum altitude is 2190 m and there are two peaks Căleanu and Ţarcu. The relief, the climate, the waters, the vegetation and the fauna is suitable for tourist activities.
Since 2007, Ţarcu Mountains have been declared Sit Natura 2000 according to the Habitats directive 92/43 passed by the European Commission, which can be found in the Romanian Law OUG 57/2007 and law 49/2011. The site has six natural ecosystems, four natural forest habitats protected by the Romanian law.
Its administration belongs to Altitudine Association since 2010, which militates for preserving natural resources and developing durable tourism. This presupposes that enduro – tourism is forbidden and mountain biking can only be done on well established marked itineraries.
Yet, since 2006, once the protocol between Romanian Federation for Motorcycling, Romanian Club for Automobiles and National Forest Agency Romsilva was signed, there are endure activities.
That is why there are traces of pollution in the Ţarcu Mountains, such as removal of vegetation layer, erosion, ditches, even landslides.
2 Codul Silvic al României, art. 54, aliniatul 1 şi 2

Eco-Ist’12, Ecological Truth, 30 May - 2 June 2012. Hotel “Srbija TIS”, Zajecar, Serbia
568
Figure 3. Tracks left motorcycles in Ţarcu Mountains Source: Altitudine Association
For cycle-tourism there is already an itinerary that starts from Poiana Mărului,
at the foot of the mountain and ends in Ţarcu Peak. Eliminating enduro type activities, this situation would stop and we could speak
about developing durable tourism.
CONCLUSIONS Both enduro- tourism and cycle-tourism are part of sports tourism and address
to action fans and adrenaline seekers, who also like to relax in nature. Enduro- tourism is associated with extreme sports and it is a polluting factor,
that is why it should be limited to restricted areas (for example, tracks) and under strict supervision.
Mountain cycle-tourism is less polluting, but, in this case, itineraries should be respected, violent brakes should be avoided in order to avoid the pollution of the environment. Protected natural environment should be the main preoccupations in our society, and practicing a durable tourism will bring more benefits in time than present “wild” tourist activities.
REFERENCES
1. NISTOREANU, P., (coordonator), 2003, Ecotourism and rural tourism, ASE Publishing House, Bucharest;
2. OLARU, M., 1996, The Banat Mountains – natural and anthropic tourist resources, Hestia Publishing House, Timişoara
3. Legea nr. 5/6.03.2000, privind aprobarea Planului de amenajare a teritoriului – secţiunea a- III-a- zone protejate, M.O. al României, nr. 152 din 15.04.2000;
4. Codul Silvic al României, art. 54, aliniatul 1 şi 2

569
XX International Scientific and Professional Meeting
"ECOLOGICAL TRUTH" ECO-IST'12
30 May - 2 June 2012, Hotel “Srbija TIS“, Zajecar, SERBIA
MANAGEMENT OF PROTECTED AREAS IN CARAŞ-SEVERIN COUNTY,
IN THE CONTEXT OF ECOTOURISM DEVELOPEMENT
Dina Maria Luţ*
, M. Ogarlaci
“Dimitrie Cantemir” Christian University, Faculty of Management in Tourism and Commerce Timişoara, ROMANIA
ABSTRACT
Ecotourism is a form of tourism in which the main motivation for the tourist is the observation and
appreciation of nature and local traditions related to nature. Ecotourism, as a form of tourism, has emerged with people's need to withdraw in nature and to visit or to meet natural areas that have or not a national or international protection status. Federation of National and Natural Parks in Europe has mentioned the tourism in the protected areas or around them.
Caras-Severin county, located in the south-west of Romania, has a remarkable touristic potential, insufficient developed, that could be in the future one of the most important branches of county’s economy. There are 62 protected natural areas in this county.
This paper highlights the main categories of protected areas in this county and also shows some aspects of the management process of these areas
.
Key words: ecotourism, Caras-Severin county, protected natural areas, sustainable development, management process
INTRODUCTION
The tourism is one of the industries which have to get involved in the
sustainable development, as an industry of resources, dependent of nature's endowment and of the cultural heritage of each society. The sustainable development in tourism is a necessity, taking into account the fact that economy and the environment are facets of the same coin, in other words, the two are strongly linked and interdependent. The place of tourism in the sustainable development is given by its role as an industry which sells the physical and human environment as its products.
Ecotourism, as a form of tourism, has emerged with people's need to withdraw in nature and to visit, to meet natural areas that have or not a national or international protection status.
With the development of ecotourism worldwide came the benefits recognition of this tourism as optimal "mechanism" for exploitation of touristic resources and landscape. These characteristics of ecotourism were reason for the UN declared the year 2002 as "International Year of Ecotourism".

Eco-Ist’12, Ecological Truth, 30 May - 2 June 2012. Hotel “Srbija TIS”, Zajecar, Serbia
570
Ecotourism is a tourism form in which the main motivation for the tourist is the observation and appreciation of nature and local traditions related to nature, having to achieve the following requirements (OUG nr. 195/2005):
• It contributes to nature conservation and protection; • It supports the well-being of local people; • It has an educational component that creates nature conservation awareness,
both for tourists and local communities; • It requires the lowest possible negative impact on the environment and on the
socio-cultural component. Ecotourism takes place in natural areas and is based on tourists’ direct and
personal experience in nature, respectively making use of nature’s geomorphological, biological, physical and cultural characteristics. Hence the emphasis on natural area is essential in planning, developing and managing the ecotourism.
Ecotourism contributes to a better understanding, appreciation and enjoyment of discovering and protecting nature and traditional local culture, both for visitors and the local community. Ecotourism products attract those tourists who want to interact with the natural environment and, in various degrees, who desire to increase their level of knowledge, understanding, appreciation and pleasure. Those who develop and coordinate ecotourism activities should offer an appropriate level of understanding of natural and cultural values of the visited areas, usually by using properly qualified guides and providing accurate information both before and during the experience.
Ecotourism contributes actively to the protection of natural areas. Ecotourism offers practical means of protection of natural areas (for example financial help in the actions of rehabilitation of natural areas, litter collection or financial contribution to nature conservation organisations).
Ecotourism contributes to the development of local communities in natural areas. Often, the local community is part of ecotourism product, thus ecotourism benefits should mostly belong to the local community. Local benefits can be obtained by using local guides, staying in local guesthouses, buying local products or using local services. Ecotourism activities and their planning must ensure the reduction of the negative impact on the local community visited and contributes to the conservation of local lifestyle/culture while offering a practical long-term contribution to these communities. Therefore, ecotourism must contribute to the conservation of the cultural part of the natural area visited.
Federation of National and Natural Parks in Europe has mentioned the tourism in the protected areas or around them, and concluded that tourism and conservation can often be compatible, mutually beneficial, but only if this type of tourism is practiced in a sustainable way in areas suitable .
A natural protected area is a terrestrial, aquatic or underground area, with a legally established perimeter with a special protection and conservation status, with species of plants and savage animals, biogeographic, landscape, geologic, paleontological, speleological elements and forms, with a special ecologic, scientific or cultural value.

Eco-Ist’12, Ecological Truth, 30 May - 2 June 2012. Hotel “Srbija TIS”, Zajecar, Serbia
571
The areas which have a natural and semi-natural status are the support of “life” and of social and economic development. At European level, Romania has the most diversified and valuable natural patrimony, but the total surface of the protected area is still below the mean of the European Union – 7%, in comparison 15%.
According to International Union for Conservation of Nature (1996), to ensure special protection measures and conservation of properties natural heritage, has established a distinct regime of protection, conservation and use, according following categories of protected areas:
a) national interest areas: scientific reserves (IUCN category I), national parks (IUCN category II), monuments (IUCN category III), nature reserves (IUCN category IV), nature parks (IUCN category V);
b) international interest areas: natural sites of universal natural heritage, geoparks, wetlands areas of international importance, biosphere reserves;
c) community importance areas or sites "Natura 2000", Special Conservation Areas, Special Protection Areas;
d) county interest areas or local interest areas: set only on public or private units administrative-territorial, as appropriate.
About 5.18% of the area of Romania has a protected status (12,360 km²),
including the Danube Delta, which makes half of these areas (2.43% of Romania's area). In Romania there are 28 major protected areas of national interest, namely:
Danube Delta Biosphere Reserve, 13 national parks and 14 natural parks.
PROTECTED AREAS IN CARAS-SEVERIN COUNTY, ROMANIA
One of the areas with a high tourism potential is represented by Caraş-Severin County. Located in the south-west of Romania, Caraş-Severin County covers an area of 8514 square kilometres (3.6% of the country, ranks third in size among the counties). The county includes 2 cities, 6 towns, 69 communes with 188 villages. The county residence is Resita.
In Caras Severin are found all three forms of landscape, but predominantly mountainous occupying 65% of the territory, represented by the Banat Mountains, Tarcu Mountains, Godeanu Mountains and Cerna Mountains , therefore it can be considered as a county of mountain. So, geographically, Caraş-Severin county is a mountainous area (65.4 % of the total surface), but has also large hilly zones (15.5%), hills (10.8%) and fields (7.3%).
Because of natural setting of the relief forms, Caras-Severin has a wide variety of natural landscapes, here is a rich tourism potential and well represented both in the urban and rural environments, which makes this administrative unit to be considered a valuable tourist destination on national and European level.
The climate of the county is temperate continental with Mediterranean influences. The average temperature in winter has higher values than in other zones of the country situated at the same altitudes.
Caras-Severin county has one of the richest river networks, with a length of coded courses of 3273 km. The Danube represents the south limit of the county on length

Eco-Ist’12, Ecological Truth, 30 May - 2 June 2012. Hotel “Srbija TIS”, Zajecar, Serbia
572
of 64 km. The point of entry into the country of the river Danube is Bazias, a locality in Caras-Severin. The Danube Defile is the longest in Europe - 134 km.
All around the county there are a lot of natural and accumulation lakes, but you can also enjoy the nement lakes: Valiug, Trei Ape, Secu, Buhui, Marghitas, Dognecea, Oravita, Bocsa, some of them being lakes of legend: Ochiul Beiului, Lacul Dracului.
The total population of the county is 333,219 inhabitants. Ethnical structure of the population is represented as follows: 294,051 Romanians (88.2 %); 7,914 Rromas (2.4 %); 6,273 Croatians (1.9 %); 6,149 Germans (1.8 %); 6,082 Serbians (1.8 %); 5,824 Hungarians (1.8 %); 3,526 Ukrainians (1.1 %); 2,479 Czechs (0.7 %); 340 Slovaks (0.1 %); others 581.
182,948 people live in the urban area and 150,272 people live in the rural area. Caras-Severin county, has a remarkable touristic potential, insufficient developed
that could be in the future one of the most important branches of county’s economy.
There are five areas with big potential: • Semenic area – was created for winter sports, situated at the altitude of 1400 m
on Semenic mountains plateau. The distance from Resita city to Semenic is 35 km;
• Cerna’s Valley – an amazing place part of the National Park Domogled - Valea Cernei. The richness of the Mediterranean fauna and flora, the thermal – mineral waters and Baile Herculane resort make this area one of the top areas in national tourism;
• Anina Mountains area, include gorges with wild beauties and also resorts; Marghitas with Buhui and Marghitas lakes, Buhui cave, Minis Gorges and spring and waterfall Bigar;
• Porţile de Fier (Iron Gates) area includes a good part of the most spectacular defile – Danube’ Gorges;
• Muntele Mic area includes the ski resort Muntele Mic, the Tarcu and Godeanu mountains and also the micro zone of Poiana Mărului resort;
Protected areas represent a significant part of county’s territory: 1800.2 sq km - 21%. There are 62 protected natural areas, including:
• 4 national parks - 1010.18 sq km - Semenic - Caras Gorges are an attractive place for the unique beauty of the
landscape, the flora richness and the multitude of the caves with a great variety of formsand colours of stalactites and stalagmites.
- Nerei Keys – Beuşniţa is protecting the most interesting natural rezervations, the longest karstic mountains from Romania, the valley with waterfalls, Ochiul Beiului Lake, rare flowers, vegetations and fauna, beautifull landscape;
- Domogled-Cerna Valley (with areas in Mehedinti and Gorj counties) Natural beech forests with Fagus sylvatica and Fagus orientalis; Large variety of the

Eco-Ist’12, Ecological Truth, 30 May - 2 June 2012. Hotel “Srbija TIS”, Zajecar, Serbia
573
Lepidoptera species, unique in Romania; habitat and ecosystem types: rocky habitats, forest and aquatic habitats;
- Retezat (with areas in Hunedoara) is the oldest Romanian national park, it was established in 1935; Retezat National Park is composed of the Retezat- Godeanu mountain ranges; the Retezat range extends north from the center, and rises from between the Petrosani and Hateg tectonic hollows; the main characteristic of the Retezat Mountains is given by the presence of two big eruptive blocks that stretch out in the direction of Lapusnicul Mare and Barbat rivers; Retezat has the highest number of mountain peaks over 2,000 m in Romania; the mountain range gurgles with streams and has more than 80 glacial lakes; Today, the core area of the park is 20.863 ha, which is reserved for nature conservation, tourism and educational purposes. This zone contains the 1,932 ha strictly protected: Gemenele - Taul Negru Scientific Reserve, reserved for scientific research and only accessible with a special permit.
• 1 natural park: Porţile de Fier - Iron Gates (with a total area of 1156.55 sq km, of which in Caras- Severin 747.74 sq km, and the rest in Mehedinti county)
• Natural reserves: 28 inside parks and 29 outside the parks (botanical, zoological, paleontological, geological, mixed forests, scientific, wetlands).
In Caraş-Severin 9 Sites were declared of Community Importance SCI -
totalling an area of 2533.77 sq km and 6 areas of special protection SPA - occupying a total area of 2242.16 ha.
THE MANAGEMENT OF PROTECTED AREAS IN CARAS-SEVERIN COUNTY, ROMANIA
The management objectives of protected areas in Caraş-Severin county are:
- scientific research; - protection of wilderness; - conservation of species diversity and genetic diversity; - maintenance of environmental services; - protection of natural and cultural features; - tourism and recreation; - education; - sustainable use of natural resources and ecosystems; - maintaining cultural and traditional activities.
In this county, for areas in the category I - strict nature reserve, the management
may be very simple, involving avoidance of harmful activities, but the management of the other categories areas is a complex process, involving more than one purpose and a variety of groups interest.
Management plan of protected areas in this county, is the official document establishing objectives and management measures to be taken to achieve effective management, responsible of these areas. It summarizes existing information on preparation of the plan, determines the areas major management objectives and an action

Eco-Ist’12, Ecological Truth, 30 May - 2 June 2012. Hotel “Srbija TIS”, Zajecar, Serbia
574
plan on a specific timeframe, usually five years. The plan behind the protected activity and is the reference document for all planning short and medium term activities related to all owners / land managers and for all who want to initiate and carry out activities on its territory.
According to GO 57/2007, through this plan is achieved internal zoning of the protected areas in Caraş-Severin county,
- strict protected zones - areas inside of protected natural areas of great scientific importance, which include wilderness areas where there were no human intervention or their level was very low. Here are carrying any prohibited human activities. Exceptions are research, education and ecotourism, with the limitations described in the management plans;
as follows:
- full protection areas - comprise the most valuable assets of the natural heritage within protected areas. In these areas are allowed ecotourism activities that do not require development of construction investment;
- buffer areas (inside of national parks they are called sustainable conservation areas and inside of natural parks they are called sustainable management areas) - make the transition between areas with full protection and sustainable development. Also, in these areas are allowed ecotourism activities that do not require development of construction investment;
- sustainable development areas of human activities - are the areas that allow investment activities, prioritizing the tourism, respecting the principle of sustainable use of natural resources and prevent any significant adverse effects on biodiversity.
Another very useful tool in the management of protected areas in Caraş-Severin county is the Management Plan of Visitors. It directs the right type of visitors to the parks or its vicinity right, creating the best opportunities to meet the imagined experience of visitors, to spend time in nature, producing a minimal negative impact on nature and local communities and creating the good opportunities for local business development of ecological tourism.
This strategy aims to: - internal zoning and setting of objectives in terms of nature conservation (as in
park management plan); - analysis of current and future situation of visitors; - setting the vision and goals of access; - setting themes and activities for visitors; - monitoring of strategy.
CONCLUSIONS
There are many actors involved in ecotourism development in Caraş-Severin county. Some of them play a more important role than others, but each makes an important contribution in the development of ecotourism. Key actors can be classified as: government agencies, local governments, administrations of protected areas, members of the private tourism sector, NGOs, local communities, donors, academics and tourists.

Eco-Ist’12, Ecological Truth, 30 May - 2 June 2012. Hotel “Srbija TIS”, Zajecar, Serbia
575
Regarding the sources of funding for ecotourism in Caraş-Severin county protected areas, it should consider both the financial capacity of entities that manage protected areas and possible sources of funding of other involved stakeholders.
Ecotourism is widely believed to be the perfect economic activity to promote both sustainability and development. Ecotourism offers the best tourism practices from the point of view of nature protection and sustainable development. Tourism activity should be planned and implemented as to reduce its impact on nature. The ecotourism product is developed in such a way so as to protect and highlight the natural environment in which it takes place.
Ecotourism projects must go beyond prevailing notions of the overlap between nature tourism and sustainable tourism to encompass the social dimensions of productive organization and environmental conservation.
Ecotourism must do more than create a series of activities to attract visitors, offering them an opportunity to interact with nature in such a way as to make it possible to preserve or enhance the special qualities of the site and its flora and fauna, while allowing local inhabitants and future visitors to continue to enjoy these qualities. They must also establish a durable productive base to allow the local inhabitants and ecotourism service providers to enjoy a sustainable standard of living while offering these services.
REFERENCES
1. Băltăreţu, Andreea, 2007, Ecoturism şi dezvoltare durabilă [Ecotourism and
Sustainable Development2. Friedmann, J., 1992, Empowerment: The politics of alternative development,
Basil Blackwell, New York;
], Pro Universitaria Publishing House, Bucharest.
3. Glăvan V., 2003, Turism rural, agroturism, turism durabil, ecoturism [Rural tourism, agro-tourism, sustainable tourism, ecotourism
4. Romanian Gouvernment, GO 195/2005 on environmental protection, GO 57/2007 on
] Economica Publishing House, Bucharest.
the regime of protected natural habitats, flora 5. Romanian Gouvernment, 2009,
and fauna. National Strategy for Ecotourism Development
in Romania6. http://www.infoturism.ro/
;
7. http://www.mdrt.ro/ 8. http://www.mmediu.ro/ 9. http://www.regiuneavest.ro/economia-regiunii-vest/parcuri-naturale/ 10. http://www.ariiprotejate-cs.ro/.

576
XX International Scientific and Professional Meeting
"ECOLOGICAL TRUTH" ECO-IST'12
30 May - 2 June 2012, Hotel “Srbija TIS“, Zajecar, SERBIA
AIR POLLUTION AS A RISK FACTOR FOR CHRONIC OBSTRUCTIVE
PULMONARY DISEASE
Suzana Milutinovic1*, Lj. Stosic1, D. Bogdanovic
1,2
1Institute for Public Health Nis, Nis, SERBIA 2
State University of Novi Pazar, SERBIA
*
ABSTRACT
Air pollution as a risk factor for chronic obstructive pulmonary disease has been recognized for more than 50 years. Although the concentrations of pollutants decreased substantially in many countries, the negative effects of air pollution are still an important public health problem. In this review, air pollution as important environmental risk factor for chronic obstructive pulmonary disease, as well as potential underlying mechanisms, are discussed and the significance of each aetiology is considered.
Key words: air pollution, chronic obstructive pulmonary disease
INTRODUCTION Chronic obstructive pulmonary disease (COPD) is one of the leading causes of morbidity and mortality in the industrialized and the developing countries [1]. COPD is currently the fourth leading cause of death in the world, and it is predicted to become the third most common cause of death and the fifth most common cause of disability in the world by 2020 [2]. The prevalence and burden of COPD are projected to increase in the coming decades due to continued exposure to COPD risk factors and and the changing age structure of the world's population (with more people living longer and therefore expressing the long term effects of exposure to COPD risk factors) [3].
RISK FACTORS FOR COPD Risk factors for COPD include both host factors and environmental exposures,
and the disease usually arises from an interaction between these two types of factors. Recognized risk factors are listed in table 1.

Eco-Ist’12, Ecological Truth, 30 May - 2 June 2012. Hotel “Srbija TIS”, Zajecar, Serbia
577
Table 1. Risk factors for COPD
Degree of certainty Environmental factors Host factors
Certain -Tobacco smoke -Some occupational exposures
-α-antitrypsin deficiency
Good evidence
-Outdoor air pollution -Low socioeconomic status -Alcohol intake -Environmental tobacco smoke in childhood -Other occupational exposures
-Low birth weight -Childhood respiratory infection -Atopy (high IgE) -Bronchial hyperresponsiveness -Family case-history
Supposed -Adenovirus infection -Dietary deficiency of vitamin C -Indoor air pollution
-Genetic predisposition -Blood group A
Modified from Siafakas et al. [4] Although there is a definite genetic component to the disease, COPD is believed to be mainly caused by inhaled agents, particularly cigarette smoke. Although the range of individual susceptibility is wide, cigarette smokers have a higher prevalence of lung-function abnormalities and respiratory simptoms, a greater annual rate of decline in FEV1 Among occupational risks, good evidence is available than cadmium and silica cause COPD. Workers at increased risk for COPD include coal miners, construction workers who handle cement, metal workers who are subject to heat exposure from furnaces, transport workers, cotton workers, and workers in paper mills. Population studies have also indicated increased risks from dust exposure and exposure to fumes [4,5].
, and higher death rates for COPD than nonsmokers [4].
There is good evidence that outdoor air pollution is important risk factor for COPD, after both acute and chronic exposure. Indoor air pollution has been implicated as a risk factor for the development of COPD, too [6]. Exposure to particulate matter, irritants, organic dust, and sensitizing agents can cause an increase in airway hyperresponsiveness, especially in airways already damaged by other occupational exposures, cigarette smoke, or astma. Continued damage leads to accelerated decline in FEV1 Published data suggest that 50–70% of COPD exacerbations are due to respiratory infections (including bacteria, atypical organisms and respiratory viruses) [8], 10% are due to environmental pollution (depending on season and geographical placement) [9], and up to 30% are of unknown aetiology [10].
in patients with COPD [7].
AIR POLLUTION AS A RISK FACTOR FOR COPD EXACERBATION
Epidemiological studies on the short-term effects of air pollution have shown that patients with respiratory diseases are susceptible to the acute effects of air pollution, and have more exacerbations during periods of increased pollution. There is also evidence of acute effects of air pollutants on respiratory function, lower respiratory symptoms and increased medication use. Acute increases in air pollutants are paralleled

Eco-Ist’12, Ecological Truth, 30 May - 2 June 2012. Hotel “Srbija TIS”, Zajecar, Serbia
578
by increases in emergency room admissions, hospital admissions and mortality for COPD. In the same time, a reduction of ambient air particles concentrations resulted in a decrease of respiratory events [11].
Recent studies indicate that effects exist around and below the current national and international air quality guidelines and standards [12].
Studies conducted in very different environments have consistently observed that admissions due to COPD increased on days with high pollution levels [13-16]. Because various measurements of particulate pollution were used, precise comparisons between the studies are difficult. Air pollutants may interact between one another as well as with other environmental factors, resulting in different effect estimates depending on local or regional conditions [17].
In APHEA 2 project, in 8 European cities, it was found that an increase of 10 μg/m
Several studies during the 1980s and 1990s in different cities in Europe, USA and Australia have shown that admissions due to COPD increased on days with high pollution levels [18-20].
3 in SO2
In the 5 year Barcelona study, an increase of 25 μg/m
was associated with a 0,6% (95% CI 0,0-1,2%) increase in emergency room admissions for COPD and asthma at ages 65+ years [21].
3 in SO2
In one of the time series study providing quantitative estimates of the short-term effects of air pollution in our country, we evaluated the short-term association between BS and SO
was associated with a 6% to 9% increase in emergency room admissions for COPD during winter and summer, respectively. For BS, a similar change was found during winter, although the change was smaller in summer. The association of each pollutant with COPD admissions remained significant after control for the other pollutant [9].
2 levels in urban air and the daily number of emergency room admissions for COPD in Niš. In this study, the emergency room admissions for all ages for COPD were significantly associated with previous-day level of BS and lag 0-2 (1,60% and 2,26% increase per 10 µg/m3, respectively). After controlling for SO2, single lagged (lag 1 and lag 2) as well as mean lagged values of BS (up to lag 0-3) were significantly associated with COPD emergencies. No effect was found for SO2
, even after controlling for black smoke. The present findings support the conclusion that current levels of ambient BS may have an effect on the respiratory health of susceptible persons [22].
POTENTIAL BIOLOGIC MECHANISMS Numerous studies evaluated acute morbidity effects of particulate pollution by
examining short-term associations between lung function measures and/or respiratory symptoms and pollution. The principal pulmonary effects of particles are seen in susceptible populations, including those with airways disease such as COPD. Fine and large particles may act as inflammatory agents with an abrupt increase in airways resistance, and worsen expiratory flow limitation and dynamic hyperinflation [23]. The ability of the lungs to protect themselves against inhaled particles, and the susceptibility of individuals to the effects of particles will also determine the outcome in terms of the adverse effects of environmental particles. In patients with COPD, and in cigarette smokers, there is damage to the cilia, which, together with the excess mucus produced,

Eco-Ist’12, Ecological Truth, 30 May - 2 June 2012. Hotel “Srbija TIS”, Zajecar, Serbia
579
overwhelm the mucociliary escalator and will reduce the ability of the lungs to deal adequately with inhaled particles [24].
The diversity of effects may reflect the complexity of airborne particulate matter, which is made up of a rich mixture of primary and secondary particles.Their size is such that they can be breathed most deeply in the lungs. The large surface area provided by ultrafine components of particles may allow absorption of substances from the environment, or from the lung epithelial lining fluid onto the particle surface, which may increase the reactivity of the particles. They include sulfates, nitrates, acids, metals, and carbon particles with various chemicals adsorbed onto their surfaces [25].
There is still considerable uncertainty as to whether SO2 is the pollutant responsible for the observed adverse effects or whether it is a surrogate for particles or some other pollutants. In the second edition of the World Health Organization, it was noted that later epidemiological studies documented separate and independent adverse public health effects for PM and SO2. Although the effect of SO2
Ozone, as a potent oxidant, may cause many short term effects. They include increased respiratory symptoms, pulmonary function changes, increased airway responsiveness and airway inflammation. The individual responsiveness to ozone exposure varies substantially for reasons which remain unexplained. Exposure to ozone is associated with increased nasal inflammation in non-atopic children [27], and SO
appears to be independent of particles, it may be associated with sulphates and be an indicator of specific particle characteristics [26].
2 and NO2
Because of urban air pollution consists of a complex mixture of enhance the response to inhaled allergens [28].
gases and particulate agents that vary over time and through space, depending on its sources, distance and meteorological
conditions, the knowledge about the underlying biologic mechanisms remains limited and requires much additional study.
CONCLUSION Air pollution as a risk factor for COPD has been recognized for more than 50 years, and has led to the development of air quality standards in many countries that substantially decreased the levels of air pollutants. However, recent studies indicate that adverse health effects exist around and below the current national and international air quality guidelines and standards. Improving our understanding of the mechanism of the harmful effects of these pollutants should allow improved risk assessment for patients with airways diseases and is essential to define the best prevention strategies.
REFERENCES
1.
2.
Viegi G, Scognamiglio A, Baldacci S, et al. Epidemiology of Chronic Obstructive Pulmonary Disease (COPD). Respiration 2001;68:4-19. Murray C, Lopez A. Evidence-based health policy - lessons from the Global Burden of Disease Study. Science 1996;274:740-3.

Eco-Ist’12, Ecological Truth, 30 May - 2 June 2012. Hotel “Srbija TIS”, Zajecar, Serbia
580
3.
4.
Global Initiative for Chronic Obstructive Lung Disease. Global strategy for the diagnosis, management, and prevention of chronic obstructive pulmonary disease, 2011Update. http://www.goldcopd.org/.
5.
Siafakas NM, Vermeire P, Pride NB, et al. Optimal assessment and management of chronic obstructive pulmonary disease (COPD). ERS Consensus Statement. Eur Respir J 1995;8:1398-420.
6.
Becklake MR. Occupational exposures: evidence for a causal association with chronic obstructive pulmonary disease. Am Rev Respir Dis 1989;140:S85-S91.
7.
Chen JC, Mannino MD. Worldwide epidemiology of chronic obstructive pulmonary disease. Current Opin Pulmon Med 1999;5:93-9.
8.
Pauwels R, Buist S, Calverley P, et al. Global strategy for the diagnosis, management, and prevention of chronic obstructive pulmonary disease. Am J Respir Crit Care Med 2001;163:1256-76.
9.
Ball P. Epidemiology and treatment of chronic bronchitis and its exacerbations. Chest 1995;108:43–52.
10.
Sunyer J, Saez M, Murillo C, et al. Air pollution and emergency room admission for chronic obstructive pulmonary disease: a five-year srudy. Am J Epidemiol 1993;137:701-5.
11.
Connors AF, Dawson NV, Tomas C, at al. Outcomes following acute exacerbations of severe chronic obstructive lung disease. The SUPPORT investigators (Study to Understanding Prognosis and Preferences for Outcomes and Risks of Treatment. Am J Respir Crit Care Med 1996;154:959-67. Brunekreef B, Holgate S. Air pollution and health. Lancet 2002;360:1233–42
12. Air Quality Guidelines for Europe. World Health Organization. Regional Office for Europe. Copenhagen, WHO Regional Publications, European series No. 23, 1987.
.
13.
14.
Anderson HR, Spix C, Medina S, et al. Air pollution and daily admissions for chronic obstructive pulmonary disease in 6 European cities: results from the APHEA project. Eur Respir J 1997;10:1064-71.
15.
Schwartz J. Air pollution and hospital admissions for the elderly in Birmingham, Alabama. Am J Epidemiol 1994;139:589-98.
16.
Schwartz J. Air pollution and hospital admissions for the elderly in Detroit, Michigan. Am J Respir Crit Care Med 1994;150:648-55.
17.
Schwartz J. Air pollution and hospital admissions for respiratory disease. Epidemiology 1996;7:20-8.
18.
Katsouyanni K, Zmirou D, Spix C, et al. Short term effects of air pollution on health: a European approach using epidemiological time-series data. Eur Resp J 1995;8:1030-8.
19.
Sunyer J. Urban air pollution and chronic obstructive pulmonary disease: a review. Eur Resp J 2001;17:1024-33.
20.
Burnett RT, Dales R, Krewski D, et al. Associations between ambient particulate sulfate and admissions to Ontario hospitals for cardiac and respiratory diseases. Am J Epidemiol 1995;142:15-22. Morgan G, Corbett S, Wlodarczyk J. Air pollution and hospital admissions in Sydney, Australia, 1990 to 1994. Am J Public Health 1998;88:1759-60.

Eco-Ist’12, Ecological Truth, 30 May - 2 June 2012. Hotel “Srbija TIS”, Zajecar, Serbia
581
21.
22.
Sunyer J, Atkinson R, Ballester F, et al. Respiratory effects of sulphur dioxide: a hierarchical multicity analysis in the APHEA 2 study. Occup Environ Med 2003;60(8):e2.
23.
Milutinović S, Nikić D, Stošić Lj, et al. Short-term association between air pollution and emergency room admissions for chronic obstructive pulmonary disease in Niš, Serbia. Cent Eur J Public Health 2009;17:8-13. Pope C
24.
. Epidemiology of Fine Particulate Air Pollution and Human Health: Biologic Mechanisms and Who's at Risk? Environmental Health Perspectives 2000;108:713-23.
25.
MacNee W, Donaldson K. Exacerbations of COPD – Environmental mechanisms. Chest 2000;117:390S-7S. Kasemo B, Lausman J. Material-tissue interfaces: the role of surface properties and process. Environ Health Prospect 1994;102:41-5
26. Air Quality Guidelines for Europe, 2nd ed. World Health Organization. Regional Office for Europe. Copenhagen, WHO Regional Publications, European series No. 91, 2000.
.
27. Kopp M, Ulmer C, Ihost G, et al. Upper airway inflammation in children exposed to ambient ozone and potential signs of adaptation. Eur Respir J 1999;14:854-61.
28. Devalia J, Rusnak C, Herdman M, et al. Effect of nitrogen dioxide and sulphur dioxide on airway response of mild asthmatic patients to allergen inhalation. Lancet 1994;344:1668-71.

582
XX International Scientific and Professional Meeting
"ECOLOGICAL TRUTH" ECO-IST'12
30 May - 2 June 2012, Hotel “Srbija TIS“, Zajecar, SERBIA
THE INFLUENCE OF PACKAGING MATERIAL ON THE CONTENT OF
TOXIC METALS IN THE BEVERAGE OF TEA FUNGUS KOMBUCHA
Biljana Kalicanin, D. Velimirovic, S. Naumovic
University of Nis, Faculty of Medicine, Department of Pharmacy, 81dr Zoran Djindjic Boulevard, 18000 Nis, SERBIA
ABSTRACT
The aim of this study was to determine the content of heavy metals in beverages of tea fungus, stored during a certain period of time in containers of different materials by using potentiometric stripping analysis (PSA). As a parameter of fermentation, the pH decreased with time. The content of lead was higher in the beverage stored in the glass container compared to the same stored in the plastic container. By comparing results with black and green tea, the beverage of tea fungus in green tea contained more lead. Cadmium was only detected in the beverage obtained from the green tea.
Key words: Kombucha, black and green tea, PSA, lead, cadmium
INTRODUCTION
Tea fungus or Kombucha is a traditional refreshing beverage obtained by the fermentation of sugared black or green tea with a symbiotic culture of acetic bacteria and fungi, consumed for its beneficial effects on health. The product of the fermentation process is initially sweet and then gets sour, slightly carbonated and refreshing taste. It is consumed worldwide, but traditionally the most in China, Russia and Germany [1]. Microbiological composition of tea fungus is not completely known. It varies from one culture to another and depends on many factors. Recent literature and research of many authors have shown that the primary bacteria in the symbiosis is Acetobacter xylinum, and beside it, there are also Acetobacter aceti, Acetobacter pasteuranus and Gluconobacter oxydans [1]. Chemical and microbiological composition and antimicrobial activity of tea fungus beverage were determined in many studies [1-6]. Some authors have shown that oxidative stress in experimental animals treated with a solution of Cr (IV) certain concetration, may be somewhat reduced using Kombucha beverage. These studies showed that beverage from tea fungus has a positive effect on detoxifying organs of treated animals [2].
Biological activity of tea fungus beverage on some human diseases and disorders differ from the activity of the tea and it can be seen in Table 1. [3].

Eco-Ist’12, Ecological Truth, 30 May - 2 June 2012. Hotel “Srbija TIS”, Zajecar, Serbia
583
Table 1. Comparasion of biological activities of tea and Kombucha beverage Effect Kombucha beverage Tea
Detox Lovering cholesterol levels
Reduction of atherosclerosis by regulation of cell wall Reduction of blood pressure Reduction of inflammation
Reduction of arthritis, rheumatism and gout symptoms Improvement of liver function
Intestinal activity regulation and balance of intestinal flora Improving the overall metabolism
Reduction of obesity and appetite regulation Prevention/treatment of bladder infections
Glands stimulation Prevention of diabetes
Increase body resistance to cancer Reduction of menstrual disorders and menopausal problems
Improving the health of hair, skin and nails Reduction of stress, nervous tension and insomnia
+ + + + + + + + + + + + + + + + +
+ + + +
+
+ + +
The reason of different biological effects of tea and the beverage of tea fungus (Table 1.) lies in their different chemical composition. Components that are the most present in tea are catechins, flavonoids and alkaloids. In addition to containing all or some of the substances that dominate in tea, tea fungus beverage contains other very important biological compounds, such as glucuronic and gluconic acid, L-lactic acid, in water soluble vitamins, and many other compounds that have no biological activity, but positively affect the action of biologically active components [4, 5]. Phan et al. showed that tea fungus beverage, in some cases, can cause adverse and harmful effects on human health. Thus, in people who consumed beverage obtained from tea fungus, stored in glazed ceramic vessels, was reported lead poisoning. The reason of that was lead migration from the packaging in tea under the influence of acetic medium. These studies have also showen that the way of preparing and storing Kombucha beverage in inadequate packaging (ceramic, metal), as well as the contaminated tea, which is used for the beverage preparation, can cause many advers effects [6]. In this paper was monitored the influence of glass and plastic packaging, in which the tea fungus was obtained, on the content of lead and cadmium in the Kombucha beverage. Packaging materials can, themselves, contain compounds of toxic metals such as auxiliary components or contamination. Given the corrosive effect of acidic medium, there is the possibility of metal ions migration from the packaging into the beverage, which can be a porential threat to human health. Lead is highly toxic metal that can enter the body through the air, food and drinking water. Lead that enters the human body has the ability to accumulate in bones, liver and kidneys. Due to its cumulative effect, high levels of this element may damage the function of these organs. Symptoms of acute toxicity of lead compounds are severe

Eco-Ist’12, Ecological Truth, 30 May - 2 June 2012. Hotel “Srbija TIS”, Zajecar, Serbia
584
gastrointestinal disorders with impairment of the digestive tract. There may be signs of liver and kidney dysfunction as well as disorders in hematopoiesis, and the high content of this metal may lead to fatal outcome [8]. Cadmium is in the first group of toxic elements with cumulative effect. The basis of cadmium toxicity is its negative effect on the enzyme system of cells, due to substitution of other metal ions (mainly Zn2+ and Cu2+
The content of toxic heavy metals lead and cadmium, in the analyzed samples of tea fungus beverage, was determined using highly sensitive microanalytical technique potentiometric stripping analysis (PSA), modified with dissolved oxygen as the oxidizing agent.
) in metaloenzymes [8]. Cadmium may bond to different biological compounds such as proteins, thiol –SH groups and anionic groups of different macromolecules. It accumulates in liver, kidneys and pancreas, with the possibility of appearence of different diseases, which can be with lethal outcome [9].
MATERIALS AND METHODS
Chemicals
• Hydrochloric acid, suprapure, Merck, Darmstad; • Standard solution of lead, Titrisol, Merck, Darmstad; • Standard solution of cadmium, Titrisol, Merck, Darmstad; • Standard solution of mercury, Titrisol, Merck, Darmstad; • Bidistilled water.
Instrumentation and experimental conditions
Analysis of all samples were performed on stripping analyzer M1, designed and manufactured in Faculty of Technology Novi Sad and Elektrouniverzal Leskovac. The optimal experimental conditions for the determination of Pb and Cd using potentiometric stripping analysis [8,9], are shown in Table 2. Table 2. Experimental conditions for the determination of Pb and Cd using PSA
Electrolysis potential (Ag/AgCl/KCl 3.5mol/L) (V) -1.065 The final potential (Ag/AgCl/KCl 3.5mol/L) (V) -0.1 Electrolysis time (s) 300 Sample volumen (L) 0.025 Pause time (s) 15 Stirring speed (min-1 4000 )
Preparation of semples Black and green tea were used to prepare the substrate for the cultivation of tea fungus. An aqueous extract of black and green tea was prepared from the tea leaves (2.5g) coated with 500 mL of boiling water and after a ten-minute extraction tea was

Eco-Ist’12, Ecological Truth, 30 May - 2 June 2012. Hotel “Srbija TIS”, Zajecar, Serbia
585
strained through the plastic strainer, so as to avoid possible contamination with metals. In obtained infus was added 35 g of white sugar and then cooled solution was transferred to the appropriate vessel in which the funfus was placed [3]. Cultivation of tea fungus was carried out at temperatures from 25°C to 30°C, under aerobic conditions, during specified period of fermentation in packaging of glass and plastic. During fermentation, yeast produce ethanol from sugar that serves bacteria as an energy source from which they produce acetic acid [4]. The content of lead and cadmium was determined in the tea fungus beverage after 3, 5 and 7 days of fermenttion.
RESULTS AND
DISCUSSION
The content of lead and cadmium in samples of tea fungus beverage, kept in glass and plastic packaging, has been determined using the calibration curve and is shown in Table 3 and 4, as the average of five measurements
.
Table 3. The content of Pb and Cd in tea fungus beverage stored in glass
Metal
packaging material
Day Black tea pH Green tea pH
Pb (μg/L)
3 5 7
0.37±0.02 0.58±0.05 0.94±0.02
3.07 2.96 2.68
0.31±0.04 1.61±0.08 3.18±0.3
3.15 2.97 2.62
Cd (μg/L)
3 5 7
n.d. n.d. 0.20±0.03
3.07 2.96 2.68
0.23±0.04 1.26±0.3 1.91±0.09
3.15 2.97 2.62
n.d. nije detektovan Table 4. The content of Pb in tea fungus beverage stored in plastic
Metal packaging material
Day Black tea pH Green tea pH
Pb (μg/L)
3 5 7
0.34±0.02 0.50±0.05 0.58±0.02
4.37 3.12 2.73
0.39±0.05 0.47±0.02 0.54±0.02
3.02 2.94 2.72
During cultivation of the fungus tea beverage, there is a fermentation process, during which organic acids are formed, so the value of pH change its potion. The initial pH value of the substrate before addition of fungus, was about 7.5 and after 3, 5 or 7 days of fermentation, acidity increases to the pH value of about 2.7 (Tables 3 and 4). Increased acidity creates the possibility of migration of metal ions from the storage containers to the beverage [11]. In Table 3 it can be seen that in samples of fungus grown in the black and green tea, that were kept in glass packaging material, the content of lead increased as a time of fermentation was longer. The content of metals in black tea was 0.37 µg/L after the third day, ie. 0.94 µg/L after seventh day of fermentation. In the samples of green tea lead content was 0.31 µg/L (3 days) and 3.18 µg/L (7 days). The increased content of toxic heavy metal lead with a longer time of fermentation, in the beverage of tea fungus, grown both in black and in green tea, may be due to the corrosive effects of acidic environment to the glass packaging material. The glass used

Eco-Ist’12, Ecological Truth, 30 May - 2 June 2012. Hotel “Srbija TIS”, Zajecar, Serbia
586
for making glass containers may contain lead as contaminants, or as a component that is added to improve some properties of the glass [10]. Kaličanin et al. showed that under the influence of 4% CH3
The heavy metal cadmium was detected only after the seventh day of fermentation in the beverage grown in black tea, and its concentration was 0.20 µg/L, while the in the fungus tea beverage grown in the green tea, concentrations of these metal ranged from 0.23 µg/L, after the third day, and to 1.91 µg/L after seventh day of fermentation (Table 3).
COOH (pH~2.75) for a period of 24 hours from glass containers, used for packaging and storing food products, disposed from about 1.82 µg/L to 2, 93 µg/L of lead [11].
In regard to the obtained values for the contents of Pb and Cd in samples of fungus grown in the black and green tea, it can be seen that the contents of these metals were higher in the samples of green tea compared to black tea samples. This indicates, that in terms of heavy metals content (Pb and Cd), black tea is a better choice for growing fungus than green tea. Kaličanin and Velimirović in their study, showed that green tea contains higher concentrations of heavy metals in relation to black tea [12].
Table 4 shows the lead content in the Kombucha fungus beverage grown in black and green tea in plastic packaging material
By comparing the results of lead content, it can be seen that the Kombucha fungus beverage grown in black tea in glass
. The concentration of metals in black tea ranged from 0.34 µg/L to 0.58 µg/L after the third or seventh day of fermentation, respectively. Lead content in green tea was 0.39 µg/L after the third day, or 0.54 µg/L after seventh day of fermentation.
packaging material contained about 1.6 times more lead than the same beverage grown in plastic containers. Similar results of lead contetnt shown the beverage of tea fungus grown in green tea, where the content of this metal was 5.8 times lower in plastic packaging material
Bohrer et al. showed that in regard to disposal of some metal ions under the influence of nutrients, plastic packaging materials were more stable compare to the glass materials [13], which is in accordance to results of this study.
in relation to the glass containers (Tables 3 and 4). Highly toxic metal Cd was not detected in the beverage tea fungus that was grown in plastic containers.
Heavy metals detected in the Kombucha beverage are present in trace amounts and are far lower than the maximum allowable content [14]. However, it is necessary to detect and monitor content of these metals in Kombucha beverage, duo to their cumulative and toxic effects on human health. Recent studies haven’t confirmed that consuming this beverage may have undesirable effects if properly maintained and used. Because of the high acidity of the of kombucha beverage, and possible corrosion by acidic media to the hard dental tissue [8,15,16], which are in direct contact and direct consumption is the same, the question is whether this solution should be drunk in undiluted form or by diluted with water.
Eco-Ist’12, Ecological Truth, 30 May - 2 June 2012. Hotel “Srbija TIS”, Zajecar, Serbia
587
CONCLUSION
Based on the results of these study it can be cocluded:
− longer duration time of fermentation increases the acidity (lower pH) of tea fungus beverage, which lead to increase the corrosive effect of the beverage on packaging materials, and thus the content of toxic metals in the beverage;
− lead and cadmium content in the analyzed samples of Kombucha beverage grown in black tea, was lower than the content of these metals in the beverage grown in green tea;
− in the beverage stored in glass containers was detected the higher lead content in relation to beverage in plastic containers, in which cadmium is detected;
− the presence of organic acids that occur as a metabolic product of bacteria that make up the culture of tea fungus beverage make it very acidic, which creates conditions for their possible adverse effects on human health, especially dental enamel.
− Acknowledgment
These results are part of projects Nº 45017 and 41018 were realized through
the partial financial support of the Republic of Serbia Ministry of Education and Science.
REFERENCES
1. Liu C. H, Hsu W. H, Lee F. L, Liao C. C. The isolation and identification of
microbes from a fermented tea beverage, Haipao, and their interactions during Haipao fermentation. Food Microbiology 13:407-415, 1996.
2. Sai Ram M, Anju B, Pauline T, Dipti P, Kain A. K, Mongia S. S, Sharma S. K, Singh B, Singh R, Ilavazhagan G, Devendra K, Selvamurthy. Effect of Kombucha tea on chromate(VI)-induced oxidative stress in albino rats. Journal of Ethnopharmacology; 71:235-240, 2000.
3. Dufresne C, Farnworth E. Tea, Kombucha, and health: a review. Food Research International 33:409-421, 2000.
4. Malbaša R. V. Investigation of antioxidant activity of beverage from tea fungus fermentation. Ph.D. thesis. Faculty of Technology Novi Sad, 2004.
5. Malbaša R. V, Lončar E. S, Kolarov Lj. A. L-ascorbic, L-lactic, total and volatile acids contents in dietetic Kombucha beverage. Roumanin Biotechnological Letters 7:891-895, 2002.
6. Phan T. G, Estell J, Duggin G, Beer I, Smith D, Ferson M. J. Lead poisoning from drinking Kombucha tea brewed in a ceramic pot. Medical Journal of Australia 169:644-646, 1998.

Eco-Ist’12, Ecological Truth, 30 May - 2 June 2012. Hotel “Srbija TIS”, Zajecar, Serbia
588
7. Toxicological profile for lead. U.S. Department of health and human services, Public Health Service, Agency for Toxic Substances and Disease Registry, Atlanta, Georgia, 1999.
8. Nikolić R, Kaličanin B. M, Nikolić G. The determination of soluble lead and soluble cadmium in dental prosthetic materials and teeth by potentiometric stripping analysis. Journal of the Serbian Chemical Society 69:575-580, 2004.
9. Kaličanin B. M, Ajduković Z. Influence of saliva medium on feeing heavy metal ion from fixed dentures. Science of the Total Environment 397:41-45, 2008.
10. Jovanović M, Blagojević N. Savremeno pakovanje. TMF, Beograd, 1996. 11. Kaličanin B. M, Marjanović N. J, Suturović Z. J. Application of potentiometric
stripping analysis with constant inverse curent in the analitic step for determining lead in glassware. Journal of the Serbian Chemical Society 67:213-220, 2002.
12. Kaličanin B. M, Velimirović D. Teški metali u različitim biljnim vrstama kao posledica zagađenja životne sredine. Ecologica 15:93-100, 2008.
13. Bohrer D, Nascimento P. C, Binotto R, Pomblum S. C. Influence of the glass packing on the contamination of pharmaceutical products by aluminium. Part I: Salts, glucose, heparin and albumin. Journal of Trace Elements in Medicine and Biology 15:95-101, 2001.
14. Službeni list SRJ 1992; 5:83. 15. Kaličanin B, Nikolić R. Potentiometric stripping analysis of zinc and copper in
human teeth and dental materials. Journal of Trace Elements in Medicine and Biology 22:93-99, 2008.
16. Phalen J, Rees J. The erosive potential of some herbal teas. Journal of Dentistry 31:241-246, 2003.

589
XX International Scientific and Professional Meeting
"ECOLOGICAL TRUTH" ECO-IST'12
30 May - 2 June 2012, Hotel “Srbija TIS“, Zajecar, SERBIA
MULTIDISCIPLINARY APPROACH TO CREATE FRENDLY
ENVIRONMENT: SCIENCEFICTION OR SCIENCEFRONTLINE
Natasa Gojkovic-Bukvic1,2, N. Bukvic3
1Logistics Management Consultancy, Bari, ITALY 2LUM Jean Monnet University, Casamassima (BA), ITALY
3University Hospital -Department of Clinical Pathology-Section of Cytogenetics and Molecular Biology, Foggia, ITALY
ABSTRACT
We discuss wide trans-disciplinary actions as potential solution for economic activity such as
transportation, strongly related to pollution output with possible repercussions on climate change and public health. To solve logistics problem by introduction of common intermodal policy and creation of more friendly transport solution, it is possible to obtain sustainable development, climate change prevention, government policy and regulation related to human health and creation of health-supportive environment. It is possible to apply key performance indicators to measure economic results as well as to implement emerging scientific knowledge to improve public health policy creation through environmental and biological monitoring. Key words: intermodal, CO2 reduction, environment, climate change, biomarkers, health policy, genetics INTRODUCTION
Economic and industrial growth in the last century provoked the massive increase of air pollutants, resulting from more intense energy consumption and exhaust emissions from vehicles, with important global environmental consequences including climate change. Undoubtedly, increase of air pollutants same as global climate change will have multiple effects on human health especially on vulnerable populations such as children, the elderly and the poor who are at increased risk from such events [1]. The contamination of air by organic and inorganic toxic pollutants same as exposure to motor vehicle emissions represents an important concern for possible long-term health effects [2-5]. Negative associations between traffic-related pollution and respiratory health has been underlined by different epidemiological studies on air pollution [6-15]. Traditionally, climate change has been considered as an environmental rather than a health issue. Quantification of the effects of climate change on health is needed on all levels (global, regional and local) through enhanced monitoring of environmental health and one of the possible ways could be biomonitoring.
Eco-Ist’12, Ecological Truth, 30 May - 2 June 2012. Hotel “Srbija TIS”, Zajecar, Serbia
590
Biomonitoring of the exposure to complex mixtures such as polluted ambient air, vehicle exhaust and smoke is a particular challenge since these exposures have many constituents in common and many people were exposed to more than one of these mixtures. It is well known that human biomonitoring comprises the determination of different validated biomarkers which are generally assigned to one of three classes: biomarkers of exposure, biomarkers of effect and biomarkers of susceptibility. Their application in epidemiological studies have been proven. Most studies used random samples of citizens with mixed activities and exposure profiles, with intention to be representative of the whole population [16]. The intensity of exposure of the study subjects could be done with passive personal samplers, as well as blood and urinary biomarkers and could be also compared with ambient, for example benzene concentrations, measured by municipal monitoring stations [17]. The project idea was born during attempt to find a way how to connect South Italy (South Europe-, Spain and Portugal) to South East Europe/Balkan Peninsula countries in the most suitable way, with less air pollution, more traffic safety and reduction of road congestion. This approach should be seen as immediate implementation of the European Union Common Transport Policy and enlargement of European Union on Balkan Peninsula countries , which are still out of EU and also to establish joined traffic management, as one of the most industrialized topic areas within transport research, with consequences for public policy issues related to government regulation, human health and/or environment. Furthermore, this could be a way to create future strategy able to “burn out” not only timeline gap provoked by recent historical events and to prepare Balkan Countries for the future partnership giving to the Countries from this region a possible solution to help health promotion and building up environmental systems able to avoid the contamination (discussed with great interest at REACT- conference 2011[18]). CLIMATE CHANGE AND TRANSPORTATION The greenhouse gas emission (GHG) in the decade up to 2008 for the EU27 decreased by 2,4%. Energy use, waste, manufacturing, construction and agriculture were the areas where emissions decreased but at the same time emissions from energy industries, industrial processes and transport were growing. The increase in emission of air pollutants and climate change due to economic and industrial growth has made air quality an important problem throughout the world. These emissions give rise to climate change with increased social costs (i.e. diseases), costs that do not have to be carried by the actual polluter. The GHG emission in EU have been reduced in most sectors over the last 15 years, beside transportation which has shown a 25% increase (Figure 2)[19].

Eco-Ist’12, Ecological Truth, 30 May - 2 June 2012. Hotel “Srbija TIS”, Zajecar, Serbia
591
-40%
-30%
-20%
-10%
0%
10%
20%
30%
1990-2006
Transport
Energy industries
Residentials
Avereage
Other (non-energy)
Services
Industrial processes
Agriculture
Industry (energy)
Waste
Fugitive emissions
Figure 2. CO2 emissions from transportation EU-25 [19]
In order to come to terms with this, many European governments have to decide to take legislative actions. The level of GHG emission is to be reduced by 40% by 2020 and by 2030 the Swedish vehicle fleet is to be fully independent on fossil fuels. The social cost will have to be internalized and to achieve this carbon taxes and emissions trading schemes will be utilizes [20, 21]. The company may choose between a number of measures in order to achieve a reduction. One measure commonly suggested is a shift in transport mode, from faster, more polluting mode such as road and air transport to slower and less polluting modes such as rail or sea transport developing proper logistics chain. A particularly interesting solution is an intermodal road-rail-short sea shipping solution. In this way, the flexibility and availability of truck transport is combined with low cost, CO2 efficient, rail transport for the longer part of the journey. Research has shown that, with this type of mode shift, CO2 emission can be reduced by 20-50% or more depending on how the energy for the train part is produced [21, 22]. Climate change is a major threat to sustainable development. On the basis of Kyoto Protocol, EU15 has a collective target of 8% of reduction below levels chosen in a base year (mostly 1990) which had decreased by 2008 by 6,9%. After that, the EU27 has set a 20% reduction target to be achieved by 2020 [23]. Transport is the second largest source of emissions in the EU and it is the sector that has exhibited continuously growing emissions [24]. A task of the EU Sustainable Development Strategy is to achieve a balanced shift towards environmentally friendly transport modes which will bring about a sustainable transport and mobility system. This shift would certainly fall GHG emissions as well towards environmental friendly transport modes.
BIOMARKERS AND ADVERSE HUMAN EXPOSURE
For many years some cytogenetic alterations as biomarkers of genotoxic exposure have been used [25-30]. The fact that most established human carcinogens are genotoxic represents a relevant reason for using these assays [25]. In fact epidemiological studies strongly suggest that the high frequency of some of them is

Eco-Ist’12, Ecological Truth, 30 May - 2 June 2012. Hotel “Srbija TIS”, Zajecar, Serbia
592
predictive of an increased risk of cancer [27, 31]. Gene polymorphisms are also able to modulate the human response to genotoxic insults [25, 26, 30-35]. In fact any polymorphism that affects genes acting on metabolism or cellular response to DNA damage may alter individual sensitivity to genotoxic carcinogens. From the 1950s mutagenicity testing became an important topic for geneticists who were well trained to recognize structural chromosome rearrangements (CA). Up today, different tests (SCE, MN, Comet Assay etc.) were introduced which correlate at least with parts of metaphase chromosome aberration assays. The newest tests and approaches are faster, less laborious and do not require a priori knowledge about the diversity of structural chromosome aberrations. This lack of knowledge can easily lead to unnecessary misinterpretation of genomic data [36]. More research for understanding of the interplay between genetic and environmental factors are necessary, as discussed by Comuzzie [37] regarding the challenge for applied genetic epidemiology and its relation on the information obtained by completion of Human Genom Project which is to put the human genome in context. This mean not only to identify genes impact, but how they interact with the environment. Currently much of the effort in genetic epidemiology is largely focused on attempting to identify which genes influence which phenotypes, largely through genome-wide efforts employing either case/control study designs utilizing association methods. While the identification of the key genes involved in the expression of a phenotype, particularly for those involved in mediating disease risk, is an important endeavour, it only represents a first step. It is highly doubtful that any gene will exert its effects completely in isolation, but rather will have its action modulated by a wide range of other genetic, epigenetic and also environmental factors. The identification of such environmental factors and the deciphering of how they impact the action of genes is a fundamental objective of genetic epidemiological analyses. Therefore, as the diversity, as well as shear amount, of genetic information continues to accumulate, the thoughtful definition, and quantification of key environmental factors must also keep pace if we are to truly understand how the critical interaction between genes and environment give rise to the phenotypic variation we observe at the population level [37].
What could be done? The idea is to create intermodal transport chain between Bari Logistic Center
and Logistic Railways Terminals in Balkan Region avoiding the road traffic and reduction of CO2 using short sea shipping by Ro/Ro vessels and block trains. One of the European Commission measure is to shift the balance between transport modes with focusing and promoting intermodal transport, type of transport strongly advocated due to its environmental concerns, safety reasons and road congestions avoidance. This is an integrated approach based on environmental and biological monitoring, including the analysis of biomarkers of exposure, early biological effects and susceptibility could be useful to evaluate global benefits (such as economics, logistics, transport, environmental and/or climate impact etc.) and would be the translation of emerging scientific knowledge in environmental health science into practical and useful information for clinical medicine as well as for public health policy.

Eco-Ist’12, Ecological Truth, 30 May - 2 June 2012. Hotel “Srbija TIS”, Zajecar, Serbia
593
FINAL REMARKS
The influence of genetic polymorphisms of the genes encoding for detoxification enzymes on a series of biomarkers, was demonstrated before [30]. Human variability, especially as it relates to polymorphisms in biotransformation enzymes represents an important factor to consider in evaluating the effects of exposure to genotoxic substances, because polymorphisms are able to act on the individual susceptibility even to the neoplastic transformation [38]. Advances in molecular analytic give the possibilities for understanding the genetic contribution to phenotypic outcomes same as to develop new and creative research designs and techniques to integrate the vast amount of biological information into models and careful measurement of the environment. This will, necessarily, have to be a multidisciplinary team science approach. The contamination of air same as climate change is essentially a social problem and because of that it needs integral and coherent transport policy. The social implications of the transport need to be constantly and carefully monitored. The starting point is to find sustainable transport and welcome the development of infrastructure changing as a policy instrument to contain and reduce congestion and reduce environmental impacts. It is well reported by Kreutzberger [39] that the environmental performance of intermodal transport is substantially better than that of unimodal road transport when looking at every use and GHG emission and this is even more outspoken when also local emissions, accidents, congestion and noise are integrated. As regards of the automatic link between economic growth and growth in freight transport, the solution is not in reduction of transport but in redistribution between modes. This is a main reason and strength of a project idea which could bring a success. Furthermore, in this case we are not only talking about redistribution between modes [40] of transport but also we are implementing a new corridor. Enlargement of the European Union is set to trigger larger exchanges of goods and so need for additional investments in transport infrastructures. It’s well known south-east Europe transport system distinguishes itself by extremely fragmented transport. Italy, especially South Italy, with its geographical position, cultural, political, humanitarian and historical connections could have prestige and favorable role between European Union and Balkans. Implementation of legal regulations under supervision could produce different positive consequences on health, transport, environment, climate etc. As environmental pollution is reaching worrying proportion worldwide and solution probably could be in different small changes of lifestyle habits which, all together, will be able to produce reduction of potentially toxicants, money waste and improvement of environmental with improvement of health and life quality. A good example we can find in “multifactorial” diseases. “Multifactorial” recognizes that these disorders are the result of both environmental and genetic factors and does prejudge the relative role of either category. Namely, in this type of diseases when conditions are favorable i.e. different mutations and/or polymorphisms of susceptibility together with adverse environment conditions, a pathological situation is observed. However if involved genes are going to be considered singularly, no one will be able to produce pathology, but with contribution given by every gene, the interaction between them and environment we have to deal with illnesses. Finally we proposed in Figure 3, wide trans-disciplinary actions of project idea, which brings a

Eco-Ist’12, Ecological Truth, 30 May - 2 June 2012. Hotel “Srbija TIS”, Zajecar, Serbia
594
solution for economic activity such as transportation, strongly related to pollution output with possible repercussions on climate change and public health.
Figure 3. Schematic presentation of project idea Starting from logistic problem, passing through possible solution – introduction of intermodal transport, problem solution could be achieved with improvement on climate change, security and safety with positive effects on public health [41].
REFERENCES
1. P. E. Sheffield and P. J. Landrigan, “Global climate change and children’s health: threats and strategies for prevention”, Environmental Health Perspectives, vol. 119, no. 3, pp. 291-298, 2011.
2. A. Y. Watson, R. R. Bates, D. Kennedy, Air pollution, the automobile, and public health, Washington, DC: Health Effects Institute, National Academy Press, 1988.
3. L. Tomatis, Air pollution and human cancer, Berlin, Springer-Verlag, 1990. 4. F. Godlee, “Health and environment. Air pollution I-II”, Editorial, BMJ, vol.
303, pp. 1459–1466, 1991. 5. K. Katsouyann and G. Pershagen, “Ambient air pollution exposure and cancer”,
Cancer Causes Control, vol. 8, pp. 289– 291, 1997. 6. M. Brauer, G. Hoek, H. A. Smit, J. C. de Jongste, J. Gerritsen et al., “Air
pollution and development of asthma, allergy and infections in a birth cohort”, Eur Respir J, vol. 29, pp. 879-888, 2007.
7. W. J. Gauderman, E. Avol, F. Lurmann, N. Kuenzli, F. Gilliland, J. Peters, R. McConnell, “Childhood asthma and exposure to traffic and nitrogen dioxide”, Epidemiology, vol. 16, pp. 737-743, 2005.
8. A. J. Venn, S. A. Lewis, M. Cooper, R. Hubbard, J. Britton, “Living near a main road and the risk of wheezing illness in children”, Am J Respir Crit Care Med, vol. 164, pp. 2177-2180, 2001.

Eco-Ist’12, Ecological Truth, 30 May - 2 June 2012. Hotel “Srbija TIS”, Zajecar, Serbia
595
9. T. Nicolai, D. Carr, S. K. Weiland et al., “Urban traffic and pollutant exposure related to respiratory outcomes and atopy in a large sample of children”, Eur Respir J, vol. 21, pp. 956-963, 2003.
10. N. Pierse, L. Rushton, R. S. Harris, C. E. Kuehni, M. Silverman, J. Grigg, “Locally generated particulate pollution and respiratory symptoms in young children”, Thorax, vol. 61, pp. 216-220, 2006.
11. P. H. Ryan, G. LeMasters, J. Biagini, D. Bernstein, S. A. Grinshpun, R. Shukla, K. Wilson, M. Villareal, J. Burkle, J. Lockey, “Is it traffic type, volume, or distance? Wheezing in infants living near truck and bus traffic”, J Allergy Clin Immunol, vol. 116, pp. 279-284, 2005.
12. R. McConnell, K. Berhane, L. Yao, M. Jerrett, F. Lurmann, F. Gilliland, N. Kunzli, J. Gauderman, E. Avol, D. Thomas, J. Peters, “Traffic, susceptibility, and childhood asthma”, Environ Health Perspect, vol. 114, pp. 766-772, 2006.
13. W. J. Gauderman, H. Vora, R. McConnell, K. Berhane, F. Gilliland, D. Thomas, F. Lurmann, E. Avol, N. Kunzli, M. Jerrett, J. Peters, “Effect of exposure to traffic on lung development from 10 to 18 years of age: a cohort study”, Lancet, vol. 369, pp. 571-577, 2007.
14. L. Bayer-Oglesby, C. Schindler, M. E. Hazenkamp-von Arx, C. Braun-Fahrlander, D. Keidel, R. Rapp, N. Kunzli, O. Braendli, L. Burdet, L. J. Sally Liu, P. Leuenberger, U. Ackermann-Liebrich, “Living near main streets and respiratory symptoms in adults: the Swiss Cohort Study on Air Pollution and Lung Diseases in Adults”, Am J Epidemiol, vol. 164, pp. 1190-1198, 2006.
15. J. Sunyer, D. Jarvis, T. Gotschi, R. Garcia-Esteban, B. Jacquemin, I. Aguilera, U. Ackerman, R. de Marco, B. Forsberg, T. Gislason, J. Heinrich, D. Norback, S. Villani, N. Kunzli, “Chronic bronchitis and urban air pollution in an international study”, Occup Environ Med, vol. 63, pp. 836-843, 2006.
16. R. Crebelli, F. Tomei, A. Zijno, S. Ghittori, M. Imbriani, D. Gamberale, A. Martini, A. Cesare, “Exposure to benzene in urban workers: environmental and biological monitoring of traffic police in Rome”, Occupational Environmental Medicine, vol. 58, pp. 165-171, 2001.
17. F. Casano, P. Bavaro, G. De Marinis, N. Bukvic, A. Giacomantonio, “Inquinamento da Benzene nella città di Bari”, G Italiana Medicina del Lavoro, vol. 20. no. 2,pp. 91-97, 1998.
18. N. Gojkovic Bukvic, Environment friendly transport solution-Transadriatic Balkan Transport Corridor, REACT Conference Workshop, Belgrade/Serbia, 2011.
19. Eurostat 2006”Greenhouse gas emissions by sector” , http//epp.eurostat.ec.europa.eu Acc.: 2009-03-20
20. Statsministern Reinfeldt, Enhallbar energy-och klimatpolitik foor miljo, konkurrnskraft och trygghert, Regeringskansliet, Stockholm 2009.
21. IFEU & Sgkv, “ Comparative analysis of energy consumption and CO2 emission of road transport and combined transport road/rail”, IRU, Geneva, 2009
22. F. Eng Larsson, D. Kollberg, Overcoming the obstacles of intermodal transport- a shipper perspective on the effects of modal shift, Master Thesis conducted at Engineering Logistics, Lund University 2009.
23. Eurostat 2011, “Climate change-driving forces”

Eco-Ist’12, Ecological Truth, 30 May - 2 June 2012. Hotel “Srbija TIS”, Zajecar, Serbia
596
http://epp.eurostat.ec.europa.eu/statistics_explained/index.php?title=Climatechange Acc. 2011-04-13
24. Eurostat 2008, “ Greenhouse gas emission by sector”, http://ec.europa.eu/eurostat/product?code=tsdcc210&language=en&mode=view), Acc.: 2011-04-13
25. H. Norppa, “Cytogenetic biomarkers and genetic polymorphism”, Tox. Lett., vol.149, pp.309-334, 2004.
26. H. Norppa, Cytogenetic biomarkers. In: Mechanistic Considerations in the Molecular Epidemiology of Cancer. IARC Science Publication, vol. 157, pp.179-205. 2004.
27. L. Hagmar, A. Brogger, I.L. Hansteen, S. Heim, B. Högstedt, L. Knudsen, B. Lambert et al., “Cancer risk in humans predicted by increased levels of chromosome aberrations in lymphocytes”: Nordic Study Group on the Health Risk of Chromosome Damage. Cancer Research, vol. 54, pp.2919-2922, 1994.
28. N. Bukvic, P. Bavaro, G. Elia G., F. Cassano, G. Guanti, “Micronucleus (MN) and Sister Chromatid Exchange (SCE) frequencies in lymphocytes of gasoline station attendants”. Mutation Research, vol. 415, no. 2, pp. 25-33, 1998.
29. P. Lovreglio, N. Bukvic, S. Fustinoni, A. Ballini , I. Drago, V. Foa, G. Ginevra, L. Soleo, “Chromosomal Aberration (CA) and Sister Chromatide Exchange (SCE) frequencies in workers exposed to very low doses of 1.3-butadien”, Archives of Toxicolog, vol. 80, pp. 378-381, 2006.
30. N. Bukvic, F. Susca, A. Ballini, M. Fanelli, P. Lovreglio, R. Bagnulo, A. Quaraglela, P. Lastella, N. Resta, L. Soleo, G. Guanti, “Relation between detoxification enzyme polymorphisms and genotoxyc cytogenetic biomarkers”, Journal of Occupational and Environmental Medicine, vol. 51, no. 7, pp. 811-821, 2009.
31. S. Bonassi, L. Hagmar, U. Strömberg, H. Montagud, H. Tinnerberg, A. Forni, P. et al. “Chromosomal aberrations in lymphocytes predict human cancer independently of exposure to carcinogens”, Cancer Research, vol. 60, pp. 1619-1625, 2000.
32. H. Norppa, “Cytogenetic markers of susceptibility: influence of polymorphic carcinogen-metabolizing enzymes”. Environmental Health Perspectives, vol. 105, suppl. 4, pp. 829-835,1997.
33. H. Norppa, Influence of genetic enzyme polymorphisms on cytogenetic biomarkers. In: Anderson D, Karakaya AE, Sram RJ (ed.). Human monitoring after environmental and occupational exposure to chemical and physical agents. NATO Science Series A: Life Sciences, 105 Press. Amsterdam, vol. 313, pp 300-11, 2000.
34. H. Norppa, “Genetic polymorphisms and chromosome damage”, International Journal of Hygiene and Environmental Health, vol. 204, pp. 31-38, 2001.
35. H. Norppa, “Genetic susceptibility, biomarker responses and cancer”, Mutation Research, vol. 544, pp. 339-348, 2003.
36. I. Schubert and M. Lysak, “Interpretation of karyotype evolution should consider chromosome structural constraints”, Trends in Genetics, vol. 27, pp. 207–216, 2011.
37. W.C. Willett, “Diet, nutrition and avoidable cancer”, Environ. Health Persp., vol.103, suppl. 8, pp. 165-170, 1995.

Eco-Ist’12, Ecological Truth, 30 May - 2 June 2012. Hotel “Srbija TIS”, Zajecar, Serbia
597
38. A.G. Comuzzie, “A grand challenge for applied genetic epidemiology: putting the human genome in context”, Frontiers in Genetics, vol. 2, 10, 2011.
39. W.W. Weber, “Influence of Heredity on Human Sensitivity to Environmental Chemicals”, Environmental Molecular Mutagenesis, vol. 25, no. 26, pp. 102-114, 1995.
40. E. Kreutzberger, C. Macharis, L. Vereecken, L. Woxenius, Is intermodal freight transport more environmental friendly than all-road freight transport? A review in:7th Nectar Conference “A New Millennium. Are things the Same? Umea Sweden 13-14 June 2003
41. A. Ogorelc, “European Union Common Transport Policy”, Nase More, vol. 50, pp. 5-6, 2003.
42. N. Gojkovic Bukvic, N. Bukvic “Wider Action Plan and Multidisciplinar Approach Could Be a Wining Idea in Creation of Friendly Environment”, Journal of Environmental and Public Health, Volume 2012, Article ID 473427

598
XX International Scientific and Professional Meeting
"ECOLOGICAL TRUTH" ECO-IST'12
30 May - 2 June 2012, Hotel “Srbija TIS“, Zajecar, SERBIA
MENTAL HEALTH AND ENVIRONMENT, FACTORS WHICH
DETERMINE OBESITY
Liljana Sokolova1*, S. Djukic Dejanovic2, D. Djokic3, N. Djokic4, Z. Prijic
5
1Department of Public Health Sombor, Sombor,Vojvodjanska 47, SERBIA 2University of Kragujevac, Faculty of Medicine,
Kragujevac, Svetozar Markovic, 69, SERBIA 3
Prince Viseslav 27, Belgrade, SERBIA High Medical School of Professional Studies "Milutin Milankovic,"
4Master Graphic Engineering and Design, Novi Sad, SERBIA 5
Doctor of biotechnical sciences, Sombor, SERBIA
ABSTRACT Obesity and over-nutrition are diseases of the modern world of
epidemic proportions. The behavior is the most important factor that determines body mass index, or BMI. Mental health is crucial to the behavior of individuals, for themselves and in interaction with the environment. This paper uses data from a survey conducted on a representative sample of 13 857 inhabitants of Serbia both sexes, aged from 20 to 65 years. In the category of Mental Health, examined the characteristics, emotional problems full of enthusiasm, anxious, anxiety, calm, energetic, sad,exhausted, happy, tired. Among respondents, 29% haveemotional problems. The most common moods are calmand happiness, and they are statistically significant for obesity.
Key words: obesity, behavior, mental health, mood, environment
INTRODUCTION
Obesity and over-nutrition as a health problem of epidemic proportions, are
increasingly present disease in our country. Numerous studies in the world, and in recent years both here and say that the most responsible factor that determines the health problems of the modern world,is behaviour only for themselves and in conjunction with the immediate and wider environment. In the late 90's,body mass index (BMI) has become popular because of their nutritional indicator determining rationality and validity of the adult population. Factors affecting BMI are among the inherited traits,

Eco-Ist’12, Ecological Truth, 30 May - 2 June 2012. Hotel “Srbija TIS”, Zajecar, Serbia
599
psychological, cultural, social, metabolic, physiological and environmental factors, suggesting that obesity is a multicausal disease that usually occurs as a result of the interaction of genotype and environmental factors.
The most common, hence the most severe comorbidities of obesity, and excessive body weight is depression, followed by cardiovascular disease and diabetes.
Mental health is crucial for the behavior of individuals and their interaction with the environment (Djukic Dejanovic). How will the individual to experience himself in terms of physical appearance, excess or shortage of weight and how they perceive their own health depends on the intellectual capacity and emotional status. Hopman in 2007. examined a range of demographic and socio-economic characteristics, activities of daily living,particularly the level of pain and level of happiness changes the body mass index
Kouvonen .
in 2006. examined the relation between psychosocial and conditions of work and level of education and came to the conclusion that the BMI can be associated with longer working hours, but this association varied depending on the level of stress
Toyoshima at work.
in 2009. Officers investigating the Japanese government's dietary habits and concluded that they are correlated with long-term mental stress, and higher body mass index, independent of energy intake and lifestyle
Ostry .
, in 2005. In his research found that underweight women are mostly students who work long hours, have poor mental health and lower social support than normal weight women. Overweight and obese women have lower education, the poor and have poorly developed internallocus of control.
In various communities, cultures and time, there are different ideals of good looks. Plump people have longconsidered the symbol of health and wealth. Ritual food intake is related to the joyous moments, and sad
.
GOAL
Paper is to emphasize the importance of mental health asfactors that determine body mass index or BMI and obesity, to emphasize the importance of behavior as the product of mental status and environment, and socialopportunities ekonomnskih family, social stnadrda,working environment and cultural characteristics that canto determine the attitude towards food and eating habits
METHOD
This paper uses data from a survey conducted on a representative sample of the population of Serbia, which makes 13 857 units of observation, both sexes age from 20 to 65 years. The survey was conducted by the Ministry of Health of the Republic of Serbia 2006. with financial and technical support from World Bank, WorldHealth Organization and the Institute of Public Health of Serbia "Dr. Milan Jovanovic Batut ". Units of study are households in which they carried out two types of surveys that began with an interview with the host. A survey wasfilled individually by family

Eco-Ist’12, Ecological Truth, 30 May - 2 June 2012. Hotel “Srbija TIS”, Zajecar, Serbia
600
members, and the other using for this opportunity of trained, professional interviewers.Were also carried out functional measurements of bloodpressure and anthropometric measurements of height and weight that are used to determine BMI. For statistical analysis, the independent variables related to the patientsand their environment, and the dependent variable was body mass index of subjects. Questionnaire relating to mental health, includes the following features: emotional problems, full of enthusiasm, anxious, anxiety, calm, energetic, sad, exhausted, happy, tired
.
RESULTS
According to results from the thesis "The factors that determine body mass index in adult population of Serbia" (Sokolova, unpublished data), the average BMI was 26.82 value which means that the total adult population of Serbia is one of the front of the obese population, highly heterogeneous interms of BMI. Most obese respondents were male, of lowersocio-economic status with style unhealthy living and low health culture.
As far as the emotional status of patients and its impact on behavior related to diet, Table 1, obtained results show that 13857 out of 9971 respondents, 71% have emotional problems, and 29%, or 3854, they have. This was statistically significant for the occurrence of obesity. The percentage of over-weight patients was correlated with people who have emotional problems. In table 2. The nominal percentage and provide answers related to the different moods. Of the total tested, 23% is a lot of enthusiasm a lot of time, and 31% for some time, statistically significant for the occurrence of obesity.
The highest percentage tested, or 37%, a little nervously, and 31% for some time, while constantly anxious only 2% of the population. We can conclude that we are not anxious nation. But that this mood was not statistically significant for obesity. Peace of mind for some time felt the highest percentage ofpersons tested, 34% and 28% much of the time. But only 3% always calm and 13% most of the time. Not statisticallysignificant. For a time full of energy 31% and 25% a good deal of timeand it is statistically significant. Continuous full power isonly 6%. Very little time is a sad 37% tested, but never 27%. Only 1% of those polled are constantly sad. Thismood did not correlate with obesity, is not statistically significant. About 48% have never tested depressed, and only 15% full-time and 2% most of the time, which is ofimportance for obesity.
Is Exhausted 36% of the nation for some time, 26% very little time, a constant only 2%. And this mood was not significant for higher values of body mass index. Tired for a time 39%, 24% very little time and only 4% of the time.This disposition is not correlated with body weight.
Lucky for some time 33% and 27% a good deal of time, while constantly only 4% and 2% never.
Not statistically significant.

Eco-Ist’12, Ecological Truth, 30 May - 2 June 2012. Hotel “Srbija TIS”, Zajecar, Serbia
601
DISCUSSION
Since the investigated mood, always dominated by fullenthusiasm, calm, energized and happy. Four times more test positive are inclined in relation to the nervous, moody, sad, exhausted. The positive and negative mood than last some time. Separated by only a sad mood and nervous, which last quite some time. At the same time, 48% had never depressed.
Of all the moods, the obesity statistics are most full of zeal and full of energy and a good deal of time and the mood are correlated with overweight, as opposed to say, the research conducted by Ali and concluded that the respondents of poor mental health and mood swings, weight gain more likely. The ideal male or female beauty, we certainly do not apply to lean persons. We should however not forget that the study included only adult populations aged 20 years and in Vojvodina, where the tradition of high calorie foods. It is known that high-fat foods is a frequent cause of obesity, which often occurs as a family phenomenon, is not always a case of hereditaryobesity, but also about fostering the cult of the "goodmouthful" and creating a habit to eat well, especially in the mentioned area (S Gligorijević, Milutinovic S
).
Table 1.Number of respondents with and without emotional problems Emotional problems Total 13857 respondents P/ significance level test No 9971 / 71%
,001 Yes 3854 / 29% No answer 32
Table 2. Categories of observed characteristics incomparison to Characteritics
mental health Constantly Most of
the time Much of the time
While Very little time
Never No response
P/ significance level test
full of enthusiasm
538 4%
1393 10%
3140 23%
4324 31%
3011 22%
1176 8%
275 / 2%
,001
Nervous 261 2%
537 4%
1570 11%
4278 31%
5147 37%
1796 13%
268 2%
,918
Calmness 499 4% 1849 13%
3932 28%
4721 34%
2183 16%
384 3%
289 2%
,182
full of energy
712 5% 1719 12%
3434 25%
4312 31%
2531 18%
857 6%
292 2%
,011
Sadi 204 1% 409 3%
966 7%
3159 23%
5128 37%
3694 27%
297 2%
,522
Exhausted 288 2% 817 6%
2311 17%
4983 36%
3629 26%
1532 11%
297 2%
,906
Happy 633 4% 2240 16%
3815 27%
4523 33%
2014 14%
320 2%
307 2%
,297
Tired 538 4% 1119 8%
2728 20%
5388 39%
3287 24%
499 4%
298 2%
,543
Depressed 151 1% 278 2%
875 6%
2177 16%
3388 25%
6700 48%
288 2%
,151

Eco-Ist’12, Ecological Truth, 30 May - 2 June 2012. Hotel “Srbija TIS”, Zajecar, Serbia
602
CONCLUSION
One can say that we are a nation with great emotional andgeneral mental capacity. If we had the least depressed, and the most calm and happy despite the crisis that weare. That the most significant mood full of enthusiasm, andfull of energy.
Of importance is that future research focus on young people and to examine how young perceive themselves or how they perceive their body and weight .
REFERENCES
1. Slavica Djukic Dejanovic, Psychiatry for medical students
2. Hopman WM, Leroux C, Berger C, Joseph L, Barr SI, Prior JC. Changes in body mass index in Canadians over a five-year period: results of a prospective, population-based study. BMC Public Health 2007; 7:150
, Kragujevac: Medicinski fakultet, Serbian, 2010.
3. Kouvonen A, Kivimäki M, Cox SJ, Cox T, Vahtera J. Relationship Between Work Stress and Body Mass Index Among 45,810 Female and Male Employees. Psychosomatic Medicine 2005; 67:577-83
4. Toyoshima H, Masuoka N, Hashimoto S, Otsuka R, Sasaki S, Tamakoshi K. Effect of the interaction between mental stress and eating pattern on body mass index gain in healthy Japanese male workers. Journal of Epidemiology 2009; 19(5): 273
5. Ostry AS, Radi S, Louie AM, LaMontagne AD. Psychosocial and other working conditions in relation to body mass index in a representative sample of Australian workers. BMC Public Health 2006; 6:53
6. Ali SM, Lindström M. Socioeconomic, psychosocial, behavioural, and psychological determinants of BMI among young women: differing patterns for underweight and overweight/obesity. Europea journal of public health 2005; 16(3):325-31
7. Prof. dr. Djordje Jakovljevic, Prof. dr. Dragoljub Djokic, Dr.sci. honey. Mirjana Pavlovic, Health status of population, health needs and health care use, Serbian
8. Gligorijević S, Milutinović S. Relevant issues concerning systematicexaminations and evaluation of nutritional status in pupils. Curent knowledge of medical nutritive prevention and therapy in children. Niš: Medicinski fakultet; Serbian, 2007.
, 1999.

603
XX International Scientific and Professional Meeting
"ECOLOGICAL TRUTH" ECO-IST'12
30 May - 2 June 2012, Hotel “Srbija TIS“, Zajecar, SERBIA
POSSIBLE ENHANCEMENT CONCEPT MANAGEMENT PLAN OF
NATIONAL PARK "ĐERDAP"
Jasmina Jaksic
University of Belgrade, Faculty of Forestry, Belgrade, SERBIA
ABSTRACT National park “Đerdap” abundant wealth and future actions and strategic goals should not only be
aimed at improving tourism and recreation, but in particular attention should be paid to scientific research and educational activities and technological advances by the National Park “Đerdap” and beyond. With this goal, in II level of protection zone it needs to be established Regional Scientific Research Center “Đerdap” (RSRC) for further education and training of students, teachers, scientists ... the implementation of new technology-nanotechnology and nanoscience.
Key words: Đerdap, nanotechnology, scientific research INTRODUCTION National park "Đerdap" is located in the southeastern part of Europe, in the
northeastern part of Serbia, at the international border with Romania. We will briefly through the following text justify its richness and beauty that adorn it, but also the dangers that threatens to undermine the magnificence. The Park covers a total area of 63608,45 ha, and the entrance to the Park is located far away from the city of Belgrade (the Serbian capital), about 120,00 km. National park "Đerdap" is one of the most important refuge of primarily forest flora and vegetation, as evidenced by a series of relict representatives of tree and endemic species (Syringa vulgaris, Juglans regia, Quercus pubescens ...) [1]. In the National Park "Đerdap" is allocated a total of about 50 forest and shrub communities. In the Park, "Đerdap" is present over 1100 plant species, 49 mammal species, 122 bird species and 17 species of rodents as from the international diversity is a great treasure. The main hydrological phenomenon of the park today is accumulation, that is man made by damming of the Danube, the second largest river in Europe, upstream of the cuttlefish. Formation of the lake flooded a few springs, and the terminal parts of the valley are tributary of the Danube and are converted into smaller or larger bays estuary forms.
The gorge has lost much of its dynamism and beauty. Moderate continental and continental climate is a climate that is changing the “Đerdap” in time. Mountainous hinterland of the gorge is characterized by a modified mountain climate.

Eco-Ist’12, Ecological Truth, 30 May - 2 June 2012. Hotel “Srbija TIS”, Zajecar, Serbia
604
Figure 1. Geological map of National Park “Đerdap”
National Park "Đerdap" is in the spatial State forests defined into seven sections: I level of protection - (1) natural reserve, (2) significant vantage points; II level of protection: (3) protection forests, (4) areas of special natural beauty, (5) scientific research facilities, (6) forest with cultural and historical complex, III level of protection: (7) recreational forest. Forest management measures National park "Đerdap" on the basis of law and Spatial Plan are determined by the forest development plan area, or plan development of forests in national parks as well as the basics of forest management of “Đerdap” National Park. Note: Currently is under adoption a new spatial plan which is in accordance with the Law on Nature Protection and the new law on the National Park “Đerdap” against which to align and protection regime. If the proposal is adopted, the surface strictest protection regime will be changed from 3,60% to about 10,00%.
I level of protection today covers 2664,26 ha - 4,20% of entire area of National Park “Đerdap”; II level of protection today covers 15262,17 ha - 24,00% of entire area of National Park “Đerdap”; III level of protection today covers 45682,02 ha - 71,80% of entire area of National Park “Đerdap”.

Eco-Ist’12, Ecological Truth, 30 May - 2 June 2012. Hotel “Srbija TIS”, Zajecar, Serbia
605
Figure 2. Map of natural potential vegetation of National Park “Đerdap”
As for the cultural and historical monuments, it is important to mention archaeological site Lepenski vir, and the Trajan Table, Golubački fortress city, the presence of more than 23 prehistoric and over 29 ancient monuments and features from the Roman period, therefore the National Park “Đerdap” unquestionably deserves to be included the list of world natural and cultural-historical heritage of UNESCO [2, 3].
THE POTENTIAL OF NATURAL AND MANMADE CONDITIONS AN FORMAS
After all the presentations of experts we can extract some of the following resources:
- Good transport connections (provides the ability to link with the natural corridor of international importance, and thus the use of hydropower, navigation, fishing, sports and tourism potential and the European E4 and pedestrian corridors Eurovelo 6);
- Geographical location of the park and the status of the park (the possibility of connecting and networking systems in Natura 2000 and Emerald networks of protected areas);
- The wealth of medicinal plants and mushrooms;

Eco-Ist’12, Ecological Truth, 30 May - 2 June 2012. Hotel “Srbija TIS”, Zajecar, Serbia
606
- Wealth-geomorphological and speleological objects - caves, dams (gives the possibility of unique scenes);
- The presence of thermal waters and groundwater, drinking water (gives the opportunity to create a brand);
- The favorable natural conditions for the formation of ponds (old meander, branch of the Danube near Kladovo);
- A large number of sunny days (gives the opportunity for summer tourism and the use of solar energy);
- Frequent winds are favorable for development of nautical tourism (gives the ability to form and raise the wind park and implementation of new technologies);
- The fertile land (provides an opportunity for organic farming); - The potential of fish stocks (the ability to provide catering, tourism and
exports); - Historical, cultural heritage, a wealth of entomological and ornithological
wealth (gives the possibility of tracing the path of knowledge and cultural courses). PROBLEMS OF NATURAL AND MANMADE CONDITIONS ARE There are lots of potential problems of the Park, but some of them are:
- The financial status of the National Park “Đerdap” is not on the budget of the Republic of Serbia;
- The legal conflict and the need for its harmonization with international instruments of protection of the area;
- Poor organization (it is necessary personnel reorganization); - Lack of awareness of the local community; - The land is in various stages of degradation; - Lack of cooperation and exchange of information between municipalities and
the National Park “Đerdap”; - Lack of activity of the reforestation to prevent erosion; - Torrential flow-enter a large amount of material into the Danube; - Eutrophication and changes in water level in the bed of the Danube river during
the day; - Abandonment of agricultural land and their neglected; - Natural migration of animals (it is necessary to set the fish passes, passes for the
animal); - Uncontrolled fishing (registration is required by local fishermen in the
economic status of persons); - The appearance of clear-cutting (it is necessary to change of editorial policy); - Threats of plant and animal species due to human activities (it is necessary that
change has sentencing policy); - The emergence of the gypsy moth-(dry forests - golobrst), (requires the use of
biological control measures overgrowth of species);

Eco-Ist’12, Ecological Truth, 30 May - 2 June 2012. Hotel “Srbija TIS”, Zajecar, Serbia
607
- Sprawl of buildings (it is necessary to use national and international law on the construction - and a private house);
- Low-forestation (the data from year of 1999 -17,00 ha is forested, and in the period from year 2000-2001-it is done nothing about afforestation);
- Mainly exploited firewood (it needs to be done renaturalisation - succession); - Lack of marketing coverage; - The last 20 years has not done any construction design (requires the preparation
of planning documents in short, medium and long term); - Poor cooperation between the National Park and the population (it requires
joint projects); - National Park “Đerdap”-financing depends on the cutting of forests; - The lack of organized tourist visits; - Improper disposal of municipal waste water treatment (requires the
implementation of new technologies); - The fruits of many forest species are still not utilized adequately; - Lack of a unique program of breeding, care and processing of wood (it need to
create new jobs); - Drinking water quality has been steadily declining; - Frequent fogs and winds; - Uncontrolled hunting, fishing and collectibles (it need reintroduction of
species). RESULTS
National Park “Đerdap”on all the above facts is a national priority and as such
can keep the same place just in case if it went up with technological developments. A well-designed, optimally organized and managed process can improve the efficiency of innovation activities and the overall effectiveness of technological innovation. With this goal, in II level of protection zone it needs to be established Regional Scientific Research Center “Đerdap” (RSRC) for further education and training of students, teachers, scientists ... the implementation of new technology-nanotechnology and nanoscience. The first year is intended to set up, defining and redefining the existing legislation and the status RSRC “Đerdap” in the international framework. After that, the next 3 years are reserved for the introduction of new facilities (tourist, cultural, accessories for high nano technology ...) and reconstruction of existing infrastructure while simultaneously training local people and training of research personnel. The aim is that the best scientific research personnel in the region and beyond focus on further development and research in the field of nano technology, that will represent a milestone in the technological and educational development in the future all over the world, a National Park “Đerdap” is the most legitimate place for the initiation of this field.
Regional Scientific Research Center “Đerdap” would be based, and took upon themselves the role of basic research and assess the possibilities of nanotechnology-oriented, applied research and development and as a result of the commercialization of

Eco-Ist’12, Ecological Truth, 30 May - 2 June 2012. Hotel “Srbija TIS”, Zajecar, Serbia
608
final products, the protection and conservation of natural resources and their placing on the European and global scientific research market, as this could take the leadership in research and technological development of nano science in the region and beyond. Also there is always the possibility of mutual cooperation of other scientific research centers for nano technology in the Republic of Serbia and beyond.
Each expert will signe the agreement with Republic of Serbia on the authenticity of all research activities that will address each individual scientist and author whose work was recognized throughout the world, and intellectual property will belong to Republic of Serbia and the Regional Scientific Research Center “Đerdap”. In return, the scientific staff will receive free accommodation, all the scientific equipment and using the most advanced laboratories for nanotechnology and all associated facilities at National Park “Đerdap”, in as many years as the contract is signed. After the expiry of contract, the scientific researchers will moved to urban areas and scientific centers of other countries in the region or in other protected areas with the same or similar technology education strategy as Regional Scientific Research Center “Đerdap” will have. Interested sides and the actors of this project will be:
Ministry of Science and Technology of Serbia, Institute of Nuclear Sciences "Vinča" Institute of Physics, Institute of Chemistry, Institute of Technology and Metallurgy, Institute of Multidisciplinary Research, Institute of Technical Sciences of Serbian Academy of Arts and Sciences, Electrical Engineering, Faculty of Chemistry, Physics Faculty of Technology and Metallurgy, Faculty of Physical Chemistry, Faculty of Mining and Geology, University of Novi Sad: Faculty of Technology, Faculty of Engineering, University of Niš and Kragujevac, Department of Environmental Protection, Ministry of Education and Science Republic of Serbia company - as a strong indicator of environmental awareness, the Institute for Nature Protection of Serbia, Foreign embassies and cultural centers, Universities, Non-governmental sector that works to encourage sustainable development, the Government Office of the Republic of Serbia for European Integration, University Students and the environment in which the exchange project students, local communities, scientific and education workers, tourists, young talents - students of secondary and primary schools, Colleges of Natural Sciences of Belgrade and other universities, organizations and associations of young researchers, students of art academies and schools, Free Artists, National Institute for Nanotechnology, Nanotechnology Center for Innovation, Center for Responsible Nanotechnology, Center for Nanotechnology Innovation, IMDEA Nanociencia Institute Jozef Stefan Institute Nanotechnology, Korea Institute of Science and Technology - Nano-Materials Research Center, Nanopin Research Centre for Nanostructure Engineering, Public Enterprise "National ”Đerdap”Park ", Donji Milanovac, Faculty of Forestry in Belgrade and the Institute of Forestry in Belgrade, Institute for the Protection of Cultural Monuments of Serbia, Ministry of Environment, Mining and Spatial Planning of Serbia.
Eco-Ist’12, Ecological Truth, 30 May - 2 June 2012. Hotel “Srbija TIS”, Zajecar, Serbia
609
CONCLUSIONS
Protection and improvement of National Park “Đerdap” should be based on all the goals and objectives provided by the proposed Management Plan for the National Park “Đerdap” (2011-2020 years).
National park “Đerdap” abundant wealth and future actions and strategic goals should not only be aimed at improving tourism and recreation, but in particular attention should be paid to scientific research and educational activities and technological advances by the National Park “Đerdap” and beyond. To make this all slightly collapsed and would not forget the urgently needed new technology and educational facilities and personnel. New facilities should be strengthened through indirect coupling of tourism development, such as that would bring in synergy benefit of economy and society during the year.
In order to establish and maintain a mechanism, that mechanism has to run round, or closed and open circuit, composed of his inevitable parts. These parts of the merger realized sustainable round. Assembling proper merging of all these parts in the circuit turns to sustainability continues.
What is in this case the particle /parts! These particles in this case are shown on one side are natural forms of National Park “Đerdap”and the man made forms on the other side.
To be relevant in science and technology and become more innovative country, Repeblic of Serbia must focus on a number of national priorities in science and technology development, and they are:
-New materials and nanoscience; -Environmental protection and climate change; -Energy-efficiency; -Agriculture and Food; -Biomedicine; -Information and communication technologies; -Improving decision-making of national interest.
The emergence of nanotechnology will result in: -Self-assembly of goods in use; -Nano-Medicine (late disease, aging, death); -Termination of pollution and automatic cleanup of existing pollution; -Molecular synthesis-food (end poverty and hunger); -Trillion times faster computers; -Extremely-new inventions (unfeasible today); -Access to superior education for every person on earth; -Reconstruction of the majority of extinct plants and animals; -Safe and affordable space travel; -The settlement of the solar system [4].

Eco-Ist’12, Ecological Truth, 30 May - 2 June 2012. Hotel “Srbija TIS”, Zajecar, Serbia
610
Only in this successive and oriented strategic plan, protected areas could be saved, otherwise it will not be an excuse for the existence of such areas through tourism and recreation, considering that the human appetite from year to year, are higher and higher, and we should all keep that in mind .
REFERENCES
1. Tomić, Z., Forest phytocenoses of Serbia, Faculty of Forestry, University of Belgrade, Belgrade, 1992.
2. Draft management plan for the area of National park Djerdap in 2001. to 2020., Public Enterprise for national park Đerdap, Donji Milanovac, 2010.
3. Draft spatial plan of Serbia in 2010. to 2020., Ministry of environment and spatial planning, Republic agency for spatial planning, Belgrade, 2012.
4. A report for the greenpeace environmental trust, Future technologies, today’s choices-nanotechnology, artificial intelligence and robotics-a technical, Political andinstitutional map of emerging technologies, „Greenpeace environmental trust“, London, 2003.

611
XX International Scientific and Professional Meeting
"ECOLOGICAL TRUTH" ECO-IST'12
30 May - 2 June 2012, Hotel “Srbija TIS“, Zajecar, SERBIA
NATURAL MINERAL WATERS AND THEIR IMPACT ON HEALTH
Tamara Premovic*
, J. Premovic
University of Novi Sad, Faculty of Technology Novi Sad, Novi Sad, SERBIA
ABSTRACT
Increase the physical volume of production as a result of the technical and technological progress at the beginning of XXI century, caused the changes in the environmental sphere by increasing pollution of the environment. Waters were the first to suffer enormous pollution. Good quality waters in natural environment are becoming rare due to uncontrolled pollution, but often because geological quality of the water at its source is not in accordance with the quality of water safe for consumption. Inadequate technology in preparation of drinking water in some water systems, and at the same time inadequate quality of water, keep forcing consumers to look for alternative sources of water, mostly bottled and packaged water, among which natural mineral waters justifiably has an important place.
Key words: pollution, water resources, natural mineral waters, health, quality parameters
INTRODUCTION
Increase the physical volume of production as a result of the technical and technological progress at the beginning of XXI century, caused the changes in the environmental sphere by increasing pollution of the environment. Changes in climate are starting to put the world as we know it in danger, slowly but surely. Seas and oceans are polluted, forests are attacked by pollutants through acid rains, cutting down the trees and destruction, the protective ozone layer is significantly damaged, clean rivers basically cannot be found. There is an increase in the number of people with no access to drinking water. The consequences are manifested by the pollution of the environment and alienation of a man from nature.
Waters were the first to suffer enormous pollution. The Earth, as a planet, has large reserves of water, however not enough drinking water, which is the precondition of life. The fact that only 1% of all the water on Earth is appropriate for drinking is strong enough for a man to understand the necessity of drawing due attention to water, without which any form of life on Earth would die. Synthetic fertilizers, poisonous gases from plants, incidents which cause direct spilling of poisonous substances into watercourses, pollution of watercourses caused by bad storage of poisonous waste in the ground, and other numerous factors caused the large part of watercourses to be seriously endangered. Unimaginable amounts of waste, of which human beings have been uncontrollably

Eco-Ist’12, Ecological Truth, 30 May - 2 June 2012. Hotel “Srbija TIS”, Zajecar, Serbia
612
disposing for decades, a bad or no system for fecal and atmospheric water disposal, irrational release of solid chemicals from plants into the rivers, seas and ground, are only some of the factors which led to the situation that today as much as a half of world’s population drinks water of questionable quality. The problem of water pollution is becoming bigger and bigger, and manifests itself as unbalanced, degraded and polluted water, inability of self-treatment, deposited substances on the bottom of the bed, degraded landscapes in the coastal areas, etc.
NATURAL MINERAL WATERS IN THE FUNCTION OF HUMAN HEALTH
Good quality waters in natural environment are becoming rare due to
uncontrolled pollution, but often because geological quality of the water at its source is not in accordance with the quality of water safe for consumption. On the other hand, the increase of number of people, urbanization and increase of standard of living, the latest toxicology research, and sometimes fear for one’s own health, cause the ever growing demand for good quality drinking water. [1]
Inadequate technology in preparation of drinking water in some water systems, and at the same time inadequate quality of water, keep forcing consumers to look for alternative sources of water, mostly bottled and packaged water, among which natural mineral waters justifiably has an important place. Due to certain wrong ideological beliefs, bottling and consumption of natural mineral waters were treated inappropriately from the economic-human point of view. Bottled water was regarded as luxury, and visits to spas a privilege enjoyed only by a certain category of people. With technological development and decrease in costs of water bottling, a considerable number of people started buying bottled water regularly. Different types of bottled water made by various producers are available on the markets of industrialized, as well as developing countries. Buyers may have different reasons for buying bottled water for drinking, such as: taste, practical reasons or just due to the fashion, but for many consumers, however, safety and good impacts on health are crucial factors for using this kind of water.
In Europe, mineral waters are traditionally consumed, firstly due to their mineral structure, which is useful in maintenance and improvement of health. Bottling and importing of mineral water started in the 16th century in Europe when the water from Spa in Belgium was transported to the capitals of Europe. The very healing characteristics of mineral waters from certain springs caused the need for their bottling, making them available to a larger number of customers. This water is used for health improvement, in therapeutic purposes for treatment of illnesses, by drinking, bathing or inhaling the water. Water with high concentrations of hydrogen carbonates are used for easier digestion, others are used for treatment of kidney illnesses, skin illnesses, neurological disorders, etc. Traditionally, healing waters have been used in our folk medicine for centuries. On the territory of our country, due to good geological structure, there are a number of registered springs of natural mineral waters, of different physicochemical composition, which represent important natural resources of Serbia. The water can be put into sale only in the original packaging, in hermetically closed

Eco-Ist’12, Ecological Truth, 30 May - 2 June 2012. Hotel “Srbija TIS”, Zajecar, Serbia
613
containers, which prevent contamination and ensure preservation of quality till the moment of opening within the shelf life of the product. It also has to contain a label in accordance with the Rulebook on Labeling and Marking of Packaged Food.
In 1984 the World Health Organization (WHO) published the first edition of Guidelines, followed by the second in 1993 and third in 2004, which are used to analyze and define the quality of drinking water, without special analyses and parameters for natural mineral waters (WHO, 1984, 1993, 2004). In recent years, international work on testing and achieving ever better quality of bottled water, and at the same time of natural mineral water, has become a subject of interest of the Codex Alimentations Commission (CAC), “The Code of Good Practice”, the World Health Organization, as well as Food and Agriculture Organization.
In the European Union, the quality of mineral water is defined by Directive 80/777/EES, which was supplemented and partly amended by Directive 80/1276/EES, 85/7/EES, 96/70/ES, and 2003/40/ES. On the territory of our country, due to good geological structure, there are a number of registered springs of natural mineral waters, of different physicochemical composition, which represent important natural resources of Serbia. In our country, the quality of natural mineral waters is regulated by the Rulebook on Quality and other Requirements for natural mineral waters, Natural Spring Water and Still Table Water, and the quality of bottled water by the Rulebook of Hygienic Safety of Drinking Water.
A number of mineral waters have been attributed with healing characteristics, and many are adjusted to those purposes. Healing waters have been traditionally used in our folk medicine for centuries, which is founded by the qualitative and physiological characteristics of mineral waters from our springs. Certain buyers believe that natural mineral waters has medicinal qualities and that it offers other positive impacts on health, and some of them are being scientifically researched. This kind of water commonly has high mineral content, sometimes even higher than concentrations normally accepted for drinking water. Mineral water often has a long tradition of use and it is often accepted, so on basis of this, it is more considered as food, than drinking water. Moreover, some mineral waters may be useful in compensation for some micronutrients, such as calcium. It is well-known that water does not go through the process of external digestion (catabolism), but that it is directly absorbed by blood, therefore (due to inorganic structure of blood and blood plasma), physiological characteristics of water are extremely important for osmosis and diffusion processes. From a physiological point of view, the content of the following is very important: sodium, potassium, calcium and magnesium, as dominant cations, as well as: chlorides, bicarbonates, phosphates and sulphates, as dominant anions. The content of ions in water has the most dominant impact on the active transport through cellular membranes, that is to the efficiency of potassium-sodium pump and distribution of static electricity. [2]
According to a large number of consumers, carbonated mineral water is pleasing and very agreeable, but attention must be drawn to the way it is used, especially if it is used instead of drinking water. The labels do not indicate it, but general public should be made aware of how, when and how much it can be consumed. Taking into consideration poliphysiological activity of mineral waters, their consumption must be controlled in order to achieve positive results. Knowing individual requirements of

Eco-Ist’12, Ecological Truth, 30 May - 2 June 2012. Hotel “Srbija TIS”, Zajecar, Serbia
614
people, it is possible to determine the type of water, period of consumption and daily intakes. It is necessary to take care about all the members of a family, for whom a long-term consumption of natural mineral waters may be risky, above all young and very old people. By consuming adequate natural mineral waters, it is possible for people who work in difficult conditions and sportsmen to quickly, suitably and physiologically efficiently compensate minerals and oligoelements lost due to intensified physical activity [2] [3].
If consumers use bottled natural mineral waters instead of tap water, they should use non carbonated water. Furthermore, they should use water with the lowest content of minerals, as well as low content of ions: sodium, fluoride, potassium, sulphates and nitrates. Inadequate consumption of mineral water, whether according to the type or in its quantity, can have negative and undesired effects. For example, inadequate consumption of mineral water rich in sodium ions can cause changes in cardiovascular system, hypertension, etc. All our natural mineral waters have their specific values, which may be physiologically optimally used if they are consumed in a proper way.
If we use natural mineral waters to prepare baby food, it is necessary to choose the one with very little sodium ions and sulphates, little nitrates and no nitrate ions. Carbonated mineral water must not be used for these purposes, only in the case if it boiled before food preparation. It is well-known that bottled natural mineral waters does not undergo disinfection, and even if does not contain pathogenic microorganisms, normal unharmful bacteria are present. Contamination of microorganisms may happen, therefore due to precautions, the water must be boiled. Opened bottles of natural mineral waters must not be kept longer than 36 hours if it is to be used for preparation of baby food, unless it is kept in a special container with a tap. Even in that case, it must be refrigerated. [2]
CHEMICAL QUALITY PARAMETERS OF NATURAL MINERAL WATER
Current legislation defines chemical physicochemical and microbiological
quality parameters of natural mineral water. The Rulebook on Quality and other Requirements for natural mineral waters, Natural Spring Water and Still Table Water defines natural mineral waters as underground water for human consumption in its natural state. It can be put into circulation only in the original packaging, in hermetically closed containers, which prevent contamination and ensure preservation of quality till the moment of opening within the shelf life of the product. It also must contain a declaration on the packaging, container or label that is in accordance with the Rulebook on Labeling and Marking of Packaged Food. [4] [5] The term “natural” may be used in a name of mineral water that has not been processed in any way, except by: separation of unstable elements, separation of iron, manganese, sulphur and arsenic compounds, and adding or eliminating carbon dioxide. [4] Natural mineral waters can be bottled only if it is chemically and microbiologically safe for drinking, if its quality is stable and formed in natural conditions and if it meets the following requirements:

Eco-Ist’12, Ecological Truth, 30 May - 2 June 2012. Hotel “Srbija TIS”, Zajecar, Serbia
615
1. if it has its source in the bed of spring waters, protected from any possibility of contamination, and rises to the surface in a natural way through one or more springs, or drilled wells;
2. if it has characteristics by which it differs from drinking water, specifically: by its nature (as the content of mineral substances, chemical elements in traces or their compounds), by its possible physiological effect and original state;
3. if it has the same quality as at its spring, that is, the above mentioned characteristics must be maintained untouched from its spring underground, which is protected from any contamination, all the way to packaging. [4]
Directives and our Rulebook on mineral waters provide a long list of
requirements, which must be considered and fulfilled before taking into consideration the status of natural mineral waters, and which can be generally classified in three groups, namely:
1. Requirements concerning characteristics of natural mineral waters, which may be important for health, and which must be analyzed and evaluated from many aspects: geological and hydrological; physical, chemical and physicochemical; microbiological; and pharmacological, physiological and clinical;
2. Requirements and criteria for monitoring and analyses: geological and hydrological monitoring; physical, chemical and physicochemical monitoring; microbiological criteria at the spring and requirements for clinical and pharmacological analysis;
3. Additional qualifications in connection to warm mineral waters: at the spring or after bottling these waters lose carbon dioxide spontaneously and in a visible way, under normal temperature and pressure. Natural mineral waters containing carbon dioxide, according to its content and
origin, can be: natural mineral waters with natural content of carbon dioxide (which has the
same content of carbon dioxide at the spring as after possible preparation and filling),
natural mineral waters with its own additional carbon dioxide (which has a higher content of carbon dioxide after possible preparation and filling than at the spring),
natural mineral waters with additional carbon dioxide (to which carbon dioxide was added, which does not originate from the same spring as the natural mineral water), and
natural mineral waters without carbon dioxide (which contains the amount of carbon dioxide needed for maintenance of hydro carbonate balance). [4]
According to the content of carbon dioxide, natural mineral water is sold as: 1. naturally carbonated mineral water, with the content of carbon dioxide both at
the spring and in the original packaging the same or higher than 250mg/l, 2. carbonated natural mineral waters, with carbon dioxide added in the
concentration higher than the natural one at the spring,

Eco-Ist’12, Ecological Truth, 30 May - 2 June 2012. Hotel “Srbija TIS”, Zajecar, Serbia
616
3. non carbonated water, with the content of carbon dioxide lower that 250 mg/l. [2]
Natural mineral waters, from which carbon dioxide was partly or completely
eliminated physically, must contain in the name of the product: “partly decarbonizes” or “completely decarbonizes”. According to the content of dissolved mineral substances, natural mineral waters are put into circulation under the following name: natural mineral waters with very low content of dissolved mineral substances
(contains to 50 mg/l of mineral salts), natural mineral waters with low content of dissolved mineral substances (from
50 to 500 mg/l of mineral salts), natural mineral waters which contains from 500 to 1.500 mg/l of mineral salts,
and natural mineral waters rich in mineral salts, containing over 1.500 mg/l of
mineral salts. [4]
According to the content of characteristic elements, natural mineral water is categorized and sold as: bicarbonates, containing more than 600 mg/l of bicarbonates, sulphate, from 200 mg/l of sulphates, chloride, from 200 mg/l of chlorides, calcium, from 150 mg/l calcium (expressed as a two valence calcium ion), magnesium, from 150 mg/l of magnesium (expressed as a two valence
magnesium ion), fluoride, from 1.0 mg/l of fluorides, iron, from 1.0 mg/l of iron (expressed as a three valence iron ion), sodium, from 200 mg/l of sodium (expressed as a one valence sodium ion), carbon acidic, from 250 mg/l of free carbon dioxide, and with low content of sodium, from 20 mg/l of sodium (expressed as a one valence
sodium ion) [4]

Eco-Ist’12, Ecological Truth, 30 May - 2 June 2012. Hotel “Srbija TIS”, Zajecar, Serbia
617
Table 1. Comparison of concentration limits of certain chemical substances according to the international and local regulations[2]
Substance Unit of measure
Recommendations of WHO of values for
chemicals important for health for drinking water
(third edition)
EU Directive
2003/40/EC
Chemical elements naturally present in
natural mineral
waters which, if exceeded,
could represent risk
to people’s health
Maximal allowed
concentrations of chemical substances in
bottled drinking
water natural waters in mg/l
Antimony mg/l 0.02 0.0050 0.0050 0.01 Arsenic mg/l 0.01(a) 0.010(1) 0.010(1) 0.05 Copper mg/l 2 1.0 1.0 0.1 Barium mg/l 0.7 1.0 1.0 0.1 Borone mg/l 0.5(b) -(2) - 1.0 Cyanide mg/l 0.07 0.070 0.070 Not available Fluoride mg/l 1.5(3) 5.0 5.0(g) 1.0 Chrome mg/l 0.05(a),for total chrome 0.050 0.050 0.05 Cadmium mg/l 0.003 0.005 0.003 0.005 Manganese mg/l 0.4 (v) 0.50 0.50 0.02 Nickel mg/l 0.02(a) 0.020 0.020 0.01 Nitrate mg/l 50 (short-term exposure) 50 50 5.0 Nitrite mg/l 3 (short-term exposure)
0.2 (long-term exposure) 0.1 0.1 Not available
Lead mg/l 0.01 0.010 0.010 0.05 Selenium mg/l 0.01 0.010 0.010 0.01 Quicksilver mg/l 0,01 0,0010 0,0010 0,001
Presence of chemically polluting substances in natural mineral waters to a large
extent determines its quality from a chemical point of view, and in most cases, also in the terms of organoleptic characteristics. Not all chemical compounds are present in all the water resources, and where they are present, their concentrations vary. According to the EU Directive (80/777/EES), mineral waters from well-known and register springs did not have limits in terms of the mineral content, and they were excluded from normal recommendations and limitations of the EU Directive on drinking water. Apart from microbiological standards, this Directive did not contain either limits or maximally allowed concentrations for most of the parameters. Due to all this, many natural mineral waters exceeded the maximal values for the range of parameters given in the EU Directive for drinking water. That is why it was decided that it was necessary to set the limits of concentration for certain elements in mineral waters, which can have an impact on the health of people, their consumers.

Eco-Ist’12, Ecological Truth, 30 May - 2 June 2012. Hotel “Srbija TIS”, Zajecar, Serbia
618
CONCLUSION
Till now, over 1000 of chemical organic and inorganic compounds in water have been identified, and it is not possible to set limits for all of them. While determining chemical substances for which it is necessary to calculate recommended values, two criteria are started off with: relatively frequent presence in water in significant concentrations and presence of chemical substances potentially harmful for public health. Guidelines for providing safe drinking water in the international legislation must be in accordance with national, regional and local conditions, which requires adaptation to environmental conditions, as well as social, economic and cultural conditions, and previous beliefs and customs. Results of numerous research have shown that from all (potentially) present chemical substances in water, only a few show to have an important impact on health (which are mostly caused by their presence in water, in higher concentrations), namely: arsenic, fluorides, nitrates, lead, selenium, iron and manganese [2] [3].
REFERENCES
1. Premović T., Premović J. Natural mineral waters, Book of abstracts FAŽIS 2011“, University Educons, Sremska Kamenica, p 42, 2011.
2. Dalmacija, B. et al. Laws, Rules and Standards of Drinking Water, chapter: Dalmacija, B., Agbaba, J. (editors), Quality control for drinking water, a group of authors, Faculty of Sciences, Department of Chemistry, Novi Sad, pp. 11-92, 2006.
3. Agbaba, J., Dalmacija, B., Chemical Aspects of Drinking water, chapter: Dalmacija, B., Agbaba, J., Klašnja, M. (editors), Modern methods in preparation of drinking water, Faculty of Sciences, Department for Chemistry, Novi Sad, pp. 75-87, 2009.
4. The Official Gazette of Serbia and Montenegro, 4/2004; 53/05. 5. Stanković, I., Conditions of Use of Additives, Labeling and Marking of Food–
Legislature, the Ministry of Internal Economic Relations of the Union of Serbia and Montenegro, 2004

619
XX International Scientific and Professional Meeting
"ECOLOGICAL TRUTH" ECO-IST'12
30 May - 2 June 2012, Hotel “Srbija TIS“, Zajecar, SERBIA
ECOTOURISM IN CONTEXT OF ENVIRONMENTAL PROTECTION
Jelena Premovic1*, Lj. Arsic2, S. Vujovic
3
1Faculty of Economics, Kragujevac, SERBIA 2Faculty of Economics, Pristina – Kosovska Mitrovica, SERBIA
3
Institute of Economics, Belgrade, SERBIA
ABSTRACT
The rapid economic growth and inefficient use of natural resources, following intensive industrialization in the second half of the twentieth century, reinforced structural effects of the global crisis that is most reflected in the field of ecology. Spending lifestyles and environmentally destructive technologies have led to the intensification of the already existing environmental problems. Ecotourism is a growing segment of the global tourism that is making important positive contributions to the environmental, social, cultural and economic well-being of destinations and local communities all over the world. Therefore, ecotourism is one of the components of sustainable tourism that can play an important role in context of protecting environment, in the preservation of natural and anthropogenic values of specified destination.
Key words: environment, sustainable tourism, ecotourism, environmental protection
INTRODUCTION
The period from the fourteenth to the end of the twentieth century marked the era of production and economies of scale whose base was the anthropocentric view on the world, which had a direct impact on the nature and man’s natural environment. Putting a man on the top of the pyramid, of the impact and importance, in front of nature and the views that natural resources are limitless, with encouraging consumerism has led to meeting the needs and development of one part of humanity, but at the same time, and the distortion of man's environment and oneself, through irrational exploitation of these same natural resources.
The emergence of global natural environmental crisis was created as a result of many decades, and we can safely say, centuries of damaging the natural environment. The rapid economic growth and inefficient use of natural resources, following intensive industrialization in the second half of the twentieth century, reinforced structural effects of the global crisis that is most reflected in the field of ecology. Spending lifestyles and environmentally destructive technologies have led to the intensification of the already existing environmental problems. [1]

Eco-Ist’12, Ecological Truth, 30 May - 2 June 2012. Hotel “Srbija TIS”, Zajecar, Serbia
620
The number of the world population around 6 billion, damage to the biosphere and the depletion of many raw materials, pollution and degradation of air, water and soil pollution, global climate change, endangering some 25.000 plants and more than 1.000 animal species, impairment of human health, etc. are the main problems with which modern society faces, and that must be resolved. Therefore, in post-industrial society has developed the idea of the necessity of reducing the use of natural material resources for the benefit of increased use of non-material resources.
TOURISM IN THE CONTEMPORARY ENVIRONMENT
Tourism in the modern world economy is considered as sector with the greatest potential growth which is expected in the coming period. In addition of this paragraph, the statistics speak of World Tourism Organization-WTO for which tourism is one of five exporter branches in as much as 83% countries, and forecast to the year 2020. the number of tourist arrivals only in Europe will be doubled. As one of the most propulsive industries with strong economic performance, tourism takes considerable environmental responsibility, which is why today more and more is analyzed so called environmental dimension of tourism in the function of the overall sustainable development. Analysis showed that the tourism industry and all institutions in the tourism industry set the task of establishing, first of all, sustainable and responsible development in order to preserve natural environment as resources for tourist product. [2]
At evaluation of the value of the natural environment should take into account the possible negative impacts on the natural environment that can be caused by usage of future activities and facilities. Along with the physical transformation of the space of new destinations, the concept and development strategy direct the development of tourism and its functional importance. There are numerous approaches to the analysis of possible interactive relationship between tourism and the natural environment (space). Impact of tourism on the nature; environment is expressed through the influence of factors such as the intensity of tourism development, the flexibility of ecosystems, law regulations in tourism and in particular for ecology and environment, transformative nature of tourism development, etc. The analysis of these aspects may come to different indicators, and in fact confirm the thesis that tourism both valorize space, it keeps it, and distorts is, it creates its own space, but also trivialized space, and finally, tourism is responsible as there was created awareness of the space problem. [3]
While it can contribute in a positive manner to socio-economic development and environmental protection, uncontrolled tourism growth can also cause a various environmental problems. Achieving sustainable tourism is a continuous process and it requires constant monitoring of impacts, introducing the necessary preventive and/or corrective measures whenever necessary. Sustainable tourism should also maintain a high level of tourist satisfaction and ensure a meaningful experience to the tourists, raising their awareness about sustainability issues and promoting sustainable tourism practices amongst them. [4]
Sustainable tourism was defined in the 1992 Agenda 21 for the Travel and Tourism Industry as tourism that "meets the needs of present tourists and host regions

Eco-Ist’12, Ecological Truth, 30 May - 2 June 2012. Hotel “Srbija TIS”, Zajecar, Serbia
621
while protecting and enhancing opportunities for the future". It implies three main principles, which are: ecological, socio-cultural and economic. [5]
ECOTOURISM (TERMINOLOGICAL DEFINITION, CRITERIA)
The requirements of environmental protection and achieving of tourism development cannot be achieved separately. To be economically sustainable, tourism must be in the function of sustainable environment, whether cultural, or natural. Tourism is a supporter of active environmental protection, which is based on a rational and deliberate use of resources. [6]
Because it is appearing in the sphere of consumption, as a result of temporary changes of permanent residence, tourism requires a number of specific qualitative and quantitative traits. Therefore, the demand is growing at tourism market for small towns with pure nature, which enable a long stay in the open, for the most part of the year, for population of all ages. [7]
Terms like ecotourism, sustainable tourism and responsible tourism are rooted in the concept of sustainable development.
According to the definition and principles of ecotourism established by The International Ecotourism Society (TIES) in 1990, ecotourism is "Responsible travel to natural areas that conserves the environment and improves the well-being of local people." (TIES, 1990).
Ecotourism is a growing segment of the global tourism that is making important positive contributions to the environmental, social, cultural and economic well-being of destinations and local communities all over the world. Ecotourism is a form of tourism that involves visiting natural areas - in the remote wilderness or urban environments. [8]
Martha Honey believes that ecotourism is "a journey into the fragile, unpolluted and usually protected areas that tend to the minimum (negative) external effects. This trip helps in education of tourists, providing funds (funds) for the conservation, makes direct use of economic development and political engagement of local communities and develops respect for different cultures and human rights". As Martha Honey points out, there are seven characteristics of ecotourism, which are:
• involves travel to natural destinations • minimizes impact • builds environmental awareness • provides direct financial benefits for conservation • provides financial benefits and empowerment for local people • respects local culture • supports human rights and democratic movements. [9]
Ecotourism, as a specific niche market, and part of a broader concept of
sustainable tourism is responsible travel to relatively well-preserved natural areas that preserves the natural environment and cultural values, inspirationally acting to increase the standards of the local population.

Eco-Ist’12, Ecological Truth, 30 May - 2 June 2012. Hotel “Srbija TIS”, Zajecar, Serbia
622
As a new form of tourism offer, ecotourism is environmentally responsible tourist travel in relatively preserved areas to stay and enjoy nature. Ecotourism is one of the components of sustainable tourism that can play an important role in the preservation of natural and anthropogenic values of specified destination.
Heterogeneity and structure of the material base of tourism depends on the (mostly natural) conditions and the assumptions for development of a particular type of tourism. As the most attractive tourist destination, today, there are those who have preserved the physical environment, protected nature and man-made tourist motives that attract tourists. Those destinations that are not able to offer such a tourist product are faced with a reduction in the number of tourists, and therefore the other negative effects that are reflected in lower foreign exchange inflows, reduction of employment. [10]
The preservation of authentic values and promoting the creation and supply of eco-tourism destinations, important role has local population. The "edit of destinations, job creation, financial management, are some of the items that ecotourism brings with it. Decisions about that help local community to realize and to become strong enough to influence the patterns of their development. This debate about the impact of the local population on the development of ecotourism grows into a discussion about the importance of ecotourism for the prosperity of local society". [11]
Ecotourism only works when it yields economic benefits to local people, supports conservation and reduces the human impact of travel. It requires the active and educated participation of tourists and the travel industry alike, and it involves everyone from the visitor to the tour operator and airline, the hotelier and the local labor force to agriculturists to individual conservationists. [12]
One destination to become with reputation of eco-tourism destination, it is necessary to meet certain criteria. The criteria adopted by the International ecotourism agencies that should meet the "true" eco-tourism are as follows:
• Preservation of bio and cultural diversity through the achievement of the minimum impact on the natural resources of protected areas.
• Creating a sustainable and legal income for the benefit of local communities. • The involvement of local communities, eco-tourists, tour operators and state
institutions in the planning and development. • Improving the environmental and cultural knowledge through the respect of
local traditions and culture. • The creation of revenues dedicated for conservation of protected areas. • Training shareholders about their role in the protection and preservation of
nature. [13] According to Ross and Wall, criteria of eco-tourist destination are present in the Table 1.

Eco-Ist’12, Ecological Truth, 30 May - 2 June 2012. Hotel “Srbija TIS”, Zajecar, Serbia
623
Table 1. Criteria for ecotourism development [14]
ECOLOGICAL ENVIRONMENT
Tourist destination must be a national park, Nature Park, a protected ecosystem or an area with pristine natural and cultural heritage.
ECO-TOURISTS
The ideal ecotourism group should make 2-4 people, and it should never be more than 15-16 people. Individual (eco) tourists in the wild (wild) may be exposed to various risks and dangers.
ENVIRONMENTAL
ACTIVITIES
Walking, as regular and study of a local nature, meetings and communication with local people and the like. Basic ecotourism activities that eco-tourists should do them.
ECOLOGICAL TRANSPORT
In the very eco-tourist destination, tourists should use ecological means of transport.
ECOLOGICAL ECONOMY
Tourism activities should be organized for the local community by the community itself.
ENVIRONMENTAL
CONTACTS AND
INFORMATION
(Eco) tourists should make contact with local people and to communicate with them as equals, overcoming language barriers, differences in culture, values and behavior. These activities can be much easier if they had previously trained the local people as well as eco-tourists. Important role in realizing mutual eco-contacts may have guides, interpreters, and codes of conduct in ecotourism, etc.
CONCLUSION
According to demographic trends, climate changes and humanity's needs for
food, one must conclude that the lives of people in the future increasingly depend on the nature, natural and cultural values. Man's work and rest, are conditioned on the one hand, with cultural values and on the other hand, with his relationship to nature. Ecotourism is considered the fastest growing market in the tourism industry with an annual growth rate of 5% worldwide and representing 6% of the world gross domestic product, 11.4% of all consumer spending - not a market to be taken lightly. (Mis)use of natural resources for the expansion of tourist travel and the growth of tourist traffic, have led to environmental problems and threats to natural heritage and to raise awareness of the necessity of establishing and constant application of the concept of sustainable tourism development, on the other. Sustainable tourism should enable optimal use of environmental resources that constitute a key element in tourism development, to allow the preservation of heritage and sustainable business. [15]
REFERENCES
1. Premović J., Boljević A., Vujović S., Ecotourism as a new form of tourist offer, pp 1-6, Ecologica, No. 3 (2012) (in press), 2012.
2. Premović J., Boljević A., Arsić LJ., Tourism in the function of the sustainable development of Serbia, pp. 156-157, Agricultural Economics, Department of

Eco-Ist’12, Ecological Truth, 30 May - 2 June 2012. Hotel “Srbija TIS”, Zajecar, Serbia
624
Agricultural Economics and Rural Sociology, University of Agriculture in Novi Sad, No. 51-52, Novi Sad, 2011.
3. Vujović S., Milanović M., Mrkalj M., Problems of sustainable tourism development, p. 63, Proceedings from IV International Conference: Mediterranean days Trebinje 2009, 2009.
4. World Commission on Environment and Development (WCED), Our Common Future, p. 43, Oxford: Oxford University Press, 1987.
5. www.wikipedia/ecotourism 6. Milenković S., Tourism and economy, p. 397, University of Kragujevac-
Faculty of Economics, 2009. 7. Stanković S., Environment, tourism and planning, pp. 24, Bulletin of the
Serbian Geographical Society, N. 2, 2003. 8. www.wikipedia/ecotourism 9. Premović, J., Milenković, S., Ecotourism in an aspect of sustainable
development, pp. 556, Conference Proceedings XIX International Scientific and Professional Meeting „Ecological Truth“ EcoIst'11, Bor, Serbia, 2011.
10. Vujović S., Milanović M., Mrkalj M., Problems of sustainable tourism development, p. 69, Proceedings from IV International Conference: Mediterranean days Trebinje 2009, 2009.
11. Milenković S., Tourism and economy, pp. 409-410, University of Kragujevac- Faculty of Economics, 2009.
12. Premović, J., Milenković, S., Ecotourism in an aspect of sustainable development, pp. 557-558, Conference Proceedings XIX International Scientific and Professional Meeting „Ecological Truth“ EcoIst'11, Bor, Serbia, 2011.
13. Drumm A., Moore A., Ecotourism Development, A Manual for Conservation Planners and Managers, Arlington, VA, The Nature Conservancy, 2005.
14. Ross S., Wall G., Evaluating ecotourism: The case of North Sulawesi, Indonesia, p.125, Tourism Management 20, 1999.
15. Premović J., Boljević A., Vujović S., Ecotourism as a new form of tourist offer, pp 1-6, Ecologica, No. 3 (2012) (in press), 2012.

625
XX International Scientific and Professional Meeting
"ECOLOGICAL TRUTH" ECO-IST'12
30 May - 2 June 2012, Hotel “Srbija TIS“, Zajecar, SERBIA
QUALITY OF WATER IN THE RIVER NISAVA BASIN
Milica Samardzic
The Faculty of Agriculture Novi Sad, SERBIA
ABSTRACT
This paper analyses value of CODKMnO4 (Chemical Oxygen Demand) and BOD5
(Biological Oxygen Demand) in the river Nišava and in its tributaries Gaberska river and Jerma, during the ten year period (2000. – 2009.), considering the human as well as natural impact to state of water quality.
Key words: COD, BOD5
, river basin
INTRODUCTION
The river Nišava derives in Bulgaria. It flows from Bulgaria through Dimitrovgrad, Pirot, Bela Palanka, Niška Banja and Niš. About 10 km after Niš it flows into Južna Morava river. Its average discharge is 34 m3
/s at its junction. Some of settlements through or beside which the river flows, represent significant sources of organic pollution. In this paper are analyzed two tributaries of Nišava - Jerma and Gaberska river. Each of them has different impact to Nišava water quality (1). The content of organic matter, chemically or biologically degradable, reflects to the river quality and sometimes can cause unusual water appearance.
MATERIAL AND METHODS OF WORK
In this paper there were used data published by the Republic Hydro meteorological Service in annual reports (2) and here were analyzed five measure points of the river Nišava basin. Three of these measure stations are installed at the main stream of Nišava (measure stations: Dimitrovgrad, Bela Palanka, Niš) and the rest profiles are placed on its tributaries – Gaberska river and Jerma (measure stations: Mrtvine, Trnski Odorovci).
Here are analyzed data about COD and BOD5
values at these profiles during the ten-year period (2000. – 2009.) including in consideration data about river flow, dissolved oxygen concentration and season.

Eco-Ist’12, Ecological Truth, 30 May - 2 June 2012. Hotel “Srbija TIS”, Zajecar, Serbia
626
RESULTS and discussion
Values of COD at MS Dimitrovgrad indicates that the river Nišava sometimes comes from Bulgaria overloaded with organic polution. For the required water category II at this profile, MAC for COD is 12 mg O2/l (3). The highest registered value of this parameter was 14,6 mgO2
Values of COD at profiles located along Nišava, for 2004. and 2009. year, are represented at the figure 1.
/l (august 2005.), which was the only sample of water with exceeded MAC for COD.
Figure 1. Values of COD (mgO2at measure stations Dimitrovgrad, Bela Palanka and Niš during 2004. and 2009.
/l) along Nišava
Water in Nišava at MS Bela Palanka is slightly loaded with organic pollution
since COD in water samples from the referent period never exceeded value of 5,1 mgO2
At MS Niš, located above the city collector discharge, there were only a few samples of water with COD closed to MAC for drinking water. The lowest values of COD at measuring profiles along the river Nišava appear mainly in periods of low temperature of air and water, no matter to season of year. Maximal values of COD in water samples at MS Mrtvine and Trnski Odorovci, were 11,2 mgO
/l (february 2006.).
2/l (august 2008.) and 5,4 mgO2
The figure 2 represents parallel overview of COD values at all analyzed measure profiles along Nišava, for some characteristic months during the referent period.
/l (march 2004., february 2005., february 2006.).

Eco-Ist’12, Ecological Truth, 30 May - 2 June 2012. Hotel “Srbija TIS”, Zajecar, Serbia
627
Figure 2. Parallel overview of COD values (mgO2for measure stations located in the river Nišava basin
/l)
Values of BOD5
at measure stations along Nišava, during two years within the referent period, are represented at the figure 3.
Figure 3. Values of BOD5 (mgO2at measure stations Dimitrovgrad, Bela Palanka and Niš during 2005. and 2009.
/l) along Nišava
MAC for Biological Oxygen Demand for the II category of water is 4,0 mgO2/l.
At MS Dimitorvgrad only once there was a sample of water with this parameter value equal to MAC (February 2005.). The lowest values of this parameter are typical for autumn while the highest values appear irregularly from february to july.

Eco-Ist’12, Ecological Truth, 30 May - 2 June 2012. Hotel “Srbija TIS”, Zajecar, Serbia
628
Water of Nišava at MS Bela Palanka, according to BOD5 values, was not polluted with biologically degradable organic matter, over the allowed concentrations, since the highest measured BOD5 was 4,9 mgO2
There were three samples of water of Nišava, at MS Niš, which values of BOD/l (july 2003.).
5 exceeded MAC for this parameter. The highest value of BOD5 at this profile was 7,6 mgO2/l (may 2000.) Extremely high values of BOD5
Even though perhaps the smallest tributary of Nišava, according to the available data, Gaberska river was highly loaded with biodegradable organic matter - sometimes water samples from consecutive months had values of BOD
at this profile used to appear during different periods of year.
5 over MAC. Periods of extremely high BOD5 values are similar to such periods at the MS Dimitrovgrad. Water in Jerma during the referent period, at MS Trnski Odorovci showed adequate quality according to the required values BOD5
Parallel overview of BOD depending on water category.
5
values at all analyzed profiles in river Nišava basin, for some characteristic months, is represented at figure 4.
Figure 4. Parallel overview of BOD5 values (mgO2for measure stations located in the river Nišava basin
/l)
DISCUSSION
According to values of COD at measuring profiles in the river Nišava basin,
quality of water during referent period mostly was adequate to required quality for defined water category.
COD at MS Niš is closed or greater than COD in the water sample at MS Dimitrovgrad. Even though some of analyzed tributary has value of COD greater than at MS Dimitrovgrad, it does not influence the organic matter pollution in water at MS Bela Palanka. Thus, Nišava is loaded with organic pollutants in area between MS Bela Palanka and Niš (agricultural activities, settlements with unregulated sewage system, wild landfills). Casual occurrence of high COD values at MS Bela Palanka seemed to be result of nearby settlements impact rather than tributaries contribution. The village

Eco-Ist’12, Ecological Truth, 30 May - 2 June 2012. Hotel “Srbija TIS”, Zajecar, Serbia
629
Lukavica that Gaberska river flows through is one of a numerous settlements with unregulated sewage system.
According to the parallel overview of COD values at all analyzed measure profiles, it is obvious that the river Nišava, as a recipient of organic pollution, reacts very well to that.
Comparing data about river flow and COD values, there was not possible to establish any general correlation between these two parameters. Extremely high values of COD appearing in different period of year, and impossibility of correlating with quantity of water and temperature of water and air, indicate that organic pollution increase is a result of an external source of pollution. For all analyzed measure profiles there is common that in periods of well saturation with dissolved oxygen, there were lowest values of COD. Except in several samples of water, from different measure stations in the river Nišava basin, according to values of BOD5 that represent presence of biologically degradable organic matter in water, water quality answered the required quality of defined water category. BOD5
Correlation between dissolved oxygen concentrations and BOD
usually increases along Nišava, from MS Dimitrovgrad to MS Niš. Biologically degradable organic matter in analyzed tributaries does not contribute to such pollutants increase in Nišava.
5 is hard to be determined. During warm periods of year and low concentrations of dissolved oxygen, water samples often have low BOD5 values. Also, in some period of year (february – april), even samples of water have very high concentrations of dissolved oxygen, also have extremely high BOD5 values. Similar correlation was noted for values of water flow and BOD5 BOD
values. 5
Analyzing values of COD and BOD
values of water samples taken at MS Mrtvine and MS Trnski Odorovci indicate that even water of Gaberska river is the most loaded with biodegradable organic matter, comparing to other measuring profiles here analyzed, neither Gaberska river nor Jerma affect the main stream of Nišava with biodegradable organic pollutants. Significant biodegradable organic pollution of Nišava occurs as the influence of other pollution sources (farms, septic tanks, unregulated sewage system) from nearby settlements, since the supernal flow of the river has evidently great power of auto purification.
5 of same water samples at measuring stations Dimitrovgrad, Bela Palanka and Niš, there is easy to be noted that periods of these parameters extreme values - match. Thus major organic pollution in water is biologically degradable. Only at MS Niš there were noted samples of water with high COD values and minimal BOD5
values.
CONCLUSION
Concentrations of chemically and biologically degradable organic matter in the river Nišava basin vary during the analyzed period and it is hard to determine eventual seasonal occurrence regularity of these pollutants concentrations over the determined MAC for the required water category. The main stream is sometimes highly loaded with organic matter at its entrance to Serbia.

Eco-Ist’12, Ecological Truth, 30 May - 2 June 2012. Hotel “Srbija TIS”, Zajecar, Serbia
630
Tributaries, specially Gaberska river no matter how small it is, also have significant impact to organic matter concentrations in the main stream, but this aspect is decreased since the tributaries contribute the main stream flow increase and so the water dilution. According to presented data, Nišava’s tributaries contribute to pollutants dillution more than to pollution increase.
On the other hand, settlements placed along the river Nišava and its tributaries, specially those with unregulated sewage system, usage of organice devices for agricultural purposes, animal farms etc. cause the main stream quality disturbance.
Here analized water quality parameters COD and BOD5
are parameters taken in account in water category as well as in water quality index determination and so should be determined more frequently at the measure stations in the river basin of Nišava. These parameters are essential for tracing the source of pollution and preventing further imapirment of water quality.
REFERENCES
1. www.wikipedia.org 2. Republicki hidometeoroloski zavod Srbije, Hidroloski godisnjaci – Kvalitet
voda 2000. – 2009- 3. Uredba o klasifikaciji voda („Službeni list Srbije“ br. 5/68)

631
XX International Scientific and Professional Meeting
"ECOLOGICAL TRUTH" ECO-IST'12
30 May - 2 June 2012, Hotel “Srbija TIS“, Zajecar, SERBIA
AIR POLLUTION INFLUENCE ON HUMAN HEALTH IN BOR AND
ZAJECAR DURING THE PERIOD SINCE YEAR 2007 UNTIL YEAR 2010
Sandra M. Pejic1, S. Urosevic1*, D. Miljkovic
2
1University of Belgrade, Technical Faculty in Bor, V.J. 12, 19210 Bor, SERBIA 2
Institute for Public Health „Timok“ Zajecar, SERBIA
*
ABSTRACT
The development of industry and the constant capacity increasement have had bigger and bigger consequences on the environment during time. Their impact is shown trough constant pollution of air, water and soil. Environmental pollution can have direct or indirect influence on human health, as well as on herbal and animal population.
An analysis of impacts of air pollution on human health is conducted in this paper, where two different communal environments, distant about 30km one from another, were used: Bor, with developed mining industry and Zajecar, with industrial facilities most of which belong to food industry.
The main cause for air pollution is considered to be Sulfur-dioxide and soot, which have the biggest influence on the respiratory organs.
Key words: air pollution, human health, technological measures, environmental protection
INTRODUCTION
Law on air protection („RS official messenger“, number 36/09), which was
accepted in may 2009, arranges air quality management as well as the measures which prevent pollutant emission into the air in a whole and all-inclusive manner. This law also establishes a foundation for accepting secondary legislation which is to arrange control of green house gases emission, as well as excluding those substances which damage the ozone layer. Air quality in some regions and cities in Serbia is dictated by SO2
Air pollution is a consequence of outdated technologies, lack of smoke gasses filtering facilities and low energetic efficiency in energetic and industrial sectors, as well as poor fuel quality. Wider application of the best available techniques and devices for stationary source emission reduction will solve the problem.
, NOx, CO, soot, particle matter, green house gases and other. Air quality especially decreases during bad weather conditions and heating season. If we exclude industrial areas, specific pollutants are not so widely represented in environment air. Industrial processes of production produce pollutants such as hydrocarbons, fluorides, chlorine, heavy metals from production and combustion processes (Ni, Mn, Cu, Cd, Hg, Pb, As,).
Eco-Ist’12, Ecological Truth, 30 May - 2 June 2012. Hotel “Srbija TIS”, Zajecar, Serbia
632
Systematic air quality monitoring is conducted in a network of measuring stations all over Serbia. However, the data from this network represent daily average levels of pollution. A lot of work is done on modernizing measuring stations in purpose of getting real time concentration values, which will make proper time reactions on the changing and exceeding the allowed values possible.
The beginning of mining and metallurgy in Bor, their development, constant increase in capacity and space consumption, made a lot of consequences on the environment during time. Their impact is primary shown trough technologies which inevitably lead to air pollution, and thus a disturbance and destruction of the environment. Air is polluted by the smelting facilities, and it is the main cause of Bor pollution. The main pollutant of Bor air is the smoke from the smelter, which is rich in SO2, SO3, CO, CO2
On city of Zajecar territory, ambient air quality is conditioned by SO
, gasses, compounds that contain As, lead, copper, Hg, carbinol, as well as tiny dust particles.
2
Problems in residential areas which appear because of environment pollution are usually associated with air pollution, which is mostly influenced by sulfur-dioxide and soot. SO
, CO, NOx, soot, powder materials which come from various objects and processes. Main source of pollution are the products of fuel combustion in business, households, private boilers, traffic, construction business, impropriate storage of materials and waste dumping.
2 shows most of its health effects on the respiratory system, by affecting the breathing, appearing of respiratory diseases and leading to lung defense system changes. Synergic effect of SO2 and soot, along with water steam, is especially dangerous, when it can convert to H2SO3
Goal of the paper: Air pollution influence on human health and taking prevention measures to preserve the environment and health condition.
which is responsible for health in the environment.
WORKING METHODOLOGY
For daily gas sampling (24 hour sample) is usually used the absorption method.
Samples are collected with the sampling apparatures, where this method is intended for several days sampling. Soot imission (smoke) is determined by reflectofotometry method. [1]
Sampling and analysis of SO2
Air protection is accomplished by taking measures of systematic air quality monitoring, reducing air pollution by pollutants below limit, taking technical-technological and other necessary measures to reduce emission and monitoring polluted air influence on human health and environment.
and soot is conducted according to the valid Rulebook of maximum values, measuring methods, measuring site founding criteria and data evidence (“Off. Messenger RS” no. 54/92, 30/99 i 19/2006) for years since 2009, and according to the Regulation on monitoring conditions and air quality demands (”Off. Messenger RS” no. 11/2010 and changes and additions 75/2010) for the year 2010.
Institute for Mining and Metallurgy in Bor has sampled on various measuring sites. Data provided by “City Park” and “Bor-institute for mining and metallurgy” measuring, is used in this paper. Institute for Public Health “Timok” has sampled air in

Eco-Ist’12, Ecological Truth, 30 May - 2 June 2012. Hotel “Srbija TIS”, Zajecar, Serbia
633
Zajecar in two locations: Municipality Kraljevica, on the “Red cross” measure site, and in the town center, in the “Electrodistribution” measuring site. Measuring stations constantly measure concentrations of SO2
In this paper, we used reports about number of registered obstructive lung diseases according to the Health evidence law (off. messenger SRJ, number 12/98 and 37/2002), as well as the Registry form and its managing, report form and the procedure for reporting and resigning certain diseases (of.mes. RS number 2/80).
as well as the weather parameters (wind speed and direction, atmospheric pressure, temperature and relative air humidity) based on the provided values, monthly reports are formed for each measuring station.
Results of measuring SO2
and soot in Bor and Zajecar, as well as the number of respiratory disease cases are shown in tables 1 and 2.
Table 1: Acute respiratory disease patients-acute bronchitis (J20-J21) and nose and sinus inflammation (J00-J01) in Bor and Zajecar since 2007 until 2010.
Year Bor Zajecar
No. of patients Share of total population No. of patients Share of total population
2007 3078 7,30% 15369 31,70% 2008 2199 5% 14743 25,40% 2009 4331 7,70% 12919 22,70% 2010 2988 10,30% 10674 22,70%
Table 2: SO2 and soot measuring results in Bor and Zajecar since 2007 until 2010. Year Average annual values Bor Zajecar
City park Institute Elektrodistribution Red cross
2007
No. of samples 365 365 329 351 No. of days SO2 above GVI (150 μg/m3) 109 20 0 0
No. of samples 143 365 328 343 No. of days soot above GVI (50μg/Nm3) 0 1 35 19
2008
No. of samples 366 366 317 346 No. of days SO2 above GVI (150 μg/m3) 95 30 0 0
No. of samples 366 366 319 345 No. of days soot above GVI (50μg/Nm3) 0 8 26 15
2009
No. of samples 350 333 340 354 No. of days SO2 above GVI (150 μg/m3) 136 104 0 0
No. of samples 350 333 341 352 No. of days soot above GVI (50μg/Nm3) 0 6 97 45
2010
No. of samples 346 214 355 336 No. of days SO2 above GVI (125 μg/m3) 180 23 0 0
No. of samples 346 245 348 336 No. of days soot above GVI (75μg/Nm3) 0 0 34 44

Eco-Ist’12, Ecological Truth, 30 May - 2 June 2012. Hotel “Srbija TIS”, Zajecar, Serbia
634
RESULT DISCUSSION
In table 2 we can conclude that, in period between 2007 and 2010. Bor had an increasement in concentrations of SO2, which is a consequence of metallurgy complex operating, while soot imissions are within limits. In Zajecar, we noted a constant increasement in soot concentrations, especially in winter, which is a direct consequence of fossil fuel combustion for heating and a large number of individual users of wood as a fuel.
Based on the description analysis data in tables 1 and 2, we can note that the number of patients relative to the number of citizens in Bor, is rising if the pollutant concentrations in air are rising. In Zajecar, the largest number of patients appeared in 2007 and 2008, as well as the pollution peak, while in 2009 and 2010 this number decreased in spite increased soot concentration. This acute respiratory patient number decreasement shows that larger soot concentration in air has a more powerful influence on chronical respiratory diseases. In the mentioned time period, only the data received by monitoring two kinds of acute diseases are given in the paper: acute bronchitis (J20-J21) and nose and sinuses inflammation (J00-J01), on which the pollution had the smallest effect.
Frequency ratio of pollutant concentrations in air and respiratory disease is shown
on figure 1.
Figure 1. Pollutant concentrations in air and respiratory disease frequency ratio in
Bor and Zajecar from 2007 to 2010

Eco-Ist’12, Ecological Truth, 30 May - 2 June 2012. Hotel “Srbija TIS”, Zajecar, Serbia
635
CONCLUSION
Air quality measuring and monitoring in communal environment is of great significance because of the evaluation of effects on human health as well as on other living beings. Measuring and monitoring air quality is a good start for seeing the problem of present condition of the environment, and the next step is taking a series of appropriate actions for solving the problem.
The biggest problem when it comes to air pollution in Bor is the smoke from the smelter, where the best solution is to start the Smelter reconstruction and Sulfuric acid plant construction project. It is planed that the project is to be finished by year 2014. The plan is to introduce a new, eco friendly flesh-smelting technology, which will reduce SO2 emission to 120μg/m3 of air. There is an open possibility that a new technologic solution will be installed after completion which will further reduce this emission. This method of smelting copper allows copper and SO2 technological usage to rise up to 98%, which means that the other poison gases and heavy metals, such as arsenic, won’t be going into the atmosphere and stock on the surrounding soil and water streams, threatening the environment. Higher usage of copper and SO2
Protecting air quality in Zajecar area and maintaining higher standards of air quality in town center, especially in winter, according to the General urban plan of the town of Zajecar, will be accomplished by applying the following rules and measures of protection and reducing the levels of pollutant emission from present sources:
will be useful for both ecology and economy.
- by applying ecologically acceptable technologies - general heating system of the town area and introducing natural gas as an
emergent, instead of fossil fuel - by using renewable energy sources for heating residential rooms in the
households - by recultivating inappropriate deponies and transferring waste to a regional
dump, which prevents self-ignition of waste and production of methane and other poison gases
- by installing green protective areas along roads, as well as inside industrial facilities [4]
Clean technologies development, energetic efficiency increasement and waste generation decreasement by raising eco conscience will certainly influence the decreasement of environment pollution.
Protection of nature must be a part of spatial planning, which is to be followed by social and industrial development. Prevention of space pollution, as a planed preventive, always and everywhere gives better results than repairing the consequences of already disturbed ecological and biotic relations and processes. Certainly the most important attitude is that protection, preservation and improvement of the environment are not an individual matter, they are a problem of the entire society.
Organizations world-wide, as well as their stakeholders, are becoming more aware of the need for environmental management, socially responsible behavior, sustainable growth and development.

Eco-Ist’12, Ecological Truth, 30 May - 2 June 2012. Hotel “Srbija TIS”, Zajecar, Serbia
636
REFERENCES
1. Milošević N., Tasić V., Miljiković D., Lazarević S., Lukić D., Air quality condition in Bor and Zajecar during 2007. and 2008., EKOIST’09 paper repertory, page 251-254., Kladovo, Serbia, (2009.)
2. Rulebook on maximum values, imission measuring methods, measuring site installation and data management criteria („Off. Messenger RS“, no. 54/92, 30/99 i 19/2006)
3. Regulation on monitoring conditions and air quality demands („Off. Messenger RS“ no. 11/10 and changes and additions 75/2010)
4. Milošević N., Annual report on air quality examination in Bor for 2007, 2008, 2009 and 2010. Institute for Mining and Metallurgy in Bor (2007; 2008; 2009; 2010.)
5. Živković-Radenković A., Milanović G., Work analysis of outpatient health institutions, using of primary health protection and outpatient morbidity in Bor and Zajecar areas in 2007, 2008, 2009, 2010. Institute for Public Health „Timok” Zajecar (2011.)
6. http://www.rtb.rs/kolektiv 7. Republic of Serbia, City assembly of Zajecar, Report on strategic evaluation of
the General urban plan of city of Zajecar on the environment, page 39. (2011.)

637
XX International Scientific and Professional Meeting
"ECOLOGICAL TRUTH" ECO-IST'12
30 May - 2 June 2012, Hotel “Srbija TIS“, Zajecar, SERBIA
THE INFLUENCE OF WIND ENERGY ON ENVIRONMENT
Bozidar Rancic1, N. Rancic2
1High Technical School, Nis, SERBIA 2
University of Nis, Faculty of Medicine, Nis , SERBIA
ABSTRACT Wind energy can be defined as energy received from the movement of the wind across the Earth.
Wind energy is one of new energy sources such as solar energy, geothermal energy and etc. People use wind power for at least 5,500 years for to launch boats and small ships. Modern wind power plants start to develop intensive from 1979 when serial production of top wind turbines was started in Denmark at the factory Kuriant, Vestas, Nordtank i Bonus. Some wind farms are capable of providing the entire electricity supply for large villages or small towns and are most effective on high ground where the wind speed is generally higher and more constant than at lower levels. Advantages of wind energy are utilization point high reliability of the operation, no fuel costs and no pollution. Disadvantages of wind energy are the high costs of building and the variability of wind speed (can not be guaranteed a supply of energy). In Serbia, at the moment, there is not a serious wind power, which would generate electricity from wind energy.
Key word: wind energy, electric energy, wind turbine. INTRODUCTION The wind is caused by the uneven heating of the surface of our earth by the sun.
The reason for the uneven heating is due to the different surfaces of our earth (land and water), [1].
Wind energy can be defined as energy received from the movement of the wind across the earth. This energy is a result of the heating of our oceans, earth, and atmosphere by the sun [1].
Wind energy is one of new enery sources such as solar energy, geothermal energy and etc. [2]. The utilisation of wind turbines
People use wind power for at least 5,500 years for to launch boats and small ships. Wind power was also used to run pumps and mills for grinding grain till the sevent cenutry of new era in Afganistan, Iran, India and Pakistan [2].
can be a great way to harness the energy of the wind in a bid to convert this into useable electricity. Harnessing the winds energy with a wind turbine can provide a source of clean and renewable electricity for large or small communities.

Eco-Ist’12, Ecological Truth, 30 May - 2 June 2012. Hotel “Srbija TIS”, Zajecar, Serbia
638
Professor James Blyth, the Scottish Academician in 1887. The experiments performed over the use of wind power electricity. Finally in 1891. he successed to patent the first machine that was driven by wind power to generate electricity. In 1890. Danish scientist and inventor Poul la Cour designed a wind turbine to generate electricity [2,3]. This invention is considered the first modern wind turbine.
Modern wind power plants start to develop intensive from 1979 when serial production of top wind turbines was started in Denmark at the factory Kuriant, Vestas, Nordtank i Bonus.
Wind turbines can be installed as single installations or as part of a wind farm. Some wind farms are capable of providing the entire electricity supply for large villages or small towns and are most effective on high ground where the wind speed is generally higher and more constant than at lower levels.
Advantages of wind energy are utilization point high reliability of the operation, no fuel costs and no pollution [4].
Disadvantages of wind energy are the high costs of building and the variability of wind speed (can not be guaranteed a supply of energy). In Serbia, at the moment, there is not a serious wind power, which would generate electricity from wind energy [4].
THE MOST SUITABLE LOCATION FOR THE USE OF WIND ENERGY IN SERBIA
1. The Pannonian Plain, north of the Danube and Sava rivers. This area covers approximately 2000 km and is suitable for wind energy because it is built road infrastructure, utility grids, proximity to major centers of electricity consumption and the like.
2. Eastern parts of Serbia –The Old mountain, Vlasina, Ozren, Rtanj, Deli Jovan, Crni Vrh etc. In these regions there are sites in which the average wind speed is over 6 m/s. This area is covering about 2000 km and it could be significant installed wind power plants.
3. The mountain areas Zlatibor, Kopaonik and Divčibare are where the measurement could determine the appropriate micro-location for installation of wind power plants. Figure 1 showed potential of Serbia for wind power utilisation.

Eco-Ist’12, Ecological Truth, 30 May - 2 June 2012. Hotel “Srbija TIS”, Zajecar, Serbia
639
Figure 1. The potentials of the Republic of Serbia for the wind turbines installation [1]
Till now, there are three very interesaanting places for installation of wind
farms in Vojvodina, which are built projects. The potential locations are:
1. Dolovo- power of the wind farm is planned of 48 MW, 24 per 2 MW 2. Bavanište- power of the wind farm is planned of 100 MW, 94 per1,1 MW 3. Bela Crkva- power of the wind farm is planned of 100 MW.

Eco-Ist’12, Ecological Truth, 30 May - 2 June 2012. Hotel “Srbija TIS”, Zajecar, Serbia
640
Sistematical investigations and development of electroenergetic systems which will use the wind power are still at the begining [2]. Till today the development of wind power systems are part of enthusiasts′s work in scientific and industrial institutions.
Some enthusiasts people by themselfs have installated several small eolic system [3,4].
CONSLUSION According to some measurements, Serbia is one of areas with important
enegretical potentials. Areas with hudge energetic potential, especially parts in mountain reagions of Vojvodina as well as in South and Southistrn Serbia, mainly above 1500m of hight. More investigations in area of eolic energy use is need.
REFERENCES
1. http://www.clean-energy-ideas.com/energy_definitions/definition_of_wind_energy.html
2. www.clean-energy-ideas.com/wind_turbines.html 3. http://www.ekologija.rs 4. http://www. planeta.org.rs

641
XX International Scientific and Professional Meeting
"ECOLOGICAL TRUTH" ECO-IST'12
30 May - 2 June 2012, Hotel “Srbija TIS“, Zajecar, SERBIA
THE IMPACT OF COAL PRODUCTION IN RB "KOLUBARA"
ON THE ENVIRONMENT
Ana Milovanovic, M. Kirov, M. Petrović, Zoran Stirbanovic
University of Begrade, Technical faculty in Bor, Vojske Jugoslavije 12, 19210 Bor, SERBIA
ABSTRACT
The world we live in is based on the use of large amounts of energy. Energy consumption is
permanently growing. The consequences of unsustainable human consumption are becoming more evident through the regional and global environmental problems. Mining, processing and transportation of coal are increasingly degrading ecosystems and the biosphere. The environmental degradation is directly linked with economic and social development.
The level of coal production in Serbia is 35 million tons per year. Two coal basins, Kolubara and Kostolac, are using surface exploitation for coal production. In Kolubara basin 27 million tons of coal is being produced annually. Geological reserves of coal are covering an area of 750 km2. However, not all reserves are exploitable, so it is not planned to dig on the whole surface of the bearing. The aim of this paper is to highlight the negative impact of coal exploitation in Kolubara coal basin on environment. Through the example of Kolubara coal basin can be seen how the exploitation of natural resources is permanently occupying space, changing the morphology of the terrain and landscapes, destroying the soil, modifying climate, impairing the hydrological regime and adversely affecting the flora and fauna. In general it is degrading and disturbing eco-systems on site and beyond.
Key words: Kolubara basin, coal production, environment, pollution
642
XX International Scientific and Professional Meeting
"ECOLOGICAL TRUTH" ECO-IST'12
30 May - 2 June 2012, Hotel “Srbija TIS“, Zajecar, SERBIA
METALLURGY AND ITS IMPACT ON THE ENVIRONMENT IN SERBIA
Milica Djordjevic, V. Nikolic, M. Katalinic
University of Belgrade, Technical faculty in Bor, V. J. 12, Bor, SERBIA
ABSTRACT
The town of Bor is one of the most polluted towns in southeastern Europe. The copper smelter which is situated in the centre of the town is the main pollutant, mostly because of its old technology, which leads to environmental pollution caused by higher concentrations of SO2 and PM10.
The area of damaged and degraded agricultural land in Municipality Bor is estimated to be about 60.6% of total agricultural land. The main causes of land degradation are mining and metallurgy, mine pits, landfills for overburden disposal and flotation tailings ponds.
Smelting of ore copper produces SO2 emissions which lead to soil acidity, dust with high contents of heavy metals and arsenic, destroying vegetation and consequently causeing soil erosion. Gas emission from smelter plant damaged soil in almost all villages in Bor municipality, to a lesser or bigger extent. Present emissions are the most significant for soil degradation. Waste gases generated during smelting are inputs for the production of sulfuric acid. During the production of copper and at the same time production of sulfuric acid, the efficiency of sulfur recovery is between 4 and 62 %, with the emission of sulfur dioxide between 26 and 260 per year.
Also, seven different wastewater sources exist from the mining activities, the tailing ponds, and the metallurgical activities. Almost 1285 t of iron, 502 t of copper, 1.5 t of nickel, 0.5 t of arsenic, 52 t of zinc, 2 t of lead, 300 kg of cadmium and 61 t of manganese are discharged annually into the rivers The target of the current metallurgical industry is introducing new, cleaner technologies by building the smelter and sulfuric acid plant which would make the current image of the environmen in Bor improved.
Key words: metallurgy, environment, smeltersmelter plant , sulfuric acid plant, emissions

643
XX International Scientific and Professional Meeting
"ECOLOGICAL TRUTH" ECO-IST'12
30 May - 2 June 2012, Hotel “Srbija TIS“, Zajecar, SERBIA
SOURCES OF POLLUTION IN THE MUNICIPALITY OF BOR
Milena Katalinic, M. Djordjevic, V. Nikolic
University of Belgrade, Technical Faculty in Bor, V.J.12, Bor, SERBIA
ABSTRACT As sources of pollution in the municipality of Bor can be extracted technological processes of
mining-metallurgical complex, industry outside the mining-metallurgical complex, municipal waste and traffic. With the development of mining in Bor, there was a significant damage and degradation of
ecosystems in the whole municipality of Bor. Significantly are affected the quality of water, air and soil due to the deposit of waste tailings, slag, dust and gaseous products of the melting process. Sulfur dioxide significantly impairs air quality in urban areas.
In the chemical reactions in the atmosphere sulfur dioxide is converted in sulfur oxides (SO2 and SO3), sulphide (H2S), sulfuric (H2SO4) and sulphurous acid (H2SO3). Sulfur dioxide and its conversion products are leading to corrosion of alloys and metals (steel, iron, zinc, sr.), paint damage, damage to textile and synthetic fiber (nylon). Increased concentrations of sulfur dioxide also has a negative impact on human health. When the concentration of sulfur dioxide is above 0.02 mg/m3
In this paper next to the main pollutants RTB Bor, are mentioned polluters PUC DH Bor which smoke and dust particles pollute the air, road traffic - noise and exhaust fumes; population - the amount of municipal waste is increasing and inadequate treatment and disposal of waste.
it leads to irritation of respiratory system, while higher concentrations can cause the appearance of conjunctivitis. The effect of sulfur dioxide on vegetation are manifested on the leaves of plants in the form of necrotic spots, chlorosis phenomena, disorder and disruption of protein biosynthesis day-night opening and closing of stomata.
In Bor is due to large aeropollution introduced monitoring system to monitor pollutant concentrations and meteorological factors. City has five sampling locations: City Park, Institute, Hospital, Jugopetrol and Brezonik.
Key words: Bor, air pollution, pollutants of urban areas.