
Knowledge formations in Problem Based Learning - final extended paper - ECER 2013

Lisbeth M Brevik
Mapping Tests:
Comparing Upper Secondary Students’
Reading Skills in L1 and L2
ECER 2014

Main interest
• How students read in English as a second
language (L2)
• Unlike first language (L1) reading,
second language (L2) reading involves
two languages. For this reason, L2 reading is
crosslinguistic and, thus, more complex than
L1 reading (Koda 2005, 2007)

A few words about Norway (context)
• Upper secondary school
• 15-16 years old (year 1)
• National reading tests
– L1: reading literacy in Norwegian (paper)
– L2: reading literacy in English (digital)
• Same population as PISA 2012
– PISA in April-May (4.686 students)
– Reading tests in September (60.000 students)
– My population: 10.331 students
ECER, 2014
Lisbeth M Brevik

Test construct L1-L2
L1 L2
ECER, 2014
Lisbeth M Brevik

Research Questions
1. What is the relationship between reading in
Norwegian (L1) and English (L2)?
2. What insights about groups of students can
be derived from the results, and how do the
groups differ?
ECER, 2014
Lisbeth M Brevik

Method
• Quantitative analysis (SPSS)
– L1 literacy (test score)
– L2 literacy (test score)
– Gender, study programme, mother tongue
• Merging the two datasets
– Analysis: frequency, reliability, factor, regression
ECER, 2014
Lisbeth M Brevik
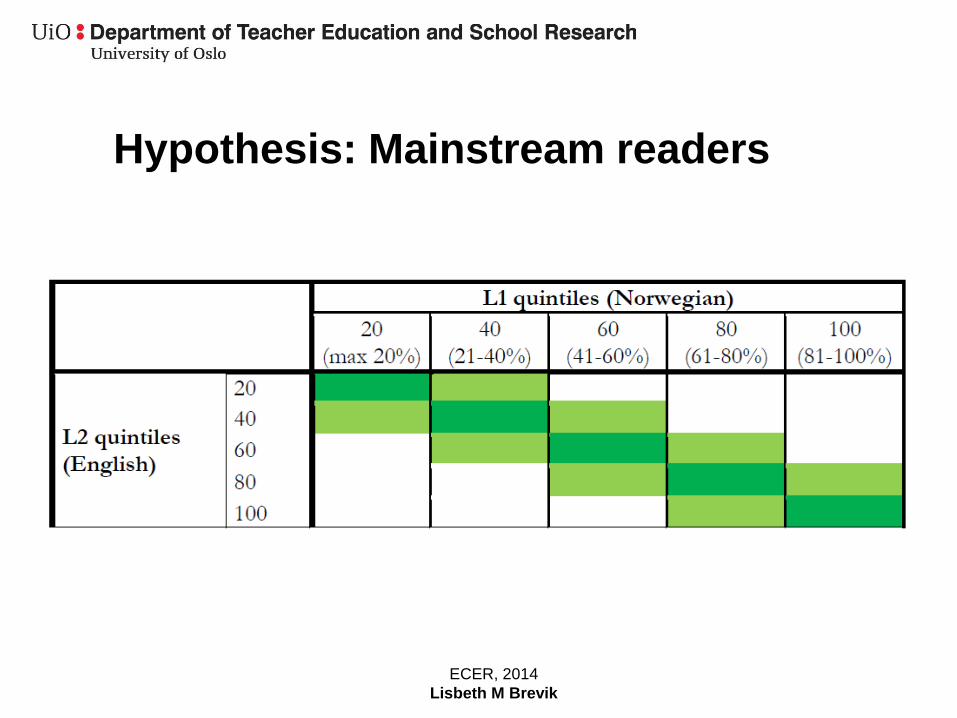
Hypothesis: Mainstream readers
ECER, 2014
Lisbeth M Brevik

Hypothesis: Outliers
ECER, 2014
Lisbeth M Brevik

Student categories
ECER, 2014
Lisbeth M Brevik
L1 low L1 higher
L2 low
Struggling readers
Low L1 and L2 performance.
The 20% lowest performing students
in both languages.
Outliers:
Weak L2 – good L1 readers
L2 (English) : Poor readers (20%)
L1: Good readers (60–100%)
L2
higher
Outliers:
Weak L1- good L2 readers
L1: Poor readers (20%)
L2 (English): Good readers (60–100%)
Mainstream readers
Equal (or almost equal) in L1 and L2.
Students in the 40-100% groups,
plus those bordering on these
groups.
Findings
1. Relationship: Strong relationship between
reading comprehension in L1 and L2
2. Mainstream: the majority of students read
equally across L1 and L2
3. Outliers: two groups of outliers read
significantly different in the two languages
ECER, 2014
Lisbeth M Brevik

Students read equally in L1 and L2
… but general study students read
better than vocational students
ECER, 2014
Lisbeth M Brevik

… and girls read better than boys
ECER, 2014
Lisbeth M Brevik

Relationship: 30% overlap between L1
and L2 reading comprehension
• 30% overlap in correlation analysis
– Regression: R Square change .297
– Correlation: .545 (significant at the 0.01 level)
ECER, 2014
Lisbeth M Brevik

Mainstream: the majority of students
read equally across L1 and L2
ECER, 2014
Lisbeth M Brevik
Outliers:
4,5% (N=463)
Outliers:
4,9% (N=505) Mainstream:
74% (N=7,601)

Weak L1 – good L2: language
Mother tongue
– 91,6% Norwegian
– 8,4% other languages
Researcher: Are you more motivated to read when it is in English?
Student: Yes. […] I just find English easier for me to read.
I actually know many more words in English than in
Norwegian… even though I’m from Norway.
ECER, 2014
Lisbeth M Brevik

Outliers: two groups read significantly
different in the two languages
ECER, 2014
Lisbeth M Brevik

Weak L1 – good L2: gender & study
ECER, 2014
Lisbeth M Brevik

Weak L1 – good L2:
boys outperform & outnumber girls
ECER, 2014
Lisbeth M Brevik

Discussion: the outliers
• Why do the weak L1 – good L2 outliers read
significantly better in L2 than in L1?
• Why do boys both outnumber and outperform
the girls in this group?
• Could it be linked to digital assessment, the
English language, shorter texts, and topic of
interest?
ECER, 2014
Lisbeth M Brevik

Conclusion
• The shift – from testing what the students know about language to
assessing what students can do with language
• The challenge – Mainstream: the majority read equally well - or poorly – in L1
and L2
– Outliers: a minority read significantly different in L1 and L2
– How can test scores be used to make inferences about the
needs of student growth - to improve learning and instruction?
– Is training in transfer of reading strategies one solution?
ECER, 2014
Lisbeth M Brevik
Selected references
• Bernhardt, E. B. (2011). Understanding advanced second-language reading.
NY: Routledge
• Brevik, L. M. (2013). Research ethics: An investigation into why school leaders
agree or refuse to participate in educational research. Problems of Education in
the 21st Century, 52, 7–20. Retrieved from http://urn.nb.no/URN:NBN:no-34383
• Brevik, L. M. (2014). Making implicit practice explicit: How do upper secondary
teachers describe their reading comprehension strategies instruction?
International Journal of Educational Research. Doi: 10.1016/j.ijer.2014.05.002
• Frones, T. S., Narvhus, E. K., & Aasebo, M. C. (2013). Nordic results from the
PISA digital reading assessment. Nordic Journal of Digital Literacy, 8(01-02),
pp. 13–31
• OECD (2009). PISA 2009 Assessment Framework. Key competencies in
reading, mathematics and science. Paris: OECD Publications.
• OECD (2013). PISA 2012 Results: Ready to Learn – Students’ Engagement,
Drive and Self-beliefs (Vol. III). Paris: OECD Publishing.
doi:10.1787/9789264201170-en
ECER, 2014
Lisbeth M Brevik

Thank you
Lisbeth M Brevik,
University of Oslo, Norway
E-mail: [email protected]
ECER, 2014
Lisbeth M Brevik

Compensatory theory of L2 reading Elizabeth B. Bernhardt, 2011
ECER, 2014
Lisbeth M Brevik
Copyright © 2022 FDOKUMEN


![S]l1~I~cek: - IRIS PAHO Home](https://static.fdokumen.com/doc/165x107/631510f36ebca169bd0b0b21/sl1icek-iris-paho-home.jpg)

