E-lEarning in Malaysian TEchnical UnivErsiTy nETwork
12
ISSN: 2180-3811 Vol. 4 No. 1 June 2013 27 E-LEARNING IN MALAYSIAN TECHNICAL UNIVERSITY NETWORK M. S. Khalid 1 , S. Yamin 2 1 Faculty of Computer Science and Information Technology, Universiti Tun Hussein Onn Malaysia, 86400 Parit Raja, Batu Pahat, Johor, Malaysia 2 Faculty of Technical Education and Vocational, Universiti Tun Hussein Onn Malaysia, 86400 Parit Raja, Batu Pahat, Johor, Malaysia ABSTRACT Mathematics is a beautiful subject with logic applications. However, mathematics is not properly studied by a group of students. The objective of this paper is to share pedagogy experience teaching and learning mathematics using e-learning approach among BIT1 Degree students in Universiti Tun Hussein Onn Malaysia (UTHM). The study was done from January to May 2012. Experimental method was used where pre-post tests onto two groups (control n1=20 and exsperimental n2=30) and this is followed by unstructured interview. Sample of 50 students were taken where ANCOVA was applied where pre-test marks was used as covariate. However, there was statistically significant difference between mean marks at post test group experimental from different groups (α= 0.044). The findings showed all participants from both groups failed to show drastic mastery solving pre-algebra problems eventhough they realized mathematics at the university needs higher skills. KEYWORDS: Brain dominance; Shallow learning; Functional engineer 1.0 INTRODUCTION Mathematics is a beautiful subject using logical thinking as its basis. However, mathematics is not generally understood by many current students inspite of learning using conventional and e-learning (Balakrishnan & Rossafri, 2010). They found that students needed a lot of pictures (visual learners) at school to understand simple concepts and this trend continues when they entered tertiary level of education. Similar visual aids were adopted to aid understanding of theoretical structure and/or 3D diagrams in Engineering Mathematics and Discrete Corresponding author email: [email protected]
-
Upload
khangminh22 -
Category
Documents
-
view
2 -
download
0
Transcript of E-lEarning in Malaysian TEchnical UnivErsiTy nETwork
ISSN: 2180-3811 Vol. 4 No. 1 June 2013
E-learning in Malaysian Technical University Network
27
E-lEarning in Malaysian TEchnical UnivErsiTy nETwork
M. s. khalid1, s. yamin2
1Faculty of Computer Science and Information Technology,Universiti Tun Hussein Onn Malaysia,
86400 Parit Raja, Batu Pahat, Johor, Malaysia
2Faculty of Technical Education and Vocational, Universiti Tun Hussein Onn Malaysia,
86400 Parit Raja, Batu Pahat, Johor, Malaysia
ABSTRACT
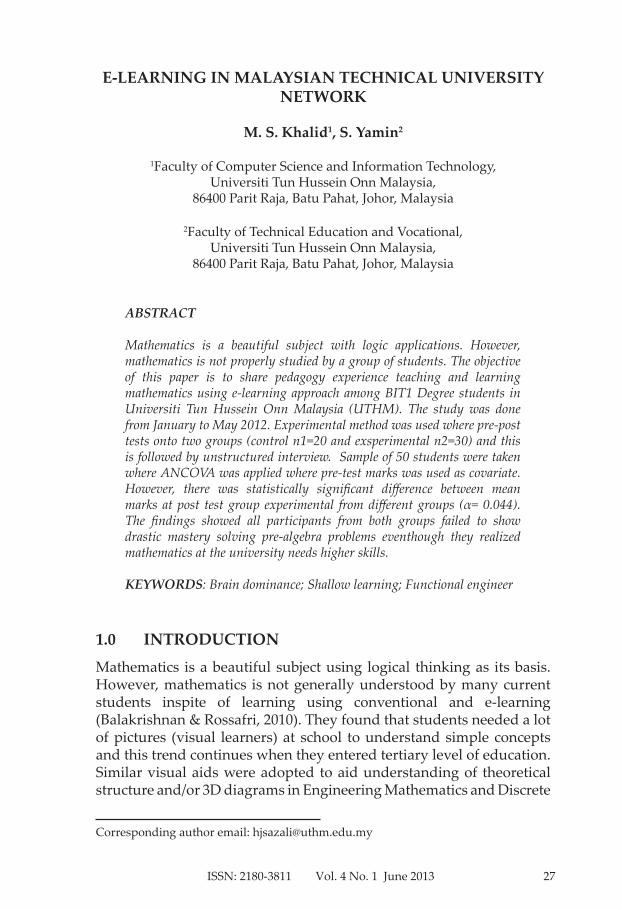
Mathematics is a beautiful subject with logic applications. However, mathematics is not properly studied by a group of students. The objective of this paper is to share pedagogy experience teaching and learning mathematics using e-learning approach among BIT1 Degree students in Universiti Tun Hussein Onn Malaysia (UTHM). The study was done from January to May 2012. Experimental method was used where pre-post tests onto two groups (control n1=20 and exsperimental n2=30) and this is followed by unstructured interview. Sample of 50 students were taken where ANCOVA was applied where pre-test marks was used as covariate. However, there was statistically significant difference between mean marks at post test group experimental from different groups (α= 0.044). The findings showed all participants from both groups failed to show drastic mastery solving pre-algebra problems eventhough they realized mathematics at the university needs higher skills.
KEYWORDS: Brain dominance; Shallow learning; Functional engineer
1.0 inTroDUcTion
Mathematics is a beautiful subject using logical thinking as its basis. However, mathematics is not generally understood by many current students inspite of learning using conventional and e-learning (Balakrishnan & Rossafri, 2010). They found that students needed a lot of pictures (visual learners) at school to understand simple concepts and this trend continues when they entered tertiary level of education. Similar visual aids were adopted to aid understanding of theoretical structure and/or 3D diagrams in Engineering Mathematics and Discrete
Corresponding author email: [email protected]
ISSN: 2180-3811 Vol. 4 No. 1 June 2013
Journal of Engineering and Technology
28
Structure using coursewares, youtube, blackboard and author learning management systems and etc.
2.0 ProBlEMs in TEaching MaThEMaTics
Malaysia is undergoing rapid development in terms of its economy and infra structure. In order to sustain this economic trend, Malaysia Ninth Malaysia Plan needs 500,000 engineers and technicians (Jabatan Perdana Menteri, 2010). The government provides big opportunity for many trainees at Teachers’ Institutions, polytechnics and community colleges to meet the above demand. In the polytechnic and college community MOHE, they undergo semi-professional courses at certificate and diploma levels for two and three years to meet job vacancies such as technicians and assistant I.T officers both at the government and private sectors. A strong credit pass in mathematics and science are needed to qualify into such institutions. But the trend is some universities admit elite students into their programmes (Rhong Zhang et al., 2008) and some took those who are stronger in hands-on skills like the four MTUN (Malaysian Technical Universities Network). As a result we are starting to have functional graduates in the market (Akept, 2012). These cover a spectrum of pure engineers and engineers cum technologists. Computer is widely used since the present generation surfs the internet using mobile phones to communicate 24/7. Blessings came aplenty when everyone can learn nowadays anytime and anywhere with the internet (Balakhrisnan & Rossafri, 2010). Educational philosophies such as constructivism, cognitivism and behaviorism (Piaget & Inhelder,1975; Mayer, 2001) are applied where students structure their own understanding using past experience in adapting to new lessons at the universities. Here, the assumption is many students should have attained the basic command of mathematics appropriate at their age such as algebra, calculus and word problems. In matriculation colleges, 30 polytechnics and 50 college communities MOHE, a big number of lecturers assumed their students had mastered algebra which is the foundation for higher engineering and computer courses. But, negative perception does creep in among university lecturers when their intakes failed miserably in the mid semester mathematics examination. The fact is at the university, the students must master basic concepts and skills in understanding higher mathematics.
2.1 Dilemma learning in groups
Malaysian polytechnic subscribed an evaluation and assessment format which is 40% theories and 60% coursework as practiced by few
ISSN: 2180-3811 Vol. 4 No. 1 June 2013
E-learning in Malaysian Technical University Network
29
German technical universities. The 40% theories are tested in the final examination while the coursework 60% comes in the form of continous assignments and projects done in teams throughout the semester. MTUN follows the same format. Team work was widely adopted not only in universities in South Africa (Styne & Maree, 2003) but also Malaysia (Mohd Sazali et al., 2012) since this encourages proper understanding and co-ordination between team members. This is because Dillenbourg in (Thorpe, 2012) stressed the actual benefits of collaborative learning depends on the quality of interactions within the group members. This is good for Malaysia which is trying to be a high income developed nation using its three main races to blend effectively towards 2020. However, group work assessment must be applied properly so that mere passengers in a team do not get higher marks than those who had played stronger roles in their end of semester projects (Mohd Sazali et al., 2007). Few low achievers bring with them ‘baggages’ like poor attitude, late comers and bad experience of getting very low marks in mathematics almost all their years in primary and secondary schools.
2.2 remedial learning
Malaysian schools subscribe some form of remedial learning. This takes some time from the teachers after the normal teaching hours. Mathematics clinic is widely taken in polytechnics and college communities. Many staffs are recruited for this such as Jabatan Matematik Sains dan Komputer which services other departments in a polytechnic (MOHE) and this comes in the form of extra classes but this method could not be applied easily in the universities. E-learning fits in into the university systems so that the students can learn anytime and anywhere as independent learners. But Learning Management System (LMS) such as Blackboard caused a lot of money to UTHM from 2004 to 2010.
2.3 learning from the lMs and internet
Learning from LMS demands a different style than conventional because there is no teachers in front of the students and the contents of the lessons are not structured from the learner’s point of view. LMS offers e-learning and this is based on hypertext where the words, sections, and thoughts are linked, the user can navigate through text in a nonlinear way, quickly and intuitively (Vaughan, 2008). Using hypertext systems, one can electronically search through all the text of a computer resident book, locate references to a certain word and then view the page where the word was found. Words or ducuments can be linked to other documents (Vaughan, 2008). As such the students
ISSN: 2180-3811 Vol. 4 No. 1 June 2013
Journal of Engineering and Technology
30
controlled what they wanted to learn. A problem may be few students did not take the learning seriously since they perceive every thing including the solutions is available on the internet. This could be dangerous from a teacher’s point of view. The students’ mental stamina to solve harder mathematics problems decline and this was found true in various reports across faculties. The pattern was shallow learning became their culture unknowingly (Mayer, 2001). Another reason is the consistent disruption that affects their focus. Mobile learning created another learning avenue but the teaching must be properly structured (Thorpe, 2012) to control the students’ focus. LMS has many advantages. Among them are the teacher can upload all the course notes into the computer system and the students can download them before entering the class and make adequate preparation. Furthermore LMS can control discussion between a teacher and the students through forums and the teacher can pose few quizzes and notices including important related web sites thus creating some degree of attention among the students 24/7. But most importantly, the management of assessment marks from quizzes, tests and examinations plus attendance can be done very effectively. The administrators can also check the progress of any courses within the university.
2.4 languages in learning mathematics and technical subjects
Malaysia implemented teaching mathematics and sciences using English (PPSMI) from 2002 to 2011. This was run from the primary to the secondary schools. Similarly, university lecturers must teach mathematics in English because Malaysia is the educational hub in this Asian region since early 2000. Therefore in Malaysia a lecturer must know three languages to teach mathematics i.e., English language, Malaysian language and the mathematics language itself (Suhaida & Mohd Sazali, 2009). Sometimes even if the class accomodated one foreign student, the lecturer taught mathematics using English. By doing so, few local students are suffering.
2.5 Dilemmaleftandrightdominanceinthehumanbrain
In the Holy Quraan a surah ‘wat-thin’, Allah Subhanawataala said that man is the best creation based on his thinking abilities. As such a man is classified (Hermann, 1995) into few categories depending on which side his brain is more dominantly used i.e., right dominance brain for the visualist while left dominance brain for mathematics and engineering. This is further supported by (Pink, 2005) where “Every parent wants their children to be scientist, engineers, doctors, software engineer”. In Malaysia
ISSN: 2180-3811 Vol. 4 No. 1 June 2013
E-learning in Malaysian Technical University Network
31
many parents wanted their children to have great qualities owned by great people like Sir Issac Newton in England and Tun Mahathir in Malaysia. But Pink opposed this strongly as “..They were wrong. Gone were the age of ‘left brain’ dominance. The future belongs to a different kind of person with a different kind of mind-designers, inventors, teachers, story tellers – creative and emphatic ‘right brain’ thinkers whose abilities mark the fault line between who gets ahead and who doesn’t” (Pink, 2005). The summary is some students, their brains are more left dominance (mathematics) while many I.T students students are visualist (right dominant brain). The question is does the current teaching and learning activities in the universities help to reinforce which dominance the students have in the first place and is it cost effective? The aim of this paper is to share (Hermann, 1995) ideas into teaching and learning processes in a subject called BIT 10103 Struktur Diskrit in UTHM with the above dilemma acting as the background to this study. Could the visualist students survived in the learning environment in UTHM where they must combine both right and left brains in learning mathematics?
3.0 METhoDology
This study took experimental method in a web technology laboratory in Level 3 Building FSKTM in UTHM. Two different groups were formed from the students. A sample of 50 students Year 1 BIT 10103 Struktur Diskrit from Section 3 only from the Faculty Computer Science and IT took part in this study. BIT 10103 offered 2 hours theories and 1 hour tutorial weekly. The students were FSKTM cohort 2011/12 only. Group 1 ‘control (n1= 20)’ dan Group 2 experimented (n2=30). Majority of the students in the experimental group were visualist where they used google, youtube and more picture based materials to learn matematics tutorial while the control group used conventional style from white board and markers. The first author took the class in theories and tutorial for both groups all the 15 weeks thus eliminating any extraneous (confounding) variables that could originate from teaching quality and experiences. The students were encouraged to discuss after they tried first the mathematics problems. Only 1 hour weekly tutorial was used as the basis for this research all along the 10 weeks. Both groups came on Thursday where first group was from 0800 to 0900 am while the control group came from 1200–1300 hours. Both groups took this strict regime of learning tutorial. The first 20 minutes in the tutorial was used to teach and learn algebra and the next 40 minutes will focus on proper Discrete Structure. It was believed that if the students were well versed in algebra, they can do better in Discrete Structure. In the experimented group, they were guided to
ISSN: 2180-3811 Vol. 4 No. 1 June 2013
Journal of Engineering and Technology
32
visit an important web site such as purplemaths and they were free to visit any links pertinent to any sub-topics within purplemath and sometimes they were trained what to google so that they got the exact materials as what the lecturer wanted. Once they got the material, the rest of the time was beyond the lecturer’s control. After 20 minutes, the class was asked to stop abruptly and focus towards structure discrete for 40 minutes according to the lecturer’s instruction which was more chalk and talk manner. This was differently done in the control group which was mainly chalk and talk for both algebra and discrete structure components. In fact in the control group, the transition phase from algebra to discrete structure was very smooth because both components were using the same teacher’s verbal mode. A total of 70% of the samples were females. Independent variable was the teaching method while the marks from the Post Test score were the dependent variable. Pre-Test marks were the co-variate. The assumption used was data was normally distributed from this 50 out of 240 students from Year 1 BIT FSKTM and ANCOVA was used since the difference between group sample was difficult to obtain at the early stage by using purposely sampling method done at random (Mohd Salleh & Zaidatun, 2001). Their academic abilities especially mathematics was said to be equivalent without any prejudice towards gender since the selection into UTHM was done by MOHE, Putrajaya. We assumed further that experimented group was a bit advance since they did what they have done at polytechnics i.e., learning using pictures as compared to the conventional group that had more text based as verbally explained by the lecturer with some sporadic drawings to supplement. Null Hipotesis (H0) the mean values from the two samples are equal while in the alternative hypothesis (H1) mean values from the two samples are different. Pre Test came as 9 questions in pre-algebra and 1 word problem at the first meeting between the groups and the lecturer in the laboratory. After 10 weeks they sat a post test with the same questions as in the Pre Test but was arranged differently to show some ‘changes’. The time to answer was 20 minutes only since the questions were quite simple based on their university students’ status. All along the 10 weeks experiment, the students were exposed to different process of learning as was described earlier on. They were guided with the help of a dedicated worksheet where they must find the solution to three algebra problems given. Every week they got different worksheets. For example, in the first five lessons they got worksheets that focused on drill and practice problem because from research this method works well for those who were a bit rusty on few basic skills like factorization and simplification ( Mohd Sazali and Helmi Adly, 2012). The next five weeks, the worksheets were more towards word problem and problem based learning. The participants were given some answers to their
ISSN: 2180-3811 Vol. 4 No. 1 June 2013
E-learning in Malaysian Technical University Network
33
algebra work before they took Discrete Structure. After the tutorial the students were given some more work to discuss. To create seriousness among the participants, the first author collected their weekly work and this was marked and passed to them in the following week. They were “warned” that the marks were included into their final semester assessment. In the assessment method for this project, each question in pretest/ post test carried 1 mark only. Questions were selected based from item analysis reports - Penilaian Menengah Rendah (PMR) and Sijil Pelajaran Malaysia (SPM) from the Ministry Education Malaysia. The first author marked the test papers but this was cross examined by another tutor to eliminate biasness. We checked the gain score which is the difference between Post Test and Pre Test. Result analysis was obtained by using statistical package called SPSS Version 16.0 and we interviewed informally some weak students from each group. The students were explained the teaching style at the early semester and they could drop out from the experiment at any time by joining other tutorials held by another tutor. A thinking dominance brain test was done at the first meeting to check which brain dominance they were in in the first place. The brain test came from (Hermann, 1995) and the members in the experimented group were visualist.
4.0 rEsUlTs
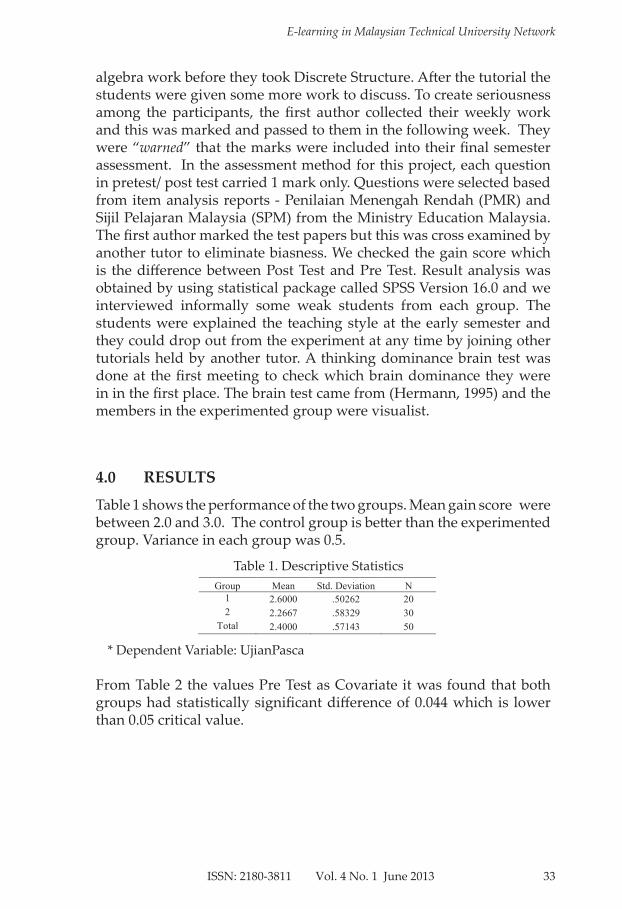
Table 1 shows the performance of the two groups. Mean gain score were between 2.0 and 3.0. The control group is better than the experimented group. Variance in each group was 0.5.
Table 1. Descriptive Statistics
place. The brain test came from (Hermann, 1995) and the members in the experimented group were visualist. 4.0 RESULTS Table 1 shows the performance of the two groups. Mean gain score were between 2.0 and 3.0. The control group is better than the experimented group. Variance in each group was 0.5.
Table 1.Descriptive Statistics
Group Mean Std. Deviation N 1 2.6000 .50262 20 2 2.2667 .58329 30
Total 2.4000 .57143 50 * Dependent Variable: UjianPasca From Table 2 the values Pre Test as Covariate it was found that both groups had statistically significant difference of 0.044 which is lower than 0.05 critical value.
Table 2. Tests of Between-Subjects Effects
Source Type III Sum
of Squares df Mean Square F Sig. Corrected Model 1.445** 2 .723 2.333 .108 Intercept 47.945 1 47.945 154.822 .000 pre .112 1 .112 .361 .551 Group 1.326 1 1.326 4.283 .044 Error 14.555 47 .310 Total 304.000 50 Corrected Total 16.000 49
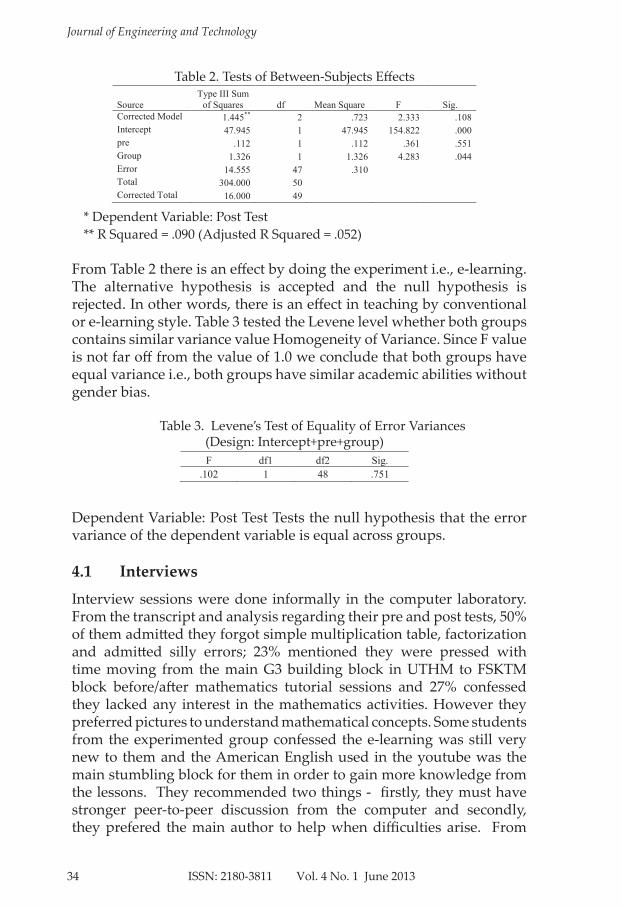
* Dependent Variable: Post Test ** R Squared = .090 (Adjusted R Squared = .052) From Table 2 there is an effect by doing the experiment i.e., e-learning. The alternative hypothesis is accepted and the null hypothesis is rejected. In other words, there is an effect in teaching by conventional or e-learning style. Table 3 tested the Levene level whether both groups contains similar variance value Homogeneity of Variance. Since F value is not far off from the value of 1.0 we conclude that both groups have equal variance i.e., both groups have similar academic abilities without gender bias.
Table 3. Levene's Test of Equality of Error Variances (Design: Intercept+pre+group)
F df1 df2 Sig. .102 1 48 .751
* Dependent Variable: UjianPasca
From Table 2 the values Pre Test as Covariate it was found that both groups had statistically significant difference of 0.044 which is lower than 0.05 critical value.
ISSN: 2180-3811 Vol. 4 No. 1 June 2013
Journal of Engineering and Technology
34
Table 2. Tests of Between-Subjects Effects
place. The brain test came from (Hermann, 1995) and the members in the experimented group were visualist. 4.0 RESULTS Table 1 shows the performance of the two groups. Mean gain score were between 2.0 and 3.0. The control group is better than the experimented group. Variance in each group was 0.5.
Table 1.Descriptive Statistics
Group Mean Std. Deviation N 1 2.6000 .50262 20 2 2.2667 .58329 30
Total 2.4000 .57143 50 * Dependent Variable: UjianPasca From Table 2 the values Pre Test as Covariate it was found that both groups had statistically significant difference of 0.044 which is lower than 0.05 critical value.
Table 2. Tests of Between-Subjects Effects
Source Type III Sum
of Squares df Mean Square F Sig. Corrected Model 1.445** 2 .723 2.333 .108 Intercept 47.945 1 47.945 154.822 .000 pre .112 1 .112 .361 .551 Group 1.326 1 1.326 4.283 .044 Error 14.555 47 .310 Total 304.000 50 Corrected Total 16.000 49
* Dependent Variable: Post Test ** R Squared = .090 (Adjusted R Squared = .052) From Table 2 there is an effect by doing the experiment i.e., e-learning. The alternative hypothesis is accepted and the null hypothesis is rejected. In other words, there is an effect in teaching by conventional or e-learning style. Table 3 tested the Levene level whether both groups contains similar variance value Homogeneity of Variance. Since F value is not far off from the value of 1.0 we conclude that both groups have equal variance i.e., both groups have similar academic abilities without gender bias.
Table 3. Levene's Test of Equality of Error Variances (Design: Intercept+pre+group)
F df1 df2 Sig. .102 1 48 .751
* Dependent Variable: Post Test ** R Squared = .090 (Adjusted R Squared = .052)
From Table 2 there is an effect by doing the experiment i.e., e-learning. The alternative hypothesis is accepted and the null hypothesis is rejected. In other words, there is an effect in teaching by conventional or e-learning style. Table 3 tested the Levene level whether both groups contains similar variance value Homogeneity of Variance. Since F value is not far off from the value of 1.0 we conclude that both groups have equal variance i.e., both groups have similar academic abilities without gender bias.
Table 3. Levene’s Test of Equality of Error Variances (Design: Intercept+pre+group)
place. The brain test came from (Hermann, 1995) and the members in the experimented group were visualist. 4.0 RESULTS Table 1 shows the performance of the two groups. Mean gain score were between 2.0 and 3.0. The control group is better than the experimented group. Variance in each group was 0.5.
Table 1.Descriptive Statistics
Group Mean Std. Deviation N 1 2.6000 .50262 20 2 2.2667 .58329 30
Total 2.4000 .57143 50 * Dependent Variable: UjianPasca From Table 2 the values Pre Test as Covariate it was found that both groups had statistically significant difference of 0.044 which is lower than 0.05 critical value.
Table 2. Tests of Between-Subjects Effects
Source Type III Sum
of Squares df Mean Square F Sig. Corrected Model 1.445** 2 .723 2.333 .108 Intercept 47.945 1 47.945 154.822 .000 pre .112 1 .112 .361 .551 Group 1.326 1 1.326 4.283 .044 Error 14.555 47 .310 Total 304.000 50 Corrected Total 16.000 49
* Dependent Variable: Post Test ** R Squared = .090 (Adjusted R Squared = .052) From Table 2 there is an effect by doing the experiment i.e., e-learning. The alternative hypothesis is accepted and the null hypothesis is rejected. In other words, there is an effect in teaching by conventional or e-learning style. Table 3 tested the Levene level whether both groups contains similar variance value Homogeneity of Variance. Since F value is not far off from the value of 1.0 we conclude that both groups have equal variance i.e., both groups have similar academic abilities without gender bias.
Table 3. Levene's Test of Equality of Error Variances (Design: Intercept+pre+group)
F df1 df2 Sig. .102 1 48 .751
Dependent Variable: Post Test Tests the null hypothesis that the error variance of the dependent variable is equal across groups. 4.1 interviews
Interview sessions were done informally in the computer laboratory. From the transcript and analysis regarding their pre and post tests, 50% of them admitted they forgot simple multiplication table, factorization and admitted silly errors; 23% mentioned they were pressed with time moving from the main G3 building block in UTHM to FSKTM block before/after mathematics tutorial sessions and 27% confessed they lacked any interest in the mathematics activities. However they preferred pictures to understand mathematical concepts. Some students from the experimented group confessed the e-learning was still very new to them and the American English used in the youtube was the main stumbling block for them in order to gain more knowledge from the lessons. They recommended two things - firstly, they must have stronger peer-to-peer discussion from the computer and secondly, they prefered the main author to help when difficulties arise. From
ISSN: 2180-3811 Vol. 4 No. 1 June 2013
E-learning in Malaysian Technical University Network
35
their opinion, human collaboration is more preferable than working silently with the computer lessons. The final comment from the first author as the main observer was the effectiveness of this experimented method depends on two things i.e., first was how engaged they were with interacting with the e-learning system and secondly, how much they can interpret the real objective of the experiment that demanded metacognitive skills ( identify, evaluate resources and most importantly prioritize and refine goals) in solving word problem and problem based learning.
5.0 DiscUssion anD FUTUrE rEcoMMEnDaTion
From the study the mean gain score between two groups was low between 2.0 to 3.0 points respectively. The control group did better than the experimented group. From their answer scripts, simple skills in mathematics were poorly displayed by some students from the experimented group who are taking I.T degree in UTHM. This was not a successful story. The limitation is visual learners in this small sample were not skilful enough in mathematics. This could be a factor that contributes to the dilemma in teaching BIT10103 Discrete Structure in the faculty. However, few lecturers in IT faculty defended that the students were highly creative in I.T subjects like multimedia and computer ethics that goes parallel to what visual learners are in (Hermann, 1995; Pink, 2005). The dilemma is - may be these learners took mathematics lightly as parallel to (Suhaida and Mohd Sazali, 2009; Mohd Sazali et al. 2011) obtained. Learning on computers failed to create deep learning episodes since computer graphics distracted their focus. May be there is a need to research when and how to create deep focus in mathematics at higher learning institutions among weak learners who came with many different educational backgrounds. Another point worth mentioning is the time frame where the experiment was run. It was quite difficult for the students to see and evaluate goals and priorities when two components were put under their focus i.e., algebra and discrete structure. The difficulty was more enormous when they were expected to solve word problem and problem based learning towards the closing weeks when the time was too limited plus their weakest point was their english language proficiency which was not ideal in following youtube lessons and mathematical notes seriously with foreign jargons. Until and unless the Malaysian lecturers themselves start to build mathematical lessons on the web in Malaysian language, the issues of effectiveness and engagement could not be properly addressed. This is because high engagement results in higher achievement, improved self-concept and self-efficacy
ISSN: 2180-3811 Vol. 4 No. 1 June 2013
Journal of Engineering and Technology
36
and more favorable attitude towards mathematical learning. There is a strong belief that points out the crucial difference between time spent and time-engaged in mathematics achievement (Renzulli & Reis, 2007). However, we got one important lesson to chew - Gone were the days where the lecturers would expect only elite students in their classrooms because presently, the students UTHM got came from many levels of backgrounds. Without some control we could not expect to produce serious learners who would exploit creative skills and innovation using mathematical patterns as explained by (Mayer, 2001). Deep learning that carries some analysis and synthesis were not shown vividly among this BIT 1 cohort 2011/12 only in UTHM from the way they answered weekly tutorials and ‘easy’ algebra questions from both pre and post tests. The solution may demand a new training regime from potential teachers and lecturers in MTUN that incorporates different style example asking questions that probe for different levels of understanding from the computer users in the laboratory. These questions will guide their focus to what they should extract from the hypertext which was at their disposal.
6.0 conclUsion
This paper exposed two different teaching and learning styles in a cohort of 50 students BIT1 in Faculty Computer Science and I.T., UTHM, Johor. The control group performed a bit better in the gain score than the experimented group within a 10 week experiment. Findings was it produced a statistically significant difference in the gain score using ANCOVA where the pre test score is the co variate. The study found that visual learners performed quite poorly using e-learning as in this small sample where their mean gain score was merely 2.27 points as compared to 2.60 from the control group after the experiment. The issues were time frame, low proficiency in English, serious engagement leading to higher achievement and improved self-concept and self-efficacy were also discussed.
7.0 acknowlEDgEMEnT
We would like to express our gratitude to the Dean, FSKTM, UTHM for allowing this study to run for 5 months Jan – May 2012 with cohort BIT1. Also all the staff that had assisted one way or another in accomplishing this study especially Mr. Mohd Hafiz Mt Saidun, a technician in Web Technology laboratory and Madame Noraini Ibrahim.
ISSN: 2180-3811 Vol. 4 No. 1 June 2013
E-learning in Malaysian Technical University Network
37
8.0 rEFErEncEsAkept (2012). Seminar Higher Education. Talk presented by Professor Ibrahim
UMK. September 22, 2012.
Balakrishnan Muniandy and Rossafri Mohammad. In Devadason R. Peter et al (2010). (Eds.) The state of use of ICT in the teaching and learning of Science & Mathematics among schools in SEAMEO member countries. Penang: SEAMEO Regional Centre for Science and Mathematics.
Bloom, B. S. (1956). Taxonomy of educational objectives, the classification of educational goals – Handbook I: Cognitive Domain New York: McKay.
Felder, R. M. (1991). Effective teaching in a workshop, Department of Chemical Engineering. North Corolina State University, Raleigh, NC.
Hermann, N. (1995). The creative brain (2nd ed.). USA: Quebecor Printing Book Group.
Jabatan Perdana Menteri. (2010). Keperluan Tenaga Mahir dan Separa Mahir, RMK 9.
Mahathir Mohamad (2011). Doctor in the house. The memoirs of Tun Mahathir Mohamad. Kuala Lumpur: MPH Publishing.
Mayer, R.E. (2001). Multimedia learning. Cambridge: Cambridge University Press.
Mohd Sazali Khalid, S. Yamin dan S. A. Sari (2011). A study on learning pre-algebra using Interactive Multimedia Courseware within collaborative learning set-up and e-mail interactions. Acheh International Journal of Science and Technology, 1(1), 20-25.
Mohd Sazali Khalid and Helmi Adly Mohd Noor (2012). The teaching and learning mathematics using CDiCL: Making sense through computers within teamwork. Parit Raja: UTHM.
Mohd Sazali Khalid, M. Alias, W. Razally and Z. Suradi (2007). The influence of multimedia interactive courseware in learning pre algebraic fractions. International Journal of Emerging Technology, 3(2), 21-24.
Mohd Sazali Khalid, Tan Lai Wai and Tutut Herawan. (2012). Road traffic engineering application in Mathematics Information Technology, Elsevier Procedia- Social and Behavioral Science, 59, 204-211.
Mohd Salleh Abu dan Z. Tasir. (2001). Pengenalan kepada Analisis Data berkomputer. SPSS 10.0 for Windows. Kuala Lumpur: Venton Publishing.
Piaget, J. and Inhelder, B. (1975). The origin of the idea of chance in children. London: Routledge & Kegan Paul.
Pink, D. (2005). A whole new mind. New York: Riverhead Books.
Renzulli, J. S. and Reis, S. M. (2007). A technology based program that matches
ISSN: 2180-3811 Vol. 4 No. 1 June 2013
Journal of Engineering and Technology
38
enrichment resources with student strengths, iJET International Journal: emerging technologies in learning, 2(3), 57-64.
Rhong Zhang, Yue Zsou dan Fukuya Ishino (2008). A preliminary Study on prediction models for English web-based remedial education: Application of Data Mining Theory. WSEAS Transactions on Advances in Engineering Education, 5(5), 331-341.
Steyn, T. and Maree, T. (2003). Study orientation in mathematics and thinking preferences of freshmen engineering and science students. Perspectives in Education, 21(2), 47-56.
Suhaida Tahir and Mohd Sazali Khalid. (2009). Language difficulties encountered by students learning elementary algebra in mathematics classroom. Journal of Research in Teacher Education, 4, 29-38.
Thorpe, M. (2012). Educational Technology: Does pedagogy still matter? Educational Technology/March–April 2012, 10-14.
Vaughan, T. (2008). Multimedia: Making it work (7th ed.). New York: McGraw Hill.