
pakistan%20earthquake%20shelter.pdf - Humanitarian Library |
Nuclear Instruments and Methods in Physics Research B 241 (2005) 759–764
www.elsevier.com/locate/nimb
Dynamics of soil parameters relevantfor humanitarian demining
Jasmina Obhod-as, Neda Vdovic, Vlado Valkovic *
Institute Ruder Boskovic, Department of Experimental Physics, Bijenicka c. 54, P.O. Box 180, 10000 Zagreb, Croatia
Available online 19 August 2005
Abstract
In this paper we analyzed characteristics of 6 different soils from the test field at the Rud-er Boskovic Institute. Manysoil properties relevant for the performance of humanitarian demining tools strongly depend on water content. This isan effort to understand better the soil moisture variability and to find soil parameters that can predict the water contentregarding the weather conditions. Such knowledge will allow to optimize demining operations. To gather the mainparameters like field capacity, rate and delay of water infiltration and soil water retention which are all related to soiltexture, daily time-series of soil moisture from August to November 2001, where analyzed.� 2005 Elsevier B.V. All rights reserved.
PACS: 92.40.Lg
Keywords: Soil moisture; Soil parameters; Demining; Time-series; Exponential smoothing
1. Introduction
The goal of instrumental methods being devel-oped for demining is to detect and identify explo-sive and its casing buried into the soil. Physicaland chemical properties of soil produce a back-ground or noise in the methods designated forlandmine detection and/or identification. Soilmoisture is one of the most relevant parameters
0168-583X/$ - see front matter � 2005 Elsevier B.V. All rights reservdoi:10.1016/j.nimb.2005.07.130
* Corresponding author. Tel.: +385 1 468 0101/1223; fax:+385 1 468 0239.
E-mail address: [email protected] (V. Valkovic).
for demining techniques. Many of the soil proper-ties, e.g. permittivity, thermal and acoustic charac-teristics will depend strongly on the soil moisturecontent and their values may have to be specifiedat a number of selected moisture contents. Thepreliminary research on the application of neutronbackscattering technique (NBT) for landminedetection in Croatia done within the frameworkof the project DIAMINE (IST-2000-25237) hasestablished that space and time variations of thewater content in soils strongly influence the NBTdetection performance. It was also evidenced thatthe soil moisture has a strong small spatial scale
ed.
heavyclay
70
80
90
100 0
1020
30
760 J. Obhod-as et al. / Nucl. Instr. and Meth. in Phys. Res. B 241 (2005) 759–764
variation [1–3]. Such an effect would certainly re-flect on other soil parameters as well. Soil proper-ties that influence soil water content must be wellunderstood in order to predict false detection sig-nals due to natural variability of soils.
clay
sandyclay
sandyclay loam
sandyloam
Siltyclay
siltyclay loam
silt loam
siltloamysandsand
loam
clay loam
0
10
20
30
40
50
60
100 90 80 70 60 50 40 30 20 10 0
4050
6070
8090
100
%cl
ay(<
4µm
)
%silt (62-4
m)
µ
% sand (2000-62µm)
T-6
T-2T-4
T-5
T-1
T-3
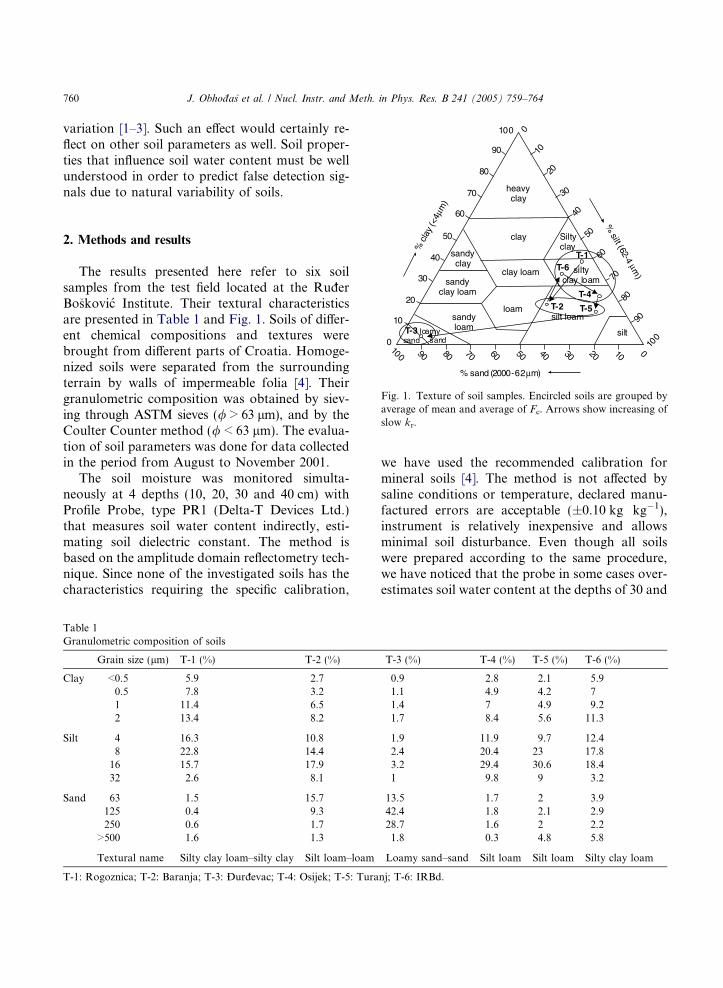
Fig. 1. Texture of soil samples. Encircled soils are grouped byaverage of mean and average of Fc. Arrows show increasing ofslow kr.
2. Methods and results
The results presented here refer to six soilsamples from the test field located at the Rud-erBoskovic Institute. Their textural characteristicsare presented in Table 1 and Fig. 1. Soils of differ-ent chemical compositions and textures werebrought from different parts of Croatia. Homoge-nized soils were separated from the surroundingterrain by walls of impermeable folia [4]. Theirgranulometric composition was obtained by siev-ing through ASTM sieves (/ > 63 lm), and by theCoulter Counter method (/ < 63 lm). The evalua-tion of soil parameters was done for data collectedin the period from August to November 2001.
The soil moisture was monitored simulta-neously at 4 depths (10, 20, 30 and 40 cm) withProfile Probe, type PR1 (Delta-T Devices Ltd.)that measures soil water content indirectly, esti-mating soil dielectric constant. The method isbased on the amplitude domain reflectometry tech-nique. Since none of the investigated soils has thecharacteristics requiring the specific calibration,
Table 1Granulometric composition of soils
Grain size (lm) T-1 (%) T-2 (%)
Clay <0.5 5.9 2.70.5 7.8 3.21 11.4 6.52 13.4 8.2
Silt 4 16.3 10.88 22.8 14.416 15.7 17.932 2.6 8.1
Sand 63 1.5 15.7125 0.4 9.3250 0.6 1.7
>500 1.6 1.3
Textural name Silty clay loam–silty clay Silt loam–loam
T-1: Rogoznica; T-2: Baranja; T-3: -Durd-evac; T-4: Osijek; T-5: Tura
we have used the recommended calibration formineral soils [4]. The method is not affected bysaline conditions or temperature, declared manu-factured errors are acceptable (±0.10 kg Æ kg�1),instrument is relatively inexpensive and allowsminimal soil disturbance. Even though all soilswere prepared according to the same procedure,we have noticed that the probe in some cases over-estimates soil water content at the depths of 30 and
T-3 (%) T-4 (%) T-5 (%) T-6 (%)
0.9 2.8 2.1 5.91.1 4.9 4.2 71.4 7 4.9 9.21.7 8.4 5.6 11.3
1.9 11.9 9.7 12.42.4 20.4 23 17.83.2 29.4 30.6 18.41 9.8 9 3.2
13.5 1.7 2 3.942.4 1.8 2.1 2.928.7 1.6 2 2.21.8 0.3 4.8 5.8
Loamy sand–sand Silt loam Silt loam Silty clay loam
nj; T-6: IRBd.
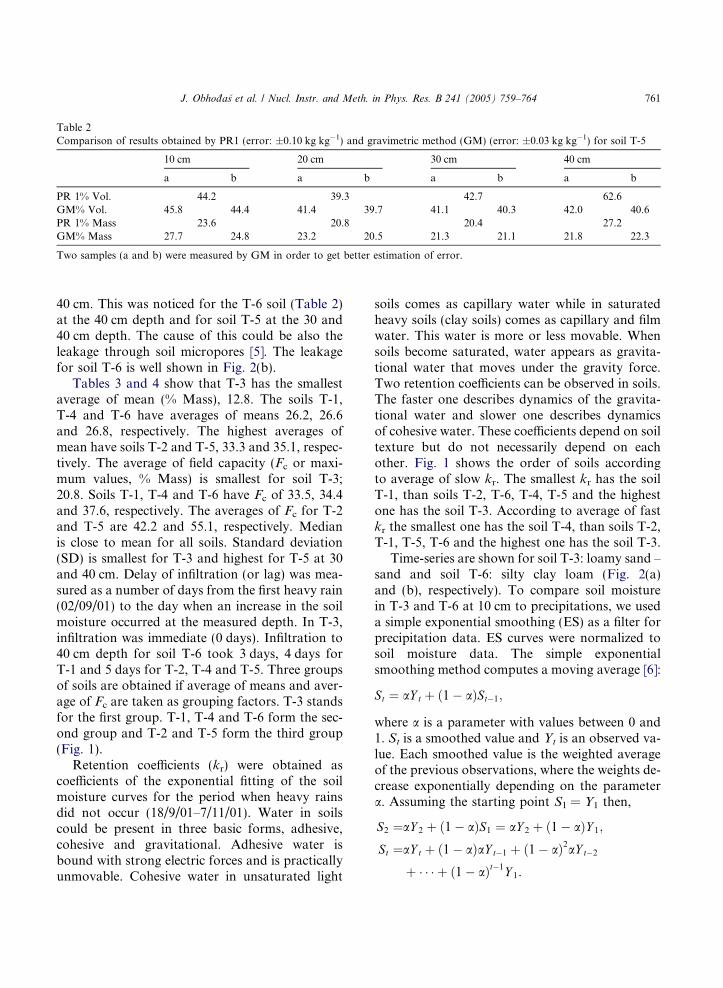
Table 2Comparison of results obtained by PR1 (error: ±0.10 kg kg�1) and gravimetric method (GM) (error: ±0.03 kg kg�1) for soil T-5
10 cm 20 cm 30 cm 40 cm
a b a b a b a b
PR 1% Vol. 44.2 39.3 42.7 62.6GM% Vol. 45.8 44.4 41.4 39.7 41.1 40.3 42.0 40.6PR 1% Mass 23.6 20.8 20.4 27.2GM% Mass 27.7 24.8 23.2 20.5 21.3 21.1 21.8 22.3
Two samples (a and b) were measured by GM in order to get better estimation of error.
J. Obhod-as et al. / Nucl. Instr. and Meth. in Phys. Res. B 241 (2005) 759–764 761
40 cm. This was noticed for the T-6 soil (Table 2)at the 40 cm depth and for soil T-5 at the 30 and40 cm depth. The cause of this could be also theleakage through soil micropores [5]. The leakagefor soil T-6 is well shown in Fig. 2(b).
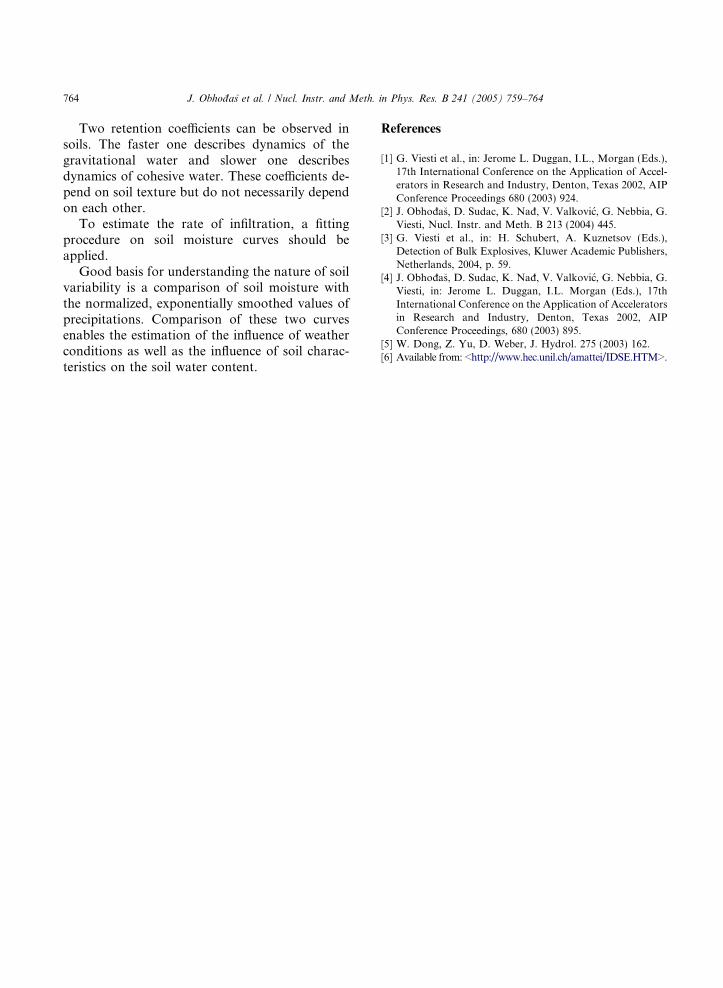
Tables 3 and 4 show that T-3 has the smallestaverage of mean (% Mass), 12.8. The soils T-1,T-4 and T-6 have averages of means 26.2, 26.6and 26.8, respectively. The highest averages ofmean have soils T-2 and T-5, 33.3 and 35.1, respec-tively. The average of field capacity (Fc or maxi-mum values, % Mass) is smallest for soil T-3;20.8. Soils T-1, T-4 and T-6 have Fc of 33.5, 34.4and 37.6, respectively. The averages of Fc for T-2and T-5 are 42.2 and 55.1, respectively. Medianis close to mean for all soils. Standard deviation(SD) is smallest for T-3 and highest for T-5 at 30and 40 cm. Delay of infiltration (or lag) was mea-sured as a number of days from the first heavy rain(02/09/01) to the day when an increase in the soilmoisture occurred at the measured depth. In T-3,infiltration was immediate (0 days). Infiltration to40 cm depth for soil T-6 took 3 days, 4 days forT-1 and 5 days for T-2, T-4 and T-5. Three groupsof soils are obtained if average of means and aver-age of Fc are taken as grouping factors. T-3 standsfor the first group. T-1, T-4 and T-6 form the sec-ond group and T-2 and T-5 form the third group(Fig. 1).
Retention coefficients (kr) were obtained ascoefficients of the exponential fitting of the soilmoisture curves for the period when heavy rainsdid not occur (18/9/01–7/11/01). Water in soilscould be present in three basic forms, adhesive,cohesive and gravitational. Adhesive water isbound with strong electric forces and is practicallyunmovable. Cohesive water in unsaturated light
soils comes as capillary water while in saturatedheavy soils (clay soils) comes as capillary and filmwater. This water is more or less movable. Whensoils become saturated, water appears as gravita-tional water that moves under the gravity force.Two retention coefficients can be observed in soils.The faster one describes dynamics of the gravita-tional water and slower one describes dynamicsof cohesive water. These coefficients depend on soiltexture but do not necessarily depend on eachother. Fig. 1 shows the order of soils accordingto average of slow kr. The smallest kr has the soilT-1, than soils T-2, T-6, T-4, T-5 and the highestone has the soil T-3. According to average of fastkr the smallest one has the soil T-4, than soils T-2,T-1, T-5, T-6 and the highest one has the soil T-3.
Time-series are shown for soil T-3: loamy sand –sand and soil T-6: silty clay loam (Fig. 2(a)and (b), respectively). To compare soil moisturein T-3 and T-6 at 10 cm to precipitations, we useda simple exponential smoothing (ES) as a filter forprecipitation data. ES curves were normalized tosoil moisture data. The simple exponentialsmoothing method computes a moving average [6]:
St ¼ aY t þ ð1� aÞSt�1;
where a is a parameter with values between 0 and1. St is a smoothed value and Yt is an observed va-lue. Each smoothed value is the weighted averageof the previous observations, where the weights de-crease exponentially depending on the parametera. Assuming the starting point S1 = Y1 then,
S2 ¼aY 2 þ ð1� aÞS1 ¼ aY 2 þ ð1� aÞY 1;
St ¼aY t þ ð1� aÞaY t�1 þ ð1� aÞ2aY t�2
þ � � � þ ð1� aÞt�1Y 1.
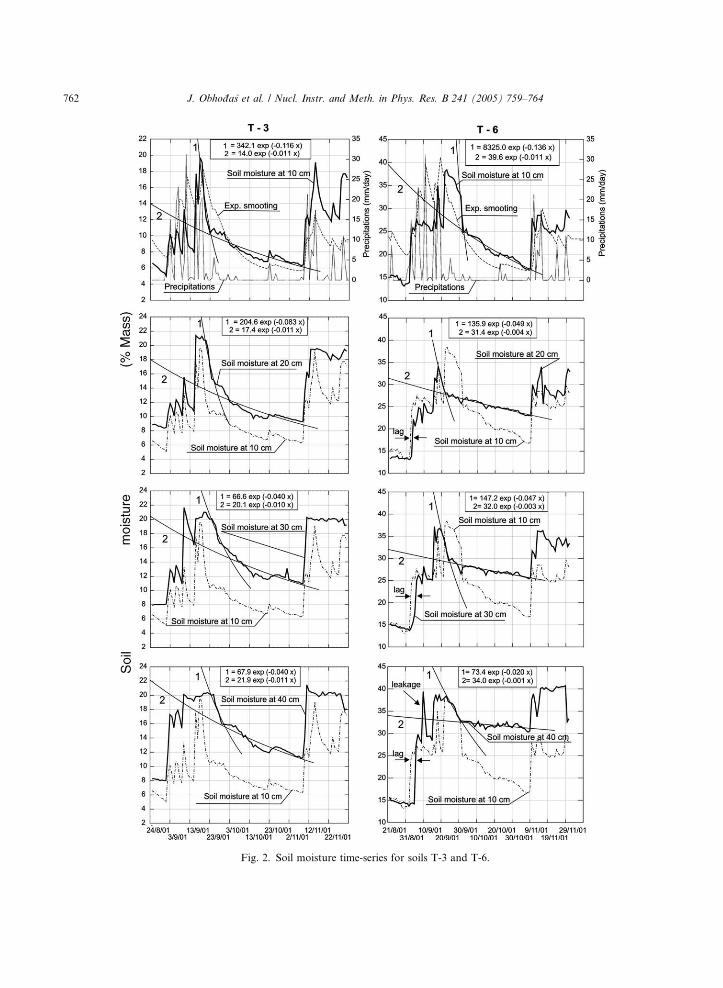
Fig. 2. Soil moisture time-series for soils T-3 and T-6.
762 J. Obhod-as et al. / Nucl. Instr. and Meth. in Phys. Res. B 241 (2005) 759–764
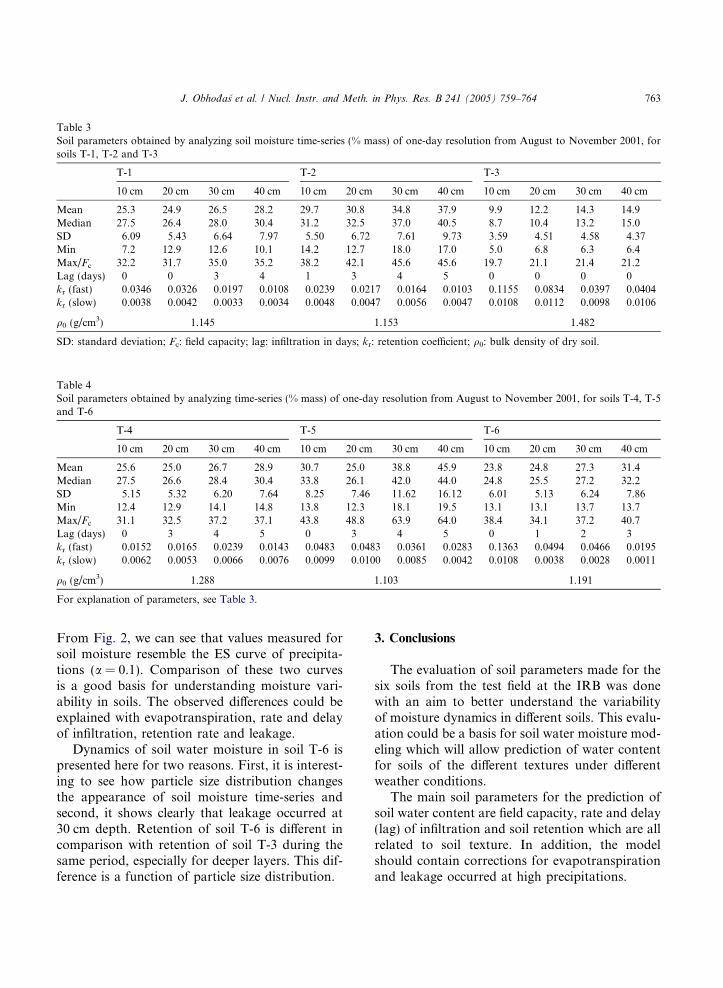
Table 3Soil parameters obtained by analyzing soil moisture time-series (% mass) of one-day resolution from August to November 2001, forsoils T-1, T-2 and T-3
T-1 T-2 T-3
10 cm 20 cm 30 cm 40 cm 10 cm 20 cm 30 cm 40 cm 10 cm 20 cm 30 cm 40 cm
Mean 25.3 24.9 26.5 28.2 29.7 30.8 34.8 37.9 9.9 12.2 14.3 14.9Median 27.5 26.4 28.0 30.4 31.2 32.5 37.0 40.5 8.7 10.4 13.2 15.0SD 6.09 5.43 6.64 7.97 5.50 6.72 7.61 9.73 3.59 4.51 4.58 4.37Min 7.2 12.9 12.6 10.1 14.2 12.7 18.0 17.0 5.0 6.8 6.3 6.4Max/Fc 32.2 31.7 35.0 35.2 38.2 42.1 45.6 45.6 19.7 21.1 21.4 21.2Lag (days) 0 0 3 4 1 3 4 5 0 0 0 0kr (fast) 0.0346 0.0326 0.0197 0.0108 0.0239 0.0217 0.0164 0.0103 0.1155 0.0834 0.0397 0.0404kr (slow) 0.0038 0.0042 0.0033 0.0034 0.0048 0.0047 0.0056 0.0047 0.0108 0.0112 0.0098 0.0106
q0 (g/cm3) 1.145 1.153 1.482
SD: standard deviation; Fc: field capacity; lag: infiltration in days; kr: retention coefficient; q0: bulk density of dry soil.
Table 4Soil parameters obtained by analyzing time-series (% mass) of one-day resolution from August to November 2001, for soils T-4, T-5and T-6
T-4 T-5 T-6
10 cm 20 cm 30 cm 40 cm 10 cm 20 cm 30 cm 40 cm 10 cm 20 cm 30 cm 40 cm
Mean 25.6 25.0 26.7 28.9 30.7 25.0 38.8 45.9 23.8 24.8 27.3 31.4Median 27.5 26.6 28.4 30.4 33.8 26.1 42.0 44.0 24.8 25.5 27.2 32.2SD 5.15 5.32 6.20 7.64 8.25 7.46 11.62 16.12 6.01 5.13 6.24 7.86Min 12.4 12.9 14.1 14.8 13.8 12.3 18.1 19.5 13.1 13.1 13.7 13.7Max/Fc 31.1 32.5 37.2 37.1 43.8 48.8 63.9 64.0 38.4 34.1 37.2 40.7Lag (days) 0 3 4 5 0 3 4 5 0 1 2 3kr (fast) 0.0152 0.0165 0.0239 0.0143 0.0483 0.0483 0.0361 0.0283 0.1363 0.0494 0.0466 0.0195kr (slow) 0.0062 0.0053 0.0066 0.0076 0.0099 0.0100 0.0085 0.0042 0.0108 0.0038 0.0028 0.0011
q0 (g/cm3) 1.288 1.103 1.191
For explanation of parameters, see Table 3.
J. Obhod-as et al. / Nucl. Instr. and Meth. in Phys. Res. B 241 (2005) 759–764 763
From Fig. 2, we can see that values measured forsoil moisture resemble the ES curve of precipita-tions (a = 0.1). Comparison of these two curvesis a good basis for understanding moisture vari-ability in soils. The observed differences could beexplained with evapotranspiration, rate and delayof infiltration, retention rate and leakage.
Dynamics of soil water moisture in soil T-6 ispresented here for two reasons. First, it is interest-ing to see how particle size distribution changesthe appearance of soil moisture time-series andsecond, it shows clearly that leakage occurred at30 cm depth. Retention of soil T-6 is different incomparison with retention of soil T-3 during thesame period, especially for deeper layers. This dif-ference is a function of particle size distribution.
3. Conclusions
The evaluation of soil parameters made for thesix soils from the test field at the IRB was donewith an aim to better understand the variabilityof moisture dynamics in different soils. This evalu-ation could be a basis for soil water moisture mod-eling which will allow prediction of water contentfor soils of the different textures under differentweather conditions.
The main soil parameters for the prediction ofsoil water content are field capacity, rate and delay(lag) of infiltration and soil retention which are allrelated to soil texture. In addition, the modelshould contain corrections for evapotranspirationand leakage occurred at high precipitations.
764 J. Obhod-as et al. / Nucl. Instr. and Meth. in Phys. Res. B 241 (2005) 759–764
Two retention coefficients can be observed insoils. The faster one describes dynamics of thegravitational water and slower one describesdynamics of cohesive water. These coefficients de-pend on soil texture but do not necessarily dependon each other.
To estimate the rate of infiltration, a fittingprocedure on soil moisture curves should beapplied.
Good basis for understanding the nature of soilvariability is a comparison of soil moisture withthe normalized, exponentially smoothed values ofprecipitations. Comparison of these two curvesenables the estimation of the influence of weatherconditions as well as the influence of soil charac-teristics on the soil water content.
References
[1] G. Viesti et al., in: Jerome L. Duggan, I.L., Morgan (Eds.),17th International Conference on the Application of Accel-erators in Research and Industry, Denton, Texas 2002, AIPConference Proceedings 680 (2003) 924.
[2] J. Obhod-as, D. Sudac, K. Nad-, V. Valkovic, G. Nebbia, G.Viesti, Nucl. Instr. and Meth. B 213 (2004) 445.
[3] G. Viesti et al., in: H. Schubert, A. Kuznetsov (Eds.),Detection of Bulk Explosives, Kluwer Academic Publishers,Netherlands, 2004, p. 59.
[4] J. Obhod-as, D. Sudac, K. Nad-, V. Valkovic, G. Nebbia, G.Viesti, in: Jerome L. Duggan, I.L. Morgan (Eds.), 17thInternational Conference on the Application of Acceleratorsin Research and Industry, Denton, Texas 2002, AIPConference Proceedings, 680 (2003) 895.
[5] W. Dong, Z. Yu, D. Weber, J. Hydrol. 275 (2003) 162.[6] Available from: <http://www.hec.unil.ch/amattei/IDSE.HTM>.
Copyright © 2022 FDOKUMEN