Dynamics of an inducible defence in the protist Euplotes
16
Arch. Hydrobiol. 160 4 431–446 Stuttgart, August 2004 Dynamics of an inducible defence in the protist Euplotes Res Altwegg 1 *, Kerry B. Marchinko 1, 2 , Shelly L. Duquette 1 , and Bradley R. Anholt 1 With 3 figures and 2 tables Abstract: Inducible antipredator defences are expressed according to current predation risk. They enhance survival in the presence of predators but have associated fitness costs. Theory predicts that food webs in which members express inducible defences can be either more or less stable than food webs in which inducible defences are absent. This effect depends, to a large degree, on the ability of the prey defence to track predation risk. We investigated the dynamics of an inducible defence in hypotrich ciliates of the genus Euplotes in replicated experimental microcosms. In response to predators or their cues (live or frozen Stenostomum sp.), Euplotes develop lateral pro- jections that significantly increase their width and effectively protect them from being eaten by this gape limited predator. Paramecium aurelia shares resources with Euplo- tes, but does not alter its morphology in response to predators. We exposed Euplotes, alone or together with Paramecium, to either live, frozen or no predators and followed the dynamics over thirty generations (cell cycles). The morphological defence of Euplotes varied over time and loosely tracked predation risk. The dynamics of the de- fence were affected by predator densities and conspecific densities to a similar degree. Loose coupling between defence level and predation risk is expected to lead to an overall weak impact of the defence on community dynamics. The dynamics of our ex- perimental Euplotes populations, characterised by the coefficient of variation in pop- ulation size, were not noticeably affected by how closely the defence matched risk. Key words: ciliates, community dynamics, inducible defences, phenotypic plasticity, predator-prey dynamics, protozoa. 1 Authors’ address: Department of Biology, University of Victoria, Box 3020, Victo- ria, British Columbia, V8 W 3N5 Canada. 2 Current address: Zoology Department, University British Columbia, Vancouver, British Columbia, V6T 1Z4 Canada. * Correspondence author: E-mail: [email protected] DOI: 10.1127/0003-9136/2004/0160-0431 0003-9136/04/0160-0431 $ 4.00 2004 E. Schweizerbart’sche Verlagsbuchhandlung, D-70176 Stuttgart
-
Upload
independent -
Category
Documents
-
view
4 -
download
0
Transcript of Dynamics of an inducible defence in the protist Euplotes
Arch Hydrobiol 160 4 431ndash446 Stuttgart August 2004
Dynamics of an inducible defence in the protistEuplotes
Res Altwegg1 Kerry B Marchinko1 2 Shelly L Duquette1 andBradley R Anholt1
With 3 figures and 2 tables
Abstract Inducible antipredator defences are expressed according to current predationrisk They enhance survival in the presence of predators but have associated fitnesscosts Theory predicts that food webs in which members express inducible defencescan be either more or less stable than food webs in which inducible defences areabsent This effect depends to a large degree on the ability of the prey defence totrack predation risk We investigated the dynamics of an inducible defence in hypotrichciliates of the genus Euplotes in replicated experimental microcosms In response topredators or their cues (live or frozen Stenostomum sp) Euplotes develop lateral pro-jections that significantly increase their width and effectively protect them from beingeaten by this gape limited predator Paramecium aurelia shares resources with Euplo-tes but does not alter its morphology in response to predators We exposed Euplotesalone or together with Paramecium to either live frozen or no predators and followedthe dynamics over thirty generations (cell cycles) The morphological defence ofEuplotes varied over time and loosely tracked predation risk The dynamics of the de-fence were affected by predator densities and conspecific densities to a similar degreeLoose coupling between defence level and predation risk is expected to lead to anoverall weak impact of the defence on community dynamics The dynamics of our ex-perimental Euplotes populations characterised by the coefficient of variation in pop-ulation size were not noticeably affected by how closely the defence matched risk
Key words ciliates community dynamics inducible defences phenotypic plasticitypredator-prey dynamics protozoa
1 Authorsrsquo address Department of Biology University of Victoria Box 3020 Victo-ria British Columbia V8W 3N5 Canada2 Current address Zoology Department University British Columbia VancouverBritish Columbia V6T 1Z4 Canada Correspondence author E-mail altwegguvicca
DOI 1011270003-913620040160-0431 0003-9136040160-0431 $ 400 2004 E Schweizerbartrsquosche Verlagsbuchhandlung D-70176 Stuttgart
432 Res Altwegg et al
Introduction
Many organisms react to variable and unpredictable predation risk by employ-ing inducible defences (recently reviewed by Tollrian amp Harvell 1999) Inthe defended state predation is reduced however prey with induced defencestructures usually grow more slowly than those undefended As predator den-sities increase more prey individuals are expected to be in the defended statePredator feeding success is expected to decrease and so is predator populationgrowth As prey density increases and resources become scarce prey individu-als are expected to invest less in costly defences become more vulnerable andenable a fast increase in predator population size (Werner amp Anholt 1993)Thus inducible defences may generate density dependence in both halves ofthe predatorprey relationship (Anholt amp Werner 1999) and possibly stabi-lise dynamics (Ives amp Dobson 1987) However inducible defences may alsodestabilise predatorprey dynamics (Abrams amp Matsuda 1997) through timedelays initiated by the reaction time of prey to changes in predation risk(Luttbeg amp Schmitz 2000) Thus the influence of inducible defences onpredator-prey dynamics depends on the ability of prey defences to track preda-tion risk
The ability of the prey defence to track predation risk depends on threeconditions 1) how quickly defensive traits change in relation to changes inpredation risk 2) reliability and transmission distance of the cue relative to lo-comotory speed of prey and predators and 3) the cost-benefit trade-off of thedefence which can be affected by additional factors such as resource levelsThese three conditions may cause fluctuations in an inducible defence thatcannot be anticipated by short term experiments alone
We studied the dynamics of an inducible defence in the ciliate protist Eup-lotes Euplotes change their cell shape by forming wing-like lateral projectionsthat effectively protect them from being eaten by gape limited predators suchas the turbellarian Stenostomum or predatory ciliates (Kuhlmann amp Heck-mann 1994 Kuhlmann et al 1999) Expressing this defence results in longercell cycles and thus slower population growth (Kusch amp Kuhlmann 1994)The defence is gradually expressed within hours (Kuhlmann amp Heckmann1985) and can be reversed within a single cell cycle Both the costs and bene-fits of defence expression in Euplotes appear to scale approximately linearlywith the level of expression (Wiackowski et al 2003)
We address two questions in this study by focusing on Euplotes populationdynamics 1) How much do predation predation risk and competition depressinitial population growth and how do these factors affect mean maximumand variation in population numbers over time 2) How closely does morpho-logical defence track predation risk as measured by the density of predatorsand conspecifics
Dynamics of an inducible defence 433
Methods
Experimental procedures
We examined the consequences of flexible body shape to population dynamics usingthree cultures of Euplotes which had been initiated from a single cell each and kept asseparate clonal lines thereafter We used one clone of each of three species Euplotesaediculatus Aed 33 E octocarinatus Octo C1 and E plumipes Plu (kindly suppliedby K Wiackowski at Jagiellonian University Krakow Poland)
All experiments were conducted in six-well tissue culture plates (Nr 353046MULTIWELLTM Becton Dickinson Labware NJ USA) Each well held 10 ml of ster-ile medium consisting of one protozoa food pellet (Nr 13-2360 Carolina BiologicalSupply Company NC USA) dissolved in 2 litres of mineral water (NAYA MirabelQueacutebec Canada) An autoclaved wheat grain was added to each well to provide nutri-ents We initially stocked each well with 50 Euplotes cells to begin the experiment atlow densities Each clone was subjected to six experimental treatments randomly as-signed to a well within a given plate The treatments were i) Euplotes alone ii) withcompetitors (50 Paramecium aurelia were added at the beginning of the experiment)iii) with predatory cue (~ 50 individuals of the predatory Stenostomum sp which hadbeen freezer-killed at ndash5 ˚C) iv) with predatory cue and competitors v) with live pred-ators (20 predators were added once at the beginning of the experiment) and vi) withlive predators and competitors Dead predators induce the defended phenotype inEuplotes (acting as a predatory cue) allowing us to separate the effects of increaseddefence level from effects of predation Dead predator treatments had to be replenishedevery two days to maintain the predation cue at a constant high level During the freez-ing process predators disintegrated and we do not know how quickly they degradedBy adding dead predators we added nutrients that potentially increased bacterialgrowth However the volume of predators added was small compared to the constantsupply from the wheat grain and the medium which was replenished every two daysWe never observed bacterial overgrowth in any of the wells associated with dead pred-ators The Paramecium cultures unintentionally contained a dicranophorid rotiferwhich subsequently reached significant population densities in the competition treat-ments
We replicated each treatment five times using a randomised block design andstarted the experiment on 23 January 2003 Every two days we removed 10 (fivesamples of 200 microl) of the content of each well and replaced it with sterile medium Allprotists rotifers and Stenostomum were counted under a dissecting microscope Everyfour days we photographed one to 33 Euplotes cells (median 10) directly through theflat bottom of the experimental containers using an inverted microscope (Leica Dm-IRB) with an attached CCD camera (COHU) The cell width (measured using the soft-ware package ImagePro) obtained from these photographs served as our measure ofthe level of induction Constrained by the available workforce we ended the E octo-carinatus treatments after 12 days E plumipes after 30 days and E aediculatus after50 days except one block which was terminated after 30 days
434 Res Altwegg et al
Statistical analyses
We divided the time series into a phase of initial population increase (phase 1 the firsteight days) and remaining time (phase 2 day 8 and onwards) We estimated the pop-ulation growth rate during phase 1 by fitting linear regression models to the logarithmsof the mean counts per day for each well The slope provides an estimate of the pop-ulation growth rate at low population densities This estimate is lower than the truevalue because it ignores the 10 density independent mortality that we imposed everytwo days through our sampling procedure Nevertheless sampling mortality was con-stant across all treatments and thus we do not further correct for this We applied anal-ysis of variance (ANOVA) to test for the effects of competition and predator treatmenton population growth rate We used the coefficient of variation of mean populationcounts (McArdle et al 1990) and the mean and maximum of each population tocharacterise population dynamics during phase 2 The effects of competition and pred-ation on these characteristics were then evaluated by multivariate analysis of variance(MANOVA)
If the level of defence closely tracks predation risk it should respond to changes inpredator density and conspecific density Specifically we evaluated the followinghypotheses First predator density alone should explain variation in the level of de-fence in Euplotes if they react only to cues emitted by the predators (Wiackowski etal 2003) Second Euplotes may base their reaction solely on the number of conspec-ifics due either to reliance on the herd effect or changes in resource allocation withconspecific density Third a simultaneous response to both predator and conspecificdensity is possible as predicted by optimality considerations (Wiackowski amp Sta-ronska 1999 Peacor 2003) Fourth there may be an interaction between the reactionto predators and the reaction to conspecific density For example at low predator densi-ties prey may not react to changes in conspecific density Finally the variation in preydefence level may not directly be related to either predator or conspecific density forexample if the defence strongly depends on the current resource level (Werner amp An-holt 1993) We fitted five linear regression models corresponding to these alternativehypotheses to the time series produced by each experimental unit and assessed thesupport for each model using the sample-size-adjusted Akaikersquos Information Criterion(AICc Burnham amp Anderson 2002) Akaike weights assess the relative support agiven model has from the data relative to the other models in the set and summing theAkaike weights for all models containing a particular factor (e g predator density)gives a measure of importance of that factor (Burnham amp Anderson 2002) The re-gression analyses related the mean width of all measured cells to the count of predatorsor conspecifics of the previous day and we weighted each observation by the squareroot of the number of measured cells This procedure assigns a higher weight to thoseobservations for which we have more reliable data Reduced major axis regression ispreferable to ordinary (least-squares) regression in our case because both independentand dependent variables were affected by measurement error (McArdle 1988) Thuswe report the reduced major axis regression slope of cell width on number of predatorsor conspecifics in the sample All statistical analyses were calculated using the R soft-ware version 171 (Ihaka amp Gentleman 1996 available at httpwwwr-projectorg)
Dynamics of an inducible defence 435
Results
Euplotes population dynamics
The Euplotes population failed to establish in two experimental units whichconsequently were eliminated from all analyses The other experimental pop-ulations grew exponentially (approximately linear on the log scale Fig1) overthe first eight days and were not significantly affected by their competitors(all P gt 05) Population growth of E aediculatus but not the other two cloneswas reduced by the predator treatments (predator treatment entered the analy-sis as a factor with two degrees of freedom F220 = 1006 P lt 0001 plumipesand octocarinatus P gt 01) with live predators having a larger negative effectthan dead predators Population growth was not significantly related to thelevel of defence on day 2 when densities were still consistently low in all ex-perimental units (linear regression of population growth on mean cell width Pgt 05 for all clones)
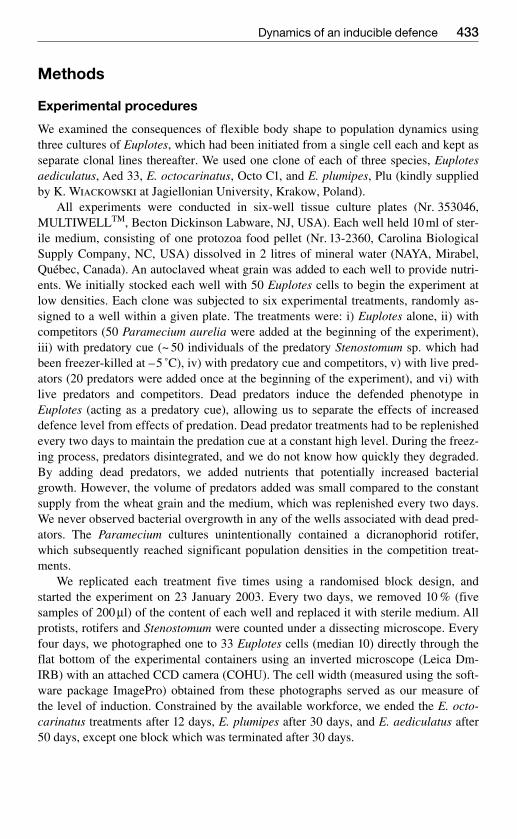
MANOVA showed that population dynamics after day eight of both Eaediculatus and E plumipes (no data were collected for E octocarinatus) wasaffected by competitors but not by predator treatment (Fig 1 Table 1) Sub-sequent univariate analyses showed that competitors depressed mean and max-imum population numbers in both clones and increased the coefficient of var-iation in population numbers in E aediculatus (all P lt 002)
Predation risk and level of defence
Euplotes strongly reacted to both live and dead predators by increasing theircell width (Fig 2) The variation in the level of this defence was larger in pred-ator treatments than predator-free replicates (standard deviation of body widthover time E aediculatus 54 124 and 137 in control dead predator andlive predator treatments F224 = 127 P lt 0001 E plumipes sd = 48 60 and102 F223 = 139 P lt 0001) In E aediculatus but not E plumipes the varia-
Table 1 Summary of MANOVA results on the effects of competition and predatortreatment on Euplotes population dynamics after day eight Population dynamics werecharacterised by the coefficient of variation in population size log(mean populationsize) and log(maximum population size)
Euplotes aediculatus E plumipes
Wilks λ F Num Den P Wilks λ F Num Den PDF Df DF Df
Competition (C) 0431 7923 3 18 0001 0686 2592 3 17 0087Predation (P) 0791 0748 6 36 0615 0830 0555 6 34 0763Block 0484 1262 12 479 0272 0248 2620 12 453 0010C times P 0676 1300 6 36 0282 0629 1481 6 34 0214
436 Res Altwegg et al
Fig1 a
tion in defence was also larger in treatments with competitors compared totreatments without competitors (E aediculatus 130 vs 77 F124 = 147 Plt0001 E plumipes P gt02)
We further investigated whether variation in defence level in live-predatortreatments was caused by fluctuations in predator numbers conspecific den-sity or both Model selection favoured the constant model in 6 out of 10 repli-cates for E aediculatus and in 9 out of 10 replicates for E plumipes (Table 2)This result reflects a generally loose relationship between risk and the level ofdefence and a tendency for the model selection criterion (AICc) to selectsimple models at the available low sample sizes Summing the Akaike weights
Dynamics of an inducible defence 437
Fig 1 Changes in population density of Euplotes aediculatus (a) and Euplotes plumi-pes (b) over time The counts are average number of cells in five samples of 200 microl ona logarithmic scale Each block (two panels) represents one replicate of each of sixtreatments where the left panel shows treatments without competing Paramecium androtifers and the right panel shows treatments with competition The time series corre-spond to the treatments live predators (L) dead predators (D) and no predators (N)The lines are non-parametric smoother curves produced by the lowess procedure in theprogram R Solid lines correspond to treatments with live predators broken lines withdead predators and dotted lines are controls
of all models containing the factors predation and conspecific density respec-tively shows that these two factors were on average equally important determi-nants of the defence level [E aediculatus predation 039 (sd = 029) con-specifics 027 (sd = 022) compared to constant model 044 (sd = 026) E
438 Res Altwegg et al
Fig 2 a
plumipes predation 011 (sd = 011) conspecifics 016 (sd = 020) comparedto constant model 074 (sd = 027)]
The relationships of cell width (level of defence) to both predator and con-specific densities were quite variable The slope of the reduced major axis(RMA) regression of cell width on number of predators in the sample variedfrom ndash2381 to 5265 (mean = 1257 sd = 2623) in E aediculatus and fromndash482 to 4459 (mean = 1704 sd = 1452) in E plumipes (Fig 3) Variation inthis relationship is unlikely to be affected greatly by variation in predator sizewhich was small compared to the variation in number of predators The RMAslope of cell width on number of conspecifics varied from ndash637 to 1269
Dynamics of an inducible defence 439
Fig 2 Mean cell width [microm] of a sample of Euplotes aediculatus (a) and E plumipes(b) cells observed over time See legend of Fig1 for details
(mean = 189 sd = 646) in E aediculatus and from ndash647 to 1530 (mean =046 sd = 580) in E plumipes Differences in how closely the defence leveltracked predation risk as indicated by the slopes of the regressions of defencelevel on predator and conspecific densities (Fig 3) did not explain a signifi-cant proportion of the variation in the coefficient of variance of Euplotes pop-ulation size over time (multiple regression of RMA slopes on CV populationsize E aediculatus R2 = 0342 E plumipes R2 = 0039 all coefficients Pgt 015) These results did not change if we considered longer time lags by re-lating defence level to predator densities observed five days earlier
440 Res Altwegg et al
Fig 3 a
Discussion
In replicated laboratory communities we investigated the dynamics of a mor-phological defence cell width of the ciliate Euplotes over thirty generationsWider cells are less likely to be eaten by gape limited predators (Kuhlmannamp Heckmann 1985) but they have a longer cell cycle and thus reduced pop-ulation growth compared to narrower cells (Kusch amp Kuhlmann 1994) Al-though we expected defence level (cell width) in Euplotes to closely trackpredation risk our study revealed that cell width was only loosely related topredation risk Euplotes did increase cell width when exposed to live or dead
Dynamics of an inducible defence 441
Fig 3 Mean cell width [microm] of Euplotes aediculatus (a) and E plumipes (b) cellsplotted against the number of predators (upper panels) and the number of Euplotes(lower panels) per 200 microl sample Only treatments with live predators are includedEach symbol type and line corresponds to one experimental unit measured repeatedlyover time and the lines are the best fitting reduced major axis (RMA) regression linesThe symbol-numbers correspond to the replicate number (ldquoBlockrdquo in Figs 1 and 2)Predator only treatments are shown in the left panels whereas treatments with pred-ators and competing Paramecium and rotifers are shown in the right panels If the de-fence levels match predation risk we expect cell width to increase with number ofpredators and decrease with number of conspecifics Note that the logarithmic scalewas used to facilitate the presentation in the lower two graphs The regression lines arelinear on the arithmetic scale
442 Res Altwegg et al
Table 2 Akaike weights based on sample-size-adjusted Akaikersquos Information Crite-rion (AICc) for five models fitted to each of ten replicate time series of the level of in-ducible defence in Euplotes aediculatus (a) and E plumipes (b) The column lsquoModelrsquodescribes factors included in the model These factors were either none (Intercept)number of predatory Stenostomum (Predation) number of conspecifics (Euplotes) andthe combination of both factors (P + E) including their interaction (P times E) K is thenumber of parameters in the model including one parameter for the variance Num-bers in parentheses indicate the length of the time series for each replicate Not all rep-licates were terminated at the same time resulting in different lengths In two caseswe had six measurements only and the most complex model (P X E) could not befitted The Akaike weights give relative support for a particular model compared to theother models and add up to one within each replicate
a) Akaike weights for E aediculatus
Model K Rep 1 Rep 2 Rep 3 Rep 4 Rep 5 Rep 6 Rep 7 Rep 8 Rep 9 Rep 10(11) (11) (12) (12) (11) (11) (12) (12) (6) (7)
Intercept 2 0025 0708 0349 0264 0190 0479 0310 0577 0672 0866Predation (P) 3 0902 0178 0061 0449 0514 0126 0073 0171 0294 0106Euplotes (E) 3 0004 0100 0207 0220 0027 0366 0425 0215 0034 0028P + E 4 0067 0014 0157 0060 0262 0029 0040 0034 0000 0001P times E 5 0003 0000 0227 0007 0007 0001 0151 0004 n a 0000
b) Akaike weights for E plumipes
Model K Rep 1 Rep 2 Rep 3 Rep 4 Rep 5 Rep 6 Rep 7 Rep 8 Rep 9 Rep 10(7) (7) (7) (7) (7) (7) (7) (7) (7) (6)
Intercept 2 0798 0884 0928 0924 0766 0779 0020 0736 0693 0893Predation (P) 3 0028 0030 0043 0035 0023 0175 0291 0225 0073 0099Euplotes (E) 3 0174 0086 0029 0042 0210 0046 0625 0038 0233 0007P + E 4 0000 0000 0000 0000 0000 0000 0064 0000 0001 0000P times E 5 0000 0000 0000 0000 0000 0000 0000 0000 0000 n a
predators and cell width varied over time in the predator treatments (seeFig 2) Earlier short-term studies have shown that Euplotes can closely adjusttheir reaction to different predator densities and that this reaction happenswithin hours under highly controlled experimental conditions (Kuhlmann ampHeckmann 1985 Kusch 1993) Despite possessing the ability to rapidly andaccurately alter their level of defence our long-term study showed that aver-age defence of a population of Euplotes may often not match predation riskclosely Our experimental conditions mimic natural systems by allowing fordynamic changes in food and predator numbers and our results are consistentwith data from natural ponds where a correlation between defence level andpredator density could not be established (Kusch 1995)
Predation risk for a single organism may depend on the density of bothpredators and conspecifics (Wiackowski amp Staronska 1999 Peacor 2003)While defence level was closely related to predator or conspecific densities in
Dynamics of an inducible defence 443
some replicates as expected we found no apparent connection between preda-tion risk and defence level in others (see Table 2 Fig 3) On average predatorand conspecific densities were about equally important across the whole ex-periment as predicted by recent theory (Peacor 2003) We observed substan-tial variation in the slope of cell width regressed on predator and competitordensities across replicates (see Fig 3) and model selection often favoured theconstant model over more complicated ones (see Table 2) This indicates thatother factors such as fluctuating resource levels may have modified the de-fensive response of Euplotes in our experiment At low resource levels organ-isms are predicted to invest less in costly defences than at high resource levels(Werner amp Anholt 1993 Wiackowski amp Szkarlat 1996) Our experimentminimised the problem of fluctuating resources by supplementing the semi-continuous batch cultures with a single wheat grain for a constant influx of nu-trients (Lawler amp Morin 1993 Holyoak et al 2000) Our procedure alsominimised the accumulation of waste products as we replaced 10 of the cul-ture content with fresh medium every two days Available resources mayhowever have varied due to changes in food quality as the bacteria commu-nity could have responded to selection imposed by the ciliates (Yoshida et al2003) A poor correspondence between risk and defence level may have beencaused by a poor reliability of the chemical cues which may have been de-graded by enzymes of bacterial origin In our experiment however cue degra-dation was not fast enough to prevent a strong reaction to added dead pred-ators
Euplotes showed different population dynamics depending on the type offood web they were embedded in In the presence of competitors (Parameciumand rotifers) the mean but not the variance in Euplotes population density wasdepressed Euplotes population density consequently showed a higher coeffi-cient of variation in the presence of competitors than in their absence as hasbeen found in other microcosm studies (Bengtsson amp Milbrink 1995)Euplotes aediculatus populations increased slowly during the initial phase ofthe experiment when predators were present With dead predators the rates ofincrease were intermediate between live and no predator treatments suggest-ing that part of the effect was caused by non-lethal effects of predation me-diated by the defensive trait of Euplotes Even though we could not establish asignificant direct connection between defence level and population growththis result is consistent with earlier studies showing that inducible defencesgenerally lead to reduced population growth and reduced competitive ability(Kusch amp Kuhlmann 1994 McPeek amp Peckarsky 1998 Lima 1998) If thecompetitive ability of a prey species depends on the level of defence predatorscan cause indirect effects in food webs without killing prey (trait-mediated in-direct effects reviewed by Werner amp Peacor 2003 Bolker et al 2003)The defensive response in Euplotes was induced by dead predator treatments
444 Res Altwegg et al
allowing us to separate trait-mediated effects from effects mediated by directpredation However competitors had similar effects on Euplotes in the pres-ence and absence of dead predators suggesting that trait-mediated indirect ef-fects on competitive ability were too weak to be detectable with our experi-mental design
Inducible defences and other types of phenotypic plasticity have typicallybeen studied over short time scales compared to the organismrsquos generationtime While earlier studies demonstrated that Euplotes reacts within hours wehere also find considerable variation in defence level on the scale of days toweeks The novel time scale we used (30 generations) therefore revealed dy-namics of the inducible defence in Euplotes that were on a similar time scaleto population dynamics For example mean cell width in one replicate holdinglive predators (E aediculatus Block 1 Fig 2) continued to increase over thewhole period Such phenotypic responses occurring over several generationsmay be difficult to anticipate from short term experiments only Yet availabletheory suggests that the time scale of response is important to community dy-namics Rapid and accurate responses tend to stabilise community dynamicswhereas delayed responses are destabilising (Ives amp Dobson 1987 Luttbegamp Schmitz 2000) Our experiment yields promising first insights into the dy-namics of inducible defence in Euplotes however the detailed data necessaryto gain a thorough understanding of the effects of inducible defences on thedynamics of this community await further study
Acknowledgements
We thank Juumlrgen Kusch Krzysztof Wiackowski and an anonymous reviewer forhelpful comments on an earlier version of the manuscript The research was funded bya NSERC of Canada research grant to BRA and Swiss Nationalfonds grant no 81ZH-68483 to RA
References
Abrams P A amp Matsuda H (1997) Prey adaptation as a cause of predator-prey cy-cles ndash Evolution 51 1742ndash1750
Anholt B R amp Werner E E (1999) Density-dependent consequences of inducedbehavior ndash In Tollrian R amp Harvell C D (eds) The ecology and evolutionof inducible defenses ndash Princeton University Press Princeton New Jersey
Bengtsson J amp Milbrink G (1995) Predicting extinctions interspecific competi-tion predation and population variability in experimental Daphnia populations ndashOecologia 101 397ndash406
Bolker B Holyoak M Krivan V Rowe L amp Schmitz O (2003) Connectingtheoretical and empirical studies of trait-mediated interactions ndash Ecology 841101ndash1114
Burnham K P amp Anderson D R (2002) Model selection and multimodel infer-ence a practical information-theoretic approach ndash Springer New York
Dynamics of an inducible defence 445
Holyoak M Lawler S P amp Crowley P H (2000) Predicting extinction pro-gress with an individual-based model of protozoan predators and prey ndash Ecology81 3312ndash3329
Ihaka R amp Gentleman R (1996) R a language for data analysis and graphics ndash JComput Graph Stat 5 299ndash314
Ives A R amp Dobson A P (1987) Antipredator behavior and the population dynam-ics of simple predator-prey systems ndash Amer Nat 130 431ndash337
Kuhlmann H-W amp Heckmann K (1985) Interspecific morphogens regulatingprey-predator relationships in protozoa ndash Science 227 1347ndash1349
ndash ndash (1994) Predation risk of typical ovoid and lsquowingedrsquo morphs of Euplotes (Pro-tozoa Ciliophora) ndash Hydrobiologia 284 219ndash227
Kuhlmann H-W Kusch J amp Heckmann K (1999) Predator-induced defenses inciliated protozoa ndash In Tollrian R amp Harvell C D (eds) The ecology andevolution of inducible defenses ndash Princeton University Press Princeton New Jer-sey pp 142ndash159
Kusch J (1993) Induction of defensive morphological changes in ciliates ndash Oecolo-gia 94 571ndash575
ndash (1995) Adaptation of inducible defense in Euplotes daidaleos (Ciliophora) topredation risks by various predators ndash Microb Ecol 30 79ndash88
Kusch J amp Kuhlmann H-W (1994) Cost of Stenostomum-induced morphologicaldefence in the ciliate Euplotes octocarinatus ndash Arch Hydrobiol 130 257ndash267
Lawler S P amp Morin P J (1993) Food web architecture and population dynamicsin laboratory microcosms of protists ndash Amer Nat 141 675ndash686
Lima S L (1998) Nonlethal effects in the ecology of predator-prey interactions ndashBioScience 48 25ndash34
Luttbeg B amp Schmitz O J (2000) Predator and prey models with flexible indi-vidual behavior and imperfect information ndash Amer Nat 155 669ndash683
McArdle B H (1988) The structural relationship regression in biology ndash Can JZool 66 2329ndash2339
McArdle B H Gaston K J amp Lawton J H (1990) Variation in the size ofanimal populations patterns problems and artefacts ndash J Anim Ecol 59 439ndash454
McPeek M amp Peckarsky B L (1998) Life histories and the strengths of species in-teractions combining mortality growth and fecundity effects ndash Ecology 79867ndash879
Peacor S D (2003) Phenotypic modifications to conspecific density arising frompredation risk assessment ndash Oikos 100 409ndash415
Tollrian R amp Harvell C D (1999) The ecology and evolution of inducible de-fenses ndash Princeton University Press Princeton New Jersey
Werner E E amp Anholt B R (1993) Ecological consequences of the trade-off be-tween growth and mortality rates mediated by foraging activity ndash Amer Nat 142242ndash272
Werner E E amp Peacor S D (2003) A review of trait-mediated indirect interac-tions in ecological communities ndash Ecology 84 1083ndash1100
Wiackowski K Fyda J Pajdak-Stoacutes A amp Adamus K (2003) Predator-inducedmorphological defence in ciliates interclonal variation for sensitivity to the induc-ing factors ndash Oikos 100 534ndash540
446 Res Altwegg et al
Wiackowski K amp Staronska A (1999) The effect of predator and prey density onthe induced defences of a ciliate ndash Funct Ecol 13 59ndash65
Wiackowski K amp Szkarlat M (1996) Effects of food availability on predator-induced morphological defence in the ciliate Euplotes octocarinatus (Protista) ndashHydrobiologia 321 47ndash52
Yoshida T Jones L E Ellner S P Fussmann G F amp Hairston Jr N G(2003) Rapid evolution drives ecological dynamics in a predator-prey system ndashNature 424 303ndash306
Submitted 8 December 2003 accepted 16 February 2004
432 Res Altwegg et al
Introduction
Many organisms react to variable and unpredictable predation risk by employ-ing inducible defences (recently reviewed by Tollrian amp Harvell 1999) Inthe defended state predation is reduced however prey with induced defencestructures usually grow more slowly than those undefended As predator den-sities increase more prey individuals are expected to be in the defended statePredator feeding success is expected to decrease and so is predator populationgrowth As prey density increases and resources become scarce prey individu-als are expected to invest less in costly defences become more vulnerable andenable a fast increase in predator population size (Werner amp Anholt 1993)Thus inducible defences may generate density dependence in both halves ofthe predatorprey relationship (Anholt amp Werner 1999) and possibly stabi-lise dynamics (Ives amp Dobson 1987) However inducible defences may alsodestabilise predatorprey dynamics (Abrams amp Matsuda 1997) through timedelays initiated by the reaction time of prey to changes in predation risk(Luttbeg amp Schmitz 2000) Thus the influence of inducible defences onpredator-prey dynamics depends on the ability of prey defences to track preda-tion risk
The ability of the prey defence to track predation risk depends on threeconditions 1) how quickly defensive traits change in relation to changes inpredation risk 2) reliability and transmission distance of the cue relative to lo-comotory speed of prey and predators and 3) the cost-benefit trade-off of thedefence which can be affected by additional factors such as resource levelsThese three conditions may cause fluctuations in an inducible defence thatcannot be anticipated by short term experiments alone
We studied the dynamics of an inducible defence in the ciliate protist Eup-lotes Euplotes change their cell shape by forming wing-like lateral projectionsthat effectively protect them from being eaten by gape limited predators suchas the turbellarian Stenostomum or predatory ciliates (Kuhlmann amp Heck-mann 1994 Kuhlmann et al 1999) Expressing this defence results in longercell cycles and thus slower population growth (Kusch amp Kuhlmann 1994)The defence is gradually expressed within hours (Kuhlmann amp Heckmann1985) and can be reversed within a single cell cycle Both the costs and bene-fits of defence expression in Euplotes appear to scale approximately linearlywith the level of expression (Wiackowski et al 2003)
We address two questions in this study by focusing on Euplotes populationdynamics 1) How much do predation predation risk and competition depressinitial population growth and how do these factors affect mean maximumand variation in population numbers over time 2) How closely does morpho-logical defence track predation risk as measured by the density of predatorsand conspecifics
Dynamics of an inducible defence 433
Methods
Experimental procedures
We examined the consequences of flexible body shape to population dynamics usingthree cultures of Euplotes which had been initiated from a single cell each and kept asseparate clonal lines thereafter We used one clone of each of three species Euplotesaediculatus Aed 33 E octocarinatus Octo C1 and E plumipes Plu (kindly suppliedby K Wiackowski at Jagiellonian University Krakow Poland)
All experiments were conducted in six-well tissue culture plates (Nr 353046MULTIWELLTM Becton Dickinson Labware NJ USA) Each well held 10 ml of ster-ile medium consisting of one protozoa food pellet (Nr 13-2360 Carolina BiologicalSupply Company NC USA) dissolved in 2 litres of mineral water (NAYA MirabelQueacutebec Canada) An autoclaved wheat grain was added to each well to provide nutri-ents We initially stocked each well with 50 Euplotes cells to begin the experiment atlow densities Each clone was subjected to six experimental treatments randomly as-signed to a well within a given plate The treatments were i) Euplotes alone ii) withcompetitors (50 Paramecium aurelia were added at the beginning of the experiment)iii) with predatory cue (~ 50 individuals of the predatory Stenostomum sp which hadbeen freezer-killed at ndash5 ˚C) iv) with predatory cue and competitors v) with live pred-ators (20 predators were added once at the beginning of the experiment) and vi) withlive predators and competitors Dead predators induce the defended phenotype inEuplotes (acting as a predatory cue) allowing us to separate the effects of increaseddefence level from effects of predation Dead predator treatments had to be replenishedevery two days to maintain the predation cue at a constant high level During the freez-ing process predators disintegrated and we do not know how quickly they degradedBy adding dead predators we added nutrients that potentially increased bacterialgrowth However the volume of predators added was small compared to the constantsupply from the wheat grain and the medium which was replenished every two daysWe never observed bacterial overgrowth in any of the wells associated with dead pred-ators The Paramecium cultures unintentionally contained a dicranophorid rotiferwhich subsequently reached significant population densities in the competition treat-ments
We replicated each treatment five times using a randomised block design andstarted the experiment on 23 January 2003 Every two days we removed 10 (fivesamples of 200 microl) of the content of each well and replaced it with sterile medium Allprotists rotifers and Stenostomum were counted under a dissecting microscope Everyfour days we photographed one to 33 Euplotes cells (median 10) directly through theflat bottom of the experimental containers using an inverted microscope (Leica Dm-IRB) with an attached CCD camera (COHU) The cell width (measured using the soft-ware package ImagePro) obtained from these photographs served as our measure ofthe level of induction Constrained by the available workforce we ended the E octo-carinatus treatments after 12 days E plumipes after 30 days and E aediculatus after50 days except one block which was terminated after 30 days
434 Res Altwegg et al
Statistical analyses
We divided the time series into a phase of initial population increase (phase 1 the firsteight days) and remaining time (phase 2 day 8 and onwards) We estimated the pop-ulation growth rate during phase 1 by fitting linear regression models to the logarithmsof the mean counts per day for each well The slope provides an estimate of the pop-ulation growth rate at low population densities This estimate is lower than the truevalue because it ignores the 10 density independent mortality that we imposed everytwo days through our sampling procedure Nevertheless sampling mortality was con-stant across all treatments and thus we do not further correct for this We applied anal-ysis of variance (ANOVA) to test for the effects of competition and predator treatmenton population growth rate We used the coefficient of variation of mean populationcounts (McArdle et al 1990) and the mean and maximum of each population tocharacterise population dynamics during phase 2 The effects of competition and pred-ation on these characteristics were then evaluated by multivariate analysis of variance(MANOVA)
If the level of defence closely tracks predation risk it should respond to changes inpredator density and conspecific density Specifically we evaluated the followinghypotheses First predator density alone should explain variation in the level of de-fence in Euplotes if they react only to cues emitted by the predators (Wiackowski etal 2003) Second Euplotes may base their reaction solely on the number of conspec-ifics due either to reliance on the herd effect or changes in resource allocation withconspecific density Third a simultaneous response to both predator and conspecificdensity is possible as predicted by optimality considerations (Wiackowski amp Sta-ronska 1999 Peacor 2003) Fourth there may be an interaction between the reactionto predators and the reaction to conspecific density For example at low predator densi-ties prey may not react to changes in conspecific density Finally the variation in preydefence level may not directly be related to either predator or conspecific density forexample if the defence strongly depends on the current resource level (Werner amp An-holt 1993) We fitted five linear regression models corresponding to these alternativehypotheses to the time series produced by each experimental unit and assessed thesupport for each model using the sample-size-adjusted Akaikersquos Information Criterion(AICc Burnham amp Anderson 2002) Akaike weights assess the relative support agiven model has from the data relative to the other models in the set and summing theAkaike weights for all models containing a particular factor (e g predator density)gives a measure of importance of that factor (Burnham amp Anderson 2002) The re-gression analyses related the mean width of all measured cells to the count of predatorsor conspecifics of the previous day and we weighted each observation by the squareroot of the number of measured cells This procedure assigns a higher weight to thoseobservations for which we have more reliable data Reduced major axis regression ispreferable to ordinary (least-squares) regression in our case because both independentand dependent variables were affected by measurement error (McArdle 1988) Thuswe report the reduced major axis regression slope of cell width on number of predatorsor conspecifics in the sample All statistical analyses were calculated using the R soft-ware version 171 (Ihaka amp Gentleman 1996 available at httpwwwr-projectorg)
Dynamics of an inducible defence 435
Results
Euplotes population dynamics
The Euplotes population failed to establish in two experimental units whichconsequently were eliminated from all analyses The other experimental pop-ulations grew exponentially (approximately linear on the log scale Fig1) overthe first eight days and were not significantly affected by their competitors(all P gt 05) Population growth of E aediculatus but not the other two cloneswas reduced by the predator treatments (predator treatment entered the analy-sis as a factor with two degrees of freedom F220 = 1006 P lt 0001 plumipesand octocarinatus P gt 01) with live predators having a larger negative effectthan dead predators Population growth was not significantly related to thelevel of defence on day 2 when densities were still consistently low in all ex-perimental units (linear regression of population growth on mean cell width Pgt 05 for all clones)
MANOVA showed that population dynamics after day eight of both Eaediculatus and E plumipes (no data were collected for E octocarinatus) wasaffected by competitors but not by predator treatment (Fig 1 Table 1) Sub-sequent univariate analyses showed that competitors depressed mean and max-imum population numbers in both clones and increased the coefficient of var-iation in population numbers in E aediculatus (all P lt 002)
Predation risk and level of defence
Euplotes strongly reacted to both live and dead predators by increasing theircell width (Fig 2) The variation in the level of this defence was larger in pred-ator treatments than predator-free replicates (standard deviation of body widthover time E aediculatus 54 124 and 137 in control dead predator andlive predator treatments F224 = 127 P lt 0001 E plumipes sd = 48 60 and102 F223 = 139 P lt 0001) In E aediculatus but not E plumipes the varia-
Table 1 Summary of MANOVA results on the effects of competition and predatortreatment on Euplotes population dynamics after day eight Population dynamics werecharacterised by the coefficient of variation in population size log(mean populationsize) and log(maximum population size)
Euplotes aediculatus E plumipes
Wilks λ F Num Den P Wilks λ F Num Den PDF Df DF Df
Competition (C) 0431 7923 3 18 0001 0686 2592 3 17 0087Predation (P) 0791 0748 6 36 0615 0830 0555 6 34 0763Block 0484 1262 12 479 0272 0248 2620 12 453 0010C times P 0676 1300 6 36 0282 0629 1481 6 34 0214
436 Res Altwegg et al
Fig1 a
tion in defence was also larger in treatments with competitors compared totreatments without competitors (E aediculatus 130 vs 77 F124 = 147 Plt0001 E plumipes P gt02)
We further investigated whether variation in defence level in live-predatortreatments was caused by fluctuations in predator numbers conspecific den-sity or both Model selection favoured the constant model in 6 out of 10 repli-cates for E aediculatus and in 9 out of 10 replicates for E plumipes (Table 2)This result reflects a generally loose relationship between risk and the level ofdefence and a tendency for the model selection criterion (AICc) to selectsimple models at the available low sample sizes Summing the Akaike weights
Dynamics of an inducible defence 437
Fig 1 Changes in population density of Euplotes aediculatus (a) and Euplotes plumi-pes (b) over time The counts are average number of cells in five samples of 200 microl ona logarithmic scale Each block (two panels) represents one replicate of each of sixtreatments where the left panel shows treatments without competing Paramecium androtifers and the right panel shows treatments with competition The time series corre-spond to the treatments live predators (L) dead predators (D) and no predators (N)The lines are non-parametric smoother curves produced by the lowess procedure in theprogram R Solid lines correspond to treatments with live predators broken lines withdead predators and dotted lines are controls
of all models containing the factors predation and conspecific density respec-tively shows that these two factors were on average equally important determi-nants of the defence level [E aediculatus predation 039 (sd = 029) con-specifics 027 (sd = 022) compared to constant model 044 (sd = 026) E
438 Res Altwegg et al
Fig 2 a
plumipes predation 011 (sd = 011) conspecifics 016 (sd = 020) comparedto constant model 074 (sd = 027)]
The relationships of cell width (level of defence) to both predator and con-specific densities were quite variable The slope of the reduced major axis(RMA) regression of cell width on number of predators in the sample variedfrom ndash2381 to 5265 (mean = 1257 sd = 2623) in E aediculatus and fromndash482 to 4459 (mean = 1704 sd = 1452) in E plumipes (Fig 3) Variation inthis relationship is unlikely to be affected greatly by variation in predator sizewhich was small compared to the variation in number of predators The RMAslope of cell width on number of conspecifics varied from ndash637 to 1269
Dynamics of an inducible defence 439
Fig 2 Mean cell width [microm] of a sample of Euplotes aediculatus (a) and E plumipes(b) cells observed over time See legend of Fig1 for details
(mean = 189 sd = 646) in E aediculatus and from ndash647 to 1530 (mean =046 sd = 580) in E plumipes Differences in how closely the defence leveltracked predation risk as indicated by the slopes of the regressions of defencelevel on predator and conspecific densities (Fig 3) did not explain a signifi-cant proportion of the variation in the coefficient of variance of Euplotes pop-ulation size over time (multiple regression of RMA slopes on CV populationsize E aediculatus R2 = 0342 E plumipes R2 = 0039 all coefficients Pgt 015) These results did not change if we considered longer time lags by re-lating defence level to predator densities observed five days earlier
440 Res Altwegg et al
Fig 3 a
Discussion
In replicated laboratory communities we investigated the dynamics of a mor-phological defence cell width of the ciliate Euplotes over thirty generationsWider cells are less likely to be eaten by gape limited predators (Kuhlmannamp Heckmann 1985) but they have a longer cell cycle and thus reduced pop-ulation growth compared to narrower cells (Kusch amp Kuhlmann 1994) Al-though we expected defence level (cell width) in Euplotes to closely trackpredation risk our study revealed that cell width was only loosely related topredation risk Euplotes did increase cell width when exposed to live or dead
Dynamics of an inducible defence 441
Fig 3 Mean cell width [microm] of Euplotes aediculatus (a) and E plumipes (b) cellsplotted against the number of predators (upper panels) and the number of Euplotes(lower panels) per 200 microl sample Only treatments with live predators are includedEach symbol type and line corresponds to one experimental unit measured repeatedlyover time and the lines are the best fitting reduced major axis (RMA) regression linesThe symbol-numbers correspond to the replicate number (ldquoBlockrdquo in Figs 1 and 2)Predator only treatments are shown in the left panels whereas treatments with pred-ators and competing Paramecium and rotifers are shown in the right panels If the de-fence levels match predation risk we expect cell width to increase with number ofpredators and decrease with number of conspecifics Note that the logarithmic scalewas used to facilitate the presentation in the lower two graphs The regression lines arelinear on the arithmetic scale
442 Res Altwegg et al
Table 2 Akaike weights based on sample-size-adjusted Akaikersquos Information Crite-rion (AICc) for five models fitted to each of ten replicate time series of the level of in-ducible defence in Euplotes aediculatus (a) and E plumipes (b) The column lsquoModelrsquodescribes factors included in the model These factors were either none (Intercept)number of predatory Stenostomum (Predation) number of conspecifics (Euplotes) andthe combination of both factors (P + E) including their interaction (P times E) K is thenumber of parameters in the model including one parameter for the variance Num-bers in parentheses indicate the length of the time series for each replicate Not all rep-licates were terminated at the same time resulting in different lengths In two caseswe had six measurements only and the most complex model (P X E) could not befitted The Akaike weights give relative support for a particular model compared to theother models and add up to one within each replicate
a) Akaike weights for E aediculatus
Model K Rep 1 Rep 2 Rep 3 Rep 4 Rep 5 Rep 6 Rep 7 Rep 8 Rep 9 Rep 10(11) (11) (12) (12) (11) (11) (12) (12) (6) (7)
Intercept 2 0025 0708 0349 0264 0190 0479 0310 0577 0672 0866Predation (P) 3 0902 0178 0061 0449 0514 0126 0073 0171 0294 0106Euplotes (E) 3 0004 0100 0207 0220 0027 0366 0425 0215 0034 0028P + E 4 0067 0014 0157 0060 0262 0029 0040 0034 0000 0001P times E 5 0003 0000 0227 0007 0007 0001 0151 0004 n a 0000
b) Akaike weights for E plumipes
Model K Rep 1 Rep 2 Rep 3 Rep 4 Rep 5 Rep 6 Rep 7 Rep 8 Rep 9 Rep 10(7) (7) (7) (7) (7) (7) (7) (7) (7) (6)
Intercept 2 0798 0884 0928 0924 0766 0779 0020 0736 0693 0893Predation (P) 3 0028 0030 0043 0035 0023 0175 0291 0225 0073 0099Euplotes (E) 3 0174 0086 0029 0042 0210 0046 0625 0038 0233 0007P + E 4 0000 0000 0000 0000 0000 0000 0064 0000 0001 0000P times E 5 0000 0000 0000 0000 0000 0000 0000 0000 0000 n a
predators and cell width varied over time in the predator treatments (seeFig 2) Earlier short-term studies have shown that Euplotes can closely adjusttheir reaction to different predator densities and that this reaction happenswithin hours under highly controlled experimental conditions (Kuhlmann ampHeckmann 1985 Kusch 1993) Despite possessing the ability to rapidly andaccurately alter their level of defence our long-term study showed that aver-age defence of a population of Euplotes may often not match predation riskclosely Our experimental conditions mimic natural systems by allowing fordynamic changes in food and predator numbers and our results are consistentwith data from natural ponds where a correlation between defence level andpredator density could not be established (Kusch 1995)
Predation risk for a single organism may depend on the density of bothpredators and conspecifics (Wiackowski amp Staronska 1999 Peacor 2003)While defence level was closely related to predator or conspecific densities in
Dynamics of an inducible defence 443
some replicates as expected we found no apparent connection between preda-tion risk and defence level in others (see Table 2 Fig 3) On average predatorand conspecific densities were about equally important across the whole ex-periment as predicted by recent theory (Peacor 2003) We observed substan-tial variation in the slope of cell width regressed on predator and competitordensities across replicates (see Fig 3) and model selection often favoured theconstant model over more complicated ones (see Table 2) This indicates thatother factors such as fluctuating resource levels may have modified the de-fensive response of Euplotes in our experiment At low resource levels organ-isms are predicted to invest less in costly defences than at high resource levels(Werner amp Anholt 1993 Wiackowski amp Szkarlat 1996) Our experimentminimised the problem of fluctuating resources by supplementing the semi-continuous batch cultures with a single wheat grain for a constant influx of nu-trients (Lawler amp Morin 1993 Holyoak et al 2000) Our procedure alsominimised the accumulation of waste products as we replaced 10 of the cul-ture content with fresh medium every two days Available resources mayhowever have varied due to changes in food quality as the bacteria commu-nity could have responded to selection imposed by the ciliates (Yoshida et al2003) A poor correspondence between risk and defence level may have beencaused by a poor reliability of the chemical cues which may have been de-graded by enzymes of bacterial origin In our experiment however cue degra-dation was not fast enough to prevent a strong reaction to added dead pred-ators
Euplotes showed different population dynamics depending on the type offood web they were embedded in In the presence of competitors (Parameciumand rotifers) the mean but not the variance in Euplotes population density wasdepressed Euplotes population density consequently showed a higher coeffi-cient of variation in the presence of competitors than in their absence as hasbeen found in other microcosm studies (Bengtsson amp Milbrink 1995)Euplotes aediculatus populations increased slowly during the initial phase ofthe experiment when predators were present With dead predators the rates ofincrease were intermediate between live and no predator treatments suggest-ing that part of the effect was caused by non-lethal effects of predation me-diated by the defensive trait of Euplotes Even though we could not establish asignificant direct connection between defence level and population growththis result is consistent with earlier studies showing that inducible defencesgenerally lead to reduced population growth and reduced competitive ability(Kusch amp Kuhlmann 1994 McPeek amp Peckarsky 1998 Lima 1998) If thecompetitive ability of a prey species depends on the level of defence predatorscan cause indirect effects in food webs without killing prey (trait-mediated in-direct effects reviewed by Werner amp Peacor 2003 Bolker et al 2003)The defensive response in Euplotes was induced by dead predator treatments
444 Res Altwegg et al
allowing us to separate trait-mediated effects from effects mediated by directpredation However competitors had similar effects on Euplotes in the pres-ence and absence of dead predators suggesting that trait-mediated indirect ef-fects on competitive ability were too weak to be detectable with our experi-mental design
Inducible defences and other types of phenotypic plasticity have typicallybeen studied over short time scales compared to the organismrsquos generationtime While earlier studies demonstrated that Euplotes reacts within hours wehere also find considerable variation in defence level on the scale of days toweeks The novel time scale we used (30 generations) therefore revealed dy-namics of the inducible defence in Euplotes that were on a similar time scaleto population dynamics For example mean cell width in one replicate holdinglive predators (E aediculatus Block 1 Fig 2) continued to increase over thewhole period Such phenotypic responses occurring over several generationsmay be difficult to anticipate from short term experiments only Yet availabletheory suggests that the time scale of response is important to community dy-namics Rapid and accurate responses tend to stabilise community dynamicswhereas delayed responses are destabilising (Ives amp Dobson 1987 Luttbegamp Schmitz 2000) Our experiment yields promising first insights into the dy-namics of inducible defence in Euplotes however the detailed data necessaryto gain a thorough understanding of the effects of inducible defences on thedynamics of this community await further study
Acknowledgements
We thank Juumlrgen Kusch Krzysztof Wiackowski and an anonymous reviewer forhelpful comments on an earlier version of the manuscript The research was funded bya NSERC of Canada research grant to BRA and Swiss Nationalfonds grant no 81ZH-68483 to RA
References
Abrams P A amp Matsuda H (1997) Prey adaptation as a cause of predator-prey cy-cles ndash Evolution 51 1742ndash1750
Anholt B R amp Werner E E (1999) Density-dependent consequences of inducedbehavior ndash In Tollrian R amp Harvell C D (eds) The ecology and evolutionof inducible defenses ndash Princeton University Press Princeton New Jersey
Bengtsson J amp Milbrink G (1995) Predicting extinctions interspecific competi-tion predation and population variability in experimental Daphnia populations ndashOecologia 101 397ndash406
Bolker B Holyoak M Krivan V Rowe L amp Schmitz O (2003) Connectingtheoretical and empirical studies of trait-mediated interactions ndash Ecology 841101ndash1114
Burnham K P amp Anderson D R (2002) Model selection and multimodel infer-ence a practical information-theoretic approach ndash Springer New York
Dynamics of an inducible defence 445
Holyoak M Lawler S P amp Crowley P H (2000) Predicting extinction pro-gress with an individual-based model of protozoan predators and prey ndash Ecology81 3312ndash3329
Ihaka R amp Gentleman R (1996) R a language for data analysis and graphics ndash JComput Graph Stat 5 299ndash314
Ives A R amp Dobson A P (1987) Antipredator behavior and the population dynam-ics of simple predator-prey systems ndash Amer Nat 130 431ndash337
Kuhlmann H-W amp Heckmann K (1985) Interspecific morphogens regulatingprey-predator relationships in protozoa ndash Science 227 1347ndash1349
ndash ndash (1994) Predation risk of typical ovoid and lsquowingedrsquo morphs of Euplotes (Pro-tozoa Ciliophora) ndash Hydrobiologia 284 219ndash227
Kuhlmann H-W Kusch J amp Heckmann K (1999) Predator-induced defenses inciliated protozoa ndash In Tollrian R amp Harvell C D (eds) The ecology andevolution of inducible defenses ndash Princeton University Press Princeton New Jer-sey pp 142ndash159
Kusch J (1993) Induction of defensive morphological changes in ciliates ndash Oecolo-gia 94 571ndash575
ndash (1995) Adaptation of inducible defense in Euplotes daidaleos (Ciliophora) topredation risks by various predators ndash Microb Ecol 30 79ndash88
Kusch J amp Kuhlmann H-W (1994) Cost of Stenostomum-induced morphologicaldefence in the ciliate Euplotes octocarinatus ndash Arch Hydrobiol 130 257ndash267
Lawler S P amp Morin P J (1993) Food web architecture and population dynamicsin laboratory microcosms of protists ndash Amer Nat 141 675ndash686
Lima S L (1998) Nonlethal effects in the ecology of predator-prey interactions ndashBioScience 48 25ndash34
Luttbeg B amp Schmitz O J (2000) Predator and prey models with flexible indi-vidual behavior and imperfect information ndash Amer Nat 155 669ndash683
McArdle B H (1988) The structural relationship regression in biology ndash Can JZool 66 2329ndash2339
McArdle B H Gaston K J amp Lawton J H (1990) Variation in the size ofanimal populations patterns problems and artefacts ndash J Anim Ecol 59 439ndash454
McPeek M amp Peckarsky B L (1998) Life histories and the strengths of species in-teractions combining mortality growth and fecundity effects ndash Ecology 79867ndash879
Peacor S D (2003) Phenotypic modifications to conspecific density arising frompredation risk assessment ndash Oikos 100 409ndash415
Tollrian R amp Harvell C D (1999) The ecology and evolution of inducible de-fenses ndash Princeton University Press Princeton New Jersey
Werner E E amp Anholt B R (1993) Ecological consequences of the trade-off be-tween growth and mortality rates mediated by foraging activity ndash Amer Nat 142242ndash272
Werner E E amp Peacor S D (2003) A review of trait-mediated indirect interac-tions in ecological communities ndash Ecology 84 1083ndash1100
Wiackowski K Fyda J Pajdak-Stoacutes A amp Adamus K (2003) Predator-inducedmorphological defence in ciliates interclonal variation for sensitivity to the induc-ing factors ndash Oikos 100 534ndash540
446 Res Altwegg et al
Wiackowski K amp Staronska A (1999) The effect of predator and prey density onthe induced defences of a ciliate ndash Funct Ecol 13 59ndash65
Wiackowski K amp Szkarlat M (1996) Effects of food availability on predator-induced morphological defence in the ciliate Euplotes octocarinatus (Protista) ndashHydrobiologia 321 47ndash52
Yoshida T Jones L E Ellner S P Fussmann G F amp Hairston Jr N G(2003) Rapid evolution drives ecological dynamics in a predator-prey system ndashNature 424 303ndash306
Submitted 8 December 2003 accepted 16 February 2004
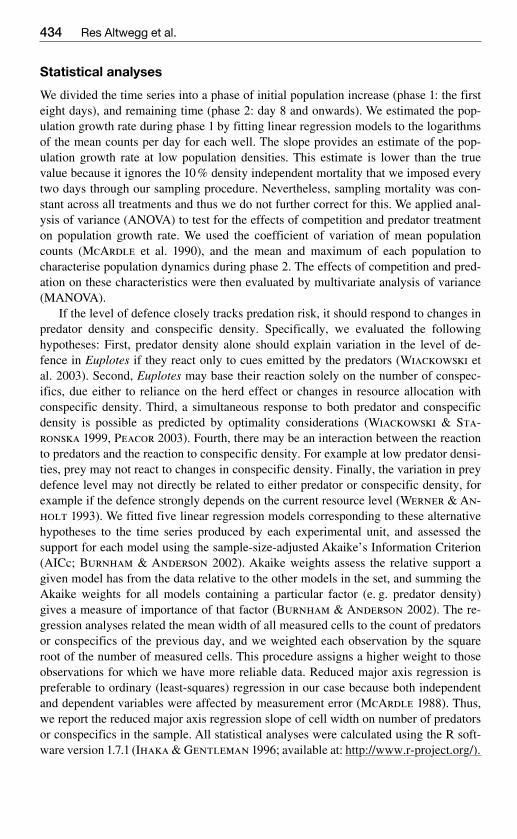
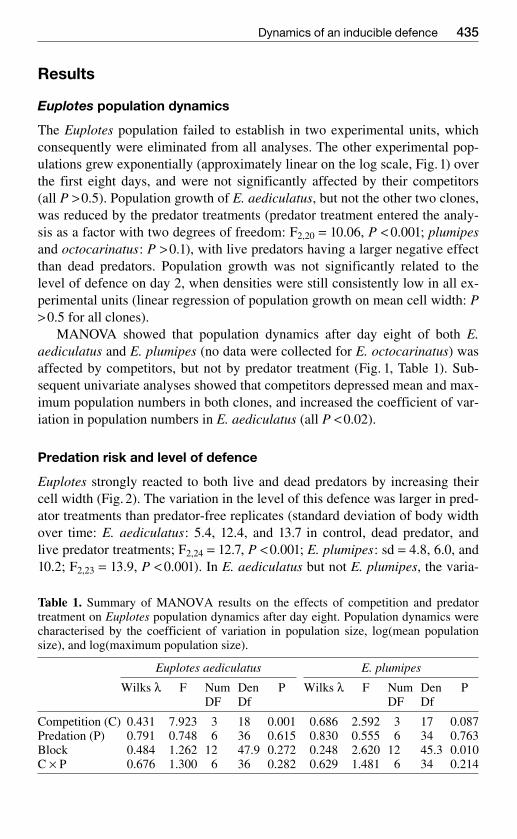
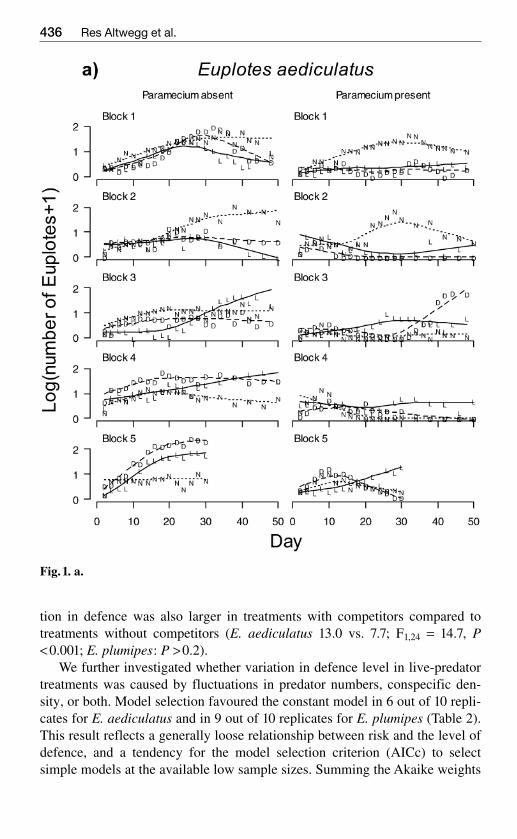
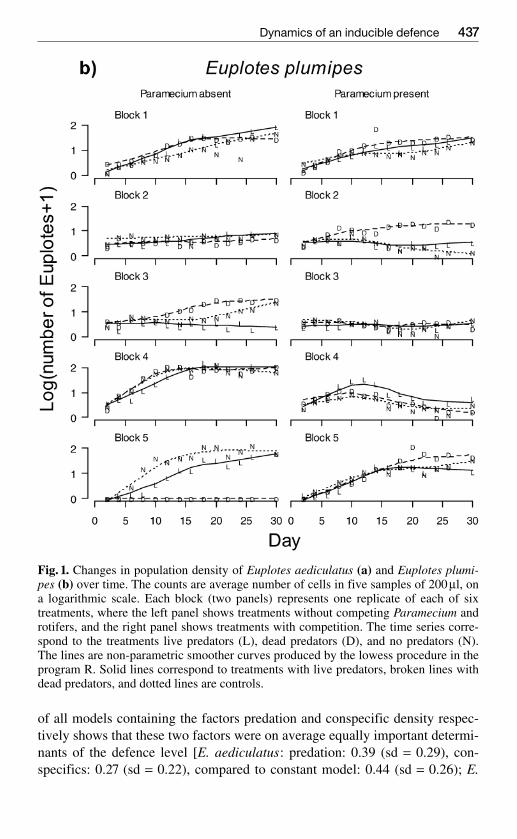
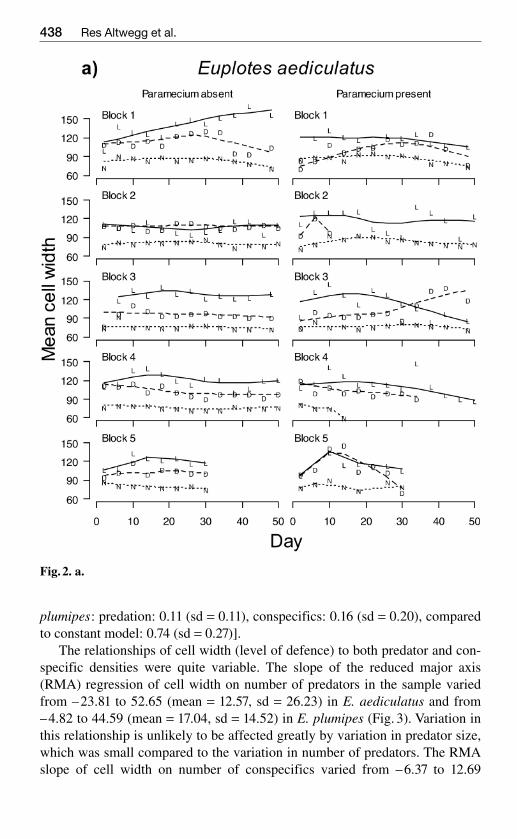
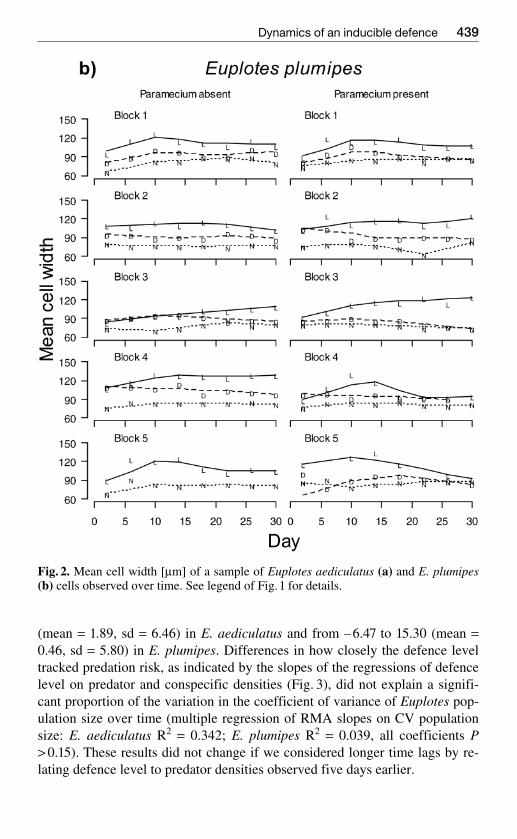
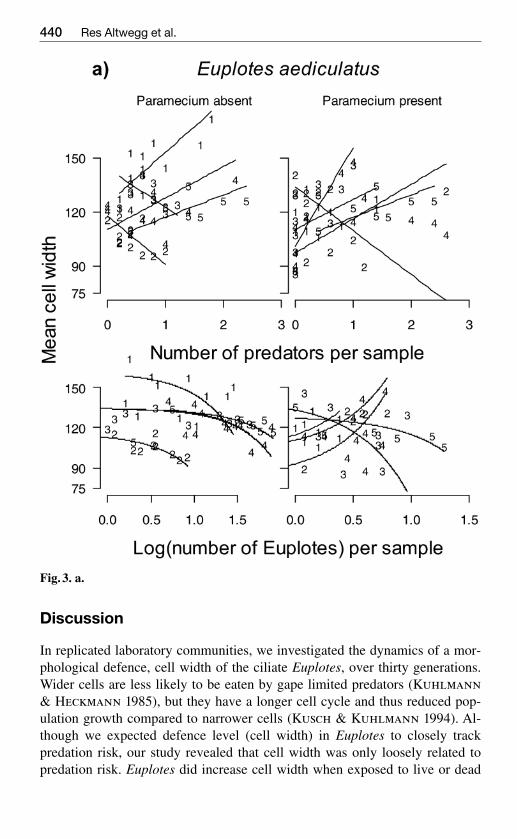
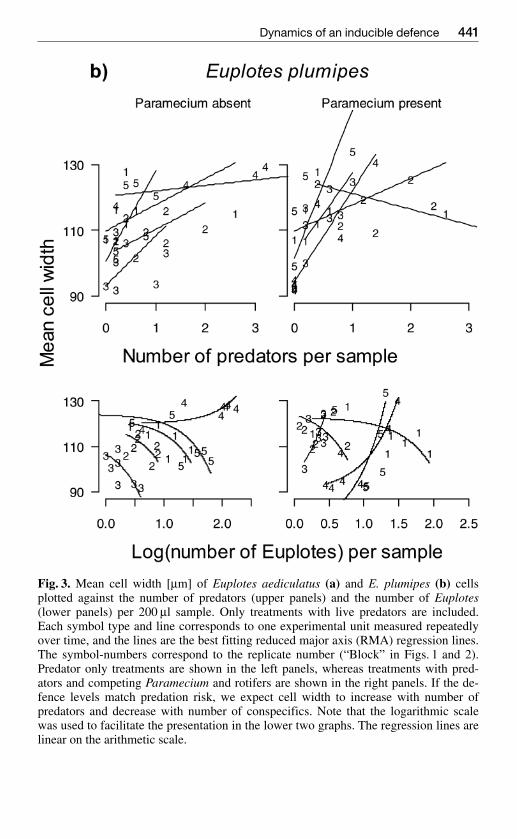
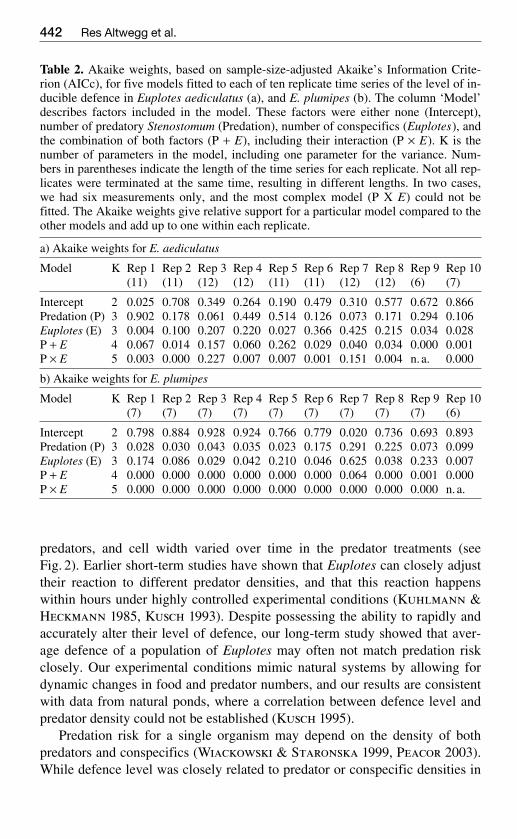
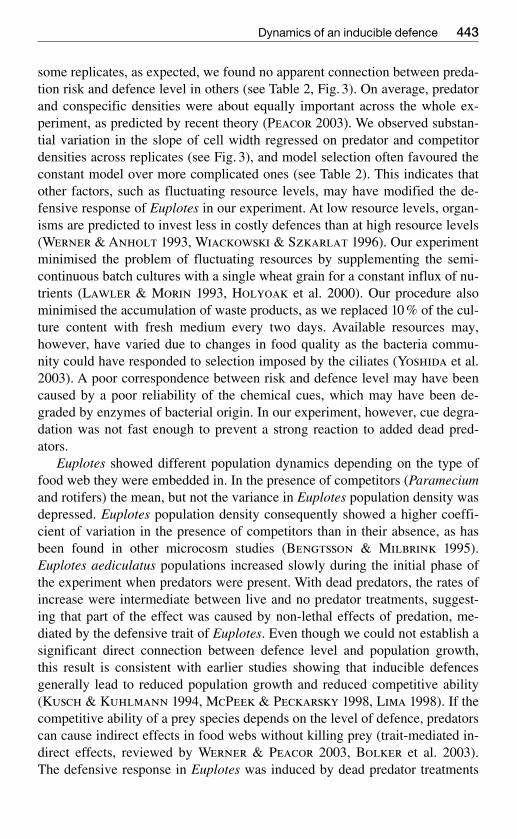