Dust: A Metric for Use in Residential and Building Exposure Assessment and Source Characterization
15
Environmental Health Perspectives • VOLUME 110 | NUMBER 10 | October 2002 969 Dust: A Metric for Use in Residential and Building Exposure Assessment and Source Characterization Paul J. Lioy, 1 Natalie C.G. Freeman, 1 and James R. Millette 2 1 Environmental and Occupational Sciences Institute, University of Medicine and Dentistry of New Jersey-Robert Wood Johnson Medical School, Piscataway, New Jersey, USA; 2 MVA, Inc., Norcross, Georgia, USA The maturation of the field of exposure analy- sis and assessment has led to the development of many innovative methods and strategies to detect, reduce, and prevent human contact with environmental toxicants. These toxicants can be found in air, water, soil, or food. Some methods employed by investigators are new (e.g., biological markers and human videotap- ing), whereas others are adaptations of meth- ods used for general or specific types of environmental or occupational investigations (microscopic analyses, modeling, and personal monitoring). Depending on the type of method chosen, each may be applicable for epidemiologic investigations, human exposure profiling for specific contaminants or events, and/or risk assessment. In addition, and as a result of the findings made in the Total Exposure Assessment Methodology (TEAM) studies and others conducted during the 1980s, the field of exposure analysis has turned its attention beyond primarily measuring toxi- cants in outdoor environmental situations (1–9). Now information is frequently obtained from one or more different microenviron- ments occupied or passed through by an indi- vidual or individuals over the course of a day. The purpose of this article is to review the types of information available on dust in residential settings, the metrics used for exposure and source characterizations, and the composition of dust. We also review and evaluate the methods used to affect residential dust and soil. We explore the applications of dust for exposure and source-related analyses and ways to improve quantitative dust char- acterization in the future. A number of studies have shown that for individuals and populations, especially chil- dren and other vulnerable subgroups, the home environment can be a potential source of passive or active exposure to toxicants (10–23). This presents a complex situation for the expo- sure specialist and for other environmental health scientists in their attempts to identify the potential or actual risk associated with common or specific environmental toxicants. There are many different types of toxicants that can be present for short or long periods in a building, and each could be in a form or location that is readily accessible for contact by inhabitants or visitors (5,24–26). Because toxi- cants can come from multiple sources (indoors or outdoors), media, and activities, exposures can occur at single or multiple routes of entry into the body. The question that arises is, how does one determine which toxicant and source, or multiples of each, are of greatest concern to the health of the residents? Beyond obtaining measurements for the toxicant levels present at routes of entry into the body, variables needed to characterize exposure are the activities and the patterns of activity and uncommon events that may result in passive or active exposures. Thus, the number and complexity of the types of vari- ables needed to understand exposure can become large. This leads directly to consider- ation of a triage to the application of sam- pling and analysis strategies for finding the best ways to identify, examine, and explain potential or actual exposures and to find and select the most appropriate mitigation or pre- vention strategies. Sampling and analysis strategies are becoming increasingly impor- tant as the field attempts to provide informa- tion on cumulative exposure to multiple toxicants in a single medium and the aggre- gate exposure associated with a single toxicant from multiple exposure pathways (26–29). Because of the multiplicity of indoor and outdoor sources and routes of contact that can occur in the home, residential dust (house dust) and residential/community soil repre- sent two categories within one medium— soil—that can benefit from a triage of measurement strategies. The approach will allow the investigation of the influence of multiple variables on the intensity and dura- tion of contact with toxicants that can result in cumulative or aggregate exposures. Soil and Dust: Perspective for Exposure Studies For many years, soil samples have been col- lected as cores in various urban and industrial locations (30). There is a wealth of information Address correspondence to P.J. Lioy, Environmental and Occupational Sciences Institute, University of Medicine and Dentistry of New Jersey-Robert Wood Johnson Medical School, 160 Frelinghuysen Road, Piscataway, NJ 08854 USA. Telephone: (732) 445-0150. Fax: (732) 445-0116. E-mail: plioy@ eohsi.rutgers.edu We thank D. Owuor for assisting in the preparation of this manuscript. This research was supported by the RTI/EOHSI NHEXAS Consortium, U.S. Envrionmental Protection Agency (EPA) cooperative agreement CR 821902; the MENTOR project, U.S. EPA cooperative agreement CR 827033; and Center for Childhood Neurotoxicology and Exposure Assessment, National Institutes of Health, 1P01ES11256-01. P.J. Lioy and N.C.G. Freeman are part of the National Institute of Environmental Health Sciences Environmental Health Center, P30-ES05022. Received 25 October 2001; accepted 5 March 2002. In this review, we examine house dust and residential soil and their use for identifying sources and the quantifying levels of toxicants for the estimation of exposure. We answer critical questions that focus on the selection of samples or sampling strategies for collection and discuss areas of uncer- tainty and gaps in knowledge. We discuss the evolution of dust sampling with a special emphasis on work conducted after the publication of the 1992 review by McArthur [Appl Occup Environ Hyg 7(9):599–606 (1992)]. The approaches to sampling dust examined include surface wipe sam- pling, vacuum sampling, and other sampling approaches, including attic sampling. The metrics of presentation of results for toxicants in dust surface loading (micrograms per square centimeter) or surface concentration (micrograms per gram) are discussed. We evaluate these metrics in terms of how the information can be used in source characterization and in exposure characterization. We discuss the types of companion information on source use and household or personal activity pat- terns required to assess the significance of the dust exposure. The status and needs for wipe sam- plers, surface samplers, and vacuum samplers are summarized with some discussion on the strengths and weaknesses of each type of sampler. We also discuss needs for research and develop- ment and the current status of standardization. Case studies are provided to illustrate the use of house dust and residential soil in source characterization, forensic analyses, or human exposure assessment. Key words: chemical composition, exposure characterization, house dust, physical composition, residence wipe sampling, source identification, vacuum sampling. Environ Health Perspect 110:969–983 (2002). [Online 15 August 2002] http://ehpnet1.niehs.nih.gov/docs/2002/110p969-983lioy/abstract.html R ESEARCH Review
-
Upload
independent -
Category
Documents
-
view
0 -
download
0
Transcript of Dust: A Metric for Use in Residential and Building Exposure Assessment and Source Characterization
Environmental Health Perspectives • VOLUME 110 | NUMBER 10 | October 2002 969
Dust: A Metric for Use in Residential and Building Exposure Assessment andSource Characterization
Paul J. Lioy,1 Natalie C.G. Freeman,1 and James R. Millette2
1Environmental and Occupational Sciences Institute, University of Medicine and Dentistry of New Jersey-Robert Wood Johnson MedicalSchool, Piscataway, New Jersey, USA; 2MVA, Inc., Norcross, Georgia, USA
The maturation of the field of exposure analy-sis and assessment has led to the developmentof many innovative methods and strategies todetect, reduce, and prevent human contactwith environmental toxicants. These toxicantscan be found in air, water, soil, or food. Somemethods employed by investigators are new(e.g., biological markers and human videotap-ing), whereas others are adaptations of meth-ods used for general or specific types ofenvironmental or occupational investigations(microscopic analyses, modeling, and personalmonitoring). Depending on the type ofmethod chosen, each may be applicable forepidemiologic investigations, human exposureprofiling for specific contaminants or events,and/or risk assessment. In addition, and as aresult of the findings made in the TotalExposure Assessment Methodology (TEAM)studies and others conducted during the1980s, the field of exposure analysis has turnedits attention beyond primarily measuring toxi-cants in outdoor environmental situations(1–9). Now information is frequently obtainedfrom one or more different microenviron-ments occupied or passed through by an indi-vidual or individuals over the course of a day.
The purpose of this article is to reviewthe types of information available on dust inresidential settings, the metrics used forexposure and source characterizations, and
the composition of dust. We also review andevaluate the methods used to affect residentialdust and soil. We explore the applications ofdust for exposure and source-related analysesand ways to improve quantitative dust char-acterization in the future.
A number of studies have shown that forindividuals and populations, especially chil-dren and other vulnerable subgroups, thehome environment can be a potential source ofpassive or active exposure to toxicants (10–23).This presents a complex situation for the expo-sure specialist and for other environmentalhealth scientists in their attempts to identifythe potential or actual risk associated withcommon or specific environmental toxicants.There are many different types of toxicantsthat can be present for short or long periods ina building, and each could be in a form orlocation that is readily accessible for contact byinhabitants or visitors (5,24–26). Because toxi-cants can come from multiple sources (indoorsor outdoors), media, and activities, exposurescan occur at single or multiple routes of entryinto the body. The question that arises is, howdoes one determine which toxicant and source,or multiples of each, are of greatest concern tothe health of the residents?
Beyond obtaining measurements for thetoxicant levels present at routes of entry intothe body, variables needed to characterize
exposure are the activities and the patterns ofactivity and uncommon events that mayresult in passive or active exposures. Thus, thenumber and complexity of the types of vari-ables needed to understand exposure canbecome large. This leads directly to consider-ation of a triage to the application of sam-pling and analysis strategies for finding thebest ways to identify, examine, and explainpotential or actual exposures and to find andselect the most appropriate mitigation or pre-vention strategies. Sampling and analysisstrategies are becoming increasingly impor-tant as the field attempts to provide informa-tion on cumulative exposure to multipletoxicants in a single medium and the aggre-gate exposure associated with a single toxicantfrom multiple exposure pathways (26–29).
Because of the multiplicity of indoor andoutdoor sources and routes of contact that canoccur in the home, residential dust (housedust) and residential/community soil repre-sent two categories within one medium—soil—that can benefit from a triage ofmeasurement strategies. The approach willallow the investigation of the influence ofmultiple variables on the intensity and dura-tion of contact with toxicants that can resultin cumulative or aggregate exposures.
Soil and Dust: Perspective forExposure StudiesFor many years, soil samples have been col-lected as cores in various urban and industriallocations (30). There is a wealth of information
Address correspondence to P.J. Lioy, Environmentaland Occupational Sciences Institute, University ofMedicine and Dentistry of New Jersey-RobertWood Johnson Medical School, 160 FrelinghuysenRoad, Piscataway, NJ 08854 USA. Telephone: (732)445-0150. Fax: (732) 445-0116. E-mail: [email protected]
We thank D. Owuor for assisting in the preparationof this manuscript.
This research was supported by the RTI/EOHSINHEXAS Consortium, U.S. EnvrionmentalProtection Agency (EPA) cooperative agreement CR821902; the MENTOR project, U.S. EPA cooperativeagreement CR 827033; and Center for ChildhoodNeurotoxicology and Exposure Assessment, NationalInstitutes of Health, 1P01ES11256-01. P.J. Lioy andN.C.G. Freeman are part of the National Institute ofEnvironmental Health Sciences EnvironmentalHealth Center, P30-ES05022.
Received 25 October 2001; accepted 5 March2002.
In this review, we examine house dust and residential soil and their use for identifying sources andthe quantifying levels of toxicants for the estimation of exposure. We answer critical questions thatfocus on the selection of samples or sampling strategies for collection and discuss areas of uncer-tainty and gaps in knowledge. We discuss the evolution of dust sampling with a special emphasison work conducted after the publication of the 1992 review by McArthur [Appl Occup EnvironHyg 7(9):599–606 (1992)]. The approaches to sampling dust examined include surface wipe sam-pling, vacuum sampling, and other sampling approaches, including attic sampling. The metrics ofpresentation of results for toxicants in dust surface loading (micrograms per square centimeter) orsurface concentration (micrograms per gram) are discussed. We evaluate these metrics in terms ofhow the information can be used in source characterization and in exposure characterization. Wediscuss the types of companion information on source use and household or personal activity pat-terns required to assess the significance of the dust exposure. The status and needs for wipe sam-plers, surface samplers, and vacuum samplers are summarized with some discussion on thestrengths and weaknesses of each type of sampler. We also discuss needs for research and develop-ment and the current status of standardization. Case studies are provided to illustrate the use ofhouse dust and residential soil in source characterization, forensic analyses, or human exposureassessment. Key words: chemical composition, exposure characterization, house dust, physicalcomposition, residence wipe sampling, source identification, vacuum sampling. Environ HealthPerspect 110:969–983 (2002). [Online 15 August 2002]http://ehpnet1.niehs.nih.gov/docs/2002/110p969-983lioy/abstract.html
RESEARCHReview
on the chemistry, physics, and microbiology ofsoils (31–33). The analytic results obtainedfrom many soil samples have been used todetermine the levels of various materials andtoxicants at a certain depth (0 to > 100 ft)from the surface, but most of this work doesnot deal directly with exposure characteriza-tion. Opportunities for using this type of datain exposure assessment include quantifying sig-nificant penetration of toxicants into thegroundwater that is used for a drinking watersupply or the diffusion of volatile material intoa basement. Most of the measurements madein soil at a distance beyond 1 ft below the sur-face are of little value in assessing direct dermalexposure (34,35). Data or soil contamination,however, is still important for profiling the dis-tribution of material to various depths, identi-fying sources, and assisting in defining theperiod of time when the deposition and/oraccumulation of toxicants occurred in the soil.Core sampling is also used to detect the pres-ence of a toxicant or tracer material in loca-tions that include ice or snow packs andsediments below bodies of water (26).Numerous soil sampling and analysis programshave been conducted at hazardous waste sites(e.g., Superfund sites) and abandoned indus-trial sites (e.g., brown fields). These programshave been designed to establish the horizontaland vertical extent of contamination beforeremediation (36). In addition, research studieshave been completed in arid regions aroundthe world. These have focused on the reen-trainment of desert sand and its redistributionto locations > 1,000 km away (37–39).However, the focus here is on the ability ofsand to be used to assess higher exposure, withthe primary purpose of accounting for the soilcomponent of residential dust.
The results of soil characterizations athazardous waste or urban sites have beenused, and in many circumstances continue tobe used, as the basis for exposure characteriza-tions in the preliminary risk assessmentsrequired before site cleanup (26,40–42).However, in addition to questions about theappropriateness of these data for a specificexposure assessment, the analytic plan usuallyemploys default factors when estimatingintensity and duration of contact with indi-vidual or multiple toxicants. The results ofsuch analyses usually provide very crude, andin some cases unreasonable, worst-case esti-mates of possible exposures and risks (43).Over the past half decade, however, effortshave been made to encourage the use of moresite-specific data to determine plausible pat-terns of activity that lead to exposure to thetoxicants that are present in soils (44).
By collecting samples from the surface of ayard, a park, open or abandoned spaces, or loca-tions downwind of an explosion or fire, charac-terization of toxicant levels in the soils have
improved human exposure assessments. Oneuse of dust collection and analysis approacheshas been to characterize the dust emitted indowntown Manhattan from the aftermath ofthe World Trade Center attack (45).
Initially, measurements in surface soilsamples were used to detect the levels of a tox-icant that were available for resuspension intothe atmosphere and then used to estimateinhalation exposure (46–48). Now such mea-surements are also applied to estimate directdermal contact and to determine the potentialingestion or skin absorption of a toxicantfound in or on dust or soil as a chemicalresidue (24). In many circumstances, the lev-els of chemical, physical, or biological contam-inants in or on surface soil will represent thematerial that has been recently deposited onthe soil and the fractions of soil that can bemost easily transferred indoors. Further, workby Wallace et al. (2) during the TEAM study;by Charney et al. (49) and Roberts et al. (50)on lead exposure; by Simcox et al. (16) forpesticide exposures on farms; by Freeman etal. (19,51) on chromium exposure; and byPellizzari et al. (52) and Bonanno et al. (53)for multiple pollutant and multiple mediaexposures during the National HumanExposure Assessment Survey (NHEXAS), toname a few, have demonstrated that a com-plex series of interactions takes place betweenhome characteristics and activities, which canalter toxicant exposure, or indoor and outdoorsource strengths.
During the early part of the twentieth cen-tury, a convenient method for collecting totalparticulate matter (undifferentiated by particlesize) in air that had deposited on surfaces wasthe dust bucket. It was a simple device, just anopen water bucket placed on a roof or othersecure location to collect material available inthe air for deposition on a surface. The sampleswere usually analyzed by visual observations,color, and total content, and then subjected tosimple chemical analyses. A bucket wouldremain out for at least a month to collect all thematerial (including bugs, etc.) that depositedfrom the atmosphere via wet and dry deposi-tion (54). The results were semiquantitative atbest and usually difficult to interpret.Fortunately, devices used to collect dry and wetdeposition have improved over time, and someare designed to make quantitative determina-tions of outdoor atmospheric deposition. Thesemodern devices are currently used in nationaland international monitoring networks spon-sored by various agencies (54). Indoors, deposi-tion plates and other passive collection deviceshave been used to quantify the contribution ofoutdoor and indoor sources of particulate mat-ter onto indoor surfaces (55).
Once researchers began to considerhuman exposure in residential neighborhoodsand on farms, field studies were designed that
included potential or actual soil contamina-tion, and they focused on quantifying themovement of resuspended, contaminated out-door soil and road dust into indoor locations(46–48,55–61). These studies were designedto examine the exposure and risk posed by tox-icants deposited in the lungs of people living inzones potentially affected by point and areasources. Eventually, hypotheses about thetransport of dust and dirt indoors, and contactby residents, led to parallel efforts on develop-ing and employing techniques to measure thelevels of contaminants in house dust after it hasbeen generated or transported indoors and set-tled on surfaces or has been tracked into thehome (15,16,23,52,53,62–71). In urban areas,some field studies have characterized the move-ment and accumulation of lead and other met-als indoors (10,19,71–76). Based on the resultsof these studies, important transport processesto consider include the resuspension and trans-port of toxicants indoors, including trackingtoxicants present in the street or in yard dustor soil by residents or pets (25,26).
For farms and residential lawn applica-tions, some investigations have focused onthe drift of pesticides to homes after sprayingand on the tracking and deposition of resus-pended outdoor dust or surface soil indoors(23,66). Recent exposure assessments forlead, pesticides, and polycyclic aromatichydrocarbons (PAHs) and other toxicants(e.g., asbestos) also include characterization ofexposure that resulted from toxicantsdeposited in and on objects found in homes.As a result, house dust is being used as a toolto assess environmental health risks by pro-viding answers to questions about the poten-tial for personal contacts that may have led toa significant exposure for one or more routesof entry into the body. Further, such infor-mation is now being used to examine the lia-bility issues related to residential toxicantexposure and will eventually lead to develop-ment of standardized protocols for use inquantified forensic exposure characterizations.
General Composition of House DustWhen residential dust is selected as a metricof exposure, questions include:• What are the components of residential
dust? • What are the behaviors and activities of the
individuals that live in a particular locationthat either led to exposure or resuspensionof dust?
If there was a homogeneous distribution ofmaterial in a home, and a major fraction of thedust was similar in composition, it would beeasier to conduct analyses of exposure. At thistime, however, limited data are available thatcan accurately describe the distribution of basicmajor constituents of house dust in Americanresidences or in residences in other countries.
Review • Lioy et al.
970 VOLUME 110 | NUMBER 10 | October 2002 • Environmental Health Perspectives
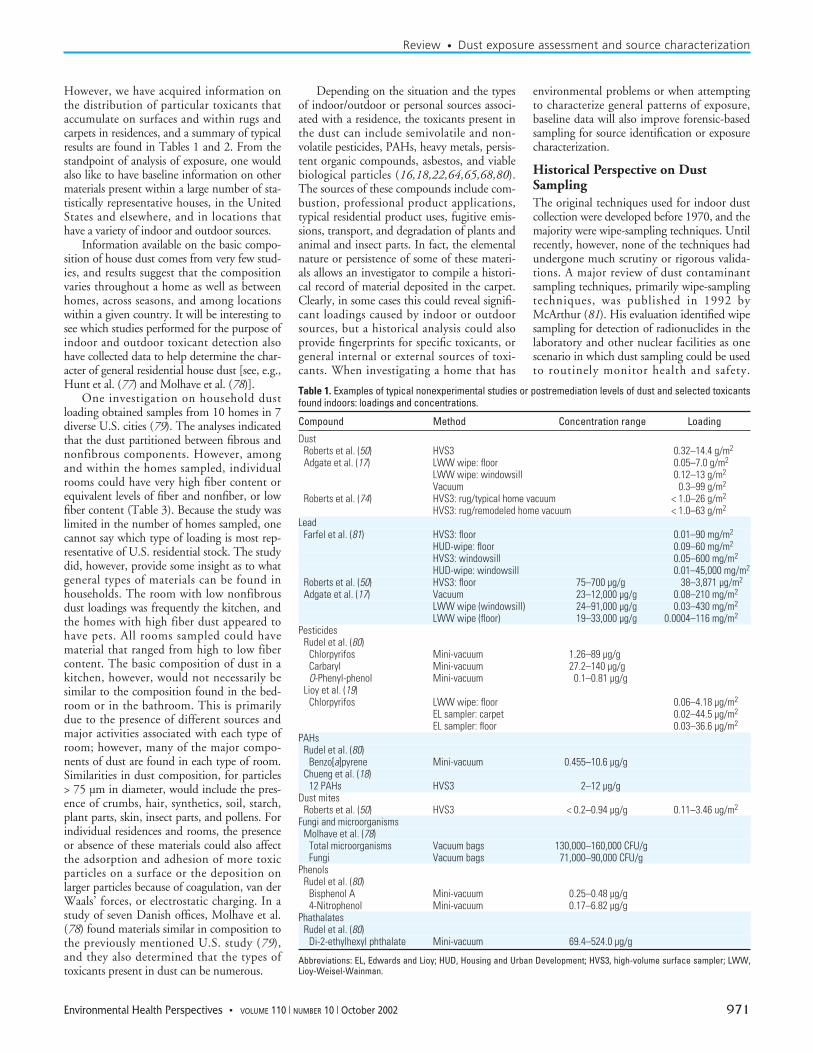
However, we have acquired information onthe distribution of particular toxicants thataccumulate on surfaces and within rugs andcarpets in residences, and a summary of typicalresults are found in Tables 1 and 2. From thestandpoint of analysis of exposure, one wouldalso like to have baseline information on othermaterials present within a large number of sta-tistically representative houses, in the UnitedStates and elsewhere, and in locations thathave a variety of indoor and outdoor sources.
Information available on the basic compo-sition of house dust comes from very few stud-ies, and results suggest that the compositionvaries throughout a home as well as betweenhomes, across seasons, and among locationswithin a given country. It will be interesting tosee which studies performed for the purpose ofindoor and outdoor toxicant detection alsohave collected data to help determine the char-acter of general residential house dust [see, e.g.,Hunt et al. (77) and Molhave et al. (78)].
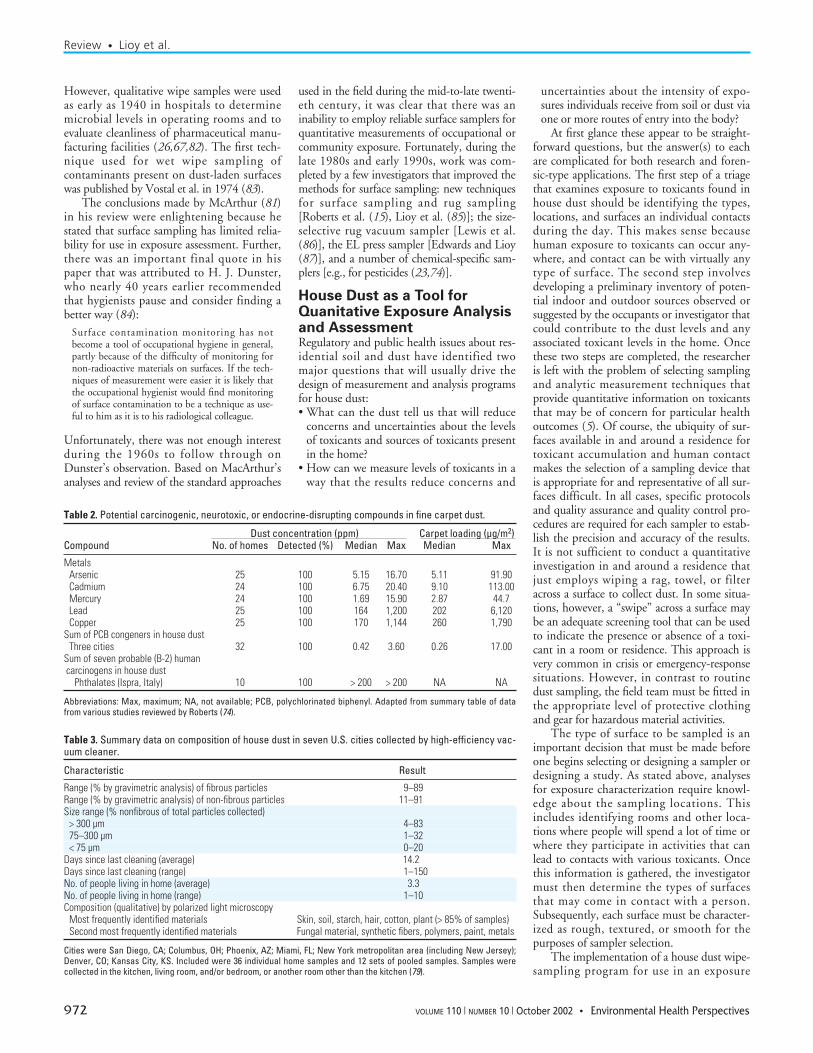
One investigation on household dustloading obtained samples from 10 homes in 7diverse U.S. cities (79). The analyses indicatedthat the dust partitioned between fibrous andnonfibrous components. However, amongand within the homes sampled, individualrooms could have very high fiber content orequivalent levels of fiber and nonfiber, or lowfiber content (Table 3). Because the study waslimited in the number of homes sampled, onecannot say which type of loading is most rep-resentative of U.S. residential stock. The studydid, however, provide some insight as to whatgeneral types of materials can be found inhouseholds. The room with low nonfibrousdust loadings was frequently the kitchen, andthe homes with high fiber dust appeared tohave pets. All rooms sampled could havematerial that ranged from high to low fibercontent. The basic composition of dust in akitchen, however, would not necessarily besimilar to the composition found in the bed-room or in the bathroom. This is primarilydue to the presence of different sources andmajor activities associated with each type ofroom; however, many of the major compo-nents of dust are found in each type of room.Similarities in dust composition, for particles> 75 µm in diameter, would include the pres-ence of crumbs, hair, synthetics, soil, starch,plant parts, skin, insect parts, and pollens. Forindividual residences and rooms, the presenceor absence of these materials could also affectthe adsorption and adhesion of more toxicparticles on a surface or the deposition onlarger particles because of coagulation, van derWaals’ forces, or electrostatic charging. In astudy of seven Danish offices, Molhave et al.(78) found materials similar in composition tothe previously mentioned U.S. study (79),and they also determined that the types oftoxicants present in dust can be numerous.
Depending on the situation and the typesof indoor/outdoor or personal sources associ-ated with a residence, the toxicants present inthe dust can include semivolatile and non-volatile pesticides, PAHs, heavy metals, persis-tent organic compounds, asbestos, and viablebiological particles (16,18,22,64,65,68,80).The sources of these compounds include com-bustion, professional product applications,typical residential product uses, fugitive emis-sions, transport, and degradation of plants andanimal and insect parts. In fact, the elementalnature or persistence of some of these materi-als allows an investigator to compile a histori-cal record of material deposited in the carpet.Clearly, in some cases this could reveal signifi-cant loadings caused by indoor or outdoorsources, but a historical analysis could alsoprovide fingerprints for specific toxicants, orgeneral internal or external sources of toxi-cants. When investigating a home that has
environmental problems or when attemptingto characterize general patterns of exposure,baseline data will also improve forensic-basedsampling for source identification or exposurecharacterization.
Historical Perspective on DustSamplingThe original techniques used for indoor dustcollection were developed before 1970, and themajority were wipe-sampling techniques. Untilrecently, however, none of the techniques hadundergone much scrutiny or rigorous valida-tions. A major review of dust contaminantsampling techniques, primarily wipe-samplingtechniques, was published in 1992 byMcArthur (81). His evaluation identified wipesampling for detection of radionuclides in thelaboratory and other nuclear facilities as onescenario in which dust sampling could be usedto routinely monitor health and safety.
Review • Dust exposure assessment and source characterization
Environmental Health Perspectives • VOLUME 110 | NUMBER 10 | October 2002 971
Table 1. Examples of typical nonexperimental studies or postremediation levels of dust and selected toxicantsfound indoors: loadings and concentrations.
Compound Method Concentration range Loading
DustRoberts et al. (50) HVS3 0.32–14.4 g/m2
Adgate et al. (17) LWW wipe: floor 0.05–7.0 g/m2
LWW wipe: windowsill 0.12–13 g/m2
Vacuum 0.3–99 g/m2
Roberts et al. (74) HVS3: rug/typical home vacuum < 1.0–26 g/m2
HVS3: rug/remodeled home vacuum < 1.0–63 g/m2
LeadFarfel et al. (81) HVS3: floor 0.01–90 mg/m2
HUD-wipe: floor 0.09–60 mg/m2
HVS3: windowsill 0.05–600 mg/m2
HUD-wipe: windowsill 0.01–45,000 mg/m2
Roberts et al. (50) HVS3: floor 75–700 µg/g 38–3,871 µg/m2
Adgate et al. (17) Vacuum 23–12,000 µg/g 0.08–210 mg/m2
LWW wipe (windowsill) 24–91,000 µg/g 0.03–430 mg/m2
LWW wipe (floor) 19–33,000 µg/g 0.0004–116 mg/m2
PesticidesRudel et al. (80)
Chlorpyrifos Mini-vacuum 1.26–89 µg/gCarbaryl Mini-vacuum 27.2–140 µg/gO-Phenyl-phenol Mini-vacuum 0.1–0.81 µg/g
Lioy et al. (19)Chlorpyrifos LWW wipe: floor 0.06–4.18 µg/m2
EL sampler: carpet 0.02–44.5 µg/m2
EL sampler: floor 0.03–36.6 µg/m2
PAHsRudel et al. (80)
Benzo[a]pyrene Mini-vacuum 0.455–10.6 µg/gChueng et al. (18)
12 PAHs HVS3 2–12 µg/gDust mites
Roberts et al. (50) HVS3 < 0.2–0.94 µg/g 0.11–3.46 ug/m2
Fungi and microorganismsMolhave et al. (78)
Total microorganisms Vacuum bags 130,000–160,000 CFU/gFungi Vacuum bags 71,000–90,000 CFU/g
PhenolsRudel et al. (80)
Bisphenol A Mini-vacuum 0.25–0.48 µg/g4-Nitrophenol Mini-vacuum 0.17–6.82 µg/g
PhathalatesRudel et al. (80)
Di-2-ethylhexyl phthalate Mini-vacuum 69.4–524.0 µg/g
Abbreviations: EL, Edwards and Lioy; HUD, Housing and Urban Development; HVS3, high-volume surface sampler; LWW,Lioy-Weisel-Wainman.
However, qualitative wipe samples were usedas early as 1940 in hospitals to determinemicrobial levels in operating rooms and toevaluate cleanliness of pharmaceutical manu-facturing facilities (26,67,82). The first tech-nique used for wet wipe sampling ofcontaminants present on dust-laden surfaceswas published by Vostal et al. in 1974 (83).
The conclusions made by McArthur (81)in his review were enlightening because hestated that surface sampling has limited relia-bility for use in exposure assessment. Further,there was an important final quote in hispaper that was attributed to H. J. Dunster,who nearly 40 years earlier recommendedthat hygienists pause and consider finding abetter way (84):
Surface contamination monitoring has notbecome a tool of occupational hygiene in general,partly because of the difficulty of monitoring fornon-radioactive materials on surfaces. If the tech-niques of measurement were easier it is likely thatthe occupational hygienist would find monitoringof surface contamination to be a technique as use-ful to him as it is to his radiological colleague.
Unfortunately, there was not enough interestduring the 1960s to follow through onDunster’s observation. Based on MacArthur’sanalyses and review of the standard approaches
used in the field during the mid-to-late twenti-eth century, it was clear that there was aninability to employ reliable surface samplers forquantitative measurements of occupational orcommunity exposure. Fortunately, during thelate 1980s and early 1990s, work was com-pleted by a few investigators that improved themethods for surface sampling: new techniquesfor surface sampling and rug sampling[Roberts et al. (15), Lioy et al. (85)]; the size-selective rug vacuum sampler [Lewis et al.(86)], the EL press sampler [Edwards and Lioy(87)], and a number of chemical-specific sam-plers [e.g., for pesticides (23,74)].
House Dust as a Tool forQuanitative Exposure Analysisand AssessmentRegulatory and public health issues about res-idential soil and dust have identified twomajor questions that will usually drive thedesign of measurement and analysis programsfor house dust:• What can the dust tell us that will reduce
concerns and uncertainties about the levelsof toxicants and sources of toxicants presentin the home?
• How can we measure levels of toxicants in away that the results reduce concerns and
uncertainties about the intensity of expo-sures individuals receive from soil or dust viaone or more routes of entry into the body?
At first glance these appear to be straight-forward questions, but the answer(s) to eachare complicated for both research and foren-sic-type applications. The first step of a triagethat examines exposure to toxicants found inhouse dust should be identifying the types,locations, and surfaces an individual contactsduring the day. This makes sense becausehuman exposure to toxicants can occur any-where, and contact can be with virtually anytype of surface. The second step involvesdeveloping a preliminary inventory of poten-tial indoor and outdoor sources observed orsuggested by the occupants or investigator thatcould contribute to the dust levels and anyassociated toxicant levels in the home. Oncethese two steps are completed, the researcheris left with the problem of selecting samplingand analytic measurement techniques thatprovide quantitative information on toxicantsthat may be of concern for particular healthoutcomes (5). Of course, the ubiquity of sur-faces available in and around a residence fortoxicant accumulation and human contactmakes the selection of a sampling device thatis appropriate for and representative of all sur-faces difficult. In all cases, specific protocolsand quality assurance and quality control pro-cedures are required for each sampler to estab-lish the precision and accuracy of the results.It is not sufficient to conduct a quantitativeinvestigation in and around a residence thatjust employs wiping a rag, towel, or filteracross a surface to collect dust. In some situa-tions, however, a “swipe” across a surface maybe an adequate screening tool that can be usedto indicate the presence or absence of a toxi-cant in a room or residence. This approach isvery common in crisis or emergency-responsesituations. However, in contrast to routinedust sampling, the field team must be fitted inthe appropriate level of protective clothingand gear for hazardous material activities.
The type of surface to be sampled is animportant decision that must be made beforeone begins selecting or designing a sampler ordesigning a study. As stated above, analysesfor exposure characterization require knowl-edge about the sampling locations. Thisincludes identifying rooms and other loca-tions where people will spend a lot of time orwhere they participate in activities that canlead to contacts with various toxicants. Oncethis information is gathered, the investigatormust then determine the types of surfacesthat may come in contact with a person.Subsequently, each surface must be character-ized as rough, textured, or smooth for thepurposes of sampler selection.
The implementation of a house dust wipe-sampling program for use in an exposure
Review • Lioy et al.
972 VOLUME 110 | NUMBER 10 | October 2002 • Environmental Health Perspectives
Table 2. Potential carcinogenic, neurotoxic, or endocrine-disrupting compounds in fine carpet dust.
Dust concentration (ppm) Carpet loading (µg/m2)Compound No. of homes Detected (%) Median Max Median Max
MetalsArsenic 25 100 5.15 16.70 5.11 91.90Cadmium 24 100 6.75 20.40 9.10 113.00Mercury 24 100 1.69 15.90 2.87 44.7Lead 25 100 164 1,200 202 6,120Copper 25 100 170 1,144 260 1,790
Sum of PCB congeners in house dustThree cities 32 100 0.42 3.60 0.26 17.00
Sum of seven probable (B-2) human carcinogens in house dust
Phthalates (Ispra, Italy) 10 100 > 200 > 200 NA NA
Abbreviations: Max, maximum; NA, not available; PCB, polychlorinated biphenyl. Adapted from summary table of datafrom various studies reviewed by Roberts (74).
Table 3. Summary data on composition of house dust in seven U.S. cities collected by high-efficiency vac-uum cleaner.
Characteristic Result
Range (% by gravimetric analysis) of fibrous particles 9–89Range (% by gravimetric analysis) of non-fibrous particles 11–91Size range (% nonfibrous of total particles collected)
> 300 µm 4–8375–300 µm 1–32< 75 µm 0–20
Days since last cleaning (average) 14.2Days since last cleaning (range) 1–150No. of people living in home (average) 3.3No. of people living in home (range) 1–10Composition (qualitative) by polarized light microscopy
Most frequently identified materials Skin, soil, starch, hair, cotton, plant (> 85% of samples)Second most frequently identified materials Fungal material, synthetic fibers, polymers, paint, metals
Cities were San Diego, CA; Columbus, OH; Phoenix, AZ; Miami, FL; New York metropolitan area (including New Jersey);Denver, CO; Kansas City, KS. Included were 36 individual home samples and 12 sets of pooled samples. Samples werecollected in the kitchen, living room, and/or bedroom, or another room other than the kitchen (79).
assessment and/or residential source identifica-tion can employ one or both of the followingdesign options: a) a device that mimics theability of the hand to pick up and retain cont-aminants on the particles that are found onmany surfaces, and b) a device that will quan-titatively collect all or a reproducible fractionof contaminants found on specific surfaces.
Currently, it is impossible to select onewipe sampler that functions properly underall conditions. For example, a sampler thatcan be used exclusively for smooth-surfacesampling would not necessarily have the samedesign as a sampler used for textured surfacesampling. It is straightforward to find a sam-pler that will retain the dust, dirt, and otherparticles present on a smooth surface. For tex-tured surfaces, one has the added problem ofensuring that contact is made between thesampler and the entire surface, including thecrevices. In both instances, a smooth or tex-tured surface, an investigator must also try tomimic the levels of contaminants picked upby the hand. Thus, the sampler needs to bedesigned with surface characteristics that cancollect the particle size distribution that bestrepresents retention by the hand, after wetand/or dry contact with an object or floor.
Potential Exposure Variables orMetrics Measured for ResidentialDust and SoilApplications of household dust in exposurecharacterizations and assessments require asampler that can measure one of two metrics(or variables) and preferably both. The first isthe loading of materials on a surface in unitsof micrograms of material or toxicant persquare centimeter of surface. To date, themetric “surface loading” has received the mostattention during the development of tech-niques because it is the simplest quantity tomeasure. At a minimum, it tells the investiga-tor whether a toxicant is present at a location,and it can provide values in micrograms persquare centimeter for the distribution of a tox-icant in a room on surfaces or throughout theentire residence. The second quantity is the“concentration of a material in the collecteddust” collected by the sampler. It is reportedas micrograms of a toxicant per gram of dust.This value is much more difficult to quantifybecause the collection medium must be pre-and postweighed under standard weighingconditions, and the medium must not changecharacter during dust collection.
Both surface loading and dust concentra-tion are valuable metrics in characterizingexposure. Measurements of surface loadingcan be used to estimate the amount of mater-ial available on a surface and the amountavailable for contact by a person. Dust con-centration can be used to characterize poten-tial sources and source types inside or outside
a home. In each case, there are limitationsand uncertainties based on the design andvalidation of each device for the intendedpurpose of sampling; the information avail-able to characterize activities and activity pat-terns and actual source use; and the area on asurface in a room or in the residence that thesamples actually represent. Some typical datacollected on dust loading and the concentra-tions of common toxicants found in housedust are previously shown in Tables 1 and 2.
Sampling Methods Surface wipe sampling. Almost any surfacefound in or around a residence can come intocontact with some part of the human body,and each would be a candidate for surfacewipe sampling. Thus, the investigator mustclearly articulate the purpose of the samplingstudy. These will guide selection of theappropriate surfaces to sample, the toxicantsto be measured, and the frequency of sam-pling. For example, if one were examining achild’s contact with a toxicant, the focuswould be on objects and surfaces that are fre-quently used, touched, or mouthed by thechild during the day (88).
A number of devices have been used toexamine the levels of toxicants on surfaces.Depending on cleaning frequency, the materi-als present on surfaces to be sampled canreflect deposits caused by many different activ-ities that occurred over a range of time periods.Undisturbed surfaces (e.g., top of a refrigera-tor), can be indicative of materials depositedover a long period of time, whereas frequentlycleaned surfaces (e.g., kitchen countertops) willbe indicative of the most recent deposits. Toysand play surfaces or work surfaces can be indi-cator surfaces for objects most frequently con-tacted by children and adults, respectively.Windowsills and wells can provide informa-tion on materials that are carried from out-doors to indoors or may reflect the materials inpaint flaking from the surfaces around thewindow. Thus, surface sampling can provide awealth of material for estimating potential con-tact with any levels of toxicants of concern foracute or chronic health effects, aggregate orcumulative exposure assessments, or identifica-tion of sources. The ability to identify sourcesis sometimes difficult using wipe samplesbecause of the relatively low levels of dust usu-ally found on many surfaces.
Rug and carpet sampling. When the analy-sis of exposure moves beyond surface samplingof floors, tables, and so on, an investigationcan focus on toxicant levels in rugs and carpetsand other plush objects such as pillows. Theseresidential furnishings pose another set of chal-lenges for the researcher to address, both con-ceptually and analytically. For example, carpetsand rugs have major structural features thatrequire the investigator to first establish what
the material deposited in a carpet actuallyrepresents (74). The first feature of a rug orcarpet associated with dust retention is its sur-face and the easily accessible layers of carpetfibers. The second is the base that binds thecarpet or rug fibers together. From the stand-point of variables used for research or forensicapplication of exposure analysis and assess-ment, each provides variables and results thatcan be interpreted in different ways.
When the material sampled from the sur-face layers of the rug is analyzed for dust massand composition, it is usually done to deter-mine the levels and types of material that areaccessible or available for contact with ahuman hand or other parts of the body. Theresults can also be used to represent the layersof a rug that can contact edible materials(e.g., food) that are rubbed or dropped on therug by a potentially exposed person andremoved by friction (89). In some instances,materials present on a rug are called dislodge-able dust, but the definition does not trulydescribe all contact issues.
Resuspendable dust can also be depositedonto clothing or skin or scavenged by foodand other mouthable objects that contact therug surface (90). Therefore, any material ortoxicant attached to the surface of a rug orcarpet can be collected and quantified.Subsequently, it may be appropriate to usethe results as an indicator of a potential der-mal contact and nondietary intake by adultsor children. The latter requires the collectionof information on activity patterns and theintensity and frequency of contact with a tox-icant to adequately assess a person or popula-tion’s exposure.
The major challenge for exposure analysesis ensuring that the sampler retrieves materialthat is indicative of the types and levels that aperson comes into contact with on the rug.For example, the type of rug (e.g., level loopor shag) will have different retention charac-teristics for particles on the rug surface. Thesurface can also significantly affect the effi-ciency of removal of particles from the surfaceby a vacuum cleaner (74). The problemsposed by such situations include ensuringthat a true indication of the levels and distrib-ution of material deposited on the surface ofrug fibers is obtained during sampling andthat the sample of dust is representative ofmaterial available for removal. Finally, workby Wang et al. (91) has shown that the collec-tion efficiency of a vacuum cleaner is affectedby the relative humidity in the home.
In contrast to the surface of a rug or car-pet, the material embedded at the base of arug or carpet can provide information neededto complete exposure analyses. The embed-ded material can be considered to be equiva-lent to the weathered loading of soil and airpollution deposited outdoors on surfaces over
Review • Dust exposure assessment and source characterization
Environmental Health Perspectives • VOLUME 110 | NUMBER 10 | October 2002 973
time via atmospheric deposition at the base ofa forest canopy or within the sediments of alake. In this case, the loading of particles atthe base of a rug would be affected by particledeposition, dynamic removal and redeposi-tion of material, and spills.
An individual rug does not provide a com-plete historical record of the loading that couldtheoretically accumulate over time. However, arug/carpet can provide a record of indoor andoutdoor sources that have contributed to theoverall levels of dust and components of dustthat were tracked into a residence, were spilledor applied to the surface, or were removedfrom the air over time. Rugs and carpets alsoare major reservoirs of material because theirlarge total surface area increases the totalamount of material deposited on or stored inthe fibers. Potentially rugs and carpets havelevels of specific materials that are available forresuspension or reemission (semivolatile com-pounds). Thus, rugs or carpets can be used as aresearch or a forensic tool a) to determine thelevels of materials that have accumulated fromdaily living in the home, b) to discriminateamong persistent sources (indoors or out-doors), or c) to specify or document one-timeor infrequent events that could lead to acutehealth outcomes.
The most important variables to considerbefore attempting to sample a rug or carpetare type (e.g., level loop or shag), age, condi-tion, location in the residence, cleaning fre-quency, and family history. An individual rugcould provide a variety of long-term or short-term data and information on the types ofactivities and sources that affect toxicant lev-els in an individual home.
Similar to outdoor situations, materialspresent in the rug or carpet can be resus-pended from the rug or carpet. However, themechanisms of resuspension are differentfrom those associated with outdoor air. Forexample, the reentrainment of carpet dust,both surface and embedded, occurs using thetypical household vacuum cleaner. Vacuumcleaners that do not use a HEPA filter systemand do not have a sealed capture system willnot efficiently pick up and retain the fine par-ticles in carpet dirt and dust (92). Theseinclude most devices generally used by thepublic. Some fine particles will be resus-pended and then redeposited on the floor andother surfaces. Thus, over time any residualsfrom major spills or applications that remainafter clean up or degradation will eventuallybe reduced in magnitude but will also con-tribute some amount of mass to the generallong-term material burden in the rug. Thelast point also brings up the considerationthat if one is attempting to look at outdoorinfluences on the rug burden, it is importantto include sampling locations near high-traf-fic doorways. This was recently done by
Bonanno (93) and by Farfel et al. (94) forlead, cadmium, and arsenic.
Work done at the Environmental andOccupational Health Sciences Institute(EOHSI) and the U.S. EnvironmentalProtection Agency (EPA) has also shown thatsemivolatile materials initially deposited on afloor or in a crack or crevice will evaporateand condensate from the point of applicationonto other surfaces (64,66,95). This is of par-ticular concern for pesticides sprayed in thehome. Over time a lower concentration of thesemivolatile compound will be spread to avariety of surfaces in a room or residence thatwere not initially sprayed with pesticides, thusincreasing the possibility of exposure to resi-dents and visitors.
In a recent study by researchers at theHarvard School of Public Health (80), a largenumber of chemicals were measured and theviable biological particles in vacuum cleanersamples obtained in residences were tested.The investigators also measured the levels ofspecific toxicants in the air. The objective ofthe study was to quantify the levels of hor-monally active agents and mammary carcino-gens in homes. A similar, but more focused,hypothesis-driven investigation was conductedfor microbiologicals and fungi obtained fromrugs in offices located in Denmark (78).
Other sampling approaches. A number oftechniques in addition to wipe samplers andvacuum samplers can provide data forresearch, regulatory, risk reduction, andforensic analyses of population and individualexposures. Each can be used to collect dustfrom undisturbed locations within a residenceor associated structures (e.g., garages, utilitysheds). One of the best examples, but onethat has been rarely used in exposure analyses,is attic dust. When one considers that thenormal life of a residential roof is 20–30 yearsor longer, if you add multiple layers of roof-ing materials, the attic can contain a record ofundisturbed archived deposited particles.Particles would have infiltrated the residenceby diffusion and advection through the evesor other passive ventilation portals (indoor oroutdoor), and then settled on surfaces. Atticdust has been used periodically to examinethe deposition of radionuclides from nuclearfallout and nuclear power plant emissions.Recently, studies have examined attic dust forthe levels of toxicants that may have beenemitted to the ambient air, transported, andthen deposited in the attic (96,97). Otherstudies examined deposition in attics located inNevada (98) or downwind of the Chernobylnuclear accident (59,99–101). Each includedmeasurements of radionuclides emitted bynuclear arms tests and/or nuclear powerplants, metals emitted from point or areasources, and specific tracers emitted by fromindustrial facilities.
Status and Issues for House andBuilding Dust Samplers and Their UseThere are a variety of samplers available tocollect indoor-generated or outdoor-generatedhouse dust, yard, or street dust. However, noone sampler has been invented that will collectmaterial from all surfaces. Further, many sam-plers are not designed to take the same type ofsample. In fact, although a number of sam-plers have been developed, most have neverbeen tested for performance in terms of whatthe collected material is supposed to represent.Some devices have been compared duringfield studies to test sampler collection perfor-mance characteristics, but usually this is doneonly with respect to the levels of a compoundor mass that other samplers generally collect.In general, the devices used in health physics,industrial hygiene, environmental hygiene,and exposure assessment measure surfaceloading as the amount of a toxicant persquare centimeter. However, in evaluatingsampler performance, it is important toevaulate and identify the method used foroperating the sampler. Clearly, without per-formance testing for specific physical/chemi-cal properties, it is not possible to obtain theinformation necessary to determine what themeasured values in a sample actually repre-sent for a surface or exposure. One alsorequires information about the character ofthe surface sampled and the atmospheric(environmental) condition at the time ofsampling. Over time, a level of consistencybetween samplers used in a study and sam-pling location can be established throughintercomparison studies and side-by-sidesampling (102–105).
For example, a baby wipe has been used asa wet surface sampler (102). It will scour anymaterial from the surface, and possibly thesubsurface, but the results obtained will beindependent of many variables that affectaccumulation on the hand. This is just oneexample of an issue associated with all surfacesamplers. Such a problem, however, does notpreclude using the results for forensic analysesor research in exposure analysis; it just requiresdefinition of the applicability of the measure-ments or what aspects of the results increase ordecrease the uncertainty of an assessment.
Wipe samplers. McArthur (81) summa-rized wipe sampling methods available in1992, and a modified list is provided in Table4 (106–119). The variety of sampler types andsolvents used to collect the material for a sur-face is large, and some are more applicablewith one toxicant, whereas others can be tai-lored to collect and provide measurements fora number of toxicants. Fenske et al. (14) com-mented that the precision of wipe samplingwould be improved by defining the area andstandardizing the materials and methods usedfor sampling.
Review • Lioy et al.
974 VOLUME 110 | NUMBER 10 | October 2002 • Environmental Health Perspectives
We have developed two devices for sur-face dust sampling. The first was the Lioy-Weisel-Wainman (LWW) dust wipe sampler(85). It was designed and tested to quantita-tively collect all materials deposited on flatsurfaces, and the design eliminated the con-founding influence of operator pressure onthe amount of dust pickup by the sampler.The LWW was also the first wipe samplerthat could quantitatively establish both theconcentration (in micrograms per gram) indust and the surface loading (in microgramsper square centimeter) of dust from the samesample. Its applications are confined to sam-pling horizontal or vertical flat surfaces,although the basic substrate used for the col-lection from the surface, a nucleopore 50 mm× 55 mm Perkin-Elmer drain disc (Perkin-Elmer, Norwalk, CT), has been tested andfound to be durable enough to collect mater-ial present in a window well. The samplingsubstrate used by the LWW can be changedto efficiently collect specific toxicants (e.g.,empore carbon-18 discs; 3M, Minneapolis,MN) for the collection of pesticides (120).
The LWW also operates as a wet or drycollection substrate for sampling specific sur-faces. Caution must be exercised, however,when selecting a wetted substrate becausewater and/or solvents can ruin finished sur-faces frequently found on furniture andfloors. In addition, if a surface is painted andthe paint is in poor condition, a wipe cantake off small chips of paint. This may giveanomalously high levels of lead in dust, butthe data cannot be ignored because lead paintchips present a hazard. Yiin et al. (75) foundthat lead loading varies with time of the year.Finally, Paustenbach (26) stated that thedevelopment of the LWW provided “fairlysophisticated work to standardize (wipe sam-pling) procedures.” Applications of the LWWwithin various studies have found the loadingof dust on flat surfaces to be associated withbiomarkers of exposure (20) and with clean-ing practices within the house (121,122).
Another issue is the protocol used for sam-pling dust. This was intensively examined andincorporated as a major feature in the designof the LWW sampler patent (123). The fea-tures of the sampler (no operator pressure anda defined template) were rigorously tested inthe design phase of the LWW and achievedreproducibility for a standard dust of a coeffi-cient of variation between 6 and 25% forreplicate samples (86). Freeman et al. (121)demonstrated that for side-by-side field sam-ples, the mean difference was 35%. This wasin an uncontrolled situation; thus there islarge potential for variability of dust loadingsin adjacent locations. The initial versions ofthe LWW were a bit cumbersome to use, buteventually a modified design was employed tothe collection of samples in approximately
300 homes during the six Midwestern StateNHEXAS pilot study, and the samples wereanalyzed for elements and pesticides (52). Incontrast, most other devices used for wipesampling, including cloth wipes, gauze pads,and gloves, have not received the same level ofperformance testing.
After the success of the LWW sampler, itwas important to go beyond collecting all thedust deposited on a surface to make infer-ences about the dermal uptake of a toxicant(88). Thus, we developed the Edwards andLioy (EL) sampler, which had a sampling sur-face designed specifically to mimic the collec-tion efficiency for the size distributions ofparticles on the surface of the human hand. Ithad an application pressure coincident withthe pressure placed on a surface by a human.The first model of the device focused on the“nonsticky hand” (i.e., dry), and it wasdesigned to collect a sample composed ofrepeated presses on a surface. It has been suc-cessfully used to determine the amount ofdust and pesticides picked up from varioustypes of textured and smooth surfaces (e.g.,floors and carpets) (120).
Edwards and Lioy (87) made extensivecomparisons with other wipe samplers (adhe-sive tapes, cotton gloves, etc.) to determinetheir utility as a metric of hand exposure todust present on surfaces. The metric for cali-bration was the final particle size distributionretained on a human hand for a series of con-trolled experiments. This was the first attemptto determine what types of loadings could betransferred from the floor to a hand by a sam-pler to eventually provide a device that couldeliminate use of the human hand as the der-mal sampling device. Up until now the only
effective way of completing dermal samplingwas to sample the actual hands of adults andchildren after contact with various surfaces.The hand rinse method can have large uncer-tainties. For example, if one does not knowthe history of activities, including hand wash-ing, and surfaces contacted prior to washingthe hand, it is difficult, if not impossible, toaccurately assess exposure. Further, in somecases the hand is washed with a liquid otherthan water, which requires added scrutiny byinstitutional review boards.
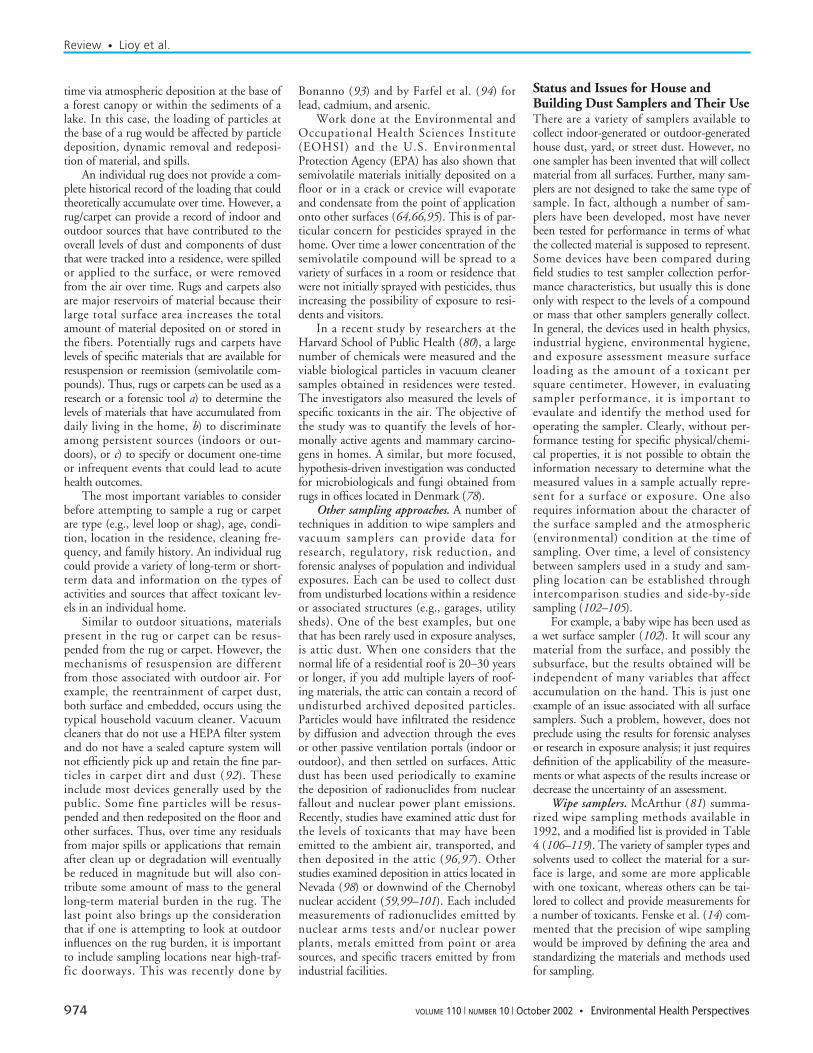
Edwards and Lioy (87) showed that meth-ods typically used for wipe and surface sam-pling did not have the same particle sizedistribution as that retained by the humanhand. The results in Figure 1 indicate thatonly synthetic skin and the C18 filter used inthe EL sampler closely mimicked the uptakeand retention characterization of the dry handfor particles < 250 µm in diameter. This wasanticipated because none of the samplers wasdesigned specifically to mimic exposure tohouse dust. The final version of the EL sam-pler collected a size distribution of the parti-cles equivalent to that attached to the humanhand for a “non-saliva–laden” condition ofthe hand. The studies to date have shown thatif one wants to mimic hand retention with asurface sampler, the total burden on the flooror other surfaces is not representative of whatwill be found on a human hand.
When sampling a surface with the ELsampler, there was no continual and uniformbuildup of mass. In fact, after about four tofive presses, little new mass was added to thesurface loading. The results of Rodes et al.(124) indicate that at some point new con-tacts with a surface just replace some of the
Review • Dust exposure assessment and source characterization
Environmental Health Perspectives • VOLUME 110 | NUMBER 10 | October 2002 975
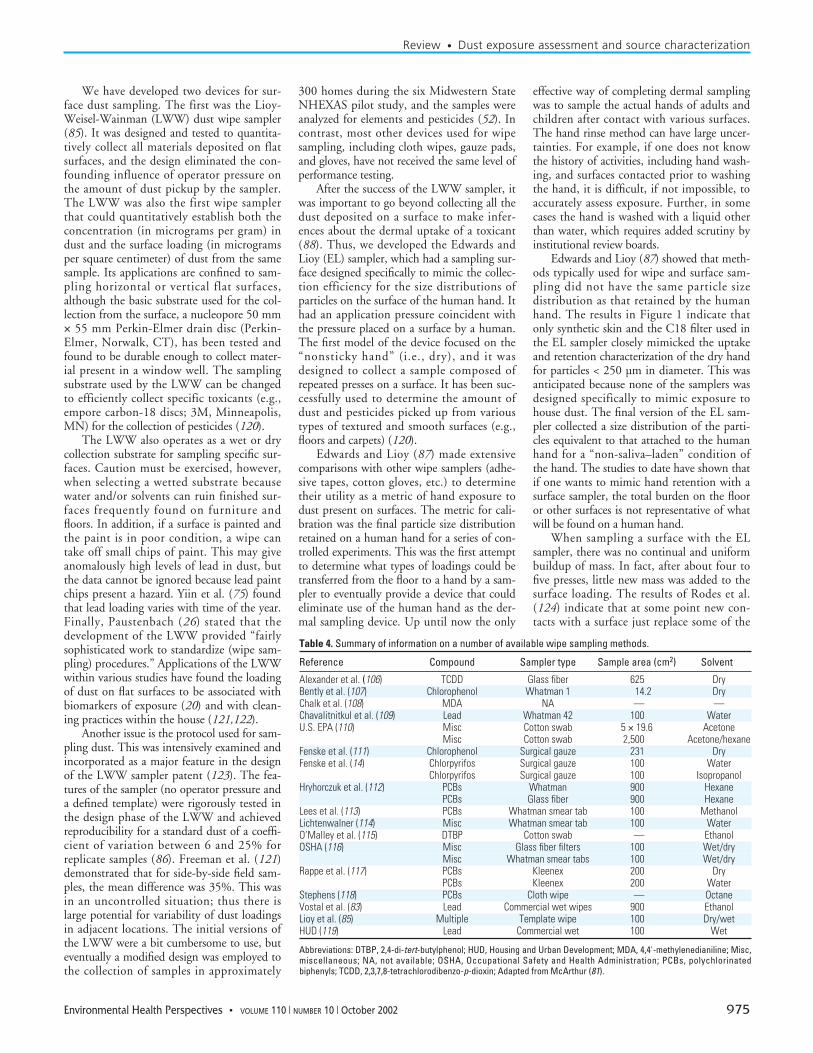
Table 4. Summary of information on a number of available wipe sampling methods.
Reference Compound Sampler type Sample area (cm2) Solvent
Alexander et al. (106) TCDD Glass fiber 625 DryBently et al. (107) Chlorophenol Whatman 1 14.2 DryChalk et al. (108) MDA NA — —Chavalitnitkul et al. (109) Lead Whatman 42 100 WaterU.S. EPA (110) Misc Cotton swab 5 × 19.6 Acetone
Misc Cotton swab 2,500 Acetone/hexaneFenske et al. (111) Chlorophenol Surgical gauze 231 DryFenske et al. (14) Chlorpyrifos Surgical gauze 100 Water
Chlorpyrifos Surgical gauze 100 IsopropanolHryhorczuk et al. (112) PCBs Whatman 900 Hexane
PCBs Glass fiber 900 HexaneLees et al. (113) PCBs Whatman smear tab 100 MethanolLichtenwalner (114) Misc Whatman smear tab 100 WaterO’Malley et al. (115) DTBP Cotton swab — EthanolOSHA (116) Misc Glass fiber filters 100 Wet/dry
Misc Whatman smear tabs 100 Wet/dryRappe et al. (117) PCBs Kleenex 200 Dry
PCBs Kleenex 200 WaterStephens (118) PCBs Cloth wipe — OctaneVostal et al. (83) Lead Commercial wet wipes 900 EthanolLioy et al. (85) Multiple Template wipe 100 Dry/wetHUD (119) Lead Commercial wet 100 Wet
Abbreviations: DTBP, 2,4-di-tert-butylphenol; HUD, Housing and Urban Development; MDA, 4,4'-methylenedianiline; Misc,miscellaneous; NA, not available; OSHA, Occupational Safety and Health Administration; PCBs, polychlorinatedbiphenyls; TCDD, 2,3,7,8-tetrachlorodibenzo-p-dioxin; Adapted from McArthur (81).
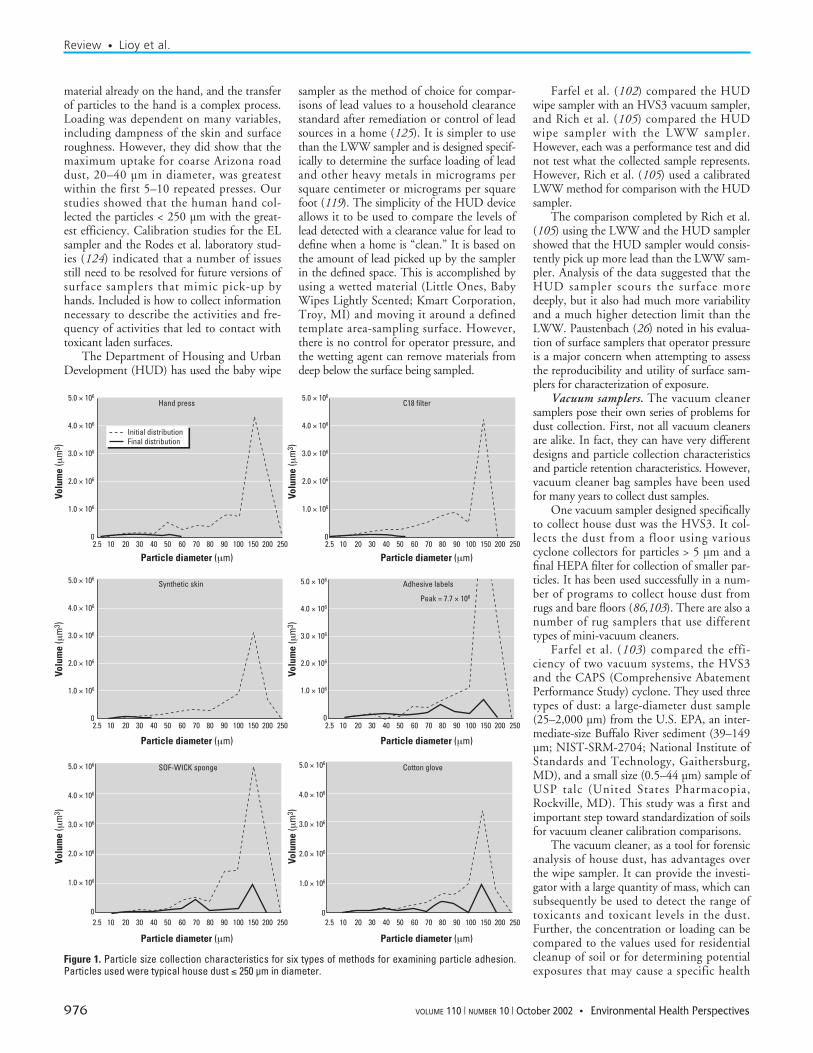
material already on the hand, and the transferof particles to the hand is a complex process.Loading was dependent on many variables,including dampness of the skin and surfaceroughness. However, they did show that themaximum uptake for coarse Arizona roaddust, 20–40 µm in diameter, was greatestwithin the first 5–10 repeated presses. Ourstudies showed that the human hand col-lected the particles < 250 µm with the great-est efficiency. Calibration studies for the ELsampler and the Rodes et al. laboratory stud-ies (124) indicated that a number of issuesstill need to be resolved for future versions ofsurface samplers that mimic pick-up byhands. Included is how to collect informationnecessary to describe the activities and fre-quency of activities that led to contact withtoxicant laden surfaces.
The Department of Housing and UrbanDevelopment (HUD) has used the baby wipe
sampler as the method of choice for compar-isons of lead values to a household clearancestandard after remediation or control of leadsources in a home (125). It is simpler to usethan the LWW sampler and is designed specif-ically to determine the surface loading of leadand other heavy metals in micrograms persquare centimeter or micrograms per squarefoot (119). The simplicity of the HUD deviceallows it to be used to compare the levels oflead detected with a clearance value for lead todefine when a home is “clean.” It is based onthe amount of lead picked up by the samplerin the defined space. This is accomplished byusing a wetted material (Little Ones, BabyWipes Lightly Scented; Kmart Corporation,Troy, MI) and moving it around a definedtemplate area-sampling surface. However,there is no control for operator pressure, andthe wetting agent can remove materials fromdeep below the surface being sampled.
Farfel et al. (102) compared the HUDwipe sampler with an HVS3 vacuum sampler,and Rich et al. (105) compared the HUDwipe sampler with the LWW sampler.However, each was a performance test and didnot test what the collected sample represents.However, Rich et al. (105) used a calibratedLWW method for comparison with the HUDsampler.
The comparison completed by Rich et al.(105) using the LWW and the HUD samplershowed that the HUD sampler would consis-tently pick up more lead than the LWW sam-pler. Analysis of the data suggested that theHUD sampler scours the surface moredeeply, but it also had much more variabilityand a much higher detection limit than theLWW. Paustenbach (26) noted in his evalua-tion of surface samplers that operator pressureis a major concern when attempting to assessthe reproducibility and utility of surface sam-plers for characterization of exposure.
Vacuum samplers. The vacuum cleanersamplers pose their own series of problems fordust collection. First, not all vacuum cleanersare alike. In fact, they can have very differentdesigns and particle collection characteristicsand particle retention characteristics. However,vacuum cleaner bag samples have been usedfor many years to collect dust samples.
One vacuum sampler designed specificallyto collect house dust was the HVS3. It col-lects the dust from a floor using variouscyclone collectors for particles > 5 µm and afinal HEPA filter for collection of smaller par-ticles. It has been used successfully in a num-ber of programs to collect house dust fromrugs and bare floors (86,103). There are also anumber of rug samplers that use differenttypes of mini-vacuum cleaners.
Farfel et al. (103) compared the effi-ciency of two vacuum systems, the HVS3and the CAPS (Comprehensive AbatementPerformance Study) cyclone. They used threetypes of dust: a large-diameter dust sample(25–2,000 µm) from the U.S. EPA, an inter-mediate-size Buffalo River sediment (39–149µm; NIST-SRM-2704; National Institute ofStandards and Technology, Gaithersburg,MD), and a small size (0.5–44 µm) sample ofUSP talc (United States Pharmacopia,Rockville, MD). This study was a first andimportant step toward standardization of soilsfor vacuum cleaner calibration comparisons.
The vacuum cleaner, as a tool for forensicanalysis of house dust, has advantages overthe wipe sampler. It can provide the investi-gator with a large quantity of mass, which cansubsequently be used to detect the range oftoxicants and toxicant levels in the dust.Further, the concentration or loading can becompared to the values used for residentialcleanup of soil or for determining potentialexposures that may cause a specific health
Review • Lioy et al.
976 VOLUME 110 | NUMBER 10 | October 2002 • Environmental Health Perspectives
Figure 1. Particle size collection characteristics for six types of methods for examining particle adhesion.Particles used were typical house dust ≤ 250 µm in diameter.
Peak = 7.7 × 10⁶
Hand press C18 filter
Synthetic skin Adhesive labels
SOF-WICK sponge Cotton glove
Particle diameter (µm) Particle diameter (µm)
Particle diameter (µm) Particle diameter (µm)
Particle diameter (µm) Particle diameter (µm)
5.0 × 10⁶
4.0 × 10⁶
3.0 × 10⁶
2.0 × 10⁶
1.0 × 10⁶
02.5 10 20 30 40 50 60 70 80 90 100 150 200 250 2.5 10 20 30 40 50 60 70 80 90 100 150 200 250
2.5 10 20 30 40 50 60 70 80 90 100 150 200 250 2.5 10 20 30 40 50 60 70 80 90 100 150 200 250
2.5 10 20 30 40 50 60 70 80 90 100 150 200 250 2.5 10 20 30 40 50 60 70 80 90 100 150 200 250
Volu
me
(µm
3 )
Volu
me
(µm
3 )
Volu
me
(µm
3 )
Volu
me
(µm
3 )
Volu
me
(µm
3 )
Volu
me
(µm
3 )
5.0 × 10⁶
4.0 × 10⁶
3.0 × 10⁶
2.0 × 10⁶
1.0 × 10⁶
0
5.0 × 10⁶
4.0 × 10⁶
3.0 × 10⁶
2.0 × 10⁶
1.0 × 10⁶
0
5.0 × 10⁶
4.0 × 10⁶
3.0 × 10⁶
2.0 × 10⁶
1.0 × 10⁶
0
5.0 × 10⁶
4.0 × 10⁶
3.0 × 10⁶
2.0 × 10⁶
1.0 × 10⁶
0
5.0 × 10⁶
4.0 × 10⁶
3.0 × 10⁶
2.0 × 10⁶
1.0 × 10⁶
0
Initial distributionFinal distribution
effect. Each device will capture different massfractions, depending on its design. The resultsobtained by various samplers indicate that fordetailed exposure assessments a very well-characterized vacuum sampler should accountfor particle size and/or determine the particlesize fractionated mass distributions. Vacuumsample results can be useful, at a minimum,in determining the presence or absence of atoxicant, and the suite of material or tracercompounds can be used to identify sources.For example, Colt et al. (126) compared thecollection of pesticides and other compoundscollected by a standard vacuum cleaner bagwith a particle size selection high-volumesampler. The compounds were detected ineach, but a more accurate record of potentialexposure was derived from the HVS3 and notthe typical vacuum bag.
The simplest sampling method is to collectdust from residential vacuum cleaner bags(126,127). Although lacking the precision ofsystematic designed vacuum sampling meth-ods, this is an effective tool for gross identifica-tion of contaminant levels in homes. Thus, itis an important screening tool for identifyinghigh-end exposures. To improve the applica-bility of the results from standard vacuumbags, information needs to be gathered on thecharacteristics and activities in the homes.Included would be the age of house, age of car-pet, when the vacuum cleaner bag wasreplaced, residential construction activities,ventilation patterns, and cleaning patterns.
Obviously, more precision can be obtainedusing a standardized vacuum cleaner that col-lects a documented size fraction of dust andthat vacuums a standard section of carpet(17,89,128). Finally, the vacuum cleanermethod of dust collection has also been used inconjunction with polyurethane foam (PUF)rollers to characterize the distribution of pesti-cides on surfaces and at various levels in a car-pet (129) or with the LWW sampler toexamine surfaces in a home (89,92).
Other samplers. The attic dust sampler, thesurface deposition plate, mats, microscope slideplates, or sticky tapes and rollers are devicesthat can provide quantitative information onthe particle size and composition of materialthat have been generated indoors or outdoors.The sampling device is deposited on a surfaceand left undisturbed for a specific amount oftime. In the case of all but the attic dust sam-ple, the location, timing, and the duration ofthe sample are selected by the investigator.Analytically this is helpful because some typesof events and sources influencing the depositedmaterial can be qualitatively or quantitativelyidentified using survey tools before or duringsample collection. During the use of a deposi-tion collector, the accuracy of source identifica-tion can be improved if videotape is runningthroughout the sampling period, but this is
difficult to achieve because of logistics. Aprospective sampling strategy can be tailored tothe toxicant or the source of concern.
An attic sample can represent the long-term dynamic accumulation of material thathas been influenced for many years by thenatural movement of air, penetration of thedust indoors, and the eventual deposition ofdust on many surfaces. Most samples are col-lected and placed in a bag using plastic scoopsor a wisk broom (96,97). The major concernis that important household activities andhome maintenance may disturb the attic dust(e.g., roof replacement, renovations).
Farfel et al. (94) placed floor mats in resi-dential entryways to examine the movementof material into and out of a residence. Floormats can be used to quantify the dust or toxi-cant levels that are tracked into the residencefrom outdoors and accumulate on the matover a specified period of time. This studyfocused on comparing the collecting effi-ciency of two vacuum cleaners for removal ofdeposited dust, and they concluded that olderhomes appeared to yield high lead loadingand this was due to higher lead concentra-tions in the deposited dust. They also didcomparative testing of the devices for stan-dard reference material that contained lead.Included were two NIST samples and a baghouse sample. Farfel et al. (94) indicated thatthe mat collection technique needs furtherevaluation if it is to be used to estimate dustdeposition rates. They stated that it is essen-tial to determine which type of mat should beused, and eventually what the collected datacan represent to assess exposure and eventu-ally risk for toxicants deposited on the matleft in an entry way. Finally, they made theimportant point that we need to find bettermethodologies for determining incrementaldust deposition in the home.
Edwards et al. (55) used a deposition plateto determine the amount of particulate matterthat settled on a deposition plate over thecourse of 30 days. The plates were located ona flat surface at 0.3 and 1.5 m off the ground.The deposited particles were measured byimage analyzer to determine the particle sizedistributions by height and time of the year.The results revealed significant differences indeposition based on particle size alone, withlarge numbers of deposited particles in thewinter and greater deposited mass in the sum-mer. The latter was due to the influence oflarge particle deposition. The lower heightsamples had more particles in the summer-time, but the size of the deposited particleswas smaller during the winter.
Pellizzari et al. (52) and Bonanno et al.(53) used entrance mats to examine the track-ing of metals indoors during the NHEXAS.Farfel et al. (94) used mats to collect and ana-lyze samples for lead. In each case, the sampler
was left in the doorway for a specific period oftime, approximately 3–4 weeks, to collect anincremental amount of mass with or withoutcontamination. Nishioka et al. (23) used SOF-WICK pads to collect pesticides deposited onlawns. They also used PUF rollers and cottongauze (23,130).
Finally, surface soil samples, which wouldbe taken from the top 1–3 cm of soil, areanother source of information on potential res-idential exposures. The purpose is to obtainthe scientific data for estimates of dermal con-tact and incidental ingestion by collecting soilin the yard that has a high potential for sus-tained human contact either currently or in thefuture. Thus, surface soil can be analyzed todetermine if the soil is the source of toxicantsof concern. The technique usually involvesselecting a Teflon or other non-backgroundladen pan and using an appropriate brush tosweep the surface soil into the pan. After a pre-scribed area is sampled, the material is placedin a sealed bag and sent out for analysis. Thistechnique has been used by numerous investi-gators for a variety of toxicants. As an example,archived soil samples collected over 36 years inthe United Kingdom at two experimental sta-tions were recently analyzed for organochlorinepesticides. The results showed decreases in lev-els over time, and the results indicated thepeak soil concentrations coincided with peakusage in the 1960s (131).
In addition to examining a rug or othersurfaces for individual particles, elements, andother physical or chemical constituents, onecan obtain quantitative and qualitative infor-mation on bacteria, molds, spores, and otherviable particles. For the material present onindividual surfaces, it is possible to transfermaterial to slides for analysis or to petri dishesfilled with an agar for colony growth and iden-tification. In addition, the investigator canplace a sampler such as a petri dish to collectbiologicals that can deposit on surfaces (132).
Other issues. The materials that can besubjected to analysis are far ranging in typesand characteristics. From the standpoint offorensic or exposure research analyses this isexceptionally good because one can address anumber of different types of exposure issuesand source receptor relationships. The majorconcern is 2-fold: how to triage the analyticopportunities and how to collect enough of theappropriate sample type to detect the toxicantof concern. Collection issues affect our abilityto measure heavy metals, organic compounds,asbestos, other inorganic species, radionuclides,and viable and nonviable biological materials.Particle size and morphology are also helpfulfor identifying and addressing many residentialexposure issues. The work of Rudel et al. (80)piloted a methodology to examine hormonallyactive agents and animal mammary carcino-gens in house dust. This advanced the use of
Review • Dust exposure assessment and source characterization
Environmental Health Perspectives • VOLUME 110 | NUMBER 10 | October 2002 977
dust to measure phenolic compounds, phtha-lates, in addition to the more common toxi-cants PAHs and pesticides. The samples werecollected using a “Mighty-Mite” vacuumcleaner. Unfortunately, the samples were notdifferentiated by surface, so the results can onlybe considered “whole” residence samples. Oneobservation was that house dust provides arecord of past exposure and can increaseunderstanding of potential exposures due tothe use of commercial products. It should beexamined for pre- and postevent issues.
The work of Molhave et al. (78) focusedon microorganisms and allergens, as well asaldehydes and the basic components of dust.Their goal was to demonstrate that dust is asource of airborne particles found in a work-place. However, an important aspect of theexperiment was the use of the contents of atypical vacuum cleaner bag as the source ofmaterial for an analyses. Thus, for forensicand screening experiments, it appears logicalto examine the content of the basic vacuumcleaner bag as a first step in a triage for con-ducting exposure and assessments in a homefor research and/or forensic purposes to selectthe major contaminants of concern.
Dust not only is present on surfaces andcarpets, but it can transfer to people’s hands.This is of particular concern for children whoexhibit mouthing behaviors. Methods for col-lecting dust from hands can be as simple aswiping the hands with a moist towelette orpaper or rinsing the hand with water, weakacid, or solvent, or placing the hand on thesurface of a culture medium. The type ofmethod used depends on the aspect of the dustthat is of interest. Several investigators haveused hand wipes for collection of dust. Vostalet al. (83) used commercial hand wipes,Wash’n Dri Towelettes, to collect dust fromthe hands of children and from windowsill orfloor surfaces. Duggan et al. (133) usedanother commercial hand wipe, Wet Ones, tocollect hand wipe samples and also evaluated arange of commercially available wipe media.The hand wipe method was found to be sim-ple and reproducible when the contaminant ofconcern was lead. The efficacy of the methodin collection of lead has been demonstrated forboth house dust and playground dust, with thefirst wipe collecting between 50 and 70% ofthe lead on hands. The use of the samemethod for collection of hand wipes and envi-ronmental samples makes it easy to comparethe measures obtained from the two sources.
The challenge in using hand wipes tomeasure total dust on children’s hands is thatthe sampling medium is not easily preweighedand therefore a mass cannot be directly calcu-lated. A way to get around this problem is toback-calculate mass using the measurementsof metals or pesticides on the hand and useanother database that provides the amount of
metals or pesticide found in size fractions ofdust that will strongly adhere to hands andother locations on the skin. This method wasrecently used with metals (90).
Hand rinses with water or rubbing alcoholhave been used to collect dust when the mate-rials of concern are pesticides (87,120,130,134,135). The disadvantage of hand rinsesare their messiness in collection and the labor-intensive reduction methods necessary beforeanalysis. It is possible, however, through care-ful evaporation of the rinsate, to obtain a mea-sure of dust mass on the hand (133,135).
Assessment of Data Obtainedfrom Residential DustInformation on activities and lifestyles neededto assess residential exposure to dust and othermedia requires the application of survey instru-ments to record home and occupant historiesbefore determining the exact location of dustsampling. For instance, an exposure-basedinvestigation first requires information on thewho, what, where, when, and why associatedwith a particular problem. This informationcan be gathered in a variety of ways, includingquestionnaires, videotaping, diaries, and inter-views (88). Each of these tools can be modifiedto address problems in specific situations. Forexample, questionnaires exist that can be usedto identify sources, characterize the physicalstructure of the house and the activities in thehouse, identify external and internal sourcetypes, health status of occupants, and productuses. Daily diaries and videotaping are surveyinstruments that can be used to get prospectiveinformation on the likelihood and frequencyof potential contact with chemical, physical,and biological agents.
Fairly simple questionnaires can be usedto evaluate the “dustiness” of homes. Roughestimates of the amount of visible dust on a3-point scale have been found to associatewell with blood lead levels in children (136)and with dust levels on windowsills (121).These scaled indicators of dust have also beenassociated with chromium loadings on win-dowsills and urine chromium of residentsnear chromate waste sites.
Questions posed to householders thataddress cleaning habits, ventilation and heatingpractices, residential construction, and pres-ence of pets and children in the home can alsoprovide valuable information related to thedust levels and composition found in homes.
Videotaping is a new and useful tool inexposure assessment. It provides an unob-structed and noncumbersome approach toexamining passive or active contact with anenvironmental toxicant (137,138). With newvideo technology, miniaturized cameras cannow be deployed that do not require theshadowing of an individual subject by a tech-nician carrying a video camera pack. Such
data can be an extremely valuable addition toforensic analyses of exposure because digital-ized results from the videotaping can helpfocus attention on specific locations, sources,and times that require sampling. The video-tape also helps reduce the amount of specula-tion about what sources or conditions oractivities lead to contact. Videotaping is anevolving tool and is extremely valuable forcharacterizing exposure to materials and cont-aminants that have multimedia sources andmultiple exposure pathways.
In the area of inhalation exposure, forexample, certain volatile organic solvents canbe emitted and accumulate in the ambientair, by drinking and showering water, and byspecific products used in or around a home orworkplace (2,139). Videotaping provides anobjective measure of the types and locationsof duration of potential or actual contact withvolatile toxicants.
Each home or building environment hasgeneral dynamic conditions associated withthe structure’s inherent characteristics and thelifestyle of the occupants. The variables thatcan influence the accumulation, movement,and removal of materials present in a ruginclude type of housing, the season, age andcondition of housing, furnishings, insulation,behavior and activities of occupants, con-struction, and location with respect to out-door sources. Gathering information on thelarge number of variables that can affect ahome environment is a daunting task; how-ever, many variables will have a long-termand consistent influence on the levels ofmaterials present in the carpet. Thus, specificvariables may provide information on levelsfor materials present, which can range incomposition from starch through heavy met-als. Other variables will reflect deposits causedby specific events, accidents, planned activi-ties, discrete changes in lifestyle, and changesin the number of occupants.
Freeman et al. (89) have shown that foodthat is frequently dropped on the floor accu-mulates toxicants, and children who play inand on contaminated surfaces will transfer tox-icants to the foods they eat when they do notwash their hands before handling food. Arecent analysis by Bonanno et al. (53) of theNHEXAS data obtained in a statistically repre-sentative population within six Midwesternstates has demonstrated that the home charac-teristics and activities are good indicators of thepotential for toxicant contamination in housedust and indoor air. This is an importantobservation that can be used in the design andimplementation of field studies because suchinformation can help with defining the triagefor a dust analysis and sampling strategy.
Hunt et al. (77) and Adgate and col-leagues (140,141) were among the firstgroups to attempt multiple source signature
Review • Lioy et al.
978 VOLUME 110 | NUMBER 10 | October 2002 • Environmental Health Perspectives
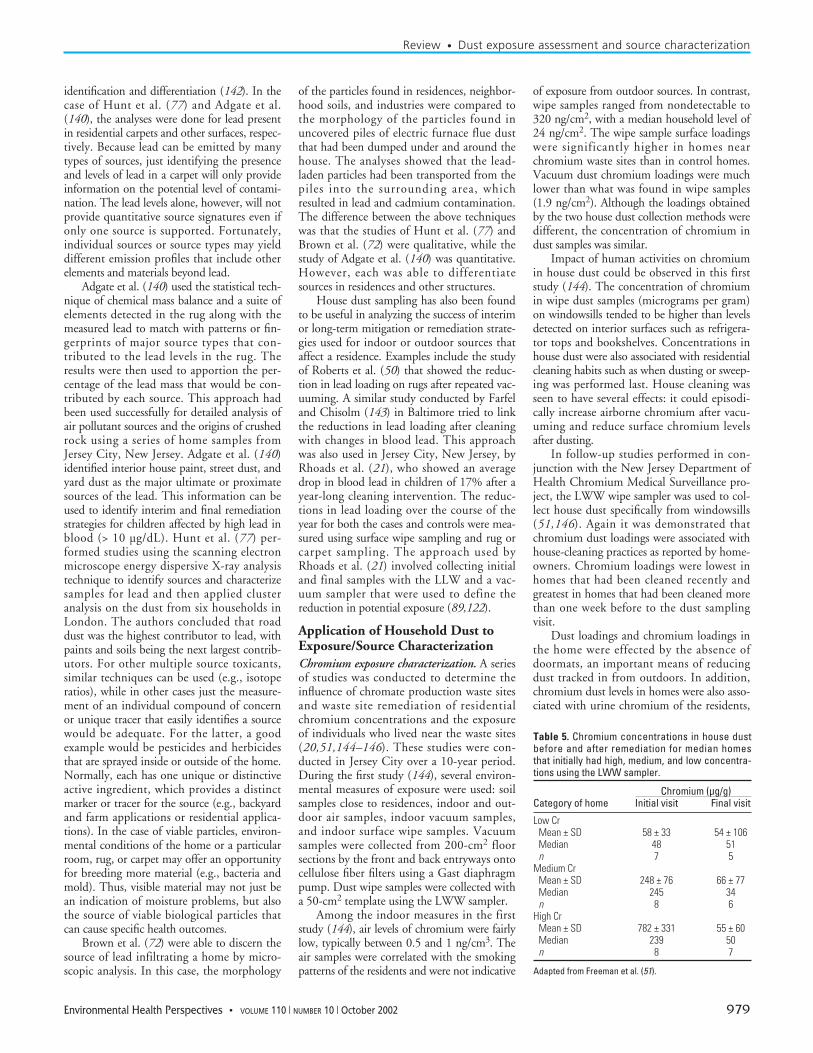
identification and differentiation (142). In thecase of Hunt et al. (77) and Adgate et al.(140), the analyses were done for lead presentin residential carpets and other surfaces, respec-tively. Because lead can be emitted by manytypes of sources, just identifying the presenceand levels of lead in a carpet will only provideinformation on the potential level of contami-nation. The lead levels alone, however, will notprovide quantitative source signatures even ifonly one source is supported. Fortunately,individual sources or source types may yielddifferent emission profiles that include otherelements and materials beyond lead.
Adgate et al. (140) used the statistical tech-nique of chemical mass balance and a suite ofelements detected in the rug along with themeasured lead to match with patterns or fin-gerprints of major source types that con-tributed to the lead levels in the rug. Theresults were then used to apportion the per-centage of the lead mass that would be con-tributed by each source. This approach hadbeen used successfully for detailed analysis ofair pollutant sources and the origins of crushedrock using a series of home samples fromJersey City, New Jersey. Adgate et al. (140)identified interior house paint, street dust, andyard dust as the major ultimate or proximatesources of the lead. This information can beused to identify interim and final remediationstrategies for children affected by high lead inblood (> 10 µg/dL). Hunt et al. (77) per-formed studies using the scanning electronmicroscope energy dispersive X-ray analysistechnique to identify sources and characterizesamples for lead and then applied clusteranalysis on the dust from six households inLondon. The authors concluded that roaddust was the highest contributor to lead, withpaints and soils being the next largest contrib-utors. For other multiple source toxicants,similar techniques can be used (e.g., isotoperatios), while in other cases just the measure-ment of an individual compound of concernor unique tracer that easily identifies a sourcewould be adequate. For the latter, a goodexample would be pesticides and herbicidesthat are sprayed inside or outside of the home.Normally, each has one unique or distinctiveactive ingredient, which provides a distinctmarker or tracer for the source (e.g., backyardand farm applications or residential applica-tions). In the case of viable particles, environ-mental conditions of the home or a particularroom, rug, or carpet may offer an opportunityfor breeding more material (e.g., bacteria andmold). Thus, visible material may not just bean indication of moisture problems, but alsothe source of viable biological particles thatcan cause specific health outcomes.
Brown et al. (72) were able to discern thesource of lead infiltrating a home by micro-scopic analysis. In this case, the morphology
of the particles found in residences, neighbor-hood soils, and industries were compared tothe morphology of the particles found inuncovered piles of electric furnace flue dustthat had been dumped under and around thehouse. The analyses showed that the lead-laden particles had been transported from thepiles into the surrounding area, whichresulted in lead and cadmium contamination.The difference between the above techniqueswas that the studies of Hunt et al. (77) andBrown et al. (72) were qualitative, while thestudy of Adgate et al. (140) was quantitative.However, each was able to differentiatesources in residences and other structures.
House dust sampling has also been foundto be useful in analyzing the success of interimor long-term mitigation or remediation strate-gies used for indoor or outdoor sources thataffect a residence. Examples include the studyof Roberts et al. (50) that showed the reduc-tion in lead loading on rugs after repeated vac-uuming. A similar study conducted by Farfeland Chisolm (143) in Baltimore tried to linkthe reductions in lead loading after cleaningwith changes in blood lead. This approachwas also used in Jersey City, New Jersey, byRhoads et al. (21), who showed an averagedrop in blood lead in children of 17% after ayear-long cleaning intervention. The reduc-tions in lead loading over the course of theyear for both the cases and controls were mea-sured using surface wipe sampling and rug orcarpet sampling. The approach used byRhoads et al. (21) involved collecting initialand final samples with the LLW and a vac-uum sampler that were used to define thereduction in potential exposure (89,122).
Application of Household Dust toExposure/Source CharacterizationChromium exposure characterization. A seriesof studies was conducted to determine theinfluence of chromate production waste sitesand waste site remediation of residentialchromium concentrations and the exposureof individuals who lived near the waste sites(20,51,144–146). These studies were con-ducted in Jersey City over a 10-year period.During the first study (144), several environ-mental measures of exposure were used: soilsamples close to residences, indoor and out-door air samples, indoor vacuum samples,and indoor surface wipe samples. Vacuumsamples were collected from 200-cm2 floorsections by the front and back entryways ontocellulose fiber filters using a Gast diaphragmpump. Dust wipe samples were collected witha 50-cm2 template using the LWW sampler.
Among the indoor measures in the firststudy (144), air levels of chromium were fairlylow, typically between 0.5 and 1 ng/cm3. Theair samples were correlated with the smokingpatterns of the residents and were not indicative
of exposure from outdoor sources. In contrast,wipe samples ranged from nondetectable to320 ng/cm2, with a median household level of24 ng/cm2. The wipe sample surface loadingswere significantly higher in homes nearchromium waste sites than in control homes.Vacuum dust chromium loadings were muchlower than what was found in wipe samples(1.9 ng/cm2). Although the loadings obtainedby the two house dust collection methods weredifferent, the concentration of chromium indust samples was similar.
Impact of human activities on chromiumin house dust could be observed in this firststudy (144). The concentration of chromiumin wipe dust samples (micrograms per gram)on windowsills tended to be higher than levelsdetected on interior surfaces such as refrigera-tor tops and bookshelves. Concentrations inhouse dust were also associated with residentialcleaning habits such as when dusting or sweep-ing was performed last. House cleaning wasseen to have several effects: it could episodi-cally increase airborne chromium after vacu-uming and reduce surface chromium levelsafter dusting.
In follow-up studies performed in con-junction with the New Jersey Department ofHealth Chromium Medical Surveillance pro-ject, the LWW wipe sampler was used to col-lect house dust specifically from windowsills(51,146). Again it was demonstrated thatchromium dust loadings were associated withhouse-cleaning practices as reported by home-owners. Chromium loadings were lowest inhomes that had been cleaned recently andgreatest in homes that had been cleaned morethan one week before to the dust samplingvisit.
Dust loadings and chromium loadings inthe home were effected by the absence ofdoormats, an important means of reducingdust tracked in from outdoors. In addition,chromium dust levels in homes were also asso-ciated with urine chromium of the residents,
Review • Dust exposure assessment and source characterization
Environmental Health Perspectives • VOLUME 110 | NUMBER 10 | October 2002 979
Table 5. Chromium concentrations in house dustbefore and after remediation for median homesthat initially had high, medium, and low concentra-tions using the LWW sampler.
Chromium (µg/g)Category of home Initial visit Final visit
Low CrMean ± SD 58 ± 33 54 ± 106Median 48 51n 7 5
Medium CrMean ± SD 248 ± 76 66 ± 77Median 245 34n 8 6
High CrMean ± SD 782 ± 331 55 ± 60Median 239 50n 8 7
Adapted from Freeman et al. (51).
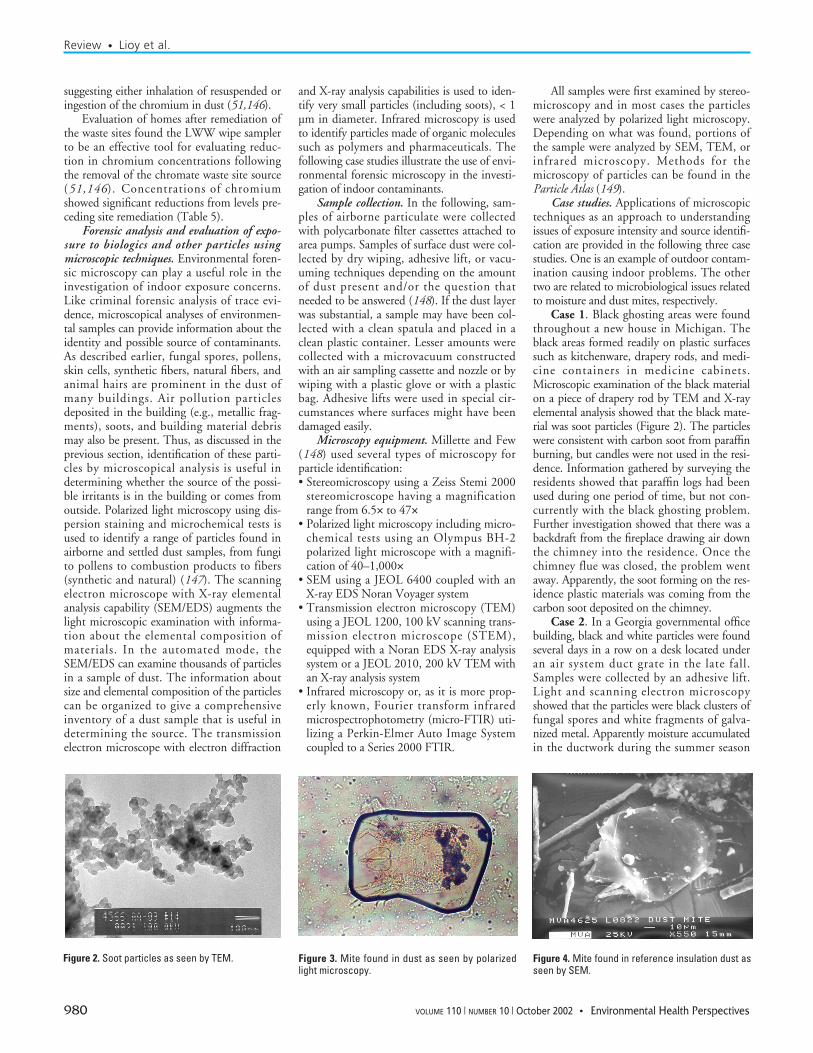
suggesting either inhalation of resuspended oringestion of the chromium in dust (51,146).
Evaluation of homes after remediation ofthe waste sites found the LWW wipe samplerto be an effective tool for evaluating reduc-tion in chromium concentrations followingthe removal of the chromate waste site source(51,146). Concentrations of chromiumshowed significant reductions from levels pre-ceding site remediation (Table 5).
Forensic analysis and evaluation of expo-sure to biologics and other particles usingmicroscopic techniques. Environmental foren-sic microscopy can play a useful role in theinvestigation of indoor exposure concerns.Like criminal forensic analysis of trace evi-dence, microscopical analyses of environmen-tal samples can provide information about theidentity and possible source of contaminants.As described earlier, fungal spores, pollens,skin cells, synthetic fibers, natural fibers, andanimal hairs are prominent in the dust ofmany buildings. Air pollution particlesdeposited in the building (e.g., metallic frag-ments), soots, and building material debrismay also be present. Thus, as discussed in theprevious section, identification of these parti-cles by microscopical analysis is useful indetermining whether the source of the possi-ble irritants is in the building or comes fromoutside. Polarized light microscopy using dis-persion staining and microchemical tests isused to identify a range of particles found inairborne and settled dust samples, from fungito pollens to combustion products to fibers(synthetic and natural) (147). The scanningelectron microscope with X-ray elementalanalysis capability (SEM/EDS) augments thelight microscopic examination with informa-tion about the elemental composition ofmaterials. In the automated mode, theSEM/EDS can examine thousands of particlesin a sample of dust. The information aboutsize and elemental composition of the particlescan be organized to give a comprehensiveinventory of a dust sample that is useful indetermining the source. The transmissionelectron microscope with electron diffraction
and X-ray analysis capabilities is used to iden-tify very small particles (including soots), < 1µm in diameter. Infrared microscopy is usedto identify particles made of organic moleculessuch as polymers and pharmaceuticals. Thefollowing case studies illustrate the use of envi-ronmental forensic microscopy in the investi-gation of indoor contaminants.
Sample collection. In the following, sam-ples of airborne particulate were collectedwith polycarbonate filter cassettes attached toarea pumps. Samples of surface dust were col-lected by dry wiping, adhesive lift, or vacu-uming techniques depending on the amountof dust present and/or the question thatneeded to be answered (148). If the dust layerwas substantial, a sample may have been col-lected with a clean spatula and placed in aclean plastic container. Lesser amounts werecollected with a microvacuum constructedwith an air sampling cassette and nozzle or bywiping with a plastic glove or with a plasticbag. Adhesive lifts were used in special cir-cumstances where surfaces might have beendamaged easily.
Microscopy equipment. Millette and Few(148) used several types of microscopy forparticle identification: • Stereomicroscopy using a Zeiss Stemi 2000
stereomicroscope having a magnificationrange from 6.5× to 47×
• Polarized light microscopy including micro-chemical tests using an Olympus BH-2polarized light microscope with a magnifi-cation of 40–1,000×
• SEM using a JEOL 6400 coupled with anX-ray EDS Noran Voyager system
• Transmission electron microscopy (TEM)using a JEOL 1200, 100 kV scanning trans-mission electron microscope (STEM),equipped with a Noran EDS X-ray analysissystem or a JEOL 2010, 200 kV TEM withan X-ray analysis system
• Infrared microscopy or, as it is more prop-erly known, Fourier transform infraredmicrospectrophotometry (micro-FTIR) uti-lizing a Perkin-Elmer Auto Image Systemcoupled to a Series 2000 FTIR.
All samples were first examined by stereo-microscopy and in most cases the particleswere analyzed by polarized light microscopy.Depending on what was found, portions ofthe sample were analyzed by SEM, TEM, orinfrared microscopy. Methods for themicroscopy of particles can be found in theParticle Atlas (149).
Case studies. Applications of microscopictechniques as an approach to understandingissues of exposure intensity and source identifi-cation are provided in the following three casestudies. One is an example of outdoor contam-ination causing indoor problems. The othertwo are related to microbiological issues relatedto moisture and dust mites, respectively.
Case 1. Black ghosting areas were foundthroughout a new house in Michigan. Theblack areas formed readily on plastic surfacessuch as kitchenware, drapery rods, and medi-cine containers in medicine cabinets.Microscopic examination of the black materialon a piece of drapery rod by TEM and X-rayelemental analysis showed that the black mate-rial was soot particles (Figure 2). The particleswere consistent with carbon soot from paraffinburning, but candles were not used in the resi-dence. Information gathered by surveying theresidents showed that paraffin logs had beenused during one period of time, but not con-currently with the black ghosting problem.Further investigation showed that there was abackdraft from the fireplace drawing air downthe chimney into the residence. Once thechimney flue was closed, the problem wentaway. Apparently, the soot forming on the res-idence plastic materials was coming from thecarbon soot deposited on the chimney.
Case 2. In a Georgia governmental officebuilding, black and white particles were foundseveral days in a row on a desk located underan air system duct grate in the late fall.Samples were collected by an adhesive lift.Light and scanning electron microscopyshowed that the particles were black clusters offungal spores and white fragments of galva-nized metal. Apparently moisture accumulatedin the ductwork during the summer season
Review • Lioy et al.
980 VOLUME 110 | NUMBER 10 | October 2002 • Environmental Health Perspectives
Figure 2. Soot particles as seen by TEM. Figure 3. Mite found in dust as seen by polarizedlight microscopy.
Figure 4. Mite found in reference insulation dust asseen by SEM.
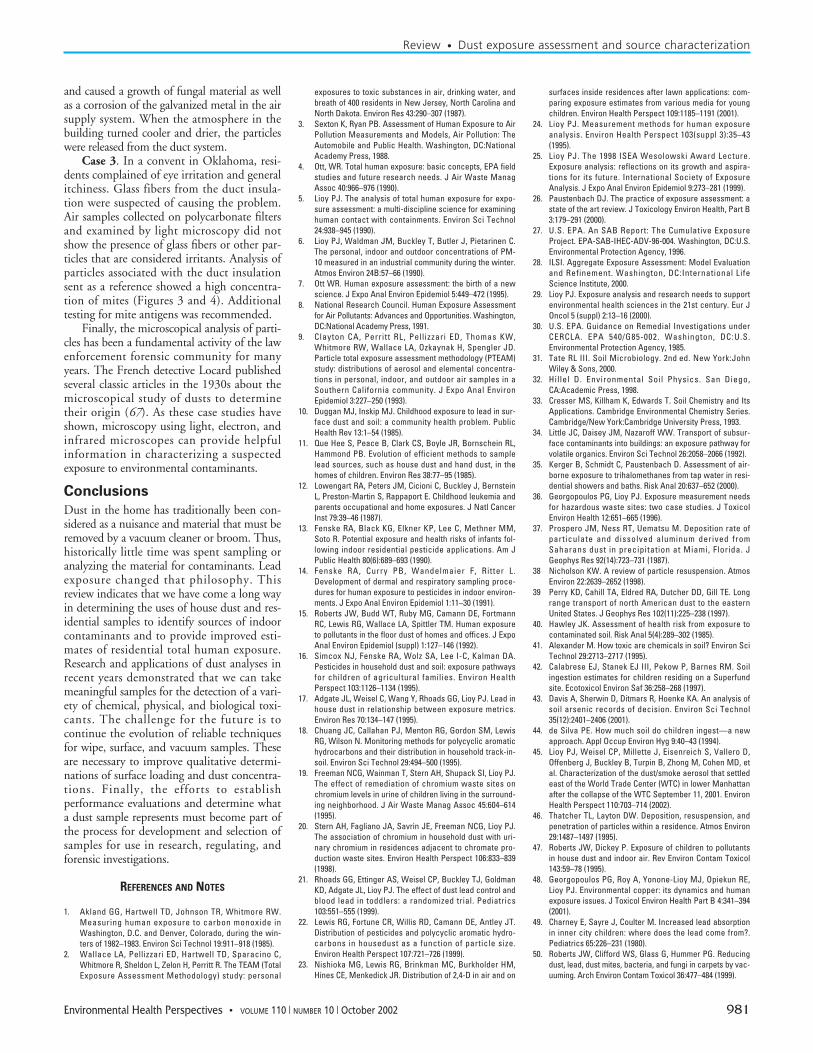
and caused a growth of fungal material as wellas a corrosion of the galvanized metal in the airsupply system. When the atmosphere in thebuilding turned cooler and drier, the particleswere released from the duct system.
Case 3. In a convent in Oklahoma, resi-dents complained of eye irritation and generalitchiness. Glass fibers from the duct insula-tion were suspected of causing the problem.Air samples collected on polycarbonate filtersand examined by light microscopy did notshow the presence of glass fibers or other par-ticles that are considered irritants. Analysis ofparticles associated with the duct insulationsent as a reference showed a high concentra-tion of mites (Figures 3 and 4). Additionaltesting for mite antigens was recommended.
Finally, the microscopical analysis of parti-cles has been a fundamental activity of the lawenforcement forensic community for manyyears. The French detective Locard publishedseveral classic articles in the 1930s about themicroscopical study of dusts to determinetheir origin (67). As these case studies haveshown, microscopy using light, electron, andinfrared microscopes can provide helpfulinformation in characterizing a suspectedexposure to environmental contaminants.
Conclusions
Dust in the home has traditionally been con-sidered as a nuisance and material that must beremoved by a vacuum cleaner or broom. Thus,historically little time was spent sampling oranalyzing the material for contaminants. Leadexposure changed that philosophy. Thisreview indicates that we have come a long wayin determining the uses of house dust and res-idential samples to identify sources of indoorcontaminants and to provide improved esti-mates of residential total human exposure.Research and applications of dust analyses inrecent years demonstrated that we can takemeaningful samples for the detection of a vari-ety of chemical, physical, and biological toxi-cants. The challenge for the future is tocontinue the evolution of reliable techniquesfor wipe, surface, and vacuum samples. Theseare necessary to improve qualitative determi-nations of surface loading and dust concentra-tions. Finally, the efforts to establishperformance evaluations and determine whata dust sample represents must become part ofthe process for development and selection ofsamples for use in research, regulating, andforensic investigations.
REFERENCES AND NOTES
1. Akland GG, Hartwell TD, Johnson TR, Whitmore RW.Measuring human exposure to carbon monoxide inWashington, D.C. and Denver, Colorado, during the win-ters of 1982–1983. Environ Sci Technol 19:911–918 (1985).
2. Wallace LA, Pellizzari ED, Hartwell TD, Sparacino C,Whitmore R, Sheldon L, Zelon H, Perritt R. The TEAM (TotalExposure Assessment Methodology) study: personal
exposures to toxic substances in air, drinking water, andbreath of 400 residents in New Jersey, North Carolina andNorth Dakota. Environ Res 43:290–307 (1987).
3. Sexton K, Ryan PB. Assessment of Human Exposure to AirPollution Measurements and Models, Air Pollution: TheAutomobile and Public Health. Washington, DC:NationalAcademy Press, 1988.
4. Ott, WR. Total human exposure: basic concepts, EPA fieldstudies and future research needs. J Air Waste ManagAssoc 40:966–976 (1990).
5. Lioy PJ. The analysis of total human exposure for expo-sure assessment: a multi-discipline science for examininghuman contact with containments. Environ Sci Technol24:938–945 (1990).
6. Lioy PJ, Waldman JM, Buckley T, Butler J, Pietarinen C.The personal, indoor and outdoor concentrations of PM-10 measured in an industrial community during the winter.Atmos Environ 24B:57–66 (1990).
7. Ott WR. Human exposure assessment: the birth of a newscience. J Expo Anal Environ Epidemiol 5:449–472 (1995).
8. National Research Council. Human Exposure Assessmentfor Air Pollutants: Advances and Opportunities. Washington,DC:National Academy Press, 1991.
9. Clayton CA, Perritt RL, Pellizzari ED, Thomas KW,Whitmore RW, Wallace LA, Ozkaynak H, Spengler JD.Particle total exposure assessment methodology (PTEAM)study: distributions of aerosol and elemental concentra-tions in personal, indoor, and outdoor air samples in aSouthern California community. J Expo Anal EnvironEpidemiol 3:227–250 (1993).
10. Duggan MJ, Inskip MJ. Childhood exposure to lead in sur-face dust and soil: a community health problem. PublicHealth Rev 13:1–54 (1985).
11. Que Hee S, Peace B, Clark CS, Boyle JR, Bornschein RL,Hammond PB. Evolution of efficient methods to samplelead sources, such as house dust and hand dust, in thehomes of children. Environ Res 38:77–95 (1985).
12. Lowengart RA, Peters JM, Cicioni C, Buckley J, BernsteinL, Preston-Martin S, Rappaport E. Childhood leukemia andparents occupational and home exposures. J Natl CancerInst 79:39–46 (1987).
13. Fenske RA, Black KG, Elkner KP, Lee C, Methner MM,Soto R. Potential exposure and health risks of infants fol-lowing indoor residential pesticide applications. Am JPublic Health 80(6):689–693 (1990).
14. Fenske RA, Curry PB, Wandelmaier F, Ritter L.Development of dermal and respiratory sampling proce-dures for human exposure to pesticides in indoor environ-ments. J Expo Anal Environ Epidemiol 1:11–30 (1991).
15. Roberts JW, Budd WT, Ruby MG, Camann DE, FortmannRC, Lewis RG, Wallace LA, Spittler TM. Human exposureto pollutants in the floor dust of homes and offices. J ExpoAnal Environ Epidemiol (suppl) 1:127–146 (1992).
16. Simcox NJ, Fenske RA, Wolz SA, Lee I-C, Kalman DA.Pesticides in household dust and soil: exposure pathwaysfor children of agricultural families. Environ HealthPerspect 103:1126–1134 (1995).
17. Adgate JL, Weisel C, Wang Y, Rhoads GG, Lioy PJ. Lead inhouse dust in relationship between exposure metrics.Environ Res 70:134–147 (1995).
18. Chuang JC, Callahan PJ, Menton RG, Gordon SM, LewisRG, Wilson N. Monitoring methods for polycyclic aromatichydrocarbons and their distribution in household track-in-soil. Environ Sci Technol 29:494–500 (1995).
19. Freeman NCG, Wainman T, Stern AH, Shupack SI, Lioy PJ.The effect of remediation of chromium waste sites onchromium levels in urine of children living in the surround-ing neighborhood. J Air Waste Manag Assoc 45:604–614(1995).
20. Stern AH, Fagliano JA, Savrin JE, Freeman NCG, Lioy PJ.The association of chromium in household dust with uri-nary chromium in residences adjacent to chromate pro-duction waste sites. Environ Health Perspect 106:833–839(1998).
21. Rhoads GG, Ettinger AS, Weisel CP, Buckley TJ, GoldmanKD, Adgate JL, Lioy PJ. The effect of dust lead control andblood lead in toddlers: a randomized trial. Pediatrics103:551–555 (1999).
22. Lewis RG, Fortune CR, Willis RD, Camann DE, Antley JT.Distribution of pesticides and polycyclic aromatic hydro-carbons in housedust as a function of particle size.Environ Health Perspect 107:721–726 (1999).
23. Nishioka MG, Lewis RG, Brinkman MC, Burkholder HM,Hines CE, Menkedick JR. Distribution of 2,4-D in air and on
surfaces inside residences after lawn applications: com-paring exposure estimates from various media for youngchildren. Environ Health Perspect 109:1185–1191 (2001).
24. Lioy PJ. Measurement methods for human exposureanalysis. Environ Health Perspect 103(suppl 3):35–43(1995).
25. Lioy PJ. The 1998 ISEA Wesolowski Award Lecture.Exposure analysis: reflections on its growth and aspira-tions for its future. International Society of ExposureAnalysis. J Expo Anal Environ Epidemiol 9:273–281 (1999).
26. Paustenbach DJ. The practice of exposure assessment: astate of the art review. J Toxicology Environ Health, Part B3:179–291 (2000).
27. U.S. EPA. An SAB Report: The Cumulative ExposureProject. EPA-SAB-IHEC-ADV-96-004. Washington, DC:U.S.Environmental Protection Agency, 1996.
28. ILSI. Aggregate Exposure Assessment: Model Evaluationand Refinement. Washington, DC:International LifeScience Institute, 2000.
29. Lioy PJ. Exposure analysis and research needs to supportenvironmental health sciences in the 21st century. Eur JOncol 5 (suppl) 2:13–16 (2000).
30. U.S. EPA. Guidance on Remedial Investigations underCERCLA. EPA 540/G85-002. Washington, DC:U.S.Environmental Protection Agency, 1985.
31. Tate RL III. Soil Microbiology. 2nd ed. New York:JohnWiley & Sons, 2000.
32. Hillel D. Environmental Soil Physics. San Diego,CA:Academic Press, 1998.
33. Cresser MS, Killham K, Edwards T. Soil Chemistry and ItsApplications. Cambridge Environmental Chemistry Series.Cambridge/New York:Cambridge University Press, 1993.
34. Little JC, Daisey JM, Nazaroff WW. Transport of subsur-face contaminants into buildings: an exposure pathway forvolatile organics. Environ Sci Technol 26:2058–2066 (1992).
35. Kerger B, Schmidt C, Paustenbach D. Assessment of air-borne exposure to trihalomethanes from tap water in resi-dential showers and baths. Risk Anal 20:637–652 (2000).
36. Georgopoulos PG, Lioy PJ. Exposure measurement needsfor hazardous waste sites: two case studies. J ToxicolEnviron Health 12:651–665 (1996).
37. Prospero JM, Ness RT, Uematsu M. Deposition rate ofparticulate and dissolved aluminum derived fromSaharans dust in precipitation at Miami, Florida. JGeophys Res 92(14):723–731 (1987).
38 Nicholson KW. A review of particle resuspension. AtmosEnviron 22:2639–2652 (1998).
39 Perry KD, Cahill TA, Eldred RA, Dutcher DD, Gill TE. Longrange transport of north American dust to the easternUnited States. J Geophys Res 102(11):225–238 (1997).
40. Hawley JK. Assessment of health risk from exposure tocontaminated soil. Risk Anal 5(4):289–302 (1985).
41. Alexander M. How toxic are chemicals in soil? Environ SciTechnol 29:2713–2717 (1995).
42. Calabrese EJ, Stanek EJ III, Pekow P, Barnes RM. Soilingestion estimates for children residing on a Superfundsite. Ecotoxicol Environ Saf 36:258–268 (1997).
43. Davis A, Sherwin D, Ditmars R, Hoenke KA. An analysis ofsoil arsenic records of decision. Environ Sci Technol35(12):2401–2406 (2001).
44. de Silva PE. How much soil do children ingest—a newapproach. Appl Occup Environ Hyg 9:40–43 (1994).
45. Lioy PJ, Weisel CP, Millette J, Eisenreich S, Vallero D,Offenberg J, Buckley B, Turpin B, Zhong M, Cohen MD, etal. Characterization of the dust/smoke aerosol that settledeast of the World Trade Center (WTC) in lower Manhattanafter the collapse of the WTC September 11, 2001. EnvironHealth Perspect 110:703–714 (2002).
46. Thatcher TL, Layton DW. Deposition, resuspension, andpenetration of particles within a residence. Atmos Environ29:1487–1497 (1995).
47. Roberts JW, Dickey P. Exposure of children to pollutantsin house dust and indoor air. Rev Environ Contam Toxicol143:59–78 (1995).
48. Georgopoulos PG, Roy A, Yonone-Lioy MJ, Opiekun RE,Lioy PJ. Environmental copper: its dynamics and humanexposure issues. J Toxicol Environ Health Part B 4:341–394(2001).
49. Charney E, Sayre J, Coulter M. Increased lead absorptionin inner city children: where does the lead come from?.Pediatrics 65:226–231 (1980).
50. Roberts JW, Clifford WS, Glass G, Hummer PG. Reducingdust, lead, dust mites, bacteria, and fungi in carpets by vac-uuming. Arch Environ Contam Toxicol 36:477–484 (1999).
Review • Dust exposure assessment and source characterization
Environmental Health Perspectives • VOLUME 110 | NUMBER 10 | October 2002 981
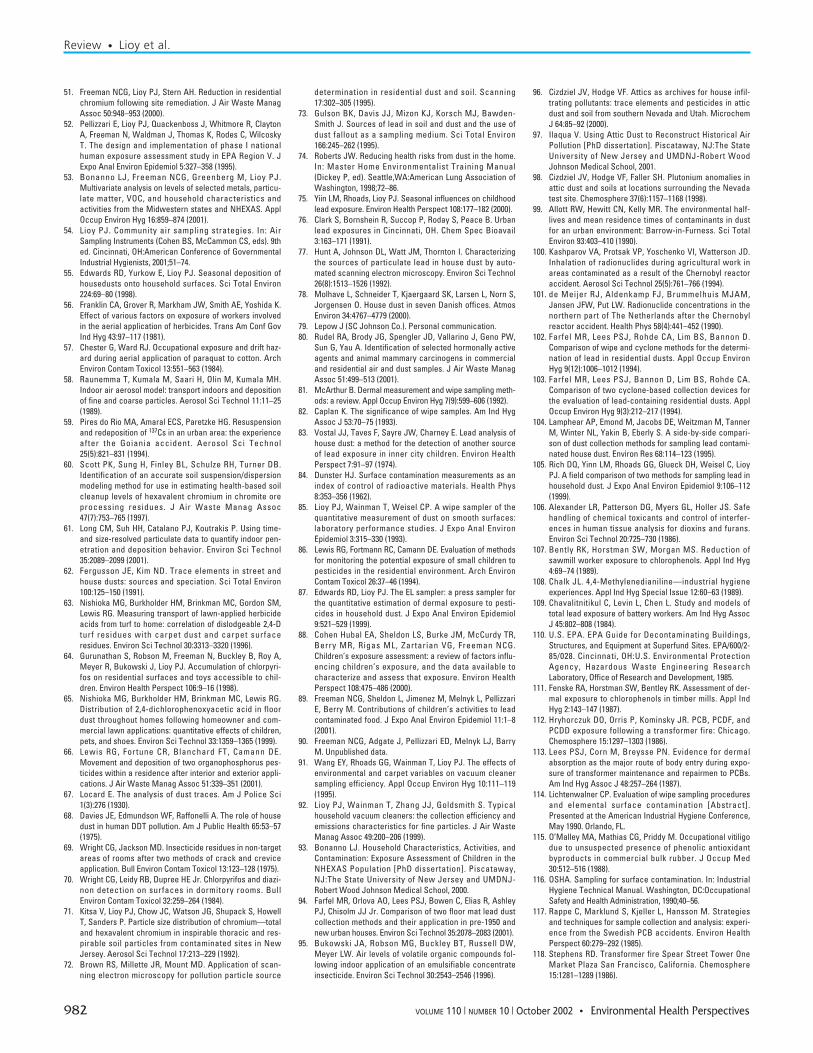
51. Freeman NCG, Lioy PJ, Stern AH. Reduction in residentialchromium following site remediation. J Air Waste ManagAssoc 50:948–953 (2000).
52. Pellizzari E, Lioy PJ, Quackenboss J, Whitmore R, ClaytonA, Freeman N, Waldman J, Thomas K, Rodes C, WilcoskyT. The design and implementation of phase I nationalhuman exposure assessment study in EPA Region V. JExpo Anal Environ Epidemiol 5:327–358 (1995).
53. Bonanno LJ, Freeman NCG, Greenberg M, Lioy PJ.Multivariate analysis on levels of selected metals, particu-late matter, VOC, and household characteristics andactivities from the Midwestern states and NHEXAS. ApplOccup Environ Hyg 16:859–874 (2001).
54. Lioy PJ. Community air sampling strategies. In: AirSampling Instruments (Cohen BS, McCammon CS, eds). 9thed. Cincinnati, OH:American Conference of GovernmentalIndustrial Hygienists, 2001;51–74.
55. Edwards RD, Yurkow E, Lioy PJ. Seasonal deposition ofhousedusts onto household surfaces. Sci Total Environ224:69–80 (1998).
56. Franklin CA, Grover R, Markham JW, Smith AE, Yoshida K.Effect of various factors on exposure of workers involvedin the aerial application of herbicides. Trans Am Conf GovInd Hyg 43:97–117 (1981).
57. Chester G, Ward RJ. Occupational exposure and drift haz-ard during aerial application of paraquat to cotton. ArchEnviron Contam Toxicol 13:551–563 (1984).
58. Raunemma T, Kumala M, Saari H, Olin M, Kumala MH.Indoor air aerosol model: transport indoors and depositionof fine and coarse particles. Aerosol Sci Technol 11:11–25(1989).
59. Pires do Rio MA, Amaral ECS, Paretzke HG. Resuspensionand redeposition of 137Cs in an urban area: the experienceafter the Goiania accident. Aerosol Sci Technol25(5):821–831 (1994).
60. Scott PK, Sung H, Finley BL, Schulze RH, Turner DB.Identification of an accurate soil suspension/dispersionmodeling method for use in estimating health-based soilcleanup levels of hexavalent chromium in chromite oreprocessing residues. J Air Waste Manag Assoc47(7):753–765 (1997).
61. Long CM, Suh HH, Catalano PJ, Koutrakis P. Using time-and size-resolved particulate data to quantify indoor pen-etration and deposition behavior. Environ Sci Technol35:2089–2099 (2001).
62. Fergusson JE, Kim ND. Trace elements in street andhouse dusts: sources and speciation. Sci Total Environ100:125–150 (1991).
63. Nishioka MG, Burkholder HM, Brinkman MC, Gordon SM,Lewis RG. Measuring transport of lawn-applied herbicideacids from turf to home: correlation of dislodgeable 2,4-Dturf residues with carpet dust and carpet surfaceresidues. Environ Sci Technol 30:3313–3320 (1996).
64. Gurunathan S, Robson M, Freeman N, Buckley B, Roy A,Meyer R, Bukowski J, Lioy PJ. Accumulation of chlorpyri-fos on residential surfaces and toys accessible to chil-dren. Environ Health Perspect 106:9–16 (1998).
65. Nishioka MG, Burkholder HM, Brinkman MC, Lewis RG.Distribution of 2,4-dichlorophenoxyacetic acid in floordust throughout homes following homeowner and com-mercial lawn applications: quantitative effects of children,pets, and shoes. Environ Sci Technol 33:1359–1365 (1999).
66. Lewis RG, Fortune CR, Blanchard FT, Camann DE.Movement and deposition of two organophosphorus pes-ticides within a residence after interior and exterior appli-cations. J Air Waste Manag Assoc 51:339–351 (2001).
67. Locard E. The analysis of dust traces. Am J Police Sci1(3):276 (1930).
68. Davies JE, Edmundson WF, Raffonelli A. The role of housedust in human DDT pollution. Am J Public Health 65:53–57(1975).
69. Wright CG, Jackson MD. Insecticide residues in non-targetareas of rooms after two methods of crack and creviceapplication. Bull Environ Contam Toxicol 13:123–128 (1975).
70. Wright CG, Leidy RB, Dupree HE Jr. Chlorpyrifos and diazi-non detection on surfaces in dormitory rooms. BullEnviron Contam Toxicol 32:259–264 (1984).
71. Kitsa V, Lioy PJ, Chow JC, Watson JG, Shupack S, HowellT, Sanders P. Particle size distribution of chromium—totaland hexavalent chromium in inspirable thoracic and res-pirable soil particles from contaminated sites in NewJersey. Aerosol Sci Technol 17:213–229 (1992).
72. Brown RS, Millette JR, Mount MD. Application of scan-ning electron microscopy for pollution particle source
determination in residential dust and soil. Scanning17:302–305 (1995).
73. Gulson BK, Davis JJ, Mizon KJ, Korsch MJ, Bawden-Smith J. Sources of lead in soil and dust and the use ofdust fallout as a sampling medium. Sci Total Environ166:245–262 (1995).
74. Roberts JW. Reducing health risks from dust in the home.In: Master Home Environmentalist Training Manual(Dickey P, ed). Seattle,WA:American Lung Association ofWashington, 1998;72–86.
75. Yiin LM, Rhoads, Lioy PJ. Seasonal influences on childhoodlead exposure. Environ Health Perspect 108:177–182 (2000).
76. Clark S, Bornshein R, Succop P, Roday S, Peace B. Urbanlead exposures in Cincinnati, OH. Chem Spec Bioavail3:163–171 (1991).
77. Hunt A, Johnson DL, Watt JM, Thornton I. Characterizingthe sources of particulate lead in house dust by auto-mated scanning electron microscopy. Environ Sci Technol26(8):1513–1526 (1992).
78. Molhave L, Schneider T, Kjaergaard SK, Larsen L, Norn S,Jorgensen O. House dust in seven Danish offices. AtmosEnviron 34:4767–4779 (2000).
79. Lepow J (SC Johnson Co.). Personal communication.80. Rudel RA, Brody JG, Spengler JD, Vallarino J, Geno PW,
Sun G, Yau A. Identification of selected hormonally activeagents and animal mammary carcinogens in commercialand residential air and dust samples. J Air Waste ManagAssoc 51:499–513 (2001).
81. McArthur B. Dermal measurement and wipe sampling meth-ods: a review. Appl Occup Environ Hyg 7(9):599–606 (1992).
82. Caplan K. The significance of wipe samples. Am Ind HygAssoc J 53:70–75 (1993).
83. Vostal JJ, Taves F, Sayre JW, Charney E. Lead analysis ofhouse dust: a method for the detection of another sourceof lead exposure in inner city children. Environ HealthPerspect 7:91–97 (1974).
84. Dunster HJ. Surface contamination measurements as anindex of control of radioactive materials. Health Phys8:353–356 (1962).
85. Lioy PJ, Wainman T, Weisel CP. A wipe sampler of thequantitative measurement of dust on smooth surfaces:laboratory performance studies. J Expo Anal EnvironEpidemiol 3:315–330 (1993).
86. Lewis RG, Fortmann RC, Camann DE. Evaluation of methodsfor monitoring the potential exposure of small children topesticides in the residential environment. Arch EnvironContam Toxicol 26:37–46 (1994).
87. Edwards RD, Lioy PJ. The EL sampler: a press sampler forthe quantitative estimation of dermal exposure to pesti-cides in household dust. J Expo Anal Environ Epidemiol9:521–529 (1999).
88. Cohen Hubal EA, Sheldon LS, Burke JM, McCurdy TR,Berry MR, Rigas ML, Zartarian VG, Freeman NCG.Children’s exposure assessment: a review of factors influ-encing children’s exposure, and the data available tocharacterize and assess that exposure. Environ HealthPerspect 108:475–486 (2000).
89. Freeman NCG, Sheldon L, Jimenez M, Melnyk L, PellizzariE, Berry M. Contributions of children’s activities to leadcontaminated food. J Expo Anal Environ Epidemiol 11:1–8(2001).
90. Freeman NCG, Adgate J, Pellizzari ED, Melnyk LJ, BarryM. Unpublished data.
91. Wang EY, Rhoads GG, Wainman T, Lioy PJ. The effects ofenvironmental and carpet variables on vacuum cleanersampling efficiency. Appl Occup Environ Hyg 10:111–119(1995).
92. Lioy PJ, Wainman T, Zhang JJ, Goldsmith S. Typicalhousehold vacuum cleaners: the collection efficiency andemissions characteristics for fine particles. J Air WasteManag Assoc 49:200–206 (1999).
93. Bonanno LJ. Household Characteristics, Activities, andContamination: Exposure Assessment of Children in theNHEXAS Population [PhD dissertation]. Piscataway,NJ:The State University of New Jersey and UMDNJ-Robert Wood Johnson Medical School, 2000.
94. Farfel MR, Orlova AO, Lees PSJ, Bowen C, Elias R, AshleyPJ, Chisolm JJ Jr. Comparison of two floor mat lead dustcollection methods and their application in pre-1950 andnew urban houses. Environ Sci Technol 35:2078–2083 (2001).
95. Bukowski JA, Robson MG, Buckley BT, Russell DW,Meyer LW. Air levels of volatile organic compounds fol-lowing indoor application of an emulsifiable concentrateinsecticide. Environ Sci Technol 30:2543–2546 (1996).
96. Cizdziel JV, Hodge VF. Attics as archives for house infil-trating pollutants: trace elements and pesticides in atticdust and soil from southern Nevada and Utah. MicrochemJ 64:85–92 (2000).
97. Ilaqua V. Using Attic Dust to Reconstruct Historical AirPollution [PhD dissertation]. Piscataway, NJ:The StateUniversity of New Jersey and UMDNJ-Robert WoodJohnson Medical School, 2001.
98. Cizdziel JV, Hodge VF, Faller SH. Plutonium anomalies inattic dust and soils at locations surrounding the Nevadatest site. Chemosphere 37(6):1157–1168 (1998).
99. Allott RW, Hewitt CN, Kelly MR. The environmental half-lives and mean residence times of contaminants in dustfor an urban environment: Barrow-in-Furness. Sci TotalEnviron 93:403–410 (1990).
100. Kashparov VA, Protsak VP, Yoschenko VI, Watterson JD.Inhalation of radionuclides during agricultural work inareas contaminated as a result of the Chernobyl reactoraccident. Aerosol Sci Technol 25(5):761–766 (1994).
101. de Meijer RJ, Aldenkamp FJ, Brummelhuis MJAM,Jansen JFW, Put LW. Radionuclide concentrations in thenorthern part of The Netherlands after the Chernobylreactor accident. Health Phys 58(4):441–452 (1990).
102. Farfel MR, Lees PSJ, Rohde CA, Lim BS, Bannon D.Comparison of wipe and cyclone methods for the determi-nation of lead in residential dusts. Appl Occup EnvironHyg 9(12):1006–1012 (1994).
103. Farfel MR, Lees PSJ, Bannon D, Lim BS, Rohde CA.Comparison of two cyclone-based collection devices forthe evaluation of lead-containing residential dusts. ApplOccup Environ Hyg 9(3):212–217 (1994).
104. Lamphear AP, Emond M, Jacobs DE, Weitzman M, TannerM, Winter NL, Yakin B, Eberly S. A side-by-side compari-son of dust collection methods for sampling lead contami-nated house dust. Environ Res 68:114–123 (1995).
105. Rich DQ, Yinn LM, Rhoads GG, Glueck DH, Weisel C, LioyPJ. A field comparison of two methods for sampling lead inhousehold dust. J Expo Anal Environ Epidemiol 9:106–112(1999).
106. Alexander LR, Patterson DG, Myers GL, Holler JS. Safehandling of chemical toxicants and control of interfer-ences in human tissue analysis for dioxins and furans.Environ Sci Technol 20:725–730 (1986).
107. Bently RK, Horstman SW, Morgan MS. Reduction ofsawmill worker exposure to chlorophenols. Appl Ind Hyg4:69–74 (1989).
108. Chalk JL. 4,4-Methylenedianiline—industrial hygieneexperiences. Appl Ind Hyg Special Issue 12:60–63 (1989).
109. Chavalitnitikul C, Levin L, Chen L. Study and models oftotal lead exposure of battery workers. Am Ind Hyg AssocJ 45:802–808 (1984).
110. U.S. EPA. EPA Guide for Decontaminating Buildings,Structures, and Equipment at Superfund Sites. EPA/600/2-85/028. Cincinnati, OH:U.S. Environmental ProtectionAgency, Hazardous Waste Engineering ResearchLaboratory, Office of Research and Development, 1985.
111. Fenske RA, Horstman SW, Bentley RK. Assessment of der-mal exposure to chlorophenols in timber mills. Appl IndHyg 2:143–147 (1987).
112. Hryhorczuk DO, Orris P, Kominsky JR. PCB, PCDF, andPCDD exposure following a transformer fire: Chicago.Chemosphere 15:1297–1303 (1986).
113. Lees PSJ, Corn M, Breysse PN. Evidence for dermalabsorption as the major route of body entry during expo-sure of transformer maintenance and repairmen to PCBs.Am Ind Hyg Assoc J 48:257–264 (1987).
114. Lichtenwalner CP. Evaluation of wipe sampling proceduresand elemental surface contamination [Abstract].Presented at the American Industrial Hygiene Conference,May 1990. Orlando, FL.
115. O’Malley MA, Mathias CG, Priddy M. Occupational vitiligodue to unsuspected presence of phenolic antioxidantbyproducts in commercial bulk rubber. J Occup Med30:512–516 (1988).
116. OSHA. Sampling for surface contamination. In: IndustrialHygiene Technical Manual. Washington, DC:OccupationalSafety and Health Administration, 1990;40–56.
117. Rappe C, Marklund S, Kjeller L, Hansson M. Strategiesand techniques for sample collection and analysis: experi-ence from the Swedish PCB accidents. Environ HealthPerspect 60:279–292 (1985).
118. Stephens RD. Transformer fire Spear Street Tower OneMarket Plaza San Francisco, California. Chemosphere15:1281–1289 (1986).
Review • Lioy et al.
982 VOLUME 110 | NUMBER 10 | October 2002 • Environmental Health Perspectives
119. HUD. Lead-based Paint: Interim Guidelines for HazardIdentification and Abatement in Public and IndianHousing: Appendix A. Washington, DC:U.S. Department ofHousing and Urban Development, 1990.
120. Lioy PJ, Edwards RD, Freeman NCG, Gurunathan S,Pellizzari E, Adgate JL, Quackenboss J, Sexton K. Housedustlevels of selected insecticides and a herbicide measured bythe EL and LWW samplers and comparisons to hand rinsesand urine metabolites. J Expo Anal Environ Epidemiol10:327–340 (2000).
121. Freeman NCG, Wainman T, Lioy PJ. Field testing of the LWWsampler and association of observed household factors withdust loading. Appl Occup Environ Hyg 11(5):476–483 (1996).
122. Lioy PJ, Yiin LM, Adgate J, Weisel C, Rhoads GG. Theeffectiveness of home cleaning intervention strategy inreducing potential dust and lead exposures. J Expo AnalEnviron Epidemiol 8:17–35 (1998).
123. Lioy PJ, Weise CP. Wipe Template Sampler. U.S. Patent5,373,748. Washington, DC:U.S. Patent and TrademarkOffice, 1994. Available: http://patft.uspto.gov/netacgi/nph-Parser?patentnumber=5373748 [cited 27 June 2002].
124. Rodes CE, Lawless PA, Evans GF, Sheldon LS, WilliamsRW, Vette AF, Creason JP, Walsh D. The relationshipsbetween personal PM exposures for elderly populationsand indoor and outdoor concentrations for three retire-ment center scenarios. J Expo Anal Environ Epidemiol11:103–115 (2001).
125. HUD. Guidelines for Evaluation and Control of Lead-basedPaint Hazards in Housing. HUD-1539-LBP. Washington,DC:U.S. Department of Housing and Urban Development ,1995.
126. Colt JS, Zihm, SH, Camann DE, Hart JA. Comparison ofpesticides and other components in carpet dust samplescollected from used vacuum cleaner bags and from a highvolume surface sampler. Environ Health Perspect106:721–724 (1998).
127. Colt JS, Hartge P, Camann DE. Pesticides, PAH, and PCBcongeners in house dust from four sites [Abstract].Presented at the annual meeting of the International Societyof Exposure Analysis, 27–29 October 2000, Monterey, CA.
128. Hysong TA, Burgess JL, O’Rourke MK. Floor dust and uri-nary arsenic levels in two Arizona Mining Towns. J ExpoAnal Environ Epidemiol (In Press).
129. Fortune CR, Ellinson WD, Blanchard FT, Camann DE.Distribution of pesticide and PAH residues in aged resi-dential carpeting [Abstract]. Presented at the Annualmeeting of the International Society of Exposure Analysis,27–29 October 2000, Monterey, CA.
130. Lu C, Fenske R. Dermal transfer of chlorpyrifos residuesfrom residential surfaces, comparison of hand press, handdrag, wipe and polyurethane foam roller measurementsafter broadcast and aerosol pesticide applications.Environ Health Perspect 107:463–467 (1999).
131. Meijer SN, Halsall CJ, Harner T, Peters AJ, Ockenden WA,Johnston AE, Jones KC. Organochlorine pesticideresidues in archived UK soil. Environ Sci Technol35:1989–1995 (2001).
132. Macher J, Burger HA. Sampling biological aerosols. In:Air Sampling Instruments (Cohen BS, McGammon CS,eds). 9th ed. Cincinnati, OH:American Conference ofGovernmental Industrial Hygienists, 2001;661–701.
133. Duggan MJ, Inskip MJ, Rundle SA, Moorcroft JS. Lead inplayground dust and on the hands of school children. SciTotal Environ 44:65–79 (1985).
134. Fenske RA, Lu C. Determination of handwash removal effi-ciency, incomplete removal of the pesticide chlorpyrifosfrom skin by standard handwash techniques. Am Ind HygAssoc J 55:425–432 (1994).
135. Kissel JC, Richter KY, Fenske RA. Field measurement ofdermal soil loading attributable to various activities: impli-cations for exposure assessment. Risk Anal 16:115–125(1996).
136. Yankel AJ, von Lindern IH, Walter SD. The Silver Valley leadstudy: the relationship between childhood blood lead levelsand environmental exposure. J Air Pollut Control Assoc27(8):763–767 (1977).
137. Zartarian V, Ferguson AC, Leckie JO. Quantified seasonalactivity data from a four child pilot field study. J Expo AnalEnviron Epidemiol 7: 543–553 (1997).
138. Reed KJ, Jimenez M, Lioy PJ, Freeman NCG. Quantification
of children’s hand and mouthing activities. J Expo AnalEnviron Epidemiol 9:513–520 (1999).
139. Jo WK, Weisel CP, Lioy PJ. Routes of chloroform expo-sure and body burden from showering with chlorinatedtap water. Risk Anal 10:575–580 (1990).
140. Adgate JL, Willis RD, Buckley TJ, Chow JC, Watson JG,Rhoads GG, Lioy PJ. Chemical mass balance sourceapportionment of lead in house dust. Environ Sci Technol32:108–114 (1998).
141. Adgate JL, Rhoads GG, Lioy PJ. The use of isotope ratiosto apportion sources of lead in Jersey City, NJ. Sci TotalEnviron 106:833–839 (1998).
142. Angle CR, Manton WI, Stanek KL. Stable isotope identifi-cation of lead sources in preschool children—the Omahastudy. Clin Toxicol 33:657–662 (1995).
143. Farfel MR, Chisolm JJ. An evaluation of experimentalpractices for abatement of residential lead. Environ Res55:199–212 (1991).
144. Lioy PJ, Freeman NCG, Wainman T, Stern AH, Boesch R,Howell T, Shupack SI. Microenvironmental analysis ofresidential exposure to chromium laden wastes in andaround New Jersey homes. Risk Anal 12:287–299 (1992).
145. Stern AH, Freeman NCG, Pleban P, Boesch R, Wainman T,Howell T, Shupack SI, Johnson BB, Lioy PJ. Residentialexposure to chromium waste—urine biological monitoringin conjunction with environmental exposure monitoring.Environ Res 58:147–162 (1992).
146. Freeman NCG, Stern AH, Lioy PJ. Exposure to chromium indust from homes in a chromium surveillance project. ArchEnviron Health 52:213–219 (1997).
147. Millette JR, Hopen TJ. Characterizing household dirt:1928–2001. In: Second NSF International Conference onIndoor Air Health Proceedings. 28–31 January, 2001, MiamiBeach, FL. Ann Arbor, MI:NSF International, 2001;174–183.
148. Millette JR, Few P. Sample collection procedures formicroscopical examination of particulate surface contam-inants. Microscope 49(1):21–27 (2001).
149. McCrone WC, Delly JG. The Particle Atlas. 2nd ed. AnnArbor, MI:Ann Arbor Science Publishers, 1973.
Review • Dust exposure assessment and source characterization
Environmental Health Perspectives • VOLUME 110 | NUMBER 10 | October 2002 983