
Durham University
34
• • •
-
Upload
khangminh22 -
Category
Documents
-
view
4 -
download
0
Transcript of Durham University

Durham Research Online
Deposited in DRO:
14 May 2020
Version of attached �le:
Accepted Version
Peer-review status of attached �le:
Peer-reviewed
Citation for published item:
Mensa-Bonsu, Golda and Lietard, Aude and Tozer, David J. and Verlet, Jan R. R. (2020) 'Low energyelectron impact resonances of anthracene probed by 2D photoelectron imaging of its radical anion.', Journal ofchemical physics., 152 (17). p. 174303.
Further information on publisher's website:
https://doi.org/10.1063/5.0007470
Publisher's copyright statement:
c© 2020 American Institute of Physics. This article may be downloaded for personal use only. Any other use requiresprior permission of the author and the American Institute of Physics. The following article appeared in Mensa-Bonsu,Golda, Lietard, Aude, Tozer, David J. Verlet, Jan R. R. (2020). Low energy electron impact resonances of anthraceneprobed by 2D photoelectron imaging of its radical anion. The Journal of Chemical Physics 152(17): 174303 and may befound at https://doi.org/10.1063/5.0007470
Use policy
The full-text may be used and/or reproduced, and given to third parties in any format or medium, without prior permission or charge, forpersonal research or study, educational, or not-for-pro�t purposes provided that:
• a full bibliographic reference is made to the original source
• a link is made to the metadata record in DRO
• the full-text is not changed in any way
The full-text must not be sold in any format or medium without the formal permission of the copyright holders.
Please consult the full DRO policy for further details.
Durham University Library, Stockton Road, Durham DH1 3LY, United KingdomTel : +44 (0)191 334 3042 | Fax : +44 (0)191 334 2971
https://dro.dur.ac.uk

1
Low energy electron impact resonances of anthracene probed by 2D
photoelectron imaging of its radical anion
Golda Mensa-Bonsu, Aude Lietard, David J. Tozer and Jan R. R. Verlet*
Department of Chemistry, Durham University, Durham DH1 3LE, United Kingdom
Abstract
Electron-molecules resonances of anthracene were probed by 2D photoelectron imaging of
the corresponding radical anion up to 3.7 eV in the continuum. A number of resonances were
observed in both the photoelectron spectra as well as angular distributions and most
resonances showed clear autodetachment dynamics. The resonances were assigned using
DFT calculations and are consistent with the available literature. Competition between direct
and autodetachment, as well as signatures of internal conversion between resonances, was
observed for some resonances. For the 12B2g resonance, a small fraction of population
recovers the ground electronic state as evidenced by thermionic emission. Recovery of the
ground electronic state offers a route of producing anions in an electron-molecule reaction,
however, the energy at which this occurs suggests that anthracene anions cannot be formed in
the interstellar medium by electron capture through this resonance.
Th
is is
the au
thor’s
peer
revie
wed,
acce
pted m
anus
cript.
How
ever
, the o
nline
versi
on of
reco
rd w
ill be
diffe
rent
from
this v
ersio
n onc
e it h
as be
en co
pyed
ited a
nd ty
pese
t. PL
EASE
CIT
E TH
IS A
RTIC
LE A
S DO
I: 10.1
063/5
.0007
470

2
I. Introduction
Polycyclic aromatic hydrocarbons (PAHs) are of interest because of their ubiquity in
various research areas including medicinal chemistry, atmospheric sciences, combustion
chemistry, astro-chemistry and molecular electronics.1–5 Many of the important properties
and uses of PAHs are linked to their electronic structure and the excited states for both their
neutral and ionised species. In the context of the interstellar medium, PAHs are believed to
represent a major store for carbon and have been implicated to contribute to the Diffuse
Interstellar Bands (DIBs).6–11 PAHs exist in regions where UV radiation and free electrons
are abundant, making the formation of charged PAHs likely. In particular, there is a
background of low-energy electrons that may lead to their capture by a neutral PAH to form
the anion.12–14 Such electron capture processes are mediated by electron-molecule resonances,
which can form temporary negative ions. The competition between autodetachment and
internal conversion dynamics of these resonances ultimately determines whether the ground
electronic state of the anion or anionic products are formed. Consequently, the study of such
electron-molecule resonances has been of considerable interest. Here, a frequency-resolved
(2D) photoelectron (PE) imaging study of the anthracene radical anion, C14H10–,
characterising the anion resonances that lie within the first 3.7 eV of the electron-neutral
continuum is presented.
Anthracene is the smallest linear PAH with a positive adiabatic electron affinity of
0.532(3) eV.15 Experimentally, anion resonances can be probed either by electron scattering
experiments such as electron transmission spectroscopy,16,17 or by optical (photoelectron)
spectroscopy of the corresponding anion.18–23 In the case of optical spectroscopy of the anion:
Schiedt and Weinkauf used photodetachment and PE spectroscopy on jet-cooled anthracene
and its complex with a single water molecule;21 Song et al. studied anionic clusters of
anthracene (C14H10)n– (n = 1 – 16) by PE specotroscopy;22 and more recently, Kregel et al.
Th
is is
the au
thor’s
peer
revie
wed,
acce
pted m
anus
cript.
How
ever
, the o
nline
versi
on of
reco
rd w
ill be
diffe
rent
from
this v
ersio
n onc
e it h
as be
en co
pyed
ited a
nd ty
pese
t. PL
EASE
CIT
E TH
IS A
RTIC
LE A
S DO
I: 10.1
063/5
.0007
470

3
presented a very high resolution slow-electron PE imaging of C14H10–.23 The PE spectra by
Song et al. at wavelengths of 532, 610 and 700 nm contained evidence of indirect detachment
features that were red-shifted relative to the direct detachment peak accessing the neutral
ground state.22 The spectral range over which this indirect band appeared was consistent with
the vertical excitation energy reported for a * resonance, from which autodetachment can
occur. While individual PE spectra can inform on the presence of a resonance, they do not
encapsulate trends and overall patterns of resonances and their dynamics. To that end, we
have developed 2D PE spectroscopy as a general method to identify such trends and
dynamical fingerprints.24 As an optical analogue of 2D electron energy loss spectroscopy,25–28
it also provides a direct link to electron spectroscopy, particularly in cases where the anion
and neutral geometries are similar, as may be expected for anthracene. Several electron
impact resonances of a number of PAHs including anthracene have been observed in electron
transmission spectra.16
The electronic structure and excited states of C14H10– have also been considered
computationally using electronic structure methods, but because of its size and open-shell
electronic structure, the number of these have been limited.29–32 The size of C14H10– lends
itself well to Density Functional Theory (DFT) calculations and provides a platform for
extending to larger PAHs. However, open-shell anionic species have traditionally proved
more challenging to compute than their neutral counterparts.33 Dessent used anthracene as a
test molecule in a DFT benchmark study of the ground state vibrational properties of the
neutral and anion,29 and Kreger et al. showed good agreement between their DFT
calculations and vibrational structure in the high-resolution PE spectra.23 Malloci et al.
focused on the electronic properties of the anion and computed the 5 lowest energy
resonances as part of a wider Time-Dependent DFT (TDDFT) study of charged PAHs.31 In
the present study, we use TDDFT calculations to support the interpretation of the 2D PE
Th
is is
the au
thor’s
peer
revie
wed,
acce
pted m
anus
cript.
How
ever
, the o
nline
versi
on of
reco
rd w
ill be
diffe
rent
from
this v
ersio
n onc
e it h
as be
en co
pyed
ited a
nd ty
pese
t. PL
EASE
CIT
E TH
IS A
RTIC
LE A
S DO
I: 10.1
063/5
.0007
470

4
spectroscopy of C14H10–. The calculations are aimed to provide qualitative insight and capture
the overall electronic structure of the observed resonances. Our work shows that, while there
are several low-lying resonances that can lead to the formation of a temporary negative ion,
there is only a small amount of ground electronic state recovery suggesting that the lifetimes
for autodetachment are relatively short and that anthracene by itself is not likely to form
C14H10– upon low energy electron impact.
II. Experimental & Computational Details
A description of the experimental setup has been presented in detail elsewhere34 and
only an outline is provided here. Solid anthracene (Sigma Aldrich) was heated at 180°C in an
Even-Lavie valve35 and the resulting molecular vapour was expanded through the pulsed
valve into vacuum using Ar as a carrier gas (5 bar). The molecular beam expansion was
intersected by an electron beam (300 eV) at the throat of the expansion, forming C14H10– and
its clusters, (C14H10)n–. An ion packet containing C14H10
– was mass-selected using a Wiley-
Mclaren time-of-flight spectrometer.36 At the focus of the mass-spectrometer, the ion packet
was intersected by nanosecond laser pulses from a tuneable Nd:YAG pumped optical
parametric oscillator. The resulting photodetached electrons were analysed using a velocity
map imaging spectrometer.37 The polar onion-peeling algorithm was used in the
reconstruction of the PE spectra from raw images.38 The electron kinetic energy (eKE) axis
for the PE spectra was calibrated using the known PE spectrum of I– and spectra have a
resolution of ∆eKE/eKE ~ 3%.
To aid the characterisation of anion resonances, DFT and TDDFT calculations were
employed. DFT optimisation calculations were performed on the open-shell anthracene anion
at the B3LYP/6-311++G level of theory using Gaussian09.39–42 This level of theory has been
shown to reproduce experimental parameters accurately.29,43 The minimum energy structure
Th
is is
the au
thor’s
peer
revie
wed,
acce
pted m
anus
cript.
How
ever
, the o
nline
versi
on of
reco
rd w
ill be
diffe
rent
from
this v
ersio
n onc
e it h
as be
en co
pyed
ited a
nd ty
pese
t. PL
EASE
CIT
E TH
IS A
RTIC
LE A
S DO
I: 10.1
063/5
.0007
470

5
of the anthracene anion was confirmed using vibrational analysis. Computation of the neutral
optimised geometry and the neutral at the anion geometry were also performed at the same
level of theory to permit the theoretical determination of the adiabatic and vertical
detachment energies, respectively. Following this, the lowest 50 excited states of anionic
anthracene were computed using TDDFT at the previously stated level of theory.
The calculation of anion resonance states is complicated by excited states describing
electron loss from the anion, i.e. discretised continuum states (DCSs).43 Resonances must be
distinguished from DCS, which we do here using the basis set stabilisation method.44 This
involves the incremental variation of the diffuseness of the basis; the energy of resonances
are insensitive to this diffuseness while the energies of DCSs decrease rapidly with increasing
basis set size.45,46 In this study, the stabilisation method was implemented using the 6-
311++G basis set, in which diffuse functions were added to both carbon and hydrogen atoms.
Both diffuse exponents were scaled between 45 – 100% of their initial values in 5%
increments. TDDFT calculations were performed at each exponent value, in which the first
50 excited states were computed.
Th
is is
the au
thor’s
peer
revie
wed,
acce
pted m
anus
cript.
How
ever
, the o
nline
versi
on of
reco
rd w
ill be
diffe
rent
from
this v
ersio
n onc
e it h
as be
en co
pyed
ited a
nd ty
pese
t. PL
EASE
CIT
E TH
IS A
RTIC
LE A
S DO
I: 10.1
063/5
.0007
470

6
III. Results and analysis
A. 2D photoelectron spectrum and angular distributions
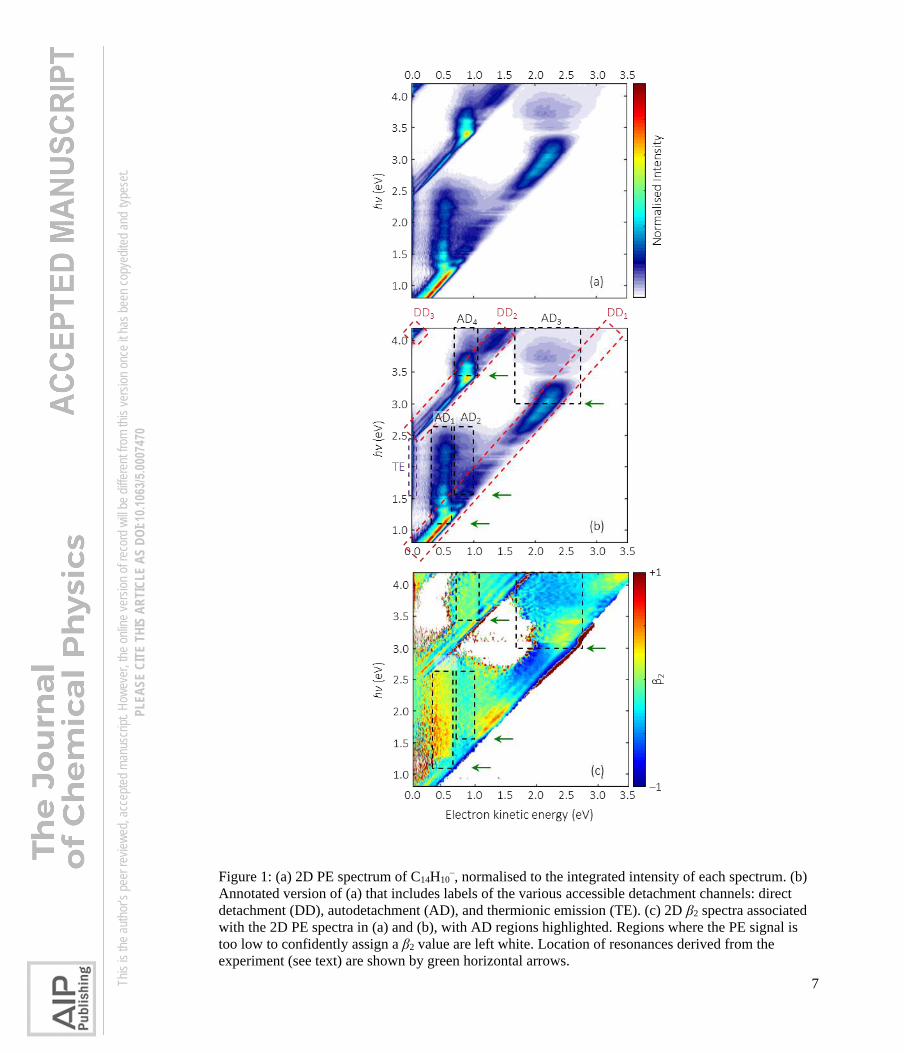
Figure 1(a) shows the 2D PE spectrum of C14H10–. The 2D map is composed of 137
individual PE spectra taken at 25 meV photon energy intervals in the range 0.8 < hv < 4.3 eV
and each spectrum has been normalised to its total (integrated) PE signal. Hence, Figure 1(a)
shows no intensity information for different hv. In Figure 1(b), we have reproduced the 2D
PE spectrum and have annotated this with labels to aid the discussion and analysis.
Figure 1(c) shows the corresponding photoelectron angular distributions, I(θ), that are
quantified by the anisotropy parameter, β2. β2 is defined through I(θ) ∝ ½ β2(3cos2θ – 1),
where θ is the angle between the electron ejection velocity vector and the polarisation axis,
which is fixed in the laboratory frame.47,48 Anisotropy parameters β2 = +2 corresponds to a
cos2θ distribution and β2 = –1 to a sin2θ distribution.
Figure 1 contains direct detachment (DD) features, which appear as diagonal features,
for which the eKE increases with increasing hv (gradient d(hv)/d(eKE) = 1), as well as
indirect autodetachment features (AD), that appear red-shifted relative to the DD features.
Three distinct DD features are clearly visible. Extrapolation of these to eKE = 0 eV yields
onset energies of 0.53, 2.40, and 4.05 eV, and we label these direct detachment channels as
DD1, DD2 and DD3, respectively, in Figure 1(b).
Th
is is
the au
thor’s
peer
revie
wed,
acce
pted m
anus
cript.
How
ever
, the o
nline
versi
on of
reco
rd w
ill be
diffe
rent
from
this v
ersio
n onc
e it h
as be
en co
pyed
ited a
nd ty
pese
t. PL
EASE
CIT
E TH
IS A
RTIC
LE A
S DO
I: 10.1
063/5
.0007
470
7
Figure 1: (a) 2D PE spectrum of C14H10–, normalised to the integrated intensity of each spectrum. (b)
Annotated version of (a) that includes labels of the various accessible detachment channels: direct
detachment (DD), autodetachment (AD), and thermionic emission (TE). (c) 2D β2 spectra associated
with the 2D PE spectra in (a) and (b), with AD regions highlighted. Regions where the PE signal is
too low to confidently assign a β2 value are left white. Location of resonances derived from the
experiment (see text) are shown by green horizontal arrows.
Th
is is
the au
thor’s
peer
revie
wed,
acce
pted m
anus
cript.
How
ever
, the o
nline
versi
on of
reco
rd w
ill be
diffe
rent
from
this v
ersio
n onc
e it h
as be
en co
pyed
ited a
nd ty
pese
t. PL
EASE
CIT
E TH
IS A
RTIC
LE A
S DO
I: 10.1
063/5
.0007
470

8
In addition to the DD channels, a number of AD features can be seen in Figure 1(a)
and are highlighted in Figure 1(b). The eKE associated with the AD feature appears mostly
independent of photon energy (vertical features in the 2D PE spectrum). The clearest AD
features are AD1, AD3 and AD4, which can be readily identified from Figure 1(a). In contrast,
the feature AD2 warrants a more careful consideration. There are a number of points that lead
us to conclude that feature AD2 is independent of AD1. Firstly, there is a distinct AD feature
to higher eKE than that of AD1. Figure 2 shows an example PE spectrum taken at hv = 2.30
eV, including a deconvolution of the spectrum into three separate Gaussian functions
representing AD1, AD2 and DD1. This clearly shows the additional signal associated with
AD2. The second point of evidence is the peak at eKE = 0 eV, clearly visible in Figure 2
(though not included in the deconvolution). This peak is labelled as TE in Figure 1(b) and
does not coincide with the hv at which AD1 appears. Instead, the TE signal only turns on at hv
> 1.6 eV, which is where AD2 appears to start contributing also. Finally, there is further
evidence in the 2D β2 spectrum, which is shown in Figure 1(c) in the range −1 < β2 < +1 to
accentuate changes. Specifically, it is expected that β2 remains mostly constant or at least is
slowly varying as a function of eKE. Instead, it is clear from Figure 1(c) that β2 associated
with AD1 differs from that of AD2. For example, for hv = 2.30 eV (PE spectrum shown in
Figure 2), β2 for AD1 is positive while that for AD2 is negative, suggesting different
electronic states are responsible for these electron emission channels.
To determine the onset at which a given AD channel appears, we have extrapolated
these vertical PE features to the point where they intersect with the corresponding DD
feature. Using this approximate method, the onsets of the AD channels are found to be at
photon energies corresponding to hv ~ 1.1, 1.6, 3.0 and 3.4 eV for AD1, AD2, AD3, and AD4,
respectively. These estimated onsets are indicated by the horizontal green arrows in
Figure 1(b). These onsets can also be identified in the 2D β2 spectrum. Abrupt changes in β2
Th
is is
the au
thor’s
peer
revie
wed,
acce
pted m
anus
cript.
How
ever
, the o
nline
versi
on of
reco
rd w
ill be
diffe
rent
from
this v
ersio
n onc
e it h
as be
en co
pyed
ited a
nd ty
pese
t. PL
EASE
CIT
E TH
IS A
RTIC
LE A
S DO
I: 10.1
063/5
.0007
470

9
as a function of hv are not expected for DD features, unless a resonance is excited.49–52 and
such changes imply excitation of resonances in the 2D β2 spectrum. For example, if one takes
an average of β2 across the DD1 diagonal feature in Figure 1(c), then clear changes can be
seen at hv ~ 1.6 eV: just below this energy, β2 of DD1 is negative and just above it, β2 of DD1
has become positive. Hence, at hv ~ 1.6 eV, a resonance is excited and this resonance
coincides with the appearance of AD2. A similar abrupt change can be seen around hv ~ 3.0
eV, where β2 rapidly changes from negative to positive with increasing hv. This change can
be associated with the appearance of AD3.
Figure 2: Photoelectron spectrum of C14H10– taken at hv = 2.30 eV. Direct and indirect features are
indicated and correspond to the regions shown in Figure 1(b). The spectrum has been fitted to three
Gaussian functions to represent features AD1 (blue), AD2 (green) and DD1 (red). The sum of these
contributions is overlaid as a thick grey line.
Figure 3(a) shows a series of PE spectra taken between hv = 1.30 and 1.45 eV that are
representative of the region where the AD1 indirect channel contributes. This clearly shows
the red-shift of the AD1 channel with respect to the corresponding DD1 channel. However,
Figure 3(a) shows that the ratio between AD1 and DD1 is not constant. For example, at
hv = 1.30 and 1.45 eV, the ratio of PE signal AD1:DD1, is greater than at hv = 1.38 eV.
Th
is is
the au
thor’s
peer
revie
wed,
acce
pted m
anus
cript.
How
ever
, the o
nline
versi
on of
reco
rd w
ill be
diffe
rent
from
this v
ersio
n onc
e it h
as be
en co
pyed
ited a
nd ty
pese
t. PL
EASE
CIT
E TH
IS A
RTIC
LE A
S DO
I: 10.1
063/5
.0007
470

10
Indeed, there is a modulation of the PE signal associated with the AD1 channel that is out-of-
phase with a similar modulation in the DD1 channel. This modulation can also be seen in the
2D PE spectrum in Figure 1(a). To provide a rough analysis of this modulation, we have
calculated the ratio of the peak intensity of the AD1 and DD1 feature. Figure 3(b) shows the
result of this analysis and clearly recovers the oscillation in AD1:DD1. Peaks in Figure 3(b)
are spaced of approximately 150 meV. Evidence of similar oscillations are also seen in AD3
and AD4 in Figure 1(a), but these are less obvious and we refrain from analysing these
channels in a similar manner.
Figure 3: (a) Photoelectron spectrum of C14H10– taken at a series of photon energies where both direct
and indirect features (DD1 and AD1 in Figure 1(b)) are visible. (b) Ratio of peak heights of AD1:DD1
as a function of photon energy.
Th
is is
the au
thor’s
peer
revie
wed,
acce
pted m
anus
cript.
How
ever
, the o
nline
versi
on of
reco
rd w
ill be
diffe
rent
from
this v
ersio
n onc
e it h
as be
en co
pyed
ited a
nd ty
pese
t. PL
EASE
CIT
E TH
IS A
RTIC
LE A
S DO
I: 10.1
063/5
.0007
470

11
B. Computational
The ground state of C14H10– has D2h symmetry. The symmetry labels are derived
assuming that anthracene lies in the y-z plane with the z-axis being the long molecular axis.
The relevant MOs are shown in Figure 4. C14H10– has an electronic configuration
…π(b1g)2π(b3u)1, corresponding to a ground 2B3u state. The two lowest neutral states are also
included in Figure 4. Loss of the electron in the singly occupied MO (SOMO) of b3u
symmetry leads to the neutral ground X 1Ag state. The lowest triplet state of the neutral has a
…π(b1g)1π(b3u)1 configuration leading to a 3B2u state.
Figure 5 shows the results from the TDDFT calculations over a range of basis set
diffuseness, where the exponent value is inverse to the diffuseness. Most excited states are
observed to vary in transition energy as the exponent (diffuseness) changes. The states that
rapidly change in energy as a function of diffuseness are associated with DCSs (as the
diffuseness describes the effective “box” size that the orbitals can occupy, L, the energy of
the DCSs will scale approximately as L–2). However, some of the states appear to deviate
from this trend and are constant in energy over limited ranges of the basis set diffuseness. An
example of one such state is highlighted in green in Figure 5. In the range where the energy is
not changing significantly, the DCS has taken on the character of a resonance and remains so
until it undergoes an avoided crossing with another DCS, at which point the resonance will
take on the character of that DCS. Despite the series of (avoided) crossings between the
states, there are clear regions over which a resonance can be identified at a given excitation
energy. These are highlighted in Figure 5 by horizontal arrows.
Th
is is
the au
thor’s
peer
revie
wed,
acce
pted m
anus
cript.
How
ever
, the o
nline
versi
on of
reco
rd w
ill be
diffe
rent
from
this v
ersio
n onc
e it h
as be
en co
pyed
ited a
nd ty
pese
t. PL
EASE
CIT
E TH
IS A
RTIC
LE A
S DO
I: 10.1
063/5
.0007
470

12
Figure 4: (a) Frontier molecular orbitals (MOs) of C14H10–. (b) Electronic configuration of neutral
ground and triplet excited states and electronic configurations of radical anion and lowest-lying
resonances, with optical excitation oscillator strength given in brackets. (c) Energy level diagram of
relevant calculated excited states of anion (black) and neutral (grey), with experimental energies from
this study given in brackets. All energies are in eV.
Figure 4 includes the excited states (energies and corresponding oscillator strength)
and the associated electronic configuration based on the relevant MOs. These were computed
using a 6-311G basis set, which is effectively the upper limit of the TDDFT calculations in
which the exponent reaches infinity and there are no diffuse functions present. The lowest
energy resonance, 12Au, corresponds to excitation of an electron in the SOMO (b3u) to the
LUMO (au) and has a calculated oscillator strength of zero (symmetry forbidden). This is
followed by two close-lying resonances, 12B2g and 12B1g, that correspond to transitions from
LUMO+1 ← SOMO and SOMO ← HOMO–1, respectively. The 12B2g ← 2B3u has the
largest oscillator strength. At higher energy, resonances are more difficult to assign because
of a much higher density of DCSs. Nevertheless, we can identify regions that are relatively
Th
is is
the au
thor’s
peer
revie
wed,
acce
pted m
anus
cript.
How
ever
, the o
nline
versi
on of
reco
rd w
ill be
diffe
rent
from
this v
ersio
n onc
e it h
as be
en co
pyed
ited a
nd ty
pese
t. PL
EASE
CIT
E TH
IS A
RTIC
LE A
S DO
I: 10.1
063/5
.0007
470

13
constant in energy just below 3 eV in Figure 5. These correspond to the transitions shown in
Figure 4 that access the 22B3u and 22Au states.
Figure 5: Stabilisation plot of the excited state energies (grey lines) as a function of basis set exponent
(small values (%) refers to diffuse basis sets). Horizontal arrows indicate the location of resonances,
with the lowest three clearly visible. The solid green line is shows an adiabatic evolution of the state
character with basis set diffuseness and shows the changes from discretised continuum states to
valence states.
IV. Discussion
A. Assignment of direct detachment channels
The adiabatic detachment energy (ADE) of C14H10– has been determined by Garand
and co-workers using high-resolution SEVI measurements to be 0.532(3) eV and the
adiabatic detachment energy to reach the first triplet state was found to be 2.404(3) eV.23
These are in agreement with the onset of the DD1 channel at 0.53 eV and the DD2 channel at
2.40 eV and allows us to assign DD1 to X 2B3u + hv → X 1Ag + e– and DD2 to
X 2B3u + hv → 3B2u + e–. Channel DD3 corresponds to the excitation of the neutral to its first
singlet excited state in the photodetachment: X 2B3u + hv → 1B2u + e–. This assignment is in
agreement with the gas-phase absorption spectrum of neutral anthracene, which has its 0-0
Th
is is
the au
thor’s
peer
revie
wed,
acce
pted m
anus
cript.
How
ever
, the o
nline
versi
on of
reco
rd w
ill be
diffe
rent
from
this v
ersio
n onc
e it h
as be
en co
pyed
ited a
nd ty
pese
t. PL
EASE
CIT
E TH
IS A
RTIC
LE A
S DO
I: 10.1
063/5
.0007
470

14
transition of the 1B2u ← X 1Ag band at 3.42 eV.53,54 Based on this, the DD3 channel is
expected to appear at hv = 3.95 eV in the present experiment, in reasonable agreement with
our measurement of 4.05 eV.
The DD1 and DD2 channels show some vibrational structure in the 1D PE spectra,
which corresponds to the vibrational modes of the ground electronic state of the neutral and
its first triplet excited state, respectively. These vibrational levels of the neutral have been
discussed in detail by Garand and coworkers,23 whose experiment is of much higher
resolution than ours, and so we will not discuss these further.
B. Assignment of resonances
There are several accessible resonances in the spectral range probed here, but there
are no bound excited states of C14H10–. From the experiment, we estimate the location of the
two lowest-lying resonances to be at approximately hv ~ 1.1 eV and 1.6 eV (see Figure 1).
The first of these is clearly identifiable by the appearance of the autodetachment feature AD1.
The second resonance also leads to autodetachment (AD2), but this is not as clear as the AD1
channel. It is more apparent in the 2D β2 spectrum in Fig. 1(c), where at 1.6 eV, there is a
very clear and abrupt change in β2. Additionally, AD2 is distinguishable from AD1 by its
different β2. Such qualitative changes highlight different molecular orbitals involved in the
autodetachment, although obtaining quantitative information is not yet possible using current
theoretical methods.
The resonances can be assigned using our calculations and those of others, as well as
the absorption spectrum and electron transmission spectra. Shida and Iwata measured an
absorption spectrum of C14H10– in a methyl-tetrahydrofuran matrix at 77 K,19,20 which is
reproduced here in Figure 6. This shows a weak transition around hv ~ 1.4 eV with a series of
vibrational peaks separated by ~ 150 meV. A second, brighter excited state was seen starting
Th
is is
the au
thor’s
peer
revie
wed,
acce
pted m
anus
cript.
How
ever
, the o
nline
versi
on of
reco
rd w
ill be
diffe
rent
from
this v
ersio
n onc
e it h
as be
en co
pyed
ited a
nd ty
pese
t. PL
EASE
CIT
E TH
IS A
RTIC
LE A
S DO
I: 10.1
063/5
.0007
470

15
at hv = 1.67 eV. At higher hv (~ 2.1 eV), there are a series of vibrational peaks and possible a
third absorption, but the absorption spectrum is too congested to be certain of this.
Figure 6: Absorption spectrum of C14H10– in a methyl-tetrahydrofuran matrix at 77 K. Reproduced and
adapted from T. Shida and S. Iwata, J. Chem. Phys. 56, 2858 (1972), with the permission of AIP
Publishing.
The weak and low energy absorption in Figure 6 was only collected for hv > 1.3 eV.
Hence, there is a possibility that the 0-0 transition of this weak band was not observed by
Shida and Iwata. This would then be consistent with the onset of AD1 channel that we have
observed at ~ 1.1 eV. It is of course also possible the transition energies in the absorption
spectrum in Figure 6 have shifted slightly because of the presence of the matrix. The second
brighter transition at 1.67 eV is not readily discerned from the 2D PE spectrum, but there is
evidence that changes in the resonance dynamics are occurring. Firstly, there is evidence that
new autodetachment signal is appearing starting from around hv > 1.6 eV (AD2). As this
signal remains constant in kinetic energy, it is clear that the relative contribution of the direct
channel (DD1) is becoming less pronounced beyond hv ~ 2 eV. Secondly, a new indirect
channel at very low energy (labelled as TE) switches on for photon energies just above
Th
is is
the au
thor’s
peer
revie
wed,
acce
pted m
anus
cript.
How
ever
, the o
nline
versi
on of
reco
rd w
ill be
diffe
rent
from
this v
ersio
n onc
e it h
as be
en co
pyed
ited a
nd ty
pese
t. PL
EASE
CIT
E TH
IS A
RTIC
LE A
S DO
I: 10.1
063/5
.0007
470

16
hv ~ 1.6 eV, suggesting a new resonance is contributing. Finally, as mentioned above, the
2D β2 spectra clearly show a sudden change in the β2 values associated with the DD1 channel.
Our determination of the resonance positions is in agreement with the electron transmission
spectra from Burrow et al.17 who noted two π* resonances at 0.6 and 1.13 eV (corresponding
to hv = 1.13 and 1.66 eV) and with their calculations55–57.
The overall picture from the absorption, electron transmission, and 2D PE spectrum is
qualitatively supported by our calculations. The lowest resonance is calculated at a transition
energy of hv = 1.62 eV with no oscillator strength, followed by a bright resonance at
hv = 2.06 eV, and a third resonance at hv = 2.29 eV. These can be compared with
experimental values of 1.1 and 1.6 eV and the absorption spectrum that suggests that the
lowest transition is weak followed by a brighter transition. The TDDFT calculations appear to
overestimate the transition energies by some way (about 0.5 eV), which is not entirely
surprising given the level of our calculations,57 but have captured the state ordering and
relative energy spacing between the exited states quite well.
Based on the above, we can confidently assign most resonances. The first resonance
that leads to AD1 in Figure 1(b) is the 12Au resonance. The second resonance that results in
the AD2 signal can be assigned to the 12B2g resonance. Both these resonances are of shape
character and may be expected to lead to efficient and very fast autodetachment.56,57 The
discrepancy between the observed and computed oscillator strength of 0 for the
12B2g ← X 2B3u transition could arise from Herzberg-Teller coupling that has not been
accounted for in the calculation. Based on our calculations, the third resonance predicted at
hv = 2.29 eV corresponds to a 12B1g ← X 2B3u transition. The 12B1g resonance is of Feshbach
character with respect to the X 1Ag neutral ground state. Hence, the lifetime of this resonance
with respect to electron loss may be expected to be longer. Burrow et al. observed this
resonance in the electron transmission spectra at 1.62 eV,17 which would correspond to
Th
is is
the au
thor’s
peer
revie
wed,
acce
pted m
anus
cript.
How
ever
, the o
nline
versi
on of
reco
rd w
ill be
diffe
rent
from
this v
ersio
n onc
e it h
as be
en co
pyed
ited a
nd ty
pese
t. PL
EASE
CIT
E TH
IS A
RTIC
LE A
S DO
I: 10.1
063/5
.0007
470

17
hv = 2.15 eV in the 2D PE spectrum. Indeed, this is where the vibrational structure changes in
the absorption spectrum (Figure 6).19 In the 2D PE spectra, there is no clear indication of this
resonance (see Figure 1(a) and (b)). The 2D β2 spectra do show an abrupt change in β2 for the
DD1 channel at hv = 2.15 eV, indicating that a different excitation is contributing. However,
while the 12B1g appears to be populated, there is no evidence that it shows differing dynamics
to that observed for the 12Au and 12B2g resonances.
The higher lying resonances are predicted to the 22B3u and 22Au resonances. The 22B3u
is a shape resonance while the 22Au is a Feshbach (Figure 4): loss of an electron from the b2g
orbital from the 22Au resonance forms the neutral triplet 3B2u state. The 2D PE spectrum is
consistent with this assignment. The lower 22B3u resonance that leads to the AD3 signal has a
higher propensity to form the neutral X 1Ag ground state even though the 3B2u + e– channel is
energetically accessible. In contrast, the AD4 feature is associated with the 3B2u + e– channel,
suggesting that the resonance leading to AD4 is a Feshbach resonance with respect to the
X 1Ag ground state, but shape with respect to the 3B2u final state. This is consistent with the
resonance 22Au calculated at hv = 3.52 eV (see Figure 4).
The above arguments are predominantly based on experimental ones that are
qualitatively supported by our TDDFT calculations. We have specifically refrained from
performing higher-level calculations to demonstrate the synergy between the experiment and
TDDFT calculations and the insight these offer without needing to resort to such methods.
C. Competition between direct detachment and resonance excitation
Figure 3 shows a modulation of the ratio of PE signal in the AD1 versus DD1
channels. Because the 2D PE spectral intensity has been normalised relative to the integrated
intensity of each spectrum, the modulation seen in Figure 3 is a relative measure rather than
an absolute measure. The absorption spectrum of C14H10– measured by Shida and Iwata
Th
is is
the au
thor’s
peer
revie
wed,
acce
pted m
anus
cript.
How
ever
, the o
nline
versi
on of
reco
rd w
ill be
diffe
rent
from
this v
ersio
n onc
e it h
as be
en co
pyed
ited a
nd ty
pese
t. PL
EASE
CIT
E TH
IS A
RTIC
LE A
S DO
I: 10.1
063/5
.0007
470

18
(Figure 6) shows the absorption band of the weak 12Au ← X 2B3u transition.19 While the
origin (0-0 transition) of the band was probably not measured, a vibrational progression with
a spacing of ~ 150 meV was observed. The oscillation in Figure 3(b) has a similar spacing
(approximately 150 meV) suggesting that the same vibrational progression in the 12Au
resonance is responsible for the observed oscillation. Any discrepancy between the
frequencies may be due to the fact that the absorption spectrum was acquired in a matrix
which will impact the frequencies. The oscillation in Figure 3 can thus be interpreted as an
increase in cross section for excitation to the 12Au state when it is resonant with specific
vibrations, which in turn leads to the enhancement in AD1 on top of a constant (or at least
smoothly varying) background associated with the DD1 channel. Oscillations in the AD:DD
ratio are also seen for the higher lying resonances (AD3 and AD4) but these have been less
well resolved.
Modulation between direct and indirect detachment as a function of hv have been
noted in the photoelectron spectra of other anionic molecules. For example, Mabbs and
coworkers observed changes in cross section in the PE spectra of CuF2–,58 and Chick-Jarrold
and coworkers recently noted interesting oscillations in the PE spectra of Sm2O–.59 We have
also previously seen such oscillation for larger organic compounds and clusters.60,61
D. Spectral shape of autodetachment spectra and resonance dynamics
A particularly striking feature of AD1 is its rather narrow spectral shape. This is
shown more clearly in Figure 2 that presents the PE spectrum taken at hv = 2.30 eV. The
feature AD1 is associated with autodetachment from the 12Au resonance and it is apparent as
soon as this channel becomes accessible (see Figure 1). The 12Au resonance is of shape
character and autodetachment may be expected to be very fast. However, scattering
calculations have indicated that the autodetachment lifetime of this resonance is in fact quite
Th
is is
the au
thor’s
peer
revie
wed,
acce
pted m
anus
cript.
How
ever
, the o
nline
versi
on of
reco
rd w
ill be
diffe
rent
from
this v
ersio
n onc
e it h
as be
en co
pyed
ited a
nd ty
pese
t. PL
EASE
CIT
E TH
IS A
RTIC
LE A
S DO
I: 10.1
063/5
.0007
470

19
long – on the order of ~ 100 fs.56,57 During this relatively long autodetachment lifetime, some
nuclear motion can take place on the 12Au potential energy surface. Nevertheless, the electron
emission is predominantly dictated by the Franck-Condon factors of the 12Au → X 1Ag + e–
channel. The relatively narrow distribution of AD1 then suggests that the 12Au potential
energy surface is quite similar to that of the X 1Ag final state of the neutral. The fact that the
AD1 feature does not change much with hv suggests that the additional vibrational energy
imparted in the 12Au resonance upon excitation is conserved in the X 1Ag final state, leading
to a constant eKE with increasing hv. A similar argument was made by Bochenkova et al. in
the analysis of the autodetachment from resonances in the green fluorescent protein
chromophore anion.62,63 By inspection of the MOs involved (Figure 5), AD1 corresponds to
loss of an electron from the LUMO, which is antibonding along only along the short axis of
the molecule and non-bonding along the long axis. Hence, it is reasonable to suggest that the
geometric difference between 12Au and X 1Ag may be relatively small.
It is quite striking that the AD1 channel persists even when the brighter 2B2g resonance
is excited at hv > 1.6 eV, as can be seen in the PE spectrum at hv = 2.30 eV in Figure 2.
While there is additional indirect signal, as exemplified by region AD2 in Figure 2, the
predominant signal remains in the AD1 channel. Similarly, if the 11B1g resonance is also
populated, this appears to not have an impact on the presence and shape of the AD1 feature.
There are two possible explanations that would be consistent with the fact that AD1
dominates even though the 12B2g resonance is populated. Firstly, the 12B2g (and perhaps also
12B1g) resonance could undergo internal conversion to form the 12Au resonance, which
subsequently undergoes autodetachment to yield AD1. Such ultrafast internal conversion
processes have previously been observed in anion resonances64,65 and are likely to be
especially efficient when the potential energy surfaces involved are energetically close at the
excitation Franck-Condon geometry so that only small nuclear displacements are required to
Th
is is
the au
thor’s
peer
revie
wed,
acce
pted m
anus
cript.
How
ever
, the o
nline
versi
on of
reco
rd w
ill be
diffe
rent
from
this v
ersio
n onc
e it h
as be
en co
pyed
ited a
nd ty
pese
t. PL
EASE
CIT
E TH
IS A
RTIC
LE A
S DO
I: 10.1
063/5
.0007
470

20
lead to a conical intersection. The concept is analogous to Kasha’s rule,66 where instead of
fluorescence occurring from the lowest lying excited state, autodetachment occurs from the
lowest lying resonance. A second scenario to explain why the AD1 yield is higher than AD2
could be that the 12B2g resonance can internally convert to the ground electronic state of the
anion (X 2B3u). In this case, a reduced amount of autodetachment would be seen from the
12B2g resonance (i.e. reduced AD2). Instead, the X 2B3u state is formed with a large amount of
internal energy and the excess electron can subsequently be emitted statistically by
thermionic emission (TE). The signature of TE is PE signal at very low eKE (peaking at
0 eV) and with an exponentially decaying spectral profile.67–69 Such a feature can indeed be
seen in Figure 2 and inspection of Figure 1 shows a small TE feature that turns on at
~ 1.6 eV, which is consistent with the resonance energy of 12B2g determined by extrapolation
of the AD2 feature. Hence, the TE peak correlates with the production of 12B2g, indicating
that at least a fraction of the population can reform the X 2B3u ground state of the anion,
although probably not all as AD2 and AD1 signals are also observed. However, both Gallup
and Carelli et al. conclude that the autodetachment lifetime for the 12B2g resonance is much
shorter than that for 12Au resonance (by a factor of ~ 8).56,57 Hence, any internal conversion
dynamics must be competitive with this short lifetime. To determine the exact dynamics
would require time-resolved PE spectroscopic studies. We have attempted such studies for
the current system at a range of different pump and probe photon energies, but these have
been frustratingly unsuccessful. Apparently, the cross sections for photodetachment from the
resonances is very low.
The higher-lying resonance, 22B3u, leads to a very broad autodetachment peak, AD3
(Figure 1). This could reflect very fast autodetachment from a resonance that has a very
different geometry leading to a broad range of Franck-Condon factors, or slower dynamics in
which nuclear dynamics can take place on the excited state and autodetachment occurs along
Th
is is
the au
thor’s
peer
revie
wed,
acce
pted m
anus
cript.
How
ever
, the o
nline
versi
on of
reco
rd w
ill be
diffe
rent
from
this v
ersio
n onc
e it h
as be
en co
pyed
ited a
nd ty
pese
t. PL
EASE
CIT
E TH
IS A
RTIC
LE A
S DO
I: 10.1
063/5
.0007
470

21
a range of different geometries. Because this shape resonance is at high energy, the final
orbital to which the SOMO electron is excited is of greater antibonding character (see Figure
4), so that the difference in geometry between this resonance and the X 1Ag ground state will
probably very large. This is consistent with the broad spectral width of AD3. Moreover,
scattering calculations suggest an extremely short lifetime (< 10 fs) for autodetachment from
the 22B3u resonance,57 which would also be consistent with the observed width of AD3, and
with the fact that no internal conversion to the lower-lying resonances is observed in
Figure 1.
E. Relevance to electron capture in the interstellar medium
As commented on in the introduction, PAHs are an important store of carbon in the
ISM and anions of PAHs have been speculated on as potentially important chemical
species.14 Here, we have shown that only the 12B2g resonance at ~ 1.1 eV above the X 1Ag
neutral ground state shows evidence of ground state (X 2B3u) formation of the anion following
electron impact. However, the temperature in the ISM is typically in the 10 – 30 K range and
electrons are effectively thermalized to this background suggesting that these actually have
very low energies, and generally below 1.1 eV.70 Hence, it is unlikely that the 12B2g
resonance, or any other resonances in the first few eV of the electronic continuum, have any
significance in the ISM and that anthracene radical anions are present. A similar conclusion
was reached for the deprotonated (closed-shell) anthacenyl anion,50 for which the 2D PE
spectroscopy found no evidence for anion ground state recovery. In contrast, the tetracenyl
anion did show strong thermionic emission, although the PE spectroscopy on this system
suffered from poor signal to noise.71 It would certainly be of interest to study tetracene and
larger acene radical anions by 2D PE imaging and we are currently pursuing these
experiments. Finally, we note that most of the PAHs in the ISM exist in icy dust grains72 and
Th
is is
the au
thor’s
peer
revie
wed,
acce
pted m
anus
cript.
How
ever
, the o
nline
versi
on of
reco
rd w
ill be
diffe
rent
from
this v
ersio
n onc
e it h
as be
en co
pyed
ited a
nd ty
pese
t. PL
EASE
CIT
E TH
IS A
RTIC
LE A
S DO
I: 10.1
063/5
.0007
470
22
not necessarily as isolated species. Hence, one should consider how the icy environment
affects the resonance dynamics and experiments probing the effect of incremental solvation
by water molecules on the dynamics are currently underway in our laboratory.
V. Summary and Conclusion
The 2D photoelectron spectroscopy of the anthracene radical anion have been
presented and reveal complex and rich dynamics occurring in the anion continuum.
Resonances are assigned based on previous work and on TDDFT calculations. The latter
show good qualitative agreement and suggest that such calculations may be suitable when
considering larger PAHs for which wavefunction-based methods become expensive.
Excitation to the lowest energy resonance, 12Au, shows an energy dependent competition
between excitation and direct detachment that can be clearly seen in the ratio of direct to
indirect electron yield. The bright 12B2g resonance shows complex dynamics with a fraction
apparently forming the 12Au resonance by internal conversion and another fraction reforming
the ground electronic state as evidenced by thermionic emission. At higher energy, other
resonances show interesting dynamics and can be assigned based on Koopmans’ correlation
to the singlet and triplet states of the neutral. Overall, the dynamics show that low energy
electron impact onto anthracene does not generate a large amount of ground state anions and
therefore can be viewed as being rather inefficient in accepting electrons, especially in the
interstellar medium.
Acknowledgements
This work was funded by the EPSRC through the award of a DTP studentship (Grant No.
EP/M507854/1) and grant EP/R023085/1.
Data availability statement
Th
is is
the au
thor’s
peer
revie
wed,
acce
pted m
anus
cript.
How
ever
, the o
nline
versi
on of
reco
rd w
ill be
diffe
rent
from
this v
ersio
n onc
e it h
as be
en co
pyed
ited a
nd ty
pese
t. PL
EASE
CIT
E TH
IS A
RTIC
LE A
S DO
I: 10.1
063/5
.0007
470

23
Data is available from the authors on reasonable request.
References
1 A. Rescifina, M.A. Chiacchio, A. Corsaro, E. De Clercq, D. Iannazzo, A. Mastino, A.
Piperno, G. Romeo, R. Romeo, and V. Valveri, J. Med. Chem. 49, 709 (2006).
2 F.F. Becker and B.K. Banik, Front. Chem. 2, (2014).
3 B.J. Finlayson-Pitts and J.N. Pitts, Science 276, 1045 (1997).
4 J. Huang, J.-H. Su, and H. Tian, J. Mater. Chem. 22, 10977 (2012).
5 M. Kitamura, T. Imada, and Y. Arakawa, Appl. Phys. Lett. 83, 3410 (2003).
6 F. Salama, E.L.O. Bakes, L.J. Allamandola, and A.G.G.M. Tielens, Astrophys. J. 458, 621
(1996).
7 T.R. Geballe, J. Phys. Conf. Ser. 728, 062005 (2016).
8 G.P. van der Zwet and L.J. Allamandola, in Light Dark Matter, edited by F.P. Israel
(Springer Netherlands, 1986), pp. 233–236.
9 A. Omont, H.F. Bettinger, and C. Tönshoff, Astron. Astrophys. 625, A41 (2019).
10 M. Steglich, J. Bouwman, F. Huisken, and T. Henning, Astrophys. J. 742, 2 (2011).
11 T.P. Snow, V. Le Page, Y. Keheyan, and V.M. Bierbaum, Nature 391, 259 (1998).
12 S. Lepp and A. Dalgarno, Astrophys. J. 335, 769 (1988).
13 F. Carelli and F.A. Gianturco, Mon. Not. R. Astron. Soc. 422, 3643 (2012).
14 D. Field, S.L. Lunt, S.V. Hoffmann, J.P. Ziesel, and R.J. Gulley, (1999).
15 J.C. Rienstra-Kiracofe, C.J. Barden, S.T. Brown, and H.F. Schaefer, J. Phys. Chem. A 105,
524 (2001).
16 K.D. Jordan and P.D. Burrow, Chem. Rev. 87, 557 (1987).
17 P.D. Burrow, J.A. Michejda, and K.D. Jordan, J. Chem. Phys. 86, 9 (1987).
18 J.K. Song, N.K. Lee, and S.K. Kim, Angew. Chem. Int. Ed. 42, 213 (2003).
Th
is is
the au
thor’s
peer
revie
wed,
acce
pted m
anus
cript.
How
ever
, the o
nline
versi
on of
reco
rd w
ill be
diffe
rent
from
this v
ersio
n onc
e it h
as be
en co
pyed
ited a
nd ty
pese
t. PL
EASE
CIT
E TH
IS A
RTIC
LE A
S DO
I: 10.1
063/5
.0007
470

24
19 T. Shida and S. Iwata, J. Chem. Phys. 56, 2858 (1972).
20 T. Shida and S. Iwata, J. Am. Chem. Soc. 95, 3473 (1973).
21 J. Schiedt and R. Weinkauf, Chem. Phys. Lett. 266, 201 (1997).
22 J.K. Song, N.K. Lee, J.H. Kim, S.Y. Han, and S.K. Kim, J. Chem. Phys. 119, 3071 (2003).
23 S.J. Kregel, G.K. Thurston, and E. Garand, J. Chem. Phys. 148, 234306 (2018).
24 C.S. Anstöter, J.N. Bull, and J.R.R. Verlet, Int. Rev. Phys. Chem. 35, 509 (2016).
25 M. Allan, K. Regeta, J.D. Gorfinkiel, Z. Mašín, S. Grimme, and C. Bannwarth, Eur. Phys.
J. D 70, 123 (2016).
26 K. Regeta and M. Allan, Phys. Rev. Lett. 110, 203201 (2013).
27 F. Currell and J. Comer, Phys. Rev. Lett. 74, 1319 (1995).
28 T. Reddish, F. Currell, and J. Comer, J. Phys. [E] 21, 203 (1988).
29 C.E.H. Dessent, Chem. Phys. Lett. 330, 180 (2000).
30 G. Malloci, G. Mulas, G. Cappellini, V. Fiorentini, and I. Porceddu, Astron. Astrophys.
432, 585 (2005).
31 G. Malloci, G. Mulas, G. Cappellini, and C. Joblin, Chem. Phys. 340, 43 (2007).
32 R.V. Khatymov, M.V. Muftakhov, and P.V. Shchukin, Rapid Commun. Mass Spectrom.
31, 1729 (2017).
33 M.-C. Kim, E. Sim, and K. Burke, J. Chem. Phys. 134, 171103 (2011).
34 J.P. Rogers, C.S. Anstöter, J.N. Bull, B.F.E. Curchod, and J.R.R. Verlet, J. Phys. Chem. A
123, 1602 (2019).
35 U. Even, J. Jortner, D. Noy, N. Lavie, and C. Cossart-Magos, J. Chem. Phys. 112, 8068
(2000).
36 W.C. Wiley and I.H. McLaren, Rev. Sci. Instrum. 26, 1150 (1955).
37 A.T.J.B. Eppink and D.H. Parker, Rev. Sci. Instrum. 68, 3477 (1997).
Th
is is
the au
thor’s
peer
revie
wed,
acce
pted m
anus
cript.
How
ever
, the o
nline
versi
on of
reco
rd w
ill be
diffe
rent
from
this v
ersio
n onc
e it h
as be
en co
pyed
ited a
nd ty
pese
t. PL
EASE
CIT
E TH
IS A
RTIC
LE A
S DO
I: 10.1
063/5
.0007
470

25
38 G.M. Roberts, J.L. Nixon, J. Lecointre, E. Wrede, and J.R.R. Verlet, Rev. Sci. Instrum. 80,
053104 (2009).
39 A.D. Becke, J. Chem. Phys. 98, 5648 (1993).
40 A.D. McLean and G.S. Chandler, J. Chem. Phys. 72, 5639 (1980).
41 R. Krishnan, J.S. Binkley, R. Seeger, and J.A. Pople, J. Chem. Phys. 72, 650 (1980).
42 M. Frisch, G. Trucks, H. Schlegel, G. Scuseria, M. Robb, J. Cheeseman, G. Scalmani, V.
Barone, B. Mennucci, G. Petersson, H. Nakatsuji, M. Caricato, X. Li, H. Hratchian, A.
Izmaylov, J. Bloino, G. Zheng, J. Sonnenberg, M. Hada, M. Ehara, K. Toyota, R. Fukuda, J.
Hasegawa, M. Ishida, T. Nakajima, Y. Honda, O. Kitao, H. Nakai, T. Vreven, J.
Montgomery, J. Peralta, F. Ogliaro, M. Bearpark, J. Heyd, E. Brothers, K. Kudin, V.
Staroverov, R. Kobayashi, J. Normand, K. Raghavachari, A. Rendell, J. Burant, S. Iyengar, J.
Tomasi, M. Cossi, N. Rega, J. Millam, M. Klene, J. Knox, J. Cross, V. Bakken, C. Adamo, J.
Jaramillo, R. Gomperts, R. Stratmann, O. Yazyev, A. Austin, R. Cammi, C. Pomelli, J.
Ochterski, R. Martin, K. Morokuma, V. Zakrzewski, G. Voth, P. Salvador, J. Dannenberg, S.
Dapprich, A. Daniels, Farkas, J. Foresman, J. Ortiz, J. Cioslowski, and D. Fox, Gaussian 09
Gaussian Inc Wallingford CT (2009).
43 C.W. Bauschlicher, Chem. Phys. Lett. 409, 235 (2005).
44 A.U. Hazi and H.S. Taylor, Phys. Rev. A 1, 1109 (1970).
45 J. Simons, J. Phys. Chem. A 112, 6401 (2008).
46 J.S. ‐Y. Chao, M.F. Falcetta, and K.D. Jordan, J. Chem. Phys. 93, 1125 (1990).
47 J. Cooper and R.N. Zare, J. Chem. Phys. 48, 942 (1968).
48 K.L. Reid, Annu. Rev. Phys. Chem. 54, 397 (2003).
49 C.W. West, J.N. Bull, E. Antonkov, and J.R.R. Verlet, J. Phys. Chem. A 118, 11346
(2014).
50 L.H. Stanley, C.S. Anstöter, and J.R.R. Verlet, Chem. Sci. 8, 3054 (2017).
Th
is is
the au
thor’s
peer
revie
wed,
acce
pted m
anus
cript.
How
ever
, the o
nline
versi
on of
reco
rd w
ill be
diffe
rent
from
this v
ersio
n onc
e it h
as be
en co
pyed
ited a
nd ty
pese
t. PL
EASE
CIT
E TH
IS A
RTIC
LE A
S DO
I: 10.1
063/5
.0007
470

26
51 C.S. Anstöter, C.R. Dean, and J.R.R. Verlet, Phys. Chem. Chem. Phys. 19, 29772 (2017).
52 C.S. Anstöter, T.E. Gartmann, L.H. Stanley, A.V. Bochenkova, and J.R.R. Verlet, Phys.
Chem. Chem. Phys. 20, 24019 (2018).
53 A. Thöny and M.J. Rossi, J. Photochem. Photobiol. Chem. 104, 25 (1997).
54 J. Ferguson, L.W. Reeves, and W.G. Schneider, Can. J. Chem. 35, 1117 (1957).
55 P.D. Burrow and G.A. Gallup, New J. Phys. 16, 028001 (2014).
56 G.A. Gallup, J. Chem. Phys. 139, 104308 (2013).
57 F. Carelli, F.A. Gianturco, M. Satta, and F. Sebastianelli, Int. J. Mass Spectrom. 365–366,
377 (2014).
58 J. Lyle, T.-C. Jagau, and R. Mabbs, Faraday Discuss. 217, 533 (2019).
59 J.L. Mason, J.E. Topolski, J. Ewigleben, S.S. Iyengar, and C.C. Jarrold, J. Phys. Chem.
Lett. 10, 144 (2019).
60 J.N. Bull, C.W. West, and J.R.R. Verlet, Chem. Sci. 7, 5352 (2016).
61 J.N. Bull, C.S. Anstöter, and J.R.R. Verlet, J. Phys. Chem. A (2020).
62 A.V. Bochenkova, B. Klærke, D.B. Rahbek, J. Rajput, Y. Toker, and L.H. Andersen,
Angew. Chem. Int. Ed. 53, 9797 (2014).
63 C.W. West, J.N. Bull, A.S. Hudson, S.L. Cobb, and J.R.R. Verlet, J. Phys. Chem. B 119,
3982 (2015).
64 J.N. Bull, C.W. West, and J.R.R. Verlet, Chem. Sci. 6, 1578 (2015).
65 D.A. Horke, Q. Li, L. Blancafort, and J.R.R. Verlet, Nat. Chem. 5, 711 (2013).
66 M. Kasha, Discuss. Faraday Soc. 9, 14 (1950).
67 E.E.B. Campbell and R.D. Levine, Annu. Rev. Phys. Chem. 51, 65 (2000).
68 J.U. Andersen, E. Bonderup, and K. Hansen, J. Phys. B At. Mol. Opt. Phys. 35, R1 (2002).
69 C.L. Adams, K. Hansen, and J.M. Weber, J. Phys. Chem. A 123, 8562 (2019).
Th
is is
the au
thor’s
peer
revie
wed,
acce
pted m
anus
cript.
How
ever
, the o
nline
versi
on of
reco
rd w
ill be
diffe
rent
from
this v
ersio
n onc
e it h
as be
en co
pyed
ited a
nd ty
pese
t. PL
EASE
CIT
E TH
IS A
RTIC
LE A
S DO
I: 10.1
063/5
.0007
470

27
70 O. Ingólfsson, Low-Energy Electrons : Fundamentals and Applications (Jenny Stanford
Publishing, 2019).
71 J.N. Bull, C.W. West, and J.R.R. Verlet, Phys. Chem. Chem. Phys. 17, 32464 (2015).
72 D.J. Burke and W.A. Brown, Phys. Chem. Chem. Phys. 12, 5947 (2010).
Th
is is
the au
thor’s
peer
revie
wed,
acce
pted m
anus
cript.
How
ever
, the o
nline
versi
on of
reco
rd w
ill be
diffe
rent
from
this v
ersio
n onc
e it h
as be
en co
pyed
ited a
nd ty
pese
t. PL
EASE
CIT
E TH
IS A
RTIC
LE A
S DO
I: 10.1
063/5
.0007
470