DSE Team S - WordPress.com
150
APIS Autonomous Pollination & Imaging System DSE Team S Delft University of Technology
-
Upload
khangminh22 -
Category
Documents
-
view
3 -
download
0
Transcript of DSE Team S - WordPress.com

APISAutonomous Pollination & Imaging System
DSE Team S9
Del
ftU
nive
rsity
ofTe
chno
logy

APISAutonomous Pollination & Imaging System
by
DSE Team S9Bolton, T.K. 4282752Commijs, T.J. 4385853El-Hajj, I.Z. 4304225Kapteijn, S. 4301242Kus, G.I. 4354923Petrescu, V. 4365119Petrov, A.P. 4355474Quesada Mañas, J.M. 4353889Van der Pluijm, A. 4379497
Project duration: April 24, 2017 – July 6, 2017Tutor: Christophe De WagterCoaches: Alberto Rius
Viswanath Dhanisetty

Preface
The number of calamities impinging upon mother nature are increasing. One unarguably worthy of tackling is theimpending extinction of bees. This problem will propagate a direct influence on the ecosystem. Specifically, for hor-ticulture, pollination of flowers will prove to be more and more challenging. Pollination is not only important for thereproduction of flowers but is also important in maintaining a clean environment. To ensure pollination is still properlydone, drones can be used. The current report series will look into designing such a drone. This is the third report andwill provide insights into the group’s vision in the process of choosing the concept to be elaborated in the final phase ofthis project.
The team is composed of nine aerospace students who are all in the final year of their bachelor program. Thebiological and environmental aspects of the project, along with the opportunity to design a drone for a useful application,are the main motivations the group members share. The project started in April 2017 within the context of the courseDesign Synthesis Exercise at the Delft University of Technology. It is carried out under the supervision of ir. de Wagter.
The group would like to thank ir. C. de Wagter and the tutors A. Rius and V. Dhanisetty for their guidance, motivationand expertise during the design process. The group also wants to thank the DSE committee for making this projectavailable. Furthermore, special thanks are extended to the MAV Lab, TU Delft, and in particular to ir. E. van derHorst for his help and shared experience on the micro air vehicles field. The team wants to express it deepest thanksto Wageningen University and to ing. J. Janse, for inviting the group to their research greenhouse facilities and forsharing knowledge about pollination. Besides, the group wants to extend its gratitude to Pieter Hermans from Jakajima,for inviting us to speak at the Smart Farming Conference, held on June 29, 2017 in Venlo. In addition, the groupacknowledges the help provided by dr.ir. A. Dieleman and F. van Noort from Wageningen university, Mr. J. VanMarrewijk from van Marrewijk tomatoes and H. de Kroon from Vanilla BV. Moreover, the team appreciates the helpreceived by PhD and Master students from the Delft University of Technology: PhD student M. Coutiño from the Centerfor Wireless Systems and Technology, for providing valuable insight in UWB technology and communication protocols,PhD student K. McGuire from the Aerospace Faculty, for her key advice on the navigation strategy, PhD student S. Lee,for his path planning expertise and Master student M. Ozo, for his experience with the Snapdragon Flight kit.
DSE Team S9Delft, July 2017
ii

Executive overview
Pollination, the process where the pollen is transferred from the anther (male part) to the stigma (female part) of a flower,is the most important step in the production of seeds. Fruiting depends directly on how this fertilization process occursas the yield, quality and size of the fruits are all affected. The transfer of pollen can be done in a variety of ways: throughwind (anemophily), through insects or by manual methods. For fruits and vegetables, the main pollinators are bees. Theyare indeed directly responsible for 75% of all crops. In order for it to be done effectively, bees are being produced forgreenhouses with the sole purpose of pollinating crops. Not all crops are however as interesting for the bees. Indeed, beesare attracted to scent and to flowers that are attractive on the outside. Planting cucumber next to tomatoes is thereforenot an option as the bees would only visit the tomatoes. Furthermore, depending on the geographical location of thegreenhouse, bees can be harder to purchase. In those cases, pollination can be done manually, but this process proves tobe very time-consuming and expensive.
An autonomous system could therefore be envisaged for pollinating plants where their current methods are insuffi-cient or ineffective. With the recent technical advances in domains such as precise vision based control, miniaturizationand autonomous flight, an opportunity for an autonomous system of micro air vehicles presents itself. Indeed, dronessuch as the AscTec Firefly are capable of recreating an entire 3D map of an unfamiliar environment and others, suchas the Aerix AERIUS, are 3 × 3 cm flight proven platforms. Autonomous flight has been achieved in projects suchas the delftAcopter where a lost backpacker had to be found in the Australian outback. The main challenge remainsin combining all these parameters into one flying vehicle. Projects such as the DelFly have shown autonomous flightis achievable on a 20 gram flapping wing system but the environment and goals for which it was tested, remain verydifferent than the ones required in this project, namely a greenhouse. Therefore, the objective of this project was to makea proof-of-concept design of a swarm of fully autonomous pollinator micro air vehicles and its support systems, within10 weeks’ time and with a team of 9 students.
To do so, several key requirements regarding the drone itself but also the way the mission is to be performed wereset. For example, the air vehicle was not to weigh more than 300 grams. It had to be able to visit at least 500 flowers aday and fly with multiple MAVs simultaneously in the same greenhouse. Furthermore, the flowers and plants were notto be damaged in any way. Communication with support systems should occur constantly and telemetry data was also tobe tracked. Moreover, regarding the sustainability of the design, the minimum life cycle of the MAV was set at 8 months,the noise level was to be under 100 dB and no direct emissions were to be produced by the MAV. The budget for thisproject was set at e500,000. Finally, it was decided to target tomato flowers in particular. This selection was motivatedby the extensive cultivated land of tomatoes in the Netherlands (1670 ha) but also by the fact that it is a self-pollinatingflower. This means that vibrations have to be induced in the stem of the flower such that the pollen can fall into thestigma. This project therefore looks to provide a solid basis for the pollination of tomato plants that can in the future beexpanded to other self-pollinating crops and to cross-pollinated crops, where the pollen need to be physically transportedfrom the anther of one flower to the stigma of another.
The requirements listed in the previous paragraph were set in the first stages of the project. Specific technical andmanagerial tasks were given to each group member to ensure the predicted work would be equally split. A chairman wasappointed to ensure managerial tasks were performed correctly and two system engineers were appointed to ensure thetechnical parts were detailed enough. A meticulous plan was furthermore set up in the form of a Gantt chart. This gave afirst insight in the work that was to be done in the later stages of the project. In the next phase, the baseline phase, threeconcepts were generated that could solve the mission. The ground support and the ways the mission would be tackledwere all tailored for each concept.
The first concept, named Flabbee, was inspired by the Delfly. It distinguished itself from the other concepts mainlyby its propulsion system. Eight flapping wings are responsible to generate the thrust needed for the Flabbee to navigatein the greenhouse. Armed with a brushing tongue to pollinate the flowers, the Flabbee uses ultra wideband (UWB)transceivers for navigation and communication purposes. Power would come from a lithium-ion battery that wouldrecharge when the Flabbee lands on a fixed ground station that contains a charging pad. It was moreover estimated itwould weigh 32 g and would have a wing span of 14 cm. The main problem with this concept was however the accuracyneeded to properly touch the flowers. Indeed, for it to be met, the size and mass of the Flabbee would have increasedover the allowed limits. These limitations can be overcome with a quadrotor, which was explored in the second concept.
The second concept was called the Robuzz. Inspired by bees, the Robuzz also pollinates flowers by coming veryclose to them and vibrating at the right frequency. This is helped by the induced flow that is generated by the four rotors
iii

iv Executive overview
it uses to propel itself. Just like the Flabbee, use is made of ultra wideband tags for navigation and communication. Abig difference can however be found in the ground station. A mobile one on wheels would move along with the swarmof Robuzzes. Batteries would be swapped automatically to minimize the charging time and maximize the operationaltime. The Robuzz was expected to weigh around 77.3 g and have a size of 13 × 13 cm. The accuracy issues the Flabbeehas were somewhat solved but at the expense of an increase in potential damage to the flower. This was coupled withanother large problem. The smaller the design, the lower the life expectancy of the various components. Given that thedesign was to be sustainable, a scaled up version of the Robuzz was generated.
The third and final concept that was generated was named APIS. Both problems the Robuzz faced were solved. Theflower safety issue was solved by introducing a blower on the drone. As such, the drone could pollinate flowers withoutdirectly coming into contact with them. The reliability issue was resolved directly as the component size increased. Theextra weight added by the blower required more thrust to be generated. The motors were therefore selected based onthe fact that the drone would weigh 250 grams. This allowed to bring additional mass on-board. As such, a powerfulprocessor and a large battery were selected such that APIS could fly accurately over long distances. The next paragraphswill focus on the various subsystems that comprise the APIS.
The blower system was selected as damage to the flowers is reduced to a minimum once the optimal air speed isfound. Through CFD simulations it was determined that at a distance of 50 cm from the flower, the exit velocity of theblower should be 10 m/s. The pointing accuracy that was found for such a jet was about 7 degrees. The blower wasimplemented in the drone such that it would have a dual usage. It indeed cools down the processor through ventilationand therefore expels warmer air towards the flower, something which improves the probability of successful pollination.The blower expels air from a nozzle that is at a 45 degree angle. This allows the MAV to blow air on the flower whileflying above the plants.
For the power and propulsion sizing, a mission analysis was performed. A typical mission is divided into sevenparts. Namely take-off, cruise, the detection phase, the pollinating phase, the turning back, the cruise back and thelanding. A drone would need to cruise towards a row and start detecting flowers after leaving the ground station. Theobstacle avoidance methods are on and the blower is also spinning during the pollination phase. The energy consumptionwas determined for each phase and the required capacity of the battery for a depth of discharge lower than 90% wasdetermined. A Li-Po graphene battery with 2S1P was selected. It has a capacity of 1500 mAh and a lifetime of 385.35 h.The motors selected provide a maximum thrust of 130 g each, resulting in hovering at 48% throttle. This allows enoughmargin for agile acceleration and even extra payload mass of 10 g.
The microcontroller forms the base of the electronics system. It is comprised of a CPU for the logic operations, aGPU to process the arithmetics, a DSP to process signal inputs, a flash memory to store data from the flight sensor, astatic random access memory, a read-only memory where the instructions are stored, I/O pins to attach more sensors andanalog to digital converters. Communication is done through two DecaWave 1000 modules, that also provide localizationand attitude information. Furthermore, additional sensors are brought on board. An IMU to measure the orientation ofthe quadrotor, a barometer sensor and a humidity temperature sensor are all added. For vision, as will be discussed later,a stereo camera and a monoscopic one are added. To accommodate all these sensors, the customized Snapdragon Flightboard is used and optimized by removing several unused modules (such as GPS or WiFi).
As mentioned above, in order for the drone to localize itself, use will be made of ultra wideband (UWB) navigation.Two tags will be placed on the drone such that it can also determine its heading. UWB was selected as location precisionup to 10 cm can be achieved. UWB also serves as the main way of communication with the ground station. With itsposition and heading known, the drone can fly towards its target, the flowers. To do so safely, obstacles must be detectedand avoided. The stereo cameras located at the front of the drone do so by generating a first place disparity map. Thosemaps allow the MAV to perceive depth. If an obstacle is detected, a combination of the D∗ algorithm and probabilisticroad maps for local path planning is considered. The code can be adjusted to detect objects that have a small resolution.This proves to be useful if the wires, connected to the tomato plants, have to be detected. Flowers are on the other handnot be detected by the stereopair but rather by the monoscopic fisheye lens located on the right side of the MAV. It isplaced at an angle such that the drone can safely fly over the row and still detect flowers. The flowers are detected by analgorithm that is tailored to the colour of the tomato flowers, bright yellow. To confirm that pollination has been done,mean shift tracking is done to ensure the flower has indeed moved.
A slightly less traditional configuration was selected for the quadcopter structure: an H-configuration. This was toaccommodate for the size of the battery. The material of the arms and the payload box is carbon fibre. The arms arehollow tubes that have been sized to the vibrational frequency of the motors. The battery is furthermore put on smalllatex foam cubes to damp those vibrations. The processing board is put on top of the battery, allowing the measurementsto also be unaffected by the vibrations.
Control and stability methods were also selected for the drone. A static analysis when the blower is on, shows thatthe drone will be flying at an angle of 1 degree when flying in the rows. The dynamics of the quadcopter were not

Executive overview v
simulated, as data about the motors is needed. However, once the missing data regarding the motors is found, the effectof the blower can best be modelled by making the latter an external disturbance in the body frame of the MAV. Thecontrol technique selected to damp out the effect of the blower was a PID controller. This was because of its simplicityand its capabilities to stabilize the attitude of the drone. The gains will be tuned at a later stage through either the ZieglerNicols or the Tyreus-Luyben method.
Finally, the ground segment and ground stations were also considered. It must be first and foremost said that theirname is misleading as they will actually be hanging from the roof structure of the greenhouse. This was decided suchthat it would not be in the way of the daily ground operations. Every greenhouse is equipped with hydraulic trolleyswhich makes their maintenance easy. Each ground station will have eight landing pads that will recharge the drones.Guiding cones and visual cues will guide the pin located on the drone towards one of several neighboring sockets. Assuch, the drone must land on a designated area, instead of one specific socket, a feat achievable with the UWB navigationand the visual cues. The ground stations are furthermore the link in between the drones and the central server. The serverstores the images that the drones pass to the ground station when recharging. The health of each drone can furthermorebe monitored on the main server. Connection between the main server and the ground station is done through standardLAN cables.
The final mass of the APIS is 250 ± 20 g and is designed in a modular way to accommodate different payloads fordifferent pollination methods. The cost of one APIS drone is e394 ± 54. The weight of the ground station is expectedto be around 13 ± 0.7 kg and the cost is expected to be e389.13 ± 73. The hub is expected to cost around e60 ± 30 andthe server around e1500 ± 500. These do not include transportation, maintenance nor installation costs.
The typical greenhouse was defined to have a size of 200 × 200 m greenhouse. The greenhouse will first have amain corridor that splits it into an upper part and lower part, each 100 × 200 m in size. A ground station will be placedalong the corridor approximately every 20 m such that the 8 ground stations have equal dedicated section. The groundstations will all be equipped with the maximum number of drones. Once the entire system is set up, the ground stationstarts sending the drones to the locations in the greenhouse that need to be pollinated. It does so by ensuring there isat all times a maximum of one drone in each half row and in each corridor. The drones are then sent one by one andstart to pollinate and take images of the flowers. They do so by entering the row, turning the blower on and detectingthe flowers. When the battery life reaches approximately 50%, the drones start flying back and start to pollinate theother side of the row. This entire process runs for 12 h a day unless stated differently on the user interface. This isbecause the vision system performs poorly in the dark and because the flowers have more difficulty getting pollinated inthe dark. Finally, the material system cost for such a greenhouse amounts to e29,998 ± 4,570. This does not includetransportation, maintenance nor installation costs.
The reliability, availability, safety and maintainability of the system were also considered. The system is made in areliable way because the system should be effective in case of unexpected failure. Spare drones are for one included. 58drones are needed to pollinate a 200x200 m greenhouse but 64 will be used such that all the charging pads are filled up.This ensures that if a drone fails, the task can still be accomplished within 3 days. The system is furthermore availableduring working hours as the maintenance plans that have been designed should be executed outside of operating hours.Moreover, regarding safety, an emergency system has been designed. A red button will be placed in a strategic location inthe greenhouse and when pressed, the drones drop to the ground in a controlled manner. Safety has also been consideredin the design of the drone. Propeller guards prevent them to damage plants and reduce injury risks. The electronics aresealed and coated to prevent short circuits and risks of fire. The battery is also enclosed in a casing such that it can notbe punctured. Finally, the system was also made to be easily maintainable as access to the parts that most likely need tobe replaced, such as the battery and the motors, is easily feasible.
The design of the system was done such that it also meets sustainability requirements. The power consumption of thedrone is marginal compared to the typical electricity consumption of a greenhouse. The latter is expected to increase by0.02% if the system is implemented. Noise levels were also considered. They were kept below 80 dB, a number whichis also below the maximum noise levels allowed in a working environment in the Netherlands. Moreover, at the end ofthe pollination season, the batteries are collected and are to be recycled. Finally, the system contributes to sustainabilityon a social, environmental and economical level. Indeed, pollination services are provided to plants where the currentmethods are inefficient or ineffective. Economic value is also created as the drone market would be stimulated.
Finally, several recommendations are made and post DSE activities are considered. First a CFD analysis has onlybeen made for the blower and testing on an actual tomato plant flower would help to determine the optimal exhaustvelocity. Another recommendation that is made it to analyze the charging method further. The pin is currently "sticking"out of the drone and could reduce its aerodynamic capacities. Post DSE activities that have been listed include amarketing plan and the long term vision of the project. This includes building the prototype and testing it and alsothe expected future developments of drone pollinator technology.

Contents
Preface iiExecutive overview iiiNomenclature ix1 Introduction 12 Market analysis 2
2.1 SWOT analysis . . . . . . . . . . . . . . . . . . . . . . . . . . . . . . . . . . . . . . . . . . . . . 22.2 General trends . . . . . . . . . . . . . . . . . . . . . . . . . . . . . . . . . . . . . . . . . . . . . 2
2.2.1 Apiculture . . . . . . . . . . . . . . . . . . . . . . . . . . . . . . . . . . . . . . . . . . . 22.2.2 Pollinators . . . . . . . . . . . . . . . . . . . . . . . . . . . . . . . . . . . . . . . . . . . 22.2.3 Economic value . . . . . . . . . . . . . . . . . . . . . . . . . . . . . . . . . . . . . . . . 3
2.3 Competitor analysis . . . . . . . . . . . . . . . . . . . . . . . . . . . . . . . . . . . . . . . . . . 42.3.1 Bee pollination . . . . . . . . . . . . . . . . . . . . . . . . . . . . . . . . . . . . . . . . . 42.3.2 Drone companies . . . . . . . . . . . . . . . . . . . . . . . . . . . . . . . . . . . . . . . . 42.3.3 Manual pollination . . . . . . . . . . . . . . . . . . . . . . . . . . . . . . . . . . . . . . . 5
2.4 Product competitiveness . . . . . . . . . . . . . . . . . . . . . . . . . . . . . . . . . . . . . . . . 52.4.1 A comparison with bees . . . . . . . . . . . . . . . . . . . . . . . . . . . . . . . . . . . . 52.4.2 A comparison with manual pollination methods. . . . . . . . . . . . . . . . . . . . . . . . . 5
2.5 Customer. . . . . . . . . . . . . . . . . . . . . . . . . . . . . . . . . . . . . . . . . . . . . . . . 6
3 Mission overview 73.1 Mission description. . . . . . . . . . . . . . . . . . . . . . . . . . . . . . . . . . . . . . . . . . . 73.2 System sizing . . . . . . . . . . . . . . . . . . . . . . . . . . . . . . . . . . . . . . . . . . . . . 73.3 Functional flow diagram (FFD) . . . . . . . . . . . . . . . . . . . . . . . . . . . . . . . . . . . . . 83.4 Functional breakdown structure (FBS) . . . . . . . . . . . . . . . . . . . . . . . . . . . . . . . . . 8
4 Operations and logistics 114.1 Documentation . . . . . . . . . . . . . . . . . . . . . . . . . . . . . . . . . . . . . . . . . . . . . 114.2 Transport . . . . . . . . . . . . . . . . . . . . . . . . . . . . . . . . . . . . . . . . . . . . . . . . 114.3 Operations (set up) . . . . . . . . . . . . . . . . . . . . . . . . . . . . . . . . . . . . . . . . . . . 124.4 Inspection and maintenance . . . . . . . . . . . . . . . . . . . . . . . . . . . . . . . . . . . . . . 134.5 Customer support. . . . . . . . . . . . . . . . . . . . . . . . . . . . . . . . . . . . . . . . . . . . 15
5 Pollination payload 165.1 General pollination process . . . . . . . . . . . . . . . . . . . . . . . . . . . . . . . . . . . . . . . 165.2 Flow analysis. . . . . . . . . . . . . . . . . . . . . . . . . . . . . . . . . . . . . . . . . . . . . . 16
5.2.1 Analytical model . . . . . . . . . . . . . . . . . . . . . . . . . . . . . . . . . . . . . . . . 165.2.2 Numerical model . . . . . . . . . . . . . . . . . . . . . . . . . . . . . . . . . . . . . . . . 195.2.3 Verification and validation . . . . . . . . . . . . . . . . . . . . . . . . . . . . . . . . . . . 225.2.4 System output determination . . . . . . . . . . . . . . . . . . . . . . . . . . . . . . . . . . 23
5.3 Payload implementation . . . . . . . . . . . . . . . . . . . . . . . . . . . . . . . . . . . . . . . . 255.3.1 Functionality . . . . . . . . . . . . . . . . . . . . . . . . . . . . . . . . . . . . . . . . . . 255.3.2 Design . . . . . . . . . . . . . . . . . . . . . . . . . . . . . . . . . . . . . . . . . . . . . 255.3.3 Analysis . . . . . . . . . . . . . . . . . . . . . . . . . . . . . . . . . . . . . . . . . . . . 26
6 Propulsion and power 306.1 Aerodynamics . . . . . . . . . . . . . . . . . . . . . . . . . . . . . . . . . . . . . . . . . . . . . 306.2 Propulsion and power . . . . . . . . . . . . . . . . . . . . . . . . . . . . . . . . . . . . . . . . . 326.3 Power consumption. . . . . . . . . . . . . . . . . . . . . . . . . . . . . . . . . . . . . . . . . . . 336.4 Battery selection . . . . . . . . . . . . . . . . . . . . . . . . . . . . . . . . . . . . . . . . . . . . 356.5 Blade element momentum theory . . . . . . . . . . . . . . . . . . . . . . . . . . . . . . . . . . . . 37
vi

Contents vii
7 Electronics 397.1 Microcontroller. . . . . . . . . . . . . . . . . . . . . . . . . . . . . . . . . . . . . . . . . . . . . 397.2 Communication . . . . . . . . . . . . . . . . . . . . . . . . . . . . . . . . . . . . . . . . . . . . 407.3 Sensors. . . . . . . . . . . . . . . . . . . . . . . . . . . . . . . . . . . . . . . . . . . . . . . . . 407.4 Electrical design . . . . . . . . . . . . . . . . . . . . . . . . . . . . . . . . . . . . . . . . . . . . 41
7.4.1 Snapdragon Flight kit. . . . . . . . . . . . . . . . . . . . . . . . . . . . . . . . . . . . . . 417.4.2 Flight board optimization . . . . . . . . . . . . . . . . . . . . . . . . . . . . . . . . . . . . 437.4.3 Mass and power estimation . . . . . . . . . . . . . . . . . . . . . . . . . . . . . . . . . . . 44
7.5 Wiring . . . . . . . . . . . . . . . . . . . . . . . . . . . . . . . . . . . . . . . . . . . . . . . . . 45
8 Navigation 478.1 Navigation strategy . . . . . . . . . . . . . . . . . . . . . . . . . . . . . . . . . . . . . . . . . . . 478.2 UWB protocol . . . . . . . . . . . . . . . . . . . . . . . . . . . . . . . . . . . . . . . . . . . . . 488.3 Indoor positioning system . . . . . . . . . . . . . . . . . . . . . . . . . . . . . . . . . . . . . . . 498.4 Attitude determination . . . . . . . . . . . . . . . . . . . . . . . . . . . . . . . . . . . . . . . . . 508.5 Navigating safely through the greenhouse. . . . . . . . . . . . . . . . . . . . . . . . . . . . . . . . 53
8.5.1 Obstacle detection . . . . . . . . . . . . . . . . . . . . . . . . . . . . . . . . . . . . . . . 538.5.2 Obstacle avoidance . . . . . . . . . . . . . . . . . . . . . . . . . . . . . . . . . . . . . . . 54
8.6 Flower detection . . . . . . . . . . . . . . . . . . . . . . . . . . . . . . . . . . . . . . . . . . . . 558.7 Flower motion tracking . . . . . . . . . . . . . . . . . . . . . . . . . . . . . . . . . . . . . . . . . 568.8 Camera selection . . . . . . . . . . . . . . . . . . . . . . . . . . . . . . . . . . . . . . . . . . . . 578.9 Verification and validation . . . . . . . . . . . . . . . . . . . . . . . . . . . . . . . . . . . . . . . 60
9 Structure 629.1 Choice of configuration. . . . . . . . . . . . . . . . . . . . . . . . . . . . . . . . . . . . . . . . . 629.2 Material selection . . . . . . . . . . . . . . . . . . . . . . . . . . . . . . . . . . . . . . . . . . . 629.3 Design of the arms . . . . . . . . . . . . . . . . . . . . . . . . . . . . . . . . . . . . . . . . . . . 63
9.3.1 Loads on the arms . . . . . . . . . . . . . . . . . . . . . . . . . . . . . . . . . . . . . . . 639.3.2 Structural analysis . . . . . . . . . . . . . . . . . . . . . . . . . . . . . . . . . . . . . . . 639.3.3 Cross-section selection . . . . . . . . . . . . . . . . . . . . . . . . . . . . . . . . . . . . . 649.3.4 Comparison and results . . . . . . . . . . . . . . . . . . . . . . . . . . . . . . . . . . . . . 64
9.4 Payload box design . . . . . . . . . . . . . . . . . . . . . . . . . . . . . . . . . . . . . . . . . . . 659.4.1 Loads on the payload box. . . . . . . . . . . . . . . . . . . . . . . . . . . . . . . . . . . . 659.4.2 Sizing of the payload box. . . . . . . . . . . . . . . . . . . . . . . . . . . . . . . . . . . . 659.4.3 Vibration in the payload box . . . . . . . . . . . . . . . . . . . . . . . . . . . . . . . . . . 66
9.5 Cover . . . . . . . . . . . . . . . . . . . . . . . . . . . . . . . . . . . . . . . . . . . . . . . . . 669.6 Verification and Validation . . . . . . . . . . . . . . . . . . . . . . . . . . . . . . . . . . . . . . . 67
10 Stability and control 6910.1 Disturbances . . . . . . . . . . . . . . . . . . . . . . . . . . . . . . . . . . . . . . . . . . . . . . 6910.2 Static stability . . . . . . . . . . . . . . . . . . . . . . . . . . . . . . . . . . . . . . . . . . . . . 6910.3 Quad-rotor dynamics . . . . . . . . . . . . . . . . . . . . . . . . . . . . . . . . . . . . . . . . . . 7010.4 Control . . . . . . . . . . . . . . . . . . . . . . . . . . . . . . . . . . . . . . . . . . . . . . . . . 71
10.4.1 Linear control techniques . . . . . . . . . . . . . . . . . . . . . . . . . . . . . . . . . . . . 7110.4.2 Non-linear control techniques. . . . . . . . . . . . . . . . . . . . . . . . . . . . . . . . . . 7210.4.3 The control method selected . . . . . . . . . . . . . . . . . . . . . . . . . . . . . . . . . . 72
10.5 Stability . . . . . . . . . . . . . . . . . . . . . . . . . . . . . . . . . . . . . . . . . . . . . . . . 73
11 Ground segment 7511.1 Greenhouse integration . . . . . . . . . . . . . . . . . . . . . . . . . . . . . . . . . . . . . . . . . 7511.2 Landing pads . . . . . . . . . . . . . . . . . . . . . . . . . . . . . . . . . . . . . . . . . . . . . . 7511.3 Electronics and infrastructure . . . . . . . . . . . . . . . . . . . . . . . . . . . . . . . . . . . . . . 7711.4 Air traffic management . . . . . . . . . . . . . . . . . . . . . . . . . . . . . . . . . . . . . . . . . 7811.5 User interface . . . . . . . . . . . . . . . . . . . . . . . . . . . . . . . . . . . . . . . . . . . . . 7911.6 Ground station weight and cost estimation . . . . . . . . . . . . . . . . . . . . . . . . . . . . . . . 81

viii Contents
12 Technical diagrams 8213 Final cost, mass and configuration 87
13.1 Design characteristics . . . . . . . . . . . . . . . . . . . . . . . . . . . . . . . . . . . . . . . . . 8713.2 CAD technical drawings . . . . . . . . . . . . . . . . . . . . . . . . . . . . . . . . . . . . . . . . 8813.3 Exploded views and BOM . . . . . . . . . . . . . . . . . . . . . . . . . . . . . . . . . . . . . . . 9013.4 Resource allocation / budget breakdown . . . . . . . . . . . . . . . . . . . . . . . . . . . . . . . . 9313.5 Total costs . . . . . . . . . . . . . . . . . . . . . . . . . . . . . . . . . . . . . . . . . . . . . . . 9413.6 Compliance matrix . . . . . . . . . . . . . . . . . . . . . . . . . . . . . . . . . . . . . . . . . . . 9513.7 Feasibility analysis . . . . . . . . . . . . . . . . . . . . . . . . . . . . . . . . . . . . . . . . . . . 99
14 Reliability, availability, maintainability and safety 10014.1 Reliability . . . . . . . . . . . . . . . . . . . . . . . . . . . . . . . . . . . . . . . . . . . . . . . 10014.2 Availability. . . . . . . . . . . . . . . . . . . . . . . . . . . . . . . . . . . . . . . . . . . . . . . 10114.3 Maintainability . . . . . . . . . . . . . . . . . . . . . . . . . . . . . . . . . . . . . . . . . . . . . 10214.4 Safety: operating hazard analysis . . . . . . . . . . . . . . . . . . . . . . . . . . . . . . . . . . . . 102
15 Production plan 10415.1 Production plan for the drones . . . . . . . . . . . . . . . . . . . . . . . . . . . . . . . . . . . . . 104
15.1.1 Manufacturing processes . . . . . . . . . . . . . . . . . . . . . . . . . . . . . . . . . . . . 10415.1.2 Manufacturing the parts . . . . . . . . . . . . . . . . . . . . . . . . . . . . . . . . . . . . 10515.1.3 Attachments . . . . . . . . . . . . . . . . . . . . . . . . . . . . . . . . . . . . . . . . . . 106
15.2 Production plan for the ground system . . . . . . . . . . . . . . . . . . . . . . . . . . . . . . . . . 106
16 Risk andmitigation 10917 Sustainable development strategy 117
17.1 Material aspects in the design. . . . . . . . . . . . . . . . . . . . . . . . . . . . . . . . . . . . . . 11717.2 Production and distribution . . . . . . . . . . . . . . . . . . . . . . . . . . . . . . . . . . . . . . . 11817.3 Operational phase . . . . . . . . . . . . . . . . . . . . . . . . . . . . . . . . . . . . . . . . . . . 118
17.3.1 Power consumption. . . . . . . . . . . . . . . . . . . . . . . . . . . . . . . . . . . . . . . 11817.3.2 Noise characteristics . . . . . . . . . . . . . . . . . . . . . . . . . . . . . . . . . . . . . . 11917.3.3 Other considerations in use phase . . . . . . . . . . . . . . . . . . . . . . . . . . . . . . . . 120
17.4 End of life . . . . . . . . . . . . . . . . . . . . . . . . . . . . . . . . . . . . . . . . . . . . . . . 12017.5 Contribution of system to sustainability . . . . . . . . . . . . . . . . . . . . . . . . . . . . . . . . . 120
18 Sensitivity analysis 12218.1 Battery capacity . . . . . . . . . . . . . . . . . . . . . . . . . . . . . . . . . . . . . . . . . . . . 12218.2 UWB position and attitude determination . . . . . . . . . . . . . . . . . . . . . . . . . . . . . . . . 12318.3 Total mass . . . . . . . . . . . . . . . . . . . . . . . . . . . . . . . . . . . . . . . . . . . . . . . 123
19 Post-DSE phase 12519.1 Long-term technology vision . . . . . . . . . . . . . . . . . . . . . . . . . . . . . . . . . . . . . . 12519.2 Long-term organizational vision . . . . . . . . . . . . . . . . . . . . . . . . . . . . . . . . . . . . 12619.3 Prototype building and testing phase . . . . . . . . . . . . . . . . . . . . . . . . . . . . . . . . . . 12819.4 Marketing strategy . . . . . . . . . . . . . . . . . . . . . . . . . . . . . . . . . . . . . . . . . . . 12919.5 Return on investment . . . . . . . . . . . . . . . . . . . . . . . . . . . . . . . . . . . . . . . . . . 130
20 Recommendations and future opportunities 13420.1 Recommendations . . . . . . . . . . . . . . . . . . . . . . . . . . . . . . . . . . . . . . . . . . . 13420.2 Expected future technological developments . . . . . . . . . . . . . . . . . . . . . . . . . . . . . . 135
21 Conclusion 136Bibliography 137
Cover photo: http://www.onlinembatoday.com/mba-specializations/

Nomenclature
Abbreviationswx,y,z Angular accelerations in x, y and z-directionADC Analog to Digital ConverterAOA Angle Of ArrivalAPI Application Programming InterfaceAPIS Autonomous Pollination & Imaging SystemAPM Advanced Power ModuleAWG American Wire GaugeBOM Bill Of MaterialsCAGR Compounded Annual Growth RateCBS Cost Breakdown StructureCDMA Code-Division Multiple AccessCEO Chief Executive OfficerCER Cost estimation relationshipCFD Computational Fluid DynamicsCOO Chief Operations OfficerCPU Central Processing UnitCRFP Carbon Fibre Reinforced PlasticCTO Chief Technical OfficerDAC Digital to Analog ConverterDC Direct CurrentDOD Depth of dischargeDOF Depth Of FieldDSE Design Synthesis ExerciseDSP Digital Signal ProcessorEEPROM Electronically Erasable Programmable Read-Only
MemoryESC Electronic Speed ControllerEV Economic ValueEV Economic ValueFBS Functional Breakdown StructureFEM Finite Element ModelFFD Functional Flow DiagramFOV Field Of ViewGFRP Glass-Fiber Reinforced PlasticGNSS Global Navigation Satellite SystemGPIO General Purpose Input-OutputGPS Global Positioning SystemGPU Graphical Processing UnitH HumidityHR Human ResourcesHSV Hue, Saturation, and ValueIC Integrated CircuitIMU Inertial Measurement UnitIPEV Insect Pollination Economic ValueIPEV Insect Pollination Economic ValueIPO Initial Public OfferingLAN Local Area NetworkLiDS Lifecycle Design StrategiesLTE Long Term EvolutionMAV Micro Aerial VechicleMISO Master Input Slave OutputMOSI Master Output Slave InputMP Mitigated ProbabilityMS Mitigated SeverityNFC Near Field CommunicationsP ProbabilityPCB Printed Circuit BoardPID Proportional Integral Derivative (controller)PIX PixelR&D Research and DevelopmentRAM Random Access MemoryRMS Root Mean SquareROI Return on investmentROM Read Only Memory
RPM Revolutions Per MinuteRRT Rapid exploring Random TreeRSS Received Signal StrengthS SeveritySCLK Serial ClockSD Secure DigitalSLAM Simultaneous Localization And MappingSoC System on ChipSPI Serial Peripheral InterfaceSPL Sound Pressure LevelSS Select SlaveSWOT Strength, Weaknesses, Opportunities, ThreatsSWOT Strengths, Weaknesses, Opportunities and ThreatsTCZ Terminal Control ZoneTDOA Time Difference Of ArrivalTOA Time Of ArrivalUART Universal Asynchronous Receiver TransmitterUAV Unmanned Aerial VehicleUSB Universal Serial BusUWB Ultra Wide BandVM Von Misses stressVP Vice PresidentWBS Work Breakdown StructureWLAN Wireless Local Area NetworkWUR Wageningen University of ResearchGreek symbolsα Angle camera makes with the horizontal or vertical axis
[rad]α Angle of attack [deg]αb ,αw Coefficients for bearing and winding failures [s]αe Heading estimation error degαloc Local angle attack of the propeller [deg]β Angle camera makes with the optical axis [rad]β Roll angle made when blower is on degδ Beam deflection [mm]δd Depth error [m]δz Pixel error [pixel]η Line lift coefficient with angle of attack [-]λP Rate of failure [1/s]λc/s Half chord sweep angle [deg]µ Dynamic viscosity [kg/m·s]µ Mean of the normal distribution [-]ν Kinematic viscosity [m2/s]ω Angular velocity rad/sω f Forced frequency Hzωn Natural frequency Hzωss Steady state RPM [RPM]φ Angle between axial and tangential flow velocities [deg]φ Azimuth angle in spherical coordinates [deg]ψ Flow velocity potential [-]ρ Air density kg/m3
ρa Ground-truth value of the rangeρb
r Observation range between the beacon and the droneσx Bending stress Paσyi eld Yield stress of the material MPaτ External torques Nmτzx Shear stress in the zx-plane Paθ Pitch angle [deg ]θ Polar angle in spherical coordinates [deg]ζ Damping ratio -Roman symbolsx Acceleration component m/s2
∆ P Pressure losses [Pa]∆pi x Variation in pixel pitch [pi xel ]y , x Velocity components m/s
ix

x Contents
Rd ,Gd , Bd Color values [-]xr & xb Positions of the receiver (the drone) and the beacon, re-
spectivelyxr , xb Tag and beacon position [m]c Chord length [m]z Distance to neutral axis mA Cross section area of the duct [m2]a Acceleration [m/s2]a Parameter in the Squire jet solution [-]Ae Exhaust cross sectional area [m2]Ai , j Matrix where each row corresponds to the measurement
of a tag [-]ax Acceleration in x direction [m/s2]ay Acceleration in y direction [m/s2]AR Aspect ratio [-]B Number of propeller blades [-]b Baseline mb Distance to the half-velocity point [m]C Transformation matrix -c Circle of confusion [m]c Damping coefficient kg/sCD Drag coefficient [−]Cd Local drag coefficient [-]CL Lift coefficient [−]Cl Local lift coefficient [-]CT ,CQ Thrust, Torque coefficient [-]CLα Lift slope [1/deg]D Diagonal measure of a camera format, film, sensor, or
print [m]d Characteristic length [m]d Distance between the lens and the object -d Nozzle outlet diameter [m]Dh Hydraulic diameter [mm]DN ,D f Distance from the camera to the near/far limit of DOF
[m]E Young’s modulus PaF External forces NF Jet force in the origin [N]f Focal length mf Vortex shedding frequency [Hz]Fz Resultant force in the Z direction NFx Sum of the forces in x direction [N]Fy Sum of the forces in y direction [N]g Gravitational constant m/s2
I Inertia matrix m4
Ix Object dimension [pi xel s]Ixx Area moment of inertia about x m4
Iy y Area moment of inertia about y m4
Izz Area moment of inertia about z m4
Jm Moment of inertia m4
k Stiffness of the material nm/radKc ,Kp ,Kcr Gain values [-]L Beam length [m]L Distance between the lens [m]Ld Lumninance [cd/m2]Lp Sound pressure level dBL0 Distance from object to lens [m]Lbeam Length of the beam mmm Magnification factor [-]m Mass of the drone [kg ]mbat ter y Mass of the battery kgmmotor Mass of the motor kgMy Moment around the y-axis NmN F-stop [-]p Wetted perimeter [m]P,Q,R Roll, Pitch, Yaw rate [rad/s]P,Q,R Aerodynamic forces Np0 Reference, Ambient sound pressure PaPcr Period of critical sin wave [1/s]Q Second moment of area mm3
r Radius in spherical coordinates [m]r1/2 Effective jet radius mRe Reynolds number [-]S Jet spread [-]S Surface area [m2]s Disparity ms Distance covered [m]St Strouhal number [-]T Temperature [◦T Thrust Nt Total trip time [s]T1,2,3,4 Torques Nmtacc Time of acceleration [s]Tcr Period of critical sin wave []u Flow velocity in x-direction [m/s]U ,V ,W Velocity components m/su0 Jet outlet velocity [m/s]V Air speed [m/s]V Velocity [m/s]v Flow velocity in y-direction [m/s]V0 Initial velocity [m/s]Vc Cruise speed [m/s]Ve Nozzle exit velocity [m/s]Vi Induced velocity below the propeller [m/s]Vz Shear force NW Weight Nw Distributed load [N/m]x, y, z Position components mz Depth m
Volumetric mass flow [m3/s]D Drag [N]

1Introduction
Pollination is the process of reproduction in plants, which allows plants to bear fruits and vegetables. In this light,the process of pollination has received much attention in the field of agricultural studies. A number of problems loomover modern horticulture. The most important of which is a shrinking bee population. This is a current and ever-growing problem. It has necessitated the search for alternatives to the natural process of bee pollination, such as manualpollination and mechanical pollination by a device. The effectiveness of natural pollination is further decreased ingreenhouses. Although the greenhouse serves as a means of protection against adverse conditions, greenhouses are alsoa structural barrier that means the natural process of pollination is hampered.
For the purposes of mass production, manual pollination is not cost effective. As a result, the industry has beenlooking for engineering solutions that would take the place of human effort. One such possibility is the use of aerialvehicles, in particular micro air vehicles, to pollinate flowers. Thanks to their relatively small size, agility and thepossibility for complete autonomy, they could keep the need for human intervention at a bare minimum.
The aim of this design synthesis exercise is to propose such a solution. Therefore the mission need statement is: "Amicro air vehicle is needed to ensure that the pollination process is performed for the plant species where the naturalmechanisms are insufficient, endangered or ineffective." During the design phase a planning, a preliminary investigationof technical aspects and several design options for different subsystems are treated. Furthermore a proposal for threeconcepts was made, which were investigated separately. Finally a trade-off was performed which resulted in a choicefor one concept, which is elaborated in detail in this report.
The structure of the report is as follows. First, the market analysis is deliberated in Chapter 2, after which themission overview is presented in Chapter 3. The services associated with the design, operations and logistics are shownin Chapter 4. Hereafter, the subsystem design ensues. Literature on the pollination process has been examined and isused to design the payload which is done in Chapter 5, the payload implementation is discussed in Section 5.3. This isfollowed by the design of the propulsion and power subsystem, the electronics, the navigation subsystem, the structureand the control and stability subsystem are presented in Chapter 6, Chapter 7,Chapter 8, Chapter 9 and Chapter 10,respectively. The technical diagrams including the software and hardware diagrams are presented in Chapter 12. With allthe aspects of the design of the drone itself explained, the final configuration of the design is summarized in Chapter 13.Upon doing that, the reliability, availability, maintainability and safety are presented in Chapter 14. This is followedby a chapter on the details of manufacturing, assembly, and integration plan shown in Chapter 15. A risk assessmentand mitigation plan is then described in Chapter 16. The sustainability of the design and the facilities is examined inChapter 17. A sensitivity analysis is conducted in Chapter 18. Finally, the aspects of the project management involvedin the project are delved into in Chapter 19.
1

2Market analysis
Before launching any new product, a market analysis should be performed to investigate whether or not the marketis ready for such a product. General trends of important factors will be provided and analyzed. From this, it will bedetermined whether or not there is actually a need for the product. Moreover, the competition will be briefly looked intoand the ideal customer will be depicted. A SWOT analysis is a market analysis tool that will also be used.
2.1. SWOT analysisA SWOT analysis regarding the product-market combination has been made and applied to the pollinator drone company.The SWOT analysis helps the team with identifying beneficial circumstances and opportunities than can be utilized. Atthe same time, the SWOT analysis is a useful tool for discovering potential threats and risks well in advance such thatprecautions can be taken. The SWOT analysis can be seen in Figure 2.1.
2.2. General trendsThe general development trends of the apiculture (beekeeping) and pollination market drivers will be addressed in thecurrent section.
2.2.1. ApicultureThe global apiculture market is expected to grow at a compounded annual growth rate (CAGR) of 2.7% from 2015 to2022 1. Some of the drivers behind this growth are the demand for more healthy food as well as the increase in demandfor more sustainable living. Environmental issues are also a major driver. However, it must be noted that this growth isrestrained by the maintenance and protection costs of bees. In the long run, a drone system could therefore contribute toa further increase in the CAGR of the global apiculture market.
In greenhouses, pollination is typically performed by bumblebees. In 1985 is was found that this species is capableof efficiently pollinating greenhouse crops [1]. Since then, the market has grown explosively. Today, the "BombisTerrestris" is used in almost all tomato greenhouses. It is estimated that in 2004 around one million colonies were sold.For this reason, this market is a billion dollar market [2]. If pollination through bumblebees would become insufficient orineffective, the pollinator drone could step in the void. Bumblebee development is found to be rather high-tech. Certainspecies are bred and specialized guiding systems for bees are developed. In Section 2.3.1, an overview of the biggestbumblebee producers is given.
2.2.2. PollinatorsPollination is done by a variety of insects. The main one insect remains the bee. They are extremely important whenit comes to the maintenance of wild plant communities and agricultural productivity. The honey bee has been capableof increasing yields up to 96% in animal pollinated crops. However, 60% of the colonies have been lost in Americabetween 1947-2005 and 25% has been lost in Europe between 1985-2005. In 2013 it was reported that 1 out of 3 hivesdid not survive the winter [3]. It is clear there is a decline in the amount of hives. Moreover, Insect pollination is directlyrequired for 75% of all crops humans use for food. These are mostly fruit crops, as rice and wheat are usually pollinatedthrough wind [4].
1http://www.einpresswire.com/article/352458218/apiculture-market-to-grow-at-a-2-7-cagr-forecast-to-2022?ref=rss&code=qlGkSB28TKD5u8mX [Cited 1 June 2017]
2

2.2. General trends 3
Helpful(to achieve the objective)
Harmful(to achieve the objective)
Inte
rnal
orig
in(p
rodu
ct/c
ompa
nyat
trib
utes
)
S W
Ext
erna
lor
igin
(env
iron
men
t/mar
ket
attr
ibut
es)
O T
• MAVs are a proven technology• Can operate in any weather condition• The payload could be modular• Can operate 24 hours a day• Can monitor the health of the plant• Can guarantee pollination for the farmer,even with a declining number of bees• Increase yield of greenhouse• Pollination performance does not diminishwith changing environment (constant andpredictable)
• The system will consume a lot of energywhen operating• High fixed cost for the farmer due to highpurchase price• May cause damage to the plant• When using a large amount of drones, it ismore likely that they collide
• Could be cheaper on the long run thancurrent pollinating systems• Fully automated• In countries where the use of invasivebumblebee species is forbidden, the prod-uct could be sold.• Further research in (sub)systems coulddecrease the price or increase performance
• Traditional use of bees might not welcomerobotic technology• Not patented technology could be easilycopied by existing companies• Legal restrictions could be enforced byauthorities• When there is a power outage, the wholesystem can not operate
Figure 2.1: SWOT analysis
Pollinator dependant crops have increased since 1961. Their average yield increase over time is as high as non-pollinator-dependant crops. This is mostly due to the use of commercial pollinators (mostly bees) and the use of handpollinators. The amount of pollinator-dependant crops has and is however increasing [4]. This means that the decliningamount of pollinators will pose to be a problem in the future [5]. More commercial solutions will need to be foundmaking a drone system interesting for the future.
2.2.3. Economic valueAccording to [1], a total of 40,000 hectares of tomato greenhouses use bumblebee pollination. The total value of thesetomato crops is estimated to be 1,2 billion euros per year. The total world economic value of insect pollination wasestimated at e153 billion in 2005 (approx 9.5% of total agricultural economic value). If insect pollination was tocompletely vanish a consumer surplus loss is estimated between e190 and e310 billion2. This negative effect wouldalso translate differently on each crop type. According to a recent report [6], the total percentage loss, or as it is calledin that report, vulnerability (ratio of insect pollination economic value (IPEV) to total economic value (EV)) was 23%for fruits, 12% for vegetables, 31% for nuts, 16% for edible oil plants and 39% for stimulants. Other crops such ascereals and spices would not really suffer with the disappearance of insect pollination. The loss of pollinators wouldtherefore be fatal and alternatives such as the pollinator drone are needed to ensure pollination does not fully vanish,
2https://www.sciencedaily.com/releases/2008/09/080915122725.htm [Cited 1 June 2017]

4 2. Market analysis
if bees do. Furthermore, the economic value of pollination is dependant of the geographical location considered. Theinsect pollination economic value per region can be found in Table 2.1 [6].
Table 2.1: Insect pollination economic value (IPEV) per geographical region and vulnerability of the considered region [6]
Geographical region IPEV (·109 e ) Region vulnerability (%)
Africa 11.9 8Asia 89.4 10Europe 22.0 11North America 14.4 11South and Central America 15.1 6
This data suggests that some regions are more dependent on insect pollination methods than other. This includesAsia, and Europe. Some regions are also vulnerable to the disappearance of insects. The regions that will be mostlyaffected are Europe and North America with each 11%. They might therefore be more interested in future solutions andalternatives such as the pollinator drone.
2.3. Competitor analysisThere are three key players on the pollination market that need to be considered. The dominant ones are companiesthat provide pollinators for greenhouses. As stated earlier, the bee-pollination is the most common pollination methodused in agriculture. The second alternative is manual pollination. This method is rather uncommon, as it is relativelyexpensive and laborious. For some crops, however, it is the only available method. The last alternative is the dronepollination. There is a number of companies specializing in drone design that potentially would be capable of developingcompetitive pollinating drone once the business case proven to be profitable. Although it is not in industrial use yet thedrone companies should be considered as key competitors as well.
2.3.1. Bee pollinationGlobal pollination market estimated to 153 billion euro worth [6]. Bee pollination is a serious competitor for the dronebusiness case. The market is rather large and mature. Three big companies cover the most of the market share. Biobestis the first commercial producer and vendor of bumblebee colonies for agriculture. Koppert Biological Systems andAgrobio are two other big companies. The market of bumblebee pollinators is very competitive. No patents can beassigned to a natural species of bees. For this reason, companies compete on price, which decreases market prices.
Table 2.2: List of bumblebee producers
Company Country Revenue [e] # workers
Koppert Biological Systems Netherlands 180,000,000 a 1,200Biobest Belgium 36,600,000 b 440Agrobio Spain
ahttps://fd.nl/ondernemen/1150230/koppert-gaat-met-beestjes-en-microben-de-strijd-aan-met-chemiereuzen [Cited 1 June 2017]
bhttp://www.biobestgroup.com/nl/nieuws/biobest-genomineerd-voor-leeuw-van-de-export-2014 [Cited 1 June2017]
2.3.2. Drone companiesDue to insufficient technology readiness, drones are not involved in pollination market yet. It is expected however thatonce the pollination with MAVs is proven possible and profitable, the drone companies might follow the trend anddevelop similar products relatively quickly.
A sample of drone manufacturers present on the market is made - small size, medium size and larger size companiesare researched. The companies specializing only in drones like Prox Dynamics or Prioria Robotics are usually mediumsized enterprises employing around 100 people. The revenues of this class of companies are in order of tens of millionseuros. The main interest of those companies are solutions for the military sector. They often work in small projectsfor defence on government contracts. There are also few larger companies like Parrot SA. Their products are mainly

2.4. Product competitiveness 5
commercially oriented. That is why it is expected that the interest of such companies in industrial projects might berather limited. Large global concerns like Lockheed Martin are also involved in UAVs development. Those companieshowever, are interested mainly in large scale projects contracted with governments. They are not expected to get involvedinto pollination business, and are therefore not considered as a direct competitor.
The players present on market are certainly capable of following and developing their own pollinating drone. Theirinterest however is in totally different branches. Naturally, companies that specialize in the greenhouse and agriculturebusiness could also be interested in developing a drone. Their expertise in this field could be combined with the expertiseof aerospace companies to develop a competitive and reliable vehicle on an industrial scale. Also, because of its earlylevel of development, the emerging of new companies specializing in pollination drones could also be expected.
2.3.3. Manual pollinationManual pollination is also used in several crops. Usually crops are hand-pollinated in case there is no other option.This is the case in south west of China in apple and pear orchards, where due to intensive use of pesticides bees donot pollinate. The drone pollination is not an option for these crops however, as the drone will be designed to operatein greenhouse. Another crop commonly pollinated by hand is vanilla. This process is very complicated and very laborintensive. On the other hand, vanilla prices are very high 3 (400 $ per kg). Currently, a large portion of vanilla cultivationhappens in Madagascar. Pollination requires a lot of labor hours and the right climate conditions. In Madagascar labor ischeap and the climate is right. Research is performed to try to pollinate vanilla in greenhouses in other countries. Largescale development is hampered by high labor prices and large price fluctuations. A mechanical device could be a goodsolution for this problem. The challenge however lies in the state of the technology. In the past, greenhouse tomatoeswere also manually pollinated by a vibrating device. Equivalent to this, a new automatic vibrating system was developedby Metazet/Formflex 4. This system can be used in countries where insect pollination is not allowed or where it is toowarm for insects to fly. The costs for this system are estimated to be between 1 and 1.50 euro per square meter. For agreenhouse of 1 hectare, the costs are between 10,000 and 15,000 euros.
2.4. Product competitivenessIn this section a preliminary estimation of the drone price will be made. This is needed in order to see whether themaximum of e500 per drone in only production costs is feasible. The drone system will be compared with bees andwith manual pollination systems.
2.4.1. A comparison with beesWhen looking at companies that sell bees, Planet Natural5 was taken as a representative. They give the followingguidelines: "Each hive consists of 45 to 60 workers and has an expected life span of 4-5 weeks. Covers up to 5,000square feet". This means that 21 boxes are needed per hectare per 5 weeks. After talking with the company Jan vanMarrewijk Tomatoes 6 , it was discovered that the pollination season lasts at least 35 weeks, which was verified at thegreenhouse visit. 147 boxes are therefore needed per hectare per season. The price of a box is e145. The typical size ofa greenhouse is 4 hectares. Using these values, the amount paid per season for pollination is around e85,260. Naturally,these numbers are not set in stone. The assumptions of lifespan and coverage can be subject to change. For example,on the website of Koppert 7, a lifetime of 8 weeks is mentioned. Also, the 5,000 square feet is dependent on the type ofcrop and the layout of the greenhouse. Finally, buying these boxes in bulk will decrease the price. For these reasons, thee85,260 can be considered as an upper limit. Once the total system price is determined, a return on investment analysiscan be done. This is presented in Section 19.5.
2.4.2. A comparison with manual pollination methodsCosts of manual pollination are mainly the costs committed for the workers salaries. It is difficult to estimate how muchtime a worker needs to pollinate a single flower. Data on this issue is also scarce. Therefore, the costs are calculated for3 different rates: 2, 5, and 10 seconds per flower. For those rates the number of flowers pollinated by a single worker inone day can be calculated. It is assumed that the work day lasts 8 hours. Next the number of workers needed to pollinateone hectare in one day can be obtained. Lastly, the total cost of workers for one 35 week long season are calculated. The
3http://rodellekitchen.com/img/site_specific/uploads/Rodelle_Vanilla_Market_Update_2017_web.pdf [Cited1 June 2017]
4http://www.tomatennet.nl/tomaten/nieuws/nieuw-trilsysteem-wekt-veel-interesse/ [Cited 1 June 2017]5https://www.planetnatural.com/product/bumble-bees-natupol/ [Cited 1 June 2017]6http://janvanmarrewijk.com/overons.html [Cited 3 May 2017]7https://www.natupol.com/why-natupol/our-best-bumblebees/longevity/ [Cited 1 June 2017]

6 2. Market analysis
salary is estimated from the statistics to be around 9.20 e/h8.Additionally the greenhouse owner needs to invest in electric pollinators. Prices of such a device vary from 30eto
300e9. Those costs however are 2 orders of magnitude lower comparing with labour costs, and therefore are not includedin the estimates
In the most optimistic case - assuming it takes only 2 seconds for the worker to pollinate a flower the total costs ofmanual pollination for 1 season are about e16,100 per hectare. It is however more realistic that the costs will oscillatebetween values that are higher. Those costs need to be committed every season, and therefore the manual pollination iseconomically unfeasible.
Table 2.3: Estimated costs of manual pollination
Time topollinatesingle flower [s]
Plants pollinatedin 1 working day
Number of workers needed per hectare Cost of labour per season(35 weeks) per hectare [e]
Lower bound:3,000 plants/ha
Upper bound:6,000 plants/ha
Lower bound:3,000 plants/ha
Upper bound:6,000 plants/ha
2 2,400 1.3 2.5 16,100 32,2005 960 3.1 6.3 40,250 80,500
10 480 6.3 12.5 80,500 161,000
2.5. CustomerFrom the data found above, an attempt will be made to depict the ideal target customer. It is clear that the pollinatordrone will be most interesting for farmers who own greenhouses. They are the ones who are currently buying or rentingbees. With the increase in price of bees over the last years, some farmers might be interested in adopting a revolutionarytechnology as long as the price remains competitive. Other farmers who do not have access to bees will also be interestedin this technology.
Preliminary estimations of the price show that the target customer should have a large amount of flowers in his fields.Indeed, if the drone is expected to pollinate a minimum of 500 flowers a day, the farmer should own a large field. Largecommercial greenhouse farmers are therefore expected to be interested in the product, as opposed to local greenhousefarmers.
The crops that are most cultivated in the Netherlands are determined and listed in Table 2.4. This was done using theresearch done by Rabobank [7] which focuses on the importance of crops in The Netherlands. It showed that the mostcultivated crops in greenhouses are:
Table 2.4: Most cultivated crops in the Netherlands with their current price in the supermarket
Vegetable Quantity cultivated in 2016 [ha] Current price
Tomatoes 1670 2.78 e/kgPeppers 1220 2.99 e/kgCucumber 510 0.75 pp (approx 2.4 e/kg if weight of one piece is 0.312kg)Strawberry 320 5.73 e/kgEggplant 120 3.16 e/kg
In order to determine the most interesting crop to pollinate, the supermarket price of these vegetables and fruits hasto be looked into. Using data provided by Albert Heijn, Table 2.4 can further be completed. The most interesting cropin the Netherlands is therefore the one that is the most cultivated and that is sold at the highest price. This is accordingto the provided data, the tomato.
8https://www.salaryexpert.com/salary/job/greenhouse-worker/netherlands [Cited 1 June 2017]9https://www.gardenamerica.com/store/VegiBee-Garden-Pollinator-battery-powered-model.html [Cited 1 June2017]

3Mission overview
This chapter gives a description of the objectives of the system. This includes the mission, the functional flow diagramsand the functional break down structure. It concludes with system sizing: estimating the number of drones and groundstations needed for pollinating a given greenhouse.
Mission need statement A micro air vehicle is needed to ensure that the pollination process is performed for the plantspecies where the natural mechanisms are insufficient, endangered or ineffective.Project Objective Statement Make a proof-of-concept design of a fully autonomous pollinator micro air vehicle andits support systems, within 10 weeks’ time and with a team of 9 students.
3.1. Mission descriptionAs stated in Section 2.5, the plants that will be pollinated by the MAVs are tomato plants. A visit was paid to theWageningen University & Research greenhouse in Bleiswijk, where some critical information about greenhouses wasobtained. Tomato plants grow vertically within the greenhouse, supported by wires, with the flowers on top. This meansthat the MAVs should be able to pollinate from above. A greenhouse is typically 4 hectares and needs to be pollinatedevery 3 days. This means a swarm of drones is required in order to take care of the pollination of the whole greenhouse.Since the drones have a limited flying time, require guidance through the greenhouse and make use of autonomouscharging, ground stations will be included as part of the system.
3.2. System sizingThe goal of this project is to pollinate all the flowers in a greenhouse every three days1. For calculating the number ofdrones that are needed for achieving this goal, parameters of a standard greenhouse should be known. These are the areaof a green house, the numbers of plants per m2 and the number of flowers per plant. The values for these parametershave been obtained by consulting the staff of the greenhouse of the Wageningen University during the group’s visit thereand can be seen in Table 3.1.
By knowing these parameters, the plants per greenhouse, row and meter could be calculated. On the same lines,the times assigned to each task also impact the number of drones. An overview of these can be found under Table 3.2.Coming from the navigation subsystem, the detection time and the time to go from one flower cluster to the next onecould be estimated. The speed in which APIS will scout in the row is currently set to 0.5 m/s. This speed follows froma requirement of at least 5 frames for each flower cluster. A more comprehensive discussion can be found in Chapter 6.Taking an estimated distance between clusters of 42 cm, a travel time between clusters of around 0.9 s was found. Closelyrelated to this, is the detection time, which is the time allocated to detect the flower once the location of the cluster hasbeen reached. It has been estimated to be 1 second, which translates to 15 frames at the current examination rate of15 fps, a more in depth discussion can be found in Chapter 8. With a combined input from the payload and navigationsubsystems, the time assigned for blowing on the plant and for drone positioning was determined. Nonetheless, theperformance times are not the only variables stipulating the number of drones. In fact, the duration of the mission orthe time spent on charging also prove to be key when sizing the swarm. A more elaborate discussion can be found inChapter 6. The current time allocated for the mission cannot exceed 10 min and 30 s for battery capacity and lifetimeissues. For this, the battery is designed to charge for 15 min.
1Contact with expert: Anja Dieleman, Wageningen University & Research
7

8 3. Mission overview
Table 3.1: Greenhouse parameters
Parameter Value
Width of corridor 1.6 mWidth of greenhouse 200 mLength of greenhouse 200 mPlants/m2 3Flowers/plant 6
Table 3.2: Time parameters for the mission with direct impact on thenumber of drones
Parameter Value [s]
Detection 1Positioning 4Flower blowing 6In-between cluster travelling 0.84Total flight time 630Charging time 900
On a higher mission level, when APIS enters the half-row it has to pollinate, it will start pollinating the right side ofthe half-row as the camera for flower detection is located at the right side of APIS as will be seen later. When almosthalf of the battery is depleted, APIS will turn around to now pollinate the flowers on the other side of the half-rowwhile simultaneously returning to the ground station. Since one drone will not be enough to pollinate an entire row, itwill communicate to the ground station how far it has made it, to ensure that the next drone will not pollinate the sameflowers. The next drone will first fly to the location that was communicated to the ground station by the previous droneand will then start pollinating from that location onward. This process will be repeated until the specific row has beencompletely pollinated. Important to note is that several rows will be pollinated at the same time through this process.
Taking all of the above into account, it was determined that the number of drones which are strictly needed topollinate the entire greenhouse is 58. Nonetheless, as it will be subsequently argued, the required number of groundstations with capacity of 8 drones has to be an integer number, so at least 8 ground stations are needed. These will befilled up, adding up to 64 drones. The margin of 6 extra MAVs will help bypass the inherent risks of being unable tofulfill the mission due to a malfunction of one or several drones.
3.3. Functional flow diagram (FFD)In the functional flow diagram, the functions that need to be performed by the system are displayed in a chronologicalorder. The most general system description is called the top level of the FFD and contains setting up the system, turningthe drone on/off, operating the drone, checking the performance of the drone and performing maintenance to the drone.In the second level of the FFD, the operation of the drone is elaborated. Roughly, it is split into the take-off from thedocking station, movement to the flowers, searching and approaching of the flowers, pollination and imaging of theflowers and checking the health of the drone. Finally in the third level, flying to starting position, searching the flower,detecting the flower, approaching the flower, and pollinating the flower are even further elaborated. Flying to the startingposition involves a sequence of tasks starting with take-off determining the attitude, adjusting the attitude, and processingthe video for obstacle avoidance. In case of obstacle detection, the drone will alter its path. Otherwise, the drone keepson flying. Searching for a flower entails running the vision algorithm and checking for a stable detection. If a detectionis obtained, then the flower can be approached. Otherwise, the process is repeated. A visual representation of this canbe found in Figure 3.1.
3.4. Functional breakdown structure (FBS)To group and further elaborate the functions found in the functional flow diagram a functional breakdown structure iscreated. Not only the behaviour of the drones during operation will be explained but also the the maintenance processwill be discussed. All the drones should be checked after a certain time to make sure that the drones still have asufficient performance. The aspects that will be checked during scheduled performance check are: the structure, thesensor calibration, the communication system, the propulsion system and if the drone is still operating (otherwise itmight be stuck somewhere). If a subsystem is broken or not working well, the drone will be repaired by the user usingmaintenance instruction manuals or by a technician as will be explained in Chapter 4. The work breakdown structure ofall the functions can be seen in Figure 3.2.

3.4. Functional breakdown structure (FBS) 9
Figure 3.1: Functional flow diagram of operating the drone

10 3. Mission overview
Figure 3.2: Functional breakdown system of the complete system

4Operations and logistics
In this chapter, first, the documentation that will come with the system will be explained. After that, the transportationof the system to the greenhouses will be addressed. Finally, the operations of the system will be elaborated upon.
4.1. DocumentationEach MAV and each ground station will come with a documentation that contains the parts and the owners guide. Thelatter will explain how to set up the product and how to use it.
Part listThe ground station and the drones will be packaged individually. The ground station package will contain the landingpads (8), the main strut (1), the bolts to attach the landing pads (16), the attachment pin to the structure (1), the cablesneeded (1 power cable + any other cables ordered) and a black box (1). The drone package will contain the drone, thepayload and the batteries (12) that are needed to go through an entire season. A special case (1) will also be providedwhere the empty batteries can be stored in. A final package that contains the emergency system will also be shippedseparately.
Owner’s guideAn owner’s guide will be included with each product that is shipped. It will contain the safety instructions, assemblyinstructions, installation instructions, instructions on how to use the product once installed, maintenance instructions,service locations, a regulatory code of compliance, the technical specifications of the product and finally the warranty.
The safety instructions will provide information on how to safely operate the system. Even though the MAV will becapable obstacle avoidance, the owner should be aware that the drone must be operated in certain conditions. The droneis indeed only limited to indoor usage and more specifically, greenhouse usage. The amount of open windows should belimited in order to minimize air currents that could disturb the drone. Additionally, the user should not be in proximityof the MAV when it is pollinating a flower as the airflow generated by the wake or at the nozzle could result in possibleeye injuries. Infants and children under the age of 5 should not use this product nor be close to it.
The assembly instructions will explain how to assemble the various parts. If the product is purchased for the firsttime, a technician will come to help install the entire setup.
The installation instructions will cover how to get started once the owner is in possession of a least one MAV and oneground station. The installation of the ground station to the rest of the greenhouse will be explained. More informationregarding the contents in this part can be found in Section 4.3. The instructions on the use of the MAV are also coveredin this section. The maintenance of the drone is covered in Section 4.4.
Finally the warranty will also be provided. This document contains the assurance that repairs or replacements willbe made free of charge. The warranty period lasts for 1 year, which is the equivalent to one pollination season. Afterthat the user can decide whether he wants to purchase additional 1 or 2 year warranty packages.
4.2. TransportTransportation of the entire system must be considered given that some greenhouses are located in remote locations.This will be arranged for the ground stations and for the drones.
Each ground station is composed of eight landing pads that are 40x40x5cm and of a main strut that is 4x4x100cm.16 screws will also be included to attach the landing pads to the main strut. The electronics box has dimensions of10x15x5cm and weighs 300grams. This means that a minimum volume of 0.0663 m3 is needed per ground station
11

12 4. Operations and logistics
package. With additional protective wrappers such as foam, the package dimensions of one ground station mount up toapproximately 0.072 m3. The mass of the package will be pproximately 13.5kg. This includes the 13kg of the groundstation, the 110g of foam, the cardboard box and a power cable. The box will have a length of 105cm, a width of 45cmand a height of 15cm.
The drones have a dimension of 28.4x29x7.62cm and weigh 250 grams. Each drone will have its own box. Thedrone will be shipped along with the batteries it needs to operate for the full season. This means 12 batteries that weigh100g will also be provided. They will be placed in a special case where after usage they should be replaced back in. Thetotal package will weigh 2kg. Foam will be used as protection. The box will have dimensions of 60x30x20cm.
The drones and the ground stations will be shipped individually by standard UPS mail unless an entire setup isbought for the first time. In that event, the amount of groundstations needed and the amount of corresponding droneswill be shipped by truck to the greenhouse. A technician that knows how to set up the system will also be present.He will be responsible to calibrate the entire system for the first time, attaching the ground station to the structure, andinitializing the rest of the system. A ModiForce 1 van will be used to ship the parts. The vans can be customized to fullyaccommodate the installation procedure that will be followed.
4.3. Operations (set up)This section will describe how to set up the systems, the user interface and what to do in emergency situations.
Setting up the systemThe first step of the application of the pollinator drone design in a greenhouse is the installation of the support system,consisting of the charging stations and anchors that will be placed at the beginning of the operation. For the final system,a certain number of ground stations is needed.
For the design case, 8 grounds stations are needed for a 200x200m greenhouse when a corridor runs through themiddle separating each row in two. The ground stations will be placed at regular intervals in the corridor. Before placingthem in the corridors however, they have to be assembled. The landing pads have to be screwed onto the main strut byusing the screws provided. The power cables that connect each pad are then passed through the strut. When this is done,the ground station can be attached to the structure of the greenhouse. A special device will be used that varies dependingon the beam geometry of the roofing of the greenhouse. Once the ground station has been securely attached, the cablescan be connected to the electronics box that will rest on top of the beams of the structure.
With the ground station now secured to the structure of the greenhouse, the drones can be placed on the dockingstation. Attention must be paid to properly position the drones on the charging pad. The front part should point towardsthe main strut and the blower should point towards the side marker.
The system has to now be set up. Into the user interface, data regarding the greenhouse has to be manually in-putted. Information about the relevant parameters is presented in the next subsection. All these details will, however,be performed by the technician who comes to set up the system. Only in case a separate ground station is bought, theprocedure should be carried out by the client. He can be guided through the steps by visual and audio support or can aska technician to come. The latter will come at a cost.
Once the software is set-up the emergency button has to be placed in the greenhouse as well. Together with thegreenhouse owner, this location will be chosen as it should be easily accessible yet should not be in the way of the dailyoperations. A final aspect that should be adjusted before usage is the place of the visual marker hanging from the groundstation. It should be adjusted to the row height of the plants. Every time this row height changes, the height of the visualmarker should also be adjusted. The system is now ready for use. Unless specified otherwise, the default operationaltime is set to 12h. This can, however, also be changed in the user interface.
The user interfaceThe user interface will be where the main setup of the system will take place. It will also display health data of the drone,and the flower images that have been taken by the drones and transferred to the ground station, can also be accessedthrough it. More information about the data gathered can be found in Section 11.5. Here, the focus will be more on theparameters that affect the performance of the entire system.
Firstly, as explained above, data about the greenhouse has to be inputted. This is because the sections that a dronehas visited will be registered and in order to direct the drone to a new section of the greenhouse, the ground station mustknow where that section is. Therefore, the 3D coordinates of the ground stations, the position in the x-y plane of eachrow, the maximum height of the greenhouse and the length of the rows should be provided. The width of the rows andof the corridors should also be provided. Data regarding the performance of the system can also be set. This includes
1http://www.modiforce.com/en/mo [Cited 26 June 2017]

4.4. Inspection and maintenance 13
for example adjusting the operational time.
Emergency situationsEmergency situations can arise with any system due to predictable or unpredictable circumstances. The predictable riskshave been identified and mitigation plans are set up in Chapter 16. Not all are however completely gone. It is thereforeimportant to have an emergency system. Two types of emergency systems are available.
The first is an emergency system integrated in the web interface. It is an emergency system that should only be usedwhen needed. All the drones will attempt to go back safely to the ground station and land on the charging pad. They willnot be damaged. The time to perform this entire operation can take a couple of minutes as air traffic around the groundstation will still be respected in order to not damage any components.
If a faster emergency system is needed, a physical red button that is placed at a strategic place in the greenhouse canbe pressed. The ground stations would stop communication with the drones and they all fall to the ground in a controlledmanner. More information about these safety procedures can be found in Section 14.4.
4.4. Inspection and maintenanceThree types of maintenance will be considered: reactive, preventive and predictive maintenance. A description of eachtype will be provided, and the reasons as to why one was selected over another will be given.
Reactive maintenance, also called breakdown maintenance, is the repair of the system once it is broken down. Itfocuses on restoring parts back to its original state [8]. Maintenance plans that rely on this method usually cost moreas it is usually not known when the system will breakdown. The life expectancy of the system is also lower. Reactivemaintenance plans do however require lower initial costs as repairs are only done at the end. No time is spent on planningthe repairs as these happen in an unpredictable way. The life cycle of the system being very important - partly also forsustainability - was the major factor that led to not using a reactive maintenance plan. A more proactive maintenanceplan is needed.
A preventive maintenance plan is already a lot more interesting. The system is inspected on a periodic basis andrepairs are carried out at fixed time intervals. The life expectancy of the system is increased and research has also shownthat it can be up to 18% cheaper than a reactive plan 2.
Another type of plans that is more proactive are the predictive maintenance plans. In this type, attempts are madeto predict failure before they happen. This is done by looking at some measurements taken by the drone. Catastrophicfailures are reduced through this method. The life cycle of the system is also increased but the initial investment cost islarger as the necessary tools must be set up properly.
A preventive maintenance plan was created for the batteries and should be meticulously followed by the user. Pre-dictive plans are also set up for the motors. A calibration procedure for the IMU is also done. Finally a preventive planis also set up for the ground station.
Battery replacement procedureGoal: This procedure will guide the user on how to replace the batteries of the drone. The batteries are 1500 mAh 2S1Pand can sustain 900 cycles of 27 mins (12 mins flying and 15 mins charging). Bearing in mind that APIS will pollinatefor 12 h a day, this adds up to a maximum of 32 days without replacement, however 1 month seems a more suitable timespan to replace them. A predictive maintenance plan is provided that explains how to properly and safely replace thebatteries. The old batteries will be placed in the storage kit that will be sent back at the end of the season to the suppliersuch that they can properly be recycled.Timeline: Perform this operation every 1 month for every drone.Tools needed: 1 new fully-charged Li-Po graphene 1.5 Ah 2S1P battery, the storage kit.Instructions:
1. Identify the drone that needs its battery replaced. This can be done by looking at the interface as data about thedrone health is collected there.
2. Once the entire system is at rest, take the drone from the charging pad. Bring the drone to ground level such thatthe operation can be performed in a safe manner.
3. Take the main casing off the drone. This can be done by squeezing it off.4. Remove carefully the blower. The battery should be visible inside the case underneath.5. Unplug the battery and place the old battery in the storage kit where the used batteries should be placed.6. Before placing the new battery, a check for dead cells with a voltmeter has to be done. The indicated voltage
should be at 7.4. If the voltage shown is 3.7, one of the cells is defect and the battery should not be used.
2http://www.uesystems.com/mechanical-inspection/the-4-basic-maintenance-modes [Cited 25 June 2017]

14 4. Operations and logistics
7. Connect the new battery and place the casing back around it. Place the blower back on top as well as the maincasing. A clicking sound must be heard to ensure the casing is properly attached.
8. Place the drone back onto the charging pad in the right direction: the front side should be facing the main beam ofthe ground station and the side with the blower should be facing the visual marker on the right side of the chargingpad.
Motor health procedureGoal: This procedure will guide the user on how to get the largest life cycle out of the motors of the drone. The motorsare DYS BX1306 and have a lifecycle of 35,000 h. The motors are on for 296.5 mins during a 12 h day which meansthat they should be replaced every 19.5 years. This is, of course, only if they are properly maintained.Timeline: Perform this operation every 1 month for every drone.Tools needed: WD-40 spray, result sheets on thrust vs current needed.Instructions:
1. Gather the sheets that show the current needed for take-off.2. If an increase in current consumption larger than 5% with respect to the initial value is noted, investigate the drone
in question. Given that an increase in 5% would already result in an increase of DoD of the battery to 83.3%,heavily damaging battery lifetime.
3. Once the entire system is at rest, take the drone from the charging pad. Bring the drone to ground level such thatthe operation can be performed in a safe manner.
4. Take the WD-40 spray and apply in small quantity to the four motors.5. Place the drone back onto the charging pad in the right direction: the front side should be facing the main beam of
the ground station and the side with the blower should be facing the visual marker on the right side of the chargingpad.
Motor replacement procedureGoal: This procedure will guide the user on how to replace a motor of a drone. The motors are DYS BX1306 andshould only be replaced in case of physical damage as the expected life cycle is 18 years. If replacement is needed, theold motor will be placed in the storage kit that will be sent back at the end of the season to the supplier such that it canproperly be recycled.Timeline: Perform this operation when the motor is broken or when the current consumption is larger than 25% of theinitial value. As this would mean an increase to 97% DoD of the battery, which would affect the battery lifetime and putsinto serious risk the mission accomplishment, as with this DoD no agile maneuvers can be performed anymore, giventhe small battery capacity left (barely 1.2 kJ out of the total 40 kJ of the full battery).Tools needed: 1 new DYS BX1306 motor, the storage kit, an imbus for 3 mm screws.Instructions:
1. Identify the drone that needs the motor replaced.2. Once the entire system is at rest, take the drone from the charging pad. Bring the drone to ground level such that
the operation can be performed in a safe manner.3. Remove the protective covers.4. With the imbus, carefully remove the screws that attach the motor to the structure.5. Place the new motor on the structure and put screws back in. Make sure the screws are tightly secured.6. Place the drone back onto the charging pad in the right direction: the front side should be facing the main beam of
the ground station and the side with the blower should be facing the visual marker on the right side of the chargingpad.
IMU calibration procedureGoal: This procedure will guide the user on how to calibrate the IMU of the drone. This should be done to reduce errorsor inaccurate measurements.Timeline: Perform this operation when using the product for the first time, in case of any software/hardware upgradesor if alert has been given by main computer.Tools needed: N.A.Instructions:
1. Before starting calibration, remove the battery. Make sure the battery it has cooled down, before placing it backagain.
2. Make sure drone is on but not flying.3. Put the drone on a flat surface and follow instructions on the main screen of the user interface.

4.5. Customer support 15
4. Place the drone back onto the charging pad in the right direction: the front side should be facing the main beam ofthe ground station and the side with the blower should be facing the visual marker on the right side of the chargingpad.
Ground station procedureGoal: This procedure is needed to ensure that the ground station is fully functioning.Timeline: Perform this operation every 6 month for every ground station.Tools needed: WD-40 spray, cotton swabsInstructions:
1. Perform visual inspection of bolts and screws that keep the ground station attached to the structure of the green-house.
2. Get dust off the markers that the drone needs for landing purposes.3. Apply WD-40 spray on the main landing pads of the ground station.4. Turn the power off such that the dock where the pin of the drone is inserted can be properly cleaned. Insert the
cotton swabs into the holes. A gentle rub on the sides is enough. Turn power back on.
4.5. Customer supportCustomer support is nowadays very important as it plays a key role in customer satisfaction. A dedicated platform will beimplemented. Customer support will be done by phone, email, and the use of social media such as a dedicated Facebookpage could be considered at a later stage. Any questions can be addressed to the customer service of the manufacturingcompany. Moreover, technicians can be available for performing the repairs, within the warranty time or at an extracost beyond this period. Customer support will also focus on providing the owners with any software updates. With bigimprovements, the owners will be contacted such that modifications that will boost the performance can be implementright away. Furthermore, the customers will have the option of subscribing to a newsletter of new products. This will ofcourse only be considered at a later stage as the current one is only at the proof of concept phase.

5Pollination payload
Plant pollination is performed using a dedicated payload, a blower. The design process of this blower is explained inthis chapter. Section 5.1 gives an introduction to the general process. Section 5.2 provides an extensive analysis aboutthe flow analysis performed. The implementation and sizing details are presented in Section 5.3.
5.1. General pollination processThe mission of the drone system is to ensure pollination process of greenhouse crops where natural mechanisms areinsufficient, endangered or ineffective. In the last phase of the project, it was chosen that this process is performed usinga dedicated payload on the drone [9]. As the tomato plant benefits from wind pollination [10], the dedicated payload is ablower that can target the airflow at the stem of the flower. When the project group visited the research greenhouse of theWageningen University, the idea was discussed with expert Jan Janse. He indicated that shaking the flower only slightlywill be enough to ensure pollination. The targeted airflow will shake the flower enough to release pollen and ensurepollination. Before explaining the process of designing the payload, some remarks about this pollination mechanismshould be made.
As discussed in Chapter 2, the conventional way of pollinating tomato flowers in a greenhouse is via bumblebees.The farmer usually buys a box of bees, places it in the greenhouse and pollination is ensured for a couple of weeks. Inthe past, pollination was performed by a vibrating stick, or even rarer, by a wind blower [10, 11]. This way of pollinatingtomatoes gives less yield. However, both articles use a large scale blower that does not have a high accuracy. If the groupachieves getting a higher accuracy in the blower, this effect could be reduced. Furthermore, Jan Janse indicated that oneof the reasons tomatoes grow in greenhouses is the lack of wind in there. If there is less wind, tomato growth and fruityield is promoted. For this reason, the blower should be designed in an accurate way precisely not to promote this effect.Some other practical points were also learned during the visit of the greenhouse. First, the flowers always appear onthe top of a plant, and one plant only has one group of flowers at the top. For the bigger tomato species, each group offlowers is cut down to six flowers to get the well-known truss of six tomatoes. Smaller tomato species have more flowersper stem. Pollination tends to happen around three times per week and cannot happen all day long. Humidity shouldnot be too high (usually in the afternoon), as the pollen tends to get too sticky and at night pollination is also difficult.In Figure 5.1, a flower of a tomato can be seen, with already pollinated flowers hanging below it. This truss could betargeted by the payload at the place where the hand is.
5.2. Flow analysisThis section introduces an analytical model for the flow analysis. After that a numerical model will be presented andexplained. Then, verification and validation will be done and in the end system outputs will be given.
5.2.1. Analytical modelFacilitating basic estimations and fast exploration of the governing parameters was deemed possible only with an ana-lytical model. In order to keep the model simple enough such that an analytical solutions exists, it was decided to recastit as a free axisymmetric submerged jet. The results of the model were then compared with experimental data in orderto evaluate the effect of the assumptions made.
The problem of a free axisymmetric submerged jet was first introduced in 1933 by Schlichting [12]. He gavepredictions about the variations in center-line velocity and jet width with the distance from the outlet. Four years later,in 1937, Bickley solved it for the case of the eponymous planar jet [13]. The solution for an axis-symmetric jet for giventotal jet momentum was developed by Landau [14], while Squire determined an exact solution for a laminar jet with a
16

5.2. Flow analysis 17
Figure 5.1: Flower of tomato plant. The blower will target the stem of the flower, approximately at the location of the fingers.
point source of momentum [15]. Similar approach is also suggested by White [16]. The Squire solution, however, is theone used for the current treatment thanks to it being the most mathematically tractable.
This approach assumes a point source of momentum, neglecting the particular outlet dimensions and flow velocity.Furthermore, it presupposes potential laminar flow. The phenomena occurring in the shear layer between the jet and theambient air are also ignored.
The equations of motion are expressed in spherical coordinates (r,θ,φ) with θ measured from the axis of the jet. Thevelocity components are (u, v,0) measured in the same respective directions. Due to the problem being axis-symmetric,it does not depend on φ. The streamlines are given by
ψ(r,θ) = νr f (θ), (5.1) f (θ) =2sin2θ
a + 1−cosθ. (5.2)
where ν is the kinematic viscosity of air. From Equation (5.1) and Equation (5.2) it becomes apparent that the flowbehavior is solely dependent on the parameter a. This value of a depends only on the momentum applied at the originand this is expressed by the implicit relation
F
2πρν2 =32(a + 1)
3a(a + 2)+ 8(1 + a)−4(1 + a)2 log
(a + 2
a
), (5.3)
where ρ is the air density and F is the force applied at the origin. In the case of a round outlet with diameter d anduniform outlet velocity u0, this force equals
F =1
4πρu2
0d 2. (5.4)
Finally, the velocity component in the flow are given as:
u =1
r 2 sinθ
∂ψ
∂θand v = − 1
r sinθ
∂ψ
∂r. (5.5)
Equations (5.1) to (5.5) are sufficient to analyze the flow behaviour. An example of the flow streamlines can beseen in Figure 5.2. The jet boundary corresponds to the points where the streamlines are closest to the jet axis, as fromthis point the free flow expands together with the jet. This is referred to as throat precisely because of the minimumcross-sectional area of the streamtubes there. It is illustrated by a thick black line in Figure 5.2.
From Figure 5.2, it can be observed that 30 cm away from the outlet the jet size is 0.3 mm. That results in a spreadratio (cone radius increase per unit distance from the nozzle) of S = 0.01. However, this is an order of magnitude lessthan the expected S = 0.1 obtained from empirical studies [17]. This discrepancy is believed to be due to the Squiresolution being limited to laminar jets and ignoring the shear layer between the jet and the ambient air. Figure 5.3 showsthe expansion angle superimposed on a close-up from the numerical model of free jet injection into steady ambient air(details about the model can be seen in Section 5.2.2). To account for the point momentum source assumption in theSquire solution, the analytical expansion angle is located at the top end of the inlet. It can be concluded from Figure 5.3that the expansion ratio found coincides with the expansion of the interface between the edge of the jet core (the regionwith the same velocity as the outlet).
Another issue observed with the analytical model is the unrealistically high jet centerline velocities for the first fewmeters from the outlet. This is illustrated in Figure 5.4. Figure 5.5 is a plot of the velocity profile of the jet 30 cm away

18 5. Pollination payload
Figure 5.2: Contour plot of the Squire analytical solution for d = 0.02 m and u0 = 1 m/s (a = 0.00032. The x axis coincides with the jet axis. The outletis assumed to be a point source of momentum located at the origin. The thick black line denotes the throat of the streamtubes
Figure 5.3: A close-up of the numerical solution of free jet injection with 1 m/s into steady ambient air with the expansion ratio S = 0.01 (the blacklines) as found by the Squire solution superimposed on the top end of the inlet
from the outlet. Both figures show velocities larger than the outlet velocity u0 = 1 m/s, which is physically impossible.Nevertheless, this result was expected due to the assumption that all the momentum of the outlet is concentrated at theorigin. The analytical model used does not differentiate between a small outlet area with large velocity and a big outletarea with low velocity, as long as the products of velocity and area are the same. In fact, the Squire model assumesinfinitesimal outlet area and infinite velocity. This is also illustrated by the asymptotic behavior close to the vertical axisin Figure 5.4.
The Squire analytical model was considered too simplified to be of practical value for accurately estimating the jetvelocity profile at a distance from the outlet. The potential flow analysis cannot match perfectly the real behavior. Oneof the main reasons for the poor approximation is considered to be the premise of a point source of momentum for theoutlet. This affects both the jet cone size, as in the physical case it has a radius at least the radius of the outlet, and thevelocity profile along the jet axis. The presupposition of laminar jet with no shear layer and mixing with the ambientair is also suspected to affect the model results significantly. For example, this is believed to be the cause of the smallexpansion ratio of 0.01 in contrast with the expected 0.1.
If further research in analytical solutions is to be performed it is advised to look into approaches that levy theseissues. For example, the treatment suggested by Abramovich [18] is deemed particularly applicable for the problem athand. Nevertheless, it requires an empirical constant that can only be obtained in an experimental set-up. For this reason,it could not be applied at this stage of the development.

5.2. Flow analysis 19
Figure 5.4: Centerline velocity of the Squire analytical solution for d =0.02 m and u0 = 1 m/s (a = 0.00032). The x axis coincides with the jetaxis. The outlet is assumed to be a point source of momentum locatedat the origin
Figure 5.5: Velocity profile of the Squire analytical solution 30 cm fromthe for d = 0.02 m and u0 = 1 m/s (a = 0.00032). The y axis is perpen-dicular to the jet axis
5.2.2. Numerical modelTwo numerical models of the blower jet were developed to predict the effectiveness of the blower. The first model is afree jet injection into steady ambient air. This model allowed to accurately estimate spread of the jet and decrease ofthe velocity along the distance and an effective range in which the jet is relatively coherent. The second model is the jetinjection toward a cylinder in ambient steady air. The cylinder is considered representative of a tomato flowers branchstem. The model allows to estimate the flow interaction with the plant and the pressure distribution over the cylinderwhich yields forces acting on the plant. Estimated forces can be used to evaluate the jet effectiveness and to size theblower. Both simulations are done for idealized cases and the results are used only for the first order estimations.
Figure 5.6: Meshed domain of the numerical model
The domain of the first model is a rectangle 2 m high and 3 m long which is equivalent to 100 and 150 nozzlediameters respectively. An elongated channel on the left side as shown on Figure 5.6 imitates the blower exhaust. Thechannel length is 30 cm and the exhaust diameter is 2 cm. Such an approach was taken to account for the jet suckingin the air from the surroundings, which might result in strong vortices. The walls of the channel are set with the wallboundary condition which imposes no slip condition (null velocity). All the other edges of the domain are set with theoutlet boundary condition with null relative pressure.

20 5. Pollination payload
The mesh for the model is shown in Figure 5.6. It consists of 4,560 hexahedron elements. The mesh is refined nearthe inlet to account for developing shear layer around the jet core. The smallest elements have length of about 2 mm.The closer the outlet the coarser the mesh becomes. The elements at the right boundary have length up to 10 cm. Thisapproach allowed to optimize number of elements and the computation time. In the future the mesh could be betteroptimized by making it coarser close to the upper - right and bottom right corners.
The simulation was run for 30 s, with time increment of 0.01 s. This was enough to obtain the steady solution. TheCourant–Friedrichs–Lewy condition coefficient is set to 0.45. The convergence was achieved and verified by plottingroot mean square (RMS) of residual values. The plot is shown on Figure 5.7.
Figure 5.7: Root square mean of residual errors vs time for steady flow CFD simulation without turbulence
The results of the simulation are shown on Figure 5.8. From the results, a velocity decay with distance is determinedand plotted on Figure 5.12. The results are compared wit analytic model, and discussed in more details in Section 5.2.3.
Figure 5.8: Results of a CFD simulation: close up on fully developed steady state jet flow for the exhaust velocity of 1 m/s
Next, the turbulence was implemented to determine how much of an influence it has on the flow. The k-epsilonmodel was used. For the coefficients, default values were used and the mesh was more refined near the inlet to enablebetter convergence.
The results of this simulation are shown in Figure 5.9. The conical divergent part of the jet close to the exhaust isdue to insufficiently refined mesh. The geometry of the jet is not much different than the one obtained with the steadysolution without turbulence model in Figure 5.8. One difference, however, is a slightly wider, more dissipated shear

5.2. Flow analysis 21
layer between the ambient air and the jet, which is caused precisely by the turbulence.Further downstream some mild fluctuations are visible. Those fluctuations are initiated by the transient part of the
solution. In general, two regions can be distinguished in the jet flow: a stable one, where the jet is relatively coherent,and an unstable one, where the jet is dissipated and the flow forms large eddies, shedding in random directions. Thesimulation focuses on the stable region, and thus does not include the region with instabilities. It is aimed to utilize thisregion of the jet to pollinate the flowers. The main advantage is that the coherent jet flow can be effectively concentratedon the target, and the flow is fully utilized, which increases efficiency of the system. In comparison, vortices in theunstable region are much more dissipated, and their velocity is reduced. In this case the transition zone (which laysabout 50 cm from the exhaust) imposes the limitation on the maximum distance from the nozzle. In order to catch allthe instabilities and vortices the domain should be extended further in the flow direction, and a Large Eddies Simulationshould be implemented. This approach however is not feasible as the computational cost of such a simulation (due tocomplexity of the problem, and time) is disproportionate to added value. The simulation would result in much largerprecision, however it would not necessarily model the reality more accurately. It needs to be emphasized that the modelis idealized, and does not account for interactions with environment (like downwash from propellers or interaction withthe plant).
Figure 5.9: Results of a CFD simulation with exhaust velocity of 5m/s and k-epsilon turbulence model
The second model is the exhaust flow pointed toward the cylinder. The objective of this simulation was to investigatethe influence that the cylinder (that imitates the plant stem) has on the jet. The goal was to determine the order ofmagnitude of the aerodynamic forces acting on the stem, to later determine whether those forces are sufficient to shakethe flower. Flow around a cylinder in a free-stream is a relatively well understood problem. In case of the flow from theblower, where the mass flow is relatively small, the free-stream conditions do not apply any more. This results in stronginteraction between the jet and the cylinder.
The model is set up on a 2 m high, and 1.5 m long rectangular domain (equivalent to 100 and 75 nozzle diameters)with 1 slab width shown in Figure 5.10. The inlet is a 2 cm high patch on the left boundary, as in the first model. Theboundary conditions are also the same: all the edges have an outlet condition imposed, with pressure set to 0. Thecylinder is placed 30 cm from the exhaust. It has 5 mm diameter which corresponds to estimated size of the tomatostem.
The mesh is split into several partitions to enable structured layout. It consists of 6,392 hexahedral elements. Themesh is refined near the cylinder and near the inlet as shown on the Figure 5.10. This approach is chosen to account forrelatively small size of the features, and prevent large numerical errors.
The results of the simulation are shown on Figure 5.11. Only the transient part was caught, because the solutionwas diverging due to software limitations. Despite these issues the treatment was considered sufficient considering thetime and resource constraints of the project. Moreover, the results from these simulations are used only for order ofmagnitude estimations and sufficient margins were applied to account for these issues.
Some conclusions can be drawn. Due to minor instabilities, the flow splits on the cylinder asymmetrically. This

22 5. Pollination payload
Figure 5.10: Mesh of the model of the jet flow on cylinder
Figure 5.11: Flow on the cylinder: large eddy roll-up
results in a vortex rolling up on one of the sides of the cylinder, as shown on Figure 5.11. This asymmetric vortexinduces a velocity field that tends to deflect the jet even more away from the cylinder.
The simulation also allowed to estimate forces acting on the cylinder. The force in x and y direction was calculatedby integrating the pressure acting on the surface. The forces per unit length calculated for 5 mm diameter cylinder in1 m/s flow are 1.15 mN/m in x direction and 0.44 mN/m in y direction. These results are validated in Section 5.2.3.
In reality the stem subjected to asymmetric forces will deflect, and therefore will influence the jet in slightly differentway than shown by the simulation. To account for this effect more accurately, a flow-structure interaction should be setup. Even then the uncertainty of the results will be relatively poor. The main reason is that the plant is idealized, in factthe stem has multiple branches that will interact with the flow as well. The stiffness of different plants might vary whichwill result in various deflections and different effects. That is why the focus of this analysis was simply to estimate theorder of magnitude of the forces and to obtain a general overview of extent up to which the plant affects the flow.
5.2.3. Verification and validationThe numerical results are compared and validated with the experimental results reported by Pope [17]. The core velocitychange with distance is plotted in Figure 5.12. The red line corresponds to measurements of the core velocity from theCFD results. The measurements were done for five different time frames with a 5 s step for fully developed flow. Thisapproach was taken to measure averaged velocity and account for vorticity and oscillations downstream.
The yellow line corresponding to experimental model is plotted starting from a distance of 6d (where d is the nozzlediameter). As mentioned by Pope [17], the experimental model is not valid close to the nozzle, and for smaller distancesthis model can not be applied (it diverges due to singularity). The numerical results predict slightly higher velocitiesthan estimated by the Pope’s model. The most likely reason is that the flow in this region becomes unstable with largevortices present, which is not accounted for in the experimental model.
The turbulent and steady state model correspond relatively closely. Comparing with the steady state solution the corevelocity of the turbulent jet is slightly lower at the beginning (until x/d = 25). This is most likely caused by a higher rate

5.2. Flow analysis 23
Figure 5.12: The jet core velocity in respect to the distance from the exhaust in dimensionless form. On the vertical axis ratio between core velocityV and the exhaust velocity Ve, on the horizontal axis distance expressed in nozzle diameters. Comparison between CFD steady flow simulation, CFDsimulation with turbulent model implemented and experimental model [17]
of dissipation due to the turbulence. For larger distances however the velocity is slightly higher. Another remarkablefeature is that the line is not perfectly smooth, i.e. it has some local peaks. This is caused by instabilities in the flowcaused by the turbulence and high vorticity.
Concluding, the numerical model gives reasonable results. The discrepancies between the lines stem from the as-sumptions and idealization of the experimental model. Taking a conservative approach, it is preferred to use the experi-mental model for the sizing of the blower, as it gives some safety margins for velocities.
The drag force acting on the cylinder obtained from the second CFD model was compared with analytically deriveddrag force per unit length (Equation (5.6)) obtained for the same conditions.
D = CD1
2ρV 2d = 1.2 · 1
2·1.225 ·0.552 ·0.005 = 1.11mN/m (5.6)
The cylinder diameter d is 5 mm and the effective velocity is 0.55 m/s (as it drops on the distance from the exhaust).The drag coefficient for cylinder in applicable range of Reynolds number is 1.2 [19]. The result is 1.11 mN/m.
The difference between the analytic solution, and the drag obtained with CFD is in the order of 3%. The discrepanciesstem most likely from different assumptions - in CFD the flow is non-uniform, and some instabilities occur.
It is assumed that the size of the nozzle is sufficient to provide enough flow velocity to pollinate the flower. Theeffectiveness could be improved more by increasing its size. However, this would result in a bigger motor and propellerneeded, which would require more power and add weight. Additionally, the force produced would increase, which wouldhave negative consequences on the control system. Smaller mass flow on the other hand would decrease the efficiency ofthe pollination. The interaction between the flower and the jet would be more pronounced (as observed on Figure 5.11),and could result in lower effectiveness of the pollination.
Internal experiments were performed in the laboratories of TU Delft to validate the performance of the blower. How-ever the accuracy of the setup and the results are much lower than Pope´s and it is recommended to run the experimentsagain in the future. It was found that a flow of 2.4 and 5.8 m/s was recorded at a distance of 50 and 25 cm respectively,for a nozzle diameter of 14 mm and 10 m/s exit velocity.
5.2.4. System output determinationAs mentioned before in Section 5.1, only a slight shaking of a flower is enough to pollinate it. Nevertheless, in orderto ensure proper pollination, it was decided that the flowers have to be shaken at the frequency of about 200 Hz, similarto bees [20]. The shaking arises thanks to the induced vibrations of the von Karman vortex street. The frequency ofthe lift variation is the same as the vortex shedding frequency while the one of drag variation is twice as much [21].In order to reduce the energy necessary to be put in the flow, the analysis is performed for shaking due to variation indrag. Therefore, the blower system has to produce a von Karman street at the flower with vortex shedding frequency of100 Hz.

24 5. Pollination payload
Figure 5.13: Dependence of the Strouhal number on the Reynolds num-ber for a cylinder [22]
Figure 5.14: Illustration of a jet and its velocity profile. The nozzleoutlet is located at the origin. The distance b is measured from the jetaxis x to the circle of the cross-section that observes half the centerlinevelocity
The non-dimensional parameter describing the vortex shedding frequency is the Strouhal number, defined as
St =f d
u, (5.7)
where f is vortex shedding frequency, d is a characteristic length and u is the flow velocity. The characteristic length dis taken to be the diameter of the branch stem (modelled as a cylinder), which is estimated to be 5 mm from measure-ments made during the greenhouse visit. The velocity u that the flower stem must be subjected to is the unknown thatneeds to be solved for. To do this, the value of the Strouhal number must be fixed. Both St and Re vary with changes inthe diameter of the cylinder and the free-stream velocity it sees, assuming fixed properties of air. Therefore, a relationbetween the two can be made. Such a relation for flow impinging on cylinders can be seen in Figure 5.13. The samecharacteristic length of 5 mm was used together with standard atmospheric properties (density ρ = 1.225 kg/m3 and dy-namic viscosity µ = 1.81×10⁻⁵ kg/(m s)) and expected range of velocities from 3 to 10 m/s. In this fashion the Reynoldsnumber was found to be in the range from 1,020 to 3,400. From Figure 5.13 it can be concluded that St is relativelyconstant in this range of Re values, therefore the average value of 0.2 will be considered in the rest of the exposition inthis section. Following from Equation (5.7), a Strouhal number of 0.2 and a frequency of 100 Hz for a cylinder withdiameter of 5 mm are achieved for a free-stream flow velocity of about 1.25 m/s.
With the target velocity that is to be achieved at the flower, the required velocity at the outlet of nozzle can beobtained. Moreover, the required pointing accuracy of the drone can be established. In order to ensure that the flowerexperiences flow with velocity of at least 1.25 m/s, given some pointing uncertainty, it was decided that this should bethe velocity at the jet edge (defined as the surface where the velocity is half of the velocity on the jet axis). Therefore,the velocity of the jet axis at the flower has to be 2.5 m/s.
In next step, it was found what nozzle exhaust velocity is needed to achieve 2.5 m/s at given distance. For thispurpose the relationship between the core velocity and the distance was used (Figure 5.12). Furthermore the velocityprofile from the experimental model developed by Pope [17]. In this case the jet spread can be approximated withEquation (5.8), where r1/2 is the effective jet radius, x is the distance from the exhaust, and S is an experimentally foundconstant, equal to 0.096. With this relationship the width of the effective jet could be estimated for a given distance asillustrated on Figure 5.14.
r1/2 = Sx (5.8)
The maximum pollination range that is considered is stipulated by the flow phenomena observed in the results ofthe numerical model. It was noted that regardless of the nozzle outlet velocity, the jet becomes unstable at a distance ofabout 50 cm. This instability is mainly expressed in large deflections of the jet due to the forming of vorticity. Theseinstabilities were more pronounced at higher velocities. Therefore, to ensure that the airflow hits the flower and is notdeflected instead, the maximum pollination distance was fixed at 50 cm. For this distance the maximum exit velocityfound with the model (Figure 5.12) is 10 m/s.
Having the distance and the jet width the pointing accuracy needed could be estimated. The accuracy is defined asthe angle between the nozzle axis and extension to the furthermost point with sufficient velocity. As the exhaust is not aninfinitesimally small point as shown on the Figure 5.14, but it has finite diamater, the pointing angle is slightly smallerthan the jet angle. The variation with distance in considered range however is in order of 1 degree, as the dimensionsof the nozzle are relatively small. Taking conservative approach the most critical case is taken, which is the pointingaccuracy of ±7deg. for distance of 50 cm.
To estimate whether the force acting on the flower is able to deflect it sufficiently for pollination, a simple first orderestimations are done. The deflection can be estimated using the beam bending formula (Equation (5.9)). The elasticity of

5.3. Payload implementation 25
the tomato stem is assumed to be 600 MPa, basing on [23]. The moment of inertia is calculated assuming that the cross-section is circular, with diameter of 5 mm. The distributed load w is estimated with the drag formula (Equation (5.6)),where the velocity taken is 2.5 m/s (for effective pollination), and CD is 2 to account for roughness of the stem. Withlength of the stem assumed to be 25 cm the maximum deflection is 1 mm.
δ =wL4
8E I(5.9)
The approach however is very conservative, as it accounts only for drag of the main stem. In reality the drag will be1 up to 2 orders of magnitude higher, as the stem has multiple branches with flowers, which significantly contribute tothe surface area, and increase the drag. This will result in deflection in range of few cm. The first order estimates suggestthat the design is feasible. Due to complexity of the problem and multiple uncertainties the performance will need to beverified in a series of tests in a greenhouse.
Finally the time of pollination is estimated. To allow the flow to develop a 1 s is taken. This estimate is base on CFDsimulation. Then for the actual pollination in nominal flow conditions 5 s period is assumed. During this period ideallythe flower will oscillate 1,000 times. The value however accounts for possible pointing jitter of the drone. Even in casethat the drone floats away slightly due to disturbances, there will be enough time for the control system for corrections.In total, a 6 second period should be considered as time for pollination of 1 flower.
5.3. Payload implementationGiven the pollination task, it was concluded that the blower should have an exhaust velocity of at least 10 m/s. Withthis driver requirement, the payload on board of the APIS drones can be sized. The problem will be approached whilekeeping in mind a modular configuration, making the drone flexible for a variety of payloads with different pollinationmethods. Therefore, a certain mass and power budget is reserved for this subsystem, which will be discussed below.First, the functionality will be discussed, followed by the design of the payload and the results of the analysis.
5.3.1. FunctionalityGenerating a flow to shake the flower can be combined with cooling the electronics on board. This is implemented byplacing a heat sink in the duct. The heat sink is placed on top of the CPU to absorb the generated heat. The fins of theheat sink are inserted into the flow through the rectangular cut out on the bottom of the duct. The duct flow passing alongthe heat sink fins provides active means of cooling.
As the heat is transferred from the heat sink to the flow, the temperature of the air in the duct increases slightly. Thisdecreases relative humidity of the air. This effect is beneficial for effectiveness of pollination - too high humidity of theair makes the pollen more sticky and hinders its motion.
5.3.2. DesignThe blower consists of a fan and duct ending with a nozzle bent 45◦ downward. Additionally there is a heat sink insidethe duct that cools the electronics. A cut view of the blower is shown in Figure 5.15.
The main reason for the choice of fan is that it could be placed in a horizontal position, which makes the whole droneassembly more compact. Another driving factor is the availability and variety of fans offered on market. The parts comewith accurate performance data provided by the manufacturer, which allows to choose a fan tailored for the design, asthe performance uncertainties were minimized.
Figure 5.15: Isometric cut view of the blower

26 5. Pollination payload
Table 5.1: Estimations of the jet deflection due to propeller wake
Critical resultant V [m/s] Angle with horizontal [deg] Deflection from thenozzle axis [deg]
Ve = 2.5 m/s 5.08 69 24Ve = 15 m/s 17.25 52 7
The fan is placed in the middle of the main structure box of the drone, very close to the center of gravity. The reasonfor this is to optimize control and stability characteristics, but also the available space. The length of the channel fromthe exit of the fan to exit of the nozzle is about 80 mm. The duct has a rectangular cross-section with rounded corners,such a shape has been chosen mainly due to space limitations and to make the duct flat and compact.
The first section of the duct, starting from the fan has a constant cross-section of 30 mm length and inner dimensionsof 24.8×17.8 mm. The length of the section was chosen to accommodate the heat sink. The next section of the duct hasvariable cross-section and is smoothly profiled to accelerate the air to the exhaust velocity. The last section of the ductis an elbow bent under 45 deg and ending with the nozzle. The air inlet of the blower is placed on top of the fan, whichis protected by a grill in order to prevent the sucking of particles and leafs in. The speed of the fan (and therefore speedof the exhaust) can be controlled via an Electronic Speed Controller (ESC). Sizing of the blower, and especially the exitcross-section stems from the analysis of the subsystem, which is explained in Section 5.3.3.
5.3.3. AnalysisThe aerodynamic analysis of the pollination payload has been done to determine the interactions of the system with thesurroundings and other subsystems. First, the flow conditions are analyzed to evaluate effectiveness of the blower. In thisway it can be verified whether the system provides sufficient performance necessary for the effective pollination. Theanalysis includes influence of the external conditions - namely the interaction of the propeller wake as well as internalconditions which focuses on the pressure losses. Furthermore, the force due to blowing is estimated, this force will bethe main disturbance exerted on the drone during the pollination and it has significant influence on the design of thecontrol and stability system. Last but not least the results of the analysis are used to size the blower, and especially theexhaust nozzle.
Rotors interactionWhen the drone is pollinating (while hovering), the estimated exit velocity just below the propeller is on average 3 m/s,and in the most critical locations, at the propeller tips, up to 6 m/s. This has been found by using the blade elementtheory, which will be described in Section 6.5. To estimate the jet deflection, the average induced velocity of 3 m/s isused. The resultant jet velocity and deflection is calculated using vector addition of different velocity components. Theresults for two most critical cases - the slowest and the fastest jet exhaust velocities are listed in Table 5.1. The deflectionfor higher velocities decreases, for the maximum exhaust velocity of 15 m/s it is about 7 deg. It should be stressed thatthe estimations do not account for effects such as swirl, turbulence and vorticity of the rotor wake, which might slightlychange the flow field. In order to predict those phenomena, a thorough aerodynamic analysis needs to be done, which ishowever out of scope for this stage of the design.
The propeller wake contains two major vortex systems - tip vortex initiated at the tip of the blade and the vortexsheet shedding along the length of the blade. The overview of the phenomena is presented on Figure 5.16a.
As shown in Figure 5.16b the tip vortex moves towards the central axis of the rotor - the radial coordinate decreasesand the vortex approaches 0.8 of the blade radius. This indicates that the wake below propeller contracts. Analyzing theaxial component of the tip vortex gives an indication of the induced velocity of the flow in the wake. For the azimuthangles between 0 and 180 deg the coordinate varies linearly with angle, which indicates a constant velocity. The slopeof the curve changes suddenly at an angle of 180 deg which indicates that the flow accelerates, which is caused by thepassage of the second blade. The velocity remains constant until an azimuth angle of around 500 degrees, where it startsto decay and approaches zero. Analyzing results of CFD simulation of the quadcopter wake reported in [24], it can beconcluded that just below the propeller the wake is indeed relatively concentrated, as found by Landgrebe [25].
In order to minimize the influence of the wake, the nozzle exhaust should be placed sufficiently far away from thepropellers. Basing on the Landgrebe’s results it can be concluded that this can be achieved by placing the nozzle outletjust outside of the perimeter of the propeller. Considering the fact that the jet is going away from the propeller wakedue to 45 deg nozzle inclination and that further downstream the wake contracts, it is concluded that the interaction issignificant close to the exhaust (where the jet is the closest to the propeller).
The disadvantage of this solution is that a longer duct is needed, which adds weight and contributes to pressure

5.3. Payload implementation 27
(a) Overview on propeller wake geometry. Both vortexsheet shedding from the propeller blade, and the tip vor-tex trajectory are shown. [25]
(b) Measurements of the rotor wake shedding from double bladerotor [25]
Figure 5.16: Overview on the results of Landgrebe’s research [25]
losses. Furthermore, as the exhaust is placed further from the center of gravity of the drone, the disturbance moment dueto the blowing force will be larger.
Pressure lossesThe pressure losses are estimated between the fan and the exhaust of the nozzle to ensure that the fan provides sufficientperformance and that the required exhaust velocity can be reached. The losses considered, are only due to friction - asthe flow is assumed to be incompressible (valid for M = 0.04) the losses due to compressibility can be neglected. Alongthe duct, there are three main contributors - friction due to heat sink, friction with the pipe walls and friction due to theelbow.
To calculate the losses in the duct a standard approach is used and the calculations are done using the Darcy–Weisbachequation1:
∆P = fL
Dh
1
2ρV 2. (5.10)
The length of the duct is 116 mm, the flow velocity at the exit of the fan is estimated using mass flow rate equation,where the mass flow and the cross-section area are given by the fan producer. The velocity estimated for unobstructedflow is 7.95 m/s. The f is the friction factor and the Dh is the hydraulic diameter.
The Reynolds number for flow in the duct is estimated to be around 62,760. For this regime the flow is turbulent, andthe friction factor can be read from the Moody diagram shown in Figure 5.171. The friction factor for the flow is around0.018. Finally the hydraulic diameter is calculated. For non-circular cross-sections this is done using Equation (5.11)where A is the cross-section area, and p is the wetted perimeter.
Dh =4A
p=
4 ·0.0238 ·0.0168
2 ·0.0238 + 2 ·0.0168= 0.0197 m (5.11)
With these values the pressure loss for the straight section of the duct is calculated, which can be seen in Equa-tion (5.12).
1https://neutrium.net/fluid_flow/pressure-loss-in-pipe [Cited 20 June 2017]

28 5. Pollination payload
Figure 5.17: Moody diagram
∆P = 0.0180.116
0.0197
1
21.225 ·7.952 = 4.1 Pa (5.12)
To calculate the effect of an elbow, the equivalent pipe length method is used. The method assumes that the pressureloss over the fitting is equivalent to pressure loss over a straight pipe of a certain length. Those equivalent lengths wereexperimentally determined for different elbow geometries and listed in standard fitting tables2. For an elbow of 45 degthat is used in this design the equivalent length is equal to 16d , where d is the pipe diameter. The pressure loss due toelbow is then calculated by using Equation (5.13).
∆P = 0.018 ·161
21.225 ·7.952 = 11.1 Pa (5.13)
The pressure loss across the heat sink is calculated using adapted Darcy–Weisbach method. Taking a conservativeapproach, it is assumed that the flow is fully ducted i.e. that the whole mass flow passes only through the heat sink.With this assumption the relative velocity U is calculated. The value found is 23 m/s. This will result in overestimationof the friction, however this accumulated margin will account for the other not considered losses. Furthermore, takinga heat sink length of 16 mm, and assuming that the flow velocity is 7.95 m/s, the Reynolds number is calculated to bearound 8,650. The friction factor corresponding to this value is 0.035, as can be read from Figure 5.17. Eventually, thehydraulic diameter Dh is calculated for single channel in between the heat sink fins. The pressure loss is then calculatedas shown in Equation (5.14).
∆P = fL
Dh
1
2ρU 2 = 0.035
0.016
0.0197
1
21.225 ·232 = 9.2 Pa (5.14)
The total pressure loss over the blower between the fan and the exhaust is the sum of all the three losses and is equalto 24.4 Pa. The estimated pressure losses can be considered as a resistance for the fan that must be overcome. Thisresistance will result in a decreased mass flow, because part of the fan power will be lost to overcome the friction. Thedecrease in the mass flow can be estimated using the mass flow - pressure relationship provided by the fan producer.The relationship has been determined through experiments and the results are plotted in Figure 5.18. The pressure in thevertical axis is the static pressure relative to atmospheric pressure, which can be considered as a resistance acting againstthe fan. For instance when the exhaust is completely blocked by a plate the mass flow is 0, and the relative static airpressure exerted on the plate is 18.5 mm H2O. On the other hand when there is no resistance - the relative static pressureis 0 mm H2O the maximum mass flow of 0.19 m3/min can be achieved.
2https://neutrium.net/fluid_flow/pressure-loss-from-fittings-equivalent-length-method/ [Cited 20 June2017]

5.3. Payload implementation 29
Figure 5.18: Pressure vs mass flow relationship for the blowing fan [26]
In this way, knowing the resistance pressure (calculated pressure losses) the maximum mass flow can be calcu-lated. For 24.4 Pa (equivalent to 2.5 mm H2O) it can be read that the maximum volumetric mass flow is 0.175 m3/min(0.002917 m3/s).
Knowing the maximum achievable mass flow and and the required exhaust velocity, the mass conservation equationcan be used to size the exhaust nozzle. The required area is calculated by using Equation (5.15).
Ae =v
Ve=
0.002917
15= 194.4 mm2 (5.15)
The width of the duct is fixed due to the fan outlet geometry and is equal to 17 mm. Assuming a square cross-sectionthe height of the exhaust becomes 11.4 mm.
All the estimated pressure losses are slightly overestimated, this has been done in order to have an extra margin. Asthe friction decreases the mass flow from the blower, it slightly decreases the velocity as well. The velocity however isused is used in the model for all three considered friction contributors. Lower velocity results in smaller losses and soon. The right approach to accurately solve this relationship would be to iterate the calculations. This has not been donein order to leave a margin for unexpected phenomena. In case the more accurate analysis is needed, a CFD simulationshould be considered.
The thrust forceThe force exerted by the blower is calculated by using the principle of conservation of momentum, which can be seenin Equation (5.16). Taking conservative approach it is assumed that the flow is accelerated from stationary and thereforethe initial velocity is 0. The maximum achievable exhaust velocity is 15 m/s. The effective mass flow generated by theblower is taken for idealized case neglecting the pressure losses. This approach is taken to add a margin in case that thelosses are lower than estimated (as the estimations resulted in rather conservative values).
F = m · (Ve −V0) = 0.003879 ·15 = 0.058 N (5.16)

6Propulsion and power
In this chapter the power consumed during the mission will be discussed in more depth with the ultimate aim to sizethe battery. Starting with, in Section 6.1, a simple, yet representative, model will be created to account for the mainaerodynamic forces to realistically find the required thrust forces. Later, the thrust required will be translated into powerconsumption in Section 6.2. Following, the nominal mission will be split into different phases for which an elaboratepower drainage will be given in Section 6.3. The final battery requirements and selection is made in Section 6.4. Lastly,an analysis required for the rotor-blower interaction will be looked into in Section 6.5.
6.1. AerodynamicsIn order to accurately size the required thrust for the travelling phases of the mission, an aerodynamic model whichincorporates aerodynamic forces and angles was created. It will be hereby explained. The solely goal of this model is tooutput the required thrust at a given part of the mission for a horizontal or vertical trip. It is a coarse and conservativemodel which will play an important role in sizing the energy consumption. The model was implemented in Python 2.7.
Assumptions• Symmetric flight: the blower is not connected during the flight, or the flight controller has counteracted it.• The aerodynamic reference frame coincides with the body fixed reference frame.• The drone can be modelled as a flat plate for the payload part, but the rotors do not contribute to this surface area.• Both lift and drag are present, are dependent on the pitch angle and act at the center of gravity which coincides
with the center or pressure of the plate.• The pitching moment is neglected.• The thrust force is equally distributed along the four rotors and is fixed perpendicular to APIS’ surface.• Pitch is defined positive downwards, as it will promote positive velocity and will make APIS advance.• Humidity contributes to a negligible increase in density at the temperatures of the greenhouse. (Up to 40 ◦ C in
the worst case)1.
Figure 6.1: Free body diagram of APIS Figure 6.2: Kinetic diagram of APIS
1http://www.engineeringtoolbox.com/density-air-d_680.html [Cited 23 June 2017]
30

6.1. Aerodynamics 31
Free-body, kinetic diagrams and equations of motion From the free body diagram and kinetic diagram on Figure 6.1and Figure 6.2, the following equations of motion can be derived:
∑Fx = m ·ax = T · si n(θ)−D = T · si n(θ)− 1
2ρV 2SCD (6.1a)
∑Fy = m ·ay = L + T · cos(θ)−W =
1
2ρV 2SCL + T · cos(θ)−m · g (6.1b)
Where, Fx and Fy are the forces in the x and y axis in N, respectively, m is the mass in kg, a are the accelerations inx and y axis in m/s2, T is the thrust in N, θ is the pitch angle in deg, ρ is the density in kg/m3, V is the forward velocityin m/s, S is the surface area and CD and CL are the drag and lift coefficients. The latter two will be discussed in moredepth in the subsequent paragraph.
Lift and drag coefficients For what concerns the lift and drag, APIS is modelled as a flat plat with dimensions 87x139mm2, which would yield an aspect ratio of around 1.6. Nonetheless, the coefficients are not constant values as theydepend on the pitch angle. To model these variations, the lift coefficient has been calculated following the Lowry andPolhamus lift coefficient dependence on the angle of attack empirical formula, Equation (6.2). This empirical relationwas found to be acceptable for aspect ratios below 2, [27]. Based on experiments, the drag coefficient was found tobehave linear for the aspect ratio of 1.6 in the range of 0 to 50 degrees of angle of attack, for which the limits of the CD
were shown to be 0.061 and 0.781 [28]. Consequently, the CD was modelled through interpolation of these two limitsas shown in Equation (6.3), where θ is the pitch angle at a given moment in degrees and is not expected to be more than50 degrees in any traveling phase.
CLα =
(1
57.3
)2πAR
2 +
√(AR2
η2
)(1 + t an2(λc/2) + 4
(6.2)
Where CLα is the variation of the lift coefficient with the angle of attack in 1/deg, AR is the aspect ratio as an unit-lessparameter, η is the line lift coefficient derivative with the angle of attack (Clα ) over 2π and λc/2 is the half-chord sweepangle. For Clα , a value of 5.3743 (1/rad) was found to be a recurrent nominal value for flat plates.
CD = 0.061 +0.781−0.061
50−0·θ (6.3)
Kinematics and dynamics In order to find the required thrust, any trip is always split into three phases, acceleration,cruise and deceleration to null velocity. Both acceleration and deceleration have been set to 10% of the total requiredtime for the trip. For any trip, the following kinematics hold:
tacc = t ·0.1 (6.4) Vc =s
t − tacc(6.5) a =
Vc
tacc(6.6)
Where tacc is the time of acceleration in s, t is the total trip time in s, Vc is the cruise speed in m/s, s is the space tocover in m and a is the acceleration required to accomplish it in m/s2.
Also a distinction has to be made between horizontal and vertical travel. For vertical trips, the x-axis accelerationand θ is set to 0, making the y-axis the only axis to look into. In this case, only the y-axis equation of motion is ofrelevance, but with the difference that there will be drag but no lift. A value of 1.28 for the CD was used for this case2.The equation to solve becomes:
m ·ay = T −m · g − 1
2ρV 2CD (6.7)
For the case of the horizontal, the acceleration in the y-axis can be set to 0, but a system of two non-linear equationsand two unknowns (T and θ) remains to be solved, namely Equation (6.1). It is worth pointing out that lift will usuallypoint in the negative direction, this will increase the required thrust level.
2https://www.grc.nasa.gov/www/k-12/airplane/shaped.html[Cited 23 June 2017]

32 6. Propulsion and power
Inputs, outputs and variables The model takes as solely inputs the distance to be covered and the time needed. Asvariables, the greenhouse temperature can be changed in Kelvin, as it impacts the air density. Also, the mass in g andsurface area in mm2 of APIS are variables. On the modelling side, the timestep can also be varied. The model outputs:
• Cruise velocity in m/s• Thrust required during the trip in N• The θ at which to fly during the trip in degrees.
As previously stated, the sole goal of this model was to get a more accurate result for the required energy consumption ofthe motors to size the battery. In fact, now that the thrust required is known, the power can be derived from Section 6.2.Once the power is known, the energy follows from the time required per phase. Another advantage of this model is theoutput of the intensity required in any point for the trip which can provide insight on more accurate required C-rates.
Verification and validation Bearing in mind that the current model only played a role on the battery model, theverification and validation will be as in depth as it feels sensible. In fact, for the case of the validation of the model,almost no applicable literature can be used. When it comes to the verification of the model, several unit tests can beperformed for which a clear output is expected, these can be found under Table 6.1. In order of appearance, the top testaims at showing how by decreasing the acceleration time, the distance and time which remains for the cruise phase leadsto an unaccelerated travel for which the cruise speed approaches the distance to cover over the input time. Subsequently,on the CL-CD calculator module, if θ is set to zero, the lift coefficient is expected to be 0, while the drag coefficient canonly be the zero-lift coefficient. Following with, a simple test to check for internal coherence is setting the distance tocover to 0 meters, this has to translate into hovering thrust and zero pitch angle. Next is checking the environment, if thetemperature is set to sea-level temperature, the density must match the sea-level temperature. Lastly, a last sanity checkon the thrust level for the cruise phase is that the thrust must always be at least slightly higher than the weight.
Table 6.1: Verification tests for modules in the propulsion energy calculation
Test Input Expected output Output Checks?
Horizontal case:Set acceleration time to small value, cruisevelocity should approach s/t
s = 50 mt = 10 stacc /t = 0.01
vc = 5 m/s vc = 5.05 m/sOk, approachesvc as expected
CLCD unit calculator:Set theta to 0 θ = 0 rad
CL = 0CD = CD0 = 0.067
CL = 0CD = 0.067 Ok
Horizontal and vertical case:Set distance to cover to 0 meters s = 0 m
T = m·gθ = 0 deg
T = m·gθ = -3.12E-12 Ok
Environment module:Set temperature to 15 C (287.15K) and ignore humidity T = 15 C ρ = 1.225 kg/m^3 ρ = 1.225 kg/m^3 Ok
Horizontal and vertical case:If s>0, the minimum thrust must be higher thanthe weight.
s = 100 mt = 50 s T >m*g = 2.4525
Hor: T = 2.4598 NVer: T = 2.4972 N Ok
On the other hand, validation proves to be a more challenging matter, given the inherent uniqueness of any MAVand especially the choice of code implementation. Nonetheless, some modules can be validated, and such is case for theCL-CD calculator. Using the values from [28], it can be shown how the CL does agree with the proposed approach inEquation (6.2). Needless to say, the CD also matches to a high accuracy level. The only remaining module which canbe validated is the environment module, for which the only input was temperature. The densities match for the giventemperatures3. Unfortunately, the thrust level cannot be directly compared to any available literature, thus cannot bevalidated in the same manner it was done for the CL-CD calculator and environment module.
6.2. Propulsion and powerWith the final goal of accurately sizing the battery, the power consumed by the propulsion system is required. For that, afirst order thrust estimate is needed. Iterations were performed in order to come up with a total weight of the drone. Thefinal result was 249.5 ±23.3 g and because the DP-MAV-14 requires the drone to hover at 50% of the maximum thrust,the latter can be found from the equilibrium state to be 500 g of thrust. With this value being fixed, the motors can nowbe chosen.
DYS 1306 motors4 with 2,300KV were suited for the current mission, leaving even room for extra payload and safety
3https://en.wikipedia.org/wiki/Density_of_air [Cited 20 June 2017]4http://www.dys.hk/ProductShow.asp?ID=115 [Cited 15 June 2017]

6.3. Power consumption 33
margins with a maximum thrust of 130 g each. At this value, a maximum power consumption of 18.5W was registeredby the manufacturer´s tests. At 80 g of thrust 11.8 W were consumed and at 40 g of thrust 4.4W were drawn by themotor. These three data points on the thrust vs. required power graph do not lie on the same line and were used forinterpolating the points in between. For example if a mission stage requires the drone to hover, it would mean that 249.5g of thrust are to be provided. This translates to 62.4 g of thrust per motor. With a linear interpolation in between thetwo data points (40 g and 80 g) 11 W are found to be required by each motor.
All the information about the motors was taken from the experiments that were performed with the DYS 1306 incombination with a 5x3 propeller (5" diameter and 3" pitch). This was found to be the best match for this motor as5" propellers have usually a low efficiency (because of the small diameter). At maximum thrust, the efficiency of thiscombo can be expressed by the thrust over power ratio, which in this case is 7 g/W.
6.3. Power consumptionIn order to find an accurate power consumption, the mission will be divided into seven main stages. For each stage, twomain parameters are assigned: the time duration and the subsystems that are needed. The mission is divided into thefollowing phases: take-off, cruise, detecting, pollination, turning, cruise back, landing. For the case of the subsystems,all the subsystems will be grouped into 5 main groups: the fish eye camera, the stereo-avoidance system (stereo cameras),the blower, the propulsion and the electronics which gather the IMU, processing unit with storage, GPU and CPU, laser-avoidance rangers, UWB, multi-function barometer and ESC. In fact, the latter will always be on for all the missionphases. The final flight mission time is found to be optimal at 10.5 min, consequently it will from now on be used asthe mission duration. In order to assign the respective times for each phase, the phases of take-off, turning and landingwill be assigned fixed times, given that they do not change, are well defined and there is no clear benefit in assigningvariable times to them. Then, the phases of cruise and cruise back are variable depending on the stage of the pollinationin the greenhouse. But for the nominal mission, they will be assigned average values of distance and time. On the otherhand, the phases of pollination and detection are where the maximum time is to be invested and also when the maximumpower is required, partly because of the blower drainage. Consequently, the time allocated for them is the remainingtime from the flight time minus the other phases. It is assumed that the phases occur subsequent to each other, with theexception of the pollination and detection phases, which occur simultaneously, and turning, which happens at half thetime duration of the pollination plus detection phases. More graphically, APIS will pollinate plus detect on one side ofthe row and when the battery level is at half, it will turn and pollinate the opposite side in the same direction from whereit took off. In order to accomplish this, the remaining time of the mission minus the time-fixed phases, is fully dedicatedto pollination plus detection. This approach allowed to fiddle with and iterate on the mission time, which will ultimatelysize the battery capacity needed.
Take-off The first phase of the nominal mission is the take-off. In this phase, APIS takes-off from the hanging groundstation and sets itself to the height of the top of the crops, from where the navigation to the target commences. For thisphase, a height decrease of around 0.5 m has to be covered. This height is the difference between the hanging groundstation and the top of the crop. Moreover, a time of 3 s is allocated. When it comes to the subsystems, the electronicsmust always be on. Also, the stereo cameras will be on for object avoidance, especially for other drones approachingthe ground station to charge. Lastly, the propulsion must be on to provide necessary lift to cover -0.5 m in 3 seconds.According to the model previously explained, the power will have to be set to 61.9% of the maximum the motor canconsume.
Cruise The second phase is cruising to the required location. Given that the distance to travel will depend on whathas and has not been pollinated, an average between the best and worst scenario is taken. The best case is that the rowto pollinate is right in front of the ground station, so practically speaking, this is a 0 meter distance. On the other hand,the worst case would be having to start from the very end of the row, so a travelling of 100 meter. Consequently, fora nominal mission a distance of 50 meter is taken, for which a duration of 50 seconds is assigned, leading to a speedof around 1.01 meter per second. For the case of the subsystems, electronics will again be on. Similarly, the stereo-avoidance will be on for object avoidance, again focused on other APIS suddenly appearing. The propulsion will haveto be powered at a 59.7% of the maximum power to get this done.
Detection The phases of detection and pollination happen interleaved. During the detection phase, APIS focuses onflower detection in order to go from one bunch of flowers to the next one. According to the input from ing. Jan Janse,there are around 4.5 plants per meter square, each has one cluster of 6 flowers and there are 63 rows in the greenhouse.Bearing in mind that the blower can pollinate the entire cluster in one go, the distance in between the plants will size

34 6. Propulsion and power
the time for this phase. Considering a greenhouse of 200x200 meters, a total of 180,000 plants are raised inside, whichmeans that there are around 2,857 plants per column. With a length of 100 meters per row, the distance in between plantsis of about 0.28 meters. Given that in this phase detection is key, the proposed speed to improve detection is 0.5 metersper second. Assuming from Section 8.6 that 15 frames per second are scanned, then at the given speed each image is3.3 cm apart. Further including the fact that flowers are in clusters of 15 cm across, the cluster will appear is around 5frames in the worst case scenario, which seems reasonable to ensure detection. This phase requires the electronics towork together with the stereo avoidance system for obstacle avoidance with special attention to both: APIS and hangingwires. Also, given the soft-start properties of brushless motors and control implications, the blower will be continuouslyon during the detection and pollination phases, rather than switching in between on and off. The propulsion modeloutputs a require 59.7% of the maximum power to fly at required speed.
Pollination The pollination phase is the heart of the mission. In this phase, three main sub-phases take place: flowerdetection confirmation, positioning and blowing. For these three, the assigned times are 1 s for confirmation of detection,4 s for positioning and 6 s for blowing and making sure the flowers are shaken. The times come from conservativeanalysis on different subsystems, 1 s for confirmation feeds from Section 8.6 and the 6 s for pollination was found tobe a conservative value from Section 5.2.4. Lastly, the 4 s for positioning and pointing of the blower was assigned on aconservative basis. As aforementioned, this phase is the core of the mission and for this reason the time for it is adaptableto the level of battery left on board. This being the case, this phase will consume the most energy when compared to theother phases. The subsystems which will work during this phase are the same as for the detection phase, with the maindifference of the propulsion thrust. Assuming that this phase will mainly be done in hovering mode, the power outputfrom the model is 59.6% of the maximum achievable.
Turning When the battery levels are at half, APIS will initiate the other-side mode, for which a change of heading willbe necessary. The assigned time for this task is 2 s. It is assumed that the maneuver can be accomplished by hoveringand shifting the rpm of counter-rotating propellers to allow the variation in angular momentum to change the heading.For this, the electronics and stereo avoidance system will be on. To accomplish this, the power setting output is the sameas for when hovering in the pollination phase: 59.6% of the maximum power.
Cruise back This phase is similar to the second phase, with the fundamental difference that now APIS returns to thehive from its mission accomplished. Nonetheless, when looking at the practical aspect, the distance and time assigned isalso set to 50 m in 50 s. As previously discussed, these values are dependent on the stage of pollination of the greenhouse,but for battery sizing purposes a mean value was chosen. The same subsystems that were connected for the cruise phaseare functioning here and the same 59.7% of propulsion power is used.
Landing The very last phase of the mission is returning home safely to ensure a proper landing to pin charge thebattery. Similar to the take-off, APIS has to climb for around 0.5 m to arrive tot he hanging ground station from the topof the crops. Nonetheless, given the added difficulty of the pin charge, extra time is budgeted for this phase, being 10 s.The subsystems used for this phase coincide with the take-off phase with the exception for the propulsion subsystem.The latter is modelled to require a 59.8% of maximum power.
Power profile and energy consumption overview At the end of the day, each phase contributes to the final energywith its own power consumption. The final values for these are tabulated on Section 6.3.
From Section 6.3 it can be seen how the phase with the highest power drainage is detection, in fact, after someexamination it also turned out to be the mission with the highest required nominal intensity, being 8,716 mA.
However, for the battery it is also important that the ability to deliver sudden short bursts of intensity to allow quickmaneuvering. For this purpose, a conservative limit has been chosen for the propulsion subsystem. Assuming that thepropulsion will work at a 100% thrust for a quick maneuvering, the intensity it would require to power APIS at thepollinating phase would add to 12,677 mA. These values will be used to size the battery subsequently.
Graphically, the energy consumption can be visualized into a percentile distribution per phase, as it can be seen inFigure 6.3. In this figure, it can be seen how the most energy costly phase is the pollination with up to 77% of the totalconsumption. This is mainly driven by its lengthily duration. Then, the phases of detection and cruises each consume6% and 8% of the total energy, respectively. Lastly, for the case of the phases of take-off, turning and landing, theircontributions are hardly visible, mainly because they extend shortly in time when compared to the other phases.

6.4. Battery selection 35
Table 6.2: Energy consumption breakdown and power consumed per phase
Phase Max power [W] Energy [J] Duration [s]
Take-off 49.376 143.1 3Cruise 49.276 2,388.2 50Detection 50.231 1,809.4 36.5Pollination 49.499 24,058.9 478.5Turning 47.7 95.4 2Cruise back 49.276 2,388.2 50Landing 47.856 477.9 10
Total 50.231 31,361.1 630
Figure 6.3: Energy consumption per phase during the mission
6.4. Battery selectionThe battery plays a key role in the mission development. To start with, the capacity sizes the endurance of the mission, themaximum intensity it can deliver constraints the connected subsystems, the maximum intensity at which it can be chargedaffects the size of the batch of drones in the greenhouse, the voltage has an impact on the number of voltage regulatorson board and the choice of motors and, last but not least, the number of cycles the battery can cope without importantdegradation also has to be taken into account. These properties have to be traded-off with mechanical characteristics likeweight and volume.
To start the selection procedure, the voltage required for APIS subsystems was the first design stage. As previouslystated, the sized motors for APIS’s weight were found to run on 7.4 V. Considering that lithium polymer is the technologyfound to best fit APIS needs [9], the cell-voltage is 3.7 V, consequently, the battery was already constraint to have a 2Sstructure. The next step is finding what capacity the battery needs. Following from the mission breakdown and energyconsumption, the required watt-hours can be found converting the Joules, from where the capacity follows from thewell-known power, intensity and voltage equation. In the end, the energy needed was 31,361.1 J, which meant 1,177mAh. Also fed from the mission breakdown, the intensity required for both nominal and short sudden bursts must betaken into account to find the C-rate required from the battery. When it came to charging, the shorter the charging timethe better at the expense of reduced lifecycles. The approach taken was based on manufacturers’ information on thecharging capabilities of the pack and if the charging C-rate was pushed more than what was recommended, the lifecycleswere lowered for that battery pack.
In the end, the decided approach was looking into currently available solutions at the worldwide supplier Hob-byKing5. Also following from the requirements (DP-MAV-3-POW-3) to maintain a good battery health, the depth ofdischarge (DoD) was set to be less than 90%, which means a battery capacity of at least 1,307 mAh. The DoD hasbeen implemented as an extra layer of security for the battery lifetime, given that the manufacturer already designs itsbatteries with mechanisms to increase it. After a lengthily investigation targeting batteries with more than 1,307 mAh,the main candidates can be found in Table 6.3. Furthermore, a final overview of the required capacities can be found inTable 6.4.
5https://www.hobbyking.com [Cited 15 June 2017]

36 6. Propulsion and power
Table 6.3: Options for batteries.
Option Brand-Family Capacity[mAh] Config. C-rate
(Nom, burst, charge)Mass
[g]Cycles
[-]Price[C] Comments
1 Turnigy-Lipolya 1500 2S1P (25C, 35C, 5C) 84 160+ 8.92 -2 Turnigy-Nanotechb 1500 2S1P (20C, 40C, 5C) 75 250+ 8.78 -
3 Turnigy-A spec G2c 850[1700]
3S1P[2S2P] (60C, 90C, 15C)
84[112] <320
11.51[23.02]
[Customized: buy 2, get rid of 1 cellin each and place them in parallel.]
4 Zippy-Compactd 1500 2S1P (40C, 50C, 5C) 99 100+ 10.81 -
5 Turnigy-Graphenee 1500[1500]
4S1P[2S1P] (45C, 90C, 15C)
201[100.5g] 900+ 14.62
[Customized: get rid of 2 cellsto end with right voltageand modify dimensions to be 139x27x15 mm3]
ahttps://hobbyking.com/en_us/turnigy-1500mah-2s-25c-lipoly-battery.html [Cited 23 June 2017]bhttps://hobbyking.com/en_us/turnigy-nano-tech-1500mah-2s1p-20-40c-lipo-receiver-pack.html [Cited 23June 2017]
chttps://hobbyking.com/en_us/turnigy-nano-tech-a-spec-g2-850mah-3s-60-90c-lipo-pack.html [Cited 23 June2017][Cited 23 June 2017]
dhttps://hobbyking.com/en_us/zippy-compact-1500mah-2s-40c-lipo-pack.html [Cited 23 June 2017]ehttps://hobbyking.com/en_us/graphene-1500mah-4s-45c-w-xt60.html [Cited 23 June 2017]
Each of the above batteries are the best suited from their technology family or available brand. However, only onecan be chosen for APIS.
Table 6.4: Overview of capacities for battery selection
DoD [%] Capacity [mAh]
Nominal mission 100 1177From requirement 90 1307Chosen battery 78.5 1500
Considering a self-posed margin of around 105 g and C50 for the battery, almost all the above options fit, except fornumber 3, which is heavier due to its overdesigned capacity, so it will be discarded. As it can be directly seen, option1 has no added value when compared to number 2, consequently it can be directly discarded. Now that the remainingoptions (2,4,5) adapt to the energy and intensity consumption, a check on the charging capabilities followed. Lithiumpolymer technologies bears the ability to be charged at an intensity higher than for lithium-ion, in fact manufacturerswill always provide the maximum charging rate that can be used without incurring into overheating problems. Fromexperience, the lower the C-rate used the less the lifecycles get affected 6. This is especially the case if the recommendedC-rate is further above the charging C-rate, however there does not seem to be enough literature on this matter and relyingon hobbyist proves to be one of the few available sources. For the chosen battery and the given consumed energy, thetime for charging results from the Equation (6.8):
Charging Time =Energy Consumed [mAh]
Nominal Intensity [mA] ·C− rate·3600 =
1177
1500 ·C− rate·3600[s] (6.8)
Consequently, when looking at the options provided in Table 6.3, the best options would be either option 3 or 5, butgiven that 3 is discarded, option 5 would be the most suitable for this aspect. However, charging at such a high C-ratemight still have detrimental effects on the battery lifecycle 7, consequently, a more conservative value is chosen for thecharging C-rate. Aiming to have a charging time of 15 min, in order to result in a total number of 58 drones and at least7.25 ground stations, from the drone sizing model calculation, the final C-rate required is of 3.1C. A key check is thatthe required intensity can be met by the battery. For this, the discharge C-rate is looked into. Knowing that the missionentitles a nominal intensity of 8,716 mA and a maximum sudden burst of 12,677 mA, the options must at least have 5.8nominal and 8.45 burst C-rate. Given that all the options check out, this is not a driving design requirement. Anotherimportant factor is the cycles of life. According to HobbyKing 8, Zippy batteries make around 100 lifecycles, TurnigyLipoly around 160 and Turnigy nano-tech makes it all the way to 250 lifecycles. On the other hand, the new technologyof graphene anodes allows for a longer cycle life at the expense of some extra weight. Ultimately, the lifetime of the
6Private conversation with Erik van der Horst, MAV lab, TU Delft7https://www.rcgroups.com/forums/showthread.php?2748131-Does-charging-at-more-than-1C-reduce-battery-life [Cited 23 June 2017]
8http://www.hobbyking.com/hobbyking/store/ebasic.asp [Cited 23 June 2017]

6.5. Blade element momentum theory 37
battery was considered to be a key parameter. Not only it heavily impacts sustainability, but it also forces the farmer toperform battery replacements more frequently, which is always undesired. Thus, considering the lifetime, for a missionthat takes 10.5 min and charges for 15 min for 12 hours during every 3 days, a battery of a 100 cycles will have tobe replaced every 3.6 days. For the case of option 5, the graphene-anode battery, the lifetime could be stretched up toaround 4.6 weeks of battery up to a 80% degradation. Considering that the battery is currently with a DoD of 78.5%, thelimit of usable life of the battery will lay around these 900 cycles. Having weighted all of the above, the battery whichseems to best suit APIS is option 5, the customized state-of-the-art graphene electrode battery. Lastly, concerning size,the size of the battery will be adapted to the drone sizes, however the volume will be kept constant. Using an initial sizeof 107x35x28 mm3, this has to be halved following the cut in the number of cells, and then the final dimensions willbe 139x27x15 mm3, which matches the needed volume. As a last advantage of the graphene technology, the internalresistance (IR) is usually smaller than for conventional Li-Po batteries. In fact, according to the manufacturer, an IR ofonly 1.2 miliOhm is present. Conservatively speaking, using the maximum intensity found along the mission, 8,716 mAduring detection, and taking it for the entire 10.5 min of the mission, only 57 J or 0.1% of the total energy consumed isloss in this resistance. Internal resistance has thus not being considered for the battery sizing. The final battery propertiescan be found in Table 6.5.
Table 6.5: Final battery implications for customized Turnigy graphene 2S1P 45C to 90C
Mass[g]
Capacity[mAh]
Charging time[min]
DoD[%]
Lifetime[h]
Change every[Days]
Dimensions[mmXmmXmm]
100.5 1500 15.2 78.5 385.35 32.11 139x27x15
6.5. Blade element momentum theory
To validate the thrust that is produced and to find the induced velocity, a blade element momentum analysis is made.The rotor is divided in a number of elements. At each element, a set of non-linear equations is set up, based on forceand momentum balance. This set of equations can be solved and the overall thrust of the rotor can be found9. First, theelemental thrust of a blade element dr can be found using Equation (6.9), where V denotes the section local flow velocity,B the number of blades, c the local chord length, Cl and Cd denote the local lift and drag coefficients respectively andφ is the local angle between the axial and tangential flow velocities. The section local flow velocity can be found bysumming the axial and tangential velocities V0 and V2, as described in Equation (6.10).
dT =1
2ρV 2Bc(Cl cosφ−Cd sinφ)dr (6.9) V =
√V 2
0 +V 22 (6.10)
The tangential velocity V2 is assumed to be equal to the rotational speed of the propeller times the distance. The axialvelocity V0 can be assumed to be equal to the induced velocity below the motor Vi . and is more difficult to calculate.As it is dependent on the local thrust at the several blade elements, an iterative process should be performed to convergeto the induced velocity. The local thrust from Equation (6.9) can be integrated over the radius of the propeller to findthe total thrust that is required. Further inputs that are required, are the local lift and drag coefficients, the shape ofthe propeller and the number of rotations per minute. The coefficients are assumed from simple linear lift behavior(Cl = 2παloc ). The propeller is assumed to have a constant chord length over the radius of 1 cm and a constant bladepitch of 16 degrees. Another assumption is that no tip loss is calculated and that all the thrust is produced between0.2c < c < 0.95c. Running this model over 16 blade elements and 7,500 rotations per minute gives an induced velocityprofile. The total thrust of four motors at this condition is 246.7 grams. In Figure 6.4, the induced velocity is plotted.
9http://s6.aeromech.usyd.edu.au/aerodynamics/index.php/sample-page/propulsion/blade-element-rotor-theory/ [Cited 7 June 2017]

38 6. Propulsion and power
Figure 6.4: Induced velocity over length of the rotor Figure 6.5: Comparing test data with blade element theory calculations
The model is verified using the limit cases. For example, zero RPM should yield zero thrust, in the model, this is thecase. Also, the results of the model are compared with a tool from internet 9. Finally, the model is validated comparingthe results to actual test data from an article [29]. Comparing with this data gives no large discrepancies. Finally, tovalidate the model, it is useful to compare the test data of the actual propeller of the APIS with the blade element model.A test was performed 10, where thrust force is tabulated together with the rotational speed, using the 5030 propeller. Thiscomparison is shown in Figure 6.5.
For the lower magnitude of revolutions per second, the total thrust seems to match quite well. At a higher number ofrotations per minute, the thrust quickly diverges. This can be explained by the assumption of linear lift behavior and theconstant angle of attack. In reality, at higher speeds, flow separation of stall phenomena occur, while this is not modeledin the analysis.
10http://www.myrcmart.com/rcx-h1306-3100kv-micro-outrunner-brushless-motor-efficiency-racing-p-7937.html [Cited 21 June 2017]

7Electronics
This chapter will show the process used for establishing the final electronic system of the quadcopter. First, the compo-nents that are needed will be described, which are the microcontroller Section 7.1, the communication system Section 7.2and the sensors Section 7.3. After that the electrical design process will be described and the block diagram will be pro-vided, Section 7.4. Also a mass and power estimation will be given, Section 7.4.3. Finally, a insightful description aboutwiring will be given in Section 7.5
7.1. MicrocontrollerAs in many of the nowadays smartphones, the microcontroller forms the base of an electronic system. It basicallyconsists of a small computer known as system on a chip (SoC) or integrated circuit (IC). This is composed of centralprocessor units (CPU), memory (ROM, RAM or flash) and pins for input/output peripherals. The microcontroller oftenalso include a graphics processor unit (GPU), a digital signal processor (DSP) and support for camera, display, locationof connectivity (LTE/Wi-Fi/BT).
The microcontroller should come pre-loaded with a bootloader in order to make it possible to be program the con-troller through USB (an example could be DFU Bootloader). The peripherals, or in this case the sensors, can be con-nected through different interfaces, the most common ones being the SPI (Serial Peripheral Interface), UART (UniversalSynchronous/Asynchronous Receiver Transmitter) or I2C (Inter-Integrated Circuit). SPI is faster and it requires 4 lines:SCLK, MOSI, MISO, SS; I2C requires only 2 lines: SDA bidirectional data and SCL, same as UART with Tx and Rxlines (one transmitting to the receiver and the other one revceiving form the transmitter). To conclude, if there are plentyof IO lines, SPI is better because it´s up to 2-3 times faster.
The number of bits of a microcontroller refers to the size of the data bus. In general, heavier computations can beperformed on a larger data bus. Hobbyists usually opt for 8 or 16 bit with less than 128kB of flash ICs for a simple dronebecause it is sufficient for the level of computations required and it is easier to solder (less pins). The components of theSoC are hereby discussed.
CPU The Central Processing Unit is the chip in charge of handling the arithmetic, logic and pin operations requiredby the software. This part of the microcontroller can be chosen on the basis of three main characteristics: clock rate,instructions per clock and, their product, Instructions Per Second (IPS). Nonetheless, this information is rarely used dueto the difficulty of coupling it with the requirements from the desired algorithm.
GPU As for the Graphical Processing Unit, it allows to process lots of arithmetic threads by using multiple smallcores; however, not all microcontrollers for MAV are equipped with it. In fact, it is only considered here due to thedemand from the optical flow and stereo matching.
DSP The Digital Signal Processor is a chip whose sole function is to process digital inputs, which can come from aADC or from the communication subsystem. Modern microcontrollers take care that the DSP matches the CPU andGPU processing capabilities.
Flash memory The flash memory is the storage capacity of the microcontroller. Here the data is stored from thein-flight sensor measurements. It has to be sized to handle the monitoring images for the entire flying time. Thedownloading capacity also plays a role here.
(S)RAM The (Static) Random Access Memory is the memory space where calculations take place. The higher theamount of RAM, the more information "readily available". The RAM requirement comes from the chosen algorithmand it is also limited by the amount of bits the microcontroller runs at.
39

40 7. Electronics
(EEP)ROM The Electronically Erasable Programmable Read-Only Memory is the location where the instructions arestored. The MAV reactions to external stimuli are based on the code found in this location. The memory size of the codeis the main input to size it.
I/O pins The number of available Input/Output pins basically allows to attach more or less external sensors. Theprotocol on which they run also has a major effect on the final required number of pins. The microcontroller must haveenough pins to connect all the required sensors.
ADC/DAC The Analog to Digital or Digital to Analog Converters, are usually coupled to the pin capabilities and theytransform the analog to digital signal and viceversa. These are rarely a variable when choosing a microcontroller, as theycome together with the pin choice.
7.2. CommunicationThe choice of communication was previously discussed to be the DecaWave Module 10001. However, in order tointegrate the DWM1000, the microcontroller must have at least one SPI port open. This means that 4 pins on SPIprotocol must be available, namely, one for chip select, Master Output Slave Input (MOSI), Master Input Slave Output(MISO) and clock. Lastly, this module requires a 3.3V input, a ground output and a reset input. The module will takean area of 13±0.2 x 23±0.21 mm2 on the board.
7.3. SensorsSimilar to insects, the pollinator drone also needs sensors to monitor and fly around in its environment. In the green-house, environmental conditions are challenging. The temperature range is between 28 and 35 degrees Celsius andaverage humidity is around 70%, with maxima lying at 95%, minima lying around 40%2. Moreover, there is a needfor having a mobile sensory system on board a flying vehicle. Therefore, it is investigated if such a sensor can also beincorporated in the electronics. These sensors can gather data all around the greenhouse and allow for more accurateclimate control and failure detection [30]. Temperature and humidity models in greenhouses are well researched andimplemented. A Mini-UAV based sensory system for greenhouses has been designed and used [31]. In this study, theDHT-22 temperature/humidity sensor from Table 7.1 is used, combined with a luminosity and CO2 sensor. Challengeslie in accurately choosing the position of the sensor and defining the influence of the airflow on the sensor. Errors for themeasurements are around 4%. Therefore, it can be stated that all the sensors listed in Table 7.1 can measure temperatureand humidity accurately enough for control and monitoring for the farmer.
Table 7.1: Humidity and temperature sensors. The T and the H in the accuracy column are the temperature and humidity, respectively
Sensor Voltage [V] Current [mA] Accuracy
DHT-22 3.3 - 3.6 1.5T: ±0.5 °CH: ±2%
DHT-11 3.0 - 5.5 2.5T: ±2°CH: ±5%
BME280 1.7 - 3.6 0.0036T:± 0.1 °CH ±3%
HTS221 1.7 - 3.6 0.002T: ±0.5 °CH ±3.5%
Generally, most small aerial vehicles have a barometer to accurately measure the height at which it is flying. InTable 7.2, a list of barometers is presented. Looking at the table, its relatively small size and low cost stand out.Attentive readers might have seen a commonality between the temperature/humidity and barometer table. The BME280is an environmental sensor that can measure temperature, relative humidity and pressure.
1https://www.decawave.com/products/dwm1000-module [Cited 9 June 2017]2Talk with greenhouse expert Jan Janse, 2 June 2017

7.4. Electrical design 41
Table 7.2: Barometer sensors. Note that all the barometer sensors have an accuracy of 8.33 cm/pa
Sensor Max Amps [µA] Max Voltage [V] Cost [$] Size [mm]
BME 280 3.6 1.2-3.6 7.5 2.5 x 2.5 x 0.93BMP 280 2.7 3.6 3.87 2.0 x 2.5 x -BMP 380 2.0 3.6 - 2.0 x 2.0 x 0.75SPT-B10W - 1.8 - 1.4 x 1.0 x 0.6MPL115A1 10 5.5 2.12 5.0 x 3.0 x 1.2MS5607-02BA03 12.5 4.0 3.68 5.0 x 3.0 x 1.0
Another unit that is needed in order to control the quadcopter is the inertial measurement unit (IMU). This unit con-sists of accelerometers, gyroscopes and magnetometers and these are essential to know the orientation of the quadcopter.For choosing the IMU, the following aspects are considered: mass, power consumption, communication, cost and size.Table 7.3 shows the IMUs that are suitable for the mission, including their properties. Moreover, not only the aspectsmentioned in the table have been considered, also the number of bits and pins have been investigated. These aspects areimportant in order to size the micro controller. Due to the fact that for the inertial measurement units these values aremostly the same, these columns have not been included in the table. The number of bits is 16 and the number of pinsis 24. However, for the ones without a magnetometer the number of pins is less. For the BMI160 and the BMI055 thenumber of pins are 14 and 16, respectively.
Table 7.3: Inertial measurement units and their properties. Note the mass is not for the chip, but for the breakout (PCB included). The (no mag) aftera IMU serial number is added if there are no magnetometers included
Sensor Mass [g] Current [mA] Voltage [V] Communication Cost [dollar] Size [mm]
MPU-9250 8.5 3.5 2.4 – 3.6I2C (400kHz)SPI (1MHz) 14.95 3.1 x 3.1 x 1.05
LSM9DS1 - 4.6 1.9 - 3.6I2C (100kHzor 400kHz)SPI (1MHz)
24.95 3.5 x 3.0 x 1.0
MPU-6050 85 0.50 2.3 - 3.4I2C (400kHz)SPI (1MHz) 39.95 25.5 x 15.2 x 2.48
BMI160 (no mag) - 0.95 1.2 - 3.6SPI, I2C,4x digital - 2.5 x 3.0 x 0.8
BMI055 (no mag) - 5.15 1.2 - 3.6SPI, I2C,4x digital - 3.0 x 4.5 x 0.95
FIS1100 IC, .146 0.990 2.4 - 3.0 SPI, I2C 9.36 3.3 x 3.3 x 1.0IMU-3000 0.091 6.1 2.1 - 3.6 I2C 9.82 euros 4.1 x 4.1 x 0.95
LSM303C 8.5 4.90 1.9 - 3.6I2C (100kHzor 400kHz)SPI (1MHz)
14.95 2.0 x 2.0 x 1.0
7.4. Electrical designIn this section, the final design of the electronics on board the drone will be presented. The interaction between theperipherals and the main controller are explained and illustrated in a block diagram (Figure 12.5). Although the mainfocus is on the interfaces between the components needed, a full schematic of the printed circuit board (PCB) will notbe provided in this report, due to the copyrights of Qualcomm. After the choice of the microcontroller needed, a generalexplanation of the Snapdragon flight kit is provided on Section 7.4.1. Once the kit is presented, the steps to optimize itwill be discussed on Section 7.4.2. Lastly, the positive consequences of this optimization are given on Section 7.4.3
7.4.1. Snapdragon Flight kitThe Snapdragon Flight kit provides with the state-of-the-art most basic elements to program the controller for the drone.This kit allows the buyer to code the brain of the drone from scratch, making it a really attractive option for developers.In a nutshell, these type of System on a Chip (SoC) are equivalent to a small, yet powerful, on-board computer andthey come with their own power feeder and data bus. This computer is initially required to stabilize the drone, but withthe recent advances on computer technology, more applications can be done on-board, such as image recognition orautonomous flight.

42 7. Electronics
In order to accomplish these, a powerful CPU, GPU and DSP come installed on the microcontroller i.e. Snapdragon801 (illustration in Figure 7.13). In fact, the computing power on-board allows to not only analyze data from the sensors,but also to transmit it. The development board can also communicate wirelessly through all the current technologies, suchas Bluetooth, LTE or Wi-Fi, apart from modern Near Field Communications (NFC). As an example, the developmentboard can extract velocity out of optic flow and record high resolution video, while enabling a wireless communication,running a heavy-duty algorithm and balancing the drone all at the same time a GPS location is looked for. Furthermore,the board comes with the possibility to connect more external sensors for other activities, which allows for even moredesign space.
Figure 7.1: Snapdragon 801 microcontroller features
More exhaustively, the Snapdragon Flight kit comes with the development board, a 4K and an optic flow camera, apower adapter and a serial connector. It features a Qualcomm Snapdragon 801 microcontroller with 2GB of RAM and32GB of flash. On the board itself an IMU (MPU-9250) and a barometer (BMP-280) are installed as well as modulesfor GPS, WLAN and Bluetooth. External connectors for GPS and WLAN antennas are implemented together with andSD card slot, an ESC connector on I2C, a USB 3.0 connection and other external ports for sensors on I2C or UARTinterfaces. A diagram of the board can be seen in Figure 7.24[3] and the corresponding pin-outs and external connectivityoptions are summarized in Table 7.45[3].
(a) Front side (b) Back side
Figure 7.2: Illustration of the Snapdragon Flight PCB. The connectors J1 to J15 are described in Table 7.4
3https://www.intrinsyc.com/vertical-development-platforms/qualcomm-snapdragon-flight/ [Cited 12 June 2017]

7.4. Electrical design 43
Table 7.4: The external connections of the Snapdragon Flight
Connector Function
J1 Stereo camera (Right)J2 USB 3.0 (KMMX-AB10) max. 2AJ3 Debugging expansion B2B, 60 pins availableJ4 Micro-SD slotJ5 Stereo camera (Left)J6 GPS passive antenna configurationJ7 WLAN0: Wi-Fi MIMO Channel 0J8 WLAN1: Wi-Fi MIMO Channel 1, Bluetooth 4.0J9 BLSP2: External IMU or GPS (on UART or I2C interface)
J10 Optic flow camera (640×480px)J11 High resolution camera (4K)J12 BLSP8: External gimbal or sensor (on UART interface)J13 BLSP6: External ESC (on UART interface)J14 5V DC IN (max. 2A) with I2C interface for Advanced Power Management (APM)J15 BLSP9: External magnetometer/radio receiver/sensors (on UART or I2C interface)
7.4.2. Flight board optimizationFortunately, the spectrum of features the Snapdragon can accomplish is too broad for this mission. Consequently, inorder to save on both power and mass, several modules will be disabled or completely removed. These changes willadapt the electronic system to the exact mission requirements and enhance the final performance, especially on thebattery side. In this subsection, the customization process will be shown and explained, including the required additionsto the board and the modules which were eliminated. An overview can be found in Table 7.5.
Table 7.5: Modifications on Snapdragon 801
Removed Add-on
Module Jumper Ultra wide band [DWM1000]Barometer [BMP280] (U20) Barometer, thermometer & humidity [BME280]Bluetooth/WLAN [QCA6234] J7, J8 Power module [LTC2960]GPS [SE868V2] J6 ATmega 328Micro SD J4USB 3.0 J2Optical flow camera J10External sensors [BLSP (2,8,9)] J12, J13, J15
Barometer Bosch has recently released a new version of the BMP280 barometer which incorporates more functionsthan just measuring the pressure. The new chip is BME280 and in addition to the pressure, it also measures the tem-perature and humidity. With only an extra 25% in surface (from 2x2.5 mm to 2.5x2.5 mm) and extra 30% in powerconsumption (from 2.8 µA to 3.6 µA) the new sensor is relatively small and consumes an insignificant amount of powercompared to the entire electronic system. The added value (i.e. getting more data) can be used as an extra feature inmonitoring the plants better, possibly generating heat and humidity maps of the greenhouse. This is not a requirement,but in the future a software update can be released to incorporate extra functionality. It is noted that the electronicschematic does not require any modifications for implementing the new chip. It has the same number of pins (8) and itworks on the same interface (I2C).
GPS, WLAN & UWB The module SE868V2 used for GPS signal reception is interesting for autonomous MAVs,but in closed environments the signal acquisitions deteriorates. In order to fix this, a different positioning techniquewas chosen, namely the ultra wide band module provided by decaWave, DWM1000. Furthermore, DWM1000 allowsto also transmit data wirelessly at different rates (110kbps, 850kbps or 6.8Mbps). Provided that the mission is to beperformed autonomously, that the images will be downloaded during the 15 min of charging and that only location datais to be shared at all moments, the data rates are good enough for the mission. Consequently, the dedicated module

44 7. Electronics
for communications, QCA6234, based on Bluetooth and WiFi is no longer needed. By implementing these changes, asave on power of 52% can be achieved; the SVE868V2 and the QCA6234 consume 45 and 260 mA respectively, whilethe DWM1000 only consumes 160 mA. Moreover, DWM1000 is a mere 17% of the surface area of QCA6234 plusSVE868V2.
The UWB module requires 4 lines of communication with the main controller i.e. the Sanpdragon 801 via the SPIinterface. The data sheet of the Snapdragon Flight board provides information about additional I2C and UART interfacesas being available6, but it does not mention anything on SPI. The serial peripheral interface is the only bus supported bythe decaWave DWM1000. Given that the IMU on board the flight controller is already connected on SPI and that it isassumed there are no more slaves supported by the Snapdragon 801, it was decided that the IMU (MPU-9250) will beconnected on the I2C interface as it supports both SPI and I2C. With the main advantage being that the UWB modulecould be now implemented, the cost paid is on the clock speed. As mentioned in the beginning of this chapter, the I2Cis two times slower than the SPI, lowering the IMU data to 400 kHz. However, this is not a big problem, since theclosed feedback loop between the IMU and the motors was originally on 400 kHz, as the interface for electronic speedcontrollers (ESCs) is on UART not SPI.
SD & USB Transmitting data to the Snapdragon 801 can be accomplished in several ways: through the USB 3.0, themicro SD and the debug connector. In order to reduce surface, power and mass, only one of these three is required to loadthe code for the mission. Given that this will be done once in every long time, a high data rate is not of utter importance.This can rule the USB 3.0 out, plus this connector requires of 9 connections points while the debug connector is basedon a USB 2.0 with only 4 connectors. The main advantage of the SD slot is the increase on flash memory, however giventhe 32 GB of flash on the Snapdragon, it is not that advantageous. Consequently, given that the debug connector can alsoaccomplish data transfer, the USB 3.0 and SD slot have been removed. At the end of the day, this change means saving62% on surface area (from 396.9 mm2 to 149.8 mm2) and 35% on power (from 4.3 W to 2.8 W) was accomplished bythis change.
External connectors One of the many positive aspects of the Snapdragon 801 is the amount of available externalports, Table 7.4. Nonetheless, for this specific application, three of them will be removed for the sake of power andsurface area reduction. In fact, the jumpers 9, 12 and 15 will be disabled and dismounted. Jumper 9 was there to allowfor an external IMU or GPS, but an IMU is already on board and, as previously reasoned, a GPS is not useful in a closedenvironment. For the case of Jumper 12, a gimbal is not required for this particular MAV, thus this port is not required.Lastly, the jumper 15 is meant for an external magnetometer or a radio receiver, which for this application do not addextra value. These removals will ultimately reduce the mass of the board. Plus, each jumper requires of its own voltageregulator before attaching to the main board, thus the power consumption will be also benefited.
ESC The ESCs (one for each motor) will also be added on the main PCB. Such a speed controller consists of severalMOSFETs which work on PWM (pulse width modulation). A low level signal is sent from the main controller to controlthe gates that feed in high current to the motors. Because there is no information on the Snapdragon being able to sendPWM signals, an additional controller ATmega328 will be added as an interface between Snapdragon 801 and the actualMOSFETs. Therefore connector J13 from Table 7.4 will be used to send UART signals to the ATmega328 which wouldbe able to send further PWM signals to the MOSFETs. Five ESCs will be considered for APIS. Four for the main rotorsand one for the fan blower.
APM In order to allow for a proper battery-board communication, an Advanced Power Module (APM) is required. Forthis purpose, a wide range APM (LTC2946) is chosen to monitor the battery current, power, voltage, charge and energyat any moment. The benefit of this module on board is that battery charging monitoring can be done on-board, thus thecharging process can also be done autonomously. According to its datasheet, implementing this module on-board wouldcost 10 mW (1.3 mA at the battery 7.4 V).
7.4.3. Mass and power estimationNow that all the components are known, the mass and the power consumption can be determined. Due to the fact thatthe mass of most of the components are unknown, a different approach should be used in order to get a mass estimation.Since the mass and volume of the Snapdragon Flight are known, these can be used in order to calculate the mass of allthe components. The first step is to find the volumes of the components. After this, the volume of the components thatwill not be used are subtracted of the total volume of the Snapdragon Flight and the volumes of the components that are
6https://www.intrinsyc.com/vertical-development-platforms/qualcomm-snapdragon-flight/ [Cited 12 June 2017]

7.5. Wiring 45
not provided by the Snapdragon Flight will be added. Now, by using the relation between the mass and the volume, themass of the electrical system can be calculated. This method will be verified by checking if the area and volume of allthe components is the same as the area and volume of the Snapdragon Flight.
First the area will be investigated. This is done by estimating the size of the PCB that is needed to combine all thecomponents. In order to estimate the size of the PCB it is assumed that the PCB should have an area which is the sameas the areas of the components combined. When using this method the area of the PCB is 1493.3 mm2, the the area ofthe Snapdragon Flight is 2320 mm2 (58 x 40 mm)7. This gives a difference 35 %, which can be explained by the factthat the components do not lie exactly next to each other, there should be extra space for circuits. This can be seen inFigure 7.2. Now by using a typical PCB thickness of 1.6 mm 8, the volume can be verified. By adding all the volumesof the components a total volume of 4953.2 mm3 is determined. The volume of the Snapdragon Flight is estimated to be5336 mm3. This gives a difference of 7.2%. Lastly, the mass of the Snapdragon Flight board is estimated. A prototypeof the board was obtained and weighed by people from the MAVlab. A weight of around 30 grams was found, includingplastic attachments and the camera. The weight for the board only was estimated to be 18 grams. Some online sourcesstate even lower values9, but their numbers are not verified.
Now that the area and the volume are estimated, it is possible to remove and add the components that are neededfor this project. The list of components used with their volumes can be seen in Table 7.7. The total volume of all thecomponents is 3443.2 mm3. By using the relation between the mass and the volume of the Snapdragon Flight a densityof 3.37 g/cm3 is obtained. Using this density gives a mass of 11.6 grams, which is 35.4% lower than the SnapdragonFlight.
In order to find the total power of the electrical system, the power consumption of the components should be known.This can be done by looking at the data sheets provided by companies. The power consumption will be provided in termsof current, because this is directly related to power. The power consumption can be seen in Table 7.7. What can be seenin the table is that the total power consumption is 2039.3 mA of the modified Snapdragon Flight. For the SnapdragonFlight the total power consumption is 2292.5 mA. This means that the power consumption of the new system uses 11.0% less power than the Snapdragon Flight.
7.5. WiringTo provide power to the motors and to transmit data between the motor and the processor, wires need to be installedbetween these two systems. Wires are usually represented by the American Wire Gauge (AWG). A higher AWG numbermeans a lower diameter wire that can carry less current. Two wires, one positive and one negative, provide the power tothe motors. These need to be able to sustain a current of 3 A. These cables are 26 AWG ones 10, with an outer diameterof 1.5 mm, can sustain 3.5 A maximum and weigh 3.5 grams per meter 11. Moreover, from each motor, three wires needto transmit data with a current of at most 0.05 A. Therefore, the smallest wire available at Hobbyking 12, the 36 AWGwire is chosen. These wires have an outer diameter 0.3 mm and an estimated weight of around 0.2 gram per meter. Thedistance from the motor to the battery is 150 mm. From these values, Table 7.6 can be made. Having eight AWG26wires gives a wire mass of 4.2 grams. The twelve data wires have a total mass of 0.36 gram. This gives a total wireweight of around 4.6 grams.
Table 7.6: Overview of wire length, wire type and mass
Type # of wires per motor Type and max. current Length [mm] Weight [g]
Power 2 AWG26 - 3.5 A 1200 4.2Data 3 AWG36 - 0.05 A 1800 0.36
7https://www.intrinsyc.com/vertical-development-platforms/qualcomm-snapdragon-flight/ [Cited 12 June 2017]8http://blog.7pcb.com/pcb-thickness-options/ [Cited 12 June 2017]9https://finance.yahoo.com/news/intrinsyc-distribute-qualcomm-r-snapdragon-130000236.html [Cited 12 June2017]
10https://hobbyking.com/en_us/catalog/category/view/s/26awg/id/6905 [Cited 23 June 2017]11https://hobbyking.com/media/file/480129157X285439X54.jpg [Cited 23 June 2017]12https://hobbyking.com/en_us/catalog/category/view/s/36awg/id/6849 [Cited 23 June 2017]

46 7. Electronics
Table 7.7: Components used in the electrical system with their current and volume. Note that the volumes of the cameras are not taken into accountfor the total volume, this is because the mass of the cameras are known
Component Serial number Current [mA] Volume [mm3]
Ultra wide band x 2 DW1000a 320 57.6Temperature, humidity andbarometer BME280b 0.0036 5.8
Flight controller ATmega328c 0.3 85.6Charging system SMBC PM8941d 900.0 8.0IMU MPU9250e 3.7 10.1Voltage regulator TPS62130RGTTf 10.0 11.6
StorageEMMC flash 32 GB(KLMBG4GEAC-B031)g 180.0 149.5
Debug interface J3 connectorh 2000.0 456.9
ProcessorSnapdragon 801(APQ8074)i 50.0 236.6
Charge and Energy Monitor LTC2946j 1.3 9.0Mosfetdigital powerconversionmicrocontrollers PM8841k 940.0 7.7
CamerasStereo pair plusfish eye camera [Chapter 8] 325 -
Lasers x 2 VL53L0S 19 21.12Connectors J1 to J11 connectors - 451.4PCB - - 1450.8
Total 2039.3 3443.2
ahttps://www.decawave.com/sites/default/files/resources/DW1000-Datasheet-V2.12.pdf [Cited 12 June 2017]bhttps://ae-bst.resource.bosch.com/media/_tech/media/datasheets/BST-BME280_DS001-11.pdf [Cited 12 June2017]
chttp://www.microchip.com/wwwproducts/en/ATmega328 [Cited 12 June 2017]dhttp://www.ebay.com/itm/1PCS-Samsung-Galaxy-S4-I9500-Power-Supply-Chip-PM8941-IC-for-Motherboard-Repair-/400875210727?hash=item5d560647e7:g:5xgAAOSwh2xX~xH- [Cited 12 June 2017]
ehttps://www.invensense.com/wp-content/uploads/2015/02/PS-MPU-9250A-01-v1.1.pdf [Cited 12 June 2017]fhttp://www.ti.com/product/tps62130 [Cited 12 June 2017]ghttp://www.samsung.com/global/business/semiconductor/file/media/Samsung_eMMC_2013_Final_HR-0.pdf[Cited 12 June 2017]
hhhttp://suddendocs.samtec.com/catalog_english/qsh.pdf [Cited 12 June 2017]ihttps://www.usenix.org/legacy/event/atc10/tech/full_papers/Carroll.pdf [Cited 12 June 2017]jhttp://cds.linear.com/docs/en/datasheet/2946fa.pdf [Cited 12 June 2017]khttp://www.st.com/content/ccc/resource/technical/document/datasheet/group3/73/70/c1/17/c8/92/4a/8c/DM00141527/files/DM00141527.pdf/jcr:content/translations/en.DM00141527.pdf [Cited 12 June 2017]

8Navigation
In this chapter, the navigation and communication between the drones and ground stations in the greenhouse are ad-dressed. First, the overall navigation of the APIS will be discussed on a detailed level. Next, the positioning systemused, which relies on UWB, will be elaborated by first discussing the protocol used and then the method for rangingadopted. After that, the method for determining the attitude based on using two UWB tags is explained. The way thedrone navigates safely through the greenhouse will then be considered. This entails an overview of obstacle detectionand obstacle avoidance methods used. This is followed by a discussion on the flower detection module and the way itconfirms that pollination has been done. The choice of cameras and the rationale behind the choice made is made clearin the section that follows. Finally, verification and validation methods pertaining to this segment are briefly discussedin the last section of this chapter.
8.1. Navigation strategyFor the MAVs to perform the pollination process they need to travel to and come close to the flowers. The process startswith the ground station determining the area that has to be pollinated by each MAV. The location of this area and theposition the drone should fly result from the 2D-map of the greenhouse that the ground station will create and updateduring the mission. This is further explained in Chapter 11. This section will also explain the positioning of the groundstations in the greenhouse. The MAV, when taking off will go to the height of the rows where the tomato flower plantsare located. It leaves the ground station and descends to a certain height that is specified by a visual marker. This visualmarker has to be manually adjusted to the row height (approximately 10 cm higher). This allows the drone to enter therow and start pollination directly. The trajectory that has to be followed to reach it’s destination will be computed by theground station and communicated to the MAV.
For the MAV to follow the right trajectory, a high positioning accuracy is needed. GNSS (Global Navigation SatelliteSystem), which is not very accurate 1, is therefore not possible. Camera based positioning was eliminated due to thefact that the MAVs are navigating in a cluttered environment and thus will be hard to track. Since an ultra wideband(UWB) system is known for its very good positioning accuracy [32], this system will be used to determine the MAVscurrent position compared to its destination. A great advantage of such a system is that it can also handle the sendingand receiving of signals and data. Several algorithms are available to perform the position estimations for the UWB. Themost interesting ones are the following: time of arrival (TOA), angle of arrival (AOA), received signal strength (RSS) andtime difference of arrival (TDOA). According to Hatami and Pahlavan, RSS is the most suitable for narrowband systemsinstead of wideband systems, thus not suitable for the UWB system [33]. Although AOA has an interesting accuracy itis not practical for the design since AOA requires the MAVs to carry large antennas. Two time-based methods remain.Both have a high accuracy due to the fact that UWB has a high time resolution [34]. The pollinator drone system willuse the TDOA algorithm since no clock synchronization is needed between the different components of the system. Thisalgorithm measures the difference in time between the arrival of the signal sent by the MAVs to the multiple receiversplaced in the greenhouse. To obtain global orientation information, a second UWB tag will also be put on drone.
To navigate the MAV to the desired location, its current one is used. The positioning accuracy is furthermoreimproved through the IMU and the on-board cameras that can also compute the MAVs location. These three locationestimates can be combined by applying a form of sensor fusion such as Kalman filtering [35].
When the distance between the MAV and its destination is known, the MAV will move forward, the relative distancewill be measured again and the attitude of the MAV will be adjusted accordingly. This process will continue until theMAV reaches the start of the row. The attitude of the MAV will now be adjusted to the location in the row where it needs
1http://www.gps.gov/systems/gps/performance/accuracy/ [Cited 21 June 2017]
47

48 8. Navigation
Figure 8.1: An illustration of three possible UWB protocols. (a) 2-way ranging; (b) combination of broadcasting and 2-way ranging; (c) broadcastingonly ranging
to start pollinating. The MAV will fly to this location under the guidance of the fused location estimation and will startwith the flower detection phase.
The altitude at which the MAV enters the row is stored and is used as reference altitude for the entire row. TheMAV travels within the row using stereo-vision to detect obstacles (more inforation provided in Section 8.5). As will beexplained in Section 8.6, a fisheye camera will be placed at the right side of the MAV at an angle of 45 degrees to detectthe flowers. The drone would then be flying at a slight elevation above the top of the row at approximately 10cm. Thewake of the MAV will also not distort the images taken by the fisheye as the camera is not directly pointing downwards.
8.2. UWB protocolUWB radio technology uses low energy signals spread over a large portion of the spectrum for short-range, high-bandwidth communications. UWB is also relatively immune to multipath fading. UWB localization and communicationis based on the the IEEE 802.15.4 [36], a standard for wireless personal area networks. They therefore only use frequen-cies allowed for general use and witness minimum interference as they represent a local small-scale network.
The biggest advantage of UWB is that the same technology and hardware are used for both localization and com-munication. Communication with throughput of up to 6.8 Mbps can be achieved with the module selected 2. Dopplereffects are considered in the protocol implementation. Nevertheless these are assumed to be negligible as the maximumvelocity under nominal operating conditions of the APIS drones is about 1 m/s. Furthermore, the UWB communicationsystem automatically tries to re-establish connection in case it is lost.
Localization of an UWB tag is achieved by finding the distance from it to a fixed beacon position. This distance canbe found from the time of flight of a message (a frame) between the tags. The distance can then be computed and thelocation can be determined through a technique called trilateration.
One of the potential issues that might arise with high number of UWB modules trying to achieve ranging is the lowupdate rates they observe. This is highly dependent on the underlying communication protocols and physical layer frameformats implemented. For example, if no two messages between UWB modules can be communicated at the same timeand have to wait for each other, then the position update rate will decrease as the number of drones increases. After aconsultation with a wireless communications expert3, it was concluded that it is possible to greatly increase the rangingupdate rate by modifying the existing protocols. For example using code-division multiple (CDMA) channel accessmethods with orthogonal codes can allow for all the fixed UWB tags to broadcast time-stamped signals to all the dronetags at the same time.
However, in order to obtain the flight time, one needs to account for the clock differences between the drone tags andthe fixed ones. For this, generally two-way communication is needed. This however, requires that each drone UWB tagsends a message to each fixed beacon, again leading to reduced update rate or decreased data throughout (Figure 8.1 (a)).The following protocol is however proposed: the fixed tags broadcast time-stamped signals with a predetermined highfrequency and two-way ranging will happen infrequently in order to correct for drift errors in the clocks (Figure 8.1 (b)).This requires synchronization of the clocks of the fixed UWB tags, which is readily achievable as they are connectedin a single wired system. Such a combination of broadcast and two-way signals can significantly increase the positionupdate rate and the data throughput.
An alternative approach to look at the localization aspect is by applying techniques commonly used for localization
2https://www.decawave.com/products/dw1000 [Accessed: 26 June 2017]3Consultation with Mario Coutiño, PhD student, TU Delft Center for Wireless Systems and Technology

8.3. Indoor positioning system 49
Figure 8.2: Typical probability distribution of line of sight 2-way ranging performance
with GNSS signals. These treat the clock correction of the drone tags as a fourth unknown (the other three being theCartesian coordinates) in a system of four linearized equations. This method is similar to the method described inSection 8.3 with only the fourth unknown added. Details can be found in [37, 38]. In case four or more fixed beacons arepresent, using this technique allows positioning only with the fixed beacons broadcasting at fixed regular intervals. Thereis no need for the drone tags to reply, allowing for even more time for data communication (Figure 8.1(c)) compared tothe methods presented before.
8.3. Indoor positioning systemTo obtain the global position of the drone in the greenhouse, UWB is relied upon. It is important to know the precisionof this positioning within the greenhouse as well as the effect that the number and the placement of the beacons have onthe precision. A model has been created to estimate these numbers.
The observation equation which will be used to connect the estimated parameters with the range measurements isgiven by Equation (8.1):
ρbr = ‖xr − xb‖ =
√(Xr −X b)2 + (Yr −Y b)2 + (Zr −Z b)2, (8.1)
where ρbr represents the range observation between the beacon and the drone, and xr and xb represent the positions
of the receiver (the drone) and the beacon, respectively.Linearizing Equation (8.1) about the ground-truth value of the range which is ρa , leads to the Equation (8.2).
ρbr = ρa +
(Xr a −X b)
ρa·∆Xr +
(Yr a −Y b)
ρa·∆Y r +
(Zr a −Z b)
ρa·∆Zr (8.2)
The parameters to estimate are then ∆Xr , ∆Yr , and ∆Zr . In matrix notation this becomes :Ax = y , where y = ρbr −ρa
and x = (∆Xr ,∆Yr ,∆Zr )T . The matrix A is composed of rows which will be filled as such. Each row will correspond tothe measurement of a certain tag.
Ai ,1 =(Xr a −X i )
ρa,i(8.3) Ai ,2 =
(Yr a −Y i )
ρa,i(8.4) Ai ,3 =
(Zr a −Z i )
ρa,i(8.5)
The model makes use of the distribution of the error in the positioning of the chosen UWB tag. This is shown fromFigure 8.2 4.
From this distribution, its peak value was used to determine its standard deviation. This was done using Equa-tion (8.6) while setting x equal to µ.
P (X ) =1
σ ·p2πe
−12 ( x−µ
σ )2(8.6)
4https://www.decawave.com/sites/default/files/resources/DW1000-Datasheet-V2.12.pdf [Cited 15 June 2017]

50 8. Navigation
The value obtained for the standard deviation is 3.5 cm. This was then used in order to sample random errors for eachobservation using the function "normrnd" which takes as arguments the mean and the standard deviation of the normaldistribution. The standard deviation was computed to be 3.5 cm and the mean is taken to be 0 cm.Using the equations presented earlier and the values of µ and σ, it was possible to make a model in MATLAB. Thismodel was used to study the effect of a number of factors:
• Height of the beacons• Planform location of beacons• Number of beaconsThe effect of the height of the beacons is shown through Figure 8.3 and Figure 8.4. A similar analysis was performed
for the planform location of the beacons from which it was also seen that the error was largest when closest to the tags.It was seen that an increase in the number of tags leads to a decrease in the maximum error obtained, while keeping thesame discretization for the generation of the 3D grid map. A summary of the effect of making changes to these threeaspects is presented in Table 8.1.
Figure 8.3: 3D plot of the accuracy of the UWB position estimates withtags placed at height of 3 m
Figure 8.4: 3D plot of the accuracy of the UWB position estimates withtags placed at height of 3 m with zoom on the height close to height of thetags
Table 8.1: Summary of effect of changes
Change Effect
Number of tags An increase in the number of tags leads to a reduction of the position error
Height of the tagsWhen the receiver is exactly at the height of the tags, the error is negligible.However, when there is a slight offset from the tag height, the error explodes,but it decreases with distance from the tag.
Planform location of the tagsSimilar to the analysis for the height, the farther away from the tags, thebetter.
8.4. Attitude determinationFor the drone to navigate successfully in the greenhouse, position estimations alone are not sufficient. Attitude (orien-tation) information is also required. In case the drone has to orient itself in a given direction (for example to point itscameras towards flowers), it has to know where it is currently pointing at. Therefore, hardware that can facilitate attitudedetermination is also implemented in the drone design. Two different types of sensors will be used for that.
The magnetometers in the IMU module are used for crude local (in the drone frame of reference) attitude changes.They cannot be reliably used for global (in the greenhouse reference frame) absolute attitude determination. If that wasthe case, then a map of the orientation of the local magnetic field lines would have to be uploaded to the drones. Such

8.4. Attitude determination 51
Figure 8.5: An illustration of the heading error estimation model. The big circles represent the actual UWB module locations while the smaller onesrepresent the position estimates. The spheres in which the positioning estimates can reside are also shown. The solid line is the true heading while thebroken one is the estimated heading. The difference αe is the heading error
maps are readily available in sufficient detail for an arbitrary location. Moreover, large-scale maps do not take intoaccount local geological features like iron deposits. Additionally, the magnetic field of the Earth has a both short-termand long-term time dependency [39]. Solar wind is an example of such a short-term dependency, while the movementof Earth’s northern magnetic pole is an example for a long-term one. Therefore the magnetometers on board can not beused for accurate global attitude determination. Nevertheless, IMU is sufficient for measuring the pitch and roll anglesof the drone, as used in most drones already. Hence, the rest of the discussion in the current section will focus only onheading determination.
A pair of UWB modules will be used for global heading determination. By using the location estimates for thetwo modules and the knowledge of their position on the drone attitude determination can be achieved. The underlyingprinciple of using location information about two points on a rigid body for heading determination is based on satelliteattitude determination with two GNSS receivers [40].
The range values to the beacons obtained via UWB are noisy, which results in a level of uncertainty in the locationestimates for the two on board receivers. Such a positioning error inadvertently results in heading errors. Therefore, inorder to discover the heading determination accuracy of the system, a simple model of the propagation of the uncertaintyin the receiver position can be made. Basing on Section 8.3, it is assumed that this position will be modeled as anuniform distribution on a sphere with radius 10 cm centered at the true receiver position. As will be shown later, theheading estimation error is inversely related to the distances between the two modules. Therefore, they are placed on theextremes of the drone structure, in particular on the outer side of two propeller protectors on the diagonal of the drone.This results in a separation distance of about 35 cm.
As mentioned before, the pitch and roll angles are of little importance for navigation and pollination and are con-stantly adjusted by the flight controller. Therefore, even though the error is considered in three dimensions (to ensurecorrespondence to the physical distribution), the analysis is performed only in the azimuth plane. An illustration of theheading error αe can be seen in Figure 8.5. A simulation was performed in which 10,000 samples for the positions ofthe two UWB tags are selected from the above-mentioned spherical uniform distribution. The number of samples wasselected with a convergence analysis, the results of which are presented in Figure 8.6. The angle between the normaland the line connecting the tags and the true heading (heading error α in Figure 8.5) is computed for each UWB modulepair. A histogram of the calculated errors can be seen in Figure 8.7. From there it can be seen that the 95th percentile ofthe heading error is 20.15◦.
It was observed that due to the random nature of the position estimate errors, the law of large numbers can be appliedto the heading angle estimation. If multiple measurements are averaged in order to obtain a single position sample, thenthe mean of these measurements will converge to the true average. That also means that the variance will decrease withthe decrease in the number of measurements taken per sample. Therefore, a study in the dependence of heading error onthe number of measurements was performed.
The single measurement sample is compared with multiple measurements samples in Figure 8.8. It can be clearlyseen that the effect of measurement averaging is strongly pronounced and that the heading error converges to about 3◦ asthe number of measurements increases. However, as tempting as it may be to use such a high number of measurementsper sample, there are hardware limitations to that. Namely, the UWB module can deliver position data with frequency ofonly about 90 Hz5 (for 6.8 Mbps data link). If one uses 30 position measurements for a single attitude sample, then theheading information can be provided at a rate of only 3 Hz. Therefore, during the implementation phase, a trade-off must
5Estimated from https://www.pozyx.io/Documentation/Datasheet/SystemPerformance#timing [Cited 21 June 2017]

52 8. Navigation
101
102
103
104
105
106
Number of samples
16
17
18
19
20
21
22
23
95th
perc
entile
of th
e h
eadin
g e
rror
[deg]
Figure 8.6: Convergence analysis of the 95th percentile of the heading error as affected by the number of samples taken in the simulation. It can beseen that for sample sizes in excess of 10,000 the error is less than a quarter of a degree away from the converging value
Figure 8.7: Histogram of the heading errors as observed from a simulation of 10,000 samples
0 5 10 15 20 25 30 35 40 45 50
Number of measurements per sample
2
4
6
8
10
12
14
16
18
20
22
95
th p
erc
en
tile
of
the
he
ad
ing
err
or
[de
g]
Figure 8.8: Dependence of the heading error on the number of measurements averaged to obtain each sample. Data generated with simulations of10,000 samples

8.5. Navigating safely through the greenhouse 53
0 10 20 30 40 50 60 70 80 90
Attitude estimation update frequency [Hz]
2
4
6
8
10
12
14
16
18
20
22
95th
perc
entile
of th
e h
eadin
g e
rror
[deg]
Figure 8.9: Relationship between heading estimation accuracy and update rate. Based on position estimation rate of 90 Hz. Data generated withsimulations of 10,000 samples
be made between heading update rate and accuracy. The plot in Figure 8.9 illustrates the relationship found between thetwo.
The software tool developed for the analysis of the UWB attitude determination presented above was verified bymanual calculation of several representative cases. As no empirical studies of using UWB positioning for such ap-plications were found, validation can only be done after tests and experiments are performed. These are presented inChapter 19.
8.5. Navigating safely through the greenhouseAutonomous navigation is one of the big challenges for current MAVs. This is partially due to the obstacle avoidancechallenge that they currently face. The on-board sensors should not weigh too much as the payload capacity of such anMAV is limited. The same goes for the power consumption as a too large one could have a detrimental effect on theavailable flying time.
Obstacle detection and avoidance are two very different aspects to consider. Even though they seem very similar,one aspect focuses on detecting an obstacle while the other looks into finding a way around the obstacle. In this section,the tools needed to detect an obstacle will be provided. The path planning method will then be discussed.
8.5.1. Obstacle detectionThe first step in safely flying around the greenhouse is to detect obstacles. This can be done in several ways that will bepresented below.
The first category considered makes use of on-board sensors. Two types of sensors were considered: active andpassive. According to NASA6, active sensors transmit energy to the environment and measure how much is reflected(or refracted - depending on the method considered) back to the sensor. Active sensors include lasers, radar instruments,sonars and any camera that uses flash.
Most of the active sensors were however not further considered for obstacle detection due to their significant weightand power consumption [41]. Additionally, the lenses required to focus some of these active sensors, such as lasers,make them quite large in size.
Passive sensors on the other hand gather data from the environment and process it to fly safely. Passive sensorsinclude cameras without flash, heat, seismic and electric field sensors. Only cameras were however considered, asthe other examples listed did not seem relevant for obstacle that need to be detected. Cameras take pictures of theenvironment and process them for obstacle avoidance. This can either be done through monocular vision or stereoscopicvision.
Monocular vision is interesting as it costs less and weighs less as only one camera is used. In 2016, Tae-Jae-Leeand his team [42] developed a monocular vision obstacle detection algorithm for autonomous robots. They use inverseperspective mapping and have achieved average distance estimation errors of 1.6cm with a segmentation precision of
6https://www.nasa.gov/directorates/heo/scan/communications/outreach/funfacts/txt_passive_active.html [Cited 8 June 2017]

54 8. Navigation
81.4%. The algorithm is however limited to ground usage. Jaysinh Sagar and Arnoud Visser use a monocular camera bycombining background subtraction, optical flow and proximity estimations [43]. They were able to detect obstacles andallows the MAV to navigate semi-autonomously in outdoor scenarios. The method relies entirely on corners and edgesof the object. Monocular vision is also used to perform SLAM (Simultaneous localization and mapping). Achtelik [44]has demonstrated that by using one camera, that SLAM autonomous flight can be done in large unknown outdoor areas.The power consumption and the memory demand of SLAM is however quite significant [45] and vision fails under 20cm[44]. A more power friendly method of SLAM was also suggested by Serrata [46], fastSLAM. Using a low variancetechnique, they were able to recognize artificial landmarks in a real environment with a power consumption of about1.14 W.
Stereoscopic vision leads to the generation of disparity maps. Using a definition found on Stackoverflow, disparitymaps "refer to the apparent pixel difference or motion between a pair of stereo image." 7. An example of how such adisparity map is created is shown in Figure 8.10. The image taken through the left side camera is combined with the oneof the right side camera and after block matching is done, the disparity map is generated.
(a) Image taken by the left side camera (b) Disparity map (c) Image taken by the right side camera
Figure 8.10: Combination of the images of the stereo camera to create a disparity map [47]
Using stereoscopic vision for obstacle detection is therefore arguably more robust than a monoscopic cameras. Innature this is also the method that is used for depth perception. Monocular cameras were therefore disregarded forseveral reasons. One, they are poor in depth perception. Monocular vision is additionally notably poor at the focus ofexpansion. Stereo-vision also provides true scale estimates of distances to obstacles. These can be estimated at a samepoint in time. For these reasons, it was decided to arm the drone with a stereo camera for obstacle detection.
Finally, a laser on top and one on the bottom of the drone will be placed. Even though it was stated that active sensorswould be disregarded, a laser was found that was extremely power efficient and lightweight. The power and weightbudgets allowed to place them and it was therefore decided to do so. This will help the drone to detect if obstacles arelocated on top/bottom of it or not. The lasers selected are from ST Micro Electronics. The model is VL53L0X and itis known to be the world smallest time-of-flight ranging and gesture detection sensor. It is 4.4 x 2.4 x 1.0mm and canmeasure distances up to 2m.
In the next subsection, the way the drone will plan its path around the obstacles will be looked into. This includesthe way the disparity maps are processed and what will be done with them.
8.5.2. Obstacle avoidanceWhen the obstacle is detected, the MAV has to navigate around it. This can again be done in several ways.
Putting cameras in the environment was the first option to be considered. They would follow the movements of thecraft allowing it to avoid obstacles. This category was however not pursued as tracking drones within a greenhouse couldprove to be very challenging. The abundance of plants in a given area and the height of the rows make it impossible touse external cameras to ensure object collision does not occur.
The second way is by using active sensors. Even though it was stated in the previous section that the power con-sumption was high, lower range lasers that consume less can be considered. If they are placed in a strategic manneraround the drone, the MAV could navigate to its target by moving around as long as it stays far away from what thelasers detect. This however does require the presence of multiple lasers on the drone.
A third method that is more robust than the first two explained are to process the images taken by the stereo cameras.A first, more power efficient way, is to not produce 3D maps. Oleynikova [48] showed that a light-weight low powerstereo vision system that uses an FPGA chip can successfully avoid obstacles in both out and indoor environments. This
7https://stackoverflow.com/questions/7337323/definition-of-a-disparity-map [Cited 8 June 2017]

8.6. Flower detection 55
reactive avoidance system makes use of U-map representations of the disparity maps. The power consumption is 5 Wattand the payload weighed 50g. The Delfy Explorer uses a "Droplet" strategy [45]. There is no need for previous imagesor maps and it is power and weight efficient. This method was however only tested on a flapping wing system. Giventhat they are passively stable, there is no need to compensate for drift. For quad-copters however, velocity estimationsare necessary for stabilization of the MAV [49]. Finally an article regarding obstacle avoidance for autonomous pocketdrones was found. McGuire has studied how obstacle avoidance can be done through stereo vision and efficient opticflow [49]. A 4g stereo-camera is used and edge distributions are used to calculate the depth and optical flow. Thelimitations of this method can be noted when the MAV approaches walls with a small angle. The field of view of thestereo-camera could not see it and the propellers touched the wall.
The other way that the stereo images can be used is by generating 3D point clouds. This helps to plan path aroundthe obstacles. The first of the sort that was looked into is RRT (Rapidly-exploring random tree). This method is designedto tackle nonholonomic constraints and high degrees of freedom [50]. A* [51] is another path planning algorithm thatcan determine a way to move around an obstacle. It uses a heuristic constant that searches for cells in a map andcalculates the best trajectory that can be made. It must however be noted that the a map must be made that contains theposition of the obstacles. Hrabar [52] has used a variation of A*, namely D* in combination with probabilistic roadmapsfor path planning in order to perform obstacle avoidance in an unknown environment. Finally, SLAM (SimultaneousLocalization And Mapping) was considered as it allows to localize the MAV within the map it generates. This optionrequires however a lot of power and additional hardware such as lasers that scan the environment. Different SLAMalgorithms were then looked into such as fastSLAM. These were however not pursued as the need to localize the MAVwhile performing the mission was not deemed necessary as UWB is used. Given that the environment changes everytime the plants are lowered, an algorithm that has been tested in an unknown environment was preferred. The use oftwo UWB tags solved position and heading problems and algorithms that calculate those were therefore dropped. Thetotal amount of hardware needed should also be at a minimum as the mass of the MAV cannot exceed 300g. SLAM wastherefore not pursued. Finally, the processing capabilities of the processor did allow to use an algorithm that processesthe images and converts them into point clouds.
In his paper, Hrabar’s uses as previously mentioned D* in combination with probabilistic roadmaps for obstacleavoidance. This method will be implemented for obstacle avoidance and local path planning. He applies this methodfor a rotorcraft UAV that has to fly close to a power line. Obstacles are detected through the stereo camera and a 3Doccupancy map is built. D* is then used to build a probabilistic roadmap for path planning. This is done by searching forthe shortest collision free path. The roadmaps are updated with the information gathered from the occupancy grid maps.The next paragraph will give some more detail into how exactly the stereo based occupancy mapping works. As statedin the paper of Hrabar [52], the points generated by the stereopair camera are sub sampled and translated to the worldcoordinate system. Every 10th point in the point cloud is taken to increase processing speed, but given the processingcapacity of the APIS, an attempt can be made to use all the points. The point cloud is binned into voxels - arrays ofelements that have a volume - and their size depends on the required resolution of the environment, value which can befound at the end of the chapter. Probabilities are given to each voxel that they are occupied and are updated after everyobservation. Thresholds are defined as to whether the voxel is free, occupied or if the state is unknown. Once obstaclesare detected, the path around the obstacle can be planned. This can only be done once it was determined whether ornot the voxel was free. If the voxel was free, the quadcopter can fly in a straight line towards the goal prescribed bythe ground station. If an obstacle is detected, more information about it is gathered as the MAV gets closer. The pathis adapted to ensure no collisions occur. Using the D* algorithm the path is planned around the obstacle. D* lite wasselected as the algorithm that would plan the path. The reason for this is that this algorithm only plans this locally insteadof globally such as algorithms like A*. A global path planner is indeed not needed as the rest of the path that should befollowed is provided through the UWB.
8.6. Flower detectionThe flowers of a tomato plant have a bright yellow color. This will be used to our advantage in the implementation ofthe flower detection algorithm which is based on [53]. The algorithm outlined in the paper consists of five main steps.The first step is to transform the RGB image to the HSV color space. The saturation in the HSV color space allowed toestimate the lighting condition. The median of the saturation and the skewness of the saturation values are used in orderto make the distinction between the darker and the brighter images. This is followed by image segmentation using twothreshold ranges, one for the images classified as brighter and another range for the darker images. Next, some noiseis removed from the images using morphological operations: opening by reconstruction and closing by reconstruction.Finally, the regions are assessed, and the ones that are too small are discarded. The paper then classifies the regions thatare left as tomato flowers. We have implemented the flower detection algorithm in MATLAB, and the implementation

56 8. Navigation
was then tested on one of the images captured during the excursion to the greenhouse of Wageningen University &Research Centre. The results are presented in Figure 8.11 until Figure 8.18, showing the results of the intermediate stepsfollowed in the implementation.
For the task of detecting flowers, a sideways camera will be used as mentioned earlier. For this camera, a fisheyelens will be used, which is an ultra wide-angle lens. Based on the routine described earlier, using a fisheye lens willallow for capturing more flowers in the images, which means that falling into the state of not seeing any flowers andnot knowing where to fly to in order to detect the flowers is smaller. The fisheye lens demonstrates significant radialdistortion. However, models and software exist for the correction of these effects. Examples of such models are Brown’sdistortion model and Conrady’s model.
When a flower is detected, the drone will fly vertically and sideways and will be constraint to flying within the planeparallel to the rows of the plant (unless an obstacle is detected in which case the local planner allows for replanning andthe replanning will not be subject to such a constraint), until the detected flower is in the center of the image. Knowingthe camera and lens properties and the fact that the tomato flowers have a diameter of 1-2 cm, it is possible to estimatethe distance to the flower. In order to ensure that the payload is able to perform proper pollination, the drone needs tobe sufficiently close, at most 50 cm Chapter 5. Since the corridors are 1.6 m wide, the drone might have to approachthe flower. Feature points are extracted and tracked from the detected flowers in order to determine the relative changein scale. This will be based on the method described by Sagar and Visser in [43]. Thus, the distance to the flowercan be estimated and the approach can be performed. Although stereo is more effective for distance estimation, havingtwo pairs of stereo cameras will lead to excessive mass and an overdesigned system. Moreover, the sideways distanceestimate need not be as precise as in the case of forward vision because the distance estimate would be needed to makesure that the blower is at most 50 cm away from the flower.
Robustness to variation in lightingVarying lighting conditions lead to changes in the irradiance of the object. The apparent color of the object as it appearsin the image depends on properties of the incident light and the light source such as color intensity and location of thelight source relative to the object. It also depends on the reflectance characteristics of the object, as well the propertiesof the camera taking the image of the object [54].
The camera is fixed, and if the properties of the flowers are more or less assumed to be fixed, the one aspect remainingwhich seems to affect the final detection is the variation in the lighting. In order to make the flower detection algorithmmore robust to variations in lighting, a color correction method will be applied namely the HSV-based color correctionmethod elaborated in [55].
The method involves using neural networks in order to learn a more robust parametrization that is robust to lightingchanges. The architecture of the neural network employed is shown in Figure 8.19. The input to the network are the RG B values of a certain pixel. A bottleneck layer can be seen in the network, where parameters λ and µ are obtained.Moreover, it is at the bottleneck that a desired luminance, Ld , is inserted to allow the inclusion of information about theillumination conditions for which the specific desired color values, Rd , Gd , and Bd , need to be obtained.
Figure 8.19: Neural network architecture for color parameterization [55]
8.7. Flower motion trackingWhen the flower is shaking, it is important to know for how long the blower needs to keep blowing the flowers, orwhether the drone has to approach the flowers even more for effective pollination. This can be done by tracking thedetected flower to check whether it is moving or not.In general, tracking and detection can be either performed separately or jointly. However, for this mission they will

8.8. Camera selection 57
be performed separately as first the flowers need to be detected to be approached. According to [56], there are threemain categories of object tracking: point tracking, kernel tracking, and silhouette tracking. Moreover, a taxonomy ofthe tracking methods is also provided. From those, the kernel tracking methods seem to be most fit for the task. Thereasoning for that is as follows. The category of point tracking methods is more suitable for tracking small objects. Asthe object becomes larger, more points need to be tracked which will require an extra step of clustering points. For thecategory of kernel tracking, the methods are good for estimating object motion as these involve parametric transformationand hence the estimation of object rotation as well as translation. The last category is suitable for tracking of the completeregion of the object which would have been important for tracking an object whose different parts move differently.
In this category, the mean-shift tracking was deemed a good approach, especially when compared to the template-based matching approaches which require brute force in searching the image to find matches between two time framesand thus are computationally intensive. The mean-shift tracking procedure is an efficient algorithm which makes use ofhistograms to describe the appearance of the object to be tracked.
8.8. Camera selectionRequired camera sensor resolutionThe first step to make the choice of the camera was to determine the required resolution. This was based on the re-quirement for detecting the object in the greenhouse with the smallest dimension: the wires. In order to determinethis resolution, three parameters needed to be decided upon. Those were the dimension of the smallest feature, theworking distance, and the field of view, where the required field of view is the area under inspection that the cameraneeds to acquire at a certain working distance. These relate to the required resolution of the camera sensor as shown inEquation (8.7). With the required resolution estimate obtained, the choice for camera sensor can be made.
Required resolution =2 · tan
( FOV2
)smallest feature
·wire thickness in pixels (8.7)
Required focal lengthUpon making the choice of a camera sensor, the next step is to determine the required focal length, or the relationbetween the focal length and the working distance where there is flexibility in the working distance. In order to choosethe right lens to still be able to have the wires in focus from a certain distance d, the following analysis is performed.The magnification is given by the ratio of the object size in the image to the real size of the object. This leads to thefollowing equation for magnification.
|m|= Ix
Lx·∆pix (8.8)
Here ∆ pix denotes the pixel pitch, Ix is the object dimension in pixel and Lx is the actual object dimension. This isa characteristic of the camera sensor. Thus, for a chosen camera sensor, a certain required magnification factor can becomputed. With the estimated required magnification factor, the required focal length for the lens to be chosen can becalculated. This is done through Equation (8.9).
m =f
f −d(8.9)
It should be noted that this equation holds for cameras whose behaviour is close to that of the pinhole camera model- in other words, for which rectilinear lenses are used. However, it will be assumed that it is good for making initialapproximations for the requirement on the focal length.For the OV2680 camera sensor, for example, the ∆ pix is 1.75 micrometers. Making the calculations for a wire which isestimated to have a width of 2mm, and to correspond to a width of 5 pixels in the image, this leads to a magnificationmagnitude of 0.004375. However, for real images, the magnification is negative. Thus, it is -0.004375. The requiredfocal length is then obtained through a manipulation of Equation (8.9). This gives:
m =f
f −d⇐⇒ f =
m ·d
m −1≈ 0.00439 ·d (8.10)
From this, it is clear that a good working distance for the stereo would require a focal length smaller than 15mm. As forthe monocular camera, due to its much shorter working distance the focal length will be in the order 1-2mm.The final step is to check the near and far limits of the depth of field of the camera. Based on the thin lens equationswhich relate the image distance, object distance, and focal length, the expression for the near and far limit of the depthof field can be derived.

58 8. Navigation
DN =d · f 2
f 2 + N · c · (d − f )(8.11) DF =
d · f 2
f 2 −N · c · (d − f )(8.12)
Here the circle of confusion, c, depends on the lens properties, the distance between the sensor and the lens, as wellas the distance between the lens and the object. This is summarized in equation Equation (8.13). A desired circle ofconfusion can be computed with Zeiss formula. It involves D which is the diagonal of the image sensor format. Hence,it depends on the choice of the camera sensor.
c =2 · (S −di ) · A
diwhere c =
D
1730(8.13)
The depth of field equation is the distance between the farthest and the nearest points at which the image is still infocus. Thus, the formula for depth of field is obtained by taking the difference between these limits, and the result isshown in Equation (8.14), where N is the F-stop
DOF =2 ·N · c · (m + 1)
m2 −(
N ·cf
)2 where N =f
D(8.14)
Chosen stereo camera sensor and lensAs mentioned earlier, two cameras are needed for obstacle avoidance. Ideally, they should have a minimum resolutionof 1K. This is based on equation Equation (8.7), and taking wire thickness in pixels to be around 5 pixels, and a FOVof around 90◦, in order to detect the wire of thickness of 2 mm from around 1m distance. For this resolution, a suitablecamera sensor was chosen. The chosen camera sensor for the stereo pair is the OV26808. If the disparity range isestimated to be around a quarter of the width, and since the disparity range scales with the product of the width, depth,and height, then the estimated computation will be 0.597 billion computations for an image. The camera is running at30 fps which amounts to 17.9 billion per second. This will be the worst case scenario when all the points on the imagesare used for stereo-matching.
After employing the equations presented above on several lenses, the results are presented in Table 8.2 and Table 8.3,corresponding to an object distance of 0.5m and 2 m. From that, it was deemed that the DSL235 lens would be mostsuitable for the stereo camera due to its having the largest DOF.
Table 8.2: Depth of field calculations for several lenses for the stereo camera and an object located at a distance of 0.5 m
Lens Focal length (f) [mm] Aperture (N) [-] DN [m] D f [m] DOF [m]
DSL235 3 3.2 0.37 0.77 0.4DSL355 4.2 2.8 0.43 0.59 0.16DSL944 7.5 2.8 0.48 0.53 0.05
Chosen monocular camera sensor and lensFor the monocular camera, a higher resolution camera was chosen in order not to compromise the robustness of theflower detection algorithm. A high resolution is also more so needed as the corrective models for distortion will lead toa loss of accuracy. The flower detection algorithm involves the use of filters applied to the image which means that thecomputational effort scales by the product of the width and height of the image. However, an increase in resolution forthe stereopair would lead to graver consequences since the disparity range scales with the product of the width, depth,and height. The camera chosen for the monocular vision is the OS08A109. The camera supports a resolution of 2592 x1944 which means the 5.04 million computations will be needed for every filter applied in the flower detection algorithm
8http://www.ovt.com/sensors/OV2680 [Cited 9 June 2017]9http://www.ovt.com/sensors/OV5675 [Cited on 9 June 2017]
Table 8.3: Depth of field calculations for several lenses for the stereo camera and an object located at a distance of 2 m
Lens Focal length (f) [mm] Aperture (N) [-] DN [m] D f [m] DOF [m]
DSL235 3 3.2 0.83 ∞ ∞DSL355 4.2 2.8 1.22 5.46 4.23DSL944 7.5 2.8 1.67 2.49 0.83

8.8. Camera selection 59
as well as for each of the morphological operations. This will lead to around 5 ·5.04 ≈ 25.2 million computations foran image. Since the camera has a frame rate of 30, the total number of computations per second will be 756 millioncomputations.Similar to the analysis performed for the stereo camera, the equation for the depth of field was used to asses differentlenses for the monocular camera and the results are presented in Table 8.4. From that, it was deemed that the DSL218lens would be the most suitable lens.Estimated number of total computationsFor the hardware chosen, the main CPU has a clock speed of 2.4 GHz and an estimated 19.2 billion computations persecond. As for the GPU onboard the snapdragon 801 chip, it is the Adreno 330 which can do 158.4 GFlops10. From,the estimated computations for the stereo matching and the flower detection, the estimated total number of computationsper second is 17.9+0.756 which is 18.7 billion computations. Thus, the GPU will be able to accommodate for thesecomputations.
Table 8.4: Depth of field calculations for several lenses for the monocular camera and an object located at a distance of 0.5 m
Lens Focal length (f) [mm] Aperture (N) [-] DN [m] D f [m] DOF [m]
DSL218 1.2 2 0.21 ∞ ∞DSL255 1.5 2 0.265 4.395 4.13DSL419 1.6 2 0.28 2.26 1.98DSL219 2 5.2 0.22 ∞ ∞
Baseline and Mount ToleranceFor the calculation of the required baseline, the equation relating the depth to the focal length, baseline, and disparityerror shown in Equation (8.15) is used.
z =f ·b
s(8.15)
Here f is the focal length, b is the baseline, d is the disparity, and z is the depth. In order to compute the requiredbaseline, a minimum depth for which stereo matching will be possible has to be decided upon. Moreover, the maximumdisparity error has to be considered. For the lens chosen for the stereo camera, the focal length is 3 mm. The maximumdisparity, considering that the width of the images is 1612, is taken to be 350 pixels. Knowing that the pixel pitch is 1.75µm, this converts to a disparity in meters of 6.125 ·10−4 m. For a minimum depth of 0.2 m, the required baseline wouldbe 4 cm.For a sanity check, the baselines of reference drones have been referred to. For navigation in office-like environments, abaseline of 6-7 cm is typically used. That is because the distance between the eyes of a human adult is usually 6.5 cm.A cluttered environment such as a greenhouse is more analogous to a dense forest environment, where smaller animalsnavigate more easily, and the distance between the eyes of these is around 4 cm. As a result, the choice of a baseline of4 cm is deemed a reasonable choice.
The stereo cameras need to be physically connected. That is usually done using a rod. Because the camera mountis not perfectly rigid, vibrations will causes rotations that will ruin the calibration of the cameras. Rotations will occurabout the horizontal axis as well as the optical axis. These rotations will lead to an offset in the epipolar line whichrisks the stereo matching algorithm searching at the wrong line for correspondence. This means the structure has to besufficiently rigid. The vibrations could lead to misalignment about the horizontal axis, the vertical axis, and the opticalaxis. The rotation of camera about the horizontal axis or the vertical axis relative to the other is given by equationEquation (8.16). The rotations about the vertical axis will result from bending of the rod holding the camera, and therotations about the horizontal axis will result from the torsion of the rod.
α =∆pi x
f(8.16)
Here f is the focal length of the camera in pixels, and ∆pi x is the pixel displacement that results in the image due to therotations. The latter can be calculated with Equation (8.17), which demonstrates its relation to the focal length in meters[57].
fpi xel =f
sensor width· Image width in pixels (8.17)
10http://kyokojap.myweb.hinet.net/gpu_gflops/ [Cited 21 June 2017]

60 8. Navigation
Moreover, some rotations will also occur about the optical axis which is the axis of symmetry for the stereo visionsystem.
β = arctan
(∆pi x
Sx2
)(8.18)
Here, Sx is the image width in pixels, which based on the specifications of the camera OV2680 is 1616 pixels. Basedon Equation (8.16) and Equation (8.18), the values corresponding to 1 pixel error are 0.0335◦ and 0.0709◦, for α and β,respectively. Moreover, the pixel error can be related to the depth error with Equation (8.19), where δd corresponds tothe disparity error and is equated to the pixel error resultant from the rotations induced by the vibrations.
δz =z2
B · f·δd (8.19)
By combining Equation (8.16), Equation (8.18), and Equation (8.19), the plots for the depth error as a function of therotation angles α and β are shown in Figure 8.20 and Figure 8.21 for angles between 0 and 10◦. As can be seen, therelations seem linear for both plots. That is expected for one corresponding to α. For the plot of depth error against β,since the angles are quite small, tanβ approximates to β which leads to a straight line, approximately.
Figure 8.20: Plot of depth error vs. α Figure 8.21: Plot of depth error vs. β
8.9. Verification and validationIn the following, a number of tests are proposed and performed to verify the flower detection algorithm. These compriseof two main groups: unit tests and an overall system test. First, the unit tests will be discussed, and then the overallsystem test along with its results will be presented.
Unit testsThe unit tests conducted are used to check whether each and every function that has been employed has executed its taskproperly. Due to the extensiveness of the tests, only a few examples will be delineated. For example, the first unit testemployed was to check if the image has been loaded properly. This was done by simply displaying the image. Display-ing intermediate results after applying the numerous filters was performed throughout. These intermediate results werethen examined and were subject to a number of sanity checks. For example, the image obtained after applying openingby reconstruction was expected to have a reduced number of small patches of color.
System testThe system test would be to run the program and test it on actual images containing tomato flowers to check whether theprogram performs what it is supposed to do. The program was applied to a photo taken from the excursion to a tomatogreenhouse. Indeed the program fulfills its intended purpose, and the result is presented in Figure 8.18.
ValidationAs for validation, this will require comparison to the results of an existing and trusted implementation of the algorithm.However, to the knowledge of the authors this is not available.

8.9. Verification and validation 61
Figure 8.11: Original Image Figure 8.12: HSV image
Figure 8.13: HSV image after hue filtering Figure 8.14: HSV image after saturation filtering
Figure 8.15: HSV image after applying AND operator between hue-filteredand saturation-filtered images Figure 8.16: HSV image after performing opening by reconstruction
Figure 8.17: HSV image after performing closing by reconstruction Figure 8.18: Final image showing flower detection result

9Structure
This chapter will explain how the structure of the quadcopter is determined. The quadcopter consists of two main parts,the arms and a payload box in the middle. First the configuration of the quadcopter will be discussed. After that thematerial selection will be explained. Thirdly, an analysis will be done for the arms, followed by the sizing of the payloadbox. After that a FEM analysis for the whole quadcopter is done and in the end verification and validation will bediscussed.
9.1. Choice of configurationFor the configuration of the quadcopter two configurations are considered, an X-frame and an H-frame. These arecommonly used configurations and can be seen in Figure 9.1 1. What can be seen in the figure is that a H-frame hasa payload box with a larger length than width, for the X-frame the payload box is a cube. Due to the fact that thebattery has a large length and a small width, the H-frame has been chosen for the main frame of the quadcopter. Thisconfiguration can be more compact because smaller arms are used and therefore, less material is needed.
Figure 9.1: H-shape and X-shape configuration
9.2. Material selectionFive materials are considered for use in the structure of the drone. These materials are shown in Table 9.1, with theirYoung’s modulus, yield stress, specific cost and density 2,3. For selecting the material these aspects will be taken intoaccount. The Young’s modulus influences the frequency and displacement, this value should be as high as possible inorder to have a high frequency and a small displacement. A high yield stress is preferred such that the cross-section canbe as small as possible. Because of the fact that the natural frequency will be critical for this design, for the materialof the motor arms a comparison has been made between aluminum and carbon fibre composites thanks to their highYoung’s Modulus. An aluminum arm has to be bigger in order to meet the requirement when comparing it with a carbonfibre composite arm. This means that the mass of the arm will be bigger due to the density and volume difference andtherefore, carbon fibre is used. This is despite the fact that the specific costs are high. Due to the fact that the mass ofthe arms are expected to be small the costs will not be critical.
1https://skynexglobaldrones.com/skynex-blog/walkera-runner-250-pro-fpv-quad-drone-racer-review-everything-you-need-to-know/ [Cited 16 June 2017]
2http://www.goodfellow.com/E/Carbon-Epoxy-Composite.html [Cited 15 June 2017]3http://web.mit.edu/course/3/3.11/www/modules/props.pdf [Cited 15 June 2017]
62

9.3. Design of the arms 63
Table 9.1: Several materials and their properties
Material Young’s modulus [GPa] Yield strength [MPa] Specific cost [$/kg] Density [g/cm^3]
Aluminum 69.0 500.0 1.8 2.7Carbon fibre 100.0 200.0 110.0 1.6GFRP Laminate (glass) 26.0 125.0 3.9 1.8Spruce 9.0 48.0 1.0 0.6Polypropyleen 3.2 35 1.1 1.2
9.3. Design of the armsThis section will explain how the arms will be sized. For this a common load case will be considered. First load casewill be explained, followed by discussing the different cross-sections. After that the results for different cross-sectionswill be given.
9.3.1. Loads on the armsThe load case that will be considered for sizing the arms is the take-off condition, where there is maximum availablethrust. This is because during this phase the force generated by the propellers will be maximum. Furthermore, thearms can be modeled as a rigid, cantilevered beams which are clamped at their base. At this place, there is a clampedconnection to the payload box in the middle. At the end of the beams, the rotors are located. These rotors create a forcegoing up, which is the thrust force. A moment around the z-axis is created by the propellers due to their aerodynamicdrag. This moment is neglected in the stress analysis, as it is small compared to the larger thrust force. The motor alsohas a mass, which is taken into account. The mass of the arm itself will also be neglected because it will be distributedover the length of the arm and is also negligible compared to the thrust force. The free body diagram can be seen inFigure 9.2, where T is the thrust force of the motor, Wmotor is the mass of the motor, Fz is the reaction force and My
is the reaction moment around the y-axis. The reaction force is equal to the thrust minus the mass of the motor and thereaction moment is equal to the resultant of the thrust and the mass of the motor times the length of the arm. Since allthe forces and moments are known the shear diagram and the moment diagram can be created. Due to the fact that thereis no distributed load the internal shear force over the arm will be constant and equal to the reaction force. The momentdiagram will be linear and proportional to the length of the beam. These diagrams can be seen in Figure 9.3. Thesediagrams are valid for the situation when vehicle is hovering at level flight.
Figure 9.2: Free body diagram in the z-x plane
Figure 9.3: Shear force diagram above and themoment diagram below
Figure 9.4: Free body diagrams of the payloadbox in the xz-plane and the zy-plan
9.3.2. Structural analysisIn Equation (9.1), the equation is presented for bending around one axis for symmetrical cross-sections. A moment Mis applied around the y-axis, with a distance z to the neutral axis and a moment of inertia Iy y around the y-axis. InEquation (9.2), the equation for calculating the shear stress due to a shear force can be seen. This equation is valid if theshear force is applied goes through the shear center. For symmetrical closed cross-sections the shear center is located inthe middle. The cross-sections that will be considered are closed symmetrical cross-sections, which means that the forceof the propeller will go through the shear center and the equation can be used. In the equation the Vz is the shear forceapplied along the z-axis, the Q is the second moment of area, the Iy y is the moment of inertia around the y-axis and thet is the thickness of the cross-section.

64 9. Structure
σx =My · z
Iy y(9.1) τzx =
Vz ·QIy y · t
(9.2)
The bending and shear stress can be compared with the yield stress of the material, using the Von Mises stresscriterion. A simplified version of this criterion is presented in Equation (9.3), where the structure yields if the this isvalid. The deflection at the tip of a cantilevered beam can be calculated by Equation (9.4), which is loaded with only aforce at the tip Fz . Lbeam , E and Iy y denote the properties of the beam.√
σ2x +τ2
zx >σyi eld (9.3) δ =Fz L3
beam
3E Iy y(9.4)
Quadcopters are vehicles that can be very sensitive to induced vibrations. The inertial measurement unit needs tobe excluded from external vibrations as much as possible. Also, resonance phenomena can occur in the structure itself.A first order frequency analysis is therefore performed to investigate these phenomena and try to mitigate these issues.The main source of external vibration is on the propellers [58]. These spin at a high frequency that could match thenormal frequency of the arm. The maximum RPM of the motor used is 17100, which gives a frequency of 285 Hz.Frombasic vibration theory, it is known that the amplitude of an harmonically forced vibration is very high when the naturalfrequency is equal to the forced frequency (ωn = ω f ). When the ratio
ω f
ωnincreases or decreases, amplitude decreases.
It is therefore assumed that the resonance can be avoided if 0.5 >ω f
ωn> 2. This means that the natural frequency of the
beam should at least be 570 Hz. Furthermore, it is assumed that the motor arm can be modeled as a clamped, masslessbeam with the mass of the motor lumped at the tip. The simplified equation for the resonance frequency in this case ispresented in Equation (9.5), where E is the Young’s modulus and Iy y is the moment of inertia around the y-axis of thebeam, depending on the cross-section used. mmotor and Lbeam are the mass of the motor and the length of the beamrespectively.
ωn =
√3E Iy y
mmotor L3beam
(9.5)
9.3.3. Cross-section selectionThis subsection will first explain how the length of the arms are determined and after that the shape selection will bedone. For the length of the arm the aerodynamic properties are important. This is because the flow of the propellersshould not interfere with one another. The diameter of the propellers is 127 mm. This means that the arm should be atleast as long as the radius of the propellers, which will be the starting point of the iteration process.
For the shape the dimensions are not determined yet. Five typical shapes of beams are considered for the arms: twohollow beams, a circular hollow and a rectangular hollow beam, one simple closed rectangular beam, an I-beam and aT-shaped beam. Their general structural properties are already known. Hollow closed beams perform well in shear andtorsion and the ’letter’-shaped beams have better performance in bending. As mentioned above, the loading conditionselaborated is in level, hovering flight. When flying forward or blowing, the vehicle encounters other loading situations,with torsional and shear loads. Other considerations are the aerodynamics and the placement of the wires to the motors.In a hollow beam, the wires can be placed within the beams, while for the other shapes, they need to be placed on theoutside. The aerodynamics of a closed beam are also preferable. From the deliberation above, two options arise: therectangular or the circular hollow beam. These are further investigated in the next subsection.
9.3.4. Comparison and resultsThe analytical model developed in the previous section is solved for two options. A beam with rectangular and circularhollow cross-section is put in the model and the displacement due to a load, the natural frequency ωn , the mass, stressdue to bending and the shear stress is found. A carbon fibre reinforced plastic (CFRP) beam with length of 62.5 mm, anE-modulus of 100 GPa and a thickness of 1 mm is taken. Typical carbon fibre tubes were investigated 4, and typical wallthickness is around 1 mm. At the tip of the beam, the mass of the motor (12 gram) and the maximum thrust of 1.275N is applied. Finally, a safety factor of 1.5 is added to the load. In Table 9.2, the results for a circular hollow beam arepresented for a varying diameter. Table 9.3 shows the different properties for a rectangular hollow beam with a width of6 mm, where the height is varying.
From the results presented above, conclusions can be made. First of all, the natural frequencies at all considereddiameters are sufficiently high to prevent resonance. For the circular beam a diameter of 4 mm is needed with a mass of0.9 g in order to meet the frequency requirement. The rectangular beam needs a height of 3 mm with a mass of 1.4 g.Comparing the circular and rectangular hollow beam, the circular beam performs better when looking at the mass. For
4https://www.rockwestcomposites.com/round-tubing/round-carbon-fiber-tubing [Cited 19 June 2017]

9.4. Payload box design 65
Table 9.2: Mechanical properties of CFRP circular hollow beam with length of 62.5 mm
Diameter [mm] Displacement [mm] ωn [Hz] Mass [g] σx [MPa] τzx [MPa] VM [MPa]
3 0.434 553.7 0.6 47.67 0.78 47.694 0.145 959 0.9 21.19 0.52 21.215 0.064 1443.8 1.2 11.68 0.38 11.76 0.033 1996.3 1.6 7.33 0.3 7.357 0.02 2608.7 1.9 5.01 0.25 5.038 0.012 3275.6 2.2 3.63 0.21 3.65
Table 9.3: Mechanical properties of CFRP rectangular hollow beam with length of 62.5 mm and width of 6 mm
Height [mm] Displacement [mm] ωn [Hz] Mass [g] σx [MPa] τzx [MPa] VM [MPa]
3 0.103 738.1 1.4 16.5 1.7 16.84 0.046 1101.7 1.6 9.9 0.8 105 0.025 1487.8 1.8 6.8 0.4 6.86 0.016 1893.6 2 5.0 0.3 5.07 0.010 2317.7 2.2 3.9 0.2 3.98 0.007 2759.1 2.4 3.1 0.1 3.2
this reason the circular beam will be chosen. Because of the fact that five wires need to go through the arms, a biggercross-section is needed. There are two big wires with a diameter of around 1.5 mm and three smaller wires that havea diameter of around 0.5 mm. This means that the inner diameter should at least be 5.5 mm, an extra 0.5 mm will beadded to make sure all the wires fit. Therefore, the outer diameter of the circular hollow cross-section will be 8 mm.
9.4. Payload box designThis section will describe the process followed for the sizing of the payload box, which is the box in between the rotorswere the battery, the electronics and the blower are located. The first step is to model the loads on the payload boxand create the shear, normal force and moment diagrams. After that the stresses are calculated and the thickness of thepayload box can be determined.
9.4.1. Loads on the payload boxWhen looking at the payload box different forces need to be taken into account, the weight of the payload and the forcegenerated by the blower. However, the load of the blower is 0.04 N and the load of the payload is 1.472 N, which is 30times bigger than the load of the blower and therefore, the force of the blower is neglected. The arms are connected tothe payload box by a clamped connection, which will be placed along the width of the payload box. This will result ina distributed load exerted on the box by the clamp, which can be seen in the top image in Figure 9.4. The weight can bemodelled as a distributed load as well. The free body diagram can be seen in Figure 9.4 in the xy-plane. Now that theloads are known the shear and moment diagrams can be made. These can be seen in the top figures shown in Figure 9.5.What can be seen is that the critical locations are located at the half of the length of the payload box.
9.4.2. Sizing of the payload boxThe sizing of the payload box will be done by analyzing the stresses. The box will have an U-shape and will be carryingthe battery. The length, width and height are already known because the size of the battery, electronic components andblower have been determined and can be fitted into the payload box together. By doing this, a length of 140 mm, awidth of 28 mm and a height of 17 mm has been determined. This means that only the thickness is left to decide. Bylooking at the yielding stress of the material, the required thickness can be determined. However, when investigatingtypical carbon fibre sheets a thickness of 1 mm has been found as minimum thickness 5, therefore this value will be usedas. The maximum stress that will occur in the material has been determined by using the Von Mises stress proposedin Section 9.3.2. For calculating the Von Mises stress, the stress due to bending and shear force have to be calculated.These equations have already been given in Section 9.3.2. In order to know the maximum stress the highest value fromthe loading diagrams Section 9.4.1 have been used. An safety factor of 1.5 has been added to the force applied. Since
5http://www.carbonmods.co.uk/Departments/Carbon-Fibre-Sheet/Rigid-Sheet.aspx [Cited on 20 June 2017]

66 9. Structure
Figure 9.5: Shear force, moment, shear stress and bending stress diagrams for the payload box over the length of the box
it was clear that a thickness of 1 mm was enough to carry all the loads, this value will be used in the final design. InFigure 9.5 the values of the shear and bending stresses over the length can be seen. The maximum value for shear stressand bending stress are 0.15 MPa and 0.039 MPa, respectively. This gives a maximum von mises stress of 0.16 MPa.
9.4.3. Vibration in the payload boxIn the payload box, induced vibrations by the motor should be mitigated as much as possible. The electric componentsare very sensitive to shaking, as their working frequency could correspond with the induced one. Placing the electriccomponents on a heavy mass (like the battery), or dampening out these components with a dedicated damper can reducethis effect. A simplified model of the vibrating battery can be made. A payload with a mass 124 grams is placed on avibrating base with stiffness k and damping ratio c, that is moving only in one degree of freedom.
The equation of motion of this model is shown in Equation (9.6). The motion of the base is given by y(t ) and theresponse of the mass by x(t ) over a time t. y(t ) has the form of y(t ) = Y si n(ωb t ). m represents the mass of materialthat needs to be damped in kg, c and k the damping coefficient and stiffness of the material, respectively. The simpleequation of motion of this figure is shown in Equation (9.6). This can be rewritten to find the required parameters. [59]
mbat ter y x + c(x − y) + k(x − y) = 0 (9.6)
The battery is put on small cubes of latex foam 6, that are placed on the corners of the battery. Equation (9.6) canbe solved for the variables. The material properties are taken from online sources [60] 7. The size of the damper isestimated to be 1 cm2 and an initial length of 6 mm is taken. This results in a spring constant k of 6,000 N /m for thefour dampers and a damping ratio ζ of 0.4, where ζ = c
2p
kmbat ter y. The mass of the battery and printed circuit board
is estimated to be 124 grams. This results in a natural frequency of around 220 r ad/s. The response is plotted for aunit base excitation magnitude of 1 at three different base frequencies. This response can be seen in Figure 9.6. Naturalfrequency ωn and ωb are also presented in the figure.
9.5. CoverThe quadcopter can harm the surroundings due to the high rotational speed of the propellers. However, the quadcopterwill not fly directly through the rows, which means that the plants should never be close to the propeller, but when thenavigation of detection system fails the quadcopter can come close to the plants. Therefore, a cover will be added whichwill be done by using a circular plastic ring around the propeller and a net structure on top. This casing has also been
6https://hobbyking.com/en_us/anti-vibration-foam-orange-latex-190mm-x-140mm-x-6mm.html?___store=en_us [Cited 16 June 2017]
7http://www.engineeringtoolbox.com/young-modulus-d_417.html [Cited 16 June 2017]
https://hobbyking.com/en_us/anti-vibration-foam-orange-latex-190mm-x-140mm-x-6mm.html?___store=en_us

9.6. Verification and Validation 67
Figure 9.6: Response of base-excited system for three different base frequencies
added such that when falling on the arms, the casing will break first. Which means that the casing has to be replaced andthe arms are still in tact. Furthermore, not only the propellers will be protected. A case is added to the payload box andblower, this has been added to protect the electronic components and the blower.
9.6. Verification and ValidationThis section will describe the verification and validation processes performed. First the verification shall be completed,then the validation will be performed.
For the verification first unit tests are performed in the code. Unit testing is important to check and prove that theimplementation of the code is correct even on the smallest building blocks of the code. It ensures that all the values havebeen used correctly and that the units are correct. For example, checking if values that should be inserted in mm areactually filled in as mm. Next to this it is also checked if the values are filled in at the correct place. For example, doesthe mass have the correct value of 250g. Not only the inputs of the program have to be checked but also the outputs ofpart of the system and the outputs of the total system. For example, it was tested if the moments of inertia calculated bythe program coincide with manual calculations. Furthermore, the eigenfrequencies of the motor arms that were foundhave been verified by using a quadcopter sizing process proposed by [61].
For the validation of the stresses computed by the model, a finite element method (FEM) will be used. This numericalmethod is performed in the CATIA model of the design. The FEM model will divide the total CATIA model in smallersimpler parts called finite elements, will apply the equations to these elements and finally assemble all of this into onelarge system again. First the arms will be analyzed. These will be analyzed the take-off case. A point load is added atthe tip of the structure and the clamp is situated at the other side of the structure. The point load has a value of 1.275 N.After the load case has been defined the stresses could be calculated. For the Von Mises stresses calculated by the FEMmodel a mesh size of 0.5 mm is used. The results that are found can be seen in Table 9.4. The stress distribution can beseen in Figure 9.7. For the Von Mises stress the deviation is 2.5 %, which means that the model has been validated.
Table 9.4: Comparison between Von Mises stresses of the analytical model and the FEM model for the arms during take-off at the critical location
Analytical modelincluding safety factor (MPa)
Analytical modelexcluding safety factor (MPa)
FEM model(MPa)
Percentage ofdeviation (%)
Von Mises stress 3.6 2.4 2.34 2.5

68 9. Structure
Figure 9.7: Von Mises stress on the arm computed by using the finite element method of CATIA
For validating the payload box the load case is assumed where the sides of the payload box are clamped. Furthermore,the weight of the payload box is applied as a distributed force over the length of the box, which is 1.472 N. The modelproposed in Section 9.4.2 gives a maximum value for the Von Mises stress in the middle of the length of the payloadbox. However, in the FEM model the maximum Von Mises stress occurs close to the clamp, the stress distribution can beseen in Section 9.6. For the analytical method this has not been taken into because the equations used do not account forstress concentrations in corners of rectangular shapes. However, the maximum Von Mises stress computed by the FEMmethod is 3.03 MPa, which means that the box can easily take the load. To validate the model a fair comparison of theVon Mises stresses is required. Therefore the Von Mises in the middle of the box will be compared. When comparing theVon Mises stress in the middle of the payload box the value for the analytical method is 0.10 MPa, whereas the numericalmethod gives a value of 0.11 Mpa. This gives a deviation of 10 % . These values can also been seen in Table 9.5.
Table 9.5: Comparison between Von Mises stresses of the analytical model and the FEM model for the payload box in the middle of the length of thepayload box
Analytical modelincluding safety factor (MPa)
Analytical modelexcluding safety factor (MPa)
FEM model(MPa)
Percentage ofdeviation (%)
Von Mises stress 0.15 0.10 0.11 10
Figure 9.8: Von Mises stress on the payload box computed by using the finite element method of CATIA

10Stability and control
The aim of this chapter is to investigate the stability and control characteristics of the drone. First, disturbances, staticstability and quad-rotor dynamics are researched in Section 10.1, Section 10.2 and Section 10.3, respectively. Hereafter,this information is used to determine control and stability characteristics, as shown in Section 10.4 and Section 10.5.
10.1. DisturbancesThe main disturbance that will be modelled is the blower. The forces and torques it generates are all modelled in the bodyframe. The blower is located in the center of gravity on the x-y plane. The blower also propels air at an angle. A forcein the positive z-direction and one in the positive x direction are therefore generated. A torque will also be modelled tosimulate the gyroscopic procession of the motor and the moment the z component of the blowing force causes about thecenter of gravity. The forces of the blower are decomposed in components and can be visualized in Figure 10.1. FromSection 5.3 it was determined that the magnitude of the force of the blower was 0.06 N and that the blower is at a 45 ◦angle. Another force that can be modelled are the fans placed on the floor of the greenhouse. These will generate a forcein the positive z direction. This force is however expected to be very small. The MAV will however not be affected bythis as it flies on top of the row and those blowers are mainly used to keep insects away from the fruits that are at thebottom of the rows.
10.2. Static stabilityA free body diagram of the forces acting on the drone can be made. Two reference systems will also be considered. It isshown in Figure 10.1. Two coordinate systems are furthermore selected. The first, which is also shown in Figure 10.1,is the body reference frame. It is a right handed orthogonal system that takes its reference at the center of gravity of thedrone. When subjected to a perturbance, the reference frame remains fixed to the drone. The forces of the propellers andthe blower will be modelled in this frame. The second frame that is considered is the inertial reference frame. It is Earth-centered and also uses the right-handed orthogonal axis system. Besides the blower, all the other external disturbanceswill be modelled in it.
The equations of motion when the blower is at full power can be set up. Taking the sum of the forces in x, z and thesum of the moments about the center of gravity yields Equation (10.1), Equation (10.2) and Equation (10.3).
∑Fx = 0 = Fxblower −W si n(β) (10.1)∑Fz = 0 = T1 + T3 + T2 + T4 + Fz,bl ower −W cos(β) (10.2)∑
Mycg = 0 = Fxblower 2.74 + Fzbl ower 100 + (T1 + T3)77.8− (T 2 + T 4)77.8 (10.3)
Rearranging Equation (10.1) allows to find the angle at which the MAV will be when hovering with the blower on.It is shown in Equation (10.4).
β = si n−1(
Fxblower
W
)= si n−1
(0.06cos(45)
0.25 ·9.81
)≈ 1◦ (10.4)
When the blower is on, the MAV will be tilted by 1 ◦. The x component of the mass will ensure that the x componentof the blower force does not move in the x direction. Now the variation in thrust can be calculated. Assuming that motors1 and 3 generate the same thrust and motors 2 and 4 do the same, Equation (10.2) and Equation (10.3) can be rearrangedto yield Equation (10.5) and Equation (10.6).
69
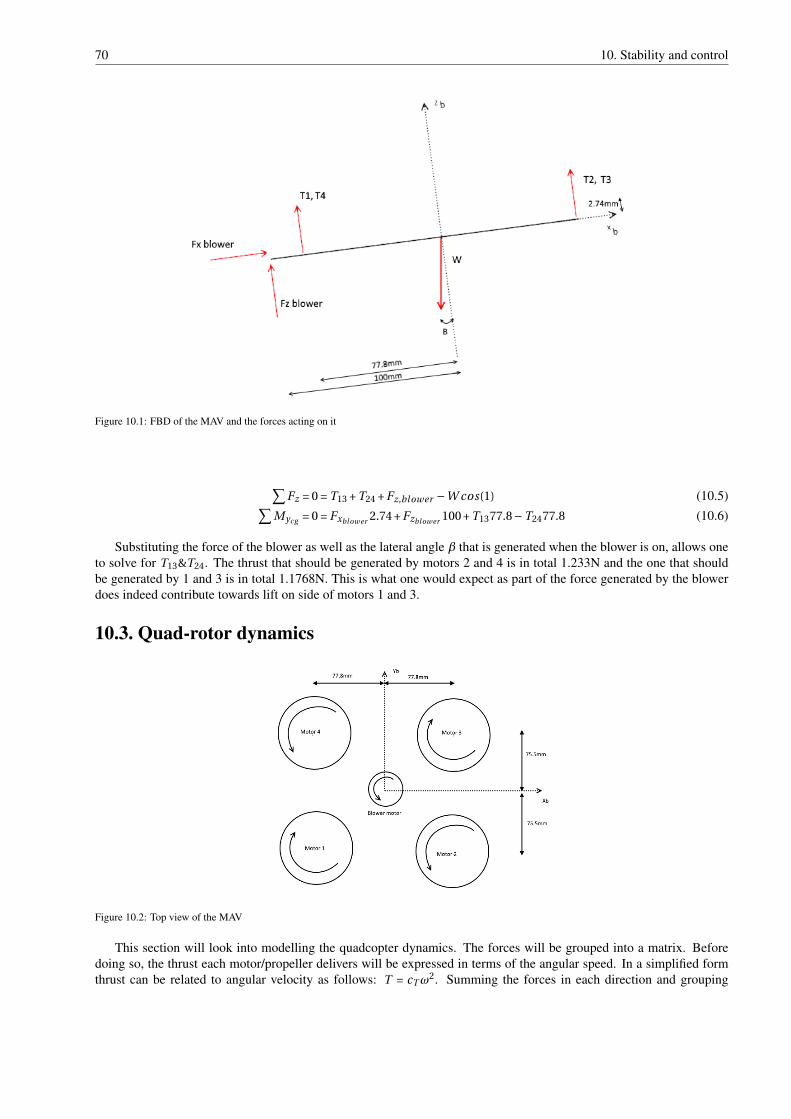
70 10. Stability and control
Figure 10.1: FBD of the MAV and the forces acting on it
∑Fz = 0 = T13 + T24 + Fz,blower −W cos(1) (10.5)∑
Mycg = 0 = Fxblower 2.74 + Fzbl ower 100 + T1377.8−T2477.8 (10.6)
Substituting the force of the blower as well as the lateral angle β that is generated when the blower is on, allows oneto solve for T13&T24. The thrust that should be generated by motors 2 and 4 is in total 1.233N and the one that shouldbe generated by 1 and 3 is in total 1.1768N. This is what one would expect as part of the force generated by the blowerdoes indeed contribute towards lift on side of motors 1 and 3.
10.3. Quad-rotor dynamics
Figure 10.2: Top view of the MAV
This section will look into modelling the quadcopter dynamics. The forces will be grouped into a matrix. Beforedoing so, the thrust each motor/propeller delivers will be expressed in terms of the angular speed. In a simplified formthrust can be related to angular velocity as follows: T = cTω
2. Summing the forces in each direction and grouping

10.4. Control 71
them into a matrix yields Equation (10.7). It must be noted that additional aerodynamic forces such as frame drag areneglected. Indeed, the forces in the x-y plane are, as can be seen from the matrix, equal 0.
F bA,T =
00
cT (ω21 +ω2
2 +ω23 +ω2
4)
(10.7)
Next the moments about x, y, z can be calculated. The thrust forces generate moments about the body axes whenmultiplied by the distances that are shown in Figure 10.2. This figure also shows the spinning directions of the motors:clockwise for motors 1 and 3, counterclockwise for motors 2,4 and the blower. The rotors also spin and generategyroscopic moments in the x and y planes. They are described by Equation (10.8) and Equation (10.9).
τφ = JmQ( π
30
)(ω1 −ω2 +ω3 −ω4) (10.8)
τθ = JmP( π
30
)(−ω1 +ω2 −ω3 +ω4) (10.9)
where P and Q are the rolling and pitching rates. The inertia (Jm) and the speed of the the motor/propeller are alsoconsidered to calculate those. The term π
30 converts RPM to radians.Regrouping the aforementioned moments yields Equation (10.10).
M bA,T =
τφτθτψ
=
−dcTω21 + dcTω
22 + dcTω
23 −dcTω
24 + JmQ
(π30
)(ω1 −ω2 +ω3 −ω4)
−dcTω21 −dcTω
22 + dcTω
23 + dcTω
24 + JmP
(π30
)(−ω1 +ω2 −ω3 +ω4)
−cQω21 + cQω
22 − cQω
23 + cQω
24
(10.10)
The state equations used for the dynamic model are described below. The first defines the angular velocity and isbased off the simple Euler equation shown in Equation (10.11). τ refers to all the external torques.
I ω+ω× (Iω) = τ (10.11)
Rearranging for the angular acceleration, yields Equation (10.12). Use is made of ωbb|i which refers to the body’s
angular velocity.
ωb = I b,−1(τb −ωb
b|i ×(I bωb
b|i))
(10.12) ωx
ωy
ωz
=
τφI−1
xx − Iy y−Izz
Ixxωyωz
τθ I−1y y − Izz−Ixx
Iy yωxωz
τψI−1zz − Ixx−Iy y
Izzωxωy
(10.13)
The next state equation used is the velocity state equation. It is represented in Equation (10.14). It describes thelinear acceleration of the center of mass in the body frame with respect to the inertial reference frame. The final stateequation that is used in the model is the position state equation shown in Equation (10.15). It gives the velocity ofthe MAV in the inertial reference frame. In this equation, use is made of the transformation matrix Ci |b . This is theequivalent of a XYZ rotation transformation. Combining all these equations in MATLAB allows to model the dynamicsof a quadrotor.
vbcm =
UVW
=F b
m+ g b −ωb
b|iωbC M |i (10.14) X i
cm =
xyz
= Ci |b vbcm|i (10.15)
10.4. ControlSeveral techniques exist to control an autonomous quadrotor. The available linear and non-linear techniques are explored.
10.4.1. Linear control techniquesThe linear techniques take the governing flight dynamics equations of motion of the quadrotor and simplify them. Theyare then used for the design of a linear controller. There are two main ways to do that. The first involves furthersimplifications by trying to further decouple the dynamics in order to make use of "successive loop closures". Theother group does not perform this decoupling. This category makes use of state space control approaches and linear

72 10. Stability and control
feedback control. Examples that employ this method are PID (proportional–integral–derivative) and MIMO (multipleinput, multiple output) controllers.
The PID controller stabilizes the attitude of the quadrotor by calculating the error between a measured value anda predefined set point. It adapts the actuators by calculating the proportional, integral and derivative responses of theoutputs. The proportional part of the controller calculated an error term in between a set point and a variable. An increasein the proportional gain will increase the speed of the control system. Attention must be paid to not enter the oscillatoryregion of the variable. This occurs when gain values are too large. The integral response uses errors that were previouslymade to minimize the errors that will come. The derivative response reacts if too fast changes occur. It is proportional tothe rate of change of the variable it is controlling and is very sensitive to noise. It could for this reason make the systemcontrol loop unstable if the gain is too large.
MIMO controllers are easier to use when more than one sensor and actuator are present. Full state feedback con-trollers use the inputs change the system dynamics. It does so by attempting the eigenvalues that are unstable to a morestable location. This can be done through a linear quadratic regulator (LQR) [62]. Hoffman has done this to controlautonomously a rotorcraft [63]. Large stability margins to loop errors are obtained but this comes at the expense ofneeding a full state of the quadcopter [64].
Finally a last linear control method that will be explored is the H-infinity. They guarantee stabilization throughoptimization of a mathematical problem. A big advantage they have is that they are directly applicable to MIMOcontrollers. However, the mathematical level needed to apply them is too big and the full state of the quadcopter isneeded. It was decided to not further explore these types of controllers for this project.
10.4.2. Non-linear control techniquesThe non-linear control techniques depend vastly on the Lyapunov theory [64]. Various methods use this theory forcontrol. Notable ones are gain scheduling, back stepping control and model predictive control.
The idea behind gain scheduling is to design several linear controllers, each with gains optimized for differenttrim conditions. During flight, the appropriate controller is chosen by the selector module basing on the state data.Implementing this method could optimize controllability of the drone, especially by designing control mode when theblower is on.
Backstepping uses nested loops to provide a powerful approach for stabilizing systems [64]. Raptis has used thistype of controller for an autonomous helicopter [65]. Attitude dynamics were found to be exponentially stable andtranslational dynamics were asymptotically stable with this method. A drawback of this method however, is that fullknowledge of the state of the vehicle is needed.
Finally, predictive control methods rely on a prediction model that often due to required accuracy, is expensive.The method in principle is based on iterative optimization of the cost function. This requires considerable computa-tional power which hinders the implementation on a simple airborne embedded systems. Indeed, their performance isinsufficient to provide a real time response.
10.4.3. The control method selectedThe controller selected for the drone was the classic PID controller. The ease of implementation as well as its attitudestabilization performance were driving factors in this decision. Furthermore, given that there are only a few types ofdisturbances, that each do not produce a large force, there was no need for a more elaborate control method.
Two types of controllers are used: one for the position and one for the attitude of the drone. The attitude of the dronewill be corrected by PID controllers whereas the position will be controlled by PD controllers. The PID controller usedfor the attitude is shown Figure 10.3. This figure illustrates the one that is used in the Matlab code to control the yawmotion of the rotorcraft.
The yawing rate (R) of the MAV is is differentiated to predict the future value of the yaw angle. The current yawangle (Psi) and the wanted attitude command are subtracted and the error is found. This error is integrated and theaccumulated offset is multiplied by the gain. The error is also passed in the proportional part of the PID controller andis multiplied by a gain.
The PD controller used for the position controllers is shown in Figure 10.4. The inertial frame velocity is the onethat is controlled. It is then mapped to the desired theta attitude command.

10.5. Stability 73
Figure 10.3: The PID controller used for yaw control [66]
Figure 10.4: The PID controller used the x position of the MAV [66]
10.5. StabilityThe model used to simulate the dynamic behaviour of the drone is the one created by MEM Senior Design Team 37 forDrexel University. It is rated 5 stars on the MathWorks official website and is open source 1. The reason this model wasused, is that it was too time consuming to make a new one.
In order to properly use this model however (or any model that gives accurate results), information about the motorsis needed. Given that the motors were not tested, it was not possible to model the dynamic behaviour of the drone.This section will therefore focus more on explaining how the missing data can be obtained and how gain tuning can bedone rather than showing how the drone reacts to disturbances. The coefficients that need to be determined are CT , thethrust coefficient, CQ , the torque coefficient and Cr and b, which are constants that are obtained by passing a linear fit inbetween the throttle percentage and the RPMs of the motor.
The thrust coefficient, CT can be determined with Equation (10.16), where T is the thrust and ω represents the RPMs.CQ can also be determined in a similar fashion. Use of Equation (10.17) is made where Q is the torque created by themotor.
CT =T
ω2 (10.16) CQ =Q
ω2 (10.17)Finally, CR and b have to be determined. CR is the throttle % to RPM conversion coefficient. It can be determined
through equation Equation (10.18). ωSS is the steady state RPM of the motor and b is the y-intercept of the linearregression that relates the percentage to the RPMs.
ωSS = Throttle% ·CR + b (10.18)
Once these values are determined, the blower can be modelled as a disturbance through functions in SIMULINK.The forces are listed below
1. Fx,bl ower = 0.06 · cos(45◦) ≈ 0.042N2. Fz,bl ower = 0.06 · cos(45◦) ≈ 0.042N
1https://nl.mathworks.com/matlabcentral/fileexchange/48053-quad-sim [Cited 9 June 2017]

74 10. Stability and control
3. My,bl ower = Fz,blower ·0.1 ≈ 0.0042N m4. τθ,g yr o = JmP
(π30
)ω
5. τψ,g yr o = JmR(π30
)ω
To calculate τθ,g yr o , P and R have to be determined. This can be done by observing the model behaviour when theother forces and moments are applied on the MAV. Applying these forces, it was noted that the roll and yaw rates werevery small and were therefore approximated to 0. The inputs are modelled through a ramp that takes 2 seconds and astep function. The time the ramp should be used for is the time the blower takes to spin at max RPM. This was foundthrough the maximum RPM value of 5300 and the acceleration of 20g. The inputs used to simulate the blower shouldreassemble to the ones of Figure 10.5. The time the blower is on at max RPM was selected arbitrarily to 6s.
Figure 10.5: The inputs provided for the model of the MAV
Once the inputs are modelled, the gains of the controllers can be tuned. Gain tuning is important as it allows thedrone to respond more accurately to disturbances. If done poorly, the system can behave in an unstable way by divergingor oscillating around the desired value. Two gain tuning methods will be looked at Ziegler–Nichols and Tyreus-Luyben.Both require some trial and error and both are relatively aggressive tuning methods. This means that it is easy for it toovershoot or become unstable.
The Ziegler–Nichols method tries to find the gain values when the system responds to a step input. At first a low Kp
value should be used. It should be increased until the system responds in a steady state oscillation. The value of Kp forwhich this occurs is denoted as Kcr . Pcr is the period of the sinusoidal wave. The gain parameters can now be tuned byfollowing Table 10.1.
Controller Kc τi nt τder
P Kcr /2PI Kcr /2.2 Pcr /1.2PID Kcr /1.7 Pcr /2 Pcr /8
Table 10.1: Gain tuning according to the Ziegler Nichols method
Controller Kc τi nt τder
PI Kcr /3.2 Pcr 2.2PID Kcr /2.2 Pcr 2.2 Pcr /6.3
Table 10.2: Gain tuning according to the Tyreus-Luyben method
The method proposed by Tyreus-Luyben follows the same method as Ziegler-Nicols but the coefficients used todetermined the gains are slightly different. They are regrouped in Table 10.2. Reducing the oscillations is the mainreason that these gains are different. Both methods can be tried out and the one that yields the most satisfactory resultscan be used.

11Ground segment
The APIS consists of the aerial segment (all the drones) and the ground segment (the supporting equipment). Most ofthe previous chapters have focused predominantly on the aerial segment. The current chapter, however, investigates thedetails about the ground segment.
The means for integrating the support equipment within the existing greenhouse environment are presented in Sec-tion 11.1. Then, the landing pads, fundamental for the autonomous recharging of the drones, are outlined in Section 11.2.Details about the electronics for the ground stations and the rest of the support equipment are given in Section 11.3. Fol-lowing, an air traffic management strategy for making sure that the drones can fly and navigate safely in the greenhouseenvironment is suggested in Section 11.4. Section 11.5 sketches the user interface. Finally, the concluding Section 11.6gives estimates for the weight and the cost of a ground station.
11.1. Greenhouse integrationOne of the main aspects of designing the ground equipment for the pollination system is the integration with existinginfrastructure. The aim is for it to require minimum additional equipment and to be not intrusive to the establishedgreenhouse practises. In order to boost production level, the amount of land unused by the plants is minimized. There-fore, introducing additional facilities would hinder the usability of these areas. For example, rows and paths should havesufficient width to allow for transport carts to pass (see Figure 11.2). Therefore, there is limited space on the floor tolocate the ground stations.
It was noted that the greenhouses typically have an elaborate roof structure featuring numerous truss structures thatsupport the weight of the tomato plants. It was therefore concluded that this structure can be used to hold the groundstations in the air above the center corridor (see Figure 11.10). Located several meters above the path, they will notobstruct the path. Maintenance can still be facilitated as most greenhouses have moving hydraulic trolleys like the onein Figure 11.31. Therefore, in case maintenance is needed, access can be readily obtained by using already existingequipment.
Pollination is also to be performed only at the very top of the plants, hence flying down to and up from ground levelfor charging is not efficient. By placing the charging stations at the height of the flowers, the energy required for thenon-pollinating part of the flights is reduced. The truss structure of the greenhouse roof also can support the power andcommunication cables feeding to the ground stations. No redesign of the floor infrastructure would have to be made. Inthis way the pollination system’s impact on the normal operations and equipment in the greenhouse is minimized.
The structure of the charging station will have a main vertical strut connected to the roof truss. The connection willbe such that the charging system is rigid enough to not move upon drones landing. The charging pad will be arrangedon two layers of four pads. If the height of the roof allows, additional layers can be added. A box holding the mainelectronic components of the ground station will be located close to the strut connection to the truss. An illustration of aground station can be seen in Figure 11.1.
11.2. Landing padsThe charging pin on the drones is designed after the standard 6.3 mm phone connector like the one in Figure 11.42. Thispin design was selected due to the relative ease with which it can be plugged, even if not ideally aligned with the socket.A drawing of the socket designed for the landing pads can be seen in Figure 11.53. The contact surfaces on the sides are1Buitendijk-Slaman http://www.buitendijk-slaman.nl/mpt.html [Cited 16 June 2017]2Image from http://www.conrad-electronic.co.uk/ce/en/product/304313 [Cited 16 June 2017]3Image from https://www.thomann.de/gb/harley_benton_parts_mono_output_jack_socket.htm [Cited 16 June 2017]
75

76 11. Ground segment
Figure 11.1: An illustration of the ground station configuration
Figure 11.2: Typical tomato picking procedure and equipment (trans-portation cart behind the man) Figure 11.3: Hydraulic cultivation trolley
compressed upon jack insertion, and hence provided restorative force that ensures proper contact. Moreover, due to theshape of the tip of the jack, and the spring-like connection, accidental detaching is improbable.
A guiding cone is located above the socket in order to assist the plugging of the pin. It was deemed desirable for theguiding that, if misaligned, the bottom of the pin touches the cone walls with the side of the bottom-most part, insteadof with the tip. The larger horizontal component of the reaction force, as well as the resulting moment acting on thedrone due to the offset of the force application point, both contribute for more effective guiding. This puts limits on themaximum cone angle as can be seen in Figure 11.6. The cone angle cannot be more than 45◦ as that is the typical plugtip angle. With 1 cm cone depth, the resulting cone opening has a diameter of 1.8 cm.
Still, the accuracy necessary for the control system to land the drone while plugging such a jack in the cone of therespective socket is prohibitive. In order to allow landing with lower precision, multiple ports are used instead. Theyare arranged in a honeycomb pattern with ridge and cone structure guiding the pin to the closest socket. This socketarray has a diameter of 5 cm. To assist the drone to align itself above the socket array, two markers are put in front of itsforward-facing stereo and its side-facing mono camera. These markers are aligned with the center of the socket array.Therefore, by aligning the markers in the center of its field of vision, the drone can align itself above the center of thesocket array as well. The charging pad design can be seen in Figure 11.7.

11.3. Electronics and infrastructure 77
Figure 11.4: Standard 6.3 mm phone jackFigure 11.5: Standard 6.3 mm phone socket
Figure 11.6: Effect of cone angle on guiding the plug into the socket. A cone angle of 30◦ is shown in (a) and (c), and a cone of 60◦ is shown in (b)and (d). Images (a) and (b) illustrate the case of vertical descend, while images (c) and (d) the case of tilted descend
11.3. Electronics and infrastructureThe ground stations have partial autonomy, receiving commands and reporting solely to a central server. This server canbe located in any supporting facility outside the actual greenhouse. It stores the images taken by the drones, provides theuser interface, communicates with the ground stations and monitors the status of every component, as well as the systemas a whole. One or more emergency stop buttons are also connected to the server. When such a button is pressed, theserver instructs the drones to slowly land wherever they are. This can result in serious system and greenhouse damage sois to be used only in a serious emergency. In case a ground station loses contact or malfunctions, it informs the user viathe user interface and reassigns its drones to other ground stations. The server also holds records of the performance ofevery drone and measurements for the temperature and humidity levels as measured by them. It also performs calibrationof location information of the UWB tags based on readings recorded during flight.
The server communicates with the ground stations via a Local Area Network (LAN) through a network switch. Theconnections between the central server, the switch and the ground stations are facilitated by a standard LAN cables withRJ45 connectors. In order to reduce the number of LAN cables that need to be placed in the greenhouse, the groundstations are given also network hub functionality. Every ground station also has extra four RJ45 ports that can be used asfor connecting other stations. This effectively reduces the total cable length needed. Nevertheless, concatenating groundstations in this fashion runs the risk of loss of multiple stations in case the hub station fails. Therefore, the trade-offbetween total cable length and redundancy should be made separately for the specific greenhouse architecture and userpreferences. The power lines follow the same philosophy with several ground stations connected to the same main lineby using T-junction cable connectors. An illustration of the ground segment connections for a small greenhouse can beseen in Figure 11.9.
The ground station controller is to be based on a general purpose microcomputer. Raspberry Pi4 and Beaglebone5
were considered as a baseline. Beaglebone was eventually preferred because of the higher number of general purposeinput-output (GPIO) it has (69 vs. 40). Sets of such GPIO pins can be used in order to allow concetivity following
4http://www.raspberrypi.org/products/raspberry-pi-3-model-b/ [Cited 16 June 2017]5http://beagleboard.org/black [Cited 16 June 2017]
78 11. Ground segment
Figure 11.7: An illustration of the charging pad with a section view on the charging sockets
standards like SPI or RJ45. An illustration of the electronics diagram for the ground station can be seen in Figure 11.9.One of the main functions of the ground station controller is to facilitate the charging of the drones via the charging
pads. The PMM8920 power management module (as introduced in Chapter 7) on board of each drone can controlthe battery charging and balancing process. Its charging integrated circuit supports four charging techniques: trickle,constant current, constant voltage, and pulsed. It monitors the charging parameters and makes decisions to controlthe charging process automatically [67]. Therefore, the ground station only has to supply DC current to the PMM8920module. Status about the charging and measures of the state of the battery do not need to be communicated to the groundstation as all decisions regarding the charging process are made on the drone. As a result, having a charging pin withonly two contacts is sufficient. A relay can be used to start and stop the current supply to the sockets. The relay controlsthe input from a voltage supply that supplies the required current. Controlling the 8 relays for the charging integratedcircuits for each of the 8 charging pads requires 8 GPIO pin of the controller.
Each ground station is equipped with a single Decawave DWM10006 UWB module for drone communication andranging. As for large greenhouses the coverage of this module might be insufficient, two ports for external UWB modulesare also present. These modules can be located away from the ground station and connected to it via cables in order toimprove the UWB localization. Each of the three UWB modules connects via SPI interface that requires 4 GPIO pins,resulting in a total of 12 pins.
The LAN hub function of the ground stations is facilitated by adding 4 additional RJ45 connectors to the controllerboard. Each such connector requires 8 GPIO pins
11.4. Air traffic managementWith dozens of drones flying within the greenhouse, air traffic management strategy is of fundamental importance forensuring safety and preventing collisions. Hereby, a basic strategy is outlined. During future developments it can befurther optimized to increase the efficiency and capacity of the system.
Each row in the greenhouse will be accommodated with drones coming from a certain ground station. This reducesthe risk of collision since only drones guided by the same ground station will be flying in certain areas. To eliminate therisk of collision in this scenario completely the drones are programmed to ask permission to the ground station whenthey need to land for recharging purposes. When the ground station confirms, the drone will land and the other dronesrequiring recharging will wait until they get confirmation from the ground station as well.
The risk of drones colliding inside the rows is successfully eliminated since almost all rows only have a single droneperforming the pollination. The rows that are on the transition between two ground station areas do have two dronesthat perform the pollination. However, the risk of these two drones colliding is mitigated by the fact that one of the two
6https://www.decawave.com/products/dwm1000-module [Cited 16 June 2017]

11.5. User interface 79
Ground
station
Ground
station
Ground
station
Power supply
Central server
Network
switch
Power supply
Internet
connection
User
terminal
Power supply
Ground
station
Ground
station
Ground
station
Power supply
Figure 11.8: An example of the ground segment for a small greenhouse. The six ground stations are powered by two main lines. Only two ofthe ground stations are directly connected to the network switch, the other use the hub functionality. Solid lines represent signals and broken linesrepresent power connections
drones will start its mission in this row and the other drone operating in this row will end its mission here. This resultsin a huge time difference of presence of both drones in the row.
The airspace in the greenhouse is divided in segments. In each segment, there could be only a single flying drone ata time. Every half-row is a segment by itself. Additionally, along the corridor, every ground station has its own segmentas well (called terminal control zone, or TCZ), dynamically corresponding to the space between the rows allocated tothe given station. An illustration of the TCZs can be seen in Figure 11.10. As there might be two ground stations sharingthe responsibility for a row, it is possible that their TCZs intersect. When a drone is in the intersection of two TCZs, thenin neither of them can be another drone flying. A drone instructed to land has to wait at the border of the TCZ if there isanother drone performing take-off or landing operations in the TCZ of the same ground station.
The main server allocates the rows in the greenhouse among the ground stations. This is done on the base of theperformance statistics for each individual drone, as well as on the location of the ground stations. This allocation isupdated dynamically as information about the pollinated quantities are dynamically reported by the ground stations.Each ground station autonomously makes the decision of which rows to assign to which drones. It would usually assignthe drones closest to it first. In this way, if at that location the rate of pollination is lower than expected, the furthermostrows can be reassigned to the neighbouring stations without the need for drones crossing through the several TCZs.
The ground stations give high-level instructions to each drone. The instructions involved with typical operations are:take-off, navigate to the beginning of the row, go to a specified starting position, execute pollination procedure; and afterthe pollination procedure is completed, navigate to beginning of the row, if TCZ is free navigate to a specified landingpad, if not wait for the TCZ to become free. After each trip, the drones report how far in the row they have advancedand both the ground station and the main server store this information and use it for planning and task allocation.
11.5. User interfaceThe user interface is web-based. In this way, it is compatible with virtually any computing platform the user might wantto use. Access is provided via cable or wireless LAN connection, or remotely if the network switch is connected to theinternet. This will be the primary tool for the user to monitor, manage and control the drone swarm and the pollinationprocess. The user interface is also the main way for the system to communicate warnings, malfunction reports or othermessages.
It provides a gallery of all images taken by the drones together with a map of the greenhouse that shows where theimages were taken. Additionally, maps of the temperature and humidity distribution in the greenhouse, measured atdifferent times, are also included.
Pollination and performance statistics are also given either per drone, ground station or for the system as a whole.

80 11. Ground segment
Charging relays
array
Ground station
controller
GPIO
GPIO
GPIO
GPIO
GPIO
GPIO
GPIO
GPIO
Charging
pad control
SPI
SPI
SPI
UWB
connection
RJ45
RJ45
RJ45
Hub
connection
RJ45
RJ45
Internal
UWB module
External
UWB module
External
UWB module
Relay
Power
Power
management5V
Communication
Relay
Relay
Relay
Relay
Relay
Relay
Relay
8.4V
Charging
sockets
Socket
Socket
Socket
Socket
Socket
Socket
Socket
Socket
Network
switch
Ground station
Power line
Another
ground station
Another
ground station
Another
ground station
Another
ground station
Figure 11.9: Electronics diagram of the ground stations. The interfaces with external components are also shown. Solid lines represent signals andbroken lines represent power connections
22
Figure 11.10: Illustration of the row assignment among the ground stations (in differentcolours). The locations of the ground stations are shown with black crosses. Moreover,the TCZ of each ground station and the intersections of these zones are also shown
Table 11.1: Cost for the ground segment components ex-cluding the ground stations
Component Price [C]
Server 1600.00a ± 500.00Switching hub 60.00b ± 30.00
aBased on Dell PowerEdge T330 Intel Xeon E3-1240 v63.7GHz + 2 1TB 7.2K RPM hard drives http://www.dell.com [Cited 26 June 2017]
bhttps://www.centralpoint.nl [Cited 26 June2017]

11.6. Ground station weight and cost estimation 81
Table 11.2: Weight and cost break-down per ground station
Component Number ofcomponents Weight [g] Total weight [g] Price [e] Total price [e]
Beaglebone board 1 40 ± 2 40 ± 2 43.07a ± 2.00 43.07 ± 2.00UWB tag 1 0.1 ± 0 0.1 ± 0 13.50b ± 2.00 13.50 ± 2.00Relay 8 4 ± 1 32 ± 8 1.57c ± 0.30 12.56 ± 2.40Other electronics + box 1 200 ± 50 200 ± 50 10.00 ± 5.00 10.00 ± 5.00Charging pad box 8 648 ± 30 5,184 ± 240 12.96d ± 2.00 103.68 ± 16.00Charging pad brace 16 324 ± 15 5,184 ± 240 6.48d ± 1.00 103.68 ± 16.00Charging socket 56 9 ± 1 504 ± 56 1.49e ± 0.50 83.44 ± 28.00Main strut 1 1,900 ± 100 1,900 ± 100 19.20f ± 2.00 19.20 ± 2.00
Total 13,044 ± 696 389.13 ± 73.40
ahttps://www.centralpoint.nl/netwerk-switches/v7/8-x-gigabit-poe-rj-45-art-pegs8-1e-num-5953521[Cited 26 June 2017]
bhttps://www.digikey.com/product-detail/en/decawave-limited/DW1000-I-TR13/1479-1001-1-ND/4499860[Cited 26 June 2017]
chttps://www.sparkfun.com/products/100 [Cited 26 June 2017]dhttps://www.distrelec.nl/en/sheet-aluminium-500-500-mm-no-brand-en-aw-5005-5x500x500mm/p/14821854[Cited 26 June 2017]
ehttps://www.thomann.de/gb/harley_benton_parts_mono_output_jack_socket.htm [Cited 26 June 2017]fhttps://www.distrelec.nl/en/aluminium-square-tube-length-alcoa-inc-en-aw-6060-t66-30x30x3mm-squar/p/14846282 [Cited 26 June 2017]
Information about the health (e.g. battery life, average pollination efficiency, state of motors) of each individual drone isalso available. This allows for the user interface to notify the user in case there is a need for the battery to be replacedor if the ESC detects motor wearing problems. Moreover statistics about the processor and memory performance (CPUdegradation can be for example detected if it requires higher voltage to be kept stable, memtest86 can be used formemory degradation measurement7) Additionally, there can be a map showing when was the last time each part of thegreenhouse was pollinated.
Finally, an application programming interface (API) is also to be developed. The API will provide complete accessto the data recorded by the system and to most of the control functionality. In that way the API will enable connectingand expanding the system with custom or third-party software.
11.6. Ground station weight and cost estimationAs the ground stations are to be attached to the existing greenhouse roof structure, it had to be confirmed that it cansupport them. Therefore, a rough initial estimate of the ground station weight was established.
A Beaglebone board weighs 40 grams8 and it was estimated that the other electronics, together with an electronicsbox weigh additional 200 grams.
The box of each charging pad was approximated as a 40×40×5 cm aluminum box with wall thickness of 0.1 mm.That resulted in a weight of 20 grams. Additionally the two braces in the front and the left side were approximated inthe conservative case as aluminum strips with length 30 cm, width 4 cm and thickness 1 cm, resulting in 648 grams forboth. Finally, seven 6.3 mm phone sockets were also added, each weighing 9 grams9. This results in total charging padweight of 1.11 kg.
The main strut is estimated as an aluminum beam with square cross-section with a side of 4 cm, length 1 m andthickness 5 mm, resulting in a weight of 1.9 kg. In total, they whole ground station weighs about 11 kg without thedrones and 13 kg with the drones. The weight break-down per ground station can also be seen in Table 11.2 togetherwith the respective cost breakdown. After a consultation with an architect10 it was concluded that a single beam of thestructure of a typical greenhouse should be able to support more than a dozen of such ground stations without a problem.
Estimated costs for the central server and the switching hub can be seen in Table 11.1. The cost margins for theserver are relatively large because the cost depends on the hardware parameters which are specific for each greenhouseuser.7http://www.memtest86.com/ [Cited 16 June 2017]8http://beagleboard.org/black [Cited 19 June 2017]9https://www.amazon.co.uk/dp/B01CEZJJYQ [Cited 19 June 2017]10Phone call to an expert: Vesela Petkova, Albena Design Bureau

12Technical diagrams
In this chapter, the technical diagrams showing the interaction between the subsystems are shown. The electrical com-ponent diagram can be seen in Figure 12.5. This diagram shows how the components are connected to the processor andwhat the interfaces are. In Figure 12.1 the electronic block diagram can be seen, in which the circuits that will be usedare shown. The software diagram is presented in two parts in Figure 12.3 and Figure 12.4, and the hardware diagram isshown in Figure 12.5.Another important diagram and an essential part of the design is the communication flow diagram. The communicationflow diagram illustrates the flow of data from the environment through the system and back to the environment again.That communication flow diagram generated for our design is shown in Figure 12.6. The data handling block diagramcan be seen in Figure 12.2.
Battery
2x UWB
Charge and
energy
monitor
Debug
interface
Storage
Processor
Flight
controller
Barometer
IMU
Stereo
cameras
Monocular
camera
2x Laser
Motor 1
Motor 2
Motor 3
Motor 4
Blower
ESC 1
ESC 2
ESC 3
ESC 4
ESC 5
Regulator 1
(3.3V 650
mA)
Regulator 2
(5V 250 mA)
Regulator 3
(2.8V 360
mA)
APM
+
+
+
+
+
+
+
+
+
230 mA
3000 mA
3000 mA
3000 mA
3000 mA
2x 320 mA
0.2 mA
240 mA
0.3 mA
180 mA
0.1 mA
3.7 mA
2x 92mA
34mA
2x 20mA
Charger pin
Figure 12.1: Electrical block diagram for the APIS showing the main power lines (DC current)
82

83
Main flight controller
Detection and avoidance system
Central Processing
Unit
Watchdog timer
Co-processor
MemoryI/o
ports
Mass storageMass storage
Data formatter and control logic
Drone data bus
Navigation system
Health management
system
Control system
Downlink
Uplink
Stereo cameras
Monocular cameras
Lasers
Propulsion system
UWB transceiver
Power system
Processor data bus
Figure 12.2: Data handling block diagram
Temperature and pressure
data
Laser signalBarometer
dataIMU data
Temperature and humidity sensor
moduleLaser module Barometer IMU module
InterMCU module for communication
over I2C
Right camera module
Monocular camera module
InterMCU module for communication
over MPI
Left camera module
InterMCU module for communication
over USB
Current sensor module
Charge sensor module
Battery checker module
Maximum power point tracker
module
InterMCU module for communication
over SPIUWB module
Image data to transfer to ground
station
OS
Figure 12.3: Software block diagram - part 1

84 12. Technical diagrams
Contr
oller
Ste
reo-b
ased
repla
nnin
g m
odule
INS m
odule
Flo
we
r d
ete
ctio
n m
od
ule
Syst
em
m
onitor
module
Filt
er
the d
ata
Filt
ere
d
baro
mete
r data
Filt
ere
d
IMU
data
Filt
ere
d
posi
tion
data
of
UW
B t
ag 1
Filt
ere
d
posi
tion
data
of
UW
B t
ag 2
Is t
he q
ualit
y o
f th
e I
MU
data
good?
Tra
nsf
orm
acc
ele
ration t
riad
data
to a
ppro
priate
re
fere
nce
fra
me
Com
pute
att
itude
from
gyro
scope
tria
d d
ata
Inte
gra
teIn
tegra
te
Kalm
an f
ilter
Dis
tort
ion
corr
ect
ion
module
Colo
r co
rrect
ion
module
Posi
tion
contr
olle
r
Att
itude
contr
olle
r
Moto
r m
ixin
g
contr
olle
r
Genera
te d
isparity
m
ap
Segm
ent
image
usi
ng
thre
shold
Apply
m
orp
holo
gic
al
opera
tions
Get
connect
ed
com
ponents
Is s
ize o
f co
mponent
suff
icie
ntly larg
e?
Convert
to
HSV c
olo
r sp
ace
Sta
te
est
imate
Velo
city
est
imate
Posi
tion
est
imate
Subsa
mple
the p
oin
t cl
oud
Tra
nsf
orm
fro
m
cam
era
to w
orld
syst
em
Bin
poin
t cl
oud into
cu
bic
voxels
Update
pro
babili
ties
for
voxels
Update
grid
occ
upancy
map
Check
cro
ssin
g w
ith
roadm
ap g
raph?
Elim
inate
vert
ices
from
the r
oadm
ap
gra
ph in p
roxim
ity
of
dete
cted
obst
acl
e
Pla
n n
ew
path
Keep f
lyin
g
usi
ng o
ld p
ath
to
ward
s w
aypoin
t
No
Yes
Com
pute
att
itude
from
tag
posi
tions
Op
erat
ing
syst
em
Yes
No
Yes
Do n
ot
use
data
for
senso
r fu
sion
Figure 12.4: Software block diagram - part 2

85
Processor
IMU
Barometer
Camera left
Camera right
Monocular
camera
UWB module
Battery
managementBattery
Flight
controller
Charging
system
ESC
Motor
Debug
interface
Temperature and
humidity sensor
Fan
Storage
I2C
I2C
MPI
MPI
MPI
SPI
UART
I2C
BLSP
SDC
USB
Navigation
Obstacle detection Payload
Propulsion
Power
5V
7.4
V
Communication
Voltage
regulator
3.3V
Laser pointing
downI2C
Laser pointing
upI2C
UWB module SPI
Figure 12.5: Electrical component diagram
Table 12.1: Table showing what data is communicated between the blocks of the communication flow diagram
Number Data description Number Data description
1 Sensor signals 17 State update: no path command2 Slave device addresses 18 State update: start pollination phase3 UWB signal 19 Blower control commands4 Image data from monocular camera 20 UWB data
5 Image data from monocularcamera with corrected color 21 Row allocation information/
designation to return to ground station
6 Image data from stereo camera 22 From UWB to localization module: ranging information.From localization to UWB module: location estimate
7 Processed stereo images 23 Location estimate8 Disparity map 24 Drone health information9 Obstacle detection signal 25 Crtitical health warning signal10 Path command 26 Mission data11 Sensor data 27 Image data12 State estimate 28 Ground station information
13 Euler angle commands as wellas altitude command 29 Command information from user
14 Corrections in Euler anglesas well as altitude 30 Information from communciation module
15 Actuator control commands 31 UWB information16 State update: guidance with path 32 Comands from user

86 12. Technical diagrams
Figure 12.6: Communication flow diagram

13Final cost, mass and configuration
This chapter summarizes the technical decisions discussed in the previous sections. The main design presented hereassembles all the subsystems and provides an illustration of the future product, APIS. Firstly, some general dimensionsof the drone (on scale) are provided to offer a better feeling of the final product. Secondly, a first order bill of materialsis tabulated together with the component price, its net weight and the source from where it can be purchased. Then,a total cost of the entire mission is generated, including that of the ground station and the system of drones. Lastly,the requirements are brushed over and they are checked for compliance. This is summarized in a compliance matrixfollowed by a feasibility analysis for the requirements that are not met or still left to be validated.
13.1. Design characteristicsAPIS is a 250 g drone designed to be modular, thus flexible for different pollination methods. The current configurationpresented in this paper accommodates for a blower suited for self pollination which weights 15 g. With this weight,APIS hovers at 48% of the maximum thrust, leaving plenty of throttle for agile maneuvers. According to requirementDP-MAV-14, the drone is allowed to hover at 50% of the maximum thrust, meaning that a maximum payload of 25 gcan be taken on board (without the blower) or extra 10 g besides the blower.
The backbone structure was built around the battery which represents 40% of the total weight spread along thelongitudinal axis. Because of that, an H-configuration was chosen in order to minimize the length of the booms. Thecustomized battery fits in a box. In order to minimize the drag caused by the volume, the blower was designed to fit in acompact casing. As a result, a centrifugal blower was chosen to obtain the required blowing velocity. This is attached tothe battery and held in place by the main case which makes sure that no moisture affects the interior of the drone.
The stereo cameras are placed in front of the case to assure visibility with the needed field of view and distancebetween each other. The monocular camera is placed under the blower and parallel to its exit flow. Two lasers are placedin the front on the top and the bottom of the case in order to scan the surroundings as the drone advances in the unknownenvironment. Last but not least, the propeller casings are there to assure the safety of the plants according to requirementDP-SAFE-1. Figure 13.1 illustrates how all the aforementioned features are incorporated into a single aerial vehicle withan animal-like aspect to perform the mission.
Figure 13.1: Isometric view of APIS. Rendered with CATIA V5
87

88 13. Final cost, mass and configuration
13.2. CAD technical drawings
This section provides the general outer dimensions of APIS. The CAD drawings are generated by CATIA V5 which alsokeeps track of the mass of each component given the material density. Figure 13.2 illustrates the top view, while theisometric, front and side views can be found in Figure 13.3.
Top viewScale: 54%
290.93
284.931
33.93
Figure 13.2: Top view of APIS. Dimensions in mm

13.2. CAD technical drawings 89
52.21
30.3
Front viewScale: 54%
16.07
6.32Side viewScale: 54%
Isometric viewScale: 27%
Figure 13.3: Isometric, front and side view of APIS. Dimensions in mm

90 13. Final cost, mass and configuration
13.3. Exploded views and BOMThis section highlights every component considered in the design. First, the blower assembly is presented in Figure 13.4followed by the propulsion system in Figure 13.5. Lastly, Figure 13.6 illustrates the final assembly including the blowerand propulsion sub-assemblies. All these exploded diagrams are followed by bills of materials (BOM) which describeeach component listing the materials, masses and costs.
5
4
3
1
Isometric viewScale: 100%
2
Figure 13.4: Exploded view of the blower assembly. Description of the balloon numbers is presented in Table 13.1
Table 13.1: Blower assembly (BLW01) bill of materials. Description of the balloon numbers from Figure 13.4. The listed masses and costs are perpart. The totals are for the entire assembly
Balloon no. Part no. Part name Quantity Material Mass [g] Cost [C]
1 BLW01TN Tube nozzle 1 ABS 1.6 ± 0.1 1.1 ± 0.12 BLW01BC Blower case 1 ABS 3.3 ± 0.1 2.2 ± 0.13 BLW01CP Centrifugal propeller 1 ABS 3.2 ± 0.1 2.1 ± 0.14 BLW01BM Brushless motor 1 - 4.5 ± 0.5 2.5 ± 1.5a
5 BLW01HS Heat sink 1 ALU 2.4 ± 0.2 1.6 ± 0.1
Total: 15 ± 1.0 9.5 ± 2.0
ahttps://www.alibaba.com/product-detail/Reasonable-Price-12V-brushless-Dc-BLDC_60625423847.html[Cited 26 June 2017]

13.3. Exploded views and BOM 91
4
3
2
7
5
6
10
8
1
9
Isometric viewScale: 82%
Figure 13.5: Exploded view of the propulsion assembly. Description of the balloon numbers is presented in Table 13.2
Table 13.2: Propulsion assembly (PROP01) bill of materials. Description of the balloon numbers from Figure 13.5. The listed masses and costs areper part. The totals are for the entire assembly
Balloon no. Part no. Part name Quantity Material Mass [g] Cost [C]
1 PROP01PC Propeller casing 4 ABS 2.90 ± 0.10 1.9 ± 0.12 PROP01PN Propeller nut 4 ALU 0.10 ± 0.05 0.1 ± 0.03 PROP015P 5" Propeller 4 ABS 2.90 ± 0.10 1.9 ± 0.14 PROP010M Motor 4 - 12.0 ± 0.20a 22 ± 1.1b
5 PROP01B3 M3x4.5 bolt 24 ALU 0.07 ± 0.01 0.01 ± 0.06 PROP01N3 M3 nut 16 ALU 0.01 ± 0.001 0.01 ± 0.07 PROP01BL Mount bracket low 4 ABS 0.22 ± 0.10 0.2 ± 0.18 PROP01HL Hollow 8mm tube 4 Carbon 2.24 ± 0.20 0.7 ± 0.2c
9 PROP01BU Mount bracket up 4 ABS 0.90 ± 0.10 0.6 ± 0.110 PROP01SC ESC 4 - 0.10 ± 0.05 6.3 ± 0.5d
Total: 87.3 ± 4.1 135.2 ± 8.8
ahttp://www.dys.hk/ProductShow.asp?ID=115 [Cited 26 June 2017]bhttps://hobbyking.com/en_us/dys-1306-2300kv-bx-series-set-of-two-cw-ccw-motors.html? [Cited 26 June2017]
chttps://hobbyking.com/en_us/carbon-fiber-tube-hollow-8x750mm.html [Cited 26 June 2017]dhttps://hobbyking.com/en_us/supermicro-systems-brushless-esc-3a-mi-3a.html [Cited 26 June 2017]

92 13. Final cost, mass and configuration
Isometric viewScale: 27%
12
13
14
6
3
2
7
4
5
1
8
9
1110
Figure 13.6: Exploded view of the APIS assembly. Description of the balloon numbers is presented in Table 13.3

13.4. Resource allocation / budget breakdown 93
Table 13.3: Main assembly (APIS) bill of materials. Description of the balloon numbers from Figure 13.6. The listed masses and costs are per part.The totals are for the entire assembly
Balloon no. Part no. Part name Quantity Material Mass [g] Cost [C]
1 STR01 Stereo camera 2 - 4.0 ± 0.5 30.8 ± 7.6a
2 LSR01 Laser 2 - 0.1 ± 0.0 2.3 ± 0.5b
3 CSG01DRN Casing 1 ABS 4.6 ± 0.6 3.0 ± 4.14 BLW01 Blower assembly 1 - 15 ± 1.0 9.5 ± 2.05 PCB01SNP PCB Snapdragon 1 - 9.4 ± 0.5 80 ± 20c
6 PCB01SPP PCB support 1 ABS 3.2 ± 0.1 2.1 ± 4.17 PROP01 Propulsion assembly 4 - 21.8 ± 4.1 33.8 ± 8.88 CAM01MNT Camera mount 1 ABS 0.3 ± 0.0 0.2 ± 0.09 CAM01MNO Monocular camera 1 - 6.0 ± 0.2 50.8 ± 7.1d
10 CHG01 Charging pin 1 ALU 0.4 ± 0.1 0.7 ± 0.111 UWB01 UWB 2 - 0.1 ± 0.0 13.5 ± 1.2e
12 BRK01 Bracket 2 ABS 1.8 ± 0.1 1.2 ± 0.113 CSG01BTT Battery case 1 Carbon 10.8 ± 4.1 3.7 ± 1.214 BTT01 Battery 1 - 100.5 ± 3.0 14.6 ± 6.0f
Total: 249.5 ± 23.3 394.2 ± 54.2
ahttp://www.optics-online.com/dsl_fifth.asp [Cited 26 June 2017]bhttp://www.st.com/en/imaging-and-photonics-solutions/vl53l0x.html [Cited 26 June 2017]chttps://pcbshopper.com/ [Cited 26 June 2017]dhttp://www.optics-online.com/dsl_fifth.asp [Cited 26 June 2017]ehttps://www.digikey.com/product-detail/en/decawave-limited/DW1000-I-TR13/1479-1001-1-ND/4499860[Cited 26 June 2017]
fhttps://hobbyking.com/en_us/graphene-1500mah-4s-65c-w-xt60.html?___store=en_us [Cited 26 June 2017]
Table 13.3 lists all the components needed for the drone to be assembled, including the propulsion and the blowersub-assemblies. As summarized at the end of the table, the total mass of the drone is approximately 250 g (273 g in theupper limit) and the total costs are about 400 C (450 C maximum). One can observe that even in the worst case, thedesign of the quad still satisfies the requirements of being maximum 300 g and costing no more than 500 C.
13.4. Resource allocation / budget breakdownIn order to arrive to the final values mentioned above, the team followed a systematic contingency approach that central-ized the design process and tracked the main changes. This is presented in Figure 13.7 and it shows how at the beginningof the detailed design phase the uncertainties were ±50% and at the end of the design, the final weight was computed tobe 250 g with an uncertainty of ±9%.
The plot was constructed by braking down the drone into main sub-systems such as propulsion (motors, ESCs andpropellers), structure (all the connection bits and structural parts such as casings), blower (including the nozzle and theradiator), cameras (two stereo and one monocular), battery and electronics (PCB). A substantial table kept track of allthe changes of the design in thrust, weight of components or other variables. In order to observe the actual effect andperform the necessary iterations, one change at the time was allowed and the list of modifications per each sub-systemis detailed below.
Propulsion The starting point for the motors was taken form the preliminary design where DYS 1306 motors wereused to provide a maximum of 130 g of thrust each. 16 g per motor, propeller and ESC were assumed at that stage withan uncertainty of ±2 g. On the 23rd of June it was confirmed that the same DYS 1306 would be perfectly suited for thenew design and with a better estimate of the propeller by CATIA, the motor, propeller and the ESC are assumed to beweighing since that date 15 g ± 1 g due to the wiring (short cables are included in the 12 g of a motor, but the heavyconnectors compensate for a needed longer length of the cables).
Structure Because the components were not known in the beginning, for a long time, the structural mass of the dronewas assumed to be 30% of the total weight (value taken from the referenced drones on the market as explained inChapter 9). After the other main components such as the battery or the motors were known, the structure was builtaround them in CATIA. With time, and after some iterative processes, the structural weight stabilized to 46 g with amargin of ± 14 g due to the simplifications in the design which omitted some bolts, clamps or adhesives.

94 13. Final cost, mass and configuration
Figure 13.7: Evolution of the total mass over time, during the detail design phase. The mean value and the margins are plotted together with the weightrequirement of 300 g
Blower Initially, a fifth DYS 1306 motor was assumed to do the job of pollination meaning that 16 g were reservedfor the payload with a margin of ± 15 g. After a more detailed research of the amount of velocity needed for pollination(explained in Chapter 5), the blower was sized down to 2.5 g (thus the sudden drop on the 15th of June). This however,was a mistake as the selected micro motor was in fact not providing the 10 m/s required by the CFD analysis. Over time,a bigger motor was chosen with a high margin. On the 19th of June a radiator was added in this sub-system in order towarm up the air targetted to the flower. In the end, an industrial centrifugal blower was chosen and remodelled in CATIAfor weight optimization, reaching a final mass og 15 g ± 1 g.
Cameras The preliminary design required only two stereo cameras for navigation and flower detection and thus, 4 gwas originally allocated for this sub-system (weight taken from Delfly stereo cameras). Unfortunately, this stereo pairwas not considered enough for accurate navigation and precise flower detection, therefore higher quality cameras wereconsidered together with a third one on the side of the drone dedicated for localizing the flowers. These three camerasended up in total at 15 g with a margin of ± 0.5 g due to the accurate manufacturer specifications.
Battery Initially a 1.2Ah Li-Po battery was considered at the beginning of the detailed design phase with a low weightof 56 g. This was proven in Chapter 6 that was not the case. A higher capacity was needed and a different batterytechnology was required for a higher amount of charging cycles. As a consequence, 100.5 g ± 3 g were set for the finalweight of the battery. This can be clearly observed as a major change on 16th of June in Figure 13.7.
Electronics The weight of the PCB did not vary that much over the detail design phase. It was assumed at the beginningto be 8.2 g and in the end, after many iterations and modifications of the original Snapdragon Flight board explained inChapter 7, the weight reached 12.6 g.
13.5. Total costsAt this point, the total number of drones needed to pollinate a typical green house (4 hectares) is fixed to 64. 58 APISvehicles are required to perform the mission in 3 days and 6 extra are added for redundancy. 8 ground stations arerequired for the same green house to offer support for 8 drones each. Additionally, a server and a hub are needed tocentralize the entire system, take decisions and sore relevant information. All these costs are summed up and concludedin Table 13.4. Note that the total value of 30,000 C represents the initial cost. A monthly fee of 934 C ± 384 Cis required to cover the 64 short-life batteries. All these costs are the material costs and they not include shipment,manufacturing logistics, R&D or other miscellaneous costs.
Table 13.4: Initial cost of the entire pollination system (for a 4 hectares greenhouse)
Product Price [C] Quantity Subtotal [C]
APIS 394 ±54 64 25,216 ±3,456Ground station 389 ±73 8 3,112 ±584Hub 60 ±30 1 60 ±30Server 1,600 ±500 1 1,600 ±500
Total: 29,988 ±4,570

13.6. Compliance matrix 95
13.6. Compliance matrixIn this section, the requirements compliance matrix is presented. This table includes the requirements and an indicationof whether they have been met. It serves as an indication for the value the design delivers.
Table 13.5: Overview of top level design requirements
Label Requirement Compli-ance Note
MAV
DP MAV 1 The MAV shall take-off, fly and land autonomously. 3 Section 8.1
DP MAV 2 The MAV shall locate, approach and shake a minimum of 500flowers a day. 3 Section 2.5
DP MAV 3 The MAV shall return to its charging station, land and recharge. 3 Section 8.1
DP MAV 4 Multiple MAVs shall be able to fly simultaneously in the samegreenhouse. 3 Section 11.4
DP MAV 5 The MAV shall keep track of which parts of the greenhouse wereprocessed and when. 7 -
DP MAV 6 The MAV shall store visual images of all visited flowers in a cen-tral database. 3 Section 11.5
DP MAV 7 The MAVs shall be in constant communication with the supportsystem. 3 Section 8.2
DP MAV 8 Average power consumption of a MAV shall be no more than70W. 3 Section 8.2
DP MAV 9 The MAV shall be able to fly uninterruptedly for 12 minutes with-out charging. 3 Section 8.2
DP MAV 10 The MAVs shall be able to send telemetry data to the support sys-tem. 3 Chapter 11
DP MAV 11 The MAVs shall have a maximum speed of 5 m/s. 3 Section 3.2DP MAV 12 The MAV shall keep track of the flowers it has pollinated. 3 Section 11.3DP MAV 13 The MAV shall not weigh more than 300 grams. 3 Chapter 13DP MAV 14 The MAV shall not hover at more than 50 % thrust 3 Section 6.1
Support system
DP SPP 1 The support system shall be able to send status data to the manu-facturer. 3 Section 11.3
DP SPP 2 The support system shall provide power to the MAVs. 3 Section 11.3
DP SPP 3 The support system shall be able to send control signals to theMAVs. 3 Section 11.3
DP SPP 4 The support system shall be able to gather telemetry data aboutthe MAVs. 3 Section 11.3
DP SPP 5 The support system shall be able to receive/gather and save pic-tures from the MAV. 3 Chapter 11
DP SPP 6 The support system shall provide a defined area to the MAV toperform its function. 3 Section 11.4
User interfaces
DP UI 1 The system does not require special training for operation. 3 Chapter 4
DP UI 2 The user shall be able to load the pictures from the system. 3From the server Sec-tion 11.3
DP UI 3 The UI shall not be compromised by the greenhouse environment. 3Web-based interfaceSection 11.5
DP UI 4 The system shall have an emergency stop button. 3 Section 11.3
Crops
DP CROP 1 The targeted crops shall be grown in a greenhouse. 3Tomato crops se-lected as crop

96 13. Final cost, mass and configuration
DP CROP 2 The MAV shall target multiple crops. 3Modularity of thepayload Section 13.1
Environment
DP ENV 1 The MAV shall be water-proof. 3 Section 13.1
DP ENV 2 The MAV shall be able to withstand temperatures ranging from 5deg C to 50 deg C. 3 Chapter 7
DP ENV 3 The MAV shall be able to withstand the chemicals used in thegreenhouse. 3 Chapter 7
DP ENV 4 The MAV shall be able to withstand the lighting conditions usedin the greenhouse. r -
DP ENV 5 The MAV shall be able to withstand the atmospheric conditions inthe greenhouse. r -
Market
DP MRK 1 The MAV shall not be currently available in the market. 3 Section 19.4
DP MRK 2 The system cost shall be competitive with the current service ofbees. 7
Proof-of-concept,not yet competitive
DP MRK 3 Publicity strategy shall be established before the proof of conceptdemonstration. 3
Conferences, mar-keting strategySection 19.4
Resources
DP RES 1 The system of MAVs shall be designed by a team of 9 students. 3
DP RES 2 The structural design of the MAV shall be performed in CATIAV5. 3 Section 13.1
DP RES 3 No external advisors or consultants shall be hired. 3
Made contact withexperts but nonewere hired
DP RES 4 No equipment, materials or components shall be bought. 3 Nothing was bought
Legal
DP LEG 1 The system shall not infringe any patent laws. 3To the best of ourknowledge
DP LEG 2 The subsystems that have contact with the plants shall complywith the Food Contact Materials of the targeted market countries. 3
No contact withflower
DP LEG 3 The MAVs shall comply with the aviation authority regulations ofthe targeted market countries. 3
Flying inside andheight does notexceed 10 m
Sustainability
DP SUST 1 The MAV shall have a minimum life-time of 8 months. r -DP SUST 2 The MAV shall have no emissions. 3 Chapter 17
DP SUST 3 The materials and joining methods used shall allow for full recy-clability. 3 Section 17.1
DP SUST 4 No hazardous materials shall be used in the system. 3 Section 17.1
DP SUST 5 No hazardous substances shall be created in case of a reaction ofthe system materials with any chemicals used in the greenhouse 3 Section 17.1
DP SUST 6 The location of a MAV that got stuck shall be tracked. 3 Section 8.3
DP SUST 7 The sound level of the MAV system shall not be more than 100dB. 3 Section 17.3.2
Safety
DP SAFE 1 The MAV shall not do any damage to the plants. r -DP SAFE 2 The MAV shall be able to avoid obstacles. 3 Section 8.5.2
DP SAFE 3 The MAV shall be able to land at the base in case of losing thecommunication 3 Chapter 16

13.6. Compliance matrix 97
DP SAFE 4 The MAV shall be able to land at the base in case of overheating. 3 Chapter 16DP SAFE 5 The system shall be able to be operated manually. 3 Section 11.5DP SAFE 6 In case of critical subsystem damage,
the MAV shall be able to turn off the propulsion system. 3 Chapter 16DP SAFE 7 The MAV shall not endanger humans upon accidental impact. r -
DP SAFE 8 The MAV shall not break the structural elements of the green-house in case of impact. r -
Schedule
DP SCH 1 Proof of concept shall be demonstrated by December 20, 2017. r -DP SCH 2 First delivery shall be completed before July 1, 2018. r -DP SCH 3 Lead time shall be no more than 2 months. r -DP SCH 4 System installation time shall be no more than 3 days. 3 Section 4.3
DP SCH 5 Baseline review shall be completed, documented and presented byMay 9, 2017. 3 See baseline report
DP SCH 6 Mid-term review shall be completed, documented and presentedby May 30, 2017. 3 See midterm report
DP SCH 7 Final review shall be completed, documented and presented byJune 30, 2017. 3 This report
DP SCH 8 The design process and results shall be presented at the DSE Sym-posium Day on July 6, 2017. 3
Cost
DP CST 1 The material cost of a single MAV shall be no more than 500euros. 3 Section 13.3
DP CST 2 The total system costs for 10 MAVs and their supporting systemsin a single greenhouse shall not exceed 50,000 3 Section 11.6
DP CST 3 The yearly maintenance costs for 10 MAVs and their supportingsystem shall not exceed 10,000 euros. r -
DP CST 4 The project development costs shall be amortized by July 1, 2022. r -
Manufacturing
DP MAN 1 Working conditions shall comply with the legal regulations. r -
DP MAN 2 No materials and substances which are hazardous to the environ-ment shall be used. 3 Section 17.1
DP MAN 3 Lean manufacturing procedures shall be implemented. 3 Chapter 15
DP MAN 4 Sustainable approach to manufacturing strategy shall be estab-lished. 3 Section 17.2
Maintenance
DP MAIN 1 A system fault shall be serviced in no more than 3 days. 3 Section 4.4DP MAIN 2 A mobile repair kit shall be designed. 3 Section 4.4DP MAIN 3 A self-diagnose analysis shall be implemented in the system. 3 Section 14.3
DP MAIN 4 A software update shall be delivered by the manufacturer onlyremotely. 3 Section 14.3
End of life
DP EOL 1 End of life support and service shall be established in less than 3months after the first delivery. 3 Section 4.4
DP EOL 2 The system shall be removable in less than one day by five people. 3 Section 4.4
DP EOL 3 Removing the system shall not compromise the system’s functionspermanently. 3 Section 4.4

98 13. Final cost, mass and configuration
Table 13.6: Overview of requirements to perform the mission technically
Label Requirement Compli-ance Note
Structure
DP MAV 11 STR 1 The structure shall be able to withstand at least 2g accel-eration. 3 Chapter 9
DP SUST 1 STR 2 The structure shall be able to withstand a fatigue load of3 ·10 9 cycles. r -
DP SUST 1 STR 3 The structure shall have a safety factor of 1.5. 3 Section 9.3.4
DP MAV 11 STR 4 The structure shall withstand an impact with a hard sur-face at max. speed. 3 Chapter 9
DP MAV 2 STR 5 The structure shall be able to withstand the vibrations ofthe payload system. 3 Section 9.4.3
DP MAV 9 STR 6 The structure shall protect the propulsion system in caseof impact. 3 Chapter 9
Control
DP MAV 2 CON 1 The MAV shall have a pointing accuracy of 7◦. r -
DP MAV 2 CON 2 The control system shall provide the stability required bythe payload subsystem. r -
DP MAV 1 CON 3 The control system shall have stabilization loops andguidance loops. 3 Chapter 10
DP MAV 1 CON 4 There shall be a separation between vertical and horizon-tal control. 3 Chapter 10
DP MAV 1 CON 5 Four modes of autonomous control shall be discerned 3 Chapter 10
Communication
DP LEG 3 COM 1 The communication system shall use only frequencies al-located for general use. 3 Section 8.2
DP SAFE 5 COM 2 The communication system shall deliver control com-mands within 100 ms. 7 Section 8.2
DP MAV 7 COM 3 The communication system shall compensate for Dopplereffects. 3 Section 8.2
DP MAV 7 COM 4 The communication system shall regain a communicationchannel when one is lost. 3 Section 8.2
DP MAV 10 COM 5 The communication system shall provide downlink ca-pacity to send telemetry data every 1000 ms. 3 Section 8.2
DP MAV 6 COM 6 The communication system shall provide a high-throughput channel for image delivery. 3 Section 8.2
Onboard computer
DP MAV 1 CMP 1 The onboard computer shall have a clockspeed of no lessthan 1.5 GHz. 3 Chapter 7
DP MAV 8 CMP 2 The onboard computer shall have a power consumptionof less than 5 Watt. 3 Chapter 7
DP MAV 13 CMP 3 The onboard computer mass shall be less than 20 grams. 3 Section 13.3
DP MAV 2 CMP 4 The onboard computer shall have interfaces for at least10 sensors. 3 Section 7.4
DP MAV 4 CMP 5 The onboard computer shall have interfaces for at least 5actuators. 3 Section 7.4
DP MAV 7 CMP 6 The onboard computer shall have interfaces for the com-munication system. 3 Chapter 7
Power

13.7. Feasibility analysis 99
DP MAV 9 POW 1 The degradation of the battery shall be no more than 5percent. 3 Section 6.4
DP MAV 9 POW 2 The chosen battery shall withstand no less than 250 dis-charge cycles. 3 Section 6.4
DP MAV 3 POW 3 The depth of discharge of the battery shall be less than90% percent. 3 Section 6.4
Propulsion
DP MAV 2 PRO 1 The propulsion subsystem shall allow three degrees offreedom. 3 Section 6.1
DP MAV 11 PRO 2 The propulsion subsystem shall provide no more than 1 gof acceleration. 3 Section 6.1
DP MAV 11 PRO 3 The propulsion subsystem shall provide no less than -0.5g of acceleration. 3 Section 6.1
DP MAV 11 PRO 4 The propulsion subsystem shall provide a rate of climb of0.1 m/s. 3 Section 6.1
Sensors
DP MAV 4 SNS 1 The sensors shall have the capabilityto provide the required data to the control system. 3 Section 7.3
DP MAV 6 SNS 2 The sensors shall assign a location to the pictures. 3 Section 7.3
DP MAV 1 SNS 3 The sensors shall be calibrated automatically. 3
Manual onlyduring instal-lation
Swarming
DP MAV 4 SWA 1 The MAVs shall not collide with each other. 3 Section 8.1DP MAV 5 SWA 2 The MAVs shall not pollinate the same flower. 3 Section 5.3DP MAV 1 SWA 3 The MAVs shall keep a safe distance from each other. 3 Section 8.1
13.7. Feasibility analysisSome of the requirements established could not be met, as can be seen in Table 13.5 and Table 13.6. This sectionelaborates on the reason why the design fails to comply with these requirements. Furthermore, while some are not met(7), others need further work for validation (r). First, the requirements relating to the overall system will be addressed,after which the ones pertaining to the subsystems are discussed.
Going through the list, the first requirement that is not satisfied is DP-MAV-5. The MAV shall not keep track ofthe parts of the greenhouse it has processed, but the ground station will do this. Another requirement that is not metis DP-MRK-2. The system cost does not have to be competitive with the current pollination service of bees, as thissystem is a proof-of-concept design. Further research or testing should decrease the price of the system be able tobecome competitive. Some requirements still need validating. This is the case with DP-SUST-1, DP-ENV-4, DP-ENV-5DP-SAFE-1, DP-SAFE-7, and DP-SAFE-8. The three scheduling requirements that are not met (DP-SCH-1, DP-SCH-2, and CP-SCH-3), can only be met over time. The same for the cost (DP-CST-3 and DP-CST-4) and manufacturingrequirements (DP-MAN-1). Upon reviewing requirement DP-SAFE-5, it was decided that manual control would beimpractical; it was envisioned that manual control would be needed for emergency situations, for example. However, theintervention of a human being would be too slow and ineffective. Instead, other measures had been devised as discussedin earlier segments, an example of which is the incorporation of the emergency button. Hence, it was deemed that manualcontrol would no longer be needed, and thus this requirement was no longer considered
As for the subsystem requirements, the rationale for having not complied with them is delved into in the following.Requirement DP-SUST-1-STR-2 is a child requirement of DP-SUST-1, which as explained earlier will need to be checkedfor in the future. More specifically, it is a requirement that remains to be validated via fatigue tests. As for DP-MAV-2-CON-1, there are several limitations to checking this requirement. One problem is that the coefficients that areneeded for the mathematical model which is used for control are not readily available and need to obtained using motortests. Another problem is that inaccuracies in modeling, especially the external disturbances will lead to discrepancieswith reality. Requirement DP-MAV-2-CON-1 is a quantification of requirement DP-MAV-2-CON-2. Hence, the samediscussion applies as that of DP-MAV-2-CON-1. Finally the same rationale for requirement DP-SAFE-5-COM-2 appliesas that of its parent requirement.

14Reliability, availability, maintainability and safety
Reliability availability maintainability and safety are crucial aspects of the design. Those elements often determinethe effectiveness of the system and decide about the success of the design. All the 4 elements are closely interrelated.For instance the reliability aspects determine needs for maintainability and together decide about the availability of thesystem.
14.1. ReliabilityReliability by definition is a probability of the system performing in satisfactory manner in given period of time. Thetotal reliability of the whole system can be found by defining first reliability of the critical components and then summingthe reliabilities using probability addition rules.
By following this approach all the critical components are identified and the failure sequence is analyzed on thefault tree. The failure modes are further elaborated on in Section 14.4. For reliability considerations the focus is onlyon dependencies between different failures. The top level failures of the drone with the most significant componentsdistinguished are presented on the fault tree in Figure 14.1. As shown the mission can fail in two cases: when the droneis unable to pollinate the flower, or when the drone is unable to sustain the flight. For each case there are multiple failureevents that can lead to those consequences.
One remarkable feature are the "or" gates present in different system levels. Those gates which combine failuresof different components mean that the failure of the upper level system can be caused by multiple alternative eventshappening independently. This is not the most optimal case, and indicates on lack of redundancy in the design. Therationale behind such a choice is explained in more detail in Section 14.1. Nevertheless the required reliability of thedrone still can be achieved by managing reliability of particular subsystems and components.
The reliability of the whole system is estimated by estimating reliability of each component shown on the fault treein Figure 14.1.
For the electric motor the reliability is estimated using model from a military handbook [68]. The model considers 2failure modes - due to wear of bearings and failure of the winding. The failure rate for given operating time is calculatedusing Equation (14.1). The coefficients αb and αw depend on the operating temperature. Taking conservative approachand assuming the temperature to be 40 deg, coefficients αb and αw are equal to 80,000 h and 500,000 h
λp =t 2
α3b
+1
αw(14.1)
For operation time of 5 years the failure rate is 5.747 ·10−6/h which was obtained as shown in Equation (14.2). Thesame applies for the blower, where the reliability is determined mainly by the electric engine of the fan.
λp =(5 ·365 ·24 · 12
27 )2
80,0003 +1
500,000= 5.747 ·10−6/h (14.2)
The most critical structural part are the arms. The arms are greatly over-designed - the maximum stress in the criticalcase is about 3 orders of magnitude lower than the strength of the material (200 MPa for the chosen rods). The probabilityof failure is negligible. Assuming standard deviation of 10 MPa in the material properties and Gaussian distribution ofthe material strength, the probability of failure is negligibly small and can be omitted in the reliability analysis.
The reliability of the battery is estimated from the number of lifecycles provided by producer. Chosen batteryaccording to the test data provided by the manufacturer is able to withstand 900 cycles. This number is verified with
100

14.2. Availability 101
Figure 14.1: Fault tree of the top level failures
experiments for LiPo batteries done by Williard [69], which reports mean time to failure of 600 cycles. Taking moreconservative approach, and assuming 600 cycles it can be calculated that the mean time between failures is 270 h(assuming that the cycle is 27 minutes in total). The failure rate is then 0.00374/h. Failure rate of the battery will bedominating failure mode.
Failures of other components are rather difficult to estimate without appropriate data. The main board, sensors andflower detection subsystem consist of dozens of electronic components. Estimation of reliability even using simplifiedapproach as in the Military handbook for reliability prediction of electronic equipment very detailed specifications areneeded. The data is not commonly available and can be obtained only by testing. Instead it is much more efficient tofind the failure rates by testing the subsystems. It is assumed that the mean time to failure for those components is inorder of years. The reasoning behind this assumption is that the same components are often used in common electronicdevices which are able to last for 3-5 years. For instance smartphones are equipped with sensors like accelerometersas well as cameras. Furthermore most of smartphones have advanced processors similar to the one on-board of thedrone. Cumulatively failure rates of all those components is still significant, and can not be neglected. Nevertheless it isexpected to be few orders of magnitude lower than for the battery, and due to lack of data is not further analyzed.
Reliability of the software is probably the most dynamic of all. As the software is updated the reliability instanta-neously decreases. The reason is that as the new version is implemented the risk of discovering new unknown problems ismuch higher. The overall reliability however increases over time, as the new versions include fixes for already identifiedproblems, and generally improve the performance of the system.
One way to increase the reliability of the systems is to incorporate redundancy concepts in the design. The conse-quence the achieved performance is often sub-optimal - for instance the weight is increased, or power consumption islarger than necessary. This is however the price that needs to be paid. Such approach is often taken for flight criticalsubsystems, for which the failure results in catastrophic consequences for the whole system.
The whole pollination system consists of multiple drones. The mission objective - which is to pollinate the flowerscan be still achieved even in case of loss of 10% of the fleet. This is elaborated in more details in Section 14.2. In caseof failure the drone needs to report the event to the flight planning and control system. The systems can then reassignthe tasks among the functioning drones. In critical case, when there is no spare drones left the consequence is a delay inpollination. This however can be accounted for by taking safety margins for predicted mission time.
Considering the drone design, the redundancy was rather avoided. The main reason for that was optimization of theweight, power consumption and efficiency of the system.
14.2. AvailabilityAvailability is the or probability that a system will be ready or available when required for use. This metric is relatedto maintainability and reliability. The more reliable the system, the more available it is. Similarly, a system that iseasier to maintain, has a higher probability of being available for use. This system consists of 8 ground stations, eachaccommodating 8 drones. There are 58 drones continuously required for pollination, and the remaining 6 drones stay

102 14. Reliability, availability, maintainability and safety
available for use in case some of the drones fail. In this case the system can operate with full performance even in case10% of the fleet fails. This approach significantly improves reliability, and therefore availability of the whole system.
Furthermore, the spare drones can be used to keep the system performance on sufficient level during the maintenance.This can be achieved if the maintenance activities are executed at up to 6 drones at the time.
14.3. MaintainabilityMaintainability refers to the ease of how it can be maintained. The modularity of the design and the accessibility to thecomponents that constitute it are therefore key parameters that determine how maintainable the APIS is.
Regarding the first criteria, the drone was designed such that the payload is modular. Replacing the payload by a newone is therefore a relatively easy task. Furthermore, the batteries are the component that need to be replaced the mostoften. Easy access to the battery compartment was ensured. Indeed, the main casing of the drone can be easily unclippedand after removing the blower that rests on top of the battery casing, the battery can be replaced. Another componentthat can be easily accessed are the motors. Indeed, the protective casing can be easily removed, and the motors can beaccessed. The propellers are simply clipped on the motors with a nut and if they need to be replaced, they are easilyaccessible.
Even though the design of the drone was done such that the components can be easily accessed in case of main-tenance needs, some components are not that easy to be replace. Indeed, the cameras used for the stereo vision andthe monoscopic vision are a combination of a selected lens and a selected sensor. If they are damaged, the user cannotsimply purchase them as off the shelf products. The same goes for the processor and the main board. The snapdragon isnot currently easily purchasable. Maintenance of these parts will therefore prove to be complicated.
It must however be said that most of the other parts are on the other hand easily accessible. Indeed, the motors usedcan be ordered online and the same goes for the propellers. The blower is also an off the shelf product and is thereforeeasily maintainable.
14.4. Safety: operating hazard analysisTo account for safety in the design, the operating hazard analysis is performed. The analysis in principle identifiespossible threats, investigates possible consequences and causes and verifies whether the implemented design solutionsare sufficient to cope with the hazards. All the hazards are initiated by failure of one of the systems. There are multiplecombinations of failure sequences of different components and systems which lead to various consequences.
First all the critical failures of different components are identified, and listed in the Table 14.1. For each failure apossible catastrophic effect is defined, and a mitigation strategy is developed. The failure mode and effect analysis tableis a foundation for more detailed operational hazard analysis, which is described in following paragraphs.
Table 14.1: System failure mode and possible countermeasures
System Item Failure mode Effect Countermeasure
Control
Software Errors, overflow Uncontrolled flight,unpredicted behaviour Emergency system
Sensing system(obstacle avoidance,UWB, cameras)
Short circuit Loss of navigation,unpredicted behaviour
Autonomous safe landingsystem, emergency system
PCB board Overheating Loss of control Active cooling (heat sink)
Propulsion Motor and ESCWear of bearings,short circuit Loss of lift, loss of control
Fail-safe landingcontrol algorithm
Structures Booms and fittings Fatigue Loss of lift, loss of controlFail-safe landingcontrol algorithm
There are 3 critical hazards identified that are analyzed: harm to the greenhouse workers, damaging the plants anddamaging the greenhouse equipment.
Rotors Spinning rotors can injure people in the greenhouse, as well as damage the plants. There are few differentscenarios that can lead to this situation. It can happen as a consequence of failure of the control system, when the dronestarts flying in an uncontrolled manner. Another alternative is a failure of the obstacle avoidance system. In case ofinjuring people there is also additional human factor - for instance lack of caution. To minimize the consequences of this

14.4. Safety: operating hazard analysis 103
hazard the rotors are shielded with special guards. Those guards shield the propeller on perimeter in such way that it isimpossible to access the propeller tip from the side. Additionally the guards provide with a mesh above the rotor. Themesh is fine enough to prevent sucking in the leafs from above. Each guard is supported by 4 spars from the bottom.The spars also play a safety role and prevent access to the propellers for bigger objects.
Impact The second critical hazard is that the drone hits into a greenhouse equipment, plant, or a greenhouse worker.The list of possible causes is similar as for the propeller hazard. Due to a failure of the control system which can becaused by the failure of software, sensors, or obstacle avoidance system the drone might begin to fly in an uncontrolledway, which might lead to crash.
Emergency system As a countermeasure an emergency system will be incorporated into the traffic control system.In case of a catastrophic emergency (especially potential worker injury) the system will be activated and all the droneswill be immediately grounded (lower the altitude in a controlled way). The system can be activated by the greenhousestaff by pushing the buttons which will be placed in different accessible locations in the greenhouse. The system willbe implemented in a fail-safe way. During the operations drones will be continuously receiving signal from the groundstations communicating that the safety system is inactivated, and allowing for flight. In case the emergency system is ac-tivated the signal stops, initiating the flight termination procedure of the drones. The large disadvantage of this approachis that the flight is terminated even in case of a false alarm - e.g. when the drone temporarily looses communication withthe ground station, it automatically executes the emergency landing procedure. As the emergency landing is executedimmediately the drones might damage the plants underneath, or get damaged themselves by landing in inconvenientplaces. It is a price however that needs to be paid for maximum reliability of the system.
Fall Another alternative hazard is that the drone loses lift and falls, which results in an impact and possible damageor injury. Possible causes include loss of the engine or failure of the structure. The loss of the engine can be caused byfailure of a different propulsion system sub-components including ESC, failure of the engine or wear out of the bearings.To minimize the risk in case of such failure the fail-safe landing control algorithm is activated. The algorithm is able torecover the control of the altitude in case of failure of one of the engines. Although with only 3 engines it is impossibleto balance the moment and the vehicle starts to spin around its central axis, the altitude can be controlled by remainingpropellers and the impact can be reduced.
Fire The last hazard considered is catching the fire. The risk is especially severe, and it has the most serious conse-quences. There are several alternative failures that can lead to setting up fire. One possibility is due to a short circuit ofone of the electronic components. The most critical part however is the battery. Lithium polymer batteries can catch firevery abruptly when punctured.
For this case the hazard mitigation strategy focuses on eliminating the causes. All the electronic parts both in controlas well as in propulsion system can fail due to short circuit. The risk is minimized by securing those parts from moisture.This is done by insulating and coating exposed connections. The only exposed part is the charging pin. In order tominimize the risk of short-circuiting the contacts on the pin, it will be switched off when the charging is finished. Thismeans that during flight the pin will be electronically insulated from the main electronic system and there is no possibilityof short circuiting it.
Furthermore all the crucial electronic components are secured from a mechanical damage. The most critical part -the main PCB board is enclosed in a casing which provides additional protection from the environment. The battery isaccommodated within the main structure box, which shields the battery from the surroundings. The wires connectingthe motors with the main board are led inside the booms, which minimizes risk of cutting it. The stereo camera is placedin such way that in case of frontal impact it is protected by the propeller guards, which will absorb most of the impactenergy.

15Production plan
After the design phase is finished, the production phase can start. Before this, a production plan should be created inorder to know in what order components have to be made, the production processes used and how the components areassembled together. When creating a detailed production plan, the costs, inventory investment and changes in work-force levels can be minimized1. The design consist of two main components that need to be produced, the drones andthe ground stations. First, the production plan for the drones will be explained and after that the production plan of theground station will be explained.
15.1. Production plan for the dronesFirst the manufacturing processes of the materials used in the drones will be addressed. After that, the production of theparts will be elaborated on and, finally, the attachments between the components will be explained.
The design of the drones has been split up into the following main categories for production: the main structure, thepropulsion system, the electronics, the blower and the casing. The different components of each of the subsystems canbe seen in Table 15.1.
Table 15.1: Categories used for the production phase
Categories Main structure Propulsion system Electronics Blower Casing
ComponentsCarbon fibre armsClampsCarbon fibre box
MotorPropellerMotor mountESCsPropeller casing
BatteryCharging pinStereo camerasFish eye cameraLasersWiresPCB
BlowerBlower mount Casing main structure
The production of these subsystems will be elaborated on in the production flow diagram. This will include the orderin which the components have to be produced. However, not all components have to be manufactured by ourselves. Thecarbon fibre arms, motors, propellers and the electronics, except for the PCB can be bought online. For every componentthat remains, the manufacturing process will be explained. Since most of the components are made out of carbon fibreand ABS plastic, first the different processes that can be used for these materials will be discussed.
15.1.1. Manufacturing processesFor manufacturing the carbon fibre parts there are two processes that can be considered, open molding and close molding.Open molding is mostly used for large parts and small production series, such as the production of boat hulls. Sincethe drone has a maximum length of about 30 cm, the product is assumed to be small. Also the production series isconsidered large because for one system 64 drones are needed. Therefore close molding will be used. This process, alsocalled vacuum infusion, is based on pushing the resin into the laminate by applying a difference in pressure. When doing
1http://www.smetoolkit.org/smetoolkit/en/content/en/907/Preparing-Your-Production-Plan [Cited 21 June2017]
104

15.1. Production plan for the drones 105
this correctly, the resin will be spread equally over the laminate. For this process a mould is needed. Furthermore, thisprocess minimizes the chemical emission, making it the most environmentally friendly out of the considered processes2.
Plastic components are manufactured by using 3D printers or injection moulding. The 3D printers are used for smallproduction series and are cheaper to use. This is because no moulds are needed while making use of less tooling andsetup costs. However, when the production series increases injection moulding can be more cost beneficial. Therefore,for creating prototypes and in the first stages of the business, 3D printing will be used and when the demand for thedrones comes above a certain threshold, injection moulding will be used3.
For choosing the 3D printing process that is best for this product, the accuracy, the materials and the environmentwill be taken into account. All 3D printers are based on adding material layer by layer until the component has beenmade. There are six different types of 3D printers, stereolithography, digital light processing, fused deposition modeling,selective laser sintering, electronic beam melting and laminated object manufacturing4. The first two types are usingphotopolymers and are mostly used for prototyping, because the costs are relatively low and because they do not take alot of time. A drawback of these is the low accuracy they can acquire. Fused deposition modeling is based on production-grade thermoplastics, which gives high mechanical, thermal and chemical quality. This process is also environmentalfriendly. The fourth process uses lasers to produce parts and the materials that can be used are nylon, glass, ceramicsand metals. Electronic beam melting is used for making metal parts. The last 3D printing method is mostly used forparts made out of paper. Due to the fact that the material used is plastic, all the processes based on making metal partscan not be used. Furthermore, a final product has to be created, therefore, a high accuracy is needed. Also when lookingat the environmental friendly aspect, only one 3D printer performs best. Therefore, the process that will be used formanufacturing the low production series plastic parts is fused deposition modeling.
Injection molding is a whole different process, which is based on injecting a liquid material. The process followedcan be seen in Figure 15.15. First the mold is placed into the machine and is clamped such that the mould can not openwhen the injection of the heated material takes place. Then the plastic granules are put into the hopper and they willgo to the barrel. After that, the plastic granules are transported with a screw to the heating area and the plastic will bemelted until it is liquid. Then the liquid plastic is injected in the mould and cooled.
Figure 15.1: Injection molding machine
15.1.2. Manufacturing the partsThis section will describe the manufacturing processes used for each of the parts. It is assumed that the a high productseries is required, thus injection moulding will be used for manufacturing the parts out of ABS plastic.
• Clamps: The clamps are made out of ABS plastic, which means that injection molding will be used. Beforemaking the clamps, the dimensions of the carbon tube have to be checked. Since a tight fit is needed, the dimen-sions should have a high level of accuracy. A margin has to be taken into account for the carbon tubes since it isimpossible to create identical products. This margin is given by the manufacturer of the carbon tubes. The upper
2http://www.compositesworld.com/knowledgecenter/closed-molding/Closed-Mold-Process/Vacuum-Infusion-Process [Cited 22 June 2017]
3https://www.xometry.com/blog/3d-printing-vs-injection-molding-breakeven [Cited 22 June 2017]4http://3dprintingfromscratch.com/common/types-of-3d-printers-or-3d-printing-technologies-overview/ [Cited 22 June 2017]
5http://easchangesystems.com/wp-content/uploads/2015/08/Injection_molding_machine.png [Cited 22 June 2017]

106 15. Production plan
margin will be chosen for the hole in the clamp, such that all the carbon tubes will fit. The mold needed for theinjection molding process will be made out of aluminum and will be manufactured using a milling machine. Anautomated computer numerical control (CNC) milling machine will be used. After the mold has been created theclamps can be manufactured.
• Carbon fibre box: The carbon fibre box will be made by using vacuum infusion. For this, first a mold has to becreated, which will be made out of wood. After that the carbon fibre box can be made. When the carbon fibre boxis done, a hole is drilled in the bottom of the box for the charging pin. For this a high speed and a low feed ratedrilling machine will be used to assure high quality of the hole [70].
• Motor mount: The motor mount is created out of ABS plastic and in order to make them the same process as theclamps will be used. However, less precision is required, because there are no tight fits needed.
• Propeller casing: The propeller casing will also be made out of ABS plastic. Since the cover is based on ahoneycomb structure and has a very small thickness a proper release agent is needed to make sure the casing willnot be damaged when released from the mold.
• PCB: To be able to design the PCB, the schematics need to be created in order to fit all the components. This willbe the most time consuming part of production, because the schematics have to be designed from scratch. Whenthis has been done the customized PCB can be ordered.
• Blower and blower mount: The blower that will be used in the design can be bought online6. However, acustom made nozzle has to be attached to it in order to let the exhaust be closer to the plants. This part will bemanufactured from ABS plastic. High precision is needed, due to the aerodynamic requirements, which meansthe mold has to be created with a high level of accuracy.
• Casing main structure: The casing of the main structure will also be made out of ABS plastic. For this part nohigh precision is needed, because the casing will not be a critical part of the design. After the part has been made,the casing has to be painted in order to give the drone a nice look.
15.1.3. AttachmentsAfter all the individual parts are obtained the drone will be assembled and all components must be attached. Differenttechniques will be used to attach the components together. Since the majority of the components are made from plastic,a lot of them can be attached by using glue:
• Stereo cameras to payload box• Fisheye camera to payload box• Lasers to payload box• Blower to PCB support plate• Nozzle to blower• Arm clamps to payload box• ESCs to motor mountsThe battery will be placed in the payload box supported by dampers and attached with hook-and-loop-fasteners. On
top of the battery, the PCB support plate is attached through hook-and-loop-fasteners as well. The PCB itself is attachedon the plate by screws. Furthermore the carbon fibre arms of the drone are assembled to the main structure by slidingthem in the clamps, subsequently they are fastened by implementing a small hole and screw in the clamp. The propellersand motor are assembled using a nut which is screwed on top of the propeller. The motor-to-motor mount, the propellercasing-to-motor mount and the motor-to-main structure mount connections will be done using bolts. Finally the casingthat will cover the whole drone will be attached via a click-on system, thus no attachment material is needed for this. InFigure 15.2 a visual representation of the complete production plan for the MAVs is given.
15.2. Production plan for the ground systemNot only the drones, but also the ground stations need a solid production plan. The ground station can be seen inSection 11.2. A ground station consists of the following components:
• Main structure• Landing pads• Sockets• Socket supports• Electronics boxTwo main materials are used to manufacture the ground stations, which are aluminum and plastic. Additionally, a
bit of copper is used for the charging sockets. For the parts that are made from plastic, the same manufacturing method
6http://www.delta-fan.com/Download/Spec/BFB0512VHD-F00.pdf [Cited 22 June 2017]

15.2. Production plan for the ground system 107
Figure 15.2: Production flow diagram for the MAV

108 15. Production plan
is used as for the plastic parts of the drones, injection molding. Only the socket supports and the electronics box willbe made out of plastic. The sockets will be glued in the socket supports and the socket supports will be glued on thecharging pads. Furthermore, the electronics box will be bolted to the main tube.
What can be seen in Section 11.2 is that there is a main structure where the landing pads are attached to. It consistsof hollow aluminum tubes where electronic wires need to go through. These tubes can be bought online and cut to theright size by using a saw. The upper "V" will be welded to the main tube. The landing pads will also be made out ofaluminum and can be made by milling it to the right size. Because of the fact that a lot of landing pads need to be madewith the same size, a CNC milling machine will be used. By using this, only one CNC program has to be made whichcan be used for all pads. The landing pads will have vertical attachments which can be bolted to the main tube. Finallythe visual recognition stickers for the drones will be placed on the structure. The flow diagram of the whole progresscan be seen in Figure 15.3
Figure 15.3: Production flow diagram for the ground system

16Risk and mitigation
The risk management process is performed in three phases. First all the technical risks are identified for given subsystem.This is done by analyzing different subsystem components under working conditions. In next step, the risks are listedand assessed. The assessment focuses on two components of the risks, namely on probability of the event and on severityof the consequences. There are 5 levels of probability defined, and listed in Table 16.1. The levels are defined based onthe guidelines developed by NASA Engineering and Safety Center [71]. Each level has certain probability range, whichenables to qualify events (possible failures) in a more systematic way. Similarly there are 5 different levels of severitydefined in Table 16.2. Each level has a description (in the 3rd column) which allows to qualify particular consequencein a definitive way.
Table 16.1: Levels of probability of failure defined for use in the riskmatrix
Probability scale Probability Probability range
5 Very high P>0.14 High 0.1>P >0.013 Moderate 0.01 >P >0.0012 Low 0.001>P >10−6
1 Very low 10−6>P
Table 16.2: Levels of severity defined for use in the risk matrix
Severity scale Severity Description
5 Catastrophic Mission failure4 Critical Mission success questionable3 Significant Decrease in performance
2 MarginalDegradation of secondary mission,small decrease in performance
1 Negligible Nonoperational impact
In the last step risks are prioritized and mitigated. The mitigation actions focus on decreasing probability of theevent or reducing the consequences. Some of the risks might be accepted without any mitigation. This is usually thecase when either the risk is relatively low, or the mitigation action would result in an in-feasible solution (for instancethe part is relatively cheap and can be easily replaced in case of failure). The described approach was implemented on allthe subsystems. The results are listed in tables below for each of the subsystems. For each of risks a probability (P) andseverity (S) were estimated, and mitigation action was defined. Each risk was reevaluated after mitigation and assignednew mitigated probability (MP), and mitigated severity (MS).
From each of the subsystems, three largest risks were chosen and placed in the risk matrix, as shown on Figure 16.1.Those risks - after mitigation - are then placed in the mitigated risk matrix shown in Figure 16.2. Comparing twomatrices the results of mitigation are apparent. Primarily most of the risks were in orange and red zone, which correspondrespectively to high and extreme risk. After mitigation there are no risks in the red zone, which means that all the criticalrisks were eliminated. Most of the risks were mitigated by decreasing probability of occurrence. Furthermore, most ofthe high risks (items at the orange field) are eliminated as well, and only two items are left in this range.
109
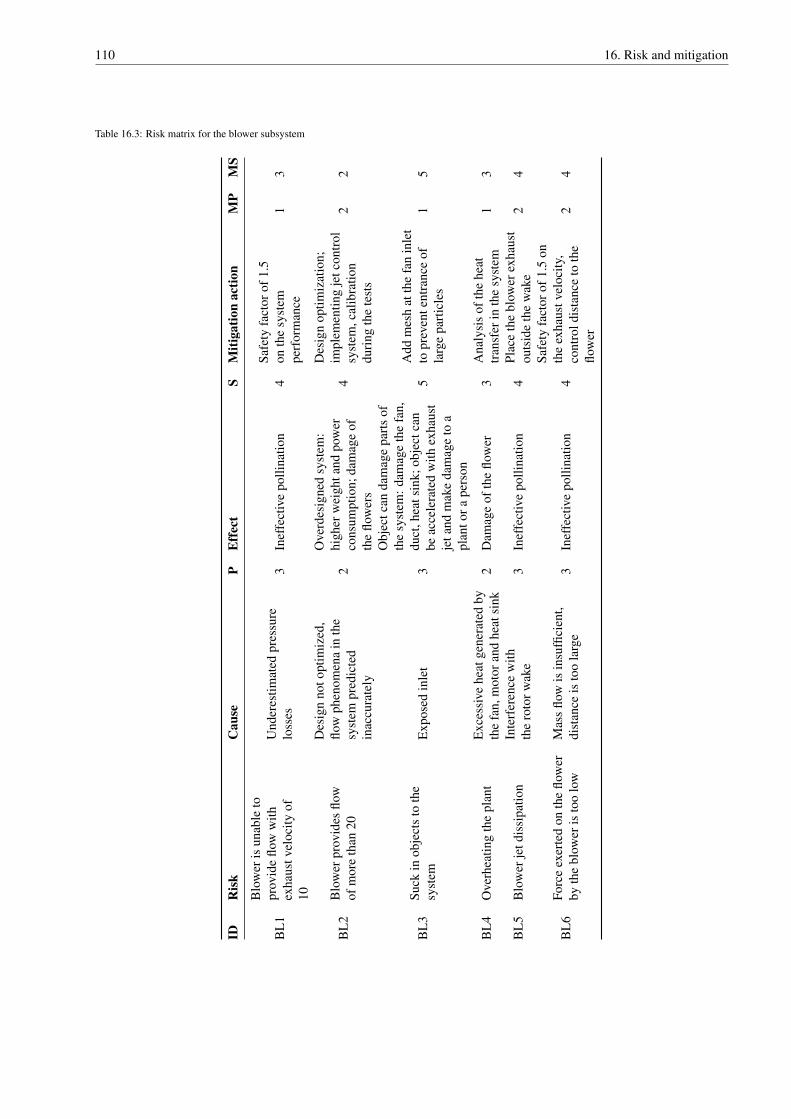
110 16. Risk and mitigation
Table 16.3: Risk matrix for the blower subsystem
IDR
isk
Cau
seP
Eff
ect
SM
itiga
tion
actio
nM
PM
S
BL
1
Blo
wer
isun
able
topr
ovid
eflo
ww
ithex
haus
tvel
ocity
of10
Und
eres
timat
edpr
essu
relo
sses
3In
effe
ctiv
epo
llina
tion
4Sa
fety
fact
orof
1.5
onth
esy
stem
perf
orm
ance
13
BL
2B
low
erpr
ovid
esflo
wof
mor
eth
an20
Des
ign
noto
ptim
ized
,flo
wph
enom
ena
inth
esy
stem
pred
icte
din
accu
rate
ly
2
Ove
rdes
igne
dsy
stem
:hi
gher
wei
ghta
ndpo
wer
cons
umpt
ion;
dam
age
ofth
eflo
wer
s
4
Des
ign
optim
izat
ion;
impl
emen
ting
jetc
ontr
olsy
stem
,cal
ibra
tion
duri
ngth
ete
sts
22
BL
3Su
ckin
obje
cts
toth
esy
stem
Exp
osed
inle
t3
Obj
ectc
anda
mag
epa
rts
ofth
esy
stem
:dam
age
the
fan,
duct
,hea
tsin
k;ob
ject
can
beac
cele
rate
dw
ithex
haus
tje
tand
mak
eda
mag
eto
apl
anto
rape
rson
5A
ddm
esh
atth
efa
nin
let
topr
even
tent
ranc
eof
larg
epa
rtic
les
15
BL
4O
verh
eatin
gth
epl
ant
Exc
essi
vehe
atge
nera
ted
byth
efa
n,m
otor
and
heat
sink
2D
amag
eof
the
flow
er3
Ana
lysi
sof
the
heat
tran
sfer
inth
esy
stem
13
BL
5B
low
erje
tdis
sipa
tion
Inte
rfer
ence
with
the
roto
rwak
e3
Inef
fect
ive
polli
natio
n4
Plac
eth
ebl
ower
exha
ust
outs
ide
the
wak
e2
4
BL
6Fo
rce
exer
ted
onth
eflo
wer
byth
ebl
ower
isto
olo
wM
ass
flow
isin
suffi
cien
t,di
stan
ceis
too
larg
e3
Inef
fect
ive
polli
natio
n4
Safe
tyfa
ctor
of1.
5on
the
exha
ustv
eloc
ity,
cont
rold
ista
nce
toth
eflo
wer
24

111
Table 16.4: Risk matrix for the charging subsystem and the ground segment
IDR
isk
Cau
seP
Eff
ect
SM
itiga
tion
actio
nM
PM
S
GS1
The
char
ging
pin
issh
ort-
circ
uite
dW
ater
cond
ensa
tion
onth
epi
n4
Bur
ning
of(p
arto
f)th
edr
one
and
grou
ndst
atio
nel
ectr
onic
s5
Impo
seop
erat
ion
cond
ition
sof
hum
idity
ofle
ssth
an80
%;
add
ate
mpe
ratu
rese
nsor
toth
ech
argi
ngpi
n∗2
4
GS2
Adr
one
isse
vere
lyda
mag
edup
onve
rtic
alim
pact
The
char
ging
pin
impi
ngin
gth
edr
one
elec
tron
ics
and
stru
ctur
e2
The
dron
eca
nnot
oper
ate
and
need
sto
bere
pair
edor
repl
aced
4M
ake
the
pin
deta
chab
leup
onap
plic
atio
nof
ast
rong
forc
e2
2
GS3
The
grou
ndse
gmen
tcan
not
bein
stal
led
Gre
enho
use
stru
ctur
eor
spac
elim
itatio
ns2
The
syst
emca
nnot
bein
stal
led
5Pr
ovid
eon
floor
grou
ndst
atio
nin
stal
latio
nop
tion
asw
ell
15
GS4
Agr
ound
stat
ion
mal
func
tions
Soft
war
eor
hard
war
efa
ilure
,or
cabl
edi
scon
nect
ion
2T
here
isno
entit
yco
ntro
lling
the
dron
esas
sign
edto
this
grou
ndst
atio
n4
The
cent
rals
erve
rrea
ssig
nsth
edr
ones
toa
neig
hbor
ing
stat
ion
that
guid
eth
emto
the
faile
dgr
ound
stat
ion
and
give
sth
emla
ndin
gin
stru
ctio
ns2
2
GS5
The
cent
rals
erve
rort
hesw
itchi
nghu
bm
alfu
nctio
nsSo
ftw
are
orha
rdw
are
failu
re,
orca
ble
disc
onne
ctio
n2
The
reis
noco
ordi
natio
nbe
twee
nth
egr
ound
stat
ions
4T
hegr
ound
stat
ions
inst
ruct
alld
rone
sto
goba
ckan
dla
nd.
22
GS6
Apo
wer
outa
geoc
curs
Ele
ctri
calg
rid
issu
es1
No
com
mun
icat
ion
orna
viga
tion
fort
hedr
ones
poss
ible
soth
eyca
nnot
retu
rnto
the
grou
ndst
atio
ns5
Inst
allb
acku
ppo
wer
batte
ries
that
prov
ide
suffi
cien
tpow
erfo
rthe
dron
esto
retu
rnto
the
grou
ndst
atio
ns1
2
GS7
Acc
ess
toa
char
ging
pad
isob
stru
cted
Gre
enho
use
wor
kerl
eavi
ngeq
uipm
entn
eart
hepa
d3
Adr
one
will
noth
ave
acce
ssto
char
ging
4T
hedr
one
can
take
turn
sw
ithth
eot
herd
rone
sto
char
ge;
the
syst
emno
tifies
the
user
31
GS8
Rem
ote
hack
ers
atta
ckth
esy
stem
Vul
nera
bilit
ies
inth
eso
ftw
are
impl
emen
tatio
n2
The
syst
em,t
hepl
ants
,and
the
gree
nhou
sein
fras
truc
ture
mig
htbe
dest
roye
d5
Hir
ecy
bers
ecur
ityco
nsul
tant
sto
ensu
reth
ese
curi
tyle
velo
fthe
syst
em;R
estr
ictr
oota
cces
son
lyfo
rdir
ectc
onne
ctio
nin
side
the
gree
nhou
se1
5
∗H
umid
ityle
velo
f80%
allo
ws
fort
hech
argi
ngpi
nto
be4◦
cool
erth
anth
esu
rrou
ndin
gai
rbef
ore
cond
ensa
tion
occu
rs[7
2,73
].Fo
rhig
her
hum
idity
leve
lsth
iste
mpe
ratu
rem
argi
ngr
ows
smal
ler.
Adi
ffer
ence
ofm
ore
than
4◦is
expe
cted
tobe
very
unlik
ely
tooc
cur.
Nev
erth
eles
s,in
case
that
isob
serv
ed,t
hete
mpe
ratu
rese
nsor
ofth
epi
nw
illde
tect
itas
pote
ntia
ldew
cond
ition
and
char
ging
will
notb
eal
low
edto
star
t.

112 16. Risk and mitigation
Table 16.5: Risk matrix for the battery subsystemID
Ris
kC
ause
PE
ffec
tS
Miti
gatio
nM
PM
S
BA
T1
Bat
tery
catc
hing
fire
Ove
rhea
ting
due
toex
cess
ive
usag
eor
shor
tcir
cuit
4A
PIS
orto
mat
oes
getb
urnt
5M
onito
rvol
tage
and
tem
pera
ture
25
BA
T2
Not
havi
ngen
ough
ener
gyon
-boa
rd
Incr
ease
den
ergy
cons
umpt
ion
due
tosu
bsys
tem
wea
r-of
f4
Shor
term
issi
ons
and
notp
ollin
atin
gin
time
2M
onito
ring
ofen
ergy
cons
umpt
ion
perm
issi
onan
dfo
rese
eth
ede
grad
atio
n3
2
BA
T3
Shor
terl
ife
cycl
eth
anex
pect
edH
igh
DoD
/C-r
ate
orm
anuf
actu
reri
nacc
urat
e4
Hig
herm
aint
aina
bilit
y3
Nev
erex
ceed
4Cat
char
ging
and
requ
estt
estb
atte
ry3
3
BA
T4
Hig
herm
ass
than
wha
tis
adve
rtis
edM
anuf
actu
ring
defe
cts
3D
ecre
ased
mis
sion
dura
tion
orcy
cle
life
3R
eque
stte
stba
ttery
and
getr
idof
casi
ngif
need
ed2
3
BA
T5
Big
gerb
atte
rysi
zeth
anad
vert
ised
Man
ufac
turi
ngde
fect
s3
Inte
grat
ion
issu
eson
the
stru
ctur
e3
Incr
ease
the
size
ofbo
x3
2
BA
T6
Bat
tery
notb
eing
cust
omiz
able
Gra
phen
ete
chno
logy
mig
htdi
ffer
inte
rnal
lyfr
omco
mm
onL
ipol
y3
Bat
tery
cann
otbe
inte
grat
ed5
Cha
nge
toan
othe
rcho
ice
ofba
ttery
33
Table 16.6: Risks associated with the propulsion subsystem
IDR
isk
Cau
seP
Eff
ect
SM
itiga
tion
MP
MS
PRO
11
mot
orfa
iling
Ove
rhea
ting
/def
ectiv
em
otor
s/s
hort
circ
uit
3M
anua
lpic
k-up
and
retu
rnto
grou
ndst
atio
n5
Soft
war
epa
tch
for
extr
apo
wer
drai
nage
/te
stin
gpr
evio
usto
impl
emen
tatio
n/f
uses
15
PRO
2M
otor
sun
der-
perf
orm
ing
Env
iron
men
tbei
ngde
trim
enta
land
corr
odin
gm
otor
s3
Hig
herm
aint
enan
ce2
App
lyco
atin
gsfo
rthe
coils
orbu
ying
ahi
gher
qual
itym
otor
12
PRO
3O
verh
eatin
gE
xces
sof
curr
enta
ndba
dhe
atdi
ssip
atio
n3
Hig
herm
aint
enan
cean
dre
duce
dlif
etim
e2
Add
ing
alum
iniu
mas
the
fram
eto
diss
ipat
ehe
at2
4
PRO
4U
nder
bala
nced
prop
elle
rsPh
ysic
alim
pact
orax
ism
isal
ignm
ent
4W
orse
effic
ienc
yan
dvi
brat
ions
onel
ectr
onic
s3
Mor
ere
gula
rmai
nten
ance
33
PRO
5C
asin
gbl
ocki
ngth
epr
opel
lers
Ben
ding
ofth
eca
se4
Hig
herp
ower
cons
umpt
ion
and
lifet
ime
redu
ctio
n5
Soft
war
epa
tch
toch
eck
rpm
’sw
ithpo
wer
35

113
Table 16.7: Risk matrix for the structure
IDR
isk
Cau
seP
Eff
ect
SM
itiga
tion
MP
MS
STR
1Fa
ilure
ofar
ms
due
toim
pact
Impa
ctdu
eto
colli
sion
with
rails
2
Prop
elle
rsdi
sint
egra
ted
from
stru
ctur
es,
wir
esbr
eak.
New
arm
san
dw
ires
mus
tbe
inco
rpor
ated
inth
esy
stem
.
4
Add
prop
elle
rcas
ing.
Thi
sw
illm
ake
sure
that
whe
nth
edr
one
falls
onth
ear
ms,
the
prop
elle
rca
sing
will
first
touc
hth
eob
ject
,br
eak
and
take
the
shoc
k.T
hepr
opel
lerc
asin
gis
easy
tore
plac
e.
14
STR
2Fa
ilure
ofpr
opel
ler
Impa
ctdu
eto
colli
sion
4Pr
opel
leri
sbr
oken
.Pr
opel
lerm
ustb
ere
plac
ed.
3A
ddpr
opel
lerc
asin
g.1
3
STR
3St
ruct
ure
disi
nteg
rate
sdu
eto
glue
failu
re.
Glu
efa
ilure
due
tohi
ghhu
mid
ityle
veli
ngr
eenh
ouse
3St
ruct
ure
isdi
sass
embl
ed.
4Pr
oper
lyte
stad
hesi
veus
edin
desi
gnfo
rhu
mid
itypr
oper
ties
(ori
nves
tigat
eda
tash
eets
).1
4
STR
4Fa
ilure
ofar
ms
due
tovi
brat
ions
Eig
enfr
eque
ncy
ofst
ruct
ure
near
mot
orfr
eque
ncy
4
Prop
elle
rsdi
sint
egra
ted
from
stru
ctur
es,w
ires
brea
k.N
ewar
ms
and
wir
esm
ust
bein
corp
orat
edin
the
syst
em.
4E
nsur
eth
atth
eei
gen
freq
uenc
yof
the
dron
eis
atle
astt
wo
times
high
erth
anth
efr
eque
ncy
ofth
em
otor
s.1
4
STR
5Fa
ilure
ofth
epa
yloa
dbo
xIm
pact
due
toco
llisi
onw
ithgr
ound
orra
ils2
Payl
oad
box
mus
tbe
repl
aced
.MAV
mus
tco
mpl
etel
ybe
reas
sem
bled
,B
atte
ry,P
CB
and
blow
erca
nbe
dam
aged
.
5A
ddca
sing
arou
ndth
epa
yloa
dbo
x,su
chth
atth
eca
sing
will
brea
kfir
st.T
his
ism
uch
easi
erto
repl
ace
and
can
take
the
shoc
k.1
5
STR
6Fa
ilure
ofM
AVIm
pact
due
toco
llisi
onw
ithgr
ound
orra
ils4
Arm
sbr
eak
off
and
dam
aged
elec
tron
icpa
rts
orba
ttery
.2
Add
casi
ngto
prot
ectt
hew
hole
stru
ctur
e.2
2
STR
7E
ntan
glem
enti
nw
ires
orpl
ants
Obj
ects
gets
tuck
inth
esp
acin
gsin
the
stru
ctur
e(b
etw
een
the
roto
rs)
3D
rone
will
gets
tuck
,m
ustb
ese
tfre
em
anua
lly.
3
Mak
esu
reth
atth
ere
are
nopl
aces
whe
reth
ew
ires
can
gets
tuck
.W
hen
stuc
kw
ithin
the
plan
tsad
da
war
ning
syst
emsu
chth
atth
eow
nerk
now
sth
atth
edr
one
isst
uck.
22
STR
8Fa
ilure
ofbl
ower
due
toim
pact
Impa
ctdu
eto
colli
sion
with
grou
ndor
rails
2N
otab
leto
perf
orm
polli
natio
nan
ymor
e4
Add
casi
ngto
the
dron
e.1
4

114 16. Risk and mitigation
Table 16.8: Risk matrix for navigation
Tag
Ris
kC
ause
PE
ffec
tS
Miti
gatio
nac
tion
MP
MS
NAV
R1
UW
Bsi
gnal
lost
Flyi
ngto
ofa
raw
ayfr
omth
egr
ound
tags
2N
olo
catio
nin
form
atio
n,no
heal
thin
form
atio
n5
Red
unda
ncy
inlo
caliz
atio
n1
5
NAV
R2
Flyi
ngto
war
dsa
wir
eD
rift
inpo
sitio
n3
Dro
neco
uld
cras
hin
tow
ire
4M
ake
cont
rolle
rmor
ero
bust
;A
ddan
extr
ata
g2
4
NAV
R3
Flyi
nghe
ight
too
low
Cup
was
notp
rope
rly
dete
cted
;im
prop
erre
gist
erin
gof
loca
tion
ofth
ecu
p2
Fly
inbe
twee
nth
epl
ants
inst
ead
ofon
top
ofth
ero
w;
4
Cha
nge
cup
into
mor
evi
sual
lyde
tect
able
obst
acle
Hav
eal
ldro
nes
that
see
the
cup
com
mun
icat
eth
elo
catio
nof
the
cup
toth
egr
ound
stat
ion
14
NAV
R4
Dro
nefly
ing
insa
me
row
On-
boar
dH
W/S
Wdi
dno
tper
form
asex
pect
ed1
Cra
shin
todr
one
and
dam
age
surr
ound
ings
5C
onsi
derc
omm
unic
atio
nin
betw
een
dron
es1
5
NAV
R5
Obj
ectm
ovin
gfa
ster
than
wha
tcan
bede
tect
edC
amer
aha
sfp
sth
atis
too
low
Poss
ibili
tyof
cras
hing
into
the
obst
acle
s.C
hang
eth
eca
mer
ato
one
that
has
ala
rger
fps
NAV
R6
Flow
ers
are
notd
etec
ted
Lig
htin
gco
nditi
ons,
Flow
erco
lorh
asch
ange
d2
The
flow
ers
that
are
notd
etec
ted
will
notb
epo
llina
ted
5
Cha
nge
the
algo
rith
mus
edto
am
ore
effic
ient
one
that
;w
orks
inva
riou
slig
htin
gco
nditi
ons
and
that
does
noto
nly
use
the
colo
urof
the
pixe
ls
15
NAV
R7
Ove
rloa
ding
ofth
eU
WB
Too
man
ysi
gnal
sse
ntov
eron
eba
nd2
Tim
efo
rdro
neto
rece
ive
and
send
data
toth
egr
ound
stat
ion
isve
ryla
rge
3In
crea
setim
ein
betw
een
two
calib
ratio
nha
ndsh
akes
12
NAV
R8
Not
enou
ghsp
ace
form
ore
pict
ures
Not
enou
ghm
emor
y1
Pict
ures
will
notb
esa
ved
orso
me
mig
htbe
over
wri
tten
3H
over
and
tran
smit
imag
esvi
aU
WB
then
dele
teth
etr
ansm
itted
imag
esfo
rext
rasp
ace
12
NAV
R9
Not
bein
gab
leto
dete
ctth
ecu
pC
upno
tbei
ngin
fov
ofdr
one
2D
rone
will
star
tflyi
ngat
the
row
atth
ew
rong
heig
ht3
Trac
kdr
one
head
ing
whe
nit
isbe
ing
desc
ende
d1
3
NAV
R10
Not
enou
ghsp
ace
tom
ove
side
way
sfr
omgr
ound
stat
ion
duri
ngta
keof
f
The
grou
ndst
atio
nw
asde
sign
edfo
race
rtai
ngr
eenh
ouse
dim
ensi
onw
hich
ifsm
alle
rcou
ldm
ake
take
-off
com
plex
3C
rash
into
near
byob
stac
le-s
uch
asa
plan
t4
Adj
ustfl
ight
path
:tr
ialb
yer
ror
try
upw
ards
14

115
Table 16.9: Risk matrix for electronics subsystemID
Ris
kC
ause
PE
ffec
tS
Miti
gatio
nM
PM
S
EL
1
Proc
esso
rno
tabl
eto
proc
ess
all
the
thin
gsat
the
sam
etim
e
The
cloc
kra
teis
noth
igh
enou
gh3
Not
able
todo
obst
acle
dete
ctio
n,co
ntro
l,po
wer
regu
latio
net
c.at
the
sam
etim
e
5U
sea
proc
esso
rtha
thas
acl
ock
rate
that
can
hand
leal
lthe
com
pone
nts
15
EL
2N
oten
ough
inpu
tpor
tsfo
ral
lthe
com
pone
nts
The
CPU
isno
tab
leto
hand
leth
eam
ount
ofco
mpo
nent
sne
eded
3Im
port
antc
ompo
nent
sca
nno
tbe
adde
d4
Mak
esu
reth
atth
epr
oces
sor
has
enou
ghpo
rts
fora
llth
eco
mpo
nent
s1
4
EL
3Fa
ilure
ofC
PUPr
ogra
mm
edw
rong
4T
hedr
one
isno
tabl
eto
oper
ate
5U
sean
offt
hesh
elfC
PU,t
hat
has
alre
ady
been
prov
enin
dron
efli
ght
25
EL
4Fa
ilure
ofth
eIM
UD
amag
edor
inst
alle
dw
rong
3N
otab
leto
know
the
orie
ntat
ion
ofth
edr
one
3U
sean
offt
hesh
elfI
MU
,tha
thas
alre
ady
been
prov
enin
dron
efli
ght
13
EL
5Fa
ilure
ofth
eba
rom
eter
Dam
aged
orin
stal
led
wro
ng3
Not
able
tokn
owth
ehe
ight
ofth
edr
one
3M
ake
sure
that
ther
eis
anot
her
subs
yste
mth
atca
nm
easu
reth
ehe
ight
13
EL
6Fa
ilure
ofth
est
ereo
-ca
mer
asD
amag
ed2
Not
able
tode
tect
obst
acle
s3
Add
anot
hers
yste
mfo
robs
tacl
eav
oida
nce
toha
vem
ore
redu
ndan
cy2
2
EL
7L
aser
sst
opw
orki
ngD
amag
ed2
Not
able
tode
tect
obst
acle
s4
Add
anot
hers
yste
mfo
robs
tacl
eav
oida
nce
toha
vem
ore
redu
ndan
cy2
3
EL
8Fa
ilure
ofU
WB
Dam
aged
2N
otkn
owin
gth
epo
sitio
nof
the
dron
e4
Use
two
UW
Bm
odul
es2
2

116 16. Risk and mitigation
Figure 16.1: Risk matrix with sample risks from all the subsystems Figure 16.2: Mitigated risk matrix with sample risks from all the sub-systems

17Sustainable development strategy
All products have a certain impact on the world. This impact has social, environmental and economical implications.If the impact in these three areas combined is minimized, sustainable development succeeds. In this chapter, the waysustainable development is taken into account in this design and the impact of this design on the environment arediscussed. These aspects are evaluated according to the Lifecycle design strategies (LiDS) wheel (Figure 17.1), whichpresents seven phases in the lifetime of the product and shows metrics to evaluate the sustainability in these phases [74].These phases are shown in Sections 17.1 to 17.4. Furthermore, the contribution of the system to sustainable developmentis evaluated in Section 17.5, which is largely inspired by the midterm report [9].
The analysis shown below is a qualitative one and gives no concrete numbers on how sustainable the product is. Adetailed lifecycle analysis can be performed using dedicated tools, such as Ecoinvent1.
17.1. Material aspects in the designThe first two spokes of the wheel have to do with the material aspects in the design. The structural elements of the droneare made of carbon fibre and ABS plastic. The APIS also contains a Lithium-polymer graphene battery, five electricmotors and electronics.
ABS plastic is a thermoplastic polymer that has a wide range of uses. In the electronics and automotive industry itis often employed, as well as in the well-known Lego bricks. It can be mass produced and in production, the harmfulemissions are below workplace limits [75]. When 3D-printed or injection moulded, the amount of material used duringproduction can be greatly reduced. However, one concern should be identified. In confined spaces using 3d printers ,ultra fine particle levels can reach dangerous levels. Lastly, although most ABS plastics are oil-based, effort is done tomake the switch to sustainable sources2.
The payload box and the motor arms are made of carbon fibre reinforced plastic. The quality aspects of this materialare fairly low. The production of carbon fibre is energy intensive, 14 times more than conventional steel [76]. Further-more, although recycling carbon fibre is possible, it is more cumbersome compared to conventional methods3. Lastly,the production waste in the production of carbon fibre is high compared to alternatives4. Production techniques shouldbe optimized to minimize this waste. The main advantages of the use of carbon fibre lie in the use phase of the vehicle.For example, it is corrosion resistant and chemically stable, although the epoxy resin can be sensitive to UV light5. ABSplastic has similar properties6.
Another material that scores low on the ’quality scale’ is the lithium polymer battery. This component containssome heavy metals, that require a lot of energy to extract and making it from recyclable material is not yet feasible.Nonetheless, recycling the material is done, although it is energy-intensive. According to literature [77], the levels ofcopper, cobalt and nickel are classified hazardous for humans by U.S. regulations. Another aspect that is important tonote is the flammability of the material. The brushless motors are generally made of materials with metals of a highquality and value. The motors are therefore often recyclable or made of recycled metals [78].
1http://www.ecoinvent.org/home.html [Cited 23 June 2017]2https://www.environmentalleader.com/2016/06/will-legos-150-million-sustainable-plastics-challenge-make-biobased-the-norm/ [Cited 22 June 2017]
3https://recyclenation.com/2015/10/is-carbon-fiber-better-for-environment-than-steel/ [Cited 22 June 2017]4https://www.theguardian.com/sustainable-business/2017/mar/22/carbon-fibre-wonder-material-dirty-secret [Cited 22 June 2017]
5http://www.christinedemerchant.com/carboncharacteristics.html [Cited 23 June 2017]6http://www.fibox.com/137/Plastic%20materials:%20PC,%20ABS,%20GRP_ENG3.html [Cited 23 June 2017]
117

118 17. Sustainable development strategy
Figure 17.1: Elements in the LiDS wheel
Finally, the printed circuit boards in the drones are of material with a high environmental impact. Due to theircomplexity, recycling is difficult and energy intensive [79]. The complexity also means that a large range of materialsis used: plastics, ceramics and several different metals. Metals such as chromium, lead and mercury can be harmful topeople [80].
17.2. Production and distributionThe next step in the life cycle is the production and distribution of the product. Combining and integrating all thesedifferent components results in a flyable vehicle. The production of this vehicle can be made environmentally efficient.Fewer production steps, low energy consumption in production and a reduction in production waste are good for en-vironment and good for profit. In distribution, clean packaging and energy efficient transport should be employed. InChapter 15, an elaborate production plan is made. From this chapter, injection moulding, vacuum infusion and millingare three main production processes. Injection moulding is a widespread production process. It involves heating a poly-mer resin and injecting it into a mould. The energy use of this process was investigated in [81]. Energy consumption ofthis industry is fairly high. The entire U.S. injection moulding industry uses a similar amount of energy as the electricityproduction of several developed countries, including the Netherlands. Composite materials are produced by vacuum in-fusion. Compared to traditional methods, this process results in less resin waste and, as it is a closed system, no harmfulgas emissions. Milling of aluminum produces a fair amount of production waste at first sight. This metal waste however,can be recycled well. In a larger scope, one could imagine that an automated process impacts more on the environment,while a manual process has more social impact.
In distribution, an energy and economically efficient method could be envisioned. As greenhouses are often built indense clusters around the world (the Westland region in the Netherlands or the Almeria region in Spain for example),production could happen close to these regions to limit the transport impact and increase service for the client.
17.3. Operational phaseDuring the use phase of the product, the most obvious environmental impact of the product can be identified. In the gener-ation of electricity, there are still emissions in the environment. An elaborate analysis on this is shown in Section 17.3.1.Another sustainability aspect in the design is the noise that the vehicles emit, as investigated in Section 17.3.2. InSection 17.3.3, other characteristics in the use phase are considered.
17.3.1. Power consumptionThe APIS system needs to use a certain amount of electricity to be able to perform its function. This electricity comesat a certain cost. The farmer needs to buy the electricity at a certain price and in the generation of electricity there isan environmental impact. This impact can be well measured by the CO2 emissions needed for electricity generation.The European Environment Agency provides a clear overview of the so-called emission intensity (grams CO2 per kWh)of the electricity mix in 2015. This data is used to estimate the environmental impact of the system during its use. InTable 17.1, the total CO2 emissions of the typical system are presented. The energy mix in the Netherlands can be

17.3. Operational phase 119
considered quite environmentally unfriendly. A low percentage of electricity production is renewable and a large portionis produced by polluting coal fire plants [82]. As the Netherlands signed the Paris accords, it will strive to use morerenewable energy.
Table 17.1: Emissions in a typical greenhouse in different countries
Country Emission intensity[g/kWh]
CO2 emissions[kg/year]
Netherlands 451.4 294.01Spain 304 198.00EU 275.9 179.70
Table 17.2: Change in energy use and CO2 emissions
Situation Energy use[kWh/year/m2]
CO2 emission[kg/year/m2]
Current situation 104.17 61.92With APIS 0.0163 0.0074Change [%] 0.016 0.012
To give these numbers some perspective, it is relevant to compare these with the electricity use and CO2 emissions ofthe Dutch greenhouse sector. According to [83], the yearly energy use of a typical Dutch greenhouse is 375 MJ·m−2 or104.2 kWh·m−2. The energy use of the APIS system, pollinating a greenhouse of 200 by 200 meters every three days isestimated to be a marginal 0.0163 kWh·m−2 a year. This means a total increase of 0.016 %. In short, adding the systemdoes not largely contribute to the energy use of the greenhouse. These results are tabulated in Table 17.2.
17.3.2. Noise characteristicsNoise is another sustainability aspect that can be identified during the use phase. If the system of drones produces toomuch noise, it can have annoying, or even harmful consequences for humans working in the greenhouse. Moreover, mostcountries’ working conditions legislation stipulates maximum noise levels allowed in the environment where workerswithout special protection gear operate.
Noise (and sound for that matter) is usually measured in Sound Pressure Level (SPL), denoted by Lp :
Lp = log10
(p
p0
)dB, (17.1)
where p0 is the reference sound pressure, usually taken to be 20 µPa. In reality, people do not perceive sounds thesame way across the frequency spectrum. For example, a low frequency sound will be perceived less loud than a highfrequency sound with the same pressure level. Therefore, in order to address the actual human perception of the noiselevels, weights are used to adjust the sound pressure level for different frequencies. The most popular of which, andtypically used in regulations and research, is the A-weighting defined in the international standard IEC 61672:2003 [84].A-weighted sound levels are denoted by dB(A).
The Dutch legislation is used as a baseline for the allowed noise that the APIS system design has to comply with. Inparticular, the Working Conditions Decree in its revision from September 2016 was consulted [85]. The maximum noiselevel stipulated there that is exempt of special requirements regarding medical examinations or protective equipment is80 dB(A), defined with p0 = 20µPa.
Modelling the noise of quad-rotors with numerical means is still something that is generally considered unreliable[86]. Therefore, instead, experimental studies were consulted. The literature consistently reports noise level values ofless than 80 dB(A) measured at distances representative to the ones potential human workers in the greenhouse wouldhave [86–88]. For the same reason, the only way to establish accurate noise values for the APIS drones is by performingfield test in an actual greenhouse.
One could assume that as there are a number of drones in the confined space inside the greenhouse, the noise levelswould be much higher. Nevertheless, thanks to the plants inside, the noise levels as would be experienced by a humanworker on the ground are not expected to be higher than the values for a single drone. Numerous studies have beenconducted into the attenuation capabilities of plants [89, 90]. In particular, it has been shown that multiple periodic rowsof plants are quite effective for noise reduction due to a periodicity in the density of the area they cover [91]. Therefore,it is expected that the tomato plants in the greenhouse will absorb a large part of the noise, particularly in the highfrequencies, which are also the ones more strongly perceived by humans.
Moreover, several techniques for reduction of propeller noise can be implemented. For example, Lu et al. havedemonstrated that shrouds around the propeller have a favorable effect on the noise emission levels [92]. The APISdrones are equipped with shrouds around the propellers, so it is expected that they will benefit from this phenomenon.Additionally, further noise reduction can be achieved by tripping the flow over the propeller. This is believed to reducethe laminar boundary layer noise and to ensure that no laminar separation bubbles exist. Leslie et al. report reductionof up to 6-7 dB(A) for small MAV propellers by using such techniques [93]. Therefore, it can be concluded that the

120 17. Sustainable development strategy
greenhouse environment, together with propeller noise reduction techniques will most probably result in noise levelsbelow the 80 dB(A) stipulated in regulations.
17.3.3. Other considerations in use phaseLengthen duration of the use phase is tightly related to reliability and maintainability as discussed in Chapter 14. Aproduct that is easy to maintain and that is reliable has longer technical life-span and therefore a lower environmentalimpact. The battery is a key element in the drone. It is the subsystem with the highest weight and a low number ofcycles. In Section 6.4, the battery selection is explained and the choice of battery is done, mainly based on its numberof cycles. It is now estimated that the battery has a lifetime of about 400 hours and that, using the APIS intensively, thebattery needs to be replaced every month. Naturally, this operation is not very sustainable. Therefore, great effort shouldbe made to collect and dispose the lithium polymer batteries safely and in a sustainable way. Also, a great plus for theAPIS is the modular design. The modular payload provides opportunity to work with other types of plants too. Thisgives the possibility to lengthen the lifetime of the system.
17.4. End of lifeA sustainable end-of-life treatment can be looked at from two ways. Either the entire, or parts of the product should bereused, or materials in the product should be efficiently recycled. The first goal should be to disassemble the productat end of life and aim for reuse of parts. If the APIS has a broken payload box for example, the motor arms could stillbe good to use in another vehicle. If reuse of parts is not possible, different materials should be separated and recycled.As discussed above, although most product can or are even required to be recycled, this process can be energy intensiveand thus unsustainable. Good awareness should be created and collection policy should be put in place to ensure goodrecycling or refurbishing of the products. Broken products could be sent back to the manufacturer, disassembled anddifferent parts can be recycled. Special care should be taken in the disposal of the LiPo batteries. Large battery recyclingschemes have been employed in several countries and a large portion of the material can be recycled [94]. Looking atLiDS wheel in Figure 17.1, all the spokes from beginning to end have been evaluated. Only the last one, about optimizingthe function has not been evaluated. This is about answering the question if the chosen product is the most sustainableway of performing the mission. This will be considered in the next section.
17.5. Contribution of system to sustainabilityThe way the product or system contributes to sustainability is presented below. This contribution is split up in threeareas. First the social contribution of the system, secondly the environmental contribution and finally the economicalcontribution.
The social contribution to sustainability can both have a positive impact or a negative impact. One example of socialimpact is to the workers in the greenhouse. They could be affected by the noise or the drones flying around, althoughthe noise levels are below restrictions. Compared to the current pollination solution, bees flying around, the noise couldbe more, but the risk of being stung or hit by a bee is almost completely mitigated. Another impact to society has moreethical grounds. Currently, agriculture is drastically changing by using genetically modified crops to boost yield. A largecontroversy is surrounding this topic as people do not like to eat food that is artificially enhanced7. A similar controversycould arise when pollinating robots are flying around and taking over an essential natural process. Furthermore, legalaspects should also be considered. Could controversy about this topic result in stricter laws that limit the use of artificialpollinators? On the other hand, in some countries the use of a natural, but invasive pollinator is forbidden. For example,in New Zealand and Australia, the use of invasive bumblebees species is prohibited8. A mechanical pollinating systemlets crops grow in greenhouses in these areas and provide home-grown vegetables to the population. The last socialcontribution that is discussed could have social impact in the long term. According to vanilla farmer Henk de Kroon, theway vanilla is currently cultivated is not sustainable. This plant is has to be pollinated by hand at one single moment bya group of people. The crop is mainly cultivated in Madagascar, where men, women and children work for a very lowwage in very bad conditions. If, after further research, a pollinator drone is made accurate enough to do this process, apollinator drone could aid in this process. This could improve the living conditions of these people.
One environmental contribution of this system lies on the intersection between social and economical implications.One could imagine that, if the system becomes efficient enough, it could replace with natural pollinator insects. The needto protect these insects (bees, bumblebees) is then limited and environmental impact (loss of insects) is then enormous.In any case, all measures should be taken to preserve natural pollination by bees. Looking at the mission need statement,7http://www.iflscience.com/environment/myths-and-controversies-gmos-0/ [Cited 23 June 2017]8http://www.environment.gov.au/biodiversity/invasive-species/insects-and-other-invertebrates/invasive-bees [Cited 23 June 2017]

17.5. Contribution of system to sustainability 121
the system would only be put in place when the natural mechanisms are insufficient, endangered or ineffective. Anotherenvironmental impact has to do with the greenhouse environment. The drones will fly around not only pollinating, butalso taking pictures and gathering other environmental data. This data can then be used to optimize the use of resourcesin the greenhouses and limit the waste of energy. Furthermore, the positive environmental impact can be seen in thepreservation of certain crops.
The system also offers multiple economical advantages. Firstly, the pollination service that is required is ensured.This limits the risk for the farmer and provides economic benefits for him. Secondly, a mechanical system could decreasethe use of expensive manual labor for the farmer. To refer to the example mentioned above, a test project to cultivatevanilla in the Netherlands is already put up9. According to Henk de Kroon, large-scale development is hampered by thehigh labor cost in the Netherlands. An mechanical pollination system would provide a reliable and cheap pollinationservice and make large-scale development possible. Coupled to this point is the third advantage. In food industrycurrently, there is a trend towards increasing the traceability of crops [95]. Having an active monitoring system canimprove this aspect and add extra economic value. Finally, it is expected that the system enhances pollination, thusboosts yield and increases profits.
9https://www.wur.nl/nl/Dossiers/dossier/Vanille-uit-de-Nederlandse-kas-Nedervanille.htm [Cited 23 June2017]

18Sensitivity analysis
A sensitivity analysis is carried out to check if the requirements are still met with the largest uncertainties. To do so thekey parameters that drive the requirements are first defined. This includes UWB precision, mass and battery capacity.When possible, the uncertainties of those parameters are found through Monte Carlo simulations. The 95% confidenceinterval has been given.
18.1. Battery capacityA Monte Carlo simulation will be carried out to determine the range of certainty of the battery capacity. The latter de-pends on a variety of parameters that each have their own uncertainty. All these parameters will be distributed uniformlyon the range [value - uncertainty, value + uncertainty]. Generating 1000000 samples, the capacity can be calculated and95% and 99% confidence intervals can be provided by using Equation (18.1) and Equation (18.2). These depend on themean (aM) and the standard deviation (bM) of the entire sample size.
95 % confidence interval =
[aM −1.96∗bMp
N,
aM + 1.96∗bMpN
](18.1)
99 % confidence interval =
[aM −2.57∗bMp
N,
aM + 2.57∗bMpN
](18.2)
A distinction has to be made between the capacity required for the mission and the capacity the chosen battery has.In fact, the chosen battery of APIS is 1500 mAh. On the other hand, depending on the duration and power consumptionduring the mission, different capacities of the battery will be consumed. These two values altogether give the depth ofdischarge for the mission. The latter is of remarkable importance given its notable impact on the lifetime. Such is theimportance, that the requirements (DP-MAV-3-POW-3) include a maximum depth of discharge of 90%, however for thenominal mission a DoD of 78.5% is used, Chapter 6. Arguably, the questions is whether in a regular basis the DoDwill be under this maximum requirement. It depends on the watt hours required which in turn depends on the energy inthe mission. As it was explained in Chapter 6, the total energy is a function of the energy consumption of the variousphases. In a typical nominal mission there are 7 phases: take-off, cruise, detection, pollination, turning, cruise back andlanding. The times given to each of these phases have uncertainties and so do the power consumption. These can befound in Table 18.1. Multiplying these two gives the energy consumption for the phase. The energy listed in Table 18.1 ishowever not the total energy, but part of the energy of the considered phase that was found differently (through a Pythonmodel for instance) as more factors came into play. It therefore carries its own uncertainty. A more elaborate discussioncan be found in Chapter 6. The final column of this table shows the total uncertainty in the energy calculations for eachphase.
Calculating the battery capacity 1,000,000 times, the standard deviation and the mean can be found. They werefound to be 189.8 and 1231 respectively. It must be noted that they change each time all the samples are recalculated asthe seed that generates the random numbers is different each time. The 95% confidence interval that was constructed was: [1164.2;1165.5], as well as a 99% one : [1164.0;1165.7]. This means that given the uncertainties listed in Table 18.1,even though they would occur, it can be said 99% confidently that the required capacity of the battery will be between[1164.0;1165.7]. For a nominal mission, the capacity the battery was sized for was 1,177 mAh, consequently, as shownfrom the Montecarlo simulation, the battery is slightly overdesigned. Unfortunately, this is not optimal, however thissmall margin can be argued to be desired for small unforeseen energy consumption, such as internal resistance in thebattery. Finally, a comment can be made regarding the maximum value that was obtained: 1,336.9 mAh. Following
122

18.2. UWB position and attitude determination 123
Table 18.1: Uncertainties for the times spent and power consumed in each phase
Phase Times [s] Power variations [W] Energy variations [J] Total energy variations [J]
Take-off 3 ±2 3.546 132.48 ± 20.66 (3 ±2) · 3.546 + (132.48 ± 20.66)Cruise 50 ±10 3.546 2210 ± 344.5 (50 ± 10)· 3.546 + (2210 ± 344.5)Non-pollinating 36.5 ±10 5.341 1614 ± 251.7 (36.5 ± 10)· 5.341 + (1614 ± 251.7)Pollination 478 ±10 5.341 21128.2 ± 3296.61 (478 ± 10)· 5.341 + (21128.2 ± 3296.61)Turning 2 ±1.8 47.7 N.A. (2 ±1.8)· 47.7Cruise back 50 ±10 3.546 2024 ± 344.5 (50 ± 10) · 3.546 + (2210 ± 344.5)Landing 10 ±5 3.546 442.47 ± 69.02 (10 ± 5)· 3.546 + (442.47 ± 69.02)
from the requirement DP-MAV-3-POW-3, a maximum depth of discharge of 90% is needed to promote a healthy andlengthily lifetime for the battery. Thus, for a nominal capacity of 1,177 mAh, a maximum capacity of 1,307 mAh couldbe consumed during the mission without much damage to the battery. The maximum value for the Montecarlo showsthat one mission in 1,000,000 will drain an excess of 70 mAh. This is obviously undesired, but will definitely not be acatastrophic risk, especially because the physical maximum the battery is 1,500 mAh.
18.2. UWB position and attitude determinationThe sensitivity analysis for the UWB position estimate was performed in a manner similar to the one for the batteryoutlined above. In particular, a Monte Carlo simulation with 1000 runs was implemented. The lower number of samplesis due to the fact that a single evaluation of the UWB position analysis code is more computationally expensive than forthe battery.
The parameter bearing most uncertainty in the module is the standard deviation of the ranging errors. As explainedin Section 8.3, the nominal value, as reported by the manufacturer, is 3.5 cm. In order to assess the effects of variabilityof this value on the position estimation accuracy, the positioning analysis tool was run for standard deviation values ona uniform distribution [2.0 cm; 5.0 cm]. For each evaluation, the maximum positioning error was recorded and the 95%and 99% confidence intervals were obtained. The 95% confidence interval was found to be [1.96 cm; 4.46 cm], andthe 99% confidence interval to be [1.86 cm; 4.60 cm]. This ranges are considered small enough, as the task, requiringhighest precision is landing, which has a tolerance of about 2 cm but is largely assisted with visual cues.
The attitude determination depends on the position estimation accuracy and the number of measurements averagedfor a single sample. The second is design choice, trading update frequency with attitude accuracy, as detailed in Sec-tion 8.4. Hence, it will not be considered as variable for the sensitivity analysis and will be have the fixed value of 10.The sensitivity to the position estimation accuracy, however, was investigated, as there is significant uncertainty in itsvalue. The manufacturer of the UWB module1 reports position errors of 10 cm. Nevertheless, shown above, using themethod outlined in Section 8.3 results in maximum error in the 99% confidence interval of 4.60 cm. Therefore, in orderaccount for these different values, the interval [4 cm; 15 cm] was set.
In total 10,000,000 evaluations were run for on-board module points uniformly distributed in spheres with radii asgiven above. The resulting distribution converges to a half-normal probability density distribution. Its 95% confidenceinterval was found to be [0.13◦; 5.37◦], and the 99% confidence interval to be [0.027◦; 7.53◦]. The upper extremes ofthese intervals are considered small enough for the navigation applications considered. Nevertheless, higher accuracycan easily be achieved by increasing the number of measurements averaged per sample.
18.3. Total massThe total mass of the drone was estimated to be 249.5 ± 23.3g. The effect of these variations can results in somechanges on the entire mission performance. Parameters such as the flying time, the depth of discharge of the battery andthe number of drones are all affected.
First, without varying the current depth of discharge, the flying time is reduced to 9 min and some seconds, if the totalweight is increased to the upper limit of 249.5 g plus the margin of 23.3 g, adding up to 272.8g. If the same number ofdrones are kept in the package, the mission cannot be performed in the required time. This is because exactly 58 dronesare required to pollinate the greenhouse in 3 days for a mission time of 10.5 min, however for a mission of only 9 min,a total of 67 drones would be required. Even considering the extra 6 drones which would be provided in the package,3 drones would still be required. If the number of drones per package is increased to meet the 67 drones requirement,
1https://www.decawave.com/sites/default/files/resources/DW1000-Datasheet-V2.12.pdf [Cited 24 June 2017]

124 18. Sensitivity analysis
the total cost goes up by 1520 C given that one extra ground station would have to be provided to accommodate all thedrones.
Now if the scenario of a varying depth of discharge is considered, the flying time can be kept constant. If the mass ofthe drone increases to 272.8g, the depth of discharge increased from 78.5% to 89.3%. This means that the mission wouldstill fit in the requirements, but with a severe impact of the battery lifetime. Furthermore, given the extra consumptionof energy, the charging time will also increase from 15 min to 17.3 min. The latter also impacts the number of dronesrequired, although not as much as in the previous case. The exact number of drones would increase from 58 to 61,luckily this value would still be covered by the extra drones provided in the package.
If the total mass of the drone is actually smaller, the flying time can be increased. This has an effect on the lifecyclesof the motors as they would be spinning more. Indeed, if the mass of the drone is reduced to 226.2g, the flying time canbe increased from 10.5 min to 12.5 min. For that increase in flying time, the lifecycle of the motors drops to 18 years.

19Post-DSE phase
The DSE is the pinnacle of the Bachelor of Aerospace Engineering program at TU Delft. As such it carries the symbolicsignificance of “an end” or “a conclusion”. Nevertheless, the current chapter is an attempt to envision what would happenwith the pollinator drone project if the effort continued past the DSE Symposium event.
First, the long-term vision for the pollinator drone technology will be presented in Section 19.1. Then the orga-nizational development for the group is outlined in Section 19.2. It considers two possible tracks: an academic and acommercial one, allowing for continue reevaluations of whether to switch from the first to the second. In this long-termplanning it was observed that the most critical phase is the one supposed to happen immediately after the end of theproject, namely the prototype building and testing phase. Precisely because of its relative importance, it considered indetail in Section 19.3. Then, two important aspects for the potential future commercialization are discussed. First, thefunding and marketing strategy is discussed in Section 19.4. Then, the difficulties encountered when estimating thereturn on the investment are outlined in Section 19.5.
19.1. Long-term technology visionCurrently there are alternatives to drone pollination for self-pollinating crops. The most prevalent one being the com-mercial bees that are readily available on the market. Indeed, at the moment bees are significantly cheaper than a systemfor drone pollination. However, there are some instances where bees cannot be obtained due to restrictions imposedby legislation or regulations1, or are affected by a disease. In these cases means of mechanical pollination are used.Sometimes manual pollination is performed. The cost of manual pollination is usually higher than a drone system.Therefore, in such cases, the APIS system can immediately have market value. In other cases, however, there are otherautomated mechanical pollination means implemented2. The cost of these might be comparable or lower than the oneof APIS, making for a difficult market entry. Nevertheless, APIS provides something that none of the other currentlyavailable pollination methods offers. That is the imaging capability. Flower imaging for helath monitoring and yield pre-diction is expected to become vital for the next generation of smart horticulture and APIS has this functionality alreadyimplemented.
The APIS pollinator drone was conceived as a proof of concept for drone pollination. Its goal is to demonstrate thatit is possible to perform mechanical pollination with drones using only currently available technology. Even more, itwas designed with the vision to serve as a test bed for future technology developments. As a result, the true value ofAPIS lies in enabling long-term developments in the field.
There are various alternatives for self-pollinating flowers, as mentioned before. But not as many for cross-pollinating.This is where another market potential for drones is believed to exist. Nevertheless, the technology development muststart here, with drones for self-pollination as a first step. The APIS drones were designed with this in mind, manifestedin the modularity of the payload section and the ease with which the blower can be swapped for a device for cross-pollination. As the accuracy of the sensors, image processing and control algorithms increases and the electronics shrinkeven further, it is expected that pollinator drones will eventually be able to pollinate via physical contact with the flowers.Moreover, it is very probable that in the (near) future the MAV community will succeed in meeting the expectations ofthe general public and indeed produce pollinator drones with the size of bee, something now possible only with a lot ofconstraints and limitations as shown by Harvard’s RoboBees [96].
1http://www.hydroponics.com.au/issue-88-bumblebees-for-pollination-of-greenhouse-tomato-crops-in-australia [Cited 30 June 2017]
2http://www.weeklytimesnow.com.au/agribusiness/horticulture/automated-pollination-machine-on-trial-in-australia/news-story/5fa92217c5f562f5912f634fc4357121 [Cited 30 June 2017]
125

126 19. Post-DSE phase
In future, we expect that pollinator drones will be able to pollinate any crop, anywhere, at any time. Again, as a firstinvestigation effort, the current treatment was limited to tomato plants. Nevertheless, the long-term goal is, of course, totarget a larger variety of crops. Moreover, even though the APIS system was designed to work in greenhouses, there iseven larger demand for pollination outdoors. As mentioned before, there are other efficient means for indoor pollination,the best example being commercially available bee colonies. Considering outdoor pollination, however, the options aremuch more limited. Therefore, this constitutes another significant market opportunity.
The potential of the imaging and monitoring capabilities of APIS is also not to be neglected. There are already anumber of successful business cases of agricultural applications of drone imagery. Some examples being Aurea Imaging,Pix4D and Bird.ai. Nevertheless, currently the focus of these applications is on the bulk of crops. However, as outlinedin Horizon 2020 [97], the future of agriculture lies in giving personal attention to every plant, providing care for its ownspecific needs. APIS can provide not only that, but also go even one level deeper: a one-to-one interaction with everysingle individual flower. This ability is facilitated by the fact that a pollinator drone has to visit every single flower. Forexample, during a discussion with Giuliano Vitali from University of Bologna it became evident that there is a need formapping and 3D reconstruction of individual orchard trees. That is currently impossible as agricultural drones generallyfly only above the fields, and therefore cannot image flowers on the sides or on the bottom of a tree. This, however, issomething that a pollinator drone can easily do as a secondary mission.
The current state of the APIS design allows for pollination and imaging of tomato flowers in the controlled environ-ment of a greenhouse. However, using this as a starting step, the future developments are expected to allow for muchmore versatile platforms with a significantly larger variety in the applications. Pollinator drones will eventually becomea market reality and APIS will be always remembered as the pioneer of this field.
19.2. Long-term organizational visionThe long term vision of the post-DSE activities is very difficult to predict as it depends on a number of internal factors,e.g. human resources, finance, knowledge, as well as on external forces like competition, market pull and the economy.Nevertheless, two main possibilities were envisioned: continuation as an academic endeavor or transformation into acommercial entity. However, before such a decision can be made, there is the most critical phase for the prospectiveteam to pass. Namely, that is the prototype building and testing phase. The whole process described in this section isillustrated in the project design and development logic flowchart in Figure 19.1.
During the prototype building and testing phase the team has to go through the iterative process of updating thedesign, producing and integrating parts for the drones and the ground stations, and testing parts, components, drones andground stations. The need for this is stipulated by the cyclic nature of solving implementation challenges. In the process,it is expected that the group could also acquire even further depth of understanding of the technology and principlesbehind the design, allowing them to improve and optimize the system even further. It is expected that at the end ofthis phase, a fully working demonstration mission could be performed. As that is an academic project, journal articlepublication and conference presentations are also expected. Due to the importance of this initial phase, it is given specialattention in Section 19.3.
Once the prototype building and testing phase is concluded, decision has to be made of whether to continue withfurther academic projects or to try to commercialize the developed technology. The main criterion behind this decisionis expected to be the market opportunities for such a technology. In other words, the market readiness. If the time is notdeemed suitable for starting the commercialization procedure, further research into the technologies that might be ableto bring APIS to the market can be investigated.
In case future research is considered, there is a main cycle of coming up with research ideas, searching for fundingopportunities for these ideas and writing research proposals. For the case of MAVs, there is the additional opportunity ofusing a relevant competition as a platform for developing and testing some of the technology needed for the progress ofAPIS. Once funding for research is secured, another cycle is entered. The research cycle essentially includes planningresearch activities, securing the necessary resources, investigating these activities, obtaining results and then using theseto adjust the planning until the point of completion. Just as most academic projects, it is expected that a publication andconference presentations will be made. In the case of a competition-driven project, participating in the competition alsohappens in this stage. The formal conclusion of the project follows. The experience and technology expertise establishedduring the phase of further research serve as the basis for a new market readiness evaluation.
In case the group decides that the current moment constitutes a good market entry opportunity, a start-up companycan be formed. For such a company one of the main pending issues is to find seed funding necessary to sustain their earlyefforts before they can start gaining revenue. The seed funding may come from university or government funds, personalor private investments, venture funds or crowdfunding. That is also the point where, slow, but important, team expansionalso happens. The main goal of the start-up company will be to establish various product ideas, build prototypes and test

19.2. Long-term organizational vision 127
Figure 19.1: Project design and development logic
them with clients until a profitable and scalable idea is found. This is paralleled by Blank’s definition of a start-up: “atemporary organization designed to search for a repeatable and scalable business model” [98]. Once that happens, theycan write their vision for the future development of this idea into a business plan.
The finalizing of the business plan marks the point in which the start-up enters its growth phase. First, growthstrategy has to be carefully drafted up. This is the phase where good start-ups often fail, either because they cannot scalefast enough or because they cannot keep with the market pull for scale. In order to deal with these sensitive issues, agrowth strategy centered on the core technology and market has to be developed. Growth also means that there will bea tremendous need for new top tier employees. Therefore, an excellent Human Resources (HR) strategy is also needed.As APIS starts selling their product, there will be also the need for customer support and product maintenance. Havinga good start with these is fundamental to retain the early adopters. Acquiring the finding necessary to grow is the pivotalpoint for this phase and all other activities are expected to often revolve around that. Therefore two early investmentrounds have also been planned. At the end of the growth phase, it is expected that APIS will have an established market

128 19. Post-DSE phase
position and brand recognition among potential future clients.Once the company is properly established it can begin a transition to a corporate structure. That is expected to begin
with redistribution of the roles and responsibilities within the team. Before this phase, the group organization structurewould have been flexible to a great extent. From this point onward, however, a more rigid and well-defined positions andresponsibilities are needed to prepare APIS future expansion into new markets. Such roles include executive positionswith company-wide oversight such as Chief Executive Officer (CEO), Chief Technical Officer (CTO), Chief OperationsOfficer (COO), as well as more domain-specific positions such as Vice President (VP) of Product Development, VPof Customer Support, VP of Finance, etc. Such a corporate structure also generally requires a dedicated Research andDevelopment (R&D) unit that is responsible for developing technology on request from the product development teams,as well as working on innovation projects that might be used as part of future products. That is also the point that isfundamental for the company to sustain the core business as it goes through this transition. Cost cutting and productivityincreasing are expected to be one of the first important goals for the new executive staff. To deal with these, leanmanufacturing techniques are proposed to be implemented. The transition to corporate structure is concluded with anInitial Public Offering (IPO) on the stock market.
With the IPO, the company will have acquired the necessary finance to start its expansion in new markets. Aniterative process is expected to be observed, flowing from seeking new market opportunities, establishing developmentsteams that target these, developing the technology and starting sales. The new experience and expertise acquired in-house are to be retained by facilitating an elaborate knowledge management environment. At the same time, it would bevital for the company to sustain the core business already developed and to grow the new markets established.
At some point it is expected that the company will witness a drop in the expansion rate and market opportunities.That will presumable come due to market saturation. At this point the founders and the main shareholders would haveto make the decision of whether to continue with sustaining the business, focusing on cutting costs and increasingproductivity and profits, or to sell it to a third party that would be willing to take charge of it during this phase.
19.3. Prototype building and testing phaseOne way of looking at the end of the DSE is as the end of the design phase of a bigger project. The current report canbe considered the document that summarizes all the details necessary for conducting a critical design review. The Finalreview, as conceived in the DSE framework, is in a sense precisely that. Moreover, the Symposium that concludes thisproject can be considered as the Design Presentation of a bigger undertaking.
If the APIS development project indeed continues beyond the design into a manufacturing and testing phase, furtheractivities, fundamentally different than the one undertaken by the group members so far, have to be planned. Hereby thesteps needed to be taken for building the prototype of the system and testing it are outlined. Only the main activities arepresented with the focus being kept on four main aspects: team organization, drones and ground segment production,testing and reporting.
The team organization requires a new structure due to the fundamentally different nature of the work in this phase.For this reason, a number of specialized roles need to be assigned to the group members. These include, among others,hardware production, software development, electronics assembly, testing, as well as communication positions.
As a demonstration of the system would require building multiple drones and possibly more than one ground stations,funding for the materials, components and production costs has to be secured before the beginning of the manufacturingphase. Moreover, a greenhouse willing to act as a partner for the demonstration case has to be found. An example forsuch a partner could be Wageningen university, in particular their research greenhouses.
In the case of success with the proof-of-concept, the group will investigate means to commercialize or value the tech-nology and methods developed. This is to be done in partnership with the TU Delft Valorisation Centre. In cooperationwith them the team will decide whether there is value in filing for patents or establishing a spin-off business unit.
There are two main components of the APIS pollination system: the drones and the ground segment. Both of theserequire specific hardware and software. While the hardware production is expected to be to a large extent linear, thesoftware development efforts will most likely be of iterative and incremental nature. In that sense, they are expected tooften include some of the testing activities in one or more points of their development iterations.
Testing is the pinnacle of the building and testing phase. During testing the true capabilities of the APIS system canbe demonstrated. Moreover, by fine-tuning a number of parameters in the software, the design can be further optimized.More importantly, there are a number of subsystem parameters that can only be acquired from empirical studies, most ofwhich have not been performed as of now. Therefore, testing and production will happen in parallel to a limited extent.Nevertheless, in this basic preliminary planning these connections are not elaborated.
The reporting of this latter phase includes also the publicity efforts of the team. It is expected that throughout theprototype building and testing phase a number of internal technical reports will have to be written. A continuous publicity

19.4. Marketing strategy 129
Figure 19.2: Cost breakdown structure for the prototype building and testing phase
campaign is also envisioned to be a major point of the reporting of the project. Maintaining social media profiles, aswell as participation in relevant forums are examples of such publicity activities.
Moreover, during the DSE, a number of industry contacts were established. Keeping these informed about the stateof the project is planned to happen regularly during the production and testing phases. The results of the project areexpected to be also published in the form of a journal article and presented at several conferences. The preparations forthat are planned to happen well in advance, given the typical lead times of applying to such events. Finally, a publicdemonstration will be held for the stakeholders from the university, industry, partners and contacts established duringDSE, as well as the media.
The main activities for the prototype building and testing phase are outlined in the Gantt chart in Figure 19.3. It canalso be considered as a Work Breakdown Structure for the immediate tasks after the end of DSE. The Cost BreakdownStructure for the
19.4. Marketing strategyEstablishing a marketing strategy comprises of three main segments. First, an environmental scan has to be performed,after which a SWOT analysis is conducted. This paves the way for the last segment which is deriving a market plan. Thefirst two segments fall under the banner of market analysis and were dealt with in Chapter 2. The third segment will bethus elaborated in the following.
Devising a market plan starts with agreeing on the vision for the organization/company. The vision contains a maingoal the organization wishes to achieve within a certain timeframe. For the case of our organization, this could be na-tional goal or a subnational goal. If this goal is met, then the organization will benefit immensely, and this could be thestepping stone towards an successful market expansion. Stated formally, the vision of the organization is as follows:
The organization shall commit itself to the goal of becoming the leading supplier of pollinator drones in theNetherlands during a period of 10 years.
With a clear vision in mind, it is now the time to analyze the competition. This step involves recognizing thecompetitors’ strengths and weaknesses, and reflecting on these insights to improve the company’s performance. Thereare a number of incumbents and challengers on the market for selling drones. All those have unique advantages dueto their product positioning on the consumer drone market. Examples of important drone-producing companies areParrot®, DJI®, 3D robotics®, Yuneec®, and JJRC®, to name a few. However, since the product developed is a proof-of-concept, there is not an existent product, to the awareness of the authors, on the market to compete with ours in termsof pollinating functionality. It is precisely this functionality that will be adopted as an anchor for our product positioning.
After the competitive analysis comes identifying the target segments whose needs will be fulfilled by our product.Before proceeding any further, it should be expressed pronouncedly that APIS is first and foremost intended as a productthat would mitigate the crisis of a dwindling bee population. For horticulture, this is a milestone. Thus, the productionof APIS benefits all species consuming fruits and vegetables. However, it can be said that the demographic that wouldbe most interested in our product would be farmers and horticulturists as they are the ones who deal with fruit, vegetable,and flower growing. Especially in Europe, and specifically the Netherlands, a lot of funding is going into smart farmingand precision farming 3.
When discussing the unique value propositions of our product, key elements should be mentioned: autonomy, ease ofuse, payload modularity, good price, recyclable material, and most importantly, imaging and pollinating functionalities.All in all, this set of values will benefit the target segments in that as consumers they will have an easy-to-use product
3http://www.hortidaily.com/article/32439/Netherlands-Two-million-euros-for-precision-farming [Cited 23 June 2017]

130 19. Post-DSE phase
that is affordable and will autonomously pollinate and monitor their plants.As for the pricing of the product, this will be done by first assessing the value of our product in comparison to other
products on the market. Since this product will be the first of its kind, this will need to be developed when similarproducts appear on the market. The initial selling price for APIS can be very close to overall cost. Upon gaining valueand reputability on the market, the price may be alterred.
It is now the turn for establishing concrete business objectives for the company. One such goal could be the pro-duction and selling the first 100 drones within a timeframe of 2 years namely to customers in the Netherlands. Onestrategy to achieve that would be through a partnership with DutchGreenhouses™ as it represents a partnership of themain greenhouse companies in the Netherlands4. Thus, it is through this partnership that will make reaching out tocustomers easier. Moreover, these partnerships with other organizations will allow the company to make a good marketentrance. As an example, a partnership with a known drone company such as DJI™ can be a good way to ensure theexpertise of that company in the production of drones can be leveraged. Another example of a good partnership wouldbe with Pix4d, whose expertise in software for generation of 2D and 3D maps can be benefited from.
Making use of the media to help achieve this business objective, or in other words, marketing collateral, will bemade use of. This could be in the form of establishing a website, documenting customer testimonials, and makingadvertisements. Besides marketing collateral, other initiatives the company undertakes to promote its product could becreating events to showcase the features and capabilities of the produced pollinator drones, or participating in productevaluations and reviews. Moreover, promotional offers should be considered that would attract the customers to get theproduct. The APIS can be available for free trial for a period of 2 weeks for example. Moreover, offers through servicesfor example can turn the leads into customers.
One final aspect to consider as part of the marketing plan is the distribution plan. The product can be sold directlyvia the company’s established website, or indirectly by distributing the product to partners which carry out the selling.
19.5. Return on investmentThe return on investment (ROI) is a very important metric for the assessment of the efficacy of the marketing plan de-veloped. This metric is an indication of the value received when compared to the capital invested. The analysis neededto obtain the ROI includes establishing a number of aspects such as achievable market share, market price and volumeof the product as well as development, production, and direct operational costs of the product.
Conducting such an analysis for APIS goes amiss on several levels. First, our product could belong to severalmarkets: either the pollinator drone market, the imaging drones market, or more broadly, the market of pollinators (thebee market, as an example). Of these, the first is nonexistent yet. As a result, it is not possible to carry out a ROI forour product in this market. As for the latter two, our product does not completely fit in either. Though APIS is animaging system, it also has the additional aspect of also being a pollination system, and this is an indispensable part ofthe positioning of APIS on the market. Hence, performing a ROI for APIS on this market might not entirely reflect thestanding of APIS on its intended market.
Another dimension of the problem arises in estimating the costs: parametric cost estimation may not be possible toestablish. Our product is a proof of concept; thus, there is no reference data with which to make the estimation. However,use can be made of analogous cost estimation, whereby cost data for MAVs or more generally UAVs can be adaptedfor our application. A parametric model for UAVs is dealt with in [99] in which cost estimation relationships (CERs)are presented for UAVs. However, even in this source, the authors make a disclaimer about the CER they establishedbetween the cost and the endurance, stating that it was not possible to validate it due to the limited data that was presentat the time of writing the article. Thus, even analogous cost estimation appears to be infeasible at this stage.
However, it is foreseen that performing such an analysis will need to be done in the near future. A need for apollinator drone market might arise. This is clear from the market analysis that was performed in Chapter 2 whichproves that the traditional ways of pollination are becoming increasingly expensive.
4https://dutchgreenhouses.com/about [Cited 23 June 2017]

19.5. Return on investment 131T
ask
na
me
Sta
rt d
ate
Fin
ish
da
te
Org
an
isa
tio
na
l a
ctiv
itie
s1
0 J
ul
'17
22
Fe
b '
18
Up
da
te p
lan
nin
g1
0 J
ul
'17
11
Ju
l '1
7
Ass
ign
ro
les
an
d r
esp
on
sib
ilit
ies
10
Ju
l '1
71
0 J
ul
'17
Se
cure
fu
nd
ing
10
Ju
l '1
71
8 A
ug
'1
7
Est
ab
lish
a d
em
on
stra
tio
n c
ase
10
Ju
l '1
71
4 J
ul
'17
Arr
an
ge
a g
ree
nh
ou
se f
or
the
de
mo
nst
rati
on
ca
se1
7 J
ul
'17
28
Ju
l '1
7
Ob
tain
pe
rmit
s a
nd
exe
mp
tio
ns
17
Ju
l '1
72
5 A
ug
'1
7
Pro
cure
ma
teri
als
, co
mp
on
en
ts a
nd
eq
uip
me
nt
24
No
v '1
72
4 N
ov '1
7
Tra
ck p
rod
uct
ion
co
sts
28
Au
g '1
72
8 A
ug
'1
7
Pla
n f
oll
ow
-up
pro
ject
s a
nd
ap
ply
fo
r fu
nd
ing
12
Ja
n '1
82
2 F
eb
'1
8
Est
ab
lish
a d
iscu
ssio
n w
ith
th
e T
U D
elf
t V
alo
risa
tio
n
Ce
ntr
e f
or
po
ten
tia
l co
mm
erc
iali
zati
on
12
Ja
n '1
82
2 F
eb
'1
8
Pro
du
ctio
n2
8 A
ug
'1
72
4 N
ov
'1
7
Pro
du
ctio
n o
f d
ron
e h
ard
wa
re2
8 A
ug
'1
71
9 S
ep
'1
7
Ass
em
ble
ca
sin
g2
8 A
ug
'1
73
1 A
ug
'1
7
Ma
ke
ca
sin
g2
8 A
ug
'1
73
0 A
ug
'1
7
Cre
ate
mo
ld2
8 A
ug
'1
72
8 A
ug
'1
7
Use
in
ject
ion
mo
ldin
g t
o c
rea
te c
asi
ng
29
Au
g '1
72
9 A
ug
'1
7
Pa
int
casi
ng
30
Au
g '1
73
0 A
ug
'1
7
Ma
ke
ca
sin
g c
on
ne
ctio
n3
1 A
ug
'1
73
1 A
ug
'1
7
Ass
em
ble
pro
pu
lsio
n s
yst
em
28
Au
g '
17
28
Au
g '1
7
Inst
all
pro
pe
lle
rs o
n m
oto
rs2
8 A
ug
'1
72
8 A
ug
'1
7
Ass
em
ble
mo
tor
mo
un
t2
8 A
ug
'1
72
8 A
ug
'1
7
Ass
em
ble
blo
we
r2
8 A
ug
'1
73
0 A
ug
'1
7
Ma
ke
blo
we
r a
tta
chm
en
t2
8 A
ug
'1
72
8 A
ug
'1
7
Ass
em
ble
blo
we
r a
tta
chm
en
t to
blo
we
r2
9 A
ug
'1
72
9 A
ug
'1
7
Ass
em
ble
blo
we
r to
PC
B s
up
po
rt m
ou
nt
30
Au
g '1
73
0 A
ug
'1
7
Ass
em
ble
ma
in s
tru
ctu
re2
8 A
ug
'1
71
Se
p '1
7
Ma
nu
fact
ure
ca
rbo
n f
ibre
pa
ylo
ad
bo
x2
8 A
ug
'1
72
9 A
ug
'1
7
Cre
ate
mo
ld2
8 A
ug
'1
72
8 A
ug
'1
7
Use
va
cuu
m in
fusi
on
to
cre
ate
p
aylo
ad
bo
x2
9 A
ug
'1
72
9 A
ug
'1
7
Ma
nu
fact
ure
cl
am
p2
8 A
ug
'1
72
9 A
ug
'1
7
Cre
ate
mo
ld2
8 A
ug
'1
72
8 A
ug
'1
7
Use
in
ject
ion
mo
ldin
g t
o c
rea
te c
lam
p2
9 A
ug
'1
72
9 A
ug
'1
7
Ma
ke
ca
rbo
n f
ibre
arm
s2
8 A
ug
'1
72
9 A
ug
'1
7
Cu
t ro
ds
to c
orr
ect
le
ng
th2
8 A
ug
'1
72
8 A
ug
'1
7
Dri
ll h
ole
s in
ro
ds
29
Au
g '1
72
9 A
ug
'1
7
Inst
all
ca
rbo
n f
ibre
arm
s in
cla
mp
s3
0 A
ug
'1
73
1 A
ug
'1
7
Sli
de
ro
ds
in c
lam
ps
30
Au
g '1
73
0 A
ug
'1
7
Fa
ste
n r
od
s w
ith
bo
lts
thro
ug
h h
ole
s3
1 A
ug
'1
73
1 A
ug
'1
7
Inst
all
cla
mp
s o
n p
ay
loa
d b
ox
1 S
ep
'1
71
Se
p '1
7
Ass
em
ble
PC
B2
8 A
ug
'1
73
1 A
ug
'1
7
De
sig
n P
CB
28
Au
g '1
72
8 A
ug
'1
7
Ass
em
ble
co
mp
on
en
ts o
n P
CB
29
Au
g '1
72
9 A
ug
'1
7
Ass
em
ble
PC
B m
ou
nt
30
Au
g '1
73
0 A
ug
'1
7
Co
nn
ect
PC
B a
nd
PC
B m
ou
nt
31
Au
g '1
73
1 A
ug
'1
7
Inst
all
wir
es
in s
yst
em
4 S
ep
'1
75
Se
p '1
7
Co
nn
ect
wir
es
to b
att
ery
4 S
ep
'1
74
Se
p '1
7
Inst
all
wir
es
thro
ug
h a
rms
for
pro
pu
lsio
n
syst
em
, E
SC
's a
nd
ste
reo
ca
me
ras
4 S
ep
'1
74
Se
p '1
7
Co
nn
ect
wir
es
to P
CB
4 S
ep
'1
74
Se
p '1
7
Co
nn
ect
wir
es
to s
tere
o c
am
era
s5
Se
p '1
75
Se
p '1
7
Co
nn
ect
wir
es
to p
rop
usi
on
syst
em
5 S
ep
'1
75
Se
p '1
7
Inst
all
ca
me
ras
in m
ain
str
uct
ure
6 S
ep
'1
77
Se
p '1
7
Ma
ke
ste
reo
ca
me
ra m
ou
nts
6 S
ep
'1
76
Se
p '1
7
Ma
ke
fis
he
ye
ca
me
ra m
ou
nt
6 S
ep
'1
76
Se
p '1
7
Inst
all
ste
reo
ca
me
ras
in p
ay
loa
d b
ox
7 S
ep
'1
77
Se
p '1
7
Inst
all
fis
he
ye
ca
me
ra in
pa
ylo
ad
bo
x7
Se
p '1
77
Se
p '1
7
Ad
d c
ha
rgin
g s
yst
em
to
ma
in s
tru
ctu
re8
Se
p '
17
8 S
ep
'1
7
Ass
em
ble
ba
tte
ry in
ma
in s
tru
ctu
re8
Se
p '1
78
Se
p '1
7
Ad
d c
ha
rgin
g p
in t
o m
ain
str
uct
ure
8 S
ep
'1
78
Se
p '1
7
Co
mb
ine
blo
we
r a
nd
ma
in s
tru
ctu
re1
1 S
ep
'1
71
1 S
ep
'1
7
25
29
16
23
30
61
32
02
73
10
17
24
18
15
22
29
51
21
92
63
10
17
24
31
71
42
12
84
11
18
25
Jul
'17
Au
g '
17
Se
p '
17
Oct
'1
7N
ov
'1
7D
ec
'17
Jan
'1
8F
eb
'1
8M
ar
'18
Figure 19.3: Gantt chart for the prototype building and testing phase
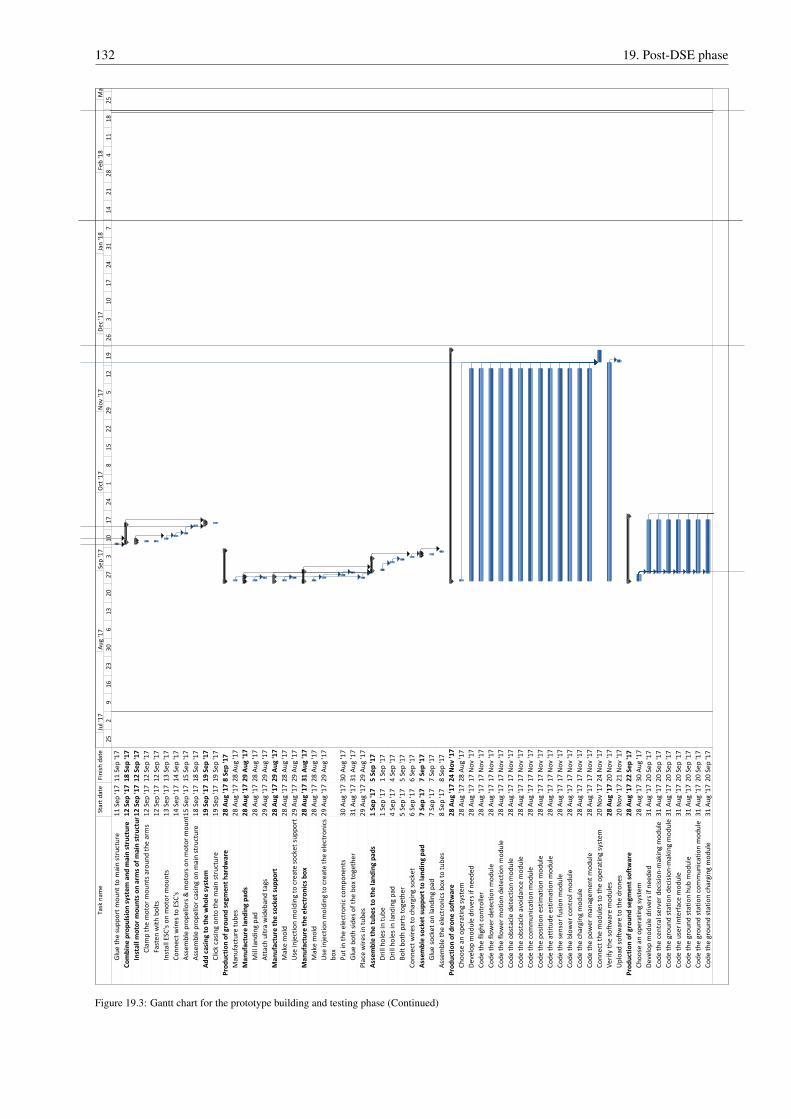
132 19. Post-DSE phase
Ta
sk n
am
eS
tart
da
teF
inis
h d
ate
Glu
e t
he
su
pp
ort
mo
un
t to
ma
in s
tru
ctu
re1
1 S
ep
'1
71
1 S
ep
'1
7
Co
mb
ine
pro
pu
lsio
n s
yst
em
an
d m
ain
str
uct
ure
12
Se
p '
17
18
Se
p '1
7
Inst
all
mo
tor
mo
un
ts o
n a
rms
of
ma
in s
tru
ctu
re1
2 S
ep
'1
71
2 S
ep
'1
7
Cla
mp
th
e m
oto
r m
ou
nts
aro
un
d t
he
arm
s1
2 S
ep
'1
71
2 S
ep
'1
7
Fa
ste
n w
ith
bo
lts
12
Se
p '1
71
2 S
ep
'1
7
Inst
all
ESC
's o
n m
oto
r m
ou
nts
13
Se
p '1
71
3 S
ep
'1
7
Co
nn
ect
wir
es
to E
SC
's1
4 S
ep
'1
71
4 S
ep
'1
7
Ass
em
ble
pro
pe
llo
rs &
mo
tors
on
mo
tor
mo
un
ts15
Se
p '1
71
5 S
ep
'1
7
Ass
em
ble
pro
pe
llo
r ca
sin
g o
n m
ain
str
uct
ure
18
Se
p '1
71
8 S
ep
'1
7
Ad
d c
asi
ng
to
th
e w
ho
le s
yst
em
19
Se
p '
17
19
Se
p '1
7
Cli
ck c
asi
ng
on
to t
he
ma
in s
tru
ctu
re1
9 S
ep
'1
71
9 S
ep
'1
7
Pro
du
ctio
n o
f g
rou
nd
se
gm
en
t h
ard
wa
re2
8 A
ug
'1
78
Se
p '1
7
Ma
nu
fact
ure
tu
be
s2
8 A
ug
'1
72
8 A
ug
'1
7
Ma
nu
fact
ure
la
nd
ing
pa
ds
28
Au
g '
17
29
Au
g '1
7
Mil
l la
nd
ing
pa
d2
8 A
ug
'1
72
8 A
ug
'1
7
Att
ach
ult
ra w
ide
ba
nd
ta
gs
29
Au
g '1
72
9 A
ug
'1
7
Ma
nu
fact
ure
th
e s
ock
et
sup
po
rt2
8 A
ug
'1
72
9 A
ug
'1
7
Ma
ke
mo
ld2
8 A
ug
'1
72
8 A
ug
'1
7
Use
in
ject
ion
mo
ldin
g t
o c
rea
te s
ock
et
sup
po
rt2
9 A
ug
'1
72
9 A
ug
'1
7
Ma
nu
fact
ure
th
e e
lect
ron
ics
bo
x2
8 A
ug
'1
73
1 A
ug
'1
7
Ma
ke
mo
ld2
8 A
ug
'1
72
8 A
ug
'1
7
Use
in
ject
ion
mo
ldin
g t
o c
rea
te t
he
ele
ctro
nic
s
bo
x
29
Au
g '1
72
9 A
ug
'1
7
Pu
t in
th
e e
lect
ron
ic c
om
po
ne
nts
30
Au
g '1
73
0 A
ug
'1
7
Glu
e b
oth
sid
es
of
the
bo
x to
ge
the
r3
1 A
ug
'1
73
1 A
ug
'1
7
Pla
ce w
ire
s in
tu
be
s2
9 A
ug
'1
72
9 A
ug
'1
7
Ass
em
ble
th
e t
ub
es
to t
he
la
nd
ing
pa
ds
1 S
ep
'1
75
Se
p '1
7
Dri
ll h
ole
s in
tu
be
1 S
ep
'1
71
Se
p '1
7
Dri
ll h
ole
s in
la
nd
ing
pa
d4
Se
p '1
74
Se
p '1
7
Bo
lt b
oth
pa
rts
tog
eth
er
5 S
ep
'1
75
Se
p '1
7
Co
nn
ect
wir
es
to c
ha
rgin
g s
ock
et
6 S
ep
'1
76
Se
p '1
7
Ass
em
ble
so
cke
t su
pp
ort
to
la
nd
ing
pa
d7
Se
p '
17
7 S
ep
'1
7
Glu
e s
ock
et
on
la
nd
ing
pa
d7
Se
p '1
77
Se
p '1
7
Ass
em
ble
th
e e
lect
ron
ics
bo
x to
tu
be
s8
Se
p '1
78
Se
p '1
7
Pro
du
ctio
n o
f d
ron
e s
oft
wa
re2
8 A
ug
'1
72
4 N
ov
'1
7
Ch
oo
se a
n o
pe
rati
ng
syst
em
28
Au
g '1
72
8 A
ug
'1
7
De
ve
lop
mo
du
le d
rive
rs i
f n
ee
de
d2
8 A
ug
'1
71
7 N
ov '1
7
Co
de
th
e f
lig
ht
con
tro
lle
r2
8 A
ug
'1
71
7 N
ov '1
7
Co
de
th
e f
low
er
de
tect
ion
mo
du
le2
8 A
ug
'1
71
7 N
ov '1
7
Co
de
th
e f
low
er
mo
tio
n d
ete
ctio
n m
od
ule
28
Au
g '1
71
7 N
ov '1
7
Co
de
th
e o
bst
acl
e d
ete
ctio
n m
od
ule
28
Au
g '1
71
7 N
ov '1
7
Co
de
th
e o
bst
acl
e a
vo
ida
nce
mo
du
le2
8 A
ug
'1
71
7 N
ov '1
7
Co
de
th
e c
om
mu
nic
ati
on
mo
du
le2
8 A
ug
'1
71
7 N
ov '1
7
Co
de
th
e p
osi
tio
n e
stim
ati
on
mo
du
le2
8 A
ug
'1
71
7 N
ov '1
7
Co
de
th
e a
ttit
ud
e e
stim
ati
on
mo
du
le2
8 A
ug
'1
71
7 N
ov '1
7
Co
de
th
e s
en
sor
fusi
on
mo
du
le2
8 A
ug
'1
71
7 N
ov '1
7
Co
de
th
e b
low
er
con
tro
l m
od
ule
28
Au
g '1
71
7 N
ov '1
7
Co
de
th
e c
ha
rgin
g m
od
ule
28
Au
g '1
71
7 N
ov '1
7
Co
de
th
e p
ow
er
ma
na
ge
me
nt
mo
du
le2
8 A
ug
'1
71
7 N
ov '1
7
Co
nn
ect
th
e m
od
ule
s to
th
e o
pe
rati
ng
syst
em
20
No
v '1
72
4 N
ov '1
7
Ve
rify
th
e s
oft
wa
re m
od
ule
s2
8 A
ug
'1
72
0 N
ov '1
7
Up
loa
d s
oft
wa
re t
o t
he
dro
ne
s2
0 N
ov
'1
72
1 N
ov '1
7
Pro
du
ctio
n o
f g
rou
nd
se
gm
en
t so
ftw
are
28
Au
g '
17
22
Se
p '1
7
Ch
oo
se a
n o
pe
rati
ng
syst
em
28
Au
g '1
73
0 A
ug
'1
7
De
ve
lop
mo
du
le d
rive
rs i
f n
ee
de
d3
1 A
ug
'1
72
0 S
ep
'1
7
Co
de
th
e c
en
tra
l se
rve
r d
eci
sio
n-m
akin
g m
od
ule
31
Au
g '1
72
0 S
ep
'1
7
Co
de
th
e g
rou
nd
sta
tio
n d
eci
sio
n-m
akin
g m
od
ule
31
Au
g '1
72
0 S
ep
'1
7
Co
de
th
e u
ser
inte
rfa
ce m
od
ule
31
Au
g '1
72
0 S
ep
'1
7
Co
de
th
e g
rou
nd
sta
tio
n h
ub
mo
du
le3
1 A
ug
'1
72
0 S
ep
'1
7
Co
de
th
e g
rou
nd
sta
tio
n c
om
mu
nic
ati
on
mo
du
le3
1 A
ug
'1
72
0 S
ep
'1
7
Co
de
th
e g
rou
nd
sta
tio
n c
ha
rgin
g m
od
ule
31
Au
g '1
72
0 S
ep
'1
7
25
29
16
23
30
61
32
02
73
10
17
24
18
15
22
29
51
21
92
63
10
17
24
31
71
42
12
84
11
18
25
Jul
'17
Au
g '
17
Se
p '
17
Oct
'1
7N
ov
'1
7D
ec
'17
Jan
'1
8F
eb
'1
8M
ar
'18
Figure 19.3: Gantt chart for the prototype building and testing phase (Continued)

19.5. Return on investment 133T
ask
na
me
Sta
rt d
ate
Fin
ish
da
te
Co
de
th
e g
rou
nd
sta
tio
n a
ir t
raff
ic m
an
ag
em
en
t
mo
du
le
31
Au
g '1
72
0 S
ep
'1
7
Ve
rify
th
e s
oft
wa
re m
od
ule
s2
8 A
ug
'1
72
1 S
ep
'1
7
Up
loa
d s
oft
wa
re t
o t
he
dro
ne
s2
1 S
ep
'1
72
2 S
ep
'1
7
Te
stin
g2
7 N
ov
'1
71
1 J
an
'1
8
Se
t-u
p t
he
gro
un
d s
eg
me
nt
in t
he
gre
en
ho
use
27
No
v '1
72
9 N
ov '1
7
Pe
rfo
rm s
tati
c te
sts
on
th
e d
ron
e s
tru
ctu
re2
7 N
ov
'1
72
8 N
ov '1
7
Pe
rfo
rm im
pa
ct t
est
s o
n t
he
dro
ne
str
uct
ure
27
No
v '1
72
8 N
ov '1
7
Ide
nti
fy o
f m
oto
r sy
ste
m p
ara
me
ters
27
No
v '1
72
7 N
ov '1
7
Ide
nti
fy o
f d
ron
e m
ech
an
ics
syst
em
pa
ram
ete
rs2
9 N
ov
'1
72
9 N
ov '1
7
Va
lid
ate
th
e p
rop
uls
ion
mo
de
l3
0 N
ov
'1
71
De
c '1
7
Va
lid
ate
th
e b
low
er
jet
mo
de
l4
De
c '1
74
De
c '1
7
Va
lid
ate
th
e b
low
er
jet
de
fle
ctio
n m
od
el
5 D
ec
'17
6 D
ec
'17
Va
lid
ate
th
e n
ozz
le p
ress
ure
lo
sse
s m
od
ule
7 D
ec
'17
7 D
ec
'17
Va
lid
ate
th
e b
low
er
thru
st f
orc
e m
od
el
8 D
ec
'17
8 D
ec
'17
Me
asu
re t
he
po
llin
ati
on
eff
ect
ive
ne
ss f
or
va
rio
us
flo
w v
elo
citi
es
8 D
ec
'17
12
De
c '1
7
Ide
nti
fy t
he
re
lati
on
ship
be
twe
en
blo
we
r o
utp
ut
ve
loci
ty a
nd
ap
pli
ed
vo
lta
ge
11
De
c '1
71
1 D
ec
'17
De
mo
nst
rate
th
e d
ron
e p
roce
sso
r's
ab
ilit
y t
o r
un
all
the
re
qu
ire
d s
oft
wa
re
27
No
v '1
72
9 N
ov '1
7
De
mo
nst
rate
dro
ne
op
era
tio
ns
at
ele
va
ted
tem
pe
ratu
res
an
d h
um
idit
y
27
No
v '1
72
9 N
ov '1
7
Ca
lib
rate
th
e m
ag
ne
tom
ete
rs2
7 N
ov
'1
72
7 N
ov '1
7
Me
asu
re t
he
IM
U a
ccu
racy
28
No
v '1
72
8 N
ov '1
7
Me
asu
re t
he
hu
mid
ity
, te
mp
era
ture
an
d b
aro
me
ter
sen
sor
acc
ura
cy
27
No
v '1
72
9 N
ov '1
7
Te
st t
he
eff
ect
s o
f ta
g p
osi
tio
nin
g o
n t
he
lo
cati
on
est
ima
tio
n a
ccu
racy
27
No
v '1
72
9 N
ov '1
7
Me
asu
re t
he
po
siti
on
est
ima
tio
n a
ccu
racy
30
No
v '1
71
De
c '1
7
Me
asu
re t
he
att
itu
de
est
ima
tio
n a
ccu
racy
4 D
ec
'17
5 D
ec
'17
Me
asu
re t
he
co
mm
un
ica
tio
n d
ata
ra
te3
0 N
ov
'1
73
0 N
ov '1
7
Me
asu
re t
he
na
vig
ati
on
acc
ura
cy1
1 D
ec
'17
13
De
c '1
7
Me
asu
re la
nd
ing
su
cce
ss r
ate
14
De
c '1
71
4 D
ec
'17
Me
asu
re t
he
po
we
r co
nsu
mp
tio
n o
f th
e v
ari
ou
s
com
po
ne
nts
27
No
v '1
73
0 N
ov '1
7
Me
asu
re t
he
lif
eti
me
of
the
ba
tte
ry
1 D
ec
'17
11
Ja
n '1
8
Me
asu
re t
he
nu
mb
er
of
cycl
es
of
the
ba
tte
ry
1 D
ec
'17
11
Ja
n '1
8
Me
asu
re f
low
er
de
tect
ion
su
cce
ss r
ate
27
No
v '1
71
De
c '1
7
Me
asu
re f
low
er
mo
tio
n t
rack
ing
su
cce
ss r
ate
4 D
ec
'17
8 D
ec
'17
Me
asu
re t
he
pe
rfo
rma
nce
of
the
ob
sta
cle
de
tect
ion
mo
du
le
27
No
v '1
71
De
c '1
7
Me
asu
re t
he
pe
rfo
rma
nce
of
the
ob
sta
cle
av
oid
an
ce m
od
ule
4 D
ec
'17
8 D
ec
'17
Me
asu
re r
ate
of
po
llin
ati
on
14
De
c '1
72
0 D
ec
'17
Me
asu
re t
he
ma
ss o
f th
e d
ron
e2
7 N
ov
'1
72
7 N
ov '1
7
Me
asu
re t
he
mo
me
nt
of
ine
rtia
of
the
dro
ne
28
No
v '1
72
8 N
ov '1
7
Me
asu
re t
he
no
ise
pro
file
of
a d
ron
e4
De
c '1
76
De
c '1
7
Me
asu
re t
he
ma
ss o
f th
e g
rou
nd
sta
tio
n2
7 N
ov
'1
72
7 N
ov '1
7
De
mo
nst
rate
th
e s
yst
em
's p
erf
orm
an
ce w
ith
a
sin
gle
ma
lfu
nct
ion
ing
gro
un
d s
tati
on
27
No
v '1
72
8 N
ov '1
7
De
mo
nst
rate
th
e s
yst
em
's p
erf
orm
an
ce w
ith
mu
ltip
le m
alf
un
ctio
nin
g g
rou
nd
sta
tio
ns
29
No
v '1
73
0 N
ov '1
7
De
mo
nst
rate
th
e p
rop
er
wo
rkin
g o
f th
e e
me
rge
ncy
sto
p b
utt
on
27
No
v '1
72
7 N
ov '1
7
Re
po
rtin
g1
0 J
ul
'17
23
Fe
b '
18
Wri
te i
nte
rna
l te
chn
ica
l re
po
rts
10
Ju
l '1
71
9 J
an
'1
8
Wri
te a
jo
urn
al
art
icle
12
Ja
n '1
82
2 F
eb
'1
8
Ap
ply
fo
r p
rese
nti
ng
at
con
fere
nce
s1
De
c '1
72
2 F
eb
'1
8
Co
mm
un
ica
te r
esu
lts
to i
nd
ust
ry p
art
ne
rs2
7 N
ov
'1
72
2 F
eb
'1
8
Arr
an
ge
a p
ub
lici
ty c
am
pa
ign
3 N
ov
'1
72
2 F
eb
'1
8
Pe
rfo
rm a
pu
bli
c d
em
on
stra
tio
n2
3 F
eb
'1
82
3 F
eb
'1
8
25
29
16
23
30
61
32
02
73
10
17
24
18
15
22
29
51
21
92
63
10
17
24
31
71
42
12
84
11
18
25
Jul
'17
Au
g '
17
Se
p '
17
Oct
'1
7N
ov
'1
7D
ec
'17
Jan
'1
8F
eb
'1
8M
ar
'18
Figure 19.3: Gantt chart for the prototype building and testing phase (Continued)

20Recommendations and future opportunities
Due to the limitations of the DSE there remain a number of future developments that can still be performed. This chapterwill describe the steps that have to be taken after this design phase in order to optimize the design.
20.1. RecommendationsTo start with, the cameras can be used to collect more data. The benefits of doing this are tantamount, as having more datayields performing yield analytics, and also automatically collecting data for control experiments. That is, the detectionof the fruit/vegetable will automate the collection of data pertaining to the crops which will facilitate making studies oneffect of certain control conditions in the greenhouse, such as the study on the effect of irrigation depth on yield that wasperformed in [100]. In either case, it becomes clear that taking images of tomatoes as they grow will be important. Onepossibility to do that is to use the side camera for detecting and taking images of the tomatoes. There exists an algorithmwhich is presented in [101] and can be used.Moreover, for added robustness in the detection of flowers, a pre-trained classifier can be used such as a support vectormachine. The training can be done on a large set of tomato flower images and by extracting suitable texture features.This classifier will serve to reduce the false detection rate.
In the current design configuration, it was decided to let the MAV charge by landing the pin attached to the MAVinside one of the sockets present in the ground station. For future designs it is recommended to switch the pin and socketaround. This is because the pin that currently sticks out of the drone will create some problems. For example, when thedrone will fall due to depletion of energy it can fall directly on the pin which might pierce the battery.
At this point of the final design the casing of the drone has not yet been optimized. For now, the casing has beenadded to give protection to the electronics, battery and payload. It has not been taken into account that things can getstuck within the casing. For example, wires can get between the propeller casing and the casing of the payload. In orderto prevent this, the casing should have no sharp corners and no cavities where wires may invade the structure.
Another thing that can be improved in the future is the methods to design a good control system for the MAVs. Tobe able to obtain the motor coefficients required for the model used in the design, motor test data is required, which wasnot available now. In the future, this information would allow obtaining coefficients corresponding to our drone whichare needed for the model, after which the tunes can be gained using the Ziegler-Nichols method or the Tyreus-Luybenmethod.
Until now, the blower has been designed by using a CFD analysis. However, the actual system has only been slightlytested on tomato flowers. Therefore, the next step that has to be taken is to validate the CFD model with a more rigorousmethodology. After that, the actual pollination method has to be validated by doing more and better tests on tomatoplants using the exact APIS’ blower. In the end the drone including the blower should be tested. When this system hasbeen proven the blower can be replaced by another payload, which will allow for other means of shaking the flower orfor cross-pollination. This could be a shaker or a stick with gel on it.
In addition to this, it is recommended that extensive lifetime tests are performed on the battery. Especially giventhat the electrodes are based on a novel material such as graphene, to properly ensure quality all along the missiondevelopment, tests on relevant environments are advised.
Some optimization can also be performed on the ground station. With improved control, better precision landing canbe established. As a result, the landing pads can be made smaller. Moreover, air traffic control can improved. It couldbe made more versatile and dynamic to allow for multiple drones to take-off and land at the same time.
In addition to this, the assigned duration for the MAV to properly point the blower to the cluster of flowers shouldbe tested more extensively. It is suspected that 4 seconds might be an overdesign, thus tests to reliably find a moreappropriate duration can help to further boost APIS efficiency.
134

20.2. Expected future technological developments 135
20.2. Expected future technological developmentsAt the current pace that technology is advancing, a wide range of opportunities opens. These opportunities are herebylisted and will set a ground onto which APIS can become more efficient, affordable and safe.
During the design of this MAV, the battery has proven to be a subsystem of limited capabilities when it comesto charging rates, lifetime or weight. Nonetheless, in the coming future, technologies to push the storage of electricalenergy more efficiently, for longer and with faster charging times are on the verge of appearing. In fact, the lithium-metaltechnology developed at MIT already has its own start-up (SolidEnergySystems) and is a matter of time that it becomeswidely available. In fact, this technology enables almost twice the energy density of the current Li-Po. Following thistrend, this battery would increase the flying time up to 25 min, for which only 30 drones and 4 ground stations areprojected to be needed.
The UWB navigation is a relatively new technology. That is why it is expected that the accuracy of the ranging esti-mates and the data link throughput will further increase in the coming years. As was noted before, the UWB localizationwith broadcasting technology, as proposed here, bears very close resemblance to the problem of state estimation withGNSS. Therefore, the applicability to UWB localization of technologies commonly applied for GNSS, such as carrierphase shift measurements can be further investigated. Moreover, to the best of the group’s knowledge, no previous useof UWB for attitude determination has been made. This poses challenges specific to the attitude determination, in par-ticular the possible ranging estimation error correlation. As this is a promising research direction, such further studiesare expected to be performed, leading to much more accurate and reliable navigation and localization techniques.
A well-known law that has guided computer development over the past years, is the Moore’s law. This states thatthe number of transistors in an integrated circuit doubles every two years. Although the pace is expected to slow down,development in this field is still going at an incredible speed. 1. Over the coming years, research in small customerelectronics will spur miniaturization and computing performance. Micro air vehicle development will also benefit fromthis. Navigation, obstacle detection and image processing, in fact, everything that needs to be computed or processed,can be done faster, more reliable and more accurate.
With the advance on miniaturization and optical technology, several more sensors could fit into APIS in the nearfuture. The use of infrared and near-infrared vision to monitor chlorophyll levels on crops is already a purchasablereality2. However, their weight is prohibitive for MAV, thus it is expected that in the coming years, these sensors canalso be a part of APIS when the weight is reduced. Together with such a sensor, a CO2/O2 measure could be mountedon board too, allowing for more accurate model of the state of the greenhouse.
1https://www.nytimes.com/2015/09/27/technology/smaller-faster-cheaper-over-the-future-of-computer-chips.html[Cited 28 June 2017]
2https://www.micasense.com/rededge/[Accessed 25 June 2017]

21Conclusion
In this final report, the selected concept from the midterm phase has been designed in depth. The ultimate goal of thedesign was to make a proof-of-concept for a pollinating autonomous system. This goal was refined to pollinating atomato greenhouse of 4 hectares in 3 days. The outcome of this design is a micro air vehicle named APIS, which standsfor Autonomous Pollination and Imaging System. The system is composed of a set of 64 autonomous APIS and 8 groundstations at a final cost of e30,000 .
Each APIS is based on a 28.3x27.8 cm H-configuration with four propellers of 5" (approximately 12 cm). Drivenby 4 DC-motors, they are able to deliver a combined 520 g of thrust. This thrust is enough to efficiently lift the 249.5 gMAV. The APIS are equipped with a front-facing pair of stereo cameras (1616x1216 pix) for obstacle detection. A pairof laser rangers top and bottom of the MAV complement this task. To detect the flowers, a fish eye high-res (2592x1944pix) camera is mounted onto the side of the MAV. Right below of it, an air nozzle connected to an inertial fan produces anairflow with an exit velocity of 10 m/s to pollinate. The inertial fan is mounted on top of the MAV and it also cools downthe electronics while blowing. To find its absolute location and heading, the MAV is equipped with a multi-functionbarometer and two ultra wide band tags. The UWB tags also serve as data transfer channels for location and imagingdownloading. To complement this, a flight controller (ATMega 328) seats on new generation processor QualcommSnapdragon 801. In fact, the Snapdragon 801 also runs stereo matching, image detection and all the communicationthrough the UWB. Also, it comes with a 32 GB flash memory and 2 GB of RAM for this purpose. The entire MAV ispowered from a state-of-the-art 2S1P 1500 mAh graphene Li-Po battery. In addition, the battery is charged through a pinconnection based on mobile phone technology is located below of the MAV and runs at a depth of discharge of 78.5%.Each APIS has a total material cost of 394.20e.
The charging takes place on the groundstations, which are equipped with hexagonal slots where the charging pinslides in. These groundstations can accommodate 8 drones and are placed hanging from the greenhouse frames 0.5meters above the top of the crop. Each groundstation also serves the purpose of UWB anchor and MAV master. Thegroundstation comes with a Beaglebone board which takes care of the task division and UWB communication. Addi-tionally, a common server and hub are added to coordinate all the groundstations and store data for the user interface.The greenhouse is pollinated every three days for 12 hours. For this, the MAV will fly for 10.5 min and charge for15 min. In fact, the MAVs will be assigned rows and will pollinate symmetric lengths on both sides of the row beforereturning to charge. It was also found that after a period of 1 month, the batteries will have to be replaced.
Despite the fact that quadcopters are not an original idea of this group, the proposed concept bears several novel ideas.The general framework of drone-greenhouse symbiosis and interaction can be considered central for the development ofthis project. Autonomous charging through a rigid pin is another example. Furthermore, the UWB protocol proposedand UWB absolute heading estimation are techniques that promise high update rate position and attitude estimations.Pollinating tomatoes by inducing an airflow from a distance in the way presented here is also a novelty. Besides that,hanging groundstations to make easier use of the greenhouse and using the blower to also cool the electronics were alsonew ideas which improved this design.
During the design of APIS, more practical implications were also analyzed. The reliability, availability, maintain-ability and safety of the design were considered. Moreover, the risks associated with each subsystem and the full-scaleMAV were found and a mitigation action was proposed. Some of these, impacted the sustainability of the design in anegative way. Consequently, to account for this, a sustainability development strategy was composed. Following thisstrategy, power consumption, noise or end-of-life procedures were duly engineered. Following it, sensitivity analysiswere performed for key subsystems such as the battery and localization. Furthermore, with the eyes on a bright future,a post-DSE schedule is given to follow for a potential product development. Lastly, a set of recommendations is givenbased on the current design and the expected future technological developments.
136

Bibliography
[1] Velthuis, H. H. and Van Doorn, A., “A century of advances in bumblebee domestication and the economic and environmental aspects of itscommercialization for pollination,” Apidologie, Vol. 37, No. 4, 2006, pp. 421.
[2] James, R. and Pitts-Singer, T. L., Bee pollination in agricultural ecosystems, Oxford University Press, 2008.[3] Monsanto, “US Beekeeping industry,” 2016.[4] Potts, S. G., Biesmeijer, J. C., Kremen, C., Neumann, P., Schweiger, O., and Kunin, W. E., “Global pollinator declines: trends, impacts and
drivers,” Trends in ecology & evolution, Vol. 25, No. 6, 2010, pp. 345–353.[5] Aizen, M. A., Garibaldi, L. A., Cunningham, S. A., and Klein, A. M., “Long-term global trends in crop yield and production reveal no current
pollination shortage but increasing pollinator dependency,” Current Biology, Vol. 18, No. 20, 2008, pp. 1572–1575.[6] Gallai, N., Salles, J.-M., Settele, J., and Vaissière, B. E., “Economic valuation of the vulnerability of world agriculture confronted with pollinator
decline,” Ecological economics, Vol. 68, No. 3, 2009, pp. 810–821.[7] Rabobank, “Glasgroenteteelt, Rabobank Cijfers & Trends,” 2016.[8] Fiix, “Reactive Maintenance,” 2017.[9] DSE Team S9, “Midterm report: Greenhouse pollinator drone,” Tech. rep., Delft University of Technology, 2017.
[10] Short, T. and Bauerle, W., “influence of pollinating techniques on tomato yields and quality,” Ohio Agr Res Develop Center Res Sum, 1972.[11] Hanna, H., “Air blowers are less effective pollinators of greenhouse tomatoes than electric vibrators but cost less to operate,” HortTechnology,
Vol. 14, No. 1, 2004, pp. 104–107.[12] Schlichting, H., “Laminare strahlausbreitung,” ZAMM-Journal of Applied Mathematics and Mechanics/Zeitschrift für Angewandte Mathematik
und Mechanik, Vol. 13, No. 4, 1933, pp. 260–263, In German.[13] Bickley, W., “LXXIII. The plane jet,” The London, Edinburgh, and Dublin Philosophical Magazine and Journal of Science, Vol. 23, No. 156,
1937, pp. 727–731.[14] Landau, L. D. and Lifshitz, E. M., “Fluid mechanics,” 1987.[15] Squire, H., “The round laminar jet,” The Quarterly Journal of Mechanics and Applied Mathematics, Vol. 4, No. 3, 1951, pp. 321–329.[16] White, F. M. and Corfield, I., Viscous fluid flow, Vol. 3, McGraw-Hill New York, 2006.[17] Pope, S., Turbulent Flows, Cambridge University Press, 2000.[18] Abramovich, G. N., Girshovich, T., Krasheninnikov, S. I., Sekundov, A., and Smirnova, I., “The theory of turbulent jets,” Moscow Izdatel
Nauka, 1984.[19] Bruschi, G., Nishioka, T., Tsang, K., and Wang, R., “Drag coefficient of a cylinder,” 2003.[20] Chapman, R. F., The insects: structure and function, Cambridge university press, 1998.[21] Zheng, Z. and Zhang, N., “Frequency effects on lift and drag for flow past an oscillating cylinder,” Journal of Fluids and Structures, Vol. 24,
No. 3, 2008, pp. 382–399.[22] Blevins, R., Flow-induced vibration, Van Nostrand Reinhold Co., 1977.[23] Zhang, X., Guo, Q., Xu, Y., Li, P., Chen, C., and Wu, S., “Mechanical Testing of Tomato Plant Stem in Relation to Structural Composition,”
Agricultural Research, Vol. 5, No. 3, 2016, pp. 236–245.[24] Escobar, J. A., “Computational Study of the Wake of a Quadcopter Propeller in Hover,” 2017.[25] Landgrebe, A. J., “The wake geometry of a hovering helicopter rotor and its influence on rotor performance,” Journal of the American Helicopter
Society, Vol. 17, No. 4, 1972, pp. 3–15.[26] Inc., D. E., “DC Blower Datasheet,” 2005, http://www.delta-fan.com/Download/Spec/BFB0512VHD-F00.pdf, accessed on 12.06.2017.[27] Torres, G. E. and Mueller, T. J., “Low aspect ratio aerodynamics at low Reynolds numbers,” AIAA journal, Vol. 42, No. 5, 2004, pp. 865–873.[28] Ortiz, X., Rival, D., and Wood, D., “Forces and moments on flat plates of small aspect ratio with application to pv wind loads and small wind
turbine blades,” Energies, Vol. 8, No. 4, 2015, pp. 2438–2453.[29] Kunz, P. J., Aerodynamics and design for ultra-low Reynolds number flight, Ph.D. thesis, Stanford University, 2003.[30] Pawlowski, A., Guzman, J. L., Rodríguez, F., Berenguel, M., Sánchez, J., and Dormido, S., “Simulation of greenhouse climate monitoring and
control with wireless sensor network and event-based control,” Sensors, Vol. 9, No. 1, 2009, pp. 232–252.[31] Roldán, J. J., Joossen, G., Sanz, D., del Cerro, J., and Barrientos, A., “Mini-UAV based sensory system for measuring environmental variables
in greenhouses,” Sensors, Vol. 15, No. 2, 2015, pp. 3334–3350.[32] Svalastog, M. S., Indoor Positioning-Technologies, Services and Architectures, Master’s thesis, 2007.[33] Hatami, A. and Pahlavan, K., “Performance comparison of RSS and TOA indoor geolocation based on UWB measurement of channel charac-
teristics,” Personal, Indoor and Mobile Radio Communications, 2006 IEEE 17th International Symposium on, IEEE, 2006, pp. 1–6.[34] Alarifi, A., Al-Salman, A., Alsaleh, M., Alnafessah, A., Al-Hadhrami, S., Al-Ammar, M. A., and Al-Khalifa, H. S., “Ultra wideband indoor
positioning technologies: Analysis and recent advances,” Sensors, Vol. 16, No. 5, 2016, pp. 707.[35] Welch, G. and Bishop, G., “An introduction to the Kalman filter,” 1995.[36] Karapistoli, E., Pavlidou, F.-N., Gragopoulos, I., and Tsetsinas, I., “An overview of the IEEE 802.15. 4a standard,” IEEE Communications
Magazine, Vol. 48, No. 1, 2010.[37] Misra, P. and Enge, P., Global Positioning System: Signals, Measurements, and Performance, Ganga-Jamuna Press, 2011.[38] Montenbruck, O. and Gill, E., Satellite Orbits: Models, Methods, and Applications, Physics and astronomy online library, Springer Berlin
Heidelberg, 2000.[39] McElhinny, M. and McFadden, P. L., The magnetic field of the earth: paleomagnetism, the core, and the deep mantle, Vol. 63, Academic Press,
1998.[40] Lightsey, E. G., Cohen, C. E., Feess, W. A., and Parkinson, B. W., “Analysis of spacecraft attitude measurements using onboard GPS,” Advances
in the Astronautical Sciences, Vol. 86, 1994, pp. 521–532.[41] Floreano, D., Zufferey, J.-C., Srinivasan, M. V., and Ellington, C., Flying insects and robots, Springer, 2010.[42] Lee, T.-J., Yi, D.-H., Cho, D.-I., et al., “A Monocular Vision Sensor-Based Obstacle Detection Algorithm for Autonomous Robots,” Sensors,
Vol. 16, No. 3, 2016, pp. 311.[43] Sagar, J. and Visser, A., “Obstacle avoidance by combining background subtraction, optical flow and proximity estimation,” IMAV 2014:
137

138 Bibliography
International Micro Air Vehicle Conference and Competition 2014, Delft, The Netherlands, August 12-15, 2014, Delft University of Technology,2014.
[44] Achtelik, M. W., Lynen, S., Weiss, S., Kneip, L., Chli, M., and Siegwart, R., “Visual-inertial SLAM for a small helicopter in large outdoorenvironments,” Intelligent Robots and Systems (IROS), 2012 IEEE/RSJ International Conference on, IEEE, 2012, pp. 2651–2652.
[45] Tijmons, S., de Croon, G. C., Remes, B. D., De Wagter, C., and Mulder, M., “Obstacle avoidance strategy using onboard stereo vision on aflapping wing mav,” IEEE Transactions on Robotics, 2017.
[46] Serrata, A. A. J., Yang, S., and Li, R., “An intelligible implementation of FastSLAM2. 0 on a low-power embedded architecture,” EURASIPJournal on Embedded Systems, Vol. 2017, No. 1, 2017, pp. 27.
[47] Scharstein, D., Szeliski, R., and Zabih, R., “A taxonomy and evaluation of dense two-frame stereo correspondence algorithms,” Stereo andMulti-Baseline Vision, 2001.(SMBV 2001). Proceedings. IEEE Workshop on, IEEE, 2001, pp. 131–140.
[48] Oleynikova, H., Honegger, D., and Pollefeys, M., “Reactive avoidance using embedded stereo vision for MAV flight,” Robotics and Automation(ICRA), 2015 IEEE International Conference on, IEEE, 2015, pp. 50–56.
[49] McGuire, K., de Croon, G., De Wagter, C., Tuyls, K., and Kappen, H., “Efficient Optical flow and Stereo Vision for Velocity Estimation andObstacle Avoidance on an Autonomous Pocket Drone,” IEEE Robotics and Automation Letters, Vol. 2, No. 2, 2017, pp. 1070–1076.
[50] LaValle, S. M., “Rapidly-exploring random trees: A new tool for path planning,” 1998.[51] Yao, J., Lin, C., Xie, X., Wang, A. J., and Hung, C.-C., “Path planning for virtual human motion using improved A* star algorithm,” Information
Technology: New Generations (ITNG), 2010 Seventh International Conference on, IEEE, 2010, pp. 1154–1158.[52] Hrabar, S., “3D path planning and stereo-based obstacle avoidance for rotorcraft UAVs,” Intelligent Robots and Systems, 2008. IROS 2008.
IEEE/RSJ International Conference on, IEEE, 2008, pp. 807–814.[53] Oppenheim, D., Edan, Y., and Shani, G., “Detecting Tomato Flowers in Greenhouses Using Computer Vision,” World Academy of Science,
Engineering and Technology, International Journal of Computer, Electrical, Automation, Control and Information Engineering, Vol. 11, No. 1,2017, pp. 104–109.
[54] Fleyeh, H., “Color detection and segmentation for road and traffic signs,” Cybernetics and Intelligent Systems, 2004 IEEE Conference on,Vol. 2, IEEE, 2004, pp. 809–814.
[55] Bascle, B., Bernier, O., and Lemaire, V., “Illumination-invariant color image correction,” Lecture notes in computer science, Vol. 4153, 2006,pp. 359.
[56] Yilmaz, A., Javed, O., and Shah, M., “Object tracking: A survey,” Acm computing surveys (CSUR), Vol. 38, No. 4, 2006, pp. 13.[57] Barry, A. J., Oleynikova, H., Honegger, D., Pollefeys, M., and Tedrake, R., “Fast Onboard Stereo Vision for UAVs,” 2015.[58] Fernandez, A., “Basic structural dynamics in multicopters,” Tech. rep., Autoquad, 2014.[59] Kuchnicki, S., “Simple Vibration Problems with MATLAB,” December 2009.[60] Darlow, M. and Zorzi, E., “Mechanical design handbook for elastomers,” 1986.[61] Phang, S. K., Li, K., Chen, B. M., and Lee, T. H., “Systematic Design Methodology and Construction of Micro Aerial Quadrotor Vehicles,”
Handbook of Unmanned Aerial Vehicles, Springer, 2015, pp. 181–206.[62] Balas, C., “Modelling and linear control of a quadrotor,” Cranfield University, 2007.[63] Hoffmann, G., Rajnarayan, D. G., Waslander, S. L., Dostal, D., Jang, J. S., and Tomlin, C. J., “The Stanford testbed of autonomous rotorcraft
for multi agent control (STARMAC),” Digital Avionics Systems Conference, 2004. DASC 04. The 23rd, Vol. 2, IEEE, 2004, pp. 12–E.[64] Valavanis, K. P. and Vachtsevanos, G. J., Handbook of unmanned aerial vehicles, Springer Publishing Company, Incorporated, 2014.[65] Raptis, I. A., Valavanis, K. P., and Moreno, W. A., “A novel nonlinear backstepping controller design for helicopters using the rotation matrix,”
IEEE Transactions on Control Systems Technology, Vol. 19, No. 2, 2011, pp. 465–473.[66] David, Drexel University for Primary Industries, “Quad-Sim,” https://nl.mathworks.com/matlabcentral/fileexchange/
48053-quad-sim, 2016, Online; accessed 15 June 2017.[67] Qualcomm Technologies, Inc., “PMM8920 Power Management Module Device Specification,” 2016.[68] of America: Department of Defense, U. S., Military Handbook: Reliability Prediction of Electronic Equipment: MIL-HDBK-217F: 2 December
1991, Department of defense, 1991.[69] Williard, N., He, W., Osterman, M., and Pecht, M., “Reliability and failure analysis of Lithium Ion batteries for electronic systems,” Electronic
Packaging Technology and High Density Packaging (ICEPT-HDP), 2012 13th International Conference on, IEEE, 2012, pp. 1051–1055.[70] Bouman, G. and van Hoorn, M., “Design and Production of composite laminates,” Tech. rep., Delft University of Technology, 2016.[71] Malone, M. and Moses, K., “Development of Risk Assessment Matrix for NASA Engineering and Safety Center (NESC),” Project Management
Challenge, 2005.[72] Wallace, J. and Hobbs, P., Atmospheric Science: An Introductory Survey, International Geophysics, Elsevier Science, 2006.[73] Lawrence, M. G., “The relationship between relative humidity and the dewpoint temperature in moist air: A simple conversion and applica-
tions,” Bulletin of the American Meteorological Society, Vol. 86, No. 2, 2005, pp. 225–233.[74] Mulder, K., Sustainable development for engineers: A handbook and resource guide, Greenleaf Publishing, 2006.[75] Unwin, J., Coldwell, M. R., Keen, C., and McAlinden, J. J., “Airborne emissions of carcinogens and respiratory sensitizers during thermal
processing of plastics,” Annals of Occupational Hygiene, Vol. 57, No. 3, 2012, pp. 399–406.[76] Das, S., “Life cycle assessment of carbon fiber-reinforced polymer composites,” The International Journal of Life Cycle Assessment, Vol. 16,
No. 3, 2011, pp. 268–282.[77] Kang, D. H. P., Chen, M., and Ogunseitan, O. A., “Potential environmental and human health impacts of rechargeable lithium batteries in
electronic waste,” Environmental science & technology, Vol. 47, No. 10, 2013, pp. 5495–5503.[78] Commission of the European Communities, “Commission Regulation implementing Directive 2005/32/EC of the European Parliament and of
the Council with regard to ecodesign requirements for electric motors,” Tech. rep., European Union, 2009.[79] Xiang, D., Mou, P., Wang, J., Duan, G., and Zhang, H. C., “Printed circuit board recycling process and its environmental impact assessment,”
The International Journal of Advanced Manufacturing Technology, Vol. 34, No. 9, 2007, pp. 1030–1036.[80] Li, J., Shrivastava, P., Gao, Z., and Zhang, H.-C., “Printed circuit board recycling: a state-of-the-art survey,” IEEE transactions on electronics
packaging manufacturing, Vol. 27, No. 1, 2004, pp. 33–42.[81] Thiriez, A. and Gutowski, T., “An environmental analysis of injection molding,” Electronics and the Environment, 2006. Proceedings of the
2006 IEEE International Symposium on, IEEE, 2006, pp. 195–200.[82] International Energy Agency, “Energy Policies of IEA Countries: The Netherlands,” Tech. rep., International Energy Agency, 2014.[83] Van der Velden, N. and Smit, P., Energiemonitor van de Nederlandse glastuinbouw 2015, Wageningen Economic Research, 2016.[84] IEC, “61672: 2003: Electroacoustics–Sound Level Meters,” 2003, Standard, IEC.[85] Government of the Netherlands, “The Working Conditions Decree,” 2006, Text amended up to September 1, 2016. Translation in English

Bibliography 139
provided by the Netherlands Focal Point for Safety and Health at Work.[86] Kloet, N., Watkins, S., and Clothier, R., “Acoustic signature measurement of small multi-rotor unmanned aircraft systems,” International
Journal of Micro Air Vehicles, Vol. 9, No. 1, 2017, pp. 3–14.[87] Sinibaldi, G. and Marino, L., “Experimental analysis on the noise of propellers for small UAV,” Applied Acoustics, Vol. 74, No. 1, 2013,
pp. 79–88.[88] Intaratep, N., Alexander, W. N., Devenport, W. J., Grace, S. M., and Dropkin, A., “Experimental Study of Quadcopter Acoustics and Perfor-
mance at Static Thrust Conditions,” 22nd AIAA/CEAS Aeroacoustics Conference, 2016, p. 2873.[89] Aylor, D., “Noise reduction by vegetation and ground,” The Journal of the Acoustical Society of America, Vol. 51, No. 1B, 1972, pp. 197–205.[90] Bullen, R. and Fricke, F., “Sound propagation through vegetation,” Journal of sound and Vibration, Vol. 80, No. 1, 1982, pp. 11–23.[91] Martínez-Sala, R., Rubio, C., García-Raffi, L. M., Sánchez-Pérez, J. V., Sánchez-Pérez, E. A., and Llinares, J., “Control of noise by trees
arranged like sonic crystals,” Journal of sound and vibration, Vol. 291, No. 1, 2006, pp. 100–106.[92] Lu, Z., Debiasi, M., and Khoo, B. C., “Acoustic characteristics of a multi-rotor MAV and its noise reduction technology,” INTER-NOISE and
NOISE-CON Congress and Conference Proceedings, Vol. 253, Institute of Noise Control Engineering, 2016, pp. 393–403.[93] Leslie, A., Wong, K. C., and Auld, D., “Broadband noise reduction on a mini-UAV propeller,” 14th AIAA/CEAS Aeroacoustics Conference
(29th AIAA Aeroacoustics Conference), 2008, p. 3069.[94] Bernardes, A., Espinosa, D. C. R., and Tenório, J. S., “Recycling of batteries: a review of current processes and technologies,” Journal of Power
Sources, Vol. 130, No. 1, 2004, pp. 291–298.[95] Opara, L. U., “Traceability in agriculture and food supply chain: a review of basic concepts, technological implications, and future prospects,”
Journal of Food Agriculture and Environment, Vol. 1, 2003, pp. 101–106.[96] Wood, R., Nagpal, R., and Wei, G.-Y., “Flight of the Robobees,” Scientific American, Vol. 308, No. 3, 2013, pp. 60–65.[97] European Commission, “Horizon 2020: Work Programme 2016–2017. 9. Food security, sustainable agriculture and forestry, marine and mar-
itime and inland water research and the bioeconomy,” 2017.[98] Blank, S. and Dorf, B., The Startup Owner’s Manual: The Step-by-step Guide for Building a Great Company, K&S Ranch, Incorporated, 2012.[99] Valerdi, R., Merrill, J., and Maloney, P., “Cost metrics for unmanned aerial vehicles,” AIAA 16th Lighter-Than-Air Systems Technology Confer-
ence and Balloon Systems Conference, 2005.[100] Monte, J. A., Carvalho, D. F. d., Medici, L. O., da Silva, L. D., and Pimentel, C., “Growth analysis and yield of tomato crop under different
irrigation depths,” Revista Brasileira de Engenharia Agrícola e Ambiental, Vol. 17, No. 9, 2013, pp. 926–931.[101] Schillaci, G., Pennisi, A., Franco, F., and Longo, D., “Detecting tomato crops in greenhouses using a vision based method,” International
conference on safety, health and welfare in agriculture and agro, 2012.